Annual Report on Activities of - jma.go.jp€¦ · Annual Report onAnnual ... JapaJapa eteon Meteo...
75
Annual Report on Annual Report on the RSMC Tokyo 20 TY Damrey (0518) Japan Meteo n the Activities of n the Activities of - Typhoon Center 05 2005-09-25 06 UTC orological Agency
Transcript of Annual Report on Activities of - jma.go.jp€¦ · Annual Report onAnnual ... JapaJapa eteon Meteo...

Annual Report onAnnual Report onthe RSMC Tokyo
20
TY Damrey (0518)
Japan MeteoJapa eteo
n the Activities ofn the Activities of- Typhoon Center05
2005-09-25 06 UTC
orological Agencyo o og ca ge cy

Table of Contents
Page Introduction Chapter 1 Operations at the RSMC Tokyo - Typhoon Center in 2005 1.1 Analysis 1 1.2 Forecast 1 1.3 Provision of RSMC Products 2 1.4 RSMC Data Serving System 4 1.5 RSMC Tokyo - Typhoon Center Website 4 1.6 Numerical Typhoon Prediction Website 4 Chapter 2 Major Activities of the RSMC Tokyo - Typhoon Center in 2005 2.1 Dissemination of RSMC Products 5 2.2 Publication 5 2.3 Monitoring of Observational Data Availability 5 Chapter 3 Atmospheric and Oceanographic Conditions in the Tropics
and Tropical Cyclones in 2005 3.1 Summary of Atmospheric and Oceanographic Conditions in the Tropics 6 3.2 Tropical Cyclones in 2005 7 Chapter 4 Verification of Forecasts in 2005 4.1 Operational Forecast 9 4.1.1 Center Position 9 4.1.2 Central Pressure and Maximum Wind Speed 12 4.2 TYM and GSM Predictions 13 4.2.1 TYM Prediction 14 4.2.2 GSM Prediction 17 Tropical Cyclones in 2005 Appendices 1 RSMC Tropical Cyclone Best Tracks in 2005 2 Track and Intensity Analysis and Forecast Errors for Each Tropical Cyclone in 2005 3 Tropical Cyclone Tracks in 2005 4 Monthly and Annual Frequency of Tropical Cyclones 5 Code Forms of RSMC Products 6 List of GPV Products and Data on the RSMC Data Serving System 7 User’s Guide to the Attached CD-ROM

Introduction
The RSMC Tokyo - Typhoon Center (hereinafter referred to as "the Center") is the Regional
Specialized Meteorological Centre (RSMC) with specialized activities in analysis, tracking and forecasting of western North Pacific tropical cyclones (TCs) within the framework of the World Weather Watch (WWW) Programme of the World Meteorological Organization (WMO). The Center was established at the headquarters of the Japan Meteorological Agency (JMA) in July 1989, following the designation by the WMO Executive Council at its 40th session held in Geneva in June 1988.
The Center conducts the following operations on a routine basis:
(1) Preparation of information on the formation, movement and development of TCs and associated meteorological phenomena,
(2) Preparation of information on synoptic scale atmospheric situations that affect the behavior of TCs, and
(3) Dissemination of the above information to National Meteorological Services (NMSs), in particular to the Members of the ESCAP/WMO Typhoon Committee, in appropriate formats for operational processing.
In addition to the routine services mentioned above, the Center distributes a series of reports entitled
“Annual Report on Activities of the RSMC Tokyo - Typhoon Center” to serve as operational references for the NMSs concerned. This report aims at summarizing the activities of the Center and reviewing TCs of the year.
In this 2005 issue, the outline of routine operations at the Center and its operational products are presented in Chapter 1. Chapter 2 reports the major activities of the Center in 2005. Chapter 3 describes atmospheric and oceanic conditions in the tropics and gives the highlights of TC activities in 2005. In Chapter 4, verification statistics of operational forecasts and predictions of the two numerical weather prediction (NWP) models of the Center are presented. The best track data for the TCs in 2005 are shown in table and chart forms in appendices. All the texts, tables, charts and appendices are included in the CD-ROM attached to this report.
The CD-ROM contains three-hourly cloud images of all the TCs in 2005 of TS intensity or higher in the area of responsibility of the Center, together with the viewer software. The software has various functions for analyzing satellite imagery such as animation of images, which facilitates efficient post analysis of TCs and their environments. A setup program and a users’ manual for the software are also included in the CD-ROM. Appendix 7 shows an outline of the CD-ROM and how to use the software.
2

Chapter 1
Operations at the RSMC Tokyo - Typhoon Center in 2005
The area of responsibility of the Center covers the western North Pacific and the South China Sea (0° - 60°N, 100°E - 180°) including the marginal seas and adjacent land areas (see Figure 1.1). The Center makes analyses and forecasts of tropical cyclones (TCs) when they are in or expected to move into the area. The Center provides the National Meteorological Services (NMSs) concerned with the RSMC products through such means as the GTS, the AFTN, the JMA radio facsimile broadcast (JMH).
Figure 1.1 Area of responsibility of the RSMC Tokyo - Typhoon Center.
1.1 Analysis
Surface analyses are performed four times a day, at 00, 06, 12 and 18 UTC. The TC analysis begins with the determination of the center position of a TC. Cloud images from the Multi-functional Transport Satellite (MTSAT) are the principal source for the determination of the center position, especially of TCs migrating over the data-sparse ocean area. The direction and speed of the movement of a TC are determined primarily from the six-hourly displacement vectors of the center position.
The central pressure of a TC is determined mainly from the CI-number, which is derived from satellite imagery using Dvorak's method. The CI-number also gives the maximum sustained wind speed in the vicinity of the center. Radii of circles for the gale-force wind and the storm-force wind are determined mainly from surface observations, QuikScat observations and low-level cloud motion winds (LCW) derived from cloud motion vectors of satellite images in the vicinity of the TC. 1.2 Forecast
Predictions of two NWP models of JMA, Typhoon Model (TYM) and Global Spectral Model (GSM), provide a primary basis for TC track forecasts. The Persistence-Climatology method (PC method) that uses statistical techniques on the basis of linear extrapolation and climatological properties of TC movements is also adopted for TCs particularly in lower latitudes. The central pressure and the maximum sustained wind speed are forecasted based on the results of NWP, Dvorak's method and the PC method.
1

Probability circle shows the range into which the center of a TC is expected to move with 70%
probability at each validation time. The radius of the circle is statistically determined according to the speed of TC movement based on verification results of the recent TC track forecasts. 1.3 Provision of RSMC Products
The Center prepares and disseminates the following RSMC bulletins and charts via the GTS, the AFTN or the JMH when
- a TC of tropical storm (TS) intensity or higher exists in the area of responsibility of the Center, - a TC is expected to reach TS intensity or higher in the area within 24 hours, or
- a TC of TS intensity or higher is expected to move into the area within 24 hours.
The RSMC products are continually issued as long as a TC keeps TS intensity or higher within the
area of responsibility. Appendix 5 denotes the code forms of the bulletins transmitted through the GTS. RSMC Tropical Cyclone Advisory (WTPQ20-25 RJTD: via GTS)
The RSMC Tropical Cyclone Advisory reports the following elements in the analysis, 24-, 48- and 72-hour forecasts of a TC, respectively:
Analysis Center position Accuracy of determination of the center position Direction and speed of the movement Central pressure Maximum sustained wind speed (10-minute averaged) Radii of over 50- and 30-knot wind areas 24-, 48- and 72-hour Center position and radius of the probability circle forecast Direction and speed of the movement Central pressure Maximum sustained wind speed (10-minute averaged) RSMC Guidance for Forecast (FXPQ20-25 RJTD: via GTS)
The RSMC Guidance for Forecast reports the results of predictions of GSM and TYM; GSM is run twice a day with initial analyses at 00 and 12 UTC while TYM is run four times a day with initial analyses at 00, 06, 12 and 18 UTC. The Guidance presents GSM’s six-hourly predictions of a TC up to 90 hours ahead for 00 and 12 UTC and TYM’s six-hourly predictions up to 84 hours ahead for 00, 06, 12 and 18 UTC. It includes following elements:
2

NWP prediction (T=06 to 84 or 90) Center position Central pressure* Maximum sustained wind speed*
* Predictions of these parameters are given as deviations from those at the initial time. SAREP (TCNA20/21 RJTD: via GTS)
The SAREP reports a TC analysis using satellite imagery including intensity information (CI-number) based on Dvorak's method. It is issued a half to one hour after observations at 00, 03, 06, 09, 12, 15, 18 and 21 UTC, and contains following elements
MTSAT imagery analysis
Center position Accuracy of determination of the center position Mean diameter of the cloud system CI-number** Apparent change in intensity in the last 24 hours** Direction and speed of the movement ** These parameters are reported only at 00, 06, 12 and 18 UTC.
Regarding the WMO plan for migration to table driven code forms, the Center started disseminating SAREP report in BUFR format (IUCC10 RJTD) in November 2005, while the Center continues disseminating SAREP in the existing format. BUFR/CREX templates to translate into table driven code forms are given in the WMO webpage (http://www.wmo.ch/web/www/WMOCodes.html).
RSMC Prognostic Reasoning (WTPQ30-35 RJTD: via GTS)
The RSMC Prognostic Reasoning provides a brief reasoning for a TC forecast. It is issued at 00 and 06 UTC following the issuance of the RSMC Tropical Cyclone Advisory. In the bulletin, general comments on the forecasting method, synoptic situation of the subtropical ridge, movement and intensity of the TC, and some relevant remarks are given in plain language.
RSMC Tropical Cyclone Best Track (AXPQ20 RJTD: via GTS)
The RSMC Tropical Cyclone Best Track gives post-analyzed data of TCs of TS intensity or higher. It contains the center position, central pressure and maximum sustained wind. The best track for a TC is finalized usually one and a half months after the termination of issuance of the above RSMC bulletins for the TC.
3

Tropical Cyclone Advisory for SIGMET (FKPQ30-35 RJTD: via AFTN)
The Center, as one of the Tropical Cyclone Advisory Centres under the framework of the International Civil Aviation Organization (ICAO), provides the Tropical Cyclone Advisory for SIGMET for Meteorological Watch Offices (MWOs) concerned to support the preparation of SIGMET information on a TC. It includes the following elements in the analysis, and 12- and 24-hour forecasts of a TC:
Analysis Center position
Direction and speed of the movement Central pressure Maximum sustained wind speed (ten-minute average)
12- and 24-hour Center position forecast Maximum sustained wind speed (ten-minute average)
1.4 RSMC Data Serving System
JMA has been operating the RSMC Data Serving System that allows NMSs concerned to retrieve NWP products such as predicted fields in grid-point-value (GPV) form and observational data through the Internet since 1995. The products and data provided through the System are listed in Appendix 6. 1.5 RSMC Tokyo - Typhoon Center Website
The RSMC Tokyo - Typhoon Center Website has been providing not only TC advisories on a real-time basis but also other products including TC analysis archive and annual reports on activities of the Center. The address of the website is as follows:
http://www.jma.go.jp/jma/jma-eng/jma-center/rsmc-hp-pub-eg/RSMC_HP.htm 1.6 Numerical Typhoon Prediction Website
JMA has been operating the Numerical Typhoon Prediction (NTP) website since 1 October 2004. NTP website provides predictions of TC tracks performed by the model of eight NWP centers: BoM (Australia), CMC (Canada), DWD (Germany), ECMWF, KMA (Republic of Korea), NCEP (USA), UKMO (UK), and JMA to assist the NMSs of the Typhoon Committee Members in better TC forecasting and warning services. NTP website includes:
- data tables and charts of the latest predicted positional data of the participating NWP centers with analysis data of JMA, which have several useful functions such as deriving an ensemble mean from any combination of the centers’ predictions, and
- maps of the NWP models of the participating NWP centers.
4

Chapter 2
Major Activities of the RSMC Tokyo - Typhoon Center in 2005
2.1 Dissemination of RSMC Products
In 2005, the Center provided operational products for tropical cyclone (TC) forecasting to NMSs via such networks as the GTS and the AFTN. Monthly and annual total numbers of issuance of the products are listed in Table 2.1.
Table 2.1 Monthly and annual total number of products issued
by the RSMC Tokyo - Typhoon Center in 2005.
Product Jan Feb Mar Apr May Jun Jul Aug Sep Oct Nov Dec Total
TCNA20 15 0 11 18 0 41 85 108 122 58 28 0 486
TCNA21 19 0 18 22 4 42 95 125 144 61 33 3 566
WTPQ20-25 37 0 37 45 10 67 197 254 294 223 67 6 1237
WTPQ30-35 9 0 9 12 2 21 49 67 88 36 22 2 317
FXPQ20-25 29 0 25 33 7 62 141 185 213 91 48 4 838
FKPQ30-35 19 0 19 22 5 38 97 124 145 60 32 3 564
AXPQ20 0 1 1 0 1 0 1 3 7 5 1 3 23
2.2 Publication
The Center published “Annual Report on Activities of the RSMC Tokyo-Typhoon Center in 2004” in October 2005. 2.3 Monitoring of Observational Data Availability
The Center carried out regular monitoring of information exchange for enhanced observations of tropical cyclones in accordance with the standard procedures stipulated in Section 6.2, Chapter 6 of “The Typhoon Committee Operational Manual (TOM) - Meteorological Component.” The monitoring for the 2004-2005 season was conducted for the following two periods:
1. from 00UTC, 20 November to 18UTC, 24 November (for TY Muifa (0425)): and 2. from 00UTC, 1 August to 18UTC, 5 August (for TY Matsa (0509)). The results were distributed to all the Typhoon Committee Members in March 2006, and are
available on the Distributed Database of JMA at the following URL: ftp://ddb.kishou.go.jp/pub/monitoring/
5

Chapter 3
Atmospheric and Oceanographic Conditions in the Tropics and Tropical Cyclones in 2005
3.1 Summary of Atmospheric and Oceanographic Conditions in the Tropics As to sea surface temperature (SST) in the tropical Pacific, positive anomalies exceeding +0.5°C were widely found from 160°E to 160°W until March, and shrank after April. In the South China Sea, no anomalies were widely found throughout the year except March when negative SST anomalies were found. Enhanced convection was widely found over the South China Sea and the sea east of the Philippines from June to September. Cyclonic wind circulations were found at lower troposphere over the sea east of the Philippines and the South China Sea from July to September, however not in June. In October, active convection was not found over the sea east of the Philippines. Monthly mean streamlines at 850hPa, outgoing longwave radiation (OLR) and TC tracks in June and September are presented in Figure 3.1. Low OLR area in lower latitudes indicates active convection.
Figure 3.1 Monthly mean streamline at 850 hPa (lines with arrows) and area of less than 230 w/m2 of OLR (shaded) in June and September 2005. Tracks of 5 named TCs formed in September are superimposed in the figure for September 2005. No named TCs formed in June 2005.
Consequently, many TCs formed over the South China Sea and the sea east of the Philippines from July to September, while few TCs formed in June and October. Use attached CD-ROM to see charts. Charts of monthly mean SST anomalies for the western North Pacific and the South China Sea, monthly mean streamlines at 850hPa and 200hPa, and OLR for the months from January to December (SST anomalies 2005.ppt and Streamline 2005.ppt).
6

3.2 Tropical Cyclones in 2005
In 2005, twenty-three TCs of tropical storm (TS) intensity or higher formed in the western North
Pacific and the South China Sea. The total number is below 26.7 of the 30-year average* frequency.
Thirteen TCs out of them (57% of the total) reached typhoon (TY) intensity. Six out of the remainder
attained severe tropical storm (STS) intensity and the others reached only TS intensity (see Table 3.1).
Table 3.1 List of TCs which attained TS intensity or higher in 2005.
Max Wind(UTC) (N) (E) (hPa) (kt)
STS KULAP (0501) 151200 Jan - 190600 Jan 171200 15.7 149.6 985 50STS ROKE (0502) 150000 Mar - 171200 Mar 160600 11.7 128.9 980 55TY SONCA (0503) 230000 Apr - 271200 Apr 241200 14.5 130.8 935 90TY NESAT (0504) 311200 May - 110000 Jun 040000 14.6 131.4 930 95TY HAITANG (0505) 130000 Jul - 200600 Jul 160600 20.3 129.1 920 105TS NALGAE (0506) 201200 Jul - 241200 Jul 220600 30.6 158.7 990 45STS BANYAN (0507) 211800 Jul - 280000 Jul 231800 21.2 137.5 975 55TS WASHI (0508) 291200 Jul - 311800 Jul 291800 19.1 110.9 985 45TY MATSA (0509) 311200 Jul - 071200 Aug 041800 25.2 123.7 950 80STS SANVU (0510) 110600 Aug - 131800 Aug 121800 21.5 117.7 985 50TY MAWAR (0511) 191800 Aug - 280000 Aug 211800 22.9 139.8 930 95STS GUCHOL (0512) 210600 Aug - 251200 Aug 220600 28.2 146.7 980 55TY TALIM (0513) 270000 Aug - 020600 Sep 291800 21.2 130.6 925 95TY NABI (0514) 291200 Aug - 080600 Sep 020600 19.6 136.8 925 95TY KHANUN (0515) 070000 Sep - 130000 Sep 100900 24.5 124.9 945 85TS VICENTE (0516) 161200 Sep - 181800 Sep 180000 17.2 108.5 985 45TY SAOLA (0517) 201800 Sep - 261200 Sep 230600 27.6 139.2 950 80TY DAMREY (0518) 210000 Sep - 271800 Sep 250600 19.1 112.4 955 80TY LONGWANG(0519) 260000 Sep - 030000 Oct 010000 22.5 126.9 930 95TY KIROGI (0520) 100600 Oct - 190600 Oct 120600 20.6 132.3 930 100TY KAI-TAK (0521) 290000 Oct - 020600 Nov 310000 14.6 111.8 950 80TS TEMBIN (0522) 100000 Nov - 101200 Nov 100000 14.9 124.5 1002 35STS BOLAVEN (0523) 160600 Nov - 200000 Nov 170600 13.0 128.9 985 55
Tropical Cyclone Duration Minimum Central Pressure(UTC) (UTC)
The TC season of this year began in mid January with the formation of Kulap (0501). Roke
(0502) is the first named TC formed in March in twelve years after Lewis (9303) formed. From April to
May, two named TCs formed around active convection area over the sea far east of the Philippines. In
June, no named TC formed (1.7 for the 30-year average*).
From July to September, five named TCs formed every month (4.1, 5.5 and 5.1 for the 30-year
average* in July, August and September, respectively). In this period, subtropical high was enhanced
south of Japan, and nine out of fifteen named TCs took westward track without recurving and made landfall
on the continent or Taiwan. Among them, Talim (0513) and Damrey (0518) brought great damage to
China, Laos, Viet Nam, the Philippines and Thailand. Talim made landfall on China in early September.
Damrey took westward track in the South China Sea and made landfall on Viet Nam in late September.
On the other hand, Nabi (0514) took northward track slowly in the sea around the Nansei Islands and
7

damaged Japan and Republic of Korea severely.
From October to December, there were fewer named TCs formed than normal. There were two
named TCs formed in October and in November, while zero in December (3.9, 2.5 and 1.3 for 30-year
average*).
Figure 3.2 Genesis points of 23 TCs generated in 2005 (dots) and frequent
distribution of genesis points for 1951-2004 (lines) derived from the RSMC
TC best track data.
The mean formation position** of named TCs in 2005 of 16.4ºN and 136.2ºE was almost the
same as the 30-year average* position of 16.2 ºN and 136.9ºE.
*30-year average from 1971 to 2000
**Mean formation position here is defined as arithmetic average of latitudes (longitudes) of formation points of
all TCs of TS intensity or higher in the year.
8

Chapter 4
Verification of Forecasts in 2005 4.1 Operational Forecast Operational forecasts of the twenty-three tropical cyclones (TCs) of TS intensity or higher in 2005 were verified with the RSMC TC best track data. Verified elements are 24-, 48- and 72-hour forecasts of the center position, central pressure and maximum sustained wind. Position and intensity errors of operational forecasts for each TC in 2005 are indicated in Appendix 2. 4.1.1 Center Position
Figure 4.1 shows annual mean errors of 24-hour (1982 - 2005), 48-hour (1988 - 2005) and 72-hour
(1997 - 2005) forecasts of the center position. Annual mean position errors in 2005 were 101km (125km in 2004) for 24-hour forecast, 176km (243km) for 48-hour forecast and 266km (355km) for 72-hour forecast, all of which were the smallest since the beginning of operation of track forecast.
Position errors of 24-, 48-
and 72-hour track forecasts for each TC in this season are summarized in Table 4.1. The forecasts of Haitang (0505), Matsa (0509), Talim (0513), and Longwang (0519), which moved westward and then made landfall on China, had relatively small errors. On the other hand, the forecasts of Banyan (0507), which moved northward over the south of Japan and made landfall on Japan, had rather large errors.
0
100
200
300
400
500
600
1982 1984 1986 1988 1990 1992 1994 1996 1998 2000 2002 2004
Error (km)
72-hour 48-hour 24-hour
Figure 4.1 Annual means of position errors of 24-, 48- and 72-hour operational track forecasts.
Position errors were also compared with those by the persistency (PER) method*. The ratios of EO
(position errors of operational forecasts) to EP (position errors of the PER method forecasts) in percentage are also described in Table 4.1. EO/EP smaller (greater) than 100% means that operational forecasts are better (worse) than the PER method forecasts. Annual mean EO/EPs for the 24-, 48- and 72-hour forecasts in 2005 were 53% (54% in 2004), 39% (47%) and 37% (45%), respectively.
*The PER method is based on the assumption that a TC holds the same movement throughout the forecast period, and
the linear extrapolation of the latest 6-hour track of the TC can be applied for TC track forecast. Position errors by
the PER method are used to evaluate the relative performance of operational forecast and model predictions.
9

Table 4.1 Mean position errors of 24-, 48- and 72-hour operational forecasts for each TC in 2005. S.D., EO, EP, and EO/EP means standard deviation of operational forecast position errors, operational forecast position error, position error of the PER method, and the ratio of EO to EP, respectively.
Figure 4.2 presents the histograms of 24-hour forecast position errors. About 82% (71% in 2004)
of 24-hour forecasts, 86% (72%) of 48-hour forecasts, and 87% (76%) of 72-hour forecasts had errors less than 150km, 300km, and 450 km, respectively.
10
Mean S.D. Num. EO/EP Mean S.D. Num. EO/EP Mean S.D. Num EO/EP(km) (km) (%) (km) (km) (%) (km) (km) (%)
STS KULAP (0501) 138 87 11 46 332 153 7 49 706 299 3 95STS ROKE (0502) 178 107 6 104 98 21 2 0 0 0 0 0TY SONCA (0503) 108 83 14 37 225 128 10 27 505 53 6 29TY NESAT (0504) 74 41 38 42 120 81 33 29 225 129 28 32TY HAITANG (0505) 95 45 25 47 122 67 21 22 142 69 17 14TS NALGAE (0506) 140 86 12 78 144 110 8 26 200 76 4 19
STS BANYAN (0507) 138 56 21 51 324 123 17 56 573 193 13 71TS WASHI (0508) 78 22 5 63 278 0 1 0 0 0 0 0TY MATSA (0509) 75 50 24 56 91 54 20 36 188 122 16 52STS SANVU (0510) 117 48 6 43 274 29 2 0 0 0 0 0TY MAWAR (0511) 107 82 29 68 188 112 25 44 318 185 21 43STS GUCHOL (0512) 74 43 13 27 210 72 9 20 355 212 5 13TY TALIM (0513) 75 33 21 57 136 61 17 40 193 92 13 32TY NABI (0514) 92 43 35 47 129 86 31 29 158 66 27 23TY KHANUN (0515) 105 67 20 65 157 87 16 40 285 165 12 53TS VICENTE (0516) 83 43 5 10 262 0 1 0 0 0 0 0TY SAOLA (0517) 129 73 19 42 263 83 15 33 278 165 1
MREY (0518) 115 81 23 72 241 153 19 77 468 257 1GWA
1 19TY DA 5 101TY LON N(0519) 78 37 24 61 145 61 20 42 226 84 1
GI (0520) 112 61 32 81 208 151 28 68 209 117TAK (0521) 78 35 13 48 115 35 9 34 152 21
6 42TY KIRO 24 40TY KAI- 5 26TS TEMBIN (0522) 0 0 0 0 0 0 0 0 0 0 0 0
STS BOLAVEN (0523) 136 28 11 65 171 76 7 37 107 10 3 15101 63 407 53 176 118 318 39 266 191 239 37Annual Mean (Total)
Tropical Cyclone 24-hour Forecast 48-hour Forecast 72-hour Forecast
24-hour Track Forecast
0 20 40 60 80 100 120 140 160 180
0- 50
50- 100
100- 150
150- 200
200- 250
250- 300
300- 350
350- 400
400- 450
450- 500Error (km)
Number of cases
Figure 4.2 Histogram of 24-hour forecast position errors in 2005.
(Those for 48- and 72- hour forecasts are shown in the attached CD-ROM.)

Table 4.2 presents mean hitting ratios and radii of 70% probability circles of operational forecasts for
each tropical cyclone in 2005. Hitting ratio means the ratio of positions within 70% probability circles among all six-hourly positions of TCs. The annual mean radius of the circles issued with 24-hour position forecasts was 160km (164km in 2004), and their hitting ratio was 84% (75% in 2004). As for 48-hour forecasts, those were 285km (288km) and 85% (70%), and for 72-hour forecasts, 434km (432km) and 87% (73%), respectively.
Table 4.2 Mean hitting ratios (%) and radii (km) of 70% probability circles issued for 24-, 48- and 72-hour operational forecasts for each TC in 2005.
Ratio Num. Radius Ratio Num. Radius Ratio Num. Radius(%) (km) (%) (km) (%) (km)
STS KULAP (0501) 73 11 185 29 7 307 33 3 513STS ROKE (0502) 50 6 176 100 2 315 0 0 0TY SONCA (0503) 64 14 169 80 10 296 50 6 494TY NESAT (0504) 92 38 163 94 33 282 96 28 435TY HAITANG (0505) 92 25 148 100 21 278 100 17 408TS NALGAE (0506) 58 12 164 88 8 285 100 4 408
STS BANYAN (0507) 71 21 165 41 17 287 38 13 448TS WASHI (0508) 100 5 148 100 1 315 0 0 0TY MATSA (0509) 92 24 157 100 20 278 94 16 408STS SANVU (0510) 67 6 148 50 2 278 0 0 0TY MAWAR (0511) 86 29 167 80 25 284 86 21 446STS GUCHOL (0512) 100 13 178 100 9 317 80 5 508TY TALIM (0513) 100 21 148 100 17 278 100 13 408TY NABI (0514) 94 35 159 94 31 284 100 27 431TY KHANUN (0515) 80 20 158 94 16 279 67 12 408TS VICENTE (0516) 100 5 152 100 1 278 0 0 0TY SAOLA (0517) 74 19 165 67 15 293 91 11 492TY DAMREY (0518) 65 23 148 58 19 278 47 15 408TY LONGWANG (0519) 96 24 154 100 20 287 100 16 417TY KIROGI (0520) 84 32 168 86 28 287 100 24 460TY KAI-TAK (0521) 100 13 148 100 9 278 100 5 408TS TEMBIN (0522) 0 0 0 0 0 0 0 0
STS BOLAVEN (0523) 64 11 148 86 7 278 100 3 40884 407 160 85 318 285 87 239 434
72-hour Forecast
Annual Mean (Total)
Tropical Cyclone 24-hour Forecast 48-hour Forecast
0
11

4.1.2 Central Pressure and Maximum Wind Speed
Table 4.3 gives root mean square errors (RMSEs) of 24-, 48- and 72-hour operational central pressure forecasts for each TC in 2005. The RMSEs for maximum wind speed forecasts are included in the attached CD-ROM. Annual mean RMSEs of the central pressure and the maximum wind speed for 24-hour forecasts were 12.8hPa (11.4hPa in 2004) and 5.7m/s (5.1m/s in 2004), for 48-hour forecasts 17.0hPa (16.1hPa) and 7.7m/s (7.1m/s), and for 72-hour forecasts 19.0hPa (18.6hPa) and 10.0m/s (8.1m/s), respectively.
Operational forecasts for central pressure and maximum wind speed in 2005 were worse than those
in 2004, which contributed to TCs developed quickly including Sonca (0503) and Mawar (0511). Sonca developed quickly from 990hPa at 06UTC, 23 April to 945hPa at 06UTC, 24 April, and Mawar also developed quickly from 985hPa at 18UTC, 20 August to 930hPa at 18UTC, 21 August.
Table 4.3 Mean intensity errors of 24-, 48- and 72-hour operational central pressure forecasts
for each TC in 2005.
Error RMSE Num. Error RMSE Num. Error RMSE Num.(hPa) (hPa) (hPa) (hPa) (hPa) (hPa)
STS KULAP (0501) 0.5 2.7 11 6.1 7.1 7 5.7 7.2 3STS ROKE (0502) 1.5 8.4 6 2.0 2.8 2 0.0 0.0 0TY SONCA (0503) 10.9 25.2 14 17.1 29.6 10 13.5 28.6 6TY NESAT (0504) 0.1 14.4 38 -4.1 16.4 33 -6.1 12.7 28TY HAITANG (0505) 1.7 10.5 25 1.9 10.9 21 -1.3 22.6 17TS NALGAE (0506) -5.8 7.3 12 -7.9 9.3 8 -9.8 11.5 4STS BANYAN (0507) -4.2 7.9 21 -11.4 14.9 17 -18.7 20.3 13TS WASHI (0508) 2.8 3.6 5 6.0 6.0 1 0.0 0.0 0TY MATSA (0509) -6.4 9.1 24 -5.0 12.3 20 -6.6 18.5 16STS SANVU (0510) -1.0 3.1 6 0.0 7.0 2 0.0 0.0 0TY MAWAR (0511) 1.8 17.0 29 1.7 20.3 25 -4.9 20.2 21STS GUCHOL (0512) 2.8 6.5 13 2.2 5.8 9 5.4 8.0 5TY TALIM (0513) 1.0 11.5 21 6.9 20.3 17 5.2 29.1 13TY NABI (0514) -2.6 12.7 35 -2.4 17.7 31 -3.7 16.4 27TY KHANUN (0515) 3.4 6.8 20 7.8 13.4 16 13.4 18.0 12TS VICENTE (0516) -7.2 7.5 5 -14.0 14.0 1 0.0 0.0 0TY SAOLA (0517) 4.2 6.8 19 9.0 13.1 15 11.4 15.4 11TY DAMREY (0518) 1.8 11.5 23 8.7 19.6 19 17.9 22.6 15TY LONGWANG (0519) 0.8 15.3 24 4.9 16.3 20 3.3 21.0 16TY KIROGI (0520) 0.6 16.3 32 -0.2 20.0 28 1.6 15.5 24TY KAI-TAK (0521) -2.5 16.5 13 -6.0 23.7 9 -5.8 12.0 5TS TEMBIN (0522) 0.0 0.0 0 0.0 0.0 0 0.0 0.0 0STS BOLAVEN (0523) -12.1 14.8 11 -13.3 14.3 7 -22.7 23.3 3
-0.1 12.8 407 0.7 17.0 318 -0.2 19.0 239
72-hour Forecast
Annual Mean (Total)
Tropical Cyclone 24-hour Forecast 48-hour Forecast
12

Figure 4.3 presents the histogram of maximum wind speed errors for 24-hour forecasts. About
55% (60% in 2004) of 24-hour forecasts, 71% (67%) of 48-hour forecasts, and 62% (63%) of 72-hour forecasts had errors less than ±3.75 m/s, ±6.25 m/s and ±6.25 m/s, respectively.
24-hour Maximum Wind Forecast
0 10 20 30 40 50 60 70 80 90 100
-23.75- -21.25
-18.75- -16.25
-13.75- -11.25
-8.75- -6.25
-3.75- -1.25
1.25- 3.75
6.25- 8.75
11.25- 13.75
Error (m/s)
Number of cases
Figure 4.3 Histogram of 24-hour forecast maximum wind speed errors in 2005.
(Those for 48- and 72- hour forecasts are shown in the attached CD-ROM.)
4.2 TYM and GSM Predictions
JMA adopted the following changes to the JMA Global Spectral Model (GSM) and Typhoon Model (TYM) in 2005:
- introduction of a four-dimensional variational (4D-Var) method into global data assimilation
system in February, - introduction of a semi-Lagrangian advection scheme for GSM in February, - a revised parameterization of cloud in radiation computation in GSM in July, and - introduction of a new thinning scheme for one-hour time slots used in 4D-Var for ATOVS
assimilation into global data assimilation system in August.
TYM and GSM provide primary information for forecasters of JMA to make operational track and intensity forecasts. Track predictions by TYM and GSM up to 84 and 90 hours, respectively, were verified with the RSMC TC best track data and predictions by the persistency (PER) method. 30-, 54- and 78-hour intensity predictions by TYM and GSM were also verified with these data.
13

4.2.1 TYM Prediction 1) Center Position
Annual mean position errors of
TYM track predictions since 1996 are indicated in Figure 4.4. Annual mean position errors for 30-*, 54-* and 78-hour* predictions in 2005 were 131km (158km in 2004), 199km (249km) and 293km (361km), respectively. The overall performance of the TYM track predictions in 2005 was the best since 1996. Mean position errors of 18-, 30-, 42-, 54-, 66- and 78-hour predictions for each TC are also shown in Table 4.4.
0
100
200
300
400
500
600
1996 1997 1998 1999 2000 2001 2002 2003 2004 2005Year
Error (km)
72-hour 54-hour 30-hour
Figure 4.4 TYM annual mean position errors since 1996.
* 30-, 54- and 78-hour predictions by TYM and GSM are the primary information for forecasters in preparing 24-, 48- and 72-hour operational forecasts, respectively.
Table 4.4 Mean position errors (km) of TYM for each TC in 2005. Numbers of samples are given in parentheses.
Tropical Cyclone T=18 T=30 T=42 T=54 T=66 T=78
STS 0501 KULAP 91.4 (16) 148.8 (14) 193.9 (12) 252.8 (10) 355.4 (8) 448.0 (6)STS 0502 ROKE 157.6 (15) 199.3 (13) 216.8 (11) 219.8 (9) 228.8 (7) 220.1 (4)TY 0503 SONCA 99.6 (19) 112.7 (17) 126.6 (15) 165.9 (13) 240.9 (11) 390.7 (9)TY 0504 NESAT 83.7 (43) 92.4 (41) 102.7 (39) 130.4 (37) 191.3 (35) 248.4 (33)TY 0505 HAITANG 116.9 (33) 149.6 (31) 162.9 (29) 155.1 (27) 156.7 (25) 154.2 (23)TS 0506 NALGAE 120.6 (15) 135.0 (13) 136.5 (11) 128.9 (9) 145.0 (7) 195.7 (5)STS 0507 BANYAN 112.4 (24) 172.7 (22) 271.7 (20) 381.8 (18) 493.7 (16) 611.8 (14)TS 0508 WASHI 70.5 (7) 92.7 (5) 84.6 (3) 315.3 (1) - (-) - (-)TY 0509 MATSA 96.4 (28) 131.7 (26) 141.9 (24) 152.3 (22) 172.9 (20) 198.6 (18)STS 0510 SANVU 116.1 (9) 190.1 (7) 208.0 (5) 284.6 (3) 292.9 (1) - (-)TY 0511 MAWAR 108.4 (29) 160.6 (27) 197.0 (25) 235.0 (22) 296.7 (20) 326.6 (18)STS 0512 GUCHOL 115.7 (14) 174.1 (12) 256.3 (10) 339.7 (8) 518.7 (6) 748.6 (4)TY 0513 TALIM 97.6 (26) 118.2 (24) 135.0 (22) 158.5 (20) 174.7 (18) 223.4 (16)TY 0514 NABI 73.0 (38) 103.4 (36) 124.7 (34) 144.6 (32) 169.6 (30) 189.3 (28)TY 0515 KHANUN 83.4 (22) 114.2 (20) 145.5 (18) 197.7 (16) 254.0 (14) 299.7 (12)TS 0516 VICENTE 113.7 (8) 68.3 (6) 83.2 (4) 131.5 (2) - (-) - (-)TY 0517 SAOLA 93.7 (22) 124.5 (20) 188.5 (18) 253.8 (16) 365.5 (14) 520.9 (12)TY 0518 DAMREY 100.7 (26) 156.3 (24) 216.8 (22) 304.5 (20) 353.4 (15) 468.5 (12)TY 0519 LONGWANG 60.5 (27) 94.2 (25) 131.5 (23) 153.8 (21) 193.9 (19) 211.9 (17)TY 0520 KIROGI 87.0 (35) 122.5 (33) 156.0 (31) 208.6 (29) 244.4 (27) 276.2 (25)TY 0521 KAI-TAK 92.2 (16) 98.6 (14) 112.1 (12) 125.3 (10) 93.0 (8) 118.1 (6)TS 0522 TEMBIN 182.1 (4) 153.9 (1) - (-) - (-) - (-) - (-)STS 0523 BOLAVEN 170.4 (16) 191.5 (14) 204.9 (12) 245.5 (10) 306.9 (8) 336.8 (6)
Annual Mean 99.6 (492) 131.0 (445) 161.1 (400) 198.5 (355) 243.1 (309) 292.5 (268)
14

Table 4.5 gives TYM’s relative performance compared with the PER method. In this comparison,
life stages of TCs were classified into three stages, “Before”, “During” and “After” recurvature. Each stage is defined with the direction of movement of each TC at each prediction time concerned. This table indicates that TYM outperformed the PER method throughout the forecast period beyond 18 hours from the initial time, and rates of error reduction of TYM to the PER-method were about 32% (28% in 2004), 49% (46%), 59% (53%), 63% (56%) and 65% (57%) for 18-, 30-, 42-, 54-, and 66-/78-hour predictions, respectively. The rates were better than those in 2004, and were relatively higher in “After” stage in which position errors of PER-methods were larger compared with other two stages, except for 66- and 78-hour predictions.
Figure 4.5 (in the attached CD-ROM) presents histograms of position errors of 30-, 54- and
78-hour predictions of TYM. About 65% (55% in 2004) of 30-hour predictions, 81% (73%) of 54-hour predictions, and 82% (75%) of 78-hour predictions had errors less than 150km, 300km, and 450km, respectively.
Table 4.5 Mean position errors (km) of TYM and PER predictions for the TCs in 2005 in stages before, during and after the recurvature. Numbers of samples are given in parentheses.
TIME MODEL Before During After Total
T=18 TYM 105.0 (253) 96.1 (122) 91.8 (117) 99.6 (492)PER 137.8 (253) 137.7 (122) 176.0 (117) 146.8 (492)IMPROV 23.8 % 30.2 % 47.8 % 32.1 %
T=30 TYM 129.0 (221) 133.0 (108) 133.0 (116) 131.0 (445)PER 231.5 (221) 238.1 (108) 320.6 (116) 256.3 (445)IMPROV 44.3 % 44.2 % 58.5 % 48.9 %
T=42 TYM 153.8 (188) 152.2 (96) 180.4 (116) 161.1 (400)PER 343.9 (188) 323.2 (96) 529.8 (116) 392.9 (400)IMPROV 55.3 % 52.9 % 66.0 % 59.0 %
T=54 TYM 185.5 (159) 166.1 (82) 240.0 (114) 198.5 (355)PER 473.8 (159) 390.5 (82) 737.8 (114) 539.3 (355)IMPROV 60.8 % 57.5 % 67.5 % 63.2 %
T=66 TYM 209.4 (131) 187.8 (69) 318.6 (109) 243.1 (309)PER 608.5 (131) 482.0 (69) 904.3 (109) 684.6 (309)IMPROV 65.6 % 61.0 % 64.8 % 64.5 %
T=78 TYM 245.1 (103) 218.9 (64) 387.5 (101) 292.5 (268)PER 727.2 (103) 658.5 (64) 1053.8 (101) 833.9 (268)IMPROV 66.3 % 66.8 % 63.2 % 64.9 %
IMPROV: Error reduction rate of TYM to the PER method.
15

2) Central Pressure and Maximum Wind Speed
Mean errors of 30-, 54- and 78-hour central pressure predictions by TYM in 2005 were +3.0hPa (+2.1hPa in 2004), +5.3hPa (+4.4hPa) and +6.2hPa (+6.4hPa), respectively. Their root mean square errors (RMSEs) were 14.7hPa (13.3hPa in 2004) for 30-hour predictions, 18.5hPa (18.0hPa) for 54-hour predictions, and 20.3hPa (19.4hPa) for 78-hour predictions. The bias for 30-, 54-, and 78-hour maximum wind speed predictions was –2.4m/s (–2.0m/s in 2004) with a RMSE of 7.2m/s (7.0m/s), –3.7m/s (–3.4m/s) with a RMSE of 9.1m/s (8.4m/s), and –4.4m/s (–4.4m/s) with a RSME of 9.8m/s (9.0m/s), respectively.
Figure 4.6 shows histograms of the errors of 30-hour central pressure and maximum wind speed predictions. About 43% (40% in 2004) of the central pressure predictions had errors less than ±7.5hPa, while 42% (41%) of the maximum wind speed predictions had errors less than ±3.75m/s. As for 54-hour ones, these ratios were 59% (56%) with errors less than ±12.5hPa, and 61% (58%) with errors less than ±6.25m/s, respectively. These ratios for 78-hour ones were 67% (71%) with errors less than ±17.5hPa and 72% (71%) with errors less than ±8.75m/s, respectively. (Figures are shown in the attached CD-ROM.)
30-hour TYM Predictionsfor Central Pressure
0 20 40 60 80 100 120
-35
-25
-15
-5
+5
+15
+25
+35
Error(hPa)
Number of Cases
30-hour TYM Predictions for Maximum Sustained Wind
0 20 40 60 80 100 120
-15.0
-10.0
-5.0
0
+5.0
+10.0
+15.0
Error(m/s)
Number of Cases
Figure 4.6 Error distributions of TYM 30-hour intensity predictions. Left figure shows ones for central pressure, and right figure shows ones for maximum wind speed.
(Those for 54- and 78-hour predictions are included in the attached CD-ROM.)
16

4.2.2 GSM Prediction
Figure 4.7 GSM annual mean position errors since 1996.
0
100
200
300
400
500
600
1996 1997 1998 1999 2000 2001 2002 2003 2004 2005Year
Error (km)
72-hour 54-hour 30-hour
1) Center Position GSM annual mean position errors
since 1996 are presented in Figure 4.7. In 2005, annual mean errors for 30-, 54- and 78-hour predictions were 127km (155km in 2004), 196km (252km) and 264km (358km), respectively. The overall performance of GSM was the best since 1996. Mean position errors of the 18-, 30-, 42-, 54-, 66- and 78-hour predictions for each TC are given in Table 4.6.
Table 4.6 Mean position errors (km) of GSM for each TC in 2005.
Numbers of samples are given in parentheses.
Tropical Cyclone T=18 T=30 T=42 T=54 T=66 T=78
STS 0501 KULAP 87.9 (8) 140.0 (7) 176.8 (6) 283.4 (5) 574.8 (4) 293.5 (2)STS 0502 ROKE 204.3 (6) 233.6 (5) 238.0 (4) 277.0 (3) 236.5 (2) 203.1 (2)TY 0503 SONCA 121.1 (10) 174.9 (9) 210.8 (8) 253.7 (7) 271.7 (6) 365.3 (5)TY 0504 NESAT 86.0 (21) 107.6 (20) 125.5 (19) 134.3 (18) 177.1 (17) 231.1 (16)TY 0505 HAITANG 108.3 (17) 139.5 (16) 164.0 (15) 166.2 (14) 154.1 (13) 158.4 (12)TS 0506 NALGAE 110.6 (8) 136.9 (7) 173.0 (6) 182.5 (5) 188.0 (4) 190.8 (3)STS 0507 BANYAN 76.1 (12) 112.0 (11) 178.7 (10) 278.5 (9) 348.6 (8) 446.1 (7)TS 0508 WASHI 55.5 (2) 73.7 (1) - (-) - (-) - (-) - (-)TY 0509 MATSA 96.3 (14) 112.3 (13) 129.9 (12) 140.8 (11) 179.6 (10) 236.8 (9)STS 0510 SANVU 102.6 (5) 122.0 (3) 193.8 (2) - (-) - (-) - (-)TY 0511 MAWAR 98.0 (15) 158.1 (13) 212.8 (11) 241.4 (9) 284.4 (7) 293.7 (6)STS 0512 GUCHOL 135.7 (7) 184.5 (6) 285.6 (5) 395.4 (4) 565.0 (3) 635.9 (2)TY 0513 TALIM 94.5 (13) 127.7 (12) 156.4 (11) 184.6 (10) 183.0 (9) 224.6 (8)TY 0514 NABI 64.8 (19) 81.3 (18) 110.1 (17) 125.7 (16) 142.5 (15) 165.4 (14)TY 0515 KHANUN 82.6 (11) 124.4 (10) 143.8 (9) 165.3 (8) 216.9 (7) 402.8 (6)TS 0516 VICENTE 105.4 (4) 79.0 (2) 115.7 (1) - (-) - (-) - (-)TY 0517 SAOLA 88.8 (11) 131.3 (10) 189.1 (9) 287.0 (8) 365.9 (7) 509.3 (6)TY 0518 DAMREY 67.6 (13) 120.1 (12) 163.9 (10) 200.7 (9) 277.5 (7) 309.7 (5)TY 0519 LONGWANG 88.6 (13) 108.7 (13) 110.0 (12) 119.5 (11) 128.3 (10) 146.6 (9)TY 0520 KIROGI 92.6 (17) 130.3 (16) 190.0 (15) 254.3 (14) 271.6 (13) 251.7 (12)TY 0521 KAI-TAK 55.1 (7) 81.4 (6) 130.3 (5) 169.9 (5) 158.5 (4) 207.5 (2)TS 0522 TEMBIN 119.4 (1) - (-) - (-) - (-) - (-) - (-)STS 0523 BOLAVEN 124.2 (8) 144.8 (7) 168.3 (6) 199.0 (5) 258.8 (4) 286.9 (3)
Annual Mean 94.4 (242) 126.8 (217) 161.9 (193) 195.9 (171) 231.5 (150) 263.8 (129)
Table 4.7 gives GSM’s relative performance compared with the PER method. Rates of error reduction of GSM to the PER method were about 36% (30% in 2004), 51% (46%), 64% (56%) and 68% (57%) for 18-, 30-, 54- and 78-hour predictions, respectively.
Figure 4.8 (in the attached CD-ROM) presents histograms of the position errors of 30-, 54- and
78-hour predictions of GSM. About 70% (55% in 2004) of 30-hour prediction, 82% (71%) of 54-hour prediction, and 86% (76%) of 78-hour prediction had errors less than 150km, 300km, and 450km, respectively.
17

Table 4.7 Mean position errors (km) of GSM and PER predictions for the TCs in 2005 in stages before, during and after the recurvature.
TIME MODEL Before During After Total
T=18 GSM 98.2 (118) 85.5 (63) 96.3 (61) 94.4 (242)PER 136.2 (118) 141.5 (63) 176.3 (61) 147.7 (242)IMPROV 27.9 % 39.6 % 45.4 % 36.1 %
T=30 GSM 117.8 (103) 116.1 (55) 152.4 (59) 126.8 (217)PER 226.6 (103) 244.6 (55) 326.9 (59) 258.4 (217)IMPROV 48.0 % 52.5 % 53.4 % 50.9 %
T=42 GSM 142.4 (87) 145.8 (48) 204.6 (58) 161.9 (193)PER 332.1 (87) 321.4 (48) 549.7 (58) 394.8 (193)IMPROV 57.1 % 54.6 % 62.8 % 59.0 %
T=54 GSM 160.2 (74) 164.4 (41) 266.1 (56) 195.9 (171)PER 464.4 (74) 356.1 (41) 771.2 (56) 538.9 (171)IMPROV 65.5 % 53.8 % 65.5 % 63.7 %
T=66 GSM 178.3 (63) 193.3 (34) 319.3 (53) 231.5 (150)PER 589.7 (63) 473.2 (34) 939.1 (53) 686.8 (150)IMPROV 69.8 % 59.2 % 66.0 % 66.3 %
T=78 GSM 193.5 (48) 265.6 (33) 332.8 (48) 263.8 (129)PER 736.9 (48) 607.0 (33) 1078.8 (48) 830.9 (129)IMPROV 73.7 % 56.3 % 69.1 % 68.3 %
IMPROV: Error reduction rate of GSM to the PER method
2) Central Pressure and Maximum Wind Speed
Figure 4.9 shows histograms of central pressure errors and the maximum wind speed errors of 30-hour predictions of GSM. The histograms show that in most cases GSM underestimated the intensity of TCs in its 30-hour predictions and had a relatively positive bias in the central pressure prediction.
30-hour GSM Predictionsfor Central Pressure
0 20 40 60 80 100 120
-35
-25
-15
-5
+5
+15
+25
+35
Error(hPa)
Number of Cases
30-hour GSM Predictions for Maximum Sustained Wind
0 20 40 60 80 100 120
-15.0
-10.0
-5.0
0
+5.0
+10.0
+15.0
Error(m/s)
Number of Cases
Figure 4.9 Error distributions of GSM 30-hour intensity predictions in 2005. Left figure shows ones for central pressure, and right figure shows ones for maximum wind speed.
(Those for 54- and 78-hour predictions are included in the attached CD-ROM.)
18
Tropical cyclones in 2005
STS KULAP (0501)
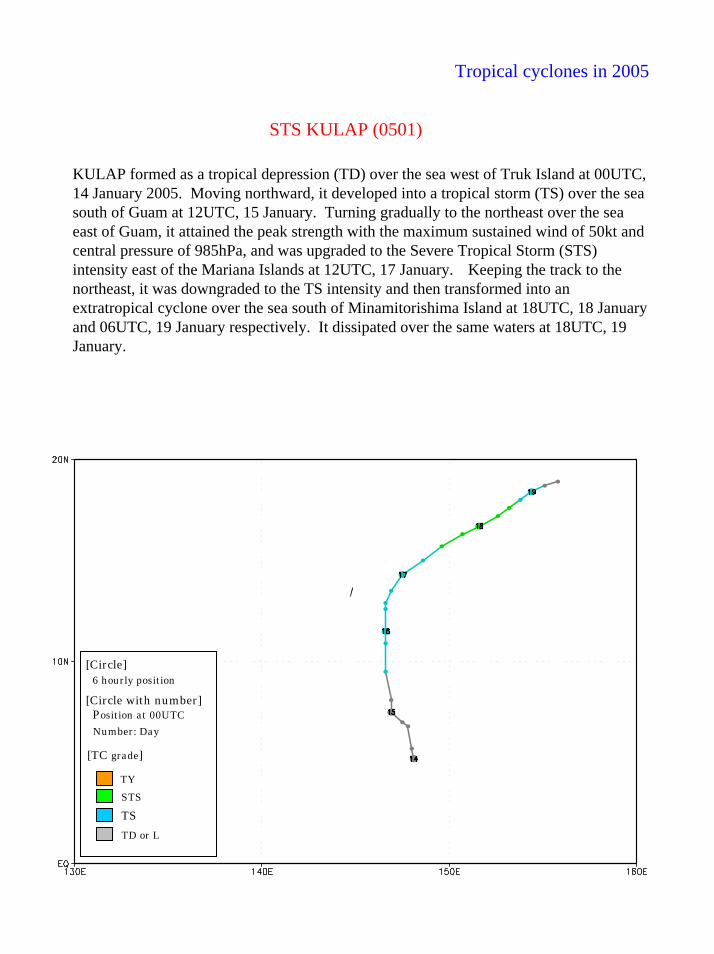
KULAP formed as a tropical depression (TD) over the sea west of Truk Island at 00UTC, 14 January 2005. Moving northward, it developed into a tropical storm (TS) over the sea south of Guam at 12UTC, 15 January. Turning gradually to the northeast over the sea east of Guam, it attained the peak strength with the maximum sustained wind of 50kt and central pressure of 985hPa, and was upgraded to the Severe Tropical Storm (STS) intensity east of the Mariana Islands at 12UTC, 17 January. Keeping the track to the northeast, it was downgraded to the TS intensity and then transformed into an extratropical cyclone over the sea south of Minamitorishima Island at 18UTC, 18 January and 06UTC, 19 January respectively. It dissipated over the same waters at 18UTC, 19 January.
TYSTS
TD or L
[TC grade]
[Circle]
[Circle with number]Position at 00UTC
6 hourly position
Number: Day
TS

Tropical cyclones in 2005
STS ROKE (0502)
ROKE formed as a tropical depression (TD) around Truck Island at 00UTC on 12 March 2005. It moved west-northwestward, and developed into a tropical storm (TS) far east of the Philippines at 00UTC, 15 March. Moving westward, it was upgraded to the Severe Tropical Storm (STS) intensity, and then reached the peak intensity with maximum sustained wind of 55kt and central pressure of 980hPa over the waters east of the Philippines at 00UTC and 06UTC, 16 March, respectively. Crossing the Philippines, it was downgraded to the TS intensity at 18UTC, 16 March and then weakened into a TD at 12UTC, 17 March. Keeping the track to the west, ROKE dissipated in the South China Sea at 12UTC, 19 March.
TYSTS
TD or L
[TC grade]
[Circle]
[Circle with number]Position at 00UTC
6 hourly position
Number: Day
TS

Tropical cyclones in 2005
TY SONCA (0503)
SONCA formed as a tropical depression (TD) around the Caroline Islands at 06UTC on 21 April 2005 and moved west-northwestward. Continuing on the westward track, it became a tropical storm (TS) over the sea east of the Philippines at 00UTC on 23 April. Then turning gradually to the north, it developed quickly into the typhoon (TY) intensity at 18UTC, 23 April. It reached the peak strength with maximum sustained wind of 90kt and central pressure of 935hPa over the same waters at 12UTC on 24 April. After the recurvature, SONCA accelerated toward the east-northeast and quickly transformed into an extratropical cyclone east-northeast of Chichijima Island at 12UTC on 27 April.Then it turned to the east and dissipated north of Wake Island at 12UTC, 29 April.
TYSTS
TD or L
[TC grade]
[Circle]
[Circle with number]Position at 00UTC
6 hourly position
Number: Day
TS

Tropical cyclones in 2005
TY NESAT (0504)
NESAT formed as a tropical depression (TD) around the Caroline Islands at 00UTC, 30 May 2005 and moved west-northwestward. It reached the tropical storm (TS) intensity south of Guam at 12UTC, 31 May. Then it developed quickly into the typhoon (TY) intensity over the sea southwest of Guam at 12UTC, 1 June. NESAT gradually turned to the northwest on 3 June and reached its peak intensity with maximum sustained wind of 95 knots and central pressure of 930hPa east of the Philippines at 00UTC on the next day. After the recurvature, it moved northeastward with slight meander. After it passed south of Hachijojima Island, it weakened into a TD and then dissipated over the sea east of Japan at 00UTC and 12UTC, 11 June, respectively.
TYSTS
TD or L
[TC grade]
[Circle]
[Circle with number]Position at 00UTC
6 hourly position
Number: Day
TS

Tropical cyclones in 2005
TY HAITANG (0505)
HAITANG formed as a tropical depression (TD) over the sea south of MinamitorishimaIsland at 18UTC on 10 July 2005. It moved westward, and developed into a tropical storm (TS) southwest of Minamitorishima Island at 00UTC, 13 July. Moving to the west-southwest, it developed quickly to the typhoon (TY) intensity north of the Mariana Islands at 18UTC, the same day. Turning westward and then west-northwestward, HAITANG reached the peak intensity with maximum sustained wind of 105kt and central pressure of 920hPa over the waters south of Okinawa Island at 06UTC, 16 July. After it moved northwestwards over the sea south of Ishigakijima Island on 17 July, it turned in the counterclockwise direction off the eastern coast of Taiwan. HAITANG turned toward the northwest, crossed Taiwan on 18 July, and then made landfall on Fujian, China on 19 July. It weakened into a TD and dissipated in the central China at 06UTC, 20 July and 18UTC, 21 July, respectively.
TYSTS
TD or L
[TC grade]
[Circle]
[Circle with number]Position at 00UTC
6 hourly position
Number: Day
TS

Tropical cyclones in 2005
TS NALGAE (0506)
NALGAE formed as a tropical depression (TD) northeast of Wake Island at 00UTC on 18 July 2005. It moved northwestward, and developed into a tropical storm (TS) over the sea east of Minamitorishima Island at 12UTC, 20 July. During the recurvature, it reached the peak intensity with maximum sustained wind of 45kt and central pressure of 990hPa over the waters northeast of Minamitorishima Island at 06UTC, 22 July. Moving to the northeast, it weakened slightly and transformed into an extratropicalcyclone over the waters far east of Japan at 12UTC, 24 July. It turned to the north and dissipated over the same waters at 00UTC, 28 July.
TYSTS
TD or L
[TC grade]
[Circle]
[Circle with number]Position at 00UTC
6 hourly position
Number: Day
TS

Tropical cyclones in 2005
STS BANYAN (0507)
BANYAN formed as a tropical depression (TD) over the sea far east of the Philippines at 12UTC on 20 July 2005. Moving northward, it developed into a tropical storm (TS) over the same waters at 18UTC, 21 July. Keeping the track to the north, it was upgraded to the severe tropical storm (STS) intensity and reached the peak intensity with maximum sustained wind of 55kt and central pressure of 975hPa over the waters east of Okinotorishima Island at 12UTC and 18UTC, 23 July, respectively. From 24 to 26 July, it moved northward with almost the same intensity. After it turned northeastward south of Japan, BANYAN made landfall on Honshu before 12UTC, 26 July. Keeping the northeast track, it transformed into an extratropical cyclone around the Kurile Islands at 00UTC, 28 July. It turnedgradually toward the east and crossed the International Date Line around the Aleutian Islands before 06UTC, 31 July.
TYSTS
TD or L
[TC grade]
[Circle]
[Circle with number]Position at 00UTC
6 hourly position
Number: Day
TS

Tropical cyclones in 2005
TS WASHI (0508)
WASHI formed as a tropical depression (TD) in the South China Sea at 18UTC on 28 July 2005. Moving westward, it developed into a tropical storm (TS) off the east coast of Hainan Island at 12UTC on the next day. Crossing Hainan Island westward, it reached the peak intensity with maximum sustained wind of 45kt and central pressure of 985hPa at 00UTC, 30 July. It moved westward in the Gulf of Tongkingand then made landfall on Vietnam on 31 July. WASHI weakened into a TD and dissipated around the boundary between Laos and Vietnam at 18UTC, 31 July and 00UTC 1 August, respectively.
TYSTS
TD or L
[TC grade]
[Circle]
[Circle with number]Position at 00UTC
6 hourly position
Number: Day
TS

Tropical cyclones in 2005
TY MATSA (0509)
TYSTS
TD or L
[TC grade]
[Circle]
[Circle with number]Position at 00UTC
6 hourly position
Number: Day
TS
MATSA formed as a tropical depression (TD) over the sea south of Yap Island at 12UTC on 30 July 2005. Moving northwestward, it developed into a tropical storm (TS) far east of the Philippines at 12UTC, 31 July. It moved to the northwest, and was upgraded to the typhoon (TY) intensity over the same waters at 12UTC, 2 August. Keeping the northwest track, it passed Ishigakijima Island before 11UTC, 4 August. Soon after it entered the East China Sea, it reached the peak intensity with maximum sustained wind of 80kt and central pressure of 950hPa at 18UTC on the same day. Moving to the northwest, MATSA made landfall on the central China and then was downgraded to the severe tropical storm (STS) intensity at 00UTC, 6 August. After it turned abruptly toward the north, it weakened into a TD north of Nanjin at 12UTC, 7 August. It transformed into an extratropical cyclone around Shandong Peninsula at 06UTC, 8 August and then turned toward the northeast. MATSA passed the Bohai and then dissipated around Liaodong Peninsula at 12UTC, 9 August.

Tropical cyclones in 2005
STS SANVU (0510)
SANVU formed as a tropical depression (TD) over the waters east of the Philippines at 18UTC on 9 August 2005. Moving to the west-northwest, it developed into a tropical storm (TS) over the same waters at 06UTC, 11 August. Keeping the west-northwestward track, it approached the north coast of Luzon Island after 12UTC on the same day. Turning gradually to the northwest, it was upgraded to the severe tropical storm (STS) intensity and reached the peak intensity with maximum sustained wind of 50kt and central pressure of 985hPa in the South China Sea at 12UTC and 18UTC on the next day. SANVU made landfall on the southern China after 00UTC, 13 August. Moving to the northwest, it was downgraded to the TS intensity and then weakened into a TD in the southern China at 12UTC and 18UTC on the same day. It dissipated in the central China at 00UTC, 15 August.
TYSTS
TD or L
[TC grade]
[Circle]
[Circle with number]Position at 00UTC
6 hourly position
Number: Day
TS

Tropical cyclones in 2005
TY MAWAR (0511)
TYSTS
TD or L
[TC grade]
[Circle]
[Circle with number]Position at 00UTC
6 hourly position
Number: Day
TS
MAWAR formed as a tropical depression (TD) over the waters northwest of the Mariana Islands at 06UTC on 19 August 2005. Moving westward, it developed into a tropical storm (TS) over the same waters at 18UTC, 19 August. Turning to the northwest, it was upgraded to the typhoon (TY) intensity over the same waters at 00UTC, 21 August and then reached the peak intensity with maximum sustained wind of 95kt and central pressure of 930hPa at 18UTC on the same day. After it recurved south of Honshu on 24 August, it made landfall on Honshu with the TY intensity after 19UTC, 25 August. Soon after MAWAR entered the Pacific again, it was downgraded to the TS intensity at 06UTC, 26 August. Moving to the east, it transformed into an extratropical cyclone east of Japan at 00UTC, 28 August. It turned abruptly to the north and then to the east again, and dissipated over the same waters at 06UTC, 1 September.

Tropical cyclones in 2005
STS GUCHOL (0512)
GUCHOL formed as a tropical depression (TD) south of Minamitorishima Island at 18UTC, 18 August 2005. Moving to the west-northwest, it developed into a tropical storm (TS) west of Minamitorishima Island at 06UTC, 21 August. Turning to the north, it was upgraded to the severe tropical storm (STS) intensity and reached the peak intensity with maximum sustained wind of 55kt and central pressure of 980hPa over the sea east of Chichijima Island at 00UTC and 06UTC on the next day, respectively. Afterthe recurvature on 22 August, it moved northeastward east of Japan keeping the intensity. GUCHOL transformed into an extratropical cyclone over the waters east of the Kurile Islands at 12UTC, 25 August. It dissipated over the same waters at 06UTC, 27 August.
TYSTS
TD or L
[TC grade]
[Circle]
[Circle with number]Position at 00UTC
6 hourly position
Number: Day
TS

Tropical cyclones in 2005
TY TALIM (0513)
TALIM formed as a tropical depression (TD) south of Guam at 18UTC on 25 August 2005. It turned to the north-northwest and developed into a tropical storm (TS) west of Guam at 00UTC, 27 August. Turning to the west-northwest, it developed into a typhoon (TY) far east of the Philippines at 06UTC, 28 August and reached the peak intensity with maximum sustained wind of 95kt and central pressure of 925hPa over the waters southeast of Okinawa at 18UTC on the next day. Weakening the intensity gradually, it passed south of Yonagunijima Island and then made landfall on Taiwan on 31 August. Moving to the west-northwest, TALIM entered the Taiwan Strait and then made landfall on the southern China with the severe tropical storm (STS) intensity on 1 September. It weakened into a TD at 06UTC, 2 September and dissipated in the central China at 00UTC on the next day.
TYSTS
TD or L
[TC grade]
[Circle]
[Circle with number]Position at 00UTC
6 hourly position
Number: Day
TS

Tropical cyclones in 2005
TY NABI (0514)
NABI formed as a tropical depression (TD) east of the Mariana Islands at 00UTC on 29 August 2005. Moving to the west, it developed into a tropical storm (TS) over the same waters at 12UTC, 29 August. Turning to the west-northwest, it developed into a typhoon (TY) around the Mariana Islands at 18UTC, 30 August and reached the peak intensity with maximum sustained wind of 95kt and central pressure of 925hPa far east of the Philippines at 06UTC, 2 September. Turning toward the north, it passed slowly around Minamidaitojima Island and Yakushima Island, and then made landfall on Kyushu with the TY intensity after 05UTC, 6 September. It moved northeastward in the Japan Sea and made landfall on Hokkaido on the next day. Turning to the east, NABI transformed into an extratropical cyclone in the Sea of Okhotsk at 06UTC, 8 September and dissipated south of the Aleutian Islands at 00UTC, 10 September.
TYSTS
TD or L
[TC grade]
[Circle]
[Circle with number]Position at 00UTC
6 hourly position
Number: Day
TS

Tropical cyclones in 2005
TY KHANUN (0515)
KHANUN formed as a tropical depression (TD) over the waters east of Yap Island at 00UTC, 5 September 2005. It moved northwestward and developed into a tropical storm (TS) over the waters far east of the Philippines at 00UTC, 7 September. Moving to the northwest, it was upgraded into the typhoon (TY) intensity over the same waters at 18UTC on the next day. Keeping the track to the northwest, KHANUN approached Miyakojima Island and reached the peak intensity with maximum sustained wind of 85kt and central pressure of 945hPa at 09UTC, 10 September. After it made landfall on China with the TY intensity on 11 September, it recurved with weakening the intensity in China. It transformed into an extratropical cyclone and dissipated in the Yellow Sea at 00UTC and 18UTC, 13 September, respectively.
TYSTS
TD or L
[TC grade]
[Circle]
[Circle with number]Position at 00UTC
6 hourly position
Number: Day
TS

Tropical cyclones in 2005
TS VICENTE (0516)
VICENTE formed as a tropical depression (TD) in the South China Sea at 06UTC, 15 September 2005. Moving to the southwest and then turning in anticlockwise direction, it developed into a tropical storm (TS) over the same waters at 12UTC, 16 September. Then it turned to the west-northwest and attained the peak intensity with maximum sustained wind of 45kt and central pressure of 985hPa over the same waters at 00UTC, 18 September. VICENTE made landfall on Vietnam on the same day, and weakened into a TD around the boundary between Laos and Thailand at 18UTC, 18 September. It crossed the 100 deg. E. longitudes at 00UTC on the next day.
TYSTS
TD or L
[TC grade]
[Circle]
[Circle with number]Position at 00UTC
6 hourly position
Number: Day
TS

Tropical cyclones in 2005
TY SAOLA (0517)
SAOLA formed as a tropical depression (TD) over the sea south of MinamitorishimaIsland at 00UTC, 19 September 2005. It moved to the west-northwest and developed into a tropical storm (TS) over the same waters at 18UTC on the next day. Keeping the west-northwestward track, it was upgraded into the typhoon (TY) intensity north of the Mariana Islands at 00UTC, 22 September. After it passed south of Chichijima Island, it reached the peak intensity with maximum sustained wind of 80kt and central pressure of 950hPa at 06UTC on the next day. After the recurvature south of Honshu, SAOLA approached Hachijojima Island with the TY intensity before 00UTC, 25 September. Turning to the east, it transformed into an extratropical cyclone over the sea east of Japan at 12UTC, 26 September and crossed the International Date Line at 00UTC, 28 September.
TYSTS
TD or L
[TC grade]
[Circle]
[Circle with number]Position at 00UTC
6 hourly position
Number: Day
TS

Tropical cyclones in 2005
TY DAMREY (0518)
DAMREY formed as a tropical depression (TD) east of the Philippines at 06UTC, 19 September 2005. Moving to the northwest, it developed into a tropical storm (TS) off the northeast coast of Luzon Island at 00UTC, 21 September. Turning to the west, it passed the Luzon Strait and entered the South China Sea. Keeping the westward track, DAMREY was upgraded to the typhoon (TY) intensity and reached the peak intensity with maximum sustained wind of 80kt and central pressure of 955hPa in the South China Sea at 12UTC, 24 September and 06UTC, 25 September, respectively. After the landfall on Hainan Island with the TY intensity on 26 September, it entered the Gulf of Tongkingand then landed on Vietnam with the severe tropical storm (STS) intensity on the next day. It weakened into a TD and crossed the 100 deg. E. longitudes at 18UTC, 27 September and 06UTC, 28 September, respectively.
TYSTS
TD or L
[TC grade]
[Circle]
[Circle with number]Position at 00UTC
6 hourly position
Number: Day
TS

Tropical cyclones in 2005
TY LONGWANG (0519)
LONGWANG formed as a tropical depression (TD) over the waters around the Mariana Islands at 06UTC, 25 September 2005. Moving to the west, it developed into a tropical storm (TS) over the same waters at 00UTC, 26 September. It moved west-northwestwards and was upgraded to the typhoon (TY) intensity south of IwojimaIsland at 00UTC on the next day. It turned to the west and reached the peak intensity with maximum sustained wind of 95kt and central pressure of 930hPa south of Okinawa Island at 00UTC, 1 October. Keeping the intensity, it made landfall on Taiwan on the same day. Weakening the intensity rapidly, it passed the Taiwan Strait and made landfall again on southern China on 2 October. It weakened into a TD and dissipated in the southern China at 00UTC and 12 UTC, 3 October, respectively.
TYSTS
TD or L
[TC grade]
[Circle]
[Circle with number]Position at 00UTC
6 hourly position
Number: Day
TS

Tropical cyclones in 2005
TY KIROGI (0520)
KIROGI formed as a tropical depression (TD) over the waters southwest of IwojimaIsland at 00UTC, 9 October 2005. Moving to the west and then turning to the south, it developed into a tropical storm (TS) over the waters south of MinamidaitojimaIsland at 06UTC on the next day. It was upgraded to the typhoon (TY) intensity over the same waters at 06UTC, 11 October. Turning to the north, it reached the peak intensity with maximum sustained wind of 100kt and central pressure of 930hPa over the same waters at 06UTC on the next day. KIROGI moved slowly toward the north with almost the same intensity. On 15 October, it turned to the northeast over the same waters. Keeping the northeastward track over the sea east of MinamidaitojimaIsland, it gradually weakened the intensity on 17 October. After KIROGI turned to the east over the waters south of Honshu on 18 October, it weakened into a TD and dissipated southeast of Hachijojima Island at 06UTC and 18UTC on the next day, respectively.
TYSTS
TD or L
[TC grade]
[Circle]
[Circle with number]Position at 00UTC
6 hourly position
Number: Day
TS

Tropical cyclones in 2005
TY KAI-TAK (0521)
KAI-TAK formed as a tropical depression (TD) in the South China Sea at 06UTC, 28 October 2005. Moving to the west, it developed into a tropical storm (TS) over the same waters at 00UTC, 29 October. It turned to the northwest on the same day and was upgraded to the typhoon (TY) intensity over the same waters at 06UTC on the next day. It reached the peak intensity with maximum sustained wind of 80kt and central pressure of 950hPa over the same waters at 00UTC, 31 October. Keeping the northwestward track, it weakened into a TD and dissipated off the coast of Vietnam at 06UTC and 12UTC, 2 November, respectively.
TYSTS
TD or L
[TC grade]
[Circle]
[Circle with number]Position at 00UTC
6 hourly position
Number: Day
TS

Tropical cyclones in 2005
TS TEMBIN (0522)
TEMBIN formed as a tropical depression (TD) southeast of Yap Island at 12UTC, 6 November 2005. It moved northwards and then turned to the west over the waters east of Philippines from 7 to 8 November. It moved to the west-northwest over the same waters on 9 November and developed into a tropical storm (TS) east of Luzon Island at 00UTC, 10 November. Moving west-northwestwards, it weakened into a TD around the east coast of Luzon Island at 12UTC on the same day. After it passed through Luzon Island, it gradually turned to the south and dissipated in the South China Sea at 18UTC, 12 November.
TYSTS
TD or L
[TC grade]
[Circle]
[Circle with number]Position at 00UTC
6 hourly position
Number: Day
TS

Tropical cyclones in 2005
STS BOLAVEN (0523)
BOLAVEN formed as a tropical depression (TD) east of Mindanao Island at 00UTC, 14 November 2005. It moved northward and developed into a tropical storm (TS) over the waters east of the Philippines at 06UTC, 16 November. After it turned to the west, it was upgraded to the severe tropical storm (STS) intensity over the same waters at 00UTC on the next day and reached the peak intensity with the maximum sustained wind of 55kt and central pressure of 985hPa 6 hours later. Then BOLAVEN turned to the west-northwest. Keeping the same track, it weakened into a TD around the east coast of Luzon Island at 00UTC, 20 November. It dissipated on Luzon Island 12 hours later.
TYSTS
TD or L
[TC grade]
[Circle]
[Circle with number]Position at 00UTC
6 hourly position
Number: Day
TS

Appendix 1RSMC Tropical Cyclone Best Tracks in 2005
Date/Time Center Position Centralpressure Max Wind CI number Grade Date/Time Center Position Central
pressure Max Wind CI number Grade Date/Time Center Position Centralpressure Max Wind CI number Grade
(UTC) Lat (N) Lon (E) (hPa) (kt) (UTC) Lat (N) Lon (E) (hPa) (kt) (UTC) Lat (N) Lon (E) (hPa) (kt)
STS KULAP (0501) TY SONCA (0503) TY NESAT(0504)14 Jan. - 19 Jan. 21 Apr. - 29 Apr. 30 May - 11 Jun.
Jan. 14/00 5.2 148.1 1004 - - TD Apr. 21/06 8.7 141.9 1004 - - TD May 30/00 8.7 148.4 1008 - - TD14/06 5.7 148.0 1002 - - TD 21/12 9.9 139.9 1006 - - TD 30/06 9.1 147.3 1006 - - TD14/12 6.8 147.8 1000 - - TD 21/18 10.6 138.6 1004 - - TD 30/12 9.3 146.6 1006 - - TD14/18 7.0 147.5 998 - - TD 22/00 11 137.4 1004 - - TD 30/18 9.5 146.1 1004 - - TD15/00 7.5 146.9 998 - - TD 22/06 11.5 136.1 1004 - - TD 31/00 9.7 145.6 1004 - - TD15/06 8.1 146.9 998 - - TD 22/12 11.5 134.4 1002 - - TD 31/06 9.9 145.0 1002 - - TD15/12 9.5 146.6 996 35 2.5 TS 22/18 11.3 133.4 1002 - - TD 31/12 10.3 144.4 1000 35 2.5 TS15/18 10.9 146.6 994 40 3.0 TS 23/00 11.6 132.8 1000 35 2.5 TS 31/18 10.5 143.7 994 45 3.0 TS16/00 11.5 146.6 994 40 3.0 TS 23/06 12.2 131.9 990 45 3.0 TS Jun. 01/00 10.8 142.8 985 50 3.5 STS16/06 12.6 146.6 992 40 3.0 TS 23/12 12.6 131.5 975 60 4.0 STS 01/06 10.7 141.6 975 60 4.0 STS16/12 12.9 146.6 992 40 3.0 TS 23/18 13.2 131.2 965 70 4.5 TY 01/12 10.6 140.5 965 70 4.5 TY16/18 13.5 146.9 990 45 3.5 TS 24/00 13.5 130.8 955 75 5.0 TY 01/18 10.7 139.6 955 75 5.0 TY17/00 14.3 147.5 990 45 3.5 TS 24/06 14.1 130.8 945 85 5.5 TY 02/00 11.2 138.5 945 80 6.0 TY17/06 15.0 148.6 990 45 3.5 TS 24/12 14.5 130.8 935 90 6.5 TY 02/06 11.5 137.4 940 85 6.0 TY17/12 15.7 149.6 985 50 3.5 STS 24/18 15.2 131 935 90 6.5 TY 02/12 11.7 136.3 935 90 6.0 TY17/18 16.3 150.7 985 50 3.5 STS 25/00 16 131.2 935 90 6.5 TY 02/18 12.1 135.4 935 90 6.0 TY18/00 16.7 151.6 985 50 3.5 STS 25/06 16.7 131.6 940 85 6.0 TY 03/00 12.3 134.4 935 90 6.0 TY18/06 17.2 152.6 985 50 3.5 STS 25/12 17.5 132.3 940 85 6.0 TY 03/06 13.0 133.7 935 90 6.0 TY18/12 17.6 153.2 985 50 3.5 STS 25/18 18.7 132.9 940 85 6.0 TY 03/12 13.7 132.6 935 90 6.0 TY18/18 18.0 153.8 990 45 3.0 TS 26/00 20.1 134 940 85 6.0 TY 03/18 14.1 131.8 935 90 6.0 TY19/00 18.4 154.4 1000 35 2.5 TS 26/06 21.7 135.6 950 80 5.5 TY 04/00 14.6 131.4 930 95 6.5 TY19/06 18.7 155.1 1004 - - L 26/12 23.5 138.1 960 75 5.0 TY 04/06 15.2 131.0 930 95 6.5 TY19/12 18.9 155.8 1012 - - L 26/18 24.7 140.1 970 65 4.5 TY 04/12 15.7 130.6 930 95 6.5 TY19/18 Dissip. 26/21 25.2 141.4 975 60 - STS 04/18 16.4 130.4 940 90 5.5 TY
27/00 25.5 142.7 980 55 4.0 STS 05/00 17.3 130.4 945 85 5.5 TY27/03 26.2 144 985 50 - STS 05/06 18.1 130.9 945 85 5.5 TY
Date/Time Center Position Centralpressure Max Wind CI number Grade 27/06 26.7 145.6 990 45 3.5 TS 05/12 18.9 131.3 950 80 5.0 TY
(UTC) Lat (N) Lon (E) (hPa) (kt) 27/12 27.7 148.7 996 - - L 05/18 19.6 132.0 955 80 5.0 TYSTS ROKE (0502) 27/18 28.5 151.6 1000 - - L 06/00 20.6 132.5 955 80 5.5 TY
12 Mar. - 19 Mar. 28/00 28.6 155.3 1004 - - L 06/06 21.3 133.4 945 85 6.0 TY28/06 28.4 158.3 1006 - - L 06/12 21.9 133.8 945 85 6.0 TY
Mar. 12/00 6.0 151.4 1008 - - TD 28/12 28.4 161.2 1006 - - L 06/18 22.3 134.1 945 85 6.0 TY12/06 6.3 150.9 1006 - - TD 28/18 28.2 163.6 1006 - - L 07/00 22.9 134.2 945 80 6.0 TY12/12 6.7 150.2 1008 - - TD 29/00 27.6 165.8 1008 - - L 07/06 23.5 134.1 950 80 6.0 TY12/18 7.0 149.5 1006 - - TD 29/06 27 167.7 1008 - - L 07/12 23.8 133.8 955 80 5.5 TY13/00 7.3 148.5 1008 - - TD 29/12 Dissip. 07/18 24.4 133.7 955 80 5.0 TY13/06 7.9 147.1 1004 - - TD 08/00 25.0 133.9 955 75 5.0 TY13/12 8.4 145.5 1002 - - TD 08/06 25.6 134.3 960 70 4.5 TY13/18 9.3 143.7 1000 - - TD 08/12 26.2 135.2 970 65 4.0 TY
14/00 9.9 142.5 1000 - - Date/Time Center Position Centralpressure Max Wind CI number Grade 08/18 26.9 135.9 970 60 4.0 STS
14/06 10.4 141.2 1000 - - TD (UTC) Lat (N) Lon (E) (hPa) (kt) 09/00 27.7 136.5 975 60 3.5 STS14/12 10.6 140.0 1000 - - TD TY HAITANG (0505) 09/06 28.5 137.1 975 60 3.5 STS14/18 10.9 138.7 1000 - - TD 10 Jul. - 21 Jul. 09/12 29.1 137.7 980 55 3.0 STS15/00 11.5 137.5 996 35 3.0 TS 09/18 29.8 138.2 985 50 3.0 STS15/06 12.1 136.0 992 40 3.0 TS Jul. 10/18 22.1 154.1 1010 - - TD 10/00 30.4 138.7 990 45 2.5 TS15/12 12.3 134.5 990 40 3.0 TS 11/00 22.1 153.6 1010 - - TD 10/03 30.8 139.0 990 45 - TS15/18 12.2 132.9 985 45 4.0 TS 11/06 22.2 153.1 1008 - - TD 10/06 31.1 139.4 990 45 2.5 TS16/00 11.8 131.1 985 50 4.0 STS 11/12 22.4 152.7 1006 - - TD 10/09 31.4 140.2 990 45 - TS16/06 11.7 128.9 980 55 4.0 STS 11/18 22.7 152.3 1006 - - TD 10/12 31.9 141.1 992 45 2.5 TS16/12 11.6 126.6 980 55 4.0 STS 12/00 23.1 151.8 1004 - - TD 10/18 32.7 142.4 994 40 2.0 TS16/18 11.0 124.7 990 45 3.5 TS 12/06 23.3 151.2 1004 - - TD 11/00 34.6 145.1 994 - - TD17/00 11.0 122.8 992 40 3.0 TS 12/12 23.3 150.6 1004 - - TD 11/06 36.6 147.4 996 - - TD17/06 11.6 121.1 996 35 2.5 TS 12/18 23.1 149.9 1002 - - TD 11/12 Dissip.17/12 11.6 120.0 1000 - - TD 13/00 22.9 149.2 998 35 2.5 TS17/18 11.8 118.7 1004 - - TD 13/06 22.3 148.3 990 40 3.0 TS18/00 11.9 117.0 1008 - - TD 13/12 21.7 147.1 980 55 4.0 STS18/06 11.9 115.9 1008 - - TD 13/18 21.3 146.0 970 65 4.0 TY18/12 11.6 114.6 1008 - - TD 14/00 20.6 144.6 965 70 4.5 TY18/18 11.4 113.4 1008 - - TD 14/06 20.0 142.7 965 70 4.5 TY19/00 10.9 112.0 1008 - - TD 14/12 19.6 141.4 965 70 4.5 TY19/06 10.5 110.5 1008 - - TD 14/18 19.3 139.3 960 75 5.0 TY19/12 Dissip. 15/00 19.1 136.9 960 75 5.0 TY
15/06 19.1 134.9 955 80 5.0 TY15/12 19.3 133.5 940 90 6.0 TY15/18 19.6 131.9 930 95 6.5 TY16/00 19.9 130.4 925 100 7.0 TY16/06 20.3 129.1 920 105 7.0 TY16/12 20.7 127.7 920 105 7.0 TY16/18 20.9 126.6 920 105 7.0 TY17/00 21.5 125.8 920 105 7.0 TY17/03 21.9 125.4 925 100 - TY17/06 22.3 125.0 930 95 6.0 TY17/09 22.7 124.4 930 95 - TY17/12 23.1 124.0 935 95 6.0 TY17/15 23.3 123.5 935 95 - TY17/18 23.7 123.1 940 90 6.0 TY17/21 24.1 122.5 945 90 - TY18/00 23.8 121.8 950 85 5.5 TY18/03 23.4 121.6 955 80 - TY18/06 24.0 121.5 960 75 4.5 TY18/09 24.2 121.4 965 70 - TY18/12 24.5 121.2 970 65 4.5 TY18/15 24.7 120.9 970 65 - TY18/18 24.8 120.6 975 60 4.0 STS19/00 25.0 120.4 980 55 3.5 STS19/06 25.6 120.1 980 55 3.5 STS19/12 26.5 119.7 985 50 3.5 STS19/18 27.1 119.2 990 45 3.0 TS20/00 27.6 118.2 992 35 2.5 TS20/06 27.8 117.6 996 - - TD20/12 28.0 116.7 998 - - TD20/18 28.1 116.1 998 - - TD21/00 28.2 115.4 1000 - - TD21/06 28.5 114.5 1000 - - TD21/12 28.8 113.9 1000 - - TD21/18 Dissip.

09/12 Dissip.
Date/Time Center Position Centralpressure Max Wind CI number Grade Date/Time Center Position Central
pressure Max Wind CI number Grade Date/Time Center Position Centralpressure Max Wind CI number Grade
(UTC) Lat (N) Lon (E) (hPa) (kt) (UTC) Lat (N) Lon (E) (hPa) (kt) (UTC) Lat (N) Lon (E) (hPa) (kt)
TY NALGAE (0506) TY BANYAN (0507) TY WASHI (0508)18 Jul. - 27 Jul. 20 Jul. - 31 Jul. 28 Jul. - 31 Jul.
Jul. 18/00 21.3 168.0 1008 - - TD Jul. 20/12 13.2 138.0 1004 - - TD Jul. 28/18 18.0 113.0 996 - - TD18/06 21.9 168.0 1008 - - TD 20/18 13.3 137.8 1000 - - TD 29/00 18.4 112.5 996 - - TD18/12 22.3 167.6 1008 - - TD 21/00 13.4 137.7 998 - - TD 29/06 18.6 112.0 994 - - TD18/18 22.7 167.1 1008 - - TD 21/06 13.7 137.5 996 - - TD 29/12 18.8 111.5 992 35 2.0 TS19/00 22.8 166.4 1008 - - TD 21/12 14.4 137.4 996 - - TD 29/18 19.1 110.9 985 40 2.5 TS19/06 23.0 165.7 1008 - - TD 21/18 15.1 137.3 990 35 2.0 TS 30/00 19.2 110.2 985 45 2.5 TS19/12 23.2 165.0 1008 - - TD 22/00 16.0 137.4 990 35 2.5 TS 30/06 19.5 109.4 985 45 2.5 TS19/18 23.6 164.4 1006 - - TD 22/06 16.9 137.5 990 40 2.5 TS 30/12 19.7 108.6 985 45 2.5 TS20/00 24.2 163.9 1004 - - TD 22/12 17.6 137.4 990 40 2.5 TS 30/18 19.8 107.8 985 45 2.5 TS20/06 25.0 163.2 1004 - - TD 22/18 18.2 137.3 990 40 2.5 TS 31/00 20.1 107.0 985 45 3.0 TS20/12 26.0 162.6 1000 35 2.5 TS 23/00 18.9 137.3 985 45 3.0 TS 31/06 20.4 105.9 985 40 2.5 TS20/18 26.5 161.9 996 40 2.5 TS 23/06 19.5 137.3 985 45 3.0 TS 31/12 20.4 104.3 990 35 2.0 TS21/00 27.0 161.1 992 45 2.5 TS 23/12 20.1 137.4 980 50 3.0 STS 31/18 20.0 103.0 998 - - TD21/06 27.6 160.4 992 45 2.5 TS 23/18 21.2 137.5 975 55 3.5 STS Aug. 01/00 Dissip.21/12 28.4 159.5 992 45 2.5 TS 24/00 22.1 137.5 975 55 3.5 STS21/18 29.3 158.8 992 45 2.5 TS 24/06 23.5 137.4 975 55 3.5 STS
22/00 30.0 158.6 992 45 2.5 TS 24/12 24.4 137.3 975 55 3.5 STS Date/Time Center Position Centralpressure Max Wind CI number Grade
22/06 30.6 158.7 990 45 2.5 TS 24/18 25.6 137.2 975 55 3.5 STS (UTC) Lat (N) Lon (E) (hPa) (kt)
22/12 31.4 159.1 990 45 2.5 TS 25/00 26.8 137.0 975 55 3.5 STS TY MATSA (0509)22/18 32.1 159.5 990 45 2.5 TS 25/06 28.5 136.9 975 50 3.0 STS 30 Jul. - 9 Aug. 23/00 32.4 159.7 992 40 2.5 TS 25/12 30.1 136.7 975 50 3.0 STS23/06 32.6 160.0 992 40 2.5 TS 25/15 30.5 136.8 975 50 - STS Jul. 30/12 9.0 137.9 1002 - - TD23/12 32.7 160.6 992 40 2.5 TS 25/18 31.0 136.9 975 45 2.5 TS 30/18 10.0 136.9 1000 - - TD23/18 33.2 161.7 992 40 2.5 TS 25/21 31.6 137.1 975 45 - TS 31/00 10.5 136.0 1000 - - TD24/00 34.4 162.8 996 35 2.5 TS 26/00 32.3 137.6 975 45 2.5 TS 31/06 11.1 134.9 1000 - - TD24/06 35.0 163.3 996 35 2.5 TS 26/03 32.7 138.0 975 45 - TS 31/12 11.8 133.8 998 35 2.0 TS24/12 35.7 163.9 1000 - - L 26/06 33.4 138.9 975 45 2.5 TS 31/18 12.6 133.0 998 35 2.0 TS24/18 36.4 164.4 1002 - - L 26/09 34.2 139.6 975 45 - TS Aug. 01/00 13.7 132.4 994 40 2.5 TS25/00 37.0 164.9 1004 - - L 26/11 35.1 140.2 978 45 - TS 01/06 14.5 131.7 992 40 2.5 TS25/06 37.7 165.4 1004 - - L 26/12 35.4 140.4 978 45 2.5 TS 01/12 15.5 130.5 990 45 2.5 TS25/12 38.4 165.8 1004 - - L 26/15 36.2 141.4 980 45 - TS 01/18 16.1 129.8 985 50 3.0 STS25/18 38.8 166.1 1004 - - L 26/18 37.0 142.2 980 45 2.5 TS 02/00 17.0 129.3 980 55 3.5 STS26/00 39.3 166.0 1004 - - L 26/21 38.1 143.5 980 45 - TS 02/06 18.0 128.6 980 60 3.5 STS26/06 39.8 165.8 1004 - - L 27/00 39.0 144.8 980 45 2.5 TS 02/12 19.0 128.2 975 65 4.0 TY26/12 40.2 165.7 1004 - - L 27/03 40.2 145.7 980 45 - TS 02/18 20.0 127.3 970 70 5.0 TY26/18 40.6 165.6 1004 - - L 27/06 41.0 146.6 980 45 2.5 TS 03/00 20.7 126.4 965 75 5.0 TY27/00 41.0 165.6 1004 - - L 27/12 43.0 148.3 980 40 - TS 03/06 21.1 126.1 960 75 5.0 TY27/06 41.5 165.5 1006 - - L 27/18 44.7 149.1 980 35 2.5 TS 03/09 21.4 125.9 960 75 - TY27/12 42.0 165.5 1006 - - L 28/00 46.2 149.9 984 - - L 03/12 21.8 125.7 960 75 5.0 TY27/18 42.6 165.5 1006 - - L 28/06 47.1 151.4 986 - - L 03/15 22.1 125.5 960 75 - TY28/00 Dissip. 28/12 47.8 152.5 988 - - L 03/18 22.4 125.3 955 80 5.0 TY
28/18 48.4 153.6 990 - - L 03/21 22.8 125.1 955 80 - TY29/00 49.1 156.3 990 - - L 04/00 23.1 124.9 955 80 5.0 TY
Date/Time Center Position Centralpressure Max Wind CI number Grade 29/06 50.4 159.3 990 - - L 04/03 23.5 124.7 955 80 - TY
(UTC) Lat (N) Lon (E) (hPa) (kt) 29/12 51.7 162.3 988 - - L 04/06 23.9 124.5 955 80 5.0 TYTY SANVU (0410) 29/18 53.3 165.2 988 - - L 04/09 24.1 124.4 955 80 - TY
9 Aug. - 14 Aug. 30/00 54.2 168.4 988 - - L 04/10 24.3 124.3 955 80 - TY30/06 54.8 170.4 990 - - L 04/12 24.6 124.2 955 80 5.0 TY
Aug. 09/18 14.0 130.6 1002 - - TD 30/12 55.1 173.3 992 - - L 04/15 24.9 123.9 955 80 - TY10/00 14.3 130.1 1002 - - TD 30/18 54.5 176.1 992 - - L 04/18 25.2 123.7 950 80 5.0 TY10/06 14.5 129.5 998 - - TD 31/00 53.8 179.4 994 - - L 04/21 25.5 123.5 950 80 - TY10/12 15.0 128.7 998 - - TD 31/06 53.1 182.0 994 - - Out 05/00 25.6 123.4 955 80 5.0 TY10/18 15.5 128.0 998 - - TD 05/03 26.2 123.3 955 80 - TY11/00 16.1 126.3 996 - - TD 05/06 26.7 123.1 960 75 4.5 TY11/06 17.1 124.6 994 35 1.5 TS 05/12 27.4 122.2 965 70 4.5 TY11/12 18.1 123.1 994 40 1.5 TS 05/18 28.1 121.6 970 65 4.0 TY11/18 19.0 121.0 992 40 1.5 TS 06/00 28.5 121.1 975 60 4.0 STS12/00 19.4 120.0 992 40 2.0 TS 06/06 29.2 120.4 985 55 4.0 STS12/06 19.9 119.1 990 45 2.5 TS 06/12 29.7 119.8 985 50 3.5 STS12/12 20.5 118.5 990 50 2.5 STS 06/18 30.3 118.9 990 45 3.0 TS12/18 21.5 117.7 985 50 2.5 STS 07/00 30.7 118.4 992 40 2.5 TS13/00 22.7 117.1 985 50 2.5 STS 07/06 31.8 118.9 994 40 2.5 TS13/06 23.7 116.3 985 50 2.5 STS 07/12 33.0 119.0 994 - - TD13/12 25.1 115.8 992 35 2.0 TS 07/18 34.7 119.3 996 - - TD13/18 26.3 115.3 996 - - TD 08/00 36.2 119.3 996 - - TD14/00 27.0 115.1 998 - - TD 08/06 36.7 119.4 992 - - L14/06 27.5 114.5 998 - - TD 08/12 37.3 119.7 994 - - L14/12 28.5 113.5 1000 - - TD 08/18 38.3 120.2 994 - - L14/18 - -29.0 112.5 1000 TD 09/00 39.2 121.6 998 - - L15/00 Dissip. 09/06 - -40.2 122.6 998 L

03/00 Dissip.
Date/Time Center Position Centralpressure Max Wind CI number Grade Date/Time Center Position Central
pressure Max Wind CI number Grade Date/Time Center Position Centralpressure Max Wind CI number Grade
(UTC) Lat (N) Lon (E) (hPa) (kt) (UTC) Lat (N) Lon (E) (hPa) (kt) (UTC) Lat (N) Lon (E) (hPa) (kt)
TY MAWAR (0511) STS GUCHOL (0512) TY NABI (0514)19 Aug. - 1 Sep 18 Aug. - 27 Aug. 29 Aug. - 9 Sep.
Aug. 19/06 20.5 142.8 1008 - - TD Aug. 18/18 21.6 153.5 1010 - - TD Aug. 29/00 14.6 154.0 1004 - - TD19/12 20.5 142.6 1008 - - TD 19/00 21.8 152.9 1010 - - TD 29/06 14.9 153.4 1000 - - TD19/18 20.5 142.4 1002 35 2.5 TS 19/06 22.0 152.4 1008 - - TD 29/12 15.0 152.3 994 40 3.0 TS20/00 20.7 142.1 1000 40 3.0 TS 19/12 22.3 151.9 1008 - - TD 29/18 15.1 151.2 990 45 3.0 TS20/06 21.0 141.8 1000 40 3.5 TS 19/18 22.5 151.5 1008 - - TD 30/00 15.1 150.2 985 50 3.5 STS20/12 21.3 141.5 996 45 4.0 TS 20/00 22.7 151.0 1006 - - TD 30/06 15.1 149.2 980 55 4.0 STS20/18 21.6 141.3 985 50 4.5 STS 20/06 22.9 150.6 1004 - - TD 30/12 14.8 147.8 975 60 4.5 STS21/00 22.0 140.7 970 65 5.0 TY 20/12 23.2 150.2 1004 - - TD 30/18 15.2 147.1 965 70 5.0 TY21/06 22.4 140.5 955 75 6.0 TY 20/18 23.6 149.6 1004 - - TD 31/00 15.6 146.3 950 80 6.0 TY21/12 22.6 140.1 940 90 6.5 TY 21/00 24.1 149.0 1004 - - TD 31/06 16.4 144.9 945 85 6.0 TY21/18 22.9 139.8 930 95 6.5 TY 21/06 24.9 148.4 1000 35 2.0 TS 31/12 16.6 143.7 935 90 6.0 TY22/00 23.4 139.3 930 95 6.5 TY 21/12 25.5 147.9 996 40 2.5 TS 31/18 16.7 142.6 935 90 6.0 TY22/06 23.7 139.2 935 90 6.5 TY 21/18 26.3 147.3 992 45 3.0 TS Sep. 01/00 17.3 141.5 935 90 6.0 TY22/12 24.0 138.8 940 85 5.5 TY 22/00 27.0 147.0 985 55 4.0 STS 01/06 17.7 140.7 935 90 6.0 TY22/18 24.6 138.2 950 80 5.5 TY 22/06 28.2 146.7 980 55 4.0 STS 01/12 18.3 139.8 930 95 6.0 TY23/00 25.4 137.8 950 80 5.5 TY 22/12 29.1 146.3 980 55 4.0 STS 01/18 18.8 138.5 930 95 6.0 TY23/06 26.3 137.6 945 80 5.5 TY 22/18 29.9 146.1 985 50 3.5 STS 02/00 19.2 137.5 930 95 6.0 TY23/12 26.9 137.3 945 80 5.5 TY 23/00 31.1 146.3 985 50 3.5 STS 02/06 19.6 136.8 925 95 6.0 TY23/18 27.8 137.0 945 80 5.5 TY 23/06 32.4 147.2 980 55 3.5 STS 02/12 20.1 136.1 925 95 5.5 TY24/00 28.7 136.9 945 85 5.5 TY 23/12 33.6 148.3 980 55 3.5 STS 02/18 20.8 135.3 930 95 5.5 TY24/06 29.7 137.0 945 85 5.5 TY 23/18 34.7 149.5 980 55 3.5 STS 03/00 21.4 134.6 935 90 5.5 TY24/12 30.6 137.2 945 85 5.5 TY 24/00 35.6 151.2 980 55 3.5 STS 03/06 22.3 134.0 935 90 5.5 TY24/15 31.2 137.2 950 80 - TY 24/06 36.8 153.2 980 55 3.5 STS 03/12 23.2 133.2 935 90 5.0 TY24/18 31.5 137.0 955 80 5.0 TY 24/12 37.9 155.2 980 55 3.5 STS 03/15 23.5 132.9 935 90 - TY24/21 32.1 137.1 960 80 - TY 24/18 39.3 157.8 980 55 3.5 STS 03/18 24.0 132.6 940 85 5.0 TY25/00 32.6 137.1 960 75 4.5 TY 25/00 40.7 160.3 985 50 3.0 STS 03/21 24.4 132.5 940 85 - TY25/03 33.0 137.3 965 75 - TY 25/06 42.9 162.9 990 45 3.0 TS 04/00 24.8 132.2 940 85 5.0 TY25/06 33.4 137.7 965 70 4.5 TY 25/12 45.6 164.7 992 - - L 04/03 25.5 132.0 940 85 - TY25/09 33.9 137.9 965 70 - TY 25/18 46.5 164.6 996 - - L 04/06 26.1 131.6 935 85 5.0 TY25/12 34.3 138.6 965 70 4.5 TY 26/00 47.2 164.4 998 - - L 04/09 26.3 131.3 935 85 - TY25/15 34.8 139.2 970 65 - TY 26/06 47.8 165.1 1000 - - L 04/12 26.6 131.2 935 85 5.0 TY25/17 35.1 139.5 975 65 - TY 26/12 48.2 166.0 1000 - - L 04/15 26.8 131.0 935 85 - TY25/18 35.3 139.8 975 65 4.0 TY 26/18 48.6 167.2 1000 - - L 04/18 27.1 131.0 935 85 5.5 TY25/19 35.5 140.0 980 65 - TY 27/00 - -49.1 168.9 1000 L 04/21 27.6 130.9 935 85 - TY25/21 35.8 140.3 985 60 - STS 27/06 Dissip. 05/00 27.9 130.7 935 85 5.5 TY26/00 36.1 141.0 985 50 3.5 STS 05/03 28.4 130.5 935 85 - TY26/03 36.3 141.6 990 50 - STS
Date/Time Center Position Central Max Wind CI number Grade
05/06 28.8 130.4 935 85 5.5 TY
26/06 36.8 142.7 990 45 3.0 TS pressure 05/09 29.1 130.2 935 85 - TY26/12 37.1 144.6 990 45 3.0 TS (UTC) Lat (N) Lon (E) (hPa) (kt) 05/12 29.4 130.2 935 85 5.5 TY26/18 37.4 146.2 992 40 3.0 TS TY TALIM (0513) 05/15 29.7 130.1 940 85 - TY27/00 37.3 148.0 994 40 2.5 TS 05/1825 Aug. - 2 Sep. 30.2 130.2 945 80 5.5 TY27/06 37.3 149.3 996 40 2.0 TS 05/21 30.8 130.2 945 80 - TY27/12 36.6 150.8 998 40 2.0 TS Aug. 25/18 12.5 144.6 1004 - - TD 06/00 31.4 130.0 950 80 5.0 TY27/18 36.3 151.8 998 40 2.0 TS 26/00 12.6 144.0 1004 - - TD 06/03 32.1 130.1 955 75 - TY28/00 35.8 153.0 1000 - - L 26/06 12.7 143.5 1002 - - TD 06/04 32.5 130.2 960 70 - TY28/06 35.7 153.3 1000 - - L 26/12 12.8 143.0 1002 - - TD 06/05 32.7 130.1 960 65 - TY28/12 36.0 153.6 1000 - - L 26/18 13.2 142.6 998 - - TD 06/06 33.0 130.2 965 65 4.5 TY28/18 36.3 153.3 1002 - - L 27/00 14.1 142.3 996 35 2.0 TS 06/09 33.5 130.3 970 65 - TY29/00 36.9 153.4 1004 - - L 27/06 15.7 141.7 996 35 2.5 TS 06/12 34.2 130.8 970 65 4.0 TY29/06 37.5 153.6 1004 - - L 27/12 16.7 141.2 992 40 2.5 TS 06/15 34.9 131.1 970 65 - TY29/12 39.1 154.5 1004 - - L 27/18 17.5 139.9 990 45 3.0 TS 06/18 36.0 131.8 975 65 3.5 TY29/18 41.0 156.2 1004 - - L 28/00 18.3 138.8 985 50 3.5 STS 06/21 36.9 132.2 975 60 - STS30/00 40.9 156.9 1006 - - L 28/06 19.5 137.8 975 65 4.0 TY 07/00 37.5 133.0 980 55 3.0 STS30/06 40.7 157.6 1006 - - L 28/12 19.9 136.8 970 65 4.5 TY 07/03 38.2 134.0 985 55 - STS30/12 40.3 158.3 1008 - - L 28/18 20.6 135.6 965 70 4.5 TY 07/06 38.8 135.2 985 50 2.5 STS30/18 40.0 158.9 1008 - - L 29/00 20.9 134.1 965 70 5.0 TY 07/09 40.0 137.0 985 50 - STS31/00 39.7 159.7 1008 - - L 29/06 21.0 132.9 955 75 5.5 TY 07/12 41.0 138.7 985 50 2.5 STS31/06 39.6 160.8 1010 - - L 29/12 20.9 131.8 935 90 6.5 TY 07/15 42.6 139.7 985 50 - STS31/12 39.5 161.7 1012 - - L 29/18 21.2 130.6 925 95 6.5 TY 07/18 44.0 141.1 985 50 2.0 STS31/18 39.5 162.6 1012 - - L 30/00 21.4 129.7 925 95 6.5 TY 07/19 44.5 141.5 985 50 - STS
Sep. 01/00 - -39.5 163.6 1014 L 30/06 21.7 128.5 925 95 6.5 TY 07/21 45.3 142.9 985 50 - STS01/06 Dissip. 30/12 22.0 127.3 925 95 6.0 TY 08/00 46.0 145.0 985 50 2.0 STS
30/15 22.1 126.8 925 95 - TY 08/03 47.0 147.0 985 50 - STS30/18 22.2 126.4 940 85 5.0 TY 08/06 47.4 147.9 986 - - L30/21 22.6 125.7 945 85 - TY 08/12 48.9 150.6 984 - - L31/00 22.7 125.2 945 85 5.0 TY 08/18 49.8 154.2 976 - - L31/03 22.9 124.7 945 85 - TY 09/00 49.9 157.6 976 - - L31/06 23.4 124.0 945 85 4.5 TY 09/06 49.8 162.2 976 - - L31/09 23.5 123.5 940 85 - TY 09/12 49.9 166.4 978 - - L31/12 23.8 122.8 935 90 5.0 TY 09/18 - -49.6 170.5 978 L31/15 24.0 122.1 940 85 - TY 10/00 Dissip.31/18 23.8 121.4 950 80 5.0 TY31/21 23.6 120.9 950 80 - TY
Sep. 01/00 24.2 120.3 960 75 4.0 TY01/03 25.0 119.7 970 70 - TY01/06 25.4 119.5 980 60 4.0 STS01/12 25.6 118.2 985 50 - STS01/18 25.9 116.9 992 45 3.5 TS02/00 26.6 115.5 996 40 3.0 TS02/06 27.5 114.8 1000 - - TD02/12 28.0 114.5 1002 - - TD02/18 - -28.5 114.4 1002 TD

27/06 19.7 105.0 990 50 3.5 STS 18/21 31.2 140.4 1002 35 - TS
28/00 20.4 101.3 1006 - - TD 19/06 31.2 141.6 1008 - - TD28/06 21.0 99.7 1006 - - Out 19/12 31.7 143.2 1012 - - TD
19/18 Dissip.
Date/Time Center Position Centralpressure Max Wind CI number Grade Date/Time Center Position Central
pressure Max Wind CI number Grade Date/Time Center Position Centralpressure Max Wind CI number Grade
(UTC) Lat (N) Lon (E) (hPa) (kt) (UTC) Lat (N) Lon (E) (hPa) (kt) (UTC) Lat (N) Lon (E) (hPa) (kt)
TY KAHNUN (0515) TY SAOLA (0517) TY LONGWANG (0519)5 Sep. - 13 Sep. 19 Sep. - 28 Sep. 25 Sep. - 3 Oct.
Sep. 05/00 8.2 142.3 1006 - - TD Sep. 19/00 20.6 156.6 1010 - - TD Sep. 25/06 18.9 145.3 1002 - - TD05/06 8.7 141.0 1004 - - TD 19/06 20.2 155.2 1008 - - TD 25/12 19.0 144.6 1002 - - TD05/12 9.3 139.9 1004 - - TD 19/12 20.4 154.0 1008 - - TD 25/18 19.2 144.1 1002 - - TD05/18 10.0 138.7 1004 - - TD 19/18 20.8 153.0 1004 - - TD 26/00 19.6 143.5 1000 35 2.0 TS06/00 10.5 137.8 1006 - - TD 20/00 21.3 152.4 1002 - - TD 26/06 20.0 143.1 996 40 2.5 TS06/06 11.1 137.0 1004 - - TD 20/06 21.6 152.0 1000 - - TD 26/12 20.3 142.4 992 45 3.0 TS06/12 12.1 136.0 1004 - - TD 20/12 21.9 151.5 1000 - - TD 26/18 20.9 141.7 980 55 4.0 STS06/18 13.0 135.2 1004 - - TD 20/18 22.3 151.1 998 35 2.5 TS 27/00 21.5 141.0 970 65 4.5 TY07/00 14.0 134.4 1002 35 2.0 TS 21/00 22.6 150.6 996 40 3.0 TS 27/06 21.7 140.1 960 70 5.0 TY07/06 14.0 134.0 998 40 2.5 TS 21/06 23.1 149.9 990 45 3.0 TS 27/12 22.0 139.2 955 75 5.0 TY07/12 14.0 133.6 992 45 3.0 TS 21/12 23.5 149.0 985 50 3.0 STS 27/18 22.1 138.4 950 80 5.5 TY07/18 14.8 133.0 985 50 3.5 STS 21/18 24.2 147.3 980 55 3.5 STS 28/00 22.3 137.5 945 85 5.5 TY08/00 15.3 132.5 980 55 3.5 STS 22/00 24.6 146.0 975 65 4.0 TY 28/06 22.5 136.7 940 90 6.0 TY08/06 16.3 132.4 980 55 3.5 STS 22/06 25.2 144.3 970 70 4.5 TY 28/12 22.5 136.2 940 90 6.0 TY08/12 17.4 131.5 975 60 4.0 STS 22/09 25.3 143.6 965 70 - TY 28/18 22.4 135.6 940 90 6.0 TY08/18 18.2 131.1 970 65 4.5 TY 22/12 25.6 142.8 955 75 5.5 TY 29/00 22.4 135.2 940 90 6.0 TY09/00 19.2 130.5 955 80 5.0 TY 22/15 26.0 142.1 955 75 - TY 29/06 22.4 134.7 940 90 6.0 TY09/06 20.4 129.7 955 80 5.0 TY 22/18 26.4 141.3 955 75 5.5 TY 29/12 22.3 133.9 940 90 6.0 TY09/12 21.4 128.5 955 80 5.0 TY 22/21 26.7 140.7 955 75 - TY 29/18 22.2 133.0 940 90 6.0 TY09/18 22.2 127.5 955 75 5.0 TY 23/00 27.2 140.2 955 75 5.5 TY 30/00 22.0 132.1 950 80 5.0 TY09/21 22.8 126.9 955 75 - TY 23/03 27.5 139.5 955 75 - TY 30/06 22.1 131.0 950 80 5.0 TY10/00 23.2 126.3 955 75 5.0 TY 23/06 27.6 139.2 950 80 5.5 TY 30/12 22.2 130.0 940 85 6.0 TY10/03 23.6 125.8 955 75 - TY 23/09 28.0 139.0 950 80 - TY 30/18 22.4 128.5 935 90 6.0 TY10/06 24.2 125.3 950 85 6.0 TY 23/12 28.4 138.7 950 80 5.5 TY 30/21 22.5 127.8 935 90 - TY10/09 24.5 124.9 945 85 - TY 23/15 28.7 138.6 950 80 - TY Oct. 01/00 22.5 126.9 930 95 6.5 TY10/12 25.1 124.5 945 85 6.0 TY 23/18 29.1 138.3 950 80 5.5 TY 01/03 22.6 126.1 930 95 - TY10/15 25.6 123.9 945 85 - TY 23/21 29.3 138.0 950 80 - TY 01/06 22.8 125.3 930 95 6.5 TY10/18 26.1 123.5 945 85 6.0 TY 24/00 29.7 137.8 950 80 5.5 TY 01/09 23.0 124.7 930 95 - TY10/21 26.7 123.3 945 85 - TY 24/03 30.1 137.9 950 80 - TY 01/12 23.1 123.9 930 95 6.5 TY11/00 27.3 122.7 950 80 6.0 TY 24/06 30.4 138.0 950 80 5.5 TY 01/15 23.2 123.2 930 95 - TY11/06 28.3 121.9 955 75 5.5 TY 24/09 30.8 138.3 950 80 - TY 01/18 23.5 122.5 935 90 6.5 TY11/12 29.4 121.0 970 65 5.0 TY 24/12 31.5 138.5 950 80 5.5 TY 01/21 23.8 121.6 945 85 - TY11/18 30.4 120.4 985 50 4.5 STS 24/15 31.8 138.8 950 80 - TY 02/00 24.3 120.9 965 70 6.0 TY12/00 31.7 119.4 996 40 4.0 TS 24/18 32.2 139.2 955 75 5.5 TY 02/03 24.3 120.4 970 65 - TY12/06 33.0 119.4 996 35 3.5 TS 24/21 32.7 139.8 955 75 - TY 02/06 24.3 119.8 980 55 5.0 STS12/12 34.3 120.2 998 35 3.0 TS 25/00 33.1 140.8 955 75 5.5 TY 02/12 24.4 118.7 990 45 5.0 TS12/18 35.0 121.1 998 35 2.5 TS 25/03 34.0 141.8 955 75 - TY 02/18 24.8 117.8 998 35 4.5 TS13/00 35.5 122.5 1000 - - L 25/06 34.7 142.9 960 75 5.0 TY 03/00 25.5 116.7 1000 - - TD13/06 36.4 124.8 1002 - - L 25/09 35.4 143.9 960 75 - TY 03/06 - -26.0 115.5 1004 TD13/12 - -36.8 126.2 1004 L 25/12 35.7 144.7 965 70 4.5 TY 03/12 Dissip.13/18 Dissip. 25/18 36.3 146.0 970 65 4.5 TY
26/00 36.9 147.2 975 65 4.0 TY
26/06 37.8 148.9 980 55 3.5 STS Date/Time Center Position Centralpressure Max Wind CI number Grade
Date/Time Center Position Centralpressure Max Wind CI number Grade 26/12 38.9 151.2 992 - - L (UTC) Lat (N) Lon (E) (hPa) (kt)
(UTC) Lat (N) Lon (E) (hPa) (kt) 26/18 39.4 154.0 992 - - L TY KIROGI (0520)TY VINCENTE (0516) 27/00 40.4 159.4 996 - - L 9 Oct. - 19 Oct.
15 Sep. - 19 Sep. 27/06 40.8 165.1 1000 - - L27/12 41.5 171.7 1002 - - L Oct. 09/00 22.0 137.9 1008 - - TD
Sep. 15/06 14.1 115.6 1004 - - TD - - L27/18 42.2 178.4 1002 09/06 22.4 137.2 1008 - - TD15/12 13.6 114.5 1004 - - TD - -28/00 42.2 184.4 1002 Out 09/12 22.7 136.4 1008 - - TD15/1816/00
12.911.8
113.6113.0
10021000
--
--
TDTD
09/1810/00
23.022.9
135.4134.5
10061004
--
--
TDTD
Date/Time Center Position Central Max Wind CI number Grade16/06 10.8 113.5 998 - - TD pressure 10/06 22.6 133.9 1000 35 2.5 TS16/12 11.4 114.2 992 35 2.0 TS (UTC) Lat (N) Lon (E) (hPa) (kt) 10/12 22.1 133.4 994 40 3.0 TS16/18 12.3 114.4 990 40 2.0 TS 10/18TY DAMREY (0518) 21.9 133.2 990 45 4.0 TS17/00 13.5 114.5 990 40 2.0 TS 19 Sep. - 28 Sep. 11/00 21.4 133.1 985 50 4.5 STS17/06 15.4 113.7 990 40 2.0 TS 11/06 21.0 133.0 970 65 5.0 TY17/12 16.6 111.5 990 40 2.0 TS Sep. 19/06 13.2 127.0 1006 - - TD 11/12 20.7 132.9 950 80 5.5 TY17/18 17.1 109.9 990 45 2.5 TS 19/12 13.8 126.1 1006 - - TD 11/18 20.5 132.6 940 85 6.5 TY18/00 17.2 108.5 985 45 3.0 TS 19/18 14.3 125.2 1004 - - TD 12/00 20.5 132.5 935 95 6.5 TY18/06 17.7 106.9 992 40 3.0 TS 20/00 14.9 124.6 1000 - - TD 12/06 20.6 132.3 930 100 6.5 TY18/12 18.8 104.7 994 35 3.0 TS 20/06 15.8 124.1 1000 - - TD 12/12 20.8 132.2 930 100 6.0 TY18/18 19.3 102.4 1000 - - TD 20/12 16.5 123.7 1000 - - TD 12/18 21.1 131.9 935 90 5.5 TY19/00 20.0 99.8 1004 - - Out 20/18 17.2 123.3 998 - - TD 13/00 21.4 131.7 940 85 5.5 TY
21/00 18.0 122.8 996 35 2.0 TS 13/06 21.5 131.8 940 85 5.5 TY21/06 18.7 122.2 992 40 2.5 TS 13/12 21.8 131.8 940 85 5.5 TY21/12 18.9 121.5 990 45 2.5 TS 13/18 22.2 131.9 940 85 5.5 TY21/18 19.3 121.2 990 45 2.5 TS 14/00 22.6 131.3 940 85 5.5 TY22/00 19.8 121.0 990 45 2.5 TS 14/06 22.9 131.3 940 85 5.5 TY22/06 20.2 120.4 990 45 2.5 TS 14/12 22.9 131.1 940 85 5.5 TY22/12 20.0 119.6 990 45 2.5 TS 14/18 23.0 131.1 940 85 5.5 TY22/18 19.8 118.8 990 45 2.5 TS 15/00 23.3 131.3 940 85 5.5 TY23/00 20.0 118.0 990 45 3.0 TS 15/06 23.5 131.3 940 85 5.5 TY23/06 20.5 116.8 990 45 3.0 TS 15/12 23.8 131.8 940 85 5.5 TY23/12 20.5 116.7 990 45 3.0 TS 15/18 24.0 132.4 940 85 5.5 TY23/18 20.3 116.1 985 50 3.0 STS 16/00 24.2 132.9 940 85 5.5 TY24/00 20.0 115.4 980 55 3.5 STS 16/06 24.6 133.5 940 85 6.0 TY24/06 19.7 114.8 975 60 4.0 STS 16/12 25.2 134.0 940 85 6.0 TY24/12 19.3 114.0 970 65 4.0 TY 16/18 25.8 134.2 940 85 6.0 TY24/18 18.9 113.4 970 65 4.0 TY 17/00 26.5 134.6 945 85 6.0 TY25/00 18.8 113.1 960 75 5.0 TY 17/06 27.6 134.9 950 80 5.0 TY25/06 19.1 112.4 955 80 5.0 TY 17/12 28.5 135.5 955 75 5.0 TY25/12 19.2 111.8 955 80 5.0 TY 17/18 29.2 136.1 955 75 5.0 TY25/18 19.1 110.7 955 80 5.5 TY 18/00 30.0 136.7 955 75 5.0 TY26/00 18.5 109.9 965 70 4.5 TY 18/06 31.0 137.9 955 75 5.0 TY26/06 18.8 108.9 970 65 4.0 TY 18/09 31.4 138.3 960 65 - TY26/12 19.4 108.1 975 60 4.0 STS 18/12 31.5 139.0 980 50 5.0 STS26/18 19.5 107.5 975 60 4.0 STS 18/15 31.5 139.5 990 45 - TS27/00 19.6 106.3 980 60 3.5 STS 18/18 31.4 140.0 998 40 5.0 TS
27/12 19.3 103.8 996 35 3.0 TS 19/00 31.2 140.8 1004 35 4.5 TS27/18 19.5 102.6 1004 - - TD 19/03 31.1 141.2 1006 35 - TS

Date/Time Center Position Centralpressure Max Wind CI number Grade Date/Time Center Position Central
pressure Max Wind CI number Grade Date/Time Center Position Centralpressure Max Wind CI number Grade
(UTC) Lat (N) Lon (E) (hPa) (kt) (UTC) Lat (N) Lon (E) (hPa) (kt) (UTC) Lat (N) Lon (E) (hPa) (kt)
TY KAI-TAK (0521) TS TEMBIN (0522) STS BOLAVEN (0523)28 Oct. - 2 Nov. 6 Nov. - 12 Nov. 14 Nov. - 20 Nov.
Oct. 28/06 12.7 115.1 1004 - - TD Nov. 06/12 8.2 140.7 1008 - - TD Nov. 14/00 8.8 129.6 1004 - - TD28/12 12.9 114.1 1004 - - TD 06/18 9.6 140.5 1008 - - TD 14/06 9.2 129.4 1002 - - TD28/18 12.8 113.8 1002 - - TD 07/00 10.1 140.4 1008 - - TD 14/12 9.6 129.5 1002 - - TD29/00 12.6 113.5 1000 35 2.5 TS 07/06 11.5 138.5 1006 - - TD 14/18 10.0 129.8 1000 - - TD29/06 12.7 112.9 990 40 3.0 TS 07/12 12.2 137.5 1006 - - TD 15/00 10.8 129.9 1000 - - TD29/12 12.9 112.8 985 45 3.5 TS 07/18 12.4 137.0 1006 - - TD 15/06 11.4 130.0 996 - - TD29/18 13.2 112.9 985 50 4.0 STS 08/00 12.5 136.5 1008 - - TD 15/12 12.3 130.0 998 - - TD30/00 14.0 112.9 975 60 4.0 STS 08/06 12.5 135.6 1008 - - TD 15/18 12.8 130.0 996 - - TD30/06 14.1 112.3 965 70 4.5 TY 08/12 12.5 134.0 1008 - - TD 16/00 13.0 129.9 996 - - TD30/12 14.1 112.2 955 75 5.5 TY 08/18 12.6 132.5 1008 - - TD 16/06 13.2 129.8 996 35 2.0 TS30/18 14.4 111.9 955 80 5.5 TY 09/00 12.8 130.8 1008 - - TD 16/12 13.3 129.7 996 40 2.0 TS31/00 14.6 111.8 950 80 5.5 TY 09/06 12.8 129.3 1006 - - TD 16/18 13.3 129.3 994 45 2.5 TS31/06 14.8 111.5 960 70 5.5 TY 09/12 12.8 127.8 1008 - - TD 17/00 13.2 129.0 990 50 3.0 STS31/12 14.9 111.0 965 65 5.0 TY 09/18 14.6 126.1 1006 - - TD 17/06 13.0 128.9 985 55 3.0 STS31/18 15.1 110.7 970 60 4.5 STS 10/00 14.9 124.5 1002 35 2.5 TS 17/12 13.1 128.7 985 55 3.0 STS
Nov. 01/00 15.4 110.0 975 60 4.5 STS 10/06 15.3 122.7 1002 35 2.5 TS 17/18 13.2 128.6 985 55 3.0 STS01/06 15.8 109.2 980 55 4.5 STS 10/12 15.8 121.8 1004 - - TD 18/00 13.3 128.5 985 55 3.0 STS01/12 16.4 108.5 985 50 4.0 STS 10/18 16.6 120.0 1004 - - TD 18/06 13.7 128.1 985 55 3.0 STS01/18 16.9 108.0 994 40 3.5 TS 11/00 16.7 119.7 1004 - - TD 18/12 14.2 127.2 985 55 3.0 STS02/00 17.4 107.4 1000 35 3.0 TS 11/06 18.0 119.0 1004 - - TD 18/18 14.6 126.3 985 55 2.5 STS02/06 18.0 106.5 1004 - - TD 11/12 19.1 118.0 1008 - - TD 19/00 15.1 125.2 985 55 2.5 STS02/12 Dissip. 11/18 19.5 117.3 1010 - - TD 19/06 15.5 124.6 985 45 2.5 TS
12/00 19.4 116.2 1010 - - TD 19/12 16.1 123.9 990 40 2.0 TS12/06 18.7 115.3 1008 - - TD 19/18 16.5 123.1 998 35 2.0 TS12/12 17.7 114.9 1008 - - TD 20/00 17.1 122.3 1006 - - TD12/18 Dissip. 20/06 17.9 121.1 1006 - - TD
20/12 Dissip.

Appendix.2
(UTC) T=00(km) T=24(km) T=48(km) T=72(km) T=24(hPa) T=48(hPa) T=72(hPa) T=24(kt) T=48(kt) T=72(kt) (UTC) T=00(km) T=24(km) T=48(km) T=72(km) T=24(hPa) T=48(hPa) T=72(hPa) T=24(kt) T=48(kt) T=72(kt)
Jan. 15/12 0 112 99 284 0 7 11 0 -10 -15 May 31/12 25 122 229 27 45 -25 -3515/18 47 340 463 892 0 7 6 0 -10 -10 31/18 67 194 37 -3016/00 0 240 551 941 0 9 0 0 -10 0 Jun. 01/00 47 157 204 255 30 25 20 -20 -15 -1516/06 45 153 370 -5 7 5 -5 01/06 0 78 195 154 20 15 10 -10 -10 -1016/12 93 200 403 0 9 0 -10 01/12 0 118 88 140 20 10 10 -15 -10 -1016/18 43 82 138 0 6 0 -5 01/18 0 88 22 46 15 10 0 -10 -10 -517/00 39 35 299 0 -2 0 0 02/00 0 59 60 48 5 0 -15 0 0 1017/06 11 54 5 -5 02/06 0 55 55 162 -5 0 -15 5 0 1017/12 0 124 5 -5 02/12 0 47 34 155 5 0 -15 0 0 1017/18 0 103 2 0 02/18 0 39 78 147 5 -10 -20 0 5 1018/00 0 71 -2 0 03/00 0 25 59 196 5 -15 -20 -5 10 1018/06 22 03/06 0 64 105 179 0 -15 -10 0 10 518/12 57 03/12 0 68 70 258 0 -20 -5 0 15 518/18 255 03/18 0 46 126 268 -10 -25 -5 5 15 519/00 0 04/00 0 24 53 137 -25 -35 -15 15 20 15
04/06 0 103 189 395 -25 -25 -20 15 15 1504/12 0 133 303 436 -30 -25 -20 20 15 1004/18 0 178 317 380 -15 0 0 5 0 -5
(UTC) T=00(km) T=24(km) T=48(km) T=72(km) T=24(hPa) T=48(hPa) T=72(hPa) T=24(kt) T=48(kt) T=72(kt) 05/00 0 53 67 143 -10 5 5 0 0 005/06 0 76 49 106 0 0 0 -5 0 505/12 0 78 94 73 10 5 5 -10 -10 0
Mar. 15/00 44 86 76 7 4 -10 -5 05/18 0 49 143 127 15 10 5 -10 -10 015/06 0 31 119 10 0 -10 0 06/00 0 52 207 108 15 15 5 -10 -10 -515/12 11 131 10 -10 06/06 0 46 20 164 -10 -20 -25 10 20 2015/18 0 253 0 0 06/12 0 59 97 228 -10 -20 -20 5 15 2016/00 11 349 -7 10 06/18 0 51 90 325 -5 -10 -10 0 15 1016/06 0 214 -11 15 07/00 0 45 145 363 0 -5 -5 0 5 516/12 0 07/06 0 23 221 444 -5 -5 -5 5 5 516/18 0 07/12 0 77 237 545 -5 -5 -2 5 5 -517/00 0 07/18 0 15 150 324 -5 -10 -4 10 10 017/06 11 08/00 0 44 145 -10 -15 10 15
08/06 0 51 33 -10 -10 10 1508/12 23 31 72 0 -2 0 008/18 39 78 19 -5 -4 5 5
(UTC) T=00(km) T=24(km) T=48(km) T=72(km) T=24(hPa) T=48(hPa) T=72(hPa) T=24(kt) T=48(kt) T=72(kt) 09/00 45 106 -5 509/06 0 80 -5 509/12 0 91 -7 5
Apr. 23/00 0 101 261 575 43 61 56 -40 -50 -45 09/18 11 96 -4 523/06 0 34 119 466 45 45 35 -40 -35 -30 10/00 023/12 0 57 138 569 45 35 15 -35 -25 -15 10/06 023/18 0 39 97 515 35 25 0 -25 -15 0 10/12 3524/00 0 49 161 467 20 20 -10 -15 -10 10 10/18 4424/06 0 24 147 436 10 15 -15 -5 -10 1524/12 0 46 323 5 5 -5 -524/18 0 44 249 5 -5 -5 525/00 0 52 204 10 -10 -10 1025/06 0 168 551 0 -20 -5 2025/12 0 274 -10 025/18 0 210 -15 1026/00 0 206 -20 1526/06 0 210 -20 2026/12 026/18 027/00 027/06 0
(UTC) T=00(km) T=24(km) T=48(km) T=72(km) T=24(hPa) T=48(hPa) T=72(hPa) T=24(kt) T=48(kt) T=72(kt) (UTC) T=00(km) T=24(km) T=48(km) T=72(km) T=24(hPa) T=48(hPa) T=72(hPa) T=24(kt) T=48(kt) T=72(kt)
Jul. 13/00 0 115 277 293 25 15 40 -15 -15 -30 Jul. 21/18 15 138 190 318 -5 5 -5 5 0 1013/06 0 103 154 99 20 15 40 -15 -15 -30 22/00 25 151 216 395 -5 -5 -15 5 10 2013/12 0 113 223 202 -5 0 20 5 -5 -20 22/06 62 64 201 383 -10 -15 -25 15 20 3013/18 0 81 123 160 -10 10 20 5 -10 -20 22/12 95 137 45 329 -5 -15 -25 10 20 3014/00 0 176 184 193 -10 15 20 5 -15 -20 22/18 72 79 172 387 0 -15 -25 5 20 3514/06 49 109 79 46 -10 15 5 5 -15 -5 23/00 25 154 318 575 -5 -15 -25 5 15 3514/12 0 157 166 121 5 15 0 -5 -15 -5 23/06 70 244 479 774 -10 -20 -25 10 25 3514/18 22 147 169 154 10 15 -5 -10 -15 0 23/12 53 235 512 916 -10 -20 -28 10 25 3515/00 0 128 147 211 15 15 -15 -15 -15 5 23/18 91 224 408 792 -10 -20 -25 10 30 3015/06 0 11 43 91 15 5 -20 -15 -5 10 24/00 59 190 379 793 -10 -20 -15 10 30 2015/12 0 25 51 84 10 -5 -35 -10 0 25 24/06 0 138 388 625 -10 -20 -15 15 30 2015/18 0 100 22 120 10 -10 -35 -10 5 25 24/12 20 106 273 580 -15 -23 -10 20 30 2516/00 0 115 112 200 5 -15 -30 -5 5 25 24/18 32 150 472 583 -15 -15 -5 25 25 2516/06 0 93 105 102 -5 -10 -15 5 10 20 25/00 0 153 421 -5 -5 20 1516/12 0 115 161 105 -15 -10 -5 5 10 5 25/06 24 84 375 5 5 10 516/18 0 93 87 104 -5 -5 -5 0 5 5 25/12 0 115 368 2 0 10 1517/00 0 11 69 126 -5 -10 -2 0 10 10 25/18 0 154 293 5 5 5 1517/06 0 54 46 -15 -10 10 10 26/00 11 173 5 017/12 0 69 110 0 0 0 0 26/06 0 93 5 017/18 0 46 112 -5 -5 5 5 26/12 0 14 5 518/00 15 104 129 0 0 0 10 26/18 0 100 0 1018/06 35 83 5 0 27/00 018/12 11 105 5 -5 27/06 4818/18 0 107 2 0 27/12 1119/00 15 116 0 10 27/18 2419/06 3319/12 019/18 020/00 3020/06 0
Track and Intensity Analysis and Forecast Errors for Each Tropical Cyclone in 2005
Date/Time Center Position Central Pressure Max. Wind
STS BANYAN (0507)
Date/Time Max. WindCentral PressureCenter Position
Central Pressure Max. Wind
Date/Time Center Position Central Pressure
TY NESAT (0504)
Date/Time Center Position Central Pressure Max. WindDate/Time Center Position Central Pressure Max. Wind
Max. Wind
TY HAITANG (0505)
STS KULAP (0501)
STS ROKE (0502)
TY SONCA (0503)
Date/Time Center Position

(UTC) T=00(km) T=24(km) T=48(km) T=72(km) T=24(hPa) T=48(hPa) T=72(hPa) T=24(kt) T=48(kt) T=72(kt) (UTC) T=00(km) T=24(km) T=48(km) T=72(km) T=24(hPa) T=48(hPa) T=72(hPa) T=24(kt) T=48(kt) T=72(kt)
Jul. 20/12 23 154 45 142 4 2 0 -5 0 5 Jul. 29/12 46 74 278 5 6 -10 -3520/18 83 24 167 320 -12 -15 -17 10 15 20 29/18 46 79 0 021/00 0 120 22 211 -12 -12 -11 10 15 15 30/00 46 113 0 021/06 0 96 72 128 -10 -12 -11 10 15 15 30/06 0 84 5 021/12 15 36 99 -5 -7 5 10 30/12 46 43 4 021/18 0 104 135 -5 -7 5 10 30/18 022/00 39 178 385 -7 -6 10 10 31/00 3122/06 0 83 224 -7 -6 10 10 31/06 022/12 59 199 -2 5 31/12 022/18 83 313 -2 523/00 0 284 -6 1023/06 0 92 -6 1023/12 023/18 924/00 024/06 56
(UTC) T=00(km) T=24(km) T=48(km) T=72(km) T=24(hPa) T=48(hPa) T=72(hPa) T=24(kt) T=48(kt) T=72(kt) (UTC) T=00(km) T=24(km) T=48(km) T=72(km) T=24(hPa) T=48(hPa) T=72(hPa) T=24(kt) T=48(kt) T=72(kt)
Jul. 31/12 11 79 92 131 4 15 20 -5 -20 -20 Aug. 27/00 0 105 198 149 11 25 60 -10 -25 -4531/18 78 224 260 353 5 10 15 -5 -15 -15 27/06 0 21 112 276 15 25 45 -20 -20 -30
Aug. 01/00 43 134 84 102 5 10 10 -5 -15 -10 27/12 0 67 245 354 10 35 40 -10 -25 -2501/06 0 59 35 122 5 15 10 -10 -15 -10 27/18 0 61 186 248 5 35 10 -5 -20 -501/12 0 54 102 135 -5 0 5 0 -5 -10 28/00 0 57 157 176 5 35 5 -5 -20 -501/18 0 140 53 115 -5 0 10 0 -5 -5 28/06 0 100 137 128 5 25 5 0 -15 -502/00 0 178 38 101 -5 5 5 -5 -10 -10 28/12 0 103 136 176 15 20 15 -10 -10 -1002/06 0 62 74 80 -5 -5 -10 0 0 5 28/18 0 108 168 278 15 0 0 -10 0 002/12 0 45 55 41 -5 -5 -15 0 0 10 29/00 0 140 179 331 15 0 -5 -10 -5 002/18 0 38 24 145 -10 -10 -25 0 5 15 29/06 0 108 80 110 15 -5 -25 -10 0 1503/00 0 93 42 149 -15 -15 -25 5 5 20 29/12 0 46 0 51 0 -5 -40 5 5 3003/06 10 46 83 273 -15 -20 -35 5 10 25 29/18 0 106 82 146 -15 -15 -32 10 10 2503/12 10 52 178 410 -15 -25 -35 5 15 30 30/00 0 39 88 83 -20 -5 -11 10 0 1003/18 10 46 135 397 -10 -5 -10 5 5 10 30/06 0 30 60 -20 -20 10 1004/00 10 73 148 367 -10 -15 -17 5 15 20 30/12 0 32 104 -5 -10 0 1004/06 0 80 78 82 -10 -15 -9 5 10 10 30/18 0 52 178 5 -12 -5 504/12 11 15 87 -10 -10 10 10 31/00 0 117 207 -5 -11 0 1004/18 15 39 68 -15 -15 10 15 31/06 0 51 -10 505/00 0 24 105 -15 -12 10 10 31/12 0 67 -10 1005/06 30 90 83 -10 -4 5 5 31/18 0 100 -7 505/12 0 15 -5 5 Sep. 01/00 0 74 -4 -4005/18 0 102 -5 5 01/06 006/00 0 53 -2 0 01/12 006/06 40 58 0 -5 01/18 006/12 39 02/00 006/18 8707/00 6607/06 29
(UTC) T=00(km) T=24(km) T=48(km) T=72(km) T=24(hPa) T=48(hPa) T=72(hPa) T=24(kt) T=48(kt) T=72(kt)
(UTC) T=00(km) T=24(km) T=48(km) T=72(km) T=24(hPa) T=48(hPa) T=72(hPa) T=24(kt) T=48(kt) T=72(kt) Aug. 29/12 0 209 212 268 15 45 40 -15 -35 -3029/18 0 143 79 170 15 35 25 -15 -25 -2030/00 49 78 88 211 20 25 20 -15 -15 -15
Aug. 11/06 91 137 245 2 7 -5 -10 30/06 0 100 182 238 15 20 25 -10 -15 -1511/12 0 53 303 -5 -7 0 15 30/12 0 139 250 266 25 20 20 -15 -15 -1511/18 172 119 0 0 30/18 0 130 213 162 15 15 15 -10 -15 -1512/00 54 175 -5 5 31/00 0 138 228 189 5 0 -5 -5 -5 012/06 0 54 0 0 31/06 0 46 95 123 0 0 -10 0 0 512/12 0 165 2 5 31/12 0 34 11 67 -5 0 -10 0 0 512/18 63 31/18 0 109 59 84 -5 -5 -15 0 0 1013/00 0 Sep. 01/00 0 84 67 135 -5 -10 -15 0 5 1013/06 0 01/06 0 54 33 98 0 -10 -5 0 5 1013/12 30 01/12 0 30 45 104 -10 -20 -15 5 10 15
01/18 0 62 84 78 -20 -30 -15 10 20 1502/00 0 94 121 141 -20 -25 -15 10 15 1002/06 0 91 161 127 -20 -20 -10 10 15 10
(UTC) T=00(km) T=24(km) T=48(km) T=72(km) T=24(hPa) T=48(hPa) T=72(hPa) T=24(kt) T=48(kt) T=72(kt) 02/12 0 70 73 103 -15 -15 -5 10 15 502/18 0 53 82 124 -10 0 0 10 5 503/00 0 84 111 173 -5 5 -5 5 0 5
Aug. 19/18 21 104 131 224 11 62 40 -10 -50 -35 03/06 0 113 112 190 0 5 -20 5 0 2020/00 15 46 196 334 15 40 15 -15 -30 -10 03/12 0 39 69 149 0 5 -20 5 0 1520/06 15 89 257 344 30 35 20 -25 -25 -10 03/18 0 60 35 63 10 5 -10 0 0 520/12 0 23 91 268 40 30 20 -35 -20 -10 04/00 0 46 104 144 5 0 -10 0 0 1020/18 15 39 108 133 40 10 15 -30 -5 -5 04/06 0 74 133 105 5 -10 -15 0 10 1521/00 0 10 54 83 25 0 5 -20 0 -5 04/12 0 59 122 175 10 -10 -15 -5 10 1521/06 0 44 143 174 10 -5 -5 -10 5 0 04/18 0 73 129 309 0 -15 -15 0 10 1521/12 0 113 201 150 -20 -25 -25 15 20 15 05/00 0 96 115 277 -5 -15 -15 0 15 1521/18 0 150 223 212 -30 -25 -35 20 20 20 05/06 0 81 61 -20 -20 15 2022/00 0 127 158 224 -30 -25 -35 20 15 20 05/12 0 67 217 -15 -20 10 1522/06 0 170 223 287 -25 -25 -40 20 15 25 05/18 0 179 340 -10 -15 5 1522/12 0 146 171 222 -5 -5 -15 5 0 10 06/00 0 91 381 -15 -15 15 1522/18 0 112 139 323 5 -5 -10 0 0 5 06/06 0 77 -20 1523/00 0 110 199 441 5 0 -10 -5 0 10 06/12 0 196 -15 1523/06 0 71 69 374 5 -5 -15 -5 5 15 06/18 18 135 -10 1023/12 0 73 64 148 5 -5 -15 -5 5 15 07/00 136 78 -5 523/18 0 33 56 238 0 0 -7 0 -5 10 07/06 024/00 0 0 67 383 -5 -5 -4 5 5 5 07/12 024/06 0 58 107 557 -10 0 -2 10 0 0 07/18 024/12 0 62 180 751 0 2 -2 0 0 0 08/00 024/18 0 100 369 803 5 0 2 -10 10 5
25/00 0 108 309 -5 0 5 525/06 0 143 302 -5 0 5 025/12 0 133 472 0 -2 0 025/18 0 52 417 -2 -4 5 026/00 0 94 -2 526/06 0 178 -4 526/12 0 384 -2 -526/18 0 323 0 027/00 027/06 027/12 027/18 0
TY NABI (0514)
TY TALIM (0513)
Date/Time Center Position Central Pressure Max. Wind
TS WASHI (0508)
Date/Time Center Position Central Pressure Max. Wind
Date/Time Center Position Central Pressure Max. WindDate/Time Center Position Central Pressure Max. Wind
Central Pressure Max. Wind
Date/Time Center Position Central Pressure Max. Wind
TS NALGAE (0506)
TY MATSA (0509)
STS SANVU (0510)
TY MAWAR (0511)
Date/Time Center Position Central Pressure Max. Wind
Date/Time Center Position

(UTC) T=00(km) T=24(km) T=48(km) T=72(km) T=24(hPa) T=48(hPa) T=72(hPa) T=24(kt) T=48(kt) T=72(kt) (UTC) T=00(km) T=24(km) T=48(km) T=72(km) T=24(hPa) T=48(hPa) T=72(hPa) T=24(kt) T=48(kt) T=72(kt)
Aug. 21/06 11 0 256 732 16 12 12 -15 -10 -10 07/00 0 296 251 92 14 30 20 -15 -30 -1521/12 0 88 279 405 10 5 5 -10 -5 -5 Sep. 07/06 77 130 198 92 10 25 20 -10 -25 -2021/18 20 68 216 237 0 5 10 0 -5 -10 07/12 55 86 176 129 10 20 25 -10 -20 -2022/00 11 116 223 300 0 5 5 0 -5 -5 07/18 0 32 213 256 5 15 30 -5 -10 -2522/06 20 28 89 102 -5 -5 -5 5 5 5 08/00 0 169 147 217 10 5 20 -10 0 -1522/12 10 123 71 -5 -5 5 5 08/06 0 95 174 432 10 10 30 -10 -10 -2522/18 10 142 233 5 5 -5 -5 08/12 0 94 186 409 5 15 15 -5 -10 -1523/00 10 72 258 5 0 -5 0 08/18 0 145 256 527 0 10 5 0 -10 -523/06 0 21 263 5 -2 -5 5 09/00 0 196 343 617 -5 10 0 10 -5 -523/12 35 71 5 -5 09/06 0 145 191 249 0 5 0 0 0 023/18 38 103 5 -5 09/12 0 61 83 180 5 -5 -2 -5 5 024/00 0 102 0 0 09/18 0 55 11 219 10 -5 -2 -10 5 024/06 0 24 -5 5 10/00 0 35 36 5 -6 -5 524/12 0 10/06 0 15 56 5 -6 0 1024/18 53 10/12 0 58 69 0 -2 0 525/00 14 10/18 0 22 127 -5 4 5 025/06 58 11/00 0 74 -6 5
11/06 0 89 -2 1011/12 24 167 -2 511/18 38 134 -2 512/00 012/06 012/12 1412/18 0
Date/Time Center Position Central Pressure Max. Wind
(UTC) T=00(km) T=24(km) T=48(km) T=72(km) T=24(hPa) T=48(hPa) T=72(hPa) T=24(kt) T=48(kt) T=72(kt)
Sep. 16/12 0 158 262 -5 -14 5 1516/18 0 74 -10 517/00 0 40 -5 10
(UTC) T=00(km) T=24(km) T=48(km) T=72(km) T=24(hPa) T=48(hPa) T=72(hPa) T=24(kt) T=48(kt) T=72(kt) 17/06 0 100 -7 1017/12 0 46 -9 1517/18 0
Sep. 20/18 41 204 254 345 14 35 35 -15 -30 -30 18/00 4621/00 67 240 237 379 10 25 25 -15 -20 -20 18/06 3921/06 33 272 195 347 5 10 5 -10 -5 -5 18/12 021/12 0 232 252 238 15 0 0 -10 0 021/18 0 80 131 79 10 5 0 -5 -5 022/00 0 70 195 96 0 5 5 0 -5 -522/06 0 92 269 231 0 0 5 0 0 -522/12 0 111 314 147 0 10 15 5 -5 -1022/18 0 111 418 643 0 10 15 5 -5 -1523/00 0 173 374 438 5 15 15 0 -10 -15 Date/Time Center Position Central Pressure Max. Wind
23/06 0 53 143 112 0 10 5 0 -10 -5 (UTC) T=00(km) T=24(km) T=48(km) T=72(km) T=24(hPa) T=48(hPa) T=72(hPa) T=24(kt) T=48(kt) T=72(kt)23/12 0 69 375 0 5 0 -523/18 0 36 330 -5 5 5 -524/00 0 50 279 0 0 0 0 Oct. 10/06 0 148 220 176 22 55 40 -20 -50 -3024/06 0 177 187 0 0 0 0 10/12 0 133 179 145 30 40 20 -25 -35 -1024/12 0 176 5 -5 10/18 0 122 111 84 30 25 15 -20 -20 -1024/18 0 77 10 -10 11/00 0 115 143 215 30 20 15 -25 -10 -1025/00 0 37 5 -5 11/06 0 126 178 231 30 15 10 -25 -10 -525/06 0 184 5 -5 11/12 0 81 89 105 0 -10 -10 -10 5 525/12 0 11/18 0 43 24 70 -5 -15 -15 0 5 525/18 42 12/00 0 63 73 68 -10 -15 -15 5 5 526/00 0 12/06 0 47 92 145 -10 -15 -15 5 10 1026/06 0 12/12 0 61 127 127 -10 -15 -15 5 10 10
12/18 0 49 168 171 -10 -10 -10 5 5 513/00 0 91 198 217 0 0 5 0 0 -513/06 0 72 165 168 0 0 5 0 0 -5
(UTC) T=00(km) T=24(km) T=48(km) T=72(km) T=24(hPa) T=48(hPa) T=72(hPa) T=24(kt) T=48(kt) T=72(kt) 13/12 0 108 153 145 0 0 5 0 0 -513/18 0 158 194 238 0 0 10 0 0 -514/00 0 188 295 369 0 0 5 0 0 -5
Sep. 21/00 31 179 228 338 6 4 10 -10 -5 -10 14/06 0 75 101 125 10 10 10 -5 -5 -521/06 48 66 83 124 -5 -10 0 5 10 0 14/12 0 39 112 53 5 5 0 -5 -5 021/12 0 33 136 187 -10 -15 0 10 15 0 14/18 0 88 270 444 5 5 10 -5 -5 -521/18 22 97 188 242 -10 -10 0 10 10 0 15/00 0 84 179 448 5 5 15 -5 -5 -1022/00 92 84 133 290 -10 -10 10 10 10 -10 15/06 0 112 214 324 5 0 10 -5 0 -522/06 53 43 293 459 -10 -5 20 10 5 -20 15/12 0 33 97 379 5 0 -5 -5 0 1022/12 53 177 416 823 -10 10 40 10 -10 -45 15/18 0 33 89 188 5 0 -23 -5 0 2022/18 64 213 432 732 -5 15 43 5 -15 -80 16/00 0 70 227 371 5 5 -29 -5 0 2523/00 38 115 337 707 5 25 33 -5 -25 -70 16/06 0 157 534 -10 -5 5 523/06 0 184 487 720 15 35 28 -15 -35 -65 16/12 0 236 609 -5 -25 5 2523/12 0 261 478 772 20 39 25 -20 -40 -60 16/18 0 260 629 -5 -43 5 3523/18 0 260 446 822 20 41 25 -20 -45 -60 17/00 0 253 365 0 -39 0 3524/00 24 252 373 442 25 31 20 -25 -30 -60 17/06 0 161 0 024/06 0 57 84 169 20 15 10 -20 -15 -50 17/12 0 123 -25 2524/12 0 67 42 199 10 5 4 -10 -5 -35 17/18 0 92 -38 3024/18 0 11 52 10 5 -10 -5 18/00 0 171 -39 3525/00 0 119 126 0 0 0 -5 18/06 025/06 0 88 126 0 -10 0 5 18/12 5625/12 0 10 120 -5 0 5 -35 18/18 11225/18 0 57 -5 5 19/00 19226/00 0 10 -5 026/06 0 67 -10 526/12 0 191 -4 526/18 027/00 027/06 027/12 0
TS VICENTE (0516)
TY KIROGI (0520)
TY KHANUN (0515)
Date/Time Center Position Central Pressure Max. Wind
Central Pressure Max. Wind
Date/Time Center Position Central Pressure Max. Wind
Date/Time Center Position Central Pressure Max. Wind
TY SAOLA (0517)
TY DAMREY (0518)
STS GUCHOL (0512)
Date/Time Center Position

Date/Time Center Position Central Pressure Max. Wind
(UTC) T=00(km) T=24(km) T=48(km) T=72(km) T=24(hPa) T=48(hPa) T=72(hPa) T=24(kt) T=48(kt) T=72(kt) (UTC) T=00(km) T=24(km) T=48(km) T=72(km) T=24(hPa) T=48(hPa) T=72(hPa) T=24(kt) T=48(kt) T=72(kt)
Sep. 26/00 0 56 197 258 28 51 56 -30 -45 -50 Oct. 29/00 0 134 141 163 21 40 10 -20 -35 -1026/06 0 113 134 168 25 35 30 -20 -30 -25 29/06 0 117 155 134 15 15 0 -15 -10 026/12 0 136 198 191 20 20 10 -15 -15 -10 29/12 34 101 125 189 15 5 -5 -10 0 526/18 0 117 93 122 15 15 10 -10 -15 -10 29/18 0 79 85 134 15 0 -14 -15 5 1527/00 0 103 138 216 10 10 0 -10 -10 0 30/00 0 34 78 142 15 -5 -20 -10 5 2027/06 0 47 100 202 5 0 -10 -10 -5 5 30/06 0 24 124 5 -15 0 1527/12 0 54 133 216 5 0 0 -10 -5 0 30/12 0 40 141 -15 -35 15 3027/18 0 83 196 287 5 0 10 -10 -5 -10 30/18 0 46 145 -20 -29 20 3028/00 0 47 166 335 0 -10 15 -5 5 -15 31/00 0 46 46 -25 -30 20 3028/06 0 44 204 354 -5 -15 10 0 10 -10 31/06 0 78 -20 1528/12 0 84 241 377 -5 -5 10 0 5 -10 31/12 0 97 -10 1028/18 0 106 227 292 -5 0 5 0 0 -5 31/18 0 102 -14 1529/00 0 159 237 242 -15 5 -25 15 0 20 01/00 0 111 -15 1529/06 0 146 158 153 -15 5 -25 15 0 25 01/06 3929/12 0 114 117 110 -5 5 -25 10 0 25 01/12 029/18 0 73 115 88 0 5 -18 0 -5 20 01/18 4930/00 0 46 60 20 5 -15 -5 02/00 10130/06 0 46 56 20 -10 -15 1030/12 0 33 88 5 -5 -5 530/18 0 61 32 0 -13 0 15 Date/Time Center Position Central Pressure Max. Wind
Oct. 01/00 0 90 -15 10 (UTC) T=00(km) T=24(km) T=48(km) T=72(km) T=24(hPa) T=48(hPa) T=72(hPa) T=24(kt) T=48(kt) T=72(kt)01/06 0 46 -30 2501/12 0 42 -20 2001/18 0 39 -23 25 Nov. 10/00 002/00 15 10/06 6402/06 002/12 002/18 0 Date/Time Center Position Central Pressure Max. Wind
(UTC) T=00(km) T=24(km) T=48(km) T=72(km) T=24(hPa) T=48(hPa) T=72(hPa) T=24(kt) T=48(kt) T=72(kt)
Nov. 16/06 89 156 151 93 5 -5 -15 -15 -5 1516/12 101 168 113 117 0 -10 -25 -10 0 2516/18 35 148 55 110 -5 -15 -28 0 10 3017/00 0 98 131 -10 -10 5 517/06 24 109 240 -20 -15 15 2017/12 34 127 295 -20 -15 15 2017/18 78 194 210 -20 -23 15 2518/00 78 136 -20 1518/06 86 116 -10 1518/12 89 109 -15 2018/18 102 139 -18 2019/00 3519/06 019/12 2519/18 34
STS BOLAVEN (0523)
TY KAI-TAK (0521)
TS TEMBIN (0522)
TY LONGWANG (0519)
Date/Time Center Position Central Pressure Max. Wind

130140
150
160
17010
20
30
0501
0501
14/JAN
14 1004
15998
16 994
17990
18985
191000
TROPICAL CYCLONE TRACKSJANUARY 2005
YYNN
TS,STS or TYTD or extratropical cyclone Position at 0000 UTCwith date & central pressurePosition at 1200 UTC
Identification number
STS Kulap (0501)
Tropical Cyclone Tracks in 2005

0
10110
120
130140
150
0502
0502
12/MAR
12
1008
13
100814
100015
996
16
98517
992
18
100819
1008
TROPICAL CYCLONE TRACKSMARCH 2005
YYNN
TS,STS or TYTD or extratropical cyclone Position at 0000 UTCwith date & central pressurePosition at 1200 UTC
Identification number
STS Roke (0502)

20
30
40
120
130140
150
160
20
30
40
0503
0503
22/APR
22
100423
100024
955
25935
26940
27
980
28
1004
29
1008
TROPICAL CYCLONE TRACKSAPRIL 2005
YYNN
TS,STS or TYTD or extratropical cyclone Position at 0000 UTCwith date & central pressurePosition at 1200 UTC
Identification number
TY Sonca (0503)

20
30
40
120
130140
150
160
20
30
40
0504
0504
30/MAY
30
1008
31
100401
985
02
94503
935
04930
05 945
06955
07 945
08955
09975
10990
11994
TY Nesat (0504)
TROPICAL CYCLONE TRACKSMAY 2005
YYNN
TS,STS or TYTD or extratropical cyclone Position at 0000 UTCwith date & central pressurePosition at 1200 UTC
Identification number

0
10
20
30
40
50
60
110
120
130140
150
160
170
0
10
20
30
40
50
60
0509
0509
31/JUL31
1000
01994
02 980
03965
04955
05 955
06975
07 992
08996
09
998
0508
0508
29/JUL
29996
30985
31 985
0507
0507
21/JUL21
998
22 990
23985
24975
25 975
26975
27980
28 984
29
990
30988
31
994
0506
0506
18/JUL
18
1008
19
1008
20
100421
99222 992
23 992
24 996
25 1004
26 100427
1004
0505
0505
11/JUL
11
101012
100413
998
14965
1596016
92517 920
18950
19980
20992
211000
TROPICAL CYCLONE TRACKSJULY 2005
YYNN
TS,STS or TYTD or extratropical cyclone Position at 0000 UTCwith date & central pressurePosition at 1200 UTC
Identification number
TY Matsa (0509)
TS Washi (0508) TY Haitang (0505)
STS Banyan (0507)
TS Nalgae (0506)

20
30
40
50
120 160
17010
20
30
40
50
0513
0513
26/AUG
26
100427996
28985
29965
30
92531
945
01 960
02996
0514
0514
29/AUG
29
1004
30
985
31
950
0193502
930
03935
04940
05935
06950
07980
08985
09
976
0511
0511
20/AUG
20100021
97022930
23950
24 945
25 960
26
985
27
994281000
291004
301006
311008
01
1014
0512
0512
19/AUG
19
1010
20
100621
100422
985
23 985
24980
25985
26998
271000
0510
0510
10/AUG
101002
11
996
12992
13 985
14998
TROPICAL CYCLONE TRACKSAUGUST 2005
YYNN
TS,STS or TYTD or extratropical cyclone Position at 0000 UTCwith date & central pressurePosition at 1200 UTC
Identification number
STS Guchol (0512)
TY Mawar (0511)
STS Sanvu (0510)
TY Talim (0513)
TY Nabi (0514)

10
20
30
40
50
110
120
130140
150
160
17010
20
30
40
50
0519
0519
26/SEP26
100027
97028
945
29
940
30
95001930
02
96503
1000
0518
0518
20/SEP
20 1000
21 996
22
9902399024
980
25
96026965
27980
281006
0517
0517
19/SEP
19
101020
100221
99622
97523
95524
950
25
955
26975
27
996
28
1002
0516
0516
16/SEP
161000
17990
18985
191004
0515
0515
05/SEP
05
100606
1006
071002
08980
09955
10955
11950
12996
13
1000
TROPICAL CYCLONE TRACKSSEPTEMBER 2005
YYNN
TS,STS or TYTD or extratropical cyclone Position at 0000 UTCwith date & central pressurePosition at 1200 UTC
Identification number
TY Saola (0517)
TY Khanun(0515)
TY Longwang(0519)
TS Vicente (0516)
TY Damrey(0518)

10
20
30
40
110
120
0521
0521
29/OCT29
1000
30 975
31 950
01 975
021000
0520
0520
09/OCT
09
1008
10
100411
98512935
13940
1494015940 16
940
17945
18955
19
1004
TROPICAL CYCLONE TRACKSOCTOBER 2005
YYNN
TS,STS or TYTD or extratropical cyclone Position at 0000 UTCwith date & central pressurePosition at 1200 UTC
Identification number
TY Kirogi (0520)
TY Kai-tak (0521)

10110
120
0523
0523
14/NOV
141004
151000
1699617
99018985
19985
201006
0522
0522
07/NOV
07
1008
08
1008
091008
101002
111004
12
1010
TROPICAL CYCLONE TRACKSNOVEMBER 2005
YYNN
TS,STS or TYTD or extratropical cyclone Position at 0000 UTCwith date & central pressurePosition at 1200 UTC
Identification number
TS Tembin (0522)
STS Bolaven (0523)

Monthly and annual frequency of tropical cyclones that attained TS intensity or higherin the western North Pacific and the South China Sea for 1951 - 2005
Year Jan Feb Mar Apr May Jun Jul Aug Sep Oct Nov Dec Total
1951 1 1 2 1 1 3 3 2 4 1 2 211952 3 3 5 3 6 3 4 271953 1 1 2 1 6 3 5 3 1 231954 1 1 1 5 5 4 3 1 211955 1 1 1 1 2 7 6 4 3 1 1 281956 1 2 1 2 5 6 1 4 1 231957 2 1 1 1 1 4 5 4 3 221958 1 1 1 4 7 5 5 3 2 2 311959 1 1 1 2 5 5 4 2 2 231960 1 1 3 3 10 3 4 1 1 27
1961 1 1 2 3 4 6 6 4 1 1 291962 1 1 2 5 8 4 5 3 1 301963 1 4 4 3 5 4 3 241964 2 2 7 5 6 5 6 1 341965 2 1 1 1 2 3 5 6 7 2 2 321966 1 2 1 4 10 9 5 2 1 351967 1 2 1 1 1 7 9 9 4 3 1 391968 1 1 1 3 8 3 5 5 271969 1 1 1 3 4 3 3 2 1 191970 1 2 3 6 5 5 4 26
1971 1 1 3 4 2 8 5 6 4 2 361972 1 1 3 7 5 4 5 3 2 311973 7 5 2 4 3 211974 1 1 1 1 4 4 5 5 4 4 2 321975 1 2 4 5 5 3 1 211976 1 1 2 2 2 4 4 5 1 1 2 251977 1 1 3 3 5 5 1 2 211978 1 1 3 4 8 5 4 4 301979 1 1 1 2 4 2 6 3 2 2 241980 1 4 1 4 2 6 4 1 1 24
1981 1 2 3 4 8 4 2 3 2 291982 3 1 3 3 5 5 3 1 1 251983 1 3 5 2 5 5 2 231984 2 5 5 4 7 3 1 271985 2 1 3 1 8 5 4 1 2 271986 1 1 2 2 4 4 3 5 4 3 291987 1 1 2 4 4 6 2 2 1 231988 1 1 3 2 8 8 5 2 1 311989 1 1 2 2 7 5 6 4 3 1 321990 1 1 1 3 4 6 4 4 4 1 29
1991 2 1 1 1 4 5 6 3 6 291992 1 1 2 4 8 5 7 3 311993 1 1 4 7 5 5 2 3 281994 1 1 2 7 9 8 6 2 361995 1 1 2 6 5 6 1 1 231996 1 1 2 6 5 6 2 2 1 261997 2 3 3 4 6 4 3 2 1 281998 1 3 5 2 3 2 161999 2 1 4 6 6 2 1 222000 2 5 6 5 2 2 1 23
2001 1 2 5 6 5 3 1 3 262002 1 1 1 3 5 6 4 2 2 1 262003 1 1 2 2 2 5 3 3 2 212004 1 2 5 2 8 3 3 3 2 292005 1 1 1 1 5 5 5 2 2 23
Normal1971-2000 0.5 0.1 0.4 0.8 1.0 1.7 4.2 5.4 5.0 3.9 2.5 1.3 26.7
Monthly and Annual Frequency of Tropical CyclonesAppendix 4

Appendix 5
Code Forms of RSMC Products (a) RSMC Tropical Cyclone Advisory (WTPQ20-25 RJTD) WTPQ i i RJTD YYGGgg RSMC TROPICAL CYCLONE ADVISORY NAME class ty-No. name (common-No.) ANALYSIS PSTN YYGGgg UTC LaLa.La N LoLoLo.Lo E (or W) confidence MOVE direction SpSpSp KT PRES PPPP HPA MXWD VmVmVm KT 50KT RdRdRd NM (or 50KT RdRdRd NM octant RdRdRd NM octant) 30KT RdRdRd NM (or 30KT RdRdRd NM octant RdRdRd NM octant) FORECAST 24HF YYGGggF UTC LaLa.LaF N LoLoLo.LoF E (or W) FrFrFr NM 70% MOVE direction SpSpSp KT PRES PPPP HPA MXWD VmVmVm KT Ft1Ft1HF YYGGggF UTC LaLa.LaF N LoLoLo.LoF E (or W) FrFrFr NM 70% MOVE direction SpSpSp KT PRES PPPP HPA MXWD VmVmVm KT Ft2Ft2HF YYGGggF UTC LaLa.LaF N LoLoLo.LoF E (or W) FrFrFr NM 70% MOVE direction SpSpSp KT PRES PPPP HPA MXWD VmVmVm KT = Notes: a. Underlined is fixed. b. Abbreviations PSTN : Position MOVE : Movement PRES : Pressure MXWD : Maximum wind HF : Hour forecast c. Symbolic letters i i : '20', '21', '22', '23', '24' or '25'. YYGGgg : Time of observation submitting the data for analysis. Date(YY), hour(GG) and minute(gg) are given in UTC. class : Intensity classification of the tropical cyclone. 'TY', 'STS', 'TS' or 'TD'. ty-No. : Domestic identification number of the tropical cyclone adopted in Japan. Given in four digits and same as the international identification number. name : Name assigned to the tropical cyclone from the name list prepared by the Typhoon Committee. common-No. : International identification number of the tropical cyclones given in four digits. LaLa.La : Latitude of the center position in "ANALYSIS" part. LoLoLo.Lo : Longitude of the center position in "ANALYSIS" part. confidence : Confidence of the center position. 'GOOD', 'FAIR' or 'POOR'. direction : Direction of movement given in 16 azimuthal direction as 'N', 'NNE', 'NE', 'ENE', etc. SpSpSp : Speed of movement. PPPP : Central pressure. VmVmVm : Maximum sustained wind. RdRdRd : Radii of 30knots and 50knots wind.

octant : Eccentric distribution of wind given in 8 azimuthal direction as 'NORTH', 'NORTHEAST', 'EAST' etc. Ft1Ft1 : 48 (00, 06, 12 and 18 UTC) or 45 (03, 09, 15 and 21 UTC) Ft2Ft2 : 72 (00, 06, 12 and 18 UTC) or 69 (03, 09, 15 and 21 UTC) YYGGggF : Time in UTC on which the forecast is valid. LaLa.LaF : Latitude of the center of 70% probability circle in "FORECAST" part. LoLoLo.LoF : Longitude of the center of 70% probability circle in "FORECAST" part. FrFrFr : Radius of 70% probability circle. d. MOVE is optionally described as 'ALMOST STATIONARY' or '(direction) SLOWLY', depending on the speed of movement. E
xample:
WTPQ20 RJTD 150000 RSMC TROPICAL CYCLONE ADVISORY NAME STS 0320 NEPARTAK (0320) ANALYSIS PSTN 150000UTC 12.6N 117.8E FAIR MOVE WNW 13KT PRES 980HPA MXWD 055KT 50KT 40NM 30KT 240NM NORTHEAST 160NM SOUTHWEST FORECAST 24HF 160000UTC 14.7N 113.7E 110NM 70% MOVE WNW 11KT PRES 965HPA MXWD 070KT 48HF 170000UTC 16.0N 111.0E 170NM 70% MOVE WNW 07KT PRES 970HPA MXWD 065KT 72HF 180000UTC 19.5N 110.0E 250NM 70% MOVE NNW 09KT PRES 985HPA
MXWD 050KT =
(b) RSMC Guidance for Forecast (FXPQ20-25 RJTD) FXPQ i i RJTD YYGGgg RSMC GUIDANCE FOR FORECAST NAME class ty-No. name (common-No.) PSTN YYGGgg UTC LaLa.La N LoLoLo.Lo E (or W) PRES PPPP HPA MXWD WWW KT FORECAST BY TYPHOON (or GLOBAL) MODEL TIME PSTN PRES MXWD (CHANGE FROM T=0) T=06 LaLa.La N LoLoLo.Lo E (or W) appp HPA awww KT T=12 LaLa.La N LoLoLo.Lo E (or W) appp HPA awww KT T=18 LaLa.La N LoLoLo.Lo E (or W) appp HPA awww KT : : T=78 (or 84) LaLa.La N LoLoLo.Lo E (or W) appp HPA awww KT= Notes: a. Underlined is fixed. b. Symbolic letters i i : '20', '21', '22', '23', '24' or '25'. YYGGgg : Initial time of the model in UTC. PPPP : Central pressure in hPa. WWW : Maximum wind speed in knots. a : Sign of ppp and www ( +, - or blank ).

ppp : Absolute value of change in central pressure from T=0, in hPa. www : Absolute value of change in maximum wind speed from T=0, in knots. c. The prediction terminates in T=78 for Typhoon Model and in T=84 for Global Model. E
xample:
FXPQ20 RJTD 180600 RSMC GUIDANCE FOR FORECAST NAME T 0001DAMREY (0001) PSTN 180000UTC 15.2N 126.3E PRES 905HPA MXWD 105KT FORECAST BY GLOBAL MODEL TIME PSTN PRES MXWD (CHANGE FROM T=0) T=06 15.4N 125.8E +018HPA -008KT T=12 15.5N 125.6E +011HPA -011KT T=18 15.8N 125.7E +027HPA -028KT : :
T=78 20.7N 128.8E +021HPA -022KT=
(c) SAREP (TCNA20/21 RJTD) TCNA i i RJTD YYGGgg CCAA YYGGg 47644 name (common-No.) nt nt LaLaLa Qc LoLoLoLo 1At Wt at tm 2St St // (9ds ds fs fs )= Notes: a. Underlined is fixed. b. Symbolic letters i i : 20 for the observation at 03, 09, 15 and 21 UTC. 21 for the observation at 00, 06, 12 and 18 UTC. YYGGgg : Time of observation submitting the data for analysis. Date(YY), hour(GG) and minute(gg) are given in UTC. nt nt : Serial number of the tropical cyclone in order of its formation in the year. Given in '01' - '99' irrespective of TS attainment in intensity. LaLaLa : Latitude given in 0.1E. Qc : Quadrant of the earth. 1: N/E, 2: S/E, 3: S/W and 4: N/W. LoLoLoLo : Longitude in 0.1E. At : Confidence. 0: =<10km 1: =<20km 2: =<50km 3: =<100km 4: =<200km 5: =<300km /: unable to determine Wt : Mean diameter (d: degree in latitude) of cloud system. 0: d<1° 1: 1°=<d<2° 2: 2°=<d<3° 3: 3°=<d<4° 4: 4°=<d<5° 5: 5°=<d<6° 6: 6°=<d<7° 7: 7°=<d<8° 8: 8°=<d<9° 9: 9°=<d /: unable to determine at : 24-hour intensity inclination. 0: further weakening 1: weakening 2: no change 3: intensifying 4: further intensifying 9: no former observation /: unable to determine tm : Time interval (t: hour) for determination of movement. 0: t<1 1: 1=<t<2 2: 2=<t<3 3: 3=<t<6 4: 6=<t<9 5: 9=<t<12 6: 12=<t<15 7: 15=<t<18 8: 18=<t<21 9: 21=<t<30 /: no (9dsdsfsfs) group StSt : Intensity. 00: weakening 15, 20, 25 … 80: CI-number (in 0.1) 99: under extratropical transformation //: unable to determine dsds : Direction of movement (in 10°). fsfs : Speed of movement (in knots).

Example: TCNA21 RJTD 180000 CCAA 18000 47644 DAMREY(0001) 29149 11272 11334 275// 92811= (d) RSMC Prognostic Reasoning (WTPQ30-35 RJTD) E
xample:
WTPQ30 RJTD 180000 RSMC TROPICAL CYCLONE PROGNOSTIC REASONING REASONING NO. 9 FOR TY 0001 DAMREY (0001) 1.GENERAL COMMENTS REASONING OF PROGNOSIS THIS TIME IS SIMILAR TO PREVIOUS ONE. POSITION FORECAST IS MAINLY BASED ON NWP AND PERSISTENCY. 2.SYNOPTIC SITUATION SUBTROPICAL RIDGE WILL NOT CHANGE ITS LOCATION AND STRENGTH FOR THE NEXT 24 HOURS. 3.MOTION FORECAST POSITION ACCURACY AT 180000 UTC IS GOOD. TY WILL DECELERATE FOR THE NEXT 12 HOURS. TY WILL RECURVE WITHIN 60 HOURS FROM 180000 UTC. TY WILL MOVE WEST FOR THE NEXT 12 HOURS THEN MOVE GRADUALLY TO WEST-NORTHWEST. 4.INTENSITY FORECAST TY WILL KEEP PRESENT INTENSITY FOR NEXT 24 HOURS.
FI-NUMBER WILL BE 7.0 AFTER 24 HOURS.=
(e) Tropical Cyclone Advisory for SIGMET (FKPQ30-35 RJTD) FKPQ i i RJTD YYGGgg TC ADVISORY DTG: yyyymmdd/time Z TCAC: TOKYO TC: name NR: number PSN: N LaLa.LaLa E LoLoLo.LoLo MOV: direction SpSpSp KT C: PPPP HPA MAX WIND: WWW KT FCST PSN +12HR: YYGGgg NLaLa.LaLa ELoLoLo.LoLo FCST MAX WIND +12HR: WWW KT FCST PSN +18HR: NIL FCST MAX WIND +18HR: NIL FCST PSN +24HR: YYGGgg N LaLa.LaLa E LoLoLo.LoLo FCST MAX WIND +24HR: WWW KT NXT MSG: yyyymmdd/time Z= Notes: a. Underlined is fixed. b. Abbreviations
DTG : Date and time TCAC : Tropical Cyclone Advisory Centre TC : Tropical Cyclone NR : Number PSN : Position MOV : Movement C : Central pressure

MAX WIND : Maximum wind FCST : Forecast NXT MSG : Next message c. Symbolic letters i i : '30', '31', '32', '33', '34' or '35'. YYGGgg : Date(YY), hour(GG) and minute(gg) are given in UTC. yyyymmdd/time : Year(yyyy), month(mm), date(dd), hour and minute (time) are given in UTC. (Using “Z”) name : Name assigned to the tropical cyclone by RSMC Tokyo-Typhoon Center. Number : Advisory number. (starting with “01” for each cyclone) LaLa.LaLa : Latitude of the center position. LoLoLo.LoLo : Longitude of the center position. direction : Direction of movement given in 16 azimuthal direction as 'N', 'NNE', 'NE', 'ENE', etc. SpSpSp : Speed of movement. PPPP : Central pressure. WWW : Maximum sustained wind. E
xample:
FKPQ30 RJTD 160600 TC ADVISORY DTG: 20040416/0600Z TCAC: TOKYO TC: SUDAL NR: 47 PSN: N2830 E15855 MOV: ENE 25KT C: 985HPA MAX WIND: 50KT FCST PSN +12HR: 161800 N3150 E15855 FCST MAX WIND 12HR: 50KT FCST PSN +18HR: NIL FCST MAX WIND 18HR: NIL FCST PSN +24HR: 170600 N3500 E16700 FCST MAX WIND 24HR: 45KT
NXT MSG: 20040416/1200Z =
(f) RSMC Tropical Cyclone Best Track (AXPQ20 RJTD) AXPQ20 RJTD YYGGgg RSMC TROPICAL CYCLONE BEST TRACK NAME ty-No. name (common-No.) PERIOD FROM MMMDDTTUTC TO MMMDDTTUTC DDTT LaLa.LaN LoLoLo.LoE PPPHPA WWWKT DDTT LaLa.LaN LoLoLo.LoE PPPHPA WWWKT DDTT LaLa.LaN LoLoLo.LoE PPPHPA WWWKT DDTT LaLa.LaN LoLoLo.LoE PPPHPA WWWKT : : DDTT LaLa.LaN LoLoLo.LoE PPPHPA WWWKT DDTT LaLa.LaN LoLoLo.LoE PPPHPA WWWKT REMARKS1)
TD FORMATION AT MMMDDTTUTC FROM TD TO TS AT MMMDDTTUTC : : DISSIPATION AT MMMDDTTUTC= Notes: a. Underlined is fixed.

b. 1) REMARKS is given optionally. c. Symbolic letters MMM : Month in UTC. Given as 'JAN', 'FEB', etc. DD : Date in UTC. TT : Hour in UTC. PPP : Central pressure. WWW : Maximum wind speed. E
xample:
AXPQ20 RJTD 020600 RSMC TROPICAL CYCLONE BEST TRACK NAME 0001 DAMREY (0001) PERIOD FROM OCT1300UTC TO OCT2618UTC 1300 10.8N 155.5E 1008HPA //KT 1306 10.9N 153.6E 1006HPA //KT 1312 11.1N 151.5E 1004HPA //KT 1318 11.5N 149.8E 1002HPA //KT 1400 11.9N 148.5E 1000HPA //KT 1406 12.0N 146.8E 998HPA 35KT : : 1712 14.6N 129.5E 905HPA 105KT 1718 14.7N 128.3E 905HPA 105KT : : 2612 32.6N 154.0E 1000HPA //KT 2618 33.8N 157.4E 1010HPA //KT REMARKS TD FORMATION AT OCT1300UTC FROM TD TO TS AT OCT1406UTC FROM TS TO STS AT OCT1512UTC FROM STS TO TY AT OCT1600UTC FROM TY TO STS AT OCT2100UTC FROM STS TO TS AT OCT2112UTC FROM TS TO L AT OCT2506UTC
DISSIPATION AT OCT2700UTC=

Appendix 6
List of GPV products and data on the RSMC Data Serving System
Area 20S-60N, 80E-160W 20S-60N, 60E-160W Resolution 2.5x2.5 degrees 1.25x1.25 degrees Levels and elements
Surface (P, U, V, T, TTd, R) 850hPa (Z, U, V, T, TTd, ω) 700hPa (Z, U, V, T, TTd, ω) 500hPa (Z, U, V, T, TTd, ζ) 300hPa (Z, U, V, T) 250hPa (Z, U, V, T) 200hPa (Z, U, V, T) 150hPa (Z, U, V, T) 100hPa (Z, U, V, T)
Surface (P, U, V, T, TTd, R)** 1000hPa (Z, U, V, T, TTd) 925hPa (Z, U, V, T, TTd, ω) 850hPa (Z*, U*, V*, T*, TTd*, ω, ψ, χ) 700hPa (Z*, U*, V*, T*, TTd*, ω) 500hPa (Z*, U*, V*, T*, TTd*, ζ) 400hPa (Z, U, V, T, TTd) 300hPa (Z, U, V, T, TTd) 250hPa (Z, U, V, T) 200hPa (Z*, U*, V*, T*, ψ, χ) 150hPa (Z, U, V, T) 100hPa (Z, U, V, T) 70hPa (Z, U, V, T) 50hPa (Z, U, V, T) 30hPa (Z, U, V, T) 20hPa (Z, U, V, T) 10hPa (Z, U, V, T)
Forecast hours
(00 and 12 UTC) 0, 6, 12, 18, 24, 30, 36, 48, 60 and 72 hours
(00 and 12 UTC) 0 to 84 every 6 hours In addition (12 UTC), * 96, 120, 144, 168 and 192 hours ** 90 to 192 every 6 hours
Frequency (initial times)
Twice a day (00 and 12 UTC) Twice a day (00 and 12 UTC)
Area Whole globe Whole globe
Resolution 2.5x2.5 degrees 1.25x1.25 degrees
Levels and elements
Surface (P, R, U, V, T) 1000hPa (Z) 850hPa (Z, U, V, T, TTd) 700hPa (Z, U, V, T, TTd) 500hPa (Z, U, V, T) 300hPa (Z, U, V, T) 250hPa (Z, U, V, T)* 200hPa (Z, U, V, T) 100hPa (Z, U, V, T)* 70hPa (Z, U, V, T)* 50hPa (Z, U, V, T)* 30hPa (Z, U, V, T)*
Surface (P, U, V, T, TTd*) 1000hPa (Z, U, V, T, TTd*)850hPa (Z, U, V, T, TTd) 700hPa (Z, U, V, T, TTd) 500hPa (Z, U, V, T, TTd*) 400hPa (Z, U, V, T, TTd*) 300hPa (Z, U, V, T, TTd*) 250hPa (Z, U, V, T) 200hPa (Z, U, V, T) 150hPa (Z, U, V, T) 100hPa (Z, U, V, T) 70hPa (Z, U, V, T) 50hPa (Z, U, V, T) 30hPa (Z, U, V, T) 20hPa (Z, U, V, T) 10hPa (Z, U, V, T)
Surface (P, U, V, T, RH, ω) 1000hPa (Z, U, V, T, RH, ω) 925hPa (Z, U, V, T, RH, ω) 850hPa (Z, U, V, T, RH, ω, ψ, χ) 700hPa (Z, U, V, T, RH, ω) 600hPa (Z, U, V, T, RH, ω) 500hPa (Z, U, V, T, RH, ω, ζ) 400hPa (Z, U, V, T, RH, ω) 300hPa (Z, U, V, T, RH, ω) 250hPa (Z, U, V, T) 200hPa (Z, U, V, T, ψ, χ) 150hPa (Z, U, V, T) 100hPa (Z, U, V, T) 70hPa (Z, U, V, T) 50hPa (Z, U, V, T) 30hPa (Z, U, V, T) 20hPa (Z, U, V, T) 10hPa (Z, U, V, T)
Forecast hours
(00 and 12 UTC) 24, 48 and 72 hours In addition (12 UTC), 96 to 192 every 24 hours * 96 and 120 only
(00 and 12 UTC) 0 hours * 00UTC only
(00 and 12 UTC) 0 to 84 every 6 hours In addition (12 UTC), 96 to 192 every 12 hours
Frequency (initial times)
Twice a day (00 and 12 UTC) Twice a day (00 and 12 UTC)

Area Whole globe Resolution 2.5x2.5 degrees Levels and elements
Surface (P) 1000hPa(Z) 850hPa (T, U, V) 500hPa (Z) 250hPa (U, V) Above GPVs are ensemble mean and standard deviation of ensemble forecast members.
Forecast hours
Every 12 hours from 0 to 192 hours
Frequency (initial times)
Once a day (12 UTC)
Notes: P : pressure reduced to MSL R : total precipitation RH : relative humidity
T : temperature TTd: dew point depression U : u-component of wind
V : v-component of wind Z : geopotential height ζ : relative vorticity
χ : velocity potential ψ : stream function ω : vertical velocity
Products/ Data Typhoon Information Global Wave Model (GRIB) 1.25x1.25 degrees Obsevational data
Contents Tropical cyclone relatedinformation (BUFR) • Position, etc.
• Significant wave height • Prevailing wave period • Prevailing wave direction Forecast hours: 0, 6, 12, 18, 24, 30, 36, 42, 48, 54,60, 66, 72, 78, 84 (00 and 12UTC); 96, 108, 120, 132, 144, 156, 168, 180 and 192 hours (12 UTC)
(a) Surface data (SYNOP, SHIP) (b) Upper-air data (TEMP, parts A-D) (PILOT, parts A-D)
Frequency (initial times)
4 times a day (00, 06, 12and 18 UTC)
Twice a day (00 and 12 UTC) (a) Mainly 4 times a day (b) Mainly 2 times a day

Appendix 7
User’s Guide to the attached CD-ROM
Copyright (c) 2006 by the Japan Meteorological Agency (JMA) All Rights Reserved. 1) This CD-ROM shall not be reproduced and not be provided to any third party. 2) The source shall be properly acknowledged, in publishing any outcome which uses software, data or
documents in this CD-ROM JMA does not accept liability for any direct and/or indirect loss or damage to the user caused by the use of the software, data or documents in this CD-ROM. Preface This CD-ROM contains all the texts, tables, charts of this report and satellite images of the tropical cyclones that attained TS intensity or higher in the western North Pacific and the South China Sea in 2005. This document is a brief user's guide for the CD-ROM. The CD-ROM was mastered in ISO-9660 format. Directory and File layout [Disk] |------ar405eng.exe (Acrobat Reader Installer) |------Readme.txt (belief explanation about the CD-ROM) |------TopMenu.exe (start menu setup program) |------SATAIDmanual.pdf (user’s manual of a satellite image viewer) |------Annual_Report |---Text (text of Annual Report 2005 in PDF) |---Figure (figures for MS PowerPoint) |---Table (tables for MS Excel) |---Appendix (appendixes for MS Excel and PowerPoint) |------Programs |---Gmslpd |--Gmslpd.exe (viewer; tropical cyclone version in English) |--Gsetup.exe, etc. (setup program, etc.) |------Satellite_Image_Data |---T0501 (3-hourly GOES image data) |---T0502 (3-hourly GOES image data) : |---T0523 (3-hourly GOES image data) |------Andata |--Besttrack
|--Best2005.txt (Best track data for the year 2005)

How to use the CD-ROM When you set the CD-ROM, start menu will be popped up automatically with a panel which has “Annual Report 2005”, “Satellite Images”, “About CD-ROM” and “Close” buttons and a file list box for some introductory documents. Choose and click a button or file which you want to see and follow instructions on your display. Required hardware/OS for the CD-ROM are: Hardware : PC/AT compatible OS : Microsoft Windows Ver. 3.1 or later < Annual Report 2005 > Annual Report 2005 is prepared in the following two formats: ”PDF files” and “MS Word/Excel/PowerPoint files”. - PDF files: Click the “Annual Report 2005” button to open the text in PDF. If you cannot open the PDF file, install ‘Adobe Acrobat Reader’ with its installer (ar405eng.exe) in the file list box on a start menu window, and try again. ‘Adobe Acrobat Reader’ (or ‘Adobe Acrobat’) is required to view PDF files. - Word/Excel/PowerPoint files: Original figures and tables prepared with Microsoft Word, Excel or PowerPoint are stored in Annual Report folder of the CD-ROM. < Satellite Images > - Installation of a program for displaying satellite images: Click the “MTSAT Satellite Image” button to run a setup program (Gsetup.exe) of a satellite image viewer. Follow the instructions, and the satellite image viewer ‘Gmslpd.exe’ will be installed into the hard disk of your computer and a list of the tropical cyclones in 2005 is displayed in the ‘Selection window’ of satellite images for tropical cyclones. - Displaying satellite images: Choose and click a tropical cyclone from the list, and 3-hourly satellite images for the tropical cyclone will be displayed. You can also display the track of the tropical cyclone superimposed on the satellite image and measure the intensity of the tropical cyclone using Dvorak's technique. - User’s manual for the viewer: Besides the above functions, the viewer has many other useful functions. See the User's Manual (SATAIDmanual.pdf) for further detailed use. - Explanation of satellite image data

Period : From Generating Stage to Weakening Stage of each tropical cyclone. Images : Infrared images (00, 03, 06, 09, 12, 15, 18 and 21UTC) Visible images (00, 03, 06, 09 and 21UTC) Range : 40 degrees in both latitude and longitude. (The image window moves following a tropical cyclone's track so that the center of a tropical cyclone is fixed at the center of the image window.) Time interval : 3-hourly Resolution : 0.08 degrees in both latitude and longitude. Compression of file: Compressed using 'compress.exe' command of Microsoft Windows. < About CD-ROM > Click the “About CD-ROM” button to open ‘Readme.txt’ file. < Close > Click the “Close” button to close start menu window. < File list box > You can open document files from a file list box on the start menu window. Choose a file and click the “Open” button or double click the file name.

Microsoft Windows is the registered trademark of Microsoft Corporation in the United States and other countries. Adobe and Acrobat Reader are the trademark of Adobe Systems Incorporated. PC-9800 Series is the trademark of NEC Corporation.
For further information, please contact the following address:
RSMC Tokyo-Typhoon Center Forecast Division Forecast Department JAPAN METEOROLOGICAL AGENCY 1-3-4 Otemachi, Chiyoda-ku, Tokyo, 100-8122 Japan FAX: +81-3-3211-8303 e-mail: [email protected]
JAPAN METEOROLOGICAL AGENCY 1-3-4 Otemachi, Chiyoda-ku, Tokyo, 100-8122 Japan