Annual Report of the Office of Economic Research … · Annual Report of the Office of Economic...
24
www.sba.gov/advocacy Office of Advocacy Annual Report of the Office of Economic Research FY 2012 January 2013
Transcript of Annual Report of the Office of Economic Research … · Annual Report of the Office of Economic...

www.sba.gov/advocacy
Office of Advocacy
Annual Report of theOffice of Economic ResearchFY 2012
January 2013
Created by Congress in 1976, the Office of Advocacy of the U.S. Small Business Administration (SBA) is an independent voice for small business within the federal government. Appointed by the President and confirmed by the U.S. Senate, the Chief Counsel for Advocacy directs the office. The Chief Counsel advances the views, con-cerns, and interests of small business before Congress, the White House, federal agen-cies, federal courts, and state policy makers. Economic research, policy analyses, and small business outreach help identify issues of concern. Regional Advocates and an office in Washington, DC, support the Chief Counsel’s efforts.
For more information on the Office of Advocacy, visit http://www.sba.gov/advocacy, or call (202) 205-6533. Receive email notices of new Office of Advocacy information by signing up on Advocacy’s Listservs at http://www.sba.gov/updates.

i Annual Report of the Office of Economic Research, FY 2012
ForewordWe are pleased to present this FY 2012 annual report for the Office of Advo-cacy’s Office of Economic Research (OER). Advocacy places a high value on sound economic research, which contributes to better policy for small busi-ness, and on providing our small business stakeholders with timely and action-able information about the current economic climate.
Throughout more than 35 years of existence, the Office of Advocacy has conducted economic research as part of its core mission. In 1976, Public Law 94-305 assigned to Advocacy the task of examining “the role of small busi-ness in the American economy and the contribution which small business can make in improving competition.”
In fiscal year 2012, Advocacy produced more than 25 contract and internal research reports about topics ranging from immigrant and veteran small busi-ness owners to small business lending, federal contracting, and innovation.
In addition to these reports, Advocacy economists participated in round-tables and conferences about various small business topics. These outreach ef-forts are important for small business stakeholders around the country.
We appreciate our stakeholders’ contributions in support of the best pos-sible research on small business and we look forward to hearing from you in the year ahead. For more information about the Office of Advocacy, visit our website at www.sba.gov/advocacy.
Winslow Sargeant, Ph.D. Joseph M. Johnson, Ph.D.Chief Counsel for Advocacy Director, Office of Economic Research

iii Annual Report of the Office of Economic Research, FY 2012
ContentsForeword iIntroduction 1Advocacy Research Reports, FY 2012 3 Advocacy Research 3 Contract Research 6Data Access 9 Small Business Data Resources Tool 9 Downloadable Data 9 Statistics of U.S. Businesses 10 Business Dynamics Statistics 11 Business Employment Dynamics 11 Nonemployer Statistics 12Appendix A: Research Functions 13Appendix B: Frequently Asked Questions 15Appendix C: Small Business Data Resources 19

1 Annual Report of the Office of Economic Research, FY 2012
Introduction
In fiscal year 2012, the Office of Advocacy continued to issue research reports on a variety of timely topics, from capital formation to immigrant entrepreneur-ship. Small business was a focus of national debates about economic growth, job creation, and the regulatory environment. The Office of Economic Research responded to the pressing need for new and timely information on small firms by making more information readily available in updated formats and by commis-sioning research on key topics.
One of the Office of Advocacy’s earliest mandates was “to examine the role of small business in the American economy and the contribution which small business can make in improving competition, encouraging economic and social mobility…and providing an avenue through which new and untested products and services can be brought to the marketplace.”1
In keeping with its research mission and in an ongoing effort to make its data products reader friendly and electronically accessible, the Office of Advocacy in FY 2012 expanded and redesigned its Frequently Asked Questions About Small Business (FAQ) (see Appendix B). The new edition includes twice as much data as previous versions, as well as charts and tables showing key small business sta-tistics and trends. Topics covered include general data about small businesses and their employment and output, the demographics of ownership (businesses owned by women, minorities, veterans, and youth), home-based business trends, business survival rates, innovation, federal procurement, tax rates, and legal forms of orga-nization. Advocacy continued quarterly updates of its two recurring publications, the Small Business Quarterly Bulletin and the Quarterly Lending Bulletin. All of the new publications continue to be well received and widely read by Advocacy stakeholders.
The Office of Advocacy continues to partner with the U.S. Census Bureau to collect and report important data on small business. Advocacy economists process and analyze the data to produce easy-to-understand statistical tables and reports downloadable from Advocacy’s website.
In FY 2012, the Office of Advocacy also provided information in easily acces-sible matrix form about its work products and resource partners. Small Business Data Resources is a listing of online databases by federal agency or private sec-tor source and topic (see Appendix C). The listed databases are hotlinked to their websites and keyed to the small-business-related topics on which they provide information.
Matrices of research by issue area display Advocacy’s annual research prod-ucts from FY 2008 to FY 2012 and the issue areas they address, broadly framed in three categories:
1 Public Law 94-305, 1976. See Appendix A.

2 Annual Report of the Office of Economic Research, FY 2012
• Small business contributions—The impact small businesses make;• Small business challenges—The hurdles small businesses face; and• Small business environment—What can be done to facilitate small busi-
ness success.2
In FY 2012, Advocacy’s Office of Economic Research advanced the mis-sion of providing small business research that is timely and relevant for use by the many stakeholders interested in small business contributions to the U.S. economy.
2 See http://www.sba.gov/advocacy/7540/161281
3 Annual Report of the Office of Economic Research, FY 2012
Advocacy Research Reports, FY 2012
In FY 2012, Advocacy’s Office of Economic Research produced reports on topics ranging from federal tax compliance burdens to entrepreneurship among veterans and women. This section lists Advocacy’s FY 2012 research reports by release date, beginning with the latest, followed by Advocacy contract research, also in re-verse chronological order. Visit the Office of Advocacy website for research reports available online: http://www.sba.gov/advocacy/7540/.
Advocacy ResearchFrequently Asked Questions about Small Business http://www.sba.gov/advocacy/7495/29581 This valuable resource gathers dozens of the latest statistics about America’s small business in one place. The FAQ is updated annually, and includes data on the to-tal number of small businesses, their share of employment and net new jobs, plus starts, closures, and overall contributions to the U.S. economy. (Released Septem-ber 2012.)
Small Business Factshttp://www.sba.gov/advocacy/7540/126001 Various authors.Periodically, Advocacy presents these one-pagers to focus on one specific small business issue. These Facts enable small business champions and others to better understand the plight of small businesses. (Released May-September 2012.)
• Gender differences in startup financing • Home values and entrepreneurship • Startup rates • Where are the jobs created? New or existing businesses? • What is the level of availability and coverage of health insurance in small
firms? • Do economic or industry factors affect business survival? • What is the difference between self-employer businesses and sole
proprietors? • Credit card financing and small business
Small Business Quarterly Bulletin, Second Quarter 2012 http://www.sba.gov/sites/default/files/SBQB_2012q2.pdf Advocacy’s Small Business Quarterly Bulletin for the second quarter of 2012 shows economic variables related to small business. (Released September 2012.)

4 Annual Report of the Office of Economic Research, FY 2012
Small Business Lending in the United States, 2010-2011http://www.sba.gov/sites/default/files/files/sbl_11study.pdf Victoria WilliamsResearch Summary No. 398This report is an update to Advocacy’s annual publication that provides informa-tion on the lending activities of depository institutions in the United States. The U.S. economy continued to recover and improved moderately during the second half of 2011 as some economic indicators turned upward. Financial market condi-tions were to some extent supportive of economic growth, but the credit supply for smaller firms remained tighter than for larger firms relative to historic norms. (Re-leased July 2012.)
Quarterly Lending Bulletin, First Quarter 2012 http://www.sba.gov/sites/default/files/SBL_2012Q1.pdf Small business borrowing remained slow in the first quarter of 2012. The number of C&I loans increased, while commercial real estate loans remained unchanged. (Released July 2012.)
Small Business Quarterly Bulletin, First Quarter 2012 http://www.sba.gov/sites/default/files/SBQB_2012q1.pdf Advocacy’s Small Business Quarterly Bulletin for the first quarter of 2012 shows economic variables related to small business. (Released June 2012.)
Small Business Quarterly Bulletin, Fourth Quarter 2011 http://www.sba.gov/sites/default/files/SBQB_2011q4_0.pdf Advocacy’s Small Business Quarterly Bulletin for the fourth quarter of 2011 shows economic variables related to small business. (Released April 2012.)
The Small Business Economy, 2011http://www.sba.gov/advocacy/849/6282 Small businesses were challenged as the economy recovered from the recent re-cession. As in previous editions of The Small Business Economy, the key set of reference tables (Section A) documents various aspects of small business participa-tion in the American economy. Many economic indicators began to show positive improvement in the months following the end of the most recent recession. The Office of Advocacy tracked small business financing trends in The Small Business Economy. This year the key financial data (Section B) tracked important trends such as movements in interest rates, credit market borrowing by businesses, their sources and uses of funds, finance company borrowing, initial public offerings of common stock, and venture capital. (Released March 2012.)
5 Annual Report of the Office of Economic Research, FY 2012
Veteran-owned Businesses and their Owners—Data from the Census Bureau’s Survey of Business Ownershttp://www.sba.gov/advocacy/7540/132031 Joseph Sobota with contributions from Jules LichtensteinResearch Summary No. 393Businesses owned by veterans and by service-disabled veterans have been a re-search priority for the U. S. Small Business Administration’s Office of Advocacy since the enactment of the Veterans Entrepreneurship and Small Business Devel-opment Act of 1999, Public Law 106-50. This report continues Advocacy’s ongo-ing veteran entrepreneurship research program and features data on veteran-owned businesses and their owners. The report is based on 2007 Survey of Business Owners data released in 2011. (Released March 2012.)
Quarterly Lending Bulletin, Fourth Quarter 2011http://www.sba.gov/sites/default/files/SBL_2011Q4.pdf Small business borrowing remained subdued in the fourth quarter of 2011. Advo-cacy’s Quarterly Lending Bulletin shows that total small business borrowing de-clined at a much slower pace than in the previous quarter. The value of small busi-ness commercial and industrial (C&I) loans increased for the first time in seven quarters. (Released March 2012.)
Report on the Regulatory Flexibility Act, FY 2011http://www.sba.gov/sites/default/files/11regflx_0.pdf Research Summary No. 391The Regulatory Flexibility Act (5 U.S.C. 601-612) requires federal agencies to consider the effects of their regulatory actions on small businesses and other small entities and to minimize any undue disproportionate burden. The Chief Counsel for Advocacy of the U.S. Small Business Administration is charged with monitor-ing federal agencies’ compliance with the act and with submitting an annual report to Congress. The Office of Economic Research contributes data on small business cost savings as a result of this work. In FY 2011, Advocacy’s RFA efforts helped save nearly $11.7 billion in first-year regulatory costs for small businesses (Re-leased February 2012.)
2011 Small Business Profiles for the States and Territorieshttp://www.sba.gov/advocacy/848/41391The economic condition of small businesses in the United States is captured in the latest edition of the Small Business Profiles for the States and Territories. This an-nual publication from the Office of Advocacy provides information on the demo-graphics of business ownership, employment, industry composition, and small busi-ness income, for each of the 50 states and the District of Columbia. The publication provides available limited data on the U.S. territories. (Released January 2012.)

6 Annual Report of the Office of Economic Research, FY 2012
Quarterly Lending Bulletin, Third Quarter 2011http://www.sba.gov/advocacy/10871/29971 Financial conditions in the third quarter continued to be supportive of economic growth. Nonetheless, demand for commercial and industrial (C&I) loans remained weak. Overall, the results indicate that small business lending appears to be stable compared with previous quarters and other economic indicators. (Released De-cember 2011.)
Annual Report of the Office of Economic Research, FY 2011http://www.sba.gov/advocacy/7540/37331 In FY 2011, the Office of Advocacy’s Office of Economic Research (OER) contin-ued to offer timely research on a variety of small business topics, with a particular focus on small business job creation and financing. In fiscal year 2011, the office published 25 separate contract and internal research reports about topics includ-ing small business innovation, demographics of ownership, and capital formation. The office produced several new well-received series, including a Quarterly Lend-ing Bulletin and Frequently Asked Questions about Small Business Finance. OER continued to provide easy-to-understand tables and reports downloadable from the website. Beyond research products, the office sponsored two research conferences in FY 2011, the first in October 2010, on innovation and financing in high-impact businesses, the second in September 2011 on the small business debt and equity capital crunch. (Released December 2011.)
Contract ResearchCharacteristics of Recent Federal Small Business Contractinghttp://www.sba.gov/advocacy/7540/149111 Eagle Eye Publishers, Inc., Fairfax, VA Research Summary No. 397This study by Eagle Eye Publishers documents the role and impact of federal pro-curement programs on small businesses. It provides a backdrop to evaluate the im-pact of the American Recovery and Reinvestment Act on small business contract-ing. (Released May 2012.)
Immigrant Entrepreneurs and Small Business Owners and their Access to Financial Capitalhttp://www.sba.gov/advocacy/7540/141841 Robert W. Fairlie, Santa Cruz, CA Research Summary No. 396The importance of immigrant entrepreneurs to the U.S. economy has been very well documented in Advocacy studies and elsewhere in the economic literature. They contribute greatly to the economy, have high business formation rates, and create successful businesses that hire employees and export goods and services. Lacking, however, was a thorough look at the financial picture that would complement what we know of them. This study, using data from the 2007 U.S. Survey of Business
7 Annual Report of the Office of Economic Research, FY 2012
Owners, attempts to complete the picture on immigrant entrepreneurship and ad-dresses questions such as the following: What hurdles do they face accessing capital? How do they use capital? (Released May 2012.)
State Antitrust Activity’s Impact on Small Business Entryhttp://www.sba.gov/advocacy/7540/139551 Robert M. Feinberg, Chevy Chase, MD Research Summary No. 395Potential business owners have a lot to debate before starting a business. For in-stance, does a state’s level of antitrust enforcement have an impact on small busi-ness entry? The study finds that lower levels of a state’s rate of economic growth (gross state product) and lower state and local tax burdens increase entry. But the research also found weak evidence for relatively high levels of a state’s antitrust enforcement increasing small business entry. Small firms view a vigorous anti-cartel policy as a desirable feature of a state’s law enforcement profile. (Released April 2012.)
The Dynamic Relationship between Entrepreneurship, Unemployment, and Growth: Evidence from U.S. Industrieshttp://www.sba.gov/advocacy/7540/132441 Jose M. Plehn-Dujowich, Plehn Analytical Economic Solutions, LLC, Willow Grove, PAResearch Summary No. 394Entrepreneurship, economic growth, and unemployment are interrelated: exactly how is the subject of this research. Does entrepreneurship lead to economic growth or vice versa? Does entrepreneurship lower unemployment, or does unemployment lead to entrepreneurship? Without the answers to such questions, policymakers may be attempting to treat the symptoms of economic problems rather than devis-ing real solutions for unemployment or slow growth. Moreover, whereas economic growth and unemployment are often the focus of academic and media attention, the importance of entrepreneurship in this triad is often overlooked. The researcher examined ten U.S. industry sectors to determine whether there are “Granger-caus-al” relationships between entrepreneurship, economic growth, and unemployment. (Released March 2012.)
Understanding Small Business Activity at the State Levelhttp://www.sba.gov/advocacy/7540/47471 John Deskins, Creighton University; Tami Gurley-Calvez, West Virginia Univer-sity, Eric Thompson, University of Nebraska–Lincoln Research Summary No. 392The study examines the impact of small business activity by industry on overall state economic growth. A few studies have focused on the impact of small business in general at the state level, but their results make it clear that the differing industry mixes among states have skewed the results. (Released February 2012.)
8 Annual Report of the Office of Economic Research, FY 2012
Small Business GDP: Update 2002-2010http://www.sba.gov/advocacy/7540/42371 Kathryn Kobe, Economic Consulting Services, LLCResearch Summary No. 390U.S. gross domestic product (GDP) is the market value of the goods and services produced by labor and property located in the United States. This research takes each component of private nonfarm GDP and estimates the proportions produced by small and large businesses. The study is another installment in the series of studies sponsored by the Office of Advocacy on small businesses’ contribution to GDP, the most recent of which was published in April 2007. (Released January 2012.)
Analysis of Small Business Innovation in Green Technologieshttp://www.sba.gov/advocacy/7540/28811 Anthony Breitzman and Patrick Thomas, 1790 AnalyticsResearch Summary No. 389Small innovative firms are 16 times more productive than large innovative firms in terms of patents per employee, and the patents of small firms were cited 79 percent more by recent patents than is typical for other patents of the same age and patent classification. Patents for “green” products form a higher percentage of the portfo-lios of small firms with at least one green patent than of large firm portfolios, and green patents from small firms are cited 2.5 times as frequently as green patents from large firms. (Released October 2011.)

9 Annual Report of the Office of Economic Research, FY 2012
Data Access
In fiscal year 2012, the Office of Advocacy continued to provide downloadable data and links to data on its website. Data cover businesses with and without em-ployees—employer and nonemployer firms.3 Most firms are nonemployer firms; the larger share of receipts and payroll are in employer firms.
Small Business Data Resources ToolInformation proliferates on the Internet, but timely, accurate, extensive, and ac-cessible databases are as good as gold—and equally hard to find. With more than 30 years of experience mining federal data sources from the Census Bureau to the Federal Financial Institutions Examination Council, the Office of Advocacy in FY 2012 offered a research tool for small business researchers and policymakers, a hy-perlinked listing of Small Business Data Resources (Appendix C).
The tool lists online databases by federal agency or private sector source, hy-perlinks the listings to their websites, and keys them to the small-business-related topics on which they provide information—all in two one-page summaries. The databases listed provide a wealth of information from federal government agencies, as well as nongovernment private sector, university, nonprofit, international, and other sources. Key topics include demographics, employment, exports, finance, firm size data, firms and establishments, health care, income and sales, pension cover-age, taxes, and training. Small Business Data Resources is an invaluable tool for researchers, policymakers, small business trade associations, and members of the media interested in small businesses’ role in the economy.
Although the list includes many of the most widely used data resources, Advo-cacy notes that inclusion of any specific database on the list does not constitute an endorsement by the Office of Advocacy or the Small Business Administration.
Downloadable Data The Office of Advocacy posts firm size data from a number of sources on its web-site. Advocacy defines a small business for research purposes as an independent business having fewer than 500 employees. Firm size data for employer firms are from the Statistics of U.S. Businesses (SUSB), Business Dynamics Statistics (BDS), and Business Employment Dynamics (BED) programs. Data on nonem-ployers are available from the Nonemployer Statistics (NE) program. The programs are annual and are from the U.S. Census Bureau, except the Business Employment Dynamics, which is quarterly and from the U.S. Department of Labor, Bureau of Labor Statistics (BLS). BDS and BED have an age component. All of the programs are essentially based on the universe of private-sector businesses.
3 See http://www.sba.gov/advocacy/849/12162.

10 Annual Report of the Office of Economic Research, FY 2012
Detailed data on owner and business characteristics are available from the U.S. Census Bureau’s Survey of Business Owners (SBO) in years ending in 2 or 7. SBO, which is part of the Economic Census, remains unfunded for 2012.
Statistics of U.S. BusinessesThe Office of Advocacy partially funds the U.S. Census Bureau to produce data by employer firm size in the Statistics of U.S. Businesses (SUSB) program. SUSB’s employer data include the number of firms, number of establishments, employ-ment, and annual payroll for employment firm size categories by location and in-dustry. A firm is defined as an aggregation of all establishments owned by a parent company (within a geographic location and/or industry) with some annual payroll. The data consist of static and dynamic data. Static data are a “snapshot” of firms at a point in time. Dynamic data follow firms from year to year and report job creation and destruction and business births and deaths. Available data include the following:
U.S. static data• U.S. data including multiple tables • Detailed industry data, NAICS 2002, NAICS 1997, SIC
U.S. dynamic data• U.S. data including multiple tables (births, deaths, growth, and decline) • Detailed industry data
State, metropolitan statistical area (MSA), and county static data• State and MSA data including multiple tables • State major industry data • State detailed industry data • MSA major industry data • Counties • Micropolitan statistics, see Census’ Statistics of U.S. Businesses
State, MSA, and county dynamic data• State and MSA data including multiple tables (births, deaths, growth, and
decline) • State major industry data, NAICS, SIC • State MSA and Non-MSA totals • MSA data • Counties
Additional Notes• Employment size categories are based on the employment size of the firm
in all industries and locations. For example, if a firm has 20 employees in an
11 Annual Report of the Office of Economic Research, FY 2012
industry but 10,000 total employees, the firm will be included in the 500+ employee category.
• Industries are defined according to the Standard Industrial Classification (SIC) and the North American Industry Classification System (NAICS).
• Annual payroll and receipts are in thousands of dollars. • Information is available about the process of producing the Statistics of
U.S. Business.
Business Dynamics StatisticsBusiness Dynamics Statistics (BDS) include employer firm data by firm age.4 Visit the U.S. Census Bureau’s Business Dynamics Statistics program for more exten-sive background about the data and see the BDS database list for more detailed data on firm size, state, and major industry (includes text files). Available data in-clude the following:
• Firms and establishments by firm age • Employment by firm age • Establishments and employment by employment size of firm • State data • Major industry data
Business Employment DynamicsBED contains employer firm data with a focus on employment changes from establishment entry, growth, decline, and exit. Much of the information dates to mid-1992.5 Note that the data are quarterly and some establishments may close and reopen during the year. Fortunately, BLS presents the data in two ways to capture the seasonal firms by listing establishment openings—establishments that did not exist in the previous quarter—and establishment births—establishments that did not exist in the previous year. Classifications are similar for closings and deaths. Visit the U.S. Bureau of Labor Statistics’ BED program for background and more detailed data. Available data include the following:
• Establishment births, deaths, and associated employment • State quarterly establishment births, deaths, and associated employment • Quarterly net job change by employment size of firm • Employer firms by employment size of firm • Employment by employment size of firm • Establishment age and survival • Establishment size of change
4 See the background paper, Business Formation and Dynamics by Business Age: Results from the New Business Dynamics Statistics, by John Haltiwanger, Ron Jarmin, and Javier Miranda for information on the data program.
5 See the background paper, Measuring Job and Establishment Flows with BLS Longitudinal Microdata, by Timo-thy Pivetz, Michael Searson, and James Spletzer for information about the data program.

12 Annual Report of the Office of Economic Research, FY 2012
Nonemployer StatisticsA nonemployer firm is defined as one that has no paid employees, has annual busi-ness receipts of $1,000 or more ($1 or more in the construction industries), and is subject to federal income taxes. Nonemployers account for about 3 percent of business receipts, and about three-quarters of all businesses. See the U.S. Census Bureau’s Nonemployer Statistics for more detailed information. The nonemployer section also contains capital expenditure data for both employers and nonemploy-ers. See the U.S. Census Bureau’s Annual Capital Expenditures Survey for more details. In recent years, the U.S. Census Bureau has begun using noise infusion for disclosure avoidance. Available data include the following:
• U.S. industry data, state totals, and capital expenditures for employers and nonemployers (Note: 2009 data were recalculated.)
• For county data, go directly to the U.S. Census Bureau’s Nonemployer Sta-tistics

13 Annual Report of the Office of Economic Research, FY 2012
Appendix A: Research Functions
Public Law 94-305: Research Functions of the Office of Advocacy
Public Law 94-305 established the Office of Advocacy within the U.S. Small Busi-ness Administration and included a list of Advocacy’s primary functions codified in 15 U.S.C. § 634b. Paragraph 11 was added to the list by P.L. 96-481 in 1980 and paragraph 12 was added by P.L. 106-50 in 1999.
15 U.S.C. § 634b: Primary functions of Office of Advocacy
The primary functions of the Office of Advocacy shall be to—
(1) examine the role of small business in the American economy and the contribu-tion which small business can make in improving competition, encouraging eco-nomic and social mobility for all citizens, restraining inflation, spurring production, expanding employment opportunities, increasing productivity, promoting exports, stimulating innovation and entrepreneurship, and providing an avenue through which new and untested products and services can be brought to the marketplace;(2) assess the effectiveness of existing Federal subsidy and assistance programs for small business and the desirability of reducing the emphasis on such existing programs and increasing the emphasis on general assistance programs designed to benefit all small businesses;(3) measure the direct costs and other effects of government regulation on small businesses; and make legislative and nonlegislative proposals for eliminating ex-cessive or unnecessary regulations of small businesses;(4) determine the impact of the tax structure on small businesses and make legisla-tive and other proposals for altering the tax structure to enable all small businesses to realize their potential for contributing to the improvement of the Nation’s eco-nomic well-being; (5) study the ability of financial markets and institutions to meet small business credit needs and determine the impact of government demands for credit on small businesses;(6) determine financial resource availability and to recommend methods for deliv-ery of financial assistance to minority enterprises, including methods for securing equity capital, for generating markets for goods and services, for providing effec-tive business education, more effective management and technical assistance, and training, and for assistance in complying with Federal, State, and local law; (7) evaluate the efforts of Federal agencies, business and industry to assist minority enterprises;

14 Annual Report of the Office of Economic Research, FY 2012
(8) make such other recommendations as may be appropriate to assist the develop-ment and strengthening of minority and other small business enterprises;(9) recommend specific measures for creating an environment in which all busi-nesses will have the opportunity to complete [compete] effectively and expand to their full potential, and to ascertain the common reasons, if any, for small business successes andfailures;(10) determine the desirability of developing a set of rational, objective criteria to be used to define small business, and to develop such criteria, if appropriate;(11) advise, cooperate with, and consult with, the Chairman of the Administrative Conference of the United States with respect to section 504(e) of title 5; and(12) evaluate the efforts of each department and agency of the United States, and of private industry, to assist small business concerns owned and controlled by vet-erans, as defined in section 632(q) of this title, and small business concerns owned and controlled by serviced-disabled [service-disabled] veterans, as defined in such section 632(q) of this title, and to provide statistical information on the utilization of such programs by such small business concerns, and to make appropriate rec-ommendations to the Administrator of the Small Business Administration and to the Congress in order to promote the establishment and growth of those small busi-ness concerns.

15 Annual Report of the Office of Economic Research, FY 2012
Appendix B: Frequently Asked Questions
Small businesses comprise what share of the U.S. economy?Small businesses make up:
99.7 percent of U.S. employer firms, 64 percent of net new private-sector
jobs,49.2 percent of private-sector
employment,42.9 percent of private-sector payroll,46 percent of private-sector output,43 percent of high-tech employment,98 percent of firms exporting goods,
and33 percent of exporting value.
Source: U.S. Census Bureau, SUSB, CPS; International Trade Administration; Bureau of Labor Statistics, BED; Advocacy-funded research, Small Business GDP: Update 2002-2010, www.sba.gov/advocacy/7540/42371.
How many small businesses are there?In 2010 there were 27.9 million small businesses, and 18,500 firms with 500 employees or more. Over three-quarters of small businesses were nonemploy-ers; this number has trended up over the past decade, while employers have been relatively flat (figure 1).
What is a small business?The Office of Advocacy defines a small business as an independent business having fewer than 500 employees. For the small business definition by indus-try used in government programs and contracting, see www.sba.gov/content/small-business-size-standards.
What percent of small businesses operate as . . . ?The many kinds of small businesses are shown in table 1. The definitions overlap so the shares total more than 100.
Table 1: Small Business SharesKind of Business Share (percent)
Home-based businessFranchiseSole proprietorCorporationEmployer businessNonemployer (business without employees)
52.02.0
73.219.521.5
78.5
Source: U.S. Census Bureau, SBO, SUSB.
What is small businesses’ share of net new jobs?Small firms accounted for 64 percent of the net new jobs created between 1993 and 2011 (or 11.8 million of the 18.5 million net new jobs). Since the latest recession, from mid-2009 to 2011, small firms, led by the larger ones in the cat-egory (20-499 employees), accounted for 67 percent of the net new jobs.Source: Bureau of Labor Statistics, BED. For the latest employment statistics, see Advo-cacy’s quarterly reports, www.sba.gov/advo-cacy/10871.
How can small businesses’ share of net new jobs be larger than their share of employment, yet their share of employment remains steady?As firms grow, they change employment size classes. So as small firms grow, their growth counts toward small firm job gains; but if they pass the 500-em-ployee mark, their employment is classi-fied as large firm employment.
Do the unemployed become self-employed?When finding work is difficult, start-ing a business can be just as difficult if not more so. But in March 2011, a significant number of the self-employed, 5.5 percent or about 900,000, had been unemployed in the previous year. This figure was up from March 2006 and March 2001, when it was 3.6 and 3.1 percent, respectively.
Which businesses create more jobs—startups or existing businesses?In the last two decades about 60 percent of the private sector’s net new jobs have been created by existing establishments and about 40 percent from the churn of startups minus closures. While firm births account for many new jobs, job losses from firm closures are equally important in accounting for net effects to employment levels.Source: Bureau of Labor Statistics, BED.
Figure 1: Number of Businesses (millions)
3.5
4.5
5.5
6.5
11
13
15
17
19
21
1985 1990 1995 2000 2005 2010
NonemployersEmployers
Nonemployers (right scale)
Employer
Source: U.S. Census Bureau, SUSB and Nonemployer Sta s cs.
23
,
16 Annual Report of the Office of Economic Research, FY 2012
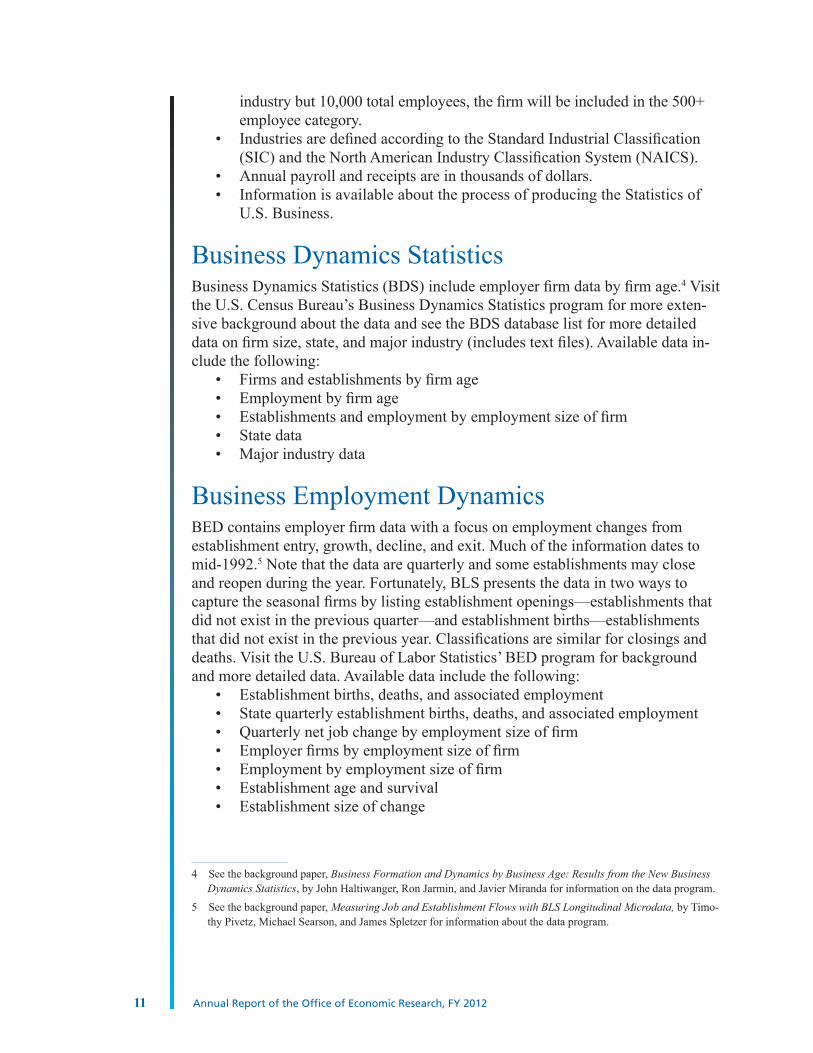
What happens to the jobs created by startups?The total employment from a group of startups is highest at birth and declines as the firms age. Put another way, em-ployment gains from growing business-es are less than employment declines from shrinking and closing businesses (figure 2).
What is the status of the startup market?While the number of new employer businesses has recovered from the reces-sionary dip, the average employment of these businesses has been declining over the past decade (figure 3).
How many businesses do women own?While women-owned firms have in-creased as a share of total businesses over the years, their size still remains smaller than national averages. The 7.8 million women-owned firms averaged $130,000 in receipts in 2007 (table 2).
How many businesses do minorities own?Asian-owned businesses numbered 1.6 million in 2007 and have average receipts of $290,000. African-American-owned businesses numbered 1.9 million in 2007 and have average receipts of $50,000. Hispanic-American-owned businesses numbered 2.3 million in 2007 and have average receipts of $120,000. Native American/Islander-owned businesses numbered 0.3 million in 2007 and have average receipts of $120,000 (table 2).
How many businesses do veterans own?Veteran-owned businesses numbered 3.7 million in 2007, with average receipts of $450,000 (table 2).Source: U.S. Census Bureau, SBO.
Is youth entrepreneurship increasing?Self-employment among younger age groups has been dropping. From 2005 to 2010, self-employment among indi-viduals age 25 and under decreased 19 percent (compared to a 7 percent drop in the overall population). In contrast, self-employment among those age 65 and over increased 24 percent over this period as their population grew. Self-employment rates increase with age; for
example, they were 2 percent for those 25 and under and 23 percent for those 65 and over in 2010.Source: Office of Advocacy calculations using U.S. Census Bureau, CPS data.
What are the home-based business trends?The share of firms that primarily oper-ate out of the home was unchanged from 2002 to 2007 at 52 percent (the latest figure available). Employers had a lower share than nonemployers, 24 percent vs. 63 percent, respectively, in 2007. Of the major industries, construction had the highest share of home-based businesses, 70 percent. (Being home-based is not synonymous with working at home.) It is interesting to note that retail trade went from 49 percent home-based in 2002 to 44 percent in 2007 while the share of Internet retail sales went from 1 percent to 3 percent of total retail sales.Source: U.S. Census Bureau, SBO and Quar-terly E-Commerce Report.
How does franchise survival compare with independent business survival?Survival among independent businesses and franchises appears to be similar, as they have similar age distributions. Of course each potential business owner debating an independent business or franchise arrangement will have unique factors to weigh, such as their manage-rial talent and sales abilities.
Figure 2: Mean Employment Level for Firm Birth Year, 1995–2010 (millions)
3.07 2.96 2.77 2.61 2.48 2.36 2.15 1.94 1.82
0 1 2 3 4 56 to 10
11 to 15
16 to 20Years in existence
Source: U.S . Census Bureau, BDS.
Employment per establishment
Establishment starts (thousands)
Source: Bureau of Labor Statistics, BED.
Figure 3: Number and Size of Establishment Births
12345678
50
100
150
200
250
1998 2000 2002 2004 2006 2008 2010 2012
Births (right scale)
Average employment(left scale)
Sole
Table 2: Number of Firms and Receipts by Demographic, 2007
Business Owner Demographic
Firms (millions)
Receipts per firm
($1,000)
All businessesMaleFemaleEqually male/femaleAfrican-AmericanAsianHispanicNative American/ Pacific IslanderVeteranPublicly held
27.113.97.8
4.6
1.91.62.3
0.3
3.70.8
1,070570130
240
50290120
120
45023,860
Source: U.S. Census Bureau, SBO.
17 Annual Report of the Office of Economic Research, FY 2012
Source: Advocacy research, Do Business Defi-nition Decisions Distort Small Business Re-search Results? http://archive.sba.gov/advo/research/rs330tot.pdf. Note that about half of the franchises in the data were nonemployers, which may not be the stereotypical franchise that individuals imagine.
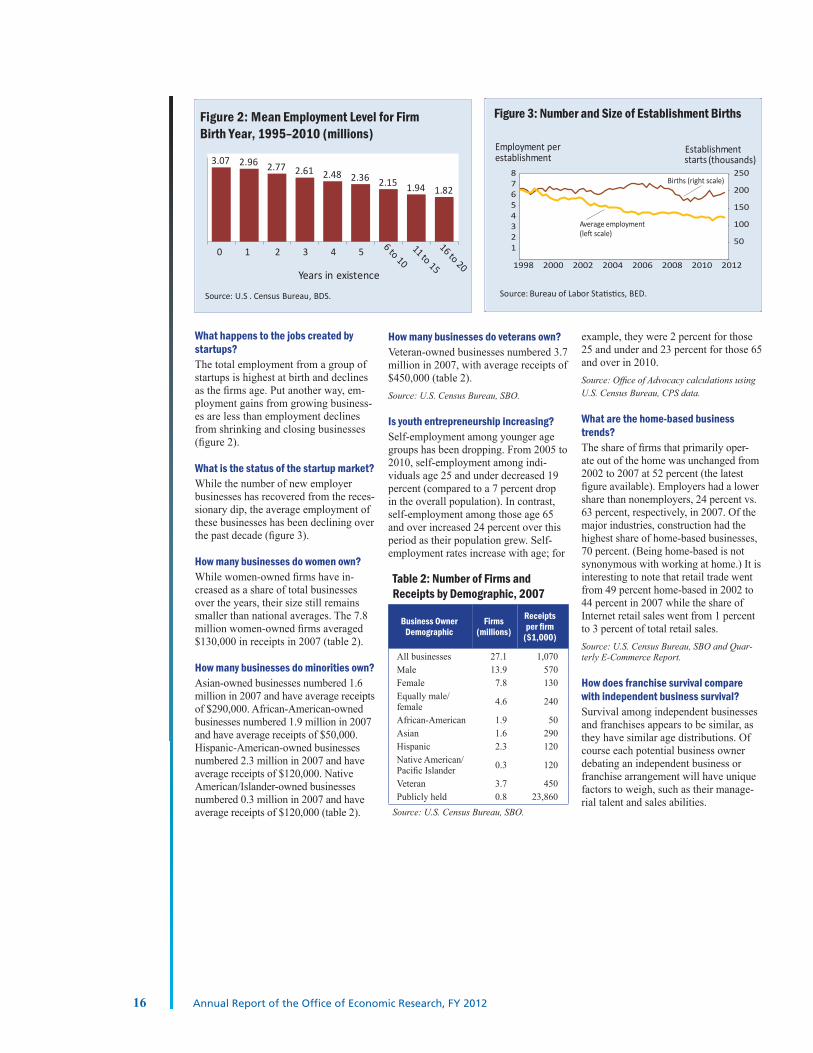
How many businesses open and close each year?About 10-12 percent of firms with em-ployees open each year and about 10-12 percent close (table 3). Employer firm births were down and deaths were up in the most recent available data because of the downturn. But establishment birth figures from 2011 show gains (figure 4). Nonemployer firms have turnover rates three times as high as employer firms, mostly because it is easier for nonem-ployers to start and stop, as they tend to be smaller than employer firms. Busi-ness bankruptcies numbered 48,000 in 2011, a decline of the about 60,000 over the previous two years. Note that not all firm deaths are business bankruptcies, and many business owners file personal bankruptcy instead of business bank-ruptcy.
What is the survival rate for new businesses?About half of all new establishments survive five years or more and about one-third survive 10 years or more. As one would expect, the probability of survival increases with a firm’s age. Survival rates have changed little over time (figure 5).
How do small and large businesses compare on innovation?Of high patenting firms (15 or more in a four-year period), small businesses produced 16 times more patents per employee than large patenting firms. Research also shows that increasing the number of employees correlates with increased innovation while increasing sales does not.Source: Advocacy-funded research, An Analysis of Small Business Patents by Industry and Firm Size, http://archive.sba.gov/advo/research/rs335tot.pdf; Innovation in Small Businesses: Drivers of Change and Value Use www.sba.gov/sites/default/files/rs342tot_0.pdf.
How are small businesses financed?Small businesses are financed through owner savings; loans from family, friends, and commercial lenders; bonds; stocks; ownership stakes; and other arrangements. For detailed financing information, see Advocacy’s Frequently Asked Questions about Small Business Finance, www.sba.gov/advocacy/9601.
How are credit conditions for small firms?For up-to-date statistics, see Advocacy’s quarterly reports, www.sba.gov/ advocacy/10871.
What is small businesses’ share of federal government procurement?In fiscal year 2011, 21.7 percent of fed-eral government small-business–eligible purchases went to small businesses. The Department of Defense accounted for the majority of small business pro-curement.Source: Small Business Goaling Report, 2012, www.fpdsng.com/downloads/top_requests/FPDSNG_SB_Goaling_FY_2010.pdf.
How are business churn and the economy related?Business churn (the sum of the firm birth and death rates) tends to follow the change in GDP with a six-quarter lag (figure 6). Recently, churn has been down, which may be a response to the general decline in output.
Figure 4: Startups and Closures(thousands of establishments, seasonally adjusted)
200
400
600
800
1,000BirthsDeaths
Source: Bureau of Labor Statistics, BED.
2011200920072005200320011999 0
20
40
60
80
100
0 2 4 6 8 10 12 14
Percent of establishments
Years in existence
1995
2000
2005
2010
Figure 5: Cumulative Survival Rates for Establishments by Birth Year
Source: Bureau of Labor Statistics, BED.
Table 3: Employer Firm Births and Deaths*1999-2000 2004-2005 2007-2008 2008-2009
Births 574,300 644,122 597,074 518,500
Deaths 542,831 565,745 641,400 680,716
*Figures are March to March. Source: U.S. Census Bureau, SUSB.

18 Annual Report of the Office of Economic Research, FY 2012
What are the effective tax rates for small businesses?The average effective tax rate for busi-nesses organized as sole proprietorships was 13.3 percent in 2004, with small S corporations facing the highest rates (table 4). (An effective tax rate is usu-ally defined as the amount of tax paid as a fraction of net income or profit.)
Table 4: Effective Tax Rates, 2004Legal form of Effective tax rate
business ownership (percent)Non-farm sole proprietorship 13.3
Partnership 23.6S corporation 26.9C corporation 17.5
Source: Advocacy-funded research, Effective Federal Income Tax Rates Faced By Small Businesses in the United States, www.sba.gov/sites/default/files/rs343tot.pdf.
What legal form of organization are small businesses?Sole proprietors and partnerships con-stituted 94 percent of nonemployers in 2010 and of the corporations, most were likely S corporations which are taxed at personal rates. Twenty-two percent of small employers were C corporations in 2009, with 71 percent taxed at personal rates and 7 percent nonprofits (figure 7).
Do you have any newer data?For updates of many quarterly small business indicators, see www.sba.gov/advocacy/10871. For more details and information, visit Advocacy’s general website, www.sba.gov/advocacy. Two of the most comprehensive pages are the Data Resources page and the Firm Size Data page. Both are accessible from www.sba.gov/advocacy/849. Two other often visited pages are the BankingStudy (www.sba.gov/advocacy/ 7540/173967) and the State Small Business Profiles (www.sba.gov/advo-cacy/848). Additional questions may be emailed to [email protected].
Abbreviations & SourcesBED Business Employment Dynam-
ics. U.S. Department of Labor, Bureau of Labor Statistics, www.bls.gov/bdm.
BDS Business Dynamics Statistics. U.S. Department of Commerce, Census Bureau, www.census.gov/ces/dataproducts/bds.
CPS Current Population Survey. U.S. Census Bureau, and U.S. Depart-ment of Labor, Bureau of Labor Statistics, www.census.gov/cps.
SBO Survey of Business Owners. U.S. Census Bureau, www.census.gov/econ/sbo.
SUSB Statistics of U.S. Businesses, U.S. Census Bureau, www.cen-sus.gov/econ/susb.
Figure 6: Business Churn versus Output (percent)
Churn Real GDP7.0 9
Real GDP (annualized change)(right scale) 6
6.5 3
06.0
Business churn rate -3(births plus deaths),
-65.5 lagged six quarters (left scale)-9
5.0 -121996 1998 2000 2002 2004 2006 2008 2010
Source: Bureau of Labor Statistics, BED (churn); Bureau of Economic Analysis (GDP).
,
Source: U.S. Census Bureau, SUSB and Nonemployer Statistics.
Sole proprietorship
16%Partnership
11%S corporation
44%Nonprofit, 7%
C corporation22%
Other, 0%
Small Employer Firms
Nonemployers
Figure 7: Legal Form of Organization of Small Business
Sole Proprietorship
86%
Partnership7%
Corporations7%
About the Office of Advocacy
The SBA’s Office of Advocacy was created by Congress in 1976. Part of the office’s mission includes conducting policy studies and economic research on issues of concern to small businesses. The office also publishes data on small firm characteristics and contributions. For further data and research information, visit the Office of Advocacy’s website at www.sba.gov/advocacy/847.
September 2012
19 Annual Report of the Office of Economic Research, FY 2012
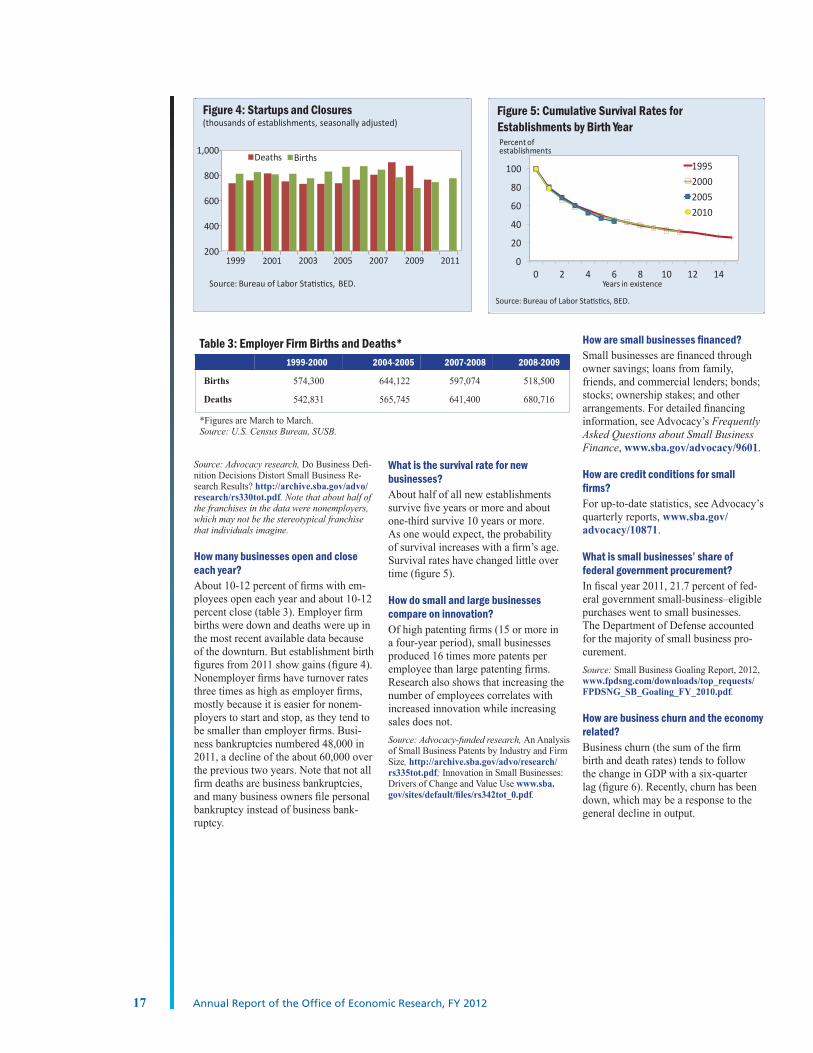
Appendix C: Small Business Data Resources
Small Business Data Resources: U.S. Federal Government
The following list includes major sources of data collected by the U.S. government and available for research on small business. Inclusion of a source on this list does not constitute an endorsement by the Office of Advocacy or the Small Business Administration.
Agency Data Program Demograp
hics
Employmen
t
Exports
Finance
Firm Size
Data
Firms /
Establis
hments
Health
Income /
Sales /
Expen
ses
Pensio
ns
Taxes
Training
Administrative Off. of U.S. Courts Bankruptcy Filings √
Agriculture Business and Industry Guaranteed Loans √
Small Farms √ √
Commerce / Corporate Profits √
Bureau of Economic Analysis Proprietors' Income √
Commerce / Census Annual Capital Expenditures Survey √
Business Dynamics Statistics √ √ √
Business Expenses √
County Business Patterns √ √
Nonemployer Statistics √ √ √
Statistics of U.S. Businesses √ √ √ √
Survey of Business Owners √ √ √ √ √ √ √
Survey of Income & Program Participation √ √ √ √ √ √
Commerce / Int. Trade Admin. Small & Medium-Sized Exporters √ √
Census & Bureau of Labor Stat. Current Population Survey √ √ √ √ √ √ √ √
Export-Import Bank Small Business Authorizations √
FFIEC Community Reinvestment Act data √
FDIC/FFIEC Call Report Data / Outstanding SB Loans √
Federal Proc. Data System Small Business Goaling Report √
Federal Reserve Board Flow of Funds √
Senior Loan Officer Opinion Survey √
Survey of Consumer Finances √ √ √
Survey of Terms of Business Lending √
Health and Human Services Medical Expenditure Panel Survey √
Labor / Bureau of Labor Statistics Business Employment Dynamics √ √ √
Job Openings and Labor Turnover Survey √ √
Survey of Employer-Provided Training √
Labor / Employee Benefits Sec. Admin. Private Pension Plan Bulletin √
Overseas Private Investment Corp. Annual Results √
Securities & Exchange Commission EDGAR Database of Publicly Traded Cos. √
Small Business Administration SBA Lending Data √ √ √
Small Business Investment Company √
SBA Office of Advocacy Small Business Research & Data √ √ √ √ √ √ √ √ √ √ √
Social Security Administration Self-employment √ √
Treasury / IRS / SOI Statistics of Income √ √ √

20 Annual Report of the Office of Economic Research, FY 2012
Small Business Data Resources: Other than U.S. Federal Government
The following list includes business data from private, nonprofit, university, international, and other sources. Inclusion of a source on this list does not constitute an endorsement by the Office of Advocacy or the Small Business Administration.
Data Source Data Demograp
hics
Employmen
t
Exports
Finance
Firm Size
Data
Firms/E
stablis
hments
Health
Income /
Sales/
Expen
ses
Pensio
ns
Taxes
Training
ADP, Inc. National Employment Report √American Express Small Business Monitor √Biz2Credit Small Business Lending Index √Capital IQ Compustat Financial Data √Center for Research in Security Prices CRSP Stock Data √Challenger, Gray & Christmas Start-Up Activity √ √Dun & Bradstreet U.S. Business Trends √ √
Employee Benefits Research Inst. EBRI IRA Database √Small Employer Retirement Survey √
Small Employer Health Benefits Survey √Intuit Small Business Employment Index √Investment Company Institute The U.S. Retirement Market √Kaiser Family Foundation Employer Health Benefits Survey √Kauffman Foundation Kauffman Firm Survey √ √ √ √Natl. Fed. of Independent Bus. Small Business Trends √ √ √ √Natl. Small Business. Assoc. Economic Report √ √ √ √ √Natl. Venture Cap. Assoc. Total Venture Capital Investments √Thomson Financial Initial Public Offerings √Thomson Reuters / Paynet Small Business Lending Index √University of Michigan Panel Study of Entrepreneurial Dynamics √ √ √U of NH, Ctr. for Vent. Research Angel Market Analysis √Visa Small Business Review √