ANNUAL REPORT OdfjELL 2011 - d3grzk40ejrt1i.cloudfront.net · 4 odfjell annual report 2011 Despite...
116
HORIZON FOR IMPROVEMENTS ANNUAL REPORT ODFJELL 2011
Transcript of ANNUAL REPORT OdfjELL 2011 - d3grzk40ejrt1i.cloudfront.net · 4 odfjell annual report 2011 Despite...

horizon for improvements
ANNUAL REPORT OdfjELL 2011

fiNANciAL cALENdAR 2012
Report 1st quarter 8 May 2012 Report 2nd quarter 21 August 2012 Report 3rd quarter 13 November 2012 Report 4th quarter 12 February 2013 The Annual General Meeting is planned 8 May 2012.Please note that the financial calendar is subject to change.
Supplementary information may be found on:www.odfjell.com
cONTENT
2 Financial Calender
3 Mission Statement
4 Horizon for Improvements
5 Profile
6 Highlights 2011
8 Key Figures/Financial Ratio
9 Odfjell Management Group
10 The Directors' Report
Annual Accounts 2011
19 Group Profit and Loss Statement 20 Group Balance Sheet 21 Group Cash Flow Statement 22 Notes to the Group Financial Statement 54 Parent Company Profit and Loss Statement 55 Parent Company Balance Sheet 56 Parent Company Cash Flow Statement 56 Notes to Parent Company Financial Statement 66 Responsibility Statement 68 Auditor’s Report
70 Worldwide Activities
74 Sustainable business is good business
80 Chemical Transportation and Storage
84 Chemical Tankers
90 Tank Terminals
96 Corporate Governance
104 Financial Risk Management and Sensitivities
108 Shareholder Information
112 Fleet and Terminal Overview
114 Glossary
115 Offices and Adresses

MissiON sTATEMENT
Odfjell shall be a leading, preferred and profitable global provider of transportation and storage of bulk liquid chemicals, acids, edible oils
and other special products. We shall be capable of combining different modes of transportation and storage. We shall provide our customers with reliable
and efficient services. We shall conduct our business to high quality, safety and environmental standards.

4 odfjell annual report 2011
Despite the increase of freight rates, particularly in the last quarter of the year, 2011 did not provide us with the recovery in earnings we had hoped for and to some extent expected. The main reason is well known by now, a significant increase of the bunker price. The average freight per tonne paid to us by our customers as a matter of fact, went up by as much as 17% from 2010 to 2011. Still however, for the year as a whole, we came out with a modest five per cent improvement of our average time charter earnings; clearly short of a recovery and what is necessary in order to make the chemical tanker industry sustainable. But it is promising that the ordering of new tonnage remained very limited, and as a result therefore, that the gap between supply and demand will continue during the next few years to develop in a direction of a better balance. This being the case, we may still have reason to hope for a recovery in 2012 despite the prevailing economic and political uncertainty, including of course a potential further escalation of the oil price.
From a performance perspective 2011 turned out better than previous years for our chemical tanker business. The total number of accidents, including those with personnel injuries, came down to an all-time low. We also saw improvements of the KPIs related to accidents in general. And the off-hire statistics improved and so did our scores related to customer vettings and port state controls. This may be seen as a result of the fact that a considerable amount of time and resources have been spent during recent years on development of a common management commitment to QHSE with special emphasize on safety.
Also in 2011 our terminal business ended with a good and satisfactory result – in line with what has become the norm. The highlight of the year obviously, was the sale to Lindsay Goldberg of 49% of our shares in our terminals in Houston and Rotterdam – plus in the new project in Charleston. With a partner like Lindsay Goldberg we now stand stronger financially to further grow our terminal business; in line with our ambitions. In that context we are proud for having embarked in 2011 onto the terminal project with Tianjin Economic-Technology Development Area for development of a new terminal and marine facility at the Nangang Industrial Zone in Tianjin, one of China’s biggest cities, 120 km from Beijing. We are also about to finalize the negotiations with Noord Natie Holding for a 25% share of their strategically well located terminal in Antwerp.
The QHSE aspect associated to our terminal business had a set-back last year as a result of some serious incidents during the last months of the year related to vapour emissions at our terminal in Rotterdam (OTR). Lately therefore, the situation at OTR has had our highest attention, and we have implemented several measures for correction of the problems. Although we have received intense scrutiny on OTR by different stakeholders, including media, we have gradually become in better control with the situation and have reason therefore, to expect continued
improvements. In fact, we need to take advantage of these incidents to drive programmes for enhanced safety culture. For the other terminals the QHSE aspect has been properly maintained and continued delivering improvements as expected by society at large, our customers and, not the least, ourselves.
At the end of the year our fleet of chemical tankers counted 100 ships. We also have interests in 21 tank terminals, associ-ated facilities included. When taking into account the fact that our ships and terminals are well maintained and also run by competent people both on board and ashore, we are favourably positioned for the years to come. However, we are faced with common industry challenges, to which unfortunately there has been little or no progress recently, and still therefore, ought to be addressed. Inefficient port operations continue to keep about 10% of the deep-sea chemical tanker capacity sitting idle at any given time waiting for occupied berths. Excessive number, scope and sometimes inconsistent consequences of customer vettings of chemical tankers remain a big challenge for shipowners. There is slow adaption of new regulations, such as making inerting of cargo tanks in connection with discharging of low flash cargoes a mandatory requirement, irrespective of ship size and age. Regrettably the industry has seen further tragic incidents related to cargo handling that could have been avoided if IMO had adopted our proposal for regulations regarding inerting cargo. Piracy remains a threat and distraction with a significant amount of time and money being spent on both passive and active protection measures.
So whilst we are waiting for a recovery of the markets in which we are operating, there are plenty of opportunities for making improvements both for our industry as a whole and for Odfjell specifically. In that sense we shall continue our pro-active role and to the extent possible seek operational improvements to the benefit of our customers, other stakeholders, ourselves and the environment.
2011 was the third year in a row with loss making within the chemical tanker segment, and both for us and for the chemical tanker industry in general a sentiment of frustration may prevail. Nevertheless, we still have confidence in our business model, and have spent the last year to position ourselves to take advantage of the improvements we see in the horizon, the only uncertainty being how long we still have to wait.
HorIZon for IMproVeMentS
JAN Arthur hAMMErPresident/CEO

5
Odfjell is a leading company in the global market for transportation and storage of chemicals and other special-ity bulk liquids. Originally set up in 1916, the Company pioneered the development of chemical tanker trades in the middle of the 1950s and the tank storage business in the late 1960s. Odfjell owns and operates chemical tankers in global and regional trades as well as a network of tank terminals.
Odfjell’s business is an important contributor to industrial and societal development around the world. Our core business comprises transporting and storing organic and inorganic bulk liquid chemicals, acids, animal fats, edible oils, potable alcohols and clean petroleum products
– important ingredients and raw materials for everyday life – in products like medicines, medical equipment, building materials, cosmetics, food, textiles, cars, plastics, etc.
StrAtEgy
Odfjell’s strategy is to maintain its position as a leading logistics service provider with customers across the world, through continuous development of efficient and safe operation of deep-sea and regional chemical tankers and tank terminals worldwide.
ChEMiCAl tANkErS
Odfjell has unprecedented experience of deep-sea trans-portation of chemicals and other liquids. Our operations
are fully integrated, with in-house functions for chartering, operation and ship management. Our major trade lanes cover the US, Europe, Asia, India, the Middle East and South America. Odfjell’s sophisticated fleet currently consists of around 100 ships including own, time chartered and commercially managed vessels. The Company also has four newbuildings on order. The total capacity of the current fleet is around 2.75 million DWT. The chemical tanker business posted gross revenues of USD 1,056 million in 2011.
tANk tErMiNAlS
Our terminal operations yield synergies with our trans-portation activities and improve quality and efficiency control across the entire transportation chain. The tank terminal business contributes to stable and stronger results for the Company. Our tank terminal operations also offer opportunities to develop new markets where the infrastructure for specialised bulk liquids is limited. Odfjell has direct investments in part-owned tank terminals in the Netherlands, the US, Singapore, Korea, Oman, China and Iran. We are currently expanding our tank terminal activities. Two new part-owned tank terminals are currently under construction in Charleston, USA and in Tianjin in China. They will become operational in 2013 and 2014 respectively. We also cooperate together with eleven terminals in South America and one in Canada through associated companies. The terminal business generated a gross revenue of USD 227 million in 2011.
WE Ship, StOrE ANd diStill ANythiNg liquid fOr EvErydAy uSE
With SkillEd pErSONNEl
2 095 Ship crew international 310 Ship crew Norwegian 880 Tank terminals 217 Headquarters 259 Branch offices abroad
EMPLOyEES (PER 31 DECEMBER 2011)
50.3% Odfjell owned ships 1.8% Ships on floating rate time charter rate30.0% Ships on fixed rate time charter rate17.9% Third party pool participant
FLEET DISTRIBUTION (CHEMICAL TANKERS)
Total employees 3 761

6 odfjell annual report 2011
fiNANCiAl pErfOrMANCE
• Gross revenues of USD 1,154 million • EBITDA of USD 113 million• EBIT of USD 21 million• Capital gain of USD 294 million relating to
terminal transactions and sale of vessels• Net profit of USD 269 million
ASSEt dEvElOpMENt
Two newbuildings Bow Elm and Bow Lind (44,000 DWT/ 2011), both fully IMO II/III chemical tankers with 29 coated tanks, were delivered to Odfjell Asia II Pte. Ltd, Singapore.
Norfra Shipping AS, a wholly owned subsidiary, took delivery of Flumar Maceio (19,975 DWT/2006), an IMO II/III chemi- cal tanker for regional trading in South America.
Odfjell y Vapores, a joint venture in Chile took delivery of Bow Andes (16,020 DWT/2000) for trading in South America. The vessel has 22 stainless steel cargo tanks.
NCC, our Saudi-Arabian joint venture partner, took delivery of a total of six IMO II/III vessels in 2011 which all entered the NCC Odfjell Chemical Tankers JLT pool.
Crystal Pool AS was established as a joint venture between Odfjell SE and Euroceanica Ltd. The pool commercially manages and operates 14 stainless steel vessels, four of which are owned by Odfjell.
As a part of a fleet development programme Odfjell sold Bow Panther (40,263 DWT/1986) and Bow Puma (40,092 DWT/
1986) for recycling. The vessels have Green Passports, and the buyers are responsible for ensuring that the recycling yard submits a working plan in accordance with IMO guidelines for ship recycling.
2011 saw substantial adjustments to our fleet, which now consists of 100 vessels. A total of four old vessels were sold and seven old vessels on time charter were redelivered to their owner. The Company took delivery of two newbuildings, acquired two second-hand vessels and took on a total of seven vessels on time charter and commercial management.
Odfjell entered a partnership with Lindsay Goldberg LLC, a US based private equity firm. Lindsay Goldberg acquired 49.0% shareholdings in each of the tank terminals in Rotterdam, the Netherlands, Houston, USA, as well as in the greenfield project in Charleston, USA.
Odfjell has signed a Letter of Intent to acquire an equity share in Noord Natie Terminal’s existing facility in Antwerp, Belgium. The intention is to expand the terminal by up to 112,000 cbm capacity. The investment will be part of Odfjell Terminals (Europe), the joint venture between Odfjell SE and Lindsay Goldberg LLC.
At the beginning of 2012 Odfjell announced that the Company had signed an agreement to enter into a joint venture with Tianjin Economic-Technology Development Area (TEDA) to develop terminal and marine facilities for bulk liquid chemicals, petroleum products and gases in the Nangang Industrial Zone (Tianjin) in China.
highlightS 2011
TOTAL ASSETS/EQUITy
Total AssetsEquity
USD MILLION
02 03 04 05 06 07 08 09 10 110
500
1 000
1 500
2 000
2 500
3 000
GROSS REVENUE/EBITDA
Gross RevenueEBITDA
USD MILLION
02 03 04 05 06 07 08 09 10 110
200
400
600
800
1 000
1 200
1 400
1 600

7
ShArEhOldEr iSSuES
At the end of 2011 Odfjell A shares were trading at NOK 36 (USD 5.99), down 33.3% from NOK 54 (USD 9.23) at year-end 2010. Odfjell B shares were trading at NOK 35 (USD 5.89) at the end of 2011, down 34.4% from NOK 54 (USD 9.23) at year-end 2010.
By way of comparison, the Oslo Stock Exchange bench-mark index fell by 12.2%, the marine index by 30.7% and the transportation index by 33.8% during the year. As of 31 December 2011, Odfjell’s market capitalisation amounted to NOK 2.8 billion (USD 469 million).
In November 2011 Odfjell SE paid an extraordinary dividend of NOK 1.00 per share, in total NOK 79 million (USD 14 million).
DIVIDEND PER SHARE (PER yEAR OF PAyMENT)
Dividend
02 03 04 05 06 07 08 09 10 110
1
2
3
4
5
6
NOK
EARNINGS PER SHARE
NOK
Earnings per share
02 03 04 05 06 07 08 09 10 11-10
-5
0
5
10
15
20
25
30

8 odfjell annual report 2011
kEy figurES/fiNANCiAl rAtiO
1) Operating result before depreciation, amortisation and capital gain (loss) on non-current assets.2) Operating result.3) Net result allocated to shareholders' equity before extraordinary items divided by the average number of shares.4) Net result allocated to shareholders' equity divided by the average number of shares.5) Net result plus interest expenses and extraordinary items divided by average total assets.6) Net result plus interest expenses divided by average total assets.7) Net result plus extraordinary items divided by average total equity.
8) Net result divided by average total equity.9) Operating result divided by average total equity plus net interest-bearing debt. 10) Shareholders' equity divided by number of shares per 31.12.11) Bank deposits and securities includes cash and cash equivalents and available-for-sale investments.12) Interest-bearing debt less bank deposits and securities, divided by cash flow before capital gain (loss) on non-current assets.13) Current assets divided by current liabilities.14) Total equity as percentage of total assets.
*) Extraordinary items are antitrust fines in 2003 and retroactive tax in 2007, 2008, 2009 and 2010.Figures from profit and loss statement are according to International Financial Reporting Standards (IFRS) as from 2004 and for balance sheet as from 2003. Historical figures per share have been adjusted for past bonus share issues and the share-splits in 2004 and 2005. Profit and loss figures have been adjusted for discontinued operation.
OdfJEll grOup figures in 2011 2010 2009 2008 2007 2006 2005 2004 2003 2002
frOM prOfit ANd lOSS StAtEMENtGross revenue USD million 1 154 1 048 1 058 1 274 1 083 958 932 828 801 764 EBITDA 1) USD million 113 94 99 209 255 196 212 152 117 113 Depreciation USD million (122) (124) (119) (122) (119) (103) (92) (86) (78) (75) Capital gain (loss) on non-current assets USD million 31 (6) 44 53 25 15 14 7 (0) 1 EBIT 2) USD million 21 (36) 11 140 159 125 148 88 53 52 Net financial items USD million (35) (30) (28) (43) (55) (38) (25) (6) 4 (15) Net result from discontinued operation USD million 288 33 30 34 27 20 16 16 14 12 Net result allocated to shareholders’ equity before extraordinary items *) USD million 269 (79) 11 131 130 116 127 94 77 45 Net result allocated to shareholders’ equity USD million 269 (79) 121 163 (10) 116 127 94 22 45 Net result USD million 269 (79) 121 163 (10) 116 128 95 22 46 Dividend paid USD million 14 - 12 34 43 72 60 53 24 22
frOM BAlANCE ShEEtTotal non-current assets USD million 2 143 2 195 2 256 2 226 2 048 1 815 1 656 1 568 1 482 1 314 Current assets USD million 388 385 442 359 331 374 300 260 233 315 Shareholders’ equity USD million 996 766 901 715 666 702 692 639 578 535 Minority interests USD million 6 6 5 6 6 6 - 4 4 4 Total non-current liabilities USD million 1 223 1 356 1 475 1 540 1 362 1 225 1 008 951 949 981 Current liabilities USD million 305 451 318 324 343 256 255 244 184 110 Total assets USD million 2 531 2 580 2 699 2 585 2 379 2 189 1 956 1 872 1 715 1 630
prOfitABilityEarnings per share - basic/diluted - before extraordinary items 3) USD 3.43 (0.46) 0.13 1.56 1.56 1.38 1.47 1.09 0.89 0.51Earnings per share - basic/diluted 4) USD 3.43 (0.99) 1.42 1.95 (0.12) 1.38 1.47 1.09 0.25 0.51 Return on total assets - before extraordinary items *) 5) % 12.4 0.4 2.3 8.2 8.5 8.2 8.6 6.9 6.3 5.0 Return on total assets 6) % 12.4 (1.2) 6.5 9.5 2.0 8.2 8.6 6.9 3.0 5.0 Return on equity - before extraordinary items *) 7) % 30.3 (4.2) 1.4 18.6 19.0 16.6 19.2 15.4 13.8 8.6 Return on equity 8) % 30.3 (9.4) 14.9 23.3 (1.5) 16.6 19.2 15.4 4.0 8.6 Return on capital employed 9) % 2.5 0.8 3.6 10.2 12.0 9.5 11.6 8.4 6.0 5.7
fiNANCiAl rAtiOSAverage number of shares million 78.56 79.29 85.22 83.81 83.34 84.23 86.77 86.77 86.77 89.73Basic/diluted equity per share 10) USD 12.71 9.75 11.00 8.24 8.00 8.41 7.98 7.36 6.66 6.17Share price per A share USD 5.99 9.23 9.03 6.22 16.47 18.34 20.26 17.54 5.54 3.95Interest-bearing debt USD million 1 246 1 527 1 576 1 500 1 347 1 293 1 037 1 000 943 957 Bank deposits and securities 11) USD million 180 107 185 193 165 242 190 233 203 230 Debt repayment capability 12) years 2.8 11.4 10.6 6.0 4.9 4.8 3.8 4.1 4.4 5.5Current ratio 13) 1.3 0.9 1.4 1.1 1.0 1.5 1.2 1.1 1.3 2.9Equity ratio 14) % 39.6 29.9 34.0 27.9 28.3 32.3 35.4 34.3 33.9 33.1
OthErUSD/NOK rate at year-end 6.01 5.85 5.76 7.00 5.40 6.27 6.76 6.04 6.68 6.96 Employees at year-end 3 761 3 796 3 707 3 690 3 634 3 487 3 296 3 416 3 316 3 201

9
OdfJEll MANAgEMENt grOup
JAN Arthur hAMMErpresident/Chief Executive Officer
Born 1957. Mr. Hammer has been with the Company since 1985. He has held various management positions at Odfjell, both in chartering and tank terminal activities. Owns 3,200 B shares and no options.
tErJE ivErSENSenior vice president/ Chief financial Officer
Born 1969. Mr. Iversen joined Odfjell in August 2011. He was previously CFO of Bergen Group. He has also held various management positions at Odfjell Drilling and PwC. Owns no shares or options.
tOrE JAkOBSENSenior vice president, Corporate investments
Born 1951. Mr. Jakobsen joined Odfjell in October 2005 and was previously President/CEO of Westfal-Larsen & Co A/S in Bergen. Owns 10,000 B shares and no options.
hArAld fOtlANdSenior vice president, Corporate Services and Support
Born 1964. Mr. Fotland joined Odfjell in December 2010 having previously been Vice President of the marine insurance company Gard AS. He has also held various positions within the Royal Norwegian Navy. Owns no shares or options.
tOrAlf SØrENESSenior vice president, quality, health, Safety and Environment
Born 1951. Mr. Sørenes has been with the Company since 1987 and was previously VP Risk Management at Odfjell. He also has extensive experience as captain in the Odfjell fleet. Owns 10,000 A shares and no options.
MOrtEN NyStAdSenior vice president, Odfjell tankers AS
Born 1959. Mr. Nystad joined the Company in 1980 and has held various management positions within Odfjell’s Chartering department in Bergen and at other overseas locations. Owns no shares or options.
hElgE OlSENSenior vice president, Ship Management
Born 1958. Mr. Olsen joined Odfjell in 2000. He has previously held management positions within Odfjell’s Ship Management in Bergen and Singapore and has experience from the Royal Norwegian Navy. Owns no shares or options.
AtlE kNutSENpresident Odfjell terminals Bv
Born 1950. Mr. Knutsen has been with the Company since 1972. He has held various management positions both within shipping and terminals at other overseas locations. Owns 26,712 A shares and 2,336 B shares. No options.
10 odfjell annual report 2011
thE dirECtOrS' rEpOrt 2011
In 2011 the net result, including that from discontinued operation, amounted to USD 269 million, compared to a loss of USD 79 million in 2010. The 2011 result includes USD 294 million in capital gains related to terminal transactions and sale of ships. Gross revenues rose by USD 106 million to USD 1,154 million. Total assets at the year-end amounted to USD 2,531 million, down from USD 2,580 million at the end of 2010. The Company’s consolidated result before taxes of continued operation in 2011 was a loss of USD 13 million, compared to a loss of USD 66 million in 2010. The loss after tax on continued operation came in at USD 20 million, compared to a loss of USD 112 million in 2010. The 2010 results were impacted by a tax charge of USD 42 million as a result of changes in the Norwegian maritime tax regime.
Odfjell’s net result from continued operation was impac- ted by a prolonged weak chemical tanker market that caused losses for our shipping business, but which was partly offset by continued strong results from our tank terminals.
While the market for the Company’s chemical tankers continued to be weak in 2011, and severely negatively impacted by the high cost of bunkers, there were some encouraging signs. Freight rates rose moderately during the year, in particular towards the end of the reporting period when rates spiked due to high volumes of spot cargoes to the Far East. A widespread transfer of ships to this tradelane to seek the benefits of these opportunities created a tighter market and, consequently, also increasing rates in other trade lanes. The CPP freight market remained depressed throughout the year. Bunker prices continued to rise in 2011, which largely explains the poor net result for shipping.
Net tonnage growth during the year for the chemical tanker fleet as a whole was 3.5%, whilst the core deep-sea fleet grew by about 6.0%. Following three years of very few new orders, fleet supply appears moderate going forward. The order book for core deep-sea vessels is now at about 7.0% of current fleet, and somewhat lower for the stainless steel segment. Forecast net fleet growth for 2012 and 2013 is about 1.5% per year. With continued unsustainable freight levels, tight ship financing and high newbuilding prices for sophisticated stainless steel vessels, we expect little contracting of such tonnage in the short- and medium-term.
In May Odfjell received USD 50.7 million from the Russian state-owned yard Sevmash following the Russian Supreme Court’s rejection of the yard’s appeal. The Company had been working hard to enforce payment of the award since December 2009. The first ruling in favour of Odfjell was
made in the Court of Arkhangelsk in December 2010. We are pleased that the case came to a satisfactory close and appreciate the support from Norwegian authorities in ensuring that this case became part of the political agenda between Norway and Russia.
2011 saw substantial adjustments to our fleet, which now consists of approximately 100 vessels. As part of our ongo-ing fleet renewal programme, a total of four older vessels were sold, two for recycling. Seven older ships on time charter were redelivered to their owners. The Company took delivery of two newbuildings, acquired three second-hand vessels and took on a total of seven modern vessels on time charter or commercial management.
Our tank terminal business delivered another solid financial result in 2011, due to added capacity and generally strong demand for tank storage and associated services at most locations.
Our tank terminal projects, including expansions at existing facilities, progressed well in 2011. We completed major expansions in Oman as well as a further expansion at our Korea terminal.
On 15 August Odfjell completed the transaction related to a new strategic partnership with Lindsay Goldberg (“LG”). LG acquired a 49.0% shareholding in each of the tank terminals in Rotterdam, Netherlands, Houston, USA, as well as in the green field project in Charleston, South Carolina, USA. Odfjell holds the remaining 51.0% stake and received cash USD 247 million in connection with the transaction. The total capital gain was USD 270 million. In line with the shareholders agreement the transaction changed our influence from control to joint control, and Odfjell’s total previous ownership has been recognised under discontinued operations, including restatement of the income statement and cash flow statements for prior periods. The change of control was effective from the 15 August 2011, when the remaining 51.0% interest was recognised as a joint venture on a proportionate consolida-tion basis since this date.
The partnership with LG will enhance our platform for organic and strategic investments and expansions in the tank terminal business in Europe and North America. We believe there are attractive expansion opportunities in the tank terminal sector, and consider LG a solid long-term partner with a shared strategic view and growth ambition.
At the beginning of 2012 Odfjell announced that the Company had signed an agreement to enter into a joint venture with Tianjin Economic-Technology Development

11
Area (TEDA) to develop terminal and marine facilities for bulk liquid chemicals, petroleum products and gases in the Nangang Industrial Zone (Tianjin) in China. The initial phase of the joint venture will consist of three deep-sea berths and have a total storage capacity of about 150,000 cubic metres. The joint venture company will be named Odfjell Nangang Terminals (Tianjin), in which Odfjell will hold a 49.0% stake and be responsible for operational management. The total initial investment on a 100.0% basis is estimated at around USD 160 million.
Since 4 May 2010 the Board has comprised of Laurence Ward Odfjell (Chairman), Bernt Daniel Odfjell, Christine Rødsæther, Terje Storeng and Irene Waage Basili.
COrpOrAtE SOCiAl rESpONSiBility
Odfjell’s Corporate Social Responsibility (CSR) initia-tives encompass quality, health, safety and care for the environment, as well as business ethics, human rights, non-discrimination and anti-corruption measures, and are also included in our mission statement. We aim to achieve sustainable development for our employees, investors, customers and the communities in which we operate. We work in accordance with international and national regula-tions that govern our business and take positive measures over and beyond mandatory compliance requirements.
In 2011 Odfjell joined the UN’s Global Compact scheme, which is an internationally recognised UN initiative intended to promote corporate social responsibility and encourage companies to embrace, support and enact, within their sphere of influence, a set of ten principles in the areas of human rights, labour, environment and anti-corruption. A CSR Council, consisting of Odfjell’s senior management, has been established to ensure compliance with our CSR policy and facilitate implementation of the ten principles. Furthermore, the Company has its own corporate Code of Conduct that addresses several of these issues. All Odfjell employees are obliged to comply with the Code of Conduct.
quAlity, hEAlth, SAfEty ANd ENvirONMENt (qhSE)
As in previous years, in 2011 Odfjell initiated a number of different activities to assure the safety of our employees. The Lost-Time Injury Frequency (LTIF) indicator for ship-ping improved, with the on board and onshore figures decreasing from 1.5 in 2010 to 1.23 in 2011. The terminals had an LTIF increase, from 2.2 in 2010 to 2.9 in 2011. No incidents involving fatalities were recorded in 2011, compared with two in 2010.
We have been focusing on risk awareness and safety culture as part of our desired proactive approach to QHSE. This is illustrated, for example, by the fact that all Board and all-employee meetings start with a QHSE update. In 2011 Odfjell implemented one common method in all business units to perform Root Cause Analysis to secure good processes for lessons learned and to share best practice for continual improvements.
Energy optimisation was a key focus area and in 2011, Odfjell responded to the annual survey performed by the Carbon Disclosure Project (CDP). CDP is the leading international not-for-profit organisation focusing on busi-nesses’ response to climate change. Our emissions have decreased in recent years and were reduced by another 7.0% in 2011, in spite of fleet growth.
The main reasons for the increased energy efficiency are a speed/consumption reduction scheme in combination with improved capacity utilisation. As a result of route optimisations, the ships saved time at sea in 2011 by at least 54 days in total. This equals a fuel saving of approximately 2,000 tonnes, equivalent to about 6,000 tonnes CO2.
Piracy in the Gulf of Aden and the Indian Ocean remains a major concern for the type of ships Odfjell operates, and the scale of our operations in the exposed area is significant. Despite implementation of several precautionary measures to reduce the risk during transit in areas exposed to pirates from Somalia, we still considered the risk unacceptably high and, in March 2011, we further strengthened our counter-piracy measures by regular use of privately contracted security personnel throughout the entire high-risk area. On 14 July 2011 Bow Elm was approached by a skiff with visible arms on board while transiting Bab al Menab in the Southern Red Sea. No other close encounters have been reported.
In 2011 four of our older ships obtained Green Passports to ensure controlled recycling of such units. We will continue this programme in 2012.
During the last months of 2011, OTR had some serious incidents related to vapour emissions. There was also a failure to properly report the incidents to the authorities. The Terminal has initiated several processes to prevent such uncontrolled emissions to happen again. Measures have been implemented with immediate effect, for repair of certain welds and replacements of gaskets, which have already reduced benzene emissions. All critical busi-ness processes have become subject to a risk analysis (HAZOP), including the butanisation (winterisation) of gasoline. These events have been firmly investigated by the environmental authority DCMR and the Labour Inspection Authority. The incidents have also caused negative media attention.
There were no lost-time injuries at the Middle East termi-nals in 2011. In 2011 Odfjell Oiltanking Terminal in Oman was certified to ISO 9001, ISO 14001 and OHSAS 18001 for the first time.
In October 2011 Odfjell Terminal Jiangyin received CDI-T certification for the first time. After the fire on 16 July 2010 in an adjacent terminal to Odfjell Terminal Dalian, the terminal has been cleaned up and repaired and has been safely brought back into full operation again since December 2011.

12 odfjell annual report 2011
COrpOrAtE gOvErNANCE
The framework for the Company’s Corporate Governance is the Norwegian Code of Practice for Corporate Governance of 21 October 2010. Odfjell is committed to ethical business practices, honesty, fair dealing and full compliance with all laws affecting our business. This includes adherence to high standards of Corporate Governance. Odfjell’s Corporate Social Responsibility policy also encompasses high focus on quality, health, safety and care for the environment as well as human rights, non-discrimination and anti-corruption. The Company has its own corporate Code of Conduct that addresses several of these issues. All Odfjell employees are obliged to comply with the Code of Conduct.
BuSiNESS SuMMAry
We remain committed to our long-term strategy of enhanc-ing Odfjell’s position as a leading logistic service provider in the area of ocean transportation and storage of bulk liquids. By focusing on safe and efficient operation of a versatile and flexible fleet of global and regional chemical tankers and together with cargo consolidation at our expanding tank terminal network, we aim to further enhance product stewardship for our customers. The fleet is operated in complex and extensive trading patterns, and our customers demand safety, quality and the highest standards of service. Critical mass enables efficient trading patterns and optimal fleet utilisation.
Chemical tankersGross revenues from our chemical tanker activities amounted to USD 1,056 million. EBITDA came in at USD 61 million, negatively impacted by high bunker costs, low volumes and still unsustainable freight rates. EBIT amounted to a loss of USD 9 million, compared to a loss of USD 58 million in 2010. Total shipping assets at year-end amounted to USD 1,723 million. Time charter income expressed in USD per day increased by about 4.3% compared to 2010.
Our shipping segment is among the most challenging in the marine industry. During 2011 our ships transported more than 500 different products comprising some 4,400 individual parcels. Unlike vessels in other shipping seg-ments, our ships have to call at a number of berths dictated by our customers, even within one and the same port. Such operations are time-consuming, fuel-inefficient and costly and thus, negatively impact our results. Our aim is therefore to consolidate and make loading and discharging more time-efficient. We believe future successful consolidation of cargoes, combined with more time-efficient port operations, will benefit our customers, ourselves and the environment.
The average cost of bunkers in 2011 was USD 514 per tonne (including compensation related to bunker escalation clauses and hedging), compared to USD 395 per tonne the preceding year. Bunker hedging mitigated this cost increase by contributing USD 15.0 million to the result in 2011. Daily operating expenses on a comparable fleet basis were about 4.7% higher in 2011 than in 2010.
By year-end 2011 our deep-sea chemical tanker fleet consisted of 80 ships of over 12,000 DWT, of which 37 were owned. The Company was also operating 20 smaller ships, eight of which were owned.
In December Norfra Shipping AS, a fully owned sub-sidiary, took delivery of Flumar Maceio (19,975/2006), an IMO II/III chemical tanker for regional trading in South America.
In January 2012, Odfjell y Vapores, a 50.0% owned joint venture in Chile took delivery of Bow Andes (16,020/2000) for trading in South America. The vessel has 22 stainless steel cargo tanks.
NCC, our Saudi-Arabian joint venture partner, took delivery of six coated IMO II vessels from SLS Shipbuilding Co. Ltd. in 2011, which all entered the NCC Odfjell Chemical Tankers JLT pool (“NOCT”). During 2012 NCC will take delivery of another five coated 45,000 DWT IMO II chemical tankers from SLS, all which will be added to the joint pool.
New time charter agreements were entered into for Stream Mia (19,702/2008), Stream Luna (19,998/2010) and SG Pegasus (13,086/2011). The time charter agreement of Bow Octavia (19,900/2007), Bow Omaria (19,900/2007), Bow Orelia (19,900/2008), Bow Olivia (19,900/2007), Bow Orania (19,993/2006), Bow Ophelia (19,900/2996) and Bow de Jin (11,752/1999) expired during 2011 and the vessels were redelivered to their owners.
As part of a fleet development programme, Odfjell sold Bow Panther (40,263/1986), Bow Puma (40,092/1986) and Bow Prosper (45,655/1987) for recycling. All vessels had Green Passports, and the buyers were responsible for ensuring that the recycling yard submitted a working plan in accordance with IMO guidelines for ship recycling.
In May 2011 Odfjell signed an agreement with Daewoo Shipbuilding & Marine Engineering Co. Ltd to build the first fully IMO II chemical tanker of 75,000 DWT capacity with 31 coated tanks for delivery in the first half of 2013. The total price for the ship is about USD 65 million. Our J/V partner NCC also ordered a sister vessel with expected delivery late 2013. The two ships will be commercially operated by NOCT.
In 2010 Odfjell cancelled three out of six shipbuilding contracts in China with Chongqing Chuandong Shipbuilding Industry (CCSIC). The remaining three vessels are under construction with delivery planned for 2012.
In combination, and as an extension of our worldwide transoceanic services, our regional business activities encompass four different geographical regions. Our largest regional operation is in Asia, which represents a strategi-cally important area for our storage and transportation business with significant new chemical production expected to come on stream in the years to come. We operate 13 ships in different trade lanes, covering the Singapore – Japan/

13
Korea – Australia/New Zealand ranges.
Crystal Pool AS, a joint venture between Odfjell SE and Euroceanica Ltd., was formed in September 2011. The pool commercially manages and operates 14 stainless steel vessels, four of which are owned by Odfjell. The ships are traded in Europe.
In South America, two Brazilian flagged ships are managed and operated by our wholly owned company Flumar. These ships are supplemented by time charter ships and our deep-sea vessels that trade in South America. Finally, we also have a 50/50 joint venture in Chile with CSAV. We currently manage and operate one Chilean-flagged vessel, which is mostly engaged in cabotage transportation of sulphuric acid along the Chilean coast.
During 2011 our ships performed well with regard to customer approvals (vetting). However, the vetting system has become increasingly cumbersome for chemical tankers, which nowadays are subject to numerous inspections and sometimes conflicting requirements by different customers. Within relevant industry associations, Odfjell is proactively seeking a reform of the vetting regime.
tank terminals Gross revenues from our expanding tank terminal activi-ties came in at USD 103 million, while EBITDA for 2011 were USD 52 million, up from USD 35 million in 2010. EBIT for 2011 amounted to USD 30 million, compared to USD 22 million the previous year. At year-end 2011, the book value of our total tank terminal assets was about USD 1,089 million, up from USD 982 million at the end of 2010.
As mentioned above, we entered into a new strategic part-nership with Lindsay Goldberg during third quarter 2011.
During the last months of 2011, OTR had some serious incidents related to vapour emissions. There was also a failure to properly report the incidents to the authorities. The Terminal has initiated several processes to prevent such uncontrolled emissions to happen again. Measures have been implemented with immediate effect, including decommissioning of an outdated vapour recovery system and repair of certain welds and replacements of gaskets, which have already reduced benzene emissions. All critical business processes have become subject to a risk analysis (HAZOP), including the butanisation (winterisation) of gasoline. These events have been firmly investigated by the environmental authority DCMR and the Labour Inspection Authority. The incidents have also caused negative media attention. EBITDA at Odfjell Terminals (Rotterdam) on a 100.0% basis were USD 35 million in 2011, compared to USD 47 million in 2010. Odfjell Terminals (Houston) closed on a 100.0% basis 2011 with an EBITDA of USD 29 million, compared to USD 30 million in 2010. Odfjell’s share of results at the terminals in Korea, Singapore, Oman, Iran and China turned
in a combined EBITDA of USD 40 million, compared with USD 30 million the previous year.
Odfjell’s existing tank terminals are located in Rotterdam, Houston, Singapore, Onsan in Korea, Sohar in Oman, BIK in Iran, and Jiangyin, Dalian and Ningbo in China. Additionally, we have a beneficial co-operation agreement with a related party that owns eleven tank terminals in South America and Canada.
The growth of our tank terminal activities continued in 2011. The expansion of the terminal in Korea was completed, adding 65,000 cbm, while the construction of additionally 27,300 cbm in Oman is expected to be completed during the third quarter of 2012.
The green field project in Charleston, South Carolina is well underway. Current plans comprise eight tanks with a total of 80,000 cbm and investments of about USD 72 million. The terminal will become operational during 2013.
In September Odfjell signed a Letter of Intent (LOI) to acquire a minority share in Noord Natie Terminal’s existing facility in Antwerp, Belgium. The intention is to expand the terminal by another 112,000 cbm storage capacity. Due diligence investigations are on-going, March 2012.
As mentioned in the introduction, in January 2012 Odfjell SE signed an agreement to enter into a joint venture, via its subsidiary Odfjell Terminals Asia Pte Ltd (Singapore), with Tianjin Economic-Technology Development Area (TEDA), via its subsidiary Nangang Port Company to develop terminal and marine facilities for bulk liquid chemicals, petroleum products and gases in the Nangang Industrial Zone (Tianjin) in China.
Odfjell Terminals’ strategy is to continue its growth along the major shipping lanes and at important locations for petrochemicals, refined petroleum products, bio-fuels and vegetable oils. Odfjell Terminals is also seeking to identify investments in emerging markets, thus enhancing the development of ship/shore infrastructure for safe and efficient operations in such regions.
prOfit fOr thE yEAr - CONSOlidAtEd
the group’s accounts have been prepared in accordance with ifrSGross revenues for the Odfjell Group came in at USD 1,154 million, up 10.0% from the preceding year. The consolidated result before taxes of continued operation in 2011 was a loss of USD 13 million, compared to a loss of USD 66 million in 2010. The tax expense in 2011 amounted to USD 6 million, compared to USD 46 million in 2010, of which USD 42 million related to non-recurring taxes. EBITDA for 2011 totalled USD 113 million, compared to USD 94 million the preceding year. EBIT came to USD 21 million, compared to a loss of USD 36 million in 2010. The net result for 2011, includ-ing from discontinued operations, amounted to USD 269 mil- lion, compared to a loss of USD 79 million in 2010.

14 odfjell annual report 2011
Net financial expenses for 2011 totalled USD 35 million, compared to USD 30 million in 2010. The average USD/NOK exchange rate in 2011 was 5.61, compared to 5.93 the previous year. The USD appreciated against the NOK from 5.85 at year-end 2010 to 6.01 at 31 December 2011.
The cash flow from operations was USD 188 million in 2011, compared to USD 169 million in 2010. The net cash flow from investments was positive with USD 111 million. This is mainly related to sale of minority shares in some tank terminals. The cash flow from financing activities was negative with USD 226 million. This reflects mainly down payment of mortgage loans and our SGD bond issued in Singapore.
Based on a solid balance sheet the Company will look for further opportunities in the financial markets to secure additional funding at reasonable terms to finance expected growth.
The Parent Company posted a loss for the year of USD 26 million. The loss will be covered by a transfer from other equity. The main part of the loss relates to the impairment of shares in some subsidiaries. As of 31 December 2011, total retained earnings amounted to USD 537 million.
The Annual General Meeting will be held on 8 May 2012 at 16:00 hours at the Company’s headquarters. Given the continued challenging market, the Board does not propose the payment of a dividend for 2011 results.
According to § 3.3 of the Norwegian Accounting Act we confirm that the financial statements have been prepared on the going concern assumption.
ShArES ANd ShArEhOldErS
The Company is an SE company (Societas Europaea) subject to Act No 14 of 1 April 2005 relating to European companies. The Company’s registered office is in the City of Bergen, Norway.
The object of the Company is to engage in shipping, ship agency, tank terminals, real estate, finance and trading activities, including the transportation of freight in the Company’s own vessels or chartered vessels, the conclu-sion of freight contracts, co-ownership agreements and cooperation agreements, ownership and operation of tank terminals, as well as investment and participation in other enterprises with a similar object and other activities related thereto.
At the end of 2011 the A shares were trading at NOK 36 (USD 5.99), down 33.3% from NOK 54 (USD 9.23) at year-end 2010. The B shares were trading at NOK 35 (USD 5.89) at the end of 2011, down 34.4% from NOK 54 (USD 9.23) at year-end 2010. By way of comparison, the Oslo Stock Exchange benchmark index fell by 12.2%, the marine index fell by 30.7% and the transportation index fell by 33.8%
during the year. As of 31 December 2011, Odfjell’s market capitalisation amounted to NOK 2.8 billion (USD 469 million). Odfjell SE owns directly and indirectly 5,891,166 treasury A shares and 2,322,482 treasury B shares.
fiNANCiAl riSk ANd StrAtEgy
Our financial strategy is to be sufficiently robust to withstand prolonged adverse conditions, such as long-term down cycles of our markets or challenging financial conditions. Odfjell adopts an active approach to managing risk in the financial markets. This is done through funding from diversi-fied sources, maintaining high liquidity or loan reserves, and by systematically monitoring and managing financial risks relating to currency, interest rates and the price of bunkers. However, the use of hedging instruments to reduce the Company’s exposure to fluctuations in the above-mentioned financial risks limits the upside potential from favourable movements in respect of the same risk factors.
The single largest monetary cost component affecting our time charter earnings is bunkers. In 2011 this item amounted to more than USD 289 million (54.0% of voyage cost). A variation in the average bunker price of USD 10 per tonne equals about USD 6 million, or a USD 230 per day change in time charter earnings of the ships in which we have a direct economic interest. Some of our bunker exposure is hedged through bunker adjustment clauses in our Contracts of Affreightment. As of 31 December 2011 we had entered into additional hedging through swaps and options for about 15.0% of the 2012 bunker exposure.
All interest-bearing debt, except debt held by tank terminals outside the US, is denominated in USD. Bonds issued in non-USD currencies are swapped to USD. Interest rates are generally based on USD LIBOR rates. A portion of the interest on our debt is fixed through long-term interest rate swaps. With our current interest rate hedging in place, about 28.0% of our loans are on a fixed rate basis. In order to reduce volatility of the net result and cash flow related to changes in short-term interest rates, interest rate periods on the floating rate debt and interest periods of our liquidity are managed to be concurrent.
The Group’s revenues are primarily denominated in US Dollars. Only tank terminals outside the US and our regional European shipping trade generate and receive income in non-USD currencies. Our currency exposure relates to the net result and cash flow from voyage-related expenses, ship operating expenses and general and administrative expenses denominated in non-USD currencies, primarily in NOK and EUR. Our estimate is that a 10.0% appreciation of the USD against the NOK and EUR would improve the pre-tax 2012 result by roughly USD 14 million, assuming no currency hedging is in place.
Our currency hedging at the end of 2011, under which we sold USD and purchased NOK, covers about 40.0% of our 2012 NOK exposure respectively. Future hedging periods may vary depending on changes in market conditions.

15
liquidity ANd fiNANCiNg As of 31 December 2011 cash and cash equivalents and available-for-sale investments amounted to USD 205 mil- lion, compared with USD 141 million as of 31 December 2010. Interest-bearing debt fell from USD 1,526 million at year-end 2010 to USD 1,245 million as of 31 December 2011. At the same date net interest-bearing debt amounted to USD 1,040 million, the equity ratio was 39.6%, and the current ratio was 1.3. In December the SGD bond matured and was redeemed by drawing on the Company’s cash reserves, in the amount of around USD 100 million. All major investment commitments are fully financed. In January Odfjell secured a new senior secured revolving credit facility of USD 80 million, which will increase the available liquidity reserves by approximately USD 50 mil-lion. With a solid balance sheet, the Company will also be looking for further opportunities in the financial markets to secure additional funding at reasonable terms to finance expected growth.
An Extraordinary General Meeting of Odfjell SE was held 26 October 2011, when the Board’s proposed dividend of NOK 1.00 per share was unanimously approved. This dividend was paid to shareholders on 8 November 2011.
kEy figurES
The return on equity for 2011 was 30.3% and the return on total assets was 12.4%. The corresponding figures for 2010 were negative 9.4% and negative 1.2%, respectively. The return on capital employed (ROCE) was 2.5% in 2011. Earnings per share from continued operations in 2011 amounted to USD -0.25 (NOK -1.50), compared to USD -1.41 (NOK -8.47) in 2010. Earnings per share from discontinued operations amounted to USD 3.67 (NOK 22.05) in 2011, compared to USD 0.42 (NOK 2.52) in 2010. The cash flow per share was USD 5.15 (NOK 30.95), compared to USD 1.46 (NOK 8.77) in 2010.
As of 31 December 2011 the Price/Earnings (P/E) ratio was 1.7 and the Price/Cash flow ratio was 1.2. Based on book value, the current Enterprise Value (EV)/EBITDA multiple was 12.9 while, based on the market capitalisation as per 31 December 2011, the EV/EBITDA multiple was 9.6. The interest coverage ratio (EBITDA/net interest expenses) was 3.5, the same as last year.
OrgANiSAtiON, WOrkiNg ENvirONMENt ANd JOB OppOrtuNitiES
Odfjell aims at being a company for which it shall be attractive to work, with an inspiring and interesting work environment both at sea and ashore. We carry out employee engagement surveys at the headquarters in Bergen and at our overseas offices, and we do ergonomics inquiries. In addition we have implemented a programme for improved health care for seafarers, with focus on the importance of exercise and a healthy diet. The work environment is considered good.
Odfjell maintains a policy of providing employees with equal opportunities for development of skills and offering new challenges within our Company. All em ployees are treated equally, irrespective of ethnic background, gender, religion or age – and they are offered equal opportuni ties for development and promotion to managerial positions. Gender-based discrimination is not allowed in terms of recruitment, promotion or wage compensation. Of about 217 employees at the headquarters in Bergen, 68.0% are men and 32.0% women, whilst the corresponding global figures (about 917 employees in our fully owned onshore operations) are 75.0% and 25.0% respectively. Two of the Directors of the Board of the Group are women. Recognizing that we employ relatively few women, we endeavour to recruit women to Ship Operations, Chartering and Ship Management, and we also promote life at sea as an attrac-tive career.
Compared to last year the recorded absence rate at the headquarters has been reduced from 4.02% to 3.15%. For the Filipino mariners the absence rate was 0.74% and for Europeans 4.84%.
The Board takes this opportunity to thank all employees for their contributions to the Company during 2011.
StAtEMENt ON SAlAry ANd OthEr BENEfitS tO thE MANAgEMENt fOr 2011 ANd 2012
It is Odfjell’s policy that Management shall be offered com-petitive terms of employment in order to ensure continuity and to enable the Company to recruit qualified personnel. The remuneration is structured so that it promotes the creation of value for the Company. The remuneration shall not be of such a kind or magnitude that it may impair the business or the public reputation of the Company.
A basic, straight salary is the main component of the remuneration. However, in addition to a basic salary there may also be other supplementary benefits, hereunder but not limited to payment in kind, incentive/recognition pay, termination payments and pension and insurance schemes.
The Company does not have any share option schemes, nor other benefit programmes as mentioned in the Public Limited Companies Act, section 6-16 subsection 1 no. 3. As the Company has no such arrangements, no specific limits regulating the different categories of benefits or the total remuneration of Management have been defined. The Board may on a discretionary basis grant recognition payments to certain employees including Management. For 2011 the maximum amount set aside for this type of payment was USD 1.2 million for the Odfjell Group as a whole. The Board has implemented a performance-related incentive scheme linked to the Company’s earnings performance and operational defined goals/KPIs for 2012 onwards, which caps recognition payment to a maximum multiple of six monthly salaries. Members of Management have no defined agreement with regards to severance payments.Remuneration to Management in 2011 was in

16 odfjell annual report 2011
compliance with the above guidelines. See Note 23 to the Odfjell Group accounts for details about the remuneration of the Management in 2011.
WOrld ShippiNg CONtEXt
The recovery witnessed in 2010 after the global economic crisis slowed during 2011, mainly due to very modest growth, and in some cases even decline in the most advanced economies. The Eurozone debt crisis deepened further, putting pressure on some larger economies, previously considered stable. The US public debt situation is also causing concern. Political leaders in Europe and in the US are struggling to agree on and implement unpopular but necessary decisions to balance public finances and thus, to find a sustainable way out of the difficult situation. The severe damages in Japan, following the earthquake, tsunami and nuclear disaster in March curbed the longed-for recovery of the Japanese economy. However, the picture is quite different within most of the developing world due to an increase in domestic demand for housing, infrastructure and consumer goods. Nevertheless, with weaker growth and purchasing power in the OECD world, the developing economies also experienced somewhat slower growth than the year before. According to IMF, economic output for the developing world as a whole increased by 6.2%, whilst the advanced economies only grew by 1.6%. Global GDP growth was 3.8%.
The slow economic growth, combined with bunker prices rising to almost record levels, contributed to make 2011 another severely difficult year for the world shipping industry. Earnings for oil tankers, bulk carriers and con-tainer ships declined further during the year, from already unhealthy levels. Shipping in general is also suffering from the order boom in the period 2005-2008, during which the order book for most segments reached 50.0–70.0% of fleet. Although the large-scale orders have now ceased and the order book has returned to a level of 10.0–30.0% of current fleet, the large influx of new tonnage during the last few years will hamper a swift general recovery for the shipping industry. Demolition continues to be modest, and the number and sizes of over-aged tonnage that are likely candidates for recycling, is insufficient to keep the fleet growth at bay during the next 2–3 years.
The latest projections for global economic output offer little short-term relief on the demand side. GDP growth is forecast to weaken somewhat further this year and to return to about 2011 figures next year. Not until 2014–2015 will the projected growth once again start to approach pre-crisis levels. The speed of the recovery will not least depend on how rapidly the US, the EU and Japan manage to solve their problems and get their respective economies back on track. China remains an important driver of world trade and shipping demand, but there are indications that Chinese growth also will weaken, with some even suggesting a hard landing. Another factor causing great political concern is the current tension between the Iranian leadership and
most of the rest of the world, and in particular the worry that the situation may escalate further into an armed conflict, causing problems for shipping through the Strait of Hormuz. Because of the dwindling contracting of new ships, prices for new orders have started to come down as many yards struggle for survival. The general consensus seems to be that prices for building new ships will reduce further. However, with stable or even rising prices for steel, labour and other input factors, there is little room for any sig-nificant reductions over and above potential productivity enhancement gains and governmental support. We are already now witnessing a limited number of new orders, basically to take advantage of new technology in terms of improved vessel speed and consumption so as to fend off the very high fuel prices. Nevertheless, with ship financing quite tight and a rather bleak short- and medium-term market outlook, there does not seem to be any significant potential for high newbuilding activity.
Piracy in the Gulf of Aden and the Indian Ocean continues to pose a severe and costly threat to ship-borne transporta-tion through the Red Sea, to and from the Middle East Gulf and along East Africa, despite substantial resources being employed by the world community in an attempt to monitor and safeguard the area. Odfjell, like many other shipping companies, has started to employ privately contracted security personnel when passing through the worst affected areas, in addition to a number of passive protection measures. However, the shipping industry and the world in general are still trying to find a lasting solution to the piracy problem.
thE ChEMiCAl MArkEt
For the world chemical industry in general, 2011 was another fairly strong year with good sales and healthy results, although somewhat weaker during the fourth quarter. Despite the economic woes, particularly in Europe but also in the US and Japan, production and trade in general remained high. The build-up of chemical production in China and the Middle East has continued, but the US chemical industry also managed to maintain its position, not least now benefiting from cheaper raw materials through shale gas.
The year also provided some longed-for encouragement for the chemical tanker industry. Freight rates rose during 2011, in particular towards the end of the year when rates reached almost record levels due to high volumes of spot cargoes to the Far East. A widespread transfer of ships to this trade lane to seek the benefits of these opportunities created a tighter market and thus increasing rates also in other trade lanes. The CPP freight market remained depressed throughout the year.
Despite the increase in freight rates, for many chemical tanker operators the situation is nevertheless far from rosy. The market imbalance after recent years’ oversupply of chemical tankers has prevented quality operators such as us from achieving freight rates that compensate for the very

17
high bunker prices and other increasing operating costs, not least related to maintaining our high standards, crewing and vetting. After several years of unsustainable market conditions, several owners have now reached a critical financial state; some forced to considerably downscale their operations or even file for bankruptcy whilst others are being kept afloat for the time being by their banks waiting for the storm to pass. Because of the crisis in the banking sector this may prove more difficult in the future. Hence, for the chemical tanker industry to be able to continue providing quality and reliable services, a re-pricing is necessary to a more sustainable level, allowing for reinvestments in our type of sophisticated tonnage. There also needs to be a more level, transparent and efficient regime for customer inspections and vetting requirements.
Net tonnage growth during the year for the chemical tanker fleet as a whole was 3.5%, whilst the core deep-sea fleet grew by about 6.0%. After three years of very few new orders, fleet supply appears moderate going forward. The order book for core deep-sea vessels is now at about 7.0% of current fleet, for the stainless steel fleet somewhat less. The forecast net fleet growth for 2012 and 2013 is about 1.5% per year. With continued unsustainable freight levels, tight ship financing and high newbuilding prices for sophisticated stainless steel vessels, we expect limited contracting of such tonnage in the short- and medium-term.
The global economy is forecast to grow by 3.0–4.0% per year over the next few years, which traditionally points to an increase in demand for seaborne transportation of 4.0–5.0% per year. Consequently, the supply/demand bal-ance should gradually turn in favour of stronger chemical tanker markets, with higher spot rates and eventually also improved terms for contracts of affreightment. Hence, barring unexpected events, we expect improved earnings also for our chemical tankers in 2012. However, changes in political and socio-economic conditions, both in terms of production and consumption, may affect trade patterns and hence, the tonne mile demand, which may cause uncertain and more dynamic trading.
COMpANy StrAtEgy ANd prOSpECtS
As a leading niche player, we strive to provide safe, efficient, and cost-effective chemical tanker and tank terminal services to our customers worldwide. In addition to the clear operational and commercial benefits from close co-operation between our shipping activities and our tank terminals, the tank terminals themselves have proven a stabilising factor in the Company’s overall financial performance as earnings from this area are less volatile as compared to earnings from our shipping activities.
On the shipping side, we are continually striving to stay competitive and flexible with a modern, versatile and adequate fleet of vessels, adjusting to changing trade patterns through organisational dexterity. Disposal of older units provides better utilisation, enhancing the results of the rest of the fleet, in spite of which overall activity levels
were unsatisfactory in 2011. Freight rates have some way to go to reach sustainable levels. We continue to witness increased activities out of the US Gulf and the Middle East, subject always however to fierce competition.
Pirate activities in the Gulf of Aden and in the Indian Ocean continue to be a concern, both from a safety and cost perspective.
The large supply overhang in the product tanker market, continued high bunker prices and our inability to fully recover these higher costs from our customers, may still hamper the recovery of our time charter results. Part of our 2012 bunker exposure is reduced through bunker clauses in our contracts or by paper hedges.
Looking forward the biggest risk factor for us and the world at large is significantly higher energy prices. In addition to the negative impact on our fuel costs, this would also be a threat to a much needed and anticipated recovery of the world economy and thus, the volumes to be shipped by chemical tankers.
The fourth quarter of 2011 saw seasonally high activity levels, in particular towards the end of the quarter, while spot rates for US and European exports climbed and cargo offerings from the Middle East were buoyant. We thus witnessed some encouraging developments in the freight market for chemicals in the fourth quarter of 2011, which potentially will translate into improved earnings for our tankers going forward.
We expect our tank terminal results to remain stable, despite some weaknesses in the refined oil market.

18 odfjell annual report 2011
thE BOArd Of dirECtOrS
ChriStiNE rØdSÆthEr
Born 1964. Board member since 4 May 2010. Rødsæther is a lawyer and partner in Vogt & Wiig and has a law
degree and a Master of Law (LLM). She specialises in Financial Regulations,
Maritime Law and Transportation and has experience within banking, finance,
corporate, shipping and offshore. Owns no shares nor options.
irENE WAAgE BASili
Born 1967. Board member since 2 December 2008. Waage Basili is CEO of GC Rieber Shipping. She has 18 years of experience within shipping
and the oil service industry. Owns no shares nor options.
FROM UPPER LEFT: Terje Storeng, Laurence Ward Odfjell, Bernt Daniel Odfjell, Irene Waage Basili and Christine Rødsæther
tErJE StOrENg
Born 1949. Former President/CEO of Odfjell SE 2003–2009. Storeng was a Board member between 1994–2004 and Managing Director of AS Rederiet Odfjell. He owns 70,560 A shares and
2,112 B shares. No options.
lAurENCE WArd OdfJEll
Born 1965. Chairman of the Board since 4 May 2010. Odfjell was
a Board member between 2004–2007 and former President of Odfjell
Terminals BV. He is a founding family member of the Company.
He controls 25,966,492 A shares and 1,755,076 B shares (incl. related parties).
No options.
BErNt dANiEl OdfJEll
Born 1938. Board member since 2010 and former Chairman of the Board. Odfjell has been with the Company since 1963 and is a founding family
member of the Company. He owns 2,032 B shares (incl. related
parties) and no options.
thE BOArd Of dirECtOrS Of OdfJEll SE Bergen, 15 March 2012

19
OdfJEll grOup
(uSd 1 000) Note 2011 2010
Gross revenue 3 1 154 116 1 048 387 Net income from associates 36 192 128 Voyage expenses 19 (532 205) (450 819)Time charter expenses 20 (167 625) (197 811)Operating expenses 21, 23 (237 998) (221 113)
gross result 216 480 178 772
General and administrative expenses 22, 23 (103 731) (84 869)
Operating result before depreciation, amortisation and capital gain (loss) on non-current assets (EBitdA) 112 749 93 903
Depreciation 10 (122 164) (124 020)Compensation 29 5 792 - Capital gain (loss) on non-current assets 10 24 880 (6 300)
Operating result (EBit) 21 257 (36 417)
Interest income 18 2 802 3 468 Interest expenses 7 (43 960) (39 696)Other financial items 26 2 494 3 797 Currency gains (losses) 27 4 035 2 885
Net financial items (34 629) (29 546)
result before taxes (13 372) (65 963)
Taxes 8 (6 233) (45 765)
Net result from continued operation (19 605) (111 728)
Net result from discontinued operation 37 288 496 32 964
Net result 268 891 (78 764)
OthEr COMprEhENSivE iNCOMECash flow hedges changes in fair value 5 (4 666) 13 874 Cash flow hedges transferred to profit and loss statement 5 (22 074) (34 056)Net unrealized gain/(loss) on available-for-sale investments (963) 256 Exchange rate differences on translating foreign operations 3 049 (12 132)
Other comprehensive income (24 654) (32 058)
total comprehensive income 244 237 (110 822)
Net result allocated to:Minority interests (121) (115)Shareholders 269 012 (78 649)
Total comprehensive income allocated to:Minority interest 526 (353)Shareholders 243 624 (110 469)
Earnings per share (USD) - basic/diluted - continued operation 13 (0.25) (1.41) Earnings per share (USD) - basic/diluted - discontinued operation 3.67 0.42
PROFIT AND LOSS STATEMENT
thE fiNANCiAl StAtEMENtOdfJEll grOup

20 odfjell annual report 2011
OdfJEll grOup
BALANCE SHEET (USD 1 000)
tErJE StOrENg lAurENCE WArd OdfJEll BErNt dANiEl OdfJEll
irENE WAAgE BASili ChriStiNE rØdSÆthEr JAN Arthur hAMMErPresident/CEO
thE BOArd Of dirECtOrS Of OdfJEll SE Bergen, 15 March 2012
Assets as per 31.12 Note 2011 2010
NON-CurrENt ASSEtSIntangible assets 11 115 178 10 760 Real estate 10 38 587 49 022 Ships 10 1 171 689 1 214 961 Newbuilding contracts 10 118 555 102 229 Tank terminals 10 591 318 707 253 Office equipment and cars 10 43 454 44 146 Investments in associates 36 1 718 1 586 Non-current receivables 28 62 288 65 364
total non-current assets 2 142 788 2 195 321
CurrENt ASSEtSCurrent receivables 29 134 781 192 087 Bunkers and other inventories 32 36 243 29 264 Derivative financial instruments 5 11 563 21 643 Available-for-sale investments 17 25 364 34 477 Cash and cash equivalents 18 180 067 107 046
total current assets 388 017 384 517 total assets 2 530 805 2 579 838
Equity and liabilities as per 31.12 Note 2011 2010
EquityShare capital 33 29 425 29 425 Treasury shares 33 (2 785) (2 785)Share premium 33 53 504 53 504 Other equity 915 851 686 015 Minority interests 6 309 5 904
total equity 1 002 303 772 063
NON-CurrENt liABilitiESDeferred tax liabilities 8 51 554 36 149 Pension liabilities 9 30 468 22 380 Non-current interest bearing debt 7 1 116 940 1 256 860 Other non-current liabilities 31 24 537 40 910
total non-current liabilities 1 223 499 1 356 299
CurrENt liABilitiESCurrent portion of interest bearing debt 7 127 997 269 800 Taxes payable 8 22 765 21 409 Employee taxes payable 6 995 5 842 Derivative financial instruments 5 47 839 27 911 Other current liabilities 30 99 405 126 513
total current liabilities 305 001 451 476 total liabilities 1 528 501 1 807 775total equity and liabilities 2 530 805 2 579 838
Guarantees 16 113 785 87 102

21
OdfJEll grOup
As per 31 December 2011 the Company had no available credit facilities.
CASH FLOW STATEMENT
STATEMENT OF CHANGES IN EQUITy
(uSd 1 000) Note 2011 2010
CASh flOW frOM OpErAtiNg ACtivitiESOperating result 21 257 (36 417)Net result discontinued operations 37 288 496 32 964 Depreciation and impairment 10 122 164 124 020 Capital (gain) loss on non-current assets 10 (24 880) 6 300 Capital (gain) loss on discontinuing operations 37 (269 516) - Compensation 29 (5 792) - Inventory (increase) decrease (6 979) 3 127 Trade debtors (increase) decrease 13 071 (4 327)Trade creditors increase (decrease) (9 081) 723 Difference in pension cost and pension premium paid 8 088 434 Other current accruals 49 282 48 089 Taxes paid 2 261 (6 297)
Net cash flow from operating activities 188 371 168 616
CASh flOW frOM iNvEStiNg ACtivitiESSale of non-current assets 116 858 72 869 Sale of discontinued operation 37 247 932 - Investment in non-current assets 10 (268 676) (196 340)Available-for-sale investments 9 113 47 010 Changes in non-current receivables 2 944 18 262 Interest received 2 802 3 468
Net cash flow from investing activities 110 973 (54 731)
CASh flOW frOM fiNANCiNg ACtivitiESNew interest bearing debt 103 451 145 291 Payment of interest bearing debt (274 428) (192 791)Purchase treasury shares - (24 826)Other financial expenses 2 494 3 797 Interest paid (43 960) (39 696)Dividend (13 914) -
Net cash flow from financing activities (226 357) (108 226)
Effect on cash balances from currency exchange rate fluctuations 33 (1 781)
Net change in cash balances 73 020 3 877 Cash and cash equivalents as per 1.1 107 046 103 169
Cash and cash equivalents as per 31.12 180 067 107 046
Available credit facilities - 20 250
(uSd 1 000)Share
capitaltreasury
sharesShare
premium
Exchange rate
differences
fair value and other reserves
retained earnings
total other
equity
total share-
holders’ equity
Minority interests
total equity
Equity as at 1.1.2010 29 425 (1 635) 53 504 22 560 23 955 773 645 820 160 901 455 4 717 906 172 Comprehensive income - - - (11 894) (19 926) - (31 820) (31 820) (353) (32 172)Net result - - - - - (78 649) (78 649) (78 649) (115) (78 764)Paid-in capital in minority interest - - - - - - - - 1 655 1 655 Share sale/repurchases - (1 150) - - - (23 676) (23 676) (24 826) - (24 826)
Equity as at 31.12.2010 29 425 (2 785) 53 504 10 666 4 029 671 320 686 015 766 159 5 904 772 063
Equity as at 1.1.2011 29 425 (2 785) 53 504 10 666 4 029 671 320 686 015 766 159 5 904 772 063 Net result - - - - - 269 012 269 012 269 012 (121) 268 891 Comprehensive income - - - 2 523 (27 703) (25 180) (25 180) 526 (24 654)Dividend - - - - - (13 997) (13 997) (13 997) - (13 997)
Equity as at 31.12.2011 29 425 (2 785) 53 504 13 189 (23 674) 926 335 915 850 995 994 6 309 1 002 303

22 odfjell annual report 2011
OdfJEll grOup
NOtE 1 COrpOrAtE iNfOrMAtiON
Odfjell SE, Conrad Mohrsv. 29, Bergen, Norway, is the ultimate parent company of the Odfjell Group. Odfjell SE is a public limited company traded on the Oslo Stock Exchange. The consolidated financial statement of Odfjell for the year ended 31 December 2011 was authorised for issue in accordance with a resolution of the Board of Directors on 15 March 2012. The Odfjell Group includes Odfjell SE, wholly owned or controlled subsidiaries incorporated in several countries (see note 34 for an overview of consolidated companies) and our share of investments in joint ventures (see note 35).
Odfjell is a leading company in the global market for transportation and storage of chemicals and other speciality bulk liquids as well as a provider of related logistical services. Through its various subsidiaries and joint ventures Odfjell owns and operates chemical tankers and tank terminals. The principal activities of the Group are described in note 3.
Unless otherwise specified the "Company", "Group", "Odfjell" and "we" refer to Odfjell SE and its consolidated companies.
NOtE 2 SuMMAry Of SigNifiCANt ACCOuNtiNg priNCiplES
2.1 Basis for preparationThe Odfjell Group has prepared its accounts according to International Financial Reporting Standards (IFRS) approved by the EU. Items in the financial statements have been reported, valued and accounted for in accordance with IFRS, which comprise standards and interpretations adopted by the International Accounting Standards Board (IASB). These include International Financial Reporting Standards (IFRS), International Accounting Standards (IAS) and interpretations originated by the International Financial Reporting Interpretations Committee (IFRIC) formerly the Standing Interpretations Committee (SIC).
The consolidated statements have been prepared on a historical cost basis, except for the measurement at fair value of derivative financial instruments (see note 2.15) and financial investments (see note 2.16).
Odfjell has changed influence from control to joint control in some terminal companies and Odfjell’s total previous ownership in these companies is presented as discon-tinued operation including representation of profit and loss and cash flows for prior period. Change of control is effective from 15 August 2011, and the remaining 51% interest is from this date presented as joint venture using proportionate consolidation.
2.2 Basis of consolidation The same accounting principles are applied to all companies (or adjusted for in the case of some joint venture ref. accounting principles 2.9 and 2.10), in the Odfjell Group. All intra-group balances, transactions, income and expenses and profits and losses resulting from intra-group transactions are eliminated.
investment in subsidiariesThe consolidated statements consist of Odfjell SE and its subsidiaries as at 31 December each year (see note 34). Minority interests are included as a separate item in the equity, and are recorded as a separate allocation of the net result. The minority interests include the minority’s share of the equity of the subsidiary, including any share of identified excess value on the date when a subsidiary was acquired.
Subsidiaries are fully consolidated from the date of acquisition, being the date on which the Group obtained control, and continues to be consolidated until the date that such control ceases. Controlling influence is normally gained when the Group owns, directly or indirectly, more than 50% of the shares in the company and is capable of exercising actual control over the company. Identified excess values have been allocated to those assets and liabilities to which the value relates. Fair value adjustments to the carrying amounts of assets and liabilities arising on the acquisition are treated as assets and liabilities of the foreign operation and translated at the exchange rate at the balance sheet date. Excess values are depreciated over the estimated economic lives, except for goodwill that is tested for impairment annually or more frequently if events or changes in circumstances indicate that there may be impairment (see note 2.14).
2.3 Application of judgment and estimates
Certain of our accounting principles require
the application of significant judgment by management in selecting the appropriate assumptions for calculating financial esti-mates that affect the reported amounts of assets, liabilities, revenues, expenses and information on potential liabilities. By their very nature, these judgments are subject to an inherent degree of uncertainty. These judgments and estimates are based on historical experience, terms of existing con-tracts, observance of trends in the industry, information provided by customers and where appropriate, information available from other outside sources. Although these estimates are based on management’s interpretations of current events and actions, future events may lead to these estimates being changed and actual results may ultimately differ from those estimates. Such changes will be recognised when new estimates can be determined. Our significant judgment and estimates include:
revenue recognitionTotal revenues and voyage related expenses in a period are accounted for as the percentage of completed voyages. Voyage accounting consists of actual figures for completed voy-ages and estimates for voyages in progress. Historically the estimated revenues and voyage expenses have not been significantly different from actual voyage related revenues and expenses. Further details are given in note 2.6.
valuation of non-current assetsNon-current assets are depreciated over the expected useful lives to an estimated residual value at the time of disposal. Expected useful lives are estimated based on earlier experi-ence and are reviewed at each balance sheet date, and where they differ significantly from previous estimates, depreciations are adjusted accordingly. We estimate residual value at the estimated time of disposal of assets, which is generally at the end of their useful life. To assess the residual value of ships we use the estimated recycling value. For terminals we use a best estimate for the value of the tank assets less dismantling expenses. The residual values are evaluated on a regular basis with any changes having an effect on future depreciations. Further details are given in note 2.11.
When an impairment test is required and when we estimate value in use, the estimates
NOtES tO thE fiNANCiAl StAtEMENt

23
OdfJEll grOup
are based upon our projections of anticipated future cash flows and an appropriate discount rate when calculating the present value of those cash flows. While we believe that our estimates of future cash flows are reasonable, different assumptions regarding such cash flows could materially affect our evaluations. Further details are given in note 2.14.
taxesThe Group is subject to income tax in many jurisdictions. Considerable judgment must be exercised to determine income tax for all countries taken together in the consolidated accounts. The final tax liability for many trans-actions and calculations will be uncertain. Deferred tax assets are recognised for all unused tax losses to the extent that it is probable that taxable profits will be avail-able against which the losses can be utilised. Significant management judgment is required to determine the amount of deferred tax assets that can be recognised, based upon the likely timing and level of future taxable profits together with future tax planning strategies. Further details are given in note 2.7.
pensionThe cost of defined benefit pension plans is determined using actuarial valuations. The actuarial valuation involves making assump-tions about discount rates, expected rates of return on assets, future salary increases, mortality rates and future pension increases. Due to the long-term nature of these plans, such estimates are subject to significant uncertainty. Further details are given in note 2.24.
provisionsProvisions are based on best estimates. Provisions are reviewed at each balance sheet date and the level shall reflect the best estimate of such possible liability. Further details are given in note 2.23.
2.4 Changes in accounting principles and disclosures
The following changes in accounting prin-ciples have been implemented in 2011 as a result of requirements stipulated in the accounting standards and IFRIC interpreta-tions. The adoption of these amendments to standards and interpretations had no material impact on Odfjell.• IAS 24 Related Party Disclosures• IAS 32 Financial Instruments: Presentation
- Classification of Rights issues• IFRIC 14 IAS 19 The limit on a Defined
Benefit Asset
• IFRIC 19 Extinguishing Financial Liabilities with Equity Instruments
2.5 Currencyfunctional and presentation currencyThe consolidated financial statements are presented in USD as the Group operates in an international market where the functional currency is mainly USD. The shipping com-panies generally have USD as the functional currency, whilst the terminal companies` functional currency is the local currency.
transactions and balancesTransactions in non-USD currency are recorded at the exchange rate on the date of the transaction. Receivables and liabilities in non-USD currencies are translated at the exchange rate on the balance sheet date. All exchange rate differences are taken to the profit and loss statement. Non-monetary items that are measured in terms of historical cost in a non-USD currency are translated using the exchange rates at the dates of the initial transactions. foreign subsidiariesThe balance sheet of foreign subsidiaries with functional currency other than USD is translated at the rate applicable on the balance sheet date, while the profit and loss statement is translated using the monthly average exchange rate for the accounting period. Exchange rate differences that arise as a result of this are included as exchange rate differences in the Statement of compre-hensive income. When a foreign subsidiary is sold, the accumulated translation adjustment related to that subsidiary is taken to the profit and loss statement. 2.6 revenue recognitionRevenue is recognised when it is probable that a transaction will generate a future economic benefit that will accrue to the Company, and the size of the amount may be reliably estimated. Revenue is measured at the fair value of the amount to be received, excluding discounts, sales taxes or duty. Total revenues and voyage related expenses in a period are accounted for as the percent-age of completed voyages. Voyage accounting consists of actual figures for completed voyages and estimates for voyages in progress. Voyages are normally discharge-to-discharge. Except for any period a ship is declared off-hire due to technical or other owner’s matters, a ship is always allocated to a voyage.
Tank rental income is recognised to the extent that it seems likely that the economic benefits will accrue and the amount may be reliably measured. Distillation income and other services are recognised in proportion to the stage of the rendered performance as at the balance sheet date. If the income from rendering of services can not be reli-ably measured, only the income up to the level of the expenses to be claimed will be recognized. 2.7 taxesThe shipping activities are operated in several countries and under different tax schemes, including the ordinary tax system in Norway, the Norwegian shipping tax system, the Approved International Shipping system in Singapore and the tonnage tax systems in the UK. In addition we operate under local tax systems, most important in Chile and Brazil. Our tank terminal activities are generally subject to the ordinary corporate tax rates within the country in which the terminal is located. The variation in the tax systems and rates may cause tax costs to vary significantly depending on the country in which profits are accumulated and taxed.
The Group’s taxes include taxes of Group companies based on taxable profit for the relevant financial period, together with tax adjustments for previous periods and any change in deferred taxes. Tax credits arising from subsidiaries’ distribution of dividends are deducted from tax expenses. Deferred income tax liabilities are recognised for all taxable temporary differences, except:• where the deferred income tax liability
arises from the initial recognition of good-will or of an asset or liability in a transaction that is not a business combination and, at the time of the transaction, affects neither the accounting profit nor taxable profit or loss; and
• in respect of taxable temporary differences associated with investments in subsidiaries, associates and interests in joint ventures, where the timing of the reversal of the temporary differences can be controlled and it is probable that the temporary differences will not reverse in the foreseeable future.
Deferred tax assets are recognised to the extent that it is probable that future taxable profit will be available to offset the temporary differences. We recognise formerly unrecog-nised deferred tax assets to the extent that it has become probable that we can utilise the

24 odfjell annual report 2011
OdfJEll grOup
deferred tax asset. Similarly, the Company will reduce its deferred tax assets to the extent that it no longer can utilise these. Deferred tax and deferred tax assets for the current and prior periods are measured at the amount expected to be paid to or recovered from the relevant tax authorities, using the tax rates and tax laws that have been enacted or substantively enacted at the balance sheet date. Deferred tax and deferred tax assets are recognised irrespective of when the differences will be reversed. Deferred tax and deferred tax assets are recognised at their nominal value and are classified as non-current liabilities (non-current assets) in the balance sheet. Companies taxed under special shipping tax systems will generally not be taxed on the basis of their net operating profit. A portion of net financial income and other non-shipping activities are normally taxed at the ordinary applicable tax rate. Taxation under shipping tax regimes requires compliance with certain requirements, and breach of such require-ments may lead to a forced exit of the regime. Tax payable and deferred taxes are recognised directly in equity to the extent that they relate to factors that are recognised directly in equity. 2.8 government grantsGovernment grants are recognised where there is reasonable assurance that the grant will be received and all attaching conditions will be complied with. When the grant relates to an expense (income) item, it is recognised as reduction (increase) of the expense (income) over the period necessary to match the grant on a systematic basis to the expense (income) that it is intended to compensate. When the grant relates to an asset, the fair value is reduced and the grant is released to the profit and loss statement over the expected useful life of the relevant asset on a straight-line basis. Further details are given in note 14.
2.9 investment in joint venturesJoint ventures are entities over which the Group has contractually agreed to share the power to govern the financial and operating policies of the entity with another venturer(s). Our share of activities under joint control (see note 35) is included according to the gross method. Under this method the Group’s proportionate share of revenues, costs, assets and liabilities are recognised with similar
items in the financial statements on a line-by-line basis. The financial statements of the joint venture are prepared for the same reporting year as Odfjell. Adjustments are made to bring into line any dissimilar account-ing policies that may exist. A review of the carrying values in joint ventures is carried out when there are indications that there is a need to recognise impairment losses or when the need of previously recognised impairment losses is no longer present.
2.10 investment in associatesAssociated companies are entities in which the Group has significant influence and which is neither a subsidiary nor a joint venture. Associated companies (see note 36) are included according to the net method. Under this method the Group’s share of the associated company’s net result for the year is recognised in the profit and loss state-ment. The Group’s interest in an associated company is carried on the balance sheet at an amount that reflects its share of the net assets of the associated company. The carrying value of investment in an associate will never be negative, unless the Group has incurred or guaranteed obligations in respect of the associated company. Goodwill relating to an associate is included in the carrying amount of the investment and is not amor-tised. The reporting dates of the associate and the Group are identical. Adjustments are made to bring into line any dissimilar accounting policies that may exist. 2.11 Non-current assetsNon-current assets are measured at histori-cal cost, which includes purchase price, capi-talised interest and other expenses directly related to the investment. The carrying value of the non-current assets on the balance sheet represents the cost less accumulated depreciation and any impairment charges. Newbuilding contracts include payments made under the contracts, capitalised inter-est and other costs directly associated with the newbuilding and are not depreciated until the asset is available for use. We estimate residual value at the estimated time of disposal of assets, which is generally at the end of their useful life. To assess the residual value of ships we use the current estimated recycling value. For terminals we use a best estimate for the value of tank assets less dismantling expenses. The residual values are measured at least on a yearly basis and any changes have an effect on future depreciations.
Each component of a non-current asset that is significant to the total cost of the item shall be depreciated separately. The Company allocates the amount initially recognised in respect of an item of non-current asset to its significant components and depreciates separately each such component over their useful lives. The book value of ships is split into two components, ships and periodic maintenance. Day-to-day repairs and maintenance costs are charged to the profit and loss statement during the financial period in which they are incurred. The cost of major renovations and periodic maintenance is included in the asset’s carrying amount. At the time of investing in a ship a portion of the purchase price is defined as periodic maintenance. The investment is depreciated over the remaining useful life of the asset and for the periodic maintenance part over the period until the next periodic maintenance. For ships chartered in on bare-boat terms, Odfjell is responsible for operating expenses and periodic maintenance. For such ships we make accruals for estimated future periodic maintenance. Expected useful lives of non-current assets are reviewed at each balance sheet date, and where they differ significantly from previous estimates, depreciations are adjusted accord-ingly. Changes are valid as from the dates of estimate changes. Depreciation of the above mentioned assets appears as depreciation in the profit and loss statement. Capital gains and losses on disposals are determined by comparing the disposal proceeds with the carrying amount and are included in the operating result. When the carrying amount of a non-current asset will be recovered principally through a sale transaction rather than through continued use they are reported at the lower of the carrying amount and the fair value less selling costs. 2.12 leasesThe determination of whether an arrange-ment is, or may represent a lease, is based on the substance of the arrangement at incep-tion date. An arrangement is a lease if the fulfilment of the arrangement is dependent on the use of a specific asset or assets or the arrangement conveys a right to use the asset. After inception reassessment is made

25
OdfJEll grOup
only if one of the following aspects occur:1. there is a change in contractual terms,
other than a renewal or extension of the arrangement
2. a renewal option is exercised or an exten-sion is granted, without the term of the renewal or extension having been initially included in the lease term
3. there is a change in the determination of whether fulfilment is dependent on a specified asset
4. there is a substantial change to the asset where a reassessment is made, lease accounting shall commence or cease from the date when the change in circumstances gave rise to the reassessment for sce-narios 1, 3 or 4 and at the date of renewal or extension period for scenario 2
Assets financed under financial leases are capitalised at the inception of the lease at the fair value of the leased asset, or if lower, at the net present value of minimum lease payments. Lease payments consist of a capital element and financial cost, the repayment of the capital element reduces the obligation to the lessor and the financial cost is expensed. Capitalised leased assets are depreciated over the estimated useful life in accordance with note 10. Leases where a significant portion of the risks and rewards of ownership are retained by the lessor are classified as operating leases. Payments made under operating leases are charged to the profit and loss statement on a straight-line basis over the lease term, see note 16 and note 20. 2.13 goodwillExcess value on the purchase of an operation that cannot be allocated to fair value on the acquisition date is shown in the balance sheet as goodwill. In the case of investments in associates, goodwill is included in the car-rying amount of the investment. Goodwill is not amortized, but goodwill is allocated to the relevant cash generating unit and an assessment is made each year as to whether the carrying amount can be justified by future earnings, see note 2.14 impairment of assets.
2.14 impairment of assetsNon-financial assetsAt each reporting date the accounts are assessed whether there is an indication that an asset may be impaired. If any such indication exists, or when annual impairment testing for an asset is required, estimates of the asset’s recoverable amount are done. The
recoverable amount is the highest of the fair market value of the asset, less cost to sell, and the net present value (NPV) of future estimated cash flow from the employment of the asset (“value in use”). The NPV is based on an inter-est rate according to a weighted average cost of capital (“WACC”) reflecting the required rate of return. The WACC is calculated based on the Company's long-term borrowing rate and a risk free rate plus a risk premium for the equity. If the recoverable amount is lower than the book value, impairment has occurred and the asset shall be revalued. Impairment losses are recognised in the profit and loss statement. Assets are grouped at the lowest level where there are separately identifiable independent cash flows. We have made the following assumptions when calculating the “value in use” for material tangible and intangible assets:
ShipsFuture cash flow is based on an assessment of what is our expected time charter earning and estimated level of operating expenses for each type of ship over the remaining useful life of the ship. As the Odfjell ships are interchangeable and the regional chemical tankers are integrated with the deep-sea chemical tankers through a logistical system, all chemical tankers are seen together as a portfolio of ships. In addition the pool of officers and crew are used throughout the fleet. Odfjell has a strategy of a total crew composition and how the crew is dedicated to the individual ships varies. Changing the crew between two ships can change the net present value per ship without any effect for the Group. This also is an argument for evalu-ating the fleet together. As a consequence, ships will only be impaired if the total value of the ships based on future estimated cash flows is lower than the total book value.
tank terminalsFuture cash flow is based on our expected result for each terminal. We have calculated the “value in use” based on estimated five years operating result before depreciation less planned capital expenditures each year plus a residual value after five years.
goodwillGoodwill acquired through business combi-nations has been allocated to the relevant cash generating unit (CGU). An assessment is made as to whether the carrying amount of the goodwill can be justified by future earnings from the CGU to which the goodwill relates. Future earnings are based on next
year’s expectations with a zero growth rate. We have calculated “value in use” based on net present value of future cash flows. If ”value in use” of the CGU is less than the carrying amount of the CGU, including goodwill, goodwill will be written down first. Thereafter the carrying amount of the CGU will be written down.
financial assetsAt each reporting date the Group assesses whether a financial asset or a group of financial assets is impaired.
Assets carried at amortised costIf there is objective evidence that an impair-ment loss on assets carried at amortised cost has been incurred, the amount of the loss is measured as the difference between the asset’s carrying amount and the pre-sent value of estimated future cash flows discounted at the financial asset’s original effective interest rate.
Available-for-sale-investmentsIf an available-for-sale-investment is impaired, an amount comprising the dif-ference between its cost and its current fair value, less any impairment loss previously recognised in profit or loss, is transferred from equity to profit and loss. This normally applies in a situation with changes exceeding 20% of the value and expected to last for more than six months, both based on original cost. With the exception of goodwill, impairment losses recognised in the profit and loss state-ments for previous periods are reversed when there is information that the basis for the impairment loss no longer exists or is not as great as it was. This reversal is classi-fied in revenue as an impairment reversal. The increased carrying amount of an asset attributable to a reversal of an impairment loss shall not exceed the carrying amount that would have been determined (net of depreciation) had no impairment loss been recognised for the asset in prior years.
2.15 derivative financial instruments and hedging
Derivative financial instruments are recog-nised on the balance sheet at fair value. The method of recognising the gain or loss is dependent on the nature of the item being hedged. On the date a derivative contract is entered into, we designate certain deriva-tives as either a hedge of the fair value of a recognised asset or liability (fair value hedge), or a hedge of a highly probable forecasted

26 odfjell annual report 2011
OdfJEll grOup
transaction (cash flow hedge) or of a firm commitment (fair value hedge). Changes in the fair value of derivatives that qualify as fair value hedges and that are highly effective both prospectively and retrospectively are recorded in the profit and loss statement together with any changes in the fair value of the hedged asset, liability or firm commitment that is attributable to the hedged risk. Changes in the fair value of derivatives that qualify as cash flow hedges and that are highly effective both prospectively and retrospectively are recognised in statement of comprehensive income. Amounts deferred in statement of comprehensive income are transferred and classified in the profit and loss statement when the underlying hedged items impact net result in a manner consist-ent with the underlying nature of the hedged transaction. If a hedging instrument expires or is sold, or when a hedge no longer meets the criteria for hedge accounting under IAS 39, any cumulative gain or loss existing in statement of comprehensive income at that time remains in statement of comprehensive income and is recognised when the commit-ted or forecasted transaction is ultimately recognised in the profit and loss statement as a finance items. However, if a committed or forecasted transaction is no longer expected to occur, the cumulative gain or loss that was reported in statement of comprehensive income is immediately transferred to the profit and loss statement. If a fair value hedge is derecognised, the fair value is recognised immediately in profit or loss. Certain derivative transactions, while providing effective economic hedges under the Group risk management policy, do not qualify for hedge accounting under the specific rules in IAS 39. Changes in the fair value of derivative instruments that do not qualify for hedge accounting under IAS 39 are shown immediately in the profit and loss statement. This also applies to any ineffective parts of a derivative financial instrument that qualifies as a hedge. At the inception of the transaction, the relationship between the hedging instru-ments and the hedged items, as well as its risk management objective and strategy for undertaking the hedge transactions, is documented. This process includes linking all
derivatives designated as hedges to specific assets and liabilities or to specific firm com-mitments or forecasted transactions. The Group also documents its assessment, both at the hedge inception and on an ongoing basis, as to whether the derivatives that are used in hedging transactions, are highly effective in offsetting changes in fair values or cash flows of the hedged items. The derivative instru-ments used by the Group are not leveraged, and are not held for speculative arbitrage or investment purposes. The fair value of derivatives that are actively traded in organised financial markets is determined by reference to quoted market bid prices at the close of business on the balance sheet date. For derivatives where there is no active market, fair value is determined using valuation techniques. Such techniques include using recent arm’s length market transactions, reference to the current market value of another substantially same instru-ment, discounted cash flow analysis or other valuation models. 2.16 financial instrumentsFinancial investments have been classified as financial assets at fair value through profit and loss, loans and receivables or available-for-sale categories. When financial assets are recognised initially, they are measured at fair value, plus, in the case of investments not at fair value through profit and loss, directly attributable transaction costs. The classifica-tion is dependent on the purpose for which the investments were acquired. Financial investments with less than 12 months to maturity or if they are being regularly traded are classified as current assets, otherwise as non-current. The Group determines the classification of its financial investments after initial recognition, and where allowed and appropriate, this designation is re-evaluated at each financial year end. Purchases and sales of financial investments are recognised on the settlement date, which is the date that the asset is delivered to or by the Group. When financial investments are recognised initially, they are measured at fair value, plus, in the case of investments not at fair value through profit and loss, directly attributable transaction cost. Fair value of investments that are actively traded in organised financial markets is determined by reference to quoted market bid prices at the close of business on the balance sheet date. For investments where there is
no active market, fair value is determined using valuation techniques. Such techniques include using recent arm’s length market transactions, reference to the current market value of another substantially same instru-ment, discounted cash flow analysis or other valuation models. financial investments at fair value through profit and loss
This category includes financial assets held for trading and financial assets designated upon initial recognition as at fair value through profit and loss. A financial investment is clas-sified in this category if acquired principally for the purpose of regular trading. Derivatives are in this category unless they are designated as hedges. Assets in this category are classified as current assets if they are expected to be realised within 12 months of the balance sheet date.
loans and receivablesLoans and receivables are non-derivative financial assets with fixed or determinable payments that are not quoted in an active market. After initial measurement loan and receivables are carried at amortised cost using the effective interest method less any allow-ance for impairment. Gains and losses are recognised in profit and loss when the loans and receivables are derecognised or impaired, as well as through the amortisation process.
Available-for-sale investmentsAvailable-for-sale investments are non-derivatives that are either designated in this category or not classified in any other category. They are included in non-current assets unless management intends to dispose of the investment within 12 months of the balance sheet date. After initial recognition, available-for-sale investments are measured at fair value with gains and losses being recog-nised as a separate component in statement of comprehensive income until the investment is derecognised, or until the investment is determined to be impaired, at which time the cumulative loss previously reported in equity is included in the income statement.
2.17 trade receivablesTrade receivables are recognised at fair value at time of initial measurement. After initial recognition, receivables are carried at amortised cost using the effective interest method less any allowance for impairment. Provisions for impairment are based on esti-mated historical data and objective indicators of a fall in value. Objective indicators are,

27
OdfJEll grOup
among other: material economical problems, economical restructuring, bankruptcy, delayed repayment or non-payment. Provisions for impairment are recognised to receivables and changes are charged profit and loss statement as reduction in gross revenue. Any receipt of earlier written off receivables are recognised in profit and loss statement as gross revenue.
2.18 inventoriesBunkers and other inventories are accounted for at purchase price, on a first-in, first-out basis. Impairment losses are recognised if the fair value (sales price less sales cost) is lower than the cost price.
2.19 Cash and cash equivalentsThe cash flow statement is prepared using the indirect method. Cash and cash equivalents include cash in hand and in bank, deposits held at call with banks and other short-term highly liquid investments with maturities of three months or less from the date of acquisition. The amount of cash and cash equivalents in the cash flow statement does not include available credit facilities. 2.20 Equity paid in equity (i) Share capitalThe portion of the paid-in-capital equalling number of shares at their nominal value.
(ii) treasury sharesThe value of treasury shares’ portion of share capital.
(iii) Share premiumThe excess value of the total paid-in-capital not reflected in the nominal value of the shares. Transaction costs of an equity transaction are accounted for as a deduction in share premium, net of any related income tax benefit.
Other equity(i) Exchange rate differencesExchange rate differences arise in connec-tion with currency differences when foreign entities are consolidated. When a foreign operation is sold, the accumulated exchange differences linked to the entity are reversed and appear in the profit and loss statement in the same period as the gain or loss on the sale is recognised.
(ii) fair value and other reservesThe fair value and other reserves include the total net change in the fair value of the cash flow hedge and financial investment available for sale. When the hedged cash flow matures or is no longer expected to occur, the net change in fair value is transferred to the profit and loss statement. When financial invest-ments are sold or impaired, the accumulated fair value adjustments in equity are included in the profit and loss statement as gains and losses from financial investment. (iii) retained earningsThe net result attributable and available for distribution to the shareholders.
Dividends are recorded as a deduction to other equity in the period in which they are approved by the shareholders.
2.21 dismantling liabilitiesIf there is legal or constructive obligation to dismantle a tank terminal at the end of its useful life, liabilities for future dismantling expenses are accrued at discounted values. The dismantling liability is capitalized in the asset value. The liabilities are regularly evaluated, and adjusted when there are mate-rial changes in interest rates, inflation or in other dismantling expenses. The adjustments are recognised as financial expenses.
2.22 interest bearing debtInterest bearing debt is classified as non-current liabilities and appears initially as the amount of proceeds received, net of transaction costs incurred. In subsequent periods, transaction costs are deferred and charged to the profit and loss statement over the life of the underlying debt according to the effective interest method. Interest bearing debt is generally non-current liabilities, while instalments within the next 12 months are classified as current liabilities.
Interest expenses are recognised as an expense using the effective interest rate method. 2.23 provisionsProvisions are recognised when the Group has a present legal or constructive obligation as a result of past events, and it is probable that an outflow of resources will be required to settle the obligation. Provisions are based on best estimates. Provisions are reviewed on each balance sheet date and reflect the best estimate of the liability. If the effect of
the time value of money is material, normally more than twelve months, provisions are discounted using a current pre tax rate that reflects the risks specific to the liability. Where discounting is used, the increase in the provision due to the passage of time is recognised as a finance cost. 2.24 pension cost and liabilitiesThe Group operates a number of pension plans in accordance with the local conditions and practices in the countries in which it operates. Such pension plans are defined benefit plans or contribution plans according to the customary pension plans prevailing in the country concerned. Defined benefit pension plans are pension plans with retirement, disability and termina-tion income benefits. The retirement income benefits are generally a function of years of employment and final salary with the Company. Generally the schemes are funded through payments to insurance companies as determined by periodic actuarial calculations. The liability in respect of defined benefit pen-sion plans is the present value of the defined benefit obligation at the balance sheet date less the fair value of plan assets, together with adjustments for actuarial gains/losses and past service cost. The net pension liability is calculated based on certain estimates with regards to interest rates, future salary adjustments etc. The estimates are based on historical experience and current market conditions. The cost of providing pensions is charged to the profit and loss statement so as to spread the regular cost over the vesting period of the employees. The effect of changes in estimates exceeding 10% of the highest of pension liabilities and plan assets is accounted for. Such changes are amortised over the remaining vesting period. For defined contribution plans, contributions are paid to pension insurance plans. Once the contributions have been paid, there are no further payment obligations. Contributions to defined contribution plans are charged to the profit and loss statement in the period to which the contributions relate.
The Group may at any time make alterations to the terms and conditions of the pension scheme and undertake that they will inform the employees of any such changes.
2.25 Earnings per shareBasic earnings per share amounts are calculated by dividing net profit for the year

28 odfjell annual report 2011
OdfJEll grOup
attributable to ordinary equity holders of the parent company by the weighted average number of ordinary shares outstanding during the year.
Diluted earnings per share amounts are cal-culated by dividing the net profit attributable to ordinary equity holders of the parent (after deducting interest on any dilutive instru-ments) by the weighted average number of ordinary shares outstanding during the year plus the weighted average number of ordinary shares that would be issued on the conversion of all the dilutive potential ordinary shares into ordinary shares.
2.26 ComparativesComparative figures have been reclassified to conform to changes in presentation in the current year when there are changes in accounting principles, corrections of errors or operations defined as discontinued.
2.27 SegmentsThe definition of main business segments, our primary reporting format, is based on the Company’s internal reporting. A busi-ness segment provides services that are subject to risks and returns that are different from those of other business segments. The Group’s secondary reporting format, geographical segments, is provided for revenue, total assets and capital expendi-ture, as the reliability measurement criteria cannot be met for other items. Any single country contributing more than 10% of total revenue/asset/capital expenditure is reported separately. Our shipping revenue is allocated on the basis of the area in which the cargo is loaded. For the tank terminals the revenue is allocated to the area where the respective companies are located. Total assets and capital expenditure are allocated to the area where the respective assets are located while ships and newbuilding contracts are not allocated to a certain area as the ships sail on a worldwide basis. Financial information relating to segments is presented in note 3.
Transactions between the individual busi-ness areas are priced at market terms and are eliminated in the consolidated accounts.
2.28 Events after the balance sheet dateEvents after the balance sheet date that do not affect the Company’s position at the balance sheet date, but which will materially affect the Company’s position in the future are stated.
2.29 related partiesIn the normal course of the conduct of its business, the Group enters into a number of transactions with related parties. The Company considers these arrangements to be on reasonable market terms.
2.30 ifrS and ifriC interpretations issued but not effective as per 31.12.2011
Odfjell expects following impact from new Standards or Interpretations, which are effective for the annual period beginning 1 January 2012 or later:
ifrS 7 financial instruments – disclosures (amendment)The amendment relates to disclosure requirements for financial assets that are derecognised in their entirety, but where the entity has a continuing involvement. The amendments will assist users in understand-ing the implications of transfers of financial assets and the potential risks that may remain with the transferor. The amended IFRS 7 is effective for annual periods beginning on or after 1 July 2011. The Group expects to imple-ment the amended IFRS 7 as of 1 January 2012. The amendment affects disclosure only and has no impact on the Group’s financial position or performance.
The IASB has introduced new disclosure requirements in IFRS 7. These disclosures, which are similar to the new US GAAP require-ments, would provide users with information that is useful in (a) evaluating the effect of potential effect of netting arrangements on an entity's financial position and (b) analysing and comparing financial statements prepared in accordance with IFRSs and US GAAP. The amended IFRS 7 is effective for annual periods beginning on or after 1 January 2013, but the amendment is not yet approved by the EU. The Group expects to implement the amended IFRS 7 as of 1 January 2013. The amendment affects disclosure only and has no impact on the Group’s financial position or performance.
ifrS 9 financial instrumentsIFRS 9 as issued reflects the first phase of the IASBs work on replacement of IAS 39 and applies to classification and measurement of financial assets and financial liabilities as defined in IAS 39. According to IFRS 9 financial assets with basic loan features shall be measured at amortised cost, unless one opts to measure these assets at fair value. All other financial assets shall be measured at fair value. The classification and measure-ment of financial liabilities under IFRS 9 is a
continuation from IAS 39, with the exception of financial liabilities designated at fair value through profit or loss (fair value option), where change in fair value relating to own credit risk shall be separated and shall be presented in other comprehensive income. In subsequent phases, the IASB will address hedge account-ing and impairment of financial assets. IFRS 9 is effective for annual periods beginning on or after 1 January 2015, but the standard is not yet approved by the EU. The Group expects to apply IFRS 9 as of 1 January 2015.
ifrS 10 Consolidated financial StatementsIFRS 10 replaces the portion of IAS 27 Consolidated and Separate Financial Statements that addresses the accounting for consolidated financial statements. It also includes the issues raised in SIC-12 Consolidation — Special Purpose Entities. IFRS 10 establishes a single control model that applies to all entities including special purpose entities. The changes introduced by IFRS 10 will require management to exercise significant judgement to determine which entities are controlled, and therefore, are required to be consolidated by a parent, compared with the requirements that were in IAS 27. This standard becomes effective for annual periods beginning on or after 1 January 2013, but is not yet approved by the EU. The Group expects to apply IFRS 10 as of 1 January 2013. ifrS 11 Joint Arrangements IFRS 11 replaces IAS 31 Interests in Joint Ventures and SIC-13 Jointly-controlled Entities — Non-monetary Contributions by Venturers. IFRS 11 removes the option to account for jointly controlled entities (JCEs) using proportionate consolidation. Instead, JCEs that meet the definition of a joint venture must be accounted for using the equity method. This standard becomes effective for annual periods beginning on or after 1 January 2013, but is not yet approved by the EU. The Group expects to apply IFRS 11 as of 1 January 2013.
ifrS 12 disclosure of involvement with Other Entities IFRS 12 includes all of the disclosures that were previously in IAS 27 related to consoli-dated financial statements, as well as all of the disclosures that were previously included in IAS 31 and IAS 28. These disclosures relate to an entity’s interests in subsidiaries, joint arrangements, associates and structured entities. A number of new disclosures are also required. This standard becomes effective

29
OdfJEll grOup
for annual periods beginning on or after 1 January 2013, but is not yet approved by the EU. The Group expects to apply IFRS 12 as of 1 January 2013. ifrS 13 fair value Measurement IFRS 13 establishes a single source of guid-ance under IFRS for all fair value measure-ments. IFRS 13 does not change when an entity is required to use fair value, but rather provides guidance on how to measure fair value under IFRS when fair value is required or permitted. The Group is currently assess-ing the impact that this standard will have on the financial position and performance. This standard becomes effective for annual periods beginning on or after 1 January 2013, but is not yet approved by the EU. The Group expects to apply IFRS 13 as of 1 January 2013. iAS 1 financial Statement presentation (amendment)
The amendments to IAS 1 change the grouping of items presented in other comprehensive income (OCI). Items that could be reclassified (or ‘recycled’) to profit or loss at a future point in time (for example, upon derecognition or settlement) would be presented separately from items that will never be reclassified. The amendment affects presentation only and has there no impact on the Group’s financial position or performance. The amendment becomes effective for annual periods begin-ning on or after 1 July 2012, but is not yet approved by the EU. The Group expects to apply the amended IAS 1 as of 1 January 2013.
iAS 12 income taxes (amendment)The amendments intend to provide a practical solution to a problem relating to investment properties that arises in certain jurisdictions. As a result of the amendments deferred tax on investment property measured at fair value is required to be determined using the rebuttable presumption that the carry-ing amount of the underlying asset will be recovered through sale (rather than use). The presumption is rebutted if the invest-ment property is depreciable and it is held within a business model whose objective is to consume substantially all of the economic benefits in the investment property over time, rather than through use. The amendments incorporate SIC 21 Income Taxes – Recovery of Revalued Non-Depreciable Assets into IAS 12. As a result IAS 12 will require that deferred tax arising from a non-depreciable asset measured using the revaluation model in IAS 16 Property, plant and equipment will always be determined on a sale basis. The
amended IAS 12 is effective for annual periods beginning on or after 1 January 2012, but the amendment has not yet been approved by the EU. The Group expects to implement the amended IAS 12 as of 1 January 2012.
iAS 19 Employee Benefits (amendment) The IASB has issued numerous amendments to IAS 19. These range from fundamental changes such as removing the corridor mechanism and the concept of expected returns on plan assets to simple clarifica-tions and re-wording. The amended standard becomes effective for annual periods begin-ning on or after 1 January 2013, but has not yet been approved by the EU. The Group expects to implement the amended IAS 19 as of 1 January 2013. iAS 27 Separate financial Statements (as revised in 2011) As a consequence of the new IFRS 10 and IFRS 12, what remains of IAS 27 is limited to accounting for subsidiaries, jointly con-trolled entities, and associates in separate financial statements. IAS 27 as revised in 2011 becomes effective for annual periods beginning on or after 1 January 2013, but the revised standard has not yet been approved by the EU. The Group expects to implement the revised IAS 27 as of 1 January 2013. iAS 28 investments in Associates and Joint ventures (as revised in 2011)
As a consequence of the new IFRS 11 and IFRS 12, IAS 28 has been renamed IAS 28 Investments in Associates and Joint Ventures, and describes the application of the equity method to investments in joint ventures in addition to associates. IAS 28 as revised in 2011 becomes effective for annual periods beginning on or after 1 January 2013, but the revised standard has not yet been approved by the EU. The Group expects to implement the revised IAS 28 as of 1 January 2013.
iAS 32 financial instruments - presentation (amendment)
The amendments to IAS 32 clarify the meaning of "currently has a legally enforce-able right to set-off" and also clarify the application of the IAS 32 offsetting criteria to settlement systems (such as central clearing house systems) which apply gross settlement mechanisms that are not simultaneously. The amended IAS 32 is effective for annual periods beginning on or after 1 January 2014, but the amendment has not yet been approved by the EU. The Group expects to implement the amended IAS 32 as of 1 January 2014.
It is expected that changes in IFRS 11 will have material effect in how Odfjell presents its joint arrangement. Changes in IAS 19, such as removing the corridor mechanism, will have material effect on the Groups financial statement. Odfjell is in a process evaluating the effect. All other changes are expected to have no or only immaterial effect on the financial statement.
NOtE 3 SEgMENt iNfOrMAtiON
The operating businesses are organised and managed separately according to the nature of the products and services provided, with each segment representing a strategic business unit that offers different products and serves different markets. The Company has two reportable business segments: Chemical Tankers and Tank Terminals. The Chemical Tankers involve a “round the world” service, servicing ports in Europe, North and South America, the Middle East and Asia, Australasia and Africa. Our fleet composition enables us to offer both global and regional transportation. Tank Terminals play an important operational role in our cargo-consolidation programme so as to reduce the time our vessels spend in ports, reduce thereby emission in port, and enable us to be one of the world-leaders in combined shipping and storage services. Pricing of services and transactions between business segments are set on an arm’s length basis in a manner similar to transactions with third parties. Segment revenue, segment expenses and segment results include trans-actions between business segments. These transactions are eliminated in consolidation.
The Group provide geographical data for revenue and total assets, as the reliability measurement criteria cannot be met for other items. The Group’s activities are mainly divided among the following regions: Europe, North and South America, the Middle East and Asia, Australasia and Africa. Vessels and newbuilding contracts are not allocated to specific geographical areas as they generally trade worldwide.
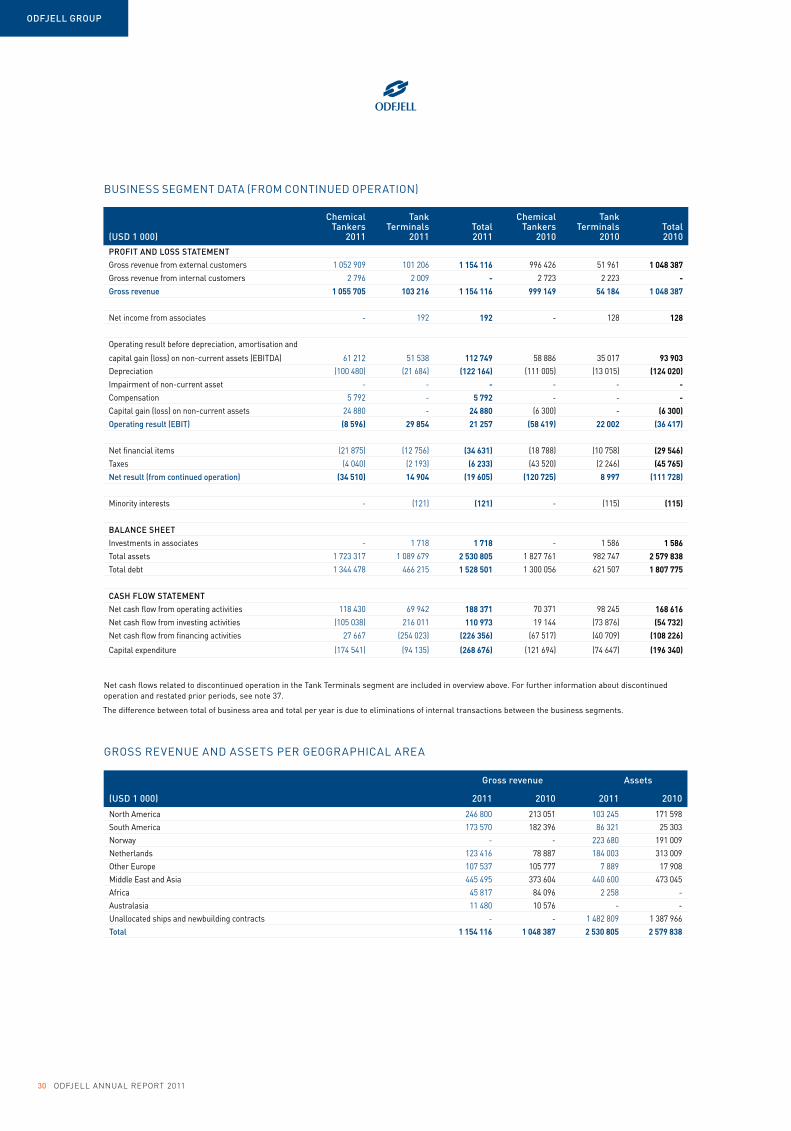
30 odfjell annual report 2011
OdfJEll grOup
(uSd 1 000)
Chemical tankers
2011
tank terminals
2011total2011
Chemical tankers
2010
tank terminals
2010total2010
prOfit ANd lOSS StAtEMENtGross revenue from external customers 1 052 909 101 206 1 154 116 996 426 51 961 1 048 387 Gross revenue from internal customers 2 796 2 009 - 2 723 2 223 -gross revenue 1 055 705 103 216 1 154 116 999 149 54 184 1 048 387
Net income from associates - 192 192 - 128 128
Operating result before depreciation, amortisation and
capital gain (loss) on non-current assets (EBITDA) 61 212 51 538 112 749 58 886 35 017 93 903Depreciation (100 480) (21 684) (122 164) (111 005) (13 015) (124 020)Impairment of non-current asset - - - - - -Compensation 5 792 - 5 792 - - -Capital gain (loss) on non-current assets 24 880 - 24 880 (6 300) - (6 300)Operating result (EBit) (8 596) 29 854 21 257 (58 419) 22 002 (36 417)
Net financial items (21 875) (12 756) (34 631) (18 788) (10 758) (29 546) Taxes (4 040) (2 193) (6 233) (43 520) (2 246) (45 765)Net result (from continued operation) (34 510) 14 904 (19 605) (120 725) 8 997 (111 728)
Minority interests - (121) (121) - (115) (115)
BAlANCE ShEEt
Investments in associates - 1 718 1 718 - 1 586 1 586Total assets 1 723 317 1 089 679 2 530 805 1 827 761 982 747 2 579 838Total debt 1 344 478 466 215 1 528 501 1 300 056 621 507 1 807 775
CASh flOW StAtEMENt
Net cash flow from operating activities 118 430 69 942 188 371 70 371 98 245 168 616Net cash flow from investing activities (105 038) 216 011 110 973 19 144 (73 876) (54 732)Net cash flow from financing activities 27 667 (254 023) (226 356) (67 517) (40 709) (108 226)
Capital expenditure (174 541) (94 135) (268 676) (121 694) (74 647) (196 340)
BUSINESS SEGMENT DATA (FROM CONTINUED OPERATION)
Net cash flows related to discontinued operation in the Tank Terminals segment are included in overview above. For further information about discontinued operation and restated prior periods, see note 37.
The difference between total of business area and total per year is due to eliminations of internal transactions between the business segments.
gross revenue Assets
(uSd 1 000) 2011 2010 2011 2010
North America 246 800 213 051 103 245 171 598South America 173 570 182 396 86 321 25 303Norway - - 223 680 191 009Netherlands 123 416 78 887 184 003 313 009Other Europe 107 537 105 777 7 889 17 908Middle East and Asia 445 495 373 604 440 600 473 045Africa 45 817 84 096 2 258 -Australasia 11 480 10 576 - -Unallocated ships and newbuilding contracts - - 1 482 809 1 387 966
total 1 154 116 1 048 387 2 530 805 2 579 838
GROSS REVENUE AND ASSETS PER GEOGRAPHICAL AREA

31
OdfJEll grOup
NOtE 4 fiNANCiAl riSk MANAgEMENt
Odfjell’s results and cash flow are influenced by a number of variable factors. Our policy is to manage the risks we are exposed to, including, but not limited to market risk, credit risk, liquidity risk, currency risk and interest rate risk. Our strategy is to systematically monitor and understand the impact of changing market conditions on our results and cash flow and to initiate mitigating actions where required. Financial risk management is carried out by a central treasury function. Various financial instruments are used to reduce fluctuations in results and cash flow caused by volatility in exchange rates, interest rates and bunker prices.
The below table show sensitivity on the Group’s pre-tax profit and equity due to changes in major cost components on yearly basis:
Bunkers, USD 10 per tonne lower 6 millionInterest rates, 1% higher (12 million)Currency, USD 10% stronger 11 million
Credit riskMultiple counterparts are used to hedge our risk. We primarily use our lending banks as counterparts to enter into hedging deriva-tives, from time to time other counterparties may be selected. We deem all to be high qual-ity counterparts. In addition, the Company’s hedging policy establishes maximum limits for each counterparty. The Group therefore regards its maximum risk exposure as being the carrying amount of trade receivables and other current receivables (see note 29). The Group has given guarantees for third parties’ liabilities as shown in note 16.
liquidity riskThe Group’s strategy is to have enough liquid assets or available credit lines to, at any time, being sufficiently robust to withstand prolonged adverse conditions in the markets where we operate. Surplus liquidity is mainly invested in bonds with low risk.
See also note 5, 7, 29 and 30 for aging analysis and currency exposure.
Currency riskThe Group enters into currency contracts to reduce currency risk in cash flows denomi-nated in non-USD currencies. Investments in
associated companies and subsidiaries with a non-USD currency as functional currency are generally not hedged. Such investments generate foreign currency translation dif-ferences that are booked directly to other comprehensive income, see Statement of other comprehensive income.
The Group has certain assets and liabilities denominated in NOK that are not fully hedged. Fluctuations in the USD/NOK exchange rate will influence the Group’s profit. The most material items are Tax liabilities (see note 8 Taxes) and Pension liabilities (see note 9 Pension liabilities) in Norway.
Bunker riskThe single largest monetary cost compo-nent affecting the time charter earnings is bunkers. The Group enters into several types of bunker derivatives to hedge against fluctuations in the results due to changes in the bunker prices.
interest rate risk The Group enters into several types of interest rate derivatives to hedge against fluctuations in the results due to changes in interest rates. Typically, the Company enters into interest rate swaps for the hedging of a share of the interest paid related to our loans portfolio.
NOtE 5 dErivAtivES ACtivitiES
The Group uses different hedging instru-ments to reduce exposures to fluctuations in financial risks.
CASh flOW hEdgiNgThe Group has anticipated future major expenses that may be variable due to changes in currency exchange rates, interest rate levels or bunker prices. The derivatives classified as cash flow hedges are accounted for at market value (fair value). The change in market value prior to maturity is accounted for under assets or liabilities and other com-prehensive income. At maturity, the result of the hedging transactions is accounted for in the account to the underlying exposure e.g. voyage-, operating-, general and administra-tive expenses or interest expenses in the profit and loss statement.
CurrencyThe Group estimates future expenses in non-USD currencies based on prior year’s actual amounts and secures part of this exposure by using forward contracts and options.
From time to time we enter into currency options that do not qualify for hedge account-ing as it is uncertain if we will receive a future delivery, also from time to time we may also enter into currency derivatives on a trading basis.
BunkersThe Group estimates future fuel oil consump-tion based on the fleet employment plan and historical data. Platt’s fuel index “3.5% fob Barges Rotterdam” is the index purchased when we hedge our bunker exposure. Each year we test the correlation of this index both with the equivalent index for Houston and Singapore, and the actual price for the fuel we have purchased in these ports. Per 31 December 2011 these correlations are sufficient to use as the reference index to hedge our future bunker purchases in these ports.
Bunker hedging contracts used are a mix of swaps and options. Average price is calculated based on current market and might therefore change if market changes.
A Contract of Affreightment (CoA) entered into with a customer typically has a bunker adjustment clause. This means that bunker price for the bunker consumption related to that contract is fixed or at least determined within parameters. With a higher bunker price in relation to trigger points our cus-tomer will compensate us for the increased cost. Likewise, with a lower bunker price we pass on to reduce costs to our customers.
interest ratesThe Group’s debt is divided between mort-gage lending, lease financing, unsecured bonds and export financing. The interest rate on this debt is typically floating. From time to time we enter into derivatives to swap the floating interest rate to fixed interest rate for a period up to ten years.
From time to time we also sell interest rate options that may, in the future, be turned into a fixed rate swaps. We may also enter into interest rate derivatives on a trading basis.
fAir vAluE hEdgiNgFrom time to time we enter into a transac-tion where we wish to swap a principal and/or a series of interest payments from one currency to another, e.g. the NOK bond we have issued is swapped to USD interest and principal payments. The derivatives classified as fair value hedges are evaluated at market

32 odfjell annual report 2011
OdfJEll grOup
time to maturity - uSd amountsCurrency Sold Bought Avg. rate < 1 year 1 - 5 years > 5 years total
Cash flow hedging USD 18 000 NOK 115 412 6.41 18 000 - - 18 000USD 12 996 SGD 16 800 1.29 12 996 - - 12 996
Non hedge 1) USD 26 000 NOK 185 835 7.15 26 000 - - 26 000
1) Weekly options, amount can be between 0 and USD 52 million
time to maturityinterest rates Avg. rate < 1 year 1 - 5 years > 5 years total
Cash flow hedging USD 257 154 4.35% 5 992 223 967 27 195 257 154EUR 30 600 4.13% 15 300 15 300 - 30 600
SGD 75 300 2.60% 11 800 63 500 - 75 300
Non hedge, IRS USD 225 000 3.11% - 125 000 100 000 225 000
Fair value hedging USD 88 261 From NOK to USD 4.87% 88 261 - 88 261
time to maturity – volumeBunker < 1 year 1 - 5 years > 5 years total
Cash flow hedging 89 850 tonnes USD 523.80 89 850 - - 89 850
time to maturity - uSd amountsCurrency Sold Bought Avg. rate < 1 year 1 - 5 years > 5 years total
Cash flow hedging USD 63 000 NOK 404 625 6.42 45 000 18 000 - 63 000EUR 30 000 USD 39 763 1.33 39 763 - - 39 763USD 12 000 SGD 15 681 1.31 12 000 - - 12 000
Non hedge 1) USD 100 000 NOK 672 345 6.72 62 000 38 000 - 100 000
Fair value hedging USD 107 955 NOK 619 500 19 694 88 261 - 107 955USD 102 751 SGD 158 000 102 751 - - 102 751
1) Weekly options, amount can be between 0 and USD 190 million
time to maturityinterest rates Avg. rate < 1 year 1 - 5 years > 5 years total
Cash flow hedging USD 200 000 4.40% - 150 000 50 000 200 000EUR 60 000 4.13% - 60 000 - 60 000
SGD 87 100 2.61% 11 800 75 300 - 87 100
Non hedge, IRS USD 125 000 3.05% - 75 000 50 000 125 000Non hedge, options USD 50 000 2.50% - - 50 000 50 000
Fair value hedging USD 92 541 From NOK to USD 4.66% 4 279 88 261 - 92 541USD 102 751 From SGD to USD 0.97% 102 751 - - 102 751
time to maturity – volume
Bunker < 1 year 1 - 5 years > 5 years total
Cash flow hedging 150 000 tonnes USD 392.68 150 000 - - 150 000
the below overview reflects status of hedging non-hedging exposure 31 december 2010 (figures 1 000)
value, however, the effect in the accounts is nil as the underlying exposure have an exact opposite change in market value.
NON hEdgiNgFor derivatives that do not qualify for hedge accounting, any change of market value prior to the maturity and the result of the derivative transaction at maturity are accounted for under other financial items in the profit and loss statement.
the below overview reflects status of hedging non-hedging exposure 31 december 2011 (figures 1 000)

33
OdfJEll grOup
hedging reserve recorded in statement of other comprehensive incomeThe table below shows fluctuations in the hedging reserve in the statement of comprehensive income from cash flow hedges (see Statement of comprehensive income) divided between the different types of hedging contracts:
(uSd 1 000)interest rate
swaps
Currency exchange contracts
Bunker contracts
total hedging reserve
Balance sheet as at 01.01.2010 (11 186) 10 438 25 415 24 667Fluctuations during the period:- Gains/losses due to changes in fair value 1 334 (189) 12 729 13 874- Transfers to the profit and loss statement (896) (6 706) (26 455) (34 056)
Balance sheet as at 31.12.2010 (10 748) 3 543 11 690 4 485Fluctuations during the period:- Gains/losses due to changes in fair value (8 734) 3 985 83 (4 666)- Transfers to the profit and loss statement (629) (6 368) (15 077) (22 074)
Balance sheet as at 31.12.2011 (20 111) 1 160 (3 305) (22 255)
fair value of financial instrumentsThe fair value of the financial assets and liabilities are included at the amount at which the instrument could be exchanged in a current transaction between willing parties, other than in a forced or liquidation sale. Derivative financial instruments and available-for-sale-investments are recorded in the balance sheet at the fair value at the balance sheet date. The fair value is obtained from active markets or based on third party quotes. For cash and cash equivalents and current liabilities the carrying amount is considered to be the best estimate of fair value of these instruments due to the short maturity date. Receivables are measured at nominal value reduced by any impairment. Carrying amount is considered to be best estimate of fair value due to short maturity date and valid terms. Fair value of interest bearing debt with fixed interest rate is calculated based on discounted future cash flows and the Group’s alternative market interest for corresponding financial instruments. Fair value of bonds is calculated based on market values on the bonds.
The Group’s financial statement does not have any differences between fair value and carrying amount.
fair value hierarchyAs at 31 December all financial instrument were valued at Level 2. Level 2 is defined where input is either directly or indirectly observable for substantially the full term of the assets and liabilities.
Classification of financial assets and liabilities as at 31 december 2011:
(uSd 1 000)
derivatives held as
hedge instrument
derivatives held at fair value over the result
loans and receivables
Available for sale
investments
liabilities recognised
at amortised cost
Non- financial
assets/ liabilities 2011
ASSEtSCash and cash equivalents - - 180 067 - - - 180 067Available-for-sale-investments - - - 25 364 - - 25 364Derivative financial instruments 8 052 3 511 - - - - 11 563Current receivables - - 134 781 - - - 134 781Non-current receivables - - 62 288 - - - 62 288Other non-financial assets - - - - - 2 116 743 2 116 743
total assets 8 052 3 511 377 136 25 364 - 2 116 743 2 530 805
liABilitiESOther current liabilities - - - - 129 165 - 129 165Derivative financial instruments 26 152 21 687 - - - - 47 839Interest bearing debt - - - - 1 244 937 - 1 244 937Other non-current liabilities - - - - 24 537 - 24 537Other non-financial liabilities - - - - - 82 022 82 022
total liabilities 26 152 21 687 - - 1 398 639 82 022 1 528 500
derivative financial instruments recorded as assets/liabilities on the balance sheet:
(uSd 1 000) 2011 2010
Bunkers 3 587 11 690Currency 3 585 9 593Interest rates (43 448) (27 551)
derivative financial instruments (36 276) (6 268)

34 odfjell annual report 2011
OdfJEll grOup
NOtE 6 CApitAl MANAgEMENtThe primary objective of the Group’s capital management is to ensure that it maintains healthy capital ratios and holds liquidity available to take advantage of investment opportunities and generally support the business. At the same time capital management should be such that the capital structure is sufficiently robust to withstand prolonged adverse conditions in significant risk factors, such as long-term down-cycles in our markets and unfavourable conditions in the financial markets.
The Group manages the capital structure and makes adjustments to it to maintain an optimal structure adapted to current economic conditions. In order to maintain or adjust the capital structure, the Company may adjust dividend payments, buy treasury shares, redemption of shares or issue new shares. No changes were made in the objectives or policies during the years ending 31 December 2011 and 2010.
The Group monitors its capital using the book equity ratio and available liquidity, being the sum of cash and cash equivalents, available-for-sale investments and available drawing facilities, as the primary measurements. The Group’s policy is to maintain an equity ratio between 30% and 35% and available liquidity of USD 150–200 million.
Classification of financial assets and liabilities as at 31 december 2010:
(uSd 1 000)
derivatives held as
hedge instrument
derivatives held at fair value over the result
loans and receivables
Available for sale
investments
liabilities recognised
at amortised cost
Non- financial
assets/ liabilities 2010
ASSEtSCash and cash equivalents - - 107 046 - - - 107 046Available-for-sale-investments - - - 34 477 - - 34 477Derivative financial instruments 16 249 5 394 - - - - 21 643Current receivables - - 192 087 - - - 192 087Non-current receivables - - 65 364 - - - 65 364Other non-financial assets - - - - - 2 159 223 2 159 223
total assets 16 249 5 394 364 496 34 477 - 2 159 223 2 579 838
liABilitiESOther current liabilities - - - - 153 765 - 153 765Derivative financial instruments 18 456 9 455 - - - - 27 911Interest bearing debt - - - - 1 526 660 - 1 526 660Other non-current liabilities - - - - 40 910 - 40 910Other non-financial liabilities - - - - - 58 529 58 529
total liabilities 18 456 9 455 - - 1 721 335 58 529 1 807 775
(uSd 1 000) 2011 2010
Equity 1 002 772Total assets 2 531 2 580Equity ratio 39.60% 29.90%Cash and cash equivalents 180 107Available-for-sale-investments 25 34Available drawing facilities - 20
total available liquidity 205 161
NOtE 7 iNtErESt BEAriNg dEBt
The interest bearing debt is a combination of secured debt and unsecured debt, finance leases from international shipping banks and bonds in the Norwegian bond market. Interest rates are generally based on floating LIBOR-rates.
(uSd 1 000)
Average interest
rate 2011 2010
Loans from financial institutions – floating interest rates 2.44% 951 514 1 112 672Loans from financial institutions – fixed interest rates - - 2 110Finance leases 1.93% 209 818 227 560Bonds 5.40% 88 261 191 178
Subtotal interest bearing debt 2.57% 1 249 593 1 533 520Transaction cost (4 655) (6 860)
total interest bearing debt 1 244 938 1 526 660Current portion of interest bearing debt (127 997) (269 800)
total non-current interest bearing debt 1 116 941 1 256 860

35
OdfJEll grOup
Average interest rate is the weighted average of interest rates, excluding hedges, as per end of 2011.
Transaction costs are deferred and charged to the profit and loss statement over the life of the underlying debt using the effective interest rate method. During 2011 USD 1.7 million (USD 1.5 million in 2010) has been charged to the profit and loss statement.
The net carrying amount of assets under finance leases are USD 256.9 million as per 31 December 2011 (USD 266.8 million as per 31 December 2010). The lease periods vary from 6 years to 25 years from inception, and may involve a right of renewal. In addition to the rental payments, the Group has obligations relating to the maintenance of the assets and insurance as would be for a legal owner. At any time the Company has the option to terminate the finance leases and become legal owner of the ship at defined termination payments. The finance leases generally do not contain provisions for payment of contingent rents. The future minimum lease payments are based on certain assumptions regarding the tax rules in the UK, including, but not limited to, tax rates and capital allowances. Changes in these assumptions and the timing of them may impact the minimum lease payments. There was no such material change in 2011. Future minimum lease payments under finance leases together with the present value of the net minimum lease payments are as follows:
The interest bearing debt does not contain any restrictions on the Company’s dividend policy or financing opportunities. The interest bearing debt is generally subject to certain covenants which include that book debt ratio shall at all times be less than 75% (excluding deferred taxes from debt) and that the liquidity shall always be minimum of USD 50 million and 6% of interest bearing debt. Maturity of interest bearing debt as at 31 december 2011:
Average maturity of the Group’s interest-bearing debt is about 4.7 years (5.0 years in 2010).
The table below summarizes interest bearing debt in different currencies:
*) Bond debt swapped to USD. See note 5 Hedging Activities
Maturity of interest bearing debt as at 31 december 2010:
(uSd 1 000) 2011 2010
Book value of interest bearing debt secured by mortgages 853 896 989 999
Book value of vessels and terminals mortgaged 1 350 706 1 518 815
(uSd 1 000) 2012 2013 2014 2015 2016 2017+ total
Loans from financial institutions – floating interest rates 105 287 195 875 128 006 238 038 57 405 226 904 951 514Finance leases 22 710 24 816 8 240 426 856 152 770 209 818Bonds - 88 261 - - - - 88 261total interest bearing debt 127 997 308 951 136 245 238 464 58 260 379 675 1 249 593
(uSd 1 000) 2011 2012 2013 2014 2015 2016+ total
Loans from financial institutions – floating interest rates 145 671 136 440 202 527 124 276 213 415 290 341 1 112 672Loans from financial institutions – fixed interest rates - 2 110 - - - - 2 110Finance leases 21 213 22 713 24 243 11 823 171 147 398 227 560Bonds 102 917 - 88 261 - - - 191 178total interest bearing debt 269 800 161 262 315 031 136 099 213 586 437 739 1 533 520
(uSd 1 000) 2011 2010
USD 968 311 1 059 488 EUR 74 732 166 004SGD 58 008 169 737NOK *) 88 261 92 541 RMB 38 416 28 720WON 21 755 17 029Other currencies 109 -
total interest bearing debt 1 249 593 1 533 520

36 odfjell annual report 2011
OdfJEll grOup
Changes in the Norwegian tonnage tax rulesAccording to the revised transition rules that were enacted in 2010, companies may either elect to operate under the old scheme, where income earned under the previous tax scheme is taxed at 28% when distributed as dividends, or under a new voluntary scheme where profits earned under the old scheme is taxed effectively at 6.67% payable over a three year period. Odfjell decided to enter the new Norwegian tonnage tax system at a cost of USD 42 million, payable during the years 2011, 2012 and 2013.
A reconciliation of the effective rate of tax and the tax rate in Odfjell SE’s country of registration:
NOtE 8 tAXES
The tax returns of the Company and its subsidiaries' are routinely examined by relevant tax authorities. From time to time, in the ordinary course of business, certain items in the tax returns are questioned or challenged. The Company believes that adequate tax provisions have been made for open years.
(uSd 1000)
2011 2010
Minimum lease payments
present value of lease payments
Minimum lease payments
present value of lease payments
Within one year 24 632 23 076 23 837 21 213After one year but not more than five years 41 569 35 803 67 438 58 950More than five years 166 046 150 939 161 253 147 398
total minimum lease payments 232 248 252 528Less amounts representing finance charges (22 429) (24 968)
present value of minimum lease payments 209 818 209 818 227 560 227 560
(uSd 1 000) 2011 2010
Taxes payable, Norway – ordinary tax (15) (628)Taxes payable, Norway – within shipping tax system - (42 145)Taxes payable, other jurisdictions (7 434) (1 010)Change in deferred tax, Norway – within shipping tax system 129 21Change in deferred tax, Norway – ordinary tax - 468Change in deferred tax, other jurisdictions 1 175 (2 471)Variance in earlier years allocation of tax payable (88) -
total taxes – Continued operations (6 233) (45 765)total taxes – discontinued operations (8 355) (14 249)
For more information about discontinued operations see note 37.
*)Effective tax rates for 2010 and 2011 are estimated without the extraordinary tax related to changes to and the transition into new tax system.
(uSd 1 000) 2011 2010
Result before taxes (13 372) (65 963)Tax assessed at the tax rate in Odfjell SE’s country of registration (28% in 2011 and 2010) 3 744 18 470Difference between Norwegian and rates in other jurisdictions (473) 122Tax related to non-deductible expenses 10 526 (789)Tax payable, Norway – transition new shipping tax system 129 (42 145)Tax related to non-taxable income (20 159) (21 422)
tax income (expenses) (6 233) (45 765)
Effective tax rate *) 47.58% 5.49%

37
OdfJEll grOup
Specification of deferred taxes (deferred tax assets):
Actual yield on the pension assets in Norway, USA and Netherlands for 2011 is in the range of 0.4%-15.6%.
(uSd 1 000) 2011
Change in temporary
differences 2010
Revaluation of investments at fair value 3 116 2 616 500Pensions 18 302 2 581 15 721Financial instruments 18 518 8 671 9 847Provisions 703 (1 818) 2 521Unrealised currency related to non-current receivables and liabilities 1 181 (3 405) 4 586Loss carried forward 29 983 836 29 147Temporary differences not accounted for (56 746) (38 253) (18 493)
total negative temporary differences 15 058 (28 772) 43 829
Differences related to depreciation of non-current assets 74 741 (72 946) 147 687Differences related to current assets 11 950 (5 621) 17 571Deferred gain related to sale of non-current assets 3 888 (9 680) 13 568Excess value related to investments of non-current assets 102 888 102 888 -
total positive temporary differences 193 467 14 641 178 826
total recognised deferred tax liabilities 51 554 15 405 36 149Tax rate 12%–35%Tax booked through income statement (1 304)
vThe Group has a total loss carried forward of USD 30 million at 31 December 2011 (2010: USD 29.2 million), that are available indefinitely to offset against future taxable profits of the companies in which the losses arose. Tax group contributions are also available within the same country and within the same tax regime. The distribution of dividend to the Odfjell SE’s shareholders does not affect the Company’s payable or deferred tax.
NOtE 9 pENSiON liABilitiES
The Group operates a number of defined benefit and contribution plans throughout the world. The most significant defined benefit pension plan is in Norway.
The main benefit from the defined benefit pension plan in Norway is a pension of 66% of the lower of the final salary and 12G (G = indexation of the public national insurance base amount, presently G equals NOK 79 216) and a 30-year accrual period. The plan also includes survivor/dependants and disability pensions. As at 31 December 2011, the different plans had 1 164 members. The commitment is calculated using straight-line accrual.
the year’s pension costs:
(uSd 1 000)Continued operation
discontinued operation 2011
Continued operation
discontinued operation 2010
Service costs 6 193 1 744 7 937 5 373 3 036 8 408Interest cost on accrued pension liabilities 3 485 2 057 5 543 2 698 2 435 5 133Estimated yield on pension assets (2 953) (1 310) (4 263) (2 343) (2 194) (4 536)Administrative expenses 258 - 258 219 - 219Amortisation of actuarial gains/losses 855 630 1 485 871 328 1 199Social security tax 824 - 824 795 - 795
total pension cost 8 662 3 122 11 785 7 613 3 605 11 218

38 odfjell annual report 2011
OdfJEll grOup
Obligations in financial statements:
Changes in the present value of the defined benefit obligations:
Changes in fair value of plan assets:
(uSd 1 000)
Over funded
pension scheme
2011
under funded
pension scheme
2011 total2011
Over funded
pension scheme
2010
under funded
pension scheme
2010
dis- continued operation
2010 total 2010
pENSiON liABilitiES –fuNdEd OBligAtiONS:Present value of accrued secured liabilities 29 112 78 064 107 176 253 55 899 64 245 120 398Fair value of pension assets (22 599) (55 248) (77 847) (184) (42 987) (46 783) (89 954)Social security tax - 2 343 2 343 - 1 821 - 1 821Actuarial gains/losses not recognised
in the income statement (7 145) (19 758) (26 903) (145) (10 135) (18 038) (28 318)funded obligation (632) 5 401 4 769 (75) 4 598 (576) 3 947
-
pENSiON liABilitiES –uNfuNdEd OBligAtiONS:Present value of accrued unsecured liabilities - 14 676 14 676 - 13 561 - 13 561Payroll tax - 2 069 2 069 - 1 912 - 1 912Actuarial gains/losses not recognised
in the income statement - 6 153 6 153 - (1 557) - (1 557)unfunded obligation - 22 899 22 899 - 13 916 - 13 916Net asset - classified as other long-term
receivables 632 2 168 2 800 75 2 588 1 854 4 517Net recognised liabilities - 30 468 30 468 - 21 103 1 278 22 380
(uSd 1 000)
Overfunded
pension scheme
2011
underfunded
pension scheme
2011
Adjusted dis-
continued operation
2011 total 2011
Overfunded
pension scheme
2010
underfunded
pension scheme
2010
dis- continued operation
2010 total 2010
Defined benefit obligation at 1 January 253 69 460 64 247 133 959 147 63 619 51 149 114 915Service cost 545 5 648 - 6 193 89 5 284 3 036 8 408Interest cost 539 2 947 - 3 485 7 2 691 2 435 5 134Settlement and business disposals 28 269 13 565 (64 247) (22 412) - - - -Actuarial loss/(gain) 392 5 726 - 6 118 10 379 12 841 13 230Benefits paid (489) (2 344) - (2 833) - (1 730) (2 273) (4 003)Exchange differences (397) (2 262) - (2 659) - (783) (2 941) (3 724)defined benefit obligation at 31 december 29 112 92 740 - 121 852 253 69 460 64 247 133 961
(uSd 1 000)
Over funded
pension scheme
2011
under funded
pension scheme
2011
Adjusted dis-
continued operation
2011 total2011
Over funded
pension scheme
2010
under funded
pension scheme
2010
dis- continued operation
2010 total 2010
Fair value of plan assets at 1 January 184 42 987 46 783 89 954 79 42 698 41 608 84 386Expected return 274 2 679 - 2 953 (8) 2 335 (1 178) 1 150Actuarial loss/(gain) - (233) - (233) 0 (4 386) (5) (4 391)Settlement and business disposals 21 491 7 967 (46 783) (17 325) - - - -Contribution 855 4 717 - 5 572 113 4 168 4 529 8 810Administrative expenses - (226) - (226) - (192) - (192)Benefits paid (489) (1 378) - (1 867) - (998) (2 273) (3 271)Exchange differences 285 (1 265) - (980) - (639) 4 102 3 463fair value of plan assets at
31 december 22 599 55 248 - 77 848 184 42 987 46 783 89 954
vEstimated contribution in 2012 is USD 10.2 million.

39
OdfJEll grOup
the major categories of plan assets in percentage of the fair value of total assets:
Norway uSA
2011 2010 2011 2010
Equities 12% 18% 61% 19%Bonds/securities 49% 49% 38% 44%Money market fund 21% 17% 1% 37%Property 18% 16% - -
The plan assets in the Netherlands are invested with an insurance company with a guaranteed investment return from year-to-year. The return for 2011 was 3%.
in calculating the net pension liabilities the following assumptions have been made:
defined contribution planSeveral of the Group companies have defined contribution plans in accordance with local legislation. The defined contribution plans cover full-time employees. As at 31 December 2011 total 1 144 members were covered by the plans. The contributions recognised as expenses equalled USD 3.9 million in 2011. For 2010 the contributions was USD 3.8 million distributed of USD 2.3 million in continuing operations and USD 1.5 million in discontinued operations.
Expected return on assets is generally the discount rate adjusted for the effect of the allocation of plan assets.
The sensitivity of the overall pension liability to changes in the weighted principal assumptions is:
Norway uSA Netherlands
2011 2010 2011 2010 2011 2010
Discount rate 2.60% 4.00% 5.70% 5.50% 4.60% 5.00%Expected return on assets 4.10% 5.40% 8.00% 8.00% 4.60% 5.00%Adjustment of wages 3.50% 4.00% 2.10% 2.00% 2.00% 2.00%Pension indexation (Sailors) 0.10%(3.25%) 1.30%(3.75%) 3.00% 3.00% 2.00% 2.00%Mortality table K2005/KU K2005/KU RP 2000 RP 2000 GBM/GBV
2010-2060GBM/GBV 2010-2060
Change in assumption impact on overall liability
Discount rate Increase/decrease by 0.5% Decrease/increase by 10%Inflation rate Increase/decrease by 0.5% Increase/decrease by 10-12%Salary growth rate Increase/decrease by 0.5% Increase/decrease by 10%Rate of mortality Increase by 1 year Increase by 2-3%

40 odfjell annual report 2011
OdfJEll grOup
(uSd 1 000) real estate
Ships and newbuilding
contractsperiodic
maintenancetank
terminals
Office equipment
and cars total
Net carrying amount 1.1.2010 41 472 1 349 715 48 175 691 204 30 599 2 161 165Investment 2 111 60 454 45 061 74 647 14 067 196 340Sale at book value (335) (69 248) (3 131) - (230) (72 946)Depreciations discontinued operation - - - (21 641) - (21 641)Depreciation and impairment 2010 (2 164) (60 952) (46 787) (7 872) (6 246) (124 020)Exchange rate differences 7 939 (6 098) - (29 082) 5 955 (21 286)Net carrying amount 31.12.2010 49 022 1 273 871 43 318 707 255 44 146 2 117 612
Investment 748 126 742 36 796 93 222 11 168 268 675Sale at book value (9 505) (79 337) (2 444) (210 028) (4 639) (305 954)Depreciations discontinued operation - - - (13 169) - (13 169)
Depreciation and impairment 2011 (1 797) (65 873) (40 351) (6 383) (7 761) (122 164)Exchange rate differences 119 (2 476) - 20 419 542 18 603Net carrying amount 31.12.2011 38 588 1 252 925 37 319 591 318 43 455 1 963 603
Cost 57 151 1 978 795 48 175 916 702 67 609 3 068 432Accumulated depreciation (15 679) (629 079) - (225 499) (37 010) (907 268)Net carrying amount 01.01.2010 41 472 1 349 716 48 175 691 204 30 599 2 161 165
Cost 66 866 1 963 901 43 319 962 265 87 402 3 123 753Depreciations discontinued operation - - - (21 641) - (21 641)
Accumulated depreciation (17 844) (690 031) - (233 369) (43 256) (984 500)Net carrying amount 31.12.2010 49 022 1 273 871 43 319 707 255 44 146 2 117 612
Cost 58 227 2 008 830 37 319 865 878 94 472 3 064 727Depreciations discontinued operation - - - (34 810) - (34 810)Accumulated depreciation (19 639) (755 905) - (239 751) (51 017) (1 066 313)
Net carrying amount 31.12.2011 38 588 1 252 925 37 319 591 318 43 455 1 963 603
Capital gain (loss) on non-current assetsIn 2011 capital gain from sale of ships was USD 24.6 million (USD 10.2 million loss in 2010).
depreciation periodsNon-current assets are depreciated straight-line over their estimated useful lives as follows (in years):
- Real estate up to 50 - Ships 25–30- Periodic maintenance 2.5–5 - Main components of tank terminals 10–40 - Office equipment and cars 3–15
fully depreciated non-current assetsAssets with a total cost price of USD 2.9 million have been fully depreciated as at 31 December 2011, but are still in use.
Assets financed under finance leases The carrying amount of ships financed under finance leases were USD 256.9 million and USD 266.8 million at 31 December 2011 and 31 December 2010 respectively. See note 2.12.
Capitalised interest on newbuilding contracts Newbuilding contracts include capitalised interest in connection with the financing of the newbuilding programme. The capitalised interest carried in the balance sheet equalled USD 2.3 million in 2011 and USD 1.7 million in 2010. The average interest rate for 2011 was 1.8%.
Change in residual valueThe residual values are evaluated on a regular basis and changes have an effect on future depreciations. During 2011 the market value for demolition of ships has been changed from USD 490 per tonne at the beginning of the year to USD 515 per tonne at the end of the year.
NOtE 10 NON-CurrENt ASSEtS

41
OdfJEll grOup
NOtE 12 iMpAirMENt Of NON-CurrENt ASSEtS ANd gOOdWill
The Company has evaluated the need for potential impairment losses in accordance with the accounting principles in note 2.14 for each CGU.
The WACC has been estimated as follows:
Borrowing rate: Debt ratio*(10 year swap rate + loan margin)+ Equity Return: Equity ratio*(10 year treasury rate + Beta * risk premium)= WACC
For Odfjell’s shipping activity the net present value of future cash flows has been calculated based on expected time charter earnings and estimated level of operating expenses for each ship over the remaining useful life of the ship. The net present value of future cash flows was based on weighted average cost of capital (WACC) of 6% in 2011 and 6.1% in 2010. As both swap and treasury US dollar based rates are currently low the WACC ends out low as well. Odfjell has used an industry Beta based on observations over a four year period.
A 1% point change in the WACC changes the “value in use” for the owned ships by about USD 125 million. The “value in use” equals the book value if the WACC increases by 2.5% point to 8.5%.
Based on actual values in the terminal sales transactions (ref. note 37) and terminal earning, we have no indicators that terminals may be impaired.
Net present value for goodwill has been calculated together with the underlying CGU, which again was measured against total capital employed.
For 2011 and 2010 no impairment was needed in non-current assets or goodwill.
NOtE 13 EArNiNgS pEr ShArE
The basic and diluted earnings per share are the same, as the Company has no convertible bond loan or stock option plan. Earnings per share are calculated as net result allocated to shareholders for the year divided by the weighted average number of shares.
(uSd 1 000) 2011 2010
Net result allocated to shareholders 268 891 (78 783)Average weighted number of shares (1 000) 78 555 79 286
Basic/diluted earnings per share 3.42 (0.99)
(uSd 1 000)Odfjell terminals
(rotterdam) Bv
Oiltanking Odfjell terminal
Singapore pte ltdOdfjell terminals
(houston) inc. total
gOOdWill:Book value 1.1.2010 5 652 5 065 - 10 717Exchange rate effect (408) 451 - 43Book value 31.12.2010 5 244 5 516 - 10 760
Book value 1.1.2011 5 244 5 516 - 10 760Allocated fair value assets 35 453 - 35 240 70 693Sale (5 244) - - (5 244)Exchange rate effect (552) (73) - (625)Book value 31.12.2011 34 901 5 443 35 240 75 584
CuStOMEr rElAtiONShip:Book value 1.1.2011 - - - -Allocated fair value assets 35 093 - 5 865 40 958Accumulated depreciation (1 168) - (196) (1 364)Book value 31.12.2011 33 925 - 5 669 39 594intangible assets 31.12.2011 68 826 5 443 40 909 115 178
See note 35 and 37 for additional information about change in control in some terminal companies.
NOtE 11 iNtANgiBlE ASSEtS
Intangible assets acquired through business combinations have been allocated to three individual cash generating units (CGU) as follows:

42 odfjell annual report 2011
OdfJEll grOup
(uSd 1 000) 2011 2010
Within one year 156 127 133 924After one year but not more than five years 354 811 386 138After five years 166 773 230 458
total operating leases 677 711 750 520
Capital commitmentsOdfjell has an agreement with Chongqing Chuandong Shipbuilding Industry Co to build a series of three 9,000 DWT stainless steel chemical tankers. These newbuildings are fully financed except for remaining equity payment totalling USD 9 million against delivery in year 2012.
Odfjell has also entered an agreement with Daewoo Shipbuilding & Marine Engineering Co., Ltd (DSME) to build one fully IMO II 75,000 DWT chemical tanker with 31 coated tanks for delivery first half 2013 at a total price of about USD 65 million. This ship is fully financed except for a remaining equity payment totalling about USD 4 million.
The Company also has capital commitments for investments in terminals in China, Korea, Singapore, the Middle East, North America and Europe of a total amount of USD 9 million.
NOtE 14 gOvErNMENt grANtS
Government grants from the Norwegian Maritime Directorate related to the reimbursement system for Norwegian seafarers of USD 1.7 million in 2011 (USD 2.1 million in 2010) is entered in the accounts as a reduction of operating expenses.
Flumar Transportes de Quimicos e Gases Ltda received USD 5.1 million in 2011 (USD 0.2 million in 2010) in AFRMM (Additional Freight for the Merchant Marine Renewal), which is a freight contribution for cargoes shipped by Brazilian flag vessels on the Brazilian coast. The AFRMM is recognised as income over the periods necessary to match the related costs which they are meant to compensate.
NOtE 16 COMMitMENtS, guArANtEES ANd CONtiNgENCiES
Operating leasesThe Group has entered into several operating leases for ships. The leases have fixed time charter commitment. The time charter rate is the compensation to the ship owner covering his financial expenses and in some cases also the ship operating expenses. In addition the Group has floating time charter arrangements where payments equal the earnings generated by the ships. See note 20 for the time charter/lease expenses.
The Group also has entered into operating leases for land, buildings and certain vehicles and items of machinery. Leases for land and buildings are generally non-cancellable and long-term. Leases for certain vehicles and items of machinery have an average period of between three and five years with no renewal option in the contracts.
The operating leases contain no restrictions on the Company’s dividend policy or financing opportunities.
The nominal value of future rents related to the operating lease fall due as follows:
NOtE 15 trANSACtiONS With rElAtEd pArtiES
The Group has carried out various transactions with related parties. All transactions have been carried out as part of the ordinary operations and on market terms.
The Odfjell Group shares offices in Brazil with a local terminal company related to a Director of the Board, Bernt Daniel Odfjell. The Director's family also has ownership interest in a company, which acts as Brazilian port agent for Odfjell as one among many customers. In addition to reimbursement of actual expenses and expenditures incurred, Odfjell Tankers AS and Flumar Transportes de Quimicos e Gases Ltda paid these companies USD 1.7 million in agency fees in 2011 (USD 1.7 million in 2010), while Flumar Transportes de Quimicos e Gases Ltda and Odfjell Brasil – Representacoes Ltds paid USD 0.5 million for administrative services in 2011 (same as in 2010).
AS Rederiet Odfjell, jointly controlled by Laurence Ward Odfjell (chairman) and Bernt Daniel Odfjell (director), rents office premises and buys limited administrative services from Odfjell Management AS in Bergen, for which Odfjell Management AS received USD 0.1 million in 2011 (same as in 2010).
Transactions with related parties are settled on a regular basis and the balances as per 31.12.2011 were immaterial.

43
OdfJEll grOup
NOtE 19 vOyAgE EXpENSES
Voyage expenses are expenses directly related to the ship voyage.
(uSd 1 000) 2011 2010
Cash at banks and in hand 142 911 77 693Short-term deposits 25 049 19 548 Other liquid investments 12 074 11 586Effect from currency exchange rate fluctuations 33 (1 781)
total cash and cash equivalents 180 067 107 046Available credit facilities 0 20 250
(uSd 1 000) 2011 2010
Port expenses 91 014 93 218Canal expenses 19 913 20 955Bunkers expenses 308 455 252 434Transhipment expenses 24 610 22 725Commission expenses 24 120 28 392Other voyage related expenses 64 093 33 096
total voyage expenses 532 205 450 819
(uSd 1 000) CurrencyAverage interest
rate 2011Book value
2011Book value
2010
Bonds and certificates issued by financial institutions USD 1.42% 15 631 18 221Bonds and certificates issued by financial institutions EUR - - 3 345Bonds and certificates issued by financial institutions NOK 3.40% 4 991 -Bonds and certificates issued by corporates NOK - - 5 104Bonds and certificates issued by corporates USD 0.73% 4 741 7 807
total available-for-sale investments 25 364 34 477
Book value equals market value. Market value of investments that are actively traded in organised financial markets is determined by reference to quoted market bid prices at the close of business on the balance sheet date. In 2011 unrealised loss of USD 1 million was recognised directly to statement of comprehensive income (unrealised gain of USD 0.3 million in 2010). Bonds and certificates generally have interest rate adjustments every three months.
NOtE 18 CASh ANd CASh EquivAlENtS
Cash at banks earn interest at floating rates based on bank time deposit rates. Short-term deposits and other liquid investments are made for varying periods of between one day and three months depending on the immediate cash requirements of the Group and earn interest at the respective short-term rates. Restricted cash of USD 3.0 million (USD 2.7 million in 2010) consist of funds for withholding taxes relating to employees in Odfjell Management AS and Odfjell Maritime Services AS. The cash and cash equivalents do not include available credit facilities.
guarantees
(uSd 1 000) 2011 2010
total guarantees 113 785 87 102
The Odfjell Group has given guarantees to third parties as part of our day-to-day business to assume responsibility for bunkers purchases, port obligations and operating lease commitments.
ContingenciesThe Company maintains insurance coverage for its activities consistent with industry practice. The Company is involved in claims typical to the chemical tanker and tank terminal industry, but none of these claims have resulted in material losses for the Company since such claims have been covered by insurance.
NOtE 17 AvAilABlE-fOr-SAlE iNvEStMENtS

44 odfjell annual report 2011
OdfJEll grOup
NOtE 22 gENErAl ANd AdMiNiStrAtivE EXpENSES
General and administrative expenses consist of expenses for headquarter’s activity, activities outside Bergen for brokerage, agency and general administration in tank terminals.
Including in the above is auditor’s remuneration for:
NOtE 23 SAlAry EXpENSES, NuMBEr Of EMplOyEES ANd BENEfitS tO BOArd Of dirECtOrS ANd MANAgEMENt
Salary expenses are included in operating and general and administrative expenses according to the activity.
NOtE 20 tiME ChArtEr EXpENSES
Time charter expenses consist of expenses for operating leases, see note 16 for future obligations.
Time charter is an arrangement for hire of a ship. These arrangements vary in form and way of payment and period of hire may differ from time to time. Bare-boat arrangements are also included in this note. See Glossary in Annual Report for additional comments.
NOtE 21 OpErAtiNg EXpENSES
Operating expenses consist of expenses for operating ships and terminals (for example wages and remunerations for crew and operational personnel and materials and equipment for ships and terminals).
(uSd 1 000) 2011 2010
Floating TC-expenses 51 725 40 947Other TC-expenses 115 900 156 864
total time charter expenses 167 625 197 811
(uSd 1 000) 2011 2010
Salary expenses (note 23) 110 035 105 562Cost of operations terminals 21 769 7 522Cost of operations ships 109 893 111 960Tonnage tax 122 92Currency hedging (3 821) (4 024)
total operating expenses 237 998 221 113
(uSd 1 000) 2011 2010
Salary expenses (note 23) 75 405 64 577Other expenses 31 636 23 330Currency hedging (3 310) (3 038)
total general and administrative expenses 103 731 84 869
(uSd 1 000 exclusive vAt) 2011 2010
Statutory auditing 996 1 025 Other assurance services 88 86Tax advisory services 212 210Other non-audit services 73 79
total remuneration 1 367 1 400
(uSd 1 000) 2011 2010
Salaries 150 563 137 602Social expenses 20 611 19 508Pension expenses defined benefit plans (note 9) 8 662 7 613Pension expenses defined contribution plans (note 9) 3 963 2 271Other benefits 1 641 3 143
total salary expenses 185 440 170 138

45
OdfJEll grOup
Compensation and benefits to the Management Group:
The President/CEO and managers reporting directly to him is included in the Company’s defined benefit pension plan or defined contribution plan, see note 9. The Company also has unfunded pension obligations related to senior management for salaries exceeding 12G (presently 12G equals USD 155 892), up to 66% of 18G.
The Management shall be offered competitive terms of employment in order to ensure continuity in the Management and to enable the Company to recruit qualified personnel. The remuneration should be composed so that it promotes the creation of values in the Company. The remuneration shall not be of such a kind, nor of such a magnitude, that it may impair the public reputation of the Company.A basic, straight salary is the main component of the remuneration. However, in addition to a basic salary there may also be other supplementary benefits, hereunder but not limited to payment in kind, incentive/recognition pay, termination payments and pension and insurance schemes.
The Company does not run any share option schemes, nor other benefit programmes as mentioned in the Public Limited Companies Act, section 6-16 subsection 1 no. 3. As the Company has no such arrangements, no specific limits regulating the different categories of benefits or the total remuneration of Management have been defined. The Board may on a discretionary basis grant recognition payments to certain employees including Management. In 2011 the maximum amount set aside for this type of payment was USD 2 million for the Odfjell Group as a whole. The Board has implemented a performance-related incentive scheme for 2012 that will be linked to the Company's earnings performance and operational defined goals over time and contains a gap of maximum six months salery. Members of Management have no defined agreement with regards to severance payments. Remuneration to Management in 2011 was in compliance with the above guidelines.
In Norway all employees are entitled to a very limited loan from the Company. Repayment period is normally five years and loans are currently calculated at 2.75% interest per annum, and total outstanding amount as per 31.12.2011 was USD 0.9 million.
Management employee loans are generally secured by property mortgages. Loans to the members of management carry an interest of 2.75% per annum and repayment period is five years. Members of the management have loans from the Company as follows: Jan A. Hammer (USD 0.05 million), Harald Fotland USD 0.006 million, Morten Nystad USD 0.05 million and Jan Didrik Lorentz USD 0.08 million.
(uSd 1 000) Salary Bonuspension
costOther
benefits total
President/CEO, Jan Arthur Hammer 598 197 50 30 876Senior Vice President/CFO Haakon Ringdal (up to August 20th 2011) 318 - 56 31 404Senior Vice President/CFO Terje Iversen (as from August 20th 2011 100 - - 10 110Senior Vice President Corporate Investments, Tore Jakobsen 334 103 31 28 497Senior Vice President Corporate Services & Support, Harald Fotland 297 - 8 28 333Senior Vice President QHSE, Jan Didrik Lorentz 245 - 37 28 311Senior Vice President Ship Management, Helge Olsen 263 - 38 28 329Senior Vice President Odfjell Tankers, Morten Nystad 368 60 18 28 474President Odfjell Terminals, Atle Knutsen 446 121 55 156 778total 2 969 481 293 367 4 110
At the end of 2011 the Board of Directors consists of five members (same as at the end of 2010). Compensation and benefits to the Board of Directors:
Average number of employees:
2011 2010
Europe 902 929North America 155 148South East Asia 2 241 2 387South America 208 203Other 262 105
total average number of employees 3 767 3 771
(uSd 1 000) 2011 2010
Salary 518 482Other benefits 36 26
total 554 508

46 odfjell annual report 2011
OdfJEll grOup
See note 5 for overview of currency hedging exposure.
NOtE 27 CurrENCy gAiNS (lOSSES)
NOtE 28 NON-CurrENt rECEivABlES
(uSd 1 000) 2011 2010
Currency hedging contracts 612 6 866Non-current receivables and liabilities 12 100 (13 274)Cash and cash equivalents 33 (1 781)Other current assets and current liabilities (8 709) 11 088
total currency gains (losses) 4 035 2 899
(uSd 1 000) 2011 2010
Loans to employees 948 1 273Prepayment of land use right 10 563 10 376Prepayment of lease 24 365 26 334Other non-current receivables 26 411 27 381
total non-current receivables 62 288 65 364
Nothing material past due or impaired.
NOtE 29 CurrENt rECEivABlES
Trade receivables are from a wide range of customers within our shipping and tank terminal business. Credits are granted to customers in the normal course of business. The Company regularly reviews its accounts receivable and makes allowances for uncollectible amounts. The amounts of the allowance is based on the age of the unpaid balance, information about the current financial condition of the customer, any disputed items and other relevant information. The claim against the Russian yard Sevmash was due for payment on 30 December 2009. In 2011 we received compensation of total USD 50.7 million of which USD 5.8 million was accounted for as income in 2011.
(uSd 1 000) 2011 2010
Trade receivables 113 350 103 721Other receivables 14 487 31 534Compensation Russian yard Sevmash - 44 772Pre-paid costs 11 601 16 434Provisions for impairment (4 657) (4 373)
total current receivables 134 781 192 087
NOtE 24 BuSiNESS COMBiNAtiONS No material business combinations in 2011 or 2010.
NOtE 25 SuBSEquENt EvENtS No special issues.
NOtE 26 OthEr fiNANCiAl itEMS
See note 5 for overview of hedging exposure.
(uSd 1 000) 2011 2010
Realised gain/losses on available-for-sale-investments 902 587Financial assets and liabilities at fair value through profit and loss (8 674) 3 716Other financial income 13 658 1 885Other financial expenses (3 391) (2 389)
total other financial items 2 494 3 797

47
OdfJEll grOup
NOtE 30 OthEr CurrENt liABilitiES
the table below summarizes total current receivables into different currencies:
the table below summarizes the maturity profile of the group’s other current liabilities:
(uSd 1 000) 2011 2010
USD 104 683 145 565EUR 17 485 32 984SGD 3 907 2 998RMB 2 068 1 564WON 1 209 1 216Other 5 428 7 760
total current receivables 134 781 192 087
(uSd 1 000) 2011 2010
Trade payables 30 710 34 541Estimated voyage expenses 33 762 37 467Provisions 2 609 7 270Other current liabilities 32 323 47 235
total other current liabilities 99 405 126 513
(uSd 1 000) total On demand <3 months 3-6 months 6-9 months > 9 months
2011 99 405 86 631 7 439 2 155 1 850 1 330
2010 126 513 104 580 17 383 1 817 834 1 900
the table below summarizes other current liabilities into different currencies:
(uSd 1 000) 2011 2010
USD 55 305 53 285EUR 24 164 38 901SGD 1 965 2 556RMB 3 914 3 306WON 1 730 1 891Other currencies 12 327 26 572
total other current liabilities 99 405 126 513
Movement in provisions for impairment:
(uSd 1 000) totalNot past due nor impaired
past due, but not impaired
<30 days 30-60 days 60-90 days >90 days
2011 127 836 62 330 41 722 7 014 4 371 12 400
2010 135 255 63 234 46 320 8 371 6 699 10 630
(uSd 1 000) 2011 2010
Total provision for impairment per 1 January 4 373 5 721This year’s expenses 1 200 1 199Write-off this year (916) (2 454)Reversed provisions - (94)
total provision for impairment per 31 december 4 657 4 373
As at 31 december, the ageing analysis of trade receivable and other current receivable are as follows:

48 odfjell annual report 2011
OdfJEll grOup
The number of shares are all authorised, issued and fully paid. Nominal value is NOK 2.50, equivalent to USD 0.42 as at 31.12.2011. All shares have the same rights in the Company, except that B shares have no voting rights.
Shares owned/controlled by members of the Board of directors, president/CEO and other members of the Management group (including related parties):
NOtE 33 ShArE CApitAl ANd prEMiuM
Number of shares (thousand)
Share capital (uSd 1 000)
Share premium (uSd 1 000)
2011 2010 2011 2010 2011 2010
A shares 65 690 65 690 22 277 22 277 40 507 40 507B shares 21 079 21 079 7 148 7 148 12 998 12 998
total 86 769 86 769 29 425 29 425 53 504 53 504Treasury sharesA shares 5 891 5 891 1 997 1 997 - -B shares 2 323 2 323 788 788 - -
total outstanding 78 555 78 555 26 640 26 640 53 504 53 504
2011 2010
A shares B shares A shares B shares
Chairman of the Board of Directors, Laurence Ward Odfjell 25 966 492 1 755 076 25 966 492 1 205 076Director, Bernt Daniel Odfjell - 2 032 - 2 032Director, Terje Storeng 70 560 2 112 70 560 2 112President/CEO, Jan Arthur Hammer - 3 200 - 3 200Senior Vice President, Corporate Investments, Tore Jakobsen - 10 000 - 10 000President, Odfjell Terminals BV, Atle Knutsen 26 712 2 336 11 712 2 336Senior Vice President, QHSE, Toralf Sørenes 10 000 - 7 000 -
dividend paid
Dividend paid per share was NOK 1.00 in 2011. No further dividend proposed for 2011.
1) Payment net of treasury shares
(uSd 1 000) 2011 2010
A shares 10 655 -B shares 3 342 -
total 1) 13 997 -
NOtE 31 OthEr NON-CurrENt liABilitiES
As a part of entering the new Norwegian tonnage tax system Odfjell has in total USD 30.2 million outstanding, of which USD 15.1 million is payable in 2013 (rest in 2012).
NOtE 32 BuNkErS ANd OthEr iNvENtOriES
(uSd 1 000) 2011 2010
Tax payable, Norway – new voluntary scheme 15 131 31 079Provision for dismantling cost 4 256 4 262Other 5 150 5 569
total other non-current liabilities 24 537 40 910
(uSd 1 000) 2011 2010
Bunkers 31 168 26 212Other inventories 5 075 3 052
total bunkers and other inventories 36 243 29 264

49
OdfJEll grOup
All treasury shares were bought in 2009 and 2010 and are held by Odfjell SE and Odfjell Chemical Tankers AS (500,000 A shares) per end of 2011.
The Annual General Meeting on 3 May 2011 authorised the Board of Directors to acquire up to 10% of the Company's share capital. This authorisation expires 3 November 2012. The purpose of purchasing own shares is to enhance shareholders' value. The Board of Directors regularly considers investments in own shares when it may be beneficial for the Company.
1) Nominee account2) No voting rights for own shares ref. Public Limited Companies Act § 5-4
Name A shares B shares totalpercent of
votespercent of
shares
1 Norchem AS 25 966 492 1 591 176 27 557 668 43.42% 31.76%
2 Odfjell SE 5 391 166 2 322 482 7 713 648 2) 8.89%
3 Rederiet Odfjell AS 3 497 472 - 3 497 472 5.85% 4.03%
4 Odfjell Shipping Bermuda Ltd. 2 750 000 715 760 3 465 760 4.60% 3.99%
5 Pareto Aksje Norge 1 928 654 1 224 706 3 153 360 3.23% 3.63%
6 SHB Stockholm Clients Account 1) 1 481 270 1 390 680 2 871 950 2.48% 3.31%
7 JP Morgan Clearing Corp. 1) 2 727 900 31 800 2 759 700 4.56% 3.18%
8 SIX SIS AG 5 PCT NOM 1) 1 036 400 1 600 800 2 637 200 1.73% 3.04%
9 Odin Norden - 2 154 133 2 154 133 - 2.48%
10 Folketrygdfondet - 1 724 900 1 724 900 - 1.99%
11 SIX SIS AG 1) 1 099 600 577 100 1 676 700 1.84% 1.93%
12 Skagen Vekst 1 664 725 - 1 664 725 2.78% 1.92%
13 Pareto Aktiv 889 381 564 123 1 453 504 1.49% 1.68%
14 Odin Norge - 857 412 857 412 - 0.99%
15 Pareto Verdi 501 178 303 050 804 228 0.84% 0.93%
16 Fondsfinans Spar 755 000 - 755 000 1.26% 0.87%
17 AS SS Mathilda 600 000 150 000 750 000 1.00% 0.86%
18 Berger 732 400 - 732 400 1.22% 0.84%
19 AS Bemacs 373 000 353 000 726 000 0.62% 0.84%
20 KLP Aksje Norge VPF 702 828 20 838 723 666 1.18% 0.83%
total 20 largest shareholders 52 097 466 15 581 960 67 679 426 78.11% 78.00%Other shareholders 13 592 778 5 496 744 19 089 522 21.89% 22.00%
total 65 690 244 21 078 704 86 768 948 100.00% 100.00%International shareholders 38 299 259 7 126 373 45 425 632 58.30% 52.35%
Treasury shares 5 891 166 2 322 482 8 213 648 2) 9.47%
Cost price treasury shares (USD 1 000) 44 256 18 660 62 916
20 largest shareholders as per 31 december 2011:

50 odfjell annual report 2011
OdfJEll grOup
Company Country of registration Ownership share voting share
Odfjell Argentina SA Argentina 100% 100%Odfjell Australia Pty Ltd Australia 100% 100%Odfjell Chemical Tankers Ltd Bermuda 100% 100%Flumar Transportes de Quimicos e Gases Ltda Brazil 100% 100%Odfjell Brasil Ltda Brazil 100% 100%Odfjell Chile Ltd Chile 100% 100%Odfjell Management Consultancy (Shanghai) Co Ltd China 100% 100%Odfjell Terminals (Jiangyin) Co Ltd China 55% 55%Odfjell Chemical Tankers (Germany) GmbH Germany 100% 100%Odfjell Japan Ltd Japan 100% 100%Odfjell Korea Ltd Korea 100% 100%Odfjell Netherlands BV Netherlands 100% 100%Odfjell Terminals BV (Netherlands) Netherlands 100% 100%Odfjell Terminals EMEA BV Netherlands 100% 100%Odfjell Terminals USA BV Netherlands 100% 100%Norfra Shipping AS Norway 100% 100%Odfjell Chemical Tankers AS Norway 100% 100%Odfjell Insurance & Properties AS Norway 100% 100%Odfjell Management AS Norway 100% 100%Odfjell Maritime Services AS Norway 100% 100%Odfjell Projects AS Norway 100% 100%Odfjell Tankers AS Norway 100% 100%Odfjell Tankers Europe AS Norway 100% 100%Odfjell Terminals SE Norway 100% 100%Odfjell Peru S.A.C. Peru 100% 100%Odfjell Ship Management (Philippines) Inc Philippines 100% 100%Odfjell Asia II Pte Ltd Singapore 100% 100%Odfjell Asia Pte Ltd Singapore 100% 100%Odfjell Singapore Pte Ltd Singapore 100% 100%Odfjell Terminals Asia Pte Ltd Singapore 100% 100%Odfjell Terminals China Pte Ltd Singapore 100% 100%Odfjell Durban South Africa (Pty) Ltd South Africa 100% 100%Odfjell (UK) Ltd United Kingdom 100% 100%Odfjell USA (Houston) Inc USA 100% 100%
NOtE 34 liSt Of SuBSidiAriES
the following subsidiaries are fully consolidated in the financial statements as per 31 december 2011:
NOtE 35 iNvEStMENtS iN JOiNt vENturES
the Odfjell group has the following investments in joint ventures, accounted for according to the gross method as per 31 december 2011:
JOiNt vENturE Country of registration Business segment Ownership share
Odfjell & Vapores Ltd Bermuda Chemical Tankers 50.0%Odfjell Ahrenkiel Europe GmbH Germany Chemical Tankers 50.0%Crystal Pool AS Norway Chemical Tankers 50.0%NCC – Odfjell Chemical Tankers JLT United Arab Emirates Chemical Tankers 50.0%Odfjell Makana SA South Africa Chemical Tankers 49.9%Odfjell y Vapores SA Chile Chemical Tankers 49.0%Thembani Shipping SA South Africa Chemical Tankers 44.9%Odfjell Terminals (Rotterdam) BV Netherlands Tank Terminals 51.0%Odfjell Terminals Maritiem BV Netherlands Tank Terminals 51.0%Odfjell Terminals (Houston) Inc USA Tank Terminals 51.0%Odfjell Terminals (Charleston) LLC USA Tank Terminals 51.0%Odfjell Terminals Lindsay Goldberg CV Netherlands Tank Terminals 51.0%Odfjell Terminals General Partner BV Netherlands Tank Terminals 51.0%Odfjell Holdings (US) Inc USA Tank Terminals 51.0%Odfjell USA Inc USA Tank Terminals 51.0%Odfjell Terminals (Europe) BV Netherlands Tank Terminals 51.0%Odfjell Terminals (Dalian) Co Ltd China Tank Terminals 50.0%Oiltanking Odfjell Terminal Singapore Pte Ltd Singapore Tank Terminals 50.0%Odfjell Terminals (Korea) Co Ltd Korea Tank Terminals 50.0%Oiltanking Odfjell GmbH Germany Tank Terminals 50.0%Odfjell Nangang Terminals (Tianjin) Co Ltd China Tank Terminals 49.0%Oiltanking Odfjell Terminals Oman BV Netherlands Tank Terminals 42.5%Exir Chemical Terminal (PJSCo) Iran Tank Terminals 35.0%Oiltanking Odfjell Terminals & Co LLC (Oman) Oman Tank Terminals 30.0%

51
OdfJEll grOup
The share of result and balance sheet items for investments in joint ventures is included line by line in the accounts. The below main figures are included for each segment in the Group accounts:
Odfjell has sold a 49% indirect interest in each of Odfjell's tank terminals in Rotterdam and Houston as well as in the greenfield project in Charleston, South Carolina. Through a shareholder agreement the transaction has changed Odfjell's influence from control to joint control, due to unanimous voting rights in financial and operational matters as stated in the shareholder agreement. Change of control is effective from 15 August 2011, and the remaining 51% interest is from this date presented as joint venture using proportionate consolidation. The transaction is done at fair value.
Total fair values specified as follows (51% share):
See also note 10 Non-current assets, note 11 Intangible assets and note 37 Discontinued operation.
2011 2010
(uSd 1 000)Chemical
tankerstank
terminals totalChemical
tankerstank
terminals total
Gross revenue 125 215 105 113 230 328 16 902 49 488 66 391Operating expenses (1 826) (36 449) (38 275) (2 106) (10 775) (12 881)Net financial items (13) (11 568) (11 581) (26) (8 146) (8 172)Net result 1 877 21 375 23 251 (610) 13 488 12 878
Non-current assets 2 009 520 999 523 008 1 978 293 044 295 022Current assets 26 844 111 401 138 246 18 623 29 901 48 523total assets 28 853 632 400 661 253 20 601 322 944 343 545
Equity opening balance 9 224 137 275 146 500 12 720 118 813 131 533Net result 1 877 21 375 23 251 (610) 13 488 12 878Equity additions/adjustments - 139 391 139 391 (3 805) (2 092) (5 897)Exchange rate differences (624) 322 (304) 918 7 067 7 985total equity closing balance 10 476 298 362 308 839 9 224 137 275 146 499
Non-current liabilities 246 269 501 269 747 178 163 541 163 720Current liabilities 18 130 64 536 82 667 11 199 22 128 33 327total liabilities 18 376 334 038 352 413 11 377 185 670 197 047
Net cash flow from operating activities (632) 65 658 65 026 4 948 18 436 23 385Net cash flow from investing activities (63) (23 807) (23 869) (515) (24 891) (25 406)Net cash flow from financing activities 108 (15 862) (15 755) 126 8 312 8 438
Uncalled committed capital - - - - - -
(uSd 1 000)
Customers relations ship 40 958Goodwill 70 696Land 2 549Building 798Terminals 66 915Office equipment 250Deferred tax liability (33 397)Pension (8 581)
Net 140 188

52 odfjell annual report 2011
OdfJEll grOup
Logo blå:PANTONEPMS 295CMYK100/60/0/35
NOtE 36 iNvEStMENtS iN ASSOCiAtES
As Odfjell is involved as a Board member and has influence in the below mentioned company, it is accounted for as an associated company. Since V.O. Tank Terminal Ningbo is an unlisted company, there are no quoted prices for a fair value consideration. (USD 1 000)
NOtE 37 diSCONtiNuEd OpErAtiONS
Odfjell announced in August 2011 that an agreement had been signed to form a strategic partnership with affiliates of US-based private equity firm Lindsey Goldberg LLC. Through the transaction Lindsay Goldberg acquired a 49% indirect interest in each of Odfjell's tank terminals in Rotterdam and Houston as well as in the greenfield project in Charleston, South Carolina. The partnership will enhance our platform for organic and strategic investments and expansions in the tank terminal business in Europe and North America. Odfjell believes there are attractive expansion opportunities in the tank terminal sector, and consider Lindsay Goldberg as a reliable long-term partner with a shared strategic view and ambition.Through a shareholder agreement the transaction has changed Odfjell's influence from control to joint control and Odfjell’s total previous ownership is presented as discontinued operation from 2Q 2011 including re-presentation of profit and loss and cash flows for prior period. Meaning that the result for these terminals are only shown as discontinued operations prior to change of control is effective from 15 August, and the remaining 51% interest is from this date presented as joint venture using proportionate consolidation (ref. disclosure 35). Total gain on the sale equalled USD 270 million (100%), this gain is included in the profit and loss statement under net result discontinued operations.
The results for the discontinued operation (from control to joint control) up to mid August in 2011 and for the whole year 2010 (100% share):
A summary of financial information for our share of the associate:
Entity Country SegmentOwnership
interestCarrying
amount
V.O. Tank Terminal Ningbo China Tank Terminals 12.5%
Investment in associates 1.1.2010 1 501Exchange rate differences on translation (43)Net income from associates 2010 128
investment in associates 31.12.2010 1 586Exchange rate differences on translation 58Dividend (118)Net income from associates 2011 192
investment in associates 31.12.2011 1 718
(uSd 1 000) 2011 2010
Gross revenue 656 519 Net result 192 128
Assets 1 779 1 641 Liabilities 60 55 Equity 1 718 1 586
(uSd 1 000) per 15 August 2011 2010
Gross revenue 124 271 190 973Operating expenses (59 270) (90 567)
gross result 65 001 100 406General and administrative expenses (19 818) (25 352)
Operating result before depreciation and capital gain (loss) on non-current assets (EBitdA) 45 183 75 054Depreciation (13 169) (21 641) Capital gain (loss) on non-current assets 269 516 -
Operating result (EBit) 301 530 53 413
Interest income 312 579Interest expenses (4 142) (5 751)Other financial items (1 029) (1 041)Currency gains (losses) 180 14
Net financial items (4 679) (6 199)
result before tax 296 851 47 214
Taxes (8 355) (14 250)
Net result from discontinued operation 288 496 32 964
Earnings per share (USD) – basic and diluted 3.67 0.42

53
OdfJEll grOup
The net cash flows incurred by discontinued operation (from control to joint control) are as follows (100% share):
The sale of discontinued operation (from control to joint control) had the following effect on the Group’s financial position (49% share):
(uSd 1 000) per 15 August 2011 2010
Net cash flow from operating activities 54 857 59 660Net cash flow from investing activities (33 127) (42 902)Net cash flow from financing activities (13 913) (21 375)
Net cash inflow/(outflow) 7 817 (4 617)
(uSd 1 000) discontinued operations sold in 2011
Assets of discontinued operations 15.08.2011 266 550Liabilities of discontinued operations 15.08.2011 (152 607)
Net identifiable assets and liabilities (49% share) 113 943
Sales expenses (5 040)Currency exchange differences 6 966Gain on sale (49% share) 132 063
Cash received (49% share sold) 247 932
NOtE 38 EXChANgE rAtES Of thE grOup’S MAJOr CurrENCiES AgAiNSt uSd
Norwegian kroner (NOk) Euro (Eur) renmimbi (rMB)
Singapore dollar (Sgd)
Average year-end Average year-end Average year-end Average year-end
2011 5.61 6.01 1.39 1.29 6.39 6.23 1.26 1.302010 5.93 5.85 1.33 1.34 6.73 6.52 1.36 1.28

54 odfjell annual report 2011
OdfJEll SE
(uSd 1 000) Note 2011 2010
OpErAtiNg rEvENuE (EXpENSES)Gross revenue 2 3 479 3 990 General and administrative expenses 16 (12 322) (9 180)Depreciation 7 (1 277) (1 223)
Operating result (EBit) (10 120) (6 413)
fiNANCiAl iNCOME (EXpENSES)Income on investment in subsidiaries 11 8 490 8 347 Interest income 11 16 533 11 297 Changes in the value of financial fixed assets 11, 18 (19 146) - Interest expenses 11 (30 157) (28 609)Other financial items 11 (3 290) 19 942 Currency gains (losses) 12 10 493 5 308
Net financial items (17 077) 16 285
result before taxes (27 197) 9 872
Taxes 5 1 058 (5 365)
Net result (26 139) 4 507
OthEr COMprEhENSivE iNCOMECash flow hedges changes in fair value 336 (2 016)Cash flow hedges transferred to profit and loss statement (928) (1 196)Net gain/(loss) on available-for-sale investments (963) 334
Other comprehensive income (1 555) (2 878)
total comprehensive income (27 694) 1 629
prOfit ANd lOSS StAtEMENt OdfJEll SE
thE fiNANCiAl StAtEMENtOdfJEll SE

55
OdfJEll SE
BAlANCE ShEEt OdfJEll SE (uSd 1 000)
Assets as per 31.12 Note 2011 2010
NON-CurrENt ASSEtSReal estate 7 13 796 14 425 Shares in subsidiaries 18 674 011 693 326 Other shares 18 22 153 22 144 Loans to group companies 13, 14 566 127 567 401 Non-current receivables 14 18 324 17 765
total non-current assets 1 294 411 1 315 060
CurrENt ASSEtSCurrent receivables 105 4 548 Group receivables 4 486 799 Derivative financial instruments 3 10 477 12 335 Available-for-sale investments 15 25 364 18 260 Cash and bank deposits 19 70 035 55 058
total current assets 110 467 91 000 total assets 1 404 879 1 406 061
Equity and liabilities as per 31.12 Note 2011 2010
pAid iN EquityShare capital 6, 20 29 425 29 425 Treasury shares 6, 20 (2 616) (2 616)Share premium 6 53 504 53 504
total paid in equity 80 313 80 313
rEtAiNEd EArNiNgSReserve of unrealized profit 6 44 894 46 448 Other equity 6 491 990 532 126
total retained earnings 536 884 578 574 total shareholders’ equity 617 197 658 887
NON-CurrENt liABilitiESDeferred tax 5 - 938 Loans from subsidiaries 4 219 429 39 433 Long-term debt 4 460 796 502 621
total non-current liabilities 680 224 542 992
CurrENt liABilitiESDerivative financial instruments 3 36 810 22 190 Current portion of long-term debt 4 63 052 101 331 Other current liabilities 5 449 4 649 Loans from subsidiaries 2 147 76 012
total current liabilities 107 458 204 182 total liabilities 787 682 747 173 total equity and liabilities 1 404 879 1 406 061
Guarantees 21 735 588 814 744
tErJE StOrENg lAurENCE WArd OdfJEll BErNt dANiEl OdfJEll
irENE WAAgE BASili ChriStiNE rØdSÆthEr JAN Arthur hAMMErPresident/CEO
thE BOArd Of dirECtOrS Of OdfJEll SE Bergen, 15 March 2012
55

56 odfjell annual report 2011
OdfJEll SE
CASh flOW StAtEMENt OdfJEll SE
As per 31 December 2011 the Company had no available credit facilities.
NOtE 1 ACCOuNtiNg priNCiplES
The parent company’s accounts have been presented in accordance with the simplified IFRS, and are based on the same accounting principles as the Group statement with the following exceptions:
A. derivative financial instruments and hedging The Company enters into derivative financial instruments to reduce currency and bunkers exposure in subsidiaries. These instruments do not qualify for hedge accounting. Changes in fair value of these financial instruments are charged to the respective subsidiary and therefore not recognised in the income statement. B. investments in subsidiaries, joint ventures and associatesInvestments are based on the Cost Method.
C. dividend Proposed dividend for the parent company’s shareholders is shown in the parent company accounts as a liability at 31 December.
(uSd 1 000) 2011 2010
CASh flOW frOM OpErAtiNg ACtivitiESNet result before taxes (27 197) 9 872 Depreciation 1 277 1 223 Changes in the value of financial non-current assets 19 146 - Exchange rate fluctuations (10 493) (5 308)Dividends and (gain)/loss from sale of shares classified as investing activities (8 574) (27 690)Other short-term accruals (56 427) (14 455)
Net cash flow from operating activities (82 268) (36 358)
CASh flOW frOM iNvEStiNg ACtivitiESInvestment in non-current assets (648) (282)Investment in subsidiaries and other shares 160 8 205 Gain/(loss) from sale of shares - 19 343 Received dividend 8 574 8 347 Available-for-sale investments (7 104) 65 247 Changes in long-term receivables (559) 8 876 Loans to/from subsidiaries 179 836 (27 520)
Net cash flow from investing activities 180 258 82 216
CASh flOW frOM fiNANCiNg ACtivitiESNew long-term debt 25 000 145 291 Payment of long-term debt (94 611) (158 068)Share repurchases - (21 720)Dividend (13 997) -
Net cash flow from financing activities (83 608) (34 497)
Effect on cash balances from currency exchange rate fluctuations 595 (3 739)
Net change in cash balances 14 977 7 622 Cash balances as per 1.1 55 058 47 436
Cash balances as per 31.12 70 035 55 058
Available credit facilities - 20 250
NOtE 2 grOSS rEvENuE
Gross revenue is related to services performed for other Odfjell Group companies and renting of real estate and other fixed assets and is recognised as revenue in the period the service is delivered and the period the assets rented.

57
OdfJEll SE
NOtE 3 dErivAtivE fiNANCiAl iNStruMENtS
The Company uses various derivative financial instruments to reduce fluctuations in earnings and cash flow caused by volatility in foreign exchange rates and interest rates. In addition the Company enters into derivative financial instruments to reduce currency and bunkers exposure in subsidiaries.
See note 4 in the Group Financial Statements for more details regarding risk management.
Below overview shows status of hedging exposure per 31 december 2011 (figures in 1 000)
Below overview shows status of hedging exposure per 31 december 2010 (figures in 1 000)
Odfjell SE held in addition to the derivatives above, currency FX forwards and bunkers swaps and options to reduce exposure in subsidiaries. The exposures from these contracts are transferred to the respective subsidiary and therefore no profit or loss effect in Odfjell SE:
fair value of financial instrumentsThe fair value of the financial assets and liabilities are included at the amount at which the instrument could be exchanged in a current transaction between willing parties, other than in a forced or liquidation sale. Derivative financial instruments and available-for-sale-investments are recorded in the balance sheet at the fair value at the balance sheet date. The fair value is obtained from active markets or based on third party quotes. For cash and cash equivalents and current liabilities the carrying amount is considered to be the best estimate of fair value of these instruments due to the short maturity date. Receivables are valued at nominal value reduced by any impairment. Carrying amount is considered to be best estimate of fair value due to short maturity date and valid terms. For dividend payable carrying amount is considered to be best estimate of fair value due to short maturity date and valid terms. Fair value of interest bearing debt with fixed interest rate is
time to maturity - uSd amounts
Currency Sold Bought Avg. rate < 1 year 1 - 5 years > 5 years total
Non hedge 1) USD 26 000 NOK 185 835 7.15 26 000 - 26 000
1) Weekly options, amount can be between 0 and USD 52 million.
time to maturity
interest rates Avg. rate < 1 year 1 - 5 years > 5 years total
Cash flow hedging USD 200 000 4.40% - 200 000 - 200 000Non hedge, IRS USD 225 000 3.11% - 125 000 100 000 225 000 Fair value hedging USD 88 261 From NOK to USD 4.87% - 88 261 - 88 261
time to maturity - uSd amounts
Currency Sold Bought Avg. rate < 1 year 1 - 5 years > 5 years total
Cash flow hedging EUR 30 000 USD 39 763 1.33 39 763 - - 39 763Non hedge 1) USD 100 000 NOK 672 345 6.72 62 000 38 000 - 100 000Fair value hedging USD 107 955 NOK 619 500 19 694 88 261 - 107 955
1) Weekly options, amount can be between 0 and USD 190 million.
time to maturity
interest rates Avg. rate < 1 year 1 - 5 years > 5 years total
Cash flow hedging USD 200 000 4.40% - 150 000 50 000 200 000
Non hedge, IRS USD 125 000 3.05% - 75 000 50 000 125 000Non hedge, options USD 50 000 2.50% - - 50 000 50 000
Fair value hedging USD 92 541 From NOK to USD 4.66% 4 279 88 261 - 92 541
(uSd 1 000) 2011 2010
Bunkers 2 501 4 559Currency 1 160 2 382
derivative financial instruments 3 661 6 941

58 odfjell annual report 2011
OdfJEll SE
Classification of financial assets and liabilities as at 31 december 2010:
(uSd 1 000)
derivatives held as
hedge instrument
derivatives held at fair value over the result
loans and receivables
Available for sale invest-
ments
liabilities recognised
at amortised cost
Non- financial
assets/ liabilities 2011
ASSEtSCash and cash equivalents - - 70 035 - - - 70 035Available-for-sale-investments - - - 25 364 - - 25 364Derivative financial instruments 8 052 2 425 - - - - 10 477Current receivables - - 4 591 - - - 4 591Non-current receivables - - 18 324 - - - 18 324Loan to group companies - - 566 127 - - - 566 127Other non-financial assets - - - - - 709 960 709 960
total assets 8 052 2 425 659 077 25 364 - 709 960 1 404 879
liABilitiESOther current liabilities - - - - 5 449 - 5 449Loan from subsidiaries - - - - 221 576 - 221 576Dividend payable - - - - - - -Derivative financial instruments 13 007 23 803 - - - - 36 810Interest bearing debt - - - - 523 848 - 523 848Other non-current liabilities - - - - - - -
total liabilities 13 007 23 803 - - 750 873 - 787 682
calculated based on discounted future cash flows and the Company’s alternative market interest for corresponding financial instruments. Fair value of bonds is calculated based on market values on the bonds.
The Company’s financial statement does not have any differences between fair value and carrying amount.
fair value hierarchyAs at 31 December all financial instrument were valued at Level 2. Level 2 is defined where inputs are either directly or indirectly observable for substantially the full term of the assets and liabilities.
Classification of financial assets and liabilities as at 31 december 2011:
(uSd 1 000)
derivatives held as
hedge instrument
derivatives held at fair value over the result
loans and receivables
Available for sale in-vestments
liabilities recognised
at amortised cost
Non- financial
assets/ liabilities 2010
ASSEtSCash and cash equivalents - - 55 058 - - - 55 058Available-for-sale-investments - - - 18 260 - - 18 260Derivative financial instruments 6 941 5 394 - - - - 12 335Current receivables - - 5 347 - - - 5 347Non-current receivables - - 17 765 - - - 17 765Loan to group companies - - 567 401 - - - 567 401Other non-financial assets - - - - - 729 894 729 897
total assets 6 941 5 394 645 571 18 260 - 729 894 1 406 061
liABilitiESOther current liabilities - - - - 4 649 - 4 649Loan from subsidiaries - - - - 115 445 - 115 445Dividend payable - - - - - - -Derivative financial instruments 12 735 9 455 - - - - 22 190Interest bearing debt - - - - 603 952 - 603 952Other non-current liabilities - - - - 938 - 938
total liabilities 12 735 9 455 - - 724 984 - 747 174

59
OdfJEll SE
NOtE 4 lONg – tErM dEBt
Maturity of interest bearing debt as per 31 december 2011:
Maturity of interest bearing debt as per 31 december 2010:
loans from subsidiaries:
Loans from group companies generally have no fixed repayment schedule. Repayment is based on available liquidity. Loans from group companies are priced on an arms-length basis.
The average term of the Company's outstanding long-term interest bearing bank debt as per 31 December 2011 was 4.0 years (4.7 years in 2010). The average term of the Company's outstanding bond debt as per 31 December 2011 was 1.8 years (2.8 years in 2010). The long-term debt is a combination of debt guaranteed by subsidiaries and bonds in the Norwegian bond market. Interest rates are generally based on floating LIBOR-rates on less than 12-months. The interest bearing debt does not contain any restrictions on the Company’s dividend policy or financing opportunities. The interest bearing debt is generally subject to certain covenants which include that, in the Odfjell Group accounts, the book debt ratio shall at all times be less than 75% (excluding deferred taxes from debt) and that the liquidity shall always be minimum of USD 50 million and 6% of interest bearing debt.
(uSd 1 000)Average
interest rate 2011 2010
Loans from financial institutions – floating interest rate 2.52% 439 695 516 954Bonds 5.40% 88 261 92 541
Subtotal interest bearing debt 3.01% 527 956 609 495Transaction cost (4 108) (5 543)
total interest bearing debt 523 847 603 952Current portion of total debt (63 052) (101 331)
total non-current interest bearing debt 460 796 502 621
(uSd 1 000) 2012 2013 2014 2015 2016 2017+ total
Loans from financial institutions – floating interest rate 63 052 91 528 64 948 176 878 22 433 20 854 439 695Bonds - 88 261 - - - - 88 261total interest bearing debt 63 052 179 790 64 948 176 878 22 433 20 854 527 956
(uSd 1 000) 2011 2012 2013 2014 2015 2016+ total
Loans from financial institutions – floating interest rate 97 052 59 199 90 199 62 433 174 040 34 031 516 954Bonds 4 279 - 88 261 - - - 92 541total interest bearing debt 101 331 59 199 178 460 62 433 174 040 34 031 609 495
(uSd 1 000) CurrencyAverage
interest rate 2011 2010
Loans from subsidiaries USD 2.78% 5 075 5 075NOK - 34 357EUR 3.48% 214 353 -
total loans from subsidiaries 219 429 39 433
NOtE 5 tAXES
(uSd 1 000) 2011 2010
Taxes payable - (2 452)Change in deferred tax 938 1 648Tax expenses relating to group contribution 2009 - (4 561)Adjustments related to earlier year 120 -
total tax expenses 1 058 (5 365)
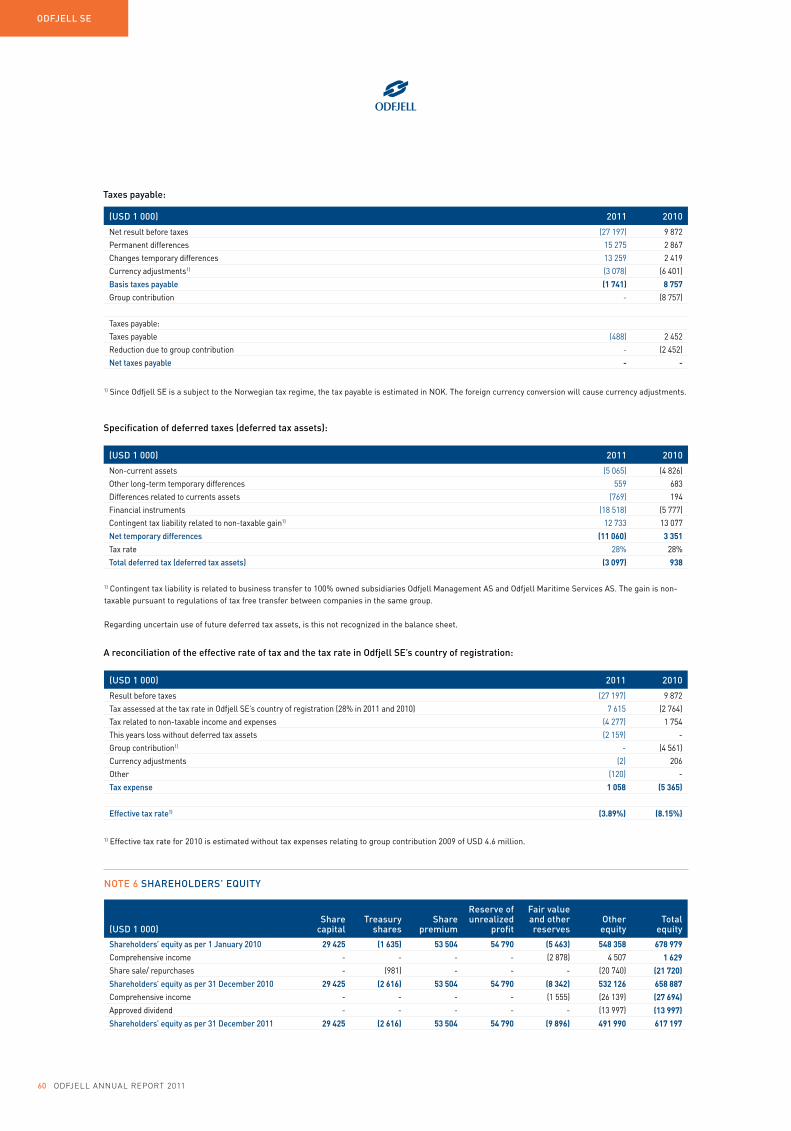
60 odfjell annual report 2011
OdfJEll SE
taxes payable:
1) Since Odfjell SE is a subject to the Norwegian tax regime, the tax payable is estimated in NOK. The foreign currency conversion will cause currency adjustments.
1) Contingent tax liability is related to business transfer to 100% owned subsidiaries Odfjell Management AS and Odfjell Maritime Services AS. The gain is non-taxable pursuant to regulations of tax free transfer between companies in the same group.
Regarding uncertain use of future deferred tax assets, is this not recognized in the balance sheet.
1) Effective tax rate for 2010 is estimated without tax expenses relating to group contribution 2009 of USD 4.6 million.
Specification of deferred taxes (deferred tax assets):
(uSd 1 000) 2011 2010
Net result before taxes (27 197) 9 872Permanent differences 15 275 2 867Changes temporary differences 13 259 2 419Currency adjustments1) (3 078) (6 401)
Basis taxes payable (1 741) 8 757Group contribution - (8 757)
Taxes payable:Taxes payable (488) 2 452Reduction due to group contribution - (2 452)
Net taxes payable - -
(uSd 1 000) 2011 2010
Non-current assets (5 065) (4 826)Other long-term temporary differences 559 683Differences related to currents assets (769) 194Financial instruments (18 518) (5 777)Contingent tax liability related to non-taxable gain1) 12 733 13 077
Net temporary differences (11 060) 3 351Tax rate 28% 28%
total deferred tax (deferred tax assets) (3 097) 938
(uSd 1 000) 2011 2010
Result before taxes (27 197) 9 872Tax assessed at the tax rate in Odfjell SE’s country of registration (28% in 2011 and 2010) 7 615 (2 764)Tax related to non-taxable income and expenses (4 277) 1 754This years loss without deferred tax assets (2 159) -Group contribution1) - (4 561)Currency adjustments (2) 206Other (120) -
tax expense 1 058 (5 365)
Effective tax rate1) (3.89%) (8.15%)
A reconciliation of the effective rate of tax and the tax rate in Odfjell SE’s country of registration:
NOtE 6 ShArEhOldErS’ Equity
(uSd 1 000)Share
capitaltreasury
sharesShare
premium
reserve of unrealized
profit
fair value and other reserves
Other equity
total equity
Shareholders’ equity as per 1 January 2010 29 425 (1 635) 53 504 54 790 (5 463) 548 358 678 979Comprehensive income - - - - (2 878) 4 507 1 629Share sale/ repurchases - (981) - - - (20 740) (21 720)Shareholders’ equity as per 31 december 2010 29 425 (2 616) 53 504 54 790 (8 342) 532 126 658 887Comprehensive income - - - - (1 555) (26 139) (27 694)Approved dividend - - - - - (13 997) (13 997)Shareholders’ equity as per 31 december 2011 29 425 (2 616) 53 504 54 790 (9 896) 491 990 617 197

61
OdfJEll SE
NOtE 7 NON-CurrENt ASSEtS
(uSd 1 000) Cost 1.1.2011 investment Sale book value
Accumulateddepreciation
prior yearsdepreciation
this yearBook value 31.12.2011
Land 408 - - - - 408Office building 22 316 648 - (8 299) (1 277) 13 388
total 22 724 648 - (8 299) (1 277) 13 796
Depreciation periods: Office building: 50 years. Land is not depreciated.
NOtE 8 rElAtEd pArtiES
In the normal course of the conduct of its business, Odfjell enters into a number of transactions with related parties. AS Rederiet Odfjell, beneficially owned by Director of the Board, Bernt Daniel Odfjell and his immediate family, rent office premises from Odfjell SE (through Odfjell Management AS) in Bergen, for which Odfjell received USD 0.1 million in 2011. The Company considers the above arrangements to be on commercially reasonable market terms and there were no outstanding balances as per 31 December 2011.
Odfjell SE does also have several financial transactions with Group companies, all considered to be at commercial reasonable market terms, see note 11, 13 and 14.
NOtE 9 COMMitMENtS ANd CONtiNgENCiES
Capital Expenditures No material future commitments related to capital expenditure.
Contingencies The Company maintains insurance coverage for its activities consistent with industry practice.
NOtE 10 SuBSEquENt EvENt
No special issues.
NOtE 11 fiNANCiAl iNCOME ANd EXpENSES
(uSd 1 000) 2011 2010
Income on investment in subsidiaries 8 490 8 347Inter-company interest income 14 332 9 099Financial assets and liabilities at fair value through profit and loss - 2 576Gain/(loss) of sale share - 19 343Other interest income 2 201 2 198Other financial income 11 160 4 346
total financial income 36 183 45 909Inter-company interest expenses 3 174 1 975Other interest expenses 26 983 26 634Other financial expenses 5 234 6 323Financial assets and liabilities at fair value through profit and loss 9 217 -Changes in the value of financial fixed assets 19 146 -
total financial expenses 63 754 34 932
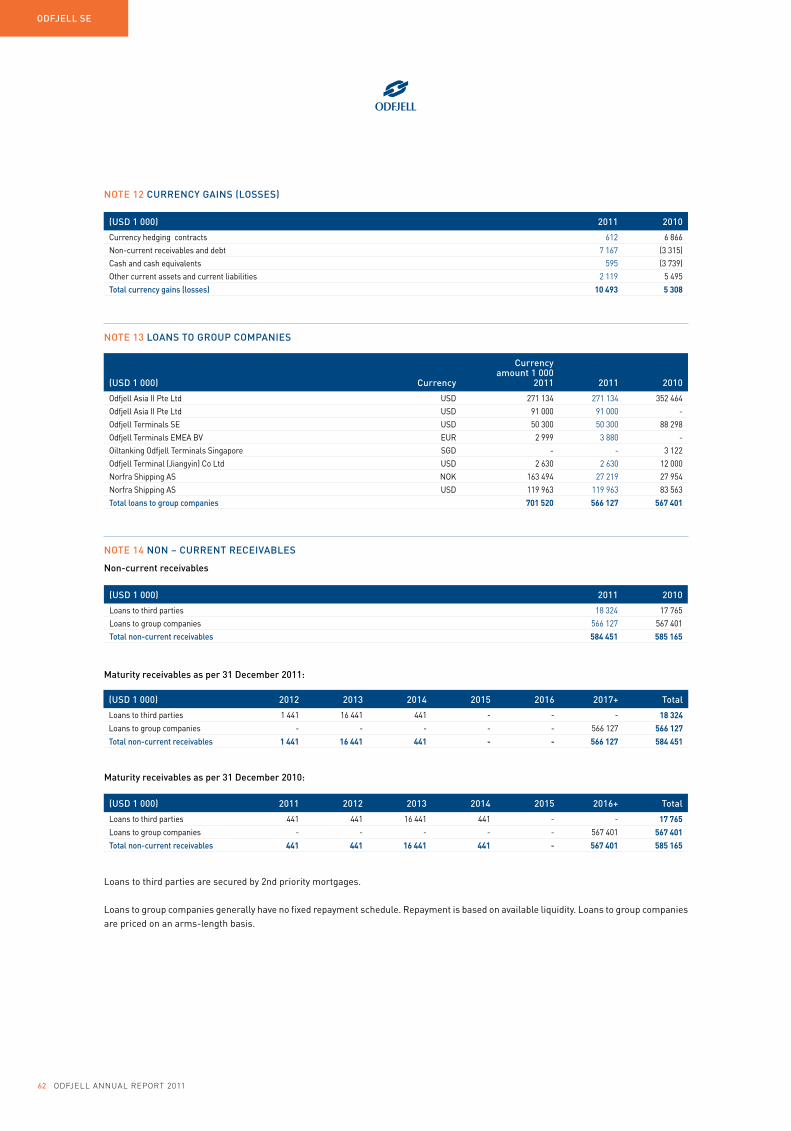
62 odfjell annual report 2011
OdfJEll SE
NOtE 12 CurrENCy gAiNS (lOSSES)
NOtE 13 lOANS tO grOup COMpANiES
NOtE 14 NON – CurrENt rECEivABlES
Non-current receivables
Maturity receivables as per 31 december 2011:
Maturity receivables as per 31 december 2010:
Loans to third parties are secured by 2nd priority mortgages.
Loans to group companies generally have no fixed repayment schedule. Repayment is based on available liquidity. Loans to group companies are priced on an arms-length basis.
(uSd 1 000) 2011 2010
Currency hedging contracts 612 6 866Non-current receivables and debt 7 167 (3 315)Cash and cash equivalents 595 (3 739)Other current assets and current liabilities 2 119 5 495
total currency gains (losses) 10 493 5 308
(uSd 1 000) Currency
Currency amount 1 000
2011 2011 2010
Odfjell Asia II Pte Ltd USD 271 134 271 134 352 464Odfjell Asia II Pte Ltd USD 91 000 91 000 -Odfjell Terminals SE USD 50 300 50 300 88 298Odfjell Terminals EMEA BV EUR 2 999 3 880 -Oiltanking Odfjell Terminals Singapore SGD - - 3 122Odfjell Terminal (Jiangyin) Co Ltd USD 2 630 2 630 12 000Norfra Shipping AS NOK 163 494 27 219 27 954Norfra Shipping AS USD 119 963 119 963 83 563
total loans to group companies 701 520 566 127 567 401
(uSd 1 000) 2011 2010
Loans to third parties 18 324 17 765Loans to group companies 566 127 567 401
total non-current receivables 584 451 585 165
(uSd 1 000) 2012 2013 2014 2015 2016 2017+ total
Loans to third parties 1 441 16 441 441 - - - 18 324Loans to group companies - - - - - 566 127 566 127total non-current receivables 1 441 16 441 441 - - 566 127 584 451
(uSd 1 000) 2011 2012 2013 2014 2015 2016+ total
Loans to third parties 441 441 16 441 441 - - 17 765Loans to group companies - - - - - 567 401 567 401total non-current receivables 441 441 16 441 441 - 567 401 585 165

63
OdfJEll SE
Book value equals market value. Market value of investments that are actively traded in organised financial markets is determined by reference to quoted market bid prices at the close of business on the balance sheet date. Bonds and certificates generally have interest rate adjustments every three months.
NOtE 16 SAlAriES, NuMBEr Of EMplOyEES, BENEfitS tO BOArd Of dirECtOrS, prESidENt/CEO, OthEr MEMBErS Of thE MANAgEMENt grOup ANd AuditOr’S rEMuNErAtiON
For 2011 the Company has no employees and the Company is not bound to have mandatory occupational pension scheme pursuant to the Norwegian law of Occupational pension scheme. Compensation and benefits to Board of directors in 2011:
Auditor´s remuneration for:
(uSd 1 000) CompensationOther
benefits total
Laurence Ward Odfjell (Chairman) 357 36 394Bernt Daniel Odfjell 36 - 36Irene Waage Basili 45 - 45Terje Storeng 45 - 45Christine Rødsæther 36 - 36total 518 36 554
(uSd 1 000 exclusive vAt) 2011 2010
Statutory auditing 152 71Other assurance services 3 6Tax advisory services 31 66Non-audit services 40 36
total remuneration 226 180
(uSd 1 000) CurrencyAverage
interest rate Book value
Bonds and certificates issued by financial institutions USD 1.42% 15 631Bonds and certificates issued by financial institutions NOK 3.40% 4 991Bonds and certificates issued by corporates USD 0.73% 4 741
total 25 364
NOtE 15 AvAilABlE-fOr-SAlE-iNvEStMENtS
NOtE 17 pENSiON COStS ANd liABilitiES
For 2011 the Company has no employees and the Company is not bound to have mandatory occupational pension scheme pursuant to the Norwegian law of Occupational pension scheme.

64 odfjell annual report 2011
OdfJEll SE
The company Odfjell Argentina SA is directly and indirectly 99% owned by Odfjell SE.
Impairment of USD 19.1 million in shares in Norfra Shipping AS due to recoverable amount was lower than book value. No other impairments were necessary.
NOtE 19 rEStriCtEd CASh ANd CASh EquivAlENtS The Company has no restricted cash and cash equivalents per 31 December 2011.
1) Result and equity on 100% basis.
Other shares registered officeShare/
voting rights Book value result 20111) Equity 20111)
Odfjell Ahrenkiel Europe GmbH Germany 50.0% 289 8 678Oiltanking Odfjell Terminal Singapore Pte Ltd Singapore 50.0% 20 195 14 738 77 834 Odfjell & Vapores Ltd Bermuda 50.0% 4 (12) 70Odfjell y Vapores S A Chile 49.0% 506 1 639 15 663 NCC Odfjell Chemical Tankers JLT United Arab Emirates, Dubai 50.0% 41 2 314 4 452 V.O.Tank Terminal Ningbo Ltd China 12.5% 1 108 1 536 13 752 Crystal Pool AS Norway 50.0% 9 (290) (254)
total other shares 22 153
(NOk 1 000)Number of
sharesNominal value
(NOk) 2011 2010
A shares 65 690 244 2.5 164 226 164 226B shares 21 078 704 2.5 52 697 52 697
total 86 768 948 216 922 216 922
NOtE 18 ShArES Subsidiaries and activities under joint control are included in the parent company accounts based on the Cost Method.
(uSd 1 000) registered officeShare/
voting rights Book value result 2011 Equity 2011
Odfjell Management AS Norway 100% 21 858 1 074 18 735 Odfjell Maritime Services AS Norway 100% 1 929 170 1 705 Odfjell Tankers AS Norway 100% 9 858 3 767 21 322 Odfjell Terminals SE Norway 100% 40 193 41 081 103 850 Odfjell Insurance & Properties AS Norway 100% 843 (32) 736Odfjell Projects AS Norway 100% 13 (4) (10)Norfra Shipping AS Norway 100% 150 030 (15 309) 124 128 Odfjell Tankers Europe AS Norway 100% 1 717 278 2 002 Odfjell Asia Pte Ltd Singapore 100% - (4) 168Odfjell Singapore Pte Ltd Singapore 100% 13 140 2 582 Odfjell USA (Houston) Inc USA 100% 0 17 1 742 Odfjell Netherlands BV Netherlands 100% 1 021 26 1 595 Odfjell (UK) Ltd United Kingdom 100% 2 166 490 38 546 Odfjell Chemical Tankes (Germany) GmbH Germany 100% 1 557 94 991Odfjell Japan Ltd Japan 100% - (686) (2 272)Odfjell Korea Ltd Korea 100% 43 (118) 108Odfjell Brasil - Representacoes Ltda Brazil 100% 983 14 1 173 Odfjell Chemical Tankers Ltd Bermuda 100% 441 262 137 446 951 Odfjell Peru Peru 100% 195 10 48Odfjell Ship Management (Philippines) Inc Philippines 100% 200 479 675Odfjell Durban SA (Pty) Ltd South Africa 100% - 7 978Odfjell Argentina SA Argentina 90% 129 164 471
total 674 011
All shares have the same rights in the Company, except that B shares have no voting rights.
NOtE 20 ShArE CApitAl ANd iNfOrMAtiON ABOut ShArEhOldErS

65
OdfJEll SE
All treasury shares were bought in 2009 and 2010 and are held by Odfjell SE and Odfjell Chemical Tankers AS (500,000 A shares). There was no sale in 2011.
The Annual General Meeting on 3 May 2011 authorised the Board of Directors to acquire up to 10% of the Company's share capital. This authorisation expires 3 November 2012. The purpose of purchasing own shares is to increase shareholders' value. The Board of Directors regularly considers investments in own shares when it may be beneficial for the Company.
Shares/controlled owned by members of the board (including related parties):
Odfjell SE has given guarantees on behalf of subsidiaries as part of our day-to-day business to assume responsibility for bunkers purchases, port obligations, credit facilities and operating lease commitments. Guarantees to and from group companies are generally entered into on arms-length basis.
NOtE 21 guArANtEES
A shares B shares total
Chairman of the Board of Directors, Laurence Ward Odfjell 25 966 492 1 755 076 27 721 568Director, Bernt Daniel Odfjell - 2 032 2 032Director, Terje Storeng 70 560 2 112 72 672
(uSd 1 000) 2011 2010
Subsidiaries 735 588 814 744
20 largest shareholders as per 31 december 2011:
1) Nominee account.2) No voting rights for own shares ref. Public Limited Companies Act § 5-4.
Name A shares B shares total percent of votespercent of
shares
1 Norchem AS 25 966 492 1 591 176 27 557 668 43.42% 31.76%
2 Odfjell SE 5 391 166 2 322 482 7 713 648 2) 8.89%
3 Rederiet Odfjell AS 3 497 472 - 3 497 472 5.85% 4.03%
4 Odfjell Shipping Bermuda Ltd. 2 750 000 715 760 3 465 760 4.60% 3.99%
5 Pareto Aksje Norge 1 928 654 1 224 706 3 153 360 3.23% 3.63%
6 SHB Stockholm Clients Account 1) 1 481 270 1 390 680 2 871 950 2.48% 3.31%
7 JP Morgan Clearing Corp. 1) 2 727 900 31 800 2 759 700 4.56% 3.18%
8 SIX SIS AG 5 PCT NOM 1) 1 036 400 1 600 800 2 637 200 1.73% 3.04%
9 Odin Norden - 2 154 133 2 154 133 - 2.48%
10 Folketrygdfondet - 1 724 900 1 724 900 - 1.99%
11 SIX SIS AG 1) 1 099 600 577 100 1 676 700 1.84% 1.93%
12 Skagen Vekst 1 664 725 - 1 664 725 2.78% 1.92%
13 Pareto Aktiv 889 381 564 123 1 453 504 1.49% 1.68%
14 Odin Norge - 857 412 857 412 - 0.99%
15 Pareto Verdi 501 178 303 050 804 228 0.84% 0.93%
16 Fondsfinans Spar 755 000 - 755 000 1.26% 0.87%
17 AS SS Mathilda 600 000 150 000 750 000 1.00% 0.86%
18 Berger 732 400 - 732 400 1.22% 0.84%
19 AS Bemacs 373 000 353 000 726 000 0.62% 0.84%
20 KLP Aksje Norge VPF 702 828 20 838 723 666 1.18% 0.83%
total 20 largest shareholders 52 097 466 15 581 960 67 679 426 78.11% 78.00%Other shareholders 13 592 778 5 496 744 19 089 522 21.89% 22.00%
total 65 690 244 21 078 704 86 768 948 100.00% 100.00%International shareholders 38 299 259 7 126 373 45 425 632 58.30% 52.35%
Treasury shares 5 891 166 2 322 482 8 213 648 2) 9.47%
Cost price treasury shares (USD 1 000) 44 256 18 660 62 916

66 odfjell annual report 2011
We confirm, to the best of our knowledge, that the financial statements for the period 1 January to 31 December 2011 have been prepared in accordance with current applicable accounting standards, and give a true and fair view of the Group and the Company’s consolidated assets, liabilities, financial position and results of operations, and that the Report from the Board of Directors provides a true and fair view of the development and performance of the business and the position of the Group and the Company, together with a description of the principal risks and uncertainties facing the Company and the Group.
rESpONSiBility StAtEMENt
tErJE StOrENg lAurENCE WArd OdfJEll BErNt dANiEl OdfJEll
irENE WAAgE BASili ChriStiNE rØdSÆthEr JAN Arthur hAMMErPresident/CEO
thE BOArd Of dirECtOrS Of OdfJEll SE Bergen, 15 March 2012

67
68 odfjell annual report 2011
AuditOr'S rEpOrt

6969

70 odfjell annual report 2011
WOrldWidE ACtivitiES
san Antoniosantiago
mejillones
Callao
houston
London
Ladrio
sao Luis
Charleston
Quebec
rotterdam
helsinki
teresina
Aracruz
sao paulosantos
triunforio Grande
Campana
Buenos Aires
hQ Bergen

71
rotterdam
helsinki
BiK
Dubai
oman
mumbai
shanghai
Ulsan tokyo
seoul
ningbo
manila
melbourne
Durban
singapore
Daliantianjin
Jiangyin
INTERNATIONAL OFFICES
ODFJELL TERMINALS
ASSOCIATED TERMINALS
TERMINAL UNDER CONSTRUCTION
71

every dropcounts
At Odfjell we give the highest priority to quality, health, safety and environmental protection. All our activities shall be based on a zero accidents philosophy, meaning that our goal is no personnel injuries, no accidental pol-lution, reduced environmental impact and no damage to cargo, ships, terminals or other properties. We shall evaluate risk, review performance and share experience.

every dropcounts

74 odfjell annual report 2011
SuStAiNABlE BuSiNESS iS gOOd BuSiNESS
Odfjell’s Corporate Social responsibility (CSr) initiatives encompass quality, health, safety and care for the environ-ment (qhSE), as well as business ethics, human rights, non-discrimination and anti-corruption measures, and are also included in our mission statement. We strive for an improved qhSE culture and all Board meetings always starts with qhSE information. the same goes for the “All Employees Meetings”. We aim to achieve sustainable development for our employees, investors, customers and the communities in which we operate. We work in accordance with international and national regulations that govern our business and aim to take positive measures over and beyond mandatory compliance requirements.
quAlity, hEAlth, SAfEty ANd ENvirONMENtAl prOtECtiON
As in previous years, in 2011 Odfjell initiated a number of different activities to assure the safety of our employees. The Lost-Time Injury Frequency (LTIF) indicator for shipping with the on board and on shore figures decreasing to 1.23 in 2011 from 1.50 previous year. The terminals have an increase from 2.20 in 2010 to 2.90 in 2011. No incidents involving fatalities were recorded in 2011, compared with two in 2010.
Our mariners have attended a combined total of nearly 6,000 training days and this year’s main theme at officer conferences has been “Safety Culture”. Most of these conferences have been held at the Odfjell Academy at Subic Bay in the Philippines where main topics have included risk assessment, incident handling and QHSE. A Terminal Training Center is established in Dalian, China to prepare for sustainable growth.
During the last months of 2011 Odfjell Terminals (Rotterdam) BV (OTR) has appeared in the public news in the Netherlands in connection with product spills and emission of vapours into the air. There has also been failure in properly reporting incidents to the authorities. These incidents have been scrutinized by the Dutch environmental authority DCMR and the Labour Inspection leading to the terminal initiating several processes to improve performance in preventing such spills and uncontrolled emission to happen again in the future. Several measures have already been taken with immediate effect. OTR has also drawn up an action plan aimed at implementing major improvements first half of 2012 and is a part of an extensive improvement programme aiming to enhance the safety culture, the primary process and the safety management system. OTR has also hired TNO and The Brown Paper Company to improve the safety culture and improve primary process. This is all in addition to investments of constructions and replacements. Operating units have been certified to the International
Safety Management code (ISM) (ship management), ISO 9001:2008 standard (terminals), CDI-T attestation (customer terminal inspection), ISPS code (terminal security manage-ment) and ISO 14001 environment standard. Several of our terminals have acquired OHSAS 18001:2007 certification, a management system standard within occupational health and safety.
Pirate activities in the Gulf of Aden and the Indian Ocean remain a major concern for the type of ships Odfjell operates and the scale of the Company’s operations in the exposed area is significant. Although we implemented several pre-cautionary measures to reduce the risk during transit in areas exposed to pirates from Somalia we still considered the risk unacceptably high and in March 2011 we further strengthened our counter-piracy measures by regular use of privately contracted security personnel throughout the entire high-risk area.
Energy optimisation is a key focus area and in 2011 Odfjell replied for the first time to the survey performed by the Carbon Disclosure Project (CDP). CDP is the leading inter-national not-for-profit organisation focusing on businesses’ response to climate change. Emissions have decreased in recent years and reduced by further 7% in 2011.
COrpOrAtE SOCiAl rESpONSiBility – CSr
CSr CouncilIn 2011 a CSR Council was established to ensure compliance with our CSR policy and facilitate a gradual implementation of the United Nations’ ten principles within the areas of Human Rights, Labour, Environment and Anti-Corruption. Odfjell signed up to the UN Global Compact programme in 2011.
By the end of March 2012, Odfjell will submit its first official “Communication on Progress” report to the stakeholders. The “Communication on Progress” report is an annual submission that will outline the Company’s efforts to implement the ten principles. The Communication on Progress report will be made available on: www.odfjell.com.
ENvirONMENtAl fOCuS
Carbon disclosure project – CdpIn 2011, Odfjell replied to the annual CDP request for

75
Sour
ce: n
orw
egia
n Sh
ipow
ners
’ ass
ocia
tion
COMPARISON OF AVERAGE ODFJELL VESSELS VS OTHER TRANSPORT MODES
Gram CO2 per tonne cargo transported 1 km
Cargoaircraft
Heavydutyvehicle
Freighttrain(diesel)
AverageOdfjellvessel
0
100
200
300
400
500
600
700
emissions and climate change data. The scope was limited to the shipping business, including the headquarters in Bergen. We recorded total annual CO2 emissions of around 1,850,000 tonnes for 2010 as a whole. The figure for 2011 was 1,700,000 tonnes CO2. The majority of the emissions relate to fuel used by the fleet, but we also reported emissions for business travel by plane, including such by seafarers. Environmental considerations relating to consumption of electricity, waste management, plane travel and use of employees’ cars were surveyed at headquarters. The figures for 2012 will also include Odfjell terminals.
Emissions improvements CDP has developed several KPIs to illustrate changes in emissions from year to year. From 2009 to 2010 our figures show a reduction in CO2 emissions of 14.3% based on total revenues and 13.9% based on number of full time employees. Emissions per cargo tonne mile show a reduction of 6.6%. Similar improvements were achieved in 2011. These figures will be reported to the CDP organisation within May 2012. There are many reasons for these improvements, such as implementation of weather-routing systems, a speed reduction scheme, installation of electronic systems to reduce lubrication oil consumption and reduced running hours on auxiliary engines. The CDP score came in at 65, which is generally considered good for a first full-year report. The maximum score is 100 and the average for Nordic companies in 2010 was 64.
ENvirONMENtAl iMpACt Of thE OdfJEll flEEt
In 2011 the Odfjell fleet consumed 545,000 tonnes of fuel oil, of which 17% was classified as low-sulphur fuel and 21,000 tonnes of marine distillates. Based on the consumption of 91 vessels, total emissions of CO2 amounted to 1,700,100 tonnes, an 7.6% reduction compared to 2010 shipping related emissions. Total emissions of SOx decreased 6% to 27,400 tonnes.
These reductions are partially the result of further
expansion of the slow-speed programme, weather routing and increased cargo volumes. All fuel purchased by Odfjell is tested by Det Norske Veritas Petroleum Service. Test results of the fuel purchased in 2011 (1,725 samples) put the average weighted sulphur content at 2.54%, compared with 2.48% in 2010. The global limit in 2011 was 4.5%.
SOx emissionsBased on all consumption in 2011 (both at port and at sea) Odfjell’s vessels emitted on average 0.28 grams per tonne cargo transported one nautical mile. This is slightly below 2010 levels.
CO2 emissionsIn 2009 IMO’s Marine Environment Protection Committee circulated guidelines for voluntary use of an Energy Efficiency Operational Indicator (EEOI), defined as the amount of CO2 emitted per unit of transport work. Since 2008 Odfjell has calculated the EEOI at ship and fleet level. The calculations are performed in accordance with IMO MEPC Circular 684.
Including fuel consumption both at port and at sea, the EEOI for the Odfjell fleet was 17.59 grams of CO2 per tonne cargo transported one nautical mile (g/tnm) in 2011. This represents an improvement of 7% compared to 2010. The figure for consumption at sea was 14.55 g/tnm, which is also an improvement of 7% compared to the previous year.
The main reasons for the increased energy efficiency are the speed/consumption reduction scheme in combination with better capacity utilisation and improved cargo volumes.
The EEOI for the main ships groups sorted in deadweight ranges can be seen in the table below:
Speed/consumption reduction schemeIn 2011 Odfjell Tankers operated 45 ships in slow or
0
10
20
30
40
50
60
70
80
EEOI CO2 EMISSIONS
Gram CO2 per tonne cargo transported 1 nautical mile (main ship groups)
6 000 DWT,7 vsls
9–18 000 DWT, 11 vsls
19–25 000DWT, 18 vsls
30–46 000DWT,55 vsls
All fleet, 91 vsls
At seaTotal
EEOI TREND FOR THE ODFJELL FLEET
Gram CO2 emitted per tonne cargo transported 1 nautical mile
16.0
16.5
17.0
17.5
18.0
18.5
19.0
19.5
20.0
20.5
08 09 10 11
76 odfjell annual report 2011
ultra-slow speed mode. This generated a net fuel saving of about 60,000 tonnes, corresponding to emission savings of approximately 180,000 tonnes of CO2 and 3,100 tonnes of SOx. At current speed mode we expect to save 100,000 tonnes of fuel in 2012 compared to running the fleet at full speed mode.
External weather routingAdvanced weather routing services have been in use since December 2009, both for our owned fleet and the time chartered ships. About 800 sea voyages were subject to external weather routing in 2011. Following the route optimisations for these voyages the ships reduced their time at sea by a total of at least 54 days. This equates to a fuel saving of approximately 2,000 tonnes, which in turn is equivalent to about 6,000 tonnes CO2.
intermediate hull cleaning and propeller polishingHull cleaning and propeller polishing are a normal part of ordinary dry docking work. However, in 2011 Odfjell established procedures to enable ships to undergo hull cleaning and propeller polishing in between scheduled dockings. All Odfjell operated ships, both time charted and owned, are being more closely monitored and cleaning intervals are being shortened. The result of this type of intermediate operations can be a significant reduction of fuel consumption and emissions of CO2, NOx and SOx. One operation conducted in 2011 is estimated to have saved approximately 1,600 tonnes of fuel during the first year, which is equivalent to 5,000 tonnes CO2.
tank cleaning – chemical treatmentOdfjell Tankers continues to develop effective tank cleaning methods that meet the highest industrial standards. Our initiative to reduce the number of cleaning chemicals to four main products and two supplementary products has been successfully implemented. In 2011 we focused on monitoring and reducing the amount of fuel used for heating water during the tank cleaning process.
COrpOrAtE qhSE AuditS
Corporate QHSE conducts internal system audits. 13 busi- ness units were audited during 2011. The purpose of system audits is to verify compliance with corporate and depart-mental procedures. The audits shall also enhance and ensure corporate governance and contribute to continual improvements.
OdfJEll MANAgEd ShipS
The Lost-Time Injury Frequency indicator for Odfjell-managed ships was 1.23 in 2011, against 1.50 in 2010, and as such was the best figure ever.
Odfjell Ship Management holds ISO 14001 certification, which covers 49 ships under own management. All relevant environmental considerations are identified, and key issues are listed in the HSSE programme. The following technical
projects reduce the environmental impact beyond the requirements contained in current regulations:
reduced oil leaks from stern tube sealing systemsIn order to improve the performance of the stern tube sealing system, Odfjell embarked on a major upgrade programme in 2009, with the aim of improving the systems on 19 ships to the highest technical standard. Three ships were upgraded in 2011.
Bilge water treatment plantsIn order to reduce the oil content in bilges to two parts per million, Odfjell has upgraded to more advanced bilge water treatment plants. The number of ships with upgraded operational plants is now 38 and the programme is continu-ing in 2012.
reduced fuel consumptionOdfjell has established a project to install a duct on the propellers on some ships. The duct will cut fuel consump-tion, and thereby reduce emissions. The first installations were completed in 2011, and seem to have positive results.
Ship recyclingOdfjell has established a programme to obtain Green Passports for all older ships, in order to guarantee con-trolled recycling of such units. The programme meets all requirements and expectations of IMO Resolutions A 962 and 179 regarding recycling of ships and means that the Company is several years ahead of the mandatory deadline for the enforcement of these resolutions. Four Odfjell ships obtained Green Passports during 2011, and the programme is continuing in 2012.
External activities involving OdfjellThrough industrial organisations and flag state administra-tions Odfjell has actively contributed to specific industrial environmental initiatives, including:
• Enhancing on board safety by promoting to expand the current inert gas requirement to apply to all tanks loaded with low flash cargoes, regardless of tank size, age of ship or cargo categorisation.
• Providing professional industrial advice regarding audit processes for relevant IMO publications on environmental protection (Marpol and IBC code).
• Chairmanship of the working group to revise the Tanker Safety Guide, Chemicals, which is an important industrial guideline for operation of chemical tankers.
The Company’s target is to actively support and promote these kinds of initiatives so that they become industry practice in the future, either through legislative changes or through new recognised industry practices and guidelines.
piracyPirate activities in the Gulf of Aden and the Indian Ocean remained a major concern for the type of ships Odfjell operates and the scale of the Company’s operations in the exposed area is significant. Although several precautions to

77
reduce the risk during transit of areas exposed to pirates were implemented in 2010, we still assessed the risk as unacceptably high and as from March 2011 we further strengthened our counter-piracy measures by regular use of privately contracted security personnel throughout the high risk area. The use of external security personnel on board our ships follow a stringent protocol concerning risk assessment and the procedures of engagement and agreements used are reviewed and approved by flag states and marine underwriters. Although pirate activities remain high, more robust counter-piracy measures on the ships, in combination with improved naval tactics, have reduced the pirates’ success rate significantly, and subsequently the cash flow supporting this criminal activity. There were 31 incidents of piracy and 4 hijackings in the fourth quarter of 2011, compared with 90 incidents and 19 hijackings in the same period in 2010. Activities in the mid and eastern part of the Indian Ocean were low in 2011. On 14 July 2011 Bow Elm was approached by a skiff with visible arms on board while she was transiting Bab al Menab in the Southern Red Sea. No other close encounters have been reported.
NEWBuildiNg prOgrAMMES
Odfjell has in its newbuilding programmes introduced several projects which will have a positive impact on the environment. These include:
• Building larger vessels at 75,000 DWT, the world’s largest IMO II chemical tanker with reduced fuel consumption and emissions per tonne mile, which represents a quantum leap for our industry.
• Ballast water treatment system, to avoid discharge of alien micro-organisms.
• Oily water separator with the ability to reduce the oil content to five ppm, well below the currently applicable requirement of 15 ppm.
• Introducing fuel saving equipment for the sea water cooling pumps, by fitting frequency-controlled electrical motors.
tANk tErMiNAlS
The Lost Time Injury Frequency (LTIF) indicator for terminals is up to 2.90, compared to 2.20 in 2010. The indicator for 2009 was 7.90. The “lessons learned” programme will continue in 2012 to share information and enhance experience transfer.
Reportable spills (spills over five litres) outside primary containment areas rose by 29%, from 42% in 2010 to 54% in 2011. Reported near-misses and non-compliances were slightly down in 2011 compared to 2010. Odfjell strives to adopt a good reporting culture and this will also involve a more active use of our experience feedback system. During 2011 the Company performed “corporate terminal audits” at its owned or managed terminals in order to review QHSE status with respect to our Corporate Quality Management Manual and QHSE expectations. The audits are part of the efforts to build a solid QHSE culture and further lift standards.
At corporate level, Odfjell Terminals BV, the focus on QHSE has been strengthened through the appointment of a new global QHSE Manager in the third quarter of 2011. His main responsibilities will be to align the terminals and leverage and improve QHSE performance.
There was one minor lost-time injury in 2011, resulting in a LTIF of 2.5 for Odfjell Terminals Rotterdam (OTR).
During the last months of 2011 OTR made the headlines in the Netherlands in connection with product spills and emission of vapours into the air. There was also a failure to properly report incidents to the authorities. These incidents have been scrutinised by the Dutch environmental authority DCMR and the Labour Inspection Authority resulting in the terminal initiating several processes to help prevent such spills and uncontrolled emissions happening again in the future.
The following measures have been taken with immediate effect:
• Benzene emissions have been reduced to a minimum.• Special measuring equipment has been acquired and is
used to detect emissions as quickly as possible.• Procedures and control measures have been tightened
to prevent emissions.• Additional safety experts have been appointed to ensure
compliance with procedures.• All critical business processes are subject to Hazop
analysis (Hazard and Operational analysis), including the the butanization (winterization) of gasoline.
OTR has also drawn up an action plan aimed at imple-menting major improvements first half of 2012 and is a part of an extensive improvement programme aiming to enhance the safety culture, the primary process and the safety management system. OTR has also hired TNO and The Brown Paper Company to improve the safety culture and improve primary process. This is all in addition to investments in constructions and replacements.
Two of the Asian terminals, Odfjell Terminals (Dalian) and Odfjell Terminals (Korea) reported no lost-time injuries in 2011. In October 2011 Odfjell Terminals (Jiangyin) received a CDI-T certificate for the first time.
After the fire on 16 July 2010 in an adjacent terminal to Odfjell Terminals (Dalian), the terminal has been cleaned up and repaired and has been in full operation again since December 2011.
There were no lost-time injuries at the Middle East termi-nals in 2011. In 2011 Odfjell Oiltanking Terminals in Oman was certified to ISO 9001, ISO 14001 and OHSAS 18001 for the first time.

AnytHInGLIQuId

AnytHInGLIQuId
Odfjell transports more than 500 different products each year, ranging from organic chemicals inclu-ding alcohols, acrylates, aromatics and clean petro-leum products, lubricating oils, vegetable oils, animal fats and inorganic chemicals such as sulphuric and phosphoric acids. The Odfjell fleet consists of ships with stainless steel and coated tanks. Ships with co-ated tanks are typically used to transport commodity-type chemicals, clean petroleum products and vege-
table oils. Ships with stainless steel tanks can carry many different products as these tanks are resistant to a variety of different products, and are easier to clean. These ships are used for the most specialised types of chemical products, which as well as requi-ring transport in stainless steel, may also demand special handling in terms of temperature and pres-sure control. Stainless steel cargo tanks are also re-quired for transporting different types of acid.

80 odfjell annual report 2011
petrochemicals are an integral part of modern life, and our societies and most industries now depend on products derived from such petrochemicals. the sector has enjoyed solid growth worldwide for many years. developing econo-mies around the world are now fuelling major increases in both consumption and production.
Historically, the production of petrochemical products was based in the US and Europe. However, production capacity has been growing in Asia, South America, South Africa and particularly in the Middle East, where Saudi Arabia plays a leading role. The new plants in these regions are mostly designed for the production of base chemicals or
“building blocks”, whilst the production of derivatives and speciality chemicals is still mostly concentrated in the US and Europe. However, the manufacturing companies in the Middle East are now investing to develop their business in the direction of further downstreaming. Chemical production facilities have traditionally been located in areas with easy access to raw materials. Historically, much petrochemical production was coal-based. Naphtha, a derivative from crude oil refining, is another raw material that is widely used, particularly in Asia. Nevertheless, the most commonly used raw material nowadays is derived from natural gas, and from which in turn ethylene and propylene are derived, the two main building blocks for the chemical industry. New plants are being built in areas where natural gas is readily available, which explains, why we are currently witnessing a massive increase in production capacity in the Middle East. The petrochemical industry is international with both production and consumption in all regions of the world. As a result of mergers and acquisitions, many of the petrochemical companies have become global in their market approach. Most of these companies primarily focus on Asia, the region with the biggest current and future expected growth in demand for chemical products.
As a result, the petrochemical industry has a constant demand for logistics service providers capable of offering different types of storage and transportation. As of today only a limited number of logistics service providers operate globally. Some of these companies specialise in one type of service, for instance bulk liquid storage. Most shipping and storage companies operate locally or within a certain region and there are only a limited number of companies with the ability to offer a multiple of different services on a global basis. Odfjell is one of few companies offering the petrochemical industry a worldwide network of both bulk shipping and storage services. Operating through offices at central locations around the world, Odfjell is a major player in the chemical tanker segment, and as such operates in all major trade lanes. Whilst chemical tankers only represent a small percentage of the total world fleet of ocean-going tankers, for which the main cargo is crude oil, there is a constant interplay between the various segments of this huge market. As far as the chemical tanker market is concerned, “handysize” product tankers are having a constant impact in the 35-50,000 DWT size range employed for carriage of clean petroleum products such as naphtha, gasoline, diesel and gas oil. A chemical tanker is designed and constructed for handling a multiple of different types of cargoes simultaneously and as such combines different customers’ requirements under single voyages. Different customers’ products are always kept segregated. Chemical tankers are often split into two different categories; ships with all or the majority of cargo tanks made of stainless steel or ships with only coated tanks.
Ships with coated tanks are typically engaged in carriage of commodity-type chemicals, clean petroleum products and vegetable oils. The biggest trades for coated chemical tank-ers are with full loads of commodity-type chemicals from
ChEMiCAl trANSpOrtAtiON ANd StOrAgE
rAw mAteriALsCoal
Gas
Crude oil
BAsiC proDUCtsBTX
Ethylene
Propylene
Methanol
Butadiene
DerivAtivesEDC
Styrene
Glycol
MTBE
Industrial alcohols
Polyester
enD proDUCtsPaint
Fibres
Plastics
Detergents
Oil additives
Rubber
ORGANIC CHEMICALS
› › ›

81
8.5% Odfjell 7.0% Stolt-Nielsen 4.0% Fairfield Lino 3.6% Tokyo Marine 3.2% Misc 3.1% Eitzen 3.0% BLT/Chembulk14.1% Other majors53.5% Others
THE CORE CHEMICAL TANKER FLEET
THE CHEMICAL TANKER FLEETNorthwest Europe, the US or the Middle East to different destinations in the Asia/Pacific region. Backhaul cargoes are often vegetable oils, molasses or clean petroleum products to Europe or the US.
Ships with cargo tanks made of stainless steel are often built to handle a higher number of different products. These ships are used for the most specialised types of chemical products, which in addition to requiring stainless steel transport, may also demand special handling in terms of temperature and pressure control. Stainless steel cargo tanks are also required for carriage of different types of acids.
For a global and long-term operator like Odfjell it is clearly an advantage to possess a varied and efficient mix of ships and thus be able to react to changing market requirements.
Odfjell carries more than 500 different products every year, ranging from organic chemicals such as alcohols, acrylates, aromatics as well as clean petroleum products, lubricating oils, vegetable oils, animal fats and inorganic chemicals like sulphuric and phosphoric acids.
With a frequent presence in all major trade lanes, Odfjell can offer unique and flexible services allowing custom-ers to ship small parcels from 100 to 150 tonnes to full cargoes of up to 40,000 tonnes. By entering into Contracts of Affreightment, the customer can plan regular shipments in order to meet required delivery targets whilst they also help Odfjell from a scheduling point of view. However, a significant part of the cargoes carried by chemical tankers is fixed in the spot market, often by trading companies taking advantage of arbitrage of commodity prices.
Odfjell’s strategy involves consolidation of loading and discharging operations at certain key hubs for chemical distribution. Our investments in small ships for tranship-ment purposes and in tank terminals at major ports such as Houston, Rotterdam, Singapore and Onsan play an important role in this respect.
Tank terminals are an integral part of the chemical logistic chain and their services constitute a natural link between our traditional shipping services and inland transportation by different modes such as barges, railcars, trucks, ISO containers and pipelines. Odfjell’s tank terminals handle, store and distribute bulk liquid chemicals to and from all different modes of transportation.
15.8% Odfjell13.3% Stolt-Nielsen 7.5% Fairfield Lino 6.8% Tokyo Marine 5.8% Misc 5.5% Eitzen 5.0% BLT/Chembulk18.6% Other majors21.7% Others
A core chemical tanker is defined as:• IMO II capacity• Average tank size ≤3,000 cbm• Commercially controlled by core chemical operator• or ≥50% stainless steel capacity

we sHIp

we sHIp
Odfjell offers exceptional experience in deep-sea transportation of chemicals and other liquids. Our operations are fully integrated, with in-house functions for chartering, operation and ship management. Our major trade lanes co-ver the US, Europe, Asia, India, the Middle East and South America. Odfjell’s sophisticated fleet currently consists of around 100 vessels including owned, time chartered and commercially managed vessels. The Odfjell Tankers fleet comprises a variety of ship types, in terms of size, degree of outfitting and automation, number of tanks, tank configuration and coating, all of which provide the flexibility to meet different customers’ requirements.

84 odfjell annual report 2011
ChArtEriNg ANd OpErAtiON
The Odfjell fleet consists of about 100 vessels; owned, time chartered, commercially managed vessels and vessels managed on a pool-basis. The fleet is operated by Odfjell Tankers AS, a wholly owned company of Odfjell SE. Odfjell Tankers is headquartered in Bergen and is represented through overseas offices in 16 countries, each responsible for marketing and providing customer service. Most offices serve dual purposes, dealing with both commercial, char-tering and operational issues, and many of the overseas offices are also co-located and enjoy close cooperation with our local terminals.
The fleet consists of a variety of ship types in terms of size, tank configuration and coating, all of which provide the requisite flexibility to meet all customers’ varying require-ments. Fleet composition, fleet scheduling and optimal vessel utilisation are thus critical success factors. Flexibility and interchangeability of ships between geographical areas and trade lanes are an integral part of Odfjell’s business model, and are facilitated by our large and diversified fleet.
Odfjell Tankers’ ships trade worldwide, calling at major ports in Europe, the US, Asia/Pacific, Africa, the Middle East and South America. Our 14 state-of-the-art 37,500 DWT Kværner built stainless steel chemical tankers, and our eight fully stainless steel 40,000 DWT chemical tankers built in Poland are among the most advanced and flexible ships in the market, and contribute to our focus on safety, efficiency and customer service. We have further strong capacity and flexibility through long-term time charters of Japanese-built 19,900 DWT and 30–33,000 DWT stainless steel vessels.
Although still in good, technical condition, some of our older ships are less in demand from our customers due to age. Odfjell has sold Bow Prosper (built 1987) for recycling in the first quarter 2012, and will consider a phasing out of a few more units in 2012. A replacement programme will be evaluated. In 2011, two 46,000 DWT re-sales from ShinaSB were delivered to Odfjell. Odfjell and NCC have also jointly ordered two 75,000 DWT coated vessels for delivery in 2013 from Daewoo Shipbuilding in South Korea.
In addition Odfjell’s remaining order book currently comprises three 9,000 DWT fully stainless steel chemical tankers from Chongqing Chuandong Shipbuilding Industry in China, for delivery in 2012. These ships will be operated in regional trades, replacing or complementing smaller vessels currently trading there.
Odfjell has been promoting high safety and new efficiency standards on chemical tankers since the inception of the
industry and thus takes a proactive approach towards international regulatory bodies and major customers in order to enhance safety. In this context Odfjell continues to address key issues, such as the practice of tank-inerting and stresses importance of implementing a more cost efficient and transparent regime of customers’ ship inspec-tions and vetting.
While an increased naval escort presence has improved security against piracy attacks in the Gulf of Aden, unfor-tunately ships continue to be hijacked. Odfjell Tankers is monitoring the situation closely, and takes necessary steps to minimise the risks. Safety of crew, ship and cargo is the first priority.
Port congestion and excessive waiting time remain a chal-lenge for the chemical tanker industry, and port time still takes up a disproportionate part of many voyages. Owners are only partly able to compensate for such inefficiency through collection of demurrage. To improve port opera-tions, and thereby also spare the environment through limiting unnecessary ship emissions, berthing and onshore cargo handling infrastructure must be further developed.
Through its regional, short-sea operations, Odfjell Tankers offer its customers quality and timely transhipment to ports with limited draft or dock facilities. Consolidation of loading and discharging operations of our deep-sea ships is another important task performed by our regional operations. By reducing the number of ports and thus the risk of delay, Odfjell Tankers is able to offer a more reliable and economical service to its customers.
Odfjell (uk) ltdOdfjell’s UK office has commercial and operational respon-sibility for three 40,000 DWT vessels.
Odfjell AsiaThe fleet operated out of our Singapore office is traded in Northeast and Southeast Asia, the Asia/Pacific region as well as to and from the Middle East/India/Africa. All of the 13 ships currently operated out of Singapore are fully stainless steel.
Crystal poolThrough a joint venture with Euroceanica, Crystal Pool offers regular sailings within Europe, including the Baltic and the Mediterranean, and to West Africa. Of the 14 vessels currently in the fleet, four are fully owned by Odfjell. NCC Odfjell Chemical tankers (NOCt)NOCT is a 50/50 joint venture between National Chemical Carriers (NCC) and Odfjell, and operates 18 deep-sea
ChEMiCAl tANkErS

85
coated vessels of which nine are owned by Odfjell. In 2011, two 46,000 DWT re-sales from ShinaSB were delivered to Odfjell. Additional five vessels, all from NCC, will enter the pool in 2012.
The two partners have ordered two 75,000 DWT vessels for delivery in 2013 from Daewoo Shipbuilding.
flumarFlumar, Odfjell’s wholly owned Brazilian shipping subsidi-ary operating out of Sao Paulo, offers transportation of bulk liquid chemicals on the Brazilian coast and within the Mercosul area. The company currently operates five chemi-cal tankers and one 51,000 DWT product tanker. Together, Odfjell and Flumar provide customers with superior service capabilities in the Mercosul region. Furthermore, the extensive network of associated terminals in Brazil and Argentina adds additional values and benefits to its customers’ logistics requirements.
Odfjell y vaporesThe 50/50 joint venture Odfjell y Vapores operates one chemical tanker of around 16,000 DWT, primarily carrying sulphuric acid along the Peruvian/Chilean coast.
OdfJEll Ship MANAgEMENt
Odfjell Ship Management is fully integrated with fleet management, crewing, risk management and technology support. As ships account for a substantial part of our total fixed assets, it is imperative that the fleet is managed and operated efficiently, assets are protected and values maintained.
Odfjell Ship Management manages all owned and bare-boat chartered vessels. As of the end of 2011, the Odfjell managed fleet consisted of 52 vessels.
Odfjell Ship Management employs personnel at offices in Bergen, Singapore, Manila, Subic Bay, Sao Paulo and Houston, which provide direct support to ships in regional trades and ships in the deep-sea fleet, as well as profes-sional crew management.
In 2011 Odfjell Ship Management stepped up efforts to develop a safety culture capable of taking Health, Safety, Security and Environment performance (HSSE) to a higher level. For that purpose annual HSSE programmes are launched and achieved performance levels are regularly reviewed.
The implemented ship maintenance programme secures safe and efficient operation, a long useful working life and high second-hand values of the vessel. The maintenance strategy is implemented through our computerised Planned Maintenance System supported by an in-house specialist team. A well structured technical project management team secures compliance with relevant rules and regulations as well as various ship performance improvements.
CHEMICAL AND PLASTICS INDEX VS GDP GROWTH
CORE CHEMICAL DEEP-SEA FLEET
INDUSTRIAL METAL COMMODITIES INDEX
Source: Odfjell
DeliveriesScrappedOrderbookOveragedNet fleet growth (%) (right hand scale)
Economist Commodity Industry/Metals
Source: CMAI. Underlying GDP forecast is sourced from IHS Global Insight
Basis Chemicals and Plastic IndexGDP Index
(INDEX 1985=100)
02 04 06 08 10 12 14100
150
200
250
300
350
400
06 07 08 09 10 11 1260
80
100
120
140
160
180
200
220
Source: DNB
0
400
800
1 200
1 600
2 000
-1 200
-800
-400
0%
2%
4%
6%
8%
10%
12%
14%
16%
02 04 06 08 10 12 14

86 odfjell annual report 2011

87
The safe operation of chemical tankers depends on highly qualified officers and crew. Our ships are mainly registered in Norway (NIS) and Singapore, and are primarily manned by Norwegian and Filipino mariners with extensive experience of chemical tankers. The Flumar fleet, which is primarily traded on the Brazilian coast, is manned by Brazilian mariners.
Odfjell devotes considerable attention to recruiting quali-fied officers and crew and at any given time, more than 200 Norwegian, British or Filipino mariners are normally employed as trainees or cadets.
Odfjell Ship Management actively applies Risk Management processes to maintain and improve performance. Every year Odfjell carries out regular internal audits of ships and offices. Customers make inspections through the Chemical Distribution Institute (CDI) and the Oil Companies International Marine Forum (OCIMF). Periodical surveys are carried out by various classification societies, flag states
and port states. DNV performs ISM Code inspections of our ships’ quality systems. When ships or offices report critical situations, accidents, non-conformances or pos-sible improvements through our Safety and Improvement Reporting System, a proper response is prepared and corrective and preventive actions implemented. We view this system as an effective tool in our work to increase safety and to prevent injuries, damages and losses.
The implemented Key Performance Indicators have been actively promoted, measured and followed up during 2011. Performance has improved in significant areas resulting in reduced lost-time injuries, fewer spills, lower insurance claims, improved near-accident reporting and reduced unscheduled off-hire.
ChEMiCAl tANkErS figurES iN 2011 2010 2009 2008 2007 2006 2005 2004 2003 2002
Gross revenue USD million 1 056 999 1 021 1 247 1 063 939 915 814 739 714
Operating result before depreciation and gain (loss) on sale of fixed assets (EBITDA) USD million 61 59 73 191 242 202 216 159 120 116
Operating result (EBIT) USD million (9) (58) (6) 129 150 106 138 85 47 48
Total shipping assets USD million 1 439 1 593 1 398 1 462 1 504 1 424 1 321 1 146 1 022 980
Volume shipped 1 000 tonnes 17 937 19 303 19 414 19 622 19 502 20 658 22 156 22 614 21 232 22 123
Number of products shipped 515 512 552 575 550 562 551 587 593 535
Number of parcels shipped 5 510 5 582 5 939 6 108 6 443 6 351 6 760 5 612 5 137 4 881
Port calls 6 259 5 648 5 658 5 730 5 884 6 030 6 234 3 991 3 704 3 586
Number of ships 100 86 95 93 92 92 93 95 98 86
Total deadweight 1 000 tonnes 2 746 2 352 2 603 2 460 2 391 2 362 2 393 2 447 2 480 2 335
FREIGHT RATES 3 000 MTS EASy GRADE CHEMICALS (USD/TONNE)
Houston/RotterdamHouston/Far East
FREIGHT RATES 1 000 MTS STAINLESS STEEL GRADE CHEMICALS (USD/TONNE)
Houston/RotterdamHouston/Far East
01 03 05 07 09 110
20
40
60
80
100
120
140
01 03 05 07 09 110
20
40
60
80
100
120
140
Sour
ce: Q
uinc
anno
n as
soci
ates
, Inc

we store
Odfjell’s terminal network comprises nine part-owned terminals and two part-owned terminals under construction offering storage capacity in strategic worldwide locations in the Netherlands, the US, Singapore, Korea, Oman, China and Iran. We also cooperate with eleven terminals in South America and one in Canada through associated compa-nies. Our terminal operations yield synergies with our transportation activities and im-prove quality- and efficiency-control along the entire transportation chain. Our tank ter-minal operations offer opportunities to develop new markets in which the infrastructure for specialised bulk liquids is limited. Our tank terminal network offers about 5.2 million cbm of storage capacity in around 1,200 tanks in 21 ports across the world.

we store

90 odfjell annual report 2011
Odfjell has nine part-owned tank terminals and two new projects at strategic locations around the world. the Company also has a co-operation agreement with 11 associated terminals in South America, plus one in Canada. in total, our tank terminal network has more than 1,000 employees and 5.2 million cbm of storage space in about 1,200 tanks in 21 ports around the world. together with our shipping business, this makes the Company one of the world leaders in both shipping and storage services for bulk liquids.
We have a strategy of expanding our tank terminal activities along major shipping lanes and at important locations for petrochemicals, refined petroleum products, bio-fuels and vegetable oils. We focus on locations in mature markets, but also increasingly in emerging ports of importance in specific rapidly developing nations. In addition to being profitable investments on a standalone basis, our tank terminals also offer cargo-consolidation programmes designed to reduce time and fuel consumption in port for our ships. Commercially, the combination of ship-ping and tank terminals gives Odfjell a unique position to offer increased safety, reliability, product stewardship, efficiency and improved arrival accuracy to its customers. We are experiencing a steady increase in demand for cargo consolidation as a result of the industry’s ongoing pursuit of efficiency improvements along the supply chain.
highlightS – BuSiNESS dEvElOpMENt
During third quarter of 2011 Odfjell concluded the sale of 49% of our shareholding in Odfjell Terminals (Rotterdam) BV (OTR), Odfjell Terminals Maritiem BV (OTM) and Odfjell Terminals (Houston) LP (OTH) and our terminal project in Charleston to Lindsay Goldberg. The future development of terminal activities in Europe and North America will be implemented jointly through Odfjell Terminals General Partners BV. Odfjell will retain responsibility for managing the existing terminals and for terminal development.
Odfjell has entered into a contract to purchase land in Charleston, USA, to construct a tank terminal. This facility is scheduled to become operational in 2013. Current plans comprise nine tanks of a total of around 80,000 cbm and an investment of around USD 72 million.
In January 2012 Odfjell finalised a joint venture with Tianjin Economic-Technological Development Area to construct a tank terminal in the Bohai Bay region. The terminal “Odfjell Nangang Terminals (Tianjin) Co., Ltd” (ONTT) becomes operational in 2014. Initial start-up plans comprise 18 tanks with a combined total of 150,000 cbm with three shore docks to handle up to 50,000 DWT vessels and an
investment of about USD 160 million.
Odfjell has further signed a Letter of Intent to acquire a 25% shareholding plus one share in the Noord Natie Terminals (NNT) in Antwerp, Belgium. The terminal has a capacity of around 300,000 cbm. We also have plans to further develop and expand capacity of the Odfjell Terminals Maritiem site.
In line with Odfjell Terminals strategy, the Company is currently evaluating several terminal projects around the world.
OdfJEll tErMiNAlS (rOttErdAM) Bv, thE NEthErlANdS (Otr)
Located at the heart of the Rotterdam harbour, the most important chemical distribution centre in Europe, OTR has a total storage capacity of about 1,635,000 cbm in 281 storage tanks. OTR is one of the largest facilities of its kind in the world. The tank terminal stores both chemicals and mineral oil products. The chemical storage capacity is approximately 810,000 cbm, while the mineral oil capacity is about 825,000 cbm. However, some of the storage capacity can be shifted from one segment to another, thus providing valuable flexibility and spreading commercial risk.
In addition to the storage business, the Rotterdam tank terminal also renders toll distillation services through its fully integrated business unit Odfjell Petrochemical Industrial Distillation (PID). PID retains a large market share of the independent product distillation market in North West Europe and operates four distillation columns with a combined total annual distillation capacity of 700,000 tonnes, depending on product streams. PID distils both (petro) chemical and mineral oils.
During February 2011 OTR successfully completed the construction of an enhanced pipeline connection to a major offsite customer. The project includes state-of-the-art technology to facilitate instream change of products plus enhanced product flow with associated upgrading of vapour handling.
Overall, the tank terminal enjoys an excellent infrastructure, with five berths for deep-sea tankers, seven positions for short-sea vessels and 14 positions for barges. The terminal also has extensive facilities for handling trucks, rail cars and ISO containers. The site has its own water treatment plant, which also serves third parties.
OTR is an important destination for Odfjell Tankers in the Amsterdam-Rotterdam-Antwerp (ARA) area, and our long-term objective is to consolidate the tank terminal as
tANk tErMiNAlS

91
one of the primary hubs for Odfjell’s shipping activities to and from Europe.
OTR is undergoing upgrading in order to satisfy regula-tory requirements and during 2012 work will also start to upgrade marine facilities.
During the last months of 2011, OTR had some serious incidents related to vapour emissions. There was also a failure to properly report the incidents to the authorities. The terminal has initiated several processes to prevent such uncontrolled emissions to happen again. Measures have been implemented with immediate effect, for repair of certain welds and replacements of gaskets, which have already reduced benzene emissions. All critical business processes have become subject to a risk analysis (HAZOP), including the butanisation (winterisation) of gasoline. These events have been firmly investigated by the environmental authority DCMR and the Labour Inspection Authority. The incidents have also caused negative media attention.
The Odfjell Terminals Maritiem BV (OTM) site is located almost directly opposite OTR on the south bank of Rotterdam’s main shipping artery Nieuwe Waterweg, surrounded by the port’s largest global-scale refineries. Odfjell currently operates the site as a direct board-to-board transhipment facility. To this end, OTR operates a
deep-sea jetty with five manifolds. The maximum depth alongside is 13.4 metres. There is also a finger pier with two barge positions.
During 2012 the complete terminal infrastructure will be dismantled to convert the location into a tank storage facility. When completed, the newly built terminal will have a final capacity of up to around 400,000 cbm.
OdfJEll tErMiNAlS (hOuStON) lp, uSA (Oth)
Houston is the major international hub for the import and export of chemicals to and from the US. OTH is the hub for Odfjell’s global and regional trades to and from the US Gulf. The realisation of synergies is always a priority and the tank terminal has multiple shared common customers with Odfjell Tankers, which demonstrates the benefit of cargo consolidation and expedited shipment for all parties.
Our tank terminal in Houston was completed by Odfjell in 1983, and since the mid 1990s has undergone a consider-able expansion period. The tank terminal has gradually expanded with the market over the years. At year-end 2011, the tank terminal had 100 tanks with a total capacity of 331,500 cbm.
The tank terminal boasts one of the largest stainless steel

92 odfjell annual report 2011
storage capacities of any independent tank terminal in the world, in total 82,000 cbm. The facilities’ unused land and existing infrastructure still offer scope for further expan-sion, with potential storage capacity of around 160,000 cbm in the existing area.
OdfJEll tErMiNAlS (dAliAN) ltd, ChiNA (Otd)
OTD started operation in 1998, but was relocated during 2007 from its original site to Dalian New Port in Xingang. In combination with the relocation, the tank terminal increased its capacity to over 50 tanks, bringing the total capacity to 119,750 cbm. The stainless steel capacity is 18,350 cbm. In recent years, the tank terminal has turned in a strong performance with the expansion of petrochemical activities in the North East of China. During 2011, OTD underwent repairs following damages caused by a fire in a neighbouring terminal facility, which partly disrupted operations.
The tank terminal has four berths for sea-going tankers with up to 50,000 DWT capacity. The location is well con-nected by rail to the vast hinterland of North East China and the tank terminal handles impressive volumes via its rail facilities which can manage up to 120 rail wagons concurrently.
Odfjell holds 50% of the shares in Odfjell Terminals Dalian and Dalian Port Company Ltd (PDA), a company listed in Hong Kong, is the other shareholder in the company.
Odfjell and PDA have jointly established a training academy for terminal operators for operations in China.
OdfJEll tErMiNAlS (JiANgyiN) CO ltd, ChiNA (OtJ)
OTJ is located in Jiangyin Economic Development Zone on the south bank of the yangtze River, approximately 150 km west of Shanghai and 12 hours by ship upriver from the estuary of the yangtze River. The 99,800 cbm terminal became operational in late 2007 and has excellent facilities for handling a wide range of petrochemicals from ships, barges and trucks. OTJ comprises 22 tanks. The stainless steel capacity is 30,000 cbm.
The jetty has five berths, which can handle ships of up to 75,000 DWT, and two additional berths for barges.
OTJ has an agreement to acquire an additional 160,000 sqm of land for future expansion. Odfjell holds a 55% shareholding, while local partner Garson Investment Co. Ltd. owns the remaining 45%.
vOpAk tErMiNAl NiNgBO, ChiNA
This tank terminal started operation in 1994. Located close to Shanghai, Ningbo is a key port for importing chemicals to the central eastern coast of China. The terminal serves ships, barges, rail cars and trucks and currently has a capacity of 63,500 cbm. Odfjell has a 12.5% shareholding
in the tank terminal, with the other partners being Vopak, Helm AG and the port authorities.
OdfJEll tErMiNAlS (kOrEA) CO ltd – ONSAN, kOrEA (Otk)
OTK is strategically located in the most important petro-chemical distribution and transhipment hub in North East Asia. Odfjell is a major carrier of bulk liquid chemicals into and out of Korea, with a significant number of port calls and transhipment operations in the region. The tank terminal entered operation in 2002 and has 85 tanks with a total storage capacity of 315,000 cbm. After completing a significant expansion in 2009, OTK completed a further expansion of 63,120 cbm in 2011.
As the most sophisticated terminal in Onsan, OTK has a 15,860 cbm stainless steel capacity. The tank terminal owns and operates four berths with user rights to another two berths that can handle vessels of up to 80,000 DWT. OTK also has modern drumming facilities for break bulk opera-tions. The tank terminal has land for future expansions.
Odfjell holds 50% of the shares and local partner Korea Petrochemical Ind.Co.Ltd (KPIC) has 43.59%, with the remaining 6.41% shareholding held by two other Korean companies.
OiltANkiNg OdfJEll tErMiNAl SiNgApOrE ptE ltd – SiNgApOrE (OOtS)
As one of the busiest ports in the world, Singapore plays a major role in the distribution of petrochemicals in South East Asia. Singapore also has a high concentration of refinery capacity, as well as large and diversified chemical production facilities. Further growth is secured through the port’s prime location, good infrastructure and a stable economy and government. OOTS is located on Jurong Island, where most of Singapore’s development of petrochemical industry is concentrated.
The tank terminal became operational in 2001. The total current capacity is 365,000 cbm in 79 tanks, varying from 800 cbm to 18,000 cbm. The stainless steel capacity is 13,520 cbm. OOTS has three deep-sea jetties. The berths can accommodate double-banking and board-to-board cargo transfers as well as delivery of bunker fuels from shore tanks. The tank terminal also performs operational management and has access to two additional berths. With the additional land available, the tank terminal can expand further.
The flexible storage and transfer services offered by the tank terminal, along with excellent marine facilities, provide a good platform for Odfjell to further develop a hub for global and regional shipping services in South East Asia.
The tank terminal is a 50/50 joint venture between Odfjell and Oiltanking.

93
OiltANkiNg OdfJEll tErMiNAlS & CO l.l.C - SOhAr, OMAN (OOtO)
Sohar Industrial Port is located in Oman outside the Strait of Hormuz only a few hours’ drive from the petrochemical industry in UAE and Saudi Arabia. The port is home to a refinery and several global-scale petrochemical complexes. This development is driven by the desire of the Sultanate of Oman to exploit the nation’s gas reserves and create a strong “value-added process economy” as opposed to an energy export economy.
OOTO has exclusive rights to manage six liquid berths and provides bulk liquid storage within Sohar Industrial Port. Based on the requirements of the captive industry in Sohar and a growing regional market for storage of chemicals and mineral oils, over the past five years OOTO has expanded into a terminal with an overall capacity of 1,267,500 cbm. In 2011 the terminal embarked on its latest expansion project consisting of 12 chemical tanks with a total capacity of 27,300 cbm, which when commissioned in mid-2012 will bring the overall capacity of the terminal to 1,294,800 cbm in more than 66 tanks.
Odfjell holds a 30% shareholding in OOTO. The company is jointly managed by Odfjell and Oiltanking.
Bik, irAN (ECt)
Exir Chemical Terminal (PJSCO) (ECT) is a joint venture between Odfjell Terminals (35%), Oiltanking (35%) and Nuian, a private Iranian investor (30%), and is the first independent tank terminal for bulk liquid chemicals in Iran.
ECT is strategically situated in the Petrochemical Special Economic Zone (PETZONE) in the port of Bandar Imam
Khomeini. The terminal is connected by pipelines to jetties of the PETZONE with a capacity of 45,000 DWT.
The terminal consists of 18 tanks, in total 22,000 cbm, and has been operational since January 2010.
ASSOCiAtEd tANk tErMiNAlS, SOuth AMEriCA
The associated tank terminals first became operational in Buenos Aires in 1969. Today, it consists of 11 tank terminals spread along the coasts of Brazil, Argentina, Chile and Peru, with a strong market position for chemical storage in the region. The Odfjell family owns these terminals privately and has operational headquarters in Sao Paulo.
The six Brazilian tank terminals are located in Santos, Rio Grande, Triunfo, Sao Luis, Teresina and Corumba. In Argentina they have two tank terminals, one in Buenos Aires and the other, a state-of-the-art terminal in Campana, about 80 km upriver from Buenos Aires. The Chilean tank terminal is located in San Antonio and the Peruvian terminal in Callao. The latest addition is a sophisticated tank terminal in Mejillones, Chile.
The associated tank terminal network in South America is also expanding. Projects to increase the capacity at existing terminals as well as the construction of new terminals are under way.
These extensive tank terminal activities in South America provide an excellent complement to Odfjell’s frequent and traditionally strong shipping activities within the region. Where practical, shipping and storage services are marketed from shared offices, facilitating logistical solutions as comprehensive as required by our customers.
tANk tErMiNAlS*) figurES iN 2011 2010 2009 2008 2007 2006 2005 2004 2003 2002
Gross revenue USD million 227 245 248 232 180 152 132 130 118 97
Operating result before depreciation and gain (loss) on sale of fixed assets (EBITDA) USD million 96 110 109 95 74 58 48 49 45 38
Operating result (EBIT) USD million 62 75 68 68 54 51 33 29 27 22
Total tank terminal assets USD million 1 092 987 691 634 481 340 286 312 293 262
Tank capacity 1 000 cbm. 4 221 3 732 3 719 3 100 2 553 2 256 2 256 2 256 2 256 2 155
*) Reflection of actual ownership share

Odfjell Terminals (Rotterdam) BV is one of the few pro-viders of independent toll distillation services to the petrochemical industry. These services are offered by Odfjell Petrochemical Industrial Distillation (Odfjell PID) at its Rotterdam site. With almost 50 years of experi-ence in toll distilling, Odfjell PID offers unique solutions to the industry, through which products are processed and restored to original specifications or split into new products with improved market values. These services include R&D facilities, receipt and storage of feedstock and distillates, quality assurance, analysis and additio-
nal treatments such as caustic washing as well as deco-lorisation. Odfjell PID operates its own laboratory, which provides quality assurance and can also perform test distillations to determine how to process the products in an optimal fashion. Odfjell PID currently operates four different multi-purpose distillation units including one for deep vacuum distillation and larger throughputs. The total annual throughput capacity is well above 700,000 tonnes per year. Typical processed parcel sizes are bet-ween 500–20,000 tonnes.
we dIstILL

we dIstILL

96 odfjell annual report 2011
COrpOrAtE gOvErNANCE
Odfjell strives to protect and enhance shareholders' equity through long-term profitable business activities. Sound corporate governance is a central element of our strategy. this section describes how the legal and operational elements are governed. Odfjell aims to create sustain-able values for shareholders and stakeholders alike. the Company is a SE (Societas Europaea) company subject to the Norwegian Act no. 14 of 1 April 2005 relating to European companies and listed on the Oslo Stock Exchange, and is thus subject to Norwegian securities legislation and stock exchange regulations.
rEpOrtiNg ON COrpOrAtE gOvErNANCE
The framework for corporate governance is the Norwegian Code of Practice for Corporate Governance of 21 October 2010. The Code is based on a "comply or explain" principle, which means that possible deviations from the Code shall be explained. Odfjell is committed to ethical business practices, honesty, fair dealing and compliance with all laws and regulations affecting our business. This includes adher-ence to high standards of corporate governance. Odfjell's corporate social responsibility policy also encompasses a strong focus on quality, health, safety and care for the environment as well as human rights, non-discrimination and anti-corruption. The Company has its own Corporate Code of Conduct that addresses several of these issues. All Odfjell employees are obliged to comply with the Code of Conduct.
The following describes Odfjell's compliance procedures in respect of each of the elements of the Norwegian Code of Practice for Corporate Governance, including explanation of any deviations.
thE COMpANy’S BuSiNESS
Article 3 of Odfjell’s Articles of Association states: The object of the Company is to engage in shipping, ship agency, tank terminals, real estate, finance and trading activities, including the transportation of freight in the Company’s own vessels or chartered vessels, the conclu-sion of freight contracts, co-ownership agreements and cooperation agreements, ownership and operation of tank terminals, as well as investment and participation in other enterprises with a similar object and other activities related thereto.
The other articles may be found on www.odfjell.com. The Company's Mission Statement and Strategy can be found on page 3 and 5 respectively of this Annual Report.
Equity ANd dividENdS
EquityOdfjell shall maintain an equity base deemed sufficient to support the Company's objectives and strategy, and able to withstand a prolonged period of adverse market conditions. The normal target is that the equity ratio shall be between 30.0 and 35.0% of total assets. The Group had book equity of USD 1,002 million as of 31 December 2011 which corresponds to an equity ratio of 39.6%.
Subscription rightsThere are no outstanding Subscription rights as of 31 December 2011.
dividend policyOdfjell aims to provide competitive long-term return on the investments for its shareholders. The Company embraces an investor-friendly dividend policy based on financial per-formance, current capital expenditure programmes and tax positions. The Company's goal is to provide for semi-annual dividend payments. Mandates granted to the Board of directorsAccording to the Norwegian Code of Practice for Corporate Governance mandates granted to the Board of Directors to increase the Company’s share capital is restricted to defined purposes. The mandates granted to the Board are also limited in time to no later than the date of the next Annual General Meeting.
Authorisation to the Board of Directors to increase of the share capital: The Board has not been assigned authority to issue new shares.
Authorisation to acquire own shares:The Annual General Meeting of 3 May 2011 authorised the Board of Directors to acquire treasury shares of up to 10% of the Company's outstanding shares, at a minimum price of NOK 2.50 (par value) and a maximum price of NOK 250 per share. This authorization expires on 3 November 2012.
Share option scheme:No option scheme has been established.
EquAl trEAtEMENt Of ShArEhOldErS ANd trANSACtiONS With ClOSE ASSOCiAtES
Class of sharesThe Company’s share capital is NOK 216,922,370, divided between 65,690,244 class A shares each with a nominal value of NOK 2.50, and 21,078,704 class B shares each with a nominal value of NOK 2.50. The Company’s shares shall be registered with the Norwegian Central Securities Depository (VPS).

97
Only holders of class A shares shall have voting rights at annual and extraordinary general meetings. In all other respects, the two classes of shares are equal. In the event of bonus issues, holders of class A shares shall be entitled to new class A shares and holders of class B shares shall be entitled to new class B shares unless otherwise decided by the General Meeting.
trading in own sharesAny transactions carried out by the Company in treasury shares will be reported to the Oslo Stock Exchange.
transactions with close associatesAny material transaction between the Company and any shareholder, Board member, Senior Management or any closely related party of the foregoing should be reviewed by an external third party before being concluded. This does not apply for any agreement approved by the General Meeting according to the Norwegian Public Limited Liability Companies Act. Independent valuations should also be obtained in respect of transactions between companies in the same group where any of the companies involved have minority shareholders.
Members of the Board of Directors and Senior Management shall notify the Board if they have any material direct, or indirect interest in any transaction entered into by the Company.
guidelines for directors and Corporate ManagementThe Board has established a policy in respect of share trading. The policy is in line with the Guidelines for Insiders issued by the Oslo Stock Exchange and applies to the Board, the President/CEO, the Senior Management and other employees whom in connection with their work may gain access to price sensitive non-public information.
frEEly NEgOtiABlE ShArES
The Company’s shares are listed on the Oslo Stock Exchange and are freely tradable. There is no form of restriction on negotiability included in the Company’s Articles of Association. The Board is not aware of any agreements that may secure any shareholder beneficial rights to own or trade shares at the expense of other shareholders.
thE gENErAl MEEtiNgS Of ShArEhOldErS
The Board is responsible for convening both annual and extraordinary general meetings. The Company arranges for the Annual General Meeting to be held within six months of the end of each financial year. The notice convening the meeting and other documents regarding the General Meeting shall be available on the Company's website no later than the 21st day before the date of the General Meeting, up to and including the day the meeting is held. When documents concerning matters that are to be con-sidered by the meeting have been made available to the shareholders on the Company’s website, the requirement of the Norwegian Public Limited Liability Companies Act
that the documents be sent to shareholders does not apply. This also applies to documents that are required by law to be included in or enclosed with the notice of the General Meeting. A shareholder may nonetheless demand to have documents sent that concern matters to be considered by the General Meeting. Shareholders who wish to attend the General Meeting must notify the Company no later than five days before the General Meeting. It is possible to register for the Annual General Meeting by mail, e-mail or fax.
The notice shall provide sufficient information on all matters to be considered at the General Meeting, voting instructions and opportunities to vote by proxy. Matters discussed at the General Meeting are restricted to those set forth in the agenda.
Representatives of the Board and the auditor participate in the Annual General Meeting. Senior Management is represented by the President/CEO and the Chief Financial Officer.
The financial calendar is published via Oslo Stock Exchange, on www.odfjell.com and in the Company's annual report.
The following matters shall be the business of the Annual General Meeting:
1. Adoption of the annual accounts and the Board of Directors’ report.
2. Application of any profit for the year or coverage of any loss for the year in accordance with the adopted balance sheet, and the declaration of dividend.
3. Election of members of the Board of Directors.4. Adoption of the remuneration of the Board of Directors.5. Any other matters that by law or pursuant to the
Company’s Articles of Association or as stated in the notice of the Annual General Meeting.
Proposals that shareholders wish the General Meeting to consider must be submitted in writing to the Board of Directors in sufficient time to be included in the notice of the General Meeting.
Any other matters which shareholders wish to have con-sidered at the Annual General Meeting must be submitted in writing to the Board of Directors in time to be included in the notice of the Annual General Meeting. Extraordinary general meetings may be called in accordance with the provision of the Norwegian Limited Liability Companies Act.
The Annual General Meeting represents an occasion for the Board to meet and discuss with shareholders face-to-face and to decide on important issues such as the appointment of the auditors, dividend payments, and the election or re-election of board members.
NOMiNAtiON COMMittEE
At the Annual General Meeting 8 May 2012 the Board will propose to establish a Nomination Committee.

98 odfjell annual report 2011
COrpOrAtE ASSEMBly ANd BOArd Of dirECtOrS - COMpOSitiON ANd iNdEpENdENCE
The Company’s Senior Management is organised in accordance with a single-tier system and it shall have an administrative body (Board of Directors).
The Company’s Board of Directors shall consist of between five and seven members to be elected by the Annual General Meeting for a period of two years. The Board elects the Chairman of the Board.
The Company has no corporate assembly. The Annual General Meeting elects the Board. The interests of the employees are upheld through an agreement between the employees and Odfjell concerning the involvement of employees. The employees have established a permanent Employee Representatives Body (ERB). The ERB consists of up to six representatives, partly from our tank terminal in Rotterdam, the headquarters in Bergen and the Officers' Council. The scope of information and consulting proce-dures shall cover transnational issues, concerning a group
of employees either in the Company directly or in one or more of its subsidiaries.
Employee involvement at corporate level and in most subsidiaries abroad is also secured by various committees and councils, in which Senior Management and employee representatives, both onshore personnel and seafarers, meet to discuss relevant issues.
Since 4 May 2010 the Board has comprised Laurence Ward Odfjell (Chairman), Bernt Daniel Odfjell, Christine Rødsæther, Terje Storeng and Irene Waage Basili. The Chairman, Laurence Ward Odfjell, has been assigned special tasks by the Board, and consequently acts as Executive Chairman. Laurence Ward Odfjell and related parties control about 43.4% of the votes and 32.0% of the shares of Odfjell SE. Terje Storeng, Christine Rødsæther and Irene Waage Basili are independent Board members. The Company believes that the Board is well positioned to act independently of the Company’s Senior Management and exercise proper supervision of the Management and

99
its operations. The Annual Report contains a presentation of the Board of Directors and details of the shareholdings of all directors. Board members are elected for a period of two years, and three of the existing Board members are up for a new election at the 2012 Annual General meeting. The proportionate representation of gender of the Board is within the legislated target.
thE WOrk Of thE BOArd Of dirECtOrS
Ultimately the Board is responsible for determining the Company's objectives and for ensuring that necessary means for achieving them are in place. Thus, the Board of Directors also determines the Company’s strategic direction and decides on matters that are of significant nature in relation to the Company's overall activities. Such matters include confirmation of the strategic guidelines including any changes to the strategic business model, approval of the budgets as well as decisions on major investments and divestments. Furthermore, the Board ensures a correct capital structure and defines the dividend policy. The Board also appoints the President/CEO and determines his/her remuneration.
It is the responsibility of the Board to ensure that the Company, its management and employees operate in a safe, legal, ethically and socially responsible manner. To emphasize the importance of these issues, a company specific corporate social responsibility policy and a Code of Conduct are in place and are widely circulated throughout the organisation. The Code of Conduct focuses on aspects of ethical behaviour in day-to-day business activities.
The Board of Directors has issued instructions for its own work as well as for the President/CEO with particular emphasis on clear internal allocation of responsibilities and duties. The instructions should be evaluated annually in connection with the annual assessment of the Board’s performance and expertise.
The Board endeavours to schedule in advance a number of regular meetings to be held during the calendar year, normally about eight to ten meetings per year, depending on the level of the Company’s activities. In addition to regular board meetings, the Board holds meetings, either by telephone conference or by written resolution at the request of the Chairman, the President/CEO or by any two Board members. The Board meetings are chaired by the Chairman unless otherwise agreed by a majority of the Directors attending. If the Chairman is not present, the Directors shall elect a director to preside over the Board Meeting.
The Board had eight ordinary meetings and seven extraordi-nary meetings in 2011, all with 100.0% director attendance.The Board has carried out a self-assessment of its work. At the Annual General Meeting 8 May 2012 the Board will propose to increase the Board with one additional Board member.
Audit CommitteeAn Audit Committee was established in May 2010. The Audit Committee is elected by the Board and consists of two board members; Terje Storeng and Irene Waage Basili. The Audit Committee reports to, and acts as a preparatory and advisory working committee for the Board. The establishment of the Audit Committee does not alter the Board's legal responsibilities or tasks.
iNtErNAl CONtrOl ANd riSk MANAgEMENt
The risk management process and the system of internal control are subject to continuous improvement.
Business strategies are prepared at regional level and are approved by the Board. In addition, there are annual budgeting and strategic planning processes. Financial forecasts are prepared every quarter. Actual performance is compared to budget, latest forecast and prior year on a monthly basis. Significant variances are investigated and explained through normal monthly reporting channels.
The Company has established an organisation structure that supports clear lines of communication and accountability, and delegation of authority rules that specify responsibility.
The Company focuses strongly on regular and relevant management reporting of both operational and financial matters, both in order to ensure adequate information for decision-making and to respond quickly to changing conditions. Evaluation and approval procedures for major capital expenditure and significant treasury transactions are established.
The Board receives monthly reports on the Company’s financial performance, company activities, and status reports on the Group’s key individual projects. The Group also regularly conducts internal audits of individual units’ adherence to systems and procedures. The QHSE depart-ment provides additional assurance to the Board and the Audit Committee that key controls are operating as intended. A safety (QHSE) update is normally the first item on the agenda of all ordinary meetings of the Board of Directors.
Financial performance is also reported on a quarterly basis to the Board and to the Oslo Stock Exchange.
Odfjell’s Compliance Officer monitors that the Company acts in accordance with applicable laws and regulations, the Company's Code of Conduct and ensures that the Company acts in an ethical and socially responsible way. Particular focus has been applied to competition law compliance, and regular updates are issued to all relevant personnel.
The Company is also subject to external control func-tions including by auditors, ship classification societies, customer vettings, port and flag state, and other regulatory bodies including IMO.

100 odfjell annual report 2011
BOArd MEMBErS’ rEMuNErAtiON
Remuneration of the Board members is decided by the Annual General Meeting. Members of the Board do not take part in any incentive or share option programmes. The remuneration of the Board of Directors is not linked to the Company's performance. Board members shall not take on other assignments for the Company.
MANAgEMENt rEMuNErAtiON
Pursuant to Section 6-16 a) of the Norwegian Public Limited Companies Act, the Board of Directors has issued a state-ment regarding the establishment of salaries and other remuneration for the Senior Management. The statement can be summarised as follows:
Senior Management shall be offered competitive terms of employment in order to ensure continuity in the manage-ment and to enable the Company to recruit suitably qualified personnel. The remuneration shall not be of such a nature or magnitude that it may impair the Company’s public reputation.
A basic, fixed salary is the main component of the remu-neration. However, in addition to a basic salary other supplementary benefits may be provided, including, but not limited to payments in kind, incentive/recognition pay, termination payments and pension and insurance schemes.
The Company does not run any share option schemes, nor other benefit programmes as stated in the Norwegian Public Limited Companies Act, section 6-16 subsection 1 no. 3. As the Company has no such arrangements, no specific limits regulating the different categories of benefits or the total remuneration of Senior Management have been defined. The Board may on a discretionary basis grant recognition payments to certain employees including Senior Management. In 2011 the maximum amount set aside for this type of payment for the Odfjell group as a whole was USD 1.2 million. Members of Management have no defined agreement with regards to severance payments. The Board has implemented a performance-related incentive scheme linked to the Company's earnings performance and operational defined goals/KPIs for 2012 onwards, which caps recognition payment to a maximum multiple of six monthly salaries.
Senior Management remuneration 2011 was in compliance with the above guidelines.
The President/CEO and managers reporting directly to him are included in the Company's defined benefit pension plan or a defined contribution scheme. The Company also has unfunded pension obligations relating to Senior Management for salaries exceeding 12G, up to 66.0% of 18G. The remuneration of Senior Management is disclosed in note 23 to the annual accounts.
iNfOrMAtiON ANd COMMuNiCAtiON
Through its corporate governance policy, the Board has implemented guidelines for disclosure of company
information. The reporting of financial and other informa-tion will be based on openness and equal treatment of all participants. The Company provides shareholders and the market as a whole with information about the Company. Such information takes the form of annual reports, quar-terly reports, stock exchange bulletins, press releases, information on the Company website and investor presenta-tions when appropriate. The Company seeks to treat all shareholders equally in line with applicable regulations. Information distributed through the Oslo Stock Exchange, or otherwise in press releases, is published simultaneously on www.odfjell.com. The Company aims to have regular presen- tations. The financial calendar is available through stock exchange announcements and on the Company’s website.
Open investor presentations are held at least twice a year in connection with Odfjell's quarterly reports. The President/CEO reviews and makes comments on results, market developments and prospects. Odfjell's CFO also participates in these presentations. The presentations of the annual and quarterly reports are published via Oslo Stock Exchange and posted on the corporate website at the same time as they are presented. The annual and mid-year results are presented in a live presentation in Oslo, whereas reports following publication of first and third quarter results are made available through webcasts. Odfjell also maintains an ongoing dialogue with, and make presentations to analysts and investors. Care is taken to secure impartial distribution of information when dealing with shareholders, investors and analysts.
The Board shall ensure that the Company’s quarterly and annual financial statements provide a correct and complete picture of the Group’s financial and business position, including the extent to which operational and strategic goals have been achieved.
tAkE-OvErS
The Board shall not seek to prevent or obstruct take-over bids for the Company’s activities or shares, unless there are particular reasons for such actions. In the event of a take-over bid for the shares in the Company, the Board shall not exercise mandates or pass any resolutions with the intention of obstructing the take-over bid unless this is approved by the General Meeting following announce-ment of the bid. In particular, the Board shall in such circumstances not without the prior approval of the General Meeting (i) issue shares or any other equity instruments in the Company, (ii) resolve to merge the Company with any other entity, (iii) resolve on any transaction that has a material effect on the Company’s activities, or (iv) purchase or sell any shares in the Company.
During the course of a take-over process, the Board will use their best efforts to ensure that all the shareholders of the Company are treated equally. The Board shall also use its best efforts to ensure that sufficient information to assess the take-over bid is provided to the shareholders.

101
Pursuant to the Norwegian Securities Trading Act, any person who through acquisition becomes the holder of shares representing more than one-third of the voting rights in the capital of the Company is obliged to make an unconditional offer at a fair price for the purchase of the balance of the issued shares in the capital of the Company. The mandatory offer must be made within four weeks after the threshold was passed. If an offer is made for the shares in the Company, the Board shall issue a statement evaluat-ing the offer and make a recommendation as to whether the shareholders should accept the offer. If the Board finds itself unable to provide such a recommendation, it shall explain the background. The Board’s statement on a bid shall make clear whether the views expressed are unanimous, and if this is not the case, it shall explain the basis on which members of the Board have excluded themselves from the Board’s statement. The Board shall consider whether to arrange a valuation from an independent expert. If any member of the Board or the Senior Management, or close associates of such persons, or anyone who has recently held such a position, is either the bidder or has a similar particular interest in the bid, the Board shall in any case arrange an independent valuation. This shall also apply if the bidder is a major shareholder in the Company. Any such valuation should be either attached to the Board’s statement, be reproduced in the statement or be referred to in the statement.
AuditOr
The Company emphasizes on keeping a close and open relationship with the Company’s auditor. The auditor participates in Board meetings for approval of the annual accounts. The Company’s auditor shall present an annual plan for its audit work to the Audit Committee. In addi-tion the auditor shall present a review of the Company’s internal control procedures, including identified weak-nesses and proposed improvements. The Board shall at least yearly have a meeting with the auditor without the Management’s presence. The auditor’s fees for auditing and other services are presented to the Annual General Meeting and are included in the note 5 to the annual accounts. The Board continuously evaluates the need for written guidelines concerning the Senior Management’s employment of the auditor for other services than audit. The Board believes that the auditor’s independence of the Company’s Senior Management is assured. The auditor shall issue a written annual declaration confirming the auditor’s independence.
In order to secure consistency in control and audits of the Group, Odfjell generally uses the same audit firm for all subsidiaries worldwide, and currently engages Ernst & young as the Company's independent auditor.

for everydAyuse

for everydAyuse
Odfjell’s business is an important contributor to industrial and societal de-velopment around the world. Our core business comprises transporting and storing organic and inorganic bulk liquid chemicals, acids, animal fats, edible oils, potable alcohols and clean petroleum products – important ingredients and raw materials in everyday life – in products including fertilisers, medi-cines, medical equipment, building materials, cosmetics, food, textiles, cars and plastics.

104 odfjell annual report 2011
With the global market as its arena, Odfjell is exposed to an infinite number of risk factors. Our financial strategy shall be sufficiently robust to withstand prolonged adverse conditions, including long-term downturns in our markets or challenging conditions in the financial markets. Odfjell adopts an active approach to managing risk in the financial markets. this is achieved through funding from diversi-fied sources, maintaining high liquidity or loan reserves, and through systematic monitoring and management of financial risks related to currencies, interest rates and bunkers. the use of hedging instruments to reduce the Company’s exposure to fluctuations in the above mentioned financial risks, at the same time, limits Odfjell’s upside potential from favourable movements in these risk factors. the Company also closely monitors the risk related to market valuation of the hedging instruments and the effect this has on the equity ratio.
EArNiNgS
Earnings within the chemical tanker markets are less volatile than in many other shipping segments as these are niche markets with specialised tonnages. The diversity of trade lanes and the products we transport provide some natural hedging against the negative effects of a general slowdown in demand. Our time charter earnings are influen- ced by external factors such as global economic growth, the general ship-freight market, bunker prices and factors specifically related to the chemical tanker parcel trade, such as cargo type and cargo volume, trading pattern required by our customers, contract and spot rates and our operational efficiency. Time is of the essence, and optimal utilisation of the fleet and an expedient com-position of cargoes, with minimal time in port, is of vital importance in order to maximise time charter earnings.
The single largest cost component affecting time charter
earnings is bunkers. In 2011 this amounted to USD 289 million (54% of voyage costs). A change in the average bunker price of USD 100 per tonne equals about USD 57 million per year (or USD 2,350 per day) change in time charter earnings for those ships where we have a direct economic interest. A certain portion of our bunker expo-sure is hedged through bunker adjustment clauses in the contracts of affreightment. As per 31 December 2011 the Company had hedged about 16% of our total 2012 bunker exposure, through swaps and options at an average price of about USD 525 per tonne.
Sensitivity analyses show that a change in time charter earnings of USD 1,000 per day for our chemical tankers (a roughly 3% change in freight rates) will impact the pre-tax net result by approximately USD 25 million. The Company is not currently engaged in the derivative market for Forward Freight Agreements.
Tank terminal activities have historically shown more stable earnings than our shipping activities and the operating result in this segment for 2011 was USD 62 million (adjust-ing for the terminal transaction). A substantial part of the tank terminal costs are fixed costs and the main drivers for earnings within a tank terminal are the occupancy rate, the volume of cargoes handled through and by the terminal, and operational efficiency.
iNtErESt rAtES
All interest-bearing debt, except debt borne by tank ter-minals outside the US, is denominated in USD. Interest rates are generally based on USD LIBOR rates. With our current interest rate hedging in place, about 20% of our loans are on a fixed rate basis. In order to reduce the volatility of the net result and cash flow relating to changes in short-term interest rates, interest rate periods
fiNANCiAl riSk MANAgEMENt ANd SENSitivitiES
BUNKERS (3.5% BARGES ROTTERDAM) INTEREST RATES (USD 3 MONTH LIBOR)
USD/TONNES
0%
1%
2%
3%
4%
5%
6%
7%
02 03 04 05 06 07 08 09 10 11 120
100
200
300
400
500
600
700
800
02 03 04 05 06 07 08 09 10 11 12

105
on floating rate debt and on liquidity are managed to be concurrent. Our interest-bearing debt as per 31 December 2011 was USD 1.245 billion, while liquid assets amounted to USD 205 million.
CurrENCy
The Group’s revenues are primarily denominated in USD. Only tank terminals outside the US and our regional European shipping trade derive income in non-USD cur-rencies. Our currency exposure relates to the net result and cash flow from voyage-related expenses, ship operat-ing expenses and general and administrative expenses denominated in non-USD currencies, primarily in NOK and EUR. We have estimated that a 10.0% appreciation of the USD against the NOK would improve the pre-tax 2011 result by around USD 11 million, ignoring the effect of any currency hedging in place.
Our currency hedging at the end of 2011, under which the Company sold USD and purchased NOK, covers about 40% of the Company’s 2012 NOK-exposure. Future hedging peri-ods may vary depending on changes in market conditions. The average USD/NOK exchange rate for open hedging positions as of 31 December 2011 for 2012 was 6.83.
FINANCING AND LIQUIDITy
Odfjell has a stable debt structure established with major international shipping banks, with whom the Company enjoys long-standing relationships. The Company has a diversified debt portfolio comprising a combination of secured loans, unsecured loans, finance leases and unsecured bonds. Although our experience is that fund-ing is available to Odfjell from various sources, including the banks and the bond market, the general trend in the financial market is towards shorter terms, as long-term funding is less available and more expensive. As a consequence our attention to timely refinancing of maturing debt is a continuous task. The average maturity of the Group’s interest-bearing debt is about 4.7 years.
Odfjell’s strategy is to maintain a high level of readily available liquidity. This liquidity is invested in bank deposits and high-grade bonds and certificates with variable interest rates.
tAX
The Odfjell Group operates within a number of jurisdictions and tax systems. Shipping activities are operated in several countries and under different tax schemes, including the Norwegian tonnage tax system, the Approved International Shipping system in Singapore and the tonnage tax systems in the UK. In addition we operate under local tax systems in Chile and Brazil. Our tank terminal activities are generally subject to the ordinary corporate tax rates within the country in which the activity is located. The variation in tax systems and rates may cause tax costs to vary significantly depending on the country in which profits are accumulated and taxed.
SENSITIVITy
Bunkers, USD 10 per tonne lower
Freight rates, 3% increase
Interest rates, 1% higher
Currency, USD 10% stronger
USD MILLION
USD/NOK
02 03 04 05 06 07 08 09 10 11 120
1
2
3
4
5
6
7
8
9
10
31% Operating and general administration cost 28% Capital expenses 24% Bunkers (net of bunkers hedge)16% Other voyage cost
COST ANALySIS
The major cost components of a typical large Odfjell chemical tanker
-20
-15
-10
-5
0
5
10
15
20
25
30

Odfjell has about 3,800 employees, both onshore and at sea. With 20 international offices, 9 terminals and 12 associated terminals worldwide, the workforce is diversified in terms of training, nationality, religion, gender and age. Odfjell of-fers a platform for a lifetime career within the Company. Our common denominator is competence.
to further enhance the competence of our seafarers, the Odfjell Academy has been established in the philippines. Comprehensive cadet programmes are implemented in both the philippines and Norway. Onshore personnel are offered a wide range of further training opportunities ran-ging from job-specific courses and training to university degrees at Masters level.
wItH sKILLedpersonneL

wItH sKILLedpersonneL

108 odfjell annual report 2011
Odfjell’s aim is to provide a competitive long-term return on investments to its shareholders. the Company emphasises an investor-friendly dividend policy based on financial performance, current capital expenditure programmes and tax positions. the Company’s goal is to provide semi-annual dividend payments. We comply with the Oslo Børs Code of practice for reporting ir information.
ShArE pErfOrMANCE
At the end of 2011 the Company’s A shares were trading at NOK 36 (USD 5.99), down 33.3% from NOK 54 (USD 9.23) at year-end 2010. The B shares were trading at NOK 35 (USD 5.89) at the end of 2011, down 34.4% from NOK 54 (USD 9.23) 12 months previously.
By way of comparison, the Oslo Stock Exchange benchmark index fell by 12.2%, the marine index by 30.7% and the transportation index by 33.8% during the year. The market capitalisation of Odfjell was NOK 2,800 million (USD 469 mil- lion) as per 31 December 2011. Given the continued challen-ging market going forward, the Board does not recommend payment of ordinary dividend for 2011.
In November 2011 Odfjell SE paid an extraordinary dividend of NOK 1 per share totalling NOK 87 million (USD 14 million).
trAdiNg vOluMES
In 2011 about 6.4 million Odfjell shares were traded, spread over 4.6 million A shares and 1.8 million B shares. This represents about 7.4% of the issued and outstanding shares. At year-end 2011 Odfjell had outstanding 65.7 million A shares and 21.1 million B shares.
ShArEhOldErS
At the end of 2011 there were 1,217 holders of Odfjell A shares and 487 holders of Odfjell B shares. Taking into account shareholders owning both share classes, the total number of shareholders was 1,412, which represents a slight increase compared to the preceding year.
iNtErNAtiONAl OWNErShip
58.3% of the Company’s A shares and 33.8% of the B shares were held by international investors at the end of the year, equivalent to 52.4% of the total share capital.
ShArE rEpurChASE prOgrAMME
At the end of 2011 the Odfjell Group owned 5,891,166 A shares and 2,322,482 B shares.
The Annual General Meeting on 3 May 2011 authorised the Board of Directors to acquire treasury shares of up to 10.0% of the Company’s outstanding shares, at a minimum price of NOK 2.50 (par value) and a maximum price of NOK 250 per share. This authorisation expires on 3 November 2012.
iNvEStOr rElAtiONS
Provision of accurate and timely information is of vital importance in order to create credibility and confidence. Our policy is to provide the market with all relevant information. We attach great importance to ensuring that shareholders receive swift, relevant and correct information about the Company. Our aim is to provide a good understanding of the Company’s activities and its prospects so that shareholders
ShArEhOldEr iNfOrMAtiON
DIVIDEND PER SHARE (PER yEAR OF PAyMENT)
Dividend
02 03 04 05 06 07 08 09 10 110
1
2
3
4
5
6
NOK
EARNINGS PER SHARE
NOK
Earnings per share
02 03 04 05 06 07 08 09 10 11-10
-5
0
5
10
15
20
25
30

109
31.76% Norchem AS 8.89% Odfjell SE 4.03% Rederiet Odfjell AS 3.99% Odfjell Shipping Bermuda LTD 3.63% Pareto Aksje Norge47.70% Others
SHAREHOLDER STRUCTURE per 31.12.2011
52.35% International shareholders47.65% Norwegian shareholders
SHAREHOLDER CITIZENSHIPS per 31.12.2011
are in a good position to assess the share’s trading price and underlying values. For more information, please see page 96 under Corporate Governance.
thE fiNANCiAl CAlENdAr fOr 2012 iS AS fOllOWS:
8 May 2012 Q1 Report 8 May 2012 Annual General Meeting 21 August 2012 Q2 Report 13 November 2012 Q3 Report 12 February 2013 Q4 Report
SpECiAl iNfOrMAtiON fOr NOrWEgiAN ShArEhOldErS
Under the tax reforms of 1 January 1992 the cost of shares for tax purposes is to be adjusted annually to reflect the Company’s retained taxed earnings in order to prevent double taxation (RISK adjustment). This system was dis-continued as from 1 January 2006. However, the RISK adjust- ments for previous years still apply.
Please see information on www.odfjell.com for further information on the RISK adjustment.
SHAREPRICE DEVELOPEMENT VERSUS OSEBX SHAREPRICE DEVELOPEMENT VERSUS TRANSPORTATION INDEX
Odfjell A shareOslo Børs Benchmark Index
Odfjell A shareOslo Børs Transportation Index
07 08 09 10 11 120
20
40
60
80
100
120
07 08 09 10 11 120
20
40
60
80
100
120

110 odfjell annual report 2011
20 LARGEST SHAREHOLDERS (AS PER 31.12.2011)
SHARE CAPITAL HISTORy
yEAr EvENt AMOuNt iN NOkShArE CApitAl
AftEr EvENt
1916 Established 517 500 517 5001969 Capitalisation bonus issue 382 500 900 0001969 Merger with A/S Oljetransport 900 000 1 800 0001981 Capitalisation bonus issue 1 800 000 3 600 0001984 Capitalisation bonus issue 3 600 000 7 200 0001985 Merger with Skibsaksjeselskapet Selje 3 320 000 10 520 0001985 Merger with Odfjell Tankers & Terminals A/S 2 000 000 12 520 0001985 Capitalisation bonus issue 6 260 000 18 780 0001986 Public offering 9 390 000 28 170 0001986 Capitalisation bonus issue 2 817 000 30 987 0001988 Capitalisation bonus issue 6 197 400 37 184 4001989 Capitalisation bonus issue 7 436 880 44 621 2801989 International private placement 10 000 000 54 621 2801990 Capitalisation bonus issue 54 621 280 109 242 5601994 Capitalisation bonus issue 109 242 560 218 485 1202000 Private placement 49 267 340 267 752 4602001 Redemption of treasury shares (13 657 500) 254 094 9602002 Redemption of treasury shares (25 409 490) 228 685 4702003 Redemption of treasury shares (11 763 100) 216 922 3702004 Share split 2:1 0 216 922 3702005 Share split 2:1 0 216 922 3702006-2011 No events 0 216 922 370
All treasury shares were bought in 2009 and 2010 and are held by Odfjell SE and Odfjell Chemical Tankers AS (500,000 A shares) per end of 2011.
1) Nominee account2) No voting rights for own shares ref. Public Limited Companies Act § 5-4
Name A shares B shares totalpercent of
votespercent of
shares
1 Norchem AS 25 966 492 1 591 176 27 557 668 43.42% 31.76%
2 Odfjell SE 5 391 166 2 322 482 7 713 648 2) 8.89%
3 Rederiet Odfjell AS 3 497 472 - 3 497 472 5.85% 4.03%
4 Odfjell Shipping Bermuda Ltd. 2 750 000 715 760 3 465 760 4.60% 3.99%
5 Pareto Aksje Norge 1 928 654 1 224 706 3 153 360 3.23% 3.63%
6 SHB Stockholm Clients Account 1) 1 481 270 1 390 680 2 871 950 2.48% 3.31%
7 JP Morgan Clearing Corp. 1) 2 727 900 31 800 2 759 700 4.56% 3.18%
8 SIX SIS AG 5 PCT NOM 1) 1 036 400 1 600 800 2 637 200 1.73% 3.04%
9 Odin Norden - 2 154 133 2 154 133 - 2.48%
10 Folketrygdfondet - 1 724 900 1 724 900 - 1.99%
11 SIX SIS AG 1) 1 099 600 577 100 1 676 700 1.84% 1.93%
12 Skagen Vekst 1 664 725 - 1 664 725 2.78% 1.92%
13 Pareto Aktiv 889 381 564 123 1 453 504 1.49% 1.68%
14 Odin Norge - 857 412 857 412 - 0.99%
15 Pareto Verdi 501 178 303 050 804 228 0.84% 0.93%
16 Fondsfinans Spar 755 000 - 755 000 1.26% 0.87%
17 AS SS Mathilda 600 000 150 000 750 000 1.00% 0.86%
18 Berger 732 400 - 732 400 1.22% 0.84%
19 AS Bemacs 373 000 353 000 726 000 0.62% 0.84%
20 KLP Aksje Norge VPF 702 828 20 838 723 666 1.18% 0.83%
total 20 largest shareholders 52 097 466 15 581 960 67 679 426 78.11% 78.00%Other shareholders 13 592 778 5 496 744 19 089 522 21.89% 22.00%
total 65 690 244 21 078 704 86 768 948 100.00% 100.00%International shareholders 38 299 259 7 126 373 45 425 632 58.30% 52.35%
Treasury shares 5 891 166 2 322 482 8 213 648 2) 9.47%
Cost price treasury shares (USD 1 000) 44 256 18 660 62 916

111

112 odfjell annual report 2011
Ship year built dWt CBM
Stainless steel, CBM
Number of tanks
OWNEd
Bow Lind 2011 46 047 48 703 - 29
Bow Elm 2011 46 098 48 703 - 29
Flumar Brasil 2010 51 188 55 452 - 14
Bow Saga 1) 2007 40 085 52 126 52 126 40
Bow Sirius 1) 2006 40 048 52 155 52 155 40
Bow Sea 2006 40 048 52 107 52 107 40
Flumar Maceio 2006 19 975 21 713 21 713 22
Bow Summer 2005 40 036 52 128 52 128 40
Bow Spring 1) 2004 39 942 52 127 52 127 40
Bow Star 2004 39 832 52 127 52 127 40
Bow Sun 2003 39 842 52 127 52 127 40
Bow Firda 2003 37 427 40 645 40 645 47
Bow Chain 2002 37 518 40 621 40 621 47
Bow Fortune 1999 37 395 40 619 40 619 47
Bow Master 1999 6 046 7 018 7 018 14
Bow Mate 1999 6 001 7 004 7 004 14
Bow Pilot 1999 6 008 7 005 7 005 14
Bow Sailor 1999 6 008 7 011 7 011 14
Bow Cecil 1998 37 369 40 515 33 236 47
Bow Flora 1998 37 369 40 515 33 236 47
Bow Balearia 1998 5 846 6 075 6 075 20
Bow Oceanic 1997 17 460 19 616 19 616 24
Bow Bracaria 1997 5 846 6 071 6 071 20
Bow Brasilia 1997 5 800 6 067 6 067 20
Bow Cardinal 1997 37 446 41 487 34 208 52
Bow Faith 1997 37 479 41 487 34 208 52
Bow Aratu 1997 13 843 15 834 15 834 29
Bow Querida 1996 10 106 11 181 11 181 18
Bow Cedar 1996 37 455 41 488 41 488 52
Bow Atlantic 1995 17 460 19 588 19 588 24
Bow Fagus 1995 37 375 41 608 34 329 52
Bow Clipper 1995 37 221 41 596 34 328 52
Bow Flower 1994 37 221 41 492 34 213 52
Bow Eagle 1988 24 728 32 347 19 662 25
Bow Cheetah 1988 40 257 43 772 - 29
Bow Leopard 1988 39 512 43 772 - 29
Bow Lion 1988 39 423 43 726 - 29
Bow Peace 1987 45 655 52 179 2 167 23
Bow Pride 1987 45 655 52 179 2 167 23
Bow Prosper 1987 45 655 52 179 2 167 23
Bow Fertility 1987 45 507 52 182 2 167 23
Bow Fraternity 1987 45 507 52 180 2 167 23
Bow Victor 1986 33 000 34 500 21 975 31
Bow Pacifico (50%) 1982 18 657 22 929 10 849 31
Bow Viking 1981 33 644 40 967 21 745 36
tiME ChArtErEd
SG Pegasus 2011 13 086 14 523 14 523 16
NCC Danah 3) 2011 45 578 52 590 - 22
NCC Nasma 3) 2011 45 550 52 590 - 22
NCC Safa 3) 2011 45 544 52 590 - 22
NCC Amal 3) 2011 45 544 52 590 - 22
NCC Huda 3) 2011 45 459 59 590 - 22
Ship year built dWt CBM
Stainless steel, CBM
Number of tanks
NCC Noor 3) 2011 45 565 52 590 - 22
Stream Luna 2010 19 998 22 161 22 161 20
Bow Tone 2009 33 625 37 974 37 974 16
Bow Hector 2009 33 694 37 384 37 384 16
Southern Jaguar 2009 19 997 22 157 22 157 20
Stream Mia 2008 19 702 22 094 22 094 26
Bow Sagami 2008 33 641 38 000 38 000 16
Bow Harmony 2008 33 619 38 052 38 052 16
Bow Cape 2008 19 975 22 158 22 158 20
Bow Kiso 2008 33 641 37 974 37 974 16
Bow Heron 2008 33 707 37 365 37 365 16
NCC Haiel 3) 2008 45 953 54 401 - 22
NCC Dammam 3) 2008 45 965 54 401 - 22
NCC Sudair 3) 2007 45 853 54 401 - 22
Bow Lima 2007 19 971 22 157 22 157 20
Bow Fuji 2006 19 805 22 140 22 140 22
Bow Plata 2006 19 807 22 143 22 143 22
Bow Engineer 2006 30 086 36 274 36 274 28
Crystal Topaz 3) 2006 11 340 11 870 11 870 20
Crystal Diamond 3) 2006 11 340 11 870 11 870 20
Bow Sky 2) 2005 40 005 52 126 52 126 40
Bow Architect 2005 30 058 36 290 36 290 28
Bow Rio 2005 19 999 21 851 21 851 22
Bow Europe 2005 19 727 22 013 22 013 36
Bow Santos 2) 2004 19 997 21 846 21 846 22
Bow Asia 2) 2004 9 901 11 088 11 088 20
Bow Singapore 2) 2004 9 888 11 089 11 089 20
Bow Americas 2004 19 707 22 735 22 735 36
Bow de Rich 2003 12 452 13 571 13 571 22
Bow de Feng 2002 12 514 13 571 13 571 22
Bow Andino 2000 16 121 17 622 17 622 30
Crystal Amaranto 3) 1999 9 887 10 983 10 893 24
Euro Corallo 3) 1999 4 482 4 553 4 553 17
Euro Mora 3) 1998 3 746 3 828 3 828 15
Crystal Skye 3) 1998 9 554 10 442 10 442 24
Crystal Ambra 3) 1998 8 053 8 399 8 399 22
Bow Jubail 2) 1996 37 499 41 488 34 209 52
Bow Mekka 2) 1995 37 272 41 606 34 257 52
Bow Riyad 2) 1995 37 221 41 492 34 213 52
Crystal Amethyst 3) 1994 8 104 9 346 9 346 17
Crystal Emerald 3) 1994 8 143 9 346 9 346 17
Crystal Pearl 3) 1994 8 143 9 346 9 346 17
Bow Baha 1988 24 728 32 363 19 662 25
JBU Sapphire 3) 2009 19 860 22 144 22 144 16
JBO Opal 3) 2009 19 865 30 301 30 301 16
JBU Onyx 3) 2008 19 865 21 712 21 712 16
COMMErCiAl MANAgEMENt
Northern Wolverine 2006 16 000 18 397 10 056 35
Northern Lynx 2003 16 533 18 397 10 056 35
Crystal Atlantica 2000 16 630 17 350 17 350 22
Number of ships 100 2 746 039 3 164 260 1 985 491
as per 31 December 2011
flEEt & tErMiNAl OvErviEW
1) Vessel beneficially owned through financial lease2) Vessel on bare-boat charter3) Vessel on variable time charter/pool

113
yard delivery dWt Owner Comment
ON OrdEr
ShinaSB (ex SLS Shipbuilding Co Ltd) 2012 45 000 NCC 5 vessels
Chongqing Chuandong Shipbuilding Industry Co Ltd 2012 9 000 Odfjell
Chongqing Chuandong Shipbuilding Industry Co Ltd 2012 9 000 Odfjell
Chongqing Chuandong Shipbuilding Industry Co Ltd 2012 9 000 Odfjell
Daewoo Shipbuilding and Marine Engineering Co Ltd 2013 75 000 Odfjell
Daewoo Shipbuilding and Marine Engineering Co Ltd 2013 75 000 NCC
Number of newbuildings 10 402 000
tank terminals location Share CBM Stainless steel, CBM Number of tanks
Odfjell Terminals (Rotterdam) BV Rotterdam, NL 51.00% 1 636 100 33 000 281
Odfjell Terminals (Houston) Inc Houston, USA 51.00% 331 338 82 035 100
Odfjell Terminals (Jiangyin) Co Ltd Jiangyin, China 55.00% 99 800 30 000 22
Odfjell Terminals (Dalian) Ltd Dalian, China 50.00% 119 750 18 350 51
Odfjell Terminals (Korea) Co Ltd Onsan, Korea 50.00% 313 710 15 860 85
Oiltanking Odfjell Terminal Singapore Ltd Singapore 50.00% 365 000 13 520 79
Oiltanking Odfjell Terminal & Co. LLC Sohar, Oman 29.75% 1 267 500 - 54
Exir Chemical Terminals PJSCO BIK, Iran 35.00% 22 000 1 000 18
Vopak Terminal Ningbo Ltd Ningbo, China 12.50% 65 550 7 900 38
total owned terminals 9 terminals 4 220 748 201 665 728
Depositos Quimicos Mineros S.A. Callao, Peru 50 380 1 600 39
Granel Quimica Ltda Santos I, Brazil 97 720 19 880 99
Granel Quimica Ltda Rio Grande, Brazil 61 150 2 900 32
Granel Quimica Ltda Sao Luis, Brazil 75 710 - 35
Granel Quimica Ltda Ladario, Brazil 8 060 - 6
Granel Quimica Ltda Triunfo, Brazil 12 000 - 2
Granel Quimica Ltda Teresina, Brazil 7 640 - 6
Odfjell Terminals Tagsa S.A. Buenos Aires, Argentina 47 140 530 87
Odfjell Terminals Tagsa S.A. Campana, Argentina 62 980 10 190 88
Terquim S.A. San Antonio, Chile 32 840 - 25
Terquim S.A. Mejillones, Chile 18 000 - 7
IMTT-Quebec Quebec, Canada 293 130 5 500 53
total (incl. associated terminals) 21 terminals 4 987 498 242 265 1 207
projects and expansions location Share CBM Stainless steel, CBM Estimated completion
Odfjell Terminals (Charleston) LLC Charleston, USA 51.00% 56 000 - ready Q1 2013
Odfjell Nangang Terminals (Tianjin) Co Ltd Tianjin, China 49.00% 150 000 ready 2014
Oiltanking Odfjell Terminal & Co.LLC Sohar, Oman 29.75% 27 300 - ready Q3 2012
total expansion owned terminals 2 new terminal 233 300 -
Depositos Quimicos Mineros S.A. Callao, Peru 2 600 ready Q1 2012
Granel Quimica Ltda Aracruz, Brazil 30 000 - ready Q3 2014
Granel Quimica Ltda Santos II, Brazil 52 000 - ready Q4 2012
Terquim S.A. Mejillones, Chile 50 000 - ready Q4 2012
total expansion (incl. associated terminals) 2 new terminals 217 900 -
grand total (incl. associated terminals) 25 terminals 5 355 398 242 265

114 odfjell annual report 2011
BALLAstAmount of unpaid cargo carried in order to provide sufficient weight to keep a ship stable.BALLAst LeGA voyage with no cargo on board, to position a ship for the next load port or dry docking.BALLAst tAnKA tank that can be filled with water, to provide stability for a ship.BAre-BoAt ChArter (B/B)An arrangement involving the hiring of a ship, under which crew costs and other operating expenses are not included in the agreement but charged as a specific fee payable per time period. The party that hires the ship covers crew costs and all other operating expenses, including docking and maintenance, in addition to all voyage-related costs. On re-delivery, the ship shall be in the same good condition as when delivered, normal wear and tear excepted.BArGinGTransfer of cargo to/from a ship from/to a barge.BroKerAn intermediary who negotiates freight contracts between owners and charterers as well as the sale and purchase of ships.BUnKers/BUnKerinGFuel oil, to power a ship’s engines. Bunkering involves taking bunkers on board.CBmCubic metre, volume measurement = 1 metre x 1 metre x 1 metre.ChArter pArtY (C/p)Agreement between a shipowner and a charterer, outlining terms and conditions governing the transaction. The agreement may be for one or several voyages, or for a certain period of time.ChArtererThe party hiring and paying for ships or ship space. This may be the cargo owner, an intermediary or the receiver of the cargo.CLAssifiCAtion soCietYAn independent, non-governmental organisation, e.g. Det Norske Veritas, which checks and verifies that the technical condition, the safety and quality of a ship complies with its own rules, as well as those of national authorities.CoAtinGPaint protecting the inside of a ship’s tanks. Usually epoxy- or zinc-based paints.ContrACt of AffreiGhtment (CoA)An agreement between an owner and a charterer setting the terms for transportation of given quantities of cargo during a given period of time.DeADweiGht tonne (Dwt or tDw)A measure of the weight-carrying capacity of the ship. The total DWT is the weight of the ship and the cargo the ship may carry over and above bunkers, fresh water, spare parts etc.Deep-seA (GLoBAL) trADeSea-borne trade that moves on intercontinental trade routes. DemUrrAGeCompensation paid by the charterer, supplier or receiver of the cargo for each day or pro rata for time spent in port during loading/discharging, in excess of the lay-time stipulated in the Charter Party.DeterGentsSubstances used for tank washing.DnvpsDet Norske Veritas Petroleum Service.DoUBLe hULLThe ship has an inner and an outer hull. This design increases safety during potential groundings or
collisions by allowing leakages to be contained. The space between the inner and outer hull may also be used as a ballast tank.DrY DoCKPutting a ship into dry dock for inspection and repairs of underwater parts, and painting of the ship bottom. Usually carried out every 2½ to 5 years.freiGht rAteAgreed price for transportation, stipulated either per metric tonne of cargo, cubic metre of cargo or as a lump sum for the total cargo.G/tnm: gram/tonne nautical mile.imoInternational Maritime Organisation, the inter-national UN advisory body on transport by sea.inorGAniC ChemiCALsChemicals whose molecular structure contains no carbon atoms (other than as part of a carbon-ate group), and which are derived from sources other than hydrocarbons, such as sulphuric acid, phosphoric acid and caustic soda.ismCInternational Safety Management Code. The first formalised initiative by IMO to provide a universal standard for ships’ safety management systems. KnotA measure of the speed of the ship. 1 knot = 1 nautical mile per hour, that ≈ 1.85 km/h.LiBorLondon Interbank Offered Rate.LtifLost-Time Injury Frequency.mArpoLThe International Conventions governing Marine Pollution Prevention, part of IMO.m/tMotor Tanker.mtMetric tonne.nisNorwegian International Ship Register.oeCDOrganisation for Economic Co-operation and Development, an information-gathering body. The members are industrialised countries in Western Europe, North America and the Asia/Pacific region.off-hireThe time a ship is prevented from being gainfully employed for its owner or charterer, e.g. time used for repairs.opA 90The US Oil Pollution Act of 1990. A US federal law that imposes strict requirements on shipping companies, ships and crews when trading in US waters.operAtinG eXpensesExpenses for crew as well as all other expenses directly connected with the running of the ship, including maintenance and insurance.operAtorA person in a shipping company whose main duties include managing contact between the ship and the charterer, giving instructions to the ship and the port agents concerning stowage, loading and discharging of cargo, and arranging purchase of bunkers etc.orGAniC ChemiCALsChemicals containing carbon-based molecules, often referred to as petrochemicals when derived from hydrocarbon sources such as oil, gas and coal.pArCeL tAnKerTanker designed for the simultaneous transporta-tion of several different segregated cargoes.
petroChemiCALsSee organic chemicals.pooLA co-operation between owners who supply their ships for an operation where net revenues are pooled and divided according to a pre-determined distribution key.ppmParts per million (1ppm=0.000001 or 1mg/kg).seGreGAtionThe division of a ship’s cargo space into individual tanks.sepSafety and Environmental Protection, classification system used by Det Norske Veritas.ship mAnAGementThe administration of a ship, including services such as technical operation, maintenance, crewing and insurance.short-seA (reGionAL) trADeSea-borne trade that moves within regional trade routes (not intercontinental). soLventsLiquids that can dissolve other substances.soXSulphur Oxides (SOx), react with moisture in the air to form sulphuric acid.spot rAteFreight rate for cargo parcel agreed based on the current market level.stCwInternational convention on standards of training, certification and watch keeping of seafarers.time ChArter (t/C)An arrangement for the hiring of a ship complete with crew against a fee, payable as a specific sum per time period. The party that hires the ship pays for bunkers, port and canal charges and any other voyage-related costs.time ChArter eArninGsGross freight revenues minus voyage costs divided by number of trading days, usually expressed in USD per day.tonneA gross registered tonne is a volume of 100 cubic feet (2.83 cubic metres). Gross registered tonnage is basically the volume of the ship’s closed areas, excluding the bridge, the galley and a few other areas. Net registered tonnage is the gross tonnage less volumes needed for the operation of the ship (deck storage room, engine room etc.), i.e. the volume available for cargo.tonne or metriC tonne1,000 kg.trADeThe geographical area where a ship mainly trades.trADinG DAYsThe number of days a ship is not off-hire.trAnshipmentTransfer of cargo from one to another ship. For example, cargo from a ship within global trade to a ship within regional trade bound for final destination/harbour. voYAGe ChArterAn agreement for the transportation of cargo from the port(s) of loading to the port(s) of discharge. Payment is normally per tonne of cargo, and the ship owner pays for bunkers, port and canal charges and other voyage-related costs.voYAGe eXpensesExpenses directly relating to the voyage, such as bunkers, port charges, canal dues, etc.
glOSSAry
Our glossary explains some of the terms that we commonly use.

115
OffiCES ANd AdrESSES
AssoCiAteD terminALs
granel quimica ltdaAv. Paulista 460, 18° andarCEP 01310- 000 São Paulo, SPBRAZILTel: +55 11 3549 5800Fax: +55 11 3549 5832
tagsa S.AAv. Alicia Moreau de Justo 1960,piso 4 Of. 4021107 Buenos AiresARGENTINATel: +54 11 4001 9700Fax: +54 11 4001 9701
terquim S.ABlanco Encalada 840Dept 702, San AntonioCHILETel: +56 35 21 1050Fax: +56 35 21 1161
dqM S.AAv.Enrique Meiggs, 240Urb.Chacaritas, Callao,PERU Tel: +51 1 614 0800Fax: +51 1 614 0801
reGionAL offiCes
Odfjell Asia pte ltd6 Shenton Way, # 27-08/09 DBS Tower 2SINGAPORE 068809Tel: +65 6349 1300Fax: +65 6224 2285
flumar transportes de quimicos e gases ltdaAv. Paulista 460 - 18 andarCEP 01310-000 Sao Paulo SP, BRAZILTel: +55 11 3549 5800Fax: +55 11 3549 5807
Odfjell tankers Europe ASConrad Mohrs veg 29P.O.Box 6101 Postterminalen5892 Bergen, NORWAyTel: +47 5527 0000Fax: +47 5527 9070
terminALs
Odfjell terminals (rotterdam) BvOude Maasweg 6, P.O. Box 5010Harbour Number 40403197 KJ Rotterdam-BotlekThe NETHERLANDSTel: +31 102 953 400Fax: +31 104 384 679
Odfjell terminals (houston) inc.12211 Port RoadSeabrook, TX 77586, USATel: +1 713 844 2300Fax: +1 713 844 2355
Odfjell terminals (dalian) ltdNew PortEconomy & TechnologyDevelopment Zone 116601, Dalian P.R. CHINATel: +86 411 8759 5500Fax: +86 411 8759 5549
Odfjell terminals (Jiangyin) Co., ltd1314 West Binjiang RoadShizhuangNew Harbour City, JiangyinJiangsu 214446 P.R. CHINATel: +86 510 8666 9111Fax: +86 510 8666 9110
Odfjell terminals (korea) Co., ltd136, Cheoyong-RiOnsan-Eup, Ulju-GunUlsan, KOREATel: +82 522 311 600Fax: +82 522 376 636
Oiltanking Odfjell terminal Singapore pte ltd1 Seraya AvenueSINGAPORE 628208Tel: +65 6473 1700Fax: +65 6479 4500
Oiltanking Odfjell terminals & Co. llc.P.O. Box 369PC., 322 Fajal Al QubailSohar, SULTANATE OF OMANTel: +968 2670 0300Fax: +968 2670 0306
vopak terminal Ningbo ltd.No. 111 Zhaobaoshan Road, Zhenhai DistrictNingbo, P.R. CHINA Tel: +86 574 2769 5638Fax: +86 574 8627 5931
internAtionAL offiCes
Odfjell uSA (houston) inc.12211 Port RoadSeabrook, TX 77586, USATel: +1 713 844 2200Fax: +1 713 844 2211
Odfjell Singapore pte ltd6 Shenton Way, # 27-08/09 DBS Tower 2SINGAPORE 068809Tel: +65 6349 1300Fax: +65 6224 2285
Odfjell Japan ltdOgawa Bldg. 8F2-2 Uchikanda 1-ChomeChiyoda-ku, Tokyo 101-0047, JAPANTel: +81 3 3259 8555Fax: +81 3 3259 8558
Odfjell Netherlands BvOude Maasweg 6, P.O. Box 50103197 XC Rotterdam-BotlekThe NETHERLANDSTel: +31 102 953 666Fax: +31 102 953 668
Odfjell Brasil ltdaAv. Paulista 460 - 18 andarCEP 01310-000 Sao Paulo SP, BRAZILTel: +55 11 3549 5800Fax: +55 11 3549 5808
Odfjell ShanghaiSuite B, 13FHuamin Empire Plaza728 yan An West RoadChangning DistrictShanghai 200050, P.R. CHINATel: +86 21 5239 9469Fax: +86 21 5239 9897
Odfjell Argentina SAAlicia Moreau de Justo 1960Office no. 202 - Puerto Madero1107 Buenos Aires, ARGENTINATel: +54 114 313 7837Fax: +54 114 313 4619
Odfjell Australia pty limitedSuite 4, Level 1443 Little Collins StreetP.O.Box 1279Melbourne VIC 3001 AUSTRALIATel: +61 3 9642 2210Fax: +61 3 9642 2214
Odfjell indiaA-26, Nandbhuvan Industrial EstateMahakali Caves Road, Andheri (East)Mumbai 400093, INDIATel: +91 22 6695 4701Fax: +91 22 6695 4707
Odfjell durban (pty) ltd 61 Bulwer Road, Glenwood P.O.Box 4045 Durban 4021, SOUTH AFRICA Tel.: +27 31 2770880 Fax: +27 31 2770899
Odfjell tankers AS, korea BranchRoom 1815 Gwanghwamum Officia Bldg.163 1-ga ShinmunnoJongn-gu, Seoul, 110-999 KoreaTel: +82 2 775 9760Fax: +82 2 775 9761
Odfjell korea ltd.136, Cheoyong-Ri,Onsan-Eup, Ulju-GunUlsan, KOREATel: +82 52 227 5527Fax: +82 52 227 5567
Odfjell ChilePuerta del Sol 55Las Condes, SantiagoCHILETel: +56 2 3307221Fax: +56 2 3307948
Odfjell philippines inc.4th Flr Atlantis Beacon Tower2315 Leon Guinto St. Malate, Manila 1004PHILIPPINESTel: +6325280341Fax: +6325262256
Odfjell (uk) ltd14 Headfort PlaceLondon SW1X 7DHUNITED KINGDOMTel: +44 207 823 0605Fax: +44 207 823 0606
Odfjell peruAv. Enrique Meiggs, 240Urb. Chacaritas,Callao, PERUTel: +51 1 614 0800Fax: +51 1 614 0801
NCC Odfjell Chemical tankers JltRoom 3101-3104, Liwa HeightsJumeirah Lake TowersP.O.Box 214459Dubai, UNITED ARAB EMIRATESTel: +971 4 440 1700Fax: +971 4 441 1701
mAin offiCe terminALsmAin offiCe oDfJeLL
Odfjell SE - Odfjell tankers ASConrad Mohrsv. 29, P.O. Box 6101 Postterminalen5892 Bergen, NORWAyTel: +47 5527 0000Fax: +47 5528 4741Fax: +47 5527 9070 (Chartering/Operations)
Odfjell terminals BvOude Maasweg 6, P.O. Box 5010Harbour Number 40403197 KJ Rotterdam-BotlekThe NETHERLANDSTel: +31 102 954 700Fax: +31 102 954 719
CreDits Design: Cox AS - Web: Globerta - Photo: Tommy Næss, Ron van de Velde, Nils Olav Mevatne, Thomas Kohnle, Kenneth Rasmus Greve, Sang-Ki Lee - Print: Scanner Grafisk AS

OdfJEll SE
Conrad Mohrsveg 29,p.o. Box 6101 postterminalen
5892 Bergen, norwaytel: +47 5527 0000fax: +47 5528 4741
e-mail: [email protected]. no: 930 192 503
www.odfjell.com