
Annual Report - Northern Bear...
53
Annual Report and Accounts 2012
-
Upload
truongtram -
Category
Documents
-
view
214 -
download
0
Transcript of Annual Report - Northern Bear...

Annual Reportand
Accounts 2012
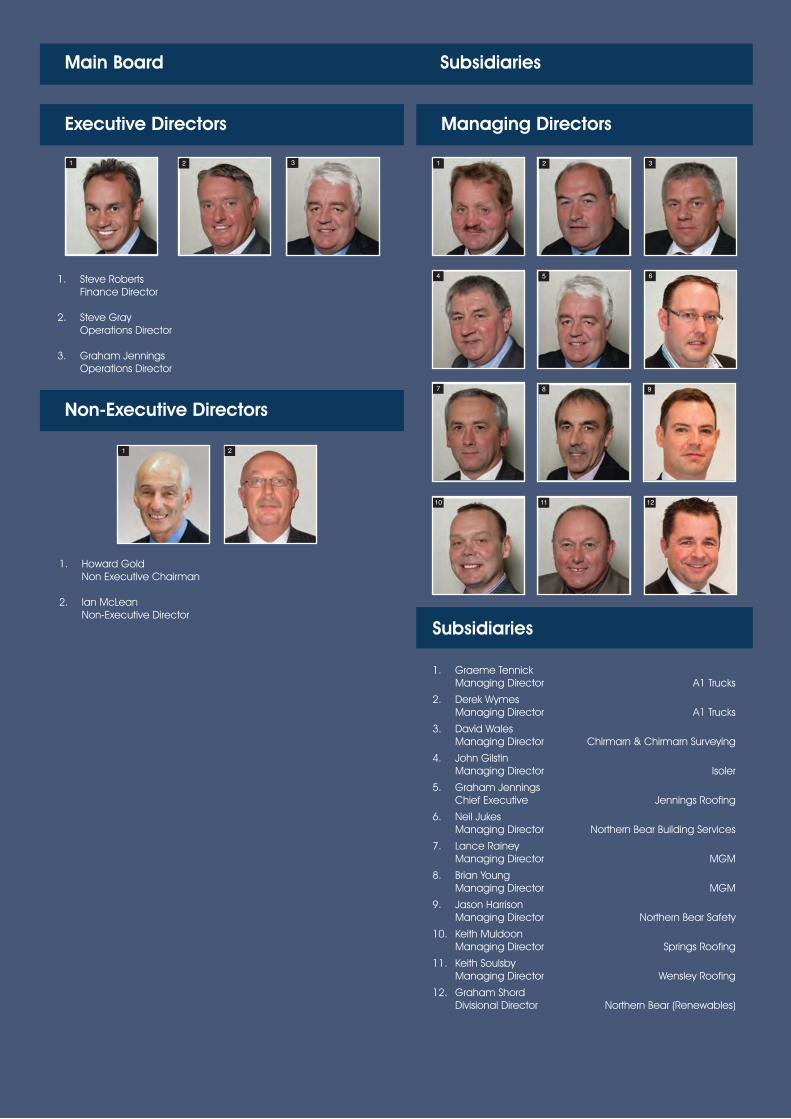
Main Board Subsidiaries
Non-Executive Directors
Executive Directors Managing Directors
Subsidiaries
1. Graeme TennickManaging Director A1 Trucks
2. Derek WymesManaging Director A1 Trucks
3. David WalesManaging Director Chirmarn & Chirmarn Surveying
4. John GilstinManaging Director Isoler
5. Graham JenningsChief Executive Jennings Roofing
6. Neil JukesManaging Director Northern Bear Building Services
7. Lance RaineyManaging Director MGM
8. Brian YoungManaging Director MGM
9. Jason HarrisonManaging Director Northern Bear Safety
10. Keith MuldoonManaging Director Springs Roofing
11. Keith SoulsbyManaging Director Wensley Roofing
12. Graham ShordDivisional Director Northern Bear (Renewables)
1 2 3 1 2 3
4 5 6
7 8 9
10 11 12
1. Howard GoldNon Executive Chairman
2. Ian McLeanNon-Executive Director
1 2
1. Steve RobertsFinance Director
2. Steve GrayOperations Director
3. Graham JenningsOperations Director

Contents
Advisors 2
Chairman’s statement 3
Directors’ report 5
Statement of directors’ responsibilities in respect of the annual report and the financial statements 9
Independent auditor’s report to the members of Northern Bear Plc 10
Consolidated statement of comprehensive income 12
Consolidated statement of changes in equity 13
Company statement of changes in equity 14
Consolidated balance sheet 15
Company balance sheet 16
Consolidated statement of cash flows 17
Company statement of cash flows 18
Notes 19

2
Advisors
AuditorKPMG Audit PlcQuayside House110 QuaysideNewcastle upon TyneNE1 3DX
BankersYorkshire Bank4 Victoria PlaceManor RoadLeedsLS11 5AE
Legal advisorsMincoffs Solicitors LLP5 Osborne TerraceJesmondNewcastle upon TyneNE2 1SQ
Nominated advisorStrand Hanson Limited26 Mount RowLondonW1K 3SQ
BrokerSeymour Pierce Limited20 Old BaileyLondonEC4M 7EN
Registered officeA1 GraingerPrestwick ParkPrestwickNewcastle upon TyneNE20 9SJ
3
Chairman’s statement
Introduction
I am pleased to report results for the year ended 31 March 2012.
Profit before tax from continuing operations increased by 25% to £1.0m (2011: £0.8m). Net cash generated fromoperating activities increased by 21% to £1.0m (2011: £0.9m).
Basic earnings per share from continuing operations were 4.0p (2011: 3.4p) and earnings per share from totaloperations were 3.1p (2011: 1.2p loss per share).
Exceptional items (from continuing operations) were £0.2m (2011: £0.3m), the majority of which wereredundancy and legal costs.
Following the disposals of Hastie D Burton Limited and The Roof Truss Company (Northern) Limited in April andMay 2011 respectively, it is not currently expected that there will be any further changes in Group structure in theshort term and, as such, no further losses from discontinued operations are envisaged. The loss fromdiscontinued operations (net of income tax) was £0.2m (2011: £0.9m).
The Board was particularly pleased with the trading performance and cash collection in the second half of thefinancial year. This was subsequent to an operational review where changes were made to the Group’smanagement structure as detailed below. The Board has been delighted with the support received fromsubsidiary management teams (in implementing the necessary changes) and with the improvements which haveresulted.
It has recently been announced that the Group has officially moved its Head Office to Prestwick Park whichshould provide efficiencies in the centralisation of certain Group functions, particularly finance.
Trading
Turnover (from continuing operations) increased by 34% to £36.4m (2011: £27.2m) which is testament to themanagement teams at the Group’s subsidiaries who have continued to attract increased volumes of work.However, due to significant margin pressure in all markets and a change in sales mix, gross profitability did notincrease at the same rate.
The uncertain macroeconomic conditions have continued to dominate the trading environment for ourbusinesses. Whilst public sector expenditure programmes continue to provide the Group with a significant levelof orders, there are constant delays between winning contracts and commencing work on site which makespredicting turnover levels more challenging.
Whilst all businesses within the Group continue to operate in extremely tough market conditions, the Boardremains cautiously optimistic that the reputation of the Group’s businesses will allow them to win more than theirfair share of the work available.
Cash flow
The Group’s bankers have remained supportive in very difficult trading conditions, especially given the marketsin which we operate and the well publicised failures of other businesses in our sector (which have had anenormous impact on the banking sector as a whole).
The cash performance of the Group remains good, with a further reduction in net bank debt to £7.0m (2011:£8.4m). This reduction includes a repayment of term loan debt of £0.4m made from disposal proceeds on thesale of The Roof Truss Company (Northern) Limited.
Dividend
Despite improved trading performance, the Board believes that it would be prudent to continue not to declaredividends.
4
Chairman’s statement (continued)
Board of Directors and Advisors
Graham Forrest announced his resignation as Chief Executive Officer and as a director of the Company, withimmediate effect, on 11 October 2011.
The Group used the occasion of Mr Forrest’s resignation to ensure that the talent that exists within the Groupwas being utilised most appropriately. Following an operational review, which was overseen by myself asChairman, the Board implemented changes to the Group’s management structure, which we believe havealready delivered benefits for the Group. This has included the appointment of Graham Jennings as ManagingDirector of the Group effective from 30 July 2012.
Mr Jennings was previously an Operations Director of the Group and was Managing Director of JenningsRoofing prior to its acquisition by the Group in November 2007. He has been involved in the constructionindustry in the North of England for 38 years and brings with him a wealth of experience to the role. Since beingappointed to the Board in April 2008 he has had overall operational responsibility for several Group companiesand has the knowledge and experience to manage the Group in trading conditions that are likely to remainchallenging.
Keith Soulsby was re-appointed to the Board as an Operations Director on 11 May 2012. Mr Soulsby haspreviously been a Director of Northern Bear for over four years (between April 2007 and September 2011). Hewas the founder and remains current Managing Director of Wensley Roofing Limited.
Outlook
The new financial year has started well and the Group’s order book remains healthy. As previously reported, theGroup retains a presence in the private housebuilding sector and we are pleased to report a slight upturn in thismarket.
Given this, we are cautiously optimistic of maintaining current levels of trade, although we remain fully aware ofthe volatile market conditions in which we continue to operate. Also, the roll-out of certain committed orders,particularly those from the public sector (where project delays are common), remains outside of our control andmakes the timing of revenues from those orders more difficult to predict.
In addition our overall priority remains to improve earnings and cash flow to continue to reduce the Group’s levelof bank debt.
People
Once again, the Board and Shareholders would like to thank all of our employees for their continuedcommitment and energy. They have faced many varied challenges during the past year and, in all cases, acombination of experience and positive attitude have ensured the Group has exceeded expectations, even inthis difficult climate.
Howard Gold
Non-Executive Chairman 24 August 2012

5
Directors’ report
The directors present their annual report and financial statements for the year ended 31 March 2012.
Business review
Principal activities
The principal activity of the Group is to operate businesses in the North of England active in the support servicessector. Furthermore, these businesses can be augmented with bolt on acquisitions or by the creation of newventures.
Objective and strategy
Having established the Group via an acquisition strategy and subsequently restructured operations during thecontinuing economic downturn through the disposal of non-core businesses, the Group now has an establishedportfolio of mature businesses wholly focused on the support services sector.
The directors continue to believe that opportunities for growth exist through both providing new services to theexisting, long established customer base, and also through further bolt on acquisitions where appropriate.
A number of areas for possible expansion into new services have been identified (in conjunction with our existingcustomers) which require very little by the way of capital outlay or working capital funding.
Measurement
The Company uses a number of financial and non financial KPI’s to measure performance and these arecommunicated to the Board of Directors through monthly reports. These KPI’s include sales information, orderbook details, manufacturing and stock levels, detailed operational costs and a number of health and safety andemployee related KPI’s. The Board considers that the KPI’s used are an effective system tailored specifically tothe demands of the sector.
Financially, the primary measurements are income, operating profit and cash flow from operations, as identifiedin the Chairman’s Statement. The major non financial KPI’s relate to health and safety measures, including ouraccident incident rate (AIR) and the number of notifiable accidents.
Statement on risks relating to the Group’s business
The nature of the building services industry means that the Group is subject to a number of risk factors. Some ofthese factors apply to the building services industry generally, while others are specific to the Group’s activitieswithin that market.
Sector demand
The Group currently consists of ten businesses which all operate in three main segments of the support servicessector of the economy. The Group is therefore exposed to varying activity levels within these diverse industries.Whilst the exposure of the Group to the new house build sector is less than 10% of Group turnover, ourexposure to public sector markets is far greater. Consequently, any sustained material reduction in Governmentexpenditure programmes will have an adverse effect on the financial position of the Group.
Competition
Some of the businesses within the Group have competitors who, as a result of their funding structure, may beable to accept lower financial returns than that required by the Group. Competition within these companiescould adversely affect the Group’s profitability and financial position.
Key clients
There can be no guarantee that the Group’s key clients will not change suppliers. While each of the Group’sbusinesses has many longstanding relationships with a number of key customers, the failure to satisfy the needsof these customers could harm the Group’s business. Furthermore, these customers may be facing challengeswithin their own businesses.

6
Directors’ report (continued)
Business review (continued)
Dependence on personnel
The Group continues to be dependent on the continued services of its senior management. Retaining qualifiedpersonnel, consultants and advisors is important to the continued successful operation of the Group’s business.There can be no assurance that the Group will be able to recruit or retain its personnel in the future, which couldhave an adverse effect upon the Group’s business and financial position. The loss of any of the Group’s seniorpersonnel could impede the achievement of its objectives.
Future outlook
The future outlook for the business is included in the Chairman’s Statement on page 4.
Proposed dividend
The directors do not recommend the payment of a dividend.
Directors
The directors who held office during the year were as follows:
HB GoldSM RobertsS GrayK Soulsby (resigned 23 September 2011, appointed 11 May 2012)GR JenningsIT McLeanGSL Forrest (resigned 11 October 2011)
The directors who held office at the end of the financial year had the following interests in the ordinary shares ofthe Company according to the register of directors’ interests:
Interest at
Interest at beginning
end of year of year
GR Jennings 1,168,324 814,569SM Roberts 753,300 753,300S Gray 655,952 827,282IT McLean 71,428 71,428HB Gold 20,000 20,000
In total the directors’ interests in the ordinary shares of the Company totalled 2,669,004 shares, representing15% of allotted shares at the year end.
All the directors benefited from qualifying third party indemnity provisions up to and including the date of thisreport.

7
Directors’ report (continued)
Significant shareholdings
At 25 May 2012, the Company had been notified or was aware of the following shareholders with 3% or more ofthe issued share capital of the Company:
Number of ordinary
shares in which % of issued
Shareholder interested share capital
JP Pither 2,937,914 16.5GR Jennings 1,168,324 6.6D Abell 1,042,000 5.9R Stanley 896,500 5.0SM Roberts 753,300 4.2K Soulsby 730,481 4.1S Gray 655,952 3.7GJ Temnick 591,251 3.3DM Wymes 591,251 3.3D Jay 543,000 3.0
Political and charitable contributions
Neither the Company nor any of its subsidiaries made any political contributions during the year (2011: £nil).Charitable donations amounted to £5,160 (2011: £8,540).
Corporate governance
The directors recognise the value of the revised Combined Code issued in June 2008.
The Company, whilst not bound by the Combined Code, seeks to comply with the Code so far as is practicableand appropriate for a public company of its size. The Company also seeks to follow the recommendations oncorporate governance of the Quoted Companies Alliance (QCA).
The Board has established an Audit Committee and a Remuneration Committee, each of which comprises thenon-executive directors with formally delegated duties and responsibilities.
The Audit Committee receives and reviews reports from the Company’s auditors relating to the annual andinterim accounts and the accounting and internal control systems in use throughout the Group. The AuditCommittee has unrestricted access to the Company’s auditors.
The Remuneration Committee reviews the scale and structure of the executive directors’ remuneration and theterms of their service contracts. The remuneration and terms and conditions of appointment of the non-executive directors are set by the Board. The Remuneration Committee also administers the Group’s shareoption schemes.
Employees
The Group provides equal opportunities to all staff and employees and recruits the most suitably qualified personfor each position. Full and fair consideration is given to applications for employment from disabled persons. Allnecessary assistance with initial training courses is given. Once employed, a career plan is developed so as toensure suitable opportunities for each disabled person. Where an existing employee becomes disabled, theGroup’s policy is to provide continuing employment under normal terms and conditions wherever possible.
The directors recognise the importance of good communications and inform and consult with employees’representatives on all matters likely to affect them.
The Group operates a range of schemes to involve employees in the financial performance of the businessincluding profit related and other cash bonus arrangements and share option schemes.
8
Directors’ report (continued)
Annual general meeting
The business of the AGM is set out in the accompanying circular to shareholders. The AGM is to be held atMincoffs Solicitors LLP, 5 Osborne Terrace, Jesmond, Newcastle upon Tyne, NE2 1SQ at 9am on 20 September2012.
Disclosure of information to auditor
The directors who held office at the date of approval of this directors’ report confirm that, so far as they are eachaware, there is no relevant audit information of which the Company’s auditor is unaware; and each director hastaken all the steps that they ought to have taken as a director to make themselves aware of any relevant auditinformation and to establish that the Company’s auditor is aware of that information.
Auditor
In accordance with Section 489 of the Companies Act 2006, a resolution for the reappointment of KPMG AuditPlc as auditor of the Company is to be proposed at the forthcoming Annual General Meeting.
By order of the board
SM Roberts
Finance Director A1 GraingerPrestwick Park
PrestwickNewcastle upon Tyne
NE20 9SJ
24 August 2012

9
Statement of directors’ responsibilities in respect of the annual report and the financial
statements
The directors are responsible for preparing the annual report and the Group and Parent Company financialstatements in accordance with applicable law and regulations.
Company law requires the directors to prepare Group and Parent Company financial statements for eachfinancial year. As required by the AIM rules of the London Stock Exchange they are required to prepare theGroup financial statements in accordance with IFRSs as adopted by the EU and applicable law and have electedto prepare the Parent Company financial statements on the same basis.
Under company law the directors must not approve the financial statements unless they are satisfied that theygive a true and fair view of the state of affairs of the Group and Parent Company and of their profit or loss for thatperiod.
In preparing each of the Group and Parent Company financial statements, the directors are required to:
• select suitable accounting policies and then apply them consistently;
• make judgements and estimates that are reasonable and prudent;
• state whether they have been prepared in accordance with IFRSs as adopted by the EU; and
• prepare the financial statements on the going concern basis unless it is inappropriate to presume that theGroup and Parent Company will continue in business.
The directors are responsible for keeping adequate accounting records that are sufficient to show and explainthe Parent Company’s transactions and disclose with reasonable accuracy at any time the financial position ofthe Parent Company and enable them to ensure that its financial statements comply with the Companies Act2006. They have general responsibility for taking such steps as are reasonably open to them to safeguard theassets of the Group and to prevent and detect fraud and other irregularities.
The directors are responsible for the maintenance and integrity of the corporate and financial informationincluded on the Company’s website. Legislation in the UK governing the preparation and dissemination offinancial statements may differ from legislation in other jurisdictions.

10
KPMG Audit PlcQuayside House110 QuaysideNewcastle upon TyneNE1 3DXUnited Kingdom
Independent auditor’s report to the members of Northern Bear Plc
We have audited the financial statements of Northern Bear plc for the year ended 31 March 2012 set out onpages 12 to 49. The financial reporting framework that has been applied in their preparation is applicable lawand International Financial Reporting Standards (IFRSs) as adopted by the EU and, as regards the ParentCompany financial statements, as applied in accordance with the provisions of the Companies Act 2006.
This report is made solely to the Company’s members, as a body, in accordance with Chapter 3 of Part 16 of theCompanies Act 2006. Our audit work has been undertaken so that we might state to the Company’s membersthose matters we are required to state to them in an auditor’s report and for no other purpose. To the fullestextent permitted by law, we do not accept or assume responsibility to anyone other than the Company and theCompany’s members, as a body, for our audit work, for this report, or for the opinions we have formed.
Respective responsibilities of directors and auditor
As explained more fully in the directors’ responsibilities statement set out on page 9, the directors areresponsible for the preparation of the financial statements and for being satisfied that they give a true and fairview. Our responsibility is to audit, and express an opinion on, the financial statements in accordance withapplicable law and International Standards on Auditing (UK and Ireland). Those standards require us to complywith the Auditing Practices Board’s (APB’s) Ethical Standards for Auditors.
Scope of the audit of the financial statements
A description of the scope of an audit of financial statements is provided on the APB’s website atwww.frc.org.uk/apb/scope/private.cfm.
Opinion on financial statements
In our opinion:
• the financial statements give a true and fair view of the state of the Group’s and of the Parent Company’saffairs as at 31 March 2012 and of the Group’s profit for the year then ended;
• the Group financial statements have been properly prepared in accordance with IFRSs as adopted by the EU;
• the Parent Company financial statements have been properly prepared in accordance with IFRSs as adoptedby the EU and as applied in accordance with the provisions of the Companies Act 2006; and
• the financial statements have been prepared in accordance with the requirements of the Companies Act 2006.
Opinion on other matters prescribed by the Companies Act 2006
In our opinion the information given in the directors’ report for the financial year for which the financial statementsare prepared is consistent with the financial statements.
11
Independent auditor’s report to the members of Northern Bear Plc (continued)
Matters on which we are required to report by exception
We have nothing to report in respect of the following matters where the Companies Act 2006 requires us toreport to you if, in our opinion:
• adequate accounting records have not been kept by the Parent Company, or returns adequate for our audithave not been received from branches not visited by us; or
• the Parent Company financial statements are not in agreement with the accounting records and returns; or
• certain disclosures of directors’ remuneration specified by law are not made; or
• we have not received all the information and explanations we require for our audit.
MR Thompson (Senior Statutory Auditor)
for and on behalf of KPMG Audit Plc, Statutory Auditor 24 August 2012Chartered AccountantsQuayside House110 QuaysideNewcastle upon TyneNE1 3DX
12
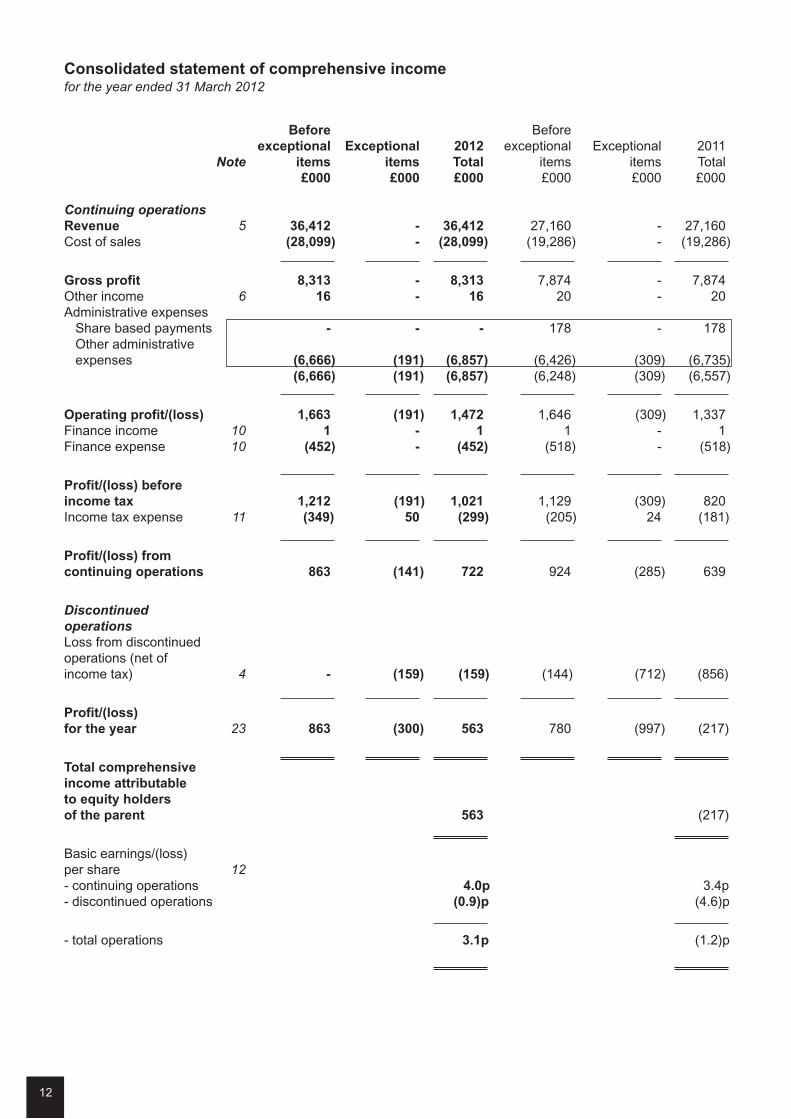
Consolidated statement of comprehensive incomefor the year ended 31 March 2012
Before Beforeexceptional Exceptional 2012 exceptional Exceptional 2011
Note items items Total items items Total£000 £000 £000 £000 £000 £000
Continuing operationsRevenue 5 36,412 - 36,412 27,160 - 27,160Cost of sales (28,099) - (28,099) (19,286) - (19,286)
Gross profit 8,313 - 8,313 7,874 - 7,874Other income 6 16 - 16 20 - 20Administrative expensesShare based payments - - - 178 - 178Other administrativeexpenses (6,666) (191) (6,857) (6,426) (309) (6,735)
(6,666) (191) (6,857) (6,248) (309) (6,557)
Operating profit/(loss) 1,663 (191) 1,472 1,646 (309) 1,337Finance income 10 1 - 1 1 - 1Finance expense 10 (452) - (452) (518) - (518)
Profit/(loss) before
income tax 1,212 (191) 1,021 1,129 (309) 820Income tax expense 11 (349) 50 (299) (205) 24 (181)
Profit/(loss) from
continuing operations 863 (141) 722 924 (285) 639
DiscontinuedoperationsLoss from discontinuedoperations (net ofincome tax) 4 - (159) (159) (144) (712) (856)
Profit/(loss)
for the year 23 863 (300) 563 780 (997) (217)
Total comprehensive
income attributable
to equity holders
of the parent 563 (217)
Basic earnings/(loss)per share 12- continuing operations 4.0p 3.4p- discontinued operations (0.9)p (4.6)p
- total operations 3.1p (1.2)p

13
Consolidated statement of changes in equityfor the year ended 31 March 2012
Share Capital Share Merger Retained Total
capital redemption premium reserve earnings equity
£000 £000 £000 £000 £000 £000
At 1 April 2010 190 - 5,169 12,586 2,029 19,974Total comprehensive income
for the year
Loss for the year - - - - (217) (217)Transactions with owners,
recorded directly in equity
Equity settled share basedpayment transactions - - - - (178) (178)Buy back of shares (6) 6 - (514) (1,766) (2,280)Transfers in respect ofdiscontinued operations - - - (1,701) 1,701 -
At 31 March 2011 184 6 5,169 10,371 1,569 17,299
At 1 April 2011 184 6 5,169 10,371 1,569 17,299Total comprehensive
income for the year
Profit for the year - - - - 563 563
At 31 March 2012 184 6 5,169 10,371 2,132 17,862
14
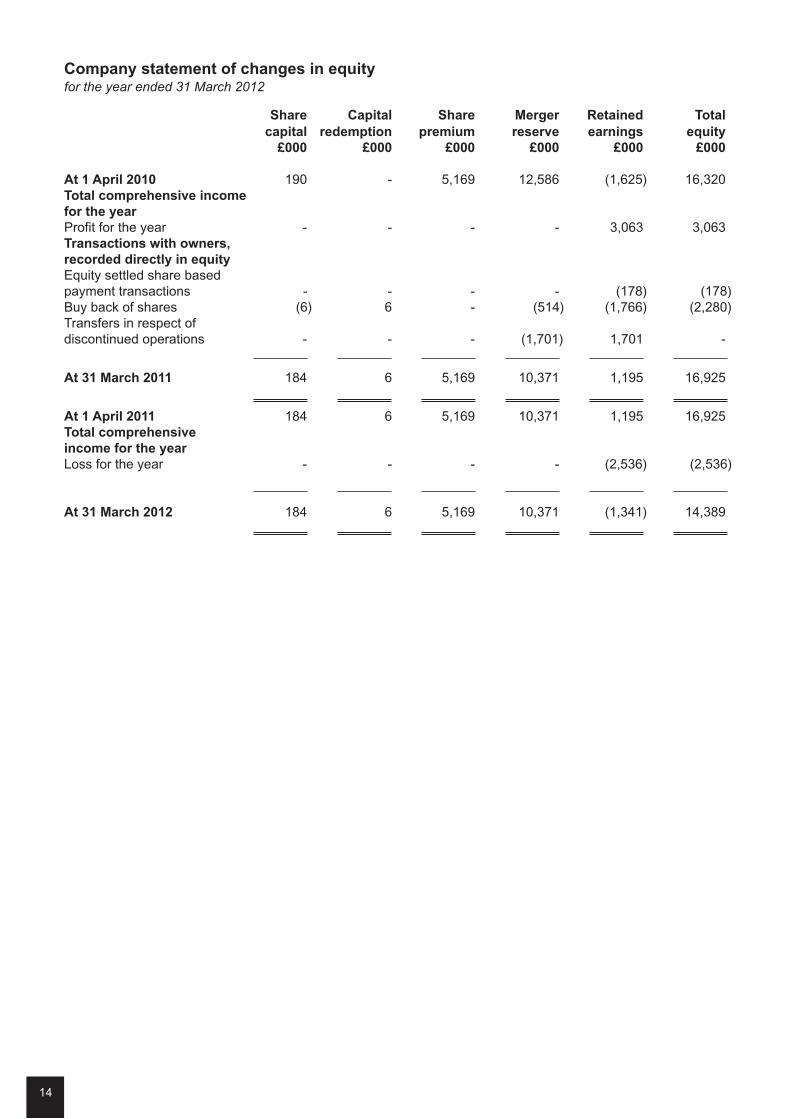
Company statement of changes in equityfor the year ended 31 March 2012
Share Capital Share Merger Retained Total
capital redemption premium reserve earnings equity
£000 £000 £000 £000 £000 £000
At 1 April 2010 190 - 5,169 12,586 (1,625) 16,320Total comprehensive income
for the year
Profit for the year - - - - 3,063 3,063Transactions with owners,
recorded directly in equity
Equity settled share basedpayment transactions - - - - (178) (178)Buy back of shares (6) 6 - (514) (1,766) (2,280)Transfers in respect ofdiscontinued operations - - - (1,701) 1,701 -
At 31 March 2011 184 6 5,169 10,371 1,195 16,925
At 1 April 2011 184 6 5,169 10,371 1,195 16,925Total comprehensive
income for the year
Loss for the year - - - - (2,536) (2,536)
At 31 March 2012 184 6 5,169 10,371 (1,341) 14,389

15
Consolidated balance sheetat 31 March 2012
Note 2012 2011£000 £000
Assets
Property, plant and equipment 13 2,220 2,258Intangible assets 14 21,348 21,348Deferred tax assets 16 33 -
Total non-current assets 23,601 23,606
Inventories 17 807 851Trade and other receivables 18 7,607 6,028Prepayments for current assets 194 145Deferred consideration receivable 222 -Cash and cash equivalents 19 243 281Assets classified as held for sale - 3,517
Total current assets 9,073 10,822
Total assets 32,674 34,428
Equity
Share capital 23 184 184Capital redemption reserve 23 6 6Share premium 23 5,169 5,169Merger reserve 23 10,371 10,371Retained earnings 23 2,132 1,569
Total equity attributable to equity holders of the Company 17,862 17,299
Liabilities
Loans and borrowings 20 2,470 3,561Deferred tax liabilities 16 - 103
Total non-current liabilities 2,470 3,664
Bank overdraft 19 4,333 4,782Loans and borrowings 20 858 754Trade and other payables 21 6,713 5,016Current tax payable 438 275Liabilities classified as held for sale - 2,638
Total current liabilities 12,342 13,465
Total liabilities 14,812 17,129
Total equity and liabilities 32,674 34,428
These financial statements were approved by the Board of Directors on 24 August 2012 and were signed on itsbehalf by:
SM Roberts
Finance Director
Company registered number: 05780581
16
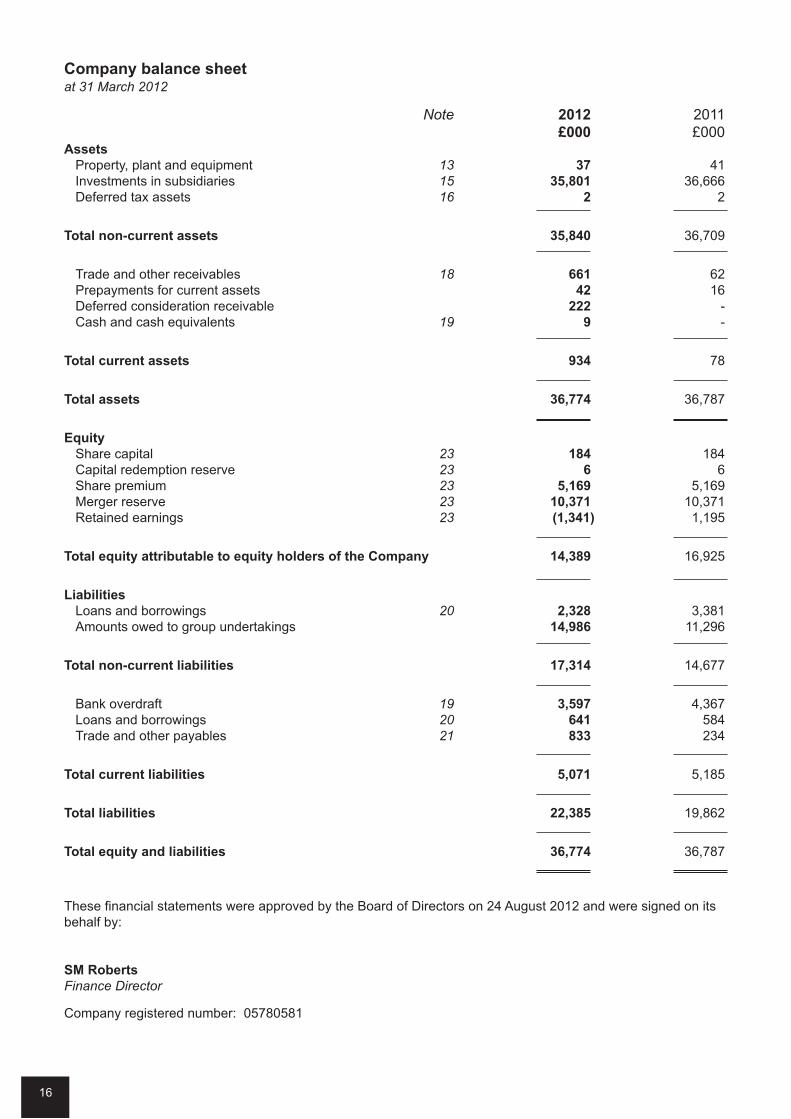
Company balance sheetat 31 March 2012
Note 2012 2011£000 £000
Assets
Property, plant and equipment 13 37 41Investments in subsidiaries 15 35,801 36,666Deferred tax assets 16 2 2
Total non-current assets 35,840 36,709
Trade and other receivables 18 661 62Prepayments for current assets 42 16Deferred consideration receivable 222 -Cash and cash equivalents 19 9 -
Total current assets 934 78
Total assets 36,774 36,787
Equity
Share capital 23 184 184Capital redemption reserve 23 6 6Share premium 23 5,169 5,169Merger reserve 23 10,371 10,371Retained earnings 23 (1,341) 1,195
Total equity attributable to equity holders of the Company 14,389 16,925
Liabilities
Loans and borrowings 20 2,328 3,381Amounts owed to group undertakings 14,986 11,296
Total non-current liabilities 17,314 14,677
Bank overdraft 19 3,597 4,367Loans and borrowings 20 641 584Trade and other payables 21 833 234
Total current liabilities 5,071 5,185
Total liabilities 22,385 19,862
Total equity and liabilities 36,774 36,787
These financial statements were approved by the Board of Directors on 24 August 2012 and were signed on itsbehalf by:
SM Roberts
Finance Director
Company registered number: 05780581

17
Consolidated statement of cash flowsfor the year ended 31 March 2012
Note 2012 2011£000 £000
Cash flows from operating activities
Profit/(loss) for the year 563 (217)Adjustments for:Depreciation 13 495 562Impairment - 530Finance income 10 (1) (1)Finance expense 10 452 518Loss on sale of property, plant and equipment 13 24 8Equity settled share-based payment transactions 22 - (178)Income tax 11 299 158
1,832 1,380Change in inventories 17 (145) (318)Change in trade and other receivables 18 (1,579) 735Change in prepayments (49) (9)Change in trade and other payables 21 1,708 (281)
1,767 1,507Interest received 10 1 1Interest paid 10 (452) (518)Tax paid (271) (126)
Net cash from operating activities 1,045 864
Cash flows from investing activities
Proceeds from sale of property, plant and equipment 13 70 99Acquisition of subsidiary, net of cash acquired - (50)Disposal of subsidiary, net of cash disposed of 4 644 (9)Acquisition of property, plant and equipment 13 (181) (246)
Net cash from investing activities 533 (206)
Cash flows from financing activities
Repayment of borrowings (983) (955)Repayment of finance lease liabilities (184) (232)
Net cash from financing activities (1,167) (1,187)
Net increase/(decrease) in cash and cash equivalents 411 (529)Cash and cash equivalents at start of year 19 (4,501) (3,972)
Cash and cash equivalents at end of year 19 (4,090) (4,501)

18
Company statement of cash flowsfor the year ended 31 March 2012
Note 2012 2011£000 £000
Cash flows from operating activities
(Loss)/profit for the year (2,536) 3,063Adjustments for:Depreciation 13 14 19Impairment 15 - 4,103Finance income 10 (1) -Finance expense 10 428 493Loss on sale of subsidiary - 38Equity settled share-based payment transactions 22 - (178)Income tax - (2)
(2,095) 7,536Change in trade and other receivables 18 (599) 215Change in prepayments (26) (3)Change in trade and other payables 21 4,289 (5,960)
1,569 1,788Interest received 10 1 -Interest paid 10 (428) (493)
Net cash from operating activities 1,142 1,295
Cash flows from investing activities
Acquisition of subsidiary - (50)Acquisition of property, plant and equipment 13 (11) (19)Disposal of subsidiary 4 644 -
Net cash from investing activities 633 (69)
Cash flows from financing activities
Repayment of borrowings (976) (843)Repayment of finance lease liabilities (20) -
Net cash from financing activities (996) (843)
Net increase in cash and cash equivalents 779 383Cash and cash equivalents at start of year 19 (4,367) (4,750)
Cash and cash equivalents at end of year 19 (3,588) (4,367)

19
Notes(forming part of the financial statements)
1 Reporting entity
Northern Bear Plc (the “Company”) is a company incorporated in England and Wales.
The Group financial statements consolidate those of the Company and its subsidiaries (together referred to as the“Group”). The Parent Company financial statements present information about the Company as a separate entityand not about its Group.
2 Basis of preparation
Statement of compliance
Both the Parent Company financial statements and the Group financial statements have been prepared andapproved by the directors in accordance with International Financial Reporting Standards as adopted by the EU(“Adopted IFRSs”).
On publishing the Parent Company financial statements here, together with the Group financial statements, theCompany is taking advantage of the exemption in s408 of the Companies Act 2006 not to present its individualstatement of comprehensive income and related notes that form a part of these approved financial statements.
Standards and interpretations applied for the first time
In these financial statements the following Adopted IFRSs, which became effective for the first time, were adoptedby the Group:
• Revised IAS 24 ‘Related Party Disclosure’;
• Improvements to IFRSs.
The adoption of the above standards and interpretations has not had a significant impact on the Group’s resultsfor the year or equity.
Basis of measurement
The financial statements are prepared on the historical cost basis.
Functional and presentation currency
These financial statements are presented in sterling, which is the Company’s functional currency.
Use of estimates and judgements
The preparation of financial statements requires management to make judgements, estimates and assumptionsthat may affect the application of accounting policies and the reported amounts of assets, liabilities, income andexpenses.
Estimates and underlying assumptions are reviewed on an ongoing basis. Revisions to accounting estimates arerecognised in the period in which the estimate is revised and in any future periods affected.
Judgements and estimates made by management in the application of Adopted IFRSs that have a significantimpact on the consolidated financial statements with a significant risk of material adjustment in the next year aredescribed in note 27.
Going concern
The Group’s business activities, together with the factors likely to affect its future development, performance andposition are set out in the Business Review on pages 5 and 6. The financial position of the Group, its cash flowsand liquidity position are described in the Chairman’s statement on pages 3 and 4. In addition, note 24 to thefinancial statements includes the Group’s objectives, policies and processes for managing its capital; its financialrisk management objectives; details of its financial instruments and its exposures to credit risk and liquidity risk.
The Group meets its day to day working capital requirements through bank overdraft and loan facilities. Theoverdraft element of the facilities is due for routine review and renewal on 31 January 2013. Whilst the currenteconomic outlook remains uncertain, the Group’s forecasts and projections, taking account of reasonably possiblechanges in trading performance, show that the Group should be able to operate within the level of its currentfacilities.

20
Notes (continued)
2 Basis of preparation (continued)
Going concern (continued)
Taking into account all of the above, the directors have a reasonable expectation that the Group has adequateresources to continue in operational existence for the foreseeable future. Accordingly they continue to adopt thegoing concern basis of accounting in preparing the annual financial statements.
3 Significant accounting policies
The accounting policies set out below have, unless otherwise stated, been applied consistently to all periodspresented in these consolidated financial statements.
Basis of consolidation
Control exists where the Group has the power, directly or indirectly, to govern the financial and operating policies ofan entity so as to obtain benefits from its activities. Subsidiaries are entities controlled by the Company. Thefinancial statements of subsidiaries are included in the consolidated financial information from the date that controlcommences until the date that control ceases.
Intercompany balances, and any unrealised gains and losses or income and expenses arising from intragrouptransactions, are eliminated when preparing the consolidated financial information.
Classification of financial instruments issued by the Group
Financial instruments issued by the Group are treated as equity only to the extent that they meet the following twoconditions:
(a) they include no contractual obligations upon the Company (or Group as the case may be) to deliver cash orother financial assets or to exchange financial assets or financial liabilities with another party under conditionsthat are potentially unfavourable to the Company (or Group); and
(b) where the instrument will or may be settled in the Company’s own equity instruments, it is either a non-derivative that includes no obligation to deliver a variable number of the Company’s own equity instruments oris a derivative that will be settled by the Company exchanging a fixed amount of cash or other financial assetsfor a fixed number of its own equity instruments.
To the extent that this definition is not met, the proceeds of issue are classified as a financial liability. Where theinstrument so classified takes the legal form of the Company’s own shares, the amounts presented in thesefinancial statements for called up share capital and share premium account exclude amounts in relation to thoseshares.
Non-derivative financial instruments
Non-derivative financial instruments comprise investments in equity, trade and other receivables, cash and cashequivalents, loans and borrowings, and trade and other payables.
Trade and other receivables
Trade and other receivables are recognised initially at fair value. Subsequent to initial recognition they aremeasured at amortised cost using the effective interest method, less any impairment losses.
Trade and other payables
Trade and other payables are recognised initially at fair value. Subsequent to initial recognition they are measuredat amortised cost using the effective interest method.
Investments in equity
Investments in subsidiaries are carried at cost less impairment in the Parent Company accounts.
Interest-bearing borrowings
Interest-bearing borrowings are recognised initially at fair value less attributable transaction costs. Subsequent toinitial recognition, interest-bearing borrowings are stated at amortised cost using the effective interest method, lessany impairment losses.

21
Notes (continued)
3 Significant accounting policies (continued)
Intangible assets and goodwill
All business combinations are accounted for by applying the purchase method. Goodwill represents amountsarising on acquisition of subsidiaries. Goodwill represents the difference between the cost of the acquisition andthe net fair value of the identifiable assets, liabilities and contingent liabilities acquired. Identifiable intangibles arethose which can be sold separately or which arise from legal rights regardless of whether those rights areseparable.
Goodwill is stated at cost less any accumulated impairment losses. Goodwill is allocated to cash-generating unitsand is not amortised but is tested annually for impairment.
Research
Expenditure on research activities is recognised as an expense in the period in which it is incurred.
Property, plant and equipment
Property, plant and equipment are stated at cost less accumulated depreciation and impairment losses. Whereparts of an item of property, plant and equipment have different useful lives, they are accounted for as separateitems of property, plant and equipment.
Leases in which the Group assumes substantially all the risks and rewards of ownership of the leased asset areclassified as finance leases. Where land and buildings are held under leases the accounting treatment of the landis considered separately from that of the buildings. Leased assets acquired by way of finance lease are stated atan amount equal to the lower of their fair value and the present value of the minimum lease payments at inceptionof the lease, less accumulated depreciation and less accumulated impairment losses. Lease payments areaccounted for as described below.
Transfers between PPE and inventory in relation to fork lift trucks reflect changes in the method of recoveringvalue, with those available for sale held in inventory and those leased to customers held in PPE. Movementsbetween these classifications reflect previously leased items being made available for sale and items previouslyavailable for sale being leased. Transfers occur at net book value with no profit or loss.
Depreciation is charged to the income statement on a straight line basis over the estimated useful economic livesof each part of an item of property, plant and equipment. The depreciation rates are as follows:
Freehold buildings 2% straight linePlant and equipment 15% diminishing balanceMotor vehicles 25% diminishing balanceFixtures and fittings 15-33% diminishing balanceLeasehold improvements life of lease straight line
The residual value, and useful economic life, is reassessed annually. Land is not depreciated.
Inventories
Inventories are stated at the lower of cost and net realisable value. The cost of inventories is based on the first-infirst-out principle and includes expenditure incurred in acquiring the inventories and other costs incurred in bringingthem to their existing location and condition. Net realisable value is the estimated selling price in the ordinarycourse of business, less the estimated costs of completion and selling expenses.
Construction work in progress
Construction work in progress represents the gross unbilled amount expected to be collected from customers forcontract work performed to date. It is measured at cost plus profit recognised to date less progress billings andrecognised losses. Cost includes all expenditure related directly to specific projects and an allocation of fixed andvariable overheads incurred in the Group’s contract activities based on normal operating capacity.
Construction work in progress is presented as part of trade and other receivables in the balance sheet.
Impairment
The carrying amounts of the Group’s assets, other than inventories and deferred tax assets, are reviewed at eachbalance sheet date to determine whether there is any indication of impairment. If any such indication exists, thenthe assets recoverable amount is estimated. For goodwill which has an indefinite life the recoverable amount isestimated at each reporting date.
22
Notes (continued)
3 Significant accounting policies (continued)
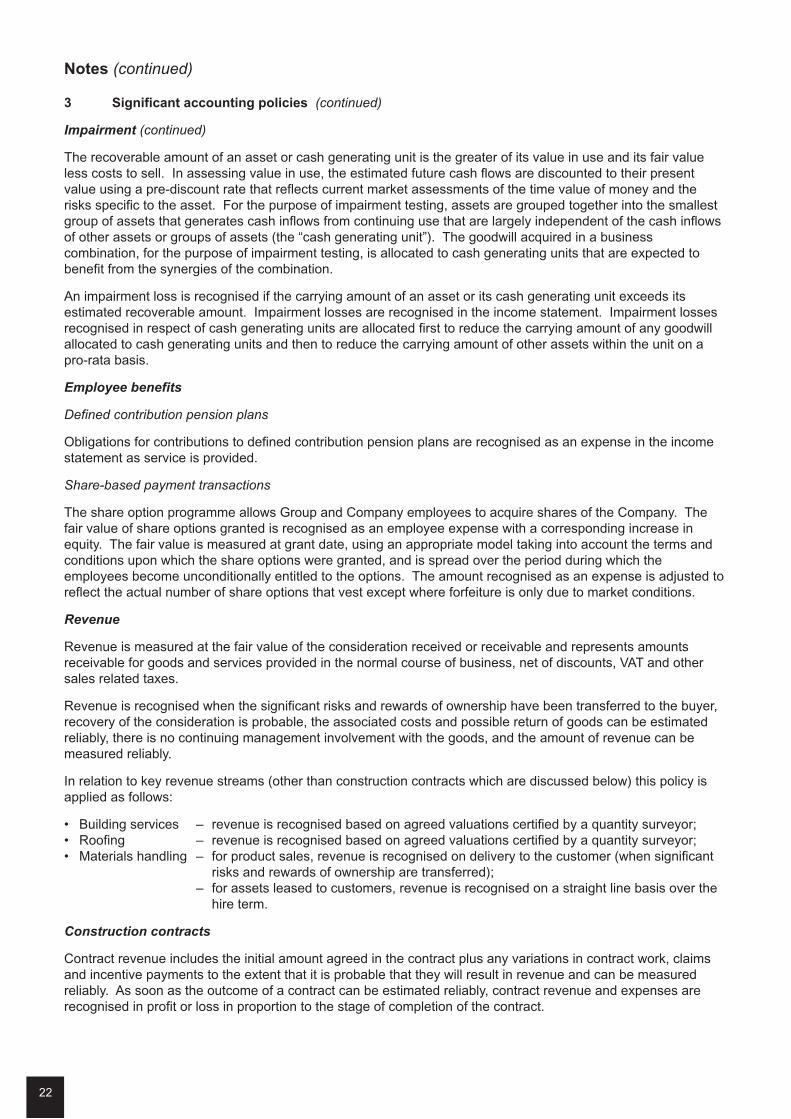
Impairment (continued)
The recoverable amount of an asset or cash generating unit is the greater of its value in use and its fair valueless costs to sell. In assessing value in use, the estimated future cash flows are discounted to their presentvalue using a pre-discount rate that reflects current market assessments of the time value of money and therisks specific to the asset. For the purpose of impairment testing, assets are grouped together into the smallestgroup of assets that generates cash inflows from continuing use that are largely independent of the cash inflowsof other assets or groups of assets (the “cash generating unit”). The goodwill acquired in a businesscombination, for the purpose of impairment testing, is allocated to cash generating units that are expected tobenefit from the synergies of the combination.
An impairment loss is recognised if the carrying amount of an asset or its cash generating unit exceeds itsestimated recoverable amount. Impairment losses are recognised in the income statement. Impairment lossesrecognised in respect of cash generating units are allocated first to reduce the carrying amount of any goodwillallocated to cash generating units and then to reduce the carrying amount of other assets within the unit on apro-rata basis.
Employee benefits
Defined contribution pension plans
Obligations for contributions to defined contribution pension plans are recognised as an expense in the incomestatement as service is provided.
Share-based payment transactions
The share option programme allows Group and Company employees to acquire shares of the Company. Thefair value of share options granted is recognised as an employee expense with a corresponding increase inequity. The fair value is measured at grant date, using an appropriate model taking into account the terms andconditions upon which the share options were granted, and is spread over the period during which theemployees become unconditionally entitled to the options. The amount recognised as an expense is adjusted toreflect the actual number of share options that vest except where forfeiture is only due to market conditions.
Revenue
Revenue is measured at the fair value of the consideration received or receivable and represents amountsreceivable for goods and services provided in the normal course of business, net of discounts, VAT and othersales related taxes.
Revenue is recognised when the significant risks and rewards of ownership have been transferred to the buyer,recovery of the consideration is probable, the associated costs and possible return of goods can be estimatedreliably, there is no continuing management involvement with the goods, and the amount of revenue can bemeasured reliably.
In relation to key revenue streams (other than construction contracts which are discussed below) this policy isapplied as follows:
• Building services – revenue is recognised based on agreed valuations certified by a quantity surveyor;• Roofing – revenue is recognised based on agreed valuations certified by a quantity surveyor;• Materials handling – for product sales, revenue is recognised on delivery to the customer (when significant
risks and rewards of ownership are transferred);– for assets leased to customers, revenue is recognised on a straight line basis over thehire term.
Construction contracts
Contract revenue includes the initial amount agreed in the contract plus any variations in contract work, claimsand incentive payments to the extent that it is probable that they will result in revenue and can be measuredreliably. As soon as the outcome of a contract can be estimated reliably, contract revenue and expenses arerecognised in profit or loss in proportion to the stage of completion of the contract.

23
Notes (continued)
3 Significant accounting policies (continued)
Construction contracts (continued)
The stage of completion is assessed by reference to the proportion of contract costs incurred for the workperformed to date in relation to total estimated contract costs. When the outcome of a contract cannot beestimated reliably, contract revenue is recognised only to the extent of contract costs incurred that are likely tobe recoverable. An expected loss on a contract is recognised immediately in profit or loss.
Expenses
(i) Operating lease payments
Payments under operating leases are recognised in the income and expenditure account on a straight line basisover the term of the lease. Lease incentives received are recognised in the income statement as an integral partof the total lease expense.
(ii) Finance lease payments
Minimum lease payments are apportioned between the finance charge and the reduction of the outstandingliability. The finance charge is allocated to each period during the lease term so as to produce a constantperiodic rate of interest on the remaining balance of the liability.
(iii) Finance income
Finance income comprises interest receivable on funds invested. Interest income is recognised in the incomestatement as it accrues using the effective interest method.
(iv) Finance expenses
Finance expenses comprise interest payable on borrowings. All borrowing costs are recognised in profit or lossusing the effective interest method.
v) Exceptional expenses
Exceptional items are defined as items of expenditure which are material and unusual in nature and which areconsidered to be of such significance that they require separate disclosure on the face of the statement ofcomprehensive income, in accordance with IAS 1.
Income tax
Income tax on the profit or loss for the period comprises both current and deferred tax. Income tax is recognisedin the statement of comprehensive income except to the extent that it relates to items recognised directly inequity, in which case it is recognised in equity.
Current tax is the expected tax payable on the taxable income for the year, using tax rates enacted orsubstantively enacted at the balance sheet date, and any adjustment to tax payable in respect of previous years.
Deferred tax is recognised using the balance sheet method, providing for temporary differences between thecarrying amounts of assets and liabilities for financial reporting purposes and the amounts used for taxationpurposes. Deferred tax is not recognised for the following temporary differences: the initial recognition of assetsor liabilities in a transaction that is not a business combination and that affects neither accounting nor taxableprofits nor differences relating to investments in subsidiaries to the extent that it is probable that they will notreverse in the foreseeable future. In addition, deferred tax is not recognised for taxable temporary differencesarising on the initial recognition of goodwill. Deferred tax is measured at the tax rates that are expected to beapplied to the temporary differences when they reverse, based on the laws that have been enacted orsubstantively enacted by the reporting date. Deferred tax assets and liabilities are offset if there is a legallyenforceable right to offset current tax liabilities and assets and they relate to income taxes levied by the same taxauthority on the same taxable entity, or on different tax entities, but they intend to settle current tax liabilities andassets on a net basis or their tax assets and liabilities will be realised simultaneously.
A deferred tax asset is recognised to the extent that it is probable that future taxable profits will be availableagainst which the asset can be utilised. Deferred tax assets are reviewed at each reporting date and arereduced to the extent that it is no longer probable that a related tax benefit will be realised.

24
Notes (continued)
3 Significant accounting policies (continued)
Segment reporting
Segmental information is provided based on internal reports regularly reviewed by the Chief Operating DecisionMaker, which is deemed to be the Board of Directors.
Segment results, assets and liabilities include items directly attributable to a segment as well as those that areallocated on a reasonable basis. Segment capital expenditure is the total cost incurred during the period toacquire segment assets that are not expected to be used for more than one segment.
Non-current assets held for sale and discontinued operations
A non-current asset or a group of assets containing a non-current asset (a disposal group) is classified as heldfor sale if its carrying amount will be recovered principally through sale rather than through continuing use, it isavailable for immediate sale and sale is highly probable within one year.
On initial classification as held for sale, non-current assets and disposal groups are measured at the lower ofprevious carrying amount and fair value less costs to sell with any adjustments taken to profit or loss. The sameapplies to gains and losses on subsequent remeasurement although gains are not recognised in excess of anycumulative impairment loss. Any impairment loss on a disposal group first is allocated to goodwill, and then toremaining assets and liabilities on pro rata basis, except that no loss is allocated to inventories, financial assets,deferred tax assets, employee benefit assets and investment property, which continue to be measured inaccordance with the Group’s accounting policies. Intangible assets and property, plant and equipment onceclassified as held for sale or distribution are not amortised or depreciated.
A discontinued operation is a component of the Group’s business that represents a separate major line ofbusiness or geographical area of operations that has been disposed of or is held for sale, or is a subsidiaryacquired exclusively with a view to resale. Classification as a discontinued operation occurs upon disposal orwhen the operation meets the criteria to be classified as held for sale, if earlier. When an operation is classifiedas a discontinued operation, the comparative income statement is restated as if the operation has beendiscontinued from the start of the comparative period.
Standards and Interpretations in use but not applied
The following standards and interpretations, which have not been applied in these financial statements, wereavailable for early adoption:
• Amendments to IFRS 7 ‘Disclosures – Transfers of Financial Assets’
The directors anticipate that the adoption of the above will have no material effect on the Group’s financialstatements.
4 Discontinued operations
The Group has disposed of operations as follows:
• The Roof Truss Company (Northern) Limited – on 26 May 2011;
• Hastie D Burton Limited – on 20 April 2011; and
• DJ McGough Limited – on 15 September 2010.
These operations were classified as discontinued in the prior year.
25
Notes (continued)
4 Discontinued operations (continued)
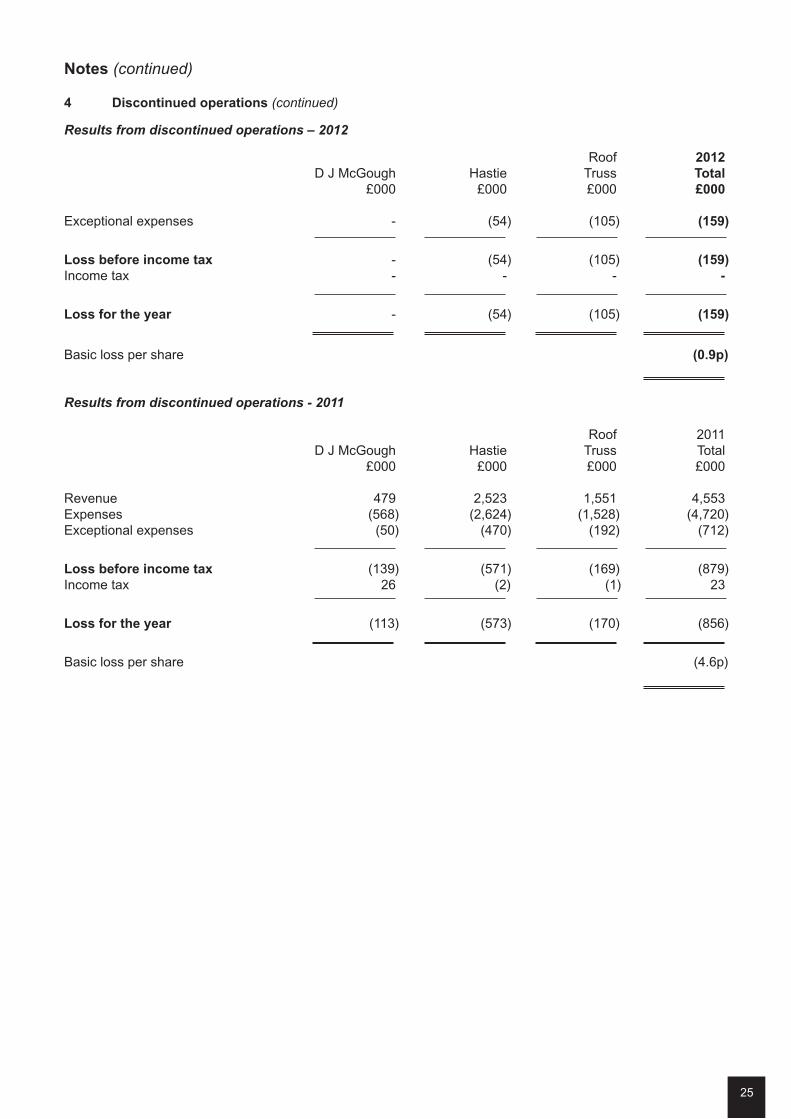
Results from discontinued operations – 2012
Roof 2012
D J McGough Hastie Truss Total
£000 £000 £000 £000
Exceptional expenses - (54) (105) (159)
Loss before income tax - (54) (105) (159)
Income tax - - - -
Loss for the year - (54) (105) (159)
Basic loss per share (0.9p)
Results from discontinued operations - 2011
Roof 2011D J McGough Hastie Truss Total
£000 £000 £000 £000
Revenue 479 2,523 1,551 4,553Expenses (568) (2,624) (1,528) (4,720)Exceptional expenses (50) (470) (192) (712)
Loss before income tax (139) (571) (169) (879)Income tax 26 (2) (1) 23
Loss for the year (113) (573) (170) (856)
Basic loss per share (4.6p)
26
Notes (continued)
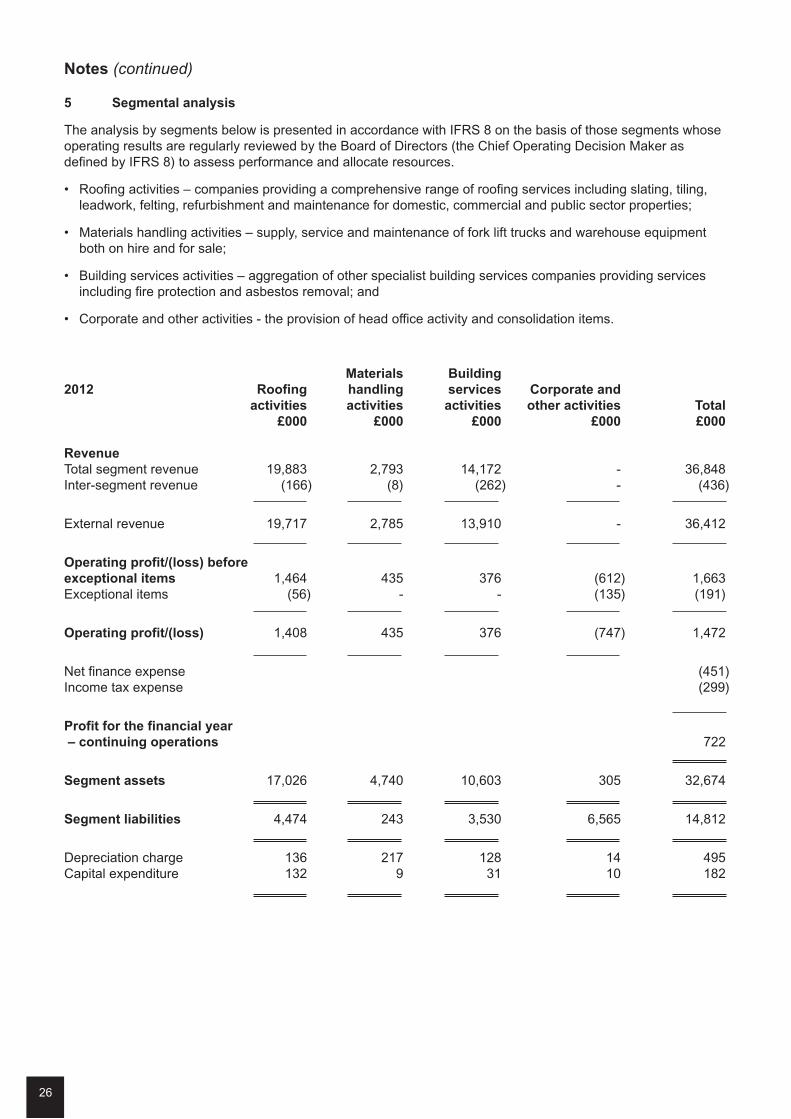
5 Segmental analysis
The analysis by segments below is presented in accordance with IFRS 8 on the basis of those segments whoseoperating results are regularly reviewed by the Board of Directors (the Chief Operating Decision Maker asdefined by IFRS 8) to assess performance and allocate resources.
• Roofing activities – companies providing a comprehensive range of roofing services including slating, tiling,leadwork, felting, refurbishment and maintenance for domestic, commercial and public sector properties;
• Materials handling activities – supply, service and maintenance of fork lift trucks and warehouse equipmentboth on hire and for sale;
• Building services activities – aggregation of other specialist building services companies providing servicesincluding fire protection and asbestos removal; and
• Corporate and other activities - the provision of head office activity and consolidation items.
Materials Building
2012 Roofing handling services Corporate and
activities activities activities other activities Total
£000 £000 £000 £000 £000
Revenue
Total segment revenue 19,883 2,793 14,172 - 36,848Inter-segment revenue (166) (8) (262) - (436)
External revenue 19,717 2,785 13,910 - 36,412
Operating profit/(loss) before
exceptional items 1,464 435 376 (612) 1,663Exceptional items (56) - - (135) (191)
Operating profit/(loss) 1,408 435 376 (747) 1,472
Net finance expense (451)Income tax expense (299)
Profit for the financial year
– continuing operations 722
Segment assets 17,026 4,740 10,603 305 32,674
Segment liabilities 4,474 243 3,530 6,565 14,812
Depreciation charge 136 217 128 14 495Capital expenditure 132 9 31 10 182

27
Notes (continued)
5 Segmental analysis (continued)
Materials Building
2011 Roofing handling services Corporate and
activities activities activities other activities Total
£000 £000 £000 £000 £000
Revenue
Total segment revenue 14,250 2,782 10,742 - 27,774Inter-segment revenue (430) (12) (172) - (614)
External revenue 13,820 2,770 10,570 - 27,160
Operating profit/(loss)
before exceptional items 819 594 828 (595) 1,646Exceptional items (280) - - (29) (309)
Operating profit/(loss) 539 594 828 (624) 1,337
Net finance expense (517)Income tax expense (181)
Profit for the financial year
– continuing operations 639
Segment assets 12,812 4,732 16,763 121 34,428
Segment liabilities 5,697 541 2,325 8,566 17,129
Depreciation charge 139 236 119 19 513Capital expenditure 77 91 76 2 246
As the Board of Directors receives segment revenue and operating profit/(loss) on the same basis as for thestatutory financial statements no further reconciliation is considered to be necessary.
Revenue
Further analysis of significant categories of gross revenue is provided below:
2012 2011£000 £000
Roofing 19,717 13,820Materials handling - sales 1,753 1,643
- leasing 1,032 1,127Building services 13,910 10,570
36,412 27,160
All revenue is derived from the UK, with no single customer contributing 10% or more of the Group’s revenue.

28
Notes (continued)
6 Other operating income
2012 2011£000 £000
Rental income 16 20
7 Expenses and auditor’s remuneration
Auditor’s remuneration:2012 2011£000 £000
Audit of these financial statements 31 31Amounts receivable by auditor and their associates in respect of:Audit of financial statements of subsidiaries pursuant to legislation 59 68
Amounts paid to the Company’s auditor and their associates in respect of services to the Company, other thanthe audit of the Company’s financial statements, have not been disclosed as the information is required insteadto be disclosed on a consolidated basis.
Administrative expenses include the following exceptional expenses:
2012 2011£000 £000
Continuing operationsRedundancy costs 86 -Legal and professional fees 55 -Aborted transaction costs 50 29Trade receivable provisions - 280
191 309
Discontinued operationsLegal and professional fees 159 91Impairment goodwill - 405Impairment property - 125Net asset impairment - 91
159 712
Redundancy costs include redundancy expenses and related costs, including professional fees.
Aborted transaction costs represent fees incurred on potential business acquisitions which aborted.
Impairments of goodwill, property and net assets relate to assets in discontinued operations, together with legalfees in relation to disposal. The impairments represent total impairment losses recognised during the year anddid not include any revalued assets. There were no reversals of impairment losses during the year.
Trade receivable provisions relate to specific exceptional cases where customers have entered administration,owing significant debts to the Group.

29
Notes (continued)
8 Staff numbers and costs
The average number of persons employed by the Group (including directors) during the year, analysed bycategory, was as follows:
Number of employees
2012 2011
Directors 7 7Administration 81 86Production 261 327
349 420
The aggregate payroll costs of these persons were as follows:
2012 2011£000 £000
Wages and salaries 8,704 9,516Social security costs 774 954Contributions to defined contribution plans 124 89
9,602 10,559
9 Directors’ remuneration
The table below sets out details of the emoluments in respect of qualifying services and compensation of eachperson who served as a Director during the year (excluding pension contributions, details of which are set outseparately below):
Directors’ Salary/fees Annual bonus Estimated value Total Totalemoluments of benefits 2012 2011
£000 £000 £000 £000 £000
HB Gold 10 - - 10 10GSL Forrest 89 - - 89 155SM Roberts 69 - - 69 63S Gray 81 - 23 104 98K Soulsby 21 - 13 34 90GR Jennings 100 42 15 157 116IT McLean 20 - - 20 20
390 42 51 483 552
Pension contributions 2012 2011£000 £000
K Soulsby 6 -GR Jennings 46 -

30
Notes (continued)
9 Directors’ remuneration (continued)
Number of directors
2012 2011Retirement benefits are accruing to the following number of directors under:
Money purchase schemes 2 -
10 Finance income and expense
Finance income 2012 2011£000 £000
Bank interest 1 1
Finance expense2012 2011£000 £000
On bank loans and overdrafts 424 484Finance charges payable in respect of finance leases and hire purchase contracts 28 34
Total finance expense 452 518
11 Taxation
Recognised in the income statement 2012 2011£000 £000
Current tax expenseCurrent year 418 167Adjustments for prior years 17 (27)
Current tax expense 435 140
Deferred tax expenseOrigination and reversal of temporary differences (130) 18Adjustments for prior years (8) 23Effect of change in tax rates 2 -
Deferred tax (credit)/expense (136) 41
Tax expense in income statement (excluding tax on discontinued operations) 299 181Tax from discontinued operations - (23)
Total tax expense 299 158

31
Notes (continued)
11 Taxation (continued)
Reconciliation of effective tax rate
2012 2011£000 £000
Profit before tax 1,021 820
Tax using the UK corporation tax rate of 26% (2011: 28%) 265 230Non-deductible expenses 72 50Small companies tax rate (8) (9)Over provided in prior years 9 (4)Income not taxable for tax purposes - (48)Effect of rate changes 2 (12)Other differences (41) (26)
Total tax expense 299 181
Factors that may affect future tax expenses
In March 2012 the Chancellor announced a reduction in the main rate of UK corporation tax to 24% with effectfrom 1 April 2012. This change became substantively enacted on 26 March 2012 and therefore the effect of therate reduction on deferred tax balances as at 31 March 2012 has been included in the figures above.
The Chancellor also proposed changes to further reduce the main rate of corporation tax by 1% per annum to22% by 1 April 2014, but these changes have not yet been substantively enacted and therefore are not included inthe figures above. The overall effect of the further reductions from 24% to 22%, if these were applied to thedeferred tax balances at 31 March 2012, would be to further reduce the deferred tax asset by approximately£3,000.
12 Earnings/(loss) per share
The calculation of basic earnings/(loss) per share was based on the profit/(loss) for the period and on theweighted average number of ordinary shares outstanding, calculated as follows:
2012 2011
Profit/(loss) for the period (£000) - continuing operations 722 639- discontinued operations (159) (856)
- total 563 (217)
Weighted average number of ordinary shares (‘000) 18,420 18,663
Earnings/(loss) per share - continuing operations 4.0p 3.4p- discontinued operations (0.9p) (4.6p)
- total 3.1p (1.2p)

32
Notes (continued)
13 Property, plant and equipment
Land and Plant and Fixtures Motor
Group buildings equipment and fittings vehicles Total
£000 £000 £000 £000 £000
Cost
Balance at 1 April 2010 957 3,339 391 2,132 6,819Disposals through sale of subsidiary (3) (97) - (80) (180)Transfers to ‘assets held for resale’ (815) (511) (36) (249) (1,611)Transfers from stock - 817 - - 817Other acquisitions - 20 130 417 567Transfers to stock - (978) - - (978)Disposals - - - (343) (343)
Balance at 31 March 2011 139 2,590 485 1,877 5,091
Balance at 1 April 2011 139 2,590 485 1,877 5,091Transfers from stock - 823 - - 823Other acquisitions - 29 22 307 358Transfers to stock - (939) - - (939)Disposals - (160) (76) (363) (599)
Balance at 31 March 2012 139 2,343 431 1,821 4,734
Depreciation and impairment
Balance at 1 April 2010 292 1,892 271 1,238 3,693Impairment charge 125 - - - 125Depreciation charge for year 1 249 51 261 562Depreciation on transfers to stock - (329) - (37) (366)Disposals - - - (190) (190)Disposals through sale of subsidiary (1) (49) - (47) (97)Transfers to ‘assets held for resale’ (290) (398) (29) (177) (894)
Balance at 31 March 2011 127 1,365 293 1,048 2,833
Balance at 1 April 2011 127 1,365 293 1,048 2,833Depreciation charge for the year 2 204 50 239 495Depreciation on transfers to stock - (305) - - (305)Disposals - (158) (74) (277) (509)
Balance at 31 March 2012 129 1,106 269 1,010 2,514
Net book value
At 1 April 2010 665 1,447 120 894 3,126
At 31 March 2011 12 1,225 192 829 2,258
At 31 March 2012 10 1,237 162 811 2,220
Impairment loss
During 2011 the Group conducted a review of the net book value of its properties in light of the deterioration inthe UK property market. Where the net book value was less than its carrying value within the balance sheet theGroup has impaired the property recoverable amount. Impairment losses on properties amounted to £nil (2011:£125,000), arising in the ‘building services activities’ operating segment.
33
Notes (continued)
13 Property, plant and equipment (continued)
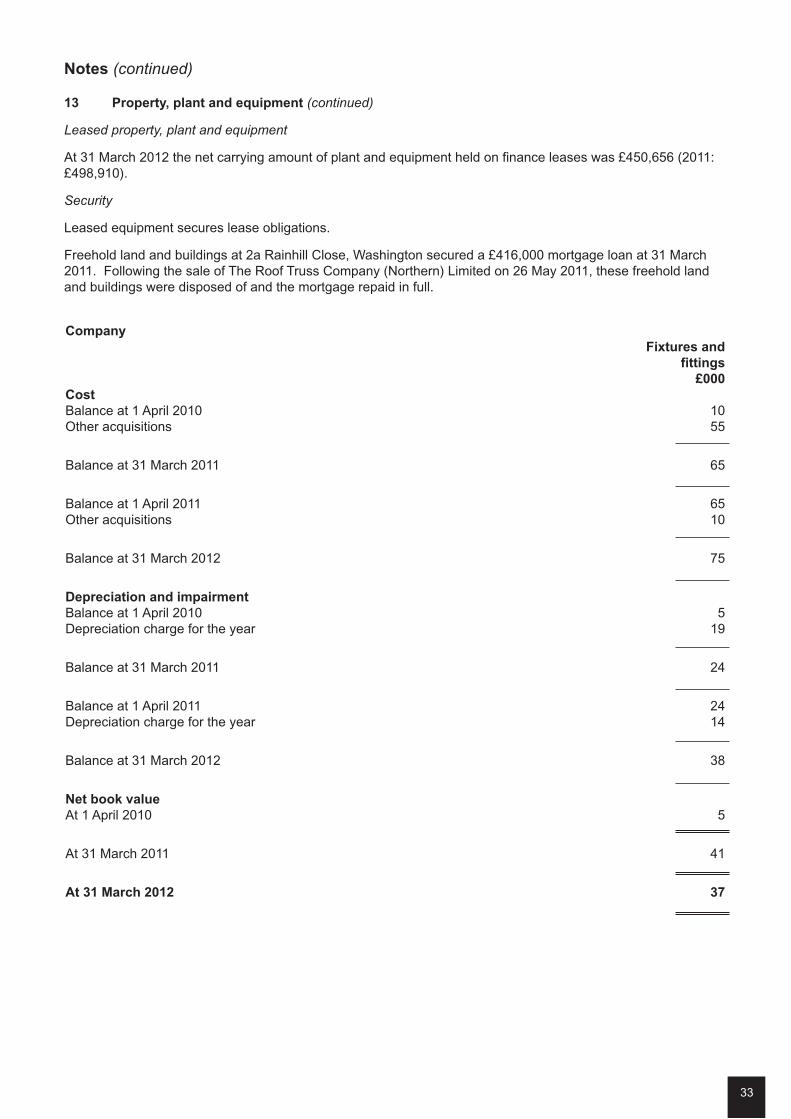
Leased property, plant and equipment
At 31 March 2012 the net carrying amount of plant and equipment held on finance leases was £450,656 (2011:£498,910).
Security
Leased equipment secures lease obligations.
Freehold land and buildings at 2a Rainhill Close, Washington secured a £416,000 mortgage loan at 31 March2011. Following the sale of The Roof Truss Company (Northern) Limited on 26 May 2011, these freehold landand buildings were disposed of and the mortgage repaid in full.
Company
Fixtures and
fittings
£000
Cost
Balance at 1 April 2010 10Other acquisitions 55
Balance at 31 March 2011 65
Balance at 1 April 2011 65Other acquisitions 10
Balance at 31 March 2012 75
Depreciation and impairment
Balance at 1 April 2010 5Depreciation charge for the year 19
Balance at 31 March 2011 24
Balance at 1 April 2011 24Depreciation charge for the year 14
Balance at 31 March 2012 38
Net book value
At 1 April 2010 5
At 31 March 2011 41
At 31 March 2012 37
34
Notes (continued)
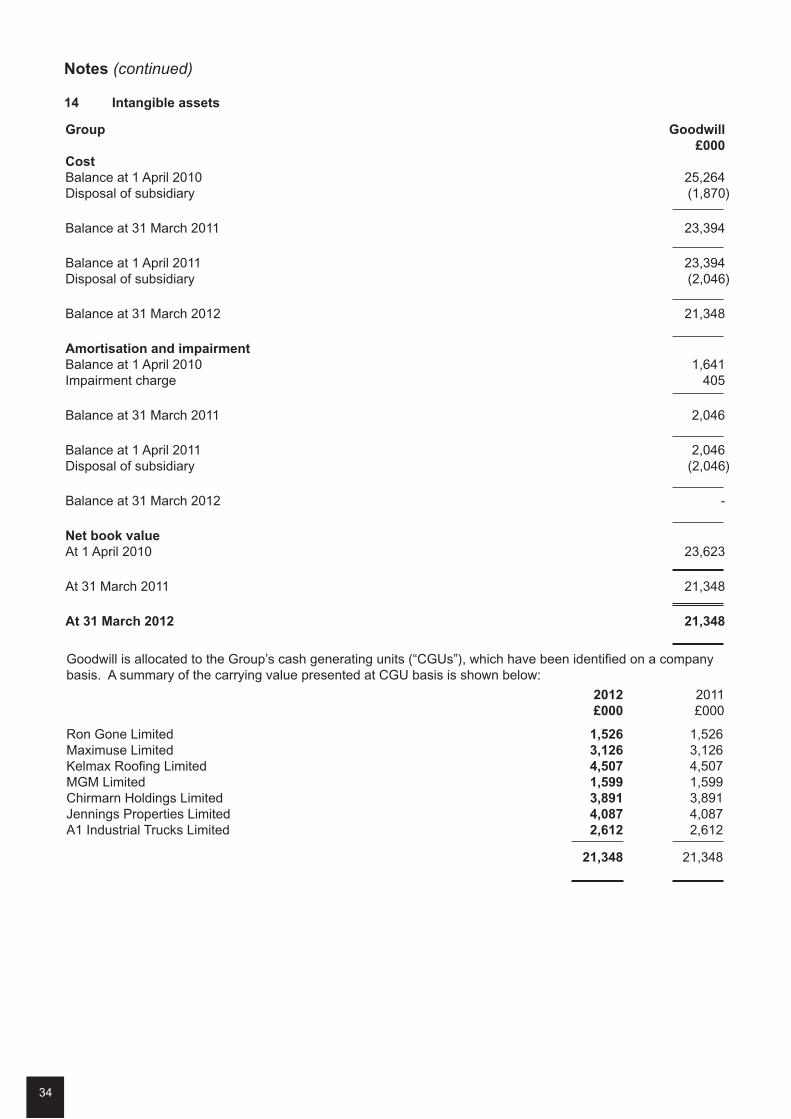
14 Intangible assets
Group Goodwill
£000
Cost
Balance at 1 April 2010 25,264Disposal of subsidiary (1,870)
Balance at 31 March 2011 23,394
Balance at 1 April 2011 23,394Disposal of subsidiary (2,046)
Balance at 31 March 2012 21,348
Amortisation and impairment
Balance at 1 April 2010 1,641Impairment charge 405
Balance at 31 March 2011 2,046
Balance at 1 April 2011 2,046Disposal of subsidiary (2,046)
Balance at 31 March 2012 -
Net book value
At 1 April 2010 23,623
At 31 March 2011 21,348
At 31 March 2012 21,348
Goodwill is allocated to the Group’s cash generating units (“CGUs”), which have been identified on a companybasis. A summary of the carrying value presented at CGU basis is shown below:
2012 2011£000 £000
Ron Gone Limited 1,526 1,526Maximuse Limited 3,126 3,126Kelmax Roofing Limited 4,507 4,507MGM Limited 1,599 1,599Chirmarn Holdings Limited 3,891 3,891Jennings Properties Limited 4,087 4,087A1 Industrial Trucks Limited 2,612 2,612
21,348 21,348
35
Notes (continued)
14 Intangible assets (continued)
Impairment testing
Goodwill is tested annually for impairment, or more frequently if there are indications the goodwill may beimpaired. All recoverable amounts are based on value in use and the key assumptions applied in the value inuse calculations are as follows:
• Cash flow projections – cash flow projections cover a 20 year period based on detailed approved budgetforecasts for the next year, directors’ projections of profits for years two to five and an assumption of 2%annual growth in profits thereafter.
• Growth rate – taking into account the current economic climate, management have made a prudentassumption that the long term growth rate in each of the CGUs from year five onwards will be 2% per annumwhen extrapolating future cash flows.
• Discount rate – management have applied a discount rate of 9% (2011: 9%) to the cash flow forecasts, whichrepresents their best estimate of the Group’s weighted average cost of capital. The calculation is based onthe split of equity and debt funding at the balance sheet date and estimated long term costs for debt andequity. Management believe the market risk associated with each CGU is similar and has applied the averagerate across the business. The discount rate reflects the continued difficult trading conditions and economicenvironment, and is comparable to rates used by other groups operating in similar segments.
Sensitivity analysis
The key sensitivities in assessing the value in use of goodwill are forecast cash flows and the discount rateapplied:
• a 1% reduction in growth rate in forecast cash flows would have no impact on carrying values; and
• a 1% increase in the discount rate applied would have no impact on carrying values.
Impairment losses
In the year ended 31 March 2011 the forecast cash flows for the business were recalculated based on a revisedbudget for 2012 and directors’ assessments for the following four years, based on detailed projections givenhistorical and current trading levels. Long term growth rates of 2% and a discount rate of 9% were retained forthe calculation. Based on the discount cash flow forecasts and terminal value estimate management prudentlyrecognised losses against the carrying value.

36
Notes (continued)
15 Investments in subsidiaries
Company Shares in group
undertakings
£000
Cost
Balance at 1 April 2010 43,087Disposals (2,318)
Balance at 31 March 2011 40,769
Balance at 1 April 2011 40,769Disposals (4.968)
Balance at 31 March 2012 35,801
Impairment
Balance at 1 April 2010 -Charged in year 4,103Balance at 31 March 2011 4,103
Balance at 1 April 2011 4,103Credited on disposal (4,103)
Balance at 31 March 2012 -
Net book value
At 1 April 2010 43.087
At 31 March 2011 36,666
At 31 March 2012 35,801
The Company has the following investments in subsidiaries:
Company Country of Class of
Incorporation shares held Ownership
2012 2011
Ron Gone Limited England and Wales Ordinary 100% 100%
Isoler Limited England and Wales Ordinary 100% 100%A Ordinary 100% 100%
Dudley Wilson Limited England and Wales A Ordinary 100% 100%B Ordinary 100% 100%
The Roof Truss Company(Northern) Limited England and Wales Ordinary - 100%
Kelmax Roofing Limited England and Wales A Ordinary 100% 100%B Ordinary 100% 100%
Springs Roofing Limited England and Wales Ordinary 100% 100%A Ordinary 100% 100%B Ordinary 100% 100%C Ordinary 100% 100%D Ordinary 100% 100%
Maximuse Limited England and Wales A Ordinary 100% 100%B Ordinary 100% 100%

37
Notes (continued)
15 Investments in subsidiaries (continued)
Company Country of Class of
Incorporation shares held Ownership
2012 2011
Wensley Roofing Limited England and Wales Ordinary 100% 100%A Ordinary 100% 100%
MGM Limited England and Wales Ordinary 100% 100%A Ordinary 100% 100%
The Floor Joist Company(Northern) Limited England and Wales Ordinary - 100%
Chirmarn Holdings Limited England and Wales Ordinary 100% 100%Chirmarn Limited England and Wales Ordinary 100%* 100%*Chirmarn (Surveying) Limited England and Wales Ordinary 100%* 100%*
Hastie Limited England and Wales Ordinary 100% 100%Hastie D Burton Limited England and Wales Ordinary - 100%*
Jennings Properties Limited England and Wales Ordinary 100% 100%A Ordinary 100% 100%B Ordinary 100% 100%
Jennings Roofing Limited England and Wales Ordinary 100%* 100%*
A1 Industrial Trucks Limited England and Wales Ordinary 100% 100%
Northern Bear Safety Limited England and Wales Ordinary 100% 100%
*held indirectly.
The Roof Truss Company (Northern) Limited and Hastie D Burton Limited were disposed of on 26 May 2011 and20 April 2011 respectively.
The Floor Joist Company (Northern) Limited was dissolved by voluntary strike off on 29 November 2011.
16 Deferred tax assets and liabilities
Recognised deferred tax assets and liabilities
Deferred tax assets and liabilities are attributable to the following:
2012 2011£000 £000
Property, plant and equipment 15 (107)Other 18 4
Net tax assets/(liability) 33 (103)
Movement in deferred tax during the year1 April Recognised 31 March
2011 in income 2012
£000 £000 £000
Property, plant and equipment (107) 122 15
Provisions 4 14 18
(103) 136 33

38
Notes (continued)
16 Deferred tax assets and liabilities (continued)
Movement in deferred tax during the prior year
1 April Recognised 31 March2010 in income 2011£000 £000 £000
Property, plant and equipment (108) 1 (107)Provisions 46 (42) 4
(62) (41) (103)
Company
Deferred tax assets in the Company represent temporary differences on property, plant and equipment.
17 Inventories
Group Company
2012 2011 2012 2011
£000 £000 £000 £000
Raw materials and consumables 807 851 - -
All inventory is expected to be recovered in less than 12 months. There were no write downs in the year.
18 Trade and other receivables
Group Company
2012 2011 2012 2011
£000 £000 £000 £000
Trade receivables 7,591 6,028 459 57Other receivables 16 - 202 5
7,607 6,028 661 62
At 31 March 2012 trade receivables include retentions of £975,000 (2011: £757,000) relating to constructioncontracts in progress.
19 Cash and cash equivalents / bank overdrafts
Group Company
2012 2011 2012 2011
£000 £000 £000 £000
Cash and cash equivalents per balance sheet 243 281 9 -Bank overdrafts (4,333) (4,782) (3,597) (4,367)
Cash and cash equivalents per cash flow statements (4,090) (4,501) (3,588) (4,367)

39
Notes (continued)
20 Loans and borrowings
This note provides information about the contractual terms of the Group and Company’s interest-bearing loansand borrowings, which are measured at amortised cost. For more information about the Group and Company’sexposure to interest rate risk, see note 24.
Group Company
2012 2011 2012 2011£000 £000 £000 £000
Non-current liabilities
Secured bank loans 2,328 3,365 2,328 3,365Finance lease liabilities 134 181 - 16Other loans 8 15 - -
2,470 3,561 2,328 3,381
Current liabilities
Current portion of secured bank loans 625 564 625 564Current portion of finance lease liabilities 184 141 16 20Shareholder loans 49 49 - -
858 754 641 584
Terms and debt repayment schedule
Nominal
interest Year of Face Carrying Face CarryingCurrency rate maturity value amount value amount
2012 2012 2011 2011£000 £000 £000 £000
Yorkshire Bank GBP Libor + 4.25 2016 2,953 2,953 3,513 3,513term loan A
Mortgage loan GBP Libor + 3.50 2017 - - 416 416
Shareholder loan GBP n/a n/a 49 49 49 49
Revolving credit GBP Libor + 4.25 2013 4,333 4,333 4,782 4,782facility and bankoverdraft
Finance lease and GBP n/a Within 318 318 322 322hire purchase 5 yearsliabilities
Other loans GBP n/a n/a 8 8 15 15
Freehold land and buildings at 2a Rainhill Close, Washington secured a £416,000 mortgaged loan at 31 March2011. Following the sale of The Roof Truss Company (Northern) Limited on 26 May 2011 these freehold landand buildings were disposed of and the mortgage loan repaid in full.
The term loan of £2,953,000 (of which £625,000 is due within one year) is secured on a fixed and floating chargeover assets (including inventories and trade receivables) of the Group.

40
Notes (continued)
20 Loans and borrowings (continued)
Finance lease liabilitiesFinance lease liabilities are payable as follows:
Minimum lease
Group payments Interest Principal
2012 2012 2012 2011£000 £000 £000 £000
Less than one year 208 (24) 184 141Between one and five years 152 (18) 134 181
360 (42) 318 322
21 Trade and other payables
Group Company
2012 2011 2012 2011£000 £000 £000 £000
Trade payables 4,924 3,647 421 113Non-trade payables and accrued expenses 1,789 1,369 412 121
6,713 5,016 833 234
22 Employee benefits
Defined contribution plans
The Group operates a number of defined contribution pension plans.
The total expense relating to these plans in the current year was £124,000 (2011: £89,000).
Share-based payments
The Group operates an Inland Revenue Approved Share Option Scheme and an Inland Revenue UnapprovedShare Option Scheme.
The terms and conditions of the grants are as follows:
Method of
settlement Number of Contractual
Grant date accounting instruments Vesting conditions life of options
18 December 2006 Equity 700,000 3 years of service Dec 07 – Dec 16
1 March 2007 Equity 300,000 3 years of service Mar 10 – Mar 17
17 December 2007 Equity 230,000 3 years of service Dec 10 – Dec 17
30 June 2008 Equity 25,000 3 years of service June 11 – June 18

41
Notes (continued)
22 Employee benefits (continued)
The number and weighted average exercise prices of share options are as follows:
Weighted Weightedaverage Number average Numberexercise of options exercise of options
price price2012 2012 2011 2011
Outstanding at the beginning and end of the year 96p 1,255,000 96p 1,255,000
Exercisable at the end of the year 1,255,000 1,230,000
The options outstanding at the year end have an exercise price in the range of 88p to 120p and a weightedaverage contractual life of 5.5 years.
The fair value of services received in return for share options granted are measured by reference to the fair valueof share options granted. The fair value of employee share options is measured using a Black-Scholes model.Measurement inputs and assumptions are as follows:
18 December 1 March 17 December 30 June2006 2007 2007 2008
Fair value at measurement date 17p 18p 22p 17p
Exercise price 88p 98p 120p 98pExpected volatility 19.0% 17.8% 18.1% 17.0%Option life (from inception) 5.5 years 5.5 years 5.5 years 5.5 yearsExpected dividends 3.0% 3.0% 3.0% 3.0%Risk-free interest rate (based on national governmentbonds) 5.0% 5.0% 5.0% 5.0%
The expected volatility is based on the volatility of the FTSE AIM All-Share Index from 1 September 2001 to thedate of the award.
Share options are granted under a service condition and, for grants after 19 December 2006, a non-marketperformance condition. Such conditions are not taken into account in the grant date fair value measurement ofthe services received.
The total (credit)/expense recognised for the year arising from share based payments are as follows:
2012 2011£000 £000
Equity settled share based payment (credit)/expense - (178)

42
Notes (continued)
23 Capital and reserves
Reconciliation of movement in capital and reserves – Group
Share Capital Share Merger Retained Total
capital redemption premium reserve earnings equity
£000 £000 £000 £000 £000 £000
At 1 April 2010 190 - 5,169 12,586 2,029 19,974Total comprehensive income
for the year
Loss for the year - - - - (217) (217)Transactions with owners,
recorded directly in equity
Equity-settled share basedpayment transactions - - - - (178) (178)Buy back of shares (6) 6 - (514) (1,766) (2,280)Transfers in respect ofdiscontinued operations - - - (1,701) 1,701 -
At 31 March 2011 184 6 5,169 10,371 1,569 17,299
At 1 April 2011 184 6 5,169 10,371 1,569 17,299Total comprehensive income
for the year
Profit for the year - - - - 563 563
At 31 March 2012 184 6 5,169 10,371 2,132 17,862
Reconciliation of movement in capital and reserves – Company
Share Capital Share Merger Retained Total
capital redemption premium reserve earnings equity
£000 £000 £000 £000 £000 £000
Balance at 1 April 2010 190 - 5,169 12,586 (1,625) 16,320Total comprehensive income
for the year
Profit for the year - - - - 3,063 3,063Transactions with owners,
recorded directly in equity
Equity settled share basedpayment transactions - - - - (178) (178)Buy back of shares (6) 6 - (514) (1,766) (2,280)Transfers in respect ofdiscontinued operations - - - (1,701) 1,701 -
Balance at 31 March 2011 184 6 5,169 10,371 1,195 16,925
Balance at 1 April 2011 184 6 5,169 10,371 1,195 16,925Total comprehensive income
for the year
Loss for the year - - - - (2,536) (2,536)
Balance at 31 March 2012 184 6 5,169 10,371 (1,341) 14,389

43
Notes (continued)
23 Capital and reserves (continued)
Share capital
Ordinary shares
In millions of shares 2012 2011
In issue at start of period 18 19Buy back of shares - (1)
In issue at end of period – fully paid 18 18
2012 2011£000 £000
Allotted, called up and fully paid18,419,724 (2011: 18,419,724) ordinary shares of 1p each 184 184
Shares classified in shareholders’ funds 184 184
The holders of ordinary shares are entitled to receive dividends from time to time and are entitled to one vote pershare at meetings of the Company.
During the prior period, as part of the disposal of DJ McGough Limited, the buyers gifted to the company 547,368ordinary shares of 1p each in the capital of the Company for nil consideration. These ordinary shares weresubsequently cancelled.
615,548 1p ordinary shares with an aggregate nominal value of £6,155 were purchased during the period inrelation to the disposal of the Roof Truss Company (Northern) Limited, and are held in treasury.
24 Financial instruments
Overview
The Group has exposure to the following risks from its use of financial instruments:
• Credit risk;• Liquidity risk; and• Market risk.
This applies to:
Trade and other receivables
The fair value of trade and other receivables, excluding construction contract debtors, is estimated as the presentvalue of future cash flows, discounted at the market rate of interest at the balance sheet date if the effect ismaterial.
Trade and other payables
The fair value of trade and other payables is estimated as the present value of future cash flows, discounted atthe market rate of interest at the balance sheet date if the effect is material.
Cash and cash equivalents
The fair value of cash and cash equivalents is estimated as its carrying amount where the cash is repayable ondemand. Where it is not repayable on demand then the fair value is estimated at the present value of future cashflows, discounted at the market rate of interest at the balance sheet date.

44
Notes (continued)
24 Financial instruments (continued)
Interest-bearing borrowings
Fair value, which after initial recognition is determined for disclosure purposes only, is calculated based on thepresent value of future principal and interest cash flows, discounted at the market rate of interest at the balancesheet date.
This note presents information about the Group’s exposure to each of the above risks, the Group’s objectives,policies and processes for measuring and managing risk, and the company’s management of capital. Furtherquantitative disclosures are included throughout these financial statements.
The Board of Directors has overall responsibility for the establishment and oversight of the Group’s riskmanagement framework.
The Group’s risk management policies are established to identify and analyse the risks faced by the Group, toset appropriate risk limits and controls, and to monitor risks and adherence to limits. Risk management policiesand systems are reviewed regularly to reflect changes in market conditions and the Group’s activities. TheGroup, through its training and management standards and procedures, aims to develop a disciplined andconstructive control environment in which all employees understand their roles and obligations.
Credit risk
Credit risk is the risk of financial loss to the Group if a customer or counterparty to a financial instrument fails tomeet its contractual obligations, and arises principally from the Group’s receivables from customers.
Trade and other receivables
The Group’s exposure to credit risk is influenced mainly by the individual characteristics of each customer. Thedemographics of the Group’s customer base, including the default risk of the industry and country in whichcustomers operate, has less of an influence on credit risk. Due to the nature of sales (high volume, low value)revenue is attributable to a large number of customers. Geographically there is a concentration of credit risk inthe United Kingdom.
The Group has established a credit policy under which each new customer is analysed individually forcreditworthiness before the Group’s standard payment and delivery terms and conditions are offered. TheGroup’s review includes external ratings where available. Purchase limits are established for each customer;these limits are reviewed regularly.
Liquidity risk
Liquidity risk is the risk that the Group will not be able to meet its financial obligations as they fall due. TheGroup’s approach to managing liquidity is to ensure, as far as possible, that it will always have sufficient liquidityto meet its liabilities when due, under both normal and stressed conditions, without incurring unacceptablelosses or risking damage to the Group’s reputation.
Market risk
Market risk is the risk that changes in market prices, such as interest rates, will affect the Group’s income. Theobjective of market risk management is to manage and control market risk exposures within acceptableparameters, while optimising the return on risk.
Capital management
The Group’s policy is to maintain a strong capital base with a view to ensuring that entities within the Group willbe able to continue as going concerns. To achieve this objective, the Group aims to maintain a prudent mix ofdebt and equity financing and considers the current capital structure to be appropriate.
Equity funding comprises issued share capital, reserves and retained earnings as disclosed in note 23 to thefinancial statements. Debt funding comprises bank facilities as described below.
The Group’s treasury policy has as its principal objective the achievement of the maximum interest rate on anycash balances whilst maintaining an acceptable level of risk.

45
Notes (continued)
24 Financial instruments (continued)
Financial assets and liabilities
The Group’s main financial assets comprise trade receivables arising from the Group’s activities and cash atbank.
Other than the bank overdraft, loans and borrowings and trade and other payables, the Group had no financialliabilities within the scope of IAS 39 as at 31 March 2012.
Fair values
The fair value of the Group’s financial assets and liabilities is not materially different from their carrying values. Asthe Group has no financial instruments carried at fair value the Group is not required to disclose a fair valuehierarchy.
Profit and loss account
Details of finance income and finance expenses are included in note 10.
Group Company
2012 2011 2012 2011
£000 £000 £000 £000
Trade receivables 7,591 6,028 459 57Cash at bank 243 281 9 -
7,834 6,309 468 57
Exposure to credit risk
The carrying amount of financial assets represents the maximum credit exposure. Therefore, the maximumexposure to credit risk at the balance sheet date for the Group was £7,834,000 (2011: £6,309,000) and for theCompany was £468,000 (2011: £57,000) being the total of the carrying amount of financial assets.
Credit quality of financial assets and impairment losses
Trade receivables consist of the following:
Group Company
2012 2011 2012 2011
£000 £000 £000 £000
Sales ledger 7,789 6,112 459 57Bad debt provision (198) (84) - -
Net trade receivables 7,591 6,028 459 57
Movements in the bad debt provision are summarised below:
Bad debtprovision
£000
At beginning of year 84Provided in year 202Write offs and recoveries (88)
At end of year 198

46
Notes (continued)
24 Financial instruments (continued)
Financial assets and liabilities
The allowance account for trade receivables is used to record impairment losses unless the Group is satisfied thatno recovery of the amount owing is possible; at that point the amounts considered irrecoverable are written offagainst the trade receivables directly.
Management has no indication that any unimpaired amounts will be irrecoverable, and relate entirely to sales inthe United Kingdom.
Interest risk
The Group’s credit risk policy is to manage its trade receivables by taking credit references and requestingpayment in advance should this be considered necessary.
Effective interest rates
In respect of income-earning financial assets and interest-bearing financial liabilities, the following table indicatestheir effective interest rates at the balance sheet date and the periods in which they mature.
2012 2011Interest Interest
rate rate
Cash and cash equivalents Base-1 Base-1Revolving credit facility and bank overdraft Libor+4.25 Libor+4.25Finance lease liabilities n/a n/aBank loan Libor+4.25 Libor+4.25Shareholder loan n/a n/aMortgage n/a Libor+3.50Other loans n/a n/a
A change of 100 basis points in interest would increase or decrease equity by £115,000 (2011: £136,000).
Both cash and cash equivalents and bank overdraft pay interest on a floating rate basis. The fair value of thefinancial assets liabilities is substantially the same as their carrying value.
Liquidity risks
The Group’s policy on liquidity risk has been to maintain sufficient cash balances and undrawn facilities to provideflexibility in the management of the Group’s liquidity.
The following are contractual maturities of financial liabilities, and exclude the impact of netting agreements:
31 March 2012
Non-derivative financial instruments
Group Carrying Contractual 6 months 6-12 1-2 2-5 More thanamount cash flow or less months years years 5 years£000 £000 £000 £000 £000 £000 £000
Trade and other payables 6,713 (6,713) (6,713) - - - -Revolving credit facilityand bank overdraft 4,333 (4,333) (2,167) (2,166) - - -Finance lease liabilities 318 (360) (100) (108) (108) (44) -Bank loan 2,953 (3,314) (324) (418) (808) (1,764) -Shareholder loan 49 (49) (49) - - - -Other loans 8 (8) - - - - (8)
14,374 (14,777) (9,353) (2,692) (916) (1,808) (8)

47
Notes (continued)
24 Financial instruments (continued)
Company Carrying Contractual 6 months 6-12 1-2 2-5 More thanamount cash flow or less months years years 5 years£000 £000 £000 £000 £000 £000 £000
Trade and other payables 833 (833) (833) - - - -Revolving credit facilityand bank overdraft 3,597 (3,597) (1,799) (1,798) - - -Finance lease liabilities 16 (19) (12) (7) - - -Bank loan 2,953 (3,314) (324) (418) (808) (1,764) -
7,399 (7,763) (2,968) (2,223) (808) (1,764) -
25 Operating leases
Operating leases in which Group is a lessee
Non-cancellable operating lease rentals are payable as follows:
Company Group
2012 2011 2012 2011£000 £000 £000 £000
Less than one year 39 - 180 135Between one and five years 161 - 498 443More than five years - - 45 107
200 - 723 685
Operating leases in which the Group operates as lessee comprise properties on both short and long term rentalagreements.
26 Related parties
Group
Identity of related parties with which the Group has transacted
The Group is controlled by its shareholders.
The Company had a related party relationship with its subsidiaries and with its directors and executive officers.
Transactions with key management personnel
Directors of the Company and their immediate relatives controlled 15% of the voting shares of the Company at31 March 2012.
The compensation of key management personnel (including the directors) is as follows:
Group
2012 2011£000 £000
Key management emoluments excluding socialsecurity costs 535 552

48
Notes (continued)
26 Related parties
Group
Directors’ loans existed as follows:
2012
£000
Loan from SM Roberts
Balance at start of year 49
Balance at end of year 49
Maximum balance outstanding during the year 49
The loan is unsecured, non-interest bearing and repayable on demand, subject to prior repayment of the loansand revolving credit facility term.
The following transactions were undertaken with entities in which the directors have a vested interest.
Mincoffs
Solicitors
LLP
£000
Balance as at beginning of period (85)Purchases (136)Settled 193
Balance as at end of period (28)
HB Gold, Chairman, is a partner of Mincoffs Solicitors LLP. Mincoffs Solicitors LLP are the Group’s legal advisorsand provided legal advice to the Group throughout the period.
The above balances are included within trade creditors.
Trading transactions with subsidiaries – Parent Company
The Group operates a cash pooling arrangement and receives dividend income from subsidiaries.
27 Accounting estimates and judgments
The key areas requiring the use of estimates and judgements which may significantly affect the financialstatements are considered to be:
Measurements of the recoverable amounts of cash generating units containing goodwill
This requires the identification of appropriate cash generating units and the allocation of goodwill to these units.Details of the estimation techniques used are set out in note 14 to the financial statements.
Measurement of the net book value of property, plant and equipment
This requires the identification of recoverable value, being the higher of value in use and fair value less costs tosell. In light of the deterioration in the UK property market and losses made in specific businesses, the estimationof recoverable value of Group properties was revised in the prior year. Fair value less costs to sell was assessedbased on third party value estimations, with value in use calculations based on estimation techniques as above.The resulting recognition of impairment losses for a property in the prior year is set out in note 13.
49
Notes (continued)
27 Accounting estimates and judgements (continued)
Revenue and profit recognition on contracting activities
The principal estimation technique used by the Group in attributing profit on contracts to a particular period is thepreparation of forecasts on a contract by contract basis. These focus on revenue and costs to complete andenable an assessment to be made on the final outturn on each contract. Variations during the course ofcontracts are taken into account but invariably are only finalised at completion. This can lead to previousestimates being amended which may have an impact on the final profit to be recognised on the contract.
28 Off balance sheet arrangements
There are no parties with whom the Group or Company has contractual or other arrangements that areconsidered material to the Group or Company’s financial position other than those arrangements disclosed in thefinancial statements.


Northern Bear Plc,A1 Grainger, Prestwick Park, Prestwick,
Newcastle upon Tyne NE20 9SJTel: 0845 6802369Fax: 0845 6802379
Email: [email protected]: www.northern-bear.com
Northern Bear Plc.Registered in England & Wales No: 05780581