Annual Report: Multiple Measures of Student Achievement · 2014-2015 Annual Report: Multiple...
37
Annual Report: Multiple Measures of Student Achievement Education/Personnel Committee Meeting January 13, 2016
Transcript of Annual Report: Multiple Measures of Student Achievement · 2014-2015 Annual Report: Multiple...

Annual Report:
Multiple Measures of
Student Achievement
Education/Personnel Committee Meeting January 13, 2016

Accountability Changes in Pennsylvania
2014-2015 Annual Report: Multiple Measures of Student Achievement
Grades 3-8 High School Accountability
NCLB
2009-10 PSSA PSSA Adequate
Yearly Progress (AYP)
2010-11 PSSA /PSSA-M PSSA-M AYP
2011-12 PSSA /PSSA-M PSSA-M AYP
NCLB Waiver
2012-13 PSSA /PSSA-M Keystones School
Performance Profile (SPP)
2013-14 PSSA Keystones SPP
2014-15 PA Core PSSA Keystones SPP (High School only)
ESSA (Every Student Succeeds Act)

2014-2015 Annual Report: Multiple Measures of Student Achievement
The mission of the Souderton Area School District is to prepare students to demonstrate competencies needed to contribute and to succeed in a changing world by building on a commitment to excellence and innovation, by working in partnership with family and community, and by assuring a quality education for all students in a safe and nurturing environment.
Demographics
2014-2015 School Year

Student Population 6,566
82.23% White (down 2.87%)
7.36% Hispanic (up 3.87%)
5.56% Asian
4.05% African American
.44% Multi-Racial
.23% Native American
.14% Pacific Islander
2014-2015 Annual Report: Multiple Measures of Student Achievement

Student Population 6,566
21.09% Economically Disadvantaged
14.97% Special Education (down 1.53%)
5.57% Gifted IEP
4.33% Limited English Proficient (up .73%)
2014-2015 Annual Report: Multiple Measures of Student Achievement

Student Population 6,566
Average Class Size
■ Primary (K-2) 21
■ Intermediate (3-5) 23
■ Middle School (6-8) 24
■ High School (9-12) 24 (core subjects)
2014-2015 Annual Report: Multiple Measures of Student Achievement

Student Population 6,566
494 Teachers
100% Highly Qualified
84% hold an earned Masters Degree
0.6% hold an earned Doctorate Degree
2014-2015 Annual Report: Multiple Measures of Student Achievement
Years of Service in Souderton
1 year 23 2-10 years 168
11-20 years 204 21-30 years 86
Over 30 years 13
On average 12.8 years teaching in
Souderton
Student Population 6,566
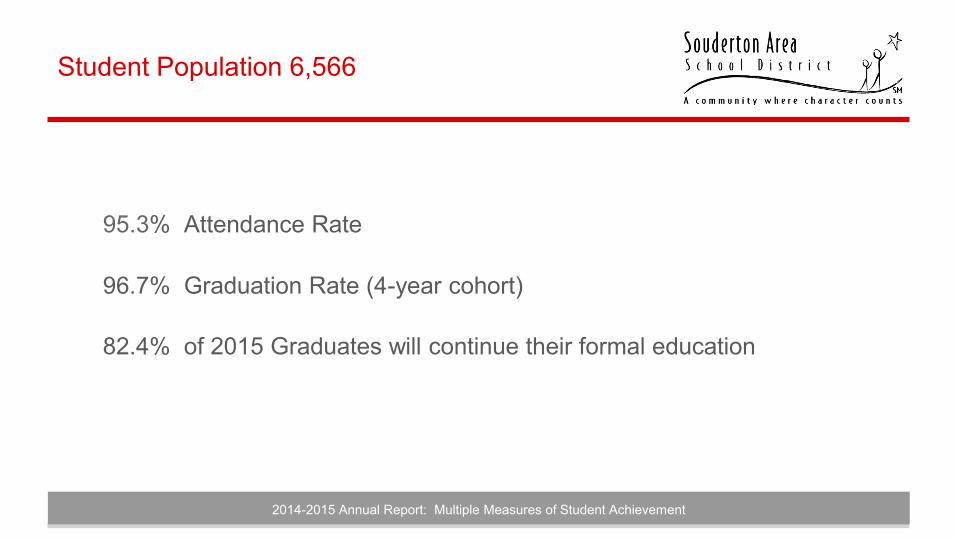
95.3% Attendance Rate
96.7% Graduation Rate (4-year cohort)
82.4% of 2015 Graduates will continue their formal education
2014-2015 Annual Report: Multiple Measures of Student Achievement

Student Population 6,566
Per Pupil Expenditure $16,477 (19th of 21 districts in Montgomery County)
144 buses daily traveled 8,995 miles, transporting 7,171 students
Served 480,730 Lunches and 64,751 Breakfasts (up 13.95%)
Administered 18,452 mandated health screenings: BMI, Vision, Hearing, Scoliosis
2014-2015 Annual Report: Multiple Measures of Student Achievement

2015 SASD Graduates
61% attending a 4-year college or university
22% attending a 2-year college or technical school
3% military
5% working full time
9% plans unknown at time of graduation
2014-2015 Annual Report: Multiple Measures of Student Achievement
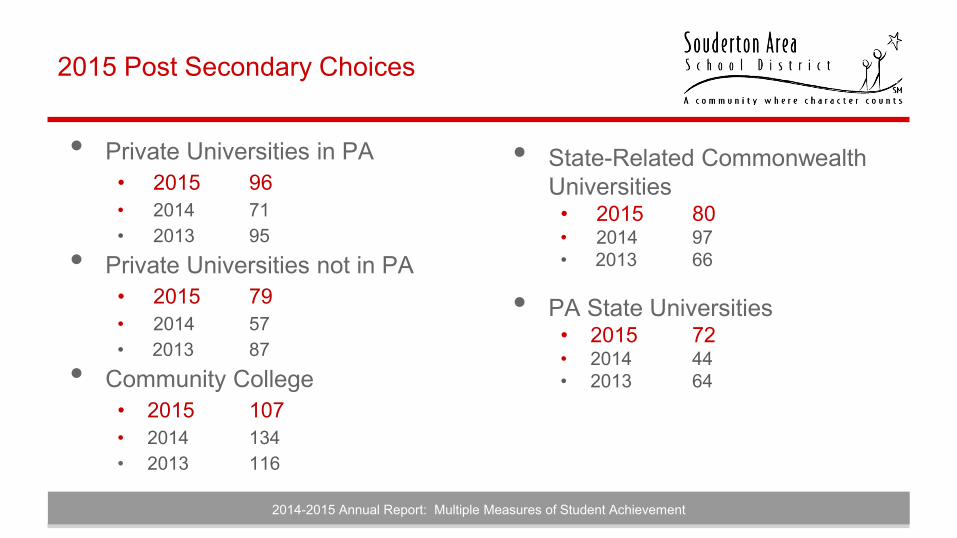
2015 Post Secondary Choices
• Private Universities in PA • 2015 96 • 2014 71 • 2013 95
• Private Universities not in PA • 2015 79 • 2014 57 • 2013 87
• Community College • 2015 107 • 2014 134 • 2013 116
2014-2015 Annual Report: Multiple Measures of Student Achievement
• State-Related Commonwealth Universities
• 2015 80 • 2014 97 • 2013 66
• PA State Universities • 2015 72 • 2014 44 • 2013 64

Academic
Achievement
2014-2015 School Year

School Performance Profile (SPP)
2014-2015 Annual Report: Multiple Measures of Student Achievement
2014-2015: only the High School has an SPP Score Breakdown of indicators used in calculating an SPP score
• Academic achievement = 40%
• Closing the Achievement Gap for all students = 5%
• Closing the Achievement Gap for historically underperforming students = 5%
• Academic growth = 40%
• Other factors = 10% (such as graduation rates, AP scores, college credit, and attendance rates)
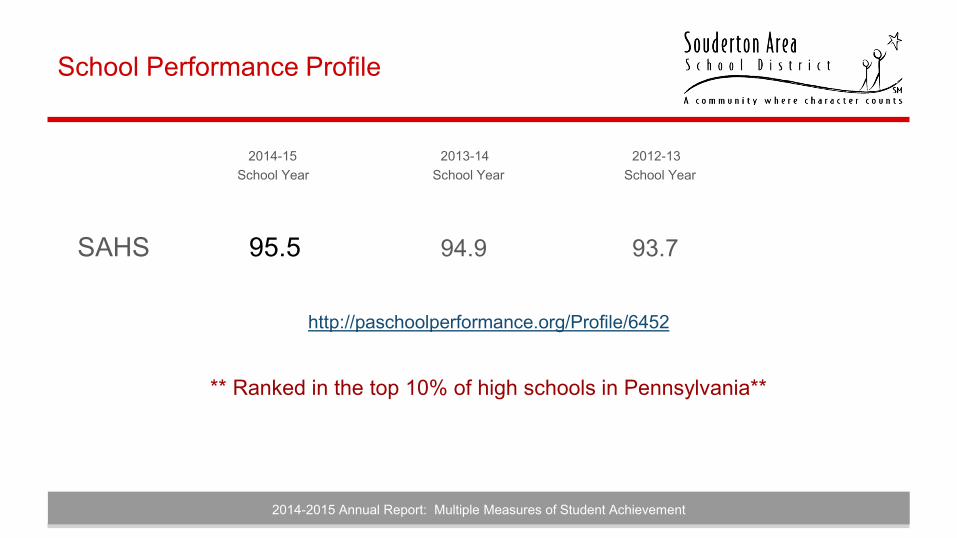
School Performance Profile
2014-2015 Annual Report: Multiple Measures of Student Achievement
2014-15 2013-14 2012-13 School Year School Year School Year
SAHS 95.5 94.9 93.7
http://paschoolperformance.org/Profile/6452
** Ranked in the top 10% of high schools in Pennsylvania**
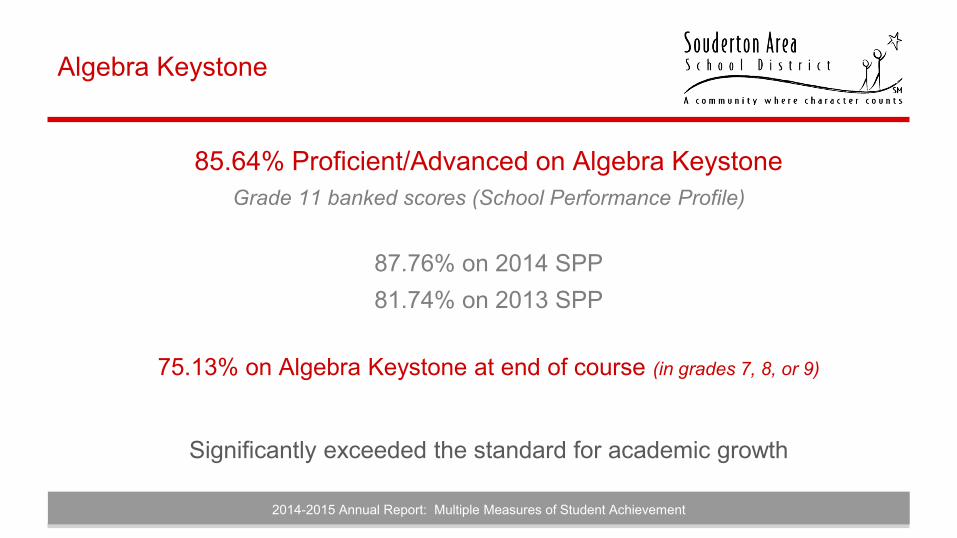
Algebra Keystone
85.64% Proficient/Advanced on Algebra Keystone Grade 11 banked scores (School Performance Profile)
87.76% on 2014 SPP 81.74% on 2013 SPP
75.13% on Algebra Keystone at end of course (in grades 7, 8, or 9)
Significantly exceeded the standard for academic growth
2014-2015 Annual Report: Multiple Measures of Student Achievement

Literature Keystone
93.98% Proficient/Advanced on Literature Keystone Grade 11 banked scores (School Performance Profile)
94.27% on 2014 SPP 93.31% on 2013 SPP
84.3% on Literature Keystone at end of course (grade 10 English)
Significantly exceeded the standard for academic growth
2014-2015 Annual Report: Multiple Measures of Student Achievement

Biology Keystone
82.76% Proficient/Advanced on Biology Keystone Grade 11 banked scores (School Performance Profile)
73.73% on 2014 SPP 48.77% on 2013 SPP
79.74% on Biology Keystone at end of course (Gr. 9 Honors Biology, Gr. 10 Biology)
Significantly exceeded the standard for academic growth
2014-2015 Annual Report: Multiple Measures of Student Achievement

What Happens When Tests Change?
• Frequently, when state tests change, scores drop dramatically. In the past, Pennsylvania has experienced decreases in proficiency levels when new standards have been set.
• Comparing ELA and Math test results is NOT an “apples to apples” comparison because the tests from prior school years and the 2014-2015 school year are dramatically different.
• Old Standards v. New PA Core Standards
2014-2015 Annual Report: Multiple Measures of Student Achievement

What Does This Mean?
• Previous assessments focused more on basic skills, whereas the PA Core aligned tests assess higher level skills: Critical thinking Problem solving Careful analysis Understanding and application of mathematical processes
• Students haven’t learned less or lost ground; they are adjusting to higher standards and more rigorous assessments
Tests from 2014-2015 provide a baseline for moving forward
2014-2015 Annual Report: Multiple Measures of Student Achievement

2015 PSSA Mathematics: All Students
2014-2015 Annual Report: Multiple Measures of Student Achievement
All SASD % at/above Proficiency
Pennsylvania % at/above Proficiency
Grade 3 63.1 48.5
Grade 4 65.1 44.4
Grade 5 64.9 42.8
Grade 6 57.9 39.7
Grade 7 45.3 33.0
Grade 8 41.0 29.8

2015 PSSA Mathematics: Historically Underperforming Students
2014-2015 Annual Report: Multiple Measures of Student Achievement
SASD Historically
Underperforming % at/above Proficiency
(ESL, IEP, Low Income)
Pennsylvania % at/above Proficiency
Grade 3 43.2 31.2
Grade 4 42.5 26.5
Grade 5 34.5 24.3
Grade 6 26.8 21.0
Grade 7 20.1 16.0
Grade 8 15.0 13.6

2015 PSSA English Language Arts: All Students
2014-2015 Annual Report: Multiple Measures of Student Achievement
All SASD % at/above Proficiency
Pennsylvania % at/above Proficiency
Grade 3 72.8 62.0
Grade 4 74.5 58.6
Grade 5 82.6 61.9
Grade 6 74.5 60.7
Grade 7 75.5 58.6
Grade 8 70.1 58.0
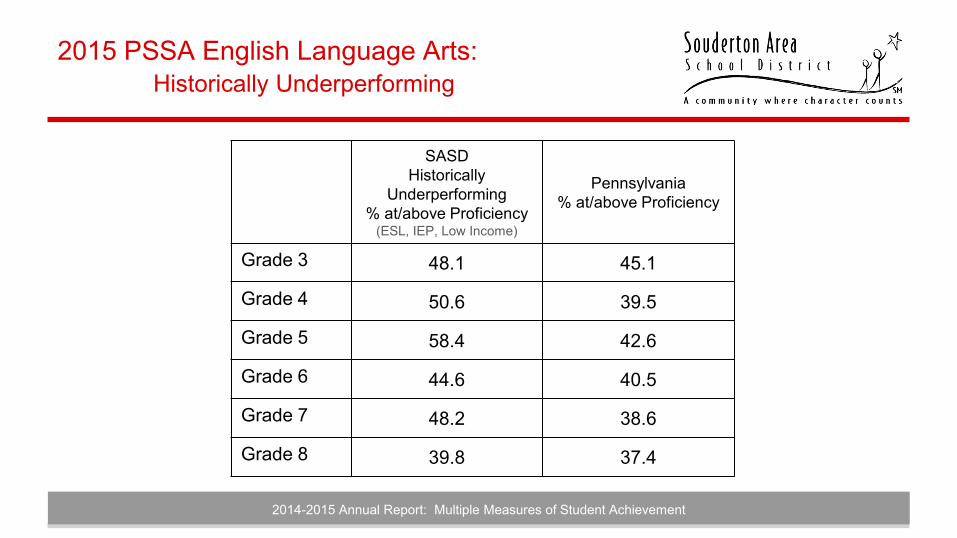
2015 PSSA English Language Arts: Historically Underperforming
2014-2015 Annual Report: Multiple Measures of Student Achievement
SASD Historically
Underperforming % at/above Proficiency
(ESL, IEP, Low Income)
Pennsylvania % at/above Proficiency
Grade 3 48.1 45.1
Grade 4 50.6 39.5
Grade 5 58.4 42.6
Grade 6 44.6 40.5
Grade 7 48.2 38.6
Grade 8 39.8 37.4

2015 PSSA Science: All Students
Grade 4 2014 90% 2013 91% Grade 8 2014 81% 2013 79%
2014-2015 Annual Report: Multiple Measures of Student Achievement
All SASD % at/above Proficiency
Pennsylvania % at/above Proficiency
Grade 4 88.9 77.3
Grade 8 71.0 58.8
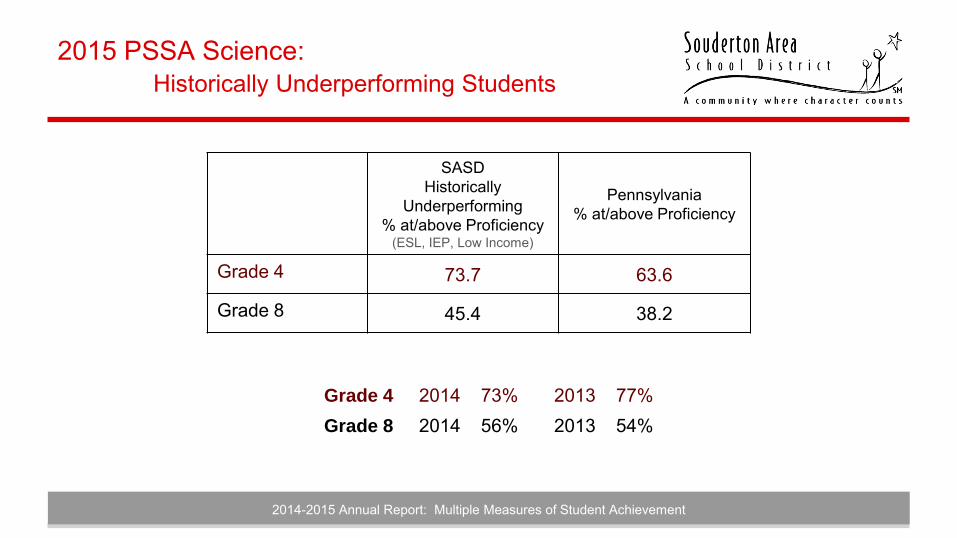
2015 PSSA Science: Historically Underperforming Students
Grade 4 2014 73% 2013 77% Grade 8 2014 56% 2013 54%
2014-2015 Annual Report: Multiple Measures of Student Achievement
SASD Historically
Underperforming % at/above Proficiency
(ESL, IEP, Low Income)
Pennsylvania % at/above Proficiency
Grade 4 73.7 63.6
Grade 8 45.4 38.2

2015 Local Assessments - Grades 3-8
2014-2015 Annual Report: Multiple Measures of Student Achievement
72% Proficient or Advanced on SASD Writing Benchmark
85% Proficient or Advanced on
Scholastic Reading
Inventory (SRI)
72% Proficient or Advanced on
Running Records, grades
2-5

Advanced Placement
21 AP Subjects Tested • From 2011 to 2015:
• —Students taking the AP exams increased from 434 to 532
• Students with a score of 3, 4 or 5 increased from 358 to 413
• Percentage of AP students with scores of 3+ is 77.6%
• 36.2% of the graduating class earned a “3” or higher on at least one AP Exam
2014-2015 Annual Report: Multiple Measures of Student Achievement

SAT Mean Score: 1575
2014-2015 Annual Report: Multiple Measures of Student Achievement
Critical Reading Mathematics Writing
2015 2014 2015 2014 2015 2014
SASD 526 521 540 532 509 501
PA 499 497 504 504 482 482
National 495 497 511 513 484 487

Comprehensive Plan Goal
Removing Barriers to Student Learning
Souderton Area School District will ensure that barriers to student learning are addressed in order to provide opportunities for students to grow and
achieve academically, socially, and emotionally.
2014-2015 Annual Report: Multiple Measures of Student Achievement
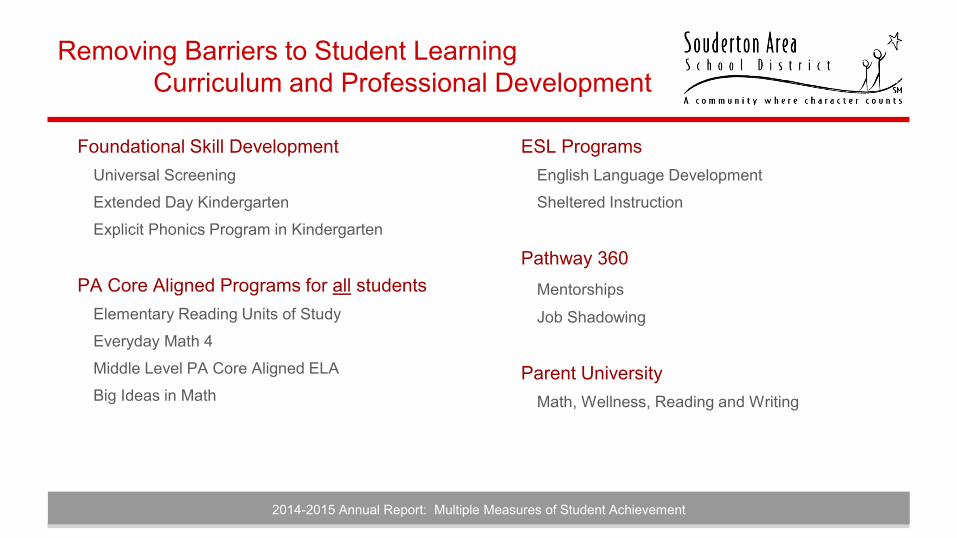
Removing Barriers to Student Learning
Curriculum and Professional Development
Foundational Skill Development Universal Screening
Extended Day Kindergarten
Explicit Phonics Program in Kindergarten
PA Core Aligned Programs for all students Elementary Reading Units of Study
Everyday Math 4
Middle Level PA Core Aligned ELA
Big Ideas in Math
ESL Programs English Language Development
Sheltered Instruction
Pathway 360 Mentorships
Job Shadowing
Parent University Math, Wellness, Reading and Writing
2014-2015 Annual Report: Multiple Measures of Student Achievement

Comprehensive Plan Goal
Integrating Technology in Teaching and Learning
Souderton Area School District will use emerging technologies to critically and creatively engage in research, communication, collaboration, and innovation to contribute to our ever-changing, interdependent world.
2014-2015 Annual Report: Multiple Measures of Student Achievement

Integrating Technology in Teaching and Learning
• 1:1 Classroom Pilots at High School
• School Visits, Conferences
• Professional Development
Role Reversal
Google Boot Camp
• Teaching and Learning Task Force
• Technology in the Classroom (Parent/Community Forum)
2014-2015 Annual Report: Multiple Measures of Student Achievement

2014-2015 Annual Report: Multiple Measures of Student Achievement
Focus Areas for Continued Improvement
• Provide Phonics program at grade 1 • Integrate the Reading and Writing Units of
Study • Invest in our Intervention Program • Revise Middle Level Science curriculum • Continue to develop curricular support for
ESL students • Expand 1:1 Integrated Technology Pilot

Expanded
Opportunities
2014-2015 School Year

A Place to Belong
2014-2015 Annual Report: Multiple Measures of Student Achievement

2014-2015 Annual Report: Multiple Measures of Student Achievement
Points of Pride
SASD awarded two Safe Schools Grants
US News & World Report includes SAHS in “America’s Best High Schools”
SASD earned Four National Merit Semi-Finalists and six Commended students
SeaPerch Robotics team wins National Championship
Girls Lacrosse team wins Suburban One Conference Championship
NMTCC Students take First Place in PA Skills USA Championship and PA Farm Show
Graduates accepted to some of the finest colleges and universities in the United States