Annual Report July 1, 2019 Multi-Scale Technologies ...
15
Annual Report July 1, 2019 – June 30, 2020 Multi-Scale Technologies Institute 1 FY 2019 – 2020 Annual Report Multi-Scale Technologies Institute August 2020
Transcript of Annual Report July 1, 2019 Multi-Scale Technologies ...
Annual Report July 1, 2019 – June 30, 2020 Multi-Scale Technologies Institute
1
FY 2019 – 2020 Annual Report
Multi-Scale Technologies Institute
August 2020

Annual Report July 1, 2019 – June 30, 2020 Multi-Scale Technologies Institute
2
MuSTI Overview for July 1, 2019 – June 30, 2020
Multi-scale technologies are those that bring together functional elements to form systems where the
relative size of components within the system spans from the nano- through the micro- and into the
macro-domain. The systems focus of MuSTI emphasizes the challenges associated with integrating
technologies that have relative feature sizes that are orders of magnitude apart, and operating
characteristics that are size dependent. MuSTI became operational near the end of 2005 and is currently
authorized until December 2020. Throughout its operation, MuSTI has enhanced research and
infrastructure to the campus and has supported undergraduate and graduate education by serving as
home to an undergraduate minor and a graduate certificate.
During 2016-17, MuSTI made significant financial contributions to help accommodate the FEI Titan
Scanning TEM and that facility became operational during 2017-2018. $115,000 was contributed to the
construction of a dedicated addition to the Advanced Technology Development Center. MuSTI also
contributed $51,090 to the upgrade during 2017-2108 of the Superior computing cluster which MuSTI
continues to support. These represent the largest contributions to critical research facilities in the 15-year
history of MuSTI.
2018-2019 2019-2020
Proposals submitted by MuSTI affiliated faculty 20 13
Number of different PIs and Co-PIs 26 16
Number of different departments/units of PIs, Co-PIs 6 4
Number of different agencies submitted to 16 9
Total Request $6,548,243 $4,491621
Number of new and incremental awards 11 9
Total funding of new and incremental awards $1,725,261 $688,790
Compared with last year, the number of submitted proposals was down, as were the number of PIs,
departments represented, and agencies. The total funds requested were down, as were the new and
incremental funds. MuSTI had a fiscal year beginning IRAD balance of $70,709 and an ending balance
of $101,574 with IRAD revenue of $39,646 and expenditures of $8,781. Expenditures supported:
• $ -1,502 Reimbursement of Unused Doctoral Fellowship Support
• $ 5,000 Educational support for Nanotechnology Minor
• $ 5,000 ACMAL Focused Ion Beam system support
• $ 283 Supplies and Services
Future Plans
Dr. Friedrich will step down as MuSTI Director in December 2020, after 15 years. The decision to renew
MuSTI is pending at this time.

Annual Report July 1, 2019 – June 30, 2020 Multi-Scale Technologies Institute
3
Computing Infrastructure Support
In 2013, MuSTI financially supported the acquisition of 64 additional processors via four compute nodes
for Superior. In 2017, 128 more processors were added via four new compute nodes. This queue
(musti.q) is used to provide the highest submission priority to MuSTI affiliates, and when not fully utilized
is open for other users, and brings the overall compute capacity to nearly 84 TFLOPS. During AY 2017-
18, the first generation MuSTI.q compute nodes were re-purposed to assist our researchers in visualizing
the output of their simulations. Though the utilization in terms of CPU hours was about 500, it has a value
beyond that number: our researchers are now able to perform aforementioned and other graphically
intense workflows that were not previously possible and vast amounts of time is saved in data transfer
as well.
The second generation of more powerful compute nodes were added during the same period (investment
of $51,090). These new nodes facilitated nearly 1900 successfully completed simulations spanning
approximately 1 million hours of CPU time (a computing value of approximately $100,000) during
AY2017-18. musti.q was used for nearly 2,000 simulations using approximately 1 million CPU-hours (a
computing value of a little over $1000,000) during AY 2018-19. During the current reporting period
AY2019-20, this queue facilitated nearly 2,200 successful simulations using nearly 1.20 million CPU-
hours (a computing value of nearly $120,000).
Since its introduction, approximately 14,200 simulations have been run through musti.q with a total
utilization of 4.05 million CPU-hours with worth equivalent to $405,000. This can be treated as the level
of funds that MuSTI researchers would have had to spend on external computing services (e.g.,
Amazon/Google Cloud Computing services) if these nodes were not available for use. The one-time cost
of acquiring the first set of nodes was $24,524 and the one-time cost of acquiring the second set of nodes
was $51,090 - for a total investment of approximately $75,000. This measurable 5.4:1 benefit-cost ratio is
an example of the ongoing reinvestment of MuSTI resources in campus-wide initiatives to grow the
Michigan Tech research enterprise.
Annual Report July 1, 2019 – June 30, 2020 Multi-Scale Technologies Institute
4
Educational Support
• Chang Kyoung Choi, Associate Professor, Department of Mechanical Engineering –
Engineering Mechanics
• Nancy Barr, Professor of Practice, Department of Mechanical Engineering – Engineering
Mechanics
MuSTI supported MEEM5130 Nanotechnology class tours to the microfabrication facility and electron
microscopy in the spring and fall semesters 2019. Graduate and undergraduate students of 23 and 19
respectively participated in the spring and fall semesters.
Nanotechnology (MEEM5130) is a graduate-level course offered in Mechanical Engineering that
introduces nanoscience, nanotechnology, and the impact of the 4th industrial revolution on the field. It
provides perspectives and tools on nanoscience as well as properties and characteristics of physics,
chemistry, and biology at the nanoscale. Nanoscience allows us to expand our understanding of
nanotechnology which includes medical nanotechnology, biomimetics, thin films, fibers, nanocomposites,
nanotubes, and etc. In addition, this course instructs students in how to give professional presentations,
choose/read academic journals, and write a proposal and manuscript via a series of assignments.
Chang Kyoung Choi (the instructor of MEEM5130) presented a paper titled "Peer Presentations as a
Student-centered Learning Approach in the Nanotechnology Class" in the Graduate Studies Division of
the 2020 ASEE Annual Conference with co-author Nancy Barr, ME-EM Professor of Practice. This paper
discussed the first phase of a multi-year study on the use of an active learning approach called student-
centered learning to build communication skills in a graduate-level nanotechnology course.
The aim of this research is to determine whether active learning can be successfully implemented in a
graduate-level course as a means to more effectively engage students with course concepts while
providing opportunities to practice critical thinking and presentation skills. Using thematic analysis, we
analyzed student responses to five open-ended questions as part of a seven-question survey given at
the end of two semesters. The results show peer presentations can guide students into developing and
articulating their own, novel interpretation of the learning materials. The guided reflection further engages
students with the material by “forcing” them to pay close attention to the presenter to answer the
questions.
The results of this research thus far point to student-centered learning as an effective means of teaching
critical reading and presentation skills. However, the variation in perceptions between predominantly
undergraduate and predominantly graduate course enrollment indicates a need for deeper inquiry into
the ways academic maturity affects those participants.

Annual Report July 1, 2019 – June 30, 2020 Multi-Scale Technologies Institute
5
Selected Research Highlights of MuSTI Affiliates
Berries & Brews: Understanding the Market and Technological Processing Opportunities of Michigan Grown Fruit in the Craft Beverage Industry
• Momoko Tajiri, Research Assistant Professor, Department of Chemistry
• Jenny Apriesnig, Assistant Professor of Economics, College of Business
• Ezquiel Medici, Research Assistant Professor & Instructor, Department of Mechanical
Engineering – Engineering Mechanics
• Kazuya Tajiri, Associate Professor, Department of Mechanical Engineering – Engineering
Mechanics
• Lynn Mazzoleni, Associate Professor, Department of Chemistry
• Martin Thompson, Associate Professor, Department of Chemistry
Overview This work is funded through the Michigan
Department of Agriculture and Rural
Development (MDRAD) - Michigan Craft
Beverage Council grant which aims to
promote Michigan agriculture through craft
beverage industry. This is the 16-month
project kicked-off on April 1, 2020.
With this work, our goal is to provide
valuable information about the use of
Michigan grown fruits to the craft beverage
industry by completing the following three
tasks: 1) Develop a market overview on the current use of fruit by the Michigan craft beverage industry,
2) Analyze the effectiveness of multiple fruit processing techniques in extracting flavoring compounds. 3)
Estimate the production costs of each processing method.
Progress
1) Marketing analyses group is preparing surveys to send out to Michigan brewers. The survey is
designed to capture current use and future plans for the use of fruits in their products. This work
is also looking for the opportunities to use Michigan grown fruits in craft beverages. The
questionnaire has been prepared with consultation from KBC and will be distributed to brewers
Across the state in early August, 2020.

Annual Report July 1, 2019 – June 30, 2020 Multi-Scale Technologies Institute
6
2) An atmospheric shock-tube facility will be used to process locally grown blueberries. The resulting
extract will be compared for their aromatic compound profiles with traditionally processed
blueberries using Mass Spectorometry (ChARM:Chemical Advanced Resolution Method Lab).
Preliminary method development and data analyses have been worked developed by researchers
with the Chemistry Department with pure blueberry juice and commercially available blueberry
flavored extract for brewers.
Initial Mass Spectra from test run (Brew: Brewer’s Extract and Juice:100% Blueberry juice)
Testing the Equivalence of Evaporation and Condensation Coefficients using the Constrained Vapor Bubble (CVB) Data from ISS Experiments
• Jeffrey Allen, Professor, Department of Mechanical Engineering – Engineering
Mechanics
• Kishan Bellur, Postdoc, Department of Mechanical Engineering – Engineering Mechanics
Wonyoung Choi, Case Western Reserve University, visiting undergraduate researcher
summer 2019
This project and funding are a result of a proposal written by Kishan Bellur while a PhD student.
Background
Liquid-vapor phase change is ubiquitous in many scientific and industrial applications. Phase change is
a complex multiscale problem and kinetic theory has provided the basis for understanding and modeling
evaporation/condensation for over a century. Classical kinetic theory is a statistical description of the
behavior of gases based on velocities of the constituent molecules. Although kinetic models have shown
to be very effective in capturing phase change, the use of the models is still limited due to the fact that
kinetic theory only describes the maximum phase change flux possible for a given thermodynamic state

Annual Report July 1, 2019 – June 30, 2020 Multi-Scale Technologies Institute
7
[1]. In reality, the phase change flux can be lower than the maximum depending on the molecular species
under consideration. Deviation from the maximum rate of phase change is accounted for through the use
of evaporation and condensation coefficients. The Hertz-Knudsen equation for liquid-vapor phase
change is shown in equation 1 and the evaporation (𝛼𝑒) and condensation (𝛼𝑐) coefficients are
highlighted.
𝐽 = √𝑚
2𝜋𝑘𝐵(𝛼𝑒
𝑃𝐿𝑖
√𝑇𝐿𝑖− 𝛼𝑐
𝑃𝑣𝑖
√𝑇𝑣) (1)
These coefficients are, in general terms, the ratio of molecules that undergo phase change to the number
of molecules that are incident on the surface [2]. Molecules that do not undergo phase change are
reflected back into the original bulk phase. A value of zero represents complete reflection and a value of
unity represents no interfacial resistance. The reported values of 𝛼𝑐 and 𝛼𝑒 are highly inconsistent [3,4].
Even for a common fluid such as water, the reported values of coefficients vary by approximately three
orders of magnitude depending on the researcher or experimental method used [4]. Determination of
accurate evaporation/condensation coefficients is further complicated by implementation of the kinetic
model into continuum descriptions of liquid flow and heat transfer near liquid-vapor interfaces. A number
of simplifying assumptions are included in these models, which makes quantitative validation of model
predictions with experimental measurements difficult. As a result, the kinetic coefficients often become
fitting parameters.
Motivation
Interfacial temperature is generally difficult to measure and both coefficients are generally unknown
making kinetic theory expressions impossible to solve explicitly even if the phase change rate was
measured accurately. This complication is often resolved through two simplifying assumptions. The first
is that 𝛼𝑐 and 𝛼𝑒 have the same value. Under this assumption the only remaining coefficient in equation
1 is 𝛼, referred to as the accommodation coefficient. The second simplification is assumption of local
equilibrium even though phase change is an inherently non-equilibrium process. The second assumption
makes the liquid-vapor interfacial temperature, Ti, is equal to the bulk vapor temperature Tv, and neglects
anisotropy in liquid pressures. Both assumptions have been shown to be incorrect but they are still widely
used for their simplicity. Kryukov and Levashov [6] concluded that assuming 𝛼𝑐 = 𝛼𝑒 “increases the error
of evaporation-condensation strongly”. Experimental evidence has shown a significant difference in liquid
and vapor temperature during phase change, suggesting that Tv ≠ Ti [7]. Badam et al. [8] showed that
assuming thermal equilibrium at the interface and 𝛼𝑐 = 𝛼𝑒 requires altering 𝛼 by an order of magnitude
in order to match experimental data. An enhanced understanding of transport at a liquid-vapor interface
has far reaching implications in many fields including but not limited to space, aerosol transport,
atmospheric science and micro- /nano-scale thermal transport in MEMS systems. A NASA pertinent
example of the importance of kinetic theory of phase change is in developing reliable models for
predicting boil-off and cryo-storage stability for liquid propellants in low gravity. The ability to predict the

Annual Report July 1, 2019 – June 30, 2020 Multi-Scale Technologies Institute
8
rate of phase change inside propellant tanks remains a challenge due to the absence of evaporation-
condensation coefficients [5].
CVB Experiment
The Constrained Vapor Bubble (CVB) experiment was conducted in the Fluids Integrated Rack (FIR) on
the International Space Station (ISS) over the last decade. The experiment has hence been retired but
the data is publicly available on the NASA Physical Sciences Informatics database. The CVB is an ideal
wickless, grooved heat pipe experiment that consists of a quartz cuvette partially filled with a working
fluid. The liquid wets the quartz forming an axisymmetric vapor bubble. A heater is placed on one end of
the cuvette and the liquid is in contact with a cold finger (thermo-electric cooler) on the opposite end. The
liquid at the heated end evaporates into the vapor. The vapor at the cold end condenses into the liquid.
The simultaneous evaporation/condensation process results in movement of vapor from the hot end to
the cold end. The condensed liquid at the cold end is then returned to the hot end through capillary flow
in the corners as illustrated in Figure 1a. During steady operation the shape of the liquid-vapor interface
is constant. Quartz cuvettes are 5.5 mm × 5.5 mm on the outside and 3 mm × 3 mm on the inside.
Cuvettes of different lengths (20 mm, 30 mm and 40 mm) were tested. Thermocouples (± 0.5K) are
embedded 0.5 mm into the wall along the cuvette axis every 1.5±0.1 mm. A pressure transducer (0 to
350 kPa, ± 600 Pa) was used to monitor the bulk liquid pressure. The Fluids Integrated Rack (FIR)
contains the Light Microscopy Module (LMM), an automated optical microscope, which is remotely
controlled from earth. In order to observe multiple scales of the CVB experiment, two sets of images are
obtained: macroscopic 10× (Figure 1b). Since the cuvette is optically transparent and flat the microscope
can be used to capture the reflectivity between the fluid and the inside surface of the cuvette. This
produces an interference pattern near the liquid-vapor interface and can be seen from the 50× images.
The individual microscopic (50×) images from the steady state operation are assembled to form a
composite, or “stitched”, image for reconstruction of the vapor bubble shape. In order to characterize the
heat loss to the environment, experiments were conducted with an evacuated cuvette and the thermal
response was recorded.
The key feature of the CVB experiment, pertinent to this project is that the number of molecules that
evaporate at the heated end must equal the number of molecules that condense at the cooler end.

Annual Report July 1, 2019 – June 30, 2020 Multi-Scale Technologies Institute
9
(a) CVB setup (b) 10X images of the 30 mm cell in μg
Figure 1. CVB experimental setup and sample 10X images [10-13].
Objective(s)
1. Using the unique configuration of the Constrained Vapor Bubble (CVB) experiment on the ISS,
evaporation and condensation coefficients αe and αc will be determined independently using a
computational approach that couples kinetic theory with conservation laws.
2. The developed methodology is then used to isolate and investigate the influence of common
kinetic model simplifying assumptions on overall heat and mass transfer.
Methodology
The proposed research effort is divided into two phases. The first is focused on analyzing CVB data.
Interferometric image analysis of the CVB data enables the reconstruction of the liquid-vapor interface to
account for enhanced evaporation at the contact line. The thermal data from the experiments allows for
the determination of the outer wall heat transfer characteristics and the net heat transfer to the vapor
bubble. The second phase is the crux of the project but requires data generated in phase one. A new
parameter is defined; β = 𝛼𝑐 / 𝛼𝑒 . An initial estimate of the interfacial temperatures can be obtained
entirely based on results of phase 1. A mass balance in the vapor bubble is used to determine β and an
energy balance is used to determine 𝛼𝑐. The interfacial temperatures are then recomputed using a
custom 3D CFD model built in ANSYS FLUENT. The local mass flux across the liquid-vapor interface is
used as a mass source/sink along with a non-slip boundary at all liquid-solid interfaces. The heat transfer
contribution from phase change is to be modeled as a heat source/sink at all points on the liquid-vapor
interface along with the experimental heater power, cooler temperature and the calculated outer wall heat
transfer coefficient as the thermal boundary conditions. This modeling approach has been successfully
used by the research team to determine interfacial temperature distributions over an evaporating liquid

Annual Report July 1, 2019 – June 30, 2020 Multi-Scale Technologies Institute
10
hydrogen meniscus [9]. The updated interfacial temperatures are compared to the initial estimates and
the process is iterated till convergence is achieved as shown in Figure 2.
Figure 2. Methodology of Phases 1 and 2.
The fact that the CVB cell is a closed system allows for closure of conservation equations such that the
simplifying assumptions are not necessary. The CVB configuration along with the interferometric images,
pressure and thermal data allows for the investigation of common assumptions made in kinetic theory
and for the first time, determine both the evaporation and condensation coefficients from a coupled
analysis. Because the experiments are closed system without the influence of gravity, the CVB data
provides a unique opportunity to isolate and investigate the various implementations of kinetic theory for
predicting rates of phase change.
Current Progress
Phase 1 Interferometric thin film analysis Phase 1 of the project focusses mostly on image and data analysis from PSI database. Figure 3a shows
a typical image (26366 x 1712 pixels) from the database. From the interferometric data in the images,
Annual Report July 1, 2019 – June 30, 2020 Multi-Scale Technologies Institute
11
the original PI’s used a relative reflectivity concept to determine a liquid film profile for a single row of
pixels. Details of the analysis are described elsewhere [10-13]. Based on the original formulation, a
similar analysis tool was built in MATLAB. The interferometric image analysis is developed as a
standalone function that only requires one row of pixel intensities as input and generates a film profile as
an output. Figure 3b shows the film profile at 4 different rows of pixels. The film profiles are validated
against published results from CVB data.
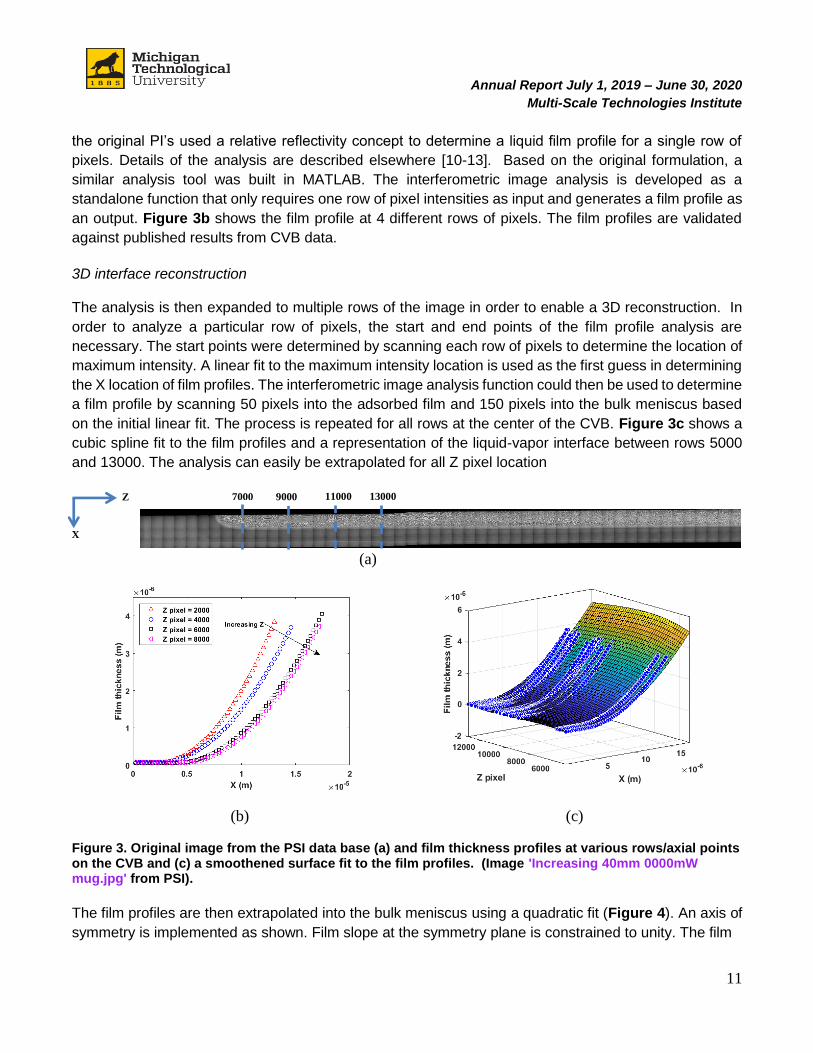
3D interface reconstruction The analysis is then expanded to multiple rows of the image in order to enable a 3D reconstruction. In
order to analyze a particular row of pixels, the start and end points of the film profile analysis are
necessary. The start points were determined by scanning each row of pixels to determine the location of
maximum intensity. A linear fit to the maximum intensity location is used as the first guess in determining
the X location of film profiles. The interferometric image analysis function could then be used to determine
a film profile by scanning 50 pixels into the adsorbed film and 150 pixels into the bulk meniscus based
on the initial linear fit. The process is repeated for all rows at the center of the CVB. Figure 3c shows a
cubic spline fit to the film profiles and a representation of the liquid-vapor interface between rows 5000
and 13000. The analysis can easily be extrapolated for all Z pixel location
(a)
(b) (c) Figure 3. Original image from the PSI data base (a) and film thickness profiles at various rows/axial points on the CVB and (c) a smoothened surface fit to the film profiles. (Image 'Increasing 40mm 0000mW mug.jpg' from PSI).
The film profiles are then extrapolated into the bulk meniscus using a quadratic fit (Figure 4). An axis of
symmetry is implemented as shown. Film slope at the symmetry plane is constrained to unity. The film
7000 Z
X
9000 11000 13000

Annual Report July 1, 2019 – June 30, 2020 Multi-Scale Technologies Institute
12
profile is mirrored on the other side of the symmetry plane as shown in Figure 4. The analysis is repeated
for all film profiles and a 3D surface is generated. The 3D geometry for the liquid-vapor interface of the
constrained vapor bubble, the geometry is converted into a file format that could be imported into ANSYS
FLUENT for heat and mass transport modeling.
Figure 4. CVB liquid-vapor interface reconstruction strategy
Currently, the interface reconstruction is only 80% complete since the PSI database does not have data
on the interface shape at the cooler end. The research team is currently working with the original PIs of
the CVB experiment and the NASA team to obtain the data and complete the entire 3D reconstruction.
Phase 2 Determination of non-uniform heat/ mass flux– multi-scale phase change model
A multi-scale approach to determine the non-uniform mass flux along the liquid vapor interface was
developed as part of postdoc Bellur’s PhD dissertation [9] and was published earlier this year [14]. The
model is developed in MATLAB and is used to describe the non-uniform phase change flux in steady
state conditions. Figure 5 shows typical results of the multi-scale phase change model. Shown here are
results for evaporation of liquid hydrogen in a 10 mm Al cell. The geometry obtained from Phase 1, is
imported into the developed modeling framework to extract the non-uniform mass flux along the entire
surface. The multi-scale model is capable of incorporating micro-scale effects such as curvature and
disjoining pressure in addition to macroscale thermal and fluid transport. It then couples the physics and
generates heat and mass fluxes based on the thermal inputs. Initially, the interface temperature is
estimated based entirely on results from phase 1 but later updated with the CFD model. Evaluation of
conservation laws enables the determination of the coefficients.

Annual Report July 1, 2019 – June 30, 2020 Multi-Scale Technologies Institute
13
Figure 5. Typical results from the multi-scale phase change model already developed. Results shown here are for a test case with liquid hydrogen steadily evaporating at 21K from a 10 mm cylindrical cell
[14].
Computation of interfacial temperatures – CFD model
The non-uniform mass flux generated from the multi-scale phase change model is used a 3D CFD model
built in ANSYS FLUENT to update the interfacial temperatures. Custom, non-uniform heat and mass
sources on the liquid-vapor interface are implemented using User Defined Functions (UDF). These
functions were written in C and compiled independently and incorporated into ANSYS FLUENT.
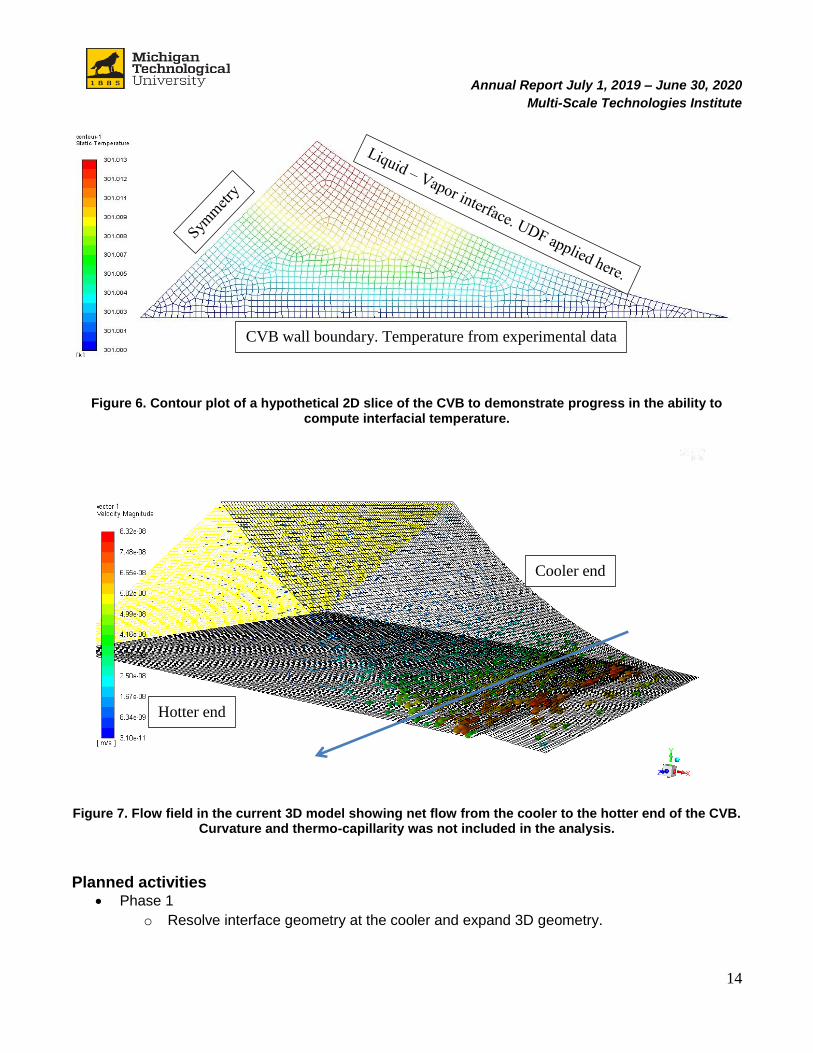
For a proof of concept, a simplified 2D model is constructed. Film profile at one Z pixel location was
implemented in ANSYS. The walls are set to 301 K per data from phase 1. A symmetry condition is
applied on the left and the UDF is applied on the curved liquid-vapor interface. The result from the 2D
simulation is shown in Figure 6. Temperature at the thin film is lowest due to evaporative cooling. The
region near the plane of symmetry shows a highest temperature on the interface indicating condensation.
Heat transport is dominated by conduction and convection is minimal. The interfacial temperature
obtained from the CFD model is then used to recompute the value of the coefficients using the multi-
scale model previously described.
A 3D simulation is a work in progress. A proof-of-concept model was constructed using a small portion
of the reconstructed geometry from phase 1. Figure 7 shows the 3D flow field velocity showing a net flow
from the cooler end to the hotter end. At this point, interface curvature and thermo-capillarity has not
been accounted for in the 3D model. This aspect of the model is under active development and will be
completed in the next few months.
Once the 3D CFD model is complete, an iterative approach will enable the determination of the
coefficients and additional investigations on the simplifying assumptions.
Annual Report July 1, 2019 – June 30, 2020 Multi-Scale Technologies Institute
14
Figure 6. Contour plot of a hypothetical 2D slice of the CVB to demonstrate progress in the ability to
compute interfacial temperature.
Figure 7. Flow field in the current 3D model showing net flow from the cooler to the hotter end of the CVB.
Curvature and thermo-capillarity was not included in the analysis.
Planned activities • Phase 1
o Resolve interface geometry at the cooler and expand 3D geometry.
CVB wall boundary. Temperature from experimental data
Cooler end
Hotter end

Annual Report July 1, 2019 – June 30, 2020 Multi-Scale Technologies Institute
15
• Phase 2
o Incorporate interface curvature and thermocapillarity in the UDF.
o Write a MATLAB script to integrate post-processed FLUENT data.
o Iterate between CFD model (FLUENT) and multi-scale phase change model (MATLAB)
to determine coefficients.
o Isolate and test the effect of different simplifying assumptions.
References 1. R. W. Schrage. A theoretical study of interphase mass transfer. Columbia University Press, 1953.
2. J. Barrett and C. Clement. Kinetic evaporation and condensation rates and their coefficients.
Journal of colloid and interface science, 150(2):352–364, 1992.
3. E. J. Davis. A history and state-of-the-art of accommodation coefficients. Atmospheric research,
82(3):561–578, 2006.
4. R. Marek and J. Straub. Analysis of the evaporation coefficient and the condensation coefficient
of water. International Journal of Heat and Mass Transfer, 44(1):39–53, 2001.
5. K. Bellur, E. F. Médici, M. Kulshreshtha, V. Konduru, D. Tyrewala, A. Tamilarasan, J. McQuillen,
J. B. Leão, D. S. Hussey, D. L. Jacobson, J. Scherschligt, J. C. Hermanson, C. K. Choi, and J. S.
Allen. A new experiment for investigating evaporation and condensation of cryogenic propellants.
Cryogenics, 74:131–137, 2016.
6. A. P. Kryukov and V. Yu. Levashov. About evaporation–condensation coefficients on the vapor–
liquid interface of high thermal conductivity matters. International Journal of Heat and Mass
Transfer, 54 (13):3042–3048, 2011.
7. G. Fang and C. Ward. Temperature measured close to the interface of an evaporating liquid.
Physical Review E, 59(1):417, 1999.
8. V. K. Badam, V. Kumar, F. Durst, and K. Danov. Experimental and theoretical investigations on
interfacial temperature jumps during evaporation. Experimental Thermal and Fluid Science,
32(1):276–292, 2007.
9. K. Bellur, “A New Technique to Determine Accommodation Coefficients of Cryogenic Propellants”.
PhD Thesis, Michigan Technological University, 2018.
10. S. S. Panchamgam, S. J. Gokhale, J. L. Plawsky, S. DasGupta, and P. C. Wayner. “Experimental
determination of the effect of disjoining pressure on shear in the contact line region of a moving
evaporating thin film”. Journal of heat transfer, 127(3):231–243, 2005.
11. S. S. Panchamgam, J. L. Plawsky, and P. C.Wayner. “Microscale heat transfer in an evaporating
moving extended meniscus”. Experimental thermal and fluid science, 30(8):745–754, 2006.
12. S. S. Panchamgam, A. Chatterjee, J. L. Plawsky, and P. C. Wayner. “Comprehensive
experimental and theoretical study of fluid flow and heat transfer in a microscopic evaporating
meniscus in a miniature heat exchanger”. International Journal of Heat and Mass Transfer,
51(21):5368–5379, 2008.
13. T. Nguyen, A. Kundan, P. C. Wayner, J. L. Plawsky, D. F. Chao, and R. J. Sicker. “Experimental
study of the heated contact line region for a pure fluid and binary fluid mixture in microgravity”.
Journal of Colloid and Interface Science, 488:48–60, 2017.
14. K. Bellur, E. F. Médici, C. K. Choi, J. Hermanson, and J. S. Allen. “A multi-scale approach to
model steady meniscus evaporation”, Physical Review Fluids, 5(2), 024001. 2020.