ANNUAL REPORT & ACCOUNTSxppower.annualreport2019.com/media/ob3au00f/xp... · Industrial...
66
ANNUAL REPORT & ACCOUNTS for the year ended 31 December 2019 POWERING THE WORLD’S CRITICAL SYSTEMS
Transcript of ANNUAL REPORT & ACCOUNTSxppower.annualreport2019.com/media/ob3au00f/xp... · Industrial...

XP POW
ER AN
NU
AL REPO
RT & ACCO
UN
TS for the year ended 31 Decem
ber 2019
ANNUAL REPORT & ACCOUNTS
for the year ended 31 December 2019
P O W E R I N G T H E W O R L D ’ S C R I T I C A L S Y S T E M S

WHAT WE DO
We provide our customers in the Healthcare, Industrial Electronics, Semiconductor Equipment Manufacturing and Technology, sectors with solutions to power their critical systems and get their products to market in the shortest possible time. We have moved steadily up the value chain from a specialist distributor, to designer, to design manufacturer.
Electronic equipment cannot operate directly from the electricity provided by the mains supply, which is a relatively high voltage alternating current.
All electronic equipment requires a stable, direct current in order to operate. In addition, we provide power converters that produce radio frequency alternating current (RF Power) used in various processes requiring plasma generation, dielectric or induction heating.
Our electronic power converters are designed into our customers’ end equipment, often with the aid of our engineering services expertise, and once designed, we enjoy a long revenue annuity for the life of the customer’s programme.
Our power solutions also provide the vital safety barrier between the potentially lethal mains supply and the user of the end equipment, and cannot be easily designed out.
Our target customers provide vital equipment where the cost of downtime or implications of failure are significant.
OUR PURPOSE
We power the world’s critical systems.
OUR VISION
To be the first choice power solutions provider delivering the ultimate experience for our customers and our people.
OUR CULTURE
Our organisational culture underpins our business decisions. This is supported by our core values.
OUR CORE VALUES
Our core values of Integrity, Knowledge, Flexibility, Speed and Customer Focus are our DNA and are fundamental to our continued success.
FOR MORE INFORMATION ON OUR CORE VALUES PLEASE SEE PAGES 52 AND 53.
CIFC
INTRODUCTION
INTEGRITY KNOWLEDGE FLEXIBILITY SPEED CUSTOMER FOCUS

CONTENTS
OverviewIntroduction IFCHighlights in 2019 02Our Investment Proposition 03
XP Power at a Glance 04Our Products 06Chairman’s Statement 08
Strategic ReportOur Marketplace 12Our Marketplace: Our Growth Drivers 16Our Business Model 18Our Competitive Advantages 21Our Strategy 22Our Strategy in Action 24Our Key Performance Indicators 28Performance: Operational Review 30Performance: Our Supply Chain 36Performance: Financial Review 38Managing our Risks 42Our Commitments to Sustainability 48Our Commitments to the SDGs 50Our Core Values 52Our Core Values in Action 53Our People and their Health and Safety 54Our Customers 57Our Suppliers 58Our Shareholders 59Our Communities 60The Environment 61Sustainability: Non Financial Disclosures Summary 62
GovernanceChairman’s Introduction to Governance 66Governance: Board and Activities 67Directors and Officers 68Corporate Governance Report 70Audit Committee Report 82Remuneration Committee Report 86Remuneration Policy 89Remuneration Report – Annual Report 95Other Governance and Statutory Disclosures 104Statement by Directors 105
FinancialsIndependent Auditor’s Report 108Consolidated Statement of Comprehensive Income 113Consolidated Balance Sheet 114Consolidated Statement of Changes in Equity 115Consolidated Statement of Cash Flows 116Notes to the Consolidated Financial Statements 117Company Balance Sheet 154Notes to the Company Balance Sheet 155Five Year Review Consolidated Information 168Advisers 169
XP Power has made good strategic progress in a challenging year where one of our end markets has been in a cyclical trough and we have had to deal with the effects of Section 301 tariffs in the USA. Against this background we have continued to bring new products to market and win new design wins. We have also made significant steps to develop our supply chain and systems with the implementation of a new Enterprise Resource Planning system in our sales entities. We have made significant progress towards the achievement of our vision of being the first choice power solutions provider, delivering the ultimate experience to our customers and our people.
Our design win pipeline was strong in 2019, boding well for continued future market share and revenue growth.
We also continued to move our product portfolio up to higher power and technically more complex applications, and to expand the number of design wins with higher engineering solutions content. We enter 2020 with optimism.DUNCAN PENNYChief Executive Officer
3 March 2020
FOR MORE INFORMATION WITHIN THE REPORT VISIT US ONLINE AT: WWW.XPPOWERPLC.COM
01
OVERVIEW
XP Power Annual Report & Accounts for the year ended 31 December 2019
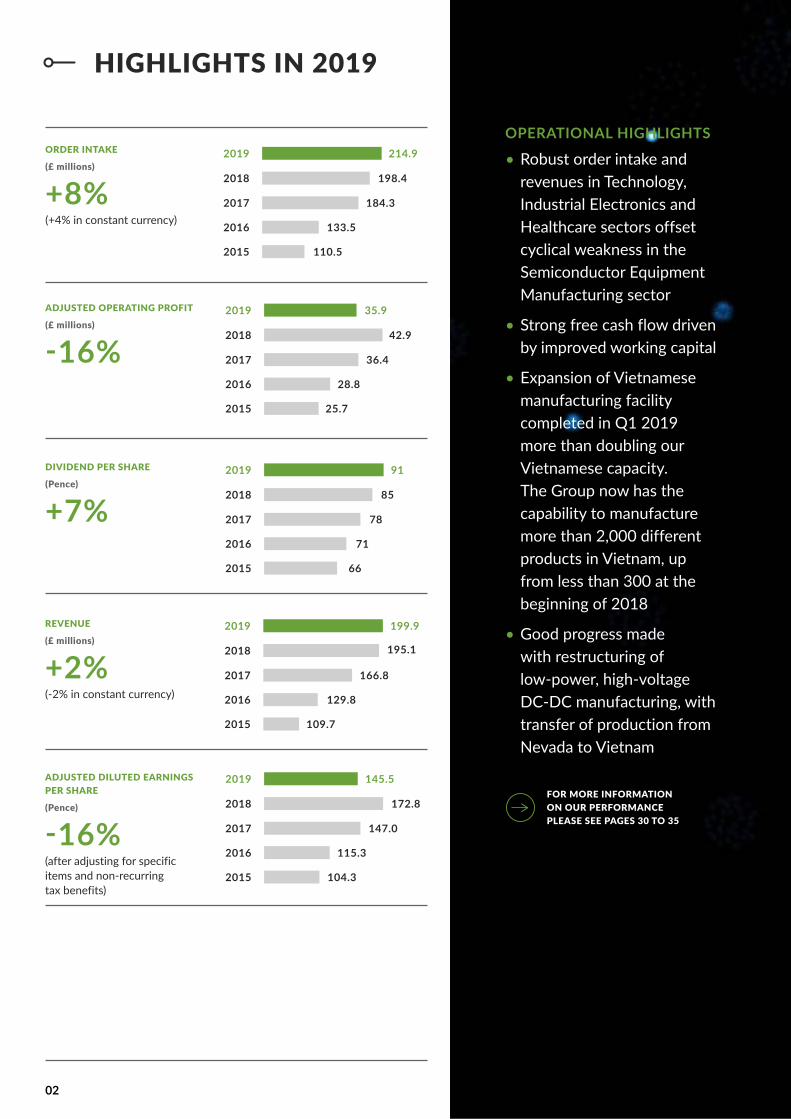
OPERATIONAL HIGHLIGHTS
• Robust order intake and revenues in Technology, Industrial Electronics and Healthcare sectors offset cyclical weakness in the Semiconductor Equipment Manufacturing sector
• Strong free cash flow driven by improved working capital
• Expansion of Vietnamese manufacturing facility completed in Q1 2019 more than doubling our Vietnamese capacity. The Group now has the capability to manufacture more than 2,000 different products in Vietnam, up from less than 300 at the beginning of 2018
• Good progress made with restructuring of low-power, high-voltage DC-DC manufacturing, with transfer of production from Nevada to Vietnam
FOR MORE INFORMATION ON OUR PERFORMANCE PLEASE SEE PAGES 30 TO 35
02
HIGHLIGHTS IN 2019
ORDER INTAKE
(£ millions)
+8%(+4% in constant currency)
ADJUSTED OPERATING PROFIT
(£ millions)
-16%
DIVIDEND PER SHARE
(Pence)
+7%
REVENUE
(£ millions)
+2%(-2% in constant currency)
ADJUSTED DILUTED EARNINGS PER SHARE
(Pence)
-16%(after adjusting for specific items and non-recurring tax benefits)
214.92019
184.32017
198.42018
133.52016
110.52015
2019
2017
2018
2016
2015
35.9
36.4
42.9
28.8
25.7
2019
2017
2018
2016
2015
91
78
85
71
66
2019
2017
2018
2016
2015
199.9
166.8
195.1
129.8
109.7
2019
2017
2018
2016
2015
145.5
147.0
172.8
115.3
104.3

Exposure to a broad cross section of end markets Industrial Electronics, Healthcare, Technology and Semifab – but with no direct exposure to consumer electronics.
A diverse customer base of over 4,500 active customers, with no one customer accounting for more than 10% of revenue.
A growing penetration of a global, blue-chip customer base.
Powerful customer relationship management tools that allow the efficient management of our customer base, identification of pricing and product trends that enable the development of appropriate, innovative new products.
An established broad portfolio of leading “Green” products that operate at high efficiency.
Revenue annuity – although design-in cycles are often long, once our power converters are approved for use in our customers’ end equipment, XP Power enjoys a revenue annuity for the lifetime of the customers’ equipment, which is typically seven years.
Attractive margins and lower capital investment requirements when compared to many manufacturing industries, resulting in strong free cash flow and margins that are amongst the highest in the industry.
Progressive Dividend – the business model allows for a progressive dividend, which is paid quarterly.
FOR MORE INFORMATION ON OUR MARKETPLACE PLEASE SEE PAGES 12 TO 15
FOR MORE INFORMATION ON OUR MARKETPLACE DRIVERS PLEASE SEE PAGES 12 TO 15
FOR MORE INFORMATION ON OUR GROWTH DRIVERS PLEASE SEE PAGES 16 AND 17
FOR MORE INFORMATION ON OUR BUSINESS MODEL PLEASE SEE PAGES 18 TO 20
FOR MORE INFORMATION ON OUR COMMITMENTS TO SUSTAINABILITY PLEASE SEE PAGES 48 AND 49
FOR MORE INFORMATION ON OUR REVENUE PLEASE SEE PAGE 19
FOR MORE INFORMATION ON OUR PERFORMANCE PLEASE SEE PAGES 30 TO 35
FOR MORE INFORMATION ON OUR DIVIDEND PLEASE SEE PAGE 20
XP Power Annual Report & Accounts for the year ended 31 December 2019 03
OVERVIEWOUR INVESTMENT PROPOSITION

READ ABOUT CULTURE ON PAGES 72 TO 73
WHAT DOES XP POWER DO?The world’s critical systems, taking the electrical mains supply from the grid and converting it into the correct form of electricity to power our customers’ equipment in critical applications.
Previously we were a specialist distributor and have moved up the value chain to designer and then to design manufacturer. We operate in the healthcare, industrial electronics, semiconductor equipment manufacturing and technology industries.
The design and integration of these essential power conversion devices into the end equipment they power involves many challenges and trade-offs. The result is a unique set of requirements from the customers who are constantly attempting to differentiate their equipment from their competitors.
Our long-term investment in research and development and excellent customer service has positioned XP Power as a key partner for the world’s leading manufacturers of critical capital equipment.
We operate across four key industries: healthcare, industrial electronics, semiconductor equipment manufacturing, and technology.
01Industrial ElectronicsPower solutions for applications such as 3D printing, process control, analytical instruments, smart grid, transport, robotics and renewable energy.
02TechnologyPower solutions for applications such as high end computing, broadcast, displays, satellite communications and security.
03HealthcareMedically approved power solutions for applications including analytics, imaging, patient monitoring, life science, robotic surgery and diagnostic equipment.
04Semiconductor Equipment ManufacturingPower solutions to power the electronics and processes with semiconductor manufacturing equipment including equipment for deposition, wafer handling, etching, semiconductor test and ion implantation.
WHAT IS A POWER CONVERTER?A power converter is an essential hardware component required in every piece of electrical equipment.
The task of the component is to convert the alternating current from the mains supply into stable direct current, which is required by all electronic equipment, or to a stable alternating current oscillating at very fast frequency in the case of an RF power converter. The power converter is also a safety critical component in any system as it protects the user of the equipment from the potentially lethal mains supply.
OUR POWERFUL OFFERING• Broad, leading-edge product line with
ultra-high efficiency
• Class-leading manufacturing ensuring excellent quality, reliability and competitive cost
• Class-leading customer service and support through our highly knowledgeable and experienced sales team and power systems engineers
• Engineering on three continents providing excellent support during design-in to reduce time to market
• XP Power is one of few companies in the world that can offer a solutions from low to high voltage and from low to high power
Our offering enables us to meet our customers’ requirementsOur offering and expertise enables us to meet the requirements of our customers. Through the transition from a specialist distributor, to designer, to design manufacturer, we have a unique understanding of our customers and market. Our business model is to sell directly to our key customers, who sit in four market sectors: healthcare, industrial electronics, semiconductor equipment manufacturing, and technology.
OUR CULTUREWe are a diverse and transnational organisation and therefore ensuring a cohesive and complementary corporate culture is fundamental to our sustainable success.
XP Power’s portfolio of leading-edge, ultra-high efficient products are helping the world’s leading manufacturers to create new technologies and products. This enables us to power the world’s critical systems.
04
XP POWER AT A GLANCE
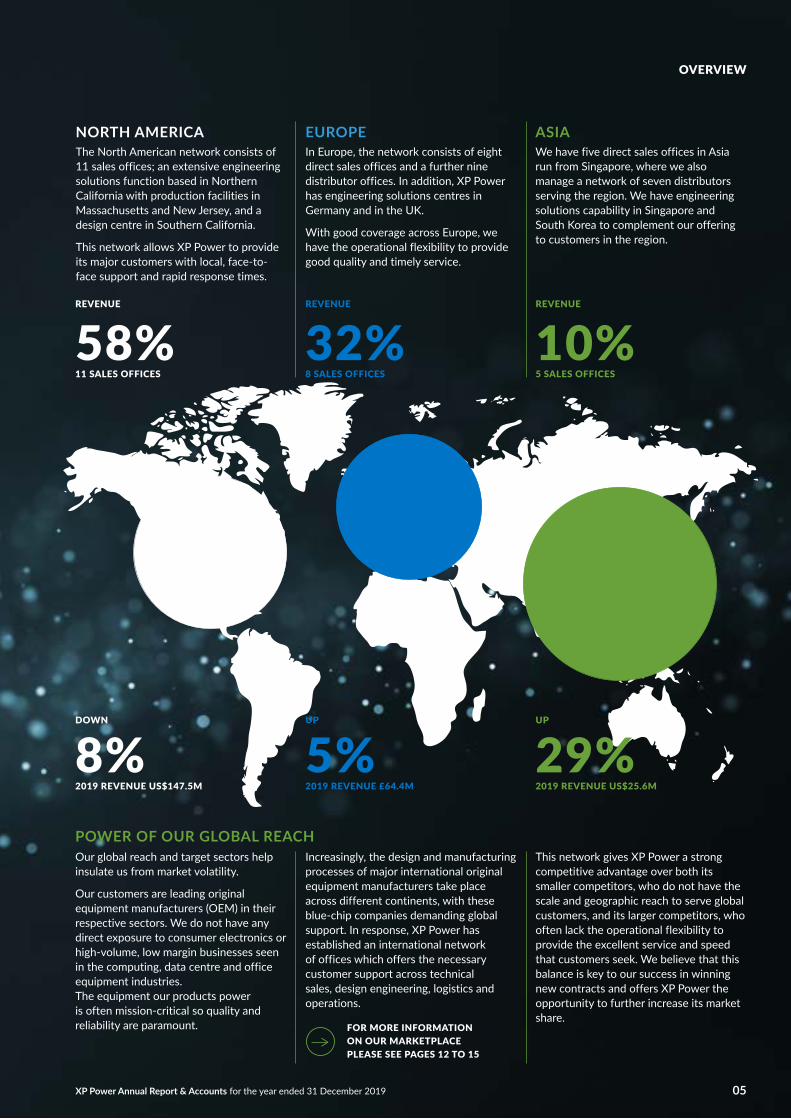
NORTH AMERICAThe North American network consists of 11 sales offices; an extensive engineering solutions function based in Northern California with production facilities in Massachusetts and New Jersey, and a design centre in Southern California.
This network allows XP Power to provide its major customers with local, face-to-face support and rapid response times.
EUROPEIn Europe, the network consists of eight direct sales offices and a further nine distributor offices. In addition, XP Power has engineering solutions centres in Germany and in the UK.
With good coverage across Europe, we have the operational flexibility to provide good quality and timely service.
ASIAWe have five direct sales offices in Asia run from Singapore, where we also manage a network of seven distributors serving the region. We have engineering solutions capability in Singapore and South Korea to complement our offering to customers in the region.
POWER OF OUR GLOBAL REACHOur global reach and target sectors help insulate us from market volatility.
Our customers are leading original equipment manufacturers (OEM) in their respective sectors. We do not have any direct exposure to consumer electronics or high-volume, low margin businesses seen in the computing, data centre and office equipment industries. The equipment our products power is often mission-critical so quality and reliability are paramount. FOR MORE INFORMATION
ON OUR MARKETPLACE PLEASE SEE PAGES 12 TO 15
DOWN
8%2019 REVENUE US$147.5M
REVENUE
58%11 SALES OFFICES
UP
5%2019 REVENUE £64.4M
REVENUE
32%8 SALES OFFICES
UP
29%2019 REVENUE US$25.6M
REVENUE
10%5 SALES OFFICES
Increasingly, the design and manufacturing processes of major international original equipment manufacturers take place across different continents, with these blue-chip companies demanding global support. In response, XP Power has established an international network of offices which offers the necessary customer support across technical sales, design engineering, logistics and operations.
This network gives XP Power a strong competitive advantage over both its smaller competitors, who do not have the scale and geographic reach to serve global customers, and its larger competitors, who often lack the operational flexibility to provide the excellent service and speed that customers seek. We believe that this balance is key to our success in winning new contracts and offers XP Power the opportunity to further increase its market share.
05
OVERVIEW
05XP Power Annual Report & Accounts for the year ended 31 December 2019
OVERVIEW
0606
OUR PRODUCTS
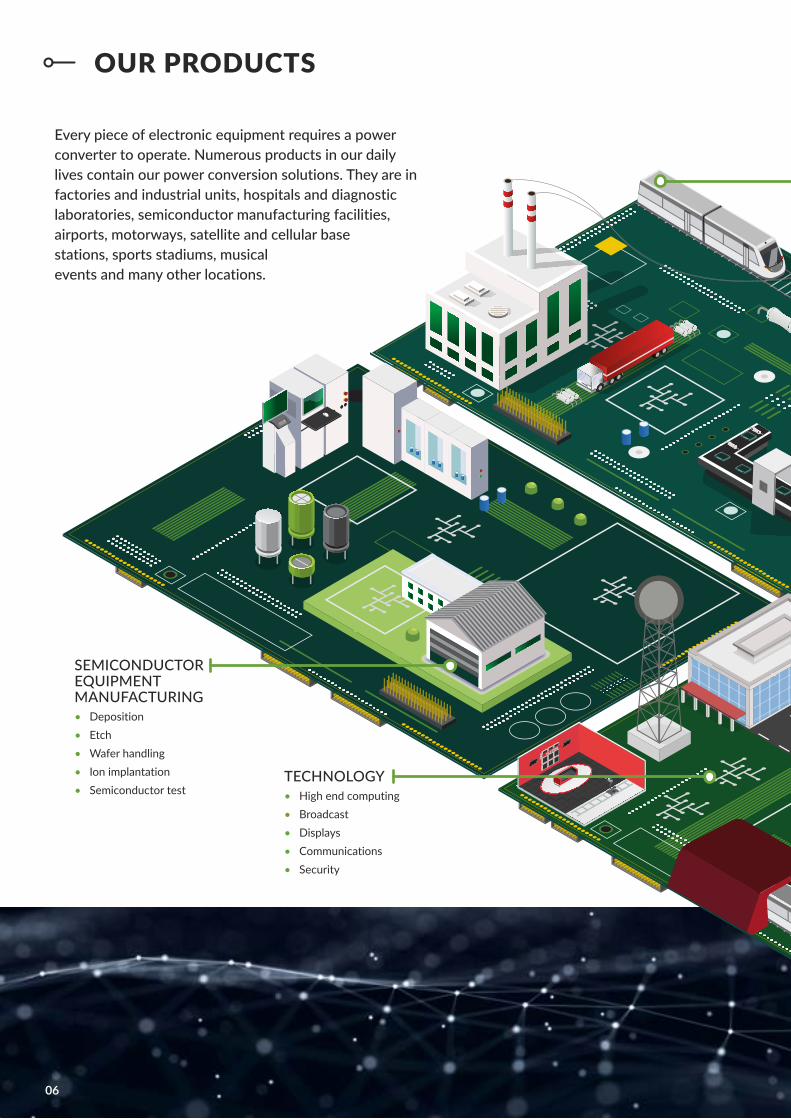
Every piece of electronic equipment requires a power converter to operate. Numerous products in our daily lives contain our power conversion solutions. They are in factories and industrial units, hospitals and diagnostic laboratories, semiconductor manufacturing facilities, airports, motorways, satellite and cellular base stations, sports stadiums, musical events and many other locations.
SEMICONDUCTOR EQUIPMENT MANUFACTURING• Deposition • Etch • Wafer handling• Ion implantation • Semiconductor test
TECHNOLOGY • High end computing • Broadcast • Displays • Communications• Security
VISIT US ONLINE AT: WWW.XPPOWERPLC.COM
OVERVIEW
XP Power Annual Report & Accounts for the year ended 31 December 2019 07
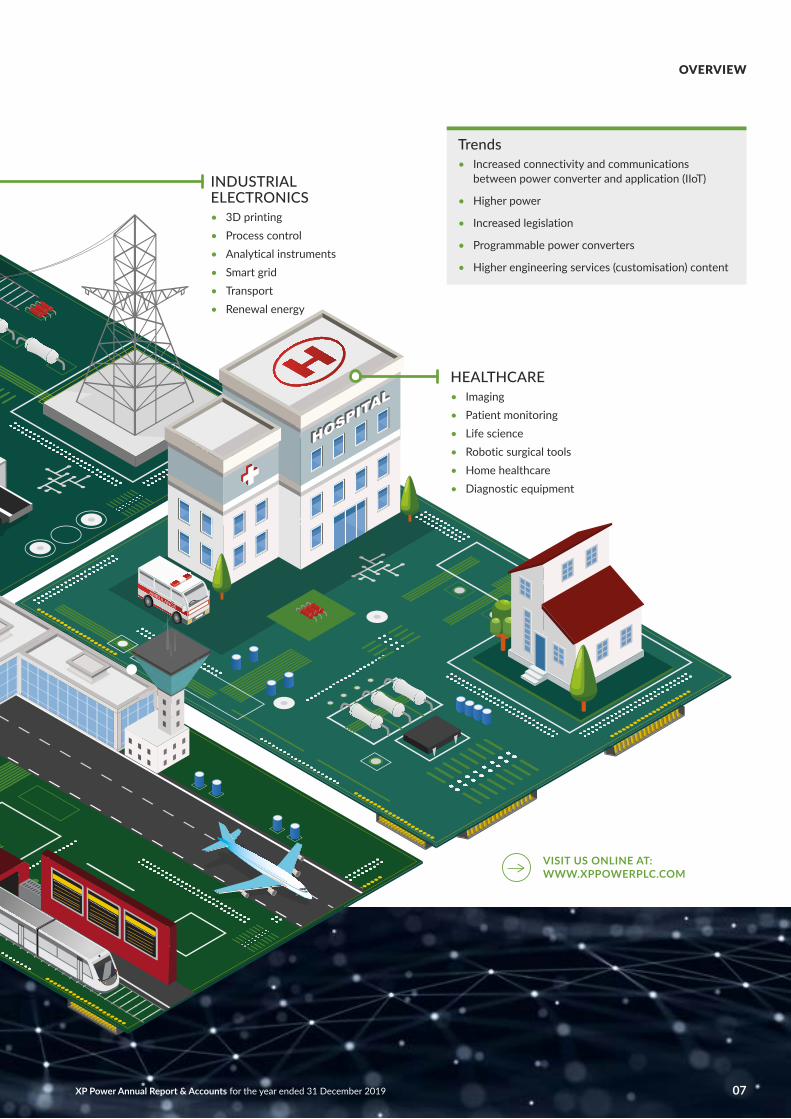
HEALTHCARE• Imaging • Patient monitoring • Life science • Robotic surgical tools • Home healthcare • Diagnostic equipment
INDUSTRIAL ELECTRONICS• 3D printing • Process control • Analytical instruments • Smart grid • Transport • Renewal energy
Trends• Increased connectivity and communications
between power converter and application (IIoT)
• Higher power
• Increased legislation
• Programmable power converters
• Higher engineering services (customisation) content
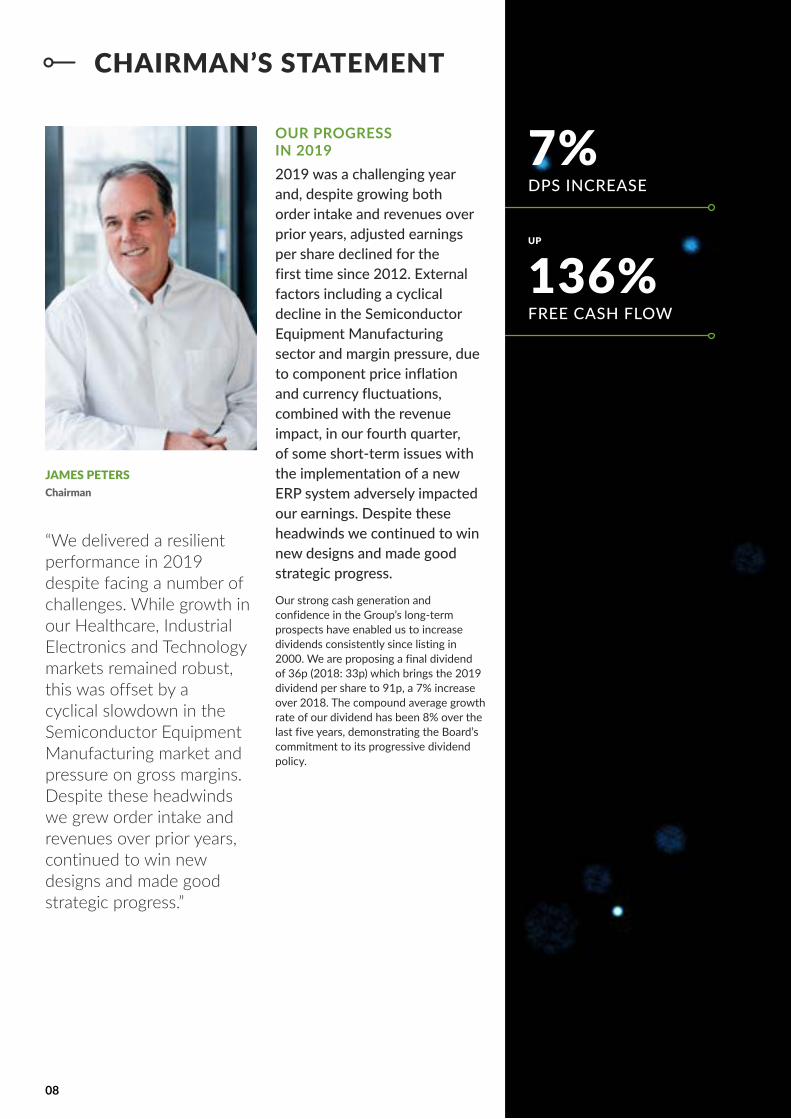
JAMES PETERSChairman
“We delivered a resilient performance in 2019 despite facing a number of challenges. While growth in our Healthcare, Industrial Electronics and Technology markets remained robust, this was offset by a cyclical slowdown in the Semiconductor Equipment Manufacturing market and pressure on gross margins. Despite these headwinds we grew order intake and revenues over prior years, continued to win new designs and made good strategic progress.”
OUR PROGRESS IN 20192019 was a challenging year and, despite growing both order intake and revenues over prior years, adjusted earnings per share declined for the first time since 2012. External factors including a cyclical decline in the Semiconductor Equipment Manufacturing sector and margin pressure, due to component price inflation and currency fluctuations, combined with the revenue impact, in our fourth quarter, of some short-term issues with the implementation of a new ERP system adversely impacted our earnings. Despite these headwinds we continued to win new designs and made good strategic progress.
Our strong cash generation and confidence in the Group’s long-term prospects have enabled us to increase dividends consistently since listing in 2000. We are proposing a final dividend of 36p (2018: 33p) which brings the 2019 dividend per share to 91p, a 7% increase over 2018. The compound average growth rate of our dividend has been 8% over the last five years, demonstrating the Board’s commitment to its progressive dividend policy.
7%DPS INCREASE
UP
136%FREE CASH FLOW
08
CHAIRMAN’S STATEMENT

STRATEGY REVIEW The Group’s strategy has remained consistent for a significant period. It is built on the development of a market leading range of competitive products, either organically or by acquisition, to enable further penetration of existing target accounts where we still have relatively low market shares, combined with a drive to move our product portfolio up the power and voltage scale. We are one of a few companies in the world with a product portfolio across the power and voltage spectrum and can use our engineering services skills to combine these capabilities and provide customers with a complete power solution.
During the year the Board completed its annual review of Group strategy. This determined that our strategy continued to work effectively to achieve long-term earnings growth, market share gains in our target sectors and customers, and our brand strength, as demonstrated by the consistent revenue growth generated in all sectors except Semiconductor Equipment Manufacturing, which was impacted in 2019 by cyclical weakness. We are confident we can continue to develop market leading products and encouraged by the potential of our product and sales pipeline to continue to deliver organic growth. Following a refinancing in 2019, we have sufficient committed funds to support targeted acquisitions. We continue to make improvements to our systems and processes, product life cycle management and supply chain to support the sales growth we are generating, as well as bringing new talent into the business to support our growth.
READ ABOUT STRATEGY ON PAGES 22 AND 23
OUR BOARD Pauline Lafferty joined the Board on 3 December 2019 as a Non-Executive Director. Pauline brings a wealth of international business experience to the Group and significant expertise in strategic human resources. She is already making a considerable contribution to the Board.
Mike Laver, Executive Director responsible for Corporate Development, retired from the Board at the Annual General Meeting on 16 April 2019. I would like to thank Mike for his significant contribution to the development of the Group over many years.
OUR PEOPLE AND OUR VALUES The success of any organisation is dependent on its culture and the people and talent within it. The Board worked closely with the Executive Leadership Team during 2019 to ensure the Group is identifying and developing its key people and bringing new talent and capabilities into the business to ensure that it can continue to grow and take market share. We have expanded our engineering capability significantly in the last two years and are taking steps to bring more talent into our Supply Chain team during 2020.
In addition to our core values of Integrity, Knowledge, Flexibility, Speed and Customer Focus, commitment to Health and Safety remain an essential part of our DNA and underpin the value proposition we offer our customers. We have conducted annual employee engagement surveys since 2015 and I am pleased that we have shown strong scores each time, having taken action to address any issues arising from the results of the prior year. One of the main findings from these employee surveys is that our employees are proud to be part of our Company, highlighting the significant engagement we have between the business and our people. The survey score is one of our non-financial key performance indicators.
READ ABOUT CULTURE ON PAGES 72 AND 73
SUSTAINABILITY We are committed to the long-term sustainable success of XP Power in all its aspects. We have helped lead the industry in developing “green” products which consume less energy while powering the application or in standby mode. These products reduce CO2 emissions year on year and are by far the biggest positive impact we can make on the environment.
Sustainability also resonates with our employees. We have adopted energy and water saving practices throughout the Group and have a network of passionate environmental representatives who promote best practices and raise awareness of sustainability issues across our global workforce.
READ ABOUT SUSTAINABILITY ON PAGES 48 AND 49
OUTLOOK We delivered a resilient performance in 2019 despite facing a number of challenges. While growth in our Healthcare, Industrial Electronics and Technology markets remained robust, this was offset by a cyclical slowdown in the Semiconductor Equipment Manufacturing market and pressure on gross margins, resulting from the increase in US trade tariffs on Chinese manufactured goods and changes in product mix. Despite these headwinds we grew order intake and revenues over prior years, continued to win new designs and made good strategic progress.
Trading conditions in the early months of 2020 give grounds for optimism. Signs of a recovery in the Semiconductor Equipment Manufacturing sector are reflected in our strong order intake in the fourth quarter of 2019 and are finding good opportunities for the products brought into the Group portfolio through the acquisitions of Comdel and Glassman. We also expect benefits from the transfer of production from Minden to Vietnam in the second half of 2020. However, we are affected by certain external events, such as the impact the outbreak of the COVID-19 virus had on our supply chain. This introduces some caution into our outlook, but we remain encouraged by our healthy order book.
JAMES PETERSChairman
XP Power Annual Report & Accounts for the year ended 31 December 2019 09
OVERVIEW

1010
CONTENTS
Strategic ReportOur Marketplace 12Our Marketplace: Our Growth Drivers 16Our Business Model 18Our Competitive Advantages 21Our Strategy 22Our Strategy in Action 24Our Key Performance Indicators 28Performance: Operational Review 30Performance: Our Supply Chain 36Performance: Financial Review 38Managing our Risks 42Our Commitments to Sustainability 48Our Commitments to the SDGs 50Our Core Values 52Our Core Values in Action 53Our People and their Health and Safety 54Our Customers 57Our Suppliers 58Our Shareholders 59Our Communities 60The Environment 61Sustainability: Non Financial Disclosures Summary 62

XP Power Annual Report & Accounts for the year ended 31 December 2019 11XP Power Annual Report & Accounts for the year ended 31 December 2019
STRATEGIC
REPORT
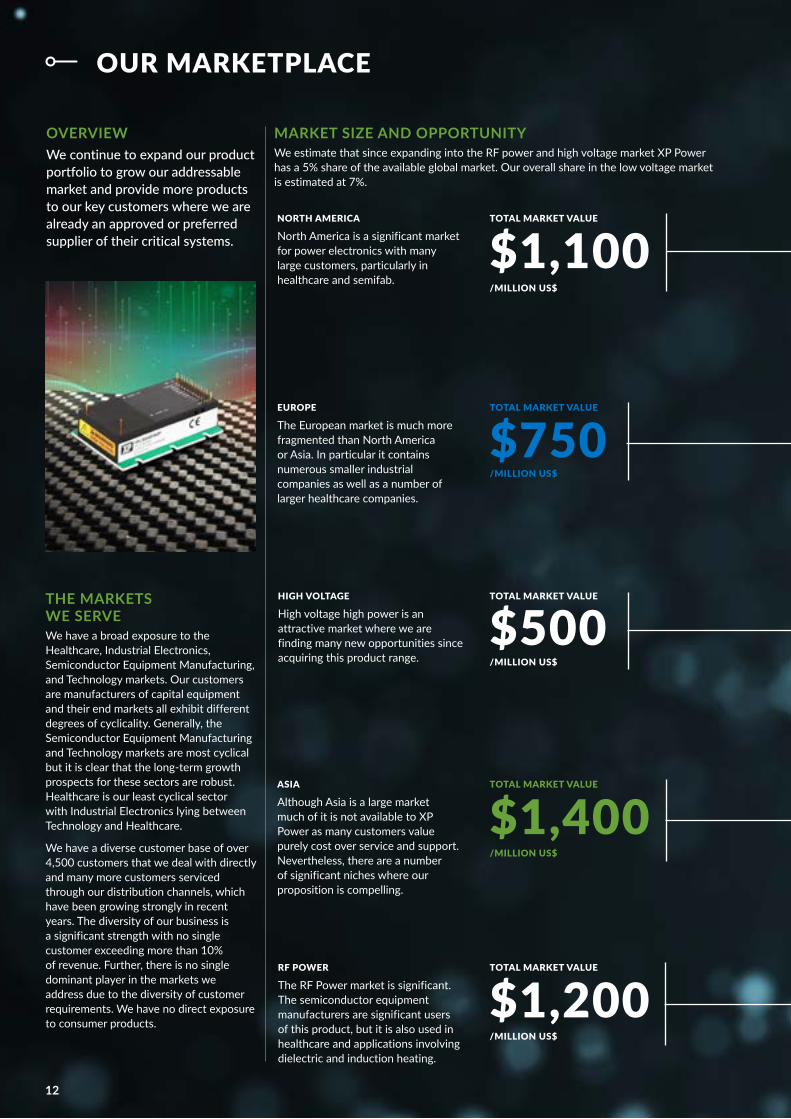
OVERVIEWWe continue to expand our product portfolio to grow our addressable market and provide more products to our key customers where we are already an approved or preferred supplier of their critical systems.
MARKET SIZE AND OPPORTUNITYWe estimate that since expanding into the RF power and high voltage market XP Power has a 5% share of the available global market. Our overall share in the low voltage market is estimated at 7%.
THE MARKETS WE SERVEWe have a broad exposure to the Healthcare, Industrial Electronics, Semiconductor Equipment Manufacturing, and Technology markets. Our customers are manufacturers of capital equipment and their end markets all exhibit different degrees of cyclicality. Generally, the Semiconductor Equipment Manufacturing and Technology markets are most cyclical but it is clear that the long-term growth prospects for these sectors are robust. Healthcare is our least cyclical sector with Industrial Electronics lying between Technology and Healthcare.
We have a diverse customer base of over 4,500 customers that we deal with directly and many more customers serviced through our distribution channels, which have been growing strongly in recent years. The diversity of our business is a significant strength with no single customer exceeding more than 10% of revenue. Further, there is no single dominant player in the markets we address due to the diversity of customer requirements. We have no direct exposure to consumer products.
NORTH AMERICA
North America is a significant market for power electronics with many large customers, particularly in healthcare and semifab.
$1,100/MILLION US$
TOTAL MARKET VALUE
ASIA
Although Asia is a large market much of it is not available to XP Power as many customers value purely cost over service and support. Nevertheless, there are a number of significant niches where our proposition is compelling.
$1,400/MILLION US$
TOTAL MARKET VALUE
RF POWER
The RF Power market is significant. The semiconductor equipment manufacturers are significant users of this product, but it is also used in healthcare and applications involving dielectric and induction heating.
$1,200/MILLION US$
TOTAL MARKET VALUE
EUROPE
The European market is much more fragmented than North America or Asia. In particular it contains numerous smaller industrial companies as well as a number of larger healthcare companies.
$750 /MILLION US$
TOTAL MARKET VALUE
HIGH VOLTAGE
High voltage high power is an attractive market where we are finding many new opportunities since acquiring this product range.
$500 /MILLION US$
TOTAL MARKET VALUE
12
OUR MARKETPLACE
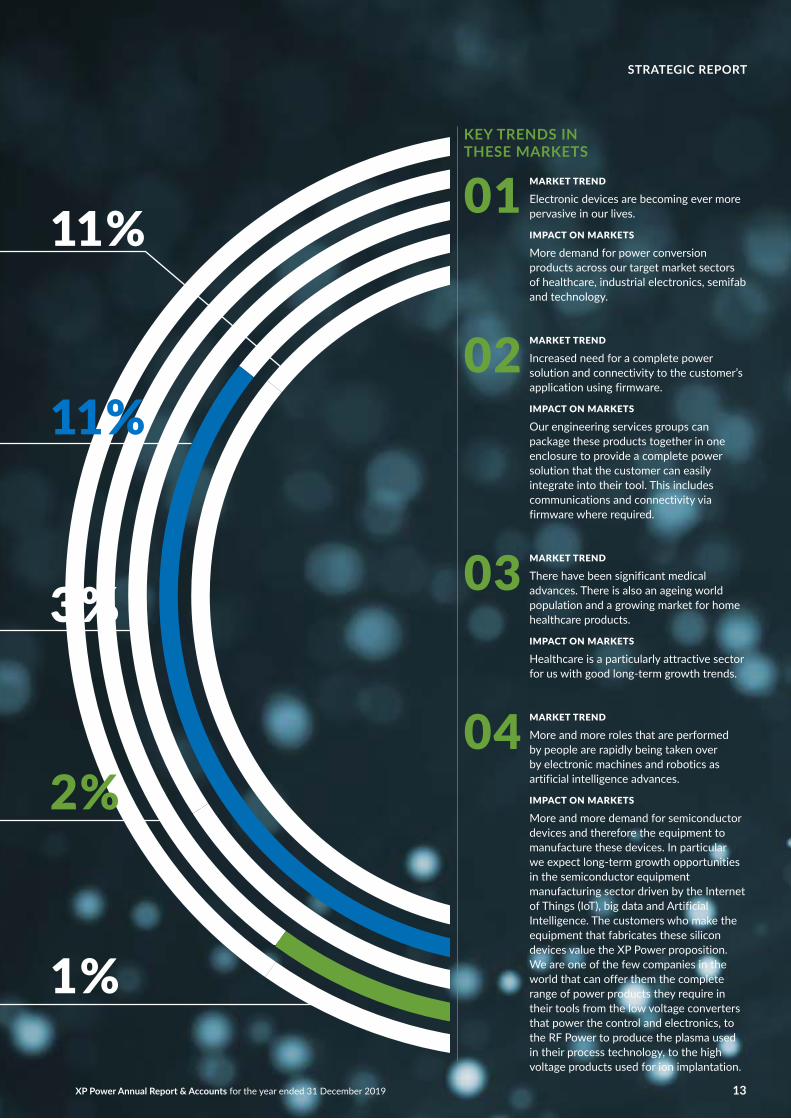
KEY TRENDS IN THESE MARKETS
MARKET TREND
Electronic devices are becoming ever more pervasive in our lives.
IMPACT ON MARKETS
More demand for power conversion products across our target market sectors of healthcare, industrial electronics, semifab and technology.
MARKET TREND
Increased need for a complete power solution and connectivity to the customer’s application using firmware.
IMPACT ON MARKETS
Our engineering services groups can package these products together in one enclosure to provide a complete power solution that the customer can easily integrate into their tool. This includes communications and connectivity via firmware where required.
MARKET TREND
There have been significant medical advances. There is also an ageing world population and a growing market for home healthcare products.
IMPACT ON MARKETS
Healthcare is a particularly attractive sector for us with good long-term growth trends.
MARKET TREND
More and more roles that are performed by people are rapidly being taken over by electronic machines and robotics as artificial intelligence advances.
IMPACT ON MARKETS
More and more demand for semiconductor devices and therefore the equipment to manufacture these devices. In particular we expect long-term growth opportunities in the semiconductor equipment manufacturing sector driven by the Internet of Things (IoT), big data and Artificial Intelligence. The customers who make the equipment that fabricates these silicon devices value the XP Power proposition. We are one of the few companies in the world that can offer them the complete range of power products they require in their tools from the low voltage converters that power the control and electronics, to the RF Power to produce the plasma used in their process technology, to the high voltage products used for ion implantation.
01
02
03
04
11%
3%
11%
2%
1%
13
STRATEGIC REPORT
XP Power Annual Report & Accounts for the year ended 31 December 2019

CAGR
11.9%
CAGR
39.1%
CAGR
12.8%
CAGR
17.2%
100908070605040302010
2019
78.12017
78.1
89.2
2018
70.22016
56.82015
100908070605040302010
37.4
29.7
47.4
14.8
10
2019
2017
2018
2016
2015
100908070605040302010
45.9
41.8
43.6
30.7
28.4
2019
2017
2018
2016
2015
100908070605040302010
27.4
17.2
20.4
14.0
14.5
2019
2017
2018
2016
2015
REVENUE TRENDS
The revenue trends for each sector are set out below:
INDUSTRIAL ELECTRONICS
£ millions
• 45% of revenue• Grew 7%
(constant currency YoY)• Most diverse sector with
high level of innovation
HEALTHCARE
£ millions
• 23% of revenue• Grew 6%
(constant currency YoY)• Building a leading position,
strong order performance• High efficiency products
well received due to high reliability
• Corporate approvals with all the major players
SEMICONDUCTOR EQUIPMENT MANUFACTURING
£ millions
• 19% of revenue• Contracted 21%
(constant currency YoY)• RF (Radio Frequency) power
and high voltage facilitate greater penetration
• Attractive long-term growth drivers
• Design win pipeline very strong
TECHNOLOGY
£ millions
• 13% of revenue• Grew 34%
(constant currency YoY)• Generally larger
programmes with short lifecycles so revenues fluctuate more than the other sectors
Revenue (£ million)
Revenue (£ million)
Revenue (£ million)
Revenue (£ million)
14
OUR MARKETPLACECONTINUED
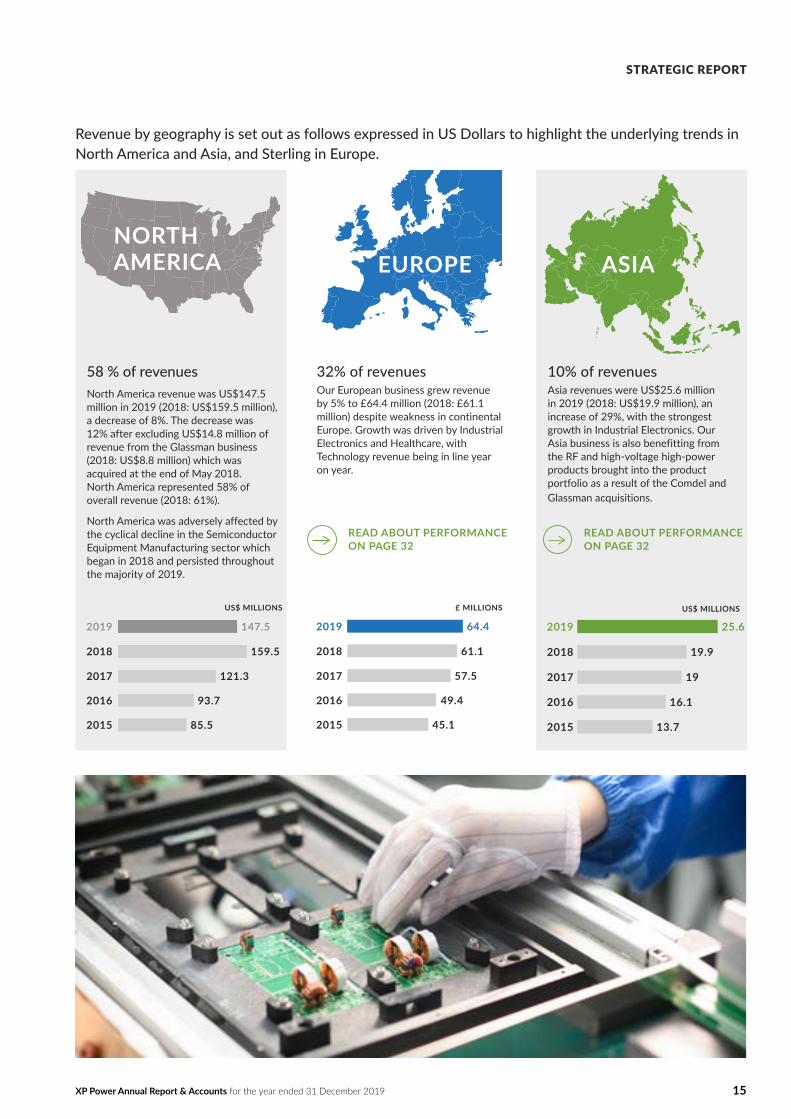
147.52019
121.32017
159.52018
93.72016
85.52015
64.42019
57.52017
61.12018
49.42016
45.12015
25.62019
192017
19.92018
16.12016
13.72015
32% of revenuesOur European business grew revenue by 5% to £64.4 million (2018: £61.1 million) despite weakness in continental Europe. Growth was driven by Industrial Electronics and Healthcare, with Technology revenue being in line year on year.
Revenue by geography is set out as follows expressed in US Dollars to highlight the underlying trends in North America and Asia, and Sterling in Europe.
10% of revenuesAsia revenues were US$25.6 million in 2019 (2018: US$19.9 million), an increase of 29%, with the strongest growth in Industrial Electronics. Our Asia business is also benefitting from the RF and high-voltage high-power products brought into the product portfolio as a result of the Comdel and Glassman acquisitions.
NORTH AMERICA EUROPE ASIA
READ ABOUT PERFORMANCE ON PAGE 32
READ ABOUT PERFORMANCE ON PAGE 32
£ MILLIONSUS$ MILLIONS US$ MILLIONS
58 % of revenuesNorth America revenue was US$147.5 million in 2019 (2018: US$159.5 million), a decrease of 8%. The decrease was 12% after excluding US$14.8 million of revenue from the Glassman business (2018: US$8.8 million) which was acquired at the end of May 2018. North America represented 58% of overall revenue (2018: 61%).
North America was adversely affected by the cyclical decline in the Semiconductor Equipment Manufacturing sector which began in 2018 and persisted throughout the majority of 2019.
STRATEGIC REPORT
15XP Power Annual Report & Accounts for the year ended 31 December 2019

READ ABOUT PERFORMANCE ON PAGES 30 AND 40
THE OPPORTUNITIES FOR XP POWER – EXPANDING OUR ADDRESSABLE MARKETThe acquisitions of Comdel in September 2017 and Glassman High Voltage in May 2018 respectively bring Radio Frequency (RF) Power and high power/high voltage products to the Group.
This expands our addressable market by an estimated US$1.7 billion. These new product ranges support can be sold to a number of our existing target customers in support of our strategy.
ENERGY EFFICIENCY AND RELIABILITYThe requirement from customers and legislation for products to consume and waste less energy is driving demand for more efficient power converters. This goes hand in hand with reliability for critical applications as ultra-high efficiency products do not require relatively unreliable fans to cool them, and cooler systems mean key components such as electrolytic capacitors have longer lifetimes.
HOW WE’RE RESPONDING We have developed a portfolio of “Green” XP Power products with class-leading efficiencies, which can operate without fan cooling.
HEALTHCAREA global population that is both increasing and ageing, coupled with advances in diagnostic technology and surgical robotics, is driving the demand for more healthcare devices. This makes Healthcare an excellent sector for XP Power. The customers in this area demand the ultimate quality and reliability, and appreciate and value XP Power’s value proposition.
HOW WE’RE RESPONDING We have the broadest, most up-to-date range of medically approved power converters in our industry.
INNOVATIONOur customers possess a competitive need to launch new products offering increased productivity and functionality while reducing harmful environmental impacts. In addition, our customers are trying to differentiate their products from their competitors, which frequently results in different or new power conversion requirements.
HOW WE’RE RESPONDING With the acquisitions in RF Power in 2017, and high voltage power in 2018, we now have six design centres around the globe offering a diverse range of products.
PROLIFERATION OF ELECTRONIC DEVICESElectronic devices are becoming more and more pervasive in our lives as new technologies and innovation emerges. This trend is accelerating with the adoption of the Internet of Things (IoT), Artificial Intelligence (AI) and big data. These devices drive demand for semiconductor manufacturing equipment, which is a key focus area for XP Power.
HOW WE’RE RESPONDING We have the broadest range of standard products in our industry which are designed to be easy to modify to power the customers’ specific application. Many of our products are suitable to power semiconductor manufacturing equipment and these customers value our engineering services proposition.
LEGISLATIONOur industry continues to be the subject of an increasing raft of legislation from numerous countries and standard setters relating to areas such as environmental impacts, safety requirements and above all, energy efficiency. The compliance costs of keeping up with this legislation for a company the size of XP Power, where we are large enough to be able to devote resources to this, yet agile enough to respond quickly with new products or documentation as required.
HOW WE’RE RESPONDING We have dedicated resources devoted to power converter legislation, which our customers value.
OUR MARKETPLACE: OUR GROWTH DRIVERS
16

PENETRATIONOur blue-chip customer base provides good opportunities to win additional new product programmes from multiple engineering teams across the globe. We have gained corporate approval at many blue-chip companies over the past few years. We are now capitalising on these approvals to win a larger share of the business that is available.
HOW WE’RE RESPONDING RF Power from the acquisition of Comdel, and high voltage from the acquisition of Glassman, increase our available market from US$3.1 billion to $4.8 billion.
CAPITAL EQUIPMENTOur products are designed into and power capital equipment and as such are subject to the capital equipment cycles. We have found growth niches in new industrial technologies such as 3D printing, analytical instruments, smart grid and robotics. New capital investment generally leads to greater productivity. We consider that the medium and long-term opportunities remain positive for capital equipment. This is particularly the case in emerging markets as we see labour costs rising significantly.
HOW WE’RE RESPONDING We have the largest direct sales force in our industry together with the broadest product portfolio so we are well positioned to take advantage of any recovery in the capital equipment markets. We have also targeted newer and faster growth industrial sectors such as 3D printing, analytical instruments, robotics and smart grid infrastructure.
EXPANSION OF “GREEN” PRODUCTSClimate change and emission of greenhouse gases is becoming an increasingly significant issue as emerging countries develop and urbanise. XP Power has taken a leading role in developing ultra-efficient products, which consume and waste less energy and that are suitable for use in healthcare and industrial applications.
HOW WE’RE RESPONDING We have developed a portfolio of “Green” XP Power products with class- leading efficiencies and have the most environmentally friendly manufacturing facility in our industry.
CONNECTIVITY AND INDUSTRY 4.0Customers’ applications are becoming ever more complicated and increasingly more connected enabling Industry 4.0.
HOW WE’RE RESPONDING Our engineering services groups are providing complete power solutions including connectivity to and from the customers’ application using firmware and, where required, to the internet.
XP Power Annual Report & Accounts for the year ended 31 December 2019
STRATEGIC REPORT
17

Strong Leadership A strong Executive team with a clear strategic vision.
Strong Relationshipswith our suppliers, employees and shareholders.
PeopleAn experienced and committed workforce.
Technology We are investing in our future through our investment in infrastructure and technology.
DesignWe have transitioned our business from a specialist distributor, to designer, to design manufacturer. This has enabled us to ascend the value chain to grow our revenues and margins. Through acquisition we have moved further up the power and voltage scale so we can fulfil more of the opportunities presented to us by our target customers. We have design engineering teams on three continents – this allows us to release a high number of innovative new products required by this highly diversified market. These products often have class-leading energy efficiency and small footprints to meet the ever-higher demands of our key customers. Additional engineering service teams in Germany, North America, Singapore and the UK are able to provide value-added services close to our key customers. We are able to provide modified product solutions which allow the customer to more easily integrate the power converter into their equipment, therefore delivering a cost saving.
ProductsWe have the broadest, most up-to-date product offering in the industry with over 250 product families in our portfolio. Our products are specific to the requirements of the various industries and applications we target. Our philosophy is to provide highly flexible products that are easy to modify.
This saves our customers the cost, time and risk of pursuing a fully customised solution. Our product portfolio has been enhanced with high voltage modules following the acquisition of EMCO in November 2015, RF power from Comdel in September 2017 and high voltage/ high power products from Glassman in May 2018.
ManufacturingWe manufacture our own products and this provides us with the ability to ensure excellent quality, and an agile supply chain to meet customers’ lead time expectations.
Building And Managing Relationships With Customers Our customers are at the heart of what we do. Our model is to sell directly to our key customers where we can add genuine value, offering excellent service and support combined with class-leading products.
We have carved out a leading position in our industry. An up-to-date, high efficiency product offering, delivered to our customers by the largest and most technically competent sales engineering team in the industry, backed up by highly skilled power systems engineers, combined with the safety and reliability benefits of world-class manufacturing, provide a compelling value proposition to our customers.
Supply Chain ManagementThe management of our supply chain is critical to our success. Quality and reliability are paramount to our customers who often provide critical healthcare or industrial systems. For that reason, we need excellent suppliers with high-quality standards.
We have a rigorous approval process which looks at all aspects of a supplier before we engage with them. This not only includes a prospective suppliers’ quality systems and standards, but also their financial viability and, of course, their environmental performance and treatment of their people.
We are a full member of the Responsible Business Alliance (RBA) and have adopted the RBA Code of Conduct throughout our organisation. This not only deals with environmental standards but also treatment of people, health and safety and business ethics.
Our customers demand excellent quality and security of supply and strong corporate social responsibility standards.
QualityOur stringent quality standards ensure the ultimate in quality and reliability. This is vital to our customers. This starts from the design phase right through to production and after sales support.
KEY ACTIVITIESKEY RESOURCES
Our business model has evolved from that of a specialist distributor, to designer, to design manufacturer.
READ ABOUT PERFORMANCE ON PAGES 30 AND 40
READ ABOUT OUR SUSTAINABILITY ON PAGES 48 AND 49
18
OUR BUSINESS MODEL

03
SALES CYCLE
Our sales process is generally a technical sale, between XP Power sales engineers and customer design engineers. Our customers are typically experts in their field, whether it is robotic surgery, a state of the art semiconductor manufacturing tool or a high-end communications device operating in a harsh environment. They
will approach a company such as ours to recommend and assist them to design a power converter into their end system to allow it to function.
Generally, with larger customers it is not possible to engage on a specific opportunity until we are on an approved or preferred vendor list. This will involve qualification by the customer’s technical, quality and purchasing teams and may often involve a physical audit of our quality systems and a factory audit.
The power converter is approved for use in the customer system
following the customer’s technical evaluation and external safety
agency approval. This is generally the longest part of the sales cycle as the technical and safety
evaluation are very time consuming for the customer. XP Power will often add value by providing technical
assistance during this stage and it is not unusual for us to have a technical power systems engineer working directly
with the customer.
XP Power Annual Report & Accounts for the year ended 31 December 2019 19XP Power Annual Report & Accounts for the year ended 31 December 2019
A new design programme is identified at a customer where we are an approved or preferred
vendor. This is typically quite late in the customer’s development cycle as they will not usually know the total power requirement of their system until
they have a working prototype.
An XP Power sales person will work with the customer to understand the requirements
including the power requirements at different voltages, communication
required between the power converter and end system, any specific safety agency requirements and the physical dimensions. XP Power will then
advocate a solution and provide a quotation to the customer. This solution could be a modification of one of our standard products.
The customer commences production of their product and XP Power’s
revenue stream starts. This is typically around
seven years depending on the application and
end market.
One or more samples are provided to the customer for them to evaluate in their system. This is a critical stage of
the sale and we often find that the first company providing a sample that works
in the equipment will win the design slot. Speed is therefore critical. Our power systems engineers will often work closely with the customer at this stage to assist them with any issues they might experience such as dealing with electrical noise.
IDENTIFICATION
QUOTATION
APPROVAL
PRODUCTION
SAMPLE
01
0205
04
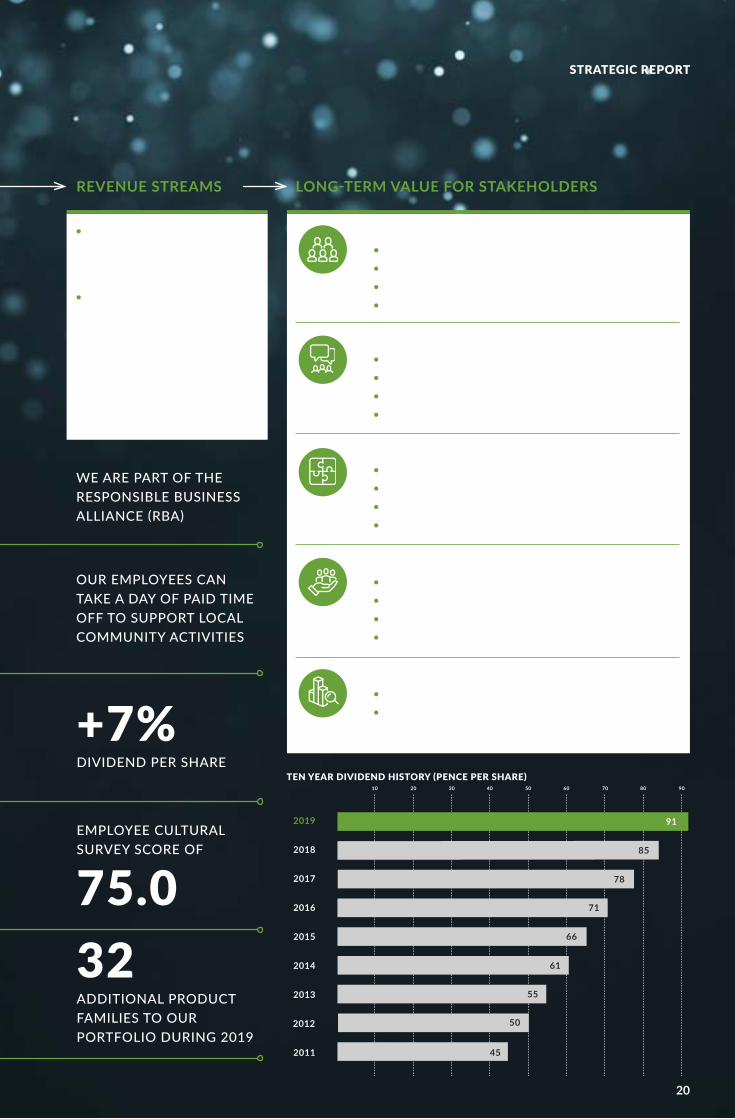
2019
2018
2017
2016
2015
2014
2013
2012
2011
55
50
45
91
71
85
66
61
78
908070605040302010
• We gain substantial revenue annuity over the life cycle of a product. The design in cycle is typically 18 to 24 months.
• Revenue from our own designs were flat compared with 2018. Our own design product created £155.8m of revenue. Labelled product accounted for £39.4m of revenue and third party was £4.7m.
LONG-TERM VALUE FOR STAKEHOLDERS
TEN YEAR DIVIDEND HISTORY (PENCE PER SHARE)
REVENUE STREAMS
EMPLOYEE CULTURAL SURVEY SCORE OF
75.0
WE ARE PART OF THE RESPONSIBLE BUSINESS ALLIANCE (RBA)
+7%DIVIDEND PER SHARE
32ADDITIONAL PRODUCT FAMILIES TO OUR PORTFOLIO DURING 2019
OUR EMPLOYEES CAN TAKE A DAY OF PAID TIME OFF TO SUPPORT LOCAL COMMUNITY ACTIVITIES
STRATEGIC REPORT
20
• Progressive dividend policy as shown below• Investing in a growing business with attractive margins and
market opportunities
• Community initiatives• Raising money for charities and volunteer work• A focus on reducing harmful emissions• Environmentally friendly design concepts moving forward
• Fair negotiation• Visibility on revenues• Dealing with a member of the responsible business alliance• Supply chain ethics and due diligence
• Quality and value• Innovation and expansion to further enhance value• High efficiency product offering• Excellent service and support
• A diverse workforce• A safe and healthy working environment• Talent management• Engagement
Our people
Our customers
Our suppliers
Our communities and the environment
Our shareholders

1
4
2
5
3
6
OUR PEOPLEAs in any business the most important asset is our people. We have a large and highly technically trained sales force.
Our customers deal directly with a sales engineer that can solve their power conversion problems. We do not put our key customers through distribution channels. We also provide global support.
Our Executive Leadership Team, located on three different continents, is not only talented, but given a relatively young average age, has an impressive average length of service. The breadth and depth of experience and collective teamwork of our people deliver genuine value to our customers.
OUR GREEN INNOVATIONEnvironmental considerations are becoming increasingly important to our customers. There is strong demand for products that consume less material, including harmful chemicals, and power converters that consume less energy.
Our product portfolio reflects this with many products having class-leading efficiencies and low stand-by power consumption.
OUR PRODUCTSWe have the broadest, most up-to-date product offering in the industry with over 250 product families in our portfolio. Our products are specific to the requirements of the various industries and applications we target. Our philosophy is to provide highly flexible products which are easy to modify. This saves our customers the cost, time and risk of pursuing a fully customised solution. Our product portfolio has been enhanced through acquisitions in RF (Radio Frequency) power and high voltage.
OUR MANUFACTURINGOur Asian manufacturing bases in China and Vietnam are not only low cost but best-in-class. This capability is instrumental to winning new programmes with larger blue-chip customers that require the ultimate in quality and reliability. We also offer highly competitive lead times and flexible logistics arrangements.
OUR QUALITYOur stringent quality standards ensure the ultimate in quality and reliability.
This is vital to our customers. This starts from the design phase right through to production and after sales support.
OUR DESIGN ENGINEERINGWe have design engineering teams on three continents – this allows us to release a high number of innovative new products required by this highly diversified market. These products often have class-leading energy efficiency and small footprints to meet the ever-higher demands of our key customers. Additional engineering service teams in Germany, North America, Singapore and the UK are able to provide value added services close to our key customers.
We are able to provide modified product solutions which allow the customer to more easily integrate the power converter into their equipment, therefore delivering a cost saving.
THESE ENABLE US TO DIFFERENTIATE OURSELVES
XP Power Annual Report & Accounts for the year ended 31 December 2019 21XP Power Annual Report & Accounts for the year ended 31 December 2019 21
OUR COMPETITIVE ADVANTAGES

Our vision is to be the first choice power solutions provider delivering the ultimate experience for our people and our customers.
Develop a market leading range of competitive products
Target accounts where we can add value
Vertical penetration of focus accounts
Build a global supply chain which balances high efficiency with market leading customer responsiveness
Lead our industry on environmental matters
Make selective acquisitions of complementary businesses to expand our offering
RATIONALE We need a market-leading range of products to be attractive to our customers. The product range also needs to be broad due to the fragmented nature of the markets we serve which have a multitude of product requirements.
The broader and more up-to-date our product range, the more chance we will have something that will work effectively in our target customers’ applications.
We pride ourselves in the level of service and support we offer to our customers, particularly during the design-in stage.
We have a compelling proposition where customers expect excellent quality and reliability to power their mission-critical equipment, but in particular where they face a power problem due to either heat dissipation or electrical noise. These are the type of customers that we target.
We still have a relatively small share of the available business in some of the accounts we call on. We are continuing to expand our product portfolio so we can address more of the opportunities that are available in these accounts to grow our revenues.
Since listing in 2000 we have built a strong brand in the power converter market. This, together with our product portfolio and excellent customer service, has allowed us to consistently take market share and grow significantly. As the Company grows we need to upgrade our systems and processes and, in particular, our supply chain processes in order to scale and run a much larger business as we continue to grow.
Strong corporate social responsibility is not only important to our key customers but also to our employees and the communities in which we operate. This incorporates not only environmental performance but also health and safety, treatment of our people and business ethics.
Our strong balance sheet and cash generative business model allow us the capacity to pursue business acquisitions. This is another avenue to expand our product offering and addressable market.
TARGET/GOAL To release sufficient products to achieve a best year revenue in excess of US$30 million.
Organic revenue growth in excess of 10%.
Organic revenue growth in excess of 10%.
Consistent improvement in lead time and on time delivery.
Consistent reduction in our CO2 intensity. Bolt-on acquisitions driving inorganic revenue growth in excess of 5%.
PAST PERFORMANCE Over the past few years we have been expanding our product portfolio and have developed a number of highly efficient, leading-edge products.
We have targeted customers for which reliability is key or where their equipment may be located in harsh environments. These customers value the support and service that our highly trained sales force and power systems engineers deliver.
We have spent the last few years gaining approved or preferred supplier status at the key customers in the Industrial Electronics, Healthcare, Semiconductor Equipment Manufacturing, and Technology sectors. We are focused on this existing customer base in order to grow our revenues.
We have evolved from a distributor to a manufacturer, now having manufacturing facilities in China, Vietnam and North America. We have recruited supply chain talent to achieve this transformation.
We are a full member of the Responsible Business Alliance (RBA). The RBA Code of Conduct to which we comply addresses all of these important ethical and environmental matters, which we strongly endorse.
Through our recent acquisitions we have added both RF power and high power/high voltage to our product range.
PLANNED FUTURE ACTIONS
Emphasis has now shifted towards products which still have leading efficiencies but which are more mainstream and attractive from a cost perspective.
We are prioritising our resource on the customers that fit our value proposition. We are de-emphasising customers that may have significant revenue potential but where cost is a more critical factor than quality and reliability or engineering support during the design phase.
As we expand our product offering through continued product development and acquisitions, we aim to address an increasing proportion of our customers’ requirements with our excellent service and support.
As the business continues to grow and become more complex we will continue to add talent to our supply chain operations in 2020.
In 2019 we have also upgraded our ERP system in our sales companies in Asia, Europe and North America.
We will remain a committed member of the RBA.
We strive to lead our industry on environmental matters and have a committee dedicated to raising awareness of “Green” initiatives, however small.
We continue to look for acquisitions to expand our product offering and other capabilities.
LINK TO KPIS • New product families released
• Proportion of own-designed revenue
• Revenue • Revenue from top 30 customers
• Adjusted earnings per share • Lifetime CO2 emissions savings from “Green” products
• New product families released
LINK TO RISKS • Competition from new market entrants and new technologies
• Loss of key personnel or failure to attract new personnel
• Dependence on key customers
• Product recall/quality management
• Dependence on key customers
• Product recall/quality management
• Loss of key personnel or failure to attract new personnel
• Cybersecurity/information systems failure
• Risks relating to regulation, compliance and taxation
• Loss of key personnel or failure to attract new personnel
• Strategic risk association with valuing or integrating new acquisitions
OUR STRATEGY
22

Develop a market leading range of competitive products
Target accounts where we can add value
Vertical penetration of focus accounts
Build a global supply chain which balances high efficiency with market leading customer responsiveness
Lead our industry on environmental matters
Make selective acquisitions of complementary businesses to expand our offering
RATIONALE We need a market-leading range of products to be attractive to our customers. The product range also needs to be broad due to the fragmented nature of the markets we serve which have a multitude of product requirements.
The broader and more up-to-date our product range, the more chance we will have something that will work effectively in our target customers’ applications.
We pride ourselves in the level of service and support we offer to our customers, particularly during the design-in stage.
We have a compelling proposition where customers expect excellent quality and reliability to power their mission-critical equipment, but in particular where they face a power problem due to either heat dissipation or electrical noise. These are the type of customers that we target.
We still have a relatively small share of the available business in some of the accounts we call on. We are continuing to expand our product portfolio so we can address more of the opportunities that are available in these accounts to grow our revenues.
Since listing in 2000 we have built a strong brand in the power converter market. This, together with our product portfolio and excellent customer service, has allowed us to consistently take market share and grow significantly. As the Company grows we need to upgrade our systems and processes and, in particular, our supply chain processes in order to scale and run a much larger business as we continue to grow.
Strong corporate social responsibility is not only important to our key customers but also to our employees and the communities in which we operate. This incorporates not only environmental performance but also health and safety, treatment of our people and business ethics.
Our strong balance sheet and cash generative business model allow us the capacity to pursue business acquisitions. This is another avenue to expand our product offering and addressable market.
TARGET/GOAL To release sufficient products to achieve a best year revenue in excess of US$30 million.
Organic revenue growth in excess of 10%.
Organic revenue growth in excess of 10%.
Consistent improvement in lead time and on time delivery.
Consistent reduction in our CO2 intensity. Bolt-on acquisitions driving inorganic revenue growth in excess of 5%.
PAST PERFORMANCE Over the past few years we have been expanding our product portfolio and have developed a number of highly efficient, leading-edge products.
We have targeted customers for which reliability is key or where their equipment may be located in harsh environments. These customers value the support and service that our highly trained sales force and power systems engineers deliver.
We have spent the last few years gaining approved or preferred supplier status at the key customers in the Industrial Electronics, Healthcare, Semiconductor Equipment Manufacturing, and Technology sectors. We are focused on this existing customer base in order to grow our revenues.
We have evolved from a distributor to a manufacturer, now having manufacturing facilities in China, Vietnam and North America. We have recruited supply chain talent to achieve this transformation.
We are a full member of the Responsible Business Alliance (RBA). The RBA Code of Conduct to which we comply addresses all of these important ethical and environmental matters, which we strongly endorse.
Through our recent acquisitions we have added both RF power and high power/high voltage to our product range.
PLANNED FUTURE ACTIONS
Emphasis has now shifted towards products which still have leading efficiencies but which are more mainstream and attractive from a cost perspective.
We are prioritising our resource on the customers that fit our value proposition. We are de-emphasising customers that may have significant revenue potential but where cost is a more critical factor than quality and reliability or engineering support during the design phase.
As we expand our product offering through continued product development and acquisitions, we aim to address an increasing proportion of our customers’ requirements with our excellent service and support.
As the business continues to grow and become more complex we will continue to add talent to our supply chain operations in 2020.
In 2019 we have also upgraded our ERP system in our sales companies in Asia, Europe and North America.
We will remain a committed member of the RBA.
We strive to lead our industry on environmental matters and have a committee dedicated to raising awareness of “Green” initiatives, however small.
We continue to look for acquisitions to expand our product offering and other capabilities.
LINK TO KPIS • New product families released
• Proportion of own-designed revenue
• Revenue • Revenue from top 30 customers
• Adjusted earnings per share • Lifetime CO2 emissions savings from “Green” products
• New product families released
LINK TO RISKS • Competition from new market entrants and new technologies
• Loss of key personnel or failure to attract new personnel
• Dependence on key customers
• Product recall/quality management
• Dependence on key customers
• Product recall/quality management
• Loss of key personnel or failure to attract new personnel
• Cybersecurity/information systems failure
• Risks relating to regulation, compliance and taxation
• Loss of key personnel or failure to attract new personnel
• Strategic risk association with valuing or integrating new acquisitions
XP Power has followed a clear and consistent dual track strategy of moving up the value chain through its internally developed products and adding complementary products through acquisitions to target key accounts where we can add genuine value.
STRATEGIC REPORT
23XP Power Annual Report & Accounts for the year ended 31 December 2019

Our product portfolio presents significant growth opportunities.
READ ABOUT STRATEGY ON PAGES 22 AND 23
5V 24V 60V 400V 800V 6KV 10KV 30KV 60KV 100KV+1W
10W
30W
75W
140W
500W
1.5KW
3KW
5KW
10KW
50KW
100KW+
RF PowerMarket size – $1.2BnXP Power – $16m
Low VoltageMarket size – $2.7BnXP Power – $210m
High Power/High VoltageMarket size – $0.5BnXP Power – $15m
Low Power/High VoltageMarket size – $250mXP Power – $15m
• Acquisitions in high voltage (EMCO and Glassman) and RF power (Comdel) expand our addressable market from $2.7 billion to $4.7 billion
• One of few companies in the world who can provide solutions right across the power and voltage spectrum
• Can use our engineering services capabilities to combine different products to give the customer a complete power solution
• Presents significant long-term growth opportunity
READ ABOUT SUSTAINABILITY ON PAGES 48 AND 49
LINK TO VALUES AND CULTURE• We aim to constantly improve our
knowledge and therefore a wider product portfolio supports this
• Our product ideas derive from our customer focus
• We are flexible regarding our product offering so we can modify our products to solve our customers’ power problems
• We ensure all opportunities for growth are qualified with integrity
LINK TO STRATEGY• Our acquisitions provide us with the
opportunity to release further new product families
• As we can create a larger product offering we can add value in accounts where we already have strong relationships
• Expanding our product offering so that we can capture opportunities in target accounts
• We can focus on “Green” products in the low voltage market to lead on environmental matters
OUR PORTFOLIO:
LINK TO SUSTAINABILITY AND THE SDGS• As we develop our product portfolio
and offering we are able to offer an increased range of “Green” products which consume and waste less energy so have lower carbon emissions. This improves the wellbeing of society, and in turn impacts climate action
• As we grow we are increasingly able to further economic growth and development in the locations that we operate in
24
OUR STRATEGY IN ACTION: PRODUCT PORTFOLIO

XP Power Annual Report & Accounts for the year ended 31 December 2019
LINK TO VALUES AND CULTURE• We aim to constantly improve
our knowledge and therefore investment in the business supports this
• This demonstrates our focus on being flexible. Vietnam provides us with enhanced business continuity options
• Throughout this process we have acted with speed and agility
• We ensure all opportunities for growth are qualified with integrity
• Our customer focus is evident from the decision to move products to Vietnam to allow them to mitigate the effects of tariffs
LINK TO SUSTAINABILITY AND THE SDGS• We are focused on supporting
decent work and economic growth. Therefore we follow our Responsible Business Alliance (RBA) commitment in Vietnam
• We ensure we act with integrity in Vietnam and encourage responsible consumption and production. Our Vietnam facility has excellent environmental credentials
LINK TO STRATEGY• This provides us with the
opportunity to invest back into the business, which will support new product families being released, and improve design for manufacture
• This supports our focus on building a global supply chain. It will provide us with increased efficiency and flexibility
• Investment back into the business will support our vision of being the first choice power solutions provider delivering the ultimate experience to our customers and our people
We are creating more flexibility within our supply chain. There has been a 75% increase in manufacturing capacity as the construction of Vietnam II is now complete. Over 2,000 products are now approved for production in Vietnam enabling our customers to mitigate the economic impact of Section 301 Tariffs in the USA. In addition, the manufacture of our low power/high voltage DC modules is transferring from Minden, Nevada, to Vietnam to reduce our manufacturing costs.
OUR RATIONALEOur rationale for increasing supply chain flexibility in Vietnam:
• Cost advantage over China and USA
• Helps mitigate Section 301 Tariffs and provides a competitive advantage over competitors with Chinese-based manufacturing
• Expect annualised cost savings of approximately £4 million with the shift from Nevada to Vietnam
• This enables us to invest back £1-2 million of the savings into the business to expand and strengthen our new product introduction team
READ ABOUT SUSTAINABILITY ON PAGES 48 AND 49
Over 2,000 products are now approved for production in Vietnam
25XP Power Annual Report & Accounts for the year ended 31 December 2019
OUR STRATEGY IN ACTION: VIETNAM
STRATEGIC REPORT

26
XP Power partnered with a leader in inventory management robotics with self-learning Artificial Intelligence to scan supermarket shelves and report inventory status and re-order items as needed. These intelligent robots help the world’s largest retailers to predict demand and manage their inventories with confidence. This allows employees to be freed from mundane tasks to interact with customers or focus on other initiatives as retailers push to meet customers’ demands to order online.
The robots have sensors and cameras that scan the shelves and communicate to the inventory control system how much is currently in stock. Employees then re-stock items as needed.
THE APPLICATIONThis application required a smart power conversion system for the robot docking station to charge the robot’s batteries. The robot is designed to be used in both warehouses and stores.
POWER REQUIREMENTThe customer required a high output power at a relatively uncommon voltage but also required power delivery at low line output enabling the robot to be used in many places in the world. Significantly they also wanted digital control of the power solution and custom firmware to allow them to:
• Monitor and control the docking station from a remote user location
• Control the sequence and timing of the battery charges to optimise the facility’s power consumption meaning greener power consumption and lower energy costs
• Report fault conditions transmitted via serial interface while also giving LED visual indicators on the docking station itself
WHY WE WON• The customer’s requirements could
not be implemented with a standard off the shelf solution due to the communication required between the power solution and the customer’s application
• Our engineering services team got to work and rapidly designed a complete power solution for the customer using a modified standard building block. XP Power was not only able to provide the power conversion hardware but could also provide the firmware control solution allowing communication between the power supply and customer’s application. This was not an offering the competition could provide
• Our solution also had superior conducted and radiated emissions and therefore presented less electrical noise issues that the customer had to contend with. This allowed the customer’s engineering team to focus on the robot solution and not worry about the complexity of the power solution and associated firmware
OUR STRATEGY IN ACTION: SOLVING OUR CUSTOMERS’ POWER PROBLEMS

27XP Power Annual Report & Accounts for the year ended 31 December 2019
We provided power expertise to deliver genuine value and contribute to our customer’s success
READ ABOUT STRATEGY ON PAGES 22 AND 23
READ ABOUT SUSTAINABILITY ON PAGES 48 AND 49
LINK TO VALUES AND CULTURE• Speed – we were fast to solve the
customer’s power problems and get them to market quickly
• Knowledge – we had the capability to provide the complete power solution including custom firmware
• Flexibility – our solution was tailored to the customer’s needs meeting their unique requirements
• Customer focus – the customer’s needs remain at the centre of everything we do
LINK TO STRATEGY• Targeting customers where we can
add genuine value
• Our broad up-to-date product offering meant we had a suitable product we could adapt for the complex solution
LINK TO SUSTAINABILITY AND THE SDGS• Industrial Electronics innovation
and infrastructure
• Decent work and economic growth
COMMERCIALThe customer ended up with a base solution that met all their unique requirments, received higher value in getting to market faster and did not have to commit their own precious engineering resource into developing firmware. This is a classic example of XP Power providing power expertise to deliver genuine value and help our customer be successful.
STRATEGIC REPORT

We have defined a number of Key Performance Indicators (KPIs), both financial and non-financial, which are closely aligned with our strategy and core values. Our performance over the years demonstrates significant and consistent progress.
Revenue growthRevenue from top 30 customers (%) Free cash flow
Adjusted diluted Earnings per share (“EPS”) growth (%) New product families released
Cultural survey score (index out of 100)
Lifetime CO2 emission savings from “green” products (tonnes)
DEFINITION We target revenue growth of 10% per annum. Whether we achieve this or not can depend on market cyclicality and exchange rates.
We expect revenue from our top 30 customers to increase as we pursue our strategy.
We target free cash flow growth of 10% per annum.
We target to grow this metric by a double digit percentage each year.
Not all products are equal in terms of their complexity to develop or their revenue potential. In assessing new product opportunities, we consider the potential revenue from a new product family as well as the absolute number of new product introductions. We target 30 new releases per annum.
We target to improve this score and be at least above the benchmark for similar sized international companies. In 2020 we changed providers to Work Buzz to use a more modern survey with enhanced online reporting tools and a different question set.
We have set a target to increase the lifetime CO2 emissions savings from “Green” XP Power products by at least 5% per annum.
WHY DO WE MEASURE THIS?
Provides an indicator of business growth between reporting periods.
Used to assess how effectively we are targeting top customers.
Provides an indicator of value created for shareholders.
Used to assess the adjusted earnings performance of the Group
Used to assess the expansion of the Group’s product portfolio.
Used to assess the Group’s performance against its People objectives.
Used to assess the Group’s performance against its environmental objectives
TARGET ACHIEVED (AND COMMENTARY)
• No • Yes Yes • No • Yes • Yes • No
OUR PROGRESS IN 2019
• Leveraged off the new products gained through acquisition, expanding sales in other regions
• Expanded our distribution channels
• This metric decreased due to the cyclical downturn in the semiconductor equipment manufacturing industry
• Excluding the cyclical impact noted above we continue to grow share of our large customers
• Improved our working capital management, specifically related to inventory
• Improved cash flow forecasting to make better use of available cash, either through debt repayment or short term deposits
• Earnings negatively impacted by US/China tariffs
• We released 32 new product families in 2019 (2018: 27)
• 25 (2018: 20) of these new product families can be classified as “Green” XP Power products
• We continue to undertake an annual employee engagement survey to identify areas our people tell us where we can improve to deliver the ultimate employee experience
• In 2019 we changed providers to Work Buzz to use a more modern survey with enhanced online reporting tools and a different question set.
• Of the 32 new product families launched in 2018, 25 were “Green”
• Our revenues from “Green” XP Power products increased by 3% to £43.2 million in 2019
• CO2 emission savings declined in 2019 due to product mix
OUR PLANS FOR 2020
• Continue to utilise our broad product offering through all sales regions
• Provide increasing support to our customers through our engineering solutions group
• Continue to grow our share of customers’ business where we are preferred or approved suppliers
• Expansion of our product portfolio to increase our addressable market in our existing customer base
• Continue to seek opportunities to maximise working capital
• Leverage strong order intake end to 2019 to grow EPS
• We will no longer report this metric as a KPI
• While employee engagement is pleasing the results of the survey indicate that we need to work to improve recognition programmes
• We will continue to release products with class-leading efficiency
LINK TO STRATEGY • Target accounts where we can add value
• Vertical penetration of focus accounts
• Build a global supply chain which balances high efficiency with market leading customer responsiveness
• Achieve operational excellence • Develop a broad range of competitive products
• Achieve operational excellence • Leading our industry on environmental matters
LINK TO CORE VALUES
LINK TO RISK
LINK TO REMUNERATION
Revenue growth drives the annual growth of our adjusted profit before tax which is a target in our Group bonus plan
Placing emphasis on revenue from our top 30 customers aligns with our strategy and long term earnings growth, a key measure in our share incentive schemes
Free cash flow is a metric in our Group bonus plan
• EPS is a performance condition in our share incentive scheme
FINANCIAL
199.92019
166.82017
195.12018
129.82016
109.72015
2019
2017
2018
2016
2015
49
50
52
44
44
2019
2017
2018
2016
2015
26.2
19.7
10.9
21.0
7.4
28
OUR KEY PERFORMANCE INDICATORS
1 2 3 4 5 1 2 3 4 56 7 8 9 10 11

Revenue growthRevenue from top 30 customers (%) Free cash flow
Adjusted diluted Earnings per share (“EPS”) growth (%) New product families released
Cultural survey score (index out of 100)
Lifetime CO2 emission savings from “green” products (tonnes)
DEFINITION We target revenue growth of 10% per annum. Whether we achieve this or not can depend on market cyclicality and exchange rates.
We expect revenue from our top 30 customers to increase as we pursue our strategy.
We target free cash flow growth of 10% per annum.
We target to grow this metric by a double digit percentage each year.
Not all products are equal in terms of their complexity to develop or their revenue potential. In assessing new product opportunities, we consider the potential revenue from a new product family as well as the absolute number of new product introductions. We target 30 new releases per annum.
We target to improve this score and be at least above the benchmark for similar sized international companies. In 2020 we changed providers to Work Buzz to use a more modern survey with enhanced online reporting tools and a different question set.
We have set a target to increase the lifetime CO2 emissions savings from “Green” XP Power products by at least 5% per annum.
WHY DO WE MEASURE THIS?
Provides an indicator of business growth between reporting periods.
Used to assess how effectively we are targeting top customers.
Provides an indicator of value created for shareholders.
Used to assess the adjusted earnings performance of the Group
Used to assess the expansion of the Group’s product portfolio.
Used to assess the Group’s performance against its People objectives.
Used to assess the Group’s performance against its environmental objectives
TARGET ACHIEVED (AND COMMENTARY)
• No • Yes Yes • No • Yes • Yes • No
OUR PROGRESS IN 2019
• Leveraged off the new products gained through acquisition, expanding sales in other regions
• Expanded our distribution channels
• This metric decreased due to the cyclical downturn in the semiconductor equipment manufacturing industry
• Excluding the cyclical impact noted above we continue to grow share of our large customers
• Improved our working capital management, specifically related to inventory
• Improved cash flow forecasting to make better use of available cash, either through debt repayment or short term deposits
• Earnings negatively impacted by US/China tariffs
• We released 32 new product families in 2019 (2018: 27)
• 25 (2018: 20) of these new product families can be classified as “Green” XP Power products
• We continue to undertake an annual employee engagement survey to identify areas our people tell us where we can improve to deliver the ultimate employee experience
• In 2019 we changed providers to Work Buzz to use a more modern survey with enhanced online reporting tools and a different question set.
• Of the 32 new product families launched in 2018, 25 were “Green”
• Our revenues from “Green” XP Power products increased by 3% to £43.2 million in 2019
• CO2 emission savings declined in 2019 due to product mix
OUR PLANS FOR 2020
• Continue to utilise our broad product offering through all sales regions
• Provide increasing support to our customers through our engineering solutions group
• Continue to grow our share of customers’ business where we are preferred or approved suppliers
• Expansion of our product portfolio to increase our addressable market in our existing customer base
• Continue to seek opportunities to maximise working capital
• Leverage strong order intake end to 2019 to grow EPS
• We will no longer report this metric as a KPI
• While employee engagement is pleasing the results of the survey indicate that we need to work to improve recognition programmes
• We will continue to release products with class-leading efficiency
LINK TO STRATEGY • Target accounts where we can add value
• Vertical penetration of focus accounts
• Build a global supply chain which balances high efficiency with market leading customer responsiveness
• Achieve operational excellence • Develop a broad range of competitive products
• Achieve operational excellence • Leading our industry on environmental matters
LINK TO CORE VALUES
LINK TO RISK
LINK TO REMUNERATION
Revenue growth drives the annual growth of our adjusted profit before tax which is a target in our Group bonus plan
Placing emphasis on revenue from our top 30 customers aligns with our strategy and long term earnings growth, a key measure in our share incentive schemes
Free cash flow is a metric in our Group bonus plan
• EPS is a performance condition in our share incentive scheme
NON-FINANCIAL
2019
2017
2018
2016
2015
145.5
147.0
172.8
115.3
104.3
2019
2017
2018
2016
2015
32
27
27
47
22
2019
2017
2018
2016
2015
75
62.0
63.4
63.0
62.9
2019
2017
2018
2016
2015
236,157
291 ,000
236,000
158,000
133,000
STRATEGIC REPORT
29XP Power Annual Report & Accounts for the year ended 31 December 2019
FOR MORE INFORMATION ON OUR STRATEGY SEE PAGES 22 AND 23
FOR MORE INFORMATION ON RISKS SEE PAGES 42 TO 47
FOR MORE INFORMATION ON OUR CORE VALUES SEE PAGES 52 AND 53
FOR MORE INFORMATION ON SUSTAINABILITY SEE PAGES 48 AND 49
1 2 3 4 56 7 8 9 10 11 6 7 8 9 10 6 7 8 9 10 11
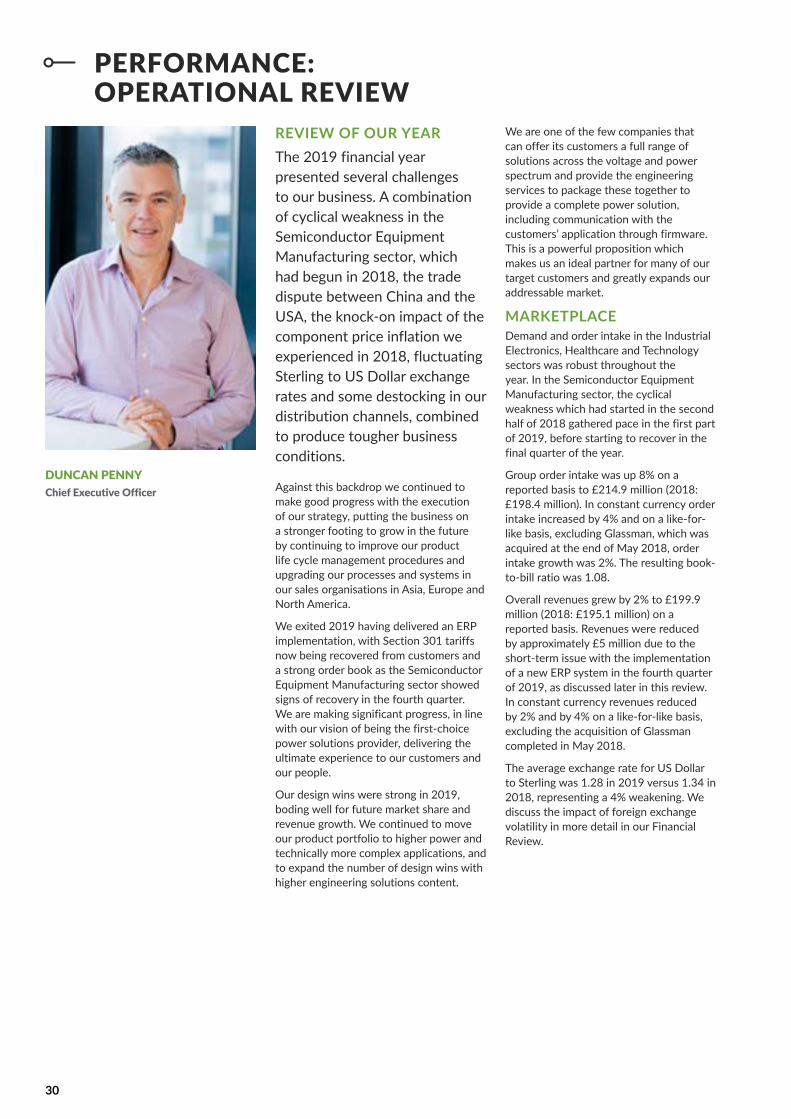
30
PERFORMANCE: OPERATIONAL REVIEW
DUNCAN PENNYChief Executive Officer
REVIEW OF OUR YEARThe 2019 financial year presented several challenges to our business. A combination of cyclical weakness in the Semiconductor Equipment Manufacturing sector, which had begun in 2018, the trade dispute between China and the USA, the knock-on impact of the component price inflation we experienced in 2018, fluctuating Sterling to US Dollar exchange rates and some destocking in our distribution channels, combined to produce tougher business conditions.
Against this backdrop we continued to make good progress with the execution of our strategy, putting the business on a stronger footing to grow in the future by continuing to improve our product life cycle management procedures and upgrading our processes and systems in our sales organisations in Asia, Europe and North America.
We exited 2019 having delivered an ERP implementation, with Section 301 tariffs now being recovered from customers and a strong order book as the Semiconductor Equipment Manufacturing sector showed signs of recovery in the fourth quarter. We are making significant progress, in line with our vision of being the first-choice power solutions provider, delivering the ultimate experience to our customers and our people.
Our design wins were strong in 2019, boding well for future market share and revenue growth. We continued to move our product portfolio to higher power and technically more complex applications, and to expand the number of design wins with higher engineering solutions content.
We are one of the few companies that can offer its customers a full range of solutions across the voltage and power spectrum and provide the engineering services to package these together to provide a complete power solution, including communication with the customers’ application through firmware. This is a powerful proposition which makes us an ideal partner for many of our target customers and greatly expands our addressable market.
MARKETPLACEDemand and order intake in the Industrial Electronics, Healthcare and Technology sectors was robust throughout the year. In the Semiconductor Equipment Manufacturing sector, the cyclical weakness which had started in the second half of 2018 gathered pace in the first part of 2019, before starting to recover in the final quarter of the year.
Group order intake was up 8% on a reported basis to £214.9 million (2018: £198.4 million). In constant currency order intake increased by 4% and on a like-for-like basis, excluding Glassman, which was acquired at the end of May 2018, order intake growth was 2%. The resulting book-to-bill ratio was 1.08.
Overall revenues grew by 2% to £199.9 million (2018: £195.1 million) on a reported basis. Revenues were reduced by approximately £5 million due to the short-term issue with the implementation of a new ERP system in the fourth quarter of 2019, as discussed later in this review. In constant currency revenues reduced by 2% and by 4% on a like-for-like basis, excluding the acquisition of Glassman completed in May 2018.
The average exchange rate for US Dollar to Sterling was 1.28 in 2019 versus 1.34 in 2018, representing a 4% weakening. We discuss the impact of foreign exchange volatility in more detail in our Financial Review.

EUROPE REPRESENTED
32% OF OVERALL REVENUES
(2018: 31%)
ASIA REPRESENTED
10% % OF OVERALL
REVENUES (2018: 8%).
XP Power Annual Report & Accounts for the year ended 31 December 2019 31
STRATEGIC REPORT
MARKETPLACE: SECTOR DYNAMICSRevenues from Industrial Electronics customers grew by 7% to £89.2 million (2018: £83.7 million) representing 45% (2018: 43%) of overall revenues. Although Industrial Electronics is our largest sector, it is very diversified with few of these customers making it into our top 30 customer list. Applications in this sector vary significantly and are principally driven by new and emerging electronic technologies and high growth niches rather than traditional areas like industrial machinery, automotive or mining. Typical drivers for our revenues in this sector include renewable energy, analytical instruments, test and measurement equipment, displays, 3D printing, smart grid and industrial printing. Our Distribution business, which represents 11% of our overall business and is exposed to a very diverse range of end markets, is also included within the Industrial Electronics sector.
The Semiconductor Equipment Manufacturing sector remains an important area for XP Power. Revenue from these customers reduced by 21% to £37.4 million (2018: £47.4 million) as a cyclical decline took hold in the latter part of 2018, before reaching a low point in the first half of 2019. We began to see signs of a recovery in this sector in our order intake in the fourth quarter of 2019. Revenue from Semiconductor Equipment Manufacturing sector customers represented 19% of overall revenue (2018: 24%). Our expansion into high-voltage and high-power products, combined with our engineering services offering, has made us an attractive supplier to this market. The new higher power and higher voltage products we now have allow us to service considerably more of the opportunities we see in this sector, significantly expanding our addressable market.
Despite the sector’s cyclicality this market remains highly attractive due to its robust fundamentals, which are being driven by the proliferation of applications involving the internet of things (IoT), artificial intelligence (AI), autonomous vehicles, big data and the roll out of 5G technology. The latest generations of semiconductor logic and memory devices are becoming more capital intensive to manufacture as they become multilayer, and as dimensions continue to shrink. This plays to XP Power’s strengths as one of few companies in the world that can offer
the whole spectrum of power and voltage required for Semiconductor Equipment Manufacturing, making us a compelling partner to the manufacturers of these state-of-the-art tools.
Revenue from Healthcare customers grew by 5% to £45.9 million (2018: £43.6 million) representing 23% of overall revenues (2018: 22%). Healthcare remains another attractive market for XP Power given the breadth of our medical product range and high level of customer service. Healthcare customers are demanding in terms of quality and reliability, making our value proposition very attractive to them. We provide mission critical power solutions for numerous applications in the healthcare arena, from patient contact applications such as robotic surgery, to diagnostic equipment such as MRI and ultrasound, through to ventilators and laboratory equipment. We also understand the many special requirements and regulatory approvals that a medical power solution has to meet. Healthcare tends to be much less cyclical than the other sectors we address which adds resilience to our diversified business model.
Revenue from Technology customers grew 34% to £27.4 million (2018: £20.4 million) representing 13% of overall revenues (2018: 11%). The strong growth achieved in 2019 was partly due to a large programme for test equipment in Asia which had been dormant for several years. Other typical applications in technology include areas such as broadcast, high-end communications such as satellite and telecom base stations, and high-end computing. These programmes are often quite large but generally have much shorter lifetimes than the seven to eight years which are typical in the other market sectors we serve.
MARKETPLACE: NORTH AMERICANorth America revenue was US$147.5 million in 2019 (2018: US$159.5 million), a decrease of 8%. The decrease was 12% after excluding US$14.8 million of revenue from the Glassman business (2018: US$8.8 million) which was acquired at the end of May 2018. North America represented 58% of overall revenue (2018: 61%).
North America was adversely affected by the cyclical decline in the Semiconductor Equipment Manufacturing sector which began in 2018 and persisted throughout the majority of 2019, as discussed above.

32
We started to see signs of a recovery in the Semiconductor Equipment Manufacturing sector in the order intake in the last quarter of 2019, which appears to be predominately driven by increased demand for next generation technology tools and reduction in excess customer inventory. Notwithstanding the disappointing performance in the Semiconductor Equipment Manufacturing sector, the Industrial Electronics, Healthcare and Technology sectors all grew year on year.
Order intake in North America was US$161.7 million (2018: US$158.1 million), an increase of 2% resulting in a book-to-bill ratio of 1.10. After excluding the order intake from the Glassman acquisition of US$14.0 million (2018: US$9.4 million), orders reduced by 1%.
The Section 301 tariffs imposed by the US government on Chinese sourced products had an adverse impact on XP Power. From September 2018 a 10% tariff was imposed on power converters imported from China, where the Group has a manufacturing facility. In May 2019 the tariff was increased to 25%. The introduction of these tariffs necessitated the implementation of a process to recover this from customers to avoid a severe impact on our margins in North America. We recovered more than 90% of the Section 301 tariffs from customers in 2019. Whilst this shortfall is almost neutral to our reported absolute gross margin, it does reduce our reported gross margin percentage by approximately 60 basis points.
Our manufacturing facility in Vietnam presented an opportunity for the Group to shift production away from China to a location where the new tariffs did not apply. We had already started shifting production of our lower power products from China to Vietnam and the introduction of the Section 301 tariffs has caused us to accelerate this process. We are now able to produce over 2,000 different products in our Vietnam facility and the majority of these have been transferred from our China facility. Many customers have now qualified our Vietnam facility so they can begin to take product from Vietnam rather than China. We believe that our established production capabilities in Vietnam give us a significant advantage against competitors who primarily have a China only manufacturing footprint.
PERFORMANCE: OPERATIONAL REVIEW CONTINUED
MARKETPLACE: EUROPEOur European business grew revenue by 5% to £64.4 million (2018: £61.1 million) despite weakness in continental Europe. Growth was driven by Industrial Electronics and Healthcare, with Technology revenue being in line year on year. The European Industrial Electronics business remains highly fragmented, and comprises of many customers and numerous applications, but growth is being driven by areas such as analytical instruments, renewable energy, industrial printing and other niches rather than traditional industrial manufacturing equipment. Semiconductor Equipment Manufacturing was the only sector to decline but this makes up less than 1% of our European business. Europe represented 32% of overall revenues (2018: 31%).
Order intake in Europe was £65.0 million (2018: £64.6 million), an increase of 0.6%, resulting in a book-to-bill ratio of 1.01.
MARKETPLACE: ASIAAsia revenues were US$25.6 million in 2019 (2018: US$19.9 million), an increase of 29%, with the strongest growth in Technology which benefited from a large customer programme for burn-in test equipment that was reinvigorated. Our Asia business is also benefitting from the RF and high-voltage high-power products brought into the product portfolio as a result of the Comdel and Glassman acquisitions. Prior to acquisition, these companies had minimal sales representation in Asia which presents a significant future opportunity for the Group. Asia represented 10% of overall revenues (2018: 8%).
Order intake in Asia was US$28.2 million (2018: US$21.4 million), an increase of 32%, resulting in a book-to-bill ratio of 1.10.

XP Power Annual Report & Accounts for the year ended 31 December 2019 33
STRATEGIC REPORT
SUPPLY CHAINAs previously announced, during the first half of 2018 we started to see a significant tightening of the supply chain for certain electronic components, which resulted in increased lead times, in some cases moving from 12 to 52 weeks, and component cost inflation. In response, we went into the market to increase our safety inventories of critical components, at prices beyond our standard costs, in order to ensure we could continue to meet our lead times to customers. The higher prices we had to pay for components were a drag on gross margins in the second half of 2018 and in 2019. As expected, we have seen an unwinding of this inventory position in 2019 which has resulted in a reduction in working capital in the period.
We remain vigilant and are keeping supply chain dynamics under close review given the advent of the COVID-19 outbreak in China, as we are now entering a period where demand for the next generation of semiconductor manufacturing equipment appears to be rising. We have already started to see the first signs of lengthening lead times for certain components such as multi-layer ceramic capacitors, purportedly driven by the roll out of 5G technology. Power semiconductor devices have also continued to be on long lead times throughout 2018 and 2019. We will continue to proactively manage our inventory to ensure continuity of supply but expect the levels to reduce further in 2020.
COVID-19 VIRUSThe situation regarding the COVID-19 virus outbreak in Wuhan, China in mid-December has been widely reported. We send our heartfelt thoughts to everyone affected by the virus outbreak, particularly our colleagues at our Kunshan manufacturing site, who we are providing with all necessary support. Our first priority is to ensure the safety of our people and we have taken epidemic prevention and control measures at both our Kunshan and Vietnam manufacturing facilities.
The Chinese authorities extended the Chinese Lunar New Year holiday and imposed a number of travel restrictions and operational restrictions on companies. These measures caused a two-week delay to the recommencement of production at our Kunshan facility, which re-opened on 17 February 2020. The difficulties our people have experienced in travelling back to work and the self-quarantine
requirements also mean that we have been operating at a reduced level of capacity and do not expect to be operating at full capacity until mid-March at the earliest. Our local supply chain has experienced similar issues and we now have a backlog of production orders to catch up. There will be an inevitable slippage of revenues from the first quarter of 2020, but it is too early to determine whether this will have a material effect on our first half performance and to what extent the worldwide economic conditions will be affected by this situation.
Our Vietnamese facility recommenced production following the Lunar New Year holiday as planned on 1 February 2020 and is operating normally. We have been taking mitigating action by accelerating the transfer of more products and materials from China to Vietnam to maintain the supply of products to our customers.
ADAPTING TO THE MARKET AND THE COMPETITIONOver the last two decades XP Power has evolved from a specialist distributor of power conversion products to a designer, and then manufacturer, of power solutions for the Industrial Electronics, Healthcare, Semiconductor Equipment Manufacturing and Technology markets. Our product portfolio has moved up the power and voltage spectrum, and now also includes RF power conversion products.
We continue to perform well against our traditional established competition. Our broad range of standard products, now augmented by recent acquisitions, and excellent customer service, delivered by the largest direct sales force in our industry, is an attractive customer proposition. We are now one of very few power solutions providers who can supply our target customers with a portfolio of products from low to high-power and low to high voltage, including RF power. This capability, when combined with our engineering services offering, which can take standard products and tailor them to provide complete plug and play power systems, often incorporating custom firmware communications, makes us a compelling business partner as the equipment we power gets more sophisticated and connected.
Our low-cost Asian competitors continue to be competitive for low-power/low-complexity products without demanding or critical applications and it is straightforward for customers to
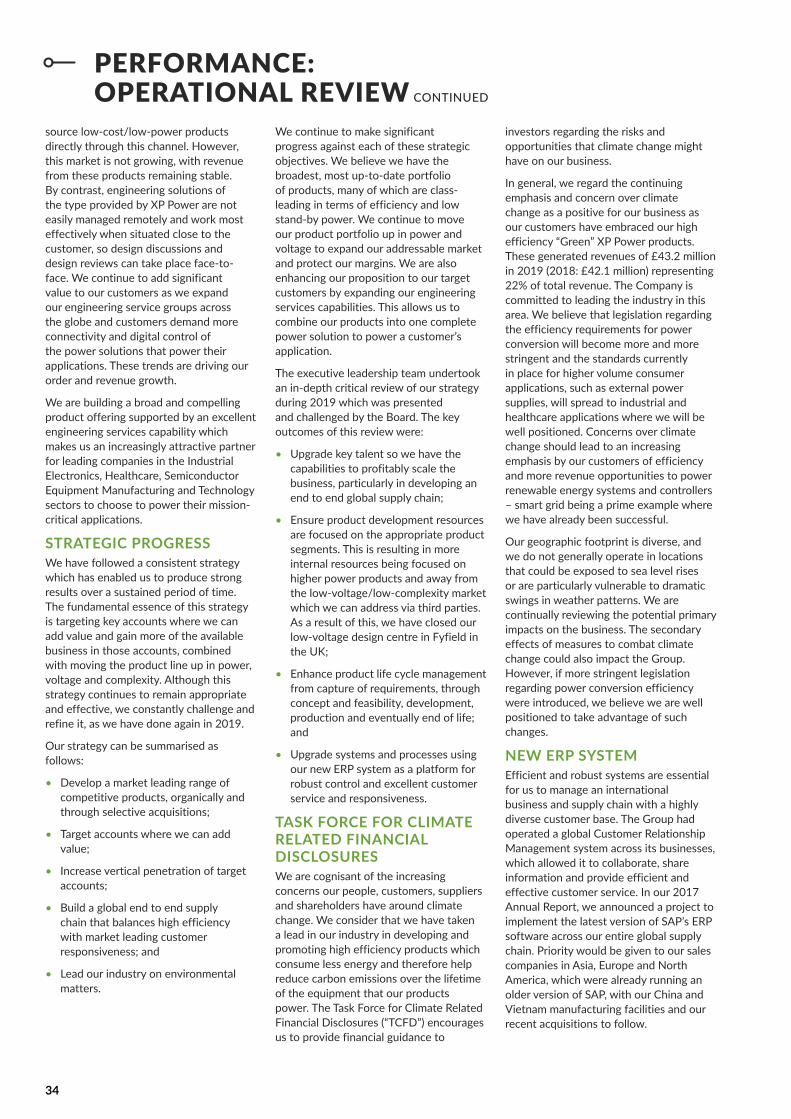
34
PERFORMANCE: OPERATIONAL REVIEW CONTINUED
source low-cost/low-power products directly through this channel. However, this market is not growing, with revenue from these products remaining stable. By contrast, engineering solutions of the type provided by XP Power are not easily managed remotely and work most effectively when situated close to the customer, so design discussions and design reviews can take place face-to-face. We continue to add significant value to our customers as we expand our engineering service groups across the globe and customers demand more connectivity and digital control of the power solutions that power their applications. These trends are driving our order and revenue growth.
We are building a broad and compelling product offering supported by an excellent engineering services capability which makes us an increasingly attractive partner for leading companies in the Industrial Electronics, Healthcare, Semiconductor Equipment Manufacturing and Technology sectors to choose to power their mission-critical applications.
STRATEGIC PROGRESSWe have followed a consistent strategy which has enabled us to produce strong results over a sustained period of time. The fundamental essence of this strategy is targeting key accounts where we can add value and gain more of the available business in those accounts, combined with moving the product line up in power, voltage and complexity. Although this strategy continues to remain appropriate and effective, we constantly challenge and refine it, as we have done again in 2019.
Our strategy can be summarised as follows:
• Develop a market leading range of competitive products, organically and through selective acquisitions;
• Target accounts where we can add value;
• Increase vertical penetration of target accounts;
• Build a global end to end supply chain that balances high efficiency with market leading customer responsiveness; and
• Lead our industry on environmental matters.
We continue to make significant progress against each of these strategic objectives. We believe we have the broadest, most up-to-date portfolio of products, many of which are class-leading in terms of efficiency and low stand-by power. We continue to move our product portfolio up in power and voltage to expand our addressable market and protect our margins. We are also enhancing our proposition to our target customers by expanding our engineering services capabilities. This allows us to combine our products into one complete power solution to power a customer’s application.
The executive leadership team undertook an in-depth critical review of our strategy during 2019 which was presented and challenged by the Board. The key outcomes of this review were:
• Upgrade key talent so we have the capabilities to profitably scale the business, particularly in developing an end to end global supply chain;
• Ensure product development resources are focused on the appropriate product segments. This is resulting in more internal resources being focused on higher power products and away from the low-voltage/low-complexity market which we can address via third parties. As a result of this, we have closed our low-voltage design centre in Fyfield in the UK;
• Enhance product life cycle management from capture of requirements, through concept and feasibility, development, production and eventually end of life; and
• Upgrade systems and processes using our new ERP system as a platform for robust control and excellent customer service and responsiveness.
TASK FORCE FOR CLIMATE RELATED FINANCIAL DISCLOSURESWe are cognisant of the increasing concerns our people, customers, suppliers and shareholders have around climate change. We consider that we have taken a lead in our industry in developing and promoting high efficiency products which consume less energy and therefore help reduce carbon emissions over the lifetime of the equipment that our products power. The Task Force for Climate Related Financial Disclosures (“TCFD”) encourages us to provide financial guidance to
investors regarding the risks and opportunities that climate change might have on our business.
In general, we regard the continuing emphasis and concern over climate change as a positive for our business as our customers have embraced our high efficiency “Green” XP Power products. These generated revenues of £43.2 million in 2019 (2018: £42.1 million) representing 22% of total revenue. The Company is committed to leading the industry in this area. We believe that legislation regarding the efficiency requirements for power conversion will become more and more stringent and the standards currently in place for higher volume consumer applications, such as external power supplies, will spread to industrial and healthcare applications where we will be well positioned. Concerns over climate change should lead to an increasing emphasis by our customers of efficiency and more revenue opportunities to power renewable energy systems and controllers – smart grid being a prime example where we have already been successful.
Our geographic footprint is diverse, and we do not generally operate in locations that could be exposed to sea level rises or are particularly vulnerable to dramatic swings in weather patterns. We are continually reviewing the potential primary impacts on the business. The secondary effects of measures to combat climate change could also impact the Group. However, if more stringent legislation regarding power conversion efficiency were introduced, we believe we are well positioned to take advantage of such changes.
NEW ERP SYSTEMEfficient and robust systems are essential for us to manage an international business and supply chain with a highly diverse customer base. The Group had operated a global Customer Relationship Management system across its businesses, which allowed it to collaborate, share information and provide efficient and effective customer service. In our 2017 Annual Report, we announced a project to implement the latest version of SAP’s ERP software across our entire global supply chain. Priority would be given to our sales companies in Asia, Europe and North America, which were already running an older version of SAP, with our China and Vietnam manufacturing facilities and our recent acquisitions to follow.

STRATEGIC REPORT
35XP Power Annual Report & Accounts for the year ended 31 December 2019
The implementation of the new system will have significant benefits in terms of factory planning and customer responsiveness, and it will give us significant operational advantages, with our factory systems running on the same platform as our sales companies. Further gains will be realised when we migrate the acquired Comdel and Glassman businesses to the new platform.
We transitioned to the new SAP ERP system in mid-October 2019. However, during the system migration and in the first few weeks of operation as the teams across the Group went up the learning curve with the new processes, we experienced some short-term disruption to the implementation which led to shipments temporarily falling behind expected run rates. This resulted in approximately £5 million of scheduled order backlog moving from the fourth quarter of 2019 into 2020.
We are confident that the new SAP ERP system will deliver significant long-term benefits to the Group’s ability to run its global business and supply chain.
In 2019, the Group capitalised £3.4 million (2018: £1.1 million) of development costs and incurred £2.2 million (2018: £0.2 million) of other project related costs in respect of this project. In 2020, we expect to capitalise a further £2.5-3.0 million and the other project related costs will be circa £1.0 million.
MANUFACTURINGIn October 2017, we commenced construction of a second manufacturing facility in Vietnam on our existing site near Ho Chi Minh City. Construction was completed in early 2019. Our existing manufacturing facility in China and our first Vietnam facility have an annual revenue capacity of US$170 million. Vietnam II conservatively adds an additional US$130 million of capacity, bringing our total Asian manufacturing capacity up to US$300 million per annum.
This additional capacity is necessary to accommodate our growth trajectory. It also gives us the opportunity to transfer production from China to Vietnam, thereby saving the costs of the Section 301 Tariffs currently imposed on Chinese goods by the USA authorities. We have transferred over 2,000 different products to Vietnam from China and are also well advanced in transferring production of our high-voltage/low-power DC-DC modules from Minden, Nevada to Vietnam. We
believe this will give us a cost advantage over many of our competitors with Chinese based manufacturing.
Our end objective is to have the flexibility to be able to build all products in either China or Vietnam to provide flexibility and robust business continuity planning.
RESTRUCTURING OF LOW-POWER, HIGH-VOLTAGE MANUFACTURING AND TRANSFER TO VIETNAMIn order to take advantage of our expanded Vietnam capacity, competitive labour rates and excellent quality, in August 2019 we announced that we would be transferring the manufacture of all our low-power, high-voltage DC-DC modules to our Vietnamese facility. Our manufacturing facility in Minden, Nevada will close by June 2020. We expect that this will result in annualised cost savings of approximately £4.0 million. Approximately £1-2 million of these cost savings will be reinvested back into the business to expand and strengthen our new product introduction team. The enlarged team will facilitate further transfers of existing engineering services production from our facility in Sunnyvale, California to Vietnam, as well as new standard products as they are introduced, resulting in additional future savings. We expect to incur approximately £1-2 million in costs associated with the full closure of the Minden site over the next 12 months which will be excluded from adjusted results.
ENGINEERING SOLUTIONSAs well as expanding our product offering, we have continued to expand our engineering solutions groups particularly in Asia and North America. As we continue to move our capabilities up to higher power and higher voltages, we are becoming an increasingly attractive partner for customers whose applications are becoming more and more demanding. These demands include not only power delivery and management, but also sophisticated connectivity involving software and firmware which enable the customer’s application to control the power solution and the power solution to communicate back to the application. As the world becomes more connected and the fourth industrial revolution gains traction, we expect this trend to gather pace. Customers place a high value on our engineering solutions capabilities which differentiate us from many of our
competitors, who focus only on providing standard products with little additional value added.
Our engineering solutions groups work closely with the customer’s engineering teams to provide these customised solutions. Speed and proximity to the customer are critical as the power solution is often one of the last parts of the system to be designed, so is invariably one of the gating items to get the end product to market. This is an area where XP Power adds significant value to its customers, and we are seeing increasing demand for these services.
RESEARCH AND DEVELOPMENTWe have continued to invest in research and development to further expand our portfolio of products and the size of our addressable market opportunity. We released 32 new product families in 2019 (2018: 27) and 25 of these can be classified as “Green” XP Power products having ultra-high efficiency and/or low standby power (2018: 20).
We continue to move our product portfolio up in power and voltage range and away from our traditional low-power/low-voltage offering, to protect our margins and expand our addressable market. As part of this process we took the decision to close our design centre in Fyfield, UK which was focused on low-power, low-voltage product. RF power is a significant long-term opportunity and is a market which contains many interesting and significant niches. We have therefore directed more of our internal product development resources away from low-power/low-voltage and are supplementing the low-power area with more third-party products designed to our specifications and quality standards while expanding the RF development resources.
2019 STRATEGIC REPORTOur Strategic Report on pages 12 to 62 has been reviewed and approved by the Board.
DUNCAN PENNYChief Executive Officer
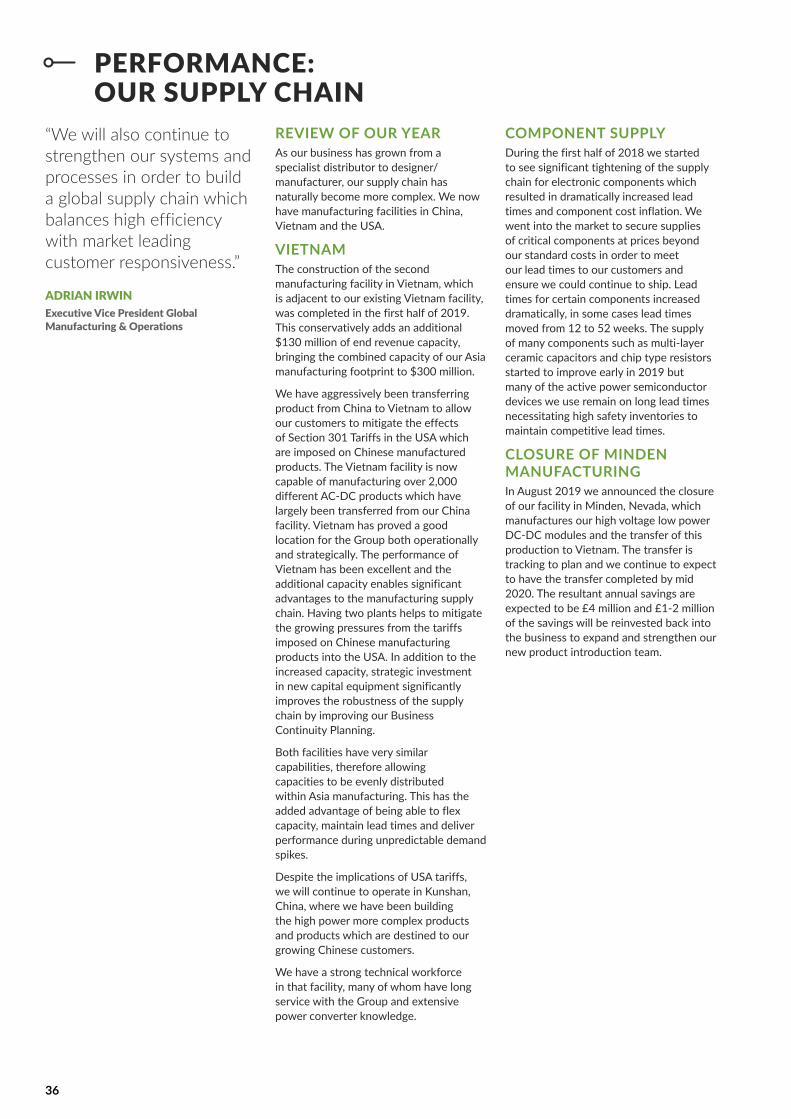
“We will also continue to strengthen our systems and processes in order to build a global supply chain which balances high efficiency with market leading customer responsiveness.”
ADRIAN IRWINExecutive Vice President Global Manufacturing & Operations
REVIEW OF OUR YEARAs our business has grown from a specialist distributor to designer/manufacturer, our supply chain has naturally become more complex. We now have manufacturing facilities in China, Vietnam and the USA.
VIETNAMThe construction of the second manufacturing facility in Vietnam, which is adjacent to our existing Vietnam facility, was completed in the first half of 2019. This conservatively adds an additional $130 million of end revenue capacity, bringing the combined capacity of our Asia manufacturing footprint to $300 million.
We have aggressively been transferring product from China to Vietnam to allow our customers to mitigate the effects of Section 301 Tariffs in the USA which are imposed on Chinese manufactured products. The Vietnam facility is now capable of manufacturing over 2,000 different AC-DC products which have largely been transferred from our China facility. Vietnam has proved a good location for the Group both operationally and strategically. The performance of Vietnam has been excellent and the additional capacity enables significant advantages to the manufacturing supply chain. Having two plants helps to mitigate the growing pressures from the tariffs imposed on Chinese manufacturing products into the USA. In addition to the increased capacity, strategic investment in new capital equipment significantly improves the robustness of the supply chain by improving our Business Continuity Planning.
Both facilities have very similar capabilities, therefore allowing capacities to be evenly distributed within Asia manufacturing. This has the added advantage of being able to flex capacity, maintain lead times and deliver performance during unpredictable demand spikes.
Despite the implications of USA tariffs, we will continue to operate in Kunshan, China, where we have been building the high power more complex products and products which are destined to our growing Chinese customers.
We have a strong technical workforce in that facility, many of whom have long service with the Group and extensive power converter knowledge.
COMPONENT SUPPLYDuring the first half of 2018 we started to see significant tightening of the supply chain for electronic components which resulted in dramatically increased lead times and component cost inflation. We went into the market to secure supplies of critical components at prices beyond our standard costs in order to meet our lead times to our customers and ensure we could continue to ship. Lead times for certain components increased dramatically, in some cases lead times moved from 12 to 52 weeks. The supply of many components such as multi-layer ceramic capacitors and chip type resistors started to improve early in 2019 but many of the active power semiconductor devices we use remain on long lead times necessitating high safety inventories to maintain competitive lead times.
CLOSURE OF MINDEN MANUFACTURINGIn August 2019 we announced the closure of our facility in Minden, Nevada, which manufactures our high voltage low power DC-DC modules and the transfer of this production to Vietnam. The transfer is tracking to plan and we continue to expect to have the transfer completed by mid 2020. The resultant annual savings are expected to be £4 million and £1-2 million of the savings will be reinvested back into the business to expand and strengthen our new product introduction team.
36
PERFORMANCE: OUR SUPPLY CHAIN
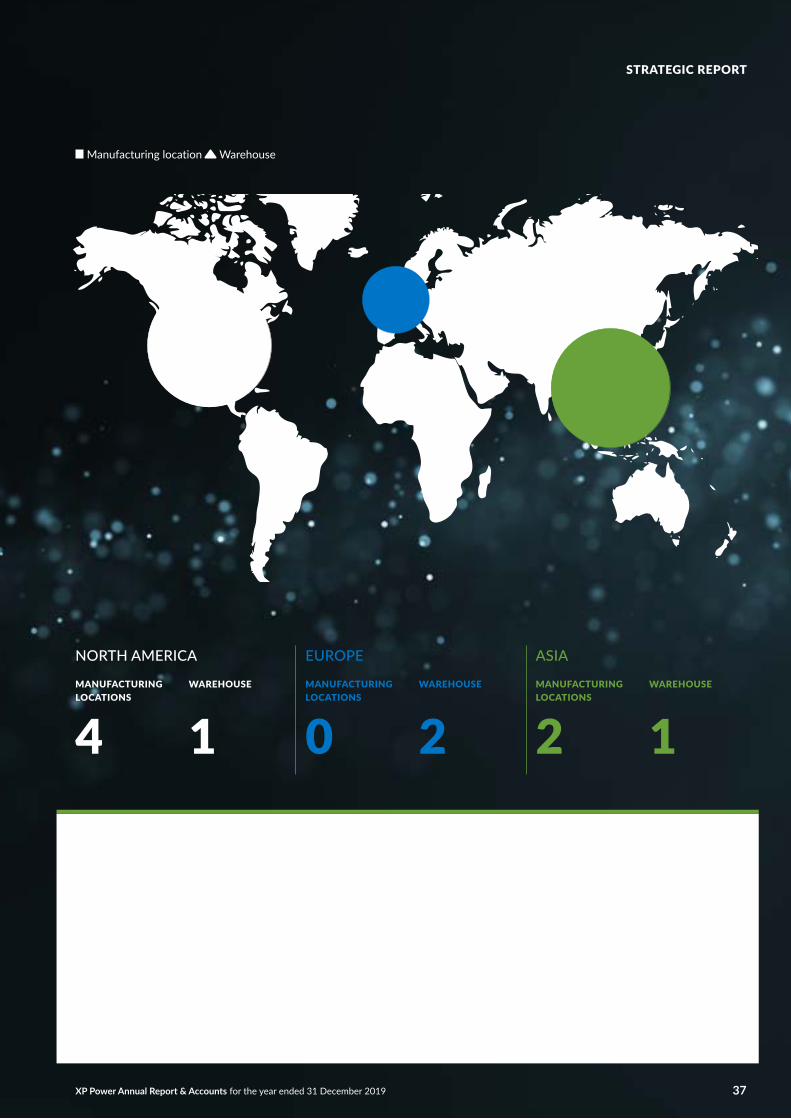
SUPPLY CHAIN STRATEGYOver the years we have built an enviable brand in the power solutions market.
Our product portfolio, excellent customer service and successful execution of our strategy has led to consistent growth in market share. In particular, growth in the past four years has been strong which has tested the agility of our supply chain and manufacturing operations. While they have been able to cope with this growth profile it became clear that we need to upgrade our systems and processes in
order to be able to scale and run a much larger company. In 2018 we embarked on a project to make SAP S/4HANA our ERP system across the Group, replacing our existing manufacturing systems. This will bring great benefits to the Group and manufacturing operations in particular. SAP S/4 HANA was implemented in our sales and marketing companies in October 2019 and we are now planning the roll out of the second phase of this project into our Asian manufacturing facilities which is expected to go live in 2021.
The recent strategic acquisitions have expanded our product offering. This also allows consolidation and leveraging of the supply chain. We are in a very strong position to leverage these supply chain synergies, improving operational flexibility, delivery, quality and cost objectives.
We will also continue to strengthen our systems and processes in order to build a global supply chain which balances high efficiency with market-leading customer responsiveness.
MANUFACTURING LOCATIONS
4WAREHOUSE
1MANUFACTURING LOCATIONS
0WAREHOUSE
2MANUFACTURING LOCATIONS
2WAREHOUSE
1
NORTH AMERICA EUROPE ASIA
37XP Power Annual Report & Accounts for the year ended 31 December 2019
STRATEGIC REPORT
Manufacturing location Warehouse

38
PERFORMANCE: FINANCIAL REVIEW
GAVIN GRIGGSChief Financial Officer
“We continue to invest in our business and people, whilst still being able to deliver strong year-on-year profit growth.”
REVIEW OF OUR YEARXP Power delivered a resilient performance in 2019. The business generated strong free cash flow due to good working capital management and continues to have a robust financial position.
STATUTORY RESULTS On a statutory basis, revenue was £199.9 million (2018: £195.1 million), representing growth of 2%. Operating profit was £26.7 million (2018: £39.3 million), a decrease of 32% over the prior year, with operating margin at 13.4% (2018: 20.1%). Net finance costs were £2.7 million (2018: £1.7 million) resulting in profit before tax of £24.0 million (2018: £37.6 million) and an income tax expense of £3.2 million (2018: £7.2 million), equivalent to an effective tax rate of 13% (2018: 19%). Basic earnings per share were 107.0 pence (2018: 157.8 pence), a decrease of 32%.
ADJUSTED RESULTS Throughout this results announcement, adjusted and other alternative performance measures are used to describe the Group’s performance. These are not recognised under International Financial Reporting Standards (IFRS) or other generally accepted accounting principles (GAAP).
When reviewing XP Power’s performance, the Board and management team focus in particular on adjusted results rather than statutory results. There are a number of items that are included in statutory results, but which are considered to be one-off in nature or not representative of the Group’s performance and which are excluded from adjusted results. The tables on page 132 show the full list of adjustments between statutory operating profit and adjusted operating profit, between statutory profit before tax and adjusted profit before tax, as well as between statutory profit after tax and adjusted profit after tax at Group level for both 2019 and 2018.
REVENUE PERFORMANCE The Group generated revenue growth of 2% during the year on a reported basis. Revenues were reduced by approximately £5 million due to the short-term issue with the implementation of a new ERP system in the fourth quarter of 2019, as discussed elsewhere in this review. In constant currency revenues reduced by 2% and by 4% on a like-for-like basis, excluding the acquisition of Glassman.
The Group’s revenue performance was impacted by the cyclical downturn in the Semiconductor Equipment Manufacturing sector, with revenue in this sector declining by 21% to £37.4 million (2018: £47.4 million). This was offset by growth all other sectors, with the Technology sector growing 34% to £27.4 million (2018: £20.4 million), the Industrial Electronics sector, increasing by 7% to £89.2 million (2018: £83.7 million) and the Healthcare sector, which grew 5% to £45.9 million (2018: £43.6 million).
Our North American region was impacted by the Semiconductor Equipment Manufacturing sector slowdown, which contributed to revenue declining by 8% to US$147.5 million from US$159.5 million. On a like-for-like basis, after excluding Glassman revenue of US$14.8 million North America decreased by 12%. Europe delivered growth of 5% to £64.4 million (2018: £61.1 million), driven by a good performance in the Nordics, up 22% and Central Europe, up 9%. Asia revenue grew by 29% to US$25.6 million (2018: US$19.9 million).
Order intake was up 8% on a reported basis to £214.9 million (2018: £198.4 million). Orders and revenue for 2019 represent a full year, book-to-bill ratio of 1.08 (2018: 1.02).
READ ABOUT SUPPLY CHAIN PERFORMANCE ON PAGES 36 TO 37
READ ABOUT OPERATIONAL PERFORMANCE ON PAGES 30 TO 35

Revenue growth has translated into earnings growth
REVENUEINCREASES
2%
NET DEPT DECREASES
21%
CASH FROM OPERATIONS
INCREASES
72%
XP Power Annual Report & Accounts for the year ended 31 December 2019 39
STRATEGIC REPORT
GROSS PROFITABILITY Gross margin decreased to 45.1% (2018: 47.3%), largely due to the impact of the Section 301 tariffs imposed on Chinese goods imported into the USA, the knock-on impact of the component price inflation experienced in 2018 and product mix.
ADJUSTED OPERATING EXPENSES AND MARGINS The Group continued to invest in the business, which resulted in adjusted operating expenses increasing by 11% to £54.2 million (8% in constant currency and 4% on an organic constant currency basis). Investing in our people remains a focus and resulted in payroll and staff costs increasing by 20%. Headcount, excluding factories, increased by 5% compared to 2018 as we invested in our engineering and sales capabilities. Non-cash share-based payment charges amounted to £0.7 million (2018: £0.8 million) and related to a grant to senior management under the Long-Term Incentive Scheme during the year. Adjusted operating margin decreased to 18.0% (2018: 22.0%) due to the lower revenues and gross margin in 2019 combined with the annualization of increased investments in 2018.
FOREIGN EXCHANGEThe Group reports its results in Sterling, but the US Dollar continues to be our principal trading currency, with approximately 83% (2018: 84%) of our revenues denominated in US Dollars. The average Sterling to US Dollar exchange rate decreased by 4%, from 1.34 to 1.28. The Sterling to US Dollar exchange rate saw large movements during the year but ultimately the net impact on the Group’s 2019 results was not significant.
FINANCE COST Net finance cost increased to £2.7 million (2018: £1.7 million) due to increased average borrowings following the acquisition of Glassman in May 2018.
Interest cover (EBITDA as a multiple of net interest expense as defined by our Revolving Credit Facility) was 17 times (2018: 32 times) which is well in excess of the four times minimum required in our banking covenants. Net debt to EBITDA at the year-end was comfortable at 0.92 (2018: 1.07). The covenant level for net debt to EBITDA is a maximum of three times.
The Company renewed its financing facilities with effect from 8 November 2019, increasing the revolving credit facility by US$15m to US$120m, with a US$60m accordion option. The facility is provided by HSBC UK Bank PLC, J.P. Morgan Securities PLC and DBS Bank Ltd on similar terms to the previous arrangements, with a four-year term up to November 2023.
ADJUSTED PROFIT BEFORE TAX The Group generated adjusted profit before tax and specific items of £33.2 million, down 19% compared to last year, due to the higher direct costs incurred.
SPECIFIC ITEMSSpecific items are excluded from management’s assessment of profit because by either their size, or their nature they are non-repetitive and therefore could distort the Group’s underlying earnings.
In 2019, the Group incurred £9.2 million (2018: £3.6 million) of specific items, predominantly related to £3.2 million for amortisation of intangible assets due to business combination (2018: £2.8 million), costs associated with acquisitions of £0.9 million (2018: £0.6 million) and ERP implementation costs of £2.2 million (2018: £0.2 million). In addition, the Group incurred legal costs of £1.9 million (2018: £Nil) related to a non-customer related legal dispute in North America and restructuring costs of £1.0 million (2018: £Nil) related to the transfer of the manufacturing of all our low-power, high-voltage DC-DC modules to our Vietnamese facility.
TAXATION The effective tax rate on adjusted profit before tax decreased by 790bps to 9.6% (2018: 17.5%). The lower effective tax rate was due to one-off credits related to prior year tax assessments in the United States.
The effective tax rate on profit before tax decreased by 580 bps to 13.3% (2018: 19.1%). Going forward, XP Power expects the effective tax rate to be approximately 18-20% depending predominantly on the regional mix of profits.

40
PERFORMANCE: FINANCIAL REVIEW CONTINUED
ADJUSTED EARNINGS PER SHAREBasic and diluted adjusted earnings per share from continuing operations before specific items both decreased by 16% to 148.3 pence and 145.5 pence respectively (2018: 176.1 pence and 172.8 pence).
CASH FLOW The Group generated £46.2 million net cash from operations compared with £26.7 million in the previous year. The higher level of operating cash flows was largely a result of improved working capital management, specifically related to a £12.4 million reduction in inventory levels.
Free cash flow before acquisitions, dividends and repayment of borrowings was £26.2 million (2018: £10.9 million).
NET DEBT AND DIVIDENDSWe finished 2019 in a net debt position of £41.3 million (2018: £52.0 million), with the decrease due to improved cashflow generation and foreign exchange movements. The Group continued its progressive dividend policy which meant returning £16.7 million (2018: £15.3 million) to shareholders in the form of dividends.
The attractive cash flow generated by the XP Power business model has enabled the Company to pursue a progressive dividend policy over a sustained period of time.
This year’s cash flow performance has enabled us to recommend a final dividend of 36 pence per share for the fourth quarter of 2019. This dividend will be payable to members on the register on 27 March 2020 and will be paid on 28 April 2020. When combined with the interim dividends for the previous three quarters, the total dividend for the year will be 91 pence per share (2018: 85 pence), an increase of 7%.
The policy is to increase dividends progressively whilst maintaining an appropriate level of dividend cover. Dividend cover for the year was 1.2 times (2018: 1.9 times). We expect dividend cover to re-build based on strong long-term prospects.
FIXED ASSETS We continue to invest in our business with the majority of the spend being on manufacturing and supporting our future sales growth. We plan to invest circa £8 million during the new financial year, in line with 2019. This investment is principally related to upgrading our ERP system.
FINANCIAL INSTRUMENTS The Group’s financial instruments consist of cash, money market deposits, and various other items such as trade receivables and trade payables that arise directly from its business operations.
The Group uses forward currency contracts to hedge highly probable forecast transactions. The instruments purchased are denominated in the currencies of the Group’s principal markets. The Group had no forward currency contracts outstanding at 31 December 2019 (2018: £10.8 million).
BREXIT In terms of the broader economic impacts of Brexit on our business, we do not consider that they will be material. Our products are made in Asia and are already imported into Europe where we have warehouses in both Germany and the United Kingdom and hence, we could ship our product destined for the European Union directly into Germany or another appropriate location. Plans are in place that will help minimise any logistical issues that may arise following the United Kingdom’s exit from the European Union.
GAVIN GRIGGSChief Financial Officer
READ ABOUT MARKETPLACE ON PAGES 12 TO 15
READ ABOUT SUPPLY CHAIN PERFORMANCE ON PAGES 36 TO 37

XP Power Annual Report & Accounts for the year ended 31 December 2019 41
STRATEGIC REPORT

THE BOARDA robust risk assessment has been carried out at Board level and where possible actions set to mitigate and/or reduce the identified risk. The Board acknowledges that it is responsible for the Group’s internal controls and for reviewing their effectiveness. XP Power has an ongoing process for identifying, evaluating and managing the significant risks faced by the Group; these identified risks and processes are documented, reviewed and updated at Board meetings.
TOP DOWNIdentifying, assessing and mitigating risk at Group level. Setting the risk appetite for the Group
BOTTOM UPIdentifying, assessing and mitigating risk across functional areas
AUDIT COMMITTEE AND INTERNAL AUDITThe Audit Committee ensures that the Group is effectively managing risk and internal control procedures. This is achieved through:• The Audit Committee reviewing the effectiveness of internal controls.• An internal audit and risk assurance programme.
OPERATIONAL LEVELA key control procedure is the day-to-day supervision of the business; this is supported by managers within the Group’s companies. These include:• Authority matrices are in place to clearly define who is able to authorise
particular transactions, transfer funds, commit Company resources and enter into particular agreements.
• Monthly reporting of management accounts and key metrics to senior management with performance measured to budget and material variances reported to the Board.
• Quality control checks throughout our manufacturing process, burn in, electrical testing to detect early failures, 100% functional testing, and quality inspection.
• Disaster recovery and business continuity plans are in place at all facilities, documented and communicated to key personnel to help cope with unexpected events.
OUR RISK MANAGEMENT FRAMEWORK
42
MANAGING OUR RISKS
The Group has well-established annual and ongoing risk management processes to identify and assess risks.
The Group’s principal risks have been mapped onto a detailed risk universe from which key areas for business focus can be identified. This helps facilitate further discussions on risk appetite and draws out the risks that require a greater level of attention in terms of audit or assessment.
OUR RISK ASSESSMENTThe key risks that have been identified and the mitigating actions are summarised on the following pages and classified according to:
• The assessment of their level of impact to the viability of the business if they occurred – ranging from severe to minor;
• The likelihood of a risk occurring – ranging from high to low; and
• The direction in which they are trending – risks are classified according to whether they are assessed as becoming more likely to occur, less likely to occur or whether the risk of occurrence remains unchanged.
Although the attributes assigned to the identified risks are judgemental and qualitative in nature, the Board regards the methodology as useful in determining the focus that should be given to each risk.
This is not an exhaustive list of risks that the Board has identified and considered but does include all risks which are assessed as having a severe or moderate impact to the business if they occurred.
RISK APPETITEThe Board determines the appropriate level of risk for operating the business and pursuing their vision and strategic objectives. A key focus for the Board is minimising the Group’s exposure to financial, operational, human, legislative and reputational risks.

HEAT MAP OF THE IDENTIFIED RISKS INDICATING THE LIKELIHOOD AND LEVEL OF IMPACT
1An event that causes a disruption to one of our manufacturing facilities.
3Competition from new market entrants and new technologies.
4 Fluctuations of revenues, expenses and operating results due to an economic shock.
5 Dependence on key customers
6 Cybersecurity/information systems failure.
7 Risks relating to regulation, compliance and taxation.
8 Strategic risk associated with valuing or integrating new acquisitions.
9 Loss of key personnel or failure to attract new personnel.
10
11
Exposure to exchange rate fluctuations.
Supply Chain
2 Product recall.
2
Impact
Likelihood
Severe
MinorLow High
1
23
45
6
7 89
10
11
Risks that could have a severe impact on the Company’s business and possibly on the viability of the Company’s business
Risk Explanation of risk Potential impact MitigationAssessedtrend
1
AN EVENT CAUSES A DISRUPTION TO OUR MANUFACTURING FACILITIES
An event that results in the temporary or permanent loss of a manufacturing facility would be a serious issue.
As the Group manufactures 80% of revenues, this would undoubtedly cause at least a short-term loss of revenues and profits and disruption to our customers and therefore damage to reputation.
• We now have two facilities (China and Vietnam) where we are able to produce power supplies. However, not all power converter series can be produced in both facilities.
• We have disaster recovery plans in place for both facilities.
• We have undertaken a risk review with the manufacturing management to identify and assess risks which could cause a serious disruption to manufacturing, and then identified and implemented actions to reduce or mitigate these risks where possible.
2
PRODUCT RECALL
A product recall due to a quality or safety issue
This would have serious repercussions to the business in terms of potential cost and reputational damage as a supplier to critical systems.
• We perform 100% functional testing on all own manufactured products and 100% hi-pot testing, which determines the adequacy of electrical insulation on own manufactured products. This ensures the integrity of the isolation barrier between the mains supply and the end user of the equipment. We also test all the medical products we manufacture to ensure the leakage current is within the medical specifications.
• Where we have contracts with customers, we limit our contractual liability regarding recall costs.
• No single customer project accounts for more than 4% of overall revenue.
43XP Power Annual Report & Accounts for the year ended 31 December 2019
STRATEGIC REPORTKey
No change to risk Increase in risk Decrease in risk

Risks that could have a severe impact on the Company’s business and possibly on the viability of the Company’s business
Risk Explanation of risk Potential impact MitigationAssessedtrend
3
COMPETITION FROM NEW MARKET ENTRANTS AND NEW TECHNOLOGIES
The power supply market is diverse and competitive. The Directors believe that the development of new technologies could give rise to significant new competition to the Group, which may have a material effect on the business.
At the lower end of the Group’s target market, in terms of both power range and programme size, the barriers to entry are lower and there is, therefore, a risk that competition could quickly increase, particularly from emerging low cost manufacturers in Asia.
• The Group reviews activities of its competition, in particular product releases, and stays up-to-date with new technological advances in our industry, especially those relating to new components and materials. The Group also tries to keep its cost base competitive by operating in low cost geographies where appropriate.
• The general direction of our product roadmap is to move away from lower complexity products and to increase our engineering solutions capabilities as to reduce the inherent market competitiveness.
4
FLUCTUATIONS OF REVENUES, EXPENSES AND OPERATING RESULTS DUE TO AN ECONOMIC SHOCKS
The revenues, expenses and operating results of the Group could vary significantly from period to period as a result of a variety of factors, some of which are outside its control. These factors include: general economic conditions; adverse movements in interest rates; conditions specific to the market; seasonal trends in revenues, capital expenditure and other costs; and the introduction of new products or services by the Group, or by its competitors.
In response to a changing competitive environment, the Group may elect from time to time to make certain pricing, service, marketing decisions or acquisitions that could have a short-term material adverse effect on the Group’s revenues, results of operations and financial condition.
• Although not immune from an economic shock or the cyclicality of the capital equipment markets, the Group’s diverse customer base, geographic spread and revenue annuities reduce exposure to this risk.
• The Group’s business model is not capital intensive and the strong profit margins lead to healthy cash generation which also helps mitigate risks from these external factors.
• The Group benefits from good order exposure 12 months out allowing it to recognise market changes and mitigate the impact.
5
DEPENDENCE ON KEY CUSTOMERS
The Group is dependent on retaining its key customers.
Should the Group lose a number of its key customers, this could have a material impact on the Group’s financial condition and results of operations. However, for the year ended 31 December 2019, no single customer accounted for more than 10% of revenue.
• The Group mitigates this risk by providing excellent service. Customer complaints and non-conformances are reviewed monthly by members of the Executive Leadership team.
44
MANAGING OUR RISKS CONTINUED

Risks that could have a severe impact on the Company’s business and possibly on the viability of the Company’s business
Risk Explanation of risk Potential impact MitigationAssessedtrend
6
CYBERSECURITY/ INFORMATION SYSTEMS FAILURE
The Group is reliant on information technology in multiple aspects of the business from communications to data storage. Assets accessible online are potentially vulnerable to theft and customer channels are vulnerable to disruption.
Any failure or downtime of these systems or any data theft could have a significant adverse impact on the Group’s reputation or on the results of operations.
• The Group has a defined Business Impact Assessment which identifies the key information assets; replication of data on different systems or in the Cloud; an established backup process in place as well as a robust anti-malware solution on our networks.
• Internally produced training materials are used to educate users regarding good IT security practice and to promote the Group’s IT policy.
• A cyber assessment carried out by the outsourced internal auditor resulted in recommendations that are being implemented to further mitigate cyber risk and safeguard the Group’s assets.
7
RISKS RELATING TO REGULATION, COMPLIANCE AND TAXATION
The Group operates in multiple jurisdictions with applicable trade and tax regulations that vary.
Failing to comply with local regulations or a change in legislation could impact the profits of the Group. In addition, the effective tax rate of the Group is affected by where its profits fall geographically. The Group’s effective tax rate could therefore fluctuate over time and have an impact on earnings and potentially its share price.
• An outsourced internal audit function provides risk assurance in targeted areas of the business and recommendations for improvement. The scope of these reviews includes behaviour, culture and ethics.
• The Group hires employees with relevant skills and uses external advisers to keep up-to-date with changes in regulations and to remain compliant.
8
STRATEGIC RISK ASSOCIATED WITH VALUING OR INTEGRATING NEW ACQUISITIONS
The Group may elect from time to time to make strategic acquisitions. A degree of uncertainty exists in valuation and in particular in evaluating potential synergies.
Post-acquisition risks arise in the form of change of control and integration challenges. Any of these could have an effect on the Group’s revenues, results of operations and financial condition.
• Preparation of robust business plans and cash projections with sensitivity analysis and the help of professional advisers if appropriate.
• Post-acquisition reviews are performed to extract “lessons learned”.
STRATEGIC REPORT
45XP Power Annual Report & Accounts for the year ended 31 December 2019

Risks that could have a severe impact on the Company’s business and possibly on the viability of the Company’s business
Risk Explanation of risk Potential impact MitigationAssessedtrend
9
LOSS OF KEY PERSONNEL OR FAILURE TO ATTRACT NEW PERSONNEL
The future success of the Group is substantially dependent on the continued services and continuing contributions of its Directors, senior management and other key personnel.
The loss of the services of key employees could have a material adverse effect on the Group’s business.
• The Group undertakes performance evaluations and reviews to help it stay close to its key personnel as well as annual employee engagement surveys. Where considered appropriate, the Group also makes use of financial retention tools such as equity awards.
10
EXPOSURE TO EXCHANGE RATE FLUCTUATIONS
The Group deals in many currencies for both its purchases and sales including US Dollars, Euros and its reporting currency Pounds Sterling. In particular, North America represents an important geographic market for the Group where virtually all the revenues are denominated in US Dollars. The Group also sources components in US Dollars and the Chinese Yuan.
The Group therefore has an exposure to foreign currency fluctuations. This could lead to material adverse movements in reported earnings.
• The Group reviews balance sheet and cash flow currency exposures and where considered appropriate, uses forward exchange contracts to hedge these exposures. Any forward contract requires the approval of both the Chief Executive Officer and Chief Financial Officer.
• The Group does not hedge any translation of its subsidiaries’ results to Sterling for reporting purposes.
11
RISK ASSOCIATED WITH SUPPLY CHAIN
The Group is dependent on retaining its key suppliers and on their ability to meet their obligations to the Group. Supply Chain may also be affected by external events, such as the impact on our Chinese supply chain with the outbreak of the COVID-19 virus.
As the proportion of our own-manufactured products has increased, the reliance on suppliers for third party product has been mitigated proportionally. There has been a shift from a finished goods risk to a raw materials risk.
• We conduct regular audits of our key suppliers and in addition keep large amounts of safety inventory of key components, which we also regularly review. We also dual source our components where possible to minimise dependency on any single supplier.
46
MANAGING OUR RISKS CONTINUED

VIABILITY STATEMENTIn accordance with provision 31 of the 2018 revision of the UK Corporate Governance Code, the Directors are required to assess the prospects of the Company over a period longer than the 12 months required by the “Going Concern” provision.
In making the assessment, the Directors considered a three-year financial model including the Group Annual Plan for 2020 and strategic financial plan for the years beyond this. The Directors assessed the viability of the Company over a three-year period as this timeframe is within the Group’s strategic financial planning period used to evaluate performance and liquidity and aligns with the design-in cycle for which the Group has visibility.
In determining the viability term, the Board assessed the deliberately austere scenarios against the controls in place to prevent or mitigate the risks occurring.
It also considered them against the Group’s current banking facilities, a revolving credit facility of US$120 million which expires in November 2023.
The Company has a business model where its products are designed into numerous applications, with numerous customers, in numerous geographies. The Company’s products are all designed into capital equipment which is generally in production for a number of consecutive years, resulting in a revenue annuity. This diversity and revenue annuity are both deemed important factors in mitigating many of the risks that could affect the long-term viability of the Group. Nevertheless, the Directors’ obligation is to assess the Company’s viability in conjunction with the principal risks that could cause a severe but plausible threat. The major risks set out on pages 42 to 46 were each modelled in a hypothetical and deliberately austere scenario to help determine the potential effect, primarily to cash flow.
The financial model was stress-tested with scenarios which considered the principal risks identified in the Group’s annual risk assessment process. Certain subjective assumptions and judgments were made to achieve this. Given the cash generative nature of the business, each risk scenario occurring in isolation did not breach the Group’s theoretical borrowing facility headroom. The most severe threats occurring in isolation were found to be a serious and prolonged systems failure, such as to our ERP or CRM systems, or a significant and permanent economic collapse/significant competition scenario.
Scenarios were also prepared to model the unlikely event of more than one risk occurring at the same time. A combination of a temporary or permanent disruption at one of our facilities together with a serious and prolonged economic shock and a combination of tax and regulations compliance failure together with a serious and prolonged economic shock was modelled. In neither of these two scenarios did the Group breach its theoretical borrowing capacity. Based on this assessment, the Directors confirm that they have a reasonable expectation that the Company is viable for at least a period of three years to 31 December 2022.
XP Power Annual Report & Accounts for the year ended 31 December 2019 47
STRATEGIC REPORT

48
OUR COMMITMENTS TO SUSTAINABILITY
SEAN ROSSEnvironmental Committee Chairman and Vice President of Quality Assurance
“This past year represented a significant milestone for our sustainability program. We surpassed over 500,000 tonnes of CO2 savings of “Green” XP Power products that have been shipped and in use since 2010. This further demonstrates the strategy of introducing green products to market has the most significant impact on the environment and aligns with the interests of our stakeholders.”
OUR COMMITMENTThe past ten years we have been a member of the RBA. This has helped us establish a base foundation from which we continue to further expand on our sustainability program.With our stakeholders we further promote a culture and clear understanding of our commitment to lead our industry on Environmental, Social and Governance matters.
A global Environmental Committee has been established which helps us achieve our vision of leading our industry on environmental matters. This group meets quarterly to collaborate and share ideas for engagement and key initiatives. This further encourages getting involved and giving back to our local communities. Members from all of our core locations are represented and set up activities within the community, promoting new environmental initiatives and encouraging more awareness of our programme.
OUR IMPACTSWe continuously review the impact that we as an organisation have on the environment. The review is consistent with our past conclusions that the greatest environmental impact we can have is the efficiency of the total power solution we provide to our customers. As part of our design and development process we have further expanded on our ultra-high efficiency products within our product portfolio. These “Green” XP Power products require less energy, are void of hazardous substances and consume less material. We continue to promote the use of these products to our customers, and the benefit of using “Green” XP Power products. These types of products help maximise energy savings during the entire lifetime of the customers’ end application. In addition, we also continue to ensure we are adopting the best practices in all of our facilities and continually promoting awareness of environmental issues among our people.
OUR SUSTAINABILITY STRATEGYXP Power’s strategy is to further product development of those power converters with industry-leading efficiency. This helps reduce the amount of wastage and heat loss during operation within a customers’ end application. The solutions we are able to develop can achieve efficiency of up to 95%. This provides a significant reduction in CO2 emissions over the lifetime of the customers’ equipment.
As we have demonstrated in the past, the example below helps convey the significance of this delta in efficiency rating:
• XP Power supplies 95% efficient products to power 100 watt load. 105 watts of input power is required to deliver 100 watts at this level of efficiency.
• Competitor supplies an 80% efficient, products to power 100 watt load. 125 watts of input power is required to deliver 100 watts at this level of efficiency.
• Moving from 80% efficiency to 95% is actually a five-fold saving in waste energy.
The waste heat as highlighted above is calculated in watts. There is a significant difference considering there is a five-fold improvement in energy wastage and the overall potential for savings will be throughout the entire lifetime of electronic equipment. To achieve these efficiency gains requires a greater number of higher cost components and more complex circuits.
The return on investment of a higher efficiency product can be captured in terms of consumption of electricity. The full payback on electricity costs is usually within the first year of use. Therefore, we continue to promote and encourage the use of these high efficiency products.
We anticipate that the trend in the market through both demand and legislation for higher efficiency products is expected to continue in the electronics industry. These legislative requirements are projected to extend across various industries from consumer equipment to the healthcare and industrial markets that we serve.

XP Power Annual Report & Accounts for the year ended 31 December 2019 49
STRATEGIC REPORT
OUR KEY ACHIEVEMENTS IN 2019There were three key significant environmental initiatives within the business:1. Surpassing 500,000 tonnes of CO2
savings from “Green” XP Power products.
2. Further integration of past acquisitions into the XP Power sustainability programme.
3. Introduction of additional “Green” XP Power products.
The revenue growth of our “Green” XP Power products continues to increase. In 2019 we shipped £43.2 million of our green products, which was an increase of 3% from 2018.
Of the 32 product families that we launched in 2019, 25 were “Green” XP Power products having high efficiency and/or low standby power.
The calculated annual savings in CO2 from these products compared to a standard 80% efficient converter are significant.
Based on our calculations, we estimate that the annual CO2 emissions savings from the “Green” XP Power converters we sold in 2019 is 33,736 tonnes, which is a slight increase from 2018.
The annual savings will recur each year for the lifetime of the product, which we estimate conservatively as seven years.
This would result in lifetime savings of 236,157 tonnes of CO2 for products shipped in 2019. This past year represented a significant milestone for our sustainability program. We surpassed over 500,000 tonnes of CO2 savings of “Green” XP Power products that have been shipped and in use since 2010. This further demonstrates the strategy of introducing green products to market has the most significant impact on the environment and aligns with the interests of our stakeholders.
SUSTAINABILITY INITIATIVE – CELEBRATING THE EARTHAs in previous years we used 22 April, Earth Day, as a platform to launch an entire week of environmental awareness. Some activities across our global locations included community refuse clean up, e-waste collection, reduction of plastic drink materials and planting of vegetation.
ECONOMIC SUSTAINABILITYAs well as responsible environmental and social responsibility practices we consider the sustainability of our business model and business practices. Our Code of Conduct sets high standards in terms of how we treat people, health and safety, integrity and business ethics, as well as the environment and how we support the communities in which we operate. We consider that this not only makes XP Power a great place to work and to do business with, but also ensures that we have a sustainable economic business model. Our movement up the value from specialist distributor through to design manufacturer has strengthened and supported our economic sustainability.
OUR PLANS FOR THE YEAR AHEADAs products we bring to market have the most significant impact, we will continue to introduce “Green” XP Power products.
25NEW XP POWER GREEN PRODUCTS LAUNCHED

READ ABOUT CULTURE ON PAGES 72 AND 73
We have utilised this framework as it is committed to solving global issues. As a transnational organisation, this is vitally important to us.
Through the application of the SDGs, the wider business environment and markets will be strengthened. Organisations can harness the 17 Sustainable Development Goals to drive growth, address risk, attract capital and focus on purpose (https://www.ey.com/en_gl/assurance/why-sustainable-development-goals-should-be-in-your-business-plan).
XP POWER IS COMMITTED TO CREATING LONG-TERM SUSTAINABLE VALUE FOR OUR STAKEHOLDERS
To achieve this goal, we have aligned our operations with the Sustainable Development Goals, providing us with a framework to map against.
In our last report we began to outline our commitment to the SDGs. Within this report we will discuss our continued progress against the goals.
OUR SUSTAINABILITY FRAMEWORK
The Sustainable Development Goals, created by the UN, are the blueprint to achieve a better and more sustainable future for all. They address the global challenges we face, including those related to poverty, inequality, poor sanitation and diseases.
50
OUR COMMITMENT TO THE SDGS
50

HOW XP POWER MEASURE AGAINST THE SDGS
We have outlined below the key SDGs that we believe we can impact the most.
03 GOOD HEALTH AND WELL-BEINGXP Power focuses on the wellbeing of our employees. We also work within the healthcare sector, supporting good health. Through our commitment to a more environmentally friendly society, we support the eradication of hazardous chemicals in the environment.
09 INDUSTRY, INNOVATION AND INFRASTRUCTUREOur core value of knowledge demonstrates our desire to constantly innovate. This is exemplified by our green products. We support our customers’ innovation through the power solutions we provide to power their leading applications. Our power converters enable infrastructure.
04 QUALITY EDUCATIONAs an organisation, XP Power are committed to continually improving their training and development. Our core value of knowledge supports this SDGs. We promote quality education and ensure opportunities are available. We have worked with schools in our communities to promote science and electronics in particular.
10 REDUCED INEQUALITIESAt XP Power, we are committed to empowering and promoting the inclusion of all. We ensure equal opportunities and adopt policies to ensure this. We recognise the benefits of a diverse and talented workforce and consider this a competitive advantage.
05 GENDER EQUALITYWe support the movement to end all forms of discrimination of women and girls by enabling their full participation at XP Power. We promote workforce diversity and ensure all women can participate in all levels of the business.
12 RESPONSIBLE CONSUMPTION AND PRODUCTIONWe aim to achieve the sustainable management and efficient use of natural resources. We integrate sustainable practices into our operations. We also raise awareness around sustainable development and desire to be a leader in our industry on environmental matters.
07 AFFORDABLE AND CLEAN ENERGYOur expansion into “Green” products supports our strategic aim of leading our industry on environmental matters. These green products require less energy, are void of hazardous substances and consume less material. We believe we are leading our industry in this area.
13 CLIMATE ACTIONThrough our green products and focus on reducing CO2 emissions we are supportingthe reduction in greenhouse gases. We are integrating climate change measures into the business through monitoring emissions and carbon disclosures.
08 DECENT WORK AND ECONOMIC GROWTHWe promote decent work for all women and men, including for young people and persons withdisabilities, and equal pay for work of equal value. We also take action to eradicate modern slavery through our modern slavery statement business practices.
16 PEACE, JUSTICE AND STRONG INSTITUTIONSOur modern slavery statement and participation in the Responsible Business Alliance demonstrate our allegiance to this goal. We work towards ensuring our supply chain partners have the same approach towards ethical business practices as XP Power.
STRATEGIC REPORT
XP Power Annual Report & Accounts for the year ended 31 December 2019 51

Honest in all our interactions with our colleagues, customers and suppliers
Always doing the right thing
Taking care of our people ensuring XP Power is a great place to work where we trust the people we work with, have pride in what we do and gain enjoyment from our work
Responding to our customers and colleagues with impressive speed
Constantly looking at faster and more efficient ways of delivering value in everything we do
Our progression from a specialist distributor, to designer, to design manufacturer demonstrate our core values in action. This shift demonstrates a clear customer focus and commitment to supporting their needs. We have strengthened our knowledge, acted with speed and flexibility whilst maintaining integrity.
Delivering genuine value to our customers through our knowledge and experience
Continually developing our skills and capabilities as individuals and as an organisation
Receptive to the needs of our customers to provide outstanding customer service
Willing to challenge the way we do things and adapt to constantly improve and innovate
Collaborating with our colleagues and customers for better results
Always considering our customers' experience in everything we do
Never forgetting that without our customer we do not have a business
LINK TO THE SDGSOur core values are fundamental to our organisational activities. They underpin how we operate and our business decisions.
We act with integrity through our commitment to reducing inequalities and ensuring responsible consumption and production. We understand the issues around greenhouse gas emissions and therefore support environmentally friendly options. In addition, we treat our employees with integrity and support their wellbeing. We ensure the reduction of corruption and are committed to ending abuse and exploitation of children.
Through our commitment to increased knowledge we ensure a quality education as well as decent work and economic growth.
We are flexible through our desire to constantly innovate, aligned with the goal around industry, innovation and infrastructure.
The importance of speed and responding to customers furthers our ability to support economic growth. It also supports the development of industry.
Our customer focus helps us to support local infrastructure and industries through our innovative approach.
OUR CORE VALUES
INTEGRITY
KNOWLEDGE
FLEXIBILITY
SPEED
CUSTOMER FOCUS
52
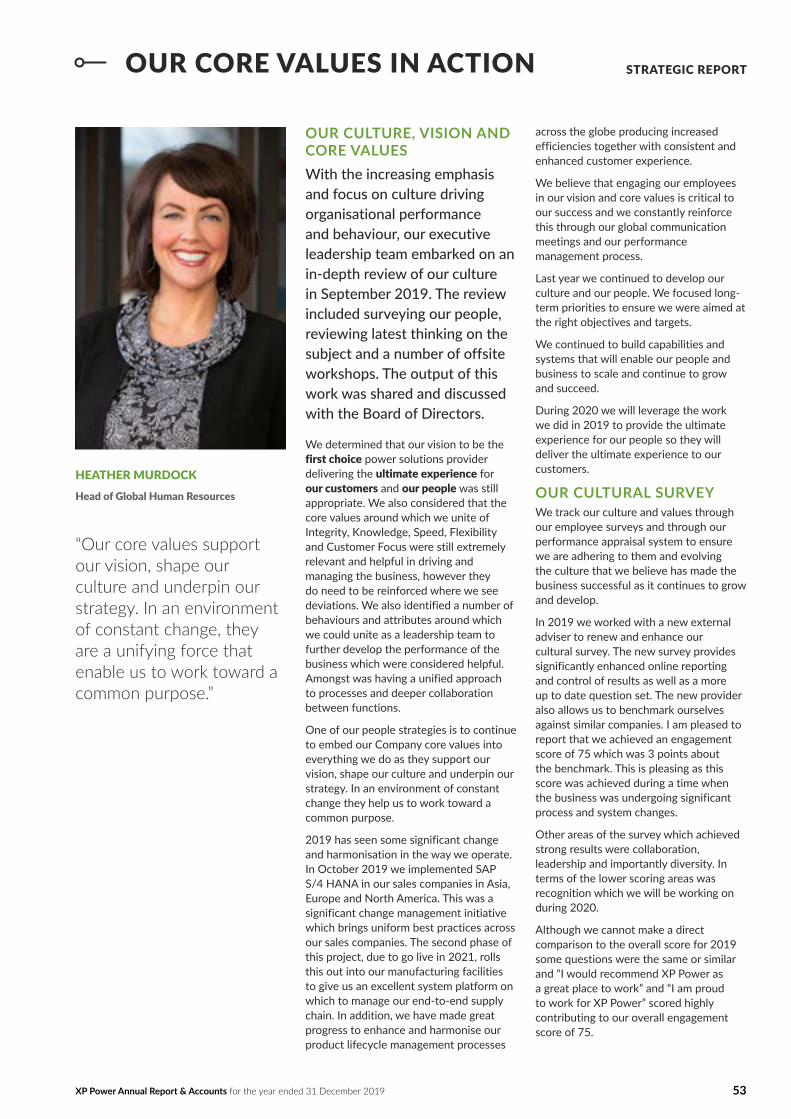
HEATHER MURDOCKHead of Global Human Resources
“Our core values support our vision, shape our culture and underpin our strategy. In an environment of constant change, they are a unifying force that enable us to work toward a common purpose.”
OUR CULTURE, VISION AND CORE VALUESWith the increasing emphasis and focus on culture driving organisational performance and behaviour, our executive leadership team embarked on an in-depth review of our culture in September 2019. The review included surveying our people, reviewing latest thinking on the subject and a number of offsite workshops. The output of this work was shared and discussed with the Board of Directors.
We determined that our vision to be the first choice power solutions provider delivering the ultimate experience for our customers and our people was still appropriate. We also considered that the core values around which we unite of Integrity, Knowledge, Speed, Flexibility and Customer Focus were still extremely relevant and helpful in driving and managing the business, however they do need to be reinforced where we see deviations. We also identified a number of behaviours and attributes around which we could unite as a leadership team to further develop the performance of the business which were considered helpful. Amongst was having a unified approach to processes and deeper collaboration between functions.
One of our people strategies is to continue to embed our Company core values into everything we do as they support our vision, shape our culture and underpin our strategy. In an environment of constant change they help us to work toward a common purpose.
2019 has seen some significant change and harmonisation in the way we operate. In October 2019 we implemented SAP S/4 HANA in our sales companies in Asia, Europe and North America. This was a significant change management initiative which brings uniform best practices across our sales companies. The second phase of this project, due to go live in 2021, rolls this out into our manufacturing facilities to give us an excellent system platform on which to manage our end-to-end supply chain. In addition, we have made great progress to enhance and harmonise our product lifecycle management processes
across the globe producing increased efficiencies together with consistent and enhanced customer experience.
We believe that engaging our employees in our vision and core values is critical to our success and we constantly reinforce this through our global communication meetings and our performance management process.
Last year we continued to develop our culture and our people. We focused long-term priorities to ensure we were aimed at the right objectives and targets.
We continued to build capabilities and systems that will enable our people and business to scale and continue to grow and succeed.
During 2020 we will leverage the work we did in 2019 to provide the ultimate experience for our people so they will deliver the ultimate experience to our customers.
OUR CULTURAL SURVEYWe track our culture and values through our employee surveys and through our performance appraisal system to ensure we are adhering to them and evolving the culture that we believe has made the business successful as it continues to grow and develop.
In 2019 we worked with a new external adviser to renew and enhance our cultural survey. The new survey provides significantly enhanced online reporting and control of results as well as a more up to date question set. The new provider also allows us to benchmark ourselves against similar companies. I am pleased to report that we achieved an engagement score of 75 which was 3 points about the benchmark. This is pleasing as this score was achieved during a time when the business was undergoing significant process and system changes.
Other areas of the survey which achieved strong results were collaboration, leadership and importantly diversity. In terms of the lower scoring areas was recognition which we will be working on during 2020.
Although we cannot make a direct comparison to the overall score for 2019 some questions were the same or similar and “I would recommend XP Power as a great place to work” and “I am proud to work for XP Power” scored highly contributing to our overall engagement score of 75.
STRATEGIC REPORT
53XP Power Annual Report & Accounts for the year ended 31 December 2019
OUR CORE VALUES IN ACTION
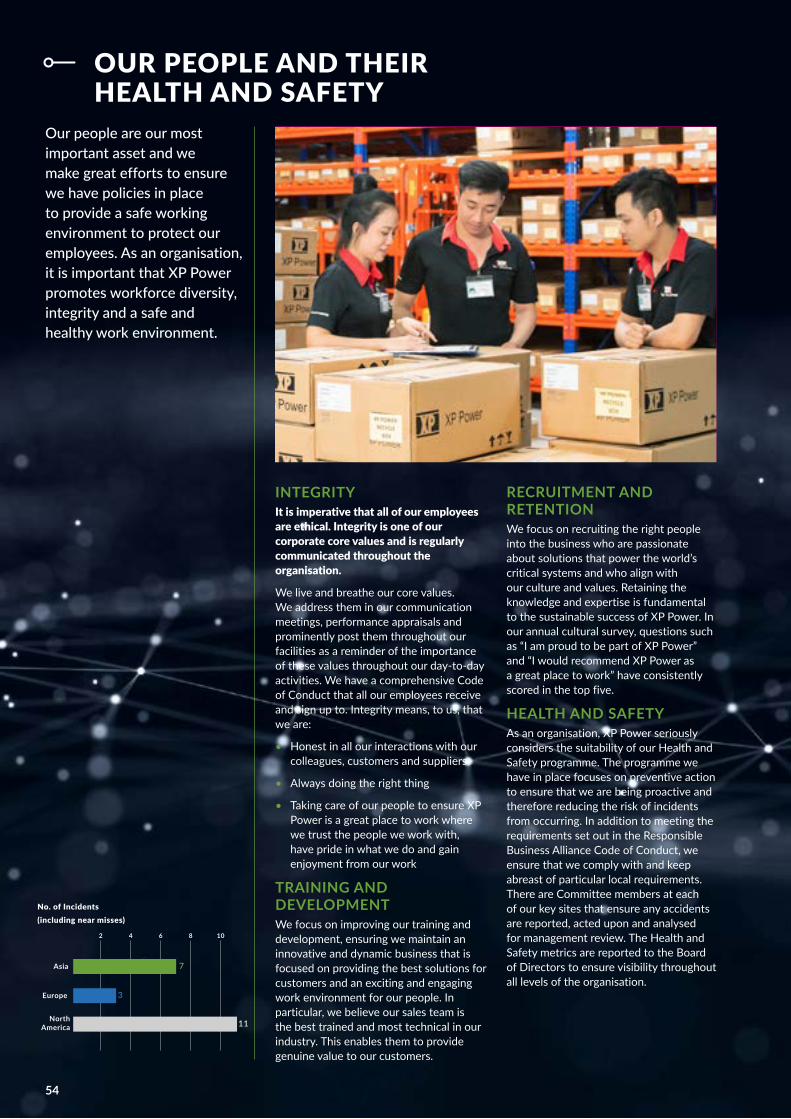
No. of Incidents (including near misses)
Our people are our most important asset and we make great efforts to ensure we have policies in place to provide a safe working environment to protect our employees. As an organisation, it is important that XP Power promotes workforce diversity, integrity and a safe and healthy work environment.
INTEGRITYIt is imperative that all of our employees are ethical. Integrity is one of our corporate core values and is regularly communicated throughout the organisation.
We live and breathe our core values. We address them in our communication meetings, performance appraisals and prominently post them throughout our facilities as a reminder of the importance of these values throughout our day-to-day activities. We have a comprehensive Code of Conduct that all our employees receive and sign up to. Integrity means, to us, that we are:
• Honest in all our interactions with our colleagues, customers and suppliers
• Always doing the right thing
• Taking care of our people to ensure XP Power is a great place to work where we trust the people we work with, have pride in what we do and gain enjoyment from our work
TRAINING AND DEVELOPMENTWe focus on improving our training and development, ensuring we maintain an innovative and dynamic business that is focused on providing the best solutions for customers and an exciting and engaging work environment for our people. In particular, we believe our sales team is the best trained and most technical in our industry. This enables them to provide genuine value to our customers.
RECRUITMENT AND RETENTIONWe focus on recruiting the right people into the business who are passionate about solutions that power the world’s critical systems and who align with our culture and values. Retaining the knowledge and expertise is fundamental to the sustainable success of XP Power. In our annual cultural survey, questions such as “I am proud to be part of XP Power” and “I would recommend XP Power as a great place to work” have consistently scored in the top five.
HEALTH AND SAFETYAs an organisation, XP Power seriously considers the suitability of our Health and Safety programme. The programme we have in place focuses on preventive action to ensure that we are being proactive and therefore reducing the risk of incidents from occurring. In addition to meeting the requirements set out in the Responsible Business Alliance Code of Conduct, we ensure that we comply with and keep abreast of particular local requirements. There are Committee members at each of our key sites that ensure any accidents are reported, acted upon and analysed for management review. The Health and Safety metrics are reported to the Board of Directors to ensure visibility throughout all levels of the organisation.
4 8 102 6
11
3
7
NorthAmerica
Europe
Asia
54
OUR PEOPLE AND THEIR HEALTH AND SAFETY
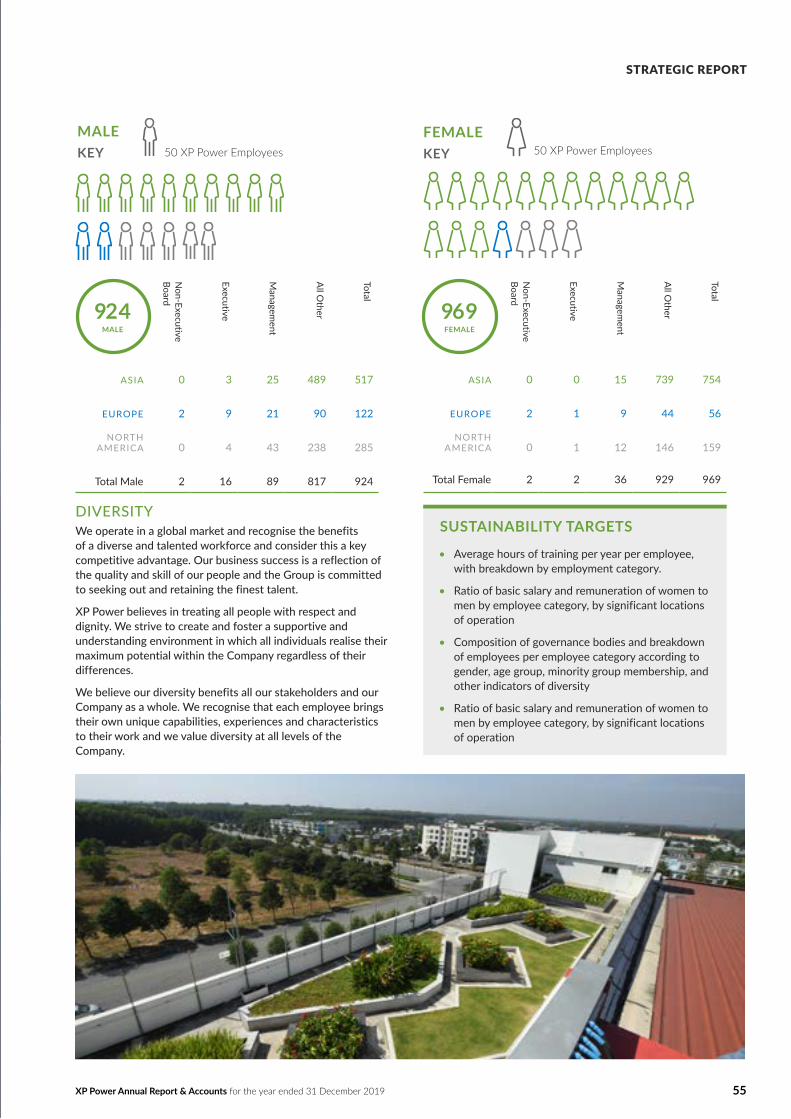
SUSTAINABILITY TARGETS
• Average hours of training per year per employee, with breakdown by employment category.
• Ratio of basic salary and remuneration of women to men by employee category, by significant locations of operation
• Composition of governance bodies and breakdown of employees per employee category according to gender, age group, minority group membership, and other indicators of diversity
• Ratio of basic salary and remuneration of women to men by employee category, by significant locations of operation
DIVERSITYWe operate in a global market and recognise the benefits of a diverse and talented workforce and consider this a key competitive advantage. Our business success is a reflection of the quality and skill of our people and the Group is committed to seeking out and retaining the finest talent.
XP Power believes in treating all people with respect and dignity. We strive to create and foster a supportive and understanding environment in which all individuals realise their maximum potential within the Company regardless of their differences.
We believe our diversity benefits all our stakeholders and our Company as a whole. We recognise that each employee brings their own unique capabilities, experiences and characteristics to their work and we value diversity at all levels of the Company.
Non-Executive
Board
Executive
Managem
ent
All O
ther
Total
ASIA 0 3 25 489 517
EUROPE 2 9 21 90 122
NORTHAMERICA 0 4 43 238 285
Total Male 2 16 89 817 924
Non-Executive
Board
Executive
Managem
ent
All O
ther
Total
ASIA 0 0 15 739 754
EUROPE 2 1 9 44 56
NORTH AMERICA 0 1 12 146 159
Total Female 2 2 36 929 969
MALEKEY 50 XP Power Employees 50 XP Power Employees
FEMALEKEY
924MALE
969FEMALE
55XP Power Annual Report & Accounts for the year ended 31 December 2019
STRATEGIC REPORT
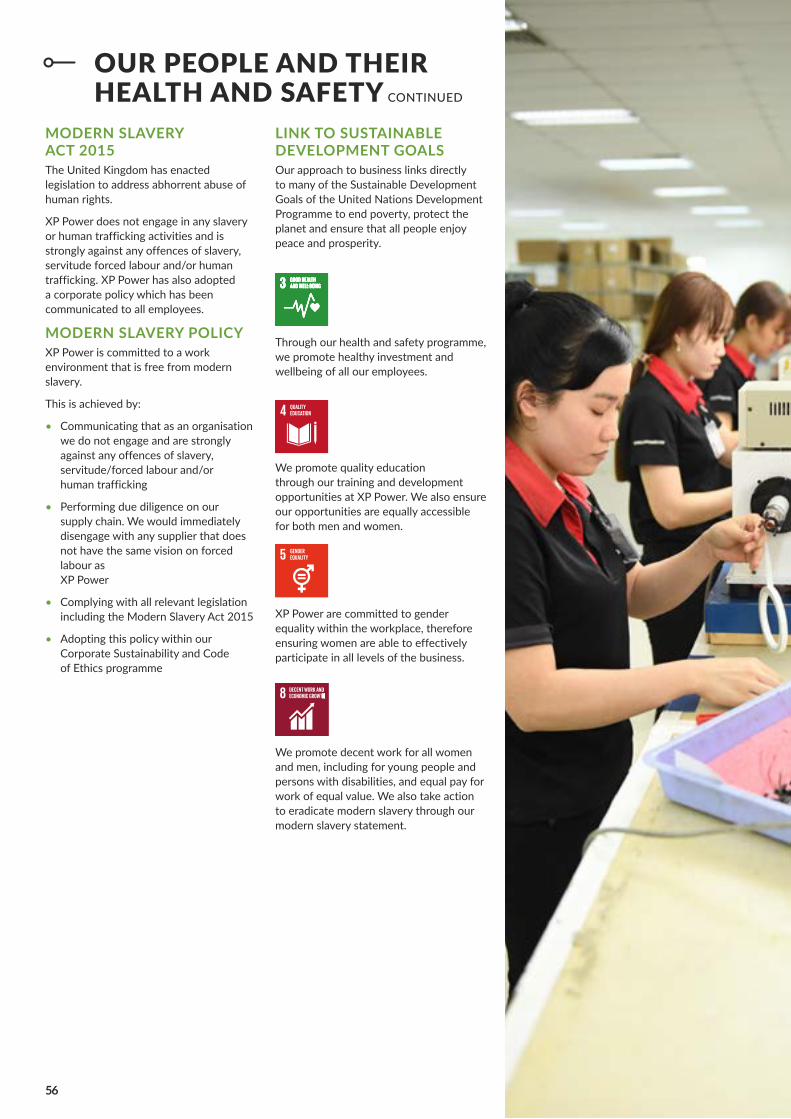
Through our health and safety programme, we promote healthy investment and wellbeing of all our employees.
We promote quality education through our training and development opportunities at XP Power. We also ensure our opportunities are equally accessible for both men and women.
XP Power are committed to gender equality within the workplace, therefore ensuring women are able to effectively participate in all levels of the business.
We promote decent work for all women and men, including for young people and persons with disabilities, and equal pay for work of equal value. We also take action to eradicate modern slavery through our modern slavery statement.
MODERN SLAVERY ACT 2015The United Kingdom has enacted legislation to address abhorrent abuse of human rights.
XP Power does not engage in any slavery or human trafficking activities and is strongly against any offences of slavery, servitude forced labour and/or human trafficking. XP Power has also adopted a corporate policy which has been communicated to all employees.
MODERN SLAVERY POLICY XP Power is committed to a work environment that is free from modern slavery.
This is achieved by:
• Communicating that as an organisation we do not engage and are strongly against any offences of slavery, servitude/forced labour and/or human trafficking
• Performing due diligence on our supply chain. We would immediately disengage with any supplier that does not have the same vision on forced labour as XP Power
• Complying with all relevant legislation including the Modern Slavery Act 2015
• Adopting this policy within our Corporate Sustainability and Code of Ethics programme
LINK TO SUSTAINABLE DEVELOPMENT GOALSOur approach to business links directly to many of the Sustainable Development Goals of the United Nations Development Programme to end poverty, protect the planet and ensure that all people enjoy peace and prosperity.
56
OUR PEOPLE AND THEIR HEALTH AND SAFETY CONTINUED
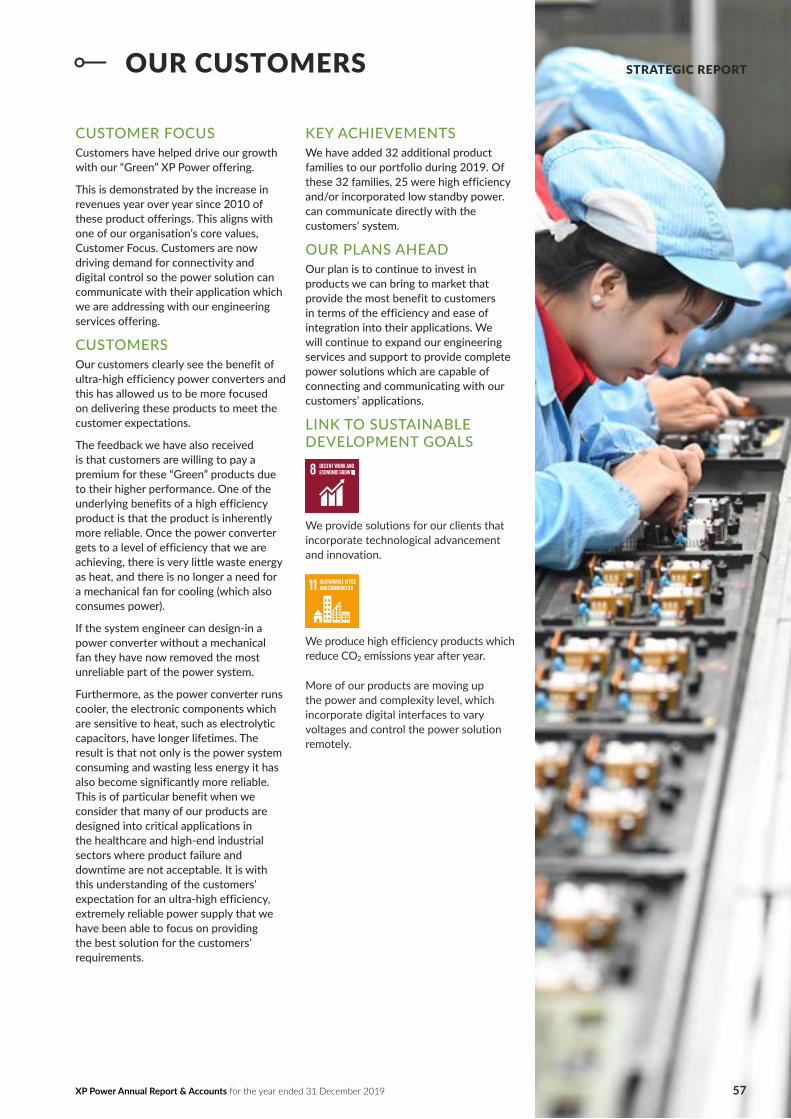
CUSTOMER FOCUSCustomers have helped drive our growth with our “Green” XP Power offering.
This is demonstrated by the increase in revenues year over year since 2010 of these product offerings. This aligns with one of our organisation’s core values, Customer Focus. Customers are now driving demand for connectivity and digital control so the power solution can communicate with their application which we are addressing with our engineering services offering.
CUSTOMERSOur customers clearly see the benefit of ultra-high efficiency power converters and this has allowed us to be more focused on delivering these products to meet the customer expectations.
The feedback we have also received is that customers are willing to pay a premium for these “Green” products due to their higher performance. One of the underlying benefits of a high efficiency product is that the product is inherently more reliable. Once the power converter gets to a level of efficiency that we are achieving, there is very little waste energy as heat, and there is no longer a need for a mechanical fan for cooling (which also consumes power).
If the system engineer can design-in a power converter without a mechanical fan they have now removed the most unreliable part of the power system.
Furthermore, as the power converter runs cooler, the electronic components which are sensitive to heat, such as electrolytic capacitors, have longer lifetimes. The result is that not only is the power system consuming and wasting less energy it has also become significantly more reliable. This is of particular benefit when we consider that many of our products are designed into critical applications in the healthcare and high-end industrial sectors where product failure and downtime are not acceptable. It is with this understanding of the customers’ expectation for an ultra-high efficiency, extremely reliable power supply that we have been able to focus on providing the best solution for the customers’ requirements.
KEY ACHIEVEMENTSWe have added 32 additional product families to our portfolio during 2019. Of these 32 families, 25 were high efficiency and/or incorporated low standby power. can communicate directly with the customers’ system.
OUR PLANS AHEADOur plan is to continue to invest in products we can bring to market that provide the most benefit to customers in terms of the efficiency and ease of integration into their applications. We will continue to expand our engineering services and support to provide complete power solutions which are capable of connecting and communicating with our customers’ applications.
LINK TO SUSTAINABLE DEVELOPMENT GOALS
We provide solutions for our clients that incorporate technological advancement and innovation.
We produce high efficiency products which reduce CO2 emissions year after year.
More of our products are moving up the power and complexity level, which incorporate digital interfaces to vary voltages and control the power solution remotely.
XP Power Annual Report & Accounts for the year ended 31 December 2019 57
STRATEGIC REPORTOUR CUSTOMERS

RESPONSIBLE BUSINESS ALLIANCE (RBA)The United Kingdom has enacted legislation to address abhorrent abuse of human rights.
XP Power does not engage in any slavery or human trafficking activities and is strongly against any offences of slavery, servitude/forced labour and/or human trafficking.
XP Power has also adopted a corporate policy which has been communicated to all employees.
SUPPLY CHAIN ETHICSOne of the key elements of XP Power’s core values is Integrity. We work towards ensuring our supply chain partners have the same approach towards ethical business practices as XP Power. This is done by a stringent on-site qualification process of potential new suppliers. It includes an assessment regarding environmental performance, treatment of labour, health and safety and business ethics standards. As the suppliers we engage with are considered long-term partners it is imperative that these suppliers share our vision.
The XP Power ethics policy is included within our Code of Conduct and includes the following requirements as it relates to suppliers:
• We will uphold high levels of business ethics in dealing with our suppliers; and
• We will not at any time take or give bribes or other means of inducement to obtain improper advantage.
These requirements have been actively communicated to our people and our supply chain partners.
SUPPLY CHAIN DUE DILIGENCEAs part of our due diligence process within our supply chain, we have updated our qualification process to include an evaluation to ensure our suppliers do not engage in or support any slavery, human trafficking, servitude or forced labour. We disengage with suppliers that fail to meet our vision on ethical standards.
In 2010 the US Dodd-Frank Wall Street Reform and Consumer Protection Action was passed concerning “conflict minerals” originating from the Democratic Republic of the Congo or adjoining countries. XP Power has worked with our suppliers to
try and eliminate using those sources that have originated from those countries in question. We have adopted the reporting template issued by the Global e-Sustainability Initiative (GeSI) and Responsible Business Alliance which we provide to our customers so they gain the necessary assurance we are not using conflict minerals in our products.
OUR PLANS FOR THE YEAR AHEADThe supply chain programme we have in place has been extremely effective in promoting industry-leading sustainable programmes with our suppliers.
We will continue to expand this programme as we determine additional ethical requirements that are in alignment with our core values.
LINK TO SUSTAINABLE DEVELOPMENT GOALSOur approach to business links directly to many of the Sustainable Development Goals of the United Nations Development Programme to end poverty, protect the planet and ensure that all people enjoy peace and prosperity.
We work with suppliers that are ethical and thereby achieve full and productive employment for all genders, ethnicities and persons with disabilities.
We source from responsible suppliers and ensure that our facilities have minimal impact on the environment.
Through the RBA we support increased transparency and accountability for suppliers.
58
OUR SUPPLIERS

COMMUNICATING WITH ALL OUR SHAREHOLDERSCommunicating what a power converter actually does and how we deliver genuine value to our customers can be challenging, especially to individual investors who do not have the advantage of face-to-face meetings with management. We make use of videos which we post to our investor relations website which explain:• what a power converter is;• the markets we serve;• our strategy;• our business model;• our fundamental growth drivers; and• our investment proposition.
We also have videos which shows the types of applications we power and how power converters are all around us but hidden from view. In providing this information we are attempting to reach out to our current and prospective shareholders to give them the best information we can. We also publish a video presentation of our results the morning of our interim and annual earnings release. Investors are able to register for our investor alert service via a website so they can receive timely notifications of all our regulatory announcements.
Our Non-Executives also make themselves available and consult our major shareholders on key issues such as corporate governance and remuneration policies.
SUSTAINABILITY TARGETS
• Number of board meetings and attendance rate
• Existence of audit committee, number of meetings and attendance rate
CREATING VALUE FOR SHAREHOLDERS We are conscious that some of the markets we operate in are cyclical which is true of semiconductor manufacturing equipment and to industrial electronics; our healthcare business is much less cyclical. Combined with our high gross margins and high operational gearing this naturally causes significant movement in our earnings through the cycles. Our business model is highly cash generative and this combined with our consistent profitability allows us to maintain a progressive dividend policy throughout the cycles. Since listing in 2000 our dividend has never declined and has grown at an average compound rate in excess of 15% over the last 10 years. We are proud of our consistent delivery of value to our shareholders.
XP Power Annual Report & Accounts for the year ended 31 December 2019 59
STRATEGIC REPORTOUR SHAREHOLDERS
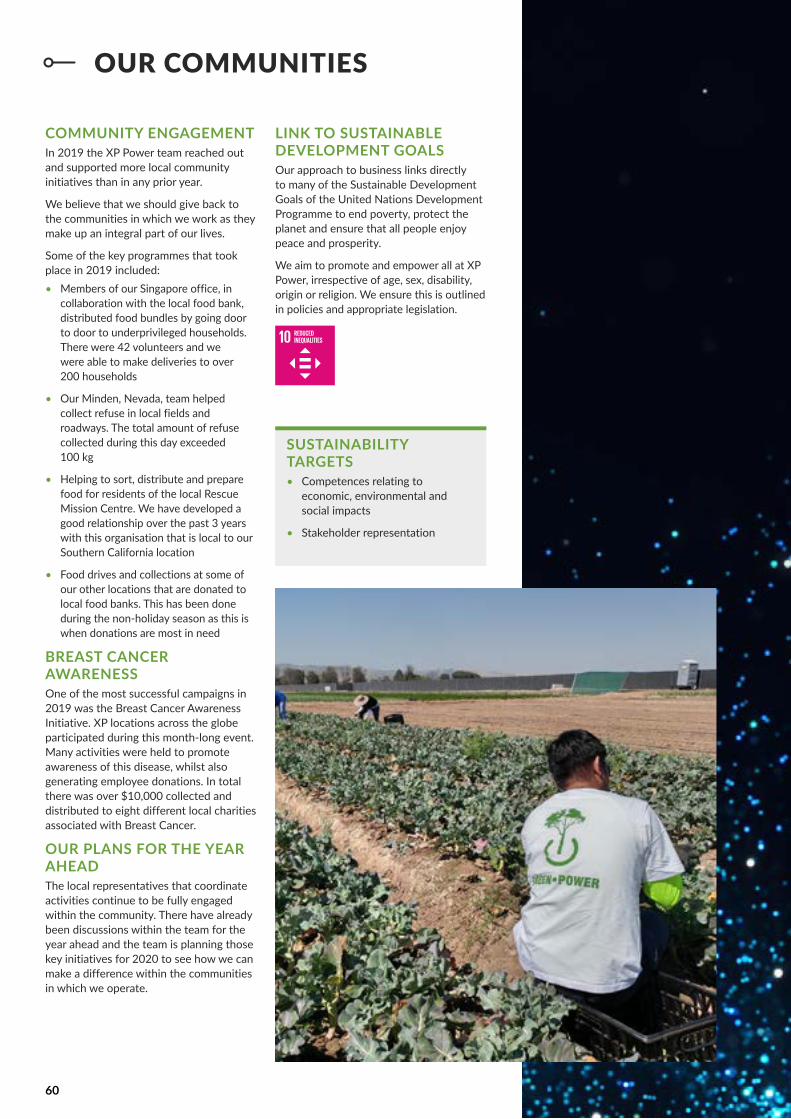
60
OUR COMMUNITIES
COMMUNITY ENGAGEMENTIn 2019 the XP Power team reached out and supported more local community initiatives than in any prior year.
We believe that we should give back to the communities in which we work as they make up an integral part of our lives.
Some of the key programmes that took place in 2019 included:• Members of our Singapore office, in
collaboration with the local food bank, distributed food bundles by going door to door to underprivileged households. There were 42 volunteers and we were able to make deliveries to over 200 households
• Our Minden, Nevada, team helped collect refuse in local fields and roadways. The total amount of refuse collected during this day exceeded 100 kg
• Helping to sort, distribute and prepare food for residents of the local Rescue Mission Centre. We have developed a good relationship over the past 3 years with this organisation that is local to our Southern California location
• Food drives and collections at some of our other locations that are donated to local food banks. This has been done during the non-holiday season as this is when donations are most in need
BREAST CANCER AWARENESSOne of the most successful campaigns in 2019 was the Breast Cancer Awareness Initiative. XP locations across the globe participated during this month-long event. Many activities were held to promote awareness of this disease, whilst also generating employee donations. In total there was over $10,000 collected and distributed to eight different local charities associated with Breast Cancer.
OUR PLANS FOR THE YEAR AHEADThe local representatives that coordinate activities continue to be fully engaged within the community. There have already been discussions within the team for the year ahead and the team is planning those key initiatives for 2020 to see how we can make a difference within the communities in which we operate.
SUSTAINABILITY TARGETS• Competences relating to
economic, environmental and social impacts
• Stakeholder representation
LINK TO SUSTAINABLE DEVELOPMENT GOALSOur approach to business links directly to many of the Sustainable Development Goals of the United Nations Development Programme to end poverty, protect the planet and ensure that all people enjoy peace and prosperity.
We aim to promote and empower all at XP Power, irrespective of age, sex, disability, origin or religion. We ensure this is outlined in policies and appropriate legislation.

61XP Power Annual Report & Accounts for the year ended 31 December 2019
STRATEGIC REPORT
CO2 EMISSIONSXP Power has been tracking and monitoring our CO2 emissions for the past 10 years. In 2009 we set ourselves a target of reducing CO2 emissions per unit of revenue by 5% per annum. This aligned with the Chinese Government’s target of reducing carbon emissions per unit of GDP by 40% to 45% between 2005 and 2020.
We measure our CO2 emissions in accordance with the internationally recognised Green House Gas (GHG) Protocol and our metrics include scope 1 and scope 2 emissions. The CO2 emissions data shows the three-month moving average of CO2 emissions per unit of revenue at our Kunshan and Vietnam facilities. Our total Green House Gas emissions for these locations in 2019 were 4,560 tonnes of CO2 compared to 4,307 tonnes in 2018. CO2 emissions per unit of revenue deteriorated in China due to lower overall revenue from this factory in 2019.
In 2019 overall CO2 emissions for recent acquisitions and other remote locations were 6,303 tonnes of CO2 emissions. This data is comprised of 11 XP global locations, including recent acquisition of XP Glassman and XP Comdel divisions.
WATERWe have determined that our operations are considered as low water usage. Water is not used in the design, manufacturing or services of our products. We are cognisant of the fact that there is some level of water usage at our facilities and try to limit the use and employ best practices. Nevertheless, we have taken action to reduce water usage in our sites including rainwater capture and reuse in our Vietnam facility.
Our water usage is tracked and monitored as one of our key environmental metrics across the business. The necessary actions are taken to reduce usage as needed and consistent with our corporate water policy. The reduction in water consumed in 2019 was the result of not requiring extra shifts of production at our China facility.
CARBON DISCLOSURE PROJECTWe continue to collaborate annually with the Carbon Disclosure Project. The data is on our environment performance and is publicly accessible through the Carbon Disclosure Project website at www.cdproject.net.
HARMFUL SUBSTANCESIn 2005 new legislation was introduced in Europe which limited the levels of certain hazardous substances. The European legislation, Restriction of Hazardous Substances (RoHS) has been implemented in the design and manufacture of XP Power products.
XP Power took the initiative to be compliant with this legislation, not just for our European customer base, but for our customers in Asia and North America.
A new Directive has now been published to add to the list of controlled substances. This Directive is 2015/EC and is titled Commission Delegated Directive (EU) 2015/863 of 31 March 2015 amending Annex II to Directive 2011/65/EU of the European Parliament and of the Council as regards the list of restricted substances. The amending Directive came into force from 22nd July 2019. We are pleased to report that except for our legacy radio frequency products, we are compliant with the latest RoHS directive.
THIRD PARTY VERIFICATIONFor 2019 we engaged with Intertek to advise us on our how we should capture and report our environmental data. The accuracy of our energy, water, paper, solar power, green power and CO2 emissions data disclosed in this report have been independently reviewed by Intertek.
OUR PLANS FOR THE YEAR
AHEAD• Continue to develop and expand on our
green product portfolio
• Reduction in our overall CO2 impact with the consolidation of our high voltage product line being manufactured in our Vietnam facility
Further assessment of our operations in which additional changes can be implemented for improved environmental performance.
LINK TO SUSTAINABLE DEVELOPMENT GOALSOur approach to business links directly to many of the Sustainable Development Goals of the United Nations Development Programme to end poverty, protect the planet and ensure that all people enjoy peace and prosperity.
We are integrating climate change measures into the business through monitoring emissions and carbon disclosures.
We are developing our focus towards promoting resource and energy efficiency.
CO2 Emissions Data 2019 2018 2017 2016 2015
CO2 emissions (tonnes) – China and Vietnam facility 4,560 4,307 3,906 3,581 3,361CO2 emissions per unit of factory revenue (kg/$1,000) – China facility 77 54 54 56 47 CO2 emissions per unit of factory revenue (kg/$1,000) – Vietnam facility 113 107 81 82 141Water Data 2019 2018 2017 2016 2015Average number of employees 1,859 1,972 1,953 1,506 1,448Water consumed (thousand litres) 30,478 39,605 39,480 32,582 32,220Water consumed per employee (thousand litres) 16.4 20.1 20.2 21.6 22.3
SUSTAINABILITY TARGETS• Company climate change
opportunities – Identification of company’s climate change opportunities w/potential to generate a substantive change in business operations, revenue or expenditure
• Company targets – Company’s active emissions reduction initiatives within the reporting year
• Company targets – Company’s intensity target + whether a science-based target
THE ENVIRONMENT

62
SUSTAINABILITY: NON FINANCIAL DISCLOSURES SUMMARY
The new EU Corporate Social Responsibility Directive (2014/95/EC) requires additional disclosure of non-financial impacts. XP Power welcomes this development and the table below summarises the requirements of the new reporting expectation, pointing to where additional information can be found.
Non-financial disclosure 2019 2018
Relevant group principal risk Action taken Due diligence
PEOPLE
Score from annual Employee Engagement Survey
75 Loss of key personnel or failure to attract new personnel
Results of our survey are reviewed by management and discussed in team meetings where employees are encouraged to come up with their own ideas of how to address areas of weakness
A third-party survey is used to ensure anonymity or results and ensure best practice
Health and safety incidents (including near misses)
21 17 An event that causes a disruption to one of our manufacturing facilities
Regional health and safety committees review our health and safety metrics to drive continuous improvement. We also undertake periodic risk assessments and include health and safety with our employee culture surveys
Benchmarking health and safety incidents with industry norms. We have also engaged with a health and safety consultant to review our health and safety processes to drive continuous improvement
CUSTOMERS
Proportion of revenue from top 30 customers (%)
49 52 Dependence on key customers
Although our strategy is to gain a higher share of business in our top accounts we also recognise the value of a balanced portfolio. Our product roadmap considers the benefit of products that can be sold into numerous applications and sectors
Review of sector splits and design wins and management review of product road map
Number of new product families released
32 27 Dependence on key customers
Expansion of products taken from third parties to expand product portfolio
All third-party products have a full design and specification verification test to ensure they meet XP Power standards
SUPPLIERS
Number of supplier audits
42 34 Dependence on key suppliers
Suppliers are required to implement corrective actions if any deficiencies are identified as a result of audits
Suppliers are ranked according to how critical they are and audit frequency is determined accordingly
OUR COMMUNITIES
Number of XP Power events benefitting local communities
8 7 Loss of key personnel or failure to attract new personnel
XP Power employees are granted an additional day’s leave to participate in activities which are charitable and benefit the local communities in which we operate
Activities are approved by the local environmental and communities committee
CO2 emissions intensity metric (kg/$’000 revenue)
30.2 27.9 Risks relating to regulation or compliance
We are continuing to work on ways to reduce our CO2 intensity by reducing burn in times for products and recycling the power used for burn in within our production facilities. Vietnam also has a solar panel array to provide power to the administration building
We measure our CO2 emissions in accordance with the internationally recognised Green House Gas (GHG) Protocol and our metrics include scope 1 and scope 2 emissions
Our metrics are independently verified by a third party
ENVIRONMENT
Water usage per employee (thousand litres)
15.9 20.1 Risks relating to regulation or compliance
Although we do not use water within our production processes our Vietnam facility has rain water capture which is used to water plants and provide water for toilets and showers
Our water usage metrics are verified by a third party

XP Power Annual Report & Accounts for the year ended 31 December 2019
STRATEGIC REPORT
63

XP POW
ER AN
NU
AL REPO
RT & ACCO
UN
TS for the year ended 31 Decem
ber 2019
XP Power Limited401 Commonwealth Drive
Haw Par TechnocentreLobby B #02-02
Singapore 149598T: +65 6411 6900F: +65 6479 6305


![[XP Day Vietnam 2015] XP is not windows XP](https://static.fdocuments.in/doc/165x107/55a69cf71a28abd47d8b4735/xp-day-vietnam-2015-xp-is-not-windows-xp.jpg)


![[XPday.vn] XP? not Windows XP {presentation} (at) [XP Day Vietnam 2015]](https://static.fdocuments.in/doc/165x107/55c4e9e3bb61ebac3f8b47ae/xpdayvn-xp-not-windows-xp-presentation-at-xp-day-vietnam-2015.jpg)