Annual reportIDARE character E R A D I Inquisitive driven agile resilient engaging Core offerings...
89
G28 for the period 2016/17–19/20 Statistics New Zealand’s Strategic intentions for the year ended 30 June 2016 Annual report
Transcript of Annual reportIDARE character E R A D I Inquisitive driven agile resilient engaging Core offerings...

G28
CONTACT USStatistics New Zealand Information CentrePO Box 2922Wellington 6140
Email [email protected] 0508 525 525 toll-freePhone +64 4 931 4600
www.stats.govt.nz
Statistics New
Zealand’s Strategic intentions for the period 2016/17–19/20 Annual report for the year ended 30 June 2016
for the period 2016/17–19/20
Statistics New Zealand’s
Strategic intentions
for the year ended 30 June 2016
Annual report

STATISTICS NEW ZEALAND’S STRATEGIC INTENTIONS FOR THE PERIOD 2016/17–19/20
ANNUAL REPORT FOR THE YEAR ENDED 30 JUNE 20161G28
Presented to the House of Representatives pursuant to sections 38 and 40 of the Public Finance Act 1989
for the period 2016/17–19/20
Statistics New Zealand’s
Strategic intentions
Presented to the House of Representatives pursuant to section 44(1) of the Public Finance Act 1989 and section 16 of the Statistics Act 1975
for the year ended 30 June 2016
Annual report
Crown copyright ©
This work is licensed under the Creative Commons Attribution 4.0 New Zealand license. You are free to copy, distribute, and adapt the work, as long as you attribute the work to Statistics New Zealand and abide by the other license terms. Please note you may not use any departmental or governmental emblem, logo, or coat of arms in any way that infringes any provision of the Flags, Emblems, and Names Protection Act 1981. Use the wording ‘Statistics New Zealand’ in your attribution, not the Statistics New Zealand logo.
LiabilityWhile all care and diligence has been used in processing, analysing, and extracting data and information in this publication, Statistics New Zealand gives no warranty it is error free and will not be liable for any loss or damage suffered by the use directly, or indirectly, of the information in this publication.
CitationStatistics New Zealand (2016). Statistics New Zealand’s Strategic intentions for the period 2016/17–19/20 Annual report for the year ended 30 June 2016. Wellington: Statistics New Zealand.
Published in October 2016 byStatistics New ZealandTatauranga AotearoaWellington, New Zealand
ContactStatistics New Zealand Information Centre: [email protected] toll-free 0508 525 525Phone international +64 4 931 4600www.stats.govt.nz
STATISTICS NEW ZEALAND’S STRATEGIC INTENTIONS FOR THE PERIOD 2016/17–19/20
ANNUAL REPORT FOR THE YEAR ENDED 30 JUNE 20163
ContentsAbout this document .........................................................................................................................................................5
Part 1: Strategic intentions 2016/17–19/20Chief Executive’s and Minister’s statements .................................................................................................9
Executive summary.......................................................................................................................................................... 10Unleashing the power of data ....................................................................................................................................... 10Accessible, usable, valuable data ................................................................................................................................. 10Our journey to meet New Zealand’s data needs .................................................................................................. 10What our future looks like ................................................................................................................................................11How we’ll get there ............................................................................................................................................................11
About our organisation ................................................................................................................................................ 12
The reasons for change ................................................................................................................................................ 13Our customers are demanding data to drive decisions ...................................................................................... 13We have started our journey ......................................................................................................................................... 13Our operating environment is changing .................................................................................................................... 14A challenge to improve our performance ................................................................................................................. 16We are managing our strategic risks ........................................................................................................................... 17
Our strategic response ................................................................................................................................................. 18Our vision and what we will achieve .......................................................................................................................... 18How we will function ........................................................................................................................................................20Measuring our journey .....................................................................................................................................................28
Part 2: Annual report for the year ended 30 June 2016Introduction from the Government Statistician and Chief Executive .................................... 32
Activity and performance for the year ended 30 June 2016 ...........................................................33
Enabling customers to maximise the value of existing data.........................................................34Integrated data and the Integrated Data Infrastructure .......................................................................................34Reducing the burden on business: Result 9 – Better for Business ................................................................36Working with iwi/Mäori, Pasifika, and non-government organisations ..........................................................37Review of the statistical standard for iwi and the classification for iwi ..........................................................38Gender identity standard world first in New Zealand ..........................................................................................38Performance information ................................................................................................................................................ 39
Taking a stewardship role to anticipate and address critical system-wide information challenges .............................................................42
New Zealand Data Futures .............................................................................................................................................42Review of statistics legislation .......................................................................................................................................42Environmental reporting ..................................................................................................................................................43Social investment insights...............................................................................................................................................44Reviews of official statistics production and dissemination ..............................................................................44Performance information ................................................................................................................................................46
STATISTICS NEW ZEALAND’S STRATEGIC INTENTIONS FOR THE PERIOD 2016/17–19/20
ANNUAL REPORT FOR THE YEAR ENDED 30 JUNE 20164
Experimenting, testing, and adopting innovative ways to improve effectiveness and efficiency ........................................................................................................ 47
2018 Census ........................................................................................................................................................................47Census Transformation ....................................................................................................................................................47Pilot partnership projects ................................................................................................................................................48Statistics NZ innovation site ...........................................................................................................................................49Redevelopment of surveys to meet the country’s needs ..................................................................................49Performance information ................................................................................................................................................ 51
Ensuring we are well positioned to enable New Zealand to unleash the power of data to change lives ..................................................................................................52
Organisation strategy and new operating model ..................................................................................................52Integrating the Statistics 2020 programme into the departmental investment portfolio ......................52Building capability for the future ..................................................................................................................................52Business Improvement Forum ......................................................................................................................................53Performance information ................................................................................................................................................54
Statement of responsibility ......................................................................................................................................55
Independent auditor’s report .................................................................................................................................56
Financial statements ......................................................................................................................................................59Statement of comprehensive revenue and expense ..........................................................................................59Statement of financial position ....................................................................................................................................60Statement of changes in equity .................................................................................................................................. 61Statement of cash flows .................................................................................................................................................62Statement of commitments .........................................................................................................................................63Statement of contingent liabilities and contingent assets .................................................................................64Notes to the financial statements ..............................................................................................................................65Appropriation statements ..............................................................................................................................................83
List of figures and tablesFigure 1: Our strategic direction ......................................................................................................................................8Figure 2: Our vision, purpose, and goals .................................................................................................................. 18Figure 3: Our value model .............................................................................................................................................. 19Figure 4: Our roles .............................................................................................................................................................20Figure 5: IDARE – Our characteristics ........................................................................................................................22Figure 6: Our decision-making principles .................................................................................................................23Figure 7: Our target operating model ......................................................................................................................... 24Figure 8: Our core offerings ...........................................................................................................................................25Figure 9: Scale of change ................................................................................................................................................26Figure 10: Scale of change by core offerings and roles ......................................................................................27Figure 11: Progress themes for 2015/16 ...................................................................................................................33Figure 12: Overview of data available in the IDI ....................................................................................................35
Table 1: Enabling customers – performance information ..................................................................................40Table 2: Taking a stewardship role – performance information ......................................................................46Table 3: Experimenting, testing, and adopting innovative ways – performance information .............. 51Table 4: Ensuring we are well positioned – performance information .........................................................54
STATISTICS NEW ZEALAND’S STRATEGIC INTENTIONS FOR THE PERIOD 2016/17–19/20
ANNUAL REPORT FOR THE YEAR ENDED 30 JUNE 20165
About this documentThis document brings together our 2015/16 annual report and our 2016/17–19/20 strategic intentions into one document. This new format allows us to tell a continuous story about our performance and intentions, enabling a clear performance narrative that is connected to our future focus.
Our 2016/17–19/20 strategic intentions are the same as the first section of our 2016/17–19/20 four-year plan, with the addition of a section describing our annual reporting approach over the next three years. Although the annual report is against last year’s strategic intentions, understanding our 2016/17–2019/20 strategic intentions is key to understanding the importance of our achievements in 2015/16 and how they are progressing us towards our newly defined target operating model and strategic direction.
A feature of the annual report component is our newly integrated performance reporting. Rather than reporting our output measures and other performance measures in an appendix at the end of the report, we have integrated them into the body of the report. Performance results can now be read within the context of the case studies that relate to them. As we work on our measures over the next few years, they will become increasingly tied to the delivery of the strategic direction outlined in the strategic intentions.

STATISTICS NEW ZEALAND’S STRATEGIC INTENTIONS FOR THE PERIOD 2016/17–19/20
ANNUAL REPORT FOR THE YEAR ENDED 30 JUNE 20166
STATISTICS NEW ZEALAND’S STRATEGIC INTENTIONS FOR THE PERIOD 2016/17–19/20
ANNUAL REPORT FOR THE YEAR ENDED 30 JUNE 20167
Part 1 Strategic intentions
2016/17–19/20

STATISTICS NEW ZEALAND’S STRATEGIC INTENTIONS FOR THE PERIOD 2016/17–19/20
ANNUAL REPORT FOR THE YEAR ENDED 30 JUNE 20168
Figure 1: Our strategic direction
Strategic direction
Our future stateOur visionUnleashing the power of data to change lives
Our purposeEmpowering decisions by adding value to New Zealand's most important data
Our goalsTo help improve outcomes for all New Zealanders, our goals are to:
• double the value of data provided by Statistics NZ to New Zealand by 2018
• create a tenfold increase in value of the data provided to New Zealand by 2030
How we'll get there
• Process – Aligning with business functions• Technology – Agile big data integrated
with a digital-first approach• Suppliers – Collaborative approach
emphasised
• Organisation – Decisions led by strategic direction
• Enterprise performance management metrics – Measuring against roles
• People capabilities and organisational culture – Stewardship at our core
• Authorising environment – Balancing open data and trust
Building our capabilities
• Agile core• Internal accelerator• External accelerator• Change leadership
Following a change approach
• Outside-in approach – Develop customer-centred response and proactive delivery
• Consultative approach – Enable the data eco-system through consulting services
• Stewardship – Further develop our stewardship role
• Data offering – Enable customers to access greater insights
• Change – Agile, accelerated change
• Processes – Modularise the statistical infrastructure in line with the business functions
• Consequent work – Enable organisational shift
Delivering strategic change work-streams
• Customer value• Open data• Trust• Lean
• Stewardship• Matched service• Talented• Experimentation
• Agility• Digital efficiency• Focus
Using decision-making principles
Key
Where we are now
Where we are going
Historical remit New remit
Optimise existing methods
Leverage new methods
Scale of change
IDARE character
ERADI Inquisitive
drivenagileresilientengaging
Core offerings
Data services Statistics for critical decision-making
Insights Consultative approach
How others see usW
hat a
nd h
ow w
e de
liver
Who
we
are
and
how
we
act Roles
Provider Enabler
Steward Innovator
Strategic delivery model
Discover
Explore
ShapeSource
Enrich
Sustain
Service delivery – Our customers will remain similar but we will service them more comprehensively, quickly, and openly
Intermediaries – Increasingly we will act through intermediaries to empower the ecosystem
Adding value
In a dynamic age of digital disruption and data-driven demand, we are seizing the opportunity to remain relevant and add value in a world that is looking for answers
Through our investment focus
What drives us
Creating customer
value

STATISTICS NEW ZEALAND’S STRATEGIC INTENTIONS FOR THE PERIOD 2016/17–19/20
ANNUAL REPORT FOR THE YEAR ENDED 30 JUNE 20169
Chief Executive’s and Minister’s statementsIn signing this information, I acknowledge that I am responsible for the information on strategic intentions for Statistics New Zealand. This information has been prepared in accordance with section 38 and section 40 of the Public Finance Act 1989.
Liz MacPhersonGovernment Statistician and Chief Executive30 September 2016
I am satisfied that the information on strategic intentions prepared by Statistics New Zealand is consistent with the policies and performance expectations of the Government.
Hon Craig FossMinister of Statistics30 September 2016
STATISTICS NEW ZEALAND’S STRATEGIC INTENTIONS FOR THE PERIOD 2016/17–19/20
ANNUAL REPORT FOR THE YEAR ENDED 30 JUNE 201610
Executive summary
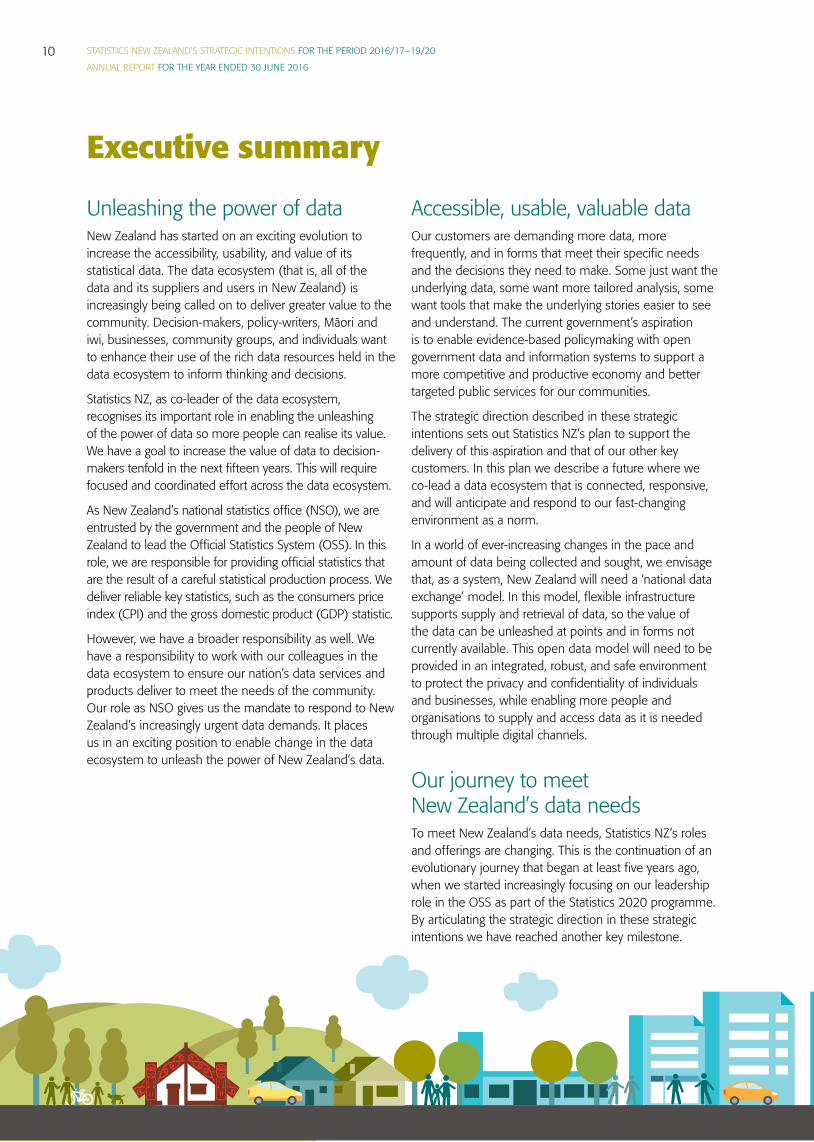
Unleashing the power of dataNew Zealand has started on an exciting evolution to increase the accessibility, usability, and value of its statistical data. The data ecosystem (that is, all of the data and its suppliers and users in New Zealand) is increasingly being called on to deliver greater value to the community. Decision-makers, policy-writers, Mäori and iwi, businesses, community groups, and individuals want to enhance their use of the rich data resources held in the data ecosystem to inform thinking and decisions.
Statistics NZ, as co-leader of the data ecosystem, recognises its important role in enabling the unleashing of the power of data so more people can realise its value. We have a goal to increase the value of data to decision-makers tenfold in the next fifteen years. This will require focused and coordinated effort across the data ecosystem.
As New Zealand’s national statistics office (NSO), we are entrusted by the government and the people of New Zealand to lead the Official Statistics System (OSS). In this role, we are responsible for providing official statistics that are the result of a careful statistical production process. We deliver reliable key statistics, such as the consumers price index (CPI) and the gross domestic product (GDP) statistic.
However, we have a broader responsibility as well. We have a responsibility to work with our colleagues in the data ecosystem to ensure our nation’s data services and products deliver to meet the needs of the community. Our role as NSO gives us the mandate to respond to New Zealand’s increasingly urgent data demands. It places us in an exciting position to enable change in the data ecosystem to unleash the power of New Zealand’s data.
Accessible, usable, valuable dataOur customers are demanding more data, more frequently, and in forms that meet their specific needs and the decisions they need to make. Some just want the underlying data, some want more tailored analysis, some want tools that make the underlying stories easier to see and understand. The current government’s aspiration is to enable evidence-based policymaking with open government data and information systems to support a more competitive and productive economy and better targeted public services for our communities.
The strategic direction described in these strategic intentions sets out Statistics NZ’s plan to support the delivery of this aspiration and that of our other key customers. In this plan we describe a future where we co-lead a data ecosystem that is connected, responsive, and will anticipate and respond to our fast-changing environment as a norm.
In a world of ever-increasing changes in the pace and amount of data being collected and sought, we envisage that, as a system, New Zealand will need a ‘national data exchange’ model. In this model, flexible infrastructure supports supply and retrieval of data, so the value of the data can be unleashed at points and in forms not currently available. This open data model will need to be provided in an integrated, robust, and safe environment to protect the privacy and confidentiality of individuals and businesses, while enabling more people and organisations to supply and access data as it is needed through multiple digital channels.
Our journey to meet New Zealand’s data needsTo meet New Zealand’s data needs, Statistics NZ’s roles and offerings are changing. This is the continuation of an evolutionary journey that began at least five years ago, when we started increasingly focusing on our leadership role in the OSS as part of the Statistics 2020 programme. By articulating the strategic direction in these strategic intentions we have reached another key milestone.
STATISTICS NEW ZEALAND’S STRATEGIC INTENTIONS FOR THE PERIOD 2016/17–19/20
ANNUAL REPORT FOR THE YEAR ENDED 30 JUNE 201611
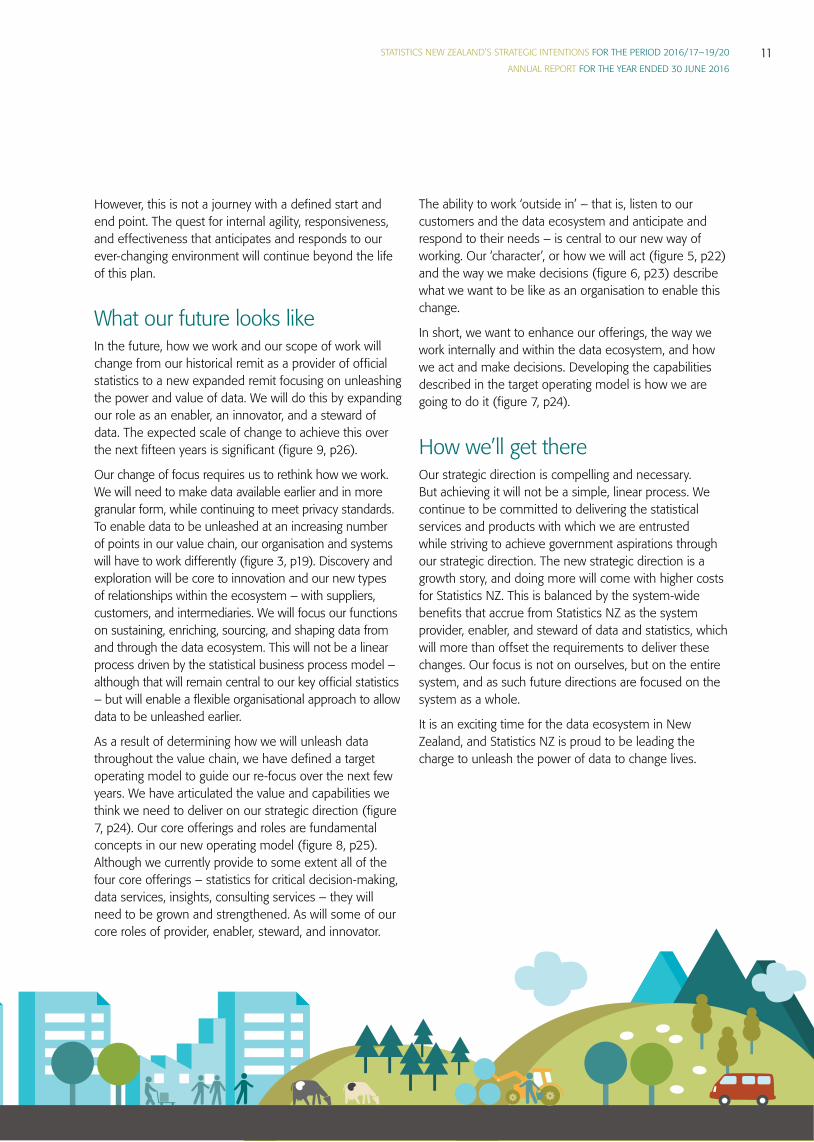
However, this is not a journey with a defined start and end point. The quest for internal agility, responsiveness, and effectiveness that anticipates and responds to our ever-changing environment will continue beyond the life of this plan.
What our future looks likeIn the future, how we work and our scope of work will change from our historical remit as a provider of official statistics to a new expanded remit focusing on unleashing the power and value of data. We will do this by expanding our role as an enabler, an innovator, and a steward of data. The expected scale of change to achieve this over the next fifteen years is significant (figure 9, p26).
Our change of focus requires us to rethink how we work. We will need to make data available earlier and in more granular form, while continuing to meet privacy standards. To enable data to be unleashed at an increasing number of points in our value chain, our organisation and systems will have to work differently (figure 3, p19). Discovery and exploration will be core to innovation and our new types of relationships within the ecosystem – with suppliers, customers, and intermediaries. We will focus our functions on sustaining, enriching, sourcing, and shaping data from and through the data ecosystem. This will not be a linear process driven by the statistical business process model – although that will remain central to our key official statistics – but will enable a flexible organisational approach to allow data to be unleashed earlier.
As a result of determining how we will unleash data throughout the value chain, we have defined a target operating model to guide our re-focus over the next few years. We have articulated the value and capabilities we think we need to deliver on our strategic direction (figure 7, p24). Our core offerings and roles are fundamental concepts in our new operating model (figure 8, p25). Although we currently provide to some extent all of the four core offerings – statistics for critical decision-making, data services, insights, consulting services – they will need to be grown and strengthened. As will some of our core roles of provider, enabler, steward, and innovator.
The ability to work ‘outside in’ – that is, listen to our customers and the data ecosystem and anticipate and respond to their needs – is central to our new way of working. Our ‘character’, or how we will act (figure 5, p22) and the way we make decisions (figure 6, p23) describe what we want to be like as an organisation to enable this change.
In short, we want to enhance our offerings, the way we work internally and within the data ecosystem, and how we act and make decisions. Developing the capabilities described in the target operating model is how we are going to do it (figure 7, p24).
How we’ll get thereOur strategic direction is compelling and necessary. But achieving it will not be a simple, linear process. We continue to be committed to delivering the statistical services and products with which we are entrusted while striving to achieve government aspirations through our strategic direction. The new strategic direction is a growth story, and doing more will come with higher costs for Statistics NZ. This is balanced by the system-wide benefits that accrue from Statistics NZ as the system provider, enabler, and steward of data and statistics, which will more than offset the requirements to deliver these changes. Our focus is not on ourselves, but on the entire system, and as such future directions are focused on the system as a whole.
It is an exciting time for the data ecosystem in New Zealand, and Statistics NZ is proud to be leading the charge to unleash the power of data to change lives.
STATISTICS NEW ZEALAND’S STRATEGIC INTENTIONS FOR THE PERIOD 2016/17–19/20
ANNUAL REPORT FOR THE YEAR ENDED 30 JUNE 201612
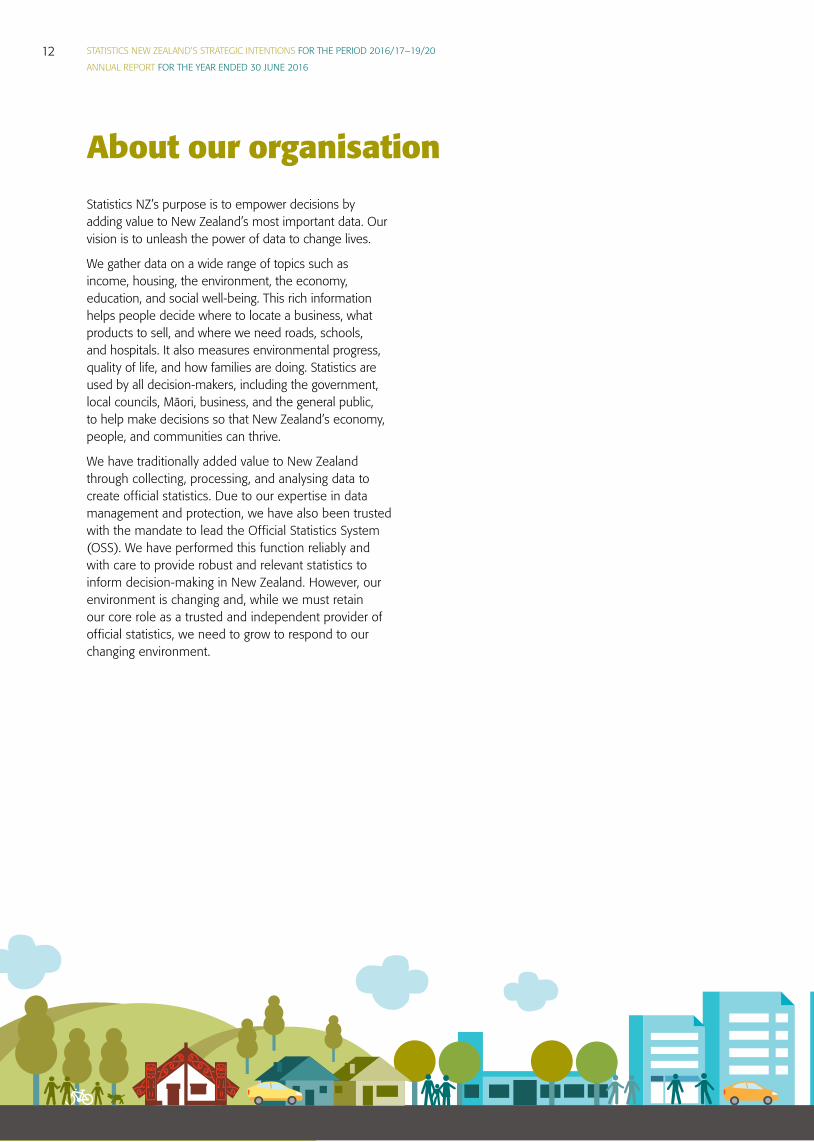
About our organisationStatistics NZ’s purpose is to empower decisions by adding value to New Zealand’s most important data. Our vision is to unleash the power of data to change lives.
We gather data on a wide range of topics such as income, housing, the environment, the economy, education, and social well-being. This rich information helps people decide where to locate a business, what products to sell, and where we need roads, schools, and hospitals. It also measures environmental progress, quality of life, and how families are doing. Statistics are used by all decision-makers, including the government, local councils, Mäori, business, and the general public, to help make decisions so that New Zealand’s economy, people, and communities can thrive.
We have traditionally added value to New Zealand through collecting, processing, and analysing data to create official statistics. Due to our expertise in data management and protection, we have also been trusted with the mandate to lead the Official Statistics System (OSS). We have performed this function reliably and with care to provide robust and relevant statistics to inform decision-making in New Zealand. However, our environment is changing and, while we must retain our core role as a trusted and independent provider of official statistics, we need to grow to respond to our changing environment.
STATISTICS NEW ZEALAND’S STRATEGIC INTENTIONS FOR THE PERIOD 2016/17–19/20
ANNUAL REPORT FOR THE YEAR ENDED 30 JUNE 201613
The reasons for change
Our customers are demanding data to drive decisionsOur customers are demanding more data, more frequently, and in forms that meet their specific needs and the decisions they need to make. As a key customer, the government’s aspiration to enable evidence-based policymaking with open government data and information systems to support a more competitive and productive economy and better targeted public services for our communities is an important contributor to the strategic direction of Statistics NZ.
While Statistics NZ has always supported government priorities by providing critical statistics, the increased focus on data-driven decision-making and investment approaches to spending within government has significantly elevated our contribution to central government decision-making.
Data-driven decision-making has moved beyond the use of the statistics that we publish, to requiring datasets that support analysis at a much more granular level. This, for example, enables more targeted spending through policy interventions directed at sub-populations. Taking a customer-centred investment approach to target spending seeks to minimise costs in the long run, through understanding longitudinal patterns and making early interventions. This creates a need for Statistics NZ to develop and steward accessible, integrated datasets that enable these investment decisions to be made.
Among the priorities agreed with the Minister of Statistics, we will ensure Statistics NZ is well positioned to enable New Zealand to unleash the power of data to change lives. Our strategic direction and implementation are directly tied to achieving this priority.
We have started our journeyOver the past five years, we have implemented transformational changes in the way we operate. We have focused on making stronger connections across government, where data will be more actively used in decision-making.
The two major budget bids in this regard were Statistics 2020 (Budget 2011) and Analysis for Outcomes / Integrated Data Infrastructure (Budget 2013).
Statistics 2020 set out four key strategic goals:
1. Lead the Official Statistics System (OSS) so that it efficiently produces the information that New Zealand needs.
2. Obtain more value from the country’s investment in official statistics.
3. Transform the way Statistics NZ delivers statistics.
4. Be a more responsive, customer-focused, influential, and sustainable organisation.
The programme was split into three key tranches, with the first focusing on ‘laying the foundations’, which emphasised replacing legacy systems and working towards a more integrated and standardised set of platforms that are more readily maintained. Later components of the programme had a stronger OSS focus, particularly in relation to raising the profile of the value of data and building capability in using data.
Meanwhile, the funding provided for Analysis for Outcomes enabled us to further develop the Integrated Data Infrastructure (IDI). This prototype brought together datasets from across government to test and to enable leading-edge data analysis and research to be undertaken, providing insights into some of New Zealand’s more complex decisions.
With Tranche 2 of Statistics 2020 underway in 2014, and the huge success of the IDI, we paused to reassess whether the longer-term directions of Statistics 2020 would deliver everything we need to remain relevant and add value in the emerging data ecosystem.
We drew on the work of the New Zealand Data Futures Forum, explored the trends emerging in New Zealand, and the global trends affecting the production and use of statistics. We challenged ourselves to refresh our strategic direction to increase the value we provide to New Zealand.
STATISTICS NEW ZEALAND’S STRATEGIC INTENTIONS FOR THE PERIOD 2016/17–19/20
ANNUAL REPORT FOR THE YEAR ENDED 30 JUNE 201614
Our operating environment is changingSeveral factors are driving our strategic response, propelled by the rapid change in our constantly evolving environment that presents both opportunities and challenges. The Statistics Legislative Review has commenced, which will explore how our governing legislation will be fit for purpose, customer centred, and future focused, addressing Statistics NZ’s expanded remit in New Zealand’s changing data environment.
New Zealand is missing out on a data-driven innovation dividendAn increasing number of reports are concluding that New Zealand is not securing the potential benefits of data-driven innovation. The most recent estimated that increased use of data to drive innovation could deliver $4.5 billion in benefits to New Zealand over the next five years.
Drive for citizen-centred public services powered by data-driven innovationThe desire for better integrated, citizen-centred, public services requires the ability to use data-supported, joined-up approaches. Data and information architecture that supports joined-up approaches is essential to achieving these aims. As a result there is increasing demand for Statistics NZ to provide leadership, skills, and expertise in these areas.
Mäori-led development is increasing the demand for relevant information and capability buildingThe Treaty settlement process is fuelling the desire for data for, rather than simply about, Mäori, so that Mäori can be the agents of their own change. Responding to the needs of Mäori customers for a quadruple bottom-line approach to value will challenge the status quo – including what is measured, how it is measured, and how it is communicated.
Social licenceThe proliferation of personal data across the data ecosystem is giving rise to questions about citizens’ privacy and confidentiality. A tension exists between the needs of decision-makers to generate insights at much deeper levels than ever before to solve systemic problems – such as the current focus on eliminating child poverty – and the desire of individuals to have their rights and privacy maintained. Our brand as trusted and independent remains strong, and is a foundation that allows us to be successful. However, as we increasingly provide new data-related services, we will need to ensure that we (and the data ecosystem as a whole) maintain our social licence as a trusted steward of the nation’s data and information.
More data is available than ever before Data is growing exponentially. This has the opportunity to provide greater insights to decision-makers than ever before. Paradoxically, it is increasingly difficult to access the rich information that sits within increasingly larger datasets. Questions are also being asked about the quality of this data and how to manage it so insights can be harnessed, while balancing privacy and confidentiality requirements and individuals’ desire for control over their own data. Decision-makers are increasingly looking to us to provide leadership and advice on:
• reusing data where possible • promoting cooperation in data storage • leading the development of data capability • providing data integration • ensuring that New Zealand’s data management and
practices are world leading.
Growing demand for real-time insightsThe exponential growth in data is being driven by digital technologies and the embedding of sensors and connectors in products (the internet of things). It has been estimated that by 2020, 50 billion devices will be connected to the internet and that the internet of things will have 5 to 10 times more impact on society than the internet*. Harnessing this real-time data and using it to
STATISTICS NEW ZEALAND’S STRATEGIC INTENTIONS FOR THE PERIOD 2016/17–19/20
ANNUAL REPORT FOR THE YEAR ENDED 30 JUNE 20161515
augment or replace existing statistical output is a critical challenge facing statistical organisations worldwide. *See ‘The internet of things’ by Dave Evans, on www.cisco.com. Retrieved 28 September 2016.
Focus is shifting from statistics to data Our traditional role has been to provide official statistics. Data was valued largely as an input into the production of these statistics. While core statistics remain critically important, increasingly decision-makers want a richness of information that enables them to make more nuanced decisions. This is resulting in a shift from the statistical outputs we produce to the interrogation of the datasets behind the statistics. The value of statistical datasets, and the associated tools and techniques for their analysis, is reaching the level of the statistics themselves in their importance as a service we provide for customers.
Increasing data cooperation and competition Private and public organisations are increasingly using their own and our data to generate insights. These same organisations may be providing data streams to us, using data and information that we create, and potentially also publicising information, at least in part, in competition to our own services. Organisations are increasingly developing their own data capabilities, which is blurring the lines of relationship, such that the same organisation can be a partner, customer, supplier, and competitor to us. We need to be able to work in this new environment, using fit-for-purpose approaches that maximise the benefits to New Zealand, not crowding out the private sector, and at the same time ensuring the organisation remains sustainable.
A shortage of data analytics capability Statisticians are ideally placed to extend their repertoire into new data analytics and become data scientists. Statistics was the data science of its time. As organisations seek to gain advantage over their competitors and increase their understanding of their customers’ needs through data, it is becoming increasingly difficult to attract and retain core statistical staff. This pressure is coming from both the public sector, and increasingly, the private
sector. The growth of data analytics as a discipline means that we need to balance our role in supporting the growth of this capability for the good of the data ecosystem, with our need to ensure an ongoing robust statistical core and to provide new statistical and data services.
Growing expectations of customers The points above mean it is no longer sufficient (if it ever was) for us to push our standard outputs out to customers, or to try to interpret their needs from within the organisation. We need to seek greater understanding of the data needs of our customers and the decisions they need to make. This will require working alongside our customers and co-creating new products and services to meet these needs.
Increasing pressure to reduce the cost of survey collectionThe cost of collecting and disseminating information digitally continues to reduce towards zero. This trend is leading to the exponential data growth mentioned earlier. It is also creating a perception that all information needs should be able to be met without the need for direct surveying. Consequently, we need to continue to challenge ourselves on how we integrate and use administrative data, and to become increasingly judicious about the scope and manner of our survey collection – for example by moving to online survey data collection.
Continued funding constraintsWe continue to be financially constrained as an organisation. This means that we need to focus on reducing inefficiencies in our collection, production, and corporate processes, to enable us to reinvest into ‘front of house’ services that support our customers to make decisions.
The Statistics 2020 programme was based on the premise that the organisation would co-fund the modernisation and ongoing maintenance of its core statistical systems through efficiency gains. Funding constraints mean that trade-offs will inevitably have to be made between either using efficiency savings to maintain core statistical systems and the status quo, or responding to customer demand for new services.
STATISTICS NEW ZEALAND’S STRATEGIC INTENTIONS FOR THE PERIOD 2016/17–19/20
ANNUAL REPORT FOR THE YEAR ENDED 30 JUNE 201616
A challenge to improve our performance Performance Improvement Framework (PIF) Review 2014In addition to changes in our operating environment, the 2014 PIF review further challenged us to consider our preferred future state. The challenges broadly fell under six areas and the thinking and commitments resulting from these challenges have directly informed our strategic response.
Strategy refreshThe PIF review challenged us to establish internal and external clarity around our role and purpose and accountability for adding value through innovation. We have undertaken a strategic refresh, confirming our high-level strategic direction in our 2015/16 four-year plan and communicating it to a deeper level in these strategic intentions.
Data leadershipThe review challenged us to develop a stronger and broader leadership role actively working with others outside the organisation. It suggested we cultivate a more proactive and collaborative role leading developments in broader data management.
Organisational characterThe Executive Leadership Team (ELT) was challenged to act with pace, clear prioritisation, and internal and external assertiveness. They were also challenged to develop organisational character that would strengthen innovation, customer-centricity, and agility. The characteristics that the organisation needs to meet these challenges have been identified. They are now being embedded into the organisation. The ELT is working to encourage, model, and celebrate these.
Operating modelWe were challenged to redevelop and embed a new operating model that supports our role as a data co-leader and collaborator. The developed target operating model (figure 7, p24) represents our critical systems, processes, and accountabilities, demonstrating customer-centricity and our partnerships across the data ecosystem. The target operating model provides a basis for strategic decision-making, nuanced risk management, and sustainability through ongoing efficiency gains.
Customer valueThe review further challenged us to put customers at the heart of everything we do. We have committed to taking an ‘outside in’ view to create new ways of hearing our customers’ voices, so we can better understand their needs and the value of data in their decision-making.
Building capability The final challenge was to attract, develop, and retain the right capability to deliver our redefined role and operating model, and to work with others to build data analytic capability across the state sector. This plan details how we will deliver this.
In response to the PIF review, the Minister of Statistics signalled the following focus areas for the four-year plan:
• Redefining Statistics NZ’s role including a refreshed strategic direction, organisation character and culture, operating model, and the development of investment principles.
• Enhancing Statistics NZ’s customer focus, including implementing new ways of hearing the customer voice and responding to customer needs.
• Developing and implementing a workforce strategy to ensure that Statistics NZ attracts and develops the right capability and expertise to lead, innovate, and collaborate in the rapidly changing data environment.
STATISTICS NEW ZEALAND’S STRATEGIC INTENTIONS FOR THE PERIOD 2016/17–19/20
ANNUAL REPORT FOR THE YEAR ENDED 30 JUNE 201617
We are managing our strategic risks Managing our strategic risks is an ongoing commitment. As summarised below, strategic risks are also key considerations when determining our strategic direction.
If we do not communicate well with New Zealanders on how government will manage information, we may lose our social licence. We are acutely aware of the need to manage the public’s trust. This risk is mitigated through our messaging on our approach to managing privacy and security, and by retaining our independence, which provides a level of trust not always enjoyed by central government.
If we cannot steward the supply and use of information across the data ecosystem, we may be unable to provide New Zealand with critical data for decision-making. This could significantly reduce trust in the data being produced within New Zealand and internationally. We manage this risk through active partnerships and engagement with other agencies to collaborate on data supply, analysis, and release. Our leadership role in the Data Futures Partnership includes promoting good governance in the data ecosystem.
If we fail to understand and meet the needs of our customer groups, suppliers, and stakeholders, and do not articulate and provide value through innovation, we may lose relevance as a national statistical agency. We continue to advance our business partnering with other organisations, including intermediaries, to add value to data needs. In addition, the Census 2018 Programme is developing and articulating how it can double the value that can be achieved from the output of the 2018 Census.
We may be unable to create the data and statistical system that supports our vision and our purpose if we do not manage our resources responsibly and ensure effective delivery of change. Our business operating model supports our strategic planning and enterprise architecture design work, and active prioritisation ensures we are focused on achieving our vision. Effective financial management remains paramount to ensuring we remain sustainable.
Delivering change and increasing the value of data are reliant on our continued development of workforce capability, leadership ability, and workplace character. We are managing this risk through the core organisational character, with which we continue to build the capability that will allow us to embrace the new operating model. In particular we continue to support the growth and development of our people, especially those in leadership roles, and to mature our health, safety, and well-being practices.
If we do not manage our partnerships well we will become increasingly vulnerable to adverse events in the data ecosystem. We manage the partnership process carefully to ensure we share information values. The review of the Statistics Act 1975 will help get the setting right for future partnerships.
STATISTICS NEW ZEALAND’S STRATEGIC INTENTIONS FOR THE PERIOD 2016/17–19/20
ANNUAL REPORT FOR THE YEAR ENDED 30 JUNE 201618
The strategic response described over the next few pages has been developed with these risks in mind, acting as a counterbalance to ensure the operation of our business and our change agenda do not open Statistics NZ to unnecessary risk.
Our strategic response is a change of remit. In response to the change drivers, the PIF, government priorities, and our strategic risks, we have reframed our strategic direction as detailed over the next few pages and summarised at figure 1, p8.
The scale of change we propose is significant.
But it is necessary change. Without this accelerated evolutionary change, Statistics NZ runs the risk of losing relevance and not delivering the value New Zealand requires.
Our strategic response articulates our vision and what we will achieve, how we will function, how we will act, how we will make decisions, and what we need to become.
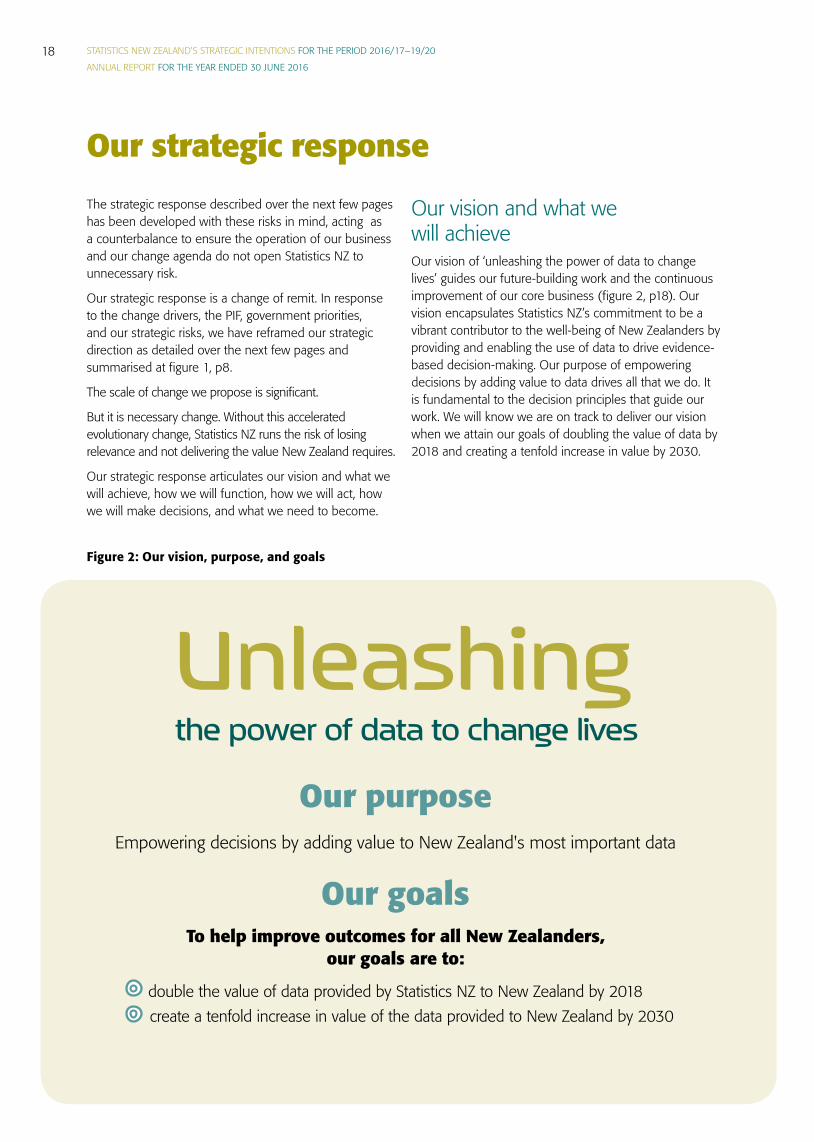
Our vision and what we will achieveOur vision of ‘unleashing the power of data to change lives’ guides our future-building work and the continuous improvement of our core business (figure 2, p18). Our vision encapsulates Statistics NZ’s commitment to be a vibrant contributor to the well-being of New Zealanders by providing and enabling the use of data to drive evidence-based decision-making. Our purpose of empowering decisions by adding value to data drives all that we do. It is fundamental to the decision principles that guide our work. We will know we are on track to deliver our vision when we attain our goals of doubling the value of data by 2018 and creating a tenfold increase in value by 2030.
Our strategic response
Figure 2: Our vision, purpose, and goals
Our purposeEmpowering decisions by adding value to New Zealand's most important data
Our goalsTo help improve outcomes for all New Zealanders,
our goals are to:
double the value of data provided by Statistics NZ to New Zealand by 2018 create a tenfold increase in value of the data provided to New Zealand by 2030
the power of data to change livesUnleashing
STATISTICS NEW ZEALAND’S STRATEGIC INTENTIONS FOR THE PERIOD 2016/17–19/20
ANNUAL REPORT FOR THE YEAR ENDED 30 JUNE 201619
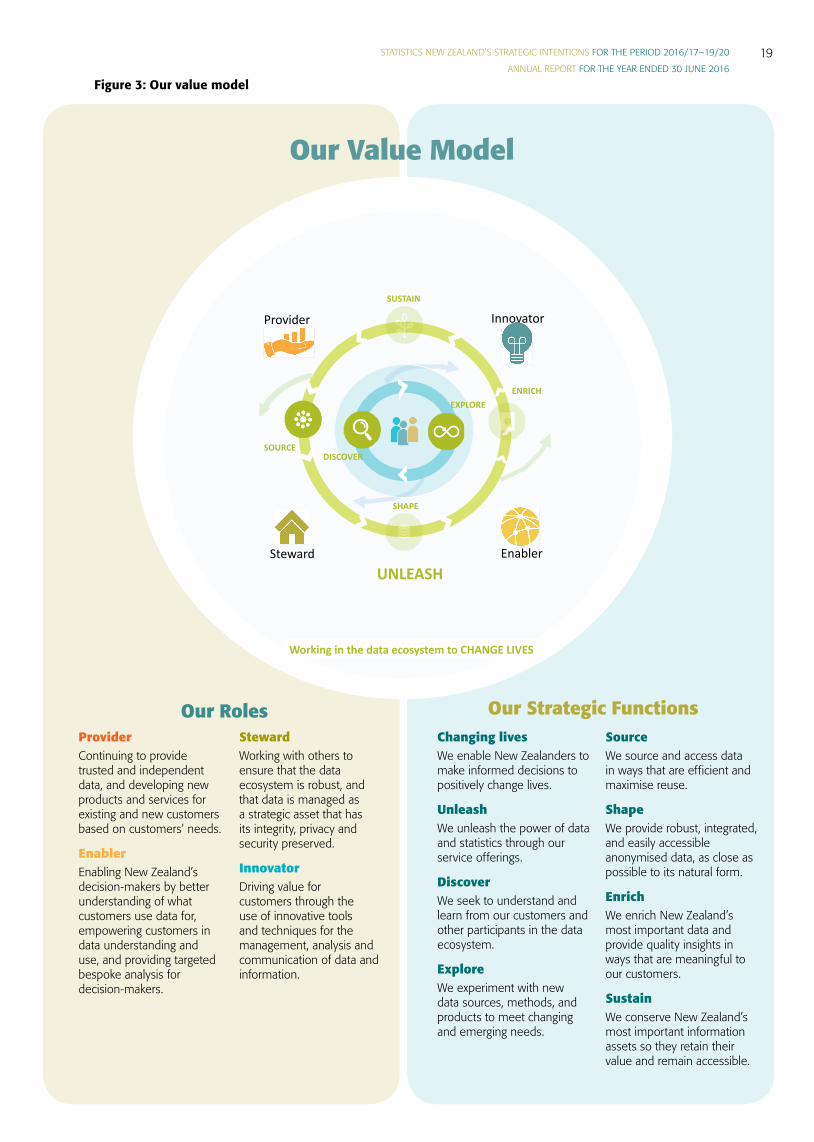
Figure 3: Our value model
Our Roles Our Strategic FunctionsChanging livesWe enable New Zealanders to make informed decisions to positively change lives.
UnleashWe unleash the power of data and statistics through our service offerings.
Discover We seek to understand and learn from our customers and other participants in the data ecosystem.
ExploreWe experiment with new data sources, methods, and products to meet changing and emerging needs.
SourceWe source and access data in ways that are efficient and maximise reuse.
ShapeWe provide robust, integrated, and easily accessible anonymised data, as close as possible to its natural form.
EnrichWe enrich New Zealand’s most important data and provide quality insights in ways that are meaningful to our customers.
SustainWe conserve New Zealand’s most important information assets so they retain their value and remain accessible.
ProviderContinuing to provide trusted and independent data, and developing new products and services for existing and new customers based on customers’ needs.
Enabler Enabling New Zealand’s decision-makers by better understanding of what customers use data for, empowering customers in data understanding and use, and providing targeted bespoke analysis for decision-makers.
StewardWorking with others to ensure that the data ecosystem is robust, and that data is managed as a strategic asset that has its integrity, privacy and security preserved.
InnovatorDriving value for customers through the use of innovative tools and techniques for the management, analysis and communication of data and information.
ENRICH
EXPLORE
DISCOVER
Working in the data ecosystem to CHANGE LIVES
UNLEASH
OUR VALUE MODEL!
Provider Innovator
Enabler
SOURCE
SHAPE
Steward
SUSTAIN
Our Value Model
STATISTICS NEW ZEALAND’S STRATEGIC INTENTIONS FOR THE PERIOD 2016/17–19/20
ANNUAL REPORT FOR THE YEAR ENDED 30 JUNE 201620
How we will functionOur value model defines how we will function in the future. Once we had decided on a clear vision, purpose, and goals, our next consideration in our strategic refresh was how we would achieve them. The two key components of the model are the roles we play in the data ecosystem and the strategic functions we perform to add value within the data ecosystem. The two lenses come together to form our value model (figure 3, p19). This model is a significant conceptual shift from Statistics NZ’s traditional role of adding value largely through statistics. The components of the value model are described below.
Our relationship with the data ecosystemThe data ecosystem consists of people and organisations and the data they generate, share, and use. It is made up of individual citizens, businesses, government agencies, non-government organisations, communities, and groups, Mäori and iwi, and international organisations. Statistics NZ is an important co-leader in New Zealand’s data ecosystem. A key change expressed in this value model is the focus given to working within the ecosystem with our customers, suppliers, and stakeholders. While the statistical business process model and quality management toolkit remain key to delivering core statistics, the way in which our organisation functions in and with our data ecosystem will change. The roles and strategic functions express this change.
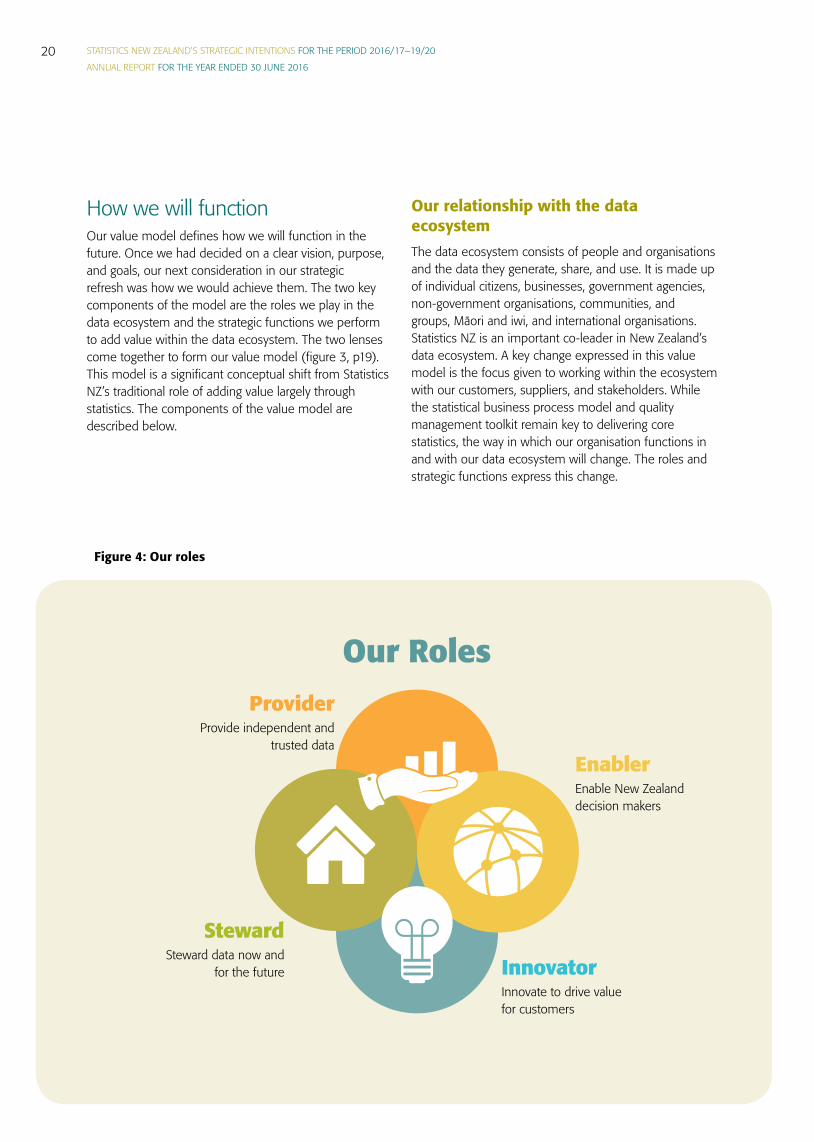
Figure 4: Our roles
EnablerEnable New Zealand decision makers
Our RolesProvider
Provide independent and trusted data
StewardSteward data now and
for the future Innovator Innovate to drive value for customers
STATISTICS NEW ZEALAND’S STRATEGIC INTENTIONS FOR THE PERIOD 2016/17–19/20
ANNUAL REPORT FOR THE YEAR ENDED 30 JUNE 201621
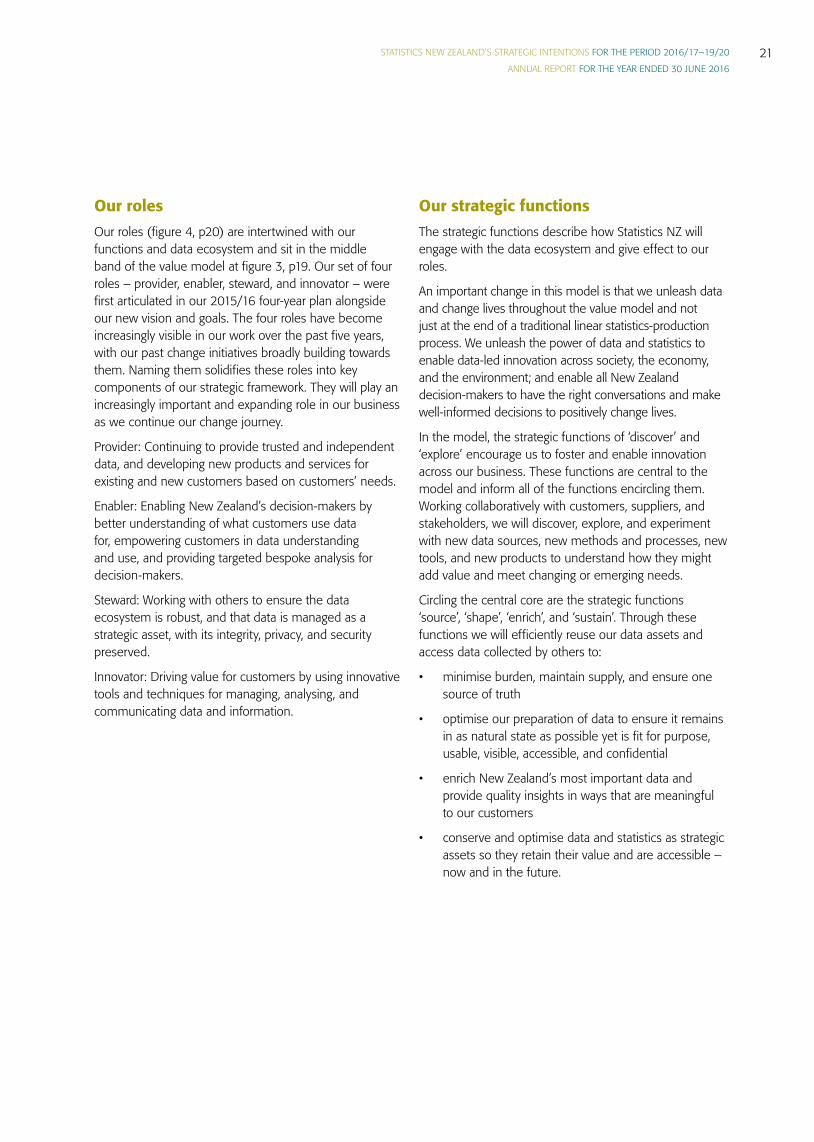
Our rolesOur roles (figure 4, p20) are intertwined with our functions and data ecosystem and sit in the middle band of the value model at figure 3, p19. Our set of four roles – provider, enabler, steward, and innovator – were first articulated in our 2015/16 four-year plan alongside our new vision and goals. The four roles have become increasingly visible in our work over the past five years, with our past change initiatives broadly building towards them. Naming them solidifies these roles into key components of our strategic framework. They will play an increasingly important and expanding role in our business as we continue our change journey.
Provider: Continuing to provide trusted and independent data, and developing new products and services for existing and new customers based on customers’ needs.
Enabler: Enabling New Zealand’s decision-makers by better understanding of what customers use data for, empowering customers in data understanding and use, and providing targeted bespoke analysis for decision-makers.
Steward: Working with others to ensure the data ecosystem is robust, and that data is managed as a strategic asset, with its integrity, privacy, and security preserved.
Innovator: Driving value for customers by using innovative tools and techniques for managing, analysing, and communicating data and information.
Our strategic functions The strategic functions describe how Statistics NZ will engage with the data ecosystem and give effect to our roles.
An important change in this model is that we unleash data and change lives throughout the value model and not just at the end of a traditional linear statistics-production process. We unleash the power of data and statistics to enable data-led innovation across society, the economy, and the environment; and enable all New Zealand decision-makers to have the right conversations and make well-informed decisions to positively change lives.
In the model, the strategic functions of ‘discover’ and ‘explore’ encourage us to foster and enable innovation across our business. These functions are central to the model and inform all of the functions encircling them. Working collaboratively with customers, suppliers, and stakeholders, we will discover, explore, and experiment with new data sources, new methods and processes, new tools, and new products to understand how they might add value and meet changing or emerging needs.
Circling the central core are the strategic functions ‘source’, ‘shape’, ‘enrich’, and ‘sustain’. Through these functions we will efficiently reuse our data assets and access data collected by others to:
• minimise burden, maintain supply, and ensure one source of truth
• optimise our preparation of data to ensure it remains in as natural state as possible yet is fit for purpose, usable, visible, accessible, and confidential
• enrich New Zealand’s most important data and provide quality insights in ways that are meaningful to our customers
• conserve and optimise data and statistics as strategic assets so they retain their value and are accessible – now and in the future.
STATISTICS NEW ZEALAND’S STRATEGIC INTENTIONS FOR THE PERIOD 2016/17–19/20
ANNUAL REPORT FOR THE YEAR ENDED 30 JUNE 201622
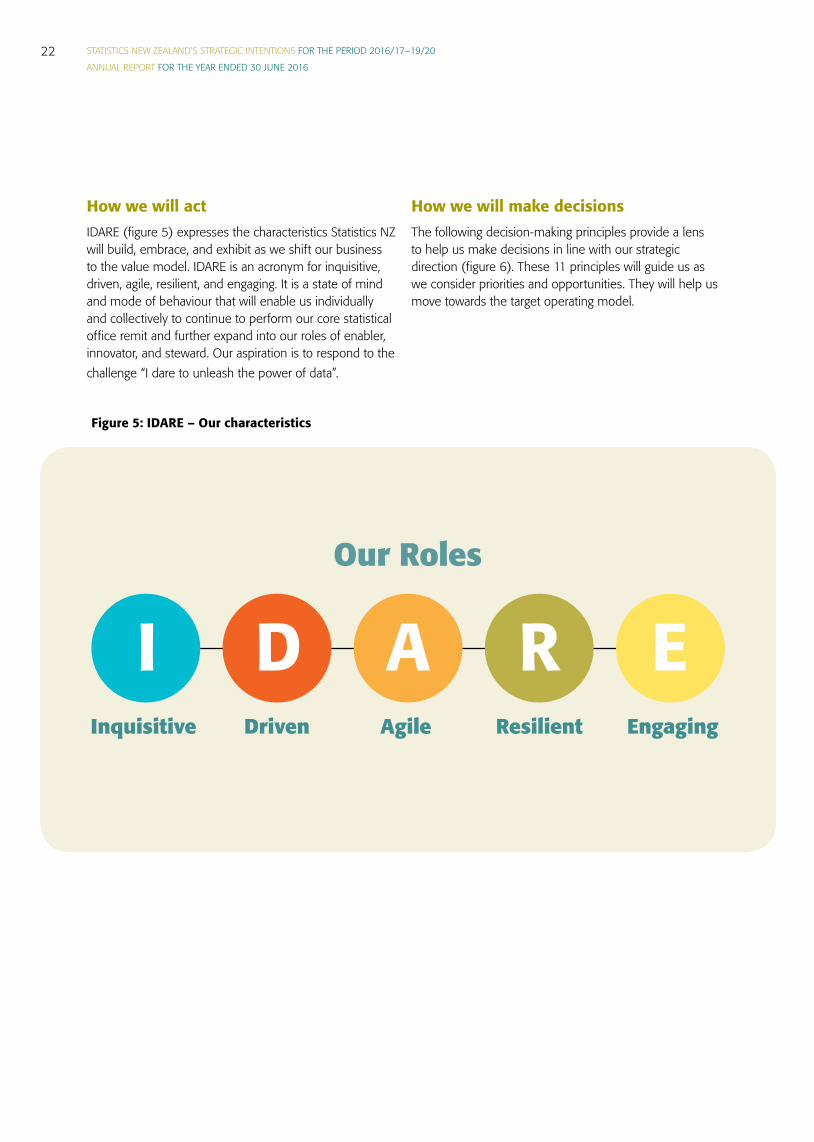
How we will actIDARE (figure 5) expresses the characteristics Statistics NZ will build, embrace, and exhibit as we shift our business to the value model. IDARE is an acronym for inquisitive, driven, agile, resilient, and engaging. It is a state of mind and mode of behaviour that will enable us individually and collectively to continue to perform our core statistical office remit and further expand into our roles of enabler, innovator, and steward. Our aspiration is to respond to the challenge “I dare to unleash the power of data”.
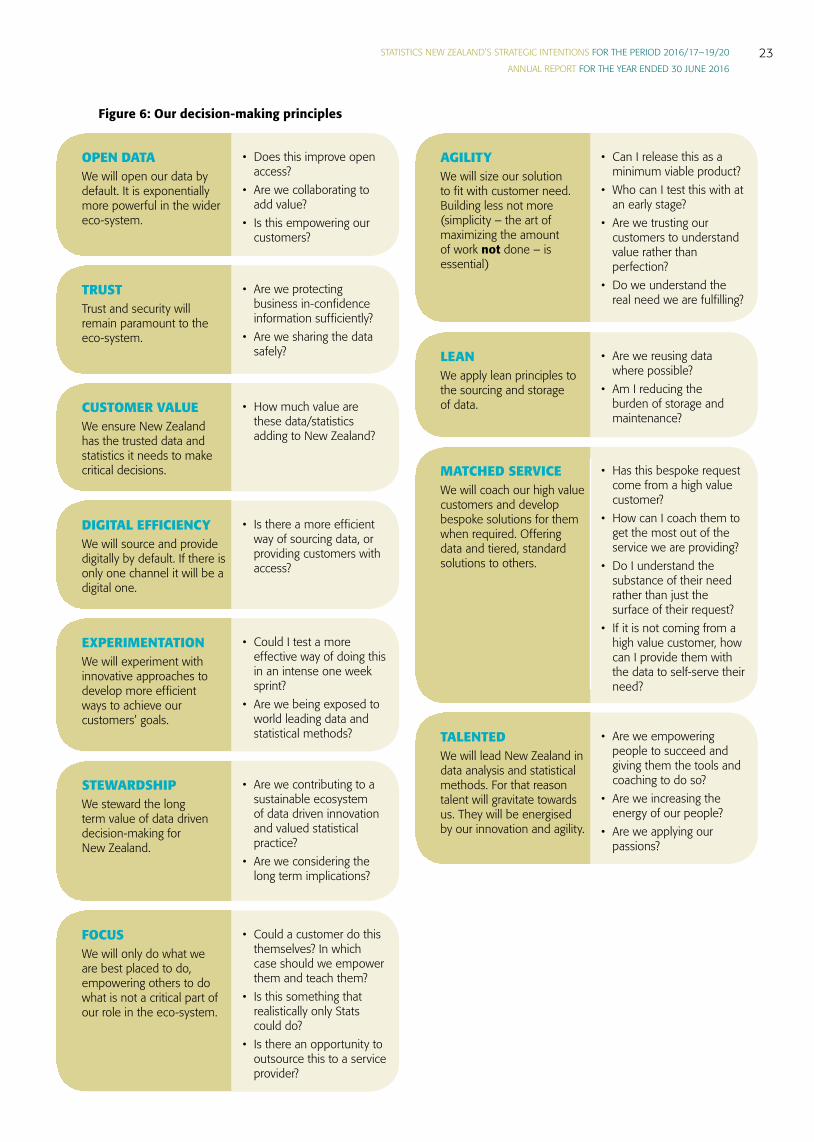
How we will make decisionsThe following decision-making principles provide a lens to help us make decisions in line with our strategic direction (figure 6). These 11 principles will guide us as we consider priorities and opportunities. They will help us move towards the target operating model.
Figure 5: IDARE – Our characteristics
Our Roles
Inquisitive Driven Agile Resilient Engaging
I D A R E
STATISTICS NEW ZEALAND’S STRATEGIC INTENTIONS FOR THE PERIOD 2016/17–19/20
ANNUAL REPORT FOR THE YEAR ENDED 30 JUNE 201623
OPEN DATAWe will open our data by default. It is exponentially more powerful in the wider eco-system.
FOCUSWe will only do what we are best placed to do, empowering others to do what is not a critical part of our role in the eco-system.
AGILITYWe will size our solution to fit with customer need. Building less not more (simplicity – the art of maximizing the amount of work not done – is essential)
LEANWe apply lean principles to the sourcing and storage of data.
MATCHED SERVICEWe will coach our high value customers and develop bespoke solutions for them when required. Offering data and tiered, standard solutions to others.
TALENTEDWe will lead New Zealand in data analysis and statistical methods. For that reason talent will gravitate towards us. They will be energised by our innovation and agility.
DIGITAL EFFICIENCYWe will source and provide digitally by default. If there is only one channel it will be a digital one.
EXPERIMENTATIONWe will experiment with innovative approaches to develop more efficient ways to achieve our customers’ goals.
STEWARDSHIPWe steward the long term value of data driven decision-making for New Zealand.
TRUSTTrust and security will remain paramount to the eco-system.
CUSTOMER VALUEWe ensure New Zealand has the trusted data and statistics it needs to make critical decisions.
• Does this improve open access?
• Are we collaborating to add value?
• Is this empowering our customers?
• Could a customer do this themselves? In which case should we empower them and teach them?
• Is this something that realistically only Stats could do?
• Is there an opportunity to outsource this to a service provider?
• Can I release this as a minimum viable product?
• Who can I test this with at an early stage?
• Are we trusting our customers to understand value rather than perfection?
• Do we understand the real need we are fulfilling?
• Are we reusing data where possible?
• Am I reducing the burden of storage and maintenance?
• Has this bespoke request come from a high value customer?
• How can I coach them to get the most out of the service we are providing?
• Do I understand the substance of their need rather than just the surface of their request?
• If it is not coming from a high value customer, how can I provide them with the data to self-serve their need?
• Are we empowering people to succeed and giving them the tools and coaching to do so?
• Are we increasing the energy of our people?
• Are we applying our passions?
• Is there a more efficient way of sourcing data, or providing customers with access?
• Could I test a more effective way of doing this in an intense one week sprint?
• Are we being exposed to world leading data and statistical methods?
• Are we contributing to a sustainable ecosystem of data driven innovation and valued statistical practice?
• Are we considering the long term implications?
• Are we protecting business in-confidence information sufficiently?
• Are we sharing the data safely?
• How much value are these data/statistics adding to New Zealand?
Figure 6: Our decision-making principles
STATISTICS NEW ZEALAND’S STRATEGIC INTENTIONS FOR THE PERIOD 2016/17–19/20
ANNUAL REPORT FOR THE YEAR ENDED 30 JUNE 201624 ANNUAL REPORT OF STATISTICS NEW ZEALAND FOR THE YEAR ENDED 30 JUNE 2016 10
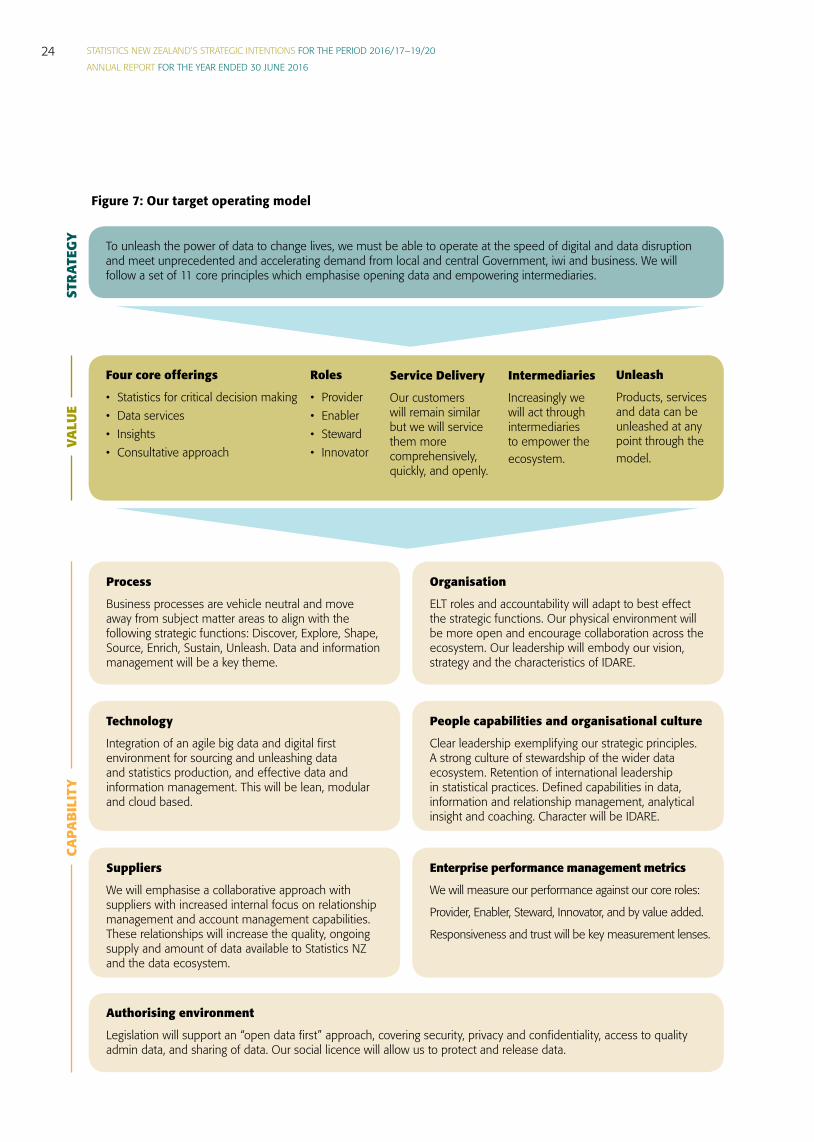
Figure 6: Statistics NZ Target operating model overview
To unleash the power of data to change lives, we must be able to operate at the speed of digital and data disruption and meet unprecedented and accelerating demand from local and central Government, iwi and business. We will follow a set of 11 core principles which emphasise opening data and empowering intermediaries.
Four core offerings
•
Statistics for critical decision making •
Data services•
Insights•
Consultative approach
Roles
• Provider• Enabler• Steward • Innovator
Service Delivery
Our customers will remain similar but we will service them more comprehensively, quickly, and openly.
Process
Business processes are vehicle neutral and move away from subject matter areas to align with the following strategic functions: Discover, Explore, Shape, Source, Enrich, Sustain, Unleash. Data and information management will be a key theme.
Technology
Integration of an agile big data and digital first environment for sourcing and unleashing data and statistics production, and effective data and information management. This will be lean, modular and cloud based.
Suppliers
We will emphasise a collaborative approach with suppliers with increased internal focus on relationship management and account management capabilities. These relationships will increase the quality, ongoing supply and amount of data available to Statistics NZ and the data ecosystem.
Authorising environment
Legislation will support an “open data first” approach, covering security, privacy and confidentiality, access to quality admin data, and sharing of data. Our social licence will allow us to protect and release data.
Organisation
ELT roles and accountability will adapt to best effect the strategic functions. Our physical environment will be more open and encourage collaboration across the ecosystem. Our leadership will embody our vision, strategy and the characteristics of IDARE.
People capabilities and organisational culture
Clear leadership exemplifying our strategic principles. A strong culture of stewardship of the wider data ecosystem. Retention of international leadership in statistical practices. Defined capabilities in data, information and relationship management, analytical insight and coaching. Character will be IDARE.
Enterprise performance management metrics
We will measure our performance against our core roles:
Provider, Enabler, Steward, Innovator, and by value added.
Responsiveness and trust will be key measurement lenses.
Intermediaries
Increasingly we will act through intermediaries to empower the ecosystem.
Unleash
Products, services and data can be unleashed at any point through the model.
STRA
TEGY
VALU
ECA
PABI
LITY
Figure 7: Our target operating model
STATISTICS NEW ZEALAND’S STRATEGIC INTENTIONS FOR THE PERIOD 2016/17–19/20
ANNUAL REPORT FOR THE YEAR ENDED 30 JUNE 201625
What we need to becomeThe target operating model brings together our goals, value model, characteristics, and decision-making principles and describes how we will look in the future (figure 7). It is Statistics NZ’s new way of working and provides us with clear goalposts for our change journey.
In this target operating model, our remit is changed. While retaining the strength of our current, trusted products and services, Statistics NZ embraces expanded roles of provider, enabler, innovator, and steward. Our internal functions change. We serve our customers’ needs more comprehensively, quickly, and openly. We empower the data ecosystem we work in by building new types of relationships. And we more readily unleash the power of data to enable evidence-based decision-making throughout the ecosystem.
The target operating model consists of three components – strategy, value, and capabilities (figure 7).
Target operating model strategyThe strategy summarises the broader intentions of the model, explicitly drawing from and reflecting other components of our strategic direction story, including an acknowledgement of the extent and impact of our changing environment and our need to respond.
Target operating model valueThe value section of the target operating model comprises our four core offerings, our roles, and our approach to service delivery, intermediaries, and the concept of ‘unleash’.
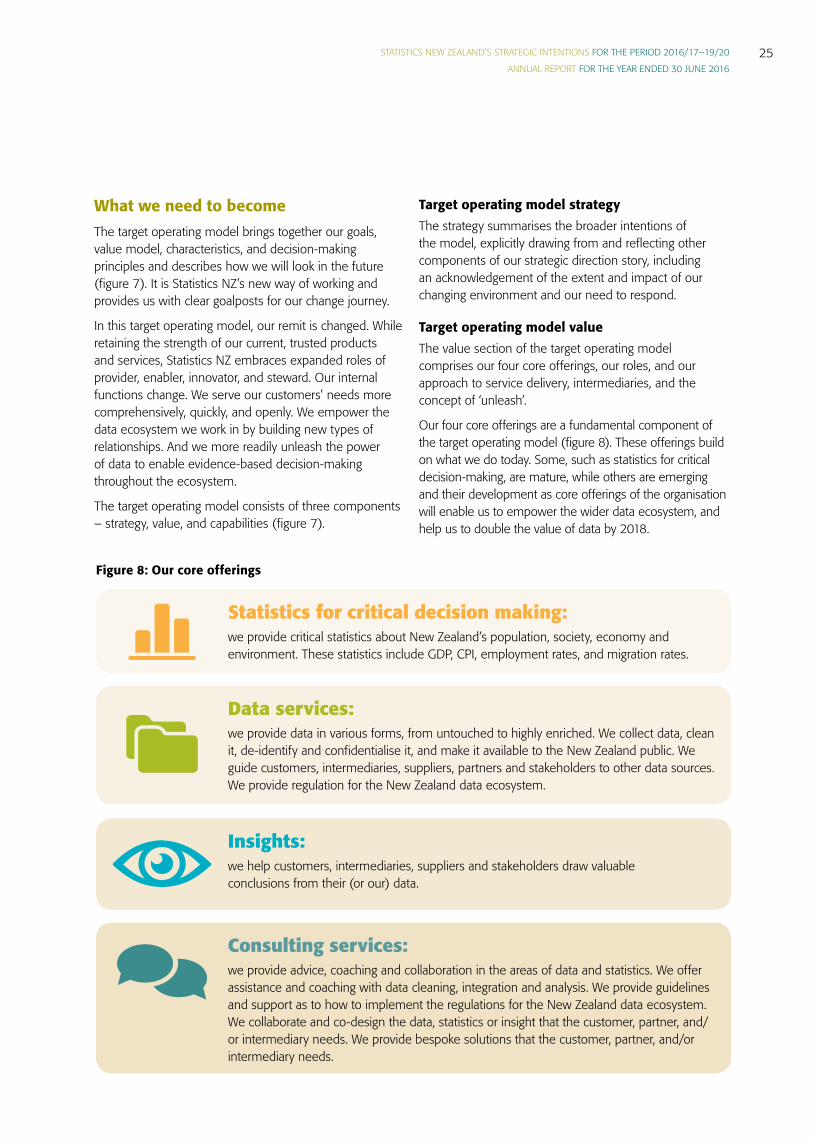
Our four core offerings are a fundamental component of the target operating model (figure 8). These offerings build on what we do today. Some, such as statistics for critical decision-making, are mature, while others are emerging and their development as core offerings of the organisation will enable us to empower the wider data ecosystem, and help us to double the value of data by 2018.
Figure 8: Our core offerings
Statistics for critical decision making:
Insights:
Data services:
Consulting services:
we provide critical statistics about New Zealand’s population, society, economy and environment. These statistics include GDP, CPI, employment rates, and migration rates.
we help customers, intermediaries, suppliers and stakeholders draw valuable conclusions from their (or our) data.
we provide data in various forms, from untouched to highly enriched. We collect data, clean it, de-identify and confidentialise it, and make it available to the New Zealand public. We guide customers, intermediaries, suppliers, partners and stakeholders to other data sources. We provide regulation for the New Zealand data ecosystem.
we provide advice, coaching and collaboration in the areas of data and statistics. We offer assistance and coaching with data cleaning, integration and analysis. We provide guidelines and support as to how to implement the regulations for the New Zealand data ecosystem. We collaborate and co-design the data, statistics or insight that the customer, partner, and/or intermediary needs. We provide bespoke solutions that the customer, partner, and/or intermediary needs.
STATISTICS NEW ZEALAND’S STRATEGIC INTENTIONS FOR THE PERIOD 2016/17–19/20
ANNUAL REPORT FOR THE YEAR ENDED 30 JUNE 201626
Target operating model capabilitiesTo deliver the value propositions above, we must align our organisation’s capabilities with them. The target operating model identifies seven key areas in which we need to grow and develop our capabilities:
• process• organisation• technology• people capabilities and organisational culture• suppliers• enterprise performance management metrics• authorising environment.
Defining these capabilities has allowed us to develop work-streams that will help us achieve the target operating model and the strategic direction.
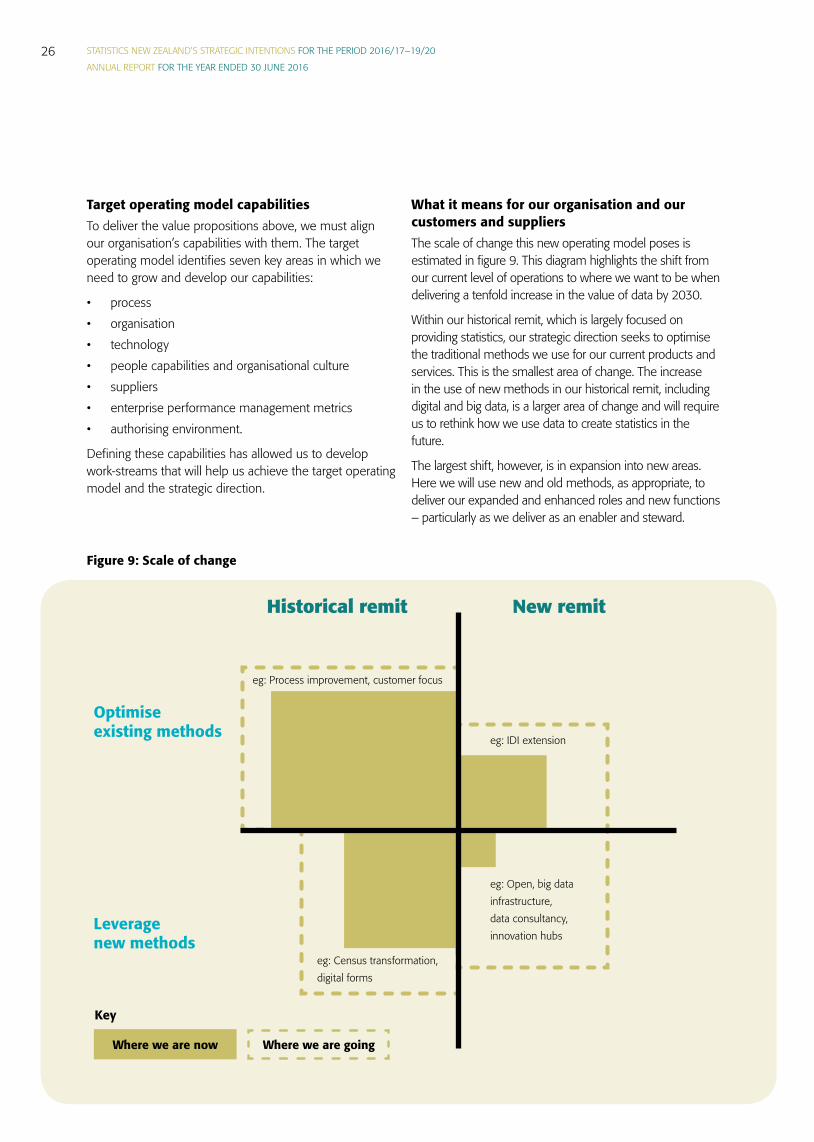
What it means for our organisation and our customers and suppliersThe scale of change this new operating model poses is estimated in figure 9. This diagram highlights the shift from our current level of operations to where we want to be when delivering a tenfold increase in the value of data by 2030.
Within our historical remit, which is largely focused on providing statistics, our strategic direction seeks to optimise the traditional methods we use for our current products and services. This is the smallest area of change. The increase in the use of new methods in our historical remit, including digital and big data, is a larger area of change and will require us to rethink how we use data to create statistics in the future.
The largest shift, however, is in expansion into new areas. Here we will use new and old methods, as appropriate, to deliver our expanded and enhanced roles and new functions – particularly as we deliver as an enabler and steward.
Figure 9: Scale of change
Where we are now Where we are going
Historical remit New remit
Optimise existing methods
Leverage new methods
Key
eg: Process improvement, customer focus
eg: Census transformation, digital forms
eg: IDI extension
eg: Open, big data infrastructure, data consultancy, innovation hubs
STATISTICS NEW ZEALAND’S STRATEGIC INTENTIONS FOR THE PERIOD 2016/17–19/20
ANNUAL REPORT FOR THE YEAR ENDED 30 JUNE 201627
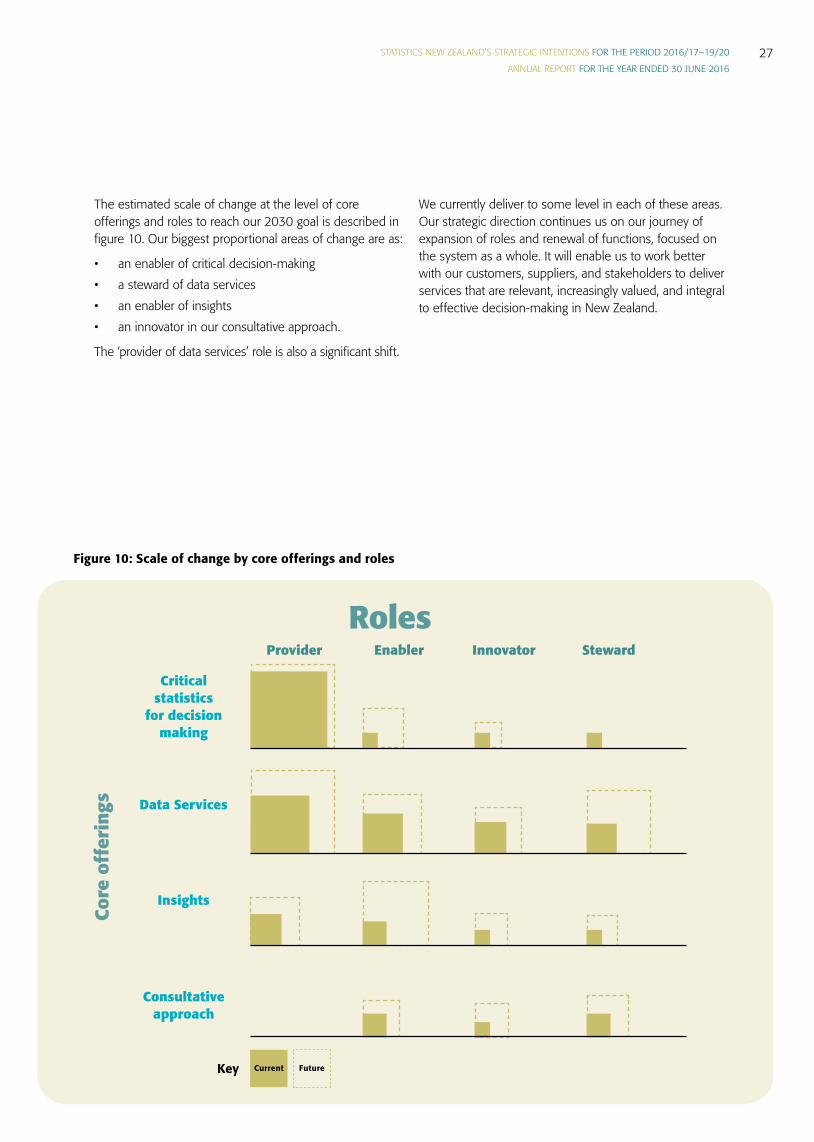
The estimated scale of change at the level of core offerings and roles to reach our 2030 goal is described in figure 10. Our biggest proportional areas of change are as:
• an enabler of critical decision-making• a steward of data services• an enabler of insights• an innovator in our consultative approach.
The ‘provider of data services’ role is also a significant shift.
We currently deliver to some level in each of these areas. Our strategic direction continues us on our journey of expansion of roles and renewal of functions, focused on the system as a whole. It will enable us to work better with our customers, suppliers, and stakeholders to deliver services that are relevant, increasingly valued, and integral to effective decision-making in New Zealand.
Figure 10: Scale of change by core offerings and roles
Key
Provider Enabler Innovator Steward
Critical statistics
for decision making
Data Services
Insights
Consultative approach
Core
off
erin
gs
Roles
Current Future
STATISTICS NEW ZEALAND’S STRATEGIC INTENTIONS FOR THE PERIOD 2016/17–19/20
ANNUAL REPORT FOR THE YEAR ENDED 30 JUNE 201628
Measuring our journeyAs we continue on our change journey, we will measure ourselves against our current remit and, further down the road, more fully against our new remit. Our annual reporting over the next four years will be guided by measures defined in two key documents:
• measures defined in our budget appropriations each year
• measures defined in our output plan (our performance agreement with our Minister) each year.
These documents are publicly available on our website (output plan) and the Treasury’s website (budget appropriations).
We are currently refreshing our performance framework and reviewing the performance measures for both of these documents in light of our new strategic direction. We expect that, over time, our measures will more closely align with the key changes described in this strategic intentions document.
We have mapped out the results we need to achieve over the next four years to reach our strategic direction, which we will review and adjust on a six-monthly basis. They are incorporated into our output plan. Our journey of accelerated evolution is an agile one, which requires smart planning and adaptable approaches. Our intention is that our approach and how we will measure it will remain relevant throughout our journey.
Sitting above all of these measures are our goals:
• double the value of the data provided by Statistics NZ to New Zealand by 2018
• create a tenfold increase in value of the data provided to New Zealand by 2030.
These goals will remain the key focus for measurement across the life of the 2016/17–2019/20 strategic intentions.
STATISTICS NEW ZEALAND’S STRATEGIC INTENTIONS FOR THE PERIOD 2016/17–19/20
ANNUAL REPORT FOR THE YEAR ENDED 30 JUNE 201629
Part 2Annual report
for the year ended 30 June 2016

STATISTICS NEW ZEALAND’S STRATEGIC INTENTIONS FOR THE PERIOD 2016/17–19/20
ANNUAL REPORT FOR THE YEAR ENDED 30 JUNE 201630
Statistics NZ by the numbers
Statistics NZ’s 2016 operating budget was $133 million
For the year ended 30 June 2016
1.2 millionOur survey interviewers travelled
93
155,207questionnaires
A female born in 2014 can expect to live to
per capita
New Zealand’s GDP was
$53,784
kilometres
years of age
We employed 918 people across New Zealand
3.5% Statistics NZ employees identify as Mäori ethnicity
Top five ethnicities at Statistics NZ: NZ European, English, Chinese, Indian, Mäori
We published 203 information releases
We collected 350,000 prices across 2,800 outlets
129 Tier 1 statistics are in production
We filled 875 customised data requests
Our Information Centre responded to 10,941 enquiries
We posted

STATISTICS NEW ZEALAND’S STRATEGIC INTENTIONS FOR THE PERIOD 2016/17–19/20
ANNUAL REPORT FOR THE YEAR ENDED 30 JUNE 201631
Top three searches on stats.govt.nz:
3.31 million
11.4 million
The number of visitors to New Zealand
Number of visitor cards scanned
Our survey interviewers travelled
2.9 million unique visits to www.stats.govt.nz
200,947 sessions from USA (second most sessions from a country other than NZ)
89% of users think government has the information they need
$485 million Mäori authorities
exported goods worth
Child poverty, population, and CPI
New Zealand’s top 3 export destinations
for 2015 were: Australia, China,
EU
1.99New Zealand’s fertility rate for 2015 was births per woman
Our interviewers asked
2.9 million questions

STATISTICS NEW ZEALAND’S STRATEGIC INTENTIONS FOR THE PERIOD 2016/17–19/20
ANNUAL REPORT FOR THE YEAR ENDED 30 JUNE 201632
I am delighted to present my third annual report as Government Statistician and Chief Executive of Statistics New Zealand.
What delights me most is the way in which the organisation is responding to the challenge inherent in our vision of “unleashing the power of data to change lives”. This includes stepping up to a data stewardship role across the public sector data ecosystem. As the trusted source of impartial data and data expertise we are in a unique position to help New Zealand realise the value of its data assets.
I subscribe strongly to the view espoused by Jack Delosa that when we find a purpose that is bigger than ourselves we become more powerful in our ability to create. I see this every day in the way in which Stats people are working with the public and private sectors, NGOs and iwi/Mäori to unleash the power of data. In engaging with our customers, stakeholders, and partners over the course of the year I have received nothing but positive feedback on our direction of travel, a desire to collaborate, and the encouragement to go even faster and harder. In fact the phrase that is used most often is “you have a success problem” – people want more of what we have to offer.
What this means is that when preparing this year’s report it was even more difficult to know what to include and what not to include, so I want to be clear that this report covers only some of the highlights for our people, partners, and customers – my thanks go to all those involved.
Over the course of the next year we will continue to challenge ourselves to lift our pace and that of the system to respond to the demands for greater access to and insights from an increasingly more diverse range of data. We will deal with our “success problem” by prioritising our areas of focus, delivering using agile approaches, and collaborating and partnering with others. I am looking forward to new opportunities to unleash the power of data to change lives.
Liz MacPhersonGovernment Statistician and Chief Executive
Introduction from the Chief Executive and Government Statistician
Manu kai mätauranga, manu kai ao.If I am to take on the world, then my food shall be knowledge.
STATISTICS NEW ZEALAND’S STRATEGIC INTENTIONS FOR THE PERIOD 2016/17–19/20
ANNUAL REPORT FOR THE YEAR ENDED 30 JUNE 201633
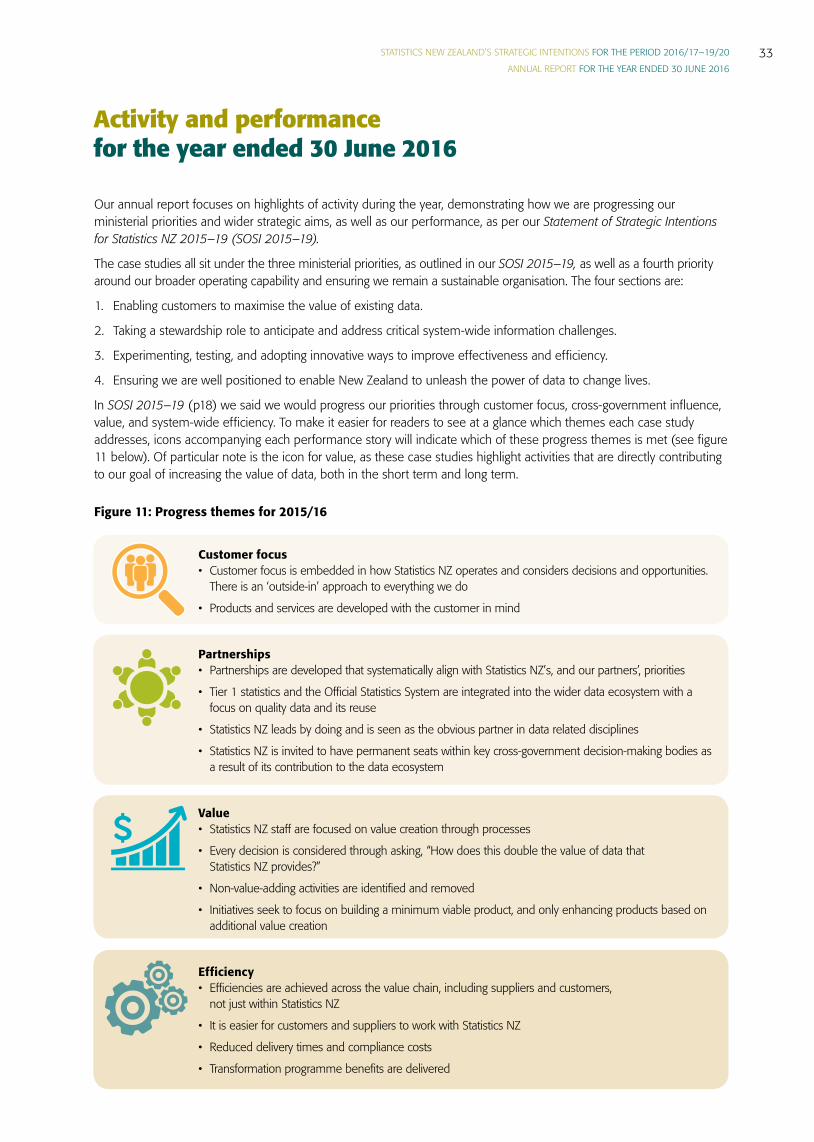
Our annual report focuses on highlights of activity during the year, demonstrating how we are progressing our ministerial priorities and wider strategic aims, as well as our performance, as per our Statement of Strategic Intentions for Statistics NZ 2015–19 (SOSI 2015–19).
The case studies all sit under the three ministerial priorities, as outlined in our SOSI 2015–19, as well as a fourth priority around our broader operating capability and ensuring we remain a sustainable organisation. The four sections are:
1. Enabling customers to maximise the value of existing data.
2. Taking a stewardship role to anticipate and address critical system-wide information challenges.
3. Experimenting, testing, and adopting innovative ways to improve effectiveness and efficiency.
4. Ensuring we are well positioned to enable New Zealand to unleash the power of data to change lives.
In SOSI 2015–19 (p18) we said we would progress our priorities through customer focus, cross-government influence, value, and system-wide efficiency. To make it easier for readers to see at a glance which themes each case study addresses, icons accompanying each performance story will indicate which of these progress themes is met (see figure 11 below). Of particular note is the icon for value, as these case studies highlight activities that are directly contributing to our goal of increasing the value of data, both in the short term and long term.
Customer focus• Customer focus is embedded in how Statistics NZ operates and considers decisions and opportunities.
There is an ‘outside-in’ approach to everything we do
• Products and services are developed with the customer in mind
Partnerships• Partnerships are developed that systematically align with Statistics NZ’s, and our partners’, priorities
• Tier 1 statistics and the Official Statistics System are integrated into the wider data ecosystem with a focus on quality data and its reuse
• Statistics NZ leads by doing and is seen as the obvious partner in data related disciplines
• Statistics NZ is invited to have permanent seats within key cross-government decision-making bodies as a result of its contribution to the data ecosystem
Value• Statistics NZ staff are focused on value creation through processes
• Every decision is considered through asking, “How does this double the value of data that Statistics NZ provides?”
• Non-value-adding activities are identified and removed
• Initiatives seek to focus on building a minimum viable product, and only enhancing products based on additional value creation
Efficiency• Efficiencies are achieved across the value chain, including suppliers and customers,
not just within Statistics NZ
• It is easier for customers and suppliers to work with Statistics NZ
• Reduced delivery times and compliance costs
• Transformation programme benefits are delivered
Activity and performance for the year ended 30 June 2016
Figure 11: Progress themes for 2015/16

STATISTICS NEW ZEALAND’S STRATEGIC INTENTIONS FOR THE PERIOD 2016/17–19/20
ANNUAL REPORT FOR THE YEAR ENDED 30 JUNE 201634
Our key highlights for the last year include:
• Integrated data and the Integrated Data Infrastructure
• Reducing the burden on business
• Working with iwi/Mäori, Pasifika, and non-government organisations
• Review of the statistical standard for iwi and the classification for iwi
• Gender identity standard world first in New Zealand
• Performance information
Integrated data and the Integrated Data Infrastructure
There is an increased focus on evidence-based decision-making in New Zealand government practice. This is principally through an investment approach to government spending (with an initial focus on the social sector) that aims to improve the lives of New Zealanders. It also aims to increase the measurability of the impact of government investment. The approach requires evidence before making investment decisions, and the Integrated Data Infrastructure (IDI) is the key data repository for such evidence.
One of the highlights for integrated data and the IDI was the addition of data from the Census of Population and Dwellings in October 2015. This addition has expanded the use of the IDI by approved researchers and will increase the value gained from the census investment. Benefits of including census data include improved information for and about Mäori, greater information on outcomes for smaller population groups, the inclusion of data that is not available through administrative data sources, and the potential to improve census data.
Other datasets added to the IDI as part of a refresh included new Inland Revenue student loans and allowances data; NZ Police recorded crime offenders’ data; and expanded ACC data.
In February 2016, we made progress on our work with the Ministry of Business, Innovation and Employment (MBIE) to link CoreLogic data into the IDI. The data from CoreLogic provides unit record information on residential properties in New Zealand, valuation data on these properties, and data about sales and transactions back to 1993. Inclusion of this data in the IDI provides information on the characteristics of residential properties in New Zealand and increases research and policy opportunities in areas such as household crowding, changes in the value of land over time, and rental affordability. It is also an important input into the work MBIE is undertaking to build a measure of housing affordability in New Zealand.
In the last IDI refresh for 2015/16 we also successfully incorporated the motor vehicle and driver licence registers, and Auckland City Mission datasets into the IDI. These datasets were made available to approved researchers on 21 July 2016. The Auckland City Mission dataset is the first non-government organisation dataset to be included in the IDI.
Researchers from across government and academia have been using the IDI to answer a wide range of research, policy, and evaluation questions. Previously unanswerable questions can be studied using the IDI because of the richness of linked data. The IDI supports the government’s approach to drive greater availability and use of data for the public good.
Ultimately, the IDI helps the government and its agencies to prioritise and maximise the impact of expenditure. IDI data can be used in liability modelling, to reduce current and future liability in areas of big government spending, such as the social sector.
An example of its use is the Treasury’s Social Investment Unit using the IDI to identify four key indicators for children at high risk of poor outcomes later in life. This work aims to identify where to invest earlier into vulnerable children and their families, rather than waiting to deal with problems after they emerge. More information on this project is available on page 44 (Social investment insights).
Enabling customers to maximise the value of existing data
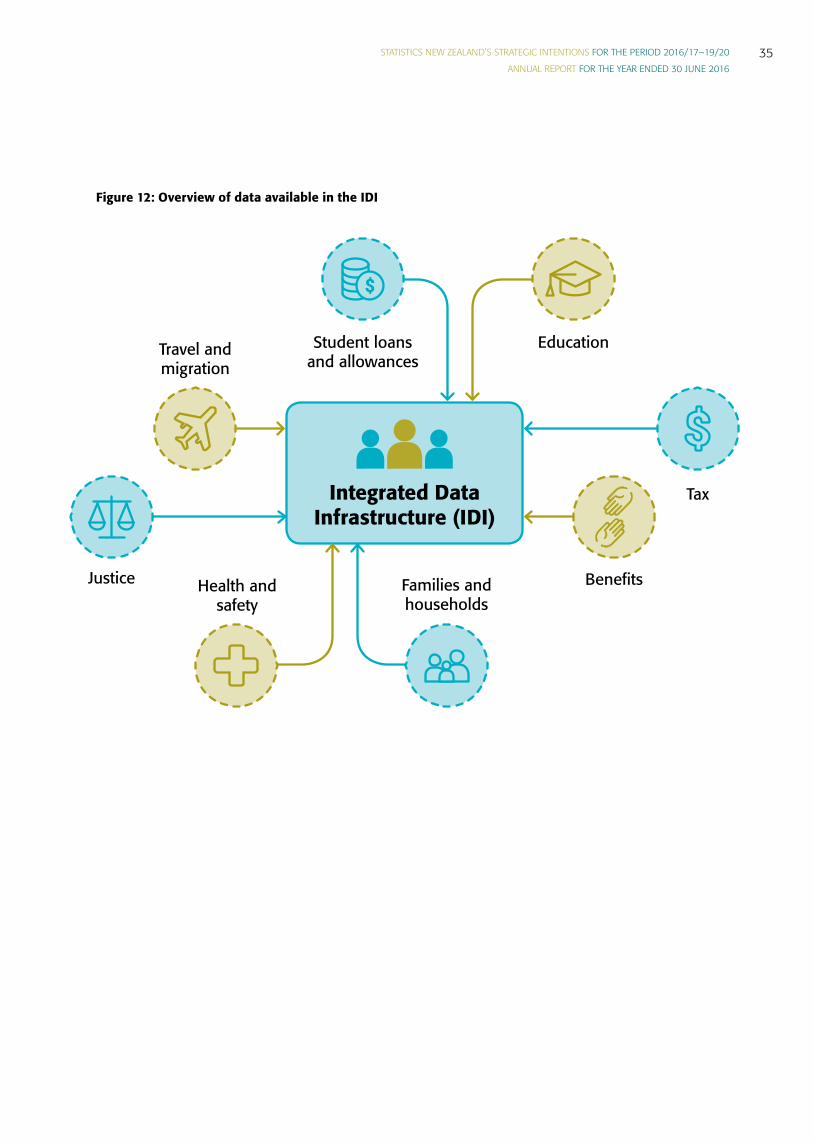
STATISTICS NEW ZEALAND’S STRATEGIC INTENTIONS FOR THE PERIOD 2016/17–19/20
ANNUAL REPORT FOR THE YEAR ENDED 30 JUNE 201635
Figure 12: Overview of data available in the IDI
Education
Tax
BenefitsFamilies and households
Health and safety
Justice
Travel and migration
Student loans and allowances
Integrated Data Infrastructure (IDI)

STATISTICS NEW ZEALAND’S STRATEGIC INTENTIONS FOR THE PERIOD 2016/17–19/20
ANNUAL REPORT FOR THE YEAR ENDED 30 JUNE 201636
Reducing the burden on business: Result 9 – Better for Business
Better for Business is a partnership of eight government agencies: Ministry of Business, Innovation and Employment (lead agency); ACC; Callaghan Innovation; Inland Revenue; New Zealand Customs Service; New Zealand Trade and Enterprise; Ministry for Primary Industries; and Statistics NZ.
As a collaborating R9 agency we are actively involved in several work-streams within the programme.
This year, one of the ways we have been responding to our R9 responsibilities is by enabling more businesses to complete our surveys online. Three business surveys have moved online, including:
• Quarterly Economic Survey of Manufacturing
• Quarterly Wholesale Trade Survey
• Quarterly Business Survey (previously the Quarterly Survey of Services).
Businesses in these quarterly business financial surveys will be able to complete their returns online for the June 2016 quarter.
Although there are 320,000 businesses in this population, we now only need to directly survey 1,500 businesses, thanks to the availability of administrative data.
Approximately 600 businesses have been included in the Quarterly Business Survey for the first time and will be able to complete their first survey online. Responses from these additional businesses support the improvements to national account statistics.
This year we also began collecting survey responses for the 2015 Agricultural Production Survey with an online option. The online option proved popular with farmers, with more than 60 percent of the surveys received completed online.
Better online help for respondentsThe Help for Survey Participants section of the Statistics NZ website was recently updated and made more respondent-friendly in time for the Census Test. The aim was to be able to provide more relevant, findable, and readable help information for survey participants, who come from all walks of life. The update was a collaborative effort from various branches of the organisation. More than 40 staff from Collection Operations, 2018 Census, Statistical Methods, Questionnaire Methodology and Development, Products Services and Insights, Customer Support, Organisation Strategy and Performance, Strategic Communications, and Applications Services provided content and support. The layout and contents are new, and will help survey participants understand what to expect during the survey, and after they have completed their survey forms.Significant changes include: • frequently asked questions based on real questions
received by field staff and Contact Centre staff
• consistent contents in the A–Z of our surveys
• a revised approach to survey compliance
• latest news about our surveys, for example the Census Test
• information on how to recognise a legitimate Statistics NZ Field Interviewer or Field Officer
• a complaints form and process that adheres to government complaints guidelines, and enables respondents to lodge complaints online.
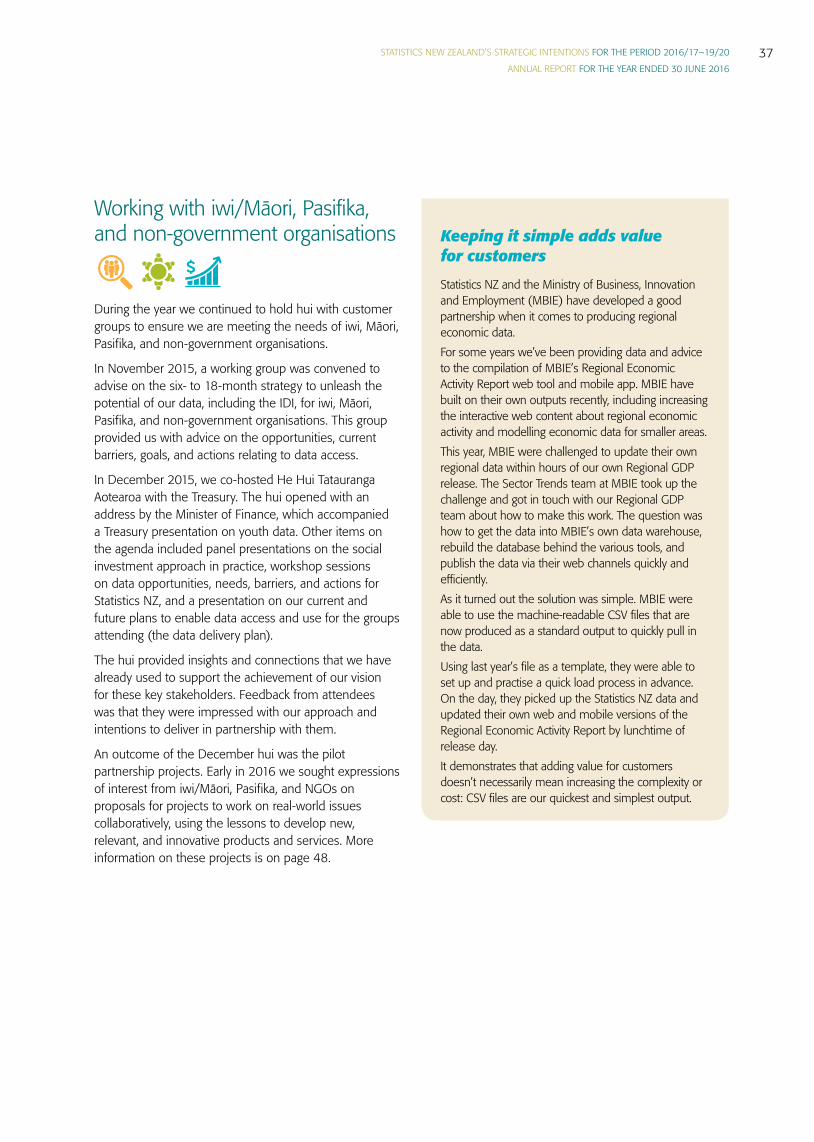
STATISTICS NEW ZEALAND’S STRATEGIC INTENTIONS FOR THE PERIOD 2016/17–19/20
ANNUAL REPORT FOR THE YEAR ENDED 30 JUNE 201637
Keeping it simple adds value for customersStatistics NZ and the Ministry of Business, Innovation and Employment (MBIE) have developed a good partnership when it comes to producing regional economic data. For some years we’ve been providing data and advice to the compilation of MBIE’s Regional Economic Activity Report web tool and mobile app. MBIE have built on their own outputs recently, including increasing the interactive web content about regional economic activity and modelling economic data for smaller areas. This year, MBIE were challenged to update their own regional data within hours of our own Regional GDP release. The Sector Trends team at MBIE took up the challenge and got in touch with our Regional GDP team about how to make this work. The question was how to get the data into MBIE’s own data warehouse, rebuild the database behind the various tools, and publish the data via their web channels quickly and efficiently.As it turned out the solution was simple. MBIE were able to use the machine-readable CSV files that are now produced as a standard output to quickly pull in the data. Using last year’s file as a template, they were able to set up and practise a quick load process in advance. On the day, they picked up the Statistics NZ data and updated their own web and mobile versions of the Regional Economic Activity Report by lunchtime of release day. It demonstrates that adding value for customers doesn’t necessarily mean increasing the complexity or cost: CSV files are our quickest and simplest output.
Working with iwi/Mäori, Pasifika, and non-government organisations
During the year we continued to hold hui with customer groups to ensure we are meeting the needs of iwi, Mäori, Pasifika, and non-government organisations.
In November 2015, a working group was convened to advise on the six- to 18-month strategy to unleash the potential of our data, including the IDI, for iwi, Mäori, Pasifika, and non-government organisations. This group provided us with advice on the opportunities, current barriers, goals, and actions relating to data access.
In December 2015, we co-hosted He Hui Tatauranga Aotearoa with the Treasury. The hui opened with an address by the Minister of Finance, which accompanied a Treasury presentation on youth data. Other items on the agenda included panel presentations on the social investment approach in practice, workshop sessions on data opportunities, needs, barriers, and actions for Statistics NZ, and a presentation on our current and future plans to enable data access and use for the groups attending (the data delivery plan).
The hui provided insights and connections that we have already used to support the achievement of our vision for these key stakeholders. Feedback from attendees was that they were impressed with our approach and intentions to deliver in partnership with them.
An outcome of the December hui was the pilot partnership projects. Early in 2016 we sought expressions of interest from iwi/Mäori, Pasifika, and NGOs on proposals for projects to work on real-world issues collaboratively, using the lessons to develop new, relevant, and innovative products and services. More information on these projects is on page 48.

STATISTICS NEW ZEALAND’S STRATEGIC INTENTIONS FOR THE PERIOD 2016/17–19/20
ANNUAL REPORT FOR THE YEAR ENDED 30 JUNE 201638
Review of the statistical standard for iwi and the classification for iwi
In December 2015 we began a review of the statistical standard for iwi. This standard is used in official statistics to classify information about the Mäori population by their iwi. The purpose of the review is to ensure the standard is relevant to current and future needs and can be used in a range of settings. As part of the review, the criteria for inclusion in the iwi classification was highlighted by stakeholders as an issue for the review to consider.
An inter-agency working group has scoped and supported the review and provided expert advice and robust discussion on:
• the importance of iwi and other related concepts to current and anticipated statistical needs of government and Mäori
• practical considerations that affect the collection of useful data on iwi and related concepts
• other parties who may have an interest in the review and should be involved.
In April 2016, led by our Kaihautu, we commenced consultation. This involves hui with iwi and Mäori organisations across New Zealand, as well as seeking online and written submissions from targeted stakeholders, such as researchers and academics.
Work on this standard continues into the next year.
Gender identity standard world first in New Zealand
In July 2015 we released the statistical standard for gender identity, a world first for gender identity information.
The release of this new standard followed consultation with groups representing people with different gender identities, and with the government organisations who will use the new classifications. This new standard expands gender identity categories beyond the current female/male boundaries, and recommends the term ‘gender diverse’ for use in official statistics.
Gender identity is about how a person feels they are – wholly male, wholly female, or having aspects of either or both. It is different to a person’s biological sex. It is a complex issue, as how people feel and experience their gender can change over their lifetimes.
We worked with a wide range of government and community groups to finalise this standard – and the terminology – and believe the gender-diverse population see it as a step towards being seen, counted, and understood.
Use of the new standard is not mandatory, but several government organisations are considering how to implement it. We will also consider how to use the standard across our own information collections. As gender information is personal, the guidance is that it should only be collected when there’s a good reason to do so.
STATISTICS NEW ZEALAND’S STRATEGIC INTENTIONS FOR THE PERIOD 2016/17–19/20
ANNUAL REPORT FOR THE YEAR ENDED 30 JUNE 201639
Performance informationIn 2015/16, Statistics NZ has mostly delivered to target with measures associated with customers and the value of the data we provide.
The use and trust survey is run annually. It surveys a revolving set of customers to understand whether the products and services we provide retain high levels of use and trust – a good indicator of perceived value. This year the survey focused on the general public. It found that 20 percent of the people surveyed had used statistics in the previous 12 months (Assessment of performance measure 1, table 1). This is a decrease on the last use and trust survey we ran with the general public in 2012/13, which reported that 27 percent had used statistics in the previous 12 months.
Alongside this result, the number of visits to the Statistics NZ website continued to increase this year, with a result 16 percent above target (2.9 million visits), indicating that statistics accessed through this channel are continuing to increase (measure 3, table 1).
Of those surveyed who reported using statistics this year, 89 percent reported that the government has the information they need – a 16 percent increase on last year (measure 2, table 1). This indicates that the expectations of the group surveyed were well met. Those surveyed also had high levels of trust in the information provided, with 68 percent reporting they trusted a sample of official statistics. This was well above the target for the year of 50 percent or more, but a decrease on the result of 82 percent reported by government workers and businesses last year (measure 14, table 1).
Our assisted advisory services are also important measures to track whether we are enabling customers to maximise the value of existing data (measures 4–6, table 1). The number of free telephone and email enquiries in 2015/16 was 5 percent lower than expected. The counting rules for this measure have changed (see footnote 9) as we ensure the measure is focusing on the right things to provide evidence of our performance against this appropriation. For example, we no longer count non-data- or statistics-related enquiries, and have started counting media enquiries and ‘live chat’ sessions. A 46 percent increase in the number of microdata access requests (measure 5, table 1) is a positive result, and is due to increasing use of the Integrated Data Infrastructure and other microdata services.
The result of 72 percent below target for capability building services (measure 8, table 1) is primarily due to a change in practice and counting rules. Statistics NZ no longer conducts a large number of visits that are recorded as ‘capability building’ only. For example, instruction on how to use web tools to extract data is no longer primarily done through visits but through Statistics NZ’s Information Centre, via the free-phone telephone number, or online web support. These are reported under ‘free enquiries’. As a consequence of this change, the number of ‘visits’ in the 2015/16 year is lower than target. This measure is under review.
Customer satisfaction (measure 7, table 1) is now measured with the ‘Net Promoter Score’ (NPS), a method used across several different industries. After receiving services from us, customers are asked to rate to what level they would recommend Statistics NZ services to others. Focusing on customised service requests, the result in 2015/16 of 92 percent of customers rating the services equivalent to ‘good’ or ‘very good’ was 11 percent above target.
The final key indicator of quality is freedom from significant errors (measures 11 and 12, table 1). One public correction notice was published on our website and emailed to subscribers in accordance with our policy for significant errors. This resulted in a 0.5 percent overachievement against our target. All releases were certified by the responsible manager as meeting Statistics NZ’s data quality standards. Across the year, Statistics NZ published 203 statistical releases (measures 9 and 10, table 1).
Statements of revenue and output expenses for each appropriation are published with the appropriation statements on pages 85–87.

STATISTICS NEW ZEALAND’S STRATEGIC INTENTIONS FOR THE PERIOD 2016/17–19/20
ANNUAL REPORT FOR THE YEAR ENDED 30 JUNE 201640
Appropriation Assessment of performance by measure
2014/15 Result
2015/16 Target
2015/16 Result
Variance to target
Official statistics, Output class 1: Coordination of government statistical activities1
1. The number of users of official statistics is increased2
27% of the general public surveyed in 2012/13 actively used New Zealand government statistics in the previous 12 months.3
Increase 20% Decrease4
Official statistics, Output class 1
2. The number of users who report that government has the information they need is increased
77% Increase 89% 16%5
Official statistics, Output class 1
3. Web-based services provide people with access to free information about all statistical services, measured by the number of visits to the Statistics NZ website
2,670,778 2,500,000 2.9 million 16%6
Official statistics, Output class 1
Assisted Advisory services: 4. Requests for customised data 1,142 950 8757 -16%8
5. Microdata access enquiries 66 60 88 46%
6. Free telephone and email enquiries
12,336 11,500 10,941 -5%9
Official statistics, Output class 1
7. Responses to statistical enquiries are provided within the timeliness standard and high-quality services are provided, measured through customer satisfaction (80% of clients rate the service as ‘very good or excellent).
92% 80% 97%10 11%
Official statistics, Output class 1
8. Number of capability building services including providing outreach seminars, workshops, and visits
32 150 41 -72%
Official statistics, Output class 2: Population, social, and labour force statistical information services
9. Number of statistical releases 75 68 75 9%11
Official statistics, Output class 3: Economic and business statistical information services
10. Number of statistical releases 141 128 128 N/A
Table 1: Enabling customers – performance information

STATISTICS NEW ZEALAND’S STRATEGIC INTENTIONS FOR THE PERIOD 2016/17–19/20
ANNUAL REPORT FOR THE YEAR ENDED 30 JUNE 201641
Official statistics, Output class 2 & 3
Free from significant errors:11. Statistical releases are free from
such significant error that they require a public correction notice to be published
100% 99% 99.5%12 0.5%
12. Certified by the responsible manager as meeting Statistics NZ’s data quality standards
100% 100% 100% N/A
Official statistics, Output class 2 & 3
13. Percentage of statistical releases published on the advertised date as agreed with the Minister of Statistics in the 2015/16 Purchase and Performance Agreement
100% 100% 100% N/A
Official statistics, Output class 2 & 3
14. Users trust official statistics: majority of responding customers trust a sample of official statistics
82% >50% 68%13 36%
1. Through this output expense, Statistics NZ fulfils the statistical coordination requirement of the Statistics Act 1975. This work contributes to building trust and confidence in official statistics through assuring the quality and delivery of fit-for-purpose statistical outputs.
2. The Statistics NZ use and trust survey was carried out online this year and targeted our customer sector defined as ‘general public’. 5,346 emails were sent out and 1,000 interviews were completed, a completion rate of 18.7 percent.
3. Survey respondents were asked if they had used ‘Statistics New Zealand statistics’ in the last 12 months. 69 percent responded ‘no’, 10 percent ‘did not know’ and 20 percent responded ‘yes’. A different sector was surveyed for this measure in 2014/15, with 61 percent of the government workers and businesses reporting using statistics in the previous 12 months.
4. A different sample was surveyed this year and the result relating to the number of users is not directly comparable to the 2014/15 or immediately prior surveys. However, other ‘use and trust survey’ measures are comparable as they are all surveying customers that have used statistics in the last 12-month period.
5. This is a positive outcome that indicates there is a high level of general trust in statistical products by the general public.
6. The number of visits to the Statistics NZ website has steadily increased over the past two years. A new website design due to be launched in 2016/17 may affect the number of visits in future years.
7. This total includes data requests from international agencies commonly known as international questionnaires.
8. It is normal that requests for customised data decrease in the later years of the census cycle.
9. This variance is due to the department no longer including all free enquiries in this count, but only those that are statistical/data enquiries. For example, a respondent calling about a survey they are participating in is no longer counted, as these calls are referred to the Contact Centre. Enquiries from media to Statistics NZ’s Strategic Communications team and live chat sessions on the website have been included from March quarter 2016. They accounted for 69 and 323 enquiries, respectively. Media enquiries and live chat sessions are reported for previous quarters.
10. This measure is reported through our ‘Net Promoter Score’ survey for customised data requests. 32 of 33 customers rated customer data service as 7 or more out of 10.
11. The projected number of statistical releases increased to 75 across the year and was met in this result.
12. A media release on 8 September 2015 advised corrections to some consumer price index (CPI) figures for the March and June 2015 quarters.
13. This figure includes respondents who reported they completely or mostly trust statistics.

STATISTICS NEW ZEALAND’S STRATEGIC INTENTIONS FOR THE PERIOD 2016/17–19/20
ANNUAL REPORT FOR THE YEAR ENDED 30 JUNE 201642
Our key highlights for the last year include:
• New Zealand Data Futures• Review of statistics legislation• Environmental reporting• Social investment insights• Reviews of official statistics production
and dissemination.
New Zealand Data Futures
In October 2015, appointments to the Data Futures Partnership Working Group were confirmed following a Cabinet Appointments process. The Data Futures Partnership follows on from the work of the New Zealand Data Futures Forum, which was set up in 2013 to explore the opportunities, risks, and benefits of sharing data.
The partnership has been tasked with taking the ideas and findings of the forum and creating the data-use ecosystem that it envisioned. It has been designed to embody the four principles of value, inclusion, trust, and control.
It has been mandated by the government to engage with citizens, the private sector, and non-government organisations to help drive change across New Zealand’s data-use ecosystem. A dedicated working group drives the overall programme of work and core deliverables for the partnership. A secretariat based at Statistics NZ supports the overall work programme.
The partnership is focusing on three streams of work to help solve these issues, and to take advantage of the opportunities:
1. Catalyst projects to demonstrate the value of data use, and help create ethical and practical frameworks.
2. Diagnose and fix ongoing and emerging issues in the data-use ecosystem.
3. Facilitate a conversation with New Zealanders about the potential value of data use, and to understand their feelings and perspectives on data use.
The working group is chaired by Dame Diane Robertson, who was previously the Auckland City Missioner. Dame
Taking a stewardship role to anticipate and address critical system-wide information challenges
Diane was chosen for her experience instigating and managing databases for a variety of agencies. She was responsible for collecting and analysing data gathered for the Auckland City Mission’s Family 100 research project, which has become one of New Zealand’s leading sources on families living in poverty.
The work group reports quarterly to their lead ministers – Minister of Finance, Minister of Justice, and Minister for Statistics. A review of the work programme is scheduled for October 2017.
Review of statistics legislation
Does our current Statistics Act 1975 meet the needs of an increasingly data-driven and digital environment? This is something that the Statistics Legislative Review team is looking at in what they describe as an once-in-a-lifetime opportunity to ‘get it right’.
In June 2016, the Cabinet Economic Growth and Infrastructure Committee (EGI) agreed to recommendations made in the Statistics Legislative Review – Scope and Timing Cabinet paper on Wednesday, 29 June 2016 (EGI-16-MIN-0138).
Any new legislation needs to enable government and all New Zealanders to have the information they need to make decisions and enable our vision of unleashing the power of data to change lives.
The challenge is finding the right balance between generating greater value from data, with maintaining the trust of New Zealanders. It also needs to support our core functions in a modern environment.
This is a fast-paced project, aiming for final Cabinet decisions by the end of the 2016.
Policy development at this pace, engaging a wide range of stakeholders, requires an innovative process, and the team are using an open policy-making process, with the views of those inside Statistics NZ, other government agencies, and those outside of government shaping policy development at an early stage.

STATISTICS NEW ZEALAND’S STRATEGIC INTENTIONS FOR THE PERIOD 2016/17–19/20
ANNUAL REPORT FOR THE YEAR ENDED 30 JUNE 201643
30 years, 122 releases, and five Government Statisticians2016 marked 30 years of the Household Labour Force Survey. To celebrate, Statistics NZ and the NZ Work Research Institute, which is based at the Auckland University of Technology, held a symposium in Auckland in April.After 30 years, 122 releases, five Government Statisticians, and countless hours of work, a lot of information has been released about New Zealand’s labour market. This means we have an incredibly rich data source with a long history to draw insights from.A lot has changed over this time, in terms of the labour market, but also in terms of the way we collect, process, and publish the data. For example, these days it is a lot harder to get in contact with people in their homes due to changing work hours, fewer households having landlines, and mobile populations. Other factors such as natural disasters, recessions, policy changes, and migration fluxes have all provided challenges for the survey, yet it still goes on strong. Many different organisations use the data in many different ways. Sessions included:• a history of the HLFS
• how the labour market has changed over time
• research into effects of the minimum wage
• gender pay gap analysis
• lives of ordinary New Zealanders
• use of socio-economic data in councils
• overview of the redevelopment of the HLFS.
Environmental reporting
In August the Government Statistician, in consultation with the Secretary for the Environment, officially approved the statistics for Environment Aotearoa 2015, ahead of the Environmental Reporting Bill being passed into Act in September.
The Act makes responsibilities for environmental reporting explicit. It sets the broad framework for the scope of reporting and timing for reporting products. Under the Act, the Government Statistician and the Secretary for the Environment have responsibility for environmental reporting. The involvement of the Government Statistician ensures that reporting is conducted at arm’s length from the government of the day and is released in line with Principles and protocols for producers of Tier 1 statistics.
The framework for environmental reporting divides the environment into five domains for the purpose of reporting. Under each domain we report on three main types of information: pressures, states, and impacts.
Topics for each domain have been identified and set in the Environmental Reporting (topics for Environmental Reports) Regulations 2016, under the Environmental Reporting Act 2015.
In October 2015, in partnership with the Ministry of the Environment, we released the first national environment report, Environment Aoteroa 2015. Environment Aotearoa 2015 was produced in the spirit of the Environmental Reporting Act. Future reports will be part of a three-year cycle, in which individual aspects of the environment are assessed as well as an overview, like Environment Aotearoa 2015. The next report – about the marine domain – will be released in October 2016.

STATISTICS NEW ZEALAND’S STRATEGIC INTENTIONS FOR THE PERIOD 2016/17–19/20
ANNUAL REPORT FOR THE YEAR ENDED 30 JUNE 201644
Social investment insights
We have worked closely with the Treasury to develop Social Investments Insights. The aim of this tool is to make complex data more easily accessible, so it can be used to inform timelier and better-targeted services. The online tool and analysis reports have been made possible through the Integrated Data Service.
The tool demonstrates what is possible through collaboration, better use of administrative data collected by government, and making detailed analytical results available and accessible to the public.
Social investment is an approach that seeks to improve the lives of New Zealanders by applying rigorous and evidence-based investment practices to social services.
This work is part of the Treasury’s commitment to higher living standards and a more prosperous, inclusive New Zealand.
Through the collection of data from across the public sector (such as health, education, and justice), Statistics NZ is enabling analysis and greater understanding to improve social and economic outcomes for New Zealanders.
The result was an interactive online tool which displays information on children and youth who are at higher risk of poor outcomes, by detailed geographical location.
The tool takes complex and sensitive data and provides it in a format which easy to use, fast, free, and interactive. As well as meeting user needs, this tool maintains individual privacy and confidentiality – thereby maintaining trust with the public over the use of their information.
Reviews of official statistics production and dissemination
This year we engaged with government agencies to review how official statistics are being produced and disseminated. Reviews of this type form a key part of our stewardship role. Two key reviews involved looking at tourism statistics, produced by the Ministry of Business, Innovation and Employment (MBIE), and the New Zealand Crime and Safety Survey, for the Ministry of Justice.
Tourism statisticsIn early 2015, officials from Statistics NZ and MBIE agreed that Statistics NZ would lead a review of MBIE’s tourism statistics.
The key purpose of the review was to assess the systems and processes used to produce the tourism statistics and to identify areas for improvement. In addition, the review assessed progress made against the recommendations from the 2011 Tourism Data Domain Plan.
The final report, released in November 2015, found that overall MBIE are doing a good job of producing tourism statistics. We recommended that improvements should focus on communication with customers to help them better understand the data and to give more warning of delays to releases. We also recommended that MBIE continue to work on regional estimates and publish these if they are of sufficient quality.
MBIE does well in production of tourism statistics, including the use of cutting-edge dissemination tools, focusing development on high-priority areas, and regularly seeking input from industry experts.
STATISTICS NEW ZEALAND’S STRATEGIC INTENTIONS FOR THE PERIOD 2016/17–19/20
ANNUAL REPORT FOR THE YEAR ENDED 30 JUNE 201645
Advisory group created to collaborate on producing economic and labour market statisticsAn external advisory group, consisting of senior economists and labour market research managers, was set up this year to collaborate and co-design with our project executives on key projects focused on producing economic and labour market statistics. The group meets on a quarterly basis.Members of the group represent a number of public and private organisations including: the Treasury, the Reserve Bank of New Zealand, Ministry for Business, Innovation and Employment, Bank of New Zealand, New Zealand Institute of Economic Research, Victoria University of Wellington, New Zealand Council of Trade Unions, and Business New Zealand. The focus of meetings to date has been on:• improving data and statistics about the labour market
(Household Labour Force Survey redevelopment)
• improving the coherence of our Gross Domestic Product data and statistics about the economy (Macroeconomic Accounts Transformed and Integrated project)
• maintaining the relevance of our data for price indexes including the consumers price index (CPI)(Prices Statistical Maintenance programme)
• developing data and statistics about New Zealand’s investment, savings, and wealth (Financial Flows and Balance Sheets development).
New Zealand Crime and Safety SurveyThe Ministry of Justice commissioned Statistics NZ to review the New Zealand Crime and Safety Survey (NZCASS) in the context of social investment and availability of other data on victims and perception of crime. The report, which was published on Statistics NZ’s website on 11 July 2016, contained recommendations based on consultation with key stakeholders, current international practice, literature on crime victim surveys, and Statistics NZ standards.
In particular, the report recommends exploring options for redeveloping NZCASS. These include annual collection of crime volumes (both reported and unreported), expanding the crime type coverage, and improving the cost efficiency.
The report also recommended bringing NZCASS data into the Integrated Data Infrastructure (IDI), and matching it with reported administrative crime data at individual victim level to improve analysis of volumes and types of offences.
At the end of the 2015/16 financial year, we were working on a plan of actions based on the report recommendations.

STATISTICS NEW ZEALAND’S STRATEGIC INTENTIONS FOR THE PERIOD 2016/17–19/20
ANNUAL REPORT FOR THE YEAR ENDED 30 JUNE 201646
Performance informationMeasures relating to Statistics NZ’s stewardship role are spread across two appropriations: the Official Statistics multi-category appropriation and the Data Futures Partnership appropriation.
The first stage indicators of success within the first six months of establishing the Data Futures working group were on track at the end of the 2015/16 year (measure 1, table 2), including development of objectives and goals for the initiative.
More broadly, the health of Tier 1 statistics being produced was maintained by producing 129 Tier 1 statistics over the year (measure 2, table 2). This is a 20 percent positive variance on the target of 107 in 2015/16. This is the first year we have reported this measure. It is intended to track New Zealand’s delivery of these statistics that are the most important for understanding how well the country is performing.
Statistics NZ’s performance against its output plan (Purchase and Performance Agreement) with the Minister was positive, with the Minister of Statistics indicating that he is ‘satisfied’ with the policy advice and ministerial servicing received in 2015/16 (measure 3, table 2).
Revenue and output expenses for each output class are published with the appropriation statements on pages 85–87.
Appropriation Assessment of performance by measure
2014/15 Result
2015/16 Target
2015/16 Result Variance to target
Data Futures Partnership (M67)
1. First stage indicators of success within six months of the establishment of the working group
New measure On track On track N/A
Official statistics, Output class 1: Coordination of government statistical activities
2. Ensure the right statistical information is produced by the Official Statistics System to better support decision-making and under-standing: Maintain the total number of Tier 1 statistics
New measure 107 1291 20%
Official statistics, Output class 1
3. Ministerial satisfaction that the Official Statistics System programme is delivered, as agreed with the Minister in the Purchase and Performance Agreement, and as varied by agreement during the year
100% 100% 100%2 N/A
1. As at March 2016, 129 of 162 Tier 1 statistics are being produced.
2. The Minister of Statistics has indicated that he is ‘satisfied’ with the policy advice and ministerial servicing received in 2015/16.
Table 2: Taking a stewardship role – performance information
STATISTICS NEW ZEALAND’S STRATEGIC INTENTIONS FOR THE PERIOD 2016/17–19/20
ANNUAL REPORT FOR THE YEAR ENDED 30 JUNE 201647
Our key focuses in 2015/16 included:
• 2018 Census• Census Transformation• Pilot partnership projects• Statistics NZ innovation site• Redevelopment of surveys to
meet the country’s needs• Performance information
2018 Census
A key part of modernising the census is to alter the ways that we collect census data in 2018. To this end, we are:
• promoting and prioritising online completion of the census
• introducing mail-out letters (sending unique access codes to households across New Zealand).
This year, we have begun our testing programme – to check that the systems and processes we are building for 2018 are fit for purpose, robust, and will enable everyone in New Zealand to participate in the census.
In March 2016, we asked 22,000 households in Auckland, Waikato, Wellington, and Canterbury to participate in the Census Test. Our response rate for the test was 59 percent. Sixty-five percent of households used the online form.
This test gave us confidence that the new approach we will be taking – sending access codes, followed by waves of reminders and targeted follow-up activity from our field officers – works in a New Zealand setting. For the first time, our field officers used hand-held devices to check addresses and manage their workloads.
This was the first of three public tests we will conduct in the lead-up to March 2018. The second test was held in July 2016, the third will be held in March 2017. They will focus on proposed new and changed questions, and a full end-to-end test of all processes and systems, respectively.
This year, we have also checked our address list, which confirmed both the quality of our information and where we need to focus our efforts over the next financial year.
We have appointed some of our key suppliers for the 2018 Census. Clemenger BBDO are our creative agency for the 2018 campaign; Telnet will be providing our
contact centre; and we are working with SilverStripe to build our online collection system.
Census Transformation
Our Census Transformation programme is investigating different ways of running the census. Its purpose is to modernise the current census model in the short to medium term, and to investigate alternative ways of producing small-area population, social, and economic statistics in the long term. This includes the possibility of changing the census frequency to every 10 years, and exploring the feasibility of a census based on administrative data.
We have been committed to publishing the results of our investigations into Census Transformation. It is important not only for keeping interested stakeholders informed of our progress, but also for providing confidence in the robustness of the research.
In the past year, seven research papers have been published:
• Comparison of ethnicity information in administrative data and the census (June 2016)
• Identifying Mäori populations using administrative data: A comparison with the census (June 2016)
• Identifying the New Zealand resident population in the Integrated Data Infrastructure (IDI) (April 2016)
• Enduring census information requirements for and about Mäori (January 2016)
• Quality of geographic information in the Integrated Data Infrastructure (December 2015)
• Comparing education and training information in administrative data sources and census (December 2015)
• Quality standards for population statistics: Accuracy requirements for future census models (December 2015).
This research output is a significant achievement for a small team. It represents a substantial body of work that is contributing to the understanding of future requirements for census information, and the ability of administrative data to meet those requirements.
The Census Transformation programme will be reporting back to the Cabinet Economic Growth and Infrastructure Committee on progress towards an administrative-data
Experimenting, testing, and adopting innovative ways to improve effectiveness and efficiency
STATISTICS NEW ZEALAND’S STRATEGIC INTENTIONS FOR THE PERIOD 2016/17–19/20
ANNUAL REPORT FOR THE YEAR ENDED 30 JUNE 201648
census, by 31 October 2016 (EGI-15-MIN-0111 refers). In preparation, work is underway to:
• research methods that reduce the impact of coverage errors in the population of New Zealand as derived from administrative data
• design a coverage survey of population and dwellings for testing in conjunction with the 2018 Census and 2018 Post-enumeration Survey
• produce the first release of an experimental series of population estimates compiled from available administrative data
• identify the investment required for census transformation beyond 2016/17
• develop cross-agency plans to improve the quality of administrative data for an integrated environment
• continue research into the potential for administrative data to replace or complement some census questions.
Pilot partnership projects
An outcome of the December 2015 hui (see Working with iwi/Mäori, Pasifika, and non-government organisations on page 37) was the pilot partnership projects. Early in 2016, we sought expressions of interest from iwi/Mäori, Pasifika, and non-government organisations (NGOs) on proposals for projects to work on real-world issues collaboratively, using the lessons to develop new, relevant, and innovative products and services.
From this process we shortlisted 10 projects. The four pilot partnership projects progressing with iwi/Mäori and NGOs were announced in May 2016. They present a diverse set of projects that are in the public good, and will enable greater learning for the organisations involved and Statistics NZ. In addition, the projects will benefit the broader iwi/Mäori and NGO sectors.
The four projects are:
• Dunedin Methodist Mission• Te Rünanganui o Ngäti Porou• Te Mana Raraunga – a network of Mäori data
practitioners• Te Tihi.
Salesforce now live for business surveysIn June, phase two of the new Enterprise Collection Platform (ECP), Salesforce, went live with our Collection Operations.Salesforce is a customer relationship management (CRM) tool that will enable greater efficiencies in data collection, and easier management of survey and respondent relationships and the data and information associated with these. The new platform replaces our current CRM and other legacy systems. It will provide the organisation with greater functionality as well as a single collections platform. Salesforce will allow our front line staff to provide a better service to our respondents. Customer service Representatives will now be able to manage responses for multiple surveys or businesses on one call, instead of a respondent receiving multiple calls for each individual survey.Customer service representative (CSR) Sarah Little began using Salesforce during our Census Test, and says it’s easy to use the new platform. “It’s a one-stop shop. CSRs are able to make calls, action tasks, and wrap up calls all in real time and in one screen without having to jump from screen to screen between different databases like before. It’s going to make us more efficient and able to provide a better service.”
Dunedin Methodist MissionThis project consists of a set of specific customised data requests that fall within four broad categories: early childhood education; youth aged 15–24 years; young mothers aged 15–24 years; and incarcerated men and their whänau. We intend to work with Dunedin Methodist Mission to establish which topics can be addressed with available data.
This project enables us to better understand NGO data needs, as well as find ways to respond to customised data requests and make recommendations to improve this.
Te Rünanganui o Ngäti PorouThis project involves developing an outcomes measurement framework, with a strong focus on strengths-based analysis.
STATISTICS NEW ZEALAND’S STRATEGIC INTENTIONS FOR THE PERIOD 2016/17–19/20
ANNUAL REPORT FOR THE YEAR ENDED 30 JUNE 201649
The demand for strengths-based analysis is strong and consistent across iwi/Mäori-affiliated organisations. Working in partnership with Ngäti Porou to develop such a framework will have wide-reaching applicability.
Te Mana Raraunga – a network of Mäori data practitionersThis project is to create an iwi-verified rohe geographic variable to link with the Integrated Data Infrastructure (IDI). This project will involve working with nominated representatives of iwi to map meshblock units to iwi-defined geographic areas. Te Mana Raraunga have signalled their intent to work in partnership with the Iwi Chairs Forum Data Leadership Group, who may suggest two or three iwi to test the project’s concept with.
This project will provide a model for iwi engagement on data sovereignty. It will create a standard and variable that provides value for future research using location-based information
Te TihiThis project involves the placement of a Te Tihi staff member at Statistics NZ to improve their analytical and statistical capability.
This project provides potential to establish a more formal programme with iwi/Mäori and/or NGOs for placements or secondments at Statistics NZ to raise data capability, overall.
The pilot projects above sit alongside existing Statistics NZ commitments to three partnership projects with iwi and NGOs:
• Auckland City Mission: a project testing integrating NGO data with the IDI (see p34)
• Ngäi Tähu: a project researching life pathways for tribal youth
• Ngäi Tühoe: a project aiming to provide insights on children at risk and on the significance of te reo Mäori.
In addition, the Government Statistician recently met Waiora Pacific to discuss a future partnership regarding democratising data for and about Mäori, with Statistics NZ as data provider.
Statistics NZ will meet each pilot project organisation to refine the scope of each project and determine criteria through which their success can be evaluated.
Statistics NZ innovation site
At Statistics NZ, we strive to put customers at the heart of what we do, and to do this we need to better understand our customers’ needs. In February 2016 we launched our innovation site, with three data-driven initiatives that aim to help customers with a range of capabilities to access and use data.
The innovation site is a place for customers to explore and provide feedback as we experiment with new ideas and initiatives. The site will also keep customers up to date as we develop, test, and refine our products and services.
The purpose of the site is to engage with customers and provide them with a channel to tell us what they want from our information. The site philosophy is one of learning by doing, and is focused on an outside-in approach.
At launch, the first initiatives on the site included the Social Investment Insights tool, Data Finder, and the Indicators Dashboard. By the end of the year, three more initiatives were added, including the Business Performance Benchmarker; an experimental series measuring monthly labour market statistics; and an interactive data tool that looks at four cultural measures for all iwi with respondents in Te Kupenga 2013.
Redevelopment of surveys to meet the country’s needs
During the year we have redeveloped several surveys to ensure they meet international standards and are fit for the 21st century.
Economic Survey of Manufacturing, Wholesale Trade Survey, and Selected Services Survey In March 2016, we completed our redevelopment of the quarterly Economic Survey of Manufacturing, Wholesale Trade Survey, and Selected Services Survey, to support
STATISTICS NEW ZEALAND’S STRATEGIC INTENTIONS FOR THE PERIOD 2016/17–19/20
ANNUAL REPORT FOR THE YEAR ENDED 30 JUNE 201650
new national accounting statistics, including the quarterly income measure of gross domestic product (GDP).
This work was designed to ensure the country can better monitor the financial markets and household outcomes.
These redeveloped surveys close significant gaps in New Zealand’s national accounts – including the until now unfilled Tier 1 ‘quarterly profit survey’ statistic, by enabling estimates of business profits by broad industry groups.
With suppliers in mind, we have worked hard to ensure the redeveloped surveys are simple and easy for large businesses to comply with.
Household Labour Force SurveyThe redeveloped Household Labour Force Survey (HLFS) went into the field on 3 April 2016, to collect data for the June 2016 quarter.
The key purpose of the 2016 HLFS redevelopment was to improve the relevance and quality of our labour market statistics. New content included more information about the nature of people’s employment conditions and work arrangements. This data can be used to better understand different patterns of employment. The new content included:
• type of employment (eg permanent or temporary work arrangement)
• length of time employed in current job • employment agreements (eg collective or individual) • union membership • preference for change from temporary employment
or self-employment to permanent work.
Statistics NZ released a paper titled Household Labour Force Survey – summary of 2016 redevelopment, which informed customers about changes to the survey, following its recent redevelopment. A new webpage, Improving labour market statistics, was also launched to provide further updates relating to the HLFS redevelopment once information became available.
On 29 June 2016, Statistics NZ published a technical paper, Household Labour Force Survey – revisions to key labour market estimates. This paper informed our customers of upcoming revisions to HLFS statistics, which were a result of improvements introduced to the survey. Statistics NZ expected the HLFS historical time series to be revised, so it was important to communicate these changes to customers before the release.
Accompanying this report, we included tables showing the magnitude of these revisions, but also a CSV file that includes the revised estimates at a detailed level.
Labour cost index Early in the year we began to consult with stakeholders on the labour cost index (LCI) to better understand the value customers obtain from the annual non-wage component. This was to ensure that the statistics provided continue to remain relevant and add value for customers.
The LCI is a Tier 1 statistic under the ‘labour costs’ category. The LCI for all labour costs is a measure of changes in salary and wage rates and non-wage labour costs combined. This is produced annually for the June quarter, while the LCIs for salary and wage rates and unadjusted salary and wage rates are produced quarterly.
The LCI for non-wage labour costs measures changes in the following non-wage costs to employers:
• annual leave and statutory holidays• superannuation• ACC employer premiums• other non-wage costs (medical insurance, motor
vehicles available for private use, and low-interest loans).
To identify the impacts of ceasing the LCI non-wage and all labour costs, we consulted organisations that have high interest in labour market measures. We engaged with ACC; Business New Zealand; Ministry of Business, Innovation and Employment; Ministry of Social Development; NZ Council of Trade Unions; Reserve Bank; State Services Commission; and the Treasury. We also sought public feedback through our website to get the views of other customers. Palmerston North City Council and NZ Trade and Enterprise responded.
Following consultation, the Government Statistician agreed to replace the largely survey-based indexes of the LCI non-wage and all labour costs with non-wage labour cost indicators based on administrative data.
Changing the method of collection will reduce data supplier load by about 2,000 hours per year. The LCI non-wage has a total of eight surveys, which translates to over 9,000 questionnaires sent to data suppliers every year. In addition, we expect cost savings in collection and compilation with additional savings every three years in processing costs.
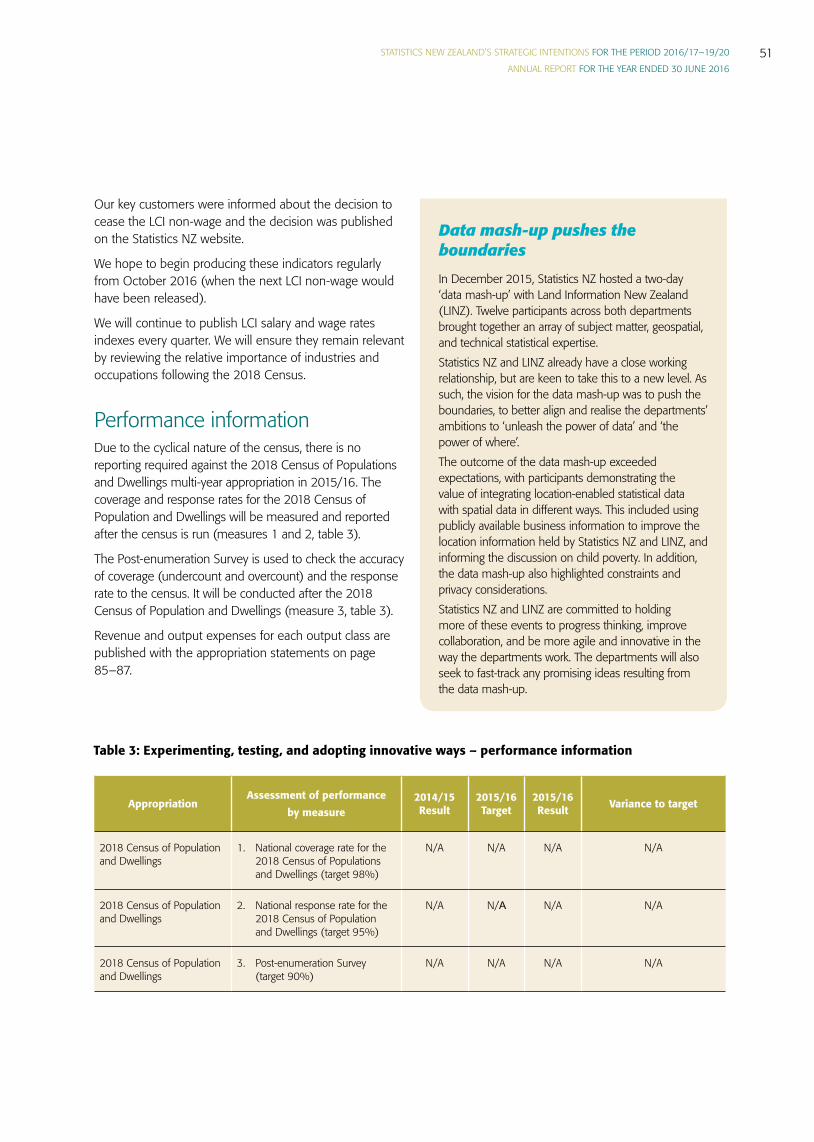
STATISTICS NEW ZEALAND’S STRATEGIC INTENTIONS FOR THE PERIOD 2016/17–19/20
ANNUAL REPORT FOR THE YEAR ENDED 30 JUNE 201651
Data mash-up pushes the boundariesIn December 2015, Statistics NZ hosted a two-day ‘data mash-up’ with Land Information New Zealand (LINZ). Twelve participants across both departments brought together an array of subject matter, geospatial, and technical statistical expertise.Statistics NZ and LINZ already have a close working relationship, but are keen to take this to a new level. As such, the vision for the data mash-up was to push the boundaries, to better align and realise the departments’ ambitions to ‘unleash the power of data’ and ‘the power of where’.The outcome of the data mash-up exceeded expectations, with participants demonstrating the value of integrating location-enabled statistical data with spatial data in different ways. This included using publicly available business information to improve the location information held by Statistics NZ and LINZ, and informing the discussion on child poverty. In addition, the data mash-up also highlighted constraints and privacy considerations.Statistics NZ and LINZ are committed to holding more of these events to progress thinking, improve collaboration, and be more agile and innovative in the way the departments work. The departments will also seek to fast-track any promising ideas resulting from the data mash-up.
Our key customers were informed about the decision to cease the LCI non-wage and the decision was published on the Statistics NZ website.
We hope to begin producing these indicators regularly from October 2016 (when the next LCI non-wage would have been released).
We will continue to publish LCI salary and wage rates indexes every quarter. We will ensure they remain relevant by reviewing the relative importance of industries and occupations following the 2018 Census.
Performance informationDue to the cyclical nature of the census, there is no reporting required against the 2018 Census of Populations and Dwellings multi-year appropriation in 2015/16. The coverage and response rates for the 2018 Census of Population and Dwellings will be measured and reported after the census is run (measures 1 and 2, table 3).
The Post-enumeration Survey is used to check the accuracy of coverage (undercount and overcount) and the response rate to the census. It will be conducted after the 2018 Census of Population and Dwellings (measure 3, table 3).
Revenue and output expenses for each output class are published with the appropriation statements on page 85–87.
AppropriationAssessment of performance
by measure 2014/15 Result
2015/16 Target
2015/16 Result Variance to target
2018 Census of Population and Dwellings
1. National coverage rate for the 2018 Census of Populations and Dwellings (target 98%)
N/A N/A N/A N/A
2018 Census of Population and Dwellings
2. National response rate for the 2018 Census of Population and Dwellings (target 95%)
N/A N/A N/A N/A
2018 Census of Population and Dwellings
3. Post-enumeration Survey (target 90%)
N/A N/A N/A N/A
Table 3: Experimenting, testing, and adopting innovative ways – performance information
STATISTICS NEW ZEALAND’S STRATEGIC INTENTIONS FOR THE PERIOD 2016/17–19/20
ANNUAL REPORT FOR THE YEAR ENDED 30 JUNE 201652
Ensuring we are well positioned to enable New Zealand to unleash the power of data to change lives
Our key highlights for the last year include:
• Organisation strategy and new operating model• Integrating the Statistics 2020 programme into the
departmental investment portfolio• Building capability for the future• Business Improvement Forum• Performance information
Organisation strategy and new operating model
As detailed in the 2016/17–19/20 strategic intentions, Statistics NZ has further developed its strategy for the future of Statistics NZ and the New Zealand data ecosystem this year. We have defined the operating model we will work towards to make our vision a reality.
The fundamental components of our strategic direction are:
• our four roles• our organisational character (IDARE)• our four core offerings • the way we will deliver our services and data in the
future (strategic delivery model) (figure 1, p8).
Together, these components will put us in a strong position to unleash the power of data to change lives.
Integrating the Statistics 2020 programme into the departmental investment portfolio
In November 2015, in consultation with the Minister of Statistics, we decided to integrate the Statistics 2020 Te Käpehu Whetü (Stats2020) portfolio of projects into the wider departmental investment portfolio. We made the decision on the understanding that our investment portfolio is governed and managed in a manner appropriate to its scale and level of risk.
Specifically, we:
• adopted the remaining Stats2020 aspirations, including benefits and savings targets, into the Vote Statistics four-year Plan and investment profile
• replaced the existing full-time equivalent (FTE) targets in Stats 2020 with the department’s FTE cap set by the State Services Commission
• transitioned the existing Stats2020 delivery programme into our Enterprise Investment Portfolio, while maintaining visibility of the current Stats2020 business case benefit commitments
• integrated the Stats2020 central agencies’ monitoring into the overall Vote Statistics four-year plan monitoring regime
• worked with the Treasury to agree which of Cabinet’s expectations for managing investment and assets applies to Statistics NZ, and subsequently to meet agreed targets through State Sector processes.
Building capability for the future
A ‘people strategy’ is being developed to support our four-year plan and organisational priorities. This includes:
• refreshing the current statistical competency framework
• investing in corporate learning and development support to improve and broaden our mix of in-house and externally sourced teaching
• development of metrics to enable us to better track workforce capacity and capability.
STATISTICS NEW ZEALAND’S STRATEGIC INTENTIONS FOR THE PERIOD 2016/17–19/20
ANNUAL REPORT FOR THE YEAR ENDED 30 JUNE 201653
We are also looking at possible redesign options for our performance management system, which would see us moving away from a system with annual performance appraisals against set goals and objectives, towards a system based on ongoing, real-time performance and coaching conversations with staff.
As an equal opportunities employer we continue to base all our appointments on merit, while recognising the employment aspirations of Mäori, ethnic and minority groups, women, and people with disabilities.
Integrating equality and diversity in the Public Service is a key aspect of strategic planning and performance, and our Chief Executive provides the lead in working towards this. Equality and diversity in the Public Service, as the State Sector Act 1988 requires, enables the best service to government and New Zealanders.
In 2016/17 we will be undertaking work, in partnership with the Public Services Association, to better understand whether our approach to equal opportunities is effective in practice.
Business Improvement Forum
The joint Business Improvement Forum was a key outcome from the settlement of the Collective Employment Agreement in 2015. Its goal is to support business improvement and to strengthen the relationship between Statistics NZ and the Public Service Association (PSA) by working towards a shared goal.
The five key principles for the forum are:
• make Statistics NZ a better place to work for all staff• an opportunity to work differently with the shared
goal of enhancing the organisation• a collaborative forum that values everyone’s
contribution
• another channel for the voices of staff to be heard
• a catalyst for positive change.
The first meeting of the forum was held in November 2015.
In March 2016 the forum ran face-to-face meetings in Statistics NZ’s three offices, as well as an online ‘ideas
jam’ to gather ideas from those who missed out on the meetings and as a way for staff to indicate support for ideas suggested by others. Another round of meetings for field interviewers ran in May.
Following the jam, the forum evaluated over 100 ideas for how to make Statistics NZ a better place to work. The forum clustered these ideas into five themes:
• process improvements • systems and tools • the work environment • development and performance • engagement.
Two major projects were identified from the exercise. These were improving performance management and enabling better connections across locations and teams.
In the last quarter of the year, the forum began to progress the work associated with making better connections. This will involve bringing together a group of people to identify the problem areas and opportunities.
Our Executive Leadership Team progressed improving performance management with the Chief People Officer. To assist, the forum prepared a full report containing all the ideas captured regarding performance management.
In addition to the two major projects, the forum identified some ‘quick wins’. These included:
• creating a comprehensive organisational chart so that people can easily see different parts of Statistics NZ
• enabling staff feedback on their managers’ performance review
• improving facilities in the Auckland office.
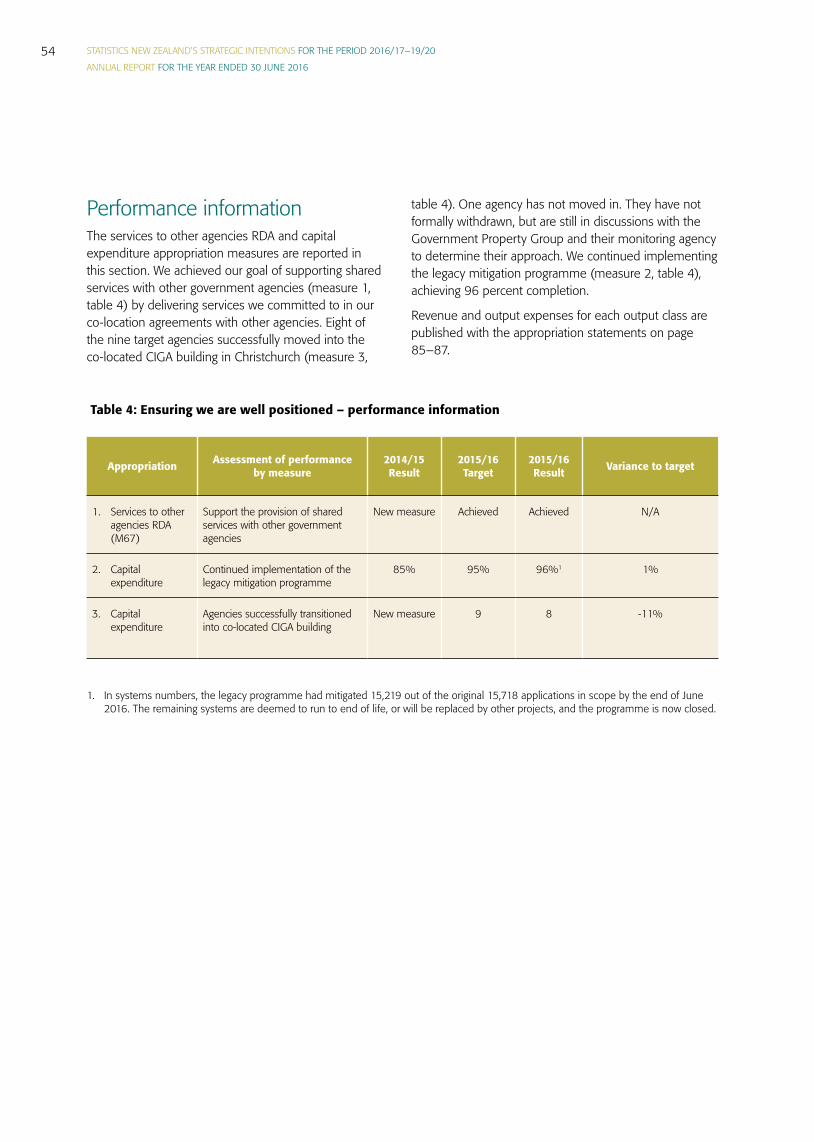
STATISTICS NEW ZEALAND’S STRATEGIC INTENTIONS FOR THE PERIOD 2016/17–19/20
ANNUAL REPORT FOR THE YEAR ENDED 30 JUNE 201654
Performance informationThe services to other agencies RDA and capital expenditure appropriation measures are reported in this section. We achieved our goal of supporting shared services with other government agencies (measure 1, table 4) by delivering services we committed to in our co-location agreements with other agencies. Eight of the nine target agencies successfully moved into the co-located CIGA building in Christchurch (measure 3,
table 4). One agency has not moved in. They have not formally withdrawn, but are still in discussions with the Government Property Group and their monitoring agency to determine their approach. We continued implementing the legacy mitigation programme (measure 2, table 4), achieving 96 percent completion.
Revenue and output expenses for each output class are published with the appropriation statements on page 85–87.
Appropriation Assessment of performance by measure
2014/15 Result
2015/16 Target
2015/16 Result Variance to target
1. Services to other agencies RDA (M67)
Support the provision of shared services with other government agencies
New measure Achieved Achieved N/A
2. Capital expenditure
Continued implementation of the legacy mitigation programme
85% 95% 96%1 1%
3. Capital expenditure
Agencies successfully transitioned into co-located CIGA building
New measure 9 8 -11%
1. In systems numbers, the legacy programme had mitigated 15,219 out of the original 15,718 applications in scope by the end of June 2016. The remaining systems are deemed to run to end of life, or will be replaced by other projects, and the programme is now closed.
Table 4: Ensuring we are well positioned – performance information
STATISTICS NEW ZEALAND’S STRATEGIC INTENTIONS FOR THE PERIOD 2016/17–19/20
ANNUAL REPORT FOR THE YEAR ENDED 30 JUNE 201655
For the year ended 30 June 2016
I am responsible, as Chief Executive of Statistics New Zealand, for:
• the preparation of Statistics NZ’s financial statements, and statements of expenses and capital expenditure, and for the judgements expressed in them
• having in place a system of internal control designed to provide reasonable assurance as to the integrity and reliability of financial reporting
• ensuring that end-of-year performance information on each appropriation administered by Statistics NZ is provided in accordance with sections 19A to 19C of the Public Finance Act 1989, whether or not that information is included in this annual report; and
• the accuracy of any end-of-year performance information prepared by Statistics NZ, whether or not that information is included in the annual report.
In my opinion:
• the financial statements fairly reflect the financial position of Statistics NZ as at 30 June 2016 and its operation for the year ended on that date; and
• the forecast financial statements fairly reflect the forecast financial position of Statistics NZ as at 30 June 2016 and its operations for the year ending on that date.
Liz MacPherson
Government Statistician and Chief Executive
30 September 2016
Statement of responsibility
STATISTICS NEW ZEALAND’S STRATEGIC INTENTIONS FOR THE PERIOD 2016/17–19/20
ANNUAL REPORT FOR THE YEAR ENDED 30 JUNE 201656
Independent auditor’s report
To the readers of Statistics New Zealand’s annual report for the year ended 30 June 2016.
The Auditor-General is the auditor of Statistics New Zealand (the Department). The Auditor-General has appointed me, Clint Ramoo, using the staff and resources of Audit New Zealand, to carry out the audit on her behalf of:
• the financial statements of the Department on pages 59 to 82, that comprise the statement of financial position, statement of commitments, statement of contingent liabilities and contingent assets as at 30 June 2016, the statement of comprehensive revenue and expense, statement of changes in equity, and statement of cash flows for the year ended on that date and the notes to the financial statements that include accounting policies and other explanatory information;
• the performance information prepared by the Department for the year ended 30 June 2016 on pages 33 to 54; and
• the statements of expenses and capital expenditure of the Department for the year ended 30 June 2016 on pages 83 to 84.
OpinionIn our opinion:
• the financial statements of the Department:
º present fairly, in all material respects:
» its financial position as at 30 June 2016; and
» its financial performance and cash flows for the year ended on that date;
º comply with generally accepted accounting practice in New Zealand and have been prepared in accordance with Tier 1 Public Benefit Entity Accounting Standards.
• the performance information of the Department:
º presents fairly, in all material respects, for the year ended 30 June 2016:
» what has been achieved with the appropriation; and
» the actual expenses or capital expenditure incurred compared with the appropriated or forecast expenses or capital expenditure;
º complies with generally accepted accounting practice in New Zealand.
• the statements of expenses and capital expenditure of the Department on pages 83 to 84 are presented fairly, in all material respects, in accordance with the requirements of section 45A of the Public Finance Act 1989.
Our audit was completed on 30 September 2016. This is the date at which our opinion is expressed.
The basis of our opinion is explained below. In addition, we outline the responsibilities of the Government Statistician and our responsibilities, and we explain our independence.
STATISTICS NEW ZEALAND’S STRATEGIC INTENTIONS FOR THE PERIOD 2016/17–19/20
ANNUAL REPORT FOR THE YEAR ENDED 30 JUNE 201657
Basis of opinionWe carried out our audit in accordance with the Auditor-General’s Auditing Standards, which incorporate the International Standards on Auditing (New Zealand). Those standards require that we comply with ethical requirements and plan and carry out our audit to obtain reasonable assurance about whether the information we audited is free from material misstatement.
Material misstatements are differences or omissions of amounts and disclosures that, in our judgement, are likely to influence readers’ overall understanding of the information we audited. If we had found material misstatements that were not corrected, we would have referred to them in our opinion.
An audit involves carrying out procedures to obtain audit evidence about the amounts and disclosures in the information we audited. The procedures selected depend on our judgement, including our assessment of risks of material misstatement of the information we audited, whether due to fraud or error. In making those risk assessments, we consider internal control relevant to the Department’s preparation of the information we audited in order to design audit procedures that are appropriate in the circumstances, but not for the purpose of expressing an opinion on the effectiveness of the Department’s internal control.
An audit also involves evaluating:
• the appropriateness of accounting policies used and whether they have been consistently applied;
• the reasonableness of the significant accounting estimates and judgements made by the Government Statistician;
• the appropriateness of the reported performance information within the Department’s framework for reporting performance;
• the adequacy of the disclosures in the information we audited; and
• the overall presentation of the information we audited.
We did not examine every transaction, nor do we guarantee complete accuracy of the information we audited. Also, we did not evaluate the security and controls over the electronic publication of the information we audited.
We believe we have obtained sufficient and appropriate audit evidence to provide a basis for our audit opinion.
Responsibilities of the Government Statistician The Government Statistician is responsible for preparing:
• financial statements that present fairly the Department’s financial position, financial performance, and its cash flows, and that comply with generally accepted accounting practice in New Zealand.
• performance information that presents fairly what has been achieved with each appropriation, the expenditure incurred as compared with expenditure expected to be incurred, and that complies with generally accepted accounting practice in New Zealand.
• statements of expenses and capital expenditure of the Department, that are presented fairly, in accordance with the requirements of the Public Finance Act 1989.
The Government Statistician’s responsibilities arise from the Public Finance Act 1989.
The Government Statistician is responsible for such internal control as is determined is necessary to ensure that the annual report is free from material misstatement, whether due to fraud or error. The Government Statistician is also responsible for the publication of the annual report, whether in printed or electronic form.
STATISTICS NEW ZEALAND’S STRATEGIC INTENTIONS FOR THE PERIOD 2016/17–19/20
ANNUAL REPORT FOR THE YEAR ENDED 30 JUNE 201658
Responsibilities of the AuditorWe are responsible for expressing an independent opinion on the information we are required to audit, and reporting that opinion to you based on our audit. Our responsibility arises from the Public Audit Act 2001.
IndependenceWhen carrying out the audit, we followed the independence requirements of the Auditor-General, which incorporate the independence requirements of the External Reporting Board.
Other than the audit, we have no relationship with or interests in the Department.
Clint RamooAudit New ZealandOn behalf of the Auditor-GeneralWellington, New Zealand
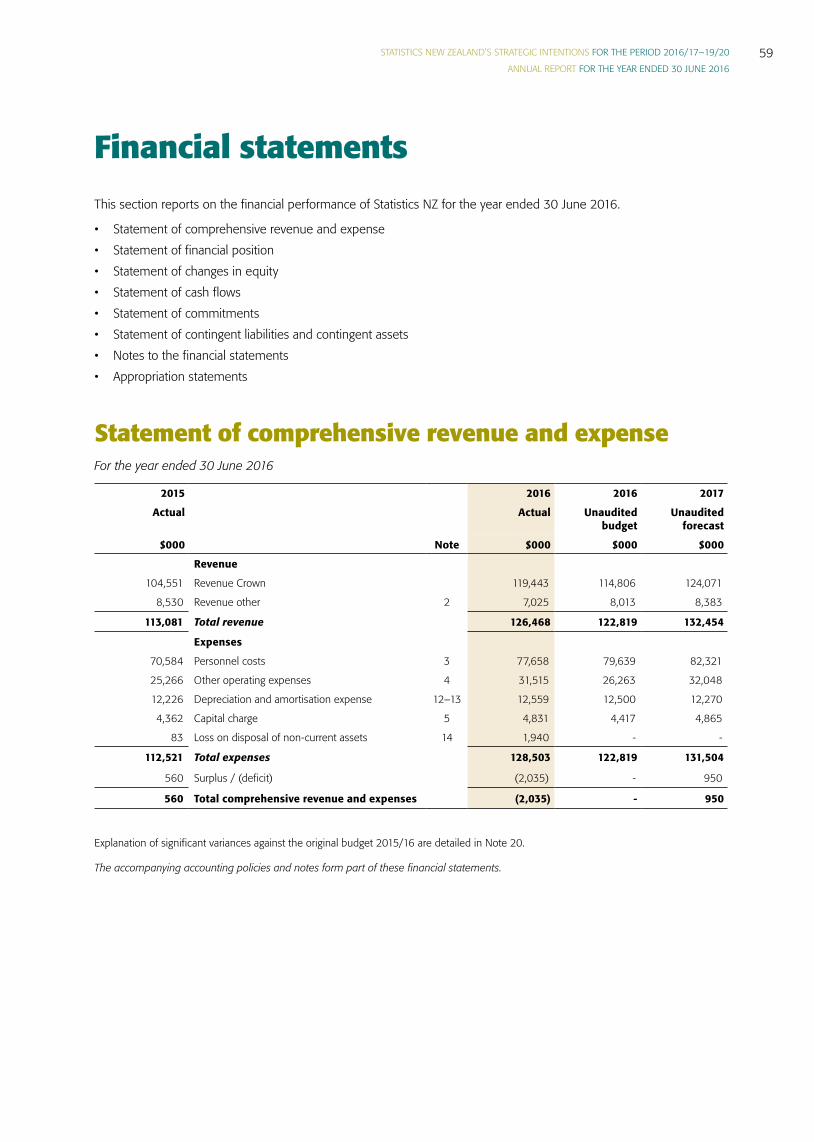
STATISTICS NEW ZEALAND’S STRATEGIC INTENTIONS FOR THE PERIOD 2016/17–19/20
ANNUAL REPORT FOR THE YEAR ENDED 30 JUNE 201659
Financial statementsThis section reports on the financial performance of Statistics NZ for the year ended 30 June 2016.
• Statement of comprehensive revenue and expense• Statement of financial position• Statement of changes in equity• Statement of cash flows• Statement of commitments• Statement of contingent liabilities and contingent assets• Notes to the financial statements• Appropriation statements
Statement of comprehensive revenue and expenseFor the year ended 30 June 2016
2015 2016 2016 2017
Actual Actual Unaudited budget
Unaudited forecast
$000 Note $000 $000 $000
Revenue
104,551 Revenue Crown 119,443 114,806 124,071
8,530 Revenue other 2 7,025 8,013 8,383
113,081 Total revenue 126,468 122,819 132,454
Expenses
70,584 Personnel costs 3 77,658 79,639 82,321
25,266 Other operating expenses 4 31,515 26,263 32,048
12,226 Depreciation and amortisation expense 12–13 12,559 12,500 12,270
4,362 Capital charge 5 4,831 4,417 4,865
83 Loss on disposal of non-current assets 14 1,940 - -
112,521 Total expenses 128,503 122,819 131,504
560 Surplus / (deficit) (2,035) - 950
560 Total comprehensive revenue and expenses (2,035) - 950
Explanation of significant variances against the original budget 2015/16 are detailed in Note 20.
The accompanying accounting policies and notes form part of these financial statements.
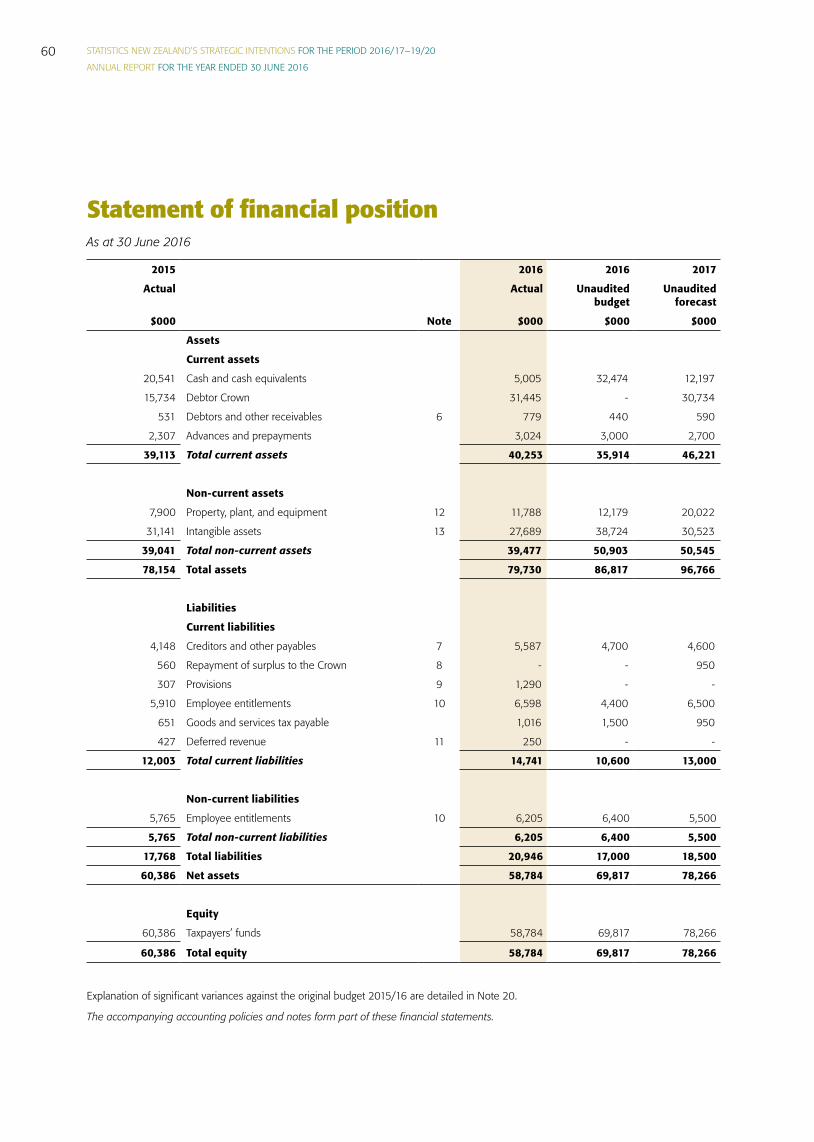
STATISTICS NEW ZEALAND’S STRATEGIC INTENTIONS FOR THE PERIOD 2016/17–19/20
ANNUAL REPORT FOR THE YEAR ENDED 30 JUNE 201660
Statement of financial position As at 30 June 2016
2015 2016 2016 2017
Actual Actual Unaudited budget
Unaudited forecast
$000 Note $000 $000 $000
Assets
Current assets
20,541 Cash and cash equivalents 5,005 32,474 12,197
15,734 Debtor Crown 31,445 - 30,734
531 Debtors and other receivables 6 779 440 590
2,307 Advances and prepayments 3,024 3,000 2,700
39,113 Total current assets 40,253 35,914 46,221
Non-current assets
7,900 Property, plant, and equipment 12 11,788 12,179 20,022
31,141 Intangible assets 13 27,689 38,724 30,523
39,041 Total non-current assets 39,477 50,903 50,545
78,154 Total assets 79,730 86,817 96,766
Liabilities
Current liabilities
4,148 Creditors and other payables 7 5,587 4,700 4,600
560 Repayment of surplus to the Crown 8 - - 950
307 Provisions 9 1,290 - -
5,910 Employee entitlements 10 6,598 4,400 6,500
651 Goods and services tax payable 1,016 1,500 950
427 Deferred revenue 11 250 - -
12,003 Total current liabilities 14,741 10,600 13,000
Non-current liabilities
5,765 Employee entitlements 10 6,205 6,400 5,500
5,765 Total non-current liabilities 6,205 6,400 5,500
17,768 Total liabilities 20,946 17,000 18,500
60,386 Net assets 58,784 69,817 78,266
Equity
60,386 Taxpayers’ funds 58,784 69,817 78,266
60,386 Total equity 58,784 69,817 78,266
Explanation of significant variances against the original budget 2015/16 are detailed in Note 20.
The accompanying accounting policies and notes form part of these financial statements.
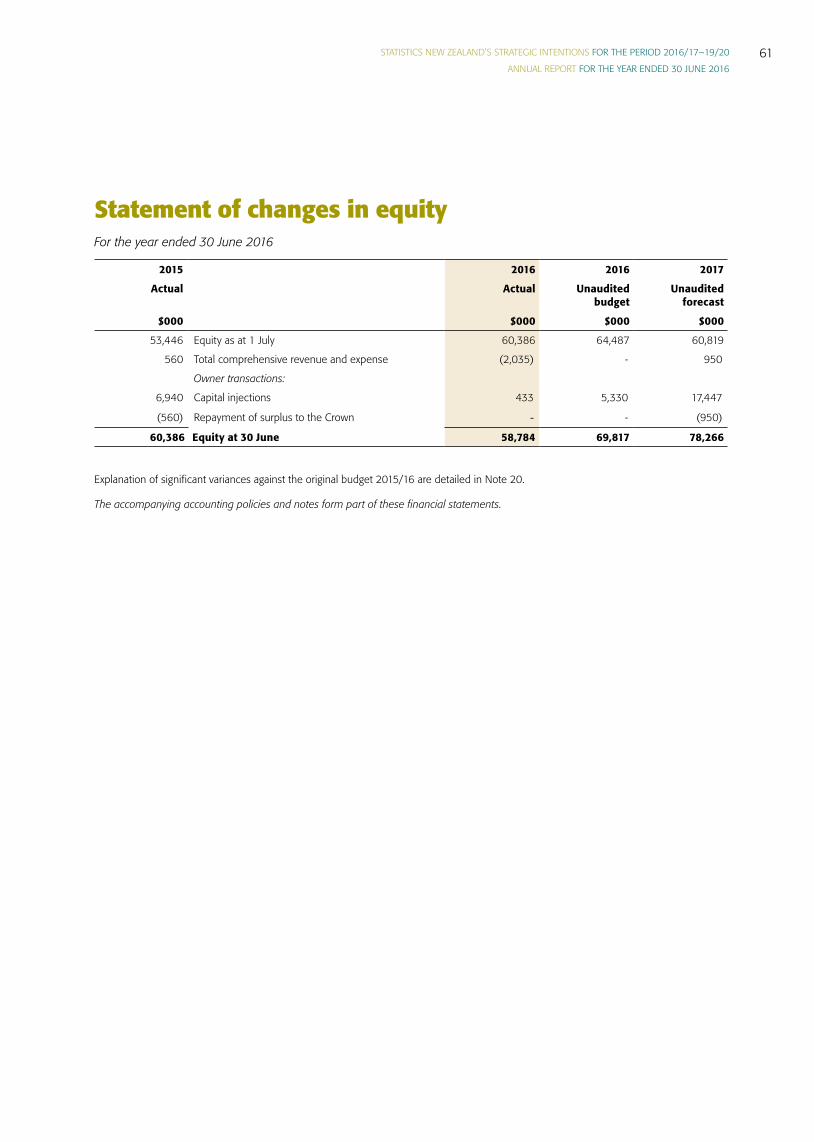
STATISTICS NEW ZEALAND’S STRATEGIC INTENTIONS FOR THE PERIOD 2016/17–19/20
ANNUAL REPORT FOR THE YEAR ENDED 30 JUNE 201661
Statement of changes in equity For the year ended 30 June 2016
2015 2016 2016 2017
Actual Actual Unaudited budget
Unaudited forecast
$000 $000 $000 $000
53,446 Equity as at 1 July 60,386 64,487 60,819
560 Total comprehensive revenue and expense (2,035) - 950
Owner transactions:
6,940 Capital injections 433 5,330 17,447
(560) Repayment of surplus to the Crown - - (950)
60,386 Equity at 30 June 58,784 69,817 78,266
Explanation of significant variances against the original budget 2015/16 are detailed in Note 20.
The accompanying accounting policies and notes form part of these financial statements.

STATISTICS NEW ZEALAND’S STRATEGIC INTENTIONS FOR THE PERIOD 2016/17–19/20
ANNUAL REPORT FOR THE YEAR ENDED 30 JUNE 201662
Statement of cash flows For the year ended 30 June 2016
2015 2016 2016 2017
Actual Actual Unaudited budget
Unaudited forecast
$000 Note $000 $000 $000
Cash flows from operating activities
88,069 Receipts from Revenue Crown 103,732 114,806 109,071
8,296 Receipts from other revenue 6,599 8,013 8,370
(95,255) Payments to suppliers and employees (105,685) (105,902) (114,766)
(644) Goods and services tax (net) 365 - 200
(4,362) Payments for capital charge (4,831) (4,417) (4,865)
(3,896) Net cash flow from operating activities 15 180 12,500 (1,990)
Cash flows from investing activities
22 Receipts from sale of property, plant, and equipment 82 - -
(2,784) Purchase of property, plant, and equipment (8,290) (8,000) (9,000)
(8,150) Purchase of intangible assets (7,381) (9,000) (8,000)
(10,912) Net cash flow from investing activities (15,589) (17,000) (17,000)
Cash flows from financing activities
6,940 Capital contribution 433 5,330 17,447
(3,679) Payment of operating surplus to the Crown (560) (3,679) (237)
3,261 Net cash flow from financing activities (127) 1,651 17,210
(11,547) Net increase/(decrease) in cash and cash equivalents (15,536) (2,849) (1,780)
32,088 Cash and cash equivalents as at 1 July 20,541 35,323 13,977
20,541 Cash and cash equivalents as at 30 June 5,005 32,474 12,197
The accompanying accounting policies and notes form part of these financial statements.

STATISTICS NEW ZEALAND’S STRATEGIC INTENTIONS FOR THE PERIOD 2016/17–19/20
ANNUAL REPORT FOR THE YEAR ENDED 30 JUNE 201663
Statement of commitmentsAs at 30 June 2016
Capital commitmentsCapital commitments are the aggregate amount of capital expenditure contracted for the acquisition of property, plant, and equipment and intangible assets that have not been paid for or not recognised as a liability at balance date.
Non-cancellable operating lease commitmentsStatistics NZ leases property, plant, and equipment in the normal course of its business. The majority of these leases are for premises, which have a non-cancellable leasing period ranging from one to 12 years.
Statistics NZ moved into its new premises in Christchurch in February 2016, with several other agencies. Statistics NZ is the head tenant in a 12-year lease, and this is reflected in the significant lease commitments from 2016 onwards.
Statistics NZ’s non-cancellable operating leases have varying terms, escalation clauses, and renewal rights. There are no restrictions placed on the department by any of its leasing arrangements.
2015 2016
Actual Actual
$000 $000
Capital commitments
- Leasehold improvements 2,261
- Total capital commitments 2,261
2015 2016
Actual Actual
$000 $000
Non-cancellable operating lease commitments
6,588 Not later than one year 6,219
15,576 Later than one year and not later than five years 12,891
20,958 Later than five years 19,077
43,122 Total non-cancellable operating lease commitments 38,187
The accompanying accounting policies and notes form part of these financial statements.
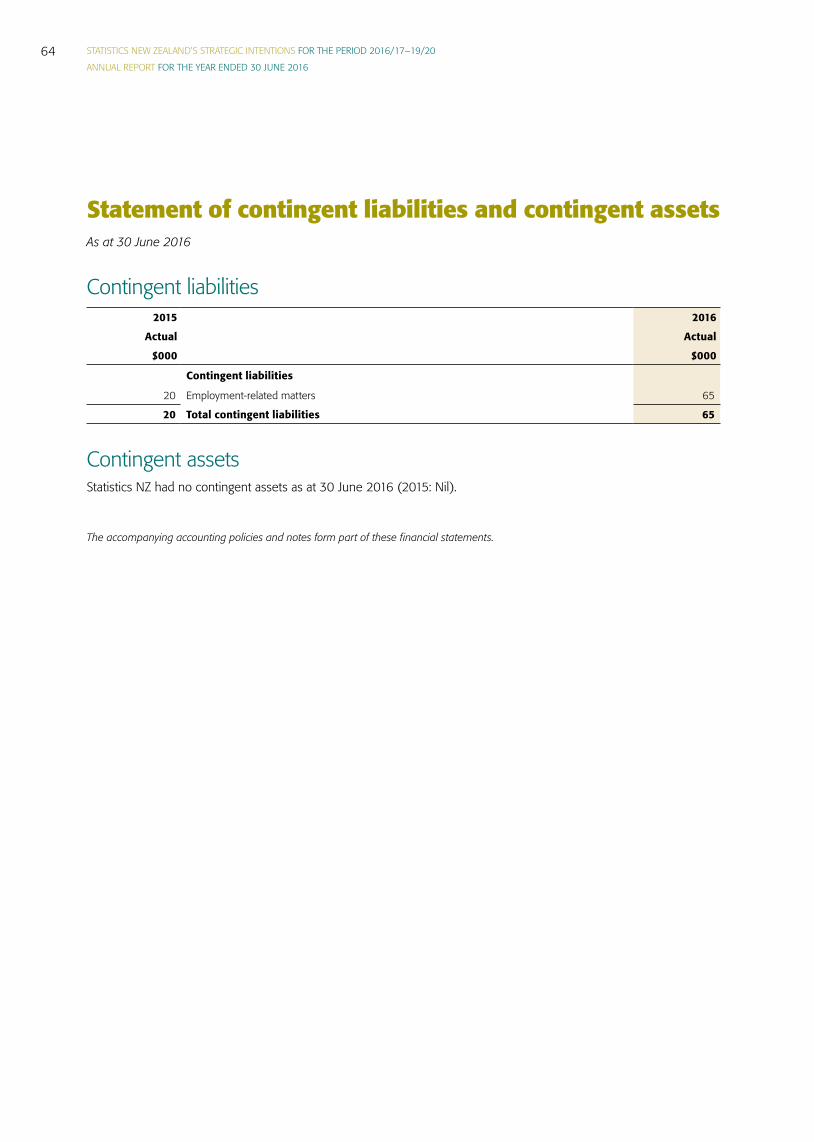
STATISTICS NEW ZEALAND’S STRATEGIC INTENTIONS FOR THE PERIOD 2016/17–19/20
ANNUAL REPORT FOR THE YEAR ENDED 30 JUNE 201664
Statement of contingent liabilities and contingent assetsAs at 30 June 2016
Contingent liabilities2015 2016
Actual Actual
$000 $000
Contingent liabilities
20 Employment-related matters 65
20 Total contingent liabilities 65
Contingent assetsStatistics NZ had no contingent assets as at 30 June 2016 (2015: Nil).
The accompanying accounting policies and notes form part of these financial statements.
STATISTICS NEW ZEALAND’S STRATEGIC INTENTIONS FOR THE PERIOD 2016/17–19/20
ANNUAL REPORT FOR THE YEAR ENDED 30 JUNE 201665
1. Statement of accounting policies for the year ended 30 June 2016
Reporting entityStatistics New Zealand (abbreviated to Statistics NZ or referred to as ‘the department’) is New Zealand’s national statistical office, and operates under the authority of the Statistics Act 1975. Statistics NZ is a government department as defined by section 2 of the Public Finance Act 1989.
Statistics NZ’s primary objective is to give New Zealand the statistical information it needs to grow and prosper. This statistical information includes economic, environmental, fiscal, population, and social statistics. The department does not operate to make a financial return.
Statistics NZ has designated itself as a public benefit entity (PBE) for financial reporting purposes.
The financial statements, which are prepared pursuant to section 45 of the Public Finance Act 1989, encompass the activities of Statistics NZ for the year ended 30 June 2016, and were approved for issue by the Government Statistician on 30 September 2016.
Basis of preparationThe financial statements have been prepared on a going concern basis, and the accounting policies have been applied consistently throughout the period.
Statement of complianceThese financial statements have been prepared in accordance with the requirements of the Public Finance Act 1989, which include the requirement to comply with New Zealand Generally Accepted Accounting Practice (NZ GAAP) and Treasury Instructions.
These financial statements, including the comparatives, have been prepared in accordance with Tier 1 Public Sector PBE Accounting Standards (PBE Standards), and have been prepared on a historical cost basis.
Presentation currency and roundingThe financial statements are presented in New Zealand dollars and all values are rounded to the nearest thousand dollars ($000) unless otherwise stated.
Standards issued and not yet effective and not early adoptedIn 2015, the External Reporting Board issued Disclosure Initiative (Amendments to PBE IPSAS 1), 2015 Omnibus Amendments to PBE Standards, and Amendments to PBE Standards and Authoritative Notice as a Consequence of XRB A1 and Other Amendments. These amendments apply to PBEs with reporting periods beginning on or after 1 January 2016. Statistics NZ will apply these amendments in preparing its 30 June 2017 financial statements. Statistics NZ expects there will be no effect in applying these amendments.
Summary of significant accounting policies
RevenueRevenue is measured at the fair value of the consideration received or receivable to the extent it is probable that the economic benefits will flow to the department and the revenue can be reliably measured. Revenue represents amounts receivable for goods and services provided in the normal course of business once significant risks and rewards of ownership have been transferred to the buyer.
Notes to the financial statements
STATISTICS NEW ZEALAND’S STRATEGIC INTENTIONS FOR THE PERIOD 2016/17–19/20
ANNUAL REPORT FOR THE YEAR ENDED 30 JUNE 201666
Revenue CrownThe fair value of revenue from the Crown is measured based on the department’s funding entitlement for the accounting period. The funding entitlement is established by Parliament when it passes the Appropriation Acts for the financial year. The amount of revenue recognised takes into account any amendments to appropriations approved in the Appropriation (Supplementary Estimates) Act for the year and certain other unconditional funding adjustments formally approved prior to balance date.
There are no conditions attached to the funding from the Crown. However, the department can incur expenses only within the scope and limits of its appropriations.
Sale of publications/customised outputsThe sale of publications/customised outputs is recognised when the product is sold to the customer. The recorded revenue is the gross amount of the sale.
Contract surveysRevenue from contracted surveys is recognised to the extent that the service has been completed by Statistics NZ.
Other incomeOther sources of income are recognised when earned and are reported in the financial periods to which they relate.
Capital chargeThe capital charge is recognised as an expense in the period to which the charge relates.
Leases
Finance leasesLeases in which Statistics NZ assumes substantially all the risks and rewards of ownership are classified as finance leases. The assets and liabilities are recognised at amounts equal to the fair value of the leased asset or, if lower, the present value of the minimum lease payments, each determined at the inception of the lease. Assets acquired by way of a finance lease are included in property, plant, and equipment, and depreciated over their useful lives. If there is no reasonable certainty that the department will obtain ownership by the end of the lease term, the asset is fully depreciated over the shorter of the lease term or its useful life.
Operating leasesAn operating lease is a lease that does not transfer substantially all the risks and rewards incidental to ownership of an asset. Lease payments under an operating lease are recognised as an expense on a straight-line basis over the lease term.
Cash and cash equivalentsCash and cash equivalents include cash on hand and funds on deposit with banks with a maturity period of 90 days or less and are measured at its carrying value.
The department is only permitted to expend its cash and cash equivalents within the scope and limits of its appropriations.
Debtors and other receivablesDebtors and other receivables are initially measured at fair value and subsequently measured at amortised cost using the effective interest rate, less impairment changes if relevant.
STATISTICS NEW ZEALAND’S STRATEGIC INTENTIONS FOR THE PERIOD 2016/17–19/20
ANNUAL REPORT FOR THE YEAR ENDED 30 JUNE 201667
Impairment of a receivable is established when there is objective evidence that the department will not be able to collect amounts due according to the original terms of the receivable. Significant financial difficulties of the debtor, probability that the debtor will enter into bankruptcy, and default in payments are considered indicators that the receivable is impaired. The amount of the impairment is the difference between the asset’s carrying amount and the present value of estimated future cash flows, discounted using the original effective interest rate. The carrying amount of the asset is reduced through the use of a provision for doubtful debts account, and the amount of the loss is recognised in the surplus or deficit. Overdue receivables that are renegotiated are reclassified as current (that is, not past due).
Property, plant, and equipmentProperty, plant, and equipment is recognised at the costs directly attributable to bringing the assets to the location and condition necessary to operate in the intended manner.
Property, plant, and equipment consists of computer equipment, leasehold improvements, furniture and fixtures, and office equipment. All property, plant, and equipment is shown at cost, less accumulated depreciation and impairment losses.
Individual assets, or group of assets, are capitalised if their cost is greater than $1,500. The value of an individual asset that is less than $1,500 and is part of a group of similar assets is capitalised.
AdditionsThe cost of an item of property, plant, and equipment is recognised as an asset if, and only if, it is probable that future economic benefits or service potential associated with the item will flow to Statistics NZ and the cost of the item can be measured reliably. Work in progress is recognised at cost less impairment and is not depreciated.
Subsequent costsCosts incurred subsequent to initial acquisition are capitalised only when it is probable that future economic benefits or service potential associated with the item will flow to the department and the cost of the item can be measured reliably.
The costs of day-to-day servicing of property, plant, and equipment are recognised in the surplus or deficit as they are incurred.
DerecognitionAn item of property, plant, and equipment is derecognised upon sale, retirement, or disposal. Realised gains and losses arising from the derecognition of property, plant, and equipment are recognised in the surplus or deficit in the period in which the transaction occurs. The gain or loss is calculated as the difference between the carrying amount of the asset and the net disposal proceeds received (if any).
DepreciationDepreciation is provided on a straight-line basis on all property, plant, and equipment, at rates that will write off the cost of the assets to their estimated residual values over their useful lives. In determining an asset’s useful life, consideration is given to its expected usage, its expected wear and tear, technical obsolescence, and legal or similar limits on its use.
The useful lives and associated depreciation rates of major classes of assets have been estimated as follows:
Furniture and office equipment 5 to 7 years Computer equipment 3 to 5 years Leasehold improvements remaining term of the lease or the estimated remaining useful lives of the improvements, but not to exceed 12 years – whichever is the shorter.
The residual value and useful life of an asset is reviewed, and adjusted if applicable, at each financial year end.

STATISTICS NEW ZEALAND’S STRATEGIC INTENTIONS FOR THE PERIOD 2016/17–19/20
ANNUAL REPORT FOR THE YEAR ENDED 30 JUNE 201668
Intangible assets
Software acquisition and developmentAcquired computer software licences are capitalised on the basis of the costs incurred to acquire and bring to use the specific software. Costs associated with maintaining computer software are recognised as an expense when incurred. Costs that are directly associated with the development of software for internal use by Statistics NZ, are recognised as an intangible asset. Direct costs include the software development, employee and directly applicable operating costs.
AmortisationThe carrying value of an intangible asset with a finite life is amortised on a straight-line basis over its useful life. Amortisation begins when the asset is available for use and ceases at the date that the asset is derecognised. The amortisation charge for each period is recognised in the statement of comprehensive revenue and expense. The useful lives and associated amortisation rates of major classes of intangible assets have been estimated as follows:
Software – acquired and developed 3 to 8 years
Impairment of non-financial assetsProperty, plant, and equipment, and intangible assets are tested for impairment whenever events or changes in circumstances indicate that the carrying amount may not be recoverable. An impairment loss is recognised for the amount by which the asset’s carrying amount exceeds its recoverable service amount. The recoverable service amount is the higher of an asset’s fair value less costs to sell and value in use.
Value in use is determined by the department as being the depreciated replacement cost for an asset. The non- financial assets of the department are designated as non-cash generating assets as they are not primarily dependent on the asset’s ability to generate net cash inflows.
If an asset’s carrying amount exceeds its recoverable service amount, the asset is impaired and the carrying amount is written down to the recoverable service amount. The total impairment loss is recognised in the statement of comprehensive revenue and expense.
Creditors and other payablesShort-term creditors and other payables are their face value.
Employee entitlements
Short-term employee entitlementsEmployee entitlements that Statistics NZ expects to be settled within 12 months of balance date are measured at nominal values, based on accrued entitlements at current rates of pay.
These include salaries and wages accrued up to balance date, annual leave earned but not yet taken at balance date, retiring and long-service leave entitlements expected to be settled within 12 months, and sick leave.
Statistics NZ recognises a liability for sick leave to the extent that absences in the coming year are expected to be greater than the sick leave entitlements earned in the coming year. The amount is calculated based on the unused sick leave entitlement that can be carried forward at balance date, to the extent that Statistics NZ anticipates it will be used by staff to cover those future absences.
Statistics NZ recognises a liability and an expense for bonuses where it is contractually obliged to pay them, or where there is a past practice that has created a constructive obligation.
STATISTICS NEW ZEALAND’S STRATEGIC INTENTIONS FOR THE PERIOD 2016/17–19/20
ANNUAL REPORT FOR THE YEAR ENDED 30 JUNE 201669
Long-term employee entitlementsEmployee entitlements that are due to be settled beyond 12 months, such as long-service leave and retiring leave, have been calculated on an actuarial basis. The calculations are based on:
• likely future entitlements based on years of service, years to entitlement, the likelihood that staff will reach the point of entitlement, and contractual entitlements information; and
• the present value of the estimated future cash flows using the three risk-free discount rates and a salary inflation factor as supplied by the New Zealand Treasury. The risk-free discount rates and the salary inflation factor are detailed in Note 10.
Superannuation schemes
Defined contribution schemesObligations for contributions to the State Sector Retirement Savings Scheme, KiwiSaver, and the Government Superannuation Fund are accounted for as defined contribution schemes and are recognised as an expense in the statement of comprehensive revenue and expense as incurred.
ProvisionsStatistics NZ recognises a provision for future expenditure of uncertain amount or timing when there is a present obligation (either legal or constructive) as a result of a past event, it is probable that an outflow of future economic benefits will be required to settle the obligation, and a reliable estimate can be made of the amount of the obligation. Provisions are not recognised for future operating losses.
Provisions are measured at the present value of the expenditures expected to be required to settle the obligation, using a discount rate that reflects current market assessments of the time value of money and the risks specific to the obligation. The increase in the provision due to the passage of time is recognised as a finance cost.
EquityEquity is the Crown’s investment in Statistics NZ and is measured as the difference between total assets and total liabilities.
CommitmentsExpenses yet to be incurred on non-cancellable contracts that have been entered into on or before balance date are disclosed as commitments to the extent that there are equally unperformed obligations.
Cancellable commitments that have penalty or exit costs explicit in the agreement on exercising that option to cancel are included in the statement of commitments at the value of that penalty or exit cost.
Goods and services tax (GST)All items in the financial statements, including appropriation statements, are stated exclusive of GST except for receivables and payables, which are stated on a GST-inclusive basis. Where GST is not recoverable as input tax, then it is recognised as part of the related asset or expense. The net amount of GST recoverable from, or payable to, Inland Revenue is included as part of receivables or payables in the statement of financial position.
The net GST paid to, or received from Inland Revenue, including the GST relating to investing and financing activities, is classified as an operating cash flow in the statement of cash flows.
Commitments and contingencies are disclosed exclusive of GST.

STATISTICS NEW ZEALAND’S STRATEGIC INTENTIONS FOR THE PERIOD 2016/17–19/20
ANNUAL REPORT FOR THE YEAR ENDED 30 JUNE 201670
Income taxStatistics NZ is a government department and consequently is exempt from income tax. Accordingly, no provision has been made for income tax.
Statement of cost accounting policiesStatistics NZ has determined the cost of outputs using the cost allocation system outlined below.
Direct costs are those costs directly attributed to an output. Indirect costs are those costs that cannot be identified in an economically feasible manner with a specific output.
Direct costs are charged directly to outputs. Indirect costs are charged to outputs based on cost drivers and related activity. Personnel costs are either charged on the basis of actual time incurred using a time recording system or assigned with other indirect costs to outputs based on the proportion of direct expenditure.
There have been no material changes to the costs allocation methodology since the date of the last audited financial statements.
Critical accounting estimates and assumptionsIn preparing these financial statements Statistics NZ has made estimates and assumptions concerning the future. These estimates and assumptions may differ from the subsequent actual results. Estimates and judgements are continually evaluated and are based on historical experience and other factors, including expectations of future events that are believed to be reasonable under the circumstances. The estimates and assumptions that have a significant risk of causing a material adjustment to the carrying amounts of assets and liabilities within the next financial year are referred to below:
Useful lives of softwareThe useful life of software is determined at the time the software is acquired or developed, and brought into use. It is reviewed at each reporting date for appropriateness. For computer software licences, the useful life represents management’s view of the expected period over which the department will receive benefits from the software, but not exceeding the licence term. For internally generated software developed by the department, the life is based on historical experience with similar systems as well as anticipation of future events, which may impact their useful life, such as changes in technology.
Long service leave and retirement gratuitiesAn analysis of the exposure in relation to estimates and uncertainties surrounding long service leave and retirement gratuities liabilities is disclosed in Note 10.
Critical judgements in applying Statistics NZ’s accounting policiesManagement has exercised the following critical judgements in applying Statistics NZ’s accounting policies for the period ended 30 June 2016:
Leases classificationDetermining whether a lease agreement is a finance lease or an operating lease requires judgement as to whether the agreement transfers substantially all the risks and rewards to the department. Judgement is required on various aspects that include, but are not limited to, the fair value of the leased asset, the economic life of the leased asset, whether or not to include renewal options in the lease term, and determining an appropriate discount rate to calculate the present value of the minimum lease payments. Classification as a finance lease means the asset is recognised in the statement of financial position as property, plant, and equipment, whereas with an operating lease no such asset is recognised.
Statistics NZ has exercised its judgement on rental leases, and has determined them to be operating leases.

STATISTICS NEW ZEALAND’S STRATEGIC INTENTIONS FOR THE PERIOD 2016/17–19/20
ANNUAL REPORT FOR THE YEAR ENDED 30 JUNE 201671
Budget and forecast figures
Basis of the budget and forecast figuresThe 2016 budget figures are for the year ended 30 June 2016 and were published in the 2014/15 annual report. They are consistent with the department’s best estimate financial forecast information submitted to Treasury for the Budget Economic and Fiscal Update (BEFU) for the year ending 2015/16.
The 2017 forecast figures are for the year ending 30 June 2017, which are consistent with the best estimate financial forecast information submitted to Treasury for the BEFU for the year ending 2016/17.
The forecast financial statements have been prepared as required by the Public Finance Act to communicate forecast financial information for accountability purposes.
The budget and forecast figures are unaudited and have been prepared using the accounting policies adopted in preparing these financial statements.
The 30 June 2017 forecast figures have been prepared in accordance with PBE FRS 42 Prospective Financial Statements. The forecast financial statements were approved for issue by the Government Statistician on 5 April 2016.
The Government Statistician is responsible for the forecast financial statements, including the appropriateness of the assumptions underlying them and all other required disclosures.
While the department regularly updates its forecasts, updated forecast financial statements for the year ending 30 June 2017 will not be published.
Significant assumptions used in preparing the forecast financialsIn preparing the forecast figures, estimates and assumptions have been made concerning the future based on the best information available to Statistics NZ. These estimates and assumptions may differ from the subsequent actual results. The main assumptions are as follows:
• The forecasts have been compiled on the basis of existing government policies and Ministerial expectations. The 2016/17 actual financial statements may include changes to the baseline budget through new initiatives or technical adjustments. Any such changes will affect Revenue from the Crown and Output Expenditure.
• Forecast sales to customers (‘Revenue other’ in the Statement of comprehensive revenue and expense) is based on the best available estimates but the actual financial result for 2016/17 is subject to demand fluctuations.
• The forecast personnel assumptions are based on the current salaries costs adjusted for any anticipated remuneration increases for the forecast year.
• Forecast expenditure is based on the assumption that Statistics NZ will continue to realise efficiency and effectiveness savings in 2016/17. The department is focused on improved oversight of expenditure through enhanced planning, budgeting, and prioritisation processes.
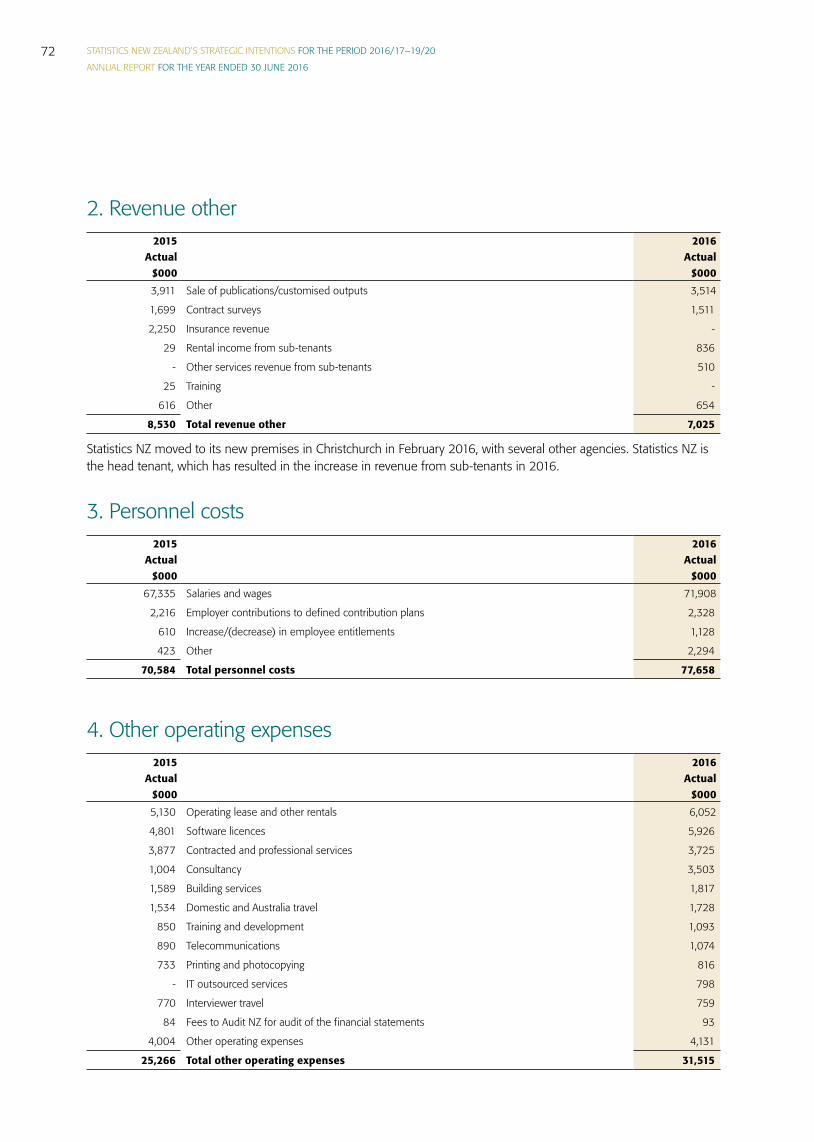
STATISTICS NEW ZEALAND’S STRATEGIC INTENTIONS FOR THE PERIOD 2016/17–19/20
ANNUAL REPORT FOR THE YEAR ENDED 30 JUNE 201672
2. Revenue other2015 2016
Actual Actual$000 $0003,911 Sale of publications/customised outputs 3,514
1,699 Contract surveys 1,511
2,250 Insurance revenue -
29 Rental income from sub-tenants 836
- Other services revenue from sub-tenants 510
25 Training -
616 Other 654
8,530 Total revenue other 7,025
Statistics NZ moved to its new premises in Christchurch in February 2016, with several other agencies. Statistics NZ is the head tenant, which has resulted in the increase in revenue from sub-tenants in 2016.
3. Personnel costs2015 2016
Actual Actual$000 $000
67,335 Salaries and wages 71,908
2,216 Employer contributions to defined contribution plans 2,328
610 Increase/(decrease) in employee entitlements 1,128
423 Other 2,294
70,584 Total personnel costs 77,658
4. Other operating expenses2015 2016
Actual Actual$000 $0005,130 Operating lease and other rentals 6,052
4,801 Software licences 5,926
3,877 Contracted and professional services 3,725
1,004 Consultancy 3,503
1,589 Building services 1,817
1,534 Domestic and Australia travel 1,728
850 Training and development 1,093
890 Telecommunications 1,074
733 Printing and photocopying 816
- IT outsourced services 798
770 Interviewer travel 759
84 Fees to Audit NZ for audit of the financial statements 93
4,004 Other operating expenses 4,131
25,266 Total other operating expenses 31,515
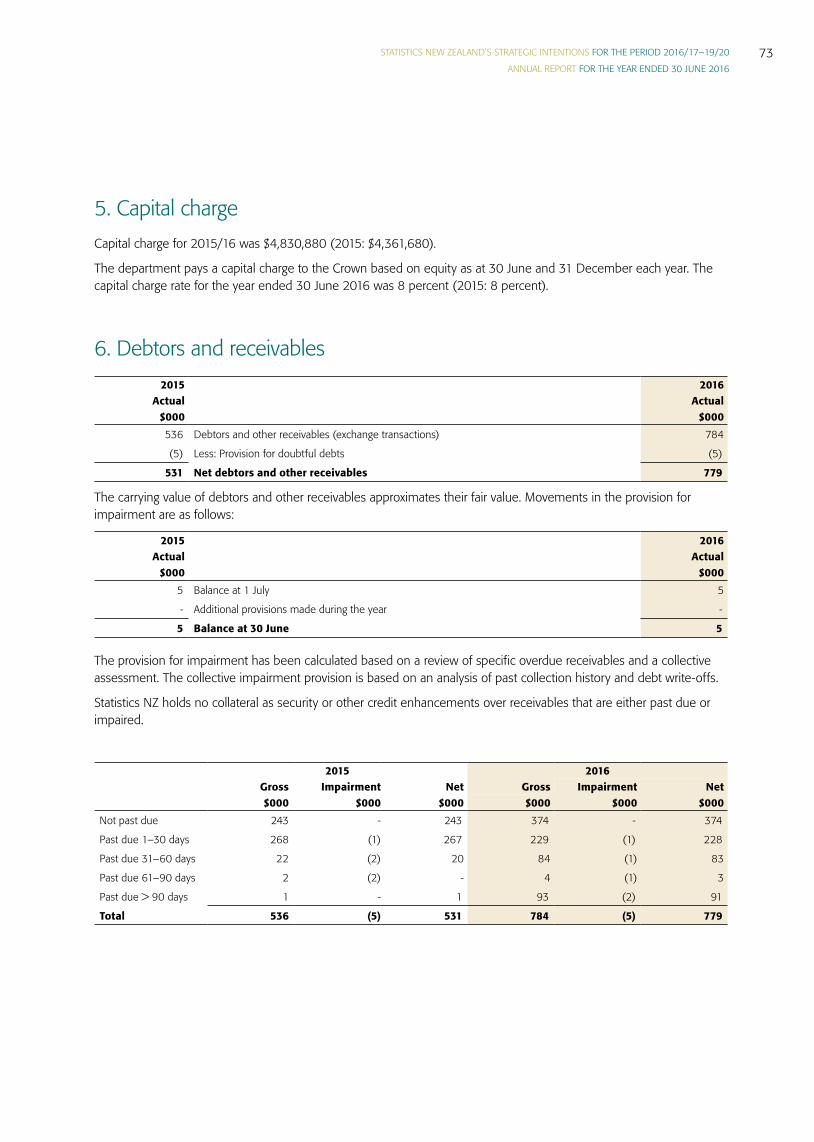
STATISTICS NEW ZEALAND’S STRATEGIC INTENTIONS FOR THE PERIOD 2016/17–19/20
ANNUAL REPORT FOR THE YEAR ENDED 30 JUNE 201673
5. Capital chargeCapital charge for 2015/16 was $4,830,880 (2015: $4,361,680).
The department pays a capital charge to the Crown based on equity as at 30 June and 31 December each year. The capital charge rate for the year ended 30 June 2016 was 8 percent (2015: 8 percent).
6. Debtors and receivables2015 2016
Actual Actual$000 $000536 Debtors and other receivables (exchange transactions) 784
(5) Less: Provision for doubtful debts (5)
531 Net debtors and other receivables 779
The carrying value of debtors and other receivables approximates their fair value. Movements in the provision for impairment are as follows:
2015 2016 Actual Actual
$000 $0005 Balance at 1 July 5
- Additional provisions made during the year -
5 Balance at 30 June 5
The provision for impairment has been calculated based on a review of specific overdue receivables and a collective assessment. The collective impairment provision is based on an analysis of past collection history and debt write-offs.
Statistics NZ holds no collateral as security or other credit enhancements over receivables that are either past due or impaired.
2015 2016Gross Impairment Net Gross Impairment Net$000 $000 $000 $000 $000 $000
Not past due 243 - 243 374 - 374
Past due 1–30 days 268 (1) 267 229 (1) 228
Past due 31–60 days 22 (2) 20 84 (1) 83
Past due 61–90 days 2 (2) - 4 (1) 3
Past due > 90 days 1 - 1 93 (2) 91
Total 536 (5) 531 784 (5) 779
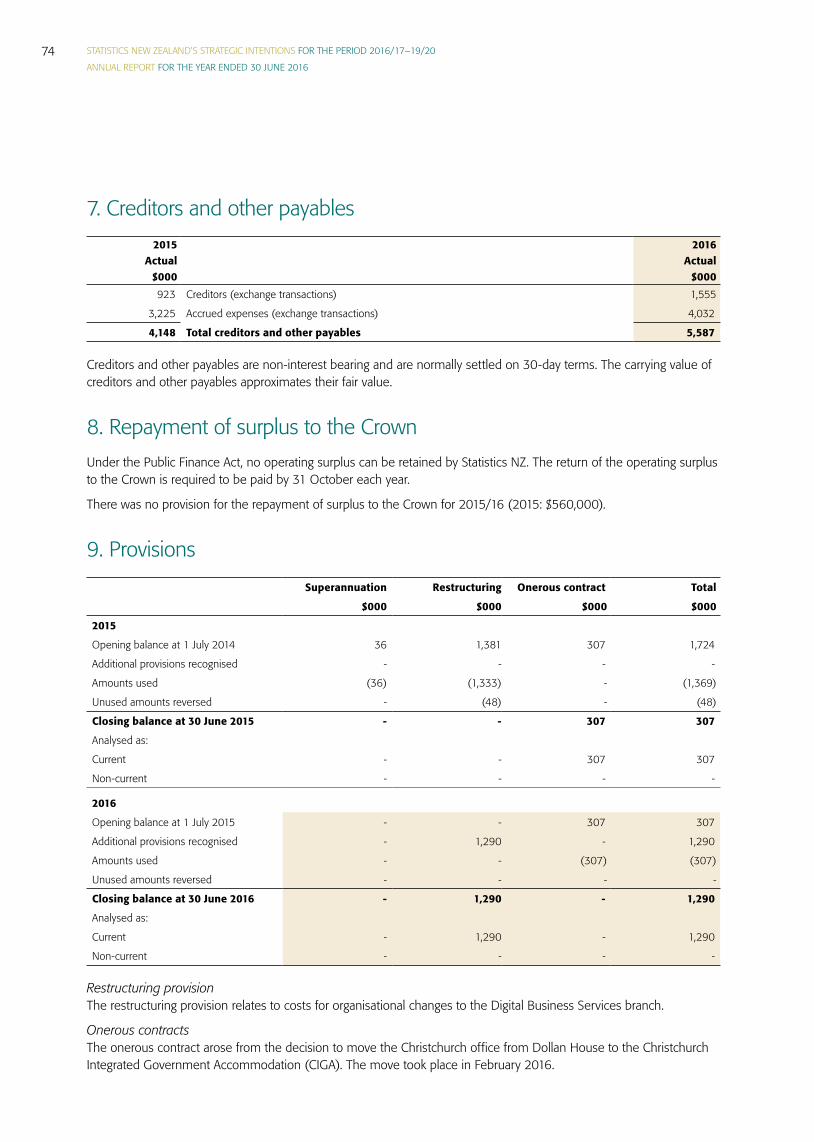
STATISTICS NEW ZEALAND’S STRATEGIC INTENTIONS FOR THE PERIOD 2016/17–19/20
ANNUAL REPORT FOR THE YEAR ENDED 30 JUNE 201674
7. Creditors and other payables2015 2016
Actual Actual$000 $000923 Creditors (exchange transactions) 1,555
3,225 Accrued expenses (exchange transactions) 4,032
4,148 Total creditors and other payables 5,587
Creditors and other payables are non-interest bearing and are normally settled on 30-day terms. The carrying value of creditors and other payables approximates their fair value.
8. Repayment of surplus to the CrownUnder the Public Finance Act, no operating surplus can be retained by Statistics NZ. The return of the operating surplus to the Crown is required to be paid by 31 October each year.
There was no provision for the repayment of surplus to the Crown for 2015/16 (2015: $560,000).
9. ProvisionsSuperannuation Restructuring Onerous contract Total
$000 $000 $000 $000
2015
Opening balance at 1 July 2014 36 1,381 307 1,724
Additional provisions recognised - - - -
Amounts used (36) (1,333) - (1,369)
Unused amounts reversed - (48) - (48)
Closing balance at 30 June 2015 - - 307 307
Analysed as:
Current - - 307 307
Non-current - - - -
2016
Opening balance at 1 July 2015 - - 307 307
Additional provisions recognised - 1,290 - 1,290
Amounts used - - (307) (307)
Unused amounts reversed - - - -
Closing balance at 30 June 2016 - 1,290 - 1,290
Analysed as:
Current - 1,290 - 1,290
Non-current - - - -
Restructuring provisionThe restructuring provision relates to costs for organisational changes to the Digital Business Services branch.
Onerous contractsThe onerous contract arose from the decision to move the Christchurch office from Dollan House to the Christchurch Integrated Government Accommodation (CIGA). The move took place in February 2016.
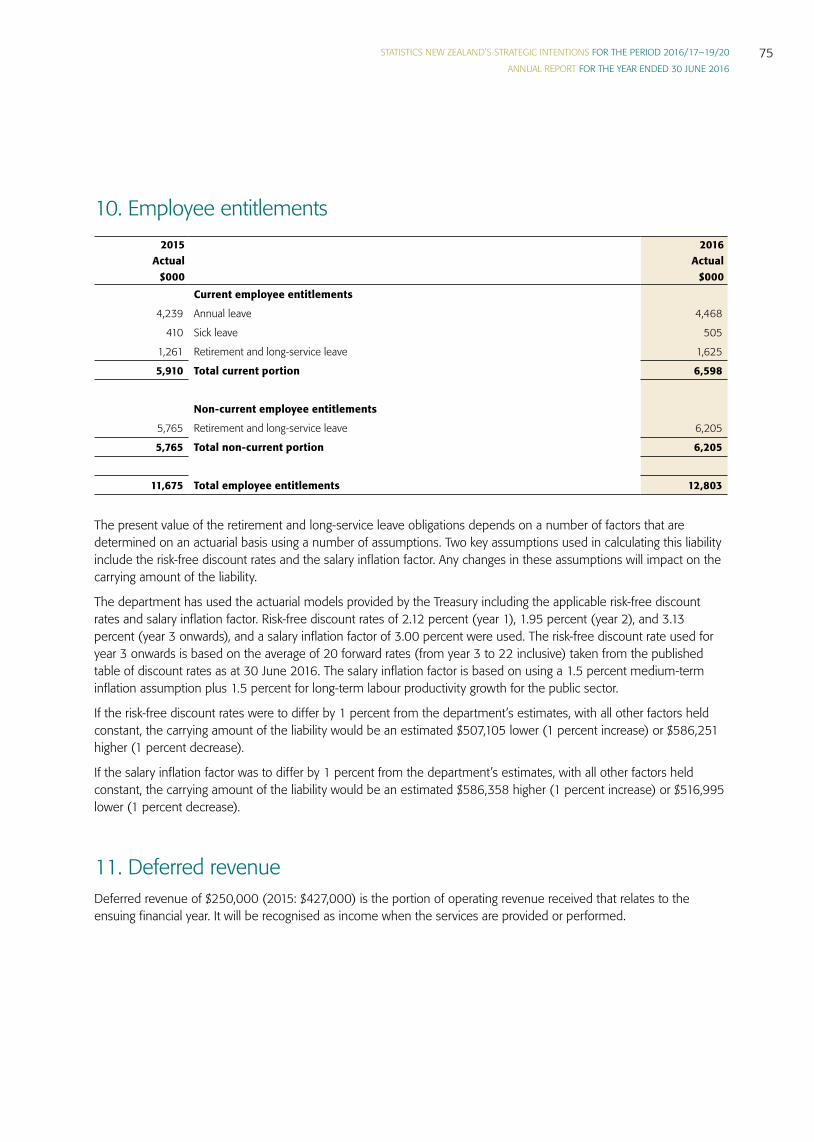
STATISTICS NEW ZEALAND’S STRATEGIC INTENTIONS FOR THE PERIOD 2016/17–19/20
ANNUAL REPORT FOR THE YEAR ENDED 30 JUNE 201675
10. Employee entitlements2015 2016
Actual Actual$000 $000
Current employee entitlements
4,239 Annual leave 4,468
410 Sick leave 505
1,261 Retirement and long-service leave 1,625
5,910 Total current portion 6,598
Non-current employee entitlements
5,765 Retirement and long-service leave 6,205
5,765 Total non-current portion 6,205
11,675 Total employee entitlements 12,803
The present value of the retirement and long-service leave obligations depends on a number of factors that are determined on an actuarial basis using a number of assumptions. Two key assumptions used in calculating this liability include the risk-free discount rates and the salary inflation factor. Any changes in these assumptions will impact on the carrying amount of the liability.
The department has used the actuarial models provided by the Treasury including the applicable risk-free discount rates and salary inflation factor. Risk-free discount rates of 2.12 percent (year 1), 1.95 percent (year 2), and 3.13 percent (year 3 onwards), and a salary inflation factor of 3.00 percent were used. The risk-free discount rate used for year 3 onwards is based on the average of 20 forward rates (from year 3 to 22 inclusive) taken from the published table of discount rates as at 30 June 2016. The salary inflation factor is based on using a 1.5 percent medium-term inflation assumption plus 1.5 percent for long-term labour productivity growth for the public sector.
If the risk-free discount rates were to differ by 1 percent from the department’s estimates, with all other factors held constant, the carrying amount of the liability would be an estimated $507,105 lower (1 percent increase) or $586,251 higher (1 percent decrease).
If the salary inflation factor was to differ by 1 percent from the department’s estimates, with all other factors held constant, the carrying amount of the liability would be an estimated $586,358 higher (1 percent increase) or $516,995 lower (1 percent decrease).
11. Deferred revenueDeferred revenue of $250,000 (2015: $427,000) is the portion of operating revenue received that relates to the ensuing financial year. It will be recognised as income when the services are provided or performed.
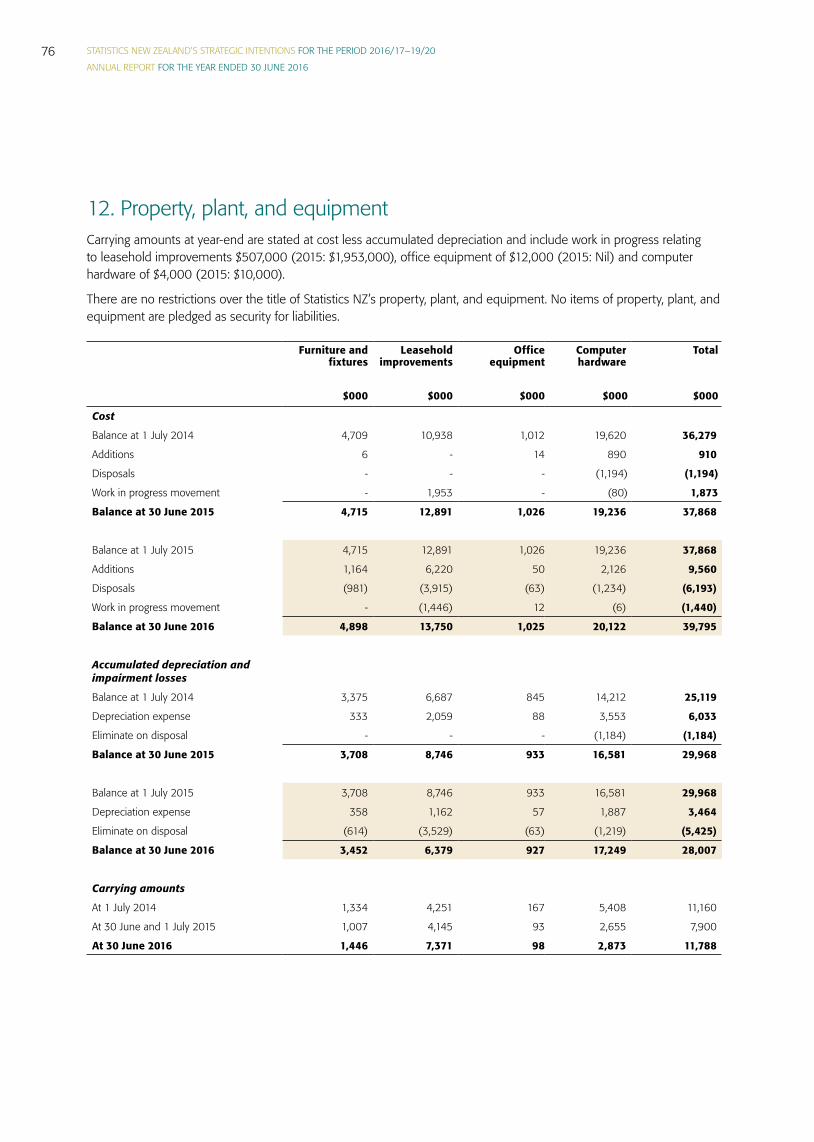
STATISTICS NEW ZEALAND’S STRATEGIC INTENTIONS FOR THE PERIOD 2016/17–19/20
ANNUAL REPORT FOR THE YEAR ENDED 30 JUNE 201676
12. Property, plant, and equipmentCarrying amounts at year-end are stated at cost less accumulated depreciation and include work in progress relating to leasehold improvements $507,000 (2015: $1,953,000), office equipment of $12,000 (2015: Nil) and computer hardware of $4,000 (2015: $10,000).
There are no restrictions over the title of Statistics NZ’s property, plant, and equipment. No items of property, plant, and equipment are pledged as security for liabilities.
Furniture and fixtures
Leasehold improvements
Office equipment
Computer hardware
Total
$000 $000 $000 $000 $000
Cost
Balance at 1 July 2014 4,709 10,938 1,012 19,620 36,279
Additions 6 - 14 890 910
Disposals - - - (1,194) (1,194)
Work in progress movement - 1,953 - (80) 1,873
Balance at 30 June 2015 4,715 12,891 1,026 19,236 37,868
Balance at 1 July 2015 4,715 12,891 1,026 19,236 37,868
Additions 1,164 6,220 50 2,126 9,560
Disposals (981) (3,915) (63) (1,234) (6,193)
Work in progress movement - (1,446) 12 (6) (1,440)
Balance at 30 June 2016 4,898 13,750 1,025 20,122 39,795
Accumulated depreciation and impairment losses
Balance at 1 July 2014 3,375 6,687 845 14,212 25,119
Depreciation expense 333 2,059 88 3,553 6,033
Eliminate on disposal - - - (1,184) (1,184)
Balance at 30 June 2015 3,708 8,746 933 16,581 29,968
Balance at 1 July 2015 3,708 8,746 933 16,581 29,968
Depreciation expense 358 1,162 57 1,887 3,464
Eliminate on disposal (614) (3,529) (63) (1,219) (5,425)
Balance at 30 June 2016 3,452 6,379 927 17,249 28,007
Carrying amounts
At 1 July 2014 1,334 4,251 167 5,408 11,160
At 30 June and 1 July 2015 1,007 4,145 93 2,655 7,900
At 30 June 2016 1,446 7,371 98 2,873 11,788
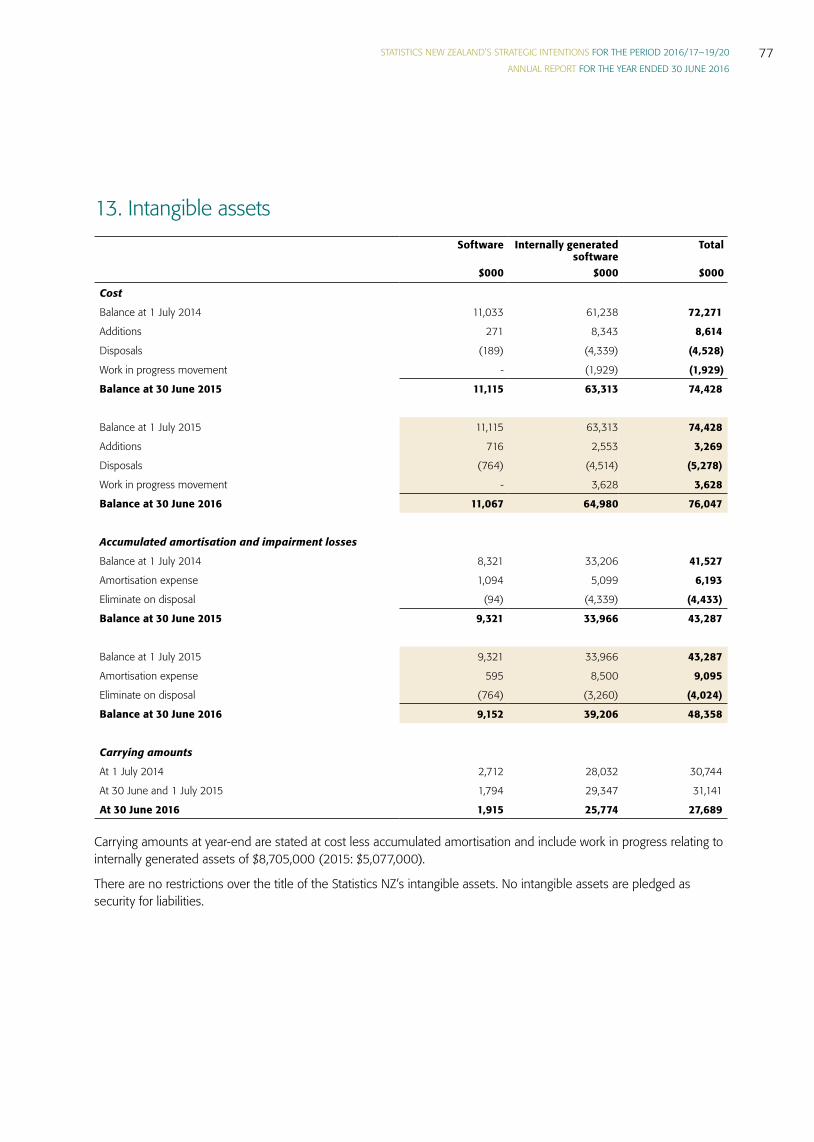
STATISTICS NEW ZEALAND’S STRATEGIC INTENTIONS FOR THE PERIOD 2016/17–19/20
ANNUAL REPORT FOR THE YEAR ENDED 30 JUNE 201677
13. Intangible assetsSoftware Internally generated
softwareTotal
$000 $000 $000
Cost
Balance at 1 July 2014 11,033 61,238 72,271
Additions 271 8,343 8,614
Disposals (189) (4,339) (4,528)
Work in progress movement - (1,929) (1,929)
Balance at 30 June 2015 11,115 63,313 74,428
Balance at 1 July 2015 11,115 63,313 74,428
Additions 716 2,553 3,269
Disposals (764) (4,514) (5,278)
Work in progress movement - 3,628 3,628
Balance at 30 June 2016 11,067 64,980 76,047
Accumulated amortisation and impairment losses
Balance at 1 July 2014 8,321 33,206 41,527
Amortisation expense 1,094 5,099 6,193
Eliminate on disposal (94) (4,339) (4,433)
Balance at 30 June 2015 9,321 33,966 43,287
Balance at 1 July 2015 9,321 33,966 43,287
Amortisation expense 595 8,500 9,095
Eliminate on disposal (764) (3,260) (4,024)
Balance at 30 June 2016 9,152 39,206 48,358
Carrying amounts
At 1 July 2014 2,712 28,032 30,744
At 30 June and 1 July 2015 1,794 29,347 31,141
At 30 June 2016 1,915 25,774 27,689
Carrying amounts at year-end are stated at cost less accumulated amortisation and include work in progress relating to internally generated assets of $8,705,000 (2015: $5,077,000).
There are no restrictions over the title of the Statistics NZ’s intangible assets. No intangible assets are pledged as security for liabilities.
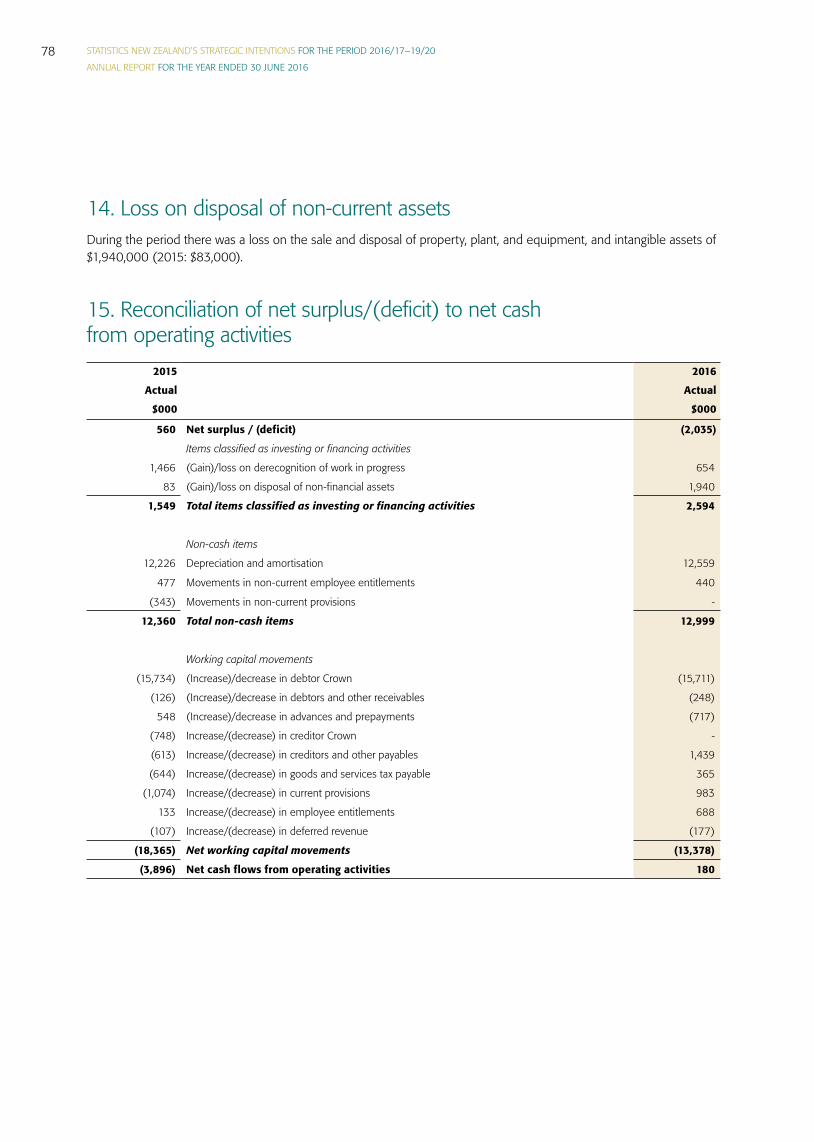
STATISTICS NEW ZEALAND’S STRATEGIC INTENTIONS FOR THE PERIOD 2016/17–19/20
ANNUAL REPORT FOR THE YEAR ENDED 30 JUNE 201678
14. Loss on disposal of non-current assetsDuring the period there was a loss on the sale and disposal of property, plant, and equipment, and intangible assets of $1,940,000 (2015: $83,000).
15. Reconciliation of net surplus/(deficit) to net cash from operating activities
2015 2016 Actual Actual
$000 $000
560 Net surplus / (deficit) (2,035)
Items classified as investing or financing activities
1,466 (Gain)/loss on derecognition of work in progress 654
83 (Gain)/loss on disposal of non-financial assets 1,940
1,549 Total items classified as investing or financing activities 2,594
Non-cash items
12,226 Depreciation and amortisation 12,559
477 Movements in non-current employee entitlements 440
(343) Movements in non-current provisions -
12,360 Total non-cash items 12,999
Working capital movements
(15,734) (Increase)/decrease in debtor Crown (15,711)
(126) (Increase)/decrease in debtors and other receivables (248)
548 (Increase)/decrease in advances and prepayments (717)
(748) Increase/(decrease) in creditor Crown -
(613) Increase/(decrease) in creditors and other payables 1,439
(644) Increase/(decrease) in goods and services tax payable 365
(1,074) Increase/(decrease) in current provisions 983
133 Increase/(decrease) in employee entitlements 688
(107) Increase/(decrease) in deferred revenue (177)
(18,365) Net working capital movements (13,378)
(3,896) Net cash flows from operating activities 180
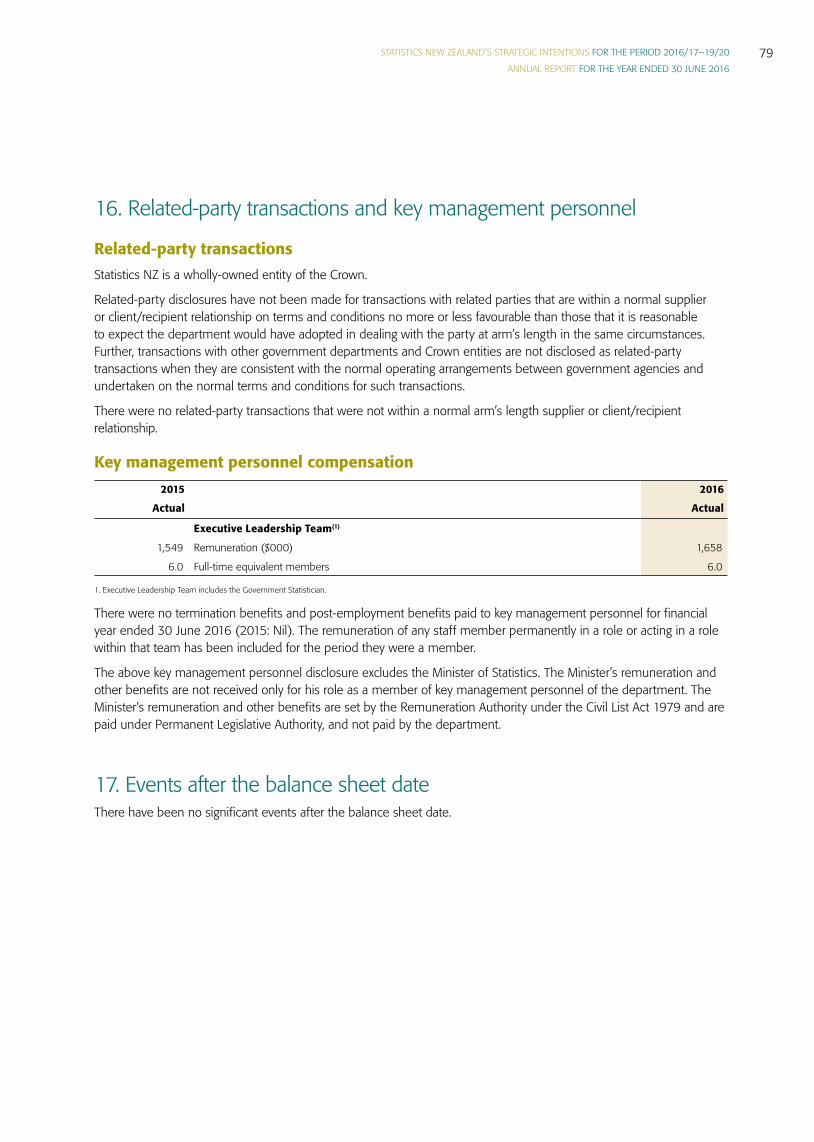
STATISTICS NEW ZEALAND’S STRATEGIC INTENTIONS FOR THE PERIOD 2016/17–19/20
ANNUAL REPORT FOR THE YEAR ENDED 30 JUNE 201679
16. Related-party transactions and key management personnel
Related-party transactionsStatistics NZ is a wholly-owned entity of the Crown.
Related-party disclosures have not been made for transactions with related parties that are within a normal supplier or client/recipient relationship on terms and conditions no more or less favourable than those that it is reasonable to expect the department would have adopted in dealing with the party at arm’s length in the same circumstances. Further, transactions with other government departments and Crown entities are not disclosed as related-party transactions when they are consistent with the normal operating arrangements between government agencies and undertaken on the normal terms and conditions for such transactions.
There were no related-party transactions that were not within a normal arm’s length supplier or client/recipient relationship.
Key management personnel compensation2015 2016
Actual Actual
Executive Leadership Team(1)
1,549 Remuneration ($000) 1,658
6.0 Full-time equivalent members 6.0
1. Executive Leadership Team includes the Government Statistician.
There were no termination benefits and post-employment benefits paid to key management personnel for financial year ended 30 June 2016 (2015: Nil). The remuneration of any staff member permanently in a role or acting in a role within that team has been included for the period they were a member.
The above key management personnel disclosure excludes the Minister of Statistics. The Minister’s remuneration and other benefits are not received only for his role as a member of key management personnel of the department. The Minister’s remuneration and other benefits are set by the Remuneration Authority under the Civil List Act 1979 and are paid under Permanent Legislative Authority, and not paid by the department.
17. Events after the balance sheet dateThere have been no significant events after the balance sheet date.

STATISTICS NEW ZEALAND’S STRATEGIC INTENTIONS FOR THE PERIOD 2016/17–19/20
ANNUAL REPORT FOR THE YEAR ENDED 30 JUNE 201680
18. Financial instruments
Financial instrument categories The carrying amounts of financial assets and financial liabilities in each of the PBE IPSAS 29 categories are as follows:
2015 2016 Actual Actual$000 $000
Loans and receivables
20,541 Cash and cash equivalents 5,005
2,838 Debtors and other receivables 3,803
23,379 Total loans and receivables 8,808
Financial liabilities measured at amortised cost
4,148 Creditors and other payables 5,587
4,148 Financial liabilities measured at amortised cost 5,587
Financial instrument risksStatistics NZ’s activities expose it to a variety of credit and liquidity risks. The department has a series of policies to manage the risks associated with financial instruments and seeks to minimise exposure from financial instruments. These policies do not allow any transactions that are speculative in nature to be entered into.
Credit riskA credit risk is the risk that a third party will default on its obligation to Statistics NZ, causing the department to incur a loss. In the normal course of its business, credit risk arises from debtors and deposits with banks.
The department is only permitted to deposit funds with Westpac, a registered bank, and enter into foreign exchange forward contracts with the New Zealand Debt Management Office (NZDMO). These entities have high credit ratings. The only concentration of credit risk is the deposits held with Westpac. For its other financial instruments, the department does not have significant concentrations of credit risk.
The department’s maximum credit risk exposure for each class of financial instrument is represented by the total carrying amount of cash and cash equivalents and net debtors and other receivables. There is no collateral held as security against these financial instruments, including those instruments that are overdue or impaired.
Liquidity riskLiquidity risk is the risk that the department will encounter difficulty raising liquid funds to meet commitments as they fall due. In meeting its liquidity requirements, the department closely monitors its forecast cash requirements with expected cash drawdowns from the NZDMO. The department maintains a target level of available cash to meet liquidity requirements. The table below analyses the department’s financial liabilities (excluding derivatives) that will be settled based on the remaining period at the balance sheet date to the contractual maturity date. The amounts disclosed are undiscounted and based on the contractual cash flows, and are equal to the carrying amounts.

STATISTICS NEW ZEALAND’S STRATEGIC INTENTIONS FOR THE PERIOD 2016/17–19/20
ANNUAL REPORT FOR THE YEAR ENDED 30 JUNE 201681
Less than 6 months
Between6 months
and 1 year
Between1 year and
5 years$000 $000 $000
2015
Creditors and other payables (Note 7) 4,148 - -
2016
Creditors and other payables (Note 7) 5,587 - -
19. Capital managementThe department’s capital is its equity, which comprises the taxpayers’ funds and revaluation reserves. Equity is represented by net assets.
The department manages its revenues, expenses, assets, liabilities, and general financial dealings prudently. The department’s equity is largely managed as a by-product of managing income, expenses, assets, liabilities, and compliance with the Government budget processes, Treasury instructions, and the Public Finance Act.
The objective of managing the department’s equity is to ensure that Statistics New Zealand effectively achieves its goals and objectives for which it has been established, while remaining a going concern.
20. Explanations of major variances against budgetThe following major budget variances occurred between the 2015/16 actuals and the 2015/16 budget. The budget figures for 2015/16 are those included in The Estimates of Appropriations for the year ending 30 June 2016.
Statement of comprehensive revenue and expense
Revenue Crown Revenue Crown was greater than budgeted by $4.637 million. This was mainly due to additional funding received of:
• $1.5 million to enable a fit-out to commence on the Wellington Statistics House building that will allow Ministry of Transport to relocate to Statistics House.
• $1.21 million for the Data Futures Partnership, a cross-sector group of influential people who will work together to help drive change across New Zealand’s data-use ecosystem.
In addition, there was a timing variance overspend of $2.2 million in the 5-year Multi Year Appropriation programme that will deliver the 2018 Census of Population and Dwellings.
Total expensesTotal expenses were greater than budgeted due to the establishment of new appropriations for the Data Futures Partnership and the provision of shared accommodation in Christchurch. Work also commenced on the Wellington Statistics House refit and there was a timing variance overspend in the 5-year Multi Year Appropriation programme that will deliver the 2018 Census of Population and Dwellings.
Surplus/(Deficit)The deficit of $2.035 million was mainly due to a shortfall in budgeted ‘revenue other’. The deficit has been funded from Equity.
STATISTICS NEW ZEALAND’S STRATEGIC INTENTIONS FOR THE PERIOD 2016/17–19/20
ANNUAL REPORT FOR THE YEAR ENDED 30 JUNE 201682
Statement of financial position
Cash and cash equivalents and Debtor CrownCash and cash equivalents were lower than budgeted as cash drawdowns from the Crown have been reduced to a level that meets short term cash requirements. This is reflected in Debtor Crown, which is higher than budgeted due to underspending on intangible assets.
Non-current assetsNon-current assets were lower than budgeted due mainly to a reduction in capital expenditure during the year.
Current liabilitiesCurrent liabilities were greater than budgeted due mainly to payables being greater than budgeted, an unbudgeted restructuring provision, and changes in the actuarial valuations for retiring and long-service leave in 2015/16.
Net assets and equityNet assets and equity were lower than budgeted due to the deficit for the year and a timing difference in the drawdown of capital funding from the Crown.
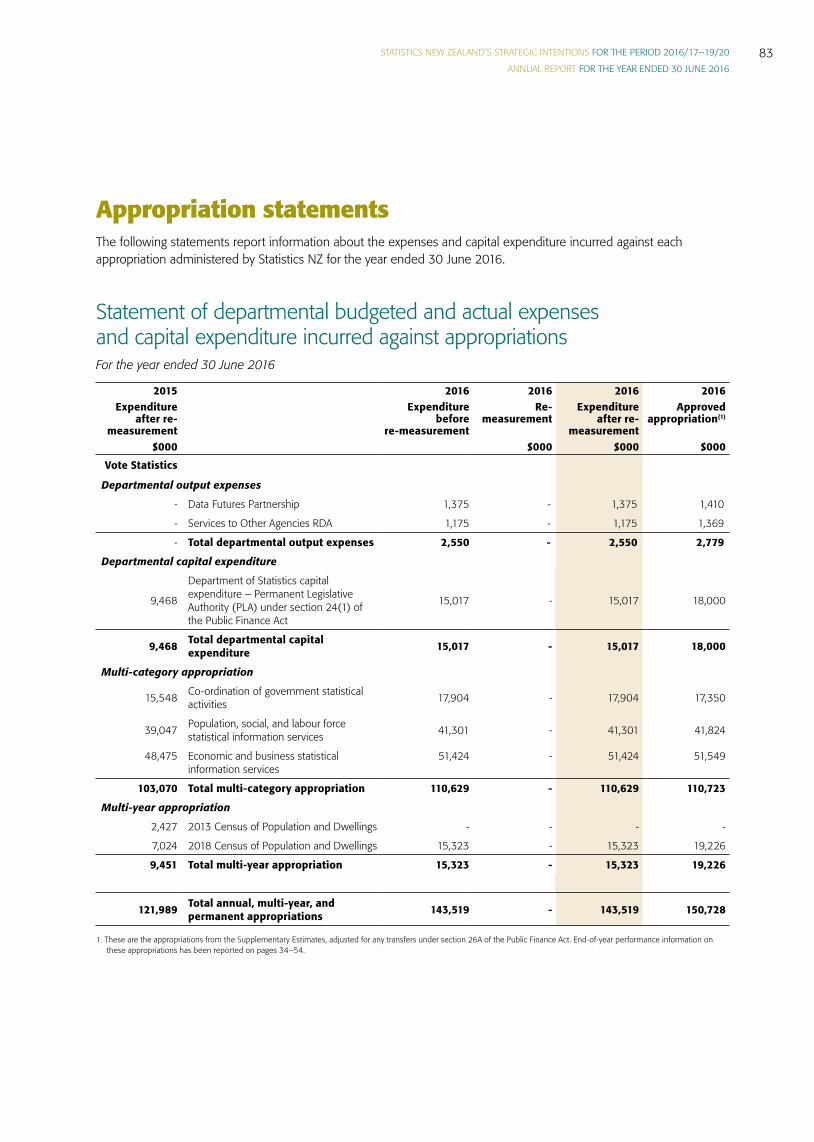
STATISTICS NEW ZEALAND’S STRATEGIC INTENTIONS FOR THE PERIOD 2016/17–19/20
ANNUAL REPORT FOR THE YEAR ENDED 30 JUNE 201683
Appropriation statementsThe following statements report information about the expenses and capital expenditure incurred against each appropriation administered by Statistics NZ for the year ended 30 June 2016.
Statement of departmental budgeted and actual expenses and capital expenditure incurred against appropriationsFor the year ended 30 June 2016
2015 2016 2016 2016 2016 Expenditure
after re-measurement
Expenditure before
re-measurement
Re-measurement
Expenditure after re-
measurement
Approved appropriation(1)
$000 $000 $000 $000Vote Statistics
Departmental output expenses
- Data Futures Partnership 1,375 - 1,375 1,410
- Services to Other Agencies RDA 1,175 - 1,175 1,369
- Total departmental output expenses 2,550 - 2,550 2,779
Departmental capital expenditure
9,468
Department of Statistics capital expenditure – Permanent Legislative Authority (PLA) under section 24(1) of the Public Finance Act
15,017 - 15,017 18,000
9,468 Total departmental capital expenditure 15,017 - 15,017 18,000
Multi-category appropriation
15,548 Co-ordination of government statistical activities 17,904 - 17,904 17,350
39,047 Population, social, and labour force statistical information services 41,301 - 41,301 41,824
48,475 Economic and business statistical information services
51,424 - 51,424 51,549
103,070 Total multi-category appropriation 110,629 - 110,629 110,723
Multi-year appropriation
2,427 2013 Census of Population and Dwellings - - - -
7,024 2018 Census of Population and Dwellings 15,323 - 15,323 19,226
9,451 Total multi-year appropriation 15,323 - 15,323 19,226
121,989 Total annual, multi-year, and permanent appropriations 143,519 - 143,519 150,728
1. These are the appropriations from the Supplementary Estimates, adjusted for any transfers under section 26A of the Public Finance Act. End-of-year performance information on these appropriations has been reported on pages 34–54.
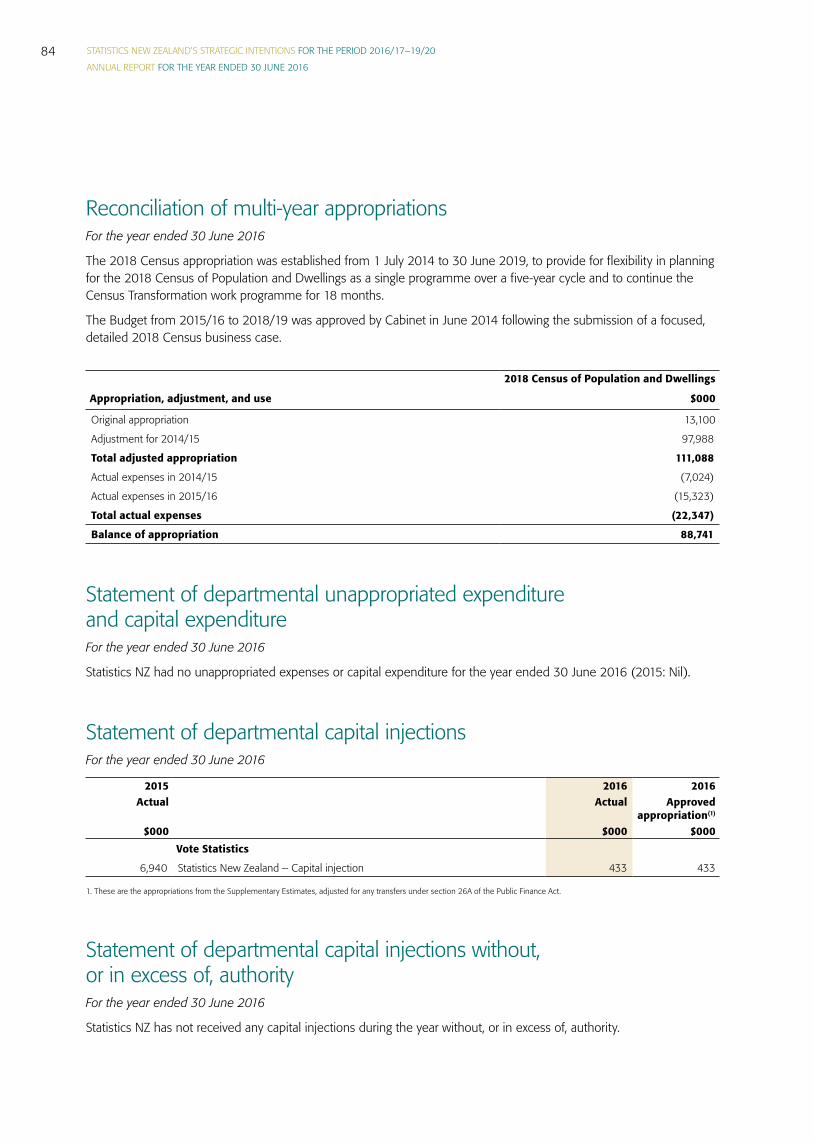
STATISTICS NEW ZEALAND’S STRATEGIC INTENTIONS FOR THE PERIOD 2016/17–19/20
ANNUAL REPORT FOR THE YEAR ENDED 30 JUNE 201684
Reconciliation of multi-year appropriations For the year ended 30 June 2016
The 2018 Census appropriation was established from 1 July 2014 to 30 June 2019, to provide for flexibility in planning for the 2018 Census of Population and Dwellings as a single programme over a five-year cycle and to continue the Census Transformation work programme for 18 months.
The Budget from 2015/16 to 2018/19 was approved by Cabinet in June 2014 following the submission of a focused, detailed 2018 Census business case.
2018 Census of Population and Dwellings
Appropriation, adjustment, and use $000
Original appropriation 13,100
Adjustment for 2014/15 97,988
Total adjusted appropriation 111,088
Actual expenses in 2014/15 (7,024)
Actual expenses in 2015/16 (15,323)
Total actual expenses (22,347)
Balance of appropriation 88,741
Statement of departmental unappropriated expenditure and capital expenditureFor the year ended 30 June 2016
Statistics NZ had no unappropriated expenses or capital expenditure for the year ended 30 June 2016 (2015: Nil).
Statement of departmental capital injectionsFor the year ended 30 June 2016
2015 2016 2016 Actual Actual Approved
appropriation(1)
$000 $000 $000Vote Statistics
6,940 Statistics New Zealand – Capital injection 433 433
1. These are the appropriations from the Supplementary Estimates, adjusted for any transfers under section 26A of the Public Finance Act.
Statement of departmental capital injections without, or in excess of, authority For the year ended 30 June 2016
Statistics NZ has not received any capital injections during the year without, or in excess of, authority.

STATISTICS NEW ZEALAND’S STRATEGIC INTENTIONS FOR THE PERIOD 2016/17–19/20
ANNUAL REPORT FOR THE YEAR ENDED 30 JUNE 201685
Statements of revenue and output expenses The overarching purpose of the official statistics multi-category appropriation is to ensure the production and availability of the highest priority official statistical information to support decision-making.
This appropriation is intended to achieve the outcome of creating an informed society through official statistics. It comprises the following output categories:
• Coordination of government statistical activities • Population, social, and labour force statistical information services • Economic and business statistical information services
Coordination of government statistical activitiesThe scope of this output category is limited to leadership of the OSS, including liaison with OSS partners, provision of ministerial services, statistical advice, and the operation of access channels.
For the year ended 30 June 2016
2015 2016 2016
Actual Actual Approvedappropriation(1)
$000 $000 $000
15,499 Revenue Crown 18,482 16,190
986 Other revenue 315 1,160
16,485 Total operating revenue 18,797 17,350
15,548 Total output expenditure 17,905 17,350
937 Net operating surplus/(deficit) 892 -
1. These are the appropriations from the Supplementary Estimates, adjusted for any transfers under section 26A of the Public Finance Act. End-year performance information on the appropriation has been reported on pages 39–41, 46.
Population, social, and labour force statistical information servicesThe scope of this output category is limited to delivery of statistical information services relating to the population, environment, household economics, social conditions, and the labour force.
For the year ended 30 June 2016
2015 2016 2016
Actual Actual Approvedappropriation(1)
$000 $000 $000
37,802 Revenue Crown 39,174 38,881
1,844 Other revenue 941 2,943
39,646 Total operating revenue 40,115 41,824
39,047 Total output expenditure 41,301 41,824
599 Net operating surplus/(deficit) (1,186) -
1. These are the appropriations from the Supplementary Estimates, adjusted for any transfers under section 26A of the Public Finance Act. End-year performance information on the appropriation has been reported on pages 39–41.
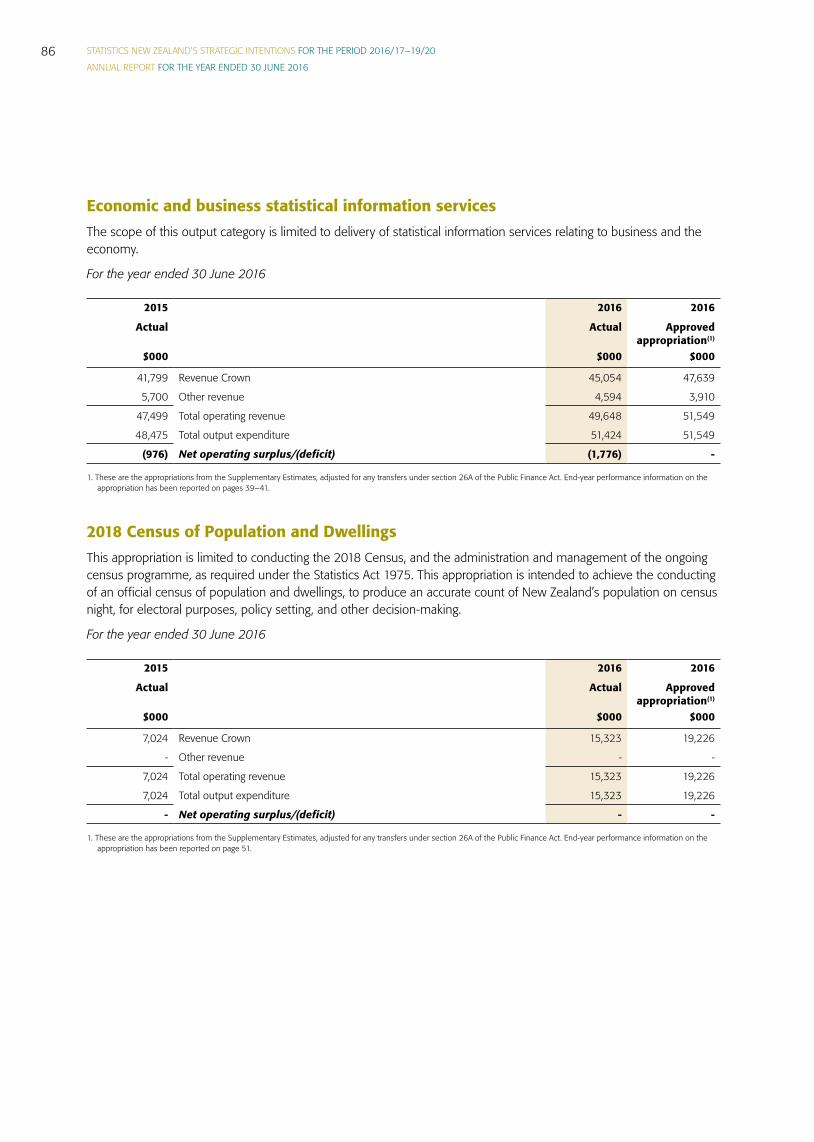
STATISTICS NEW ZEALAND’S STRATEGIC INTENTIONS FOR THE PERIOD 2016/17–19/20
ANNUAL REPORT FOR THE YEAR ENDED 30 JUNE 201686
Economic and business statistical information servicesThe scope of this output category is limited to delivery of statistical information services relating to business and the economy.
For the year ended 30 June 2016
2015 2016 2016
Actual Actual Approvedappropriation(1)
$000 $000 $000
41,799 Revenue Crown 45,054 47,639
5,700 Other revenue 4,594 3,910
47,499 Total operating revenue 49,648 51,549
48,475 Total output expenditure 51,424 51,549
(976) Net operating surplus/(deficit) (1,776) -
1. These are the appropriations from the Supplementary Estimates, adjusted for any transfers under section 26A of the Public Finance Act. End-year performance information on the appropriation has been reported on pages 39–41.
2018 Census of Population and DwellingsThis appropriation is limited to conducting the 2018 Census, and the administration and management of the ongoing census programme, as required under the Statistics Act 1975. This appropriation is intended to achieve the conducting of an official census of population and dwellings, to produce an accurate count of New Zealand’s population on census night, for electoral purposes, policy setting, and other decision-making.
For the year ended 30 June 2016
2015 2016 2016
Actual Actual Approvedappropriation(1)
$000 $000 $000
7,024 Revenue Crown 15,323 19,226
- Other revenue - -
7,024 Total operating revenue 15,323 19,226
7,024 Total output expenditure 15,323 19,226
- Net operating surplus/(deficit) - -
1. These are the appropriations from the Supplementary Estimates, adjusted for any transfers under section 26A of the Public Finance Act. End-year performance information on the appropriation has been reported on page 51.
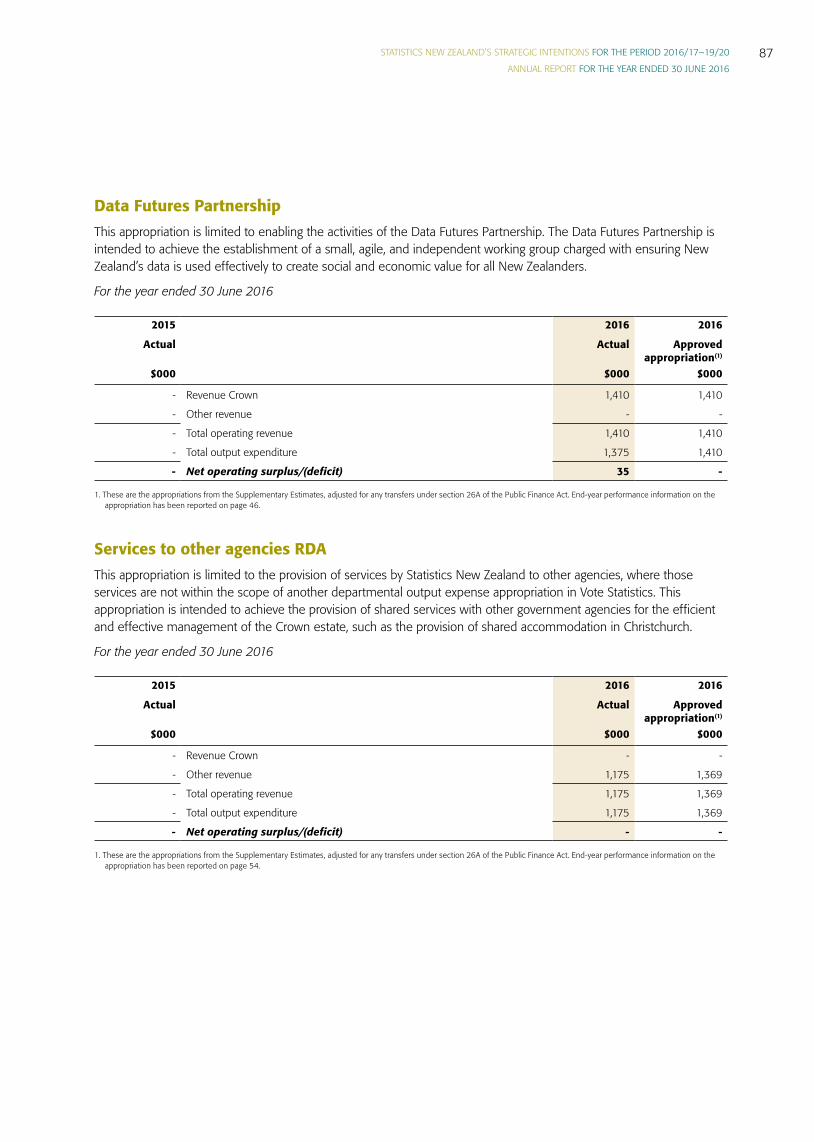
STATISTICS NEW ZEALAND’S STRATEGIC INTENTIONS FOR THE PERIOD 2016/17–19/20
ANNUAL REPORT FOR THE YEAR ENDED 30 JUNE 201687
Data Futures PartnershipThis appropriation is limited to enabling the activities of the Data Futures Partnership. The Data Futures Partnership is intended to achieve the establishment of a small, agile, and independent working group charged with ensuring New Zealand’s data is used effectively to create social and economic value for all New Zealanders.
For the year ended 30 June 2016
2015 2016 2016
Actual Actual Approvedappropriation(1)
$000 $000 $000
- Revenue Crown 1,410 1,410
- Other revenue - -
- Total operating revenue 1,410 1,410
- Total output expenditure 1,375 1,410
- Net operating surplus/(deficit) 35 -
1. These are the appropriations from the Supplementary Estimates, adjusted for any transfers under section 26A of the Public Finance Act. End-year performance information on the appropriation has been reported on page 46.
Services to other agencies RDAThis appropriation is limited to the provision of services by Statistics New Zealand to other agencies, where those services are not within the scope of another departmental output expense appropriation in Vote Statistics. This appropriation is intended to achieve the provision of shared services with other government agencies for the efficient and effective management of the Crown estate, such as the provision of shared accommodation in Christchurch.
For the year ended 30 June 2016
2015 2016 2016
Actual Actual Approvedappropriation(1)
$000 $000 $000
- Revenue Crown - -
- Other revenue 1,175 1,369
- Total operating revenue 1,175 1,369
- Total output expenditure 1,175 1,369
- Net operating surplus/(deficit) - -
1. These are the appropriations from the Supplementary Estimates, adjusted for any transfers under section 26A of the Public Finance Act. End-year performance information on the appropriation has been reported on page 54.

STATISTICS NEW ZEALAND’S STRATEGIC INTENTIONS FOR THE PERIOD 2016/17–19/20
ANNUAL REPORT FOR THE YEAR ENDED 30 JUNE 201688


![Primer [consultative politics]](https://static.fdocuments.in/doc/165x107/5551bf22b4c905ca7f8b50c9/primer-consultative-politics.jpg)