Annual Report - Home | LEO Pharma This Annual Report is an extract of the Company’s statutory...
39
— we help people achieve healthy skin LEO Pharma A/S Annual Report 2016
Transcript of Annual Report - Home | LEO Pharma This Annual Report is an extract of the Company’s statutory...
— we help peopleachieve healthy skin
LEO Pharma A/S
Annual Report 2016

This Annual Report is an extract of the Company’s statutory annual report pursuant to Section 149 of the Danish Financial Statements Act. The statutory annual report will be submitted to the Danish Business Authority, and a copy may be obtained via the Authority’s website www.cvr.dk.
32
LEO mission
— we help people achieve healthy skinLEO vision
— we are the preferred dermatology care partner improving people’s lives around the world
Contents
OUR PERFORMANCE
CEO letter: A defining year . . . . . . . . . . . . . . . . . . . . . . . . . . . . . . . . . . . . . . . . . . . . . . . . . . . . . . . . . . . . . . . . . . . . . . . . . . . . . . . . . . . . . . . . . . . . . . . . . . . . . . . . . . . . . . . . . . . . . . . . . . . . . . . . . . . . . . . . . . . . . . . . . . . . 4 Key figures and events in 2016 . . . . . . . . . . . . . . . . . . . . . . . . . . . . . . . . . . . . . . . . . . . . . . . . . . . . . . . . . . . . . . . . . . . . . . . . . . . . . . . . . . . . . . . . . . . . . . . . . . . . . . . . . . . . . . . . . . . . . . . . . . . . . . . . . . . . . . . . . . . . 6 Financial review and outlook . . . . . . . . . . . . . . . . . . . . . . . . . . . . . . . . . . . . . . . . . . . . . . . . . . . . . . . . . . . . . . . . . . . . . . . . . . . . . . . . . . . . . . . . . . . . . . . . . . . . . . . . . . . . . . . . . . . . . . . . . . . . . . . . . . . . . . . . . . . . . . . 8 Basis for future earnings . . . . . . . . . . . . . . . . . . . . . . . . . . . . . . . . . . . . . . . . . . . . . . . . . . . . . . . . . . . . . . . . . . . . . . . . . . . . . . . . . . . . . . . . . . . . . . . . . . . . . . . . . . . . . . . . . . . . . . . . . . . . . . . . . . . . . . . . . . . . . . . . . . . . .12 Special business and financial risks . . . . . . . . . . . . . . . . . . . . . . . . . . . . . . . . . . . . . . . . . . . . . . . . . . . . . . . . . . . . . . . . . . . . . . . . . . . . . . . . . . . . . . . . . . . . . . . . . . . . . . . . . . . . . . . . . . . . . . . . . . . . . . . . . .14
OUR BUSINESS
Our strategy . . . . . . . . . . . . . . . . . . . . . . . . . . . . . . . . . . . . . . . . . . . . . . . . . . . . . . . . . . . . . . . . . . . . . . . . . . . . . . . . . . . . . . . . . . . . . . . . . . . . . . . . . . . . . . . . . . . . . . . . . . . . . . . . . . . . . . . . . . . . . . . . . . . . . . . . . . . . . . . . . . . . . . . . . .16 Living with a skin disease . . . . . . . . . . . . . . . . . . . . . . . . . . . . . . . . . . . . . . . . . . . . . . . . . . . . . . . . . . . . . . . . . . . . . . . . . . . . . . . . . . . . . . . . . . . . . . . . . . . . . . . . . . . . . . . . . . . . . . . . . . . . . . . . . . . . . . . . . . . . . . . . . . .18 Innovating for healthy skin . . . . . . . . . . . . . . . . . . . . . . . . . . . . . . . . . . . . . . . . . . . . . . . . . . . . . . . . . . . . . . . . . . . . . . . . . . . . . . . . . . . . . . . . . . . . . . . . . . . . . . . . . . . . . . . . . . . . . . . . . . . . . . . . . . . . . . . . . . . . . . . . .20 Our innovation ecosystem . . . . . . . . . . . . . . . . . . . . . . . . . . . . . . . . . . . . . . . . . . . . . . . . . . . . . . . . . . . . . . . . . . . . . . . . . . . . . . . . . . . . . . . . . . . . . . . . . . . . . . . . . . . . . . . . . . . . . . . . . . . . . . . . . . . . . . . . . . . . . . . . . .22 Convenience, please . . . . . . . . . . . . . . . . . . . . . . . . . . . . . . . . . . . . . . . . . . . . . . . . . . . . . . . . . . . . . . . . . . . . . . . . . . . . . . . . . . . . . . . . . . . . . . . . . . . . . . . . . . . . . . . . . . . . . . . . . . . . . . . . . . . . . . . . . . . . . . . . . . . . . . . . . . .24
GOVERNANCE AND COMPLIANCE
Ownership structure . . . . . . . . . . . . . . . . . . . . . . . . . . . . . . . . . . . . . . . . . . . . . . . . . . . . . . . . . . . . . . . . . . . . . . . . . . . . . . . . . . . . . . . . . . . . . . . . . . . . . . . . . . . . . . . . . . . . . . . . . . . . . . . . . . . . . . . . . . . . . . . . . . . . . . . . . . . .26 Remuneration committee . . . . . . . . . . . . . . . . . . . . . . . . . . . . . . . . . . . . . . . . . . . . . . . . . . . . . . . . . . . . . . . . . . . . . . . . . . . . . . . . . . . . . . . . . . . . . . . . . . . . . . . . . . . . . . . . . . . . . . . . . . . . . . . . . . . . . . . . . . . . . . . . . . .26 Corporate social responsibility . . . . . . . . . . . . . . . . . . . . . . . . . . . . . . . . . . . . . . . . . . . . . . . . . . . . . . . . . . . . . . . . . . . . . . . . . . . . . . . . . . . . . . . . . . . . . . . . . . . . . . . . . . . . . . . . . . . . . . . . . . . . . . . . . . . . . . . . . .26
FINANCIAL STATEMENTS
Consolidated Financial Statements . . . . . . . . . . . . . . . . . . . . . . . . . . . . . . . . . . . . . . . . . . . . . . . . . . . . . . . . . . . . . . . . . . . . . . . . . . . . . . . . . . . . . . . . . . . . . . . . . . . . . . . . . . . . . . . . . . . . . . . . . . . . . . . . . . .28 Notes – Group . . . . . . . . . . . . . . . . . . . . . . . . . . . . . . . . . . . . . . . . . . . . . . . . . . . . . . . . . . . . . . . . . . . . . . . . . . . . . . . . . . . . . . . . . . . . . . . . . . . . . . . . . . . . . . . . . . . . . . . . . . . . . . . . . . . . . . . . . . . . . . . . . . . . . . . . . . . . . . . . . . . . . . .36 Financial Statements – Parent Company . . . . . . . . . . . . . . . . . . . . . . . . . . . . . . . . . . . . . . . . . . . . . . . . . . . . . . . . . . . . . . . . . . . . . . . . . . . . . . . . . . . . . . . . . . . . . . . . . . . . . . . . . . . . . . . . . . . . . . . . . .54 Notes – Parent Company . . . . . . . . . . . . . . . . . . . . . . . . . . . . . . . . . . . . . . . . . . . . . . . . . . . . . . . . . . . . . . . . . . . . . . . . . . . . . . . . . . . . . . . . . . . . . . . . . . . . . . . . . . . . . . . . . . . . . . . . . . . . . . . . . . . . . . . . . . . . . . . . . . . .62 Management’s statement . . . . . . . . . . . . . . . . . . . . . . . . . . . . . . . . . . . . . . . . . . . . . . . . . . . . . . . . . . . . . . . . . . . . . . . . . . . . . . . . . . . . . . . . . . . . . . . . . . . . . . . . . . . . . . . . . . . . . . . . . . . . . . . . . . . . . . . . . . . . . . . . . .71 Independent Auditor’s Report . . . . . . . . . . . . . . . . . . . . . . . . . . . . . . . . . . . . . . . . . . . . . . . . . . . . . . . . . . . . . . . . . . . . . . . . . . . . . . . . . . . . . . . . . . . . . . . . . . . . . . . . . . . . . . . . . . . . . . . . . . . . . . . . . . . . . . . . . . . .72 Company information . . . . . . . . . . . . . . . . . . . . . . . . . . . . . . . . . . . . . . . . . . . . . . . . . . . . . . . . . . . . . . . . . . . . . . . . . . . . . . . . . . . . . . . . . . . . . . . . . . . . . . . . . . . . . . . . . . . . . . . . . . . . . . . . . . . . . . . . . . . . . . . . . . . . . . . . .75
The Management's Review, as defined by the Danish Financial Statements Act, is found on pages 1-27.
Presented and adopted at the Annual General Meeting of the Company on 30 March 2017.
CVR no. 56 75 95 14
3
Contents
The images used in this annual report are our corporate brand images of ordinary people in everyday situations
showing healthy skin – and as our mission states: “We help people achieve healthy skin”

54
Our performance
4
Our performance
CEO letter: A defining year
In 2016, LEO Pharma invested significantly in expanding current and future treatments, delivering better care for more people and securing LEO Pharma a unique posi-tion to help people with skin diseases. We helped 73 million people, which is a big step towards our aspira-tion to reach more than 100 million people by 2020.
In China, Russia and other markets, we doubled the number of people we help by expanding our offering to include Protopic® for eczema, Locoid® for eczema and psoriasis, Locobase® for skin care and Zineryt® for acne. In the US and Europe, we introduced Enstilar®, which provides people with psoriasis with the first-ever fixed-dose combination spray foam.
LEO Pharma’s performance in 2016 surpassed our ex-pectations. Our top line grew significantly by 17% to a record high of DKK 9,863 million. This is as a result of expanding our portfolio with new products, such as Enstilar® and Protopic®, as well as the strong perfor-mance of innohep®. Our operating profit before depre-ciation, amortisation and impairment losses (EBITDA) totalled DKK 1,346 million, while our operating profit (EBIT) totalled DKK 341 million. This is as a result of increased amortisation due to the planned significant investments in our future.
Expanding our treatment offeringWe entered biologics in dermatology and established a strong pipeline in this area during the year. The most ad-vanced projects are brodalumab for psoriasis and tralokinumab for atopic dermatitis. For earlier-stage projects, we initiated a partnership with MorphoSys to discover and develop therapeutic antibodies.
To help people with skin conditions, we look at all aspects of their everyday life. At the LEO Innovation Lab, we are successfully building and rolling out digital technologies and platforms that help patients and physicians in completely new ways. Moreover, we established our LEO Science & Tech Hub in Boston, US, which will support us in identifying future opportunities for skin solutions.
All of this means that LEO Pharma has a unique and broad treatment offering for helping people achieve healthy skin – meeting the many different needs of
people with skin diseases, whether their condition is mild, moderate or severe or whether they are looking for skin care products.
We continued to work hard on developing our organisa-tion and capabilities. We need new capabilities to develop our portfolio and we need to continue to increase the effi-ciency of our global operations to make sure that LEO Pharma stays competitive and healthy in the long term. Our efficiency projects led us to say goodbye to some em-ployees in 2016, especially employees working in support and commercial functions in Europe. Decisions about lay-offs are always tough, but I am convinced that we are do-ing the right thing for patients and for the Company.
Reducing the burden of diseaseOne quarter of the world’s population suffers from a skin disease, yet their needs are often overlooked. Only a fraction of people have access to optimal treatment, and many struggle to follow their treatment regime. Whenever I meet with patients, I am deeply touched by their stories about how their skin disease impacts their lives. For example, many psoriasis patients tell me that they never dare to go to a public swimming pool be-cause people mistakenly believe psoriasis is conta-gious. As a result, the physical burden of their psoriasis is compounded by the social stigma.
Therefore, I was very pleased to see that the WHO has issued a global report on psoriasis in order to raise awareness about this serious global problem that af-fects more than 125 million people worldwide.
LEO Pharma’s ambition is to help even more people achieve healthy skin and, as a foundation-owned company, we have a responsibility to invest in helping more patients. All 5,000 employees at LEO Pharma worldwide will continue to work towards this goal.
I am happy to say that we are in a stronger position than ever before to deliver on this promise.
Gitte P. AaboPresident & CEO, LEO Pharma
“We helped 73 million people
in 2016”

Key figures
Key events
76
Our performance
6
Our performance
Key figures and events in 2016
(DKK million) 2016 2015* 2014† 2013† 2012†
Income statement
Revenue 9,863 8,457 7,973 7,842 8,216
Operating profit 341 763 762 675 -179
Net financials 766 178 1,288 1,000 1,049
Profit before tax 1,104 928 2,050 1,675 870
Net profit for the year 743 713 1,544 1,175 663
Balance sheet
Net investment in:
Intangible assets 6,115 244 160 225 186
Property, plant and equipment 297 193 121 235 343
Fixed assets 19,672 15,093 17,357 22,681 24,695
Current assets 17,140 16,989 14,270 10,454 4,737
Total assets 36,812 32,082 31,627 33,135 29,432
Equity 25,212 24,751 24,523 23,136 21,990
Ratios
Operating profit margin 3% 9% 10% 9% -2%
Return on assets 1% 2% 2% 2% -1%
Return on equity 4% 4% 9% 7% 4%
Solvency ratio 68% 77% 78% 70% 75%
Employees
Average number of employees 5,170 4,813 4,712 4,733 4,783
* These figures have been restated to reflect adoption of the new Danish Financial Statements Act. For a description of the effect of the transition to the
amended Danish Financial Statements Act, please refer to note 23 in the Consolidated Financial Statements.
† In accordance with section 101 of the Danish Financial Statements Act, the Company has chosen not to restate the comparative figures
for 2014, 2013 and 2012.
Enstilar®, LEO Pharma’s latest topical treatment for psoriasis, was launched in January in the US as the first market and in May in the EU. Enstilar® is the first fixed-combination foam spray for the treatment of plaque psoriasis. The product supplements LEO Pharma’s existing topical psoriasis portfolio consisting of Daivobet® gel, Daivobet® gel Applicator, Daivobet® Ointment, Xamiol® gel and the Daivonex® range.
In July, LEO Pharma entered into a strategic partnership with AstraZeneca. LEO Pharma acquired the global licence for tralokinumab for skin diseases and the exclusive licence for brodalumab in Europe, strengthening the Company’s presence in biologics within derma-tology.
In November, LEO Pharma entered into a strategic partnership with MorphoSys relating to thera-peutic antibodies. The alliance strengthens LEO Pharma’s presence in biologics within derma-tology, marking the third partnership within therapeutic antibodies, following the partner-ships with AstraZeneca and arGEN-X.
In April, LEO Pharma successfully transferred the global dermatology portfolio acquired from Astellas, comprising prescription and over-the-counter products, including established and strong brands, such as Protopic® for eczema, Locoid® for eczema and psoriasis, Locobase® for skin care and Zineryt® for acne. The portfolio is expected to enable LEO Pharma to reach more than 25 million additional people in 2017.
In September, LEO Pharma expanded its part-nering presence with the establishment of the LEO Science & Tech Hub in Boston, US. The Hub aims to catalyse early-stage collaborations in science and technology in order to advance the treatment of skin diseases.
Throughout the year, the LEO Innovation Lab launched an array of new solutions for people with skin diseases. The new solutions – includ-ing online communities, apps and information portals – all aim to empower people with skin conditions to manage their disease. The LEO Innovation Lab also expanded its presence in 2016 by establishing a satellite in the US.

98
Our performance Our performance
REVENUELEO Pharma’s revenue in 2016 amounted to DKK 9,863 million. This is an increase of DKK 1,406 million or 19% in local currencies compared to 2015, which is above expectations for 2016.
Revenue by therapeutic areaSales within our eczema/skin infection solutions grew by DKK 1,341 million or 97% in local currencies. This was the main driver behind the total net sales growth. The growth in eczema/skin infection solutions was primarily related to the acquisition of the global der-matology portfolio from Astellas, which contributed an increase of 88% in local currencies for nine months of sales and strengthened LEO Pharma’s business world-wide. This is 13% above expectations, mainly due to strong sales of Protopic® in the US and Europe.
Financial review and outlook
Revenue by therapeutic area – delivering treatments to more people
Region EUROPE+
Region INTERNATIONAL
Region US
Countries where our solutions are not available
Global presence – offering treatments in more than 100 countries
Region EUROPE+DKK 5,497 million
Region EUROPE+DKK 5,852 million (+13%*)
Region INTERNATIONALDKK 2,786 million (+39%*)
Region USDKK 1,225 million (+16%*)
Excluding sales from the product portfolio acquired from Astellas, revenue increased by 9% in local cur-rencies compared to 2015.
The psoriasis business grew by 1% in local currencies compared to 2015. LEO Pharma saw strong Daivobet® Ointment sales in Japan, up by 40% in local currencies. In addition, our sales within the psoriasis area avoided the negative impact of generic competition due to the positive outcome of the EU ruling on the Daivobet® Ointment patent. The launch of Enstilar® in the US in January 2016 was another growth driver, contribut-ing a 5% increase in local currencies. The sales growth of Enstilar® was partly offset by a decline in Taclonex® Topical Suspension sales of 21% in local currencies. In addition, Enstilar® was launched in Germany and the UK in the second half of 2016.
Revenue by region – expanding our global reach
Region EUROPE+
Region US
Region INTERNATIONAL
10,000
9,000
8,000
7,000
6,000
5,000
4,000
3,000
2,000
1,000
02015 2016 Year
Total 2016: DKK 9,863 million (+19%*)
Sales of Picato®, LEO Pharma’s actinic keratosis treat-ment solution, declined by 11% in local currencies compared to 2015. Picato® sales are declining in the US following a change in the product label and are flat in most European markets apart from France and Ger-many, where sales are growing. The level of invest-ment in Picato® has been reduced accordingly.
Thrombosis sales grew by DKK 255 million or 7% in local currencies. This growth was driven by innohep® sales, which grew by 9% in local currencies. This strong growth came from across Europe, where LEO Pharma continues to help more people with cancer- associated thrombosis.
Revenue by regionRegion EUROPE+ grew by DKK 355 million for net sales or 13% in local currencies. The majority of the growth was driven by the global dermatology portfolio ac-quired from Astellas. In addition, EUROPE+ showed organic growth of 1% during 2016, which is an im-provement on the 0.5% organic growth seen in 2015. This organic growth was mainly driven by the strong performance of our European thrombosis business (7% growth) and growth of 1% in the Fucidin® range. Psoriasis sales were flat compared to 2015. The launches of Enstilar® in the UK, Ireland, Germany and Denmark were successful. Generic competition for
Eczema/skin infections DKK 2,694 million (+97%*)
Key products:Protopic® ointmentLocoid® cream, ointment, lipocream, scalp lotion, creloLocobase® creamFucicort® cream, lipid creamFucidin® cream, ointment, suspension, tablets, gauzeFucidin® H cream
ThrombosisDKK 2,623 million (+7%*)
Key products:innohep® low-molecular-weight
heparin injection and vials
Other DKK 872 million (+3%*)
Psoriasis DKK 3,311 million (+1%*)
Key products: Enstilar® spray foam
Daivobet® gel, ointment, gel Applicator Xamiol® gel
Daivonex® ointment, cream, solution
Actinic keratosisDKK 363 million (-11%*)
Key products:Picato® gel
73 million patients (+32%)
DKK 9,863 million (+19%*)
2016
Region INTERNATIONALDKK 1,860 million
Region USDKK 1,100 million
* The development in % is presented in local currencies.
* The development in % is presented in local currencies.
DKK million

1110
Our performance Our performance
LEO Pharma's revenue increased to DKK 9,863 million in 2016
2017 outlook In 2017, LEO Pharma expects revenue to be DKK 9.5-10 billion, primarily driven by the full-year im-pact of the global dermatology portfolio acquired from Astellas. The Company’s result will be chal-lenged by continued pressure for price reduc-tions and the risk of increased generic competi-tion for Daivobet® Ointment in Europe.
Operating profit for the financial year 2017 is expected to be positively impacted by both the realised cost savings from organisational restructuring and benefits from efficiency projects carried out during 2016. Operating profit for 2017 is expected to be DKK 525-675 million.
In 2017, LEO Pharma will continue to explore new ways to improve the lives of people with skin diseases, through the search for new business
development and innovation opportunities in line with the Company’s mission.
ELEMENTS OF UNCERTAINTY LEO Pharma focuses on proactively aligning and developing its organisation to address changes in the marketplace and to ensure that resources are invested where they matter the most: help-ing patients.
Financial expectations are subject to uncertain-ties and assumptions. This may cause actual re-sults to differ from expectations. The factors that may affect future results include delayed or un-successful development projects, market-driven price reductions for products, exposure to prod-uct liability and other lawsuits, changes in reim-bursement rules and governmental laws.
Daivobet® and price cuts for the Daivobet® gel Applica-tor are counterbalancing the growth in Region EUROPE+.
Region US grew by DKK 125 million or 16% in local currencies, driven by royalties from Protopic® and the launch of Enstilar®. The overall growth in the region was impacted by a decline in Taclonex® Topical Sus-pension sales, due to lower demand. The overall de-velopment in the psoriasis business in the US was neg-atively impacted by a decline in Dovonex® cream, due to a third generic entering the market.
Region INTERNATIONAL grew by DKK 926 million in to-tal or 39% in local currencies, and by 10% excluding the global dermatology portfolio acquired from Astellas. The successful integration of the new portfolio was a key contributor to the strong financial performance of Region INTERNATIONAL, particularly in the Chinese and Russian markets. Organic growth in the region was pri-marily driven by Japan and LAMEA. Net sales in Japan grew by approximately 29%, despite the launch of a product approved for the same indication as Dovobet®. In LAMEA, organic growth of 11% was driven by the Fucidin® portfolio, which saw net sales growth in excess of 23% in local currencies compared to 2015.
OPERATING PROFIT Operating profit before depreciation, amortisation and impairment losses increased from DKK 1,209 million to DKK 1,346 million. Operating profit decreased from DKK 763 million in 2015 to DKK 341 million in 2016. The operating profit is above expectations for 2016.
The decrease in operating profit was predominantly due to higher administrative as well as sales and distribution costs, which were DKK 1,171 million higher than in 2015. The acquisition of the global dermatology portfolio from Astellas led to increased costs, including higher amortisation. Furthermore, the increase in costs was driven by one-off organisational restruc turing costs due to a focus on efficiency projects which, among other things, led to the announcement that 400 positions will be discontinued.
EMPLOYEESThanks to its global team of people from different cul-tures and backgrounds, LEO Pharma is a workplace where innovation thrives and people grow. It is LEO Pharma’s 2020 aspiration for nine out of 10 employ-ees to recommend LEO Pharma as a great place to work (up from eight out of 10 in the most recent em-ployee survey).
In 2016, LEO Pharma continued to strengthen its capabilities through a team performance programme for its leaders and the introduction of a global competency framework.
To facilitate the Company’s entry into biologics, LEO Pharma strengthened its leadership team and announced plans for a reorganisation at the end of October. This will help safeguard investments in upcoming products and bring in new competencies, while continuously optimising operations and reducing costs where possible. As a result, approximately 400 positions will cease to exist. At the same time, LEO Pharma plans to create up to 200 new positions supporting the new products.
FINANCIAL ITEMSIn 2016, net financial income increased by DKK 588 million to DKK 766 million. DKK 550 million of the in-crease was due to the improved performance of the investment portfolios. The net financial result was negatively impacted by currency exchange losses of DKK 48 million (2015: DKK 223 million) and one-off items, including write-downs of investments, totalling DKK 40 million.
The market value of LEO Pharma’s financial securities amounted to DKK 10,694 million, of which the held-to-maturity bond portfolio amounted to DKK 10,661 million at 31 December 2016 (2015: DKK 11,576 million). The decrease in value was predominantly due to expired bonds being used to repay loans during the year. LEO Pharma’s listed investments had a market value of DKK 12,268 million at 31 December 2016
(2015: DKK 11,462 million). The portfolio includes low-volatility stocks, covered bonds and investment-grade corporate bonds.
SATISFACTORY EARNINGSLEO Pharma generated a net profit of DKK 743 million in 2016, compared to DKK 713 million in 2015.
Net investments in intangible assets amounted to DKK 6,115 million in 2016 (2015: DKK 244 million). The investments primarily concerned the strategic acquisitions and partnerships with Astellas and AstraZeneca. Furthermore, LEO Pharma continued to invest in a SAP-based ERP system, resulting in software additions of DKK 321 million.
In 2016, LEO Pharma invested (net) DKK 297 million (2015: DKK 193 million) in the expansion and optimisation of production facilities to ensure capacity for the future growth of LEO Pharma’s solutions and in preparations for the launch of new products.
Operating activities generated a positive cash flow of DKK 3,074 million (2015: DKK 903 million). LEO Pharma achieved a 4% return on equity (2015: 4%) and equity of DKK 25,212 million at 31 December 2016 (2015: DKK 24,751 million). Based on these re-sults, LEO Pharma entered 2017 with a solvency ratio of 68% (2015: 77%).
1312
Our performance
12
Our performance
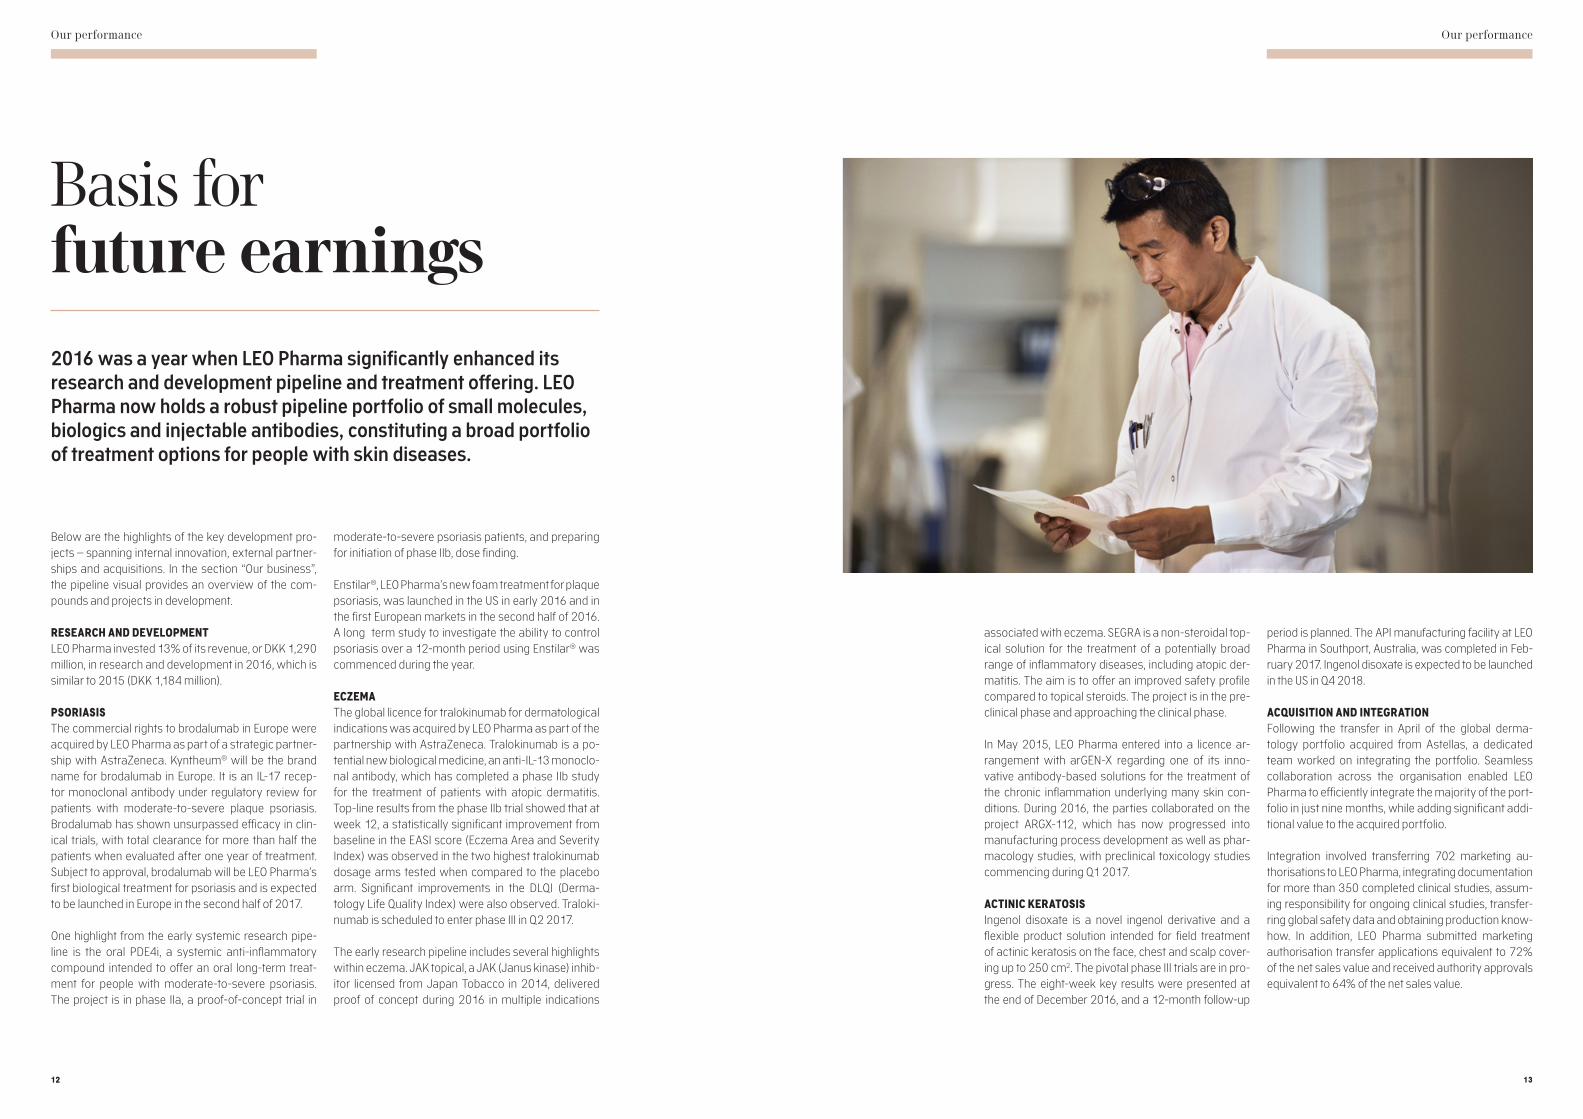
Basis for future earnings
Below are the highlights of the key development pro-jects – spanning internal innovation, external partner-ships and acquisitions. In the section “Our business”, the pipeline visual provides an overview of the com-pounds and projects in development.
RESEARCH AND DEVELOPMENT LEO Pharma invested 13% of its revenue, or DKK 1,290 million, in research and development in 2016, which is similar to 2015 (DKK 1,184 million).
PSORIASISThe commercial rights to brodalumab in Europe were acquired by LEO Pharma as part of a strategic partner-ship with AstraZeneca. Kyntheum® will be the brand name for brodalumab in Europe. It is an IL-17 recep-tor monoclonal antibody under regulatory review for patients with moderate-to-severe plaque psoriasis. Brodalumab has shown unsurpassed efficacy in clin-ical trials, with total clearance for more than half the patients when evaluated after one year of treatment. Subject to approval, brodalumab will be LEO Pharma’s first biological treatment for psoriasis and is expected to be launched in Europe in the second half of 2017.
One highlight from the early systemic research pipe-line is the oral PDE4i, a systemic anti-inflammatory compound intended to offer an oral long-term treat-ment for people with moderate-to-severe psoriasis. The project is in phase IIa, a proof-of-concept trial in
moderate-to-severe psoriasis patients, and preparing for initiation of phase IIb, dose finding.
Enstilar®, LEO Pharma’s new foam treatment for plaque psoriasis, was launched in the US in early 2016 and in the first European markets in the second half of 2016. A long term study to investigate the ability to control psoriasis over a 12-month period using Enstilar® was commenced during the year.
ECZEMAThe global licence for tralokinumab for dermatologi cal indications was acquired by LEO Pharma as part of the partnership with AstraZeneca. Tralokinumab is a po-tential new biological medicine, an anti-IL-13 monoclo-nal antibody, which has completed a phase IIb study for the treatment of patients with atopic dermatitis. Top-line results from the phase IIb trial showed that at week 12, a statistically significant improvement from baseline in the EASI score (Eczema Area and Severity Index) was observed in the two highest tralokinumab dosage arms tested when compared to the placebo arm. Significant improvements in the DLQI (Derma-tology Life Quality Index) were also observed. Traloki-numab is scheduled to enter phase III in Q2 2017.
The early research pipeline includes several highlights within eczema. JAK topical, a JAK (Janus kinase) inhib-itor licensed from Japan Tobacco in 2014, delivered proof of concept during 2016 in multiple indications
associated with eczema. SEGRA is a non-steroidal top-ical solution for the treatment of a potentially broad range of inflammatory diseases, including atopic der-matitis. The aim is to offer an improved safety profile compared to topical steroids. The project is in the pre-clinical phase and approaching the clinical phase.
In May 2015, LEO Pharma entered into a licence ar-rangement with arGEN-X regarding one of its inno-vative antibody-based solutions for the treatment of the chronic inflammation underlying many skin con-ditions. During 2016, the parties collaborated on the project ARGX-112, which has now progressed into manufacturing process development as well as phar-macology studies, with preclinical toxicology studies commencing during Q1 2017.
ACTINIC KERATOSISIngenol disoxate is a novel ingenol derivative and a flexible product solution intended for field treatment of actinic keratosis on the face, chest and scalp cover-ing up to 250 cm2. The pivotal phase III trials are in pro-gress. The eight-week key results were presented at the end of December 2016, and a 12-month follow-up
period is planned. The API manufacturing facility at LEO Pharma in Southport, Australia, was completed in Feb-ruary 2017. Ingenol disoxate is expected to be launched in the US in Q4 2018.
ACQUISITION AND INTEGRATIONFollowing the transfer in April of the global derma-tology portfolio acquired from Astellas, a dedicated team worked on integrating the portfolio. Seamless collabor ation across the organisation enabled LEO Pharma to efficiently integrate the majority of the port-folio in just nine months, while adding significant addi-tional value to the acquired portfolio.
Integration involved transferring 702 marketing au-thorisations to LEO Pharma, integrating documentation for more than 350 completed clinical studies, assum-ing responsibility for ongoing clinical studies, transfer-ring global safety data and obtaining production know-how. In addition, LEO Pharma submitted marketing authorisation transfer applications equivalent to 72% of the net sales value and received authority approvals equivalent to 64% of the net sales value.
2016 was a year when LEO Pharma significantly enhanced its research and development pipeline and treatment offering. LEO Pharma now holds a robust pipeline portfolio of small molecules, biologics and injectable antibodies, constituting a broad portfolio of treatment options for people with skin diseases.

14 15
Our performance
14
Our performance
Special business and financial risksOPERATING RISKSLEO Pharma continually works to ensure a reasonable balance between risk exposure and value creation. Therefore, LEO Pharma regularly enters into long-term agreements for the supply of raw materials and other critical input for the Group’s production.
MARKET RISKS LEO Pharma makes considerable efforts to protect its intellectual property rights at all times, both for new and existing products, and to ensure that we conduct our business without infringing the rights of others.
FOREIGN EXCHANGE RISKS The majority of LEO Pharma's sales are in EUR, USD, GBP, CAD and JPY. Consequently, LEO Pharma’s for-eign exchange risk is most significant in USD, GBP and CAD, as the foreign exchange risk arising from EUR sales is regarded as low due to Denmark's fixed-rate policy towards the EUR.
LEO Pharma does not hedge net investments in foreign affiliates. The Group's hedging is centralised at Parent Company level. Hedging is carried out based on the cash flows generated from realised transactions.
LIQUIDITY RISKS Thanks to its foundation ownership, LEO Pharma is in a unique position to help people with skin diseases. Owned 100% by a private commercial foundation, the LEO Foundation, LEO Pharma is an independent com-pany with no external shareholders. All profits are re-invested in the LEO Group with the aim of continually providing better solutions to patients – so that LEO Pharma can go further in its mission to help people achieve healthy skin.
LEO Pharma has a high solvency ratio and thus has no significant liquidity risks.
INTEREST RATE RISKS Interest rate risks occur in connection with our invest-ments in various asset classes. LEO Pharma invests in low-volatility stocks, real estate, investment-grade corporate bonds and covered bonds, all with high ratings.
The interest rate risk on our hold-to-maturity portfolio of Danish mortgage bonds is partly offset by the interest rate risk of our debt portfolio, as interest rate swaps are used to hedge the interest rate of our debt portfolio.
CREDIT RISKS LEO Pharma’s credit risk consists of two components.The first component is the risk related to payment terms for LEO Pharma’s customers. LEO Pharma has a continued focus on credit assessment, customers’ payment behaviour and dunning procedures in order to mitigate future losses on bad debt.
The second component is the counterparty risk re-lated to LEO Pharma’s banking partners. The coun-terparty risk is estimated to be low, due to the mix of high bank partner ratings and signed Credit Support Annexes.
There are not considered to be any material risks relating to individual customers or business partners.
171616
At any point in time, an estimated one in four people worldwide are living with a skin disease, making skin diseases some of the most prevalent diseases worldwide . Nevertheless, skin diseases continue to receive little attention in global health . As a result, the burden of disease remains high .
LEO Pharma is in a unique position to help peo-ple with skin diseases and is at a strategic turning point in the Company’s more than 100-year history . In 2009, LEO Pharma made dermatology its strat-egic focus and began its growth journey . This led to a new mission to help people achieve healthy skin and a new vision to become the preferred dermatol-ogy care partner, improving people’s lives around the world . Since then, LEO Pharma has established a global presence, demonstrated expertise in skin
diseases such as psoriasis and expanded into new therapeutic areas and markets .
Today, LEO Pharma is recognised for having made significant advances in dermatology and for helping people with skin diseases improve their quality of life .
A high unmet need remains, however . Many people with skin diseases do not have access to treatment . Of those who do have access to medication, many fail to adhere to their treatment regime . Despite an in-crease in disease awareness, far too many people ex-perience the stigmatisation and social isolation often associated with a skin disease . Patients worldwide are looking for better treatment and support, so that they can take control of their disease and enjoy a bet-ter quality of life .
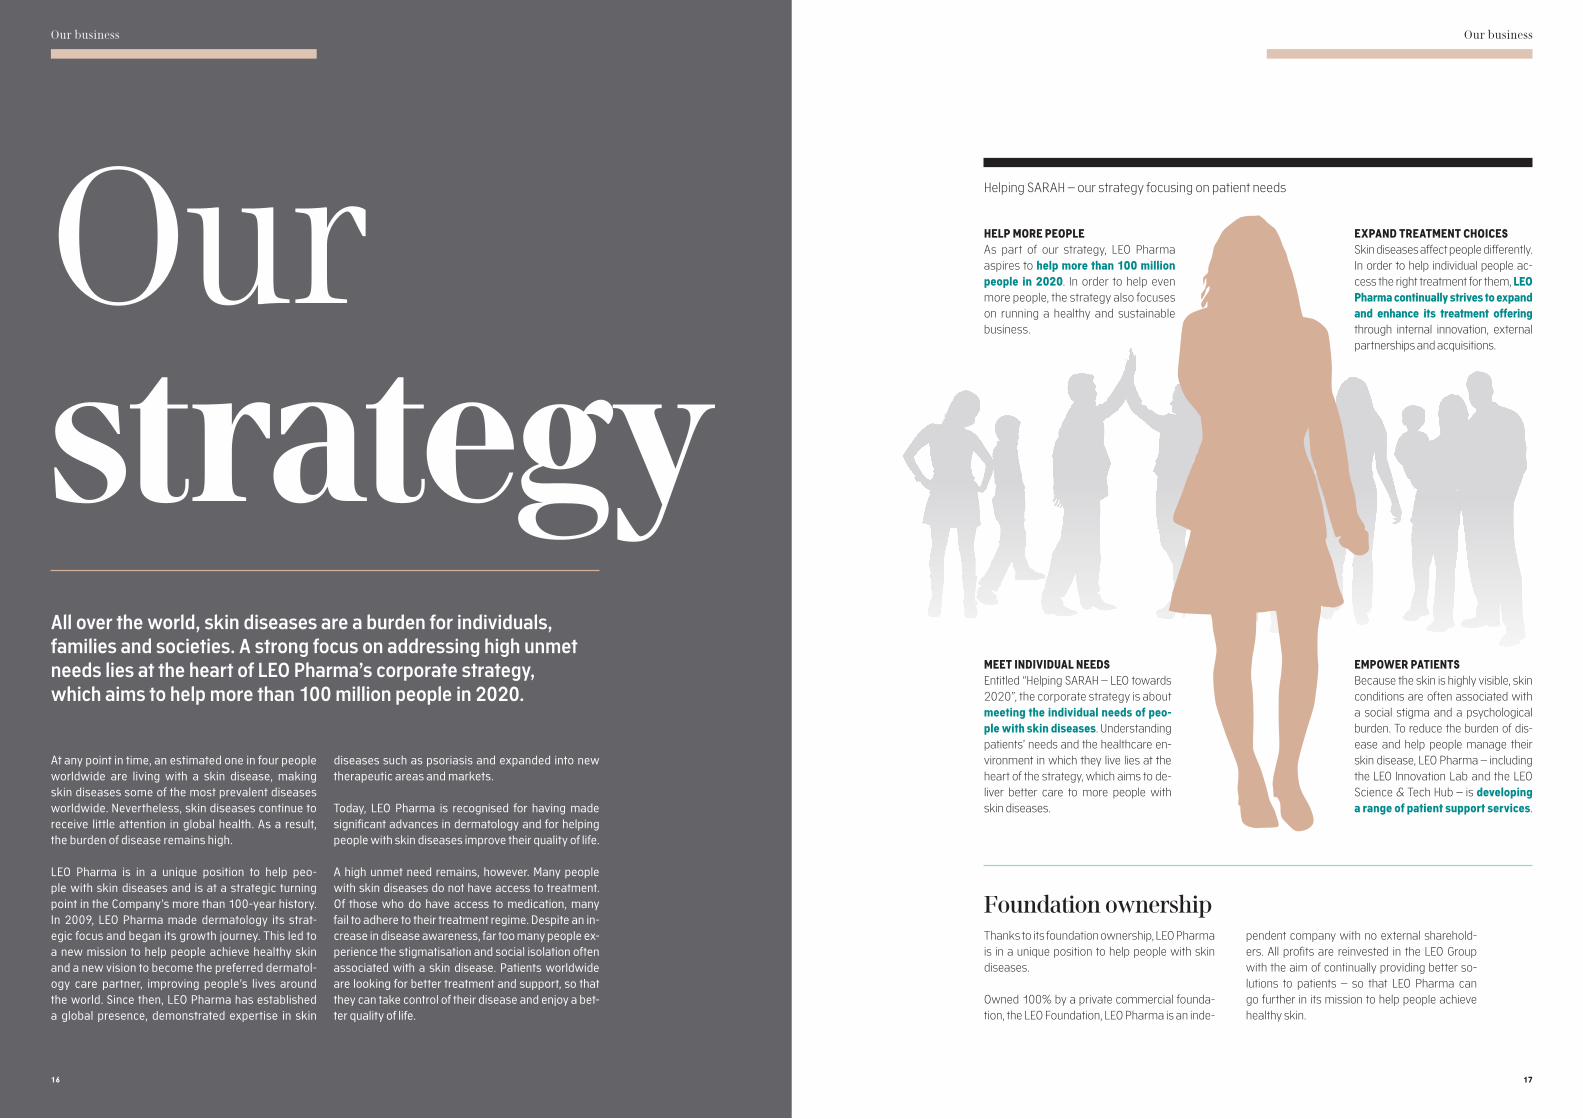
All over the world, skin diseases are a burden for individuals, families and societies. A strong focus on addressing high unmet needs lies at the heart of LEO Pharma’s corporate strategy, which aims to help more than 100 million people in 2020.
Our business
Our strategy
Our business
MEET INDIVIDUAL NEEDSEntitled “Helping SARAH – LEO towards 2020”, the corporate strategy is about meeting the individual needs of peo-ple with skin diseases. Understanding patients’ needs and the healthcare en-vironment in which they live lies at the heart of the strategy, which aims to de-liver better care to more people with skin diseases.
HELP MORE PEOPLEAs part of our strategy, LEO Pharma aspires to help more than 100 million people in 2020. In order to help even more people, the strategy also focuses on running a healthy and sustainable business.
Helping SARAH – our strategy focusing on patient needs
EXPAND TREATMENT CHOICES Skin diseases affect people differently. In order to help individual people ac-cess the right treatment for them, LEO Pharma continually strives to expand and enhance its treatment offering through internal innovation, external partnerships and acquisitions.
EMPOWER PATIENTSBecause the skin is highly visible, skin conditions are often associated with a social stigma and a psychological burden. To reduce the burden of dis-ease and help people manage their skin disease, LEO Pharma – including the LEO Innovation Lab and the LEO Science & Tech Hub – is developing a range of patient support services.
Foundation ownershipThanks to its foundation ownership, LEO Pharma is in a unique position to help people with skin diseases. Owned 100% by a private commercial founda-tion, the LEO Foundation, LEO Pharma is an inde-
pendent company with no external sharehold-ers. All profits are reinvested in the LEO Group with the aim of continually providing better so-lutions to patients – so that LEO Pharma can go further in its mission to help people achieve healthy skin.

1918
Our businessOur business
– Worldwide, 1 in 4 people suffers from a skin disease at any point in time
– More than 125 million people worldwide suffer from psoriasis
DID YOU KNOW?
Living with a skin diseaseAt LEO Pharma, we help people achieve healthy skin. This means understanding the science of the skin. It also means looking at all as- pects of the everyday lives of people with skin diseases. Because the skin is highly visible, skin conditions are often compounded by a social stigma, leading to an additional psychological burden. We listen to patients and their caregivers to understand their needs and develop solutions that empower people to manage their skin condition.
“No matter what you do in life, you carry your body and skin around with you. You’re constantly con-fronted with other people’s reactions to your ap-pearance. My skin condition has taught me that most challenges in life give you a chance to grow.” Julie, Denmark
“I remember being younger, I never liked going to the beach. I used to go when there were no others. I guess I felt embarrassed because of my skin. Get-ting older I’ve also gotten much better at treating my condition. Learning to deal with my psoriasis has given me more confidence.”Ignacio, Spain
“The itching is ridiculous. Sometimes I’ve scratched during the night so badly that I’ve ended up being ad-mitted into hospital because my psoriasis has been so severe.” Rena, UK
“I’d do anything to get rid of my psoriasis tomorrow, absolutely anything. I first developed psoriasis when I was 12. That was quite difficult to deal with. People associate skin disease with a certain social class or level of cleanliness, and judge you because of that.” Caroline, UK
“Some people find themselves in a vicious cycle where stress can trigger their psoriasis and cause them to feel more stressed and anxious. It’s really important that we view people as an entire person and not just treat the symptoms we can see.” Carla Renton, The Psoriasis Association, UK
“While non-sufferers refer to psoriasis as ‘just’ a skin condition, it’s often the psychological burden that’s the real problem.”Dr Stuart Wolfman, dermatologist, UK

Psoriasis
Eczema
Actinic keratosis
Discovery Phase 1DescriptionProject Phase 2b Phase 3
Proof of concept Filed/regulatory approval Launch
A �xed-dose combination gel for scalp and body psoriasis. Development ongoing to bring the treatment to Japan.
Daivobet® GelLP0076
BrodalumabLP0160
An IL-17 receptor monoclonal antibody under regulatory review for people with psoriasis.
Oral PDE4iLP0058
A systemic anti-inammatory compound intended to o�er an oral long-term treatment option for people with moderate-to-severe psoriasis.
A new topical formulation for treatment of psoriasis.
A connected solution intended to help people with skin conditions to adhere to topical treatment.
Topical formulationLP0113
SmartTop™LP0123
A �xed-dose combination spray foam for psoriasis. Launched in several markets, including the US and Europe.
Enstilar®
LP0053
JAK Topical LP0133
A topical treatment for inammatory skin diseases using a pan-JAK inhibitor, intended to o�er an improved safety pro�le compared to topical steroids.
TralokinumabLP0162
An IL-13 anti-inammatory monoclonal antibody under development for people with atopic dermatitis.
A selective glucocorticoid non-steroidal receptor agonist for the topical treatment of atopic dermatitis, intended to o�er an improved safety pro�le compared to topical steroids.
An anti-inammatory monoclonal antibodyfor the treatment of atopic dermatitis.
SEGRALP0155
ARGX-112LP0145
Ingenol disoxateLP0084
A novel topical compound for the treatment of actinic keratosis in large areas.
Phase 2a
Our clinical pipeline
2120
Our business Our business
Innovating for healthy skin
We innovate to advance treatment standards for people with skin conditions worldwide. Our robust portfolio of small molecules and antibodies allows us to meet the diverse medical needs of the patients we serve. Our goal is to find functional cures, enabling people with skin conditions to live a life free from symptoms.
LEO Pharma’s innovation engine is powered by a global R&D organisation with more than 700 scientists and specialists. Together with our partners, we have built a strong pipeline focused on dermatology, covering sev-eral indications. We are expanding our internal inno-vation and external partnerships to bring life-changing medicines to people with skin conditions.
Today, corticosteroids are among the most prescribed topical medications to clear flare-ups of skin inflammation. We are working to find new topical treatments that combine the benefits of steroids with safety and efficacy for long-term use.
Likewise, we are moving into the field of systemic treatment in order to provide new treatment options for severe skin conditions.
EXPANDING OUR PIPELINEOur pipeline includes a novel JAK inhibitor for the non-steroidal topical treatment of inflammatory skin dis-eases (phase II); a novel small-molecule compound for the topical treatment of actinic keratosis (phase III); a novel orally bioavailable PDE4 inhibitor for pso-riasis (phase II); tralokinumab, an IL-13 antibody for the systemic treatment of atopic dermatitis (phase II) and brodalumab, an IL-17R antibody for the systemic treat-ment of moderate-to-severe psoriasis (undergoing regulatory review).
Recently, LEO Pharma launched two new topical for-mulations for psoriasis patients: Enstilar®, a fixed-dose combination spray foam, and Daivobet® gel Applica-tor, a fixed-dose combination gel with an applicator for scalp and body psoriasis.
In addition, we explore opportunities to make treat-ment easier for patients through innovations within medical device technologies and digital solutions and services.
We are moving into the field of systemic treatment

2322
Our businessOur business
Five important elements make up LEO Pharma’s unique innovation ecosystem: our internal R&D capabilities, partnerships and acquisitions, open innovation, the LEO Innovation Lab and the LEO Science & Tech Hub.
Collaboration and co-creation are the glue that binds our ecosystem together, advancing science and tech-nolo gy to fuel the development of new treatment solutions.
At LEO Pharma, we are committed to developing great solutions through innovation. We believe that being truly innovative requires global ambitions, significant investments and a diverse approach where multiple initiatives go hand in hand.
LEO PHARMA R&DLEO Pharma’s R&D organisation is located at headquarters in Ballerup, Denmark, and is made up of more than 700 scientists and specialists. Through internal in-novation and external partnerships, the R&D organisation pioneers advances in dermatology care. Research and development projects are increasingly based on the efforts of multidisciplinary project teams integrating advanced knowledge in R&D disciplines with expertise in clinical practice and therapeutic needs. In-sight-driven innovation propels all product development.
LEO PHARMA OPEN INNOVATIONLEO Pharma Open Innovation is a platform for exploring opportunities for drug discovery with ex-ternal partners. It allows external partners to submit compounds for testing using the unique re-search tools at LEO Pharma’s laboratories. To ensure compound confidentiality, we do not ask for the structures of confidential compounds. All the data generated by testing a partner's compounds are reported to that partner. Promising results can lead to a collaboration or business partnership. www.openinnovation.leo-pharma.com
LEO INNOVATION LABThe LEO Innovation Lab is LEO Pharma’s separate innovation unit that develops non-pharmaceutical solutions in order to improve the lives of people with skin diseases. With satellites in Denmark, France, the UK, the US and Canada, the LEO Innovation Lab develops apps, digital platforms and other initiatives to support people with skin diseases in areas such as diet and nutrition, health, fitness, dialogue with doctors and mental health. The LEO Innovation Lab was established in 2015 for an initial pe-riod of three years with EUR 60 million in funding. More than 50 people work at the LEO Innovation Lab. www.leoinnovationlab.com
PARTNERSHIPS LEO Pharma’s commitment to research and development is strengthened by extensive collabor- ations between the R&D organisation and more than 400 academic and institutional research centres and industry partners worldwide, making the world our lab. By collaborating with scien-tific experts globally, LEO Pharma aims to enhance its knowledge of skin diseases and explore new potential treatments.
LEO SCIENCE & TECH HUBThe LEO Science & Tech Hub in Boston, US, explores cutting-edge science and technology opportunities with relevance to dermatology. By partnering with public and private institutions in the world’s leading life science cluster in Boston, the LEO Science & Tech Hub acts as a catalyst to transform early-stage innovations and technologies into solutions that will improve quality of life for people with skin diseases. The LEO Science & Tech Hub was officially inaugurated in September 2016. www.leo-scitech.com
Our innovation ecosystem

252424 25
Our business Our business
Convenience, please How do you help people with psoriasis follow their treatment regime and achieve better treatment outcomes? Start by developing a product that works and is easy to use. That is the ethos behind LEO Pharma’s user-driven innovation, where patients’ needs are central to product development. The latest result is Enstilar®, a spray foam for the treatment of psoriasis.
For people with psoriasis, sticking to their treatment regime is not always easy . Finding time can be dif-ficult in a busy day, when work and family account for most waking hours . In fact, up to 40% of people with psoriasis do not use their medication as prescribed . With more than 125 million people worldwide suf-fering from psoriasis, the lack of adherence is literally affecting the lives of millions .
It is a huge issue, which is why LEO Pharma – like many other pharmaceutical companies – sets out to develop treatments that are not only effective in tackling disease, but also convenient and easy to use . The hope is that by providing treatments that are user-friendly and cosmetically acceptable, people are more likely to follow their treatment regime – and achieve better health outcomes as a result .
“Top of patients’ wish list isn’t just improved efficacy, but also convenience,” says Kim Kjøller, Executive Vice President, Global Research & Development, LEO Pharma . “Making an effective product is one thing, but we need to develop treatments that meet the real-life challenges facing people with skin diseases .”
INNOVATING WITH PATIENTSThis mindset was sparked by patients’ feedback, which revealed that LEO Pharma could do better in product development . Patients described their daily treatment routines, and it was clear that the products were not as easy to use as intended .
Some people struggled to get the ointment out of the tube . Others struggled to find time to apply the oint-ment and let it dry . Many voiced a need for more alter-native treatments and support services .
LEO Pharma decided to change its approach to in-novation . Whereas the Company used a more tradi-tional research model in the past, today it is commit-ted to using an increasingly user-driven innovation model . It is a change that supports LEO Pharma in its ongoing efforts to meet patients’ needs .
IMPROVING QUALITY OF LIFEThe latest result of LEO Pharma’s user-driven innova-tion goes by the name of Enstilar®, a spray foam for the treatment of plaque psoriasis in adults . Launched in 2016, Enstilar® was developed based on insights from the everyday lives of people with psoriasis .
The treatment comes just a year after the launch of another topical psoriasis treatment co-developed by LEO Pharma with patients: Daivobet® gel Applicator, a drug device that makes it easier for people with pso-riasis to apply Daivobet® gel in a more targeted way and reach difficult-to-reach areas .
Thanks to LEO Pharma’s representatives and external-facing colleagues, who have been educating potential prescribers and payers about the product’s efficacy and safety profile, Enstilar® is now reaching people with psoriasis .
NEXT TREATMENT IN THE PIPELINESo what will be the next addition to LEO Pharma’s treatment offering?
In 2017, LEO Pharma expects to launch brodalumab, an IL-17 receptor monoclonal antibody for people with moderate-to-severe plaque psoriasis . The move into
biologics within dermatology is a milestone for LEO Pharma, whose legacy is firmly grounded in topicals .
Entering the highly competitive space of biologics will be no easy ride . However, it is an important step in the Company’s efforts to expand its treatment offering and meet the needs of people with skin diseases .
GOING BEYOND MEDICINE
To help people adhere to their treatment regime and achieve optimal outcomes, LEO Pharma and the LEO Innovation Lab have developed a suite of resources, including:
- TREAT, a nutritional coaching service that helps people with inflammatory diseases transform their diet and reduce the inflammation that can cause symptoms
- Flaym, a community that enables people with psoriasis to connect with other people with psoriasis worldwide and find support, acceptance and friends
- Imagine, an app that helps people with psoriasis track and analyse their condition over time using advanced image analysis
- InTouch, allowing people with skin conditions to send photos, videos or texts to their dermatologist as part of a dialogue to evaluate treatment progress

26
Governance and complianceGovernance and compliance
Governance and compliance
27
OWNERSHIP STRUCTURE LEO Pharma A/S is a wholly owned subsidiary of the LEO Foundation, Industriparken 55, 2750 Ballerup, Denmark.
REMUNERATION COMMITTEE The Company has set up a Remuneration Committee.
The members of the Committee are: Jukka Pertola, Chairman John R. Weeks
The Committee’s task is to establish the terms and conditions of employment for the Company’s top management.
CORPORATE SOCIAL RESPONSIBILITYCompliance by LEO Pharma A/S with Sections 99a and 99b of the Danish Financial Statements Act is reported in a separate Corporate Social Responsibility (CSR) report available at: www.leo-pharma.com/csr-report-2016
Thanks to its foundation ownership,
LEO Pharma is in a unique position
to help people with skin diseases

2928
Consolidated Financial Statements Consolidated Financial Statements
Consolidated Financial StatementsFINANCIAL STATEMENTS
Income statement . . . . . . . . . . . . . . . . . . . . . . . . . . . . . . . . . . . . . . . . . . . . . . . . . . . . . . . . . . . . . . . . . . . . . . . . . . . . . . . . . . . . . . . . . . . . . 31 Balance sheet at 31 December . . . . . . . . . . . . . . . . . . . . . . . . . . . . . . . . . . . . . . . . . . . . . . . . . . . . . . . . . . . . . . . . . . . . . . . . . . . . . . . . 32 Cash flow statement . . . . . . . . . . . . . . . . . . . . . . . . . . . . . . . . . . . . . . . . . . . . . . . . . . . . . . . . . . . . . . . . . . . . . . . . . . . . . . . . . . . . . . . . . . . 34 Consolidated statement of equity . . . . . . . . . . . . . . . . . . . . . . . . . . . . . . . . . . . . . . . . . . . . . . . . . . . . . . . . . . . . . . . . . . . . . . . . . . . . . . 35
NOTES
Note 1 – Revenue . . . . . . . . . . . . . . . . . . . . . . . . . . . . . . . . . . . . . . . . . . . . . . . . . . . . . . . . . . . . . . . . . . . . . . . . . . . . . . . . . . . . . . . . . . . . . . 38 Note 2 – Other external expenses . . . . . . . . . . . . . . . . . . . . . . . . . . . . . . . . . . . . . . . . . . . . . . . . . . . . . . . . . . . . . . . . . . . . . . . . . . . . . . 38 Note 3 – Staff expenses . . . . . . . . . . . . . . . . . . . . . . . . . . . . . . . . . . . . . . . . . . . . . . . . . . . . . . . . . . . . . . . . . . . . . . . . . . . . . . . . . . . . . . . . 39 Note 4 – Amortisation, depreciation and impairment losses . . . . . . . . . . . . . . . . . . . . . . . . . . . . . . . . . . . . . . . . . . . . . . . . . . . . 39 Note 5 – Financial income . . . . . . . . . . . . . . . . . . . . . . . . . . . . . . . . . . . . . . . . . . . . . . . . . . . . . . . . . . . . . . . . . . . . . . . . . . . . . . . . . . . . . . 40 Note 6 – Financial expenses . . . . . . . . . . . . . . . . . . . . . . . . . . . . . . . . . . . . . . . . . . . . . . . . . . . . . . . . . . . . . . . . . . . . . . . . . . . . . . . . . . . 40 Note 7 – Tax on profit for the year . . . . . . . . . . . . . . . . . . . . . . . . . . . . . . . . . . . . . . . . . . . . . . . . . . . . . . . . . . . . . . . . . . . . . . . . . . . . . . 40 Note 8 – Intangible assets . . . . . . . . . . . . . . . . . . . . . . . . . . . . . . . . . . . . . . . . . . . . . . . . . . . . . . . . . . . . . . . . . . . . . . . . . . . . . . . . . . . . . 41 Note 9 – Property, plant and equipment . . . . . . . . . . . . . . . . . . . . . . . . . . . . . . . . . . . . . . . . . . . . . . . . . . . . . . . . . . . . . . . . . . . . . . . . 42 Note 10 – Other financial securities . . . . . . . . . . . . . . . . . . . . . . . . . . . . . . . . . . . . . . . . . . . . . . . . . . . . . . . . . . . . . . . . . . . . . . . . . . . . 43 Note 11 – Deferred tax . . . . . . . . . . . . . . . . . . . . . . . . . . . . . . . . . . . . . . . . . . . . . . . . . . . . . . . . . . . . . . . . . . . . . . . . . . . . . . . . . . . . . . . . . 43 Note 12 – Share capital . . . . . . . . . . . . . . . . . . . . . . . . . . . . . . . . . . . . . . . . . . . . . . . . . . . . . . . . . . . . . . . . . . . . . . . . . . . . . . . . . . . . . . . . 43 Note 13 – Pension assets and pension obligations . . . . . . . . . . . . . . . . . . . . . . . . . . . . . . . . . . . . . . . . . . . . . . . . . . . . . . . . . . . . . 44 Note 14 – Other provisions . . . . . . . . . . . . . . . . . . . . . . . . . . . . . . . . . . . . . . . . . . . . . . . . . . . . . . . . . . . . . . . . . . . . . . . . . . . . . . . . . . . . . 44 Note 15 – Other long-term liabilities . . . . . . . . . . . . . . . . . . . . . . . . . . . . . . . . . . . . . . . . . . . . . . . . . . . . . . . . . . . . . . . . . . . . . . . . . . . . 44 Note 16 – Other adjustments . . . . . . . . . . . . . . . . . . . . . . . . . . . . . . . . . . . . . . . . . . . . . . . . . . . . . . . . . . . . . . . . . . . . . . . . . . . . . . . . . . 44 Note 17 – Unusual circumstances . . . . . . . . . . . . . . . . . . . . . . . . . . . . . . . . . . . . . . . . . . . . . . . . . . . . . . . . . . . . . . . . . . . . . . . . . . . . . . 45 Note 18 – Contingencies . . . . . . . . . . . . . . . . . . . . . . . . . . . . . . . . . . . . . . . . . . . . . . . . . . . . . . . . . . . . . . . . . . . . . . . . . . . . . . . . . . . . . . . 45 Note 19 – Financial instruments . . . . . . . . . . . . . . . . . . . . . . . . . . . . . . . . . . . . . . . . . . . . . . . . . . . . . . . . . . . . . . . . . . . . . . . . . . . . . . . 45 Note 20 – Related parties . . . . . . . . . . . . . . . . . . . . . . . . . . . . . . . . . . . . . . . . . . . . . . . . . . . . . . . . . . . . . . . . . . . . . . . . . . . . . . . . . . . . . . 45 Note 21 – Events after the balance sheet date . . . . . . . . . . . . . . . . . . . . . . . . . . . . . . . . . . . . . . . . . . . . . . . . . . . . . . . . . . . . . . . . . . 45 Note 22 – Companies in the LEO Group . . . . . . . . . . . . . . . . . . . . . . . . . . . . . . . . . . . . . . . . . . . . . . . . . . . . . . . . . . . . . . . . . . . . . . . . . 46 Note 23 – Accounting policies . . . . . . . . . . . . . . . . . . . . . . . . . . . . . . . . . . . . . . . . . . . . . . . . . . . . . . . . . . . . . . . . . . . . . . . . . . . . . . . . . . 48

3130
Consolidated Financial StatementsConsolidated Financial Statements
(DKK million) Note 2016 2015
Revenue (1) 9,863 8,457
Cost of sales (3,4) -2,720 -2,155
Gross profit 7,143 6,302
Sales and distribution costs (3,4) -4,098 -3,437
Research and development costs (3,4) -1,290 -1,184
Administrative costs (2,3,4) -1,444 -934
Other operating income 47 40
Other operating expenses -17 -24
Operating profit 341 763
Income from investment in associate -3 -13
Financial income (5) 903 430
Financial expenses (6) -137 -252
Profit before tax 1,104 928
Tax on profit for the year (7) -361 -215
Net profit for the year 743 713
Income statement

Consolidated Financial Statements Consolidated Financial Statements
3332
Balance sheet at 31 December
ASSETS
(DKK million) Note 2016 2015
Intellectual property rights 4,527 133
Trademarks 0 5
Development projects 1,081 336
Software 389 107
Intangible assets (8) 5,997 581
Land and buildings 760 824
Leasehold improvements 70 81
Plant and machinery 492 593
Other fixtures and fittings, tools and equipment 83 70
Fixed assets under construction 406 256
Property, plant and equipment (9) 1,811 1,824
Investment in associate 3 5
Other financial securities (10) 10,539 11,519
Deferred tax assets (11) 1,322 1,164
Financial fixed assets 11,864 12,688
Fixed assets 19,672 15,093
Raw materials and consumables 151 214
Work in progress 951 936
Finished goods and goods for resale 628 513
Inventories 1,730 1,663
Trade receivables 2,410 1,992
Other receivables 504 1,308
Prepayments 83 121
Receivables 2,997 3,421
Other securities 12,269 11,531
Cash at bank and in hand 144 374
Current assets 17,140 16,989
TOTAL ASSETS 36,812 32,082
EQUITY AND LIABILITIES
(DKK million) Note 2016 2015
Share capital (12) 250 250
Retained earnings 24,962 24,501
Equity 25,212 24,751
Deferred tax (11) 0 39
Pension obligations (13) 780 627
Other provisions (14) 935 593
Provisions 1,715 1,259
Other long-term liabilities (15) 1,622 0
Non-current liabilities 1,622 0
Credit institutions 5,258 4,023
Trade payables 2,375 1,383
Loan from the LEO Foundation 61 90
Corporation tax 31 30
Other payables 538 546
Current liabilities 8,263 6,072
TOTAL EQUITY AND LIABILITIES 36,812 32,082
Balance sheet at 31 December

Consolidated Financial Statements Consolidated Financial Statements
353434
Cash flow statement Consolidated statement of equity
(DKK million) Share capital
Retained
earnings Total
Equity at 1 January 2016 250 24,501 24,751
Net profit for the year 0 743 743
Adjustment of financial instruments 0 8 8
Exchange rate adjustment 0 -108 -108
Actuarial gains and losses 0 -214 -214
Tax on changes in equity 0 32 32
Equity at 31 December 2016 250 24,962 25,212
Equity at 1 January 2015 250 24,273 24,523
Adjustment of opening balance 0 -719 -719
Adjusted equity at 1 January 2015 250 23,554 23,804
Net profit for the year 0 713 713
Adjustment of financial instruments 0 85 85
Exchange rate adjustment 0 49 49
Actuarial gains and losses 0 147 147
Tax on changes in equity 0 -47 -47
Equity at 31 December 2015 250 24,501 24,751
(DKK million) Note 2016 2015
Profit before tax 1,104 928
Adjustments
Amortisation, depreciation and impairment losses 1,005 446
Unrealised exchange rate adjustment -85 100
Corporation tax paid 359 -538
Pension obligations -44 -45
Other provisions 326 -15
Other adjustments (16) -249 202
Change in working capital
Change in inventories and receivables -273 -458
Change in trade payables and other payables 931 283
CASH FLOWS FROM OPERATING ACTIVITIES 3,074 903
Investments in intangible assets, net -6,115 -241
Investments in property, plant and equipment, net -288 -181
Other securities 242 -571
Acquisition of companies 0 -19
CASH FLOWS FROM INVESTING ACTIVITIES -6,161 -1,012
Change in long-term debt 1,622 0
Change in bank debt 1,235 -378
CASH FLOWS FROM FINANCING ACTIVITIES 2,857 -378
CHANGE IN CASH AND CASH EQUIVALENTS -230 -487
Cash and cash equivalents at 1 January 374 861
Cash and cash equivalents at 31 December 144 374
The figures in the cash flow statement cannot be directly derived from the figures in the Consolidated Financial Statements .
3736
Notes – GroupNotes – Group
36
Notes Group

393838
NOTE 1 – REVENUE
(DKK million) 2016 2015
Revenue by region
EUROPE+ 5,852 5,497
INTERNATIONAL 2,786 1,860
US 1,225 1,100
Total 9,863 8,457
Revenue by therapeutic area
Psoriasis 3,311 3,467
Eczema/skin infections 2,694 1,353
Thrombosis 2,623 2,368
Actinic keratosis 363 423
Other 872 846
Total 9,863 8,457
NOTE 2 – OTHER EXTERNAL EXPENSES
(DKK million) 2016 2015
Fees to auditors appointed at the annual general meeting
Statutory audit -6 -7
Tax advisory services -10 -10
Other services -2 -3
Total -18 -20
NOTE 3 – STAFF EXPENSES
(DKK million) 2016 2015
Wages and salaries -2,895 -2,640
Pensions -245 -223
Social security expenses -270 -230
Other employee expenses -191 -204
Capitalised staff expenses 36 30
Total -3,565 -3,267
Included in
Cost of sales -614 -676
Sales and distribution costs -1,777 -1,755
Research and development costs -526 -471
Administrative costs -648 -365
Total -3,565 -3,267
Remuneration to the Board of Directors -4 -4
Remuneration to the Executive Board -15 -27
Average number of full-time employees 5,170 4,813
NOTE 4 – AMORTISATION, DEPRECIATION AND IMPAIRMENT LOSSES
(DKK million) 2016 2015
Amortisation -666 -171
Depreciation -307 -261
Impairment losses -32 -14
Total -1,005 -446
Included in
Cost of sales -276 -225
Sales and distribution costs -565 -14
Research and development costs -12 -89
Administrative costs -152 -118
Total -1,005 -446
Notes – GroupNotes – Group

414040
NOTE 5 – FINANCIAL INCOME
(DKK million) 2016 2015
Interest income on bonds 282 327
Capital gains, financial assets 604 90
Other financial income 17 13
Total 903 430
NOTE 6 – FINANCIAL EXPENSES
(DKK million) 2016 2015
Exchange rate losses -48 -223
Other financial expenses -89 -29
Total -137 -252
NOTE 7 – TAX ON PROFIT FOR THE YEAR
(DKK million) 2016 2015
Current tax for the year -253 -381
Change in deferred tax -101 156
Adjustment relating to previous years -7 10
Total -361 -215
Tax on changes in equity 32 -47
Tax in affiliates totalled DKK 201 million (2015: DKK 288 million) .
NOTE 8 – INTANGIBLE ASSETS
(DKK million)
Intellectual
property rights Trademarks
Development
projects Software
Total
intangible assets
Cost at 1 January 2016 5,138 30 2,064 154 7,386
Exchange rate adjustment -1 0 1 0 0
Additions during the year 5,013 0 984 118 6,115
Transfers 0 0 -203 203 0
Cost at 31 December 2016 10,150 30 2,846 475 13,501
Amortisation and impairment losses at 1 January 2016 -5,005 -25 -1,728 -47 -6,805
Exchange rate adjustment -1 0 0 0 -1
Amortisation for the year -585 -5 -37 -39 -666
Impairment losses for the year -32 0 0 0 -32
Amortisation and impairment losses at 31 December 2016 -5,623 -30 -1,765 -86 -7,504
CARRYING AMOUNT AT 31 DECEMBER 2016 4,527 0 1,081 389 5,997
Cost at 1 January 2015 5,135 30 1,820 154 7,139
Exchange rate adjustment 3 0 0 0 3
Additions during the year 0 0 246 0 246
Disposals during the year 0 0 -2 0 -2
Cost at 31 December 2015 5,138 30 2,064 154 7,386
Amortisation and impairment losses at 1 January 2015 -4,933 -19 -1,655 -10 -6,617
Exchange rate adjustment -3 0 0 0 -3
Amortisation for the year -61 -6 -67 -37 -171
Impairment losses for the year -8 0 -6 0 -14
Amortisation and impairment losses at 31 December 2015 -5,005 -25 -1,728 -47 -6,805
CARRYING AMOUNT AT 31 DECEMBER 2015 133 5 336 107 581
Development projects amounted to DKK 1,081 million (2015: DKK 336 million), of which development projects in progress represented DKK 1,081 million (2015: DKK 299 million) . Capitalised costs for development projects primarily consist of licences in relation to research and development projects and internally developed software .
Notes – GroupNotes – Group

434242
NOTE 9 – PROPERTY, PLANT AND EQUIPMENT
(DKK million)
Land and
buildings
Leasehold
improvements
Plant and
machinery
Other fixtures
and fittings,
tools and
equipment
Fixed assets
under
construction
Total property,
plant and
equipment
Cost at 1 January 2016 2,160 144 2,398 459 256 5,417
Exchange rate adjustment -1 0 -1 0 0 -2
Additions during the year 0 26 1 25 250 302
Disposals during the year -1 -12 -1 -29 -1 -44
Transfers 40 0 49 10 -99 0
Cost at 31 December 2016 2,198 158 2,446 465 406 5,673
Depreciation and impairment losses at 1 January 2016 -1,336 -63 -1,805 -389 0 -3,593
Exchange rate adjustment 0 0 -1 0 0 -1
Disposals during the year 1 10 1 27 0 39
Depreciation for the year -103 -35 -149 -20 0 -307
Depreciation and impairment losses at 31 December 2016 -1,438 -88 -1,954 -382 0 -3,862
CARRYING AMOUNT AT 31 DECEMBER 2016 760 70 492 83 406 1,811
Cost at 1 January 2015 2,146 141 2,303 475 212 5,277
Exchange rate adjustment 2 0 3 0 0 5
Additions during the year 11 5 66 15 164 261
Disposals during the year -2 -2 -25 -33 -64 -126
Transfers 3 0 51 2 -56 0
Cost at 31 December 2015 2,160 144 2,398 459 256 5,417
Depreciation and impairment losses at 1 January 2015 -1,233 -45 -1,711 -398 0 -3,387
Exchange rate adjustment -1 0 -2 0 0 -3
Disposals during the year 0 1 24 33 0 58
Depreciation for the year -102 -19 -116 -24 0 -261
Depreciation and impairment losses at 31 December 2015 -1,336 -63 -1,805 -389 0 -3,593
CARRYING AMOUNT AT 31 DECEMBER 2015 824 81 593 70 256 1,824
NOTE 10 – OTHER FINANCIAL SECURITIES
(DKK million) 2016 2015
Cost at 1 January 11,556 13,986
Additions during the year 2,659 1,702
Disposals during the year -3,637 -4,132
Cost at 31 December 10,578 11,556
Value adjustment at 1 January -37 2
Value adjustment for the year -6 -23
Value adjustment on disposals for the year 4 -16
Value adjustment at 31 December -39 -37
CARRYING AMOUNT AT 31 DECEMBER 10,539 11,519
Market value at 31 December 10,694 11,576
NOTE 11 – DEFERRED TAX
(DKK million) 2016 2015
Deferred tax at 1 January 1,125 967
Exchange rate adjustment, beginning of year -5 18
Adjustments relating to previous years -14 -7
Reclassifications 284 34
Deferred tax on equity 33 -43
Deferred tax on profit for the year -101 156
Deferred tax at 31 December (net) 1,322 1,125
Deferred tax is recognised in the balance sheet as follows
Deferred tax assets 1,322 1,164
Deferred tax liabilities 0 -39
Deferred tax at 31 December (net) 1,322 1,125
The deferred tax assets relate to current assets, licences, fixed assets, losses relating to previously jointly taxed foreign affiliates, intercompany profits, indirect production costs, etc . Deferred tax has been calculated as the temporary differences between assets and liabilities expected to be realised, based on the tax rates applicable for the respective countries .
NOTE 12 – SHARE CAPITAL
The share capital comprises 250 shares with a nominal value of DKK 1 million. The share capital is divided into 170 A shares and 80 B shares. Holders of A shares have pre-emption rights if the share capital is increased. Holders of B shares can only vote in connection with alterations to the articles of association, cf. Section 107 of the Danish Companies Act.
No shares or shareholders have any additional special rights.
The total share capital is owned by the LEO Foundation.
Notes – GroupNotes – Group

454444
NOTE 13 – PENSION ASSETS AND PENSION OBLIGATIONS
(DKK million) 2016 2015
Provision for pension obligations at 1 January 627 817
Exchange rate adjustment, beginning of year -17 2
Actuarial gains and losses 214 -147
Other movements -44 -45
Provision for pension obligations at 31 December 780 627
The Group companies in Ireland, the UK and France operate defined benefit plans .
NOTE 14 – OTHER PROVISIONS
(DKK million) 2016 2015
Discounts 460 351
Product returns 208 148
Staff-related provisions 218 51
Other provisions 49 43
Total 935 593
Other provisions fall due
0-1 year 700 425
1-5 years 221 164
> 5 years 14 4
Total 935 593
NOTE 15 – OTHER LONG-TERM LIABILITIES
(DKK million) 2016 2015
Other long-term liabilities fall due
1-5 years 1,620 0
> 5 years 2 0
Total 1,622 0
NOTE 16 – OTHER ADJUSTMENTS
(DKK million) 2016 2015
Inventory write-down -164 57
Provision for bad debt -104 31
Gain/loss on sale of fixed assets -10 -4
Deferred income 0 107
Accrued interest, bonds 20 24
Other 9 -13
Total -249 202
NOTE 17 – UNUSUAL CIRCUMSTANCES
In 2016, the Group incurred restructuring costs of DKK 377 million. Restructuring costs recognised in the Parent Company amounted to DKK 68 million.
NOTE 18 – CONTINGENCIES
The Parent Company's security provided and guarantee commitments totalled DKK 974 million at 31 December 2016 (2015: DKK 961 million). The amount for the Group totalled DKK 1,039 million at 31 December 2016 (2015: DKK 999 million).
Guarantees issued relating to the Group's Irish companies comprised all liabilities of the companies. At 31 December 2016, the companies had total external liabilities, excluding pensions, of DKK 147 million (2015: DKK 110 million).
Guarantees issued relating to pension commitments in the Group companies totalled DKK 728 million at 31 December 2016 (2015: DKK 791 million).
The Parent Company had lease obligations of DKK 37 million (2015: DKK 36 million), of which DKK 22 million related to affiliates (2015: DKK 20 million). Lease obligations relating to the Group totalled DKK 357 million (2015: DKK 317 million).
The Parent Company has pledged bonds at a carrying amount of DKK 6,145 million (2015: DKK 4,719 million) as security for bank loans and overdraft facilities at a carrying amount totalling DKK 7,058 million (2015: DKK 4,023 million), as well as established guarantee commit-ments at a value of DKK 77 million (2015: DKK 24 million). The amount for the Group also totalled DKK 6,145 million (2015: DKK 4,719 million).
At the end of 2016, there were pending patent lawsuits filed by and against LEO Pharma concerning rights related to products in LEO Pharma's psoriasis portfolio in both the US and Europe. LEO Pharma does not expect the pending cases to have any significant effect on the Group's financial position.
As a global business, LEO Pharma will from time to time have tax audits and tax discussions with tax authorities in various countries regarding transfer pricing issues. Management is of the opinion that current tax audits and tax discussions will have no significant influence on LEO Pharma's financial position.
The Parent Company is jointly taxed with all the Danish affiliates. The Parent Company is jointly and severally liable with the other com- panies in the joint taxation scheme for Danish corporate taxes and withholding taxes on dividends, interest and royalties within the joint taxation scheme.
NOTE 19 – FINANCIAL INSTRUMENTS
The Group and the Parent Company use both option and forward contracts as part of managing foreign exchange risks.
At 31 December 2016, there were outstanding forward contracts in: BRL, CAD, CHF, CNH, CZK, EUR, GBP, HKD, JPY, KRW, MXN, MYR, NOK, PHP, RON, RUB, SAR, SEK, SGD, THB, USD and ZAR. The total contract amount at 31 December 2016 was DKK 3,674 million (2015: DKK 8,193 million).
At 31 December 2016, the Group and the Parent Company also had option contracts in USD, CAD and SGD with contract amounts of DKK 78 million (2015: DKK 478 million).
NOTE 20 – RELATED PARTIES
LEO Pharma A/S' related parties with significant influence comprise the Company's Board of Directors and Executive Board, the LEO Foundation and affiliates of LEO Pharma A/S.
The Company has chosen to disclose transactions that are not carried out on an arm's length basis in accordance with section 98c(7) of the Danish Financial Statements Act. There were no such transactions in 2016.
NOTE 21 – EVENTS AFTER THE BALANCE SHEET DATE
No events have occurred in the period from the balance sheet date until the presentation of the financial statements that materially affect the assessment of the Annual Report.
Notes – GroupNotes – Group

46 4746
NOTE 22 – COMPANIES IN THE LEO GROUP
Affiliates Reg. office Ownership Currency
Nominal capital
(thousand)
SARL LEO Pharma Algeria 100% DZD 2,000
Peplin Operations Pty Ltd Australia 100% AUD 24,000
LEO Pharma Pty Ltd Australia 100% AUD 5,500
LEO Pharma GmbH Austria 100% EUR 76
LEO Pharma NV Belgium 100% EUR 273
LEO Pharma LTDA. Brazil 100% BRL 4,500
LEO Pharma Inc. Canada 100% CAD 8,400
LEO Pharma Consultancy Company Ltd. China 100% USD 3,600
LEO Pharma Trading Company Ltd. China 100% CNY 5,000
LEO Pharma s.r.o. Czech Republic 100% CZK 350
Løvens Kemiske Fabriks Handelsaktieselskab Denmark 100% DKK 30,000
Aktieselskabet af 30. april 2003 Denmark 100% DKK 3,500
LEO Pharma OY Finland 100% EUR 151
Laboratoires LEO S.A. France 100% EUR 9,000
LEO Pharma GmbH Germany 100% EUR 750
LEO Pharmaceutical Hellas S.A. Greece 100% EUR 8,551
LEO Laboratories Ltd. Ireland 100% EUR 30,394
Wexport Ltd. Ireland 100% EUR 2,600
LEO Pharma Holding Ltd. Ireland 100% EUR 100
LEO Pharma S.p.A. Italy 100% EUR 620
LEO Pharma K.K. Japan 100% JPY 10,000
LEO Pharmaceuticals, S. de R.L. de C.V. Mexico 100% MXN 7,922
LEO Pharma LLC Morocco 100% MAD 100
LEO Pharma BV Netherlands 100% EUR 227
LEO Pharma Ltd. New Zealand 100% NZD 85
LEO Pharma AS Norway 100% NOK 3,000
LEO Pharma Sp. z o.o. Poland 100% PLN 95
LEO Farmacêuticos Lda. Portugal 100% EUR 626
LEO Pharmaceutical Products LLC Russia 100% RUB 16,500
LEO Pharma Asia PTE Ltd. Singapore 100% SGD 100
LEO Pharma Ltd South Korea 100% KRW 1,800,000
Laboratorios LEO Pharma S.A. Spain 100% EUR 1,214
LEO Pharma AB Sweden 100% SEK 1,000
Lövens Läkemedel AB Sweden 100% SEK 100
LEO Pharmaceutical Products Sarath Ltd. Switzerland 100% CHF 50
LEO Pharma SARL Tunisia 100% TND 10
LEO Pharma İlaç Ticaret Anonim Şirketi Turkey 100% TRY 1,300
LEO Laboratories Ltd. United Kingdom 100% GBP 12,000
LEO Pharma Inc. USA 100% USD 2,500
Peplin Inc. USA 100% USD 15
Associate
SkinVision B.V Netherlands 26.32% EUR 30
Notes – GroupNotes – Group

494848
NOTE 23 – ACCOUNTING POLICIES
The Consolidated Financial Statements of LEO Pharma for 2016 have been prepared in accordance with the provisions of the Danish Financial Statements Act applying to large enterprises of reporting class C.
LEO Pharma has implemented Act no. 738 of 1 June 2015 from 1 January 2016, when it came into force.
This has entailed the following changes to recognition and measurement:– Going forward, the residual value of intangible assets and prop-erty, plant and equipment will be reassessed on an ongoing basis. Pursuant to the transitional provisions of the Act, any adjustments to residual values will be made prospectively as an accounting esti-mate without restatement of comparative figures and without any impact on equity.
– Going forward, the corridor method for recognising actuarial gains and losses will not be applied. As a result, actuarial losses ex-isting in the Group have a direct effect on the consolidated state-ment of financial position and lead to an increase in provisions for pension and similar obligations and a reduction in equity. Since the actuarial losses will be recognised directly in equity, the income statement will in future remain free from the effects of amortisation of the amount exceeding the corridor.
The comparative figures have been restated to reflect the changed accounting policies. Apart from the above, the accounting policies used in the preparation of the financial statements are consistent with those of last year.
RECOGNITION AND MEASUREMENTRevenues are recognised in the income statement as earned. Value adjustments of financial assets and liabilities measured at fair value or amortised cost are also recognised. Moreover, all expenses in-curred to achieve the earnings for the year are recognised in the in-come statement, including depreciation, amortisation and impair-ment losses and provisions, as well as reversals due to changed accounting estimates of amounts that have previously been recog-nised in the income statement.
Assets are recognised in the balance sheet when it is probable that future economic benefits attributable to the asset will flow to the Group and the value of the asset can be measured reliably.
Liabilities are recognised in the balance sheet when it is probable that future economic benefits will flow out of the Group and the value of the liability can be measured reliably.
Assets and liabilities are initially measured at cost. Subsequently, as- sets and liabilities are measured as described for each item below.
Certain financial assets and liabilities are measured at amortised cost, which involves recognition of a constant effective interest rate over the maturity period. Amortised cost is calculated as original cost less any repayments, with addition/deduction of the cumula-tive amortisation of any difference between cost and the nominal amount. In this way, capital losses and gains are allocated over the maturity period.
Recognition and measurement take into account predictable losses and risks occurring before the presentation of the Annual Report that confirm or invalidate circumstances and conditions existing at the balance sheet date.
The measurement currency is Danish kroner (DKK). All other cur-rencies are regarded as foreign currencies.
The Financial Statements for 2016 are presented in DKK (million).
CONSOLIDATED FINANCIAL STATEMENTSThe Consolidated Financial Statements comprise the Parent Company, LEO Pharma A/S, and affiliates in which LEO Pharma A/S directly or indirectly holds more than 50% of the votes or otherwise exercises control.
The Consolidated Financial Statements are prepared by combining the Financial Statements of the Parent Company and all affiliates with subsequent elimination of intercompany transactions, inter-company shareholdings and balances, as well as unrealised profits from intercompany transactions.
The Financial Statements of all companies have been prepared according to the same accounting policies as applied by the Parent Company.
Enterprises acquired during the year and newly formed enter-prises are consolidated from the date of acquisition or formation. Enterprises that are sold or wound up during the year are included in the consolidated income statement until the date of disposal or until the business was wound up. Comparative figures are not re-stated for newly acquired, sold or wound-up enterprises.
NOTE 23 – ACCOUNTING POLICIES
FOREIGN CURRENCY TRANSLATIONOn recognition, transactions in foreign currencies are translated at the exchange rates at the transaction dates. Exchange differences arising between the transaction-date rates and the rates at the pay-ment dates are recognised in financial income and expenses in the income statement.
Receivables, payables and other monetary items in foreign curren-cies are translated at the exchange rates at the balance sheet date. Any differences between the exchange rates at the balance sheet date and the rate at the time when the receivable or payable arises, or on recognition in the most recent financial statements, are rec-ognised in financial income and expenses in the income statement.
Fixed assets acquired in foreign currencies are measured at the transaction-date rates.
On recognition of foreign affiliates, income statements are trans-lated at the average exchange rates for the period, and balance sheet items are translated at the exchange rates at the balance sheet date.
Exchange adjustments arising on translation of the opening equity of foreign affiliates at the exchange rates at the balance sheet date, and on translation of the income statement from average exchange rates to the exchange rates at the balance sheet date, are recog-nised directly in equity.
DERIVATIVE FINANCIAL INSTRUMENTSDerivative financial instruments are used to manage the exposure to market risk. In 2016, LEO Pharma used forward exchange contracts to hedge currency risk on assets and liabilities, and interest rate swaps to hedge the interest rate risk for each loan in its debt portfolio.
Derivative financial instruments are recognised in the balance sheet at cost and are subsequently remeasured to their fair values at the end of the reporting period. Positive and negative fair values of derivative financial instruments are recognised in other receivables and other payables respectively.
Changes in the fair values of derivative financial instruments that are designated and qualify as fair value hedges are recognised in the income statement, in the same way as any changes in the fair value of the hedged asset or liability.
Changes in the fair values of financial and derivative financial in-struments that are designated and qualify as hedges of future cash flows are recognised as other receivables and other payables, and as financial hedges in equity. Income and expenses relating to such hedging transactions are transferred from equity on realisation of the hedged item and recognised as financial income and expenses.
REVENUERevenue from the sale of goods for resale and finished goods is recognised in the income statement when the sale is considered effected based on the following criteria:• Delivery and transfer of risk have taken place before year-end• The sales price can be measured reliably and payment has
been received or may with reasonable certainty be expected to be received
Revenue is recognised exclusive of VAT and net of discounts relating to sales.
Revenue includes licence income and royalties from outlicensed products as well as milestone payments and other revenues in con-nection with partnerships. These revenues are recognised when it is probable that future economic benefits will flow to the Group and these benefits can be measured reliably.
COST OF SALESCost of sales comprises costs incurred to achieve the revenue for the year. Cost of sales includes direct and indirect costs of raw ma-terials and consumables; salaries; maintenance, depreciation and impairment of production plant; and costs and expenses relating to the operation, administration and management of factories. Also included are inventory write-downs.
SALES AND DISTRIBUTION COSTSSales and distribution costs comprise costs relating to the sale and distribution of products, including salaries, sales commissions, ad-vertising and marketing costs, depreciation and impairment, etc.
RESEARCH AND DEVELOPMENT COSTSResearch and development costs comprise costs, including salaries, depreciation of operating assets, amortisation and write-down of development projects and equipment directly or indirectly attributable to the Group’s research and development activities.
The effect of the transition to the amended Danish Financial Statements Act is as follows:
(DKK million) 1 January 2015
31 December 2015
Effect on
Deferred tax assets 121 -27
Provision for pension obligations 840 -215
Administrative costs - 68
Equity -719 188
Notes – GroupNotes – Group

515050
ADMINISTRATIVE COSTSAdministrative costs comprise expenses incurred for management and administration. Administrative costs include office expenses, sal-aries, depreciation and impairment, losses on trade receivables, etc.
OTHER OPERATING INCOME AND EXPENSESOther operating income and expenses comprise items secondary to the principal activities. Other operating income includes non-recurring income from the sale of rights and gains on the sale of fixed assets, etc.
The sale of rights, etc. is recognised as income at the time of sale. If the sale results in an obligation for the Group, the income is accrued over the duration of the obligation, and in the case of sales where the income is dependent on future events, the amount is recognised as income when the event occurs.
FINANCIAL INCOME AND EXPENSESFinancial income and expenses comprise interest, realised and unrealised exchange adjustments, price adjustment of securities, as well as extra payments and repayments under the on-account taxation scheme.
TAX ON PROFIT/LOSS FOR THE YEARTax for the year comprises current tax and changes in deferred tax for the year. The tax attributable to the profit for the year is recognised in the income statement, whereas the tax attributable to equity transac-tions is recognised directly in equity. Any changes in deferred tax due to changes in tax rates are recognised in the income statement.
INTANGIBLE ASSETSIntangible assets are measured at cost less accumulated amortisa-tion and impairment losses. Amortisation is provided on a straight-line basis over the expected useful lives of the assets. The amortisa-tion profile is adjusted for the risk relating to the underlying asset, so that up to 33% of the amortisation is brought forward from the sec-ond half of the asset’s expected useful life to the first half. Amortisation and impairment are recognised in the income statement as cost of sales, sales and distribution costs, and administrative costs.
Costs relating to the maintenance of patents, etc. are expensed in the income statement as incurred.
Development projects that are clearly defined and identifiable, where there is evidence of the technical utilisation degree, sufficient re-sources and a potential future market or development opportunities in the Group, and where LEO Pharma intends to produce, market or use the project, are recognised as intangible assets if it is probable that costs incurred will be covered by future earnings. The cost of such de-velopment projects includes direct salaries, materials, and other direct and indirect costs attributable to the development projects.
Amortisation and write-down of such capitalised development pro-jects start from the date of completion and are included in research and development costs. Other development costs are recognised in the income statement as incurred.
Projects are assessed on an ongoing basis, taking into account de-velopment progress, expected approvals and commercial utilisation.
PROPERTY, PLANT AND EQUIPMENTProperty, plant and equipment are measured at cost less accumu-lated depreciation and impairment. Cost comprises expenses for materials, sub-suppliers and salaries, etc. The total cost of an asset is broken down into components that are depreciated separately if the expected useful lives of the individual components are not the same. Cost does not include any interest or other borrowing expenses.
Assets costing less than DKK 75 thousand or with an estimated use-ful life of less than three years are expensed in the year of acquisition.
Gains and losses on the sale of property, plant and equipment are calculated as the difference between the sales price less selling expenses and the carrying amount at the time of sale. Gains and losses are recognised in the income statement under other operat-ing income and expenses (net).
IMPAIRMENT OF FIXED ASSETSThe carrying amounts of intangible assets and property, plant and equipment are reviewed on an annual basis to determine whether there is any indication of a decrease in value other than that ex-pressed by amortisation and depreciation. If so, an impairment test is carried out to determine whether the recoverable amount is
NOTE 23 – ACCOUNTING POLICIES
Depreciation is provided on a straight-line basis over the expected useful lives of the assets. The expected useful lives are as follows:
Buildings 10-25 years
Plant and machinery 5-10 years
Other fixtures and fittings, tools and equipment 3-10 years
Leasehold improvements Up to 10 years
The expected useful lives are as follows:
Intellectual property rights, trademarks and development projects 3-20 years
Software 5-10 years
lower than the carrying amount, and the asset is written down to its lower recoverable amount.
The recoverable amount of the asset is calculated as the higher of net selling price and value in use. Where a recoverable amount can-not be determined for the individual asset, the assets are assessed in the smallest group of assets for which a reliable recoverable amount can be determined based on a total assessment.
LEASESLeases are classified as finance leases if they transfer substan-tially all the risks and rewards incident to ownership to the lessee. All other leases are classified as operating leases. Operating lease payments are recognised in the income statement over the term of the lease.
INVESTMENTS IN ASSOCIATESInvestments in associates are measured under the equity method. This means that the associates are measured in the balance sheet at the proportionate share of their net asset value, with deduction or ad-dition of unrealised intercompany profits or losses, and with addition of any remaining value of positive differences (goodwill) and deduction of any remaining value of negative differences (negative goodwill). The Parent Company’s share of the associates’ profit for the year is recog-nised in the income statement less unrealised intercompany profits.
The total net revaluation of investments in associates is transferred upon distribution of profit to “Reserve for net revaluation under the equity method” under equity. The reserve is reduced by dividends distributed to the Parent Company and adjusted for other equity movements in associates.
OTHER FINANCIAL SECURITIESOther financial securities consist of equity investments and bonds held to maturity.
Equity investments, which comprise unlisted shares, are measured at cost less any impairment losses.
The holding of bonds that are held to maturity is classified as a fixed asset investment. The bonds are initially recognised in the balance sheet at cost. Subsequently, the bonds are measured at amortised cost, which includes revaluation/write-down of the holding at par over the term of the individual series of bonds.
INVENTORIESRaw materials and consumables are measured at the lower of cost under the FIFO method and net realisable value.
Work in progress and finished goods are measured at cost. The cost of finished goods and work in progress comprises the cost of raw materials, consumables, direct labour and indirect production costs. Indirect production costs comprise indirect materials and la-bour as well as maintenance and depreciation of the machinery, factory buildings and equipment used in the manufacturing pro-cess, and costs of factory administration and management.The net realisable value of inventories is calculated as sales price with deduction of costs of completion and expenses incurred to ef-fect the sale, and is determined allowing for marketability, obsoles-cence and development in expected sales price.
Obsolete goods, including slow-moving goods, are expensed.
RECEIVABLESReceivables are measured at amortised cost less write-down for expected bad debt losses. Based on an individual assessment of each receivable, write-downs have been made where this is con-sidered necessary.
PREPAYMENTS Prepayments include prepaid expenses incurred relating to rent, insurance premiums, subscriptions and interest.
OTHER SECURITIES (CURRENT ASSETS)Other securities, which consist of listed bonds and shares classified as current assets, are measured at fair value at the balance sheet date. Fair value is determined based on the latest quoted market price.
EQUITY DividendThe dividend distribution for the year proposed by Management is disclosed as a separate equity item.
Exchange rate adjustmentsExchange rate adjustments of intercompany balances with affiliates that are considered part of the total net investment in the affiliate are recognised directly in equity.
PROVISIONSProvisions are recognised when, as a result of events before or at the balance sheet date, the Group has a legal or a constructive obli-gation and it is probable that there may be an outflow of economic resources to settle the obligation.
NOTE 23 – ACCOUNTING POLICIES
Notes – GroupNotes – Group

52 5352
LIABILITIES OTHER THAN PROVISIONSFinancial liabilities are recognised at the date of borrowing at cost, corresponding to the proceeds received less transaction costs paid. Subsequently, the loans are measured at amortised cost. The differ-ence between the proceeds and the nominal value is recognised as an interest expense in the income statement over the loan period.
Other liabilities are measured at amortised cost, which corresponds to nominal value.
PENSIONSPayments to defined contribution plans are recognised in the in-come statement in the period to which they relate, and any amounts payable are recognised in other payables in the balance sheet.
Where defined benefit plans are concerned, an annual actuarial calculation is made of the value in use of future payments under the scheme. The value in use is calculated based on the assump-tions relating to future developments in pay levels, interest rates, inflation and mortality. The value in use is calculated only for the benefits to which the employees have earned a right through their employment with the Group. Plan assets are recognised to the ex-tent the Group is able to obtain future economic benefits in the form of reimbursement from the pension scheme or reduction of future payments.
Pension costs for the year are recognised in the income statement based on actuarial estimates and financial expectations at the be-ginning of the year.
Any differences between expected developments in plan assets and pension obligations on the one hand and the realised values calculated at the beginning of the year on the other are considered actuarial gains or losses. Actuarial gains and losses are recognised in equity. Pension costs relating to previous years are recognised as incurred.
TAXDeferred tax is measured using the balance sheet liability method for all temporary differences between the carrying amount and tax base of assets and liabilities.
The tax base of tax losses carried forward is included in the calcula-tion of deferred tax to the extent the values are likely to be utilised in future taxable income.
Deferred tax is measured at the tax rate expected to be effective when the deferred tax is expected to crystallise as current tax for the enterprise concerned. Tax payable includes current tax calcu-lated on the basis of the expected taxable income for the year, as well as any adjustment for taxes payable for previous years.
Current tax receivables and liabilities are recognised in the balance sheet at the amount calculated based on the expected taxable in-come for the year, adjusted for tax on taxable incomes for prior years. Tax receivables and liabilities are offset if there is a legally enforceable right of set-off and an intention to settle on a net basis or simultaneously.
DEFINITION OF KEY FIGURES
SEGMENT REPORTINGSegment information is provided on business segments and geographical markets. The segment information is in line with the Group's accounting policies, risks and internal financial management.
CASH FLOW STATEMENT FOR THE GROUPThe cash flow statement is prepared according to the indirect method based on profit before tax. The statement shows cash flows from operating, investing and financing activities, as well as cash and cash equivalents at the beginning and end of the year.
Cash flows from operating activities are calculated as the Group’s profit for the year before extraordinary items and tax, adjusted for non-cash operating items such as depreciation, amortisation and impairment losses, and changes in working capital. Working capital comprises inventories, trade receivables and trade pay-ables, etc.
Cash flows from investing activities comprise payments from ac-quisitions and disposals of intangible assets, property, plant and equipment, as well as fixed asset investments.
Cash flows from financing activities comprise payments from the raising and repayment of short-term and long-term debt, and pay-ments to and from shareholders.
Cash and cash equivalents comprise solely cash at bank and in hand.
NOTE 23 – ACCOUNTING POLICIES
Average number of employees
Average number of full-time equivalent employees
Operating profit marginOperating profit
Revenuex 100
Return on assetsOperating profit Average assets
x 100
Return on equityProfit before tax Average equity
x 100
Solvency ratioEquity Assets
x 100
Notes – GroupNotes – Group

5554
Financial Statements – Parent CompanyFinancial Statements – Parent Company
Financial Statements Parent CompanyFINANCIAL STATEMENTS
Income statement . . . . . . . . . . . . . . . . . . . . . . . . . . . . . . . . . . . . . . . . . . . . . . . . . . . . . . . . . . . . . . . . . . . . . . . . . . . . . . . . . . . . . . . . . . . . . 57 Balance sheet at 31 December . . . . . . . . . . . . . . . . . . . . . . . . . . . . . . . . . . . . . . . . . . . . . . . . . . . . . . . . . . . . . . . . . . . . . . . . . . . . . . . . 58 Statement of equity . . . . . . . . . . . . . . . . . . . . . . . . . . . . . . . . . . . . . . . . . . . . . . . . . . . . . . . . . . . . . . . . . . . . . . . . . . . . . . . . . . . . . . . . . . . . 60
NOTES
Note 1 – Revenue . . . . . . . . . . . . . . . . . . . . . . . . . . . . . . . . . . . . . . . . . . . . . . . . . . . . . . . . . . . . . . . . . . . . . . . . . . . . . . . . . . . . . . . . . . . . . . 64 Note 2 – Staff expenses . . . . . . . . . . . . . . . . . . . . . . . . . . . . . . . . . . . . . . . . . . . . . . . . . . . . . . . . . . . . . . . . . . . . . . . . . . . . . . . . . . . . . . . . 64 Note 3 – Amortisation, depreciation and impairment losses . . . . . . . . . . . . . . . . . . . . . . . . . . . . . . . . . . . . . . . . . . . . . . . . . . . . 65 Note 4 – Financial income . . . . . . . . . . . . . . . . . . . . . . . . . . . . . . . . . . . . . . . . . . . . . . . . . . . . . . . . . . . . . . . . . . . . . . . . . . . . . . . . . . . . . . 65 Note 5 – Financial expenses . . . . . . . . . . . . . . . . . . . . . . . . . . . . . . . . . . . . . . . . . . . . . . . . . . . . . . . . . . . . . . . . . . . . . . . . . . . . . . . . . . . 65 Note 6 – Tax on profit for the year . . . . . . . . . . . . . . . . . . . . . . . . . . . . . . . . . . . . . . . . . . . . . . . . . . . . . . . . . . . . . . . . . . . . . . . . . . . . . . 65 Note 7 – Proposed distribution of net profit for the year . . . . . . . . . . . . . . . . . . . . . . . . . . . . . . . . . . . . . . . . . . . . . . . . . . . . . . . . 66 Note 8 – Intangible assets . . . . . . . . . . . . . . . . . . . . . . . . . . . . . . . . . . . . . . . . . . . . . . . . . . . . . . . . . . . . . . . . . . . . . . . . . . . . . . . . . . . . . 66 Note 9 – Property, plant and equipment . . . . . . . . . . . . . . . . . . . . . . . . . . . . . . . . . . . . . . . . . . . . . . . . . . . . . . . . . . . . . . . . . . . . . . . . 67 Note 10 – Investments in affiliates . . . . . . . . . . . . . . . . . . . . . . . . . . . . . . . . . . . . . . . . . . . . . . . . . . . . . . . . . . . . . . . . . . . . . . . . . . . . . 68 Note 11 – Other financial securities . . . . . . . . . . . . . . . . . . . . . . . . . . . . . . . . . . . . . . . . . . . . . . . . . . . . . . . . . . . . . . . . . . . . . . . . . . . . 68 Note 12 – Deferred tax assets . . . . . . . . . . . . . . . . . . . . . . . . . . . . . . . . . . . . . . . . . . . . . . . . . . . . . . . . . . . . . . . . . . . . . . . . . . . . . . . . . . 69 Note 13 – Other provisions . . . . . . . . . . . . . . . . . . . . . . . . . . . . . . . . . . . . . . . . . . . . . . . . . . . . . . . . . . . . . . . . . . . . . . . . . . . . . . . . . . . . . 69 Note 14 – Other long-term liabilities . . . . . . . . . . . . . . . . . . . . . . . . . . . . . . . . . . . . . . . . . . . . . . . . . . . . . . . . . . . . . . . . . . . . . . . . . . . . 69 Note 15 – Other notes . . . . . . . . . . . . . . . . . . . . . . . . . . . . . . . . . . . . . . . . . . . . . . . . . . . . . . . . . . . . . . . . . . . . . . . . . . . . . . . . . . . . . . . . . . 69 Note 16 – Accounting policies . . . . . . . . . . . . . . . . . . . . . . . . . . . . . . . . . . . . . . . . . . . . . . . . . . . . . . . . . . . . . . . . . . . . . . . . . . . . . . . . . . 70

5756
Financial Statements – Parent CompanyFinancial Statements – Parent Company
Income statement
(DKK million) Note 2016 2015
Revenue (1) 7,360 6,876
Cost of sales (2,3) -4,644 -4,838
Gross profit 2,716 2,038
Sales and distribution costs (2,3) -1,928 -733
Research and development costs (2,3) -1,072 -1,085
Administrative costs (2,3) -1,156 -987
Other operating income 350 356
Other operating expenses -1 -15
Operating profit -1,091 -426
Income from investments in affiliates (10) 967 940
Income from investment in associate -3 -13
Financial income (4) 910 432
Financial expenses (5) -118 -265
Profit before tax 665 668
Tax on profit for the year (6) 78 45
Net profit for the year (7) 743 713

Financial Statements – Parent Company Financial Statements – Parent Company
5958
Balance sheet at 31 December
ASSETS
(DKK million) Note 2016 2015
Intellectual property rights 4,527 133
Trademarks 0 5
Development projects 1,079 299
Software 389 107
Intangible assets (8) 5,995 544
Land and buildings 378 415
Leasehold improvements 1 3
Plant and machinery 235 257
Other fixtures and fittings, tools and equipment 62 58
Fixed assets under construction 178 159
Property, plant and equipment (9) 854 892
Investment in associate 3 5
Investments in affiliates (10) 3,451 4,488
Other financial securities (11) 10,539 11,519
Deferred tax assets (12) 246 160
Financial fixed assets 14,239 16,172
Fixed assets 21,088 17,608
Raw materials and consumables 30 34
Work in progress 497 311
Finished goods and goods for resale 418 333
Inventories 945 678
Trade receivables 1,108 822
Loans to affiliates 899 566
Receivables from affiliates 557 2,355
Other receivables 934 1,442
Prepayments 32 70
Receivables 3,530 5,255
Other securities 12,268 11,531
Current assets 16,743 17,464
TOTAL ASSETS 37,831 35,072
EQUITY AND LIABILITIES
(DKK million) Note 2016 2015
Share capital (15) 250 250
Net revaluation, affiliates 206 1,248
Reserve for development projects 83 0
Retained earnings 24,523 23,253
Proposed dividend 150 0
Equity 25,212 24,751
Other provisions (13) 26 44
Provisions 26 44
Other long-term liabilities (14) 1,618 0
Non-current liabilities 1,618 0
Credit institutions 5,400 4,022
Bank loans 0 84
Trade payables 1,596 671
Loans from affiliates 2,860 3,464
Payables to affiliates 839 1,792
Other payables 280 244
Current liabilities 10,975 10,277
TOTAL EQUITY AND LIABILITIES 37,831 35,072
Balance sheet at 31 December
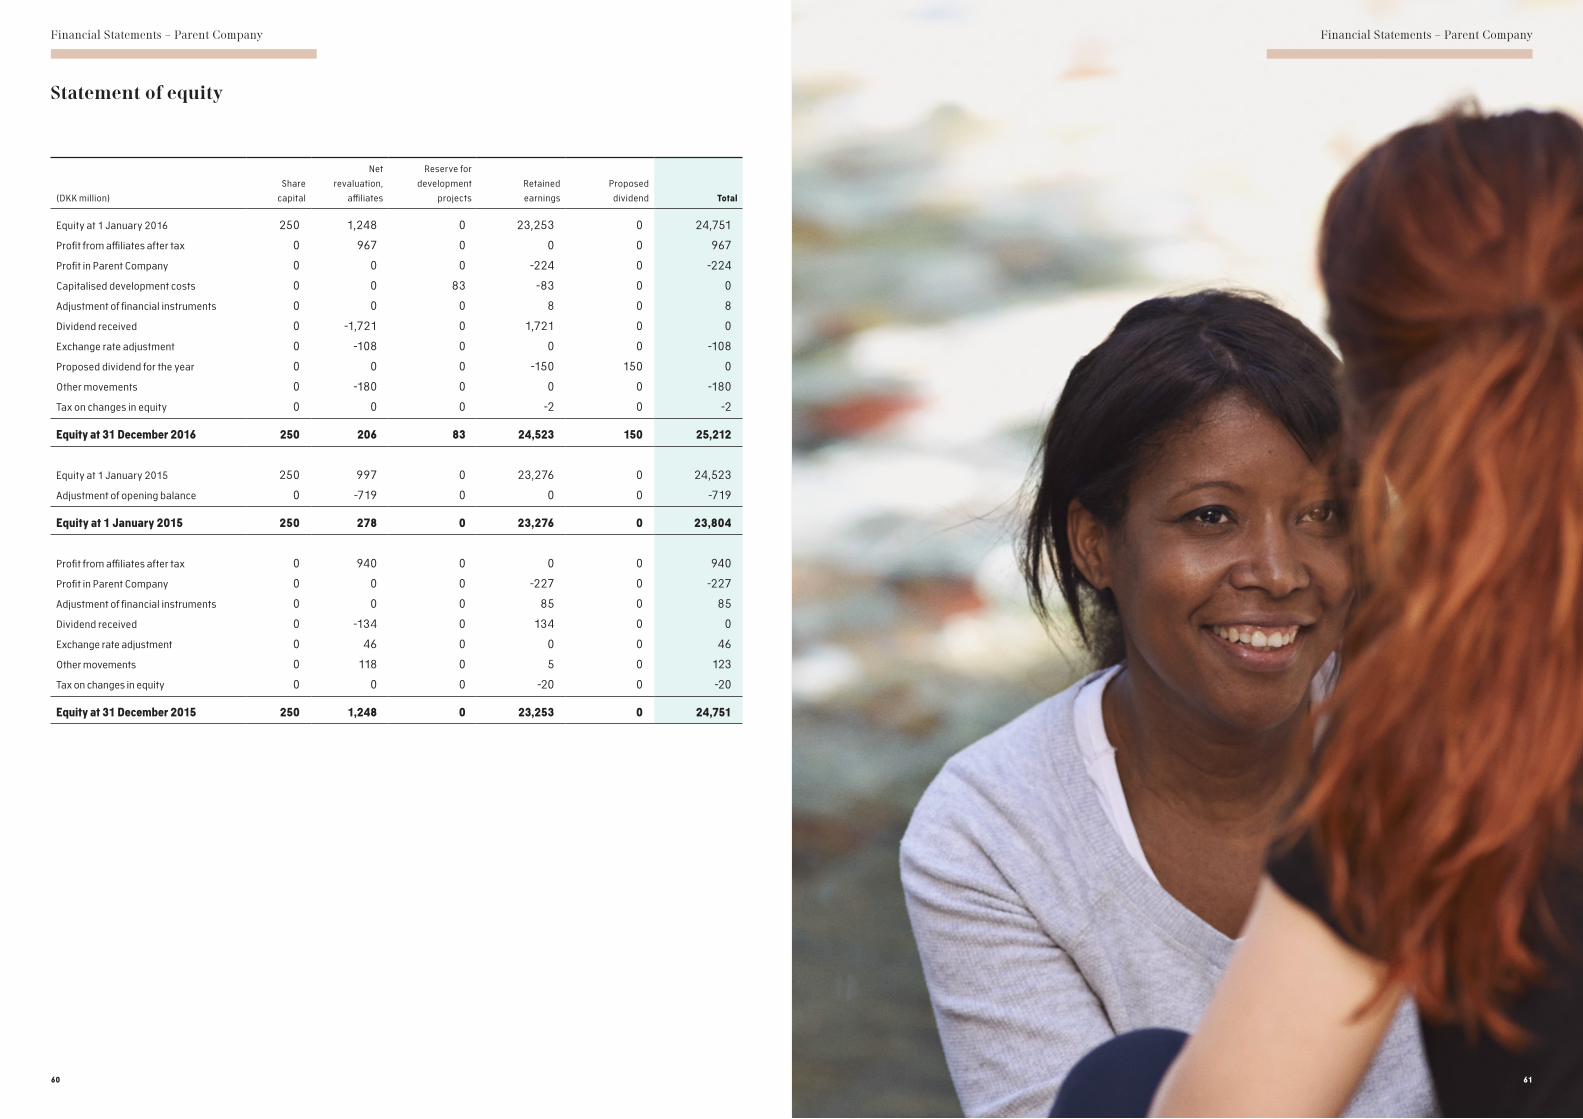
Financial Statements – Parent Company
60 61
Financial Statements – Parent Company
(DKK million)
Share
capital
Net
revaluation,
affiliates
Reserve for
development
projects
Retained
earnings
Proposed
dividend Total
Equity at 1 January 2016 250 1,248 0 23,253 0 24,751
Profit from affiliates after tax 0 967 0 0 0 967
Profit in Parent Company 0 0 0 -224 0 -224
Capitalised development costs 0 0 83 -83 0 0
Adjustment of financial instruments 0 0 0 8 0 8
Dividend received 0 -1,721 0 1,721 0 0
Exchange rate adjustment 0 -108 0 0 0 -108
Proposed dividend for the year 0 0 0 -150 150 0
Other movements 0 -180 0 0 0 -180
Tax on changes in equity 0 0 0 -2 0 -2
Equity at 31 December 2016 250 206 83 24,523 150 25,212
Equity at 1 January 2015 250 997 0 23,276 0 24,523
Adjustment of opening balance 0 -719 0 0 0 -719
Equity at 1 January 2015 250 278 0 23,276 0 23,804
Profit from affiliates after tax 0 940 0 0 0 940
Profit in Parent Company 0 0 0 -227 0 -227
Adjustment of financial instruments 0 0 0 85 0 85
Dividend received 0 -134 0 134 0 0
Exchange rate adjustment 0 46 0 0 0 46
Other movements 0 118 0 5 0 123
Tax on changes in equity 0 0 0 -20 0 -20
Equity at 31 December 2015 250 1,248 0 23,253 0 24,751
Statement of equity

6362
Notes – Parent Company Notes – Parent Company
Notes Parent Company

6564
Notes – Parent Company
64
Notes – Parent Company
64
NOTE 1 – REVENUE
(DKK million) 2016 2015
Revenue by region
EUROPE+ 4,409 4,985
INTERNATIONAL 2,159 1,437
US 792 454
Total 7,360 6,876
Segmentation – business areas
Healthcare 7,360 6,876
Total 7,360 6,876
NOTE 2 – STAFF EXPENSES
(DKK million) 2016 2015
Wages and salaries -1,301 -1,103
Pensions -123 -111
Social security expenses -14 -13
Other employee expenses -30 -40
Capitalised staff expenses 27 25
Total -1,441 -1,242
Included in
Cost of sales -321 -258
Sales and distribution costs -207 -194
Research and development costs -428 -409
Administrative costs -485 -381
Total -1,441 -1,242
Remuneration to the Board of Directors -4 -4
Remuneration to the Executive Board -15 -27
Average number of full-time employees 1,993 1,849
NOTE 3 – AMORTISATION, DEPRECIATION AND IMPAIRMENT LOSSES
(DKK million) 2016 2015
Amortisation -629 -104
Depreciation -118 -122
Impairment losses -32 -14
Total -779 -240
Included in
Cost of sales -51 -107
Sales and distribution costs -540 0
Research and development costs -11 -20
Administrative costs -177 -113
Total -779 -240
NOTE 4 – FINANCIAL INCOME
(DKK million) 2016 2015
Interest income on bonds 282 327
Interest income from affiliates 7 2
Capital gains, financial assets 604 90
Other financial income 17 13
Total 910 432
NOTE 5 – FINANCIAL EXPENSES
(DKK million) 2016 2015
Interest expenses to affiliates -2 -5
Exchange rate losses -47 -238
Other financial expenses -69 -22
Total -118 -265
NOTE 6 – TAX ON PROFIT FOR THE YEAR
(DKK million) 2016 2015
Current tax for the year -8 -9
Change in deferred tax 86 55
Adjustment relating to previous years 0 -1
Total 78 45
Tax on changes in equity -2 -20

676666
NOTE 8 – INTANGIBLE ASSETS
(DKK million)
Intellectual
property rights Trademarks
Development
projects Software
Total
intangible assets
Cost at 1 January 2016 5,138 30 376 154 5,698
Exchange rate adjustment -1 0 1 0 0
Additions during the year 5,013 0 982 118 6,113
Transfers 0 0 -203 203 0
Cost at 31 December 2016 10,150 30 1,156 475 11,811
Amortisation and impairment losses at 1 January 2016 -5,005 -25 -77 -47 -5,154
Exchange rate adjustment -1 0 0 0 -1
Amortisation for the year -585 -5 0 -39 -629
Impairment losses for the year -32 0 0 0 -32
Amortisation and impairment losses at 31 December 2016 -5,623 -30 -77 -86 -5,816
CARRYING AMOUNT AT 31 DECEMBER 2016 4,527 0 1,079 389 5,995
Cost at 1 January 2015 5,138 30 130 154 5,452
Additions during the year 0 0 246 0 246
Cost at 31 December 2015 5,138 30 376 154 5,698
Amortisation and impairment losses at 1 January 2015 -4,936 -19 -71 -10 -5,036
Amortisation for the year -61 -6 0 -37 -104
Impairment losses for the year -8 0 -6 0 -14
Amortisation and impairment losses at 31 December 2015 -5,005 -25 -77 -47 -5,154
CARRYING AMOUNT AT 31 DECEMBER 2015 133 5 299 107 544
Development projects amounted to DKK 1,079 million (2015: DKK 299 million), of which development projects in progress represented DKK 1,079 million (2015: DKK 299 million) . Capitalised costs for development projects primarily consist of licences in relation to research and development projects and internally developed software .
NOTE 9 – PROPERTY, PLANT AND EQUIPMENT
(DKK million)
Land and
buildings
Leasehold
improvements
Plant and
machinery
Other fixtures
and fittings,
tools and
equipment
Fixed assets
under
construction
Total property,
plant and
equipment
Cost at 1 January 2016 1,056 4 1,190 384 159 2,793
Exchange rate adjustment 0 -1 0 -1 0 -2
Additions during the year 0 0 0 13 71 84
Disposals during the year -1 0 -1 -25 0 -27
Transfers 14 0 28 10 -52 0
Cost at 31 December 2016 1,069 3 1,217 381 178 2,848
Depreciation and impairment losses at 1 January 2016 -641 -1 -933 -326 0 -1,901
Disposals during the year 1 0 1 23 0 25
Depreciation for the year -51 -1 -50 -16 0 -118
Depreciation and impairment losses at 31 December 2016 -691 -2 -982 -319 0 -1,994
CARRYING AMOUNT AT 31 DECEMBER 2016 378 1 235 62 178 854
Cost at 1 January 2015 1,053 3 1,136 404 122 2,718
Additions during the year 3 1 9 9 92 114
Disposals during the year -2 0 -6 -31 0 -39
Transfers 2 0 51 2 -55 0
Cost at 31 December 2015 1,056 4 1,190 384 159 2,793
Depreciation and impairment losses at 1 January 2015 -589 0 -890 -337 0 -1,816
Disposals during the year 0 0 7 30 0 37
Depreciation for the year -52 -1 -50 -19 0 -122
Depreciation and impairment losses at 31 December 2015 -641 -1 -933 -326 0 -1,901
CARRYING AMOUNT AT 31 DECEMBER 2015 415 3 257 58 159 892
NOTE 7 – PROPOSED DISTRIBUTION OF NET PROFIT FOR THE YEAR
(DKK million) 2016 2015
Net revaluation for the year 967 940
Proposed dividend 150 0
Retained earnings -374 -227
Total 743 713
Notes – Parent CompanyNotes – Parent Company

696868
NOTE 10 – INVESTMENTS IN AFFILIATES
(DKK million) 2016 2015
Cost at 1 January 3,240 3,313
Additions 5 2
Disposals 0 -75
Cost at 31 December 3,245 3,240
Value adjustment at 1 January 1,248 278
Share of profit/loss for the year 967 940
Dividend -1,721 -134
Exchange rate adjustment -108 46
Other movements -180 118
Value adjustment at 31 December 206 1,248
CARRYING AMOUNT AT 31 DECEMBER 3,451 4,488
NOTE 11 – OTHER FINANCIAL SECURITIES
(DKK million) 2016 2015
Cost at 1 January 11,556 13,986
Additions during the year 2,659 1,702
Disposals during the year -3,637 -4,132
Cost at 31 December 10,578 11,556
Value adjustment at 1 January -37 2
Value adjustment for the year -6 -23
Value adjustment on disposals for the year 4 -16
Value adjustment at 31 December -39 -37
CARRYING AMOUNT AT 31 DECEMBER 10,539 11,519
Market value at 31 December 10,694 11,576
NOTE 12 – DEFERRED TAX ASSETS
(DKK million) 2016 2015
Deferred tax assets at 1 January 160 124
Adjustments relating to previous years 0 -3
Deferred tax on equity 0 -16
Deferred tax on profit for the year 86 55
Deferred tax assets at 31 December 246 160
The deferred tax assets relate to current assets, licences, fixed assets, losses relating to previously jointly taxed foreign affiliates, intercompany profits, indirect production costs, etc . Deferred tax has been calculated as the temporary differences between assets and liabilities expected to be realised, based on a tax rate of 22% .
NOTE 13 – OTHER PROVISIONS
(DKK million) 2016 2015
Staff-related provisions 25 29
Other provisions 1 15
Total 26 44
Other provisions fall due
0-1 year 8 26
1-5 years 7 10
> 5 years 11 8
Total 26 44
NOTE 14 – OTHER LONG-TERM LIABILITIES
(DKK million) 2016 2015
Other long-term liabilities fall due
1-5 years 1,618 0
Total 1,618 0
NOTE 15 – OTHER NOTES
For Share capital, please refer to note 12 in the Consolidated Financial Statements.
For Unusual circumstances, please refer to note 17 in the Consolidated Financial Statements.
For Contingencies, please refer to note 18 in the Consolidated Financial Statements.
For Financial instruments, please refer to note 19 in the Consolidated Financial Statements.
For Related parties, please refer to note 20 in the Consolidated Financial Statements.
For Events after the balance sheet date, please refer to note 21 in the Consolidated Financial Statements.
Notes – Parent CompanyNotes – Parent Company

Management’s statementThe Executive Board and the Board of Directors have today considered and adopted the Annual Report of LEO Pharma A/S for the financial year 1 January – 31 December 2016.
The Annual Report has been prepared in accordance with the Danish Financial Statements Act.
In our opinion, the Consolidated Financial Statements and the Financial Statements of the Parent Company give a true and fair view of the financial position at 31 De-cember 2016 of the Group and the Parent Company, and of the results of the Group’s and the Parent Company’s operations and the consolidated cash flows for 2016.
In our opinion, Management’s Review includes a true and fair account of the matters addressed in the Review.
We recommend that the Annual Report be adopted at the Annual General Meeting.
Ballerup, 30 March 2017
EXECUTIVE BOARD:
Gitte P. Aabo Anders Kronborg President & CEO CFO
BOARD OF DIRECTORS:
Jukka Pertola Patrik O. Dahlén Jens Bo Olesen Peder Holk Nielsen Chairman Vice Chairman
John R. Weeks Ingelise Saunders Jesper Høiland Jannie Kogsbøll
Karin Attermann Lotte Hjortshøj Larsen
7170
Management’s statement
70
NOTE 16 – ACCOUNTING POLICIES
The Financial Statements of the Parent Company, LEO Pharma A/S, for 2016 have been prepared in accordance with the provisions of the Danish Financial Statements Act applying to large enterprises of reporting class C.
LEO Pharma has implemented Act no. 738 of 1 June 2015 from 1 January 2016, when it came into force.
The comparative figures have been restated to reflect the changed accounting policies.
Furthermore, the amended Danish Financial Statements Act has en- tailed the following changes to presentation for the Parent Company:– Going forward, an amount corresponding to the capitalised de-velopment costs will be tied to the restricted reserve, “Reserve for development costs”, under equity. This reserve cannot be used for dividends or distributions or to cover losses. If the recognised devel-opment costs are sold or otherwise excluded from the Company's operations, the reserve will be dissolved and transferred directly tothe distributable reserves under equity. If the recognised develop-ment costs are written down, the part of the reserve corresponding to the write-down of the development costs will be reversed. If a write-down of development costs is subsequently reversed, the re-serve will be re-established. The reserve is reduced by amortisation of capitalised development costs on an ongoing basis.
Apart from the above, the accounting policies used in the prepar-ation of the Financial Statements are consistent with those of last year and are the same as for the Consolidated Financial Statements with the following additions.
For a description of the Group’s accounting policies, please refer to note 23 in the Consolidated Financial Statements.
CASH FLOW STATEMENTIn accordance with the exemption clause in section 86(4) of the Danish Financial Statements Act, no separate cash flow statement has been prepared for the Parent Company.
TAXThe Parent Company is jointly taxed with all Danish affiliates.
The jointly taxed Danish affiliates settle the tax with the Parent Company. The current Danish tax is allocated between the jointly taxed companies in proportion to their taxable income.
EQUITYReserve for development costsThe reserve for development costs comprises capitalised develop-ment costs. This reserve cannot be used for dividends or distribu-tions or to cover losses. If the recognised development costs are sold or otherwise excluded from the Company's operations, the re-serve will be dissolved and transferred directly to the distributable reserves under equity. If the recognised development costs are written down, the part of the reserve corresponding to the write-down of the development costs will be reversed. If a write-down of development costs is subsequently reversed, the reserve will be re-established. The reserve is reduced by amortisation of capitalised development costs on an ongoing basis.
INVESTMENTS IN AFFILIATESInvestments in affiliates are measured under the equity method. This means that the affiliates are measured in the balance sheet at the proportionate share of their net asset value, with deduction or addition of unrealised intercompany profits or losses, and addi-tion of any remaining value of positive differences (goodwill) and deduction of any remaining value of negative differences (negative goodwill). The Parent Company’s share of the affiliates’ profit for the year is recognised in the income statement less unrealised inter-company profits.
The total net revaluation of investments in affiliates is transferred upon distribution of profit to “Reserve for net revaluation under the equity method” under equity. The reserve is reduced by dividends distributed to the Parent Company and adjusted for other equity movements in affiliates.
The effect of the transition to the amended Danish Financial Statements Act is as follows:
(DKK million) 1 January 2015
31 December 2015
Effect on
Investments in affiliates -719 188
Income from investments in affiliates after tax
- 68
Equity -719 188
Notes – Parent Company
7372
Independent Auditor’s ReportIndependent Auditor’s Report
72 73
Allan KnudsenState Authorised Public Accountant
Kim Füchsel State Authorised Public Accountant
Independent Auditor’s ReportTo the Shareholder of LEO Pharma A/S
OUR OPINIONIn our opinion, the Consolidated Financial Statements and the Parent Company Financial Statements give a true and fair view of the financial position of the Group and the Parent Company at 31 December 2016, and of the results of the Group’s and the Parent Company’s operations as well as the consolidated cash flows for the financial year 1 January – 31 December 2016 in ac-cordance with the Danish Financial Statements Act.
We have audited the Consolidated Financial State-ments and the Parent Company Financial Statements of LEO Pharma A/S for the financial year 1 January – 31 December 2016, which comprise income state-ment, balance sheet, statement of equity and notes, in-cluding a summary of significant accounting policies, for both the Group and the Parent Company, as well as consolidated statement of cash flows (“financial state-ments”).
BASIS FOR OPINIONWe conducted our audit in accordance with Interna-tional Standards on Auditing (ISAs) and the additional requirements applicable in Denmark. Our responsibili-ties under those standards and requirements are further described in the Auditor’s Responsibilities for the Audit of the Financial Statements section of our report. We are independent of the Group in accordance with the Inter-national Ethics Standards Board for Accountants’ Code of Ethics for Professional Accountants (IESBA Code) and the additional requirements applicable in Denmark, and we have fulfilled our other ethical responsibilities in ac-cordance with these requirements. We believe that the audit evidence we have obtained is sufficient and appro-priate to provide a basis for our opinion.
STATEMENT ON MANAGEMENT’S REVIEWManagement is responsible for Management’s Review.
Our opinion on the financial statements does not cover Management’s Review, and we do not express any form of assurance conclusion thereon.
In connection with our audit of the financial statements, our responsibility is to read Management’s Review and, in doing so, consider whether Management’s Review is materially inconsistent with the financial statements or our knowledge obtained during the audit, or otherwise appears to be materially misstated.
Moreover, it is our responsibility to consider whether Management’s Review provides the information re-quired under the Danish Financial Statements Act.
Based on the work we have performed, in our view, Management’s Review is in accordance with the Con-solidated Financial Statements and the Parent Com-pany Financial Statements and has been prepared in accordance with the requirements of the Danish Finan-cial Statements Act. We did not identify any material misstatement in Management’s Review.
MANAGEMENT’S RESPONSIBILITIES FOR THE FINANCIAL STATEMENTSManagement is responsible for the preparation of Con-solidated Financial Statements and Parent Company Financial Statements that give a true and fair view in accordance with the Danish Financial Statements Act, and for such internal control as Management deter-mines is necessary to enable the preparation of finan-cial statements that are free from material misstate-ment, whether due to fraud or error.
In preparing the financial statements, Management is responsible for assessing the Group’s and the Parent Company’s ability to continue as a going concern, disclosing, as applicable, matters related to
going concern and using the going concern basis of accounting in preparing the financial statements unless Management either intends to liquidate the Group or the Parent Company or to cease operations, or has no realistic alternative but to do so.
AUDITOR’S RESPONSIBILITIES FOR THE AUDIT OF THE FINANCIAL STATEMENTSOur objectives are to obtain reasonable assurance as to whether the financial statements as a whole are free from material misstatement, whether due to fraud or error, and to issue an auditor’s report that includes our opinion. Reasonable assurance is a high level of assurance, but is not a guarantee that an audit conducted in accordance with ISAs and the additional requirements applicable in Denmark will always detect a material misstatement when it exists. Misstatements can arise from fraud or error and are considered material if, individually or in the aggregate, they could reasonably be expected to influence the economic decisions of users taken on the basis of these financial statements.
As part of an audit conducted in accordance with ISAs and the additional requirements applicable in Denmark, we exercise professional judgement and maintain pro-fessional scepticism throughout the audit. We also:• Identify and assess the risks of material misstate-
ment of the financial statements, whether due to fraud or error, design and perform audit procedures responsive to those risks, and obtain audit evidence that is sufficient and appropriate to provide a basis for our opinion. The risk of not detecting a material misstatement resulting from fraud is higher than for one resulting from error, as fraud may involve collu-sion, forgery, intentional omissions, misrepresenta-tions or the override of internal control.
• Obtain an understanding of internal control rele-vant to the audit in order to design audit procedures that are appropriate in the circumstances, but not
for the purpose of expressing an opinion on the ef-fectiveness of the Group’s and the Parent Compa-ny’s internal control.
• Evaluate the appropriateness of accounting policies used and the reasonableness of accounting esti-mates and related disclosures made by Management.
• Conclude on the appropriateness of Management’s use of the going concern basis of accounting in pre-paring the financial statements and, based on the audit evidence obtained, whether a material un-certainty exists related to events or conditions that may cast significant doubt on the Group’s and the Parent Company’s ability to continue as a go-ing concern. If we conclude that a material uncer-tainty exists, we are required to draw attention in our auditor’s report to the related disclosures in the financial statements or, if such disclosures are in-adequate, to modify our opinion. Our conclusions are based on the audit evidence obtained up to the date of our auditor’s report. However, future events or conditions may cause the Group and the Parent Company to cease to continue as a going concern.
• Evaluate the overall presentation, structure and contents of the financial statements, including the disclosures, and whether the financial statements represent the underlying transactions and events in a manner that gives a true and fair view.
• Obtain sufficient appropriate audit evidence re-garding the financial information of the entities or business activities within the Group to express an opinion on the Consolidated Financial Statements. We are responsible for the direction, supervision and performance of the group audit. We remain solely responsible for our audit opinion.
We communicate with those charged with governance regarding, among other matters, the planned scope and timing of the audit and significant audit findings, including any significant deficiencies in internal control that we identify during our audit.
Hellerup, 30 March 2017 PricewaterhouseCoopers Statsautoriseret Revisionspartnerselskab CVR no.: 33 77 12 31

75
Company information
Company informationCOMPANY LEO Pharma A/S Industriparken 55 2750 Ballerup Denmark
Phone: +45 44 94 58 88 Fax: +45 72 26 33 21 Website: www.leo- pharma.com CVR no.: 56 75 95 14 Incorporated: 1908 Municipality of reg. office: Ballerup Financial year: 1 January – 31 December
BOARD OF DIRECTORS Jukka Pertola, Chairman Patrik O. Dahlén, Vice Chairman Jens Bo Olesen Peder Holk Nielsen John R. Weeks Ingelise Saunders Jesper Høiland Jannie Kogsbøll Karin Attermann Lotte Hjortshøj Larsen
EXECUTIVE BOARD Gitte P. Aabo, CEO Anders Kronborg, CFO
AUDITORS PricewaterhouseCoopers Statsautoriseret Revisionspartnerselskab
Strandvejen 44 2900 Hellerup
Denmark
74
Company information

Phone +45 4494 5888CVR no . 56759514www .leo-pharma .com
LEO Pharma A/SIndustriparken 552750 BallerupDenmark
The LEO wordmark and the LEO logo are registered trademarks of LEO Pharma A/S .© March/2017 LEO Pharma A/S