ANNUAL REPORT - Grape Growers of Ontario · · 2015-03-23ANNUAL REPORT. OUR VISION ... Market...
23
Year ending January 31, 2015 67 th ANNUAL REPORT
Transcript of ANNUAL REPORT - Grape Growers of Ontario · · 2015-03-23ANNUAL REPORT. OUR VISION ... Market...
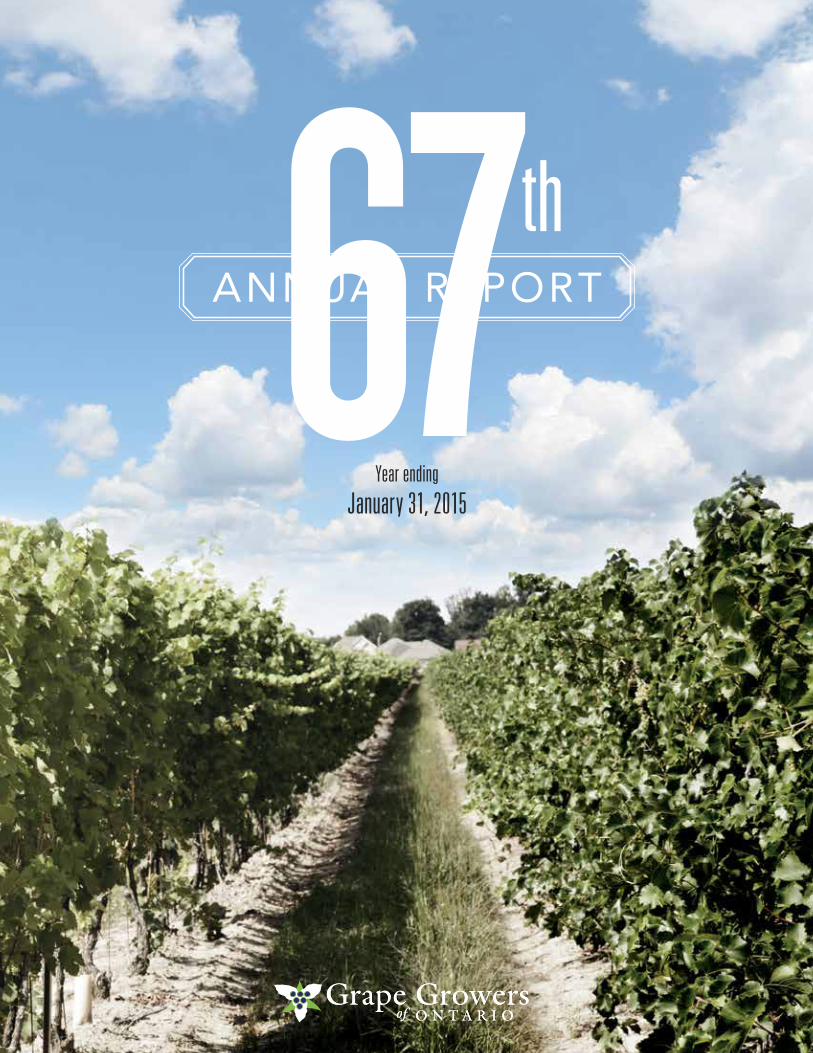
Year ending
January 31, 2015
67thANNUAL REPORT
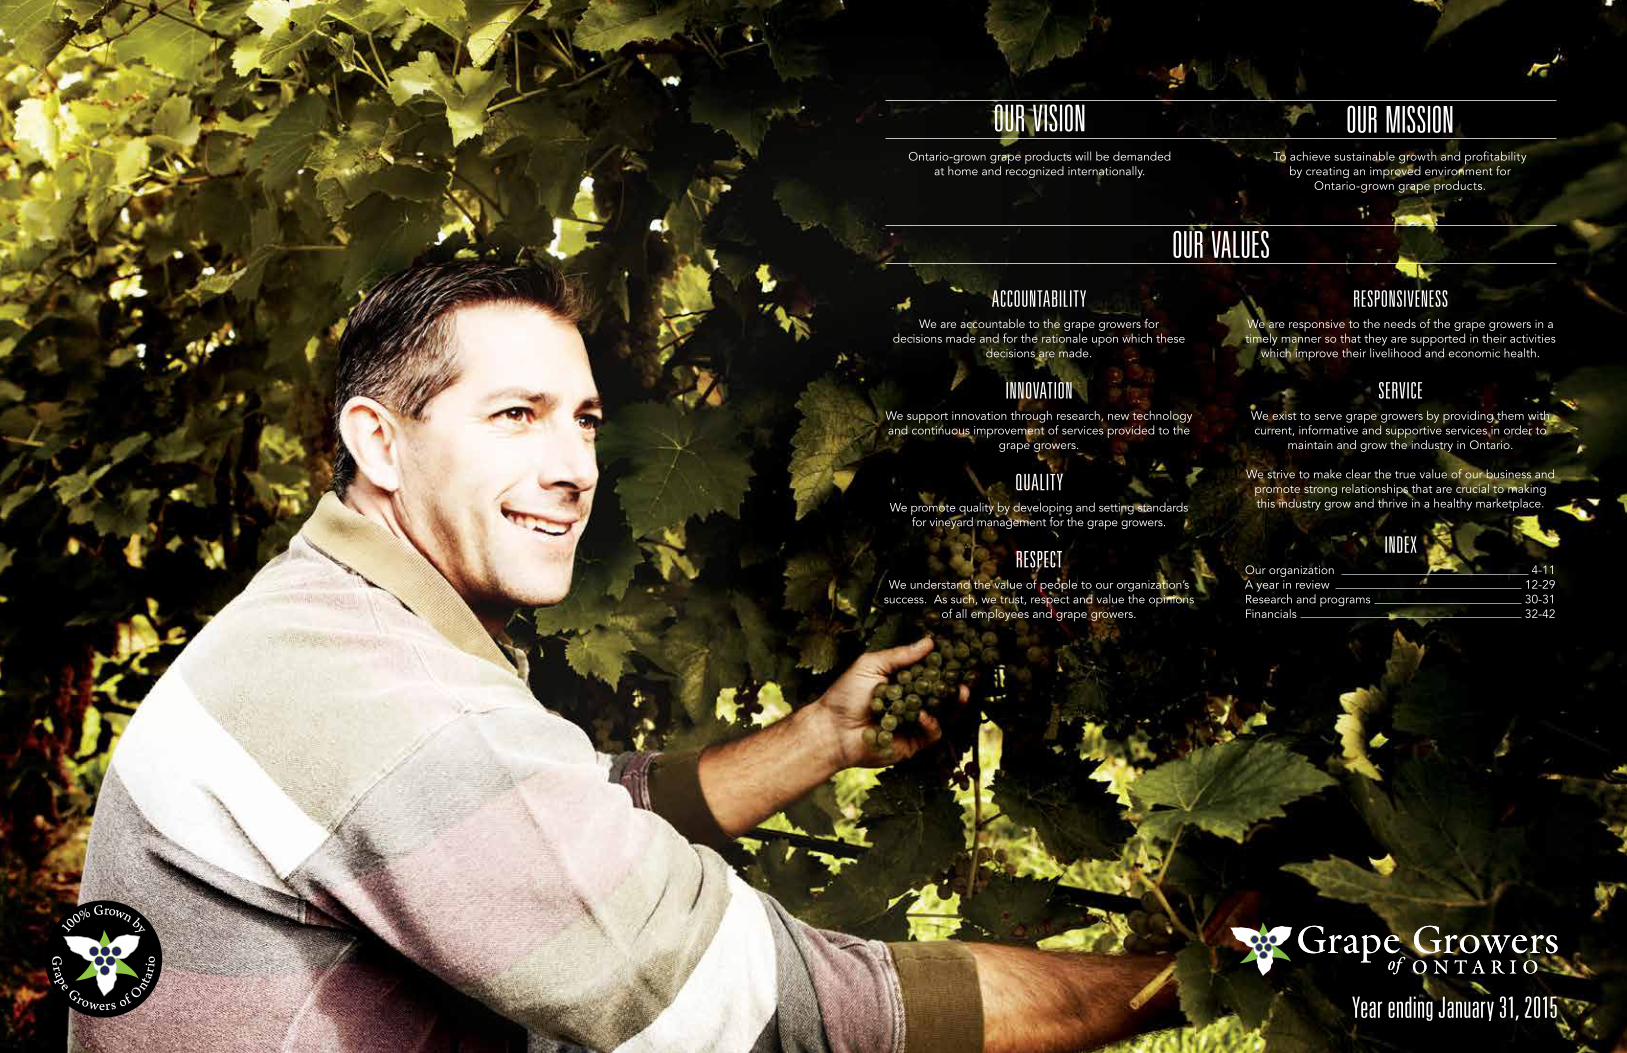
OUR VISION Ontario-grown grape products will be demanded
at home and recognized internationally.
OUR VALUES
OUR MISSIONTo achieve sustainable growth and profitability
by creating an improved environment for Ontario-grown grape products.
Year ending January 31, 2015
RESPONSIVENESSWe are responsive to the needs of the grape growers in a timely manner so that they are supported in their activities
which improve their livelihood and economic health.
SERVICEWe exist to serve grape growers by providing them with current, informative and supportive services in order to
maintain and grow the industry in Ontario.
We strive to make clear the true value of our business and promote strong relationships that are crucial to making this industry grow and thrive in a healthy marketplace.
INDEXOur organization 4-11A year in review 12-29Research and programs 30-31Financials 32-42
ACCOUNTABILITYWe are accountable to the grape growers for
decisions made and for the rationale upon which these decisions are made.
INNOVATIONWe support innovation through research, new technology and continuous improvement of services provided to the
grape growers.
QUALITYWe promote quality by developing and setting standards
for vineyard management for the grape growers.
RESPECTWe understand the value of people to our organization’s
success. As such, we trust, respect and value the opinions of all employees and grape growers.

2014-2015 BOARD OF DIRECTORSChair Bill George ◆ Vice Chair Matthias Oppenlaender ◆ CEO Debbie Zimmerman
Directors Ryan Bosgoed ◆ Trevor Falk ◆ Debra Marshall ◆ Jim Morrison Steve Pohorly ◆ Brock Puddicombe ◆ Bill Schenck ◆ Kevin Watson
2014-2015 STAFFChief Executive Officer Debbie Zimmerman ◆ Executive Assistant Gillian McWilliams
◆ Market Analyst Mary Jane Combe ◆ Project Manager Nick Lemieux
2014 brought changes to the GGO staff. Thank you to Nick Hubbard for his hard work and dedication over the past 7 years.
SHARED STAFFTreasurer Maureen Connell ◆ Office Manager/Accounts Payable Sylvana Lagrotteria
◆ Administrative Assistant Kelle Neufeld
GROWERS’ DELEGATESNiagara Peninsula Fruit and Vegetable Growers’ Association Steve Pohorly Ontario Fruit and Vegetable Growers’ Association Ray DucOntario Federation of Agriculture Jim MorrisonCanadian Horticultural Council Bill GeorgeNiagara Grape and Wine Festival Bill SchenckGreater Niagara Chamber of Commerce Bill SchenckNiagara-on-the-Lake Chamber of Commerce Matthias OppenlaenderNiagara Region Agricultural Policy and Action Committee Bill SchenckVintners’ Quality Alliance Kevin WatsonF.A.R.M.S. Trevor FalkWine Grape Industry Advisory Committee Bill George Matthias Oppenlaender Kevin Watson Trevor FalkJuice Grape Industry Advisory Committee Bill George Matthias Oppenlaender Jim Morrison Brock PuddicombeOntario Grape and Wine Research Inc. Matthias Oppenlaender Kevin Watson
2014-2015 GROWERS’ COMMITTEEBill George ◆ Matthias Oppenlaender ◆ Ryan Bosgoed ◆ Trevor Falk ◆ Don Forrer ◆
Doug Funk Jr. ◆ Ed Hughes ◆ Gerald Klose ◆ Ron Koop ◆ David Lambert ◆ Debra Marshall ◆ Jim Morrison ◆ Steve Pohorly ◆ Brock Puddicombe ◆ Bill Schenck ◆ Martin Schuele ◆
Albrecht Seeger ◆ Chris Van de Laar ◆ Kevin Watson ◆ Erwin Wiens ◆ Philip Wiley
54

On behalf of the Government of Ontario and the Ministry of Agriculture, Food and Rural Affairs, I am pleased to extend greetings to Ontario’s grape growers.
I am proud of Ontario’s grape and wine sector. It is a valuable part of Ontario’s economy and has potential for growth. This potential is especially important as we consider ways to meet the Premier’s Agri-Food Challenge – to double the agri-food sector’s growth rate and create 120,000 jobs by 2020.
The year 2014 was a busy one for the grape industry. While it was a challenging growing season and the crop was smaller, I am pleased to know that grape quality remained high.
The programs under the government’s 2009 Wine and Grape Strategy will be coming to a close this year. Over the past year, my ministry has been working closely with industry leaders to define the details of a renewed strategy. I appreciate the great collaboration that took place within the sector and with our government to build on the earlier strategy’s successes. Details of the renewed strategy will be shared with you in the very near future.
Part of the renewed Wine and Grape Strategy has already been successfully put in place: the sale of Vintners Quality Alliance (VQA) wine at farmers’ markets. By the end of 2014, there were 78 Ontario wineries selling their VQA wines at 139 Ontario farmers’ markets. This pilot project has improved consumers’ access to VQA wines, and sales of VQA wines at farmers’ markets have reached over $1 million. Our government will continue to closely monitor this pilot project as it moves into its second year.
In the meantime, grape growers continue to benefit from support provided through the final year of the Ontario Vineyard Improvement Program (OVIP).
Congratulations on your achievements in 2014. I wish you all the very best for success in 2015.
Kindest regards,
Honourable Jeff LealMinister of Agriculture, Food and Rural Affairs
GREETINGS FROM THE HONOURABLE
JEFF LEAL
57

On behalf of the Government of Canada, I’d like to thank Grape Growers of Ontario for your dedication to this dynamic sector for the past 67 years.
Ontario’s grape sector is an important contributor to the province’s and Canada’s economy, and the future continues to look bright. Your world-class wine industry generated almost $400 million in sales in 2013. Ontario is the biggest wine volume producer in Canada. The sector provides thousands of jobs through the value chain and, in addition to wines, delivers delicious juices and other grape products to consumers.
Our Government is helping to keep the Ontario grape industry competitive through investments in innovation. Great work is happening at the PARC-Summerland Research Centre to combat grape vine trunk diseases, and develop and implement effective control strategies for Canadian growers. We’ve improved access to new safe and effective crop protection tools under the Minor Use Pesticides Program, which has delivered over 1,500 new uses since its inception, including many for Ontario grapes.
Thanks to our joint investments under Growing Forward 2 of $417 million over five years, the governments of Canada and Ontario are supporting proactive initiatives from innovation, to food safety, to environment, to exports.
Once again, thank you for your commitment to Ontario’s grape sector and our economy. I wish you a successful year ahead.
GREETINGS FROM THE HONOURABLE
GERRY RITZAs the Member of the Legislative Assembly of Ontario for St. Catharines, it is my pleasure to again welcome everyone to the Annual General Meeting of the Grape Growers of Ontario. Those of us who reside in this province, and particularly those of us who reside in areas where our grapes are grown and our wine is produced, are very much aware of the contribution that the grape and wine industry makes to the economic prosperity of our province, both directly and indirectly.
Those who established the Ontario Grape Growers Marketing Board over six decades ago are responsible for the impressive progress that has been experienced in this area and have contributed to the status of Ontario as an internationally acclaimed wine region. By producing high quality grapes, you have ensured that vintners have been able to produce excellent wines which consistently win prestigious international awards. This is a testament to the commitment, capability and knowledge of Ontario grape growers.
Although our growers have had to confront many challenges over the years, the success that has been achieved in the grape and wine industry in Ontario is evidenced by the fact that the industry has grown and prospered, and for this, we are grateful to the Grape Growers of Ontario and your many dedicated members.
With very best wishes for continued success in 2015, I am
Yours sincerely,
Jim Bradley, MPP Chair, Ontario Wine Secretariat
Gerry Ritz, PC, MPMinister of Agriculture and Agri-food
GREETINGS FROM THE HONOURABLE
JIM BRADLEY
98

GRAPE KINGKEVIN BUIS
Kevin Buis was crowned Grape King at his family’s
Glenlake Vineyards in Niagara-on-the-Lake on
September 17, 2014. Kevin grew up on the family
farm, attended Denis Morris Secondary School and
then graduated with an engineering degree from
the University of Guelph in 1986.
Following university, Kevin joined his brother
working on the farm which was started by their
parents Peter and Margaret in 1957. His parents
retired in the late 1990’s and Kevin and his brother
Peter are together carrying on the family business,
which now consists of 400 acres of 14 varieties of
wine grapes and some tender fruit.
I have learned from my family
and from all of the previous
men and women who have worn
this chain, the importance of
contributing to our community
and to the agriculture industry.
The growers have long known
the importance of good policy
and the impact on the bottom
line of the farm gate.
Kevin, his wife Jacqueline and their family
look forward to being ambassadors for Ontario’s
grape growers over the coming year.
2014

MESSAGE FROM YOUR CEOMESSAGE FROM YOUR BOARD CHAIR
DEBBIE ZIMMERMANBILL GEORGE
Debbie Zimmerman CEO, Grape Growers of Ontario
Bill GeorgeChair, Grape Growers of Ontario
“Killer cold” weather will be how 2014 will be recorded in the grape growing history annals. On average, the winter of 2014 was 3 degrees colder than normal with extreme cold affecting many vineyards across Ontario. Despite the challenges of weather, grape growers produced a 52,716 tonne crop that included 2,164 tonnes of juice grapes. Incredible odds were against growers this year; however, a superb vintage will be available for consumers in the coming months.
Growing the Ontario market for Ontario wine continues to be our focus. The renewed Grape and Wine Strategy announced by the Premier of Ontario in December 2013 included a directive to industry to work towards establishing measurable goals as part of the new program framework. The work of many sub-committees, from marketing to program development, will ensure the effective use of the $75 million, five-year funding program. We thank the Government of Ontario and the Ministry of Agriculture, Food and Rural Affairs for their ongoing commitment to grape growers across the province.
Government policies play an important role with a direct impact on the success of the grape and wine industry. The GGO was invited to participate in a number of government policy reviews including the Alcohol and Gaming Commission of Ontario (AGCO) “Regulatory Modernization in Ontario’s Beverage Alcohol Industry”. In September, the AGCO announced a number of reforms affecting the wine industry that included a provision for post ’93 wineries to be able to blend wine for sale through the LCBO or Direct Delivery to Licensees.
In May, the province of Ontario launched a new program for the sale of VQA Wines at Farmers’ Markets across the province. This two-year pilot program was developed to allow more access for consumers to Ontario VQA wines. Over 100 Farmers’ Markets participated in the program and 67 local wineries.
The kick off to the Grape and Wine Festival each year is the Grape Growers of Ontario Celebrity Luncheon. This year, celebrated Canadian athlete Rick Hansen provided an inspiring talk to over 400 guests. We continued to focus on building the grower story by sponsoring a number of industry events: International Cool Climate Chardonnay Celebration (i4c), Insight Summit, Cuvée Awards, Grape and Wine Festival, media events and the Ontario Wine Awards. Social media continued to be a focus of the GGO’s marketing plan and, in September, Gabby Grape, the new Grape Mascot, launched her YouTube video. The industry bade a fond farewell to Mr. Grape who participated in 38 Grape and Wine Festival parades.
eGrape, after two years of development, went live for the harvest of 2014. This next generation of Vitis and Setgo systems was seamlessly introduced and welcomed by growers and processors. In addition to real time accurate data for users, the internal functionality has created a more efficient system for staff. Data collection will continue to be the cornerstone of the GGO’s strategic focus.
As we review our accomplishments over the past year, the overall success of the organization is without a doubt a reflection of the collective effort of Board leadership, Growers’ Committee participation and a dedicated staff.
The harvest of 2014 will be fondly remembered and described by two words: “Polar Vortex”. Record cold temperatures across Ontario and all grape growing regions resulted in winter injury to some varieties. The 2014 harvest was much reduced compared to 2013 and was recorded at 52,716 tonnes, comprised of 2,164 tonnes of juice grapes and 50,552 tonnes of wine grapes. The total farm gate value of the grape crop was $62.3 million. While it was a much smaller crop and valued significantly less than last year, the 2014 vintage produced by growers was another quality crop.
Following the completion of a successful two-year pricing agreement, the Grape Growers of Ontario (GGO), Wine Council of Ontario (WCO) and Winery and Grower Alliance of Ontario (WGAO) reached another two-year pricing arrangement in July 2014. The agreement included price increases for both White and Red Hybrids, White Vinifera and most Red Vinifera. While the increases are modest, the GGO also achieved an extension to Plateau Pricing and flexibility for processors by removing all hybrids from the sugar schedule. It was also agreed that all parties need to meet early in 2015 to begin discussions for pricing opportunities for 2016 and beyond.
Juice Grape pricing negotiations with the WGAO were completed on August 14, 2014 and also resulted in a two-year agreement with a 1.5% increase in 2014, and a 1% increase to all juice grapes in 2015.
2014 was the final year of the Ontario Vineyard Improvement Program (OVIP) which has been a true success story for grape growers, processors, and the Government of Ontario. To date, both the Government of Ontario and grape growers have invested $31,068,981 million into the grape industry.
The Government of Ontario also announced late last year the renewal of the five-year $75 million Wine and Grape Strategy. Throughout 2014, working with the Wine Council of Ontario, Winery and Grower Alliance, Grape Growers of Ontario, and government staff, the industry has collaborated on setting measurable targets for the programs over the next five years. In addition to government program review meetings, the Grape Growers of Ontario provided input and presented our views to Premier Wynne’s Advisory Council on Government Assets. The objective of this panel is to “make Ontario’s assets work better for taxpayers and consumers.” Our presentation to the panel emphasized the need to maintain and grow access for Ontario-grown product at the LCBO, and to ensure any recommendations contemplated by the panel would ensure our industry remains competitive with a focus on growth targets.
Your Board’s work reaches far beyond negotiating prices and each Director participates actively on many committees from governance, marketing, VQAO, and Information Technology (IT).
2014 will also be noted as a year of great loss in the grape growing community. In particular, we were saddened by the sudden passing of industry giant, Howard Staff. Howard was a leader in the grape and wine industry, and left an indelible mark on our industry. Tom Greensides, former GGO Board Chair, and Jack Forrer, former Board Director, who were pioneers in the grape growing industry also passed away this year.
Our success as an organization is reflected through the ongoing dedication of the Board of Directors, Grower Committee members and staff. I thank you for your commitment to the Grape Growers of Ontario.
1312

YEAR IN REVIEWThe 2014 harvest produced a crop of 52,716 tonnes, comprised of 2,164 tonnes of juice grapes and 50,552 tonnes of wine grapes, valued at $62.3 million.
Grapes “naturally frozen” on the vine produce Ontario’s premier Icewine. This year 3,751 tonnes were left hanging for Icewine, which may produce between 560,000 and 600,000 litres. Temperatures dipped below -8°C in early January 2015 creating ideal conditions for Icewine harvest.
VQA wine sales in Ontario have reached 16.0 million litres and $280 million in annual sales in 2013-2014, up from 15.9 million litres the year before. Ontario’s VQA wines account for 9.33% of sales and ICB/non-VQA wine adds another 29.36%, giving a total of 38.69% of wine sold in Ontario. Each year wineries are selling more 100% Ontario ICB/non-VQA wine.
Ontario Wineries by Region
Lake Erie North Shore 17
Niagara Peninsula 98
Prince Edward County 37
Emerging Regions 26
Total Ontario Wineries 178
(including Virtual wineries)
Cabernet Franc 9 %
Other White Vinifera 8 %
Pinot Gris 4 % Riesling 12 %
Chardonnay 13 %
Other White French Hybrids 2 %
Vidal 12 %
Blue/Red French Hybrids 8 %
Labrusca 5 %
Merlot 8 %
Pinot Noir 7 %
Cabernet Sauvignon 7 %
Other Red Vinifera 5 %
53% of acres are white grapes
47% of acres arered grapes
2014 WEATHER REPORT2014 had characteristic growing degree day accumulation and comprised normal to slightly above normal seasonal rainfall. This growing season was noteworthy for its warm spring, cool summer, and warm autumn.
January through March was, on average, 3°C cooler than normal with some extreme cold temperatures reaching killing temperatures for primary buds. April temperatures started normal to slightly above and declined to below normal at the end of the month. Below normal temperatures continued through the first half of May. Temperatures from end of May through June were above normal. Overnight lows deviated less than daytime highs in spring.
Temperatures between July and August were below normal. September and October returned to above normal temperatures. Growing Degree Days (GDD) accumulated quickly and steadily during the warm spring. The cool summer temperatures slowed GDD accumulation to maintain near normal accumulated GDD for the season.
In terms of rainfall, the 2014 growing season commenced with above-normal April totals, except for the Lake Erie North Shore appellation which had near normal rainfall. The month of May brought slightly above normal rain to Ontario appellations.
Eastern Niagara and Prince Edward County received above normal rainfall during June, while rainfall in Western Niagara
and Lake Erie North Shore was normal to slightly below. July rainfall was above normal for all appellations. Niagara received below normal rainfall for both August and September. However, the Lake Erie North Shore appellation had above normal rainfall in September. The month of October returned to normal rainfall in Niagara West and Prince Edward County while Niagara East and Lake Erie North Shore received slightly below normal rainfall. Below normal rainfall led to more favourable harvest conditions for September and October compared to the wetter conditions last year.
2014 wrapped up with normal temperatures to start November followed by a period of below normal temperature in mid-November. December proved to be warmer than normal with daytime highs exceeding 5 degrees above normal. The accumulation of Nov-Dec 2014 icewine hours averaged 29 hours across Niagara, 51 hours across the Lake Erie North Shore appellation and 62 hours across the Prince Edward County appellation.
This season provided some challenges but the growing season still produced quality yields for wine and icewine from the many practiced viticulturalists and winemakers across the Ontario appellations.
For more detailed weather data, management tools and weather reports throughout the year, visit vineinnovations.com – sponsored by the Grape Growers of Ontario.
Seasonal Accumulation of Base 10˚C GDD
Rainf
all (m
m)
April AugustJune OctoberMay SeptemberJuly-60
20
-40
40
-20
60
0
80
Lake Erie North Shore
Niagara West
Prince Edward Country
Niagara East
2014 Monthly Rainfall Deviation from Normal
Ontario Wine Grape Vineyards (by acreage)
2007 2008 2009
2012
2010
20132011 2014
1250500 15007500 17501000250
NIAGARA
LENS
PEC
4 51514
PRODUCTIONTABLE I
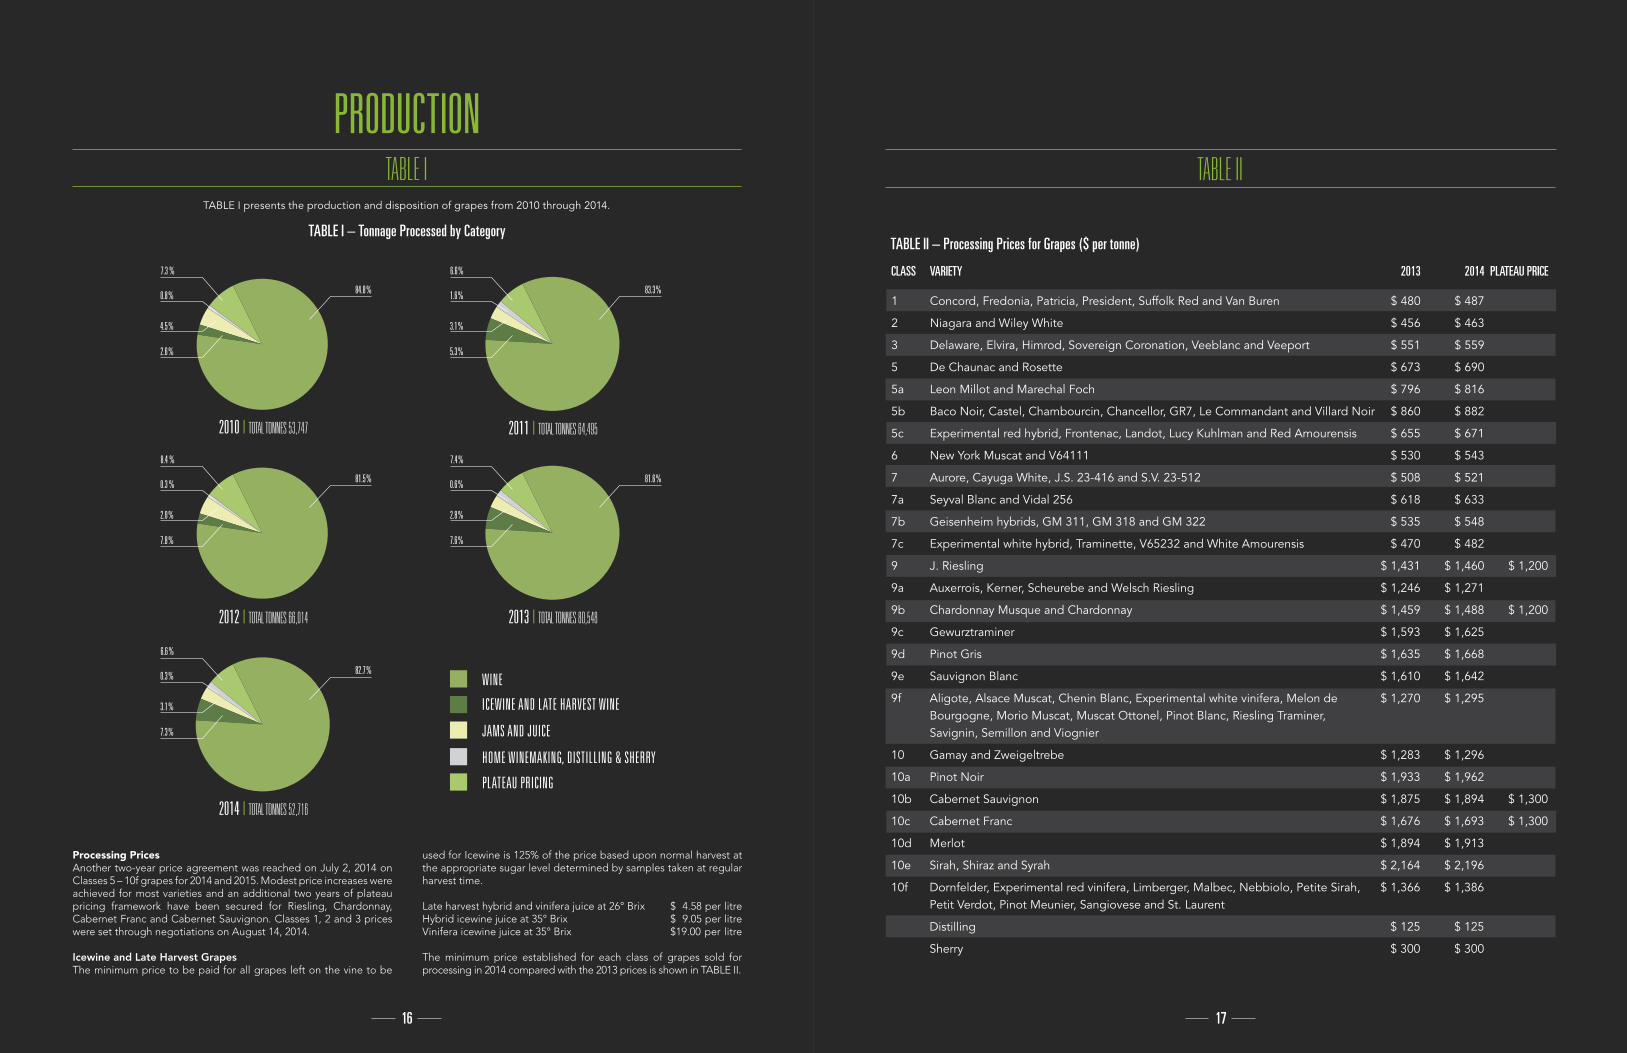
TABLE I presents the production and disposition of grapes from 2010 through 2014.
TABLE I – Tonnage Processed by Category
WINE
ICEWINE AND LATE HARVEST WINE
JAMS AND JUICE
HOME WINEMAKING, DISTILLING & SHERRY
PLATEAU PRICING
2010 | TOTAL TONNES 53,747
7.3 %
0.8 %
4.5 %
2.6 %
84.8 %
2012 | TOTAL TONNES 66,014
8.4 %
0.3 %
2.0 %
7.8 %
81.5 %
2011 | TOTAL TONNES 64,495
6.6 %
1.6 %
3.1 %
5.3 %
83.3 %
2013 | TOTAL TONNES 80,548
7.4 %
0.6 %
2.8 %
7.6 %
81.6 %
2014 | TOTAL TONNES 52,716
6.6 %
0.3 %
3.1 %
7.3 %
82.7 %
Processing PricesAnother two-year price agreement was reached on July 2, 2014 on Classes 5 – 10f grapes for 2014 and 2015. Modest price increases were achieved for most varieties and an additional two years of plateau pricing framework have been secured for Riesling, Chardonnay, Cabernet Franc and Cabernet Sauvignon. Classes 1, 2 and 3 prices were set through negotiations on August 14, 2014.
Icewine and Late Harvest GrapesThe minimum price to be paid for all grapes left on the vine to be
used for Icewine is 125% of the price based upon normal harvest at the appropriate sugar level determined by samples taken at regular harvest time.
Late harvest hybrid and vinifera juice at 26° Brix $ 4.58 per litreHybrid icewine juice at 35° Brix $ 9.05 per litreVinifera icewine juice at 35° Brix $19.00 per litre
The minimum price established for each class of grapes sold for processing in 2014 compared with the 2013 prices is shown in TABLE II.
TABLE II
CLASS VARIETY 2013 2014 PLATEAU PRICE
1 Concord, Fredonia, Patricia, President, Suffolk Red and Van Buren $ 480 $ 487
2 Niagara and Wiley White $ 456 $ 463
3 Delaware, Elvira, Himrod, Sovereign Coronation, Veeblanc and Veeport $ 551 $ 559
5 De Chaunac and Rosette $ 673 $ 690
5a Leon Millot and Marechal Foch $ 796 $ 816
5b Baco Noir, Castel, Chambourcin, Chancellor, GR7, Le Commandant and Villard Noir $ 860 $ 882
5c Experimental red hybrid, Frontenac, Landot, Lucy Kuhlman and Red Amourensis $ 655 $ 671
6 New York Muscat and V64111 $ 530 $ 543
7 Aurore, Cayuga White, J.S. 23-416 and S.V. 23-512 $ 508 $ 521
7a Seyval Blanc and Vidal 256 $ 618 $ 633
7b Geisenheim hybrids, GM 311, GM 318 and GM 322 $ 535 $ 548
7c Experimental white hybrid, Traminette, V65232 and White Amourensis $ 470 $ 482
9 J. Riesling $ 1,431 $ 1,460 $ 1,200
9a Auxerrois, Kerner, Scheurebe and Welsch Riesling $ 1,246 $ 1,271
9b Chardonnay Musque and Chardonnay $ 1,459 $ 1,488 $ 1,200
9c Gewurztraminer $ 1,593 $ 1,625
9d Pinot Gris $ 1,635 $ 1,668
9e Sauvignon Blanc $ 1,610 $ 1,642
9f Aligote, Alsace Muscat, Chenin Blanc, Experimental white vinifera, Melon de $ 1,270 $ 1,295 Bourgogne, Morio Muscat, Muscat Ottonel, Pinot Blanc, Riesling Traminer, Savignin, Semillon and Viognier
10 Gamay and Zweigeltrebe $ 1,283 $ 1,296
10a Pinot Noir $ 1,933 $ 1,962
10b Cabernet Sauvignon $ 1,875 $ 1,894 $ 1,300
10c Cabernet Franc $ 1,676 $ 1,693 $ 1,300
10d Merlot $ 1,894 $ 1,913
10e Sirah, Shiraz and Syrah $ 2,164 $ 2,196
10f Dornfelder, Experimental red vinifera, Limberger, Malbec, Nebbiolo, Petite Sirah, $ 1,366 $ 1,386 Petit Verdot, Pinot Meunier, Sangiovese and St. Laurent
Distilling $ 125 $ 125
Sherry $ 300 $ 300
TABLE II – Processing Prices for Grapes ($ per tonne)
1716

VALUE OF CROP PURCHASEDTABLE III – Farm Gate Value of Grapes Purchased by Processors
GRAPE KINGS PAST AND PRESENT
2010 2011 2012 2013 2014
GROSS FARM GATE VALUE ($’000)
$69,425$78,661
$88,630
$100,795
$62,303
LICENCE FEESTABLE IV
In the aggregate, licence fees for the 2014-2015 fiscal year represent approximately 1.5% of the total farm gate value of the crop. This remained constant from the 2013-2014 fiscal year in which licence fees also represented approximately 1.5% of the crop value.
CLASS VARIETY 2013 2014
1 Concord, Fredonia, Patricia, President, Suffolk Red and Van Buren $ 7.00 $ 7.00
2 Niagara and Wiley White $ 7.00 $ 7.00
3 Delaware, Elvira, Himrod, Sovereign Coronation, Veeblanc and Veeport $ 7.00 $ 7.00
5 De Chaunac and Rosette $ 15.15 $ 15.30
5a Leon Millot and Marechal Foch $ 16.25 $ 16.40
5b Baco Noir, Castel, Chambourcin, Chancellor, GR7, Le Commandant and Villard Noir $ 16.80 $ 17.00
5c Experimental red hybrid, Frontenac, Landot, Lucy Kuhlman and Red Amourensis $ 14.95 $ 15.10
6 New York Muscat and V64111 $ 13.85 $ 13.95
7 Aurore, Cayuga White, J.S. 23-416 and S.V. 23-512 $ 13.65 $ 13.75
7a Seyval Blanc and Vidal 256 $ 14.65 $ 14.75
7b Geisenheim hybrids, GM 311, GM 318 and GM 322 $ 13.90 $ 14.00
7c Experimental white hybrid, Traminette, V65232 and White Amourensis $ 13.30 $ 13.40
9 J. Riesling $ 21.95 $ 22.20
9a Auxerrois, Kerner, Scheurebe and Welsch Riesling $ 20.30 $ 20.50
9b Chardonnay Musque and Chardonnay $ 22.20 $ 22.45
9c Gewurztraminer $ 23.40 $ 23.70
9d Pinot Gris $ 23.80 $ 24.10
9e Sauvignon Blanc $ 23.55 $ 23.85
9f Aligote, Alsace Muscat, Chenin Blanc, Experimental white vinifera, Gruner Veltliner, $ 20.50 $ 20.75 Italian Muscat, Melon de Bourgogne, Morio Muscat, Muscat Ottonel, Muscat Petit Le Grain, Pinot Blanc, Riesling Traminer, Savignin, Semillon and Viognier
10 Gamay and Zweigeltrebe $ 20.60 $ 20.75
10a Pinot Noir $ 26.45 $ 26.75
10b Cabernet Sauvignon $ 25.95 $ 26.10
10c Cabernet Franc $ 24.15 $ 24.30
10d Merlot $ 26.10 $ 26.30
10e Sirah, Shiraz and Syrah $ 28.55 $ 28.85
10f Blauberger, Dornfelder, Experimental red vinifera, Limberger, Malbec, Nebbiolo, Petite $ 21.35 $ 21.55 Sirah, Petit Verdot, Pinot Meunier, Sangiovese, St. Laurent, Tannat and Tempranillo
Distilling $ 5.50 $ 5.50
Sherry $ 7.75 $ 7.75
TABLE IV – Licence Fees per Tonne by Class and Variety (including R & D fee of $2.05)
Note: 2014 Vertically Integrated Tonnage licence fee rebate is $2.00 per tonne.
St. Catharines Mayor’s Grape Stomp at Niagara Wine Festival: Kevin Buis, 2014 Grape King; Wes Wiens, 2013 Grape King; and Bill George, Chair GGO
Celebrity Luncheon: Debbie Zimmerman, CEO; John Howard, Recipient of the Rick Hansen Foundation Difference Maker’s Award; Rick Hansen, Celebrity Guest Speaker; Bill George, Chair GGO
4 51918
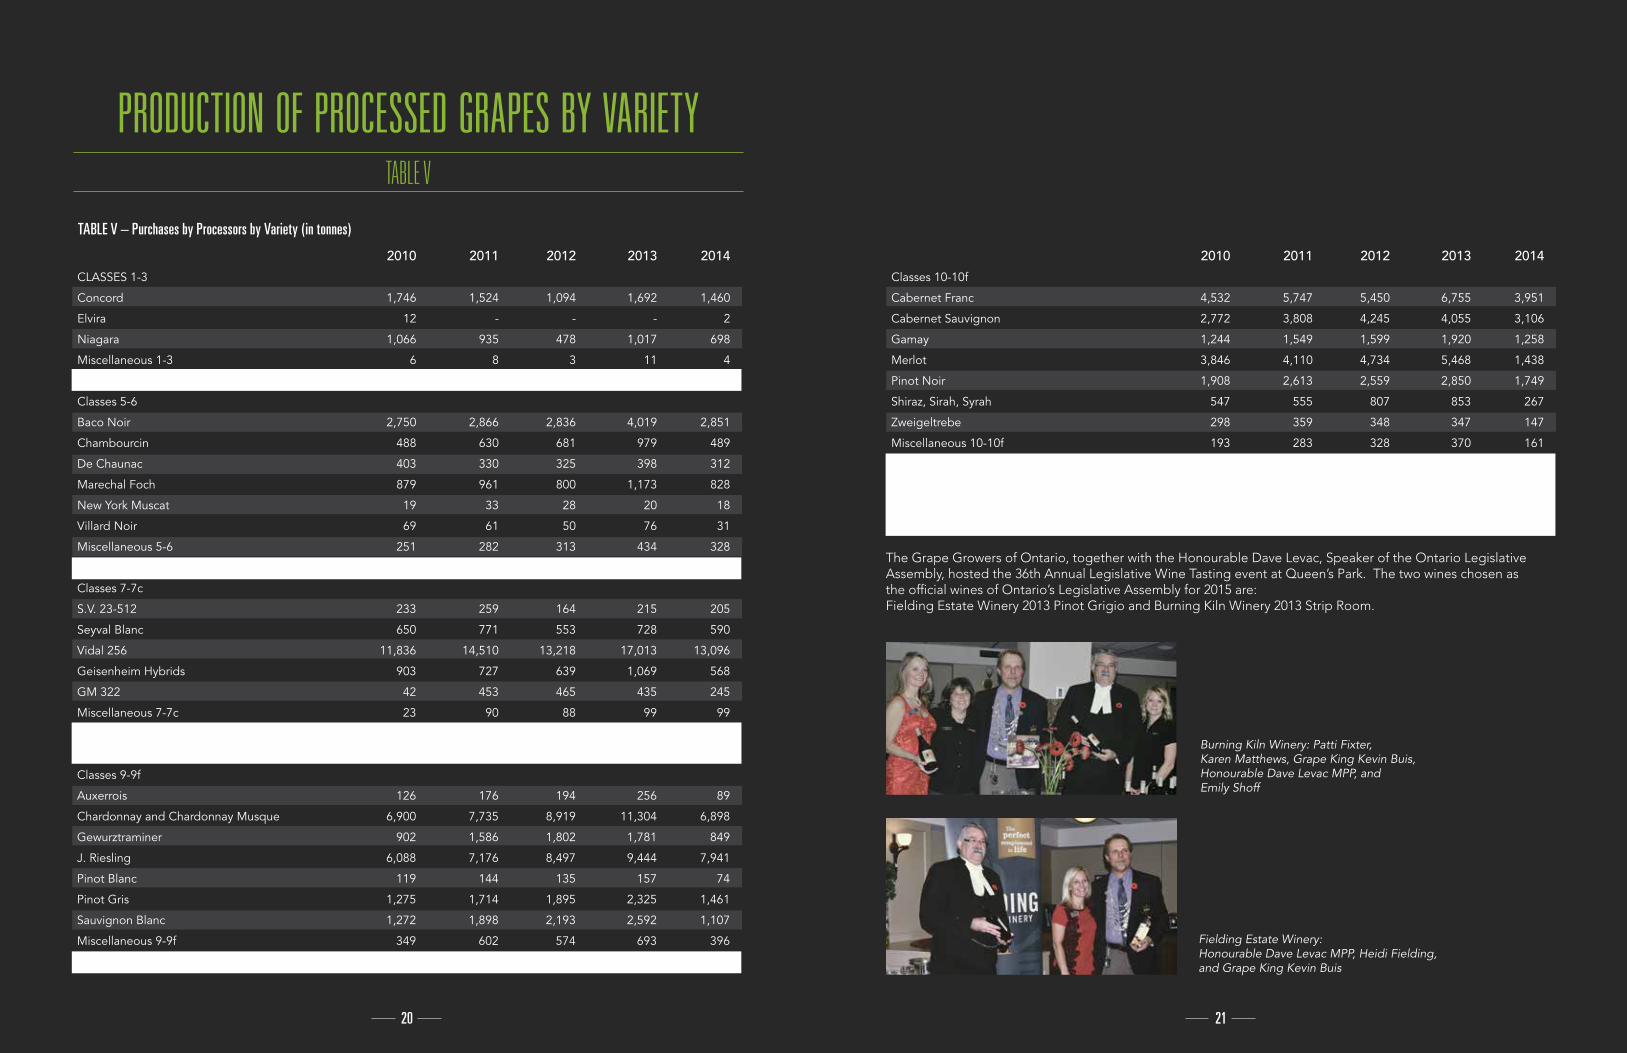
PRODUCTION OF PROCESSED GRAPES BY VARIETYTABLE V
2010 2011 2012 2013 2014
CLASSES 1-3
Concord 1,746 1,524 1,094 1,692 1,460
Elvira 12 - - - 2
Niagara 1,066 935 478 1,017 698
Miscellaneous 1-3 6 8 3 11 4
SUB-TOTAL (Labrusca) 2,830 2,467 1,575 2,720 2,164
Classes 5-6
Baco Noir 2,750 2,866 2,836 4,019 2,851
Chambourcin 488 630 681 979 489
De Chaunac 403 330 325 398 312
Marechal Foch 879 961 800 1,173 828
New York Muscat 19 33 28 20 18
Villard Noir 69 61 50 76 31
Miscellaneous 5-6 251 282 313 434 328
SUB-TOTAL (Blue/Red French hybrids) 4,859 5,163 5,033 7,099 4,857
Classes 7-7c
S.V. 23-512 233 259 164 215 205
Seyval Blanc 650 771 553 728 590
Vidal 256 11,836 14,510 13,218 17,013 13,096
Geisenheim Hybrids 903 727 639 1,069 568
GM 322 42 453 465 435 245
Miscellaneous 7-7c 23 90 88 99 99
SUB-TOTAL (White French Hybrids) 13,687 16,810 15,127 19,559 14,803
SUB-TOTAL (Hybrids) 18,546 21,973 20,160 26,658 19,660
Classes 9-9f
Auxerrois 126 176 194 256 89
Chardonnay and Chardonnay Musque 6,900 7,735 8,919 11,304 6,898
Gewurztraminer 902 1,586 1,802 1,781 849
J. Riesling 6,088 7,176 8,497 9,444 7,941
Pinot Blanc 119 144 135 157 74
Pinot Gris 1,275 1,714 1,895 2,325 1,461
Sauvignon Blanc 1,272 1,898 2,193 2,592 1,107
Miscellaneous 9-9f 349 602 574 693 396
SUB-TOTAL (White Vinifera) 17,031 21,031 24,209 28,552 18,815
2010 2011 2012 2013 2014
Classes 10-10f
Cabernet Franc 4,532 5,747 5,450 6,755 3,951
Cabernet Sauvignon 2,772 3,808 4,245 4,055 3,106
Gamay 1,244 1,549 1,599 1,920 1,258
Merlot 3,846 4,110 4,734 5,468 1,438
Pinot Noir 1,908 2,613 2,559 2,850 1,749
Shiraz, Sirah, Syrah 547 555 807 853 267
Zweigeltrebe 298 359 348 347 147
Miscellaneous 10-10f 193 283 328 370 161
SUB-TOTAL (Red Vinifera) 15,340 19,024 20,070 22,618 12,077
SUB-TOTAL (Vinifera) 32,371 40,055 44,279 51,170 30,892
TOTAL HYBRID & VINIFERA 50,917 62,028 64,439 77,828 50,552
GRAND TOTAL 53,747 64,495 66,014 80,548 52,716
TABLE V – Purchases by Processors by Variety (in tonnes)
The Grape Growers of Ontario, together with the Honourable Dave Levac, Speaker of the Ontario Legislative Assembly, hosted the 36th Annual Legislative Wine Tasting event at Queen’s Park. The two wines chosen as the official wines of Ontario’s Legislative Assembly for 2015 are:Fielding Estate Winery 2013 Pinot Grigio and Burning Kiln Winery 2013 Strip Room.
Fielding Estate Winery: Honourable Dave Levac MPP, Heidi Fielding, and Grape King Kevin Buis
Burning Kiln Winery: Patti Fixter, Karen Matthews, Grape King Kevin Buis, Honourable Dave Levac MPP, and Emily Shoff
2120

TABULATION OF GROWERS WITH PRODUCTION WINE SALES IN ONTARIO
MARKET SHARE OF WINE SOLD IN ONTARIO
TABLE VI TABLE VII
TABLE VIII
TABLE VI – Number of Growers with Production Registered with the Board Table VII – Wine Sales in Ontario (by Volume, ‘000s litres)
TABLE VIII – Market Share of Wine Sold in Ontario (by Volume)
2010 2011 2012 2013 2014
District 1 Niagara-on-the-Lake and Niagara Falls 163 170 173 172 178
District 2 St. Catharines, Fort Erie, Pelham, Port Colborne, 45 40 39 38 34 Thorold, Wainfleet and Welland
District 3 Town of Lincoln 157 149 154 151 141
District 4 Wellington and Hamilton, Grimsby and West Lincoln 28 28 24 21 19
District 5 Brant, Chatham-Kent, Essex, Elgin, Haldimand, Lambton, 36 36 37 36 15 Middlesex, Norfolk and Oxford
District 6 Prince Edward and all other geographic areas not included in Districts 1 to 5 52 50 51 51 52
TOTAL 481 473 478 469 439
% Change 2010 2011 2012 2013 2014 2013 to 2014
VQA Sales in Ontario** 13,856 14,222 15,090 15,917 16,048 0.8%
Non-VQA/ICB Sales in Ontario 44,518 45,288 46,017 48,431 50,490 4.3%
Ontario VQA & Non-VQA/ICB Wine 58,374 59,510 61,107 64,348 66,538 3.4% Sold in Ontario*
Imported Wine Sold in Ontario 92,209 95,501 97,978 101,832 105,048 3.2%
Out-of-Province Sales in Ontario 527 456 467 479 400 -16.5%
Total Wine Sold in Ontario 151,110 155,467 159,552 166,659 171,986 3.2%
VQA Sales Outside Ontario** 1,204 1,345 1,527 1,456 1,402 -3.7%
The number of growers with production registered with the Grape Growers of Ontario in 2014 decreased by 6.4% from 469 in 2013 to 439 in 2014.
Table VII below shows the five-year history of wine sales in Ontario. Total wine sales in Ontario grew by 3.2% to 172 million litres in 2014. Ontario (VQA & NON-VQA/ICB) wine sales increased by 3.4% to 66.5 million litres. Imported wine sales increased by 3.2% to 105 million
litres, while out-of-province wine sales in Ontario decreased by 16.5% to 0.4 million litres.
Ontario Wine Sold in Ontario for 2012-2013 has been revised by LCBOFiscal Year April 1 to March 31 (statistical data provided by the LCBO)* Includes sales through LCBO, Winery Retail Stores, Direct Delivery to Licensees, embassies, airlines and industrial sales** VQA figures from VQAO Annual Report – March 31, 2014
Prince Edward County Winegrowers’ Association supports Community Food Banks: Seona Halsey, Picton Food Bank; Kathleen Greenaway, PECWA Chair; Linda Downey, Wellington Food Bank
Jean-Pierre Colas and Doug Whitty, 13th Street Winery, test the new eGrape system
ONTARIO NON-VQA/ICB IMPORTEDVQA
2010
9.17 %
29.46 %
61.37 %
2011
9.15 %
29.13 %
61.72 %
2012
9.46 %
28.84 %
61.70 %
2013
9.55 %
29.06 %
61.39 %
2014
9.33 %
29.36 %
61.31 %
4 52322

BLENDING MATERIALSTABLE IX
Table IX shows the quantity of blending grape product imported into Ontario over the last five years. The Ontario Wine content and Labelling Act (WCLA) required a winery that uses imported grapes or grape product to use an average of 40% or more of grapes grown in Ontario up to March 31, 2014. The requirement of 25% Ontario grape content in a bottle of wine continues to be in effect. Wine imported for blending purposes decreased by 9.4% from 24 million litres to 21.9 million litres. Concentrate decreased by 37.0% from 6,136 equivalent tonnes to 3,868 tonnes in 2014. Grape juice is down 1.8% from 921 equivalent tonnes to 904 equivalent tonnes. In total,
blending material was down 13.5% from 39,309 equivalent tonnes in 2013 to 33,986 equivalent tonnes in 2014.
2010 2011 2012 2013 2014
Wine (litres) 25,504,088 23,930,798 22,082,863 24,188,300 21,909,911
Concentrate (equivalent tonnes)
at 165 litres per tonne 4,512 3,615 8,579 6,136 3,868
Grape Juice (equivalent tonnes)at 750 litres per tonne 1,975 982 1,084 921 904
TABLE X presents the quantity of importation of wine categories from 2010-2014. The total imports of wine categories in Canada increased 2.4% from 308 million litres in 2013 to 315 million litres in 2014. The importation of sparkling wine increased by 12.0% in 2014.
2010 2011 2012 2013 2014
Aperitif 808 795 825 825 702
Champagne 928 1,017 1,039 1,050 1,195
Miscellaneous wines 10,708 11,734 12,861 12,807 8,542
Port 1,921 1,857 1,764 1,764 1,623
Sherry 648 619 588 588 535
Sparkling wine (includes crackling table) 7,557 7,897 8,683 8,726 9,777
Still wine 260,023 269,021 280,295 280,369 291,219
Vermouth 2,352 2,295 2,234 2,234 2,134
TOTAL 284,945 295,235 308,289 308,363 315,727
IMPORTATION OF WINETABLE X
TABLE IX – Blending Materials Imported into Ontario
TABLE X – Quantity of Importation of Wine Categories (‘000 litres)
Statistical data provided by LCBO
Statistical data provided by Association of Canadian Distillers and Canadian Vintners Association.
25
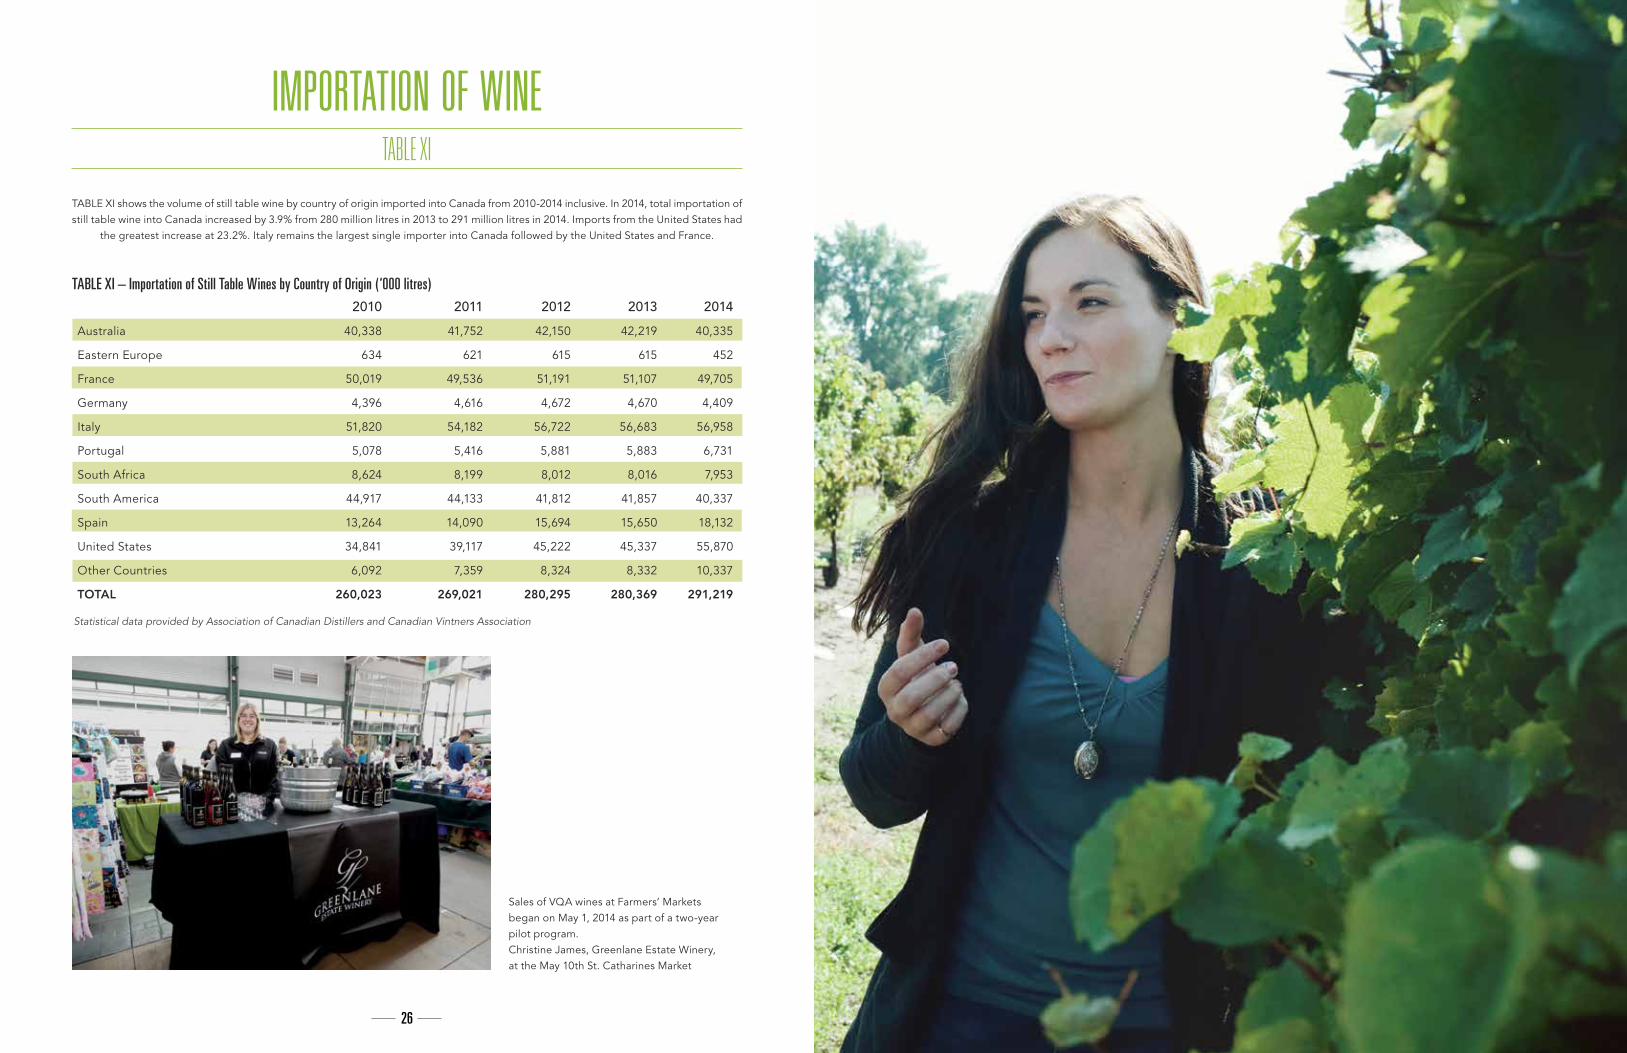
IMPORTATION OF WINETABLE XI
TABLE XI shows the volume of still table wine by country of origin imported into Canada from 2010-2014 inclusive. In 2014, total importation of still table wine into Canada increased by 3.9% from 280 million litres in 2013 to 291 million litres in 2014. Imports from the United States had
the greatest increase at 23.2%. Italy remains the largest single importer into Canada followed by the United States and France.
2010 2011 2012 2013 2014
Australia 40,338 41,752 42,150 42,219 40,335
Eastern Europe 634 621 615 615 452
France 50,019 49,536 51,191 51,107 49,705
Germany 4,396 4,616 4,672 4,670 4,409
Italy 51,820 54,182 56,722 56,683 56,958
Portugal 5,078 5,416 5,881 5,883 6,731
South Africa 8,624 8,199 8,012 8,016 7,953
South America 44,917 44,133 41,812 41,857 40,337
Spain 13,264 14,090 15,694 15,650 18,132
United States 34,841 39,117 45,222 45,337 55,870
Other Countries 6,092 7,359 8,324 8,332 10,337
TOTAL 260,023 269,021 280,295 280,369 291,219
TABLE XI – Importation of Still Table Wines by Country of Origin (‘000 litres)
Sales of VQA wines at Farmers’ Markets began on May 1, 2014 as part of a two-year pilot program. Christine James, Greenlane Estate Winery, at the May 10th St. Catharines Market
Statistical data provided by Association of Canadian Distillers and Canadian Vintners Association
426

CROP INSURANCE
PROMOTION EXPENSES
TABLE XII
TABLE XIII
Data included in TABLE XII below was supplied by Agricorp, the Corporation responsible for delivering Crop Insurance Programs and providing the statistical history of the Grape Crop Insurance Program, 2004-2014 inclusive. The number of accounts remained the same
as 2013. Claims were the highest since 2005 with 197 claims valued at $10.5 million.
In 2014-15, the Grape Growers of Ontario continued to engage consumers and industry through social media: Facebook, Twitter, Pinterest, and Youtube with The Grape Escape with wineONtour.ca video featuring Gabby Grape, the new mascot of the Niagara Wine Festival. Grower members from District 5 and District 6 were promoted through sponsorships to Essex Pelee Island Coast Wine Association and Prince Edward County Winegrowers’ Association. The GGO continued with a series of activities such as Celebrity Luncheon, Grape Stomp, Grape King Float, and Legislative Wine Tasting. Congratulations to Burning Kiln Winery and Fielding Estate Winery whose wines were chosen as the official wines to be served at the Ontario Legislature for 2015, and to Ron Koop, Koop Farms, on receiving the Cuvée
Award of Excellence in Viticulture. The GGO continues to be a proud sponsor of the Niagara Grape and Wine Festival.
No. of No. of Total Premiums Total Claims Premiums less Accounts Claims * $’000 $’000** Claims $’000
2004 329 149 4,743 3,641 1,102
2005 332 285 5,188 22,315 -17,127
2006 336 58 7,205 1,064 6,141
2007 317 74 7,791 1,239 6,552
2008 308 77 7,089 1,495 5,594
2009 293 149 7,830 3,984 3,846
2010 288 91 6,668 1,373 5,295
2011 290 72 5,909 1,806 4,103
2012 281 61 5,538 953 4,585
2013 276 20 4,549 275 4,274
2014 276 197 5,149 10,496 -5,347
Promotion 2012/2013 2013/2014 2014/2015
Promotions, Sponsorship & Public Relations $ 121,198 $ 173,265 $ 179,874
Miscellaneous – Wines 9,926 6,438 15,991
SUB-TOTAL $ 131,124 $ 179,703 $195,865
Grape & Wine Festival and Grape King’s Crowning 28,802 21,632 31,084
International Cool Climate Chardonnay Celebration 35,000 25,000 25,000
Grape Growers of Ontario promotion (OMIF) 25,100 - -
TOTAL $ 220,026 $ 226,335 $ 251,949
The Grape Growers of Ontario is a contributing member and/or sponsor to a number of agricultural and trade organizations. The organizations supported in the 2014/2015 year include:
Memberships Amount
Agricultural Adaptation Council $150
British Columbia Grape Growers Association 150
Canadian Agricultural Hall of Fame 500
Canadian Horticultural Council 11,769
Greater Niagara Chamber of Commerce 307
Grimsby and District Chamber of Commerce 247
Lincoln Chamber of Commerce 200
Niagara-on-the-Lake Chamber of Commerce 125
Ontario Agri-Food Education Inc. 500
Ontario Agricultural Commodity Council 1,000
Ontario Fruit & Vegetable Growers’ Association 25,000
Ontario Federation of Agriculture 500
Ontario’s South Coast Wineries 100
President’s Council 300
St. Catharines Club 715
TOTAL $41,563
Sponsorships Amount
Essex Pelee Island Coast Winegrowers’ Association $ 10,000
Grape & Wine Industry Summit 10,000
Grape King 2,500
Grape Stomp 400
Niagara Grape and Wine Festival 20,000
Niagara Peninsula Fruit and Vegetable Growers’ Association 950
Ontario Wine Awards 3,000
Outstanding Young Farmers’ Program – 2014 400
Prince Edward County Winegrowers’ Association 8,000
Subaru of Hamilton – Niagara Running Series 1,500
Wine Country Ontario Travel Guide 4,225
TOTAL $ 60,975
TABLE XII – CROP INSURANCE
TABLE XIII – Promotion Expenses
MEMBERSHIPS AND SPONSORSHIPS
* Total grower and government premiums** Claims data refers to approved claims only - Data is as of January 30, 2015 and is subject to change
29

ONTARIO VINEYARD IMPROVEMENT PROGRAM (OVIP) ONTARIO GRAPE AND WINE RESEARCH INC. (OGWRI)
CROP PROTECTION REPORT
OVIP: PRODUCER SUPPORT COMPONENT
The Ontario Vineyard Improvement Program (OVIP) - Producer Support Component (PSC) is an application based, cost-share program funded by the Ontario Ministry of Agriculture, Food and Rural Affairs to assist eligible growers to transition to higher demand grape varieties and improve grape quality in line with the industry varietal plan.
Intake 3 of the OVIP-PSC program was fully subscribed by growers and provided support for investment in vineyard innovation. Of the applications received, 82% were from the Niagara Region, 0.5% from Essex County and 1% were from Prince Edward County. The remaining 16.5% of applications came from Ottawa Region, Norfolk County, Lennox & Addington County, Frontenac County, Stormont, Dundas and Glengarry, Dufferin, Elgin, and York Region.
Growers are investing in a variety of improvements including:
• 52% for improved viticulture practices (e.g. equipment); • 13% for vine trellis systems; • 12% for vineyard preparation including tile drainage systems/upgrades and land grading, and land preparation; • 11.5% for cold injury reduction (e.g. wind machines);• 8% for pest management (e.g. bird netting).
The objective of OGWRI is to enhance the profitability and sustainability of the Ontario grape and wine industry through directed and coordinated financing of research and development activities. Matthias Oppenlaender is Chair, and the Board of Directors has representatives from GGO, Wine Council of Ontario, and Winery and Grower Alliance of Ontario. A technical committee establishes annual research priorities and reviews research project proposals. Projects must fall into one of three research pillars of viticulture, oenology and market research. The following projects are currently approved for funding or have been completed over the previous year:
Growers are investing in a variety of improvements including:
• Establishing best practices guidelines to optimize grapevine winter hardiness; • Management of sour rot and volatile acidity in grapes; • Best management practices for control of nuisance flies dispersing through the Ontario Grape and Wine Industry;• Profiling wastewater solutions opportunities for Ontario wineries;• Adapt viticulture in Ontario to climate change and drought stress;• Development and validation of reliable, effective and affordable diagnostic technologies to enhance productivity and
international competitiveness of Ontario grape and wine industries;• The incidence of potential leafhopper vectors of Grapevine red blotch disease in Ontario viticultural regions and
evaluation of their vectoring potential.
All completed projects and material are available at the Ontario Grape and Wine Research Inc.’s newly developed website: www.ontariograpeandwineresearch.com
In 2014, the grape industry obtained registration of a number of pesticides through the efforts of Jim Chaput, Minor Use Coordinator, OMAFRA, and Pest Management Regulatory Agency (PMRA). Dr. Wendy McFadden-Smith, OMAFRA, assisted with pest management issues related to minor use registrations and represented grapes at the Minor Use Priority Setting Workshop in Ottawa to highlight priorities for tree fruit and grapes. Wendy also represented the grape industry at the Fruit Technical Working Group which is responsible for the inclusion of products in Publication 360 “Guide to Fruit Production”.
Brown Marmorated Stink Bug and Spotted Wing Drosophila have been reported throughout Ontario. Neither pest has caused documented economic losses to grapes to date. OMAFRA continues to monitor for the presence of these pests and collaborative research projects among OMAFRA, University of Guelph, Vineland Research and Innovation Centre, and Agriculture and Agri-Food Canada continue to investigate the biology, economic impact and management of these invasive species.
Mancozeb and metiram (Polyram) fungicides are currently being reviewed by PMRA. Neonicotinoid insecticides (Admire, Assail, Clutch) are also targeted for their potential impact on bee mortality. The GGO has provided input to the Pest Management Centre to try to ensure that we retain both fungicides and insecticides as crucial tools for pest management.
The following are new product registrations, label changes and emergency registrations for 2014:
Fungicides: Botector, Fullback 125SC, Nova Fungicide (replaces Nova 40W), Timorex GoldMiticide: NealtaHerbicide: Frontier Max HerbicideMinor use emergency registrations for Spotted Wing Drosophila: Delegate, Entrust, Malathion, Ripcord
* Includes Intakes 1,2,3, and preliminary Intake 4 - Intake 4 investment amounts include final completed projects and the maximum eligible amounts of ongoing projects. There is currently an over commitment on projects to allow for expected savings on project costs.
OVIP: Industry Support Component
The OVIP Industry Support Component is a fund provided by the Ontario Ministry of Agriculture, Food and Rural Affairs and administered by the GGO through a management committee to assist the sector as a whole with access to additional tech-nologies and capacities to help improve grape production in the vineyard. Projects for 2013-2014 include:
• Light Deterrent Bird Scaring Research • Weather Information • Winter Injury Bud Sampling • Leaf Roll and Red Blotch Survey• Brown Marmorated Stink Bug Research • Third Party Testing Dispute Resolution• Industry Insight Conference• International Cool Climate Chardonnay Celebration
Government Investment Grower Investment Total Investment
$9,744,592 $21,324,390 $31,068,982
TOTAL INVESTMENTS* BY GROWERS AND THE ONTARIO GOVERNMENT THROUGH THE OVIP PROGRAM TO DATE ARE:
4 53130

INDEPENDENT AUDITOR’S REPORT
We have audited the accompanying financial statements of the Grape Growers of Ontario, which comprise the statement of financial position as at January 31, 2015, and the statements of operations and unrestricted net assets, restricted net assets, and cash flows for the year ended January 31, 2015 and a summary of significant accounting policies and other explanatory information.
Management’s Responsibility for the Financial StatementsManagement is responsible for the preparation and fair presen-tation of these financial statements in accordance with Canadian accounting standards for not-for-profit organizations, and for such internal control as management determines is necessary to enable the preparation of financial statements that are free from material misstatement, whether due to fraud or error.
Auditor’s ResponsibilityOur responsibility is to express an opinion on these financial statements based on our audit. We conducted our audit in accordance with Canadian generally accepted auditing standards. Those standards require that we comply with ethical requirements and plan and perform the audit to obtain reasonable assurance about whether the financial statements are free from material misstatement.
To the Members of Grape Growers of Ontario
Chartered Accountants Licensed Public Accountants
St. Catharines, Canada March 2, 2015
Grant Thornton LLP80 King StreetSuite 200St. Catharines, ON L2R 7G1
T +1 905 682 8363F +1 905 682 2191www.GrantThornton.ca
An audit involves performing procedures to obtain audit evidence about the amounts and disclosures in the financial statements. The procedures selected depend on the auditor’s judgment, including the assessment of the risks of material misstatement of the financial statements, whether due to fraud or error. In making those risk assessments, the auditor considers internal control relevant to the organization’s preparation and fair presentation of the financial statements in order to design audit procedures that are appropriate in the circumstances, but not for the purpose of expressing an opinion on the effectiveness of the organization’s internal control. An audit also includes evaluating the appropriateness of accounting policies used and the reasonableness of accounting estimates made by management, as well as evaluating the overall presentation of the financial statements.
We believe that the audit evidence we have obtained is sufficient and appropriate to provide a basis for our audit opinion.
OpinionIn our opinion, the financial statements present fairly, in all material respects, the financial position of the Grape Growers of Ontario as at January 31, 2015, and the results of its operations and its cash flows for the year ended January 31, 2015 in accordance with Canadian accounting standards for not-for-profit organizations.
533

Revenues 2015 2014
Licence fees $ 1,149,244 $ 1,787,946
Vertically integrated rebate (20,279) (38,747)
Appropriation for research and development (215,709) (324,775)
913,256 1,424,424
Government and industry funding for research and other projects 420,558 1,538,926
Interest and other income 86,146 76,910
1,419,960 3,040,260
Expenses
Directors’ fees, honoraria and benefits 75,380 72,650
Salaries and benefits (Note3) 415,863 446,230
Travel 44,263 42,590
Meetings and conventions 18,842 15,000
Office supplies and expenses 42,236 47,758
Postage 9,205 6,058
Telephone 15,022 19,878
Dues and subscriptions 21,603 22,552
Professional fees (Note 4) 110,108 101,222
Utilities and maintenance 22,331 26,025
Building insurance and property taxes 11,788 14,046
Amortization 11,781 12,161
Festival 31,084 21,632
Assessment O.F. & V.G.A. 25,000 20,000
Research and other projects (Note 5)
Grape Growers funded portion 28 38,914
Government and industry funded portion 314,780 1,505,118
Promotional projects (Note 5)
Grape Growers funded portion 94,465 145,895
Government and industry funded portion 101,400 33,808
Professional development 2,100 141
Maintenance agreements 600 10,550
Labour issues co-ordinating committee 5,000 5,000
Gain on foreign exchange (494) (387)
Bad debts 1,663 -
Expense recoveries from other associations (31,339) (31,073)
1,342,709 2,575,768
Excess of revenues over expenses 77,251 464,492
Unrestricted net assets - beginning of year 1,015,551 1,202,834
Transfer to operational reserve - (651,775)
Unrestricted net assets - end of year $ 1,092,802 $ 1,015,551
Research and Promotion Fund 2015 2014
Revenues $ - $ -
Expenses - -
Fund Balance - beginning of year $ 664,657 664,657
Fund Balance - end of year $ 664,657 664,657
Operational Reserve
Fund balance - beginning of year $ 2,000,000 $ 1,348,225
Transfer from unrestricted net assets - 651,775
Fund balance - end of year $ 2,000,000 $ 2,000,000
Ontario Grape and Wine Research Fund
Growers Contributions
Revenues
Growers fees $ 103,262 $ 158,998
Expenses
Contributions to OGWRI (31,660) (110,176)
Excess of revenues over expenses 71,602 48,822
Fund Balance - beginning of year 477,340 428,518
Fund Balance - end of year $ 548,942 $ 477,340
Processor Contributions
Revenues
Processor fees $ 112,517 $ 165,777
Expenses
Contributions to OGWRI (31,661) (53,780)
Excess of revenues over expenses 80,856 111,997
Fund balance - beginning of year 381,834 269,837
Fund balance - end of year $ 462,690 $ 381,834
Total Ontario Grape and Wine Research Fund $ 1,011,632 $ 859,174
GRAPE GROWERS OF ONTARIO GRAPE GROWERS OF ONTARIOSTATEMENT OF OPERATIONS AND UNRESTRICTED NET ASSETS - YEAR ENDED JANUARY 31 STATEMENT OF RESTRICTED NET ASSETS - YEAR ENDED JANUARY 31
See accompanying notes to the financial statementsSee accompanying notes to the financial statements
4 53534

Assets 2015 2014
Current Cash $ 1,308,743 $ 766,746
Guaranteed investment certificates (Note 6) 3,504,145 3,543,166
Accounts receivable (Note 7) 70,738 115,279
Contributions receivable (Note 5) 74,621 325,945
Prepaid expenses 24,893 32,208
4,983,140 4,783,344
Long-term Due from related parties (Note 8) 125,170 184,892
Investments (Note 9) 191,867 191,867
317,037 376,759
$ 5,300,177 $ 5,160,103
Liabilities
Current
Accounts payable and accrued liabilities (Note 10) $347,873 $ 372,947
Government remittances payable 150,243 206,714
Deferred contributions (Note 5) 32,970 41,060
531,086 620,721
Net assets
Unrestricted Invested in other entities 191,867 191,867
Available for operations 900,935 823,684
1,092,802 1,015,551
Restricted
Research and promotion fund (Page 4) 664,657 664,657
Operational reserve (Page 4) 2,000,000 2,000,000
Ontario Grape and Wine Research Fund (Page 4) 1,011,632 859,174
3,676,289 3,523,831
$ 5,300,177 5,160,103
Increase in cash 2015 2014
Operating
Excess of revenues over expenses for the year $ 77,251 $ 464,492
Ontario Grape and Wine Research Fund
Growers excess of revenues over expenses 71,602 48,822
Processors excess of revenues over expenses 80,856 111,997
229,709 625,311
Changes in non-cash working capital
Accounts receivable 44,541 (22,447)
Contributions receivable 243,234 (136,454)
Interest receivable 77,085 (36,789)
Prepaid expenses 7,315 (20,200)
Accounts payable and accrued liabilities (25,074) (187,890)
Government remittances payable (56,471) 2,340
520,339 223,871
Investing
Repayments from (to) related parties 59,722 (10,398)
Purchase of guaranteed investment certificates (3,495,814) (1,657,750)
Proceeds of guaranteed investment certificates 3,457,750 1,467,326
21,658 (200,822)
Increase in Cash 541,997 23,049
Beginning of year 766,746 743,697
End of year $ 1,308,743 $ 766,746
GRAPE GROWERS OF ONTARIO GRAPE GROWERS OF ONTARIOSTATEMENT OF FINANCIAL POSITION - YEAR ENDED JANUARY 31 STATEMENT OF CASH FLOWS - YEAR ENDED JANUARY 31
See accompanying notes to the financial statements
Approved on behalf of the Board
Director Director
See accompanying notes to the financial statements
4 53736

GRAPE GROWERS OF ONTARIO GRAPE GROWERS OF ONTARIONOTES TO THE FINANCIAL STATEMENTS - YEAR ENDED JANUARY 31 NOTES TO THE FINANCIAL STATEMENTS - YEAR ENDED JANUARY 31
1. Nature of Operations
The Grape Growers of Ontario is a board which operates under the Farm Products Marketing Act, established for the purpose of marketing and promoting Ontario grapes for processing. The Board is a not-for-profit organization incorporated without share capital under the laws of Ontario, and is exempt from income taxes under the Income Tax Act.
2. Significant Accounting Policies
The financial statements were prepared in accordance with Canadian accounting standards for not-for-profit organizations in Part III of the CICA Handbook and include the following significant accounting policies:
Financial Instruments
Measurement
The board initially measures its financial assets and liabilities at fair value, except for certain non-arm’s length transactions.
Financial assets or liabilities obtained in related party transactions with a person or entity whose sole relationship with the Board is in the capacity of management are accounted for in accordance with financial instruments.
The board subsequently measures all of its financial assets and financial liabilities at amortized cost. Financial assets and liabilities measured at amortized cost include cash, guaranteed investment certificates, accounts receivable, contributions receivable, and amounts due from related parties, accounts payable and accrued liabilities, government remittances payable and deferred contributions.
Impairment
Financial assets measured at cost are tested for impairment when there are indicators of impairment. Previously recognized impairment losses are reversed to the extent of the improvement provided the asset is not carried at an amount, at the date of the reversal, greater than the amount that would have been the carrying amount had no impairment loss been recognized previously. The amounts of any write-downs or reversals are recognized in excess of revenues over expenses for the year.
Fund Accounting
The board follows the deferral method of accounting for government and industry contributions and reports using fund accounting.
The board follows the restricted fund method of accounting for grower contributions. Revenues and expenses related to marketing operations and administrative activities are reported in the operating fund. Revenues and expenses related to research activities are reported in the research fund. Fees and payments collected from growers and processors and contributed to the Ontario Grape and Wine Research Inc. (OGWRI) are reported in the Ontario Grape and Wine Research Fund. The operational reserve fund reports the net assets which have been internally restricted by the board as an operational reserve.
Revenue recognition
The Grape Growers of Ontario has the authority to collect licence fees under the provisions of the Farm Products Marketing Act. Fees are recognized as the crop is received, weighed and graded by processors and collection is reasonably assured.
Amortization
Property and equipment which are shared with other marketing boards are capitalized by Grape and Tender Fruit (Ontario) Limited. The amortization charge for property and equipment is reported according to the cost sharing arrangement by each benefiting Board.
Investments
Investments in subsidiaries are accounted for using the cost method.
The cost method is a basis of accounting for investments whereby the investment is initially recorded at cost; earnings from such investments are recognized only to the extent received or receivable.
Use of estimates
Management reviews the carrying amounts of items in the financial statements at each statement of financial position date to assess the need for revision or any possibility of impairment. Many items in the preparation of these financial statements require management`s best estimate. Management determines these estimates based on assumptions that reflect the most probable set of economic conditions and planned courses of actions.
These estimates are reviewed periodically and adjustments are made to excess of revenue over expenses as appropriate in the year they become known.
Items subject to significant management estimate include the allowance for doubtful accounts.
3. Salaries and benefits
2015 2014
Total salaries and benefits $ 529,867 $ 604,325
Recoveries:
Project management (103,604) (147,695)
Ontario Grape and Wine Research Inc. (10,400) (10,400)
$ 415,863 $446,230
4. Professional fees
2015 2014
Audit $ 14,675 $ 15,325
Legal 21,932 8,173
Industry consulting 73,501 77,724
$ 110,108 $ 101,222
4 53938

Research and Other Projects:
Pesticide Initiatives $ (19,692) $ - $ - $ - $ (19,692)
Traceability foundations initiative 160,161 160,200 39 - -
OVIP - Vineyard Improvement Program (Admin) 11,056 70,000 77,107 - 18,163
OVIP - Vineyard Improvement Program (ISC) 2,593 200,000 227,155 - 29,748
Canadian Agricultural Adaptation Program 78,955 79,824 869 - -
WRAMI – Evaluating Irrigation Water Use Efficiency 41,644 41,644 - - -
Grape Leafroll and Red Blotch Virus Survey 12,849 16,194 3,345 28 -
Harvesting Innovation for Growth and Sustainability 18,687 24,952 6,265 - -
306,253 592,814 314,780 28 28,219
Promotional Projects:
Grown by GGO strategic marketing plan - 27,290 54,000 18,423 26,710
Celebrity Luncheon (21,368) 39,310 47,400 - (13,278)
Non-Grant Funded Promotion (21,368) 66,600 101,400 18,423 13,432
76,042
GGO portion of promotion activities 94,465
$ 284,885 $ 41,651
Comprised of:Contributions receivable $ 325,945 $ 74,621
Deferred contributions (41,060) (32,970)
$ 284,885 $ 41,651
GRAPE GROWERS OF ONTARIONOTES TO THE FINANCIAL STATEMENTS - JANUARY 31, 2015
(Deferred)Receivable
Contributions
February 1, 2014
Government/Industry
Expenses
2014/2015
Government/Industry
ContributionsReceived (Repaid)
2014/2015
Grape Growers of Ontario
Portion
2014/2015
(Deferred)Receivable
Contributions
January 31, 2015
GRAPE GROWERS OF ONTARIONOTES TO THE FINANCIAL STATEMENTS - JANUARY 31, 2015
6. Guaranteed investment certificates
The Board has guaranteed investment certificates that mature between 2015 and 2016 and earn interest between 1.40% and 2.85% (2014 – 1.50% and 2.50%)
7. Accounts receivable 2015 2014
Accounts receivable $ 72,401 $ 115,279
Allowance for doubtful accounts (1,663) -
$ 70,738 $ 115,279
8. Related Party Transactions
The Grape Growers of Ontario exercise significant influence over Ontario Grape and Wine Research Inc. (OGWRI), an entity incorporated to perform research and development activities related to the grape and wine industries. Transactions with OGWRI include recovery of salaries (disclosed in Note 3) and contributions to research projects (disclosed in the statement of changes in internally restricted net assets).
The Grape Growers of Ontario is related to Grape & Tender Fruit (Ontario) Limited (GTFOL), a jointly controlled enterprise who operates the marketing boards’ shared offices and who owns the shared land and building.
The Grape Growers of Ontario proportionate share of GTFOL is as follows: 2015 2014
Assets $ 337,573 $ 355,755
Liabilities 145,726 163,908
Net Assets $ 191,847 $ 191,847
Expenses include a $133,234 (2014 – $156,233) charge for the board’s share (50% (2014 – 50%)) of management operation costs incurred during the year by GTFOL. These amounts are recognized in the form of allocated rent payments at the exchange amount by the Board, and represent the Board’s share of the revenue and expenses of the joint venture.
Amounts due from related parties: 2015 2014
GTFOL $ 125,170 $ 137,997
OGWRI - 46,895
$ 125,170 $ 184,892
5. Contributions for research and other activities
4 54140

9. Investments 2015 2014
Grape & Tender Fruit (Ontario) Limited 94 common shares (47% interest) $ 47 $ 47
1,918 special shares (40% interest) 191,800 191,800
Ontario Grape and Wine Research Inc. 20 common shares (50% interest) 20 20
$ 191,867 $ 191,867
10. Accounts payable and accrued liabilities
2015 2014
Accounts payable and accrued liabilities $ 64,324 $ 118,996
Grading fees payable 283,550 253,951
$ 347,874 $ 372,947
11. Financial Instruments
The board is exposed to various risks through its financial instruments. The following analysis provides a measure of the board’s risk exposures and concentrations at January 31, 2015:
Credit risk
Credit risk is the risk that one party to a financial instrument will cause a financial loss for the other party by failing to discharge an obligation. The board’s main credit risks relate to its accounts receivable. The board provides credit to its growers in the normal course of its operations.
Market risk
Market risk is the risk that the fair value of expected future cash flows of a financial instrument will fluctuate because of changes in market prices. Market risk comprises three types of risk: currency risk, interest rate risk and other price risk. The board is mainly exposed to interest rate risk.
(i) Interest rate risk
Interest rate risk is the risk that the fair value or future cash flows of a financial instrument will fluctuate because of changes in market interest rates. The board is exposed to interest rate risk with respect to its fixed rate guaranteed investment certificates. Given the composition of financial instruments, the board is subject to a fair value risk.
GRAPE GROWERS OF ONTARIONOTES TO THE FINANCIAL STATEMENTS - JANUARY 31, 2015
2014 HIGHLIGHTS
1. Niagara Emerging Entrepreneur of the Year, Sue-Ann Staff (centre) with Dana, Howard, Drew and Wendy Staff
2. Bruce Irons, BASF Canada, presents Ron Koop with Cuvée Award of Excellence in Viticulture
3. Honourable Ted McMeekin, Minister of Municipal Affairs and Housing with Bill George, Chair at the 2014 Annual General Meeting
4. Rick Hansen, Celebrity Luncheon Speaker with Mark Molnar, Town Crier
5. Debbie Zimmerman, CEO; Honourable Kevin Flynn, Minister of Labour; Honourable Jim Bradley, Deputy Government House Leader; Bill Schenck, Director
6. Nick Hubbard with Gabby Grape
7. Leslie and Warren Saunders, 2014 Annual General Meeting
442
mjcombe
Text Box
Lance Grandison, 2014 Annual General Meeting

GRAPE KING2014
KEVIN BUISKevin Buis was crowned Grape King
on September 17, 2014 in his family’s
Niagara-on-the-Lake vineyards.
ADDRESS1634 South Service Road, St. Catharines, Ontario L2R 6P9
Phone: 905.688.0990 Fax: 905.688.3211Email: [email protected]: www.grapegrowersofontario.com
MAILING ADDRESS
P.O. Box 100, Vineland Station, Ontario L0R 2E0
grapegrowersofontario
@grapegrowersont
grapegrowers