Annual Report for FY14 NPDES Municipal Separate Storm ......06-DP-3320-MD0068349 MARCH 2015 Annual...
175
06-DP-3320-MD0068349 MARCH 2015 Annual Report for FY14 NPDES Municipal Separate Storm Sewer System Permit Published by the Montgomery County Department of Environmental Protection for the Maryland Department of the Environment
Transcript of Annual Report for FY14 NPDES Municipal Separate Storm ......06-DP-3320-MD0068349 MARCH 2015 Annual...

06-DP-3320-MD0068349 MARCH 2015
Annual Report for FY14
NPDES Municipal Separate
Storm Sewer System Permit
Published by the Montgomery County Department of Environmental Protection
for the Maryland Department of the Environment


06-DP-3320-MD0068349 Page i
Annual Report March 2015
Montgomery County Department of Environmental Protection
Table of Contents LIST OF ACRONYMS .................................................................................................................. ii
LIST OF FIGURES ........................................................................................................................ v
LIST OF TABLES ........................................................................................................................ vii
LIST OF ATTACHMENTS ........................................................................................................... x
I. BACKGROUND ................................................................................................................... I-1
II. OVERVIEW ........................................................................................................................ II-1
III. STANDARD PERMIT CONDITIONS ............................................................................. III-1
A. Permit Administration ..................................................................................................... III-1
B. Legal Authority ............................................................................................................... III-3
C. Source Identification ....................................................................................................... III-6
C.1 Storm Drain System................................................................................................. III-6
C.2 Urban Best Management Practices .......................................................................... III-6
C.3 Impervious Surfaces ................................................................................................ III-9
C.4 Monitoring Locations .............................................................................................. III-9
C.5 Watershed Restoration ........................................................................................... III-10
D. Discharge Characterization ........................................................................................... III-10
E. Management Programs ................................................................................................. III-10
E.1 Stormwater Management Program ........................................................................ III-10
E.2 Erosion and Sediment Control ............................................................................... III-20
E.3 Illicit Discharge Detection and Elimination (IDDE) ............................................. III-21
E.4 Trash and Litter ..................................................................................................... III-28
E.5 Property Management ............................................................................................ III-35
E.6 Road Maintenance ................................................................................................. III-40
E.7 Public Education and Outreach ............................................................................. III-47
F. Watershed Assessment .................................................................................................. III-64
G. Watershed Restoration .................................................................................................. III-73
H. Assessment of Controls............................................................................................... III-104
H.1 Watershed Restoration Assessment ..................................................................... III-107
H.2 Stormwater Management Assessment ................................................................. III-120
I. Program Funding ........................................................................................................ III-131
J. TMDLs ........................................................................................................................ III-131
IV. ANNUAL REPORTING ................................................................................................ IV-1
V. SPECIAL PROGRAMMATIC CONDITIONS .................................................................. V-1
A. Tributary Strategy ............................................................................................................ V-1
B. Comprehensive Planning ................................................................................................. V-1
06-DP-3320-MD0068349 Page ii
Annual Report March 2015
Montgomery County Department of Environmental Protection
List of Acronyms
ANS Anacostia Naturalist Society
ARP Anacostia River Restoration
BIBI Benthic Index of Biological Integrity
BMP Best Management Practice
BOD Biochemical Oxygen Demand
BUP Bethesda Urban Partnership
CBT Chesapeake Bay Trust
CCTV Closed Circuit Television
CD Compact Disk
CIP Capital Improvement Program
CMP Clarksburg Monitoring Partnership
CPV Channel Protection Volume
CWF Chesapeake Watershed Forum
CWP Center for Watershed Protection
DA Drainage Area
DEP Department of Environmental Protection
DEPC Division of Environmental Policy and Compliance
DHCA Department of Housing and Community Affairs
DHS Division of Highway Services
DOT Department of Transportation
DPS Department of Permitting Services
DGS Department of General Services
DSWS Division of Solid Waste Services
DTS Division of Transit Services
ESD Environmental Site Design
EMC Event Mean Concentration
EMTOC Equipment Maintenance and Transit Operations Center
EPA Environmental Protection Agency
ESC Erosion and Sediment Control
ESD Environmental Site Design
FFG Functional Feeding Group
FIBI Fish Index of Biological Integrity

06-DP-3320-MD0068349 Page iii
Annual Report March 2015
Montgomery County Department of Environmental Protection
FMD Fleet Management Division
FOG Fats, Oils, Grease
FOSC Friends of Sligo Creek
GIS Geographic Information Systems
HEC-RAS Hydrologic Engineering Center-River Analysis System
HUC Hydrologic Unit Code
HVAC Heating, Ventilation and Air Conditioning
IBI Index of Biological Integrity
IDDE Illicit Discharge Detection and Elimination
IPM Integrated Pest Management
LID Low Impact Development
MC Mean Concentration
MCPS Montgomery County Public Schools
MDE Maryland Department of the Environment
MEP Maximum Extent Practicable
M-NCPPC Maryland-National Capital Park and Planning Commission
MOU Memorandum of Understanding
MS4 Municipal Separate Storm Sewer System
MWCOG Metropolitan Washington Council of Governments
NOI Notice of Intent
NOVs Notice of Violation
NPDES National Pollutant Discharge Elimination
P2 Pollution Prevention
PHED Planning, Housing and Economic Development
POSWP Public Outreach and Stewardship Work Plan
ROW Right of Way
SHA State Highway Administration
SPA Special Protection Area
SPCC Spill Prevention Control and Countermeasure
SSO Sanitary Sewer Overflow
SWM Stormwater Management
SWPPP Stormwater Pollution Prevention Plan
TKN Total Kjeldahl Nitrogen
TMDL Total Maximum Daily Load

06-DP-3320-MD0068349 Page iv
Annual Report March 2015
Montgomery County Department of Environmental Protection
TN Total Nitrogen
TOC Time of Concentration
TP Total Phosphorous
TPH Total Petroleum Hydrocarbons
TSS Total Suspended Solids
UST Underground Storage Tank
WIP Watershed Implementation Plan
WLA Wasteload Allocation
WMATA Washington Metropolitan Area Transit Authority
WMD Watershed Management Division
WQPC Water Quality Protection Charge
WQv Water Quality Volume
WTM Watershed Treatment Model
ZTA Zoning Text Amendment
06-DP-3320-MD0068349 Page v
Annual Report March 2015
Montgomery County Department of Environmental Protection
List of Figures
Figure III.E.1. Map of the Stormwater Facility Maintenance Regions ................................... III-11
Figure III.E.2. FY13 Outfall Screening – Coquelin Run, Kensington Branch and KenGar
Tributaries of the Lower Rock Creek Watershed ..................................................................... III-22
Figure III.E.3. Map of the Sligo Creek Watershed Study Area ............................................... III-24
Figure III.E.4. Heavy Metal Concentrations from HVAC Discharges (n=9) ......................... III-25
Figure III.E.5. Number of Bags Reported per Retailer Reporting .......................................... III-31
Figure III.E.6. Pond Trash Collected in FY14 by Type ........................................................... III-33
Figure III.E.7. Inorganic Material Removed from the SWM Ponds Annually ........................ III-34
Figure III.E.8. Countywide Street Sweeping ........................................................................... III-41
Figure III.E.9. Annual Average Daily Traffic 2010 ................................................................ III-41
Figure III.E.10. Montgomery County Arterial Street Sweeping Routes .................................. III-42
Figure III.E.11. Tons of Material Applied During Winter Activities and Collected by Street
Sweeping 1998-2014 ................................................................................................................ III-43
Figure III.E.12. Annual Montgomery County Street Sweeping Mileage 1996-2013 .............. III-44
Figure III.E.13. Montgomery County Street Sweeping Mileage and Average Cost 2005-2013 ......
....................................................................................................................................... III-44
Figure III.E.14. Responses to Post Pet Waste Station Project Survey .................................... III-52
Figure III.E.15. Join the Poop Loop – Taking the Pet Waste Pick Up Pledge ........................ III-53
Figure III.E.16. Eric Naibert, DEP Biologist, and Virginia Vassalotti, Chesapeake Bay Trust
Conservation Corps Volunteer, Assisting at the 2014 H2O Summit ...................................... III-57
Figure III.E.17. DEP Chief Operating Officer, Kathleen Boucher, Presenting Kay Fulcomer
with a Volunteer Excellence Award ........................................................................................ III-58
Figure III.E.18. Stream Steward Volunteers Assisting at the 2014 H2O Summit .................. III-58
Figure III.E.19. Attendees Learning About Stormwater Flows from an H2O Summit Exhibitor ....
....................................................................................................................................... III-58
Figure III.E.20. Sample Passport Question from the Aspen Hill Library Bioretention Facility ......
....................................................................................................................................... III-59
Figure III.E.21. “Slidin’ Down Sligo Geocache Site” Focused on Proper Pet Waste
Management ............................................................................................................................. III-59
Figure III.E.22. Storm Drain Art in Spanish ........................................................................... III-60
Figure III.E.23. Storm Drain Art in Progress ......................................................................... III-60
Figure III.E.24. Storm Drain Art – Drains to Rock Creek ...................................................... III-60
Figure III.E.25. Storm Drain Art Highlighting the Issue of Pet Waste. “Protect Rock Creek,
Scoop the Poop” ...................................................................................................................... III-60

06-DP-3320-MD0068349 Page vi
Annual Report March 2015
Montgomery County Department of Environmental Protection
Figure III.E.26. RainScapes for Schools Conservation Landscape Garden Filtering Water
Before it Enters the Storm Drain System at Montgomery Blair High School ......................... III-62
Figure III.E.27. Number of RainScape Reward Projects Submitted over the Past 6 Years .... III-64
Figure III.F.1. Stream Conditions in the Great Seneca Creek Watershed 1997-1998, 2013 .. III-68
Figure III.F.2. Upper Great Seneca Combined % Max IBI (average of the BIBI and FIBI as a
percentage of the maximum possible) for Stations Monitored in 1997, 2001, 2006 and 2013 for
Benthic Macroinvertebrates and/or Fish ................................................................................. III-69
Figure III.F.3. Middle Great Seneca Combined % Max IBI ................................................... III-70
Figure III.F.4. Lower Great Seneca Combined % Max IBI .................................................... III-71
Figure III.F.5. Percentage of Combined % Maximum IBI for each Category in the Great Seneca
Watershed ................................................................................................................................ III-72
Figure III.G.1. County Area Subject to the MS4 Permit ......................................................... III-74
Figure III.G.2. Pre-restoration (left) and Post-restoration Conditions (right) at Hollywood
Branch ..................................................................................................................................... III-91
Figure III.G.3. Project Locations and Status of Various School and Public Facilities through
FY14 ....................................................................................................................................... III-93
Figure III.G.4. Project Locations and Status of Various Green Streets through FY14 .......... III-94
Figure III.G.5. Recently Completed Donnybrook Green Streets Neighborhood Curb Extensions,
Located on Grubb Road ........................................................................................................... III-95
Figure III.G.6. Recently Completed Sligo Park Hills Green Streets Project Located on Wessex
Road ....................................................................................................................................... III-95
Figure III.G.7. RainScapes Rewards Projects Countywide Through FY14 ............................ III-97
Figure III.G.8. Locations of FY14 RainScapes Neighborhoods .............................................. III-98
Figure III.H.1. Location of the Breewood Tributary within the Sligo Creek Subwatershed of the
Anacostia. ............................................................................................................................. III-105
Figure III.H.2. Locations of Stream Chemistry, Biological, Physical Habitat and
Geomorphology Monitoring Stations, Breewood Tributary of Sligo Creek .......................... III-106
Figure III.H.3. Locations of the Breewood Tributary Restoration Projects ......................... III-107
Figure III.H.4. Functional Feeding Group Comparison in the Breewood Tributary (SCBT101)
and in the Good Hope Tributary (PBGH108) ....................................................................... III-114
Figure III.H.5. BIBI vs. Habitat Condition at Breewood Tributary and Reference Stream,
Spring 2010 thru Spring 2013................................................................................................ III-115
Figure III.H.6. Representative Cross Sections from Breewood Tributary, Study Area 1 ...... III-117
Figure III.H.7. Representative Cross Sections From Breewood Tributary, Study Area 2 .... III-118
Figure III.H.8. Upstream View of Sligo Creek, Breewood Tributary, Study Area 1- Cross
Section 1 ................................................................................................................................. III-119
Figure III.H.9. Location of the Clarksburg Monitoring Partnership three test areas and two
control areas. ........................................................................................................................ III-121

06-DP-3320-MD0068349 Page vii
Annual Report March 2015
Montgomery County Department of Environmental Protection
Figure III.H.10. Comparison of Time of Concentration (TOC) at the control area (LSLB101)
stream gage and at the test area (LSLS104) stream gage for rainfall greater than 1/2" in 24
hours. ..................................................................................................................................... III-124
Figure III.H.11. Geomorphology Survey Locations: Test Area (A), Control Area (B) ........ III-125
Figure III.H.12. Representative cross sections from the test area (LSLS104), cross section
location 4 (most downstream location). ............................................................................... III-128
Figure III.H.13. Representative cross sections from the control area, cross section location 4
(most downstream location). . ............................................................................................... III-129
Figure III.H.14. Longitudinal Profiles Test Area (LSLS104) and Sopers Branch Control, Study
Area Location 4 (Most Downstream Location). .................................................................... III-130
Figure III.J.1. County Watersheds with Impairments and EPA Approved TMDLs .............. III-133
List of Tables
Table II.1. County Erosion and Sediment Control Program Enforcement Action Summary ..... II-5
Table II.2. Investigation Results of Suspected Illicit Discharges During FY14 ......................... II-7
Table II.3. Illicit Discharge Detection and Elimination Summary, FY11-FY13 ........................ II-7
Table II.4. Summary of Enforcement Actions, FY11-FY14 ........................................................ II-9
Table II.5. County Facilities Covered under the Maryland General Discharge Permit for Storm
Water Associated with Industrial Activities .............................................................................. II-10
Table II.6. Inventory and Status of MCPS Facilities Covered under the Maryland General
Discharge Permit for Storm Water Associated with Industrial Activities (12-SW) .................. II-12
Table II.7. TMDLs Approved Since 2009 ................................................................................. II-19
Table III.A.1. Organization Chart for Montgomery County Permit-Required Programs ......... III-1
Table III.B.1. List of Contacts for Municipalities Co-permittees .............................................. III-5
Table III.C.1. FY14 Total Number of Storm Water BMP Facilities by Structure Type
Designation ................................................................................................................................ III-8
Table III.E.1. Total Number of Inspections ............................................................................. III-11
Table III.E.2. FY14 Repairs and Maintenance ........................................................................ III-14
Table III.E.3. Summary of General Findings, ESD Barriers, Gaps, and Opportunities ......... III-18
Table III.E.4. Draft Zoning Code Rewrite Timeline ................................................................ III-19
Table III.E.5. Investigation Results of Suspected Illicit Discharges During FY14 ................. III-21
Table III.E.6. Suspected HVAC Discharge Water Sample Analysis Results ........................... III-26
Table III.E.7. FY14 Stormwater Discharge Enforcement Cases ............................................. III-27
Table III.E.8. Trash Collected From Ponds FY2014 (Pounds) ............................................... III-33
Table III.E.9. Estimated FY13 Trash Reduction Costs ............................................................ III-35

06-DP-3320-MD0068349 Page viii
Annual Report March 2015
Montgomery County Department of Environmental Protection
Table III.E.10. Inventory and Status of County Facilities Covered under the Maryland General
Discharge Permit for Storm Water Associated with Industrial Activities ............................... III-35
Table III.E.11. FY14 Pollution Prevention Needs at County Facilities Covered Under the State
General Discharge Permit for Storm Water Associated with Industrial Activities ................. III-37
Table III.E.12. Inventory and Status of MCPS Facilities Covered under the Maryland General
Discharge Permit for Storm Water Associated with Industrial Activities (12-SW) ................ III-39
Table III.E.13. Summary of County’s FY14 Street Sweeping Program................................... III-42
Table III.E.14. Arterial Street Sweeping by Watershed FY14 ................................................. III-45
Table III.E.15. DOT Inlet Cleaning, by Fiscal Year 2010-2013 ............................................. III-46
Table III.E.16. Herbicide Usage by Montgomery Weed Control Inc. on Montgomery County
Rights of Way ........................................................................................................................... III-46
Table III.E.17. DOT Winter Weather Deicing Material Usage from FY10-FY13. .............. III-47
Table III.E.18. Full DEP Website Statistics ............................................................................ III-48
Table III.E.19. Water Section Statistics ................................................................................... III-48
Table III.E.20. Stormwater Outreach Efforts in FY14............................................................. III-50
Table III.E.21. Stream Stewards Volunteer Activities FY14 .................................................... III-54
Table III.E.22. County Watershed Group Capacity Building Accomplishments in FY14 ....... III-55
Table III.E.23. FY14 H2O Summit Survey Responses ............................................................. III-57
Table III.F1. Montgomery County Watershed Groupings and Plans Found in the Strategy . III-65
Table III.F2. Status of Montgomery County Watersheds’ Assessments .................................. III-65
Table III.F3. Summary of 2010-2013 Monitoring Results ....................................................... III-73
Table III.G.1. County Impervious Area Summary ................................................................... III-75
Table III.G.2. FY14 Restoration Implementation Progress Summary ..................................... III-76
Table III.G.3. FY14 Summary of Watershed Restoration Projects Completed ....................... III-76
Table III.G.4. Summary of Watershed Restoration Projects Completed Through FY14 ........ III-77
Table III.G.5. Summary of Watershed Restoration Projects Under Construction in FY14 .... III-81
Table III.G.6. FY14 Summary of Watershed Restoration Projects in Design ......................... III-82
Table III.G.7. Summary of Watershed Restoration Projects under Task Order for Design FY15 ..
....................................................................................................................................... III-87
Table III.G.8. Summary of Watershed Restoration Potential Opportunity Projects Identified for
Future Consideration ............................................................................................................... III-88
Table III.G.9. Highlighted Watershed Restoration Projects for FY14 .................................... III-90
Table III.G.10. FY10-FY14 Capital Improvement Program Costs for Watershed Assessment and
Restoration ............................................................................................................................... III-99
Table III.G.11. Department of Environmental Protection Approved (May 2012) FY13-18
Stormwater Management (SWM) Capital Improvement Program Budget (in $) .................... III-99

06-DP-3320-MD0068349 Page ix
Annual Report March 2015
Montgomery County Department of Environmental Protection
Table III.G.12. Department of Environmental Protection Approved (May 2014) FY15-20
Stormwater Management (SWM) Capital Improvement Program Budget (in $) .................. III-100
Table III.G.13. TMDL Summary by Impairment ................................................................... III-102
Table III.H.1. Drainage Area to Breewood Water Chemistry Monitoring Stations .............. III-108
Table III.H.2. Breewood Tributary Impervious Area 2012 ................................................... III-108
Table III.H.3. Mean Storm EMCs and Baseflow MCs ......................................................... III-110
Table III.H.4. Baseflow, Stormflow, and Total Annual Loadings (lbs.) in Breewood Tributary,
2013 ..................................................................................................................................... III-111
Table III.H.5. In-Situ Water Chemistry Results at Breewood Tributary (SCBT101) and at the
Good Hope Tributary (PBGH108) Reference Stream ........................................................... III-116
Table III.H.6. Descriptions of the Five USGS Stream Gages in the Clarksburg Study Area III-122
Table III.H.7. Time of Concentration in Minutes for Water Years 2008-2013 .................... III-123
Table III.H.8. Sinuosity indices and survey information for test area (LSLS104) and control area
(LBSB01). ............................................................................................................................... III-127
Table III.I.1. Total Funding for County MS4 Related Programs By Fiscal Year (in 000s) .. III-131
Table III.J.1. Summary of the Strategy’s Progress Toward MS4 Water Quality Requirements .....
..................................................................................................................................... III-132
Table III.J.2. TMDLs Approved Since 2009 .......................................................................... III-134
Table III.J.3. Watershed TMDL Summary ............................................................................. III-134
Table III.J.4. Summary of the Implementation Plan Schedule for the Cabin John Creek
Watershed with Expected TMDL Compliance Endpoints ...................................................... III-135
Table III.J.5. Summary of the Implementation Plan Schedule for the Rock Creek Watershed with
Expected TMDL Compliance Endpoints ................................................................................ III-135
Table III.J.6. TMDL Reduction by Permit Cycles for the Seneca Creek Watershed ............. III-136
Table III.J.7. TMDL Reduction by Permit Cycles for the Lower Monocacy Watershed ....... III-137
Table III.J.8. TMDL Reduction by Permit Cycles for the Potomac Direct Watershed ......... III-137

06-DP-3320-MD0068349 Page x
Annual Report March 2015
Montgomery County Department of Environmental Protection
List of Attachments
ATTACHMENT 1. COMPACT DISK WITH THE FOLLOWING ELECTRONIC FILES
APPENDIX A Annual Report Databases
MDENPDES14.accdb Required information in ACCESS 2000 database A. GIS Storm Drain System Mapping Associated With GIS Coverage (Part III.C.1), 1998 through
February 2013
B. Urban Best Management Practices Associated with GIS Coverage (Part III.C.2)
C. Impervious Surfaces Associated with GIS Coverage (Part III.C.3)
D. Watershed Restoration Project Locations Associated with GIS Coverage (Part III.C.5)
E. Monitoring Site Locations Associated With GIS Coverage (Part III.C.4.)
E.1. Monitoring Site Locations- Use for Multiple Land Use Values in the Drainage Area
E.2. Monitoring Site Locations- Use for Multiple Stormwater BMPs in the Drainage Area
F. Chemical Monitoring (Part III.H.1.a)
G. Pollutant Load Reductions Associated With GIS Coverage (Part III.J.)
G.1. Additional Pollutants (Part III.J.)
G.2. Pollutant Load Reductions Associated With GIS Coverage (Part III.H.1.a.iv.)
G.3. Additional Pollutants (Part III.H.1.a.iv.)
H. Biological and Habitat Monitoring (Part III.H.1.b and c.)
I. Illicit Discharge Detection and Elimination (Part III.E.3)
J. Responsible Person Certification (Part III.E.2.b)
K. Quarterly Grading Permit Information Associated with GIS Coverage (Part III.E.2.c)
L. Fiscal Analysis (Part III.I)
Appendix B. MDE Letter Approving the Strategy after review.
Appendix C. MCPS Report to the County on MS4 Activities in FY 2014.
Appendix D. EPA MS4 inspection Findings and County Response
Appendix E. Implementing_ESD_Report_FINAL_110910.pdf
Zoning Code ESD changes
Appendix F. MDE SW Triennial Review Letter with County Response
Appendix G. Final Report for IDDE Special Study
Appendix H. Updated SWP3 Plans for County Facilities, SWPPP Annual Inspections FY13, MDE NOI
Acceptance Letters
Appendix I. Lower Monocacy Watershed Implementation Plan
Potomac Direct Watershed Implementation Plan
Patuxent River Watershed Implementation Plan
Seneca Creek Watershed Implementation Plan
Appendix J. Strategy Guidance Document
Appendix K. NPDES Water Chemistry Monitoring in the Breewood Tributary of Upper Sligo
Creek, 2009-2013
Breewood Project Fact Sheet
Rationale to Use Breewood tributary for NPDES Required Monitoring
Appendix L. Watershed Restoration Project Monitoring FY2013
Appendix M. Montgomery County NPDES 2003 Annual MS4 Report
06-DP-3320-MD0068349 Page I-1
Annual Report March 2015
Montgomery County Department of Environmental Protection
MONTGOMERY COUNTY MARYLAND
NATIONAL POLLUTANT DISCHARGE ELIMINATION SYSTEM (NPDES)
MUNICIPAL SEPARATE STORM SEWER SYSTEM (MS4) DISCHARGE PERMIT
I. Background
The Montgomery County Department of Environmental Protection’s (DEP) submission to the
Maryland Department of the Environment (MDE) fulfills the annual progress report requirement
as specified in Part IV of Permit Number 06-DP-3320 MD0068349 (the Permit). The 5-year
Permit term began February 16, 2010, covering stormwater discharges from the MS4 in
Montgomery County, Maryland (the County). This is the fifth report in this current permit cycle
(February 16, 2010-February 15, 2015) and covers the County’s Fiscal Year 2014 (FY14) for
July 1, 2013 to June 30, 2014.
The MDE modified the County's second generation Permit effective January 26, 2004 to add six
small localities as co-permittees for coverage under the Phase 2 of the NPDES MS4 Permit
Program. These included five municipalities: the Towns of Chevy Chase, Kensington,
Poolesville, and Somerset, and Chevy Chase Village; and one special tax district, the Village of
Friendship Heights. For the third generation Permit, MDE added the Montgomery County
Public Schools (MCPS) as a co-permittee.
Significant accomplishments in the County’s stormwater management program during FY14 are
highlighted in the Overview. The report itself has been organized based on the headings in the
Permit’s Part III, Standard Permit Conditions, to document implementation of required elements.
Information required by the Permit’s Attachment A, Annual Report Databases, Parts A. through
L. can be found electronically on the compact disc (CD) submission in Appendix A.
The DEP Watershed Management Division (WMD) has primary responsibility for the majority
of the Permit requirements, including interagency coordination, annual reporting, source
identification, discharge characterization, monitoring, stormwater facility inspection and
maintenance, enforcement, illicit discharge detection and elimination, watershed public outreach,
watershed assessment and restoration. WMD is also responsible for assessment of stormwater
controls, and for tracking progress towards meeting the County’s Total Maximum Daily Load
(TMDL) urban stormwater wasteload allocations (WLAs) in applicable watersheds. The DEP
Division of Solid Waste Services (DSWS) is responsible for all solid waste related programs,
including programs to increase awareness of waste reduction and recycling.
The Department of Permitting Services (DPS) is responsible for reviewing and permitting plans
for Stormwater Management (SWM) and Erosion and Sediment Control (ESC), and for ensuring
plan compliance.. The Department of Transportation (DOT) is responsible for storm drains, road
and roadside maintenance. The Department of General Services, (DGS), DEP’s DSWS, and
DOT are responsible for property maintenance activities at County-owned facilities covered
under the NPDES General Permit for Storm Water Discharges Associated with Industrial
Facilities.
The Permit required DEP to develop and submit a countywide implementation plan within 1 year
of Permit issuance to identify how the County would achieve Permit requirements within the
06-DP-3320-MD0068349 Page I-2
Annual Report March 2015
Montgomery County Department of Environmental Protection
5-year permit cycle. In February 2011, DEP submitted the draft Montgomery County
Coordinated Implementation Strategy (the Strategy) and associated Watershed Implementation
Plans to MDE with the FY10 MS4 Annual Report. The Strategy presents the restoration and
outreach initiatives that are needed to meet the watershed-specific restoration goals and water
quality standards, and is referenced frequently in this report. Specifically, the Strategy provides
the planning basis for the County to:
1. Meet Total Maximum Daily Loads (TMDLs) and Wasteload Allocations (WLAs) approved
by the U.S. Environmental Protection Agency (EPA).
2. Provide additional stormwater runoff management on impervious acres equal to 20 percent
of the impervious area for which runoff is not currently managed to the maximum extent
practicable (MEP).
3. Meet commitments in the Trash Free Potomac Watershed Initiative 2006 Action Agreement
which include support for regional strategies and collaborations aimed at reducing trash,
increasing recycling, and increasing education and awareness of trash issues throughout the
Potomac Watershed.
4. Educate and involve residents, businesses, and stakeholder groups in achieving measurable
water quality improvements.
5. Establish a reporting framework that will be used for annual reporting as required in the
County’s Permit.
6. Identify necessary organizational infrastructure changes needed to implement the Strategy.
The MDE approved the Strategy in July 2012. The approval letter can be found in the electronic
attachment to this report in Appendix B. A final version of the Strategy, and Watershed
Implementation Plans, are accessible on DEP's website at:
http://www.montgomerycountymd.gov/DEP/water/county-implementation-strategy.html.

06-DP-3320-MD0068349 Page II-1
Annual Report March 2015
Montgomery County Department of Environmental Protection
II. Overview
This Overview will summarize County progress in meeting the Permit requirements for FY14,
and where possible, over the 5-year Permit term.
Permit Administration The Permit requires the County to designate an individual to act as liaison with the MDE for
Permit implementation. The Permit also requires the County to submit an organizational chart
detailing personnel and groups responsible for major NPDES program tasks.
An updated organization chart and contact information is shown in Table III.A.1. These are the
contacts as of February 2015.
Legal Authority The Permit requires the County to maintain adequate legal authority in accordance with NPDES
regulations 40 CFR Part 122 throughout the term of the Permit.
Chapter 19 of the Montgomery County Code- The Stormwater Management
Ordinance:
Chapter 19 establishes minimum requirements and procedures to control the adverse impacts
associated land disturbance and increased stormwater runoff from developed and developing
lands. Chapter 19 includes:
Article I - Establishes the County’s legal authority to administer a Sediment and Erosion
Control program
Article II - Establishes the County’s legal authority to administer a Stormwater Management
Program
Article IV - Establishes the County’s authority to regulate discharges of pollutants to County
streams, and establish inspection and enforcement procedures and penalties for non
compliance.
Chapter 19 was modified during the current Permit cycle to add:
Stormwater Management
In July 2010 and March 2011, the County Council passed Bill 40-10 amending the County’s
stormwater management law to require management of stormwater runoff through the use of
nonstructural Best Management Practices (BMPs) to the MEP for new development and
redevelopment projects approved by DPS. In response to MDE concerns that a portion of Bill
40-10 was less restrictive than State law, Bill 40-10 was amended in March 2011 as Expedited
Bill 7-11 to limit certain alternative SWM measures to redevelopment only. The bills then
brought the County’s stormwater management law into compliance with the Maryland
Stormwater Management Act of 2007 and associated state implementing regulations adopted in
2010.

06-DP-3320-MD0068349 Page II-2
Annual Report March 2015
Montgomery County Department of Environmental Protection
The revised County stormwater management law maintained more stringent requirements than
State law for redevelopment sites to protect water quality. Specifically, the Maryland
Stormwater Management Act of 2007 requires management of the first inch of runoff from
50 percent of the redevelopment site using Environmental Site Design (ESD) to the MEP.
County law requires stormwater management to protect water quality volume (WQv- the first
inch of runoff) and channel protection volume (CPv-the expected runoff from a 1-year 24-hour
duration rainfall) from 100 percent of the redevelopment site, and requires the use of ESD to the
MEP to meet these standards.
Sediment and Erosion Control
On March 29, 2013, the County Council passed Expedited Bill 1-13, Erosion and Sediment
Control, which brings local erosion and sediment control requirements into compliance with the
Maryland Stormwater Management Act of 2007 and the 2011 Maryland Standards and
Specifications for Soil Erosion and Sediment Control. The County legislation mirrors the
requirements in State law and regulations, including more stringent stabilization requirements
and the establishment of maximum grading unit criteria.
Water Quality Protection Charge
In April 2013, the County Council passed Bill 34-12, Stormwater Management-Water Quality
Protection Charge (WQPC). Bill 34-12 modified the structure of the County’s original WQPC to
comply with the 2012 State HB 987, the Stormwater Management- Watershed Protection and
Restoration Program Bill.
Coal Tar Sealants
In September 2012, the County Council passed the Coal Tar Pavement Products Law, Bill 21-12,
that banned the use of coal tar products, effective December 18, 2012. Under the law, use of a
coal-tar based sealant can lead to a fine of up to $1,000—for both the property owner and the
applicator.
Other Legislation Enacted During the Current Permit Cycle:
Carryout Bag Law
On January 1, 2012, the County's Carryout Bag Law, Bill 11-8, went into effect. The goal of the
law was to increase awareness about the problem with disposable bag litter and to reduce the use
of carryout bags. The Carryout Bag Law taxes 5 cents for each paper and plastic bag that a
customer takes from certain retail establishments to carry purchases out. The Department of
Finance is responsible for enforcement of the Bag Law. Restaurants that use paper bags for
carryout food do not need to charge the tax.
Source Identification The Permit requires the County to submit information for all County watersheds in geographic
information systems (GIS) format with associated tables.
The County continues to improve its storm drain mapping to facilitate identification of pollution
sources from the MS4. The County’s storm drain inventory can be found in Appendix A, Part
A., on the CD attached to this report.

06-DP-3320-MD0068349 Page II-3
Annual Report March 2015
Montgomery County Department of Environmental Protection
The DEP’s Urban BMP database as of June 30, 2014, with associated coverage is included in
Appendix A, Part B. Over the Permit term, DEP made progress towards updating the drainage
areas of all stormwater BMPs.
The County’s 2009 impervious area associated with GIS coverage, which was used in the
Strategy development, is included in Appendix A, Part C. In this Permit cycle, the County
evaluated success towards meeting its Permit restoration requirements using the 2009 impervious
coverage. In FY14, DEP continued to digitize and update impervious areas for other Permit
requirements and for the County’s stormwater utility charge, the WQPC, based on 2012 aerial
photography.
The DEP’s monitoring locations and locations of watershed restoration projects are also included
electronically in Appendix A, Parts D. and E.
Discharge Characterization The Permit requires the County to assess the effectiveness of stormwater management programs,
and to document progress towards meeting WLAs included in the TMDLs approved by the EPA.
The DEP conducts monitoring required under this section at the Breewood Tributary within the
Anacostia Watershed and in the Clarksburg Town Center drainage within the Seneca Watershed.
Detailed results are presented in the report Part III.H titled ‘Assessment of Controls’ set forth
below.
Management Programs
Stormwater Management (SWM) Facility Maintenance and Inspection
The Permit requires the County to conduct preventative maintenance inspections of all SWM
facilities (BMPs) on at least a triennial basis.
The DEP SWM Facility Maintenance and Inspection Program oversees the triennial inspections,
structural and non structural maintenance of all SWM BMPs under the County’s jurisdiction and
assesses repair and maintenance needs. From FY11- FY14, the number of SWM BMPS under
County jurisdiction increased from 4,200 to over 8,700. From FY11- FY14, DEP oversaw 4,721
triennial inspections and 7,311 SWM BMPs were maintained by either the DEP structural
maintenance program or by the private owner of the facility. DEP also issued over 500 Notice of
Violations (NOVs) for correction of deficiencies noted during the triennial inspections.
Additionally, DEP sent over 400 routine maintenance notification letters to property owners.
DEP also performed a total of 135 unscheduled inspections. These occurred in response to
public complaints, at facilities being considered for transfer into DEP's SWM facility
maintenance program, or to assess conditions after a large storm event.
During the Permit term, the SWM Facilities Maintenance and Inspection Program developed
new protocols to remain in compliance with County and State SWM facility maintenance
requirements while remaining fiscally responsible:
In December 2012, DEP acquired contractual services for routine maintenance of publically
owned ESD practices, including Roadway Right-of-Way (ROW), beginning one of the first

06-DP-3320-MD0068349 Page II-4
Annual Report March 2015
Montgomery County Department of Environmental Protection
environmental site design (ESD) maintenance programs in the Washington metropolitan
area.
In FY15, many of the first permitted and installed ESD facilities will be due for triennial
inspections. In FY14, DEP began developing policies and procedures for ESD related
inspections, enforcement and administrative processes, and will pilot a residential ESD
inspection and maintenance program in FY15-FY16.
During FY13, DEP developed a protocol to rank maintenance need levels for privately
owned and maintained facilities. DEP assigns the maintenance need level using results from
the triennial inspections, from those requiring immediate attention (Emergency level) to
those with less serious maintenance needs (Routine level). The new protocols ensure that the
BMPs with the most serious repair needs are addressed in a timely manner.
In FY13-FY14, DEP also modified the inspection protocol for public and private
underground facilities. Prior to FY13, DEP required that all underground facilities be
cleaned once per year. The new inspection protocol requires a pre-cleaning inspection of the
facility, in order to determine cleaning need. Facilities deemed acceptable clean and
functioning properly and not cleaned until their triennial inspection, allowing facility owners
to reduce maintenance costs.
Implementing Maryland’s Stormwater Management Act of 2007
The Permit requires the County to implement SWM design policies, principles, methods, and
practices found in the 2000 Maryland Stormwater Design Manual and provisions of Maryland’s
Stormwater Management Act of 2007. The Permit requires the County to modify its SWM
ordinances, regulations and new development plan approval processes within one year after
State adoption of regulations; April 24, 2009, with an effective date of May 4, 2009. The Permit
also requires the County to review local codes and ordinances to identify impediments to and
opportunities for promoting ESD to the MEP within one year, and to remove those impediments
within two years of the Permit’s issuance.
As described under the section “Legal Authority”, in July 2010 and March 2011, the County
Council passed Bill 40-10 amending the County’s stormwater management law to require
management of stormwater runoff through the use of nonstructural BMPs to the MEP for new
development and redevelopment projects approved by DPS. The bills then brought the County’s
stormwater management law into compliance with the Maryland Stormwater Management Act
of 2007 and associated state implementing regulations adopted in 2010.
In 2010, the County summarized how the County's codes, regulations, programs, and policies
may need to be updated to allow the use of ESD techniques to the MEP in the report,
Implementing Environmental Site Design in Montgomery County. The most significant updates
required were accomplished through the Zoning Code rewrite, completed by the Planning
Department of the Maryland-National Capital Park and Planning Commission (M-NCPPC). The
zoning code rewrite, Zoning Text Amendment (ZTA) 13-04 was approved by Council March 5,
2014, and took effect October 30, 2014.
The DPS has been working with its fellow agencies and some members of the SWM
construction community through the Policy and Design Committee and the New Products
Committee on design and maintenance aspects of various ESD practices. The goal is to assure
that these practices provide cost-effective designs that provide maximum runoff reduction and
06-DP-3320-MD0068349 Page II-5
Annual Report March 2015
Montgomery County Department of Environmental Protection
pollutant removal without increasing average maintenance cost per facility. This is critical since
the decentralized nature of the ESD approach results in many more structures per site that must
be inspected to assure aesthetic (i.e. trash and invasive plant removal) as well as continued
function.
The DEP also continues outreach on ESD practices to increase community acceptance of these
practices and future stewardship for routine housekeeping of the roadside ESD practices.
Watershed groups, such as the Audubon Naturalist Society (ANS) and the Friends of Sligo Creek
(FoSC) have provided assistance to DEP outreach efforts, both for the “Green Streets” pilot (a
DEP/DOT partnership where ESD practices are installed in the roadway right of way) and also
for residential properties retrofits through DEP’s RainScapes Neighborhoods program. DEP also
has developed numerous fact sheets designed to provide assistance to residents in maintenance of
their ESD practices.
MDE’s Triennial Stormwater Program Review
The Permit requires the County to maintain programmatic and implementation information
according to the requirements established as part of MDE’s triennial stormwater program
review.
In April 2013, MDE completed a review of the County’s stormwater management program,
evaluating the status of implementing ESD to the MEP in the County’s plan review and approval
process. MDE found the County’s program to be acceptable under State law and in compliance
with Part III.E.1 of the Permit.
Erosion and Sediment Control (ESC)
The Permit requires the County to maintain an acceptable ESC program, including
implementing program improvements identified in any MDE evaluation of the County’s
application for the delegation of ESC enforcement authority, conduct responsible personnel
certification classes and report quarterly information on earth disturbances exceeding one acre
or more.
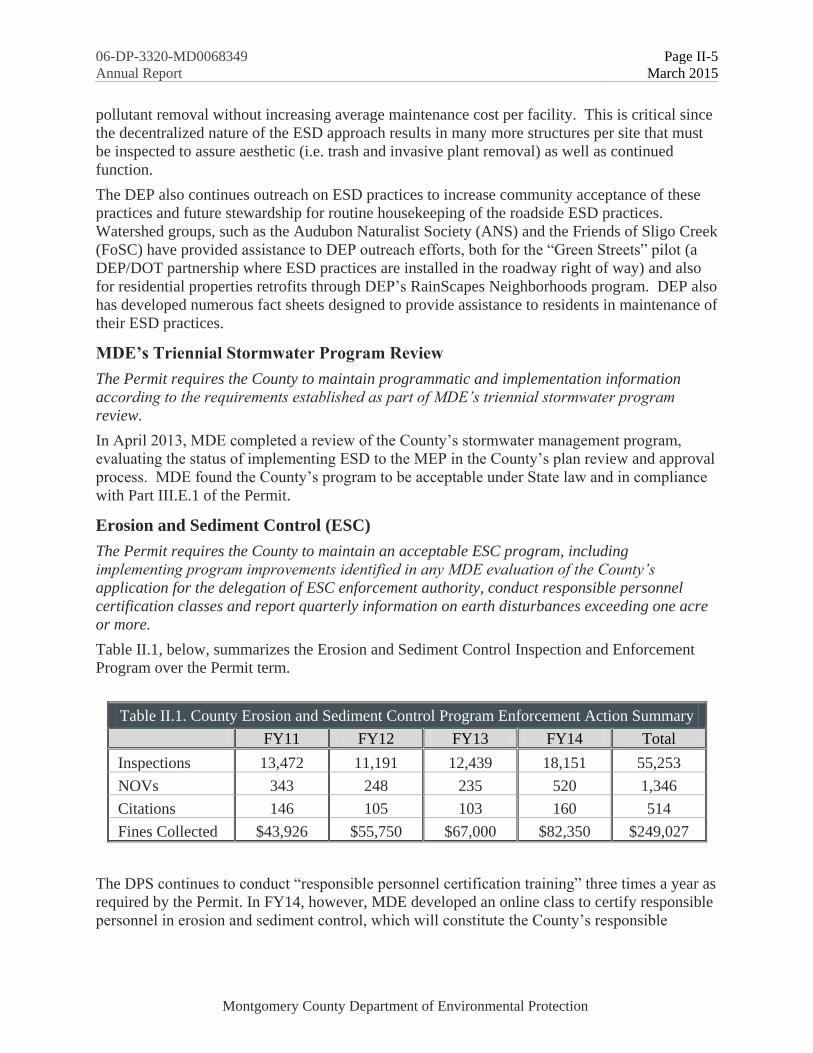
Table II.1, below, summarizes the Erosion and Sediment Control Inspection and Enforcement
Program over the Permit term.
Table II.1. County Erosion and Sediment Control Program Enforcement Action Summary
FY11 FY12 FY13 FY14 Total
Inspections 13,472 11,191 12,439 18,151 55,253
NOVs 343 248 235 520 1,346
Citations 146 105 103 160 514
Fines Collected $43,926 $55,750 $67,000 $82,350 $249,027
The DPS continues to conduct “responsible personnel certification training” three times a year as
required by the Permit. In FY14, however, MDE developed an online class to certify responsible
personnel in erosion and sediment control, which will constitute the County’s responsible

06-DP-3320-MD0068349 Page II-6
Annual Report March 2015
Montgomery County Department of Environmental Protection
certification and comply with the County’s Permit conditions. DPS also continues to report to
MDE quarterly information on earth disturbances exceeding 1 acre or more.
On March 29, 2013, the County Council passed Expedited Bill 1-13, Erosion and Sediment
Control, which brings local erosion and sediment control requirements into compliance with the
Maryland Stormwater Management Act of 2007 and the 2011 Maryland Standards and
Specifications for Soil Erosion and Sediment Control.
The MDE performed a biennial evaluation of the County’s ESC program as part of their review
of the County’s application for the delegation of ESC enforcement authority in November of
2013. Continued delegation was granted by Brian Clevenger, Program Manager of MDE’s
Sediment, Stormwater and Dam Safety Program in a letter dated January 6, 2014. In that letter,
MDE stated that it “has also determined that the County’s program is in compliance with the
erosion and sediment control program elements stipulated in Part III.E.2 of the Montgomery
County MS4 Permit”.
Illicit Discharge Detection and Elimination (IDDE)
The Permit requires the County to implement an inspection and enforcement program to ensure
that all discharges to and from the MS4 system that are not composed entirely of stormwater are
either permitted by MDE or eliminated. The Permit requires the County to field screen
150 outfalls annually, conduct routine surveys of commercial and industrial areas, and maintain
an enforcement program to address discharges, dumping and spills.
In previous Permits, DEP conducted outfall surveys in areas where the County’s monitoring
program found biological impairments not related to physical habitat degradation. DEP then
used the County’s storm drain layer to identify outfalls in those areas for investigation.
Evaluation of that method found that it did not effectively identify illicit discharges. For
example, from 2007-2009, 231 outfalls were screened, but only six outfalls (2.5 percent) were
found with dry weather discharges that exceeded the detection levels of the Permit required field
chemical tests.
In FY11, DEP partnered with the Center for Watershed Protection (CWP) to perform a pilot
IDDE investigation of the Sligo Creek subwatershed of the Anacostia following protocols in the
CWP’s Illicit Discharge Detection and Elimination Manual. The CWP protocol added two
elements that greatly improved the efficiency of the investigations. The team physically walked
the entire reach of the targeted waterbody, allowing comprehensive evaluation of the frequency
of problems, and provided information that will improve the accuracy of the County’s storm
drain GIS layer. The protocol also added additional field test parameters, notably ammonia,
potassium, and fluoride, which provided more information on possible sources of the discharges
and increased the likelihood of source identification and elimination.
In FY14, DEP performed outfall screening in the Little Falls watershed. DEP screened
154 outfalls and found 66 with dry weather flow. DEP performed field testing for permit
required water chemistry parameters and also for ammonia, potassium and fluoride. Nineteen
outfalls had elevated parameters, and follow up investigations were performed. Of those 19
outfalls, 16 were found to have normal water chemistry parameters during follow up visits.
Table II.2 shows the problems identified at the remaining outfalls.

06-DP-3320-MD0068349 Page II-7
Annual Report March 2015
Montgomery County Department of Environmental Protection
Table II.2. Investigation Results of Suspected Illicit Discharges During FY14
Outfall ID Location Problem Found Resolution
GM562P0600 Shops at Sumner Pl. Sewage Discharge from
private facility
Property
Management
working to correct
HN121P0329 Arlington Road Suspected Sewage
Discharge
Continuing to
investigate source
HM343P0106 Willard Ave. Wastewater cross-
connection to storm drain
NOV issued and
problem corrected
HM343P0106 Willard Ave. Discharge from parking
garage cleaning
Required change to
cleaning procedures
Table II.3, below, summarizes DEP’s IDDE program during the Permit term. From FY11-FY14,
DEP assessed 716 outfalls by walking the entire reach of waterbodies in four separate
subwatersheds, capturing most of the existing outfalls in each drainage area. DEP is targeting
subwatersheds with the highest percentages of commercial and industrial areas to identify and
eliminate pollutant sources in those areas.
Table II.3. Illicit Discharge Detection and Elimination Summary, FY11-FY14
% of Total
Outfalls Screened 716
Outfalls Unmapped 518 72% of Total Outfalls Screened
Suspected Illicit Discharges 96 13% of Total Outfalls Screened
Resulting Investigations 74 10% of Total Outfalls Screened
Problem Resolved 13 1.8% Of Total Outfalls Screened
CCTV Inspections in FY14
Tracking illicit discharges in heavily urban areas is problematic for a number of reasons.
Tracking the discharge above ground by looking into up gradient manholes is often not
successful due to missing storm drain information, very complex storm drain systems, paved
over manholes, or intermittent flow. In FY14, DEP has obtained contractual support to conduct
closed circuit television (CCTV) investigations into the remaining unidentified discharges.
Results included:
Wayne Avenue Discharge - CCTV inspection determined that a dry weather discharge
originated from an underground SWM management facility behind a shopping center. The
SWM facility received runoff from a loading dock and dumpster area behind a grocery store.
DEP worked with the shopping center property owner to clean the underground SWM
facility and repair any leaking dumpsters.

06-DP-3320-MD0068349 Page II-8
Annual Report March 2015
Montgomery County Department of Environmental Protection
Maple Avenue Discharge - CCTV inspection identified several small flows originating from
apartment building heating, ventilation and air conditioning (HVAC) units. A subsequent
inspection of the Maple Avenue outfall also identified flow coming from a large underground
SWM facility. Other investigations of smaller flows revealed a clogged storm drain referred
to DOT for repair.
HVAC Discharge Pilot Study
For FY14, DEP worked with the CWP under contract to further study and quantify the extent of
pollution from anti-microbial agents used in rooftop HVAC systems. During previous year
investigations in the Sligo Creek subwatershed, high ammonia discharges in two drainage areas
were traced to commercial sites, and were found to originate from air conditioner condensate.
Limited sampling conducted by CWP suggests pollution loading for nitrogen, copper and zinc,
but specific management measures and products that contribute to the problem are still unknown.
The study focused on the Sligo Creek subwatershed. Field crews found 33 suspected HVAC
discharges, all with elevated levels of ammonia, and metals. Investigations were conducted at
nine sites, five of which had cooling towers. Building managers generally did not know whether
condensate or cooling tower water drained to the storm drain or sanitary system. All managers
reported that their systems received regular service by an external contractor. Condenser coils
were generally cleaned on an annual or semi-annual frequency either by vacuum or high-
pressure water jet and sometimes with ammonia-based anti-microbial products. Biocide
products were also used in A/C drip pans at several sites to control the growth of algae, mold,
and fungi and to eliminate odors and pan corrosion.
Rooftop inspections confirmed HVAC discharges to the storm drain at two locations. One
additional inspection determined that the discharge was not associated with an HVAC system but
was actually tied to a first-floor refrigeration unit at a restaurant. Two other inspections were
inconclusive.
The County Water Quality Ordinance (Chapter 19, Article IV) prohibits anything other than
clean water from being discharged to the MS4 system, and would apply to HVAC discharges.
The cooling tower discharges should be connected to the sanitary system, but WSSC does not
currently accept HVAC condensate discharges. MDE should address HVAC discharge pollution
at a statewide-scale since it is unlikely that this source is limited to only Montgomery County. If
condensate cannot be directed to WSSC, the following strategies should be undertaken:
1. Work with property owners to eliminate the use of biocides in A/C drip pans and condenser
coils. A/C drip pans can be cleaned regularly with mild soap and water.
2. Encourage property owners to clean condenser coils monthly or quarterly, preferably by
vacuum or other dry methods or with mild detergent solution if needed.
3. Drain condensate lines to landscaped areas and not the street or storm drain system. On-site
treatment options can be explored with MDE.
4. Re-use condensate, where possible, in subsurface irrigation systems or in cooling towers.
Enforcement Actions
DEP’s Division of Environmental Policy and Compliance (DEPC) implements a highly effective
environmental enforcement group that has great success in eliminating discharges reported by

06-DP-3320-MD0068349 Page II-9
Annual Report March 2015
Montgomery County Department of Environmental Protection
the public. Over the Permit term, the group has responded to 774 water quality related
complaints, which led to 149 enforcement actions.
Most complaints are reported to DEP through the County’s call center for non-emergency
services (311), or through the DEP website.
DEPC also investigates illegal dumping complaints. Details on the enforcement actions over the
Permit term are summarized in Table II.4.
Table II.4. Summary of Enforcement Actions, FY11-FY14
FY11 FY12 FY13 FY14 Total
Water Quality Investigations 122 208 206 238 774
NOV 16 17 14 28 75
Citations 18 14 11 6 49
Fines Collected $9,000 $7,000 $6,000 $3,000 $25,000
Illegal Dumping Cases 471 450 377 354 1,652
NOVs 34 36 16 18 104
Citations 7 11 0 2 20
Fines $3,500 $5,500 0 $1,000 $10,000
DEP is also partnering with community groups for faster response when a pollution discharge is
reported. In January 2012, the DEPC established an e-mail process for Friends of Sligo Creek
(FoSC) members to report water quality incidents directly to DEPC staff. Subsequently, two
residents formed a neighborhood group, Water WatchDogs to work with DEP and the FoSC to
enhance reporting and facilitate follow up for pollution incidents. Members are trained to
provide specific information that is transmitted via email straight to DEP field enforcement staff.
In FY13, volunteers reported 13 incidents covering a wide range of water pollution problems,
resulting in five investigations with one enforcement action.
Trash and Litter
The Permit requires the County to meet its obligations under the Potomac River Watershed
Trash Treaty, including trash abatement program implementation, education, and evaluation.
The Strategy includes trash reduction work plans designed to meet the Potomac Trash Free
Treaty goals and the MS4 wasteload allocations for the 2010 Anacostia Trash TMDL. The
County is also working with the Anacostia Watershed Restoration Partnership, the Alice
Ferguson Foundation, and other partners to meet regional trash reduction goals. Initiatives
directly related to the regional campaign include ongoing education and outreach for recycling
and litter reduction, mass media outreach campaigns, and litter removal from streets, stormwater
ponds, and transit stops.
On January 1, 2012, the County's Carryout Bag Law, Bill 11-8, went into effect. The Carryout
Bag Law taxes 5 cents for each paper and plastic bag that a customer takes from certain retail
establishments to carry purchases out. From the implementation to June 2014, over 146 million
bags were sold in Montgomery County. In FY14, approximately 60 million carryout bags were

06-DP-3320-MD0068349 Page II-10
Annual Report March 2015
Montgomery County Department of Environmental Protection
sold. This represents an average of a little less than five disposable bags bought per county
resident each month. In the first month of FY14, the County had 1,108 registered retailers
remitting the bag tax collected from their business. As of June 2014, there are 1,185 registered
retailers in the system. Bag law data analysis to date suggest a slight downward trend, however
DEP does not have enough data to definitively report a change in bag usage for the County.
The DEP continues via contract to conduct trash monitoring and assessment in the Anacostia
Watershed. The litter survey and evaluation for instream trash structures in Rock Creek was
completed in 2012. FY14 highlights include:
Completed four cycles of post-TMDL trash monitoring in the Anacostia. The Anacostia
tributary monitoring follows the same protocols for stream-level and land-based surveys as
those used for trash TMDL development. As of FY14, there is a general decreasing trend for
plastic bag, plastic bottle and Styrofoam trash categories.
Began three additional types of observation surveys within the White Oak neighborhood of
Silver Spring (Anacostia watershed) since monitoring results have shown this area to have
the highest amounts of litter found in the stream; a bus stop survey, walking survey, and
storm drain inlet survey. This data will be used to help analyze and implement future litter
control projects that may be tested for effectiveness in this neighborhood and potentially
replicated in new areas.
Property Management
The Permit requires the County to ensure that a Notice of Intent (NOI) has been submitted to
MDE, and a pollution prevention plan developed, for each County owned and municipal facility
requiring a NPDES General Permit for Stormwater Associated with Industrial Activities.
Table II.5 lists the County facilities covered under the MDE General Discharge Permit for Storm
Water Associated with Industrial Activities (the General Permit). The MDE accepted Notices of
Intent (NOI’s) for these facilities in August 2014 for coverage until December 31, 2018.
Table II.5. County Facilities Covered under the Maryland General
Discharge Permit for Storm Water Associated with Industrial Activities
Name of Facility / Responsible Agency Watershed / Acreage
Colesville Highway Maintenance Depot (DOT) Anacostia/Paint Branch; 12 acres
Damascus Highway Maintenance Depot (DOT) Potomac/Great Seneca: 1.4 acres
Gaithersburg: Highway Maintenance Facility (DOT)
Potomac/Rock Creek: 15.1 acres Gaithersburg: Equipment Maintenance and Transit
Operations Center (EMTOC) (DGS)
Poolesville Highway Maintenance Facility (DOT) Potomac/Dry Seneca Creek: 4 Acres
Bethesda/Seven Locks Automotive Service Center
(DGS) Potomac/Cabin John Creek: 19 Acres
Bethesda/Seven Locks Highway Maintenance
Facility, Sign Shop and Signal Shop (DGS)
Kensington Small Transit Service Maintenance
Facility at Nicholson Court Potomac/Rock Creek: 3.31 acres

06-DP-3320-MD0068349 Page II-11
Annual Report March 2015
Montgomery County Department of Environmental Protection
Table II.5. County Facilities Covered under the Maryland General
Discharge Permit for Storm Water Associated with Industrial Activities
Name of Facility / Responsible Agency Watershed / Acreage
Silver Spring/Brookville Road Highway
Maintenance Facility (DOT) Potomac/Rock Creek: 18 Acres
Silver Spring/Brookville Road Transit Center/ Fleet
Maintenance Center (DGS)
Shady Grove Processing Facility (DEP) Potomac/Rock Creek; 43 out of
52.5 acres
Gude Landfill (DEP) Potomac/Rock Creek; 120 acres
Oaks Landfill (DEP) Patuxent/Hawlings River (355 acres)
and Potomac/Rock Creek;(190 acres)
In 2008, new Capital Improvement Program (CIP) funding dedicated to environmental
compliance was added to the DGS budget. In 2014, the following environmental compliance
CIP initiatives were accomplished:
As part of the County’s Smart Growth Initiative, the Gaithersburg Heavy Equipment
Maintenance and Operations Center, Transit Services and Highway Maintenance facility
were relocated to the County’s Equipment Maintenance and Transit Operations Center
(EMTOC). The onsite facilities include many pollution prevention and stormwater
management upgrades including a green roof, new bus wash facility, heavy equipment
storage shed, soil/gravel storage area, salt barns, and Highway Services bays.
Spill Prevention Control and Countermeasure (SPCC) Plans were developed for the new
County facilities.
Stormwater Pollution Prevention Plans (SWPPP) were developed for all County facilities
covered under the General Permit.
The DGS removed underground storage tanks (USTS) and contaminated soils from the old
location of the Gaithersburg Heavy Equipment Maintenance and Operations Center.
DGS is also currently replacing USTs with aboveground storage tanks at County Fire
Stations.
Construction of the Silver Spring /Brookville Road Depot stormwater improvements
continues, which will add two Baysaver water quality structures, and trench drains to
improve the water quality from the transit maintenance facility area. Planned improvements
for FY15 include a new permanent structure for bulk storage of highway maintenance
materials (topsoil, sand, gravel), and an improved bus stream bay.
Upgraded oil handling area at the Brookville Depot.
DGS/DOT has begun routine mechanical sweeping of all the industrial facilities, and
increasing the cleaning frequency of facility oil/grit separators. In FY14, all depots were
swept.
The MCPS conducted pollution prevention (P2) training for staff, prepared and implemented
SWPPP and SPCC plans at all industrial sites. P2 improvements have been implemented at these

06-DP-3320-MD0068349 Page II-12
Annual Report March 2015
Montgomery County Department of Environmental Protection
sites as recommended by the annual inspections. MCPS also continued to implement an
Integrated Pest Management Program (IPM) program at all facilities. Table II.6 lists the MCPS
facilities covered under the MDE General Discharge Permit for Storm Water Associated with
Industrial Activities (the General Permit).
Table II.6. Inventory and Status of MCPS Facilities Covered under the Maryland General
Discharge Permit for Storm Water Associated with Industrial Activities (12-SW)
Name of Facility / Responsible
Agency
Watershed /
Acreage
Status
Bethesda Fleet Maintenance /
Bethesda Facilities Maintenance
Depot
Cabin John Creek
6.2 acres
NOI accepted for registration under
the NPDES General Permit.
SWPPP updated in FY14.
Randolph Fleet Maintenance /
Randolph Facilities Maintenance
Anacostia
9.3 acres
NOI accepted for registration under
the NPDES General Permit.
SWPPP updated in FY14.
Shady Grove Fleet Maintenance /
Shady Grove Facilities
Maintenance
Rock Creek
15 acres
NOI accepted for registration under
the NPDES General Permit.
SWPPP updated in FY14.
West Farm Transportation Depot Anacostia River
5.06 acres
NOI accepted for registration under
the NPDES General Permit.
SWPPP updated in FY14.
Clarksburg Fleet
Maintenance/Clarksburg Facilities
Seneca Creek
15.11 acres
NOI accepted for registration under
the NPDES General Permit.
SWPPP updated in FY14.
Road Maintenance
The Permit requires the County to continue to implement a program to reduce pollutants
associated with road maintenance activities.
Street Sweeping
In FY14, the County continued its street sweeping program, focusing on twice monthly sweeping
of 229 miles in selected arterial routes, removing 406.4 tons of material. The sweeping
frequency provides equivalents for impervious acreage control and pollutant reduction credit as
specified in the MDE’s August 2014 “Accounting for Stormwater Wasteload Allocations and
Impervious Acreage Treated” guidance document. For FY14, the County controlled an
impervious acreage equivalent of 162.6 acres and reduced 1421 pounds of Total Nitrogen (TN)
and 568 pounds of Total Phosphorous (TP).
The DOT completed annual sweeping for all residential routes. In FY14, DOT swept a total of
4,055 residential curb miles, removing 981 tons of material. However, MDE does not provide
for impervious acre credit for once only frequency street sweeping.

06-DP-3320-MD0068349 Page II-13
Annual Report March 2015
Montgomery County Department of Environmental Protection
Inlet Cleaning
For FY14, DOT reported cleaning 648 storm drain inlets, and 20,710 linear feet of storm drain,
collecting 217 tons of material.
Use of Herbicides
The County’s roadside noxious weed spraying program is conducted by Montgomery Weed
Control Inc., a cooperative weed control program between Montgomery County Department of
Economic Development, Agricultural Services Division, and the Maryland Department of
Agriculture, Plant Protection and Weed Management Section. The County uses no other
pesticides or any fertilizers for roadside vegetation management.
Application of Sand and Salt
The DOT reported applying 111,787 tons of salt and 121,787 gallons of salt brine to County
roadways during December through March of FY14. In 2009, DOT had begun a salt brine pilot
program on 240 lane miles of primary roads. Salt brine is a 23 percent salt solution created in a
brine maker that has a lower freezing point than salt. In FY14, over 2,034 lane miles of both
primary and secondary roads received salt brine applications using contracted and County
equipment.
Public Education and Outreach
The Permit requires the County to implement a public education and outreach program to
reduce stormwater pollutants.
Over the Permit term, DEP continued to expand its education and outreach programs to meet
Permit requirements as outlined in the Strategy public outreach and stewardship work plan
(POSWP). The POSWP identified eight major areas of stormwater impact education, including
pet waste management, lawn stewardship, anti-littering, stormwater awareness, and establishing
a volunteer Stream Stewards program. Over the Permit term, DEP has participated in 309 events
focused on stormwater awareness, representing direct contact with an estimated 33,000 residents.
The RainScapes program hosted an additional 120 workshops on small scale stormwater
practices for homeowners and landscape professionals, reaching an additional 4,300 residents.
The DEP tracks details on watershed outreach events, and has included event information in the
Permit required Annual Report Database, Part D, found electronically in Appendix A. The goal
for the DEP program is to eventually quantify pollutant reductions associated with behavior
changes from its education and outreach programs.
Summary of Stormwater Outreach Efforts During the Permit Term
The DEP expanded its outreach and stewardship during this fiscal year and throughout the permit
cycle. Outreach and stewardship highlights include:
Creating a public outreach and stewardship plan in 2010
Hiring three watershed outreach staff
General watershed outreach activities increased 745 percent from FY10-FY14
Overhauling the DEP website to better suit the needs of the public
Creating a “My Green Montgomery” website as a public interactive website to promote
green initiatives and activities.
06-DP-3320-MD0068349 Page II-14
Annual Report March 2015
Montgomery County Department of Environmental Protection
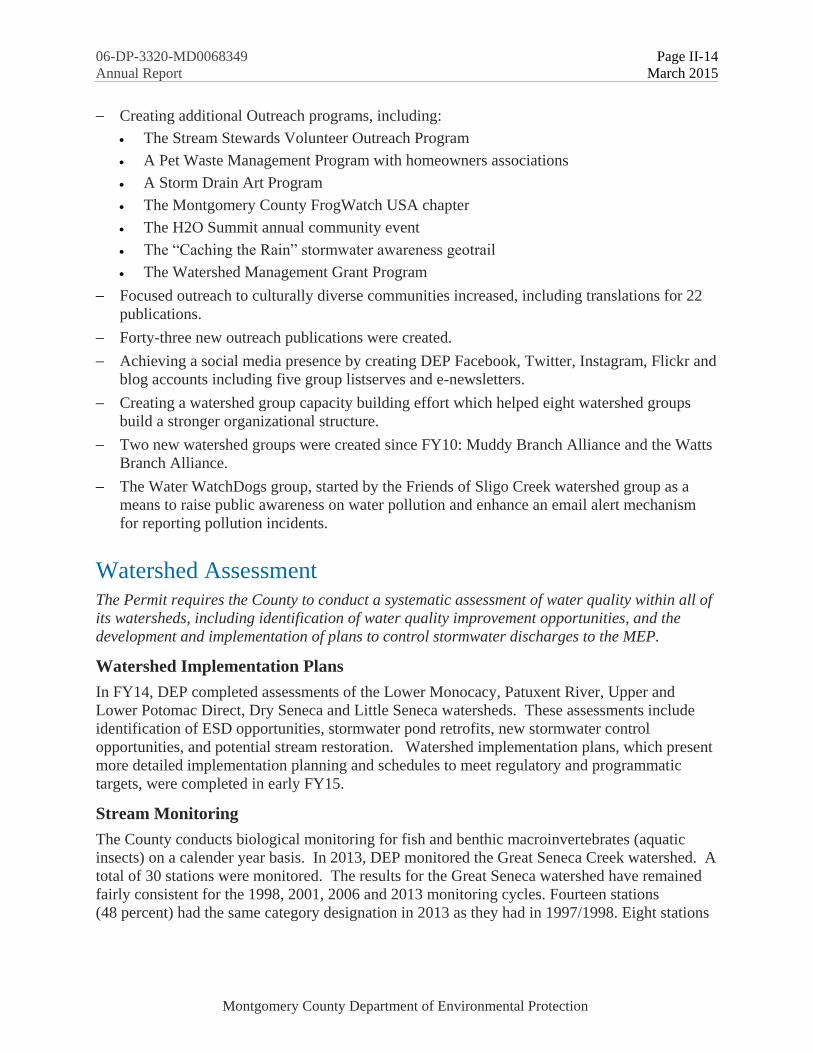
Creating additional Outreach programs, including:
The Stream Stewards Volunteer Outreach Program
A Pet Waste Management Program with homeowners associations
A Storm Drain Art Program
The Montgomery County FrogWatch USA chapter
The H2O Summit annual community event
The “Caching the Rain” stormwater awareness geotrail
The Watershed Management Grant Program
Focused outreach to culturally diverse communities increased, including translations for 22
publications.
Forty-three new outreach publications were created.
Achieving a social media presence by creating DEP Facebook, Twitter, Instagram, Flickr and
blog accounts including five group listserves and e-newsletters.
Creating a watershed group capacity building effort which helped eight watershed groups
build a stronger organizational structure.
Two new watershed groups were created since FY10: Muddy Branch Alliance and the Watts
Branch Alliance.
The Water WatchDogs group, started by the Friends of Sligo Creek watershed group as a
means to raise public awareness on water pollution and enhance an email alert mechanism
for reporting pollution incidents.
Watershed Assessment The Permit requires the County to conduct a systematic assessment of water quality within all of
its watersheds, including identification of water quality improvement opportunities, and the
development and implementation of plans to control stormwater discharges to the MEP.
Watershed Implementation Plans
In FY14, DEP completed assessments of the Lower Monocacy, Patuxent River, Upper and
Lower Potomac Direct, Dry Seneca and Little Seneca watersheds. These assessments include
identification of ESD opportunities, stormwater pond retrofits, new stormwater control
opportunities, and potential stream restoration. Watershed implementation plans, which present
more detailed implementation planning and schedules to meet regulatory and programmatic
targets, were completed in early FY15.
Stream Monitoring
The County conducts biological monitoring for fish and benthic macroinvertebrates (aquatic
insects) on a calender year basis. In 2013, DEP monitored the Great Seneca Creek watershed. A
total of 30 stations were monitored. The results for the Great Seneca watershed have remained
fairly consistent for the 1998, 2001, 2006 and 2013 monitoring cycles. Fourteen stations
(48 percent) had the same category designation in 2013 as they had in 1997/1998. Eight stations

06-DP-3320-MD0068349 Page II-15
Annual Report March 2015
Montgomery County Department of Environmental Protection
(28 percent) were not monitored in the 1997/8 and/or 2013, three stations improved categories
and four stations decreased categories.
From 2010 through 2013, 117 baseline stations and 20 Special Protection Area (SPA) stations
have been monitored to provide assessment of water quality. When compared to the earlier
results, 36 sites had an increase in rating category, 21 had a decrease while 72 did not change
categories in this monitoring cycle (2010-2013). Six stations had incomplete data sets for the
current monitoring period, generally fishing results. Results have predominantly remained
unchanged or increased slightly since the first monitoring cycle. Sligo Creek has been the focus
of restoration since the mid 1980’s however substantial change in IBI scores have yet to be
realized. All Sligo Creek sites with long-term monitoring have remained in the poor category.
However restorations efforts in Lower Rock Creek, specifically Joseph's Branch, have seen
slight improvements in the biology. Restoration efforts have affected fish habitat the most. Fish
results have increased at a faster rate than the benthic macroinvertebrate communities. The
urbanized location may limit noticeable improvements to the benthos.
Watershed Restoration The Permit requires the County to implement practices identified in its watershed assessments to
control stormwater discharges to the MEP. The Permit specifically requires the County to
complete the implementation of restoration projects identified in the previous Permit term to
restore 10% of the County’s impervious surface area. The permit also requires the County to
complete the implementation of restoration to restore an additional 20% of the County’s
impervious surface area that is not restored to the MEP.
The Strategy provides the planning basis to meet the Permit’s restoration goal. DEP developed
the Strategy using 2009 data, including impervious area and BMP drainage areas. DEP notes
that the Strategy was developed prior to MDE guidance for accounting for stormwater wasteload
allocations and impervious acres treated.
Several developments over the Permit term now allow more accurate impervious area control
accounting. DEP updated the County impervious area GIS coverage, and the urban BMP
database, adding over 1,000 new BMPs. DEP made progress digitizing and refining the BMP’s
drainage areas. MDE also published “Accounting for Stormwater Wasteload Allocations and
Impervious Acres Treated” (MDE Guidance Document) in August 2014. DEP is currently using
the new information to re-analyze the Permit baseline of uncontrolled impervious area, the
impervious area controlled to the MEP in 2009, and the control achieved through implementation
of restoration projects during the Permit term. DEP expects that re-analysis will show that fewer
impervious acres were uncontrolled in the 2009 baseline year. Since the Permit requires the
County to restore 20% of its uncontrolled impervious, the County’s impervious restoration goal
is also expected to be reduced.
Because DEP’s annual MS4 Permit reports are based on fiscal year, this report only covers the
County’s progress towards meeting its Permit requirements through June 30, 2014 (FY14). DEP
will submit a final report documenting County progress towards meeting watershed restoration
requirements through the end of the Permit term (February 16, 2015) in June 2015. The final
Watershed Restoration report will present the results of DEP’s comprehensive re-analysis of
County controlled and uncontrolled impervious area, and area treated by restoration projects.
06-DP-3320-MD0068349 Page II-16
Annual Report March 2015
Montgomery County Department of Environmental Protection
County progress towards meeting all other Permit requirements in FY15 will be reported in the
FY15 MS4 Annual Report.
Achieving the 2001 MS4 Permit Watershed Restoration Goal
The County’s second generation Permit issued in 2001 required the County to restore a
watershed or combination of watersheds equal to 10 percent of County impervious area not
treated to the MEP. Using data developed for the Strategy, DEP calculated the 10 percent
watershed restoration goal to be 2,146 acres. In FY11, the County reported that SWM BMP CIP
projects completed through FY10 achieved control of 1,091 impervious acres. Based on the
MDE draft guidance published in June 2011, DEP also calculated that 20 miles of completed
stream restoration added the remaining equivalent impervious acreage treatment of 1,055 acres.
Thus the total reported impervious control added through CIP watershed restoration projects was
2,146 impervious acres, meeting the 10 percent watershed restoration requirement.
Progress Towards Meeting the 2010 MS4 Permit Watershed Restoration Goal
The DEP has an aggressive watershed restoration program to meet the current Permit’s
requirement to add control to 20 percent of the impervious areas not currently controlled to the
MEP (3,976 impervious acres):
Projects completed through FY14 have added control to 1,030 impervious acres.
Projects under construction during FY14 will treat an additional 130 uncontrolled
impervious acres.
In FY14, DEP released task orders to DEP’s water resources engineering consultants that
facilitate the design of watershed restoration projects to control an additional 2,386 acres
of uncontrolled impervious area.
Task Orders will be issued in FY15 to for projects that will add stormwater control to 220
additional impervious acres.
The remaining 210 acres will be controlled through partnership projects currently in
design and under construction with other County and external agencies. These projects
include facility modification and modernizations performed by DOT, DGS, and MCPS,
and WSSC’s stream restoration activities during their asset modernization. They also
include the Maryland State Highway Administration’s (SHA’s) Inter County Connector
(ICC) stewardship partnership projects. More detail about these future partnership
projects will be provided in the final Watershed Restoration report.
Meeting Wasteload Allocations in Watersheds with EPA approved Total Maximum
Daily Loads
The Permit requires the County to report progress toward meeting any applicable WLAs
developed under EPA approved TMDLs in watersheds where restoration has occurred.
The Strategy used the Watershed Treatment Model (WTM) to verify pollutant baseline loads in
TMDL watersheds, and estimate pollutant load reductions by SWM BMPs and retrofits
constructed after TMDL baseline years. DEP then added nutrients and sediment reductions from
stream restoration projects using efficiencies provided in MDE’s June 2011 Accounting for
Stormwater Wasteload Allocations and Impervious Acres Treated. The County stormwater

06-DP-3320-MD0068349 Page II-17
Annual Report March 2015
Montgomery County Department of Environmental Protection
control and watershed restoration initiatives implemented after the TMDL baselines for County
watersheds have made progress towards meeting watersheds WLAs by removing an estimated
115 billion MPN/year of E.coli, 29,745 billion MPN/year Enterococci, 15,708 tons/year of
sediment, 15,292 pounds/year of nitrogen, 9,483 pounds/year of phosphorus, and 8,229 pounds/
year of trash from the watersheds with WLAs. Since 2010, the baseline year of the Chesapeake
Bay TMDL, an estimated 7,264 pounds of nitrogen, and 2,566 pounds of phosphorous have been
removed from Countywide stormwater runoff.
RainScapes Program
The DEP’s RainScapes program promotes and implements environmentally friendly
landscaping, small scale stormwater control and infiltration projects on residential, institutional,
and commercial properties. DEP offers technical and financial assistance to property owners for
eligible RainScapes techniques, such as rain gardens, tree planting, rain barrels, and conservation
landscaping. The RainScapes program consists of RainScapes Rewards, a rebate program, and
the RainScapes Neighborhoods, which evaluates targeted neighborhoods for County installed
on-lot stormwater runoff reduction approaches. To date in FY14, over 14 impervious acres are
being controlled through RainScapes projects for at least the first inch of rainfall, with many
projects controlled up to the 1-year storm event.
Restoration Funding Sources
During FY14, DEP continued to identify funding sources to support project implementation.
The 6-year SWM CIP budget for FY15-FY20 reflects the significant increase in implementation
that will be needed to meet the Permit requirement to control 20% of the County’s uncontrolled
impervious area. As shown in Tables III.G.11 and III.G.12, the approved budget for FY15 is
$53,345,000 compared to $35,000,000 for FY14 and $25,000,000 for FY13.
The approved FY15-FY20 SWM Program totals $363.7 million, an increase of $128.7 million,
or 55 percent from the amended approved FY13-FY18 program of $235 million. This increase in
stormwater management activity will be financed primarily through water quality protection
bonds. The debt service for these bonds will be supported by the County’s WQPF. The budget
assumes $60 million in State aid over the 6 year CIP cycle, based on past grants received.. The
RainScapes Program is also funded through the WQPF but not as a CIP category.
Assessment of Controls The Permit requires that the County use discharge characterization monitoring, along with
biological and physical monitoring to assess “the effectiveness of stormwater management
programs, County watershed restoration projects, and to document progress towards meeting
wasteload allocations (WLAs) indicated in the Total Maximum Daily Loads (TMDLs) approved
by the U.S. Environmental Protection Agency (EPA) for watersheds or stream segments located
in the County”. The Permit specifically requires monitoring where the cumulative effects of
watershed restoration activities (the Breewood Tributary) and the effectiveness of stormwater
management practices for stream channel protection (Clarksburg Special Protection Area) can
be assessed.

06-DP-3320-MD0068349 Page II-18
Annual Report March 2015
Montgomery County Department of Environmental Protection
Watershed Restoration Assessment
The DEP targeted the Breewood tributary of Sligo Creek (Anacostia watershed) for
comprehensive watershed restoration efforts and assessment of controls. The Permit requires
water chemistry, biological and physical monitoring of the watershed, both pre and post
restoration. In FY14, the restoration had not been fully implemented, and monitoring reflects
pre-restoration conditions. No conclusions can be made yet about the restoration effectiveness.
During 2013, DEP continued pre-restoration water chemistry monitoring. Water samples were
collected at an instream station and a stormwater outfall station for a total of 41 storms and
55 baseflow events monitored from 2009 through 2013. For each station, baseflow mean
concentrations (MC) were calculated for all Permit required parameters over the 3-year
monitoring period. MCs were also calculated for total petroleum hydrocarbons (TPH) and
Enterococcus during first flush stormflow.
Storm event mean concentrations (EMCs) represent the weighted average pollutant
concentrations based on samples collected at discrete intervals during a storm. EMCs were
calculated and averaged over the three-year monitoring period for each parameter except TPH
and Enterococcus. The average EMCs and MCs of each parameter at each station were com-
pared:
Storm samples generally had more concentrated pollutants at the outfall than at the instream
station.
At the instream station, there was not a consistent relationship between flow types and
results.
At the outfall, no clear trends in pollutant concentrations by flow type were found.
The 2010 thru 2013 biological and physical monitoring results provide evidence that the
Breewood tributary is impaired and will likely benefit from stream restoration. Monitoring will
continue annually to evaluate improvements to the biology and habitat that are anticipated as a
result of the restoration efforts.
Stormwater Management Assessment
Maryland Design Manual Monitoring in Clarksburg
The DEP submitted 2013 monitoring results for the developing Newcut Road Neighborhood
tributary to Little Seneca Creek “test” area in the Clarksburg SPA as compared to results from
the undeveloped Sopers Branch, Little Bennett subwatershed “control” area to evaluate the
effectiveness of the Maryland Design Manual criteria to protect the stream channel.
Development in the test area’s drainage is mostly complete, and ESC BMPs are being converted
to SWM BMPs. There is a small portion of the test area at the downstream end that was
undergoing new construction in 2013. DEP expects all the BMPs to be converted to SWM BMPs
in 2014. The land uses in the Soper’s Branch control area remained unchanged.
The natural hydrology of the test area has been altered dramatically by the development process.
On average, the overall amount of precipitation infiltrating into the ground or lost via
evapotransporation has steadily declined in the test area while remaining fairly constant in the
control area. The construction phase of development has impacted the test area channel
morphology due to channel straightening, down-cutting, and enlargement. DEP will continue to

06-DP-3320-MD0068349 Page II-19
Annual Report March 2015
Montgomery County Department of Environmental Protection
evaluate the ability of SWM BMPs to mimic pre-construction hydrologic conditions as the
construction process is completed and the SWM BMPs are on-line.
Program Funding The Permit requires that the County submit annual expenditures for the capital, operation, and
maintenance expenditures in database format specified in Permit Part IV.
The required database is included in electronic format on CD in Attachment A. During FY14,
the reported costs associated with Permit requirements were $51,728,358.
Total Maximum Daily Loads The Permit requires development of implementation plans showing how the County will meet the
MS4 WLAs for any EPA approved TMDLs within one year of EPA approval.
The County Strategy addressed all existing TMDLs in September 2009, the baseline for the
Strategy. Since the baseline date, EPA has approved additional TMDLs, which are shown in
Table II.7 below, with the status of their implementation plans. The plans are included in the
electronic attachment to this report in Appendix I.
Table II.7. TMDLs Approved Since 2009
Watershed TMDL Status of Implementation Plan
Anacostia PCB Implementation Plan Submitted in 2013
Cabin John Creek Sediment Required Reductions Shown in Strategy
Lower Monocacy Bacteria Implementation Plan Complete 2014
Lower Monocacy Phosphorous Implementation Plan Complete 2014
Potomac River Direct Sediment Implementation Plan Complete 2014
Rock Creek Sediment Required Reductions Shown in Strategy
Rock Creek Phosphorous Required Reductions Shown in Strategy
Seneca Creek Sediment Implementation Plan Complete 2014
Special Programmatic Conditions
Tributary Strategy The DEP continued to serve as the local liaison for activities related to Maryland’s Watershed
Implementation Plan (WIP) process. In July 2014, the MDE published the results of its
evaluation of local programs in meeting 2012-2013 Milestones. The County received 'High'
ratings for most of these categories including resource enhancements, legal authority,
organizational enhancements, and planning/studies. The County's stormwater sector received
'High' ratings in every category. The County received a “Medium” rating in the review category
“addresses appropriate sectors (comprehensiveness)” because there were no milestones
developed for pollution reduction from the septic sector. The County plans to develop
06-DP-3320-MD0068349 Page II-20
Annual Report March 2015
Montgomery County Department of Environmental Protection
milestones in the septic sector in the future. The complete evaluation is available on the MDE
web site:
http://www.mde.state.md.us/programs/Water/TMDL/TMDLImplementation/Documents/Milesto
nes/2012-2013/Local/Evaluations/Local_2013_Milestone_Summary_Evaluations.pdf
There were no local meetings held during FY14 related to the WIP efforts. However, the DEP
continued to coordinate with the four Phase 2 MS4 Permit localities as MDE moved forward
with the next phase in the Maryland WIP process. This included participating in the WIP
regional meetings held by MDE in April and November of 2013 and coordinating submission in
January 2014 for Phase 2 milestones and local progress. Implementation remains on track as
proposed in the WIP Phase 2 document submitted to MDE in November 2011.
Comprehensive Planning The County agencies are routine participants for review and comment as MNCPPC Sector Plan
and Master Plan documents are being developed. During FY14, the DEP provided data and
analysis of local stream conditions for use in the Bethesda Sector Plan and will continue to
participate in the development of the Bethesda EcoDistrict being envisioned. The DEP along
with DPS was a lead local agency for technical and policy support during the 2012-2014 process
for the Ten Mile Creek area Limited Amendment to the Clarksburg Master Plan and Hyattstown
Special Study Area. This process included a watershed-based approach to evaluating existing
water quality and potential development impacts to those receiving streams. The County
Council took the step of establishing the entire Ten Mile Creek watershed as a Special Protection
Area in addition to the protective zoning recommendations from the Planning Board.

06-DP-3320-MD0068349 Page III-1
Annual Report March 2015
Montgomery County Department of Environmental Protection
III. Standard Permit Conditions
A. Permit Administration Table III.A.1, below, shows County personnel responsible for major NPDES program tasks.
These are the County’s contacts as of February 2015.
Table III.A.1. Organization Chart for Montgomery County Permit-Required Programs
Part III. Standard Permit
Elements
Responsible Party
Department Name Title Telephone
A. Organization Chart-
Liaison with MDE for
Permit Implementation
DEP/WMD Pam Parker Senior Planning
Specialist 240-777-7758
B. Legal Authority OCA Walter Wilson Associate County
Attorney 240-777-6759
C. Source Identification
1. Storm Drain GIS DEP/WMD Craig Carson Manager 240-777-7709
DEP/DO Vicky Wan IT Manager 240-777-7722
2. Urban Best
Management
Practices GIS
DEP/WMD Amy Stevens Manager 240-777-7766
3. Impervious Surfaces
GIS DEP/DO Vicky Wan IT Manager 240-777-7722
4. Monitoring Locations DEP/WMD Meosotis Curtis Manager 240-777-7726
D. Discharge Characterization (as described in Part III H. Assessment of Controls)
E. Management Programs
1. Stormwater Management
1.a. Stormwater Facility
Inspections and
Maintenance DEP/WMD Amy Stevens Manager 240-777-7766
1.b. Stormwater
Management
Permitting and Plan
Review-Implement
2000 Maryland
Stormwater Design
Manual, and
provisions of
Maryland’s
Stormwater
Management Act of
2007
DPS Richard Brush Manager 240-777-6343
2. Erosion and
Sediment Control
DPS Derek Isensee Manager 240-777-6344
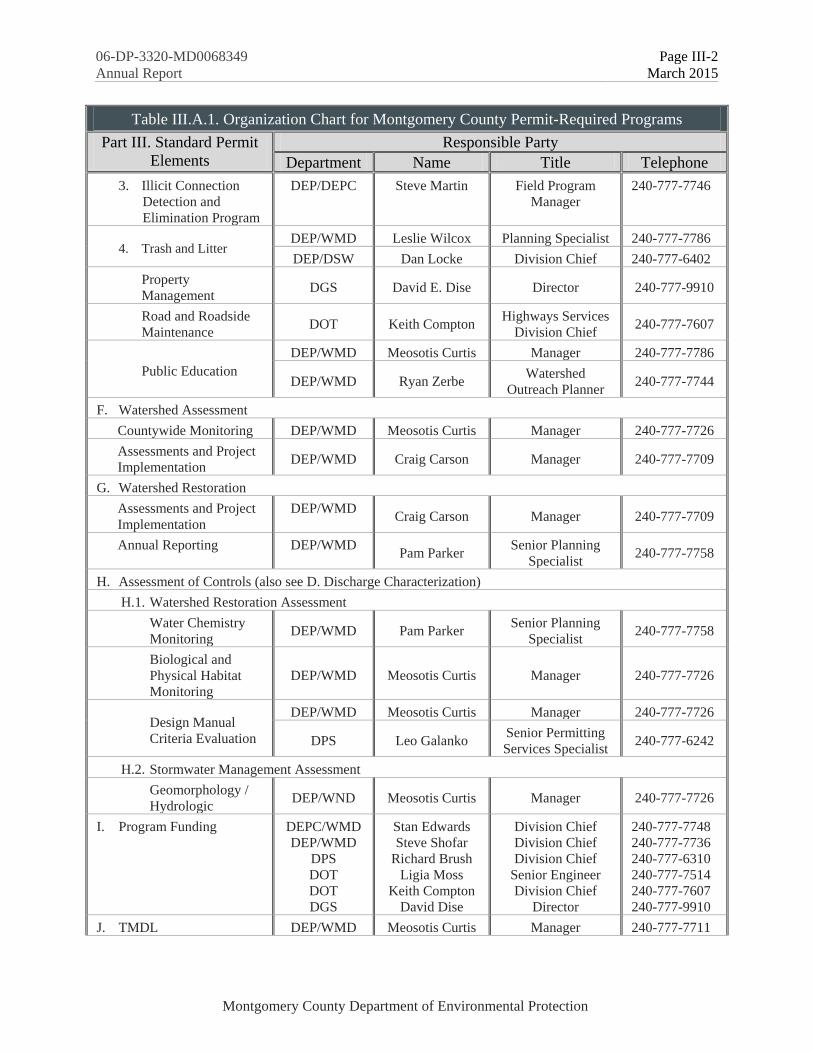
06-DP-3320-MD0068349 Page III-2
Annual Report March 2015
Montgomery County Department of Environmental Protection
Table III.A.1. Organization Chart for Montgomery County Permit-Required Programs
Part III. Standard Permit
Elements
Responsible Party
Department Name Title Telephone
3. Illicit Connection
Detection and
Elimination Program
DEP/DEPC Steve Martin Field Program
Manager
240-777-7746
4. Trash and Litter DEP/WMD Leslie Wilcox Planning Specialist 240-777-7786
DEP/DSW Dan Locke Division Chief 240-777-6402
Property
Management DGS David E. Dise Director 240-777-9910
Road and Roadside
Maintenance DOT Keith Compton
Highways Services
Division Chief 240-777-7607
Public Education
DEP/WMD Meosotis Curtis Manager 240-777-7786
DEP/WMD Ryan Zerbe Watershed
Outreach Planner 240-777-7744
F. Watershed Assessment
Countywide Monitoring DEP/WMD Meosotis Curtis Manager 240-777-7726
Assessments and Project
Implementation DEP/WMD Craig Carson Manager 240-777-7709
G. Watershed Restoration
Assessments and Project
Implementation
DEP/WMD Craig Carson Manager 240-777-7709
Annual Reporting DEP/WMD Pam Parker
Senior Planning
Specialist 240-777-7758
H. Assessment of Controls (also see D. Discharge Characterization)
H.1. Watershed Restoration Assessment
Water Chemistry
Monitoring DEP/WMD Pam Parker
Senior Planning
Specialist 240-777-7758
Biological and
Physical Habitat
Monitoring
DEP/WMD Meosotis Curtis Manager 240-777-7726
Design Manual
Criteria Evaluation
DEP/WMD Meosotis Curtis Manager 240-777-7726
DPS Leo Galanko Senior Permitting
Services Specialist 240-777-6242
H.2. Stormwater Management Assessment
Geomorphology /
Hydrologic DEP/WND Meosotis Curtis Manager 240-777-7726
I. Program Funding DEPC/WMD
DEP/WMD
DPS
DOT
DOT
DGS
Stan Edwards
Steve Shofar
Richard Brush
Ligia Moss
Keith Compton
David Dise
Division Chief
Division Chief
Division Chief
Senior Engineer
Division Chief
Director
240-777-7748
240-777-7736
240-777-6310
240-777-7514
240-777-7607
240-777-9910
J. TMDL DEP/WMD Meosotis Curtis Manager 240-777-7711

06-DP-3320-MD0068349 Page III-3
Annual Report March 2015
Montgomery County Department of Environmental Protection
Table III.A.1. Organization Chart for Montgomery County Permit-Required Programs
Part III. Standard Permit
Elements
Responsible Party
Department Name Title Telephone
Part IV. Program Review and
Annual Progress Reporting DEP/WMD Pam Parker
Senior Planning
Specialist 240-777-7758
Part V. Special
Programmatic Conditions DEP/WMD Meosotis Curtis Manager 240-777-7711
DEPARTMENT ADDRESSES:
DEP/DEPC: Department of Environmental Protection/Division of Environmental Policy and Compliance
255 Rockville Pike, Ste 120, Rockville MD 20850
DEP/DO: Department of Environmental Protection/ Director's Office
255 Rockville Pike, Ste 120, Rockville MD 20850
DEP/WMD: Department of Environmental Protection//Watershed Management Division
255 Rockville Pike, Ste 120, Rockville MD 20850
DGS: Department of General Services
101 Monroe Street, 9th Floor, Rockville, MD 20850
DPS: Department of Permitting Services/Division of Land Development Services
255 Rockville Pike, 2nd floor, Rockville MD 20850
DPWT/DHS: Department of Public Works and Transportation/Division of Highway Services
101 Orchard Ridge Dr. 2nd Flr. Gaithersburg MD 20878
DPWT/DO: Department of Public Works and Transportation/Division of Operations
101 Orchard Ridge Dr. 2nd Flr. Gaithersburg MD 20878
OCA: Office of the County Attorney
101 Monroe St. 3rd Floor, Rockville, MD 20850
B. Legal Authority The County maintains all legal authority required to meet the requirements of the MS4 permit.
Including:
Chapter 19 of the Montgomery County Code - The Stormwater Management
Ordinance
Chapter 19 was established to protect, maintain and enhance the public health, safety, and
general welfare by establishing minimum requirements and procedures to control the adverse
impacts associated land disturbance and increased stormwater runoff from developed and
developing lands. Chapter 19 includes:
Article I - Establishes the County’s legal authority to administer a Sediment and Erosion
Control program.
Article II - Establishes the County’s legal authority to administer a Stormwater Management
Program.

06-DP-3320-MD0068349 Page III-4
Annual Report March 2015
Montgomery County Department of Environmental Protection
Article IV - Establishes the County’s authority to regulate discharges of pollutants to County
streams, and establish inspection and enforcement procedures and penalties for non
compliance.
Chapter 19 was modified during the current Permit cycle to add:
Stormwater Management
In July 2010 and March 2011, the County Council passed Bill 40-10, later amended to Expedited
Bill 7-11, which amends the County’s stormwater management law to require management of
stormwater runoff through the use of nonstructural BMPs to the MEP for new development and
redevelopment projects approved by DPS. The bills brought the County’s stormwater
management law into compliance with the Maryland Stormwater Management Act of 2007 and
associated state implementing regulations adopted in 2010.
The revised County stormwater management law maintained more stringent requirements than
State law for redevelopment sites to protect water quality. Specifically, the Maryland
Stormwater Management Act of 2007 requires management of the first inch of runoff from 50%
of the redevelopment site using ESD to the MEP. County law requires stormwater management
to protect water quality volume (WQv- the first inch of runoff) and channel protection volume
(CPv-the expected runoff from a 1-year 24-hour duration rainfall) from 100 percent of the
redevelopment site, and requires the use of ESD to the MEP to meet these standards.
Sediment and Erosion Control
On March 29, 2013, the County Council passed Expedited Bill 1-13, Erosion and Sediment
Control, which brings local erosion and sediment control requirements into compliance with the
Maryland Stormwater Management Act of 2007 and the 2011 Maryland Standards and
Specifications for Soil Erosion and Sediment Control. The County legislation mirrors the
requirements in State law and regulations, including more stringent stabilization requirements
and the establishment of maximum grading unit criteria.
Water Quality Protection Charge
In April 2013, the County Council passed Bill 34-12, Stormwater Management-WQPC. Bill 34-
12 modified the structure of the County’s original WQPC to comply with the 2012 State HB 987,
the Stormwater Management- Watershed Protection and Restoration Program Bill.
Coal Tar Sealants
In September 2012, the County Council passed the Coal Tar Pavement Products Law, Bill 21-12,
that banned the use of coal tar products, effective December 18, 2012. Under the law, use of a
coal-tar based sealant can lead to a fine of up to $1,000—for both the property owner and the
applicator.
Other Legislation Enacted During the Permit Cycle
Carryout Bag Law
The County passed the Carryout Bag Law, Bill 11-8, in January, 2012, to help the County meet
Permit requirements related to trash reduction. The goal of the law was to increase awareness
about the problem with disposable bag litter and to reduce the use of carryout bags. The
Carryout Bag Law taxes 5 cents for each paper and plastic bag that a customer takes from certain

06-DP-3320-MD0068349 Page III-5
Annual Report March 2015
Montgomery County Department of Environmental Protection
retail establishments to carry purchases out. The Department of Finance is responsible for
enforcement of the Bag Law. Restaurants that use paper bags for carryout food do not need to
charge the tax.
Adding Co-Permittees
The MDE modified the County's Permit effective January 26, 2004 to add six small localities as
co-permittees for coverage under the Phase II of the NPDES MS4 Permit Program. In FY14, the
County continued its oversight, inspection, and enforcement authority over the Towns of Chevy
Chase, Kensington, Poolesville, and Somerset, and Chevy Chase Village; and one special tax
district, the Village of Friendship Heights. Municipality contacts are shown in Table III.B.1.
Table III.B.1. List of Contacts for Municipalities Co-permittees
Municipality Contact Name and Title Address Telephone
Chevy Chase Village Shana R. Davis-Cook, Manager
Michael Younes, Director of
Municipal Operations
Village Hall
5906 Connecticut Avenue
Chevy Chase, MD 20915
301-654-7300
Friendship Heights Julian Mansfield, Village Manager 4433 South Park Avenue
Chevy Chase, MD 20815
301-656-2797
Town of Chevy Chase Todd Hoffman, Town Manager 4301 Willow Lane
Chevy Chase, MD 20815
301-654-7144
Town of Kensington Sanford Daily, Town Manager 3710 Mitchell Street
Kensington, MD 20895
301-949-2424
Town of Poolesville Wade Yost, Town Manager P.O. Box 158
Poolesville, MD 20827
301-428-8927
Town of Somerset Jeffrey Slavin, Mayor
Rich Charnovich, Town Manager
4510 Cumberland Avenue
Chevy Chase, MD 20815
301-654-1258
In January, 2010, MDE added MCPS as a co-permittee. MCPS designated Brian Mullikin,
Environmental Team Leader, Division of Maintenance, and Agustin Diaz, Environmental
Specialist, as staff responsible to implement stormwater management programs and coordinate
on Permit issues. MCPS provided a detailed annual report on MS4 related activities, MCPS
Report to the County on MS4 Activities in FY 2014, which can be found in Appendix C in the CD
attachment to this report. This report includes information on MCPS MS4 related activities as
appropriate.
EPA Region III Inspection
On June 27 and 28, 2013, EPA Region III inspected the County’s MS4 Permit programs,
including office visits and field inspections. The inspection primarily focused on the County’s
SWM Facility Maintenance and Inspections Program, Sediment and Erosion Control Program,
IDDE program, and inspection of County facilities covered under the General NPDES Discharge
Permit for Stormwater Associated with Industrial Facilities.
On February 18, 2014, EPA sent an electronic copy of their inspection findings. The report can
be found in Appendix D. The County submitted a response on March 14, 2014. The response,
with supporting documentation can also be found in Appendix D. As of July 1, 2104, EPA has
not yet submitted a final inspection report.

06-DP-3320-MD0068349 Page III-6
Annual Report March 2015
Montgomery County Department of Environmental Protection
C. Source Identification The following information is submitted for all County watersheds in GIS format as required by
the Permit in Part IV. and Attachment A, Annual Report Databases, Parts A.-L. The information
can be found in this report’s CD attachment in Appendix A, MDENPDES14.accdb, Parts A-L.
C.1 Storm Drain System
The County’s storm drain inventory is found in Appendix A, MDENPDES14.accdb, Part A.
Storm Drain System Mapping Associated with GIS Coverage. Each storm drain feature type is a
feature class. Each feature class is a table in the database including both spatial and attribute
information.
The storm drain inventory was compiled from three sources. It includes data captured by DPS
during the new construction approval process from 2002 until January 10, 2013. It includes
1,404 drainage areas delineated in 2008 for all major storm drain outfalls (defined as >24”) in the
County, used to help investigate and track sources of illicit discharges in the County. The
inventory also contains information for all storm drain outfalls on or immediately adjacent to
MCPS property with associated drainage areas.
C.2 Urban Best Management Practices
The County’s Urban BMP database as of June 30, 2014 with associated coverage is included
electronically in Appendix A, MDENPDES14.mbd, Part B. The database uses the format
required by the Permit’s Attachment A., Annual Report Databases and Table B, Urban BMPs.
There are 8,762 records in this database, shown by structure type in Table III.C.1. The greatest
numbers of structure types are Dry Wells (2,383), Flow Splitters (992), Sand filters (783), and
Oil Grit Separators (681).
There are a few data fields in the Urban BMP database with consistently missing data or data
irregularities. Explanation for why data is missing, and what actions DEP is taking to complete
the data, follows:
Drainage Area (DA)
Some structure drainage areas have not yet been delineated for a number of reasons.
Pretreatment and diversion devices have identical DA’s to their parent SWM BMPs and are
not delineated separately. DEP is not delineating drainage areas for ESD practices at this
time due to the level of effort needed to delineate a very small drainage area for a large
number of practices (over 1,500) added to the database in FY13. DEP is instead
concentrating on delineating the drainage areas of other, more significant SWM structures
that are currently back logged.
Built Date
Built date was not recorded and cannot be determined from existing paper files for many of
the pre-1996 structures. DEP adding built date data for the facilities entered into the database
after 1996 where possible. Those facilities where a date cannot be determined have an entry
date of 01/01/1111.

06-DP-3320-MD0068349 Page III-7
Annual Report March 2015
Montgomery County Department of Environmental Protection
Structure Type
The MDE structure type designated as “Other” is frequently used by DEP. An explanation of
how DEP classifies structures with an MDE "Other” structure type is included in general
comments.
Permit Number
The DEP has included a “place-holder permit number” for the facilities that were built prior
to 1986 and do not have a permit number. Because many of these facilities were built prior
to Montgomery County’s authority to permit such facilities, DEP will not be able to recover a
permit number from the paper files. This place holder number is “0000000000” and
represents DEP’s final attempt to recover the data from the paper files. All original permit
numbers known for the facilities built prior to 1986 have been entered into the database
(typically a 6 digit number). In addition, a 10 digit place holder number beginning with
900118XXXX was also entered for those facilities built prior to 1986. This number was
created by DPS in order for those facilities to be entered into their database system. The
DEP has kept this permit number in order to allow interface with the DPS database. There
are also data missing in the permit number field for facilities built after 1986. The DEP will
work to pull the permit number from the paper files and as-built plans to populate this field.
ADC Map
The DEP made a concerted effort to populate the ADC Map field with the most recent ADC
Map Book locations. The DEP’s efforts specifically focus on those facilities that lack the MD
grid coordinate data as it is understood that ADC map book location can be used in place of
the Maryland grid coordinates. The DEP continues to default to populating this field when
MD grid coordinates are not available.
RCN
The DEP’s new asset and maintenance management system requires a number for all number
fields. Those records with an RCN of “0” are records where the RCN was not provided in
the paper files.
Construction Purpose
This is a new field and the data must be created for all existing BMPs. The DEP will
populate the data for the MS4 FY15 annual report.
Impervious Area
This is a new field and the data must be created for all existing BMPs.
Last Inspection Date
This is a new field. The data reported is for the scheduled month of inspection. Actual
inspection date is now being tracked in a separate field in the database (where it previously
was not). DEP began reporting the actual date with this report and will continue to improve
the data in future Permit reports. Future dates in the Last Inspection field indicate that the
facility is scheduled for an inspection.
Where the date field contains a pre-2012 date (594 entries), one of two circumstances exists.
Either 1) the inspections are due in 2014, but have yet to be performed by date of this report,

06-DP-3320-MD0068349 Page III-8
Annual Report March 2015
Montgomery County Department of Environmental Protection
or 2) enforcement actions are pending. 559 facilities (6 percent) had last inspection in 2011,
and are due again in 2014. However, the inspections have not been completed or scheduled
as of the date of this report. An additional 35 facilities (.04 percent) were last inspected in
2010, however, the facilities require enforcement action and follow-up to ensure the
inspection is completed.
Where the date field has been left blank (3,612 instances), one of two circumstances exists:
1) 1,665 inspections are technically not due until 2015 or later, so have not been scheduled
and 2) 1,947 should have had an inspection. Of that 1947, 1,620 are ESD facilities for which
DEP does not currently have an inspection paradigm because most of these practices are
located on single family lots and many of DEP’s current standard inspection and enforcement
procedures are not appropriate. The DEP is developing a new process for inspection of ESD
measures. The remaining 327 facilities are structural underground facilities and coordination
must be made with property owners to have a confined space inspection performed before
further DEP inspections can occur. DEP is working with property owners to schedule these
inspection issuances.
WQ Volume
This is a new field and the data must be created for all existing BMPS.
Table III.C.1. FY14 Total Number of Storm Water BMP
Facilities by Structure Type Designation
Practice Type Code Description Number
Attenuation Swale SW Includes dry swales, wet swales, grass swales,
and ESDSW
151
Bioretention BR Includes Bioretention, microbioretention
(ESDMB), and rain garden (ESDRG)
475
Detention Structure DP Includes dry ponds 669
Dry Well DW Includes dry wells, stormchambers, raintank,
and ESDDW
2,383
Environmental Site
Design
ESD Includes Environmental Site Design practices
and Micro-infiltration trenches
234
Extended Detention, Dry EDSD Dry ponds with extended detention 60
Extended Detention, Wet EDSW Wet ponds with extended detention 157
Flow Splitter FLSP 992
Hydrodynamic Structure:
Oil Grit Separator
OGS Includes Oil Grit Separators and water quality
inlets
681
Hydrodynamic Structure:
BaySaver
BS Baysavers 138
Hydrodynamic Structure:
Stormceptor
SC Stormceptors 241
Infiltration Basin IB Includes infiltration basins with quality and
quantity control
60

06-DP-3320-MD0068349 Page III-9
Annual Report March 2015
Montgomery County Department of Environmental Protection
Table III.C.1. FY14 Total Number of Storm Water BMP
Facilities by Structure Type Designation
Practice Type Code Description Number
Infiltration Trench IT Includes, infiltration trench with quality and
quantity control, and buried surface fed,
688
Other OTH Includes structure types not identified by an
MDE code, including stormfilters, aquafilters,
aquaswirls, bayseparator-flowsplitters, Snouts,
Treeboxes, Vortecnics, Vortsentry, and V2B1
380
Porous Pavement PP Includes porous concrete, asphalt, and pavers,
and ESDPERMP
95
Sand Filter SF Includes surface sand filters and underground
sand filters
783
Shallow Marsh SM Includes all constructed wetlands, artificial
wetlands, shallow wetlands, and wetlands with
extended detention
120
Wet Pond WP Includes retention ponds and wet ponds 45
Underground Storage UGS Includes underground storage vaults, pipes,
and storage pipes with infiltration
410
Total Number of Facilities 8,762
C.3 Impervious Surfaces
The County’s 2009 impervious area with associated coverage can be found in Appendix A,
MDENPDES14.mbd, Part C. Impervious Surfaces Associated with GIS Coverage. This
impervious information was used to develop the Strategy.
In FY14, DEP continued to digitize and update impervious areas for the Permit requirements and
the WQPC, based on 2012 aerial photography. DEP is also updating the drainage areas of all
SWM BMPs. When complete, DEP will submit an updated layer of County impervious area,
BMP drainage areas, and an updated analysis of the County’s progress towards meeting the
20 percent impervious area control goal as of February 15, 2015. The analysis will be submitted
to MDE by June 16, 2015, as part of the County’s final Watershed Restoration Report.
C.4 Monitoring Locations
The GIS coverage and associated attribute information for locations established for chemical,
biological, and physical monitoring of watershed restorations efforts required in Part III.H.
Assessment of Controls, (Tables E., E.1., and E.2.; Monitoring Site Locations) can be found in
Appendix A, MDENPDES14.accdb, Part E., E.1., and E.2. Monitoring Site Locations Associated
with GIS Coverage.

06-DP-3320-MD0068349 Page III-10
Annual Report March 2015
Montgomery County Department of Environmental Protection
C.5 Watershed Restoration
The GIS coverage and associated attribute information for watershed restoration projects
proposed, under construction and completed with associated drainage areas can be found in
Appendix A, MDENPDES14.accdb, Part D. Water Quality Improvement Project Locations
Associated with GIS Coverage.
D. Discharge Characterization The Permit requires that the County use discharge characterization monitoring gathered since the
early 1990s and additional monitoring data required under the Permit to assess the effectiveness
of its SWM programs and watershed restoration projects. The County must also document
progress towards meeting the WLAs in EPA approved TMDLs for watersheds or stream
segments located in the County. Discharge characterization results and County progress towards
meeting WLAs can be found in Appendix A, MDENPDES14.accdb, Parts F., G., G.1., G.2., and
H. Details about this monitoring can be found in Part III. H. Assessment of Controls.
E. Management Programs
E.1 Stormwater Management Program
Section E.1.a of the Permit requires the County to conduct preventative maintenance inspections
of all SWM facilities on at least a triennial basis.
SWM Facility Inspections and Maintenance
The DEP SWM Facility Maintenance and Inspection Program oversees inspection and
maintenance of all SWM facilities in the County. Program staff includes a manager, two field
supervisors, six inspectors, three engineers, a planning specialist, a landscape architect, an office
assistant and contractors.
The DEP performs structural maintenance on facilities owned by the County, MCPS, MNCPPC,
and ESD practices located on County property and rights-of-way. All ESD facilities located on
private property remain the responsibility of the property owners.
In 2003, the County enacted legislation giving DEP the authority to perform structural
maintenance on residential SWM facility types defined in Chapter 3 of the 2000 Maryland
Stormwater Design Manual. DEP then developed a process for private property owners,
including Homeowner Associations (HOAs), to transfer their facilities into the DEP structural
maintenance program, including executing maintenance agreements. Private property owners are
responsible for all maintenance of facilities not transferred into the DEP’s program.
The data reported for FY14 represents DEP’s inspection and maintenance responsibilities as
defined in County Code (Chapter 19) and Part III.E.1 of the Permit. DEP’s SWM Facility
Maintenance and Inspection Programs are funded by the WQPF.
SWM Facility Inspections
The DEP oversees inspection of all SWM facilities under County jurisdiction to assess repair and
maintenance needs. In FY14, there were over 8,700 SWM facilities. DEP uses a contractor to
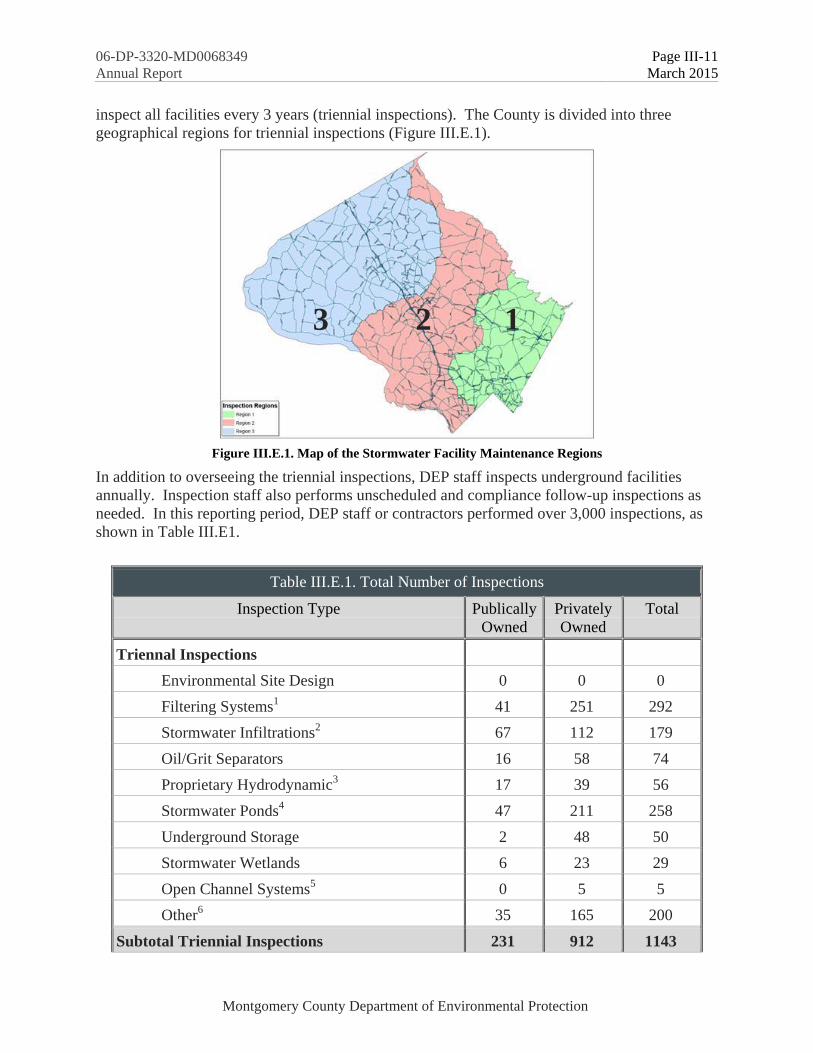
06-DP-3320-MD0068349 Page III-11
Annual Report March 2015
Montgomery County Department of Environmental Protection
inspect all facilities every 3 years (triennial inspections). The County is divided into three
geographical regions for triennial inspections (Figure III.E.1).
Figure III.E.1. Map of the Stormwater Facility Maintenance Regions
In addition to overseeing the triennial inspections, DEP staff inspects underground facilities
annually. Inspection staff also performs unscheduled and compliance follow-up inspections as
needed. In this reporting period, DEP staff or contractors performed over 3,000 inspections, as
shown in Table III.E1.
Table III.E.1. Total Number of Inspections
Inspection Type Publically
Owned
Privately
Owned
Total
Triennal Inspections
Environmental Site Design 0 0 0
Filtering Systems1
41 251 292
Stormwater Infiltrations2
67 112 179
Oil/Grit Separators 16 58 74
Proprietary Hydrodynamic3
17 39 56
Stormwater Ponds4
47 211 258
Underground Storage 2 48 50
Stormwater Wetlands 6 23 29
Open Channel Systems5
0 5 5
Other6
35 165 200
Subtotal Triennial Inspections 231 912 1143
3 2 1

06-DP-3320-MD0068349 Page III-12
Annual Report March 2015
Montgomery County Department of Environmental Protection
Table III.E.1. Total Number of Inspections
Inspection Type Publically
Owned
Privately
Owned
Total
Inspections Not Completed (as of June 30, 2014 68 164 232
Unscheduled Inspections 29 37 66
Annual Pre-Maintenance Inspections (UG Facilities) 288 500 788
Follow-up Maintenance Compliance Inspections 146 1177 1323
Total Inspections in FY14 3552 1This includes all aboveground and underground sand filters, proprietary filters such as Stormfilters, and Chapter 3 bioretention
2This includes trenches and basins
3This includes BaySaver, Stormceptor, vortechnices, and other proprietary hydrodynamic devices
4This includes all dry and wet ponds, and ponds with extended detention
5This includes dry swales and bioswales
6This includes all other type of devices not captured, including flow splitters
During FY14, DEP staff and contractors performed inspections in Regions 1 and 3. Of the 1375
SWM facilities due for triennial inspection, 1143 inspections were conducted. The remaining
232 facilities were not inspected due to site conditions or are currently scheduled to be
completed in FY15. DEP schedules inspections and maintenance on a calendar year basis, so
reports by fiscal year will always include information on facilities in two regions. The majority
of the triennial inspections, as shown in Table III.E.1, occurred at three structure types—filtering
systems (292), ponds (258), and other types (200). DEP also requires the inspection of flow
splitters at the time of any stormwater facility inspection; these are included in the “Other”
category.
There were 66 unscheduled inspections. These occurred in response to public complaints, at
facilities being considered for transfer into DEP’s SWM Facility Maintenance Program, and to
assess conditions after a large storm event. Additionally, 788 pre-maintenance inspections were
completed at underground facilities in order to screen for maintenance needs (see Modified
Inspection Protocol for DEP Maintained Underground SWM Facilities). DEP staff also
performed 1,323 follow-up inspections of privately maintained above ground and underground
facilities. Follow up inspections are required to ensure that repair work is completed when a
facility’s maintenance need is ranked as “high” or “emergency” (see Privately Owned and
Maintained Facilities: Determining Maintenance Criticality and Enforcement). Follow up
inspections are also required to ensure routine cleaning/maintenance has been completed.
Maintenance
In addition to inspections, the DEP SWM Facility Maintenance Program oversees structural and
non structural maintenance of all SWM facilities under the County’s jurisdiction. There are two
work sections based whether the SWM facilities are structurally maintained by DEP or by the
private property owner:

06-DP-3320-MD0068349 Page III-13
Annual Report March 2015
Montgomery County Department of Environmental Protection
SWM Facilities publically or privately owned and structurally maintained by DEP. Includes
over 3,000 facilities, of which 1,400 are privately owned (i.e., facilities that serve residential
properties) and over 1,600are publicly owned (i.e., facilities that serve public schools).
SWM facilities privately owned and structurally maintained by the private property owners.
DEP’s program ensures and enforces maintenance on over 5,600 privately owned facilities.
Maintenance Program Modifications During the Permit Cycle
During the Permit cycle, DEP modified the SWM Facility Maintenance Program in two ways to
increase Program efficiency and reduce costs.
Privately Owned and Maintained Facilities: Determining Maintenance Need Level and
Enforcement
During FY12-FY13, DEP launched a new protocol to rank the maintenance need level for
privately owned and maintained facilities. DEP assigns a maintenance need level using
results of the triennial inspection, which then informs what follow up notifications and
enforcement actions DEP will initiate with the property owners. DEP defined the following
maintenance need levels:
EMERGENCY: Failure to perform repairs may result in a threat to public health and
safety or significant structure failure and must be corrected immediately.
HIGH: Repairs necessary to ensure the proper functioning of the facility, which, if not
performed, could affect the structural integrity of the facility and impact water quality
within the watershed. Deficiencies must be corrected within 60 days (aboveground) or 45
days (underground).
ROUTINE: Repairs necessary to ensure proper functioning of the facility, which must be
performed regularly and should be corrected within 60 days. If the deficiencies are not
performed within the following 12 months they could elevate criticality of repairs to high
level.
Modified Inspection Protocol for Underground SWM Facilities
In FY13, DEP developed and piloted a new inspection protocol for DEP maintained
underground SWM facilities. Prior to FY13, DEP cleaned and inspected each underground
facility annually regardless of the facility’s condition, and performed maintenance if needed.
DEP inspectors observed that certain facilities did not appear to require annual cleaning to
function properly. DEP began performing an annual pre-maintenance inspection, using
inspection criteria developed from best professional judgment, engineering expertise, and
manufacturers’ recommendations. Facilities deemed acceptably clean and functional were
not cleaned, allowing the County to save maintenance costs.
The DEP found that over half of the DEP maintained facilities did not require any
maintenance and could be expected to continue to function properly for at least another year
without it. DEP continues to gather data on the condition of the underground facilities and
their tendency to require less than yearly maintenance. Note that each underground facility is
cleaned, inspected and maintained every 3 years at minimum as part of the required triennial
inspection.
In January 2014, DEP extended the modified inspection protocol to privately maintained
facilities. The new protocol includes an inspection in the 3 years between triennial
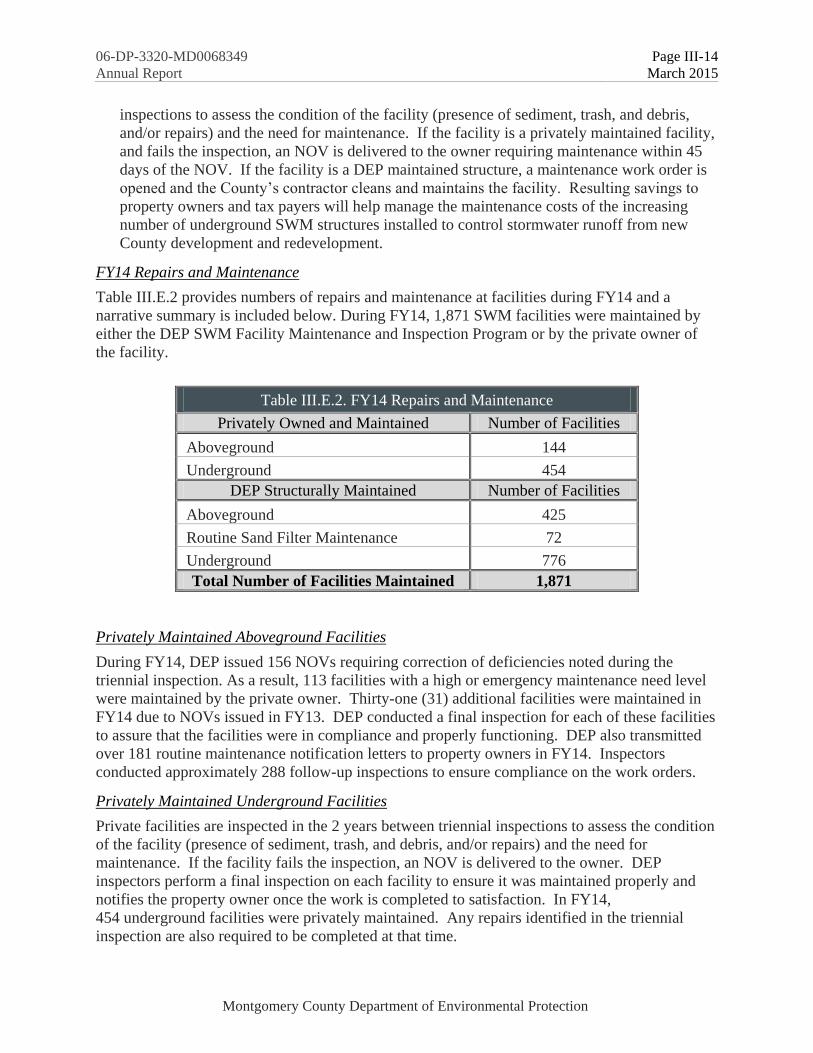
06-DP-3320-MD0068349 Page III-14
Annual Report March 2015
Montgomery County Department of Environmental Protection
inspections to assess the condition of the facility (presence of sediment, trash, and debris,
and/or repairs) and the need for maintenance. If the facility is a privately maintained facility,
and fails the inspection, an NOV is delivered to the owner requiring maintenance within 45
days of the NOV. If the facility is a DEP maintained structure, a maintenance work order is
opened and the County’s contractor cleans and maintains the facility. Resulting savings to
property owners and tax payers will help manage the maintenance costs of the increasing
number of underground SWM structures installed to control stormwater runoff from new
County development and redevelopment.
FY14 Repairs and Maintenance
Table III.E.2 provides numbers of repairs and maintenance at facilities during FY14 and a
narrative summary is included below. During FY14, 1,871 SWM facilities were maintained by
either the DEP SWM Facility Maintenance and Inspection Program or by the private owner of
the facility.
Table III.E.2. FY14 Repairs and Maintenance
Privately Owned and Maintained Number of Facilities
Aboveground 144
Underground 454
DEP Structurally Maintained Number of Facilities
Aboveground 425
Routine Sand Filter Maintenance 72
Underground 776
Total Number of Facilities Maintained 1,871
Privately Maintained Aboveground Facilities
During FY14, DEP issued 156 NOVs requiring correction of deficiencies noted during the
triennial inspection. As a result, 113 facilities with a high or emergency maintenance need level
were maintained by the private owner. Thirty-one (31) additional facilities were maintained in
FY14 due to NOVs issued in FY13. DEP conducted a final inspection for each of these facilities
to assure that the facilities were in compliance and properly functioning. DEP also transmitted
over 181 routine maintenance notification letters to property owners in FY14. Inspectors
conducted approximately 288 follow-up inspections to ensure compliance on the work orders.
Privately Maintained Underground Facilities
Private facilities are inspected in the 2 years between triennial inspections to assess the condition
of the facility (presence of sediment, trash, and debris, and/or repairs) and the need for
maintenance. If the facility fails the inspection, an NOV is delivered to the owner. DEP
inspectors perform a final inspection on each facility to ensure it was maintained properly and
notifies the property owner once the work is completed to satisfaction. In FY14,
454 underground facilities were privately maintained. Any repairs identified in the triennial
inspection are also required to be completed at that time.

06-DP-3320-MD0068349 Page III-15
Annual Report March 2015
Montgomery County Department of Environmental Protection
DEP Maintained Aboveground Facilities
In FY14, DEP used a general contractor to perform structural maintenance on 425 aboveground
SWM facilities and ESD practices. This type of maintenance is considered routine and usually
involves actions such as removing minor accumulations of sediment, unblocking clogged low
flows, minor concrete repair, erosion repair, restoring/replenishing media, installing plants, and
debris removal. DEP also performs routine maintenance on all sand filters for facilities in the
maintenance program. Seventy-two (72) surface sand filters had routine sand filter maintenance
(i.e., scarification) performed by DEP and 12 ponds have regular mowing and monthly trash
removal performed by DEP contractors.
DEP Maintained Underground Facilities
During FY14, DEP performed cleaning and repairs on 776 underground facilities. The facilities
included 33 located at County maintenance depots that are maintained twice a year, 3 BaySavers
at a bus depot that are maintained 6 times a year, and 3 Stormceptors at the Transfer Station that
are maintained 3 times a year.
Maintenance of ESD Facilities on County Property
The DEP is constructing many new ESD projects on County property and ROWs as one strategy
to meet the Permit’s impervious area control requirement. In FY14, DEP expanded routine
contract maintenance to those publically owned ESD facilities, from 47 bioretention or rain
gardens maintained in FY13, to 58 in FY14. In addition, 24 County owned facilities were
repaired and reconstructed. The facilities were maintained monthly using a trained and dedicated
crew to ensure consistency. The contractor was compensated on average for one hour of labor
per crew at a cost of $135/per facility per month. Additional costs for materials, including
plants, mulch, and watering, concrete, stone, and soils, brought the estimated total cost to
approximately $2,000 per facility per fiscal year for maintenance. Routine maintenance tasks
varied according to season and included weeding, removing trash and other debris, edging,
removing sediment, mulch redistribution and replenishment, pruning, watering and plant
replacement. To better coordinate shared maintenance responsibilities with schools, parks, and
private facilities, and in anticipation of new coming facilities currently under design or
construction, DEP bid and contracted a new vendor for landscape maintenance. Beginning mid
FY15, the contractor will provide routine and preventative maintenance for 116 publically
owned facilities. The number of publically owned ESD facilities will continue to grow as DEP
completes construction of additional facilities.
Frequency and type of maintenance varies depending on several factors including size, drainage
area, plant composition, impacts from stormwater, humans and vehicles, site safety, and
visibility. Monthly maintenance of the ESD facilities successfully addresses the maintenance
variability and ensures that the practices are functioning as designed. DEP has incorporated
lessons learned to improve inspection and contracting needs for ESD practices, to better educate
the public, landowners, school, and park administrators with ESD facilities, and to lower overall
costs through more efficient maintenance planning. Community residents have expressed
appreciation for the ESD facilities, and DEP maintenance, as well as DEP’s efforts to address
community concerns.
DEP is now a more significant stakeholder of the ROWs, sharing spaces with gas lines, water
lines, power lines, and transportation. The maintenance program has worked to develop new and

06-DP-3320-MD0068349 Page III-16
Annual Report March 2015
Montgomery County Department of Environmental Protection
mutually cooperative relationships with public utilities such as Washington Gas and WSSC, as
well as DOT, to manage maintenance needs among all groups sharing the right of way to deliver
community services.
Inspection and Maintenance Outreach Activities
In FY14, the DEP SWM Facility Maintenance Program continued to create multiple publications
and hosted several presentations to increase understanding and awareness of County SWM
facility maintenance. In addition, the Program staff works with DEP outreach staff, providing
SWM maintenance related publications for dissemination at public events. The two sections
work together to provide an opportunity for County resident volunteers to learn about the
function of SWM ponds during annual pond clean up events. For more information, please see
Part III.E.7. Public Education.
Lessons Learned During the Permit Cycle: Challenges and Successes
During the Permit cycle, DEP has developed several new protocols in order to remain in
compliance with County and State SWM facility maintenance requirements and regulations
while remaining fiscally responsible:
During the Permit term, DEP embarked on one of the first ESD maintenance programs in the
metropolitan area. Between FY12 and FY13, DEP experienced some challenges to find the
right combination of contractor specifications, direction, and maintenance frequency to
ensure the ESD features in the ROW Green Streets Program (see page III-94) were
functioning properly, while meeting aesthetic expectations of the residents. DEP eventually
recognized that ESD features require at least 10 months of maintenance to ensure
functionality. Early in FY14, DEP found that the general contractor labor force does not
have the mobilization, and set-up to frequently maintain ESD facilities. To assist in
addressing this gap, DEP then developed an innovative contract targeted to local small
business landscape contractors, who are more accustomed to frequent maintenance on
gardens and other landscaped features, at reduced maintenance costs. The contracts were not
fully executed by the end of FY14, and are expected to be fully used in FY15.
In FY15, many of the first permitted and installed ESD facilities will be due for triennial
inspections, and ESD inspections will increase dramatically. Utilizing staff expertise and
consultants, DEP is developing necessary policies and procedures for ESD related
inspections, enforcement and administrative processes, and has hired a staff member
dedicated to this task. DEP expects to pilot a residential ESD inspection and maintenance
program during FY15-FY16.
Co-Permittee Structural and Nonstructural Maintenance on SWM BMPs-MCPS
The MCPS Division of Maintenance upgraded and repaired existing underground and
aboveground SWM facilities in FY14, in preparation for transferring maintenance responsibility
to DEP in accordance with a MOU signed by both parties in 2007. The MCPS also performed
nonstructural maintenance on aboveground SWM facilities, and maintained several underground
facilities not eligible for transfer to the County. MCPS contracts out the maintenance on ESD
facilities (bioretention and green roofs). The cost of the FY14 MCPS SWM facility maintenance
and inspection program was $341,238.

06-DP-3320-MD0068349 Page III-17
Annual Report March 2015
Montgomery County Department of Environmental Protection
Stormwater Management Plan Review and Permitting
Complying with the Maryland Stormwater Management Act of 2007
Section III.E.1.b of the Permit requires the County to implement the SWM design policies,
principles, methods, and practices found in the 2000 Maryland Stormwater Design Manual and
the provisions of Maryland’s Stormwater Management Act of 2007. The Permit requires the
County to modify its SWM ordinances, regulations and new development plan approval
processes within 1 year after State adoption of regulations; April 24, 2009, with an effective date
of May 4, 2009.
In July 2010 and March 2011, the County Council passed Bill 40-10 which amended the
County’s SWM law to require management of stormwater runoff through the use of
nonstructural BMPs to the MEP for new development and redevelopment projects approved by
DPS. In response to MDE concerns that a portion of Bill 40-10 was less restrictive than State
law, Bill 40-10 was amended in March 2011 as Expedited Bill 7-11, which limited certain
alternative SWM measures to redevelopment only. The bills then brought the County’s
stormwater management law into compliance with the Maryland Stormwater Management Act
of 2007 and associated state implementing regulations adopted in 2010.
The revised County stormwater management law maintained more stringent requirements than
State law for redevelopment sites to protect water quality. Specifically, the Maryland
Stormwater Management Act of 2007 requires management of the first inch of runoff from
50 percent of the redevelopment site using ESD to the MEP. County law requires stormwater
management to protect water quality volume (WQv- the first inch of rainfall) and channel
protection volume (CPv-the expected runoff from a 1-year 24-hour duration rainfall) from
100 percent of the redevelopment site, and requires the use of ESD to the MEP to meet these
standards.
The DPS has been reviewing all development projects submitted since then to assure compliance
with the 2007 Stormwater Design Manual. Consequently, there has been a considerable increase
in type and number of nonstructural practices for new development and redevelopment in the
County.
Stormwater Management Plan Review and Permitting – Incorporating ESD
The Permit also requires the County to review local codes and ordinances to identify
impediments to and opportunities for promoting ESD to the MEP within 1-year, and to remove
those impediments within 2 years of the Permit’s issuance.
In December 2010, the County released the report “Implementing Environmental Site Design in
Montgomery County”, which summarizes how the County’s codes, regulations, programs, and
policies may need to be updated to allow the use of ESD and ESD techniques to the MEP. The
most significant barriers, gaps and opportunities were identified in the County’s Zoning
Ordinance and the Development Review Process. The report is summarized in Table III.E.3.
The Report is publicly available on the County’s website at:
http://www6.montgomerycountymd.gov/content/dep/downloads/water/Implementing_ESD_Rep
ort_FINAL_110910.pdf

06-DP-3320-MD0068349 Page III-18
Annual Report March 2015
Montgomery County Department of Environmental Protection
Table III.E.3. Summary of General Findings, ESD Barriers, Gaps, and Opportunities
Significant Barriers, Gaps, or
Opportunities
Fewer but Important Barriers, Gaps, or
Opportunities
• Ch 59. Zoning
• Development Approval Process
• Ch 22. Fire Safety Code
• Ch 26. Housing and Building Maintenance
Standards
• Ch 49. Streets and Roads
• Ch 50. Subdivision of Land
• Commercial-Residential ZTA
Limited Barriers, Gaps, or
Opportunities No Barriers or Gaps
• Ch 8. Buildings
• Ch 22A. Forest Conservation – Trees
• Ch 40. Real Property
• Ch 41. Recreation and Recreation
Facilities
• Ch 58. Weeds
• Trees, Approved Technical Manual
(MNCPPC)
• Ch 14. Development Districts
• Ch 18A. Environmental Sustainability
• Ch 21. Fire and Rescue Services
• Ch 24B. Homeowners’ Associations
• Ch 27A. Individual Water Supply and
Sewage Disposal Facilities
• Ch 36. Pond Safety
• Ch 44. Schools and Camps
• Ch 45. Sewers, Sewage Disposal and
Drainage
• Ch 54A. Transit Facilities
• Ch 56. Urban Renewal and Community
Development
• Guidelines for Environmental Management
of Development in Montgomery County
(MNCPPC)
In 2007, the M-NCPPC Department of Planning began a rewrite of the County’s antiquated
zoning code, Chapter 59, as ordered by the Montgomery County Council. The Planning
Department worked with a consultant, a citizen’s advisory group (Zoning Advisory Panel), and
with other County agencies to accomplish the rewrite. A completed Consolidated Draft was
released July 2012. The rewrite sections were reviewed as they became available, first by the
Planning Department, then by other County Agencies, and then by the Zoning Advisory Panel
and general public. A summary of ESD code review recommendations and how they were
addressed during the Zoning Code rewrite can be found on the CD attachment to this Report in
Appendix E.
There was significant additional opportunity for comment during the Public Hearing Draft
Review period, and in the Planning Board and County Council review processes. Table III.E.4,
below, shows the timeline for the Planning Department zoning code rewrite.

06-DP-3320-MD0068349 Page III-19
Annual Report March 2015
Montgomery County Department of Environmental Protection
Table III.E.4. Draft Zoning Code Rewrite Timeline
Complete Zoning Code Rewrite Draft
July 2012 Consolidated Draft (Public Hearing Draft) released
Summer - Fall 2012 Planning Department work sessions
December 2012 - January 2013 Finalize Planning Board Consolidated Draft
May 12, 2013 Draft transmitted to the County Council for review
Summer 2013- Fall 2013 The Council Planning, Housing and Economic Development
committee (PHED) holding work sessions
November 12 and 14, 2013 Full Council will hold public hearings on the revised
preliminary draft text
December 2013 PHED finalized the PHED draft, which can be found at
http://montgomeryplanning.org/development/zoning
March 5, 2014 County Council adopted the Zoning Code
September 30, 2014 ZTA 14-09, which incorporates updates, clarifications, and
corrections into the new zoning code, was adopted by
County Council.
October 30, 2014 The new Zoning Code, Chapter 59 of the Montgomery
County Code, takes effect
Additional Efforts to Incorporate ESD
The DPS, fellow agencies and members of the stormwater management construction community
formed a Policy and Design Committee and a New Products Committee to assess design and
maintenance aspects of various ESD practices. The committee’s goal is to assure that these
practices provide cost-effective designs that provide maximum runoff reduction and pollutant
removal without increasing average maintenance cost per facility.
The County’s Executive Branch (DPS, DOT, and DEP) and Planning Board agencies continue
working together on the “Streamlining the Development Process” initiative. The workgroup
presented recommendations to Council in September 2012 that identified areas for improvement
including publication of approved ESD technologies to facilitate implementation, adopting
guidelines for use of ESD practices in the right of way, and completing and publishing Context-
Sensitive Road Designs.
The DEP is working with DOT to include ESD measures in the County ROW, as part of a Green
Streets pilot program. For more information see Part G. Watershed Restoration. County partners
have learned much through the evaluation, design, and construction process, particularly working
with limitations presented by existing gray infrastructure that cannot be readily re-located. DEP
and DOT are now drafting technical standards for some of these practices, which will greatly
facilitate implementation and reduce overall costs for using these practices as retrofits.
The DEP invests considerable staff time and resources to promote ESD outreach to communities.
DEP hopes to increase community acceptance of these practices and future stewardship for
routine maintenance of the roadside ESD practices. Watershed groups, such as the ANS and the
06-DP-3320-MD0068349 Page III-20
Annual Report March 2015
Montgomery County Department of Environmental Protection
Friends of Sligo Creek (FOSC) provided assistance to DEP outreach efforts, both for the Green
Streets pilot and also for residential properties retrofits through the RainScapes Neighborhoods
program. In FY13, DEP’s SWM Facility Maintenance and Inspection Program also developed
numerous fact sheets designed to provide assistance to residents on how to maintain their ESD
practices including rain barrels, rain gardens, grass swales, buried dry wells, porous pavements,
and green roofs. The fact sheets are available on DEP’s website at
http://www.montgomerycountymd.gov/DEP/water/stormwater-facilities.html
MDE Review of the County’s Stormwater Management Program
Section III.E.1.c. of the Permit requires the County to maintain programmatic and
implementation information according to the requirements established as part of MDE’s triennial
stormwater program review.
In April 2013, MDE completed a review of the County’s stormwater management program,
including evaluation of implementing ESD to the MEP in the County’s plan review and approval
process. MDE found the County’s program to be acceptable under State law and in compliance
with Part III.E.1 of the Permit. MDE’s approval letter, with the County’s response, can be found
in Appendix F.
E.2 Erosion and Sediment Control
Section III.E.2 of the Permit requires the County to maintain an acceptable erosion and sediment
control program, including implementation of improvements identified in MDE’s biennial
evaluation of the County’s ESC program. The Permit also requires the County to conduct
responsible personnel certification classes to educate construction site operators regarding
erosion and sediment control compliance, and to report quarterly information regarding earth
disturbances exceeding 1 acre.
MDE performed a biennial evaluation of the County’s ESC program as part of their review of the
County’s application for the delegation of ESC enforcement authority in November of 2013.
Continued delegation was granted through June 30, 2016 by Brian Clevenger, Program Manager
of MDE’s Sediment, Stormwater and Dam Safety Program in a letter dated January 6, 2014. In
that letter, MDE “has also determined that the County’s program is in compliance with the
erosion and sediment control program elements stipulated in Part III.E.2 of the Montgomery
County MS4 Permit”.
In FY14, 18,151 ESC inspections were performed. Enforcement actions included 520 NOVs and
160 civil citations which collected $82,350.50.
Responsible Personnel Certification
In FY14, MDE developed an online class to certify responsible personnel in erosion and
sediment control. Ray Bahr, in a personal communication with the DPS Field Supervisor Derek
Isensee, indicated that the online class “will constitute Montgomery County’s RPC efforts and
comply with the County’s MS4 permit conditions”. At least three times per year prior to FY14,
the DPS, Land Development Division, Sediment and Storm Water Section conducted a
“Responsible Personnel Certification” course. Documentation on these courses can be found in
Appendix A, MDENPDES14.mbd, Part J. Responsible Personnel Certification.

06-DP-3320-MD0068349 Page III-21
Annual Report March 2015
Montgomery County Department of Environmental Protection
Quarterly Grading Permits
Quarterly grading permit information for earth disturbances in the County of 1 acre or more can
be found in Appendix A, MDENPDES14.mbd, Part K. Quarterly Grading Permit Information.
E.3 Illicit Discharge Detection and Elimination (IDDE)
The Permit requires the County to implement an inspection and enforcement program to ensure
that all non-stormwater discharges to the municipal separate storm sewer system are either
permitted by MDE or eliminated. The permit requires field screening of at least 150 outfalls
annually, with field water chemistry analysis of dry weather discharges according to parameters
specified in the Permit’s Attachment A, Annual Report Databases, Part I. Illicit Discharge
Detection and Elimination.
Outfall Screening
In FY14, DEP performed outfall screening in the Little Falls watershed, Figure III.E.2, below.
DEP screened 154 outfalls and found 66 with dry weather flow (34 with dry weather flows and
32 piped streams). Screening teams walked the entire length of the stream beds within the
watershed to identify all outfalls. This method allowed DEP to identify 110 new outfalls that
were not mapped in the storm drain inventory. DEP performed field testing on the dry weather
flows for permit required water chemistry parameters and also for ammonia, potassium and
fluoride.
Of the 34 outfalls found to have dry weather flow, field water quality testing found that 19 had
elevated parameters as measured during the initial screening, and follow up investigations were
performed. Of those 19 outfalls, 16 were found to have normal water chemistry parameters
during follow up visits. Table III.E.5 shows the problems identified at the remaining outfalls.
Table III.E.5. Investigation Results of Suspected Illicit Discharges During FY14
Outfall ID Location Problem Found Resolution
GM562P0600 Shops at Sumner Pl. Sewage Discharge from private
facility
Property Management working
to correct
HN121P0329 Arlington Road Suspected Sewage Discharge Continuing to investigate source
HM343P0106 Willard Ave. Wastewater cross-connection to
storm drain
NOV issued and problem
corrected
HM343P0106 Willard Ave. Discharge from parking garage
cleaning
Required change to cleaning
procedures
For FY15, DEP will screen outfalls in the Lower and Middle Mainstem subwatersheds of the
Northwest Branch subwatershed of the Anacostia.
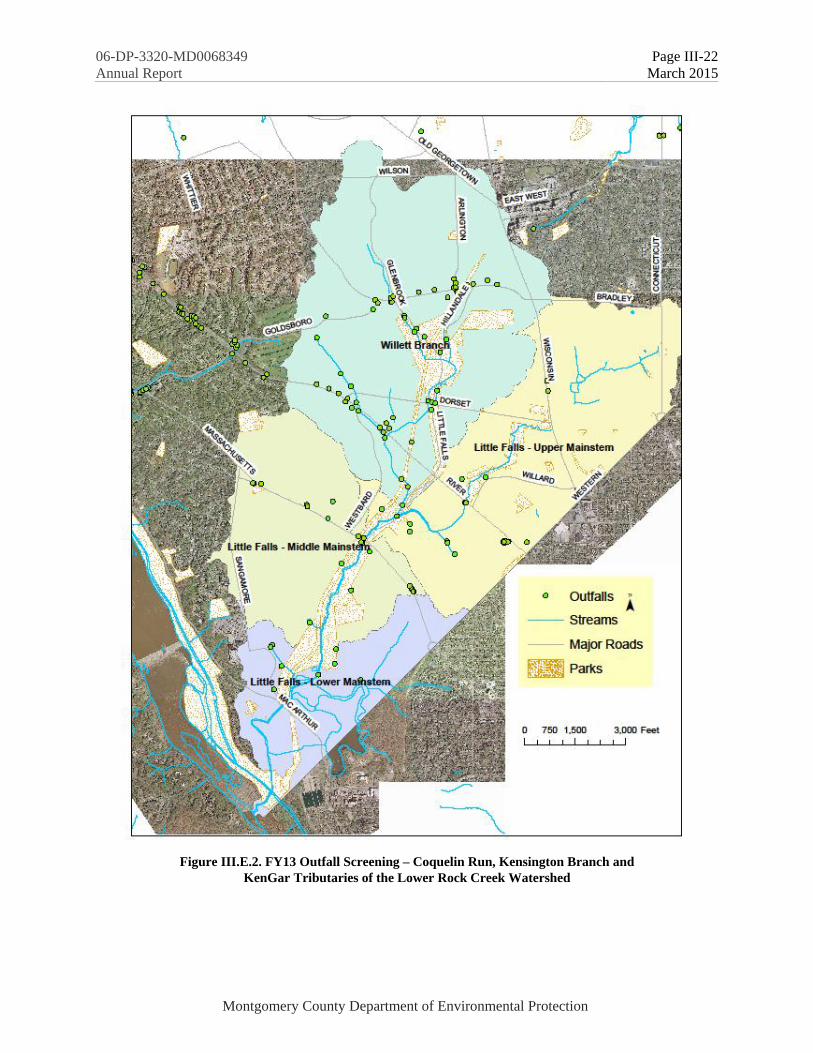
06-DP-3320-MD0068349 Page III-22
Annual Report March 2015
Montgomery County Department of Environmental Protection
Figure III.E.2. FY13 Outfall Screening – Coquelin Run, Kensington Branch and
KenGar Tributaries of the Lower Rock Creek Watershed

06-DP-3320-MD0068349 Page III-23
Annual Report March 2015
Montgomery County Department of Environmental Protection
WSSC Sanitary Sewer Overflow Follow Up Investigations
The DEP is continuing to work with WSSC by performing follow-up site visits for reported
sanitary sewer overflows (SSOs) in the County, and performed 88 site visits in FY14. DEP
verifies that SSOs have been corrected, ensures adequate cleanup and treatment of all affected
areas, and ensures that adequate public notice signage has been posted in affected areas. Also,
DEP is continuing to work with WSSC’s Fats, Oils and Grease (FOG) Program on restaurant
grease issues.
CCTV Inspections in the Sligo Creek Subwatershed of the Anacostia
In FY14, DEP worked with a contractor to perform CCTV inspections of two dry weather
discharges detected during IDDE outfall screenings in FY11. Previous DEP efforts to track
these discharges to their sources by following manholes and performing above ground
inspections were not successful. The CCTV inspections showed the following:
Wayne Avenue Discharge - CCTV inspection determined that a dry weather discharge
originated from an underground SWM management facility behind a shopping center. The
SWM facility received runoff from a loading dock and dumpster area behind a grocery store.
DEP worked with the shopping center property owner to clean the underground SWM
facility and repair any leaking dumpsters.
Maple Avenue Discharge - CCTV inspection identified several small flows originating from
apartment building HVAC units. A subsequent inspection of the Maple Avenue outfall also
identified flow coming from a large underground SWM facility. Other investigations of
smaller flows revealed a clogged storm drain referred to DOT for repair.
Illicit Discharges from Rooftop HVAC Units- Pilot Study
During FY12 and FY13, DEP partnered with the CWP to focus IDDE efforts in the Sligo Creek
subwatershed of the Anacostia. During the IDDE investigations, the team discovered three dry
weather discharges with high ammonia levels which were traced to HVAC units. High levels of
ammonia were found in discharges from cooling towers as well as air conditioner condensate
discharges. Limited sampling conducted by CWP suggested pollution loading for nitrogen,
copper and zinc as well. Investigations determined that all three HVAC systems were
maintained with nitrogen or ammonia based antimicrobial products.
In FY14, CWP and DEP performed a pilot research project to investigate the source and extent
of nitrogen compounds and other pollutants associated with HVAC systems, and to explore
recommendations to address these pollution sources. The study was completed and is
summarized below. The full report “Final Report for IDDE Special Study” can be found in
Appendix G in the electronic attachment.
The study focused on the downtown areas of the Sligo Creek watershed (Figure III.E.3). During
street level inspections, perimeters of selected buildings were walked to look for rooftop
discharges draining to sidewalks, street or storm drain systems. Water quality parameters were
analyzed at street level, including ammonia, copper, temperature, pH and flow. An action level
threshold for further investigation was defined as presence of ammonia (>0.2 mg/l) and/or
presence of copper (>0.1 mg/l). Samples were collected at each site for lab analysis of total
dissolved nitrogen. At every fifth site a sample was collected and sent to the lab for copper
(dissolved) and zinc (dissolved) analysis. Duplicate samples were taken for total nitrogen by

06-DP-3320-MD0068349 Page III-24
Annual Report March 2015
Montgomery County Department of Environmental Protection
each of the two teams one time per day to determine reproducibility and consistency of the lab
methods. Follow-up interviews of building managers or those familiar with management of the
HVAC system were conducted.
Figure III.E.3. Map of the Sligo Creek Watershed Study Area

06-DP-3320-MD0068349 Page III-25
Annual Report March 2015
Montgomery County Department of Environmental Protection
Field crews sampled 86 sites, and found 33 with discharges. Water analysis results from the
street-level inspections are summarized in Table III.E.6. All discharges exceeded the ammonia
threshold of 0.2 mg/L and were suspected to be HVAC discharges. Mean ammonia
concentrations from this study were well above the USEPA chronic water quality standard at
4.17 mg/L. Mean total nitrogen concentrations were 4.56 mg/L. The pH values ranged from
4.7 to 8.7, and temperature ranged from 19.8°C to 37.7°C. All of the laboratory-analyzed
samples for metals were approximately ten times greater than the Maryland water quality
standards (Figure III.E.4). Maryland’s water quality standard for zinc is 0.12 mg/L; for copper, it
is 0.013 mg/L (acute) and 0.009 mg/L (chronic) to protect aquatic life from toxicity.
Figure III.E.4. Heavy Metal Concentrations from HVAC Discharges (n=9)1
1The toxicity of Cu and Zn will vary based on water hardness and pH (i.e. lower toxicity as hardness of water increases).
MD zinc standard = 0.12 mg/L
MD Copper standard = 0.13 mg/L
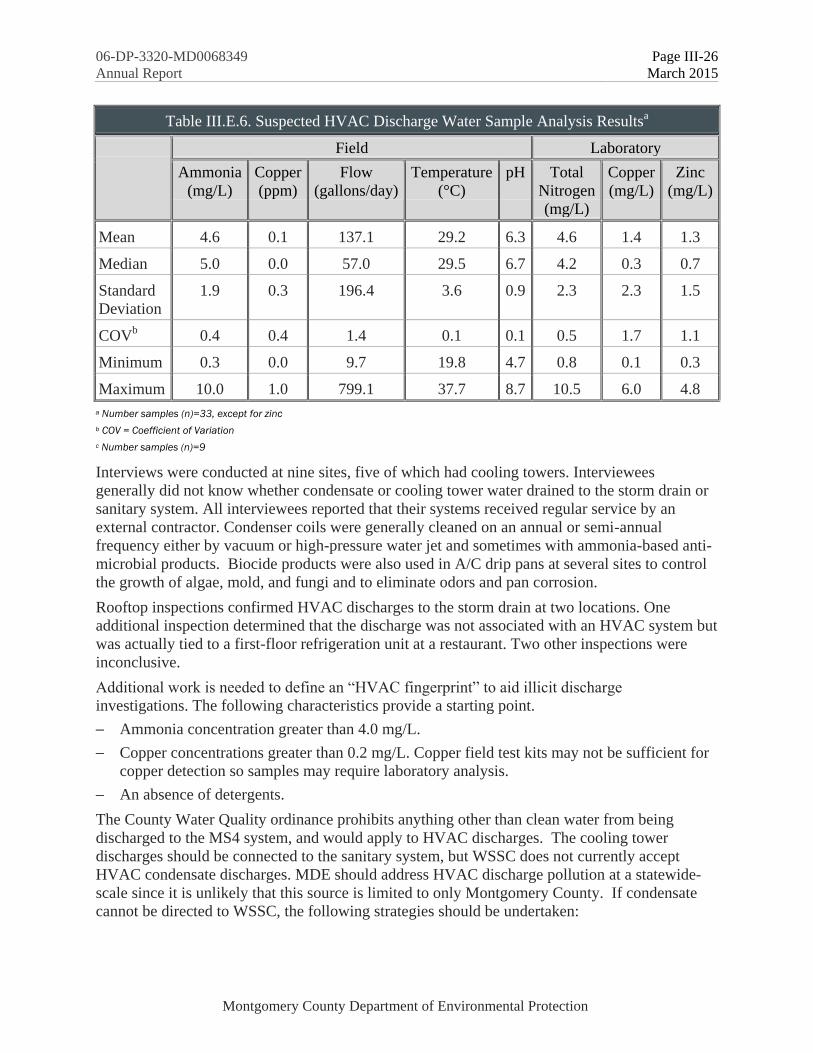
06-DP-3320-MD0068349 Page III-26
Annual Report March 2015
Montgomery County Department of Environmental Protection
Table III.E.6. Suspected HVAC Discharge Water Sample Analysis Resultsa
Field Laboratory
Ammonia
(mg/L)
Copper
(ppm)
Flow
(gallons/day)
Temperature
(°C)
pH
Total
Nitrogen
(mg/L)
Copper
(mg/L)
Zinc
(mg/L)
Mean 4.6 0.1 137.1 29.2 6.3 4.6 1.4 1.3
Median 5.0 0.0 57.0 29.5 6.7 4.2 0.3 0.7
Standard
Deviation
1.9 0.3 196.4 3.6 0.9 2.3 2.3 1.5
COVb 0.4 0.4 1.4 0.1 0.1 0.5 1.7 1.1
Minimum 0.3 0.0 9.7 19.8 4.7 0.8 0.1 0.3
Maximum 10.0 1.0 799.1 37.7 8.7 10.5 6.0 4.8
a Number samples (n)=33, except for zinc
b COV = Coefficient of Variation
c Number samples (n)=9
Interviews were conducted at nine sites, five of which had cooling towers. Interviewees
generally did not know whether condensate or cooling tower water drained to the storm drain or
sanitary system. All interviewees reported that their systems received regular service by an
external contractor. Condenser coils were generally cleaned on an annual or semi-annual
frequency either by vacuum or high-pressure water jet and sometimes with ammonia-based anti-
microbial products. Biocide products were also used in A/C drip pans at several sites to control
the growth of algae, mold, and fungi and to eliminate odors and pan corrosion.
Rooftop inspections confirmed HVAC discharges to the storm drain at two locations. One
additional inspection determined that the discharge was not associated with an HVAC system but
was actually tied to a first-floor refrigeration unit at a restaurant. Two other inspections were
inconclusive.
Additional work is needed to define an “HVAC fingerprint” to aid illicit discharge
investigations. The following characteristics provide a starting point.
Ammonia concentration greater than 4.0 mg/L.
Copper concentrations greater than 0.2 mg/L. Copper field test kits may not be sufficient for
copper detection so samples may require laboratory analysis.
An absence of detergents.
The County Water Quality ordinance prohibits anything other than clean water from being
discharged to the MS4 system, and would apply to HVAC discharges. The cooling tower
discharges should be connected to the sanitary system, but WSSC does not currently accept
HVAC condensate discharges. MDE should address HVAC discharge pollution at a statewide-
scale since it is unlikely that this source is limited to only Montgomery County. If condensate
cannot be directed to WSSC, the following strategies should be undertaken:

06-DP-3320-MD0068349 Page III-27
Annual Report March 2015
Montgomery County Department of Environmental Protection
1. Work with property owners to eliminate the use of biocides in A/C drip pans and condenser
coils. A/C drip pans can be cleaned regularly with mild soap and water.
2. Encourage property owners to clean condenser coils monthly or quarterly, preferably by
vacuum or other dry methods or with mild detergent solution if needed.
3. Drain condensate lines to landscaped areas and not the street or storm drain system. On-site
treatment options can be explored with MDE.
4. Re-use condensate, where possible, in subsurface irrigation systems or in cooling towers.
Water Quality Investigations During FY14 (7/1/13 – 6/30/14)
For the FY14, the DEP DEPC investigated 238 water quality issues (150 complaints and
88 SSO’s) and 26 hazardous materials related cases, which resulted in the issuance of 34 formal
Enforcement Actions (6 Civil Citations with fines totaling $3,000 and 28 NOVs) and
34 Warning Letters. The formal Enforcement Actions are summarized in the following
Table III.E.7.
Table III.E.7. FY14 Stormwater Discharge Enforcement Cases
No. Case
Number
Date $ Fine Case Type Case Sub-Type Citation #
1 2013967 7/24/2013 $500 Stormwater Pollutant Discharge 6Z39883234
2 20131060 8/22/2013 $500 Water Chemical Discoloration 0Z39883235
3 2013867 7/2/2013 $500 Stormwater Pollutant Discharge 1Z39882039
4 2014403 4/2/2014 $500 Water Chemical Discoloration 2Z39882040
5 2013984 9/23/2013 $500 Stormwater Pollutant Discharge 3Z39883196
6 20131196 10/1/2013 $500 Stormwater Pollutant Discharge 5Z39889659
7 2013877 7/1/2013 NOV Stormwater Pollutant Discharge N/A
8 2013931 7/12/2013 NOV Stormwater Pollutant Discharge N/A
9 2013938 7/16/2013 NOV Stormwater Pollutant Discharge N/A
10 2013938 7/16/2013 NOV Stormwater Pollutant Discharge N/A
11 2013944 7/18/2013 NOV Stormwater Pollutant Discharge N/A
12 2013944 7/18/2013 NOV Stormwater Pollutant Discharge N/A
13 2013944 7/18/2013 NOV Stormwater Pollutant Discharge N/A
14 2013954 7/22/2013 NOV Stormwater Pollutant Discharge N/A
15 2013984 7/30/2013 NOV Stormwater Pollutant Discharge N/A
16 2013984 7/30/2013 NOV Stormwater Pollutant Discharge N/A
17 20131178 9/20/2013 NOV Stormwater Pollutant Discharge N/A
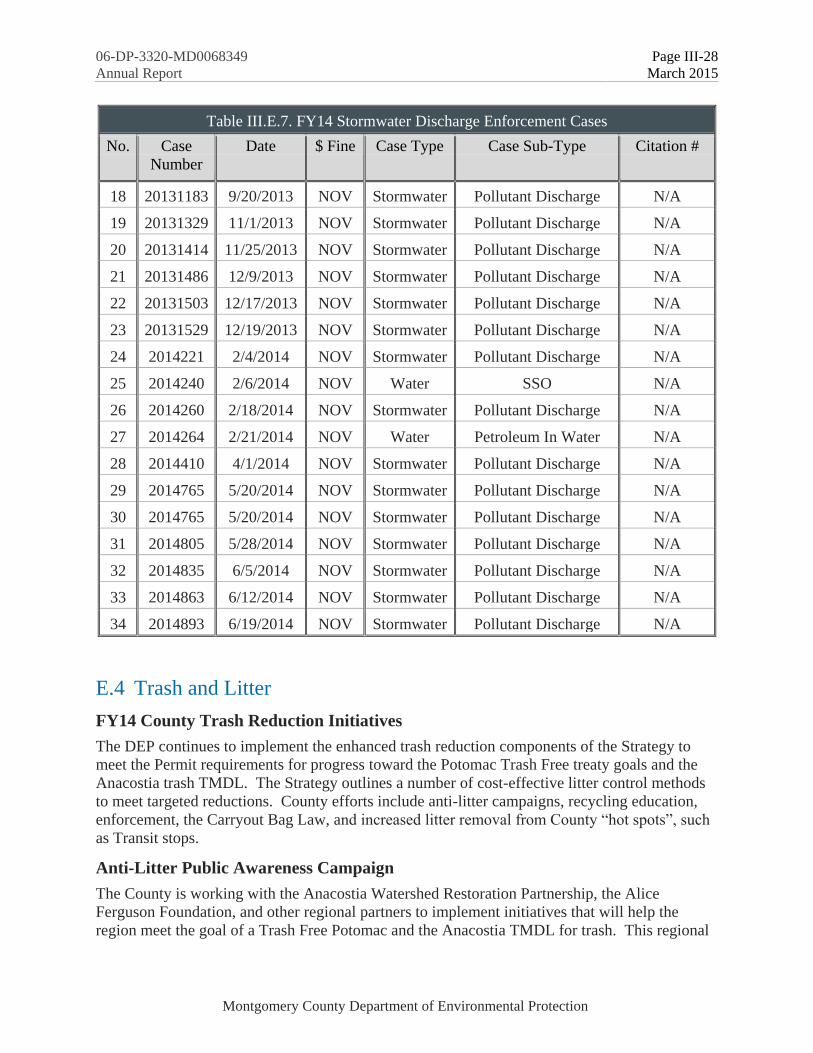
06-DP-3320-MD0068349 Page III-28
Annual Report March 2015
Montgomery County Department of Environmental Protection
Table III.E.7. FY14 Stormwater Discharge Enforcement Cases
No. Case
Number
Date $ Fine Case Type Case Sub-Type Citation #
18 20131183 9/20/2013 NOV Stormwater Pollutant Discharge N/A
19 20131329 11/1/2013 NOV Stormwater Pollutant Discharge N/A
20 20131414 11/25/2013 NOV Stormwater Pollutant Discharge N/A
21 20131486 12/9/2013 NOV Stormwater Pollutant Discharge N/A
22 20131503 12/17/2013 NOV Stormwater Pollutant Discharge N/A
23 20131529 12/19/2013 NOV Stormwater Pollutant Discharge N/A
24 2014221 2/4/2014 NOV Stormwater Pollutant Discharge N/A
25 2014240 2/6/2014 NOV Water SSO N/A
26 2014260 2/18/2014 NOV Stormwater Pollutant Discharge N/A
27 2014264 2/21/2014 NOV Water Petroleum In Water N/A
28 2014410 4/1/2014 NOV Stormwater Pollutant Discharge N/A
29 2014765 5/20/2014 NOV Stormwater Pollutant Discharge N/A
30 2014765 5/20/2014 NOV Stormwater Pollutant Discharge N/A
31 2014805 5/28/2014 NOV Stormwater Pollutant Discharge N/A
32 2014835 6/5/2014 NOV Stormwater Pollutant Discharge N/A
33 2014863 6/12/2014 NOV Stormwater Pollutant Discharge N/A
34 2014893 6/19/2014 NOV Stormwater Pollutant Discharge N/A
E.4 Trash and Litter
FY14 County Trash Reduction Initiatives
The DEP continues to implement the enhanced trash reduction components of the Strategy to
meet the Permit requirements for progress toward the Potomac Trash Free treaty goals and the
Anacostia trash TMDL. The Strategy outlines a number of cost-effective litter control methods
to meet targeted reductions. County efforts include anti-litter campaigns, recycling education,
enforcement, the Carryout Bag Law, and increased litter removal from County “hot spots”, such
as Transit stops.
Anti-Litter Public Awareness Campaign
The County is working with the Anacostia Watershed Restoration Partnership, the Alice
Ferguson Foundation, and other regional partners to implement initiatives that will help the
region meet the goal of a Trash Free Potomac and the Anacostia TMDL for trash. This regional

06-DP-3320-MD0068349 Page III-29
Annual Report March 2015
Montgomery County Department of Environmental Protection
effort has produced a unified anti- litter message for advertising in print media, on buses, and on
bus shelters in Montgomery County. DEP’s outreach and education programs for anti-littering
can be found in Part III.E.7, Public Outreach and Education.
Recycling Initiatives
According to the MDE’s Calendar Year 2012 Maryland Waste Diversion Rates & Tonnages
Report, Montgomery County’s overall recycling and waste diversion rate, was 59.8 percent. The
County has a goal to reduce waste and recycle 70 percent of all waste by 2020.
The DEP’s DSWS continues to conduct extensive outreach, education, training and enforcement
programs to increase awareness of waste reduction and recycling. During FY14, staff and
DSWS Recycling Program volunteers participated in 288 outreach and education events,
providing 36,849 people with assistance and information on waste reduction, recycling, buying
recycled, composting, grasscycling and other topics. The County continues to utilize a corps of
dedicated volunteers to educate others on the benefits of and the need to recycle. Together, the
volunteers contributed nearly 1,726 hours of direct service with an estimated value of $43,144.
More detailed information on DSWS’s outreach activities and other trash and litter reduction
measures can be found in the Division’s Quarterly Reports, posted at:
http://www6.montgomerycountymd.gov/swstmpl.asp?url=/content/dep/solidwaste/news/mon
thly_reports.asp
During FY14, DSWS staff continued efforts to conduct on-site consultations to businesses,
organizations, and local, state and federal government facilities providing technical assistance,
hands-on guidance, and specific recommendations on setting up, maintaining, and expanding
waste reduction, recycling, and buying recycled programs.
The DSWS constantly monitors the recycling markets to identify potential opportunities to
remove additional materials from the waste stream:
County residents can bring bulky rigid plastic items to the Montgomery County Shady Grove
Processing Facility and Transfer Station for recycling.
DSWS has also been operating a model food scrap recycling collection demonstration
project at the Montgomery County Executive Office Building in Rockville since November
2011. This project, in which pre-consumer food scraps generated in the building’s cafeteria
are separated for recycling collection, has diverted a total of 45.2 tons of food scraps for
commercial composting through the end of FY14.
DSWS helps to ensure that paint is not wasted or dumped down drains by accepting unused
paint and offering it for residents to take or donating it to charities. In FY14, the county gave
away 479 gallons of paint through the free paint program. Also, 233 tons of paint was
donated.
DSWS also participates in the “Bikes for the World” program. In FY14 they removed
15 tons of bikes for restoration and shipment to countries worldwide.
The County Transfer Station has a vendor that accepts Waste Vegetable Oil (WVO) for the
sole purpose of bio-diesel production; in FY14, 26 tons of straight vegetable oil was shipped
out for processing into biodiesel (http://www.montgomerycountymd.gov/veggieoil)
The county also gave away 17 tons of usable donated construction materials and 28 tons of
books dropped off for donation at the Transfer Station.

06-DP-3320-MD0068349 Page III-30
Annual Report March 2015
Montgomery County Department of Environmental Protection
Illegal Dumping Enforcement
The County has a call center (311) for non-emergency services where citizens can report
incidents involving environmental problems, including illegal dumping. Outside normal
business hours citizens can report issues through the MC311 and DEP websites. During FY14,
there were 354 complaints concerning the illegal dumping of solid waste, which resulted in the
issuance of 10 formal Enforcement Actions (2 Civil Citations with fines totaling $1,000 and
8 NOVs) and numerous Warning Letters. The vast majority of complaints concerned bags of
trash, vegetation (leaves and brush), or other unwanted materials either dumped or being stored
on private or public property. Only a small percentage of these cases represented a potential for
direct runoff of contaminated material into a storm drain or receiving system. Complaint
resolution invariably involved removal and proper disposal of trash and debris and proper
storage (i.e. under cover) of other materials.
Anti-Litter Enforcement in FY14
The County’s Police Force participated in the annual Litter Enforcement Month (April 2014)
conducting additional vigilance and community engagement on litter, especially with teens in
urban areas.
The Department of Housing and Community Affairs (DHCA) Code Enforcement Division
investigates and enforces violations of litter codes on private property. In FY14, they handled
3,615 trash/rubbish related complaints, and issued 408 civil citations. DCHA estimates that 132
tons of trash was removed as a result of their “clean or lien program”. DHCA also conducts an
Alternative Community Service (ACS) litter removal program, a weekly collection of street
debris in targeted neighborhoods, which collected 7,605 bags of trash in FY14.
Carryout Bag Law
From the implementation of the carryout bag fee (January 2012) to June 2014, there have been a
total of 146 million bags sold in Montgomery County. Approximately 60 million were sold in
FY14, about 5 million non-reusable bags sold per month. According to the Census Bureau, the
County population estimate for 2013 is 1,016,667 people. This continues to average out to a little
less than five disposable bags bought per county resident each month. In the first month of FY14
the county had 1,108 registered retailers paying the bag fee collected from their business. As of
June 2014, there are 1,185 registered retailers in the system. Bag law data analysis to date
suggest a slight downward trend, however DEP does not have enough data to definitively report
a change in bag usage for the County. Figure III.E.5, below, shows that there has been a steady
decline in the number of bags reported per retailer from January 2012 through June 2014.
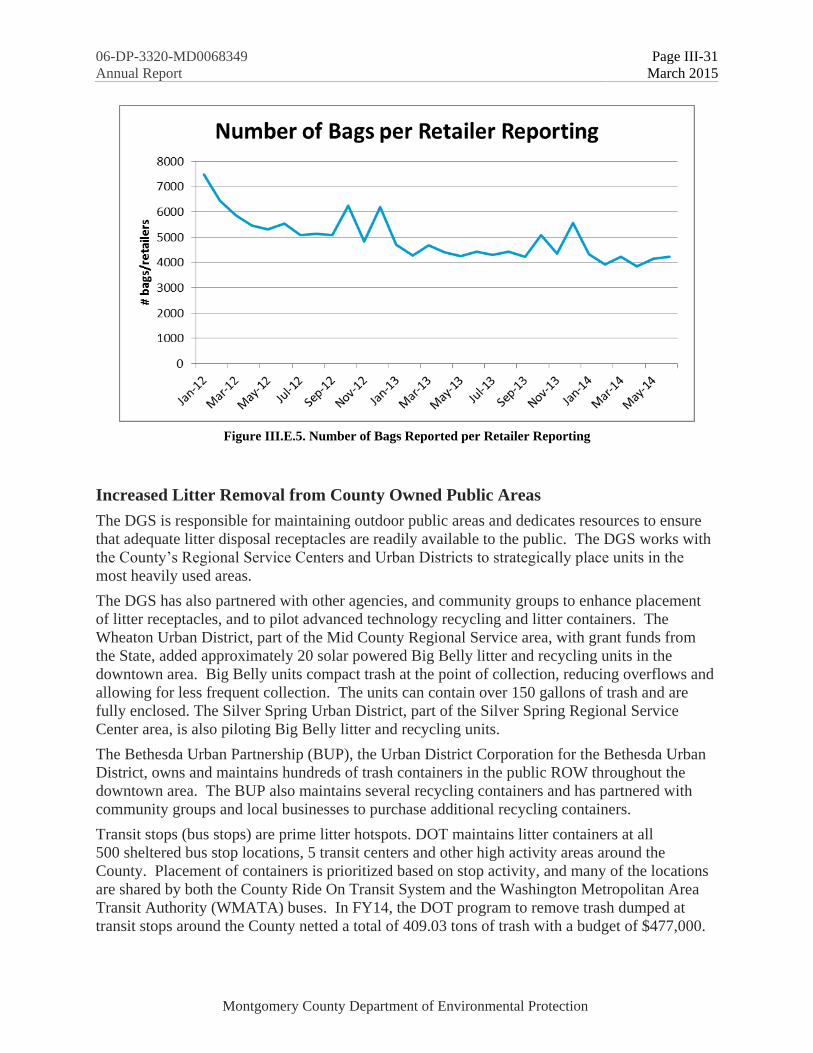
06-DP-3320-MD0068349 Page III-31
Annual Report March 2015
Montgomery County Department of Environmental Protection
Figure III.E.5. Number of Bags Reported per Retailer Reporting
Increased Litter Removal from County Owned Public Areas
The DGS is responsible for maintaining outdoor public areas and dedicates resources to ensure
that adequate litter disposal receptacles are readily available to the public. The DGS works with
the County’s Regional Service Centers and Urban Districts to strategically place units in the
most heavily used areas.
The DGS has also partnered with other agencies, and community groups to enhance placement
of litter receptacles, and to pilot advanced technology recycling and litter containers. The
Wheaton Urban District, part of the Mid County Regional Service area, with grant funds from
the State, added approximately 20 solar powered Big Belly litter and recycling units in the
downtown area. Big Belly units compact trash at the point of collection, reducing overflows and
allowing for less frequent collection. The units can contain over 150 gallons of trash and are
fully enclosed. The Silver Spring Urban District, part of the Silver Spring Regional Service
Center area, is also piloting Big Belly litter and recycling units.
The Bethesda Urban Partnership (BUP), the Urban District Corporation for the Bethesda Urban
District, owns and maintains hundreds of trash containers in the public ROW throughout the
downtown area. The BUP also maintains several recycling containers and has partnered with
community groups and local businesses to purchase additional recycling containers.
Transit stops (bus stops) are prime litter hotspots. DOT maintains litter containers at all
500 sheltered bus stop locations, 5 transit centers and other high activity areas around the
County. Placement of containers is prioritized based on stop activity, and many of the locations
are shared by both the County Ride On Transit System and the Washington Metropolitan Area
Transit Authority (WMATA) buses. In FY14, the DOT program to remove trash dumped at
transit stops around the County netted a total of 409.03 tons of trash with a budget of $477,000.
06-DP-3320-MD0068349 Page III-32
Annual Report March 2015
Montgomery County Department of Environmental Protection
Trash Removal from County ROW
The County 311 call center tracks all calls related to litter on County roads, and clean up is
handled by DOT. This information is conveyed to the County’s Police force in order to increase
surveillance of these roadside hotspots.
The DOT’s Adopt-A-Road Program supplies 392 community groups who adopt 409 roads (some
groups adopt more than one road) with equipment in exchange for their voluntary service of
picking up trash and litter along roadways. 171 groups reported 659 clean ups, picking up a total
of 2,577 bags of trash in FY14. 157 groups reported 543 clean ups, picking up a total of 2,117
bags of trash in FY13.
Each spring, DOT conducts a roadway litter pick up campaign. In FY14, several teams collected
litter along 255 miles of County roads, collecting 430 tons of litter. This program is referred to as
Refresh Montgomery.
Trash Removal at Stormwater Facilities
The County contracts the removal of organic debris and trash from County maintained SWM
facilities. These trash collections are augmented by citizen volunteer clean-ups. In FY14 there
were 22 trash collections at 13 different facilities. Four of the 22 collections were performed by
volunteers. This is a 49 percent decrease from the 43 total facility cleanings done in FY13.
Cleanings are scheduled on an as-needed basis and are related to number of storms that wash in
large amounts of trash.
A total of 2,062 pounds of inorganic trash (including aluminum, plastic, and glass containers,
plastic bags, tires, styrofoam, paper and miscellaneous items) were removed in FY14. This is an
increase of 301 pounds from the amount of inorganic trash removed in FY13. The increased
amount of material collected from far fewer cleanings may be a result of several large storms
rapidly moving material into the facilities.
In FY14, as shown in Table III.E.8 and Figure III-E.6, by weight 70 percent of the material
removed was organic debris (e.g. leaves, twigs, and branches), plastic bottles or miscellaneous
items. There was a noticeable increase in the amount of miscellaneous trash collected. This
could be partly due to more aggressive collections by volunteers and more accurate record
keeping.
Recyclable materials (aluminum, glass and plastic bottles, styrofoam and paper) comprised
69 percent of the inorganic materials found. These materials could easily have been removed
from the waste stream through the County’s recycling program. Over the past 4 years there has
been a clear shift away from glass bottles and a corresponding increase in plastic bottles. In
FY14 plastic bottles made up 26 percent by weight of the items collected at the ponds. More
pounds of plastic bottles were collected than any of the other categories besides organic debris
and miscellaneous trash. Future trash source control efforts will need to focus on additional
ways to keep plastic bottles and the other recyclables from entering waterways.

06-DP-3320-MD0068349 Page III-33
Annual Report March 2015
Montgomery County Department of Environmental Protection
Figure III.E.6. Pond Trash Collected in FY14 by Type
Table III.E.8. Trash Collected From Ponds FY2014 (Pounds)
Date Ponds
Cleaned
Aluminum Glass
bottles
Oil quart
containers
Plastic
Bags
Plastic
Bottles
Styrofoam
& Paper
Tires Organic
Debris
Misc Total
10/19/13 1 31 7 126 370 534
11/8/13 2 19 30 0 29 13 23 0 110 45 269
11/11/13 2 4 4 0 25 25 7 0 0 68 133
11/12/13 1 25 17 4 67 128 14 42 0 17 314
11/13/13 2 14 2 0 10 23 6 0 60 15 131
11/14/13 1 1 6 0 2 2 0 0 0 10 21
11/15/13 2 1 0 0 4 14 1 0 0 10 30
4/15/14 1 4 3 0 25 22 6 0 0 4 64
4/17/14 2 20 34 123 128 305
4/26/14 1 4 24 1 188 217
5/13/14 3 56 41 10 101 137 25 0 6 71 447
5/14/14 3 13 3 0 26 36 14 0 0 21 113
5/15/14 1 1 4 0 7 4 5 0 5 11 37
Total 22 193 151 14 296 676 102 42 551 588 2613
Percent 7.4% 5.8% 0.5% 11.3% 25.9% 3.9% 1.6% 21.1% 22.5% 100%
The Carryout Bag Law which went into effect on January 1, 2012 (FY12) does not appear to be
reducing the amount of bags collected at the ponds. As seen on Figure III.E.7, the amount of
plastic bags collected was about the same as in FY13. Plastic bags comprised a smaller fraction
of the trash collected in prior years.

06-DP-3320-MD0068349 Page III-34
Annual Report March 2015
Montgomery County Department of Environmental Protection
Figure III.E.7. Inorganic Material Removed from the SWM Ponds Annually
Post-Anacostia Trash TMDL Monitoring
The DEP continues to conduct trash monitoring and assessment in the Anacostia through a
contract with the Metropolitan Washington Council of Governments (MWCOG). Monitoring to
date includes:
Completed four cycles of post-TMDL trash monitoring in the Anacostia. The Anacostia
tributary monitoring follows the same protocols for stream-level and land-based surveys as
those used for trash TMDL development. As of FY14, there is a general decreasing trend for
plastic bag, plastic bottle and Styrofoam trash categories.
Began three additional types of observation surveys within the White Oak neighborhood of
Silver Spring (Anacostia watershed) since monitoring results have shown this area to have
the highest amounts of litter found in the stream; a bus stop survey, walking survey, and
storm drain inlet survey. This data will be used to help analyze and implement future litter
control projects that may be tested for effectiveness in this neighborhood and potentially
replicated in new areas.
Cost of Trash Reduction Efforts
For FY14, the County invested an estimated $7,204,186 in trash reduction strategies and
programs (Table III-E.9).

06-DP-3320-MD0068349 Page III-35
Annual Report March 2015
Montgomery County Department of Environmental Protection
Table III.E.9. Estimated FY13 Trash Reduction Costs
Program FY11 Cost
Solid Waste Management $4,692,497
Enforcement Programs $2,000,129
Street Litter Removal $479,000
Trash Removal from Stormwater Ponds $11,110
Anti-Litter Outreach $21,450
Total $7,204,186
E.5 Property Management
Table III.E.10 lists the County facilities covered under the MDE General Discharge Permit for
Storm Water Associated with Industrial Activities (the General Permit). The MDE accepted
NOI’s for these facilities in August 2014 for coverage until December 31, 2018. MDE’s
acceptance letters, as well as the most current SWPPP can be found in Appendix H.
For most of the facilities, DGS has the overall responsibility for meeting the requirements of the
General Permit, including updates to the facilities’ SWPPP. Agencies housed at the facilities are
responsible for implementing portions of the SWPPP that relate to their operations, and include:
DOT (Division of Highway Services [DHS] and Division of Transit Services [DTS]); DEP
(DSWS and WMD); and DGS Fleet Management Division (FMD). Both the FMD and DHS
have Program Managers responsible for environmental compliance for their respective
operations at these facilities.
Table III.E.10. Inventory and Status of County Facilities Covered under the Maryland General
Discharge Permit for Storm Water Associated with Industrial Activities
Name Of Facility/
Responsible Agency
Watershed/Acreage Most Recent Pollution Prevention
Inspection and/or Plan
(Electronic File included on CD
enclosed)
Colesville Highway
Maintenance Depot (DOT)
Anacostia/Paint Branch;
11.73 acres
NOI accepted for registration under the
NPDES General Permit.
SWPPP updated in FY14.
Damascus Highway
Maintenance Depot (DOT)
Potomac/Great Seneca:
1.4 acres
NOI accepted for registration under the
NPDES General Permit.
SWPPP updated in FY14.

06-DP-3320-MD0068349 Page III-36
Annual Report March 2015
Montgomery County Department of Environmental Protection
Table III.E.10. Inventory and Status of County Facilities Covered under the Maryland General
Discharge Permit for Storm Water Associated with Industrial Activities
Name Of Facility/
Responsible Agency
Watershed/Acreage Most Recent Pollution Prevention
Inspection and/or Plan
(Electronic File included on CD
enclosed)
Gaithersburg: Highway
Maintenance Facility (DOT)
NOI accepted for registration under the
NPDES General Permit.
SWPPP updated in FY14.
Gaithersburg: EMTOC (DGS) Potomac/Rock Creek:
15.1 acres
Poolesville Highway
Maintenance Facility (DOT)
Potomac/Dry Seneca
Creek: 4 Acres
NOI accepted for registration under the
NPDES General Permit.
SWPPP updated in FY14.
Seven Locks Automotive
Service Center (DGS)
Potomac/Cabin John
Creek: 18.86 Acres
NOI accepted for registration under the
NPDES General Permit.
SWPPP updated in FY14. Bethesda Highway
Maintenance Facility, Sign
Shop and Signal Shop (DGS)
Kensington Small Transit
Service Maintenance Facility
at Nicholson Court
Potomac/Rock Creek:
3.31 acres
NOI accepted for registration under the
NPDES General Permit.
SWPPP updated in FY14.
Silver Spring/Brookville Road
Highway Maintenance
Facility (DOT)
Potomac/Rock Creek:
17.47Acres
NOI accepted for registration under the
NPDES General Permit.
SWPPP updated in FY14.
Silver Spring/Brookville Road
Transit Center/ Fleet
Maintenance Center (DGS)
Shady Grove Processing
Facility (DEP)
Potomac/Rock Creek:
43 out of 52.5 acres
NOI accepted for registration under the
NPDES General Permit.
SWPPP updated in FY14.
Gude Landfill (DEP) Potomac/Rock Creek:
120 acres
NOI accepted for registration under the
NPDES General Permit.
SWPPP updated in FY14.
Oaks Landfill (DEP) Patuxent/Hawlings
River (355 acres) and
Potomac/Rock Creek
(190 acres)
NOI accepted for registration under the
NPDES General Permit.
SWPPP updated in FY14.

06-DP-3320-MD0068349 Page III-37
Annual Report March 2015
Montgomery County Department of Environmental Protection
All County facilities have annual comprehensive stormwater pollution prevention (P2)
inspections. They are also inspected monthly or quarterly. In FY14, DGS and DOT managed
sites consistently had the following P2 related needs, as shown in Table III.E.11.
Table III.E.11. FY14 Pollution Prevention Needs at County Facilities Covered Under the State
General Discharge Permit for Storm Water Associated with Industrial Activities
Pollution Prevention Need Action Taken
Depot lots need more frequent sweeping. DGS is now funding routine depot lot sweeping.
More frequent (daily) housekeeping
inspections and small spill clean-up.
Facility personnel are trained annually in proper
spill clean-up and preventative housekeeping.
Sites need better storage facilities for
equipment.
Recommended capital improvements are being
evaluated for implementation.
Covered storage areas for loose gravels and
similar materials with retaining walls
separating each product.
Recommended capital improvements are being
evaluated for implementation.
Most sites need to be repaved and
resurfaced.
SWM facilities need more frequent
inspection.
Underground SWM facilities at all depots are
inspected and cleaned twice annually with
additional maintenance as necessary by DEP’s
SWM Facility Maintenance and Inspection
Program.
Improved storage area for waste oil
recycling was recommended for the
Poolesville Depot.
Covered storage area for the solid waste
receiving area is being evaluated. The site is
routinely inspected by County contractors.
Parking lot cleaning and inlet protection
needed at the Transit area of the Brookville
Depot.
The County has a contractor to clean the depot
parking lots. The contractor will clean the lots
using inlet protection to prevent the wash water
from entering the storm drain.
New stormwater quality structures are being
added to the Transit bus area at the Brookville
Depot.
New salt domar was installed at the
Poolesville Depot. At time of inspection,
domar cover was torn.
Domar cover replaced and re-tightened.

06-DP-3320-MD0068349 Page III-38
Annual Report March 2015
Montgomery County Department of Environmental Protection
Pollution Prevention at DSWS Facilities
The DEP’s DSWS is responsible for meeting the General Permit requirements at the Gude and
Oaks Landfills and the Shady Grove Processing Facility. The DSWS Compliance Officer is
responsible for ensuring environmental compliance at Solid Waste operational facilities.
The DSWS quarterly P2 inspection reports indicate that the Oaks and Gude Landfills and the
Shady Grove Processing Facility are in good shape. Litter is picked up on the sites and along the
perimeter fence lines regularly and the landfill berms are well vegetated. The Gude Landfill has a
few persistent stormwater depressions and leachate seeps that are repaired promptly. The Shady
Grove Processing Facility storm drain inlet screens had some partial blockage from blowing leaf
and grinding debris, and were cleaned. Cleaning of three of the stormceptor SWM BMPs were
put on a quarterly cleaning schedule (from biannual) to facilitate structure function and sediment
removal.
In FY14, DOT, DGS, and DEP continued to deliver yearly training on the General Permit
requirements to all facility operation employees. Operation specific training, incorporating
annual P2 inspection findings, was delivered at each facility location. Assessments, needs and
improvements were covered in this training as well as ways to reduce hazardous substances,
pollutants, or contaminants.
In 2008, new CIP funding dedicated to environmental compliance was added to the DGS budget.
In FY14, the following environmental compliance CIP initiatives were accomplished:
As part of the County’s Smart Growth Initiative, the Gaithersburg Heavy Equipment
Maintenance and Operations Center, Transit Services and Highway Maintenance facility
were relocated to the County’s EMTOC. The onsite facilities include many pollution
prevention and stormwater management upgrades including a new bus wash facility, heavy
equipment storage shed, soil/gravel storage area, salt barns, and Highway Services bays.
SPCC measures Plans were developed for the new County facilities.
The DGS removed USTs and contaminated soils from the old location of the Gaithersburg
Heavy Equipment Maintenance and Operations Center.
DGS is also currently replacing underground storage tanks with aboveground storage tanks
at County Fire Stations.
Construction of the Silver Spring/Brookville Road Depot stormwater improvements
continues, which will add two Baysaver water quality structures, and trench drains to
improve the water quality from the transit maintenance facility area. Planned improvements
for FY15 include a new permanent structure for bulk storage of highway maintenance
materials (topsoil, sand, gravel), and an improved bus stream bay.
Upgraded oil handling area at the Brookville Depot.
DGS/DOT has begun routine mechanical sweeping of all the industrial facilities, and
increasing the cleaning frequency of facility oil/grit separators. In FY14, all depots were
swept.

06-DP-3320-MD0068349 Page III-39
Annual Report March 2015
Montgomery County Department of Environmental Protection
County Co-Permittees Property Management
Town of Poolesville
The Town of Poolesville is the only one of the six small municipal co-permittees that is required
to have a General Permit NOI. The Town of Poolesville has a maintenance yard associated with
the Poolesville Wastewater Treatment Plant, with outside truck and materials storage, and
maintains a current SWP3 for the site. The Town’s Public Works Director is responsible for the
SWP3 on this site and conducts weekly inspections to assure compliance. The Town reported no
changes for FY14.
MCPS
MCPS runs and operates five industrial sites that require coverage under the Maryland General
Permit for Discharges Associated with Industrial facilities, Permit 12-SW. The facilities are
listed below in Table III.E.12. All facilities are maintained by the MCPS Department of
Facilities Management—Division of Maintenance, and Department of Transportation- Division
of Fleet Maintenance. The exception is West Farm, which is managed by the Department of
Transportation only. All facilities submitted an NOI for coverage under the current General
Permit in FY14.
During FY14, MCPS performed the annual evaluation of the SWPPP and SPCC Plans for all five
industrial facilities. Improvements have been implemented at these sites as recommended by the
annual inspections. MCPS also maintains 30 underground storage tanks at 15 facilities in
compliance with MDE regulations. In FY14, MCPS spent $232,204 on facility pollution
prevention.
Table III.E.12. Inventory and Status of MCPS Facilities Covered
under the Maryland General Discharge Permit for Storm Water
Associated with Industrial Activities (12-SW)
Name Of Facility/
Responsible Agency
Watershed/Acreage Status
Bethesda Fleet Maintenance/
Bethesda Facilities
Maintenance Depot
Cabin John Creek
6.2 acres
NOI accepted for registration under
the NPDES General Permit.
SWPPP updated in FY14.
Randolph Fleet Maintenance/
Randolph Facilities
Maintenance
Anacostia
9.3 acres
NOI accepted for registration under
the NPDES General Permit.
SWPPP updated in FY14.
Shady Grove Fleet
Maintenance/ Shady Grove
Facilities Maintenance
Rock Creek
15 acres
NOI accepted for registration under
the NPDES General Permit.
SWPPP updated in FY14.
West Farm Transportation
Depot
Anacostia River
5.06 acres
NOI accepted for registration under
the NPDES General Permit.
SWPPP updated in FY14.

06-DP-3320-MD0068349 Page III-40
Annual Report March 2015
Montgomery County Department of Environmental Protection
Table III.E.12. Inventory and Status of MCPS Facilities Covered
under the Maryland General Discharge Permit for Storm Water
Associated with Industrial Activities (12-SW)
Name Of Facility/
Responsible Agency
Watershed/Acreage Status
Clarksburg Fleet
Maintenance/Clarksburg
Facilities
Seneca Creek
15.11 acres
NOI accepted for registration under
the NPDES General Permit.
SWPPP updated in FY14.
MCPS is responsible for training employees in positions that have particular potential for storm
water pollution; primarily maintenance and transportation staff. In FY12, an MCPS contractor
performed in depth in-house storm water and pollution prevention training for staff in the
Facilities Maintenance Division. To date, 72 Fleet Maintenance staff members and 190 from
Facilities Maintenance have received such training. In FY14, refresher training was provided to
110 Fleet Maintenance staff. MCPS plans to provide online stormwater awareness training to all
MCPS support services staff on a 5-year cycle.
The MCPS has programs in place to reduce the amount of pesticides, herbicides and fertilizers
on MCPS property. MCPS implements an IPM program at all schools, centers and facilities,
with an emphasis on physical rather than chemical measures for pest control, in accordance with
MCPS Regulation ECF-RB, Pesticides Use in Schools. Under Maryland Law, only licensed and
registered pest control workers may apply any pesticides or herbicides in a school building or on
school grounds (COMAR 15.05.02.10). In addition, only certain products are approved for use
in and around MCPS facilities by certified pest applicators and all chemicals used undergo a
thorough safety review by professional staff. State law also enumerates specific requirements
about the storage, use, signage and notification required for pesticide applications. MCPS IPM
staff work with facility occupants to stress the need for proper sanitation measures and structural
exclusion to control pests, using pesticides only when all other measures have failed. To have
more centralized controls in place over fertilizer and herbicide applications, MCPS has a process
to pre-qualify contractors whom perform athletic field maintenance at high school athletic fields
in order to. In FY14, MCPS spent $301,100 on IPM and fertilizer management.
The MCPS continues to work with the WSSC’s FOG program to reduce and eliminate SSOs that
could potentially originate from MCPS sites and negatively impact stream water quality. As part
of this process, MCPS has scheduled the installation and clean out of grease interceptors,
provided training, and implemented operational BMPs in all school cafeterias.
E.6 Road Maintenance
The Permit requires the County to reduce pollutants associated with roadways by implementing a
road maintenance program that includes street sweeping, inlet cleaning, reducing the use of
pesticides, herbicides, fertilizers and other pollutants associated with roadway vegetation
management, and controlling the overuse of winter weather deicing materials.

06-DP-3320-MD0068349 Page III-41
Annual Report March 2015
Montgomery County Department of Environmental Protection
Montgomery County Street Sweeping Program
The DOT and DEP oversee a street sweeping program that uses funding from both agencies. In
FY14, DOT funded street sweeping on residential routes, and DEP funded arterial route
sweeping (arterial routes are larger roads with more commercial activity, traffic and more
observed trash). In the past, DOT oversaw all County street sweeping. In FY14, DEP assumed
oversight and inspection of the DEP portion of the sweeping program.
The DOT sweeps 56 residential routes shown on Figure III.E.8 at least once per year. Nineteen
of these routes have been designated as priority residential routes based on the average tons per
curb mile collected, lack of adequate stormwater management, and water quality impairment
from sediment. These routes also tend to coincide with areas in the County of the highest annual
average daily traffic as shown on Figure III.E.9. Sweeping is scheduled so that the priority
residential routes are swept first early in the spring to more effectively recover material applied
during winter storms.
The remaining 37 DOT swept routes are considered “non-priority” residential routes, and are
generally swept once per year following priority residential route sweeping. Some residential
roads in rural areas (western and northern) of the County are not swept. The relatively low
amount of vehicle traffic and the lack of curbs in these areas make street sweeping impractical.
As in past years, more material was collected per curb mile from the priority routes in FY14.
The DEP funded sweeping of 229 curb miles on arterial routes, shown on Figure III.E.10. The
routes are swept at night when traffic volumes are low. Sweeping is only done on segments of
the roads without residential housing because of noise considerations. In FY14, DEP swept the
arterial routes 19 cycles.
Figure III.E.8. Countywide Street Sweeping Figure III.E.9. Annual Average
Daily Traffic 2010

06-DP-3320-MD0068349 Page III-42
Annual Report March 2015
Montgomery County Department of Environmental Protection
Figure III.E.10. Montgomery County Arterial Street Sweeping Routes
A summary of the County’s FY14 street sweeping program is shown in Table III.E.13.
Table III.E.13. Summary of County’s FY14 Street Sweeping Program
Category Materials
Removed
(tons)
Curb
Miles
Swept
Tons
Material/
Curb Mile
Cost per ton Cost per
curb mile
Total Cost
Priority Residential
Routes
543.30 1271.37 0.43 $170.83 $73.00 $92,810.01
Non-Priority
Residential Routes
438.15 2784.58 0.16 $463.94 $73.00 $203,274.34
Arterial Routes
19 cycles
406.4 4358.03 0.09 $428.94 $40.00 $174,321.20
Totals 1387.85 8413.98 $470,405.55
County Average Tons
Material/Curb Mile
0.16
Figure III.E.11 shows tons of materials removed annually by street sweeping from 1999 to
present. The tons of sand and salt applied were not reported for FY09 and FY10. In 2002, no
County street sweeping was conducted due to lack of funding. The amount of material removed
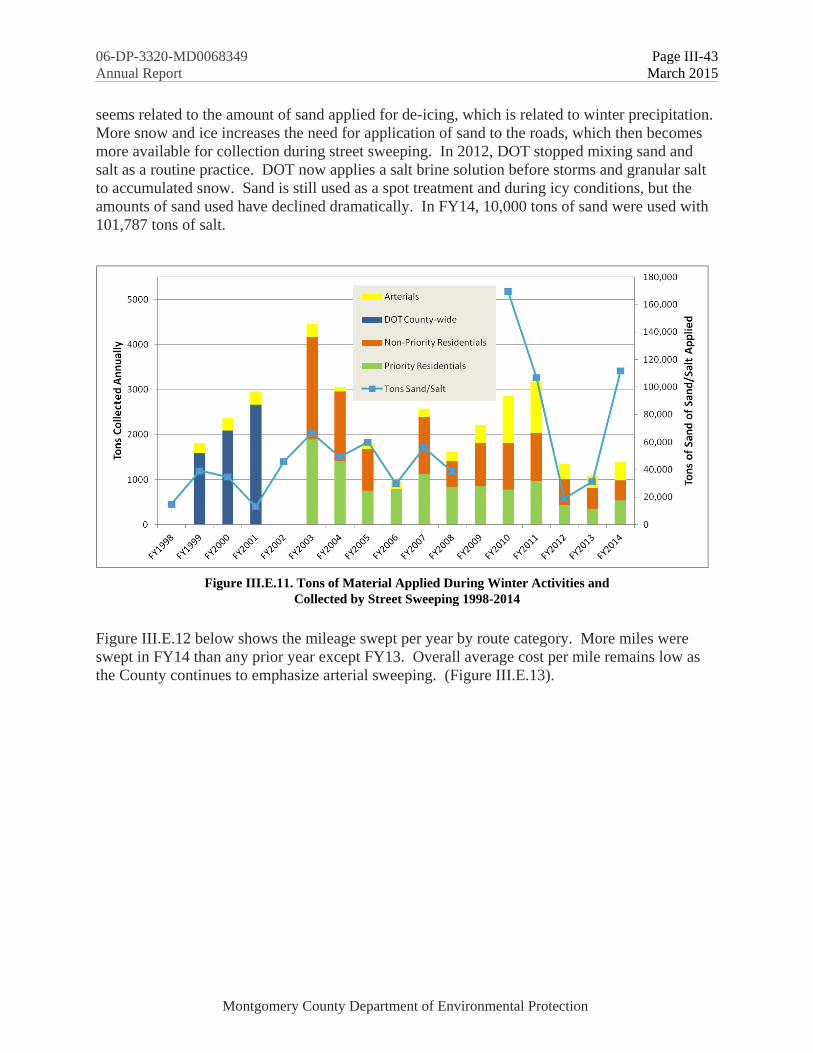
06-DP-3320-MD0068349 Page III-43
Annual Report March 2015
Montgomery County Department of Environmental Protection
seems related to the amount of sand applied for de-icing, which is related to winter precipitation.
More snow and ice increases the need for application of sand to the roads, which then becomes
more available for collection during street sweeping. In 2012, DOT stopped mixing sand and
salt as a routine practice. DOT now applies a salt brine solution before storms and granular salt
to accumulated snow. Sand is still used as a spot treatment and during icy conditions, but the
amounts of sand used have declined dramatically. In FY14, 10,000 tons of sand were used with
101,787 tons of salt.
Figure III.E.11. Tons of Material Applied During Winter Activities and
Collected by Street Sweeping 1998-2014
Figure III.E.12 below shows the mileage swept per year by route category. More miles were
swept in FY14 than any prior year except FY13. Overall average cost per mile remains low as
the County continues to emphasize arterial sweeping. (Figure III.E.13).

06-DP-3320-MD0068349 Page III-44
Annual Report March 2015
Montgomery County Department of Environmental Protection
Figure III.E.12. Annual Montgomery County Street
Sweeping Mileage 1996-2013
Figure III.E.13. Montgomery County Street Sweeping Mileage and Average Cost 2005-2013

06-DP-3320-MD0068349 Page III-45
Annual Report March 2015
Montgomery County Department of Environmental Protection
In FY14, DEP decided to update the arterial street sweeping program to identify routes in
watersheds with TMDL’s. Street sweeping would then be located in areas with water quality
impairments that could benefit from additional pollution controls. DEP is assembling a set of
arterial routes in the Anacostia and Rock Creek watersheds, which both have TMDLs for
sediment and phosphorous. DEP will prioritize roads with high traffic volumes and those
serving commercial, industrial or multi-family residential land uses.
Calculating Equivalent Impervious Acreage and Pollutant Reductions for TMDL Watersheds
and Countywide
In FY12, the County began sweeping 229 miles of roadway identified as arterial routes twice
monthly. Table III.E.14 shows the miles of arterial routes, along with the percent of the total
arterial routes, for each watershed. This sweeping frequency allows the County to take credit for
stormwater control for impervious acreage equivalent and stormwater pollutant load reductions
both Countywide and in applicable 8 digit watersheds with approved TMDLs. The credits were
calculated according to MDE’s August 2014 Draft Guidance “Accounting for Stormwater
Wasteload Allocations and Impervious Acres Treated”, Table 3.E. Alternative Urban BMPs.
Table III.E.14. Arterial Street Sweeping by Watershed FY14
Arterial Street Sweeping by Watershed
MD8DIG Watershed Miles Percent of
Roadway
Swept by
Watershed
IA
Credit
(acres)
TN
Removed
(lbs)
TP
Removed
(lbs)
TSS
Removed
(tons)
02131108 Brighton Dam
Reservoir
0.1 0.1% 0.2 0.9 0.4 0.1
02140202 Potomac Direct 28.8 12.5% 20.3 177.8 71.1 10.7
02140205 Anacostia 28.7 12.5% 20.3 177.8 71.1 10.7
02140206 Rock Creek 86.4 37.7% 61.3 536.2 214.5 32.2
02140207 Cabin John Creek 26.9 11.7% 19.0 166.7 66.7 10.0
02140208 Seneca Creek 58.3 25.4% 41.3 361.3 144.5 21.7
02140302 Lower Monocacy 0.1 0.1% 0.2 0.9 0.4 0.1
Grand Total 229.4 100.0% 162.6 1421.7 568.7 85.3
Notes:
Total Amount of Material Collected in Arterial Routes in FY14= 406.4 tons
IA= Impervious Area
TN= Total Nitrogen
TP= Total Phosphorous
TSS= Total Suspended Solids

06-DP-3320-MD0068349 Page III-46
Annual Report March 2015
Montgomery County Department of Environmental Protection
Inlet Cleaning
Table III.E.15, below, compares the DOT inlet cleaning program for this Permit cycle from
2010-2014. Impervious acres equivalence treated is 86 acres, as calculated using guidance from
“Accounting for Stormwater Wasteload Allocations and Impervious Acres Treated”, MDE,
August 2014.
Table III.E.15. DOT Inlet Cleaning, by Fiscal Year 2010-2013
Year # Inlets
Cleaned
Linear Ft.
Cleaned
Debris
Collected
(tons)
IA Equivalence
Treated
Cost
FY14 648 20,710 217 86 $418,353
FY13 803 15,769 494 $246,200
FY12 811 14,382 367 $275,392
FY11 1,191 17,604 107 $269,593
2010 2,011 24,128 181 Not Reported
Roadside Vegetation Management
Montgomery Weed Control, Inc. conducts the County’s State required roadside weed spraying
program for noxious weeds. Specialized spray equipment achieves cost efficient control with
minimal use of herbicides. Operational (BMPs) are always followed. All personnel employed by
Montgomery Weed Control Inc. are pesticide applicators registered and trained in compliance
with the State Pesticide Applicator’s Law.
Other than for noxious weed control, the County uses no other pesticides, and no fertilizers, for
roadside vegetation management. Table III.E.16 shows the amount of herbicides applied along
County roadways from 2010-2014.
Table III.E.16. Herbicide Usage by Montgomery Weed
Control Inc. on Montgomery County Rights of Way
Purpose 2014 2013 2012 2011 2010
State-mandated
Treatment for
Noxious Weeds
7.35 Gal
Clopyralid
2.58 Gal
Glyphosate
4.84 Gal
Clopyralid
4.10 Gal
Glyphosate
4.78 Gal.
Clopyralid
4.55 Gal.
Glyphosate
5.20 Gal.
Clopyralid
4.55 Gal.
Glyphosate
7.53 Gal.
Clopyralid
2.57 Gal.
Glyphosate
Program Cost $22,000 $22,765 $22,000 $20,000 Not Available
Note: Herbicide use is directly correlated to growing conditions for each season

06-DP-3320-MD0068349 Page III-47
Annual Report March 2015
Montgomery County Department of Environmental Protection
Winter Weather Materials Application
The DOT uses plowing and salting to achieve a desired level of winter weather roadway
treatment. The DOT follows the October 2011 Maryland State Highway Administration Salt
Management Plan. All application equipment is calibrated once a year. In FY11, DOT launched
a new on-line system to track the status and progress of roadway treatment and plowing during
winter weather events. In FY12, the Snow Tracking Application was revised to include salt used
per route to identify trends in salt usage and improve salt use management. In 2012, the DOT
discontinued ordering sand for use in de-icing roads. There was a stockpile of approximately
18,000 tons of salt/sand (80 percent-20 percent) that continued to be used until depleted.
In 2009, DOT began a salt brine pilot program on 240 lane miles of primary roads. Salt brine is a
23 percent salt solution created in a brine maker and stored in tanks until used. Brine has a
freezing point of -6 degrees F and continues to work when salt, which loses effectiveness at
20 degrees F, does not. A contractor sprays the salt brine on highways 2 hours to 2 days prior to
the onset of frozen precipitation to prevent snow and ice from bonding to pavements. In 2010,
over 400 lane miles of both primary and secondary roads received salt brine applications using
contracted and County equipment. In the 2011-2012 winter seasons, DOT purchased additional
salt brine making equipment and storage tanks and developed the salt brine treatment program to
include 678 lane miles of primary, secondary and some neighborhood roads. In FY14, DOT
sprayed a total of 122,000 gallons to treat 2,034 miles.
Table III.E.17, below, compares DOT’s winter weather deicing materials use from FY10-FY14.
Table III.E.17. DOT Winter Weather Deicing Material Usage
from FY10-FY13. NR=not Reported
FY14 FY13 FY12 FY11 FY10
Salt, tons 111,787 31,309 15,200 85,600 169,633 sand and
salt combined Sand, tons 10,000 0 3,800 21,400
Salt Brine, gallons 121,787 93,005 122,031 NR NR
E.7 Public Education and Outreach
Compliance Hotline
The Permit requires the County to establish and publicize a compliance hotline for public
reporting of spills, illegal dumping and suspected illicit discharges. The County maintains a call
center that allows citizens to call one number (311) for all concerns in the County, including
surface water quality concerns. More information can be found on the 311 home page at:
http://www3.montgomerycountymd.gov/311/Home.aspx
DEP Communications
In FY14, the My Green Montgomery online education portal (www.mygreenmontgomery.org)
expanded its outreach efforts with the creation of a monthly newsletter and expanded blog.

06-DP-3320-MD0068349 Page III-48
Annual Report March 2015
Montgomery County Department of Environmental Protection
Social Media Statistics for DEP
Facebook “likes” grew from 196 to 305, a 55 percent increase in reach.
Twitter followers grew from 98 to 415, a 323 percent increase in reach.
More than 4,422 pictures and videos on Flickr, almost all of them related to water, restoration
and outreach.
Newsletters
The My Green Montgomery monthly newsletter grew from 262 recipients to 399, a 52 percent
increase in readers.
My Green Montgomery Website
Twenty-one blog articles focused on water issues, including blogs on the storm drain art at the
Aspen Hill Library, pet waste education, Stream Stewards and three on the new FrogWatch
program. The My Green Montgomery website had more than 10,700 users in FY14 and 3,584
(13.7 percent) unique pageviews were of water-themed content.
DEP Website
The DEP website (www.montgomerycountymd.gov/dep) went through a complete overhaul in
January 2014. The website has a new structure with new navigation, content and features. The
new site was launched almost exactly halfway through the year, so statistics are divided into two
parts as noted in Tables III.E.18 and III.E.19.
Table III.E.18. Full DEP Website Statistics
Old Website
(July 2013 – January 2014)
New Website
(January 2014 – July 2014)
• 167,495 Unique Users
• 550,075 Pageviews
• 2.02 Pages per Session
• 1 Minute 38 Seconds Average
Session Duration
• 164, 498 Unique Users
• 553,891 Pageviews*
• 2.91 Pages per Session
• 1 Minute 48 Seconds Average
Session Duration
Table III.E.19. Water Section Statistics
Old Website
(July 2013 – January 2014)
New Website
(January 2014 – July 2014)
• 60,643 Unique Pageviews
• 2 Minute 2 Seconds Average
Session Duration
• 9,405 Unique Pageviews*
• 1 Minute 38 Seconds Average
Session Duration
*The decline in the number of unique pageviews is attributed to the fact that there was a decline
in the overall number of water pages as content was consolidated and re-structured.

06-DP-3320-MD0068349 Page III-49
Annual Report March 2015
Montgomery County Department of Environmental Protection
Public Outreach and Stewardship Work Plan
The Permit requires the County to develop and implement a public outreach and education
program focused on stormwater pollution reduction with specific goals and deadlines. To meet
this requirement, the County developed a POSWP as part of the County’s overall Strategy,
submitted to MDE in FY11.
The POSWP outlines eight specific priorities to address many of the Permit outreach
requirements in III.E.7.b.i-viii. The priorities include: pet waste management, lawn stewardship,
anti-littering, stormwater awareness, establishing a volunteer program, riparian reforestation,
roof runoff reduction and parking lot recharge. In the POSWP, each priority is summarized in a
practice sheet which identifies performance goals, key messages, intended outcomes, targeted
audiences, partnerships to develop, delivery techniques, startup costs, measurement objectives,
timelines and milestones from start up through 2025. The POSWP can be found online at
http://www.montgomerycountymd.gov/DEP/Resources/Files/ReportsandPublications/Water/Cou
ntywide%20Implementation%20Strategy/Watershed-Outreach-Plan-2012.pdf.
Summary of Stormwater Outreach Efforts During the Third Generation Permit
Cycle
The DEP expanded its outreach and stewardship during this fiscal year and throughout the permit
cycle. Outreach and stewardship highlights include:
Creating a public outreach and stewardship plan in 2010
Hiring three watershed outreach staff
General watershed outreach activities increased 745 percent from FY10-FY14
Overhauling the DEP website to better suit the needs of the public
Creating a “My Green Montgomery” website as a public interactive website to promote
green initiatives and activities.
Creating additional Outreach programs, including:
The Stream Stewards Volunteer Outreach Program
A Pet Waste Management Program with homeowners associations
A Storm Drain Art Program
The Montgomery County FrogWatch USA chapter
The H2O Summit annual community event
The “Caching the Rain” stormwater awareness geotrail
Collaboration on a regional anti-litter campaign with the Alice Ferguson Foundation and
several other jurisdictions.
Focused outreach to culturally diverse communities increased, including translations for 22
publications.
Forty-three new outreach publications were created.
Achieving a social media presence by creating DEP Facebook, Twitter, Instagram, Flickr
and blog accounts including five group listserves and e-newsletters.
Creating a watershed group capacity building effort which helped eight watershed groups
build a stronger organizational structure.
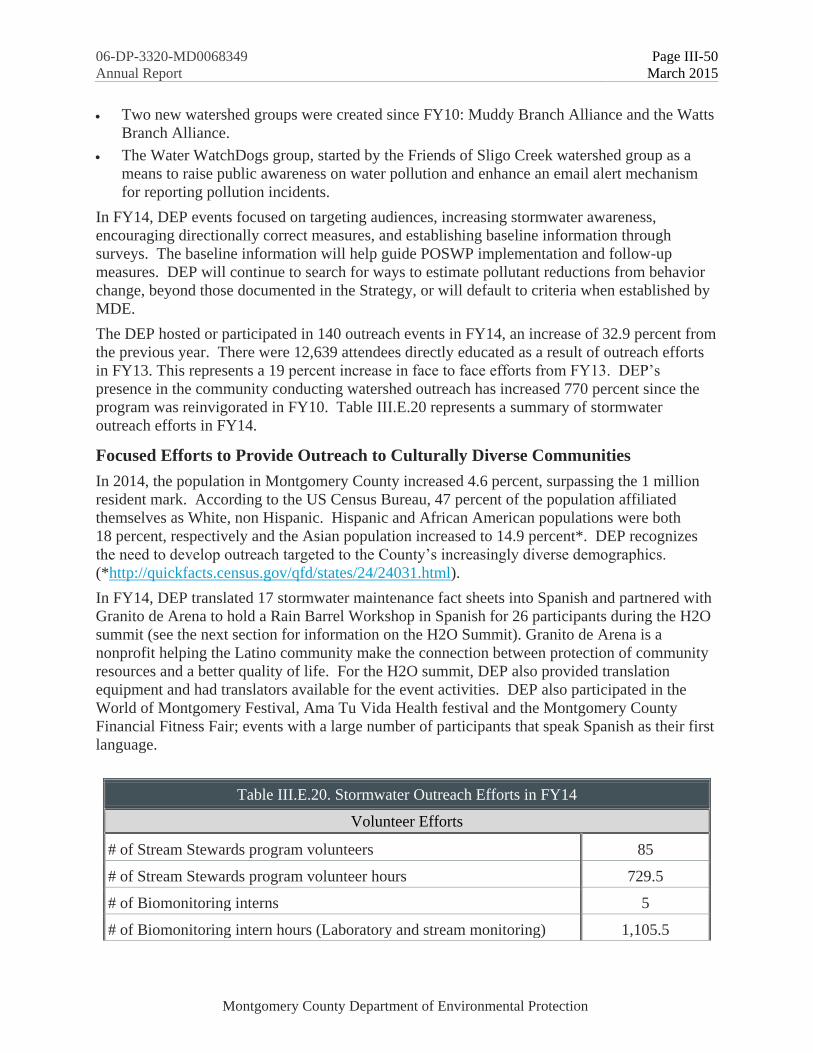
06-DP-3320-MD0068349 Page III-50
Annual Report March 2015
Montgomery County Department of Environmental Protection
Two new watershed groups were created since FY10: Muddy Branch Alliance and the Watts
Branch Alliance.
The Water WatchDogs group, started by the Friends of Sligo Creek watershed group as a
means to raise public awareness on water pollution and enhance an email alert mechanism
for reporting pollution incidents.
In FY14, DEP events focused on targeting audiences, increasing stormwater awareness,
encouraging directionally correct measures, and establishing baseline information through
surveys. The baseline information will help guide POSWP implementation and follow-up
measures. DEP will continue to search for ways to estimate pollutant reductions from behavior
change, beyond those documented in the Strategy, or will default to criteria when established by
MDE.
The DEP hosted or participated in 140 outreach events in FY14, an increase of 32.9 percent from
the previous year. There were 12,639 attendees directly educated as a result of outreach efforts
in FY13. This represents a 19 percent increase in face to face efforts from FY13. DEP’s
presence in the community conducting watershed outreach has increased 770 percent since the
program was reinvigorated in FY10. Table III.E.20 represents a summary of stormwater
outreach efforts in FY14.
Focused Efforts to Provide Outreach to Culturally Diverse Communities
In 2014, the population in Montgomery County increased 4.6 percent, surpassing the 1 million
resident mark. According to the US Census Bureau, 47 percent of the population affiliated
themselves as White, non Hispanic. Hispanic and African American populations were both
18 percent, respectively and the Asian population increased to 14.9 percent*. DEP recognizes
the need to develop outreach targeted to the County’s increasingly diverse demographics.
(*http://quickfacts.census.gov/qfd/states/24/24031.html).
In FY14, DEP translated 17 stormwater maintenance fact sheets into Spanish and partnered with
Granito de Arena to hold a Rain Barrel Workshop in Spanish for 26 participants during the H2O
summit (see the next section for information on the H2O Summit). Granito de Arena is a
nonprofit helping the Latino community make the connection between protection of community
resources and a better quality of life. For the H2O summit, DEP also provided translation
equipment and had translators available for the event activities. DEP also participated in the
World of Montgomery Festival, Ama Tu Vida Health festival and the Montgomery County
Financial Fitness Fair; events with a large number of participants that speak Spanish as their first
language.
Table III.E.20. Stormwater Outreach Efforts in FY14
Volunteer Efforts
# of Stream Stewards program volunteers 85
# of Stream Stewards program volunteer hours 729.5
# of Biomonitoring interns 5
# of Biomonitoring intern hours (Laboratory and stream monitoring) 1,105.5

06-DP-3320-MD0068349 Page III-51
Annual Report March 2015
Montgomery County Department of Environmental Protection
Table III.E.20. Stormwater Outreach Efforts in FY14
Collective dollar value of volunteers to the county $42,296.75
Public Events
# of total outreach events hosted or attended 140
# of residents directly reached 12,639
# of participants attending 2014 H2O Summit 490
# of public meetings held 61
# of RainScapes events held 50
# of Stormwater Facilities Maintenance events held 6
Watershed Group Capacity Building
# of watershed groups working towards official nonprofit status 2
# of watershed groups assisted 7
# of watershed group trainings held (including one on one sessions) 10
Materials
# of publications produced 33
# of publication copies printed 12,000
# of publications translated 17
# of listserve subscribers (Stormwater maint., Rainscapes & Landscape
Professionals)
600 / 2,426 / 644
Media Distribution (gazette readership) 400,000
Communications Including Web/Social Media
# of e-newsletter subscribers (My Green Montgomery/Stormwater
Maintenance/ RainScapes/ RS Landscapers, Stream Stewards)
399 / 831 / 2,523 /
765 / 300
# of Blogs on My Green Montgomery 21
# of Unique Users on www.montgomerycountymd.gov/dep
(1st half of FY14)
167,495
# of Unique Users on www.montgomerycountymd.gov/dep
(2nd
half of FY14)
164,498
# of Pageviews -water section of www.montgomerycountymd.gov/dep
(1st half of FY14)
60,643
# of Pageviews -water section of www.montgomerycountymd.gov/dep
(2nd
half of FY14)
39,405
# of Unique Users on www.mygreenmontgomery.org 10,776

06-DP-3320-MD0068349 Page III-52
Annual Report March 2015
Montgomery County Department of Environmental Protection
Table III.E.20. Stormwater Outreach Efforts in FY14
# of Pageviews of water content on www.mygreenmontgomery.org 3,584
# of viewers of County Cable’s My Green Montgomery YouTube
Videos
801
# of Facebook Likes / Twitter Followers 305 / 415
# of Emails sent to the County on water through online inquiry form
(April-June 2014)
55 (19.3% of all
emails)
Implementation of Priority Practices
Pet Waste Management Program (POSWP Priority Practice #1)
In FY14, DEP continued to work with three HOAs in the Rock Creek watershed to establish pet
waste stations. DEP funded the pilot project for 1 year, after which the HOAs had the ability to
take over maintenance of the stations. DEP also provided outreach to the communities on pet
waste problems and the importance of reducing stormwater pollution, with an emphasis on local
stream health. Each community received regular updates as to how much waste was collected.
A total of 1,669 pounds of pet waste was collected at the 7 installed stations during this period.
This resulted in the prevention of 17 trillion fecal coliform bacteria from entering the Rock
Creek watershed, along with reducing 96 pounds of nitrogen and 13 pounds of phosphorous.
At the end of the 12-month period, each community decided to adopt their pet waste stations.
They also participated in a post project survey to determine if the community’s habits had
changed. As shown on Figure III.E14, the availability of a pet waste station was a positive factor
in encouraging residents to pick up their pet’s waste, more influential than laws and fines, or
knowing that waste pollutes local waters.
Figure III.E.14. Responses to Post Pet Waste Station Project Survey

06-DP-3320-MD0068349 Page III-53
Annual Report March 2015
Montgomery County Department of Environmental Protection
DEP staff also created a pet waste pledge that citizens could sign indicating their promise to pick
up after their pet. For their pledge, citizens received a portal bag holder that affixes to a leash.
In FY14, 275 citizens signed the pet waste pledge.
Figure III.E.15. Join the Poop Loop – Taking the Pet Waste Pick Up Pledge
Anti Litter Campaign (POSWP Priority Practice #3)
The DEP’s public outreach campaign against litter pollution continued to be a priority in FY14.
In FY13, regional Alice Ferguson Foundation (AFF) anti-litter ads were placed on the outside of
County Ride On buses and at bus shelters. Many ads remained in place for FY14. The County
also added AFF anti-litter ads to the entire fleet of County recycling trucks (125 trucks) and on
the inside of Ride On buses.
In FY13, DEP identified an area in the White Oak neighborhood of Silver Spring with high
amounts of litter for an anti-litter awareness outreach pilot program and conducted community
outreach and an Earth Day clean up event. In FY14, DEP staff worked with the MWCOG to
conduct surveys of the area’s apartment complexes and shopping centers to better understand
factors contributing to the litter issues and establish baseline information. The voluntary survey
included questions on property management activities related to littering and attempted to
identify specific trends that could be better addressed. DEP contacted 61 multi-family and 16
commercial property managers to request participation. The survey rate of return for the multi-
family properties and commercial properties was 38 percent and 31 percent respectively.
Stream Stewards Outreach and Stewardship Campaign (POSWP Priority Practice #5)
These are programs to create champions for neighborhood streams and to increase involvement
of local residents and businesses in protecting those streams.

06-DP-3320-MD0068349 Page III-54
Annual Report March 2015
Montgomery County Department of Environmental Protection
Stream Stewards Volunteer Program
In FY14, the Stream Stewards program continued to train citizen volunteers to help DEP
expand watershed outreach to the community. DEP trained 85 volunteers during four
orientation sessions, a 63.5 percent increase from volunteers trained in FY13. Volunteers
donated 729.5 hours through the program, a 70 percent increase from FY13. Forty percent
more individuals signed up to receive the Stream Stewards e-newsletter as well. Finally, the
volunteers participated in 13 events and collected 1,075.75 pounds of trash. Results from the
program are shown in Table III.E.21.
Table III.E.21. Stream Stewards Volunteer Activities FY14
Volunteer Opportunity Number of
Hours
Number of
Volunteers
Service Value
Office Assistance 17.5 1 $403.38
Orientation 59.5 30 $1,371.48
Watershed Ambassador 306.5 60 $7,064.83
Watershed Keeper 346 126 $7,975.30
Watershed Speaker $
Total 729.5 85* $16,814.98
Total Events in FY14 13 events
Total Pounds of Trash Collected 1075.75 lbs
*Total number of volunteers, not total times a volunteer participated, some volunteers participate multiple times.
*Service value per Independent Sector (http://www.independentsector.org/volunteer_time)
Watershed Management Interns
The DEP Biological Monitoring Section conducts detailed biological, chemical, and physical
assessments of County watersheds on a 5-year rotating basis (see III.F. Watershed
Assessment). DEP recruits and trains volunteer interns each year to assist with the
monitoring and laboratory analysis. In FY14, five volunteers donated a total of 1,105.5 hours
to the program helping staff to analyze and monitoring water quality and area resource
conditions in the County.
In FY14, DEP hosted a Conservation Corps intern from the Chesapeake Bay Trust (CBT).
Paid through a CBT stipend of $15,500, the intern assisted with DEP programs and also led
the creation of two new programs: The Montgomery County Chapter of FrogWatch and a
stormwater awareness geotrail entitled, “Caching the Rain”. Details of these programs are
described below under the section titled “New Outreach Programs”. The Conservation Corps
intern provided 1,653.75 hours in FY14.

06-DP-3320-MD0068349 Page III-55
Annual Report March 2015
Montgomery County Department of Environmental Protection
Watershed Group Capacity Building
The DEP works with County watershed groups to develop increased organizational capacity,
fostering sustainable local groups that can provide additional outreach to their communities
on stormwater pollution prevention, education programming, and fostering behavior change
in the County.
Representatives of six County watershed groups attended a strategic planning session held in
November 2013. Ninety-three percent of the attendees rated the training as effective or
highly effective. After the training, the groups stated that their knowledge of strategic
planning increased and that their Board of Directors also increased participation in planning
efforts. From July 2013 to January 2104, DEP employed a professional strategic planning
consultant to assist the local groups in plan development. During this time, four groups
developed draft annual work plans and two developed draft strategic plans.
For the 3rd
year, DEP provided funding for one representative from each watershed group to
attend the annual Chesapeake Watershed Forum (CWF) sponsored by the Alliance for the
Chesapeake Bay. The CWF sessions provided information on grass roots approaches for
watershed outreach and implementation. After the CWF, the attendees provided feedback to
the County on enhancing future capacity building assistance efforts. The groups emphasized
the importance of DEP provided scholarships for forum attendance.
In February 2014, DEP drafted a technical report describing the capacity building process
and results since the project began in July 2011. Table III.E.22 shows accomplishments in
FY14. The final project report can be viewed at:
https://www.montgomerycountymd.gov/DEP/Resources/Files/ReportsandPublications/Water
/Countywide%20Implementation%20Strategy/H2O-Group-Capacity-Building-Factsheet.pdf
Table III.E.22. County Watershed Group Capacity
Building Accomplishments in FY14
Watershed Group Capacity Building
Activity #
Trainings held 1
One on One Sessions 9
Part-time executive director hired 1
Strategic Plans developed 2
Draft annual workplans developed 4

06-DP-3320-MD0068349 Page III-56
Annual Report March 2015
Montgomery County Department of Environmental Protection
Watershed Group Accomplishments
During FY14, eight watershed groups actively recruited members and conducted special
activities including roadway and watershed clean-ups, and invasive plant work days. These
groups include the Friends of Sligo Creek, the Neighbors of Northwest Branch, the Rock
Creek Conservancy, the Little Falls Watershed Alliance, the Friends of Cabin John Creek,
the Muddy Branch Alliance, the Seneca Creek Watershed Partners and the Watts Branch
Alliance.
The DEP continued its focus on tracking litter removal and community outreach by the
watershed groups. In FY14, however, DEP received a report documenting FY14
accomplishments from only the Rock Creek Conservancy. DEP notes that activities from all
the groups have noticeably increased over the past year even though reports were not
received.
Rock Creek Conservancy
The Rock Creek Conservancy worked with DEP on two projects in FY14: Storm Drain Art
(described below) and the Pet Waste pilot (described previously). They also individually
completed the following activities in their watershed:
Hosted 8 educational events
Engaged 137 volunteers who donated 266 service hours
Participated in stream cleanups through the Stream Team program (results are reported
by M-NCPPC)
Increased their members to 1200 individuals
Collected 175 bags of trash and recyclables
H2O Summit
“I learn something great every year and network more and more. I appreciate the time and
effort to share this knowledge. Thank you for doing this event!” – 2014 H2O Summit
attendee
The 4th
annual H2O Summit was held in FY14, and had 490 attendees; the event’s largest
number to date. The event is composed of family friendly festival and workshop components
that focus on water resource related topics including stream health, stormwater pollution and
litter reduction. The festival portion of the event drew the largest number of attendees.
DEP conducted a survey of the attendees, and found that most attended the Summit to
expand their environmental knowledge, to network and because they had an interest in
stormwater management. A total of 67 exhibitors participated in the Summit (an increase of
11.6 percent from FY13). 117 of the 174 event registrants filled out a pre-survey (67 percent
rate of return). Post surveys were sent out to 140 attendees, and 33.6 percent were returned.
Table III.E.23 summarizes participant survey responses. Figures III.E.16-19 show pictures
from the event.

06-DP-3320-MD0068349 Page III-57
Annual Report March 2015
Montgomery County Department of Environmental Protection
Table III.E.23. FY14 H2O Summit Survey Responses
2014 H2O Summit
Total Attendance 490
Reason for attending Expand Environmental knowledge, Networking,
Interest in Stormwater Management
Collective Workshop ratings 8.85 out of 10
Likelihood of attending future events 97.4%
DEP’s effectiveness rating of
protecting the County’s water
resources
7 out of 10
Household pollution habits (117) Recycling (32%), Not applying fertilizers/ pesticides
(28%), Not littering/picking up litter (28%)
Registered attendees average age (174) 43.4 years
Figure III.E.16. Eric Naibert, DEP Biologist, and
Virginia Vassalotti, Chesapeake Bay Trust Conservation
Corps Volunteer, Assisting at the 2014 H2O Summit

06-DP-3320-MD0068349 Page III-58
Annual Report March 2015
Montgomery County Department of Environmental Protection
Figure III.E.19. Attendees Learning About Stormwater
Flows from an H2O Summit Exhibitor
Figure III.E.17. DEP Chief Operating
Officer, Kathleen Boucher, Presenting
Kay Fulcomer with a Volunteer
Excellence Award
Figure III.E.18. Stream Steward Volunteers
Assisting at the 2014 H2O Summit
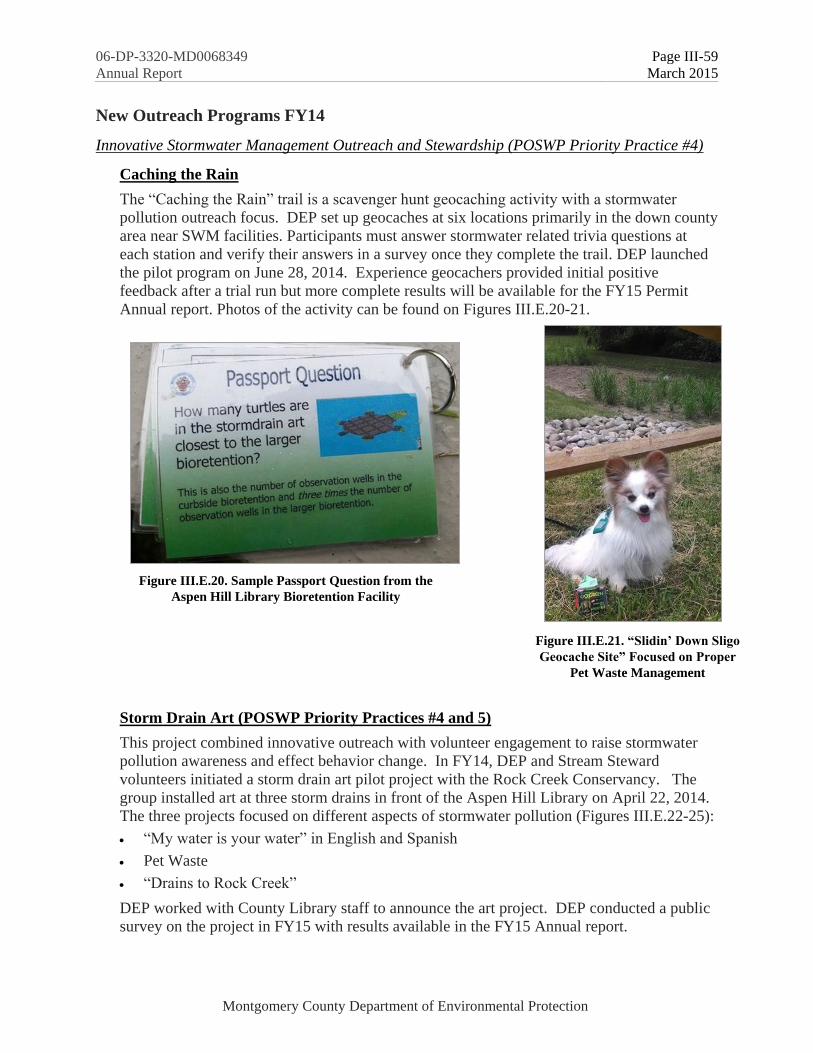
06-DP-3320-MD0068349 Page III-59
Annual Report March 2015
Montgomery County Department of Environmental Protection
New Outreach Programs FY14
Innovative Stormwater Management Outreach and Stewardship (POSWP Priority Practice #4)
Caching the Rain
The “Caching the Rain” trail is a scavenger hunt geocaching activity with a stormwater
pollution outreach focus. DEP set up geocaches at six locations primarily in the down county
area near SWM facilities. Participants must answer stormwater related trivia questions at
each station and verify their answers in a survey once they complete the trail. DEP launched
the pilot program on June 28, 2014. Experience geocachers provided initial positive
feedback after a trial run but more complete results will be available for the FY15 Permit
Annual report. Photos of the activity can be found on Figures III.E.20-21.
Storm Drain Art (POSWP Priority Practices #4 and 5)
This project combined innovative outreach with volunteer engagement to raise stormwater
pollution awareness and effect behavior change. In FY14, DEP and Stream Steward
volunteers initiated a storm drain art pilot project with the Rock Creek Conservancy. The
group installed art at three storm drains in front of the Aspen Hill Library on April 22, 2014.
The three projects focused on different aspects of stormwater pollution (Figures III.E.22-25):
“My water is your water” in English and Spanish
Pet Waste
“Drains to Rock Creek”
DEP worked with County Library staff to announce the art project. DEP conducted a public
survey on the project in FY15 with results available in the FY15 Annual report.
Figure III.E.20. Sample Passport Question from the
Aspen Hill Library Bioretention Facility
Figure III.E.21. “Slidin’ Down Sligo
Geocache Site” Focused on Proper
Pet Waste Management
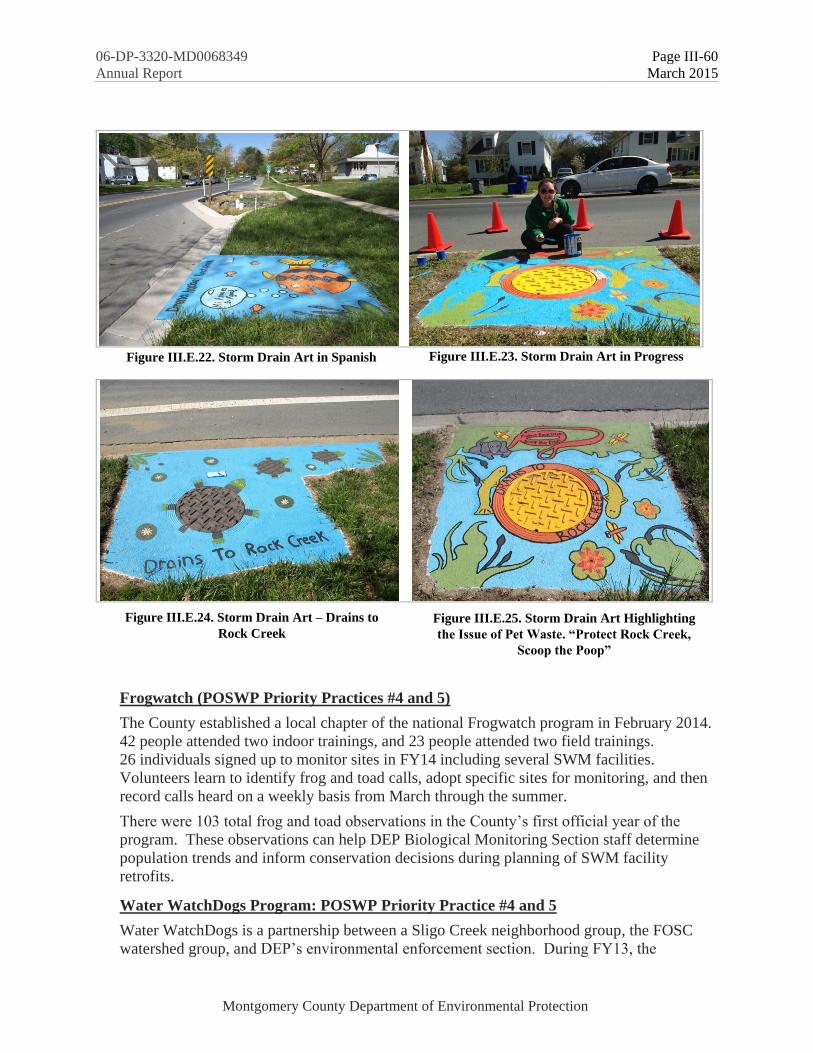
06-DP-3320-MD0068349 Page III-60
Annual Report March 2015
Montgomery County Department of Environmental Protection
Frogwatch (POSWP Priority Practices #4 and 5)
The County established a local chapter of the national Frogwatch program in February 2014.
42 people attended two indoor trainings, and 23 people attended two field trainings.
26 individuals signed up to monitor sites in FY14 including several SWM facilities.
Volunteers learn to identify frog and toad calls, adopt specific sites for monitoring, and then
record calls heard on a weekly basis from March through the summer.
There were 103 total frog and toad observations in the County’s first official year of the
program. These observations can help DEP Biological Monitoring Section staff determine
population trends and inform conservation decisions during planning of SWM facility
retrofits.
Water WatchDogs Program: POSWP Priority Practice #4 and 5
Water WatchDogs is a partnership between a Sligo Creek neighborhood group, the FOSC
watershed group, and DEP’s environmental enforcement section. During FY13, the
Figure III.E.22. Storm Drain Art in Spanish Figure III.E.23. Storm Drain Art in Progress
Figure III.E.24. Storm Drain Art – Drains to
Rock Creek
Figure III.E.25. Storm Drain Art Highlighting
the Issue of Pet Waste. “Protect Rock Creek,
Scoop the Poop”

06-DP-3320-MD0068349 Page III-61
Annual Report March 2015
Montgomery County Department of Environmental Protection
partnership developed an email alert mechanism for reporting water pollution incidents
discovered by the community. FOSC keeps track of the pollution reports that result from the
email alerts, and relays information to the community through their Action Log blogging
system. Three volunteers administer the program, including advertising though community
presentations and trainings. The program is featured on the FOSC website as an Action Log
(which includes a new webpage specific to the program, http://www.fosc.org/AL-
WaterWatchDog.htm). The Montgomery County Civic Federation awarded FOSC the
Community Hero Award. Winners of the award also recognized DEP’s contribution to the
program’s success.
Stormwater Management Maintenance and Inspection Program Outreach
In FY14, the DEP SWM Facility Maintenance and Inspection Program created multiple
publications and hosted several presentations to promote understanding and awareness of the
County’s program. Most fact sheets are two pages and contain information on the importance of
keeping SWM facilities maintained, actions the public can take to keep facilities in proper
working condition and where to go for additional information. The fact sheets specifically
address structural and non structural maintenance for many of the practices. The fact sheets are
available on DEP’s website at http://www.montgomerycountymd.gov/DEP/water/stormwater-
facilities.html.
Also in FY14:
DEP distributed BMP maintenance newsletters to over 600 subscribers. The newsletter
included helpful seasonal tips on SWM facility maintenance.
For stormwater professionals, DEP conducted two trainings for contractors and one training
for DEP’s ESD maintenance contractor. These trainings focused on the procedures and
requirements for performing maintenance on stormwater facilities in Montgomery County.
DEP SWM Facility Maintenance and Inspection Program partnered with the DEP WMD
Outreach group to involve residents in the clean-up of storm water ponds. The residents
received education about the SWM Facility Maintenance and Inspection Program and the
importance of SWM measures throughout the county.
RainScapes Program Outreach
The DEP’s RainScapes program promotes and implements environmentally friendly landscaping
and small scale stormwater control and infiltration projects on residential, institutional, and
commercial properties. DEP developed the multi-strand program, which is designed to provide
information and training to residents and landscape professionals, as well as incentives and
project delivery to County sites. For more information on the incentive programs; RainScapes
Rewards and RainScapes neighborhoods, please see Part III.G.
RainScapes for Schools and the RainScapes for Schools Growing program entered its 5th
year in
FY14. Since inception in FY10, the Growing program has provided native plants, soil, pots and
educational materials to MCPS high school horticulture classes to support instruction on the use
of plants in stormwater management. This program has actively supported and influenced the
direction of the new MCPS Environmental Horticulture Program, which now includes storm
water management as part of their horticulture curriculum. Plants from the program have been
used in community based projects and in RainScapes classes as take home materials. In spring
FY14, nearly 1000 plants were used as replacement plantings in DEP Green Streets projects.

06-DP-3320-MD0068349 Page III-62
Annual Report March 2015
Montgomery County Department of Environmental Protection
RainScapes for Schools projects have included both conservation landscapes and rain gardens for
curriculum support and runoff reduction (Figure III.E26). Some schools have done more than
one project; since 2008, the RainScapes program has supported 15 Montgomery County public
school based projects.
Figure III.E.26. RainScapes for Schools Conservation Landscape Garden Filtering
Water Before it Enters the Storm Drain System at Montgomery Blair High School
In FY14, DEP continued to train local designers and contractors on RainScapes project
requirements and installation, including drainage site assessment, and rain garden design. In
addition, DEP provided training in cooperation with the Landscape Technology Program of
Montgomery College, and at conferences in Maryland, Pennsylvania, West Virginia and
Massachusetts. RainScapes program staff also trained several municipal level staff members and
their non-profit partners charged with starting up similar incentive based programs for their MS4
permits. Materials, including technical information, inspection documents, process details and
formats, lessons learned were shared freely with several Maryland jurisdictions that requested
such collaboration.
In FY14, the DEP RainScapes team provided 40 outreach presentations to community groups,
reaching 1300 outside of the scope of hands-on intensive workshops. The team continued to
provide hands-on workshops focused on RainScapes Rewards Rebate qualified practices. From
2008-2014, these hands on workshops have reached 1680 residents, averaging 240 participants
each year. In addition to presentations and workshops, in FY14, RainScapes developed
RainScapes grant criteria for the new DEP Watershed Outreach Grant program and anticipate
using this mechanism to expand partnership efforts with local watershed and environmental

06-DP-3320-MD0068349 Page III-63
Annual Report March 2015
Montgomery County Department of Environmental Protection
groups to benefit the RainScapes Neighborhoods, RainScapes for Schools and RainScapes
Rewards components of the program.
For FY15 and FY16, DEP is developing customized outreach approaches to communities
defined by a specific focus such as faith based organizations, civic associations, home owner
associations, private pools and the commercial sector. The approaches will include creation and
translation of materials specific to the focused group, including best use of social media and
other modes of information sharing.
FY14 Highlights of RainScapes Outreach include:
Provided outreach and education materials to over 1300 residents, business owners, and
stakeholders at 43 local and regional events as well as staffing the DEP booth at the
Montgomery County Fair.
Offered three workshops on Rain Gardens, Rain Barrels, and Conservation Landscapes to
County residents.
Initiated joint training with DEP Stormwater Facility Maintenance and Inspection Program
with the Montgomery College Landscape Technology Program.
Provided advanced storm water training for Master Gardeners at the state level.
Partnered with the Tower Company and MCPS to create a pollinator and conservation
landscape garden project at a local middle school.
Developed a professionally oriented template on Rain Gardens and published on DEP’s
website. This 66 page illustrated guide provides detailed construction and planting plan
guidance for design and installation of rain gardens in the County.
Conducted a marketing study to inform decisions regarding effective messaging and
outreach strategies.
Accelerated the pace of site assessment, design and installation for RainScapes
Neighborhoods areas in the County, increasing the total number of installed projects on
residential lots using the Neighborhoods approach by a third in 1-year — from 38 to 51.
Presented to regional level conferences and shared RainScapes program materials with four
other counties in Maryland, as well as provided guidance and review of incentive programs.
Application numbers jumped in FY14, suggesting effective outreach efforts. Figure III.E.27
shows the increase in RainScapes Reward Projects over the past 6 years.

06-DP-3320-MD0068349 Page III-64
Annual Report March 2015
Montgomery County Department of Environmental Protection
Figure III.E.27. Number of RainScape Reward Projects Submitted over the Past 6 Years
F. Watershed Assessment As required by the Permit, DEP continues to develop watershed assessments by evaluating
current water quality and identifying and ranking structural, non-structural and programmatic
watershed restoration opportunities for each County watershed. Full watershed assessments
include field investigations, prioritized project (action) inventories with structural and non-
structural project concepts, and cost estimates. Watershed implementation plans include results
from the watershed assessments, and present more detailed implementation planning and
schedules to meet regulatory and programmatic targets.
The Strategy was developed from implementation plans or pre-assessments for each of the
County’s 8-digit watershed groupings. These are shown in Table III.F1. The final version of the
Strategy can be found online at:
http://www.montgomerycountymd.gov/dectmpl.asp?url=/content/dep/water/wris.asp#plans
Implementations plans were developed for those watersheds with existing EPA approved
TMDLs in 2009, and also for watersheds where existing assessments and project inventories had
been previously compiled (Muddy and Watts Branch). These plans identify BMPs, quantify
treatment by those practices, determine the watershed restoration potential, evaluate the ability of
the watersheds to meet applicable TMDLs, and provide schedules and cost estimates. More
information on implementation plan development for EPA approved TMDLs is shown in Part
III. J. Total Maximum Daily Loads.
The status and schedule of watershed restoration planning is shown in Table III.F2. As shown in
Table III.G.10, in Part III.G. Watershed Restoration, DEP budgeted $749,130 in FY11,
$502,244.23in FY12, $879,435 in FY13, and $1,658,518 in FY14 for watershed assessment and
planning.

06-DP-3320-MD0068349 Page III-65
Annual Report March 2015
Montgomery County Department of Environmental Protection
Table III.F1. Montgomery County Watershed Groupings
and Plans Found in the Strategy
Implementation
Plan
Pre-Assessment
Watershed Grouping
Anacostia X
Rock Creek X
Cabin John Creek X
Seneca Creek
Great Seneca (including Clopper Lake) X
Dry Seneca and Little Seneca X
Lower Monocacy X
Upper Potomac Direct (West of Seneca
Creek, not described in any other
grouping)
X
Lower Potomac Direct (East of Seneca Creek, not described in any other grouping)
Muddy Branch and Watts Branch X
All other subwatersheds X
Patuxent (Triadelphia/Brighton Dam and
Rocky Gorge)
X
Table III.F2. Status of Montgomery County Watersheds’ Assessments
8 Digit Watershed Watershed Assessment Status TMDLs
(Issue Date)
Anacostia Anacostia Watershed Restoration
Plan (ARP)(2010)
Strategy WIP (2011)
PCB WIP (2012)
Bacteria (2007)
Sediment (2007)
Nitrogen (2008)
Phosphorous (2008)
Trash (2010)
PCB (2011)
Rock Creek Strategy WIP (2011) Bacteria (2007)
Sediment (2011)
Phosphorous (2013)
Cabin John Creek Strategy WIP (2011) Bacteria (2002)
Sediment (2011)

06-DP-3320-MD0068349 Page III-66
Annual Report March 2015
Montgomery County Department of Environmental Protection
Table III.F2. Status of Montgomery County Watersheds’ Assessments
8 Digit Watershed Watershed Assessment Status TMDLs
(Issue Date)
Seneca Creek Strategy WIP (2011)- Completed
for Great Seneca Subwatershed,
including Clopper Lake
Clopper Lake : Phosphorus and
Sediment (2002)
WIP Completed FY14 Sediment (2009)
Lower Monocacy Updated WIP Completed FY14 Sediment (2009)
Bacteria (2009)
Phosphorus (2013)
Potomac Direct WIP Completed FY14 Sediment (2011)
Patuxent- Rocky
Gorge and Tridelphia
Reservoirs
WIP Complete FY14 Rocky Gorge-Phosphorous (2008)
Tridelphia-Phosphorous (2008)
Tridelphia- Sediment (2008)
Status of Watershed Assessments
In FY14, DEP developed complete watershed implementation plans for two 8 digit watersheds
not fully addressed in the Strategy; the Seneca Creek watershed, and Potomac Direct watershed.
DEP also developed updated WIPs for the Lower Monocacy and Patuxent Watersheds (Rocky
Gorge Reservoir and Tridelphia Reservoir). The WIPs include data review, field assessments,
and project inventories for potential restoration projects. The Lower Monocracy, Seneca, and
Potomac Direct WIPs include timelines and schedules to meet the WLAs of TMDLs approved
subsequent to Strategy development in 2009. Final watershed assessment reports were
completed October 2014. The four new WIPS are included in Appendix I in the CD attachment
to this report. More information on the WIPs, including timelines showing pollutant reductions
to meet the TMDL WLAs can be found in Section J, TMDLs.
Great Seneca and Muddy Branch Watersheds Study
During 2004, the County began the watershed inventories in the Great Seneca and Muddy
Branch watersheds as cooperative efforts with the USACE, the City of Gaithersburg, and
MNCPPC. These areas represent roughly one-third of the total County land area and include
drainage from the densely developed areas of Gaithersburg and Germantown. The study was to
be completed by FY13, but is delayed indefinitely due to limited Federal funding. Projects
identified in the study are included in the new Seneca WIP, and in DEP’s project planning.
Anacostia River Watershed Restoration Plan (ARP) (February 2010)
The final report for the inter-jurisdictional restoration of the Anacostia, Anacostia River
Watershed Restoration Plan and Report, was completed in February 2010
(http://www.anacostia.net/plan.html). Currently, DEP is conducting an ecosystem restoration
feasibility study with the USACE to develop stream restoration design concepts for 9.6 miles of
streams identified in the ARP. After the concepts are developed and the feasibility study is
complete in Fiscal Year 2016, the study recommendations will be submitted for future USACE

06-DP-3320-MD0068349 Page III-67
Annual Report March 2015
Montgomery County Department of Environmental Protection
funding authorization to finalize designs for future construction. These selected projects
contribute towards reducing future WLAs and accounting towards the County impervious area
restoration goal.
Watershed Screening
The DEP Biological Monitoring Group monitors water chemistry, biological community, and
stream habitat conditions at representative stations in all County watersheds on a rotating basis
over a 5-year cycle. The DEP then develops a multi-metric Index of Biological Integrity (IBI) to
develop narrative ratings of biological conditions in the water bodies. A benthic IBI (BIBI) is
calculated using benthic macroinvertebrate (aquatic insects) sampling results. A fish IBI (FIBI)
is calculated using fish sampling results. For the purposes of this report, a combined IBI for
benthic insects and fish is used for second, third and fourth order streams. The combined IBI
score is converted to a percentage such that 100 percent is the highest possible score. For first
order streams the only the BIBI is used. Biological conditions in the water bodies are then
described as excellent, good, fair, and poor, based on distributing the calculated IBI scores by
quartiles; the highest 25 percent scores are 'excellent' while the lowest 25 percent scores are
'poor'.
The County categorizes the monitored subwatersheds as impaired or unimpaired by analyzing
and comparing the BIBIs, FIBIs and habitat condition scores. BIBIs based on benthic insects
(BIBIs) only are used in smaller drainage areas of less than 300 acres. The small streams in
these subwatersheds typically support pioneering fish species only, which, because of their
adaptability to changing habitat and flow conditions, are not reliable indicators for rating
impairments.
In 2013, DEP monitored 30 stations in the Great Seneca watershed for fish and/or benthic
macroinvertebrates. Many of the stations have been monitored every 5 years since 1997-1998
which allows DEP to track cumulative changes in stream conditions.
The Great Seneca subwatershed is the largest of those in the Seneca Creek watershed, which is
the largest of the eight major watersheds in Montgomery County. The Great Seneca
subwatershed represents approximately 72 square miles out of the total 130 square miles of the
Seneca Creek watershed. The headwaters of the subwatershed begin in the Damascus area and
include the Damascus Wastewater Treatment Plant in the Magruder Branch subwatershed. As
Great Seneca flows south, the land becomes increasingly more urban. Drainage is received from
sections of Gaithersburg and Germantown. The land use changes back to low-density residential
and active agricultural near Riffle Ford Road. The impervious cover for the subwatershed is
12 percent.
Figure III.F.1 compares the stream conditions in the Great Seneca subwatershed for 1997-98 and
2013. The Great Seneca subwatershed is composed of three smaller subwatersheds; the Upper ,
Lower and Middle Great Seneca subwatersheds. Lower Great Seneca stream stations were
generally located in more urban areas while Upper Great Seneca stream stations were generally
in low-density residential or agricultural areas. Fourteen stations monitored had a change in
stream condition between 1997-98 and 2013. Seven stations showed improvement, four stations
showed a decline and three were variable between monitoring rounds. More detailed
comparisons of results within the Upper, Middle, and Lowers Great Seneca are presented in
separate sections.

06-DP-3320-MD0068349 Page III-68
Annual Report March 2015
Montgomery County Department of Environmental Protection
Figure III.F.1. Stream Conditions in the Great Seneca Creek Watershed 1997-1998, 2013
Upper Great Seneca
Figure III.F.2 shows stream conditions as a combined fish and aquatic insect IBI unless
otherwise noted. Only results from the selected years are displayed. Stream conditions were
predominantly good for the eight stations sampled in 1997-1998. Conditions remained generally
in the good range for the next four monitoring rounds. Of the eleven stations monitored during
both the 2006 and 2013 rounds, only one showed a change in stream condition (GSGS132) with
a slight increase in IBI score moving it from good to excellent.
Because GSGS132 is a first order stream, only benthic macroinvertebrate sampling results are
considered for IBI comparisons. The land use is low density residential and agricultural. Ratings
have been good since monitoring began in 1997 and 2013 is the first occurrence of excellent.
This increase appears to be related to the reemergence of the stonefly Amphinemura sp. well as
improvement in the diversity of the community. Amphinemura sp., an intolerant shredder,
dominated the 1997 sample (154 individuals). A low was recorded in 2001 (21 individuals). In
2013 numbers rebounded (108 individuals). Specialized feeding groups such as shredders and
scrapers have become more prevalent while increases in sensitive ephemerella, plecoptera, and
trichoptera (EPT) taxa (Mayflies, Stoneflies and Caddisflies) have also contributed to the
diversity in general.
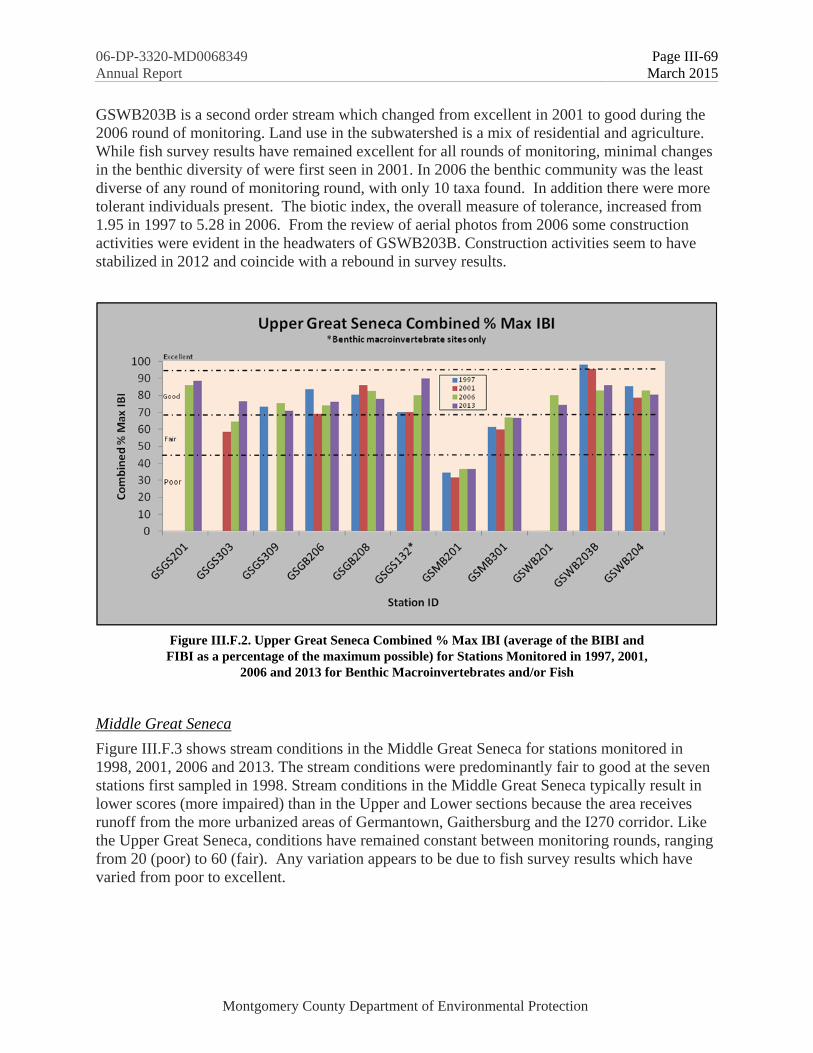
06-DP-3320-MD0068349 Page III-69
Annual Report March 2015
Montgomery County Department of Environmental Protection
GSWB203B is a second order stream which changed from excellent in 2001 to good during the
2006 round of monitoring. Land use in the subwatershed is a mix of residential and agriculture.
While fish survey results have remained excellent for all rounds of monitoring, minimal changes
in the benthic diversity of were first seen in 2001. In 2006 the benthic community was the least
diverse of any round of monitoring round, with only 10 taxa found. In addition there were more
tolerant individuals present. The biotic index, the overall measure of tolerance, increased from
1.95 in 1997 to 5.28 in 2006. From the review of aerial photos from 2006 some construction
activities were evident in the headwaters of GSWB203B. Construction activities seem to have
stabilized in 2012 and coincide with a rebound in survey results.
Figure III.F.2. Upper Great Seneca Combined % Max IBI (average of the BIBI and
FIBI as a percentage of the maximum possible) for Stations Monitored in 1997, 2001,
2006 and 2013 for Benthic Macroinvertebrates and/or Fish
Middle Great Seneca
Figure III.F.3 shows stream conditions in the Middle Great Seneca for stations monitored in
1998, 2001, 2006 and 2013. The stream conditions were predominantly fair to good at the seven
stations first sampled in 1998. Stream conditions in the Middle Great Seneca typically result in
lower scores (more impaired) than in the Upper and Lower sections because the area receives
runoff from the more urbanized areas of Germantown, Gaithersburg and the I270 corridor. Like
the Upper Great Seneca, conditions have remained constant between monitoring rounds, ranging
from 20 (poor) to 60 (fair). Any variation appears to be due to fish survey results which have
varied from poor to excellent.
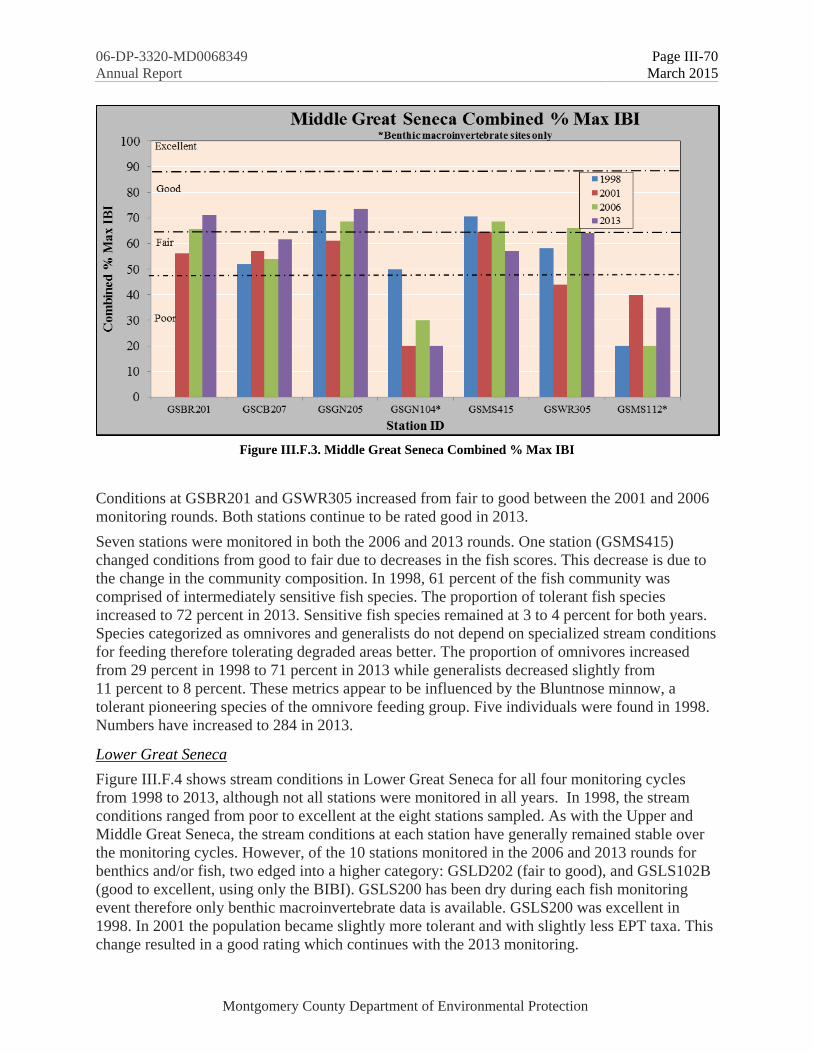
06-DP-3320-MD0068349 Page III-70
Annual Report March 2015
Montgomery County Department of Environmental Protection
Figure III.F.3. Middle Great Seneca Combined % Max IBI
Conditions at GSBR201 and GSWR305 increased from fair to good between the 2001 and 2006
monitoring rounds. Both stations continue to be rated good in 2013.
Seven stations were monitored in both the 2006 and 2013 rounds. One station (GSMS415)
changed conditions from good to fair due to decreases in the fish scores. This decrease is due to
the change in the community composition. In 1998, 61 percent of the fish community was
comprised of intermediately sensitive fish species. The proportion of tolerant fish species
increased to 72 percent in 2013. Sensitive fish species remained at 3 to 4 percent for both years.
Species categorized as omnivores and generalists do not depend on specialized stream conditions
for feeding therefore tolerating degraded areas better. The proportion of omnivores increased
from 29 percent in 1998 to 71 percent in 2013 while generalists decreased slightly from
11 percent to 8 percent. These metrics appear to be influenced by the Bluntnose minnow, a
tolerant pioneering species of the omnivore feeding group. Five individuals were found in 1998.
Numbers have increased to 284 in 2013.
Lower Great Seneca
Figure III.F.4 shows stream conditions in Lower Great Seneca for all four monitoring cycles
from 1998 to 2013, although not all stations were monitored in all years. In 1998, the stream
conditions ranged from poor to excellent at the eight stations sampled. As with the Upper and
Middle Great Seneca, the stream conditions at each station have generally remained stable over
the monitoring cycles. However, of the 10 stations monitored in the 2006 and 2013 rounds for
benthics and/or fish, two edged into a higher category: GSLD202 (fair to good), and GSLS102B
(good to excellent, using only the BIBI). GSLS200 has been dry during each fish monitoring
event therefore only benthic macroinvertebrate data is available. GSLS200 was excellent in
1998. In 2001 the population became slightly more tolerant and with slightly less EPT taxa. This
change resulted in a good rating which continues with the 2013 monitoring.

06-DP-3320-MD0068349 Page III-71
Annual Report March 2015
Montgomery County Department of Environmental Protection
Figure III.F.4. Lower Great Seneca Combined % Max IBI
Based on aerial photos, the drainage area of GSLD202 appears to have undergone little change
since monitoring began in 1998. Stream conditions have been consistently rated fair prior to
2013. The increase to a good rating is due to the improvement of the benthic IBI. Between 2006
and 2013, the BIBI score increased 83 percent impart to the presence of more scraper taxa. An
increase in the proportion of scrapers may indicate limited easing of stressors to the stream. The
slight increase in BIBI scores which occurred at GSLS102B was due to more EPT (pollutant
sensitive) taxa and more taxa in general found in the 2013 sample. The upper reaches of the
GSLS102B drainage area does appear to have gone through some limited construction activities
since monitoring began here in 2001 perhaps reflected in the decrease in conditions during 2006
with an apparent rebound in 2013.
Conclusions
Great Seneca
The results for the Great Seneca watershed have remained fairly consistent for the 1998, 2001,
2006, and 2013 monitoring cycles. Fourteen (14) stations (48 percent) had the same category
designation in 2013 as they had in 1997/1998. Eight stations (28 percent) were not monitored in
the 1997/8 and/or 2013, three stations improved categories and four stations decreased
categories.

06-DP-3320-MD0068349 Page III-72
Annual Report March 2015
Montgomery County Department of Environmental Protection
Figure III.F.5. Percentage of Combined % Maximum IBI for
each Category in the Great Seneca Watershed
Figure III.F.5 displays the percentage of stations categorized as poor, fair, good and excellent.
The Great Seneca watershed is predominantly rated good or excellent. The stations with lower
ratings are located closer to more urban areas with older stormwater management. Unlike in the
Rock Creek watershed, there are no restoration projects completed within this Permit cycle.
However, average BIBI scores are used with other parameters to prioritize less healthy
watersheds for improvements.
New BMP Assessment Screening/Prioritization
Right-of-Way BMP Assessment Screening/Prioritization
Urban Reforestation Site Assessment Screening/Prioritization
Stream Corridor Assessment Screening/Prioritization
Overview from 2010-2013
From 2010 through 2013, 117 baseline stations and 20 SPA stations have been monitored to
provide assessment of water quality as required under Part III. F of the County’s MS4 permit.
For a summary of monitoring information and results for 2010-2013 see Table III.F.3. When
compared to the earlier results, 36 sites had an increase in rating category, 21 had a decrease
while 72 did not change categories in this monitoring cycle (2010-2013). Six stations had
incomplete data sets for the current monitoring period, generally fishing results. Fishing surveys
did not occur at LPAT201, LPRG202, PBPB302, LRLR425, GSLS203 and GSLS430 for
reasons ranging from staffing limitations to the site being unfishable. Results have
predominantly remained unchanged or increased slightly since the first monitoring cycle. Sligo
Creek has been the focus of restoration since the mid 1980s however substantial change in IBI
scores have yet to be realized. All Sligo Creek sites with long term monitoring have remained in
the poor category. However restorations efforts in Lower Rock Creek, specifically Joseph's
Branch, have seen slight improvements in the biology. Restoration efforts have affected fish
habitat the most. Fish results have increased at a faster rate than the benthic macroinvertebrate
communities. The urbanized location may limit noticeable improvements to the benthos.

06-DP-3320-MD0068349 Page III-73
Annual Report March 2015
Montgomery County Department of Environmental Protection
Table III.F3. Summary of 2010-2013 Monitoring Results
Watershed Total #
of
Stations
Monitoring
Year
Total #
of Poor
Ratings
Total #
of Fair
Ratings
Total #
of Good
Ratings
Total # of
Excellent
Ratings
No
Rating*
Hawlings 8 2010 0 0 7 1 0
Horsepen 4 2010 0 1 3 0 0
Little Monocacy 3 2010 0 0 1 2 0
Patuxent 16 2010 0 1 6 6 3
Rock Run 2 2010 1 1 0 0 0
Little Paint Branch 6 2011 1 3 2 0 0
Northwest Branch 18 2011 2 11 5 0 0
Paint Branch 17 2011 0 8 8 0 1
Silgo Creek 6 2011 5 1 0 0 0
Rock Creek 28 2012 4 7 11 5 1
Great Seneca 29 2013 5 4 15 4 1
Total 137 ----- 18 37 58 18 6
*At the following stations fish surveys did not occur: LPRG203, LPRG202, LPAT201, LRLR425 and PBPB302, GSLS430
G. Watershed Restoration The Permit requires the County to implement restoration practices identified through watershed
assessments to control twenty percent of the County’s impervious area not already controlled to
the MEP. The Strategy provides the planning basis to meet the Permit’s restoration goal. DEP
developed the Strategy using 2009 data, including impervious area and BMP drainage areas.
DEP notes that the Strategy was developed prior to MDE guidance for accounting for stormwater
wasteload allocations and impervious acres treated. Figure III.G.1, below, shows the County
impervious area subject to the Permit (2009).
The DEP is implementing watershed restoration projects to add stormwater management,
improve water quality and minimize physical impacts to streams from uncontrolled urban runoff.
Projects are completed primarily through DEP’s Watershed Restoration program, funded through
the County’s CIP program and include construction of SWM pond retrofits, new stormwater
ponds, ESD practices and stream restoration. DEP is continually assessing emerging stormwater
control guidance and improving County data critical to watershed planning to ensure that the
most beneficial, and cost effective projects are selected for implementation.
Several developments over the Permit term now allow more accurate impervious area control
accounting. DEP updated the County impervious area GIS layer, and the urban BMP database,
adding over 1,000 new BMPs. DEP made progress digitizing and refining the BMP’s drainage

06-DP-3320-MD0068349 Page III-74
Annual Report March 2015
Montgomery County Department of Environmental Protection
areas. MDE also published “Accounting for Stormwater Wasteload Allocations and Impervious
Acres Treated” (MDE Guidance Document) in August 2014. DEP is currently using the new
information to re-analyze the Permit baseline of uncontrolled impervious area, the impervious
area controlled to the MEP in 2009, and the control achieved through implementation of
restoration projects during the Permit term. DEP expects that re-analysis will show a reduced
number of uncontrolled impervious acres in 2009. Since the Permit requires the County to
restore 20% of its uncontrolled impervious, the County’s impervious restoration goal is also
expected to reduce.
Because DEP’s annual MS4 Permit reports are based on fiscal year, this report only covers the
County’s progress towards meeting its Permit requirements through June 30, 2014 (FY14). DEP
will submit a final Watershed Restoration report for this Permit cycle which will include County
progress up to the end of the Permit term (February 16, 2015). The final Watershed Restoration
report will present the results of DEP’s comprehensive re-analysis of County controlled and
uncontrolled impervious area, and area treated by restoration projects.
Figure III.G.1. County Area Subject to the MS4 Permit

06-DP-3320-MD0068349 Page III-75
Annual Report March 2015
Montgomery County Department of Environmental Protection
Table III.G.1, below, summarizes County controlled and uncontrolled impervious area.
Table III.G.1. County Impervious Area Summary
Description Area in Acres
Total County Area 324,552
Total Impervious Area 35,965
Total County Area Subject to MS4 Permit (1) 138,649
Total County Impervious Area Subject to MS4 Permit 25,119
County MS4 Impervious Area with MEP Stormwater
Management in 2009
5,239
Under or Uncontrolled Impervious Area Subject to MS4 Permit 19,880
20% Restoration Goal 3,976
1. Exclusions include: Certain zoning codes, parklands, forests, municipalities with own stormwater management
programs, state and federal properties, and state and federal maintained roads
Progress Towards Meeting the Permit Impervious Restoration Goal
Since 2009, and through FY14, the County has:
Implemented 651 projects restoring 646 impervious acres (Table III.G.3)
Discovered from updated SWM BMP data that stormwater controls were added to an
additional 143 impervious acres since 2009. Documentation for these BMPs will be
provided in the final Watershed Restoration report.
Partnered with other County and external agencies to complete projects which added
stormwater controls to 241 impervious acres in the County’s MS4 area. These projects
include facility modification and modernizations performed by DOT, DGS, and MCPS, and
WSSC’s stream restoration activities during their asset modernization. They also include the
Maryland State Highway Administration’s (SHA’s) Inter County Connector (ICC)
mitigation partnership projects.
Released Task Orders to DEP’s water resources engineering consultants that facilitate the
design of watershed restoration projects that will control an additional 2,386 impervious
acres.
County progress towards meeting the 20 percent impervious restoration goal is shown in
Table III.G.2, below. At the end of FY14, the County will achieve stormwater control for 3,766
impervious acres through restoration projects that are completed, under construction or in design.
The remaining 210 acres will be controlled through partnership projects currently in design or
under construction. More detail about these future partnership projects will be provided in the
final Watershed Restoration report.
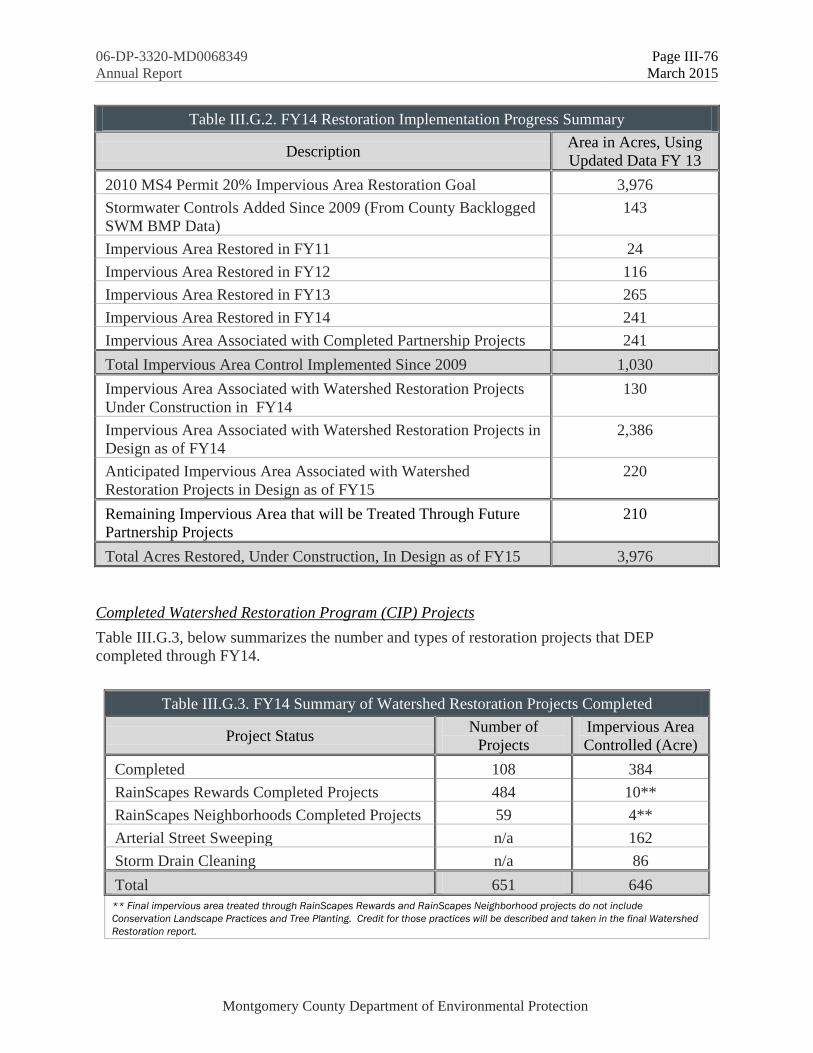
06-DP-3320-MD0068349 Page III-76
Annual Report March 2015
Montgomery County Department of Environmental Protection
Table III.G.2. FY14 Restoration Implementation Progress Summary
Description Area in Acres, Using
Updated Data FY 13
2010 MS4 Permit 20% Impervious Area Restoration Goal 3,976
Stormwater Controls Added Since 2009 (From County Backlogged
SWM BMP Data)
143
Impervious Area Restored in FY11 24
Impervious Area Restored in FY12 116
Impervious Area Restored in FY13 265
Impervious Area Restored in FY14 241
Impervious Area Associated with Completed Partnership Projects 241
Total Impervious Area Control Implemented Since 2009 1,030
Impervious Area Associated with Watershed Restoration Projects
Under Construction in FY14
130
Impervious Area Associated with Watershed Restoration Projects in
Design as of FY14
2,386
Anticipated Impervious Area Associated with Watershed
Restoration Projects in Design as of FY15
220
Remaining Impervious Area that will be Treated Through Future
Partnership Projects
210
Total Acres Restored, Under Construction, In Design as of FY15 3,976
Completed Watershed Restoration Program (CIP) Projects
Table III.G.3, below summarizes the number and types of restoration projects that DEP
completed through FY14.
Table III.G.3. FY14 Summary of Watershed Restoration Projects Completed
Project Status Number of
Projects
Impervious Area
Controlled (Acre)
Completed 108 384
RainScapes Rewards Completed Projects 484 10**
RainScapes Neighborhoods Completed Projects 59 4**
Arterial Street Sweeping n/a 162
Storm Drain Cleaning n/a 86
Total 651 646
** Final impervious area treated through RainScapes Rewards and RainScapes Neighborhood projects do not include
Conservation Landscape Practices and Tree Planting. Credit for those practices will be described and taken in the final Watershed
Restoration report.

06-DP-3320-MD0068349 Page III-77
Annual Report March 2015
Montgomery County Department of Environmental Protection
Table III.G.4 provides detail on County projects completed through FY14.
Table III.G.4. Summary of Watershed Restoration Projects Completed Through FY14
Watershed and Project
Total
Drainage
Area
(Acre)
Impervious Area
Controlled
(Acre)
Anacostia River 111.65 181.13
Low Impact Development (LID) Project Total: 77.59 29.40
Arcola Avenue Green Streets - LID37 - SWM#3 0.13 0.05
Arcola Avenue Green Streets - LID38 - SWM#4A 0.28 0.10
Arcola Avenue Green Streets - LID39 - SWM#4B 0.28 0.10
Arcola Avenue Green Streets - LID40 - SWM#5 0.68 0.22
Arcola Avenue Green Streets - LID41 - SWM#6A 0.79 0.14
Arcola Avenue Green Streets - LID42 - SWM#6B 0.79 0.14
Arcola Avenue Green Streets - LID43 - SWM#7 0.29 0.11
Arcola Avenue Green Streets - LID44 - SWM#8 0.23 0.10
Arcola Avenue Green Streets - LID45 - SWM#9A 0.20 0.40
Arcola Avenue Green Streets - LID46 - SWM#9B 0.40 0.40
Arcola Avenue Green Streets - LID47 - SWM#9C 0.40 0.40
Arcola Avenue Green Streets - LID48 - SWM#6C 0.79 0.14
Dennis Avenue Green Streets - Phase 1 - LID53 - SWM#3 0.35 0.10
Dennis Avenue Green Streets - Phase 1 - LID59 - SWM#8 0.10 0.09
Dennis Avenue Green Streets - Phase 1 - LID61 - SWM#9A 0.10 0.07
Dennis Avenue Green Streets - Phase 1 - LID65 - SWM#15 0.17 0.11
Dennis Avenue Green Streets - Phase 1 - LID68 - SWM#17 2.69 0.72
Dennis Avenue Green Streets - Phase 1 - LID69 - SWM#19 0.09 0.06
Dennis Avenue Green Streets - Phase 1 - LID70 - SWM#20 0.08 0.06
Dennis Avenue Green Streets - Phase 1 - LID75 - SWM#33 0.20 0.07
Dennis Avenue Green Streets - Phase 1A-1B, 2A-2B 36.10 10.35
Dennis Avenue Green Streets - Phase 2b - LID - SWM#11 5.10 0.00
Dennis Avenue Green Streets - Phase 2B - LID54 -SWM#3A 0.10 0.09
Dennis Avenue Green Streets - Phase 3A-B, 4 0.00 9.05
Forest Estates Right of Way LID - LID13 - BMP#1 1.04 0.22
Forest Estates Right of Way LID - LID14 - BMP#3 0.55 0.15
Forest Estates Right of Way LID - LID15 - BMP#6 0.31 0.12
Forest Estates Right of Way LID - LID16 - BMP#7 0.09 0.06
Forest Estates Right of Way LID - LID17 - BMP#8 1.09 0.27
Forest Estates Right of Way LID - LID18 - BMP#9 0.75 0.23
Forest Estates Right of Way LID - LID19 - BMP#10 0.38 0.12

06-DP-3320-MD0068349 Page III-78
Annual Report March 2015
Montgomery County Department of Environmental Protection
Table III.G.4. Summary of Watershed Restoration Projects Completed Through FY14
Watershed and Project
Total
Drainage
Area
(Acre)
Impervious Area
Controlled
(Acre)
Forest Estates Right of Way LID - LID20 - BMP#12 0.13 0.13
Forest Estates Right of Way LID - LID21 - BMP#13 0.80 0.32
Forest Estates Right of Way LID - LID22 - BMP#18 1.91 0.56
Forest Estates Right of Way LID - LID23 - BMP#21 0.34 0.15
Forest Estates Right of Way LID - LID24 - BMP#22 0.56 0.28
Forest Estates Right of Way LID - LID25 - BMP#23 0.46 0.21
Forest Estates Right of Way LID - LID26 - BMP#25 2.32 0.48
Forest Estates Right of Way LID - LID27 - BMP#26 0.78 0.26
Forest Estates Right of Way LID - LID28 - BMP#27 0.83 0.42
Forest Estates Right of Way LID - LID29 - BMP#41 0.44 0.19
Forest Estates Right of Way LID - LID30 - BMP#28 0.15 0.07
Forest Estates Right of Way LID - LID31 - BMP#30 0.21 0.11
Forest Estates Right of Way LID - LID32 - BMP#35 0.39 0.20
Forest Estates Right of Way LID - LID33 - BMP#36 0.23 0.11
Forest Estates Right of Way LID - LID34 - BMP#37 0.30 0.14
Forest Estates Right of Way LID - LID35 - BMP#43 0.28 0.15
Forest Estates Right of Way LID - LID36 - BMP#44 0.22 0.11
White Oak LID (Lockwood Drive and Stewart Lane) 12.69 1.27
Pavement Removal Total: 0.09 0.06
Arcola Avenue Green Streets - LID - SWM#6B Pavement
Removal 0.01 0.01
Arcola Avenue Green Streets - LID - SWM#6C Pavement
Removal 0.01 0.01
Arcola Avenue Green Streets - LID - SWM#9C Pavement
Removal 0.02 0.01
Arcola Avenue Green Streets - LID38 - SWM#4A Pavement
Removal 0.01 0.01
Arcola Avenue Green Streets - LID39 - SWM#4B Pavement
Removal 0.01 0.01
Arcola Avenue Green Streets - LID40 - SWM#5 Pavement
Removal 0.01 0.01
Arcola Avenue Green Streets - LID41 - SWM#6A Pavement
Removal 0.00 0.00
Arcola Avenue Green Streets - LID43 - SWM#7 Pavement
Removal 0.01 0.01
Arcola Avenue Green Streets - LID44 - SWM#8 Pavement
Removal 0.01 0.01

06-DP-3320-MD0068349 Page III-79
Annual Report March 2015
Montgomery County Department of Environmental Protection
Table III.G.4. Summary of Watershed Restoration Projects Completed Through FY14
Watershed and Project
Total
Drainage
Area
(Acre)
Impervious Area
Controlled
(Acre)
Stream Restoration Total: 0.00 136.12
Batchellors Run East Stream Restoration 0.00 19.01
Batchellors Run II Stream Restoration 0.00 25.87
Bryants Nursery Run Stream Restoration 0.00 17.42
Sherwood Forest I Stream Restoration 0.00 29.04
Upper Northwest Branch Stream Restoration 0.00 21.65
Woodlawn Stream Restoration 0.00 23.13
Stream Restoration Complete by DOT Total: 0.00 4.65
Road Culvert Stabilization - 821 McCeney Avenue (McCeney at
Harper) 0.00 0.40
Road Culvert Stabilization - Burnt Mills Avenue at Hoyle Avenue 0.00 0.75
Stream Bank Stabilization through Gabion Walls - Woodman Ave
Median 0.00 0.00
Stream Restoration - Bucknell Drive Median Stream Channel 0.00 3.50
Stream Restoration through Gabion Walls - 9512 Columbia Blvd 0.00 0.00
Stormwater Outfall Stabilization Complete by DOT Total: 0.00 0.00
Outfall Stabilization - 13717 Mills Avenue 0.00 0.00
Outfall Stabilization - 1517 Menlee Drive 0.00 0.00
Outfall Stabilization - 611 Lamberton Drive 0.00 0.00
Outfall Stabilization - Wayne Avenue at Sligo Creek Parkway 0.00 0.00
Stormwater Pond Retrofit Total: 75.17 10.91
Fairland Ridge Dry PD 53.45 7.36
Peachwood I 21.72 3.54
Cabin John Creek 0.00 49.71
Stream Restoration Total: 0.00 48.46
Lower Booze Creek 0.00 48.46
Stream Restoration Complete by DOT Total: 0.00 1.25
Stream Restoration - 9014 Marseille Drive 0.00 1.25
Stormwater Outfall Stabilization Complete by DOT Total: 0.00 0.00
Outfall Stabilization - 7208 Helmsdale Road 0.00 0.00
Potomac Direct 116.40 11.48
Low Impact Development (LID) Project Total: 1.25 0.67
Cold Spring Elementary School 1.25 0.67
Stream Restoration Total: 0.00 10.56
Little Falls - Somerset 0.00 5.28

06-DP-3320-MD0068349 Page III-80
Annual Report March 2015
Montgomery County Department of Environmental Protection
Table III.G.4. Summary of Watershed Restoration Projects Completed Through FY14
Watershed and Project
Total
Drainage
Area
(Acre)
Impervious Area
Controlled
(Acre)
Little Falls III 0.00 5.28
Stream Restoration Complete by DOT Total: 0.00 0.25
Road Culvert Stabilization - Circle Drive at Spring Drive 0.00 0.25
Rock Creek 218.18 138.26
Low Impact Development (LID) Project Total: 2.86 1.26
Aspen Hill Library BMP-103 2.04 0.47
Aspen Hill Library BMP-104 0.32 0.12
Kensington Park Library BMP-201 0.41 0.22
Kensington Park Library BMP-203 0.09 0.06
Kensington Park Library BMP-204 0.00 0.07
Kensington Park Library BMP-205 0.00 0.32
Pavement Removal Total: 0.02 0.02
Aspen Hill Library BMP-104 - Pavement Removal 0.01 0.01
Kensington Park Library - Pavement Removal 0.01 0.01
Stormwater Outfall Stabilization Complete by DOT Total: 0.00 11.06
Joseph's Branch Phase 3B Spruell Drive 0.00 10.06
Stream Outfall Restoration - 4305 Havard Street 0.00 1.00
Stormwater Pond Retrofit Total: 9.74 15.68
Silver Spring Ride-on/Brookville Bus Depot 9.74 6.60
Georgian Colonies (Condominium Associates #1-4) 0.00 4.08
Georgian Woods Colonies (Georgian Colonies Condo Assoc. #5) 0.00 5.00
New Stormwater Pond 215.30 110.24
NIH Pond 215.30 110.24
Rocky Gorge Dam 0.00 0.00
Stormwater Outfall Stabilization Complete by DOT Total: 0.00 0.00
Outfall Stabilization - 1012 Parrs Ridge 0.00 0.00
Seneca Creek 3.11 3.64
Low Impact Development (LID) Project Total: 3.11 1.79
Ridgeview Middle School LID Retrofits - LID77 - BMP #101 1.08 0.77
Ridgeview Middle School LID Retrofits - LID77 - BMP #105 0.61 0.19
Ridgeview Middle School LID Retrofits - LID78 - BMP #102 0.49 0.33
Ridgeview Middle School LID Retrofits - LID78 - BMP #104 0.60 0.32
Ridgeview Middle School LID Retrofits - LID79 - BMP #103 0.33 0.18
Stream Restoration Complete by DOT Total: 0.00 1.85
Road Culvert Replacement - Davis Mill Road at Wildcat Road 0.00 1.00

06-DP-3320-MD0068349 Page III-81
Annual Report March 2015
Montgomery County Department of Environmental Protection
Table III.G.4. Summary of Watershed Restoration Projects Completed Through FY14
Watershed and Project
Total
Drainage
Area
(Acre)
Impervious Area
Controlled
(Acre)
Culvert
Road Culvert Replacement - Prathertown Road Culverts 0.00 0.35
Stream Restoration - 9412 Emory Grove Road 0.00 0.50
Stormwater Outfall Stabilization Complete by DOT Total: 0.00 0.00
Outfall Stabilization - Wightman Road at Aspenwood Culverts 0.00 0.00
Grand Total 449.34 384.22
Note: Impervious Acre controlled for Stream Restoration based on MDE Guidance, June 2011.
Watershed Restoration Projects (CIP) Under Construction
Projects under construction through DEP’s Watershed Restoration (CIP) program in FY14 will
treat another 129.80 acres of uncontrolled impervious area, and are presented in Table III.G.5,
below.
Table III.G.5. Summary of Watershed Restoration Projects Under Construction in FY14
Watershed and Project
Total
Drainage
Area (Acre)
Impervious Area
Controlled
(Acre)
Anacostia River 93.64
Low Impact Development (LID) Project Under Construction
Total:
18.50
Sligo Park Hills - DOT Partnership TBD 18.50
Stream Restoration Under Construction Total: 44.70
Hollywood Branch 3 44.70
Stormwater Pond Retrofit Under Construction Total: 30.44
Montgomery Auto Sales Park Regional 180.99 21.50
Naples Manor Dry Pond 57.85 8.94
Potomac Direct 13.10
Stormwater Pond Retrofit Under Construction Total: 13.10
Fallsberry SWM Pond 55.80 13.10
Rock Creek 23.06
Low Impact Development (LID) Project Under Construction: 3.42
Donnybrook Drive 2.30 3.42
Stream Restoration Under Construction: 19.64
Lower Donnybrook 19.64
Grand Total 129.80
*The proposed impervious drainage area is an estimate and does not reflect the final project computations
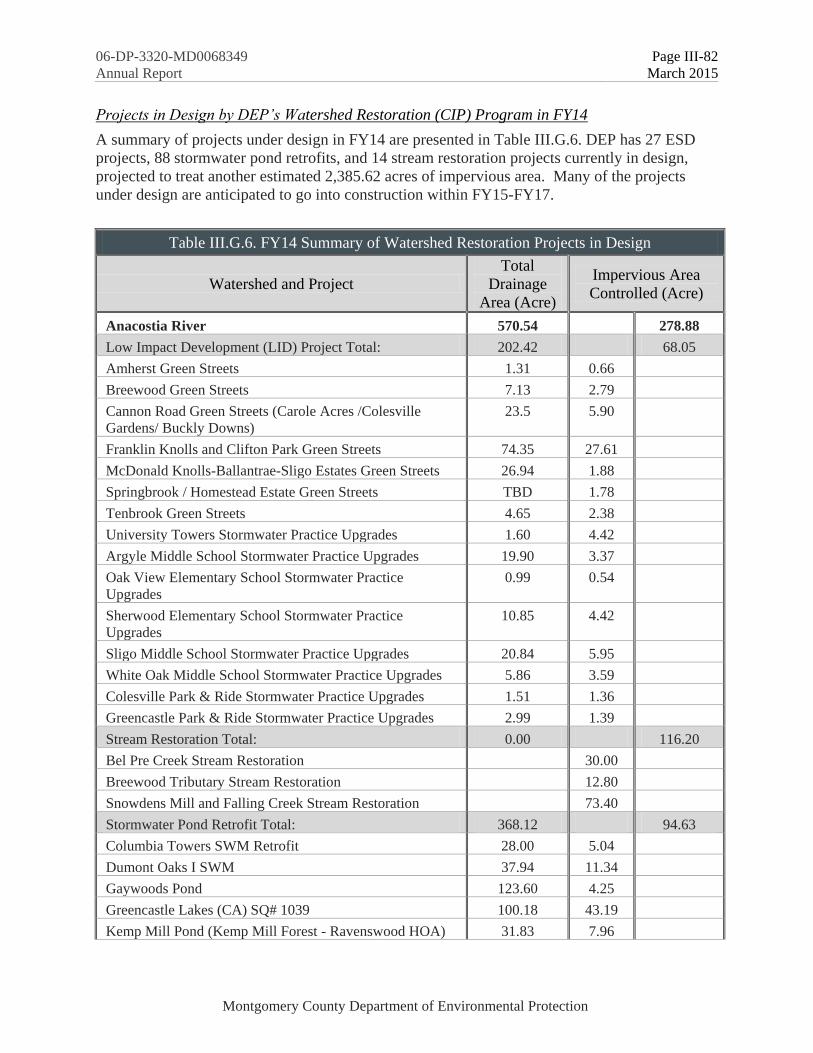
06-DP-3320-MD0068349 Page III-82
Annual Report March 2015
Montgomery County Department of Environmental Protection
Projects in Design by DEP’s Watershed Restoration (CIP) Program in FY14
A summary of projects under design in FY14 are presented in Table III.G.6. DEP has 27 ESD
projects, 88 stormwater pond retrofits, and 14 stream restoration projects currently in design,
projected to treat another estimated 2,385.62 acres of impervious area. Many of the projects
under design are anticipated to go into construction within FY15-FY17.
Table III.G.6. FY14 Summary of Watershed Restoration Projects in Design
Watershed and Project
Total
Drainage
Area (Acre)
Impervious Area
Controlled (Acre)
Anacostia River 570.54 278.88
Low Impact Development (LID) Project Total: 202.42 68.05
Amherst Green Streets 1.31 0.66
Breewood Green Streets 7.13 2.79
Cannon Road Green Streets (Carole Acres /Colesville
Gardens/ Buckly Downs)
23.5 5.90
Franklin Knolls and Clifton Park Green Streets 74.35 27.61
McDonald Knolls-Ballantrae-Sligo Estates Green Streets 26.94 1.88
Springbrook / Homestead Estate Green Streets TBD 1.78
Tenbrook Green Streets 4.65 2.38
University Towers Stormwater Practice Upgrades 1.60 4.42
Argyle Middle School Stormwater Practice Upgrades 19.90 3.37
Oak View Elementary School Stormwater Practice
Upgrades
0.99 0.54
Sherwood Elementary School Stormwater Practice
Upgrades
10.85 4.42
Sligo Middle School Stormwater Practice Upgrades 20.84 5.95
White Oak Middle School Stormwater Practice Upgrades 5.86 3.59
Colesville Park & Ride Stormwater Practice Upgrades 1.51 1.36
Greencastle Park & Ride Stormwater Practice Upgrades 2.99 1.39
Stream Restoration Total: 0.00 116.20
Bel Pre Creek Stream Restoration 30.00
Breewood Tributary Stream Restoration 12.80
Snowdens Mill and Falling Creek Stream Restoration 73.40
Stormwater Pond Retrofit Total: 368.12 94.63
Columbia Towers SWM Retrofit 28.00 5.04
Dumont Oaks I SWM 37.94 11.34
Gaywoods Pond 123.60 4.25
Greencastle Lakes (CA) SQ# 1039 100.18 43.19
Kemp Mill Pond (Kemp Mill Forest - Ravenswood HOA) 31.83 7.96

06-DP-3320-MD0068349 Page III-83
Annual Report March 2015
Montgomery County Department of Environmental Protection
Table III.G.6. FY14 Summary of Watershed Restoration Projects in Design
Watershed and Project
Total
Drainage
Area (Acre)
Impervious Area
Controlled (Acre)
Kemp Mill Urban Park Stormwater Pond Retrofit 0.00 2.00
Longmeade Crossing Pond 14.34 9.70
Bel Pre Manor Stormwater Pond Retrofit
(NW-U-01-S-130)
18.50 5.46
Stonehedge Condo SWM Retrofit 13.73 5.69
Cabin John Creek 137.02 54.76
Low Impact Development (LID) Project Total: 10.39 2.65
Potomac Community Recreation Center Stormwater
Practice Upgrades
10.39 2.65
Stream Restoration Total: 0.00 18.00
Old Farm Creek Stream Restoration 0.00 18.00
Stormwater Pond Retrofit Total: 126.63 34.11
Fox Hills of Potomac 15.20 4.35
Fox Hills of Potomac (Normandy Falls HOA) SQ#314 5.39 2.25
Pine Knolls 81.04 18.10
Washington Science Center 25.00 9.41
Potomac Direct 1,055.91 376.68
Low Impact Development (LID) Project Total: 1.85 1.97
Little Falls Library Stormwater Practice Upgrades 1.85 1.970
Stream Restoration Total: 0.00 125.80
Glenstone Stream Restoration 0.00 80.00
Fallsreach Stormwater Pond Upgrades and Stream
Restoration
0.00 15.85
Flints Grove Stormwater Pond Upgrades and Rich Branch
Stream Restoration
0.00 15.00
Kilgour Branch Stormwater Pond Upgrades and Stream
Restoration
0.00 14.95
Stormwater Pond Retrofit Total: 1,054.06 248.91
Bedfordshire SWM 144.20 47.60
Clagett Farm - Glynshire Way 50.80 15.60
Clagett Farm - Ridge Mist Terrace 27.50 7.20
Fallsreach SWM Pond 135.70 29.30
Flints Grove HOA Dufief 82.18 11.40
Mills Farm 56.11 14.50
Potomac Chase 131.49 34.60
Potomac Chase (Fox Hills North CA) - SQ#389 52.59 19.80
Potomac Ridge (HOA) SQ#148 60.40 18.51
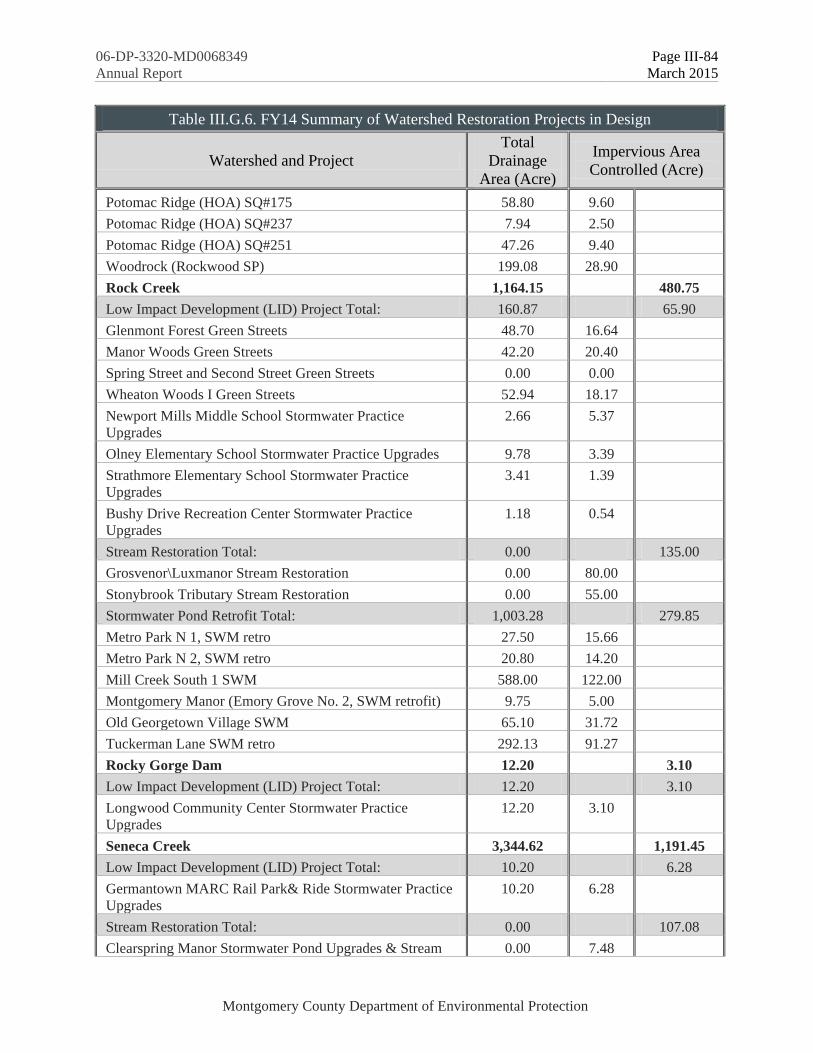
06-DP-3320-MD0068349 Page III-84
Annual Report March 2015
Montgomery County Department of Environmental Protection
Table III.G.6. FY14 Summary of Watershed Restoration Projects in Design
Watershed and Project
Total
Drainage
Area (Acre)
Impervious Area
Controlled (Acre)
Potomac Ridge (HOA) SQ#175 58.80 9.60
Potomac Ridge (HOA) SQ#237 7.94 2.50
Potomac Ridge (HOA) SQ#251 47.26 9.40
Woodrock (Rockwood SP) 199.08 28.90
Rock Creek 1,164.15 480.75
Low Impact Development (LID) Project Total: 160.87 65.90
Glenmont Forest Green Streets 48.70 16.64
Manor Woods Green Streets 42.20 20.40
Spring Street and Second Street Green Streets 0.00 0.00
Wheaton Woods I Green Streets 52.94 18.17
Newport Mills Middle School Stormwater Practice
Upgrades
2.66 5.37
Olney Elementary School Stormwater Practice Upgrades 9.78 3.39
Strathmore Elementary School Stormwater Practice
Upgrades
3.41 1.39
Bushy Drive Recreation Center Stormwater Practice
Upgrades
1.18 0.54
Stream Restoration Total: 0.00 135.00
Grosvenor\Luxmanor Stream Restoration 0.00 80.00
Stonybrook Tributary Stream Restoration 0.00 55.00
Stormwater Pond Retrofit Total: 1,003.28 279.85
Metro Park N 1, SWM retro 27.50 15.66
Metro Park N 2, SWM retro 20.80 14.20
Mill Creek South 1 SWM 588.00 122.00
Montgomery Manor (Emory Grove No. 2, SWM retrofit) 9.75 5.00
Old Georgetown Village SWM 65.10 31.72
Tuckerman Lane SWM retro 292.13 91.27
Rocky Gorge Dam 12.20 3.10
Low Impact Development (LID) Project Total: 12.20 3.10
Longwood Community Center Stormwater Practice
Upgrades
12.20 3.10
Seneca Creek 3,344.62 1,191.45
Low Impact Development (LID) Project Total: 10.20 6.28
Germantown MARC Rail Park& Ride Stormwater Practice
Upgrades
10.20 6.28
Stream Restoration Total: 0.00 107.08
Clearspring Manor Stormwater Pond Upgrades & Stream 0.00 7.48

06-DP-3320-MD0068349 Page III-85
Annual Report March 2015
Montgomery County Department of Environmental Protection
Table III.G.6. FY14 Summary of Watershed Restoration Projects in Design
Watershed and Project
Total
Drainage
Area (Acre)
Impervious Area
Controlled (Acre)
Restoration
Germantown Park Stormwater Pond Upgrades and Stream
Restoration (Phase II)
0.00 8.00
Gunners Branch Stream Restoration 0.00 78.60
Plum Gar Stream Restoration 0.00 13.00
Stormwater Pond Retrofit Total: 3,334.42 1,078.09
Chadswood 195.27 16.70
Chesney 20.00 4.14
Churchill Town Sector (Waters Landing Assoc.) 67.50 11.50
Cinnamon Woods (Homes Association) SQ#125 1.18 0.74
Cinnamon Woods (Homes Association) - 615 20.16 5.00
Cinnamon Woods (Homes Association) - North Pond 1.82 2.71
Cinnamon Woods (Homes Association) - South Pond 1.79 2.71
Cinnamon Woods (Homes Association) SQ#612 28.21 10.43
Cinnamon Woods (Homes Association) SQ#616 4.55 2.18
Cinnamon Woods (Homes Association) SQ#617 9.23 2.73
Clearspring Manor 66.22 7.25
Collingwood HOA 18.80 7.64
Emory Grove (Greenfield Station HOA) 21.00 8.22
Germantown Park (Gunners Branch Local Park) SQ#871 4.95 1.92
Germantown View (Seneca Forest HOA) 25.37 11.59
Goshen East 66.61 34.43
Green Hills (Magruder Branch SVU) SQ#720 17.00 3.91
Greenhills (Magurder Branch SVU) SQ#106 62.00 12.79
Gunners Lake Village 1037.20 226.11
Hunters Woods III SWM (Cabin Branch SVP) 25.60 6.20
Manchester Farm Comm. Assoc. Regional 276.57 160.40
Meadowvale 37.80 11.92
Montgomery County Airpark Regional 84.80 60.72
Montgomery Village (PEPCO) 28.70 10.92
Montgomery Village 1-B (South Village Homes
Corporation)
8.70 5.50
Montgomery Village/Horizon Run 49.20 23.97
North Lake Apartments 15.18 5.97
Partridge Place 46.58 2.95
Plumgar II Regional (Great Seneca SVU) 7.20 27.73
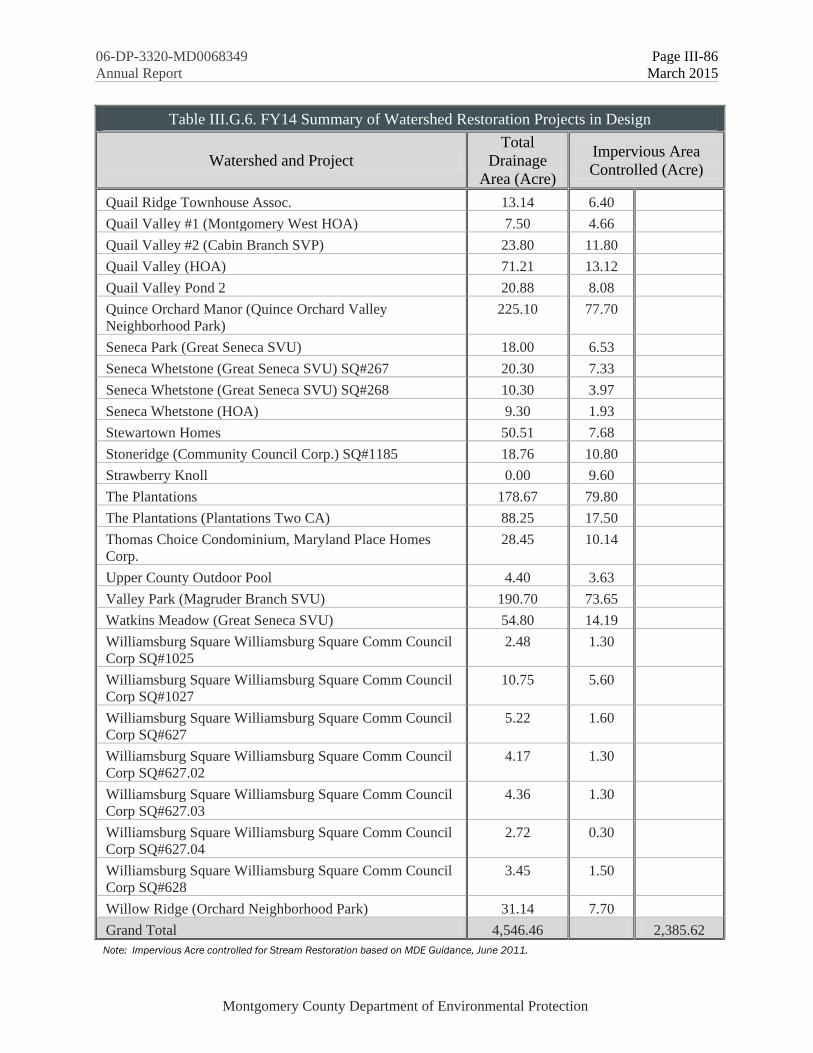
06-DP-3320-MD0068349 Page III-86
Annual Report March 2015
Montgomery County Department of Environmental Protection
Table III.G.6. FY14 Summary of Watershed Restoration Projects in Design
Watershed and Project
Total
Drainage
Area (Acre)
Impervious Area
Controlled (Acre)
Quail Ridge Townhouse Assoc. 13.14 6.40
Quail Valley #1 (Montgomery West HOA) 7.50 4.66
Quail Valley #2 (Cabin Branch SVP) 23.80 11.80
Quail Valley (HOA) 71.21 13.12
Quail Valley Pond 2 20.88 8.08
Quince Orchard Manor (Quince Orchard Valley
Neighborhood Park)
225.10 77.70
Seneca Park (Great Seneca SVU) 18.00 6.53
Seneca Whetstone (Great Seneca SVU) SQ#267 20.30 7.33
Seneca Whetstone (Great Seneca SVU) SQ#268 10.30 3.97
Seneca Whetstone (HOA) 9.30 1.93
Stewartown Homes 50.51 7.68
Stoneridge (Community Council Corp.) SQ#1185 18.76 10.80
Strawberry Knoll 0.00 9.60
The Plantations 178.67 79.80
The Plantations (Plantations Two CA) 88.25 17.50
Thomas Choice Condominium, Maryland Place Homes
Corp.
28.45 10.14
Upper County Outdoor Pool 4.40 3.63
Valley Park (Magruder Branch SVU) 190.70 73.65
Watkins Meadow (Great Seneca SVU) 54.80 14.19
Williamsburg Square Williamsburg Square Comm Council
Corp SQ#1025
2.48 1.30
Williamsburg Square Williamsburg Square Comm Council
Corp SQ#1027
10.75 5.60
Williamsburg Square Williamsburg Square Comm Council
Corp SQ#627
5.22 1.60
Williamsburg Square Williamsburg Square Comm Council
Corp SQ#627.02
4.17 1.30
Williamsburg Square Williamsburg Square Comm Council
Corp SQ#627.03
4.36 1.30
Williamsburg Square Williamsburg Square Comm Council
Corp SQ#627.04
2.72 0.30
Williamsburg Square Williamsburg Square Comm Council
Corp SQ#628
3.45 1.50
Willow Ridge (Orchard Neighborhood Park) 31.14 7.70
Grand Total 4,546.46 2,385.62
Note: Impervious Acre controlled for Stream Restoration based on MDE Guidance, June 2011.

06-DP-3320-MD0068349 Page III-87
Annual Report March 2015
Montgomery County Department of Environmental Protection
Projects to be in Design by DEP’s Watershed Restoration (CIP) Program in FY15
A summary of projects to be designed in FY15 are presented in Table III.G.7. DEP anticipates
2 ESD projects, 24 stormwater pond retrofits, and 2 stream restoration projects expected to be in
design in FY15. Projects currently scoped for bidding includes 220 currently uncontrolled
impervious acres captured once these projects are completed.
Table III.G.7. Summary of Watershed Restoration
Projects under Task Order for Design FY15
Watershed and Project Number of
Projects
Drainage Area
(Acre)
Proposed
Impervious
Anacostia River 4 36
Stormwater Pond Retrofit 3 93
Stream Restoration 1 0
Potomac Direct 8 50
Stormwater Pond Retrofit 8 217
Rock Creek 6 64
Stormwater Pond Retrofit 5 179
Stream Restoration 1 0
Seneca Creek 8 70
Stormwater Pond Retrofit 8 334
Other Budgeted FY15 Projects* 2 TBD*
Low Impact Development 2 TBD*
Total for All Watersheds 26 220
*Individual projects to be identified in FY15
Table III.G.8 presents a summary of projects identified through watershed assessments as
potential future projects. This summary does not include projects identified in the new Patuxent,
Lower Monocacy, Potomac Direct, and Seneca Creek watershed studies, as they were not
complete by the end of FY14.
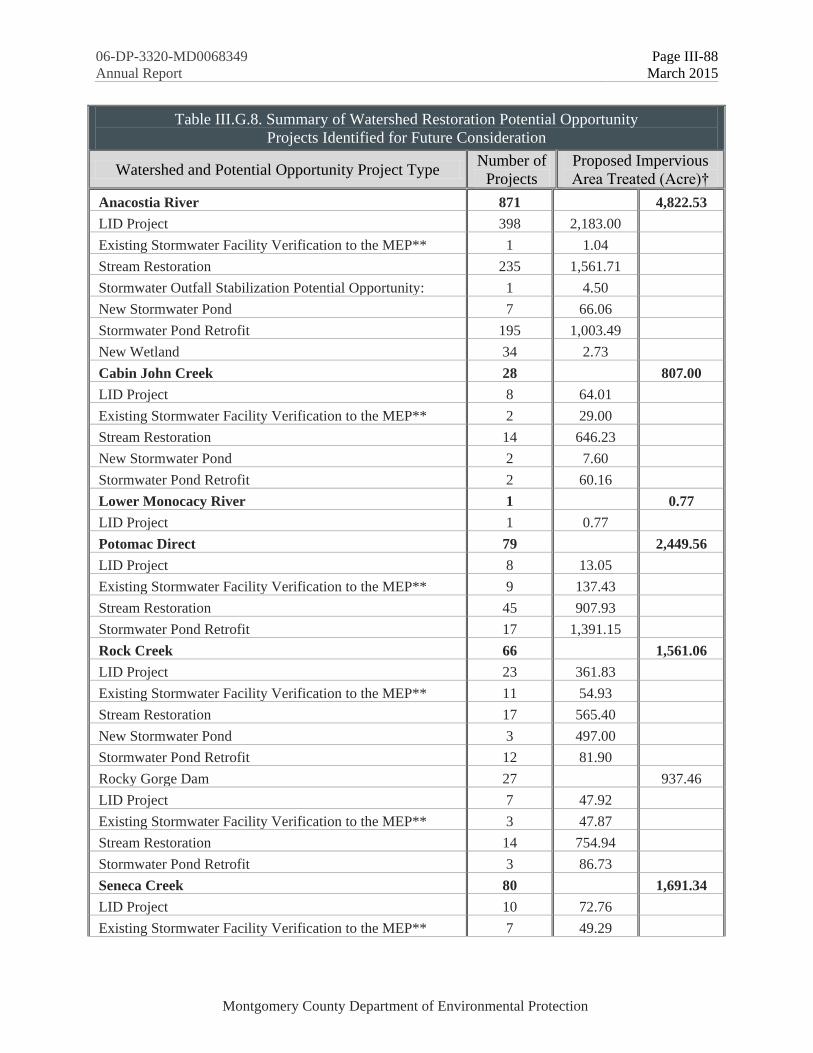
06-DP-3320-MD0068349 Page III-88
Annual Report March 2015
Montgomery County Department of Environmental Protection
Table III.G.8. Summary of Watershed Restoration Potential Opportunity
Projects Identified for Future Consideration
Watershed and Potential Opportunity Project Type Number of
Projects
Proposed Impervious
Area Treated (Acre)†
Anacostia River 871 4,822.53
LID Project 398 2,183.00
Existing Stormwater Facility Verification to the MEP** 1 1.04
Stream Restoration 235 1,561.71
Stormwater Outfall Stabilization Potential Opportunity: 1 4.50
New Stormwater Pond 7 66.06
Stormwater Pond Retrofit 195 1,003.49
New Wetland 34 2.73
Cabin John Creek 28 807.00
LID Project 8 64.01
Existing Stormwater Facility Verification to the MEP** 2 29.00
Stream Restoration 14 646.23
New Stormwater Pond 2 7.60
Stormwater Pond Retrofit 2 60.16
Lower Monocacy River 1 0.77
LID Project 1 0.77
Potomac Direct 79 2,449.56
LID Project 8 13.05
Existing Stormwater Facility Verification to the MEP** 9 137.43
Stream Restoration 45 907.93
Stormwater Pond Retrofit 17 1,391.15
Rock Creek 66 1,561.06
LID Project 23 361.83
Existing Stormwater Facility Verification to the MEP** 11 54.93
Stream Restoration 17 565.40
New Stormwater Pond 3 497.00
Stormwater Pond Retrofit 12 81.90
Rocky Gorge Dam 27 937.46
LID Project 7 47.92
Existing Stormwater Facility Verification to the MEP** 3 47.87
Stream Restoration 14 754.94
Stormwater Pond Retrofit 3 86.73
Seneca Creek 80 1,691.34
LID Project 10 72.76
Existing Stormwater Facility Verification to the MEP** 7 49.29
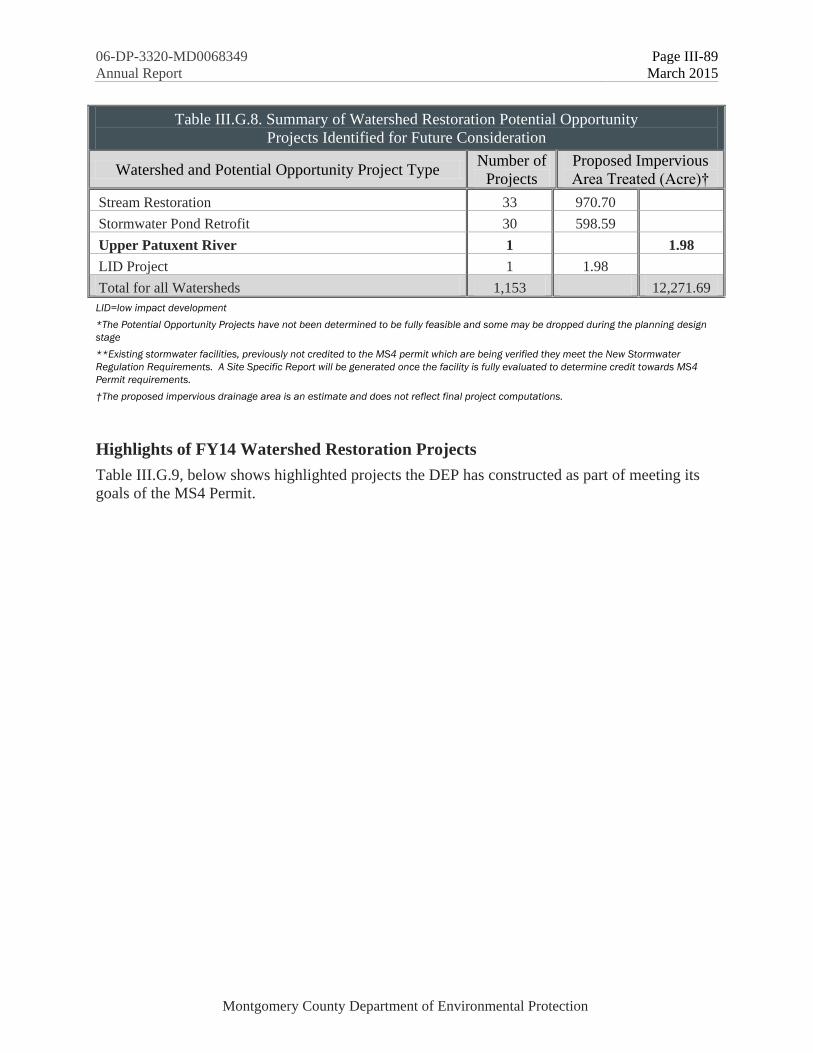
06-DP-3320-MD0068349 Page III-89
Annual Report March 2015
Montgomery County Department of Environmental Protection
Table III.G.8. Summary of Watershed Restoration Potential Opportunity
Projects Identified for Future Consideration
Watershed and Potential Opportunity Project Type Number of
Projects
Proposed Impervious
Area Treated (Acre)†
Stream Restoration 33 970.70
Stormwater Pond Retrofit 30 598.59
Upper Patuxent River 1 1.98
LID Project 1 1.98
Total for all Watersheds 1,153 12,271.69
LID=low impact development
*The Potential Opportunity Projects have not been determined to be fully feasible and some may be dropped during the planning design
stage
**Existing stormwater facilities, previously not credited to the MS4 permit which are being verified they meet the New Stormwater
Regulation Requirements. A Site Specific Report will be generated once the facility is fully evaluated to determine credit towards MS4
Permit requirements.
†The proposed impervious drainage area is an estimate and does not reflect final project computations.
Highlights of FY14 Watershed Restoration Projects
Table III.G.9, below shows highlighted projects the DEP has constructed as part of meeting its
goals of the MS4 Permit.

06-DP-3320-MD0068349 Page III-90
Annual Report March 2015
Montgomery County Department of Environmental Protection
Table III.G.9. Highlighted Watershed Restoration Projects for FY14
Project Name Impervious
Acres Captured Photo
Stormwater
Pond
Georgian
Colonies
5 Acres
Stream Donnybrook
Stream
Restoration
19.64 Acres
Public Property
Low Impact
Development
(LID)
Kensington
Library
0.67 Acres
Roadway LID Franklin Knolls
Green Streets –
Phases 1 and 2
~28 Acres
Hollywood Branch Steam Restoration Project
The Hollywood Branch Stream Restoration was identified during the prior Permit cycle as a
project required to meet watershed restoration goals. The Project will be completed during the
current Permit term, and will mitigate stream degradation caused by past suburban development
without adequate stormwater controls. Hollywood Branch is located in an eastern Montgomery

06-DP-3320-MD0068349 Page III-91
Annual Report March 2015
Montgomery County Department of Environmental Protection
County suburb and is a 2.5 mile long, second order tributary to Paint Branch (a tributary of the
Anacostia River). Stream restoration goals include: stabilizing erosive areas, improving
floodplain access, enhancing riparian conditions, enhancing stream conditions and improving
overall aquatic resources. In May of 2014, DEP began construction on the upper project reach
and continued 3,200 linear feet downstream until the stream closure period. While constructing
the project, DEP discovered a leaking sewer house connection and worked with WSSC to repair
the broken pipe and prevent raw sewage from entering into the stream channel. During the
stream closure over 256 trees, 429 shrubs and 3,684 live stakes were planted within the
completed reach. Figure III.G.2 shows a Hollywood Branch section before and after restoration.
Figure III.G.2. Pre-restoration (left) and Post-restoration Conditions (right) at
Hollywood Branch (Photos taken: 8/30/11 and 12/18/14 respectively)
Public Property ESD
During FY14, the DEP continued to design and implement ESD projects on public property,
including school grounds, libraries and community centers and along county roadways within the
public ROW. Figure III.G.3 shows project locations and status of various school and public
facilities through FY14.
MCPS Properties
In 2010, when MCPS was added to the County’s Permit as a co-permittee, DEP and MCPS
executed a memorandum of understanding (MOU) defining relative roles and responsibilities
concerning Permit requirements. The MOU included provisions for identification and
construction of SWM BMPs, including ESD practices, on MCPS properties through DEP
programs. DEP is working with MCPS to construct stormwater control above that required
for new school construction and modernization, and to construct SWM BMP retrofits on
other MCPS properties. The MOU also provided for MCPS staff education on SWM BMPs
function, and correct non-structural maintenance.
In FY13, MCPS completed 160 stormwater projects that incorporated ESD to the MEP, as
required by new storm water management regulations, through the use of vegetative roofs,
bioretention and bio filtering facilities, micro bioretention structures, porous pavements and
other innovative devices, at a cost of $10,124,553.

06-DP-3320-MD0068349 Page III-92
Annual Report March 2015
Montgomery County Department of Environmental Protection
In FY13, DEP continued the assessment of 61 schools located within the Little Seneca Creek,
Rock Creek, Little Falls, Cabin John, Muddy Branch, Watts Branch, and Little Bennett
subwatersheds for ESD retrofit opportunities. ESD retrofit opportunities at these 61 schools
will be added to an existing inventory of ESD retrofit opportunities at 70 schools (completed
in October 2011). The ESD retrofit inventory will then include opportunities from 131
schools or 60 percent of all schools in the county. DEP meets every 2 months with
Montgomery County Public Schools to coordinate implementation of ESD retrofit projects
on school sites. The ESD retrofit inventory provides a vital planning tool for the
coordination meetings.
During FY13, DEP constructed eight (8) ESD retrofit projects, providing water quality
treatment for a total 2.75 impervious acres, at Cold Spring Elementary School and Ridgeview
Middle School. Engineering and design for ESD retrofit projects are underway at five
additional schools (Olney Elementary School, Rosa Parks Middle School, Oakview
Elementary School, Strathmore Elementary School and White Oak Middle School), with
construction expected in FY15. Due to safety concerns, all construction activities at MCPS
must occur during the summer months when schools are closed, which may result in delays.
In FY14, DEP continued work on engineered design plans for ESD retrofit projects at five
schools (Olney Elementary School, Rosa Parks Middle School, Oakview Elementary School,
Strathmore Elementary School and White Oak Middle School) and expect projects at these
schools to be ready for construction in summer of 2016. Work began on engineered design
plans for ESD retrofit projects at four additional schools (Newport Middle School, Sligo
Middle School, Argyle Middle School and Sherwood Elementary School).
Public Facilities
The DEP completed construction of 6 ESD projects that treat 1.26 impervious acres at Aspen
Hill and Kensington Libraries. ESD project engineering and design began in March 2013 at
two county owned facilities, Little Falls Library and Bushey Drive Recreation Center.
Within FY14, work continued on engineered design plans for ESD retrofit projects at Little
Falls Library and Bushey Drive Recreation Center, construction is expected FY16.

06-DP-3320-MD0068349 Page III-93
Annual Report March 2015
Montgomery County Department of Environmental Protection
Figure III.G.3. Project Locations and Status of Various School and Public Facilities through FY14
Public Right of Way-County “Green Streets” Program
“Green Streets” are roadways where ESD practices are constructed within the street right-of-
ways to capture stormwater runoff. DEP collaborates with DOT to implement “Green
Street” projects in areas where DOT is schedule to do roadway maintenance or renovation.
“Green Streets” are part of a County initiative to capture stormwater runoff in neighborhoods
with minimal stormwater controls and little open space to install large stormwater practices.
They also create aesthetically attractive streetscapes, provide natural habitat, and help
visually to connect neighborhoods, schools, parks, and business districts.
The DEP continued to work on implementing ESD projects within the ROW along Amherst
Ave (2 projects), Arcola Ave (12 projects), Dennis Ave (9 projects), Breewood
neighborhood, Forest Estates neighborhood (24 projects), Sligo Park Hills neighborhood,
White Oak – Stewart Ln and Lockwood Dr. (12 projects). Figure III.G.4, below, shows the
locations of Green Streets Projects.
During FY14 construction began on Green Streets neighborhood projects in the Breewood,
Franklin Knolls, Sligo Park Hills (Figure III.G.6), Donnybrook (Figure III.G.5), and in the
Dennis Ave. Work also began on engineered design plans for Green Streets in Springbrook-
Homestead neighborhood, Wheaton Woods neighborhood and the Glenmont Forest
neighborhood.

06-DP-3320-MD0068349 Page III-94
Annual Report March 2015
Montgomery County Department of Environmental Protection
Figure III.G.4. Project Locations and Status of Various Green Streets through FY14

06-DP-3320-MD0068349 Page III-95
Annual Report March 2015
Montgomery County Department of Environmental Protection
Private Property ESD – RainScapes Program
The DEP’s RainScapes program continues to promote and implement environmentally
friendly landscaping and small-scale, ESD based stormwater control and infiltration projects
on residential, institutional, and commercial properties to reduce stormwater pollution and
achieve measurable water quality benefits. Projects are also designed to provide water
quantity benefits by controlling, at a minimum, the first inch of rainfall using runoff
reduction techniques. DEP offers technical and financial assistance (funded by the County’s
WQPF) to encourage property owners to implement eligible RainScapes techniques, such as
rain gardens, rain barrels or cisterns, conservation landscaping, pavement removal and/or
replacement and canopy trees.
RainScapes Rewards provides rebates to private property owners who choose to implement
qualified small-scale stormwater projects. Since the program’s inception, 1,075 projects have
been received and reviewed by the RainScapes team. In FY14, 165 new RainScapes
Rewards projects were reviewed for residential and private institutional properties and there
was a shift towards more substantial projects, such as permeable paver retrofits rather than
smaller water harvesting/rain barrel projects. Of these, 61 were completed, including 10 tree
canopy projects which were completed to add 27 more trees. By the end of the FY14, 696
RainScapes Rewards Rebate projects had been completed in the County, with a broad
geographic distribution.
RainScapes Rewards Rebate projects provide a visible and distributed presence for
stormwater management on private lots across the County and are serving to raise both
Figure III.G.5. Recently Completed Donnybrook
Green Streets Neighborhood Curb Extensions,
Located on Grubb Road (Photo taken 7/15/14)
Figure III.G.6. Recently Completed Sligo Park
Hills Green Streets Project Located on Wessex
Road (Photo taken 9/11/14)

06-DP-3320-MD0068349 Page III-96
Annual Report March 2015
Montgomery County Department of Environmental Protection
public awareness and action. Conservation landscape projects are now being designed to
explicitly treat runoff from rooftops and, using a rain garden volume estimate, are being sized
to capture the first inch of runoff.
The RainScapes Rewards projects meet or exceed the water quality volume control; in FY14,
this added treatment for an additional 2.9 acres of previously uncontrolled impervious area.
As a program overall, runoff from over 21 impervious acres is being controlled as of the end
of FY14 for at least the first inch of rain; many projects controlled up to the 1-year storm
event. Another 3.88 impervious acres will be treated once approved, but not yet complete
projects are done. Figure III.G.7 shows a summary of RainScapes Rewards project locations
that have been installed Countywide as of the end of FY14.
The volume reduction from the 21 impervious acres does not include the impact from canopy
tree planting efforts which will, over time, add additional shading and leaf interception.
Canopy trees, while not having a direct metric to measure their impervious area stormwater
control contribution or evapotranspiration effectiveness, represent 24.5 percent of installed
projects. Since 2008, 694 canopy trees have been planted at 148 sites through the RainScapes
Rewards tree incentive. There are an additional 17 tree projects approved for 49 more
canopy trees.
As of FY14, the program has been working as a multi-strand program consisting of five
identifiable program elements and staff was expanded by one planning professional. All
program elements are designed to provide information and training to residents and
landscape professionals, as well as incentives and project delivery to County sites.
Information on two elements - RainScapes Rewards, and RainScapes Neighborhoods, can be
found below. The remaining elements are focused on RainScapes outreach and training, and
are described in Part III.E.7, Public Education and Outreach.
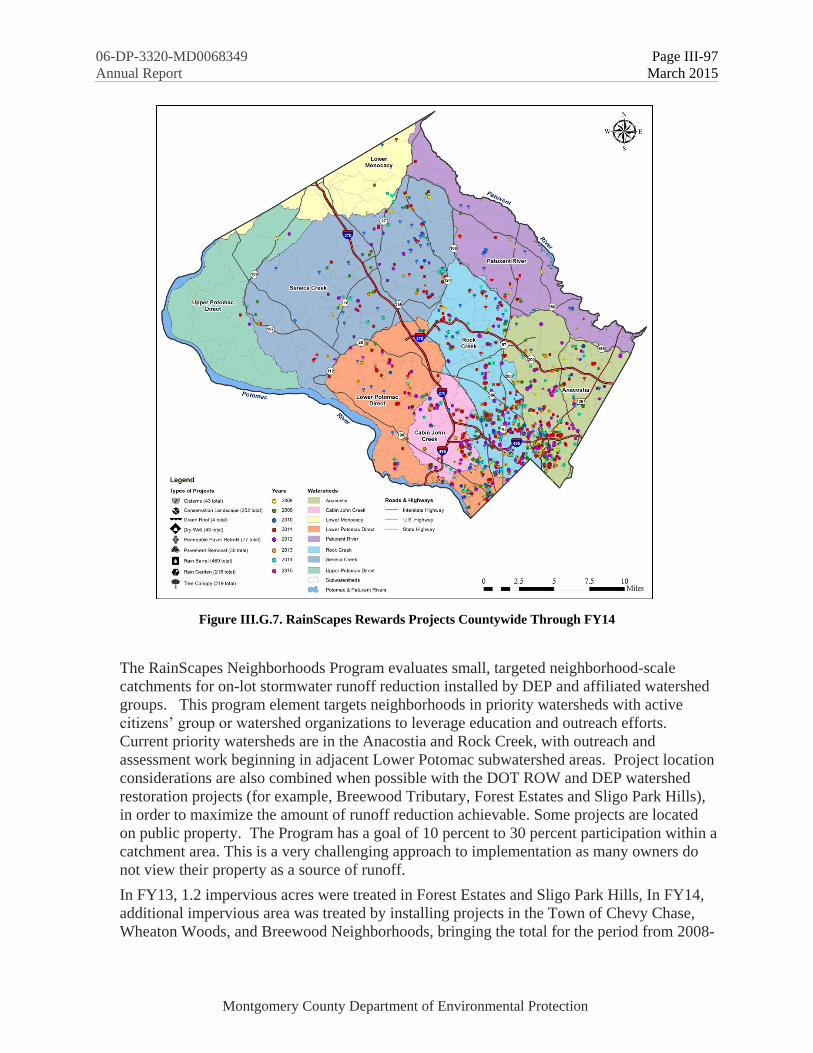
06-DP-3320-MD0068349 Page III-97
Annual Report March 2015
Montgomery County Department of Environmental Protection
Figure III.G.7. RainScapes Rewards Projects Countywide Through FY14
The RainScapes Neighborhoods Program evaluates small, targeted neighborhood-scale
catchments for on-lot stormwater runoff reduction installed by DEP and affiliated watershed
groups. This program element targets neighborhoods in priority watersheds with active
citizens’ group or watershed organizations to leverage education and outreach efforts.
Current priority watersheds are in the Anacostia and Rock Creek, with outreach and
assessment work beginning in adjacent Lower Potomac subwatershed areas. Project location
considerations are also combined when possible with the DOT ROW and DEP watershed
restoration projects (for example, Breewood Tributary, Forest Estates and Sligo Park Hills),
in order to maximize the amount of runoff reduction achievable. Some projects are located
on public property. The Program has a goal of 10 percent to 30 percent participation within a
catchment area. This is a very challenging approach to implementation as many owners do
not view their property as a source of runoff.
In FY13, 1.2 impervious acres were treated in Forest Estates and Sligo Park Hills, In FY14,
additional impervious area was treated by installing projects in the Town of Chevy Chase,
Wheaton Woods, and Breewood Neighborhoods, bringing the total for the period from 2008-

06-DP-3320-MD0068349 Page III-98
Annual Report March 2015
Montgomery County Department of Environmental Protection
2014 to 1.36 impervious acres on private property was treated using the RainScapes
Neighborhood approach. Combined with the public property sites and school sites, the total
is 4.65 IA treated using community and school based approaches. Most of the public sites
were installed as part of the education and outreach initiatives of RainScapes. After program
review in the summer of 2013, a change to the program was made to shift to a site
assessment and education focus, rather than a direct installation focus. Extensive outreach
was conducted in the towns of Somerset and the Town of Chevy Chase, with workshops,
individual site assessments prepared for interested property owners, and follow-up design
assistance. Each assessment ranked opportunities for RainScapes projects to reduce runoff
should the property owner follow through with a RainScapes installation. Participants are
encouraged to work with local design professionals to plan and install a RainScapes project
using the cost-share RainScapes Rewards Rebate Program. Using this approach, 59 site
assessments were completed in Somerset and the Town of Chevy Chase by the end of June.
An estimated 1.8 acres of impervious area would be treated with RainScapes projects if
installation efforts go forward from these site assessments. Additional outreach is occurring
in FY15 to support this effort. Implementation will continue in FY15 and expand into the
Four Corner areas of the County and Lower Potomac subwatersheds. Figure III-G.8 shows
the locations of the RainScapes Neighborhoods.
Included in the non-Rewards/RainScapes Neighborhoods project treatment numbers are
RainScapes demonstration projects which have been installed. Some are private property
parcels by the County, specifically at a few churches and on HOA and non-profit properties
these projects were placed to provide a locally accessible example so that people could learn
about RainScapes and how to install a project on their own property.
Figure III.G.8. Locations of FY14 RainScapes Neighborhoods
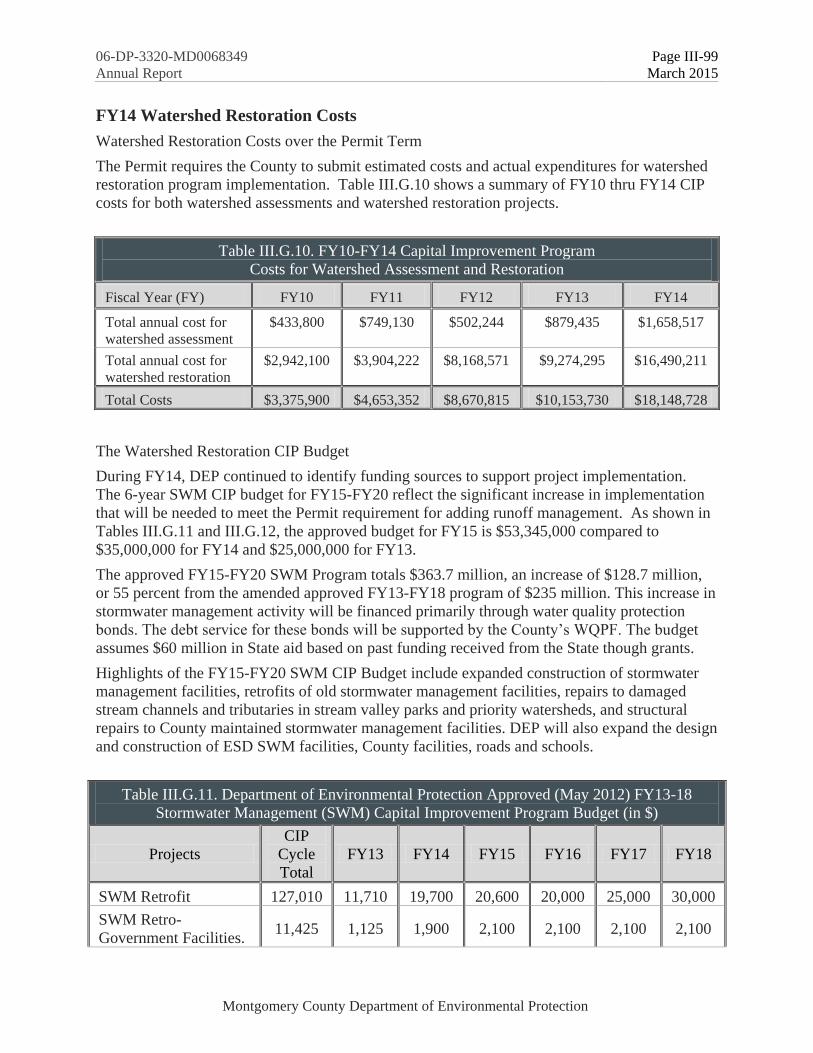
06-DP-3320-MD0068349 Page III-99
Annual Report March 2015
Montgomery County Department of Environmental Protection
FY14 Watershed Restoration Costs
Watershed Restoration Costs over the Permit Term
The Permit requires the County to submit estimated costs and actual expenditures for watershed
restoration program implementation. Table III.G.10 shows a summary of FY10 thru FY14 CIP
costs for both watershed assessments and watershed restoration projects.
Table III.G.10. FY10-FY14 Capital Improvement Program
Costs for Watershed Assessment and Restoration
Fiscal Year (FY) FY10 FY11 FY12 FY13 FY14
Total annual cost for
watershed assessment
$433,800 $749,130 $502,244 $879,435 $1,658,517
Total annual cost for
watershed restoration
$2,942,100 $3,904,222 $8,168,571 $9,274,295 $16,490,211
Total Costs $3,375,900 $4,653,352 $8,670,815 $10,153,730 $18,148,728
The Watershed Restoration CIP Budget
During FY14, DEP continued to identify funding sources to support project implementation.
The 6-year SWM CIP budget for FY15-FY20 reflect the significant increase in implementation
that will be needed to meet the Permit requirement for adding runoff management. As shown in
Tables III.G.11 and III.G.12, the approved budget for FY15 is $53,345,000 compared to
$35,000,000 for FY14 and $25,000,000 for FY13.
The approved FY15-FY20 SWM Program totals $363.7 million, an increase of $128.7 million,
or 55 percent from the amended approved FY13-FY18 program of $235 million. This increase in
stormwater management activity will be financed primarily through water quality protection
bonds. The debt service for these bonds will be supported by the County’s WQPF. The budget
assumes $60 million in State aid based on past funding received from the State though grants.
Highlights of the FY15-FY20 SWM CIP Budget include expanded construction of stormwater
management facilities, retrofits of old stormwater management facilities, repairs to damaged
stream channels and tributaries in stream valley parks and priority watersheds, and structural
repairs to County maintained stormwater management facilities. DEP will also expand the design
and construction of ESD SWM facilities, County facilities, roads and schools.
Table III.G.11. Department of Environmental Protection Approved (May 2012) FY13-18
Stormwater Management (SWM) Capital Improvement Program Budget (in $)
Projects
CIP
Cycle
Total
FY13 FY14 FY15 FY16 FY17 FY18
SWM Retrofit 127,010 11,710 19,700 20,600 20,000 25,000 30,000
SWM Retro-
Government Facilities. 11,425 1,125 1,900 2,100 2,100 2,100 2,100
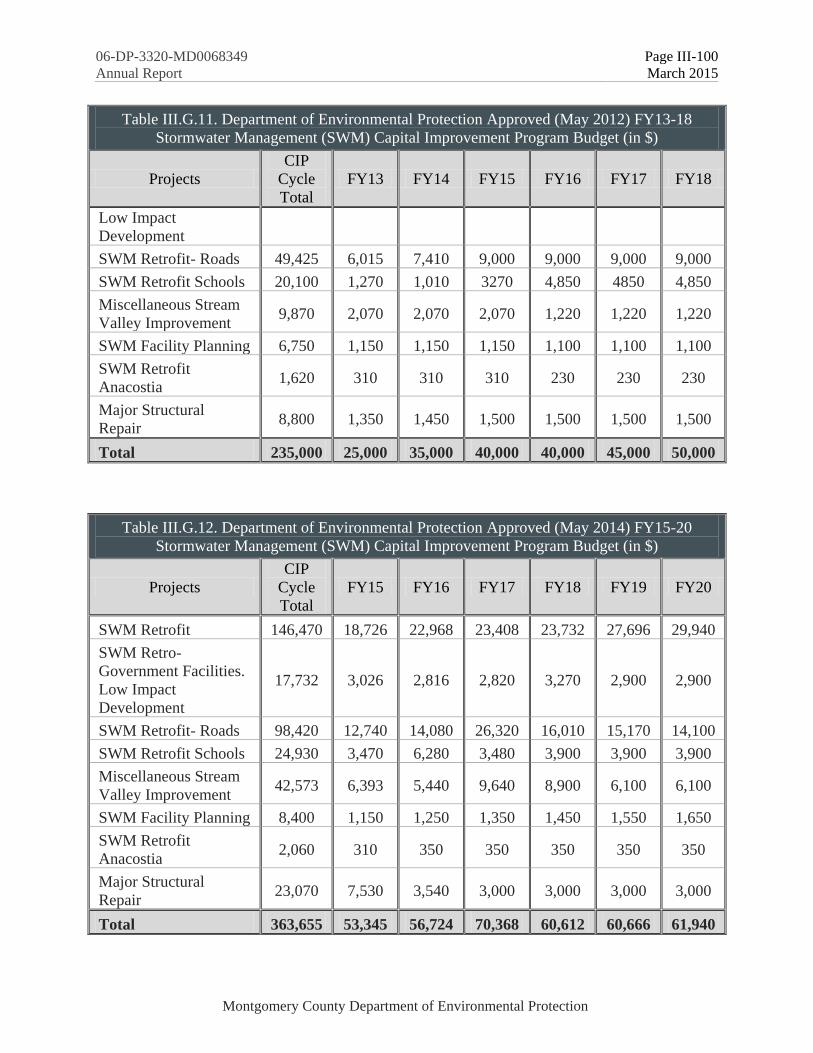
06-DP-3320-MD0068349 Page III-100
Annual Report March 2015
Montgomery County Department of Environmental Protection
Table III.G.11. Department of Environmental Protection Approved (May 2012) FY13-18
Stormwater Management (SWM) Capital Improvement Program Budget (in $)
Projects
CIP
Cycle
Total
FY13 FY14 FY15 FY16 FY17 FY18
Low Impact
Development
SWM Retrofit- Roads 49,425 6,015 7,410 9,000 9,000 9,000 9,000
SWM Retrofit Schools 20,100 1,270 1,010 3270 4,850 4850 4,850
Miscellaneous Stream
Valley Improvement 9,870 2,070 2,070 2,070 1,220 1,220 1,220
SWM Facility Planning 6,750 1,150 1,150 1,150 1,100 1,100 1,100
SWM Retrofit
Anacostia 1,620 310 310 310 230 230 230
Major Structural
Repair 8,800 1,350 1,450 1,500 1,500 1,500 1,500
Total 235,000 25,000 35,000 40,000 40,000 45,000 50,000
Table III.G.12. Department of Environmental Protection Approved (May 2014) FY15-20
Stormwater Management (SWM) Capital Improvement Program Budget (in $)
Projects
CIP
Cycle
Total
FY15 FY16 FY17 FY18 FY19 FY20
SWM Retrofit 146,470 18,726 22,968 23,408 23,732 27,696 29,940
SWM Retro-
Government Facilities.
Low Impact
Development
17,732 3,026 2,816 2,820 3,270 2,900 2,900
SWM Retrofit- Roads 98,420 12,740 14,080 26,320 16,010 15,170 14,100
SWM Retrofit Schools 24,930 3,470 6,280 3,480 3,900 3,900 3,900
Miscellaneous Stream
Valley Improvement 42,573 6,393 5,440 9,640 8,900 6,100 6,100
SWM Facility Planning 8,400 1,150 1,250 1,350 1,450 1,550 1,650
SWM Retrofit
Anacostia 2,060 310 350 350 350 350 350
Major Structural
Repair 23,070 7,530 3,540 3,000 3,000 3,000 3,000
Total 363,655 53,345 56,724 70,368 60,612 60,666 61,940

06-DP-3320-MD0068349 Page III-101
Annual Report March 2015
Montgomery County Department of Environmental Protection
Progress Towards Meeting Wasteload Allocations for EPA Approved TMDLs
The Permit requires development of implementation plans to meet County MS4 WLAs for any
EPA approved TMDL in County watersheds within 1 year of EPA approval. The County must
also report progress towards meeting those WLAs where watershed restoration is occurring.
Implementation plan development is addressed in Part III. J. Total Maximum Daily Loads of this
report.
The County successfully submitted the Strategy to meet Permit requirements, including meeting
the TMDL WLAs, in February 2011, 1 year after issuance of the Permit. The Strategy used the
WTM to verify pollutant baseline loads in TMDL watersheds, and estimate pollutant load
reductions of a variety of completed and planned structural, non-structural, and programmatic
watershed restoration practices. Pollutant load reduction efficiencies were selected based on the
best information available during model development. The model estimated pollutant treatment
by SWM BMPs and retrofits constructed after TMDL baseline years. Details on the WTM
assumptions can be found in the Montgomery County Coordinated Strategy, Appendix B,
Modeling Framework, which can be found in Appendix J.
Table III.G.13, below summarizes watershed-specific TMDLs and pollutant reductions achieved
by watershed restoration projects constructed after TMDL baseline data date. The reductions
include nutrients and sediment reductions from stream restoration projects using efficiencies
provided in MDE’s August 2014 Accounting for Stormwater Wasteload Allocations and
Impervious Acres Treated. The FY14 pollutant load reduction information can also be found in
this report’s electronic (CD) attachment in Appendix A, MDENPDES14.mbd, Parts G., G.1., and
G.3.
The Strategy land cover loading rates and BMP reduction efficiencies do not match those
published in the subsequent August 2014 MDE guidance. DEP has been working to update
impervious area data, along with updating urban BMP data to include over 1,000 new structures
with their delineated drainage areas. Once the data is complete, DEP will run the WTM again
and address the inconsistencies by correcting the WTM assumptions. This iterative approach
will refine the current pollutant reduction estimates and lead to a clearer picture of the reductions
associated with the County’s watershed restoration efforts.

06-DP-3320-MD0068349 Page III-102
Annual Report March 2015
Montgomery County Department of Environmental Protection
Table III.G.13. TMDL Summary by Impairment
Impairment Watershed Issue
Date Pollutant
County
MS4
Baseline
Load
Annual
Allocation Units
WLAsw
Percent
Reduction
Percent
Reduction
Since Baseline
Date*
TMDL
Baseline
Data
Date
Bac
teri
a
Cabin John Creek 2007c E. coli 44,257 30,670 (Billion
MPN/yr) 30.7% 0.40% 2003
Rock Creek 2007d Enterococci 453,669 18,195 (Billion
MPN/yr) 96.0% 3.50% 2003
Anacostia River 2007b Enterococci 247,809 29,978 (Billion
MPN/yr) 87.9% 5.10% 2003
Lower Monocacy River 2009e E. coli 67,452 9,848 (Billion
MPN/yr) 85.4% 1.00%
2003-
2004
Sed
imen
ts
Anacostia River 2007a TSS 7,682 1,101 (tons/yr) 87.5% 129.10% 1997
Triadelphia Reservoir 2008b TSS 29 29 (tons/yr) 0.0% 0.02% 2003
Clopper Lake 2002 TSS 13 13 (tons/yr) 0.0% 0.00% 2002
Lower Monocacy River 2009d TSS 253 99 (tons/yr) 60.8% 2.0% 2000
Seneca Creek 2011 TSS 5,735 3,185 (tons/yr) 44.6% 21.00% 2005
Rock Creek 2011 TSS 8,667 5,345 (tons/yr) 38.3% 50.60% 2005
Cabin John Creek 2011 TSS 3,143 2,430 (tons/yr) 22.7% 20.00% 2005
Potomac River Direct 2011 TSS 4,365.00 2,783.20 (tons/yr) 36.20% 2.00% 2005
Nu
trie
nts
Clopper Lake 2002 Phosphorus 101 55 (lbs/yr) 45.4% 0.00% 2002
Anacostia River 2008a Nitrogen 206,312 38,959 (lbs/yr) 81.8% 9.00% 1997
Anacostia River 2008a Phosphorus 20,953 3,947 (lbs/yr) 81.2% 29.00% 1997
Triadelphia Reservoir 2008b Phosphorus 438 373 (lbs/yr) 15.0% 0.30% 2003
Rocky Gorge Reservoir 2008b Phosphorus 4,268 3,628 (lbs/yr) 15.0% 2.00% 2003
Lower Monocacy River 2013 Phosphorus 1,872 1,305 (lbs/yr) 30.0% 0.00 2009
Rock Creek 2013 Phosphorus 12,503 8,089 (lbs/yr) 35.0% 0.98% 2009
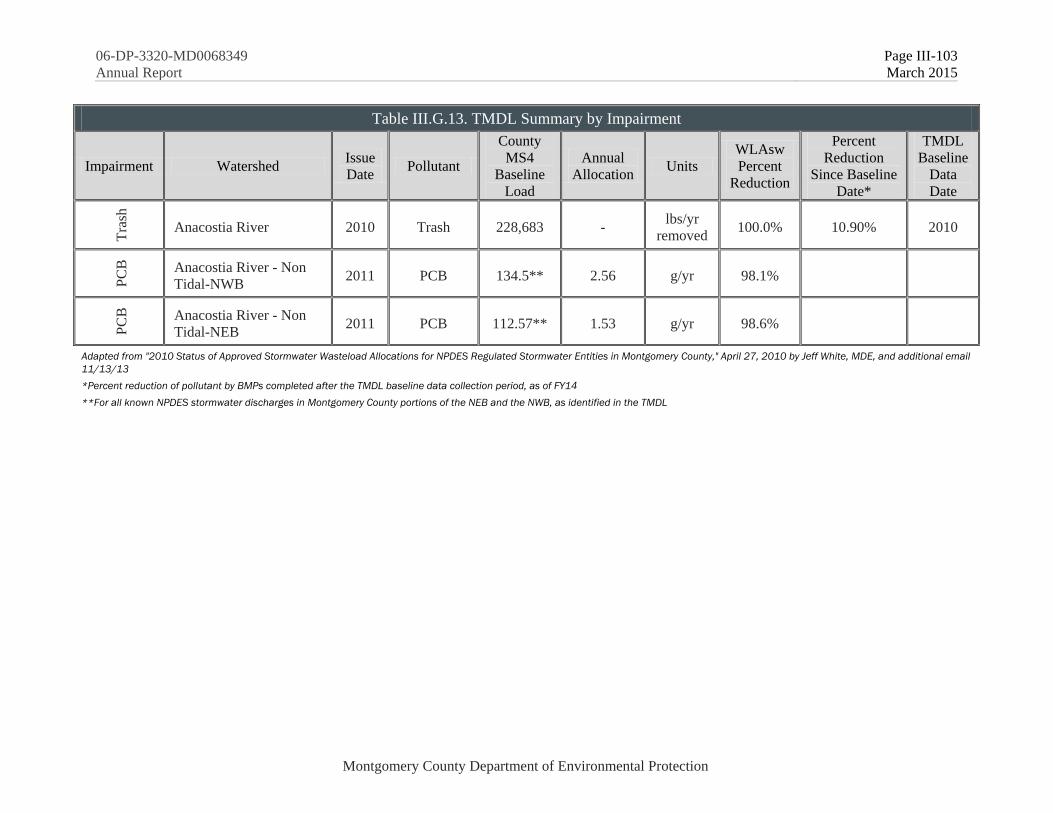
06-DP-3320-MD0068349 Page III-103
Annual Report March 2015
Montgomery County Department of Environmental Protection
Table III.G.13. TMDL Summary by Impairment
Impairment Watershed Issue
Date Pollutant
County
MS4
Baseline
Load
Annual
Allocation Units
WLAsw
Percent
Reduction
Percent
Reduction
Since Baseline
Date*
TMDL
Baseline
Data
Date
Tra
sh
Anacostia River 2010 Trash 228,683 - lbs/yr
removed 100.0% 10.90% 2010
PC
B
Anacostia River - Non
Tidal-NWB 2011 PCB 134.5** 2.56 g/yr 98.1%
PC
B
Anacostia River - Non
Tidal-NEB 2011 PCB 112.57** 1.53 g/yr 98.6%
Adapted from "2010 Status of Approved Stormwater Wasteload Allocations for NPDES Regulated Stormwater Entities in Montgomery County," April 27, 2010 by Jeff White, MDE, and additional email
11/13/13
*Percent reduction of pollutant by BMPs completed after the TMDL baseline data collection period, as of FY14
**For all known NPDES stormwater discharges in Montgomery County portions of the NEB and the NWB, as identified in the TMDL

06-DP-3320-MD0068349 Page III-104
Annual Report March 2015
Montgomery County Department of Environmental Protection
H. Assessment of Controls The Permit requires the County to assess the effectiveness of its stormwater management
program and control measures using pre-restoration and post restoration watershed monitoring,
which includes chemical, physical and biological monitoring. The County must also document
progress towards meeting the watershed restoration goals identified in Part III.G and any
applicable WLAs developed under the EPA approved TMDLs. DEP is responsible for
requirements under this part of the Permit.
Breewood Tributary Restoration Project
The DEP targeted the Breewood tributary for comprehensive watershed restoration efforts. In
2009, MDE approved DEP’s proposal to conduct pre and post restoration monitoring required in
Part III.H.1, Watershed Restoration Assessment, to assess effectiveness of the Breewood
tributary restoration efforts.
The tributary is located within the Sligo Creek subwatershed of the Anacostia River watershed as
shown on Figure III.H.1. Figure III.H.2 shows the Breewood tributary drainage area and
locations of chemical, physical and biological monitoring stations. The Breewood tributary is a
1,200-foot first order stream in a small catchment (63 acres) containing 35 percent impervious.
The catchment is predominantly medium density (quarter acre) residential, and also contains a
condominium complex, townhouse development, senior living center, high school and church.
There are two primary roads, University Boulevard and Arcola Avenue in the upper portion of
the catchment. Curb and gutter designed streets support residential development located in the
middle and lower sections of the catchment. The majority of the stormwater runoff from the
impervious areas is not controlled and has led to a severely unstable stream channel which
transports sediment, and other associated pollutants downstream.
The DEP’s Breewood Tributary Restoration Project is an innovative comprehensive management
approach which will link neighborhood outreach and upland watershed source control measures
to achieve measurable water quality improvements. Stormwater control measures will include
ESDpractices with stream and wetland restoration. The outreach efforts will focus on increasing
resident awareness and active stewardship to protect the tributary and associated local park from
trash and runoff pollutants. In FY14, DEP launched a website dedicated to the entire project
where project details, information, and status updates are shared. The webpage is located at:
http://www.montgomerycountymd.gov/DEP/Restoration/breewood.html
The DEP is currently designing 14 right of way ESD practices along residential roads and
promoting RainScapes techniques to address runoff from 54 residential properties. Phase 2 of
the project is underway and includes the design of 1,200 linear feet of stream restoration and a
ESD project on a larger private property bordering the residential properties.
The stream restoration project will:
stabilize the banks to prevent erosion,
add new trees and plants,
reduce the amount of sediment entering Sligo Creek,
improve water quality in both the Breewood Tributary and Sligo Creek,

06-DP-3320-MD0068349 Page III-105
Annual Report March 2015
Montgomery County Department of Environmental Protection
reconnect the stream to its floodplain, and
improve the ecological health of the Breewood Tributary and adjacent floodplain areas.
A summary of projects proposed for the Breewood tributary is on the electronic attachment in
Appendix L. Figure III.H.3 shows the locations of the restoration projects.
Figure III.H.1. Location of the Breewood Tributary within the Sligo Creek
Subwatershed of the Anacostia. Note that the actual size of the Breewood
tributary drainage area is 63 acres according to a recent recalculation.
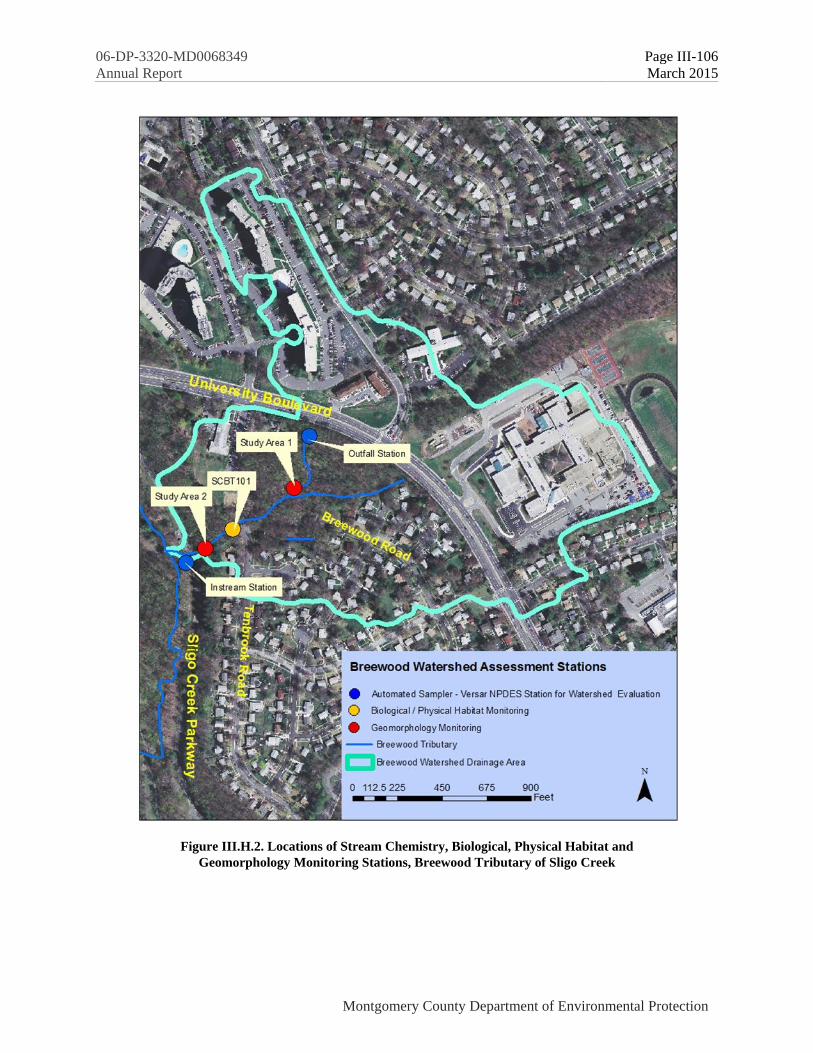
06-DP-3320-MD0068349 Page III-106
Annual Report March 2015
Montgomery County Department of Environmental Protection
Figure III.H.2. Locations of Stream Chemistry, Biological, Physical Habitat and
Geomorphology Monitoring Stations, Breewood Tributary of Sligo Creek

06-DP-3320-MD0068349 Page III-107
Annual Report March 2015
Montgomery County Department of Environmental Protection
Figure III.H.3. Locations of the Breewood Tributary Restoration Projects
H.1 Watershed Restoration Assessment
Breewood Tributary Chemical Monitoring
During 2013, DEP continued water chemistry monitoring in the Breewood tributary at one storm
drain outfall draining University Boulevard and points north (the outfall station) and an instream
station downstream of a culvert underneath Sligo Creek Parkway (the instream station), as shown
on Figure III.H.2. A continuously recording rain gauge is located at the Wheaton Branch
stormwater ponds in Silver Spring, approximately 1 mile southwest of the monitoring stations.
The Permit required chemical monitoring data is included electronically in Appendix A,
MDENPDES14.accdb, Part F. The summary report NPDES Water Chemistry Monitoring in the

06-DP-3320-MD0068349 Page III-108
Annual Report March 2015
Montgomery County Department of Environmental Protection
Breewood Tributary of Upper Sligo Creek 2009-2013 is also included in the electronic
attachment in Appendix K.
Table III.H.1 shows the drainage area to each water chemistry station. Table III.H.2 shows the
contribution of impervious land uses to total impervious area in the drainage area.
Table III.H.1. Drainage Area to Breewood Water Chemistry Monitoring Stations
Location Acres
Total DA to the outfall water chemistry station 16.9
Total DA to the instream water chemistry station 62.9
Total DA 63
Table III.H.2. Breewood Tributary Impervious Area 2012
Impervious Property Type Acres Percent of
Impervious Area
Percent of
Watershed
Buildings (Includes accessory structures) 8.12 31% 13%
Multi-family Residence 1.02 4% 2%
Non Residential 0.53 2% 1%
Residential Single Family Attached 0.25 1% 0%
Residential Single Family Detached 1.96 7% 3%
School 4.36 16% 7%
Parking/Driveway 11.69 44% 19%
Multi-family Residence 4.01 15% 6%
Parks and Planning 0.02 0% 0%
Non Residential 1.23 5% 2%
Right of Way 0.24 1% 0%
Residential Single Family Attached 0.09 0% 0%
Residential Single Family Detached 0.57 2% 1%
School 5.54 21% 9%
Road 6.09 23% 10%
Road 6.09 23% 10%

06-DP-3320-MD0068349 Page III-109
Annual Report March 2015
Montgomery County Department of Environmental Protection
Table III.H.2. Breewood Tributary Impervious Area 2012
Impervious Property Type Acres Percent of
Impervious Area
Percent of
Watershed
All other impervious 0.72 3% 1%
Multi-family Residence 0.54 2% 1%
Right of Way 0.10 0% 0%
Residential Single Family Detached 0.08 0% 0%
Grand Total 26.63 100% 42%
Hydrology Modeling
The Permit requires that rainfall to runoff characteristics of the contributing watershed be
evaluated using a standard, accepted hydrology model. The County produced a Hydrologic
Engineering Center River Analysis System (HEC-RAS) model of the Breewood Tributary
watershed as part of the stream restoration design process. The model was completed in FY14.
Summary of Water Chemistry Monitoring Results
The DEP’s contractor installed the monitoring stations, performed water chemistry monitoring
(e.g., metals, nutrients), water quality monitoring (e.g., pH, specific conductivity, temperature,
dissolved oxygen), continuous flow monitoring, and continuous rainfall monitoring according to
methods described in the Quality Assurance and Quality Control Document for Water Chemistry
Monitoring at Breewood Road Tributary (Hage and Jones 2010). Field teams collected baseflow
samples monthly and conducted automated storm runoff monitoring, targeting three events per
quarter. A total of 41 storms and 55 baseflow events were monitored from 2009 through 2013.
For each storm event, samples were collected along the rising, peak, and falling limbs of the
hydrograph and then subsequently, a storm EMC calculated from the results of these three
samples.
Drainage area size and land use to both the outfall and instream stations affected flow rate, total
stormflow volume, and response of flow to rainfall. As expected for rain events, rise in stream
stage at the instream station occurred later than the first appearance of flow at the outfall station.
Stormflow appears at the outfall faster because its drainage area contains higher percentages of
impervious area and connectivity. Flow rate values and total stormflow volumes were generally
greater at the instream station as expected given its greater drainage area. The instream station
also is somewhat less responsive to small events because of the relatively lower amount of
impervious area and greater travel time through the system.
For each station, baseflow MC were calculated for all Permit- required parameters over the
5-year monitoring period.
Storm EMCs represent the weighted average pollutant concentrations based on samples collected
at discrete intervals during a storm. EMCs were calculated and averaged over the 5-year
monitoring period for each parameter except TPH and Enterococcus. Stormflow samples for
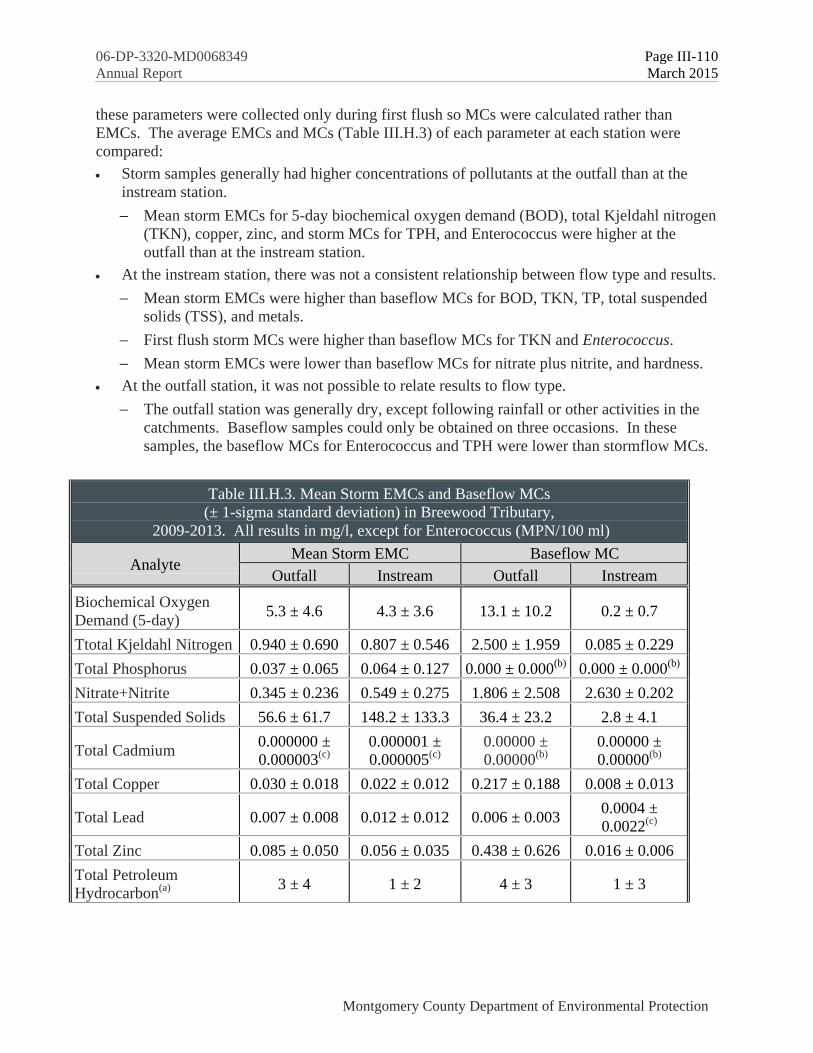
06-DP-3320-MD0068349 Page III-110
Annual Report March 2015
Montgomery County Department of Environmental Protection
these parameters were collected only during first flush so MCs were calculated rather than
EMCs. The average EMCs and MCs (Table III.H.3) of each parameter at each station were
compared:
Storm samples generally had higher concentrations of pollutants at the outfall than at the
instream station.
Mean storm EMCs for 5-day biochemical oxygen demand (BOD), total Kjeldahl nitrogen
(TKN), copper, zinc, and storm MCs for TPH, and Enterococcus were higher at the
outfall than at the instream station.
At the instream station, there was not a consistent relationship between flow type and results.
Mean storm EMCs were higher than baseflow MCs for BOD, TKN, TP, total suspended
solids (TSS), and metals.
First flush storm MCs were higher than baseflow MCs for TKN and Enterococcus.
Mean storm EMCs were lower than baseflow MCs for nitrate plus nitrite, and hardness.
At the outfall station, it was not possible to relate results to flow type.
The outfall station was generally dry, except following rainfall or other activities in the
catchments. Baseflow samples could only be obtained on three occasions. In these
samples, the baseflow MCs for Enterococcus and TPH were lower than stormflow MCs.
Table III.H.3. Mean Storm EMCs and Baseflow MCs
(± 1-sigma standard deviation) in Breewood Tributary,
2009-2013. All results in mg/l, except for Enterococcus (MPN/100 ml)
Analyte Mean Storm EMC Baseflow MC
Outfall Instream Outfall Instream
Biochemical Oxygen
Demand (5-day) 5.3 ± 4.6 4.3 ± 3.6 13.1 ± 10.2 0.2 ± 0.7
Ttotal Kjeldahl Nitrogen 0.940 ± 0.690 0.807 ± 0.546 2.500 ± 1.959 0.085 ± 0.229
Total Phosphorus 0.037 ± 0.065 0.064 ± 0.127 0.000 ± 0.000(b)
0.000 ± 0.000(b)
Nitrate+Nitrite 0.345 ± 0.236 0.549 ± 0.275 1.806 ± 2.508 2.630 ± 0.202
Total Suspended Solids 56.6 ± 61.7 148.2 ± 133.3 36.4 ± 23.2 2.8 ± 4.1
Total Cadmium 0.000000 ±
0.000003(c)
0.000001 ±
0.000005(c)
0.00000 ±
0.00000(b)
0.00000 ±
0.00000(b)
Total Copper 0.030 ± 0.018 0.022 ± 0.012 0.217 ± 0.188 0.008 ± 0.013
Total Lead 0.007 ± 0.008 0.012 ± 0.012 0.006 ± 0.003 0.0004 ±
0.0022(c)
Total Zinc 0.085 ± 0.050 0.056 ± 0.035 0.438 ± 0.626 0.016 ± 0.006
Total Petroleum
Hydrocarbon(a)
3 ± 4 1 ± 2 4 ± 3 1 ± 3

06-DP-3320-MD0068349 Page III-111
Annual Report March 2015
Montgomery County Department of Environmental Protection
Table III.H.3. Mean Storm EMCs and Baseflow MCs
(± 1-sigma standard deviation) in Breewood Tributary,
2009-2013. All results in mg/l, except for Enterococcus (MPN/100 ml)
Analyte Mean Storm EMC Baseflow MC
Outfall Instream Outfall Instream
Enterococcus(a)
11,910 ±
31,545 1,285 ± 2,931 1,073 ± 1,212 274 ± 508
Hardness 34 ± 17 43 ± 15 174 ± 156 108 ± 9
(a)EMCs are not calculated for TPH or Enterococcus. These values are arithmetic averages of first flush grab results.
(b)Analytical results below detection limits and therefore means set to zero.
(c)Additional digits added to storm EMC and baseflow MC results to illustrate difference in results.
Analysis of the flow and water chemistry data collected for this project will be used to evaluate
the effectiveness of watershed restoration efforts at improving hydrology and water chemistry.
Data collected to date document baseline conditions, prior to retrofit construction. In the future,
a variety of approaches will be employed to evaluate retrofit effectiveness, including analyzing
changes in hydrograph sensitivity to rainfall and annual pollutant loadings.
Annual Pollutant Loadings
Annual pollutant loadings for each station during 2013 were computed from separate baseflow
annual loadings and stormflow annual loadings. Stormflow annual load for a given parameter at
each station was determined by multiplying the average annual EMC (in mg/l) by the total
annual stormflow discharge (in CF) and converting units. Baseflow annual load was determined
by multiplying the average annual baseflow MC by the total annual baseflow discharge. The
total annual baseflow discharge was obtained by separating baseflow values from the flow rate
data record. The total annual stormflow discharge was determined by subtracting total annual
baseflow discharge from the total annual discharge (determined by plotting the annual
hydrograph in Flowlink). Loading values were calculated from baseflow MCs, stormflow MCs
and stormflow EMCs and are presented in Table III.H.4. reported in the electronic attachment to
this report, Appendix A., MDENPDES14.accdb, Part G.2. Pollutant Loads Associated with GIS
Coverage.
Table III.H.4. Baseflow, Stormflow, and Total Annual
Loadings (lbs.) in Breewood Tributary, 2013
Analyte Stormflow Loading Baseflow Loading
Total Loading
(Stormflow plus
Baseflow)
Outfall Instream Outfall Instream Outfall Instream
Biochemical Oxygen
Demand (5-day) 792 1,418 NS 0
(a) 792 1,418
Total Kjeldahl Nitrogen 131 261 NS 0.018 131 261
Total Phosphorus 5 12 NS 0(a)
5 12

06-DP-3320-MD0068349 Page III-112
Annual Report March 2015
Montgomery County Department of Environmental Protection
Table III.H.4. Baseflow, Stormflow, and Total Annual
Loadings (lbs.) in Breewood Tributary, 2013
Analyte Stormflow Loading Baseflow Loading
Total Loading
(Stormflow plus
Baseflow)
Outfall Instream Outfall Instream Outfall Instream
Nitrate+Nitrite 42 158 NS 1 42 159
Total Suspended Solids 5,999 34,508 NS 0.943 5,999 34,509
Total Cadmium 0(a)
0(a)
NS 0(a)
0(a)
0(a)
Total Copper 4 7 NS 0.002 4 7
Total Lead 1 5 NS 0(a)
1 5
Total Zinc 13 22 NS 0.006 13 22
Total Petroleum
Hydrocarbons 102 0
(a) NS 0
(a) 102 0
(a)
Enterococcus 541,274 157,611 NS 122 541,274 157,733
Hardness 4,002 12,321 NS 42 4,002 12,363
(a) Zero load indicates all concentration data below detection limits.
NS = no concentration data collected during baseflow events at the outfall station.
Continuous Water Quality Monitoring
In June 2014, DEP began continuous monitoring at the instream and outfall station for dissolved
oxygen, specific conductivity, temperature, and turbidity. Through this monitoring, DEP hopes
to gain additional information on the nature of the stream biological community degradation,
specifically any effect due to dissolved oxygen concentration.
Breewood Tributary Biological Monitoring
In March 2010, DEP established a biological monitoring station (SCBT101) in the Breewood
tributary. As shown on Figure III.H.2, the station is located upstream of the Sligo Creek
Parkway and the instream water chemistry monitoring station. Station SCBT101 is monitored
each spring for benthic macroinvertebrates. No fish monitoring is conducted because of the
extremely small drainage area of the tributary.
The DEP uses a BIBI to assess stream conditions at SCBT101. Pre-restoration benthic
community analysis will be compared with post-restoration data to help evaluate watershed
restoration success. DEP will analyze eight metrics of benthic macroinvertebrate community
composition and function. The metrics include examining the percentage of functional feeding
groups (FFGs) present, evaluating taxa richness, taxa composition, and pollution tolerance. Each
measurement responds in a predictable way to increasing levels of stressors. Changes in the
metrics will be seen as the biological community improves and may be seen before the overall
BIBI score increases.

06-DP-3320-MD0068349 Page III-113
Annual Report March 2015
Montgomery County Department of Environmental Protection
FFG classifications organize benthic macroinvertebrates by their feeding strategies (Camann,
2003 and Cummins in Loeb and Spacie, 1994). The five FFGs usually examined in a
bioassessment are collector gatherers, filtering collectors, shredders, scrapers, and predators.
Collector gatherers are the most generalized in feeding and habitat needs and are usually the
most abundant FFG because their food source of fine particulate organic matter is abundant.
Shredders reduce coarse material (like leaves) into fine material which can then be transported
downstream for use by collectors. Shredders are considered specialized feeders and sensitive
organisms and are typically well-represented in healthy streams (U.S. EPA 2008). Other FFGs
include scrapers and predators. Scrapers scrape and graze on diatoms and other algae, are
sensitive to environmental degradation and are associated with high quality streams. Predators
attack and consume other insects and macroinvertebrates.
In 2010, the BIBI score for the tributary was 14 out of a possible 40, indicating a poor benthic
community. Only six taxa were present, indicating low species richness. Shredders accounted
for only 2 percent of the total sample collected at SCBT101 and no scrapers were found.
Collector gatherers accounted for 57 percent of the sample collected at SCBT101. Filterers
accounted for 3 percent and predator organisms composed 38 percent of the total sample.
In 2011, the BIBI score for the tributary was 18 out of a possible 40, indicating a fair benthic
community. There were 14 taxa present, indicating moderate species richness. Shredders
accounted for 11 percent of the total sample collected at SCBT101 and no scrapers were found.
Collector gatherers accounted for 52 percent of the sample collected at SCBT101. Filterers
accounted for 6 percent and predator organisms composed 31 percent of the total sample.
In 2012, the BIBI score for the tributary was 14 out of a possible 40, indicating a poor benthic
community. There were thirteen taxa present, indicating moderate species richness. Shredders
accounted for 2 percent of the total sample collected at SCBT101 and no scrapers were found.
Collector gatherers accounted for 64 percent of the sample collected at SCBT101. Filterers
accounted for 4 percent and predator organisms composed 26 percent of the total sample.
In 2013, the BIBI score for the tributary was 16 out of a possible 40, indicating a poor benthic
community. There were 19 taxa present, indicating moderately high species richness. Shredders
accounted for 5 percent of the total sample collected at SCBT101, but like in 2012 no scrapers
were found. Collector gatherers accounted for 70 percent of the sample collected at SCBT101.
Filterers accounted for 6 percent and predator organisms composed 17 percent of the total
sample.
Figure III.H.4 shows the average proportion of each FFG at SCBT101 and in a reference stream
reach, the Good Hope tributary to Paint Branch (PBGH108). The benthic community of
PBGH108 was rated good in 2010 and fair in 2011 thru 2013. Note that the relative percentage
of predator taxa decreases and the percentages of filterer, shredder, and scraper taxa increases
with an increase in benthic community rating.

06-DP-3320-MD0068349 Page III-114
Annual Report March 2015
Montgomery County Department of Environmental Protection
Figure III.H.4. Functional Feeding Group Comparison in the Breewood
Tributary (SCBT101) and in the Good Hope Tributary (PBGH108)
The DEP used additional metrics to characterize the benthic macroinvertebrate community of the
Breewood tributary in 2013. The biotic index, which measures tolerance to organic pollution,
was 7.05 (out of 10), indicating a relatively high tolerance to organic pollution. In addition, the
dominant taxa in the Breewood assessment were members of the Chironomidae (midge) family,
which tend to be tolerant of pollution and other environmental stressors (Pedersen and Perkins
1986; Jones & Clark 1987). DEP identified a steady decline in the percent of Chironomidae in
the samples (down from 91 percent in 2011 to 62 percent in 2013), but not an obvious cause.
The BIBI score analysis also includes determining the presence of EPT taxa (commonly known
as mayfly, stonefly, and caddisfly) which are sensitive species commonly associated with high
quality streams. In the 2013 Breewood tributary benthic macroinvertebrate sample, there were
very few EPT taxa present.
Breewood Tributary Physical Habitat Assessment
Starting in 2010, DEP performed yearly physical habitat assessments at SCBT101. Pre-
restoration monitoring will establish a baseline for comparison with future habitat assessments.
Results indicate that the habitat is consistently rated fair, receiving a score of 77 (out of a
possible 200) in 2013. Scores from 2010 to 2012 ranged from 71 to 97. DEP found that the
stream has poor riffle quality, high embeddedness values, bank instability, and a narrow riparian
zone, which lowered the overall habitat score. DEP observed an increase in riffle quality in 2011
and 2012, which contributed to the overall increase in habitat score. In 2013, however; DEP
noted reduced riffle quality, and higher embeddedness due in part to pre-restoration activities,
and overland flow diverted from a non-functioning storm drain. Figure III.H.5 shows a
comparison of the Breewood tributary BIBI and habitat conditions with those in the Paint Branch
reference stream reach from 2010 to 2013.
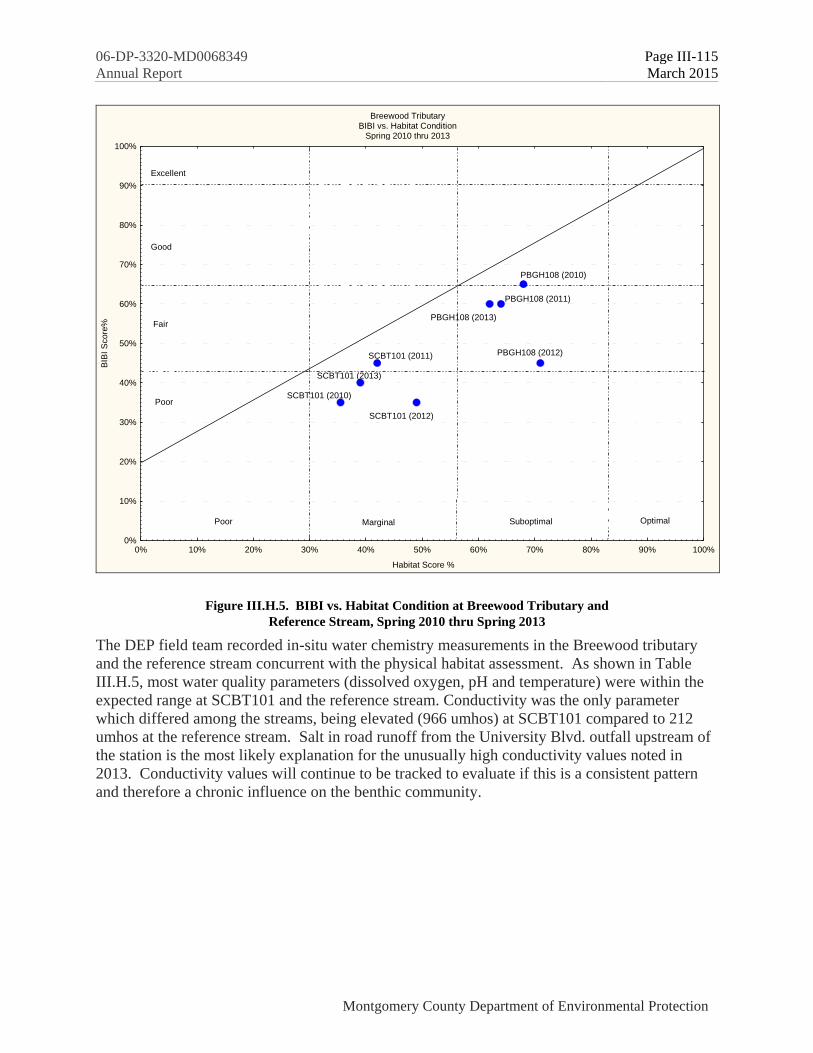
06-DP-3320-MD0068349 Page III-115
Annual Report March 2015
Montgomery County Department of Environmental Protection
Breewood TributaryBIBI vs. Habitat Condition
Spring 2010 thru 2013
0% 10% 20% 30% 40% 50% 60% 70% 80% 90% 100%
Habitat Score %
0%
10%
20%
30%
40%
50%
60%
70%
80%
90%
100%
BIB
I S
core
%
SCBT101 (2010)
PBGH108 (2010)
SCBT101 (2011)
PBGH108 (2011)
SCBT101 (2012)
PBGH108 (2012)
SCBT101 (2013)
PBGH108 (2013)
OptimalSuboptimalMarginalPoor
Excellent
Good
Fair
Poor
Figure III.H.5. BIBI vs. Habitat Condition at Breewood Tributary and
Reference Stream, Spring 2010 thru Spring 2013
The DEP field team recorded in-situ water chemistry measurements in the Breewood tributary
and the reference stream concurrent with the physical habitat assessment. As shown in Table
III.H.5, most water quality parameters (dissolved oxygen, pH and temperature) were within the
expected range at SCBT101 and the reference stream. Conductivity was the only parameter
which differed among the streams, being elevated (966 umhos) at SCBT101 compared to 212
umhos at the reference stream. Salt in road runoff from the University Blvd. outfall upstream of
the station is the most likely explanation for the unusually high conductivity values noted in
2013. Conductivity values will continue to be tracked to evaluate if this is a consistent pattern
and therefore a chronic influence on the benthic community.

06-DP-3320-MD0068349 Page III-116
Annual Report March 2015
Montgomery County Department of Environmental Protection
Table III.H.5. In-Situ Water Chemistry Results at Breewood Tributary
(SCBT101) and at the Good Hope Tributary (PBGH108) Reference Stream
Station Type Benthic
Community
Rating
Date Dissolved
Oxygen
(>5mg/l)
% Dissolved
Oxygen
Saturation
pH Conductivity
(<= 300
umhos)
Air
Temp.
(deg
C)
Water
Temp.
(deg C)
SCBT101 Benthic Poor 5/7/2010 8.73 87 7.30 566 21 15.4
SCBT101 Benthic Fair 3/9/2011 10.57 87 7.83 727 5 7.8
SCBT101 Benthic Poor 3/19/2012 10.35 90 5.9 565 22 14.3
SCBT101 Benthic Poor 3/21/2013 9.05 83 7.56 966 12 12.0
PBGH108 Benthic Good 4/22/2010 10.69 90 6.24 166 12 11.0
PBGH108 Benthic Fair 4/18/2011 10.60 104 6.79 143 17 14.4
PBGH108 Benthic Fair 4/11/2012 11.27 110 7.36 157 14 10.6
PBGH108 Benthic Fair 3/20/2013 12.31 102 6.27 212 9 7.2
Breewood Tributary Physical Geomorphic Assessment
In 2010-2011, DEP established two study area for physical geomorphic monitoring (20-bankfull
widths) in the Breewood tributary (Figure III.H.2). Study Area 2 extends downstream from the
end of Tenbrook Drive to just upstream from Sligo Creek Parkway and includes the biological
monitoring station at SCBT101. A second study area (Study Area 1) extends from the outfall
channel below University Boulevard to the Breewood tributary.
Figure III.H.6 provides representative cross section views of Study Area 1. In 2011, the average
particle size of the channel substrate below the bankfull channel height was 0.062 mm, which is
classified as fine sand. In 2012 and 2013, the average particle size of the channel substrate
below the bankfull channel height was slightly coarser, at 0.65 mm in 2012 and 0.55 in 2013,
which is classified as coarse sand. This area of the stream is predominated by riffles and runs.
In 2011, riffles accounted for 39 percent of the reach surveyed and runs accounted for 38 percent
of the reach surveyed. In 2012 and 2013, riffles accounted for approximately 48 percent of the
reach surveyed and runs accounted for 31 percent of the reach surveyed. The results of the
survey indicate a degraded channel with low sinuosity, and high erosion potential.

06-DP-3320-MD0068349 Page III-117
Annual Report March 2015
Montgomery County Department of Environmental Protection
Figure III.H.6. Representative Cross Sections from Breewood Tributary, Study Area 1
Figure III.H.7 provides representative cross section views of Study Area 2. The average particle
size of the channel substrate below the bankfull channel height ranged from 2.8 mm (very fine
gravel) in 2010 to 12 mm (medium gravel) in 2011. In 2013 the average particle size was 8 mm
(fine gravel). This area of the stream is predominated by riffles, which accounted for between
47 percent and 54 percent of the reach surveyed. The results of the survey also indicate a
degraded channel with low sinuosity, and high erosion potential. More annual variability is
noted in the cross sections at Study Area 2 than at Study Area 1.

06-DP-3320-MD0068349 Page III-118
Annual Report March 2015
Montgomery County Department of Environmental Protection
Figure III.H.7. Representative Cross Sections From Breewood Tributary, Study Area 2
Figure III.H.8 provides a photograph of a representative cross-section with Study Area 1,
demonstrating the severe down-cutting that has occurred in this part of the Breewood tributary.

06-DP-3320-MD0068349 Page III-119
Annual Report March 2015
Montgomery County Department of Environmental Protection
Figure III.H.8. Upstream View of Sligo Creek,
Breewood Tributary, Study Area 1- Cross Section 1
Summary of Biological and Physical Monitoring of the Breewood Tributary
The 2010 thru 2013 monitoring results document pre-restoration conditions and provide
evidence that the Breewood tributary is impaired and will likely benefit from stream restoration.
Monitoring will continue annually to evaluate improvements to the biology and habitat that are
anticipated as a result of the restoration efforts.
Additional Monitoring: Watershed Restoration Project Monitoring
In addition to the Permit required monitoring, DEP monitors stream restoration projects and
some associated stormwater retrofits to assess whether project goals are met and to determine
how future projects will be designed and built to ensure a positive impact on the aquatic
ecosystem. The purpose of restoration monitoring is to document whether specific project goals
have been met and whether desired improvements to the watershed, as a whole, have been
reached. Short-term monitoring (usually within 5 years) can often show the effect of a specific
project on a stream, but long term monitoring (at least 10 years) is needed to show trends within
a watershed.
Montgomery County’s watershed restoration monitoring program has evolved over the years to
collaborate more with the design of the projects themselves. In the early days of the program,
monitoring not as well integrated and resulted in lack of pre-construction data or lack of relevant
data in general. Projects are now typically developed with a clear set of quantifiable goals that
can be monitored. Monitoring conducted prior to the construction of a project aids in the design
of the project. There is adequate time to collect necessary pre-construction data and ensure a
sampling design that fits the design of the specific project. Also, after many years of continued

06-DP-3320-MD0068349 Page III-120
Annual Report March 2015
Montgomery County Department of Environmental Protection
restoration efforts, certain watersheds have had enough comprehensive restoration performed
and enough years of monitoring to begin to show cumulative results. These more recent reports
are forthcoming and , when available, will be posted on the MCDEP website. The full technical
report for FY14 can be found in Appendix L in the electronic attachment to this report.
H.2 Stormwater Management Assessment
The Permit requires the County to assess effectiveness of stormwater management practices
found in the 2000 Maryland Stormwater Design Manual for stream channel protection. During
the previous permit cycle, MDE approved DEP’s proposal to conduct the required monitoring
within a developing area of the Clarksburg SPA. Specific monitoring requirements include an
annual stream profile and survey of permanently mounted cross-sections, and comparison to
baseline conditions.
The DEP established monitoring stations in two drainage areas; a “positive control” where the
drainage area will remain undeveloped and mostly forested and a “test area” where development
occurs in the contributing drainage area. The test area is located in the Newcut Road
Neighborhood tributary to Little Seneca Creek (LSLS104). The control area is located in
Soper’s Branch to the Little Bennett Creek (LBSB101). Methodology is described in the
County’s 2003 NPDES Report, Part III.D2, attached to this report as Appendix M. Figure
III.H.9 shows the locations of the two areas and their contributing drainage areas, with the
control area shown in yellow labeled “Soper’s Branch”, and the test area shown in red labeled
“Trib 104”.
Both drainage areas include a stream gage at the bottom of each study catchment. The test and
control areas are also visited once per year to monitor biological conditions, habitat and physical-
chemical data. Benthic macroinvertebrates are monitored during the spring index period (March
15 through April 30). Fish were not used as indicators for the small first order streams since
frequently there is limited fish habitat.
Figure III.H.9 also shows the locations of three other areas monitored as part of the Clarksburg
Monitoring Partnership (CMP), a consortium of local and federal agencies and universities. Two
additional test areas were selected for the CMP: one area also in the Newcut Road Neighborhood
(shown as Trib109) and one in the Cabin Branch Neighborhood (shown as Cabin Branch). One
additional control area (shown as Crystal Rock) was set up in an existing developed area in
Germantown. All the test and control areas have USGS flow gages installed, where continuous
stream flow data is being collected. Two rain gages monitor area rainfall and document local
rainfall intensities to correlate rainfall to stream flow. One gage is located at Little Bennett
Regional Park, and the other gage is located at Black Hill Regional Park.
The CMP is using a Before, After, Control, Impact (BACI) design or paired catchment
(watershed) design (Farahmand et al. 2007) approach to assess the land use changes and the
impacts to stream conditions. The CMP has been monitoring since 2004. The CMP is also using
Light Detection and Ranging (LiDAR) imagery to provide greater resolution in mapping
landscape changes at this smaller drainage area scale than is possible using traditional aerial
photography.
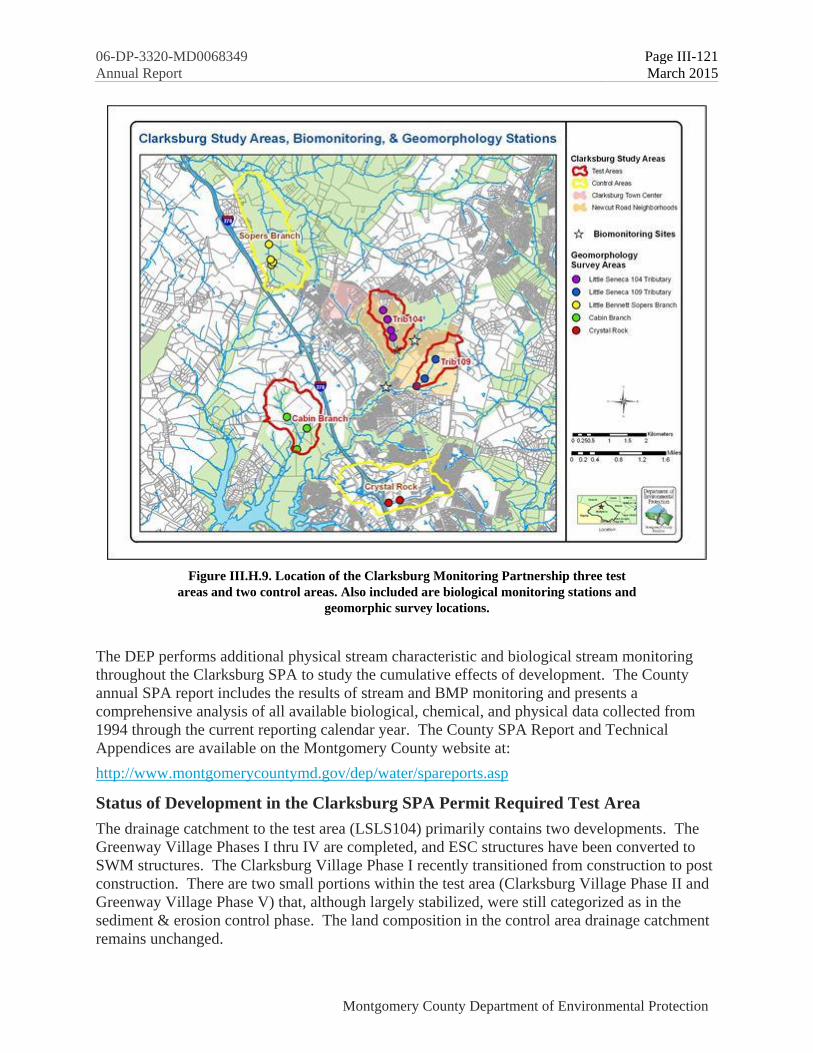
06-DP-3320-MD0068349 Page III-121
Annual Report March 2015
Montgomery County Department of Environmental Protection
Figure III.H.9. Location of the Clarksburg Monitoring Partnership three test
areas and two control areas. Also included are biological monitoring stations and
geomorphic survey locations.
The DEP performs additional physical stream characteristic and biological stream monitoring
throughout the Clarksburg SPA to study the cumulative effects of development. The County
annual SPA report includes the results of stream and BMP monitoring and presents a
comprehensive analysis of all available biological, chemical, and physical data collected from
1994 through the current reporting calendar year. The County SPA Report and Technical
Appendices are available on the Montgomery County website at:
http://www.montgomerycountymd.gov/dep/water/spareports.asp
Status of Development in the Clarksburg SPA Permit Required Test Area
The drainage catchment to the test area (LSLS104) primarily contains two developments. The
Greenway Village Phases I thru IV are completed, and ESC structures have been converted to
SWM structures. The Clarksburg Village Phase I recently transitioned from construction to post
construction. There are two small portions within the test area (Clarksburg Village Phase II and
Greenway Village Phase V) that, although largely stabilized, were still categorized as in the
sediment & erosion control phase. The land composition in the control area drainage catchment
remains unchanged.

06-DP-3320-MD0068349 Page III-122
Annual Report March 2015
Montgomery County Department of Environmental Protection
Precipitation, Infiltration, and Annual Flows
Average annual precipitation is about 42 inches in the Baltimore-Washington area (NWS 2008).
Average monthly precipitation varies slightly throughout the year but localized spring and
summer thunderstorms can cause significant variations in precipitation among nearby locations
(Doheny et al. 2006; James 1986). To assure that such localized events were accurately
captured, two rain gages were established for the Clarksburg Monitoring Partnership at Black
Hill Regional Park in Cabin Branch and Little Bennett Regional Park in Soper’s Branch. The
data collected provides statistics on pattern and amount of rainfall, storm durations, storm mean
intensity, and storm peak intensity.
Hydrologic Data Analysis and Interpretation
Stream flow gages continue to provide data that allows the calculation of instantaneous peak
discharge and daily mean discharge as well as stream height response during storm events.
Descriptive information on the five flow gages is presented in Table III.H.6.
Table III.H.6. Descriptions of the Five USGS Stream Gages in the Clarksburg Study Area
Gage Id.
Number
Name Date
Started
DA
(mi2)
DA
(acres)
Closest Test
or Control
Area
01644371
Newcut Road Neighborhood tributary
to Little Seneca Creek Near
Clarksburg, MD (“Test Area”)
5/2004 0.43 275.2 Test Area
(LSLS104)
01643395 Soper’s Branch at Hyattstown, MD
(“Control Area”) 2/2004 1.17 748.8
Control Area
(LBSB201)
01644375 Little Seneca Creek Tributary Near
Germantown, MD 6/2004 1.35 864 Crystal Rock
01644372 Little Seneca Creek Tributary at
Brink, MD 6/2004 0.37 236.8 LSLS109
01644380 Cabin Branch Near Boyds, MD 6/2004 0.79 505.6 Cabin Branch
Annual runoff from stream gages in the test area (USGS gage 01644371) and the control area
(USGS Gage 01643395) was compared to rainfall data from the Cabin Branch and Soper’s
Branch rain gages to determine how much average annual precipitation infiltrates into the
groundwater or is released into the atmosphere through evapotransporation within the drainage
areas of the gages. Data were obtained from the online Water Year Reports published by the
USGS, Baltimore Office (Doheny 2009, personal communication) for water years 2005 thru
2013. Water Years cover the period from October 1 of 1-year to September 30 of the next year.
The 2013 USGS Water Data Report for the two stream gages is available at:
http://wdr.water.usgs.gov/wy2013/pdfs/01643395.2013.pdf (Soper’s Branch control area)
http://wdr.water.usgs.gov/wy2013/pdfs/01644371.2013.pdf (Little Seneca Creek test area)

06-DP-3320-MD0068349 Page III-123
Annual Report March 2015
Montgomery County Department of Environmental Protection
Summary information on stream characteristics at the test area and the control area will be
provided in the 2012/2013 Special Protection Area Report. The report will be available on the
Montgomery County website at:
http://www.montgomerycountymd.gov/dep/water/spareports.asp
Time of Concentration
Time of concentration (TOC) is defined as the difference in time between the start of rainfall and
when discharge begins to increase at the stream gaging station (Doheny et al. 2006). Changes in
the TOC of a drainage area can be useful in understanding stream response to impervious area
increase. When the conversion process to SWM BMPs has been completed in the test area, TOC
will be evaluated to determine if the test area response to rainfall has changed compared to the
control area. In this report, DEP evaluated TOC during the construction period in the test area
(USGS Water Years 2008 through 2013). Table III.H.7 shows the TOC for the developed test
area (LSLS104) stream gage and the control area (LBSB101) stream gage.
Table III.H.7. Time of Concentration in Minutes
for Water Years 2008-2013
Control Station
(LBSB101)
Test Station
(LSLS104))
Mean 181 86
Median 123 45
Max 1080 720
During the construction period (October 1, 2007 thru September 30, 2013), the TOC was
evaluated at the control area stream gage (LBSB101) and at the test area stream gage (LSLS104).
On average, the test area tributary responded twice as fast as the control area for the same range
of storms exceeding ½ -inch of rainfall (see Figure III.H.10).

06-DP-3320-MD0068349 Page III-124
Annual Report March 2015
Montgomery County Department of Environmental Protection
Figure III.H.10. Comparison of Time of Concentration (TOC)
at the control area (LSLB101) stream gage and at the test area (LSLS104)
stream gage for rainfall greater than 1/2" in 24 hours.
Stream Geomorphology Monitoring
Figures III.H.11 A and B provide survey locations for the stream geomorphology monitoring in
the test area tributary and in the control area. Multiple surveys were completed in both areas to
document the temporal change in stream channel morphology. Survey information includes
longitudinal profiles, cross sections, bed composition (pebble counts), and sinuosity.
Surveys were established within similar habitat sections of each study stream. At that time, the
upstream habitat sections were steeply-graded, straight channels (low sinuosity index) consisting
mostly of riffle habitat. More downstream sections were characterized by decreasing slopes,
increasing sinuosity and pools become more prevalent. There are four channel cross-section
locations in both study areas, labeled from 1-4, with location 4 representing the most
downstream cross-section location. All cross sections used in this comparison were measured in
riffle/run stream areas. Riffle/run areas serve as grade control for the stream and are areas that
resist changes to cross-section features.
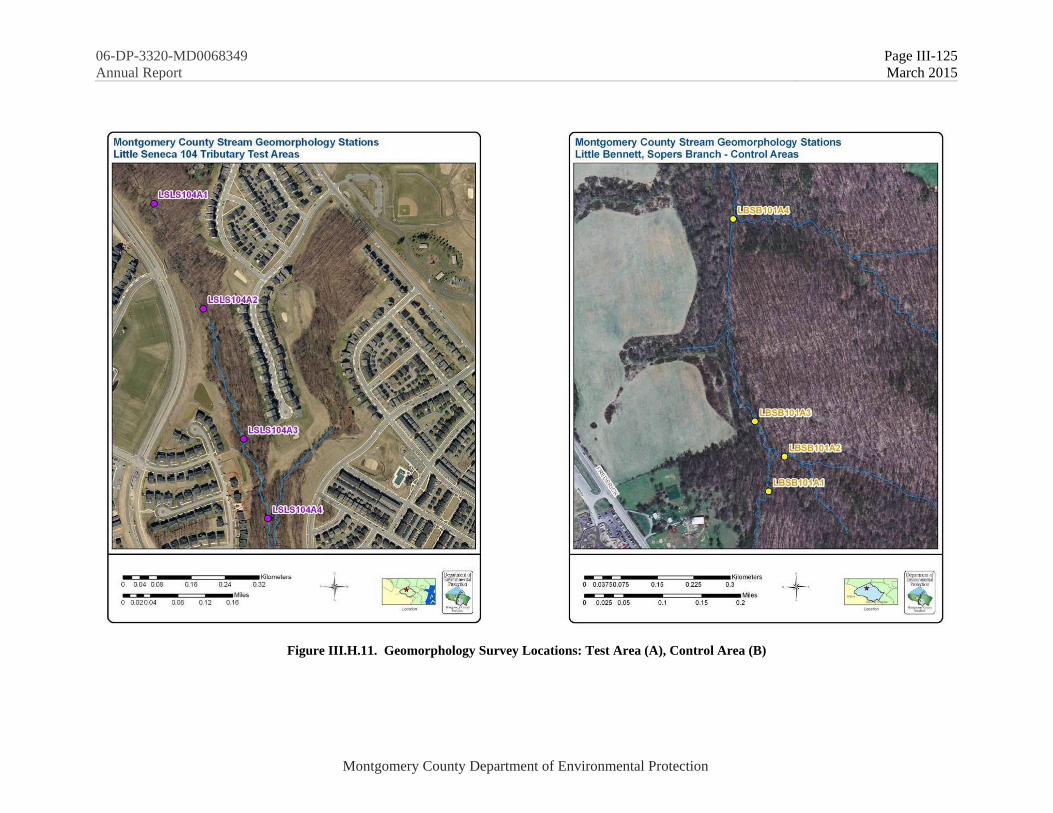
06-DP-3320-MD0068349 Page III-125
Annual Report March 2015
Montgomery County Department of Environmental Protection
Figure III.H.11. Geomorphology Survey Locations: Test Area (A), Control Area (B)
06-DP-3320-MD0068349 Page III-126
Annual Report March 2015
Montgomery County Department of Environmental Protection
Data Analysis and Interpretation
As development alters an area’s surface hydrology, rainfall infiltration will decrease and
stormwater runoff will increase, with corresponding higher peak flows and scour in the receiving
stream channel. The eroded material is carried away and deposited downstream (aggradation).
As the development site stabilizes, the receiving stream enters an erosional phase where the
overland sediment supply is reduced and geomorphic readjustment takes place (Paul and Meyer
2001). To document stream physical changes during development, DEP conducts annual
monitoring of cross-sections, pebble counts for average particle size, stream bed elevation, and
measures of sinuosity. Table III.H.8 summarizes sinuosity indices and survey information for
the test area (LSLS104) and the control area (LBSB101). Data are shown for the furthest
downstream survey area within each reach.
Evaluation of sinuosity over time documents a difference between the test and control stations.
Sinuosity is the ratio between the length of the stream and the corresponding length of the stream
valley. A ratio of 1:1 would indicate a very straight and channelized stream. From 2003 to 2006
sinuosity ratios went from 1.4 to 1.0. This would be consistent with the increased annual runoff
to the test area. After SWM began to be functional in late 2008, the ratio began to increase
slightly, and is currently at 1.2. The sinuosity of the control area channel has remained more
consistent than in the test area throughout the monitoring period.
The average particle size (D-50) for substrate material in the test area exhibited an increase at the
most downstream study area through 2010. In 2011 the average particle size decreased at the
test area for the first time since 2004. This corresponds with the beginning of the post-
construction period at Clarksburg Village Phase I. The average particle size increased in 2012,
but decreased again in 2013. Increased runoff rates during the construction period may have
been flushing the finer particles downstream, while the coarser, parent material aggregates of the
stream channel were left in place. Increased impervious may also result in a system which
prevents sediment from entering the system naturally. To reach equilibrium, sediment is
removed from the stream channel in one location and deposited downstream in another area.
Cross sections from the test area illustrate this process on Figure III-H.12. The cross sections
generally show channel aggradation corresponding to the most active years of construction
(2004, 2005 and 2006), and then channel degradation and some widening from 2007 to 2011 as
the test area neared final elevations and stabilization. In 2012 approximately 1 foot of
aggradation was observed. In 2013, little change was noted, indicating that the channel may be
stabilizing. Changes are most evident in the lower portion of the cross section profiles, at or
below frequent storm elevation.
In contrast, representative sections from the control area showed little yearly change
(Figure III.H.13).

06-DP-3320-MD0068349 Page III-127
Annual Report March 2015
Montgomery County Department of Environmental Protection
Table III.H.8. Sinuosity indices and survey information for test area (LSLS104) and control area (LBSB01). Data are shown for
furthest downstream survey areas within each reach
Sinuosity Index (SI)
Year ‘03 ‘04 ‘05 ‘06 ‘07 ‘09 ‘10 ‘11 ‘12 ‘13
LSLS104 A4 1.4 1.4 1.3 1.0 1.0 1.2 1.3 1.2 .12 1.2
LBSB201 A4 1.1 1.1 1.0 1.2 1.2 1.1 1.2 1.0 1.0 1.0
LSCB201 A3 NA 1.4 1.1 1.4 1.1 1.2 1.2 1.3 1.1 1.1
Total Longitudinal Slope (%)
Year ‘03 ‘04 ‘05 ‘06 ‘07 ‘09 ‘10 ‘11 ‘12 ‘13
LSLS104 A4 1.3 1.3 1.3 1.3 1.4 1.4 1.4 1.4 1.3 1.3
LBSB201 A4 1.1 0.9 1.5 1.4 1.4 1.5 1.2 1.3 0.9 1.1
D50 (mm)
Year ‘03 ‘04 ‘05 ‘06 ‘07 ‘09 ‘10 ‘11 ‘12 ‘13
LSLS104 A4 8.2 5.7 5.7 7.1 8.5 14 20 0.062 8.9 0.062
LBSB201 A4 16 0.062 8.7 14 9.2 0.062 0.062 0.062 0.062 13
D50 (particle)
Year ‘03 ‘04 ‘05 ‘06 ‘07 ‘09 ‘10 ‘11 ‘12 ‘13
LSLS104 A4 Med.
Gravel
Fine
Gravel
Fine
Gravel
Fine
Gravel
Med.
Gravel
Med.
Gravel
Coarse
Gravel
Fine
Gravel
Med.
Gravel
Fine
Gravel
LBSB201 A4 Course
Gravel
Silt Med.
Gravel
Med.
Gravel
Med.
Gravel
Fine
Gravel
Fine
Gravel
Fine
Gravel
Fine
Gravel
Med.
Gravel

06-DP-3320-MD0068349 Page III-128
Annual Report March 2015
Montgomery County Department of Environmental Protection
Figure III.H.12. Representative cross sections from the test area (LSLS104),
cross section location 4 (most downstream location).
Cross sections are both measured in riffle/run features.

06-DP-3320-MD0068349 Page III-129
Annual Report March 2015
Montgomery County Department of Environmental Protection
Figure III.H.13. Representative cross sections from the control area,
cross section location 4 (most downstream location).
Cross sections both measured in riffle/run features.
Figure III.H.14 shows results of longitudinal profiles, looking parallel to the stream channel,
for the test area (LSLS104) and for the control area (Sopers Branch), respectively. The
stream bed elevation in the test area tributary has shown considerable instability since
construction was initiated, and features frequently change as sediment loads move through
the system. The channel depth and channel width at the downstream study area has increased
since construction began, likely in response to changes in hydrology. Whereas, over the

06-DP-3320-MD0068349 Page III-130
Annual Report March 2015
Montgomery County Department of Environmental Protection
same time period greater consistency was observed in stream bed elevation and feature type
at the control station. The channel area at the control station has also increased, but not as
rapidly as at the test area. This is consistent with more stable hydrologic pattern and possibly
indicative of less sediment moving through the system. An examination of the percent of
riffle/run to percent pool at the test and the control sites revealed no observable trends.
The results presented represent conditions which may still be in a state of flux as the system
responds to the conversion from S&EC to SWM structures. Post-construction monitoring
has not yet been completed. However, from the preliminary results it appears that the
construction phase of development has impacted the test area channel morphology as evinced
by straightening, down-cutting, and enlargement of the channel.
Figure III.H.14. Longitudinal Profiles Test Area (LSLS104) and Sopers Branch Control,
Study Area Location 4 (Most Downstream Location).

06-DP-3320-MD0068349 Page III-131
Annual Report March 2015
Montgomery County Department of Environmental Protection
I. Program Funding The Permit requires that the County submit annual funding for the capital, operation, and
maintenance expenditures in database format specified in Permit Part IV Attachment A,
MDENPDES14.mbd, Parts A-L. The required database is included in electronic format in
Appendix A, MDENPDES14.accdb., Part L. Fiscal Analysis. A discussion of the CIP budget for
stormwater management including watershed assessment and restoration is presented in
Part III.G Watershed Restoration.
During FY14, the reported total funding associated with Permit requirements was $51,728,358,
an increase of 14 percent over the Permit costs in FY13. For FY13-FY14, DEP is reporting all
costs associated with MS4 Program requirements including reporting costs, administrative costs,
overhead, and debt service. It does not include operational DOT and DGS costs associated with
pollution prevention on County property because these agencies do not have a way to separate
out these specific costs from their other operating costs.
Table III.I.1. Total Funding for County MS4 Related Programs By Fiscal Year (in 000s)
Fiscal Year (FY) FY0 FY11 FY12 FY13 FY14
Total Budgeted $27,415 $30,097 $30,302 $44,773* $51,728*
Increase between fiscal years 9.7% .70% 48% 14%
*Including personnel, administrative and debt service costs not reported FY10-FY12.
J. TMDLs The Permit requires the County to develop implementation plans showing how the County will
achieve pollutant load reductions to meet WLAs for any EPA approved TMDLs in County
watersheds. The WIPs must be developed within one year of the TMDL’s approval by EPA.
The final revised Strategy includes implementation plans for all those watersheds groupings
which had one or more EPA-approved TMDLs prior to June 2009.
A summary of the Strategy’s projected progress towards MS4 water quality requirements is
presented in Table III.J.1. For TMDL planning purposes, the County is delineated into eight
watershed groupings based on the eight-digit USGS hydrologic unit codes (HUCs). Figure III.J.1
shows those watersheds with MDE identified impairments and EPA-approved TMDLs as of
January 2014.

06-DP-3320-MD0068349 Page III-132
Annual Report March 2015
Montgomery County Department of Environmental Protection
Table III.J.1. Summary of the Strategy’s Progress
Toward MS4 Water Quality Requirements
The MDE approved the Strategy in July 2012. The approval letter can be found in the electronic
attachment to this report in Appendix B. The County will continue to work with MDE to address
any potential technical issues in the Strategy that are inconsistent with MDE modeling efforts. A
final version of the Strategy incorporating MDE and public comments including the Watershed
Implementation Plans and supporting documents are publicly available on the DEP website at:
http://www.montgomerycountymd.gov/dectmpl.asp?url=/content/dep/water/wris.asp#plans

06-DP-3320-MD0068349 Page III-133
Annual Report March 2015
Montgomery County Department of Environmental Protection
Figure III.J.1. County Watersheds with Impairments and EPA Approved TMDLs
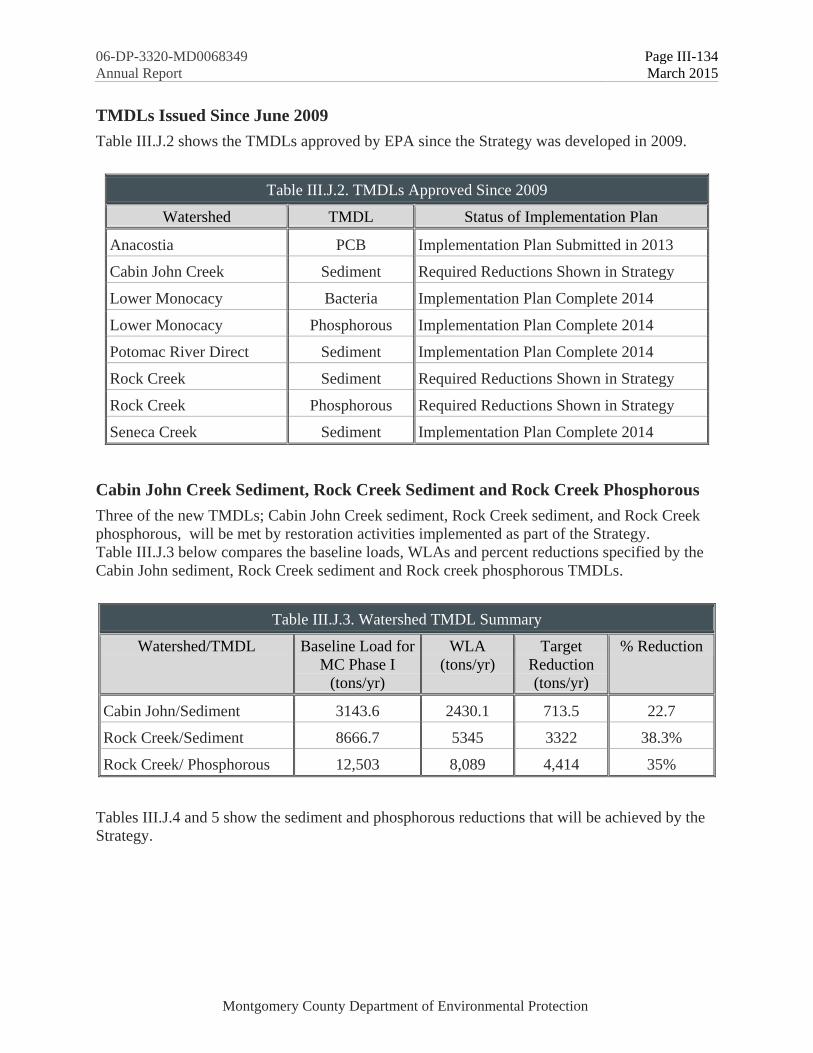
06-DP-3320-MD0068349 Page III-134
Annual Report March 2015
Montgomery County Department of Environmental Protection
TMDLs Issued Since June 2009
Table III.J.2 shows the TMDLs approved by EPA since the Strategy was developed in 2009.
Table III.J.2. TMDLs Approved Since 2009
Watershed TMDL Status of Implementation Plan
Anacostia PCB Implementation Plan Submitted in 2013
Cabin John Creek Sediment Required Reductions Shown in Strategy
Lower Monocacy Bacteria Implementation Plan Complete 2014
Lower Monocacy Phosphorous Implementation Plan Complete 2014
Potomac River Direct Sediment Implementation Plan Complete 2014
Rock Creek Sediment Required Reductions Shown in Strategy
Rock Creek Phosphorous Required Reductions Shown in Strategy
Seneca Creek Sediment Implementation Plan Complete 2014
Cabin John Creek Sediment, Rock Creek Sediment and Rock Creek Phosphorous
Three of the new TMDLs; Cabin John Creek sediment, Rock Creek sediment, and Rock Creek
phosphorous, will be met by restoration activities implemented as part of the Strategy.
Table III.J.3 below compares the baseline loads, WLAs and percent reductions specified by the
Cabin John sediment, Rock Creek sediment and Rock creek phosphorous TMDLs.
Table III.J.3. Watershed TMDL Summary
Watershed/TMDL Baseline Load for
MC Phase I
(tons/yr)
WLA
(tons/yr)
Target
Reduction
(tons/yr)
% Reduction
Cabin John/Sediment 3143.6 2430.1 713.5 22.7
Rock Creek/Sediment 8666.7 5345 3322 38.3%
Rock Creek/ Phosphorous 12,503 8,089 4,414 35%
Tables III.J.4 and 5 show the sediment and phosphorous reductions that will be achieved by the
Strategy.

06-DP-3320-MD0068349 Page III-135
Annual Report March 2015
Montgomery County Department of Environmental Protection
Table III.J.4. Summary of the Implementation Plan Schedule for the
Cabin John Creek Watershed with Expected TMDL Compliance Endpoints
Fiscal Year 2015 2017 2020 2025 2030
Impervious Treated (acres) 187 380 570 1,018 1,018
ESD (% Impervious) 52% 72% 78% 87% 87%
Cost (Million $) 23 65 114 215 219
ESD (% Cost) 92% 91% 86% 90% 88%
% R
edu
ctio
n f
rom
bas
elin
e
TN 21% 27% 39% 55% 58%
TP 20% 26% 35% 49% 51%
TSS 6% 17% 60% 91% 100%
Bacteria 16% 22% 27% 40% 40%
Trash 6% 12% 19% 34% 34%
Table III.J.5. Summary of the Implementation Plan Schedule for the
Rock Creek Watershed with Expected TMDL Compliance Endpoints
Fiscal Year 2015 2017 2020 2025 2030
Impervious Treated (acres) 1,541 1,961 2,381 3,625 3,989
ESD (% Impervious) 17% 28% 36% 57% 61%
Cost (Million $) 87 172 262 566 658
ESD (% Cost) 70% 79% 79% 89% 90%
% R
educt
ion f
rom
bas
elin
e
TN 24% 30% 38% 55% 61%
TP 25% 30% 38% 54% 60%
TSS 38% 50% 92% 100% 100%
Bacteria 21% 27% 33% 50% 55%
Trash 17% 24% 31% 50% 55%
Meeting TMDL WLAs in the Seneca Creek, Lower Monocacy, and Potomac Direct
Watersheds
The DEP completed WIPs of the Seneca Creek, Lower Monocacy, and Potomac Direct in FY15.
The WIPs show how the County will meet the WLAs of those TMDLs by implementing
identified restoration opportunities.

06-DP-3320-MD0068349 Page III-136
Annual Report March 2015
Montgomery County Department of Environmental Protection
Seneca Creek
Based on the total restoration potential analysis performed using the WTM, it will cost the
County approximately $100.74 Million to meet the sediment TMDL requirements. At the
current allocation of funds toward the Seneca Creek watershed, and assuming a 5 percent growth
rate, the County will meet the sediment TMDL by the 2025-2029 permit cycle.
Similarly for the phosphorus TMDL for Clopper Lake, it is anticipated that the County will meet
the phosphorus TMDL by the 2035-2039 permit cycle. The permit cycles with corresponding
pollutant reductions are shown in Table III.J.6, below:
Table III.J.6. TMDL Reduction by Permit Cycles for the Seneca Creek Watershed
Impairment Target Percent
Removal
2015-
2019
2020-
2024
2025-
2029
2030-
2034
2035-
2039
Sediment 44.6% 37.2% 43.7% 51.7% 61.7% 66.6%
Nutrients (Clopper Lake) 45.4% 31.5% 33.4% 38.2% 44.0% 45.7%
Budget (Watershed Subtotal, $ M) $25.81 $32.92 $42.01 $53.62 $42.05
Lower Monocacy Watershed
Based on the total restoration potential analysis performed using the WTM, it will cost the
County approximately $36.1 Million to meet the sediment TMDL requirements. At the current
allocation of funds toward the Lower Monocacy watershed, and assuming a 5 percent growth
rate, the County will meet the sediment TMDL by the 2035-2039 permit cycle.
Similarly for the phosphorus TMDL, it is anticipated that the County will meet the phosphorus
TMDL by the 2035-2039 permit cycle.
The WTM modeling of the Lower Monocacy watershed showed that meeting the bacterial
reduction required by the TMDL is not achievable by the restoration practices considered, and
that the wildlife load within the watershed exceeds the technology available for removal. The
complete suite of practices explored would cost $36.39 Million to implement, which would be
exhausted by the 2035-2039 permit cycle.
The permit cycles with corresponding pollutant reductions are shown in Table III.J.7, below:

06-DP-3320-MD0068349 Page III-137
Annual Report March 2015
Montgomery County Department of Environmental Protection
Table III.J.7. TMDL Reduction by Permit Cycles for the Lower Monocacy Watershed
Impairment Units Target Percent
Removal
2015-
2019
2020-
2024
2025-
2029
2030-
2034
2035-
2039
Sediment tons/yr 60.8% 13.9% 19.9% 27.0% 33.8% 80.9%
Bacteria Billion
MPN/yr
85.4% 21.7% 28.0% 34.8% 40.0% 43.0%
Nutrients
(Phosphorus)
lbs/yr 30.0% 9.1% 13.8% 19.2% 23.7% 37.5%
Budget (Watershed Subtotal, $ M) $1.39 $1.78 $2.25 $2.89 $27.79
Potomac Direct
Based on the total restoration potential analysis performed using the WTM, it will cost the
County approximately $41.59 Million to meet the sediment TMDL requirements. At the current
allocation of funds toward the Potomac Direct watershed, and assuming a 5 percent growth rate,
the County will meet the sediment TMDL by the 2025-2029 permit cycle.
Table III.J.8 shows the County strategy for meeting the local sediment TMDL for the Potomac
Direct watershed.
Table III.J.8. TMDL Reduction by Permit Cycles for the Potomac Direct Watershed
Impairment Target Percent Removal 2015-2019 2020-2024 2025-2029
Sediment 36.2% 28.5% 35.5% 43.4%
Budget (Watershed Subtotal, $ M) $25.53 $32.59 $41.59
Chesapeake Bay TMDL
Information on the County’s Phase II WIP submittal for the Chesapeake Bay TMDL is presented
below in Part V. Special Programmatic Conditions, A. Tributary Strategy


06-DP-3320-MD0068349 Page IV-1
Annual Report March 2015
Montgomery County Department of Environmental Protection
IV. ANNUAL REPORTING
Annual progress reports are required under 40 CFR 122.42(c). This Permit report fulfills this
requirement.


06-DP-3320-MD0068349 Page V-1
Annual Report March 2015
Montgomery County Department of Environmental Protection
V. SPECIAL PROGRAMMATIC CONDITIONS
A. Tributary Strategy The DEP continued to serve as the local liaison for activities related to Maryland’s WIP process.
In July 2014, the MDE published the results of its evaluation of local programs in meeting 2012-
2013 Milestones. The County received 'High' ratings for most of these categories including
resource enhancements, legal authority, organizational enhancements, and planning/studies. The
County's stormwater sector received 'High' ratings in every category. The County received a
“Medium” rating in the review category “addresses appropriate sectors (comprehensiveness)”
because there were no milestones developed for pollution reduction from the septic sector. The
County plans to develop milestones in the septic sector in the future.The complete evaluation is
available on the MDE web site:
http://www.mde.state.md.us/programs/Water/TMDL/TMDLImplementation/Documents/Milesto
nes/2012-2013/Local/Evaluations/Local_2013_Milestone_Summary_Evaluations.pdf
There were no local meetings held during FY14 related to the WIP efforts. However, the DEP
continued to coordinate with the four Phase 2 MS4 Permit localities as MDE moved forward
with the next phase in the Maryland WIP process. This included participating in the WIP
regional meetings held by MDE in April and November of 2013 and coordinating submission in
January 2014 for Phase 2 milestones and local progress. Implementation remains on track as
proposed in the WIP Phase 2 document submitted to MDE in November 2011.
B. Comprehensive Planning The County agencies are routine participants for review and comment as MNCPPC Sector Plan
and Master Plan documents are being developed. During FY14, the DEP provided data and
analysis of local stream conditions for use in the Bethesda Sector Plan and will continue to
participate in the development of the Bethesda EcoDistrict being envisioned. The DEP along
with DPS was a lead local agency for technical and policy support during the 2012-2014 process
for the Ten Mile Creek area Limited Amendment to the Clarksburg Master Plan and Hyattstown
Special Study Area. This process included a watershed-based approach to evaluating existing
water quality and potential development impacts to those receiving streams. The County
Council took the step of establishing the entire Ten Mile Creek watershed as a Special Protection
Area in addition to the protective zoning recommendations from the Planning Board.