ANNUAL REPORT & FINANCIAL STATEMENTS 2013 Libetry Holdings.pdfPwC Tower, Waiyaki Way/Chiromo Road,...
80
ANNUAL REPORT & FINANCIAL STATEMENTS 2013
Transcript of ANNUAL REPORT & FINANCIAL STATEMENTS 2013 Libetry Holdings.pdfPwC Tower, Waiyaki Way/Chiromo Road,...

ANNUAL REPORT & FINANCIAL STATEMENTS 2013


Table of Contents
Table of Contents
Company Review
Company Informartion 1
The Chairman’s Statement 2-3
The Board of Directors 4-5
The Management Team 6-9
Director’s Report 10
Statement of Directors Responsibilities 11
Report of the Consulting Actuary 12
Statement on Corporate Governance 13 - 17
Corporate Social Investment 18 - 20
Five Year Financial Highlights 21
Report of the Independent Auditor 23
Financial Statements
Statement of Profit or Loss 25
Statement of Other Comprehensive Income 25
Statement of Financial Position 26
Statement of Changes in Equity 27 - 29
Statement of Cash flows 30
Notes to the Financial Statement 31 - 71
Supplementary Information 72

OUR MISSIONTo protect and secure life through relevant insurance and financial solutions. With passion, we respond to changing consumer needs through innovative solutions and technologically efficient processes.

Company Information 1ANNUAL REPORT &
FINANCIAL STATEMENTS 2013
REGISTERED OFFICE
CfC House, Mamlaka Road | P.O. Box 30364-00100 Nairobi
INDEPENDENT AUDITOR
PricewaterhouseCoopersPwC Tower, Waiyaki Way/Chiromo Road, Westlands, Nairobi, Kenya
ACTUARIES
Aon South Africa (Pty) LtdThe place, 1 Sandton Drive, Sandhurst, Sandton, South Africa
PRINCIPAL BANKERS
CfC Stanbic Bank LimitedCfC Stanbic Centre, Chiromo road, Westlands, Nairobi, Kenya
Citibank Citibank House, Upperhill Road, Nairobi, Kenya
Commercial Bank of Africa LtdMara and Ragati Roads, Upper Hill, Nairobi, Kenya
TAX CONSULTANTS
Deloitte and ToucheDeloitte Place, Waiyaki Way, Muthangari | P.O. Box 40092-00100 Nairobi, Kenya
CREATIVE AGENCY
Perfect Vision Limited | Duplex Lower Hill | P.O. Box 32766 - 00100, Nairobi | [email protected]

The Chairman’s Statement
It is my pleasure to present to you the annual report and financial statements for the year ended 31 December 2013.
Business environment
The country’s real GDP growth rate in the year 2013 remained fairly flat at 4.7% when compared to 4.6% in 2012. This was as a result of reduced activity by the government and the challenges brought about by the devolution process which was fraught by numerous teething problems especially with regards to the budget. The Country also experienced security lapses which negatively affected the tourism sector; in particular the Westgate Mall attack was a setback to the business community at large.
During the year, the currency remained resilient losing only 0.3% in the year despite strong external forces that would have justified a weaker currency. Intervention by the Central Bank was not uncommon as it sought to shore up the shilling in order to avoid macroeconomic imbalances. The policy rate was gradually adjusted downward signalling an expansionary monetary policy. The CBK rate was cut from 11% to 8.5% during the year.
Inflation pressures during the year remained low, recording an average of 5.7% compared to 9.6% in 2012. The Central Bank announced that they would be targeting inflation within a range of 2.5% to 7.5% as a policy objective. The low inflation was mainly driven by low food prices throughout the year. The introduction of the VAT Act in October 2013 had a slight impact, causing a temporary upsurge in inflation, the effects of which waned out after Treasury clarified on its application.
The market for Treasury securities was quite active during the year with the Treasury Bill rates recording mixed performance in the year. We saw rates decline significantly in the first half of the year to touch lows of 5% but the trend gradually reversed to the double digits level in the second half of the year. The yield curve largely tracked lower than 2012 levels on all tenors though marginally. The bond portfolios therefore recorded a positive performance during the year.
For the second year running, the stock market recorded strong performance with the NSE 20 Share index going up by 19% while the All Share Index (NASI) recorded an impressive 44% during the same period. Foreign investor participation in the bourse was strong throughout the year despite the fact that it was an electioneering year.
Company performance
The operating environment was stable for the Company, particularly after the elections. The period preceding the elections was characterized by a fairly heated political environment which did not augur well for our business development initiatives. Our overall performance was therefore weighed down by a poor first quarter. The resilience of our sales force, which has never been in doubt, came through in the second and third quarters when we recovered most of the lost ground to register a growth of 12% in gross written premium for the year. At the same time pension contributions grew by 10% and total pension liabilities stood at Ksh.11.1b, up from Ksh.10.5b in the prior year. The Group Life line grew by 40% and remained profitable in spite of the rate undercutting in the market. Investment income was slightly below prior year due to the reduction in the value of some of the shares in our portfolio. An exercise to rationalize our expense base saw it increase only marginally by 4%. The solvency margin for the company remained fairly strong at 1.46 times the statutory minimum. The company registered a profit of Shs 437 million before tax, the highest in its history, against a restated prior year loss of Shs 51 million.
The company changed its accounting policy during the year to conform to a new accounting convention and to align our reporting standards to those of the parent company, Liberty Holdings Limited. This involved the recognition in the profit or loss account of any changes in the fair value of financial assets, accounting for deferred tax and valuing the actuarial liabilities through Gross Premium Valuation (GPV) instead of Net Premium Valuation (NPV) as was the case previously. The impact of these restatements can be seen in the set of financial accounts in this report.
In order to enhance the level of our operational efficiency we embarked on a project dubbed “Boresha CfC Life” to clean up all areas that were identified as bottlenecks within our operations. All members of staff were involved in the identification of substandard areas of our operations that required remedy. Good progress has been made in resolving the identified issues and as at the time of writing this report 80% of the identified issues had been closed. As a result of this exercise our operating platform is much improved which will enable us to deliver better value to our customers.
During the year the company was awarded a number of accolades to recognize its excellent service to customers. One of our agents also won the coveted AKI Agent of the
2

The Chairman’s Statement (Continued)
Year Award. All these are a result of our concerted effort to benchmark ourselves against the best in the industry. We will continue to afford our agents quality training so that they remain well positioned to give prospective clients sound financial advice. Similarly our employee value proposition calls for job enrichment and competitive remuneration. The high score attained in the Employee Attitude Survey in the year is a testimony to the high regard with which we hold our staff.
Management in conjunction with members of the board formulated a new business strategy within the year to drive growth and profitability of the Company for the next 4 years to 2017. This strategy is premised on aggressive growth in all lines of business, particularly group risk where our market share is currently below 6%. We will also drive growth in retail life through the innovation of new products and use of non-traditional distribution channels in order to deliver insurance solutions to more Kenyans. The new strategy equally calls for rebranding of the Company to align it with the internationally recognized “Liberty Life” brand of our majority shareholder. Secondly, the adoption of the new name will avoid the name confusion that is currently apparent in the market with another player.
Business outlook
The economic outlook for 2014 is promising with the projected real GDP growth rate expected to surpass the 5% level. Whereas this is lower than the envisaged 10% growth in the Vision 2030 country blue print, it is imperative that the economy remains on a positive growth trajectory. The growth drivers for 2014 will include; agriculture, tourism, manufacturing, and financial services. The devolution process will also support widespread growth across the country as county governments start implementing their development plans. The stock market has so far showed signs of weakness driven largely by increased exit of foreign investors. US tapering of the Quantitative Easing program is a key event that has direct impact on investors asset allocation choices where we may see a re-allocation to Treasury securities as yields pick-up. Inflation is expected to remain in the single digits with pressure piling on the food index. This will inform the interest rate direction in the short term. The currency is expected to remain fairly firm at the current levels but with a bias of weakness especially in the wake of US dollar strengthening. Judging by the past, the Treasury is expected to intervene as necessary to shore up the currency in order to pre-empt any steep devaluation.
In the meantime we have positioned ourselves for radical growth in 2014 and beyond, having finalized the strategic plan for the Company for 2014-2017. While this growth will not be possible without the introduction of new products, we will enhance our customer service proposition to encourage valued customers to stay longer with us. In addition to our agency distribution network we will continue to build relationships with banks in order to grow our bancassurance book as this remains a major growth area for the Company. Similarly our market share in the area of group risk is still very low, a fact that presents us with a good opportunity to grow in this line of business. We will therefore continue to leverage our improving broker relations to acquire new schemes but I should like to mention that a leapfrog growth in future for group risks will largely depend on our ability to leverage on the non-traditional distribution channels, particularly where we partner with other organizations to provide cover to their client base through the Affinity model. The market continues to evolve and the wide usage of technology such as mobile telephony and the internet presents us with opportunities to distribute our products using such media. We are exploring ways in which we can effectively leverage technology to expand our distribution capabilities.
Acknowledgements
I wish to thank my fellow directors for their continued support and commitment to the Company. I also wish to thank our staff and agents for their hard work and unrelenting support to the organisation in spite of all the challenges we faced during the year.
Finally, I wish to appreciate and salute the thousands of clients who continue to support our business so loyally. I assure them of our commitment to continue providing them with unparalleled service and a range of products that will sufficiently address their needs in 2014 and beyond.
P N GethiChairman31 March, 2014
3ANNUAL REPORT &
FINANCIAL STATEMENTS 2013

The Board of Directors
ABEL MUNDAPETER NDERITU GETHI CLAIRE W. MWANGI JOHN MILNE
PETER NDERITU GETHI (Chairman)
Mr Gethi holds a BSc (Hons) degree in Agricultural Economics and has expansive managerial experience in Agricultural Business Management. He has been a General Manager with Kilimanjaro Plantations Ltd (TZ) and Senior Group Manager with SCEM Ltd (formerly Standard Chartered Estate Management). He currently works both as a an Agricultural Consultant and is involved with Real Estate Development as Managing Director of Nebange Ltd. He is also the Chairman of Heritage Insurance (K) Ltd; Director Heritage Insurance (T); Director CfC Stanbic Holdings; Director CfC Stanbic Bank. He serves in the Audit & Risk Committees of Liberty Holdings Kenya Ltd and Heritage Insurance (T).
ABEL MUNDA (Managing Director)
Mr. Abel Munda, holds a Masters of Business Administration and is a Certified Public Accountant. He is also a fellow of the Life Office Management Institute. Mr. Munda has a rich working experience in accounting and financial management having worked in various senior management positions both in the USA and Africa operations of American Life International Company (ALICO) for over twenty two years prior to joining CfC Life Assurance Limited in February 2005 as the Finance Director. In February 2006 he joined CfC Bank as the director in charge of Finance and Administration a position he held for two and a half years prior to joining CfC Life in 2008 as the managing director.
JOHN MILNE
Mr Milne is the Managing Director of the Heritage Kenya, an associate company of CfC Life. He has vast knowledge and experience in the insurance industry in Kenya and Tanzania where he is a member of the Board of Heritage Tanzania.
CLAIRE W. MWANGI
Ms Mwangi is a career banker having held various Executive Director positions in CfC STANBIC Bank Kenya responsible for global markets business in Kenya and South Sudan, regional responsibility for Uganda, Tanzania and Mauritius. She has also worked with CITIBANK NA in Kenya, Mauritius And Tanzania. She also holds various directorships in banks and financial services companies.
4

The Board of Directors (Continued)
SONAL SEJPALGAYLING MAY MIKE DU TOIT STUART WENMAN
GAYLING MAY
Mr May has an extensive accounting background and is a member of the Institute of Certified Public Accountants of Kenya (ICPAK) and a fellow of the Institute of Chartered Accounts in England and Wales (FCPA). He has worked in the UK, USA and for the most part, Kenya, and has a history of 37 years with PricewaterhouseCoopers, 32 of which as a Partner/Regional Senior Partner. He is currently the Regional Representative of the Eastern Africa Association, a business information service based in Nairobi, but operating throughout East Africa. He holds various directorships in banks, insurance companies, manufacturing entities and an aircraft ground handling company.
MIKE DU TOIT
Mr. du Toit is the Company’s Managing Director and Liberty Africa Regional Managing Director for East Africa responsible primarily for Strategic Growth initiatives. He joined Liberty in 2010, prior to which he was the Managing Director of CfC Stanbic Bank having led the merger of the Stanbic and CfC Groups. As a career banker, he has extensive experience in the financial services field across sub-Sahara Africa having worked and lived in, amongst others, Botswana, Mozambique, South Africa and Uganda,.
SONAL SEJPAL
Ms Sejpal is a consultant lawyer with Anjarwalla and Khanna Advocates, a member of the Africa Legal Network. She has an excellent reputation in Kenya as a corporate finance and commercial lawyer. She advises clients on a range of corporate matters, including mergers and acquisitions, joint ventures, schemes of arrangements, project finance, aviation, oil and gas projects, employment matters, commercial contracts and general corporate advice on an ad hoc basis.
STUART WENMAN
Mr Wenman is an Executive Director of Liberty South Africa in charge of Insurance in Africa responsible for the strategy and commercial results of all the Life and Short Term Insurance businesses outside of South Africa for Liberty Holdings. He holds vast experience in actuarial science, risk management and insurance.
5ANNUAL REPORT &
FINANCIAL STATEMENTS 2013

The Management Team 6

The Management Team (Continued) 7ANNUAL REPORT &
FINANCIAL STATEMENTS 2013
Simon Mwaura General Manager Finance and Administration
Peter Kirori Head of Corporate Sales
Edwin Obuya Head of Bancassurance
Alex Amolloh Head of Operations
Moses Mutuli General Manager Actuarial
William Oluande Country Head Agency Sales
Juliana Nguli General Manager Human Resources
Gerardus Otiti Head of Group Life
Gladys Musembi Head of Deposit Administration
Musili Kivuitu General Manager Risk and Compliance
Charles Kiboi General Manager Information & Communication Technology
Roselyne Khamala Acting Manager Customer Service and Conservation
Back (left to right)
Front (left to right)
The Management Team (Continued)
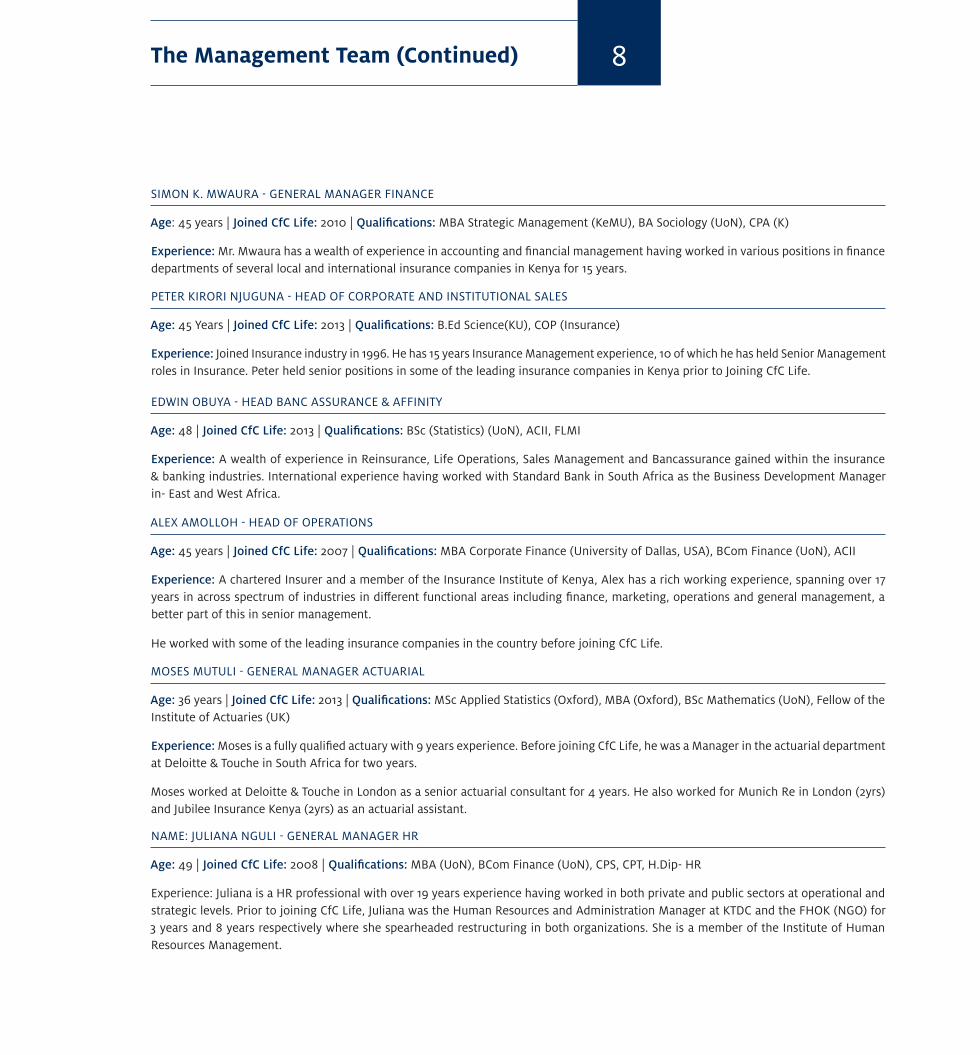
EDWIN OBUYA - HEAD BANC ASSURANCE & AFFINITY
Age: 48 | Joined CfC Life: 2013 | Qualifications: BSc (Statistics) (UoN), ACII, FLMI
Experience: A wealth of experience in Reinsurance, Life Operations, Sales Management and Bancassurance gained within the insurance & banking industries. International experience having worked with Standard Bank in South Africa as the Business Development Manager in- East and West Africa.
NAME: JULIANA NGULI - GENERAL MANAGER HR
Age: 49 | Joined CfC Life: 2008 | Qualifications: MBA (UoN), BCom Finance (UoN), CPS, CPT, H.Dip- HR
Experience: Juliana is a HR professional with over 19 years experience having worked in both private and public sectors at operational and strategic levels. Prior to joining CfC Life, Juliana was the Human Resources and Administration Manager at KTDC and the FHOK (NGO) for 3 years and 8 years respectively where she spearheaded restructuring in both organizations. She is a member of the Institute of Human Resources Management.
MOSES MUTULI - GENERAL MANAGER ACTUARIAL
Age: 36 years | Joined CfC Life: 2013 | Qualifications: MSc Applied Statistics (Oxford), MBA (Oxford), BSc Mathematics (UoN), Fellow of the Institute of Actuaries (UK)
Experience: Moses is a fully qualified actuary with 9 years experience. Before joining CfC Life, he was a Manager in the actuarial department at Deloitte & Touche in South Africa for two years.
Moses worked at Deloitte & Touche in London as a senior actuarial consultant for 4 years. He also worked for Munich Re in London (2yrs) and Jubilee Insurance Kenya (2yrs) as an actuarial assistant.
PETER KIRORI NJUGUNA - HEAD OF CORPORATE AND INSTITUTIONAL SALES
Age: 45 Years | Joined CfC Life: 2013 | Qualifications: B.Ed Science(KU), COP (Insurance)
Experience: Joined Insurance industry in 1996. He has 15 years Insurance Management experience, 10 of which he has held Senior Management roles in Insurance. Peter held senior positions in some of the leading insurance companies in Kenya prior to Joining CfC Life.
SIMON K. MWAURA - GENERAL MANAGER FINANCE
Age: 45 years | Joined CfC Life: 2010 | Qualifications: MBA Strategic Management (KeMU), BA Sociology (UoN), CPA (K)
Experience: Mr. Mwaura has a wealth of experience in accounting and financial management having worked in various positions in finance departments of several local and international insurance companies in Kenya for 15 years.
ALEX AMOLLOH - HEAD OF OPERATIONS
Age: 45 years | Joined CfC Life: 2007 | Qualifications: MBA Corporate Finance (University of Dallas, USA), BCom Finance (UoN), ACII
Experience: A chartered Insurer and a member of the Insurance Institute of Kenya, Alex has a rich working experience, spanning over 17 years in across spectrum of industries in different functional areas including finance, marketing, operations and general management, a better part of this in senior management.
He worked with some of the leading insurance companies in the country before joining CfC Life.
8

The Management Team (Continued)
CHARLES KIBOI - GENERAL MANAGER ICT
Age: 45 | Joined CfC Life: 1999 | Qualifications: B.Ed Science (KU), CPA (II), H. Diploma – IDPM
Experience: A cumulative experience in the IT field of 22 years gained through working with firms in the financial, manufacturing and IT sectors in both private and public institutions. He has been with ICT department of CfC Life for the last 14 years having joined as a System Analyst in 1999 from East African Breweries Ltd. He was promoted to head the ICT function in August of 2002, a role he has held to date.
ROSELYNE KHAMALA - ACTING MANAGER-CUSTOMER SERVICE & CONSERVATION
Age: 37 years | Joined CfC Life: MARCH 2003 | Qualifications: Bachelor of Agribusiness Management (EU), ALMI, ICS
Experience: Roselyne has 11 years experience in customer service at CfC Life at operational and strategic levels. She has successfully served in various capacities within the company: Roselyne has effectively executed the Customer Service strategy from September 2013 to date. Before joining CfC Life, she worked at KADET (Kenya Agency for Development, Enterprise and Technology) in 2002, where she spearheaded Service Devolution to the Branch network. She is also an active participant of the ICS, Kenya (Institute of Customer Service, Kenya).
GLADYS MUSEMBI - HEAD OF DEPOSIT ADMINISTRATION
Age: 46 | Joined CfC Life: 2011 | Qualifications: BA - Banking and Insurance (Sheffield University - UK), Executive MBA ( JKUAT), FCII
Experience: Gladys has extensive experience in pension funds management, she started her career at Kenya Reinsurance and later moved to ICEA where she rose to Head of Corporate Trustee and Administration. Prior to joining CfC Life she worked at Co-operative Bank as Head of Custody.
WILLIAM OLUANDE - COUNTRY HEAD AGENCY SALES
Age: 59 | Joined CfC Life: 1981 | Qualifications: 1st degree equivalent in Aviation, COP, Aviation-Aeronautical Information and Air Traffic Control (E.A. School of Aviation and Sofreavia –Paris, France)
Experience: He has a total of 33 years experience in sales and sales management. William has a wealth of experience in recruitment and retention of agents, agent’s development, motivation and agency management. Prior to this, he held senior management position as chief aeronautical information officer for 5 years with the Kenya Civil Aviation Authority having gone up the ranks through merited promotions. During this time, he was in charge of flight planning and aeronautical information services.
GERARDUS OTITI - HEAD OF GROUP LIFE SCHEMES
Age: 43 years | Qualifications: MBA Strategic Management (UoN), BCom Insurance (UoN), AIIK
Experience: Gerardus has 18 years experience in managing corporate business, knowledge and experience in running end to end value proposition by working effectively with broker, agents, bancassurance, direct and affinity channels to develop business opportunities. Gerardus sits in Finance Committee at Insurance Institute of Kenya (IIK), and is a member of Micro Insurance Committee at AKI.
MUSILI KIVUITU - GENERAL MANAGER, RISK & COMPLIANCE
Age: 40 | Joined CfC Life: 2003 | Qualifications: BSc Physics (UoN), ACCA
Experience: He has ten years working experience in audit and financial management of financial institutions, manufacturing, entities and the public sector. He joined CfC Group in February 2003 as the Internal Audit Manager at CfC Bank and took up the position of Head of Internal Audit – Insurance Businesses (Heritage AII – Kenya and Tanzania & CfC Life) in August 2005. In April 2006, he was appointed Head of Finance and Administration of CfC Life. In late 2008, he moved on to head the Company’s Strategy, Risk & Compliance.
He is a member of the Institute of Internal Auditors.
9ANNUAL REPORT &
FINANCIAL STATEMENTS 2013
Director’s Report
The Directors submit their report together with the audited financial statements for the year ended 31 December 2013 which disclose the state of affairs of CfC Life Assurance Ltd.
Principal activities
The Company underwrites Long-term insurance as defined in the Insurance Act. It also issues investment contracts to provide customers with asset management solutions for their savings and retirement needs.
Results and dividend
Profit/ (Loss) for the year of Shs 416,460,000; (2012 Restated: Shs (98,647,000)) has been added to /(deducted from) retained earnings.
The Directors do not recommend a dividend for the year 2013.However during the year 2013, Shs 100m representing a dividend for the year 2012 was paid.
Directors’
The names of the Directors who held office during the year and to the date of this report are set out on page 4 - 5. In accordance with the Company’s Articles of Association, all Directors retire and being eligible, offer themselves for re-election.
Auditor
PricewaterhouseCoopers, continues in office in accordance with Section 159(2) of the Companies Act.
By order of the Board
Caroline KioniCompany Secretary31 March 2014
10

11ANNUAL REPORT &
FINANCIAL STATEMENTS 2013
The Kenyan Companies Act requires the Directors to prepare financial statements for each financial year which give a true and fair view of the state of affairs of the Company as at the end of the financial year and of its profit or loss for that year. It also requires the Directors to ensure that the Company maintains proper accounting records that disclose, with reasonable accuracy, the financial position of the Company. The directors are also responsible for safeguarding the assets of the Company.
The Directors accept responsibility for the preparation and fair presentation of financial statements that are free from material misstatements whether due to fraud or error. They also accept responsibility for:
(i) Designing, implementing and maintaining internal controls as they deem necessary to enable the preparation of financial statements that are free from material misstatements, whether due to fraud or error.
(ii) Selecting and applying appropriate accounting policies; (iii) Making accounting estimates and judgments that are reasonable in the circumstances.
The Directors are of the opinion that the financial statements give a true and fair view of the financial position of the Company at 31 December 2013 and of the Company’s financial performance and cash flows for the year then ended in accordance with International Financial Reporting Standards and the requirements of the Kenyan Companies Act.
Nothing has come to the attention of the Directors to indicate that the Company will not remain a going concern for at least the next twelve months from the date of this statement.
Approved by the Board of Directors on 31 March 2014 and signed on its behalf by:
…………………………………………… ……………………………………………
P N Gethi A Munda
Statement of Directors’ Responsibilities

Report of the Consulting Actuary 12
We have conducted an actuarial valuation of the life assurance business of CfC Life Assurance Limited as at 31 December 2013.
The valuation was conducted in accordance with generally accepted actuarial principles and in accordance with the requirements of the Kenyan Insurance Act. These principles require prudent provision for future outgo under contracts, generally based upon the assumptions that current conditions will continue. Provision is therefore not made for all possible contingencies.
In completing the actuarial valuation, we have relied upon the financial statements of the Company.
In our opinion, the life assurance business of the Company was financially sound and the actuarial value of the liabilities in aggregate for life insurance business did not exceed the amount of funds of the life insurance business as at 31 December 2013.
Ritin I ChauhanAppointed ActuaryFellow of the Actuarial Society of South AfricaAon South Africa (Pty) LtdMarch 2014
Statement on Corporate Governance
CfC Life is committed to a transparent governance process that provides stakeholders with a high degree of confidence that the company is being managed ethically, within prudent risk parameters and in compliance with international best practice. The Board of Directors considers sound corporate governance as pivotal to delivering responsible and sustainable growth in the interests of all stakeholders.
At CfC Life we believe that good corporate governance is integral to the structures and processes that the Boards has put in place to inform, advise, manage and supervise the activities of the company toward the achievement of its strategic objectives. CfC Life constantly monitors developments and trends in corporate governance. We are subject to various jurisdictional requirements, and therefore we conduct our operations in accordance with nationally accepted principles of good corporate governance and best practices, ensuring compliance with the highest of each of those standards. The Board prescribes to the Commonwealth Association of Corporate Governance principles and has adopted the 15 recommended guidelines and associated best practice codes.
The Directors’ exercise stewardship of the Company’s total portfolio of assets and resources with the objective of maintaining and increasing shareholder value and satisfying other stakeholders in the context of its corporate mission. They are concerned with creating a balance between economic and social goals and between individual and communal goals while encouraging the efficient use of resources, accountability in the use of power and stewardship and, as far as possible, the alignment of interests of individuals, corporations and society as a whole.
The following report includes descriptions of our company’s corporate governance structures and procedures, along with an explanation of the work of the various Boards and how they have applied the principles of leadership, effectiveness, accountability and relations with shareholders.
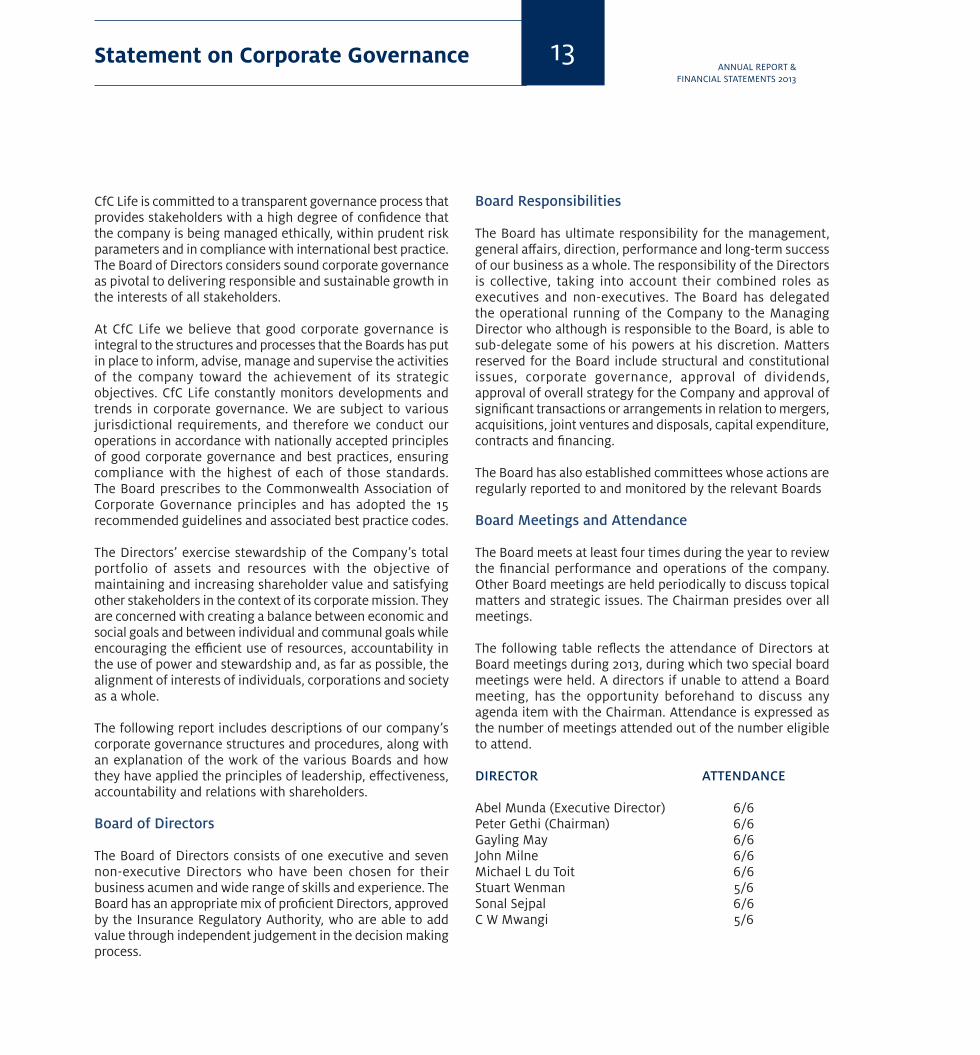
Board of Directors
The Board of Directors consists of one executive and seven non-executive Directors who have been chosen for their business acumen and wide range of skills and experience. The Board has an appropriate mix of proficient Directors, approved by the Insurance Regulatory Authority, who are able to add value through independent judgement in the decision making process.
Board Responsibilities
The Board has ultimate responsibility for the management, general affairs, direction, performance and long-term success of our business as a whole. The responsibility of the Directors is collective, taking into account their combined roles as executives and non-executives. The Board has delegated the operational running of the Company to the Managing Director who although is responsible to the Board, is able to sub-delegate some of his powers at his discretion. Matters reserved for the Board include structural and constitutional issues, corporate governance, approval of dividends, approval of overall strategy for the Company and approval of significant transactions or arrangements in relation to mergers, acquisitions, joint ventures and disposals, capital expenditure, contracts and financing.
The Board has also established committees whose actions are regularly reported to and monitored by the relevant Boards
Board Meetings and Attendance
The Board meets at least four times during the year to review the financial performance and operations of the company. Other Board meetings are held periodically to discuss topical matters and strategic issues. The Chairman presides over all meetings.
The following table reflects the attendance of Directors at Board meetings during 2013, during which two special board meetings were held. A directors if unable to attend a Board meeting, has the opportunity beforehand to discuss any agenda item with the Chairman. Attendance is expressed as the number of meetings attended out of the number eligible to attend.
DIRECTOR ATTENDANCE
Abel Munda (Executive Director) 6/6Peter Gethi (Chairman) 6/6Gayling May 6/6John Milne 6/6Michael L du Toit 6/6Stuart Wenman 5/6Sonal Sejpal 6/6C W Mwangi 5/6
13ANNUAL REPORT &
FINANCIAL STATEMENTS 2013
Statement on Corporate Governance (continued)
Appointment of Directors
Upon consideration and recommendation from the Nominating and Corporate Governance Committee for a candidate to be nominated as an independent Director, suitable candidates are appointed by shareholders at an AGM. All existing Directors, unless they are retiring, submit themselves for re-election every year, and shareholders vote to re-appoint them by a simple majority vote.
Board Evaluation
The Board remains focused on the need for continued improvements in its effectiveness and corporate governance performance and regularly conduct self-assessment evaluations along the lines of structure, process and effectiveness.
Board Induction, Training and Support
All newly appointed Directors are taken through an induction programme immediately upon appointment. Any specific training needs or areas of Board improvement identified from the Board self-assessment process are also addressed regularly.
Remuneration
CfC Life Assurance Limited has a clear policy on remuneration of Executive and Non-Executive directors at levels that are fair and reasonable in a competitive market for the skill, knowledge, experience, nature and size of the Board.
Conflict of Interests
We attach special importance to avoiding conflicts of interest between CfC Life Assurance Limited and our Directors. The Board is responsible for ensuring that there are rules in place to avoid conflicts of interest by Board members. Conflicts of interest are understood not to include transactions and other activities between companies in the CfC Life and Liberty as a group. Authorisation of situational conflicts is given by the Board to the relevant Director. The authorisation includes conditions relating to keeping CfC Life information confidential and to their exclusion from receiving and discussing relevant information at Board meetings. Situational conflicts are reviewed annually by the Boards as part of the determination of Director Independence. In between those reviews Directors have a duty to inform the Boards of any relevant changes to their situation. A Director may not vote on, or be counted in a quorum in relation to, any resolution of the Boards in respect
of any contract in which he or she has a material interest. The procedures that CfC Life has put in place to deal with conflicts of interest continue to operate effectively
Role of the Chairman vs. the Chief Executive
The roles of the Chairman and the Chief Executive are clearly defined and are not vested in the same person. The day-to-day executive management of the Group is delegated to the Chief Executive whereas the running of the Board is the responsibility of the Chairman. The Chief Executive directs the implementation of the Board decisions and instructions on the general management of the Group with the assistance of the Executive Management.
Role of the Board vs. the Executive Management
The roles of the Board and those of the Executive Management are separate and except for the office of the Chief Executive who acts both as a director and as a member of the Executive Management, the offices are not vested in the same persons. The Board is responsible for the long term strategic direction and profitable growth of the Group, while the Executive Management is responsible for the operational day to day running of the Group.
Board Committees
The Board has established two Board Committees, the Audit and Risk Committee and the Investment Committee both formally set up by Board resolutions with defined limits.
These committees are comprised of a balanced mix of non-executive directors, Executive management and Group consultants, with experts and service providers invited to meetings on occasions to provide specific expertise. All Committees are provided with sufficient resources to undertake their duties.
Audit and Risk Committee
The Committee consists of four non-executive Directors. It has an approved mandate and is responsible for the monitoring of risk management, compliance and internal controls as established by the Board and executed by the management of the Company.
It regularly reviews the internal systems controls and effectiveness of financial and operational reporting through
14

the establishment of an internal audit function. It ensures the function is independent, adequately resourced and proficient in its duties. The committee also acts as a liaison with the external auditors approving their scope of work, recommending their remuneration and reviewing their reports.
The Audit and Risk Committee reports to the Board on a quarterly basis and constantly evaluates the ability of the Company to continue as a going concern. The Managing Director, Head of Finance, Head of Risk Management and Head of Internal Audit regularly attend the Committee meetings to respond to issues raised by Committee members.
The attendance of Committee members at the four meetings held in the year 2013 was as follows:
NAME DIRECTORSHIP ATTENDANCE STATUS AT MEETINGSGayling May Non-Executive Director 4/4 (Chairman) Michael L du Toit Non-Executive Director 4/4Stuart Wenman Non-Executive Director 3/4Sonal Sejpal Non-Executive Director 4/4
Investment Committee
The primary function of the Investment Committee is to monitor performance of the Company’s investment portfolio and to ensure that the appointed investment managers comply with the set benchmarks and performance standards. This Committee consists of four non-executive Directors and the Managing Director.
The Committee determines the overall investment strategy for the Company and monitors the performance of the fund managers in achieving the strategy. The company secretary attends the Committee meetings and acts as Secretary to the committee.
The members of the Committee, and their attendance at the meetings held in the year 2013 was as follows:
NAME DIRECTORSHIP ATTENDANCE STATUS AT MEETINGSMichael du Toit Non-Executive Director 4/4 (Chairman) Abel Munda Executive Director 4/4John Milne Non-Executive Director 3/4Stuart Wenman Non-Executive Director 4/4C Wanjiru Mwangi Non-Executive Director 4/4
Management and Operational Committees
For effective implementation of the strategic plan and operations, several management Committees have been constituted. The members of these Committees are mainly the executive management team and business unit leaders. These Committees report to the Managing Director and form the basis of development of strategic objectives and performance management for the Company.
Their main areas of focus are:
• Developmentandimplementationofthestrategicplanandbudgets
• MonitoringoffinancialandoperationalperformanceoftheCompany in line with budgets and international standards
• Management and monitoring of key projects beingundertaken
• ImplementationandmanagementofICTprojects.• Productinnovationanddevelopment.
Internal Control and Risk Management
CfC Life is committed to increasing shareholder value through the prudent management of risks inherent in the production, distribution and maintenance of products and services. CfC Life is mindful of achieving this objective in the interest of all stakeholders. The company continues to explore opportunities to develop and grow its business sustainably, with strategic plans being subject to careful consideration of the trade-off between risk and reward, taking into account the risk appetite limits.
Ultimate responsibility for risk management resides with the Board which ensures that the Business executive is responsible and is held accountable for risk management. The Business executive is supported by risk specialists who instil risk management best practice among all staff.
The Company’s governance structures and processes are aligned with enterprise-wide value and risk management principles. In particular these structures and processes provide clarity of accountability for the management of risk.
Statement on Corporate Governance (continued)
15ANNUAL REPORT &
FINANCIAL STATEMENTS 2013

Governance and the ‘three lines of defence’ model
The chart below depicts CfC Life’s risk management governance
model:
GO
VER
NA
NCE
Ass
uran
ceM
anag
emen
t
Board of Directors and Key Sub Commitees
CfC Life Executive and Key Sub Commitees
First Line of Defense
Second Line of Defense
Third Line of Defense
• Business Unit Executive Committee
• Management of Operations
• Statutory Actuaries and Risk Policy Oversight
• Head of Risk
• Internal Audit Services and Independent External Auditors
Ove
rsig
ht
The Company has adopted the ‘three lines of defence’ model for managing risk. This model defines the roles, responsibilities and accountabilities for managing, reporting and escalating risks and issues. The model incorporates the oversight, management and assurance of risk management, essentially giving three independent views of risk in the organisation. The implementation of this model helps ensure that risk management is embedded in the culture of the organisation and provides assurance to the Board and senior management that risk management is effective.
Within this structure the Company relies on the Board, its standing committees and the company executive committee to provide oversight of the operation of the Company’s enterprise-wide value and risk management.
Roles and responsibilities within the governance model
The roles, responsibilities and accountabilities for managing, reporting and escalating risks and issues have been defined as follows:
Oversight
Board of directors and standing committees
The Board of directors and standing committees of the Board provide an oversight function of the company’s risk management activities. Their accountabilities, membership and related information are described in the following commentary.
Management Committees
The Chief Executive utilises the company executive committee and key management committees to manage the components of risk. A description of each committee’s responsibilities is contained under Board standing committees.
Risk mitigation, monitoring and assurance
First line of defence – business unit management
Business unit management is accountable for:• Managingday-to-dayriskexposuresbyapplyingappropriate
procedures, internal controls and company policies;• Theeffectivenessofriskmanagementandriskoutcomes,
and for allocating resources to execute risk management activities;
• Tracking riskeventsand losses, identifying issuesandimplementing remedial actions to address these issues; and
• Reportingandescalatingmaterialrisksandissuestotherelevant governance bodies as deemed appropriate.
Second line of defence – Head of Risk and Compliance, statutory actuaries, company and business unit risk policy and oversight functions
The individuals responsible for these positions are primarily responsible for verification and identification of key risks and provide the day to day interface between the Boards’ standing committees and management. Their objective is to assist in the effective management of the risks identified within the Company. Various assurances are also provided by these functions and reported to the board, regulators and other authorised stakeholder representatives.
Statement on Corporate Governance (continued) 16

Third line of defence – assurance
This comprises the company’s assurance functions that are intended to provide an independent and balanced view of all aspects of risk management (both first and second line of defence) across the company to the various governance bodies within the organisation.
The company’s key risk management objectives are to: • Grow shareholder value by generating a long-term
sustainable return on capital; • Ensuretheprotectionofpolicyholderandinvestorinterests
by maintaining adequate solvency levels; • Meetthestatutoryrequirementsregulatedandmonitored
by the IRA and other regulators; and • Ensurethatcapitalandresourcesarestrategicallyfocused
on activities that generate the greatest value on a risk adjusted basis.
The management of risks is currently focused on managing shareholder exposures within strategic limits, whilst ensuring sufficient allocation of capital on both a regulatory and economic capital basis.
The framework is based upon the following principles: • Identificationofrisks• Clarityofaccountabilityandownershipofrisks• Riskappetiteneedstobesetmakinguseof limitsand
controls and the risks need to be managed accordingly • Riskquantificationandmeasurement• Riskmonitoringandreporting• Assessmentofvaluecreationonariskadjustedbasis
The Company enhances the risk management framework designed to achieve enterprise-wide value optimisation (value creation, value realisation and value protection) through the following six business capabilities: • Capitalfundingandrisktransfer• Strategicplanningandcapitalallocation• Asset-liabilityandinvestmentmanagement• Productdevelopmentandpricing• Performancemanagementandincentivisation• ExternalcommunicationandreportingRiskmanagement
and mitigation
Business Ethics
The Board subscribes to the highest levels of professionalism and integrity in conducting CfC Life’s business and in dealing with stakeholders. All CfC Life employees and representatives are expected to act in a manner that inspires trust and confidence from the general public. All employees within the Company are required to sign the Company’s Code of Conduct. The Code sets out the Company’s commitment to ethical behaviour in the conduct of its business. Appropriate codes of conduct are driven by governance practice (code of ethics, corporate citizenship code etc.), statutory and regulatory requirements, service objectives (service level agreements, business protocols, business excellence models) and the corporate governance framework itself. Management are required to ensure there is compliance with the code.
Strategic Drive
The CfC Life Year 2014 to Year 2017 strategy that has been developed by Staff and Management in liaison with the Board was approved in Year 2013. The strategy will be reviewed annually and built into the budgeting process for the respective year’s. At each quarterly Board meeting, the Board is briefed by the Management of the progress made to achieve the various checkpoints as detailed in the four year strategic plan.
Statement on Corporate Governance (continued)
17ANNUAL REPORT &
FINANCIAL STATEMENTS 2013

Our Community EngagementsCfC Life CSR main objective continues to aim at improving the living conditions of our employees and their families, our customers and the communities in which we operate, thereby creating a sense of employee satisfaction and customer loyalty. We have continually achieved this objective by encompassing projects that are external to the normal business activities of CfC Life, and not directly for purposes of increasing company profit. The projects we undertake aim to have a strong developmental approach and utilize company resources to benefit and uplift communities, and are not primarily driven as marketing initiatives.
Our CSR policy that has been approved by the Board and also aligned to the group policy mainly focuses on education as the key pillar, but also incorporates other areas of national issues and has the following key guiding principles:
1) Strategic relevance – concerned primarily with education needs in the society.
2) Proportional payback – expenses incurred or resources allocated are covered by the notional value of the benefit derived of ensuring customer loyalty and employee satisfaction.
3) Substance – sufficient to make a real, measurable impact on society
4) Sustainability – projects should be sustainable to ensure the impact is felt by the intended group
In approving the above the Board carefully considered the impact of the Company’s products, services, operations and procedures, to ensure they balance the needs of all stakeholders especially shareholders, employees, our customers and the community at large.
Education PillarIn 2013, we sponsored with either partial or full scholarship a total of 56 high school students, among who were children of CfC Life workforce, children of parents who are policyholders, and some very deserving children whose parents could not afford to pay school fees. Among the student we had 9 who sat their KCSE in the year and registered very good grades which will enable them to further their education. We intend to keep in touch with the students into their higher education in order to create a lasting bond and track their progression into the future.
We are pleased to report that in 2013, we established a partnership with both Starehe Boys’ Centre and School, and Starehe Girls Centre and we provided full scholarship to 1 needy student in each of the school. Apart from the school fees to the two schools we also participated in various activities including 1) the Starehe Girls Walk on 8th June 2013 and golf event at Windsor on 15th November 2013,
aimed at raising money for the school, and 2) Starehe Boys Centre founders day held on 27th July 2013, where we got an opportunity to share will those in attendance how they too can partner with the school, whose reputation of changing life’s by providing quality education to the needy boys in the society spans several decades. We plan to continue with these partnerships in the coming years as we aim to increase the full scholarship category to needy students in order to make valuable contribution in the education sector.
In the same year we participated in the Nelson Mandela Day held on 18th July 2013 at Kilimani Primary School, a Nairobi City Council school that caters for disadvantaged children from Kibera slums, some of them who are visually impaired. We contributed in the renovation of an old store room into a modern library by both having our staff undertake the actual painting and donating Shs 150,000. Further, we entered the Liberty challenge for CSR activities, and won the school the first prize which amounted to R30,000, money that the school plans to use to enhance the students upkeep by improving the efficiency of the feeding programme in the school.
In line with our objective to keep a close relationship with the students and the schools, we ensured hand delivery of all the school fee cheques, and a discussion with the schools principals. This approach has resulted in increased interaction thus providing a mentoring opportunity in order to keep our students motivated and focused towards achieving excellence in their academic goals.
Other contributions to national issuesIn order to ensure participation to the wider society, we also continued to partner with other institutions involved in various activities that are aimed at enhancing the welfare of the community and in 2013 we gave cash donation for two such activities:1) Gertrude Children’s Hospital- Shs 100,0002) Red Cross- Shs 100,000
Further in support of the national call to support victims of the Westgate Mall attack, we rallied over 100 staff members and agency workforce to Uhuru Park to donate blood. While there, we learnt of the need to ensure an adequate blood bank in the country, and hence we aim to make blood donation an annual event in the CSR calendar involving all the staff, so that we can continue to make a difference in the society.
In coming years CfC Life CSR policy will continue enriching the educations needs in the society and truly leave a mark of excellence in the life’s of the children that we sponsor, as we aim to make contribution to the Country vision 2030. We shall also continue to partner with different stakeholders to address societal issues of national interest that aim at improving living standards in our nation.
Corporate Social Investment 18
Corporate Social Investment (continued)
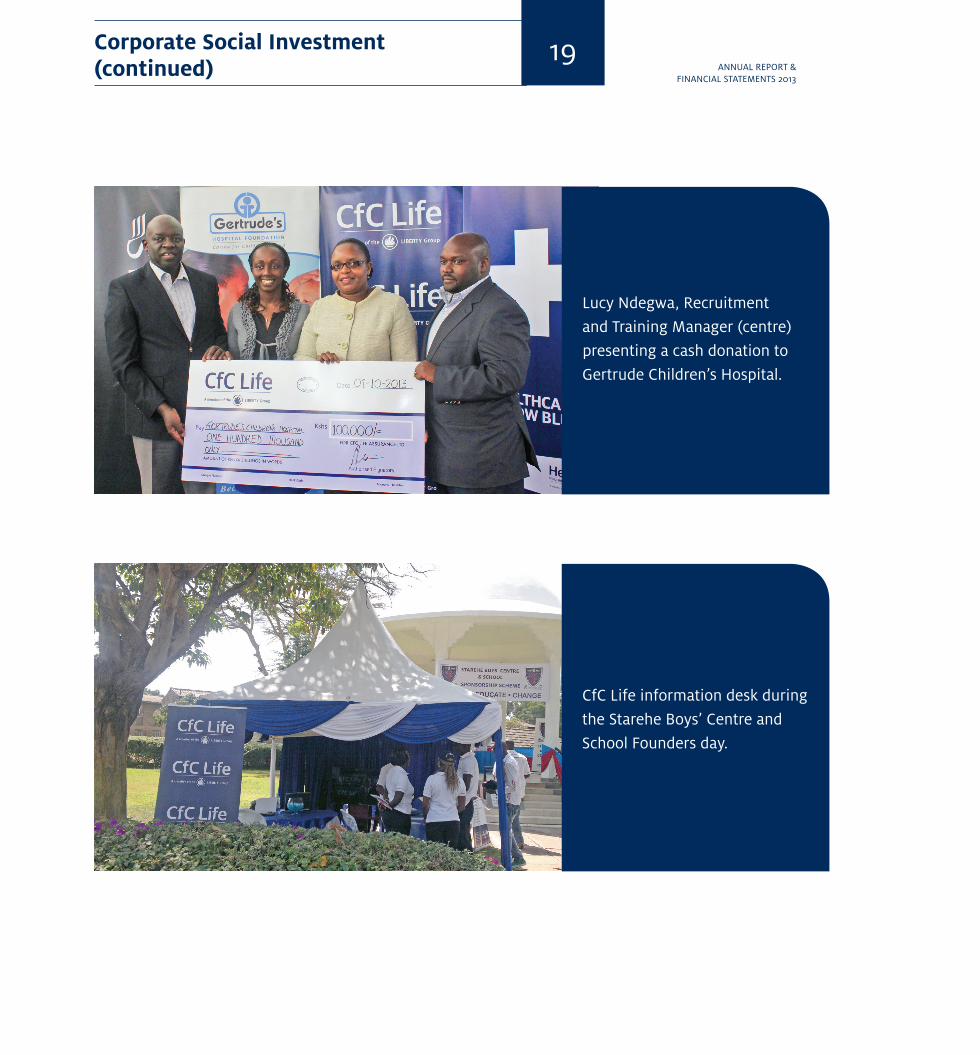
Lucy Ndegwa, Recruitment and Training Manager (centre) presenting a cash donation to Gertrude Children’s Hospital.
CfC Life information desk during the Starehe Boys’ Centre and School Founders day.
19ANNUAL REPORT &
FINANCIAL STATEMENTS 2013

Corporate Social Investment (continued) 20
A group of Liberty Kenya staff memberspresenting a cash donation to Kilimani Primary School as part of Nelson Mandela’s day celebration.
Staff participating in Nelson Mandela Day celebration, painting Kilimani Primary School.
Lucy Ndegwa, Recruitment and Training Manager receiving 2nd runners up award for the Socially Responsible Corporate Award category from Neema Wamai, Managing Director Standard Newspapers-during the Think Business Award night.

5 Year Financial Highlights
Gross premiums in 2013 was Shs 1.7billion, an increase of 13% compared to Shs 1.5billion in 2012.
Policyholders paid out in 2013 was Shs 2.0 billion compared to Shs 2.6 billion in 2012.
Total assets grew by 12% to stand at Shs 20.3 billion in 2013 compared to Shs 18.1 billion in 2012.
(Shs
Bill
ions
)
-0.51.01.52.02.53.0
Policy Holder Benefits
Total Assets
Gross Premiums
(Shs
Bill
ions
)
2.0
1.5
1.0
0.5
-2009 2010 2011
Year2012 2013
2009 2010 2011Year
2012 2013
Year
-
5
10
15
20
25
2009 2010 2011 2012 2013
(Shs
Bill
ions
)
21ANNUAL REPORT &
FINANCIAL STATEMENTS 2013

Total Assets grew by 12% to stand at Ksh 20.3 billion compared to Ksh 18.1 billion.
GROUP VALUES1. Be passionate about our work and utilise our talents to add value.
2. Take initiative and responsibility.
3. Respect and appreciate constructive criticism and the opinions of others. 4. Focus on set goals and deadlines.
5. Be proud ambassadors of our Company and Group
6. Put our customers at the centre of our thinking and serve them with diligence.
7. Encourage teamwork, respect and trust one another. 8. Take ownership for the consequences of our actions. 9. Perform our duties with care, integrity and honesty. 10. Deliver beyond expectation. 11. Constantly improve our skills and knowledge.12. Embrace change.

Report of the Independent Auditor to the members of CfC Life Assurance Limited
PricewaterhouseCoopers CPA. PwC Tower, Waiyaki Way/Chiromo Road, Westlands P O Box 43963 – 00100 Nairobi, Kenya, T: +254 (20)285 5000 F: +254 (20)285 5001 www.pwc.com/ke
Partners: A Eriksson P Kinisu K Muchiru M Mugasa F Muriu P Ngahu A Njeru R Njoroge B Okundi K Saiti R Shah
23ANNUAL REPORT &
FINANCIAL STATEMENTS 2013
We have audited the accompanying financial statements of CfC Life Assurance Limited (the “Company”) set out on pages 25 to 71. These financial statements comprise the statement of financial position at 31 December 2013, and the statement of profit or loss, statement of other comprehensive income, statement of changes in equity and a statement of cash flows for the period then ended, and a summary of significant accounting policies and other explanatory notes.
Directors’ responsibility for the financial statementsThe directors are responsible for the preparation and fair presentation of these financial statements in accordance with International Financial Reporting Standards and with the requirements of the Companies Act and for such internal control, as the directors determine necessary to enable the preparation of financial statements that are free from material misstatements, whether due to fraud or error.
Auditor’s responsibilityOur responsibility is to express an opinion on the financial statements based on our audit. We conducted our audit in accordance with International Standards on Auditing. Those standards require that we comply with ethical requirements and plan and perform our audit to obtain reasonable assurance that the financial statements are free from material misstatement. An audit involves performing procedures to obtain audit evidence about the amounts and disclosures in the financial statements.
The procedures selected depend on the auditor’s judgment, including the assessment of the risks of material misstatement of the financial statements, whether due to fraud or error. In making those risk assessments, the auditor considers internal controls relevant to the entity’s preparation and fair presentation of the financial statements in order to design audit procedures that are appropriate in the circumstances, but not for the purpose of expressing an opinion on the effectiveness of the entity’s internal controls.
An audit also includes evaluating the appropriateness of accounting policies used and the reasonableness of accounting estimates made by the directors, as well as evaluating the overall presentation of the financial statements.
We believe that the audit evidence we have obtained is sufficient and appropriate to provide a basis for our opinion.
OpinionIn our opinion the accompanying financial statements give a true and fair view of the state of the company’s financial affairs at 31 December 2013 and of its financial results and cash flows for the year then ended in accordance with International Financial Reporting Standards and the Kenyan Companies Act.
Kenya’s Companies Act requires that in carrying out our audit we consider and report to you on the following matters. We confirm that:
i) we have obtained all the information and explanations which to the best of our knowledge and belief were necessary for the purposes of our audit;
ii) in our opinion proper books of account have been kept by the company, so far as appears from our examination of those books; and
iii) the company’s statement of financial position and statement of profit or loss are in agreement with the books of account.
The engagement partner responsible for the audit resulting in this independent auditor’s report is CPA Kang’e Saiti –
P/No 1652.
Certified Public Accountants
Nairobi.
11 April, 2014

1. To encourage all employees and agents to exercise their skills and creativity in providing added value to customers, business partners and shareholders.
2. To develop and deliver superior products and services.
3. To maintain a cost effective and efficient operation responsive to technological and market changes.
4. To select and develop employees and agents dedicated to acting with integrity at all times and committed to maintaining the highest standards of professionalism.
OUR OBJECTIVES

Financial Statements 25ANNUAL REPORT &
FINANCIAL STATEMENTS 2013
Statement of profit or loss - For the year ended 31 December
Note 2013 2012 Restated Shs’000 Shs’000Gross earned premiums 5 1,683,137 1,513,455 Less: reinsurance premium ceded (208,640) (185,020) Net earned premiums 1,474,497 1,328,435 Investment income 6 2,028,137 2,171,087 Commissions earned 91,426 64,526 Fee income 15,899 13,292 Total revenue 3,609,959 3,577,340 Claims and policyholder benefits payable 7 2,115,090 2,575,841 Claims recoverable from re-insurers 7 (94,857) (43,366)Net insurance benefits and claims 2,020,233 2,532,475Commissions payable 220,599 196,931 Operating and other expenses 8 932,491 899,301 Total out-flow 3,173,323 3,628,707 Profit before income tax 436,636 (51,368) Income tax expense 10 (20,176) (47,279)Profit/(loss) for the year 416,460 (98,647)
Statement of other comprehensive income - For the year ended 31 December
2013 2012 Restated Note Shs ‘000 Shs ‘000Profit/(loss) for the year 416,460 (98,647) Other comprehensive incomeItems that may be reclassified to profit or lossGain on revaluation of land and buildings 13 38,260 54,211 Less: Deferred income tax on revaluation of land and buildings (11,478) (16,263) Other comprehensive income for the year net of tax 26,782 37,948 Total comprehensive income for the year 443,242 (60,699)

Financial Statements (continued) 26
Statement of financial position - As at 31 December
Note 2013 2012 2011 Restated Restated Shs’ 000 Shs’ 000 Shs’ 000CAPITAL EMPLOYEDCapital Reserves: Share capital 12 612,340 612,340 612,340 Revaluation reserves 13 295,015 268,233 230,285 Retained earnings 14 (341,363) (356,062) (453,606) Statutory reserves 15 955,817 554,056 652,436 Proposed dividends - 100,000 -
Shareholders’ funds 1,521,809 1,178,567 1,041,455
REPRESENTED BY: Property and equipment 16 658,291 660,272 630,777 Intangible assets 17 48,254 63,180 100,935 Prepaid operating lease rentals 639 650 660 Investment properties 18 898,000 756,249 412,500 Government and other securities held-to-maturity 19 6,494,874 7,730,557 6,622,028 Financial assets at fair value through profit or loss 20 5,720,440 2,546,107 2,661,628 Loans and receivables 21 1,055,921 914,153 873,874 Insurance receivables 40,256 35,278 14,470 Reinsurance receivables 23 109,857 27,383 20,450 Re-insurers’ share of technical provisions and reserves 22 76,980 130,506 105,660 Current income tax 34,692 - - Deferred acquisition costs 4,533 - - Other assets 23 132,915 215,622 253,088 Deposits with financial institutions 30 4,773,736 4,746,312 1,490,305 Cash and bank balances 30 232,533 237,864 153,208
TOTAL ASSETS 20,281,921 18,064,133 13,339,583
LIABILITIES Underwriting provisions: Insurance contract liabilities 24 6,366,464 5,185,263 3,783,334 Payable under deposit administration contracts 25 11,103,758 10,465,500 7,651,478 Outstanding claims 192,056 152,737 100,505 Provision for unearned premiums 26 118,709 45,296 - Deferred income tax 29 352,215 340,737 172,874 Creditors arising from reinsurance arrangements 42,384 8,078 1,557 Current tax liabilities - 42,679 6,963 - Other payables 27 584,526 645,276 581,417
TOTAL LIABILITIES 18,760,112 16,885,566 12,298,128
NET ASSETS 1,521,809 1,178,567 1,041,455
The financial statements on pages 25 to 71 were approved for issue by the board of directors on 31 March 2014 and signed on its behalf by:
P N Gethi A Munda G May
Financial Statements (continued) 27ANNUAL REPORT &
FINANCIAL STATEMENTS 2013
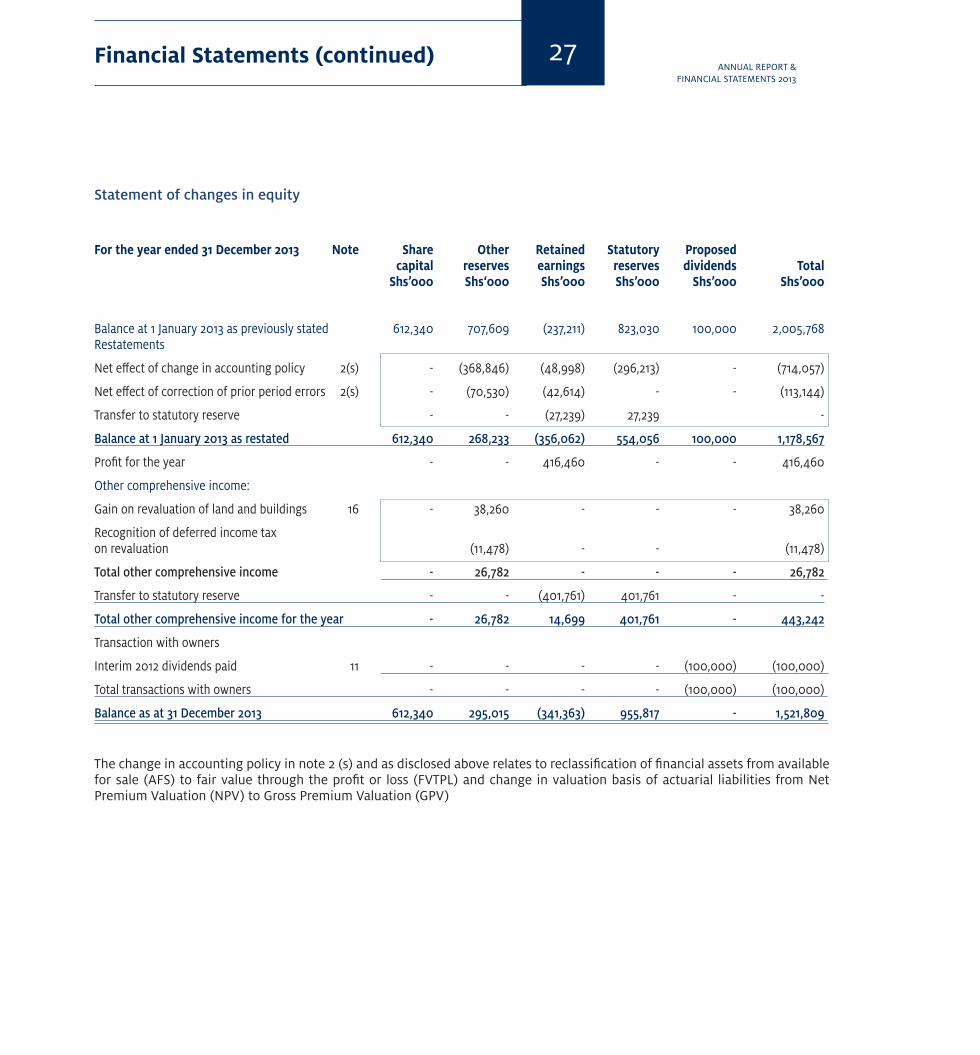
Statement of changes in equity
For the year ended 31 December 2013 Note Share Other Retained Statutory Proposed capital reserves earnings reserves dividends Total Shs’000 Shs‘000 Shs’000 Shs’000 Shs’000 Shs’000
Balance at 1 January 2013 as previously stated 612,340 707,609 (237,211) 823,030 100,000 2,005,768 Restatements
Net effect of change in accounting policy 2(s) - (368,846) (48,998) (296,213) - (714,057)
Net effect of correction of prior period errors 2(s) - (70,530) (42,614) - - (113,144)
Transfer to statutory reserve - - (27,239) 27,239 -
Balance at 1 January 2013 as restated 612,340 268,233 (356,062) 554,056 100,000 1,178,567
Profit for the year - - 416,460 - - 416,460
Other comprehensive income:
Gain on revaluation of land and buildings 16 - 38,260 - - - 38,260
Recognition of deferred income tax on revaluation (11,478) - - (11,478)
Total other comprehensive income - 26,782 - - - 26,782
Transfer to statutory reserve - - (401,761) 401,761 - -
Total other comprehensive income for the year - 26,782 14,699 401,761 - 443,242
Transaction with owners
Interim 2012 dividends paid 11 - - - - (100,000) (100,000)
Total transactions with owners - - - - (100,000) (100,000)
Balance as at 31 December 2013 612,340 295,015 (341,363) 955,817 - 1,521,809
The change in accounting policy in note 2 (s) and as disclosed above relates to reclassification of financial assets from available for sale (AFS) to fair value through the profit or loss (FVTPL) and change in valuation basis of actuarial liabilities from Net Premium Valuation (NPV) to Gross Premium Valuation (GPV)

Financial Statements (continued) 28
Statement of changes in equity
For the year ended 31 December 2012 Note Share Other Retained Statutory Proposed- Restated capital reserves earnings reserves dividends Total Shs’000 Shs‘000 Shs’000 Shs’000 Shs’000 Shs’000
Balance at 1 January 2012 as previously reported 612,340 350,521 (312,546) 318,022 - 968,337
2011 Restatements
Net effect of change in accounting policy 2(s) - 48,987 267,535 (144,711) 171,811
Net effect of correction of prior period errors 2(s) - (169,223) 70,530 (98,693)
Transfer to statutory reserve - - (479,125) 479,125 -
Balance at 1 January 2012 as restated 612,340 230,285 (453,606) 652,436 - 1,041,455
Loss for the year - - (98,647) - - (98,647)
Other comprehensive income:
Gain on revaluation of land and buildings 16 - 54,211 - - - 54,211
Recognition of deferred income tax amount 2(s) - (16,263) - - - (16,263)
Total other comprehensive income for the year - 37,948 - - - 37,948
Transfer from statutory reserve - - 220,858 (372,360) - (151,502)
Balances transferred from Heritage - - 75,333 273,980 349,313
- - 296,191 (98,380) - 197,811
Transaction with owners
Proposed dividends 11 - - (100,000) - 100,000 -
Total transactions with owners - - (100,000) - 100,000 -
Balance as at 31 December 2012 612,340 268,233 (356,062) 554,056 100,000 1,178,567
The change in accounting policy in note 2 (s) and as disclosed above relates to reclassification of financial assets from available for sale (AFS) to fair value through the profit or loss (FVTPL) and change in valuation basis of actuarial liabilities from Net Premium Valuation (NPV) to Gross Premium Valuation (GPV)

Financial Statements (continued) 29ANNUAL REPORT &
FINANCIAL STATEMENTS 2013
Statement of changes in equity
For the year ended 31 December 2011 Note Share Other Retained Statutory- Restated capital reserves earnings reserves Total Shs’000 Shs‘000 Shs’000 Shs’000 Shs’000
Balance at 1 January 2011 as previously reported 612,340 1,313,248 (88,660) 78,716 1,915,644
Effect of change in accounting policy
- Reclassification from AFS to FVTPL 2(s) - (913,740) 913,740 - -
- Reclassification of revaluation reserves (70,530) 70,530 - -
- Income tax expense 2(s) - (98,693) - (72,919) (171,612)
- Transfer to statutory reserve 14 (479,125) 479,125 -
Balance at 1 January 2011 as restated 612,340 230,285 416,485 484,922 1,744,032
Profit for the year - - 315,420 - 315,420
- Reclassification from AFS to FVTPL 2(s) - - (962,727) - (962,727)
- Valuation of liabilities from NPV to GPV 2(s) - - 316,522 - 316,522
- Recognition of deferred tax on surplus 28 - - - (71,792) (71,792)
Transfer from statutory reserve - - (239,306) 239,306 -
Total other comprehensive income for the year - - (570,091) 167,514 (402,577)
Transaction with owners
Interim dividend paid 11 - - (300,000) - (300,000)
Total transactions with owners - - (300,000) - (300,000)
Balance as at 31 December 2011 612,340 230,285 (453,606) 652,436 1,041,455
The change in accounting policy in note 2 (s) and as disclosed above relates to reclassification of financial assets from available for sale (AFS) to fair value through the profit or loss (FVTPL) and change in valuation basis of actuarial liabilities from Net Premium Valuation (NPV) to Gross Premium Valuation (GPV)

Financial Statements (continued) 30
Statement of cash flows - For the year ended 31 December
Note 2013 2012 Restated Shs’ 000 Shs’ 000Cash flows from operating activities
Cash generated from operations 31 382,532 2,512,619Income tax paid (42,736) (15,407)Net cash from operating activities 339,796 2,497,212 Cash flows from investing activities Interest received 1,161,020 1,206,737 Purchase of property and equipment 16 (20,265) (68,457)Purchase of intangible assets 17 (2,092) (13,308)Net investments in equities 20(i) (725,092) 868,813Government and other securities - Fair value through P&L assets 20(ii) (2,079,297) (486,770)Net investment in government securities - HTM 19 1,182,085 (1,013,799) Net investment in corporate bonds 19 9,275 124,400 Net investment in policy loans 21 (37,964) 157,457Net investment in mortgage and staff loans 21 (2,469) (22,341)Dividends received 297,096 90,719 Net cash used in investing activities (217,703) 843,451Cash flows from financing activities Dividends paid (100,000) - Net cash used in financing activities (100,000) - Increase in cash and cash equivalents 22,093 3,340,663 Movement in cash and cash equivalents At start of year 4,984,176 1,643,513 Increase 22,093 3,340,663 At end of year 30 5,006,269 4,984,176
Notes to the Financial Statements 31ANNUAL REPORT &
FINANCIAL STATEMENTS 2013
1. REPORTING ENTITY
CfC Life Assurance Company Limited (the “Company”) is incorporated in Kenya under the Companies Act and is domiciled in Kenya. The address of its registered office is:-
CfC HouseMamlaka RdP.O. Box 30364-00100Nairobi.
The Company is engaged in long-term insurance that comprises life assurance and deposit administration. Life assurance business relates to the underwriting of risks relating to death of an insured person, and includes contracts subject to the payment of premiums for a term dependent on the termination or continuance of the life of an insured person. Deposit administration business relates to administration of pension scheme funds.
For Kenyan Companies Act reporting purposes, the balance sheet is represented by the statement of financial position and the profit and loss account by the statement of profit or loss in these financial statements.
2. SUMMARY OF SIGNIFICANT ACCOUNTING POLICIES
The principal accounting policies adopted in the preparation of these financial statements are set out below. These accounting policies have been consistently applied to all years presented, unless otherwise stated.
(a) Basis of preparation
The financial statements have been prepared in accordance with International Financial Reporting Standards (“IFRS”). The measurement basis applied is the historical cost basis, except for land and buildings, which have been measured at fair value.
The preparation of financial statements in conformity with IFRS requires the use of certain critical accounting estimates. It also requires the directors to exercise judgement in the process of applying the Company’s accounting policies. The areas involving a higher degree of judgement or complexity, or where assumptions and estimates are significant to the financial statements, are disclosed in Note 3.
Changes in accounting policy and disclosures(i) New and amended standards adopted by the Company
The following standards have been adopted by the Company for the first time for the financial year beginning on or after 1 January 2013 and have a material impact on the Company:
Amendment to IAS 1, ‘Financial statement presentation’ regarding other comprehensive income. The main change resulting from these amendments is a requirement for items presented in ‘other comprehensive income’ (OCI) on the basis of whether they are potentially reclassifiable to profit or loss subsequently (reclassification adjustments).
Amendment to IFRS 7, ‘Financial instruments: Disclosures’, on asset and liability offseting. This amendment includes new disclosures to facilitate comparison between those entities that prepare IFRS financial statements to those that prepare financial statements in accordance with US GAAP.
Amendments to IAS 36, ‘Impairment of assets’, on the recoverable amount disclosures for non-financial assets. This amendment removed certain disclosures of the recoverable amount of cash-generating unit (CGUs) which had been included in IAS 36 by the issue of IFRS 13. The amendment is not mandatory for the Company until 1 January 2014, however the Company has decided to early adopt the amendment as of 1 January 2013.
IFRS 13, ‘Fair value measurement’, aims to improve consistency and reduce complexity by providing a precise definition of fair value and a single source of fair value measurement and disclosure requirements for use across IFRSs. The requirements, which are largely aligned between IFRSs and US GAAP, do not extend the use of fair value accounting but provide guidance on how it should be applied where its use is already required or permitted by other standards within IFRSs.
(ii) New standards and interpretations not yet adopted
A number of new standards and amendments to standards and interpretations are effective for annual periods beginning after 1 January 2013, and have not been applied in preparing these consolidated financial statements. None of these is expected to have a significant effect on the consolidated financial statements of the Group, except the following set out below:
IFRS 9, ‘Financial instruments’, addresses the classification, measurement and recognition of financial assets and

Notes to the Financial Statements (continued)
2. SUMMARY OF SIGNIFICANT ACCOUNTING POLICIES (CONTINUED)
32
financial liabilities. IFRS 9 was issued in November 2009 and October 2010. It replaces the parts of IAS 39 that relate to the classification and measurement of financial instruments. IFRS 9 requires financial assets to be classified into two measurement categories: those measured as at fair value and those measured at amortised cost. The determination is made at initial recognition. The classification depends on the entity’s business model for managing its financial instruments and the contractual cash flow characteristics of the instrument. For financial liabilities, the standard retains most of the IAS 39 requirements. The main change is that, in cases where the fair value option is taken for financial liabilities, the part of a fair value change due to an entity’s own credit risk is recorded in other comprehensive income rather than the income statement, unless this creates an accounting mismatch. The Company is yet to assess IFRS 9’s full impact. The Group will also consider the impact of the remaining phases of IFRS 9 when completed by the Board.
IFRIC 21, ‘Levies’, sets out the accounting for an obligation to pay a levy that is not income tax. The interpretation addresses what the obligating event is that gives rise to pay a levy and when should a liability be recognised. The Group is not currently subjected to significant levies so the impact on the Group is not material.
There are no other IFRSs or IFRIC interpretations that are not yet effective that would be expected to have a material impact on the Group.
(b) Insurance contracts
Classification
The Company issues contracts that transfer insurance risk or financial risk or both. Insurance contracts are those contracts that transfer significant insurance risk. Such contracts may also transfer financial risk. As a general guideline, the Company defines as significant insurance risk, the possibility of having to pay benefits on the occurrence of an insured event that are at least 10% more than the benefits payable if the insured event did not occur.
Investment contracts are those contracts that transfer financial risk with no significant insurance risk. The accounting policy for these contracts is described under note 2(d) to the financial statements.
Insurance contracts and investment contracts are classified into two main categories, depending on the duration of risk and as per the provisions of the Kenyan Insurance Act.
Long-term insurance business includes insurance business of all or any of the following classes, namely, life assurance business, superannuation business, industrial life assurance business, bond investment business and business incidental to any such class of business.
Life assurance business means the business of, or in relation to, the issuing of, or the undertaking of a liability to pay money on death (not being death by accident or in specified sickness only) or on the happening of any contingency dependent on the termination or continuance of human life (either with or without provision for a benefit under a continuous disability insurance contract) and include a contract which is subject to the payment of premiums for term dependent on the termination or continuance of human life and any contract securing the grant of an annuity for a term dependent upon human life; Superannuation business means life assurance business, being business of, or in relation to, the issuing of or the undertaking of liability under superannuation, group life and permanent health insurance policy.
Recognition and measurement
(i) Premium income
Premiums are recognised as revenue when they become payable by the contract holder. Premiums are shown before deduction of commission.
(ii) Claims
Benefits are recorded as an expense when they are incurred. Claims arising on maturing policies are recognised when the claim becomes due for payment. Death claims are accounted for on notification. Surrenders are accounted for on payment.
A liability for contractual benefits that are expected to be incurred in the future is recorded when the premiums are recognised. The liability is determined as the sum of the expected discounted value of the benefit payments and the future administration expenses that are directly related to the contract, less the expected discounted value of the theoretical premiums that would be required to meet the benefits and administration expenses based on the valuation assumptions used (the valuation premiums). The liability is based on
(a) Basis of preparation (continued)

2. SUMMARY OF SIGNIFICANT ACCOUNTING POLICIES (CONTINUED)
Notes to the Financial Statements (continued) 33ANNUAL REPORT &
FINANCIAL STATEMENTS 2013
assumptions as to mortality, persistency, maintenance expenses and investment income that are established at the time the contract is issued. A margin for adverse deviations is included in the assumptions.
Where insurance contracts have a single premium or a limited number of premium payments due over a significantly shorter period than the period during which benefits are provided, the excess of the premiums payable over the valuation premiums is deferred and recognised as income in line with the decrease of unexpired insurance risk of the contracts in-force or, for annuities in force, in line with the decrease of the amount of future benefits expected to be paid.
The liabilities are recalculated at each financial reporting date using the assumptions established at inception of the contracts.
(iii) Commissions payable and deferred acquisition costs (“DAC”)
Deferred acquisition costs represent the proportion of commissions payable and other acquisition costs that relates to policies that are in force at the year end where the premium has not been earned. DAC is recognised as an asset and is subsequently amortised over the life of the contracts in line with premium revenue using assumptions consistent with those used in calculating future policy benefit liabilities.
(iv) Liability adequacy test
At each financial reporting date, liability adequacy tests are performed to ensure the adequacy of the contract liabilities net of related DAC. In performing these tests, current best estimates of future contractual cash flows and claims handling and administration expenses, as well as investment income from the assets backing such liabilities, are used. Any deficiency is immediately charged to income statement initially by writing off DAC and by subsequently establishing a provision for losses arising from liability adequacy tests (the unexpired risk provision).
As set out above, long-term insurance contracts are measured based on assumptions set out at the inception of the contract. When the liability adequacy test requires the adoption of new best estimate assumptions, such assumptions (without margins for adverse deviation) are used for the subsequent measurement of these liabilities.
(v) Reinsurance contracts held
Contracts entered into by the Company with re-insurers under which the Company is compensated for losses on one or more contracts issued by the Company and that meet the classification requirements for insurance contracts are classified as reinsurance contracts held. Contracts that do not meet these classification requirements are classified as financial assets. Insurance contracts entered into by the Company under which the contract holder is another insurer (inward reinsurance) are included with insurance contracts. During the twelve months ended 31 December 2013, the Company did not enter into any such contracts (2012: Nil).
The benefits to which the Company is entitled under its reinsurance contracts held are recognised as reinsurance assets. These assets consist of short-term balances due from reinsurers, as well as longer term receivables that are dependent on the expected claims and benefits arising under the related reinsured insurance contracts. Amounts recoverable from or due to reinsurers are measured consistently with the amounts associated with the reinsured insurance contracts and in accordance with the terms of each reinsurance contract. Reinsurance liabilities are primarily premiums payable for reinsurance contracts and are recognised as an expense when due.
The Company assesses its reinsurance assets for impairment on a quarterly basis. If there is objective evidence that the reinsurance asset is impaired, the Company reduces the carrying amount of the reinsurance asset to its recoverable amount and recognises that impairment loss in the income statement. The Company gathers the objective evidence that a reinsurance asset is impaired using the same process adopted for financial assets held at amortised cost. The impairment loss is also calculated following the same method used for these financial assets. These processes are described in Note 2 (i).
(vi) Receivables and payables related to insurance contracts and investment contracts
Receivables and payables are recognised when due. These include amounts due to and from agents and insurance contract holders.
If there is objective evidence that the insurance receivable is impaired, the Company reduces the carrying amount of the insurance receivable accordingly and recognises that impairment loss in the income statement. The Company
(b) Insurance contracts (continued)(ii) Claims (continued)

Notes to the Financial Statements (continued)
2. SUMMARY OF SIGNIFICANT ACCOUNTING POLICIES (CONTINUED)
34
gathers the objective evidence that an insurance receivable is impaired using the same process adopted for loans and receivables. The impairment loss is also calculated under the same method used for these financial assets. These processes are described in Note 2 (i).
(c) Revenue recognition
(i) Insurance premium revenue
The revenue recognition policy relating to insurance contracts is set out under note (b) above.
(ii) Commissions earned
Commissions receivable are recognised as income in the period in which they are earned.
(iii) Rendering of services
Revenue arising from asset management and other related services offered by the Company are recognised in the accounting period in which the services are rendered. Fees consist primarily of investment management fees arising from services rendered in conjunction with the issue and management of investment contracts where the Company actively manages the consideration received from its customers to fund a return that is based on the investment profile that the customer selected on origination of the instrument. These services comprise the activity of trading financial assets in order to reproduce the contractual returns that the Company’s customers expect to receive from their investments. Such activities generate revenue that is recognised by reference to the stage of completion of the contractual services. In all cases, these services comprise an indeterminate number of acts over the life of the individual contracts. For practical purposes, the Company recognises these fees on a straight-line basis over the estimated life of the contract. Certain upfront payments received for asset management services (‘front-end fees’) are deferred and amortised in proportion to the stage of completion of the service for which they were paid.
The Company charges its customers for asset management and other related services using the following different approaches:
• Front-endfeesarechargedtotheclientoninception.Thisapproach is used particularly for single premium contracts. The consideration received is deferred as a liability and
recognised over the life of the contract on a straight-line basis; and
• Regular fees are charged to the customerperiodically(monthly, quarterly or annually) either directly or by making a deduction from invested funds. Regular charges billed in advance are recognised on a straight-line basis over the billing period; fees charged at the end of the period are accrued as a receivable that is offset against the financial liability when charged to the customer.
(iv) Interest income
Interest income for all interest-bearing financial instruments, including financial instruments measured at fair value through profit or loss, is recognised within “investment income’ (Note 6) in the income statement using the effective interest rate method. When a receivable is impaired, the Company reduces the carrying amount to its recoverable amount, being the estimated future cash flow discounted at the original effective interest rate of the instrument, and continues unwinding the discount as interest income.
(v) Dividend income
Dividend income for equities is recognised when the right to receive payment is established – this is the ex-dividend date for equity securities.
(d) Investment contracts
The Company issues investment contracts with fixed and guaranteed terms (fixed interest rate). The investment contracts include funds administered for a number of retirement benefit schemes.
The Company designates investment contracts with fixed and guaranteed terms to be measured at amortised cost. In this case, the liability is initially measured at its fair value less transaction costs that are incremental and directly attributable to the acquisition or issue of the contract.
Subsequent measurement of investment contracts at amortised cost uses the effective interest method. This method requires the determination of an interest rate (the effective interest rate) that exactly discounts to the net carrying amount of the financial liability, the estimated future cash payments or receipts through the expected life of the financial instrument or, when appropriate, a shorter period if the holder has the option to redeem the instrument earlier than maturity.
(b) Insurance contracts (continued)(vi) Receivables and payables related to insurance contracts and investment contracts (continued)

Notes to the Financial Statements (continued)
2. SUMMARY OF SIGNIFICANT ACCOUNTING POLICIES (CONTINUED)
35ANNUAL REPORT &
FINANCIAL STATEMENTS 2013
The Company re-estimates at each reporting date the expected future cash flows and recalculates the carrying amount of the financial liability by computing the present value of estimated future cash flows using the financial liability’s original effective interest rate. Any adjustment is immediately recognised as income or expense in the income statement.
(e) Functional currency and translation of foreign currencies
i) Functional and presentation currency
Items included in the financial statements are measured using the currency of the primary economic environment in which the entity operates (‘the functional currency’). The financial statements are presented in Kenya Shillings (“Shs”) which is the Company’s functional currency.
ii) Transactions and balances
Foreign currency transactions are translated into the functional currency of the respective entity using the exchange rates prevailing at the dates of the transactions. Foreign exchange gains and losses resulting from the settlement of such transactions and from the translation at year-end exchange rates of monetary assets and liabilities denominated in foreign currencies are recognised in the income statement.
Foreign exchange gains and losses that relate to borrowings and cash and cash equivalents are presented in the income statement within ‘finance income or cost’. All other foreign exchange gains and losses are presented in income statement within ‘other income’ or ‘other expenses’.
(f) Property and equipment
All categories of property and equipment are initially recorded at cost. Buildings are subsequently shown at market value, based on annual valuations by external independent valuers, less subsequent depreciation. All other property and equipment is stated at historical cost less depreciation. Historical cost includes expenditure that is directly attributable to the acquisition of the items.
Subsequent costs are included in the asset’s carrying amount or recognised as a separate asset, as appropriate, only when it is probable that future economic benefits associated with the item will flow to the Company and the cost of the item can be measured reliably. All other repairs and maintenance
are charged to the income statement during the year in which they are incurred.
Increases in the carrying amount of buildings arising on revaluation are credited to a revaluation reserve. Decreases that offset previous increases of the same asset are charged against the revaluation reserve; all other decreases are charged to the income statement. Each year the difference between depreciation based on the revalued carrying amount of the asset (the depreciation charged to the income statement) and depreciation based on the asset’s original cost is transferred from the revaluation reserve to retained earnings.
Depreciation is calculated on the straight line basis to write down the cost of each asset, or the revalued amount, to its residual value over its estimated useful life as follows:
Buildings 25 – 40 yearsEquipment 3 – 10 years Motor vehicles 4 years
The assets’ residual values and useful lives are reviewed, and adjusted if appropriate, at each financial reporting date.
Property and equipment is reviewed for impairment whenever events or changes in circumstances indicate that the carrying amount may not be recoverable. An impairment loss is recognised for the amount by which the asset’s carrying amount exceeds its recoverable amount. The recoverable amount is the higher of an asset’s fair value less costs to sell and value in use. For the purposes of assessing impairment, assets are grouped at the lowest levels for which there are separately identifiable cash flows (cash-generating units).
Gains and losses on disposal of property and equipment are determined by reference to their carrying amounts and are taken into account in determining profit or loss. On disposal of revalued assets, amounts in the revaluation reserve relating to that asset are transferred to retained earnings.
(g) Investment property
Investment properties comprise land and buildings and parts of buildings held to earn rentals and/or for capital appreciation. They are carried at fair value, determined annually by external independent valuers. Fair value is based on active market prices as adjusted, if necessary, for any difference in the nature, condition or location of the specific asset.
(d) Investment contracts (continued)

2. SUMMARY OF SIGNIFICANT ACCOUNTING POLICIES (CONTINUED)
36
Investment properties are not subject to depreciation. Changes in their carrying amount between financial reporting dates are recorded, net of deferred tax, through the income statement. On disposal of an investment property, the difference between the net disposal proceeds and the carrying amount is charged or credited to the income statement.
(h) Intangible assets
Acquired computer software licences are capitalised on the basis of the costs incurred to acquire and bring to use the specific software. These costs are amortised over their estimated useful lives (three to five years).
Costs associated with developing or maintaining computer software programmes are recognised as an expense as incurred. Costs that are directly associated with the production of identifiable and unique software products controlled by the Company, and that will probably generate economic benefits exceeding costs beyond one year, are recognised as intangible assets. Direct costs include the software development, employee costs and an appropriate portion of relevant overheads.
Computer software development costs recognised as assets are amortised over their estimated useful lives (not exceeding three years).
(i) Impairment of non-financial assets
Assets that have an indefinite useful life are not subject to amortisation and are tested annually for impairment. Assets that are subject to amortisation are reviewed for impairment whenever events or changes in circumstances indicate that the carrying amount may not be recoverable. An impairment loss is recognised for the amount by which the asset’s carrying amount exceeds its recoverable amount.
The recoverable amount is the higher of an asset’s fair value less costs to sell and value in use. For the purposes of assessing impairment, assets are grouped at the lowest levels for which there are separately identifiable cash flows (cash-generating units). Non-financial assets other than goodwill that suffered impairment are reviewed for possible reversal of the impairment at each reporting date.
(j) Financial assets
The Company classifies its financial assets into the following categories: financial assets at fair value through profit or loss; loans, advances and receivables and held-to-maturity financial assets. Management determines the appropriate classification of its financial assets at initial recognition.
(i) Financial assets at fair value through profit or loss
This category has two sub-categories: financial assets held for trading, and those designated at fair value through profit or loss at inception. A financial asset is classified as held-for-trading if acquired principally for the purpose of selling in the short term. Derivatives are also categorised as held-for-trading. Financial assets are designated at fair value through profit or loss when:
a) Doing so significantly reduces or eliminates a measurement inconsistency; or
b) They form part of a group of financial assets that is managed and evaluated on a fair value basis in accordance with a documented risk management or investment strategy and reported to key management personnel on that basis.
These assets are initially recorded at fair value. Subsequent to initial recognition, these investments are re-measured at fair value. Fair value adjustments and realised gain and loss are recognised in the income statements
Financial assets at fair value through profit or loss comprise quoted shares, government securities, commercial paper and corporate bonds.
(ii) Loans, advances and receivables
Loans, advances and receivables are non-derivative financial assets with fixed or determinable payments that are not quoted in an active market, other than:
(a) Those classified as held-for-trading and those that the Company on initial recognition designates as at fair value through profit and loss;
(b) Those for which the holder may not recover substantially all of its initial investment, other than because of credit deterioration.
Notes to the Financial Statements (continued)
(g) Investment property (continued)

2. SUMMARY OF SIGNIFICANT ACCOUNTING POLICIES (CONTINUED)
37ANNUAL REPORT &
FINANCIAL STATEMENTS 2013
(iii) Held-to-maturity
Held-to-maturity assets are non-derivative financial assets with fixed or determinable payments and fixed maturities that management has the positive intention and ability to hold to maturity. Were the Company to sell more than an insignificant amount of held-to-maturity assets, the entire category would have to be reclassified as fair value through profit or loss. Corporate bonds and part of government securities are classified under this category.
(iv) Recognition, de-recognition and measurement
Financial assets are initially recognised at fair value plus, for all financial assets except those carried at fair value through profit or loss, transaction costs. Financial assets are de-recognised when the rights to receive cash flows from the financial assets have expired or where the Company has transferred substantially all risks and rewards of ownership.
Loans, advances and receivables and held to maturity financial assets are carried at amortised cost using the effective interest rate method. Financial assets at fair value through profit or loss are carried at fair value. Gains and losses arising from changes in the fair value of ‘financial assets at fair value through profit or loss’ are included in the income statement in the period in which they arise.
Gains and losses arising from changes in the fair value of available-for-sale financial assets are recognised in ‘other comprehensive income’ until the financial asset is derecognised or impaired, at which time the cumulative gain or loss previously recognised in other comprehensive income is recognised in the income statement. However, interest calculated using the effective interest method is recognised in the income statement.
Dividends on available-for-sale equity instruments are recognised in the income statement when the Company’s right to receive payment is established.
Fair values of quoted investments in active markets are based on current bid prices. Fair values for unlisted equity securities are estimated using valuation techniques. These include the use of recent arm’s length transactions, discounted cash flow analysis and other valuation techniques commonly used by market participants. Equity securities for which fair values cannot be measured reliably are recognised at cost less impairment.
(v) Financial liabilities
All the Company’s financial liabilities are measured at amortised cost. These include payables under deposit administration and creditors arising from reinsurance arrangements. Financial liabilities are initially measured at fair value and subsequently at amortised cost. Financial liabilities are derecognised when extinguished.
(k) Impairment of financial assets
The Company assesses at each financial reporting date whether there is objective evidence that a financial asset or a group of financial assets is impaired. A financial asset or a group of financial assets is impaired and impairment losses are incurred only if there is objective evidence of impairment as a result of one or more events that occurred after initial recognition of the asset (a ‘loss event’) and that loss event (or events) has an impact on the estimated future cash flows of the financial asset or group of financial assets that can be reliably estimated such as:
a) significant financial difficulty of the borrower;b) a breach of contract, such as default or delinquency in
interest or principal repayments;c) the Company granting to the borrower, for economic or
legal reasons relating to the borrower’s financial difficulty, a concession that the Company would not otherwise consider;
d) it becoming probable that the borrower will enter bankruptcy or other financial reorganisation;
e) the disappearance of an active market for that financial asset because of financial difficulties;
f) observable data indicating that there is a measurable decrease in the estimated future cash flows from a group of financial assets since the initial recognition of those assets, although the decrease cannot yet be identified with the individual financial assets in the group, including:
- Adverse changes in the payment status of borrowers in the group; or
- National or local economic conditions that correlate with defaults on the assets in the group; or
Notes to the Financial Statements (continued)
(j) Financial assets (continued)
2. SUMMARY OF SIGNIFICANT ACCOUNTING POLICIES (CONTINUED)
38
g) Significant or prolonged decline in the fair value of investments in equity instruments below their cost.
The estimated period between a loss occurring and its identification is determined by management for each identified portfolio.
(i) Assets carried at amortised cost
The Company assesses whether objective evidence of impairment exists for individual financial assets.
If there is objective evidence that an impairment loss on financial assets carried at amortised cost has been incurred, the amount of the loss is measured as the difference between the asset’s carrying amount and the present value of estimated future cash flows (excluding future credit losses that have not been incurred) discounted at the financial instrument’s original effective interest rate.
The carrying amount of the asset is reduced through the use of an allowance account and the amount of the loss is recognised in the income statement.
If a loan or held-to-maturity asset has a variable interest rate, the discount rate for measuring any impairment loss is the current effective interest rate determined under the contract. As a practical expedient, the Company may measure impairment on the basis of an instruments fair value using an observable market price.
The calculation of the present value of the estimated future cash flows of a collateralised financial asset reflects the cash flows that may result from foreclosure less costs for obtaining and selling the collateral, whether or not foreclosure is probable.
When a loan is uncollectible, it is written off against the related provision for loan impairment. Such loans are written off after all the necessary procedures have been completed and the amount of the loss has been determined. Subsequent recoveries of amounts previously written off decrease the amount of the provision for loan impairment in the income statement.
If, in a subsequent period, the amount of the impairment loss decreases and the decrease can be related objectively to an event occurring after the impairment was recognised (such as an improvement in the debtor’s credit rating), the previously
recognised impairment loss is reversed by adjusting the allowance account. The amount of the reversal is recognised in the income statement.
(ii) Assets carried at fair value
In the case of equity investments classified as fair value through profit or loss, a significant or prolonged decline in the fair value of the security below its cost is considered in determining whether the assets are impaired. If any such evidence exists for fair value through profit or loss financial assets, the cumulative loss – measured as the difference between the acquisition cost and the current fair value, less any impairment loss on that financial asset previously recognised in profit or loss – is removed from equity and recognised in the income statement.
Impairment losses recognised in the income statement on equity instruments are not reversed through the income statement. If, in a subsequent period, the fair value of a debt instrument classified as available-for-sale increases and the increase can be objectively related to an event occurring after the impairment loss was recognised in the income statement, the impairment loss is reversed through the income statement.
(iii) Renegotiated loans
Loans that are either subject to collective impairment assessment or individually significant and whose terms have been renegotiated are no longer considered to be past due but are treated as new loans. In subsequent years, the renegotiated terms apply in determining whether the asset is considered to be past due.
(l) Accounting for leases
Leases of property, plant and equipment where the Company assumes substantially all the risks and rewards of ownership are classified as finance leases. Assets acquired under finance leases are capitalised at the inception of the lease at the lower of their fair value and the estimated present value of the underlying lease payments.
Each lease payment is allocated between the liability and finance charges so as to achieve a constant rate on the finance balance outstanding. The corresponding rental obligations, net of finance charges, are included in non-current liabilities. The interest element of the finance charge is charged to the income statement over the lease period. Property, plant and
Notes to the Financial Statements (continued)
(k) Impairment of financial assets (continued)

2. SUMMARY OF SIGNIFICANT ACCOUNTING POLICIES (CONTINUED)
39ANNUAL REPORT &
FINANCIAL STATEMENTS 2013
equipment acquired under finance leases are depreciated over the estimated useful life of the asset.
(m) Share capital
Ordinary shares are classified as ‘share capital’ in equity; any premium received over and above the par value of the shares is classified as ‘share premium’ in equity.
(n) Cash and cash equivalents
Cash and cash equivalents are carried in the statement of financial position at amortised cost. For the purposes of the Statement of Cash flows, cash and cash equivalents comprise cash on hand, deposits held at call with banks, and other short-term highly liquid investments with original maturities of three months or less.
(o) Employee entitlements
Employee entitlements to long service awards are recognised when they accrue to employees. A provision is made for the estimated liability for such entitlements as a result of services rendered by employees up to the financial reporting date.
The estimated monetary liability for employees’ accrued annual leave entitlement at the financial reporting date is recognised as an expense accrual.
(p) Retirement benefit obligations
The Company operates a defined contribution scheme for its employees. The assets of the scheme are held in separate trustee administered funds, which are funded from contributions from both the Company and employees. The employees of the Company are also members of the National Social Security Fund (“NSSF”).
The Company’s contributions to the defined contribution scheme and NSSF are charged to the income statement in the year to which they relate.
(q) Income tax
(i) Current income tax
The tax expense for the period comprises current and deferred income tax. Tax is recognised in profit or loss, except to the extent that it relates to items recognised in
other comprehensive income or directly in equity. In this case, the tax is also recognised in other comprehensive income or directly in equity respectively.
Current income tax is the amount of income tax payable on the taxable profit for the year determined in accordance with the relevant tax legislation. The current income tax charge is calculated on the basis of the tax enacted or substantively enacted at the statement of financial position date. Management periodically evaluates positions taken in tax returns with respect to situations in which applicable tax regulation is subject to interpretation. It establishes provisions where appropriate on the basis of amounts expected to be paid to the tax authorities.
(ii) Deferred income tax
Deferred income tax is recognised, using the liability method, on temporary differences arising between the tax bases of assets and liabilities and their carrying amounts in the financial statements as well as on the accumulated undistributed shareholder surplus. However, deferred income tax is not accounted for if it arises from initial recognition of an asset or liability in a transaction other than a business combination that at the time of the transaction affects neither accounting nor taxable profit or loss. Deferred income tax is determined using tax rates (and laws) that have been enacted or substantively enacted at the statement of financial position date and are expected to apply when the related deferred income tax asset is realised or the deferred income tax liability is settled.
Deferred income tax assets are recognised only to the extent that it is probable that future taxable profits will be available against which the temporary differences can be utilised.
Deferred income tax assets and liabilities are offset when there is a legally enforceable right to offset current tax assets against current tax liabilities and when the deferred income taxes assets and liabilities relate to income taxes levied by the same taxation authority on either the same taxable entity or different taxable entities where there is an intention to settle the balances on a net basis.
(r) Dividends
Dividends on ordinary shares are charged to equity in the period in which they are declared. Proposed dividends are accounted for as a separate component of equity until they have been ratified at an Annual General Meeting.
Notes to the Financial Statements (continued)
(l) Accounting for leases (continued)

2. SUMMARY OF SIGNIFICANT ACCOUNTING POLICIES (CONTINUED)
40
(s) Restatements
(i) Insurance contract liabilities, Payable under Deposit administration contracts and Financial assets
The Company changed the accounting basis of valuation of the policyholders insurance liabilities from the Net Premium Valuation (NPV) basis to Gross Premium Valuation (GPV) to align this Group’s accounting policies. In making the policy change the Company has taken advantage of the provisions in IFRS 4 Insurance Contracts which allow an entity to reclassify the basis of measurement of its financial instruments. Financial instruments which were previously classified as available for sale were reclassified to financial assets through profit or loss. This was done so as to match the movements in policyholder liabilities with the fair value movements in corresponding financial assets at fair value through profit or loss. The impact of this policy change has been accounted for retrospectively in line with IAS 8 Accounting policies, changes in accounting estimates and errors and is shown on the summary of adjustments below.
(ii) Deferred tax
During the year the Company adopted the Group policy to recognise deferred income tax on the undistributed portion of the life fund surplus. The impact has been accounted for retrospectively in line with IAS 8 Accounting policies, changes in accounting estimates and errors. The overall impact on the current and prior years statement of profit or loss and statement of financial position is shown on the summary of adjustments.
(iii) Reclassification of revaluation reserves
Revaluation reserves that related to disposed property have been subsequently released to retained earnings to align with correct accounting treatment. The reclassification has been accounted for in line with IAS 8 Accounting policies, changes in accounting estimates and errors.
(iv) Income builder adjustments
As part of the Company’s process of internal reviews the actuaries identified that the income builder investment product that provides for dividend to be paid on the 10th anniversary had not been properly set-up in the valuation model. Dividends on this product were erroneously omitted understating the policyholder liabilities by Shs 80 million. Due to information limitations the actuaries are unable the split the impact beyond 2012. The directors have hence presented the cumulative impact in 2012 in line with the provisions of IAS 8 Accounting policies, changes in accounting estimates and errors. Refer to summary of adjustments below.
(v) Deposit administration adjustments
The deposit administration liabilities as at 31 December 2012 were understated by Shs 113 million due to system limitations where certain liabilities had been erroneously omitted. The misstatement was identified as part of the enhancement of systems and processes during 2013.
Notes to the Financial Statements (continued)

2. SUMMARY OF SIGNIFICANT ACCOUNTING POLICIES (CONTINUED)
41ANNUAL REPORT &
FINANCIAL STATEMENTS 2013
Notes to the Financial Statements (continued)
The impact which is limited to the 2012 financial statements has been accounted for in line with IAS 8 Accounting policies, changes in accounting estimates and errors as shown in the table below;
Summary of adjustmentsStatement of financial position
As previously stated Insurance Deposit Deferred tax Revaluation Income Income Transfer to Restated 31 December 2011 contracts admini- reserve tax builder Statutory 31 Dece- stration mber refer to (i) refer to refer to (ii) refer to (iii) refer to (ii) refer to (iv) Reserves 2011 (i)&(v) Shs’ 000 Shs’ 000 Shs’ 000 Shs’ 000 Shs’ 000 Shs’ 000 Shs’ 000 Shs’ 000 Shs’ 000
Share capital 612,340 612,340 Revaluation reserves 350,521 (169,223) 48,987 230,285 Retained earnings (312,546) 529,319 (62,267) (48,987) (80,000) (479,125) (453,606)Statutory reserves 318,022 (72,919) (71,792) 479,125 652,436 Proposed dividends - - SHAREHOLDER’S FUNDS 968,337 529,319 (62,267) (242,142) - (71,792) (80,000) - 1,041,455 REPRESENTED BY: Property and equipment 630,777 630,777 Intangible assets 100,935 100,935 Prepaid operating lease rentals 660 660 Investment properties 412,500 412,500 Government and other securities held-to-maturity 6,622,028 6,622,028 Financial assets at fair value through profit or loss 2,661,628 2,661,628Loans and receivables 873,874 873,874 Insurance receivables 14,470 14,470 Reinsurance receivables 20,450 20,450 Reasssurers’ share of technical provisions and reserves 105,660 105,660Income tax receivable 63,564 (63,564) -Other assets 253,088 253,088 Deposits with financial institutions 1,490,305 1,490,305Cash and bank balances 153,208 153,208 TOTAL ASSETS 13,403,147 - - - - (63,564) - - 13,339,583 LIABILITIES Insurance contract liabilities 4,232,653 (529,319) 80,000 3,783,334 Payable under deposit administration contracts 7,589,211 62,267 7,651,478 Outstanding claims 100,502 100,502 Deferred income tax liabilities - 171,612 1,262 172,874 Creditors arising from reassurance arrangements 1,557 1,557 Current tax liabilities - 6,966 6,966 Other liabilities 510,887 70,530 581,417 TOTAL LIABILITIES 12,434,810 (529,319) 62,267 242,142 - 8,228 80,000 - 12,298,128 NET ASSETS 968,337 529,319 (62,267) (242,142) - (71,792) (80,000) - 1,041,455
(s) Restatements (continued)

2. SUMMARY OF SIGNIFICANT ACCOUNTING POLICIES (CONTINUED)
42
Statement of financial position
As previously stated Insurance Deposit Deferred tax Revaluation Income Income Transfer to Restated 31 December 2012 contracts admin- reserve tax builder Statutory 31 istration Dec- refer to (i) refer to(i) refer to (ii) refer to (iii) refer to (ii) refer to (iv) Reserves ember 2012 Shs’000 Shs’000 Shs’000 Shs’000 Shs’000 Shs’000 Shs’000 Shs’000 Shs’000
Share capital 612,340 612,340 Revaluation reserves 707,609 (185,486) (253,890) 268,233 Retained earnings (237,211) 95,724 (361,224) 253,890 (80,000) (27,239) (356,060)Statutory reserves 823,030 (224,421) (71,792) 27,239 554,056 Proposed dividends 100,000 100,000 SHAREHOLDER’S FUNDS 2,005,768 95,724 (361,224) (409,907) - (71,792) (80,000) - 1,178,569 REPRESENTED BY: Property and equipment 660,272 660,272 Intangible assets 63,180 63,180 Prepaid operating lease rentals 650 650 Investment properties 756,249 756,249 Government and other securities held-to-maturity 7,730,557 7,730,557 Financial assets at fair value through profit or loss 2,546,107 2,546,107 Loans and receivables 914,153 914,153 Insurance receivables 35,278 35,278 Reinsurance receivables 27,383 27,383 Reasssurers’ share of technical provisions and reserves 130,506 130,506 Income tax receivable 28,719 (28,719) -Other assets 215,622 215,622 Deposits with financial institutions 4,746,312 4,746,312 Cash and bank balances 237,864 237,864 TOTAL ASSETS 18,092,852 - - - - (28,719) - 18,064,133 LIABILITIES Insurance contract liabilities 5,200,987 (95,724) 80,000 5,185,263 Payable under deposit administration contracts 10,104,276 361,224 10,465,500 Outstanding claims 152,737 152,737 Provision for unearned premiums 45,296 45,296 Deferred income tax liabilities - 339,377 1,359 340,736 Creditors arising from reassurance arrangements 8,078 8,078 Current tax liabilities 965 41,714 42,679 Other liabilities 574,745 70,530 645,275 TOTAL LIABILITIES 16,087,084 (95,724) 361,224 409,907 - 43,073 80,000 16,885,564 NET ASSETS 2,005,768 95,724 (361,224) (409,907) - (71,792) (80,000) 1,178,569
Notes to the Financial Statements (continued)
(s) Restatements (continued)

2. SUMMARY OF SIGNIFICANT ACCOUNTING POLICIES (CONTINUED)
43ANNUAL REPORT &
FINANCIAL STATEMENTS 2013
Statement of profit or loss
As previously Revaluation GPV DA Income Restated reported 2012 reserve Liabilities Restatement Builder 2012 adjustment Adjustment refer to (iii) refer to (i) refer to (i) refer to (iv) Shs’ 000 Shs’ 000 Shs’ 000 Shs’ 000 Shs’ 000 Shs’ 000
Gross earned premiums 1,513,455 1,513,455
Less: reinsurance premium ceded (185,020) (185,020)
Net earned premiums 1,328,435 - - - 1,328,435
Investment income 1,868,210 302,875 2,171,085
Commissions earned 64,526 64,526
Fee Income 13,292 13,292
Total revenue 3,274,463 302,875 - - 3,577,338
Claims and policyholder benefits Payable 1,843,288 539,409 113,141 80,000 2,575,839
Claims recoverable from re-insurers (43,366) (43,366)
Net Insurance Benefits and Claims 1,799,922 - 539,409 113,141 80,000 2,532,472
Commissions payable 196,931 196,931
Operating and other expenses 899,301 899,301
Total out-flow 2,896,154 - 539,409 113,141 80,000 3,628,704
Profit before tax 378,309 302,875 (539,409) (113,141) (80,000) (51,367)
Income tax (expense)/ Credit (47,279) (47,279)
Profit/(loss) for the year 331,030 302,875 (539,409) (113,141) (80,000) (98,646)
Notes to the Financial Statements (continued)
(s) Restatements (continued)

44
Statement of other comprehensive income
As previously Revaluation GPV DA Income Deferred Restated reported 2012 reserve Liabilities Restatement Builder Tax 2012 adjustment Adjustment refer to (iii) refer to (i) refer to (i) refer to (iv) Shs’ 000 Shs’ 000 Shs’ 000 Shs’ 000 Shs’ 000 Shs’ 000 Shs’ 000
Profit for the year 331,030 302,875 (539,409) (113,141) (80,000) - (98,646)
Other comprehensive income /(expenses) (net of tax):
Gain on revaluation of land and buildings 54,211 54,211
Less: Deferred tax on revaluation of land and buildings - (16,263) (16,263)
Change in fair value of AFS assets 259,682 (259,682) -
Impairment on AFS investments 14,783 (14,783) -
Other comprehensive income/ (expenses) for the year net of tax 328,676 (274,465) - - - (16,263) 37,948
Total comprehensive income for the year 659,706 28,410 (539,409) (113,141) (80,000) (16,263) (60,698)
On the statement of profit or loss, statement of financial position and statement of changes in equity
The accounting policy changes and correction of prior period misstatements has no impact on the financial statements for the year ended 31 December 2013
Notes to the Financial Statements (continued)
2. SUMMARY OF SIGNIFICANT ACCOUNTING POLICIES (CONTINUED)

45ANNUAL REPORT &
FINANCIAL STATEMENTS 2013
3. CRITICAL ACCOUNTING ESTIMATES AND JUDGEMENTS IN APPLYING ACCOUNTING POLICIES
The Company makes estimates and assumptions that affect the reported amounts of assets and liabilities within the next financial year. Estimates and judgements are continually evaluated and based on historical experience and other factors, including expectations of future events that are believed to be reasonable under the circumstances.
(a) Impairment losses on loans and receivables
The Company assesses its loan portfolios for impairment at each financial reporting date. In determining whether an impairment loss should be recorded in the income statement, the Company makes judgements as to whether there is observable data indicating a measurable decrease in the estimated future cash flows from a portfolio of loans before the decrease can be allocated to an individual loan in that portfolio. Estimates are made of the duration between the occurrence of a loss event and the identification of a loss on an individual basis. The impairment for performing loans is calculated on a portfolio basis, based on historical loss ratios, adjusted for national and industry-specific economic conditions and other indicators present at the reporting date that correlate with defaults on the portfolio.
Mortgage loans are individually impaired if the amounts are due and unpaid for three or more months. Other loans are analysed on a case-by-case basis taking into account breaches of key loan conditions. Management’s estimates of future cash flows on individually impaired loans are based on historical loss experience for assets with similar credit risk characteristics. The methodology and assumptions used for estimating both the amount and timing of future cash flows are reviewed regularly to reduce any differences between loss estimates and actual loss experience.
No impairment losses were recognised in 2013 (2012: Nil). If impairment losses were to be recognised by a decrease/increase by 1% of the current values of loans and receivables, the profit/loss for the year would decrease/increase by 4% (2012: 8%).
(b) Fair values of financial assets
Fair values of certain financial assets recognised in the financial statements may be determined in whole or part using valuation
techniques based on assumptions that are supported by prices from current market transactions or observable market data.
The fair values of financial instruments that are not quoted in active markets are determined by using valuation techniques. Where valuation techniques (for example models) are used to determine fair values, they are validated and periodically independently reviewed by qualified senior personnel. All models are certified before they are used, and models are calibrated to ensure that outputs reflect actual data and comparative market prices. To the extent practical, models use observable data. However, areas such as credit risk (both own and counter-party), volatilities and correlations require management to make estimates.
(c) Held-to-maturity investments
The Company follows the guidance of IAS 39 on classifying certain non-derivative financial assets with fixed or determined payments and fixed maturity, as held-to-maturity. This classification requires judgement of the Company’s ability to hold such investments to maturity. Held to maturity investments comprises bonds on lien. Investments are initially recognised at fair value plus transaction costs. Held-to-maturity investments are subsequently measured at amortized cost using the effective interest method. Gains and losses on held-to –maturity assets are recognised on impairment, derecognition and through the amortisation process.
(d) Insurance contract liabilities
The Company determines its liabilities on the long-term insurance contracts on a realistic basis, namely the Gross Premium Valuation (GPV) method.
The GPV method makes explicit assumptions on expected future deaths, investment returns, lapses, expenses and bonuses as well as margins for uncertainty on these assumptions. Assumptions used are based on recent experience investigations conducted by the company while taking into consideration prior year assumptions and the outlook of future experience.
(i) Mortality
An appropriate base table of standard mortality is chosen depending on the type of contract and class of business. Industry standard tables are used for smaller classes of business, while Company specific tables are used for larger
Notes to the Financial Statements (continued)

46
classes. Estimates are made as to the expected number of deaths for each of the years in which the Company is exposed to risk. The Company bases these estimates on standard mortality tables that reflect historical mortality experience. The estimated number of deaths determines the value of the benefit payments and the value of the valuation premiums. The main source of uncertainty is that epidemics such as AIDS could result in future mortality being significantly worse than in the past for the age groups in which the Company has significant exposure to mortality risk. However, continuing improvements in medical care and social conditions could result in improvements in longevity in excess of those allowed for in the estimates used to determine the liability for contracts where the Company is exposed to longevity risk.
For contracts without fixed terms, it is assumed that the Company will be able to increase mortality risk charges in future years in line with emerging mortality experience.
An investigation into mortality experience is performed annually. The period investigation extends over the latest three full years for larger classes of business. Investigations relating to smaller classes usually extend over five years in order to gain sufficient credibility of the data. The results of the investigation are used to set the valuation assumptions, which are taken as an adjustment to the respective standard table.
In setting the assumptions, provision is made for the expected increase in AIDS-related claims. In general, Actuarial Society of South Africa (ASSA) models are used to allow AIDS-related claims. The practice differs by class of business, however for major classes of business; a basic allowance for AIDS related deaths is included in the base mortality rates against which annual mortality investigations are conducted. A further discretionary margin is then held using the ASSA2000 lie model.
(ii) Morbidity
The incidence of disability claims is derived from industry experience studies, adjusted where appropriate for CfC Life’s own experience. The same is true for the incidence of recovery from disability.
(iii) Withdrawal
The withdrawal assumptions are based on the most recent withdrawal investigations taking into account past as well as expected future trends. The withdrawal rates are analysed by
product type and policy duration. These withdrawal rates vary considerably by duration, policy term and Company. Typically the rates are higher for risk type products versus investment type products, and are higher at early durations.
(iv) Correlation
No correlations between assumptions are allowed for.
4. MANAGEMENT OF INSURANCE AND FINANCIAL RISK
The Company’s activities expose it to a variety of risks, including insurance risk, financial risk, credit risk, and the effects of changes in debt and equity market prices, foreign currency exchange rates and interest rates. The Company’s overall risk management programme focuses on the identification and management of risks and seeks to minimize potential adverse effects on its financial performance, by use of underwriting guidelines and capacity limits, reinsurance planning, credit policy governing the acceptance of clients, and defined criteria for the approval of intermediaries and reinsurers. Investment policies are in place which help manage liquidity, and seek to maximize return within an acceptable level of interest rate risk.
This section summarizes the way the Company manages key risks:
(a) Insurance risk
The risk under any one insurance contract is the possibility that the insured event occurs and the uncertainty of the amount of the resulting claim. By the very nature of an insurance contract, this risk is random and therefore unpredictable.
For a portfolio of insurance contracts where the theory of probability is applied to pricing and provisioning, the principal risk that the Company faces under its insurance contracts is that the actual claims and benefit payments exceed the carrying amount of the insurance liabilities. This could occur because the frequency or severity of claims and benefits are greater than estimated. Insurance events are random and the actual number and amount of claims and benefits will vary from year to year from the level established using statistical techniques.
Experience shows that the larger the portfolio of similar insurance contracts, the smaller the relative variability about the expected outcome will be. In addition, a more diversified
Notes to the Financial Statements (continued)
3. CRITICAL ACCOUNTING ESTIMATES AND JUDGEMENTS IN APPLYING ACCOUNTING POLICIES (CONTINUED)
(d) Insurance contract liabilities (continued)(i) Mortality (continued)
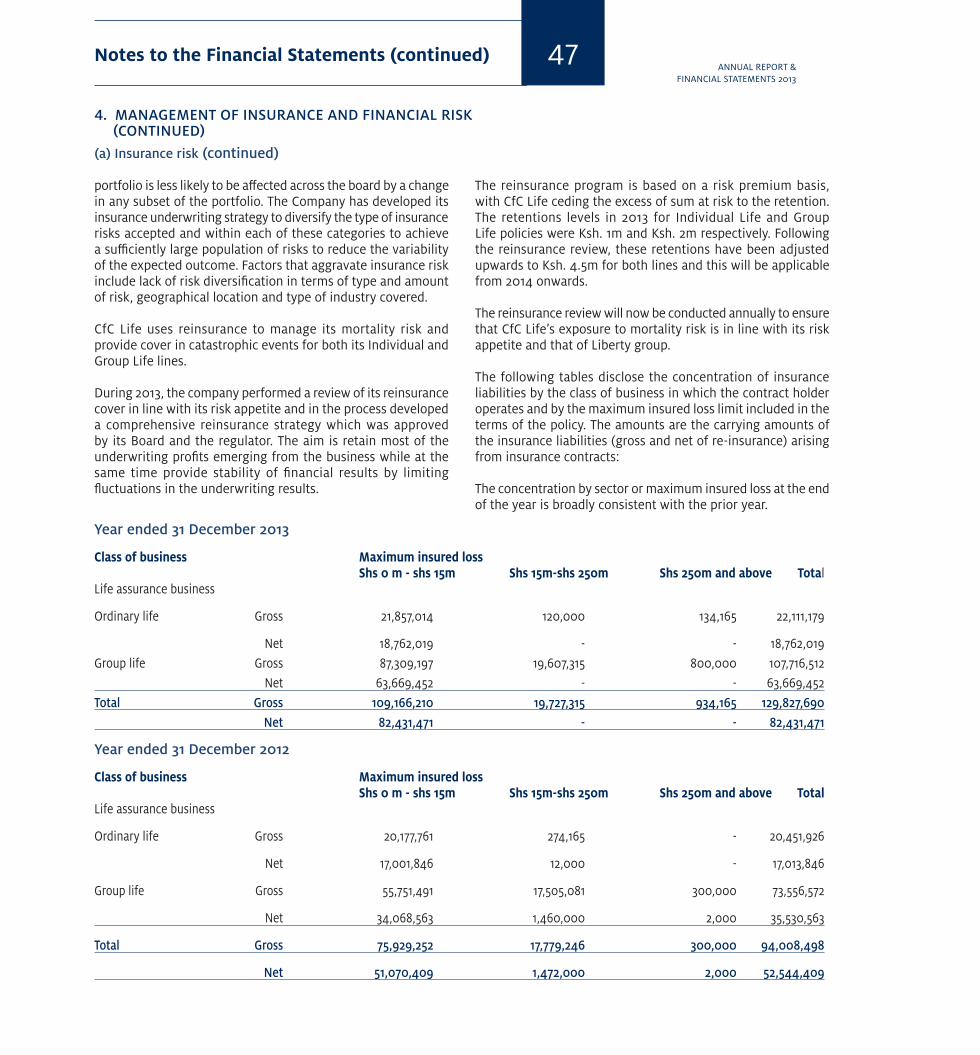
47ANNUAL REPORT &
FINANCIAL STATEMENTS 2013
portfolio is less likely to be affected across the board by a change in any subset of the portfolio. The Company has developed its insurance underwriting strategy to diversify the type of insurance risks accepted and within each of these categories to achieve a sufficiently large population of risks to reduce the variability of the expected outcome. Factors that aggravate insurance risk include lack of risk diversification in terms of type and amount of risk, geographical location and type of industry covered.
CfC Life uses reinsurance to manage its mortality risk and provide cover in catastrophic events for both its Individual and Group Life lines.
During 2013, the company performed a review of its reinsurance cover in line with its risk appetite and in the process developed a comprehensive reinsurance strategy which was approved by its Board and the regulator. The aim is retain most of the underwriting profits emerging from the business while at the same time provide stability of financial results by limiting fluctuations in the underwriting results.
The reinsurance program is based on a risk premium basis, with CfC Life ceding the excess of sum at risk to the retention. The retentions levels in 2013 for Individual Life and Group Life policies were Ksh. 1m and Ksh. 2m respectively. Following the reinsurance review, these retentions have been adjusted upwards to Ksh. 4.5m for both lines and this will be applicable from 2014 onwards.
The reinsurance review will now be conducted annually to ensure that CfC Life’s exposure to mortality risk is in line with its risk appetite and that of Liberty group.
The following tables disclose the concentration of insurance liabilities by the class of business in which the contract holder operates and by the maximum insured loss limit included in the terms of the policy. The amounts are the carrying amounts of the insurance liabilities (gross and net of re-insurance) arising from insurance contracts:
The concentration by sector or maximum insured loss at the end of the year is broadly consistent with the prior year.
Year ended 31 December 2013
Class of business Maximum insured loss Shs 0 m - shs 15m Shs 15m-shs 250m Shs 250m and above TotalLife assurance business
Ordinary life Gross 21,857,014 120,000 134,165 22,111,179
Net 18,762,019 - - 18,762,019Group life Gross 87,309,197 19,607,315 800,000 107,716,512 Net 63,669,452 - - 63,669,452Total Gross 109,166,210 19,727,315 934,165 129,827,690 Net 82,431,471 - - 82,431,471
Year ended 31 December 2012
Class of business Maximum insured loss Shs 0 m - shs 15m Shs 15m-shs 250m Shs 250m and above TotalLife assurance business
Ordinary life Gross 20,177,761 274,165 - 20,451,926
Net 17,001,846 12,000 - 17,013,846
Group life Gross 55,751,491 17,505,081 300,000 73,556,572
Net 34,068,563 1,460,000 2,000 35,530,563
Total Gross 75,929,252 17,779,246 300,000 94,008,498
Net 51,070,409 1,472,000 2,000 52,544,409
Notes to the Financial Statements (continued)
4. MANAGEMENT OF INSURANCE AND FINANCIAL RISK (CONTINUED)
(a) Insurance risk (continued)

48
(b) Financial risk
The Company is exposed to financial risk through its financial assets, financial liabilities (investment contracts), reinsurance assets and insurance liabilities. In particular the key financial risk is that the proceeds from its financial assets are not sufficient to fund the obligations arising from its insurance and investment contracts. The most important components of this financial risk are interest rate risk, equity price risk, currency risk and credit risk.
These risks arise from open positions in interest rate, currency and equity products, all of which are exposed to general and specific market movements. The risks that the Company primarily faces due to the nature of its investments and liabilities are interest rate risk and equity price risk.
The Company manages these positions within an asset liability management (ALM) framework that has been developed to achieve long-term investment returns in excess of its obligations under insurance and investment contracts, and being cognisant of the need to ensure that there is sufficient capital to meet the Company’s obligations. The principal technique of the Company’s ALM is to match assets to the liabilities arising from insurance and investment contracts by reference to the type of benefits payable to contract holders.
(c) Market risk
(i) Foreign exchange risk
The Company underwrites some policies contracted in US dollars. In addition, the Company has cash balances held in foreign denominated accounts with local banks. This exposes the Company to foreign exchange risk arising from various currency exposures, primarily with respect to the US dollar. Foreign exchange risk arises from future commercial transactions, recognised assets and liabilities and net investments in foreign currencies.
The Company manages foreign exchange risk arising from future commercial transactions and recognised assets and liabilities using forward contracts, but has not designated any derivative instruments as hedging instruments.
At 31 December 2013, if the Shilling had weakened/strengthened by 5% against the US dollar with all other variables held constant, the Company’s post tax profit/(loss) for the period would have been Shs 7,115,221 (2012: Shs 4,014,715 ) higher/
lower, mainly as a result of US dollar investments and bank balances.
(ii) Price risk
The Company is exposed to equity securities price risk because of investments in quoted classified as fair value through profit or loss. The Company is not exposed to commodity price risk. To manage its price risk arising from investments in equity and debt securities, the Company diversifies its portfolio. Diversification of the portfolio is done in accordance with limits set by the Company and the Insurance Act. All quoted shares held by the Company are traded on the Nairobi Securities Exchange (NSE). Some shares are also held in offshore stock exchanges.
At 31 December 2013, if the NSE Index had increased/decreased by 5% with all other variables held constant and all the Company’s equity instruments moved according to the historical correlation to the index, the value of equities held would have been Shs 95,249,504 (2012: Shs 39,662,750) higher/lower.
(iii) Cash flow and fair value interest rate risk
Fixed interest rate financial instruments expose the Company to fair value interest rate risk. Variable interest rate financial instruments expose the Company to cash flow interest rate risk. The Company’s fixed interest rate financial instruments are government securities and deposits with financial institutions. The Company’s variable interest rate financial instruments are quoted corporate bonds.
No limits are placed on the ratio of variable rate financial instruments to fixed rate financial instruments. The Company manages its cash flow interest rate risk by diversification of its portfolio mix. The sensitivity analysis for interest rate risk illustrates how changes in the fair value or future cash flows of a financial instrument will fluctuate because of changes in market interest rates at the reporting date.
For liabilities under long-term insurance contracts with fixed and guaranteed terms, changes in interest rate will cause a change to the amount of the liability. Investment contracts with fixed and guaranteed terms, government securities and deposits with financial institutions held to maturity are accounted for at amortised cost and their carrying amounts are not sensitive to changes in the level of interest rates.
Notes to the Financial Statements (continued)
4. MANAGEMENT OF INSURANCE AND FINANCIAL RISK (CONTINUED)

49ANNUAL REPORT &
FINANCIAL STATEMENTS 2013
(d) Credit risk
The Company has exposure to credit risk, which is the risk that a counterparty will be unable to pay amounts in full when due. Key areas where the Company is exposed to credit risk are: Insurance receivables; Reinsurance receivables; and Reinsurers’ share of insurance liabilities.
Other areas where credit risk arises include cash at bank, corporate bonds and deposits with banks, reinsurer’s share of insurance contract liabilities and other receivables. The Company has no significant concentrations of credit risk. The Company structures the levels of credit risk it accepts by placing limits on its exposure to a single counterparty, or groups of counterparty, and to geographical and industry segments. Such risks are subject to an annual or more frequent review.
Reinsurance is used to manage insurance risk. This does not, however, discharge the Company’s liability as primary insurer. If a reinsurer fails to pay a claim for any reason, the Company remains liable for the payment to the policyholder. The creditworthiness of reinsurers is considered on an annual basis by reviewing their financial strength prior to finalisation of any contract. The exposure to individual counterparties is also managed by other mechanisms, such as the right of offset where counterparties are both debtors and creditors of the Company. Management information reported to the
Company includes details of provisions for impairment on loans and receivables and subsequent write-offs. Internal audit makes regular reviews to assess the degree of compliance with the Company’s procedures on credit. Exposures to individual policyholders and groups of policyholders are collected within the ongoing monitoring of the controls associated with regulatory solvency. Where there exists significant exposure to individual policyholders, or homogenous groups of policyholders, a financial analysis equivalent to that conducted for reinsurers is carried out by the Company underwriting department.
The credit quality of financial asset that are neither past due nor impaired can be assessed by reference to the external credit ratings if available, or historical information about counterparty default rates. None of the company’s credit counterparties has external credit rating except the government of Kenya which has a B rating. For credit risk counterparties without and external credit rating, the company classifies them as follows.
Group 1 - New customers/related partiesGroup 2 - Existing customers/related parties with no defaults in the pastGroup 3 - Existing customers /related parties with some default in the past. All defaults were fully recoveredThe amount that best represents the Company’s maximum exposure to credit risk at 31 December 2013 is made up as follows
Maximum exposure to credit risk before collateral held: Credit quality 2013 2012 2011 grouping Restated Restated Shs ‘000 Shs ‘000 Shs ‘000
Receivables arising out of reinsurance arrangements Group 2 109,857 27,383 20,450 Receivables arising out of direct insurance arrangements Group 2 40,256 35,278 14,470 Reinsurers’ share of notified claims (Note 2) Group 2 76,980 130,506 105,660 Government and other securities held-to-maturity B+ 6,494,874 7,730,557 6,622,028 Fair value through P&L assets B+ 5,720,440 2,546,107 2,661,628 Deposits with financial institutions Group 2 4,773,736 4,746,312 1,490,305 Mortgage Loans Group 2 233,389 226,107 200,413 Policy loans Group 2 754,199 615,992 673,461 Other receivables Group 2 240,472 287,676 316,653 Cash at bank Group 2 232,533 237,864 153,208At end of year 18,676,736 16,583,781 12,258,276
Notes to the Financial Statements (continued)
4. MANAGEMENT OF INSURANCE AND FINANCIAL RISK (CONTINUED)

50
All mortgage loans have the property secured as collateral while policy loans have the cash value of the policy secured as collateral. In the case of car loans, the cars are secured as security. All receivables that are neither past due or impaired are within their approved credit limits, and no receivables have had their terms renegotiated. The fair value of property securing the mortgages was Shs 458,300,000 (2012: Shs 561,257,000). In the opinion of the directors, the fair values of the securities supporting car loans approximate the carrying values of the secured loans. The fair value of the collateral for the policy loan was Shs 887,723,000 (2012: Shs 724,696,000).
None of the above assets are past due or impaired except for insurance receivables (which are due upon invoicing):
Financial assets that are past due or impaired:
Insurance receivables are summarised as follows: 2013 2012 Shs ‘000 Shs ‘000
Neither past due nor impaired 40,256 35,278
Past due but not impaired - -
Impaired - -
Gross 40,256 35,278
Less: allowance for impairment - -
Net 40,256 35,278
Insurance receivables past due but not impaired:
2013 2012 Shs ‘000 Shs ‘000
- by up to 30 days 22,500 10,941
- by 31 to 60 days 4,988 9,750
- by 61 to 150 days 9,682 9,881
- by 151 to 360 days 3,086 4,706
Total past due but not impaired 40,256 35,278
All receivables past due by more than 360 days are considered to be impaired, and are carried at their estimated recoverable value.
(e) Liquidity risk
Liquidity risk is the risk that the Company is unable to meet its payment obligations associated with its financial liabilities as they fall due and to replace funds when they are withdrawn.
The table below presents the cash flows receivable and payable by the Company under financial assets and liabilities by remaining contractual maturities at the Statement of financial position date, except insurance contract liabilities which are stated at their expected maturities. All figures are in thousands of Kenya Shillings.
Notes to the Financial Statements (continued)
4. MANAGEMENT OF INSURANCE AND FINANCIAL RISK (CONTINUED)

51ANNUAL REPORT &
FINANCIAL STATEMENTS 2013
(e) Liquidity risk
1-3 3-12 1-5 Over 5 months months years years TotalAs at 31 December 2013: Shs’000 Shs’000 Shs’000 Shs’000 Shs’000
Liabilities
Insurance contract liabilities - 103,765 575,110 5,687,589 6,366,464Payable under deposit administration contracts - (36,297) 1,388,077 9,751,978 11,103,758Provision for unearned premiums 118,709 - - - 118,709Creditors arising from reinsurance arrangements 42,384 - - - 42,384Other payables 584,526 - - - 584,526Total financial liabilities 745,619 67,468 1,963,187 15,439,567 18,215,841 (expected maturity dates)
Assets
Other receivables 281,997 - - - 281,997Receivables arising out of direct Insurance arrangements 27,488 9,699 3,069 - 40,256Reinsurers’ share of notified claims 76,980 - - - 76,980Government securities held-to-maturity 497,251 759,489 2,398,373 2,839,761 6,494,874Fair value through P & L 78,258 1,059,800 1,959,519 2,622,863 5,720,439Loans receivable 1,055,921 - - - 1,055,921Deposits with financial institutions 4,773,736 - - - 4,773,736Cash and bank balances 232,533 - - - 232,533Total financial assets 7,024,164 1,828,988 4,360,961 5,462,624 18,676,737 (contractual maturity dates)
Notes to the Financial Statements (continued)
4. MANAGEMENT OF INSURANCE AND FINANCIAL RISK (CONTINUED)

52
1-3 3-12 1-5 Over 5 months months years years TotalAs at 31 December 2012: Shs’000 Shs’000 Shs’000 Shs’000 Shs’000
Liabilities
Insurance contract liabilities - (642,804) (83,797) 5,911,864 5,185,263Payable under deposit administration contracts - (218,257) 679,575 10,004,182 10,465,500Provision for unearned premiums 45,296 - - - 45,296Creditors arising from reinsurance arrangements 8,078 - - - 8,078Other payables 645,276 - - - 645,276Total financial liabilities 698,650 (861,061) 595,778 15,916,046 16,349,413 (expected maturity dates)
Assets
Other receivables 83,596 49,703 80,353 29,353 243,005Receivables arising out of direct Insurance arrangements 30,572 4,706 - - 35,278Reinsurers’ share of notified claims 130,506 - - - 130,506Government securities held-to-maturity 944,542 284,891 2,017,270 4,483,854 7,730,557Available-for-sale investments 2,546,107 - - - 2,546,107Loans receivable 615,992 - 38,087 260,074 914,153Deposits with financial institutions 4,746,312 - - - 4,746,312Cash and bank balances 237,864 - - - 237,864Total financial assets 9,335,491 339,300 2,135,710 4,773,281 16,583,782 (contractual maturity dates)
Long-term insurance and deposit administration contracts can be surrendered before maturity for a cash surrender value specified in the contractual terms and conditions. Prudent liquidity risk management includes maintaining sufficient cash balances to cover anticipated surrenders before the contractual maturity dates. In addition, the Company invests only a limited proportion of its assets in investments that are not actively traded. The Company’s listed securities are considered readily realisable, as they are actively traded on the Nairobi Stock Exchange.
(f) Capital management
The Company’s objectives when managing capital, which is a broader concept than the ‘equity’ on the Statement of financial positions, are:
• TocomplywiththecapitalrequirementsassetoutintheInsurance Act;
• Tocomplywithregulatorysolvencyrequirementsassetout in the Insurance Act.
• TosafeguardtheCompany’sabilitytocontinueasagoingconcern, so that it can continue to provide returns to shareholders and benefits for other stakeholders; and
• Toprovideanadequatereturntoshareholdersbypricinginsurance and investment contracts commensurately with the level of risk.
The Insurance Act requires the insurance Company to hold the minimum level of paid up capital of Shs 150 million.
Long-term insurance businesses are required to keep a solvency margin i.e. admitted assets less admitted liabilities equivalent to the higher of Shs 10 million or 5% of total admitted liabilities.
Notes to the Financial Statements (continued)
4. MANAGEMENT OF INSURANCE AND FINANCIAL RISK (CONTINUED)

53ANNUAL REPORT &
FINANCIAL STATEMENTS 2013
During the year the Company held the minimum paid up capital required and met the required solvency margin for its long-term business. The Company’s paid up capital at 31 December 2013 and 31 December 2012 is reflected on Note 12.
The solvency margin of the Company as at 31 December 2013, 31 December 2012 and 31 December 2011 is illustrated below:
2013 2012 2011 Restated Restated Shs’000 Shs’000 Shs’000
Admitted assets 20,148,496 17,873,395 13,127,198Admitted liabilities 18,774,713 16,885,566 12,298,128
Margin 1,373,784 987,829 829,070Required margin 938,736 844,278 614,906
(g) Fair value estimation
IFRS 7 requires disclosure of fair value measurements for financial assets that are measured at fair value by level of the following fair value measurement hierarchy:
Quoted prices (unadjusted) in active markets for identical assets or liabilities (level 1). Inputs other than quoted prices included within level 1 that are observable for the asset or liability, either directly (that is, as prices) or indirectly (that is, derived from prices) (level 2). Inputs for the asset or liability that are not based on observable market data (that is, unobservable inputs) (level 3).
The following table presents the Company’s assets and liabilities that are measured at fair value.
As at 31 December 2013 Level 1 Level 2 Level 3 Total Shs’000 Shs’000 Shs’000 Shs’000
Assets Financial assets at fair value Fair value through P&L financial assets: – Equity securities 1,904,990 31,458 - 1,936,448– Debt investments - 3,783,992 - 3,783,992Investment property 898,000 898,000Buildings 442,000 442,000Total assets 1,904,990 5,155,450 - 7,060,440
As at 31 December 2012 Restated Level 1 Level 2 Level 3 Total Shs’000 Shs’000 Shs’000 Shs’000
Assets Financial assets at fair value Fair value through P&L financial assets: – Equity securities 929,443 - - 929,443– Debt investments - 1,616,664 - 1,616,664 Investment property 756,249 756,249Buildings 396,336 396,336Total assets 929,443 2,769,249 - 3,698,692
Notes to the Financial Statements (continued)
4. MANAGEMENT OF INSURANCE AND FINANCIAL RISK (CONTINUED)

54
The fair value of financial instruments traded in active markets is based on quoted market prices at the financial reporting date. A market is regarded as active if quoted prices are readily and regularly available from an exchange, dealer, broker, industry group, pricing service, or regulatory agency, and those prices represent actual and regularly occurring market transactions on an arm’s length basis.
The quoted market price used for financial assets held by the group is the current bid price. These instruments are included in level 1. Instruments included in level 1 comprise primarily listed on the Nairobi Securities Exchange (NSE) equity investments classified as trading securities or available-for-sale.
The fair value of financial instruments that are not traded in an active market (for example, government securities) is determined by using valuation techniques.
These valuation techniques maximise the use of observable market data where it is available and rely as little as possible on entity specific estimates. If all significant inputs required to fair value an instrument are observable, the instrument is included in level 2.
If one or more of the significant inputs is not based on observable market data, the instrument is included in level 3.
Specific valuation techniques used to value financial instruments include:
• Quoted market prices or dealer quotes for similarinstruments.
• Thefairvalueofgovernmentsecuritiesisdeterminedusingyield curve based on prices of similar securities traded on the Nairobi Securities Exchange.
Other techniques, such as discounted cash flow analysis, are used to determine fair value for the remaining financial instruments.
The Company had no financial instruments included in level 3 as at 31 December 2013 (2012: Shs Nil).
Fair value of other financial assets and liabilities
The held-to-maturity government security portfolio of the Company had a fair value of Shs 6,494,874 (2012: 7,730,557). In the opinion of the directors, the carrying values of the company’s other financial assets and liabilities approximates the fair value.
5. GROSS EARNED PREMIUMS 2013 2012 Shs’000 Shs’000
Life assurance business: - Ordinary life gross written 1,190,996 1,156,761- Group life gross written 565,353 402,497- Unearned premium reserves (73,212) (45,803)Gross earned premiums 1,683,137 1,513,455
Notes to the Financial Statements (continued)
4. MANAGEMENT OF INSURANCE AND FINANCIAL RISK (CONTINUED)

55ANNUAL REPORT &
FINANCIAL STATEMENTS 2013
6. INVESTMENT INCOME 2013 2012 Shs’000 Shs’000
Interest from government securities 904,223 814,916Interest on bank deposits 344,823 204,915Rental income from investment property 128,846 65,033Fair value gain on investment property (Note 18) 141,751 64,500Fair value gain on financial assets 306,088 302,877Interest on corporate bonds 136,891 132,580Interest on policy loans 99,241 91,355Dividend income 300,430 90,720Other (334,156) 404,191Total Investment Income 2,028,137 2,171,087
7. CLAIMS AND POLICY HOLDER
2013 2012 Shs’000 Shs’000
Insurance contracts with fixed and guaranteed terms: - Death, maturity and surrender benefits paid and payable 744,907 740,701- Increase in policyholder liabilities 442,643 926,576- Interest payable on deposit administration contracts 832,683 865,198 Total claims and policyholders benefits payable 2,020,233 2,532,475
8. OPERATING AND OTHER EXPENSES
2013 2012 Shs’000 Shs’000 The following items are included within operating and other expenses:Staff costs (Note 9) 302,983 312,981Statutory audit fees 3,089 4,013Actuarial fees 24,793 28,762Legal fees 239 1,145Premium collection charges 30,218 29,622Premium tax and stamp duty 18,724 19,431Rent and related expenses 37,855 16,603Advertising 41,808 26,733Depreciation (Note 16) 61,107 66,797 Amortisation of intangible asset (Note 17) 17,018 51,664System costs 76,277 54,387Other Expenses 318,380 287,163Total operating expenses 932,491 899,301
Notes to the Financial Statements (continued)

56
9. STAFF COSTS
2013 2012 Shs’000 Shs’000Staff costs include the following: - Social Security costs 240 243 - Retirement benefit costs 19,626 18,328- Salaries and wages 283,117 294,410Total staff costs 302,983 312,981
10. INCOME EXPENSE
The Company’s current tax charge is computed in accordance with income tax rules applicable to life insurance companies. A reconciliation of the tax charge is shown below. 2013 2012 Shs’000 Shs’000Profit before income tax 436,636 28,633Tax calculated at the statutory income tax rate of 30% (2012: 30%) 130,991 8,590Tax effect of: -Prior year tax under provision - (1,148) -Expenses not deductible for tax purposes (151,167) (54,721)Income tax expense (20,176) (47,279)
11. DIVIDENDS
In 2013, no dividend was proposed. However Shs 100 million proposed in 2012 was paid.
12. SHARE CAPITAL
Number of Ordinary Share shares shares premium (Thousands) Shs’000 Shs’000 Balance at 1 January 2012, 1 January 2013 and 31 December 2013 30,617 612,340 -
The total authorised number of ordinary shares is 30,617,000 with a par value of Shs 20 per share. As at 31 December 2013, all issued shares had been fully paid up.
Notes to the Financial Statements (continued)

57ANNUAL REPORT &
FINANCIAL STATEMENTS 2013
13. REVALUATION RESERVES
Revaluation reserves comprise the revaluation surplus on buildings and freehold land (included within property and equipment) which is a non distributable reserve.
Revaluation reserve – Buildings 2013 2012 2011 Restated Restated Shs’000 Shs’000 Shs’000At start of year 268,233 230,285 230,285Deferred income tax amount (Note 29) (11,478) (16,263) -Revaluation gain in the year (Note 16) 38,260 54,211 -At end of year 295,015 268,233 230,285
14 RETAINED EARNINGS
The retained earnings balance represents the amount available for dividend distribution to the shareholders of the Company, with the exception of cumulative fair value gains on the Company’s investment properties of Shs 387,033,187 (2012: Shs 245,282,000) whose distribution is subject to restrictions imposed by the Insurance Regulatory Authority. 2013 2012 2011 Restated Restated Shs ‘000 Shs ‘000 Shs ‘000As at 1 January (356,062) (453,606) (88,660) Profit for the year 416,460 (98,646) 315,420 Reclassification of AFS to FVTPL - - (48,987)Reclassification of revaluation reserve - - 70,530Restatement arising from change in valuation from NPV to GPV - - 316,522 Transfer to statutory reserves (401,761) 220,858 (718,431) Transfer of retained earnings from Heritage - 75,333 -Interim dividends paid - (100,000) (300,000) As at 31 December (341,363) (356,061) (453,606)
Notes to the Financial Statements (continued)

58
15 STATUTORY RESERVE
The statutory reserve represents surpluses from the life fund whose distribution is subject to restrictions imposed by the Kenya Insurance Act. The total of the statutory reserve and other reserves represents 70% of the surplus of the life fund and any undistributed surpluses available to the shareholders. The Act limits the amounts of surpluses of the life business available for distribution to shareholders to 30% of the accumulated profits of the life business.
During the year a total of Shs Nil net of taxes was available to the shareholders of which none was distributed to them. In 2012, Shs 100,000,000 net of taxes was available to the shareholders of which all was distributed to them.
2013 2012 2011 Restated Restated Shs ‘000 Shs ‘000 Shs ‘000As at 1 January 554,056 652,436 78,716 Transfer from Heritage - 273,980 -Transfer to/(from) statutory reserve 401,761 (451,886) 479,125Income tax expense adjustment - (151,502) (144,711)Surplus for the year - 231,028 239,306 As at 31 December 955,817 554,056 652,436
The total un-appropriated Surplus in the life fund is Shs 1,250,832,000 (2012: Restated Shs 822,289,000) analysed as follows;
2013 2012 2011 Restated Restated Restated Shs ‘000 Shs ‘000 Shs ‘000 Amount in statutory reserve 955,817 554,056 652,436Amount in other reserves 295,015 268,233 230,285At end of year 1,250,832 822,289 882,721
Notes to the Financial Statements (continued)

59ANNUAL REPORT &
FINANCIAL STATEMENTS 2013
16. PROPERTY AND EQUIPMENT
Buildings Motor Computers Furniture Leasehold Work in Total vehicles & fixtures & improve- Progress equipment fittings mentsYear ended 31 December 2013: Shs’000 Shs’000 Shs’000 Shs’000 Shs’000 Shs’000 Shs’000Cost or valuation
At start of year 397,000 39,566 129,794 420,815 44,011 1,935 1,033,121Additions 6,740 - 8,228 3,425 1,305 567 20,265Disposals - (5,396) (164) (388) (905) - (6,852)Revaluation gains (note 13) 38,260 - - - - - 38,260Reclassification - - 300 1,029 (1,329) - -Transfer from work-in-progress - - 1,935 - - (1,935) -At end of year 442,000 34,170 140,093 428,880 43,083 567 1,084,793
Comprising:
Cost 403,740 34,170 140,093 428,880 43,083 567 1,046,533Revaluation gains 38,260 - - - - - 38,260At end of year 442,000 34,170 140,093 428,880 43,083 567 1,084,793
Depreciation
At start of year 664 22,123 104,981 229,371 15,708 - 372,847Charge for the year (Note 8) (664) 7,661 9,320 39,531 5,259 - 61,107Cumulated on disposals - (5,396) (153) (267) (1,636) - (7,453)At end of year - 24,388 114,148 268,635 19,331 - 426,502Net book amount At 31 December 2013 442,000 9,782 25,945 156,245 23,752 567 658,291
Notes to the Financial Statements (continued)

60
Buildings Motor Computers Furniture Leasehold Work in Total vehicles & fixtures & improve- Progress equipment fittings mentsYear ended 31 December 2012: Shs’000 Shs’000 Shs’000 Shs’000 Shs’000 Shs’000 Shs’000Cost or valuation At start of year 324,153 45,659 112,066 418,265 47,619 22,577 970,339Additions 19,636 10,692 7,359 7,925 20,910 1,935 68,457Disposals - (16,785) - (16,476) (24,518) (1,647) (59,426)Revaluation gains (note 13) 54,211 - - - - - 54,211Transfer to investment properties (note 18) (1,000) - - - - - (1,000)Transfer from Heritage (Note 35) - - - 540 - - 540Transfer from work-in-progress - - 10,369 10,561 - (20,930) -At end of year 397,000 39,566 129,794 420,815 44,011 1,935 1,033,121Comprising: Cost 342,789 39,566 129,794 420,815 44,011 1,935 978,910Revaluation gains 54,211 - - - - - 54,211At end of yearDepreciation At start of year 607 30,105 95,968 193,088 19,794 - 339,562Charge for the year (Note 8) 57 7,184 9,013 44,089 6,453 - 66,797Cumulated on disposals - (15,165) - (7,805) (10,539) - (33,509)At end of year 664 22,124 104,981 229,372 15,708 - 372,849Net book amount At 31 December 2012 396,336 17,442 24,813 191,443 28,303 1,935 660,272
Buildings were revalued as at 31 December 2013, by Tysons Limited, independent valuers, on the basis of the market value for existing use. The resultant revaluation surplus was credited to the revaluation reserve.
If the land and buildings were stated on the historical cost basis, the amounts would be as follows:
2013 2012 Shs’000 Shs’000Cost 158,405 138,769Addition 6,740 19,636Accumulated depreciation (76,517) (72,482)Net book amount 88,628 85,923
Notes to the Financial Statements (continued)
16. PROPERTY AND EQUIPMENT (CONTINUED)
397,000 39,566 129,794 420,815 44,011 1,935 1,033,121

61ANNUAL REPORT &
FINANCIAL STATEMENTS 2013
17. INTANGIBLE ASSETS
2013 2012 Shs’000’ Shs’000Cost At 1 January 304,805 290,896Additions 2,092 13,308 Other - 601At 31 December 306,897 304,805 Amortisation At 1 January 241,625 189,961Charge for the year (Note 8) 17,018 51,664At 31 December 258,643 241,625Net book amount 48,254 63,180 18. INVESTMENT PROPERTY
2013 2012 Shs’000’ Shs’000At 1 January 756,249 412,500Transfer from Heritage (Note 35) - 278,249Transfer from owner occupied (note 16) - 1,000Fair value gains (Note 6) 141,751 64,500As at 31 December 898,000 756,249 Investment properties are carried at fair value, which has been determined based on valuations carried out by Tysons Limited as at 31 December 2013.The fair value represents the amount at which the assets could be exchanged at an arm’s length transaction between a willing buyer and a willing seller. The valuation is based on the property’s anticipated rental income.
The valuations are carried out on an annual basis and the fair value gains and losses are recorded in the income statement.
The property rental income earned by the Company from its investment properties, leased out under operating leases as at 31 December 2013, amounted to Shs 128,845,587 (2012: Shs 65,033,001). Direct operating expenses arising on the investment property amounted to Shs 102,475,717 (2012: Shs 34,678,358).
Notes to the Financial Statements (continued)

62
19. GOVERNMENT AND OTHER SECURITIES HELD
2013 2012 2011 Restated Restated Shs ‘000 Shs ‘000 Shs ‘000Listed debt securities: Government securities 5,114,542 6,339,940 5,282,643 Corporate bonds 1,380,332 1,390,617 1,339,386 Total 6,494,874 7,730,557 6,622,029
Movements in Government and other securities held-to-maturity assets during the year are as follows:
2013 2012 2011 Restated Restated Shs ‘000 Shs ‘000 Shs ‘000At start of year 7,730,557 6,622,029 2,983,928Additions 60,000 1,673,601 3,759,996Maturities (1,251,360) (604,259) (167,019)Accrued Interest (44,323) 39,186 45,124At end of year 6,494,874 7,730,557 6,622,029
Maturity Analysis:
2013 2012 2011 Restated Restated Shs ‘000 Shs ‘000 Shs ‘000 < 1 year 1,256,740 1,793,614 1,005,448 1-5 years 2,398,373 2,553,964 2,371,263 5-10 years 1,569,155 1,847,310 1,908,780 > 10 years 1,270,606 1,535,669 1,336,538Total 6,494,874 7,730,557 6,622,029
As at 31 December 2013 a total of Shs 1,533,427,507 (2012: Shs 799,020,212) of the government securities classified as held-to-maturity were held under lien by the Central Bank of Kenya.
Notes to the Financial Statements (continued)

63ANNUAL REPORT &
FINANCIAL STATEMENTS 2013
20. FAIR VALUE THROUGH P&L ASSETS
2013 2012 2011 Restated Restated Shs ‘000 Shs ‘000 Shs ‘000Equity securities: -Listed 1,904,990 929,443 1,687,686 -Unlisted 31,458 - -Listed debt securities: Government securities 3,730,362 1,589,609 947,741 Corporate bonds 53,630 7,055 26,201 Total 5,720,440 2,546,107 2,661,628
Movements in fair value through P&L assets during the year are as follows: 2013 2012 2011 Shs ‘000 Shs ‘000 Shs ‘000i) Equity securities: At start of year 929,443 1,687,686 2,879,429 Additions 963,950 319,610 17,911 Disposals (238,858) (1,188,424) ( 477,222) Fair value gain /(loss) 281,914 110,570 (732,432) At end of year 1,936,448 929,443 1,687,686
iii) Listed debt securities: At start of year 1,616,664 973,942 3,845,240 Additions 2,717,819 1,945,770 897,378 Disposals (638,522) (1,459,000) (3,330,646) Accrued Interest 63,857 3,784 (48,518) Fair value gain/ (loss) 24,174 152,167 (389,512) At end of year 3,783,992 1,616,663 973,942
Maturity analysis: 2013 2012 2011 Shs ‘000 Shs ‘000 Shs ‘000< 1 year 1,138,058 595,373 668,0441-5 years 1,959,519 617,832 241,7185-10 years 168,733 222,389 45,403> 10 years 2,454,130 1,110,513 1,706,463Total 5,720,440 2,546,107 2,661,628
Notes to the Financial Statements (continued)

64
21. LOANS AND RECEIVABLES
2013 2012 Shs ‘000 Shs ‘000Mortgage loans 233,389 226,107 Policy loans 754,199 615,992 Staff loans 68,333 72,054 Total 1,055,921 914,153
Movements in loans and receivables during the year are as follows: 2013 2012 Shs ‘000 Shs ‘000 At start of year 914,153 948,589Loan advanced 478,525 270,933Repayments (438,092) (406,049)Accrued interest 101,335 100,680At end of year 1,055,921 914,153
(i) Mortgage loans 2013 2012 Shs ‘000 Shs ‘000 At start of year 226,107 200,413 Loan advanced 58,655 51,289 Repayments ( 52,465) (26,287) Accrued interest 1,092 692 At end of year 233,389 226,107
(ii) Policy loans 2013 2012 Shs ‘000 Shs ‘000At start of year 615,992 673,461 Loan advanced 390,077 191,165 Repayments (352,113) (348,622) Accrued interest 100,243 99,988 At end of year 754,199 615,992
(iii) Staff loans 2013 2012 Shs ‘000 Shs ‘000 At start of year 72,054 74,715 Loan advanced 29,793 28,479Repayments (33,514) (31,140)Accrued interest - - At end of year 68,333 72,054
Notes to the Financial Statements (continued)

65ANNUAL REPORT &
FINANCIAL STATEMENTS 2013
22. RE-INSURERS’ SHARE OF TECHNICAL PROVISIONS AND RESERVES
2013 2012 Shs ‘000 Shs ‘000Re-insurers’ share of: - notified claims outstanding 76,980 130,506Total 76,980 130,506
Amounts due from re-insurers in respect of claims already paid by the Company on contracts that are reinsured are included in reinsurance receivables on the Statement of financial position.
23. OTHER ASSETS
2013 2012 Note Shs ‘000 Shs ‘000Receivables from group companies 32(d) 29,615 71,832Prepayments 70,901 63,615Other receivables 32,399 80,175 132,915 215,622
24. INSURANCE CONTRACT LIABILITIES
(a) Movements in insurance contract liabilities 2013 2012 2011 Restated Restated Shs ‘000 Shs ‘000 Shs ‘000As at 1 January 5,185,263 3,783,334 3,726,709 Premiums received 1,474,497 1,328,435 1,204,732 Maturities/payment to policyholders (744,907) (740,701) (547,848)Interest payable to policyholders 127,334 161,968 45,672 Other movements* 324,277 652,227 (645,931)As at 31 December 6,366,464 5,185,263 3,783,334
*Other movements relate to Increase/ (decrease) in actuarial liabilities.
Notes to the Financial Statements (continued)

66
(b) Movements in insurance contract liabilities and reinsurance assets: 31 December 2013 31 December 2012 Gross Reinsurance Net Gross Reinsurance Net Shs ‘000 Shs ‘000 Shs ‘000 Shs ‘000 Shs ‘000 Shs ‘000 Insurance contract liabilities 6,366,464 (109,857) 6,256,607 5,185,263 (27,383) 5,157,880
At 31 December 6,366,464 (109,857) 6,256,607 5,185,263 (27,383) 5,157,880
c) Movements in the reinsurance asset is as shown below: 2013 2012 Shs ‘000 Shs ‘000Opening balance 27,383 20,450Current year 82,474 6,933Total 109,857 27,383
1) Long-term insurance contracts
The Company determines its liabilities on the long-term insurance contracts on a realistic basis, namely the Gross Premium Valuation (GPV) method.
The GPV method makes explicit assumptions on expected future deaths, investment returns, lapses, expenses and bonuses as well as margins for uncertainty on these assumptions. Assumptions used are based on recent experience investigations conducted by the company while taking into consideration prior year assumptions and the outlook of future experience.
The liabilities are determined by the Company on the advice of the consulting actuary and actuarial valuations are carried out on an annual basis. The latest actuarial valuation of the Company’s life fund was undertaken as at 31 December 2013 by the consulting actuaries – AON Actuaries and Consultants (Pty) Limited.
2) Valuation assumptions:
The significant valuation assumptions for the actuarial valuation as at 31 December 2013 are summarised below:
i) Mortality
The GPV basis uses 100% of the SA85/90 ultimate mortality table plus an AIDS allowance of 100% of the AB1 Select and
Ultimate tables (2008 ASSA model). Mortality assumption is based on recent mortality investigation conducted by the company while taking into consideration prior year assumptions and the outlook of future experience.
For Group Life contracts which are only valued as an IBNR, there is a mitigating effect of changing premium rates on an annual basis as contracts are reviewed annually and no mortality guarantees are offered.
ii) Investment returns
The GPV actuarial valuation as at 31 December 2013 used an expected future investment return of 12.8% compounded annually for individual long term insurance contracts and annuity business. On the GPV basis the valuation interest rate assumption allows for a margin over the expected future investment return, hence strengthening the prudence in the GPV valuation basis.
The weighted average rate of return on a Fair Value basis as earned by the assets backing the life fund for the year ended 31 December 2013 was 10.62% p.a. (2012: 16.37% p.a.) and the average over the last three years was 9.06% p.a.
iii) Expenses and expense inflation
The current level of management expenses is taken to be an appropriate expense base for the GPV basis. The expense assumption is derived from the recent expense investigation.
Notes to the Financial Statements (continued)
24. INSURANCE CONTRACT LIABILITIES (CONTINUED)

67ANNUAL REPORT &
FINANCIAL STATEMENTS 2013
24. INSURANCE CONTRACT LIABILITIES (CONTINUED)
The purpose of the investigation was to split of expenses between initial and renewal expenses. The result of the investigation showed that the initial and renewal expenses decreased in real terms comparative to prior year.
For the GPV basis an appropriate assumption is made on the increase of renewal expenses. An expense inflation of 9.2% (2012: 9.0%) is assumed.
iv) Withdrawals
The GPV method allows assumptions to be set on the rate of termination of an insurance contract following a failure to pay premiums (lapse) or the voluntarily termination before the insurance contract maturity (surrender) per policy year.
The withdrawal assumption is derived from recent withdrawal experience investigation conducted by the Company while taking into consideration prior year assumptions and the outlook of future experience.
v) Sensitivity analysis
The sensitivity of the GPV results has been tested to certain key assumptions by calculating the effect of assumptions not
being met. The results of the sensitivity analysis (in Shs’000) can be summarized as follows:
Shs’000 % Change
Main basis 17,470,222 Expenses plus 10% 17,592,514 0.7%Mortality and other claim experience plus 10% 17,487,692 0.1%Interest rate less 1% 17,540,103 0.4%Expense inflation plus 1% 17,522,633 0.3%Withdrawals plus 10% 17,435,282 -0.2%
As can be seen from the above table, the valuation results depend on the assumptions made. If these assumptions are not realized in practice, then the surplus in the Life Fund would differ from that expected.
It should be noted that the sensitivity calculations have been done independently. This means that interactions between various factors have not been considered. For instance, in the event of withdrawals increasing, it is likely that per policy expenses will also increase. Thus, when considering various scenarios, one needs to use an interplay of the above figures. This has not been allowed for in the above analysis.
25. AMOUNTS PAYABLE UNDER DEPOSIT ADMINISTRATION CONTRACTS
Deposit administration contracts are recorded at amortised cost. Movements in amounts payable under deposit administration contracts during the year were as shown below. The liabilities are shown inclusive of interest accumulated to 31 December 2012 and 31 December 2011. Interest was declared and credited to the customer accounts at a weighted average rate of 10% for year ended 31 December 2013 (2012: 10 %).
2013 2012 2011 restated restated Shs ‘000 Shs ‘000 Shs ‘000At 1 January 10,465,500 7,651,478 7,100,559Opening balance adjustment - 20,277 -Pension fund deposits received 1,722,239 1,566,223 1,576,505Transfer from Heritage - 1,883,013 -Surrenders and annuities paid (1,916,664) (1,593,361) (1,345,265)Interest payable to policyholders 1,012,244 752,054 257,412*Other movements (179,561) 185,816 62,267At end of year 11,103,758 10,465,500 7,651,478
*Other movements relate to Increase/ (decrease) in actuarial liabilities.
Notes to the Financial Statements (continued)

68
26. UNEARNED PREMIUMS
2013 2012 Gross Reinsurance Net Gross Reinsurance NetAt beginning of year (45,296) - (45,296) - - -Decrease in the period (net) (73,413) - (73,413) (45,296) - (45,296)At end of year 118,709 - (118,709) (45,296) - (45,296)
27. OTHER PAYABLES
2013 2012 Shs ‘000 Shs ‘000Due from related companies (Note 32 (d)) 30,574 65,195Accrued expenses 160,621 92,048Stale cheques 40,780 47,315Reserve for maturities 236,710 233,607 Other payables transferred from Heritage - 77,700Other payables 115,841 129,411 584,526 645,276
28. CONTIGENT LIABILITIES AND COMMITMENTS
As is common with the insurance industry in general, the Company is subject to litigation arising in the normal course of insurance business. The Directors are of the opinion that this litigation will not have a material effect on the financial position or results of the Company.
Operating lease commitments
The future minimum lease payments under non-cancellable operating leases are as follows: 2013 2012 Shs ‘000 Shs ‘000Not later than 1 year 9,683 13,962 Later than 1 year and not later than 5 years 13,166 54,361 22,849 68,323
Notes to the Financial Statements (continued)

69ANNUAL REPORT &
FINANCIAL STATEMENTS 2013
29. DEFERRED INCOME TAX
Deferred income tax is calculated, in full, on all temporary differences under the liability method using the enacted tax rate of 30% (2012: 30%). The movement on the deferred income tax account is as follows: 2013 2012 2011 Restated Restated Shs’000 Shs’000 Shs’000At start of year 340,737 172,874 - Statement of changes in equity charge 11,478 167,863 172,874At end of year 352,215 340,737 172,874
Deferred income tax assets and liabilities, deferred income tax charge/ (credit) in the statement of changes in equity is attributable to the following items:
Year ended 31 December 2011 Statutory Other Total reserves reserves Shs’000 Shs’000 Shs’000At start of year - - - Statement of changes in equity charge 74,181 98,693 172,874At end of year 74,181 98,693 172,874
Year ended 31 December 2012 Statutory Other Total reserves reserves Shs’000 Shs’000 Shs’000
At start of year 74,181 98,693 172,874Statement of changes in equity charge 151,502 16,263 167,766At end of year 225,683 114,956 340,737
Year ended 31 December 2013 Statutory Other Total reserves reserves Shs’000 Shs’000 Shs’000At start of year 225,683 114,956 340,737 Statement of changes in equity charge - 11,478 11,478At end of year 225,683 126,434 352,215
Notes to the Financial Statements (continued)

70
30. CASH AND CASH EQUIVALENTS
For the purposes of the Statement of Cash flows, cash and cash equivalents comprise the following: 2013 2012 Shs ‘000 Shs ‘000Cash at bank and in hand 232,533 237,864 Deposits with financial institutions 4,773,736 4,746,312 5,006,269 4,984,176
31. CASH GENERATED FROM OPERATIONS 2013 2012 Restated Shs ‘000’ Shs ‘000’Profit before tax 436,636 28,633 Adjustment for: Interest income (946,650) (1,273,676)Depreciation(Note 16) 61,107 66,797 Amortization of intangible assets 17,018 51,664 Loss on sale of assets 1,800 17,378 Amortization of operating lease rentals 11 11 Change in fair value of investment property (141,752) (64,500)Foreign exchange gain (512) (528)impairment loss on available for sale assets - 14,783 Realised gains on sale of AFS financial assets (55,644) (683,950)Dividends received (297,098) (90,720)Fund management fees 61,389 35,873 Other net interest expenses (715,246) (125,747)Operating cash flows before changes in working capital items (1,578,941) (2,023,982)
Changes in : Insurance contract liabilities 1,181,201 1,401,929Outstanding claims 39,319 52,232Provision for unearned premiums 73,413 45,296 Payable under deposit administration contracts 638,258 2,814,022Deferred tax 11,478 167,863 Other payables (60,750) 63,859Creditors arising from reassurance arrangements 34,306 6,521Deferred acquisition costs (4,533) - Re-insurers’ share of technical provisions 53,526 (24,846)Insurance receivables (Outstanding premiums) (4,978) (20,810)Reinsurance receivables (82,474) (6,933) Other receivables 82,707 37,466 Cash generated from operations 382,532 2,512,619
Notes to the Financial Statements (continued)

71ANNUAL REPORT &
FINANCIAL STATEMENTS 2013
32.RELATED PARTY TRANSACTIONS
The Company is controlled by Liberty Holdings Kenya (LHK) incorporated in Kenya. The ultimate parent of the Company is Standard Bank PLC, a Company incorporated in the Republic of South Africa. There are other companies which are related to CfC Life Assurance Limited through common shareholdings or common directorships. The following transactions were carried out with related parties: Total Total 2013 2012 Shs ‘000 Shs ‘000(a) Investments held in related companies Bank deposits 458,298 886,860Corporate bonds 349,864 249,951 Fair value through profit or loss : quoted shares 23,316 11,501 831,478 1,148,312(b) Investment management expenses charged by related companies Management fees 61,389 35,873Stock brokerage fees 7,008 15,612Bonds brokerage fees 499 271 68,896 51,756(c) Income received from related party investments Dividend received 160 175Interest on deposits 94,059 137,321Rental income 47,005 40,464 144,224 177,960(d) Outstanding balances with related parties (i) Receivable from: Heritage Insurance (Kenya) 17,728 61,386Liberty Uganda 4,086 -Heritage Tanzania 433 38StanLib 7,368 10,408 29,615 71,832(ii) Payables to: StanLib - 5,668Liberty Africa 30,574 47,874Heritage Kenya - 11,653 30,574 65,195(e) Key management compensation Salaries and other short-term employment benefits 216,038 129,744 216,038 129,744(f) Directors’ remuneration - fees for services as a director 6,025 4,353- other emoluments (included in (e) above) 46,486 29,408 52,511 33,761
Notes to the Financial Statements (continued)

72
Long term business revenue account - For the year ended 31 DECEMBER
Long term funds at the end of the year comprise amounts attributable to: 2013 2012 restated Shs 000 Shs 000Income Earned Premium 4,213,924 3,618,239 Reinsurance Premium ceded (208,640) (185,020)Investment Income 2,273,609 2,332,404 Administration fees (229,574) (148,053)Unearned Premium Reserve (73,212) (56,112)A: Total Income 5,976,108 5,561,458
Outgo Incurred claims 2,661,571 2,254,058 Management fees 129,173 132,405 Management Expenses 932,491 899,274 Taxation 20,176 47,279 B: Total Outgo 3,743,410 3,333,017
Excess of Income Over Outgo (A-B) 2,232,698 2,228,441
Plus: Life Fund brought Forward 16,473,051 12,317,533 Plus: Change in other reserves 26,783 37,947 Plus: Heritage Life Fund transfer - 2,156,993 Less: Change in deferred tax provision (11,478) (167,863)Life fund at the end of the year (Before transfer to shareholders fund) 18,721,054 16,573,051
Less: Transfer to shareholders - (100,000) Life fund at the end of the year 18,721,054 6,473,051
Life Fund Reconciliation with Balance sheet Balance Sheet Assets 20,281,920 18,064,133 Less: Current Liabilities 1,289,890 1,234,803 Less: Share Capital 612,340 612,340 Less: Retained earnings (341,363) (256,061)Life fund at the end of the year 18,721,054 16,473,051
Supplementary Information

Notes 73ANNUAL REPORT &
FINANCIAL STATEMENTS 2013
Notes 74

COMPANY DETAILS
REGISTERED HEAD OFFICE
CfC House, Mamlaka Road P. O. Box 30364 - 00100 Nairobi Kenya Tel: (+254) 20 2866000 Cell: 0711 028 000 Fax: (+254) 20 271 8365E: [email protected]. www.cfclife-kenya.com
Thika Branch
Zuri Centre, Kenyatta AvenueP. O Box 1540 Thika, 01000Tel: (+254) 202866560E: [email protected] [email protected]
Nanyuki Branch
Silver Plaza, 1st Floor, Nanyuki Meru RoadTel: (+254) 202866338E: [email protected]
Nakuru Branch
Polo Centre, 1st FloorTom- Mboya off Kenyatta AvenueP. O Box 13843 - 20100, NakuruTel: (+254) 0512210209E: [email protected] [email protected]
Eldoret Branch
Imperial Court, 1st Floor, Uganda RoadP. O Box 13843 - 20100, NakuruTel: (+254) 0532031527 / 2033488E: [email protected] [email protected]
Kisumu Branch
Tivoli Centre, Along Court RdP. O Box 1953- 40100 KisumuTel: (+254) 0572020096 /99 / 2023521E: [email protected] [email protected]
Kisii Branch
Royal Plaza, Hospital Road.Tel: (+254) 202866564Email: [email protected] [email protected]
Meru Branch
Mwitu Center BuildingE: [email protected]
Mombasa Branch
Nkuruma Rd, Nssf bldg 6th floorP. O Box 84772, 80100 MombasaTel: (+254)2315893 / 2315731 /2 / 0722204664E: [email protected] [email protected]
Kitui Branch
Muli Mall, Biashara street, opposite Equity Bank1st Floor room 92P. O Box 30364 - 00100 Nairobi KenyaTel: (+254) 20 2866 000E: [email protected]

76