
Annual Report final - United Nations Office on Drugs … · MNSL Maldives National Shipping Limited...
72
s d s a c ANNUAL REPORT 2002 Maldives Monetary Authority Maldives Monetary Authority Maldives Monetary Authority Maldives Monetary Authority Maldives Monetary Authority
Transcript of Annual Report final - United Nations Office on Drugs … · MNSL Maldives National Shipping Limited...
1
MMA ANNUAL REPORT 2002
s d s ac
ANNUAL REPORT
2002
Maldives Monetary AuthorityMaldives Monetary AuthorityMaldives Monetary AuthorityMaldives Monetary AuthorityMaldives Monetary Authority

2

3
MMA ANNUAL REPORT 2002
MALDIVES MONETMALDIVES MONETMALDIVES MONETMALDIVES MONETMALDIVES MONETARARARARARY AUTHORITYY AUTHORITYY AUTHORITYY AUTHORITYY AUTHORITYMalé, Republic of Maldives
Dear Sir,
In accordance with Article 35 (2) of Maldives Monetary Authority Act (1981), I have the honour to submit theAnnual Report of the Maldives Monetary Authority for 2002, which includes a copy of the Financial State-ments for the year ended 31 December 2002, audited by the Government Auditors.
Yours sincerely
Mohamed JaleelVice Governor
H.E. Maumoon Abdul Gayoom,President of the Republic of Maldives,Office of the President,Malé.
Letter of Transmittal

4
Letter of TransmittalLetter of TransmittalLetter of TransmittalLetter of TransmittalLetter of Transmittal ............................................................................................................................................................................................................................................................................................................................................................................................................................................................................................................................................................................................... 33333
List of AcronymsList of AcronymsList of AcronymsList of AcronymsList of Acronyms ............................................................................................................................................................................................................................................................................................................................................................................................................................................................................................................................................................................................................................. 66666
An Overview of the Maldives Monetary AuthorityAn Overview of the Maldives Monetary AuthorityAn Overview of the Maldives Monetary AuthorityAn Overview of the Maldives Monetary AuthorityAn Overview of the Maldives Monetary Authority .......................................................................................................................................................................................................................................................................................................................................... 77777
Organisational Chart of Maldives Monetary Authority............................................................... 8Organisational Chart of Maldives Monetary Authority............................................................... 8Organisational Chart of Maldives Monetary Authority............................................................... 8Organisational Chart of Maldives Monetary Authority............................................................... 8Organisational Chart of Maldives Monetary Authority............................................................... 8
Directors and Senior OfficialsDirectors and Senior OfficialsDirectors and Senior OfficialsDirectors and Senior OfficialsDirectors and Senior Officials ............................................................................................................................................................................................................................................................................................................................................................................................................................................................................................................... 99999
PrefacePrefacePrefacePrefacePreface .................................................................................................................................................................................................................................................................................................................................................................................................................................................................................................................................................................................................................................................................................................................. 1 01 01 01 01 0
Economic ReviewEconomic ReviewEconomic ReviewEconomic ReviewEconomic Review ........................................................................................................................................................................................................................................................................................................................................................................................................................................................................................................................................................................................................................ 1 11 11 11 11 1
Domestic Economic ReviewDomestic Economic ReviewDomestic Economic ReviewDomestic Economic ReviewDomestic Economic Review ................................................................................................................................................................................................................................................................................................................................................................................................................................................................................................ 1 31 31 31 31 3
1. Overview1. Overview1. Overview1. Overview1. Overview ................................................................................................................................................................................................................................................................................................................................................................................................................................................................................................................................................................................ 1 31 31 31 31 3
2. Production, Prices and Employment2. Production, Prices and Employment2. Production, Prices and Employment2. Production, Prices and Employment2. Production, Prices and Employment ..................................................................................................................................................................................................................................................................................................................................... 1 51 51 51 51 5
2.1 Tourism ................................................................................................................. 15
2.2 Fisheries ................................................................................................................ 17
2.3 Agriculture ............................................................................................................ 18
2.4 Distribution .......................................................................................................... 18
2.5 Construction. ........................................................................................................ 19
2.6 Inflation ................................................................................................................ 19
2.7 Employment ......................................................................................................... 19
3. Public Finance3. Public Finance3. Public Finance3. Public Finance3. Public Finance ................................................................................................................................................................................................................................................................................................................................................................................................................................................................................................................................... 2 02 02 02 02 0
4. Financial Sector4. Financial Sector4. Financial Sector4. Financial Sector4. Financial Sector ......................................................................................................................................................................................................................................................................................................................................................................................................................................................................................................................... 2 12 12 12 12 1
4.1 Banking System and Monetary Policy ................................................................ 21
4.2 Money and Credit Developments in the Banking Sector .................................. 22
4.2.1 Operations of the Commercial Banks ..................................................... 23
4.3 Non-Bank Financial Activities .............................................................................. 25
4.4 Capital Market. ....................................................................................................... 25
5. Balance of Payments5. Balance of Payments5. Balance of Payments5. Balance of Payments5. Balance of Payments ................................................................................................................................................................................................................................................................................................................................................................................................................................................................................. 2 72 72 72 72 7
5.1 Current Account ................................................................................................... 27
5.2 Merchandise Trade .............................................................................................. 27
5.3 Services and Transfers ........................................................................................ 28
5.4 Capital Account ................................................................................................... 29
5.5 Overall Balance of Payments and International Reserves ................................ 29
6. Interest Rate and Exchange Rate Developments6. Interest Rate and Exchange Rate Developments6. Interest Rate and Exchange Rate Developments6. Interest Rate and Exchange Rate Developments6. Interest Rate and Exchange Rate Developments ........................................................................................................................................................................................................................................... 3 03 03 03 03 0
7. External Debt7. External Debt7. External Debt7. External Debt7. External Debt ............................................................................................................................................................................................................................................................................................................................................................................................................................................................................................................................................. 3 03 03 03 03 0
International Economic ReviewInternational Economic ReviewInternational Economic ReviewInternational Economic ReviewInternational Economic Review ............................................................................................................................................................................................................................................................................................................................................................................................................................................................. 3 23 23 23 23 2
Page
COContentsContentsContentsContentsContents

5
MMA ANNUAL REPORT 2002
Administration and OperationsAdministration and OperationsAdministration and OperationsAdministration and OperationsAdministration and Operations ................................................................................................................................................................................................................................................................................................................................................................................................................................................................................................ 3 53 53 53 53 5
Board Meetings ................................................................................................................ 37
Key Operational Developments .............................................................................................. 37
Human Resource Management and Development ............................................................... 38
Technical Assistance ............................................................................................................... 41
Visitors ................................................................................................................ 42
Financial StatementsFinancial StatementsFinancial StatementsFinancial StatementsFinancial Statements ............................................................................................................................................................................................................................................................................................................................................................................................................................................................................................................................................................................................... 4 34 34 34 34 3
Audit Report ............................................................................................................................. 45
Income Statement .................................................................................................................... 46
Balance Sheet. ......................................................................................................................... 47
Notes to the Financial Statements ........................................................................................... 49
AppendicesAppendicesAppendicesAppendicesAppendices .......................................................................................................................................................................................................................................................................................................................................................................................................................................................................................................................................................................................................................................................................... 5 15 15 15 15 1
Appendix 1Appendix 1Appendix 1Appendix 1Appendix 1 List of Statistical Tables ..................................................................................... 53
Statistical Tables ................................................................................................. 54
Appendix 2Appendix 2Appendix 2Appendix 2Appendix 2 Commercial Banks Operating in the Maldives ................................................ 71
Monetary Measures and Prudential Regulations in Effect During 2002 ........ 71
Char t sChar t sChar t sChar t sChar t s
Chart 1 GDP by major sectors, 1996 - 2002 ...................................................... 13
Chart 2 Tourist Bednights, 1996 - 2002. ............................................................. 15
Chart 3 Tourist Arrivals by Nationality, 1996 - 2002 ......................................... 16
Chart 4 Fish Landings and Exports, 1996 - 2002 ............................................... 17
Chart 5 Inflation, 1996 - 2002 ............................................................................. 19
Chart 6 Expatriate Employment by Industry, 2002. .......................................... 20
Chart 7 Government Revenue and Grants, 1996 - 2002 ................................... 21
Chart 8 Government Expenditure, 1996 - 2002 ................................................. 21
Chart 9 Monetary Indicators, 1996 - 2002 .......................................................... 22
Chart 10 Domestic Credit, 1996 - 2002 ................................................................. 22
Chart 11 Net Foreign Assets, 1996 - 2002 ............................................................ 23
Chart 12 Credit by Major Economic Sectors, 2002 ............................................. 24
Chart 13 Commercial Banks’ Deposits by Type, 1996 - 2002 ............................ 24
Chart 14 Total Value of Shares Traded by Companies, Apr - Dec 2002. .......... 25
Chart 15 International Trade, 1996 - 2002 ........................................................... 27
Chart 16 Composition of Imports, 2000 - 2002. .................................................. 28
Chart 17 Balance of Payments as a Percentage of GDP, 1996 - 2002............... 29
Chart 18 Change in Rufiyaa Exchange Rate against Major Foreign
Currencies 1996 - 2002. .......................................................................... 30
Chart 19 External Debt, 1996 - 2002 .................................................................... 31
Text TablesText TablesText TablesText TablesText Tables
Table 1 Key Economic Indicators, 1999 - 2002 ................................................. 14
Table 2 Fish Landings and Exports, 1999 - 2002 ............................................... 17
Table 3 Summary of Government Finance, 1999 - 2002 .................................. 20
Table 4 Monetary Aggregates, 2001 - 2002 ........................................................ 23
Table 5 International Economic Indicators, 1999 - 2002. ................................. 32
BoxesBoxesBoxesBoxesBoxes
Box 1 Non-Bank Financial Activities in the Maldives ...................................... 26
Page

6
C.I.F Cost, Insurance and Freight
CBSS Credit and Bank Supervision Section
CD Certificate of Deposit
CPI Consumer Price Index
DER Department of External Resources
EEZ Exclusive Economic Zone (75-200 miles from the coast)
ERSD Economic Research and Statistics Division
F.O.B Free On Board
FES Foreign Exchange Section
GDP Gross Domestic Product
HSBC Hongkong and Shanghai Banking Corporation
IMF International Monetary Fund
LIBOR London Interbank Overnight Rate
M1 Narrow Money Supply
M2 Broad Money Supply (Total Liquidity)
MCS Maldives Customs Service
MIFCO Maldives Industrial Fisheries Company Ltd.
MMA Maldives Monetary Authority
MNSL Maldives National Shipping Limited
MOFAMR Ministry of Fisheries, Agriculture and Marine Resources
MOFT Ministry of Finance and Treasury
MOT Ministry of Tourism
MPND Ministry of Planning and National Development
MRR Minimum Reserve Requirement
MT Metric Tonne
NYPR New York Prime Rate
PLC Public Limited Company
PNFE Public Non-Financial Enterprises
PPR Personnel and Public Relations
Rf Rufiyaa
SAARC South Asian Association for Regional Cooperation
SDR Special Drawing Rights
STO State Trading Organisation plc.
TDC Total Domestic Credit
TDS Total Debt Service
XGS Exports of Goods and Services
List of AcronymsList of AcronymsList of AcronymsList of AcronymsList of Acronyms
7
MMA ANNUAL REPORT 2002
The Maldives Monetary Authority (MMA) was
established on 1st July 1981 under the Maldives
Monetary Authority Act (1981) to act as the central
bank of the Maldives. The principal purposes of the
Authority as stipulated in the 1981 Act are: to issue
currency and regulate the availability and international
value of the Maldivian rufiyaa; to provide advisory
services to the Government on banking and monetary
matters; to supervise and regulate banking so as to
promote a sound financial structure; and to promote
in the country and outside the country the stability of
Maldivian currency, and foster financial conditions
conducive to the orderly and balanced economic
development of the Maldives.
Board of DirectorsBoard of DirectorsBoard of DirectorsBoard of DirectorsBoard of Directors
The highest policy making body of the MMA is the
Board of Directors. The Board consists of the Minister
of Finance as ex-officio Governor, the senior most
official of the Ministry of Finance as ex-officio Vice
Governor, three members from amongst the cabinet,
and two members representing the private sector
appointed by the President of the Republic.
The OrganisationThe OrganisationThe OrganisationThe OrganisationThe Organisation
The Maldives Monetary Authority is structured in three
Divisions: the Operations Division, the Economic
Research and Statistics Division and the General
Division.
The Operations DivisionOperations DivisionOperations DivisionOperations DivisionOperations Division consists of the Foreign
Exchange, Banking, Currency, Credit and Bank
Supervision, Capital Market Development, Accounts,
Non-Bank Financial Institutions Supervision and Public
Debt Sections. The Foreign Exchange Section deals
with all matters relating to foreign currency transactions
by the MMA and the management of the country's
foreign reserves. The Banking Section, in addition to
maintaining the accounts of government offices and
commercial banks, acts as a clearinghouse for the
commercial banks operating in the Maldives. The
Currency Section is responsible for printing and minting
of currency notes and coins, issuing commemorative
coins, maintaining the records of currency in
circulation and in stock and releasing new notes and
coins into circulation. The Accounts Section maintains
the General Ledger and prepares management and
financial accounts of the Maldives Monetary Authority.
A An Overview of the Maldives Monetary AuthorityAn Overview of the Maldives Monetary AuthorityAn Overview of the Maldives Monetary AuthorityAn Overview of the Maldives Monetary AuthorityAn Overview of the Maldives Monetary Authority
The duties of the Credit and Bank Supervision Section
include issuing licences for commercial banks to
operate in the Maldives, monitoring activities of
commercial banks to ensure their compliance to the
rules and regulations of the MMA, and assessing the
financial performance of commercial banks. The
Capital Market Development Section is responsible
for establishing and developing a capital market in
the Maldives, including licensing and supervising
capital market institutions to protect the interests of
investors. The Non-Bank Financial Institutions
Supervision Section is responsible for licensing,
regulating and supervising insurance companies,
leasing companies and other non-bank financial
institutions to ensure their smooth functioning. The
Public Debt Section, when it becomes operational,
would be responsible for securitising, monitoring and
managing government debt.
The Economic Research and Statistics DivisionEconomic Research and Statistics DivisionEconomic Research and Statistics DivisionEconomic Research and Statistics DivisionEconomic Research and Statistics Division
(ERSD)(ERSD)(ERSD)(ERSD)(ERSD), consists of the Statistics Section and the
Research Section. The Statistics Section gathers
economic and financial data from relevant sources
within the MMA and outside, and maintains a database
of such information. The Research section undertakes
research and analysis broadly on the areas of
production, prices and labour force, money and
banking, government budget and the balance of
payments. ERSD also undertakes the publication of
MMA's Annual Report and the Quarterly Economic
Bulletin, and in addition, operates as the focal point
for the Maldives' interactions with the International
Monetary Fund.
The General DivisionGeneral DivisionGeneral DivisionGeneral DivisionGeneral Division consists of the Personnel and
Public Relations Section, the Information Technology
Section and the Expenditure Section. The Personnel
and Public Relations Section deals with matters relating
to employment and training, the affairs of the Board
of Directors, official meetings, conferences, travel, and
various administrative reports. In addition, this section
is responsible for co-ordinating all aspects related to
the media. The Information Technology (IT) Section
is responsible for the management of the computer
network and databases, maintenance of the MMA
website and other IT needs of the Authority. The
Expenditure Section deals with the MMA budget,
finance, and all aspects of general maintenance of
assets and premises.

8
Organisational Chart
BOARD OF DIRECTORS
Governor
Vice Governor
General Manager
Executive Director
Assistant General Manager
Operations Division Economic Research &
Statistics Division
General Division
Banking Section Accounts Section
Currency Section
Capital Market
Development Section
Credit & Bank
Supervision Section
Personnel & Public
Relations Section
Expenditure Section
Research Section
Statistics Section
Non-bank FinancialInstitutionsSupervision Section
InformationTechnology Section
Foreign Exchange
Section
Public Debt Section
Publications and LibraryPublications and LibraryPublications and LibraryPublications and LibraryPublications and Library
With a view to highlighting the major issues relating
to the development of the country and the affairs of
the organisation, the MMA regularly publishes this
Annual Report, and a Quarterly Economic Bulletin,
which covers the macroeconomic developments
during the quarter. The MMA has a small library, which
contains a collection of reports, periodicals, annual
reports and statistical publications including those of
international organisations such as the International
Monetary Fund and foreign central banks. The library
also has foreign and local newspapers, and books
related to economics, finance and development.
PP

9
MMA ANNUAL REPORT 2002
Board of DirectorsBoard of DirectorsBoard of DirectorsBoard of DirectorsBoard of Directors
H.E. Maumoon Abdul Gayoom ............................... Governor, Minister of Finance and Treasury
(Board Chairman)
Hon. Mohamed Jaleel .............................................. Vice Governor, Minister of State for Finance and Treasury
Hon. Fathulla Jameel ................................................ Minister of Foreign Affairs
Hon. Ismail Shafeeu ................................................ Minister of Education
Hon. Hassan Sobir ................................................... Minister of Tourism
Mr. Mohamed Umar Maniku ................................... Chairman, Universal Enterprises Pvt. Ltd.
(Private Sector member)
Mr. Mohamed Solih ................................................. Chairman, DAMAS Company Pvt. Ltd.
(Private Sector member)
Board Secretary
Ms. Khadeeja Hassan ............................................... Executive Director of MMA
Senior OfficialsSenior OfficialsSenior OfficialsSenior OfficialsSenior Officials
H.E. Maumoon Abdul Gayoom ............................... Governor
Hon. Mohamed Jaleel .............................................. Vice Governor
Ms. Khadeeja Hassan ............................................... Executive Director
Mr. Abdul Ghafoor Abdul Latheef ........................... General Manager
Mr. Ibrahim Naeem .................................................. Assistant General Manager
Directors and Senior Officials as at 31 December 2002

10
This report covers developments in the domestic economy during 2002 and a brief overview of events in theglobal economy during the year. It also presents the financial statements of the MMA as at 31 December 2002 asrequired by the MMA Act (1981), and the key administrative and operational developments in MMA during theyear. All domestic analyses are based on information relating to the year 2002, received from relevant governmentauthorities, public enterprises, commercial banks operating in the country and other private sector sources, as at30th June 2003. The section on international developments is based on information obtained from publicationsof the International Monetary Fund (IMF), and other international sources as at 31 October 2003. The viewsexpressed in this Report, however, are those of this Authority and do not necessarily represent those of thesource of data. We thank all those who have contributed to the publication of this report including the provisionof the information contained here in.
Preface

11
MMA ANNUAL REPORT 2002
T h e
Th e
s d f s d f d s f s a f
EECONOMIC REVIEW
2002

12

13
MMA ANNUAL REPORT 2002
1. Overview1. Overview1. Overview1. Overview1. Overview
According to GDP estimates released by the MPND
in March 2003, real economic growtheconomic growtheconomic growtheconomic growtheconomic growth accelerated to
6.0 percent in 2002 from 3.5 percent in 2001. Post
‘September 11' recovery in tourism commenced
around mid-2002, which together with the strong
pickup witnessed in the fisheries sector during the
year resulted in the higher growth for 2002.
The tourism sectortourism sectortourism sectortourism sectortourism sector, which contributed around 31
percent to the country's GDP in 2002, witnessed
continued decline in tourist arrivals through the first
half of 2002. However, the sector recovered in the
latter half of the year, and strong growth was registered
in the last few months, resulting in an annual growth
of 5 percent in tourist arrivals and 3 percent in
bednights. In 2001 both arrivals and bednights
recorded annual declines. Meanwhile, average
duration of stay once again fell slightly in 2002, while
the average occupancy rate increased to 69 percent,
from 66 percent in 2001. Average occupancy rate
registered over 74 percent in the period 1996-1999,
but had fallen to 68 percent in 2000 following the
large increase in bed capacity between 1996-2000.
Average number of beds in operation was less in
2002 than in the previous year, mainly as a result of
renovation work undertaken in quite a number of
resorts, at various times during the year.
The fisheries sectorfisheries sectorfisheries sectorfisheries sectorfisheries sector was buoyant during the year,
accounting for 7 percent of total GDP and witnessing
an annual growth of 23 percent. This followed a 6
percent growth in 2001 and a decline of 2 percent in
2000. During the year, fish landings (excluding EEZ)
increased notably over 2001 while total fish exports
(excluding live tropical fish) increased as well.
According to MIFCO data, unit prices received on
exports of canned and frozen tuna were better during
the year than in the previous year. Liberalisation of
the tuna industry began in 2001 with the awarding of
licences in the first zone to two private sector parties,
which provided them with rights to process and export
tuna bought from domestic fisherman. These two
parties commenced their operations in 2002, and the
first exports resulting from the liberalisation were
recorded in December of the year, when each party
shipped two consignments of frozen tuna.
As for domestic prices, the annual inflation rateinflation rateinflation rateinflation rateinflation rate, as
measured by the percentage change in the Consumer
Price Index, continued to remain below 1 percent for
the third consecutive year, registering 0.9 percent
during 2002.
In terms of employmentemploymentemploymentemploymentemployment, at the end of 2002, total
public sector employment stood at 26,363 which was
about 1 percent lower than 2001. In the private sector,
demand continued to be high in the labour market.
While detailed employment statistics are not available
on an annual basis, expatriate employment data
indicated that the average number of foreign workers
in the country during the year increased by about 1
percent.
According to provisional estimates for the year
published in December 2002, the overall fiscalfiscalfiscalfiscalfiscal
positionpositionpositionpositionposition was less favourable in 2002 than the actual
outcome of 2001. The overall deficit showed a 64
percent increase during the year, from the 2001 actual
outcome, depicting the recent trend of higher growth
in expenditure (including net lending) compared to
the expansion in revenue (including grants). In
particular, the large overall deficit in 2002 was the
result of large investment expenditure and lower
than anticipated revenue due to the general weakness
in the economy. Financing of the deficit was largely
from foreign sources; as a result of which domestic
financing declined quite significantly.
Domestic Economic ReviewDomestic Economic ReviewDomestic Economic ReviewDomestic Economic ReviewDomestic Economic Review
0
1000
2000
3000
4000
5000
6000
7000
1996 1997 1998 1999 2000 2001 2002
Tourism Transport and communicat ions
Fisheries M anufacturing & elect ricityGovernment Administration Others
In m illions of ruf iy aa
Chart 1.
GD P B Y M A JOR SEC T OR S, 1996-2002
Sour ce: Ministry of Planning and National Development

14
ECONOMIC REVIEW
Money and credit Money and credit Money and credit Money and credit Money and credit developments during 2002 featured
accelerated growth in net foreign assets, a slight
deceleration in growth of domestic credit, which
resulted in a sharp rise in the rate of growth of broad
money. After falling for the past three years, net foreign
assets of the banking system grew strongly in 2002
mainly due to strong growth in the net foreign assets
of MMA. Meanwhile, total domestic credit growth
decelerated with growth in credit extended to the
private sector slowing significantly. In 2001, a steep
rise was seen in this variable following the removal
(in July 2001) of the credit ceiling that was previously
imposed on banks by the MMA. In terms of sectoral
allocation of private sector credit, the tourism sector
accounted for over half of the credit outstanding at
the end of the year, while the commerce sector
accounted for almost a quarter. Growth in net credit
to the government also continued to decelerate, while
credit to public enterprises grew during the year, after
remaining at around the same level in 2001. As a
result, total liquidity (broad money, M2) increased by
19 percent at the end of the year. Quasi money
comprising of mainly foreign currency deposits rose
more steeply than narrow money (consisting mainly
of demand deposits and currency in circulation)
resulting in an increase in the dollarisation ratio (ratio
of foreign currency deposits to broad money) from
45 percent in 2001 to 47 percent in 2002.
According to estimates of May 2003, the Maldives'
balance of paymentsbalance of paymentsbalance of paymentsbalance of paymentsbalance of payments improved significantly during
2002. The merchandise trade deficit improved by
around 11 percent, while on the services account,
receipts were lower than 2001 by around 0.4 percent,
largely owing to the decline in receipts from tourism.
The transfers account also deteriorated during the
year, with a sharp decline in inflow of official grant
aid together with a slight increase in the remittances
made by expatriate workers. The financing of the
current account was largely through official medium
and long-term flows, which were almost five times
more than the flows recorded during 2001, while
private capital inflows also increased. Consequently,
the overall balance of payments strengthened
significantly during the year, recording an inflow of
around US$39.8 million, as opposed to the net outflow
of US$21.4 million registered in 2001. This contributed
to the positive developments witnessed in the grossgrossgrossgrossgross
international reservesinternational reservesinternational reservesinternational reservesinternational reserves which grew by US$40.2
million during the year to reach a total of US$134.5
million by the end of the year. In terms of past 12
months' merchandise import cover, this was equivalent
to 4.1 months of imports at the end of December
2002, as opposed to 2.9 months at the end of
December 2001 and 3.8 months at the end of
December 2000. The exchange rateexchange rateexchange rateexchange rateexchange rate of the Rufiyaa
vis-à-vis the US dollar remained at the mid rate of
Rf12.80 per US dollar through out the year, with a
spread of 10 laaris between the buying and selling
rates.
Statistics on the external indebtednessexternal indebtednessexternal indebtednessexternal indebtednessexternal indebtedness of the
economy are limited to medium and long-term
government and government guaranteed borrowings
Table 1.
KEY ECONOMIC INDICATORS, 1999 - 2002
1999 2000 2001 2002
Gross Domestic Product
GDP (1995 constant prices) Rf mn 1/ 6,056.6 6,345.5 6,564.4 6,958.4
% change in GDP 7.2 4.8 3.5 6.0
Consumer Price Index
% change in CPI 3.0 (1.2) 0.7 0.9
Tourism
Tourist arrivals ('000) 429.7 467.2 461.0 484.7
Bed night capacity ('000) 2/ 5,348.5 5,787.8 6,015.1 5,886.9
Capacity utilization (%) 69.7 68.2 65.6 69.0
Fish Production
Landings('000 MTs) excl. EEZ 123.3 115.4 125.0 160.2
Total fish exports ('000 MTs) 3/ 37.6 28.3 29.7 44.6
Total fish exports (US$ mn) 3/ 34.4 34.0 35.8 49.2
Government Finance (Rf mn) 4/
Total revenue and grants 2,225.3 2,372.7 2,522.6 2,720.4
Expenditure and net lending 2,506.4 2,694.2 2,885.9 3,316.0
Overall balance (+/-) (281.1) (321.5) (363.3) (595.6)
Money and Banking (Rf mn)
Net foreign assets 1,405.4 1,312.2 1,153.0 1,662.9
Domestic credit 2,259.3 2,586.8 3,089.9 3,445.7
Net credit to govt. 760.2 995.0 1,078.6 1,133.9
Net credit to public enterprises 196.3 184.7 184.0 211.0
Net credit to private sector 1,302.8 1,407.1 1,827.2 2,100.8
Narow Money (M1) 1,585.2 1,760.4 1,655.9 1,886.7
Total liquidity (M2) 2,929.8 3,049.8 3,324.7 3,966.4
Quasi money 1,344.6 1,289.4 1,668.8 2,079.7
Balance of Payments 5/
Exports (f.o.b) 91.5 108.7 110.2 133.6
Imports (f.o.b) (353.9) (342.0) (346.3) (344.7)
Services (net) 203.6 208.8 206.4 207.7
Non-monetary capital (net) 71.7 43.5 35.9 83.8
Overall balance (7.2) (7.9) (21.4) 39.8
Gross International Reserves (US$ mn) 6/ 128.5 124.1 94.3 134.5
External Reserves
in months of Imports 3.8 3.8 2.9 4.1
Exchange Rate
Rufiyaa / Euro (End of Period) 11.69 10.35 11.03 12.66
Rufiyaa / US$ (End of Period) 11.77 11.77 12.80 12.80
1/ Figures for 1999 -2000 are revised estimates of 10th November 2002, figures for 2001 are revised
estimates of 16th December 2002 and figure for 2002 are revised estimate of March 2003
2/ Bed capacity x number of days per month.
3/ Excluding live tropical fish.
4/ Figures for 2002 are provisional estimates.
5/ Figures for 2001 and 2002 are revised estimates.
6/ Foreign Assets of MMA
Source: MPND, MOT, MOFAMR, MOFT, Maldives Customs Service & MMA.

15
MMA ANNUAL REPORT 2002
and the external debt of the banking sector. Total
recorded external debt stockexternal debt stockexternal debt stockexternal debt stockexternal debt stock stood at US$257.1
million at the end of 2002, with medium and long-
term public debt stock constituting 86 percent, and
foreign liabilities of the commercial banks the rest.
The public sector external debt stock comprises of
loans received from bilateral and multilateral sources
(largely on concessional terms), loans taken from
financial markets, as well as of suppliers' credits. At
the end of 2002, multilateral loans accounted for 63
percent of total medium and long-term external debt
stock, while suppliers' credits accounted for 21
percent, bilateral loans for 11 percent and loans from
financial markets for 4 percent. During 2002,
disbursements of medium and long-term foreign debt
to the public sector stood at US$43.5 million, while
debt service totalled US$23.5 million, which is the
equivalent of around 5 percent of Maldives' exports
of goods and non-factor services.
2. Production, Prices and2. Production, Prices and2. Production, Prices and2. Production, Prices and2. Production, Prices and Employment Employment Employment Employment Employment
2.1 Tourism2.1 Tourism2.1 Tourism2.1 Tourism2.1 Tourism
Tourism activities, which were started very modestly
in the 1970s by a couple of small local entrepreneurs,
have grown rapidly during the years. At present the
tourism sector is very dynamic and plays a vital role
in the economic development of the country. The
sectoral contribution of tourism has averaged at
around 32 percent of GDP in the past 5 years in
addition to directly accounting for about 30 percent
of the government's total revenue and approximately
66 percent of foreign exchange earnings of the
country. Tourism developments have also stimulated
growth in various other sectors of the economy such
as transport, commerce, construction and
communication.
At the end of 2002 there were 87 tourist resortstourist resortstourist resortstourist resortstourist resorts in
operation in the county with 16,400 beds. Of these,
43 resorts were located in Kaafu Atoll and 26 in Alifu
Atoll, and these two atolls together had 77 percent of
the total beds in operation. The remaining 18 resorts
were in Vaavu, Lhaviyani, Baa, Dhaalu, Meemu, Faafu
and Raa atoll. In terms of ownership, except for one
resort all the resorts were on lease holdings at the
end of 2002, with Maldivians holding leases on 67
resorts, foreign companies 10 resorts, and joint venture
lease-ownership of 9 resorts. However, in the recent
past, there has been an increasing trend towards the
use of various types of management contracts, and
at the end of 2002, Maldivian management was existent
in only 46 resorts, while 32 resorts were in the hands
of foreign management, and the rest were being
managed as joint ventures.
Due to the nature of tourism, the sector remains highly
vulnerable to international developments and this was
very clear in the aftermath of the September 11th
incident in 2001. Tourism activities started to contract
immediately afterwards and for the first time, touristtouristtouristtouristtourist
arrivalsarrivalsarrivalsarrivalsarrivals registered a negative annual growth rate of
1 percent. This trend continued in the first half of
2002, with the growth in tourist arrivals witnessing a 9
percent decline during the period compared to the
same period of 2001. However, the sector bounced
back strongly in the latter months of the year,
culminating in an annual growth of 5 percent in tourist
arrivals. In absolute terms the number of tourists that
visited the country during 2002 stood at 484.7
thousand, compared to 461.0 thousand in 2001 and
467.2 thousand in 2000.
Total tourist bednightstourist bednightstourist bednightstourist bednightstourist bednights during the year 2002 grew
by about 3 percent, a little lower than the growth in
tourist arrivals, indicating a slight reduction in the
T OUR IST B ED N IGH T S, 1996-2002
0
1000
2000
3000
4000
5000
6000
7000
1996 1997 1998 1999 2000 2001 2002
Sour ce: Ministry of T our ism
In t housands
Bednights Unut ilised Bednight Capacity
Chart 2.

16
ECONOMIC REVIEW
average length of a tourist visit. Average length oflength oflength oflength oflength of
staystaystaystaystay was shorter from 8.6 days in 2001 to 8.4 days in
2002. While the number of tourist resorts during 2002
stood at the same level as 2001 at 87 resorts, the
average number of beds that were in operation during
the year was lower than 2001 by around 350 beds.
This was largely on account of the renovation work
that was undertaken in some of these resorts during
the year. However, most of the beds that were under
construction during the year were in operation at the
end of the year and the total bed capacitybed capacitybed capacitybed capacitybed capacity of the
industry stood at 17,070, about 462 more beds than
at the end of 2001. The average utilisationutilisationutilisationutilisationutilisation of bed
capacity, which fell from 68 percent in 2000 to 66
percent in 2001 rose to 69 percent in 2002. However,
it must be noted that there was considerable variation
in the utlisation rate throughout the year, with the rate
as high as 82 percent and as low as 42 percent in
some months.
The major tourism generating marketsmarketsmarketsmarketsmarkets during the
year 2002 were Europe and Asia, as in the past years,
with European tourists accounting for 77 percent of
the market and Asian tourists accounting for 20
percent. The number of tourists from Europe totalled
373.4 thousand in 2002 with an annual growth of 3
percent. The majority of tourists arrived from Italy
(24 percent of the total tourist arrivals) during the
year, but reflected a slight negative growth of 1 percent
on annual terms in 2002 following a growth of 9
percent in 2001. Tourist arrivals from United Kingdom,
accounting for about 17 percent of total tourists, grew
by a further 4 percent in 2002 after an 8 percent
increase in 2001. Although German tourists accounted
for about 13 percent of the total number of tourists
from this country has been steadily declining in the
past few years. Hence, arrivals from Germany after
declining by 10 percent in 2000 and 15 percent in
2001, further declined by 4 percent in 2002.
Meanwhile, strong growth was witnessed in the Swiss
market registering an annual growth of 12 percent in
2002 following a 15 percent growth in 2001. Tourists
from France after increasing by 11 percent in 2001
showed a modest increase of 2 percent in 2002.
Tourists from these two countries each accounted
for about 7 percent of the total tourist arrivals.
Following a 7 percent decline in tourist arrivals from
the Asian region in 2001, such arrivals grew strongly
by 18 percent in 2002. This mainly reflected the
developments in the Japanese market, as tourists from
Japan accounted for about 46 percent of the Asian
tourists and 9 percent of the total tourists into the
country. The number of Japanese tourists who visited
the country after declining by 11 percent in 2001,
registered a 4 percent increase in 2002. The Chinese
market has also been steadily growing in recent years,
with the share of Chinese among Asian tourists
increasing from 5 percent in 1999 to 13 percent in
2002. Hence, the number of Chinese tourists who
visited the country increased by 65 percent in 2002.
Tourist arrivals from India, accounting for about 12
percent of Asian tourists, had been on a declining
trend in recent years with arrivals declining by 20
percent in 2001. However, in 2002 the trend reversed
and grew by 34 percent. In terms of the share of
arrivals from China and India in total tourists, each
held a 2 percent share in 2002.
0
100
200
300
400
1996 1997 1998 1999 2000 2001 2002
Germany Italy UK Japan France Switzerland Other
In t housands
Sour ce: Minis try of T ourism
Chart 3.
TOUR IST A R R IVA LS B Y N A T ION A LIT Y, 1996-2002

17
MMA ANNUAL REPORT 2002
2.2 Fisheries2.2 Fisheries2.2 Fisheries2.2 Fisheries2.2 Fisheries
Although the tourism sector is more dominant in the
economic development of the country, the fisheries
sector is much more inter-linked with the lives of the
vast majority of the population. According to the 2000
census, about 11 percent of the working population
were engaged in fishing.
Fisheries sector developments during the year 2002
were exceptionally good, with the sectoral contribution
to GDP edging up from 6 percent in 2001 to 7 percent
in 2002. In terms of growth rates, the value added to
GDP of the fisheries sector grew by 23 percent in
2002, following a 6 percent growth in 2001 and a
negative 2 percent growth in 2000. This was on account
of the high fish landingsfish landingsfish landingsfish landingsfish landings recorded during the year
2002, which (excluding EEZ) totalled 160 thousand
metric tons compared with 125 thousand metric tons
in 2001, registering an increase of 28 percent during
the period. The Maldivian fishery continued to be
dominated by tuna varieties, especially skipjack tuna,
which accounted for about 72 percent of total fish
catch in 2002. According to fisheries statistics, of the
total fish catch, about 48 percent were used for local
consumption and 49 percent were exported during
2002. Despite higher fish catch, the number of fishingfishingfishingfishingfishing
vesselsvesselsvesselsvesselsvessels that were engaged in fishing during a month
on average was a little lower in 2002 at 1,102 compared
to 1,128 in 2001. Hence, fish catch per unit of effort
expended per trip increased from 600 kg in 2001 to
748 kg in 2002.
MIFCO, largest company operating in the fisheries
sector, bought about 32 percent of the coastal fish
catch or 51.4 thousand metric tonnes, for production.
This was 64 percent higher than the amount bought
in 2002. Meanwhile, fish procurement prices procurement prices procurement prices procurement prices procurement prices of
MIFCO declined in 2002 with prices of skipjack over
2 kilograms falling by 4 percent to Rf3,150.0 per metric
tonne, while those weighing between 1.5 and 2
kilogram declined by 22 percent to Rf2,175.0 and those
under 1.5 kilogram declined by 44 percent to Rf1,000.0.
The total production of MIFCO, mainly in the form of
canned and frozen tuna and fishmeal, totalled 58.3
thousand metric tonnes during 2002 compared to 39.6
thousand metric tonnes in 2001, registering an increase
of 47 percent. The two private parties that were
awarded licences to process and export tuna bought
from domestic fishermen in Zone 11, under the
fisheries sector liberalisation program, commenced
their operations in 2002. They started purchasing fish
for production in October 2002 and bought 1.8
thousand metric tonnes during the year, exporting
their first consignments of frozen tuna in December
2002.
1 For coastal fisheries purposes the country has been divided into four
zones. Zone 1 encompasses the northern most atolls of Haa Alifu, Haa
Dhaalu, Shaviyani and Noonu, whilst Zone 2 comprises of Raa, Baa,
Lhaviyani and Kaafu Atoll. Zone 3 comprises of Alifu Alifu, Alifu Dhaalu,
Vaavu, Meemu, Faafu, Dhaalu, Thaa, and Laamu Atoll and Zone 4 com-
prises of Gaafu Alifu, Gaafu Dhaalu, Gnaviyani and Seenu Atoll. While
two private sector parties have been given the license to operate in Zone
1 under the fisheries sector liberalisation program, MIFCO continues
to operate in Zone 2 and Zone 4.
0
20
40
60
80
100
120
140
160
180
1996 1997 1998 1999 2000 2001 2002
Landings Exports
In t housands of m et ric t onnes
Chart 4.
F ISH LA N DIN GS A N D EXP OR T S, 1996-2002
Source: Landings ; Minis try of Fis her ies, Agriculture and Mar ine Resources
Exports; Maldives Customs Ser vice
Table 2.
FISH LANDINGS AND EXPORTS, 1999 - 2002
In thousands of metric tonnes
1999 2000 2001 2002
Coastal Catch 123.3 115.4 125.0 160.2
Skipjack 92.9 79.7 88.0 115.3
Yellow fin 14.3 12.2 14.6 21.7
Other tuna 5.5 6.3 6.8 7.2
Reef and bottom fish 10.6 17.2 15.6 16.0
Fish Exports 1/ 37.6 28.3 29.7 44.6
Frozen/Chilled 25.9 14.5 15.8 31.8
Canned 4.6 7.3 7.0 5.7
Dried 5.3 5.8 6.0 5.8
Salted 1.9 0.7 0.8 1.2
Source: Ministry of Fisheries, Agriculture and Marine Resources/ Maldives Customs Service

18
The volume of total fish exports fish exports fish exports fish exports fish exports (excluding live
tropical fish) increased significantly by 50 percent from
29.7 thousand metric tonnes in 2001 to 44.6 thousand
metric tonnes in 2002. This was mainly on account
of considerably higher exports of frozen tuna in 2002,
which accounted for 70 percent of fish export volume
and increased by over 100 percent during the year.
Meanwhile, the volume of dried fish and canned fish
exported declined by 4 percent and 18 percent
respectively in 2002. Earnings from fish exports
increased from US$35.8 million in 2001 to US$49.2
million in 2002, reflecting a considerable increase
albeit smaller than the increase in volume. This was
largely due to the lower unit value received for dried
fish as the unit values of other major export categories
registered annual increases in 2002. (Please see section
5.2 for a more detailed analysis of fish exports)
2.3 Agriculture2.3 Agriculture2.3 Agriculture2.3 Agriculture2.3 Agriculture
Agricultural activities in the country are constrained
by the lack of arable and fertile land, coupled with
the shortage of human and physical resources
necessary for the development of the sector. The value
added of the sector has remained at around 3 percent
of GDP and registered an annual growth rate of 4
percent during the year. According to the Census 2000,
less than 3 percent of the country's working
population were engaged in the agricultural sector.
Agricultural activities in the country have been primarily
a subsistence activity and backyard or homestead
cropping continue to be the major suppliers of the
produce. However, commercial production of some
varieties such as banana, papaya, watermelon and
chilli are increasing, with a few islands becoming
specialised in certain crops. Moreover, in 2002 there
were 16 uninhabited islands where relatively larger-
scale production of different fruits and vegetables
were being undertaken. These islands have been
leased by the Government to private individuals for
long-term use, with the objective of promoting
agricultural activities in the country.
A two year hydroponics agriculture pilot project,
which was launched by the Ministry of Fisheries,
Agriculture and Marine Resources in March 2000 with
the assistance of UNDP, was extended for a further
year in 2002. The major activities of this project were
carried out at the Ministry's agricultural centre in Haa
Dhaalu Hanimaadhoo, where there are three green
houses for this purpose. Products from this centre,
which included rockmelon, cucumber and chillies,
have been sold in Male' as well as in the Haa Alifu
and Haa Dhaalu atolls. While the first two years of
the project focussed on the technical feasibility of
hydroponics agriculture in the country, in the third
and final year the project aims to further disseminate
information and train more personnel in the area in
different atolls.
2.4 Distribution2.4 Distribution2.4 Distribution2.4 Distribution2.4 Distribution
Distribution activities (mainly wholesale and retail
trade) have increased rapidly in recent years and play
an important role in the domestic economy. While
the developments in the sector are closely linked to
the fisheries and construction sector activities, it is
the activities in the tourism sector that provides the
major impetus to the sector. As such, developments
in the tourism sector have direct and spill over effects
to distribution activities. In terms of the sector's
contribution to GDP, the sector accounted for about
4 percent of GDP in 2002 and grew by 2 percent in
the year following a growth rate of close to zero
percent in 2001. Apart from value added to GDP, the
leading indicators of the sector are private sector
imports and commercial banks’ credit to commerce.
Imports by the private sectorImports by the private sectorImports by the private sectorImports by the private sectorImports by the private sector (excluding tourism
sector imports2) increased by 4 percent in 2002 after
a 2 percent decline in 2001, mainly reflecting the
developments in the tourism sector. While the crcrcrcrcrediteditediteditedit
extended to the sector by the commercial banks
showed a significant annual decline of 20 percent at
the end of 2002, this was following a large increase
of 68 percent at the end of 2001. This increase in
2001 was mainly due to the removal of the credit
ceiling in July 2001, which led to a rapid increase in
credit up until June 2002.
2 Sectoral breakdowns are made on the basis of Customs records, which
are based on the sector an importer is from. As such, the sectoral analy-
sis will not strictly reflect the total imports consumed by each of these
sectors
ECONOMIC REVIEW
19
MMA ANNUAL REPORT 2002
2.5 Construction2.5 Construction2.5 Construction2.5 Construction2.5 Construction
The construction sector contributing about 3 percent
of GDP in 2002, registered a marginal decline of 0.6
percent in the year after a positive growth of 12 percent
in 2001. The activities in the sector have been broadly
based on public sector projects, private sector activity
in tourism, and housing and commercial property
development. Despite the overall decline in the
construction sector as reflected in the GDP, some of
the individual indicators of the sector showed positive
growth. As such, according to Customs statistics
import of construction materialsimport of construction materialsimport of construction materialsimport of construction materialsimport of construction materials showed a 4
percent increase in 2002 following an 8 percent
increase in the previous year. The stock of bank loansloansloansloansloans
and advancesand advancesand advancesand advancesand advances to the sector trended upwards by about
1 percent on a year-on-year basis. However,
commercial bank credit extended to housing
development showed a 12 percent decline in 2002,
which corroborates the decline in the number of
buildings completed during the year, which fell from
279 in 2001 to 264 in 2002. Moreover, buildings
authorised for construction also decreased from 588
in 2001 to 452 in 2002.
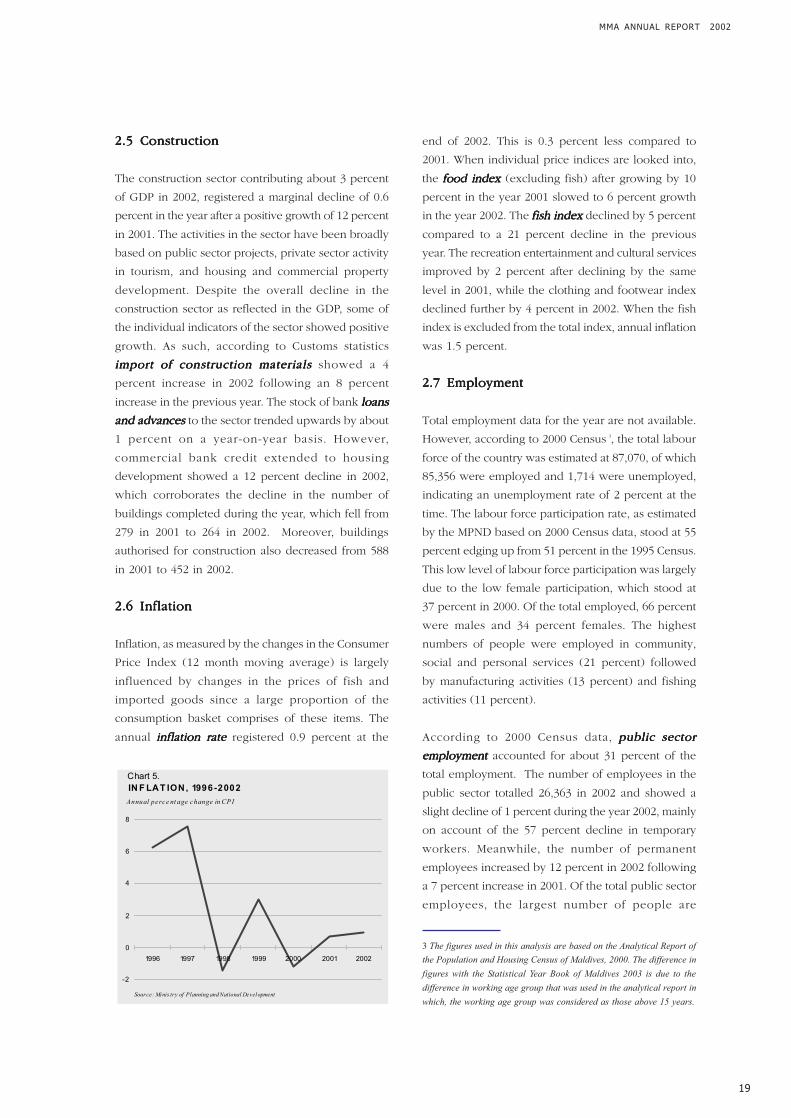
2.6 Inflation2.6 Inflation2.6 Inflation2.6 Inflation2.6 Inflation
Inflation, as measured by the changes in the Consumer
Price Index (12 month moving average) is largely
influenced by changes in the prices of fish and
imported goods since a large proportion of the
consumption basket comprises of these items. The
annual inflation rateinflation rateinflation rateinflation rateinflation rate registered 0.9 percent at the
end of 2002. This is 0.3 percent less compared to
2001. When individual price indices are looked into,
the food indexfood indexfood indexfood indexfood index (excluding fish) after growing by 10
percent in the year 2001 slowed to 6 percent growth
in the year 2002. The fish indexfish indexfish indexfish indexfish index declined by 5 percent
compared to a 21 percent decline in the previous
year. The recreation entertainment and cultural services
improved by 2 percent after declining by the same
level in 2001, while the clothing and footwear index
declined further by 4 percent in 2002. When the fish
index is excluded from the total index, annual inflation
was 1.5 percent.
2.7 Employment2.7 Employment2.7 Employment2.7 Employment2.7 Employment
Total employment data for the year are not available.
However, according to 2000 Census 3, the total labour
force of the country was estimated at 87,070, of which
85,356 were employed and 1,714 were unemployed,
indicating an unemployment rate of 2 percent at the
time. The labour force participation rate, as estimated
by the MPND based on 2000 Census data, stood at 55
percent edging up from 51 percent in the 1995 Census.
This low level of labour force participation was largely
due to the low female participation, which stood at
37 percent in 2000. Of the total employed, 66 percent
were males and 34 percent females. The highest
numbers of people were employed in community,
social and personal services (21 percent) followed
by manufacturing activities (13 percent) and fishing
activities (11 percent).
According to 2000 Census data, public sectorpublic sectorpublic sectorpublic sectorpublic sector
employmentemploymentemploymentemploymentemployment accounted for about 31 percent of the
total employment. The number of employees in the
public sector totalled 26,363 in 2002 and showed a
slight decline of 1 percent during the year 2002, mainly
on account of the 57 percent decline in temporary
workers. Meanwhile, the number of permanent
employees increased by 12 percent in 2002 following
a 7 percent increase in 2001. Of the total public sector
employees, the largest number of people are
3 The figures used in this analysis are based on the Analytical Report of
the Population and Housing Census of Maldives, 2000. The difference in
figures with the Statistical Year Book of Maldives 2003 is due to the
difference in working age group that was used in the analytical report in
which, the working age group was considered as those above 15 years.
-2
0
2
4
6
8
1996 1997 1998 1999 2000 2001 2002
Annual perce nt age change in CPI
Chart 5.
IN F LAT ION, 1996-2002
Source: Minis try of Planning and National Development

20
ECONOMIC REVIEW
employed as service providers (43 percent) followed
by the education sector (30 percent) and health sector
(15 percent).
In spite of increases in the labour force, the relatively
low domestic labour force participation rate as well
as the buoyant economic performance has resulted
in the continuation of a tight labour market situation.
As a result, the expatriate labour forceexpatriate labour forceexpatriate labour forceexpatriate labour forceexpatriate labour force has
continued to expand during 2002 as well, producing
negative effects on the balance of payments, with the
transfers made by the expatriates estimated at around
US$ 50 million. The average number of expatriate
workers in the country during 2002 was 29,680,
compared to 29,385 in 2001, reflecting a 1 percent
growth during the period. The largest number of
expatriate workers continued to be employed in the
tourism sector, accounting for about 29 percent of
the total. While the construction sector employed about
17 percent of the expatriates, 13 percent were
employed in business related activities and 11 percent
in community, social and personal services. At the
end of 2002, the largest group within the expatriate
workforce (41 percent of total expatriate labour) were
classified as labourers, who were employed in various
industries such as maintenance, construction/building,
fisheries and as odd-jobbers.
3. Public Finance3. Public Finance3. Public Finance3. Public Finance3. Public Finance
According to provisional estimates for the year
published in December 2002, the overall fiscal
position was less favourable in 2002 than the actual
outcome of 2001. The overall deficit overall deficit overall deficit overall deficit overall deficit increased by
64 percent during the year from the 2001 actual
outcome, depicting the recent trend of higher growth
in expenditure (including net lending) compared to
the expansion in revenue (including grants). In
particular, the large overall deficit in 2002 was the
result of an increase in expenditure related to large
investment projects and lower than anticipated revenue
due to general weakness in the economy.
For 2002, total revenuetotal revenuetotal revenuetotal revenuetotal revenue including grants was estimated
at Rf2,720.4 million after registering Rf2,522.6 million
in 2001. This reflected a growth of 8 percent after
witnessing a 6 percent growth in 2001. Total taxtaxtaxtaxtax
revenuerevenuerevenuerevenuerevenue registered Rf1,046.6 in 2001 and was expected
to increase to Rf1,071.2 million in 2002. In terms of
growth, this was a deceleration from 3 percent growth
in 2001 to 2 percent growth in 2002. Import duty
increased from Rf661.7 million in 2001 to Rf669.5
million in 2002 with the growth rate remaining the
same (1 percent) in both years. Meanwhile, tourism
tax earnings increased by Rf12.5 million to Rf 305.2
million in 2002. However, in terms of growth rates,
this reflected a deceleration from a 6 percent growth
in 2001 to a 4 percent growth in 2002. Receipts from
Table 3.
SUMMARY OF GOVERNMENT FINANCE, 1999 - 2002
Annual percentage change
1999 2000 2001 2002
(Prv.Est.)
Total revenue and grants 15.3 6.6 6.3 7.8
Total revenue 16.8 7.0 4.7 11.4
Tax 8.3 3.7 3.2 2.4
Nontax 25.6 9.9 5.0 20.1
Grants1/
-1.1 2.0 27.6 -30.5
Expenditure and net lending 22.1 7.5 7.1 14.9
Current expenditure 19.1 21.4 5.1 8.4
Capital expenditure 16.3 -9.0 8.9 27.4
Net lending 2/
-119.0 -497.4 -42.7 -30.5
Overall deficit 128.4 14.4 13.0 63.9
Foreign financing -56.1 -93.7 3950.0 247.6
Domestic financing -3719.4 41.7 -31.6 -59.2
1/ Includes grants-in-kind and cash but excludes direct expenditure by donors.
2/ Comprises development expenditure financed from domestic sources
and by foreign grants.
Source: Ministry of Finance and TreasuryEducation
(8%)
Hotels &
Restaur ants
(7%)
Manuf actur ing
(8%)
Constr ucti on
(17%)
Tour i sm
(28%)
Other
(8%)
Financi ng, Business
and Real estate
(13%)
Communi ty, Social
and Per sonal
Ser vices
(11%)
Source: Ministry of Planning and National Development
Chart 6.
EXP A T R IA T E EM P LOYM ENT BY IN D UST R Y, 2002

21
MMA ANNUAL REPORT 2002
non-tax revenuenon-tax revenuenon-tax revenuenon-tax revenuenon-tax revenue increased from Rf1,247.7 million in
2001 to Rf1,498.4 million in 2002, accelerating from a
5 percent growth to a 20 percent growth, mainly due
to the increase in profit transfers from public
enterprises and income from resort lease rent.
Meanwhile, grantsgrantsgrantsgrantsgrants inflow was estimated to have
declined by 30 percent to Rf147.2 million in 2002
after recording a 28 percent growth in 2001.
Total expenditure and net lending expenditure and net lending expenditure and net lending expenditure and net lending expenditure and net lending grew by 15
percent to Rf3,316.0 million in 2002, with 47 percent
of total expenditure and net lending being spent on
social services, 33 percent on public services and 16
percent on economic services. Current expenditureCurrent expenditureCurrent expenditureCurrent expenditureCurrent expenditure
increased from Rf1,971.4 million in 2001 to Rf2,136.1
million in 2002, accounting for 64 percent of total
expenditure and net lending, and recording an 8
percent growth in 2002 after registering a 5 percent
growth in 2001. Capital expenditure increased by 27
percent in 2002 following a 9 percent increase in 2001.
Reflecting these changes in revenue and expenditure,
the overall deficit deteriorated from Rf363.3 million
in 2001 to Rf595.6 million in 2002. FinancingFinancingFinancingFinancingFinancing of the
deficit was largely from foreign sources; the major
project financed by foreign loans was the Hulhumalé
Housing and Infrastructure project, which accounted
for around 39 percent of total loan disbursements
during the year. Consequently, domestic financingdomestic financingdomestic financingdomestic financingdomestic financing
declined from 60 percent of the deficit in 2001 to 15
percent in 2002.
4. Financial Sector4. Financial Sector4. Financial Sector4. Financial Sector4. Financial Sector
4.1 Banking System and Monetary Policy4.1 Banking System and Monetary Policy4.1 Banking System and Monetary Policy4.1 Banking System and Monetary Policy4.1 Banking System and Monetary Policy
The banking system consists of the Maldives Monetary
Authority (MMA) and five commercial banks. The
role of central banking is undertaken by the MMA
which was established in 1981, with the principal
functions of issuing currency, licensing, supervising
and regulating commercial bank operations,
undertaking banking activities on behalf of the
Government, providing domestic financing for
Government operations and the management of
international reserves and the exchange rate.
Of the commercial banks, only one is a domestic
bank, Bank of Maldives Plc. (BML), jointly owned by
the government (51 percent), general public (25
percent), Government Employees' Provident Fund (9
percent), State Trading Organisation Plc., Maldives
Transport and Contracting Company Plc. and Island
Communities (5 percent each). At the end of 2002,
BML had fourteen branches and five mobile banking
units (dhonis), with three out of the fourteen branches
located in Male', one at Male' International Airport
and the rest distributed amongst the atolls, each with
a designated command area. The Bank of Maldives
also undertakes development banking activities
whereby credit is extended to private parties for
various income generating activities. Of the foreign
0
500
1000
1500
2000
2500
1996 1997 1998 1999 2000 2001 2002
Others
Profit remittance by PNFE
Grants
Tourism Tax
Import Duty
In m illions of ruf iy aa
Chart 7.
GOVER N M ENT R EVEN UE A N D GR A N T S, 1996-2002
Sour ce: Ministry of Finance and Tr eas ury
0
500
1000
1500
2000
1996 1997 1998 1999 2000 2001 2002
Current Expenditure
Capital Expenditure and Net Lending
Chart 8.
GOVERNM ENT EXP ENDITURE, 1996-2002In millions of ruf iyaa
Source: Minis try of Finance and Treasury
22
ECONOMIC REVIEW
commercial banks, all of which are located in Malé,
three are branches of South Asian banks, namely State
Bank of India, Habib Bank Ltd. of Pakistan and Bank
of Ceylon and one is a branch of the Hong Kong
Shanghai Banking Corporation, HSBC. The latter
obtained license to operate in December 2001 and
commenced its operations in March 2002. These banks
play an important role in providing short and medium-
term loans to the private sector especially to the tourism
sector. They continue to be the principal institutions
for mobilising savings and for providing foreign
exchange to the private sector.
As in past years, monetary policy during 2002 has
been aimed at ensuring macroeconomic stability in
the country by supporting a low inflationary growth
and maintaining an adequate level of external reserves.
In order to achieve these objectives MMA uses an
exchange rate peg with the US dollar as the
intermediate target and is gradually moving towards
more market-based instruments of monetary policy.
The main policy instrumentspolicy instrumentspolicy instrumentspolicy instrumentspolicy instruments currently in use are
the 35 percent minimum reserve requirement on all
commercial banks; a Lombard facility providing short-
term rufiyaa liquidity to commercial banks; a 20
percent ceiling on rufiyaa lending rate; and MMA
Certificates of Deposits (CDs), which are used to
manage liquidity in the system.
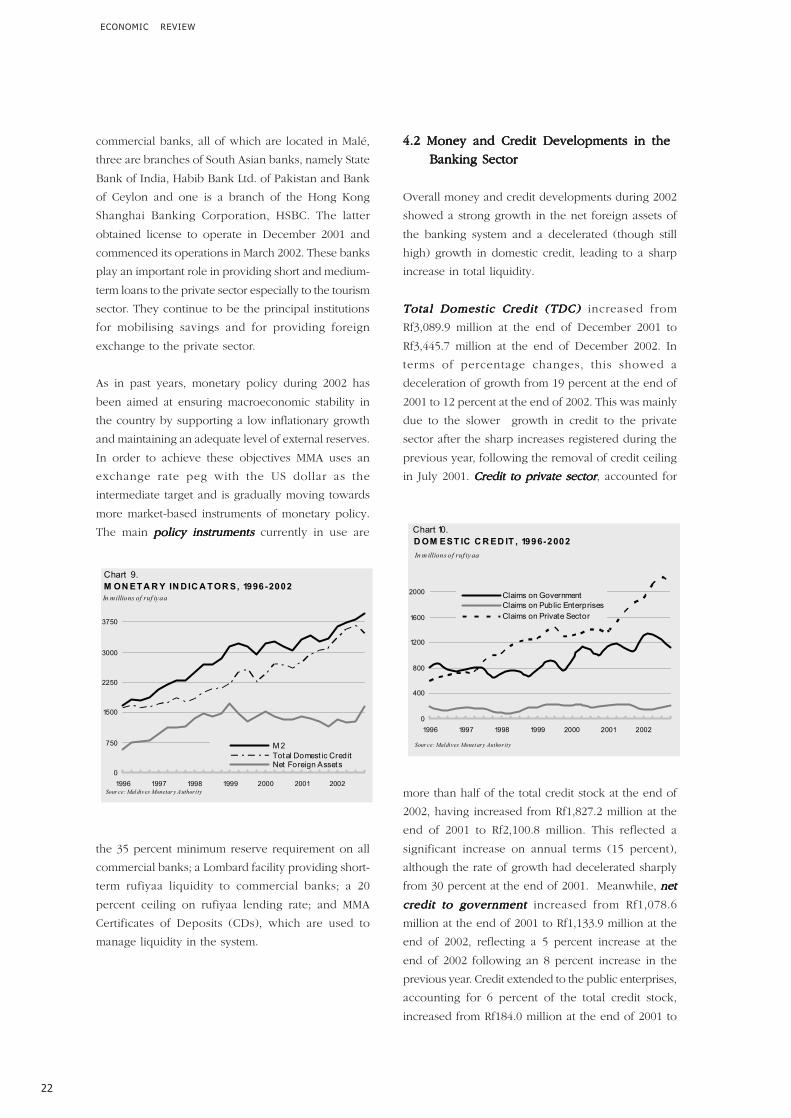
4.2 Money and Credit Developments in the4.2 Money and Credit Developments in the4.2 Money and Credit Developments in the4.2 Money and Credit Developments in the4.2 Money and Credit Developments in the
Banking Sector Banking Sector Banking Sector Banking Sector Banking Sector
Overall money and credit developments during 2002
showed a strong growth in the net foreign assets of
the banking system and a decelerated (though still
high) growth in domestic credit, leading to a sharp
increase in total liquidity.
Total Domestic Credit (TDC)Total Domestic Credit (TDC)Total Domestic Credit (TDC)Total Domestic Credit (TDC)Total Domestic Credit (TDC) increased from
Rf3,089.9 million at the end of December 2001 to
Rf3,445.7 million at the end of December 2002. In
terms of percentage changes, this showed a
deceleration of growth from 19 percent at the end of
2001 to 12 percent at the end of 2002. This was mainly
due to the slower growth in credit to the private
sector after the sharp increases registered during the
previous year, following the removal of credit ceiling
in July 2001. CrCrCrCrCredit to private sectoredit to private sectoredit to private sectoredit to private sectoredit to private sector, accounted for
more than half of the total credit stock at the end of
2002, having increased from Rf1,827.2 million at the
end of 2001 to Rf2,100.8 million. This reflected a
significant increase on annual terms (15 percent),
although the rate of growth had decelerated sharply
from 30 percent at the end of 2001. Meanwhile, netnetnetnetnet
credit to governmentcredit to governmentcredit to governmentcredit to governmentcredit to government increased from Rf1,078.6
million at the end of 2001 to Rf1,133.9 million at the
end of 2002, reflecting a 5 percent increase at the
end of 2002 following an 8 percent increase in the
previous year. Credit extended to the public enterprises,
accounting for 6 percent of the total credit stock,
increased from Rf184.0 million at the end of 2001 to
0
750
1500
2250
3000
3750
1996 1997 1998 1999 2000 2001 2002
M 2
Total Domest ic Credit Net Foreign Assets
Chart 9.
M ON ET A R Y IN DIC A T OR S, 1996-2002In millions of ruf iyaa
Sour ce: Maldives Monetar y Authori ty
0
400
800
1200
1600
2000
1996 1997 1998 1999 2000 2001 2002
Claims on Government
Claims on Public Enterprises
Claims on Private Sector
Chart 10.
D OM EST IC C R ED IT , 1996-2002
In m illions of ruf iyaa
Sour ce: Maldives Monetary Authority

23
MMA ANNUAL REPORT 2002
Rf211.0 million at the end of 2002, registering a 15
percent increase during the period.
The Net Foreign Assets (NFA)Net Foreign Assets (NFA)Net Foreign Assets (NFA)Net Foreign Assets (NFA)Net Foreign Assets (NFA) position of the
banking system showed a substantial improvement
in 2002, with the NFA increasing sharply from Rf1,153.0
million at the end of 2001 to Rf1,662.9 million at the
end of 2002. This was a significant growth of 44
percent during the period, compared to a 12 percent
decline at the end of the previous year. The
improvement in NFA was due to the substantial
increase in the NFA of MMA, which increased from
Rf1,196.9 million at the end of 2001 to Rf1,711.7 million
at the end of 2002, following a 17 percent decline at
the end of 2001. In contrast, commercial banks
continued to register a net foreign liability position at
the end of 2002 which stood 11 percent higher than
2001.
Reflecting the developments in credit and with the
strong growth in net foreign assets, total liquiditytotal liquiditytotal liquiditytotal liquiditytotal liquidity
(broad money)(broad money)(broad money)(broad money)(broad money) of the banking system increased by
19 percent at the end of 2002, following a 9 percent
increase in the previous year. In absolute terms, total
liquidity increased from Rf3,324.7 million at the end
of 2001 to Rf3,966.4 million at the end of 2002. As
regards the components of broad money, narrownarrownarrownarrownarrow
moneymoneymoneymoneymoney, after declining by 6 percent at the end of
2001, registered a 14 percent increase at the end of
2002. This was largely on account of the increase in
rufiyaa demand deposits of the commercial banks
which following a 5 percent decline at the end of
2001 grew sharply by 23 percent at the of 2002. Quasi Quasi Quasi Quasi Quasi
moneymoneymoneymoneymoney, the other component of broad money,
increased by 25 percent at the end of 2002 fuelled by
the 26 percent growth in foreign currency deposits,
reflecting the positive developments in the tourism
sector. As a result, the dollarisation ratiodollarisation ratiodollarisation ratiodollarisation ratiodollarisation ratio (ratio of
foreign currency deposits to broad money) edged up
from 45 percent at the end of 2001 to 47 percent at
the end of 2002.
4.2.1 Operations of the Commercial Banks4.2.1 Operations of the Commercial Banks4.2.1 Operations of the Commercial Banks4.2.1 Operations of the Commercial Banks4.2.1 Operations of the Commercial Banks
Commercial bank activities expanded relatively
strongly during the year 2002, with the growth in assets
and liabilities accelerating sharply by 23 percent from
Rf4,051.7 million at the end of 2001 to Rf4,965.9 million
at the end of 2002. Banks hold a substantial part of
their assets in the form of reserves, reflecting the high
minimum reserve requirements. Total reserveTotal reserveTotal reserveTotal reserveTotal reservesssss,
accounting for 42 percent of the total assets, increased
by 34 percent in 2002 after a decline of 8 percent at
the end of 2001. As over 95 percent of total reserves
comprised of funds invested in MMA CDs and those
held at MMA mainly as minimum reserve requirement,
the increase reflected the growth in these two
variables. Commercial banks investment in MMA CDs
increased from Rf321.0 at the end of 2001 to Rf479.3
million at the end of 2002, reflecting an increase of
49 percent. The funds held with MMA by the
commercial banks also increased by a further 28
percent at the end of 2002 following a 22 percent
-500
0
500
1000
1500
2000
1996 1997 1998 1999 2000 2001 2002
MM A Commercial Banks
Sour ce: Maldives Monetary Author ity
N ET FOR EIGN ASSET S, 1996 - 2002
Chart 11.
In mill ions of ruf iyaa; end of period
Table 4.
MONETARY AGGREGATES, 2001 - 2002Year-on-year percentage change
2001
Mar Jun Sep Dec
Net foreign assets -12.1 -6.4 -6.0 -0.5 44.2
Domestic assets (net) 25.0 21.8 19.2 27.7 6.1
Domestic credit 19.4 22.5 21.9 20.9 11.5
Claims on Govt (net) 8.4 15.0 11.9 12.8 5.1
Claims on public enterprises -0.4 -32.6 -37.4 -26.9 14.7
Claims on private sector 29.9 37.0 38.0 33.0 15.0
Other items (net) 8.1 24.2 28.2 8.0 24.4
Total liquidity (M2) 9.0 9.7 9.2 16.6 19.3
Money supply (M1) -5.9 -9.7 1.7 15.0 13.9
o/w Currency outside banks -8.3 -9.9 -7.1 -1.6 0.6
Quasi money 29.4 34.2 18.8 18.2 24.6
o/w. Foreign currency deposits 36.6 42.9 29.0 22.1 26.0
Source: Maldives Monetary Authority
2002

24
ECONOMIC REVIEW
growth at the end of 2001. As regards the foreign
assets of commercial banks, which accounted for
about 8 percent of the total assets, it grew strongly
during the year 2002 registering a 29 percent growth
at the end of the year. This followed a 23 percent
increase in such assets at the end of 2001.
The domestic credit stockdomestic credit stockdomestic credit stockdomestic credit stockdomestic credit stock of the commercial banks
increased by Rf300.5 million at the end of 2001 to
Rf2,310.3 million at the end of 2002. Such credit, the
growth of which increased sharply from 6 percent in
2000 to 26 percent in 2001 after the removal of the
credit ceiling in July of that year, witnessed a
moderation in the rate of growth to 15 percent at the
end of 2002. Of the total credit stock of the banks,
about 91 percent was extended to the private sector,
while the rest was borrowed by the public enterprises.
The rate of growth in credit to the private sector halved
to 15 percent at the end of 2002, from 30 percent in
2001. Meanwhile, credit to public enterprises grew
significantly by 15 percent in 2002 following declines
in the two previous years. As regards the allocation
of commercial bank credit to various sectors of the
economy, the tourism sector held the largest share of
the portfolio (56 percent), followed by commerce (25
percent), construction (7 percent) and fishing (6
percent). Credit extended to the tourism sector
increased by Rf336 million in absolute terms or by 41
percent at the end of 2002, having grown by 11 percent
at the end of 2001. Meanwhile, credit to the commerce
sector, following a 68 percent growth in 2001 declined
by 20 percent at the end of 2002. Credit to the
construction sector increased by just 1 percent
following a 17 percent increase at the end of the
previous year. At the end of 2002, the amount of
credit extended to the fisheries sector was more than
double the level recorded at the end of 2001, though
in absolute terms the increase was only about Rf39.5
million.
On the liabilities side total depositstotal depositstotal depositstotal depositstotal deposits of commercial
banks, accounting for 72 percent of the total liabilities,
increased by Rf670.0 million and stood at Rf3,595.4
million at the end of 2002. In terms of growth this
was an increase of 23 percent following a growth of
16 percent at the end of 2001. The acceleration in
growth of this variable was due to the increase in
both the foreign currency deposits as well as local
currency deposits. Foreign currency depositsForeign currency depositsForeign currency depositsForeign currency depositsForeign currency deposits grew
by 25 percent in the year to 2002 while local currency
deposits grew by 21 percent. This was compared to a
40 percent and a 2 percent decline in foreign and
local currency deposits, respectively, registered at the
end of 2001. The proportion of rufiyaa depositsrufiyaa depositsrufiyaa depositsrufiyaa depositsrufiyaa deposits in
total deposits fell from 48 percent at the end of 2001
to 47 percent at the end of December 2002.
Of the total deposits, demand deposits and time and
savings deposits accounted for 68 percent and 32
percent respectively at the end of 2002, while having
recorded 69 and 31 percent respectively at the end of
2001. As regards the growth in these variables, demand
deposits which grew by 13 percent at the end of 2001,
increased by 21 percent at the end of 2002. Growth
in time and savings deposits increased from 22 percent
at the end of 2001 to 27 percent at the end of 2002.
0
400
800
1200
1600
2000
1996 1997 1998 1999 2000 2001 2002
Demand Deposits
Time, Saving and Foreign Currency Deposits
In millions of ruf iyaa
Chart 13.
C OM M ER C IA L B A NKS' D EP OSIT S B Y
T YP E, 1996-2002
Source: Maldives Monetary Authority
Tour ism
56%Const ruct ion
7%
Commerce
25%
Ot hers
7%
Fishing
6%
Source: Maldives Monetar y Authority
Chart 12.
C R ED IT B Y M AJOR EC ON OM IC SEC T ORS, 2002

25
MMA ANNUAL REPORT 2002
4.3 Non-Bank Financial Activities4.3 Non-Bank Financial Activities4.3 Non-Bank Financial Activities4.3 Non-Bank Financial Activities4.3 Non-Bank Financial Activities
Although the banking sector continues to dominate
the financial sector in the country, non-bank
financial activities have been steadily increasing and
gaining more prominence in the industry. During
the year 2002, insurance companies, market
intermediaries from regional countries, a finance
leasing company and several development finance
activities channelled through the Ministry of Finance
and Treasury were actively engaged in various
financial activities in the country. (Please see Box 1
for a review of the non-bank financial activities)
The MFLCMFLCMFLCMFLCMFLC, which commenced its operations in
June 2002 , provides medium and long-term capital
equipment finance to various economic sectors. In
the six months of its operation in 2002, the company
financed Rf27.8. million worth of capital equipment,
out of which 79 percent was for the tourism sector.
The equipments that were financed include
speedboats, live-aboard safari and fishing vessels,
dhonis, computers, excavators, etc. The lease period
of these equipments ranged from 12 months to 60
months, with the majority being for 60 months.
4.4 Capital Market4.4 Capital Market4.4 Capital Market4.4 Capital Market4.4 Capital Market
The foundation for organized securities trading in
Maldives was laid in the year 2002 (April 14th 2002)
with the opening of the securities trading floor within
the premises of the Capital Market Development
Section. This was at a time when investor sentiments
were low in the aftermath of the September 11 events
and the local and international economies were not
performing at their best. Despite this situation
companies whose shares were publicly traded
performed well. Although the market was a sellers
market to begin with, with increasing public
awareness the demand for share trading also grew.
The biggest drawback for the growth of capital market
has been the shortage of shares available for trading
in the market, in terms of the number of listed
companies and shares sold to the public of the
listed companies.
Shares of three public companies, Maldives
Transport and Contracting Company (MTCC) Plc., State
Trading Organization (STO) Plc. and Bank of Maldives
(BML) Plc. were traded on the Securities Trading Floor
during the year. At the end of 2002, sharsharsharsharshares issuedes issuedes issuedes issuedes issued to
the public by the three companies totalled over 156
thousand. During the eight months of operations 1,038
shares were traded on the Floor (475 shares of MTCC,
470 shares of BML and 93 shares of STO) with the
trading volume peaking during the month of
September when 275 shares were traded. MTCC was
the most frequently traded stock during the period
under review, while BML had the highest value of
shares traded during the period, registering 66 percent
of the total value of shares traded.
The turnover for the year was Rf468.0 thousand.
Market capitalisationMarket capitalisationMarket capitalisationMarket capitalisationMarket capitalisation peaked in October at around
Rf676.0 million and was followed by a gradual
downward trend in the last quarter to register Rf662.0
million as at 31 December 2002. The market
capitalization to GDP stood at around 9 percent at
the end of the year.
T OT A L VA LUE OF SH A R ES T R A DED B Y
C OM P A NIES, A P R IL - D EC EM B ER 2002
STO
9%
BML
66%
MTCC
25%
Chart 14.
Source: Maldives Monetar y Authority
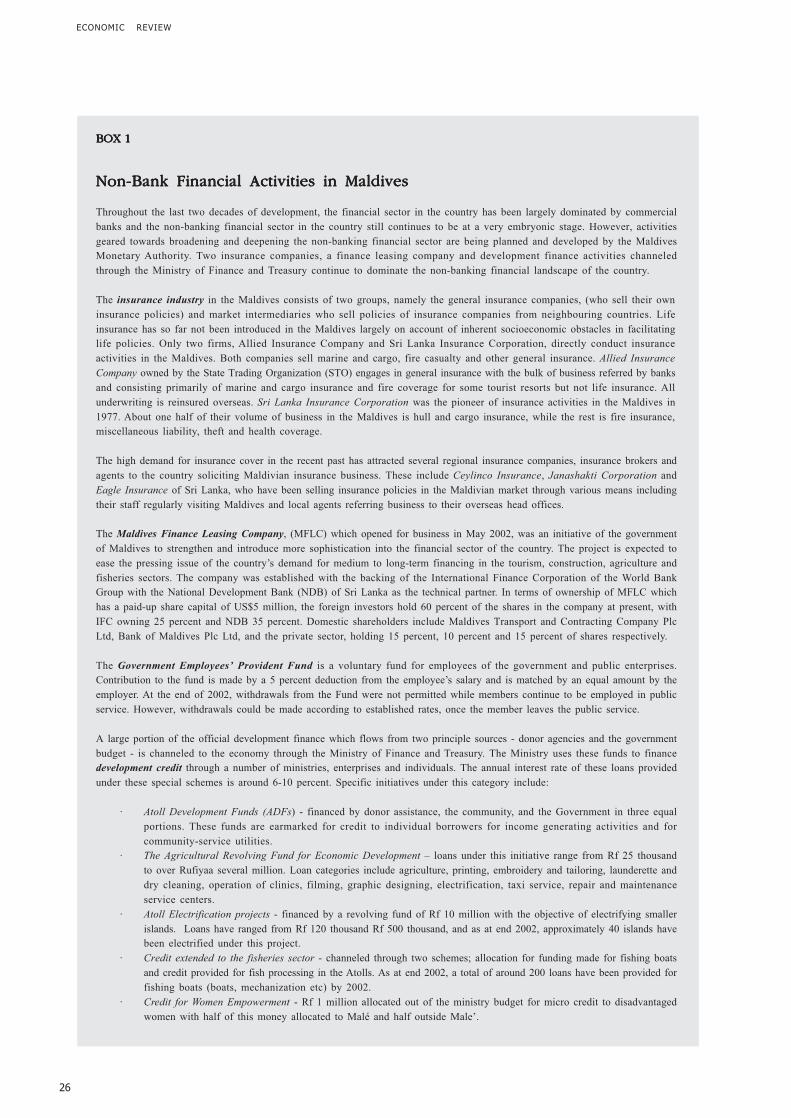
BOX 1BOX 1BOX 1BOX 1BOX 1
Non-Bank Financial Activities in MaldivesNon-Bank Financial Activities in MaldivesNon-Bank Financial Activities in MaldivesNon-Bank Financial Activities in MaldivesNon-Bank Financial Activities in Maldives
Throughout the last two decades of development, the financial sector in the country has been largely dominated by commercial
banks and the non-banking financial sector in the country still continues to be at a very embryonic stage. However, activities
geared towards broadening and deepening the non-banking financial sector are being planned and developed by the Maldives
Monetary Authority. Two insurance companies, a finance leasing company and development finance activities channeled
through the Ministry of Finance and Treasury continue to dominate the non-banking financial landscape of the country.
The insurance industry in the Maldives consists of two groups, namely the general insurance companies, (who sell their own
insurance policies) and market intermediaries who sell policies of insurance companies from neighbouring countries. Life
insurance has so far not been introduced in the Maldives largely on account of inherent socioeconomic obstacles in facilitating
life policies. Only two firms, Allied Insurance Company and Sri Lanka Insurance Corporation, directly conduct insurance
activities in the Maldives. Both companies sell marine and cargo, fire casualty and other general insurance. Allied Insurance
Company owned by the State Trading Organization (STO) engages in general insurance with the bulk of business referred by banks
and consisting primarily of marine and cargo insurance and fire coverage for some tourist resorts but not life insurance. All
underwriting is reinsured overseas. Sri Lanka Insurance Corporation was the pioneer of insurance activities in the Maldives in
1977. About one half of their volume of business in the Maldives is hull and cargo insurance, while the rest is fire insurance,
miscellaneous liability, theft and health coverage.
The high demand for insurance cover in the recent past has attracted several regional insurance companies, insurance brokers and
agents to the country soliciting Maldivian insurance business. These include Ceylinco Insurance, Janashakti Corporation and
Eagle Insurance of Sri Lanka, who have been selling insurance policies in the Maldivian market through various means including
their staff regularly visiting Maldives and local agents referring business to their overseas head offices.
The Maldives Finance Leasing Company, (MFLC) which opened for business in May 2002, was an initiative of the government
of Maldives to strengthen and introduce more sophistication into the financial sector of the country. The project is expected to
ease the pressing issue of the country’s demand for medium to long-term financing in the tourism, construction, agriculture and
fisheries sectors. The company was established with the backing of the International Finance Corporation of the World Bank
Group with the National Development Bank (NDB) of Sri Lanka as the technical partner. In terms of ownership of MFLC which
has a paid-up share capital of US$5 million, the foreign investors hold 60 percent of the shares in the company at present, with
IFC owning 25 percent and NDB 35 percent. Domestic shareholders include Maldives Transport and Contracting Company Plc
Ltd, Bank of Maldives Plc Ltd, and the private sector, holding 15 percent, 10 percent and 15 percent of shares respectively.
The Government Employees’ Provident Fund is a voluntary fund for employees of the government and public enterprises.
Contribution to the fund is made by a 5 percent deduction from the employee’s salary and is matched by an equal amount by the
employer. At the end of 2002, withdrawals from the Fund were not permitted while members continue to be employed in public
service. However, withdrawals could be made according to established rates, once the member leaves the public service.
A large portion of the official development finance which flows from two principle sources - donor agencies and the government
budget - is channeled to the economy through the Ministry of Finance and Treasury. The Ministry uses these funds to finance
development credit through a number of ministries, enterprises and individuals. The annual interest rate of these loans provided
under these special schemes is around 6-10 percent. Specific initiatives under this category include:
· Atoll Development Funds (ADFs) - financed by donor assistance, the community, and the Government in three equal
portions. These funds are earmarked for credit to individual borrowers for income generating activities and for
community-service utilities.
· The Agricultural Revolving Fund for Economic Development – loans under this initiative range from Rf 25 thousand
to over Rufiyaa several million. Loan categories include agriculture, printing, embroidery and tailoring, launderette and
dry cleaning, operation of clinics, filming, graphic designing, electrification, taxi service, repair and maintenance
service centers.
· Atoll Electrification projects - financed by a revolving fund of Rf 10 million with the objective of electrifying smaller
islands. Loans have ranged from Rf 120 thousand Rf 500 thousand, and as at end 2002, approximately 40 islands have
been electrified under this project.
· Credit extended to the fisheries sector - channeled through two schemes; allocation for funding made for fishing boats
and credit provided for fish processing in the Atolls. As at end 2002, a total of around 200 loans have been provided for
fishing boats (boats, mechanization etc) by 2002.
· Credit for Women Empowerment - Rf 1 million allocated out of the ministry budget for micro credit to disadvantaged
women with half of this money allocated to Malé and half outside Male’.
ECONOMIC REVIEW
2662626

27
MMA ANNUAL REPORT 2002
5. Balance of Payments5. Balance of Payments5. Balance of Payments5. Balance of Payments5. Balance of Payments
5.1 Current Account5.1 Current Account5.1 Current Account5.1 Current Account5.1 Current Account
The current accountcurrent accountcurrent accountcurrent accountcurrent account of the balance of payments
improved in 2002, with the deficit narrowing by
around 23 percent to an estimated US$44.0 million
(around 7 percent of GDP) for the year. This was
following negative developments in 2001, when the
deficit grew by over 11 percent. Contributory factors
were the narrowing of the merchandise trade deficit
while the services surplus picked up marginally.
Meanwhile the transfers account continued the
deteriorating trend of the past five years.
5.2 Merchandise Trade5.2 Merchandise Trade5.2 Merchandise Trade5.2 Merchandise Trade5.2 Merchandise Trade
The merchandise trademerchandise trademerchandise trademerchandise trademerchandise trade balance improved by around
11 percent as a result of a 21 percent increase in
exports, while imports declined marginally by 0.4
percent during the year.
Merchandise exportsMerchandise exportsMerchandise exportsMerchandise exportsMerchandise exports recorded US$133.6 million,
with domestic exports registering US$90.4 million,
having grown by 19 percent in value terms, and re-
exports registering US$43.3 million having increased
by 27 percent. As in previous years, the largest share
of domestic exports was on account of marine exports,
which constituted 62 percent, while garments
accounted for 38 percent. Earnings from fish exports
(excluding live tropical fish) increased by over 37
percent during 2002 to record US$49.2 million, and
the volume increased by over 50 percent to record
44.6 thousand metric tonnes. In terms of composition
of such fish exports, around 95 percent of exports
were within the categories of frozen non-reef fish,
dried fish and canned fish. Frozen non-reef fish
accounted for 56 percent of fish export earnings
during 2002, having witnessed a modest increase in
unit value from US$842.0 in 2001 to US$879.8 in 2002.
Canned fish accounted for 20 percent of earnings,
recording US$10.0 million, while registering a 31
percent increase in unit value. As a result, an increase
in earnings of around 8 percent was witnessed, while
volume exported fell by 18 percent. Export earnings
from dried fish accounted for 18 percent, registering
US$9.0 million with an export volume of 5.8 thousand
metric tonnes, both lower than that recorded in the
previous year. Live tropical fish accounted for around
3 percent of earnings received from fish and fish
products, with almost 373 thousand of such fish being
exported during the year. With regard to non-fish
marine products (5 percent of total marine products),
earnings from this category had increased though its
volume had declined by more than half. This was
the result of a marked increase (157 percent) in the
unit value of sea cucumber as this product accounts
for around 80 percent of fish exports. Garment exports
increased during the year both in terms of earnings
as well as volume exported to register US$34.5 million
(7 percent higher than the previous year) and 34.9
thousand units (a 35 percent increase from the
preceding year) respectively.
Re-exports continued the increasing trend of the past
few years, registering a 27 percent increase in 2002 to
reach US$43.3 million. Jet fuel which had accounted
for around 83 - 86 percent of re-exports in the past
two years, witnessed a decline in contribution to 75
percent. However, earnings from jet fuel increased
by about 16 percent compared to 2001 mainly due to
an increase in quantity, as average prices in the
international market were more or less the same as in
2001.
Total merchandise importsmerchandise importsmerchandise importsmerchandise importsmerchandise imports (c.i.f.)(c.i.f.)(c.i.f.)(c.i.f.)(c.i.f.) had declined
marginally by 0.4 percent from US$393.5 million in
2001 to US$391.7 million in 2002. This was owing to
the decline in tourism-related imports and pubic sector
imports by 5 percent and 6 percent respectively,
though the largest (private excluding tourism) sector
-400
-300
-200
-100
0
100
1996 1997 1998 1999 2000 2001 2002
Exports (fob) Imports (fob) Trade Balance
Chart 15.
IN T ER N AT ION A L T R A D E, 1996-2002In millions of US dollars
Sour ce: Maldives Customs Service and Maldives Airports Company

28
4 Please see Section 2.1 for further details on the tourism sector.
had witnessed an increase of 4 percent or US$8.4
million during the year. Imports by the private sector
(excluding tourism) increased from US$214.9 million
in 2001 to US$223.3 million in 2002, with consumer
goods contributing over 65 percent of the growth value,
mainly on account of an increase in food items and
tobacco imports. Tourism-related imports had fallen
to US$60.3 million registering a US$3.0 million decline,
almost entirely on account of intermediate and capital
goods (mostly construction related material) imported
by the sector. Under the public sector imports, both
government imports and PNFE imports had declined
(by 20 percent and 3 percent) to reach US$17.8 million
and US$90.3 million, respectively. Government sector
imports registered a decline of US$4.3 million, which
was mainly contributed by the 76 percent or US$7.8
million fall in imports of transport equipment and
parts. PNFE imports displayed the lowest sectoral
change of 3 percent or US$2.8 million.
In terms of composition of total imports, consumer
goods accounted for 44 percent and increased by
over 2 percent. The highest single category of imports
into the country was food imports, constituting 21
percent of total imports and 49 percent of consumer
goods, which declined by 1 percent during the year.
Imports of staple foods, (rice, wheat flour and sugar)
with the combined import value of US$10.5 million,
accounted for 12 percent of food items, and witnessed
a decline of 15 percent. Intermediate and capital
goods accounting for 43 percent of total imports,
declined by 6 percent during 2002. The petroleum
products category, which accounted for around 13
percent of total imports, witnessed an increase of 11
percent, mainly on account of the increase in the
import of diesel (marine gas oil).
In terms of direction of tradedirection of tradedirection of tradedirection of tradedirection of trade, the largest share of
imports was sourced from Asian countries (69
percent), with Europe accounting for the next highest
share (15 percent), and the Middle East, the third
highest, comprising 8 percent. Within Asia, SAARC
countries accounted for around 38 percent (26 percent
of total imports), the largest share of which was on
account of food items. On a bilateral level, Singapore
accounted for over a quarter of total imports, while
Sri Lanka accounted for 15 percent, India for 11 percent
and United Arab Emirates for 7 percent of total imports.
The largest share (48 percent) of merchandise exports
during 2002 were directed to Asia, followed by North
America which received 38 percent, and Europe which
received 14 percent of total exports. The SAARC region
received around 15 percent of total exports of Maldives.
The largest bilateral export partner during the year
was the United States of America, which received 38
percent of total exports, constituting almost entirely
of garments. Sri Lanka and Thailand were the next
biggest export partners, each accounting for around
15 percent of exports, with Thailand importing frozen
and chilled tuna from Maldives and Sri Lanka receiving
mainly dried and salted fish. Meanwhile, more than
three quarters of exports to Europe were canned fish.
5.3 Services and Transfers5.3 Services and Transfers5.3 Services and Transfers5.3 Services and Transfers5.3 Services and Transfers
The servicesservicesservicesservicesservices surplus of the economy reflected a
marginal increase from 2001 (less than 1 percent) on
account of the growth in the tourism sector4in the
last quarter of the year and the associated impact on
travel receipts. Consequently, an estimated balance
of US$207.7 million was recorded on the services
account in 2002 as opposed to US$206.4 million in
2001. On the receipts side, income from travel, which
usually accounts for around 90 percent of service
exports, was estimated to have recorded US$332.5
million during the year, reflecting a growth of around
2 percent during the year. In 2001, despite the
September 11th events, the annual growth in receipts
ECONOMIC REVIEW
C OM P OSIT ION OF IM P OR TS, 2000 - 2002
0.0
50.0
100.0
150.0
200.0
250.0
300.0
350.0
400.0
450.0
2000 2001 2002
Construct ion
related
imports
Fuel (petrol,
diesel &
aviation gas)Transport
equipments &
parts
Staple foods
Other food
items
Non-food
consumer
goodsOther
Chart 16.
In mil lions of dollars
Source: Maldives Customs Services

29
MMA ANNUAL REPORT 2002
was higher than that witnessed in 2002 due to the
good performance of the sector in the high season in
the earlier part of 2001. The steep year-on-year declines
witnessed during the earlier part of 2002 and the
reduced room rates used to attract more guests were
the key contributing factors to the deterioration of
growth in earnings from tourism during 2002.
Meanwhile, transportation receipts accounting for
around 4 percent of total receipts and factor income
for 1 percent, declined slightly.
On the payments side, total service payments were
estimated to have fallen by around 2 percent to record
US$151.9 million. Non-factor payments, consisting
mainly of outflows on account of freight and
insurance and travel abroad by residents, was
estimated as accounting for 73 percent of total
payments, while factor payments accounted for 27
percent. In terms of growth, non-factor payments were
estimated to have gained 2 percent, recording
US$111.2 million in 2002, while factor payments were
estimated to have declined by over 10 percent, mainly
on account of investment income, particularly profit
remittances of commercial banks.
The deficit on transferstransferstransferstransferstransfers account continued its
widening trend with a US$13.0 million or 47 percent
deterioration, on account of a lower transfer inflow
from grants coupled with the slight increase in the
outward transfers by expatriate workers. Official
inward grant flows were estimated to have decreased
from US$22.0 million in 2001 to US$9.6 million in
2002, while the amount transferred out of the country
by foreign employees was estimated to have grown
by just over 1 percent to US$50.2 million. As a result,
the net outflow of transfers increased to US$40.6 million
in 2002 from US$27.6 million in the previous year. In
terms of aid donors, the largest bilateral donor was
Japan, contributing around 51 percent of total grants,
and 67 percent of bilateral grants, while the highest
proportion of aid from multilateral sources was from
UNDP, contributing around 9 percent of total grants,
and 37 percent of multilateral grants.
5.4 Capital Account5.4 Capital Account5.4 Capital Account5.4 Capital Account5.4 Capital Account
In terms of financing the current account deficit, the
non-monetary capital accountcapital accountcapital accountcapital accountcapital account witnessed a net inflow
of official capital totalling US$37.0 million in 2002,
almost five times the inflow of the 2001. Disbursements
more than doubled from US$23.4 million in 2001 to
US$54.0 million in 2002, while amortisation also
increased, but by only US$1.4 million, to reach
US$17.0 million (Please see section on External Debt
for details). Private capital inflow was also expected
to have grown by around 39 percent to US$33.8 million
in 2002, to some extent on account of the inflows of
the fisheries sector liberalisation and related
investments, the establishment of the the Maldives
Finance Leasing Company (MFLC) and the new
commercial bank (a branch of HSBC).
5.5 Overall Balance of Payments and5.5 Overall Balance of Payments and5.5 Overall Balance of Payments and5.5 Overall Balance of Payments and5.5 Overall Balance of Payments and
International Reserves International Reserves International Reserves International Reserves International Reserves
Reflecting the positive developments in the capital
and the current accounts, the overall balanceoverall balanceoverall balanceoverall balanceoverall balance of
payments improved from an outflow of US$21.4
million in 2001 to an inflow of US$39.8 million in
2002. This resulted in the strengthening of the foreignforeignforeignforeignforeign
reserve positionreserve positionreserve positionreserve positionreserve position of the country with the official
reserve accumulation during the year amounting to
US$40.2 million. This increased the stock of gross
international reserves at year-end to US$134.5 million,
translating to 4.1 months of merchandise imports.
-15
-10
-5
0
5
10
15
1996 1997 1998 1999 2000 2001 2002
Capital Account Current Account Overall Balance
Chart 17.
Sour c e: Maldive s Monetar y Aut hor ity
BALANCE OF P AYM ENTS AS A P ERECENTAGE
OF GDP , 1996-2002

30
6. Interest Rate and Exchange Rate6. Interest Rate and Exchange Rate6. Interest Rate and Exchange Rate6. Interest Rate and Exchange Rate6. Interest Rate and Exchange Rate Developments Developments Developments Developments Developments
During 2002 key developments were seen in the interest
rate structure of commercial banks operating in the
country. With HSBC entering the domestic banking
arena in March 2002, a marked change was seen in
interest ratesinterest ratesinterest ratesinterest ratesinterest rates, with a widening of the rate band for
both deposits and lending. With respect to deposit
rates, savings rates which had ranged between 5.0-
6.0 percent for both rufiyaa and dollar denominated
savings at the end of 2001 were brought down to 2.5-
5.5 percent for dollar denominated deposits and 3.25-
5.0 percent for rufiyaa denominated deposits, by the
end of the year. Rates on term deposits ranged between
2.5-7.5 percent for dollar denominated deposits while
rates on rufiyaa denominated deposits had a band of
3.25-7.5 percent.
As for lending rates, the band widened on both sides,
with the rates on conventional lending denominated
in rufiyaa going from 12-13 percent to 9-14 percent,
while the band on such lending denominated in
foreign currency widened from 12-15 percent to 8.5-
15 percent.
Meanwhile the interest rate on MMA CDs continued
to remain at 8 percent per annum, at the end of 2002,
while the rate paid on the remunerable portion of
commercial bank reserves deposited with MMA (see
Monetary Measures on page 71 for details) remained
at 2.5 percent per annum.
The rufiyaa has remained unchanged against the US
dollar at Rf12.8, since the 9 percent devaluation in
July 2001. However, as a result of the peg with the US
dollar, the rufiyaa lost value against other major traded
currencies as well as those of Maldives' trading partners
due to the marked weakening of the US dollar during
the year. Relative to the end of 2002, the rufiyaa had
depreciated by 11 percent against the Sterling pound,
15 percent against the Euro, 4 percent against the
Malaysian Ringgit, 73 percent against the UAE Dirham,
8 percent against Thai Baht and 4 percent against the
Singapore dollar. However, marginal appreciation (0.2
percent) was noted against the Japanese yen while
against the Indian rupee and the Sri Lankan rupee,
the rufiyaa appreciated by 0.5 percent and 4 percent
respectively.
7. External Debt7. External Debt7. External Debt7. External Debt7. External Debt
Statistics on the external debt of the country cover
only medium and long-term government and
government guaranteed borrowings and the external
debt of the banking sector. Currently there is no
information available on developments in aggregate
private sector external debt or debt servicing.
Current estimates indicate that the total external debtexternal debtexternal debtexternal debtexternal debt
stockstockstockstockstock stood at US$257.1 million at the end of 2002.
The public sector medium and long-term debt
outstanding and disbursed (DOD) totalled an estimated
US$221.2 million at the end of 2002, while DOD at
the end of 2001 recorded US$181.5 million. Foreign
liabilities of the commercial banks meanwhile
registered US$35.9 million at the end of 2002 compared
to US$28.3 million at the end of 2001. As a result, the
total officially recorded debt stock of the economy
increased by around 23 percent during 2002.
At present the public sector external debt stock
consists of loans received from bilateral and
multilateral sources (largely on concessional terms),
of loans taken from financial markets and of suppliers'
credits. Bilateral loans comprised 11 percent of the
medium and long-term public debt stock at the end
of 2002, while loans from multilateral sources
ECONOMIC REVIEW
80
100
120
140
160
1996 1997 1998 1999 2000 2001 2002
US dollars Japanese yen
Euro
(2001 Q3 = 100)
Chart 18.
C H A N GE IN R UF IYA A EXC HA N GE R A T E A GA IN ST
M A JOR F OREIGN C UR R IEN C IES , 1996-2002
Sour ce: Maldives Monetary Author ity

31
MMA ANNUAL REPORT 2002
accounted for 63 percent, suppliers' credits for 21
percent and borrowings from financial markets for 4
percent.
In terms of sectoral allocation of medium and long-
term public sector borrowing, the largest proportion
of the current debt stock outstanding and disbursed
were on account of the education sector, followed
by the fishing and energy sectors. Loans to the
education sector account for 16 percent of total debt
stock, while borrowings for the fisheries and energy
sectors account for 15 percent and 14 percent of DOD
respectively. During 2002, disbursementsdisbursementsdisbursementsdisbursementsdisbursements almost
doubled from US$23.4 million to US$43.5 million. Of
this around 45 percent was extended to the housing
and urban development sector, mainly on account
of the Hulhumalé project, 16 percent was extended
to rural infrastructure and human development
(essentially to the Regional Development Project5) and
approximately 12 percent each for education and ports
development. Of total disbursements during the year,
multilateral lenders accounted for 37 percent with 15
percent received from the Asian Development Bank,
11 percent from the Islamic Development Bank and
7 percent from the International Development Agency
of the World Bank Group. Bilateral lenders constituted
6 percent of disbursements with funds received from
the Kuwait Fund and the Belgian government. Of the
disbursements from private creditors, suppliers' credits
accounted for 56 percent, while financial markets
accounted for the remaining 1 percent.
AmortisationAmortisationAmortisationAmortisationAmortisation totalled US$19.0 million during the year,
with the largest proportion of the repayments being
on account of loans taken for civil defence and public
safety (26 percent) and for airport development (14
percent). Interest paymentsInterest paymentsInterest paymentsInterest paymentsInterest payments on public sector external
debt amounted to US$4.5 million during the year, and
total debt servicetotal debt servicetotal debt servicetotal debt servicetotal debt service therefore totalled US$23.5 million,
which was equivalent of around 5 percent of Maldives'
exports of goods and non-factor services during the
year.
5 The Regional Development Project is aimed at providing improve-
ments in the standard of living in the northern (Haa Alif, Haa Dhaal &
Shaviyani atolls) and southern (Gaafu Alif, Gaafu Dhaal, Gnaviyani
and Seenu atolls) development regions through improvements in the
institutional, infrastructure and environmental aspects. The main com-
ponents of the project include the establishment of regional develop-
ment and management offices in each region, the upgrading of a 10.5 km
road linking the islands between Gan and Hithadoo in Seenu atoll, en-
hancement of rainwater collection and sanitation, establishing solid
waste management, opening up ocean to lagoon water flows and envi-
ronmental monitoring.
EXT ER N A L D EB T , 1996 - 2002
0
50
100
150
200
250
1996 1997 1998 1999 2000 2001 2002
0
1
2
3
4
5
6
7
8
DOD Debt Service Ratio
In millions of dollarsIn per cent
Chart 19.
Source: Ministry of Finance and T reasur y
DOD = Debt Outstanding Disbursed
Debt Service Rat io = Total Debt Service / Exports of Goods and non-
factor Services
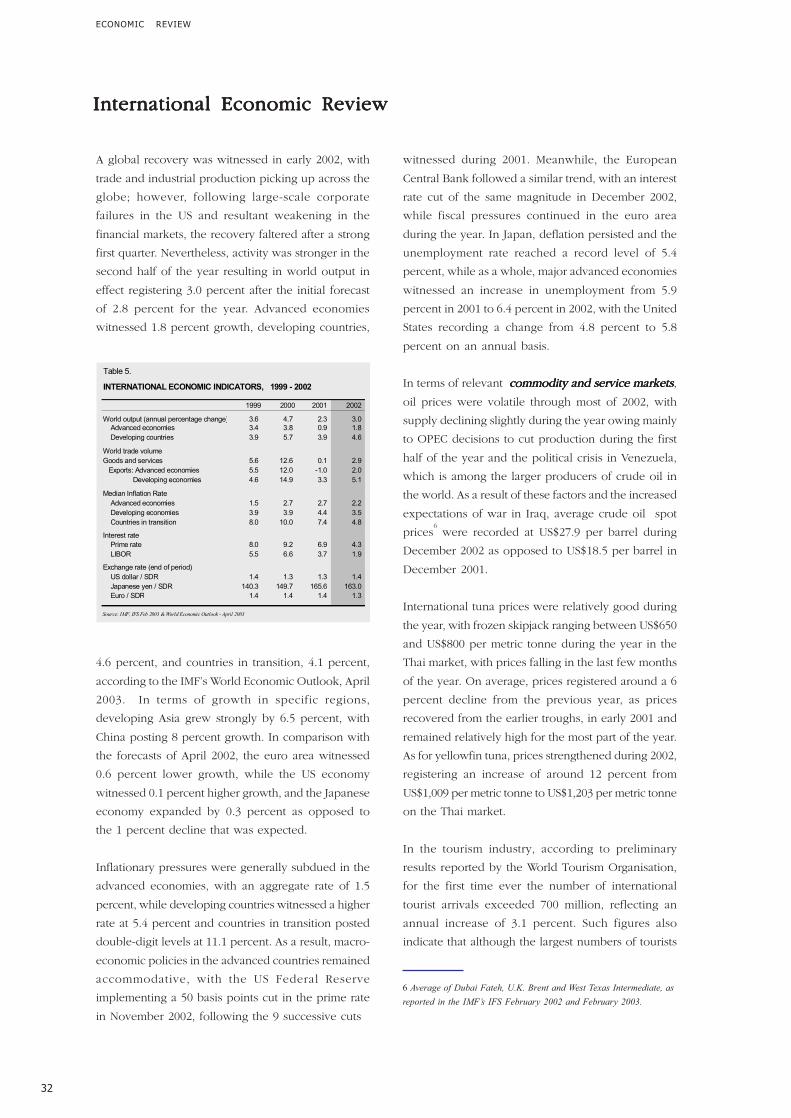
32
A global recovery was witnessed in early 2002, with
trade and industrial production picking up across the
globe; however, following large-scale corporate
failures in the US and resultant weakening in the
financial markets, the recovery faltered after a strong
first quarter. Nevertheless, activity was stronger in the
second half of the year resulting in world output in
effect registering 3.0 percent after the initial forecast
of 2.8 percent for the year. Advanced economies
witnessed 1.8 percent growth, developing countries,
4.6 percent, and countries in transition, 4.1 percent,
according to the IMF's World Economic Outlook, April
2003. In terms of growth in specific regions,
developing Asia grew strongly by 6.5 percent, with
China posting 8 percent growth. In comparison with
the forecasts of April 2002, the euro area witnessed
0.6 percent lower growth, while the US economy
witnessed 0.1 percent higher growth, and the Japanese
economy expanded by 0.3 percent as opposed to
the 1 percent decline that was expected.
Inflationary pressures were generally subdued in the
advanced economies, with an aggregate rate of 1.5
percent, while developing countries witnessed a higher
rate at 5.4 percent and countries in transition posted
double-digit levels at 11.1 percent. As a result, macro-
economic policies in the advanced countries remained
accommodative, with the US Federal Reserve
implementing a 50 basis points cut in the prime rate
in November 2002, following the 9 successive cuts
witnessed during 2001. Meanwhile, the European
Central Bank followed a similar trend, with an interest
rate cut of the same magnitude in December 2002,
while fiscal pressures continued in the euro area
during the year. In Japan, deflation persisted and the
unemployment rate reached a record level of 5.4
percent, while as a whole, major advanced economies
witnessed an increase in unemployment from 5.9
percent in 2001 to 6.4 percent in 2002, with the United
States recording a change from 4.8 percent to 5.8
percent on an annual basis.
In terms of relevant commodity and service markets commodity and service markets commodity and service markets commodity and service markets commodity and service markets,
oil prices were volatile through most of 2002, with
supply declining slightly during the year owing mainly
to OPEC decisions to cut production during the first
half of the year and the political crisis in Venezuela,
which is among the larger producers of crude oil in
the world. As a result of these factors and the increased
expectations of war in Iraq, average crude oil spot
prices6 were recorded at US$27.9 per barrel during
December 2002 as opposed to US$18.5 per barrel in
December 2001.
International tuna prices were relatively good during
the year, with frozen skipjack ranging between US$650
and US$800 per metric tonne during the year in the
Thai market, with prices falling in the last few months
of the year. On average, prices registered around a 6
percent decline from the previous year, as prices
recovered from the earlier troughs, in early 2001 and
remained relatively high for the most part of the year.
As for yellowfin tuna, prices strengthened during 2002,
registering an increase of around 12 percent from
US$1,009 per metric tonne to US$1,203 per metric tonne
on the Thai market.
In the tourism industry, according to preliminary
results reported by the World Tourism Organisation,
for the first time ever the number of international
tourist arrivals exceeded 700 million, reflecting an
annual increase of 3.1 percent. Such figures also
indicate that although the largest numbers of tourists
6 Average of Dubai Fateh, U.K. Brent and West Texas Intermediate, as
reported in the IMF’s IFS February 2002 and February 2003.
Table 5.
INTERNATIONAL ECONOMIC INDICATORS, 1999 - 2002
1999 2000 2001 2002
World output (annual percentage change) 3.6 4.7 2.3 3.0 Advanced economies 3.4 3.8 0.9 1.8
Developing countries 3.9 5.7 3.9 4.6
World trade volume
Goods and services 5.6 12.6 0.1 2.9
Exports: Advanced economies 5.5 12.0 -1.0 2.0
Developing economies 4.6 14.9 3.3 5.1
Median Inflation Rate
Advanced economies 1.5 2.7 2.7 2.2
Developing economies 3.9 3.9 4.4 3.5
Countries in transition 8.0 10.0 7.4 4.8
Interest rate
Prime rate 8.0 9.2 6.9 4.3
LIBOR 5.5 6.6 3.7 1.9
Exchange rate (end of period)
US dollar / SDR 1.4 1.3 1.3 1.4
Japanese yen / SDR 140.3 149.7 165.6 163.0
Euro / SDR 1.4 1.4 1.4 1.3
Source: IMF, IFS Feb 2003 & World Economic Outlook - April 2003
OInternational Economic ReviewInternational Economic ReviewInternational Economic ReviewInternational Economic ReviewInternational Economic Review
ECONOMIC REVIEW

33
MMA ANNUAL REPORT 2002
were once again hosted by Europe with 57.5 percent
of the total market, there were more inflows into Asia
and Pacific (18.3 percent of market) than the Americas
(16.8 percent of market) this year, unlike in previous
years. As for international arrivals to African and
Middle Eastern destinations, the numbers remained
low in relative terms, constituting 4 percent and 3.4
percent of total market respectively; however they
increased slightly above the world's average. During
the year, Europe, Asia and the Pacific and African
and Middle Eastern countries witnessed higher growth
rates than in 2001, while the Americas witnessed a
decline of around 0.6 percent as opposed to
5.7 percent decline in 2001.
On the international financial marketsinternational financial marketsinternational financial marketsinternational financial marketsinternational financial markets the year
began on an optimistic note, although there were
concerns over the level and quality of corporate
reporting following the Enron collapse early in the
year. However, conditions deteriorated towards the
middle of the year reflecting the sharp erosion of
investor confidence as a result of corporate earnings
disappointments and the disclosure of corporate
accounting irregularities and fraud. Steps were taken
to strengthen corporate governance in the US, and
the Sarbanes-Oxley Act was enacted on July 30th to
regulate corporate governance and financial disclosure
issues. Nevertheless, the severe dent in investor
confidence resulted in periods of extremely high
volatility, market contagion and increased risk
aversion, and in September US and European markets
hit lows last seen in 1997, while the Japanese market
fell to 1984 lows. Meanwhile, net private capital flows
to emerging market economies more than doubled
during the year from US$38.8 billion in 2001 to US$85.9
billion in 2002 with Developing Asia witnessing a
marked increase of around US$54.0 billion in net
inflows while the Western Hemisphere witnessed a
fall of US$32.6 million. Meanwhile, countries in
transition also registered a growth in net private inflows
(of US$13.2 billion), while Middle East and Turkey
registered a decline in net outflows from US$38.3
billion to US$25.3 billion.
In the foreign exchange marketforeign exchange marketforeign exchange marketforeign exchange marketforeign exchange market, continued doubt
about the recovery of the US economy resulted in
the US dollar remaining volatile and depreciating vis-
à-vis most major trade currencies during the year.
The euro and the Japanese yen strengthened
significantly in relation to the dollar, by around 16
percent and 9 percent respectively, while the Sterling
pound appreciated by 10 percent. As for major Asian
trading currencies, the Singapore dollar rose by 6
percent, the Chinese yuan depreciated by a mere 0.01
percent, while the Malaysian ringgit remained
unchanged against the US dollar.
Sources:
IMF World Economic Outlook - April 2002, September
2002, April 2003
IMF Global Financial Stability Report - June 2002,
September 2002, December 2002, March 2003
IMF International Financial Statistics - June 2003
www.opec.org
http://www.treasury.gov.au/documents/580/RTF/
Oil_Market.rtf
http://www.ipaa.org/govtrelations/factsheets/
UnderstandingWorldPetro.asp
www.foodmarketexchange.com
http://www.world-tourism.org/newsroom/Releases/
2003/jan/numbers2002.htm
http://www.mas.gov.sg/annual0203/index.htm

34
International Economic Review
35
MMA ANNUAL REPORT 2002
ADMINISTRATION AND
OPERATIONS
2002

36

37
MMA ANNUAL REPORT 2002
.
Board MeetingsBoard MeetingsBoard MeetingsBoard MeetingsBoard Meetings
During the year ended 31 December 2002, MMA’s
Board of Directors held 4 meetings at which 4
resolutions were passed. The Resolutions implemented
during the year were;
.
.
.
.
Key Operational DevelopmentsKey Operational DevelopmentsKey Operational DevelopmentsKey Operational DevelopmentsKey Operational Developments
Development of the Banking SectorDevelopment of the Banking SectorDevelopment of the Banking SectorDevelopment of the Banking SectorDevelopment of the Banking Sector
Inauguration of the Hong Kong and Shanghai Banking
Corporation (HSBC) branch in the Maldives The
operations of the branch of the HSBC commenced
unofficially on 11 March 2002, under an operational
license which was granted in December 2001 The
branch was officially inaugurated by His Excellency
President Maumoon Abdul Gayoom on 15 May 2002.
ATM Services: Habib Bank Limited began providing
ATM services on 20 September 2002.
Development of the Non-Bank FinancialDevelopment of the Non-Bank FinancialDevelopment of the Non-Bank FinancialDevelopment of the Non-Bank FinancialDevelopment of the Non-Bank Financial
SectorSectorSectorSectorSector
Insurance Regulation: The Maldives became a member
of The South Asian Insurance Regulators’ Forum
which was established to further strengthen and
develop the insurance regulatory bodies of the South
Asian region on 2 August 2002.
Leasing: In order to strengthen and introduce more
sophistication into the financial sector of the Maldives,
work was carried out as in the past two years with the
International Finance Corporation (IFC), an affiliate
of the World Bank, to establish Maldives Finance
Leasing Company (MFLC). The company commenced
operations on 12 June 2002.
Financial Sector SupervisionFinancial Sector SupervisionFinancial Sector SupervisionFinancial Sector SupervisionFinancial Sector Supervision
Formulation of Anti-Money Laundering legislation and
the establishment of a Financial Intelligence Unit: Work
was initiated to formulate a law to govern Money
Laundering. During 2002, the MMA sought assistance
of relevant government agencies to gather the
necessary information from the respective international
institutions.
Work also commenced to set up a Financial
Intelligence Unit.
Capital Market DevelopmentCapital Market DevelopmentCapital Market DevelopmentCapital Market DevelopmentCapital Market Development
Establishment of Securities’ Trading Floor: A securities’
trading floor was established within the premises of
the Capital Market Development Section (CMDS) of
the MMA on 14 April 2002. Shares of three public
companies, Maldives Transport and Contracting
Company Ltd (MTCC), State Trading Organization
(STO) and Bank of Maldives (BML) were traded on
the Securities Trading Floor during the year.
Information Dissemination: A website was launched
on 14 April 2002 to provide information on the
securities market to the general public. In addition,
several information sessions were held to educate
various sectors of the public including public
enterprises, school children, members of the private
trade and tourism communities, staff of some
government agencies, and financial institutions.
Development of Legislation: Work was undertaken with
the Attorney General’s office to strengthen the legal
framework regarding the stock exchange. As such a
series of discussions were held in the Law Commision
of Maldives to finalise the draft of the proposed
Securities’ Act.
Minting of 1 laari coins
Granting authorisation for opening and
operating a finance leasing company in
Maldives in the name of ‘Maldives Finance
Leasing Company Private Limited’ (MFLC).
Approval of MMA’s annual accounts and
annual report for the fiscal year 2001.
Approval of annual office budget for the
fiscal year 2003.
Administration and OperationsAdministration and OperationsAdministration and OperationsAdministration and OperationsAdministration and Operations

38
Office AutomationOffice AutomationOffice AutomationOffice AutomationOffice Automation
Computerisation of accounts maintained by the Foreign
Exchange Section: The accounting software (MYOB)
which is being used to maintain the accounts of the
Foreign Exchange Section (FES) was fully
implemented in January 2002.
Minting of CoinsMinting of CoinsMinting of CoinsMinting of CoinsMinting of Coins
1 laari coin: During the year 500,000 pieces of the 1
laari coin were minted to restore stocks to required
levels.
Human Resource Management andHuman Resource Management andHuman Resource Management andHuman Resource Management andHuman Resource Management andDevelopmentDevelopmentDevelopmentDevelopmentDevelopment
Employment, Promotions and TransfersEmployment, Promotions and TransfersEmployment, Promotions and TransfersEmployment, Promotions and TransfersEmployment, Promotions and Transfers
At the end of 2002, MMA had a workforce of ninety-
three employees. Eleven staff were newly employed
by MMA during the year, while two staff were re-
employed after the completion of their respective
degree courses.
General Division
Ms. Neeza Imad was re-employed and promoted to
the post of Deputy Manager upon her return to MMA
after completing a Master of Commerce (Management)
degree conducted at the University of Wollongong,
Australia.
Personnel & Public Relations Section
Ms. Fathimath Shirani was employed as an Officer
(Trainee).
Operations Division
Credit & Bank Supervision Section
Mr. Mohamed Giyas left MMA.
Mr. Razeen Rasheed, Mr. Mohamed Shafau Hassan
and Ms. Aishath Rayaheen Shareef were employed
as Officer (Trainees).
Mr. Razeen Rasheed, Officer (Trainee) left MMA.
Banking Section
Mr. Ibrahim Naseer, Officer-in-Charge, was promoted
to the post of Assistant Manager.
Ms. Zeeshan Abdul Raheem, Officer, left MMA to
pursue higher studies.
Accounts Section
Ms. Aminath Shaheeda was employed as an Officer
(Trainee).
Foreign Exchange Section
Ms. Fathimath Niha, Officer, was re-employed after a
1 year period of no-pay leave.
Ms. Mariyam Nilfa was employed as an Officer
(Trainee).
Non-Bank Financial Institutions Supervision
Section
Ms. Zulaikha Ismail was employed as an Officer
(Trainee).
Capital Market Development Section
Ms. Azleema Ahmed was employed as an Officer-in-
Charge.
Ms. Zihna Naseer and Mr. Mujuthaba Jaleel were
employed as Officer (Trainees).
Economic Research & Statistics Division
Research Section
Ms. Idham Hussain was re-employed and promoted
to the post of Assistant Manager upon her return to
MMA after completing a Bachelor of Commerce
(Economics & Management) degree at Curtin
University of Technology, Australia.
Statistics Section
Mr. Mohamed Haleem Abdulla was employed as an
Officer (Trainee).
TrainingTrainingTrainingTrainingTraining
Short-term TrainingShort-term TrainingShort-term TrainingShort-term TrainingShort-term Training
Ms. Fathimath Jauza, Senior Officer, Accounts Section
attended the Workshop on Central Banking
Accounting conducted by the IMF Singapore Regional
Training Institute in Singapore from 14-18 January
2002.
ADMNISTRATION AND OPERATIONS

39
MMA ANNUAL REPORT 2002
Ms. Khadeeja Mufliha, Assistant Officer, CMDS,
attended the Regional Training Programme on Capital
Markets at the Securities & Stock Exchange
Commission of Sri Lanka from 20 February to 13 March
2002.
Mr. Shammoon Adam, Officer (Trainee), CMDS,
attended the Training Programme on Understanding
Modern Financial Markets offered under the Technical
Cooperation Scheme of Colombo Plan at the Unit
Trust of India (UTI) Institute of Capital Markets,
Mumbai, India from 5-16 March 2002.
Mr. Ahmed Adhly, Officer (Trainee), CMDS, attended
the Training Programme on Debt Markets, Fixed
Income Analytics & Credit Rating offered under the
Technical Cooperation Scheme of Colombo Plan at
the UTI Institute of Capital Markets, Mumbai, India
from 19-30 March 2002.
Ms. Aishath Abdul Qadir, Officer (Trainee), NBFIS,
attended the First Training Programme on Insurance
Regulation and Supervision for South Asian Insurance
Supervisors organized by the Insurance Forum of Sri
Lanka held in New Delhi, India from 1-25 April 2002.
Mr. Ahmed Imad, Officer (Trainee), CBSS, attended
the Course on Monetary & Financial Statistics
conducted by the IMF Singapore Regional Training
Institute in Singapore from 15 April to 3 May 2002.
Mr. Ibrahim Naeem, Assistant General Manager,
attended the Course on Macroeconomic Management
& Financial Sector Issues conducted by the IMF
Institute in Washington D.C. from 22 April to 3 May
2002.
Ms. Fathimath Shafeega, Deputy Manager, CMDS,
attended the G.T.C Stock Exchange Seminar for Asian
Countries held at the Tokyo Stock Exchange, Tokyo,
Japan from 9 May to 1 June 2002.
Ms. Shafeenaz Abdul-Sattar, Deputy Manager, Research
Section, attended the Course on Balance of Payments
Statistics conducted by the IMF Singapore Regional
Training Institute in Singapore from 3-22 June 2002.
Ms. Aminath Zahir, Deputy Manager, PDS participated
in the Workshop on Monetary Operations conducted
by the IMF Singapore Regional Training Institute in
Singapore from 1-5 July 2002.
Mr. Moosa Ahmed Manik. Officer (Trainee),
Information Technology Section, attended the
International Training Programme on Auditing
Information Technology organized by the Colombo
Plan for Technical Co-operation held at the
International Centre for Information Systems and Audit,
New Delhi, India from 9 September to 8 October 2002.
Ms. Aishath Rasheeda, Officer, Banking Section,
attended the Regional Workshop on Selected Payments
Issues conducted by the IMF Singapore Regional
Training Institute in Singapore from 30 September to
4 October 2002.
Mr. Rifaath Jaleel, Director, Investment Partners Private
Limited, (a broker trained under the programme
conducted by CMDS in 2001) attended the Programme
on Portfolio Analysis & Strategies offered under the
Technical Cooperation Scheme of Colombo Plan at
the UTI Institute of Capital Markets, Mumbai, India
from 30 September to 11 October 2002.
Ms. Fathimath Shafeega, Deputy Manager, CMDS,
attended the Course on Macroeconomic Management
& Financial Sector Issues conducted by the IMF
Singapore Regional Training Institute in Singapore
from 4-15 November 2002.
Mr. Ismail Abdul Razzaq, Officer (Trainee), CMDS,
attended the Training Programme on Understanding
Equity Markets & Trading offered under the Technical
Cooperation Scheme of Colombo Plan at the UTI
Capital Markets Institution, Mumbai, India from 18-30
November 2002.
Mr. Abdulla Saeed, Administration Manager, Novelty
Printers & Publishers Pvt. Ltd, (a broker trained under
the programme conducted by CMDS in 2001) attended
the Debt Markets, Fixed Income Analytics & Credit
Rating offered under the Technical Cooperation
Scheme of Colombo Plan at the UTI Institute of Capital
Markets, Mumbai, India from 9-20 December 2002.
Ms. Fathimath Niha, Foreign Exchange Officer

40
ADMINISTRATION AND OPERATIONS
participated in the Workshop on Foreign Exchange
Policies & Operations Macroeconomic Management
& Financial Sector Issues conducted by the IMF
Singapore Regional Training Institute in Singapore
from 18-22 November 2002.
Ms. Mariyam Shifa, Assistant Manager, CBSS
participated in the Workshop on Promotion of Modern
Financial Markets offered under the Technical
Cooperation Scheme of Colombo Plan at the UTI
Institute of Capital Markets, in Mumbai, India from 2-
13 December 2002.
Long term TrainingLong term TrainingLong term TrainingLong term TrainingLong term Training
Ms. Neeza Imad, Deputy Manager, General Division,
completed a Master of Commerce (Management)
degree programme at the University of Wollongong
in Australia. The course was completed in August
2002 and was sponsored by the MMA HRD Program.
Ms. Idham Hussain, Assistant Manager, Research
Section, completed a Bachelor of Commerce
(Economics & Management) degree course conducted
under a twinning program by Metropolitan College in
Kuala Lumpur, Malaysia, and Curtin University of
Technology in Perth, Australia. The course was
completed in July 2002 and was sponsored by the
MMA HRD Program.
Ms. Ameeliya Hussain, Officer (Trainee), CMDS,
commenced a three-year Bachelor of Information
Technology degree course at the ABS College in
Colombo, Sri Lanka. The course started in November
2002 and is sponsored by the Villa Scholarship
Scheme.
Mr. Ahmed Asif, Officer (Trainee), Research Section,
commenced a three-year Bachelor of Information
Technology degree course at Osmania University in
Hyderabad, India. The course started in July 2002
and is sponsored by the Villa Scholarship Scheme.
Mr. Mansoor Zubair, Assistant Officer, Statistics Section,
commenced a three-year Bachelor of Banking &
Finance degree course conducted under a twinning
programme with the Curtin University of Technology,
Australia, at Metropolitan College, Malaysia. The course
started in July 2002 and is sponsored by the MMA
HRD Program.
Mr. Abdulla Ashraf, Officer (Trainee), FES, commenced
a three-year Bachelor of Law degree course
conducted under a twinning program with the
University of Tasmania, Australia at Kolej Damansara
Utama, Malaysia. The course started in April 2002 and
is sponsored by the MMA HRD Program.
Ms. Aminath Hema, Officer (Trainee), FES,
commenced a three-year Bachelor of Business
Administration degree course conducted under a
twinning program with Charles Sturt University,
Australia, at HELP Institute, Malaysia. The course started
in January 2002.
International Conferences,International Conferences,International Conferences,International Conferences,International Conferences,
Meetings and Seminars attendedMeetings and Seminars attendedMeetings and Seminars attendedMeetings and Seminars attendedMeetings and Seminars attended
by MMA Staffby MMA Staffby MMA Staffby MMA Staffby MMA Staff
Mr. Abdul Ghafoor, General Manager, attended the
SAARC Finance Meeting of Co-coordinators &
Research Directors held at the Central Bank of Sri
Lanka on 7 January 2002.
Mr. Abdul Ghafoor, General Manager, and Ms.
Shafeenaz Abdul-Sattar, Deputy Manager, Research
Section attended the SAARC Finance Seminar on
External Sector Management held at the Central Bank
of Sri Lanka from 8-9 January 2002.
Hon. Mohamed Jaleel Vice Governor and Mr. Ibrahim
Naeem Ismail, Assistant Manager, NBFIS attended the
Symposium on Insurance & Contractual Savings
organized by the International Finance Corporation
in Sri Lanka from 15-16 February 2002.
Ms. Khadeeja Hassan, Executive Director attended
the Tenth International Conference on Currency
Counterfeiting & the Fifth International Conference
on Fraudulent Documents held at the Raj Congress
Centre, Amsterdam, Netherlands from 8-12 April 2002.
Ms. Khadeeja Hassan, Executive Director attended
the Fifth Annual Meeting of the Asia Pacific Group
on Money Laundering organized by the Government
of Australia and held at the Brisbane Convention &
Exhibition Centre from 4-7 June 2002.

41
MMA ANNUAL REPORT 2002
Ms. Aminath Zahir, Deputy Manager, PDS attended
the Thirty First Meeting of the Board of Directors of
the Asian Clearing Union (A.C.U), held at the Central
Bank of Sri Lanka in Colombo, Sri Lanka from 30-31
May 2002.
Mr. Abdul Ghafoor, General Manager attended the
Meeting of SAARC Finance Coordinators & Directors
of Research held at the Nepal Rastra Bank,
Kathmandu, Nepal on 7 August 2002.
Mr. Abdul Ghafoor, General Manager, Uz. Shaheen
Hameed, Vice Chairman, Law Commission, Uza.
Mariya Ahmed Didi, Director of Public Prosecution,
Attorney General’s Office, and Uz. Abdulla Muizzu,
State Attorney, Attorney General’s Office, attended the
United States Anti-Terrorism Assistance Counter-
Terrorism Legislation Seminar held at Washington D.C.,
U.S.A. from 7-14 September 2002.
Mr. Abdul Ghafoor, General Manager, and Mr. Ibrahim
Naeem Ismail, Assistant Manager, NBFIS attended the
Consultation on Concepts, Principles & Operations
Relating to Islamic Insurance & Banking, organized
by the South Asian Insurance Regulations Forum,
Insurance Board of Sri Lanka, held at the World Trade
Centre, Colombo, Sri Lanka from 26-27 September
2002.
Ms. Khadeeja Hassan, Executive Director attended
the Currency Conference: ‘Surfing the Tide’,
organized by the Bundesdruckerei, G.M.B.H.,
Germany at Honolulu, Hawaii from 6-9 October
2002.
Mr. Abdul Ghafoor, General Manager, Mr. Hassan
Latheef, State Attorney, Attorney General’s Office, and
Ms. Aminath Zahir, Deputy Manager, PDS, attended
the World Bank Global Policy Dialogue On Combating
Money Laundering & Terrorist Financing Activities
organized by The World Bank in Colombo, Sri Lanka
on 23 October 2002.
Mr. Ibrahim Naeem Ismail, Assistant Manager, NBFIS
attended the SAARC Finance Seminar on Financial
Sector Assessment organized by the National Institute
of Banking & Finance held at the State Bank of
Pakistan, Islamabad, Pakistan from 24-25 October 2002.
Ms. Mariyam Hussain Didi, Assistant Manager, FES
attended the 4th Annual Asian Seminar for Central
Bankers organized by the Citi Group Investment Bank
(Singapore) Limited in Hong Kong from 30 October
to 2 November 2002.
TTTTTechnical Assistanceechnical Assistanceechnical Assistanceechnical Assistanceechnical Assistance
Bank Supervision AdvisorBank Supervision AdvisorBank Supervision AdvisorBank Supervision AdvisorBank Supervision Advisor
Mr. Md. Nazrul Huda, the Bank Supervision Advisor
recruited under the Islamic Development Bank’s tech-
nical assistance programme completed his term of
service in February 2002. Under his contract, the Ad-
visor trained CBSS staff in conducting both on-site
and off-site inspections of commercial banks and
assisted in formulating new directives to commercial
banks.
Microfinance ConsultantMicrofinance ConsultantMicrofinance ConsultantMicrofinance ConsultantMicrofinance Consultant
Mr. David Lucock, recruited with assistance from the
United Nations Development Programme (UNDP)
completed his assignment with a mission from 4-16
January 2002. During his consultancy, he assisted the
Non-Bank Financial Institutions Supervision Section
to identify a feasible framework for the regulation
and monitoring of non-bank credit-creating agencies
and loan schemes active in the country.
Capital Market Development AdvisorCapital Market Development AdvisorCapital Market Development AdvisorCapital Market Development AdvisorCapital Market Development Advisor
Mr. Rohan Fernando, the advisor for the Capital Market
Development Section recruited with assistance from
the Commonwealth Secretariat began work in Maldives
from 1 July 2002.
Resource persons for Macroeconomic Frame-Resource persons for Macroeconomic Frame-Resource persons for Macroeconomic Frame-Resource persons for Macroeconomic Frame-Resource persons for Macroeconomic Frame-
work Wwork Wwork Wwork Wwork Workshoporkshoporkshoporkshoporkshop
Ms. Maple Kongsamut, Economist, Asia and Pacific
Department, International Monetary Fund and Mr. Eric
Bell, Senior Economist of the World Bank visited
Maldives as resource persons for the Macro-Economic
Framework Workshop jointly organized by the Ministry
of Finance & Treasury, the Ministry of Planning &
National Development and the MMA and held on 21-
22 July 2002.

42
IMF AdvisorIMF AdvisorIMF AdvisorIMF AdvisorIMF Advisor
Mr. Klaus Dornseif, Advisor from the International
Monetary Fund fielded three visits to the Maldives
during the year, from 27 January - 14 February, from
8 July - 1 August and from 13- 31 October. During his
visits he provided advice and assistance on the
monetary policy framework and undertook work on
the revision of the existing MMA Act (1981).
Monetary and Exchange Affairs (MAE)Monetary and Exchange Affairs (MAE)Monetary and Exchange Affairs (MAE)Monetary and Exchange Affairs (MAE)Monetary and Exchange Affairs (MAE)
MissionMissionMissionMissionMission
A four-member mission of the Monetary and
Exchange Affairs Department of the International
Monetary Fund comprising of Mr. Karl Habermeier,
Ms. Jung Yeon Kim (MAE) and Messrs. Herman
Bussers (retd Belgian National Bank) and Douglas
Kruse (formerly with the U.S. Treasury) visited
Maldives from 13-24 October 2002. The Research
Advisor Mr. Dornseif also visited as part of the team.
The mission focussed mainly on the areas of monetary
and foreign exchange management and the linkages
between these two areas. The mission also reviewed
progress in banking supervision and provided
recommendations for management of related issues.
VisitorsVisitorsVisitorsVisitorsVisitors
IMF’s APD Division ChiefIMF’s APD Division ChiefIMF’s APD Division ChiefIMF’s APD Division ChiefIMF’s APD Division Chief
Mr. Alessandro Zanello, the new Division Chief of the
Asia and Pacific Department of the International
Monetary Fund (IMF) visited the Maldives from 30
May – 2 June. During his visit he held discussions
with officials from MMA, MOFT, other government
ministries and the private sector, and provided
assistance on the medium term macro economic
framework being generated by the government of
Maldives.
IMF Article IV Consultation MissionIMF Article IV Consultation MissionIMF Article IV Consultation MissionIMF Article IV Consultation MissionIMF Article IV Consultation Mission
The annual consultation mission from the IMF visited
the Maldives from 6-14 October for discussions under
Article IV of the Articles of Agreement. The mission
held discussions with officials from the government
and the private sector regarding the macro economic
developments in 2001-2002 and the outlook for the
medium term.
ADMINISTRATION AND OPERATIONS

43
MMA ANNUAL REPORT 2002
FINANCIAL STATEMENTS
2002

44

45
MMA ANNUAL REPORT 2002
d f

46
FINANCIAL STATEMENTS
Rf Rf Rf Rf
INCOME
Commission 3,828,906.46 4,855,227.67
Interest Received 117,063,206.50 134,427,141.85
Other Income 3,009,855.61 123,901,968.57 2,909,470.63 142,191,840.15
EXPENSES
Administrative Expenses 9,706,960.21 9,218,743.94
Security Printing and Minting 0.00 5,917,050.38
Depreciation of Property 1,073,223.70 711,999.10
Interest and Charges Paid 16,220,513.85 15,514,007.70
Provision for Doubtful Debts 83,533.12 115,025.48
Discount on CD's 34,580,522.22 61,664,753.10 46,745,587.00 78,222,413.60
PROFIT FROM OPERATIONS 62,237,215.47 63,969,426.55
Transferred to Government 31,200,277.35 28,354,947.64
Transferred to Retained Profit Account 6,200,000.00 6,400,000.00
For Provisions 24,836,938.12 29,214,478.91
GENERAL RESERVE
Balance at beginning of year 8,000,000.00 8,000,000.00
Transferred from Operations - -
Balance at end of year 8,000,000.00 8,000,000.00
INCOME STATEMENT
FOR THE YEAR ENDED 31ST DECEMBER 2002
2002 2001

47
MMA ANNUAL REPORT 2002
ASSETS
Rf Rf Rf Rf
EXTERNAL ASSETS
Gold, Silver etc. 7,580,601.86 6,018,385.62
Foreign Currency held in Male': Cash 6,667,866.61 3,961,394.74
Foreign Currency held abroad on Deposit 1,665,659,950.35 1,158,344,685.27
Holdings of Special Drawing Rights (IMF) 4,818,736.54 1,684,727,155.36 3,986,242.77 1,172,310,708.40
FIXED ASSETS 2,275,221.27 2,927,546.00
CLAIMS ON GOVERNMENT
Government Debt 120,000,000.00 120,000,000.00
Loans to Government 142,464,088.77 137,462,477.61
Government Guaranteed Securities 31,036,959.00 31,036,959.00
MMA Claims on Government of Maldives
o/a of foreign Govt./Institutions 12,012,039.20 305,513,086.97 13,168,194.00 301,667,630.61
SUBSCRIPTION TO INT'L AGENCIES 132,168,987.88 123,341,458.71
OTHER ASSETS
Ways and Means Advance 1,263,000,000.00 1,134,000,000.00
Other 74,601,816.75 1,337,601,816.75 113,728,366.43 1,247,728,366.43
3,462,286,268.23 2,847,975,710.15
BALANCE SHEET AS AT 31 DECEMBER 2002
2002 2001

48
FINANCIAL STATEMENTS
LIABILITIES
Rf Rf Rf Rf
CURRENCY IN CIRCULATION 624,330,776.80 609,843,079.30
MMA CD'S IN CIRCULATION 554,398,025.38 323,013,064.10
DEMAND LIABILITIES
Deposits by Government and Government Agencies 389,324,785.44 361,204,006.31
Deposits by Commercial Banks 1,441,450,917.57 1,119,791,502.75
Deposits by International Agencies 130,007,728.36 1,960,783,431.37 122,335,962.35 1,603,331,471.41
OTHER LIABILITIES
Commercial Banks Assigned Capital 79,441,751.02 64,441,751.02
Allocation of Special Drawing Rights - IMF 4,877,302.16 4,520,998.08
Other 87,156,090.90 171,475,144.08 86,345,136.79 155,307,885.89
CAPITAL AND RESERVES
Capital: Authorised Rf 4,000,000
Issued and fully paid 1,000,000.00 1,000,000.00
General Reserve 8,000,000.00 8,000,000.00
Foreign Asset Revaluation Reserve 75,198,890.60 86,580,209.45
Retained Profit Account 67,100,000.00 151,298,890.60 60,900,000.00 156,480,209.45
3,462,286,268.23 2,847,975,710.15
2002 2001
BALANCE SHEET AS AT 31 DECEMBER 2002

49
MMA ANNUAL REPORT 2002
NOTES TO THE FINANCIAL STATEMENTS
31 December 2002
ACCOUNTING POLICIES
The Maldives Monetary Authority (the Authority) was established under the Maldives Monetary Authority Act
1981 (the Act). The accounts have been prepared under the historic cost convention. A summary of the
most important accounting policies, which have been applied consistently, are set out below.
Basis of Accounts
These financial statements are prepared in accordance with the historic cost convention.
External Assets
External Assets shown under this heading are those assets defined by Article 21(2) of the Act.
Gold and Silver Bullion
Gold and silver bullion is stated at cost.
Fixed Assets
Fixed Assets are stated at purchase cost less accumulated depreciation. Depreciation is based on the
straight line method over the expected useful life of the asset. The annual depreciation rates used for this
purpose are:
Buildings 2.5 %Furniture and Fittings 20 %Machinery and Equipment 20 %Computers 33.3 %
Translation of Foreign Currency
These financial statements are expressed in Rufiyaa. Assets and liabilities in foreign currency aretranslated at the rate of exchange ruling at the end of the month in which the transaction took place. Allexchange gains and losses, both realised and unrealised, are taken to the Revaluation Reserve inaccordance with Article 28(2) of the Act and are not included in the computation of the annual profits orlosses of the Authority. Out of the balance in the Revaluation Reserve one fifth has been transferred to theGovernment in accordance with Article 28(4) of the Act.

50

51
MMA ANNUAL REPORT 2002
APPENDICES
2002

52

53
MMA ANNUAL REPORT 2002
Page
APPENDIX 1APPENDIX 1APPENDIX 1APPENDIX 1APPENDIX 1
List of Statistical Tables
Table 1 Gross Domestic Product (1995 constant prices), 1998 - 2002 ................................................................ 54
Table 2 Monetary Survey, 1998 - 2002 ................................................................................................................... 55
Table 3 Money Supply, 1998 - 2002 ........................................................................................................................ 55
Table 4 Assets and Liabilities of the Maldives Monetary Authority, 1998 - 2002 .................................................. 56
Table 5 Assets and Liabilities of the Commercial Banks, 1998 - 2002 .................................................................. 57
Table 6 Commercial Banks Deposits Distributed by Type, 1998 - 2002 ................................................................. 58
Table 7 Commercial Banks Deposits Distributed by Owners, 1998 - 2002 ........................................................... 59
Table 8 Commercial Banks Interest Rates, 1998 - 2002 ......................................................................................... 59
Table 9 Commercial Banks Loans and Advances by Major Economic Groups, 1998 - 2002 ................................ 60
Table 10 Commercial Banks Loans and Advances by Major Groups of Borrowers and Types, 1998 - 2002 ....... 61
Table 11 Commercial Banks Loans and Advances by Securities Pledged, 1998 - 2002 ........................................ 61
Table 12 Tourism Indicators, 1998 - 2002 ................................................................................................................. 62
Table 13 Fish Production and Exports, 1998 - 2002 ................................................................................................. 63
Table 14 Summary of Central Government Finance, 1998 - 2002 ........................................................................... 63
Table 15 Government Revenue, 1998 - 2002 ........................................................................................................... 64
Table 16 Government Expenditure, 1998 - 2002 ...................................................................................................... 65
Table 17 Functional Classification of Government Expenditure, 1998 - 2002 ......................................................... 65
Table 18 Functional Classification of Government Current Expenditure, 1998 - 2002 ............................................ 66
Table 19 Functional Classification of Government Capital Expenditure, 1998 - 2002 ............................................. 66
Table 20 Balance of Payments, 1998 - 2002 ............................................................................................................ 67
Table 21 Composition of Exports (f.o.b.), 1998 - 2002 ............................................................................................. 68
Table 22 Composition of Imports (c.i.f.), 1998 - 2002 ............................................................................................... 69
Table 23 Summary of External Public and Publicly Guaranteed Debt, 1998 - 2002 ................................................. 70
Table 24 Exchange Rates, 1998 - 2002 .................................................................................................................... 70
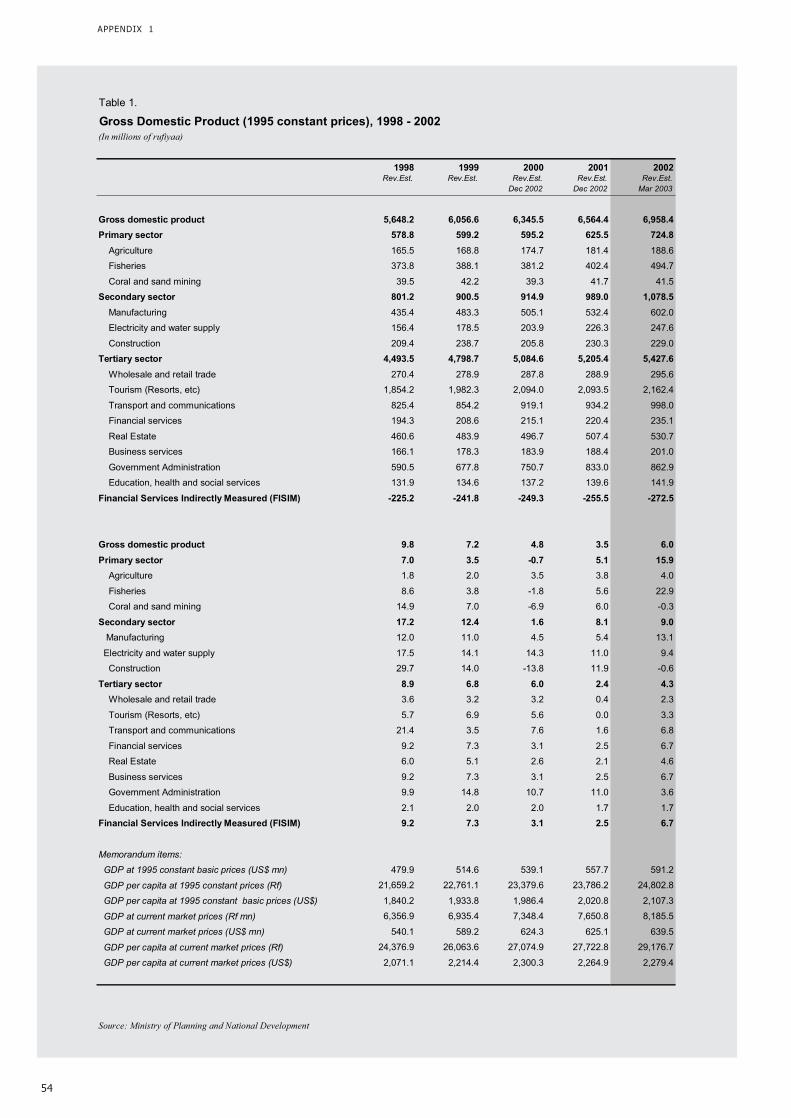
54
APPENDIX 1
Table 1.
Gross Domestic Product (1995 constant prices), 1998 - 2002(In millions of rufiyaa)
1998 1999 2000 2001 2002Rev.Est. Rev.Est. Rev.Est. Rev.Est. Rev.Est.
Dec 2002 Dec 2002 Mar 2003
Gross domestic product 5,648.2 6,056.6 6,345.5 6,564.4 6,958.4
Primary sector 578.8 599.2 595.2 625.5 724.8
Agriculture 165.5 168.8 174.7 181.4 188.6
Fisheries 373.8 388.1 381.2 402.4 494.7
Coral and sand mining 39.5 42.2 39.3 41.7 41.5
Secondary sector 801.2 900.5 914.9 989.0 1,078.5
Manufacturing 435.4 483.3 505.1 532.4 602.0
Electricity and water supply 156.4 178.5 203.9 226.3 247.6
Construction 209.4 238.7 205.8 230.3 229.0
Tertiary sector 4,493.5 4,798.7 5,084.6 5,205.4 5,427.6
Wholesale and retail trade 270.4 278.9 287.8 288.9 295.6
Tourism (Resorts, etc) 1,854.2 1,982.3 2,094.0 2,093.5 2,162.4
Transport and communications 825.4 854.2 919.1 934.2 998.0
Financial services 194.3 208.6 215.1 220.4 235.1
Real Estate 460.6 483.9 496.7 507.4 530.7
Business services 166.1 178.3 183.9 188.4 201.0
Government Administration 590.5 677.8 750.7 833.0 862.9
Education, health and social services 131.9 134.6 137.2 139.6 141.9
Financial Services Indirectly Measured (FISIM) -225.2 -241.8 -249.3 -255.5 -272.5
Gross domestic product 9.8 7.2 4.8 3.5 6.0
Primary sector 7.0 3.5 -0.7 5.1 15.9
Agriculture 1.8 2.0 3.5 3.8 4.0
Fisheries 8.6 3.8 -1.8 5.6 22.9
Coral and sand mining 14.9 7.0 -6.9 6.0 -0.3
Secondary sector 17.2 12.4 1.6 8.1 9.0
Manufacturing 12.0 11.0 4.5 5.4 13.1
Electricity and water supply 17.5 14.1 14.3 11.0 9.4
Construction 29.7 14.0 -13.8 11.9 -0.6
Tertiary sector 8.9 6.8 6.0 2.4 4.3
Wholesale and retail trade 3.6 3.2 3.2 0.4 2.3
Tourism (Resorts, etc) 5.7 6.9 5.6 0.0 3.3
Transport and communications 21.4 3.5 7.6 1.6 6.8
Financial services 9.2 7.3 3.1 2.5 6.7
Real Estate 6.0 5.1 2.6 2.1 4.6
Business services 9.2 7.3 3.1 2.5 6.7
Government Administration 9.9 14.8 10.7 11.0 3.6
Education, health and social services 2.1 2.0 2.0 1.7 1.7
Financial Services Indirectly Measured (FISIM) 9.2 7.3 3.1 2.5 6.7
Memorandum items:
GDP at 1995 constant basic prices (US$ mn) 479.9 514.6 539.1 557.7 591.2
GDP per capita at 1995 constant prices (Rf) 21,659.2 22,761.1 23,379.6 23,786.2 24,802.8
GDP per capita at 1995 constant basic prices (US$) 1,840.2 1,933.8 1,986.4 2,020.8 2,107.3
GDP at current market prices (Rf mn) 6,356.9 6,935.4 7,348.4 7,650.8 8,185.5
GDP at current market prices (US$ mn) 540.1 589.2 624.3 625.1 639.5
GDP per capita at current market prices (Rf) 24,376.9 26,063.6 27,074.9 27,722.8 29,176.7
GDP per capita at current market prices (US$) 2,071.1 2,214.4 2,300.3 2,264.9 2,279.4
Source: Ministry of Planning and National Development

55
MMA ANNUAL REPORT 2002
Table 3.
Money Supply, 1998 - 2002
(In millions of rufiyaa; end of period)
1998 1999 2000 2001 2002
Mar Jun Sep Dec
Currency issued 604.5 674.9 697.9 684.7 648.4 653.5 642.4 682.8
Currency held by MMA 61.2 38.8 40.8 74.9 61.6 47.2 25.6 58.5
Currency held with commercial banks 18.4 42.8 38.9 43.3 45.3 50.8 55.1 54.5
Currency in circulation 1/
524.9 593.3 618.1 566.5 541.4 555.5 561.7 569.9
Demand deposits (Rufiyaa only) 2/725.4 935.9 1,074.4 1,022.1 1,064.8 1,278.9 1,224.4 1,253.0
Money supply 1,384.2 1,585.2 1,760.4 1,655.9 1,666.9 1,939.9 1,876.1 1,886.7
1/ Excludes currency held by both MMA and commercial banks. The figure in the MMA audited balance sheet excludes only
currency held in MMA
2/ Excludes inter-bank and government deposits.
Source: Maldives Monetary Authority
Table 2.
Monetary Survey, 1998 - 2002
(In millions of rufiyaa; end of period)
1998 1999 2000 2001 2002
Mar Jun Sep Dec
Net foreign assets 1,490.5 1,405.4 1,312.2 1,153.0 1,322.0 1,270.0 1,274.3 1,662.9
Net domestic assets 1,338.1 1,524.3 1,737.7 2,171.7 2,300.9 2,465.3 2,530.9 2,303.6
Domestic credit 2,091.4 2,259.3 2,586.8 3,089.9 3,345.7 3,567.1 3,666.6 3,445.7
Net claims on Government 1/673.1 760.2 995.0 1,078.6 1,309.5 1,324.8 1,248.5 1,133.9
Claims on public enterprises 165.1 196.3 184.7 184.0 140.4 136.8 176.8 211.0
Claims on private sector 1,253.2 1,302.8 1,407.1 1,827.2 1,895.9 2,105.6 2,241.3 2,100.8
Net other items (753.3) (734.9) (849.1) (918.2) (1,044.9) (1,101.9) (1,135.7) (1,142.1)
Total liquidity (M2) 2,828.7 2,929.8 3,049.8 3,324.7 3,622.9 3,735.3 3,805.2 3,966.4
Narrow money (M1) 1,384.2 1,585.2 1,760.4 1,655.9 1,666.9 1,939.9 1,876.1 1,886.7
o/w: Currency outside banks 524.9 593.3 618.1 566.5 541.4 555.5 561.7 569.9
Quasi money 1,444.4 1,344.6 1,289.4 1,668.8 1,956.0 1,795.4 1,929.1 2,079.7
1/ This includes loans to MNSL and MIFCO
Source: Maldives Monetary Authority

56
APPENDIX 1
Table 4.
Assets and Liabilities of the Maldives Monetary Authority, 1998 - 2002
(In millions of rufiyaa; end of period)
1998 1999 2000 2001 2002
Mar Jun Sep Dec
Total assets 2,527.0 2,781.8 2,981.3 2,877.0 3,100.6 3,340.6 3,340.2 3,487.4
Foreign assets 1,411.6 1,512.4 1,460.5 1,207.1 1,262.9 1,372.7 1,483.8 1,721.8
Claims on government 1,024.4 1,156.1 1,409.0 1,584.5 1,775.6 1,899.9 1,793.4 1,704.3
Claims on PNFE 3.2 2.5 1.6 1.5 1.5 1.5 1.5 1.5
Claims on commercial banks 1.4 1.4 0.0 0.0 0.0 0.0 0.0 0.0
Other assets 1/86.5 109.4 110.2 84.0 60.5 66.5 61.5 59.8
Total liabilities 2,527.0 2,781.8 2,981.3 2,877.0 3,100.6 3,340.6 3,340.2 3,487.4
Reserve money (exc.CDs) 1,540.8 1,651.3 1,733.5 1,871.5 2,163.6 2,151.0 2,174.0 2,224.0
Currency outside banks 524.9 593.3 618.1 566.5 541.4 555.5 561.7 569.9
Currency with commercial banks 18.4 42.8 38.9 43.3 45.3 50.8 55.1 54.5
Public enterprises and local govt. deposits 154.6 82.4 105.2 77.4 79.1 124.9 111.8 78.7
Local currency 133.9 55.9 67.9 67.2 60.7 105.5 90.0 63.9
Foreign currency 20.7 26.5 37.4 10.2 18.3 19.4 21.9 14.9
Banks' deposits 842.9 932.8 971.2 1,184.2 1,497.8 1,419.8 1,445.3 1,520.9
Foreign liabilities 10.1 10.1 10.2 10.2 10.2 10.2 11.1 10.2
Government deposits 225.2 235.0 231.8 283.8 212.0 296.6 271.2 310.6
Capital accounts 105.4 118.3 179.3 185.6 117.8 135.7 154.5 89.1
MMA certificates of deposits 2/480.0 569.0 666.9 323.0 331.0 477.6 487.3 554.4
Other liabilities 1/165.6 198.1 159.6 203.0 266.2 269.5 242.1 299.2
(annual percentage change)
Reserve money (exc.CDs) 9.8 7.2 5.0 8.0 13.0 11.8 12.8 18.8
Currency outside banks 7.2 13.0 4.2 -8.3 -9.9 -7.1 -1.6 0.6
Banks' deposits 9.0 10.7 4.1 21.9 26.1 21.2 15.7 28.4
1/ An MMA claim on govt. (which is written off when compiling the monetary survey) has been taken from other assets included in other liabilites
2/ MMA CDS were first issued during June 1995.
Source: Maldives Monetary Authority

57
MMA ANNUAL REPORT 2002
Table 5.
Assets and Liabilities of the Commercial Banks, 1998 - 2002
(In millions of rufiyaa; end of period)
1998 1999 2000 2001 2002
Mar Jun Sep Dec
Total assets 3,183.4 3,405.7 3,687.5 4,051.7 4,439.9 4,631.7 4,896.9 4,965.9
Reserves 1,346.5 1,553.5 1,695.2 1,563.4 1,868.6 1,970.5 1,977.6 2,094.3
Cash 18.4 42.8 38.9 43.3 45.3 50.8 55.1 54.5
Balance with MMA - - - - - - - -
Investment in securities 542.8 635.9 736.8 392.4 403.8 564.7 546.6 588.3
Required reserves 785.4 874.8 919.5 1,127.7 1,419.5 1,355.0 1,376.0 1,451.6
Foreign Assets 278.4 224.7 257.5 318.5 370.7 268.9 317.6 411.2
Claims on public sector 161.9 193.8 183.2 182.6 138.9 135.3 175.4 209.5
Government - - - - - - - -
Public enterprises 161.9 193.8 183.2 182.6 138.9 135.3 175.4 209.5
Claims on private sector 1,253.2 1,302.8 1,407.1 1,827.2 1,895.9 2,105.6 2,241.3 2,100.8
Unclassified assets 143.4 131.0 144.5 160.0 165.9 151.4 185.1 150.0
Total liabilities 3,183.4 3,405.7 3,687.5 4,051.7 4,439.9 4,631.7 4,896.9 4,965.9
Demand deposits 1,465.5 1,580.1 1,701.2 1,925.5 2,107.7 2,219.8 2,141.8 2,343.3
Time and savings deposits 683.7 673.9 625.3 755.3 894.8 835.1 989.9 974.5
Foreign liabilities 189.3 321.4 395.7 362.4 301.4 361.5 516.0 460.0
Banks abroad 169.6 312.7 377.9 339.9 280.3 342.0 496.5 442.3
Nonresident's deposits 19.8 8.7 17.8 22.5 21.1 19.5 19.5 17.8
Government deposits 126.1 161.0 182.2 222.1 254.1 278.5 273.7 259.8
Capital accounts 487.0 496.2 610.9 572.1 642.3 678.1 692.9 646.5
Credit from MMA 0.9 0.1 - - - - - -
Other liabilities 231.0 173.0 172.3 214.4 239.6 258.7 282.6 281.7
Memorandum items:
Total deposits 2,295.0 2,423.7 2,526.4 2,925.3 3,277.7 3,352.8 3,424.9 3,595.4
Local currency 984.5 1,212.2 1,440.5 1,405.6 1,471.3 1,686.4 1,702.0 1,697.3
Foreign currency 1,310.5 1,211.5 1,085.9 1,519.8 1,806.4 1,666.4 1,722.9 1,898.1
Source: Maldives Monetary Authority

58
APPENDIX 1
Table 6.
Commercial Banks Deposits Distributed by Type, 1998 -2002 1/
(In millions of rufiyaa; end of period)
1998 1999 2000 2001 2002
Mar Jun Sep Dec
1. Current deposits
Amount 822.1 825.2 874.6 972.2 1135.2 1188.0 1097.8 1143.4
No. of Accounts 14,351 14,130 15,988 17,171 17,836 18,330 19,537 20,204
2. Call deposits
Amount 16.9 0.6 0.5 0.4 0.4 35.2 33.9 30.4
No. of Accounts 3 2 2 2 2 4 4 4
3. Other deposit accounts
Amount 82.3 3.4 4.0 1.8 5.3 10.2 10.8 11.1
No. of Accounts 127 14 25 24 20 37 31 39
4. Savings deposits
Amount 664.1 803.0 893.1 1032.5 1076.6 1137.4 1143.8 1278.0
No. of Accounts 59,775 63,461 76,335 89,058 92,100 95,599 98,881 101,784
5. Fixed (or term) deposits
Amount 709.6 900.4 754.3 918.4 1060.1 982.0 1138.8 1132.4
No. of Accounts 733 867 837 1,010 983 1,064 1,072 1,142
(a) Upto 3 months
Amount 33.4 139.6 280.9 341.1 382.5 250.3 397.4 392.8
No. of Accounts 9 110 153 204 258 254 271 250
(b) Over 3 months to 6 months
Amount 110.9 241.7 105.3 160.1 75.8 148.7 129.5 134.1
No. of Accounts 64 94 83 129 82 136 125 182
(c) Over 6 months to 1 year
Amount 542.3 492.0 341.4 387.8 572.0 564.5 588.0 566.6
No. of Accounts 603 559 562 636 605 631 633 664
(d) Over 1 year to 2 years
Amount 3.7 12.0 23.8 22.6 23.0 11.3 17.9 32.7
No. of Accounts 20 76 20 23 21 19 23 25
(e) Over 2 years to 3 years
Amount 17.4 11.2 1.0 1.6 1.5 1.6 0.3 0.3
No. of Accounts 15 10 5 8 6 10 6 6
(f) Over 3 years to 5 years
Amount 1.8 1.5 1.8 5.2 5.2 5.5 5.5 5.8
No. of Accounts 19 12 11 8 9 12 12 13
(g) Over 5 years
Amount 0.1 2.5 0.1 0.1 0.1 0.1 0.1 0.1
No. of Accounts 3 6 3 2 2 2 2 2
Total
Amount 2295.0 2532.6 2526.4 2925.3 3277.7 3352.8 3424.9 3595.4
No. of Accounts 74,989 78,474 93,187 107,265 110,941 115,034 119,525 123,173
1/ Excludes interbank deposits.
Source: Maldives Monetary Authority
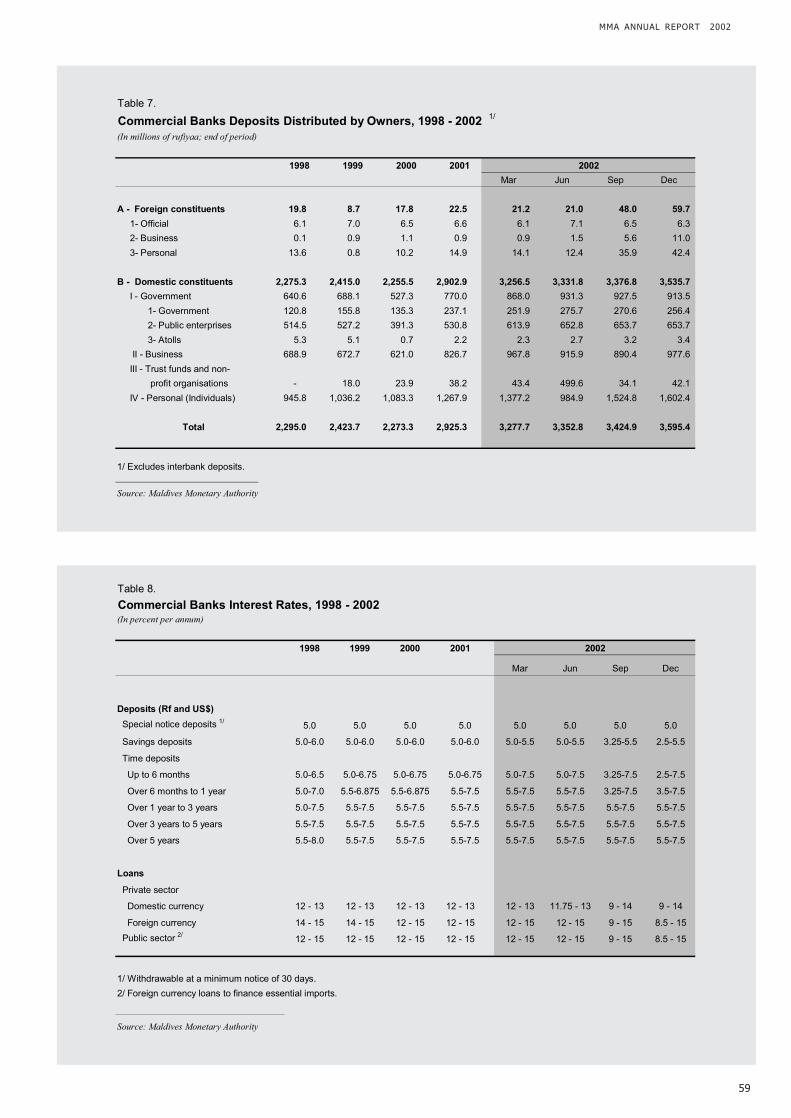
59
MMA ANNUAL REPORT 2002
Table 8.
Commercial Banks Interest Rates, 1998 - 2002(In percent per annum)
1998 1999 2000 2001 2002
Mar Jun Sep Dec
Deposits (Rf and US$)
Special notice deposits 1/5.0 5.0 5.0 5.0 5.0 5.0 5.0 5.0
Savings deposits 5.0-6.0 5.0-6.0 5.0-6.0 5.0-6.0 5.0-5.5 5.0-5.5 3.25-5.5 2.5-5.5
Time deposits
Up to 6 months 5.0-6.5 5.0-6.75 5.0-6.75 5.0-6.75 5.0-7.5 5.0-7.5 3.25-7.5 2.5-7.5
Over 6 months to 1 year 5.0-7.0 5.5-6.875 5.5-6.875 5.5-7.5 5.5-7.5 5.5-7.5 3.25-7.5 3.5-7.5
Over 1 year to 3 years 5.0-7.5 5.5-7.5 5.5-7.5 5.5-7.5 5.5-7.5 5.5-7.5 5.5-7.5 5.5-7.5
Over 3 years to 5 years 5.5-7.5 5.5-7.5 5.5-7.5 5.5-7.5 5.5-7.5 5.5-7.5 5.5-7.5 5.5-7.5
Over 5 years 5.5-8.0 5.5-7.5 5.5-7.5 5.5-7.5 5.5-7.5 5.5-7.5 5.5-7.5 5.5-7.5
Loans
Private sector
Domestic currency 12 - 13 12 - 13 12 - 13 12 - 13 12 - 13 11.75 - 13 9 - 14 9 - 14
Foreign currency 14 - 15 14 - 15 12 - 15 12 - 15 12 - 15 12 - 15 9 - 15 8.5 - 15
Public sector 2/12 - 15 12 - 15 12 - 15 12 - 15 12 - 15 12 - 15 9 - 15 8.5 - 15
1/ Withdrawable at a minimum notice of 30 days.
2/ Foreign currency loans to finance essential imports.
Source: Maldives Monetary Authority
Table 7.
Commercial Banks Deposits Distributed by Owners, 1998 - 2002 1/
(In millions of rufiyaa; end of period)
1998 1999 2000 2001 2002
Mar Jun Sep Dec
A - Foreign constituents 19.8 8.7 17.8 22.5 21.2 21.0 48.0 59.7
1- Official 6.1 7.0 6.5 6.6 6.1 7.1 6.5 6.3
2- Business 0.1 0.9 1.1 0.9 0.9 1.5 5.6 11.0
3- Personal 13.6 0.8 10.2 14.9 14.1 12.4 35.9 42.4
B - Domestic constituents 2,275.3 2,415.0 2,255.5 2,902.9 3,256.5 3,331.8 3,376.8 3,535.7
I - Government 640.6 688.1 527.3 770.0 868.0 931.3 927.5 913.5
1- Government 120.8 155.8 135.3 237.1 251.9 275.7 270.6 256.4
2- Public enterprises 514.5 527.2 391.3 530.8 613.9 652.8 653.7 653.7
3- Atolls 5.3 5.1 0.7 2.2 2.3 2.7 3.2 3.4
II - Business 688.9 672.7 621.0 826.7 967.8 915.9 890.4 977.6
III - Trust funds and non-
profit organisations - 18.0 23.9 38.2 43.4 499.6 34.1 42.1
IV - Personal (Individuals) 945.8 1,036.2 1,083.3 1,267.9 1,377.2 984.9 1,524.8 1,602.4
Total 2,295.0 2,423.7 2,273.3 2,925.3 3,277.7 3,352.8 3,424.9 3,595.4
1/ Excludes interbank deposits.
Source: Maldives Monetary Authority

60
APPENDIX 1
Table 9.
Commercial Banks Loans and Advances by Major Economic Groups, 1998 - 2002 1/
(In millions of rufiyaa; end of period)
1998 1999 2000 2001 2002
Mar Jun Sep Dec
Total 1,256.6 1,294.7 1,391.3 1,811.5 1,880.1 2,086.0 2,225.5 2,085.0
Fishing 58.5 69.2 68.7 75.7 77.0 74.5 89.5 115.3
Tourism 609.5 714.4 742.5 824.0 831.3 905.0 1,124.4 1,160.0
Hotels and restaurant 28.5 21.5 21.0 25.8 27.0 28.4 80.2 88.1
Development of tourism 580.9 692.9 721.5 798.1 804.4 876.6 1,044.2 1,071.9
Agriculture 4.8 4.5 3.8 7.3 8.1 8.2 9.5 10.5
Construction: 74.1 71.2 115.4 135.0 131.4 158.3 143.3 136.1
Housing 71.9 69.5 113.8 133.1 129.9 152.4 121.4 117.8
Others 2.2 1.7 1.6 1.9 1.6 6.0 21.8 18.3
Manufacturing 26.1 24.6 17.6 30.0 32.9 36.4 35.9 14.6
Commerce 2/ 406.2 371.1 392.0 659.2 713.7 819.9 696.7 529.4
Electricity, gas water and sanitary services 40.5 1.9 1.1 3.5 3.156 2.9 10.1 0.7
Transport, storage and communication 17.0 24.1 24.0 31.2 32.7 35.6 58.2 37.0
Services 11.938 11.093 22.889 45.29 49.677 44.523 40.646 48.909
Professional and community 8.2 7.6 12.8 36.4 34.2 32.8 25.1 35.6
Personal non-business, loans to individual 3.7 3.5 10.1 8.8 15.5 11.7 15.5 13.3
Employees, and activities not adequately described 8.0 2.5 3.4 0.3 0.2 0.7 17.3 32.6
(percentage contribution)
Total 100.0 100.0 100.0 100.0 100.0 100.0 100.0 100.0
Fishing 4.7 5.3 4.9 4.2 4.1 3.6 4.0 5.5
Tourism 48.5 55.2 53.4 45.5 44.2 43.4 50.5 55.6
Hotels and restaurant 2.3 1.7 1.5 1.4 1.4 1.4 3.6 4.2
Development of tourism 46.2 53.5 51.9 44.1 42.8 42.0 46.9 51.4
Agriculture 0.4 0.4 0.3 0.4 0.4 0.4 0.4 0.5
Construction: 5.9 5.5 8.3 7.5 7.0 7.6 6.4 6.5
Housing 5.7 5.4 8.2 7.3 6.9 7.3 5.5 5.7
Others 0.2 0.1 0.1 0.1 0.1 0.3 1.0 0.9
Manufacturing 2.1 1.9 1.3 1.7 1.7 1.7 1.6 0.7
Commerce 2/ 32.3 28.7 28.2 36.4 38.0 39.3 31.3 25.4
Electricity, gas water and sanitary services
Transport, storage and communication 1.4 1.9 1.7 1.7 1.7 1.7 2.6 1.8
Services
Professional and community 0.7 0.6 0.9 2.0 1.8 1.6 1.1 1.7
Personal non-business, loans to individual 0.3 0.3 0.7 0.5 0.8 0.6 0.7 0.6
Employees, and activities not adequately described 0.6 0.2 0.2 0.0 0.0 0.0 0.8 1.6
1/ Excludes bills, advances to public sector and interbank advances.
2/ Includes wholesale and retail trade, import and export trade
Source: Maldives Monetary Authority

61
MMA ANNUAL REPORT 2002
Table 11.
Commercial Banks Loans and Advances by Securities Pledged, 1998 - 2002 1/
(In millions of rufiyaa; end of period)
1998 1999 2000 2001 2002
Mar Jun Sep Dec
1- Merchandise 8.0 8.9 26.3 26.0 23.8 22.5 0.7 0.7
(i) Food items 0.1 0.1 0.0 0.0 0.0 0.2 - -
(ii) Raw materials - 0.3 0.5 0.5 0.5 0.5 0.5 0.5
(iii) Finished manufactured goods 7.9 8.6 25.8 25.5 23.2 21.7 0.2 0.2
2- Machinery and other
fixed assets 197.9 255.1 263.7 392.2 413.5 442.2 146.8 150.7
3- Real estate 334.9 331.0 301.2 231.2 207.8 226.5 864.8 901.4
(i) Housing 306.8 202.7 273.1 182.4 159.0 159.9 323.2 337.3
(ii) Commercial building 28.2 128.3 28.1 48.8 48.8 66.6 541.6 564.1
4- Financial obligations 133.0 79.9 90.9 188.1 166.4 200.9 109.8 70.0
5- Gold bullion, gold & silver
ornaments, precious metals - - - - - - - -
6- Stock securities 11.3 11.5 12.4 27.7 4.3 6.6 29.5 16.8
(i) Government and other trustee
securities 11.3 11.5 12.4 27.7 4.3 6.6 10.1 8.3
(ii) Shares & debentures of
joint stock companies. - - - - - - 19.4 8.5
7- Others 758.4 812.7 880.0 1,128.9 1,203.3 1,326.4 1,249.4 1,155.1
(i) Other secured advances 580.3 635.8 747.5 956.2 1,016.9 1,164.0 996.1 908.9
(ii) Advances secured by
guarantee of guarantees 82.8 97.2 84.4 120.2 107.5 76.6 87.1 133.0
(iii) Unsecured advances 95.3 79.6 48.1 52.4 78.9 85.9 166.2 113.2
Total 1,443.5 1,499.0 1,574.5 1,994.1 2,019.0 2,225.1 2,400.9 2,294.6
1/ Excludes interbank advances.
Source: Maldives Monetary Authority
Table 10.
Commercial Banks Loans and Advances by Major Groups of Borrowers and Types, 1998 - 2002 1/
(In millions of rufiyaa; end of period)
1998 1999 2000 2001 2002
Mar Jun Sep Dec
A - Foreign constituents - - - - - - - -
B - Domestic constituents 1,443.5 1,499.0 1,574.5 1,994.1 2,019.0 2,225.1 2,400.9 2,294.6
I - Government 173.8 206.9 184.8 186.2 142.3 138.4 178.4 209.5
1 - Government - - - - - - - -
2 - Public enterprises 170.2 204.3 183.2 182.6 138.9 135.3 175.4 209.5
3 - Atolls 3.5 2.6 1.6 3.7 3.4 3.2 3.0 -
II - Business 1,032.0 1,088.7 1,159.7 1,512.2 1,571.9 1,780.0 1,909.6 1,646.8
III - Personal (Individuals) 237.7 203.4 230.0 295.6 304.8 306.7 312.9 438.2
Total 1,443.5 1,499.0 1,574.5 1,994.1 2,019.0 2,225.1 2,400.9 2,294.6
1/ Excludes interbank advances.

62
APPENDIX 1
Table 12.
Tourism Indicators, 1998 - 2002
1997 1998 1999 2000 2001 2002
Total arrivals 384,471 419,779 456,048 496,117 492,044 513,852
Of which: Tourists 365,563 395,725 429,666 467,154 460,984 484,680
Tourist Bed nights (000's) 3,271 3,467 3,718 3,937 3,933 4,066
Average stay (days) 9.0 8.8 8.7 8.4 8.6 8.4
Bed capacity /beds in operation
(Resorts&Hotels) 1/ 11,555 12,453 14,652 15,812 16,478 16,131
Total tourist expenditure (US$ mn) 1/ 286.0 303.0 313.5 320.7 327.1 304.5
Tourist expenditure per arrival ($) 2/ 782.4 765.6 729.7 686.6 709.5 628.3
Expenditure per bednight ($) 87.4 87.4 84.3 81.5 83.2 74.9
Bed-night capacity ('000) 4,217 4,546 5,348 5,788 6,015 5,887
Capacity utilization (in percent) 77.45 76.19 69.71 68.16 65.62 68.97
Number of resorts by lease holders (end-year) 3/ 87
Local 67
Foreign 10
Joint Venture 9
Other 1
Number of resorts by Operators (end-year)3/ 87
Local 46
Foreign 32
Joint Venture 9
Other
Resort bed capacity by lease holders (end-year) 3/ 16,400
Local 12,842
Foreign 1,384
Joint Venture 1,870
Other 304
Resort bed capacity by lease holders (end-year) 3/ 16,400
Local 9,606
Foreign 5,072
Joint Venture 1,722
Other
1/ These are estimates made by MMA for tourist expenditure for travel component of the balance of payments statistics.
2/ The series was revised in May 1999 as previously tourist expenditure per arrival was derived by dividing total tourist
expenditure by the total arrivals, not tourist arrivals. Revised series reflects total tourist expenditure divided by tourist arrivals.
3/ Figures prior to 2002 are not available on a comparable basis.
Source: Ministry of Tourism and Maldives Monetary Authority

63
MMA ANNUAL REPORT 2002
Table 14.
Summary of Central Government Finance, 1998 - 2002(In millions of rufiyaa)
1998 1999 2000 2001 2002
(Prv. Est.)
Total revenue and grants 1,930.2 2,225.3 2,372.7 2,522.6 2,720.4
Current revenue 1,763.6 2,058.6 2,202.6 2,294.3 2,569.6
Capital revenue 2.1 4.0 4.2 16.6 3.6
Grants 164.5 162.7 165.9 211.7 147.2
Expenditure and net lending 2,053.3 2,506.4 2,694.2 2,885.9 3,316.0
Current expenditure 1,297.9 1,545.5 1,875.9 1,971.4 2,136.1
Capital expenditure 816.0 949.4 864.0 940.7 1,198.1
Net lending (60.6) 11.5 (45.7) (26.2) (18.2)
Overall balance (123.1) (281.1) (321.5) (363.3) (595.6)
Overall balance excluding grants (287.6) (443.8) (487.4) (575.0) (742.8)
Current balance 465.7 513.1 326.7 322.9 433.5
Foreign financing 129.3 56.7 3.6 145.8 506.8
Domestic financing (6.2) 224.4 317.9 217.5 88.7
Total debt ( end of period) 2,605.5 2,782.9 3,002.9 3,326.4 3,991.3
Of which: Foreign 1,625.2 1,681.9 1,685.5 1,831.3 2,338.1
Source: Ministry of Finance and Treasury
Table 13.
Fish Production and Exports, 1998 - 2002
(In thousands of metric tonnes)
1998 1999 2000 2001 2002
Fish Catch 118.1 124.1 119.0 127.2 164.3
Coastal Catch 115.1 123.3 115.4 125.0 160.2
Skipjack 78.4 92.9 79.7 88.0 115.3
Yellow fin 14.2 14.3 12.2 14.6 21.7
Other tuna 8.3 5.5 6.3 6.8 7.2
Reef and bottom fish 14.2 10.6 17.2 15.6 16.0
EEZ 3.0 0.8 3.5 2.2 4.1
Fish Exports (excluding live tropical fish) 29.8 37.6 28.3 29.7 44.6
Frozen/Chilled non-reef fish 15.0 25.4 13.9 15.3 31.2
Frozen/Chilled reef fish 0.1 0.5 0.6 0.6 0.6
Canned Tuna 6.7 4.6 7.3 7.0 5.7
Dried Fish 5.7 5.3 5.8 6.0 5.8
Salted Fish 2.3 1.9 0.7 0.8 1.2
MIFCO Production
Canned tuna 5.4 4.9 4.7 5.6 4.3
Fishmeal 2.6 2.6 2.3 2.6 2.6
Frozen tuna 30.9 27.0 27.7 31.4 51.4
Maldives fish 0.0 0.2 0.3 0.2 0.0
Fresh/ chilled fish 0.1 0.2 0.7 1.4
Other 0.5 1.0 0.6 1.0 0.7
Memorandum items:
Number of fishermen 21,998 22,098 19,108 16,816 14,355
Average no.of vessels engaged
per month in fishing (excluding EEZ) 1,511 1,411 1,376 1,296 1,276
Source: Ministry of Fisheries, Agriculture and Marine Resources/ Statistical Yearbook of Maldives 2003/ Maldives Customs Service

64
APPENDIX 1
Table 15.
Government Revenue, 1998 - 2002(In millions of rufiyaa)
1998 1999 2000 2001 2002
(Prv. Est.)
Total revenue and grants 1,930.2 2,225.3 2,372.7 2,522.6 2,720.4
Total revenue 1,765.7 2,062.6 2,206.8 2,310.9 2,573.2
Current revenue 1,763.6 2,058.6 2,202.6 2,294.3 2,569.6
Tax revenue 902.7 977.3 1,013.8 1,046.6 1,071.2
Import duties 576.5 628.5 652.6 661.7 669.5
Export duties - - - - -
Tourism tax 257.7 276.0 276.6 292.7 305.2
Bank profit tax 35.4 42.1 46.9 52.4 50.9
Others 1/ 33.1 30.7 37.7 39.8 45.6
Nontax revenue 658.4 834.5 929.4 954.0 1,180.1
Enterpreneurial and property income 467.6 602.5 653.3 648.9 862.6
Net sales to public enterprises 67.0 116.2 98.0 90.0 124.2
Bank of Maldives 4.6 5.0 5.0 5.3 5.3
Dhivehi Raajjeyge Gulhun Pvt Ltd. 49.7 55.3 67.2 96.8 106.2
Island Aviations Services Ltd. - - - 3.0 4.5
Maldives Monetary Authority 56.2 58.1 71.2 64.8 65.6
Maldives Industrial Fisheries Company 5.0 - - - -
Maldives Transport and Contracting Co. 2.1 2.6 2.9 2.9 3.3
Maldives Ports Authority 20.0 30.0 30.0 15.0 16.1
Maldives Airports Authority 45.0 75.0 50.0 64.2 72.5
Maldives Water and Sewerage Company - - 6.7 18.8 23.9
Other Enterprises and institutions 24.9 20.8 33.1 44.7 49.3
State Trading Organisation 40.0 96.2 87.3 65.0 109.2
State Electric Company 27.0 20.0 10.7 25.0 15.0
Royalties, land and resort rent 304.3 394.8 470.1 479.8 657.2
Resorts lease rent 267.4 351.9 416.7 423.2 586.9
Resorts land rent 6.4 8.5 9.8 9.9 21.3
Royalties 30.5 34.4 43.6 46.7 49.0
Interest 96.3 91.5 85.2 79.1 81.2
Administrative fees and charges 144.4 168.5 189.8 224.6 241.8
Permit fee 25.3 38.3 45.0 48.1 51.2
Administrative fees 50.1 64.0 73.9 68.5 74.8
Building rent 24.0 16.7 18.3 18.7 22.7
Non-industrial sales 45.0 49.5 52.6 89.3 93.1
Fines and Forfeits 18.3 22.6 32.9 20.4 20.0
Other 28.1 40.9 53.4 60.1 55.7
Capital revenue (sales of assets) 2.1 4.0 4.2 16.6 3.6
Grants 2/ 164.5 162.7 165.9 211.7 147.2
1/ Includes license fees, company registration fees, revenue stamps and motor vehicle taxes.
2/ Includes grants-in-kind and cash but excludes direct expenditure by donors.
Source: Ministry of Finance and Treasury

65
MMA ANNUAL REPORT 2002
Table 17.
Functional Classification of Government Expenditure, 1998 - 2002
(In millions of rufiyaa)
1998 1999 2000 2001 2002
(Prv. Est.)
Total expenditure 2,113.9 2,494.9 2,739.9 2,912.1 3,334.2
Public services 797.1 1,061.4 1,164.5 1,088.1 1,105.8
General administration 426.8 534.3 715.6 624.2 656.3
Public order and internal security 370.3 527.1 448.9 463.9 449.5
Social services 993.7 1,022.9 1,140.5 1,198.3 1,570.0
Education 432.1 450.8 541.2 515.6 589.8
Health 224.2 259.4 299.2 300.8 314.9
Social Security and Welfare 71.3 70.0 77.0 99.7 98.0
Community programs 266.1 242.7 223.1 282.2 567.3
Economic services 241.5 311.9 328.5 509.2 516.5
Fisheries & agriculture 22.0 23.2 47.7 39.3 26.3
Transportation 159.1 215.6 166.2 305.9 368.4
Post and telecommunication 2.3 22.3 4.5 33.2 6.8
Tourism 15.8 22.9 27.7 31.4 32.8
Trade and industry 6.3 7.0 6.1 4.7 4.6
Electricity 36.0 20.9 76.3 94.7 77.6
Interest on public debt 81.6 98.7 106.4 116.5 141.9
Source: Ministry of Finance and Treasury
Table 16.
Government Expenditure, 1998 - 2002(In millions of rufiyaa)
1998 1999 2000 2001 2002
(Prv. Est.)
Total expenditure and net lending 2,053.0 2,506.4 2,694.2 2,885.9 3,316.0
Current expenditure 1,297.6 1,545.5 1,875.9 1,971.4 2,136.1
Expenditure on goods and services 1,188.1 1,421.8 1,741.2 1,824.8 1,958.6
Salaries and wages 290.7 366.1 466.9 505.8 533.5
Other 897.4 1,055.7 1,274.3 1,319.0 1,425.1
Interest payments 81.6 98.7 106.4 116.5 141.9
Subsidies 27.9 25.0 28.3 30.1 35.6
Capital expenditure 816.0 949.4 864.0 940.7 1,198.1
Net lending 1/(60.6) 11.5 (45.7) (26.2) (18.2)
Domestic (62.6) (1.8) (45.7) (26.2) (18.2)
Abroad 2.0 13.3 - - -
1/ Net lending is not included in the regular budget.
Source: Ministry of Finance and Treasury

66
APPENDIX 1
Table 19.
Functional Classification of Government Capital Expenditure, 1998 - 2002 (In millions of rufiyaa)
1998 1999 2000 2001 2002
(Prv.Est.)
Capital expenditure 816.0 949.4 864.0 940.7 1,198.1
General public services 260.3 409.7 377.2 286.7 236.8
General administration 118.4 180.4 269.7 197.5 176.5
Public order & internal security 141.9 229.3 107.5 89.2 60.3
Social services 370.7 296.7 249.7 247.1 563.9
Education 135.4 113.1 112.7 77.6 105.3
Health 68.6 72.0 57.3 37.8 49.6
Welfare services 1.0 2.3 - 1.0 0.5
Community programs 165.7 109.3 79.7 130.7 408.5
Economic services 185.0 243.0 237.1 406.9 397.4
Fisheries & Agriculture 15.4 16.7 39.8 27.8 14.8
Transportation 132.1 181.7 118.6 255.5 303.2
Post and telecommunication 0.2 18.3 0.4 27.7 0.2
Tourism 0.3 4.2 1.1 0.6 1.3
Trade and industry 1.0 1.2 0.9 0.6 0.3
Electricity 36.0 20.9 76.3 94.7 77.6
Source: Ministry of Finance and Treasury
Table 18.
Functional Classification of Government Current Expenditure 1998 - 2002(In millions of rufiyaa)
1998 1999 2000 2001 2002
(Prv. Est.)
Current expenditure 1,297.9 1,545.5 1,875.9 1,971.4 2,136.1
General public services 536.8 651.7 787.3 801.4 869.0
General administration 308.4 353.9 445.9 426.7 479.8
Public order and internal security 228.4 297.8 341.4 374.7 389.2
Social services 623.0 726.2 890.8 951.2 1,006.1
Education 296.7 337.7 428.5 438.0 484.5
Health 155.6 187.4 241.9 263.0 265.3
Social security and welfare 70.3 67.7 77.0 98.7 97.5
Community programs 100.4 133.4 143.4 151.5 158.8
Economic services 56.5 68.9 91.4 102.3 119.1
Fisheries & agriculture 6.6 6.5 7.9 11.5 11.5
Transportation 27.0 33.9 47.6 50.4 65.2
Post and telecommunication 2.1 4.0 4.1 5.5 6.6
Tourism 15.5 18.7 26.6 30.8 31.5
Trade and industry 5.3 5.8 5.2 4.1 4.3
Interest on public debt 81.6 98.7 106.4 116.5 141.9
Source: Ministry of Finance and Treasury

67
MMA ANNUAL REPORT 2002
Table 20.
Balance of Payments, 1998 - 2002
(In millions of U.S. dollars)
1998 1999 2000 2001 2002
Rev. Est. Rev. Est.
31/12/02 25/05/03
Current account balance -21.9 -78.9 -51.5 -57.3 -44.0
Trade balance -215.9 -262.4 -233.3 -236.0 -211.1
Exports, f.o.b 95.6 91.5 108.7 110.2 133.6
Domestic exports 74.3 63.7 75.9 76.2 90.4
Re-exports 21.3 27.8 32.8 34.0 43.3
Imports, f.o.b -311.5 -353.9 -342.0 -346.3 -344.7
Services (net) 204.3 203.6 208.8 206.4 207.7
Balance on nonfactor services 232.4 234.6 238.8 244.8 244.3
Receipts 331.3 342.8 348.5 354.1 355.5
Of which: Travel 303.0 313.5 320.7 327.1 332.5
Payments -98.9 -108.1 -109.7 -109.2 -111.2
Balance on factor services -28.2 -31.0 -30.0 -38.5 -36.6
Receipts 8.6 9.0 10.3 6.8 4.1
Payments -36.8 -40.1 -40.3 -45.3 -40.7
Unrequited transfers (net) -10.3 -20.1 -27.0 -27.6 -40.6
Official 20.3 20.4 19.3 22.0 9.6
Private -30.6 -40.5 -46.2 -49.6 -50.2
Non-monetary capital (net) 50.9 71.7 43.5 35.9 83.8
Official medium-and long-term 14.6 5.2 -1.9 7.8 37.0
Disbursements 25.7 17.6 12.4 23.4 54.0
Amortization -11.1 -12.5 -14.3 -15.6 -17.0
Private capital 42.9 42.9 25.6 24.3 33.8
Net errors/omissions -6.6 23.6 19.9 3.8 13.0
Overall balance 29.1 -7.2 -7.9 -21.4 39.8
Monetary movements -29.1 7.2 7.9 21.4 -39.8
Maldives Monetary Authority -20.2 -8.6 4.4 29.7 -40.2
Commercial banks -8.8 15.8 3.5 -8.3 0.4
Note: Decimal places might differ due to rounding off.
Source: Maldives Monetary Authority

68
APPENDIX 1
Table 21.
Composition of Exports (f.o.b.), 1998 - 2002(In millions of US dollars)
1998 1999 2000 2001 2002
Total merchandise exports 95.6 91.5 108.7 110.2 133.6
Domestic exports 74.3 63.7 75.9 76.1 90.4
Total marine exports 56.5 38.8 40.7 43.7 55.8
Fish and fish products( including live fish) 56.1 38.3 38.3 40.9 52.7
Fish exports (excluding tropical live fish) 51.9 34.4 34.0 35.8 49.2
Frozen tuna 23.0 13.4 9.9 12.9 27.5
Frozen reef fish 0.6 2.0 1.7 1.8 1.7
Canned fish 16.7 8.6 10.8 9.3 10.0
Dried fish 9.2 9.0 10.9 11.0 9.0
Salted fish 1.2 0.7 0.0 0.1 0.4
Salted reef fish 1.2 0.7 0.7 0.7 0.6
Live tropical fish 2.3 1.9 2.0 3.1 1.8
Fish products 2.0 2.0 2.3 2.0 1.8
Other marine products 0.4 0.4 2.5 2.8 3.0
Garments 17.8 24.8 35.0 32.3 34.5
Other 0.1 0.1 0.1 0.2 0.1
Re-exports 1/ 21.3 27.8 32.8 34.0 43.3
1/ Includes the sale of jet fuel; excludes currency.
Source: Maldives Customs Service
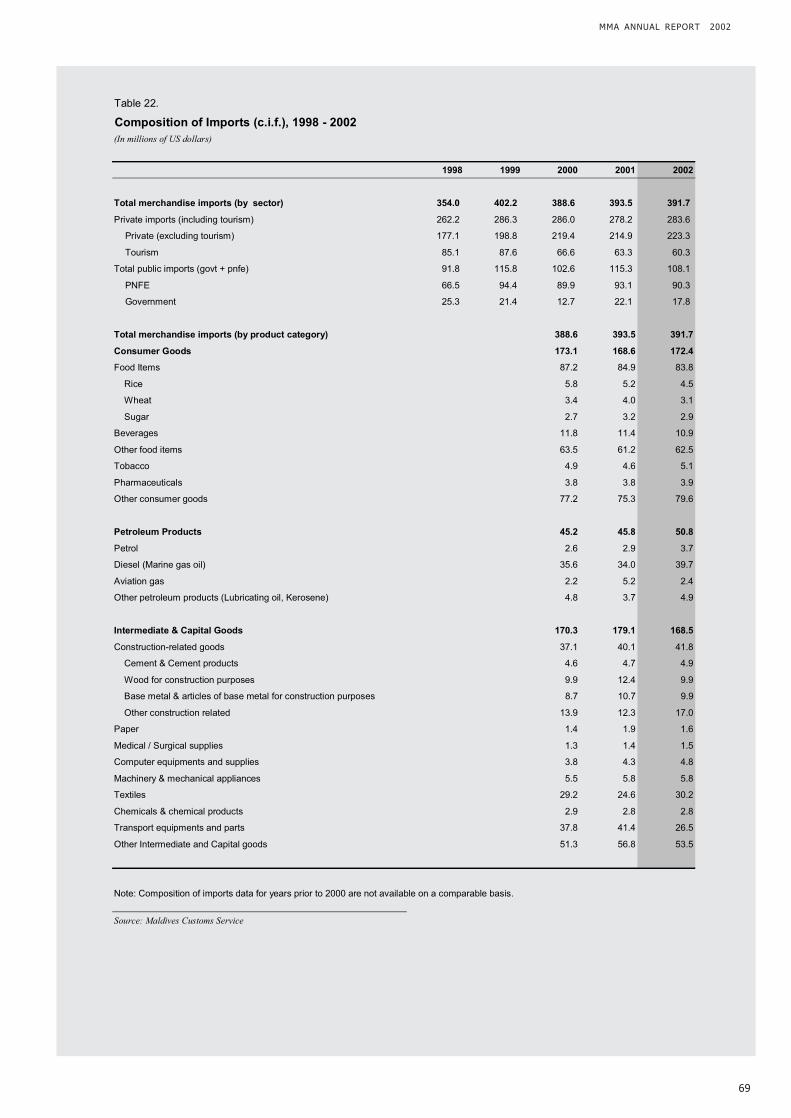
69
MMA ANNUAL REPORT 2002
Table 22.
Composition of Imports (c.i.f.), 1998 - 2002
(In millions of US dollars)
1998 1999 2000 2001 2002
Total merchandise imports (by sector) 354.0 402.2 388.6 393.5 391.7
Private imports (including tourism) 262.2 286.3 286.0 278.2 283.6
Private (excluding tourism) 177.1 198.8 219.4 214.9 223.3
Tourism 85.1 87.6 66.6 63.3 60.3
Total public imports (govt + pnfe) 91.8 115.8 102.6 115.3 108.1
PNFE 66.5 94.4 89.9 93.1 90.3
Government 25.3 21.4 12.7 22.1 17.8
Total merchandise imports (by product category) 388.6 393.5 391.7
Consumer Goods 173.1 168.6 172.4
Food Items 87.2 84.9 83.8
Rice 5.8 5.2 4.5
Wheat 3.4 4.0 3.1
Sugar 2.7 3.2 2.9
Beverages 11.8 11.4 10.9
Other food items 63.5 61.2 62.5
Tobacco 4.9 4.6 5.1
Pharmaceuticals 3.8 3.8 3.9
Other consumer goods 77.2 75.3 79.6
Petroleum Products 45.2 45.8 50.8
Petrol 2.6 2.9 3.7
Diesel (Marine gas oil) 35.6 34.0 39.7
Aviation gas 2.2 5.2 2.4
Other petroleum products (Lubricating oil, Kerosene) 4.8 3.7 4.9
Intermediate & Capital Goods 170.3 179.1 168.5
Construction-related goods 37.1 40.1 41.8
Cement & Cement products 4.6 4.7 4.9
Wood for construction purposes 9.9 12.4 9.9
Base metal & articles of base metal for construction purposes 8.7 10.7 9.9
Other construction related 13.9 12.3 17.0
Paper 1.4 1.9 1.6
Medical / Surgical supplies 1.3 1.4 1.5
Computer equipments and supplies 3.8 4.3 4.8
Machinery & mechanical appliances 5.5 5.8 5.8
Textiles 29.2 24.6 30.2
Chemicals & chemical products 2.9 2.8 2.8
Transport equipments and parts 37.8 41.4 26.5
Other Intermediate and Capital goods 51.3 56.8 53.5
Note: Composition of imports data for years prior to 2000 are not available on a comparable basis.
Source: Maldives Customs Service

70
APPENDIX 1
Table 24.
Exchange Rates, 1998 - 2002(In rufiyaa per foreign currency; end of period mid rate)
1998 1999 2000 2001 2002
Mar Jun Sep Dec
U.S dollar 11.7700 11.7700 11.7700 12.8000 12.8000 12.8000 12.8000 12.8000
Japanese yen 0.0942 0.1127 0.1025 0.1020 0.0945 0.1008 0.1064 0.1018
Singapore dollar 6.9910 6.8805 6.6436 6.8312 6.8434 7.0255 7.1894 7.1140
Indian rupee 0.2726 0.2654 0.2468 0.2615 0.2567 0.2558 0.2583 0.2601
Sri Lankan rupee 0.1725 0.1601 0.1443 0.1357 0.1317 0.1304 0.1303 0.1297
Great Britain Pound 19.3075 18.7329 16.9721 17.8251 17.8940 18.3984 19.2928 19.7971
Euro - 11.6863 10.3454 11.0299 10.9873 11.7751 12.2920 12.6607
SDR 16.5725 16.1544 15.3353 16.0719 15.9604 17.0299 16.0707 17.3386
Source: Maldives Monetary Authority
Table 23.
Summary of External Public and Publicly Guaranteed Debt, 1998 - 2002
(In millions of US dollars)
1998 1999 2000 2001 2002
26/05/03
Debt outstanding, including undisbursed Commitments 232.1 257.2 273.0 279.1 348.4
Debt outstanding, disbursed (DOD) 184.7 185.6 178.0 181.5 221.2
Disbursements 1/ 25.7 17.6 12.4 23.4 43.5
Amortisation 2/ 11.1 12.5 14.3 15.6 19.0
Net flows 3/ 14.6 5.2 (1.9) 7.8 24.5
Interest payments (INT) 4/ 3.8 4.3 4.6 4.5 4.5
Total debt service (TDS) 5/ 15.0 16.8 19.0 20.1 23.5
Net transfers 6/ 10.8 0.9 (6.6) 3.3 20.0
Selected ratios
DOD/GDP 34.2 31.5 28.5 29.0 34.6
INT/XGS 0.9 1.0 1.0 1.0 0.9
TDS/XGS 3.5 3.9 4.2 4.3 4.8
Memorandum Item:
Exports of goods & non-factor services (XGS) 426.9 434.3 457.2 464.3 489.1
1/ Disbursements of loans during the year.
2/ Repayments of loans (principal only) during the year.
3/ Disbursements less principal repayments.
4/ Interest on loans.
5/ Sum of principal repayments and interest.
6/ Disbursements less total debt service.
Source; Ministry of Finance and Treasury

71
MMA ANNUAL REPORT 2002
Commercial Banks Operating in theCommercial Banks Operating in theCommercial Banks Operating in theCommercial Banks Operating in theCommercial Banks Operating in theMaldivesMaldivesMaldivesMaldivesMaldives
BankBankBankBankBank Date established Date established Date established Date established Date establishedState Bank of India 4 February 1974Habib Bank Limited 11 April 1976Bank of Ceylon 7 May 1981Bank of Maldives 11 November 1982HSBC 11 March 2002
Monetary Measures and PrudentialMonetary Measures and PrudentialMonetary Measures and PrudentialMonetary Measures and PrudentialMonetary Measures and PrudentialRegulations in Effect During 2002Regulations in Effect During 2002Regulations in Effect During 2002Regulations in Effect During 2002Regulations in Effect During 2002
Interest RatesInterest RatesInterest RatesInterest RatesInterest Rates
***** With effect from 24 June 1995, commercial banksare free to determine the annual rates of interestchargeable on loans and advances and theannual interest payable on deposits denominatedin US dollars.
***** Banks are required to inform the changes ininterest rates to the Credit and Bank SupervisionSection of the MMA before the close of businesson the date on which such new rates becomeeffective. Banks are also required to displayinterest rates in a prominent location in the publichall of the bank.
***** With effect from 15 August 2001, banks are freeto determine interest rates on both rufiyaadeposits and loans, with the proviso that lendingrates on rufiyaa denominated loans should notexceed 20 percent per annum, which has beenin effect since 24 June 1995.
Minimum Reserve RequirementMinimum Reserve RequirementMinimum Reserve RequirementMinimum Reserve RequirementMinimum Reserve Requirement
***** With effect from 1 September 1992, the MinimumReserve Requirement (MRR) for commercialbanks has been set at 35 percent of total rufiyaaand foreign currency demand and time deposits.Balances of the minimum reserve deposits inexcess of 15 percent bear an interest rate of 2.5percent per annum. The reserve requirement forrufiyaa has to be met in the form of rufiyaadeposits, while for foreign currency, US dollardeposits are required.
Certificates of DepositCertificates of DepositCertificates of DepositCertificates of DepositCertificates of Deposit
***** With effect from 3 June 1995, MMA commencedits Certificates of Deposit programme, wherebycommercial banks operating in the Maldives, maypurchase such certificates with maturity periodsof 90 and 180 days. With effect from 26 August2001, public enterprises may also purchase thesecertificates.
AAAAAAPPENDIX 2APPENDIX 2APPENDIX 2APPENDIX 2APPENDIX 2
Lombard facilityLombard facilityLombard facilityLombard facilityLombard facility
***** With effect from 6 August 2001, commercialbanks operating in the country are able to availof a Lombard window at the MMA, the durationof which would be decided on a case-by-casebasis at MMA's discretion, with a maximuminterest of 5 percentage points above the highestrate of interest prevailing in the banking industryat the given time.
Foreign ExchangeForeign ExchangeForeign ExchangeForeign ExchangeForeign Exchange
***** With effect from 1 July 1985 all commercial banksoperating in the Maldives are required to adhereto the foreign currency buying and selling ratespublished by the MMA.
***** With effect from 12 October 1985, all taxes, rentsand related fines due from foreigners (excludingexpatriates serving the Government who are paidin rufiyaa), tourist hotels and guesthouses, arerequired to be paid in foreign currenciesaccepted by the MMA.
***** With effect from 19 July 2000, the MMAdiscontinued the foreign exchange purchasesand sales services of the Post Office Exchange.Commercial banks were requested to provideforeign exchange purchases and sales service(including the purchase and/ or collection ofmiscellaneous foreign currency notes and otherinstruments) and cater to the public demand ina cooperative and sustainable manner.
Prudential requirementsPrudential requirementsPrudential requirementsPrudential requirementsPrudential requirements
***** With effect from 20 September 1986, allcommercial banks operating in the Maldives arerequired to include in their loan agreements, theprovision that re-payments are to be made inthe currency in which a loan is disbursed.
***** With effect from 25 April 1996, banks are requiredto follow the MMA's classification criteria inaccordance with a uniform credit risk gradingsystem or loan asset classification matrix andcharge a loan loss provision against all classifiedloans and advances as per regulations establishedby the MMA.
***** With effect from 18 April 1996, banks are requiredto obtain MMA's approval on all payments andprofit repatriation to their head offices overseas.
***** With effect from 31 December 1996, banks arerequired to use a standard format of financialstatements outlined by the MMA, and to exhibitthe annual financial statements in a conspicuousplace within the place of business of the bank.

72
***** With effect from 23 March 1997, the ReserveAccount and the Clearing Account ofcommercial banks with the MMA have beenconsolidated and the computation of theMinimum Reserve Requirement has beenchanged to a weekly average basis.
***** With effect from 3 April 1997, banks are requiredto report their net foreign currency position toMMA on a daily basis.
***** With effect from 1 January 1998 all commercialbanks are required to maintain a minimum levelof paid-up capital that is not less than rufiyaa 30million. Branches of foreign banks operating inMaldives will meet a similar minimum capitalrequirement through the assignment or allocationof equity capital into their Maldives operationsfrom the home country office. Half of theminimum required capital has to be depositedwith MMA as ‘capital deposit', bearing interest at1.5 percent per annum. In addition, allcommercial banks have to maintain, at all times,a capital adequacy ratio not less than 8 percentof risk-weighted assets.
***** With effect from 27 January 1997 banks are
requested to submit a report on the income,expenditure and distribution of profits on aquarterly basis.
***** With effect from 29 October 1997 banks arerequested to submit a report on the classificationof loans and advances on a quarterly basis.
***** With effect from 30 September 1997, all banksare required to complete the form 'Computationof Risk Weighted Assets' and submit it to theMMA on a quarterly basis
***** With effect from March 1999, banks are requiredto recognise the discount on Certificates ofDeposits (CDs) periodically over the life of theCD using the 'gross' method. Banks are requiredto make CD discounts on a regular basis overthe maturity period of the CD calculated at thedaily rate. This change to the accounting for MMA
APPENDIX 2
Certificate of Deposits (CDs) was made toovercome the difficulties that arise because ofthe inconsistency in the compilation of thebanking statistics and also to follow the GenerallyAccepted Accounting Standards.
***** With effect from 15 August 2001, banks arerequired to submit details of foreign currencysales on a daily (next day) basis.
***** With effect from 1 January 2001, banks arerequired to seek MMA's approval to appoint newCEO / GM for their banks.
***** With effect from 5 July 2001, banks are requiredto submit on a daily basis their total outstandingloans and advances and on a weekly basis, theportfolio breakdown by major economic groups.They are also required to submit their interestrates, commissions and fees on a weekly basis
TaxationTaxationTaxationTaxationTaxation
***** Pursuant to Law 9/85 of 27 June 1985, allcommercial banks operating in the Maldives arerequired to pay a profit tax of 25 percent.