ANNUAL REPORT DUNDEE PRECIOUS METALS INC.
148
2016 ANNUAL REPORT DUNDEE PRECIOUS METALS INC. F O C U S E D O N O U R S T R A T E G Y P E O P L E O P T I M I Z A T I O N G R O W T H I N N O V A T I O N
Transcript of ANNUAL REPORT DUNDEE PRECIOUS METALS INC.
2016ANNUAL REPORT
DUNDEE PRECIOUS METALS INC.
FOC
US
ED O
N
OUR S TRATEGY
PEO
PLE
OPT
IMIZATION
GROWTH
INNOVATION


FOCUSED ON DELIVERING ON OUR STRATEGY
Dundee Precious Metals In the face of challenging gold and copper markets in 2016, we remained focused on strengthening our financial flexibility, reducing costs, optimizing operating performance, and building and advancing a portfolio of organic growth projects.
RICK HOWESPRESIDENT AND CHIEF EXECUTIVE OFFICER
1 | DUNDEE PRECIOUS METALS INC.
2016 OPERATING HIGHLIGHTS AND GROWTH PROGRESS | It is an exciting time for Dundee Precious Metals as we start to realize the benefits of the hard work we have put into building a unique and growing global gold producer. Built on a solid foundation of strong corporate values, a diverse and talented board and management team and good assets that have significant potential, we are committed to executing our unique strategy to create and deliver superior value and benefits for all stakeholders.

2 | DUNDEE PRECIOUS METALS INC.
Our aim is to be a consistent and reliable, low cost gold producer and we demonstrated that again in 2016 as we met or exceeded all of our guidance for the year, with the exception of smelter concentrate throughput and unit cost. In 2016, we achieved gold and copper in concentrate production of 172,000 ounces of gold, and 39.1 million pounds of copper. Gold production declined by 12% compared with 2015 due to the sale of the Kapan mine (“Kapan”) in April. Our consolidated all-in sustaining cost per ounce of gold, net of by-product credits, was $747, a 24% increase over 2015 due primarily to lower by-product copper prices. We continued to reduce cash cost per tonne of ore processed at our Chelopech mine which again declined by 10% year over year.
After successfully transforming our Chelopech mine in Bulgaria into a profitable, modern, efficient, environmentally and socially responsible operation and securing a long-term processing solution for the Chelopech concentrate at our Tsumeb smelter in Namibia, we are now ready for our next stage of gold production growth. Building on our success in Bulgaria, we began a two-year construction phase to build our Krumovgrad open pit gold mine in southern Bulgaria in October 2016. With the completion of this project, we expect to see average annual
gold production of over 100,000 ounces during the first five years at a cash cost of $364 per ounce starting in 2019, resulting in a 75% increase in overall gold production to over 260,000 ounces per year. This will put us in the lowest cost quartile of gold producers and generate increased earnings and free cash flow.
Although the journey to get to this point with Krumovgrad has been a long and sometimes difficult one, it is rewarding to see that the dedication, commitment and perseverance of all those involved in this effort has paid off.
The Krumovgrad project is unique in many ways. It will be the first mining project in Europe to be constructed inside a Natura 2000 protected area, which are designated protection areas to ensure the long-term survival of Europe’s most valuable and threatened species and habitat.
The project is quite innovative and has been shaped by many community, government and non-governmental stakeholders who expressed their desires and concerns for the project and who have worked closely with us to find mutually acceptable solutions. For example, we reduced the footprint of the project significantly by replacing wet tailings disposal with a dry stacked co-disposal method of waste rock and thickened
After three consecutive years of declining gold prices, prices rose modestly in 2016. Gold sold off somewhat immediately after the US election as ETF physical gold holdings were reduced as a result of a stronger US dollar, rising bond yields and increased US Federal Reserve rate hike expectations. Copper saw four consecutive years of declining prices and, had it not been for the rebound after the US election, there could have been a fifth. Weaker Euro, Canadian dollar and Namibian dollar currencies relative to the US dollar helped to partially offset the effects of these weaker metal prices.
It is difficult to predict where gold prices will go in the long term let alone in the near term in this volatile, uncertain and weak global environment. Our goal is to be an innovative, low cost gold producer that can generate margins throughout the cycle and proactively adapt the portfolio and strategy to changing markets in order to maximize shareholder returns and take advantage of opportunities for efficient and effective use of capital.
In the face of challenging gold and copper markets in 2016, we remained focused on strengthening our financial flexibility, reducing costs, optimizing operating performance, and building and advancing our organic growth projects.
FOCUSED ON DELIVERING ON OUR STRATEGY
3 | DUNDEE PRECIOUS METALS INC.
In 2016, we completed our strategic initiative to secure the processing of Chelopech complex copper gold concentrate by completing our major multi-year investment program at the Tsumeb smelter to improve environmental, health and safety performance and debottleneck processing capacity. We have successfully reduced the plants fugitive and stack emissions and transformed our Tsumeb smelter into a unique, sustainable, specialty complex copper concentrate tolling smelter.
The work completed in early 2016 included the commissioning of two new large converters with the gas capture from those converters into the new acid plant, which was commissioned in September 2015. The focus has now shifted to ramping up the new, modern facility to its full name plate capacity of 240,000 tonnes per year of concentrate throughput, which we expect to reach in the second half of 2017. With the ramp-up to full capacity, the smelter itself is expected to generate positive free cash flow on a standalone basis, recognizing that, as an integrated operation with Chelopech, the greater benefit is a long-term secure processing outlet for Chelopech’s concentrate and a strong overall return on the total investment.
We are planning for the future expansion of the smelter to 370,000 tonnes per year of throughput to capture some of the expected growth in the complex copper concentrate market and increase cash margins and earnings. The expansion would involve the installation of a holding furnace between the Ausmelt furnace and converters and additional cooling capacity for the Ausmelt furnace. The feasibility study for this expansion was
completed in 2016 and confirms that, with a capital investment of approximately $52 million, it would generate a quick payback and high return on investment. A decision to advance this project would be subject to stabilizing smelter performance at the 240,000 tonnes per year level, obtaining the necessary permits and securing adequately priced feed contracts to fill this increased capacity, all of which are being pursued. It is currently expected that we will be in a position to make the decision to proceed or not in early 2018.
We have a strong mineral reserve and resource base and continue to invest in exploration to extend the life of our current operations and provide organic growth potential from new discoveries. With the acquisition of the remaining outstanding shares of Avala in April and their Serbian exploration assets, which includes the Timok sediment hosted gold deposit and the Tulare copper gold porphyry deposit, our 2016 Measured and Indicated gold Resources, exclusive of Mineral Reserves, grew by 67% over 2015 to 3.12 million ounces. Our Proven and Probable gold Mineral Reserves declined by 9% to 2.8 million ounces over 2015, due primarily to annual depletion from mining at Chelopech. We have achieved exploration success at Chelopech over the last 10 years, essentially replacing what we have mined and, with the recent discovery of the high grade zone 153 orebody, we expect that success to continue. Following receipt of several new exploration licences immediately surrounding the existing Chelopech mining concession, we have also begun a regional exploration program around Chelopech.
tailings. We also eliminated the use of cyanide by producing a flotation concentrate for offsite smelting and refining treatment. With these changes, we gained the necessary support to advance this project to construction.
The Krumovgrad project is a relatively small, high grade, low tonnage open pit with a low strip ratio and straightforward processing solution. The relatively low go-forward capital and operating costs result in a strong after tax return of 25% at gold prices of $1,250/oz. We are also actively exploring for satellite deposits in the immediate vicinity to extend the initial eight year operating life of this operation and, with a recent geological discovery at Kupel North and the previously discovered Surnak, it looks promising.
In 2016, we successfully executed our financial strategy to increase financial flexibility and positioned ourselves to successfully execute this $178 million capital project, even under a stressed price scenario. With available liquidity of $295 million, no net debt and positive forecast free cash flow, we expect to complete the construction phase of the Krumovgrad project with only a moderate drawdown of our $275 million credit facility and, with strong free cash flow after completion, we expect to quickly payback that debt. As part of that financing strategy, which included a combination of hedging, the sale of Kapan, pre-paid forward gold sales and some equity, we also did a $33 million strategic equity investment with the European Bank for Reconstruction and Development (“EBRD”). Given that the EBRD is the largest investor in Bulgaria, it helps to have a strong and influential shareholder supporting our investments in the country.

4 | DUNDEE PRECIOUS METALS INC.
technology, digital networks and connectivity, artificial intelligence, machine learning and predictive analytics, we see significant opportunity to better use data to gain insights, make faster and better decisions, improve and optimize performance, reduce costs, increase productivity, improve safety and reduce impacts to the environment. We intend to be a leader in our industry in applying these new opportunities for competitive advantage starting at our Chelopech and Krumovgrad mines.
In summary, we believe DPM represents an attractive investment opportunity for a growth oriented, value minded investor. Our Krumovgrad project, which is expected to generate a 75% increase in low cost gold production, is now fully permitted and in construction with first production expected in the fourth quarter of 2018. We are operating in mining friendly and politically stable jurisdictions. We have a strong balance sheet with sufficient available liquidity and forecast cash flow generation to complete this project and weather a potentially weaker commodity market. We have a strong reserve and resource base and active exploration programs to sustain and grow our business and we have a strong management team with the capability and track
record for gaining stakeholder support and turning around under- performing assets. Finally, with our innovative team and digital transformation strategy, we expect to be able to leverage that strength to achieve higher margins than would be possible using the current conventional operating models, methods and practices.
On behalf of our board, I would like to express our sincere appreciation to the more than 2,100 employees around the world for their dedication, hard work and commitment to working safely and making 2016 a year of great progress and success. We can all take pride in the fact that we are building a successful global mining company that demonstrates care and a commitment to responsible mining.
We are also having success with our greenfield exploration work in Serbia. The focus of our exploration is currently on the Timok sediment hosted gold discovery, which contains open pit potential with an Indicated Resource of 1.7 million ounces at 1.54g/t. Recent drilling has indicated the potential for additional oxidized mineralization one kilometre northwest of Bigar Hill with a 50 metre intersection at 2g/t starting at 17 metres from surface.
Another key aspect of our strategy involves innovation. We are using our strong in-house technical and operating talents, along with external partnerships, to find new and innovative ways to improve and optimize the performance of our operations and projects. With a rapidly changing world of new and innovative technologies, and rising social, political, environmental and economic challenges and expectations, we believe mining companies need to learn to adapt and adopt technological changes more quickly if they are going to be successful. Our project called “taking the lid off the mine” at our underground mine at Chelopech is certainly a good example of successfully deploying innovation. We believe that, in this digital and network age, mining is poised for disruptive change. With advances in sensor
FOCUSED ON DELIVERING ON OUR STRATEGY
RICK HOWESPRESIDENT AND CHIEF EXECUTIVE OFFICER
March 23,2017

6 MANAGEMENT’S DISCUSSION AND ANALYSIS
7 Overview10 Key Operational and Financial Highlights12 Review of Consolidated Results19 2016 Actual Results Comparison to Original Guidance20 2017 Guidance22 Review of Operating Results by Segment from Continuing Operations30 Review of Corporate and Other Segment Results31 Review of Operating Results from Discontinued Operations32 Liquidity and Capital Resources37 Financial Instruments40 Exploration47 Development and Other Major Projects50 Off Balance Sheet Arrangements50 Selected Quarterly Information and Annual Information52 Critical Accounting Estimates and Policies58 New Standards and Interpretations Not Yet Adopted59 Non-GAAP Financial Measures67 Risks and Uncertainties80 Disclosure Controls and Procedures and Internal Control Over Financial Reporting80 Cautionary Note Regarding Forward Looking Statements82 Cautionary Note to United States Investors Concerning Estimates of Measured, Indicated and Inferred Resources
83 MANAGEMENT’S REPORT ON INTERNAL CONTROL OVER FINANCIAL REPORTING
84 INDEPENDENT AUDITOR’S REPORT
86 CONSOLIDATED FINANCIAL STATEMENTS86 Consolidated Statements of Financial Position87 Consolidated Statements of Loss88 Consolidated Statements of Comprehensive Loss89 Consolidated Statements of Cash Flows90 Consolidated Statements of Changes in Shareholders’ Equity
91 NOTES TO CONSOLIDATED FINANCIAL STATEMENTS91 Note 1: Corporate Information91 Note 2.1: Basis of Preparation92 Note 2.2: ������������� ������������108 Note 2.3: New Standards not yet Adopted110 Note 3: Kapan Disposition and Discontinued Operations 112 Note 4: Impairment Charges113 Note 5: ��������������������113 Note 6: Accounts Receivable113 Note 7: Inventories114 Note 8: Financial Instruments119 Note 9: Exploration and Evaluation Assets120 Note 10: Mine Properties121 Note 11: Property, Plant and Equipment122 Note 12: Intangible Assets123 Note 13: ������������������123 Note 14: Accounts Payable and Accrued Liabilities123 Note 15: Debt125 Note 16: Deferred Revenue125 Note 17: Rehabilitation Provisions126 Note 18: �����������������������127 Note 19: Share Based Compensation Plans130 Note 20: Expenses by Nature130 Note 21: Finance Cost130 Note 22: Other (Expense) Income131 Note 23: �����������133 Note 24: Loss Per Share133 Note 25: Key Management Remuneration134 Note 26: Supplementary Cash Flow Information134 Note 27: Supplementary Shareholders’ Equity Information135 Note 28: Commitments and Other Contingencies136 Note 29: Financial Risk Management140 Note 30: Operating Segment Information143 Note 31: Comparative Figures
145 CORPORATE INFORMATION
DUNDEE PRECIOUS METALSTABLE OF CONTENTSFINANCIAL RESULTS 2016
5 | DUNDEE PRECIOUS METALS INC.

6 | DUNDEE PRECIOUS METALS INC.
MANAGEMENT’S DISCUSSION AND ANALYSIS ����������� �������������������� ����������� �������
����������������� ���������������� (All monetary figures are expressed in U.S. dollars unless otherwise stated)
� � � �
The following is Management’s Discussion and Analysis (“MD&A”) of the consolidated financial condition and results of operations of Dundee Precious Metals Inc. (“DPM” and, together with its consolidated subsidiaries, collectively referred to as the “Company”) for the three and twelve months ended December 31, 2016. This MD&A should be read in conjunction with DPM’s audited consolidated financial statements for the year ended December 31, 2016 prepared in accordance with International Financial Reporting Standards (“IFRS”). Additional Company information, including the Company’s most recent annual information form (“AIF”) and other continuous disclosure documents, can be accessed through the System for Electronic Document Analysis and Retrieval (“SEDAR”) website at www.sedar.com and the Company’s website at www.dundeeprecious.com. To the extent applicable, updated information contained in this MD&A supersedes older information contained in previously filed continuous disclosure documents. Capitalized terms used in this MD&A that have not been defined have the same meanings attributed to them in DPM’s audited consolidated financial statements for the year ended December 31, 2016. Information contained on the Company’s website is not incorporated by reference herein and does not form part of this MD&A. This MD&A contains forward looking statements that are based on certain estimates and assumptions and involve risks and uncertainties. Actual results may vary materially from management’s expectations. See the “Cautionary Note Regarding Forward Looking Statements” and “Risks and Uncertainties” sections later in this MD&A for further information. The technical information in this MD&A, with respect to the Company’s material mineral projects, has been prepared in accordance with Canadian regulatory requirements set out in National Instrument 43-101 Standards of Disclosure for Mineral Projects (“NI 43-101”) of the Canadian Securities Administrators and the Canadian Institute of Mining, Metallurgy and Petroleum (“CIM”), Definition Standards for Mineral Resources and Mineral Reserves, and has been reviewed and approved by Richard Gosse, M.Sc. (Mineral Exploration), Senior Vice President, Exploration of DPM and Ross Overall, B.Sc. (Applied Geology), Corporate Senior Resource Geologist of DPM, who are Qualified Persons as defined under NI 43-101 (“QP”), and not independent of the Company. This MD&A has been prepared as at February 15, 2017.

MANAGEMENT’S DISCUSSION AND ANALYSIS
7 | DUNDEE PRECIOUS METALS INC.
OVERVIEW Our Business DPM is a Canadian based, international gold mining company engaged in the acquisition of mineral properties, exploration, development, mining and processing of precious metals. Its common shares (symbol: DPM) are traded on the Toronto Stock Exchange (“TSX”). The Company’s vision is to be a progressive gold mining company that unlocks superior value through innovation and strong partnerships with stakeholders. Through operational excellence and innovation capability, DPM is focused on optimizing the performance of each of its operating assets to deliver strong margins and safe and reliable production results. The Company is also focused on building a pipeline of future growth opportunities that leverages that same expertise to unlock value and generate a superior return on capital employed. DPM’s demonstrated ability to engage and work closely with key stakeholders, and conduct its business in a responsible and sustainable manner, allows the Company to be successful in each of the countries in which it operates.
Continuing operations:
DPM’s principal subsidiaries include:
� 100% of Dundee Precious Metals Chelopech EAD (“Chelopech”), which owns and operates a gold, copper and silver mine located east of Sofia, Bulgaria;
� 100% of Dundee Precious Metals Krumovgrad EAD (“Krumovgrad”), which is currently constructing a gold mine located in south eastern Bulgaria, near the town of Krumovgrad, that is expected to commence production in the fourth quarter of 2018; and
� 100% of Dundee Precious Metals Tsumeb (Proprietary) Limited (“Tsumeb”), which owns and operates a custom smelter located in Tsumeb, Namibia.
DPM also owns 100% of Avala Resources Ltd. (“Avala”), which is incorporated in British Columbia, Canada, and focused on the exploration and development of the Lenovac project, the Timok gold project, the Tulare copper and gold project and other early stage projects in Serbia. In April 2016, the Company acquired all of the issued and outstanding shares of Avala not already owned by DPM.
Discontinued operations:
On April 28, 2016, DPM sold 100% of Dundee Precious Metals Kapan CJSC (“Kapan”), which owns and operates a gold, copper, zinc and silver mine in the town of Kapan, located south east of the capital city of Yerevan in southern Armenia.
Summary of Significant Operational and Financial Highlights Overall, financial results in 2016 were impacted by impairment charges, principally at Tsumeb, lower copper prices, and higher depreciation and local currency operating expenses at Tsumeb, partially offset by a weaker ZAR.
Chelopech
� Annual mine production of 2.2 million tonnes resulting in gold and copper contained in concentrates produced of 165,665 ounces and 38.4 million pounds, respectively, a decrease of 2% and 3% over 2015 as a result of lower grades, partially offset by higher volumes of ore mined and processed. Mine and metals production outperformed the 2016 guidance issued in February 2016;
� Sold 139,324 ounces of payable gold and 36.1 million pounds of payable copper generating revenue of $161.6 million, pre-tax earnings of $37.8 million and adjusted EBITDA(1) of $87.3 million;
� Cost of sales of $108.2 million was $4.5 million lower than 2015 due primarily to the decrease in copper concentrate deliveries and ongoing improvement initiatives. Cash cost per tonne of ore processed(1) of $32.97 was 11% lower than 2015 due primarily to higher volumes of ore mined and
MANAGEMENT’S DISCUSSION AND ANALYSIS
8 | DUNDEE PRECIOUS METALS INC.
processed and ongoing improvement initiatives. Cash cost per ounce of gold, net of by-product credits(1) of $562 was 72% higher than 2015 due primarily to lower copper prices;
� In December, DPM announced the discovery of a new zone of high grade copper and gold mineralization. This new zone, called Zone 153, is located near existing infrastructure in the upper levels of the mine’s Western area;
Kapan � On April 28, the Company sold its interest in Kapan to Polymetal International Plc (“Polymetal”)
through the disposition of all of the issued and outstanding shares of Kapan (the “Kapan Disposition”); � As a result of the Kapan Disposition, the operating results and cash flows of Kapan have been
presented as discontinued operations in the consolidated statements of loss and cash flows. Refer to the “Review of Operating Results from Discontinued Operations” section of this MD&A for a more detailed discussion of the Kapan Disposition and results of discontinued operations.
Tsumeb
� Complex concentrate smelted of 200,272 tonnes was 2% higher than 2015 but well below the original guidance issued in February 2016 as a result of an unplanned 21 day shutdown following a regional power outage in Namibia in July and post-commissioning issues related to the installation of the acid plant and new copper converters, which were completed and commissioned in the fourth quarter of 2015 and first quarter of 2016, respectively;
� Generated revenue of $117.9 million, a loss before income taxes of $151.9 million and adjusted EBITDA of $9.7 million in 2016;
� Cost of sales in 2016 of $149.8 million was $36.4 million higher than 2015 due to higher depreciation and operating expenses. Cash cost per tonne of complex concentrate smelted, net of by-product credits(1) of $440 was 5% higher than 2015 due primarily to higher local currency operating expenses, partially offset by a weaker ZAR;
� Impairment charges of $107.5 million and $118.7 million were recognized in the fourth quarter and twelve months of 2016, respectively, of which $107.0 million related primarily to lower forecast third party toll rates and reduced volumes related to a slower ramp-up to 370,000 tonnes per year and $11.2 million related to a write-down of Tsumeb’s arsenic plant reflecting management’s third quarter decision to discontinue production of arsenic trioxide;
Krumovgrad
� Following the receipt of the construction permit in August and mobilization of the earthworks contractor, construction of the project started in the fourth quarter and remains on track for first concentrate production in late 2018, at a final estimated cost of $178 million;
Corporate and other
� Approximately 92% and 53% of the Company’s expected payable copper production for 2017 and 2018, respectively, has been hedged at an average price of $2.40 and $2.62 per pound. Approximately 31% of the expected gold production in 2017 has been hedged at a floor price of $1,200 per ounce and a ceiling price of $1,497 per ounce;
� Approximately 20% of the Company’s projected Euro operating expenses for 2017 have been hedged at an average rate of 1.1287. Approximately 56% of projected Namibian dollar operating expenses for 2017 have been hedged at an average rate of 13.87;
� In April, the Company acquired all of the issued and outstanding shares of Avala not already owned by DPM for consideration of 0.044 of a DPM common share for each Avala share outstanding. As a result, DPM issued 956,329 common shares valued at $1.6 million;
� In July, DPM completed its bought deal financing with a syndicate of investment dealers pursuant to which the Company issued 18,216,000 common shares at a price of Cdn$3.00 per share, for aggregate gross proceeds of $41.9 million (Cdn$54.6 million) (the “Offering”). Concurrent with the Offering, the Company also completed a non-brokered private placement (“Non-Brokered Private Placement”) of 840,000 shares of the Company at a price of Cdn$3.00 per share, for additional gross proceeds of $1.9 million (Cdn$2.5 million). Total net proceeds from the Offering and the Non-

MANAGEMENT’S DISCUSSION AND ANALYSIS
9 | DUNDEE PRECIOUS METALS INC.
Brokered Private Placement, after deducting the Underwriters’ fee and issuance costs, were $41.3 million;
� In September, the Company entered into a prepaid forward gold sales arrangement with several of DPM’s existing lenders whereby the Company will deliver 45,982 ounces of gold on specified dates over a 21-month period commencing in May 2019 in exchange for an upfront cash prepayment of $50.0 million. Deliveries of gold will be in the form of unallocated gold credits sourced from any of the Company’s own mines over 21 months during 2019 and 2020; and
� In January 2017, the Company completed a non-brokered private placement with the European Bank for Reconstruction and Development (“EBRD”), pursuant to which the Company issued 17,843,120 common shares at a price of Cdn$2.45 per share for gross proceeds of $33.2 million (Cdn$43.7 million). As a result of this transaction, the EBRD holds approximately 9.99% of the Company’s common shares (on a non-diluted basis).
______________ 1) Adjusted earnings before interest, taxes, depreciation and amortization (“EBITDA”), cash cost per tonne of ore processed, cash cost per ounce
of gold sold, net of by-product credits, and cash cost per tonne of concentrate smelted, net of by-product credits are not defined measures under generally accepted accounting principles (“GAAP”). Refer to the “Non-GAAP Financial Measures” section of this MD&A for reconciliations to IFRS.

MANAGEMENT’S DISCUSSION AND ANALYSIS
10 | DUNDEE PRECIOUS METALS INC.
KEY OPERATIONAL AND FINANCIAL HIGHLIGHTS The following tables summarize the Company’s key operational and financial results: $ thousands, unless otherwise indicated Three Months Twelve MonthsEnded December 31, 2016 2015(12) 2016 2015(12) Financial Results Revenue(1) 82,061 53,708 279,489 225,134 Cost of sales(1) 68,963 59,262 258,013 226,113 Depreciation and amortization(1) 20,346 18,662 78,991 63,699 Impairment charges(1) 115,205 52 126,339 905 Other income (expense)(1) 3,091 12,899 (5,638) 41,693 (Loss) earnings before income taxes from
continuing operations (106,230)
(380)
(146,929)
7,554 Income tax expense(1) (1,373) (607) (3,653) (5,795) Net (loss) earnings attributable to common
shareholders from continuing operations (107,472)
(845)
(149,947)
2,812 Net loss attributable to common shareholders (109,970) (48,509) (151,552) (46,989) Basic (loss) earnings per share from
continuing operations (0.67)
(0.01)
(1.00)
0.02 Basic loss per share attributable to common
shareholders (0.69)
(0.35)
(1.01)
(0.33) Adjusted EBITDA(1),(2) 30,208 22,085 72,972 84,726 Adjusted earnings (loss) before income taxes
(1),(2) 7,477
(15)
(18,141)
10,665 Adjusted net earnings (loss)(1),(2) 5,661 (795) (22,372) 4,998 Adjusted basic earnings (loss) per share(1),(2) 0.04 (0.01) (0.15) 0.04 Cash provided from operating activities(1) 15,700 29,141 84,081 77,285 Cash provided from operating activities, before
changes in non-cash working capital(1),(2) 24,837 22,300 122,073 78,959
Free cash flow(1),(2) 11,084 2,413 74,916 32,946 Capital expenditures incurred(1):
Growth(2) 9,545 8,758 29,553 53,913 Sustaining(2) 4,578 9,753 21,328 23,778 Total capital expenditures 14,123 18,511 50,881 77,691
Operational Highlights Payable metals in concentrate sold(1) Gold (ounces)(3) 37,259 35,086 139,324 148,137
Copper (‘000s pounds) 8,786 9,814 36,074 37,913 Silver (ounces) 37,940 51,286 160,537 192,468
Payable metals in concentrate sold from continuing and discontinued operations:
Gold (ounces) 37,259 41,884 146,628 168,755 Copper (‘000s pounds) 8,786 10,620 36,911 40,272 Zinc (‘000s pounds) - 3,070 2,688 10,267 Silver (ounces) 37,940 176,728 280,819 549,424
Cash cost per tonne of ore processed ($)(2),(4) 32.63 39.07 32.97 37.14 Cash cost per ounce of gold sold, net of by-
product credits ($)(1),(2),(5),(6),(7) 529 409 562
327 Cash cost per ounce of gold sold in pyrite
concentrate ($)(2),(9) 651 895 776 919 All-in sustaining cost per ounce of gold
($)(1),(2),(5),(7),(8) 602
628 738
492 Complex concentrate smelted at Tsumeb
(tonnes) 61,270 55,833 200,272 196,107 Cash cost per tonne of complex concentrate
smelted at Tsumeb, net of by-products credits ($)(2),(10) 369 336 440
418

MANAGEMENT’S DISCUSSION AND ANALYSIS
11 | DUNDEE PRECIOUS METALS INC.
As at,December
31, 2016 December
31, 2015 Financial Position Cash and cash equivalents 11,757 26,570 Investments at fair value 19,216 13,911 Total assets 733,952 906,151 Debt(11) 41,110 147,035 Equity 552,027 638,113 Common shares outstanding (‘000s) 160,588 140,576 Share price (Cdn$ per share) 2.25 1.28
___________________ 1) Information relates to continuing operations. 2) Cash cost per tonne of ore processed, cash cost per ounce of gold sold, net of by-product credits; cash cost per ounce of gold sold in pyrite
concentrate; all-in sustaining cost per ounce of gold; cash cost per tonne of complex concentrate smelted, net of by-product credits; adjusted EBITDA;adjusted earnings (loss) before income taxes; adjusted net earnings (loss); adjusted basic earnings (loss) per share; cash provided from operating activities, before changes in non-cash working capital; free cash flow; and growth and sustaining capital expenditures are not defined measures under GAAP. Refer to the “Non-GAAP Financial Measures” section of this MD&A for reconciliations to IFRS.
3) Includes payable gold in pyrite concentrate sold in the fourth quarter and twelve months of 2016 of 8,140 ounces and 31,380�ounces, respectively, compared to 9,779 ounces and 38,156 ounces for the corresponding periods in 2015.
4) Cash cost per tonne of ore processed represents Chelopech related production expenses, including mining, processing, services, royalties and general and administrative, divided by tonnes of ore processed.
5) Excludes metals in pyrite concentrate sold, and where applicable, the treatment charges, transportation and other selling costs related to the sale of pyrite concentrate, which is reported separately. Cash cost per ounce of gold sold, net of by-product credits, including payable gold in pyrite concentrate sold, in the fourth quarter and twelve months of 2016 was $556 and $610, respectively, compared to $545 and $480 for the corresponding periods in 2015. All-in sustaining cost per ounce of gold, including payable gold in pyrite concentrate sold, in the fourth quarter and twelve months of 2016 was $612�and $747, respectively, compared to $703 and $602 for the corresponding periods in 2015.
6) Cash cost per ounce of gold sold, net of by-product credits, represents cost of sales at Chelopech less depreciation, amortization and other non-cash expenses plus treatment charges, penalties, transportation and other selling costs less by-product copper and silver revenues, including realized losses and gains on copper swap contracts, divided by the payable gold in copper concentrate sold.
7) Includes realized loss and realized gains on copper derivative contracts, entered to hedge a portion of projected payable production, of $0.5 million and $2.6�million during the fourth quarter and twelve months of 2016, respectively, compared with realized gains of $9.2�million and $26.5 million for the corresponding periods in 2015.
8) All-in sustaining cost per ounce of gold represents cost of sales at Chelopech less depreciation, amortization and other non-cash items plus treatment charges, penalties, transportation and other selling costs, sustaining capital expenditures, rehabilitation related accretion expenses and an allocated portion of the Company’s general and administrative expenses and corporate social responsibility expenses, less by-product revenues in respect of copper and silver, including realized losses and gains on copper swap contracts, divided by the payable gold in copper concentrate sold.
9) Cash cost per ounce of gold sold in pyrite concentrate represents treatment charges and freight costs associated with the sale of pyrite concentrate divided by the payable gold in pyrite concentrate sold.
10) Cash cost per tonne of complex concentrate smelted, net of by-product credits at Tsumeb represents cost of sales less depreciation and amortization, net of revenue related to the sale of acid and arsenic divided by the volumes of complex concentrate smelted.
11) Long-term debt, including current portion. 12) Certain comparative figures have been reclassified as a consequence of several expenses previously classified as general and administrative
expenses being classified as operating costs and included in cost of sales to better reflect the operating results of each segment.

MANAGEMENT’S DISCUSSION AND ANALYSIS
12 | DUNDEE PRECIOUS METALS INC.
REVIEW OF CONSOLIDATED RESULTS
Market Trends
Commodity prices are one of the principal determinants of the Company’s results of operations and financial condition. In addition, as an entity reporting in U.S. dollars with operations in several countries, fluctuations in foreign exchange rates between the U.S. dollar and the Bulgarian lev, which is pegged to the Euro, the Namibian dollar, which is tied to the South African rand (“ZAR”) on a 1:1 basis, and the Canadian dollar (“Cdn$”) can also impact the Company’s results of operations and financial condition. The following table summarizes the average trading price for gold, copper and silver based on the London Bullion Market Association (“LBMA”) for gold and silver, and the London Metal Exchange (“LME”) for copper (Grade A) for the three and twelve months ended December 31, 2016 and 2015 and highlights the overall year over year strength (weakness) in commodity prices. Metal Market Prices (Average)Ended December 31,
Three Months Twelve Months2016 2015 Change 2016 2015 Change
LBMA gold ($/ounce) 1,219 1,105 10% 1,248 1,160 8%LME settlement copper ($/pound) 2.40 2.22 8% 2.21 2.50 (12%)LBMA spot silver ($/ounce) 17.18 14.76 16% 17.10 15.70 9% The following table sets out the average foreign exchange rates for the principal currencies impacting the Company and highlights the overall year over year strength (weakness) of the U.S. dollar relative to these currencies. Average Foreign Exchange RatesEnded December 31,
Three Months Twelve Months2016 2015 Change 2016 2015 Change
US$/Cdn$ 1.3343 1.3351 - 1.3253 1.2785 4%Euro/US$ 1.0790 1.0952 1% 1.1068 1.1105 -US$/ZAR 13.9126 14.2135 (2%) 14.6950 12.7464 15% The following table sets out the applicable closing foreign exchange rates. As at December 31, 2016 and 2015 and the extent to which the U.S. dollar has (weakened) strengthened relative to each of the currencies. Closing Foreign Exchange Rates As at December 31, 2016 2015 ChangeUS$/Cdn$ 1.3427 1.3840 (3%)Euro/US$ 1.0516 1.0906 4%US$/ZAR 13.7004 15.5293 (12%) Operational Highlights
Deliveries from continuing operations In the fourth quarter of 2016, payable gold in concentrates sold increased by 6% to 37,259 ounces, payable copper decreased by 10% to 8.8 million pounds and payable silver decreased by 26% to 37,940 ounces, in each case, relative to the corresponding period in 2015. The increase in payable gold was due primarily to higher gold production in 2016. The decrease in payable copper was due primarily to the decrease in copper production as a result of lower grades, and the timing of shipments. In 2016, payable gold in concentrates sold decreased by 6% to 139,324 ounces, payable copper decreased by 5% to 36.1 million pounds and payable silver decreased by 17% to 160,537 ounces, in each case, relative to the corresponding period in 2015. The decrease in payable gold was consistent with the decrease in copper and pyrite concentrate deliveries as a result of the decrease in production, partially offset by higher gold grades in copper concentrate sold. The decrease in payable copper was due primarily to the decrease in copper production as a result of lower grades, and the timing of shipments.

MANAGEMENT’S DISCUSSION AND ANALYSIS
13 | DUNDEE PRECIOUS METALS INC.
Concentrate smelted
Complex concentrate smelted during the fourth quarter of 2016 of 61,270 tonnes was 10% higher than the corresponding period in 2015 due primarily to improved performance resulting from the installation of the new copper converters. Complex concentrate smelted during 2016 of 200,272 tonnes was 2% higher than 2015. Performance of the smelter in 2016 was significantly impacted by a 21 day unplanned shutdown of the Ausmelt furnace following a regional power outage in July 2016, which reduced throughput by approximately 14,000 tonnes, and post commissioning issues related to the acid plant and new copper converters, which contributed to an 8,000 tonne shortfall relative to targeted performance. Converter optimization is ongoing and the introduction of matte holding furnaces in the second quarter of 2017 is expected to resolve the remaining converter constraints.
Smelter concentrate processed in the fourth quarter of 2016 was a new record, with the treatment of 23,686 tonnes of concentrate in December 12% higher than the previous record. The increased production rates achieved during the fourth quarter of 2016 were due primarily to increased stabilization of the operations as a result of various improvement initiatives being implemented at the smelter. These and other initiatives are expected to support improved and more consistent performance from the smelter during the course of 2017.
Financial Highlights
Revenue from continuing operations Revenue during the fourth quarter of 2016 of $82.1 million was $28.4 million higher than the corresponding period in 2015 due primarily to lower deductions for treatment charges and transportation costs at Chelopech, higher market gold and copper prices, higher volumes of payable gold sold, higher volumes of complex concentrate smelted, reduced deductions for estimated metals exposure at Tsumeb and higher acid revenue. These favourable variances were partially offset by lower toll rates at Tsumeb and lower volumes of payable copper sold. Revenue in the fourth quarter of 2016 excluded realized losses of $0.6 million (2015 – realized gains of $10.2 million) on copper and gold derivative contracts related to payable copper and gold sold in the period, which were recorded in other expense (income) in the consolidated statements of loss. Revenue during 2016 of $279.5 million was $54.4 million higher than the corresponding period in 2015 due primarily to favourable mark-to-market price adjustments on provisionally priced sales, the sale of acid following the commencement of commercial production in the fourth quarter of 2015, reduced deductions for estimated metals exposure at Tsumeb, lower transportation costs and higher market gold prices, partially offset by lower market copper prices. Revenue in 2016 excluded realized gains of $2.4 million (2015 – $28.7 million) on copper and gold derivative contracts related to payable copper and gold sold in the period, which were recorded in other expense (income) in the consolidated statements of loss. Included in revenue were unfavourable metal price adjustments on provisionally priced sales of $2.1 million (2015 – $3.3 million) and favourable metal price adjustments on provisionally priced sales of $3.1 million (2015 – unfavourable adjustments of $14.0 million) during the fourth quarter and twelve months of 2016, respectively. These adjustments were offset by hedge gains or losses on cash settled derivative contracts entered to mitigate the metal price exposure associated with the time lag between the provisional and final determination of concentrate sales (“QP Hedges”). These QP Hedge gains or losses were recorded in other expense (income) in the consolidated statements of loss. The average realized gold price, including realized hedging losses and gains, for the fourth quarter and twelve months of 2016 was $1,193 per ounce and $1,244 per ounce, respectively, up 7% compared to each of the corresponding periods in 2015. The average realized copper price, including realized hedging losses and gains, for the fourth quarter and twelve months of 2016 was $2.35 per pound and $2.31 per pound, respectively, down 25% and 27% compared to the corresponding periods in 2015. Realized gold and copper prices are not defined measures under GAAP. Refer to the “Non-GAAP Financial Measures” section of this MD&A for reconciliations to IFRS.

MANAGEMENT’S DISCUSSION AND ANALYSIS
14 | DUNDEE PRECIOUS METALS INC.
Cost of sales from continuing operations Cost of sales in the fourth quarter and twelve months of 2016 of $69.0 million and $258.0 million, respectively, was $9.7 million and $31.9 million higher than the corresponding periods in 2015 due primarily to higher depreciation related to the new acid plant and copper converters, and local currency operating expenses related to contractors, consumables, labour and electricity at Tsumeb, and additional expenses related to the acid plant running for 12 months in 2016 versus three months in 2015, which were partially offset by the favourable impact of a stronger U.S. dollar in 2016 relative to 2015.
All-in sustaining cost per ounce of gold from continuing operations
All-in sustaining cost per ounce of gold in the fourth quarter of 2016 of $602 was $26 lower than the corresponding period in 2015. This decrease was due primarily to lower cash outlays for sustaining expenditures, lower treatment charges and transportation costs, and higher volumes of payable gold in concentrate sold, partially offset by a 25% decrease in realized copper prices. All-in sustaining cost per ounce of gold in 2016 of $738 was $246 higher than 2015 due primarily to a 27% decrease in realized copper prices, resulting in an increase in cash cost per ounce of approximately $305, partially offset by lower transportation costs. Cash cost per tonne of complex concentrate smelted, net of by-product credits Cash cost per tonne of complex concentrate smelted, net of by-product credits, during the fourth quarter and twelve months of 2016 of $369 and $440, respectively, was 10% and 5% higher than the corresponding periods in 2015 due primarily to higher local currency operating costs related to contractors, consumables, labour and electricity, partially offset by a weaker ZAR in 2016 relative to 2015. The unplanned 21 day shutdown in 2016 had the effect of increasing cash cost by approximately $24 per tonne.
Impairment charges As at December 31, 2016, the Company assessed the recoverable amount of each of its cash generating units (“CGUs”) as a result of the market capitalization of its shares being less than their carrying value. Based on this assessment, the carrying values of all CGUs were considered to be recoverable with the exception of Tsumeb.
Tsumeb impairment
As at December 31, 2016, the carrying value of Tsumeb exceeded its estimated recoverable amount resulting in an impairment charge of $107.0 million being recognized in the consolidated statements of loss, of which $102.9 million related to property, plant and equipment and $4.1 million related to intangible assets. This impairment charge was primarily attributable to lower forecast third party toll rates and lower forecast volumes related to a slower ramp-up of throughput to 370,000 tonnes per year. Tsumeb’s recoverable amount of $266 million as at December 31, 2016 was determined using fair value less cost of disposal (“FVLCD”), which was calculated based on projected future cash flows utilizing the latest information available and management’s estimates, including throughput, toll rates, which were based on historical terms received and the Company’s knowledge of the complex concentrate market, operating costs, capital expenditures and foreign exchange rates. These projected cash flows were prepared in current dollars and discounted using a real discount rate of 10.3%, representing the estimated weighted average real cost of capital. This rate was estimated based on the Capital Asset Pricing Model where the costs of equity and debt were based on, among other things, estimated interest rates, market returns on equity, share volatility, leverage and risks specific to the mining sector and Tsumeb. Sensitivities
The projected cash flows and estimated FVLCD can be affected by any one or more changes in the estimates used. Changes in volumes of concentrate smelted, third party toll rates and operating costs have the greatest impact on value, where a 5% change in volumes, third party toll rates, or operating costs would each change FVLCD by approximately $38 million to $44 million. If Tsumeb were to continue to operate at current production levels and not proceed with its expansion, there would be a further impairment charge.

MANAGEMENT’S DISCUSSION AND ANALYSIS
15 | DUNDEE PRECIOUS METALS INC.
Other impairments on property, plant and equipment During the year ended December 31, 2016, Tsumeb also recognized an $11.2 million impairment charge reflecting management’s decision to discontinue producing arsenic trioxide, a by-product of the Tsumeb smelter process, by the end of the first quarter of 2017. During the fourth quarter and twelve months of 2016, Chelopech recognized a $7.7 million impairment charge on certain equipment that it does not expect to use. These impairment charges, as summarized in the table below, were recognized in the consolidated statements of loss for the years ended December 31, 2016, and reduced carrying values to their estimated fair values as at December 31, 2016. $ thousandsEnded December 31,
Three Months Twelve Months2016 2015 2016 2015
Impairment charges on exploration and evaluation assets - -
- 803
Impairment charges on property, plant and equipment 111,098 52
122,232 60
Impairment charges on intangible assets 4,107 - 4,107 42 Total impairment charges 115,205 52 126,339 905
Other income (expense) from continuing operations Other income (expense) is comprised of any realized gains or losses from the sales of certain publicly traded securities, foreign exchange translation gains or losses, unrealized gains or losses on Sabina Gold and Silver Corp. (“Sabina”) special warrants, gains or losses on commodity swap and option contracts, gains or losses on the forward point component of the forward foreign exchange contracts and impairment charges on financial assets. The commodity swap and option contracts and the forward point component of the forward foreign exchange contracts, which are effective hedges from an economic perspective, are deemed not to be effective from an accounting perspective, and therefore do not receive hedge accounting treatment. As a result, unrealized gains or losses on these contracts are included in other income (expense). The following table summarizes the items making up other income (expense) from continuing operations: $ thousandsEnded December 31,
Three Months Twelve Months2016 2015 2016 2015
Net (losses) gains on Sabina special warrants (814) 667
557 278
Net gains (losses) on commodity swap and option contracts 3,363 10,200
(5,922) 33,291
Net gains on forward foreign exchange contracts 1,078 2,120
4,639 4,670
Net gains on equity settled warrants - 493 - 3,100 Impairment charges on publicly traded
securities -
(12)
(24)
(654) Net foreign exchange (losses) gains (218) (343) (3,037) 2,027 Interest income 70 54 239 211 Other expense, net (388) (280) (2,090) (1,230) Total other income (expense) 3,091 12,899 (5,638) 41,693
During the fourth quarter and twelve months of 2016, the Company reported unrealized gains on commodity swap and option contracts related to continuing operations of $2.5 million (2015 – unrealized losses of $4.3million) and unrealized losses of $5.0 million (2015 – $10.5 million), respectively. The Company also reported realized gains on the settlement of certain commodity swap contracts related to continuing operations of $0.9

MANAGEMENT’S DISCUSSION AND ANALYSIS
16 | DUNDEE PRECIOUS METALS INC.
million (2015 – $14.5 million) and realized losses of $0.9 million (2015 – realized gains of $43.8 million) during the fourth quarter and twelve months of 2016, respectively. Income tax expense
The effective tax rate of the Company can vary significantly from one period to the next based on a number of factors. For the three and twelve months ended December 31, 2016 and 2015, the Company’s effective tax rate was impacted primarily by the Company’s amount of earnings and losses, mix of foreign earnings and losses, which are subject to lower tax rates in certain jurisdictions, and unrecognized tax benefits relating to the corporate operating, exploration and development costs.
Net (loss) earnings attributable to common shareholders from continuing operations In the fourth quarter of 2016, the Company reported a net loss attributable to common shareholders from continuing operations of $107.5 million compared to $0.9 million in the corresponding period in 2015. The higher loss was due primarily to impairment charges of $115.2 million, including $107.0 million in respect of Tsumeb, a 25% decrease in realized copper prices, higher local currency operating expenses and depreciation at Tsumeb and lower toll rates at Tsumeb. These unfavourable variances were partially offset by lower deductions for treatment charges and transportation costs at Chelopech, higher volumes of payable gold in concentrate sold, a 7% increase in realized gold prices, and higher volumes of complex concentrate smelted and reduced deductions for estimated metals exposure at Tsumeb. In 2016, the Company reported a net loss attributable to common shareholders of $150.0 million compared to net earnings of $2.8 million in 2015. This loss was due primarily to impairment charges of $126.3 million, including $118.2 million in respect of Tsumeb, a 27% decrease in realized copper prices, higher local currency operating expenses and depreciation at Tsumeb, and higher general and administrative, exploration and finance costs. These unfavourable variances were partially offset by reduced deductions for estimated metals exposure at Tsumeb, lower transportation costs for Chelopech, a stronger U.S. dollar relative to the ZAR and a 7% increase in realized gold prices. Net loss attributable to common shareholders from continuing operations for the fourth quarter and twelve months of 2016 was impacted by net after-tax losses of $113.1 million (2015 – $0.1 million) and $127.6 million (2015 – $2.2 million), respectively, related to several items not reflective of the Company’s underlying operating performance, including impairment charges on property, plant and equipment and certain intangible assets, unrealized gains and losses on commodity swap and option contracts entered into to hedge a portion of future production, unrealized losses and gains on the forward point component of the forward foreign exchange contracts entered to hedge a portion of foreign denominated operating costs, and net gains and losses on Sabina special warrants, each of which are excluded from adjusted net earnings (loss). Adjusted net earnings (loss) from continuing operations
Adjusted net earnings from continuing operations in the fourth quarter of 2016 was $5.7 million compared to an adjusted net loss of $0.8 million in the fourth quarter of 2015. Adjusted net loss from continuing operations in 2016 was $22.4 million compared to adjusted net earnings of $5.0 million in 2015. Adjusted net earnings (loss) from continuing operations were impacted by the same factors affecting net (loss)
$ thousandsEnded December 31, 2016 2016 2015 2016 2015
(Loss) earnings before income taxesfrom continuing operations (106,230) (380) (146,929) 7,554
Combined Canadian federal and provincialstatutory income tax rates 26.5% 26.5% 26.5% 26.5%
Expected income tax (recovery) expense (28,151) (101) (38,936) 2,002 Lower rates on foreign losses (earnings) 27,934 (1,101) 34,378 (4,974) Unrecognized tax benefits relating to losses 271 1,035 7,048 7,398 Non-deductible portion of capital losses 687 192 433 1,003 Non-deductible share based compensation expense 69 99 400 522 Other, net 563 483 330 (156) Income tax expense 1,373 607 3,653 5,795 Effective income tax rates (1.3%) (159.7%) (2.5%) 76.7%
Three Months Twelve Months

MANAGEMENT’S DISCUSSION AND ANALYSIS
17 | DUNDEE PRECIOUS METALS INC.
earnings attributable to common shareholders from continuing operations, except for impairment charges, net gains and losses on Sabina special warrants, unrealized losses and gains on the forward point component of the forward foreign exchange contracts entered to hedge a portion of foreign denominated operating costs, and unrealized gains and losses on commodity swap and option contracts entered to hedge a portion of future production, each of which are excluded from adjusted net earnings (loss) from continuing operations.
The following table summarizes the key drivers affecting the change in adjusted net earnings (loss) from continuing operations:
1) Includes gains and losses on commodity swap contracts, except unrealized gains and losses on commodity swap and option contracts related to
projected payable production, and metal price adjustments related to provisionally priced sales. 2) Excludes impact of depreciation and foreign exchange. 3) Reflects higher copper concentrate deliveries to Xiangguang Copper Co. (“XGC”) and lower deliveries to Tsumeb in the fourth quarter of 2016
relative to the corresponding period in 2015, resulting in lower overall treatment charges at Chelopech. 4) Reflects the favourable impact of higher gold grades in copper concentrate sold in the fourth quarter of 2016 relative to the corresponding period in
2015. 5) Includes net realized gains and losses on forward foreign exchange contracts.
Adjusted EBITDA from continuing operations
Adjusted EBITDA in the fourth quarter and twelve months of 2016 was $30.2 million and $73.0 million, respectively, compared to $22.1 million and $84.7 million in the corresponding periods in 2015. These variances were due to the same factors affecting adjusted net earnings (loss), except for depreciation, interest and income taxes, which are excluded from adjusted EBITDA. The following table shows the adjusted EBITDA from continuing operations by segment: $ thousandsEnded December 31,
Three Months Twelve Months2016 2015 2016 2015
Chelopech 28,557 17,553 87,299 99,128 Tsumeb 6,612 8,498 9,687 6,830 Corporate & Other (4,961) (3,966) (24,014) (21,232) Total adjusted EBITDA 30,208 22,085 72,972 84,726
The Corporate and Other Segment includes corporate general and administrative costs, corporate social responsibility expenses, exploration and development projects, and other income and cost items that do not pertain directly to an operating segment. Refer to the “Review of Operating Results by Segment from Continuing Operations” section of this MD&A for a more detailed discussion of Chelopech, Tsumeb and Corporate & Other results.
($ millions)
Ended December 31,Adjusted net (loss) earnings - 2015 (0.8) 5.0 Lower metal prices (1) (4.9) (22.0)Higher depreciation (1.7) (15.3)Higher smelter local currency operating costs (2) (4.8) (14.1)Lower (higher) general and administrative, exploration and finance costs 0.5 (4.2)Other (0.6) (3.4)Lower treatment charges (3) 7.0 0.5 Higher volumes of complex concentrate smelted 4.2 1.5 Higher volumes of metals sold (4) 4.6 2.4 (Lower) higher toll rates at Tsumeb (4.6) 3.0 Stronger U.S. dollar (5) 0.6 7.4 Lower transportation costs 2.7 7.9 Reduced metals exposure, net of increased stockpile interest 3.5 8.9 Adjusted net earnings (loss) - 2016 5.7 (22.4)
Three Months
Twelve Months
MANAGEMENT’S DISCUSSION AND ANALYSIS
18 | DUNDEE PRECIOUS METALS INC.
Net loss from discontinued operations Net loss from the discontinued Kapan operation in the fourth quarter of 2016 was $2.5 million compared to $47.7 million in the corresponding period in 2015. Net loss from discontinued operations in 2016 was $1.6 million compared to $49.8 million in the corresponding period in 2015. Refer to the “Review of Operating Results from Discontinued Operations” section of this MD&A for a more detailed discussion of the Kapan Disposition and results of discontinued operations.
Cash provided from operating activities of continuing operations Cash provided from operating activities in the fourth quarter of 2016 was $15.7 million compared to $29.2million in the corresponding period in 2015. This decrease was due primarily to unfavourable changes in non-cash working capital. Cash provided from operating activities in 2016 was $84.1 million compared to $77.3 million in the corresponding period in 2015. This increase was due primarily to proceeds from the prepaid forward sales of gold of $50.0 million and higher realized gold prices, partially offset by unfavourable changes in non-cash working capital and lower realized copper prices. In September 2016, the Company entered into a prepaid forward gold sales arrangement with several of DPM’s existing lenders whereby the Company will deliver 45,982 ounces of gold on specified dates over a 21-month period commencing in May 2019 in exchange for an upfront cash prepayment of $50.0 million. Deliveries of gold will be in the form of unallocated gold credits sourced from any of the Company’s own mines over 21 months during 2019 and 2020. The cash prepayment of $50.0 million was recorded as deferred revenue in the consolidated statements of financial position, and will be recognized as revenue when deliveries are made under the prepaid forward gold sales arrangement. The unfavourable change in non-cash working capital in the fourth quarter of 2016 of $9.1 million was due primarily to an increase in accounts receivable and a decrease in accounts payable and accrued liabilities, in each case as a result of timing, partially offset by a decrease in inventories. The favourable change in non-cash working capital in the fourth quarter of 2015 of $6.9 million was due primarily to a decrease in accounts receivable as a result of the timing of receipts from customers, partially offset by an increase in inventories.
The unfavourable change in non-cash working capital in 2016 of $38.0 million was due primarily to an increase in accounts receivable as a result of the timing of receipts from customers, a decrease in accounts payable and accrued liabilities as a result of the timing associated with supplier payments and a reduced fair value loss on outstanding forward foreign exchange contracts, and an increase in inventories as a result of the timing of deliveries. The unfavourable change in non-cash working capital in 2015 of $1.6 million was due primarily to a decrease in accounts payable and accrued liabilities, and an increase in inventories, partially offset by a decrease in accounts receivables. Cash provided from operating activities, before changes in non-cash working capital, during the fourth quarter and twelve months of 2016 was $24.8 million and $122.1 million, respectively, compared to $22.3million and $78.9 million in the corresponding periods in 2015.
Free cash flow from continuing operations
Free cash flow in the fourth quarter and twelve months of 2016 was $11.1 million and $74.9 million, respectively, compared to $2.4 million and $32.9 million in the corresponding periods in 2015. These increases were due primarily to the same factors affecting adjusted cash flow from operations, except for changes in non-cash working capital which are excluded from free cash flow, partially offset by higher cash outlays for sustaining capital expenditures in 2016 relative to 2015. Capital expenditures from continuing operations
Capital expenditures during the fourth quarter and twelve months of 2016 totaled $14.1 million and $50.9 million, respectively, compared to $18.5 million and $77.7 million in the corresponding periods in 2015. Growth capital expenditures during the fourth quarter and twelve months of 2016 were $9.6 million and $29.6 million, respectively, compared to $8.7 million and $53.9 million in the corresponding periods in 2015. The year over year decrease was due primarily to lower spending on the acid plant and new copper converters

MANAGEMENT’S DISCUSSION AND ANALYSIS
19 | DUNDEE PRECIOUS METALS INC.
at Tsumeb. Sustaining capital expenditures during the fourth quarter and twelve months of 2016 were $4.5 million and $21.3 million, respectively, compared to $9.8 million and $23.8 million in the corresponding periods in 2015. 2016 ACTUAL RESULTS COMPARISON TO ORIGINAL GUIDANCE As a result of the Kapan Disposition, which occurred in April 2016, the Company revised its original guidance issued in February 2016 to reflect only four months of operation for Kapan. The following table provides a comparison of the Company’s 2016 results to this revised guidance.
US$ millions, unless otherwise indicated Guidance(1) 2016 Results Ore mined/milled (‘000s tonnes) 2,165 – 2,395 2,343 / 2,342 Complex concentrate smelted (‘000s tonnes) 215 – 250 200 Metals contained in copper and zinc concentrates produced(2),(3)
Gold (‘000s ounces) 101 – 115 125 Copper (million pounds) 33.8 – 38.6 39.2 Zinc (million pounds) 2.8 – 3.2 2.8 Silver (‘000s ounces) 319 – 354 339
Payable gold in pyrite concentrate sold (‘000s ounces) 26 – 40 31 Cash cost per tonne of ore processed ($)(4),(5) 32 – 36 33 Cash cost per ounce of gold sold, net of by-product
credits ($)(2),(4),(5) 560 – 760 562
All-in sustaining cost per ounce of gold ($)(2),(4),(5) 800 – 950 738 Cash production cost per tonne of complex concentrate
smelted, net of by-product credits ($)(4) 305 – 400 440
Cash cost per ounce of gold sold in pyrite concentrate ($)(4)
790 – 890 776
General & administrative expenses 17 – 21 18 Exploration expenses 5 – 6 6 Sustaining capital expenditures 22 – 28 21 Growth capital expenditures 27– 31 30
1) Reflects original guidance updated in May 2016 to reflect Kapan Disposition. 2016 guidance was subsequently updated during the year. 2) Excludes metals in pyrite concentrate and, where applicable, the treatment charges, transportation and other selling costs related to the sale of pyrite
concentrate, which is reported separately. 3) Metals contained in concentrate produced are prior to deductions associated with smelter terms. 4) Cash cost per tonne of ore processed, cash cost per ounce of gold sold, net of by-product credits, all-in sustaining cost per ounce of gold, cash cost
per tonne of complex concentrate smelted, net of by-product credits, and cash cost per ounce of gold sold in pyrite concentrate have no standardized meaning under GAAP. Refer to the “Non-GAAP Financial Measures” section of this MD&A for reconciliations to IFRS.
5) Information relates to continuing operations.
Chelopech achieved or outperformed its original guidance.
Performance of the smelter in 2016 was significantly impacted by a 21 day unplanned shutdown of the Ausmelt furnace following a regional power outage in July 2016, which reduced throughput by approximately 14,000 tonnes, and post commissioning issues related to the installation of the acid plant and new copper converters, which contributed to an 8,000 tonne shortfall relative to targeted performance. The unplanned 21 day shutdown had the effect of increasing cash cost by approximately $24 per tonne in 2016.

MANAGEMENT’S DISCUSSION AND ANALYSIS
20 | DUNDEE PRECIOUS METALS INC.
2017 GUIDANCE The information contained in this section of the MD&A contains forward looking statements that are based on certain estimates and assumptions and involve risks and uncertainties. Actual results may vary materially from management’s expectations. See the “Cautionary Note Regarding Forward Looking Statements” and “Risks and Uncertainties” sections later in this MD&A for further information.
The Company’s guidance for 2017 is set out in the following table.
U.S. millions, unless otherwise indicated Chelopech TsumebConsolidated
Guidance(5)
Ore mined/milled (‘000s tonnes) 2,040 – 2,200 - 2,040 – 2,200 Complex concentrate smelted (‘000s tonnes) - 210 – 240 210 – 240 Metals contained in concentrates produced(1),(2)
Gold (‘000s ounces) 157 – 174 - 157 – 174 Copper (million pounds) 33.7 – 37.0 - 33.7 – 37.0
Payable metals in concentrates sold(1) Gold (‘000s) 135 – 150 - 135 – 150 Copper (million pounds) 32.0 – 35.0 - 32.0 – 35.0
Cash cost per tonne of ore processed ($)(3),(4) 32 – 36 - 32 – 36 Cash cost per ounce of gold sold, net of by-
product credits ($)(3),(4),(5) 670 - 810 - 670 – 810
All-in sustaining cost per ounce of gold ($)(3),(4),(5)
- - 840 – 965
Cash cost per tonne of complex concentrate smelted, net of by-product credits ($)(3),(4)
- 400 – 485 400 – 485
General & administrative expenses(3),(6) - - 18 – 22 Exploration expenses(3) - - 7 – 9 Sustaining capital expenditures(3) 13 – 15 12 – 17 25 – 32
1) Includes gold in pyrite concentrate produced of 42,000 to 47,000 ounces and payable gold in pyrite concentrate sold of 27,000 to 30,000 ounces. 2) Metals contained in concentrate produced are prior to deductions associated with smelter terms. 3) Based on foreign exchange rates and, where applicable, metal prices that approximate current rates and prices. The assumed copper price reflects
the impact of 92% of 2017 payable copper production being hedged at $2.40 per pound. 4) Cash cost per tonne of ore processed, cash cost per ounce of gold sold, net of by-product credits, all-in sustaining cost per ounce of gold and cash
cost per tonne of complex concentrate smelted, net of by-product credits, have no standardized meaning under GAAP. Refer to the “Non-GAAP Financial Measures” section of this MD&A for reconciliations to IFRS.
5) Includes the treatment charges, transportation and other selling costs related to the sale of pyrite concentrate, and payable gold in pyrite concentrate sold. Cash cost per ounce of gold sold, net of by-product credits, excluding payable gold in pyrite concentrate sold and related costs, is expected to range between $640 and $790 in 2017. All-in sustaining cost per ounce of gold, excluding payable gold in pyrite concentrate sold and related costs,is expected to range between $850 and $985 in 2017.
6) Excludes mark-to-market adjustments on share-based compensation.
For 2017, the majority of the Company’s growth capital expenditures(1) are primarily focused on the construction of the Krumovgrad gold project and are expected to range between $116 million and $140 million. The 2017 guidance provided above is not expected to occur evenly throughout the year. The estimated metals contained in concentrates produced and volumes of complex concentrate smelted are expected to vary from quarter to quarter depending on the areas being mined, the timing of concentrate deliveries and planned outages. Production in the second half of 2017 is expected to be higher than the first half based on the existing mine plans at Chelopech and the annual maintenance shutdown at Tsumeb, which started on February 9, 2017 and is expected to take approximately three weeks to complete. This relining was originally scheduled to occur in May, however, increased wear to a section of the lining where converter rather than Ausmelt bricks had to be used last year following the unplanned additional relining, prompted a rescheduling, and will result in Tsumeb being able to take advantage of the earlier than expected installation of matte holding furnaces in the converter aisle, which will be commissioned in March. During this maintenance shutdown, the Ausmelt and converter linings will be replaced and the acid plant will undertake its annual maintenance. As result, all annual maintenance will be completed during this three week period. For 2017, Tsumeb throughput is expected to increase by approximately 5% to 20% over 2016 as a result of increased availability of the Ausmelt furnace, ongoing converter improvement initiatives and the

MANAGEMENT’S DISCUSSION AND ANALYSIS
21 | DUNDEE PRECIOUS METALS INC.
introduction of matte holding furnaces in the second quarter of 2017 at a capital cost of approximately $2 million. The rate of capital expenditures is also expected to vary from quarter to quarter based on the schedule for, and execution of, each capital project.

MANAGEMENT’S DISCUSSION AND ANALYSIS
22 | DUNDEE PRECIOUS METALS INC.
REVIEW OF OPERATING RESULTS BY SEGMENT FROM CONTINUING OPERATIONS
Chelopech – Key Operational and Financial Highlights $ thousands, unless otherwise indicated Three Months Twelve MonthsEnded December 31, 2016 2015(11) 2016 2015(11) Operational Highlights Ore mined (mt) 544,250 516,705 2,211,814 2,039,921 Ore processed (mt) 547,017 515,397 2,212,340 2,052,138 Head grade / Recoveries in copper concentrate
(ore milled)
Gold (g/mt) / % 3.42 / 52.4 3.69 / 48.4 3.43 / 48.5 3.70 / 47.0 Copper (%) / % 0.88 / 83.0 1.25 / 80.8 0.98 / 80.5 1.10 / 80.1 Silver (g/mt) / % 7.31 / 39.7 11.29 / 34.5 8.95 / 35.8 10.69 / 34.3
Copper concentrate produced (mt) 25,034 33,015 107,108 113,466 Metals contained in copper concentrate
produced(1):
Gold (ounces) 31,577 29,582 118,428 114,951 Copper (pounds) 8,816,530 11,439,963 38,458,797 39,760,363 Silver (ounces) 51,035 64,592 227,673 242,094
Cash cost per tonne of ore processed ($)(2),(4),(5) 32.63 39.07 32.97 37.14 Cash cost per ounce of gold in copper
concentrate produced ($)(1),(2),(3),(4) 347 360 368 360 Cash cost per pound of copper in copper
concentrate produced ($)(2),(3),(4) 0.68 0.75 0.66 0.78 Copper concentrate delivered (mt) 26,232 30,236 106,752 115,179 Payable metals in copper concentrate sold:
Gold (ounces)(1),(6) 29,119 25,307 107,944 109,981 Copper (pounds)(6) 8,785,929 9,814,078 36,074,302 37,913,492 Silver (ounces)(6) 37,940 51,286 160,537 192,468
Cash cost per ounce of gold sold, net of by-product credits ($)(1),(4),(7),(8) 529 409 562 327
Pyrite concentrate produced (mt) 53,637 61,321 214,775 239,298 Gold contained in pyrite concentrate produced
(ounces) 12,387 13,656 47,237 54,774 Pyrite concentrate delivered (mt) 52,596 57,232 217,872 224,829 Payable gold in pyrite concentrate sold (ounces) 8,140 9,779 31,380 38,156 Cash cost per ounce of gold sold in pyrite
concentrate ($)(4) 651 895 776 919 Financial Highlights Net revenue(9),(10) 45,537 22,578 161,626 131,695 Cost of sales 28,055 27,495 108,180 112,634 Impairment charges 7,707 54 7,641 54 Earnings before income taxes 13,491 4,915 37,761 52,493 Adjusted EBITDA(4) 28,557 17,553 87,299 99,128 Adjusted earnings before income taxes(4) 19,227 8,068 49,887 61,757 Depreciation 9,209 9,276 36,822 36,497 Capital expenditures incurred:
Growth(4) 873 1,270 2,856 5,675 Sustaining(4) 1,907 3,198 10,421 12,793 Total capital expenditures 2,780 4,468 13,277 18,468
1) Excludes metals in pyrite concentrate produced and/or sold, and where applicable, the treatment charges, transportation and other selling costs related to the sale of pyrite concentrate, which is reported separately. Cash cost per ounce of gold sold, net of by-product credits, including payable gold in pyrite concentrate sold and related costs, in the fourth quarter and twelve months of 2016 was $556 and $610, respectively, compared to $545 and $480 in the corresponding periods in 2015.
2) Cash costs are reported in U.S. dollars, although the majority of costs incurred are denominated in non-U.S. dollars, and consist of all production related expenses including mining, processing, services, royalties and general and administrative.
3) Gold and copper are accounted for as co-products. Total cash costs are net of by-product silver sales revenue.4) Refer to the “Non-GAAP Financial Measures” section of this MD&A for reconciliations of these non-GAAP measures.
MANAGEMENT’S DISCUSSION AND ANALYSIS
23 | DUNDEE PRECIOUS METALS INC.
5) Cash cost per tonne of ore processed, excluding royalties, was $29.86 and $30.15 in the fourth quarter and twelve months of 2016, respectively, compared to $36.04 and $34.08 in the corresponding periods in 2015.
6) Represents payable metals in copper concentrate sold based on provisional invoices.7) Cash cost per ounce of gold sold, net of by-product credits, represents cost of sales, less depreciation, amortization and other non-cash expenses, plus treatment
charges, penalties, transportation and other selling costs, less by-product copper and silver revenues, including realized losses and gains on copper swap contracts, divided by the payable gold in copper concentrate sold.
8) Includes realized losses and realized gains on copper swap contracts, entered to hedge a portion of projected payable production, of $0.5 million and $2.6 million during the fourth quarter and twelve months of 2016, respectively, compared to realized gains of $9.2 million and $26.5 million in the corresponding periods in 2015.
9) Net revenue includes the value of payable metals sold, deductions for treatment charges, penalties, transportation and other selling costs, and mark-to-market adjustments and final settlements to reflect any physical and cost adjustments on provisionally priced sales. Net favourable mark-to-market adjustments and final settlements of $2.6 million and $4.8 million were recognized during the fourth quarter and twelve months of 2016, respectively, compared to net unfavourable mark-to-market adjustments and final settlements of $5.7 million and $17.4 million in the corresponding periods in 2015. Deductions during the fourth quarter and twelve months of 2016 were $23.5 million and $100.6 million, respectively, compared to $32.4 million and $118.5 million in the corresponding periods in 2015.
10) Net revenue excludes realized and unrealized gains and losses on commodity swap and option contracts entered to hedge the mark-to-market impacts associated with provisionally priced sales and future production. Under IFRS, these gains and losses are reported in other expense (income).
11) Certain comparative figures have been reclassified as a consequence of several expenses previously classified as general and administrative expenses being classified as operating costs and included in cost of sales to better reflect the operating results of each segment.
Operational Highlights – Chelopech
Ore mined
Ore mined in the fourth quarter and twelve months of 2016 of 544,250 tonnes and 2,211,814 tonnes, respectively, was 5% and 8% higher than the corresponding periods in 2015 due to an increased production rate.
Ore processed Ore processed during the fourth quarter and twelve months of 2016 of 547,017 tonnes and 2,212,340tonnes, respectively, was 6% and 8% higher than the corresponding periods in 2015 as a result of increased ore mined.
Concentrate and metal production Copper concentrate produced during the fourth quarter and twelve months of 2016 of 25,034 tonnes and 107,108 tonnes, respectively, was 24% and 6% lower than the corresponding periods in 2015 due primarily to lower copper grades, partially offset by higher volumes of ore mined and processed. Pyrite concentrate produced during the fourth quarter and twelve months of 2016 of 53,637 tonnes and 214,775 tonnes, respectively, was 13% and 10% lower than the corresponding periods in 2015. These results were in line with the mine plan. Relative to the fourth quarter of 2015, gold contained in copper concentrate produced in the fourth quarter of 2016 increased by 7% to 31,577 ounces, copper production decreased by 23% to 8.8 million pounds and silver production decreased by 21% to 51,035 ounces. The increase in gold production was due primarily to higher recoveries and higher volumes of ore mined and processed, partially offset by lower grades. The decreases in copper and silver production were due primarily to lower grades, partially offset by higher recoveries and higher volumes of ore mined and processed. Relative to 2015, gold contained in copper concentrate produced in 2016 increased by 3% to 118,428 ounces, copper production decreased by 3% to 38.4 million pounds and silver production decreased by 6% to 227,673 ounces. The increase in gold production was due primarily to higher volumes of ore mined and processed and higher gold recoveries, partially offset by lower gold grades. The decreases in copper and silver production were due primarily to lower grades, partially offset by higher volumes of ore mined and processed. Gold contained in pyrite concentrate produced during the fourth quarter and twelve months of 2016 was 12,387 ounces and 47,237 ounces, respectively, compared to 13,656 ounces and 54,774 ounces in the corresponding periods in 2015. These decreases were consistent with the decrease in pyrite concentrate production. Grades can vary period over period depending on the areas being mined. Overall grades achieved in 2016 were consistent with the grades contained in the mine plan.

MANAGEMENT’S DISCUSSION AND ANALYSIS
24 | DUNDEE PRECIOUS METALS INC.
Deliveries Deliveries of copper concentrate during the fourth quarter and twelve months of 2016 of 26,232 tonnes and 106,752 tonnes, respectively, were 13% and 7% lower than the corresponding periods in 2015 due primarily to the decrease in production as a result of lower copper grades, and the timing of shipments. Deliveries of pyrite concentrate in the fourth quarter and twelve months of 2016 of 52,596 tonnes and 217,872 tonnes, respectively, were 8% and 3% lower than the corresponding periods in 2015 due primarily to lower pyrite concentrate production. In the fourth quarter of 2016, payable gold in copper concentrate sold increased by 15% to 29,119 ounces, payable copper decreased by 10% to 8.8 million pounds and payable silver decreased by 26% to 37,940 ounces, in each case, relative to the corresponding period in 2015. The increase in payable gold was due primarily to higher gold production in 2016. The decrease in payable copper was consistent with the decrease in copper concentrate delivered. Payable gold in pyrite concentrate sold in the fourth quarter of 2016 of 8,140 ounces was 17% lower than the corresponding period in 2015 consistent with the decrease in pyrite concentrate produced and delivered. In 2016, payable gold in copper concentrate sold decreased by 2% to 107,944 ounces, payable copper decreased by 5% to 36.1 million pounds and payable silver decreased by 17% to 160,537 ounces, in each case, relative to the corresponding period in 2015. The decrease in payable gold was due primarily to lower copper concentrate delivered, partially offset by higher gold production. The decrease in payable copper was consistent with the decrease in copper concentrate delivered. Payable gold in pyrite concentrate sold in 2016 of 31,380 ounces was 18% lower than 2015 consistent with the decrease in pyrite concentrate produced and delivered.
Inventory Copper concentrate inventory totaled 7,785 tonnes at December 31, 2016, up slightly from 7,429 tonnes at December 31, 2015, reflecting higher 2016 operating rates and the timing of deliveries.
Financial Highlights – Chelopech
Net revenue Net revenue in the fourth quarter of 2016 of $45.5 million was $22.9 million higher than the corresponding period in 2015 due primarily to lower deductions for treatment charges and transportation costs, higher volumes of payable gold in concentrate sold and higher market metal prices, partially offset by lower volumes of payable copper in concentrate sold. Net revenue in the fourth quarter of 2016 excluded realized losses on copper and gold derivative contracts related to payable metals sold in the period of $0.6 million (2015 – realized gains of $10.2 million), which were recorded in other expense (income) in the consolidated statements of loss. Net revenue of $161.6 million in 2016 was $29.9 million higher than 2015 due primarily to favourable mark-to-market price adjustments on provisionally priced sales, higher market gold prices and lower transportation costs, partially offset by lower market copper prices. Net revenue in 2016 excluded realized gains on copper and gold derivative contracts related to payable metals sold in the period of $2.4 million (2015 - $28.7 million), which were recorded in other expense (income) in the consolidated statements of loss. Included in net revenue were unfavourable mark-to-market price adjustments on provisionally priced sales of $2.1 million (2015 – $3.3 million) and favourable mark-to-market price adjustments on provisionally priced sales of $3.1 million (2015 – unfavourable adjustments of $14.0 million) during the fourth quarter and twelve months of 2016, respectively. These adjustments were offset by gains and losses on QP Hedges, which were recorded in other expense (income) in the consolidated statements of loss.
Cost of sales
Cost of sales in the fourth quarter of 2016 of $28.1 million was comparable to the corresponding period in 2015. Cost of sales in 2016 of $108.2 million was $4.5 million lower than 2015 consistent with the decrease in copper concentrate deliveries and ongoing improvement initiatives.

MANAGEMENT’S DISCUSSION AND ANALYSIS
25 | DUNDEE PRECIOUS METALS INC.
Cash cost measures Cash cost per tonne of ore processed in the fourth quarter and twelve months of 2016 of $32.63 and $32.97, respectively, was 16% and 11% lower than the corresponding periods in 2015 due primarily to higher volumes of ore mined and processed, and ongoing improvement activities. Cash cost per ounce of gold sold, net of by-product credits, during the fourth quarter of 2016 of $529 was $120 higher than the corresponding period in 2015. This increase was due primarily to a 25% decrease in realized copper prices, partially offset by lower treatment charges and transportation costs and a lower cost per tonne as a result of higher volumes of ore mined and processed. Cash cost per ounce of gold sold, net of by-product credits, in 2016 of $562 was $235 higher than 2015 due primarily to a 27% decrease in realized copper prices, partially offset by lower transportation costs and a lower cost per tonne as a result of higher volumes of ore mined and processed. Cash cost per ounce of gold sold in pyrite concentrate in the fourth quarter and twelve months of 2016 was $651 and $776, respectively, compared to $895 and $919 in the corresponding periods in 2015. These decreases were due primarily to lower transportation costs. Earnings before income taxes
Earnings before income taxes in the fourth quarter of 2016 of $13.5 million were $8.6 million higher than the corresponding period in 2015 due primarily to lower deductions for treatment charges and transportation costs, higher volumes of payable gold in concentrate sold and a 7% increase in realized gold prices, partially offset by a 25% decrease in realized copper prices and impairment charges on certain equipment. Earnings before income taxes in 2016 of $37.8 million were $14.7 million lower than 2015 due primarily to a 27% decrease in realized copper prices and impairment charges on certain equipment, partially offset by lower transportation costs, a 7% increase in realized gold prices and the favourable impact of higher gold grades in copper concentrate sold in 2016. Impairment charges of $7.7 million, related to certain equipment that Chelopech does not expect to use, were recognized in the fourth quarter and twelve months of 2016. Earnings before income taxes were also impacted by unrealized gains of $1.9 million (2015 – unrealized losses of $3.3 million) and unrealized losses of $4.4 million (2015 – $9.1 million) in the fourth quarter and twelve months of 2016, respectively, on copper and gold derivative contracts related to projected payable production. Adjusted EBITDA
Adjusted EBITDA in the fourth quarter and twelve months of 2016 was $28.6 million and $87.3 million, respectively, compared to $17.6 million and $99.1 million in the corresponding periods in 2015. These variances were due to the same factors affecting earnings before income taxes, except for depreciation, impairment charges and unrealized gains and losses on copper and gold derivative contracts related to projected payable production, which were excluded from adjusted EBITDA as these items are not reflective of Chelopech’s underlying operating performance. Adjusted earnings before income taxes
Adjusted earnings before income taxes in the fourth quarter and twelve months of 2016 were $19.2 million and $49.9 million, respectively, compared to $8.1 million and $61.8 million in the corresponding periods in 2015. Unrealized gains of $1.9 million (2015 – unrealized losses of $3.3 million) and unrealized losses of $4.4 million (2015 – $9.1 million) in the fourth quarter and twelve months of 2016, respectively, on copper and gold derivative contracts related to projected payable production, which were included in earnings before income taxes, were excluded from adjusted earnings before income taxes. Impairment charges of $7.7 million on certain equipment that Chelopech does not expect to use, which were included in earnings before income taxes in the fourth quarter and twelve months of 2016, were also excluded from adjusted earnings before income taxes.
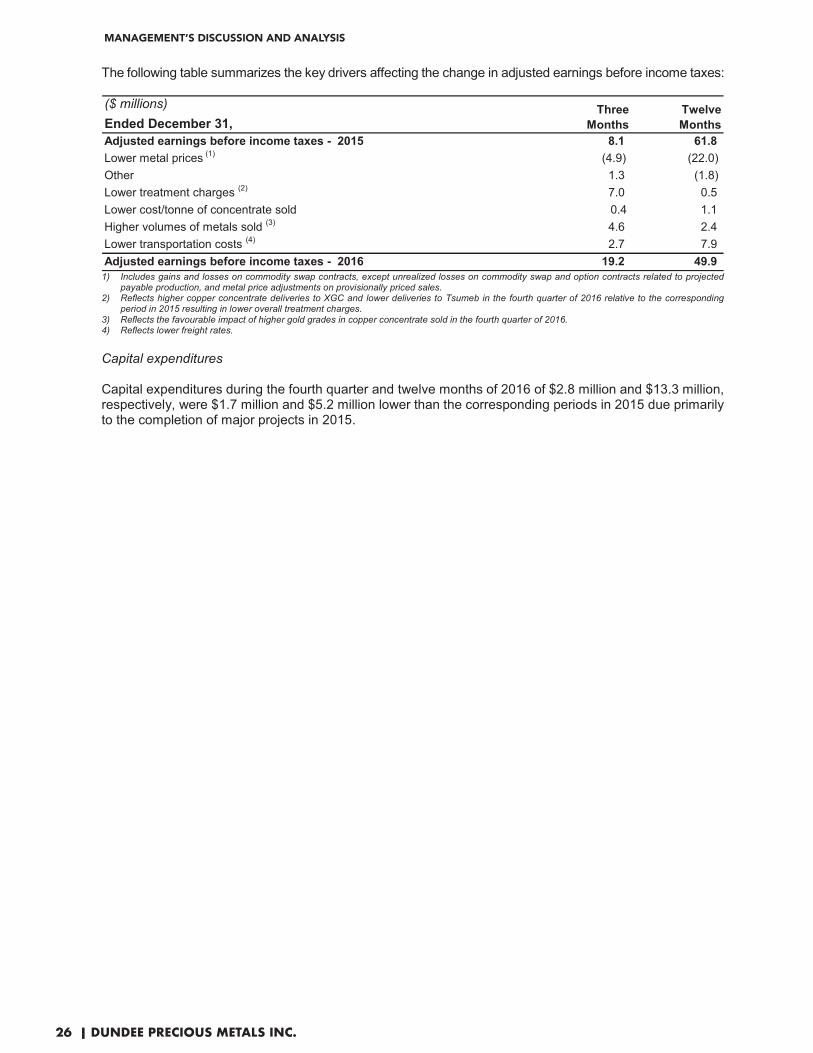
MANAGEMENT’S DISCUSSION AND ANALYSIS
26 | DUNDEE PRECIOUS METALS INC.
The following table summarizes the key drivers affecting the change in adjusted earnings before income taxes:
1) Includes gains and losses on commodity swap contracts, except unrealized losses on commodity swap and option contracts related to projected payable production, and metal price adjustments on provisionally priced sales.
2) Reflects higher copper concentrate deliveries to XGC and lower deliveries to Tsumeb in the fourth quarter of 2016 relative to the corresponding period in 2015 resulting in lower overall treatment charges.
3) Reflects the favourable impact of higher gold grades in copper concentrate sold in the fourth quarter of 2016. 4) Reflects lower freight rates.
Capital expenditures
Capital expenditures during the fourth quarter and twelve months of 2016 of $2.8 million and $13.3 million, respectively, were $1.7 million and $5.2 million lower than the corresponding periods in 2015 due primarily to the completion of major projects in 2015.
($ millions)Ended December 31,Adjusted earnings before income taxes - 2015 8.1 61.8 Lower metal prices (1) (4.9) (22.0)Other 1.3 (1.8)Lower treatment charges (2) 7.0 0.5 Lower cost/tonne of concentrate sold 0.4 1.1 Higher volumes of metals sold (3) 4.6 2.4 Lower transportation costs (4) 2.7 7.9 Adjusted earnings before income taxes - 2016 19.2 49.9
Three Months
Twelve Months
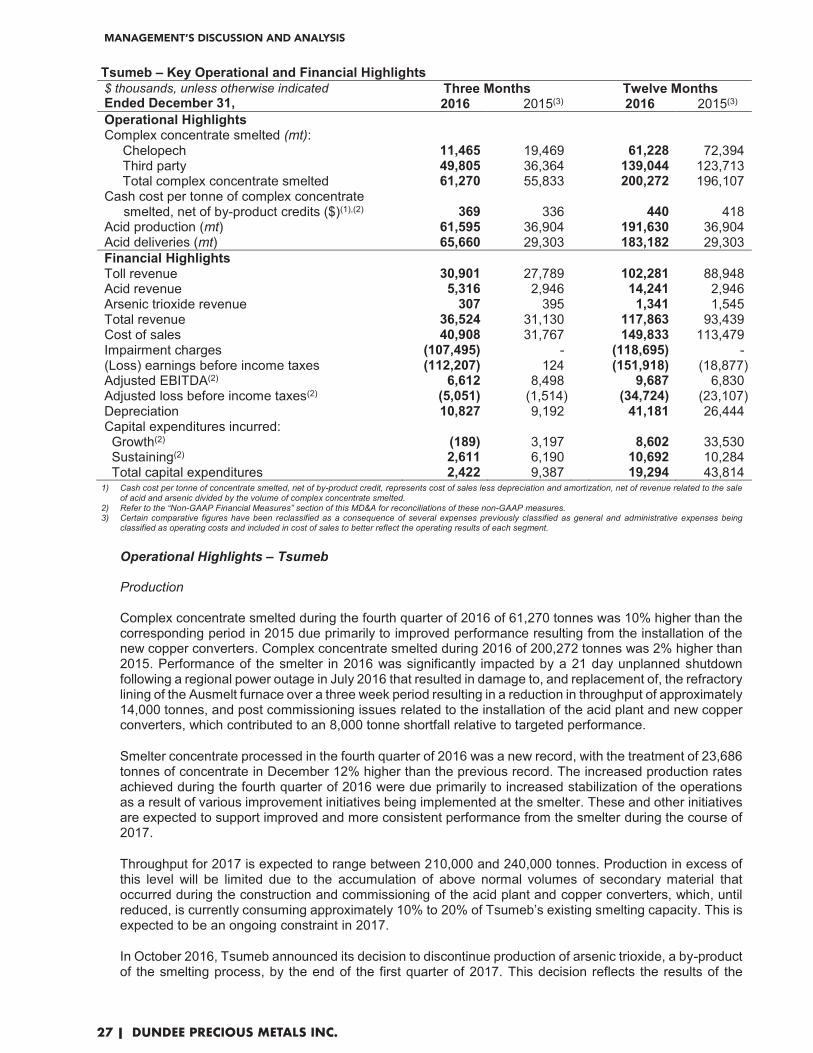
MANAGEMENT’S DISCUSSION AND ANALYSIS
27 | DUNDEE PRECIOUS METALS INC.
Tsumeb – Key Operational and Financial Highlights $ thousands, unless otherwise indicatedEnded December 31,
Three Months2016 2015(3)
Twelve Months2016 2015(3)
Operational Highlights Complex concentrate smelted (mt): Chelopech 11,465 19,469 61,228 72,394 Third party 49,805 36,364 139,044 123,713 Total complex concentrate smelted 61,270 55,833 200,272 196,107 Cash cost per tonne of complex concentrate
smelted, net of by-product credits ($)(1),(2) 369 336
440 418 Acid production (mt) 61,595 36,904 191,630 36,904 Acid deliveries (mt) 65,660 29,303 183,182 29,303 Financial Highlights Toll revenue 30,901 27,789 102,281 88,948 Acid revenue 5,316 2,946 14,241 2,946 Arsenic trioxide revenue 307 395 1,341 1,545 Total revenue 36,524 31,130 117,863 93,439 Cost of sales 40,908 31,767 149,833 113,479 Impairment charges (107,495) - (118,695) - (Loss) earnings before income taxes (112,207) 124 (151,918) (18,877) Adjusted EBITDA(2) 6,612 8,498 9,687 6,830 Adjusted loss before income taxes(2) (5,051) (1,514) (34,724) (23,107) Depreciation 10,827 9,192 41,181 26,444 Capital expenditures incurred: Growth(2) (189) 3,197 8,602 33,530 Sustaining(2) 2,611 6,190 10,692 10,284 Total capital expenditures 2,422 9,387 19,294 43,814
1) Cash cost per tonne of concentrate smelted, net of by-product credit, represents cost of sales less depreciation and amortization, net of revenue related to the sale of acid and arsenic divided by the volume of complex concentrate smelted.
2) Refer to the “Non-GAAP Financial Measures” section of this MD&A for reconciliations of these non-GAAP measures. 3) Certain comparative figures have been reclassified as a consequence of several expenses previously classified as general and administrative expenses being
classified as operating costs and included in cost of sales to better reflect the operating results of each segment.
Operational Highlights – Tsumeb
Production Complex concentrate smelted during the fourth quarter of 2016 of 61,270 tonnes was 10% higher than the corresponding period in 2015 due primarily to improved performance resulting from the installation of the new copper converters. Complex concentrate smelted during 2016 of 200,272 tonnes was 2% higher than 2015. Performance of the smelter in 2016 was significantly impacted by a 21 day unplanned shutdown following a regional power outage in July 2016 that resulted in damage to, and replacement of, the refractory lining of the Ausmelt furnace over a three week period resulting in a reduction in throughput of approximately 14,000 tonnes, and post commissioning issues related to the installation of the acid plant and new copper converters, which contributed to an 8,000 tonne shortfall relative to targeted performance.
Smelter concentrate processed in the fourth quarter of 2016 was a new record, with the treatment of 23,686 tonnes of concentrate in December 12% higher than the previous record. The increased production rates achieved during the fourth quarter of 2016 were due primarily to increased stabilization of the operations as a result of various improvement initiatives being implemented at the smelter. These and other initiatives are expected to support improved and more consistent performance from the smelter during the course of 2017.
Throughput for 2017 is expected to range between 210,000 and 240,000 tonnes. Production in excess of this level will be limited due to the accumulation of above normal volumes of secondary material that occurred during the construction and commissioning of the acid plant and copper converters, which, until reduced, is currently consuming approximately 10% to 20% of Tsumeb’s existing smelting capacity. This is expected to be an ongoing constraint in 2017.
In October 2016, Tsumeb announced its decision to discontinue production of arsenic trioxide, a by-product of the smelting process, by the end of the first quarter of 2017. This decision reflects the results of the

MANAGEMENT’S DISCUSSION AND ANALYSIS
28 | DUNDEE PRECIOUS METALS INC.
Company’s assessment of the arsenic trioxide plant and market, the low returns being generated, and the expectation that additional capital investment would be required to sustain existing production levels. The closure of this plant will also ensure efforts are focused on optimizing and expanding the smelter’s core operations. The Company is continuing to evaluate longer term options to replace the arsenic waste facility, which is expected to reach its capacity in six to eight years.
Financial Highlights - Tsumeb
Net revenue Net revenue in the fourth quarter of 2016 of $36.5 million was $5.4 million higher than the corresponding period in 2015 due primarily to reduced deductions for estimated metals exposure, higher volumes of complex concentrate smelted and acid revenue from the new acid plant, partially offset by lower toll rates. Deliveries of acid in the fourth quarter of 2016 generated revenue of $5.3 million (2015 - $2.9 million). Net revenue in 2016 of $117.9 million was $24.4 million higher than 2015 due primarily to acid revenue from the new acid plant, reduced deductions for estimated metals exposure, higher toll rates and higher volumes of complex concentrate smelted, partially offset by higher stockpile interest deductions. Deliveries of acid in 2016 generated revenue of $14.2 million (2015 - $2.9 million). Secondary materials have remained at elevated levels in 2016. Tsumeb has been focused on stabilizing the operation following the installation of the new copper converters and acid plant. While this activity will continue in 2017, secondary levels are expected to begin declining, and, as a consequence, reduce stockpile interest deductions.
Cost of sales
Cost of sales in the fourth quarter and twelve months of 2016 of $40.9 million and $149.8 million, respectively, was $9.1 million and $36.4 million higher than the corresponding periods in 2015 due primarily to higher depreciation related to the new acid plant and copper converters, additional expenses related to the acid plant which commenced commercial production in the fourth quarter of 2015, and higher local operating expenses related to contractors, consumables, labour and electricity, partially offset by a weaker ZAR in 2016 relative to 2015.
Cash cost per tonne of complex concentrate smelted, net of by-product credits Cash cost per tonne of complex concentrate smelted, net of by-product credits, during the fourth quarter and twelve months of 2016 of $369 and $440, respectively, was 10% and 5% higher than the corresponding periods in 2015 due primarily to higher local currency operating costs related to contractors, consumables, labour and electricity, partially offset by a weaker ZAR in 2016 relative to 2015. The unplanned 21 day shutdown in 2016 had the effect of increasing cash cost by approximately $24 per tonne.
(Loss) earnings before income taxes Loss before income taxes in the fourth quarter of 2016 was $112.2 million compared to net earnings before income taxes of $0.1 million in the corresponding period in 2015. This loss was due primarily to impairment charges of $107.5 million, higher local currency operating expenses, lower toll rates and higher depreciation, partially offset by higher volumes of complex concentrate smelted and reduced deductions for estimated metals exposure. Loss before income taxes in 2016 was $151.9 million compared to $18.9million in 2015. The higher loss was due primarily to impairment charges of $118.7 million, higher local currency operating expenses and higher depreciation, partially offset by a weaker ZAR, reduced deductions for estimated metals exposure, higher toll rates and higher volumes of complex concentrate smelted.
Impairment charges of $107.5 million and $118.7 million were recognized in the fourth quarter and twelve months of 2016, respectively, of which $107.0 million related primarily to lower forecast third party toll rates and reduced volumes related to a slower ramp-up to 370,000 tonnes per year and $11.2 million related to a write-down of Tsumeb’s arsenic plant reflecting management’s third quarter decision to discontinue production of arsenic trioxide.

MANAGEMENT’S DISCUSSION AND ANALYSIS
29 | DUNDEE PRECIOUS METALS INC.
Loss (earnings) before income taxes was also impacted by unrealized losses of $0.2 million (2015 – unrealized gains of $1.6 million) and unrealized gains of $1.0 million (2015 – $4.2 million) on the forward point component of the forward foreign exchange contracts in the fourth quarter twelve months of 2016, respectively.
Adjusted EBITDA Adjusted EBITDA in the fourth quarter and twelve months of 2016 was $6.6 million and $9.7 million, respectively, compared to $8.5 million and $6.8 million in the corresponding periods in 2015. These variances were due primarily to the same factors affecting loss before income taxes, except for depreciation, impairment charges and unrealized gains and losses on the forward point component of the forward foreign exchange contracts, which were excluded from adjusted EBITDA as these items are not reflective of Tsumeb’s underlying operating performance.
Adjusted loss before income taxes
Adjusted loss before income taxes during the fourth quarter and twelve months of 2016 was $5.1 million and $34.7 million, respectively, compared to $1.5 million and $23.1 million in the corresponding periods in 2015. Unrealized losses of $0.2 million (2015 – unrealized gains of $1.6 million) and unrealized gains of $1.0million (2015 – $4.2 million) on the forward point component of the forward foreign exchange contracts, which were included in loss before income taxes in the fourth quarter and twelve months of 2016, respectively, were excluded from adjusted loss before income taxes. Impairment charges of $107.0 million and $118.2 million in the fourth quarter and twelve months of 2016, respectively, as discussed above, which were included in loss before income taxes, were also excluded from adjusted loss before income taxes. The following table summarizes the key drivers affecting the change in adjusted loss before income taxes:
1) Excludes impact of foreign exchange and depreciation. 2) Includes net realized gains and losses on forward foreign exchange contracts. Capital expenditures Capital expenditures during the fourth quarter and twelve months of 2016 were $2.4 million and $19.3million, respectively, compared to $9.4 million and $43.8 million in the corresponding periods in 2015. These decreases were due primarily to lower spending on the acid plant and the new copper converters compared to the corresponding periods in 2015. Refer to the “Development and Other Major Projects” section of this MD&A for a more detailed discussion of Tsumeb’s major capital projects.
($ millions)
Ended December 31,Adjusted loss before income taxes - 2015 (1.5) (23.1)Higher depreciation (1.6) (14.7)Higher operating expenses (1) (4.8) (14.1)Other (0.9) (3.6)Higher stockpile interest (0.7) (1.1)Higher volumes of concentrate smelted 4.2 1.5 (Lower) higher toll rates (4.6) 3.0 Weaker ZAR (2) 0.6 7.4 Reduction in estimated metals exposure 4.2 10.0 Adjusted loss before income taxes - 2016 (5.1) (34.7)
Three Months
Twelve Months

MANAGEMENT’S DISCUSSION AND ANALYSIS
30 | DUNDEE PRECIOUS METALS INC.
REVIEW OF CORPORATE AND OTHER SEGMENT RESULTS
The corporate and other segment results include corporate administrative costs, corporate social responsibility expenses, exploration and development projects, and other income and cost items that do not pertain directly to an operating segment. The following table summarizes the Company’s corporate and other segment results:
1) Excludes impairment charges, net gains and losses on Sabina special warrants, unrealized gains and losses on commodity swap and option contracts entered to hedge a portion of future production and unrealized gains and losses on forward foreign exchange contracts.
2) Certain comparative figures have been reclassified as a consequence of several expenses previously classified as general and administrative expenses being classified as operating costs and included in cost of sales to better reflect the operating results of each segment.
General and administrative expenses General and administrative expenses, excluding depreciation, of $15.4 million in 2016 were $2.0 million higher than the corresponding period in 2015 due primarily to mark-to-market adjustments related to share based compensation.
Exploration expenses
Exploration expenses during the fourth quarter and twelve months of 2016 of $2.0 million and $5.7 million, respectively, were $1.2 million and $1.8 million higher than the corresponding periods in 2015. Refer to the “Exploration” section of this MD&A for a more detailed discussion of the Company’s exploration activities.
$ thousands Three Months Twelve MonthsEnded December 31, 2016 2015(2) 2016 2015(2) Financial Highlights General and administrative expenses,
excluding depreciation (1,809)
(1,855)
(15,394)
(13,440) Corporate social responsibility expenses (656) (1,066) (1,522) (2,275) Exploration expenses (1,970) (800) (5,738) (3,914) Other expense(1) (526) (245) (1,360) (1,603) Adjusted loss before interest, taxes, depreciation and amortization (4,961)
(3,966)
(24,014) (21,232)
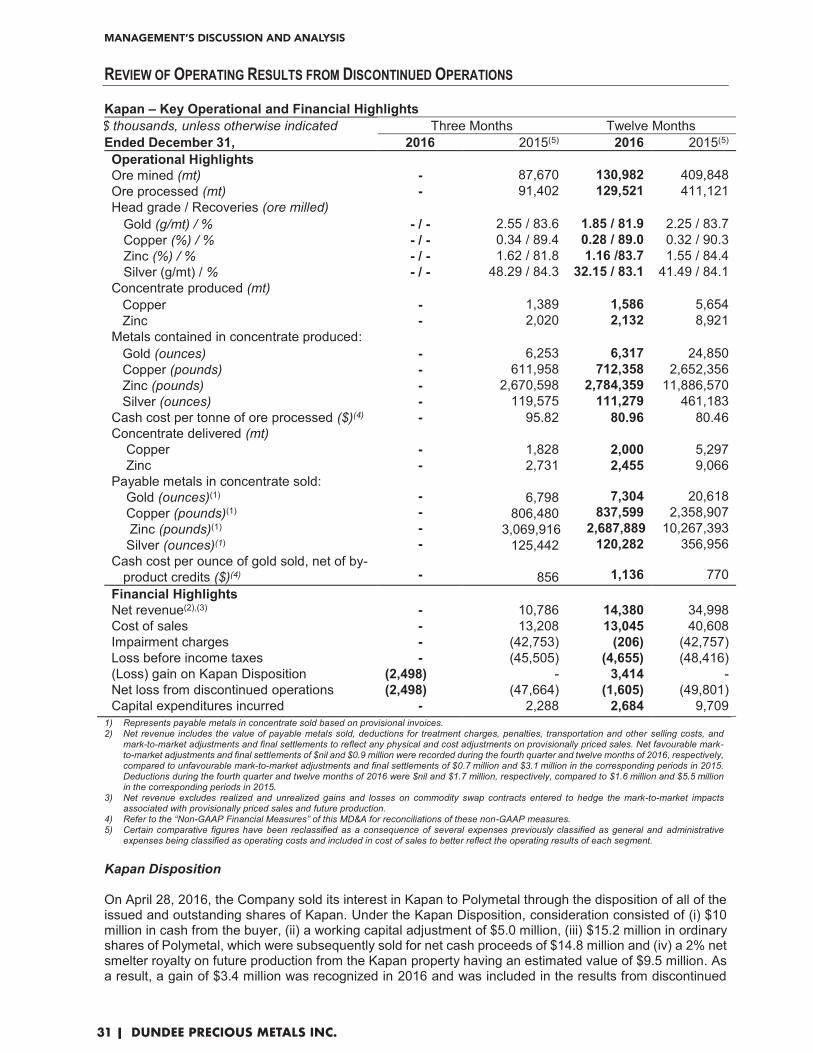
MANAGEMENT’S DISCUSSION AND ANALYSIS
31 | DUNDEE PRECIOUS METALS INC.
REVIEW OF OPERATING RESULTS FROM DISCONTINUED OPERATIONS
Kapan – Key Operational and Financial Highlights $ thousands, unless otherwise indicated Three Months Twelve Months Ended December 31, 2016 2015(5) 2016 2015(5) Operational Highlights Ore mined (mt) - 87,670 130,982 409,848 Ore processed (mt) - 91,402 129,521 411,121 Head grade / Recoveries (ore milled)
Gold (g/mt) / % - / - 2.55 / 83.6 1.85 / 81.9 2.25 / 83.7 Copper (%) / % - / - 0.34 / 89.4 0.28 / 89.0 0.32 / 90.3 Zinc (%) / % - / - 1.62 / 81.8 1.16 /83.7 1.55 / 84.4 Silver (g/mt) / % - / - 48.29 / 84.3 32.15 / 83.1 41.49 / 84.1
Concentrate produced (mt) Copper - 1,389 1,586 5,654 Zinc - 2,020 2,132 8,921 Metals contained in concentrate produced: Gold (ounces) - 6,253 6,317 24,850 Copper (pounds) - 611,958 712,358 2,652,356 Zinc (pounds) - 2,670,598 2,784,359 11,886,570 Silver (ounces) - 119,575 111,279 461,183 Cash cost per tonne of ore processed ($)(4) - 95.82 80.96 80.46 Concentrate delivered (mt) Copper - 1,828 2,000 5,297 Zinc - 2,731 2,455 9,066 Payable metals in concentrate sold: Gold (ounces)(1) - 6,798 7,304 20,618 Copper (pounds)(1) - 806,480 837,599 2,358,907 Zinc (pounds)(1) - 3,069,916 2,687,889 10,267,393 Silver (ounces)(1) - 125,442 120,282 356,956 Cash cost per ounce of gold sold, net of by- product credits ($)(4) -
856
1,136
770
Financial Highlights Net revenue(2),(3) - 10,786 14,380 34,998 Cost of sales - 13,208 13,045 40,608 Impairment charges - (42,753) (206) (42,757) Loss before income taxes - (45,505) (4,655) (48,416) (Loss) gain on Kapan Disposition (2,498) - 3,414 - Net loss from discontinued operations (2,498) (47,664) (1,605) (49,801) Capital expenditures incurred - 2,288 2,684 9,709
1) Represents payable metals in concentrate sold based on provisional invoices.2) Net revenue includes the value of payable metals sold, deductions for treatment charges, penalties, transportation and other selling costs, and
mark-to-market adjustments and final settlements to reflect any physical and cost adjustments on provisionally priced sales. Net favourable mark-to-market adjustments and final settlements of $nil and $0.9 million were recorded during the fourth quarter and twelve months of 2016, respectively,compared to unfavourable mark-to-market adjustments and final settlements of $0.7�million and $3.1�million in the corresponding periods in 2015.Deductions during the fourth quarter and twelve months of 2016 were $nil and $1.7 million, respectively, compared to $1.6�million and $5.5�million in the corresponding periods in 2015.
3) Net revenue excludes realized and unrealized gains and losses on commodity swap contracts entered to hedge the mark-to-market impacts associated with provisionally priced sales and future production.
4) Refer to the “Non-GAAP Financial Measures” of this MD&A for reconciliations of these non-GAAP measures.5) Certain comparative figures have been reclassified as a consequence of several expenses previously classified as general and administrative
expenses being classified as operating costs and included in cost of sales to better reflect the operating results of each segment.
Kapan Disposition
On April 28, 2016, the Company sold its interest in Kapan to Polymetal through the disposition of all of the issued and outstanding shares of Kapan. Under the Kapan Disposition, consideration consisted of (i) $10 million in cash from the buyer, (ii) a working capital adjustment of $5.0 million, (iii) $15.2 million in ordinary shares of Polymetal, which were subsequently sold for net cash proceeds of $14.8 million and (iv) a 2% net smelter royalty on future production from the Kapan property having an estimated value of $9.5 million. As a result, a gain of $3.4 million was recognized in 2016 and was included in the results from discontinued
MANAGEMENT’S DISCUSSION AND ANALYSIS
32 | DUNDEE PRECIOUS METALS INC.
operations. The Kapan Disposition was subject to customary representations, warranties, covenants and indemnities for a transaction of this nature. As a result of the Kapan Disposition, the operating results and cash flows of Kapan have been presented as discontinued operations in the consolidated statements of loss and cash flows for the three and twelve months ended December 31, 2016 and 2015.
Financial Highlights – Kapan
Net revenue from discontinued operations
Net revenue during 2016 was $14.4 million compared to $35.0 million in the corresponding period in 2015 due primarily to lower volumes of payable metals in concentrate sold as a result of the Kapan Disposition. Included in revenue were favourable metal price adjustments on provisionally priced sales of $1.2 million (2015 – unfavourable adjustments of $1.1 million) on provisionally priced sales during 2016. These adjustments were offset by losses or gains on QP Hedges.
Net loss from discontinued operations Net loss from discontinued operations in 2016 was $1.6 million compared to $49.8 million in the corresponding period in 2015. A gain on the Kapan Disposition of $3.4 million was recognized in 2016. As a result of lower metal prices and a slower than anticipated ramp-up of production, an impairment charge of $42.7 million was recognized in net loss from discontinued operations in the fourth quarter and twelve months of 2015. LIQUIDITY AND CAPITAL RESOURCES
As of December 31, 2016, the Company had cash and cash equivalents of $11.8 million, investments at fair value of $19.2 million, and $250 million of undrawn lines of credit under its $275 million committed revolving credit facility (“RCF”). The Company’s liquidity is impacted by several factors which include, but are not limited to, gold, copper and silver market prices, production levels, capital expenditures, operating cash costs, interest rates and foreign exchange rates. These factors are monitored by the Company on a regular basis. At December 31, 2016, the Company’s cash resources and available lines of credit under its RCF continue to provide sufficient liquidity and cash resources to meet its current operating and capital expenditure requirements, as well as all contractual commitments and mandatory principal repayments. The Company may, from time to time, raise additional capital to ensure it maintains its financial strength and has sufficient liquidity to support its discretionary growth capital projects and the overall needs of the business. On January 24, 2017, the Company completed a non-brokered private placement with the EBRD, pursuant to which the Company issued 17,843,120 common shares of the Company at a price of Cdn$2.45 per share for gross proceeds of $33.2 million (Cdn$43.7 million). Proceeds will be used for the construction of the Krumovgrad gold project and will serve to further strengthen the Company’s financial position and flexibility during the construction phase of this project.

MANAGEMENT’S DISCUSSION AND ANALYSIS
33 | DUNDEE PRECIOUS METALS INC.
The following table summarizes the Company’s cash flow activities of continuing operations:
$ thousandsEnded December 31,
Three Months Twelve Months2016 2015 2016 2015
Cash provided from operating activities of continuing operations, before changes in non-cash working capital 24,837
22,300 122,073
78,959 Changes in non-cash working capital (9,137) 6,841 (37,992) (1,674) Cash provided from operating activities of
continuing operations 15,700
29,141 84,081
77,285 Cash used in investing activities of continuing
operations (10,719) (16,209) (20,804)
(66,027)
Cash used in financing activities of continuing operations (55,143)
(5,757) (74,915)
(22,610) (Decrease) increase in cash and cash
equivalents of continuing operations (50,162) 7,175 (11,638)
(11,352)
Cash and cash equivalents of continuing operations, beginning of period 61,919 16,220 23,395
34,747
Cash and cash equivalents of continuing operations, end of period 11,757 23,395 11,757
23,395
Cash and cash equivalents balance of continuing operations at December 31, 2016 of $11.7 million was $11.6 million lower than the corresponding period in 2015. The primary factors impacting these cash flow movements are summarized below.
Operating Activities of Continuing Operations Cash provided from operating activities in the fourth quarter of 2016 was $15.7 million compared to $29.2 million in the corresponding period in 2015. This decrease was due primarily to unfavourable changes in non-cash working capital. Cash provided from operating activities in 2016 was $84.1 million compared to $77.3 million in the corresponding period in 2015. This increase was due primarily to proceeds from the prepaid forward sales of gold of $50.0 million and higher realized gold prices, partially offset by unfavourable changes in non-cash working capital and lower realized copper prices. In September 2016, the Company entered into a prepaid forward gold sales arrangement with several of DPM’s existing lenders whereby the Company will deliver 45,982 ounces of gold on specified dates over a 21-month period commencing in May 2019 in exchange for an upfront cash prepayment of $50.0 million. Deliveries of gold will be in the form of unallocated gold credits sourced from any of the Company’s own mines over 21 months during 2019 and 2020. The cash prepayment of $50.0 million was recorded as deferred revenue in the consolidated statements of financial position, and will be recognized as revenue when deliveries are made under the prepaid forward gold sales arrangement.
The unfavourable change in non-cash working capital in the fourth quarter of 2016 of $9.1 million was due primarily to an increase in accounts receivable and a decrease in accounts payable and accrued liabilities, in each case as a result of timing, partially offset by a decrease in inventories. The favourable change in non-cash working capital in the fourth quarter of 2015 of $6.9 million was due primarily to a decrease in accounts receivable as a result of the timing of receipts from customers, partially offset by an increase in inventories.
The unfavourable change in non-cash working capital in 2016 of $38.0 million was due primarily to an increase in accounts receivable as a result of the timing of receipts from customers, a decrease in accounts payable and accrued liabilities as a result of the timing associated with supplier payments and a reduced fair value loss on outstanding forward foreign exchange contracts, and an increase in inventories as a result of the timing of deliveries. The unfavourable change in non-cash working capital in 2015 of $1.6 million was due primarily to a decrease in accounts payable and accrued liabilities, and an increase in inventories, partially offset by a decrease in accounts receivables.

MANAGEMENT’S DISCUSSION AND ANALYSIS
34 | DUNDEE PRECIOUS METALS INC.
Investing Activities of Continuing Operations
Cash used in investing activities in the fourth quarter and twelve months of 2016 was $10.7 million and $20.8 million, respectively, compared to $16.2 million and $66.0 million in the corresponding periods in 2015. Investing activities for the twelve months of 2016 included upfront proceeds from the Kapan Disposition, which closed on April 28, 2016, of $24.8 million. Additional proceeds related to the working capital adjustment and the net smelter royalty are expected to be received in 2017 and over the life of the Kapan mine, respectively. The following table provides a summary of the Company’s cash outlays for capital expenditures in respect of continuing operations:
$ thousandsEnded December 31,
Three Months Twelve Months2016 2015 2016 2015
Chelopech 1,717 5,258 12,349 14,990 Tsumeb 2,424 6,418 18,109 38,020 Krumovgrad 6,602 4,279 14,764 12,622 Other 63 520 581 838 Total cash capital expenditures of continuing
operations 10,806 16,475 45,803
66,470
Cash outlays for capital expenditures in the fourth quarter and twelve months of 2016 were lower than the corresponding periods in 2015 due primarily to lower spending on the acid plant and copper converters at Tsumeb.
Financing Activities of Continuing Operations
Net cash used in financing activities in the fourth quarter and twelve months of 2016 was $55.1 million and $74.9 million, respectively, compared to $5.8 million and $22.6 million in the corresponding periods in 2015.
On July 11, 2016, the Company completed a bought deal financing with a syndicate of underwriters, pursuant to which the Company issued 18,216,000 common shares of the Company at a price of Cdn$3.00 per share, for aggregate gross proceeds of $41.9 million (Cdn$54.6 million). Concurrent with the Offering, the Company has also completed a Non-Brokered Private Placement of 840,000 common shares of the Company at a price of Cdn$3.00 per share, for additional gross proceeds of $1.9 million (Cdn$2.5 million). Cash proceeds from the Offering and the private placement, net of the share issuance costs of $2.5 million, were $41.3 million. DPM used the net proceeds of the Offering and the private placement to reduce borrowings under the RCF that were incurred to fund the construction of the sulphuric acid plant and the installation of new converters at Tsumeb. Repayments under the RCF in the fourth quarter and twelve months of 2016 were $45.0 million and $90.0 million, respectively, compared to drawdowns of $5.0 million in each of the corresponding periods in 2015.
Scheduled repayments of term-loan debt in the fourth quarter and twelve months of 2016 of $8.1 million and $16.2 million, respectively, were comparable to the corresponding periods in 2015.
Interest paid of $1.4 million and $7.1 million during the fourth quarter and twelve months of 2016, respectively, compared to $2.4 million and $9.4 million in the corresponding periods in 2015. These decreases were due primarily to lower debt levels in 2016.
Repayments of finance lease obligations of $0.4 million and $1.6 million during the fourth quarter and twelve months of 2016, respectively, compared to $0.3 million and $1.6 million in the corresponding periods in 2015.

MANAGEMENT’S DISCUSSION AND ANALYSIS
35 | DUNDEE PRECIOUS METALS INC.
Cash Flows from Discontinued Operations
The following table summarizes the cash flow activities of discontinued operations:
$ thousandsEnded December 31,
Three Months Twelve Months2016 2015 2016 2015
Cash provided from (used in) operating activities of discontinued operations -
3,896
(861)
10,425
Cash used in investing activities of discontinued operations -
(1,982)
(2,314)
(8,795) Increase (decrease) in cash and cash
equivalents of discontinued operations - 1,914
(3,175)
1,630
Cash and cash equivalents of discontinued operations, beginning of period - 1,261
3,175
1,545
Cash and cash equivalents of discontinued operations, end of period - 3,175
-
3,175
Financial Position
$ thousands December December Increase/As at, 31, 2016 31, 2015 (Decrease)Cash and cash equivalents 11,757 26,570 (14,813)Accounts receivable, inventories and other current assets 79,849 80,147 (298)Investments at fair value 19,216 13,911 5,305Non-current assets, excluding investments at fair value 623,130 785,523 (162,393)Total assets 733,952 906,151 (172,199)Current liabilities 58,804 72,738 (13,934)Non-current liabilities 123,121 195,300 (72,179)Equity attributable to common shareholders 551,804 637,457 (85,653)Non-controlling interests 223 656 (433)
Cash and cash equivalents decreased by $14.8 million to $11.8 million in 2016 due primarily to the timing of cash receipts and repayments of drawdowns under the RCF. Accounts receivable, inventories and other current assets decreased by $0.3 million to $79.8 million due primarily to the Kapan Disposition. Partially offset by an increase in accounts receivable from continuing operations, reflecting the timing of payments from customers. Non-current assets, excluding investments at fair value, decreased by $162.4 million to $623.1 million due primarily to the Kapan Disposition, depreciation and impairment charges of $126.3 million recognized in 2016, partially offset by capital expenditures at Chelopech, Tsumeb and Krumovgrad. Current liabilities decreased by $13.9 million to $58.8 million in 2016 due primarily to the Kapan Disposition and a reduced fair value loss on outstanding forward foreign exchange contracts. Non-current liabilities decreased by $72.2 million to $123.1 million in 2016 due primarily to repayments of drawdowns under the RCF and the scheduled principal repayments under the Term Loans, partially offset by an increase in deferred revenue related to the prepaid forward gold sales arrangement. Equity attributable to common shareholders decreased by $85.6 million to $551.8 million due primarily to impairment charges of $126.3 million recognized in 2016, partially offset by proceeds from the Offering.

MANAGEMENT’S DISCUSSION AND ANALYSIS
36 | DUNDEE PRECIOUS METALS INC.
Contractual Obligations The Company has the following minimum contractual obligations as at December 31, 2016: $ thousands up to 1 year 1 – 5 years over 5 years TotalDebt 16,250 25,000 - 41,250Finance lease obligations 3,048 10,848 8,816 22,712Capital commitments 55,677 - - 55,677Purchase obligations 9,884 - - 9,884Operating lease obligations 3,724 15,018 1,340 20,082Other obligations 1,800 451 370 2,621Total contractual obligations 90,383 51,317 10,526 152,226
As at December 31, 2016, Tsumeb had approximately $130 million of third party in-process secondary material, which it is obligated to process and return, generally in the form of blister. This level of secondary material is expected to be reduced by approximately 75% over the course of the next two years.
Debt As at December 31, 2016, the Company’s total debt was $41.3 million, of which $16.3 million related to the Company’s secured term loans (“Term Loans”) and $25.0 million to the Company’s RCF. As at December 31, 2016, the Company’s total debt, as a percentage of total capital, was 7% (December 31, 2015 – 19%) and the Company’s total debt net of cash and cash equivalents, as a percentage of total capital, was 5% (December 31, 2015 – 16%). As at December 31, 2016, the Company was in compliance with all of its debt covenants. Term Loans
The original aggregate principal amount of DPM’s Term Loans was $81.25 million. The Term Loans are repayable in 10 equal semi-annual installments, which commenced in June 2013, and bear interest at a rate equal to the three month U.S. Dollar LIBOR plus 2.80%. The Term Loans are secured by pledges of the Company’s investments in Krumovgrad, Chelopech and Tsumeb and by guarantees from each of these subsidiaries. The Term Loans contain financial covenants (the “Financial Covenants”) that require DPM to maintain: (i) a debt leverage ratio (funded net debt to adjusted EBITDA, as defined in the Term Loans agreement) below 4.0:1 during the construction of the Krumovgrad gold project (below 3.5:1 thereafter), (ii) a current ratio (including the unutilized credit within the $150.0 million tranche of the committed RCF in current assets) of greater than 1.5:1, and (iii) a minimum net worth of $500.0 million plus (minus) 50% of ongoing annual net earnings (losses). As at December 31, 2016, the Term Loans had an outstanding balance of $16.3 million. Credit Agreements and Guarantees
Chelopech and Krumovgrad
Chelopech and Krumovgrad have a $16.0 million multi-purpose credit facility that matures on November 29, 2017. This credit facility is guaranteed by DPM. Advances under the multi-purpose revolving credit facility bear interest at a rate equal to the one month U.S. Dollar LIBOR plus 3.25%. As at December 31, 2016, $4.2 million (December 31, 2015 – $4.1 million) had been utilized against the multi-purpose revolving facility in the form of letters of credit and letters of guarantee. Chelopech also has a Euro 21.0 million ($22.1 million) credit facility to support the Chelopech mine closure and rehabilitation plan. This credit facility matures on December 31, 2017 and is guaranteed by DPM. As at December 31, 2016, $14.6 million (December 31, 2015 - $22.9 million) had been utilized against this credit facility in the form of letters of guarantee, which were posted with the Bulgarian Ministry of Energy.
MANAGEMENT’S DISCUSSION AND ANALYSIS
37 | DUNDEE PRECIOUS METALS INC.
DPM DPM has a committed RCF with a consortium of banks. In February 2015 and April 2016, the RCF was amended to extend the terms of tranche A and tranche B by an additional year. In August 2016, the RCF was further amended to extend the term of tranche C by an additional two years in anticipation of moving forward with the Krumovgrad gold project. As at December 31, 2016, the RCF is comprised of a $45.0 million tranche A maturing in February 2021, a $150.0 million tranche B maturing in February 2019, and an $80.0 million tranche C maturing in September 2021 that has quarterly availability reductions of $4.0 million beginning in the third quarter of 2018. The RCF bears interest at a spread above LIBOR, which varies between 2.75% and 5.50% depending upon the tranche being drawn and the Company’s debt leverage ratio (funded net debt to adjusted EBITDA), as defined in the RCF agreement. The RCF contains the same Financial Covenants and shares in the same security package as the Term Loans. As at December 31, 2016, DPM was in compliance with all financial covenants and $25.0 million was drawn under the RCF.
Outstanding Share Data
DPM’s common shares are traded on the TSX under the symbol DPM. As at February 15, 2017, 178,440,698 common shares were issued and outstanding. In July 2016, the Company completed a bought deal financing with a syndicate of underwriters, pursuant to which the Company issued 18,216,000 common shares of the Company at a price of Cdn$3.00 per share. Concurrent with the Offering, the Company also completed a Non-Brokered Private Placement of 840,000 common shares of the Company at a price of Cdn$3.00 per share. On January 24, 2017, the Company completed a non-brokered private placement with the EBRD, pursuant to which the Company issued 17,843,120 common shares of the Company at a price of Cdn$2.45 per share. DPM also has 5,612,055 stock options outstanding as of the date of this MD&A with exercise prices ranging from Cdn$2.05 to Cdn$10.33 per share (weighted average exercise price – Cdn$4.44 per share). Other
The Company is involved in legal proceedings, from time to time, arising in the ordinary course of its business. It is not expected that any material liability will arise from current legal proceedings or have a material adverse effect on the Company’s future business, operations or financial condition. FINANCIAL INSTRUMENTS Investments at fair value As at December 31, 2016, the Company’s investments at fair value were $19.2 million, the vast majority of which related to the value of its investment in Sabina common shares and special warrants. The fair value of the Sabina Series B special warrants, including significant assumptions, is detailed in note 8(a) to DPM’s consolidated financial statements for the three and twelve months ended December 31, 2016. As at December 31 2016, DPM held: (i) 23,539,713 common shares of Sabina or 10.7% of the outstanding common shares (fair value of Cdn$23.1 million) and (ii) 5,000,000 Series B special warrants, which will be automatically exercised upon a positive production decision with respect to the Back River project or upon the occurrence of certain other events. Each of the special warrants is exercisable into one common share until 2044. As at December 31, 2016, the estimated fair value of the special warrants was $2.0 million (December 31, 2015 - $1.5 million). Refer to the “Risks and Uncertainties” section of this MD&A for a discussion on the risks related to the Company’s investment portfolio.
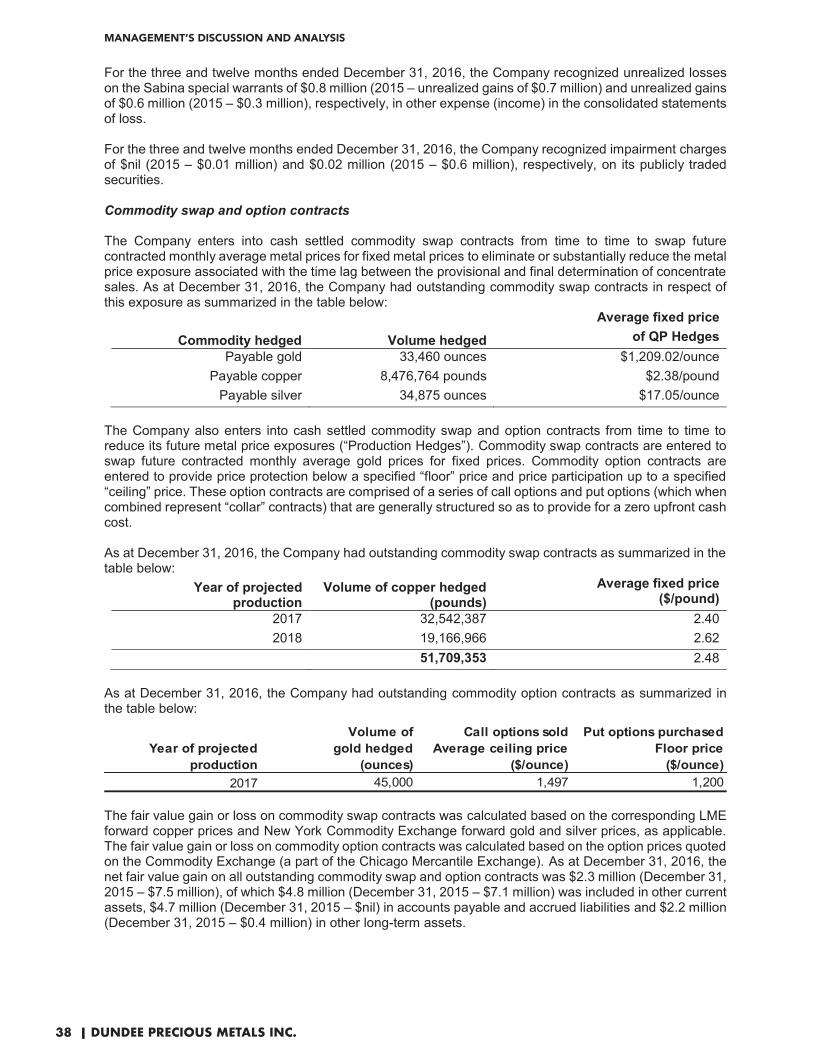
MANAGEMENT’S DISCUSSION AND ANALYSIS
38 | DUNDEE PRECIOUS METALS INC.
For the three and twelve months ended December 31, 2016, the Company recognized unrealized losses on the Sabina special warrants of $0.8 million (2015 – unrealized gains of $0.7 million) and unrealized gains of $0.6 million (2015 – $0.3 million), respectively, in other expense (income) in the consolidated statements of loss.
For the three and twelve months ended December 31, 2016, the Company recognized impairment charges of $nil (2015 – $0.01 million) and $0.02 million (2015 – $0.6 million), respectively, on its publicly traded securities.
Commodity swap and option contracts
The Company enters into cash settled commodity swap contracts from time to time to swap future contracted monthly average metal prices for fixed metal prices to eliminate or substantially reduce the metal price exposure associated with the time lag between the provisional and final determination of concentrate sales. As at December 31, 2016, the Company had outstanding commodity swap contracts in respect of this exposure as summarized in the table below:
Commodity hedged Volume hedged
Average fixed priceof QP Hedges
Payable gold 33,460 ounces $1,209.02/ounce Payable copper 8,476,764 pounds $2.38/pound
Payable silver 34,875 ounces $17.05/ounce The Company also enters into cash settled commodity swap and option contracts from time to time to reduce its future metal price exposures (“Production Hedges”). Commodity swap contracts are entered to swap future contracted monthly average gold prices for fixed prices. Commodity option contracts are entered to provide price protection below a specified “floor” price and price participation up to a specified “ceiling” price. These option contracts are comprised of a series of call options and put options (which when combined represent “collar” contracts) that are generally structured so as to provide for a zero upfront cash cost. As at December 31, 2016, the Company had outstanding commodity swap contracts as summarized in the table below:
Year of projectedproduction
Volume of copper hedged(pounds)
Average fixed price($/pound)
2017 32,542,387 2.40 2018 19,166,966 2.62
51,709,353 2.48 As at December 31, 2016, the Company had outstanding commodity option contracts as summarized in the table below:
Year of projected production
Volume of gold hedged
(ounces)
Call options soldAverage ceiling price
($/ounce)
Put options purchased Floor price
($/ounce)2017 45,000 1,497 1,200
The fair value gain or loss on commodity swap contracts was calculated based on the corresponding LME forward copper prices and New York Commodity Exchange forward gold and silver prices, as applicable. The fair value gain or loss on commodity option contracts was calculated based on the option prices quoted on the Commodity Exchange (a part of the Chicago Mercantile Exchange). As at December 31, 2016, the net fair value gain on all outstanding commodity swap and option contracts was $2.3 million (December 31, 2015 – $7.5 million), of which $4.8 million (December 31, 2015 – $7.1 million) was included in other current assets, $4.7 million (December 31, 2015 – $nil) in accounts payable and accrued liabilities and $2.2 million (December 31, 2015 – $0.4 million) in other long-term assets.

MANAGEMENT’S DISCUSSION AND ANALYSIS
39 | DUNDEE PRECIOUS METALS INC.
For the three and twelve months ended December 31, 2016, the Company reported unrealized gains on commodity swap and option contracts related to continuing operations of $2.5 million (2015 – unrealized losses of $4.3 million) and unrealized losses of $5.0 million (2015 – $10.5 million), respectively, in other expense (income). The Company also reported realized gains on the settlement of certain commodity swap contracts related to continuing operations of $0.9 million (2015 – $14.5 million) and realized losses of $0.9 million (2015 – realized gains of $43.8 million), respectively, in other expense (income) for the three and twelve months ended December 31, 2016. For the three and twelve months ended December 31, 2016, the Company reported unrealized losses of $nil (2015 – $0.1 million) and $0.3 million (2015 – $1.0 million), respectively, on commodity swap contracts related to discontinued operations in net loss from discontinued operations. The Company also reported realized losses on the settlement of certain commodity swap contracts related to discontinued operations of $nil (2015 – realized gains of $1.1 million) and $1.5 million (2015 – realized gains of $3.2 million), respectively, in net loss from discontinued operations for the three and twelve months ended December 31, 2016. Approximately 92% and 53% of the Company’s expected payable copper production for 2017 and 2018, respectively, has been hedged. Approximately 31% of the expected payable gold production for 2017 has been hedged. The Company’s reported (loss) earnings are exposed to unrealized mark-to-market gains and losses from future price movements during the term of the forward sales contracts.
Forward foreign exchange contracts The Company enters into forward foreign exchange contracts from time to time to reduce the foreign exchange exposure associated with projected operating expenses denominated in foreign currencies. All forward foreign exchange contracts the Company has entered into are related to continuing operations. As at December 31, 2016, the Company had outstanding forward foreign exchange contracts in respect of projected foreign denominated operating expenses as summarized in the table below:
Year of projected operating expenses
Foreign currency hedged
Amount hedgedin foreign currency
Average exchange rateForeign currency/US$
2017 Euro 10,800,000 1.1287 ZAR 720,000,000 13.8699
Euro hedges represent approximately 20% of projected Euro operating expenses for 2017. ZAR hedges represent approximately 56% of projected Namibian dollar operating expenses for 2017. The fair value gain or loss on these outstanding contracts was calculated based on the forward foreign exchange rates quoted in the market. As at December 31, 2016, the net fair value loss on all outstanding forward foreign exchange contracts was $2.0 million (December 31, 2015 - $21.3 million), of which $2.0 million (December 31, 2015 - $10.1 million) was included in accounts payable and other accrued liabilities, and $nil million (December 31, 2015 - $11.2 million) in other long-term liabilities. For the three and twelve months ended December 31, 2016, the Company recognized unrealized gains of $0.8 million (2015 – unrealized losses of $10.4 million) and $18.5 million (2015 – unrealized losses of $25.4 million), respectively, in other comprehensive income (loss) on the spot component of the outstanding forward foreign exchange contracts. The Company also recognized realized losses of $1.9 million (2015 – $2.0 million) and $10.2 million (2015 – $2.6 million) for the three and twelve months ended December 31, 2016, respectively, in cost of sales on the spot component of those contracts which have been settled. For the three and twelve months ended December 31, 2016, the Company recognized unrealized losses of $0.2 million (2015 – unrealized gains of $1.8 million) and unrealized gains of $0.9 million (2015 – $4.1 million), respectively, in other expense (income) on the forward point component of the outstanding forward foreign exchange contracts. The Company also recognized realized gains of $1.2 million (2015 – $0.4 million) and $3.7 million (2015 – $0.6 million) for the three and twelve months ended December 31, 2016, respectively, in other expense (income) on the forward point component of those contracts which have been settled.

MANAGEMENT’S DISCUSSION AND ANALYSIS
40 | DUNDEE PRECIOUS METALS INC.
The Company is also exposed to credit and liquidity risks in the event of non-performance by counterparties in connection with its commodity swap and option contracts, and forward foreign exchange contracts. These risks, which are monitored on a regular basis, are mitigated, in part, by entering into transactions with financially sound counterparties, and, where possible, ensuring contracts are governed by legally enforceable master agreements. EXPLORATION Chelopech In 2016, an intensive underground resource development diamond drilling program of 44,294 metres was completed, comprising 21,572 metres of grade control drilling and 22,722 metres of extensional drilling, designed to replace and increase Mineral Resources and Mineral Reserves. The focus of this drilling has been on the ‘Upper Levels’ resource development drilling program, initiated by the Company in mid-2015, to delineate and upgrade Mineral Resources in proximity to the historically mined areas within the Chelopech Mine, above the 390 level. The grades from material in this section of the mine are typically higher grade and are relatively more copper-rich than the average resource grade and were identified as an attractive target for drilling. Key mineralized zones targeted during the year were the upper levels of Blocks 19, 103 and 10. Holes drilled near historical cave zones were subject to a geotechnical assessment to understand the ground conditions for future mining. The highlight of the 2016 drilling program was the discovery of a new mineralization zone, called Zone 153. The new zone is located near existing infrastructure in the upper levels of the mine’s Western Area and was discovered as part of the on-going ‘Upper Levels’ resource development drill program. The discovery is a result of drilling on the 440 level that was targeting mineralization outside of the current Chelopech Mineral Resource inventory. Elsewhere, resource development drilling concentrated on the north-west part of deposit, in particular Block 149 and an area south of it, which was highlighted as a high potential area for adding Mineral Resources. Another area of emphasis was the Block 10 area in the south-east part of the deposit which, based on historic drilling results in combination with structural and geology models, was defined as a high potential target. A detailed review of the 2016 drilling program is discussed below. Central Area The main focus of underground resource development drilling in the Central area of the mine was to replace and to reclassify Mineral Resources as well as to extend known economic mineralization on the upper levels of Block 19, in the zones around and down plunge of Blocks 10 and 17. In total, 6,298 metres were drilled in Block 19 from 17-395. After an initial wide space drilling program, which explored the upper levels of Block 19, closer-spaced drilling continued to the northwest in proximity to historical sub-level cave zones in the second quarter of 2016. This drilling program was designed to improve Mineral Resource confidence in the Block 19 area and, furthermore, was used for a geotechnical assessment to better understand risk in the cave zones before consideration for conversion to Mineral Reserves. As a result, these drill holes, the silica envelope that was earlier defined as a high potential area, and the Mineral Resource contours of Block 19W, were extended between 440 mRL and 370 mRL in a northwest direction (significant intercepts are shown in the table below - see hole EXT19W_400_05, 09). The majority of the year’s grade control drilling was conducted in Block 19 from drilling locations on levels 290 and 350. The drilling program from level 350 was designed to improve Mineral Resource confidence in order to deliver reserves to the life of mine plan between 410 mRL and 310 mRL. Whereas the drilled metres from level 290 aimed to better define the boundaries and the shape of the ore body between 290 mRL and 230 mRL. As a result of 26 holes drilled from level 350 in Block 19 (5,800 metres), Block 19W was extended in a northwest direction between 430 mRL and 310 mRL. Notably for the geologic model, a new steep fault zone was defined (19FZW), which is a potential mineralization control in the western periphery of the block. Significant results are presented in the table below within holes “G19W_350_09”, “G19W_350_11” and “G19W_350_23”. Drilling on the 290 level was designed to check the continuity of mineralization in a north-

MANAGEMENT’S DISCUSSION AND ANALYSIS
41 | DUNDEE PRECIOUS METALS INC.
northeasterly direction from Block 19E. Five holes with a total length of 756 metres were completed (significant intercepts are shown from holes G19E_290_21, 22). Grade control drilling in deeper portions of Block 19W, which commenced in the fourth quarter of 2015, was accomplished from three locations (27 drill holes, a total of 3,334 metres) in 2016. The drill holes were directed in a west-northwest direction to check the continuity of mineralization on the western flank of Block 19W. Drill holes from the 19W-190-RA and 19W-210-RA locations expanded the silica envelope and the extents of known economic mineralization, extending the ore body of Block 19W in depth (from 220mRL to 150mRL). This zone comprises of a series of sub-parallel, vertically-oriented lenses, hosted predominantly within breccias that exhibit advanced argillic alteration and vuggy quartz. Mineralization consists mainly of pyrite and small amounts of sulfosalts and is characterized by particularly high gold grades, relative to other ore bodies at Chelopech. Five holes were completed from location 19E-230-SD on level 230. Designed to define the western part of Block 19, they extended the silica envelope and intercepted several small mineralized zones, which will be included in future Mineral Resource updates. Significant results from this drilling program are presented in the table below within holes “G19W_210_02” and “G19W_210_05”. For the Block 10 drilling program, a total of 16 holes with a cumulative length of 4,554 metres were completed in 2016 from drill cuddy ND-730-440-VH. The objective was to further explore Block 10 and test for new mineralized zones nearby. As a result, the silica envelope and the extents of the Block 10 mineralized zone were extended down plunge. Significant intercepts are shown in holes “EXT10_555_01”, “EXT10_555_02”, “EXT10_555_09”and “EXT10_555_16”. Drilling will continue in 2017 to further delineate this block. Also part of the Block 10 program, an initial wide-spaced drilling pattern commenced in the second quarter of 2016 from location 17-395. Of significance, was extensional drill hole EXT19W_400_14 which was oriented in a southerly direction towards Block 17. It identified a new zone of mineralization of the style typical of ore bodies within the central area of the Chelopech deposit. A significant intercept from this new zone of 25.5 m at 2.13% Cu and 1.99g/t Au is shown in the table below within drill hole “EXT19W_400_14”. It may genetically be related to the Block 17 mineralization, which is 30 metres above the intercept between 390mRL and 370mRL. Due to the initial success of the program, additional holes were planned in the third quarter of 2016 and subsequently drilled to explore the eastern margins of Block 17 (seven exploration holes for a total of 1,077 metres). They extended the silica envelope and delimited several small mineralized zones, which will be included in future Mineral Resource updates (significant intercepts are shown from holes EXT19W_400_19, 21). On the 380 level, approximately 1,150 metres of infill drilling was completed from the 18-380-P2 drill platform. As a result of the grade control drilling, the mineralization contours were extended and the shape better defined in the western part of Block 18. One exploratory drill hole was drilled in a south-westerly direction to check for a continuation of mineralization in Block 17. The drill hole identified a new advanced argillic alteration zone hosting mineralization of economic grades, down plunge of Block 17 between 340mRL and 280mRL. Currently the boundary of economic mineralization to the north, south and down plunge remains open and requires further drill testing (a significant intercept is shown below from drill hole G17_380_01). Western Area Approximately 4,230 metres of extensional drilling was accomplished for the Block 103 program, from the 450 level. Drilling on the upper levels continued to test high grade zones situated close to the eastern boundary of Block 103 between 460mRL and 350mRL, which were defined during a previous exploration program. The outcome of the drilling was positive, resulting in the re-definition of the silica alteration envelope and the expansion of the ore contours (significant intercepts are shown from holes EXT103_450_18, 20, 25). Grade control drilling in Block 103 was conducted from two positions: 103-270-P13 and 103-270-P1 on the 270 level. Drilling from 103-270-P13 aimed to verify the northeastern contact of Block 103 and increase the

MANAGEMENT’S DISCUSSION AND ANALYSIS
42 | DUNDEE PRECIOUS METALS INC.
ore body extents (three holes with a combined total length of 357 metres). Eleven grade control holes were drilled from 103-270-P1, which expanded the block 103 ore contours (see drill holes G103_270_32 and G103_270_34 in the table below). From the Block 150 area, seven extensional drill holes were completed from the 225 level. Drill holes were designed to test for a continuation of mineralization along strike in a north-easterly direction. As a result, the silica envelope and the Mineral Resource contours of Block 150 were extended between 230 mRL and 170 mRL (significant intercepts are shown from hole EXT150_225_02). Grade control drilling in Block 150 was conducted from one position – drill cuddy 150-225-P27VH. Drilling aimed to verify a branch of mineralization extending from the northeastern flank of Block 150 (eight holes with a combined total length of 1,197 metres). Currently the boundary of economic mineralization remains open to the south-east and requires further drilling. A significant intercept from this zone is reported from drill hole “G150_225_27” and is shown in the table below. Block 149-South & Target 148 Extensional drilling in the north-west section of the deposit, in particular Block 149 and an area south of it, is ongoing. During the year, 3,180 metres of drilling was achieved in this area. Drilling from level 225 in Block 149 redefined the silica alteration envelope and the mineralized contours in the western periphery of the block. The result was the enlargement of the ore bodies in Blocks 149 and 149 South, in a westerly direction between 240 mRL and 200 mRL. Significant results from Blocks 149 and 149 South drill programs are presented in the table below (significant intercepts are shown from holes EXT149_225_77, 84). A preliminary drill program for “Target 148”, which is oriented sub-parallel to Block 149 South, from location 149-220-RA-DDC, was concluded in the second quarter of 2016. As a result of this drilling, the mineralization outline was expanded in a southeasterly direction between levels 210 and 160. Further advanced exploration of Target 148 commenced in the fourth quarter of 2016 and, to date, two drill holes have been completed from level 225. Drill hole assays are still pending for these two holes. Testing of this high potential area will continue in 2017. Zone 153 A highly significant new mineralized zone, called Zone 153, was intersected during drilling on the 440 level, during the fourth quarter of 2016. Zone 153 is located approximately 150 metres east of Block 150, 170 metres north of Block 103 and 250 metres above Block 152. The zone is open to the northeast, above and for approximately 100 metres below the 440 level. It is hosted within a broad silica-envelope alteration zone, defined between the 230-560 levels, which is considered to have high potential for hosting further mineralization. Zone 153 represents a Cu-Au±Ag high sulphidation type of epithermal mineralization, comprising semi-massive to massive stockwork vein and hydrothermal breccia zones of chalcopyrite, Cu-As-Sb sulfosalts (enargite, tennantite and tetrahedrite) and gold-rich pyrite that is typical of mineralization in the upper levels at Chelopech. Subsequent to the Company’s press release issued in December 2016 concerning the discovery of Zone 153, further drill results have been received from the ongoing diamond drill program. Drill hole EXT150_440_07, which was designed to explore the western boundary of Zone 153, returned semi-massive and disseminated mineralization between 148.50 metres to 170.00 metres that aligns well with the interpreted contacts of Zone 153. Drill hole EXT150_440_08, which targeted Zone 153 approximately 65 metres below the discovery drill hole EXT150_440_06, returned stockwork mineralization between 165.76 metres to 179.80 metres within a wide zone of silica alteration, however, this interval did not meet the significant intercept criteria, as outlined below in the ‘significant intercepts table’. Currently drilling is in progress to test the north-easterly extension of Zone 153. Significant intercepts to date are reported in the table below, from drill holes EXT150_440_02, 06 and 07. Outlook The medium term resource development strategy for Chelopech has been planned, focusing on drilling the southeast and northwest sections of the deposit.

MANAGEMENT’S DISCUSSION AND ANALYSIS
43 | DUNDEE PRECIOUS METALS INC.
A high priority has been placed on drill holes within the Zone 153 program and drilling operations will be expedited during the first half of 2017. Drilling will continue from the current location during the first quarter of 2017 and, subsequently, will test higher elevations of Zone 153 using a second drill rig located on the 505 level during the second quarter of 2017. In total, 6,000 metres of drilling has been budgeted to achieve this goal. Additionally, DPM has plans to test the following targets:
� Extensional drilling in a southerly direction between Blocks 17 and 18, based on the positive results of holes drilled during 2016 and recent re-interpretation of both mineralized zones;
� Grade control drilling, in a northwesterly direction from level 405 (405-P421-VOZDOL) targeting the upper levels of Block 150, to expand the known ore body extents and convert Mineral Resources into Mineral Reserves;
� Grade control drilling to develop Target 148 from location 150-225-P2. This area has been tested using only a wide-spaced drill pattern to date; and
� Extensional drilling in the areas close to Blocks 10 and 8 targeting the discovery of new and expansion of known ore bodies. Historic drilling results in combination with structural and geology models indicate untested mineralization may be present in this area.
Significant intercepts (gold equivalent (“AuEq”) cut-off grade of 3g/t) received during 2016:
HOLE ID EAST NORTH RL AZ DIP FROM TOTrue
Width (m)
AuEq (g/t)
Au (g/t)
Ag (g/t)
Cu (%)
EXT10_555_01 6635 30025 558 226.6 -32.6 177 192 12.3 4.13 2.59 3.71 0.75
EXT10_555_02 6635 30026 558 218.5 -37.6 186 230 34.5 9.06 7.26 8.24 0.87
EXT10_555_09 6635 30027 558 214.4 -38 195 221 17.8 14.67 11.18 6.14 1.7
EXT10_555_16 6635 30027 558 213.4 -42.6 208.5 233 13.8 20.01 15.94 11.06 1.98
EXT103_450_18 5802 29191 448 177.1 8 48 69 19 4 2.01 4.68 0.97
EXT103_450_20 5800 29193 447 219 -7 177 204 20 4.19 2.54 3.03 0.8
EXT103_450_25 5801 29193 448 217.6 11.9 82.5 99 10.7 4.72 1.49 4 1.57
EXT103_450_39 5800 29194 448 249.9 5.1 160.5 200 38 3.47 2.01 2.3 0.71
EXT148_225_09 5530 29668 227 303.1 4.7 145.5 161 14.5 7.59 5.69 12.28 0.92
EXT148_225_11 5530 29664 227 263.9 4.9 40.5 55.5 14.8 4.72 2.55 9.05 1.05
EXT149_225_77 5462 29781 224 282.8 14.6 0 13.5 9 93.62 77.74 33.98 7.71
EXT149_225_84 5464 29783 224 348.2 -7.2 0 10.5 10.5 21.94 17.48 9.23 2.17
EXT150_225_02 5650 29469 228 86.4 -13.9 100.5 117 15 3.11 2.62 2.16 0.23
EXT150_440_02 5762 29212 442 359.2 0.9 159 176 13.5 10.44 6.6 10.95 1.86
EXT150_440_02 5762 29212 442 359.2 0.9 192 210 14.8 3.05 2.01 2.48 0.51
EXT150_440_06 5762 29212 442 6.6 -0.5 150 234 62.5 19.49 13.58 14.23 2.87
EXT150_440_07 5762 29212 442 350.1 1 148.5 170 21 4.35 3.4 6.17 0.46
EXT19W_400_05 5988 29698 399 303 -0.1 247.2 270 22.7 16.95 2.76 31.4 6.88
EXT19W_400_09 5988 29698 399 316.2 0.4 292.5 323 29.4 3.69 1.94 7.03 0.85
EXT19W_400_14 5987 29692 399 201.1 -9.2 102 128 25.7 6.39 1.99 13.05 2.13
EXT19W_400_19 5987 29692 399 201.2 -19 109.5 117 5.4 12.88 4.52 20.26 4.06
EXT19W_400_21 5987 29692 399 199.6 6.2 142.5 168 8.5 4.51 2.65 5.64 0.9
G103_270_32 5662 29179 277 81 -33.6 1.5 66 30 4.23 1.77 3.84 1.19
G103_270_34 5662 29178 277 72 -24 22.5 49.5 24 4.2 2.03 5.31 1.05
G150_225_27 5687 29471 229 0.8 -26.4 6 27 13 3.49 2.07 4.04 0.69
G17_380_01 5999 29703 378 238.3 -58.2 49.5 94.5 24 8.03 6.26 6.69 0.86
G19E_290_21 5971 29889 290 15.2 -24.9 120 129 5.9 3.54 1.89 6.85 0.8
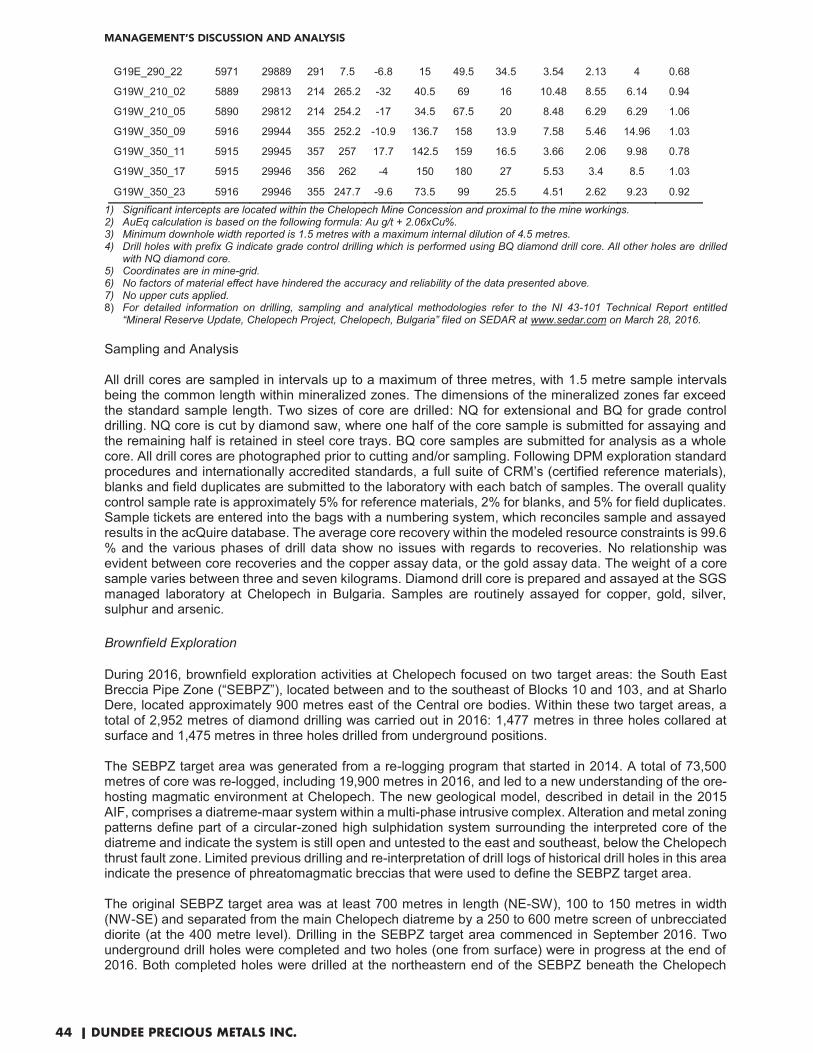
MANAGEMENT’S DISCUSSION AND ANALYSIS
44 | DUNDEE PRECIOUS METALS INC.
G19E_290_22 5971 29889 291 7.5 -6.8 15 49.5 34.5 3.54 2.13 4 0.68
G19W_210_02 5889 29813 214 265.2 -32 40.5 69 16 10.48 8.55 6.14 0.94
G19W_210_05 5890 29812 214 254.2 -17 34.5 67.5 20 8.48 6.29 6.29 1.06
G19W_350_09 5916 29944 355 252.2 -10.9 136.7 158 13.9 7.58 5.46 14.96 1.03
G19W_350_11 5915 29945 357 257 17.7 142.5 159 16.5 3.66 2.06 9.98 0.78
G19W_350_17 5915 29946 356 262 -4 150 180 27 5.53 3.4 8.5 1.03
G19W_350_23 5916 29946 355 247.7 -9.6 73.5 99 25.5 4.51 2.62 9.23 0.92
1) Significant intercepts are located within the Chelopech Mine Concession and proximal to the mine workings. 2) AuEq calculation is based on the following formula: Au g/t + 2.06xCu%. 3) Minimum downhole width reported is 1.5 metres with a maximum internal dilution of 4.5 metres. 4) Drill holes with prefix G indicate grade control drilling which is performed using BQ diamond drill core. All other holes are drilled
with NQ diamond core. 5) Coordinates are in mine-grid. 6) No factors of material effect have hindered the accuracy and reliability of the data presented above. 7) No upper cuts applied. 8) For detailed information on drilling, sampling and analytical methodologies refer to the NI 43-101 Technical Report entitled
“Mineral Reserve Update, Chelopech Project, Chelopech, Bulgaria” filed on SEDAR at www.sedar.com on March 28, 2016. Sampling and Analysis
All drill cores are sampled in intervals up to a maximum of three metres, with 1.5 metre sample intervals being the common length within mineralized zones. The dimensions of the mineralized zones far exceed the standard sample length. Two sizes of core are drilled: NQ for extensional and BQ for grade control drilling. NQ core is cut by diamond saw, where one half of the core sample is submitted for assaying and the remaining half is retained in steel core trays. BQ core samples are submitted for analysis as a whole core. All drill cores are photographed prior to cutting and/or sampling. Following DPM exploration standard procedures and internationally accredited standards, a full suite of CRM’s (certified reference materials), blanks and field duplicates are submitted to the laboratory with each batch of samples. The overall quality control sample rate is approximately 5% for reference materials, 2% for blanks, and 5% for field duplicates. Sample tickets are entered into the bags with a numbering system, which reconciles sample and assayed results in the acQuire database. The average core recovery within the modeled resource constraints is 99.6 % and the various phases of drill data show no issues with regards to recoveries. No relationship was evident between core recoveries and the copper assay data, or the gold assay data. The weight of a core sample varies between three and seven kilograms. Diamond drill core is prepared and assayed at the SGS managed laboratory at Chelopech in Bulgaria. Samples are routinely assayed for copper, gold, silver, sulphur and arsenic. Brownfield Exploration During 2016, brownfield exploration activities at Chelopech focused on two target areas: the South East Breccia Pipe Zone (“SEBPZ”), located between and to the southeast of Blocks 10 and 103, and at Sharlo Dere, located approximately 900 metres east of the Central ore bodies. Within these two target areas, a total of 2,952 metres of diamond drilling was carried out in 2016: 1,477 metres in three holes collared at surface and 1,475 metres in three holes drilled from underground positions. The SEBPZ target area was generated from a re-logging program that started in 2014. A total of 73,500 metres of core was re-logged, including 19,900 metres in 2016, and led to a new understanding of the ore-hosting magmatic environment at Chelopech. The new geological model, described in detail in the 2015 AIF, comprises a diatreme-maar system within a multi-phase intrusive complex. Alteration and metal zoning patterns define part of a circular-zoned high sulphidation system surrounding the interpreted core of the diatreme and indicate the system is still open and untested to the east and southeast, below the Chelopech thrust fault zone. Limited previous drilling and re-interpretation of drill logs of historical drill holes in this area indicate the presence of phreatomagmatic breccias that were used to define the SEBPZ target area. The original SEBPZ target area was at least 700 metres in length (NE-SW), 100 to 150 metres in width (NW-SE) and separated from the main Chelopech diatreme by a 250 to 600 metre screen of unbrecciated diorite (at the 400 metre level). Drilling in the SEBPZ target area commenced in September 2016. Two underground drill holes were completed and two holes (one from surface) were in progress at the end of 2016. Both completed holes were drilled at the northeastern end of the SEBPZ beneath the Chelopech
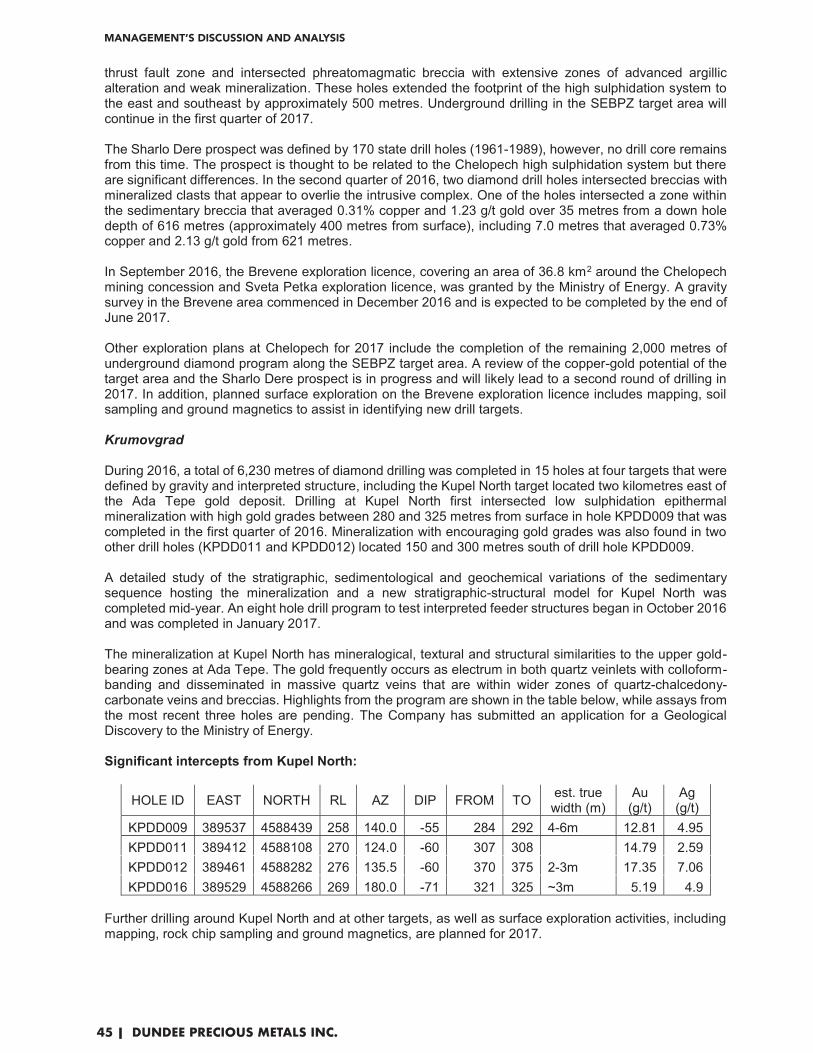
MANAGEMENT’S DISCUSSION AND ANALYSIS
45 | DUNDEE PRECIOUS METALS INC.
thrust fault zone and intersected phreatomagmatic breccia with extensive zones of advanced argillic alteration and weak mineralization. These holes extended the footprint of the high sulphidation system to the east and southeast by approximately 500 metres. Underground drilling in the SEBPZ target area will continue in the first quarter of 2017. The Sharlo Dere prospect was defined by 170 state drill holes (1961-1989), however, no drill core remains from this time. The prospect is thought to be related to the Chelopech high sulphidation system but there are significant differences. In the second quarter of 2016, two diamond drill holes intersected breccias with mineralized clasts that appear to overlie the intrusive complex. One of the holes intersected a zone within the sedimentary breccia that averaged 0.31% copper and 1.23 g/t gold over 35 metres from a down hole depth of 616 metres (approximately 400 metres from surface), including 7.0 metres that averaged 0.73% copper and 2.13 g/t gold from 621 metres. In September 2016, the Brevene exploration licence, covering an area of 36.8 km2 around the Chelopech mining concession and Sveta Petka exploration licence, was granted by the Ministry of Energy. A gravity survey in the Brevene area commenced in December 2016 and is expected to be completed by the end of June 2017. Other exploration plans at Chelopech for 2017 include the completion of the remaining 2,000 metres of underground diamond program along the SEBPZ target area. A review of the copper-gold potential of the target area and the Sharlo Dere prospect is in progress and will likely lead to a second round of drilling in 2017. In addition, planned surface exploration on the Brevene exploration licence includes mapping, soil sampling and ground magnetics to assist in identifying new drill targets.
Krumovgrad During 2016, a total of 6,230 metres of diamond drilling was completed in 15 holes at four targets that were defined by gravity and interpreted structure, including the Kupel North target located two kilometres east of the Ada Tepe gold deposit. Drilling at Kupel North first intersected low sulphidation epithermal mineralization with high gold grades between 280 and 325 metres from surface in hole KPDD009 that was completed in the first quarter of 2016. Mineralization with encouraging gold grades was also found in two other drill holes (KPDD011 and KPDD012) located 150 and 300 metres south of drill hole KPDD009.
A detailed study of the stratigraphic, sedimentological and geochemical variations of the sedimentary sequence hosting the mineralization and a new stratigraphic-structural model for Kupel North was completed mid-year. An eight hole drill program to test interpreted feeder structures began in October 2016 and was completed in January 2017. The mineralization at Kupel North has mineralogical, textural and structural similarities to the upper gold-bearing zones at Ada Tepe. The gold frequently occurs as electrum in both quartz veinlets with colloform-banding and disseminated in massive quartz veins that are within wider zones of quartz-chalcedony-carbonate veins and breccias. Highlights from the program are shown in the table below, while assays from the most recent three holes are pending. The Company has submitted an application for a Geological Discovery to the Ministry of Energy.
Significant intercepts from Kupel North:
HOLE ID EAST NORTH RL AZ DIP FROM TO est. true width (m)
Au (g/t)
Ag (g/t)
KPDD009 389537 4588439 258 140.0 -55 284 292 4-6m 12.81 4.95 KPDD011 389412 4588108 270 124.0 -60 307 308 14.79 2.59 KPDD012 389461 4588282 276 135.5 -60 370 375 2-3m 17.35 7.06 KPDD016 389529 4588266 269 180.0 -71 321 325 ~3m 5.19 4.9
Further drilling around Kupel North and at other targets, as well as surface exploration activities, including mapping, rock chip sampling and ground magnetics, are planned for 2017.

MANAGEMENT’S DISCUSSION AND ANALYSIS
46 | DUNDEE PRECIOUS METALS INC.
Serbia Exploration activities in the fourth quarter of 2016 focused on the evaluation of new targets close to existing resources at the Timok gold project. By the end of December 2016, 2,752 metres were drilled, as part of this near-resource drilling program, including one drill hole at the Coka Rakita prospect. In addition, 52 line kilometres of induced polarization (“IP”) geophysical survey, an infill soil program (2,063 samples) and 2,453 metres of trenching were carried out in 2016. The near-resource drilling has continued into 2017 and was completed by the end of January 2017. Some assays are pending and interpretation is in progress. Near resource drilling at the Timok gold project identified the potential for additional mineralization approximately one kilometre northwest of Bigar Hill and 1.5 kilometres southwest of Korkan. Drill hole KWDD016 intersected 51 metres with an average grade of 2.00 g/t gold from 17 metres down the hole (using a 0.5g/t Au cutoff, three metre minimum length and two metre maximum internal dilution). The true width of the mineralization is not known. Two scissor holes drilled from a single location 60 metres to the southwest of KWDD016 at angles of -45 and -70 degrees, returned highlights of 35 metres with an average grade of 1.29 g/t gold from 12 metres down hole and 23 metres with an average grade of 1.29 g/t gold from eight metres down hole, respectively (using the same cutoff parameters as those of KWDD016). In contrast to much of the mineralization at the nearby resources of Bigar Hill and Korkan, all intervals noted above are completely oxidized. The overall orientation of the mineralized zone is, however, not known and additional drilling to test the along-strike continuity is in progress. At the Lenovac joint venture project, a ground magnetics and gravity survey was completed over the property during the second quarter of 2016 and an additional deep resistivity survey (NSAMT) was carried out over selected areas during the period. On the basis of the results delivered from these geophysical surveys and in consultation with the joint-venture partner, Rio Tinto Mining & Exploration Limited (“Rio Tinto”), a drilling program was carried out, with total of 2,569 metres drilled by the end of December 2016, with drilling expected to continue during the first quarter of 2017. Rio Tinto has fulfilled the requirement of a minimum commitment of $1 million by the end of 2016, required under the earn-in and joint venture agreement. Other
In Armenia, fieldwork commenced during the second quarter of 2016 on properties which are held under option agreements signed in June 2015. During 2016, DPM completed 1,200 metres of diamond drilling on one of the project areas. DPM continues to conduct reviews of projects and prospective belts in other parts of the world.
Sampling and Analysis of Exploration Drill Core Most of the exploration diamond drill holes are collared with PQ size, continued with HQ, and are sometimes finished with NQ. Triple tube core barrels are used whenever possible to improve recovery. All drill core is cut lengthwise into two halves using a diamond saw; one half is sampled for assaying and the other half is retained in core trays. All drill core is sampled in intervals ranging up to three metres, however, the common length for sample intervals within mineralized zones is one metre. Weights of drill core samples range from three to eight kilograms, depending on the size of core, rock type, and recovery. A numbered tag is placed into each sample bag, and the samples are grouped into batches for laboratory submissions. Quality control samples, comprising certified reference materials, blanks, and field duplicates are inserted into each batch of samples, and locations for crushed duplicates are specified. All drill core and quality control samples are tabulated on sample submission forms that specify sample preparation procedures and codes for analytical methods. For internal quality control, the laboratory includes its own quality control samples comprising certified reference materials, blanks, and pulp duplicates. Chain of custody records are maintained from sample shipment to the laboratory until analyses are completed and remaining sample materials are returned to the Company. Drill core samples submitted to the laboratory are dried at 105°C for a minimum of 12 hours and then jaw crushed to about 80% passing 4 mm. Sample preparation duplicates are created by riffle splitting crushed samples on a 1 in 20 basis. Larger samples are riffle split prior to pulverizing, whereas, smaller samples

MANAGEMENT’S DISCUSSION AND ANALYSIS
47 | DUNDEE PRECIOUS METALS INC.
are pulverized entirely. Pulverizing specifications are approximately 90% passing 70 microns. Gold analyses are done using a conventional 50 gram fire assay and AAS finish. Multi-element analyses comprising 49 elements, including Cu, Mo, As, Bi, Pb, Sb, and Zn, are done using a four-acid digestion, and an ICP finish. Samples returning over 10,000 ppm for base metals are re-analyzed using high grade methods. DEVELOPMENT AND OTHER MAJOR PROJECTS Krumovgrad The mine site is located at Ada Tepe, approximately three kilometres south of the town of Krumovgrad in southeastern Bulgaria. The project plan contemplates the construction of an open pit mining operation comprised of a process plant, which will employ conventional crushing, grinding and flotation processing for gold extraction, and the disposal of thickened tailings, together with mine rock waste, in an integrated mine waste facility (“IMWF”). The plant is designed to treat up to 840,000 tonnes of ore per year over an eight year mine life, including processing stockpiled low grade ore at the end of the project, which is consistent with existing permitting applications and environmental submissions. Following completion of a feasibility study in 2011, the “NI 43-101 Technical Report, Ada Tepe Deposit, Krumovgrad Project, Bulgaria” was filed on SEDAR at www.sedar.com on March 28, 2014 (the “Krumovgrad Technical Report”) The table below is a summary of the estimated capital costs required to construct and commission the project, together with the additional sustaining capital expenditures and closure costs expected to be incurred over the life of the project.
UPDATED CAPITAL COST ESTIMATE SUMMARY(1)
Item Total ($M) Direct costs 117.1 Indirect costs 48.7 Contingency P50 (7.5% of direct + indirect costs) 12.4 Total Initial Construction Capital 178.2Sustaining capital 6.2 Closure and rehabilitation costs 6.0
(1) Costs expressed as Q4 2015 US$ based on a US$ / Euro exchange rate of 1.14 and exclude escalation, financing and sunk costs.
Operating costs are based on processing an average of 775,000 tonnes per year, producing an annual average of 85,700 ounces of gold and 38,700 ounces of silver for an estimated eight years.
SUMMARY OF ESTIMATED OPERATING COSTS(1)
Item $/t ore processed(2)
Mining costs 15.03 Processing costs 19.39 Tailings treatment & IMWF costs 1.88 General & administration 5.33 Royalty 3.78 Total Annual Operating Costs 45.41
(1) Expressed as Q4 2015 US$. (2) Average cash cost over eight years. Based on the Mineral Reserves and Mineral Resources contained in the Krumovgrad Technical Report, as well as the updated capital and operating costs, the project economics and other key metrics are shown in the table below:
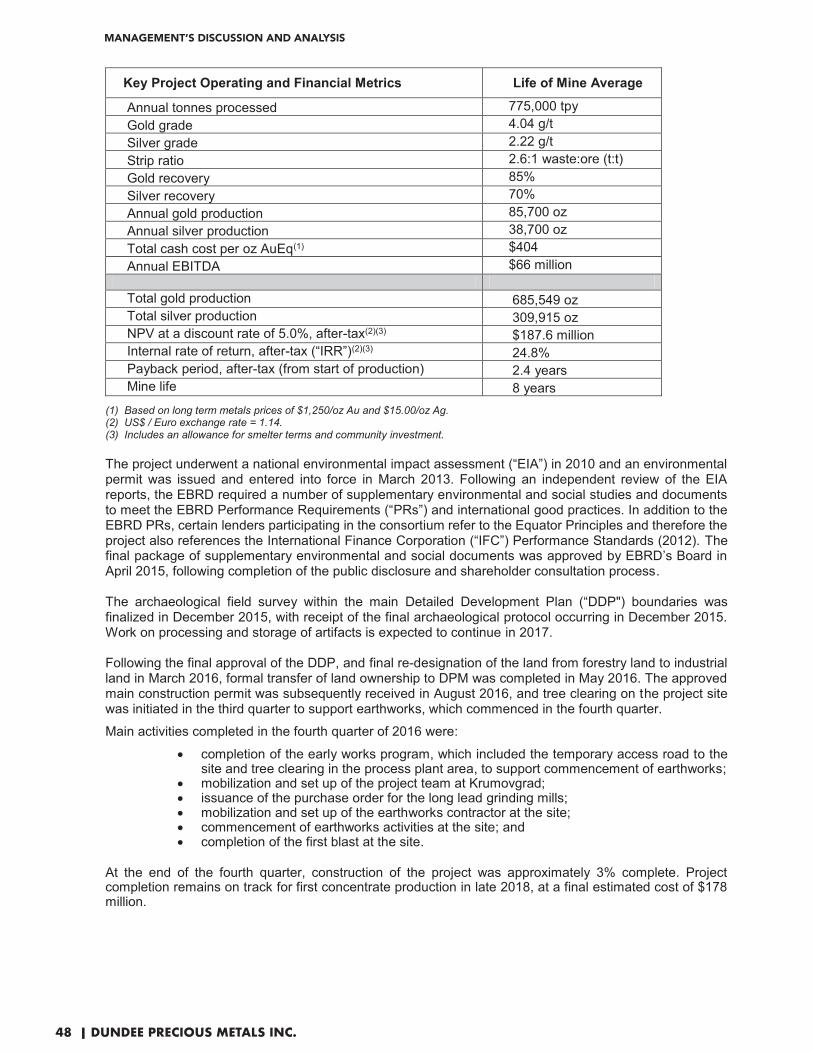
MANAGEMENT’S DISCUSSION AND ANALYSIS
48 | DUNDEE PRECIOUS METALS INC.
Key Project Operating and Financial Metrics Life of Mine Average
Annual tonnes processed 775,000 tpy Gold grade 4.04 g/t Silver grade 2.22 g/t Strip ratio 2.6:1 waste:ore (t:t) Gold recovery 85% Silver recovery 70% Annual gold production 85,700 oz Annual silver production 38,700 oz Total cash cost per oz AuEq(1) $404 Annual EBITDA $66 million
Total gold production 685,549 oz Total silver production 309,915 oz NPV at a discount rate of 5.0%, after-tax(2)(3) $187.6 million Internal rate of return, after-tax (“IRR”)(2)(3) 24.8% Payback period, after-tax (from start of production) 2.4 years Mine life 8 years
(1) Based on long term metals prices of $1,250/oz Au and $15.00/oz Ag. (2) US$ / Euro exchange rate = 1.14. (3) Includes an allowance for smelter terms and community investment. The project underwent a national environmental impact assessment (“EIA”) in 2010 and an environmental permit was issued and entered into force in March 2013. Following an independent review of the EIA reports, the EBRD required a number of supplementary environmental and social studies and documents to meet the EBRD Performance Requirements (“PRs”) and international good practices. In addition to the EBRD PRs, certain lenders participating in the consortium refer to the Equator Principles and therefore the project also references the International Finance Corporation (“IFC”) Performance Standards (2012). The final package of supplementary environmental and social documents was approved by EBRD’s Board in April 2015, following completion of the public disclosure and shareholder consultation process. The archaeological field survey within the main Detailed Development Plan (“DDP") boundaries was finalized in December 2015, with receipt of the final archaeological protocol occurring in December 2015. Work on processing and storage of artifacts is expected to continue in 2017. Following the final approval of the DDP, and final re-designation of the land from forestry land to industrial land in March 2016, formal transfer of land ownership to DPM was completed in May 2016. The approved main construction permit was subsequently received in August 2016, and tree clearing on the project site was initiated in the third quarter to support earthworks, which commenced in the fourth quarter.
Main activities completed in the fourth quarter of 2016 were:
� completion of the early works program, which included the temporary access road to the site and tree clearing in the process plant area, to support commencement of earthworks;
� mobilization and set up of the project team at Krumovgrad; � issuance of the purchase order for the long lead grinding mills; � mobilization and set up of the earthworks contractor at the site; � commencement of earthworks activities at the site; and � completion of the first blast at the site.
At the end of the fourth quarter, construction of the project was approximately 3% complete. Project completion remains on track for first concentrate production in late 2018, at a final estimated cost of $178 million.

MANAGEMENT’S DISCUSSION AND ANALYSIS
49 | DUNDEE PRECIOUS METALS INC.
During 2016, all key milestones were achieved. The current project baseline schedule contemplates the following milestones:
Milestone Actual/Expected CompletionMunicipal approval of main DDP Q4 2015 (complete) Detailed project execution plan Q1 2016 (complete) Updated capital cost estimate and baseline project schedule Q1 2016 (complete) Land re-designation Q1 2016 (complete) Detailed engineering Q1 2016 (complete) Land purchase Q2 2016 (complete) Approval of technical packages Q2 2016 (received) Construction permit Q3 2016 (received) Mobilize earthworks contractor to site Q4 2016 (complete) Commence construction on site Q4 2016 (commenced) Pour first concrete on the site Q2 2017 Commence main civil/mechanical/electrical construction Q3 2017 Complete bulk earthworks Q4 2017 Start cold commissioning Q2 2018 Start hot Commissioning Q3 2018 First concentrate production Q4 2018
The Company continues to engage in an active dialogue with the municipality, government and other stakeholders, and will do so throughout the construction phase, which includes receipt of the remaining final permanent access road and discharge pipeline approvals, and the subsequent operating approvals to support the Krumovgrad gold project advancing to operations in late 2018, as planned.
Tsumeb - Capital Projects Sulphuric Acid Plant and Copper Converters The sulphuric acid plant entered into commercial operations in the fourth quarter of 2015 and is now fully operational. Pursuant to a definitive supply agreement with Rössing Uranium Limited (“Rössing”), 225,000 tonnes of sulphuric acid is to be sold to Rössing on an annual basis. Tsumeb also has an agreement with Weatherly International (“WTI”) for the supply of acid to WTI’s Tschudi copper project. These agreements provide for the sale of all acid production over the next five years. Construction of two new larger copper converters, together with their associated off-gas system and tie-ins to the acid plant, was completed in the first quarter of 2016. The copper converters, which were commissioned in the first quarter of 2016, entered into commercial production in the second quarter, resulting in significant reductions in SO2 emissions being recorded in the smelter and surrounding areas.
The final capital cost for the construction of the acid plant and new copper converters was $243 million.
Rotary Holding Furnace
The Company is continuing to assess opportunities to further optimize the smelter operation, including the installation of a rotary holding furnace which is expected to provide surge capacity between the Ausmelt furnace and the converters. This is a potentially high return project that is expected to debottleneck and increase the throughput of complex concentrate by over 50% to up to 370,000 tonnes and, in turn, generate significant incremental margins given the fixed cost nature of the facility.
An independent pre-feasibility study was completed in 2015, which evaluated a number of options to increase throughput and identified a preferred option. A subsequent independent feasibility study, based upon the preferred option, was completed in the fourth quarter of 2016 and confirmed the robust project economics, with an estimated implementation capital cost of approximately $52 million. The scope of the project includes the rotary holding furnace, additional cooling and other upgrades to the Ausmelt furnace, as well as upgrades to the slag mill area. Incremental fixed operating costs associated with the operation of the holding furnace are estimated to be approximately $6.0 million per year, excluding the variable costs
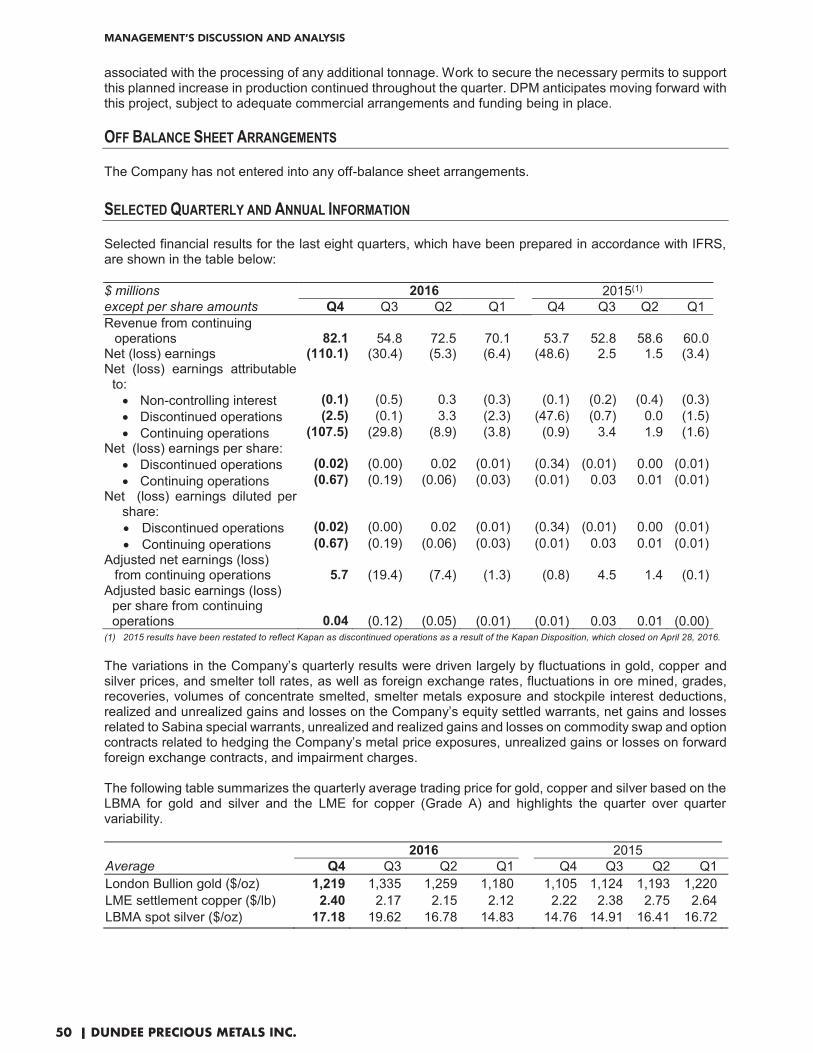
MANAGEMENT’S DISCUSSION AND ANALYSIS
50 | DUNDEE PRECIOUS METALS INC.
associated with the processing of any additional tonnage. Work to secure the necessary permits to support this planned increase in production continued throughout the quarter. DPM anticipates moving forward with this project, subject to adequate commercial arrangements and funding being in place.
OFF BALANCE SHEET ARRANGEMENTS The Company has not entered into any off-balance sheet arrangements. SELECTED QUARTERLY AND ANNUAL INFORMATION Selected financial results for the last eight quarters, which have been prepared in accordance with IFRS, are shown in the table below: $ millions 2016 2015(1) except per share amounts Q4 Q3 Q2 Q1 Q4 Q3 Q2 Q1 Revenue from continuing
operations 82.1
54.8
72.5 70.1 53.7 52.8 58.6 60.0 Net (loss) earnings (110.1) (30.4) (5.3) (6.4) (48.6) 2.5 1.5 (3.4) Net (loss) earnings attributable
to:
� Non-controlling interest (0.1) (0.5) 0.3 (0.3) (0.1) (0.2) (0.4) (0.3) � Discontinued operations (2.5) (0.1) 3.3 (2.3) (47.6) (0.7) 0.0 (1.5) � Continuing operations (107.5) (29.8) (8.9) (3.8) (0.9) 3.4 1.9 (1.6)
Net (loss) earnings per share: � Discontinued operations (0.02) (0.00) 0.02 (0.01) (0.34) (0.01) 0.00 (0.01) � Continuing operations (0.67) (0.19) (0.06) (0.03) (0.01) 0.03 0.01 (0.01)
Net (loss) earnings diluted per share:
� Discontinued operations (0.02) (0.00) 0.02 (0.01) (0.34) (0.01) 0.00 (0.01) � Continuing operations (0.67) (0.19) (0.06) (0.03) (0.01) 0.03 0.01 (0.01)
Adjusted net earnings (loss) from continuing operations 5.7
(19.4)
(7.4) (1.3) (0.8) 4.5 1.4 (0.1)
Adjusted basic earnings (loss) per share from continuing operations 0.04
(0.12)
(0.05) (0.01) (0.01) 0.03 0.01 (0.00) (1) 2015 results have been restated to reflect Kapan as discontinued operations as a result of the Kapan Disposition, which closed on April 28, 2016.
The variations in the Company’s quarterly results were driven largely by fluctuations in gold, copper and silver prices, and smelter toll rates, as well as foreign exchange rates, fluctuations in ore mined, grades, recoveries, volumes of concentrate smelted, smelter metals exposure and stockpile interest deductions, realized and unrealized gains and losses on the Company’s equity settled warrants, net gains and losses related to Sabina special warrants, unrealized and realized gains and losses on commodity swap and option contracts related to hedging the Company’s metal price exposures, unrealized gains or losses on forward foreign exchange contracts, and impairment charges. The following table summarizes the quarterly average trading price for gold, copper and silver based on the LBMA for gold and silver and the LME for copper (Grade A) and highlights the quarter over quarter variability.
2016 2015 Average Q4 Q3 Q2 Q1 Q4 Q3 Q2 Q1 London Bullion gold ($/oz) 1,219 1,335 1,259 1,180 1,105 1,124 1,193 1,220 LME settlement copper ($/lb) 2.40 2.17 2.15 2.12 2.22 2.38 2.75 2.64 LBMA spot silver ($/oz) 17.18 19.62 16.78 14.83 14.76 14.91 16.41 16.72
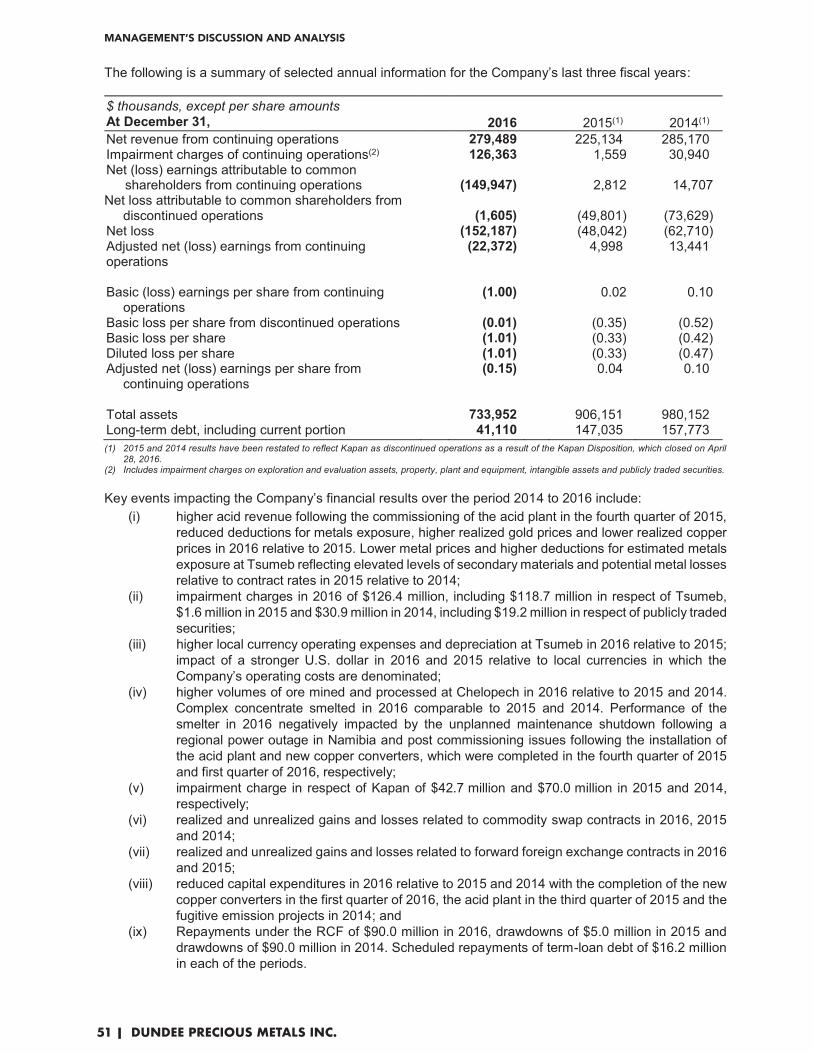
MANAGEMENT’S DISCUSSION AND ANALYSIS
51 | DUNDEE PRECIOUS METALS INC.
The following is a summary of selected annual information for the Company’s last three fiscal years: $ thousands, except per share amountsAt December 31, 2016 2015(1) 2014(1) Net revenue from continuing operations 279,489 225,134 285,170 Impairment charges of continuing operations(2) 126,363 1,559 30,940 Net (loss) earnings attributable to common
shareholders from continuing operations (149,947) 2,812 14,707 Net loss attributable to common shareholders from
discontinued operations (1,605)
(49,801)
(73,629) Net loss (152,187) (48,042) (62,710) Adjusted net (loss) earnings from continuing operations
(22,372) 4,998 13,441
Basic (loss) earnings per share from continuing
operations (1.00) 0.02 0.10
Basic loss per share from discontinued operations (0.01) (0.35) (0.52) Basic loss per share (1.01) (0.33) (0.42) Diluted loss per share (1.01) (0.33) (0.47) Adjusted net (loss) earnings per share from
continuing operations (0.15) 0.04 0.10
Total assets 733,952 906,151 980,152 Long-term debt, including current portion 41,110 147,035 157,773 (1) 2015 and 2014 results have been restated to reflect Kapan as discontinued operations as a result of the Kapan Disposition, which closed on April
28, 2016. (2) Includes impairment charges on exploration and evaluation assets, property, plant and equipment, intangible assets and publicly traded securities.
Key events impacting the Company’s financial results over the period 2014 to 2016 include:
(i) higher acid revenue following the commissioning of the acid plant in the fourth quarter of 2015, reduced deductions for metals exposure, higher realized gold prices and lower realized copper prices in 2016 relative to 2015. Lower metal prices and higher deductions for estimated metals exposure at Tsumeb reflecting elevated levels of secondary materials and potential metal losses relative to contract rates in 2015 relative to 2014;
(ii) impairment charges in 2016 of $126.4 million, including $118.7 million in respect of Tsumeb, $1.6 million in 2015 and $30.9 million in 2014, including $19.2 million in respect of publicly traded securities;
(iii) higher local currency operating expenses and depreciation at Tsumeb in 2016 relative to 2015; impact of a stronger U.S. dollar in 2016 and 2015 relative to local currencies in which the Company’s operating costs are denominated;
(iv) higher volumes of ore mined and processed at Chelopech in 2016 relative to 2015 and 2014. Complex concentrate smelted in 2016 comparable to 2015 and 2014. Performance of the smelter in 2016 negatively impacted by the unplanned maintenance shutdown following a regional power outage in Namibia and post commissioning issues following the installation of the acid plant and new copper converters, which were completed in the fourth quarter of 2015 and first quarter of 2016, respectively;
(v) impairment charge in respect of Kapan of $42.7�million and $70.0�million in 2015 and 2014, respectively;
(vi) realized and unrealized gains and losses related to commodity swap contracts in 2016, 2015 and 2014;
(vii) realized and unrealized gains and losses related to forward foreign exchange contracts in 2016 and 2015;
(viii) reduced capital expenditures in 2016 relative to 2015 and 2014 with the completion of the new copper converters in the first quarter of 2016, the acid plant in the third quarter of 2015 and the fugitive emission projects in 2014; and
(ix) Repayments under the RCF of $90.0 million in 2016, drawdowns of $5.0 million in 2015 and drawdowns of $90.0 million in 2014. Scheduled repayments of term-loan debt of $16.2 million in each of the periods.

MANAGEMENT’S DISCUSSION AND ANALYSIS
52 | DUNDEE PRECIOUS METALS INC.
CRITICAL ACCOUNTING ESTIMATES AND POLICIES The preparation of the Company’s consolidated financial statements in conformity with IFRS requires management to make judgments, estimates and assumptions that affect the reported amounts of assets, liabilities and contingent liabilities on the date of the consolidated financial statements and the reported amounts of revenues and expenses during the reporting period. Estimates and assumptions are evaluated and are based on management’s experience and other factors, including expectations of future events that are believed to be reasonable under the circumstances. However, actual outcomes can differ from these estimates. The following is a list of the most critical accounting estimates made by the Company: (i) Mineral exploration and evaluation expenditures
Exploration and evaluation activities involve the search for Mineral Resources and Mineral Reserves, the assessment of technical and operational feasibility and the determination of an identified Mineral Resource or Mineral Reserve’s commercial viability. Once the legal right to explore has been acquired, exploration and evaluation expenditures are expensed as incurred until economic production is probable. Exploration expenditures in areas where there is a reasonable expectation to convert existing estimated Mineral Resources to estimated Mineral Reserves or to add additional Mineral Resources with additional drilling and evaluations in areas near existing Mineral Resources or Mineral Reserves and existing or planned production facilities, are capitalized. Exploration properties that contain estimated Proven and Probable Mineral Reserves, but for which a development decision has not yet been made, are subject to periodic review for impairment when events or changes in circumstances indicate the project’s carrying value may not be recoverable. Exploration and evaluation assets are reclassified to “Mine Properties - Mines under construction” when the technical feasibility and commercial viability of extracting the Mineral Resources or Mineral Reserves are demonstrable and construction has commenced or a decision to construct has been made. Exploration and evaluation assets are assessed for impairment before reclassification to “Mines under construction”, and the impairment charge, if any, is recognized through net loss. The application of the Company’s accounting policy for exploration and evaluation expenditures requires judgment in determining whether it is probable that future economic benefits will be generated from the exploitation of an exploration and evaluation asset when activities have not yet reached a stage where a reasonable assessment of the existence of reserves can be determined. The estimation of Mineral Resources is a complex process and requires significant assumptions and estimates regarding economic and geological data and these assumptions and estimates impact the decision to either expense or capitalize exploration and evaluation expenditures. Management is required to make certain estimates and assumptions about future events and circumstances in order to determine if an economically viable extraction operation can be established. Any revision to any of these assumptions and estimates could result in the impairment of the capitalized exploration costs. If new information becomes available after expenditures have been capitalized that the recovery of these expenditures is no longer probable, the expenditures capitalized are written down to the recoverable amount and charged to net loss in the period the new information becomes available. As a result, there could be a material impact on the Company’s financial position and results of operations. (ii) Mine Properties
Mine Properties - Mines under construction All expenditures undertaken in the development, construction, installation and/or completion of mine production facilities are capitalized and initially classified as “Mines under construction”. Upon the commencement of production at the expected capacity level, all related assets included in “Mines under construction” are reclassified to “Mine Properties - Producing mines” or “Property, plant and equipment”. All expenditures related to the construction of mine declines and ore body access, including mine shafts and ventilation raises, are considered to be underground capital development and are capitalized. Expenses incurred after reaching the ore body are regarded as operating development costs and are included in the cost of ore hoisted.

MANAGEMENT’S DISCUSSION AND ANALYSIS
53 | DUNDEE PRECIOUS METALS INC.
Mine Properties – Producing mines All assets reclassified from “Mines under construction” to “Producing mines” are stated at cost less accumulated depletion and accumulated impairment charges. Costs incurred for the acquisition of land are stated at cost. The initial cost of a producing mine comprises its purchase price or construction cost, any costs directly attributable to bringing it to a working condition for its intended use, the initial estimate of the rehabilitation costs, and for qualifying assets, applicable borrowing costs during construction. The purchase price or construction cost is the aggregate amount of cash consideration paid and the fair value of any other consideration given to acquire the asset. When a mine construction project moves into production, the capitalization of certain mine construction costs ceases, and from that point on, costs are either regarded as inventory costs or expensed as cost of sales, except for costs related to mine additions or improvements, mine development or mineable reserve development, which qualify for capitalization.
Depletion The depletion of a producing mine asset is based on the unit-of-production method over the estimated economic life of the related deposit. Mineral Resources and Mineral Reserves estimates
The estimation of Mineral Resources and Mineral Reserves, as defined under NI 43-101 standards, is a complex process and requires significant assumptions and estimates. The Company prepares its Mineral Resources and Mineral Reserves estimates based on information related to the geological data on the size, depth and shape of the ore body which is compiled by appropriately qualified persons. Mineral Resources and Mineral Reserves estimates are based upon factors such as metal prices, capital requirements, production costs, foreign exchange rates, geotechnical and geological assumptions and judgments made in estimating the size and grade of the ore body. Mineral Resources and Mineral Reserves estimates, together with forecast production, determine the life of mine estimates and therefore changes in the Mineral Resources or Mineral Reserves estimates may impact the carrying value of exploration and evaluation assets, mine properties, property, plant and equipment, depletion and depreciation charges, rehabilitation provisions and deferred income tax assets. (iii) Property, plant and equipment Property, plant and equipment are stated at cost less accumulated depreciation and accumulated impairment charges. The initial cost of property, plant and equipment comprises its purchase price or construction cost, any costs directly attributable to bringing it to a working condition for its intended use, the initial estimate of the rehabilitation costs, and for qualifying assets, applicable borrowing costs during construction. The purchase price or construction cost is the aggregate amount of cash consideration paid and the fair value of any other consideration given to acquire the asset. Where an item of property, plant and equipment is comprised of significant components with different useful lives, the components are accounted for as separate items of property, plant and equipment. The capitalized value of a finance lease is also included in property, plant and equipment.
Depreciation The depreciation of property, plant and equipment related to a mine is based on the unit-of-production method over the estimated economic life of the related deposit, except in the case of an asset whose estimated useful life is less than the life of the deposit, in which case the asset is depreciated over its estimated useful life based on the straight-line method. For all other property, plant and equipment, depreciation is based on the estimated useful life of the asset on a straight-line basis. Depreciation of property, plant and equipment used in a capitalized exploration or development project is capitalized to the project.

MANAGEMENT’S DISCUSSION AND ANALYSIS
54 | DUNDEE PRECIOUS METALS INC.
Depreciation of property, plant and equipment, which are depreciated on a straight-line basis over their estimated useful lives, is as follows:
Asset Category Estimated useful life(Years)
Buildings 10-25Machinery and Equipment 3-25Vehicles 5Computer Hardware 2-5Office Equipment 3-7
Construction work-in-progress includes property, plant and equipment in the course of construction and is carried at cost less any recognized impairment charge. These assets are reclassified to the appropriate category of property, plant and equipment and depreciation of these assets commences when they are completed and ready for their intended use. An item of property, plant and equipment, including any significant part initially recognized, is derecognized upon disposal or when no future economic benefits are expected from its use or disposal. Any gain or loss arising on derecognition of the asset (calculated as the difference between the net disposal proceeds and the carrying amount of the asset) is included in net loss when the asset is derecognized. The residual values, useful lives and methods of depreciation of all assets are reviewed at each financial year end and are adjusted prospectively, if appropriate. Significant judgment is involved in the determination of estimated residual values and useful lives and no assurance can be given that actual residual values and useful lives will not differ significantly from current estimates. Depreciation of mine specific assets is based on the unit-of-production method. The life of these assets is assessed annually with regard to both their anticipated useful life and the present assessments of the economically recoverable reserves of the mine property where these assets are located. These calculations require the use of estimates and assumptions, including the amount of recoverable reserves. Any changes to these calculations based on new information are accounted for prospectively. Rates of depreciation and, in turn, the annual depreciation expense could therefore be materially affected by changes in underlying estimates. Changes in estimates can be the result of differences in actual production or changes in forecast future production, changes in Mineral Resources or Mineral Reserves through exploration activities, differences between estimated and actual costs of mining and differences in metal prices used in the estimation of Mineral Reserves. Exploration and evaluation assets, mine properties, property, plant and equipment and intangible assets balances could be materially impacted if other assumptions and estimates had been used. In addition, future operating results could be impacted if different assumptions and estimates are applied in future periods. (iv) Impairment of non-financial assets The carrying values of capitalized exploration and evaluation expenditures, mine properties, intangible assets and property, plant and equipment are assessed for impairment whenever indicators of potential impairment exist. If any indication of potential impairment exists, an estimate of the asset’s recoverable amount is calculated. The recoverable amount is determined as the higher of the FVLCD and its value in use. This is determined on an asset-by-asset basis, unless the asset does not generate cash flows that are largely independent of those from other assets or groups of assets. If this is the case, individual assets are grouped together into a CGU for impairment purposes. Such CGUs represent the lowest level for which there are separately identifiable cash inflows that are largely independent of the cash flows from other assets or groups of assets. If the carrying amount of an asset or CGU exceeds its recoverable amount, the carrying amount of the asset or CGU is reduced to its recoverable amount with the corresponding impairment being charged to earnings in the period of impairment. Impairment charges related to continuing operations are recognized in the consolidated statements of loss in those expense categories consistent with the function of the impaired asset.

MANAGEMENT’S DISCUSSION AND ANALYSIS
55 | DUNDEE PRECIOUS METALS INC.
An assessment is also made at each reporting date as to whether there is any change in events or circumstances relating to a previously recognized impairment. If a change has occurred, the Company makes an estimate of the recoverable amount for the previously impaired asset or CGU. A previously recognized impairment charge is reversed only if there has been a change in the estimates used to determine the asset or CGU’s recoverable amount since the last impairment charge was recognized. If this is the case, the carrying amount of the asset or CGU is increased to its newly determined recoverable amount. The increased amount cannot exceed the carrying amount that would have been determined, net of depreciation and amortization, had no impairment charge been recognized for the asset or CGU in prior years. The assessment of impairment is based, in part, on certain factors that may be partially or totally outside of the Company’s control, and requires the use of estimates and assumptions related to future value drivers, such as commodity prices, discount rates, foreign exchange rates and operating and capital costs. These estimates and assumptions, some of which may be subjective, require that management make decisions based on the best available information at each reporting period. It is possible that the actual recoverable amount could be significantly different than those estimates. Reductions in metal price forecasts, increases in estimated future costs of production, increases in estimated future capital costs, reductions in the amount of recoverable reserves, resources and exploration potential, and/or adverse market conditions can result in a write-down of the carrying amounts of the Company’s assets. Fair value is determined as the net amount that would be obtained from the sale of the asset in an arm’s length transaction between knowledgeable and willing parties. Value in use is based on estimated future cash flows discounted to their present value using a current pre-tax discount rate that is consistent with the risks specific to the asset. Management has assessed the Company’s CGUs as being an individual mine or processing site.
(v) Rehabilitation provisions Mining, processing, development and exploration activities are subject to various laws and regulations governing the protection of the environment. The Company recognizes a liability for its rehabilitation obligations in the period when a legal and/or constructive obligation is identified. The liability is measured at the present value of the estimated costs required to rehabilitate operating locations based on the risk free nominal discount rates that are specific to the countries in which the operations are located. A corresponding increase to the carrying amount of the related asset is recorded and depreciated in the same manner as the related asset. The nature of these restoration and rehabilitation activities includes: i) dismantling and removing structures; ii) rehabilitating mines and tailing dams; iii) dismantling operating facilities; iv) closure of plant and waste sites; and v) restoration, reclamation and re-vegetation of affected areas. Other environmental costs incurred at the operating sites, such as environmental monitoring, water management and waste management costs, are charged to net loss when incurred. The liability is accreted over time to its expected future settlement value. The accretion expense is recognized in finance cost in the consolidated statements of loss. The Company assesses its rehabilitation provisions at each reporting date. The rehabilitation liability and related assets are adjusted at each reporting date for changes in the discount rates and in the estimated amount, timing and cost of the work to be carried out. Any reduction in the rehabilitation liability and therefore any deduction in the related rehabilitation asset may not exceed the carrying amount of that asset. If it does, any excess over the carrying value is immediately credited to net loss. Significant estimates and assumptions are made by management in determining the nature and costs associated with the rehabilitation liability. The estimates and assumptions required include estimates of the timing, extent and costs of rehabilitation activities, technology changes, regulatory changes, and changes in the discount and inflation rates. These uncertainties may result in future expenditures being different from the amounts currently provided. Changes in the underlying assumptions used to estimate the rehabilitation liability as well as changes to environmental laws and regulations could cause material changes in the expected cost and expected future settlement value.
MANAGEMENT’S DISCUSSION AND ANALYSIS
56 | DUNDEE PRECIOUS METALS INC.
At December 31, 2016, the undiscounted future cost for the rehabilitation obligations before inflation was estimated to be $44.7 million. The carrying value of the rehabilitation liability was $30.3 million at December 31, 2016 and $35.1 million at December 31, 2015. (vi) Revenue recognition
Revenue from the sale of concentrates containing gold, copper, zinc and silver is recognized when the significant risks and rewards of ownership have been transferred, which is considered to occur when products have been delivered to the location specified in the sales contract and the risk of loss has been transferred to the buyer. Revenue is recognized to the extent that it is probable that economic benefits will flow to the Company and the revenue can be reliably measured. Revenue is measured at the fair value of the consideration received or receivable. Revenue from the sale of concentrates is initially recorded based on a provisional value which is a function of prevailing market prices, estimated weights and grades less smelter and financial deductions. Under the terms of the concentrate sales contracts, the final metal price ("settlement price") for the payable metal is based on a predetermined quotational period of LME daily prices. The price of the concentrate is the sum of the metal payments less the sum of specified deductions, including treatment and refining charges, penalties for deleterious elements, and freight. The terms of these contracts result in embedded derivatives because of the timing difference between the prevailing metal prices for provisional payments and the actual contractual metal prices used for final settlement. These embedded derivatives are adjusted to fair value at the end of each reporting period through to the date of final price determination with any adjustments recognized in revenue. Any adjustments to the amount receivable for each shipment on the settlement date, caused by final assay results, are adjusted through revenue at the time of determination. A decrease in the selling prices of the metals produced and sold by the Company may result in unfavourable mark-to-market adjustments and a reduction in net revenue. Conversely, an increase in the selling prices of the metals produced and sold by the Company may result in favourable mark-to-market adjustments and an increase in net revenue. Revenue from processing concentrate is recognized when concentrate has been smelted and is based on the toll rate specified in the toll agreement, which can vary based on the composition of the concentrate processed and prevailing market conditions at the time the agreement was entered. Under each toll agreement, Tsumeb incurs a carrying charge in respect of the concentrate it processes until blister copper is delivered. This charge is recorded as a reduction of revenue. Revenue from processing concentrate is also adjusted for any over or under recoveries of metals delivered relative to contracted rates, which are subject to estimation, including the amount of metals contained in concentrate received, material in-process and blister delivered. These estimates are based on the Company’s process knowledge and multiple assay results, the final results of which could differ materially from initial estimates. Revenue from the sale of sulphuric acid and arsenic, a by-product from processing concentrate at the Tsumeb smelter, is measured at the price specified in the sales contract and is recognized when the significant risks and rewards of ownership have been transferred, which is considered to occur when the products have been delivered to the location specified in the sales contract and the risk of loss has been transferred to the buyer. (vii) Deferred revenue Deferred revenue is recognized in the consolidated statements of financial position when a cash prepayment is received from one or more buyers prior to the sale of concentrate containing payable metal. Revenue is subsequently recognized in the consolidated statements of loss when the sale of concentrate occurs, which generally occurs when the significant risks and rewards of ownership have been transferred to the buyer.
MANAGEMENT’S DISCUSSION AND ANALYSIS
57 | DUNDEE PRECIOUS METALS INC.
(viii) Income taxes
Current income tax
Current income tax assets and liabilities are measured at the amount expected to be recovered from or paid to the taxation authorities on the taxable loss or income for the period. The tax rates and tax laws used to compute the amount are those enacted or substantively enacted by the end of the reporting period. Current income tax assets and current income tax liabilities are only offset if a legally enforceable right exists to offset the amounts and the Company intends to settle on a net basis or to realize the asset and settle the liability simultaneously. Deferred income tax
Deferred income tax is provided using the balance sheet method on temporary differences on the reporting date between the tax bases of assets and liabilities and their carrying amounts for financial reporting purposes. Deferred income tax liabilities are recognized for all taxable temporary differences. Deferred income tax assets are recognized for all deductible temporary differences, and the carry forward of unused tax credits and unused tax losses, to the extent that it is probable that taxable income will be generated in future periods to utilize these deductible temporary differences.
The following temporary differences do not result in deferred income tax assets or liabilities:
� The initial recognition of assets or liabilities, not arising from a business combination, that does not affect accounting or taxable profit;
� Initial recognition of goodwill, if any; and � Investments in subsidiaries, associates and jointly controlled entities where the timing of the reversal
of temporary differences can be controlled and reversal in the foreseeable future is not probable. The carrying amount of deferred income tax assets is reviewed at the end of each reporting period and reduced to the extent that it is no longer probable that sufficient future taxable income will be generated to allow all or part of the deferred income tax asset to be utilized. Unrecognized deferred income tax assets are reassessed at the end of each reporting period and are recognized to the extent that it has become probable that future taxable income will be generated to allow the deferred income tax asset to be recovered. Deferred income tax assets and liabilities are measured at the tax rates that are expected to be in effect in the period when the asset is expected to be realized or the liability is expected to be settled, based on tax rates that have been enacted or substantively enacted by the end of the reporting period. Deferred income tax assets and liabilities are offset if a legally enforceable right exists to offset current income tax assets against current income tax liabilities and the deferred income taxes relate to the same taxable entity and the same taxation authority. Current and deferred income taxes related to items recognized directly in equity are recognized in equity and not in net loss. Management periodically evaluates positions taken in tax returns with respect to situations in which applicable tax regulations are subject to interpretation and establishes provisions where appropriate. Judgment is required in determining whether deferred income tax assets are recognized on the consolidated statements of financial position. Deferred income tax assets, including those arising from unutilized tax losses, require management to assess the likelihood that the Company will generate future taxable income in order to utilize the deferred income tax assets. Estimates of future taxable income are based on forecasted cash flows from operations or other activities and the application of existing tax laws in each jurisdiction. To the extent that future cash flows and taxable income differ significantly from estimates, the ability of the Company to realize the net deferred income tax assets recorded on the reporting date could be impacted. Additionally, future changes in tax laws in the jurisdictions in which the Company operates could impact tax deductions in future periods and the value of its deferred income tax assets and liabilities.
MANAGEMENT’S DISCUSSION AND ANALYSIS
58 | DUNDEE PRECIOUS METALS INC.
NEW STANDARDS AND INTERPRETATIONS NOT YET ADOPTED The following new standards are not yet effective for the year ending December 31, 2016, and have not been applied when preparing the Company’s consolidated financial statements for the year ended December 31, 2016. The Company’s assessment of the impact of these new standards is set out below. IFRS 9, Financial Instruments IFRS 9, published in July 2014, replaces International Accounting Standard (“IAS”) 39, Financial Instruments: Recognition and Measurement. IFRS 9 introduces new requirements for the classification, measurement and impairment of financial assets and hedge accounting. It establishes two primary measurement categories for financial assets: (i) amortized cost and (ii) fair value; establishes criteria for classification of financial assets within the measurement category based on business model and cash flow characteristics; and eliminates existing held for trading, held to maturity, available for sale, loans and receivable and other financial liabilities categories. IFRS 9 also introduces a new model for the impairment of financial assets and requires an economic relationship between the hedged item and hedging instrument. While the Company has not finalized its detailed assessment of the classification and measurement of financial assets, equity investments currently classified as available-for-sale financial assets are expected to satisfy the conditions for classification as an asset that is fair valued through other comprehensive income or loss. Gains and losses in respect of these investments are recognized in other comprehensive income or loss, are not transferred to the consolidated statements of loss upon disposition and are not subject to impairment assessments. Equity instruments currently measured at fair value with any resulting gains or losses recognized through profit or loss would likely continue to be measured on the same basis under IFRS 9. Accordingly, the Company does not expect the new standard to have a significant impact on the classification and measurement of its financial assets. The new hedge accounting rules will align the accounting for hedging instruments more closely with the Company’s risk management practices. As a general rule, more hedge relationships are expected to be eligible for hedge accounting, as the standard introduces a more principles-based approach. While the Company has not finalized its detailed assessment, it is expected that the Company’s current hedge relationships such as forward foreign exchange contracts would continue to qualify as hedges upon the adoption of IFRS 9 and that the Company’s commodity swap and option contracts, which currently do not qualify for hedge accounting under IAS 39, would qualify for hedge accounting. The new impairment model requires the recognition of impairment provisions based on expected credit losses rather than only incurred credit losses as is the case under IAS 39 and applies to financial assets classified at amortized cost. While the Company has not finalized its detailed assessment of how impairment provisions on its accounts receivables would be affected by the new model, the Company does not expect the new impairment guidance to have a significant impact. The new standard also introduces expanded disclosure requirements and changes in presentation with respect to financial instruments, which are expected to change the nature and extent of the Company’s disclosures in the year the new standard is adopted. IFRS 9 is effective for annual periods beginning on or after January 1, 2018 with early adoption permitted. The Company is planning to adopt this standard effective January 1, 2018.
IFRS 15, Revenue from Contracts with Customers IFRS 15, issued in May 2014, establishes the principles that an entity shall apply to report the nature, amount, timing, and uncertainty of revenue and cash flows arising from a contract with a customer. IFRS 15 replaces IAS 11, Construction contracts, IAS 18, Revenue, International Financial Reporting Interpretation Committee (“IFRIC”) 13, Customer Loyalty Programmes, IFRIC 15, Agreements for the Construction of Real Estate, IFRIC 18, Transfers of Assets from Customers and Standard Interpretations Committee interpretation 31, Revenue – Barter Transactions Involving Advertising Services. IFRS 15 will also result in enhanced revenue disclosures, provide guidance for transactions that were not previously addressed comprehensively and improve guidance for multiple-element arrangements. IFRS 15 is based on the general principle that revenue is recognized when control of a good or service transfers to a customer rather than when the significant risks and rewards of ownership are transferred as is the case under IAS 18.

MANAGEMENT’S DISCUSSION AND ANALYSIS
59 | DUNDEE PRECIOUS METALS INC.
While the Company has not finalized its detailed impact assessment, the Company does not expect the new standard to have a significant impact on the measurement or timing of revenue recognition. IFRS 15 is effective for annual periods beginning on or after January 1, 2018, with early adoption permitted. The Company is planning to adopt IFRS 15 effective January 1, 2018. IFRS 16, LeasesIFRS 16, issued in January 2016, replaces IAS 17, Leases. IFRS 16 results in most leases being reported on the balance sheet for lessees, eliminating the distinction between a finance lease and an operating lease. The standard is expected to impact the accounting for the Company’s operating leases, which are currently reflected in the consolidated statements of loss and in the Company’s disclosure in respect of future commitments. Under IFRS 16, all operating leases, except for short term and low value leases, are expected to be accounted for as finance leases. As a result, the leased assets and the associated obligations are recognized in the consolidated statements of financial position. The leased assets will be depreciated over the shorter of the estimated useful life of the asset and the lease term. The lease payments are apportioned between finance charges and a reduction of the lease liability. The current operating lease expense will be replaced with a depreciation charge on the leased assets and a finance charge on the lease liability, which are in aggregate expected to result in a higher total periodic expense in the earlier periods of the lease. IFRS 16 is effective for annual periods beginning on or after January 1, 2019. Early adoption is permitted for companies that also adopt IFRS 15. The Company does not intend to adopt IFRS 16 before its mandatory date. NON-GAAP FINANCIAL MEASURES Certain financial measures referred to in this MD&A are not measures recognized under IFRS and are referred to as Non-GAAP measures. These measures have no standardized meanings under IFRS and may not be comparable to similar measures presented by other companies. The definitions established and calculations performed by DPM are based on management’s reasonable judgment and are consistently applied. These measures are used by management and investors to assist with assessing the Company’s performance, including its ability to generate sufficient cash flow to meet its return objectives and support its investing activities and debt service obligations. These measures are intended to provide additional information and should not be considered in isolation or as a substitute for measures prepared in accordance with IFRS. Non-GAAP financial measures, together with other financial measures calculated in accordance with IFRS, are considered to be important factors that assist investors in assessing the Company’s performance.
Non-GAAP Cash Cost and All-in Sustaining Cost Measures
Cash cost per tonne of ore processed, cash cost per pound of copper in concentrate produced, cash cost per ounce of gold in concentrate produced, cash cost per ounce of gold sold, net of by-product credits, cash cost per ounce of gold sold in pyrite concentrate, all-in sustaining cost per ounce of gold and cash cost per tonne of complex concentrate smelted, net of by-product credits, capture the important components of the Company’s production and related costs. Management utilizes these metrics as an important tool to monitor cost performance at the Company’s operations.
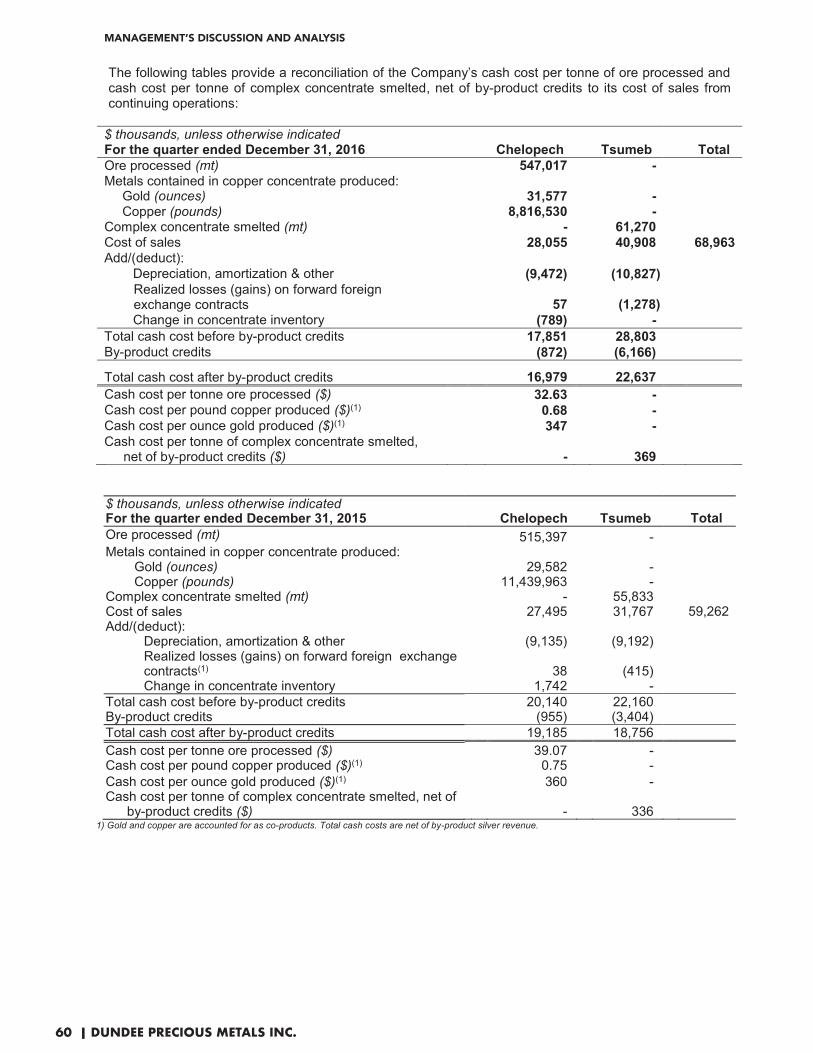
MANAGEMENT’S DISCUSSION AND ANALYSIS
60 | DUNDEE PRECIOUS METALS INC.
The following tables provide a reconciliation of the Company’s cash cost per tonne of ore processed and cash cost per tonne of complex concentrate smelted, net of by-product credits to its cost of sales from continuing operations:
$ thousands, unless otherwise indicatedFor the quarter ended December 31, 2016 Chelopech Tsumeb TotalOre processed (mt) 547,017 -Metals contained in copper concentrate produced:
Gold (ounces) 31,577 -Copper (pounds) 8,816,530 -
Complex concentrate smelted (mt) - 61,270Cost of sales 28,055 40,908 68,963Add/(deduct): Depreciation, amortization & other (9,472) (10,827) Realized losses (gains) on forward foreign
exchange contracts 57 (1,278) Change in concentrate inventory (789) -Total cash cost before by-product credits 17,851 28,803By-product credits (872) (6,166)
Total cash cost after by-product credits 16,979 22,637Cash cost per tonne ore processed ($) 32.63 -Cash cost per pound copper produced ($)(1) 0.68 -Cash cost per ounce gold produced ($)(1) 347 -Cash cost per tonne of complex concentrate smelted,
net of by-product credits ($) - 369 $ thousands, unless otherwise indicated For the quarter ended December 31, 2015
Chelopech
Tsumeb
������
Ore processed (mt) 515,397 - Metals contained in copper concentrate produced: Gold (ounces) 29,582 - Copper (pounds) 11,439,963 - Complex concentrate smelted (mt) - 55,833 Cost of sales 27,495 31,767 59,262 Add/(deduct):
Depreciation, amortization & other (9,135) (9,192) Realized losses (gains) on forward foreign exchange contracts(1)
38 (415)
Change in concentrate inventory 1,742 - Total cash cost before by-product credits 20,140 22,160 By-product credits (955) (3,404) Total cash cost after by-product credits 19,185 18,756 Cash cost per tonne ore processed ($) 39.07 - Cash cost per pound copper produced ($)(1) 0.75 - Cash cost per ounce gold produced ($)(1) 360 - Cash cost per tonne of complex concentrate smelted, net of
by-product credits ($)
- 336 1) Gold and copper are accounted for as co-products. Total cash costs are net of by-product silver revenue.

MANAGEMENT’S DISCUSSION AND ANALYSIS
61 | DUNDEE PRECIOUS METALS INC.
$ thousands, unless otherwise indicatedFor the twelve months ended December 31, 2016 Chelopech Tsumeb TotalOre processed (mt) 2,212,340 -Metals contained in copper concentrate produced: Gold (ounces) 118,428 -Copper (pounds) 38,458,797 -Complex concentrate smelted (mt) - 200,272Cost of sales 108,180 149,833 258,013Add/(deduct):
Depreciation, amortization & other (37,362) (41,181) Realized losses (gains) on forward foreign
exchange contracts 161 (3,866) Change in concentrate inventory 1,963 -Total cash cost before by-product credits 72,942 104,786By-product credits (3,873) (16,621)
Total cash cost after by-product credits 69,069 88,165Cash cost per tonne ore processed ($) 32.97 -Cash cost per pound copper produced ($)(1) 0.66 -Cash cost per ounce gold produced ($)(1) 368 -Cash cost per tonne of complex concentrate smelted, net of by-product credits ($) - 440 $ thousands, unless otherwise indicated For the twelve months ended December 31, 2015
Chelopech
Tsumeb
������
Ore processed (mt) 2,052,138 - Metals contained in copper concentrate produced: Gold (ounces) 114,951 - Copper (pounds) 39,760,363 - Complex concentrate smelted (mt) - 196,107 Cost of sales 112,634 113,479 226,113 Add/(deduct):
Depreciation, amortization & other (36,438) (26,444) Realized losses (gains) on forward foreign exchange contracts
56 (639)
Change in concentrate inventory (26) - Total cash cost before by-product credits 76,226 86,396 By-product credits (3,787) (4,369) Total cash cost after by-product credits 72,439 82,027 Cash cost per tonne ore processed ($) 37.14 - Cash cost per pound copper produced ($)(1) 0.78 - Cash cost per ounce gold produced ($)(1) 360 - Cash cost per tonne of complex concentrate smelted, net of
by-product credits ($)
- 418 1) Gold and copper are accounted for as co-products. Total cash costs are net of by-product silver revenue.

MANAGEMENT’S DISCUSSION AND ANALYSIS
62 | DUNDEE PRECIOUS METALS INC.
The following table provides, for the periods indicated, a reconciliation of Chelopech cash cost per ounce of gold sold, net of by-product credits, to its cost of sales:
$ thousands, unless otherwise indicatedEnded December 31,
Three Months Twelve Months2016 2015 2016 2015
Cost of sales(1) 28,112 27,533 108,341 112,690 Add/(deduct):
Depreciation, amortization & other (9,472) (9,135) (37,362) (36,438) Other charges, including freight(2) 18,221 23,653 76,234 83,496 By-product credits(3) (21,443) (31,698) (86,539) (123,769)
Cash cost of sales, net of by-product credits 15,418 10,353 60,674 35,979 Payable gold in concentrate sold (ounces)(4) 29,119 25,307 107,944 109,981 Cash cost per ounce of gold sold, net of by-
product credits ($) 529 409 562 327
1) Includes realized losses on the forward point component of the forward foreign exchange contracts in the three and twelve months ended December 31, 2016 and 2015.
2) Excludes treatment charges, transportation and other selling costs related to the sale of pyrite concentrate in the three and twelve months ended December 31, 2016 and 2015.
3) Includes realized losses and realized gains on copper derivative contracts, entered to hedge a portion of projected payable production, of $0.5 million and $2.6 million, respectively, during the fourth quarter and twelve months of 2016, compared to realized gains of $9.2 million and $26.5 million in the corresponding periods in 2015.
4) Excludes payable gold in pyrite concentrate sold in the three and twelve months ended December 31, 2016 and 2015. DPM’s all-in sustaining cost per ounce of gold from continuing operations calculation is set out in the following table: $ thousands, unless otherwise indicatedEnded December 31,
Three Months Twelve Months2016 2015 2016 2015
Cash cost of sales, net of by-product credits(1) 15,418 10,353 60,674 35,979 Accretion expenses(1) 80 143 358 610 General and administrative expenses(2) 966 1,051 9,423 8,202 Cash outlays for sustaining capital(1) 1,054 4,356 9,191 9,305 All-in sustaining costs 17,518 15,903 79,646 54,096 Payable gold in copper concentrate sold (ounces) 29,119 25,307 107,944 109,981 All-in sustaining cost per ounce of gold ($) 602 628 738 492
1) Represents the cash cost of sales, net of by-product credits, accretion expenses and cash sustaining capital expenditures that are specific to Chelopech
2) Represents an allocated portion of DPM’s general and administrative expenses, including share-based remuneration and excluding depreciation and expenses related to Avala and Krumovgrad, based on Chelopech proportion of total revenue, excluding revenue related to pyrite concentrate.
Chelopech cash cost per ounce of gold sold in pyrite concentrate calculation is set out in the following table: $ thousands, unless otherwise indicatedEnded December 31,
Three Months Twelve Months2016 2015 2016 2015
Treatment charges and refining costs 2,617 4,705 10,894 18,397 Transportation costs 2,682 4,047 13,466 16,663 Cash cost of sales related to pyrite concentrate
sold 5,299 8,752 24,360
35,060 Payable gold in pyrite concentrate sold (ounces) 8,140 9,779 31,380 38,156 Cash cost of sales per ounce of gold sold in pyrite
concentrate ($) 651 895 776
919
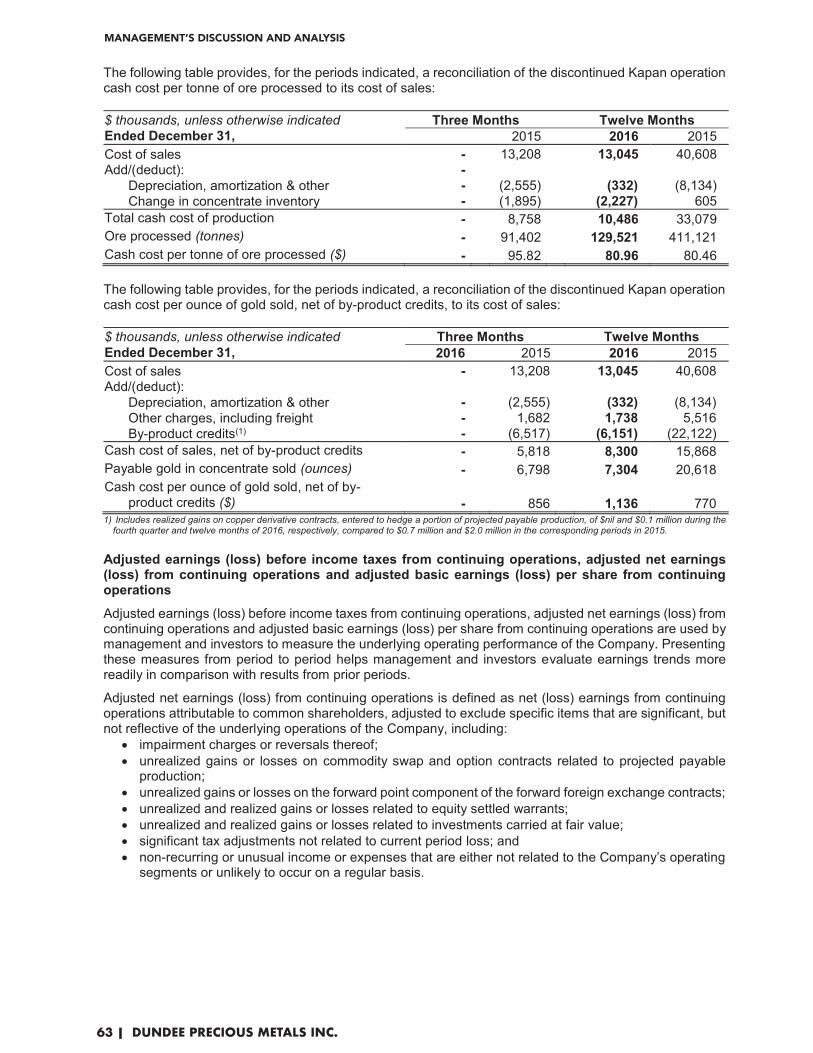
MANAGEMENT’S DISCUSSION AND ANALYSIS
63 | DUNDEE PRECIOUS METALS INC.
The following table provides, for the periods indicated, a reconciliation of the discontinued Kapan operation cash cost per tonne of ore processed to its cost of sales:
$ thousands, unless otherwise indicatedEnded December 31,
Three Months Twelve Months 2015 2016 2015
Cost of sales - 13,208 13,045 40,608 Add/(deduct): -
Depreciation, amortization & other - (2,555) (332) (8,134) Change in concentrate inventory - (1,895) (2,227) 605
Total cash cost of production - 8,758 10,486 33,079 Ore processed (tonnes) - 91,402 129,521 411,121 Cash cost per tonne of ore processed ($) - 95.82 80.96 80.46 The following table provides, for the periods indicated, a reconciliation of the discontinued Kapan operation cash cost per ounce of gold sold, net of by-product credits, to its cost of sales:
$ thousands, unless otherwise indicatedEnded December 31,
Three Months Twelve Months2016 2015 2016 2015
Cost of sales - 13,208 13,045 40,608 Add/(deduct):
Depreciation, amortization & other - (2,555) (332) (8,134) Other charges, including freight - 1,682 1,738 5,516 By-product credits(1) - (6,517) (6,151) (22,122)
Cash cost of sales, net of by-product credits - 5,818 8,300 15,868 Payable gold in concentrate sold (ounces) - 6,798 7,304 20,618 Cash cost per ounce of gold sold, net of by-
product credits ($) - 856 1,136
770 1) Includes realized gains on copper derivative contracts, entered to hedge a portion of projected payable production, of $nil and $0.1 million during the
fourth quarter and twelve months of 2016, respectively, compared to $0.7 million and $2.0 million in the corresponding periods in 2015.
Adjusted earnings (loss) before income taxes from continuing operations, adjusted net earnings (loss) from continuing operations and adjusted basic earnings (loss) per share from continuing operations
Adjusted earnings (loss) before income taxes from continuing operations, adjusted net earnings (loss) from continuing operations and adjusted basic earnings (loss) per share from continuing operations are used by management and investors to measure the underlying operating performance of the Company. Presenting these measures from period to period helps management and investors evaluate earnings trends more readily in comparison with results from prior periods.
Adjusted net earnings (loss) from continuing operations is defined as net (loss) earnings from continuing operations attributable to common shareholders, adjusted to exclude specific items that are significant, but not reflective of the underlying operations of the Company, including:
� impairment charges or reversals thereof; � unrealized gains or losses on commodity swap and option contracts related to projected payable
production; � unrealized gains or losses on the forward point component of the forward foreign exchange contracts; � unrealized and realized gains or losses related to equity settled warrants; � unrealized and realized gains or losses related to investments carried at fair value; � significant tax adjustments not related to current period loss; and � non-recurring or unusual income or expenses that are either not related to the Company’s operating
segments or unlikely to occur on a regular basis.
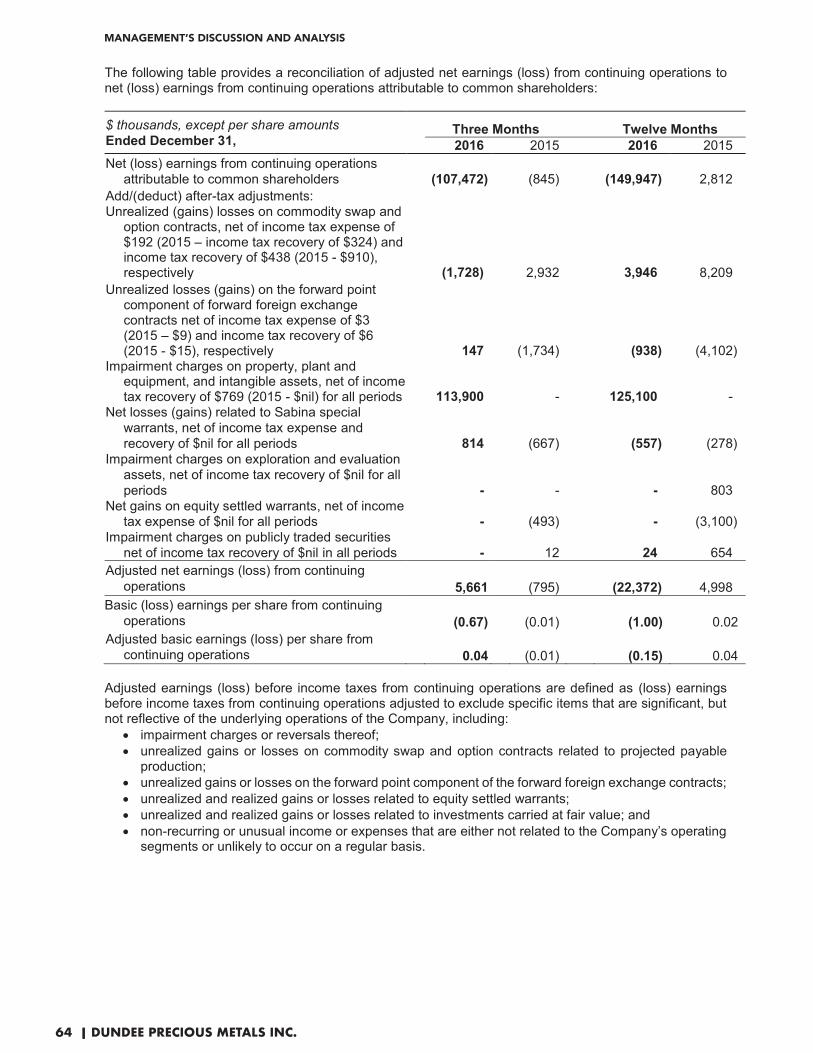
MANAGEMENT’S DISCUSSION AND ANALYSIS
64 | DUNDEE PRECIOUS METALS INC.
The following table provides a reconciliation of adjusted net earnings (loss) from continuing operations to net (loss) earnings from continuing operations attributable to common shareholders: $ thousands, except per share amounts Ended December 31,
Three Months Twelve Months2016 2015 2016 2015
Net (loss) earnings from continuing operations attributable to common shareholders (107,472) (845) (149,947) 2,812
Add/(deduct) after-tax adjustments: Unrealized (gains) losses on commodity swap and
option contracts, net of income tax expense of $192 (2015 – income tax recovery of $324) and income tax recovery of $438 (2015 - $910), respectively (1,728) 2,932 3,946
8,209 Unrealized losses (gains) on the forward point
component of forward foreign exchange contracts net of income tax expense of $3 (2015 – $9) and income tax recovery of $6 (2015 - $15), respectively 147 (1,734) (938)
(4,102) Impairment charges on property, plant and
equipment, and intangible assets, net of income tax recovery of $769 (2015 - $nil) for all periods 113,900 - 125,100 -
Net losses (gains) related to Sabina special warrants, net of income tax expense and recovery of $nil for all periods 814 (667) (557)
(278) Impairment charges on exploration and evaluation
assets, net of income tax recovery of $nil for all periods - - -
803
Net gains on equity settled warrants, net of income tax expense of $nil for all periods - (493) -
(3,100)
Impairment charges on publicly traded securities net of income tax recovery of $nil in all periods - 12 24
654
Adjusted net earnings (loss) from continuing operations 5,661 (795) (22,372) 4,998
Basic (loss) earnings per share from continuing operations (0.67) (0.01) (1.00)
0.02
Adjusted basic earnings (loss) per share from continuing operations 0.04 (0.01) (0.15)
0.04
Adjusted earnings (loss) before income taxes from continuing operations are defined as (loss) earnings before income taxes from continuing operations adjusted to exclude specific items that are significant, but not reflective of the underlying operations of the Company, including:
� impairment charges or reversals thereof; � unrealized gains or losses on commodity swap and option contracts related to projected payable
production; � unrealized gains or losses on the forward point component of the forward foreign exchange contracts; � unrealized and realized gains or losses related to equity settled warrants; � unrealized and realized gains or losses related to investments carried at fair value; and � non-recurring or unusual income or expenses that are either not related to the Company’s operating
segments or unlikely to occur on a regular basis.

MANAGEMENT’S DISCUSSION AND ANALYSIS
65 | DUNDEE PRECIOUS METALS INC.
The following table provides a reconciliation of adjusted earnings (loss) before income taxes from continuing operations to (loss) earnings before income taxes from continuing operations: $ thousands, except per share amounts Ended December 31,
Three Months Twelve Months2016 2015 2016 2015
(Loss) earnings before income taxes from continuing operations (106,230) (380) (146,929) 7,554
Add/(deduct) adjustments: Unrealized (gains) losses on commodity swap and
option contracts (1,920) 3,256 4,384 9,119 Unrealized losses (gains) on the forward point
component of forward foreign exchange contracts 144 (1,743) (932) (4,087)
Net losses (gains) related to Sabina special warrants 814 (667) (557) (278)
Impairment charges on property, plant and equipment, and intangible assets 114,669 - 125,869 -
Impairment charges on exploration and evaluation assets - - - 803
Net gains on equity settled warrants - (493) - (3,100) Impairment charges on publicly traded securities - 12 24 654 Adjusted earnings (loss) before income taxes from
continuing operations 7,477 (15) (18,141) 10,665
Adjusted EBITDA from continuing operations Adjusted EBITDA from continuing operations is used by management and investors to measure the underlying operating performance of the Company’s operating segments. Adjusted EBITDA from continuing operations excludes the following from (loss) earnings before income taxes:
� depreciation and amortization; � interest income; � finance cost; � impairment charges or reversals thereof; � unrealized gains or losses on commodity swap and option contracts related to projected payable
production; � unrealized gains or losses on the forward point component of the forward foreign exchange contracts; � unrealized and realized gains or losses related to equity settled warrants; � unrealized and realized gains or losses related to investments carried at fair value; and � non-recurring or unusual income or expenses that are either not related to the Company’s operating
segments or unlikely to occur on a regular basis.
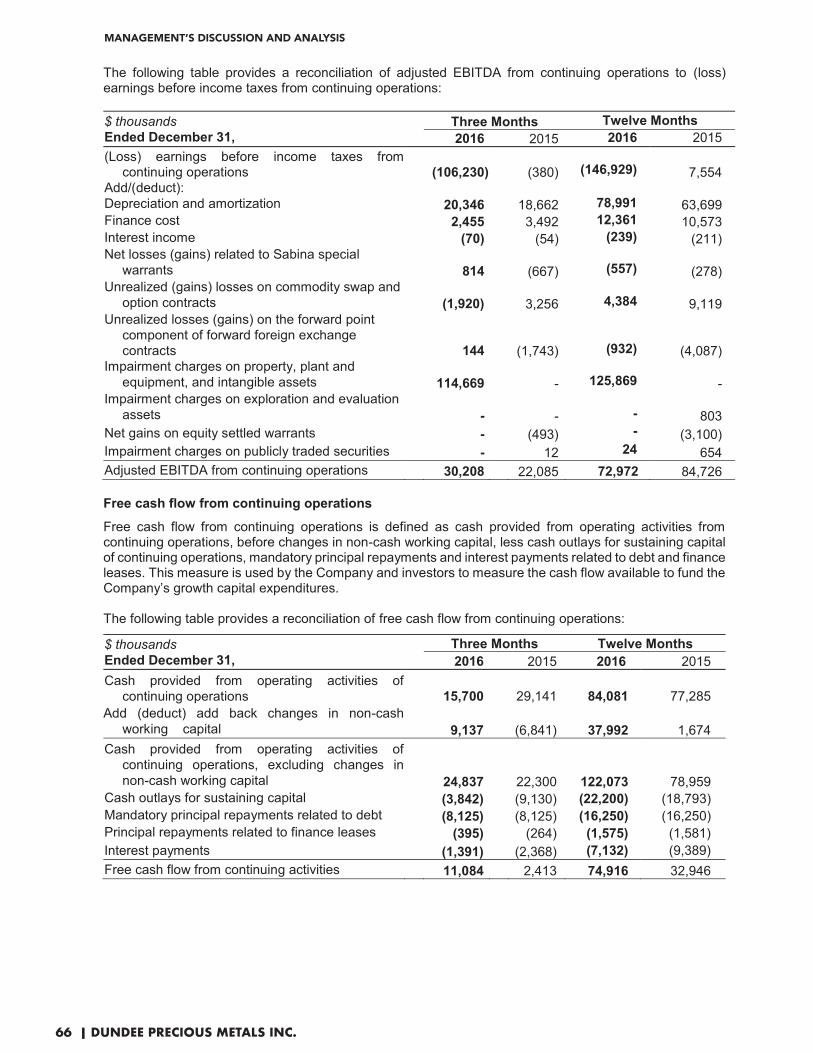
MANAGEMENT’S DISCUSSION AND ANALYSIS
66 | DUNDEE PRECIOUS METALS INC.
The following table provides a reconciliation of adjusted EBITDA from continuing operations to (loss) earnings before income taxes from continuing operations: $ thousandsEnded December 31,
Three Months Twelve Months2016 2015 2016 2015
(Loss) earnings before income taxes from continuing operations (106,230) (380) (146,929) 7,554
Add/(deduct): Depreciation and amortization 20,346 18,662 78,991 63,699 Finance cost 2,455 3,492 12,361 10,573 Interest income (70) (54) (239) (211) Net losses (gains) related to Sabina special
warrants 814 (667) (557) (278) Unrealized (gains) losses on commodity swap and
option contracts (1,920) 3,256 4,384 9,119 Unrealized losses (gains) on the forward point
component of forward foreign exchange contracts 144 (1,743) (932) (4,087)
Impairment charges on property, plant and equipment, and intangible assets 114,669 - 125,869 -
Impairment charges on exploration and evaluation assets - - - 803
Net gains on equity settled warrants - (493) - (3,100) Impairment charges on publicly traded securities - 12 24 654 Adjusted EBITDA from continuing operations 30,208 22,085 72,972 84,726
Free cash flow from continuing operations
Free cash flow from continuing operations is defined as cash provided from operating activities from continuing operations, before changes in non-cash working capital, less cash outlays for sustaining capital of continuing operations, mandatory principal repayments and interest payments related to debt and finance leases. This measure is used by the Company and investors to measure the cash flow available to fund the Company’s growth capital expenditures. The following table provides a reconciliation of free cash flow from continuing operations:
$ thousandsEnded December 31,
Three Months Twelve Months2016 2015 2016 2015
Cash provided from operating activities of continuing operations 15,700
29,141 84,081
77,285
Add (deduct) add back changes in non-cash working capital 9,137
(6,841) 37,992
1,674
Cash provided from operating activities of continuing operations, excluding changes in non-cash working capital 24,837
22,300 122,073
78,959 Cash outlays for sustaining capital (3,842) (9,130) (22,200) (18,793) Mandatory principal repayments related to debt (8,125) (8,125) (16,250) (16,250) Principal repayments related to finance leases (395) (264) (1,575) (1,581) Interest payments (1,391) (2,368) (7,132) (9,389) Free cash flow from continuing activities 11,084 2,413 74,916 32,946
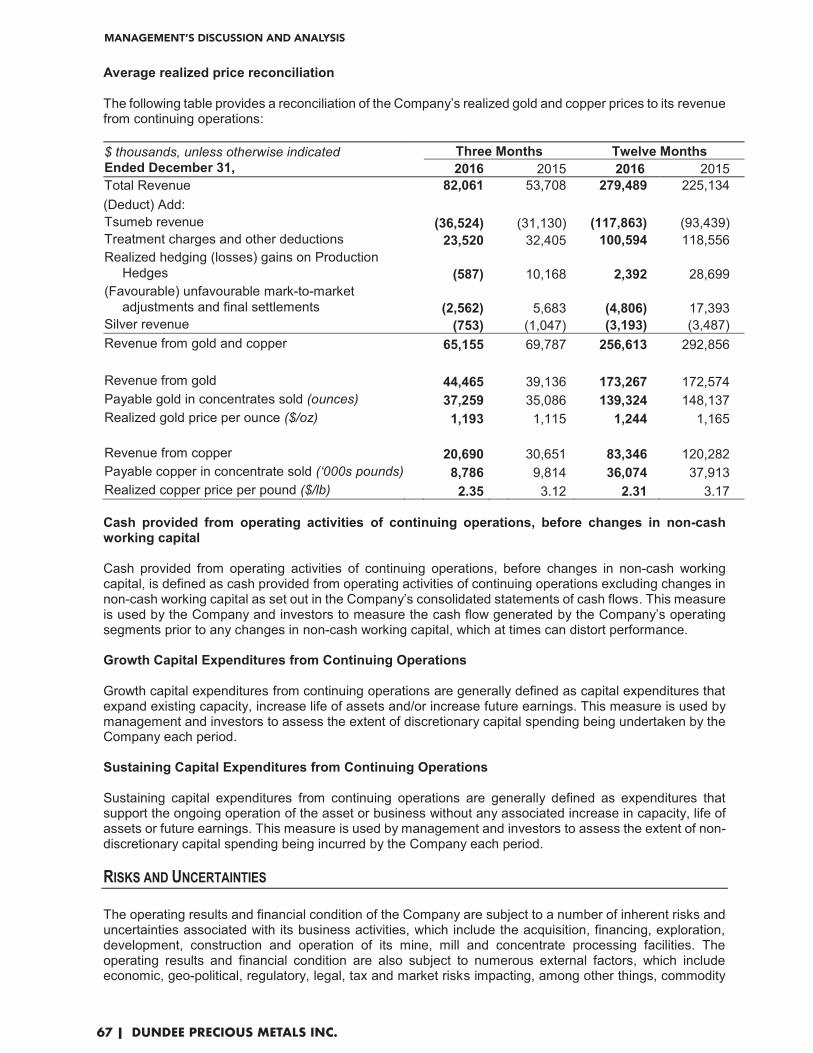
MANAGEMENT’S DISCUSSION AND ANALYSIS
67 | DUNDEE PRECIOUS METALS INC.
Average realized price reconciliation
The following table provides a reconciliation of the Company’s realized gold and copper prices to its revenue from continuing operations:
$ thousands, unless otherwise indicated Ended December 31,
Three Months Twelve Months2016 2015 2016 2015
Total Revenue 82,061 53,708 279,489 225,134 (Deduct) Add: Tsumeb revenue (36,524) (31,130) (117,863) (93,439) Treatment charges and other deductions 23,520 32,405 100,594 118,556 Realized hedging (losses) gains on Production
Hedges (587)
10,168 2,392
28,699 (Favourable) unfavourable mark-to-market
adjustments and final settlements (2,562)
5,683 (4,806)
17,393 Silver revenue (753) (1,047) (3,193) (3,487) Revenue from gold and copper 65,155 69,787 256,613 292,856 Revenue from gold 44,465 39,136 173,267 172,574 Payable gold in concentrates sold (ounces) 37,259 35,086 139,324 148,137 Realized gold price per ounce ($/oz) 1,193 1,115 1,244 1,165 Revenue from copper 20,690
30,651 83,346 120,282
Payable copper in concentrate sold (‘000s pounds) 8,786 9,814 36,074 37,913 Realized copper price per pound ($/lb) 2.35 3.12 2.31 3.17
Cash provided from operating activities of continuing operations, before changes in non-cash working capital Cash provided from operating activities of continuing operations, before changes in non-cash working capital, is defined as cash provided from operating activities of continuing operations excluding changes in non-cash working capital as set out in the Company’s consolidated statements of cash flows. This measure is used by the Company and investors to measure the cash flow generated by the Company’s operating segments prior to any changes in non-cash working capital, which at times can distort performance.
Growth Capital Expenditures from Continuing Operations
Growth capital expenditures from continuing operations are generally defined as capital expenditures that expand existing capacity, increase life of assets and/or increase future earnings. This measure is used by management and investors to assess the extent of discretionary capital spending being undertaken by the Company each period.
Sustaining Capital Expenditures from Continuing Operations
Sustaining capital expenditures from continuing operations are generally defined as expenditures that support the ongoing operation of the asset or business without any associated increase in capacity, life of assets or future earnings. This measure is used by management and investors to assess the extent of non-discretionary capital spending being incurred by the Company each period. RISKS AND UNCERTAINTIES � The operating results and financial condition of the Company are subject to a number of inherent risks and uncertainties associated with its business activities, which include the acquisition, financing, exploration, development, construction and operation of its mine, mill and concentrate processing facilities. The operating results and financial condition are also subject to numerous external factors, which include economic, geo-political, regulatory, legal, tax and market risks impacting, among other things, commodity

MANAGEMENT’S DISCUSSION AND ANALYSIS
68 | DUNDEE PRECIOUS METALS INC.
prices, foreign exchange rates, inflation and the availability and cost of capital to fund the capital requirements of the business. Each of these risks could have a material adverse effect on the Company’s future business, results of operations and financial condition, and could cause actual results to differ materially from those described in any forward looking statements contained in this MD&A. The Company endeavors to manage these risks and uncertainties in a balanced manner with a view to mitigate risk while maximizing total shareholder returns. It is the responsibility of senior management, and the functional head of each business, to identify and to effectively manage the risks of each business. This includes developing appropriate risk management strategies, policies, processes and systems. There can be no assurance that the Company has been or will be successful in identifying all risks or that any risk-mitigating strategies adopted to reduce or eliminate risk will be successful. A description of the more significant business risks and uncertainties affecting the Company are set out below. These risks and uncertainties should be considered when evaluating the Company and its guidance. Additional risks not identified below may affect the Company.
Metal Prices
The Company sells and hedges its products at prices that are effectively determined by reference to the traded prices on major commodity exchanges, including the LME, LBMA, New York Commodity Exchange, and the Commodity Exchange (a part of the Chicago Mercantile Exchange). The fluctuation of the price of a metal sold by the Company can significantly impact revenues and can significantly impact all-in sustaining cost per ounce of gold and other cost measures that are reported net of by-product credits. Therefore, the prices of gold, copper and silver are major factors influencing the Company’s business, results of operations and financial condition, and, in turn, the price for its common shares. Gold, copper and silver prices can fluctuate widely and are affected by numerous factors beyond the Company’s control, including overall global market conditions; the sale or purchase of gold and silver by various central banks, financial institutions and Exchange Traded Funds; interest rates; foreign exchange rates; inflation or deflation; global and regional supply and demand; and the political and economic conditions of major gold, silver and copper producing and consuming countries throughout the world. If gold, silver and copper prices were to decline significantly from current levels, there can be no assurance that cash flow from operations, together with cash on hand and available lines of credit under the Company’s RCF, will be sufficient to meet the Company’s operating and capital requirements, including its contractual commitments and mandatory debt repayments, and the Company could be forced to discontinue production, reassess the feasibility of a particular project, and/or could lose its interest in, or be forced to sell, some of its properties. In addition, a significant commodity price decline could result in significant reductions in Mineral Reserve and Mineral Resource estimates, which could adversely impact the value of one or more of the Company’s CGUs and result in an impairment of the carrying value of certain assets, including exploration and evaluation assets, mine properties, and property, plant and equipment. In accordance with established risk management policies, from time to time, the Company enters into cash settled commodity swap contracts to swap future contracted monthly average metal prices for fixed metal prices in order to reduce the metal price exposure associated with the time lag between the provisional and final determination of concentrate sales as well as its by-product metals price exposure on future sales. Currently approximately 92% and 53% of the Company’s expected payable copper production for 2017 and 2018, respectively, has been hedged at an average price of $2.40 and $2.62 per pound. The Company also selectively enters into commodity option contracts from time to time to reduce its price exposure. These contracts are entered primarily to provide price protection below a specified “floor” price and, to reduce the upfront cost of these contracts, are typically accompanied by option contracts that provide price participation up to a specified “ceiling” price. Currently, approximately 31% of the Company’s expected payable gold in concentrate production for 2017 has been hedged using option contracts, which provide for a floor price of $1,200 per ounce and a ceiling price of $1,497 per ounce. These hedges introduce earnings volatility as a result of potential unrealized mark-to-market gains or losses as they are deemed not to be hedges for accounting purposes, notwithstanding that they are effective from an economic perspective.
Financing and Liquidity
The Company relies on the cash flows generated from its operations, including provisional payments received from its customers, cash on hand, available lines of credits under its RCF, and its ability to raise debt and equity from the capital markets to fund its operating, investment and liquidity needs. The cyclical nature of the Company’s businesses, general economic conditions and the volatility of capital markets are such that conditions could change dramatically, affecting the Company’s cash flow generating capability, its

MANAGEMENT’S DISCUSSION AND ANALYSIS
69 | DUNDEE PRECIOUS METALS INC.
ability to maintain, or draw upon, its RCF or the existing terms under its concentrate sales or toll agreements, as well as its liquidity, cost of capital and its ability to access additional capital, which could adversely affect the Company’s earnings and cash flows and, in turn, could affect total shareholder returns. To reduce these risks, the Company: (i) prepares regular cash flow forecasts to monitor its capital requirements, available liquidity and compliance with its debt covenants; (ii) strives to maintain a prudent capital structure that is comprised primarily of equity financing as well as long-term amortizing debt and a long-term committed RCF; and (iii) targets a minimum level of liquidity comprised of surplus cash balances and/or available committed lines of credit to avoid having to raise additional capital at times when the costs or terms would be regarded as unfavourable. As at December 31, 2016, the Company’s total debt was $41.3 million, of which $16.3 million related to the Company’s Term Loans and $25.0 million to the Company’s RCF. As at December 31, 2016, the Company’s total debt, as a percentage of total capital, was 7% (December 31, 2015 – 19%) and total debt, net of cash, cash equivalents and short-term investments, as a percentage of total capital, was 5% (December 31, 2015 – 16%). As at December 31, 2016, the Company was in compliance with all of its debt covenants. The Term Loans are repayable in 10 equal semi-annual installments, which commenced June 2013, and bear interest at a rate equal to the three month U.S. Dollar LIBOR plus 2.80%. The RCF bears interest at a spread above LIBOR, which varies between 2.75% and 5.50% depending upon the tranche being drawn upon and the Company’s debt leverage ratio (funded net debt to adjusted EBITDA), as defined in the RCF agreement. The RCF is comprised of a $45.0 million tranche A maturing in February 2021, a $150.0 million tranche B maturing in February 2019, and an $80.0 million tranche C maturing in September 2021 that has quarterly availability reductions of $4.0 million beginning in the third quarter of 2018. As at December 31, 2016, $25.0 million was drawn under the RCF. There can be no assurance that the Company’s operations will remain profitable or that the Company will be able to raise capital on terms that it considers reasonable. Adverse commodity market, general economic conditions and adverse capital market conditions could result in a delay or the indefinite postponement of development or construction projects and could adversely impact the Company’s financial condition, results of operations and share price.
Smelter Toll Rates, Metal Recoveries and Feed
The availability of sufficient volumes of high value complex concentrate, at suitable toll rates, is critical to the profitability of the smelter, given the fixed cost nature of the operation. The Company has entered into a long-term agreement to facilitate the procurement of sufficient quantities of suitable high value complex concentrate. There can be no assurance that such concentrate will be available to the smelter in future or that the parties will agree on contracted toll rates that will be sufficient to generate an adequate return. Failure to find sufficient quantities of suitable high value complex concentrate to be processed at acceptable toll rates could have an adverse impact on the Company’s business, financial condition and results of operations.
Under this agreement, Tsumeb must return specified quantities of copper, gold and silver. Metal over and under recoveries at the smelter are subject to smelter processing capabilities, contracted terms, and various estimates, including the quantities of metal contained in concentrate received, material in-process and blister delivered. These estimates are based on the Company’s process knowledge and multiple assay results. Actual metal deliveries could differ materially from initial estimates and could have an adverse impact on the Company’s business, financial condition and results of operations as any over or under recovery of metals is recorded in revenue.
Foreign Exchange
By virtue of its international operations, the Company incurs costs and expenses in a number of foreign currencies. The revenue received by the Company is denominated in U.S. dollars since the prices of the metals that it produces are referenced in U.S. dollars, while the majority of operating and capital expenditures are denominated in Bulgarian leva, which is pegged to the Euro, the Namibian dollar, which is tied to the ZAR, and the Canadian dollar. Fluctuations in these foreign exchange rates give rise to foreign exchange exposures, either favourable or unfavourable, which could have a material impact on the Company’s results of operations and financial condition.
MANAGEMENT’S DISCUSSION AND ANALYSIS
70 | DUNDEE PRECIOUS METALS INC.
From time to time, the Company enters into forward foreign exchange contracts in order to reduce the foreign exchange exposure associated with projected operating expenses denominated in foreign currencies. In future, the Company may also enter into forward foreign exchange contracts in order to reduce the foreign exchange exposure associated with projected capital expenditures denominated in foreign currencies. Currently approximately 20% of projected Euro operating expenses for 2017 have been hedged at an average exchange rate of 1.13. In addition, approximately 56% of projected Namibian dollar operating expenses for 2017 have been hedged at an average exchange rate of 13.87.
Counterparty Risk
The Company is exposed to counterparty risk, including market pricing and credit-related risk, in the event any counterparty, whether a customer, debtor or financial intermediary, is unable or unwilling to fulfill their contractual obligations to the Company or where such agreements are otherwise terminated and not replaced with agreements on substantially the same terms. Under the terms of the Company’s existing concentrate sale contracts, the risk to counterparties is mitigated, in part, through required provisional payments that range between 70% and 90% of the provisional value of each lot at the time title of the concentrate transfers. A final adjusting payment, reflecting the actual metal prices for the specified quotational period, is made when final weights and assays are established. During 2016, the Company had contracts with eight customers, one of whom accounted for approximately 56% (2015 - 74%) of the Company’s revenue. All contractual commitments are subject to force majeure clauses which, if implemented, could have an adverse impact on the Company’s business, financial condition and results of operations. While there can be no assurance that the Company will not experience a material loss for non-performance by any counterparty with whom it has a commercial relationship, the Company has established policies to manage its credit exposure that include assessing financial strength, limiting aggregate exposure to new and existing counterparties, and using contractual arrangements, including provisional payments and the use of International Swaps and Derivatives Association (“ISDA”) master netting agreements that permit netting of exposures associated with a single counterparty. Should any such losses arise, they could adversely affect the Company’s business, financial condition and results of operations. Environmental, Health and Safety
The Company’s operations are subject to extensive environmental, health and safety regulations in the various jurisdictions in which it operates. These regulations mandate, among other things, emissions; air and water quality standards; land use; rehabilitation and reclamation; and safety and work environment standards, including human rights. They also set forth limitations on the generation, transportation, storage and disposal of various wastes, including hazardous wastes. Environmental, health and safety legislation continues to evolve and, while the Company takes active steps to monitor this legislation, it could result in stricter standards and enforcement, increased fines and penalties for non-compliance, more stringent environmental assessments of proposed projects and a heightened degree of responsibility for companies and their officers, directors and employees. There can be no assurance that future changes in environmental, health and safety regulations, if any, will not adversely affect the Company’s operations and business. Environmental hazards may exist on the properties in which the Company holds interests, which are unknown to the Company at present, and which have been caused by previous or existing owners or operators of the properties. The Company may also acquire properties with known or undiscovered environmental risk. Any indemnifications by the previous owners or others may not be adequate to pay all the fines, penalties and costs incurred related to such properties. Some of the Company’s properties have also been used for mining and related operations for many years before the Company acquired them and were acquired “as is” or with assumed environmental liabilities from previous owners or operators. The Company has been required to address contamination at its properties in the past and may need to do so in the future, either for existing environmental conditions or for leaks, discharges or contamination that may arise from its ongoing operations or other contingencies. The cost of addressing environmental conditions or risks, and liabilities associated with environmental damage may be significant, and could have a material adverse effect on the Company’s business results of operation and financial condition. Production at the Company’s mines and processing facilities involves the use of various chemicals, including certain chemicals that are designated as hazardous substances. Contamination from hazardous substances, either at the Company’s

MANAGEMENT’S DISCUSSION AND ANALYSIS
71 | DUNDEE PRECIOUS METALS INC.
own properties or other locations for which it may be responsible, may subject the Company to liability for the investigation or remediation of contamination, as well as for claims seeking to recover costs for related property damage, personal injury or damage to natural resources. The occurrence of any of these adverse events could have a material adverse effect on the Company’s business, financial condition and results of operations. The operations of the Company require licenses and permits from various governmental authorities to develop and exploit its properties, and the process for obtaining licenses and permits from governmental authorities often takes an extended period of time and is subject to numerous delays and uncertainties. Such licenses and permits are subject to change in various circumstances. The Company’s exploration programs are subject to laws and regulations relating to exploration procedures, employee health and safety, air quality standards, pollution of stream, river and fresh water sources, odour, noise, dust, and other environmental protection controls adopted by governmental authorities as well as the rights of adjoining property owners. Failure to comply with applicable laws, regulations and permitting requirements may result in enforcement actions, including orders issued by regulatory or judicial authorities causing operations to cease or be curtailed and may include corrective measures requiring capital expenditures, installation of additional equipment or remedial actions. Parties engaged in mining and processing operations or in the exploration or development of mineral properties may be required to compensate those suffering loss or damage by reason of the mining and processing activities and may have civil or criminal fines or penalties imposed for violations of applicable laws or regulations. Amendments to current laws, regulations, and permits and licenses governing the Company’s mining, processing, development and exploration activities, or more stringent implementation thereof, could have a material adverse impact on the Company and cause increases in exploration expenses, capital expenditures, production costs or future rehabilitation costs or reduction in levels of production at producing properties or require abandonment or delays in development of new mining properties. The Company has completed a major multi-year capital program at its smelter in Namibia directed at modernizing the environmental equipment being utilized and debottlenecking its processing capacity. This included the completion of a sulphuric acid plant, which has reduced the plant’s SO2 emissions. The Company is committed to making further improvements to the health, safety and environmental performance of the smelter and is continuously assessing the scope of any capital expenditures required to support these further improvements. The Company’s environmental and occupational health and safety performance will be subject to continued monitoring by the Namibian authorities to ensure that the modifications made to the off-gas and dust handling systems and the completion of the acid plant continue to deliver on the expected decrease in emissions. Failure of these new systems and the acid plant to achieve the expected environmental and occupational health outcomes could adversely impact the Company’s future production, results of operations and financial condition.
The Company recognizes a liability for its asset retirement obligations (“ARO”) when a legal and/or constructive obligation is identified. The liability is measured at the present value of estimated costs required to rehabilitate the operating locations based on the risk free nominal discount rates applicable to the countries in which the operations are located. The carrying value of the ARO liability was $30.3 million and $35.1 million at December 31, 2016 and 2015, respectively. Changes in the underlying assumptions used to estimate the AROs as well as changes to environmental laws and regulations could cause material changes in the expected cost and the fair value of the AROs and these changes could have a material adverse impact on the Company’s results of operations and financial condition.
Operations
Mining operations and related processing and infrastructure facilities are subject to risks normally encountered in the mining and metals industry. Such risks include, without limitation, environmental hazards, industrial accidents, disruptions in the supply of critical materials and supplies, labour disputes, changes in laws, technical difficulties or failures, equipment failure, failure of retaining dams around tailings disposal areas which may result in environmental pollution and consequent liability, unusual and unexpected geologic formations, seismic activity, rock bursts, cave-ins, flooding and other conditions involved in the drilling and removal of material. Such risks could result in damage to, or destruction of,

MANAGEMENT’S DISCUSSION AND ANALYSIS
72 | DUNDEE PRECIOUS METALS INC.
mines and other processing facilities, damage to life or property, environmental damage, delays in mining and processing, losses and possible legal liability. Any prolonged downtime or shutdowns at the Company’s mining and processing facilities could materially affect the Company’s business, financial condition and results of operations.
Success of the Company’s operations also depends on adequate public infrastructure. Reliable roads, bridges, power sources and water supplies are important determinants which affect capital and operating costs. Natural events, such as seismic events and severe climatic conditions, as well as sabotage, government or other interference in the maintenance or provision of such infrastructure could adversely affect the Company’s business, financial condition and results of operations.
Dependence on a Restricted Portfolio of Assets
The Company’s operations at the Chelopech mine in Bulgaria accounted for the vast majority of the Company’s gold and copper production in 2016 and are expected to continue to do so in 2017 and 2018, following which the Krumovgrad gold mine is expected to be operational. Any adverse condition affecting the Chelopech mine could have an adverse impact on the Company’s business, financial condition and results of operations. Until such time as the Company acquires or develops other significant producing assets, the Company will continue to be dependent on its operations at the Chelopech mine for a substantial portion of its cash flow provided by mining activities.
Production, Operating and Shipping Costs
Many unforeseen factors can impact the Company’s future production and total cash costs of production, such as cost of inputs used in mining and processing operations; cost of fuel, energy, supplies, labour and equipment; availability of suitable high value complex concentrates to be processed at the smelter; regulatory factors; royalties and taxes; foreign exchange rates; adverse climatic conditions and natural phenomena; and industrial accidents can impact the accuracy of these projections. As such, there can be no assurance that production and production cost estimates will be achieved. Failure to achieve production or total cash cost estimates could have an adverse impact on the Company’s business, financial condition and results of operations. The Company contracts for the shipment of its concentrates to its customers on varying terms and conditions, all subject to the prevailing rates, availability and general circumstances surrounding this market. Adverse changes to the shipping markets and/or the terms and conditions of shipping contracts could have a material adverse impact on the Company’s business, financial condition and results of operations. Mineral Resources and Mineral Reserves
The Mineral Resources and Mineral Reserves disclosed by the Company are estimates and no assurance can be given that the anticipated tonnages and grades will be achieved or that the indicated level of recovery will be realized. There are numerous uncertainties inherent in estimating Mineral Resources and Mineral Reserves, including many factors beyond the Company’s control. Such estimation is a subjective process and the accuracy of any resource estimate is a function of the quantity and quality of available data and of the assumptions made and judgments used in engineering and geological interpretation. Short-term operating factors, such as the need for orderly development of the ore bodies or the processing of new or different ore grades, may cause the mining operation to be unprofitable in any particular accounting period. In addition, there can be no assurance that gold, silver or copper recoveries in small scale laboratory tests will be duplicated in larger scale tests under on-site conditions or during production.
Fluctuations in gold, copper and silver prices, results of drilling, change in cut-off grades, metallurgical testing, production and the evaluation of mine plans subsequent to the date of any estimates may require revision of such estimates. The volume and grade of Mineral Reserves mined and processed, and the recovery rates achieved may not be the same as currently anticipated. Any material reduction in the estimated Mineral Resources and Mineral Reserves could have a material adverse effect on the Company’s business, financial condition and results of operations. A significant decrease in the Mineral Reserve and Mineral Resource estimates could adversely impact the carrying value of exploration and evaluation assets, mine properties, property, plant and equipment, depletion and depreciation charges, and rehabilitation provisions, and could result in an impairment of the carrying value.

MANAGEMENT’S DISCUSSION AND ANALYSIS
73 | DUNDEE PRECIOUS METALS INC.
Inferred Mineral Resources
Inferred Mineral Resources that are not Mineral Reserves do not have demonstrated economic viability. Due to the uncertainty which may be attached to Inferred Mineral Resources, there can be no assurance that Inferred Mineral Resources will be upgraded to Proven and Probable Mineral Reserves as a result of continued exploration.
Need for Mineral Reserves
As mines have limited lives based on Proven and Probable Mineral Reserves, the Company must continually develop, replace and expand its Mineral Reserves as its mines produce gold, silver and copper concentrates. The Company’s ability to maintain or increase its annual production of gold, silver and copper and its aggregate Mineral Reserves will be significantly dependent on its ability to expand Mineral Reserves both at its existing mines and new mines it intends to bring into production in the future.
Exploration
Exploration is speculative and involves many risks that even a combination of careful evaluation, experience and knowledge utilized by the Company may not eliminate. Once a site with gold or other precious metal mineralization is discovered, it may take several years from the initial phases of drilling until production is possible. Substantial expenditures are normally required to locate and establish Mineral Reserves and to permit and construct mining and processing facilities. While the discovery of an ore body may result in substantial rewards, few properties that are explored are ultimately developed into producing mines.
Foreign Country and Political
The majority of the Company’s operations and business are outside of Canada, primarily in Eastern Europe and southern Africa, and as such, the Company’s operations are exposed to various political and other risks and uncertainties.
These risks and uncertainties vary from country to country and include, but are not limited to, terrorism; corruption; crime; hostage taking or detainment of personnel; military repression; extreme fluctuations in foreign currency exchange rates; high rates of inflation; labour unrest; the risks of war or civil unrest; expropriation and nationalization; renegotiation or nullification of existing concessions, licenses, permits and contracts; absence of reliable rule of law, regulatory and judiciary processes; illegal mining; changes in taxation or royalty policies; restrictions on foreign exchange and movements of capital; changing political conditions; inappropriate laws and regulations; and governmental regulations that favour or require the awarding of contracts to local contractors or require foreign contractors to employ citizens of, or purchase supplies from, a particular jurisdiction.
Other risks include the potential for fraud and corruption by suppliers, Company personnel or government officials which could implicate the Company, compliance with applicable anti-corruption laws, including the Canadian Corruption of Foreign Public Officials Act (“CFPOA”) by virtue of the Company operating in jurisdictions that may be vulnerable to the possibility of bribery, collusion, kickbacks, theft, improper commissions, facilitation payments, conflicts of interest and related party transactions and the Company’s possible failure to identify, manage and mitigate instances of fraud, corruption, or violations of its code of conduct and applicable regulatory requirements. Although the Company has adopted a formal Anti-Bribery and Anti-Corruption policy, for which training has been provided to those employees who are employed in areas of the business that are deemed to be higher risk, there can be no assurance that these measures will prevent or detect the occurrence of a corrupt act, which could adversely impact the Company’s business, financial condition and results of operation.
Any changes in mining or investment policies or shifts in political attitude in the countries in which the Company conducts its business and operations may adversely affect the Company’s business, financial condition and results of operations.
The Company also currently conducts mining, development and exploration activities in countries with developing economies. It is difficult to predict the future political, social and economic direction of the countries in which the Company operates, and the impact government decisions could have on its business. Any political or economic instability in the countries in which the Company currently operates could adversely impact the Company’s business, financial condition and results of operations.
In addition, authorities and court systems in the countries in which the Company conducts its business and operations may be unpredictable. Challenges to foreign asset ownership, operations and regulatory

MANAGEMENT’S DISCUSSION AND ANALYSIS
74 | DUNDEE PRECIOUS METALS INC.
compliance may be brought by government authorities for reasons that cannot be predicted and that may not be motivated by substantive law. It is also not unusual, in the context of a dispute resolution, for a party in these foreign jurisdictions to use the uncertainty of the legal environment as leverage in its business negotiations.
Failure to comply with applicable laws, regulations and local practices relating to mineral right applications and tenure could result in loss, reduction or expropriation of entitlements.
Risks with Respect to Inadequate Controls over Financial Reporting
The Company assessed and tested its internal control procedures in order to satisfy the requirements of NI 52-109, which require an annual assessment by management of the operating effectiveness of the Company's internal control over financial reporting. The Company's failure to satisfy the requirements of NI 52-109 on an ongoing and timely basis could result in the loss of investor confidence in the reliability of its financial statements, which in turn could adversely impact the Company's business and share price. In addition, any failure to implement required new or improved controls, or difficulties encountered in their implementation, could adversely impact the Company's financial results, results of operations and share price.
No evaluation can provide absolute assurance that the Company's internal control over financial reporting will detect or uncover all material information required to be reported. Furthermore, there can be no certainty that the Company’s internal control over financial reporting will prevent or detect all errors and fraud. In addition, with ever increasing regulations and changes in the Company’s business it is expected that the Company’s internal control over financial reporting will continue to evolve and improve over time.
Community Relations and License to Operate
The Company’s relationship with the host communities where it operates is critical to ensure the future success of its existing operations and the construction and development of its projects. There is an increasing level of public concern relating to the perceived effect of mining and smelter activities on the environment and on communities impacted by such activities. Certain non-governmental organizations (“NGOs”) and civil society groups, some of which oppose globalization and resource development, are often vocal critics of the mining industry and its practices, including the use of hazardous substances and the handling, transportation and storage of various waste, including hazardous waste. Adverse publicity generated by such NGOs and civil society groups or others related to the extractive industries generally, or the Company’s operations specifically, could have adverse effects on, including but not limited to, the laws under which the Company operates, its ability to secure new permits and its reputation. Reputation loss may result in decreased investor confidence, increased challenges in developing and maintaining community relations and an impediment to the Company’s overall ability to advance its projects and/or continue its operations, which could have a material adverse impact on the Company’s business, results of operations and financial condition.
Development Projects
As part of the Company’s growth strategy, it expects to invest in the development, design, construction, operation and optimization of existing and new facilities to enhance operations and increase future production. In developing these new projects, the Company may be required to incur significant preliminary engineering, environmental, permitting and legal-related expenditures prior to determining whether a project is technically feasible and economically viable. The commercial viability of development projects is based on many factors, including: in the case of a mine, the particular attributes of the deposit, such as size, grade and proximity to infrastructure; metal recoveries, metal prices and, in the case of the smelter, toll rates, each of which are highly cyclical; availability of complex concentrate; government regulations; capital and operating costs of such projects; and foreign currency exchange rates. Development projects are also subject to the successful completion of feasibility studies, issuance of necessary governmental permits, subsequent appeals of such permits, including favourable EIA decisions, the acquisition of satisfactory surface or other land rights and having adequate funding arrangements in place.
All projects are approved for development on a project-by-project basis after considering its strategic fit, inherent risks, and expected financial returns. This approach, which incorporates a gated project governance model, and combined with an experienced management team, staff and contract personnel, mitigates some of the risk associated with development projects. However, there can be no assurance that there will not be delays in obtaining the necessary permits or that the development or construction of any one or more projects will be completed on time, on budget or at all, or that the ultimate operating cost of

MANAGEMENT’S DISCUSSION AND ANALYSIS
75 | DUNDEE PRECIOUS METALS INC.
the operation will not be higher than originally envisaged. In addition, to secure long lead times required for ordering equipment, the Company may place orders for equipment and make deposits thereon or advance projects before obtaining all requisite permits and licenses. Such actions are taken only when the Company reasonably believes such licenses or permits will be forthcoming prior to the requirement to expend the full amount of the purchase price. In the event a project, which was deemed economically viable, is not completed or does not operate at anticipated performance levels, the Company may be unable to fully recover its investment and be required to record a write-down. This, in turn, may adversely affect the Company’s business, results of operations and financial condition. It is not unusual in the mining industry, especially in a jurisdictions like Bulgaria and Namibia, for operations to experience construction challenges or delays and unexpected problems during the start-up phase, resulting in delays and requiring more capital than anticipated. Given the inherent risks and uncertainties associated with any major capital project, there can be no assurance that construction will proceed in accordance with current expectations or at all, or that construction costs will be consistent with the budget, or that the operation will operate as planned. Risks Related to Construction and Start-up of Krumovgrad
The Company presents estimates with respect to capital costs, operating costs and other project economics with respect to the Krumovgrad project. The Company’s actual costs, production, returns, payback and other financial and economic performance metrics for the Krumovgrad project are dependent on a number of factors, including currency exchange rates, the price of gold and by-product metals, the cost of inputs used in mining development and operations and events that impact cost and production levels that are not in the Company’s control. DPM’s actual costs may vary from estimates for a variety of reasons, including changing waste-to-ore ratios, ore grade metallurgy, labour and other input costs, commodity prices, general inflationary pressures and currency exchange rates. Failure to achieve cost estimates or other economic performance metrics or material increases in costs could have an adverse impact on DPM’s future cash flows, profitability, results of operations and financial condition. As a result of the substantial expenditures involved in development projects, development projects are prone to material cost overruns versus budget. The capital expenditures and time required to develop new mines are considerable and changes in cost or construction schedules can significantly increase both the time and capital required to build the project. It is not unusual for new mining operations to experience construction challenges or delays and unexpected problems during the start-up phase, including failure of equipment, machinery, the processing circuit or other processes to perform as designed or intended, inadequate water, insufficient ore stock pile or grade, and failure to deliver adequate tonnes of ore to the mill, any of which could result in delays, slowdowns or suspensions and require more capital than anticipated. Given the inherent risks and uncertainties associated with the development of a new mine, there can be no assurance that the construction will continue in accordance with current expectations or at all, or that construction costs will be consistent with the budget, or that the mine will operate as planned.
Competition
The Company faces competition from other mining companies in connection with the acquisition of properties producing, or capable of producing, precious and base metals, as well as the ultimate sale of its production. Many of these companies have greater financial resources, operational experience and technical capabilities than the Company. As a result of this competition, there can be no assurance that the Company will be able to acquire or maintain attractive operations or sell its production on economically acceptable terms. Consequently, the Company’s business, results of operations and financial condition could be adversely affected.
The Company also faces competition from other smelting companies as well as trading companies, notably those with blending operations, to secure complex feed for its Tsumeb smelter operation. Such competitive forces and supply-demand dynamics could cause terms for complex copper concentrate to fall below levels at which it is economic for the Company to smelt this material. Consequently, the Company’s business, results of operations and financial condition could be adversely affected.
MANAGEMENT’S DISCUSSION AND ANALYSIS
76 | DUNDEE PRECIOUS METALS INC.
Enforcement of Legal Rights
The Company’s material subsidiaries are organized under the laws of foreign jurisdictions. Given that the Company’s material assets are located outside of Canada, investors may have difficulty in effecting service of process within Canada and collecting from or enforcing against the Company, any judgments obtained by the Canadian courts or Canadian securities regulatory authorities and predicated on the civil liability provisions of Canadian securities legislation or otherwise. Similarly, in the event a dispute arises from the Company’s foreign operations, the Company may be subject to the exclusive jurisdiction of foreign courts or may not be successful in subjecting foreign persons to the jurisdictions of courts in Canada. See “Other Disclosure Related to OSC Requirements for Companies Operating in Emerging Markets” in the AIF.
Insurance and Uninsured Risks
The Company’s business is subject to numerous risks and hazards, including severe climatic conditions, industrial accidents, equipment failures, labour disputes, unusual or unexpected geological conditions, ground or slope failures, cave-ins, changes in the regulatory environment and other natural events such as earthquakes. Such occurrences could result in damage to mineral properties or processing facilities, personal injury or death, environmental damage to the Company’s properties or the properties of others, delays in mining and processing, monetary losses and possible legal liability. In order to eliminate or reduce certain risks, the Company purchases and maintains insurance coverage, subject to limits and deductibles that are considered reasonable and prudent. This insurance coverage does not cover all potential risks because of customary exclusions and/or limited availability, and in some instances, the Company’s view that the cost of certain insurance coverage is excessive in relation to the risk or risks being covered. Further, there can be no assurance that insurance coverage will continue to be available on commercially reasonable terms, that such coverage will ultimately be sufficient, or that insurers will be able to fulfill their obligations should a claim be made. Losses arising from any such events that are not fully insured may cause the Company to incur significant costs that could have a material adverse effect on its business, financial condition and results of operations.
Value of Investment Portfolio
The value of the Company’s investment portfolio of securities will vary based on the underlying value of the securities acquired by the Company. The business activities of issuers in the resource industry (“Resource Issuers”) are speculative and may be adversely affected by factors outside the control of those issuers. Resource Issuers may not hold or discover commercial quantities of precious metals or minerals, have limited access to capital, and profitability may be affected by adverse fluctuations in commodity prices, demand for commodities, general economic conditions and cycles, unanticipated depletion of reserves or resources, native land claims, liability for environmental damage, competition, imposition of tariffs, duties or other taxes and government regulations, as applicable. Because the Company has and may continue to invest primarily in securities issued by Resource Issuers engaged in the mining industry or related resource businesses (including junior issuers), the value of the Company’s investment portfolio of securities may be more volatile than portfolios with a more diversified investment focus. In some cases, the value of securities owned by the Company may also be affected by such factors as investor demand, specified rights or restrictions associated with the security, general market trends or regulatory restrictions. Fluctuations in the market values of such securities may occur for a number of reasons beyond the control of the Company, and there can be no assurance that an adequate liquid market will exist for securities or that quoted market prices at any given time will properly reflect the value at which the Company could monetize these securities.
Government Laws and Regulations
The activities of the Company are subject to various laws governing prospecting, development, production, taxes, labour standards and occupational health, mine safety, toxic substances, land use, water use, land claims of local people, archaeological discovery and other matters. Although the Company currently carries out its operations and business in accordance with all applicable laws, rules and regulations, no assurance can be given that new laws, rules and regulations will not be enacted or that existing laws, rules and regulations will not be changed or be applied in a manner which could limit or curtail production or development. Furthermore, amendments to current laws and regulations governing operations and activities of mining, milling and processing or more stringent implementation thereof could cause costs and

MANAGEMENT’S DISCUSSION AND ANALYSIS
77 | DUNDEE PRECIOUS METALS INC.
delays that will have a material adverse impact on the results of operations and financial condition of the Company.
The Company’s current and future operations and development activities are subject to receiving and maintaining permits from appropriate governmental authorities. Although the Company currently has the required permits for its current operations, there can be no assurance that delays will not occur in connection with obtaining all necessary renewals of such permits for the existing operations or additional permits for planned new operations or changes to existing operations.
Labour Relations
While the Company has good relations with both its unionized and non-unionized employees, there can be no assurance that it will be able to maintain positive relationships with its employees or that new collective agreements will be entered into without work interruptions. In addition, relations between the Company and its employees may be impacted by regulatory or governmental changes introduced by the relevant authorities in whose jurisdictions the Company carries on business. Adverse changes in such legislations or in the relationship between the Company and its employees could have a material adverse impact on the Company’s business, results of operations and financial condition.
A two-year collective agreement with the Company’s unionized employees at Chelopech is in force from July 1, 2015 to July 1, 2017. An agreement was also reached with the Company’s unionized employees at the smelter and is in force until March 2018.
Income Tax
The Company operates in Canada and several foreign jurisdictions, through a number of subsidiary intermediary entities, and in some instances may utilize inter-company interest-bearing and non-interest bearing debt. As a result, it is subject to potential changes in tax laws, judicial interpretations in respect thereof, and the administrative and/or assessing practices of tax authorities in each jurisdiction. While these tax risks are proactively managed and monitored by senior management and outside tax experts, there can be no assurance that there will not be tax changes or rulings that could adversely affect the Company’s business, financial condition and results of operations.
The Company believes that it is not currently a passive foreign investment company (“PFIC”) for U.S. Federal income tax purposes and it does not anticipate becoming a PFIC in the foreseeable future. However, the PFIC rules are complex, and, as a Canadian company publicly listed on the TSX, the Company does not operate its business in a manner specifically intended to avoid being classified as a PFIC. Accordingly, there can be no assurance that the Company will not be considered a PFIC. The Company also has not and does not expect to provide any shareholder with information that will enable a U.S. shareholder to make a qualified electing fund election in respect of the Company. To the extent that the Company is a PFIC in respect of any taxable year, its status as such would have adverse tax consequences for taxable U.S. investors. U.S. investors should consult their own tax advisors regarding the PFIC rules and the potential adverse U.S. Federal income tax consequences to which they may be subject in respect of an investment in the Company’s common shares.
Future Plans
As part of its overall business strategy, the Company examines, from time to time, opportunities to acquire and/or develop new mineral projects and businesses. A number of risks and uncertainties are associated with these potential transactions and DPM may not realize all of the anticipated benefits. The acquisition and the development of new projects and businesses are subject to numerous risks, including the particular attributes of the deposit, political, regulatory, design, construction, labour, operating, technical, and technological risks, as well as uncertainties relating to the availability and cost of capital, future metal prices, foreign currency rates and toll rates, in the case of the smelter. Failure to successfully realize the anticipated benefits associated with one or more of these initiatives successfully could have an adverse effect on the Company’s business, financial condition and results of operations.
Land Title
Although the title to the properties owned by the Company were reviewed by, or on behalf of, the Company, there can be no assurances that there are no title defects affecting such properties. Title insurance generally is not available, and the Company’s ability to ensure that it has obtained a secure claim to individual mineral properties or mining concessions may be severely constrained. The Company has not conducted surveys

MANAGEMENT’S DISCUSSION AND ANALYSIS
78 | DUNDEE PRECIOUS METALS INC.
of the claims in which it holds direct or indirect interests and, therefore, the precise area and location of such claims may be in doubt.
Accordingly, the Company’s mineral properties may be subject to prior unregistered liens, agreements, transfers or claims, and title may be affected by, among other things, undetected defects. In addition, the Company may be unable to operate its properties as permitted or to enforce its rights with respect to its properties.
Market Price of Common Shares
The Company’s common shares are listed on the TSX. The price of these and other shares making up the mining sector have historically experienced substantial volatility, often based on factors unrelated to the financial performance or prospects of the companies involved. These factors include macroeconomic developments in North America and globally, including those impacting the price of commodities, interest rates, market perceptions concerning equity securities generally and the precious and base metal sectors in particular, and factors that may be specific to the Company, including daily traded volumes of its common shares.
As a result of any of these factors, the market price of the common shares at any given point in time may not accurately reflect the Company’s long-term value, which in turn could impact the ability of the Company to raise equity or raise equity on terms considered to be acceptable. Securities class action litigation often has been brought against companies following periods of volatility in the market price of their securities. The Company may in the future be the target of similar litigation. Securities litigation could result in substantial costs and damages and divert management’s attention and resources and have an adverse effect on the Company’s business, financial condition and results of operations.
Dilution to Common Shares
During the life of the Company’s outstanding stock options granted under its share based compensation plans, the holders are given an opportunity to profit from an increase in the market price of the common shares with a resulting dilution in the interest of shareholders. The holders of stock options may exercise such securities at a time when the Company may have been able to obtain any needed capital by a new offering of securities on terms more favourable than those provided by the outstanding rights. The increase in the number of common shares in the market, if all or part of these outstanding rights were exercised, and the possibility of sales of these additional shares may have a negative effect on the price of the common shares.
The Company may need to raise additional financing in the future through the issuance of additional equity securities. If the Company raises additional funding by issuing additional equity securities, such financings may substantially dilute the interests of shareholders of the Company and reduce the value of their investment in the Company’s securities.
Anti-Corruption Laws
The Company’s operations are governed by, and involve interactions with, many levels of government in numerous countries. Its operations take place in jurisdictions ranked unfavourably under Transparency International’s Corruption Perception Index. The Company is required to comply with anti-corruption and anti-bribery laws, including the Criminal Code, the CFPOA, as well as similar laws in the countries in which the Company conducts its business. In recent years, there has been a general increase in both the frequency of enforcement and the severity of penalties under such laws, resulting in greater scrutiny and punishment to companies convicted of violating anti-corruption and anti-bribery laws. Furthermore, a company may be found liable for violations by not only its employees, but also by its contractors and third party agents. Although the Company has adopted steps to mitigate such risks, including the implementation of training programs, internal monitoring, reviews and audits, and policies to ensure compliance with such laws, such measures may not always be effective in ensuring that the Company, its employees, contractors or third party agents will comply strictly with such laws. If the Company finds itself subject to an enforcement action or is found to be in violation of such laws, this may result in significant penalties, fines and/or sanctions imposed on the Company resulting in a material adverse effect on the Company’s reputation, business, financial condition and results of operations.
MANAGEMENT’S DISCUSSION AND ANALYSIS
79 | DUNDEE PRECIOUS METALS INC.
Information Systems Security Threats DPM has entered into agreements with third parties for hardware, software, telecommunications and other information technology (“IT”) services in connection with its operations. The Company’s operations depend, in part, on how well the Company and its suppliers protect networks, equipment, IT systems and software against damage from a number of threats, including, but not limited to, cable cuts; damage to physical plants; natural disasters; terrorism; fire; power loss; hacking; computer viruses; vandalism and theft. The Company’s operations also depend on the timely maintenance, upgrade and replacement of networks, equipment, IT systems and software to mitigate the risk of failures. Any of these and other events could result in information loss, system failures, business interruptions and/or increases in capital expenses, which could adversely impact the Company’s reputation, business, financial condition and results of operations. Although to date the Company has not experienced any material losses relating to cyber-attacks or other information security breaches, there can be no assurance that DPM will not incur such losses in the future. The Company’s risk and exposure to these matters cannot be fully mitigated because of, among other things, the evolving nature of these threats. As a result, cyber security and the continued development and enhancement of controls, processes and practices designed to protect systems, computers, software, data and networks from attack, damage or unauthorized access remain a priority. As cyber threats continue to evolve, the Company may be required to expend additional resources to continue to modify or enhance protective measures or to investigate and remediate any security vulnerabilities.
Interest Rate
The Company’s exposure to the risk of changes in market interest rates relates primarily to the Company’s cash and cash equivalents, floating rate denominated long-term debt, revolver line of credit and finance lease obligations, the majority of which have associated cash flows based on floating interest rates. Climate Change Risks
Many governments are moving to enact climate change legislation and treaties at the international, national, state, provincial and local levels. Where legislation already exists, regulations relating to emission levels and energy efficiency are becoming more stringent. Some of the cost associated with meeting more stringent regulations can be offset by increased energy efficiency and technological innovation. However, if the current regulatory trend continues, meeting more stringent regulations is anticipated to result in increased costs, which could have a material adverse impact on the Company’s business, results of operations and financial condition.
Foreign Subsidiaries
The Company conducts its operations through foreign subsidiaries and substantially all of its assets are held in such entities. Accordingly, any limitation on the transfer of cash or other assets between or among DPM and such entities, could restrict or impact the Company’s ability to fund or receive cash from its operations. Any such limitations, or the perception that such limitations may exist now or in the future, could have an adverse impact on the Company’s business, financial condition and results of operations.
Key Executives and Senior Personnel
The Company is dependent on the services of key executives, including its President and Chief Executive Officer and a number of highly skilled and experienced executives and senior personnel. The loss of these persons or the Company’s inability to attract and retain additional highly skilled employees could adversely affect its business and future operations.
Conflicts of Interest
Certain of the directors and officers of the Company also serve as directors and/or officers of other companies involved in natural resource exploration and development or investment in or provide services to natural resource companies and consequently there exists the possibility for such directors and officers to be in a position of conflict. The Company expects that any decision made by any of such directors and officers will be made in accordance with their duties and obligations to deal fairly and in good faith with a view to the best interests of the Company and its shareholders, but there can be no assurance in this regard. In addition, each of the directors is required to declare and refrain from voting on any matter in

MANAGEMENT’S DISCUSSION AND ANALYSIS
80 | DUNDEE PRECIOUS METALS INC.
which such directors may have a conflict of interest in accordance with the procedures set forth in the Canada Business Corporations Act and other applicable laws.
Significant Shareholder Dundee Corporation owns approximately 20.4% of the Common Shares. As a result, Dundee Corporation has the ability to significantly influence the outcome of corporate actions requiring shareholder approval, including the election of directors of DPM and the approval of certain corporate transactions.
Public Company Obligations
The Company’s business is subject to evolving corporate governance and public disclosure regulations that have increased both the Company’s compliance costs and the risk of non-compliance, which could adversely impact the Company’s share price.
The Company is subject to changing rules and regulations promulgated by a number of governmental and self-regulated organizations, including the Canadian Securities Administrators, the TSX, and the International Accounting Standards Board. These rules and regulations continue to evolve in scope and complexity creating many new requirements. The Company’s efforts to comply with rules and obligations could result in increased general and administration expenses and a diversion of management time and attention from revenue-generating activities.
DISCLOSURE CONTROLS AND PROCEDURES AND INTERNAL CONTROL OVER FINANCIAL REPORTING The President and Chief Executive Officer (“CEO”) and the Chief Financial Officer (“CFO”) are responsible for establishing and maintaining disclosure controls and procedures (“DC&P”) and internal control over financial reporting (“ICFR”), as defined in National Instrument 52-109, Certification of Disclosure in Issuers’ Annual and Interim Filings (“NI 52-109”). The CEO and CFO evaluated or caused to be evaluated under their supervision the design and operating effectiveness of the DC&P and ICFR as defined by NI 52-109 as of December 31, 2016. Based on this evaluation, the CEO and CFO concluded that the Company's DC&P and ICFR were designed and operating effectively as of December 31, 2016. ICFR was designed using the Internal Control – Integrated Framework (2013) developed by COSO (Committee of Sponsoring Organizations of the Treadway Commission). The board of directors also assesses the integrity of the public financial disclosures through the oversight of the Audit Committee. NI 52-109 also requires Canadian public companies to disclose in their MD&A any change in ICFR that has materially affected, or is reasonably likely to materially affect, ICFR. No material changes were made to ICFR in the year ended December 31, 2016. Only reasonable, rather than absolute assurance, that misstatements are prevented or detected on a timely basis by ICFR can be provided due to the inherent limitations of the ICFR system. Such limitations also apply to the effectiveness of ICFR as it is also possible that controls may become inadequate because of changes in conditions or deterioration in compliance with policies and procedures. CAUTIONARY NOTE REGARDING FORWARD LOOKING STATEMENTS Certain statements and other information included in this MD&A and our other disclosure documents constitute “forward looking information” or “forward looking statements” within the meaning of applicable securities legislation, which we refer to collectively hereinafter as “forward looking statements”. Our forward looking statements include, but are not limited to, statements with respect to the estimated capital costs, operating costs and other project economics with respect to Krumovgrad, the timing of development, permitting, construction, and commissioning activities in respect of Krumovgrad and further optimization work at Tsumeb, the future price of gold, copper, silver and acid, toll rates, metals exposure and stockpile interest deductions, the estimation of Mineral Reserves and Mineral Resources, the realization of such mineral estimates, the timing and amount of estimated future production and output, life of mine, costs of production, cash costs and other cost measures, capital expenditures, costs and timing of the development of new deposits, the results of economic studies, success of exploration activities, permitting time lines, currency fluctuations, requirements for additional capital, government regulation of mining and smelting operations, success of permitting activities, environmental risks, reclamation expenses, the potential or anticipated outcome of title disputes or claims and timing and possible outcome of pending litigation. Forward looking statements are statements that are not historical facts and are generally, but not always,

MANAGEMENT’S DISCUSSION AND ANALYSIS
81 | DUNDEE PRECIOUS METALS INC.
identified by the use of forward looking terminology such as “plans”, “expects”, or “does not expect”, “is expected”, “budget”, “scheduled”, “estimates”, “forecasts”, “outlook”, “intends”, “anticipates”, or “does not anticipate”, or “believes”, or variations of such words and phrases or that state that certain actions, events or results “may”, “could”, “would”, “might” or “will” be taken, occur or be achieved.
Without limitation to the foregoing, the following section outlines certain specific forward looking statements contained in the “2017 Guidance” of this MD&A, unless otherwise noted, and provides certain material assumptions used to develop such forward looking statements and material risk factors that could cause actual results to differ materially from the forward looking statements (which are provided without limitation to the additional general risk factors discussed herein):
Ore mined/milled: assumes Chelopech mines perform at planned levels. Subject to a number of risks, the more significant of which is: failure of plant, equipment or processes to operate as anticipated. Metals contained in concentrate produced: assumes grades and recoveries are consistent with current estimates of Mineral Resources and Mineral Reserves and DPM’s current expectations; and ore mined/milled is consistent with guidance. Subject to a number of risks, the more significant of which are: lower than anticipated ore grades, recovery rates and ore mined/milled. Cash cost per tonne of ore processed: assumes Chelopech ore mined/milled in line with the guidance provided; foreign exchange rates remain at or around current levels; and operating expenses at Chelopech are at planned levels. Subject to a number of risks, the more significant of which are: lower than anticipated ore mined/milled; a weaker U.S. dollar relative to the Euro; and unexpected increases in labour and other operating costs. Cash cost per ounce of gold sold, net of by-product credits: assumes metals contained in concentrate produced and cash cost per tonne of ore processed at Chelopech are each in line with the guidance provided; copper and silver prices remain at or around current levels; and concentrate deliveries are consistent with DPM’s current expectations. Subject to a number of risks, the more significant of which are: lower than anticipated metals contained in concentrate produced, concentrate deliveries and metal prices; and higher than anticipated cash cost per tonne of ore processed. All-in sustaining costs: assumes that metals contained in concentrate produced, cash cost per ounce of gold sold, net of by-product credits, general and administrative expenses and sustaining capital expenditures are consistent with the guidance provided. Subject to a number of risks, the more significant of which are: lower than anticipated metals contained in concentrate produced, concentrate deliveries and metal prices; a higher than anticipated cash cost per tonne of ore processed; and higher than anticipated sustaining capital expenditures and general and administrative expenses. Complex concentrate smelted at Tsumeb: assumes no significant disruption in equipment availability or concentrate supply. Subject to a number of risks, the more significant of which are: unanticipated operational issues; lower than anticipated equipment availability; and disruptions to or changes in the supply of complex concentrate. Cash cost per tonne of complex concentrate smelted, net of by-product credits: assumes complex concentrate smelted is consistent with the guidance provided; acid prices are at or around current levels; acid production and operating expenses are at planned levels; and foreign exchange rates remain at or around current levels. Subject to a number of risks, the more significant of which are: complex concentrate smelted and acid production are lower than anticipated; acid prices are lower than anticipated; strengthening of the ZAR relative to the U.S. dollar; and higher than anticipated operating and transportation costs due to a variety of factors, including higher than anticipated inflation, labour and other operating costs.
Sustaining and growth capital expenditures: assumes foreign exchange rates remain at or around current levels, and all capital projects proceed as planned and at a cost that is consistent with the budget established for each project. Subject to a number of risks, the more significant of which are: technical challenges, delays related to securing necessary approvals, equipment deliveries, equipment performance, and the speed with which work is performed; availability of qualified labour; and changes in project parameters and estimated costs, including foreign exchange impacts.

MANAGEMENT’S DISCUSSION AND ANALYSIS
82 | DUNDEE PRECIOUS METALS INC.
Liquidity (see comments contained in “Liquidity and Capital Resources” section): assumes the operating and cost performance at Chelopech and Tsumeb are consistent with current expectations; metal and acid prices, and foreign exchange rates remain at or around current levels; concentrate and acid sales agreements, and smelter toll terms are consistent with current terms and/or forecast levels; progress of capital projects is consistent with current expectations; and DPM’s RCF remains in place. Subject to a number of risks, the more significant of which are: lower than anticipated metals production at Chelopech, complex concentrate throughput and acid production at Tsumeb, deliveries of concentrate and metal prices; weaker U.S. dollar relative to local operating currencies; changes in contractual sales and/or toll terms and acid prices; changes to project parameters, schedule and/or costs; and the inability to draw down on DPM’s RCF due to a breach or potential breach of one of its covenants.
Forward looking statements are based on the opinions and estimates of management as of the date such statements are made and they involve known and unknown risks, uncertainties and other factors which may cause the actual results, performance or achievements of the Company to be materially different from any other future results, performance or achievements expressed or implied by the forward looking statements. In addition to factors already discussed in this document, such factors include, among others: the uncertainties with respect to actual results of current exploration activities, actual results of current reclamation activities, conclusions of economic evaluations and economic studies; changes in project parameters as plans continue to be refined; possible variations in ore grade or recovery rates; failure of plant, equipment or processes to operate as anticipated; accidents, labour disputes and other risks of the mining industry; delays in obtaining governmental approvals or financing or in the completion of development or construction activities, uncertainties inherent with conducting business in foreign jurisdictions where corruption, civil unrest, political instability and uncertainties with the rule of law may impact the Company’s activities; fluctuations in metal and acid prices, toll rates and foreign exchange rates; unanticipated title disputes; claims or litigation; limitation on insurance coverage; cyber attacks; as well as those risk factors discussed or referred to in any other documents (including without limitation the Company’s most recent AIF) filed from time to time with the securities regulatory authorities in all provinces and territories of Canada and available on SEDAR at www.sedar.com. Although the Company has attempted to identify important factors that could cause actual actions, events or results to differ materially from those described in forward looking statements, there may be other factors that cause actions, events or results not to be anticipated, estimated or intended. There can be no assurance that forward looking statements will prove to be accurate, as actual results and future events could differ materially from those anticipated in such statements. Unless required by securities laws, the Company undertakes no obligation to update forward looking statements if circumstances or management’s estimates or opinion should change. Accordingly, readers are cautioned not to place undue reliance on forward looking statements. CAUTIONARY NOTE TO UNITED STATES INVESTORS CONCERNING ESTIMATES OF MEASURED, INDICATED AND INFERRED RESOURCES This MD&A uses the terms “Measured”, “Indicated” and “Inferred” Mineral Resources. United States investors are advised that while such terms are recognized and required by Canadian regulations, the U.S. Securities and Exchange Commission (“SEC”) does not recognize them. “Inferred Mineral Resources” have a great amount of uncertainty as to their existence and as to their economic and legal feasibility. It cannot be assumed that all or any part of an Inferred Mineral Resource will ever be upgraded to a higher category. Under Canadian rules, estimates of Inferred Mineral Resources may not form the basis of feasibility or pre-feasibility studies. United States investors are cautioned not to assume that all or any part of Measured or Indicated Mineral Resources will ever be converted into Mineral Reserves. United States investors are also cautioned not to assume that all or any part of an Inferred Mineral Resource exists, or is economically or legally mineable.
MANAGEMENT’S REPORT ON INTERNAL CONTROL OVER FINANCIAL REPORTING
83 | DUNDEE PRECIOUS METALS INC.
�
MANAGEMENT’S REPORT ON INTERNAL CONTROL OVER FINANCIAL REPORTING The accompanying consolidated financial statements of Dundee Precious Metals Inc. (the “Company”) and all information in this financial report are the responsibility of management. The consolidated financial statements have been prepared in accordance with International Financial Reporting Standards and, where appropriate, include management’s best estimates and judgments. Management has reviewed the financial information presented throughout this report and has ensured it is consistent with the consolidated financial statements. Management maintains a system of internal control designed to provide reasonable assurance that assets are safeguarded from loss or unauthorized use, and that financial information is timely and reliable. However, any system of internal control over financial reporting, no matter how well designed and implemented, has inherent limitations and may not prevent or detect all misstatements. The Board of Directors is responsible for ensuring that management fulfils its responsibilities for financial reporting and is ultimately responsible for reviewing and approving the consolidated financial statements. The Board carries out this responsibility principally through its Audit Committee. The Board of Directors appoints the Audit Committee, and all of its members are independent directors. The Audit Committee meets periodically with management and the auditors to review internal controls, audit results, accounting principles and related matters. The Board of Directors approves the consolidated financial statements on recommendation from the Audit Committee. PricewaterhouseCoopers LLP, an independent firm of Chartered Professional Accountants, was appointed by the shareholders at the last annual meeting to examine the consolidated financial statements and provide an independent professional opinion. PricewaterhouseCoopers LLP has full and free access to the Audit Committee.
(Signed) “Richard Howes”
(Signed) “Hume Kyle” Richard Howes President and Chief Executive Officer
Hume Kyle Executive Vice President and Chief Financial Officer
February 15, 2017

INDEPENDENT AUDITOR’S REPORT
84 | DUNDEE PRECIOUS METALS INC.
����������� ������� ������������������������������������������������������������������ !��"���#�$��%�����&���&&��'#�$��%���&� ���� �����(���(��)*��� �PwC� refers to PricewaterhouseCoopers LLP, an Ontario limited liability partnership.
February 15, 2017
Independent Auditor’s Report
To the Shareholders of Dundee Precious Metals Inc.
We have audited the accompanying consolidated financial statements of Dundee Precious Metals Inc., and its subsidiaries which comprise the consolidated statements of financial position as at December 31, 2016 and 2015 and the consolidated statements of loss, comprehensive loss, cash flows and changes in shareholders’ equity for the years then ended, and the related notes, which comprise a summary of significant accounting policies and other explanatory information.
Management’s responsibility for the consolidated financial statements Management is responsible for the preparation and fair presentation of these consolidated financial statements in accordance with International Financial Reporting Standards, and for such internal control as management determines is necessary to enable the preparation of consolidated financial statements that are free from material misstatement, whether due to fraud or error.
Auditor’s responsibility Our responsibility is to express an opinion on these consolidated financial statements based on our audits. We conducted our audits in accordance with Canadian generally accepted auditing standards. Those standards require that we comply with ethical requirements and plan and perform the audit to obtain reasonable assurance about whether the consolidated financial statements are free from material misstatement.
An audit involves performing procedures to obtain audit evidence about the amounts and disclosures in the consolidated financial statements. The procedures selected depend on the auditor’s judgment, including the assessment of the risks of material misstatement of the consolidated financial statements, whether due to fraud or error. In making those risk assessments, the auditor considers internal control relevant to the entity’s preparation and fair presentation of the consolidated financial statements in order to design audit procedures that are appropriate in the circumstances, but not for the purpose of expressing an opinion on the effectiveness of the entity’s internal control. An audit also includes evaluating the appropriateness of accounting policies used and the reasonableness of accounting estimates made by management, as well as evaluating the overall presentation of the consolidated financial statements.
We believe that the audit evidence we have obtained in our audits is sufficient and appropriate to provide a basis for our audit opinion.

INDEPENDENT AUDITOR’S REPORT
85 | DUNDEE PRECIOUS METALS INC.
2 of 2
Opinion In our opinion, the consolidated financial statements present fairly, in all material respects, the financial position of Dundee Precious Metals Inc. as at December 31, 2016 and 2015 and its financial performance and its cash flows for the years then ended in accordance with International Financial Reporting Standards. (Signed) “PricewaterhouseCoopers LLP” Chartered Professional Accountants, Licensed Public Accountants
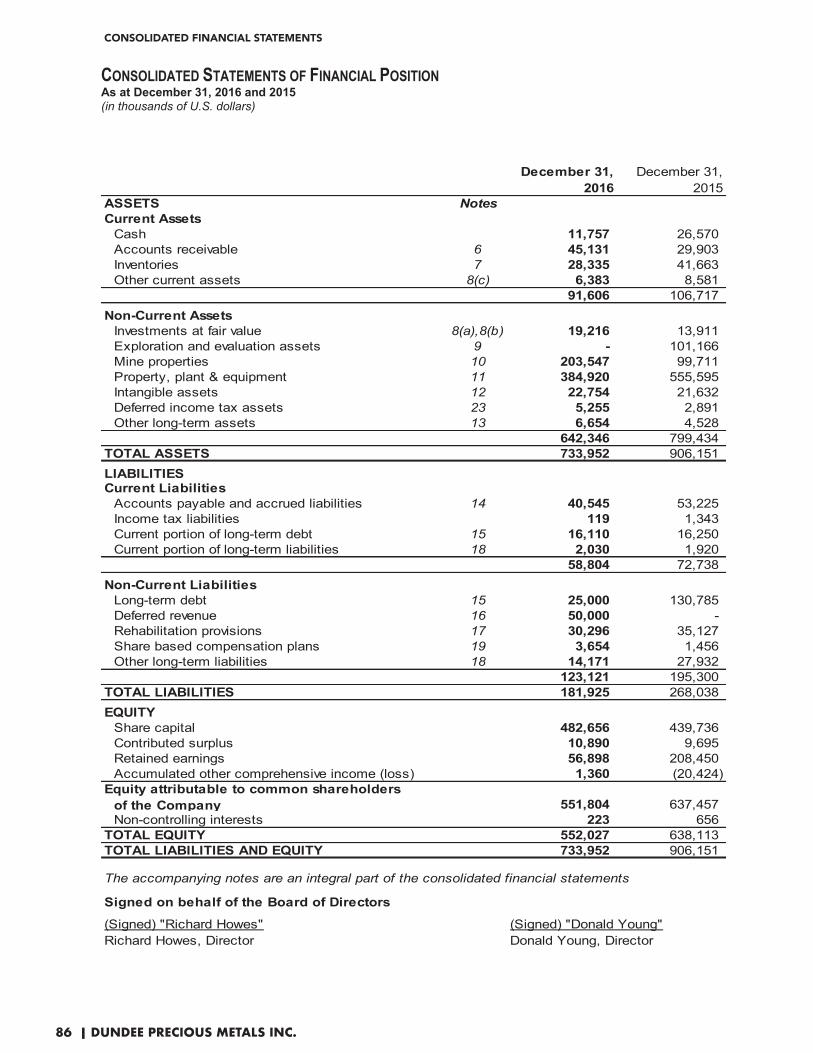
CONSOLIDATED FINANCIAL STATEMENTS
86 | DUNDEE PRECIOUS METALS INC.
CONSOLIDATED STATEMENTS OF FINANCIAL POSITION�� � As at December 31, 2016 and 2015 (in thousands of U.S. dollars)
December 31, 2016
December 31, 2015
ASSETS NotesCurrent Assets
Cash 11,757 26,570 Accounts receivable 6 45,131 29,903 Inventories 7 28,335 41,663 Other current assets 8(c) 6,383 8,581
91,606 106,717 Non-Current Assets
Investments at fair value 8(a),8(b) 19,216 13,911 Exploration and evaluation assets 9 - 101,166 Mine properties 10 203,547 99,711 Property, plant & equipment 11 384,920 555,595 Intangible assets 12 22,754 21,632 Deferred income tax assets 23 5,255 2,891 Other long-term assets 13 6,654 4,528
642,346 799,434 TOTAL ASSETS 733,952 906,151 LIABILITIESCurrent Liabilities
Accounts payable and accrued liabilities 14 40,545 53,225 Income tax liabilities 119 1,343 Current portion of long-term debt 15 16,110 16,250 Current portion of long-term liabilities 18 2,030 1,920
58,804 72,738 Non-Current Liabilities
Long-term debt 15 25,000 130,785 Deferred revenue 16 50,000 - Rehabilitation provisions 17 30,296 35,127 Share based compensation plans 19 3,654 1,456 Other long-term liabilities 18 14,171 27,932
123,121 195,300 TOTAL LIABILITIES 181,925 268,038 EQUITY
Share capital 482,656 439,736 Contributed surplus 10,890 9,695 Retained earnings 56,898 208,450 Accumulated other comprehensive income (loss) 1,360 (20,424)
Equity attributable to common shareholdersof the Company 551,804 637,457 Non-controlling interests 223 656
TOTAL EQUITY 552,027 638,113 TOTAL LIABILITIES AND EQUITY 733,952 906,151
The accompanying notes are an integral part of the consolidated financial statements
Signed on behalf of the Board of Directors
(Signed) "Richard Howes" (Signed) "Donald Young"Richard Howes, Director Donald Young, Director
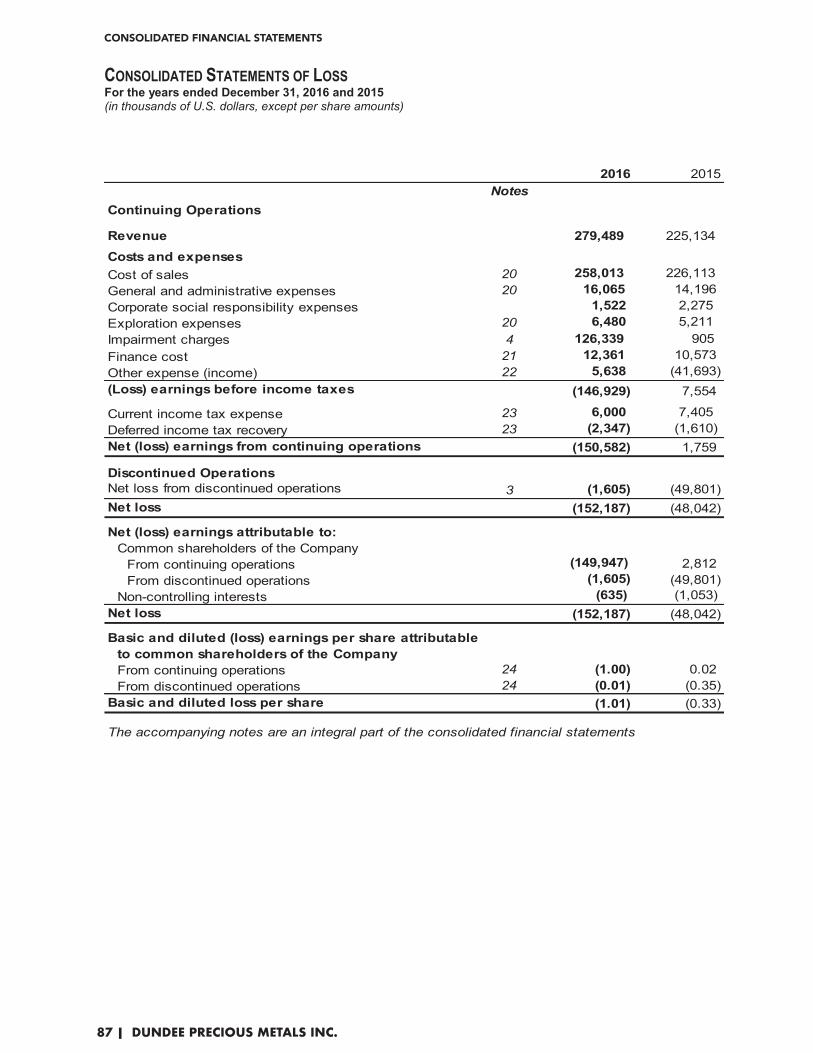
CONSOLIDATED FINANCIAL STATEMENTS
87 | DUNDEE PRECIOUS METALS INC.
CONSOLIDATED STATEMENTS OF LOSS For the years ended December 31, 2016 and 2015 (in thousands of U.S. dollars, except per share amounts)
2016 2015Notes
Continuing Operations
Revenue 279,489 225,134
Costs and expensesCost of sales 20 258,013 226,113 General and administrative expenses 20 16,065 14,196 Corporate social responsibility expenses 1,522 2,275 Exploration expenses 20 6,480 5,211 Impairment charges 4 126,339 905 Finance cost 21 12,361 10,573 Other expense (income) 22 5,638 (41,693)(Loss) earnings before income taxes (146,929) 7,554
Current income tax expense 23 6,000 7,405 Deferred income tax recovery 23 (2,347) (1,610)Net (loss) earnings from continuing operations (150,582) 1,759
Discontinued Operations Net loss from discontinued operations 3 (1,605) (49,801)Net loss (152,187) (48,042)
Net (loss) earnings attributable to:Common shareholders of the Company
From continuing operations (149,947) 2,812 From discontinued operations (1,605) (49,801)
Non-controlling interests (635) (1,053)Net loss (152,187) (48,042)
Basic and diluted (loss) earnings per share attributable to common shareholders of the CompanyFrom continuing operations 24 (1.00) 0.02 From discontinued operations 24 (0.01) (0.35)
Basic and diluted loss per share (1.01) (0.33)
The accompanying notes are an integral part of the consolidated financial statements �
�

CONSOLIDATED FINANCIAL STATEMENTS
88 | DUNDEE PRECIOUS METALS INC.
CONSOLIDATED STATEMENTS OF COMPREHENSIVE LOSS For the years ended December 31, 2016 and 2015 (in thousands of U.S. dollars)�
2016 2015
Net loss (152,187) (48,042)
Other comprehensive income (loss)
Unrealized gains (losses) on forward foreign exchange contractsdesignated as cash flow hedges, net of income tax recovery(expense) of $15 (2015 - $(15)) 8,258 (28,036)
Realized losses on forward foreign exchange contractstransferred to net loss, net of income tax expense of$9 (2015 - $41) 10,223 2,631
Unrealized gains on publicly traded securities,net of income tax recovery of $nil (2015 - $nil) 4,748 5,406
Impairment charges on publicly traded securities transferred to net loss, net of income tax recovery of $nil (2015 - $nil) 24 654
Currency translation adjustments 13 (379) 23,266 (19,724)
Comprehensive loss, net of income taxes (128,921) (67,766)
Comprehensive loss attributable to:Common shareholders of the Company
From continuing operations (126,681) (16,724) From discontinued operations (1,605) (49,801)
Non-controlling interests (635) (1,241) Comprehensive loss, net of income taxes (128,921) (67,766)
The accompanying notes are an integral part of the consolidated financial statements
Items that may be reclassified subsequently to profit or loss
�������������������
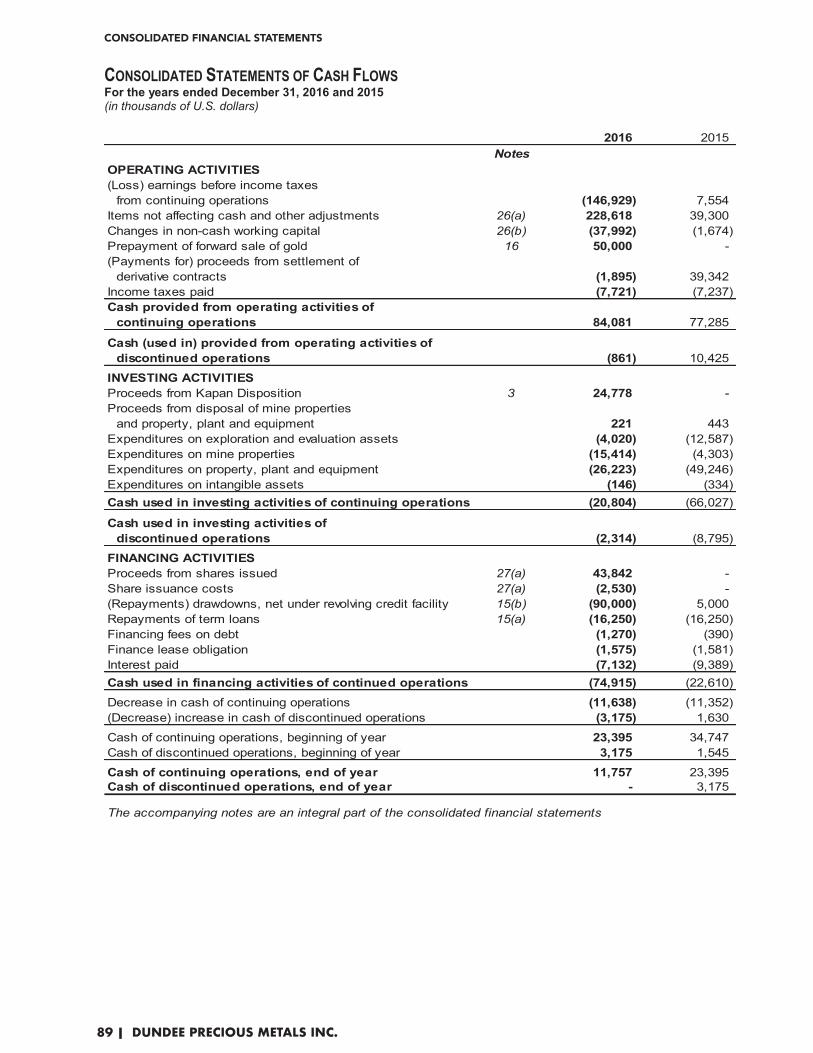
CONSOLIDATED FINANCIAL STATEMENTS
89 | DUNDEE PRECIOUS METALS INC.
CONSOLIDATED STATEMENTS OF CASH FLOWS For the years ended December 31, 2016 and 2015 (in thousands of U.S. dollars)
2016 2015Notes
OPERATING ACTIVITIES(Loss) earnings before income taxes
from continuing operations (146,929) 7,554 Items not affecting cash and other adjustments 26(a) 228,618 39,300 Changes in non-cash working capital 26(b) (37,992) (1,674) Prepayment of forward sale of gold 16 50,000 - (Payments for) proceeds from settlement of
derivative contracts (1,895) 39,342 Income taxes paid (7,721) (7,237) Cash provided from operating activities of
continuing operations 84,081 77,285
Cash (used in) provided from operating activities ofdiscontinued operations (861) 10,425
INVESTING ACTIVITIESProceeds from Kapan Disposition 3 24,778 - Proceeds from disposal of mine properties
and property, plant and equipment 221 443 Expenditures on exploration and evaluation assets (4,020) (12,587) Expenditures on mine properties (15,414) (4,303) Expenditures on property, plant and equipment (26,223) (49,246) Expenditures on intangible assets (146) (334) Cash used in investing activities of continuing operations (20,804) (66,027)
Cash used in investing activities of discontinued operations (2,314) (8,795)
FINANCING ACTIVITIESProceeds from shares issued 27(a) 43,842 - Share issuance costs 27(a) (2,530) - (Repayments) drawdowns, net under revolving credit facility 15(b) (90,000) 5,000 Repayments of term loans 15(a) (16,250) (16,250) Financing fees on debt (1,270) (390) Finance lease obligation (1,575) (1,581) Interest paid (7,132) (9,389) Cash used in financing activities of continued operations (74,915) (22,610)
Decrease in cash of continuing operations (11,638) (11,352) (Decrease) increase in cash of discontinued operations (3,175) 1,630
Cash of continuing operations, beginning of year 23,395 34,747 Cash of discontinued operations, beginning of year 3,175 1,545
Cash of continuing operations, end of year 11,757 23,395 Cash of discontinued operations, end of year - 3,175
The accompanying notes are an integral part of the consolidated financial statements

CONSOLIDATED FINANCIAL STATEMENTS
90 | DUNDEE PRECIOUS METALS INC.
CONSOLIDATED STATEMENTS OF CHANGES IN SHAREHOLDERS’ EQUITY For the years ended December 31, 2016 and 2015 (in thousands of U.S. dollars, except for number of shares)
Number Amount Number Amount
Share capitalAuthorized
Unlimited common and preference shares with no par value
IssuedFully paid common shares
with one vote per shareBalance at beginning of year 140,575,783 439,736 140,575,783 439,736
Shares issued on financing (note 27(a)) 19,056,000 43,842 Share issuance costs (note 27(a)) - (2,530) - - Shares issued upon Avala acquisition
(note 5) 956,329 1,608 - - Balance at end of year 160,588,112 482,656 140,575,783 439,736
Contributed surplusBalance at beginning of year 9,695 7,723
Share based compensation expense 1,510 1,971 (315) 1
Balance at end of year 10,890 9,695
Retained earningsBalance at beginning of year 208,450 255,439
shareholders of the Company (151,552) (46,989) Balance at end of year 56,898 208,450
(note 27(b))Balance at beginning of year (20,424) (888)
Other comprehensive income (loss) 21,784 (19,536) Balance at end of year 1,360 (20,424)
common shareholders of the Company 551,804 637,457 Non-controlling interests
Balance at beginning of year 656 1,896 (635) (1,053)
- (188) 202 1
Balance at end of year 223 656 Total equity at end of year 552,027 638,113
The accompanying notes are an integral part of the consolidated financial statements
Other changes in non-controlling interests
December 31, 2016 December 31, 2015
Other changes in contributed surplus
Net loss attributable to common
Accumulated other comprehensive income (loss)
Total equity attributable to
Net loss attributable to non-controlling interestsOther comprehensive loss attributable to
non-controlling interests

NOTES TO CONSOLIDATED FINANCIAL STATEMENTS
91 | DUNDEE PRECIOUS METALS INC.
NOTES TO CONSOLIDATED FINANCIAL STATEMENTS For the years ended December 31, 2016 and 2015 (in thousands of U.S. dollars, unless otherwise indicated)
1. CORPORATE INFORMATION Dundee Precious Metals Inc. (“DPM”) is a Canadian based, international gold mining company engaged in the acquisition, exploration, development, mining and processing of precious metals. DPM is a publicly listed company incorporated in Canada with limited liability under legislation of the Province of Ontario. DPM has common shares traded on the Toronto Stock Exchange (“TSX”). The address of DPM’s registered office is 1 Adelaide Street East, Suite 500, P. O. Box 195, Toronto, Ontario, M5C 2V9. As at December 31, 2016, DPM’s consolidated financial statements include DPM and its subsidiary companies (collectively, the “Company”). Continuing operations: DPM’s principal subsidiaries include:
� 100% of Dundee Precious Metals Chelopech EAD (“Chelopech”), which owns and operates a gold, copper and silver mine located east of Sofia, Bulgaria;
� 100% of Dundee Precious Metals Krumovgrad EAD (“Krumovgrad”), which is currently constructing a gold mine located in south eastern Bulgaria, near the town of Krumovgrad; and
� 100% of Dundee Precious Metals Tsumeb (Proprietary) Limited (“Tsumeb”), which owns and operates a custom smelter located in Tsumeb, Namibia.
DPM also owns 100% of Avala Resources Ltd. (“Avala”), which is incorporated in British Columbia, Canada and focused on the exploration and development of the Lenovac project, the Timok gold project, the Tulare copper and gold project and other early stage projects in Serbia. In April 2016, the Company acquired all of the issued and outstanding shares of Avala not already owned by DPM (note 5).�
�
Discontinued operations (note 3): On April 28, 2016, DPM sold 100% of Dundee Precious Metals Kapan CJSC (“Kapan”) which owns and operates a gold, copper, zinc and silver mine in the town of Kapan, located south east of the capital city of Yerevan in southern Armenia. 2.1 BASIS OF PREPARATION The Company’s consolidated financial statements have been prepared in accordance with International Financial Reporting Standards (“IFRS”), as issued by the International Accounting Standards Board (“IASB”) and Interpretations of the International Financial Reporting Interpretations Committee (“IFRIC”) which the Canadian Accounting Standards Board has approved for incorporation into Part I of the Chartered Professional Accountants of Canada Handbook – Accounting. These consolidated financial statements were approved by the Board of Directors on February 15, 2017. These consolidated financial statements have been prepared on a historical cost basis except for held for trading and available-for-sale financial instruments (note 8) that are measured at fair value. The Company’s significant accounting policies are set out below. �
NOTES TO CONSOLIDATED FINANCIAL STATEMENTS
92 | DUNDEE PRECIOUS METALS INC.
NOTES TO CONSOLIDATED FINANCIAL STATEMENTS For the years ended December 31, 2016 and 2015 (in thousands of U.S. dollars, unless otherwise indicated)
2.2 SIGNIFICANT ACCOUNTING POLICIES
(a) Basis of consolidation
Subsidiaries are all entities over which the Company has control. The Company controls an entity when the Company is exposed to, or has rights to, variable returns from its involvement with the entity and has the ability to affect those returns through its power over the entity. The Company uses the acquisition method of accounting to account for business combinations. The fair value of the acquisition of a subsidiary is based on the fair value of the assets acquired, the liabilities assumed, and the fair value of the consideration. The fair value of the assets acquired and liabilities assumed includes any contingent consideration arrangement. Acquisition-related costs are expensed as incurred. Identifiable assets acquired and liabilities and contingent liabilities assumed in a business combination are measured initially at their fair values on the acquisition date. The Company recognizes any non-controlling interest in the acquiree on an acquisition-by-acquisition basis either at fair value or at the non-controlling interest’s proportionate share of the acquiree’s net assets. The excess, if any, of the consideration and the amount of any non-controlling interest in the acquiree over the fair value of the identifiable net assets acquired is recorded as goodwill. In the case of a bargain purchase, where the total consideration and the non-controlling interest recognized are less than the fair value of the net assets of the subsidiary acquired, the difference is recognized directly in the consolidated statements of loss. Subsidiaries are fully consolidated from the date on which control is acquired by the Company and they are deconsolidated from the date that control ceases. The financial statements of the subsidiaries are prepared for the same reporting period as the parent company using consistent accounting policies. All inter-company balances, revenues and expenses and earnings and losses resulting from inter-company transactions are eliminated on consolidation. Non-controlling interests in the net assets of consolidated subsidiaries are a separate component of the Company’s equity. Non-controlling interests consist of the non-controlling interests on the date of the original business combination plus the non-controlling interests’ share of changes in equity since the date of acquisition. (b) Critical accounting estimates and judgments The preparation of the Company’s consolidated financial statements in conformity with IFRS requires management to make judgments, estimates and assumptions that affect the reported amounts of assets, liabilities and contingent liabilities on the date of the consolidated financial statements and the reported amounts of revenues and expenses during the reporting period. Estimates and assumptions are evaluated and are based on management’s experience and other factors, including expectations of future events that are believed to be reasonable under the circumstances. However, actual outcomes can differ from these estimates.

NOTES TO CONSOLIDATED FINANCIAL STATEMENTS
93 | DUNDEE PRECIOUS METALS INC.
NOTES TO CONSOLIDATED FINANCIAL STATEMENTS For the years ended December 31, 2016 and 2015 (in thousands of U.S. dollars, unless otherwise indicated)
2.2 SIGNIFICANT ACCOUNTING POLICIES ��������� � The significant areas of estimation and/or judgment considered by management in preparing the consolidated financial statements include, but are not limited to:
� mineral exploration and evaluation expenditures (note 2.2(l)); � mine properties (note 2.2(m)); � property, plant and equipment (note 2.2(n)); � intangible assets (note 2.2(o)); � impairment of assets (note 2.2(h) and 2.2(q)); � rehabilitation provisions and contingencies (note 2.2(r)); � revenue recognition related to toll smelting arrangements (note 2.2(t)); � deferred revenue (note 2.2(u)); and � deferred income tax assets and liabilities (note 2.2(x)).
(c) Presentation and functional currency The Company’s presentation currency is the U.S. dollar and the functional currency of DPM and its wholly-owned operations is the U.S. dollar as it was assessed by management as being the primary currency of the economic environment in which the Company operates. (d) Foreign currency �Foreign currency transactions Monetary assets and liabilities denominated in foreign currencies are translated into U.S. dollars at exchange rates on the reporting date. Non-monetary assets and liabilities denominated in foreign currencies that are measured at fair value are translated at the exchange rates on the dates that their fair values are determined. Non-monetary assets and liabilities denominated in foreign currencies that are measured at historical cost are translated at the exchange rates on the dates of the transactions. Income and expense items are translated at the exchange rate on the dates of the transactions. Exchange gains and losses resulting from the translation of these amounts are included in net loss, except those arising on the translation of available-for-sale equity instruments that are recorded in other comprehensive income (loss). Foreign operations The assets and liabilities of foreign operations, including fair value adjustments arising on acquisition, are translated into U.S. dollars at exchange rates on the reporting date. The income and expenses of foreign operations are translated into U.S. dollars at exchange rates on the dates of the transactions. Foreign currency differences are recognized as currency translation adjustments in other comprehensive income (loss). As at December 31, 2016, the functional currency was the U.S. dollar for all of the Company’s operations. Prior to DPM’s acquisition in April 2016 of the issued and outstanding shares of Avala not already owned by DPM (note 5), the functional currencies of Avala and its subsidiaries were the Canadian dollar and the Serbian dinar, respectively. (e) Cash and cash equivalents Cash and cash equivalents comprise cash deposits, guaranteed investment certificates and/or other highly rated and liquid securities with an original maturity of less than three months.
�
NOTES TO CONSOLIDATED FINANCIAL STATEMENTS
94 | DUNDEE PRECIOUS METALS INC.
NOTES TO CONSOLIDATED FINANCIAL STATEMENTS For the years ended December 31, 2016 and 2015 (in thousands of U.S. dollars, unless otherwise indicated)
2.2 SIGNIFICANT ACCOUNTING POLICIES ��������� �
(f) Short-term investments Short-term investments include guaranteed investment certificates and/or other highly rated and liquid securities with original maturities between three months and less than one year at the time the investment is made. Short-term investments are recorded at amortized cost. (g) Inventories
Inventories of ore and concentrates are measured and valued at the lower of average production cost and net realizable value. Net realizable value is the estimated selling price of the concentrates in the ordinary course of business based on the prevailing metal prices on the reporting date, less estimated costs to complete production and to bring the concentrates to sale. Production costs that are inventoried include the costs directly related to bringing the inventory to its current condition and location, such as materials, labour, other direct costs (including external services and depreciation, depletion and amortization), production related overheads and royalties. Inventories of sulphuric acid, arsenic, spare parts, supplies and other materials are valued at the lower of average cost and net realizable value. Obsolete, redundant and slow moving inventories are identified at each reporting date and written down to their net realizable values.
(h) Financial assets and liabilities
Financial assets
Initial recognition and measurement Non-derivative financial assets within the scope of International Accounting Standard (“IAS”) 39, Financial Instruments: Recognition & Measurement, are classified as “financial assets at fair value through profit or loss”, “loans and receivables”, or “available-for-sale financial assets”, as appropriate. The Company determines the classification of its financial assets at initial recognition. All financial assets are recognized initially at fair value plus, in the case of investments not at fair value through profit or loss, directly attributable transaction costs on the trade date at which the Company becomes a party to the contractual provisions of the instrument.
Subsequent measurement - Financial assets at fair value through profit or loss Financial assets at fair value through profit or loss include financial assets held for trading and financial assets designated upon initial recognition at fair value through profit or loss. Financial assets are classified as held for trading if management intends to sell the financial assets in the short term. This category includes any derivative financial instrument that is not designated as a hedging instrument in a hedge relationship under IAS 39. Financial assets at fair value through profit or loss are carried in the consolidated statements of financial position at fair value with changes in fair value recognized in other expense (income) in the consolidated statements of loss. The Company’s investment in Sabina Gold & Silver Corp. (“Sabina”) special warrants, the commodity swap and option contracts entered to economically hedge a portion of its provisionally priced sales and projected production, and the forward point component of the forward foreign exchange contracts entered to hedge a portion of its projected operating expenses denominated in foreign currencies are, where applicable, classified as financial assets at fair value through profit or loss.

NOTES TO CONSOLIDATED FINANCIAL STATEMENTS
95 | DUNDEE PRECIOUS METALS INC.
NOTES TO CONSOLIDATED FINANCIAL STATEMENTS For the years ended December 31, 2016 and 2015 (in thousands of U.S. dollars, unless otherwise indicated)
2.2 SIGNIFICANT ACCOUNTING POLICIES ��������� � Derivatives are recognized initially at fair value and all attributable transaction costs are recognized in other expense (income) in the consolidated statements of loss, as incurred. Derivatives embedded in host contracts are accounted for as separate derivatives and recorded at fair value if their economic characteristics and risks are not closely related to those of the host contracts. Host contracts are not held for trading or designated at fair value through profit or loss. These embedded derivatives are measured at fair value with changes in fair value recognized in the consolidated statements of loss. Reassessment only occurs if there is a change in the terms of the contract that significantly modifies the cash flows that would have otherwise been required.
Subsequent measurement - Loans and receivables Loans and receivables are non-derivative financial assets with fixed or determinable payments that are not quoted in an active market. These include cash and cash equivalents, restricted cash, accounts receivables, loans receivable and short-term investments. After initial measurement, such financial assets are subsequently measured at amortized cost using the effective interest rate (“EIR”) method less any impairment. Amortized cost is calculated by taking into account any discount or premium on acquisition and fees or costs that are an integral part of the EIR. The EIR amortization is included in interest income in the consolidated statements of loss. The losses arising from impairment, if any, are recognized as finance cost.
Subsequent measurement - Available-for-sale financial assets Available-for-sale financial assets are non-derivative financial assets that are designated as available-for-sale and that are not classified in any of the previous categories. The Company’s portfolio investments in publicly traded equity securities are classified as available-for-sale financial assets. After initial measurement, available-for-sale investments are subsequently measured at fair value with unrealized gains or losses recognized in other comprehensive income or loss. When the investment is sold or impaired, the cumulative gain or loss is removed from accumulated other comprehensive income or loss and recognized in other income or expense in the consolidated statements of loss.
Derecognition
A financial asset is derecognized when the contractual rights to the cash flows from the asset expire, or the Company transfers substantially all the risks and rewards of ownership of the asset.
Impairment of financial assets The Company assesses at each reporting date whether there is any objective evidence that a financial asset or a group of financial assets is impaired. A financial asset or a group of financial assets is deemed to be impaired if there is objective evidence of impairment as a result of one or more events that has occurred after the initial recognition of the asset (an incurred “loss event”) and the loss has an impact on the estimated cash flows of the financial asset or group of assets that can be reliably estimated. For financial assets carried at amortized cost, the Company considers evidence of impairment at both a specific asset and collective level. Objective evidence could include the default or delinquency of a debtor or restructuring of an amount due to the Company on terms that the Company would not consider otherwise. All individually significant financial assets are assessed for specific impairment. Financial assets that are not individually significant are collectively assessed for impairment by grouping together financial assets with similar risk characteristics. If there is objective evidence that an impairment charge has been incurred, the amount of the charge is recognized in the consolidated statements of loss and is measured as the difference between the asset’s carrying amount and the present value of estimated future cash flows, excluding future credit losses that have not yet been incurred. If, in a subsequent period, the estimated impairment charge decreases because of an event, any reversal would be credited to net loss. �

NOTES TO CONSOLIDATED FINANCIAL STATEMENTS
96 | DUNDEE PRECIOUS METALS INC.
NOTES TO CONSOLIDATED FINANCIAL STATEMENTS For the years ended December 31, 2016 and 2015 (in thousands of U.S. dollars, unless otherwise indicated)
2.2 SIGNIFICANT ACCOUNTING POLICIES ��������� �
For available-for-sale investments, the Company assesses at each reporting date whether there is objective evidence that an investment or a group of investments is impaired. In the case of equity investments classified as available-for-sale, objective evidence would include a significant or prolonged decline in the fair value of the investment below its original cost. “Significant” is evaluated against the original cost of the investment and “prolonged” against the period in which the fair value has been below its original cost. Where there is evidence of impairment, the cumulative loss, which is measured as the difference between the acquisition cost and the current fair value, less any impairment charge on that investment previously recognized in net loss, is removed from accumulated other comprehensive income (loss) and recognized in other expense (income) in the consolidated statements of loss. Impairment charges on equity investments are not reversed through net loss; and increases in their fair value after impairment are recognized directly in other comprehensive income (loss). The assessment for impairment in respect of available-for-sale investments requires judgment, where management evaluates, among other factors, the duration or extent to which the fair value of an investment is less than its cost; and the financial health of and short-term business outlook for the investee, including factors such as industry and sector performance, changes in technology and operational and financing cash flows.
Financial liabilities
Initial recognition and measurement �Financial liabilities within the scope of IAS 39 are classified as “financial liabilities at fair value through profit or loss”, or “other financial liabilities”. The Company’s financial liabilities include trade and other payables, loans and borrowings, and derivative financial instruments, where applicable. All financial liabilities are recognized initially at fair value and in the case of loans and borrowings, net of directly attributable transaction costs. Subsequent measurement - Financial liabilities at fair value through profit or loss Financial liabilities at fair value through profit or loss include financial liabilities held for trading and financial liabilities designated upon initial recognition at fair value through profit or loss. Financial liabilities are classified as held for trading if management intends to settle the financial liabilities in the short term. This category includes any derivative financial instrument that is not designated as a hedging instrument in a hedge relationship under IAS 39. Financial liabilities at fair value through profit or loss are carried at fair value with changes in fair value recognized in other expense (income) in the consolidated statements of loss. The equity settled warrants issued by the Company, the commodity swap and option contracts entered to economically hedge a portion of its provisionally priced sales and projected production, and the forward point component of the forward foreign exchange contracts entered to hedge a portion of its projected operating expenses denominated in foreign currencies are, where applicable, classified as financial liabilities at fair value through profit or loss.
Subsequent measurement - Other financial liabilities After initial recognition, other financial liabilities are subsequently measured at amortized cost using the EIR method. Amortized cost is calculated by taking into account any discount or premium on acquisition and fees or costs that are an integral part of the EIR. The EIR amortization is included in finance cost in the consolidated statements of loss. �

NOTES TO CONSOLIDATED FINANCIAL STATEMENTS
97 | DUNDEE PRECIOUS METALS INC.
NOTES TO CONSOLIDATED FINANCIAL STATEMENTS For the years ended December 31, 2016 and 2015 (in thousands of U.S. dollars, unless otherwise indicated)
2.2 SIGNIFICANT ACCOUNTING POLICIES ��������� �
Derecognition A financial liability is derecognized when the obligation under the liability is discharged, cancelled or expires with any associated gains or losses reported in other expense (income) in the consolidated statements of loss.
(i) Offsetting of financial instruments Financial assets and financial liabilities are offset if, and only if, there is a currently enforceable legal right to offset the recognized amounts and there is an intention to settle on a net basis, or realize the assets and settle the liabilities simultaneously. (j) Fair value of financial instruments The fair value of financial instruments that are traded in active markets at each reporting date is determined by reference to quoted market prices or dealer price quotations (bid price for long positions and ask price for short positions), without any deduction for transaction costs. For instruments not traded in an active market, the fair value is determined using appropriate valuation techniques. Such techniques may include using recent arm’s length transactions; reference to the current fair value of another instrument that is substantially the same; discounted cash flow analysis or other valuation models. These valuation models require the use of assumptions, including future stock price volatility and probability of exercise. Changes in the underlying assumptions could materially impact the Company’s investments at fair value through profit or loss. Further details on measurement of the fair values of financial instruments are provided in note 8. (k) Derivative financial instruments and hedging activities Derivatives are initially recognized at fair value on the dates they are entered into and are subsequently re-measured at their fair value at each reporting period. The method of recognizing the resulting gain or loss depends on whether the derivative is designated as a hedging instrument, and if so, the nature of the item being hedged. The Company designates the spot component of the forward foreign exchange contracts entered to hedge a portion of its projected operating expenses denominated in foreign currencies as a cash flow hedge. The Company documents at the inception of the transaction the relationship between hedging instruments and hedged items, as well as its risk management objectives and strategy for undertaking various hedging transactions. The Company also documents its assessment, both at hedge inception and on an ongoing basis, of whether the derivatives that are used in hedging transactions are highly effective in offsetting changes in cash flows of hedged items. The spot component of the forward foreign exchange contracts is designated as a cash flow hedge and qualifies for hedge accounting. The forward points, or interest rate differential, which form a component of these contracts, are not designated and therefore do not qualify for hedge accounting. The effective portion of any change in the fair value of the spot component of the outstanding contracts is recognized in other comprehensive income or loss in the consolidated statements of comprehensive loss. The gain or loss relating to the ineffective portion, if any, and the gain or loss relating to changes in the forward points are recognized immediately in other income or expense in the consolidated statements of loss. Amounts accumulated in other comprehensive income or loss are reclassified to the consolidated statements of loss in cost of sales in the same periods as the underlying projected operating expenses are incurred.
NOTES TO CONSOLIDATED FINANCIAL STATEMENTS
98 | DUNDEE PRECIOUS METALS INC.
NOTES TO CONSOLIDATED FINANCIAL STATEMENTS For the years ended December 31, 2016 and 2015 (in thousands of U.S. dollars, unless otherwise indicated)
2.2 SIGNIFICANT ACCOUNTING POLICIES ��������� � The full fair value of a hedging derivative is classified as a non-current asset or liability when the remaining maturity is more than 12 months, and as a current asset or liability when the remaining maturity is 12 months or less. (l) Mineral exploration and evaluation expenditures
Exploration and evaluation activities involve the search for Mineral Resources and Mineral Reserves, the assessment of technical and operational feasibility and the determination of an identified Mineral Resource or Mineral Reserve’s commercial viability. Once the legal right to explore has been acquired, exploration and evaluation expenditures are expensed as incurred until economic production is probable. Exploration expenditures in areas where there is a reasonable expectation to convert existing estimated Mineral Resources to estimated Mineral Reserves or to add additional Mineral Resources with additional drilling and evaluations in areas near existing Mineral Resources or Mineral Reserves and existing or planned production facilities, are capitalized. Exploration properties that contain estimated Proven and Probable Mineral Reserves, but for which a development decision has not yet been made, are subject to periodic review for impairment when events or changes in circumstances indicate the project’s carrying value may not be recoverable. Exploration and evaluation assets are reclassified to “Mine Properties - Mines under construction” when the technical feasibility and commercial viability of extracting the Mineral Resources or Mineral Reserves are demonstrable and construction has commenced or a decision to construct has been made. Exploration and evaluation assets are assessed for impairment before reclassification to “Mines under construction”, and the impairment charge, if any, is recognized through net loss. The application of the Company’s accounting policy for exploration and evaluation expenditures requires judgment in determining whether it is probable that future economic benefits will be generated from the exploitation of an exploration and evaluation asset when activities have not yet reached a stage where a reasonable assessment of the existence of reserves can be determined. The estimation of Mineral Resources is a complex process and requires significant assumptions and estimates regarding economic and geological data and these assumptions and estimates impact the decision to either expense or capitalize exploration and evaluation expenditures. Management is required to make certain estimates and assumptions about future events and circumstances in order to determine if an economically viable extraction operation can be established. Any revision to any of these assumptions and estimates could result in the impairment of the capitalized exploration costs. If new information becomes available after expenditures have been capitalized that the recovery of these expenditures is no longer probable, the expenditures capitalized are written down to the recoverable amount and charged to net loss in the period the new information becomes available. � �
NOTES TO CONSOLIDATED FINANCIAL STATEMENTS
99 | DUNDEE PRECIOUS METALS INC.
NOTES TO CONSOLIDATED FINANCIAL STATEMENTS For the years ended December 31, 2016 and 2015 (in thousands of U.S. dollars, unless otherwise indicated)
2.2 SIGNIFICANT ACCOUNTING POLICIES ��������� � (m) Mine properties
Mine Properties - Mines under construction
All expenditures undertaken in the development, construction, installation and/or completion of mine production facilities are capitalized and initially classified as “Mines under construction”. Upon the commencement of production at the expected capacity level, all related assets included in “Mines under construction” are reclassified to “Mine Properties - Producing mines” or “Property, plant and equipment”. All expenditures related to the construction of mine declines and ore body access, including mine shafts and ventilation raises, are considered to be underground capital development and are capitalized. Expenses incurred after reaching the ore body are regarded as operating development costs and are included in the cost of ore hoisted. Mine Properties – Producing mines All assets reclassified from “Mines under construction” to “Producing mines” are stated at cost less accumulated depletion and accumulated impairment charges. Costs incurred for the acquisition of land are stated at cost. The initial cost of a producing mine comprises its purchase price or construction cost, any costs directly attributable to bringing it to a working condition for its intended use, the initial estimate of the rehabilitation costs, and for qualifying assets, applicable borrowing costs during construction. The purchase price or construction cost is the aggregate amount of cash consideration paid and the fair value of any other consideration given to acquire the asset. When a mine construction project moves into production, the capitalization of certain mine construction costs ceases, and from that point on, costs are either regarded as inventory costs or expensed as cost of sales, except for costs related to mine additions or improvements, mine development or mineable reserve development, which qualify for capitalization. Depletion The depletion of a producing mine asset is based on the unit-of-production method over the estimated economic life of the related deposit. Mineral Resources and Mineral Reserves estimates
The estimation of Mineral Resources and Mineral Reserves, as defined under National Instrument 43-101, Standards of Disclosure for Mine Projects (“NI 43-101”), is a complex process and requires significant assumptions and estimates. The Company prepares its Mineral Resources and Mineral Reserves estimates based on information related to the geological data on the size, depth and shape of the ore body which is compiled by appropriately qualified persons. Mineral Resources and Mineral Reserves estimates are based upon factors such as metal prices, capital requirements, production costs, foreign exchange rates, geotechnical and geological assumptions and judgments made in estimating the size and grade of the ore body. Mineral Resources and Mineral Reserves estimates, together with forecast production, determine the life of mine estimates and therefore changes in the Mineral Resources or Mineral Reserves estimates may impact the carrying value of exploration and evaluation assets (note 2.2(l)), mine properties, property, plant and equipment (note 2.2(n)), depletion and depreciation charges (note 2.2(n)), rehabilitation provisions (note 2.2(r)), and deferred income tax assets (note 2.2(w)). �
NOTES TO CONSOLIDATED FINANCIAL STATEMENTS
100 | DUNDEE PRECIOUS METALS INC.
NOTES TO CONSOLIDATED FINANCIAL STATEMENTS For the years ended December 31, 2016 and 2015 (in thousands of U.S. dollars, unless otherwise indicated)
2.2 SIGNIFICANT ACCOUNTING POLICIES ��������� � (n) Property, plant and equipment Property, plant and equipment are stated at cost less accumulated depreciation and accumulated impairment charges. The initial cost of property, plant and equipment comprises its purchase price or construction cost, any costs directly attributable to bringing it to a working condition for its intended use, the initial estimate of the rehabilitation costs, and for qualifying assets, applicable borrowing costs during construction. The purchase price or construction cost is the aggregate amount of cash consideration paid and the fair value of any other consideration given to acquire the asset. Where an item of property, plant and equipment is comprised of significant components with different useful lives, the components are accounted for as separate items of property, plant and equipment. The capitalized value of a finance lease is also included in property, plant and equipment.
Depreciation The depreciation of property, plant and equipment related to a mine is based on the unit-of-production method over the estimated economic life of the related deposit, except in the case of an asset whose estimated useful life is less than the life of the deposit, in which case the asset is depreciated over its estimated useful life based on the straight-line method. For all other property, plant and equipment, depreciation is based on the estimated useful life of the asset on a straight-line basis. Depreciation of property, plant and equipment used in a capitalized exploration or development project is capitalized to the project. Depreciation of property, plant and equipment, which are depreciated on a straight-line basis over their estimated useful lives, is as follows:
Asset Category Estimated useful life(Years)
Buildings 10-25Machinery and Equipment 3-25Vehicles 5Computer Hardware 2-5Office Equipment 3-7
Construction work-in-progress includes property, plant and equipment in the course of construction and is carried at cost less any recognized impairment charge. These assets are reclassified to the appropriate category of property, plant and equipment and depreciation of these assets commences when they are completed and ready for their intended use. An item of property, plant and equipment, including any significant part initially recognized, is derecognized upon disposal or when no future economic benefits are expected from its use or disposal. Any gain or loss arising on derecognition of the asset (calculated as the difference between the net disposal proceeds and the carrying amount of the asset) is included in net loss when the asset is derecognized. The residual values, useful lives and methods of depreciation of all assets are reviewed at each financial year end and are adjusted prospectively, if appropriate. Significant judgment is involved in the determination of estimated residual values and useful lives and no assurance can be given that actual residual values and useful lives will not differ significantly from current estimates.

NOTES TO CONSOLIDATED FINANCIAL STATEMENTS
101 | DUNDEE PRECIOUS METALS INC.
NOTES TO CONSOLIDATED FINANCIAL STATEMENTS For the years ended December 31, 2016 and 2015 (in thousands of U.S. dollars, unless otherwise indicated)
2.2 SIGNIFICANT ACCOUNTING POLICIES ��������� � Depreciation of mine specific assets is based on the unit-of-production method. The life of these assets is assessed annually with regard to both their anticipated useful life and the present assessments of the economically recoverable reserves of the mine property where these assets are located. These calculations require the use of estimates and assumptions, including the amount of recoverable reserves. Any changes to these calculations based on new information are accounted for prospectively. Rates of depreciation and, in turn, the annual depreciation expense could therefore be materially affected by changes in underlying estimates. Changes in estimates can be the result of differences in actual production or changes in forecast future production, changes in Mineral Resources or Mineral Reserves through exploration activities, differences between estimated and actual costs of mining and differences in metal prices used in the estimation of Mineral Reserves. Major maintenance and repairs Expenditures on major maintenance include the cost of replacing part of an asset and overhaul costs. When part of an asset is being replaced and it is probable that future economic benefits associated with the replacement or overhauled item will flow to the Company through an extended life, the expenditure is capitalized as a separate asset and the carrying amount of the replaced part is written off. (o) Intangible assets Intangible assets include software, exploration and software licenses, long-term customer contracts and a net smelter royalty. Intangible assets acquired separately are measured upon initial recognition at cost, which comprises the purchase price plus any costs directly attributable to the preparation of the asset for its intended use. Intangible assets acquired through business combinations are initially recognized at fair value as at the date of acquisition. Subsequent to initial recognition, intangible assets are carried at cost less accumulated amortization and any accumulated impairment charges. The amortization of the net smelter royalty is based on the unit-of-production method over the estimated economic life of the Kapan mine. All other intangible assets are amortized on a straight-line basis over their estimated useful lives. Amortization for intangible assets, which are amortized on a straight-line basis over their estimated useful lives, is as follows:
Asset Category Estimated useful life(Years)
Computer Software 3-5Exploration and Software Licenses 3-7Long-term Customer Contract 11 Changes in the expected useful life or the expected pattern of consumption of future economic benefits embodied in the intangible assets require the use of estimates and assumptions and are accounted for by changing the amortization period or method, as appropriate, and are treated as changes in accounting estimates. The amortization expense attributable to an intangible asset is recognized in the consolidated statements of loss in the expense category consistent with the function of the intangible asset. The gain or loss arising from the derecognition of an intangible asset is measured as the difference between the net disposal proceeds and the carrying amount of the asset and is recognized in net loss when the asset is derecognized. �

NOTES TO CONSOLIDATED FINANCIAL STATEMENTS
102 | DUNDEE PRECIOUS METALS INC.
NOTES TO CONSOLIDATED FINANCIAL STATEMENTS For the years ended December 31, 2016 and 2015 (in thousands of U.S. dollars, unless otherwise indicated)
2.2 SIGNIFICANT ACCOUNTING POLICIES ��������� �
(p) Assets held for sale and discontinued operations Non-current assets that are expected to be recovered primarily through sale rather than through continuing use are classified as assets held for sale. Immediately before being classified as held for sale, the assets are re-measured in accordance with the Company’s accounting policies relevant to the assets. Thereafter the assets are measured at the lower of their carrying amount and fair value less cost to sell. Impairment charges on initial classification as held for sale and subsequent gains or losses on re-measurement are recognized in net loss. The reversal of any previously recognized impairment charge cannot exceed the carrying amount that would have been determined had no impairment charge been recognized for the asset held for sale. The measurement of assets held for sale requires the use of estimates and assumptions related to the carrying value and its recoverability through sale. The actual sale proceeds may materially differ from the carrying value. A discontinued operation is a component of the Company that has been disposed of or is classified as held for sale and that represents a separate line of business or geographical area of operations. The results of discontinued operations are presented separately in the consolidated statements of loss.
(q) Impairment of non-financial assets The carrying values of capitalized exploration and evaluation expenditures, mine properties, intangible assets and property, plant and equipment are assessed for impairment whenever indicators of potential impairment exist. If any indication of potential impairment exists, an estimate of the asset’s recoverable amount is calculated. The recoverable amount is determined as the higher of the fair value less costs of disposal (“FVLCD”) and its value in use. This is determined on an asset-by-asset basis, unless the asset does not generate cash flows that are largely independent of those from other assets or groups of assets. If this is the case, individual assets are grouped together into a Cash Generating Unit (“CGU”) for impairment purposes. Such CGUs represent the lowest level for which there are separately identifiable cash inflows that are largely independent of the cash flows from other assets or groups of assets. If the carrying amount of an asset or CGU exceeds its recoverable amount, the carrying amount of the asset or CGU is reduced to its recoverable amount with the corresponding impairment being charged to earnings in the period of impairment. Impairment charges related to continuing operations are recognized in the consolidated statements of loss in those expense categories consistent with the function of the impaired asset. An assessment is also made at each reporting date as to whether there is any change in events or circumstances relating to a previously recognized impairment. If a change has occurred, the Company makes an estimate of the recoverable amount for the previously impaired asset or CGU. A previously recognized impairment charge is reversed only if there has been a change in the estimates used to determine the asset or CGU’s recoverable amount since the last impairment charge was recognized. If this is the case, the carrying amount of the asset or CGU is increased to its newly determined recoverable amount. The increased amount cannot exceed the carrying amount that would have been determined, net of depreciation and amortization, had no impairment charge been recognized for the asset or CGU in prior years.
NOTES TO CONSOLIDATED FINANCIAL STATEMENTS
103 | DUNDEE PRECIOUS METALS INC.
NOTES TO CONSOLIDATED FINANCIAL STATEMENTS For the years ended December 31, 2016 and 2015 (in thousands of U.S. dollars, unless otherwise indicated)
2.2 SIGNIFICANT ACCOUNTING POLICIES ��������� � The assessment of impairment is based, in part, on certain factors that may be partially or totally outside of the Company’s control, and requires the use of estimates and assumptions related to future value drivers, such as commodity prices, discount rates, foreign exchange rates and operating and capital costs. These estimates and assumptions, some of which may be subjective, require that management make decisions based on the best available information at each reporting period. It is possible that the actual recoverable amount could be significantly different than those estimates. Reductions in metal price forecasts, increases in estimated future costs of production, increases in estimated future capital costs, reductions in the amount of recoverable reserves, resources and exploration potential, and/or adverse market conditions can result in a write-down of the carrying amounts of the Company’s assets. Fair value is determined as the net amount that would be obtained from the sale of the asset in an arm’s length transaction between knowledgeable and willing parties. Value in use is based on estimated future cash flows discounted to their present value using a current pre-tax discount rate that is consistent with the risks specific to the asset. Management has assessed the Company’s CGUs as being an individual mine or processing site. (r) Provisions and contingencies
General Provisions are recognized when: a) the Company has a present obligation (legal or constructive) as a result of a past event; and b) it is probable that an outflow of resources embodying economic benefits will be required to settle the obligation and a reliable estimate can be made for the amount of the obligation. Where some or all of the expenditure required to settle a provision is expected to be reimbursed by another party, the reimbursement shall be recognized when it is virtually certain that reimbursement will be received if the Company settles the obligation. The reimbursement shall be treated as a separate asset. If the effect of the time value of money is material, provisions are discounted using a current pre-tax discount rate that reflects, where appropriate, the risks specific to the liability. Where discounting is used, the increase in the provision as a result of the passage of time is recognized in finance cost in the consolidated statements of loss.
A contingent liability is not recognized in the case where no reliable estimate can be made; however, disclosure is required unless the possibility of an outflow of resources embodying economic benefits is remote. By its nature, a contingent liability will only be resolved when one or more future events occur or fail to occur. The assessment of a contingent liability inherently involves the exercise of significant judgment and estimates of the outcome of future events.
Rehabilitation provisions Mining, processing, development and exploration activities are subject to various laws and regulations governing the protection of the environment. The Company recognizes a liability for its rehabilitation obligations in the period when a legal and/or constructive obligation is identified. The liability is measured at the present value of the estimated costs required to rehabilitate operating locations based on the risk free nominal discount rates that are specific to the countries in which the operations are located. A corresponding increase to the carrying amount of the related asset is recorded and depreciated in the same manner as the related asset. The nature of these restoration and rehabilitation activities includes: i) dismantling and removing structures; ii) rehabilitating mines and tailing dams; iii) dismantling operating facilities; iv) closure of plant and waste sites; and v) restoration, reclamation and re-vegetation of affected areas. Other environmental costs incurred at the operating sites, such as environmental monitoring, water management and waste management costs, are charged to net loss when incurred. The liability is accreted over time to its expected future settlement value. The accretion expense is recognized in finance cost in the consolidated statements of loss.

NOTES TO CONSOLIDATED FINANCIAL STATEMENTS
104 | DUNDEE PRECIOUS METALS INC.
NOTES TO CONSOLIDATED FINANCIAL STATEMENTS For the years ended December 31, 2016 and 2015 (in thousands of U.S. dollars, unless otherwise indicated)
2.2 SIGNIFICANT ACCOUNTING POLICIES ��������� � The Company assesses its rehabilitation provisions at each reporting date. The rehabilitation liability and related assets are adjusted at each reporting date for changes in the discount rates and in the estimated amount, timing and cost of the work to be carried out. Any reduction in the rehabilitation liability and therefore any deduction in the related rehabilitation asset may not exceed the carrying amount of that asset. If it does, any excess over the carrying value is immediately credited to net loss. Significant estimates and assumptions are made by management in determining the nature and costs associated with the rehabilitation liability. The estimates and assumptions required include estimates of the timing, extent and costs of rehabilitation activities, technology changes, regulatory changes, and changes in the discount and inflation rates. These uncertainties may result in future expenditures being different from the amounts currently provided.
(s) Leases
The determination of whether an arrangement is, or contains, a lease is based on the substance of the agreement on the inception date. Finance leases Finance leases which transfer substantially all the risks and rewards incidental to ownership of the leased item to the Company as a lessee, are capitalized at the inception of the lease at the fair value of the leased asset, or, if lower, at the present value of the minimum lease payments. Lease payments are apportioned between finance charges and the reduction of the lease liability. Finance charges are recognized in finance cost in the consolidated statements of loss. Capitalized leased assets are depreciated over the shorter of the estimated useful life of the asset and the lease term, if there is no reasonable certainty that the Company will obtain ownership by the end of the term of the lease.
Operating leases Leases that do not transfer substantially all the risks and rewards incidental to ownership to the Company as a lessee are classified as operating leases. Operating lease payments are recognized as an expense in the consolidated statements of loss on a straight-line basis over the lease term. (t) Revenue recognition Revenue from the sale of concentrates containing gold, copper, zinc and silver is recognized when the significant risks and rewards of ownership have been transferred, which is considered to occur when products have been delivered to the location specified in the sales contract and the risk of loss has been transferred to the buyer. Revenue is recognized to the extent that it is probable that economic benefits will flow to the Company and the revenue can be reliably measured. Revenue is measured at the fair value of the consideration received or receivable. Revenue from the sale of concentrates is initially recorded based on a provisional value which is a function of prevailing market prices, estimated weights and grades less smelter and financial deductions. Under the terms of the concentrate sales contracts, the final metal price ("settlement price") for the payable metal is based on a predetermined quotational period of London Metal Exchange daily prices. The price of the concentrate is the sum of the metal payments less the sum of specified deductions, including treatment and refining charges, penalties for deleterious elements, and freight. The terms of these contracts result in embedded derivatives because of the timing difference between the prevailing metal prices for provisional payments and the actual contractual metal prices used for final settlement. These embedded derivatives are adjusted to fair value at the end of each reporting period through to the date of final price determination with any adjustments recognized in revenue.

NOTES TO CONSOLIDATED FINANCIAL STATEMENTS
105 | DUNDEE PRECIOUS METALS INC.
NOTES TO CONSOLIDATED FINANCIAL STATEMENTS For the years ended December 31, 2016 and 2015 (in thousands of U.S. dollars, unless otherwise indicated)
2.2 SIGNIFICANT ACCOUNTING POLICIES ��������� � Any adjustments to the amount receivable for each shipment on the settlement date, caused by final assay results, are adjusted through revenue at the time of determination. Revenue from processing concentrate is recognized when concentrate has been smelted and is based on the toll rate specified in the toll agreement, which can vary based on the composition of the concentrate processed and prevailing market conditions at the time the agreement was entered. Under each toll agreement, Tsumeb incurs a carrying charge in respect of the concentrate it processes until blister copper is delivered. This charge is recorded as a reduction of revenue. Revenue from processing concentrate is also adjusted for any over or under recoveries of metals delivered relative to contracted rates, which are subject to estimation, including the amount of metals contained in concentrate received, material in-process and blister delivered. These estimates are based on the Company’s process knowledge and multiple assay results, the final results of which could differ materially from initial estimates. Revenue from the sale of sulphuric acid and arsenic, a by-product from processing concentrate at the Tsumeb smelter, is measured at the price specified in the sales contract and is recognized when the significant risks and rewards of ownership have been transferred, which is considered to occur when the products have been delivered to the location specified in the sales contract and the risk of loss has been transferred to the buyer. (u) Deferred revenue Deferred revenue is recognized in the consolidated statements of financial position when a cash prepayment is received from one or more buyers prior to the sale of concentrate containing payable metal. Revenue is subsequently recognized in the consolidated statements of loss when the sale of concentrate occurs, which generally occurs when the significant risks and rewards of ownership have been transferred to the buyer. (v) Borrowing costs Borrowing costs directly related to the acquisition and the construction of a qualifying capital asset are capitalized and added to the cost of the asset until such time as the asset is considered substantially ready for its intended use. Where funds are borrowed specifically to finance a project, the amount capitalized represents the actual borrowing costs incurred. Where funds used to finance a project form part of general borrowings, the amount capitalized is calculated using the weighted average cost applicable to relevant general borrowings of the Company during the period. All other borrowing costs are recognized in net loss in the period in which they are incurred.
(w) Share based compensation transactions
Equity-settled transactions Stock options are granted to directors and selected employees to buy common shares of the Company. Options vest equally over a three-year period and expire five years from the date of grant. Grants of stock options are based on the closing price of the common shares on the TSX the day before the effective grant date and reflect the Company’s estimate of the number of awards that will ultimately vest. The stock options are measured on the date of grant by reference to the fair value determined using a Black-Scholes valuation model, further details of which are given in note 18. The value is recognized as a general and administrative expense in the consolidated statements of loss and an increase to contributed surplus in the consolidated statements of changes in shareholders’ equity over the period in which the performance and/or service conditions are fulfilled. The dilutive effect of outstanding options is reflected as additional share dilution in the computation of diluted earnings per share.�

NOTES TO CONSOLIDATED FINANCIAL STATEMENTS
106 | DUNDEE PRECIOUS METALS INC.
NOTES TO CONSOLIDATED FINANCIAL STATEMENTS For the years ended December 31, 2016 and 2015 (in thousands of U.S. dollars, unless otherwise indicated)
2.2 SIGNIFICANT ACCOUNTING POLICIES ��������� �
Cash-settled transactions
A Deferred Share Unit (“DSU”) Plan was established for directors and certain employees in lieu of cash compensation. The DSUs are paid in cash based on the five-day volume weighted average price (“Market Price”) of DPM’s publicly traded common shares on the date the employee ceases to be employed by DPM or a subsidiary thereof or at any time before the end of the year following the year in which the director ceases to be a director of DPM or a subsidiary thereof. The cost of the DSUs is measured initially at fair value based on the closing price of DPM’s common shares preceding the day the DSUs are granted. The cost of the DSUs is recognized as a liability under share based compensation plans in the consolidated statements of financial position and as a general and administrative expense in the consolidated statements of loss. The liability is remeasured to fair value based on the Market Price of DPM’s common shares at each reporting date up to and including the settlement date, with changes in fair value recognized in general and administrative expenses in the consolidated statements of loss.
A Restricted Share Unit (“RSU”) Plan was established for directors, certain employees and eligible contractors (“Participant”) of DPM and its wholly-owned subsidiaries in consideration of past services to the Company. Under this plan, the Board of Directors may, at its sole discretion, (i) grant non-performance based RSUs and RSUs with a performance-based component, referred to as performance share units (“PSUs”), subject to performance conditions to be achieved by the Company, the Participant, or a class of Participants; and (ii) determine the entitlement date or dates of such RSUs and PSUs. The non-performance based RSUs vest equally over a three year period and are paid in cash based on the Market Price of DPM’s publicly traded common shares on the entitlement date or dates. The PSUs vest after three years from the grant date and are paid in cash based on the 20-day volume weighted average price of DPM’s publicly traded common shares, subject to performance criteria based on total shareholder return relative to a peer group established for this purpose, on the entitlement date or dates. The cost of the RSUs and PSUs is measured initially at fair value on the authorization date based on the closing price of DPM’s common shares preceding the day the RSUs and PSUs are granted. The cost of RSUs and PSUs is recognized as a liability under share based compensation plans, with the current portion recognized in accounts payable and accrued liabilities, in the consolidated statements of financial position and as an expense in the consolidated statements of loss over the vesting period. The liability is remeasured to fair value based on the Market Price of DPM’s common shares and, in the case of PSUs, subject to performance criteria, at each reporting date up to and including the settlement date, with changes in fair value recognized in the consolidated statements of loss. (x) Income taxes
Current income tax
Current income tax assets and liabilities are measured at the amount expected to be recovered from or paid to the taxation authorities on the taxable loss or income for the period. The tax rates and tax laws used to compute the amount are those enacted or substantively enacted by the end of the reporting period. Current income tax assets and current income tax liabilities are only offset if a legally enforceable right exists to offset the amounts and the Company intends to settle on a net basis or to realize the asset and settle the liability simultaneously. �

NOTES TO CONSOLIDATED FINANCIAL STATEMENTS
107 | DUNDEE PRECIOUS METALS INC.
NOTES TO CONSOLIDATED FINANCIAL STATEMENTS For the years ended December 31, 2016 and 2015 (in thousands of U.S. dollars, unless otherwise indicated)
2.2 SIGNIFICANT ACCOUNTING POLICIES ��������� �
Deferred income tax
Deferred income tax is provided using the balance sheet method on temporary differences on the reporting date between the tax bases of assets and liabilities and their carrying amounts for financial reporting purposes. Deferred income tax liabilities are recognized for all taxable temporary differences. Deferred income tax assets are recognized for all deductible temporary differences, and the carry forward of unused tax credits and unused tax losses, to the extent that it is probable that taxable income will be generated in future periods to utilize these deductible temporary differences.
The following temporary differences do not result in deferred income tax assets or liabilities:
� The initial recognition of assets or liabilities, not arising from a business combination, that does not affect accounting or taxable profit;
� Initial recognition of goodwill, if any; and � Investments in subsidiaries, associates and jointly controlled entities where the timing of the reversal
of temporary differences can be controlled and reversal in the foreseeable future is not probable. The carrying amount of deferred income tax assets is reviewed at the end of each reporting period and reduced to the extent that it is no longer probable that sufficient future taxable income will be generated to allow all or part of the deferred income tax asset to be utilized. Unrecognized deferred income tax assets are reassessed at the end of each reporting period and are recognized to the extent that it has become probable that future taxable income will be generated to allow the deferred income tax asset to be recovered. Deferred income tax assets and liabilities are measured at the tax rates that are expected to be in effect in the period when the asset is expected to be realized or the liability is expected to be settled, based on tax rates that have been enacted or substantively enacted by the end of the reporting period. Deferred income tax assets and liabilities are offset if a legally enforceable right exists to offset current income tax assets against current income tax liabilities and the deferred income taxes relate to the same taxable entity and the same taxation authority. Current and deferred income taxes related to items recognized directly in equity are recognized in equity and not in net loss. Management periodically evaluates positions taken in tax returns with respect to situations in which applicable tax regulations are subject to interpretation and establishes provisions where appropriate. Judgment is required in determining whether deferred income tax assets are recognized on the consolidated statements of financial position. Deferred income tax assets, including those arising from unutilized tax losses, require management to assess the likelihood that the Company will generate future taxable income in order to utilize the deferred income tax assets. Estimates of future taxable income are based on forecasted cash flows from operations or other activities and the application of existing tax laws in each jurisdiction. To the extent that future cash flows and taxable income differ significantly from estimates, the ability of the Company to realize the net deferred income tax assets recorded on the reporting date could be impacted. Additionally, future changes in tax laws in the jurisdictions in which the Company operates could impact tax deductions in future periods and the value of its deferred income tax assets and liabilities.
�

NOTES TO CONSOLIDATED FINANCIAL STATEMENTS
108 | DUNDEE PRECIOUS METALS INC.
NOTES TO CONSOLIDATED FINANCIAL STATEMENTS For the years ended December 31, 2016 and 2015 (in thousands of U.S. dollars, unless otherwise indicated)
2.2 SIGNIFICANT ACCOUNTING POLICIES ��������� �
(y) Earnings per share Basic earnings per share is computed by dividing the net earnings available to common shareholders by the weighted average number of shares outstanding during the reporting period. Diluted earnings per share reflects the potential dilution that could occur if additional common shares are assumed to be issued under securities that entitle their holders to obtain common shares in the future. The number of additional shares for inclusion in diluted earnings per share is determined using the treasury stock method, whereby stock options and warrants, whose exercise price is less than the average market price of the Company’s common shares, are assumed to be exercised at the beginning of the period with proceeds based on the average market price for the period. The incremental number of common shares issued under stock options and warrants is included in the calculation of diluted earnings per share.
2.3 NEW STANDARDS NOT YET ADOPTED The following new standards are not yet effective for the year ending December 31, 2016, and have not been applied when preparing these consolidated financial statements. The Company’s assessment of the impact of these new standards is set out below. IFRS 9, Financial InstrumentsIFRS 9, published in July 2014, replaces IAS 39. IFRS 9 introduces new requirements for the classification, measurement and impairment of financial assets and hedge accounting. It establishes two primary measurement categories for financial assets: (i) amortized cost and (ii) fair value; establishes criteria for classification of financial assets within the measurement category based on business model and cash flow characteristics; and eliminates existing held for trading, held to maturity, available for sale, loans and receivable and other financial liabilities categories. IFRS 9 also introduces a new model for the impairment of financial assets and requires an economic relationship between the hedged item and hedging instrument. While the Company has not finalized its detailed assessment of the classification and measurement of financial assets, equity investments currently classified as available-for-sale financial assets are expected to satisfy the conditions for classification as an asset that is fair valued through other comprehensive income or loss. Gains and losses in respect of these investments are recognized in other comprehensive income or loss, are not transferred to the consolidated statements of loss upon disposition and are not subject to impairment assessments. Equity instruments currently measured at fair value with any resulting gains or losses recognized through profit or loss would likely continue to be measured on the same basis under IFRS 9. Accordingly, the Company does not expect the new standard to have a significant impact on the classification and measurement of its financial assets. ��The new hedge accounting rules will align the accounting for hedging instruments more closely with the Company’s risk management practices. As a general rule, more hedge relationships are expected to be eligible for hedge accounting, as the standard introduces a more principles-based approach. While the Company has not finalized its detailed assessment, it is expected that the Company’s current hedge relationships such as forward foreign exchange contracts would continue to qualify as hedges upon the adoption of IFRS 9 and that the Company’s commodity swap and option contracts, which currently do not qualify for hedge accounting under IAS 39, would qualify for hedge accounting. ��The new impairment model requires the recognition of impairment provisions based on expected credit losses rather than only incurred credit losses as is the case under IAS 39 and applies to financial assets classified at amortized cost. While the Company has not finalized its detailed assessment of how impairment provisions on its accounts receivables would be affected by the new model, the Company does not expect the new impairment guidance to have a significant impact. ��
NOTES TO CONSOLIDATED FINANCIAL STATEMENTS
109 | DUNDEE PRECIOUS METALS INC.
NOTES TO CONSOLIDATED FINANCIAL STATEMENTS For the years ended December 31, 2016 and 2015 (in thousands of U.S. dollars, unless otherwise indicated)
The new standard also introduces expanded disclosure requirements and changes in presentation with respect to financial instruments, which are expected to change the nature and extent of the Company’s disclosures in the year the new standard is adopted. IFRS 9 is effective for annual periods beginning on or after January 1, 2018 with early adoption permitted. The Company is planning to adopt this standard effective January 1, 2018. IFRS 15, Revenue from Contracts with CustomersIFRS 15, issued in May 2014, establishes the principles that an entity shall apply to report the nature, amount, timing, and uncertainty of revenue and cash flows arising from a contract with a customer. IFRS 15 replaces IAS 11, Construction contracts, IAS 18, Revenue, IFRIC 13, Customer Loyalty Programmes, IFRIC 15, Agreements for the Construction of Real Estate, IFRIC 18, Transfers of Assets from Customers and Standard Interpretations Committee interpretation 31, Revenue – Barter Transactions Involving Advertising Services. IFRS 15 will also result in enhanced revenue disclosures, provide guidance for transactions that were not previously addressed comprehensively and improve guidance for multiple-element arrangements. IFRS 15 is based on the general principle that revenue is recognized when control of a good or service transfers to a customer rather than when the significant risks and rewards of ownership are transferred as is the case under IAS 18. While the Company has not finalized its detailed impact assessment, the Company does not expect the new standard to have a significant impact on the measurement or timing of revenue recognition. IFRS 15 is effective for annual periods beginning on or after January 1, 2018, with early adoption permitted. The Company is planning to adopt IFRS 15 effective January 1, 2018. IFRS 16, LeasesIFRS 16, issued in January 2016, replaces IAS 17, Leases. IFRS 16 results in most leases being reported on the balance sheet for lessees, eliminating the distinction between a finance lease and an operating lease. The standard is expected to impact the accounting for the Company’s operating leases, which are currently reflected in the consolidated statements of loss and in the Company’s disclosure in respect of future commitments. Under IFRS 16, all operating leases, except for short term and low value leases, are expected to be accounted for as finance leases. As a result, the leased assets and the associated obligations are recognized in the consolidated statements of financial position. The leased assets will be depreciated over the shorter of the estimated useful life of the asset and the lease term. The lease payments are apportioned between finance charges and a reduction of the lease liability. The current operating lease expense will be replaced with a depreciation charge on the leased assets and a finance charge on the lease liability, which are in aggregate expected to result in a higher total periodic expense in the earlier periods of the lease. IFRS 16 is effective for annual periods beginning on or after January 1, 2019. Early adoption is permitted for companies that also adopt IFRS 15. The Company does not intend to adopt IFRS 16 before its mandatory date. �

NOTES TO CONSOLIDATED FINANCIAL STATEMENTS
110 | DUNDEE PRECIOUS METALS INC.
NOTES TO CONSOLIDATED FINANCIAL STATEMENTS For the years ended December 31, 2016 and 2015 (in thousands of U.S. dollars, unless otherwise indicated)
3. KAPAN DISPOSITION AND DISCONTINUED OPERATIONS
On March 1, 2016, the Company entered into a definitive agreement with Polymetal International Plc ("Polymetal") for the sale of its interest in the Kapan mine through the disposition of all of the issued and outstanding shares of Kapan ("Kapan Disposition"). The Kapan Disposition was completed on April 28, 2016. Kapan Disposition Consideration received:Cash 10,000 Working capital adjustment 5,018 Polymetal ordinary shares (i) 15,214 Net smelter royalty stream (ii) 9,500 Total consideration received 39,732 Less: transaction costs (848) Net consideration received 38,884 Net assets disposed of:
Cash and cash equivalents 960 Accounts receivable 11,880 Inventories 12,023 Other current assets 155 Mine properties 11,827 Property, plant & equipment 8,613 Total assets disposed of 45,458 Accounts payable and accrued liabilities 3,867 Rehabilitation provisions 6,121 Total liabilities disposed of 9,988 Net assets disposed of 35,470 Gain on Kapan Disposition included in net loss
from discontinued operations 3,414 (i) The Polymetal ordinary shares were sold subsequent to the closing for net cash proceeds of $14.8
million, which was included in the proceeds from Kapan Disposition in the consolidated financial statements of cash flows for the year ended December 31, 2016.
(ii) The estimated fair value of the net smelter royalty component of the total consideration received was based on management’s estimated future pre-tax cash flows of Kapan utilizing the latest information available, including metal prices, available Mineral Resources, ore mined, grades, recoveries, certain operating costs, capital expenditures and foreign exchange rates. These projected cash flows were prepared in current dollars and discounted using a real discount rate of 10% representing the estimated pre-tax real weighted average cost of capital. This rate was estimated based on the Capital Asset Pricing Model where the cost of equity and debt were built up based on estimated risk free interest rates, market returns on equity and debt, volatility, debt-to-equity ratios and risks specific to the Company and mining sector.

NOTES TO CONSOLIDATED FINANCIAL STATEMENTS
111 | DUNDEE PRECIOUS METALS INC.
NOTES TO CONSOLIDATED FINANCIAL STATEMENTS For the years ended December 31, 2016 and 2015 (in thousands of U.S. dollars, unless otherwise indicated)
Management’s estimate of the fair value of the net smelter royalty was classified as level 3 in the fair value hierarchy. The assumed metal prices used to determine the fair value of the net smelter royalty at the time of disposition were as follows:
Metal PriceGold ($/ounce) 1,150 – 1,250
Copper ($/pound) 2.20 – 2.80 Silver ($/ounce) 14.80 – 17.35 Zinc ($/pound) 0.79 – 1.00
The estimated fair value of the net smelter royalty was recognized as an intangible asset in the consolidated statements of financial position and will be amortized based on the unit-of-production method over the estimated economic life of the Kapan mine, which corresponds with timing when the net smelter royalty income is expected to be recognized. The net smelter royalty income and the amortization expense were both recorded in other expense (income) (note 22) in the consolidated statements of loss.
Discontinued operations The following table summarizes the operating results of Kapan, up to the date of disposition, which have been aggregated and presented as discontinued operations for the years ended December 31, 2016 and 2015:
2016 2015
Revenue 14,380 34,998Costs and expensesCost of sales 13,045 40,608 Exploration expenses 97 939 Impairment charges (a) 206 42,757 Finance cost 287 825 Other expense (income) 5,400 (1,715) Loss before income taxes (4,655) (48,416) Current income tax expense 364 133 Deferred income tax expense - 1,252 Net loss from discontinued operations
before gain on Kapan Disposition (5,019) (49,801)
Gain on Kapan Disposition 3,414 -
Net loss from discontinued operations (1,605) (49,801)
(a) As at December 31, 2015, the carrying value of Kapan exceeded its estimated recoverable amount by $42.7 million, of which $21.7 million was allocated to Kapan’s mine properties, $20.1 million to property, plant and equipment and $0.9 million to intangible assets, with the resulting impairment charge recognized in the net loss from discontinued operations for the year ended December 31, 2015. This impairment charge was primarily attributable to projected lower commodity prices and a slower ramp-up of production.
�
� �

NOTES TO CONSOLIDATED FINANCIAL STATEMENTS
112 | DUNDEE PRECIOUS METALS INC.
NOTES TO CONSOLIDATED FINANCIAL STATEMENTS For the years ended December 31, 2016 and 2015 (in thousands of U.S. dollars, unless otherwise indicated)
4. IMPAIRMENT CHARGES As at December 31, 2016, the Company assessed the recoverable amount of each of its CGUs as a result of the market capitalization of its shares being less than their carrying value. Based on this assessment, the carrying values of all CGUs were considered to be recoverable with the exception of Tsumeb.
Tsumeb impairment
As at December 31, 2016, the carrying value of Tsumeb exceeded its estimated recoverable amount resulting in an impairment charge of $107.0 million being recognized in the consolidated statements of loss, of which $102.9 million related to property, plant and equipment and $4.1 million related to intangible assets. This impairment charge was primarily attributable to lower forecast third party toll rates and lower forecast volumes related to a slower ramp-up of throughput to 370,000 tonnes per year. Tsumeb’s recoverable amount of $266 million as at December 31, 2016 was determined using FVLCD, which was calculated based on projected future cash flows utilizing the latest information available and management’s estimates including throughput, toll rates, which were based on historical terms received and the Company’s knowledge of the complex concentrate market, operating costs, capital expenditures and foreign exchange rates. These projected cash flows were prepared in current dollars and discounted using a real discount rate of 10.3%, representing the estimated weighted average real cost of capital. This rate was estimated based on the Capital Asset Pricing Model where the costs of equity and debt were based on, among other things, estimated interest rates, market returns on equity, share volatility, leverage and risks specific to the mining sector and Tsumeb. Management’s estimates of Tsumeb’s FVLCD are classified as level 3 in the fair value hierarchy. Sensitivities
The projected cash flows and estimated FVLCD can be affected by any one or more changes in the estimates used. Changes in volumes of concentrate smelted, third party toll rates and operating costs have the greatest impact on value, where a 5% change in volumes, third party toll rates, or operating costs would each change FVLCD by approximately $38 million to $44 million. If Tsumeb were to continue to operate at current production levels and not proceed with its expansion there would be a further impairment charge. Other impairments on property, plant and equipment
During the year ended December 31, 2016, Tsumeb also recognized an $11.2 million impairment charge reflecting management’s decision to discontinue producing arsenic trioxide, a by-product of the Tsumeb smelter process, by the end of the first quarter of 2017. During the year ended December 31, 2016, Chelopech recognized a $7.7 million impairment charge on certain equipment that it does not expect to use. These impairment charges, as summarized in the table below, were recognized in the consolidated statements of loss for the year ended December 31, 2016 and reduced carrying values to their estimated fair values as at December 31, 2016.
2016 2015
Impairment charges on exploration and evaluation assets (note 9) - 803 Impairment charges on property, plant & equipment (note 11) 122,232 60 Impairment charges on intangible assets (note 12) 4,107 42
126,339 905 �
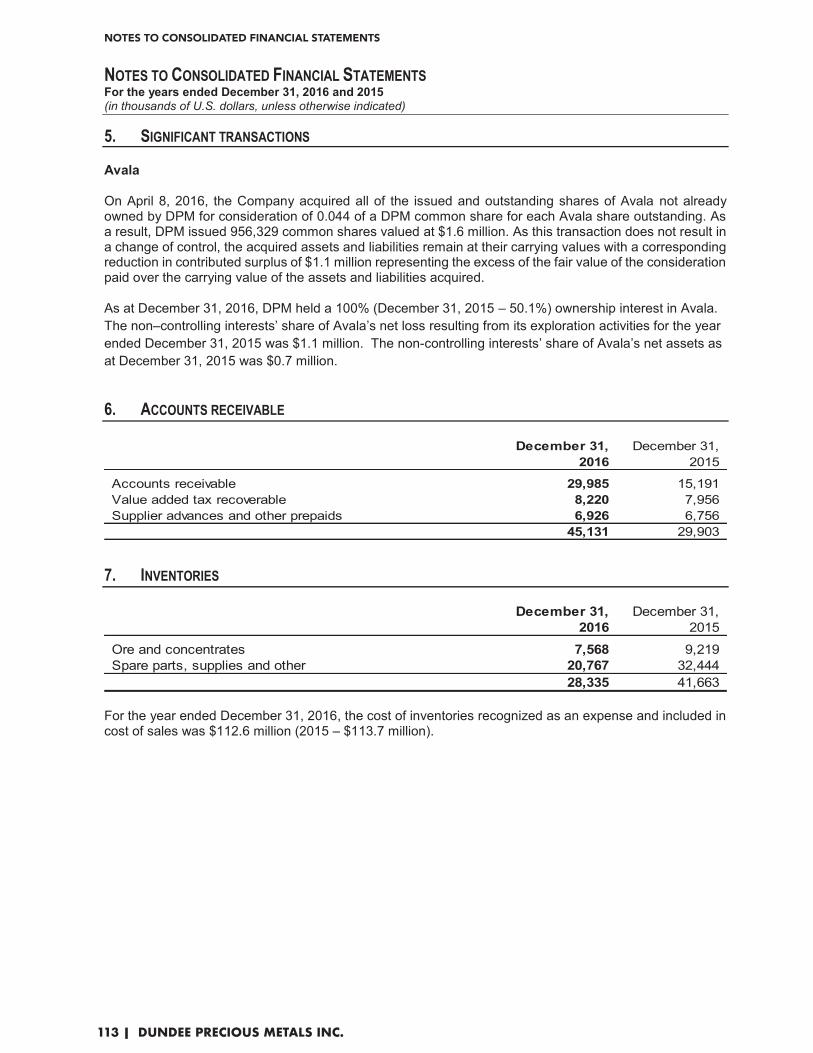
NOTES TO CONSOLIDATED FINANCIAL STATEMENTS
113 | DUNDEE PRECIOUS METALS INC.
NOTES TO CONSOLIDATED FINANCIAL STATEMENTS For the years ended December 31, 2016 and 2015 (in thousands of U.S. dollars, unless otherwise indicated)
5. SIGNIFICANT TRANSACTIONS
Avala On April 8, 2016, the Company acquired all of the issued and outstanding shares of Avala not already owned by DPM for consideration of 0.044 of a DPM common share for each Avala share outstanding. As a result, DPM issued 956,329 common shares valued at $1.6 million. As this transaction does not result in a change of control, the acquired assets and liabilities remain at their carrying values with a corresponding reduction in contributed surplus of $1.1 million representing the excess of the fair value of the consideration paid over the carrying value of the assets and liabilities acquired. As at December 31, 2016, DPM held a 100% (December 31, 2015 – 50.1%) ownership interest in Avala. The non–controlling interests’ share of Avala’s net loss resulting from its exploration activities for the year ended December 31, 2015 was $1.1 million. The non-controlling interests’ share of Avala’s net assets as at December 31, 2015 was $0.7 million.
6. ACCOUNTS RECEIVABLE
December 31, December 31,2016 2015
Accounts receivable 29,985 15,191 Value added tax recoverable 8,220 7,956 Supplier advances and other prepaids 6,926 6,756
45,131 29,903
7. INVENTORIES
December 31, December 31,2016 2015
Ore and concentrates 7,568 9,219 Spare parts, supplies and other 20,767 32,444
28,335 41,663
For the year ended December 31, 2016, the cost of inventories recognized as an expense and included in cost of sales was $112.6 million (2015 – $113.7 million).
�

NOTES TO CONSOLIDATED FINANCIAL STATEMENTS
114 | DUNDEE PRECIOUS METALS INC.
NOTES TO CONSOLIDATED FINANCIAL STATEMENTS For the years ended December 31, 2016 and 2015 (in thousands of U.S. dollars, unless otherwise indicated)
8. FINANCIAL INSTRUMENTS
Set out below is a comparison, by category, of the carrying amounts of the Company’s financial instruments that are recognized in the consolidated statements of financial position:
Financial instrument classification
December 31, 2016
December 31, 2015
Financial assetsCash and cash equivalents Loans and receivables 11,757 26,570 Accounts receivable (note 6) Loans and receivables 45,131 29,903 Restricted cash Loans and receivables 2,216 2,026 Sabina special warrants (a) Held for trading 2,008 1,451 Publicly traded securities (b) Available for sale 17,208 12,460 Commodity swap and option
contracts (c) Derivatives held for trading 6,941 7,548
Financial liabilitiesAccounts payable
and accrued liabilities (note 14) Other financial liabilities 33,905 43,108 Debt (note 15) Other financial liabilities 41,110 147,035 Commodity swap and option
contracts (c) Derivatives held for trading 4,685 - Forward foreign exchange
contracts (d) Derivatives for cash flow hedges 1,955 21,345
Carrying Amount
The carrying values of all the financial assets and liabilities approximate their fair values as at December 31, 2016 and 2015. (a) Sabina warrants and special warrants As at December 31, 2016, DPM held: (i) 23,539,713 common shares of Sabina; and (ii) 5,000,000 Series B special warrants, which will be automatically exercised upon a positive production decision with respect to the Back River project or upon the occurrence of certain other events. Each of the special warrants is exercisable for a period of 35 years into one common share until 2044. The fair value of the special warrants was based on the fair value of the Sabina common shares, which was determined based on the closing bid prices as at December 31, 2016 and 2015. The fair value of the Sabina special warrants was included in investments at fair value in the consolidated statements of financial position. For the year ended December 31, 2016, the Company recognized an unrealized gain on the Sabina special warrants of $0.6 million (2015 – $0.3 million) in other expense (income) (note 22) in the consolidated statements of loss.

NOTES TO CONSOLIDATED FINANCIAL STATEMENTS
115 | DUNDEE PRECIOUS METALS INC.
NOTES TO CONSOLIDATED FINANCIAL STATEMENTS For the years ended December 31, 2016 and 2015 (in thousands of U.S. dollars, unless otherwise indicated)
(b) Publicly traded securities
Publicly traded securities include a portfolio of equity investments in publicly traded mining and exploration companies, comprised primarily of Sabina common shares. These investments are measured at fair value with unrealized gains or losses recognized in other comprehensive income or loss in the consolidated statements of comprehensive loss. When these investments are sold or considered to be impaired due to a significant or prolonged decline in fair value, the cumulative gain or loss is removed from accumulated other comprehensive income or loss and recognized in other expense (income) in the consolidated statements of loss. Any future unrealized loss below the carrying value of these investments, immediately after recognizing any such impairment charge, is recognized as an impairment charge in other expense while any future unrealized gain is recognized in other comprehensive income (loss). For the year ended December 31, 2016, the Company recognized unrealized gains on these publicly traded securities of $4.7 million (2015 – $5.4 million) in other comprehensive income (loss). Unrealized losses in respect of publicly traded securities considered to be impaired of $0.02 million (2015 – $0.6 million) for the year ended December 31, 2016 were transferred to other expense (income) (note 22). (c) Commodity swap and option contracts
The Company enters into cash settled commodity swap contracts from time to time to swap future contracted monthly average metal prices for fixed metal prices to eliminate or substantially reduce the metal price exposure associated with the time lag between the provisional and final determination of concentrate sales (“QP Hedges”). As at December 31, 2016, the Company had outstanding commodity swap contracts in respect of this exposure as summarized in the table below:
Commodity hedged Volume hedgedAverage fixed price
of QP HedgesPayable gold 33,460 ounces $1,209.02/ounce
Payable copper 8,476,764 pounds $2.38/poundPayable silver 34,875 ounces $17.05/ounce
The Company also enters into cash settled commodity swap and option contracts from time to time to reduce its future metal price exposures (“Production Hedges”). Commodity swap contracts are entered to swap future contracted monthly average gold prices for fixed prices. The commodity option contracts are entered to provide price protection below a specified “floor” price and price participation up to a specified “ceiling” price. These option contracts are comprised of a series of call options and put options (which when combined represent “collar” contracts) that are generally structured so as to provide for a zero upfront cash cost. As at December 31, 2016, the Company had outstanding commodity swap contracts as summarized in the table below:
Year of projected production
Volume of copper hedged(pounds)
Average fixed price($/pound)
2017 32,542,387 2.40 2018 19,166,966 2.62
51,709,353 2.48
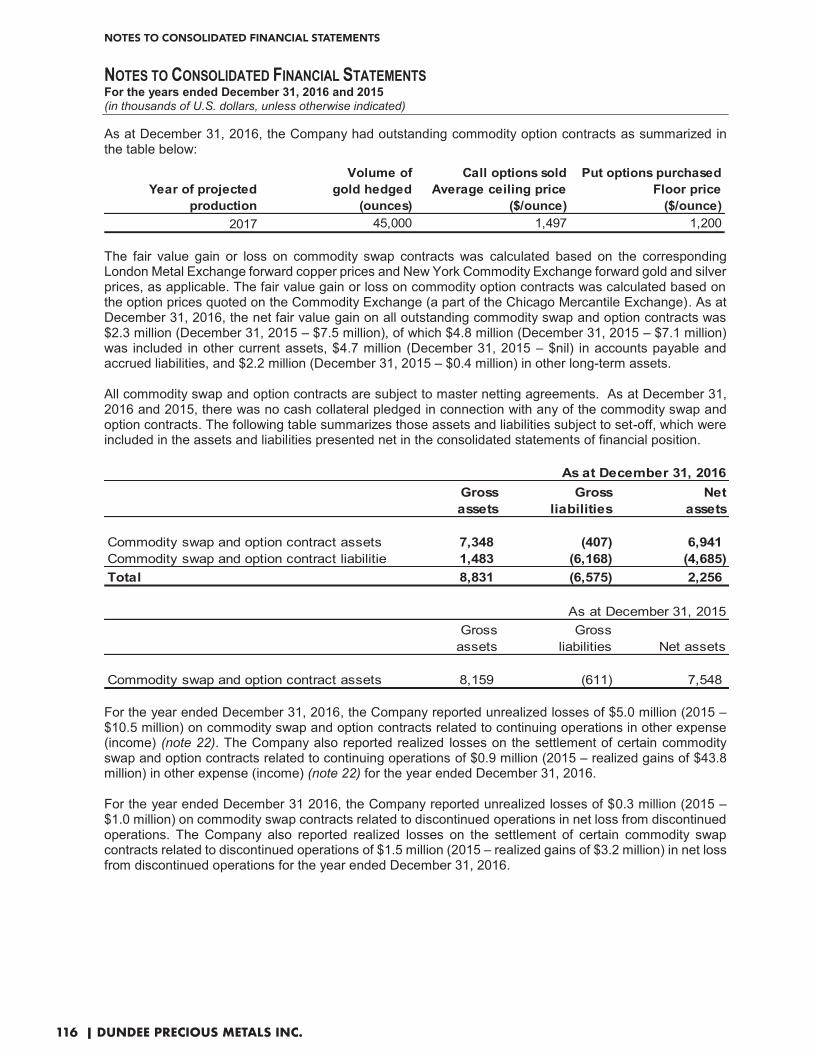
NOTES TO CONSOLIDATED FINANCIAL STATEMENTS
116 | DUNDEE PRECIOUS METALS INC.
NOTES TO CONSOLIDATED FINANCIAL STATEMENTS For the years ended December 31, 2016 and 2015 (in thousands of U.S. dollars, unless otherwise indicated)
As at December 31, 2016, the Company had outstanding commodity option contracts as summarized in the table below:
Year of projected production
Volume of gold hedged
(ounces)
Call options soldAverage ceiling price
($/ounce)
Put options purchased Floor price
($/ounce)2017 45,000 1,497 1,200
The fair value gain or loss on commodity swap contracts was calculated based on the corresponding London Metal Exchange forward copper prices and New York Commodity Exchange forward gold and silver prices, as applicable. The fair value gain or loss on commodity option contracts was calculated based on the option prices quoted on the Commodity Exchange (a part of the Chicago Mercantile Exchange). As at December 31, 2016, the net fair value gain on all outstanding commodity swap and option contracts was $2.3 million (December 31, 2015 – $7.5 million), of which $4.8 million (December 31, 2015 – $7.1 million) was included in other current assets, $4.7 million (December 31, 2015 – $nil) in accounts payable and accrued liabilities, and $2.2 million (December 31, 2015 – $0.4 million) in other long-term assets. All commodity swap and option contracts are subject to master netting agreements. As at December 31, 2016 and 2015, there was no cash collateral pledged in connection with any of the commodity swap and option contracts. The following table summarizes those assets and liabilities subject to set-off, which were included in the assets and liabilities presented net in the consolidated statements of financial position.
As at December 31, 2016Gross assets
Gross liabilities
Net assets
Commodity swap and option contract assets 7,348 (407) 6,941 Commodity swap and option contract liabilitie 1,483 (6,168) (4,685) Total 8,831 (6,575) 2,256
As at December 31, 2015Gross
assetsGross
liabilities Net assets
Commodity swap and option contract assets 8,159 (611) 7,548 For the year ended December 31, 2016, the Company reported unrealized losses of $5.0 million (2015 – $10.5 million) on commodity swap and option contracts related to continuing operations in other expense (income) (note 22). The Company also reported realized losses on the settlement of certain commodity swap and option contracts related to continuing operations of $0.9 million (2015 – realized gains of $43.8 million) in other expense (income) (note 22) for the year ended December 31, 2016. For the year ended December 31 2016, the Company reported unrealized losses of $0.3 million (2015 – $1.0 million) on commodity swap contracts related to discontinued operations in net loss from discontinued operations. The Company also reported realized losses on the settlement of certain commodity swap contracts related to discontinued operations of $1.5 million (2015 – realized gains of $3.2 million) in net loss from discontinued operations for the year ended December 31, 2016. �
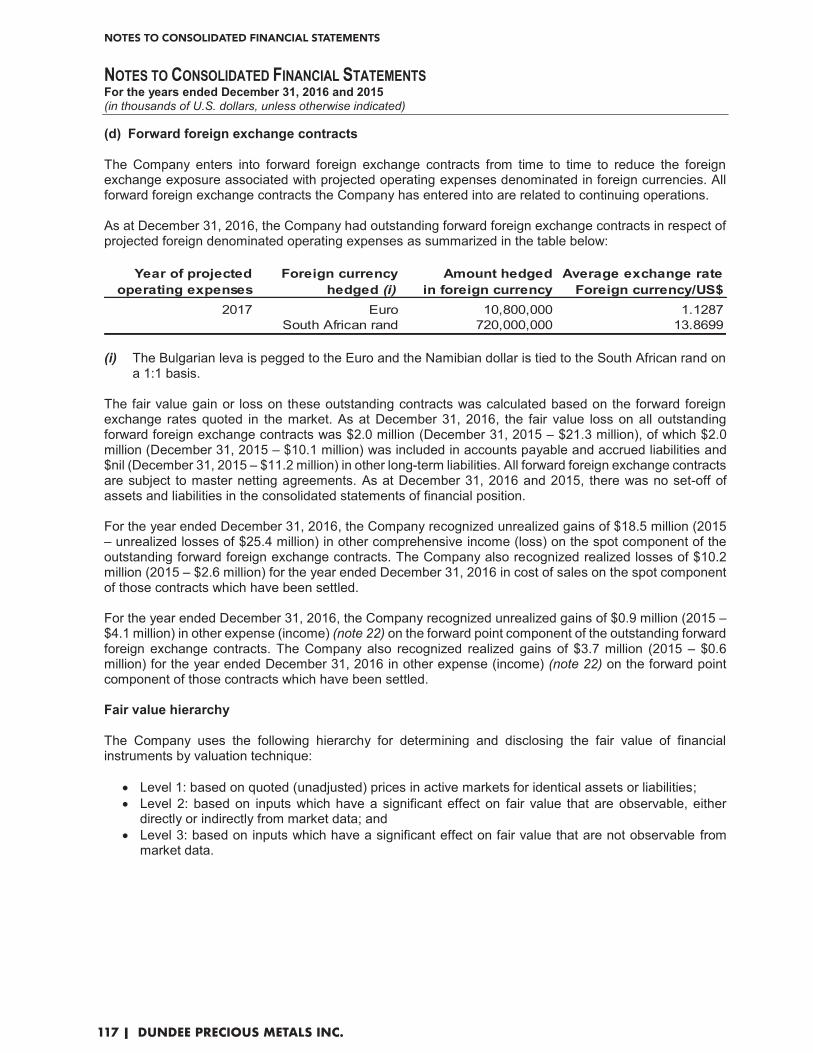
NOTES TO CONSOLIDATED FINANCIAL STATEMENTS
117 | DUNDEE PRECIOUS METALS INC.
NOTES TO CONSOLIDATED FINANCIAL STATEMENTS For the years ended December 31, 2016 and 2015 (in thousands of U.S. dollars, unless otherwise indicated)
(d) Forward foreign exchange contracts The Company enters into forward foreign exchange contracts from time to time to reduce the foreign exchange exposure associated with projected operating expenses denominated in foreign currencies. All forward foreign exchange contracts the Company has entered into are related to continuing operations. As at December 31, 2016, the Company had outstanding forward foreign exchange contracts in respect of projected foreign denominated operating expenses as summarized in the table below:
Year of projected operating expenses
Foreign currency hedged (i)
Amount hedgedin foreign currency
Average exchange rateForeign currency/US$
2017 Euro 10,800,000 1.1287 South African rand 720,000,000 13.8699
(i) The Bulgarian leva is pegged to the Euro and the Namibian dollar is tied to the South African rand on
a 1:1 basis. The fair value gain or loss on these outstanding contracts was calculated based on the forward foreign exchange rates quoted in the market. As at December 31, 2016, the fair value loss on all outstanding forward foreign exchange contracts was $2.0 million (December 31, 2015 – $21.3 million), of which $2.0 million (December 31, 2015 – $10.1 million) was included in accounts payable and accrued liabilities and $nil (December 31, 2015 – $11.2 million) in other long-term liabilities. All forward foreign exchange contracts are subject to master netting agreements. As at December 31, 2016 and 2015, there was no set-off of assets and liabilities in the consolidated statements of financial position. For the year ended December 31, 2016, the Company recognized unrealized gains of $18.5 million (2015 – unrealized losses of $25.4 million) in other comprehensive income (loss) on the spot component of the outstanding forward foreign exchange contracts. The Company also recognized realized losses of $10.2 million (2015 – $2.6 million) for the year ended December 31, 2016 in cost of sales on the spot component of those contracts which have been settled. For the year ended December 31, 2016, the Company recognized unrealized gains of $0.9 million (2015 – $4.1 million) in other expense (income) (note 22) on the forward point component of the outstanding forward foreign exchange contracts. The Company also recognized realized gains of $3.7 million (2015 – $0.6 million) for the year ended December 31, 2016 in other expense (income) (note 22) on the forward point component of those contracts which have been settled.
Fair value hierarchy The Company uses the following hierarchy for determining and disclosing the fair value of financial instruments by valuation technique:
� Level 1: based on quoted (unadjusted) prices in active markets for identical assets or liabilities; � Level 2: based on inputs which have a significant effect on fair value that are observable, either
directly or indirectly from market data; and � Level 3: based on inputs which have a significant effect on fair value that are not observable from
market data.

NOTES TO CONSOLIDATED FINANCIAL STATEMENTS
118 | DUNDEE PRECIOUS METALS INC.
NOTES TO CONSOLIDATED FINANCIAL STATEMENTS For the years ended December 31, 2016 and 2015 (in thousands of U.S. dollars, unless otherwise indicated)
The following table illustrates the classification of the Company’s financial instruments within the fair value hierarchy as at December 31, 2016 and 2015:
Level 1 Level 2 Level 3 Total
Financial assets Sabina special warrants - - 2,008 2,008 Publicly traded securities 17,208 - - 17,208 Commodity swap and option contracts - 6,941 - 6,941 Financial liabilitiesCommodity swap and option contracts - 4,685 - 4,685 Forward foreign exchange contracts - 1,955 - 1,955
Level 1 Level 2 Level 3 Total
Financial assets Sabina special warrants - - 1,451 1,451 Publicly traded securities 12,460 - - 12,460 Commodity swap contracts - 7,548 - 7,548 Financial liabilitiesForward foreign exchange contracts - 21,345 - 21,345
As at December 31, 2016
As at December 31, 2015
During the years ended December 31, 2016 and 2015, there were no transfers between Level 1 and Level 2 fair value measurements, and no transfers into or out of Level 3 fair value measurements. The following table reconciles level 3 fair value measurements from January 1, 2015 to December 31, 2016:
December 31, December 31,2016 2,015
Balance at beginning of year 1,451 1,173 Unrealized gains included in net loss (note 22) 557 278
Balance at end of year 2,008 1,451
�
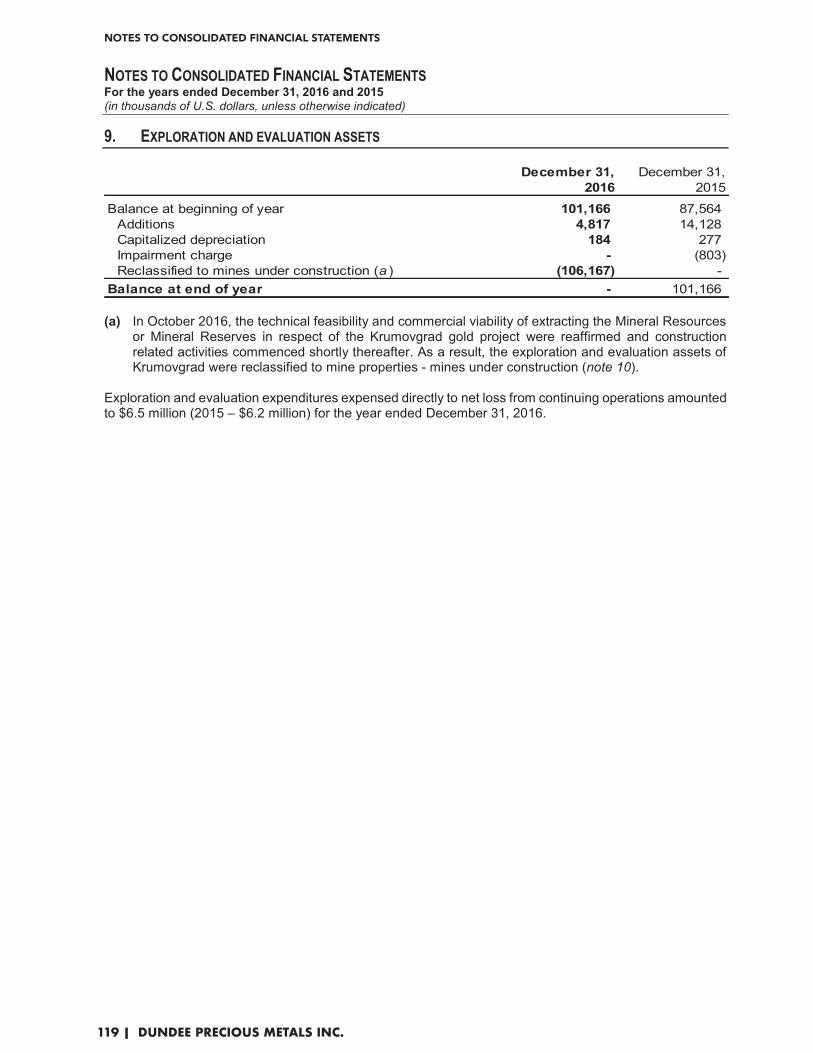
NOTES TO CONSOLIDATED FINANCIAL STATEMENTS
119 | DUNDEE PRECIOUS METALS INC.
NOTES TO CONSOLIDATED FINANCIAL STATEMENTS For the years ended December 31, 2016 and 2015 (in thousands of U.S. dollars, unless otherwise indicated)
9. EXPLORATION AND EVALUATION ASSETS
December 31, December 31,2016 2015
Balance at beginning of year 101,166 87,564 Additions 4,817 14,128 Capitalized depreciation 184 277 Impairment charge - (803) Reclassified to mines under construction (a ) (106,167) -
Balance at end of year - 101,166 (a) In October 2016, the technical feasibility and commercial viability of extracting the Mineral Resources
or Mineral Reserves in respect of the Krumovgrad gold project were reaffirmed and construction related activities commenced shortly thereafter. As a result, the exploration and evaluation assets of Krumovgrad were reclassified to mine properties - mines under construction (note 10).
Exploration and evaluation expenditures expensed directly to net loss from continuing operations amounted to $6.5 million (2015 – $6.2 million) for the year ended December 31, 2016.

NOTES TO CONSOLIDATED FINANCIAL STATEMENTS
120 | DUNDEE PRECIOUS METALS INC.
NOTES TO CONSOLIDATED FINANCIAL STATEMENTS For the years ended December 31, 2016 and 2015 (in thousands of U.S. dollars, unless otherwise indicated)
10. MINE PROPERTIES
MinesProducing under
Mines Construction Total
Cost:Balance as at January 1, 2015 188,982 52 189,034
Additions 10,421 - 10,421 Capitalized depreciation 1,433 - 1,433 Change in rehabilitation provisions (7,438) - (7,438) Disposals (1,053) - (1,053) Impairment charge (note 3) (34,679) - (34,679)
Balance as at December 31, 2015 157,666 52 157,718 Additions 7,850 12,716 20,566 Capitalized depreciation 562 65 627 Change in rehabilitation provisions 316 306 622 Disposals (14) - (14) Reclassified from exploration and
evaluation assets (note 9) - 106,167 106,167 Kapan Disposition (note 3) (12,019) - (12,019)
Balance as at December 31, 2016 154,361 119,306 273,667
Accumulated depreciation and impairment:Balance as at January 1, 2015 58,486 - 58,486
Depletion 13,568 - 13,568 Disposals (1,053) - (1,053) Impairment charge (note 3) (12,994) - (12,994)
Balance as at December 31, 2015 58,007 - 58,007 Depletion 12,305 - 12,305 Kapan Disposition (note 3) (192) - (192)
Balance as at December 31, 2016 70,120 - 70,120
Net book value:As at December 31, 2015 99,659 52 99,711 As at December 31, 2016 84,241 119,306 203,547 (a) Included in additions were capitalized borrowing costs amounting to $0.1 million (2015 – $nil) for the
year ended December 31, 2016, at a weighted average interest rate of 4.81% (2015 – nil). The depletion expense for producing mines from continuing operations has been fully charged to cost of sales in the consolidated statements of loss for the years ended December 31, 2016 and 2015. �
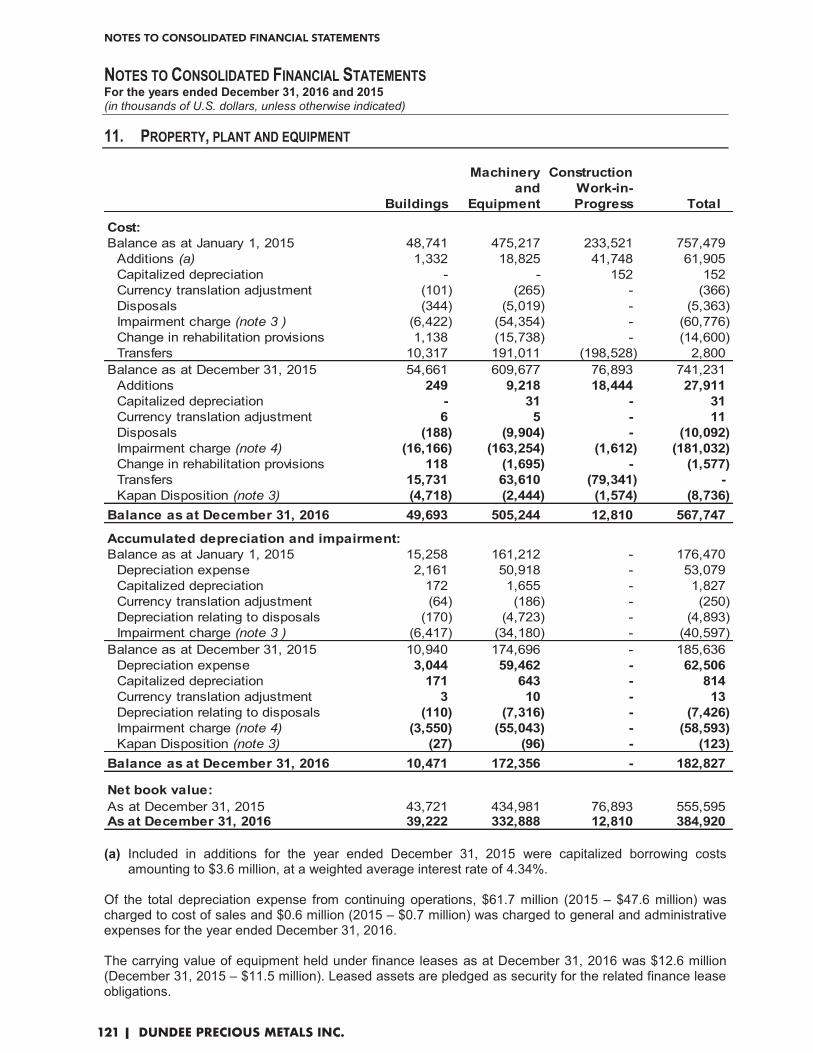
NOTES TO CONSOLIDATED FINANCIAL STATEMENTS
121 | DUNDEE PRECIOUS METALS INC.
NOTES TO CONSOLIDATED FINANCIAL STATEMENTS For the years ended December 31, 2016 and 2015 (in thousands of U.S. dollars, unless otherwise indicated)
11. PROPERTY, PLANT AND EQUIPMENT
Machinery Constructionand Work-in-
Buildings Equipment Progress Total
Cost:Balance as at January 1, 2015 48,741 475,217 233,521 757,479
Additions (a) 1,332 18,825 41,748 61,905 Capitalized depreciation - - 152 152 Currency translation adjustment (101) (265) - (366) Disposals (344) (5,019) - (5,363) Impairment charge (note 3 ) (6,422) (54,354) - (60,776) Change in rehabilitation provisions 1,138 (15,738) - (14,600) Transfers 10,317 191,011 (198,528) 2,800
Balance as at December 31, 2015 54,661 609,677 76,893 741,231 Additions 249 9,218 18,444 27,911 Capitalized depreciation - 31 - 31 Currency translation adjustment 6 5 - 11 Disposals (188) (9,904) - (10,092) Impairment charge (note 4) (16,166) (163,254) (1,612) (181,032) Change in rehabilitation provisions 118 (1,695) - (1,577) Transfers 15,731 63,610 (79,341) - Kapan Disposition (note 3) (4,718) (2,444) (1,574) (8,736)
Balance as at December 31, 2016 49,693 505,244 12,810 567,747
Accumulated depreciation and impairment:Balance as at January 1, 2015 15,258 161,212 - 176,470
Depreciation expense 2,161 50,918 - 53,079 Capitalized depreciation 172 1,655 - 1,827 Currency translation adjustment (64) (186) - (250) Depreciation relating to disposals (170) (4,723) - (4,893) Impairment charge (note 3 ) (6,417) (34,180) - (40,597)
Balance as at December 31, 2015 10,940 174,696 - 185,636 Depreciation expense 3,044 59,462 - 62,506 Capitalized depreciation 171 643 - 814 Currency translation adjustment 3 10 - 13 Depreciation relating to disposals (110) (7,316) - (7,426) Impairment charge (note 4) (3,550) (55,043) - (58,593) Kapan Disposition (note 3) (27) (96) - (123)
Balance as at December 31, 2016 10,471 172,356 - 182,827
Net book value:As at December 31, 2015 43,721 434,981 76,893 555,595 As at December 31, 2016 39,222 332,888 12,810 384,920 (a) Included in additions for the year ended December 31, 2015 were capitalized borrowing costs
amounting to $3.6 million, at a weighted average interest rate of 4.34%.
Of the total depreciation expense from continuing operations, $61.7 million (2015 – $47.6 million) was charged to cost of sales and $0.6 million (2015 – $0.7 million) was charged to general and administrative expenses for the year ended December 31, 2016. The carrying value of equipment held under finance leases as at December 31, 2016 was $12.6 million (December 31, 2015 – $11.5 million). Leased assets are pledged as security for the related finance lease obligations.
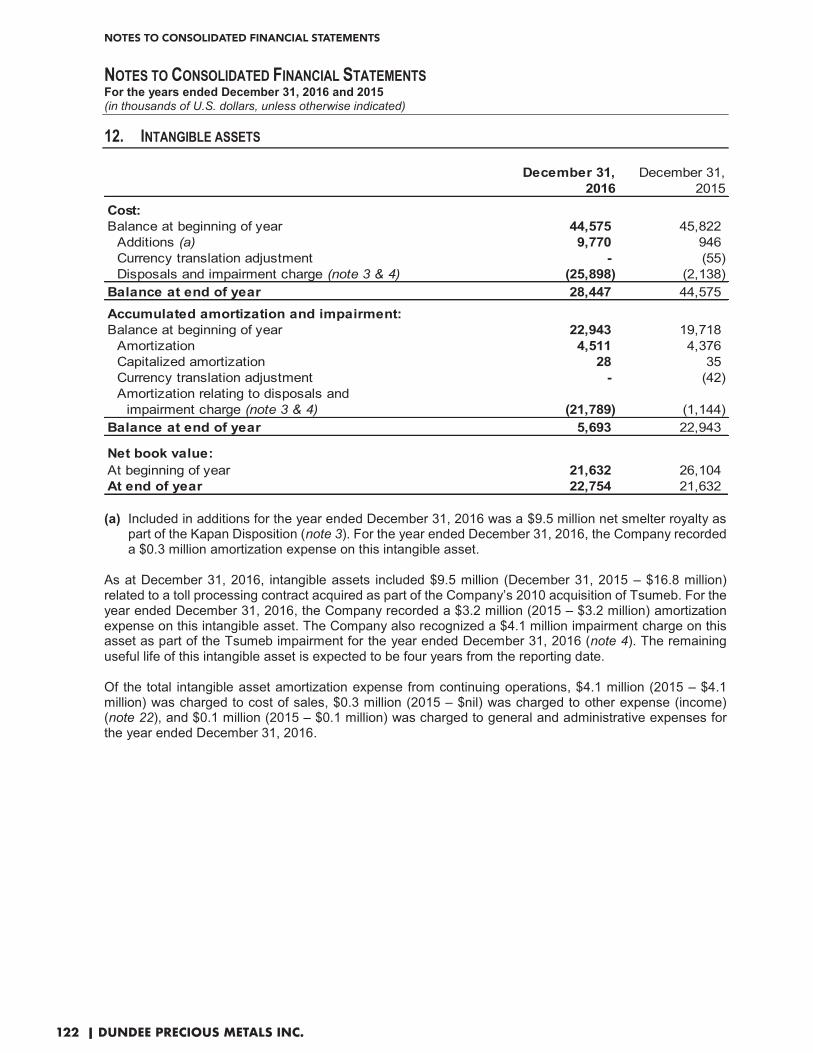
NOTES TO CONSOLIDATED FINANCIAL STATEMENTS
122 | DUNDEE PRECIOUS METALS INC.
NOTES TO CONSOLIDATED FINANCIAL STATEMENTS For the years ended December 31, 2016 and 2015 (in thousands of U.S. dollars, unless otherwise indicated)
12. INTANGIBLE ASSETS
December 31, December 31,2016 2015
Cost:Balance at beginning of year 44,575 45,822
Additions (a) 9,770 946 Currency translation adjustment - (55) Disposals and impairment charge (note 3 & 4) (25,898) (2,138)
Balance at end of year 28,447 44,575
Accumulated amortization and impairment:Balance at beginning of year 22,943 19,718
Amortization 4,511 4,376 Capitalized amortization 28 35 Currency translation adjustment - (42) Amortization relating to disposals and
impairment charge (note 3 & 4) (21,789) (1,144) Balance at end of year 5,693 22,943
Net book value:At beginning of year 21,632 26,104 At end of year 22,754 21,632 (a) Included in additions for the year ended December 31, 2016 was a $9.5 million net smelter royalty as
part of the Kapan Disposition (note 3). For the year ended December 31, 2016, the Company recorded a $0.3 million amortization expense on this intangible asset.
As at December 31, 2016, intangible assets included $9.5 million (December 31, 2015 – $16.8 million) related to a toll processing contract acquired as part of the Company’s 2010 acquisition of Tsumeb. For the year ended December 31, 2016, the Company recorded a $3.2 million (2015 – $3.2 million) amortization expense on this intangible asset. The Company also recognized a $4.1 million impairment charge on this asset as part of the Tsumeb impairment for the year ended December 31, 2016 (note 4). The remaining useful life of this intangible asset is expected to be four years from the reporting date. Of the total intangible asset amortization expense from continuing operations, $4.1 million (2015 – $4.1 million) was charged to cost of sales, $0.3 million (2015 – $nil) was charged to other expense (income) (note 22), and $0.1 million (2015 – $0.1 million) was charged to general and administrative expenses for the year ended December 31, 2016.�

NOTES TO CONSOLIDATED FINANCIAL STATEMENTS
123 | DUNDEE PRECIOUS METALS INC.
NOTES TO CONSOLIDATED FINANCIAL STATEMENTS For the years ended December 31, 2016 and 2015 (in thousands of U.S. dollars, unless otherwise indicated)
13. OTHER LONG-TERM ASSETS
December 31, December 31, 2016 2015
Restricted cash 1,614 1,424 Commodity swap and option contracts (note 8(c)) 2,169 444 Value added tax recoverable 153 67 Other 2,718 2,593
6,654 4,528 14. ACCOUNTS PAYABLE AND ACCRUED LIABILITIES
December 31, December 31,2016 2015
Accounts payable 12,892 21,479 Accrued liabilities 20,913 21,356 Commodity swap and option contracts (note 8(c)) 4,685 - Forward foreign exchange contracts (note 8(d)) 1,955 10,117 Other payables 100 273
40,545 53,225 15. DEBT
December 31, December 31,2016 2015
Current portion of debtTerm loans (a) 16,110 16,250
16,110 16,250
Long-term portion of debtTerm loans (a) - 15,785 Revolving credit facility (b) 25,000 115,000
25,000 130,785 Total debt 41,110 147,035
(a) Loans
Term Loans The original aggregate principal amount of DPM’s secured term loans (“Term Loans”) was $81.25 million. The Term Loans are repayable in 10 equal semi-annual instalments, which commenced in June 2013, and bear interest at a rate equal to the three month U.S. Dollar LIBOR plus 2.80%. The Term Loans are secured by pledges of the Company’s investments in Krumovgrad, Chelopech and Tsumeb and by guarantees from each of these subsidiaries.

NOTES TO CONSOLIDATED FINANCIAL STATEMENTS
124 | DUNDEE PRECIOUS METALS INC.
NOTES TO CONSOLIDATED FINANCIAL STATEMENTS For the years ended December 31, 2016 and 2015 (in thousands of U.S. dollars, unless otherwise indicated)
The Term Loans contain financial covenants that require DPM to maintain: (i) a debt leverage ratio (funded net debt to adjusted earnings before interest, taxes, depreciation, and amortization (“EBITDA”), as defined in the Term Loans agreement) below 4.0:1 during the construction of the Krumovgrad gold project (below 3.5:1 thereafter), (ii) a current ratio (including the unutilized credit within the $150.0 million tranche of the committed revolving credit facility (“RCF”) in current assets) of greater than 1.5:1, and (iii) a minimum net worth of $500.0 million plus (minus) 50% of ongoing annual net earnings (losses). As at December 31, 2016, the Term Loans had an outstanding balance of $16.3 million and DPM was in compliance with all financial covenants. (b) Credit Agreements and Guarantees Chelopech and Krumovgrad Chelopech and Krumovgrad have a $16.0 million multi-purpose credit facility that matures on November 29, 2017. This credit facility is guaranteed by DPM. Advances under the multi-purpose revolving credit facility bear interest at a rate equal to the one month U.S. Dollar LIBOR plus 3.25%. As at December 31, 2016, $4.2 million (December 31, 2015 – $4.1 million) had been utilized against the multi-purpose revolving facility in the form of letters of credit and letters of guarantee. Chelopech also has a Euro 21.0 million ($22.1 million) credit facility to support the Chelopech mine closure and rehabilitation plan. This credit facility matures on December 31, 2017 and is guaranteed by DPM. As at December 31, 2016, $14.6 million (December 31, 2015 – $22.9 million) had been utilized against this credit facility in the form of letters of guarantee, which were posted with the Bulgarian Ministry of Energy.
DPM DPM has a committed RCF with a consortium of banks. In February 2015 and April 2016, the RCF was amended to extend the terms of tranche A and tranche B by an additional year. In August 2016, the RCF was further amended to extend the term of tranche C by an additional two years in anticipation of moving forward with the Krumovgrad gold project. As at December 31, 2016, the RCF is comprised of a $45.0 million tranche A maturing in February 2021, a $150.0 million tranche B maturing in February 2019, and an $80.0 million tranche C maturing in September 2021 that has quarterly availability reductions of $4.0 million beginning in the third quarter of 2018. The RCF bears interest at a spread above LIBOR, which varies between 2.75% and 5.50% depending upon the tranche being drawn and the Company’s debt leverage ratio (funded net debt to adjusted EBITDA), as defined in the RCF agreement. The RCF contains the same financial covenants and shares in the same security package as the Term Loans. As at December 31, 2016, DPM was in compliance with all financial covenants and $25.0 million was drawn under the RCF. Scheduled debt repayments under these debt arrangements are presented in the table below:
up to 1 year 1 - 5 years TotalTerm loans 16,250 - 16,250 Revolving credit facility - 25,000 25,000
16,250 25,000 41,250 Unamortized deferred financing costs (140) Total debt 41,110
Payments Due by Period
�

NOTES TO CONSOLIDATED FINANCIAL STATEMENTS
125 | DUNDEE PRECIOUS METALS INC.
NOTES TO CONSOLIDATED FINANCIAL STATEMENTS For the years ended December 31, 2016 and 2015 (in thousands of U.S. dollars, unless otherwise indicated)
16. DEFERRED REVENUE
In September 2016, the Company entered into a prepaid forward gold sales arrangement with several of DPM’s existing lenders whereby the Company will deliver 45,982 ounces of gold on specified dates over a 21-month period commencing in May 2019 in exchange for an upfront cash prepayment of $50.0 million. Deliveries of gold will be in the form of unallocated gold credits sourced from any of the Company’s own mines in 21 monthly instalments during 2019 and 2020. The cash prepayment of $50.0 million was recorded as deferred revenue in the consolidated statements of financial position, and will be recognized as revenue when deliveries are made under the prepaid forward gold sales arrangement. 17. REHABILITATION PROVISIONS The rehabilitation provisions represent the present value of rehabilitation costs relating to the Chelopech and Tsumeb sites, which are expected to be incurred between 2017 and 2039. Key assumptions used in determining the rehabilitation provisions were as follows:
December 31, December 31,2016 2015
Discount periodChelopech 2017 - 2029 2017 - 2029Tsumeb 2017 - 2039 2016 - 2039Krumovgrad 2019 - 2041 N/AKapan N/A 2025 - 2027
Local discount rateChelopech 1.8% 2.4%Tsumeb 10.0% 10.7%Krumovgrad 1.8% N/AKapan N/A 16.9%
Local inflation rateChelopech 2.0% 2.0%Tsumeb 5.0% 5.5%Krumovgrad 2.0% N/AKapan N/A 4.0%
Changes to rehabilitation provisions were as follows:
Chelopech Tsumeb Krumovgrad Kapan TotalBalance as at January 1, 2015 24,953 22,939 - 5,893 53,785
Change in cost estimate (a) (9,902) - - - (9,902) Remeasurement of provisions (b) (1,079) (9,360) - (1,697) (12,136) Accretion expense (note 21) 610 1,945 - 825 3,380
Balance as at December 31, 2015 14,582 15,524 - 5,021 35,127 Change in cost estimate (a) - (4,753) 306 - (4,447) Remeasurement of provisions (b) 341 2,167 - 813 3,321 Accretion expense (note 21) 358 1,771 - 287 2,416 Kapan Disposition (note 3) - - - (6,121) (6,121)
Balance as at December 31, 2016 15,281 14,709 306 - 30,296

NOTES TO CONSOLIDATED FINANCIAL STATEMENTS
126 | DUNDEE PRECIOUS METALS INC.
NOTES TO CONSOLIDATED FINANCIAL STATEMENTS For the years ended December 31, 2016 and 2015 (in thousands of U.S. dollars, unless otherwise indicated)
(a) During the year ended December 31, 2016, Tsumeb decreased its estimated rehabilitation costs based on its current activities, updated closure plan and existing closure obligations. During the year ended December 31, 2016, Krumovgrad commenced construction of its gold mine and as a result, a mine closure plan has been developed and a rehabilitation provision was recognized to reflect its rehabilitation obligations related to this work. During the year ended December 31, 2015, Chelopech decreased its estimated rehabilitation costs based on its current activities, updated closure plan and existing closure obligations.
(b) Remeasurement of provisions resulted from the changes in discount rates, inflation rates and foreign exchange rates at each site.
18. OTHER LONG-TERM LIABILITIES
December 31, December 31,2016 2015
Finance leases (a) 14,636 15,839 Forward foreign exchange contracts (note 8(d)) - 11,228 Environmental commitment 602 602 Other liabilities 963 2,183
16,201 29,852 Less: Current portion (2,030) (1,920)
14,171 27,932
(a) Tsumeb has a long-term lease agreement for the supply of oxygen. The initial term of the lease was 15 years extending to 2025, payable on a monthly basis. The lease payments were discounted at a rate of 12.5%.
Future minimum lease payments under finance leases, together with the present value of the net minimum lease payments, are as follows:
up to 1 year 1 - 5 years over 5 years Total
Minimum lease payments 1,462 5,958 7,216 14,636 Finance charges 1,586 4,890 1,600 8,076 Present value of minimum lease payments 3,048 10,848 8,816 22,712
Payments Due by Period
�

NOTES TO CONSOLIDATED FINANCIAL STATEMENTS
127 | DUNDEE PRECIOUS METALS INC.
NOTES TO CONSOLIDATED FINANCIAL STATEMENTS For the years ended December 31, 2016 and 2015 (in thousands of U.S. dollars, unless otherwise indicated)
19. SHARE BASED COMPENSATION PLANS
RSU plan DPM has an RSU plan for directors, certain employees and eligible contractors of DPM and its wholly-owned subsidiaries in consideration of past services to the Company. The Board of Directors administers the RSU plan and determines the grants. (a) Non-performance based RSUs These RSUs vest equally over a three year period and are paid in cash based on the Market Price of DPM’s publicly traded common shares on the entitlement date or dates, which should not be later than December 31 of the year that is three years after the year of service for which the RSUs are granted, as determined by the Board of Directors in its sole discretion. The following is a summary of the RSUs granted for the years indicated:
Number of RSUs AmountBalance as at January 1, 2015 1,761,474 2,101
RSUs granted 1,080,650 2,768 RSUs redeemed (747,358) (1,762) RSUs forfeited (155,637) (122) Mark-to-market adjustments (2,020)
Balance as at December 31, 2015 1,939,129 965 RSUs granted 1,824,700 3,138 RSUs redeemed (920,012) (1,560) RSUs forfeited (83,837) (55) Mark-to-market adjustments (2)
Balance as at December 31, 2016 2,759,980 2,486 As at December 31, 2016, there was $2.0 million (December 31, 2015 – $1.7 million) of RSU expenses remaining to be charged to net earnings in future periods relating to the RSU plan. (b) PSUs Under the RSU plan, the Board of Directors may, at its sole discretion, (i) grant RSUs with a performance-based component, referred to as PSUs, subject to performance conditions to be achieved by the Company, the Participant, or a class of Participants; and (ii) determine the entitlement date or dates of such PSUs. During the year ended December 31, 2016, the Company granted 854,500 (2015 – 380,200) PSUs with a fair value of $1.5 million (2015 – $0.9 million). These PSUs vest after three years and are paid in cash based on the market value of DPM’s publicly traded common shares, subject to performance criteria based on total shareholder return relative to a peer group established for this purpose, on the entitlement date or dates, which shall not be later than December 31 of the year that is three years after the year of service for which the PSUs were granted, as determined by the Board of Directors in its sole discretion.

NOTES TO CONSOLIDATED FINANCIAL STATEMENTS
128 | DUNDEE PRECIOUS METALS INC.
NOTES TO CONSOLIDATED FINANCIAL STATEMENTS For the years ended December 31, 2016 and 2015 (in thousands of U.S. dollars, unless otherwise indicated)
The following is a summary of the PSUs granted for the years indicated:
Number of PSUs Amount
Balance as at January 1, 2015 - - PSUs granted 380,200 201 PSUs forfeited (10,400) (2) Mark-to-market adjustments - (120)
Balance as at December 31, 2015 369,800 79 PSUs granted 854,500 592 PSUs forfeited (62,500) (25) Mark-to-market adjustments (6)
Balance as at December 31, 2016 1,161,800 640 As at December 31, 2016, there was $1.2 million (December 31, 2015 – $0.5 million) of expenses remaining to be charged to net earnings in future periods relating to these PSUs.
DSU plan DPM has a DSU plan for directors and certain employees. Under the employee DSU plan, grants to employees of the Company are determined by the Board of Directors, or the compensation committee, in lieu of a cash bonus. The DSUs are redeemable in cash based on the market value of DPM’s publicly traded common shares at any time before the end of the year following the year in which�the employee ceases to be employed by DPM or a subsidiary thereof. Under the director DSU plan, directors may receive a portion of their annual compensation in the form of DSUs. The DSUs are redeemable in cash based on the Market Price of DPM’s publicly traded common shares at any time before the end of the year following the year in which the director ceases to be a director of DPM or a subsidiary thereof. The following is a continuity of the DSUs for the years indicated:
Number of DSUs Amount
Balance as at January 1, 2015 826,411 1,850 DSUs granted 295,609 452 Mark-to-market adjustments (1,253)
Balance as at December 31, 2015 1,122,020 1,049 DSUs granted 254,750 500 DSUs redeemed (121,383) (225) Mark-to-market adjustments 755
Balance as at December 31, 2016 1,255,387 2,079
DPM stock option plan
The Company has established an incentive stock option plan for the directors, selected employees and consultants. Pursuant to the plan, the exercise price of the option cannot be less than the closing price of DPM’s common shares on the trading date preceding the day the option is granted. The aggregate number of shares that can be issued from treasury under this plan is 12,500,000. Options granted vest equally over a three year period and expire five years from the date of grant.

NOTES TO CONSOLIDATED FINANCIAL STATEMENTS
129 | DUNDEE PRECIOUS METALS INC.
NOTES TO CONSOLIDATED FINANCIAL STATEMENTS For the years ended December 31, 2016 and 2015 (in thousands of U.S. dollars, unless otherwise indicated)
During the year ended December 31, 2016, the Company granted 1,262,584 (2015 – 1,660,754) stock options with a fair value of $1.1 million (2015– $2.0 million). The estimated value of the options granted will be recognized as an expense in the consolidated statements of loss and an addition to contributed surplus in the consolidated statements of changes in shareholders’ equity over the vesting period. The Company recorded stock option expenses of $1.5 million (2015 – $2.0 million) for the year ended December 31, 2016 under the DPM stock option plan. As at December 31, 2016, there was $0.9 million (December 31, 2015 – $1.1 million) of share based compensation cost remaining to be charged to net earnings in future periods relating to stock option grants. The fair value of options granted was estimated using the Black-Scholes option pricing model. The expected volatility is estimated based on the historic average share price volatility. The inputs used in the measurement of the fair values at the time the options were granted were as follows:
2016 2015Five year risk free interest rate 0.5% - 0.6% 0.5%Expected life in years 4.75 4.75 Expected volatility 64.8% - 66.3% 59.6%Dividends per share - - The following is a stock option continuity for the years indicated:
Number of options
Weighted average
exercise price per share
(Cdn$)Balance as at January 1, 2015 5,977,802 6.56
Options granted 1,660,754 2.97 Options forfeited (73,867) 3.74 Options expired (1,437,752) 4.82
Balance as at December 31, 2015 6,126,937 6.03 Options granted 1,262,584 2.21 Options forfeited (103,735) 2.64 Options expired (1,638,133) 8.81
Balance as at December 31, 2016 5,647,653 4.44 The following lists the options outstanding and exercisable as at December 31, 2016:
Range of exercise prices
per share (Cdn$)
Number of options
outstanding
Weighted average
remaining years
Weighted average exercise
price per share
(Cdn$)
Number of options
exercisable
Weighted average exercise
price per share
(Cdn$)2.05 - 3.96 4,176,603 3.19 3.05 1,472,327 3.55 6.56 - 7.84 717,850 1.18 7.82 717,850 7.82
8.34 - 10.33 753,200 0.30 8.88 753,200 8.88 2.05 - 10.33 5,647,653 2.55 4.44 2,943,377 5.95
Options outstanding Options exercisable
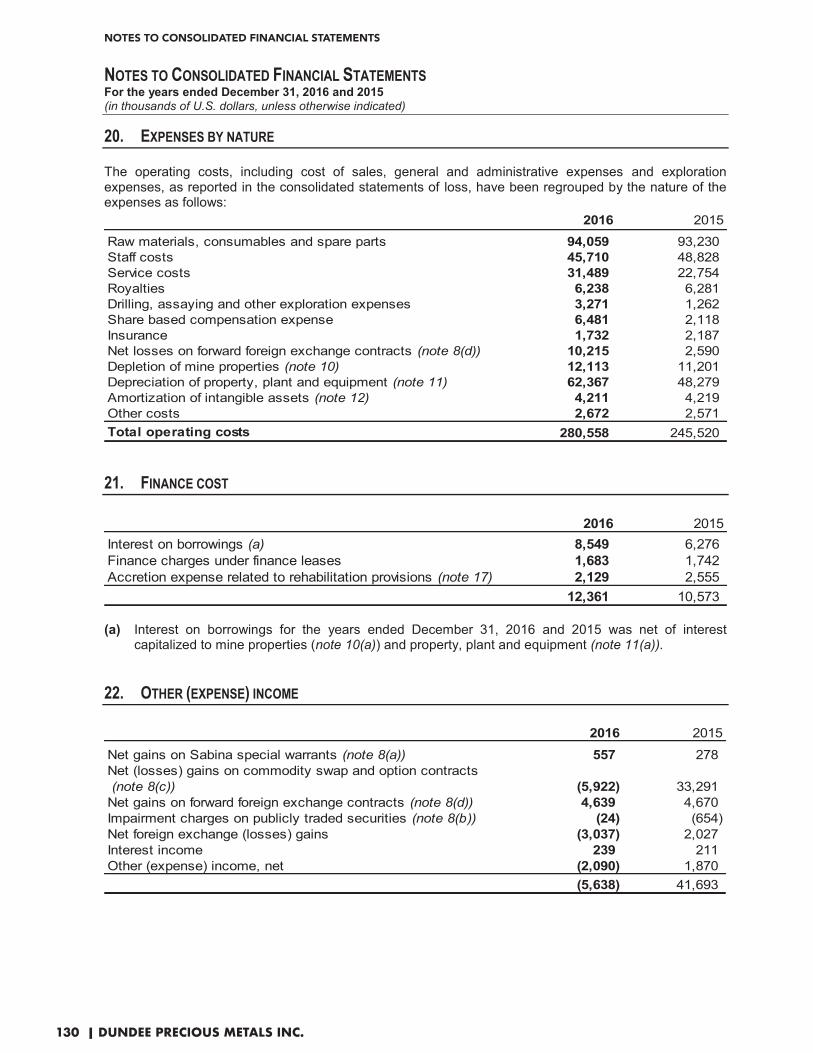
NOTES TO CONSOLIDATED FINANCIAL STATEMENTS
130 | DUNDEE PRECIOUS METALS INC.
NOTES TO CONSOLIDATED FINANCIAL STATEMENTS For the years ended December 31, 2016 and 2015 (in thousands of U.S. dollars, unless otherwise indicated)
20. EXPENSES BY NATURE The operating costs, including cost of sales, general and administrative expenses and exploration expenses, as reported in the consolidated statements of loss, have been regrouped by the nature of the expenses as follows:
2016 2015
Raw materials, consumables and spare parts 94,059 93,230 Staff costs 45,710 48,828 Service costs 31,489 22,754 Royalties 6,238 6,281 Drilling, assaying and other exploration expenses 3,271 1,262 Share based compensation expense 6,481 2,118 Insurance 1,732 2,187 Net losses on forward foreign exchange contracts (note 8(d)) 10,215 2,590 Depletion of mine properties (note 10) 12,113 11,201 Depreciation of property, plant and equipment (note 11) 62,367 48,279 Amortization of intangible assets (note 12) 4,211 4,219 Other costs 2,672 2,571 Total operating costs 280,558 245,520
21. FINANCE COST
2016 2015Interest on borrowings (a) 8,549 6,276 Finance charges under finance leases 1,683 1,742 Accretion expense related to rehabilitation provisions (note 17) 2,129 2,555
12,361 10,573
(a) Interest on borrowings for the years ended December 31, 2016 and 2015 was net of interest capitalized to mine properties (note 10(a)) and property, plant and equipment (note 11(a)).
22. OTHER (EXPENSE) INCOME
2016 2015
Net gains on Sabina special warrants (note 8(a)) 557 278 Net (losses) gains on commodity swap and option contracts (note 8(c)) (5,922) 33,291 Net gains on forward foreign exchange contracts (note 8(d)) 4,639 4,670 Impairment charges on publicly traded securities (note 8(b)) (24) (654) Net foreign exchange (losses) gains (3,037) 2,027 Interest income 239 211 Other (expense) income, net (2,090) 1,870
(5,638) 41,693
�

NOTES TO CONSOLIDATED FINANCIAL STATEMENTS
131 | DUNDEE PRECIOUS METALS INC.
NOTES TO CONSOLIDATED FINANCIAL STATEMENTS For the years ended December 31, 2016 and 2015 (in thousands of U.S. dollars, unless otherwise indicated)
23. INCOME TAXES The major components of income tax expense recognized in net loss were as follows:
2016 2015Current income tax expense on earnings 6,000 7,405 Deferred income tax recovery related to
origination and reversal of temporary differences (2,347) (1,610) Income tax expense 3,653 5,795
The reconciliation of the combined Canadian federal and provincial government statutory income tax rates to the effective tax rate was as follows:
2016 2015
(Loss) earnings before income taxesfrom continuing operations (146,929) 7,554
Combined Canadian federal and provincial statutory income tax rates 26.5% 26.5%
Expected income tax (recovery) expense (38,936) 2,002 Lower rates on foreign losses (earnings) 34,378 (4,974) Unrecognized tax benefit relating to losses 7,048 7,398 Non-deductible portion of capital losses 433 1,003 Non-deductible share based compensation expense 400 522 Other, net 330 (156) Income tax expense 3,653 5,795 The income tax credited to other comprehensive income (loss) for the year ended December 31, 2016 was $0.02 million (2015 – $0.03 million) relating to the deferred income tax recovery on losses on forward foreign exchange contracts designated as cash flow hedges.

NOTES TO CONSOLIDATED FINANCIAL STATEMENTS
132 | DUNDEE PRECIOUS METALS INC.
NOTES TO CONSOLIDATED FINANCIAL STATEMENTS For the years ended December 31, 2016 and 2015 (in thousands of U.S. dollars, unless otherwise indicated)
The significant components of the Company’s deferred income taxes as at December 31, 2016 and 2015 were as follows:
December 31, December 31,2016 2015
Deferred income tax assetsNon-capital losses 44,605 38,113 Cumulative Canadian exploration expenses 1,700 1,700 Depreciable property, plant and equipment 5,247 3,939 Investments 2,659 3,337 Rehabilitation provisions 1,068 1,953 Share based compensation expense 968 386 Financing costs 623 366 Other 1,494 3,233 Gross deferred income tax assets 58,364 53,027 Unrecognized tax benefit relating to tax losses (52,814) (48,258) Total deferred income tax assets 5,550 4,769 Deferred income tax liabilitiesInvestments 247 1,819 Depreciable property, plant and equipment 41 56 Other 13 16 Total deferred income tax liabilities 301 1,891 Net deferred income tax assets 5,249 2,878 As at December 31, 2016, the Company had $5.2 million (December 31, 2015 – $2.9 million) of net deferred income tax assets after offsetting deferred income tax assets and liabilities incurred by the same legal entities in the same jurisdictions in its consolidated statements of financial position. Of the total deferred income tax assets recognized in 2016, $5.3 million (2015 – $4.0 million) is expected to be recovered after more than 12 months. Of the total deferred income tax liabilities recognized in 2016, $0.3 million (2015 – $0.1 million) is expected to be payable after more than 12 months. As at December 31, 2016, the Company had Canadian non-capital losses of $133.4 million (December 31, 2015 – $108.4 million) expiring between 2026 and 2036, Serbian non-capital losses of $59.1 million (December 31, 2015 – $61.1 million) expiring between 2017 and 2021, and Bulgarian non-capital losses of $1.2 million (December 31, 2015 – $3.8 million) expiring between 2017 and 2018, for which no deferred income tax assets had been recognized. The Company is subject to assessments by various taxation authorities which may interpret tax legislation and tax filing positions differently than the Company. Such differences are provided for when it is probable that the Company’s filing position will not be upheld and the amount of the tax exposure can be reasonably estimated. As at December 31, 2016 and 2015, no provisions have been made in the consolidated financial statements for potential tax liabilities relating to such assessments and interpretations. �

NOTES TO CONSOLIDATED FINANCIAL STATEMENTS
133 | DUNDEE PRECIOUS METALS INC.
NOTES TO CONSOLIDATED FINANCIAL STATEMENTS For the years ended December 31, 2016 and 2015 (in thousands of U.S. dollars, unless otherwise indicated)
24. LOSS PER SHARE
2016 2015Net (loss) earnings attributable to
common shareholders of the CompanyFrom continuing operations (149,947) 2,812 From discontinued operations (1,605) (49,801)
Net loss (151,552) (46,989) Basic and diluted weighted average number of
common shares 150,280,777 140,575,783 Basic and diluted (loss) earning per share attributable to
common shareholders of the CompanyFrom continuing operations (1.00) 0.02 From discontinued operations (0.01) (0.35)
Basic and diluted loss per share (1.01) (0.33)
25. KEY MANAGEMENT REMUNERATION The Company’s related parties include its key management. Key management includes directors (executive and non-executive), the Chief Executive Officer (“CEO”) and the Executive and Senior Vice Presidents reporting directly to the CEO. The remuneration of the key management of the Company recognized in the consolidated statements of loss for the years ended December 31, 2016 and 2015 was as follows:
2016 2015Salaries, management bonuses and director fees 4,469 4,659 Other benefits 385 386 Share based compensation 3,906 1,346 Total remuneration 8,760 6,391
�

NOTES TO CONSOLIDATED FINANCIAL STATEMENTS
134 | DUNDEE PRECIOUS METALS INC.
NOTES TO CONSOLIDATED FINANCIAL STATEMENTS For the years ended December 31, 2016 and 2015 (in thousands of U.S. dollars, unless otherwise indicated)
26. SUPPLEMENTARY CASH FLOW INFORMATION
(a) Items not affecting cash and other adjustments: 2016 2015
Depreciation and amortization 78,991 63,699 Net interest expense 9,993 7,807 Accretion expense related to rehabilitation provisions 2,129 2,555 Share based compensation expense 1,510 1,971 Net gains on Sabina special warrants (557) (278) Net losses (gains) on commodity swap and options contracts 5,922 (33,291) Net losses (gains) on forward foreign exchange contracts 5,576 (2,080) impairment charges on publicly traded securities 24 654 impairment charges on exploration and evaluation assets - 803 impairment charges on property, plant & equipment 122,232 60 impairment charges on intangible assets 4,107 42 Other, net (1,309) (2,642)
228,618 39,300 (b) Changes in non-cash working capital:
2016 2015(Increase) decrease in accounts receivable and other assets (23,903) 6,333 Increase in inventories (3,124) (2,171) Decrease in accounts payable and accrued liabilities (12,192) (5,999) Increase in other liabilities 1,227 163
(37,992) (1,674)
27. SUPPLEMENTARY SHAREHOLDERS’ EQUITY INFORMATION (a) Equity financing On July 11, 2016, the Company completed a bought deal financing with a syndicate of underwriters, pursuant to which the Company issued 18,216,000 common shares of the Company at a price of Cdn$3.00 per share, for aggregate gross proceeds of $41.9 million (Cdn$54.6 million) (the “Offering”). Concurrent with the Offering, the Company has also completed a non-brokered private placement of 840,000 common shares of the Company at a price of Cdn$3.00 per share, for additional gross proceeds of $1.9 million (Cdn$2.5 million). The gross cash proceeds of $43.8 million from the Offering and the private placement, and the share issuance costs of $2.5 million, were reported in financing activities of continuing operations in the consolidated statements of cash flows for the year ended December 31, 2016. On January 24, 2017, the Company completed a non-brokered private placement with the European Bank for Reconstruction and Development (“EBRD”), pursuant to which the Company issued 17,843,120 common shares of the Company at a price of Cdn$2.45 per share for gross proceeds of $33.2 million (Cdn$43.7 million). The proceeds will be used for the construction of the Krumovgrad mine. ��

NOTES TO CONSOLIDATED FINANCIAL STATEMENTS
135 | DUNDEE PRECIOUS METALS INC.
NOTES TO CONSOLIDATED FINANCIAL STATEMENTS For the years ended December 31, 2016 and 2015 (in thousands of U.S. dollars, unless otherwise indicated)
(b) Changes in accumulated other comprehensive income (loss)
2016 2015
Unrealized losses on forward foreign exchange contractsdesignated as cash flow hedgesBalance at beginning of year (25,405) - Unrealized gains (losses) on forward foreign exchange contracts
designated as cash flow hedges, net of income taxes 8,258 (28,036) Realized losses on forward foreign exchange contracts
transferred to net loss, net of income taxes 10,223 2,631 Balance at end of year (6,924) (25,405)
Unrealized gains on publicly traded securitiesBalance at beginning of year 6,095 35 Unrealized gains on publicly traded securities,
net of income taxes 4,748 5,406 Impairment charges on publicly traded securities
transferred to net loss, net of income taxes 24 654 Balance at end of year 10,867 6,095
Accumulated currency translation adjustmentsBalance at beginning of year (1,114) (923) Currency translation adjustments (1,469) (191) Balance at end of year (2,583) (1,114)
Accumulated other comprehensive income (loss) 1,360 (20,424)
28. COMMITMENTS AND OTHER CONTINGENCIES
(a) Contractual obligations
The Company had the following minimum future contractual obligations as at December 31, 2016:
up to 1 year 1 - 5 years over 5 years TotalCapital commitments 55,677 - - 55,677 Purchase obligations 9,884 - - 9,884 Operating lease obligations 3,724 15,018 1,340 20,082 Total commitments 69,285 15,018 1,340 85,643
As at December 31, 2016, Tsumeb had approximately $130 million of third party in-process secondary materials, which it is obligated to process and return, generally in the form of blister.
(b) Other
The Company is involved in legal proceedings, from time to time, arising in the ordinary course of its business. It is not expected that any material liability will arise from current legal proceedings or have a material adverse effect on the Company’s future business, operations or financial condition. �

NOTES TO CONSOLIDATED FINANCIAL STATEMENTS
136 | DUNDEE PRECIOUS METALS INC.
NOTES TO CONSOLIDATED FINANCIAL STATEMENTS For the years ended December 31, 2016 and 2015 (in thousands of U.S. dollars, unless otherwise indicated)
29. FINANCIAL RISK MANAGEMENT The Company’s principal financial liabilities comprise accounts payable and accrued liabilities and long-term debt. The main purpose of these financial instruments is to assist with the management of the Company’s short term and long term cash flow requirements. The Company has various financial assets, such as cash and cash equivalents and accounts receivable, which arise directly from its operations. The main risks that could adversely affect the Company’s financial assets, liabilities or future cash flows are market risk (which includes commodity price risk, interest rate risk and foreign currency risk), liquidity risk and credit risk. Management reviews each of these risks and establishes policies for managing them as summarized below.
The following discussion also includes a sensitivity analysis that is intended to illustrate the sensitivity to changes in market variables on the Company’s financial instruments and the impact on net loss and shareholders’ equity, where applicable. Financial instruments affected by market risk include cash and cash equivalents, accounts receivable, investments at fair value, commodity swap and option contracts, forward foreign exchange contracts, long-term debt, accounts payable and accrued liabilities. The sensitivity has been prepared using financial assets and liabilities held as at the reporting dates. The Company has designated the forward foreign exchange contracts as cash flow hedges and applies hedge accounting on these contracts. The commodity swap and option contracts that the Company has entered into do not meet existing IFRS criteria for hedge accounting and therefore do not receive hedge accounting treatment notwithstanding the fact that they serve as effective economic hedges. The Company has established risk management policies to identify and analyze the risks of the Company, to set appropriate risk limits and controls, and to monitor risks and adherence to limits. Risk management policies and systems are reviewed regularly to reflect changes in market conditions and the Company’s activities. The Company, through its training and management standards and procedures, aims to develop a disciplined and constructive control environment in which all employees involved in risk management activities understand their roles and obligations.
Market risk
Market risk is the risk that the future cash flows or the fair value of a financial instrument will fluctuate because of changes in market prices. Market risk is comprised of three types of risks: commodity price risk, interest rate risk and foreign currency risk. The impact of each of these components is discussed below.
Commodity price risk The Company is subject to price risk associated with fluctuations in the market prices for metals. The Company sells its products at prices that are effectively determined by reference to the traded prices on the London Metal Exchange and London Bullion Market. The prices of gold, copper, zinc and silver are major factors influencing the Company’s business, results of operations and financial condition. The Company regularly enters into derivative contracts to reduce the price exposure associated with the time lag between the provisional and final determination of its concentrate sales. In addition, the Company periodically enters into commodity swap contracts to reduce the price exposure associated with the projected payable copper production. The Company also selectively enters into commodity swap contracts to reduce its price exposure applicable to the projected payable gold contained in Chelopech’s pyrite concentrate production. As at December 31, 2016, a 5% increase or decrease in the metal prices impacting the Company’s accounts receivables and outstanding commodity swap contracts, with all other variables held constant, would decrease or increase earnings before income taxes from continuing operations by $8.4 million (2015 – $5.5 million). The impact on equity is the same as the impact on net loss.

NOTES TO CONSOLIDATED FINANCIAL STATEMENTS
137 | DUNDEE PRECIOUS METALS INC.
NOTES TO CONSOLIDATED FINANCIAL STATEMENTS For the years ended December 31, 2016 and 2015 (in thousands of U.S. dollars, unless otherwise indicated)
The following table demonstrates the effect on 2016 and 2015 earnings before income taxes from continuing operations of a 5% increase in commodity prices on its sales, excluding the impact of any hedges and with all other variables held constant. The impact on equity is the same as the impact on net loss. Effect of a 5% increase in metal prices on earnings before income taxes
2016 2015
Gold 8,675 8,508 Copper 4,036 4,688 Silver 160 174 Total increase on earnings before income taxes 12,871 13,370
The effect of a 5% decrease in metal prices would decrease earnings before income taxes from continuing operations by an equivalent amount.
Interest rate risk Interest rate risk is the risk that the future cash flows or fair value of a financial instrument will fluctuate because of changes in market interest rates. The Company’s exposure to the risk of changes in market interest rates relates primarily to the Company’s cash and cash equivalents, floating rate denominated long-term debt and finance lease obligations, the majority of which have associated cash flows based on floating interest rates. For the year ended December 31, 2016, a 100 basis point increase or decrease in interest rates across the yield curve, with all other variables held constant, would increase or decrease earnings from continuing operations by $0.3 million (2015 – $0.4 million), excluding a $0.02 million (2015 – $0.8 million) increase or decrease related to capitalized interest. The impact on equity is the same as the impact on net loss.
Foreign currency risk The Company’s foreign currency exposures arise primarily from a significant portion of its operating and capital costs being denominated in currencies other than the U.S. dollar, the Company’s functional currency. The Company periodically undertakes to purchase, in advance, a portion of its foreign denominated cash flow requirements on a spot or forward basis to reduce this exposure. In 2015, the Company also entered into forward foreign exchange contracts in order to reduce the foreign exchange exposure associated with projected operating expenses denominated in foreign currencies. The following table demonstrates the effect on 2016 and 2015 earnings before income taxes and equity from continuing operations of a 5% appreciation of the U.S. dollar relative to the Company’s key foreign currencies on the Company’s outstanding forward foreign exchange contracts, with all other variables held constant.
2016 2015 2016 2015Euro (7) (18) (574) (1,239) Namibian Dollar 85 310 (2,412) (4,236) Total increase (decrease) 78 292 (2,986) (5,475)
Effect of a 5% appreciation of the U.S. dollar onEarnings before income taxes Equity
The effect of a 5% depreciation of the U.S. dollar relative to these foreign currencies on the Company’s outstanding forward foreign exchange contracts, with all other variables held constant, would be to decrease earnings before income taxes from continuing operations and increase equity by equivalent amounts.
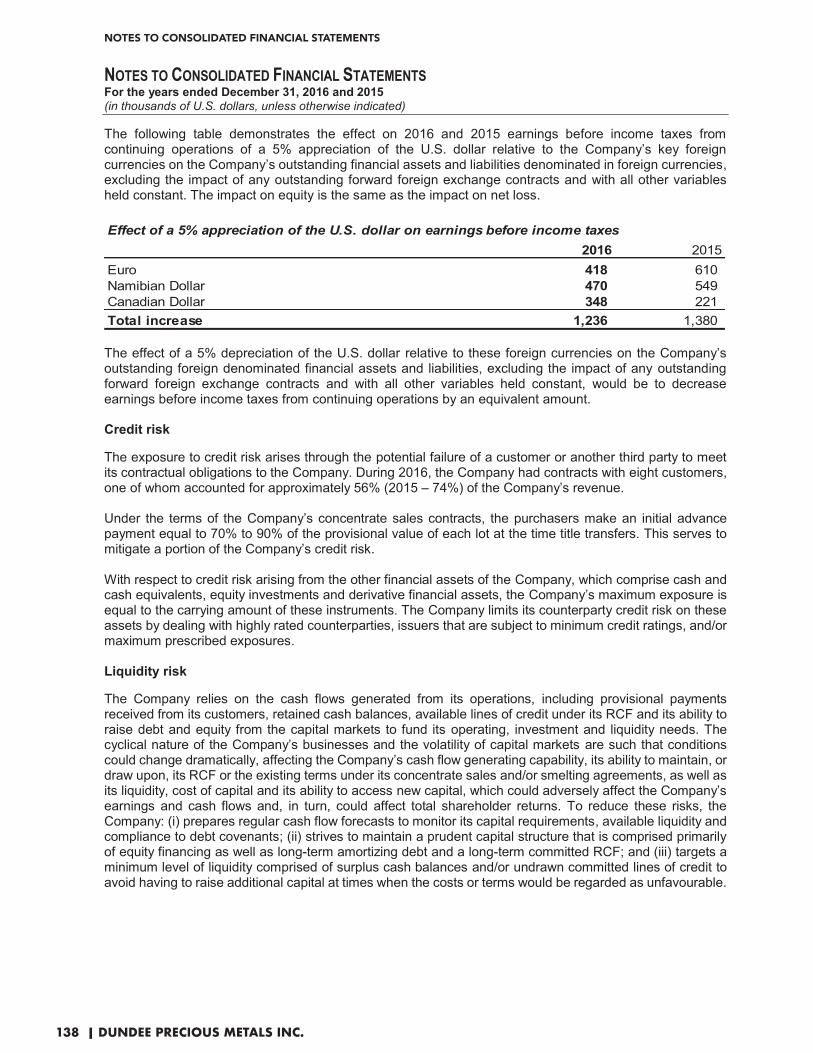
NOTES TO CONSOLIDATED FINANCIAL STATEMENTS
138 | DUNDEE PRECIOUS METALS INC.
NOTES TO CONSOLIDATED FINANCIAL STATEMENTS For the years ended December 31, 2016 and 2015 (in thousands of U.S. dollars, unless otherwise indicated)
The following table demonstrates the effect on 2016 and 2015 earnings before income taxes from continuing operations of a 5% appreciation of the U.S. dollar relative to the Company’s key foreign currencies on the Company’s outstanding financial assets and liabilities denominated in foreign currencies, excluding the impact of any outstanding forward foreign exchange contracts and with all other variables held constant. The impact on equity is the same as the impact on net loss.
2016 2015Euro 418 610 Namibian Dollar 470 549 Canadian Dollar 348 221 Total increase 1,236 1,380
Effect of a 5% appreciation of the U.S. dollar on earnings before income taxes
The effect of a 5% depreciation of the U.S. dollar relative to these foreign currencies on the Company’s outstanding foreign denominated financial assets and liabilities, excluding the impact of any outstanding forward foreign exchange contracts and with all other variables held constant, would be to decrease earnings before income taxes from continuing operations by an equivalent amount.
Credit risk
The exposure to credit risk arises through the potential failure of a customer or another third party to meet its contractual obligations to the Company. During 2016, the Company had contracts with eight customers, one of whom accounted for approximately 56% (2015 – 74%) of the Company’s revenue. Under the terms of the Company’s concentrate sales contracts, the purchasers make an initial advance payment equal to 70% to 90% of the provisional value of each lot at the time title transfers. This serves to mitigate a portion of the Company’s credit risk. With respect to credit risk arising from the other financial assets of the Company, which comprise cash and cash equivalents, equity investments and derivative financial assets, the Company’s maximum exposure is equal to the carrying amount of these instruments. The Company limits its counterparty credit risk on these assets by dealing with highly rated counterparties, issuers that are subject to minimum credit ratings, and/or maximum prescribed exposures. Liquidity risk The Company relies on the cash flows generated from its operations, including provisional payments received from its customers, retained cash balances, available lines of credit under its RCF and its ability to raise debt and equity from the capital markets to fund its operating, investment and liquidity needs. The cyclical nature of the Company’s businesses and the volatility of capital markets are such that conditions could change dramatically, affecting the Company’s cash flow generating capability, its ability to maintain, or draw upon, its RCF or the existing terms under its concentrate sales and/or smelting agreements, as well as its liquidity, cost of capital and its ability to access new capital, which could adversely affect the Company’s earnings and cash flows and, in turn, could affect total shareholder returns. To reduce these risks, the Company: (i) prepares regular cash flow forecasts to monitor its capital requirements, available liquidity and compliance to debt covenants; (ii) strives to maintain a prudent capital structure that is comprised primarily of equity financing as well as long-term amortizing debt and a long-term committed RCF; and (iii) targets a minimum level of liquidity comprised of surplus cash balances and/or undrawn committed lines of credit to avoid having to raise additional capital at times when the costs or terms would be regarded as unfavourable.

NOTES TO CONSOLIDATED FINANCIAL STATEMENTS
139 | DUNDEE PRECIOUS METALS INC.
NOTES TO CONSOLIDATED FINANCIAL STATEMENTS For the years ended December 31, 2016 and 2015 (in thousands of U.S. dollars, unless otherwise indicated)
The table below summarizes the maturity profile of the Company’s financial liabilities based on contractual undiscounted payments.
As at December 31, 2016up to 1 year 1 - 5 years over 5 years Total
Accounts payable and accrued liabilities 32,305 - - 32,305 Commodity swap and option contracts 4,685 - - 4,685 Forward foreign exchange contracts 1,955 - - 1,955 Long term debt 16,250 25,000 - 41,250 Finance lease obligations 3,048 10,848 8,816 22,712 Other obligations 1,800 451 370 2,621
60,043 36,299 9,186 105,528
As at December 31, 2015up to 1 year 1 - 5 years over 5 years Total
Accounts payable and accrued liabilities 43,108 - - 43,108 Forward foreign exchange contracts 10,117 11,228 - 21,345 Long term debt 16,250 131,250 - 147,500 Finance lease obligations 3,097 11,103 11,424 25,624 Other obligations 2,037 1,875 70 3,982
74,609 155,456 11,494 241,559
Capital management
The Company’s objective for capital management is to: (i) maintain sufficient levels of liquidity to fund and support its exploration, development and operating activities; (ii) maintain a strong financial position to ensure it has ready access to debt and equity markets to supplement free cash flow being invested in its growth projects; and (iii) comply with all financial covenants set out in its credit agreements and guarantees. See note 15 for discussion on the Company’s compliance with these requirements. The Company monitors its financial position and the potential impact of adverse market conditions on an ongoing basis. The Company manages its capital structure and makes adjustments to it based on prevailing market conditions and according to its business plan. The Company's long term funding strategy is to maintain a capital structure comprised primarily of equity sourced from equity offerings and net earnings generated from its businesses and, as a result, the targeted level of debt making up the Company’s capital base is relatively low. Given the long term nature of the assets being funded and the U.S. dollar denominated revenue stream generated therefrom, the Company’s general strategy around any debt financing is to raise long-term U.S. dollar denominated debt to supplement these equity financings. Overall financial leverage is monitored based upon a number of non-financial and financial factors, including a number of credit related ratios contained in DPM’s loan agreements and net debt (defined as total debt less cash and cash equivalents) as a percentage of total capital (defined as total equity plus net debt). As of December 31, 2016, the Company was in compliance with all loan covenants and its net debt as a percentage of total capital was 5% (December 31, 2015 – 16%). �
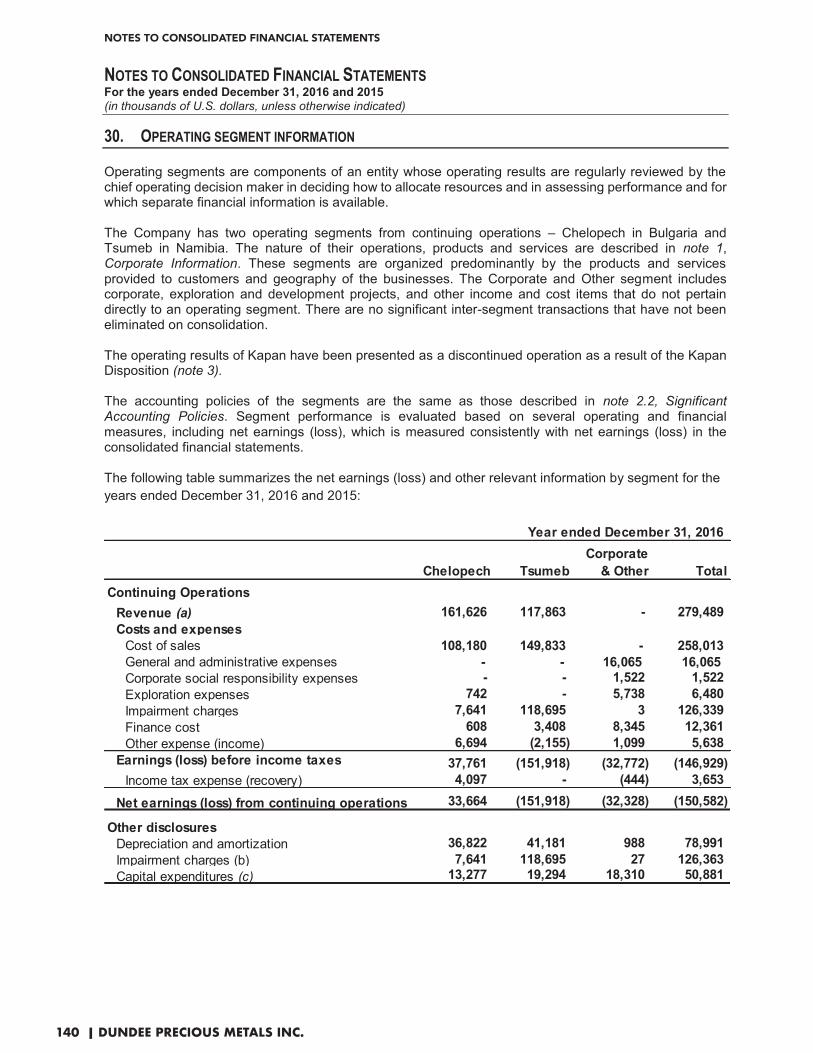
NOTES TO CONSOLIDATED FINANCIAL STATEMENTS
140 | DUNDEE PRECIOUS METALS INC.
NOTES TO CONSOLIDATED FINANCIAL STATEMENTS For the years ended December 31, 2016 and 2015 (in thousands of U.S. dollars, unless otherwise indicated)
30. OPERATING SEGMENT INFORMATION
Operating segments are components of an entity whose operating results are regularly reviewed by the chief operating decision maker in deciding how to allocate resources and in assessing performance and for which separate financial information is available. The Company has two operating segments from continuing operations – Chelopech in Bulgaria and Tsumeb in Namibia. The nature of their operations, products and services are described in note 1, Corporate Information. These segments are organized predominantly by the products and services provided to customers and geography of the businesses. The Corporate and Other segment includes corporate, exploration and development projects, and other income and cost items that do not pertain directly to an operating segment. There are no significant inter-segment transactions that have not been eliminated on consolidation. The operating results of Kapan have been presented as a discontinued operation as a result of the Kapan Disposition (note 3). The accounting policies of the segments are the same as those described in note 2.2, Significant Accounting Policies. Segment performance is evaluated based on several operating and financial measures, including net earnings (loss), which is measured consistently with net earnings (loss) in the consolidated financial statements. The following table summarizes the net earnings (loss) and other relevant information by segment for the years ended December 31, 2016 and 2015:
Year ended December 31, 2016
Chelopech Tsumeb Corporate
& Other Total Continuing Operations
Revenue (a) 161,626 117,863 - 279,489 Costs and expenses
Cost of sales 108,180 149,833 - 258,013 General and administrative expenses - - 16,065 16,065 Corporate social responsibility expenses - - 1,522 1,522 Exploration expenses 742 - 5,738 6,480 Impairment charges 7,641 118,695 3 126,339 Finance cost 608 3,408 8,345 12,361 Other expense (income) 6,694 (2,155) 1,099 5,638
Earnings (loss) before income taxes 37,761 (151,918) (32,772) (146,929) Income tax expense (recovery) 4,097 - (444) 3,653
Net earnings (loss) from continuing operations 33,664 (151,918) (32,328) (150,582)
Other disclosures Depreciation and amortization 36,822 41,181 988 78,991 Impairment charges (b) 7,641 118,695 27 126,363 Capital expenditures (c) 13,277 19,294 18,310 50,881

NOTES TO CONSOLIDATED FINANCIAL STATEMENTS
141 | DUNDEE PRECIOUS METALS INC.
NOTES TO CONSOLIDATED FINANCIAL STATEMENTS For the years ended December 31, 2016 and 2015 (in thousands of U.S. dollars, unless otherwise indicated)
Year ended December 31, 2015
Chelopech Tsumeb Corporate
& Other Total
Continuing OperationsRevenue (a) 131,695 93,439 - 225,134 Costs and expenses
Cost of sales 112,634 113,479 - 226,113 General and administrative expenses - - 14,196 14,196 Corporate social responsibility expenses - - 2,275 2,275 Exploration expenses 1,297 - 3,914 5,211 Impairment charges 54 - 851 905 Finance cost 890 3,665 6,018 10,573 Other income (35,673) (4,828) (1,192) (41,693)
Earnings (loss) before income taxes 52,493 (18,877) (26,062) 7,554 Income tax expense 5,611 - 184 5,795
Net earnings (loss) from continuing operations 46,882 (18,877) (26,246) 1,759
Other disclosures Depreciation and amortization 36,497 26,444 758 63,699 Impairment charges (b) 54 - 1,505 1,559 Capital expenditures (c) 18,468 43,814 15,409 77,691
(a) Chelopech’s revenues were generated from the sale of concentrate and Tsumeb’s revenues were
generated from processing concentrate. For the year ended December 31, 2016, revenues from the sale of concentrate of $97.3 million or 60% (2015 – $76.6 million or 58%) and revenues from processing concentrate of $102.3 million (2015 – $88.9 million) or 87% (2015 – 95%) were derived from a single external customer. Revenues from the sale of concentrate of $55.5 million or 34% (2015 – $52.2 million or 40%) were also derived from another single external customer.
(b) Included in the impairment charges were the impairment charges in respect of exploration and evaluation assets, property, plant and equipment and intangible assets (note 4), and impairment charges on publicly traded securities recognized in other expense (income) (note 22) for the years ended December 31, 2016 and 2015.
(c) Capital expenditures represent cash and non-cash additions to exploration and evaluation assets (note 9), mine properties (note 10), property, plant and equipment (note 11) and intangible assets (note 12).

NOTES TO CONSOLIDATED FINANCIAL STATEMENTS
142 | DUNDEE PRECIOUS METALS INC.
NOTES TO CONSOLIDATED FINANCIAL STATEMENTS For the years ended December 31, 2016 and 2015 (in thousands of U.S. dollars, unless otherwise indicated)
The following table summarizes the total assets and total liabilities by segment as at December 31, 2016 and 2015:
Chelopech TsumebCorporate
& Other TotalTotal current assets 53,222 19,596 18,788 91,606 Total non-current assets 222,178 261,774 158,394 642,346 Total assets 275,400 281,370 177,182 733,952 Total liabilities 36,066 40,053 105,806 181,925
Chelopech TsumebCorporate
& OtherKapan
(note 3) TotalTotal current assets 45,789 14,911 14,199 31,818 106,717 Total non-current assets 249,691 406,518 125,244 17,981 799,434 Total assets 295,480 421,429 139,443 49,799 906,151 Total liabilities 35,299 64,864 158,147 9,728 268,038
As at December 31, 2016
As at December 31, 2015
DPM is domiciled in Canada. Revenues by geographic location are based on the location in which the revenues originate. Revenues by geographic location for the years ended December 31, 2016 and 2015 are summarized below:
Canada Europe Namibia TotalRevenue - 161,626 117,863 279,489
Canada Europe Namibia Total
Revenue - 131,695 93,439 225,134
Year ended December 31, 2016
Year ended December 31, 2015
Assets by geographic location as at December 31, 2016 and 2015 are summarized below:
Canada Europe Namibia TotalTotal current assets 10,057 61,953 19,596 91,606 Financial assets 19,216 2,169 1,614 22,999 Deferred income tax assets - 5,255 - 5,255 Other non-current assets 12,262 341,670 260,160 614,092 Total assets 41,535 411,047 281,370 733,952
Canada Europe NamibiaArmenia(note 3) Total
Total current assets 10,712 49,276 14,911 31,818 106,717 Financial assets 13,911 402 1,424 42 15,779 Deferred income tax assets - 2,891 - - 2,891 Other non-current assets 3,267 354,464 405,094 17,939 780,764 Total assets 27,890 407,033 421,429 49,799 906,151
As at December 31, 2016
As at December 31, 2015
�

NOTES TO CONSOLIDATED FINANCIAL STATEMENTS
143 | DUNDEE PRECIOUS METALS INC.
NOTES TO CONSOLIDATED FINANCIAL STATEMENTS For the years ended December 31, 2016 and 2015 (in thousands of U.S. dollars, unless otherwise indicated)
31. COMPARATIVE FIGURES Certain comparative figures in the consolidated statements of loss and cash flows have been reclassified as a consequence of (i) the Kapan Disposition (note 3), which results in Kapan being presented as a discontinued operation for the year ended December 31, 2016 and 2015; and (ii) several expenses previously classified as general and administrative expenses being classified as operating costs to better reflect the operating results of each segment. For the year ended December 31, 2016, $5.7 million (2015 – $4.4 million) was reclassified to cost of sales, of which $5.3 million (2015 – $3.2 million) was included in cost of sales from continuing operations and $0.4 million (2015 – $1.2 million) in net loss from discontinued operations.


CORPORATE INFORMATIONDIRECTORSR. Peter Gillin2,5 Toronto, Ontario, CanadaJonathan Goodman Toronto, Ontario, CanadaRichard Howes Toronto, Ontario, CanadaMurray John4 Mill Bay, British Columbia, CanadaJeremy Kinsman2,3 Victoria, British Columbia, CanadaGarth MacRae1,4 Toronto, Ontario, CanadaJuanita Montalvo3,4 Toronto, Ontario, CanadaPeter Nixon2,3 Niagara-on-the-Lake, Ontario, CanadaMarie-Anne Tawil1,3 Westmount, Québec, CanadaAnthony P. Walsh1,2 Vancouver, British Columbia, CanadaDonald Young1,4 Vancouver, British Columbia, Canada1 Audit Committee 2 Compensation Committee 3 Corporate Governance and Nominating Committee 4 Health, Safety and Environment Committee 5 Lead Director
OFFICERSJonathan Goodman Executive ChairmanRichard Howes President and Chief Executive OfficerHume Kyle Executive Vice President and Chief Financial OfficerDavid Rae Executive Vice President and Chief Operating OfficerLori E. Beak Senior Vice President, Governance and Corporate SecretaryMichael Dorfman Senior Vice President, Corporate DevelopmentRichard Gosse Senior Vice President, Exploration
Nikolay Hristov Senior Vice President, Sustainable Business DevelopmentJohn Lindsay Senior Vice President, ProjectsPaul Proulx Senior Vice President, Corporate ServicesMark Crawley Vice President, CommercialIliya Garkov Vice President and General Manager, BulgariaBrent Johnson Vice President, EnvironmentZebra Kasete Vice President and Managing Director Dundee Precious Metals Tsumeb (Pty) LimitedPatrick Lim Director, Finance and Global Controller
SHAREHOLDER CONTACTJanet Reid [email protected] Tel: 416-365-5191 Fax: 416-365-9080
CORPORATE OFFICEDundee Precious Metals Inc. 1 Adelaide Street East Suite 500, P.O. Box 195 Toronto, Ontario, Canada, M5C 2V9 Tel: 416-365-5191 Fax: 416-365-9080
REGIONAL OFFICES���� Dundee Precious Metals Krumovgrad EAD 26 Bacho Kiro Street, 3rd Floor Sofia 1000, Bulgaria Tel: +359-2-9301500 Fax: +359-2-9301595
Windhoek Dundee Precious Metals Tsumeb (Pty) Limited 35 Schanzen Road Klein Windhoek Windhoek, Namibia Tel: +264-0-61-385000 Fax: +264-0-61-385001
OPERATIONSChelopech Mine Dundee Precious Metals Chelopech EAD Village of Chelopech 2087 Bulgaria Tel: +359-728-68-226 Fax: +359-728-68-286
Krumovgrad Project Dundee Precious Metals Krumovgrad EAD 1 Hristo Botev Street District of Kardzhali 6900 Krumovgrad, Bulgaria Tel: +359-0-3641-6803 Fax: +359-0-3641-7093
Tsumeb Smelter Dundee Precious Metals Tsumeb (Pty) Limited P.O. Box 936 Smelter Road, Tsumeb, Namibia Tel: +264-67-223-4000
STOCK LISTING AND SYMBOLThe Toronto Stock Exchange DPM – Common SharesCopies of the Company’s Quarterly and Annual Reports are available on written request from our registrar.
REGISTRARComputershare Investor Services Inc. 100 University Avenue, 8th Floor Toronto, Ontario, Canada M5J 2Y1Tel: 514-982-7555 (International direct dial)Tel: (toll-free): 800-564-6253 (North America) Fax: 416-263-9394 (International) Fax: (toll free): 888-453-0330 (North America)Website: www.computershare.com Email: [email protected]
ANNUAL GENERAL MEETINGThursday, May 4, 2017 at 4:00 pm TSX Broadcast Centre – Gallery The Exchange Tower 130 King Street West Toronto, Ontario, Canada, M5X 1J2
CAUTION REGARDING FORWARD-LOOKING STATEMENTSThis document contains statements about expected future events and financial and operating performance that are forward looking. Forward-looking statements are necessarily based on estimates and assumptions that are inherently subject to known and unknown risks, uncertainties and other factors that may cause actual results, level of activity, performance or achievements to be materially different from those expressed or implied by such forward-looking statements. Forward-looking statements are not guarantees of future performance, and actual results and future events could materially differ from those anticipated in such statements. All of the forward-looking statements contained in this document are qualified by cautionary statements. Dundee Precious Metals expressly disclaims any intention or obligation to update or revise any forward-looking statements whether as a result of new information, events or otherwise, except in accordance with applicable securities laws.

www.dundeeprecious.com
1 Adelaide Street EastSuite 500, P.O. Box 195Toronto, Ontario, CanadaM5C 2V9
Tel: 416 365 5191Fax: 416 365 9080