Annual Report - dcdd.nt.gov.au
242
Annual Report 2008-2009 :: 1 DBE Financial Statements DEPARTMENT OF BUSINESS AND EMPLOYMENT Annual Report 2008–09
Transcript of Annual Report - dcdd.nt.gov.au

Annual Report 2008-2009 :: 1
DB
E F
inan
cial Statem
ents
DEPARTMENT OF BUSINESS AND EMPLOYMENT
Annual Report2008–09

2 :: Department of Business and Employment
Introduction
© Northern Territory Government Department of Business and Employment
GPO Box 3200 Darwin NT 0801 www.nt.gov.au/dbe
Published by the Department of Business and Employment
Design and layout by Sprout Creative Printed by the Government Printer of the Northern Territory
ISSN 1837-4239 (Print)
ISSN 1837-4247 (Online)
ISSN 1837-4255 (CD-ROM)

Annual Report 2008-2009 :: 3
Intro
du
ction
PURPOSE OF THE REPORT
The annual report provides insight into activities undertaken by the Department of Business and Employment towards achieving its business outcomes as identified in the 2008-09 Budget.
The department was established by an Administrative Arrangements Order as part of the administrative restructure on 18 August 2008 to continue to provide a broad range of services to all Northern Territory Government agencies, and align business and employment synergies together.
The report aims to:
provide Government, employees, organisations and individuals with an understanding of the department’s objectives, activities and measures of its performance
provide qualitative and quantitative commentary on progress towards achieving departmental goals
to provide an insight into future directions.
This annual report is prepared in accordance with section 28 of the Public Sector Employment and Management Act and the Financial Management Act. It presents the Ministers with a summary of the activities of the department in 2008-09.
Visit our website www.nt.gov.au/dbe for further information about the Department of Business and Employment.
Dr Chris Burns MLA
Minister for BusinessMinister for Defence Support
Hon Paul Henderson MLA
Minister for Employment
Mr Karl Hampton MLA
Minister for Information, Communication and Technology Policy

4 :: Department of Business and Employment
Header Here

Annual Report 2008-2009 :: 5
Head
er Here

6 :: Department of Business and Employment
Introduction
CONTENTS
INTRODUCTION ...............................................................................................3
Purpose of the Report ..................................................................................................3
Representation Letter ...................................................................................................4
Table of Contents .........................................................................................................6
OVERVIEW .......................................................................................................8
Chief Executive’s Foreword ..........................................................................................8
Our Organisation ........................................................................................................10
Our Operational Structure ..........................................................................................13
Our Corporate Plan ....................................................................................................14
Our Executive Structure..............................................................................................16
Our People..................................................................................................................17
Our Customers and Stakeholders ..............................................................................18
Our Finances ..............................................................................................................18
Achievements in 2008-09 ...........................................................................................21
Regional Highlights .....................................................................................................25
Priorities in 2009-10 ....................................................................................................27
CORPORATE GOVERNANCE .......................................................................29
Corporate Governance Framework ............................................................................29
Governance Committees ............................................................................................31
Management Environment .........................................................................................34
Planning ......................................................................................................................36
Communication ..........................................................................................................37
Accountabilities...........................................................................................................38
Greener Government ..................................................................................................41
OUR PEOPLE .................................................................................................44
Overview.....................................................................................................................44
Supporting and Growing Our People..........................................................................46
Initiatives Planned for 2009-10 ...................................................................................48
Legislative Compliance ...............................................................................................48
OUTPUT PERFORMANCE REPORTING ......................................................52
Overview.....................................................................................................................52
Output Group – Shared Services ...............................................................................53
Output: Finance Services .......................................................................................53

Annual Report 2008-2009 :: 7
Intro
du
ction
Output: Human Resource Services ........................................................................56
Output: Procurement Policy and Services ..............................................................59
Output: Information and Communication Technology Services ..............................62
Output: Office Leasing Management ......................................................................66
Output Group – Business Development .....................................................................69
Output Group – Employment ......................................................................................77
Government Business Divisions .................................................................................80
Data Centre Services ..............................................................................................80
Government Printing Office .....................................................................................83
NT Fleet ..................................................................................................................85
FINANCIAL STATEMENTS ............................................................................88
Department of Business and Employment .................................................................88
Data Centre Services ...............................................................................................118
Government Printing Office ......................................................................................147
NT Fleet ....................................................................................................................175
APPENDICES ...............................................................................................206
Appendix A – List of Acronyms ................................................................................206
Appendix B – DBE Service Price List .......................................................................207
Appendix C – Audits by the Auditor-General ............................................................209
Appendix D – Internal Reviews ................................................................................212
Appendix E – Self Insurance Claims ........................................................................213
Appendix F – Key Performance Indicators ...............................................................214
Appendix G – Territory Business Growth Program and Territory Business Centre Statistics ...................................................228
Appendix H – Research and Innovation Grants Awarded ........................................229
Appendix I – Grant Payments ...................................................................................230
Appendix J – Industry Assistance, Grants and Sponsorship ....................................236
Appendix K – Loans Portfolio ...................................................................................237
Appendix L – Gifted and Loaned Vehicles ................................................................238
Appendix M – Current Industry Participation Plans..................................................239
Appendix N – Settler Arrivals by Birthplace ..............................................................240
Appendix O – Accommodation Costs for Non-Government Organisations ..............241

8 :: Department of Business and Employment
Overview
OVERVIEW
CHIEF EXECUTIVE’S FOREWORD
Change and challenge marked an interesting year 2008-09 for the Department of Business and Employment. On 18 August 2008, the Chief Minister, the Hon Paul Henderson MLA, announced a restructure of the public service, which meant some responsibilities of the Department of Business, Economic and Regional Development (DBERD) and the Department of Employment, Education and Training (DEET) were combined with the Department of Corporate and Information Services (DCIS) in the creation of the Department of Business and Employment (DBE). This diversity involved reporting to three Ministers in respect to employment, information and communication technology policy, and business services.
Ministerial responsibility for the department is primarily with Dr Chris Burns MLA, Minister for Business and Minister for Defence Support, with the Hon Paul Henderson MLA, Minister for Employment and Mr Karl Hampton MLA, Minister for Information, Communication and Technology Policy. Minister Burns assumed the Business portfolio in February 2009. Previously the Hon Konstantine Vatskalis MLA held the portfolio.
Highlights of the department’s activities in 2008-09 were similarly diversified, ranging from improving the efficiency of government in procuring private sector services, to boosting the number of apprentices being trained and emerging to take up placements in the Territory’s workforce. The government set a target of 200 new public sector apprentices in its Jobs Plan 3 initiative, and I am pleased to report 236 apprentices have been employed as a result. Of these, 56 per cent were Indigenous and 40 per cent were in regional or remote locations.
Other highlights included:
Arnhem fibre optic link and remote communications infrastructure strategies
establishment of Workforce Growth NT
growing awareness and uptake of business growth across the Territory, including regional centres
changes to the Land Development Corporation (LDC) charter and legislation to include residential development.
the introduction of ecoBiz NT, a service offering advice and financial assistance to help Territory businesses reduce their environmental impact, achieving a reduction of 542 tonnes of CO2 emissions in 2008-09
core finance and payroll functions across government were co-located in Alice Springs and Darwin respectively in July 2008, resulting in further process efficiencies and standardisation
Human Resources Services Contact Centre established
assisting government to meet Working Future targets, taking particular responsibility for three initiatives of cross-cultural training, boosting Indigenous employment in the Northern Territory Public Sector (NTPS) via the administrative stream and developing procurement strategies to support Indigenous employment

Annual Report 2008-2009 :: 9
Overview
supporting government strategy to respond to climate change by developing and implementing green policies in the areas of fleet, procurement, leasing and information technology
coordinating development and implementation of an e-services strategy, with particular emphasis on e-services applications in education, health and e-government support to business
managing the next round of major information and communications technology (ICT) contracts, including computers, telecommunications and messaging services, by developing a sourcing strategy to meet the needs of government
establishment of an outposted procurement network in agencies and changes to the procurement system, including tender thresholds.
The department’s continuing evolution, plus population, business and industrial growth Territory-wide, will mean further challenges in 2009-10. Strategic issues will need to have a strong focus on:
alignment with the Territory 2030 strategy
developing services to the 20 Territory Growth Towns
green initiatives, through fleet, leasing and procurement activities
remote telecommunications
third generation ICT outsourcing contracts
development of e-business strategies
procurement network
internal investment assessment framework
Defence support
business development programs
Indigenous employment programs, both NTPS and Indigenous Training for Employment Program (ITEP)
a new Jobs Plan strategy.
I would like to acknowledge Dennis Bree who, as Chief Executive of the department for most of 2008-09, provided effective leadership through the transition and positioned the Department of Business and Employment to move forward.
In presenting this annual report, I thank employees for their ongoing efforts in a time of change, for their commitment and willingness to deliver the achievements that are outlined in this report, and for their continued commitment to increasing these outcomes in 2009-10.
Graham Symons

10 :: Department of Business and Employment
Overview
OUR ORGANISATION
DBE comprises five entities: the Department of Business and Employment and three government business divisions (GBDs) named Data Centre Services, NT Fleet, the Government Printing Office; and a statutory authority – the Land Development Corporation (LDC).
The diagram on page 16 represents a high-level view of the organisation’s structure.
The organisation comprises around 800 staff (by budget allocation), with the majority working in the department (674 based on allocated budget), and the remainder spread across the GBDs and Land Development Corporation.
The total budget for 2008-09 is just over $144 million, excluding the GBDs, which are separate budget entities. Refer to page 88 for more financial information. Land Development Corporation as a statutory authority produces its own annual report.
The department has centres in Darwin, Alice Springs, Katherine, Tennant Creek and Nhulunbuy.
Details of our performance highlights for 2008-09 and priorities for 2009-10 can be found in the performance reports starting on page 52.
A glossary of acronyms used throughout this report is detailed in Appendix A.
Profiles and Key Functional Responsibilities
Department of Business and Employment
The Department of Business and Employment’s primary responsibilities are to deliver business and industry development services, defence support, employment and corporate shared services.
The department works with business to develop and broaden the Northern Territory economic base. This includes the provision of strategic programs and activities to support business and industry development.
It is responsible for providing strategic labour market policy advice and forecasting to maximise employment opportunities for Territorians and meet industry needs.
The department provides corporate shared services to all Northern Territory Government (NTG) agencies and business divisions, including financial and human resource administration, procurement, information technology management and property management.

Annual Report 2008-2009 :: 11
Overview
Key functional responsibilities are to:
operate corporate systems to enable processing of NTG transactions such as accounts and payroll
develop procurement policy, provide secretariat services to the Procurement Review Board and provide procurement advice to agencies
coordinate employment programs for graduates, new apprentices and Indigenous cadets
provide information technology services to support government business
develop information and communications technology policy including telecommunications strategy for remote area communication services
lease office accommodation and manage leased property to support NTG service delivery
identify, assess and support business and industry development opportunities
improve business competitiveness and productivity
stimulate business innovation, research and knowledge development
provide strategic labour market research and advice
develop, promote and implement employment strategies, including coordination of Indigenous employment, Regional Job Hubs, skilled migration programs and Workforce Growth NT.
Data Centre Services
Data Centre Services (DCS) delivers a range of information technology services to all Northern Territory Government agencies.
Key functional responsibilities are to:
host and manage mainframe applications
host and manage mid-range server applications
administer databases
manage enterprise data storage
host information and communications technology (ICT) infrastructure for agencies and contracted service providers
manage various whole of government information technology functions, electronic security and identity management.

12 :: Department of Business and Employment
Overview
Government Printing Office
The Government Printing Office (GPO) provides cost-effective printing and publication services to Parliament and government agencies.
Key functional responsibilities are to:
provide a secure environment for the timely production of government documents
outsource to local industry as appropriate.
NT Fleet
NT Fleet is responsible for management of all government vehicles except for Northern Territory Police, Fire and Emergency Services.
Key functional responsibilities are to:
manage the strategic replacement program for the fleet
match vehicles with agencies’ operational needs
administer supply and service contracts
manage the maintenance and disposal of vehicles, plant and equipment.
Land Development Corporation
As a statutory authority, the Land Development Corporation has prepared a separate annual report.

Annual Report 2008-2009 :: 13
Overview
OUR OPERATIONAL STRUCTURE
The department’s operational structure and outputs (service delivery) contribute to the achievement of its strategic goals. The operational structure is underpinned by the Corporate Support Services division, which supports all areas of the department.
The following diagrams outline the department’s operational structure by output group and the areas of the department that are responsible for the outputs.
Output Group Business Unit responsible Outputs
Shared Services Finance Services Finance Services
HR Services HR Services
Corporate Reporting
CSR Review Program Office
Procurement Policy Procurement Policy and services
CAPS
IT Service Management ICT Services
ICT
NT Property Management Office Leasing Management
Business Development Industry Development Business Development
Innovation
Economics
Investment Services
Defence Support
Commercial Services
Business Support
ecoBiz NT
Business Liaison
Territory Business Centre
Procurement Liaison
Business Services
Employment Employment Employment
Indigenous Workforce Development
Workforce Growth NT
Strategy and Research
Business and Skilled Migration
GBD Division responsible to Business Line
Data Centre Services Corporate and Information Services
Data Centre Management
GPO Procurement Printing and Publication Services
NT Fleet Procurement Management of the Vehicle Fleet

14 :: Department of Business and Employment
Overview
OUR CORPORATE PLAN
The department’s Corporate Plan covers 2009-2011. It outlines strategic issues and sets priorities that focus on supporting the department to realise the tactical issues it faces over the next three years.
We Value
People
Performance
Professionalism
Our business is to: build industry capabilities through support and solutions for Territory businesses
develop, attract and retain a skilled Territory workforce
provide corporate shared services to the NTG.
Our strategic issues: employment
business support and industry development
Indigenous development
electronic service delivery
land development
climate change.
To meet and respond to our strategic issues we must employ the following targeted actions:
Employment
enhance labour Market Analysis model
develop NT Employment Strategy across the Territory incorporating Indigenous employment and career development
establish regional Job Hubs
enhance Skilled Worker Campaign
develop NT Business and Skilled Migration Strategy.
Business and Industry Growth
promote and facilitate industry and business development
conduct forums to inform small businesses about major project opportunities
land for industry growth initiative
identify and support the development of new industries, opportunities and investment
stimulate innovation, research and knowledge development
maintain and improve the Territory’s business operating environment.

Annual Report 2008-2009 :: 15
Overview
Working Future – Indigenous Development
Develop and implement:
cross-cultural training for government
Indigenous recruitment to NTG administrative stream
recruitment and support for NTG Indigenous apprentices and trainees
telecommunications infrastructure and e-services applications.
e-Services Develop an Information and Communications Technology (ICT) strategy for NTG
NTG to advance electronic service delivery in the areas of:
e-health
e-government
e-learning
e-government support to business
high speed broadband.
Corporate Services implement Corporate Services Review for Finance and Human Resource Services
improve reporting to assist in agency decision making
plan for development of enhanced Human Resources information systems
identify future opportunities to improve corporate services efficiency and effectiveness.
Climate Change Develop and implement policies for:
Green Fleet, Procurement and Leasing strategies
green IT
ecoBiz NT initiative
We will deliver our strategic actions by:
attracting capable employees
realising staff potential
building leadership capacity
being solution-focused
strengthening policy skills
understanding and anticipating customer needs
actively engaging with stakeholders
supporting work life balance and occupational health and safety.

16 :: Department of Business and Employment
Overview
OUR EXECUTIVE STRUCTURE
as at 30 June 2009
Pro
cure
men
t P
olic
y
Con
tract
s an
d
Pro
cure
men
t
Ser
vice
s
HR
Ser
vice
s
Fina
nce
S
ervi
ces
Cor
pora
te
Rep
ortin
g
Lega
l Sup
port
Peo
ple
and
Info
rmat
ion
Chi
ef F
inan
cial
�
����
�
ICT
Sup
port
Em
ploy
men
t
Indi
geno
us
Wor
kfor
ce
Dev
elop
men
t
Wor
kfor
ce
Gro
wth
NT
&
Ski
lled
M
igra
tion
Stra
tegy
&
Res
earc
h
Pro
cure
men
t Li
aiso
n
Bus
ines
s S
ervi
ces
Bus
ines
s/B
AN
T
Chi
ef E
xecu
tive
Den
nis
Bre
e
Dep
uty
Chi
ef E
xecu
tive
G
raha
m S
ymon
s
Bus
ines
s &
In
dust
ry
Dev
elop
men
t E
xecu
tive
D
irect
or
Sal
li C
ohen
Bus
ines
s
Sup
port
Exe
cutiv
e D
irect
or
Dou
g P
hilli
ps
Em
ploy
men
tE
xecu
tive
D
irect
or
Kim
Jen
kins
on
Pro
cure
men
tE
xecu
tive
Dire
ctor
B
rad
Irvin
e
ICT
Exe
cutiv
e D
irect
or
Les
Hod
gson
Cor
pora
te a
nd
Sha
red
Ser
vice
sE
xecu
tive
Dire
ctor
K
athl
een
Rob
inso
n
IT S
ervi
ce
Man
agem
ent
Gar
ry H
aigh
Pro
perty
M
anag
emen
tJo
hn G
lees
on
Cor
pora
te
Ser
vice
s
Rev
iew
P
rogr
amJo
esph
Bab
bini
#Dat
a C
entre
S
ervi
ces
Chr
is H
oski
ng
*Des
ert K
now
ledg
e A
ustra
liaE
xecu
tive
Dire
ctor
Jo
hn H
uige
n
Tele
com
mun
icat
ions
ICT
Pol
icy
and
S
trate
gy
Info
rmat
ion
Stra
tegy
ICT
Sec
urity
#NT
Flee
tM
alco
lm G
arne
r
#Gov
ernm
ent
��
��
���
���
����
���
��
Indu
stry
D
evel
opm
ent
Eco
nom
ics
Def
ence
Sup
port
Inno
vatio
n
Inve
stm
ent
Ser
vice
s
Man
agem
ent B
oard
Mem
ber
Bus
ines
s U
nit
Gov
ernm
ent B
usin
ess
Div
isio
nS
atut
ory
Aut
horit
y# *
Reg
ions
Dire
ctor
Ia
n Lo
w
Cor
pora
te C
omm
sD
irect
or
Bar
bara
Hat
ton
*Lan
d D
evel
opm
ent
Cor
pora
tion
Exe
cutiv
e D
irect
or
John
Col
eman

Annual Report 2008-2009 :: 17
Overview
OUR PEOPLE
The department strives to foster a positive and productive working environment that provides a platform for open and honest communication, empowers staff, treats them fairly and equitably and encourages them to take personal responsibility. The department actively promotes occupational health and safety within the work environment, particularly in those specialised workplaces where heavy machinery is used.
The department supports and promotes staff learning and development through its Corporate Capability Plan, which facilitates networking and learning opportunities through various in-house programs and external leadership and development programs.
The department is staffed according to the following full-time budgeted allocations:
Department – 674
Data Centre Services – 59
NT Fleet - 30
Government Printing Office – 36
Land Development Corporation – 7
Within the department, 58 per cent of staff work for Finance Services (162) and Human Resource Services (226). The remaining 42 per cent of staff work in the areas of procurement services, property management, information, communications and technology services, employment, business and industry support, and internal corporate management.
Further details of the department’s staff profile and human resource strategies and achievements are included in this report at page 46.
Full Time Equivalent (FTE)
Department
Data Centre Services
NT Fleet
Government Printing Office
Land Development Corporation83.6%
7.3%
3.7%4.5% 0.9%

18 :: Department of Business and Employment
Overview
OUR CUSTOMERS AND STAKEHOLDERS
A key priority for the department is continuous improvement of our relationship with customers and stakeholders.
Our customers are:
the business community
NTG agencies, business divisions and statutory authorities
NTG employees and prospective employees.
Other stakeholders are:
business and industry
the ICT industry
the Territory community.
The department’s approach and responses are consistent across all groups, with an emphasis on prompt and reliable service delivery, open communication and a consultative approach that encourages input and feedback.
OUR FINANCES
As the department was established as part of the administrative restructure on 18 August 2008 with retrospective effect for accounting purposes from 1 July 2008, no comparative disclosures are available (this does not apply to the GBDs).
There are four budget entities reported in this report: the department and three government business divisions. The Land Development Corporation is a separate budget entity and is reported in a separate annual report.
The department is primarily funded by Output appropriation from the Central Holding Authority which comprises around 90 per cent of departmental revenue, and provides for:
shared corporate services to NTG agencies and government business divisions
leadership to develop and broaden the Northern Territory economic base, and strategic programs and activities to support business and industry development
strategic labour market policy advice and forecasting to maximise employment opportunities for Territorians and to meet industry needs.
The remaining revenue is earned from charges for services.

Annual Report 2008-2009 :: 19
Overview
Departmental expenses comprise property leasing costs (34.6 per cent), employee costs (34.5 per cent), grants (11.1 per cent), IT support costs to operate and maintain whole of government corporate systems (10.8 per cent) and operational costs (9 per cent).
The department notionally charges NTG agencies and actually charges government business divisions for the services it provides. Its overall aim is to provide cost-effective services, with service prices based on a cost recovery model. The price list as at 30 June 2009 is detailed in Appendix B.
Financial Statements
Financial statements for each of the four budget entities are included in this report, starting at page 88. The audited statements for the three government business divisions received unqualified audit opinions.
Data Centre Services
Data Centre Services continues to see revenue growth in mid-range services and ePass services. In line with increasing demands for storage and backup services, it has acquired a new storage area network at a capital cost of $0.7 million. Revenue and operational costs of the electronic passport2 system (ePASS2) have increased following the completion of development and the subsequent implementation in July 2008.
Data Centre Services net surplus after tax for 2008-09 was $0.2 million higher than anticipated at $1.9 million.
0
4
8
12
16
20
$ M
illio
ns
2005/06 2006/07 2007/08 2008/09
Expenses Goods & Services Revenue
Other Revenue
DCS – Expenditure and Revenue Trends

20 :: Department of Business and Employment
Overview
NT Fleet
NT Fleet continues to operate profitably with increased revenues from vehicle hire contracts. Expenses also increased, primarily from higher depreciation and vehicle repairs and maintenance due to growth in vehicle numbers.
NT Fleet’s net surplus after tax was $7.0 million for 2008-09, around $0.5 million higher than anticipated.
$ M
illio
ns
0 1 2 3 4 5 6 7
2005/06 2006/07 2007/08 2008/09
Expenses Goods & Services Revenue
Other Revenue
0 5
10 15 20 25 30 35 40 45
$ M
illio
ns
2005/06 2006/07 2007/08 2008/09
Expenses Goods & Services Revenue
Other Revenue
NT Fleet – Expenditure and Revenue Trends
Government Printing Office
The demand for printed materials reduced across various product categories during the year.
In response to changes in revenue, the GPO actively focused on improving internal efficiencies to offset cost increases for labour, power and raw materials.
The GPO has continued to make a profit, achieving a net surplus after tax of $0.013 million for 2008-09.
GPO – Expenditure and Revenue Trends

Annual Report 2008-2009 :: 21
Overview
ACHIEVEMENTS IN 2008-09
Output Group – Shared Services
Finance Services
Implemented a number of corporate systems and process improvements as part of a multi-year program to streamline the provision of corporate services across government, including:
- Travel Request Information Processing System (TRIPS) improved and made available to all agencies
- Receipts Processing System (RePS) introduced into selected client agencies to reduce manual processing of receipts
- new credit management policies revised and implemented
- core accounts receivable and accounts payable functions across government centralised in July 2008, with further process efficiencies and standardisation.
Human Resource Services
Implemented a number of corporate system and process improvements as part of a multi-year program to streamline the provision of corporate services across government, including:
- payroll processing for casual nurses automated, improving accuracy and timeliness of salary payments
- new payslip supplement developed to provide greater payroll information to hospital shift-based staff, primarily nursing staff
- HR Services Contact Centre established on a trial basis to provide a first point of contact for all payroll enquiries from NTPS employees.
Supported the Working Future strategy by:
- successfully piloting across four NTG agencies the Indigenous Employment Program (Administrative Stream) with eight Indigenous job-seekers gaining a Certificate II in Business and permanent full-time employment at the Administrative Officer level 2
- developing a cultural competence framework, together with learning outcomes for a range of new cross-cultural training courses in consultation with key agencies and in collaboration with Charles Darwin University.
As part of the Jobs Plan 3 initiative employed a total of 236 apprentices.

22 :: Department of Business and Employment
Overview
Procurement Policy and Services
Implemented government policy to streamline a range of procurement initiatives:
- an increase to all procurement thresholds
- Tier 3 – $50 000 but less than $200 000 - public quotations issued via Tenders Online
- disclosure of tender assessment criteria weightings for all tenders with an estimated value of $200 000 and greater
- mandatory use of Agency Procurement Requisition Online (APRO) for Tier 2, $15 000 but less than $50 000, to Tier 5, $5 million and greater
- increased delegation to Agency Chief Executive’s for Certificate of Exemption from Public Tendering.
Stage two of the Northern Territory Government procurement initiatives established a Procurement Network of departmental procurement professionals out-posted to agencies to improve procurement outcomes.
In supporting the Working Future strategy the Procurement Policy unit worked closely with the Employment Division to review the Procurement Directions to identify how more accurate recording of achievements in employment can be achieved.
Developed a procurement policy which takes into account environmental sustainability.
Information and Communication Technology Services
Sourcing Strategy developed and endorsed by government for release of tenders in July 2009 as part of the third generation of major ICT outsourcing contracts in 2009-10.
Prepared for the next round of ICT service contracts by:
- appointing a Project Director and establishing a project office
- forming a Steering Committee along with Agency Advisory Group
- completing the industry and agency consultation process.
Completed e-services strategy consultancies for e-business, e-health and e-learning to enhance the Territory’s capacity in electronic service delivery.
Invested $6.8 million in partnership with Telstra, the Northern Land Council and Rio Tinto to build a $34 million fibre communications link across Arnhem Land, connecting nine remote communities with high speed broadband.
The NTG has bid for funding from the following national programs:
- the National Broadband Network Backbone Blackspots - $250 million available nationally. Bids have been lodged for work in the Territory for a competitive fibre link
- Public Internet Access - $2.2 million funding bid under the Australian Government’s Digital Regions program over four years to remote communities.

Annual Report 2008-2009 :: 23
Overview
Office Leasing Management
Developed and implemented policies for a Green Leasing Strategy to support the government’s focus on reducing energy consumption.
Drafted a national sustainability framework for NTG occupied office premises as part of the Government Real Estate Group.
Developed the Commercial Property Management Framework.
Worked with the Department of the Chief Minister to develop policy and procedures for land leasing in remote communities for non-housing infrastructure.
Output Group – Business Development
Launched ecoBiz NT, a business efficiency program to assist Territory businesses reduce their environmental impact through ecoBiz NT grants.
Successful delivery of the 14th October Business Month, targeted at providing new business management knowledge and ideas to the Territory business community.
Continued the Territory Business Upskills program offering Territory small businesses opportunities to identify areas for improvement that can increase capacity and capability.
Encouraged business, through the Territory Business Growth Program, to achieve growth and employment, and improve chances of gaining government tenders and developing and implementing quality assurance and occupational procedures.
Provided support to ensure that Territory businesses utilise the department’s wide range of business development programs.
Continued membership and input to the Aviation Inter-agency Advisory Committee, leading to the development of a three year aviation strategy.
Implemented and enhanced the Building Northern Territory Industry Participation (BNTIP) policy.
Assisted the continued broadening and growth of the Territory’s economic base.
Promoted the Common User Area and its availability and benefits to project proponents and prime contractors in the mining and oil and gas industries.
Continued priority promotion of Territory industry capability, and promotion and marketing of the Territory and its Defence support industry.

24 :: Department of Business and Employment
Overview
Output Group – Employment
Completed Jobs Plan 3, which achieved:
- the target of 10 000 apprentice and trainee commencements over four years
- increased knowledge of the labour market in government, industry and the community through the release of the Workforce NT Report 2008 and the NT Occupation Shortage list 2009.
The Indigenous Training for Employment Program supported 13 ongoing programs across all regions and initiated 12 new programs.
Continued promotion of the Territory as a business and skilled migration destination.
Established Workforce Growth NT unit.
Business Line – Data Centre Management
Finalised the electronic passport2 system (ePASS2) and implemented the system’s second phase to manage all NTPS employee identity information and ICT service requests.
Developed a strategic forward plan for future enterprise storage requirements.
Delivered more efficient application hosting and reduced carbon emissions through server virtualisation technologies.
Business Line – Printing and Publication Services
Continued to work in partnership with private sector printing firms to support private industry by outsourcing work fairly and equitably.
Implemented a customer feedback questionnaire to ascertain customer satisfaction with the GPO services.
Business Line – Management of the Government Vehicle Fleet
Developed and implemented a Green Fleet Strategy as part of the government’s focus on reducing energy consumption.
Continued to work with agencies to:
- acquire a safer, more environmentally friendly fleet
- minimise the cost of owning and operating the fleet.

Annual Report 2008-2009 :: 25
Overview
REGIONAL HIGHLIGHTS
The department has regional offices in Alice Springs, Katherine, Tennant Creek and Nhulunbuy. Of these, Alice Springs is the largest and delivers the broadest range of services including finance and human resource, business and industry support and employment, together with procurement, properties, ICT and fleet services. Accounts receivable administration functions for all government agencies across the Territory are provided from the Alice Springs office. This office also directly supports the Tennant Creek office, with the Katherine office providing support for the Nhulunbuy office.
Regional staff benefited from greater use of teleconferencing and video conferencing in 2008-09 to allow participation in workshops and meetings. Increased use of these applications expected in 2009-10.
Highlights: Alice Springs and Tennant Creek
Highly successful transfer of the Accounts Receivable functions from across the department to the Alice Springs office, together with a successful skills transfer and training program.
Transfer of the Accounts Payable and Asset Management functions to Darwin, together with the transfer of the payroll function to Casuarina and Palmerston.
Effective organisational merger of the business and industry support and employment functions with the shared services functions to form a strong departmental presence within the region.
In Tennant Creek, the Territory Business Centre and the shared services group successfully amalgamated to establish the new Department of Business and Employment office.
Over 30 regional apprentices engaged during 2008-09, including 10 Indigenous apprentices. The apprentices work in 12 different apprenticeship areas, with the majority working in Business Skills or Captive Animals.
October Business Month activities were well attended and well received, with 14 events delivered in Alice Springs to 807 attendees and six events in Tennant Creek delivered to 192 attendees.
Business Support Client Managers and Procurement Liaison regularly visited Alice Springs and Tennant Creek businesses.
Successful delivery of business improvement programs, including:
Alice Springs
- 20 New Starter Workshops, 18 Territory Business Upskills Workshops and 15 Business Coaching sessions delivered
- 23 grants under the Territory Business Growth program

26 :: Department of Business and Employment
Overview
Tennant Creek
- Five New Starter Workshops and nine Territory Business Upskills Workshops
- Five grants under the Territory Business Growth program
Highlights: Katherine and Nhulunbuy
Developed a strong working relationship between the corporate and business areas of the department, realising joint projects such as the Katherine Show stand and the Farm and Garden Day stand, and joint sponsorship of the Rivers Region Youth Development Service Industry Breakfast.
Nhulunbuy office relocated to new premises.
Over 15 regional apprentices engaged in 2008-09, including nine Indigenous apprentices.
Departmental apprentice Kathleen Jeans won the Katherine region NT Apprentice of the Year, gaining a Certificate III in Business.
October Business Month events were well attended and well received, with 10 events delivered in Katherine to 325 attendees and three events delivered in Nhulunbuy to 45 attendees.
Client Managers regularly visited Katherine and Nhunulbuy businesses and Procurement Liaison met with businesses in Katherine.
Successful delivery of business improvement programs including:
Katherine
- 10 New Starter Workshops, 17 Territory Business Upskills Workshops and one Business Coaching session delivered
- eight grants under the Territory Business Growth program
Nhulunbuy
- five New Starter Workshops, one Territory Business Upskills Workshops and two Business Coaching sessions delivered
- six grants under the Territory Business Growth program

Annual Report 2008-2009 :: 27
Overview
PRIORITIES IN 2009-10
Output Group – Shared Services
Complete the Territory’s commitment to the construction of the fibre optic telecommunications link between Jabiru and Nhulunbuy to facilitate the delivery of e-services to Nhulunbuy and nine Arnhem Land communities.
Assess, negotiate and sign ICT contracts for third generation ICT outsourcing contracts.
Successfully disengage from existing ICT contracts and transition to new arrangements.
Streamline the provision of corporate services across government.
Implement the Electronic Invoice Management System to automate the accounts payable process.
Complete the pilot of the Indigenous Employment Program (Administrative Stream) and undertake a comprehensive review of phase I of the pilot.
Implement programs to deliver cross-cultural awareness training for NTPS recruits and senior officers.
Progress strategies to enhance communications infrastructure across the Territory
Support the development of e-services strategies to meet the needs of the Territory, in partnership with service delivery agencies, especially in relation to education, health and support to business.
Complete the procurement and commence implementation of a new HR Reporting Solution that will deliver a full suite of HR reports for use across government.
Complete the procurement and commence implementation of a new electronic recruitment system across government that will deliver contemporary automated recruitment processes for government agencies.
Output Group – Business Development
Promote business and industry development and growth, and provide assistance to business in responding to the challenges of current market conditions.
Deliver an internal investment assessment framework for the department to help evaluate requests for government assistance including the web-based investment information portal, an investment inquiries database and an investment project assessment tool for project developers.
Continue the Industry Development Support Program to provide operational and program support.
Carry out the commitment of a new Business Efficiency Program to improve environmental aspects through grants and training to business operators.
Support research and innovation, including the Northern Territory Research and Innovation Grants program.

28 :: Department of Business and Employment
Overview
Assist Territory businesses with their export marketing objectives through the provision of Trade Support Scheme grants.
Progress the project to improve provision of e-government support to business and to increase the range of government services available electronically.
Output Group – Employment
Develop and implement a whole of government employment strategy which will include direction and initiatives to support the Territory workforce.
Continue to identify employment opportunities in remote communities and provide relevant training and workforce development strategies through the Indigenous Training Employment Program that lead to employment outcomes.
Advance the development of the Skilled Worker Campaign and Workforce Growth Unit to attract skilled and unskilled labour to the Territory from around Australia and overseas.
Establish Regional Job Hubs in Nhulunbuy and Tennant Creek.
Business Line – Data Centre Management
Improve technological and computing capabilities through the acquisition of a new mainframe processor and further expansion of virtual server infrastructure.
Meet agency demand for fully-managed computing services.
Contain the carbon footprint of an energy intensive facility.
Ensure minimal disruption and continuity of critical government business systems by enhancing disaster recovery capabilities.
Implement improvements to the ePASS2 system to improve and automate the ICT service requests in preparation for the third generation outsourcing contracts.
Implement the use of electronic forms interface technologies integrated to key government IT systems to replace current paper forms.
Business Line – Printing and Publication Services
Work in partnership with private sector printers to provide cost-effective printing, publication and distribution services to government.
Review internal production procedures to deliver greater efficiencies across the operations of the Government Printing Office.
Business Line – Management of the Government Vehicle Fleet
Implement the Green Fleet initiative.
Continue to provide clients with quality and timely fleet management information.
Continue to achieve an acceptable return on the asset base.

Annual Report 2008-2009 :: 29
Co
rpo
rate Go
vernan
ce
CORPORATE GOVERNANCE
This section highlights key elements of the Department of Business and Employment’s corporate governance framework including leadership and governance structures, risk management, reviews and audits, planning, communication, information management requirements under the Information Act and legislation governed.
CORPORATE GOVERNANCE FRAMEWORK
The department’s Governance Framework:
provides a structured framework through which the department is directed, controlled and held to account for its actions
guides how decisions are made, risks are managed and the future of the department is planned
facilitates and guides the necessary planning, budgeting and management of performance
requires accountability for the stewardship of resources, while encouraging effective and efficient use of these resources
supports the Chief Executive, Executive Management Group and the Management Board in providing leadership of the department
strategically links management, principles and services with our people and customers.
The Corporate Governance Model outlines a governance structure consisting of a Management Board and three sub-committees reporting to the Executive Group and Chief Executive. The board and sub-committees oversee the strategic deployment of resources across the department and the development and implementation of policies, plans and procedures that will provide a foundation of good governance for the department’s activities.
The Corporate Governance Model encompasses the department, its Government Business Divisions (GBDs) - Data Centre Services, NT Fleet, Government Printing Office and the statutory authority Land Development Corporation (LDC). The Land Development Corporation as a statutory authority produces its own annual report. While the GBDs and Land Development Corporation are treated as distinct budget entities and are required to produce audited financial statements, they report, and are accountable, to the Chief Executive.

30 :: Department of Business and Employment
Corporate Governance
DBE Corporate Governance Model
Leadership
Accountability
Stewardship
Ethical Behaviour
Transparency
Communication
Legislation
Government Policy
Strategy
Budget Management
DBE Values
Internal ControlsChief Executive
Management Board
PeopleInformation and
Communications TechnologyRisk and Audit
Human Resource Governance
Committee (HRGC)
Information Management
Committee (IMC)
Risk Management and Audit
Committee (RMAC)
HRGC Terms of Reference
ICT Governance Framework
IMC Terms of Reference
Risk Management Framework
RMAC Terms of Reference
DBE HR Policies
DBE Capability Plan
Workplace Planning
Change Management Procedure
OH&S Management Plan
ICT Strategic Architecture
ICT Application Standards
ICT Strategic Plan
Transition Plans
ICT Policies
Risk Management Procedures
DBE Fraud Control Policy
Risk Management Action Plans
DBE Business Continuity Plan
Cyclone Plans and Guidelines.P
olic
ies,
Pla
ns
& P
roce
du
res P
olicies, P
lans &
Pro
cedu
res

Annual Report 2008-2009 :: 31
Co
rpo
rate Go
vernan
ce
Corporate Governance within the department is guided by the following principles:
strong leadership with a clearly defined executive and a robust and active governance committee structure
accountability through the implementation of appropriate internal controls and corporate policies
effective stewardship of resources through compliance with legislation, Northern Territory Government policies and internal procedures
comprehensive planning and a continuous improvement approach to management and service delivery
cohesive governance frameworks addressing the department’s primary resources – people, finances and information
a focus on risk and appropriate risk mitigation through a risk management framework
ethical behaviour expectations communicated at all levels with fair and equitable treatment, respect for others, and professional and responsive service delivery
clear advice and guidance for staff to ensure that governance requirements are well understood
communication with stakeholders, including Ministers and Government.
GOVERNANCE COMMITTEES
The Corporate Governance Model is supplemented by frameworks which outline the requirements for core governance responsibilities. Together the model, frameworks and their associated policies and procedures form a comprehensive foundation for the good governance of the department.
Frameworks developed under the Corporate Governance Model at this time are:
ICT Governance Framework
Risk Management Framework.
Each framework is managed by its own governance committee to provide a specific focus and careful monitoring of its requirements.
In addition, the department maintains a suite of governance committees to provide a specific focus and careful monitoring of critical corporate governance requirements
The committees report to the Chief Executive through the Management Board.

32 :: Department of Business and Employment
Corporate Governance
Risk Management and Audit Committee
The Risk Management and Audit Committee:
oversees risk management activities, audit and review programs for the department
monitors progress against recommendations arising from audits and reviews conducted under these programs
oversees reviews which are required under the conditions of the ICT outsourcing contracts.
During 2008-09, the department implemented a number of key governance frameworks including a Risk Management Framework and an Internal Audit Charter. The Risk Management Framework provides a structured approach to risk management through the development of key procedures and business processes designed to identify, analyse, monitor and report on key risks across the department. This approach enables risk mitigation strategies to be developed in relation to strategic and operational risks, and strengthen the department’s current risk management processes for major projects and programs. The Internal Audit Charter outlines the purpose of the internal audit function within the department, including the role and responsibilities of the function, scope of activities and authority to conduct reviews and audits.
The Risk Management and Audit Committee is chaired by the Executive Director Corporate and Shared Services, and its members are the Chief Executive, Director Finance Services and Director Information Technology Service Management. A representative from the Department of Planning and Infrastructure is an external member and a representative of the NT Auditor-General’s Office participates in an observer role.
With the department’s whole of government roles in providing corporate services and maintaining critical corporate systems, the NT Auditor-General’s Office continued its comprehensive audit program during 2008-09. The audit findings were mostly satisfactory, with some isolated instances of control breakdowns, non-observance of procedures and minor issues noted. A summary of the findings for this year’s external audits is at Appendix C.
The department continues to undertake internal reviews across the agency to improve processes and provide assurance. The internal reviews completed during 2008-09 were focused on ICT service provider compliance with service level agreements and contracts. A summary of internal reviews conducted in 2008-09 is at Appendix D.
Human Resource Governance Committee
The Human Resource Governance Committee (HRGC):
oversees and advises on human resourcing requirements for the department and its business divisions
reviews and endorses recruitment action
actively monitors unattached officers
undertakes a human resources governance role for the department.

Annual Report 2008-2009 :: 33
Co
rpo
rate Go
vernan
ce
In 2008-09 the committee continued to actively and cohesively manage human resources and employment strategies across the department. The process was invaluable during the recent Corporate Services Review, facilitating the placement of redeployed officers within a three month period.
The committee is chaired by the Executive Director Corporate and Shared Services, and its members are the Director Information Technology Service Management, Executive Director Business and Industry Development and Director People and Information (secretariat). The committee meets weekly and reports regularly to the Management Board. Procedures governing the functions and terms of reference have been developed and disseminated across the department and business divisions.
All unattached officers from stage one of the Corporate Services Review co-location project have been successfully placed. In 2009-10 the committee will again be integral to the placing of unattached officers as a result of Corporate Services Review stage two projects, the implementation of electronic invoice management.
The HRGC also oversees Occupational Health and Safety (OH&S) requirements including site committee structures, roles and OH&S management plans.
Occupational Health and Safety Steering Committee
The department’s Occupational Health and Safety (OH&S) Steering Committee:
ensures that mechanisms are in place to identify and address OH&S issues
ensures that site-specific OH&S committees meet on a regular basis
ensures the department’s OH&S guidelines are available and understood by staff.
The committee is chaired by the Director People and Information and comprises representatives from each work site, together with a regional representative.
The committee monitors the department’s OH&S performance, reports to the Management Board on a quarterly basis and, where required, develops OH&S policy for endorsement by the board and the Chief Executive.
The committee is actively working towards achieving compliance with the requirements of the Workplace Health and Safety Act and this will be completed in 2009-10.
Information Management Committee
The Information Management Committee:
oversees the development of the department’s information management strategic direction by overseeing the ICT Governance Framework and facilitating the strategic planning of ICT requirements
develops and reviews the department’s ICT policies and standards for the assessment of technology proposals to ensure they meet departmental ICT objectives

34 :: Department of Business and Employment
Corporate Governance
monitors ICT projects and the implementation of appropriate new technologies to ensure consistency with the department’s strategic direction and its ICT Governance Framework.
The committee is chaired by the Director Data Centre Services, with the Executive Director Business and Industry Development, Director ICT Policy and Strategy, Director Human Resource Services and Director Corporate Communications and Secretariat as members.
The committee implemented an ICT Governance Framework during 2008-09 as part of an overarching corporate governance framework. The framework is supported by a set of internal policies and procedures including the ICT Business Application Criteria and Standards, ICT Systems Management Guidelines and a detailed inventory of existing ICT systems. The framework provides a structured and strategic approach to the management of information and communication technology in the department.
MANAGEMENT ENVIRONMENT
Executive Management Group
The Executive Management Group is a key part of the department’s leadership group and decision making body, including governance matters. The Chief Executive has the primary responsibility for providing strategic leadership and systems development for the department. The group meets weekly and consists of the Chief Executive, Deputy Chief Executive, Executive Director Corporate and Shared Services, Executive Director Business and Industry Development, Executive Director Employment, Executive Director Business Support and General Manager Land Development Corporation.
Management Board
The board provides advice to the Chief Executive and the Executive Management Group on governance matters across the department and focuses on achieving the department’s objectives and strategies.
The board reviews, endorses and approves corporate policies to provide a cohesive approach to the delivery of organisational strategies and to monitor and review departmental performance.
Chaired by the Chief Executive, the Management Board is the department’s principal planning and decision making body and meets monthly to:
provide advice and assist the Chief Executive in governing the department and meeting statutory responsibilities
facilitate a co-operative approach to the delivery of organisational strategies and to monitor and review departmental performance.
Because the department was only formed during the current reporting period, a strong emphasis has been to work on reports to the board. In particular, performance

Annual Report 2008-2009 :: 35
Co
rpo
rate Go
vernan
ce
reporting requirements needed to be aligned with the new Corporate Plan, government and department priorities and election commitments to keep track of and to focus on strategic challenges facing the department. Other key initiatives arising from the board included the refinement of the meetings and agenda planning, with a strong focus on the establishment of key corporate policies and governance frameworks for the department, and business planning to align with the Corporate Plan.
The Disclosure of Interest Policy was one of the first corporate policies endorsed by the Management Board. It requires all board members and other executives to complete a full disclosure declaration on an annual basis.
Members of the Management Board are highlighted in the Executive Structure on page 16.
Engagement with Divisional Managers
At the Management Board November 2008 meeting, the Board endorsed an Executive Officers Group. Membership is drawn from staff at EO1 level and above and the group will be engaged to provide input into the broader NTG strategic issues such as Working Futures, Climate Change and Managing Growth.
The board also endorsed the Senior Officers Group which will incorporate the Executive Officers Group and extend to AO7 and AO8 levels in management roles, including regional section heads.
Both groups met and were intensively involved in the planning stages for the Corporate Plan. This was also the first time that officers from across the new agency were bought together and was a key driver to syndicating work groups to identify department synergies and form the department’s culture.
Ethical Standards
The department’s values are underpinned by the Northern Territory Public Sector (NTPS) Principles and Code of Conduct, which provide guidance to staff on a range of moral and ethical issues they may face during their employment in the NTPS. The Code of Conduct forms part of the terms and conditions of employment and is therefore binding on all employees. All new employees to the department are provided with a copy of the Code of Conduct booklet.
The binding nature of the Code of Conduct is explained to all new staff at induction programs. As the department is responsible for the collection and retention of sensitive personal information for all NT Government employees, privacy requirements for information are highlighted.
The department recognises that any conflict of interest, whether real or perceived, erodes confidence in the integrity of the department specifically, or of the NTG in general. All Executive Directors and Directors are required to declare private and other interests which might result in a conflict of interest. If such interests are identified, appropriate action is taken to resolve the conflict or prevent it from arising. Completed declarations are held as evidence of disclosure and, as such, provide
36 :: Department of Business and Employment
Corporate Governance
some protection against unfounded allegations of bias concerning department advice or decisions. The Disclosure of Interest Policy was one of the first corporate policies endorsed by the board.
Specific departmental policies have been developed to guide employees in ethical issues such as outside employment, harassment in the workplace, addressing grievances, gifts and benefits, and preventing and responding to fraud and dishonesty. The policies and procedures are located on the staff-only intranet site, where they are available to all employees.
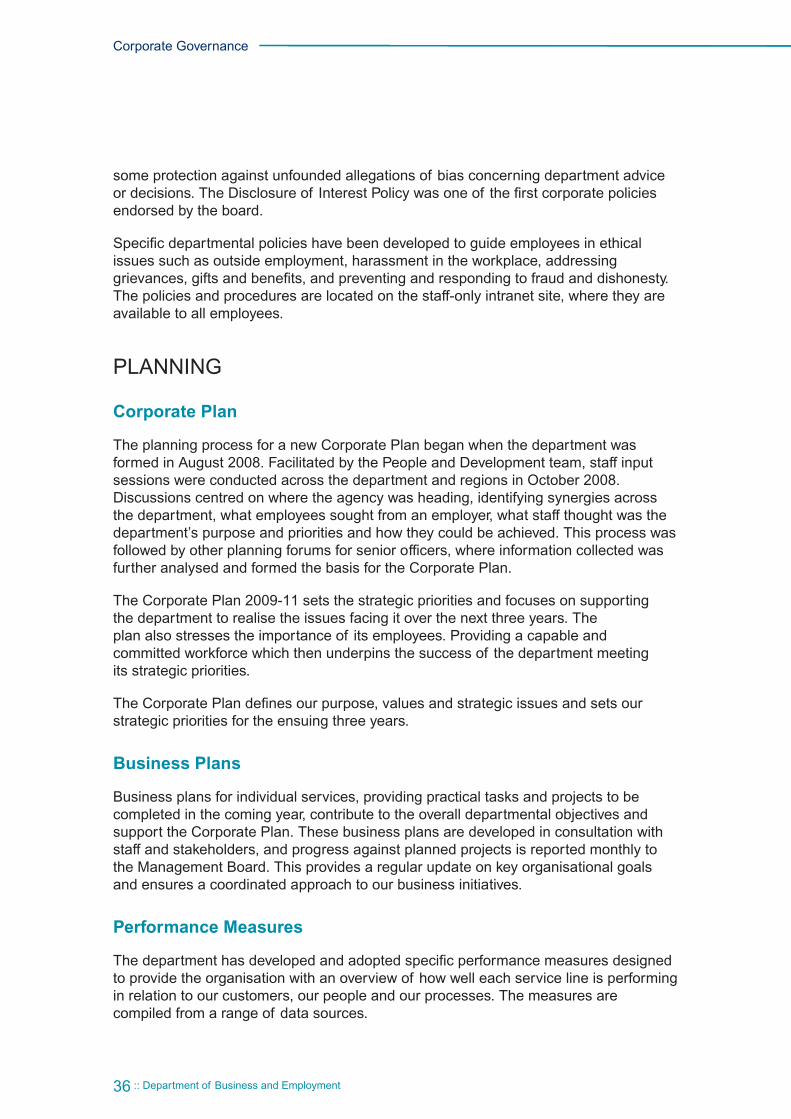
PLANNING
Corporate Plan
The planning process for a new Corporate Plan began when the department was formed in August 2008. Facilitated by the People and Development team, staff input sessions were conducted across the department and regions in October 2008. Discussions centred on where the agency was heading, identifying synergies across the department, what employees sought from an employer, what staff thought was the department’s purpose and priorities and how they could be achieved. This process was followed by other planning forums for senior officers, where information collected was further analysed and formed the basis for the Corporate Plan.
The Corporate Plan 2009-11 sets the strategic priorities and focuses on supporting the department to realise the issues facing it over the next three years. The plan also stresses the importance of its employees. Providing a capable and committed workforce which then underpins the success of the department meeting its strategic priorities.
The Corporate Plan defines our purpose, values and strategic issues and sets our strategic priorities for the ensuing three years.
Business Plans
Business plans for individual services, providing practical tasks and projects to be completed in the coming year, contribute to the overall departmental objectives and support the Corporate Plan. These business plans are developed in consultation with staff and stakeholders, and progress against planned projects is reported monthly to the Management Board. This provides a regular update on key organisational goals and ensures a coordinated approach to our business initiatives.
Performance Measures
The department has developed and adopted specific performance measures designed to provide the organisation with an overview of how well each service line is performing in relation to our customers, our people and our processes. The measures are compiled from a range of data sources.

Annual Report 2008-2009 :: 37
Co
rpo
rate Go
vernan
ce
Key Performance Indicators (KPIs) for 2008-09 align with the Corporate Plan and focus on qualitative and timeliness measures rather than on more traditional quantitative measures.
Our internal monthly reporting is being further refined in 2009-10 to address the key objectives and measures in our corporate and business plans. Reporting to the Management Board on a monthly basis has been tailored to highlight those areas of significant activity, performance concerns and corresponding corrective action. This has assisted in monitoring efficiencies and seeking opportunities to further develop processes to achieve more effective service outcomes.
KPIs comparing actual performance against targets for the 2008-09 year are reported extensively in the performance reporting beginning on page 52.
COMMUNICATION
The department has several mechanisms for ensuring effective internal and external communication.
The department website presents information about the department to the broader community. In addition to the primary departmental website, corporate communications staff manage further sites, including the staff intranet, the DBE (former DCIS) intranet, The Territory, Operation Stimulus, Buy Territory, Business and Skilled Migration, October Business Month and the Land Development Corporation.
The DBE intranet is the department’s main business communication tool for the shared services part of the department and contains information on services, procedures and forms utilised by both the department and agencies in the delivery of corporate services.
Staff only intranet for use by department staff only. This contains policies, forms and procedures utilised within the department and information on employment and news within the department.
A Chief Executive’s Newsletter is issued regularly to keep staff informed of corporate initiatives and developments, key staff achievements, across agency projects and significant customer interactions. It is posted on the staff intranet. An internal communication strategy will be implemented in 2009-10.
The department’s corporate communications team maintains regular contact with the Minister’s office to ensure accurate and timely release of news and information to the public through the media. More than 50 media releases were prepared during 2008-09.
The corporate communications staff work closely with other business units in the department to manage and promote programs and services including Defence Support, Innovation, Employment Services, Land Development Corporation, Recruitment, October Business Month, Upskills, and Territory Business Centre.

38 :: Department of Business and Employment
Corporate Governance
The department participated in the Northern Territory show circuit, promoting its activities and services to the public at shows in Alice Springs, Tennant Creek, Katherine, Nhulunbuy and Darwin.
Regional newspapers run regular columns managed by the department to keep regional Territorians advised of the department’s activities and programs.
ACCOUNTABILITIES
Statutory Accountability
The department is required to comply with the Financial Management Act, Superannuation Act, Public Sector Employment and Management Act and other employment-related legislation such as the Anti-Discrimination Act and the Workplace Health and Safety Act. Through the department’s Orientation Program, staff are made aware of the department’s corporate governance system and the relevant statutes, and training in these matters is included in the department’s staff development plans.
Legislation Administered
DBE has responsibility for administering the following Acts:
Biological Resources
Desert Knowledge Australia
Information (Part 9 except Archives Management)
Northern Territory Products Symbol
Procurement
Year 2000 Information Disclosure.
The Biological Resources Act and subordinate legislation provides for and regulates bioprospecting in the Territory.
The Desert Knowledge Australia Act and subordinate legislation encourages and facilitates learning, research and sustainable economic and social development relating to deserts and arid lands and establishes Desert Knowledge Australia.
The Information Act (Part 9 except Archives Management) – in so far as it relates to Northern Territory Government records management.
The Northern Territory Products Symbol Act and subordinate legislation authorises the use of a products symbol to distinguish and promote the sale of products made in the Territory.
The Procurement Act and subordinate legislation provides a cohesive framework for the procurement of supplies by government agencies and aims at achieving

Annual Report 2008-2009 :: 39
Co
rpo
rate Go
vernan
ce
value for money from expenditure on supplies by way of procedures and processes that are transparent to all suppliers.
The Year 2000 Information Disclosure Act was to encourage the voluntary disclosure and exchange of information about year 2000 computer problems and remediation efforts.
Delegations
The Chief Executive is the Accountable Officer for the department for the purposes of the Financial Management Act and the Procurement Act. The department maintains and regularly reviews delegations covering procurement, financial and human resource management activities. The delegations allow appropriately authorised departmental staff to undertake specific responsibilities of the Accountable Officer or Chief Executive Officer prescribed in the Financial Management Act, the Procurement Act and the Public Sector Employment and Management Act. The functions and authority of the governance committees are recognised in the respective delegations. A comprehensive review of the delegations commenced in 2008-09 due to the formation of the department and is due for release in 2009-10.
Accounting and Property Manual
In accordance with the Financial Management Act, the department has a detailed Accounting and Property Manual that specifies finance procedures and internal control requirements to be observed by departmental staff. This manual is also made available to other agencies to assist them in meeting their financial accountabilities.
Policies and Standard Operating Procedures
Comprehensive standard operating procedures have been developed for finance, human resources, information management and procurement functions. The procedures provide guidance and instruction for the department’s staff to ensure consistent and appropriate processes are observed across the department. These procedures are regularly reviewed and updated as improvements are made to policy, processes and systems.
As the Northern Territory Government’s shared services provider, the department also has a requirement to develop and maintain policies and procedures that have a whole of government focus.
Legal Services
The department has an out-posted lawyer from the Solicitor for the Northern Territory (a statutory body managed by the Department of Justice) located full time within the Executive Unit, who is available to give advice, prepare legal documentation and manage any necessary outsourcing of legal services on behalf of the department.
40 :: Department of Business and Employment
Corporate Governance
Information Act Requests
The department received one application under the Information Act to access information in 2008-09 that was finalised within 90 days of receipt of application. A total of 107 pages of information was released in full to the applicant.
The department receipted a total of 45 applications under the Information Act on behalf of other government agencies.
In accordance with the Act, the Freedom of Information Annual Statistical Return for the department has been recorded in the Department of the Chief Minister’s Freedom of Information dataset for the Information Commissioner and this information is incorporated in the Commissioner’s annual report.
Ombudsman Enquiries
There was one preliminary enquiry in 2008-09 relating to payroll services, which the Ombudsman found no need to undertake further investigation after receiving the department’s response.
Insurance Arrangements
Department of Business and Employment
Consistent with the department’s Risk Management Framework, an external consultant was engaged during 2008-09 to facilitate risk assessment workshops of operational risks across the department, including any applicable insurable risks. Risks identified during the risk management process were evaluated to determine the level of risk to the department and strategies identified to mitigate or manage those risks.
In accordance with Treasurer’s Direction R2.1 – Insurance Arrangements released in November 2008, the department’s risk management processes did not identify a requirement to obtain commercial insurance cover for 2008-09 and the department continues to self insure all applicable insurable risks. As the department was created as a result of a Northern Territory Government administrative restructure and did not exist prior to 2008-09, departmental self insurance data is not available for earlier years. Any claims applicable to self insurance for the department for 2008-09 are detailed in Appendix E.
Data Centre Services
Data Centre Services undertakes risk management in accordance with the department’s Risk Management Framework and mitigates risks to its operations via internal controls, policies and where required policies of commercial insurance. Prior to the release of Treasurer’s Direction R2.1 – Insurance Arrangements in November 2008, Data Centre Services self insured all insurable risks through the department.
Data Centre Services undertook an operational risk assessment during 2008-09 and a specific internal assessment of insurable risks was undertaken subsequent to the

Annual Report 2008-2009 :: 41
Co
rpo
rate Go
vernan
ce
release of Treasurer’s Direction R2.1. As a result of this assessment, Data Centre Services obtained commercial insurance during 2008-09 with the total premium cost $27 300. In addition, Data Centre Services is currently investigating the procurement of commercial insurance for a number of other insurable risks. There were no claims on commercial insurance policies during 2008-09, however, there were claims on self insured risks during 2007-08 and 2008-09 prior to the release of Treasurer’s Direction R2.1. Details of claims applicable to self insurance are detailed in Appendix E.
Government Printing Office
The Government Printing Office undertakes risk management in accordance with the department’s Risk Management Framework, mitigating and managing risks to its operations via internal controls and policies. The Government Printing Office was included in the whole of department risk assessment workshops in 2008-09 and undertook an internal assessment of its insurable risks subsequent to the release of Treasurer’s Direction R2.1. In addition, the Government Printing Office engaged an insurance consultant during 2008-09 to undertake a risk assessment of its operations, including its insurable risks.
Prior to the release of Treasurer’s Direction R2.1 the insurable risks of the Government Printing Office were self insured through the department. Subsequently and following the evaluation of findings from both the internal and insurance consultant’s reviews, policies of commercial insurance were obtained to protect or reduce the Government Printing Office from exposure to financial loss or undue claims from activities. The total cost of premiums for commercial insurance policies during 2008-09 was $12 600 with no claims on policies during the year. Details of self insurance claims for 2008-09 and 2007-08 are detailed in Appendix E.
NT Fleet
NT Fleet undertakes risk management in accordance with the department’s Risk Management Framework, mitigating and minimising risks to its operations via internal controls and policies and was included in whole of agency operational risk assessments conducted in 2008-09. Following the release of Treasurer’s Direction R2.1 in November 2008, NT Fleet undertook an internal risk assessment of its insurable risks and identified a number of risks requiring policies of commercial insurance to protect or reduce NT Fleet’s exposure to financial loss or undue claims. The total premium cost for commercial insurance policies in 2008-09 was $32 600.
Prior to the release of Treasurer’s Direction R2.1, the insurable risks of NT Fleet were self insured through the department. Details of the cost of claims of self insured risk for 2008-09 and 2007-08 are detailed in Appendix E.
GREENER GOVERNMENT
As the Shared Services provider the department is also charged with leading and developing various initiatives and activities designed to reduce and improve better environmental practices across government for government leased buildings, the government fleet, IT space, business, procurement and printing.

42 :: Department of Business and Employment
Corporate Governance
Chan Data Centre
Data centres around the world are facing an increasing demand to provide additional computer support. Growing demand by agencies for IT infrastructure and managed computing services have resulted in a large increase in the number of servers and storage devices located in the Chan Data Centre. Electricity usage is increasing commensurately. Within this operational constraint, staff continue to monitor electricity usage to ensure effective use of energy and minimal wastage.
To deliver more efficient application hosting and reduced carbon emissions through server virtualisation technologies, the department has implemented a ‘virtualise first’ policy, where business systems are hosted in a virtualised server environment rather than physical server devices.
To contain the carbon footprint of the Chan Data Centre within an energy intensive business environment that is experiencing significant and sustained growth, the department has delivered a reduction in total potential carbon emissions of 50 metric tonnes per month, largely as a result of server virtualisation.
NT Fleet
NT Fleet has implemented the Government’s ‘Greening the Fleet’ strategy which will see a 20 per cent reduction in the average CO2 gases produced by its passenger and light commercial fleets measured in gm/km over the next five years. Discussions commenced with a view to setting individual agency targets over the 2009-10 financial year.
Four-cylinder vehicles now comprise 64 per cent of the fleet. However the focus during the year shifted from the number of four cylinder vehicles to the acquisition of more fuel efficient vehicles, particularly those vehicles with a ‘green vehicle guide’ rating of 5.5 or higher.
Government Printing Office
The GPO investigated the opportunity to join the National Printing Industry ‘Sustainable Green Print’ Environmental Management Certification System.
Procurement
A Procurement Policy which takes into account environmental sustainability has been developed with the Office of Climate Change within the Department of the Chief Minister and will be incorporated with the proposed NT Climate Change Policy.
A proposal was prepared for the NT Government to adopt the Australian Procurement and Construction Council Sustainable Procurement Framework.
NT Property Management
NT Property Management works closely with the Department of Planning and Infrastructure to achieve energy efficiencies in government-leased accommodation. Energy usage reports have been prepared for all significant leases, with recommendations implemented during lease negotiations. During 2008-09, a draft

Annual Report 2008-2009 :: 43
Co
rpo
rate Go
vernan
ce
Green Leasing strategy to support the Government’s proposed climate change policy was developed. The proposed policy settings are consistent with other state and territory jurisdictions. The recommended Rating Tools for buildings are:
- National Australian Built Environment Rating System (NABERS) – Energy Efficiency; Green Star – Environmental Sustainability
- existing buildings - 4.5 Stars NABERS for leased > 2000m2 and three year term
- new buildings - 5 Stars NABERS and Green Star.
ecoBiz NT
ecoBiz NT is a business efficiency program to assist businesses reduce their environmental impact. The pilot program was launched in late 2008 and has already achieved a reduction of 542 tonnes of CO2.
ICT Services
The department is working with ICT service providers to reduce carbon emissions associated with services delivered under outsourced contracts.
New contracts will have achievable targets for carbon emissions reductions.
Initiatives will be incorporated in the NT Climate Change Policy for inclusion in ICT contracts.
Departmental Green Office Initiatives
The department has continued to make concerted efforts to reduce its carbon emissions and energy usage in 2008-09 through a range of activities to reduce the environmental impact of its operations.
The following initiatives are encouraged across all departmental buildings and locations:
defaulting department computers to double-sided and black and white printing
paper recycling bins installed across business units
toner and ink cartridge recycling bins in place throughout the department
utilising intranet and internet to publish large documents
changing behaviours to switch off lights and computers when not in use
review and rationalise the department’s fleet where possible
active participation in Earth Hour
encouraging all staff to switch off all electrical equipment when not in use
building lights and air-conditioning pre-timed to switch off after office hours and operate on a two-hour timer for outside hours use
timers installed on photocopiers and hot water heaters to reduce after hours use of electricity
introduction of zone lighting controls in certain buildings.

44 :: Department of Business and Employment
Our People
OUR PEOPLE
OVERVIEW
The Department of Business and Employment’s services are delivered through its people. Our business outcomes are underpinned by the corporate values of People, Professionalism and Performance. We are committed to supporting and developing our people to guide performance and build skills and competencies.
Since the formation of the department in August 2008, significant work has been undertaken to establish a corporate identity and build productive networks. Three workshops have been facilitated that included all Executives and Senior Officers. The purpose of these workshops was to:
understand the business of the department
develop a corporate plan
identify corporate values
identify synergies across the department
develop productive networks.
These workshops led to the development of Corporate Plan 2009-2011 which is available online. It is planned that during 2009-10 the corporate values of People, Professionalism and Performance will be workshopped with staff at the manager and team leader level, who will then work with their teams to incorporate the values within their team’s activities and behaviours.
Another significant milestone for the People and Development (P&D) unit was to review all policies and ensure relevance to the new department. This review also provided an opportunity for staff input into the revised documents which are now available on the department’s staff-only intranet site.
Our Staff in Profile
At 30 June 2009, 845 people (by head count) were employed across the department in a range of classifications, with more than half in the AO2 and AO4 classifications.
The following graph shows a breakdown of classifications by gender, and the variation in staff numbers by classification over a two-year period.

Annual Report 2008-2009 :: 45
Ou
r Peo
pleThe distribution of age is fairly even across the department, with females representing
more than 65 per cent of staff.
DBE Staffing by Age and Gender
0
50
100
150
200
Female Male
Trainee
Technica
l
Professional
Physica
l
Execu
tive
AO8AO7
AO6AO5
AO4AO3
AO2AO1
Num
ber
of s
taff
DBE Classification Streams by Gender at 30 June 2009
Female Male
16-20 21-25
26-30 31-35
36-40 41-45
46-50 51-55
56-60 61-65
66-70 71-75
0
20
40
60
80
100
120
Num
bers
Age Group

46 :: Department of Business and Employment
Our People
SUPPORTING AND GROWING OUR PEOPLE
The department recognises the need to develop its staff, build skills, make provision for succession planning, facilitate careers and progress knowledge to build a competent and capable workforce. In 2008-09, the department spent almost $430 000 on training and study expenses.
The following table outlines a number of corporate initiatives progressed or undertaken to support and develop our people during 2008-09.
Program / Process Action
Personal Planning Process (3P)
3P is a mechanism for staff and their supervisors to establish a shared understanding of work unit objectives and identify personal professional development needs on an annual basis.
This year’s 3P process saw a return of more than 70% across the department.
The completion of a work plan and professional development plan by all staff encourages personal responsibility for learning and development needs.
Through this process the department’s corporate learning needs are identified and incorporated in the Corporate Capability Plan.
Corporate Capability Plan
The Corporate Capability Plan identifies and maps the department’s capability gaps. The plan is used throughout the year to guide development initiatives and drive the content and availability of a number of programs.
Focus areas identified for development in the 2008-09 Corporate Capability Plan were:
leadership
staff selection
project management
cross-cultural awareness.
These areas were addressed through formal and informal development programs.
In-House Workshops
The in-house workshops provide a forum for staff to network and learn through sharing information and experiences related to a specific topic or theme. Sessions are conducted by People and Development consultants and/or external providers.
When P&D consultants visit regional offices the delivery of workshops are incorporated as part of the visit. Topics are selected by staff in that region relevant to them or corporate initiatives.
Workshop topics during 2008-09 included:
Stress Management
Time Management
Staff Selection
Work-life Balance
Succession Planning
Telephone and video conferencing have been utilised to deliver programs to regional offices and there are plans to increase the use of this delivery mechanism in 2009-10.
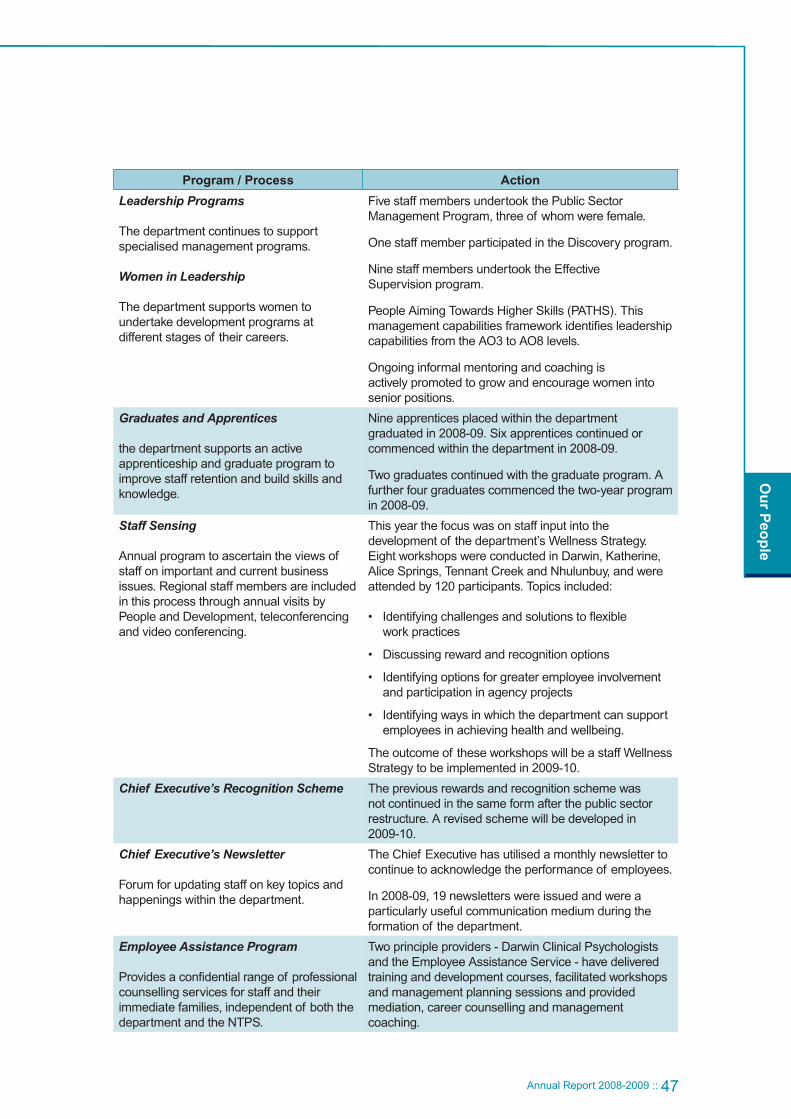
Annual Report 2008-2009 :: 47
Ou
r Peo
ple
Program / Process Action
Leadership Programs
The department continues to support specialised management programs.
Women in Leadership
The department supports women to undertake development programs at different stages of their careers.
Five staff members undertook the Public Sector Management Program, three of whom were female.
One staff member participated in the Discovery program.
Nine staff members undertook the Effective Supervision program.
People Aiming Towards Higher Skills (PATHS). This management capabilities framework identifies leadership capabilities from the AO3 to AO8 levels.
Ongoing informal mentoring and coaching is actively promoted to grow and encourage women into senior positions.
Graduates and Apprentices
the department supports an active apprenticeship and graduate program to improve staff retention and build skills and knowledge.
Nine apprentices placed within the department graduated in 2008-09. Six apprentices continued or commenced within the department in 2008-09.
Two graduates continued with the graduate program. A further four graduates commenced the two-year program in 2008-09.
Staff Sensing
Annual program to ascertain the views of staff on important and current business issues. Regional staff members are included in this process through annual visits by People and Development, teleconferencing and video conferencing.
This year the focus was on staff input into the development of the department’s Wellness Strategy. Eight workshops were conducted in Darwin, Katherine, Alice Springs, Tennant Creek and Nhulunbuy, and were attended by 120 participants. Topics included:
Identifying challenges and solutions to flexible work practices
Discussing reward and recognition options
Identifying options for greater employee involvement and participation in agency projects
Identifying ways in which the department can support employees in achieving health and wellbeing.
The outcome of these workshops will be a staff Wellness Strategy to be implemented in 2009-10.
Chief Executive’s Recognition Scheme The previous rewards and recognition scheme was not continued in the same form after the public sector restructure. A revised scheme will be developed in 2009-10.
Chief Executive’s Newsletter
Forum for updating staff on key topics and happenings within the department.
The Chief Executive has utilised a monthly newsletter to continue to acknowledge the performance of employees.
In 2008-09, 19 newsletters were issued and were a particularly useful communication medium during the formation of the department.
Employee Assistance Program
Provides a confidential range of professional counselling services for staff and their immediate families, independent of both the department and the NTPS.
Two principle providers - Darwin Clinical Psychologists and the Employee Assistance Service - have delivered training and development courses, facilitated workshops and management planning sessions and provided mediation, career counselling and management coaching.

48 :: Department of Business and Employment
Our People
INITIATIVES PLANNED FOR 2009-10
In keeping with the department’s commitment to grow and support our people, key initiatives planned for 2009-10 include:
Develop and implement a Wellness Strategy within the department. This will incorporate rewards and recognition, health and wellbeing and employee involvement initiatives
Provide ongoing training, growth and development opportunities for staff across the department, further multi-skill our employees through the encouragement of participation in leadership programs, staff rotations, coaching and continuing support for the graduate and apprenticeship programs
Assist managers and staff with transitioning functions and job changes following the implementation of major system projects as part of the Corporate Services Review program
Refine the department’s performance management systems through updating and modernising policies and documentation for both the 3Ps and executive contractor performance monitoring processes
Increase the use of video conferencing to bring networking, involvement and development opportunities to the regions
Explore opportunities for online learning to ensure equity of access to development opportunities and flexible delivery.
LEGISLATIVE COMPLIANCE
Reporting Against Employment Instructions
The department’s performance against each instruction is reported below.
Employment Instruction and Agency Requirements
Department’s Action
Number 1 – Recruitment
Agency to develop procedures on recruitment and selection for internal use.
Chief Executive required to report annually on the number of employees in each designation and variations since last report.
The department implemented policy and established procedures for use by managers and selection panels.
During 2008-09, 188 vacancies were advertised, 199 staff commenced and 146 separations were processed.
One appeal was lodged in 2008-09 and was disallowed.

Annual Report 2008-2009 :: 49
Ou
r Peo
ple
Employment Instruction and Agency Requirements
Department’s Action
Number 2 - Probation
Chief Executive to develop a probationary process for the agency and convey details of the probationary process to employees within their first week of reporting for duty.
The department probation policy has been implemented and is distributed to staff through workplace induction. In 2008-09, one employee was terminated under the probation process.
Number 3 – Natural Justice
The rules of natural justice to be observed in all dealings with employees.
The department endeavours to observe the principles of natural justice in all dealings with employees.
The Supervisors’ Toolkit includes a short guide to natural justice principles.
Number 4 – Performance Management
Chief Executive to report annually to the Office of the Commissioner for Public Employment (OCPE) on management training and staff development programs.
Chief Executive to develop and implement performance management systems for their agency.
Management training and staff development activities and performance management are reported though the 3P program, as described in this report.
Further information on management and staff development programs are included in this section of this report.
Number 5 – Medical Incapacity
No agency action or reporting requirements.
Department managers liaise with the People and Development (P&D) Unit and the OCPE for specific advice on resolving medical incapacity as required and on a case-by-case basis.
Number 6 – Inability to Discharge Duties
Chief Executive to provide OCPE with information on the extent to which this Employment Instruction has been used by the agency.
Chief Executive may establish procedures regarding inability within their agency.
Department managers liaise with the P&D Unit and the OCPE seeking specific advice and assistance as required and on a case by case basis. One process was commenced in 2008-09.
Number 7 – Discipline
Chief Executive to provide OCPE with information on the extent to which this Employment Instruction has been used by the agency.
Chief Executive may establish procedures regarding discipline within their agency.
The department has implemented performance management policy and procedures. P&D consultants work closely with managers to ensure processes are followed correctly.
No formal disciplinary action was required in the department during 2008-09.
Number 8 – Grievances
Chief Executive shall establish written procedures for the agency that should outline steps for dealing with grievances and be available to employees.
The department has implemented grievance policy and procedures. P&D consultants work closely with managers and employees to ensure processes are followed correctly.
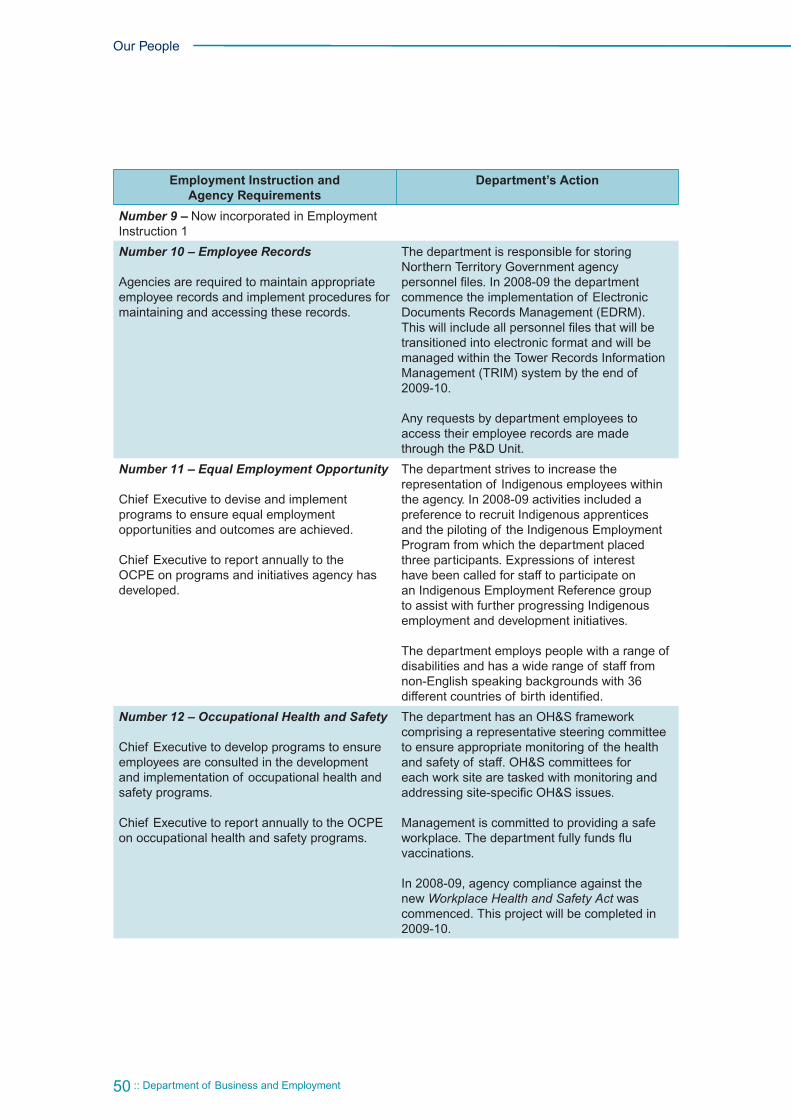
50 :: Department of Business and Employment
Our People
Employment Instruction and Agency Requirements
Department’s Action
Number 9 – Now incorporated in Employment Instruction 1
Number 10 – Employee Records
Agencies are required to maintain appropriate employee records and implement procedures for maintaining and accessing these records.
The department is responsible for storing Northern Territory Government agency personnel files. In 2008-09 the department commence the implementation of Electronic Documents Records Management (EDRM). This will include all personnel files that will be transitioned into electronic format and will be managed within the Tower Records Information Management (TRIM) system by the end of 2009-10.
Any requests by department employees to access their employee records are made through the P&D Unit.
Number 11 – Equal Employment Opportunity
Chief Executive to devise and implement programs to ensure equal employment opportunities and outcomes are achieved.
Chief Executive to report annually to the OCPE on programs and initiatives agency has developed.
The department strives to increase the representation of Indigenous employees within the agency. In 2008-09 activities included a preference to recruit Indigenous apprentices and the piloting of the Indigenous Employment Program from which the department placed three participants. Expressions of interest have been called for staff to participate on an Indigenous Employment Reference group to assist with further progressing Indigenous employment and development initiatives.
The department employs people with a range of disabilities and has a wide range of staff from non-English speaking backgrounds with 36 different countries of birth identified.
Number 12 – Occupational Health and Safety
Chief Executive to develop programs to ensure employees are consulted in the development and implementation of occupational health and safety programs.
Chief Executive to report annually to the OCPE on occupational health and safety programs.
The department has an OH&S framework comprising a representative steering committee to ensure appropriate monitoring of the health and safety of staff. OH&S committees for each work site are tasked with monitoring and addressing site-specific OH&S issues.
Management is committed to providing a safe workplace. The department fully funds flu vaccinations.
In 2008-09, agency compliance against the new Workplace Health and Safety Act was commenced. This project will be completed in 2009-10.

Annual Report 2008-2009 :: 51
Ou
r Peo
ple
Employment Instruction and Agency Requirements
Department’s Action
Number 13 – Code of Conduct
Chief Executive may issue guidelines regarding acceptance of gifts and benefits to employees. Chief Executive may issue agency specific Code of Conduct.
New staff are provided with the NTPS Principles and Code of Conduct as part of their commencement package. The code is also an integral component in the department Orientation Program that is mandatory for all new staff.
Refresher sessions are conducted by P&D staff for individual work units as required.
Number 14 – Part-time Employment
Chief Executive to advise unions on a six monthly basis of number of part-time employees by salary stream.
The department is supportive of part-time working arrangements and other flexible work arrangements and has a policy as part of its Flexible Work Practices policy. In 2008-09:
18 people were undertaking part-time work
12 people utilised recreation leave at half pay
eight people utilised extended leave for a career break
25 people have home-based work arrangements.
It is the department’s aim to make flexible working arrangements available wherever practical.

52 :: Department of Business and Employment
Output Performance Reporting
OUTPUT PERFORMANCE REPORTING
OVERVIEW
There have been significant changes to the agency’s outputs structure since the original 2008-09 Budget Papers were published. Output groups were moved from the former agencies of Department of Corporate and Information Services, Department of Business, Economic and Regional Development (DBERD) and Department of Employment, Education and Training (DEET) and now form the Department of Business and Employment.
The former Output Group Office Leasing Management was incorporated in the newly-titled Output Group Shared Services (formerly Corporate Services).
The performance measures and targets included in this annual report are consistent with the 2009-10 Budget Paper No. 3, which reflects the current output structure that has been in place for most of the reporting period.
Elements of the former DBERD have been incorporated into a new Output Group Business Development.
Elements of the Employment Output Group within the former DEET have become the new Output Group Employment.
The following diagram sets out the output structure:
Shared Services
Finance Services
Human Resource Services
Procurement Policy and Services
Information and Communication Technology Services
Office Leasing Management
Business Development
Business Development
Employment
Employment
Data Centre Services
Government Printing Office
NT Fleet

Annual Report 2008-2009 :: 53
Ou
tpu
t Perfo
rman
ce Rep
ortin
g
OUTPUT GROUP – SHARED SERVICES
This Output Group provides shared corporate services to support Northern Territory Government agencies and business divisions.
The outcome is the provision of cost-effective shared financial and human resource administration, procurement, information technology management and office leasing services for all Government agencies.
OUTPUT: FINANCE SERVICES
Responsibilities:
delivering finance services to Government agencies, including accounts, asset records, corporate tax returns, financial system management and administration of corporate credit cards
providing support, maintenance and development of the Government Accounting System (GAS), a financial reporting warehouse and a number of smaller corporate financial systems that are linked to GAS
providing regular finance-related training and awareness sessions for agencies.
Performance
Initiative or Activity Achievement
Automated Ledger Transfer Facility for inter-government transactions - finalise development and roll-out.
� The updated Ledger Transfer Facility was successfully implemented across all agencies by April 2009.
Receipts Processing System (RePS) – introduce into selected client agencies to assist in reducing manual processing of receipts
� 12 agencies are using the Receipts Processing System. Further enhancements have been identified to incorporate self service for RTM advance reimbursements, receipt prepayments and other minor administrative improvements in later versions.
Travel Request Information Processing System (TRIPS) – improve functionality and make the system available to all agencies
� Several major enhancements have been implemented to accommodate specific agency and whole of government requirements. In 2009 TRIPS will be fully integrated with the Government Accounting System (GAS) to automate travel allowance payments.
A further enhancement to TRIPS to automate payments for Fares out of Isolated Locations (FOILs) is planned.
Electronic Card Management System (ECMS) – enhance reporting and automate reconciliation processes
� While some progress has been made, this initiative has mostly been deferred with resources redirected to higher priority Corporate Services Review projects. It is likely that the initiative will be deferred until 2010-11.
��Achieved Partially Achieved ��Not Achieved ��Continues into 2009-10

54 :: Department of Business and Employment
Output Performance Reporting
Initiative or Activity Achievement
Improve system automation and process standardisation across Finance Services
�
�
Core accounts receivable and accounts payable functions across Government were centralised in July 2008. This has resulted in further process efficiencies and standardisation.
Selected successful tender for EIMS.
Develop and present training and awareness sessions for customers
�
�
Credit card and procurement training program addressing new Government credit card procedures was rolled out to all agencies.
ECMS training sessions updated to meet client needs were held throughout the year.
Corporate Taxation (GST and FBT) seminars delivered across Government.
Corporate Reporting information sessions and client training were held in Darwin, Katherine and Alice Springs.
Enhance agency extracts and business views in the financial reporting data warehouse to increase efficiency and reduce server requirements
� Business Objects software was upgraded to latest supported release which improved functionality but caused delays in advancing other financial reporting projects.
Technology retirement and new products provided a change of direction with business views in 2008-09. New products acquired and deployed and trials have commenced with the new functionality.
Enhance financial reporting to agencies to better meet their management information and statutory reporting requirements
� New reporting tools promise increased flexibility, better self service and more efficient report development and deployment.
A simple and interactive finance report was developed which replaced numerous budget reports and has been well received by clients.
Revise and implement new credit management policies
� A single customer master file was created to enable cross Government sharing of debtor information and benefits through streamlining records.
Enhance the Fixed Asset Wizard to remove the need to rely on external unsupported software
� Project put on hold while new whole of government Asset Management System is implemented by the Department of Planning and Infrastructure. Future requirements for this enhancement are to be reassessed in 2010-11 after the new system is implemented.
��Achieved Partially Achieved ��Not Achieved ��Continues into 2009-10

Annual Report 2008-2009 :: 55
Ou
tpu
t Perfo
rman
ce Rep
ortin
g
Finance Services Budget Performance Indicators
Changes in measures between 2008-09 Original Budget and 2008-09 Revised Budget; and movements between original Revised and Actual Budget 2008-09 are explained in Appendix F.
Performance Measures 2008-09 2009-10 Original Budget
Original Budget
Revised Budget
Actual
Quantity
Creditor Invoices processed 330 000 340 000 359 665 345 000
Debtor Invoices issued 32 000 32 000 30 960 33 000
Quality
Processing error rate <0.5% <0.5% <0.4% <0.5%
System availability 100% 100% 100% 100%
Timeliness
Creditor Invoices paid within 30 days - 90% 88% 90%
Average days to collect debts 45 55 52 55
Priorities for 2009-10
Continue to implement a number of corporate system and process improvements as part of the multi-year Corporate Services Review program to streamline the provision of corporate services across Government. The major initiatives in this program that will improve efficiency and service quality are described below:
Implement an Electronic Invoice Management System (EIMS) which will see invoices scanned and managed through the payment process electronically. This represents a major new corporate system which will have key functional requirements such as:
- invoice scanning and optical character recognition to provide automated data capture
- automated purchase order matching
- electronic workflow of invoice coding and approval throughout all agencies across Government
- financial and process reporting
- tracking of invoices with audit trails and automatic escalation provisions.
Design and implement an electronic purchase requisition workflow for Tier 1 (less than $15 000) purchases, which will see requisitions raised and approved online and automatic generation of purchase orders in the Government Accounting System
Identify and record standard forms used by agencies across Finance and Human Resource Services and provide recommendations on the most cost effective way of creating “Smart Forms” as part of the e-Government strategy

56 :: Department of Business and Employment
Output Performance Reporting
Financial reporting – continue to enhance existing financial reporting through improving security and access, consolidating similar reports for more useful output and developing reports more efficiently
Leverage new reporting products to pilot the design of new generation finance reports, focusing initially on refreshable financial management reports.
OUTPUT: HUMAN RESOURCE SERVICES
Responsibilities:
recruitment of employees
delivering payroll and other human resource administration services across government to assist agencies, employees and prospective employees
coordinating employment programs for graduates, new apprentices and Indigenous cadets
providing support, maintenance and development of the government’s core IT systems of PIPS, the employee self-service interface to PIPS (known as myHR) and the payment disbursement system (PAPMS)
coordinating the delivery of short course training, employment programs and job evaluation services for government agencies
coordinating the Northern Territory Public Service Traineeship Program with a particular focus on employing Indigenous apprentices in remote areas to build skills and a local workforce.
Performance
Initiative or Activity Achievement
Improvements to human resource reporting to meet agency management information and statutory reporting requirements
� During 2008-09, the department:
completed a full review of existing HR reports produced for agencies
automated some agency workforce demographic reporting
commenced development of reports for agency HR managers to track new and temporary employees
Develop strategies to support the Working Future initiative such as programs to facilitate an increase in the number of Indigenous people employed in the Northern Territory Public Service (NTPS) administrative stream
� The Indigenous Employment Program Administrative Stream was successfully piloted in 2009 with eight Indigenous job-seekers gaining a Certificate II in Business and permanent full-time employment as an Administrative Officer level 2. Agencies participating in the pilot program were the departments of Local Government and Housing, the Chief Minister, Business and Employment and NT Treasury.
Phase II of the pilot program is due to commence in early 2010, and will be made available to all agencies.
��Achieved Partially Achieved ��Not Achieved ��Continues into 2009-10

Annual Report 2008-2009 :: 57
Ou
tpu
t Perfo
rman
ce Rep
ortin
g
Initiative or Activity Achievement
Develop strategies to support the Working Future initiative such as delivery of cross-cultural training programs for NTPS employees
� A cultural competence framework, together with learning outcomes a range of new cross-cultural training courses has been developed in consultation with key agencies and in collaboration with Charles Darwin University.
It is anticipated that course delivery will commence in early 2010.
Implement a number of corporate system and process improvements as part of a multi-year program to streamline the provision of corporate services across government, including improvements to system automation and process standardisation across human resource services
� Payroll processing for casual nurses was automated, improving accuracy and timeliness of salary payments. A new payslip supplement was developed to provide greater payroll information to hospital shift-based staff, primarily nursing staff.
An HR Services Contact Centre was implemented on a trial basis providing a first point of contact for all payroll enquiries from employees across the NTPS.
Provision of additional funding of $1.6 million over three years to assist with the employment of 200 apprentices within government as part of the Jobs Plan Initiatives
Coordinate the Northern Territory Public Sector Traineeship Program with a focus on employing Indigenous apprentices in remote areas to build skills and local workforces
� A total of 236 apprentices have been employed under the Jobs Plan 3 initiative: 56% of these were Indigenous and 40% located in regional or remote workplaces.
To help maintain these participation rates the 2008-09 recruitment campaign for apprentices included advertising in diverse media outlets such as the Koori Mail, Tennant Times, Centralian Advocate, Territory Regional Weekly and Katherine Times as well as radio stations CAAMA, TEABBA, Yolngu and Radio Larrakia.
Apprenticeship disciplines cover a variety of vocations including:
Agriculture
Automotive Mechanical Technology (Heavy/Light Vehicle)
Business
Captive Animal Management
Children’s Services
Community Services
Conservation and Land Management
Dental Assisting
Drilling
Horticulture
Indigenous Education Worker
Information Technology
Laboratory Skills
Printing and Graphic Arts
Tourism
Veterinary Nursing
Implement a new human resources reporting framework
� Functional specifications were developed and procurement of a new HR reporting solution commenced.
��Achieved Partially Achieved ��Not Achieved ��Continues into 2009-10

58 :: Department of Business and Employment
Output Performance Reporting
Human Resource Services Budget Performance Indicators
Changes in measures between 2008-09 Original Budget and 2008-09 Revised Budget; and movements between original Revised and Actual Budget 2008-09 are explained in Appendix F.
Performance Measures 2008-09 2009-10 Original Budget
Original Budget
Revised Budget
Actual
Quantity
Payroll transactions processed - 920 000 932 324 950 000
Commencements and terminations processed 13 300 13 300 14 794 13 420
Quality
Processing error rate - 0.08% 0.03% 0.05%
Proportion of apprentices completing qualification - 80% 60% 80%
Timeliness
Payroll transactions processed in applicable pay period - 98% 98% 98%
Average days to commence new employees - 5 5 5
Workers compensation claims processed within statutory time limits 100% 100% 97% 100%
Priorities for 2009-10
HR Services will complete the pilot of the Indigenous Employment Program Administrative Stream and conduct a post implementation review of phase I of the pilot. Subject to the outcome of the review, phase II of the pilot will see the program expanded in 2009-10 to include all agencies.
The HR Services Division will go to the market to establish a panel of suitably qualified training providers to deliver a range of training courses under an endorsed cultural competence framework for the NTPS. It is expected that training will be incorporated in the department’s 2010 short course training calendar.
Through the implementation of several HR system enhancements and process automation initiatives committed savings will be delivered during 2009-10 and beyond as part of the multi-year Corporate Services Review program. Specific initiatives include:
- enhance the TRIPS system to enable automatic calculation of entitlements for Fares Out of Isolated Locations (FOILs)
- evaluate the pilot HR Services Contact Centre with a view to deciding and progressing an appropriate permanent solution
- streamline processing of Payroll Transaction Records (PTR) through processing high volume low-risk payroll transactions without secondary manual intervention

Annual Report 2008-2009 :: 59
Ou
tpu
t Perfo
rman
ce Rep
ortin
g
- develop electronic timesheets and workflow to facilitate automatic processing of hours worked, particularly overtime, for some key employee categories. The initial focus in 2009-10 will be timesheets for police.
Corporate reporting will complete the procurement and commence the implementation of a new HR Reporting Solution that will deliver a full suite of HR reports for use across government, ranging from practical reporting for program managers to summarised visual executive reporting. This solution will enable a comprehensive and flexible reporting capability for HR practitioners in all agencies. Implementation of this solution will extend into 2010-11.
Market testing and procurement of an electronic recruitment system are planned for 2009-10. The system will significantly enhance and modernise recruitment processes, with expanded functionality, automation improved job application lodgement, candidate management and workflow. A project to implement a selected e-recruitment system and business processes will continue into 2010-11.
Identify and record standard forms used by agencies across Finance and Human Resource Services and provide recommendations on most cost effective way of creating “Smart Forms” as part of the e-Government strategy.
OUTPUT: PROCUREMENT POLICY AND SERVICES
Responsibilities:
administering the Procurement Act and its subordinate legislation, which includes providing advice to agencies on compliance requirements, engaging industry stakeholders and proposing amendments to the legislation
establishing and administering across-government common use contracts
providing advisory and consulting services to agencies on procurement, This includes advice and assistance with procurement planning, specifying requirements, tender assessment and preparing recommendations
placing a strong focus on effective two-way communication with industry through regular contact with a number of industry groups including the Chamber of Commerce, NT Industry Capability Network and Contractor Accreditation Limited
ensuring that the relationship with industry is fostered to achieve successful outcomes for both sectors.

60 :: Department of Business and Employment
Output Performance Reporting
Performance
Initiative or Activity Achievement
Implement government policy to streamline a range of procurement initiatives in response to the Australian Government’s stimulus package and in an effort to “Cut Red Tape” in Northern Territory Government procurement processes
� Effective from 30 March 2009:
all procurement thresholds increased
Tier 3 – $50 000 but less than $200 000 - public quotations issued via Tenders Online.
Disclosure of tender assessment criteria weightings for all tenders with an estimated value of $200,000 and greater
Mandatory use of Agency Procurement Requisition Online (APRO) for Tier 2, $15 000 but less than $50 000, to Tier 5, $5 million and greater
Increased delegation to Agency Chief Executive’s for Certificate of Exemption from Public Tendering
Stage two of procurement reforms to establish a model of out-posted strategic procurement professionals in agencies
� Recruitment of staff and transfer of some existing staff from other agencies arranged, effective from 1 July 2009.
Implement changes to standard tender response schedules to simplify and clarify requirements
� Modifications to response schedules are implemented on an ongoing basis to reflect agency specific needs.
Develop and present information sessions targeting agency needs in the areas of government procurement policy and tendering requirements
� Six procurement awareness sessions were delivered for agencies throughout the year, covering general procurement and the use of the electronic tender assessment tool.
Quarterly meeting for Procurement Managers and the Executive Procurement Group were achieved.
Develop procurement strategies to support Indigenous employment as part of the Closing the Gap initiatives
Existing provisions with the Procurement Directions have been reviewed and the Procurement Policy unit has worked closely with the Employment division to identify how it can more accurately record achievements in employment.
Develop procurement policy which takes into account environmental sustainability
� Procurement Policy has worked with the Office of Climate Change within the Department of the Chief Minister and on the development of the NT Climate Change Policy.
Proposal prepared for the NT Government to adopt the Australian Procurement and Construction Council Sustainable Procurement Framework.
��Achieved Partially Achieved ��Not Achieved ��Continues into 2009-10

Annual Report 2008-2009 :: 61
Ou
tpu
t Perfo
rman
ce Rep
ortin
g
Initiative or Activity Achievement
Continue the development of the Agencies Purchase Requisitions Online (APRO) system to capture data following tender assessment, incorporate Procurement Review Board approvals workflow and provide enhanced agency reporting
� Due to changes in procurement thresholds on 30 March 2009 and the introduction of public quotations, this project has been broken down into three sub-projects. The first phase, incorporating agency recommendations, is complete and awaiting testing.
Phase two, Procurement Review Board (PRB) Approval Workflows and Phase three Reporting will be progressed in 2009-10.
Develop a business case for interfacing with the Australian Business Register to more efficiently allow tenderers to identify themselves and reduce repetitive data entry when registering to acquire tender documents
� This project was postponed due to the workload generated by changes to tendering thresholds in March 2009. Some technical issues require resolution prior to proceeding with the initiative.
��Achieved Partially Achieved ��Not Achieved ��Continues into 2009-10
Procurement Services Budget Performance Indicators
Changes in measures between 2008-09 Original Budget and 2008-09 Revised Budget; and movements between original Revised and Actual Budget 2008-09 are explained in Appendix F.
Performance Measures 2008-09 2009-10 Original Budget
Original Budget
Revised Budget
Actual
Quantity
Tenders awarded - 700 757 600
Quality
Addenda to tenders issued <20% 14% 31.7% 14%
Proportion of tenders lodged electronically
- 50% 46.5% 70%
Procurement Review Board appeals upheld as a proportion of tenders awarded
- 2% 1.25% 2%
Timeliness
Average days to issue tenders 7 7 4.9 7
Priorities for 2009-10
Continue the establishment and development of the Procurement Network of out-posted procurement consultants into line agencies
Ongoing development of procurement policy which takes into account environmental sustainability

62 :: Department of Business and Employment
Output Performance Reporting
Develop procurement strategies to support Indigenous employment as part of the Government’s Working Futures initiatives
Improving efficiency and service quality through increased automation and standardisation of processes across government by implementing significant corporate systems and business process changes across core service lines, including:
- continued development of the Agencies Purchase Requisitions Online (APRO) system to capture data following tender assessment, incorporate Procurement Review Board approvals workflow and provide enhanced agency reporting
- upgrading the Tender Document Management System (TDMS).
OUTPUT: INFORMATION AND COMMUNICATION TECHNOLOGY SERVICES
Responsibilities:
management of whole of government outsourced ICT services and security and the provision of ICT infrastructure and services across government
development of whole of government ICT strategies, architectures and policies encompassing IT systems and data communications, including internet and telephones
providing ICT security advice, incident response coordination and management of the NT Government’s internet and intranet web sites
identifying economic development opportunities for the ICT industry in the Northern Territory and delivers government components of the NT ICT Industry Strategic Plan to help grow the local ICT industry
developing telecommunications and broadcasting policy, including establishing strategies to improve telecommunications services, particularly to remote communities in the Territory
coordinating funding submissions to boost the provision of contemporary telecommunications services across the Northern Territory
providing government agencies with an advisory service to support management of their IT requirements and ICT environment
developing a records management policy, maintaining the records management system and providing records management support to agencies.

Annual Report 2008-2009 :: 63
Ou
tpu
t Perfo
rman
ce Rep
ortin
g
Performance
Initiative or Activity Achievement
Develop a sourcing strategy for the third generation of major ICT outsourcing contracts in 2009-10 to ensure maximum benefits to the government and continued reliability of systems and infrastructure
� Sourcing Strategy developed and endorsed by government for release of tenders in July 2009.
The tender process is due for completion in February 2010.
Transition to new contracts and delivery model expected by 30 June 2010.
Develop a roadmap for government in managing the identities of citizens and businesses needing to interact online with government
� Initiative re-scheduled to align with COAG On-Line and Communications Council national direction on authentication in 2009-10.
Progress an application development strategy to lower the cost and speed up development of applications which support online services
� The NTG ICT Application Strategy has been developed and is awaiting endorsement by the NTG Information Management Committee (IMC).
Prepare a business case for the upgrade to TRIM Context version 6 release 2
� The upgrade to TRIM 6.2 across the NTG is in progress and approximately 50% completed. The project is scheduled for completion in late December 2009.
Progressively review and plan the implementation of electronic documents records management (EDRM) solutions across government
� The move to EDRM is based on individual agency resourcing. Most agencies are waiting on the TRIM 6.2 upgrade project to finish as a prerequisite to moving to EDRM.
Revise the records management Certificate lll training module and develop Certificate IV training modules to assist agencies to comply with the records management provisions of the Information Act
� The Certificate IV training modules have been completed and the first training based on these new modules scheduled for September 2009.
Monitor the progress of initiatives incorporated in the NT ICT Strategic Plan
� The NTG ICT Strategic Intent is to be submitted for endorsement to the NTG IMC in July 2009 and then submitted for Territory 2030.
Assess the application of emerging information technologies that could lead to cost and service efficiencies across government
� Completed the development of the NTG ICT Strategic Intent which addresses emerging ICT as an enabler to cost and service efficiencies.
Continue to encourage skills development and recognise academic achievement
� $500 prize awarded to the highest achieving Year 12 Territory high school student in IT studies. ICT industry presentations at six Territory schools to encourage tertiary studies to further a career in ICT.
Continue monitoring the maintenance flights of IT service provider technicians to remote communities
� 40 hours of free maintenance time used to support local ICT remote community services.
��Achieved Partially Achieved ��Not Achieved ��Continues into 2009-10

64 :: Department of Business and Employment
Output Performance Reporting
Initiative or Activity Achievement
Complete the Advanced Training project, providing train the trainer and advanced ICT skills training in remote communities for Indigenous residents
� Final report accepted by the Australian Government and all funds acquitted. The Australian Government has adopted a similar training regime nationally to address social access issues identified in the Glasson response.
Continue to focus on accessing Australian Government funding for improved telecommunications services in the Territory, including telecommunications infrastructure in remote areas and wholesale competition through a second fibre optic cable connecting the Territory to other jurisdictions
� The NTG has bid for funding from the following national programs:
Blackspots - $250 million available nationally. Bids have been lodged for work in the Territory for a competitive fibre link and awarding of tenders is expected prior to the end of December 2009.
under the Australian Government’s Digital Regions program over four years to remote communities.
Through a focused information campaign, improve the uptake of digital TV and reduce the reliance on NT House as a television broadcasting site for Darwin
� Take-up now estimated at 73% in Darwin. There has been no action this year. Program was delayed to bring the activity into closer alignment with the Australian Government’s revised timeline for the cessation of analogue TV.
Enable not for profit community groups and non-government organisations to apply for ‘refurbished’ government computers at little or no cost
� ‘Computers for the Community’ initiative was launched in October 2007 and 400 computers have been provided to community organisations since then.
Prepare for the next round of ICT outsourced service contracts which are due to go to tender in late 2008-09
� Project Director appointed and project office established.
Steering committee formed along with agency advisory group.
Industry and agency consultation process completed.
Tenders released to the market late July 2009.
Work with all ICT service providers to achieve reduced carbon emissions associated with services delivered under new outsourced contracts
� Ensure new contracts have achievable targets for carbon emissions reductions. Work with the Department of the Chief Minister on NTG’s policy inclusion in ICT contracts.
Progress strategies to enhance communications infrastructure in the Territory, particularly in remote communities
� NTG invested $6.8 million in partnership with Telstra, the Northern Land Council and Rio Tinto to build a $34 million fibre communications link across Arnhem Land, connecting nine remote communities with high speed broadband.
Develop a strategy to enhance the Territory’s capacity in electronic service delivery, in cooperation with relevant agencies
� Completed e-services strategy consultancies for e-business, e-health and e-learning.
��Achieved Partially Achieved ��Not Achieved ��Continues into 2009-10

Annual Report 2008-2009 :: 65
Ou
tpu
t Perfo
rman
ce Rep
ortin
g
Information and Communications Technology Services Budget Performance Indicators
Changes in measures between 2008-09 Original Budget and 2008-09 Revised Budget; and movements between original Revised and Actual Budget 2008-09 are explained in Appendix F.
Performance Measures 2008-09 2009-10 Original Budget
Original Budget
Revised Budget
Actual
Quantity
Laptops/workstations 11 700 12 500 12 697 12 500
Average monthly user service calls to help desk 9 000 11 000 11 156 10 000
Remote communities connected to broadband - 17 17 21
Quality
Agency scorecard for desktop services (out of 10)
7.5 7.7 8.8 7.8
Outsourced services provided within agreed service levels
100% 85% 98% 87%
Records management system availability 99% 99% 98% 99%
Timeliness
Severe desktop faults restored within the service level agreement
100% 100% 100% 100%
Records management system work requests resolved within two days
100% 98% 98% 100%
Priorities for 2009-10
Develop National Broadband Network strategy to maximise opportunities in the Northern Territory under the $43 billion Australian Government investment.
National Broadband Network Backhaul Blackspots funding of fibre link into the Territory due for announcement in 2009-10.
Continue ICT industry presentations at NT schools to encourage tertiary studies to further a career in ICT.
Continue the Computers for Community initiative.
Develop a Northern Territory ICT Industry website to showcase capability and provide an information portal for the industry.
Assess, negotiate and sign ICT contracts for third generation ICT outsourcing contracts.
Successfully disengage from existing ICT contracts and transition to new arrangements.
Completion of NTG Voice network upgrade under the Telstra Telecommunications contract.

66 :: Department of Business and Employment
Output Performance Reporting
Successfully complete all Desktop Transformation projects under the Fujitsu contract.
Digital Regions Initiative to seek up to $7 million of Australian Government funding for e-Health/e-Learning initiatives and broadband infrastructure in identified 20 Territory Growth Towns.
Deploy with the Northern Territory Library (Department of Natural Resources, Environment, the Arts and Sport) and the Department of Education and Training public internet access to nine of the 20 remote Territory Growth Town.
Respond to climate change by developing and implementing strategies to reduce greenhouse gases associated with the operation of the NTG ICT.
Develop e-business strategies to meet the needs of Territory businesses, in partnership with service delivery agencies, especially in relation to licences and registrations with the Department of Justice and the Department of Regional Development, Primary Industry, Fisheries and Resources.
Continue the TRIM upgrade to all agencies by December 2009.
OUTPUT - OFFICE LEASING MANAGEMENT
Property leasing matters are overseen by the Government Office Accommodation Committee (GOAC), which is responsible for providing a whole of government approach to coordinating and managing the office accommodation portfolio. GOAC comprises the Chief Executives of the department, Treasury, the Department of Planning and Infrastructure (DPI) and the Commissioner for Public Employment.
Responsibilities:
management of leased properties, security and cleaning services which meet the service demands of government agencies
management of commercial accommodation leased by the NT Government. The portfolio currently consists of more than 400 leases over approximately 186 000 m² of space leased throughout the Northern Territory
providing corporate real estate services to government agencies including accommodation strategies, lease negotiation, contract procurement and tenant advocacy. This includes managing relationships with landlords, developers and other government agencies which supply tenancy services.

Annual Report 2008-2009 :: 67
Ou
tpu
t Perfo
rman
ce Rep
ortin
g
Performance
Initiative or Activity Achievement
As part of the Government Real Estate Group, draft a national sustainability framework for government occupied office premises
� Participation in three ongoing working groups working towards the draft framework - Green Leasing, Asset Management and Effective Portfolio Utilisation.
The framework is to be presented to Council of Australian Governments in 2009 for implementation in 2010.
Develop the commercial property management framework
� GOAC has endorsed the management framework.
Northern Territory Property Management (NTPM) is developing five year portfolio plans for each urban centre in conjunction with client business plans, and the management framework.
Implement a new suite of Standard Lease Documents: Office, Retail and Industrial, and Green Lease Schedule
� Three new standard lease documents are drafted ready for use as part of a broader policy framework.
Ongoing consultation with the Property Council of Australia (PCA) regarding key commercial terms.
It is intended that the new lease will be implemented by end of December 2009.
Evaluate current and future requirements for a leased property management system
NTPM is working with DPI to develop a scope of NTPM’s requirements so they can be addressed as part of the new whole of government asset management system – funding yet to be confirmed.
Development of a formal business case underway with SAP.
Work with property owners to achieve reduced carbon emissions in leased government accommodation
� Adopt a partnership approach to develop green occupancy agreements between NTPM, client agencies and building owners.
Green occupancy agreements developed in all leases > 2000m2 and terms of three years. Develop, implement and monitor via Building Management Committees.
Develop and implement policies for a Green Leasing Strategy to support the government’s Climate Change Policy
� Draft policy has been developed with proposed policy settings consistent with other state and territory Jurisdictions. The recommended rating tools are: National Australian Built Environment Rating System (NABERS) – Energy Efficiency; Green Star – Environmental Sustainability.
Recommended policy settings are included in the Department of the Chief Minister Climate Change submission to government.
��Achieved Partially Achieved ��Not Achieved ��Continues into 2009-10

68 :: Department of Business and Employment
Output Performance Reporting
Initiative or Activity Achievement
Work with the Department of the Chief Minister (DCM) to develop policy and procedures for land leasing in remote communities for non-housing infrastructure.
� NTPM sits on a working group with other key agencies run by DCM, which is developing a lease policy for remote communities.
The department, with input from NTPM, is preparing a strategy to support Working Futures 20 Territory Growth Towns. As part of strategy development, agency surveys have been distributed by NTPM to identify potential tenants in the 20 Territory Growth Towns.
The process for developing Government Business Centre (GBC) model commenced.
DCM is preparing a draft submission to government.
��Achieved Partially Achieved ��Not Achieved ��Continues into 2009-10
Office Leasing Management Budget Performance Indicators
Changes in measures between 2008-09 Original Budget and 2008-09 Revised Budget; and movements between original Revised and Actual Budget 2008-09 are explained in Appendix F.
Performance Measures 2008-09 2009-10 Original Budget
Original Budget
Revised Budget
Actual
Quantity
Property leases 148 170 183 195
Area leased (000m2) 172 183 187 200
Average cost per m2 $280 $274 $262 $285
Quality
Area of leased commercial property accredited for energy efficiency under NABERS 4 Star or better (m2)1 - 11 437 11 437 13 577
Timeliness
Rental payments made on time 99.8% 99.0% 99.0% 99.0%
1. NABERS is the Australian built environmental rating system, 4 Star is equivalent to Australian best practice.
Priorities for 2009-10
- servicing requests for leased commercial property in urban and remote areas in a timely and professional manner
- establishing Government Business Centres in the 20 Territory Growth Towns in conjunction with the Department of the Chief Minister

Annual Report 2008-2009 :: 69
Ou
tpu
t Perfo
rman
ce Rep
ortin
g
- provision of central lease administration services for land tenure in remote communities.
Reduce the impact of the leased office portfolio on the natural environment by developing and implementing strategies to reduce energy consumption and promote recycling.
Develop and implement policy in relation to Workplace Design and Management to reduce the time and costs associated with the design, installation and maintenance of fit-outs.
Obtain Government approval for the Portfolio Management Framework endorsed by the Government Office Accommodation Committee. Once approved implement the framework via leasing initiatives and other actions to improve overall portfolio performance.
OUTPUT GROUP: BUSINESS DEVELOPMENT
This Output Group provides strategic programs and activities to support sustainable business development.
The outcome is substantial and lasting economic benefits for business and the broader community.
Output: Business Development
Responsibilities:
assisting in the development of a better informed and capable Territory business community through providing business information, access to training, coaching and business planning programs
provision of strategic policy advice and analysis to enhance economic development, business competitiveness and productivity
pursuing industry development opportunities in specific industry sectors such as Defence support
stimulating business innovation, research and knowledge development
providing strategic business advice and administrative management of industry development funding programs and ensuring the loan portfolio is prudently managed
providing Territory Business Centres as a first contact and referral point for many business-related services and products from government agencies, including start-up business information, and assistance with the lodgement and issue of permits and registrations required to operate in business.

70 :: Department of Business and Employment
Output Performance Reporting
Performance
Initiative or Activity Achievement
The Business Enterprise Centre (BEC NT) is contracted to provide new and intending business owners with workshops that cover the basics of running a business
� This workshop series will continue to be held across all major centres in the Territory.
110 workshops were delivered to 1175 participants, including:
20 workshops in Alice Springs (178 attendees)
10 in Katherine (40)
five in Tennant Creek (five)
five in Nhulunbuy (26).
877 client management services were also provided.
Procurement Liaison � 53 matters were referred to Procurement Liaison, compared to 46 in 2007-08.
ecoBiz NT is a business efficiency program to assist NT businesses reduce their environmental impact
� The pilot program was successfully launched in late 2008. The program has been reviewed and processes refined to achieve maximum effect. 17 grants totalling $314 965 were delivered and a reduction of 542 tonnes of CO2 per year was achieved.
October Business Month (OBM) is targeted at providing new business management knowledge and ideas to the NT business community
� Up-to-date information provided on topics identified by the business community.
OBM 2008 delivered a total of 94 events with 4424 attendees, broken into regions as follows:
Darwin – 51 events, 2860 attendees
Katherine – 10 events, 325 attendees
Tennant Creek – six events, 192 attendees
Alice Springs – 14 events, 807 attendees
Nhulunbuy – three events, 45 attendees
Community Roadshow – 10 events, 195 attendees.
��Achieved Partially Achieved ��Not Achieved ��Continues into 2009-10

Annual Report 2008-2009 :: 71
Ou
tpu
t Perfo
rman
ce Rep
ortin
g
Initiative or Activity Achievement
The Territory Business Upskills program offers existing Northern Territory small businesses the opportunities to identify areas for improvement that can increase the capacity and capability of each enterprise
� Identification of potential new workshop topics in conjunction with consultants and clients to address emerging business issues.
78 workshops were delivered to 656 attendees, as well as 62 Business Coaching Sessions including:
Darwin – 33 workshops, 344 attendees and 42 coaching sessions
Katherine – 17 workshops, 92 attendees and one coaching session
Tennant Creek – nine workshops, 49 attendees
Alice Springs – 18 workshops, 162 attendees and 15 coaching sessions
Nhulunbuy – one workshop, nine attendees, two coaching sessions
Jabiru – two coaching session
Territory Business Growth (TBG) Program
� The TBG program provided 111 grants totalling $502 934 to NT businesses to develop formal business plans that address areas of need for each business. The program is available Territory wide and is delivered by suitably qualified business consultants.
Appendix G provides a regional breakdown of the businesses that have completed the program.
Client Management Program
Met with industry associations conducting presentations on government services and support
� 2400 businesses were visited across regional Territory centres promoting NT and Australian Government assistance programs.
Business issues reported to management and 9 business snapshot surveys were conducted.
Reviewed the Meet the Buyers program for improvements to business needs – better met outcome was the Government to Business Expo
� Following the success of Meet the Buyers workshops and attendee feedback to involve all levels of Government to create a one stop shop forum for Territory businesses, the Government to Business Exhibition was developed. First one held in Darwin July 2009 and Alice Springs August 2009.
Territory Business Centres (TBC) provide a single point of contact for business to access government services and requirements
� TBCs operate in Darwin, Katherine, Tennant Creek and Alice Springs. More than 120 000 client contacts were made in 2008-09.
Appendix G provides a breakdown by month and by region.
��Achieved Partially Achieved ��Not Achieved ��Continues into 2009-10

72 :: Department of Business and Employment
Output Performance Reporting
Initiative or Activity Achievement
The Federal Minister for Innovation, Industry, Science and Research announced the National Innovation System (NIS) Review on 22 January 2008 and invited submissions from all jurisdictions. Further Northern Territory input and advocacy will be important when the NIS Review report and the Australian Government’s policy and program responses are released
� As a consequence of the review of NIS, the Territory endorsed the establishment of a Framework of Principles for Innovation Initiatives, to be completed in 2009-10.
The Australian Department of Education, Science and Training launched a new initiative in 2007 (Scientists in Schools) aimed at inspiring school children to enter science as a career
� The department and the Northern Territory Research and Innovation Board continued to encourage Territory schools and scientists to participate in the Scientists in Schools initiative with national and Territory academic institutions and Commonwealth agencies based on the success of the 2007-08 program.
Backing Territory Research – Research Priorities for the Northern Territory 2008-15
� Development of a comprehensive implementation strategy was delayed following the Australian Government’s decision to delay the release of the White Paper Powering Ideas: an innovation agenda for the 21st Century until the release of the 2009-10 budget in May 2009. This will carry over to 2009-10.
NT Research and Innovation
� The NT Research and Innovation Board recommended funding of 14 research projects and five innovation projects totalling $391 000.
Refer to Appendix H.
2009 NT Research and Innovation Awards
� Decision made to hold the awards on a biennial basis with the next awards to be held in 2010.
The Charles Darwin Research and Innovation Medal was introduced acknowledging lifelong or sustained contribution to innovation. Inaugural medals are to be presented at the Charles Darwin Symposium Dinner September 2009.
Provide support to ensure that Territory businesses utilise the department’s wide range of business development programs
� Support was provided to NT industry associations and business to ensure effective utilisation of the department’s programs. This was particularly important following the onset of the global financial crisis and the subsequent changes to business conditions.
Continue membership and input to the aviation inter-agency advisory committee leading to the development of a three-year aviation strategy
� The department chaired and managed the NT Aviation Committee and developed a draft NT Aviation Strategy to be released in late 2009. Assistance and support was also provided for the development of the Darwin Aviation Hub by Jetstar Airlines Limited.
��Achieved Partially Achieved ��Not Achieved ��Continues into 2009-10

Annual Report 2008-2009 :: 73
Ou
tpu
t Perfo
rman
ce Rep
ortin
g
Initiative or Activity Achievement
Continue ongoing liaison with key sector service providers to ascertain likely changes to aircraft schedules and load capacity
� Liaison continued with aviation service providers on aircraft placement, schedules, load factors, utilisation data and related industry developments, in conjunction with the Tourism NT Director Aviation, including action to achieve more competitive operating conditions in the Territory.
Continue to encourage, facilitate and support the development of biodiscovery-based research projects with the potential to generate economic benefits for the Northern Territory. Key among these is with the US-based National Cancer Institute, which will continue a large scale screening program of Northern Territory biological resources in the coming year
� The department continued to encourage biodiscovery based research projects with five Benefit Sharing Deeds executed by organisations, including Australian and international universities, a listed biotech company) and a further six drafts issued for consideration. An extensive initial screening by the US National Cancer Institute for novel compounds with potential to generate economic benefit is continuing. The NT has been recognised nationally and globally by the United Nations Working Group on Access and Benefit Sharing of Genetic Resources under the Convention on Biological Diversity for its legislative leadership in managing access to biological resources.
Small Business Ministerial Council (SBMC) – host and manage the secretariat duties of the SBMC
� Preparation for the July SMBC meeting and associated Indigenous Small Business Development Seminar in Darwin.
Three Senior Officials meetings were held during 2008-09, including a face to face meeting in Alice Springs in February 2009. Planning for an officials meeting in Darwin in July 2009 was also advanced.
Assisting with the continued broadening and growth of the Territory’s economic base
� Planning documents on prospective sectors were completed and used to guide commencement of prospective sector development initiatives.
In conjunction with other agencies, commence a review of the investment facilitation process and ways in which it could be improved
� In conjunction with other agencies, development commenced on a web-based investment facilitation portal and framework. An interagency investment group is to be established to oversee its future development and management.
Investment Services – Common User Area
� The department continued its key role in promoting the Common User Area and its availability and benefits to project proponents and prime contractors in the mining and oil and gas industries. A strategic management group was established to guide future development, consisting of the department, Land Development Corporation, Darwin Port Corporation, Northern Territory Industry Capability Network and the Manufacturers Council.
��Achieved Partially Achieved ��Not Achieved ��Continues into 2009-10

74 :: Department of Business and Employment
Output Performance Reporting
Initiative or Activity Achievement
Provide specialist advice and input related to the planning for, and development of, the East Arm Marine Services Precinct and the development of marinas and berthing on Darwin Peninsula
� Specialist advice and input was provided to the Land Development Corporation on planning for the East Arm Marine Maintenance Precinct. Further progress on the marina and berth development was also achieved.
Commercial Services – continue to provide strategic business advice and administrative management of industry development funding programs and ensure the department’s loan portfolio is prudently managed
� The department provided a range of grant and sponsorship programs to eligible businesses and industry organisations across the Territory. Details of all grant payments during 2008-09 are at Appendices I to J.
Strategic business advice and administrative management support for industry development funding programs was provided throughout the year. This encompassed:
departmental programs (Territory Business Growth, Industry Development Grants, Industry Association Grants, ecoBiz NT and sponsorships)
Department of Regional Development, Primary Industry, Fisheries and Resources programs (Indigenous Business Development, Regional Economic Development, Exceptional Circumstances Drought Scheme (Commonwealth)
DCM programs (Trade Support Scheme) T-NT program.
The department’s loan portfolio was also managed prudently. Details are at Appendix K.
Industry Participation Plans � Implementation of the Building Northern Territory Industry Participation (BNTIP) policy continued. Further reforms to the operational arrangements and procurement policies relating to industry participation were introduced. Refer Appendix M.
Additional Industry Participation Plans relating to major projects receiving government assistance were also finalised or commenced by proponents, including the three SIHIP Alliances, Territory Alliance, New Future Alliance and Earth Connect Alliance, in accord with the BNTIP policy during the year.
Continue to work with the Land Development Corporation (LDC) to develop and promote the Defence Support Hub and to attract defence support businesses and defence related contracts to the Territory
� Development of the Defence Support Hub in collaboration with the Land Development Corporation continued during 2008-09.
In particular, the hub was promoted to small and medium enterprises (SMEs) and to prime Defence contractors at national defence industry conferences, exhibits and elsewhere.
��Achieved Partially Achieved ��Not Achieved ��Continues into 2009-10

Annual Report 2008-2009 :: 75
Ou
tpu
t Perfo
rman
ce Rep
ortin
g
Initiative or Activity Achievement
Promote living in Katherine via a DVD to inform defence personnel and families about to be posted, or considering a posting, to RAAF Base Tindal
� The DVD to promote living in Katherine to Defence personnel and families was well received.
Facilitate the development of a hand guide to Territory Government services and contacts for Defence personnel and their families to use when posted to the Territory
� Project redesigned to take advantage of low cost, environmentally friendly technology. Information now available on the department website.
Study of the benefit to the Katherine economy of the Defence presence at RAAF Base Tindal
� The study was completed and the results fed into the wider Katherine Regional Economic Study.
Promote and market the Northern Territory and its defence support industry through Defence media, at conferences and exhibits
� The NTG hosted exhibits at the Land Warfare Conference in Brisbane in October 2008 and the Defence and Industry Conference in Adelaide in June 2009.
NT SMEs and business associations also participated.
Industry capability was particularly promoted to Defence and prime contractors.
Continue to engage with Defence prime contractors who have won contracts to deliver through life support service contracts on platforms based in the Territory, such as the Armidale Class Patrol Boats, the Abrams Tanks and ASLAVs and Tiger Armed Reconnaissance Helicopters
� Good relationships are now established with the key contractors. The Abrams tanks and ASLAVs contract for through-life support is yet to be awarded by Defence and a decision is expected in early 2010.
Continue to support AIDN-NT to implement the Northern Territory Defence Support Industry Development Strategy and other projects
� The Defence Support Division continued to assist AIDN-NT with the implementation of the Strategy, prime contractor visits, exhibiting and networking at major conferences, arranging forums for SME’s and support for the Annual Gala Dinner.
Continue to promote to Defence the Northern Territory industry capability to support Defence equipment based in the Territory
� Promotion of NT industry capability continued as an ongoing priority through engagements with Minister for Defence and Minister for Defence Personnel, Materiel and Science and senior Defence representatives.
Assisted local industry to promote its capabilities on the new Defence e-Portal, with over 100 NT businesses now on the database promoting more than 1000 capabilities.
��Achieved Partially Achieved ��Not Achieved ��Continues into 2009-10

76 :: Department of Business and Employment
Output Performance Reporting
Business Development Services Budget Performance Indicators
Changes in measures between 2008-09 Original Budget and 2008-09 Revised Budget; and movements between original Revised and Actual Budget 2008-09 are explained in Appendix F.
Performance Measures 2008-09 2009-10 Original Budget
Original Budget
Revised Budget
Actual
Quantity
Licence and business infrastructure services provided by Territory Business Centres
- 100 000 120 463 100 000
Economic reports and fact sheets issued - 35 54 35
Industry and investment projects facilitated - 71 67 60
Businesses and Industry Associations provided with financial assistance
150 100 222 100
Research and Innovation grants 10 19 19 15
Quality
October Business Month participant satisfaction1 - 90% 94% 90%
Upskills Workshops participant satisfaction1 - 96% 97% 96%
Timeliness
Business Growth applications assessed within 30 days
- 100% 100% 100%
1. This measure is defined as the proportion of participant evaluation responses recording an above average or excellent rating.
Priorities for 2009-10
Continue to promote to Defence the Northern Territory industry capability to support Defence equipment based in the Northern Territory.
Assist with the continued broadening and growth of the Territory’s economic base.
Evaluate and deliver a suite of professional business development programs and services to people and businesses across the Territory.
Assist Territory business and industry to adjust to changed business and market conditions.
Deliver an internal investment assessment framework for the department to help evaluate requests for government assistance, including a web-based investment information portal, an investment inquiries database and an investment project assessment tool for project developers.
Continue to work with the Land Development Corporation to develop and promote the Defence Support Hub and to attract Defence support businesses and Defence related contracts to the Northern Territory.

Annual Report 2008-2009 :: 77
Ou
tpu
t Perfo
rman
ce Rep
ortin
g
Promote and market the Northern Territory and its Defence support industry through Defence media, at conferences and exhibits.
Continue to engage with Defence prime contractors who have won contracts to deliver through life support service contracts on platforms based in the Territory, such as the Armidale Class Patrol Boats, the Abrams Tanks, ASLAVS and Tiger Armed Reconnaissance Helicopters.
Continue to support AIDN-NT to implement the Northern Territory Defence Support Industry Development Strategy and other projects, such as facilitating visits by leaders of Defence and Defence prime contractors and to lead delegations of Territory SMEs interstate with the objective of facilitating engagement in prime contractor bids and projects.
Continue key role of promoting the Common User Area and its availability and benefits to project proponents and prime contractors in the mining and oil and gas industries.
Coordinate an interagency investment group to oversee the future development and management of the investment portal and framework.
The Territory Business Growth program will expand to include the tourism business sector and will work with regional businesses to ensure they can maximise their opportunities from Working Futures strategies.
OUTPUT GROUP: EMPLOYMENT
This Output Group provides the capacity to forecast and determine employment opportunities and promotes the Northern Territory nationally and internationally as a place to live and work.
The outcomes are a diversified skill base with fewer skills shortages and maximised employment opportunities for Territorians.
Output: Employment
Responsibilities:
providing strategic advice and forecasts on employment opportunities in the Northern Territory to ensure a skilled workforce is available to meet identified employment needs
developing, promoting and implementing employment strategies, including coordination of Indigenous employment and Regional Job Hubs
matching labour and skills development supply and demand through Workforce Growth NT and skilled migration to meet employers’ needs, particularly in the regions
providing advice and information about business and skilled migration programs and promoting the Territory to potential skilled and business migrants overseas to settle, work and establish businesses and contribute to the skills, population and overall economic base of the Territory.

78 :: Department of Business and Employment
Output Performance Reporting
Performance
Initiative or Activity Achievement
The Business and Skilled Migration Strategy enters its fourth year of implementation in 2008-09. Key elements of the strategy are communication and promotion.
� The NT has increased its share of the Australian skilled migrant intake to 0.62% in 2007-08. Refer Appendix N.
Visas for nominations and sponsorships certified increased to 1340.
Established an officer in Alice Springs to support the strategy.
Promotion of the Territory as a business and skilled migration destination will continue
� In 2008-09. the department participated in five international migration exhibitions in three countries: South Africa, New Zealand and the United Kingdom.
In addition to the international migration exhibitions, the department worked with the Charles Darwin University to promote the Territory as an international student destination in China, Indonesia and the Philippines.
The NT Business and Skilled Migration Strategy Implementation Working Group will continue to meet
� The Implementation Working Group met in 2008-09 to provide advice to government on the strategy.
An independent evaluation of the progress of the strategy was undertaken during 2008-09.
Outcomes of the review are to be incorporated into 2009-10 implementation plans where appropriate.
Jobs Plan 3 - a comprehensive, long-term strategy to create a highly skilled and flexible workforce and to maximise employment opportunities for all Territorians
� Jobs Plan 3 reached completion in 2009 and achieved:
the target of 10 000 apprentice and trainee commencements over four years
increasing the knowledge of the labour market amongst government, industry and the community through the release of the Workforce NT Report 2008 and the NT Occupation Shortage list 2009.
Indigenous Training for Employment Program (ITEP)
� ITEP supported 13 ongoing programs across all regions of the NT in a combination of accredited and non-accredited training, and to achieve employment outcomes.
Initiated 12 new programs in 2008-09.
Improved processes supported by systems enhancements are being implemented
� Commenced enhancement of the Territory Worker Database.
The Northern Territory Occupation Shortage List 2009 was released in March 2009
� The list is reviewed annually in consultation with industry, businesses, government agencies and the community to take into account emerging and existing occupation shortages.
More than 50 responses were received from stakeholders, resulting in 18 new occupations being added to the list in 2009.
��Achieved Partially Achieved ��Not Achieved ��Continues into 2009-10

Annual Report 2008-2009 :: 79
Ou
tpu
t Perfo
rman
ce Rep
ortin
g
Initiative or Activity Achievement
Skilled Worker Campaign � The campaign included a comprehensive program of local and interstate print, radio and exhibition promotions. Three job shows were held interstate, in Newcastle, Adelaide and Melbourne.
Workforce Growth NT � The Workforce Growth NT unit has been established within the department.
Initial consultations on the Regional Job Hubs in Nhulunbuy and Tennant Creek were completed in preparation for implementation in the 2009-10 year.
��Achieved Partially Achieved ��Not Achieved ��Continues into 2009-10
Employment Services Budget Performance Indicators
Changes in measures between 2008-09 Original Budget and 2008-09 Revised Budget; and movements between original Revised and Actual Budget 2008-09 are explained in Appendix F.
Performance Measures 2008-09 2009-10 Original Budget
Original Budget
Revised Budget
Actual
Quantity
Workforce Growth NT / Skilled migration database registrations
- International - 550 543 550
- Interstate - 2 000 2 158 2 000
Employment programs developed and introduced1
- - - 2
Business and skilled migration visas for nominations and sponsorships certified
- 870 1 340 850
Quality
Client satisfaction with employment programs1 - - - 80%
Timeliness
Timeframes met as agreed1 - - - 100%
1. New measure in 2009-10; data not available for 2008-09.
Priorities for 2009-10
Business and Skilled Migration Strategy - continue awareness raising activities with employers and businesses, and strengthen regional business and skilled migration services.
Review the Northern Territory Occupation Shortage List, due for release in March 2010.
Continue the ITEP grant program to support initiatives for Indigenous Territorians in regional and remote areas.

80 :: Department of Business and Employment
Output Performance Reporting
Recruit Workforce Growth NT officers in Katherine and Alice Springs to provide a local conduit to ensure employees and employers in the regions are linked into all elements of the Territory Worker Campaign.
Continue to participate in targeted migration promotions activities in countries which are key sources for skilled migrants and for occupations where ongoing skill shortages exist in the Territory.
Continue joint promotional work with the International Office of the Charles Darwin University with a focus on the major source countries for overseas tertiary students.
Develop and implement a whole of government employment strategy which will include direction and initiatives to support the Territory Workforce through a workforce development framework.
Enhance the Territory Worker Database as a tool to link employees with Territory employers.
Promote employment opportunities and skill shortages in the Territory through regional and interstate job shows and target migration expos.
Establish Regional Job Hubs in Nhulunbuy and Tennant Creek.
Endeavour to influence national skilled migration policy by engaging with the Department of Immigration and Citizenship and profiling the Territory’s employment environment and the needs of Territory employers.
GOVERNMENT BUSINESS DIVISIONS
Data Centre Services
Data Centre Services (DCS) manages the operations of the Northern Territory Government’s mainframe, mid-range, application services and other centralised computer processing facilities.
The outcome is that the government’s critical business systems operate in a computing environment that is flexible, reliable and secure, with high levels of access and availability.
Responsibilities:
mainframe application hosting and management
mid-range server application hosting and management
database administration
enterprise data storage management
hosting information and communications technology (ICT) infrastructure for agencies and contracted service providers
operation of the Chan Data Centre facility
management of various whole of government information technology functions, electronic security and identity management.

Annual Report 2008-2009 :: 81
Ou
tpu
t Perfo
rman
ce Rep
ortin
g
Performance
Initiative or Activity Achievement
Provide the host environment for the government’s shared services portal
� Completed. DCS has implemented a shared hosting infrastructure for the SharePoint suite of software.
Finalise the electronic passport2 system (ePASS2) to manage all government employee identity information and communication technology service requests
� ePASS2 was successfully implemented in July 2008.
Implement measures to mitigate the risks associated with a Data Centre disaster scenario and strengthen capability to respond to a disaster or major business interruption
� Project in progress but not completed. A submission proposing options to government is expected to be finalised in early 2010.
Develop a strategic forward plan for future enterprise storage requirements
� DCS implemented a new enterprise storage solution in 2008 and government business systems data has been consolidated into this environment.
Commence a benchmarking study of mid-range services to examine market parity
� Not completed. This work will be undertaken in 2009-10 as part of an extensive benchmarking study encompassing mainframe, mid-range, data storage and data centre carbon footprint.
Develop a strategic capital replacement framework for major IT infrastructure over a four-year rolling replacement program
� A four-year capital replacement program has been developed and approved.
Expand fully managed computing services for agencies
� DCS has continued to expand its fully-managed computing services with a footprint of over 230 virtual servers providing end to end management for government business systems.
Deliver more efficient application hosting and reduced carbon emissions through server virtualisation technologies
� DCS has implemented a ‘virtualise first’ policy where business systems are hosted in a virtualised server environment rather than physical server devices.
Contain the carbon footprint of the Chan Data Centre within an energy intensive business environment that is experiencing significant and sustained growth
� DCS has delivered a reduction in total potential carbon emissions of 50 metric tonnes per month, largely as a result of server virtualisation.
Implement the second phase of the ePASS2 system to manage government employee identity information and ICT service requests
� Completed. Increased functionality was delivered through the upgrade of ePASS to the latest release of the software.
Implement a central service desk as the next phase of adopting the ITIL service delivery framework
� Completed. All DCS requests for services are now routed through a central ITIL service desk.
��Achieved Partially Achieved ��Not Achieved ��Continues into 2009-10

82 :: Department of Business and Employment
Output Performance Reporting
Data Centre Services Budget Performance Indicators
Changes in measures between 2008-09 Original Budget and 2008-09 Revised Budget; and movements between original Revised and Actual Budget 2008-09 are explained in Appendix F.
Performance Measures 2008-09 2009-10 Original Budget
Original Budget
Revised Budget
Actual
Quantity
Billable mainframe (CPU) seconds processed per month 1.65M 1.72M 1.65M 1.70M
Servers hosted in a secure Data Centre facility 440 440 440 440
Fully managed servers 270 299 311 325
Terabytes of Storage Area Network 35 51 75 65
Quality
Unplanned outages per month – mainframe services - - 0.1 -
Unplanned outages per month – virtual server environment - 3 3 3
Timeliness
Response time for mainframe services (<5 seconds) 98.5% 98.5% 98.3% 98.5%
Performance report for mid-range services provided to clients each month <10 days <10 days <10 days <10 days
Priorities for 2009-10
Meeting agency demand for fully managed computing services.
Upgrading mainframe computing infrastructure.
Implementation of a new back-up solution to improve efficiency in the back-up of NTG business data.
Containing the carbon footprint of an energy intensive facility.
Ensuring minimal disruption and continuity of critical government business systems by enhancing disaster recovery capabilities.
Improving technological and computing capabilities through:
- the acquisition of a new mainframe processor
- further expansion of virtual server infrastructure.
Infrastructure review of the Chan Data Centre.
Implementing improvements to the ePASS system to improve and automate ICT service request in preparation for the third generation outsourcing contracts.
Implementing the use of electronic forms interface technologies integrated to key government IT systems to replace paper forms.

Annual Report 2008-2009 :: 83
Ou
tpu
t Perfo
rman
ce Rep
ortin
g
Government Printing Office
The Government Printing Office (GPO) delivers efficient and high quality specialised and general printing and government publications, involving the use of both in-house and local printing industry sources.
The outcome is printing and publications that meet client requirements in respect of time, cost, quality and security.
Responsibilities:
Parliament and Government agencies in a secure environment including the Daily Hansard, Bills, Acts, subordinate legislation, Gazettes annual reports, budget papers, ballot papers, stationery, brochures, posters, and other reports, publications and promotional material
government in partnership with the private sector printing industry to outsource a consistent portion of print jobs in order to best meet its customers’ specific printing requirements.
Performance
Initiative or Activity Achievement
Continue to work in partnership with private sector printing firms to support private industry by outsourcing work fairly and equitably
� Outsourced 28.6% of work to the private sector.
Foster professional relationships with the GPO’s panel contractors
� Professional relationships were maintained by regular contact with panel contractors and timely reporting to panel contractors on successful and unsuccessful tenders.
Transition to a contemporary print management system utilising digital imaging technology that will deliver better service and allow customers to achieve efficiency gains
This project is progressing, with business strategies for upgrading the printing and digital imaging technology being considered currently.
Continue to improve the Prism Print Management Information System for the benefit of the GPO and customers
� Refinements to various PRISM information reporting modules were actioned during 2008-09. These refinements have greatly improved access to day to day business data.
Implement a customer feedback questionnaire to ascertain customer satisfaction with the GPO’s services to assist in assessing performance
� An independent customer survey will be undertaken in July 2009 to ascertain the level of customer service achieved by the GPO during 2008-09.
Customers will rate their overall experience with the GPO including the following aspects: Helpfulness, Product Quality, Customer Service, Knowledge, Timeliness, Accuracy and Communication.
��Achieved Partially Achieved ��Not Achieved ��Continues into 2009-10

84 :: Department of Business and Employment
Output Performance Reporting
Initiative or Activity Achievement
Enhance efficiency to better achieve the GPO’s business objectives and deliver more streamlined services to customers.
� The GPO business performance improved throughout 2008-09. The independent customer survey was one mechanism used to rate performance delivery. Results will be available July 09.
Consider ways to reduce the GPO’s carbon footprint through lowering energy usage and greenhouse gas emissions.
� The GPO investigated the opportunity to join the National Printing Industry ‘Sustainable Green Print’ Environmental Management Certification System.
Continue to build business relationships with customers and suppliers.
� The GPO fostered excellent relationships with its valued customers and suppliers during 2008-09 and delivered positive outcomes for many local industry participants.
��Achieved Partially Achieved ��Not Achieved ��Continues into 2009-10
Printing Services Budget Performance Indicators
Changes in measures between 2008-09 Original Budget and 2008-09 Revised Budget; and movements between original Revised and Actual Budget 2008-09 are explained in Appendix F.
Performance Measures 2008-09 2009-10 Original Budget
Original Budget
Revised Budget
Actual
Quantity
Jobs undertaken 3 450 3 050 3 130 3 100
Proportion of printing sales outsourced 24% 25% 28.6% 25%
Quality
Jobs reworked <0.1% <0.1% 0.4% <0.1%
Timeliness
Quotes provided within required timeframes 99% 99% 99% 99%
Jobs completed within required timeframes 99% 99% 98% 99%
Priorities for 2009-10
Continue to build business relationships with customers and suppliers.
Review customer future demands for printed materials to ensure the GPO is positioned to be able to deliver the required services in a highly effective manner.
Enhance efficiency to better achieve the GPO’s business objectives and deliver more streamlined value added services to customers.
Implement the National Printing Industry ‘Sustainable Green Print’ Environmental Management Certification System within its business during 2009-10.

Annual Report 2008-2009 :: 85
Ou
tpu
t Perfo
rman
ce Rep
ortin
g
NT Fleet
NT Fleet provides agencies with a modern fleet of vehicles matched to their operational needs.
The outcome, in cooperation with client agencies, is to strive to achieve a safe, environmentally friendly and cost-effective government vehicle fleet.
Responsibilities:
managing the NTG vehicle fleet, including light and heavy vehicles and plant and equipment, except for police, fire and emergency services vehicles
managing vehicle acquisition and disposal, contract management, vehicle usage monitoring, coordination of maintenance and repairs, and reporting to agencies
providing policy advice to government on vehicle fleet matters and fleet planning and operational advice to agencies
providing ‘not for profit’ community based organisations with vehicles as a gift or loan following successful application to the government’s Community Benefit Fund. A list of vehicles gifted or loaned through this government initiative detailed in Appendix L.
Performance
Initiative or Activity Achievement
Continue to work with agencies to acquire a safer, more environmentally friendly fleet, and minimise the cost of owning and operating the fleet
� NT Fleet continued to benchmark against other jurisdictions to assist identification and adoption of best practice fleet management. Regular negotiations took place with agencies to ensure vehicles acquired were safe, complied with green fleet policy and were matched to operational needs.
Review NT Fleet business systems to establish the strategic ICT direction
� Consultancy delayed until second half of 2009 as a result of a system technology upgrade which needed to be factored into the consultancy brief.
Implement the ‘pool vehicle booking system’ across government and monitor usage
� Without affecting those agencies already using the system, the strategy changed from full roll out across government to pilot agency approach. Working directly with the Department of Health and Community Services has resulted in considerable improvement in functionality which will increase the system’s effectiveness when full role out is resumed in the first half of 2010.
Implement a range of strategies from the ‘Fleet Stages of Excellence’ model to improve the effectiveness of service delivery and strengthen customer relationships
� Considerable effort has been made in increasing customer awareness of the need to acquire vehicles whose functionality matches operational needs and is greenhouse friendly in readiness for the introduction of the Government’s ‘Greening the Fleet’ strategy. A comprehensive unfair wear and tear document is now available.
��Achieved Partially Achieved ��Not Achieved ��Continues into 2009-10

86 :: Department of Business and Employment
Output Performance Reporting
Initiative or Activity Achievement
Meeting the demands of the Northern Territory National Emergency Response (the Intervention)
� The demand brought on by the Australian Government Intervention was met in part by retaining some vehicles due for replacement, thus avoiding the need for additional capital spending. The downside to this strategy, due to ageing vehicles and increased utilisation, has been lower returns and lower numbers of vehicles available for disposal. However, this has been more than offset by agencies’ ability to deliver on government programs.
Increase numbers of four-cylinder vehicles in the fleet thus reducing greenhouse gas emissions
� Four-cylinder vehicles now comprise 64% of the fleet. However the focus during the year shifted from the number of four-cylinder vehicles to the acquisition of more fuel efficient vehicles, particularly those vehicles with a ‘green vehicle guide’ rating of 5.5 or higher.
Further enhance the fleet management information provided to clients
� The website continued to be updated during the year. Green vehicle guide ratings were added to Indicative Hire Rate schedules. Agencies were given the opportunity to evaluate suitability of new models as they were released onto the market.
Continue to achieve an acceptable return on the asset base
� NT Fleet made a net profit of $7 million after tax which represents an 8.6% return on asset base.
Develop and implement a Green Fleet Strategy as part of the government’s Climate Change Policy
� NT Fleet has implemented the government’s ‘Greening the Fleet’ strategy which will see a 20% reduction in the average CO2 gases produced by the government’s passenger and light commercial fleets measured in gm/km over the next five years. Discussions commenced with the view to setting individual agency targets in 2009-10.
Finalise the elevating work platforms (EWP) replacement program for the Power and Water Corporation
� Almost Complete. Unreasonable delays in the delivery of the last two units has meant the replacement of EWP is scheduled for October 2009.
��Achieved Partially Achieved ��Not Achieved ��Continues into 2009-10

Annual Report 2008-2009 :: 87
Ou
tpu
t Perfo
rman
ce Rep
ortin
g
NT Fleet Budget Performance Indicators
Changes in measures between 2008-09 Original Budget and 2008-09 Revised Budget; and movements between original Revised and Actual Budget 2008-09 are explained in Appendix F.
Performance Measures 2008-09 2009-10 Original Budget
Original Budget
Revised Budget
Actual
Quantity
Light vehicles managed 2 485 2 695 2 680 2 700
Light vehicles disposed 920 830 851 1 050
Heavy vehicles managed - 650 639 650
Quality
Age profile of light vehicle fleet (proportion less than two years old) 80% 65% 66% 80%
Reduction in greenhouse gases produced per km travelled (gm/km of CO2)
1 - - - 5%
Timeliness
Vehicles available for auction within 36 days - 73% 73% 95%
1. New measure in 2009-10; data not available for 2008-09.
Priorities for 2009-10
Responding to climate change by developing and implementing strategies to reduce greenhouse gases associated with the operation of the Northern Territory Government vehicle fleet.
Implementing the ‘Green Fleet’ initiative.
Continuing to achieve an acceptable return on the asset base.
Continuing to provide clients with quality and timely fleet management information.
Work with agencies to acquire a safer, more environmentally friendly fleet and minimise the cost of owning and operating the Government fleet.

88 :: Department of Business and Employment
DBE Financial Statements
DEPARTMENT OF BUSINESS AND EMPLOYMENT
FINANCIAL REPORT
The Department of Business and Employment (DBE) provides:
shared corporate services for government agencies and business divisions including financial and human resource administration, procurement, information technology management and office leasing
leadership to develop and broaden the Northern Territory economic base and strategic programs and initiatives to support business and industry development
strategic labour market policy advice and forecasting to maximise employment opportunities for Territorians and meet industry needs.
ADMINISTRATIVE RESTRUCTURE
The Department of Business and Employment was established as a part of the administrative restructure on 18 August 2008 with retrospective effect for accounting purposes from 1 July 2008. Some responsibilities of the previous Department of Business, Economic and Regional Development and the Department of Employment, Education and Training were combined with the then Department of Corporate and Information Services to create the Department of Business and Employment.
No comparative disclosures are available because the agency was created on 18 August 2008.
FINANCIAL PERFORMANCE
The Department’s operating surplus of $3.9 million for 2008-09 is a strong improvement on the budgeted deficit of $1.7 million. This was primarily due to:
a one-off $3.6 million revenue item received as a settlement in lieu of contract service credits, which was applied to transfer the perpetual licence for the human resource information system to DBE
Commonwealth grant funding of $1.5 million received in 2008-09 with related expenditure due in 2009-10, requiring the expenditure amount to be carried forward
higher than anticipated goods and services revenue
partially offset by an increase in operating expenses.
Table 1: 2008-09 Actual and Budget Performance
Actual $’000
Budget $’000
Variation $’000
Income 146 687 142 362 4 325
Expenses 142 778 144 016 1 238
Surplus/(Deficit) 3 909 (1 654) 5 563
FINANCIAL STATEMENT OVERVIEW For the Year Ended 30 June 2009

Annual Report 2008-2009 :: 89
DB
E F
inan
cial Statem
ents
Income
By far the majority of the Department’s income is sourced from appropriation from the Central Holding Authority (called output revenue). The Department’s corporate shared services are provided free-of-charge to general government agencies, although notional charges are recorded and reflected in each agency’s budget and output costs. Government business divisions are charged for the Department’s corporate shared services with this income included in goods and services revenue. Additionally, direct costs for some specific services, such as salary packaging administration and training courses are recouped from recipients.
The ‘goods and services revenue’ category includes the one-off $3.6 million revenue item described above.
Table 2: Income by Category
Output Revenue Goods and Services Revenue
Commonwealth Revenue
Other Revenue TOTAL
$’000 % $’000 % $’000 % $’000 % $’000 %
125 454 85.5 18 055 12.3 1624 1.1 1 554 1.1 146 687 100
Expenses
Property costs, primarily office lease rents for all government agencies, comprise the largest expense category for the Department, followed closely by employee costs. Both property and ICT costs are mostly committed by long term, fixed contracts and are generally non-discretionary. Employee expenses are the second major expense category with ongoing efforts to contain and reduce these costs.
Table 3: Expense by Category
Employee Property ICT Operational Grants TOTAL
$’000 % $’000 % $’000 % $’000 % $’000 % $’000 %
49 308 34.5 49 436 34.6 15 390 10.8 12 814 9.0 15 830 11.1 142 778 100.0
The Department had a $15.8M grant program in 2008-09, with Business Development grants making up the bulk (63%) of the grant expenses.
Significant one-off grants in 2008-09 include:
Business Development
$5M aviation hub
$0.3M centre bush bus
$0.2M major projects election commitment
Shared Services
$4M ICT infrastructure project

90 :: Department of Business and Employment
DBE Financial Statements
In considering expenses by output group, the Shared Services output group represents the largest share as it incorporates property costs, almost all ICT costs and the majority of employee costs.
Table 4: Expense by Output Group
Shared Services Business Development
Employment Total
$’000 $’000 $’000 $’000
Employee 39 928 7 744 1 636 49 308
Operational 72 161 4 203 1 276 77 640
Grants 4 274 10 008 1 548 15 830
Total 116 363 21 955 4 460 142 778
Percentage 81.5% 15.4% 3.1% 100.0%
FINANCIAL POSITION
The Department’s net asset position at the end of 2008-09 is $10.7M.
Major assets include:
$5.0M – cash and deposits
$4.0M – receivables, primarily relating to the property leasing portfolio
$3.7M – prepayments, primarily relating to the property leasing portfolio
$9.9M – property, plant and equipment, primarily ICT infrastructure assets.
Major liabilities include:
$3.8M – payables
$5.5M – current provisions – includes employee entitlements of $4.7M and payroll on-costs of $0.8M
$2.2M – non-current employee entitlements.
The most significant asset movement in 2008-09 was the transfer of the perpetual licence for the human resource information system for $3.6M.

Annual Report 2008-2009 :: 91
DB
E F
inan
cial Statem
ents
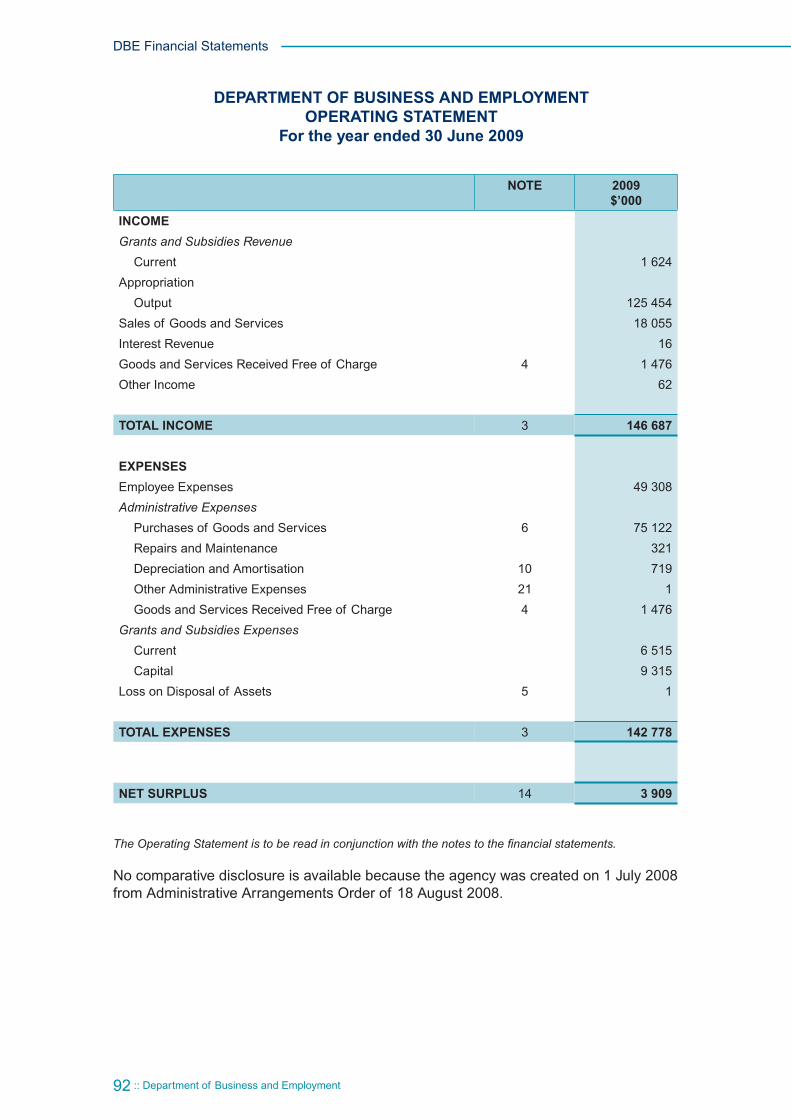
92 :: Department of Business and Employment
DBE Financial Statements
NOTE 2009 $’000
INCOME
Grants and Subsidies Revenue
Current 1 624
Appropriation
Output 125 454
Sales of Goods and Services 18 055
Interest Revenue 16
Goods and Services Received Free of Charge 4 1 476
Other Income 62
TOTAL INCOME 3 146 687
EXPENSES
Employee Expenses 49 308
Administrative Expenses
Purchases of Goods and Services 6 75 122
Repairs and Maintenance 321
Depreciation and Amortisation 10 719
Other Administrative Expenses 21 1
Goods and Services Received Free of Charge 4 1 476
Grants and Subsidies Expenses
Current 6 515
Capital 9 315
Loss on Disposal of Assets 5 1
TOTAL EXPENSES 3 142 778
NET SURPLUS 14 3 909
The Operating Statement is to be read in conjunction with the notes to the financial statements.
No comparative disclosure is available because the agency was created on 1 July 2008 from Administrative Arrangements Order of 18 August 2008.
DEPARTMENT OF BUSINESS AND EMPLOYMENT OPERATING STATEMENT
For the year ended 30 June 2009

Annual Report 2008-2009 :: 93
DB
E F
inan
cial Statem
ents
NOTE 2009 $’000
ASSETS
Current Assets
Cash and Deposits 7 5 023
Receivables 8 3 970
Loans and Advances 9 231
Prepayments 3 672
Total Current Assets 12 896
Non-Current Assets
Property, Plant and Equipment 10 9 854
Total Non-Current Assets 9 854
TOTAL ASSETS 22 750
LIABILITIES
Current Liabilities
Deposits Held 337
Payables 11 3 835
Provisions 12 5 542
Other Liabilities 13 136
Total Current Liabilities 9 850
Non-Current Liabilities
Provisions 12 2 245
Total Non-Current Liabilities 2 245
TOTAL LIABILITIES 12 095
NET ASSETS 10 655
EQUITY 14
Capital 7 882
Reserves 324
Accumulated Funds 2 449
TOTAL EQUITY 10 655
The Balance Sheet is to be read in conjunction with the notes to the financial statements.
No comparative disclosure is available because the agency was created on 1 July 2008 from Administrative Arrangements Order of 18 August 2008.
DEPARTMENT OF BUSINESS AND EMPLOYMENT BALANCE SHEET As at 30 June 2009

94 :: Department of Business and Employment
DBE Financial Statements
NOTE 2009 $’000
BALANCE OF EQUITY AT 1 JULY 3 111
Capital 14
Balance at 1 July 4 247
Equity Injections 3 726
Equity Withdrawals (91)
Balance at 30 June 7 882
Reserves 14
Balance at 1 July 324
Changes in Accounting Policies -
Correction of Prior Period Errors -
Increase/(Decrease) in Asset Revaluation Reserve -
Balance at 30 June 324
Accumulated Funds 14
Balance at 1 July (1 460)
Surplus/(Deficit) for the Period 3 909
Balance at 30 June 2 449
BALANCE OF EQUITY AT 30 JUNE 10 655
The Statement of Changes in Equity is to be read in conjunction with the notes to the financial statements.
No comparative disclosure is available because the agency was created on 1 July 2008 from Administrative Arrangements Order of 18 August 2008.
DEPARTMENT OF BUSINESS AND EMPLOYMENT STATEMENT OF CHANGES IN EQUITY
For the year ended 30 June 2009

Annual Report 2008-2009 :: 95
DB
E F
inan
cial Statem
ents
NOTE 2009 $’000
(Outflows) / InflowsCASH FLOWS FROM OPERATING ACTIVITIESOperating Receipts
Grants and Subsidies ReceivedCurrent 1 624
Appropriation Output 125 454
Receipts From Sales of Goods And Services 25 511Interest Received 18
Total Operating Receipts 152 607Operating Payments
Payments to Employees (47 273)Payments for Goods and Services (83 931)Grants and Subsidies Paid
Current (6 515)Capital (9 315)
Total Operating Payments (147 034)Net Cash From Operating Activities 15 5 573
CASH FLOWS FROM INVESTING ACTIVITIESInvesting Receipts
Proceeds from Asset Sales 5 (1)Repayment of Advances 184
Total Investing Receipts 183Investing Payments
Purchases of Assets (3 860)Advances and Investing Payments (22)
Total Investing Payments (3 882)Net Cash Used In Investing Activities (3 699)
CASH FLOWS FROM FINANCING ACTIVITIESFinancing Receipts
Proceeds of Borrowings 394Deposits Received (52)Equity Injections 14
Capital Appropriation 762Other Equity Injections 2 055
Total Financing Receipts 3 159Financing Payments
Repayment of Borrowings (395)
Equity Withdrawals 14 (91)Total Financing Payments (486)Net Cash From Financing Activities 2 673
Net Increase in Cash Held 4 547Cash at Beginning of Financial Year 476
CASH AT END OF FINANCIAL YEAR 7 5 023
The Cash Flow Statement is to be read in conjunction with the notes to the financial statements.
No comparative disclosure is available because the agency was created on 1 July 2008 from Administrative Arrangements Order of 18 August 2008.
DEPARTMENT OF BUSINESS AND EMPLOYMENT CASH FLOW STATEMENT
For the year ended 30 June 2009

96 :: Department of Business and Employment
DBE Financial Statements
INDEX OF NOTES TO THE FINANCIAL STATEMENTS
1. Objectives and Funding
2. Statement of Significant Accounting Policies
3. Operating Statement by Output Group
INCOME
4. Goods and Services Received Free of Charge
5. Loss on Disposal of Assets
EXPENSES
6. Purchases of Goods and Services
ASSETS
7. Cash and Deposits
8. Receivables
9. Loans and Advances
10. Property, Plant and Equipment
LIABILITIES
11. Payables
12. Provisions
13. Other Liabilities
EQUITY
14. Equity
OTHER DISCLOSURES
15. Notes to the Cash Flow Statement
16. Financial Instruments
17. Commitments
18. Contingent Liabilities and Contingent Assets
19. Events Subsequent to Balance Date
20. Accountable Officer’s Trust Account
21. Write-offs, Postponements and Waivers
DEPARTMENT OF BUSINESS AND EMPLOYMENT NOTES TO THE FINANCIAL STATEMENTS
For the year ended 30 June 2009

Annual Report 2008-2009 :: 97
DB
E F
inan
cial Statem
ents
1. OBJECTIVES AND FUNDING
The objective of the Department of Business and Employment is to build industry capabilities through support and solutions for Territory businesses, develop, attract and retain a skilled Territory workforce and provide shared corporate services to the Northern Territory Government.
The Department is predominantly funded by, and is dependent on the receipt of Parliamentary appropriations. The financial statements encompass all funds through which the Department controls resources to carry on its functions and deliver outputs. For reporting purposes, outputs delivered by the Department are summarised into three Output Groups. Note 3 provides summary financial information in the form of an Operating Statement by Output Group.
The Department has the following output groups and outputs:
Shared Services
Finance Services
Human Resource Services
Procurement Policy and Services
Information and Communication Technology Services
Office Leasing Management
Business Development
Business Development
Employment
Employment
Detailed information about these outputs can be found within the annual report.
2. STATEMENT OF SIGNIFICANT ACCOUNTING POLICIES
a) Basis of Accounting
The financial statements have been prepared in accordance with the requirements of the Financial Management Act and related Treasurer’s Directions. The Financial Management Act requires the Department to prepare financial statements for the year ended 30 June based on the form determined by the Treasurer. The form of Department financial statements is to include:
(i) a Certification of the Financial Statements
(ii) an Operating Statement
(iii) a Balance Sheet
(iv) a Statement of Changes in Equity
(v) a Cash Flow Statement
(vi) applicable explanatory notes to the financial statements.
The financial statements have been prepared using the accrual basis of accounting, which recognises the effect of financial transactions and events when they occur, rather than when cash is paid out or received.
Except where stated, the financial statements have also been prepared in accordance with the historical cost convention.

98 :: Department of Business and Employment
DBE Financial Statements
The form of the Department financial statements is also consistent with the requirements of Australian Accounting Standards. The effects of all relevant new and revised Standards and Interpretations issued by the Australian Accounting Standards Board (AASB) that are effective for the current annual reporting period have been evaluated. The Standards and Interpretations and their impacts are:
AASB 1004 Contributions (revised)
The revisions have the effect of relocating the requirements on contributions from AASs 27, 29 and 31, substantively unamended (with some exceptions), into AASB 1004. The Standard will not have an impact on the financial statements.
AASB 1052 Disaggregated Disclosures
The main requirements of the Standard are for a government department to disclose by each major activity the major classes of income and expenses, assets deployed and liabilities incurred. The Department is unable to conform to all the requirements of the Standard for 2008-09 because assets and liabilities are not disaggregated by output group.
AASB 2007-9 Amendments to Australian Accounting Standards arising from the Review of AAS 27, AAS 29 and AAS 31
The Standard relocates certain relevant requirements from AASs 27, 29 and 31, substantively unamended, into existing topic based standards. This standard also makes consequential amendments, arising from the short term review of AASs 27, 29 and 31, to AASB 5, AASB 8, AASB 101 and AASB 114. The Standard will not have an impact on the financial statements.
AASB 2008-10 Amendments to Australian Accounting Standards – Reclassification of Financial Instruments.
The Standard will not have an impact on the financial statements.
b) Australian Accounting Standards and Interpretations issued but not yet effective
At the date of authorisation of the financial statements, the Standards and Interpretations listed below were in issue but not yet effective.
Note: It is likely that the 2009-10 Department financial statement formats will be brought in line with those within the Treasurer’s Annual Financial Report (TAFR). An Exposure Draft (ED174 Amendments to Australian Accounting Standards to facilitate GAAP/GFS Harmonisation for Entities within the general government sector) is currently under review.
AASB 2009-2 Amendments to Australian Accounting Standards – Improving Disclosures about Financial Instruments
Effective for annual reporting periods beginning on or after 1 January 2009 that end on or after 30 April 2009.
The Standard amends AASB 7 to require enhanced disclosures about fair value measurement of financial instruments.
Annual Report 2008-2009 :: 99
DB
E F
inan
cial Statem
ents
c) Agency and Territory Items
The financial statements of the Department include income, expenses, assets, liabilities and equity over which the Department has control (Agency items). Certain items, while managed by the Department, are controlled and recorded by the Territory rather than the Department (Territory items). Territory items are recognised and recorded in the Central Holding Authority as discussed below.
Central Holding Authority
The Central Holding Authority is the ‘parent body’ that represents the Government’s ownership interest in Government controlled entities.
The Central Holding Authority also records all Territory items, such as income, expenses, assets and liabilities controlled by the Government and managed by agencies on behalf of the Government. The main Territory item is Territory income, which includes taxation and royalty revenue, Commonwealth general purpose funding (such as GST revenue), fines, and statutory fees and charges.
The Central Holding Authority also holds certain Territory assets not assigned to agencies as well as certain Territory liabilities that are not practical or effective to assign to individual agencies such as unfunded superannuation and long service leave.
d) Comparatives
The Department of Business and Employment was established as a result of the administrative restructure of 18 August 2008. As a new entity, the Department of Business and Employment is not required to provide comparative financial disclosures for the 2008-09 financial year in this financial report. See Note 2(w).
e) Presentation and Rounding of Amounts
Amounts in the financial statements and notes to the financial statements are presented in Australian dollars and have been rounded to the nearest thousand dollars, with amounts of $500 or less being rounded down to zero.
f) Changes in Accounting Policies
There have been no changes to accounting policies adopted in 2008-09 as a result of management decisions.

100 :: Department of Business and Employment
DBE Financial Statements
g) Accounting Judgements and Estimates
The preparation of the financial report requires the making of judgements and estimates that affect the recognised amounts of assets, liabilities, revenues and expenses and the disclosure of contingent liabilities. The estimates and associated assumptions are based on historical experience and various other factors that are believed to be reasonable under the circumstances, the results of which form the basis of making the judgements about the carrying values of assets and liabilities that are not readily apparent from other sources. Actual results may differ from these estimates.
The estimates and underlying assumptions are reviewed on an ongoing basis. Revisions to accounting estimates are recognised in the period in which the estimate is revised if the revision affects only that period, or in the period of the revision and future periods if the revision affects both current and future periods.
Judgements and estimates that have significant effects on the financial statements are disclosed in the relevant notes to the financial statements. Notes that include significant judgements and estimates are:
Employee Benefits – Note 2(s) and Note 12: Non-current liabilities in respect of employee benefits are measured as the present value of estimated future cash outflows based on the appropriate Government bond rate, estimates of future salary and wage levels and employee periods of service.
Contingent Liabilities – Note 18: The present value of material quantifiable contingent liabilities are calculated using a discount rate based on the published 10-year Government bond rate.
Allowance for Impairment Losses – Note 2(n) and Note 8: Receivables.
Depreciation and Amortisation – Note 2(k), Note 10: Property, Plant and Equipment.
h) Goods and Services Tax
Income, expenses and assets are recognised net of the amount of Goods and Services Tax (GST), except where the amount of GST incurred on a purchase of goods and services is not recoverable from the Australian Taxation Office (ATO). In these circumstances the GST is recognised as part of the cost of acquisition of the asset or as part of the expense.
Receivables and payables are stated with the amount of GST included. The net amount of GST recoverable from, or payable to, the ATO is included as part of receivables or payables in the Balance Sheet.
Cash flows are included in the Cash Flow Statement on a gross basis. The GST components of cash flows arising from investing and financing activities which are recoverable from, or payable to, the ATO are classified as operating cash flows. Commitments and contingencies are disclosed net of the amount of GST recoverable or payable unless otherwise specified.

Annual Report 2008-2009 :: 101
DB
E F
inan
cial Statem
ents
i) Income Recognition
Income encompasses both revenue and gains.
Income is recognised at the fair value of the consideration received, exclusive of the amount of GST. Exchanges of goods or services of the same nature and value without any cash consideration being exchanged are not recognised as income.
Grants and Other Contributions
Grants, donations, gifts and other non-reciprocal contributions are recognised as revenue when the Department obtains control over the assets comprising the contributions. Control is normally obtained upon receipt.
Contributions are recognised at their fair value. Contributions of services are only recognised when a fair value can be reliably determined and the services would be purchased if not donated.
Appropriation
Output Appropriation is the operating payment to each agency for the outputs they provide and is calculated as the net cost of Department outputs after taking into account funding from Department income. It does not include any allowance for major non-cash costs such as depreciation.
Commonwealth Appropriation is new to 2008-09, and follows from the Intergovernmental Agreement on Federal Financial Relations. It has resulted in Special Purpose Payments and National Partnership payments being made by the Commonwealth Treasury to state treasuries, in a manner similar to arrangements for GST payments. These payments are received by Treasury on behalf of the Central Holding Authority and then on passed to the relevant agencies as Commonwealth Appropriation.
Revenue in respect of Appropriations is recognised in the period in which the Department gains control of the funds.
Sale of Goods
Revenue from the sale of goods is recognised (net of returns, discounts and allowances) when:
the significant risks and rewards of ownership of the goods have transferred to the buyer
the Department retains neither continuing managerial involvement to the degree usually associated with ownership nor effective control over the goods sold
the amount of revenue can be reliably measured
it is probable that the economic benefits associated with the transaction will flow to the Department
the costs incurred or to be incurred in respect of the transaction can be measured reliably.

102 :: Department of Business and Employment
DBE Financial Statements
Rendering of Services
Revenue from rendering services is recognised by reference to the stage of completion of the contract. The revenue is recognised when:
the amount of revenue, stage of completion and transaction costs incurred can be reliably measured
it is probable that the economic benefits associated with the transaction will flow to the entity.
Interest Revenue
Interest revenue is recognised as it accrues, taking into account the effective yield on the financial asset.
Goods and Services Received Free of Charge
Goods and services received free of charge are recognised as revenue when a fair value can be reliably determined and the resource would have been purchased if it had not been donated. Use of the resource is recognised as an expense.
Disposal of Assets
A gain or loss on disposal of assets is included as a gain or loss on the date control of the asset passes to the buyer, usually when an unconditional contract of sale is signed. The gain or loss on disposal is calculated as the difference between the carrying amount of the asset at the time of disposal and the net proceeds on disposal. Refer also to Note 5.
Contributions of Assets
Contributions of assets and contributions to assist in the acquisition of assets, being non-reciprocal transfers, are recognised, unless otherwise determined by Government, as gains when the Department obtains control of the asset or contribution. Contributions are recognised at the fair value received or receivable.
j) Repairs and Maintenance Expense
Funding is received for repairs and maintenance works associated with Department assets as part of Output Revenue. Costs associated with repairs and maintenance works on Department assets are expensed as incurred.

Annual Report 2008-2009 :: 103
DB
E F
inan
cial Statem
ents
k) Depreciation and Amortisation Expense
Items of property, plant and equipment, including buildings but excluding land, have limited useful lives and are depreciated or amortised using the straight-line method over their estimated useful lives.
Amortisation applies in relation to intangible non-current assets with limited useful lives and is calculated and accounted for in a similar manner to depreciation.
The estimated useful lives for each class of asset are in accordance with the Treasurer’s Directions and are determined as follows:
2009
Buildings 50 Years
Plant and Equipment 10 Years
Leased Plant and Equipment 5 Years
Intangible Assets 10 Years
Assets are depreciated or amortised from the date of acquisition or from the time an asset is completed and held ready for use.
l) Interest Expense
Interest expenses include interest and finance lease charges. Interest expenses are expensed in the period in which they are incurred.
m) Cash and Deposits
For the purposes of the Balance Sheet and the Cash Flow Statement, cash includes cash on hand, cash at bank and cash equivalents. Cash equivalents are highly liquid short-term investments that are readily convertible to cash. Cash at bank includes monies held in the Accountable Officer’s Trust Account (AOTA) that are ultimately payable to the beneficial owner – refer also to Note 20.
n) Receivables
Receivables include accounts receivable and other receivables and are recognised at fair value less any allowance for impairment losses.
The allowance for impairment losses represents the amount of receivables the Department estimates are likely to be uncollectible and are considered doubtful. Analyses of the age of the receivables that are past due as at the reporting date are disclosed in an ageing schedule under credit risk in Note 16 Financial Instruments.
Accounts receivable and other receivables are generally settled within 30 days.
104 :: Department of Business and Employment
DBE Financial Statements
o) Property, Plant and Equipment
Acquisitions
All items of property, plant and equipment with a cost, or other value, equal to or greater than $5 000 are recognised in the year of acquisition and depreciated as outlined below. Items of property, plant and equipment below the $5 000 threshold are expensed in the year of acquisition.
The construction cost of property, plant and equipment includes the cost of materials and direct labour, and an appropriate proportion of fixed and variable overheads.
Complex Assets
Major items of plant and equipment comprising a number of components that have different useful lives, are accounted for as separate assets. The components may be replaced during the useful life of the complex asset.
Subsequent Additional Costs
Costs incurred on property, plant and equipment subsequent to initial acquisition are capitalised when it is probable that future economic benefits in excess of the originally assessed performance of the asset will flow to the Department in future years. Where these costs represent separate components of a complex asset, they are accounted for as separate assets and are separately depreciated over their expected useful lives.
Construction (Work in Progress)
As part of Financial Management Framework, the Department of Planning and Infrastructure is responsible for managing general government capital works projects on a whole of Government basis. Therefore appropriation for the Department’s capital works is provided directly to the Department of Planning and Infrastructure and the cost of construction work in progress is recognised as an asset of that Department. Once completed, capital works assets are transferred to the Department.

Annual Report 2008-2009 :: 105
DB
E F
inan
cial Statem
ents
p) Revaluations and Impairment
Revaluation of Assets
Subsequent to initial recognition, assets belonging to the following classes of non-current assets are revalued with sufficient regularity to ensure that the carrying amount of these assets does not differ materially from their fair value at reporting date:
Land
Buildings
Intangible Assets.
Fair value is the amount for which an asset could be exchanged, or liability settled, between knowledgeable, willing parties in an arm’s length transaction.
Plant and equipment are stated at historical cost less depreciation, which is deemed to equate to fair value.
Impairment of Assets
An asset is said to be impaired when the asset’s carrying amount exceeds its recoverable amount. Non-current physical and intangible Department assets are assessed for indicators of impairment on an annual basis. If an indicator of impairment exists, the Department determines the asset’s recoverable amount. The asset’s recoverable amount is determined as the higher of the asset’s depreciated replacement cost and fair value less costs to sell. Any amount by which the asset’s carrying amount exceeds the recoverable amount is recorded as an impairment loss.
Impairment losses are recognised in the Operating Statement unless the asset is carried at a revalued amount. Where the asset is measured at a revalued amount, the impairment loss is offset against the Asset Revaluation Reserve for that class of asset to the extent that an available balance exists in the Asset Revaluation Reserve.
In certain situations, an impairment loss may subsequently be reversed. Where an impairment loss is subsequently reversed, the carrying amount of the asset is increased to the revised estimate of its recoverable amount. A reversal of an impairment loss is recognised in the Operating Statement as income, unless the asset is carried at a revalued amount, in which case the impairment reversal results in an increase in the Asset Revaluation Reserve. Note 14 provides additional information in relation to the Asset Revaluation Reserve.

106 :: Department of Business and Employment
DBE Financial Statements
q) Leased Assets
Leases under which the Department assumes substantially all the risks and rewards of ownership of an asset are classified as finance leases. Other leases are classified as operating leases.
Finance Leases
Finance leases are capitalised. A leased asset and a lease liability equal to the present value of the minimum lease payments are recognised at the inception of the lease.
Lease payments are allocated between the principal component of the lease liability and the interest expense.
Operating Leases
Operating lease payments made at regular intervals throughout the term are expensed when the payments are due, except where an alternative basis is more representative of the pattern of benefits to be derived from the leased property. Lease incentives under an operating lease of a building or office space are recognised as an integral part of the consideration for the use of the leased asset. Lease incentives are to be recognised as a deduction from the lease expenses over the term of the lease.
r) Payables
Liabilities for accounts payable and other amounts payable are carried at cost which is the fair value of the consideration to be paid in the future for goods and services received, whether or not billed to the Department. Accounts payable are normally settled within 30 days.
s) Employee Benefits
Provision is made for employee benefits accumulated as a result of employees rendering services up to the reporting date. These benefits include wages and salaries and recreation leave. Liabilities arising in respect of wages and salaries and recreation leave and other employee benefit liabilities that fall due within twelve months of reporting date are classified as current liabilities and are measured at amounts expected to be paid. Non-current employee benefit liabilities that fall due after twelve months of the reporting date are measured at present value, calculated using the Government long term bond rate.
No provision is made for sick leave, which is non-vesting, as the anticipated pattern of future sick leave to be taken is less than the entitlement accruing in each reporting period.
Employee benefit expenses are recognised on a net basis in respect of the following categories:
wages and salaries, non-monetary benefits, recreation leave, sick leave and other leave entitlements
other types of employee benefits.
As part of the Financial Management Framework, the Central Holding Authority assumes the long service leave liabilities of Government agencies, including the Department and as such no long service leave liability is recognised in Department financial statements.

Annual Report 2008-2009 :: 107
DB
E F
inan
cial Statem
ents
t) Superannuation
Employees’ superannuation entitlements are provided through the:
NT Government and Public Authorities Superannuation Scheme (NTGPASS)
Commonwealth Superannuation Scheme (CSS) or
non-government employee nominated schemes for those employees commencing on or after 10 August 1999.
The Department makes superannuation contributions on behalf of its employees to the Central Holding Authority or non-government employee nominated schemes. Superannuation liabilities related to government superannuation schemes are held by the Central Holding Authority and as such are not recognised in Department financial statements.
u) Contributions by and Distributions to Government
The Department may receive contributions from Government where the Government is acting as owner of the Department. Conversely, the Department may make distributions to Government. In accordance with the Financial Management Act and Treasurer’s Directions, certain types of contributions and distributions, including those relating to administrative restructures, have been designated as contributions by, and distributions to, Government. These designated contributions and distributions are treated by the Department as adjustments to equity.
The Statement of Changes in Equity and Note 14 provide additional information in relation to contributions by, and distributions to, Government.
v) Commitments
Disclosures in relation to capital and other commitments, including lease commitments are shown at Note 17 and are consistent with the requirements contained in AASB 101, AASB 116 and AASB 117.
Commitments are those contracted as at 30 June where the amount of the future commitment can be reliably measured.
w) Administrative Restructure
The Administrative Arrangements Order was revised on 18 August 2008. The changes to the Administrative Arrangements Order under the Financial Management Act come into effect from 1 July of the financial year in which they occur. The Department of Corporate and Information Services was amalgamated in total and together with other functions such as Business Development (from the former Department of Business, Economic and Regional Development) and Employment (from the former Department of Employment, Education and Training), into the new Department of Business and Employment from 1 July 2008.
In accordance with Treasurer’s Directions, the recognition of net assets was treated as an equity adjustment shown in the Statement of Changes in Equity and related note disclosures.

108 :: Department of Business and Employment
DBE Financial Statements
3 OPERATING STATEMENT BY OUTPUT GROUP
Note Shared Services
Business Development
Employment Total
$’000 $’000 $’000 $’000
INCOME
Grants and Subsidies Revenue
Current 534 90 1 000 1 624
Appropriation
Output 102 625 19 644 3 185 125 454
Sales of Goods and Services 17 095 960 - 18 055
Interest Revenue - 16 - 16
Goods and Services Received Free of Charge
4 - 1 210 266 1 476
Other Income 62 - - 62
TOTAL INCOME 120 316 21 920 4 451 146 687
EXPENSES
Employee Expenses 39 928 7 744 1 636 49 308
Administrative Expenses
Purchases of Goods and Services
6 71 210 2 920 992 75 122
Repairs and Maintenance 274 38 9 321
Depreciation and Amortisation
10 676 34 9 719
Loss on Disposal of Assets 5 1 - - 1
Other Administrative Expenses
21 1 - - 1
Goods and Services Received Free of Charge
4 - 1 210 266 1 476
Grants and Subsidies Expenses
Current 274 4 693 1 548 6 515
Capital 4 000 5 315 - 9 315
TOTAL EXPENSES 116 364 21 954 4 460 142 778
NET SURPLUS 14 3 952 (34) (9) 3 909
The Operating Statement by Output Group is to be read in conjunction with the notes to the financial statements.

Annual Report 2008-2009 :: 109
DB
E F
inan
cial Statem
ents
2009 $’000
4. GOODS AND SERVICES RECEIVED FREE OF CHARGECorporate and Information Services relating to Business and Employment 1 476Total Goods and Services Received Free of Charge 1 476
5. LOSS ON DISPOSAL OF ASSETSNet proceeds from the disposal of non-current assets 3Less: carrying value of non-current assets disposed (4)Total Loss on Disposal of Assets (1)
6. PURCHASES OF GOODS AND SERVICESThe net surplus/(deficit) has been arrived at after charging the following expenses:Goods and Services Expenses:
Information Technology 12 406
Office Leasing 49 436
Consultants (1) 3 888Advertising (2) 450
Marketing and Promotion (3) 1 090Document Production 95Legal Expenses (4) 270Recruitment (5) 266Training and Study 427Official Duty Fares 434Travelling Allowance 112
(1) Includes ICT, marketing and promotion consultants.
(2) Does not include recruitment advertising or marketing and promotion advertising.
(3) Includes advertising for marketing and promotion but excludes marketing and promotion consultants’ expenses, which are incorporated in the consultants’ category.
(4) Includes legal fees, claim and settlement costs.
(5) Includes recruitment related advertising costs.
7. CASH AND DEPOSITSCash on Hand 61Cash at Bank 4 962Total Cash and Deposits 5 023
8. RECEIVABLESCurrentAccounts Receivable 2 650Less: Allowance for Impairment Losses -
2 650GST Receivable 812Other Receivables 508Total Receivables 3 970

110 :: Department of Business and Employment
DBE Financial Statements
2009 $’000
9. LOANS AND ADVANCESAdvances Paid 415Advances Repaid (184)Total Loans and Advances 231
10. PROPERTY, PLANT AND EQUIPMENTLand At fair value 1 400
1 400Buildings At fair value 5 175Less: Accumulated Depreciation (3 062)
2 113Plant and EquipmentAt cost 2 116Less: Accumulated Depreciation (1 176)
940Computer SoftwareAt fair value 6 897Less: Accumulated Amortisation (1 496)
5 401Computer HardwareAt fair value 357Less: Accumulated Depreciation (357)
-
Total Property, Plant and Equipment 9 854
2009 Property, Plant and Equipment Reconciliations
A reconciliation of the carrying amount of property, plant and equipment at the beginning and end of 2008-09 is set out below:
Land Buildings Plant & Equipment
Computer Software
Computer Hardware
Total
$’000 $’000 $’000 $’000 $’000 $’000
Carrying Amount as at 1 July 2008 1 400 2 204 369 2 230 - 6 203
Additions - - 296 3 564 - 3 860
Disposals - - (4) - - (4)
Depreciation and Amortisation - (107) (203) (392) (17) (719)
Additions/(Disposals) from Asset Transfers - 15 481 - 17 513
Carrying Amount as at 30 June 2009 1 400 2 113 940 5 401 - 9 854

Annual Report 2008-2009 :: 111
DB
E F
inan
cial Statem
ents
2009 $’000
11. PAYABLESAccounts Payable 2 068
Accrued Expenses 1 767
Total Payables 3 835
12. PROVISIONSCurrent
Employee Benefits
Recreation Leave 3 971
Leave Loading 575
Recreation Leave Airfares 175
Other Current Provisions
Other Provisions 821
5 542
Non-Current
Employee Benefits
Recreation Leave 2 245
2 245
Total Provisions 7 787
Reconciliation of Other Provisions
Balance as at 1 July 2008 547
Additional Provisions Recognised 2 148
Reductions Arising from Payments (1 874)
Balance as at 30 June 2009 821
The Department employed 629 full-time equivalent employees as at 30 June 2009.

112 :: Department of Business and Employment
DBE Financial Statements
2009 $’000
13. OTHER LIABILITIESCurrent
Other Liabilities 136
Total Other Liabilities 136
14. EQUITYEquity represents the residual interest in the net assets of the Department. The Government’s ownership interest in the Department is held in the Central Holding Authority as described in Note 2(c).
Capital
Balance as at 1 July 4 247
Equity Injections
Capital Appropriation 762
Equity Transfers In 909
Other Equity Injections 2 055
Equity Withdrawals
Equity Transfers Out (91)
Balance as at 30 June 7 882
Reserves
Asset Revaluation Reserve
(i) Nature and Purpose of the Asset Revaluation Reserve
The asset revaluation reserve includes the net revaluation increments and decrements arising from the revaluation of non-current assets. Impairment adjustments may also be recognised in the Asset Revaluation Reserve.
(ii) Movements in the Asset Revaluation Reserve
Balance as at 1 July 324
Increment/(Decrement) – Land -
Increment/(Decrement) – Buildings -
Balance as at 30 June 324
Accumulated Funds
Balance as at 1 July (1 460)
Surplus for the Period 3 909
Balance as at 30 June 2 449
Total Equity 10 655

Annual Report 2008-2009 :: 113
DB
E F
inan
cial Statem
ents
2009 $’000
15. NOTES TO THE CASH FLOW STATEMENTReconciliation of Cash
The total of Department Cash and Deposits of $5 022 929 recorded in the Balance Sheet is consistent with that recorded as ‘cash’ in the Cash Flow Statement.
Reconciliation of Net Surplus to Net Cash From Operating Activities
Net Surplus 3 909
Non-Cash Items:
Depreciation and Amortisation 719
(Gain)/Loss on Disposal of Fixed Assets 4
Repairs and Maintenance – Minor New Works (non-cash) 2
Changes in Assets and Liabilities:
Decrease/(Increase) in Receivables (1 642)
Decrease/(Increase) in Prepayments (163)
(Decrease)/Increase in Payables 889
(Decrease)/Increase in Provision for Employee Benefits 1 546
(Decrease)/Increase in Other Provisions 274
(Decrease)/Increase in Other Liabilities 35
Net Cash From Operating Activities 5 573
16. FINANCIAL INSTRUMENTS
A financial instrument is a contract that gives rise to a financial asset of one entity and a financial liability or equity instrument of another entity. Financial instruments held by the Department include cash and deposits, receivables, payables and finance leases. The Department has limited exposure to financial risks as discussed below.
(a) Categorisation of Financial Instruments
The carrying amounts of the Department’s financial assets and liabilities by category are disclosed in the following table.
2009 $’000
Financial Assets
Cash and deposits 5 023
Receivables 3 970
Loans and Advances 231
Total Financial Assets 9 224
Financial Liabilities
Deposits Held 337
Payables 3 835
Total Financial Liabilities 4 172

114 :: Department of Business and Employment
DBE Financial Statements
16. FINANCIAL INSTRUMENTS (Continued)
b) Credit Risk
The Department has limited credit risk exposure (risk of default). In respect of any dealings with organisations external to Government, the Department has adopted a policy of only dealing with credit worthy organisations and obtaining sufficient collateral or other security where appropriate, as a means of mitigating the risk of financial loss from defaults.
The carrying amount of financial assets recorded in the financial statements, net of any allowances for losses, represents the Department’s maximum exposure to credit risk without taking account of the value of any collateral or other security obtained.
Receivables
Receivable balances are monitored on an ongoing basis to ensure that exposure to bad debts is not significant. A reconciliation and ageing analysis of receivables is presented below.
2009 $’000
Ageing of Receivables
Not overdue 3 356
Overdue for less than 30 days 440
Overdue for 30 to 60 days 33
Overdue for more than 60 days 141
Total Receivables 3 970
(c) Liquidity risk
Liquidity risk is the risk that the Department will not be able to meet its financial obligations as they fall due. The Department’s approach to managing liquidity is to ensure that it will always have sufficient liquidity to meet is liabilities when they fall due.
The following tables detail the undiscounted cash flows payable by the Department by remaining contractual maturity for its financial liabilities. It should be noted that as these are undiscounted, totals may not reconcile to the carrying amounts presented in the Balance Sheet.
2009 Maturity analysis for financial liabilities
Variable Interest
Fixed Interest Rate Non Interest Bearing
Total Weighted AverageLess
than a Year
1 to 5 Years
More than 5 Years
$’000 $’000 $’000 $’000 $’000 $’000 %
Deposits Held - - - - 337 337
Payables - - - - 3 835 3 835
Total Financial Liabilities:
- - - - 4 172 4 172

Annual Report 2008-2009 :: 115
DB
E F
inan
cial Statem
ents
16. FINANCIAL INSTRUMENTS (Continued)
(d) Market Risk
Market risk is the risk that the fair value of future cash flows of a financial instrument will fluctuate because of changes in market prices. It comprises interest rate risk, price risk and currency risk. The primary market risk that an agency is likely to be exposed to is interest rate risk.
i) Interest Rate Risk
The Agency is not exposed to interest rate risk as Department financial assets and financial liabilities are non-interest bearing.
ii) Price Risk
The Department is not exposed to price risk as the Department does not hold units in unit trusts.
iii) Currency Risk
The Department is not exposed to currency risk as the Department does not hold borrowings denominated in foreign currencies or transactional currency exposures arising from purchases in a foreign currency.
(e) Net Fair Value
The carrying amount of financial assets and financial liabilities recorded in the financial statements approximates their respective net fair values. Where differences exist, these are not material.
2009
Total carrying amount $’000
Net Fair Value $’000
Financial Assets
Cash and Deposits 5 023 5 023
Receivables 3 970 3 970
Loans and Advances 231 231
Total Financial Assets: 9 224 9 224
Financial Liabilities
Deposits Held 337 337
Payables 3 835 3 835
Total Financial Liabilities: 4 172 4 172

116 :: Department of Business and Employment
DBE Financial Statements
17. COMMITMENTS
(a) Property Lease Commitments
The Department leases property under non-cancellable operating leases expiring from 1 month to 25 years. Leases generally provide the Department with a right of renewal at which time all lease terms are renegotiated. The Department also leases items of plant and equipment under non-cancellable operating leases. Future operating lease commitments not recognised as liabilities are payable as follows:
2009 $’000
Within one year 37 101
Later than one year and not later than five years 93 742
Later than five years 63 910
194 753
(b) Operating Lease CommitmentsOther non-cancellable expenditure commitments not recognised as liabilities are payable as follows
Within one year 60
Later than one year and not later than five years 52
112
18. CONTINGENT LIABILITIES AND CONTINGENT ASSETS
The Department had no material contingent liabilities or contingent assets as at 30 June 2009.
19. EVENTS SUBSEQUENT TO BALANCE DATE
No events have arisen between the end of the financial year and the date of this report that require adjustment to, or disclosure in these financial statements.

Annual Report 2008-2009 :: 117
DB
E F
inan
cial Statem
ents
20. ACCOUNTABLE OFFICER’S TRUST ACCOUNT
In accordance with section 7 of the Financial Management Act, an Accountable Officer’s Trust Account has been established for the receipt of money to be held in trust. A summary of activity is shown below:
Nature of Trust Money Opening Balance
1 July 2008
Receipts Payments Closing Balance 30 June 2009
Superannuation returned cheques - 5 5 -
- 5 5 -
21. WRITE-OFFS, POSTPONEMENTS AND WAIVERS
2009 $’000
No. of Trans.
Write-offs, Postponements and Waivers Under the 1 1
Financial Management Act
Represented by:
Amounts written-off, postponed and waived by Delegates
Public property written-off 1 1
Total written-off, postponed and waived by Delegates 1 1

118 :: Department of Business and Employment
DCS Financial Statements
FINANCIAL PERFORMANCE
Data Centre Services continued to produce a strong result in 2008-09 with a surplus of $1.9M, exceeding the budget estimate by $0.2M. This surplus result is after paying taxes of $0.8M. Data Centre Services will also return a dividend of $0.9M to Government for 2008-09.
With the ever expanding development of information and communications technology (ICT) solutions, Data Centre Services operates in an environment of increasing demand for its services. Growth is mostly focused in the Midrange Services area with the expansion of virtual servers and data storage in the Storage Area Network.
In 2008-09, Data Centre Services consolidated ePass as the Government’s central ICT identity and access management system following implementation of the ePass 2 project in 2007-08. Revenues and costs for ePass settled into more usual operational patterns in 2008-09. An upgrade to ePass is scheduled for 2009-10 along with an increase in charges to agencies that will see ePass revenue rise and improve cost recovery.
Data Centre Services has three main business functions – midrange services, mainframe services and a whole of government IT security administration function. Revenue and expenses for these functions are provided below.
Table 1: 2008-09 Budget and Actual Performance
Actual $’000
Budget $’000
Variation $’000
2009 2008 2009 2008 2009 2008
Income 19 568 19 003 19 586 18 989 (18) 14
Expenses 16 895 14 754 17 211 16 248 316 1 494
Net Surplus before Tax 2 673 4 249 2 375 2 741 298 1 508
Income Tax Expense 802 1 275 713 822 (89) (453)
Net Surplus after Tax 1 871 2 974 1 662 1 919 209 1 055
DATA CENTRE SERVICES
FINANCIAL REPORT
FINANCIAL STATEMENT OVERVIEW For the Year Ended 30 June 2009

Annual Report 2008-2009 :: 119
DC
S F
inan
cial Statem
ents
Income
Data Centre Services primary revenue source is from providing information technology services to Government agencies and external clients. This is classified as goods and services revenue and represents 99% of total revenue.
Table 2: Revenue by Category
Year Goods and Services
Interest Other TOTAL
$’000 % $’000 % $’000 % $’000 %
08-09 19 331 98.8 212 1.1 25 0.1 19 568 100.0
07-08 18 721 98.5 246 1.3 36 0.2 19 003 100.0
Table 3: Revenue by Business Function
Year Midrange Mainframe IT Security / ePass TOTAL
$’000 % $’000 % $’000 % $’000 %
08-09 12 887 65.9 4 425 22.6 2 256 11.5 19 568 100.0
07-08 14 154 74.5 2 956 15.6 1 893 10.0 19 003 100.0
Expenses
In the provision of services, Data Centre Services incurs the majority of its expenditure on:
ICT- information technology related costs for hardware and software, including contractors
employee costs.
Table 4: Expenses by Category
Year ICT Employee Operational Depreciation Property Total
$’000 % $’000 % $’000 % $’000 % $’000 % $’000 %
08-09 7 575 44.8 5 456 32.3 913 5.4 1 962 11.6 989 5.9 16 895 100.0
07-08 6 827 46.3 4 874 33.0 700 4.7 1 425 9.7 928 6.3 14 754 100.0
While all cost categories increased in absolute terms in 2008-09, the major cost categories decreased in percentage share terms over the period. Depreciation experienced the largest growth primarily due to the prior investment in the ePass 2 system which commenced being depreciated in 2008-09.

120 :: Department of Business and Employment
DCS Financial Statements
Figure 1 compares Data Centre Services’ expenses across financial years by category
Figure 1: Expenses by Category
The demand for Midrange and ePass services has increased revenue; it has also resulted in increased costs.
Table 5: Expenses by Business Function
Year Midrange Mainframe IT Security / ePass TOTAL
$’000 % $’000 % $’000 % $’000 %
08-09 11 453 67.8 2 875 17.0 2 567 15.2 16 895 100.0
07-08 11 618 78.7 2 131 14.4 1 005 6.9 14 754 100.0
FINANCIAL POSITION
Data Centre Services continued to maintain a strong financial position in 2008-09 increasing net assets from $8.1M to $9.1M. Total liabilities reduced by $1.2M, partially offset by a small reduction in total assets to provide an overall improvement of $1.0M. The reduction in liabilities for 2008-09 was due to a combination of reduced income tax liability and provision for dividends.
Due to Data Centre Services strong cash position, asset acquisitions in 2008-09 were funded from cash balances at a capital cost of $0.7M and software licences of $0.2M. Acquisitions were more than offset by depreciation increases of $1.9M.
Expense Category
06-07 07-08 08-09
$ M
illio
ns
0
1
2
3
4
5
6
7
8
9
ICT Employee Operational Depreciation Property

Annual Report 2008-2009 :: 121
DC
S F
inan
cial Statem
ents

122 :: Department of Business and Employment
DCS Financial Statements

Annual Report 2008-2009 :: 123
DC
S F
inan
cial Statem
ents
NOTE 2009 $’000
2008 $’000
INCOME
Sales of Goods and Services 19 331 18 721
Interest Revenue 212 246
Other Income 25 36
TOTAL INCOME 19 568 19 003
EXPENSES
Employee Expenses 5 456 4 874
Administrative Expenses
Purchases of Goods and Services 3 9 469 8 510
Depreciation and Amortisation 7 1 962 1 425
Other Administrative Expenses 8 55
Interest Expenses - -
TOTAL EXPENSES 16 895 14 754
Income Tax Expense 4 802 1 275
NET SURPLUS 12 1 871 2 974
The Income Statement is to be read in conjunction with the notes to the financial statements.
DATA CENTRE SERVICESOPERATING STATEMENT
For the year ended 30 June 2009

124 :: Department of Business and Employment
DCS Financial Statements
NOTE 2009 $’000
2008 $’000
ASSETS
Current Assets
Cash 5 5 045 4 507
Receivables 6 2 139 2 087
Prepayments 1 567 1 304
Total Current Assets 8 751 7 898
Non-Current Assets
Property, Plant and Equipment 7 3 850 4 885
Total Non-Current Assets 3 850 4 885
TOTAL ASSETS 12 601 12 783
LIABILITIES
Current Liabilities
Payables 8 517 804
Income Tax Liabilities 9 802 1 275
Provisions 10 1 543 2 080
Other Liabilities 11 368 316
Total Current Liabilities 3 230 4 475
Non-Current Liabilities
Provisions 10 230 197
Total Non-Current Liabilities 230 197
TOTAL LIABILITIES 3 460 4 672
NET ASSETS 9 141 8 111
EQUITY 12
Capital 569 475
Accumulated Funds 8 572 7 636
TOTAL EQUITY 9 141 8 111
The Balance Sheet is to be read in conjunction with the notes to the financial statements.
DATA CENTRE SERVICES BALANCE SHEETAs at 30 June 2009

Annual Report 2008-2009 :: 125
DC
S F
inan
cial Statem
ents
NOTE 2009 $’000
2008 $’000
BALANCE OF EQUITY AT 1 JULY 8 111 6 480
Capital 12
Balance at 1 July 475 331
Equity Injections 94 144
Balance at 30 June 569 475
Accumulated Funds 12
Balance at 1 July 7 636 6 149
Surplus for the Period 1 871 2 974
Dividends payable (935) (1 487)
Balance at 30 June 8 572 7 636
BALANCE OF EQUITY AT 30 JUNE 9 141 8 111
The Statement of Changes in Equity is to be read in conjunction with the notes to the financial statements.
DATA CENTRE SERVICESSTATEMENT OF CHANGES IN EQUITY
For the year ended 30 June 2009

126 :: Department of Business and Employment
DCS Financial Statements
NOTE 2009 $’000
(Outflows) / Inflows
2008 $’000
(Outflows) / Inflows
CASH FLOWS FROM OPERATING ACTIVITIES
Operating Receipts
Receipts from Sales of Goods and Services 20 393 19 709
GST Receipts 1 108 1 856
Interest Received 230 235
Total Operating Receipts 21 731 21 800
Operating Payments
Payments to Employees (5 323) (4 810)
Payments for Goods and Services (11 241) (10 210)
GST Payments (1 034) (1 243)
Income Tax Paid (1 275) (680)
Interest Paid - -
Total Operating Payments (18 873) (16 943)
Net Cash From Operating Activities 13 2 858 4 857
CASH FLOWS FROM INVESTING ACTIVITIES
Investing Payments
Purchases of Assets (833) (3 609)
Total Investing Payments (833) (3 609)
Net Cash Used In Investing Activities (833) (3 609)
CASH FLOWS FROM FINANCING ACTIVITIES
Financing Payments
Finance Lease Payments - -
Dividends Paid 10, 12 (1 487) (793)
Total Financing Payments (1 487) (793)
Net Cash (Used In) Financing Activities (1 487) (793)
Net Increase in Cash Held 538 455
Cash at Beginning of Financial Year 4 507 4 052
CASH AT END OF FINANCIAL YEAR 5 5 045 4 507
The Cash Flow Statement is to be read in conjunction with the notes to the financial statements.
DATA CENTRE SERVICESCASH FLOW STATEMENT
For the year ended 30 June 2009

Annual Report 2008-2009 :: 127
DC
S F
inan
cial Statem
ents
INDEX OF NOTES TO THE FINANCIAL STATEMENTS
1. Objectives and Funding
2. Statement of Significant Accounting Policies
EXPENSES
3. Purchases of Goods and Services
4. Income Tax Expense
ASSETS
5. Cash
6. Receivables
7. Property, Plant and Equipment
LIABILITIES
8. Payables
9. Income Tax Liabilities
10. Provisions
11. Other Liabilities
EQUITY
12. Equity
OTHER DISCLOSURES
13. Notes to the Cash Flow Statement
14. Financial Instruments
15. Commitments
16. Contingent Liabilities and Contingent Assets
17. Events Subsequent to Balance Date
18. Write-offs, Postponements and Waivers
DATA CENTRE SERVICESNOTES TO THE FINANCIAL STATEMENTS
For the year ended 30 June 2009

128 :: Department of Business and Employment
DCS Financial Statements
1. OBJECTIVES AND FUNDING
Data Centre Services delivers a range of information technology services to all Northern Territory Government agencies and ensures that critical business systems operate in an environment that is flexible, reliable and secure with high levels of access and availability.
Data Centre Services is funded through income generated by services provided to Northern Territory Government agencies. The financial statements encompass all funds and resources which Data Centre Services controls to carry on its functions and deliver the output of Data Centre Management.
2. STATEMENT OF SIGNIFICANT ACCOUNTING POLICIES
(a) Basis of Accounting
The financial statements have been prepared in accordance with the requirements of the Financial Management Act and related Treasurer’s Directions. The Financial Management Act requires Data Centre Services to prepare financial statements for the year ended 30 June based on the form determined by the Treasurer. The form of the financial statements is to include:
(i) a Certification of the Financial Statements
(ii) an Operating Statement
(iii) a Balance Sheet
(iv) a Statement of Changes in Equity
(v) a Cash Flow Statement
(vi) applicable explanatory notes to the financial statements.
The form of agency financial statements is consistent with the accrual budget format and the requirements of the Australian Accounting Standards, including AASB 101 and AASB 107. The format also requires additional disclosures specific to Northern Territory Government entities.
The financial statements have been prepared using the accrual basis of accounting, which recognises the effect of financial transactions and events when they occur, rather than when cash is paid out or received. As part of the preparation of the financial statements, all intra agency transactions and balances have been eliminated.
Except where stated, the financial statements have also been prepared in accordance with the historical cost convention.
AASB 2007-9 Amendments to Australian Accounting Standards arising from the Review of AAS 27, AAS 29 and AAS 31
The Standard relocates certain relevant requirements from AASs 27, 29 and 31, substantively unamended, into existing topic based standards. This standard also

Annual Report 2008-2009 :: 129
DC
S F
inan
cial Statem
ents
makes consequential amendments, arising from the short term review of AASs 27, 29 and 31, to AASB 5, AASB 8, AASB 101 and AASB 114. The Standard will not have an impact on the Financial Statements.
(b) Australian Accounting Standards and Interpretations Issued but not yet Effective
At the date of authorisation of the financial statements, the Standards and Interpretations listed below were in issue but not yet effective.
AASB 101 Presentation of Financial Statements (revised September 2007), AASB 2007-8 Amendments to Australian Accounting Standards Arising from AASB 101, AASB 2007-10 Further Amendments to Australian Accounting Standards arising from AASB 101
Effective for annual reporting period beginning on or after 1 January 2009.
AASB 2009-2 Amendments to Australian Accounting Standards – Improving Disclosures about Financial Instruments
Effective for annual reporting period beginning on or after 1 January 2009 that ends on or after 30 April 2009.
AASB Interpretation 18 Transfer of Assets from Customers
Effective for annual reporting beginning on or after 1 July 2009.
Data Centre Services anticipates that the adoption of these Standards and Interpretations in future reporting periods will have no material impact on the financial statements. These Standards and Interpretations will be first applied in the financial report that relates to the annual reporting period beginning after the effective date of each pronouncement.
(c) Agency and Territory Items
The financial statements of Data Centre Services include income, expenses, assets, liabilities and equity over which it has control (Agency items). Certain items, while managed by the Government Business Division (GBD), are controlled and recorded by the Territory rather than the GBD (Territory items). Territory items are recognised and recorded in the Central Holding Authority as discussed below.
Central Holding Authority
The Central Holding Authority is the ‘parent body’ that represents the Government’s ownership interest in Government controlled entities.
The Central Holding Authority also holds certain Territory assets not assigned to Agencies as well as certain Territory liabilities that are not practical or effective to assign to individual Agencies such as unfunded superannuation and long service leave.

130 :: Department of Business and Employment
DCS Financial Statements
(d) Comparatives
Where necessary, comparative information for the 2007-08 financial year has been reclassified to provide consistency with current year disclosures.
(e) Presentation and Rounding of Amounts
Amounts in the financial statements and notes to the financial statements are presented in Australian dollars and have been rounded to the nearest thousand dollars, with amounts less than $500 being rounded down to zero.
(f) Changes in Accounting Policies
There have been no changes to accounting policies adopted in 2008-09 as a result of management decisions.
(g) Accounting Judgements and Estimates
The preparation of the financial report requires the making of judgements and estimates that affect the recognised amounts of assets, liabilities, revenues and expenses and the disclosure of contingent liabilities. The estimates and associated assumptions are based on historical experience and various other factors that are believed to be reasonable under the circumstances, the results of which form the basis of making the judgements about the carrying values of assets and liabilities that are not readily apparent from other sources. Actual results may differ from these estimates.
The estimates and underlying assumptions are reviewed on an ongoing basis. Revisions to accounting estimates are recognised in the period in which the estimate is revised if the revision affects only that period, or in the period of the revision and future periods if the revision affects both current and future periods.
Judgements and estimates that have significant effects on the financial statements are disclosed in the relevant notes to the financial statements. Notes that include significant judgements and estimates are:
Employee Benefits – Note 2(u) and Note 10: Non-current liabilities in respect of employee benefits are measured as the present value of estimated future cash outflows based on the appropriate Government bond rate, estimates of future salary and wage levels and employee periods of service.
Contingent Liabilities – Note 16: The present value of material quantifiable contingent liabilities are calculated using a discount rate based on the published 10-year Government bond rate.
Doubtful Debts – Note 2(o) and Note 6: Receivables.
Depreciation and Amortisation – Note 2(k) and Note 7: Property, Plant and Equipment.
(h) Goods and Services Tax
Income, expenses and assets are recognised net of the amount of Goods and Services Tax (GST), except where the amount of GST incurred on a purchase of goods and services is not recoverable from the Australian Taxation Office (ATO). In these circumstances the GST is recognised as part of the cost of acquisition of the asset or as part of the expense.

Annual Report 2008-2009 :: 131
DC
S F
inan
cial Statem
ents
Receivables and payables are stated with the amount of GST included. The net amount of GST recoverable from, or payable to, the ATO is included as part of receivables or payables in the Balance Sheet.
Cash flows are included in the Cash Flow Statement on a gross basis. The GST components of cash flows arising from investing and financing activities which are recoverable from, or payable to, the ATO are classified as operating cash flows. Commitments and contingencies are disclosed net of the amount of GST recoverable or payable unless otherwise specified.
(i) Income Recognition
Income encompasses both revenue and gains.
Income is recognised at the fair value of the consideration received, exclusive of the amount of Goods and Services Tax (GST). Exchanges of goods or services of the same nature and value without any cash consideration being exchanged are not recognised as income.
Deferred income is recognised when income is received prior to the transfer of goods or provision of services to a customer.
Sale of Goods
Revenue from the sale of goods is recognised (net of returns, discounts and allowances) when:
the significant risks and rewards of ownership of the goods have transferred to the buyer
Data Centre Services retains neither continuing managerial involvement to the degree usually associated with ownership nor effective control over the goods sold
the amount of revenue can be reliably measured
it is probable that the economic benefits associated with the transaction will flow to Data Centre Services;
and
the costs incurred or to be incurred in respect of the transaction can be measured reliably.
Rendering of Services
Revenue from rendering services is recognised by reference to the stage of completion of the contract. The revenue is recognised when:
the amount of revenue, stage of completion and transaction costs incurred can be reliably measured
it is probable that the economic benefits associated with the transaction will flow to the entity.

132 :: Department of Business and Employment
DCS Financial Statements
Interest Revenue
Interest revenue is recognised as it accrues, taking into account the effective yield on the financial asset.
Disposal of Assets
A gain or loss on disposal of assets is included as a gain or loss on the date control of the asset passes to the buyer, usually when an unconditional contract of sale is signed. The gain or loss on disposal is calculated as the difference between the carrying amount of the asset at the time of disposal and the net proceeds on disposal.
Contributions of Assets
Contributions of assets and contributions to assist in the acquisition of assets, being non-reciprocal transfers, are recognised, unless otherwise determined by Government, as gains when Data Centre Services obtains control of the asset or contribution. Contributions are recognised at the fair value received or receivable.
(j) Repairs and Maintenance Expenses
Costs associated with repairs and maintenance works on Data Centre Services’ assets are expensed as incurred.
(k) Depreciation and Amortisation Expense
Items of property, plant and equipment, including buildings but excluding land, have limited useful lives and are depreciated or amortised using the straight-line method over their estimated useful lives.
Amortisation applies in relation to intangible non-current assets with limited useful lives and is calculated and accounted for in a similar manner to depreciation.
The estimated useful lives for each class of asset are in accordance with the Treasurer’s Directions and are determined as follows:
2009 2008
Plant and Equipment 2 - 10 Years 2 - 10 Years
Computer Software 2 - 5 Years 2 - 5 Years
Computer Hardware 2 - 4 Years 2 - 4 Years
Assets are depreciated or amortised from the date of acquisition or from the time an asset is completed and held ready for use.
(l) Interest Expenses
Interest expenses include interest and finance lease charges. Interest expenses are expensed in the period in which they are incurred.

Annual Report 2008-2009 :: 133
DC
S F
inan
cial Statem
ents
(m) Taxation
Data Centre Services is required to pay income tax on its accounting surplus at the company rate of 30% in accordance with the requirements of the Treasurer’s Directions, NT Tax Equivalents Regime.
(n) Cash and Deposits
For the purposes of the Balance Sheet and the Cash Flow Statement, cash includes cash on hand, cash at bank and cash equivalents. Cash equivalents are highly liquid short-term investments that are readily convertible to cash.
(o) Receivables
Receivables include accounts receivable and other receivables and are recognised at fair value less any allowance for impairment losses.
The allowance for impairment losses represents the amount of receivables Data Centre Services estimates are likely to be uncollectible and are considered doubtful. Analyses of the age of the receivables that are past due as at the reporting date are disclosed in an aging schedule under credit risk in Note 14 Financial Instruments. Reconciliation of changes in the allowance accounts is also presented.
Accounts receivable and other receivables are generally settled within 30 days.
(p) Property, Plant and Equipment
Acquisitions
All items of property, plant and equipment with a cost, or other value, equal to or greater than $5 000 are recognised in the year of acquisition and depreciated as outlined below. Items of property, plant and equipment below the $5 000 threshold are expensed in the year of acquisition.
The construction cost of property, plant and equipment includes the cost of materials and direct labour, and an appropriate proportion of fixed and variable overheads.
Complex Assets
Major items of plant and equipment comprising a number of components that have different useful lives are accounted for as separate assets. The components may be replaced during the useful life of the complex asset.
Subsequent Additional Costs
Costs incurred on property, plant and equipment subsequent to initial acquisition are capitalised when it is probable that future economic benefits in excess of the originally assessed performance of the asset will flow to Data Centre Services in future years. Where these costs represent separate components of a complex asset, they are accounted for as separate assets and are separately depreciated over their expected useful lives.
Construction (Work in Progress)
As part of Financial Management Framework, the Department of Planning and

134 :: Department of Business and Employment
DCS Financial Statements
Infrastructure is responsible for managing general government capital works projects on a whole of Government basis. Therefore appropriation for Data Centre Services’ capital works is provided directly to the Department of Planning and Infrastructure and the cost of construction work in progress is recognised as an asset of that Department. Once completed, capital works assets are transferred to the Data Centre Services.
(q) Revaluations and Impairment
Revaluation of Assets
Subsequent to initial recognition, assets belonging to the following classes of non-current assets are revalued with sufficient regularity to ensure that the carrying amount of these assets does not differ materially from their fair value at reporting date:
Infrastructure Assets.
Fair value is the amount for which an asset could be exchanged, or liability settled, between knowledgeable, willing parties in an arms length transaction.
(r) Impairment of Assets
An asset is said to be impaired when the asset’s carrying amount exceeds its recoverable amount.
Non-current physical and intangible Data Centre Services assets are assessed for indicators of impairment on an annual basis. If an indicator of impairment exists, Data Centre Services determines the asset’s recoverable amount. The asset’s recoverable amount is determined as the higher of the asset’s depreciated replacement cost and fair value less costs to sell. Any amount by which the asset’s carrying amount exceeds the recoverable amount is recorded as an impairment loss.
Impairment losses are recognised in the Operating Statement unless the asset is carried at a revalued amount. Where the asset is measured at a revalued amount, the impairment loss is offset against the Asset Revaluation Reserve for that class of asset to the extent that an available balance exists in the Asset Revaluation Reserve.
In certain situations, an impairment loss may subsequently be reversed. Where an impairment loss is subsequently reversed, the carrying amount of the asset is increased to the revised estimate of its recoverable amount. A reversal of an impairment loss is recognised in the Operating Statement as income, unless the asset is carried at a revalued amount, in which case the impairment reversal results in an increase in the Asset Revaluation Reserve.
(s) Leased Assets
Leases under which Data Centre Services assumes substantially all the risks and rewards of ownership of an asset are classified as finance leases. Other leases are classified as operating leases.
Finance Leases

Annual Report 2008-2009 :: 135
DC
S F
inan
cial Statem
ents
Finance leases are capitalised. A leased asset and a lease liability equal to the present value of the minimum lease payments are recognised at the inception of the lease.
Lease payments are allocated between the principal component of the lease liability and the interest expense.
Operating Leases
Operating lease payments made at regular intervals throughout the term are expensed when the payments are due, except where an alternative basis is more representative of the pattern of benefits to be derived from the leased property. Lease incentives under an operating lease of a building or office space are recognised as an integral part of the consideration for the use of the leased asset. Lease incentives are recognised as a deduction of the lease expense over the term of the lease.
(t) Payables
Liabilities for accounts payable and other amounts payable are carried at cost, which is the fair value of the consideration to be paid in the future for goods and services received, whether or not billed to Data Centre Services. Accounts payable are normally settled within 30 days.
(u) Employee Benefits
Provision is made for employee benefits accumulated as a result of employees rendering services up to the reporting date. These benefits include wages and salaries and recreation leave. Liabilities arising in respect of wages and salaries and recreation leave and other employee benefit liabilities that fall due within twelve months of reporting date are classified as current liabilities and are measured at amounts expected to be paid. Non-current employee benefit liabilities that fall due after twelve months of the reporting date are measured at present value, calculated using the Government long term bond rate.
No provision is made for sick leave, which is non-vesting, as the anticipated pattern of future sick leave to be taken is less than the entitlement accruing in each reporting period.
Employee benefit expenses are recognised on a net basis in respect of the following categories:
wages and salaries, non-monetary benefits, recreation leave, sick leave and other leave entitlements
other types of employee benefits.
As part of the Financial Management Framework, the Central Holding Authority assumes the long service leave liabilities of Government agencies, including Data Centre Services and, as such, no long service leave liability is recognised in the financial statements.

136 :: Department of Business and Employment
DCS Financial Statements
(v) Superannuation
Employees’ superannuation entitlements are provided through the:
NT Government and Public Authorities Superannuation Scheme (NTGPASS)
Commonwealth Superannuation Scheme (CSS)
non-government employee nominated schemes for those employees commencing on or after 10 August 1999.
Data Centre Services makes superannuation contributions on behalf of its employees to the Central Holding Authority or non-government employee nominated schemes. Superannuation liabilities related to government superannuation schemes are held by the Central Holding Authority and as such are not recognised in Data Centre Services’ financial statements.
(w) Contributions by and Distributions to Government
Data Centre Services may receive contributions from Government where the Government is acting as owner of Data Centre Services. Conversely, Data Centre Services may make distributions to Government. In accordance with the Financial Management Act and Treasurer’s Directions, certain types of contributions and distributions, including those relating to administrative restructures, have been designated as contributions by, and distributions to, Government. These designated contributions and distributions are treated by Data Centre Services as adjustments to equity.
The Statement of Changes in Equity and Note 12 provide additional information in relation to contributions by, and distributions to, Government.
(x) Dividends
Data Centre Services has provided for a dividend payable at the rate of 50% of net profit after tax in accordance with the NT Government’s dividend policy.
(y) Commitments
Disclosures in relation to commitments are shown at Note 15 and are consistent with the requirements contained in AASB 101, AASB 116 and AASB 117.
Commitments are those contracted as at 30 June where the amount of the future commitment can be reliably measured.

Annual Report 2008-2009 :: 137
DC
S F
inan
cial Statem
ents
2009 $’000
2008 $’000
3. PURCHASES OF GOODS AND SERVICESThe net surplus has been arrived at after charging the following expenses:
Goods and Services Expenses:
Consultants (1) 2 535 1 886
Marketing and Promotion (2) 1 15
Legal Expenses (3) - -
Recruitment (4) 17 10
Training and Study 239 69
Official Duty Fares 7 12
Travelling Allowance 3 4
Corporate Support from Other Agencies 267 263
Audit Fees 16 11
(1) Includes marketing, promotion and IT consultants. (2) Includes advertising for marketing and promotion but excludes
marketing and promotion consultants’ expenses, which are incorporated in the consultants’ category.
(3) Includes legal fees, claim and settlement costs. (4) Includes recruitment related advertising costs.
4. INCOME TAX EXPENSECurrent Year Surplus 2 672 4 249
Prima facie income tax expense calculated at 30% on the surplus 802 1 275
Total Income Tax Expense 802 1 275
5. CASH Cash at Bank 5 045 4 507
Total Cash 5 045 4 507

138 :: Department of Business and Employment
DCS Financial Statements
2009 $’000
2008 $’000
6. RECEIVABLESCurrent
Accounts Receivable 480 337
Less: Allowance for Impairment Losses (11) (2)
469 335
Interest Receivable 11 29
GST Receivable 25
Other Receivables 1 659 1 698
Total Receivables 2 139 2 087
7. PROPERTY, PLANT AND EQUIPMENTPlant and Equipment
At Cost 502 375
Less: Accumulated Depreciation (262) (141)
240 234
Computer Software
At Cost 2 317 2 317
Less: Accumulated Amortisation (738) (197)
1 579 2 120
Computer Hardware
At Cost 6 385 5 585
Less: Accumulated Depreciation (4 354) (3 054)
2 031 2 531
Total Property, Plant and Equipment 3 850 4 885
Impairment of Property, Plant and Equipment
Data Centre Services’ property, plant and equipment assets were assessed for impairment as at 30 June 2009. No impairment adjustments were required as a result of this review.

Annual Report 2008-2009 :: 139
DC
S F
inan
cial Statem
ents
7. PROPERTY, PLANT AND EQUIPMENT (Continued)
Plant & Equipment
Computer Software
Computer Hardware
Total
$’000 $’000 $’000 $’000
Carrying Amount as at 1 July 2008 234 2120 2 531 4 885
Additions/ Transfer In 127 - 846 973
Transfer (Out) - - (46) (46)
Depreciation / Amortisation (121) (541) (1 300) (1 962)
Carrying Amount as at 30 June 2009 240 1 579 2 031 3 850
Plant & Equipment
Computer Software
Computer Hardware
Total
$’000 $’000 $’000 $’000
Carrying Amount as at 1 July 2007 385 4 2 221 2 610
Additions 141 2 314 1 462 3 917
Transfer In / (Out) (214) (3) - (217)
Depreciation / Amortisation (78) (195) (1 152) (1 425)
Carrying Amount as at 30 June 2008 234 2 120 2 531 4 885
2009 $’000
2008 $’000
8. PAYABLESAccounts Payable 41 447
Accrued Expenses 426 357
GST Payable 50
Total Payables 517 804
9. INCOME TAX LIABILITIESIncome Tax Payable 802 1 275
Total Income Tax Liabilities 802 1 275

140 :: Department of Business and Employment
DCS Financial Statements
2009 $’000
2008 $’000
10. PROVISIONSCurrent
Employee Benefits
Recreation Leave 420 344
Leave Loading 71 81
Other Employee Benefits – Recreation Leave Airfares 8 9
Other Current Provisions
Provision for Dividend 935 1 487
Provision for Fringe Benefits Tax 3 4
Provision for Superannuation 60 53
Provision for Payroll Tax 46 39
Provision for Workers Compensation Premium 13
Provision for Public Liability Insurance 50
1 543 2 080
Non-Current
Employee Benefits
Recreation Leave 230 197
230 197
Total Provisions 1 773 2 277
Reconciliation of Dividends
Balance as at 1 July 2008 1487 793
Reductions Arising from Payments (1487) (793)
Additional Provisions Recognised 935 1 487
Balance as at 30 June 2009 935 1 487
Data Centre Services employed 57 employees as at 30 June 2009 (57 employees as at 30 June 2008).
11. OTHER LIABILITIESCurrent
Deferred Revenue 368 316
Total Other Liabilities 368 316

Annual Report 2008-2009 :: 141
DC
S F
inan
cial Statem
ents
2009 $’000
2008 $’000
12. EQUITY
Equity represents the residual interest in the net assets of Data Centre Services. The Government’s ownership interest in Data Centre Services is held in the Central Holding Authority as described in Note 2(c).
Capital
Balance as at 1 July 475 331
Equity Injections
Equity Transfers In 94 144
Balance as at 30 June 569 475
Data Centre Services has made no adjustment to reserves for the year ended 2008-09 or 2007-08
Accumulated Funds
Balance as at 1 July 7 636 6 149
Surplus for the Period 1 871 2 974
Dividends Payable (935) (1 487)
Balance as at 30 June 8 572 7 636
Total Equity 9 141 8 111

142 :: Department of Business and Employment
DCS Financial Statements
2009 $’000
2008 $’000
13. NOTES TO THE CASH FLOW STATEMENTReconciliation of Cash
The total of Data Centre Services Cash of $5.045M recorded in the Balance Sheet is consistent with that recorded as ‘cash’ in the Cash Flow Statement.
Reconciliation of Net Surplus to Net Cash from Operating Activities
Net Surplus 1 871 2 974
Non-Cash Items:
Depreciation and Amortisation 1 962 1 425
Assets Written Down - 4
Repairs and Maintenance - minor new works - non-cash - 49
Changes in Assets and Liabilities:
Decrease/(Increase) in Receivables (52) (204)
Decrease/(Increase) in Prepayments (263) (269)
(Decrease) in Accounts Payable (407) 185
(Decrease)/Increase in Other Payables 120 (48)
(Decrease)Increase in Provision for Employee Benefits 98 8
(Decrease)/Increase in Other Provisions (50) 93
(Decrease)/Increase Income Tax Liabilities (473) 595
(Decrease)/Increase in Deferred Income 52 45
Net Cash From Operating Activities 2 858 4 857
Non-Cash Financing and Investing Activities
Finance Lease Transactions
During the financial year Data Centre Services acquired $nil (2008: $nil) plant and equipment / computer equipment and software by means of finance leases.

Annual Report 2008-2009 :: 143
DC
S F
inan
cial Statem
ents
14. FINANCIAL INSTRUMENTS
A financial instrument is a contract that gives rise to a financial asset of one entity and a financial liability or equity instrument of another entity. Financial instruments held by the Data Centre Services include cash, receivables and payables. Data Centre Services has limited exposure to financial risks as discussed below.
Data Centre Services’ operating account earns monthly interest at a variable interest rate (NT Treasury Corporation’s average 11am cash rate less 25 basis points).
Negative cash balances of $50 000 or less and negative cash balances over $50 000, which have an overdraft facility or by prior arrangement with NT Treasury Corporation, attract the average 11am cash rate for the month plus 50 basis points.
Negative balances without overdraft facilities or prior arrangement with NT Treasury Corporation will be charged the overdraft rate applied to the Government Bank Account by the Westpac Banking Corporation.
(a) Categorisation of Financial Instruments
The carrying amounts of the Data Centre Services financial assets and liabilities by category are disclosed in the table below.
2009 $’000
2008 $’000
Financial Assets
Cash 5 045 4 507
Receivables 2 139 2 087
Financial Liabilities
Payables 517 804
(b) Credit Risk
Data Centre Services has limited credit risk exposure (risk of default). In respect of any dealings with organisations external to Government, Data Centre Services has adopted a policy of only dealing with credit worthy organisations and obtaining sufficient collateral or other security where appropriate, as a means of mitigating the risk of financial loss from defaults.
The carrying amount of financial assets recorded in the financial statements, net of any allowances for losses, represents Data Centre Services’ maximum exposure to credit risk without taking account of the value of any collateral or other security obtained.
Data Centre Services has limited credit risk exposure (risk of default).

144 :: Department of Business and Employment
DCS Financial Statements
14. FINANCIAL INSTRUMENTS (Continued)
Receivables
Receivable balances are monitored on an ongoing basis to ensure that exposure to bad debts is not significant. A reconciliation and aging analysis of receivables is presented below.
2009 $’000
2008 $’000
Aging of Receivables
Not Overdue 338 216
Overdue for 30 to 60 Days 101 39
Overdue for more than 60 Days 29 1
Overdue for more than 90 days 11 81
Total Receivables 479 337
Aging of Impaired Receivables
Impaired Receivables for more than 90 Days 11 2
Total Impaired Receivables 11 2
2009 $’000
2008 $’000
Reconciliation of the Allowance for Impairment Losses
Allowance for Impairment Losses at the Beginning of the Reporting Period 2 57
Amounts written off during the year - -
Amounts recovered during the year - -
Increase/(decrease) in allowance recognised in profit or loss 9 (55)
Allowance for Impairment Losses at the End of the Reporting Period 11 2
(c) Liquidity risk
Liquidity risk is the risk that Data Centre Services will not be able to meet its financial obligations as they fall due. Data Centre Services’ approach to managing liquidity is to ensure that it will always have sufficient liquidity to meet is liabilities when they fall due.
The following tables detail the undiscounted cash flows payable by Data Centre Services by remaining contractual maturity for its financial liabilities. It should be noted that as these are undiscounted, totals may not reconcile to the carrying amounts presented in the Balance Sheet.

Annual Report 2008-2009 :: 145
DC
S F
inan
cial Statem
ents
14. FINANCIAL INSTRUMENTS (Continued)
2009 Maturity analysis for financial liabilities
Variable Interest
Fixed Interest Rate Non Interest Bearing
Total Weighted Average Less
than a Year
1 to 5 Years
More than 5 Years
$’000 $’000 $’000 $’000 $’000 $’000 %
Payables - - - - 517 517 4.54
Total Financial Liabilities: - - - - 517 517
2008 Maturity analysis for financial liabilities
Variable Interest
Fixed Interest Rate Non Interest Bearing
Total Weighted Average Less
than a Year
1 to 5 Years
More than 5 Years
$’000 $’000 $’000 $’000 $’000 $’000 %
Payables - - - - 804 804 6.57
Total Financial Liabilities: - - - - 804 804
(d) Market Risk
Market risk is the risk that the fair value of future cash flows of a financial instrument will fluctuate because of changes in market prices. It comprises interest rate risk, price risk and currency risk.
i) Interest Rate Risk
Data Centre Services has limited exposure to interest rate risk as Agency financial assets and financial liabilities are non-interest bearing. Finance lease arrangements are established on a fixed interest rate and as such do not expose Data Centre Services to interest rate risk. The Data Centre Services’ exposure to interest rate risk on financial assets and financial liabilities is set out in the following tables.
2009 $’000
2008 $’000
Variable rate instruments
Financial assets - -
Cash 5 045 4 507
Total 5 045 4 507

146 :: Department of Business and Employment
DCS Financial Statements
14. FINANCIAL INSTRUMENTS (Continued)
Market Sensitivity Analysis
Changes in the variable rates of 100 basis points (1 per cent) at reporting date would have the following effect on Data Centre Services’ profit or loss and equity.
Profit or Loss and Equity
100 basis points increase
$’000
100 basis points decrease
$’000
30 June 2009
Financial Assets - Cash at bank 50 (50)
30 June 2008
Financial Assets - Cash at bank 45 (45)
ii) Price Risk
Data Centre Services is not exposed to price risk as government business division does not hold units in unit trusts.
iii) Currency Risk
Data Centre Services has limited exposure to currency risk as the government business division does not hold borrowings denominated in foreign currencies, but has limited transactional currency exposures arising from purchases in a foreign currency.
(e) Net Fair Value
The carrying amount of financial assets and financial liabilities recorded in the financial statements approximates their respective net fair values. Where differences exist, these are not material.
The carrying amount for Accounts Receivable have been adjusted for Impairment Losses as detailed in Note 6 to these statements and is considered immaterial to the carrying value of the asset.
15. COMMITMENTS
Data Centre Services had no material commitments as at balance date 30 June 2009 or 30 June 2008.
16. CONTINGENT LIABILITIES AND CONTINGENT ASSETS
Data Centre Services had no contingent liabilities or contingent assets as at 30 June 2009 or 30 June 2008.
17. EVENTS SUBSEQUENT TO BALANCE DATE
Data Centre Services had no events subsequent to balance date as at 30 June 2009.
18. WRITE-OFFS, POSTPONEMENTS AND WAIVERS
Data Centre Services had no write-offs, postponements or waivers for the year ended 2008-09 or 2007-08.

Annual Report 2008-2009 :: 147
GP
O F
inan
cial Statem
ents
FINANCIAL PERFORMANCE
The Government Printing Office achieved a net surplus after tax of $13 000 for 2008-09. While this result is marginal, it is a substantial improvement over the budget projected result of a $90 000 deficit. The Government Printing Office will return a dividend to Government of $6 500 and taxes of $5 000 for 2008-09.
Advances in electronic transmission of documents and personal computing technology are impacting on the printing industry globally and leading to a reduction in demand for some traditional categories of printed product. Cognisant of the revenue trends, the Government Printing Office has focussed on improving internal business processes and carefully managing its costs throughout 2008-09 resulting in lowering expenses over the past two years. This is a significant achievement in an environment of annually increasing wage costs and inflation, particularly price rises in raw materials such as paper.
Table 1: 2008-09 Budget and Actual Performance
Actual $’000
Budget $’000
Variation $’000
2009 2008 2009 2008 2009 2008
Income 5 831 6 013 5 817 6 055 14 (42)
Expenses 5 813 5 868 5 907 5 914 94 46
Net Surplus/(Deficit) Before Tax 18 145 (90) 141 108 4
Income Tax Expense 5 43 - 42 5 1
Surplus/(Deficit) 13 102 (90) 99 103 3
Income
Income from printing services represents over 98% of the Government Printing Office total income. Income decreased by $0.18M from $6.01M in 2007-08 to $5.83M in 2008-09.
GOVERNMENT PRINTING OFFICE
FINANCIAL REPORT
FINANCIAL STATEMENT OVERVIEW For the Year Ended 30 June 2009

148 :: Department of Business and Employment
GPO Financial Statements
Expenses
Employee costs comprise the largest expense category for the Government Printing Office. Employee costs were contained in 2008-09 despite salary increases. Costs for sub-contractors increased in 2008-09 due to a greater demand for specialised printing requirements. Table 2 below shows the composition of major expense categories.
Table 2: Expenses by Category
Year Employee Sub Contractors
Operational Raw Materials
Plant & Equipment
TOTAL
$’000 % $’000 % $’000 % $’000 % $’000 % $’000 %
08-09 2 405 41.4 1 323 22.8 1 113 19.1 564 9.7 408 7.0 5 813 100
07-08 2 402 40.9 1 165 19.9 1 163 19.8 591 10.1 547 9.3 5 868 100
Figure 1 shows the Government Printing Office’s expenses by the various categories.
Figure 1: Expenses by Category
FINANCIAL POSITION
Current assets increased by over $0.17M in 2008-09 with a growth in cash balances. This was off-set by a reduction of $0.2M in non-current asset balances at year end due to depreciation and amortisation on printing plant and equipment. Total assets reduced by $0.035M overall.
Total liabilities reduced by $0.042M over the year mostly through careful management of creditors.
The combined effect of the movements in assets and liabilities resulted in the Government Printing Office’s financial position reflecting a slight improvement of $7 000 in 2008-09.
Expense Category
06-07 07-08 08-09
0
0.5
1
1.5
2
2.5
3
Employee
Sub Contractors
Operational
Raw Materials Plant &
Equipment
$ M
illio
ns

Annual Report 2008-2009 :: 149
GP
O F
inan
cial Statem
ents

150 :: Department of Business and Employment
GPO Financial Statements

Annual Report 2008-2009 :: 151
GP
O F
inan
cial Statem
ents
NOTE 2009 $’000
2008 $’000
INCOME
Sales of Goods and Services 5 713 5 871
Interest Revenue 105 133
Gain on Disposal of Assets 3 4
Other Income 9 9
TOTAL INCOME 5 831 6 013
EXPENSES
Employee Expenses 2 405 2 402
Administrative Expenses
Purchases of Goods and Services 4 3 121 3 042
Repairs and Maintenance 73 133
Depreciation and Amortisation 9 214 291
Other Administrative Expenses
Interest Expenses
TOTAL EXPENSES 5 813 5 868
Income Tax Expense 5 43
NET SURPLUS 14 13 102
The Operating Statement is to be read in conjunction with the notes to the financial statements.
GOVERNMENT PRINTING OFFICEOPERATING STATEMENT
For the year ended 30 June 2009

152 :: Department of Business and Employment
GPO Financial Statements
NOTE 2009 $’000
2008 $’000
ASSETS
Current Assets
Cash and Deposits 6 2 669 2 516
Receivables 7 628 569
Inventories 8 204 234
Prepayments 29 39
Total Current Assets 3 530 3 358
Non-Current Assets
Property, Plant and Equipment 9 560 767
Total Non-Current Assets 560 767
TOTAL ASSETS 4 090 4 125
LIABILITIES
Current Liabilities
Payables 10 322 379
Income Tax Liabilities 11 5 43
Provisions 12 384 439
Other Liabilities 13 193 76
Total Current Liabilities 904 937
Non-Current Liabilities
Provisions 12 158 167
Total Non-Current Liabilities 158 167
TOTAL LIABILITIES 1 062 1 104
NET ASSETS 3 028 3 021
EQUITY 14
Capital 373 373
Accumulated Funds 2 655 2 648
TOTAL EQUITY 3 028 3 021
The Balance Sheet is to be read in conjunction with the notes to the financial statements.
GOVERNMENT PRINTING OFFICEBALANCE SHEET As at 30 June 2009

Annual Report 2008-2009 :: 153
GP
O F
inan
cial Statem
ents
NOTE 2009 $’000
2008 $’000
BALANCE OF EQUITY AT 1 JULY 3 021 2 969
Capital 14
Balance at 1 July 373 373
Equity Injections - -
Equity Withdrawals - -
Balance at 30 June 373 373
Accumulated Funds 14
Balance at 1 July 2 648 2 595
Surplus for the Period 13 102
Dividends Payable (6) (50)
Balance at 30 June 2 655 2 648
BALANCE OF EQUITY AT 30 JUNE 3 028 3 021
The Statement of Changes in Equity is to be read in conjunction with the notes to the financial statements.
GOVERNMENT PRINTING OFFICESTATEMENT OF CHANGES IN EQUITY
For the year ended 30 June 2009

154 :: Department of Business and Employment
GPO Financial Statements
NOTE 2009 $’000
(Outflows) / Inflows
2008 $’000
(Outflows) / Inflows
CASH FLOWS FROM OPERATING ACTIVITIES
Operating Receipts
Receipts From Sales of Goods And Services 6 350 6 549
Interest Received 112 129
Other Operating Receipts 9 9
Total Operating Receipts 6 471 6 687
Operating Payments
Payments to Employees (2 413) (2 326)
Payments for Goods and Services (3 808) (3 759)
Income Tax Paid (43) (45)
Total Operating Payments (6 264) (6 130)
Net Cash From Operating Activities 15 207 557
CASH FLOWS FROM INVESTING ACTIVITIES
Investing Receipts
Proceeds from Asset Sales 3 4 -
Total Investing Receipts 4 -
Investing Payments
Purchases of Assets (7) (23)
Total Investing Payments (7) (23)
Net Cash From/(Used In) Investing Activities (3) (23)
CASH FLOWS FROM FINANCING ACTIVITIES
Financing Payments
Dividends Paid 12 (51) (53)
Total Financing Payments (51) (53)
Net Cash (Used In) Financing Activities (51) (53)
Net Increase in Cash Held 153 481
Cash at Beginning of Financial Year 2 516 2 035
CASH AT END OF FINANCIAL YEAR 6 2 669 2 516
The Cash Flow Statement is to be read in conjunction with the notes to the financial statements.
GOVERNMENT PRINTING OFFICECASH FLOW STATEMENT
For the year ended 30 June 2009

Annual Report 2008-2009 :: 155
GP
O F
inan
cial Statem
ents
INDEX OF NOTES TO THE FINANCIAL STATEMENTS
1. Objectives and Funding
2. Statement of Significant Accounting Policies
INCOME
3. Gain on Disposal of Assets
EXPENSES
4. Purchases of Goods and Services
5. Income Tax Expense
ASSETS
6. Cash and Deposits
7. Receivables
8. Inventories
9. Property, Plant and Equipment
LIABILITIES
10. Payables
11. Income Tax Liabilities
12. Provisions
13. Other Liabilities
EQUITY
14. Equity
OTHER DISCLOSURES
15. Notes to the Cash Flow Statement
16. Financial Instruments
17. Commitments
18. Contingent Liabilities and Contingent Assets
19. Events Subsequent to Balance Date
20. Write-offs, Postponements and Waivers
GOVERNMENT PRINTING OFFICENOTES TO THE FINANCIAL STATEMENTS
For the year ended 30 June 2009

156 :: Department of Business and Employment
GPO Financial Statements
1. OBJECTIVES AND FUNDING
The Government Printing Office (GPO) operates as a Government Business Division and delivers cost effective printing and publishing services to the Northern Territory Government from premises located at Parap in a secure environment, specifically designed for efficient production of a diverse range of products and services.
The Government Printing Office is a self-funded organisation. It generates its income from sales of printed products and services to Government agencies.
2. STATEMENT OF SIGNIFICANT ACCOUNTING POLICIES
a) Basis of Accounting
The financial statements have been prepared in accordance with the requirements of the Financial Management Act and related Treasurer’s Directions. The Financial Management Act requires the Government Printing Office to prepare financial statements for the year ended 30 June based on the form determined by the Treasurer. The form of financial statements is to include:
(i) a Certification of the Financial Statements
(ii) an Operating Statement
(iii) a Balance Sheet
(iv) a Statement of Changes in Equity
(v) a Cash Flow Statement
(vi) applicable explanatory notes to the financial statements.
The financial statements have been prepared using the accrual basis of accounting, which recognises the effect of financial transactions and events when they occur, rather than when cash is paid out or received. As part of the preparation of the financial statements, all intra Agency transactions and balances have been eliminated.
Except where stated, the financial statements have also been prepared in accordance with the historical cost convention.
The form of the Government Printing Office financial statements is also consistent with the requirements of Australian Accounting Standards. The effects of all relevant new and revised Standards and Interpretations issued by the Australian Accounting Standards Board (AASB) that are effective for the current annual reporting period have been evaluated. The Standards and Interpretations and their impacts are:

Annual Report 2008-2009 :: 157
GP
O F
inan
cial Statem
ents
AASB 2007-9 Amendments to Australian Accounting Standards arising from the Review of AAS 27, AAS 29 and AAS 31
The Standard relocates certain relevant requirements from AASs 27, 29 and 31, substantively unamended, into existing topic based standards. This standard also makes consequential amendments, arising from the short term review of AASs 27, 29 and 31, to AASB 5, AASB 8, AASB 101 and AASB 114. The Standard will not have an impact on the Financial Statements.
AASB 2008-10 Amendments to Australian Accounting Standards – Reclassification of Financial Instruments.
The Standard will not have an impact on the Financial Statements.
b) Australian Accounting Standards and Interpretations issued but not yet effective
At the date of authorisation of the financial statements, the Standards and Interpretations listed below were in issue but not yet effective.
Note: It is likely that the 2009-10 Agency financial statement formats will be brought in line with those within the Treasurer’s Annual Financial Report (TAFR). An Exposure Draft (ED174 Amendments to Australian Accounting Standards to facilitate GAAP/GFS Harmonisation for Entities within the GGS) is currently under review.
AASB 101 Presentation of Financial Statements (revised September 2007), AASB 2007-8 Amendments to Australian Accounting Standards Arising from AASB 101, AASB 2007-10 Further Amendments to Australian Accounting Standards arising from AASB 101
Effective for annual reporting period beginning on or after 1 January 2009.
AASB 2009-2 Amendments to Australian Accounting Standards – Improving Disclosures about Financial Instruments
Effective for annual reporting period beginning on or after 1 January 2009 that ends on or after 30 April 2009.
The Standard amends AASB 7 to require enhanced disclosures about fair value measurement of financial instruments.
AASB Interpretation 18 Transfer of Assets from Customers
Effective for annual reporting beginning on or after 1 July 2009.
The Interpretation clarifies the accounting for agreements in which an entity receives from a customer an item of property, plant and equipment that the entity must then use either to connect the customer to a network or to provide the customer with ongoing access to a supply of goods or services.

158 :: Department of Business and Employment
GPO Financial Statements
c) Agency and Territory Items
The financial statements of Government Printing Office include income, expenses, assets, liabilities and equity over which the Government Printing Office has control (Agency items). Certain items, while managed by the Government Printing Office, are controlled and recorded by the Territory rather than the Government Printing Office (Territory items). Territory items are recognised and recorded in the Central Holding Authority as discussed below.
Central Holding Authority
The Central Holding Authority is the ‘parent body’ that represents the Government’s ownership interest in Government controlled entities.
The Central Holding Authority also holds certain Territory assets not assigned to Agencies as well as certain Territory liabilities that are not practical or effective to assign to individual Agencies such as unfunded superannuation and long service leave.
d) Comparatives
Where necessary, comparative information for the 2007-08 financial year has been reclassified to provide consistency with current year disclosures.
e) Presentation and Rounding of Amounts
Amounts in the financial statements and notes to the financial statements are presented in Australian dollars and have been rounded to the nearest thousand dollars, with amounts of $500 or less being rounded down to zero.
f) Changes in Accounting Policies
There have been no changes to accounting policies adopted in 2008-09 as a result of management decisions.
g) Accounting Judgements and Estimates
The preparation of the financial report requires the making of judgements and estimates that affect the recognised amounts of assets, liabilities, revenues and expenses and the disclosure of contingent liabilities. The estimates and associated assumptions are based on historical experience and various other factors that are believed to be reasonable under the circumstances, the results of which form the basis of making the judgements about the carrying values of assets and liabilities that are not readily apparent from other sources. Actual results may differ from these estimates.
The estimates and underlying assumptions are reviewed on an ongoing basis. Revisions to accounting estimates are recognised in the period in which the estimate is revised if the revision affects only that period, or in the period of the revision and future periods if the revision affects both current and future periods.

Annual Report 2008-2009 :: 159
GP
O F
inan
cial Statem
ents
Judgements and estimates that have significant effects on the financial statements are disclosed in the relevant notes to the financial statements. Notes that include significant judgements and estimates are:
Employee Benefits – Note 2(v) and Note 12: Non-current liabilities in respect of employee benefits are measured as the present value of estimated future cash outflows based on the appropriate Government bond rate, estimates of future salary and wage levels and employee periods of service.
Contingent Liabilities – Note 18: The present value of material quantifiable contingent liabilities are calculated using a discount rate based on the published 10-year Government bond rate.
Allowance for Impairment Losses – Note 2(p) and Note 7: Receivables.
Depreciation and Amortisation – Note 2(k) and Note 9: Property, Plant and Equipment.
h) Goods and Services Tax
Income, expenses and assets are recognised net of the amount of Goods and Services Tax (GST), except where the amount of GST incurred on a purchase of goods and services is not recoverable from the Australian Taxation Office (ATO). In these circumstances the GST is recognised as part of the cost of acquisition of the asset or as part of the expense.
Receivables and payables are stated with the amount of GST included. The net amount of GST recoverable from, or payable to, the ATO is included as part of receivables or payables in the Balance Sheet.
Cash flows are included in the Cash Flow Statement on a gross basis. The GST components of cash flows arising from investing and financing activities which are recoverable from, or payable to, the ATO are classified as operating cash flows. Commitments and contingencies are disclosed net of the amount of GST recoverable or payable unless otherwise specified.

160 :: Department of Business and Employment
GPO Financial Statements
i) Income Recognition
Income encompasses both revenue and gains.
Income is recognised at the fair value of the consideration received, exclusive of the amount of GST. Exchanges of goods or services of the same nature and value without any cash consideration being exchanged are not recognised as income.
Sale of Goods
Revenue from the sale of goods is recognised (net of returns, discounts and allowances) when:
the significant risks and rewards of ownership of the goods have transferred to the buyer
the Government Printing Office retains neither continuing managerial involvement to the degree usually associated with ownership nor effective control over the goods sold
the amount of revenue can be reliably measured
it is probable that the economic benefits associated with the transaction will flow to the Government Printing Office
the costs incurred or to be incurred in respect of the transaction can be measured reliably.
Rendering of Services
Revenue from rendering services is recognised by reference to the stage of completion of the contract. The revenue is recognised when:
the amount of revenue, stage of completion and transaction costs incurred can be reliably measured
it is probable that the economic benefits associated with the transaction will flow to the entity.
Interest Revenue
Interest revenue is recognised as it accrues, taking into account the effective yield on the financial asset.
Disposal of Assets
A gain or loss on disposal of assets is included as a gain or loss on the date control of the asset passes to the buyer, usually when an unconditional contract of sale is signed. The gain or loss on disposal is calculated as the difference between the carrying amount of the asset at the time of disposal and the net proceeds on disposal. Refer also to Note 3.
Contributions of Assets
Contributions of assets and contributions to assist in the acquisition of assets, being non-reciprocal transfers, are recognised, unless otherwise determined by Government, as gains when the Government Printing Office obtains control of the asset or contribution. Contributions are recognised at the fair value received or receivable.

Annual Report 2008-2009 :: 161
GP
O F
inan
cial Statem
ents
j) Repairs and Maintenance Expense
Funding is received for repairs and maintenance works associated with Government Printing Office assets as part of Output Revenue. Costs associated with repairs and maintenance works on Government Printing Office assets are expensed as incurred.
k) Depreciation and Amortisation Expense
Items of property, plant and equipment, including buildings but excluding land, have limited useful lives and are depreciated or amortised using the straight-line method over their estimated useful lives.
Amortisation applies in relation to intangible non-current assets with limited useful lives and is calculated and accounted for in a similar manner to depreciation.
The estimated useful lives for each class of asset are in accordance with the Treasurer’s Directions and are determined as follows:
2009 2008
Plant and Equipment 2-20 Years 2-20 Years
Computer Hardware and Software 1-5 Years 1-5 Years
Assets are depreciated or amortised from the date of acquisition or from the time an asset is completed and held ready for use.
l) Interest Expense
Interest expenses include interest and finance lease charges. Interest expenses are expensed in the period in which they are incurred.
m) Taxation
The Government Printing Office is required to pay income tax on its accounting surplus at the company rate of 30% in accordance with the requirements of the Treasurer’s Directions, NT Tax Equivalents Regime.
n) Cash
For the purposes of the Balance Sheet and the Cash Flow Statement, cash includes cash on hand, cash at bank and cash equivalents. Cash equivalents are highly liquid short-term investments that are readily convertible to cash.
o) Inventories
General inventories are valued at the lower of cost and net realisable value, while those held for distribution are carried at the lower of cost and current replacement cost. Cost of inventories includes all costs associated with bringing the inventories to their present location and condition. When inventories are acquired at no or nominal consideration, the cost will be the current replacement cost at date of acquisition.
Inventories held for distribution are those inventories distributed at no or nominal consideration, and are carried at the lower cost and current replacement cost.

162 :: Department of Business and Employment
GPO Financial Statements
p) Receivables
Receivables include accounts receivable and other receivables and are recognised at fair value less any allowance for impairment losses.
The allowance for impairment losses represents the amount of receivables the Government Printing Office estimates are likely to be uncollectible and are considered doubtful. Analyses of the age of the receivables that are past due as at the reporting date are disclosed in an ageing schedule under credit risk in Note 16 Financial Instruments. Reconciliation of changes in the allowance accounts is also presented.
Accounts receivable and other receivables are generally settled within 30 days.
q) Property, Plant and Equipment
Acquisitions
All items of property, plant and equipment with a cost, or other value, equal to or greater than $5 000 are recognised in the year of acquisition and depreciated as outlined below. Items of property, plant and equipment below the $5 000 threshold are expensed in the year of acquisition.
The construction cost of property, plant and equipment includes the cost of materials and direct labour, and an appropriate proportion of fixed and variable overheads.
Complex Assets
Major items of plant and equipment comprising a number of components that have different useful lives, are accounted for as separate assets. The components may be replaced during the useful life of the complex asset.
Subsequent Additional Costs
Costs incurred on property, plant and equipment subsequent to initial acquisition are capitalised when it is probable that future economic benefits in excess of the originally assessed performance of the asset will flow to the Government Printing Office in future years. Where these costs represent separate components of a complex asset, they are accounted for as separate assets and are separately depreciated over their expected useful lives.
Construction (Work in Progress)
As part of the Financial Management Framework, the Department of Planning and Infrastructure is responsible for managing general government capital works projects on a whole of Government basis. Therefore appropriation for GPO capital works is provided directly to the Department of Planning and Infrastructure and the cost of construction work in progress is recognised as an asset of that Department. Once completed, capital works assets are transferred to the Government Printing Office.

Annual Report 2008-2009 :: 163
GP
O F
inan
cial Statem
ents
r) Revaluations and Impairment
Revaluation of Assets
Subsequent to initial recognition, assets belonging to the following classes of non-current assets are revalued with sufficient regularity to ensure that the carrying amount of these assets does not differ materially from their fair value at reporting date:
Infrastructure Assets.
Fair value is the amount for which an asset could be exchanged, or liability settled, between knowledgeable, willing parties in an arm’s length transaction.
Plant and equipment are stated at historical cost less depreciation, which is deemed to equate to fair value.
Impairment of Assets
An asset is said to be impaired when the asset’s carrying amount exceeds its recoverable amount.
Non-current physical and intangible Government Printing Office assets are assessed for indicators of impairment on an annual basis. If an indicator of impairment exists, the Government Printing Office determines the asset’s recoverable amount. The asset’s recoverable amount is determined as the higher of the asset’s depreciated replacement cost and fair value less costs to sell. Any amount by which the asset’s carrying amount exceeds the recoverable amount is recorded as an impairment loss.
Impairment losses are recognised in the Operating Statement unless the asset is carried at a revalued amount. Where the asset is measured at a revalued amount, the impairment loss is offset against the Asset Revaluation Reserve for that class of asset to the extent that an available balance exists in the Asset Revaluation Reserve.
In certain situations, an impairment loss may subsequently be reversed. Where an impairment loss is subsequently reversed, the carrying amount of the asset is increased to the revised estimate of its recoverable amount. A reversal of an impairment loss is recognised in the Operating Statement as income, unless the asset is carried at a revalued amount, in which case the impairment reversal results in an increase in the Asset Revaluation Reserve.
s) Assets Held for Sale
Assets held for sale consist of those assets which management has determined are available for immediate sale in their present condition, and their sale is highly probably within the next twelve months.
These assets are measured at the lower of the asset’s carrying amount and fair value less costs to sell. These assets are not depreciated. Non-current assets held for sale have been recognised on the face of the financial statements as current assets.

164 :: Department of Business and Employment
GPO Financial Statements
t) Leased Assets
Leases under which the Government Printing Office assumes substantially all the risks and rewards of ownership of an asset are classified as finance leases. Other leases are classified as operating leases.
Finance Leases
Finance leases are capitalised. A leased asset and a lease liability equal to the present value of the minimum lease payments are recognised at the inception of the lease.
Lease payments are allocated between the principal component of the lease liability and the interest expense.
Operating Leases
Operating lease payments made at regular intervals throughout the term are expensed when the payments are due, except where an alternative basis is more representative of the pattern of benefits to be derived from the leased property. Lease incentives under an operating lease of a building or office space is recognised as an integral part of the consideration for the use of the leased asset. Lease incentives are to be recognised as a deduction of the lease expenses over the term of the lease.
u) Payables
Liabilities for accounts payable and other amounts payable are carried at cost which is the fair value of the consideration to be paid in the future for goods and services received, whether or not billed to the Government Printing Office. Accounts payable are normally settled within 30 days.
v) Employee Benefits
Provision is made for employee benefits accumulated as a result of employees rendering services up to the reporting date. These benefits include wages and salaries and recreation leave. Liabilities arising in respect of wages and salaries and recreation leave and other employee benefit liabilities that fall due within twelve months of reporting date are classified as current liabilities and are measured at amounts expected to be paid. Non-current employee benefit liabilities that fall due after twelve months of the reporting date are measured at present value, calculated using the Government long term bond rate.
No provision is made for sick leave, which is non-vesting, as the anticipated pattern of future sick leave to be taken is less than the entitlement accruing in each reporting period.
Employee benefit expenses are recognised on a net basis in respect of the following categories:
wages and salaries, non-monetary benefits, recreation leave, sick leave and other leave entitlements
other types of employee benefits.
As part of the Financial Management Framework, the Central Holding Authority assumes the long service leave liabilities of Government Agencies, including the Government Printing Office and as such no long service leave liability is recognised in the Government Printing Office financial statements.

Annual Report 2008-2009 :: 165
GP
O F
inan
cial Statem
ents
w) Superannuation
Employees’ superannuation entitlements are provided through the:
NT Government and Public Authorities Superannuation Scheme (NTGPASS)
Commonwealth Superannuation Scheme (CSS)
non-government employee nominated schemes for those employees commencing on or after 10 August 1999.
The Government Printing Office makes superannuation contributions on behalf of its employees to the Central Holding Authority or non-government employee nominated schemes. Superannuation liabilities related to government superannuation schemes are held by the Central Holding Authority and as such are not recognised in the Government Printing Office’s financial statements.
x) Contributions by and Distributions to Government
The Government Printing Office may receive contributions from Government where the Government is acting as owner of the Government Printing Office. Conversely, the Government Printing Office may make distributions to Government. In accordance with the Financial Management Act and Treasurer’s Directions, certain types of contributions and distributions, including those relating to administrative restructures, have been designated as contributions by, and distributions to, Government. These designated contributions and distributions are treated by the Government Printing Office as adjustments to equity.
The Statement of Changes in Equity and Note 14 provide additional information in relation to contributions by, and distributions to, Government.
y) Dividends
The Government Printing Office has provided for a dividend payable at the rate of 50% of net profit after tax in accordance with the NT Government’s dividend policy.
z) Commitments
Disclosures in relation to capital and other commitments, including lease commitments are shown at Note 19 and are consistent with the requirements contained in AASB 101, AASB 116 and AASB 117.
Commitments are those contracted as at 30 June where the amount of the future commitment can be reliably measured.

166 :: Department of Business and Employment
GPO Financial Statements
2009 $’000
2008 $’000
3. GAIN ON DISPOSAL OF ASSETSNet proceeds from the disposal of non-current assets 4 -Less: Carrying value of non-current assets disposed Total Gain on Disposal of Assets 4 -
4. PURCHASES OF GOODS AND SERVICESThe net surplus/(deficit) has been arrived at after charging the following expenses:Goods and Services Expenses:
Consultants (1) - 29Recruitment (2) 2 1Training and Study 7 4Official Duty Fares 4 1Travelling Allowance 3 1Audit Fees 23 23Corporate Support from Other Agencies 60 60
(1) Includes marketing, promotion and IT consultants. (2) Includes recruitment related advertising costs.
5. INCOME TAX EXPENSECurrent Year Profit 18 145
Prima facie income tax expense calculated at 30% on the surplus
5 43
Total Income Tax Expense 5 43
6. CASH Cash on Hand 12 12Cash at Bank 2 657 2 504Total Cash 2 669 2 516
7. RECEIVABLESCurrentAccounts Receivable 623 556Interest Receivable 5 13
Total Receivables 628 569
8. INVENTORIESGeneral Inventories
At cost 139 161139 161
Work in ProgressAt cost 65 73
65 73Total Inventories 204 234

Annual Report 2008-2009 :: 167
GP
O F
inan
cial Statem
ents
2009 $’000
2008 $’000
9. PROPERTY, PLANT AND EQUIPMENTPlant and Equipment At cost 4 189 4 647Less: Accumulated Depreciation (3 643) (3 912)
546 735Computer HardwareAt cost 177 339Less: Accumulated Depreciation (165) (313)
12 26Computer SoftwareAt cost 453 480Less: Accumulated Depreciation (451) (474)
2 6
Total Property, Plant and Equipment 560 767
Impairment of Property, Plant and Equipment
The Government Printing Office’s property, plant and equipment assets were assessed for impairment as at 30 June 2009. No impairment adjustments were required as a result of this review.
2009 Property, Plant and Equipment Reconciliations
A reconciliation of the carrying amount of property, plant and equipment at the beginning and end of 2008-09 is set out below:
Plant and Equipment
Computer Software
Computer Hardware
Total
$’000 $’000 $’000 $’000Carrying Amount as at 1 July 2008 735 6 26 767
Additions 7 7DisposalsDepreciation and Amortisation (189) (4) (21) (214)
Carrying Amount as at 30 June 2009 546 2 12 560
A reconciliation of the carrying amount of property, plant and equipment at the beginning and end of 2007-08 is set out below:
Plant and Equipment
Computer Software
Computer Hardware
Total
$’000 $’000 $’000 $’000
Carrying Amount as at 1 July 2007 988 6 41 1 035
Additions 10 5 8 23DisposalsDepreciation and Amortisation (263) (5) (23) (291)
Carrying Amount as at 30 June 2008 735 6 26 767

168 :: Department of Business and Employment
GPO Financial Statements
2009 $’000
2008 $’000
10. PAYABLESAccounts Payable 120 126
Accrued Expenses 153 191
GST Payables 49 62
Total Payables 322 379
11. INCOME TAX LIABILITIESIncome Tax Liabilities 5 43
Total Income Tax Liabilities 5 43
12. PROVISIONSCurrent
Employee Benefits
Recreation Leave 196 197
Leave Loading 43 41
Other Employee Benefits – Recreation Leave Fares
71 73
Other Current Provisions
Provision for Dividends 6 50
Provision for Fringe Benefits Tax 2 2
Provision for Workers Compensation Premium
5 10
Provision for Payroll Tax 8 12
Provision for Superannuation 53 54
384 439
Non-Current
Employee Benefits
Recreation Leave 158 167
158 167
Total Provisions 542 606
Reconciliation of Dividends
Balance as at 1 July 2008 50 53
Additional Provisions Recognised 6 50
Reductions Arising from Payments (50) (53)
Balance as at 30 June 2009 6 50
The GPO employed 36 employees as at 30 June 2009 (38 employees as at 30 June 2008).

Annual Report 2008-2009 :: 169
GP
O F
inan
cial Statem
ents
2009 $’000
2008 $’000
13. OTHER LIABILITIESCurrent
Deferred Income 193 76
Total Other Liabilities 193 76
14. EQUITYEquity represents the residual interest in the net assets of the GPO. The Government’s ownership interest in the GPO is held in the Central Holding Authority as described in Note 2(c).
Capital
Balance as at 1 July 373 373
Equity Injections
Equity Transfers In
Equity Withdrawals
Equity Transfers Out
Balance as at 30 June 373 373
Accumulated Funds
Balance as at 1 July 2 648 2 596
Surplus for the Period 13 102
Dividends Payable (6) (50)
Balance as at 30 June 2 655 2 648
Total Equity 3 028 3 021

170 :: Department of Business and Employment
GPO Financial Statements
2009 $’000
2008 $’000
15. NOTES TO THE CASH FLOW STATEMENTReconciliation of Cash
The total of Agency Cash and Deposits of $2.669M recorded in the Balance Sheet is consistent with that recorded as ‘cash’ in the Cash Flow Statement.
Reconciliation of Net Surplus/(Deficit) to Net Cash From Operating Activities
Net Surplus/(Deficit) 13 102
Non-Cash Items:
Depreciation and Amortisation 214 291
(Gain)/Loss on Disposal of Assets (4)
Changes in Assets and Liabilities:
Decrease/(Increase) in Receivables (72) 4
Decrease/(Increase) in Interest Receivable 7 (4)
Decrease/(Increase) in Inventories 30 (16)
Decrease/(Increase) in Prepayments 10 (25)
Decrease/(Increase) in Accrued Revenue 6 5
(Decrease)/Increase in Payables (57) 65
(Decrease)/Increase in Income Tax Liabilities (38) (2)
(Decrease)/Increase in Provision for Employee Benefits (10) 12
(Decrease)/Increase in Other Provisions (10) 49
(Decrease)/Increase in Deferred Income 118 76
Net Cash From Operating Activities 207 557
Non-Cash Financing and Investing Activities
Finance Lease Transactions
During the financial year the GPO Office acquired $nil (2008: $nil) plant and equipment / computer equipment and software by means of finance leases.

Annual Report 2008-2009 :: 171
GP
O F
inan
cial Statem
ents
16. FINANCIAL INSTRUMENTS
A financial instrument is a contract that gives rise to a financial asset of one entity and a financial liability or equity instrument of another entity. Financial instruments held by the Government Printing Office include cash and deposits, receivables, payables and finance leases. The Government Printing Office has limited exposure to financial risks as discussed below.
The Government Printing Office’s operating account earns monthly interest at a variable interest rate (NT Treasury Corporation’s average 11am cash rate less 25 basis points).
Negative cash balances of $50 000 or less and negative cash balances over $50 000, which have an overdraft facility or by prior arrangement with NT Treasury Corporation, attract the average 11am cash rate for the month plus 50 basis points.
Negative balances without overdraft facilities or prior arrangement with NT Treasury Corporation will be charged the overdraft rate applied to the Government Bank Account by the Westpac Banking Corporation.
(a) Categorisation of Financial Instruments
The carrying amounts of the Government Printing Office financial assets and liabilities by category are disclosed in the table below.
2009 $’000
2008 $’000
Financial Assets
Cash 2 669 2 516
Receivables 657 608
Financial Liabilities
Payables 322 379
(b) Credit Risk
The Government Printing Office has limited credit risk exposure (risk of default). In respect of any dealings with organisations external to Government, the Government Printing Office has adopted a policy of only dealing with credit worthy organisations and obtaining sufficient collateral or other security where appropriate, as a means of mitigating the risk of financial loss from defaults.
The carrying amount of financial assets recorded in the financial statements, net of any allowances for losses, represents the Government Printing Office’s maximum exposure to credit risk without taking account of the value of any collateral or other security obtained.

172 :: Department of Business and Employment
GPO Financial Statements
16. FINANCIAL INSTRUMENTS (Continued)
Receivables
Receivable balances are monitored on an ongoing basis to ensure that exposure to bad debts is not significant. A reconciliation and ageing analysis of receivables is presented below.
2009 $’000
2008 $’000
Ageing of Receivables
Not overdue 462 373
Overdue for less than 30 days 35 14
Overdue for 30 to 60 days 26 45
Overdue for more than 60 days (1) 17
Total Receivables 522 449
(c) Liquidity risk
Liquidity risk is the risk that the Government Printing Office will not be able to meet its financial obligations as they fall due. The Government Printing Office’s approach to managing liquidity is to ensure that it will always have sufficient liquidity to meet is liabilities when they fall due.
The following tables detail the undiscounted cash flows payable by the Government Printing Office by remaining contractual maturity for its financial liabilities. It should be noted that as these are undiscounted, totals may not reconcile to the carrying amounts presented in the Balance Sheet.
2009 Maturity analysis for financial liabilities
Variable Interest
Fixed Interest Rate Non Interest Bearing
Total Weighted AverageLess
than a Year
1 to 5 Years
More than 5 Years
$’000 $’000 $’000 $’000 $’000 $’000 %Payables 322 322 4.54Employee Benefits 390 390Income Tax Payable 5 5Dividends Payable 6 6Total Financial Liabilities: 723 723
2008 Maturity analysis for financial liabilities
Variable Interest
Fixed Interest Rate Non Interest Bearing
Total Weighted AverageLess
than a Year
1 to 5 Years
More than 5 Years
$’000 $’000 $’000 $’000 $’000 $’000 %Payables 379 379 6.57
Employee Benefits 478 478Income Tax Payable 43 43Dividends Payable 50 50Total Financial Liabilities: 950 950

Annual Report 2008-2009 :: 173
GP
O F
inan
cial Statem
ents
16. FINANCIAL INSTRUMENTS (Continued)
(d) Market Risk
Market risk is the risk that the fair value of future cash flows of a financial instrument will fluctuate because of changes in market prices. It comprises interest rate risk, price risk and currency risk.
i) Interest Rate Risk
The Government Printing Office is not exposed to interest rate risk as Government Printing Office financial assets and financial liabilities, with the exception of finance leases are non-interest bearing. Finance lease arrangements are established on a fixed interest rate and as such do not expose the Government Printing Office to interest rate risk. The Government Printing Office’s exposure to interest rate risk on financial assets and financial liabilities is set out in the following tables.
2009 $’000
2008 $’000
Variable rate instruments
Financial assets
Cash 2 669 2 516
Total 2 669 2 516
Market Sensitivity Analysis
Changes in the variable rates of 100 basis points (1 per cent) at reporting date would have the following effect on the Government Printing Office’s profit or loss and equity
Profit or Loss and Equity
100 basis points increase
$’000
100 basis points decrease
$’000
30 June 2009
Financial assets – cash at bank 27 (27)
30 June 2008
Financial assets – cash at bank 25 (25)
ii) Price Risk
The Government Printing Office is not exposed to price risk as Government Printing Office does not hold units in unit trusts.
iii) Currency Risk
The Government Printing Office is not exposed to currency risk as Government Printing Office does not hold borrowings denominated in foreign currencies or transactional currency exposures arising from purchases in a foreign currency.
(e) Net Fair Value
The carrying amount of financial assets and financial liabilities recorded in the financial statements approximates their respective net fair values. Where differences exist, these are not material.

174 :: Department of Business and Employment
GPO Financial Statements
17. COMMITMENTS
2009 $’000
2008 $’000
Other Expenditure Commitments
Other non-cancellable expenditure commitments not recognised as liabilities are payable as follows:
Within one year 30 49
Later than one year and not later than five years 8 33
Later than five years
38 82
18. CONTINGENT LIABILITIES AND CONTINGENT ASSETS
The Government Printing Office had no contingent liabilities or contingent assets as at 30 June 2009 or 30 June 2008.
19. EVENTS SUBSEQUENT TO BALANCE DATE
The Government Printing Office had no events subsequent to balance date as at 30 June 2009.
20. WRITE-OFFS, POSTPONEMENTS AND WAIVERS
The Government Printing Office had no write-offs, postponements or waivers in 2008-09 or 2007-08.

Annual Report 2008-2009 :: 175
NT
Fleet F
inan
cial Statem
ents
FINANCIAL PERFORMANCE
NT Fleet produced a net surplus after tax of $7.0M in 2008-09 which was $0.5M higher than the budget estimate, due to continuing strong demand for vehicles. There is a close correlation between numbers of vehicles managed, vehicle hire revenue and fleet costs, particularly vehicle depreciation and repairs and maintenance. NT Fleet will pay taxes of $3.0M and return a dividend of $3.5M to Government for 2008-09.
NT Fleet manages two fleets, a light vehicle fleet (made up of passenger and light commercial vehicles) and a heavy vehicle fleet (made up of trucks, plant and equipment). The majority of vehicles are in the light fleet, with the heavy fleet comprising of fewer vehicles, although generally at a higher individual value. Over the year the light and heavy vehicle fleets grew by 6% and 3% respectively. Revenue and expenses for both fleets are provided below.
Table 1: 2008-09 Budget and Actual Performance
Actual Budget Variation
$’000 $’000 $’000
2009 2008 2009 2008 2009 2008
Income 40 710 37 783 39 227 36 898 1 483 885
Expenses 30 737 27 320 29 959 27 201 (778) (119)
Net Surplus Before Income Tax 9 973 10 463 9 268 9 697 705 766
Income Tax Expense 2 992 3 139 2 780 2 909 (212) (230)
Net Surplus After Income Tax 6 981 7 324 6 488 6 788 493 536
Income
Most of NT Fleet’s revenue comes from goods and services revenue (96%) with vehicle hire charges being the primary revenue source. This revenue increased by $3.5M in 2008-09 due to an increase in the size of the leased vehicle fleet and an increase in the vehicle hire rates charged to customers. The size of the fleet is dictated by agency business needs and vehicle hire rates are influenced by a number of vehicle related costs.
Asset income was $1.3M in 2008-09, down by $0.47M on the previous year due to falling sale prices and the sale of fewer vehicles with vehicles retained for longer periods.
Table 2: Revenue by Category
Year Goods and Services
Investment Other1 Asset TOTAL
$’000 % $’000 % $’000 % $’000 % $’000 %
08-09 39 097 96.0 223 0.6 90 0.2 1 300 3.2 40 710 100.0
07-08 35 551 94.1 379 1.0 80 0.2 1 773 4.7 37 783 100.0
Note: 1 Other includes miscellaneous income such as motor vehicle registration refunds.
FINANCIAL STATEMENT OVERVIEWFor the Year Ended 30 June 2009
NT FLEET
FINANCIAL REPORT

176 :: Department of Business and Employment
NT Fleet Financial Statements
Table 3: Revenue by Fleet Type
Year Light Fleet Heavy Fleet TOTAL
$’000 % $’000 % $’000 %
08-09 34 939 85.8 5 771 14.2 40 710 100.0
07-08 32 385 85.7 5 398 14.3 37 783 100.0
Expenses
NT Fleet’s expenses increased by $3.4M in 2008-09. The majority of NT Fleet’s expenditure is directly related to its holdings of vehicle assets which increased over the year. The largest cost categories are:
depreciation – 58% of total expenses and an increase of $2.2M in 2008-09
vehicle repairs and maintenance – 28% of total expenses and an increase of $1.0M in 2008-09.
Table 4: Expenses by Category
Year Depreciation Repairs & Maintenance
Employees Operational TOTAL
$’000 % $’000 % $’000 % $’000 % $’000 %
08-09 17 787 57.9 8 733 28.4 2 094 6.8 2 123 6.9 30 737 100.0
07-08 15 623 57.2 7 709 28.2 2 120 7.8 1 868 6.8 27 320 100.0
Figure 1 shows NT Fleet’s expenses by the various categories.
Figure 1: Expense by Category
Expense Category
06-07 07-08 08-09
$ M
illio
ns
0
2
4
6
8
10
12
14
16
18
20
Depreciation
Vehicle Repairs &
Maintenance Employee
Operational

Annual Report 2008-2009 :: 177
NT
Fleet F
inan
cial Statem
ents
Table 5: Expenses by Fleet Type
Year Light Fleet Heavy Fleet TOTAL
$’000 % $’000 % $’000 %
08-09 26 464 86.1 4 273 13.9 30 737 100.0
07-08 23 377 85.6 3 943 14.4 27 320 100.0
FINANCIAL POSITION
NT Fleet’s net assets at 30 June 2009 were $80.5M, an increase of $3.5M on the same time last year. This improvement is mainly due to a fleet modernisation program and an increase in the size of the fleet. Vehicle asset balances grew by $4.8M over 2008-09 with a partly offsetting reduction in current assets of $3.2M, mostly due to use of cash to purchase vehicles resulting in a lower cash balance at year-end. Total assets improved by $1.6M overall. Total current liabilities reduced by $1.9M over 2008-09 with non-current liability balances remaining static and the movement being almost entirely due to removal of a deferred income current liability in 2008-09.
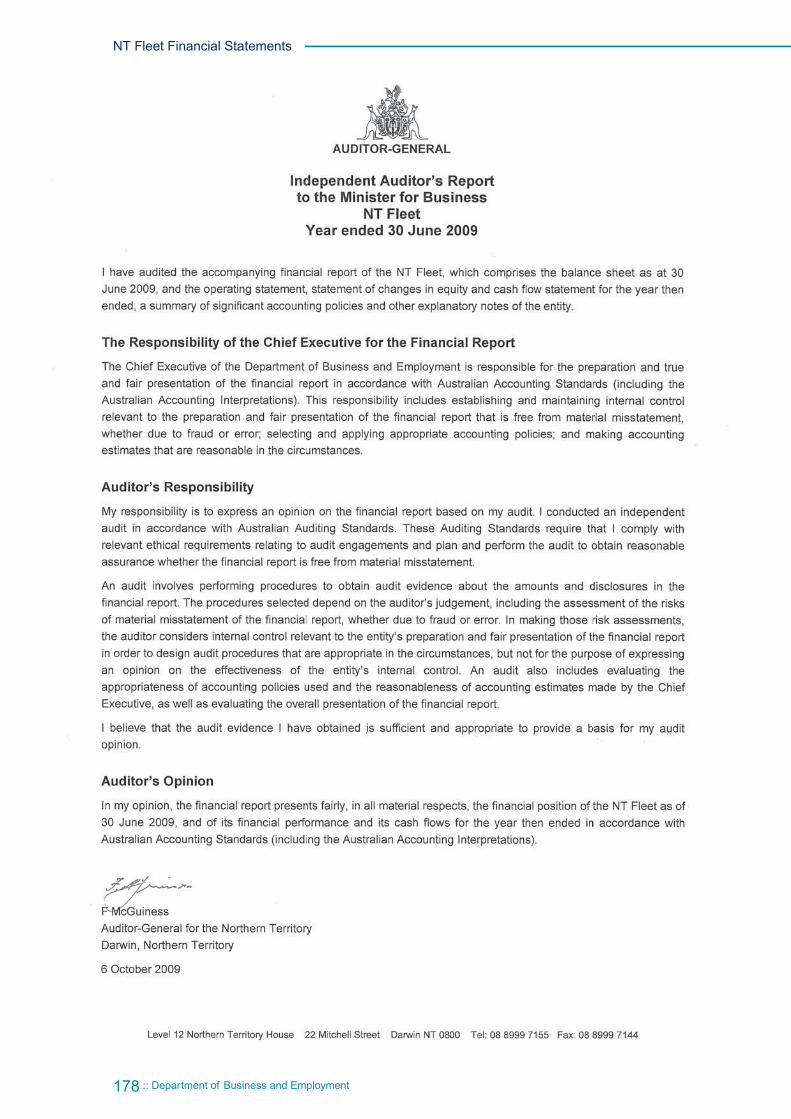
178 :: Department of Business and Employment
NT Fleet Financial Statements

Annual Report 2008-2009 :: 179
NT
Fleet F
inan
cial Statem
ents

180 :: Department of Business and Employment
NT Fleet Financial Statements
NOTE 2009 $’000
2008 $’000
INCOME
Sales of Goods and Services 39 097 35 551
Interest Revenue 223 379
Gain on Disposal of Assets 3 1 300 1 773
Other Income 90 80
TOTAL INCOME 40 710 37 783
EXPENSES
Employee Expenses 2 094 2 120
Administrative Expenses
Purchases of Goods and Services 4 1 839 1 583
Repairs and Maintenance 8 733 7 709
Depreciation and Amortisation 9 17 787 15 623
Interest Expenses 284 285
TOTAL EXPENSES 30 737 27 320
Income Tax Expense 5 2 992 3 139
NET SURPLUS/(DEFICIT) 6 981 7 324
The Operating Statement is to be read in conjunction with the notes to the financial statements.
NT FLEETOPERATING STATEMENT
For the year ended 30 June 2009

Annual Report 2008-2009 :: 181
NT
Fleet F
inan
cial Statem
ents
NOTE 2009 $’000
2008 $’000
ASSETS
Current Assets
Cash 6 5 952 8 775
Receivables 7 900 1 293
Inventories 8 12 10
Prepayments 17 4
Total Current Assets 6 881 10 082
Non-Current Assets
Property, Plant and Equipment 9 87 904 83 085
Total Non-Current Assets 87 904 83 085
TOTAL ASSETS 94 785 93 167
LIABILITIES
Current Liabilities
Payables 10 3 376 3 076
Income Tax Liabilities 11 2 992 3 139
Provisions 12 3 786 3 982
Other Liabilities 13 - 1 874
Total Current Liabilities 10 154 12 071
Non-Current Liabilities
Borrowings and Advances 14 4 000 4 000
Provisions 12 136 122
Total Non-Current Liabilities 4 136 4 122
TOTAL LIABILITIES 14 290 16 193
NET ASSETS 80 495 76 974
EQUITY 15
Capital 467 436
Accumulated Funds 80 028 76 538
TOTAL EQUITY 80 495 76 974
The Balance Sheet is to be read in conjunction with the notes to the financial statements.
NT FLEETBALANCE SHEETAs at 30 June 2009

182 :: Department of Business and Employment
NT Fleet Financial Statements
NOTE 2009 $’000
2008 $’000
BALANCE OF EQUITY AT 1 JULY 76 974 73 404
Capital 15
Balance at 1 July 436 528
Equity Injections 31 20
Equity Withdrawals - (112)
Balance at 30 June 467 436
Accumulated Funds 15
Balance at 1 July 76 538 72 876
Correction of Prior Period Errors - -
Surplus/(Deficit) for the Period 6 981 7 324
Dividends Payable (3 491) (3 662)
Balance at 30 June 80 028 76 538
BALANCE OF EQUITY AT 30 JUNE 80 495 76 974
This Statement of Changes in Equity is to be read in conjunction with the notes to the financial statements.
NT FLEETSTATEMENT OF CHANGES IN EQUITY
For the year ended 30 June 2009

Annual Report 2008-2009 :: 183
NT
Fleet F
inan
cial Statem
ents
NOTE 2009 $’000
(Outflows) / Inflows
2008 $’000
(Outflows) / Inflows
CASH FLOWS FROM OPERATING ACTIVITIES
Operating Receipts
Receipts From Sales of Goods And Services 42 430 40 942
Interest Received 257 346
Total Operating Receipts 42 687 41 288
Operating Payments
Payments to Employees (2 098) (2 121)
Payments for Goods and Services (14 822) (13 564)
Interest Paid (283) (286)
Income Tax Paid (3 139) (2 651)
Total Operating Payments (20 342) (18 622)
Net Cash From/(Used In) Operating Activities 16 22 345 22 666
CASH FLOWS FROM INVESTING ACTIVITIES
Investing Receipts
Proceeds from Asset Sales 3 16 276 18 699
Total Investing Receipts 16 276 18 699
Investing Payments
Purchases of Assets (37 782) (33 850)
Total Investing Payments (37 782) (33 850)
Net Cash From/(Used In) Investing Activities (21 506) (15 151)
CASH FLOWS FROM FINANCING ACTIVITIES
Financing Payments
Dividend Paid (3 662) (3 093)
Total Financing Payments (3 662) (3 093)
Net Cash From/(Used In) Financing Activities (3 662) (3 093)
Net Increase/(Decrease) in Cash Held (2 823) 4 422
Cash at Beginning of Financial Year 8 775 4 353
CASH AT END OF FINANCIAL YEAR 6 5 952 8 775
The Cash Flow Statement is to be read in conjunction with the notes to the financial statements.
NT FLEETCASH FLOW STATEMENT
For the year ended 30 June 2009

184 :: Department of Business and Employment
NT Fleet Financial Statements
INDEX OF NOTES TO THE FINANCIAL STATEMENTS
1. Objectives and Funding
2. Statement of Significant Accounting Policies
INCOME
3. Gain on Disposal of Assets
EXPENSES
4. Purchases of Goods and Services
5. Income Tax Expense
ASSETS
6. Cash
7. Receivables
8. Inventories
9. Property, Plant and Equipment
LIABILITIES
10. Payables
11. Income Tax Liabilities
12. Provisions
13. Other Liabilities
14. Borrowings and Advances
EQUITY
15. Equity
OTHER DISCLOSURES
16. Notes to the Cash Flow Statement
17. Financial Instruments
18. Commitments
19. Contingent Liabilities and Contingent Assets
20. Events Subsequent to Balance Date
21. Write-offs, Postponements and Waivers
NT FLEETNOTES TO THE FINANCIAL STATEMENTS
For the year ended 30 June 2009

Annual Report 2008-2009 :: 185
NT
Fleet F
inan
cial Statem
ents
1. OBJECTIVES AND FUNDING
NT Fleet manages the light and heavy vehicle fleet for all Territory Government agencies, except Northern Territory Police, Fire and Emergency Services. Management of the Government vehicle fleet incorporates acquisition, vehicle hire, maintenance and disposal.
Key functional responsibilities are:
managing the strategic replacement program for the Territory Government’s fleet
minimising the total cost of fleet ownership
administering supply and service contracts, vehicle specifications and delivery programs
managing the disposal of vehicles, plant and equipment.
Funding is provided predominantly via vehicle hire income derived from client agencies.
2. STATEMENT OF SIGNIFICANT ACCOUNTING POLICIES
a) Basis of Accounting
The financial statements have been prepared in accordance with the requirements of the Financial Management Act and related Treasurer’s Directions. The Financial Management Act requires NT Fleet to prepare financial statements for the year ended 30 June based on the form determined by the Treasurer. The form of financial statements is to include:
(i) a Certification of the Financial Statements
(ii) an Operating Statement
(iii) a Balance Sheet
(iv) a Statement of Changes in Equity
(v) a Cash Flow Statement
(vi) applicable explanatory notes to the financial statements.
The financial statements have been prepared using the accrual basis of accounting, which recognises the effect of financial transactions and events when they occur, rather than when cash is paid out or received. As part of the preparation of the financial statements, all intra Agency transactions and balances have been eliminated.
Except where stated, the financial statements have also been prepared in accordance with the historical cost convention.

186 :: Department of Business and Employment
NT Fleet Financial Statements
The form of the financial statements is also consistent with the requirements of Australian Accounting Standards. The effects of all relevant new and revised Standards and Interpretations issued by the Australian Accounting Standards Board (AASB) that are effective for the current annual reporting period have been evaluated. The Standards and Interpretations and their impacts are:
AASB 1004 Contributions (revised)
The revisions have the effect of relocating the requirements on contributions from AASs 27, 29 and 31, substantively unamended (with some exceptions), into AASB 1004. The Standard does not have an impact on the Financial Statements.
AASB 2007-9 Amendments to Australian Accounting Standards arising from the Review of AAS 27, AAS 29 and AAS 31
The Standard relocates certain relevant requirements from AASs 27, 29 and 31, substantively unamended, into existing topic based standards. This standard also makes consequential amendments, arising from the short term review of AASs 27, 29 and 31, to AASB 5, AASB 8, AASB 101 and AASB 114. The Standard does not have an impact on the Financial Statements.
AASB 2008-10 Amendments to Australian Accounting Standards – Reclassification of Financial Instruments. The Standard does not have an impact on the Financial Statements.
NT Fleet anticipates that the adoption of these standards and interpretations in future periods will have no material impact to the Financial Statements.
b) Australian Accounting Standards and Interpretations issued but not yet effective
At the date of authorisation of the financial statements, the Standards and Interpretations listed below were in issue but not yet effective.
AASB 101 Presentation of Financial Statements (revised September 2007), AASB 2007-8 Amendments to Australian Accounting Standards Arising from AASB 101, AASB 2007-10 Further Amendments to Australian Accounting Standards arising from AASB 101
Effective for annual reporting period beginning on or after 1 January 2009.
The main changes from the previous version of AASB 101 require an entity to: (a) present non-owner changes in equity separately from owner changes in equity. The former cannot be presented in the statement of changes in equity; (b) display components of other comprehensive income in the statement of comprehensive income.
Annual Report 2008-2009 :: 187
NT
Fleet F
inan
cial Statem
ents
AASB 2009-2 Amendments to Australian Accounting Standards – Improving Disclosures about Financial Instruments
Effective for annual reporting period beginning on or after 1 January 2009 that ends on or after 30 April 2009.
The Standard amends AASB 7 to require enhanced disclosures about fair value measurement of financial instruments.
NT Fleet anticipates that the adoption of these standards and interpretations in future periods will have no material impact to the Financial Statements.
c) Agency and Territory Items
The financial statements of NT Fleet include income, expenses, assets, liabilities and equity over which NT Fleet has control (Agency items). Certain items, while managed by NT Fleet, are controlled and recorded by the Territory rather than NT Fleet (Territory items). Territory items are recognised and recorded in the Central Holding Authority as discussed below.
Central Holding Authority
The Central Holding Authority is the ‘parent body’ that represents the Government’s ownership interest in Government controlled entities.
The Central Holding Authority also holds certain Territory assets not assigned to Agencies as well as certain Territory liabilities that are not practical or effective to assign to individual Agencies such as unfunded superannuation and long service leave.
d) Comparatives
Where necessary, comparative information for the 2007-08 financial year has been reclassified to provide consistency with current year disclosures.
e) Presentation and Rounding of Amounts
Amounts in the financial statements and notes to the financial statements are presented in Australian dollars and have been rounded to the nearest thousand dollars, with amounts of $500 or less being rounded down to zero.
f) Changes in Accounting Policies
There have been no changes to accounting policies adopted in 2008-09 as a result of management decisions.

188 :: Department of Business and Employment
NT Fleet Financial Statements
g) Accounting Judgements and Estimates
The preparation of the financial report requires the making of judgements and estimates that affect the recognised amounts of assets, liabilities, revenues and expenses and the disclosure of contingent liabilities. The estimates and associated assumptions are based on historical experience and various other factors that are believed to be reasonable under the circumstances, the results of which form the basis of making the judgements about the carrying values of assets and liabilities that are not readily apparent from other sources. Actual results may differ from these estimates.
The estimates and underlying assumptions are reviewed on an ongoing basis. Revisions to accounting estimates are recognised in the period in which the estimate is revised if the revision affects only that period, or in the period of the revision and future periods if the revision affects both current and future periods.
Judgements and estimates that have significant effects on the financial statements are disclosed in the relevant notes to the financial statements. Notes that include significant judgements and estimates are:
Employee Benefits – Note 2(w) and Note 12: Non-current liabilities in respect of employee benefits are measured as the present value of estimated future cash outflows based on the appropriate Government bond rate, estimates of future salary and wage levels and employee periods of service.
Contingent Liabilities – Note 19: The present value of material quantifiable contingent liabilities are calculated using a discount rate based on the published 10-year Government bond rate.
Doubtful Debts – Note 2(p) and Note 7: Receivables.
Depreciation and Amortisation – Note 2(l) and Note 9: Property, Plant and Equipment.
h) Goods and Services Tax
Income, expenses and assets are recognised net of the amount of Goods and Services Tax (GST), except where the amount of GST incurred on a purchase of goods and services is not recoverable from the Australian Taxation Office (ATO). In these circumstances the GST is recognised as part of the cost of acquisition of the asset or as part of the expense.
Receivables and payables are stated with the amount of GST included. The net amount of GST recoverable from, or payable to, the ATO is included as part of receivables or payables in the Balance Sheet.
Cash flows are included in the Cash Flow Statement on a gross basis. The GST components of cash flows arising from investing and financing activities which are recoverable from, or payable to, the ATO are classified as operating cash flows. Commitments and contingencies are disclosed net of the amount of GST recoverable or payable unless otherwise specified.
Annual Report 2008-2009 :: 189
NT
Fleet F
inan
cial Statem
ents
i) Income Recognition
Income encompasses both revenue and gains.
Income is recognised at the fair value of the consideration received, exclusive of the amount of goods and services tax (GST). Exchanges of goods or services of the same nature and value without any cash consideration being exchanged are not recognised as income.
Sale of Goods
Revenue from the sale of goods is recognised (net of returns, discounts and allowances) when:
the significant risks and rewards of ownership of the goods have transferred to the buyer;
NT Fleet retains neither continuing managerial involvement to the degree usually associated with ownership nor effective control over the goods sold;
the amount of revenue can be reliably measured;
it is probable that the economic benefits associated with the transaction will flow to NT Fleet; and
the costs incurred or to be incurred in respect of the transaction can be measured reliably.
Rendering of Services
Revenue from rendering services is recognised by reference to the stage of completion of the contract. The revenue is recognised when:
the amount of revenue, stage of completion and transaction costs incurred can be reliably measured; and
it is probable that the economic benefits associated with the transaction will flow to the entity.
Interest Revenue
Interest revenue is recognised as it accrues, taking into account the effective yield on the financial asset.
Disposal of Assets
A gain or loss on disposal of assets is included as a gain or loss on the date control of the asset passes to the buyer, usually when an unconditional contract of sale is signed. The gain or loss on disposal is calculated as the difference between the carrying amount of the asset at the time of disposal and the net proceeds on disposal. Refer also to note 3.
Contributions of Assets
Contributions of assets and contributions to assist in the acquisition of assets, being non-reciprocal transfers, are recognised, unless otherwise determined by Government, as gains when NT Fleet obtains control of the asset or contribution. Contributions are recognised at the fair value received or receivable.

190 :: Department of Business and Employment
NT Fleet Financial Statements
j) Repairs and Maintenance Expense
Costs associated with repairs and maintenance works on NT Fleet’s assets are expensed as incurred.
k) Taxation
NT Fleet is required to pay income tax on its accounting surplus at the company rate of 30% in accordance with the requirements of the Treasurer’s Directions, NT Tax Equivalents Regime.
l) Depreciation and Amortisation Expense
Items of property, plant and equipment, including buildings but excluding land, have limited useful lives and are depreciated or amortised using the straight-line method over their estimated useful lives.
Amortisation applies in relation to intangible non-current assets with limited useful lives and is calculated and accounted for in a similar manner to depreciation.
The estimated useful lives for each class of asset are in accordance with the Treasurer’s Directions and are determined as follows:
2009 2008
Vehicles – light 2 – 3 Years 2 – 3 Years
Vehicles – heavy 3 – 10 Years 3 – 10 Years
Leasehold improvements 10 – 15 Years 10 – 15 Years
Computer software 1 – 5 Years 1 – 5 Years
Assets are depreciated or amortised from the date of acquisition or from the time an asset is completed and held ready for use.
m) Interest Expense
Interest expenses include interest and finance lease charges. Interest expenses are expensed in the period in which they are incurred.
n) Cash
For the purposes of the Balance Sheet and the Cash Flow Statement, cash includes cash on hand, cash at bank and cash equivalents. Cash equivalents are highly liquid short-term investments that are readily convertible to cash.
o) Inventories
General inventories are all inventories other than those held for distribution and are carried at the lower of cost and net realisable value. Cost of inventories includes all costs associated with bringing the inventories to their present location and condition. When inventories are acquired at no or nominal consideration, the cost will be the current replacement cost at date of acquisition.
Inventories held for distribution are those inventories distributed at no or nominal consideration and are carried at the lower of cost and current replacement cost.

Annual Report 2008-2009 :: 191
NT
Fleet F
inan
cial Statem
ents
p) Receivables
Receivables include accounts receivable and other receivables and are recognised at fair value less any allowance for impairment losses.
The allowance for impairment losses represents the amount of receivables NT Fleet estimates are likely to be uncollectible and are considered doubtful. Analyses of the age of the receivables that are past due as at the reporting date are disclosed in an aging schedule under credit risk in Note 17 Financial Instruments. Reconciliation of changes in the allowance accounts is also presented.
Accounts receivable and other receivables are generally settled within 14 days.
q) Property, Plant and Equipment
Acquisitions
All items of property, plant and equipment with a cost, or other value, equal to or greater than $5 000 are recognised in the year of acquisition and depreciated as outlined below. Items of property, plant and equipment below the $5 000 threshold are expensed in the year of acquisition.
The construction cost of property, plant and equipment includes the cost of materials and direct labour, and an appropriate proportion of fixed and variable overheads.
Complex Assets
Major items of plant and equipment comprising a number of components that have different useful lives, are accounted for as separate assets. The components may be replaced during the useful life of the complex asset.
Subsequent Additional Costs
Costs incurred on property, plant and equipment subsequent to initial acquisition are capitalised when it is probable that future economic benefits in excess of the originally assessed performance of the asset will flow to NT Fleet in future years. Where these costs represent separate components of a complex asset, they are accounted for as separate assets and are separately depreciated over their expected useful lives.
Software (Work in Progress)
NT Fleet funded the migration to a new programming tool suit utilised by the NT Government’s software programming contractor. The cost associated with this project has been capitalised.

192 :: Department of Business and Employment
NT Fleet Financial Statements
r) Revaluations and Impairment
Revaluation of Assets
Subsequent to initial recognition, assets belonging to the following classes of non-current assets are revalued with sufficient regularity to ensure that the carrying amount of these assets does not differ materially from their fair value at reporting date:
Heavy vehicles
Intangibles
Fair value is the amount for which an asset could be exchanged, or liability settled, between knowledgeable, willing parties in an arms length transaction.
The unique nature of some of the heritage and cultural assets may preclude reliable measurement. Such assets have not been recognised in the financial statements.
Impairment of Assets
An asset is said to be impaired when the asset’s carrying amount exceeds its recoverable amount.
Non-current physical and intangible Agency assets are assessed for indicators of impairment on an annual basis. If an indicator of impairment exists, NT Fleet determines the asset’s recoverable amount. The asset’s recoverable amount is determined as the higher of the asset’s depreciated replacement cost and fair value less costs to sell. Any amount by which the asset’s carrying amount exceeds the recoverable amount is recorded as an impairment loss.
Impairment losses are recognised in the Operating Statement unless the asset is carried at a revalued amount. Where the asset is measured at a revalued amount, the impairment loss is offset against the Asset Revaluation Reserve for that class of asset to the extent that an available balance exists in the Asset Revaluation Reserve.
In certain situations, an impairment loss may subsequently be reversed. Where an impairment loss is subsequently reversed, the carrying amount of the asset is increased to the revised estimate of its recoverable amount. A reversal of an impairment loss is recognised in the Operating Statement as income, unless the asset is carried at a revalued amount, in which case the impairment reversal results in an increase in the Asset Revaluation Reserve.
s) Assets Held for Sale
Assets held for sale consist of those assets which management has determined are available for immediate sale in their present condition, and their sale is highly probably within the next twelve months.
These assets are measured at the lower of the asset’s carrying amount and fair value less costs to sell. These assets are not depreciated. Non-current assets held for sale have been recognised on the face of the financial statements as current assets.

Annual Report 2008-2009 :: 193
NT
Fleet F
inan
cial Statem
ents
t) Leased Assets
Leases under which NT Fleet assumes substantially all the risks and rewards of ownership of an asset are classified as finance leases. Other leases are classified as operating leases.
Finance Leases
Finance leases are capitalised. A leased asset and a lease liability equal to the present value of the minimum lease payments are recognised at the inception of the lease.
Lease payments are allocated between the principal component of the lease liability and the interest expense.
Operating Leases
Operating lease payments made at regular intervals throughout the term are expensed when the payments are due, except where an alternative basis is more representative of the pattern of benefits to be derived from the leased property. Lease incentives under an operating lease of a building or office space is recognised as an integral part of the consideration for the use of the leased asset. Lease incentives are to be recognised as a deduction of the lease expenses over the term of the lease.
u) Payables
Liabilities for accounts payable and other amounts payable are carried at cost which is the fair value of the consideration to be paid in the future for goods and services received, whether or not billed to NT Fleet. Accounts payable are normally settled within 30 days.
v) Borrowings
Government loans are initially recognised at the fair value of the consideration received less directly attributable transaction cost.
After initial recognition, borrowings are subsequently measured at amortised cost using the effective interest method.
w) Employee Benefits
Provision is made for employee benefits accumulated as a result of employees rendering services up to the reporting date. These benefits include wages and salaries and recreation leave. Liabilities arising in respect of wages and salaries and recreation leave and other employee benefit liabilities that fall due within twelve months of reporting date are classified as current liabilities and are measured at amounts expected to be paid. Non-current employee benefit liabilities that fall due after twelve months of the reporting date are measured at present value, calculated using the Government long term bond rate.
No provision is made for sick leave, which is non-vesting, as the anticipated pattern of future sick leave to be taken is less than the entitlement accruing in each reporting period.

194 :: Department of Business and Employment
NT Fleet Financial Statements
Employee benefit expenses are recognised on a net basis in respect of the following categories:
wages and salaries, non-monetary benefits, recreation leave, sick leave and other leave entitlements
other types of employee benefits.
As part of the Financial Management Framework, the Central Holding Authority assumes the long service leave liabilities of Government Agencies, including NT Fleet and as such no long service leave liability is recognised in Agency financial statements.
x) Superannuation
Employees’ superannuation entitlements are provided through the:
NT Government and Public Authorities Superannuation Scheme (NTGPASS)
Commonwealth Superannuation Scheme (CSS)
Non-government employee nominated schemes for those employees commencing on or after 10 August 1999.
NT Fleet makes superannuation contributions on behalf of its employees to the Central Holding Authority or non-government employee nominated schemes. Superannuation liabilities related to government superannuation schemes are held by the Central Holding Authority and as such are not recognised in NT Fleet’s financial statements.
y) Contributions by and Distributions to Government
NT Fleet may receive contributions from Government where the Government is acting as owner of NT Fleet. Conversely, NT Fleet may make distributions to Government. In accordance with the Financial Management Act and Treasurer’s Directions, certain types of contributions and distributions, including those relating to administrative restructures, have been designated as contributions by, and distributions to, Government. These designated contributions and distributions are treated by NT Fleet as adjustments to equity.
The Statement of Changes in Equity and note 15 provide additional information in relation to contributions by, and distributions to, Government.
z) Dividends
NT Fleet has provided for a dividend payable at the rate of 50% of net profit after tax in accordance with the NT Government’s dividend policy.
aa) Commitments
Disclosures in relation to capital and other commitments, including lease commitments are shown at note 18 and are consistent with the requirements contained in AASB 101, AASB 116 and AASB 117.
Commitments are those contracted as at 30 June where the amount of the future commitment can be reliably measured.

Annual Report 2008-2009 :: 195
NT
Fleet F
inan
cial Statem
ents
2009 $’000
2008 $’000
3. GAIN ON DISPOSAL OF ASSETSProceeds from the disposal of non-current assets 16 276 18 699
Less: Carrying value of non-current assets disposed 14 976 16 926
Gain on Disposal of Non-Current Assets 1 300 1 773
4. PURCHASES OF GOODS AND SERVICESThe net surplus/(deficit) has been arrived at after charging the following expenses:
Goods and Services Expenses:
Consultants (1) - 19
Advertising (2) - 1
Document Production 5 8
Recruitment (3) 7 -
Training and Study 14 11
Official Duty Fares 5 8
Travelling Allowance 2 7
Corporate Support from Other Agencies 377 339
(1) Includes marketing and promotion consultants. (2) Does not include recruitment advertising or marketing and
promotion advertising.(3) Includes recruitment related advertising costs.
5. INCOME TAX EXPENSECurrent Year Profit 9 973 10 463
Prima Facie Tax Expense Calculated at 30% of the surplus 2 992 3 139
Total Income Tax Expense 2 992 3 139
6. CASH Cash on Hand 9 1
Cash at Bank 5 943 8 774
Total Cash 5 952 8 775
7. RECEIVABLESCurrent
Accounts Receivable 243 896
Interest Receivable 11 45
GST Receivable 36 16
Other Receivables 610 336
Total Receivables 900 1 293
8. INVENTORIESRaw Material and Stores 12 10
Total Inventories 12 10

196 :: Department of Business and Employment
NT Fleet Financial Statements
2009 $’000
2008 $’000
9. PROPERTY, PLANT AND EQUIPMENTMotor Vehicles – Light
At Cost 99 314 91 540
Less: Accumulated Depreciation (24 658) (20 576)
74 656 70 964
Motor Vehicles – Heavy
At Cost 24 866 22 750
Less: Accumulated Depreciation (11 918) (10 889)
12 948 11 861
Intangibles – Computer Software
At cost 249 239
Leasehold Improvements
At capitalised cost 54 23
Less: Accumulated Depreciation (3) (2)
51 21
Total Property, Plant and Equipment 87 904 83 085
Impairment of Property, Plant and Equipment
NT Fleet’s property, plant and equipment were assessed for impairment as at 30 June 2009. No impairment adjustments were required as a result of this review.

Annual Report 2008-2009 :: 197
NT
Fleet F
inan
cial Statem
ents
9. PROPERTY, PLANT AND EQUIPMENT (Continued)
2009 Property, Plant and Equipment Reconciliations
A reconciliation of the carrying amount of property, plant and equipment at the beginning and end of 2008-09 is set out below:
Motor Vehicles
Light
Motor Vehicles Heavy
Leasehold Improvements
Intangibles – Software
Total
$’000 $’000 $’000 $’000 $’000
Carrying Amount as at 1 July 2008 70 964 11 861 21 239 83 085
Additions 34 130 3 410 31 10 37 581
Disposals (14 645) (330) (14 975)
Depreciation (15 793) (1 993) (1) (17 787)
Carrying Amount as at 30 June 2009 74 656 12 948 51 249 87 904
2008 Property, Plant and Equipment Reconciliations
A reconciliation of the carrying amount of property, plant and equipment at the beginning and end of 2007-08 is set out below:
Motor Vehicles
Light
Motor Vehicles Heavy
Leasehold Improvements
Intangibles – Software
Total
$’000 $’000 $’000 $’000 $’000
Carrying Amount as at 1 July 2007 70 535 10 279 22 160 80 995
Additions 30 669 4002 - 79 34 750
Disposals (16 280) (646) - - (16 926)
Additions/(Disposals) from Asset Transfers (112) - - - (112)
Depreciation (13 848) (1 773) (1) - (15 623)
Carrying Amount as at 30 June 2008 70 964 11 861 21 239 83 085

198 :: Department of Business and Employment
NT Fleet Financial Statements
2009 $’000
2008 $’000
10. PAYABLESAccounts Payable 3 032 2 792
Accrued Expenses 56 55
Other Accrued Expenses and Accrued Salaries 288 229
Total Payables 3 376 3 076
11. INCOME TAX LIABILITIESIncome Tax Payable 2 992 3 139
Total Income Tax Liabilities 2 992 3 139
12. PROVISIONSCurrent
Employee Benefits
Recreation Leave 168 163
Leave Loading 31 29
Recreation Leave Fares 12 36
Other Current Provisions
Provision for Dividend 3 491 3 662
Provision for Fringe Benefits Tax 4 4
Provision for Payroll Tax 27 31
Provision for Superannuation 47 49
Provision for Workers Compensation Premium 6 8
Total Current Provisions 3 786 3 982
Non-Current
Employee Benefits
Recreation Leave 136 122
Total Non-Current 136 122
Total Provisions 3 922 4 104
Reconciliations of Dividends
Balance as at 1 July 2008 3 662 3 093
Reductions Arising from Payments (3 662) (3 093)
Additional Provisions Recognised 3 491 3 662
Balance as at 30 June 2009 3 491 3 662
NT Fleet employed 32 employees as at 30 June 2009 (32 employees as at 30 June 2008).

Annual Report 2008-2009 :: 199
NT
Fleet F
inan
cial Statem
ents
2009 $’000
2008 $’000
13. OTHER LIABILITIESCurrent
Deferred Income - 1 874
Total - 1 874
14. BORROWINGS AND ADVANCESNon-Current
Loans and Advances 4 000 4 000
Total Borrowings and Advances 4 000 4 000
15. EQUITYEquity represents the residual interest in the net assets of NT Fleet. The Government’s ownership interest in NT Fleet is held in the Central Holding Authority as described in note 2(c).
Capital
Balance as at 1 July 436 528
Equity Injections
Equity Transfers In 31 20
Equity Withdrawals
Equity Transfers Out - (112)
Balance as at 30 June 467 436
Accumulated Funds
Balance as at 1 July 76 538 72 876
Surplus for the Period 6 981 7 324
Dividends Payable (3 491) (3 662)
Balance as at 30 June 80 028 76 538
Total Equity 80 495 76 974

200 :: Department of Business and Employment
NT Fleet Financial Statements
2009 $’000
2008 $’000
16. NOTES TO THE CASH FLOW STATEMENTReconciliation of Cash
The total of NT Fleet Cash and Deposits of $5.952M recorded in the Balance Sheet is consistent with that recorded as ‘cash’ in the Cash Flow Statement.
Reconciliation of Net Surplus/(Deficit) to Net Cash From Operating Activities
Net Surplus 6 981 7 324
Non-Cash Items:
Depreciation and Amortisation 17 787 15 623
(Gain) on Disposal of Assets (1 300) (1 773)
Repairs and Maintenance – minor new works - 20
Changes in Assets and Liabilities:
Decrease/(Increase) in Receivables 393 (861)
Decrease/(Increase) in Inventories (2) (2)
Decrease/(Increase) in Prepayments (14) (4)
(Decrease)/Increase in Payables 532 (16)
(Decrease)/Increase in Provision for Employee Benefits (2) (68)
(Decrease)/Increase in Other Provisions (156) 549
(Decrease)/Increase in Deferred Income (1 874) 1 874
Net Cash From Operating Activities 22 345 22 666

Annual Report 2008-2009 :: 201
NT
Fleet F
inan
cial Statem
ents
17. FINANCIAL INSTRUMENTS
A financial instrument is a contract that gives rise to a financial asset of one entity and a financial liability or equity instrument of another entity. Financial instruments held by NT Fleet include cash and deposits, receivables, payables and finance leases. NT Fleet has limited exposure to financial risks as discussed below.
NT Fleet’s operating account earns monthly interest at a variable interest rate (NT Treasury Corporation’s average 11am cash rate less 25 basis points).
Negative cash balances of $50 000 or less and negative cash balances over $50 000, which have an overdraft facility or by prior arrangement with NT Treasury Corporation, attract the average 11am cash rate for the month plus 50 basis points.
Negative balances without overdraft facilities or prior arrangement with NT Treasury Corporation will be charged the overdraft rate applied to the Government Bank Account by the Westpac Banking Corporation.
(a) Categorisation of Financial Instruments
The carrying amounts of the NT Fleet financial assets and liabilities by category are disclosed in the table below.
2009 $’000
2008 $’000
Financial Assets
Cash 5 952 8 775
Receivables 900 1 293
Financial Liabilities
Payables 3 376 3 076

202 :: Department of Business and Employment
NT Fleet Financial Statements
17. FINANCIAL INSTRUMENTS (continued)
(b) Credit Risk
NT Fleet has limited credit risk exposure (risk of default). In respect of any dealings with organisations external to Government, NT Fleet has adopted a policy of only dealing with credit worthy organisations and obtaining sufficient collateral or other security where appropriate, as a means of mitigating the risk of financial loss from defaults.
The carrying amount of financial assets recorded in the financial statements, net of any allowances for losses, represents NT Fleet’s maximum exposure to credit risk without taking account of the value of any collateral or other security obtained.
Receivables
Receivable balances are monitored on an ongoing basis to ensure that exposure to bad debts is not significant. A reconciliation and aging analysis of receivables is presented below.
2009 $’000
2008 $’000
Ageing of Receivables
Not Overdue 91 144 283 402
Overdue for less than 30 Days 149 835 562 885
Overdue for 30 to 60 Days 2 097 24 272
Overdue for more than 60 Days 25 002
Total Receivables 243 076 895 561
(c) Liquidity risk
Liquidity risk is the risk that NT Fleet will not be able to meet its financial obligations as they fall due. NT Fleet’s approach to managing liquidity is to ensure that it will always have sufficient liquidity to meet is liabilities when they fall due.
The following tables detail the undiscounted cash flows payable by NT Fleet by remaining contractual maturity for its financial liabilities. It should be noted that as these are undiscounted, totals may not reconcile to the carrying amounts presented in the Balance Sheet.

Annual Report 2008-2009 :: 203
NT
Fleet F
inan
cial Statem
ents
17. FINANCIAL INSTRUMENTS (Continued)
2009 Maturity
Variable Interest
Fixed Interest Rate Non Interest Bearing
Total Weighted Average Less
than a Year
1 to 5 Years
More than
5 Years
$’000 $’000 $’000 $’000 $’000 $’000 %
Deposits Held 5 943 9 5 952 4.5
Receivable 900 900
Payable (3 376) (3 376)
Employee Benefits (347) (347)
Government Loan (4 000) (4 000) 7.1
Dividends (3 491) (3 491)
Total Financial Assets 5 943 (4 000) (6 305) (4 362)
2008 Maturity
Variable Interest
Fixed Interest Rate Non Interest Bearing
Total Weighted Average Less
than a Year
1 to 5 Years
More than 5 Years
$’000 $’000 $’000 $’000 $’000 $’000 %
Deposits Held 8 774 1 8 775 6.6
Receivable 1 293 1 293
Payable (3 076) (3 076)
Employee Benefits (350) (350)
Government Loan (4 000) (4 000) 7.1
Dividends (3 662) (3 662)
Total Financial Liabilities 8 774 (4 000) (5 794) (1 020)
(d) Market Risk
Market risk is the risk that the fair value of future cash flows of a financial instrument will fluctuate because of changes in market prices. It comprises interest rate risk, price risk and currency risk.
i) Interest Rate Risk
NT Fleet has limited exposure to interest rate risk. Finance lease arrangements are established on a fixed interest rate and as such do not expose NT Fleet to interest rate risk. NT Fleet’s exposure to interest rate risk on financial assets and financial liabilities is set out in the following tables. The average interest rate is based on the outstanding balance at the end of the year. NT Fleet’s operating accounts earns quarterly interest at a variable interest rate (NT Treasury’s Corporation’s weighted average cash returns less 50 basis points).

204 :: Department of Business and Employment
NT Fleet Financial Statements
17. FINANCIAL INSTRUMENTS (Continued)
Assuming the financial assets and liabilities as at 30 June 2009 were to remain until maturity or settlement without any action by NT Fleet to alter the resulting interest rate risk exposure, an immediate and sustained increase of 1 percent in market interest rates across all maturities would have an impact on the net income of plus or minus $50 000 and is considered not material to NT Fleet.
2009 $’000
2008 $’000
Fixed rate instruments
Financial Liabilities (4 000) (4 000)
Total
Variable rate instruments
Financial assets 5 943 8 774
Total 1 943 4 774
Market Sensitivity Analysis
Changes in the variable rates of 100 basis points (1 per cent) at reporting date would have the following effect on NT Fleet’s profit or loss and equity.
Profit or Loss and Equity
100 basis points increase $’000
100 basis points decrease $’000
30 June 2009
Financial assets – cash at bank 19 (19)
30 June 2008
Financial assets – cash at bank 47 (47)
ii) Price Risk
NT Fleet is not exposed to price risk as NT Fleet does not hold units in unit trusts.
The analysis below demonstrates the impact of a movement in prices of units held in unit trusts. It is assumed that any relevant price change occurs as at reporting date.
iii) Currency Risk
NT Fleet is not exposed to currency risk as NT Fleet does not hold borrowings denominated in foreign currencies or transactional currency exposures arising from purchases in a foreign currency.
(e) Net Fair Value
The carrying amount of financial assets and financial liabilities recorded in the financial statements approximates their respective net fair values. Where differences exist, these are not material.

Annual Report 2008-2009 :: 205
NT
Fleet F
inan
cial Statem
ents
2009 $’000
2008 $’000
18. COMMITMENTS
(i) Capital Expenditure Commitments
Estimated capital expenditure contracted for at balance date but not provided for and payable:
Within one year 8 383 9 808
8 383 9 808
(ii) Operating Lease Commitments
NT Fleet leases property under non-cancellable operating leases expiring on 23 January 2010 and 11 November 2012. Leases generally provide NT Fleet with a right of renewal at which time all lease terms are renegotiated. NT Fleet also leases items of plant and equipment under non-cancellable operating leases. Future operating lease commitments not recognised as liabilities are payable as follows:
Within one year 4 4
Later than one year and not later than five years 5 3
9 7
(iii) Operating Lease Commitments Receivable
Received not later than one year 31 889 28 539
Later than one year and not later than five years 19 192 17 174
51 081 45 713
19. CONTINGENT LIABILITIES AND CONTINGENT ASSETS
NT Fleet had no contingent liabilities or contingent assets as at 30 June 2009 or as at 30 June 2008.
20. EVENTS SUBSEQUENT TO BALANCE DATE
No events have arisen between the end of the financial year and the date of this report that require adjustment to, or disclosure in these financial statements.
21. WRITE-OFFS, POSTPONEMENTS AND WAIVERS
NT Fleet had no write offs, postponements or waivers in 2008-09 and 2007-08.

206 :: Department of Business and Employment
Appendices
APPENDIX A
LIST OF ACRONYMS
3P Personal Planning Process
APRO Agency Procurement Requisitions Online (IT system)
CAPS Contracts and Procurement Services (DBE business unit)
CIS Corporate and Information Services (DBE business unit)
COAG Council of Australian Governments
DBE Department of Business and Employment
DBERD Department of Business, Economic and Regional Development (former department)
DCIS Department of Corporate and Information Services (former department)
DCS Data Centre Services (GBD)
ECMS Electronic Card Management System
EDRM Electronic Document Records Management
ePASS Electronic Passport
GAS Government Accounting System (IT system)
GBD Government Business Division
GOAC Government Office Accommodation Committee
GST Goods and Services Tax
FTE Full Time Equivalent
HRIS Human Resources Information Systems (IT systems)
ICT Information and Communications Technology
ITIL Information Technology Infrastructure Library
JES Job Evaluation System
KPI Key Performance Indicator
NABERS National Australian Built Environment Rating System
NTG Northern Territory Government
NTG IMC Northern Territory Government Information Management Committee
NTPM Northern Territory Property Management
NTPS Northern Territory Public Sector
OCPE Office of the Commissioner for Public Employment
OH&S Occupational Health and Safety
P&D People and Development (DBE business unit)
PAPMS Payoll and Payment Management Services (IT system)
PIPS Personnel Information and Payroll System (IT system)
PSMP Public Sector Management Program
RePS Receipts Processing System (IT system)
SLA Service Level Agreement
SME Small to Medium Enterprises
SPIN Support Program and Information Network (development program)
TRIM Tower Records and Information Management (IT system)
TRIPS Travel Request Information Processing System (IT system)

Annual Report 2008-2009 :: 207
Ap
pen
dices
APPENDIX B
DBE SERVICE PRICE LIST
As at 30 June 2009
Service Cost Measure Price ($)
FINANCIAL AND ACCOUNTING SERVICES
Accounts Payable
- Invoice processed 1-5 lines Per invoice 13.10
- Invoice processed 6 -10 lines Per invoice 25.50
- Invoice processed >10 lines Per invoice 40.50
- Ledger Transfer Per invoice 12.00
- Regional travel Per travel request 20.65
- RTM advance cheques Per cheque 25.80
- Deskbank payments Per payment 86.00
- Credit card management No. of credit cards (pa) 420.00
Accounts Receivable
- Invoice manual requisition Per invoice 61.00
- Invoice electronic requisition Per invoice 25.00
- Receiver statements – manual Per statement 50.00
- Receiver statements – pay online Per statement 10.00
- RTM Per receipt 5.20
- Bank account management Per bank account (pa) 2 496.00
Asset Accounting
- Asset accounting No. of assets (pa) 81.60
- Disposals Per asset disposed 28.00
Taxation Services
- BAS lodgement Per line per return 0.40
- FBT Tax Per line comprising FBT liability 22.00
- Payroll Tax Per cost code per return 6.50
Financial Reporting
- Auto Per page produced 1.25
Financial Systems DASD usage (per 1% per annum) 72 000.00
Contract and Procurement Services
CAPS
- Tender Management Per tenders managed 2 000.00
- Standard RFT Per standard RFT 1 500.00
- Complex RFT Per complex RFT 4 100.00
- Addenda/Extension Per addenda/extension 540.00
- CAPS Advisory Service Per no. of paid employees (pa) 20.00
- CAPS Whole of Govt Contracts Per no. of paid employees (pa) 20.00
- RFQ Administration Per no. of quotations entered 200.00
Couriers/Despatch Per drop off/ pick up 12.00

208 :: Department of Business and Employment
Appendices
Service Cost Measure Price ($)
Human Resource Services
HR System Per no. of paid employees (pa) 345.00
Job Evaluation Services Per JESd position 250.00
Payroll Services
- Per Employee Charge Per no. of paid employees (pa) 155.00
- Per PTR Charge - Auto Per PTR - auto 3.00
- Per PTR Charge - Manual Per PTR - manual 10.00
- Commencement / Termination Per commencement / termination 260.00
Recruitment Services
- New Starter Per new starter 510.00
- Temporary or Nominal Move Per temporary or nominal move 30.00
Entry Level Recruitment Per no. of admin staff (pa) 70.00
Short Courses Per person / half day 135.00
Employment Programs No. of apprentices 2 480.00
Venue Management
- Venue Management - Belvedere House A/S L1 Per half day 50.00
- Venue Management - Belvedere House A/S L2 Per half day 120.00
- Venue Management - Sadgroves Room Per half day 50.00
- Venue Management - Timor Room Per half day 100.00
- Venue Management - Frances Bay Room Per half day 150.00
- Venue Management - Kath Govt Centre Per half day 90.00
OH&S Per hour 110.00
Workers Compensation Per hour 83.00
INFORMATION AND COMMUNICATIONS TECHNOLOGY SERVICES
ICT Policy & Strategy Per no. of desktops (pa) 110.00
IT Service Management
- Contract Services Per no. of desktops (pa) 165.00
- Agency Services Allocation of FTE - Managers (pa) 130 000.00
Allocation of FTE - Directors (pa) 175 000.00
Records Policy & Systems Per no. of paid employees (pa) 65.00
PROPERTY MANAGEMENT Cost
Leased Property Management Overheads 3.47%

Annual Report 2008-2009 :: 209
Ap
pen
dices
APPENDIX C
AUDITS BY THE AUDITOR-GENERAL
For year ending 30 June 2009
Audit Audit Outcome/ Recommendation Summary
Action
DCIS End of Year Compliance Audit 2007-08
Standard operating procedures were not followed in all instances - one employee contract was not signed by employee and employer.
Employees with negative leave balances were noted.
Signed contract located and filed. Procedures reinforced.
Actions that address this matter have been completed.
DBERD Agency Compliance Audit 2007-08
Accounting and Property Manual to be regularly reviewed.
Territory Business Centre Receipting and Tracking System allows deletion of receipts and incorrectly rounds GST.
Territory Business Centre safe combination to be changed on a more regular basis.
DBE Accounting and Property Manual is currently under review and captures the DBERD audit findings.
A new receipting and tracking system currently being implemented and will replace old system.
Safe upgraded and a policy implemented requiring regular combination changes.
NT Fleet Financial Statement Audit 2007-08
Cash Receipts Clearing Account was not cleared to zero at 30 June 2008.
A journal was posted in period 14 in error due to a misunderstanding. NT Fleet is working more closely with DBE Ledgers to ensure the issue does not occur again.
Government Printing Office Financial Statement Audit 2007-08
Instances were noted where invoices were being approved by employees without appropriate delegations.
Compliance with delegations reinforced with staff.
Data Centre Services Financial Statement Audit 2007-08
Lack of segregation of duties identified for some journals and end of year reconciliations.
Administrative position filled resolving segregation issue.
GAS Controls 2007-08 GAS user profiles to be reviewed quarterly and conflicting profiles addressed immediately with reports signed to evidence reviews.
Approved credit management policies to be in place, collection status of debtors updated and reviewed reports evidenced.
Accounting and Property Manual should be complied with to reduce exposure.
Profiles reviewed, modified and requirement to evidence profile reviews reiterated.
Credit management policies now revised.
Accounting and Property Manual currently being updated and additional training provided to staff.

210 :: Department of Business and Employment
Appendices
Audit Audit Outcome/ Recommendation Summary
Action
Information Security Policy & Awareness and Social Engineering
Security awareness to be included in induction programs with an ongoing awareness campaign implemented for employees.
Physical access security controls require improvement at Palm Court.
Ongoing ICT security audits should be conducted with a focus on areas of identified weakness.
Configuration of email systems should be reviewed to maximise protection.
Security awareness given higher profile. Awareness campaign includes orientation programs and regular reminders to NTPS staff.
Physical access to Palm Court building upgraded.
ICT security policy to be reviewed. Audit options to be considered within new sourcing contracts.
Migration to Microsoft Outlook across Government will resolve issues relating to configuration of email systems.
NT Fleet Interim Financial Statement Audit 2008-09
Methodology for estimating residual values or the projected price of heavy vehicles or machinery recorded in the Fleet Business System may require review.
Fleet Business System should be modified to enable journals to be reversed or re-entered.
Fleet Business System allows accounts payable and accounts receivable journal entries to be deleted.
Heavy vehicle fleet residual values have been reviewed.
A review of the Fleet Business System is planned to modernise the system. This will incorporate issues identified during the audit.
IT Controls Processes for review and maintenance of GAS security profiles require improvement.
Monthly review of NTG agencies’ GAS user access should be enhanced.
Data Centre backup and disaster recovery controls should be enhanced.
Data Centre monitoring of sensitive PIPS and GAS events require improvement.
Documentation of processes nearing completion.
GAS user access review process updated.
Consultant engaged to assist with enhancements of disaster recovery controls.
Process now implemented to address issue, including reports to identify sensitive events.

Annual Report 2008-2009 :: 211
Ap
pen
dices
Audit Audit Outcome/ Recommendation Summary
Action
Salary Processing Services (PIPS) Compliance - 2009
Exception reports should be promptly reviewed and actioned in accordance with procedures.
Internal controls for employee deduction changes could be improved.
Some employee files selected for audit were unable to be located.
Two employee contracts selected for review were not signed by employee and employer.
Adherence to procedures reiterated with staff, further training conducted and additional spot checks implemented.
Standard operating procedures reiterated to staff.
DBE is currently moving to electronic recording of employee files which will alleviate the risk of missing files.
Practices reinforced and tightened with a signed contract required before an employee can be paid.
Territory Business Centre Compliance Audit 2009
TBC service level agreement should be updated to reflect new departmental structure.
TBC should adopt the DBE Accounting and Property Manual.
Departmental delegations should be updated for ledger transfers.
The Receipt and Tracking System does not generate a complete list of cancelled receipts.
A strategic directions and objectives document will replace outdated service level agreement.
The DBE Accounting and Property Manual has been adopted by the TBC.
Approval processes have been revised to ensure delegated officers sign transfers.
A new Receipt and Tracking System is being implemented that will replace the current system.

212 :: Department of Business and Employment
Appendices
APPENDIX D
INTERNAL REVIEWS
For year ending 30 June 2009
Review Description Outcome
Review of Assets – Dedicated Equipment List
Review by Deloitte Touche Tohmatsu – to determine the accuracy and suitability of processes and systems currently in use by the relevant service providers to accurately record, track and determine the current financial value of assets used in the delivery of ICT services to the Northern Territory Government.
The review identified instances where the requirements around the recording and documenting of assets were not sufficiently detailed or specific.
All contracts have been reviewed with action plans developed with service providers to improve compliance with contractual obligations. Identified weaknesses have been corrected and regular reviews are now in place.
Billing Review of Fujitsu Australia Limited for the period 1 June 2006 to 31 March 2009
Review by Deloitte Touche Tohmatsu –to determine whether appropriate controls exist within the service provider’s billing functions to ensure the completeness, accuracy and validity of billing transactions to NT Government agencies.
Nothing came to the attention of the auditors that caused them to believe that Fujitsu Australia Limited had not complied, in all material respects, with their contractual requirements.
Review of Security Practice, Policy and Procedure
Review by Stantons International - to determine the existence and use of appropriate security policy, practice and processes within the service provider environment, report on the current state and, if required, make recommendations for improvement.
One service provider demonstrated a strong alignment with the other two demonstrating a general alignment to the NTG ICT Access Policy and many of the requirements articulated in the Australian standard
Action plans were developed in consultation with service providers resulting in the identified weaknesses being corrected.
Service Credits Audit
Review by Stantons International - to determine the accuracy and suitability of processes and systems currently in use by the relevant service providers to calculate and report on service credits payable as a result of not meeting specified service levels.
It was concluded that service reporting is based mostly on the requirements of the respective contracts; however, not all measures were reported.
The integrity of data feeds into reporting databases could not be fully validated for some of the service providers, as there were some instances where control mechanisms for feeds were lacking and the data was assumed to be accurate.
The findings and recommendations were discussed with service providers and amendments made to some service levels through variations to the contracts.

Annual Report 2008-2009 :: 213
Ap
pen
dices
APPENDIX E
SELF INSURANCE CLAIMS
Department of Business and Employment
Risk Category Number of claims Value of claims Average cost of claims
2007-08 2008-09 2007-08 2008-09 2007-08 2008-09
Workers compensation¹ N/A² 18 N/A² $612882³ N/A² $34049³
¹ Figures provided are for all claims during the financial year including new, ongoing and finalised claims. ² Department of Business and Employment was created in August 2008 and no data is available. ³ Total value and average cost of claims include a lump sum settlement of $280 000. Excluding the
settlement, the average cost of claims is $18 493.
Data Centre Services
Risk Category Number of claims Value of claims Average cost of claims
2007-08 2008-09 2007-08 2008-09 2007-08 2008-09
Workers compensation 1 1 $2076 $313 $2076 $313
Government Printing Office
Risk Category Number of claims Value of claims Average cost of claims
2007-08 2008-09 2007-08 2008-09 2007-08 2008-09
Workers compensation 1 1 $1535 $1814 $1535 $1814
NT Fleet
Risk Category Number of claims Value of claims Average cost of claims
2007-08 2008-09 2007-08 2008-09 2007-08 2008-09
Workers compensation 1 1 $740 $567 $740 $567

214 :: Department of Business and Employment
Appendices
APPENDIX F
KEY PERFORMANCE INDICATORS
Finance Services
New measures added to 2008-09 Revised Budget
Creditor Invoices paid within 30 days With the focus on continuing to streamline processing of accounts, the new measure was introduced to record NT Government achievement against meeting its policy of paying undisputed supplier accounts within 30 days.
Measures discontinued from 2008-09 Original Budget
Assets Recorded Measure provides minimal insight into service being provided to agencies as there is a regular turnover of assets, with new assets acquired, and assets obsolete or excess to requirements retired or sold.
Finance System Costs Measure recorded costs of running financial systems within DBE, which do not reflect and are not determined by service delivery performance.
Creditor Invoices processed < 8 days Measure is of less relevance than replacement measure, with the priority focus on meeting the Government’s 30 day payment policy.
Average days to record assetsMeasure is not considered useful in providing an understanding of output performance.
Performance Measures 2008-09 2009-10 Original Budget
Original Budget
Revised Budget
Actual
Quantity
Creditor Invoices processed 330 000 340 000 359 665 345 000
Debtor Invoices issued 32 000 32 000 30 960 33 000
Quality
Processing error rate <0.5% <0.5% <0.4% <0.5%
System availability 100% 100% 100% 100%
Timeliness
Creditor Invoices paid within 30 days - 90% 88% 90%
Average days to collect debts 45 55 52 55
Movements between Original and Revised Budget 2008-09
Creditor Invoices processed +10 000 Volume increase anticipated due to increased activity, including the Working Future initiative.
Movements between 2008-09 Revised Budget and Actual
Creditor Invoices processed +19 665 Actual volume increase was greater than anticipated.

Annual Report 2008-2009 :: 215
Ap
pen
dices
Human Resource Services
New measures added to 2008-09 Revised Budget
Payroll transactions processed This represents a more relevant and informative measure of business output than the previous measure of Employees Paid.
Processing error rate Measure provides a meaningful indicator of the quality of the output and one that HR Services can directly influence and benchmark.
Proportion of apprentices completing qualification Measure provides an indication of the effectiveness of the services that the output delivers.
Average days to commence new employees This provides a measure of recruitment and payroll services efficiency and effectiveness.
Measures discontinued from 2008-09 Original Budget
Number of Employees Paid Measure has been replaced by Payroll transactions processed as it is not a representative measure of service delivery performance.
Pay transactions processed electronically via myHR Pay transactions processed manually via PIPS Measures were relevant when myHR was first introduced. Now that the facility has wide acceptance the measures have been replaced with “Payroll Transactions Processed” and “Processing Error Rates” as these better address processing efficiency and accuracy.
Human Resource System Costs Measure recorded costs of running human resource systems within DBE which do not reflect and are not determined by service delivery performance.
Number of half days training delivered Training course participant satisfactionFocus has been moved to apprenticeship programs with “Proportion of Apprentices Completing Qualification” now reported as a more meaningful indicator of effectiveness.

216 :: Department of Business and Employment
Appendices
Performance Measures 2008-09 2009-10 Original Budget
Original Budget
Revised Budget
Actual
Quantity
Payroll transactions processed - 920 000 932 324 950 000
Commencements and terminations processed 13 300 13 300 14 794 13 420
Quality
Processing error rate - 0.08% 0.03% 0.05%
Proportion of apprentices completing qualification - 80% 60% 80%
Timeliness
Payroll transactions processed in applicable pay period - 98% 98% 98%
Average days to commence new employees - 5 5 5
Workers compensation claims processed within statutory time limits 100% 100% 97% 100%
Movements between 2008-09 Revised Budget and Actual
Proportion of apprentices completing qualification -20% Completion rate appears low due to the number of apprenticeships that span more than the 2008 09 financial year (for example Cert IV apprenticeships that take a minimum of 3 years to complete). This is a new measure and it may take some refinements before the measure is fully reliable.
Commencements and terminations processed +1 494 This measure is always difficult to forecast with a high degree of accuracy and is influenced by short term contract arrangements, including those related to the Working Future initiative and the Australian Government intervention.

Annual Report 2008-2009 :: 217
Ap
pen
dices
Procurement Policy and Services
New measures added to 2008-09 Revised Budget
Tenders Awarded This is a meaningful metric of procurement activity.
Proportion of Tenders lodged electronically This is an important metric to measure the uptake of electronic tender submissions by the business community.
Procurement Review Board appeals upheld as a proportion of tenders awarded This measure provides an indication of the effectiveness of procurement processes.
Average days to issue tenders This measure captures the number of days from when an agency submits a tender to CAPS to the tender being advertised. It provides a reflection on service delivery performance.
Measures discontinued from 2008-09 Original Budget
Tenders managed Tenders developedThis reflected the number of tenders awarded that were fully developed by agencies and processed through CAPS. The new metric “Tenders awarded” includes both tenders managed and developed as a total volume. Historically, this performance indicator originated from the two types of tender processes for different charging mechanisms.
Across Government contracts administered This measure reported the number of current contracts administered by CAPS which is a metric that remains fairly constant. As there is currently no plan to significantly increase or decrease the number of these contracts, there is limited benefit in retaining this measure.
Procurement Review Board rejection rate This measure reflected the quality of business papers submitted for the Procurement Review Board by CAPS and was an internal quality indicator that was difficult to track and interpret reliably. The measure was usually low and is now not considered a meaningful measure of performance.
Average days to prepare papers for the Procurement Review Board This internal indicator is not considered a useful measure of output performance, as it reflects a routine task rather than a key activity.

218 :: Department of Business and Employment
Appendices
Performance Measures 2008-09 2009-10 Original Budget
Original Budget
Revised Budget
Actual
Quantity
Tenders awarded - 700 757 600
Quality
Addenda to tenders issued <20% 14% 31.7% 14%
Proportion of tenders lodged electronically - 50% 46.5% 70%
Procurement Review Board appeals upheld as a proportion of tenders awarded - 2% 1.25% 2%
Timeliness
Average days to issue tenders 7 7 4.9 7
Movements between 2008-09 Revised Budget and Actual
Addenda to tenders issued +53.8% Previously addenda were reported only on those tenders managed by CAPS. However, this has proved to be inaccurate due to the way data is recorded and did not reflect the overall situation. The 2008-09 actual reported is the total number of addenda issued compared to the total number of tenders issued. The 2009-10 estimate will need to be revised to align with this new approach.
Average days to issue tenders -2.1 The performance improvement is related to improved workflow and systems within CAPS.

Annual Report 2008-2009 :: 219
Ap
pen
dices
Information and Communications Technology Services
New measures added to 2008-09 Revised Budget
Remote communities connected to broadband Broadband is recognised as being an essential enabler to improve outcomes for remote Indigenous health, education and employment. Broadband availability is targeted for all 20 identified Territory townships and other larger remote communities.
Measures discontinued from 2008-09 Original BudgetAgency information technology support hours No longer considered a useful measure of performance. Hours are based on the number of resources assigned to supporting agencies. This number changes based on demand and availability and does reflect output service performance.
Performance Measures 2008-09 2009-10 Original Budget
Original Budget
Revised Budget
Actual
QuantityLaptops/workstations 11 700 12 500 12 697 12 500Average monthly user service calls to help desk 9 000 11 000 11 156 10 000Remote communities connected to broadband - 17 17 21QualityAgency scorecard for desktop services (out of 10) 7.5 7.7 8.8 7.8Outsourced services provided within agreed service levels 100% 85% 98% 87%Records management system availability 99% 99% 98% 99%TimelinessSevere desktop faults restored within the service level agreement 100% 100% 100% 100%Records management system work requests resolved within 2 days 100% 98% 98% 100%
Movements between Original and Revised Budget 2008-09Average monthly user service calls to help desk +2 000 Increase in helpdesk calls is primarily due to an increase in subscription numbers and some major ICT projects in the year.
Outsourced services provided within agreed service levels -15% The original estimate of 100% is the contracted performance target. In practice, it is usual for performance achievement to be within the 95 to 99% range. The 2008-09 estimate was revised down based on projected provider performances after considering outstanding disputes and their potential to affect service levels, combined with delays in some major projects.
Movements between 2008-09 Revised Budget and ActualAgency scorecard for desktop services (out of 10) +1.1 Actual achievement reflects better than expected project deliverables and alignment of service level measurements as part of contract governance.
Outsourced services provided within agreed service levels +13% Contractual disputes were resolved to the satisfaction of both parties and service level reductions were avoided. Expected effect on performance due to project delays was avoided by alignment of service levels and project timelines as part of contract governance.

220 :: Department of Business and Employment
Appendices
Office Leasing Management
New measures added to 2008-09 Revised Budget
Area of leased commercial property accredited for energy efficiency under NABERS 4 Star or better (m2)This measure provides a focus on energy efficiency to highlight property performance aligned to the Government’s emphasis on reducing energy consumption.
Measures discontinued from 2008-09 Original Budget
Percentage of leases renewed before expiry Replaced by a measure considered to be more appropriate in relation to reporting quality of performance - “Area of leased commercial property accredited for energy efficiency under NABERS 4 Star or better”.
Performance Measures 2008-09 2009-10 Original Budget
Original Budget
Revised Budget
Actual
Quantity
Property leases 148 170 183 195
Area leased (000m2) 172 183 187 200
Average cost per m2 $280 $274 $262 $285
Quality
Area of leased commercial property accredited for energy efficiency under NABERS 4 Star or better (m2)1 - 11 437 11 437 13 577
Timeliness
Rental payments made on time 99.8% 99.0% 99.0% 99.0%
1. NABERS is the Australian built environmental rating system, 4 Star is equivalent to Australian best practice.
Movements between Original and Revised Budget 2008-09
Property leases +22 Increased property leases related to additional accommodation requirements for health, community services and community safety initiatives, including programs funded under the Working Future initiative and the Australian Government intervention.
Movements between 2008-09 Revised Budget and Actual
Property leases +13 Increased property leases related to additional accommodation requirements for health, community services and community safety initiatives, including programs funded under the Working Future initiative and the Australian Government intervention.

Annual Report 2008-2009 :: 221
Ap
pen
dices
Business Development
Changes in measures between 2008-09 Original Budget and 2008-09 Revised BudgetThe output groups and outputs of the previous DBERD agency were reviewed following the formation of DBE. Output and structural changes were made within the business development and support functions to better reflect services to business and industry. This resulted in performance measures also being revised with a focus on reporting measures that demonstrate performance in delivery of output services. It was decided to move away from the broad capacity concept measurement to more readily identify and measure how the output assists and develops Northern Territory businesses.
Performance Measures 2008-09 2009-10 Original Budget
Original Budget
Revised Budget
Actual
QuantityLicence and business infrastructure services provided by Territory Business Centres - 100 000 120 463 100 000Economic reports and fact sheets issued - 35 54 35Industry and investment projects facilitated - 71 67 60Businesses and Industry Associations provided with financial assistance 150 100 222 100Research and Innovation grants 10 19 19 15QualityOctober Business Month participant satisfaction1 - 90% 94% 90%Upskills Workshops participant satisfaction1 - 96% 97% 96%TimelinessBusiness Growth applications assessed within 30 days - 100% 100% 100%
1. This measure is defined as the proportion of participant evaluation responses recording an above average or excellent rating.
Movements between Original and Revised Budget 2008-09Businesses and Industry Associations provided with financial assistance -50 The decrease reflects the transfer of Aboriginal Regional Development grants to the Department of Regional Development, Primary Industry, Fisheries and Resources.
Research and Innovation grants +9 The increase is due to a higher number of lower value research grants to be given in 2008-09.
Movements between 2008-09 Revised Budget and ActualLicence and business infrastructure services provided by Territory Business Centres +20 463The increase is reflective of the increase in business activity, additional businesses opening and increased tradespeople moving to the Territory. The 2009-10 original estimate will likely need to be revised accordingly.
Economic reports and fact sheets issued +19 Additional reporting in 2008-09 due to Global Financial Crisis and Small Business Ministerial Council.
Businesses and Industry Associations provided with financial assistance +122 Increased uptake of grant programs in regional areas. The 2009-10 original estimate will likely need to be revised accordingly.
222 :: Department of Business and Employment
Appendices
Employment
New measures added to 2008-09 Revised Budget
The employment function was transferred into the new Department of Business and Employment in early 2008-09. Output and structural changes were made to better reflect employment related functions. This resulted in performance measures also being revised with a focus on reporting measures that demonstrate performance in delivery of output services.
Workforce Growth NT/Skilled Migration database registrations - international and interstateNew function which includes international and interstate registrations actively managed by the Department and recorded in the Territory Worker database.
Employment programs developed and introduced Two new grant programs negotiated with the Australian Government - Indigenous Job Outcomes and Indigenous Workforce Development. This was previously a training oriented program only and now is employment focused.
Business and Skilled Migration visas for nominations and sponsorships certified Visa sponsorship applications associated with the Regional Certifying Body assessment process. Measure provides a reliable indicator of workloads and service delivery for this output.
Client satisfaction with employment programs New measure built into grants contracts with proponents to ensure outcomes are achieved.
Timeframes met as agreed Employment initiatives (including grants) and advice delivered within negotiated timeframes. Measure provides indication of service performance.

Annual Report 2008-2009 :: 223
Ap
pen
dices
Performance Measures 2008-09 2009-10 Original Budget
Original Budget
Revised Budget
Actual
Quantity
Workforce Growth NT / Skilled migration database registrations
- International - 550 543 550
- Interstate - 2 000 2 158 2 000
Employment programs developed and introduced1 - - - 2
Business and skilled migration visas for nominations and sponsorships certified - 870 1 340 850
Quality
Client satisfaction with employment programs1 - - - 80%
Timeliness
Timeframes met as agreed1 - - - 100%
1. New measure in 2009-10; data not available for 2008-09.
Movements between 2008-09 Revised Budget and Actual
Workforce Growth NT / Skilled Migration database registrations – Interstate +158 Increased marketing of the Territory Worker database interstate.
Business and Skilled Migration visas for nominations and sponsorships certified +470 General increase in applications across most visa subclasses consistent with trend across Australia. The 2009-10 original estimate will likely need to be revised.

224 :: Department of Business and Employment
Appendices
Data Centre Services
New measures added to 2008-09 Revised Budget
Unplanned outages per month – virtual server environment New measure added as more servers are moved from physical to virtual environment.
Terabytes of storage area network Replaced “Gigabytes of storage area network” to reflect the increasing size of storage.
Measures discontinued from 2008-09 Original Budget
Servers managed – mid-range services Renamed to “fully managed servers”.
Databases hosted – mid-range services Variation in size of individual databases makes measure less meaningful as an indicator of performance.
Gigabytes of storage area network Measure replaced with ‘Terabytes of storage area network’ due to the increasing size of storage.
Performance Measures 2008-09 2009-10 Original Budget
Original Budget
Revised Budget
Actual
QuantityBillable mainframe (CPU) seconds processed per month
1.65M 1.72M 1.65M 1.70M
Servers hosted in a secure Data Centre facility 440 440 440 440Fully managed servers 270 299 311 325Terabytes of Storage Area Network 35 51 75 65QualityUnplanned outages per month – mainframe services
- - 0.1 -
Unplanned outages per month – virtual server environment
- 3 3 3
TimelinessResponse time for mainframe services (<5 seconds)
98.5% 98.5% 98.3% 98.5%
Performance report for mid-range services provided to clients each month
<10 days <10 days <10 days <10 days
Movements between Original and Revised Budget 2008-09
Fully managed servers +29 Continued uptake of servers hosted in a virtual server environment.
Terabytes of Storage Area Network +16 Increased storage capacity due to demand growth.
Movements between 2008-09 Revised Budget and Actual
Fully managed servers +12 Actual uptake of servers hosted in a virtual server environment was greater than anticipated.
Terabytes of Storage Area Network +24 Increased capacity due to acquisition of a new storage area network.

Annual Report 2008-2009 :: 225
Ap
pen
dices
Government Printing Office
Performance Measures 2008-09 2009-10 Original Budget
Original Budget
Revised Budget
Actual
Quantity
Jobs undertaken 3 450 3 050 3 130 3 100
Proportion of printing sales outsourced 24% 25% 28.6% 25%
Quality
Jobs reworked <0.1% <0.1% 0.4% <0.1%
Timeliness
Quotes provided within required timeframes 99% 99% 99% 99%
Jobs completed within required timeframes 99% 99% 98% 99%
Movements between Original and Revised Budget 2008-09
Jobs undertaken -400 Demand for printed products diminished from original budget projection – the GPO has no control over demand.
Movements between 2008-09 Revised Budget and Actual
Jobs undertaken +80 Actual customer demand was higher than anticipated.
Proportion of printing sales outsourced +3.6% A higher number of print jobs required specialised printing capability that necessitated additional work being outsourced.
Jobs reworked -0.3% The volume of rework increased in 2008-09, although it remained well below the industry standard of <1% of sales.

226 :: Department of Business and Employment
Appendices
NT Fleet
New measures added to 2008-09 Revised Budget
Heavy vehicles managed This measure has been added to provide a more complete picture of the Government’s vehicle fleet.
Reduction in greenhouse gases produced per km travelled This measure supersedes four cylinder vehicles in fleet as it is deemed to be more representative of the Government’s strategy to reduce greenhouse gas emissions (measured in gm/km of CO2) by 20% over the next 5 years.
Vehicles available for auction within 36 days Vehicles retained and reallocated to meet agency program demands and retained longer to compensate for falling market values resulting in ageing fleet. Expected that replacement program will be ramped up over next twelve months.
This measure replaces “vehicles offered for sale within 45 days”. It records the time taken to prepare the vehicle for auction and is measured from the date the vehicle is de-allocated from the ageancy to the date the vehicle is made available to the auctioneer for public auction.
Measures discontinued from 2008-09 Original Budget
Four cylinder vehicles in fleet Measure was used as an indicator of improved fuel efficiency, however, this has been superseded by reduction in greenhouse gases which is deemed to be a more effective measure.
Vehicles offered for sale within 45 days Vehicles retained and reallocated to meet agency program demands and retained longer to compensate for falling market values resulting in aging fleet. Expected that replacement program will be ramped up over next twelve months.This measure has been replaced by “vehicles available for auction within 36 days”, which provides a more meaningful indication of NT Fleet performance. It measured the time taken from the date the vehicle was de-allocated from the agency to the day of its first appearance at public auction.

Annual Report 2008-2009 :: 227
Ap
pen
dices
Performance Measures 2008-09 2009-10 Original Budget
Original Budget
Revised Budget
Actual
Quantity
Light vehicles managed 2 485 2 695 2 680 2 700
Light vehicles disposed 920 830 851 1 050
Heavy vehicles managed - 650 639 650
Quality
Age profile of light vehicle fleet (proportion less than two years old)
80% 65% 66% 80%
Reduction in greenhouse gases produced per km travelled (gm/km of CO2)
1
- - - 5%
Timeliness
Vehicles available for auction within 36 days -95% 73% 73% 95%
1. New measure in 2009-10; data not available for 2008-09.
The measure has been reduced from 45 days to 36 days which has resulted in a lower estimate for 2008-09. Procedures have been put in place to ensure the new target of 95% is achieved for 2009-10.
Movements between Original and Revised Budget 2008-09
Light vehicles managed + 210 Growth due to expansion of Government demand, particularly initiatives such as in particular ‘A Working Future’ and the Australian Government Intervention program.
Light vehicles disposed -90 Replaced vehicles retained for reallocation to meet agency program needs.
Age profile of light vehicle fleet (proportion less than two years old) -15% Vehicles retained kept in service longer and reallocated to meet agency program needs and retained longer to compensate offset for falling market values. It is resulting in ageing fleet. Eexpected that replacement program will be ramped up over next twelve months.

228 :: Department of Business and Employment
Appendices
APPENDIX G
TERRITORY BUSINESS GROWTH PROGRAM
Regional Breakdown
Financial Year
2006-07 2007-08 2008-09
No. Funding $ No. Funding $ No. Funding $
Darwin 30 189 546 36 207518 69 304081
Alice Springs 2 6 817 13 69563 23 86507
Tennant Creek 2 12 690 4 19 095 5 21 901
Katherine 1 4 075 2 10 227 8 51990
Nhulunbuy 0 0 2 13 909 6 38 455
TOTAL 35 213 128 57 320 312 111 502934
TERRITORY BUSINESS CENTRE STATISTICS 2008-09
TOTAL JUL AUG SEP OCT NOV DEC JAN FEB MAR APR MAY JUN
Darwin 97673 8228 7705 9004 8658 9202 7072 7225 7741 8180 8226 8444 7988
Alice Springs 12291 1026 1116 1241 810 996 886 664 1002 998 1160 1190 1202
Katherine 7552 630 604 784 878 337 438 601 679 616 750 588 647
Tennant Creek 2630 196 20 293 376 213 186 224 192 286 262 172 210
TOTAL 120146 10080 9445 11322 10722 10748 8582 8714 9614 10080 10398 10394 10047

Annual Report 2008-2009 :: 229
Ap
pen
dices
APPENDIX H
RESEARCH AND INNOVATION GRANTS AWARDED 2008
For year ending 30 June 2009
Project Title Funding $
Dr Naor Bar Zeev, MSHR – Respiratory illness among Aboriginal children 25 000
Dr Guy Boggs, CDU – Using Remote Sensing to monitor wetland health in the Barkly Basin 35 000
Dr Matt Brearley, NT Institute of Sport – Physiological analysis of athletes competing in the tropics and development of practical cooling methods 10 000
Assoc Prof Dean Carson, CDU – Demographic modelling and policy reappraisal: cyclone damage mitigation in Darwin 7 000
Prof Keith Christian, CDU – Freshwater crocodiles: model organisms for studying perturbations of natural populations 35 000
Dr Iain Field, CDU – Assessing the benefits of removing feral pigs from tropical landscapes 7 000
Assoc Prof Karen Gibb, CDU – Microbiology of marine sponges in a high nutrient environment 15 000
Dr Chris Glasby, NRETAS – Remediation of aquaculture ponds using the bloodworm polychaete Marphysa 7 000
Dr Lindsay Hutley, CDU – Impacts of plantation forestry and land clearing in the Daly catchment 45 000
Dr Mirjam Kaestli, Prof Bart Currie, MSHR – The microhabitat of the melioidosis bacterium Burkholderia pseudomallei in Darwin 5 000
Dr Samantha Setterfield, CDU – Exotic Grass 45 000
Dr Therese Kearns, MSHR – Beating Scabies and Strongyloides in Community 46 000
Prof David Parry, CDU – Ecotoxicology methods for Australian tropical marine species 46 000
Dr Martin Young, CDU – Gambling venues, accessibility and social harm in northern Australia 22 000
Mr John Trott – Ozylift Shovel clamp on handle 8 000
Mr Angus Cameron – Nomad Art Productions: Evolution: Genus Origins and Ancestors celebrating 200th anniversary of birth of Charles Darwin 8 000
Mr Richard Weinmann – Development of a low cost plant health imaging system 5 000
Mr Paul Greville, Greville Aluminium Fabrication – Curved Trench Grates system 9 000
Mr Roger Chapman – Road Transformer 11 000
TOTAL 391 000

230 :: Department of Business and Employment
Appendices
APPENDIX I
GRANT PAYMENTS
For year ending 30 June 2009
Industry Development Support Program Cost ($)
Australian Hotels Association - NT 60 000
Australian Industry Defence Network - NT Inc. 137 000
Business Enterprise Centre (Darwin Region) Inc. 165 000
Clubs NT Inc. 45 000
Film and Television Association of the NT Inc. 8 000
International Business Council 157 000
Manufactors Council 88 000
Motor Trades Association (NT) Inc. 58 000
Northern Territory Industry Capability Network 959 950
Welding Technology Institute of Australia 45 000
TOTAL EXPENDITURE 1 722 950
Industry Development Grants Cost ($)
Centre Bush Bus Pty Ltd 270 000
Northern Territory Seafood Council 15 960
Northern Territory Industry Capability Network 200 000
Tiwi Land Council 36 000
Tourism Top End 25 000
TOTAL EXPENDITURE 546 960
Business Growth Cost ($)
Agentur 2 727
AKS Welding and Fabrication 5 241
Alice Paint & Panel Pty Ltd 3 636
Alice Springs Paint Supplies 3 636
All Pro Constructions 9 000
All Rural Mechanical 4 000
Arafura Sailing Adventures 1 773
Arafura Sea Charters 2 727
Araluen Plumbing 3 636
Athanasios Athanasiou Pty Ltd 7 727
Attitude for Men 2 727
Auslink Pty Ltd 2 727
Aussie Move International 3 636
Australian Blue Cypress Oil Pty Ltd 2 727
Australian Outback Pest Company 2 727

Annual Report 2008-2009 :: 231
Ap
pen
dices
Business Growth (Continued) Cost ($)
Avant Personnel Pty Ltd 1 280
Barkly All Trades Pty Ltd 1 839
Barkly Hardware & Gas 5 475
Bennett Design 3 636
BHE Pty Ltd 3 636
Big ‘O’ Pty Ltd 7 386
Blkmgk ICT 2 727
Bowden McCormack Lawyers and Advisers 3 636
Broadsword Marine Contractors Pty Ltd 3 636
C & S Refridgeration and Air Conditioning Pty Ltd 13 044
Cantila Pty Ltd 5 000
Carcom Installations Pty Limited 1 580
Central Communications (Alice Springs) Pty Ltd 3 636
Coach Charters Australia 10 636
Coaching Mentoring and Training Services 3 000
Crab Claw Island Pty Ltd 2 810
Darren’s Northern Territory Barra Safaris 3 318
Darwin Economy Kitchens Pty Ltd 9 091
Davies Metal Works Pty Ltd 1 212
Deltareef Pty Ltd 10 320
Duke of Edinburgh’s Award in Australia Northern Territory Division Inc 2 727
DXH Electrical Pty Ltd 2 727
Eagle Training Services NT 5 000
Earl James & Associates 8 636
Earthbuilt Pty Ltd 3 636
EASA Inc 3 636
Fannie Bay Physiotherapy 3 636
Fishing Tropical Australia 9 091
Gallery Gondwana 3 636
Garrett Homes Pty Ltd 3 636
Good Luck Shop 2 727
Gove Pharmacy 5 000
GRT Australia Pty Ltd 5 475
Healthy Outlook 2 727
IM Concepts 2 727
Indo Pacific Marine 900
Jalyn NT Pty Ltd 4 545
JC Electrical Security Pty Ltd 3 636
John Bedwell Management 4 364
Karen Sheldon Catering Pty Ltd 2 727

232 :: Department of Business and Employment
Appendices
Business Growth (Continued) Cost ($)
Katherine Aviation Pty Ltd 13 591
Katherine Country Club Incorporated 4 245
Katherine Doors and Windows 4 364
Keller’s 3 636
Kosmos Foods Pty Ltd 3 636
Laudatory Nominees Pty Ltd 3 636
Leading Edge Computers Tennant Creek 5 475
Leaping Lizards Gallery 3 636
Lisanote Pty Ltd 4 727
Master Tech Automotive Pty Ltd 3 636
McKenna Constructions Pty Ltd 2 727
Mengel’s Heli Services Pty Ltd 2 727
Milkwood Steiner School 3 182
Nautical Supplies Pty Ltd 11 136
Nightcliff Builders Holdings Pty Ltd 2 727
Nomad Art Productions 3 636
Northern Power Services Pty Ltd 2 727
Northern Profile Services Pty Ltd 2 727
Northern Territory Seafood Council Incorporated 3 636
Northern Territory Trades & Labour Council Incorporated 7 182
NT Recycling Solutions 9 000
NT Scaffolds Pty Ltd 5 000
Ogden Electrical 3 636
OGMSA Oil, Gas & Mining Services Australia 7 250
Palmerston Bakery 3 636
Palmerston Clothing 3 636
Penny Farthing Avanti Plus 3 636
Peterkin Davis Pty Ltd 3 636
Pets Eternal Tranquillity 2 045
Phais Pty Ltd 3 636
Phillips Earthmoving Pty Ltd 3 636
Pine Creek Hotel 14 636
Pine Creek Service Station 3 636
Precision Honda 3 636
PTM Homes 3 636
Ray White Central Northern Territory 12 727
Relational Data Systems 14 136
Remote Area Services Pty Ltd 3 636
RSPCA Central Australia 2 727
Satellite City Motor Trimmers and Canvas Works 3 636
Security & Technology Services 3 636

Annual Report 2008-2009 :: 233
Ap
pen
dices
Business Growth (Continued) Cost ($)
Shady Lane Tourist Park 4 245
Sterling Property Services Pty Ltd 3 636
Subway Mt Gillen 2 727
Territory Hirex 3 636
Territory Loans Pty Ltd 3 636
The Darwin Sailing Club Incorporated 9 091
Top End Pest Control 3 636
Top End Physiotherapy & Sports Injury Clinic Pty Ltd 2 727
Top End Upholsters & Motor Trimmers 3 636
Treehaven Pty Ltd t/as Territory Building Certifiers 4 000
Tropical Computers 3 636
Tropical Test and Tag 2 727
True Blue Angels Pty Ltd 3 575
Universal Engineering 4 091
Ward Keller 3 400
TOTAL EXPENDITURE 502 911
Trade Support Scheme Cost ($)
ABTS -Australia Business Training & Support 863
ACIL Tasman Pty Ltd 827
AL Logistics Pty Ltd 3 553
Alice Springs Helicopters 3 284
All Round Supplies 808
Anangu WAAI 5 944
Bamurru Plains 9 610
Batji Tours 2 250
Birds Australia 2 129
Bluescope Distribution 2 282
Bond Springs Outback Retreat 7 313
Bridge Toyota 3 017
Buku Larrnggay Mulka Incorporated 3 708
Capiteq Pty Ltd 3 131
Clark Oldfield Services Pty Ltd 4 078
CSA Global Pty Ltd 9 931
Dataline Visual Link Pty Ltd 1 953
Davidson’s Arnhemland Safaris Pty Ltd 5 880
Duprada Performing Arts Association 15 344
Emily Kngwarreye 36 142
Emmerson Resources Ltd 5 632
Energy Metals Limited 4 236

234 :: Department of Business and Employment
Appendices
Trade Support Scheme (Continued) Cost ($)
Everest Enterprises Pty Ltd - Transhose (NT) 7 633
Flagonwheel Music 5 404
Gurrumul Yunupingu 8 402
Hercules Offshore Lifting Gear Pty Ltd 9 488
Industries Services Training 6 164
International Business Council 8 491
ITW Buildex 2 268
J Blackwood & Son Ltd 8 883
Jongs Upholstery & Canvas Pty Ltd 1 050
JVC Investments Pty Ltd 10 253
Kakadu Culture Camp 15 917
Leithen Valley Trophy Hunts 6 055
Linetec Engineering Pty Ltd 5 895
Lords Kakadu & Arnhemland Safaris 4 051
Maningrida Arts and Culture 4 687
Nedrill Blasting Contractors Pty Ltd 11 477
Nitmiluk Tours Pty Ltd 5 000
Northern Territory Cattlemen’s Association Inc 5 415
Northern Territory Livestock Exporters Association Inc 21 106
Northern Territory Outback Safaris 5 000
NT Immersions Pty Ltd 4 209
Northern Territory Resources Council 4 343
NT Tyre Service 1 753
OGM Engineering 2 225
Outback Ballooning Pty Ltd 7 967
Outback Private Tours 14 244
Outstation Art From Art Centres 1 569
Travellers Auto Barn 1 847
Professional Helicopter Services 3 428
Proto Resources & Investments 4 111
Safaritrek Intl.Leisure Group (Aust) Pty Ltd 6 429
Skinnyfish Music 9 057
Skycity Darwin Pty Ltd 8 192
Shadetech 4 351
Territory Uranium Company Limited 6 415
Locker Group Pty Ltd 2 490
The Shade and Canvas Company Pty Ltd 5 972
Thoroughbred Racing NT Incorporated 3 291
Thrifty Northern Territory 4 599
Tingari Arts 12 147
TNG Limited 17 019
Travel North Group of Companies 1 205

Annual Report 2008-2009 :: 235
Ap
pen
dices
Trade Support Scheme (Continued) Cost ($)
Tropical Plant Brokers 3 143
Truscott Mining Corporation Limited 2 390
Voyages Hotels and Resorts Pty Ltd 3 428
Warlukurlangu Artists Aboriginal Corporation 12 588
Wayoutback Desert Safaris 13 029
Wilderness 4WD Adventures 12 178
Wordfly 1 561
TOTAL EXPENDITURE 459 734
Sponsorship Cost ($)
Australian Hotels Association - NT Branch 10 000
Australian Industry & Defence Network NT 5 000
Australian Institute of Company Directors 5 000
Australian Institute of Project Management 4 000
Chamber of Commerce Northern Territory 12 000
Charles Darwin University 600
Engineers Australia - Northern Division 5 000
Legacy Club of the NT 1 000
Northern Territory Young Achiever Awards 9 000
Palmerston Regional Business Association Inc 35 000
Rural Area Business Group 6 000
Territory Construction Association Inc 10 000
TOTAL EXPENDITURE 102 600
ecoBiz NT Cost ($)
AA & GM Whitehouse Pty Ltd 30 000
Australian Barramundi Culture Pty Ltd 30 000
Banyan View Lodge 30 000
Crossways Hotel 26 931
Darwin Crash Repairs Pty Ltd 13 526
Galaxy Gold Pty Ltd 8 125
Katherine Camping and Fishing 17 393
Katherine Club Inc 17 403
Katherine Hotel 13 382
Katherine Sports & Recreation Club Inc 19 723
Knotts Crossing Resort 17 640
P & M Investments (NT) Pty Ltd 18 135
R & B Dawson Pty Ltd 7 047
R.Buzzo Nominees Pty Ltd 17 600
Randazzo C & G Holdings Pty Ltd 28 799
Territory Construction Association Inc 15 000
Town and Country Butchers 4 261
TOTAL EXPENDITURE 314 965

236 :: Department of Business and Employment
Appendices
APPENDIX J
INDUSTRY ASSISTANCE, GRANTS AND SPONSORSHIP
For year ending 30 June 2009
Program 2007-08 2008-09
Number of businesses
Cost $’000s
Number of businesses
Actual expenses
Committed but not drawn
$’000s
Industry Association Grants (IDSP) 8 1 214 10 1 723 Nil
Industry Development Grants 6 696 5 547 20
Business Growth 57 320 111 503 103
Sponsorship 10 124 12 103 28
Trade Support Scheme 42 292 71 460 50
ecoBiz NT Nil Nil 17 315 17
TOTAL 123 2 646 226 3 651 218

Annual Report 2008-2009 :: 237
Ap
pen
dices
APPENDIX K
LOANS PORTFOLIO
At 30 June 2009, the portfolio compromised 10 loans with outstanding balances totalling $493 413.
Categories Cost ($)
BTEC – 1 loan 109 562
Natural Disaster Relief (1998 Katherine Flood) – 5 loans 170 622
Natural Disaster Relief (2006 Katherine & region flooding) – 2 loans 100 300
Natural Disaster Relief (Cyclone Ingrid) – 2 loans 112 929
TOTAL 493 413

238 :: Department of Business and Employment
Appendices
APPENDIX L
GIFTED AND LOANED VEHICLES
For the period 1 July 2008 to 30 June 2009
Gifted and Loaned Vehicles Cost ($)
Gifted Vehicles
NT Softball Association 5 178
Yothu Yindi Foundation 9 171
Julallikari Council 29 091
Pensioners Workshop Association 13 129
Darwin Toy Library 23 000
Sunrise Health Service 34 000
Metal Health Association of Central Australia 17 000
Larrakeyah Nation 17 000
Neighbourhood Watch 6 937
NPY Women’s Council 34 000
Dundee Progress Association 32 000
St John’s Ambulance 14 000
Bawinanga 29 000
Step Out Community 27 000
Sommerville Community Services 10 500
Blue Bush Community (Trailer) 1
Drovers Volunteer Services 21 000
Ilpurla Aboriginal Corporation 28 000
SUB TOTAL 350 007
Gifted and Loaned Vehicles Cost ($)
Loan Vehicles
Darwin Rugby League 2 686
Darwin Festival 21 559
Yothu Yindi Foundation 50 913
Indigenous Music Awards 2 801
Arts Festival 9 007
Bass In The Dust 1823
Boxing NT 2 180
Table Tennis Association 897
Anaconda Mountain Bike Endruo 3 085
NT Writers Festival 3 193
Humpty Doo Scouts 2 459
Fred Pass Show 667
Yothu Yindi – Wellbeing Project 3 277
Finke Desert Race 18 578
Sids and Kids 1 808
Greek Orthodox 14 937
SUB TOTAL 139 869
TOTAL 489 876

Annual Report 2008-2009 :: 239
Ap
pen
dices
APPENDIX M
CURRENT INDUSTRY PARTICIPATION PLANS
As at 30 June 2009
Northern Territory Government Assisted Project Commencement Date
Estimated Project value
$million
ENI Blacktip JV 2007 600
Darwin Helium Plant 2008 33
APT Bonaparte Gas Pipeline 2008 130
Jetstar Airlines Darwin Hub 2008 8
SIHIP New Future Alliance 2009 211
SIHIP – Territory Alliance – Tiwi Islands Package 1 2009 20
SIHIP – Earth Connect Alliance – Groote Island Package 2009 28
SUB TOTAL 1030
Northern Territory Government Project Commencement Date
Estimated Project value
$million
PWC – Vegetation Management 2008 5
Darwin Hospital Oncology Unit 2008 10
Archer Zone Substation 2008 7
NT Netball Centre 2008 5
Fort Hill Demolition 2008 7
NTPFES Digital radio Network 2008 13
PWC – Lovegrove Substation and Owen Springs Switch Yard 2008 13
Rosebery Pre Primary and Middle Schools 2009 59
PWC – Asset and GIS Management Solution 2009 5
Alice Springs Correctional Centre Stage 2 2009 6
Darwin Business Park South and Stage 1 North 2009 15
Palmerston Super Clinic 2009 12
Johnston Subdivision Stage 1 Headworks 2009 10
Bellamack Subdivision 2009 11
PWC – Supply & Deliver HV and MV Cables 2009 10
PWC – All Centres Supply of New Apprentices 2009 5
SUB TOTAL 434
TOTAL 1464
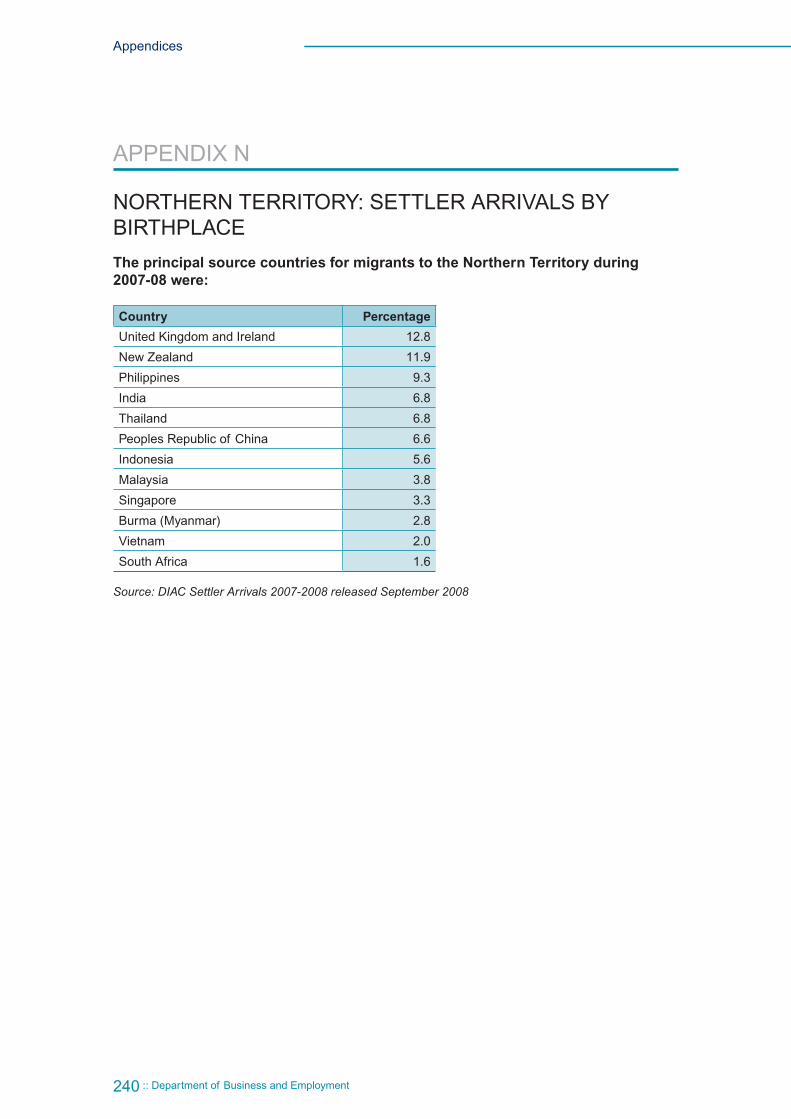
240 :: Department of Business and Employment
Appendices
APPENDIX N
NORTHERN TERRITORY: SETTLER ARRIVALS BY BIRTHPLACE
The principal source countries for migrants to the Northern Territory during 2007-08 were:
Country Percentage
United Kingdom and Ireland 12.8
New Zealand 11.9
Philippines 9.3
India 6.8
Thailand 6.8
Peoples Republic of China 6.6
Indonesia 5.6
Malaysia 3.8
Singapore 3.3
Burma (Myanmar) 2.8
Vietnam 2.0
South Africa 1.6
Source: DIAC Settler Arrivals 2007-2008 released September 2008

Annual Report 2008-2009 :: 241
Ap
pen
dices
APPENDIX O
ACCOMMODATION COSTS FOR NON-GOVERNMENT ORGANISATIONSFor the period 1 July 2008 to 30 June 2009
Non-Government Organisation Building Cost ($)Amateur Fishing Association of the NT Malak Shopping Centre 35 075Association of Independent Schools of the Northern Territory
Darwin Central 20 064
Asthma Foundation Eurilpa House, Alice Springs 4 355Australia Day Council Darwin Central 20 064Australian Association of Young People In Care Casuarina Plaza 9 150Bushfires Council Lot 1718/19 Albatross Street,
Winnellie103 591
Camp Quality Lot 521 Pavonia Place, Nightcliff 38 088Cancer Council 44 Bath Street, Alice Springs 27 360Cancer Council Casi House, Casuarina 51 000Cancer Council Randazzo Centre, Katherine 13 725Child Birth Education Casuarina Plaza 6 710Childrens’ Services Support Program Eurilpa House Alice Springs 31 936Deaf Association Casuarina Plaza 14 366Downs Syndrome Association Rapid Creek Shopping Centre 16 905Duke of Edinburgh Award Berrimah Star Centre 70 440Environmental Hub Rapid Creek Shopping Centre 38 010Family Planning Association Eurilpa House, Alice Springs 13 998Gagadju Association Government Centre, Jabiru 16 385Genealogy Society Cavenagh Court, Darwin 43 810Good Beginnings Randazzo Centre, Katherine 27 450Greening Australia and CLMA Leichhardt Building, Alice Springs 32 913GROW Casuarina Plaza 18 300Health Connections Government Centre, Katherine 35 482Heart Foundation Darwin Central 40 283Keep Australia Beautiful Council Stuart Park Shopping Centre 38 656Kidsafe NT and SIDS Rapid Creek Shopping Centre 22 853Lerrluk Indigenous Housing Advisory Service Government Centre, Katherine 14 549L’here Artepe Aboriginal Corporation Leichhardt Building, Alice Springs 32 807Mental Health Association of Central Australia Hansen House, Alice Springs 20 799Multicultural Community Services of Central Australia
20 Parsons Street, Alice Springs 12 020
Multicultural Council NT and Multilingual Broadcasting Council NT
Malak Shopping Centre 69 584
Pensioners’ Workshop 48 Albatross Street, Winnellie 23 008Radio Larrakia Greek Community Centre, Nightcliff 15 582Red Cross Casuarina Recreation Centre 73 219Territory Business Council Randazzo Centre, Katherine 40 870Training Advisory Council Darwin Plaza 62 700Training Advisory Council Winlow House, Darwin 137 424Various Arts Organisations Warehouse Tiger Place, Winnellie 32 196Various Community Arts and Craft Groups 96 Winnellie Road, Winnellie 163 429Victims of Crime NT La Grande, Darwin 42 228YWCA Satepak House, Palmerston 72 468YWCA Highway House, Palmerston 32 870
TOTAL 1 626 722