Annual Report - CMG Mutual Funds€¦ · annual report april 30, 2017 cmg mauldin solutions core...
58
Annual Report April 30, 2017 CMG MAULDIN SOLUTIONS CORE FUND (FORMERLY CMG GLOBAL EQUITY FUND) CLASS ASHARES – GEFAX CLASS ISHARES – GEFIX CMG TACTICAL BOND FUND CLASS ASHARES – CHYAX CLASS ISHARES ‐ CHYOX CMG GLOBAL MACRO STRATEGY FUND CLASS ASHARES – PEGAX CLASS ISHARES – PEGMX CMG TACTICAL ALL ASSET STRATEGY FUND CLASS ASHARES – CMGQX CLASS ISHARES ‐ CMGHX 1‐866‐CMG‐9456 www.cmgmutualfunds.com This report and the financial statements contained herein are submitted for the general information of shareholders and are not authorized for distribution to prospective investors unless preceded or accompanied by an effective prospectus. Nothing herein contained is to be considered an offer of sale or solicitation of an offer to buy shares of CMG Funds. Such offering is made only by prospectus, which includes details as to offering price and other material information. Distributed by Northern Lights Distributors, LLC Member FINRA
Transcript of Annual Report - CMG Mutual Funds€¦ · annual report april 30, 2017 cmg mauldin solutions core...

Annual Report
April 30, 2017
CMG MAULDIN SOLUTIONS CORE FUND (FORMERLY CMG GLOBAL EQUITY FUND)
CLASS A SHARES – GEFAX CLASS I SHARES – GEFIX
CMG TACTICAL BOND FUND
CLASS A SHARES – CHYAX CLASS I SHARES ‐ CHYOX
CMG GLOBAL MACRO STRATEGY FUND
CLASS A SHARES – PEGAX CLASS I SHARES – PEGMX
CMG TACTICAL ALL ASSET STRATEGY FUND
CLASS A SHARES – CMGQX CLASS I SHARES ‐ CMGHX
1‐866‐CMG‐9456 www.cmgmutualfunds.com
This report and the financial statements contained herein are submitted for the general information of shareholders and are not authorized for distribution to prospective investors unless preceded or accompanied by an effective prospectus. Nothing herein contained is to be considered an offer of sale or solicitation of an offer to buy shares of CMG Funds. Such offering is made only by prospectus, which includes details as to offering price and other material information.
Distributed by Northern Lights Distributors, LLC Member FINRA

Dear Shareholder,
The purpose of this letter is to review performance, provide a comparison of performance vs. appropriate benchmarks,and discuss our outlook for the CMG Mauldin Solutions Core Fund (formerly the CMG Global Equity Fund), the CMG GlobalMacro Strategy Fund, the CMG Tactical All Asset Strategy Fund and the CMG Tactical Bond Fund.
CMG Mauldin Solutions Core Fund (formerly the CMG Global Equity Fund)
The Fund returned +2.50% (Class A Shares) and +2.78% (Class I Shares) over the past year (April 30, 2016 through April 30,2017), net of fees. The Morningstar World Stock Category, the Fund’s peer group, returned +14.34% over the past year(April 30, 2016 through April 30, 2017). The benchmark for the Fund, the MSCI All Country World Index, returned +15.77%over the past year (April 30, 2016 through April 30, 2017).
The Fund was fully invested in equities for the past year and the active volatility management strategy as implemented byAlphaSimplex was hedged in the first half of 2016. For most of 2016, stocks were choppy until a positive post-electionsentiment drove markets to new record highs. Over the past year, the Fund’s equity holdings were impacted by severalfactors, namely the surge in the value of the dollar in the second half of 2016 and the volatility surrounding internationalequity holdings. Through most of 2016, international stocks outperformed domestic stocks albeit with emerging marketsunderperforming developed countries.
The Fund’s stock selection process attempts to focus on strong earnings growth, return on equity, solid cash flows andbalance sheets. This process biases the portfolio to quality companies, most of which are in developed countries. In June2016, the Fund made several changes in the portfolio, a summary of which is provided below along with the percentageof the portfolio each holding represents as of April 30, 2017. (The following portfolio holdings are subject to change atany time and should not be considered investment advice.)
Added to the portfolio:
Healthcare Services Group (2.35%) Accenture PLC (1.87%) Tractor Supply Company (1.90%)
Removed from the portfolio:
Capital One Financial Corp. Microsoft Corp. Oracle Corp. Rotork PLC The Buckle Inc.
Investors searching for outsized returns drove market momentum in emerging markets. Additionally, the Brexit votefurther put the future of the European Union in doubt, leaving a cloud of European equities where the Fund had exposureof approximately 30% for most of the past year. Although the equity portfolio withstood drawdowns better than thebroader markets, it struggled to keep pace in capturing upside.
After the US election in November, domestic equities outpaced international equities as investor sentiment boostedstocks; in particular, small caps were seen to benefit on a relative basis versus multinationals due to the protectionistrhetoric of then-candidate Trump. The equity portfolio did not have large exposure to small cap stocks as they typically
1

do not screen well in the stock selection process. Finally, the surge in the dollar was a contributing factor to the Fund’sunderperformance in the second half of 2016. As the specter of an interest rate hike by the Fed hung over the market formost of the year, the resulting stronger dollar impacted internationally listed stocks in the portfolio.
The active volatility management strategy, as implemented by AlphaSimplex, the sub-advisor to the Fund, was hedged inearly 2016, and then steadily reduced exposure before moving to a neutral position and finally going long during thesecond half of 2016. While US equity downside market volatility declined to moderate levels early in the third quarter of2016, downside market volatility remained elevated for longer in international and emerging markets causing the Fund tostay modestly hedged for longer. Once volatility readings declined, the sub-advisor equitized long exposure by establishinga long futures position.
At the December 2016 Board meeting, the Advisor proposed a change of sub-advisor and strategy that was approved andthe Advisor transitioned to a new strategy on March 10, 2017. The Fund’s investment objective was changed and MauldinSolutions, LLC was appointed as sub-advisor to the Fund.
CMG Global Macro Strategy Fund
The Fund returned +2.90% (Class A Shares) and +3.24% (Class I Shares) over the past year (April 30, 2016 through April30, 2017), net of fees. The Morningstar Multialternative Category, the Fund’s peer group, returned +3.83% over the pastyear (April 30, 2016 through April 30, 2017). The benchmark for the Fund, the Credit Suisse Managed Futures Index,returned -9.35% over the past year (April 30, 2016 through April 30, 2017).
Over the past year, the Fund has oscillated from periods of strong outperformance to periods of underperformance withchanges in macroeconomic trends impacting the FX and bond positions in the portfolio most significantly. Over the pastyear, the decoupling of global monetary policy, in particular, the Fed’s tightening of policy by raising interest rates, hasbeen the primary driver of volatility and performance for the portfolio. The U.S. emerged as the first developed economyto implement tighter monetary policy and has hence diverged from the EU and Japan which continue to stimulate througha combination of low interest rates and asset purchase programs. The result has been a strong rally in the dollar over thepast year as global investors seek higher yields in the U.S. However, this process has not been linear as the Fed has beenvery deliberate about the pace of tightening, at times putting off rate hikes when markets expected them. Bonds andcurrencies have reacted accordingly, and the subsequent volatility helped generate gains for the Fund in one quarter anddrive underperformance the next. Specifically, the second quarter was positive for the Fund, the third quarter wasnegative for the Fund and during the fourth quarter of 2016, the Fund significantly outperformed as all three sub-strategiesperformed well. The environment has been challenging to say the least. A summary of performance and positioning forthe sub-strategies for the Fund, the FX, equity and bond strategies, are provided below.
FX Strategy: The primary factors that drove portfolio positioning over the past year were (1) rate differentials, wherecountries with higher rates are more attractive; (2) the short end of the yield curve, where countries with steeper yieldcurves, between 1 and 12 months, are more attractive; (3) capital flows, where countries with better performing equitymarkets are more attractive; (4) commodity prices, where countries with less exposure are slightly more attractive. Thishas translated into positioning that was primarily long the U.S dollar, short European currencies and to a lesser extent, thecommodity currencies, such as the Australian and Canadian dollars in mid-2016. Later in the year and in 2017, thepositioning in the FX Strategy was primarily long the U.S. dollar and short the Japanese yen and European currencies.
2
Bond Strategy: The Global Bond Strategy typically moves positions more tactically than the FX and equity models and as aresult, the bond positioning in the portfolio changed frequently over the past year. Prior to the election last year, acombination of factors drove bond positioning; namely, the short-term rates, short end of the yield curve, cross assetprice, and sentiment factors. During the Brexit vote, the strategy benefited from net long bond price exposure, particularlyin European positions where the UK Gilt, the French Oat and the German Bund made significant positive performancecontributions. However, as concerns over the immediate impact of Brexit waned, European bonds sold off leading to amodest decline in the performance during the third quarter when yields began to climb globally. After the U.S. PresidentialElection, global yields continued to rise sharply and volatility in global yields hit a 12 month high. The strategy waspositioned well for this market reaction, generating strong performance during the quarter and during the month ofNovember in particular. Two driving factors, the cross asset price relationship and long end of the yield curve, dominatedthe fixed income forecast throughout November. Both drivers were largely net short bond price, long yield. The strategyprofited during the period by forecasting the volatile back-and-forth price action through increased reliability of the crossasset price relationships factor. This driver is technically oriented, with an average holding period of two weeks. By theend of November, the cross asset price relationship factor became the lead driver of the Global Bond Strategy, contributingover 60% to the overall forecast. At the start of the New Year, the cross asset price relationship factor continued to drivepositioning with an 85% factor significance weight. The bond strategy entered January looking for volatility, which failedto materialize. Performance waned during the month as confidence in the cross asset price relationship factor started todeteriorate in favor of the long end of the yield curve factor. As the strategy processed new data during the first fourmonths of the year, leverage remained low and the bond strategy was primarily positioned long the Canadian 10-YearBond, the U.S. 10-Year Bond, and the U.K. Gilt, with short exposures to the Italian 10-Year Bond, the French Oat, and theGerman Bund.
Equity Strategy: The trend in global equities was higher over the past year with U.S. markets setting a series of record newhighs for most major indices. However, Brexit and the U.S. Presidential Election were two significant events that impactedfactors driving positioning and the equity strategy’s returns. In mid-2016, interest rate and risk factors remained neutral;while capital flow factors stayed mildly bearish. This translated into positioning where the strategy held short positions inthe U.S., the U.K. and China. Post-Brexit, equity markets settled back into trading ranges, with Australia and the U.K. upslightly while the U.S., Germany, Japan, and China were down slightly. The capital flows factor moved to a neutral positionand while sentiment and yield factors improved, the portfolio was fairly neutral, resulting in positioning that was neutralJapan, the U.K., and Australia, with small short positions in Germany and the U.S. Post-election, most equity markets rallied,breaking the trading ranges that had persisted for several months. Interest rate shifts, sentiment shifts, and supply demandchanges ended the neutral outlook of our pre-election forecasts. Although interest rate changes had little effect on themodels, the sentiment and capital flows factors turned bullish in the U.S., Japan, China, and Australia. In particular, thestrength in small cap stocks and firmness in credit strengthened the sentiment factor, while the robust performance ofadvancing vs. declining stocks, new highs and upside volume moved the capital flows factor to bullish in many markets. Tostart 2017, global equity markets largely consolidated their November and December gains. As is typical in mid to late stagebull markets, the capital flows factor was the dominant factor early in the year and through most of the first quarter. Formost of the quarter, the strategy was positioned long U.S., Chinese, Japanese and Australian equities, with short positions inthe U.K. and Germany.
In April, the Board of Trustees determined based on the recommendation of the Advisor that it is in the best interests of theFund and its shareholders that the Fund cease operations. The Board approved a plan of liquidation and has determined toclose the Fund and redeem all outstanding shares on May 26, 2017.
CMG Tactical All Asset Strategy Fund
The Fund returned +4.00% (Class A Shares) and +4.29% (Class I Shares) over the past year (April 30, 2016 through April 30,2017), net of fees. The Morningstar Multialternative Category, the Fund’s peer group, returned +3.83% over the past year
3

(April 30, 2016 through April 30, 2017). The benchmark for the Fund, the Morningstar Moderate Target Risk TR Index,returned +10.51% over the past year (April 30, 2016 through April 30, 2017).
The Fund commenced operations last year in May and maintained a balanced risk allocation, split 50/50 between equityand fixed income positions, during the second quarter of 2016. International equities, emerging market bonds andprecious metals positions contributed to positive performance during this period while investments in real estate andutilities detracted. Prior to the Brexit vote, the Fund was in a balanced asset allocation but after the short-term volatilityfollowing the vote, the portfolio increased its exposure to equities, rotating out of fixed income positions and intotechnology, telecommunications, international and emerging equities. The Fund remained in an aggressive equity-oriented position for most of the summer but reduced exposure heading into October, rotating into fixed income positionsas uncertainty regarding the U.S. election increased volatility and dampened the equity market outlook. However, afterthe surprise outcome of the election, equity markets rallied into year end and the Fund quickly migrated to higher betaequity positions. The Fund moved out of long duration and emerging market bonds and into broad based emerging marketpositions, information technology and U.S. regional banks. The Fund maintained a high equity allocation for the balanceof the year, averaging close to 80% equity exposure for the fourth quarter. Its equity allocation peaked in December whenthe Fund had only one fixed income position with the balance of the portfolio exposed to diversified equity positions. TheFund remained in an aggressive risk position for the entire first quarter of 2017, maintaining over 80% equity exposure.Primary drivers of performance were small caps, regional banks, technology and several positions in international equities,specifically emerging markets. Historically, during Fed rate tightening cycles, international equities have performed well,in many cases outperforming U.S. equity markets. We were pleased that the relative strength process correctly identifiedthese trends in late 2016 and early 2017. After a strong bull market run in the first quarter, the Fund rotated into abalanced position by the end of April, holding close to a 50/50 split between equity and fixed income positions. A heatmap showing portfolio exposure by asset class is provided below.
Portfolio allocations are subject to change at any time.
4

CMG Tactical Bond Fund
The Fund returned +3.73% (Class A Shares) over the past year (April 30, 2016 through April 30, 2017) and +4.13% (Class IShares) over the past year (April 30, 2016 through April 30, 2017), net of fees. The Morningstar Nontraditional BondCategory, the Fund’s peer group, returned +5.39% over the period (April 30, 2016 through April 30, 2017). The benchmarkfor the Fund, the Bloomberg Barclays U.S. Corporate High Yield Bond Index, returned +13.30% over the past year (April30, 2016 through April 30, 2017).
In early 2016, forecasts for High Yield bond returns ranged from -3 to +6% based on an annual survey by LCD, a unit of S&PCapital IQ, with most forecasts from the major banks in the +4-6% range. Markets were concerned about the exposure ofhigh yield credits to the energy sector and there were legitimate concerns about defaults for companies with direct exposureto the sector. After a fitful start, high yields started to trend higher in the second quarter of 2016 and kept pushing higherfor most of the past year, albeit with some volatility around Brexit, rumored Fed hikes and the U.S. Presidential Election. TheFund was primarily long for most of the past year, but pockets of short-term volatility triggered our model to trade morefrequently, causing the Fund to be whipsawed on several trades that lead to underperformance primarily in the second andthird quarters of 2016.
The Fund moved into defensive cash positions at several key points during the past year. Our model signaled defensivepositions ahead of the Brexit vote and ahead of the U.S. Presidential Election last year. In both cases, after sidesteppingdrawdowns around those events, the strategy moved back to a long position quickly thereafter. Since the U.S. election,high yields have trended higher (in price) as investors have bid up risk assets. During equity bull markets, high yield bondstend to trend higher, often exhibiting a strong correlation to small cap stocks. The Fund has been primarily long for mostof this bullish market move. However, we believe high yields are getting rich. Not unlike the equity markets, high yieldbond investors have priced in expectations for fiscal stimulus (tax cuts), infrastructure spending and deregulation. Webelieve that bullish sentiment has disconnected from reality. The sell-off in early March after the House’s healthcare votefailed was a sign that investors may not get the stimulus they want. However, investors have shaken off those concernsand the bullish trend has continued higher in the second quarter of 2017. In fact, as prices have moved higher, yields aregetting to the lowest level in almost three years. Although we believe high yields are likely to have a strong year, on ashort-term basis, they are overvalued on a relative basis. As tactical managers, we focus on technical price indicators andwill adapt to the market environment as it evolves this year. We continue to believe that actively managing risk andawaiting an opportunity to re-enter the market at lower bond prices and higher yields is prudent at this point in the interestrate cycle.
Market Outlook
Global equity markets continued their post-election rally to start the year posting strong performance across all majormarket indices. Fixed income markets were mixed as the Federal Reserve raised its target range a quarter point to a rangeof 0.75% to 1% in March. The euphoria that gripped investors in November of last year carried markets higher andmacroeconomic data strongly suggests that the global economy is primed to grow more comprehensively (more countriesexpanding in concert) than in previous years. The U.S., Eurozone, Japan and China all show positive economic growthtrends. However, as we wrote in our fourth quarter update, there is a risk that equity markets, in particular, have gottenahead of themselves.
SOFT VS. HARD DATA
In the first quarter, we started to see a divergence in “soft” and “hard” economic data. Soft data refers to reports basedon sentiment or investor behavior, i.e., consumer sentiment and consumer confidence that are typically done via survey.In contrast, hard data is about actual results, such as retail sales, construction spending and home sales. Soft data
5

measures how people feel about the economy and hard data tells us how we are actually doing. Both are important andthey have now reached a large divergence. Morgan Stanley released the chart below highlighting what they see as a“record gap.” Without digging into all of the indicators, here are three data points that further illuminate this conundrum:
Expectation of higher stock prices in 12 months: Investors are more optimistic about equity returns than theyhave been in nearly 20 years.
Economic data is now surprising to the downside: Both Citigroup and Bloomberg track the deviations in themeasures of economic news (actual releases vs. surveys). We are now seeing more surprises to the downsideindicating a higher level of optimism amongst professionals.
The Fed revised GDP forecasts down leading into the first quarter release. The Atlanta Federal Reserve’s GDPNowforecasting model consistently revised its first quarter GDP estimate down from their initial forecast of 2.3% onJanuary 30 to 0.20% on April 27, the day before the first quarter GDP number was released. The GDPNow modelis updated daily as new economic data is released. The Blue Chip range of forecasts (a survey of leading businesseconomists) was 2% on the high end and just under 1% on the low end. This was significantly lower than the rangeof 2.75% to 2% at the start of the year. Notice the correlation to the economic surprise index – both are pointingdown. The first estimate for Q1 GDP came in at 0.70%, surprising to the downside.
Now this does not mean that we are on the verge of a recession or a stock market crash, but the lights are flashing yellowand it might be time to pull some chips off the table after a good equity market run. At some point, we believe there willbe a reversion in either the soft or hard data. If hard data picks up, then we could see a macro tailwind for stocks and theFed will continue on course with rate hikes. However, if the soft data is revealed to be irrational exuberance, the likelihoodof an equity correction could rise significantly, especially as we enter seasonally difficult periods (Sell in May and Go Away– Summer Doldrums).
Perc
enta
ge D
evia
tion
Betw
een
Indi
cato
rs
Number of Months Prior to March 2017Past performance is no guarantee of future results
6

TAX CUTS
After a failed attempt to repeal the Affordable Care Act, Congress and Trump have moved on to cutting taxes. Althoughthere is a rebooted attempt to pass another healthcare repeal / replace bill, the chances do not look good. The release ofa tax outline (it’s difficult to call it a plan at this stage) by Treasury Secretary Mnuchin gave us a preview of what type oftax cuts to expect in the next couple of months (according to officials). The last time Congress passed a sweeping taxreform was under President Reagan. The Tax Reform Act of 1986, known as part two of Reagan’s tax cuts, was a bipartisaneffort that took almost a year to pass after it was introduced into the House. The process started earlier, in 1981, whenpart one, the Economic Recovery Tax Act of 1981, was passed; the largest tax cut in U.S. history. A year after its passing,the deficit rose significantly, driving interest rates higher (from 12% to 20%) and the U.S. economy into the second dip of
7

a double-dip recession that started in 1978. The point is not that we are destined to repeat history but to highlight thedifficulty of passing smart “tax reform” and not just “tax cuts.” The effort in 1986 was bipartisan – today’s is not evenclose. In 1986, Democrats voted 176 to 74 in the House and 33 to 12 in the Senate, along with a majority of Republicans(believe it or not it was not a unanimous vote) to pass reform. To really get a sense of the times, both Democratic Senatorsfrom Massachusetts, Ted Kennedy and John Kerry, voted yea.
That brings us to today. From election night to the present, there has been a widespread belief that the economy will getall of the stimulative goodies it wants (deregulation, infrastructure spending, etc.) with tax reform being the cherry on top.The probability of success on tax reform goes down by the day (not many days left in the Congressional calendar and mid-term elections are on the horizon), ultimately leading to temporary tax cuts since they are not likely to be revenue neutral.The size of the cut being debated blows a hole in the Federal budget and balloons the national debt. How fiscalconservatives come to terms with this exploding debt, a concept that was anathema for the past eight years will, alongwith Democratic participation (or lack thereof), be critical to if and how a bill passes. Finally, if a debt financed tax cut ispassed, it is likely that the Fed will become more hawkish in the face of market bubbles and increased inflation.
A DANGEROUS G-ZERO WORLD
Ian Bremmer, President and Founder of geopolitical consulting firm Eurasia Group, coined the term “G-Zero World” in2012 along with fellow political scientist David F. Gordon. Their view is that we are in a vacuum of global leadership. Thatleadership vacuum coincides with rising global populism that is pushing world leaders to look inward, towards domesticcommitments. Since the end of the Cold War, the U.S. has been the sole superpower, serving as policy leader for theglobal economy through the IMF, World Bank and WTO and underwriting security through NATO and the UN. With theelection of Donald Trump, the U.S. is pulling back from such prominent commitments and seeking more transactionalbilateral relations.
The problem with a transactional approach in the absence of an articulated policy is that it is very difficult to keep track ofwhere actions are relative to stated principles. Since the end of the Cold War, the Washington Consensus has been theeconomic policy the U.S. has prescribed and espoused across the globe. As a result, the promotion of capitalism anddemocracy have been key tenants of U.S. administrations, both Republican and Democrat over that time. Thisphilosophical approach guided policy in a relatively consistent and predictable way. The departure from this view, onethat embraces protectionism and a more tolerant or indifferent view towards regional politics, increases uncertainty incapital markets as countries across the global will reassess their relations with the U.S. and China. Undermining globalinstitutions that have served the U.S. well is Russia’s strategic objective, which in turn drives its global disinformationcampaign.
UNCERTAINTY
There is a nuanced, yet significant, difference between how risk and uncertainty are understood and priced into markets.As asset managers, we are tasked with quantifying and managing risk every day in an uncertain world. While we don’tknow what will happen next, we have a sense of the probabilities and the statistical distribution of possible outcomes.However, we are at a point in time where the global order is changing (in many ways paralleling what happened beforeWorld War I) and where there is more uncertainty. It is a period of time where risk cannot be quantified because wesimply don’t know what the probabilities are or what choices are even on the table. From North Korea to Syria and fromthe French elections to Brexit, there is a lot of uncertainty from political outsiders and also from an absence of anycoordinated policy and leadership. The fact that volatility remains muted, suggests that markets are oddly comfortablewith what they view as the risk of certain outcomes. If the past year has proven anything, it’s that uncertainty and BlackSwan events happen more often than we think and when markets reassess risk, it can be quick and painful. This brings us
8

back to the divergence between sentiment and economic data and output. While the mood among investors andconsumers is positive regarding stimulus, there remains a high degree of uncertainty about timing and actual policy. Withexpectations set so high, markets should prepare for some surprises to the downside and to quote Art Cashin, investorsshould “stay wary, alert and very, very nimble.”
Kindest regards,
Stephen B. BlumenthalPJ GrzywaczMichael Hee
Portfolio ManagersMay 24, 2017
3385-NLD-5/24/2017
Additional Index Disclosure: The MSCI All Country World Index (MSCI ACWI) is a free float-adjusted market capitalization weighted index that is designedto measure the equity market performance of developed and emerging markets. The MSCI ACWI consists of 46 country indexes comprising 23 developedand 23 emerging market country indexes. The developed market country indexes included are: Australia, Austria, Belgium, Canada, Denmark, Finland,France, Germany, Hong Kong, Ireland, Israel, Italy, Japan, Netherlands, New Zealand, Norway, Portugal, Singapore, Spain, Sweden, Switzerland, the UnitedKingdom and the United States. The emerging market country indexes included are: Brazil, Chile, China, Colombia, Czech Republic, Egypt, Greece,Hungary, India, Indonesia, Korea, Malaysia, Mexico, Peru, Philippines, Poland, Qatar, Russia, South Africa, Taiwan, Thailand, Turkey and United ArabEmirates. The Bloomberg Barclays U.S. Corporate High Yield Bond Index is an unmanaged index that covers the universe of fixed-rate, noninvestmentgrade debt. The Morningstar Moderate Target Risk Index is a rules-based index based on a well-established asset allocation methodology from IbbotsonAssociates, a Morningstar company. The index seeks to provide both capital appreciation and income. This index tends to hold larger positions in stocksthan conservative-allocation portfolios. The index typically has 50-70% of assets in equities. The index is rebalanced annually. TheCredit Suisse ManagedFutures Index is a subset of the Credit Suisse Hedge Fund Index that measures the aggregate performance of managed futures hedge funds. Managedfutures funds (often referred to as CTAs or Commodity Trading Advisors) typically focus on investing in listed bond, equity, commodity futures andcurrency markets, globally. Managers tend to employ systematic trading programs that largely rely upon historical price data and market trends. Asignificant amount of leverage may be employed since the strategy involves the use of futures contracts. CTAs tend not to have a particular bias towardsbeing net long or net short any particular market. The Morningstar World Stock Category: World stock portfolios have few geographical limitations. It iscommon for these portfolios to invest the majority of their assets in the U.S., Europe, and Japan, with the remainder divided among the globe’s smallermarkets. These portfolios typically have 20%-60% of assets in U.S. stocks. The Morningstar Multialternative Category: The Multialternative Categorycontains funds that offer investors exposure to several different alternative investment tactics. Funds in this category have a majority of their assetsexposed to alternative strategies. An investor’s exposure to different tactics may change slightly over time in response to market movements. Funds inthis category include both funds with static allocations to alternative strategies and funds tactically allocating among alternative strategies and assetclasses. The gross short exposure is greater than 20%. The Morningstar Nontraditional Bond Category: The Nontraditional Bond Category contains fundsthat pursue strategies divergent in one or more ways from conventional practice in the broader bond-fund universe. Many funds in this group describethemselves as “absolute return” portfolios, which seek to avoid losses and produce returns uncorrelated with the overall bond market; they employ avariety of methods to achieve those aims. Another large subset are self-described “unconstrained” portfolios that have more flexibility to invest tacticallyacross a wide swath of individual sectors, including high-yield and foreign debt, and typically with very large allocations. Funds in the latter group typicallyhave broad freedom to manage interest-rate sensitivity, but attempt to tactically manage those exposures in order to minimize volatility. The category isalso home to a subset of portfolios that attempt to minimize volatility by maintaining short or ultra-short duration portfolios, but explicitly court significantcredit and foreign bond market risk in order to generate high returns. Funds within this category often will use credit default swaps and other fixed incomederivatives to a significant level within their portfolios. The Morningstar Long Short Equity Category: Long-short portfolios hold sizable stakes in bothlong and short positions in equities and related derivatives. Some funds that fall into this category will shift their exposure to long and short positionsdepending on their macro outlook or the opportunities they uncover through bottom-up research. Some funds may simply hedge long stock positionsthrough exchange-traded funds or derivatives. At least 75% of the assets are in equity securities or derivatives. Definitions: Long: Buying a security suchas a stock, commodity or currency, with the expectation that the asset will rise in value. Short: Any sale that is completed by the delivery of a securityborrowed by the seller. Short sellers assume they will be able to buy the stock at a lower amount that the price at which they sold short.
9

CMG Mauldin Solutions Core Fund PORTFOLIO REVIEW (Unaudited) April 30, 2017
Comparisons of the Change in Value of a $10,000 Investment
Annualized Total Returns as of April 30, 2017
CMG Mauldin Solutions Core Fund: One Year Since
Inception*
Class A
Without sales charge 2.50% 1.95%
With sales charge (3.36)% 0.44%
Class I 2.78% 2.24%
MSCI AC World Index 15.77% 7.51%
MSCI World Index 14.65% 7.71%
________________ * Class A and Class I shares commenced operations on May 15, 2013. The MSCI World Index is a free float‐adjusted market capitalization index that is designed to measure global developed market equity performance consisting of 24 developed market country indices. Investors cannot invest directly in an index or benchmark. The MSCI All Country World Index is a free float‐adjusted market capitalization weighted equity index designed to measure the performance of equities in developed and emerging markets. Investors cannot invest directly in an index or benchmark. Past performance is not predictive of future results. The investment return and principal value of an investment will fluctuate. An investor’s shares, when redeemed, may be worth more or less than the original cost. Total return is calculated assuming reinvestment of all dividends and distributions, if any. The Fund’s total annual operating expenses, including underlying funds, are 2.00% for Class A and 1.75% for Class I per the Fund’s prospectus dated March 10, 2017. The graph does not reflect the deduction of taxes that a shareholder would have to pay on Fund distributions, if any, or the redemption of the Fund shares. For performance information current to the most recent month‐end, please call 1‐866‐CMG‐9456.
10

CMG Mauldin Solutions Core Fund PORTFOLIO REVIEW (Unaudited) (Continued) April 30, 2017
Portfolio Composition as of April 30, 2017 (Unaudited) Percent of
Net Assets
Exchange Traded Funds: 96.7%
Commodity Funds 2.9%
Debt Funds 34.3%
Equity Funds 59.5%
Exchange Traded Notes: 2.2%
Commodity Funds 0.8%
Equity Funds 1.4%
Short‐Term Investments 1.1%
Other Assets less Liabilities 0.0%
Total 100.0%
Please refer to the Portfolio of Investments in this annual report for a detailed analysis of the Fund’s holdings.
11
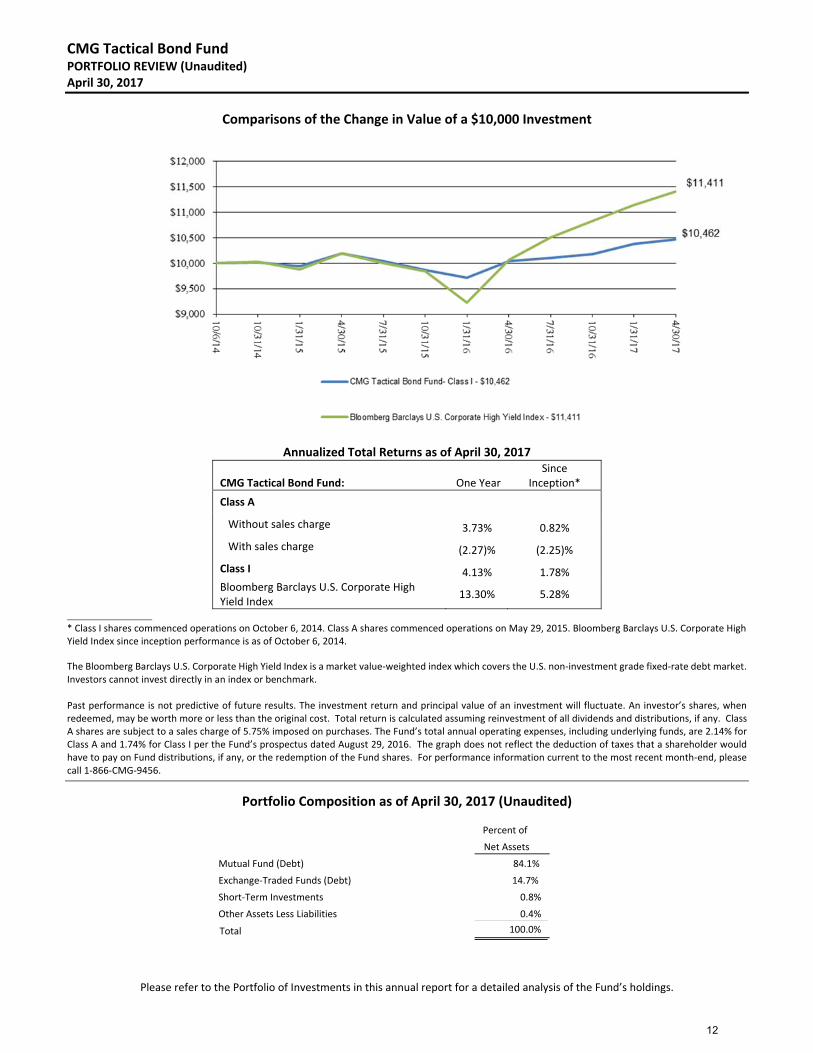
CMG Tactical Bond Fund PORTFOLIO REVIEW (Unaudited) April 30, 2017
Comparisons of the Change in Value of a $10,000 Investment
Annualized Total Returns as of April 30, 2017
CMG Tactical Bond Fund: One Year Since
Inception*
Class A
Without sales charge 3.73% 0.82%
With sales charge (2.27)% (2.25)%
Class I 4.13% 1.78% Bloomberg Barclays U.S. Corporate High Yield Index
13.30% 5.28%
________________ * Class I shares commenced operations on October 6, 2014. Class A shares commenced operations on May 29, 2015. Bloomberg Barclays U.S. Corporate High Yield Index since inception performance is as of October 6, 2014. The Bloomberg Barclays U.S. Corporate High Yield Index is a market value‐weighted index which covers the U.S. non‐investment grade fixed‐rate debt market. Investors cannot invest directly in an index or benchmark. Past performance is not predictive of future results. The investment return and principal value of an investment will fluctuate. An investor’s shares, when redeemed, may be worth more or less than the original cost. Total return is calculated assuming reinvestment of all dividends and distributions, if any. Class A shares are subject to a sales charge of 5.75% imposed on purchases. The Fund’s total annual operating expenses, including underlying funds, are 2.14% for Class A and 1.74% for Class I per the Fund’s prospectus dated August 29, 2016. The graph does not reflect the deduction of taxes that a shareholder would have to pay on Fund distributions, if any, or the redemption of the Fund shares. For performance information current to the most recent month‐end, please call 1‐866‐CMG‐9456.
Portfolio Composition as of April 30, 2017 (Unaudited)
Please refer to the Portfolio of Investments in this annual report for a detailed analysis of the Fund’s holdings.
Percent of
Net Assets
Mutual Fund (Debt) 84.1%
Exchange‐Traded Funds (Debt) 14.7%
Short‐Term Investments 0.8%
Other Assets Less Liabilities 0.4%
Total 100.0%
12

CMG Global Macro Strategy Fund PORTFOLIO REVIEW (Unaudited) April 30, 2017
Comparisons of the Change in Value of a $10,000 Investment
Total Returns as of April 30, 2017
CMG Global Macro Strategy Fund: One Year Since
Inception*
Class A
Without sales charge 2.90% (8.18)%
With sales charge (3.16)% (12.01)%
Class I 3.24% (7.88)%
Credit Suisse Managed Futures Index (9.35)% (7.49)%
_______________ * Class A and Class I shares commenced operations on December 8, 2015. The Credit Suisse Managed Futures Index is a subset of the Credit Suisse Hedge Fund Index that measures the aggregate performance of managed futures hedge funds. Managed futures funds (often referred to as CTAs or Commodity Trading Advisors) typically focus on investing in listed bond, equity, commodity futures and currency markets, globally. Managers tend to employ systematic trading programs that largely rely upon historical price data and market trends. A significant amount of leverage may be employed since the strategy involves the use of futures contracts. CTAs tend not to have a particular bias towards being net long or net short any particular market. Investors cannot invest directly in an index or benchmark. Past performance is not predictive of future results. The investment return and principal value of an investment will fluctuate. An investor’s shares, when redeemed, may be worth more or less than the original cost. Total return is calculated assuming reinvestment of all dividends and distributions, if any. Total returns would have been lower had the adviser not waived its fees and reimbursed a portion of the Fund’s expenses. Class A shares are subject to a sales charge of 5.75% imposed on purchases. The Fund’s total annual operating expenses, including underlying funds, are 3.30% for Class A and 3.05% for Class I per the Fund’s prospectus dated August 29, 2016. The graph does not reflect the deduction of taxes that a shareholder would have to pay on Fund distributions, if any, or the redemption of the Fund shares. For performance information current to the most recent month‐end, please call 1‐866‐CMG‐9456.
Portfolio Composition as of April 30, 2017 (Unaudited)
Please refer to the Portfolio of Investments in this annual report for a detailed analysis of the Fund’s holdings.
Percent of
Net Assets
Exchange‐Traded Fund (Debt) 47.0%
Private Investment Fund 25.2%
Short Term Investments 6.3%
Other Assets Less Liabilities 21.5%
Total 100.0%
13
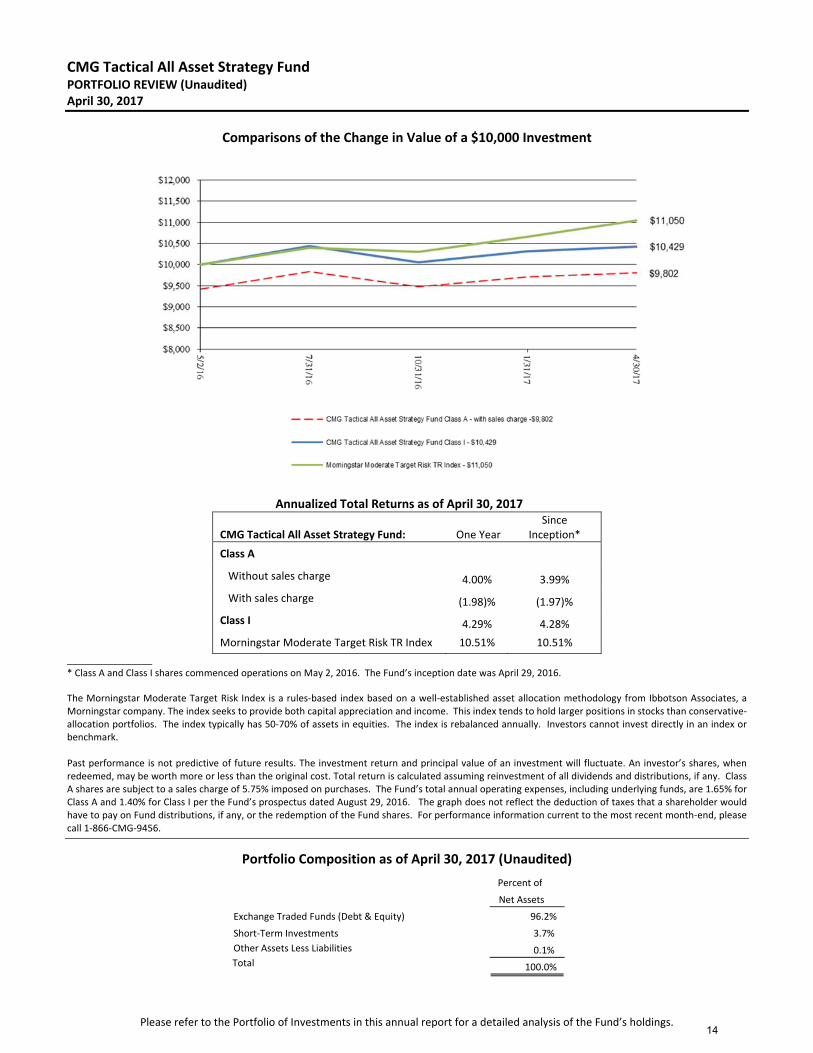
CMG Tactical All Asset Strategy Fund PORTFOLIO REVIEW (Unaudited) April 30, 2017
Comparisons of the Change in Value of a $10,000 Investment
Annualized Total Returns as of April 30, 2017
CMG Tactical All Asset Strategy Fund: One Year Since
Inception*
Class A
Without sales charge 4.00% 3.99%
With sales charge (1.98)% (1.97)%
Class I 4.29% 4.28%
Morningstar Moderate Target Risk TR Index 10.51% 10.51%
________________ * Class A and Class I shares commenced operations on May 2, 2016. The Fund’s inception date was April 29, 2016.
The Morningstar Moderate Target Risk Index is a rules‐based index based on a well‐established asset allocation methodology from Ibbotson Associates, a Morningstar company. The index seeks to provide both capital appreciation and income. This index tends to hold larger positions in stocks than conservative‐allocation portfolios. The index typically has 50‐70% of assets in equities. The index is rebalanced annually. Investors cannot invest directly in an index or benchmark.
Past performance is not predictive of future results. The investment return and principal value of an investment will fluctuate. An investor’s shares, when redeemed, may be worth more or less than the original cost. Total return is calculated assuming reinvestment of all dividends and distributions, if any. Class A shares are subject to a sales charge of 5.75% imposed on purchases. The Fund’s total annual operating expenses, including underlying funds, are 1.65% for Class A and 1.40% for Class I per the Fund’s prospectus dated August 29, 2016. The graph does not reflect the deduction of taxes that a shareholder would have to pay on Fund distributions, if any, or the redemption of the Fund shares. For performance information current to the most recent month‐end, please call 1‐866‐CMG‐9456.
Portfolio Composition as of April 30, 2017 (Unaudited)
Please refer to the Portfolio of Investments in this annual report for a detailed analysis of the Fund’s holdings.
Percent of
Net Assets
Exchange Traded Funds (Debt & Equity) 96.2%
Short‐Term Investments 3.7%
Other Assets Less Liabilities 0.1%Total 100.0%
14

Shares Security ValueEXCHANGE‐TRADED FUNDS ‐ 96.7 %COMMODITY FUNDS‐ 2.9 %
344 ETFS Physical Platinum Shares* $ 31,204 19,937 iShares Gold Trust* 243,4312,049 PowerShares DB Base Metals Fund* 32,600
TOTAL COMMODITY FUNDS (Cost ‐ $299,422) 307,235
DEBT FUNDS ‐ 34.3 %1,893 iShares 3‐7 Year Treasury Bond ETF 234,2021,295 iShares 7‐10 Year Treasury Bond ETF 138,0472,065 iShares 20+ Year Treasury Bond ETF 252,6534,678 iShares Emerging Markets High Yield Bond ETF 237,5491,434 iShares iBoxx & Investment Grade Corporate Bond ETF 170,6324,780 iShares Short Maturity Bond ETF 240,2432,320 iShares TIPS Bond ETF 266,8234,641 SPDR Bloomberg Barclays High Yield Bond ETF 172,3678,936 SPDR Bloomberg Barclays Long Term Treasury ETF 631,7752,816 SPDR Doubleline Total Return Tactical ETF 138,6882,133 Vanguard Emerging Markets Government Bond ETF 171,5572,397 Vanguard Extended Duration Treasury ETF 271,3402,325 Vanguard Long‐Term Bond ETF 211,9706,663 Vanguard Total Bond Market ETF 543,368
TOTAL DEBT FUNDS (Cost ‐ $3,654,443) 3,681,214
EQUITY FUNDS ‐ 59.5 %3,023 Consumer Discretionary Select Sector SPDR Fund 272,251577 Consumer Staples Select Sector SPDR Fund 31,839
3,710 Financial Select Sector SPDR Fund 87,296724 Health Care Select Sector SPDR Fund 54,662496 Industrial Select Sector SPDR Fund 32,905
2,605 iShares Core MSCI EAFE ETF 155,0502,263 iShares Core S&P Mid‐Cap ETF 390,5715,804 iShares Edge MSCI USA Momentum Factor ETF 492,0637,670 iShares MSCI ACWI ETF 493,0286,049 iShares MSCI Emerging Markets ETF 242,3231,867 iShares MSCI Frontier 100 ETF 53,6202,568 iShares MSCI India ETF 82,381
62 Materials Select Sector SPDR Fund 3,2902,536 PowerShares QQQ Trust Series 1 344,8719,208 PowerShares S&P 500 Low Volatility Portfolio 403,67914,690 PowerShares S&P 500 Quality Portfolio 405,5915,442 Schwab U.S. Large‐Cap Value ETF 270,3586,848 Schwab U.S. Small‐Cap ETF 434,7793,002 SPDR EURO STOXX 50 ETF 113,5662,627 Technology Select Sector SPDR Fund 142,85621,841 Vanguard FTSE Emerging Markets ETF 881,066
393 Vanguard Global ex‐U.S. Real Estate ETF 21,4033,448 Vanguard REIT ETF 285,460299 Vanguard S&P 500 ETF 65,361404 Vanguard Small‐Cap ETF 54,306
2,111 Vanguard Small‐Cap Value ETF 260,3923,636 Vanguard Total World Stock ETF 240,9941,106 WisdomTree Japan Hedged Equity Fund 56,483
6,372,444
TOTAL EXCHANGE‐TRADED FUNDS (Cost ‐ $10,257,160) 10,360,893
EXCHANGE‐TRADED NOTES ‐ 2.2 %COMMODITY FUNDS‐ 0.8 %
21,760 51,6801,420 iPath Bloomberg Livestock Subindex Total Return ETN* 34,364
TOTAL COMMODITY FUNDS (Cost ‐ $84,634) 86,044
EQUITY FUNDS ‐ 1.4 %4,701 JPMorgan Alerian MLP Index ETN (Cost ‐ $151,105) 149,727
TOTAL EXCHANGE‐TRADED NOTES (Cost ‐ $235,739) 235,771
CMG Mauldin Solutions Core Fund
PORTFOLIO OF INVESTMENTS
April 30, 2017
TOTAL EQUITY FUNDS (Cost ‐ $6,303,295)
ELEMENTS Linked to the Rogers International Commodity Index ‐ Energy Total Return*
The accompanying notes are an integral part of these financial statements.
15

Shares Security ValueSHORT‐TERM INVESTMENTS ‐ 1.1 %MONEY MARKET FUND ‐ 1.1 %
120,490 $ 120,526 TOTAL SHORT‐TERM INVESTMENTS (Cost ‐ $120,490)
TOTAL INVESTMENTS ‐ 100.0 % (Cost ‐ $10,613,389) (a) $ 10,717,190 475
NET ASSETS ‐ 100.0 % 10,717,665$
ETF ‐ Exchange‐Traded FundETN ‐ Exchange‐Traded NoteMLP ‐ Master Limited Partnership* Non‐income producing security.+ Money Market Fund; interest rate reflects seven‐day effective yield on April 30, 2017.(a) Represents cost for financial reporting purposes. Aggregate cost for federal income tax purposes is $10,613,575 and differs from value by net unrealized appreciation (depreciation) of securities as follows:
Unrealized Appreciation: 133,277$ Unrealized Depreciation: (29,662)
Net Unrealized Appreciation: 103,615$
Federated Institutional Prime Obligations Fund, Institutional Shares, 0.91% +
OTHER ASSETS LESS LIABILITIES ‐ 0.0 %
CMG Mauldin Solutions Core Fund
April 30, 2017
PORTFOLIO OF INVESTMENTS (Continued)
The accompanying notes are an integral part of these financial statements.
16

Shares Security ValueMUTUAL FUND ‐ 84.1 %DEBT FUND ‐ 84.1 %
1,797,753 PIMCO High Yield Fund ‐ Institutional Shares $ 16,125,843 TOTAL MUTUAL FUND (Cost ‐ $16,000,000)
EXCHANGE‐TRADED FUNDS ‐ 14.7 %DEBT FUNDS ‐ 14.7 %
10,636 iShares iBoxx $ High Yield Corporate Bond ETF 937,244 49,539 PowerShares Fundamental High Yield Corporate Bonds Portfolio 939,260 25,266 SPDR Bloomberg Barclays High Yield Bond ETF 938,379
TOTAL EXCHANGE‐TRADED FUNDS (Cost ‐ $2,802,299) 2,814,883
SHORT‐TERM INVESTMENTS ‐ 0.8 %MONEY MARKET FUND ‐ 0.8 %
146,757 146,801 TOTAL SHORT‐TERM INVESTMENTS (Cost ‐ $146,777)
TOTAL INVESTMENTS ‐ 99.6 % (Cost ‐ $18,949,076) (a) $ 19,087,527 74,627
NET ASSETS ‐ 100.0 % $ 19,162,154
ETF ‐ Exchange‐Traded Fund+ Money Market Fund; interest rate reflects seven‐day effective yield on April 30, 2017.(a) Represents cost for financial reporting purposes. Aggregate cost for federal income tax purposes is $18,950,550 anddiffers from value by net unrealized appreciation (depreciation) of securities as follows:
Unrealized Appreciation: 138,451$Unrealized Depreciation: (1,474)
Net Unrealized Appreciation: 136,977$
CMG Tactical Bond Fund
PORTFOLIO OF INVESTMENTS
April 30, 2017
Federated Institutional Prime Obligations Fund, Institutional Shares, 0.91% +
OTHER ASSETS LESS LIABILITIES ‐ 0.4 %
The accompanying notes are an integral part of these financial statements.17

Shares Security ValueEXCHANGE‐TRADED FUND ‐ 47.0 %DEBT FUND ‐ 47.0 %
116,275 $ 5,317,256 TOTAL EXCHANGE‐TRADED FUND (Cost ‐ $5,314,717)
PRIVATE INVESTMENT FUND ‐ 25.2 %3,161 Global Macro Stategy LLC* # 2,847,516
SHORT‐TERM INVESTMENTS ‐ 9.1 %MONEY MARKET FUND ‐ 9.1 %
710,976 711,189 320,962 320,962
1,032,151
TOTAL INVESTMENTS ‐ 81.3 % (Cost ‐ $9,535,550) (a) $ 9,196,923 2,107,255
NET ASSETS ‐ 100.0 % $ 11,304,178
ETF ‐ Exchange‐Traded Fund
* Non‐income producing security.
# Affiliated Fund.+ Money market fund; interest rate reflects seven‐day yield on April 30, 2017.(a) Represents cost for financial reporting purposes. Aggregate cost for federal income tax purposes is $9,449,463 and
differs from value by net unrealized appreciation (depreciation) of securities as follows:
Unrealized Appreciation: $ 996,501
Unrealized Depreciation: (1,249,041)Net Unrealized Depreciation: $ (252,540)
Contracts
Unrealized
Appreciation/(Depreciation)
6 Canadian 10 Year Bond, June 2017 $ 3,819 (Underlying Face Amount at Value $612,643)
8 DAX Index, June 2017 102,413 (Underlying Face Amount at Value $2,716,668)
11 S&P 500 Emini, June 2017 (3,163)(Underlying Face Amount at Value $1,309,275)
277 FTSE China A50, May 2017 22,160 (Underlying Face Amount at Value $2,876,645)
20 Russell 2000 Mini, June 2017 16,695 (Underlying Face Amount at Value $1,398,400)
18 SPI 200 Index, June 2017 35,282 (Underlying Face Amount at Value $1,991,114)
23 Yen Denominated Nikkei, June 2017 726 (Underlying Face Amount at Value $1,984,128)
$ 177,932 TOTAL OPEN LONG FUTURES CONTRACTS
OPEN LONG FUTURES CONTRACTS ++
OTHER ASSETS LESS LIABILITIES ‐ 18.7 %
TOTAL SHORT‐TERM INVESTMENTS (Cost ‐ $1,031,995)
CMG Global Macro Strategy Fund
CONSOLIDATED PORTFOLIO OF INVESTMENTS
April 30, 2017
SPDR Bloomberg Barclays 1‐3 Month T‐Bill ETF
TOTAL PRIVATE INVESTMENT FUND (COST ‐ $3,188,838)
Federated Institutional Prime Obligations Fund, Institutional Shares, 0.91% +JPMorgan U.S. Treasury Plus Money Market Fund, Class I, 0.58% + ++
The accompanying notes are an integral part of these financial statements.18

Contracts
Unrealized
Appreciation/(Depreciation)
(20) Australian Dollar, June 2017 $ (1,612)(Underlying Face Amount at Value $1,495,200)
(2) British Pound, June 2017 (5,565)(Underlying Face Amount at Value $162,050)
(1) Canadian Dollar, June 2017 1,065 (Underlying Face Amount at Value $73,200)
(1) CHF/USD, June 2017 (2,163)(Underlying Face Amount at Value $126,100)
(32) Euro FX, June 2017 (113,894)(Underlying Face Amount at Value $4,368,400)
(6) Euro OAT, June 2017 (18,227)(Underlying Face Amount at Value $979,504)
(14) Euro‐BTP, June 2017 (7,670)(Underlying Face Amount at Value $2,008,973)
(5) Euro‐Bund, June 2017 3,748 (Underlying Face Amount at Value $881,297)
(71) Japanese Yen, June 2017 (184,237)(Underlying Face Amount at Value $7,982,175)
(3) Long Gilt, June 2017 (583)(Underlying Face Amount at Value $498,175)
(1) New Zealand Dollar, June 2017 320 (Underlying Face Amount at Value $68,620)
(5) US 10YR Note, June 2017 3,124 (Underlying Face Amount at Value $626,150)
(325,694)
$ (147,762)
++ All of this investment is a holding of DGM AEX Strategy LLC.
Face amounts are the underlying reference amounts to stock exchange indices, equities and foreign currencies upon which the fair value of the
futures contracts traded by the Fund are based. While face amounts do not represent the current fair value and are not necessarily indicative of the
future cash flows of the Fund's futures contracts, the underlying price changes in relation to the variables specified by the face amounts affect the
fair value of these derivative financial instruments.
April 30, 2017
OPEN SHORT FUTURES CONTRACTS ++
TOTAL OPEN SHORT FUTURES CONTRACTS
TOTAL OPEN FUTURES CONTRACTS
CMG Global Macro Strategy Fund
CONSOLIDATED PORTFOLIO OF INVESTMENTS (Continued)
The accompanying notes are an integral part of these financial statements.19
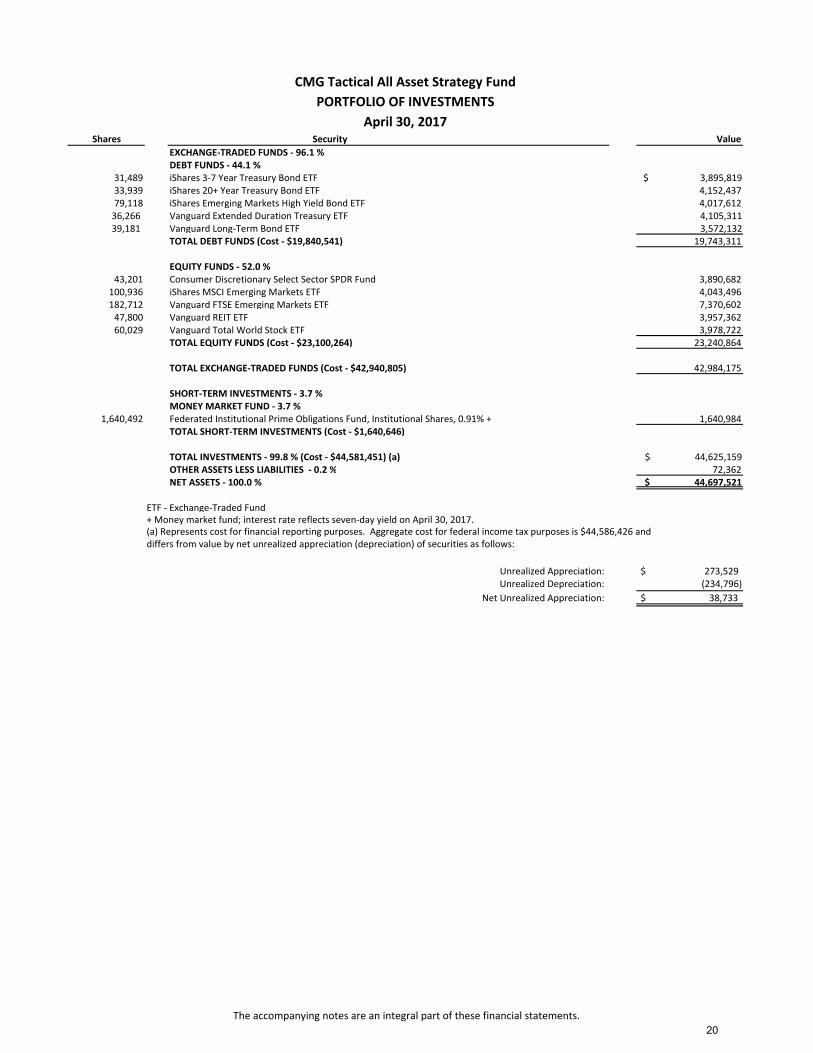
Shares Security Value
EXCHANGE‐TRADED FUNDS ‐ 96.1 %DEBT FUNDS ‐ 44.1 %
31,489 iShares 3‐7 Year Treasury Bond ETF $ 3,895,819 33,939 iShares 20+ Year Treasury Bond ETF 4,152,43779,118 iShares Emerging Markets High Yield Bond ETF 4,017,61236,266 Vanguard Extended Duration Treasury ETF 4,105,311 39,181 Vanguard Long‐Term Bond ETF 3,572,132
TOTAL DEBT FUNDS (Cost ‐ $19,840,541) 19,743,311
EQUITY FUNDS ‐ 52.0 %43,201 Consumer Discretionary Select Sector SPDR Fund 3,890,682
100,936 iShares MSCI Emerging Markets ETF 4,043,496182,712 Vanguard FTSE Emerging Markets ETF 7,370,60247,800 Vanguard REIT ETF 3,957,36260,029 Vanguard Total World Stock ETF 3,978,722
TOTAL EQUITY FUNDS (Cost ‐ $23,100,264) 23,240,864
TOTAL EXCHANGE‐TRADED FUNDS (Cost ‐ $42,940,805) 42,984,175
SHORT‐TERM INVESTMENTS ‐ 3.7 %MONEY MARKET FUND ‐ 3.7 %
1,640,492 1,640,984TOTAL SHORT‐TERM INVESTMENTS (Cost ‐ $1,640,646)
$ 44,625,159 72,362
NET ASSETS ‐ 100.0 % $ 44,697,521
ETF ‐ Exchange‐Traded Fund+ Money market fund; interest rate reflects seven‐day yield on April 30, 2017.(a) Represents cost for financial reporting purposes. Aggregate cost for federal income tax purposes is $44,586,426 anddiffers from value by net unrealized appreciation (depreciation) of securities as follows:
Unrealized Appreciation: $ 273,529 Unrealized Depreciation: (234,796)
Net Unrealized Appreciation: $ 38,733
OTHER ASSETS LESS LIABILITIES ‐ 0.2 %
Federated Institutional Prime Obligations Fund, Institutional Shares, 0.91% +
TOTAL INVESTMENTS ‐ 99.8 % (Cost ‐ $44,581,451) (a)
CMG Tactical All Asset Strategy Fund
PORTFOLIO OF INVESTMENTS
April 30, 2017
The accompanying notes are an integral part of these financial statements.
20

CMG FundsSTATEMENTS OF ASSETS AND LIABILITIES April 30, 2017
CMG Mauldin
Solutions Core
Fund *
CMG Tactical
Bond Fund
CMG Global
Macro Strategy
Fund
(Consolidated)
CMG Tactical
All Asset
Strategy Fund
Assets:Investments in Unaffiliated Securities at Value (identified cost $10,613,389, $18,949,076, $6,346,712 and $44,581,451, respectively) 10,717,190$ 19,087,527$ 6,349,407$ 44,625,159$ Investments in Affiliated Securities at Value (identified cost $0, $0, $0, $3,188,838
‐ ‐ 2,847,516 ‐Total Investments 10,717,190 19,087,527 9,196,923 44,625,159
Cash ‐ ‐ 21,849 ‐Deposits with Broker 1,361 ‐ 2,237,282 ‐Receivable for Securities Sold 315,995 ‐ ‐ 3,799,715 Dividends and Interest Receivable 15,799 65,072 284 611Receivable for Fund Shares Sold 5,778 16,205 ‐ 190,048 Deferred Costs ‐ ‐ ‐ 6,028Prepaid Expenses and Administrative Fees 30,062 17,313 35,923 26,224 Total Assets 11,086,185 19,186,117 11,492,261 48,647,785
Liabilities:Payable for Securities Purchased 324,325 ‐ ‐ 3,891,697 Payable for Fund Shares Redeemed 16,120 ‐ 850 11,408 Due to Broker ‐ Variation Margin ‐ ‐ 147,762 ‐Accrued Advisory Fees 9,184 14,916 6,878 26,818 Accrued Management Fees ‐ ‐ 7,387 ‐Accrued Distribution Fees 641 341 3 7,714Payable to Related Parties 10,395 8,706 19,549 12,218 Accrued Expenses and Other Liabilities 7,855 ‐ 5,654 409Total Liabilities 368,520 23,963 188,083 3,950,264
NET ASSETS 10,717,665$ 19,162,154$ 11,304,178$ 44,697,521$
Composition of Net Assets:At April 30, 2017, Net Assets consisted of:
Paid‐in‐Capital 10,339,846$ 21,374,862$ 12,392,155$ 44,062,540$ Accumulated Net Investment Income (Loss) (60,539) 7,037 (10,078) ‐
Accumulated Net Realized Gain (Loss) From Investments, Futures, Op ons and Foreign Currency Transactions 335,799 (2,358,196) (591,510) 591,273 Net Unrealized Appreciation (Depreciation) on: Investments 103,801 138,451 (338,627) 43,708 Futures ‐ ‐ (147,762) ‐ Foreign Currency Translations (1,242) ‐ ‐ ‐
Net Assets 10,717,665$ 19,162,154$ 11,304,178$ 44,697,521$
Net Asset Value, Offering and Redemption Price Per ShareClass A Shares:Net Assets 3,048,673$ 1,042,261$ 14,320$ 38,741,476$
293,124 106,879 1,612 3,753,565 10.40$ 9.75$ 8.88$ 10.32$ 10.40 10.34 9.42 10.95
Class I Shares:Net Assets 7,668,992$ 18,119,893$ 11,289,858$ 5,956,045$
732,884 1,858,315 1,266,271 576,295 Net Asset Value (Net Assets ÷ Shares Outstanding), Offering and Redemption Price
10.46$ 9.75$ 8.92$ 10.34$
* Formerly CMG Global Equity Fund
interest authorized)
interest authorized)
Per Share
and $0, respectively)
Net Asset Value (Net Assets ÷ Shares Outstanding) and Redemption Price Per Share Maximum Offering Price Per Share (Maximum sales charge of 5.75% except CMG Mauldin)
Shares of beneficial interest outstanding (unlimited shares of no par beneficial
Shares of beneficial interest outstanding (unlimited shares of no par beneficial
The accompanying notes are an integral part of these financial statements.
21

CMG FundsSTATEMENTS OF OPERATIONSFor the Year or Period Ended April 30, 2017
CMG Mauldin
Solutions Core
Fund *
CMG Tactical Bond
Fund
CMG Global
Macro Strategy
Fund
(Consolidated)
CMG Tactical All
Asset Strategy
Fund **
Investment Income:
149,567$ 975,743$ 8,216$ 402,494$ Unaffiliated Investments Interest Income 3,805 19,243 8,415 7,219 Total Investment Income 153,372 994,986 16,631 409,713
Expenses:Investment Advisory Fees 85,756 231,572 123,526 165,810 Administration Fees ^ 113,636 95,171 134,819 108,540 Distribution Fees‐ Class A 8,189 2,490 30 48,602 Non 12b‐1 Shareholder Servicing Fees 1,922 20,344 1,622 923 Interest Expense 16,021 11,299 ‐ ‐ Organizational Costs (Note 2) ‐ ‐ ‐ 6,805 Management Fees ^ ‐ ‐ 107,103 ‐ Professional Fees ^ ‐ ‐ 19,278 ‐ Miscellaneous Fees ^ ‐ ‐ 13,046 ‐ Total Expenses 225,524 360,876 399,424 330,680 Less: Fees Waived by Adviser ‐ ‐ (30,882) ‐ Net Expenses 225,524 360,876 368,542 330,680 Net Investment Income (Loss) (72,152) 634,110 (351,911) 79,033
Net Realized and Unrealized Gain (Loss) on Investments:Net Realized Gain (Loss) on: Unaffiliated Investments 691,777 702,358 (193) 740,246
Affiliated Investments ‐ ‐ (76,587) ‐
Futures Contracts (79,204) ‐ 97,657 ‐
Option Contracts Purchased (264,466) (16,992)
Option Contracts Written 132,068 465 ‐ ‐ Foreign Currency Transactions (17,081) ‐ ‐ ‐
Net Change in Unrealized Appreciation (Depreciation) On:Unaffiliated Investments (262,483) (453,709) 2,269 43,708 Affiliated Investments ‐ ‐ 212,736 ‐ Futures Contracts 33,838 ‐ 576,914 ‐
Option Contracts Purchased (5,288) (38,484) ‐ ‐ Option Contracts Written 3,128 21,818 ‐ ‐ Foreign Currency Translations 1,249 ‐ ‐ ‐
Net Realized and Unrealized Gain on Investments 233,538 215,456 812,796 783,954
Net Increase in Net Assets Resulting From Operations 161,386$ 849,566$ 460,885$ 862,987$
* Formerly CMG Global Equity Fund.
** Commencement of Operations on May 2, 2016.
Unaffiliated Investments Dividend Income (net of foreign taxes
withheld of $5,829, $0, $0 and $0, respectively)
^ All of the Management Fees, Professional Fees, Miscellaneous Fees and a portion of the Administration Fees for CMG Global Macro Strategy Fund are expenses
of DGM AEX Strategy LLC.
The accompanying notes are an integral part of these financial statements.
22

CMG FundsSTATEMENTS OF CHANGES IN NET ASSETS
For the Year For the Year For the Year For the Year
Ended Ended Ended Ended
April 30, 2017 April 30, 2016 April 30, 2017 April 30, 2016
Operations:Net Investment Income (Loss) (72,152)$ (141,955)$ 634,110$ 821,144$ Net Realized Gain (Loss) on Investments 463,094 376,063 685,831 (2,376,150)
Distributions of Realized Gains from Underlying Investment Companies ‐ ‐ ‐ 7,427
Net Change in Unrealized Appreciation (Depreciation) on Investments (229,556) (953,513) (470,375) 105,096
Net Increase (Decrease) in Net Assets
Resulting From Operations 161,386 (719,405) 849,566 (1,442,483)
Distributions to Shareholders from:
Net Investment Income
Class A ‐ (20,799) (13,271) (2,585) Class I ‐ (40,345) (613,802) (818,561)
Net Realized Gains
Class A (25,601) ‐ ‐ ‐
Class I (22,410) ‐ ‐ ‐
Return of CapitalClass A ‐ ‐ ‐ (1,084)
Class I ‐ ‐ ‐ (213,506)
Total Distributions to Shareholders (48,011) (61,144) (627,073) (1,035,736)
Beneficial Interest Transactions:Class A Shares:
Proceeds from Shares Issued 652,607 1,126,017 739,147 300,010
Distributions Reinvested 25,486 20,154 13,271 3,669
Cost of Shares Redeemed (1,424,327) (2,065,844) (31,568) (800)
Total Class A Transactions (746,234) (919,673) 720,850 302,879
Class I Shares:
Proceeds from Shares Issued 6,105,482 2,451,919 5,934,660 14,516,067
Distributions Reinvested 22,205 40,211 550,912 923,540
Cost of Shares Redeemed (3,310,148) (5,426,918) (21,861,037) (29,946,427)
Total Class I Transactions 2,817,539 (2,934,788) (15,375,465) (14,506,820)
Net Increase (Decrease) in Net Assets Resulting
from Beneficial Interest Transactions 2,071,305 (3,854,461) (14,654,615) (14,203,941)
Increase (Decrease) in Net Assets 2,184,680 (4,635,010) (14,432,122) (16,682,160)
Net Assets:
Beginning of Year 8,532,985 13,167,995 33,594,276 50,276,436 End of Year** 10,717,665$ 8,532,985$ 19,162,154$ 33,594,276$
* Formerly CMG Global Equity Fund** Includes accumulated net investment income (loss) of: (60,539)$ (108,438)$ 7,037$ ‐$
Share Activity:
Class A Shares:Shares Issued 64,608 106,311 77,076 31,401
Shares Reinvested 2,569 1,921 1,370 391
Shares Redeemed (141,398) (196,684) (3,275) (84) Net increase (decrease) in shares of beneficial interest outstanding (74,221) (88,452) 75,171 31,708
Class I Shares:
Shares Issued 590,748 233,654 615,084 1,502,469
Shares Reinvested 2,229 3,822 57,004 97,174
Shares Redeemed (325,552) (510,785) (2,273,670) (3,183,150) Net increase (decrease) in shares of beneficial interest outstanding 267,425 (273,309) (1,601,582) (1,583,507)
CMG Mauldin Solutions Core Fund * CMG Tactical Bond Fund
The accompanying notes are an integral part of these financial statements.
23
CMG FundsSTATEMENTS OF CHANGES IN NET ASSETS (Continued)
CMG Tactical All
Asset Strategy Fund
Year For the Period * For the Period **
Ended Ended Ended
April 30, 2017 April 30, 2016 April 30, 2017
Operations:
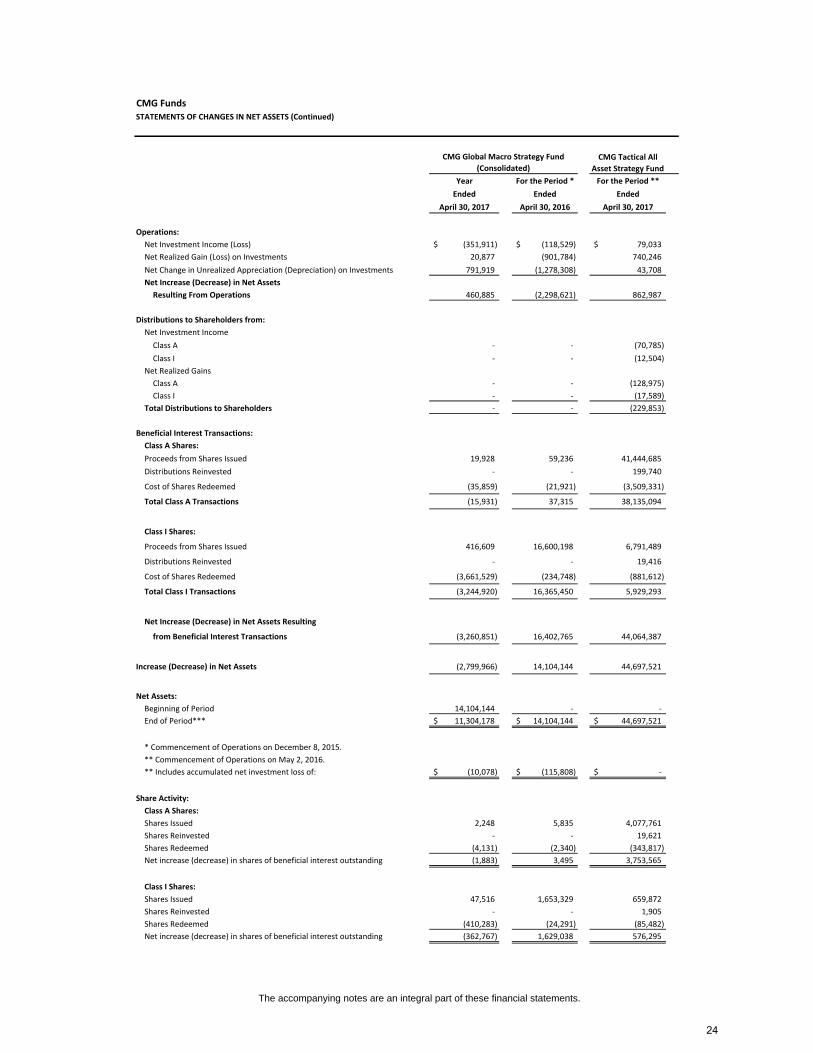
Net Investment Income (Loss) (351,911)$ (118,529)$ 79,033$
Net Realized Gain (Loss) on Investments 20,877 (901,784) 740,246
Net Change in Unrealized Appreciation (Depreciation) on Investments 791,919 (1,278,308) 43,708
Net Increase (Decrease) in Net Assets
Resulting From Operations 460,885 (2,298,621) 862,987
Distributions to Shareholders from:
Net Investment Income
Class A ‐ ‐ (70,785)
Class I ‐ ‐ (12,504)
Net Realized Gains
Class A ‐ ‐ (128,975)
Class I ‐ ‐ (17,589)
Total Distributions to Shareholders ‐ ‐ (229,853)
Beneficial Interest Transactions:
Class A Shares:
Proceeds from Shares Issued 19,928 59,236 41,444,685
Distributions Reinvested ‐ ‐ 199,740
Cost of Shares Redeemed (35,859) (21,921) (3,509,331)
Total Class A Transactions (15,931) 37,315 38,135,094
Class I Shares:
Proceeds from Shares Issued 416,609 16,600,198 6,791,489
Distributions Reinvested ‐ ‐ 19,416
Cost of Shares Redeemed (3,661,529) (234,748) (881,612)
Total Class I Transactions (3,244,920) 16,365,450 5,929,293
Net Increase (Decrease) in Net Assets Resulting
from Beneficial Interest Transactions (3,260,851) 16,402,765 44,064,387
Increase (Decrease) in Net Assets (2,799,966) 14,104,144 44,697,521
Net Assets:
Beginning of Period 14,104,144 ‐ ‐
End of Period*** 11,304,178$ 14,104,144$ 44,697,521$
* Commencement of Operations on December 8, 2015.
** Commencement of Operations on May 2, 2016.
** Includes accumulated net investment loss of: (10,078)$ (115,808)$ ‐$
Share Activity:
Class A Shares:
Shares Issued 2,248 5,835 4,077,761
Shares Reinvested ‐ ‐ 19,621
Shares Redeemed (4,131) (2,340) (343,817)
Net increase (decrease) in shares of beneficial interest outstanding (1,883) 3,495 3,753,565
Class I Shares:
Shares Issued 47,516 1,653,329 659,872
Shares Reinvested ‐ ‐ 1,905
Shares Redeemed (410,283) (24,291) (85,482)
Net increase (decrease) in shares of beneficial interest outstanding (362,767) 1,629,038 576,295
CMG Global Macro Strategy Fund
(Consolidated)
The accompanying notes are an integral part of these financial statements.
24

CMG FundsFINANCIAL HIGHLIGHTS
The table below sets forth financial data for one share of beneficial interest outstanding throughout each period presented.
Year Year Year Period
Ended Ended Ended Ended
April 30, 2017 April 30, 2016 April 30, 2015 April 30, 2014 **
Net Asset Value, Beginning of Period 10.23$ 11.00$ 10.95$ 10.00$
Decrease From Operations:
Net investment loss (a) (0.13) (0.16) (0.07) (0.03)
Net gain (loss) from investments
(both realized and unrealized) 0.38 (0.56) 0.30 1.07
Total from operations 0.25 (0.72) 0.23 1.04
Distributions to shareholders from:
Net investment income ‐ (0.05) (0.03) ‐
Net realized gains (0.08) ‐ (0.15) (0.09)
Total distributions (0.08) (0.05) (0.18) (0.09)
Net Asset Value, End of Period 10.40$ 10.23$ 11.00$ 10.95$
Total Return (b) 2.50% (6.57)% 2.12% 10.39% (f)
Ratios/Supplemental Data
Net assets, end of period (in 000's) 3,049$ 3,757$ 5,013$ 2,791$
Ratio of expenses to average net assets:
Before expense reimbursement (c) 3.40% 2.95% 2.48% 3.24% (e)
After expense reimbursement (c) 3.40% 2.95% 2.31% 1.90% (e)
Ratio of net investment loss to average net assets (c)(d) (1.26)% (1.44)% (0.67)% (0.33)% (e)
Portfolio turnover rate 248% 20% 41% 40% (f)
__________
* Formerly CMG Global Equity Fund.
** Class A shares commenced operations on May 15, 2013.
(a) Per share amounts are calculated using the average shares method, which appropriately presents the per share data for the period.
(c) Does not include the expenses of the underlying investment companies in which the Fund invests.
(e) Annualized.
(f) Not annualized.
CMG Mauldin Solutions Core Fund *
Class A
(b) Total returns are historical in nature and assume changes in share price, reinvestment of dividends and capital gains distributions, if any, and
excludes sales charges. Had the Adviser not waived a portion of the Fund's expenses, total returns would have been lower.
(d) Recognition of net investment loss by the Fund is affected by the timing and declaration of dividends by the underlying investment companies in
which the Fund invests.
The accompanying notes are an integral part of these financial statements.
25
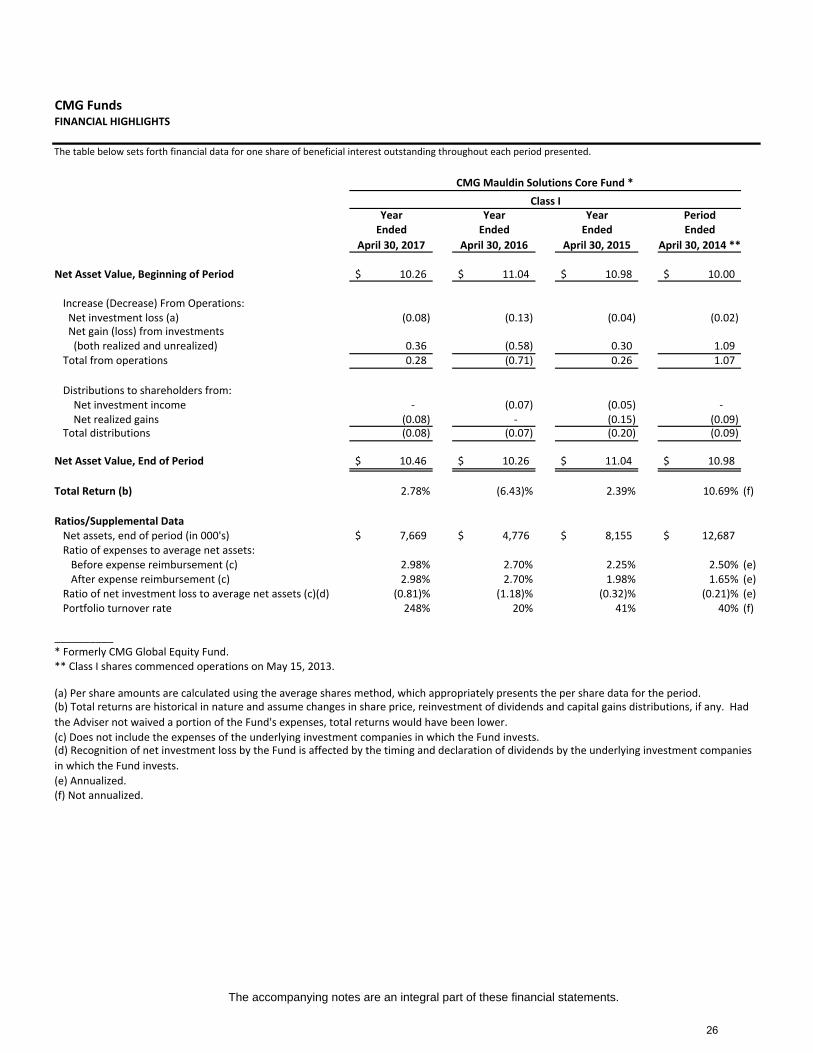
CMG FundsFINANCIAL HIGHLIGHTS
The table below sets forth financial data for one share of beneficial interest outstanding throughout each period presented.
Year Year Year PeriodEnded Ended Ended Ended
April 30, 2017 April 30, 2016 April 30, 2015 April 30, 2014 **
Net Asset Value, Beginning of Period 10.26$ 11.04$ 10.98$ 10.00$
Increase (Decrease) From Operations: Net investment loss (a) (0.08) (0.13) (0.04) (0.02) Net gain (loss) from investments (both realized and unrealized) 0.36 (0.58) 0.30 1.09 Total from operations 0.28 (0.71) 0.26 1.07
Distributions to shareholders from: Net investment income ‐ (0.07) (0.05) ‐ Net realized gains (0.08) ‐ (0.15) (0.09) Total distributions (0.08) (0.07) (0.20) (0.09)
Net Asset Value, End of Period 10.46$ 10.26$ 11.04$ 10.98$
Total Return (b) 2.78% (6.43)% 2.39% 10.69% (f)
Ratios/Supplemental DataNet assets, end of period (in 000's) 7,669$ 4,776$ 8,155$ 12,687$
Ratio of expenses to average net assets: Before expense reimbursement (c) 2.98% 2.70% 2.25% 2.50% (e) After expense reimbursement (c) 2.98% 2.70% 1.98% 1.65% (e)Ratio of net investment loss to average net assets (c)(d) (0.81)% (1.18)% (0.32)% (0.21)% (e)Portfolio turnover rate 248% 20% 41% 40% (f)
__________* Formerly CMG Global Equity Fund.** Class I shares commenced operations on May 15, 2013.
(c) Does not include the expenses of the underlying investment companies in which the Fund invests.
(e) Annualized.(f) Not annualized.
CMG Mauldin Solutions Core Fund *
Class I
(a) Per share amounts are calculated using the average shares method, which appropriately presents the per share data for the period.(b) Total returns are historical in nature and assume changes in share price, reinvestment of dividends and capital gains distributions, if any. Had
the Adviser not waived a portion of the Fund's expenses, total returns would have been lower.
(d) Recognition of net investment loss by the Fund is affected by the timing and declaration of dividends by the underlying investment companies
in which the Fund invests.
The accompanying notes are an integral part of these financial statements.
26

CMG FundsFINANCIAL HIGHLIGHTS
The table below sets forth financial data for one share of beneficial interest outstanding throughout each period presented.
Year PeriodEnded Ended
April 30, 2017 April 30, 2016 *
Net Asset Value, Beginning of Period 9.60$ 9.96$
Increase (Decrease) From Operations:
Net investment income (a) 0.23 0.12 Net gain (loss) from investments (both realized and unrealized) 0.12 (0.33) Total from operations 0.35 (0.21)
Distributions to shareholders from:
Net investment income (0.20) (0.11) Return of Capital ‐ (0.04) Total distributions (0.20) (0.15)
Net Asset Value, End of Period 9.75$ 9.60$
Total Return (b) 3.73% (2.07)% (f)
Ratios/Supplemental DataNet assets, end of period (in 000's) 1,042$ 305$
Ratio of expenses to average net assets (c) 1.82% 1.76% (e)Ratio of net investment income to average net assets (c)(d) 2.38% 1.41% (e)Portfolio turnover rate 1,268% 1,413% (f)
__________* Class A shares commenced operations on May 29, 2015.
(f) Not annualized.
(e) Annualized.
Class A
CMG Tactical Bond Fund
(a) Per share amounts are calculated using the average shares method, which appropriately presents the per share data for the period.
(b) Total returns are historical in nature and assume changes in share price, reinvestment of dividends and capital gains distributions, if any, and excludes sales
charges, if any.
(c) Does not include the expenses of the underlying investment companies in which the Fund invests.
(d) Recognition of net investment income by the Fund is affected by the timing and declaration of dividends by the underlying investment companies in which the
Fund invests.
The accompanying notes are an integral part of these financial statements.
27

CMG FundsFINANCIAL HIGHLIGHTS
The table below sets forth financial data for one share of beneficial interest outstanding throughout each period presented.
Year Year PeriodEnded Ended Ended
April 30, 2017 April 30, 2016 April 30, 2015 *
Net Asset Value, Beginning of Period 9.62$ 9.97$ 10.00$
Increase (Decrease) From Operations: Net investment income (a) 0.25 0.17 0.21 Net gain (loss) from investments (both realized and unrealized) 0.14 (0.32) (0.02) Total from operations 0.39 (0.15) 0.19
Distributions to shareholders from: Net investment income (0.26) (0.16) (0.22) Return of Capital ‐ (0.04) ‐
Total distributions (0.26) (0.20) (0.22)
Net Asset Value, End of Period 9.75$ 9.62$ 9.97$
Total Return (b) 4.13% (1.44)% 1.94% (f)
Ratios/Supplemental Data
Net assets, end of period (in 000's) 18,120$ 33,290$ 50,276$
Ratio of expenses to average net assets (c) 1.47% 1.36% 1.53% (e)
Ratio of net investment income to average net assets (c)(d) 2.61% 1.81% 3.71% (e)
Portfolio turnover rate 1,268% 1,413% 442% (f)
__________
* Class I shares commenced operations on October 6, 2014.
(e) Annualized.
(f) Not annualized.
Class I
CMG Tactical Bond Fund
(a) Per share amounts are calculated using the average shares method, which appropriately presents the per share data for the period.
(b) Total returns are historical in nature and assume changes in share price, reinvestment of dividends and capital gains distributions, if any, and excludes sales charges, if
any.
(c) Does not include the expenses of the underlying investment companies in which the Fund invests.
(d) Recognition of net investment income by the Fund is affected by the timing and declaration of dividends by the underlying investment companies in which the Fund
invests.
The accompanying notes are an integral part of these financial statements.
28

CMG FundsFINANCIAL HIGHLIGHTS
The table below sets forth financial data for one share of beneficial interest outstanding throughout each period presented.
Year PeriodEnded Ended
April 30, 2017 April 30, 2016 *
Net Asset Value, Beginning of Period 8.63$ 10.00$
Decrease From Operations: Net investment loss (a) (0.30) (0.11) Net gain (loss) from investments (both realized and unrealized) 0.55 (1.26)Total from operations 0.25 (1.37)
Net Asset Value, End of Period 8.88$ 8.63$
Total Return (b) 2.90% (13.70)% (f)
Ratios/Supplemental DataNet assets, end of period (in 000's) 14$ 30$
Ratio of expenses to average net assets: Before expense reimbursement (c) 3.82% (g) 3.53% (e,g) After expense reimbursement (c) 3.52% (g) 3.28% (e,g)Ratio of net investment loss to average net assets (c)(d) (3.39)% (g) (3.17)% (e,g)Portfolio turnover rate 0% 0% (f)
__________* Commencement of Operations on December 8, 2015.
CMG Global Macro Strategy Fund
(Consolidated)
Class A
(b) Total returns are historical in nature and assume changes in share price, reinvestment of dividends and capital gains distributions, if any, and excludes sales
charges, if any. Had the Adviser not waived a portion of the Fund's expenses, total returns would have been lower.
(a) Per share amounts are calculated using the average shares method, which appropriately presents the per share data for the period.
(c) Does not include the expenses of the underlying investment companies in which the Fund invests.(d) Recognition of net investment loss by the Fund is affected by the timing and declaration of dividends by the underlying investment companies in which the Fund
invests.(e) Annualized.(f) Not annualized.(g) Ratios include the income and expenses of DGM AEX Strategy LLC, see Note 1.
The accompanying notes are an integral part of these financial statements.
29

CMG FundsFINANCIAL HIGHLIGHTS
The table below sets forth financial data for one share of beneficial interest outstanding throughout each period presented.
Year PeriodEnded Ended
April 30, 2017 April 30, 2016 *
Net Asset Value, Beginning of Period 8.64$ 10.00$
Decrease From Operations: Net investment loss (a) (0.26) (0.11) Net gain (loss) from investments (both realized and unrealized) 0.54 (1.25) Total from operations 0.28 (1.36)
Net Asset Value, End of Period 8.92$ 8.64$
Total Return (b) 3.24% (13.60)% (f)
Ratios/Supplemental DataNet assets, end of period (in 000's) 11,290$ 14,074$
Ratio of expenses to average net assets: Before expense reimbursement (c) 3.25% (g) 3.28% (e,g) After expense reimbursement (c) 2.98% (g) 3.03% (e,g)Ratio of net investment loss to average net assets (c)(d) (2.85)% (g) (2.92)% (e,g)Portfolio turnover rate 0% 0% (f)
__________* Commencement of Operations on December 8, 2015.
(c) Does not include the expenses of the underlying investment companies in which the Fund invests.
(e) Annualized.(f) Not annualized.(g) Ratios include the income and expenses of DGM AEX Strategy LLC, see Note 1.
CMG Global Macro Strategy Fund
(Consolidated)
Class I
(a) Per share amounts are calculated using the average shares method, which appropriately presents the per share data for the period.(b) Total returns are historical in nature and assume changes in share price, reinvestment of dividends and capital gains distributions, if any, and excludes sales
charges, if any. Had the Adviser not waived a portion of the Fund's expenses, total returns would have been lower.
(d) Recognition of net investment loss by the Fund is affected by the timing and declaration of dividends by the underlying investment companies in which the Fund
invests.
The accompanying notes are an integral part of these financial statements.
30

CMG FundsFINANCIAL HIGHLIGHTS
The table below sets forth financial data for one share of beneficial interest outstanding throughout the period presented.
CMG Tactical All Asset
Strategy Fund
Class APeriodEnded
April 30, 2017 *
Net Asset Value, Beginning of Period 10.00$
Decrease From Operations: Net investment income (a) 0.03 Net gain from investments (both realized and unrealized) 0.37 Total from operations 0.40
Distributions to shareholders from: Net investment income (0.03) Net realized gains (0.05) Total distributions (0.08)
Net Asset Value, End of Period 10.32$
Total Return (b) 4.00% (f)
Ratios/Supplemental DataNet assets, end of period (in 000's) 38,741$
Ratio of expenses to average net assets (c) 1.53% (e)Ratio of net investment income to average net assets (c)(d) 0.32% (e)Portfolio turnover rate 451% (f)
__________* Commencement of Operations on May 2, 2016.
(c) Does not include the expenses of the underlying investment companies in which the Fund invests.
(e) Annualized.
(f) Not annualized.
(a) Per share amounts are calculated using the average shares method, which appropriately presents the per share data for the period.
(b) Total returns are historical in nature and assume changes in share price, reinvestment of dividends and capital gains distributions, if any, and
excludes sales charges, if any.
(d) Recognition of net investment income by the Fund is affected by the timing and declaration of dividends by the underlying investment companies
in which the Fund invests.
The accompanying notes are an integral part of these financial statements.
31

CMG FundsFINANCIAL HIGHLIGHTS
The table below sets forth financial data for one share of beneficial interest outstanding throughout the period presented.
CMG Tactical All Asset
Strategy Fund
Class IPeriodEnded
April 30, 2017 *
Net Asset Value, Beginning of Period 10.00$
Decrease From Operations: Net investment income (a) 0.06 Net gain from investments (both realized and unrealized) 0.37
Total from operations 0.43
Distributions to shareholders from: Net investment income (0.04) Net realized gains (0.05)Total distributions (0.09)
Net Asset Value, End of Period 10.34$
Total Return (b) 4.29% (f)
Ratios/Supplemental Data 5,956$Net assets, end of period (in 000's)
Ratio of expenses to average net assets (c) 1.28% (e)Ratio of net investment income to average net assets (c)(d) 0.58% (e)Portfolio turnover rate 451% (f)
__________* Commencement of Operations on May 2, 2016.
(c) Does not include the expenses of the underlying investment companies in which the Fund invests.
(e) Annualized.(f) Not annualized.
(a) Per share amounts are calculated using the average shares method, which appropriately presents the per share data for the period.
(b) Total returns are historical in nature and assume changes in share price, reinvestment of dividends and capital gains distributions, if any, and
excludes sales charges, if any.
(d) Recognition of net investment income by the Fund is affected by the timing and declaration of dividends by the underlying investment companies
in which the Fund invests.
The accompanying notes are an integral part of these financial statements.
32

CMG Funds NOTES TO FINANCIAL STATEMENTS April 30, 2017
1. ORGANIZATION
CMG Mauldin Solutions Core Fund (formerly CMG Global Equity Fund) (the “Mauldin Fund”) CMG Tactical Bond Fund (the “Bond Fund”), CMG Global Macro Strategy Fund (the “Macro Fund”) and CMG Tactical All Asset Strategy Fund (“Tactical Fund”) (each a “Fund”, collectively, the “Funds”) are each a non‐diversified series of shares of beneficial interest of the Northern Lights Fund Trust (the “Trust”), a Delaware statutory trust organized on January 19, 2005. The Trust is registered under the Investment Company Act of 1940 as amended (the “1940 Act”), as an open‐end management investment company.
The Funds currently offer Class A shares and Class I shares. Class I shares are offered at net asset value. Class A shares for all Funds except the Mauldin Fund are offered at net asset value plus a maximum sales charge of 5.75%. Each class represents an interest in the same assets of the Funds and classes are identical except for their sales charge structures and ongoing service and distribution charges. All classes of shares have equal voting privileges except that each class has exclusive voting rights with respect to the respective class’ service and/or distribution plans. Each Fund’s income, expenses (other than class specific distribution fees) and realized and unrealized gains and losses are allocated proportionately each day based upon the relative net assets of each class. The Mauldin Fund seeks capital appreciation as its investment objective. Class A and Class I of the Mauldin Fund commenced operations on May 15, 2013. The Bond Fund seeks to generate total returns over a complete market cycle through capital appreciation and income. Class I of the Bond Fund commenced operations on October 6, 2014. Class A of the Bond Fund commenced operations on May 29, 2015. The investment objective of the Macro Fund is to seek capital appreciation. Class A and Class I of the Macro Fund commenced operations on December 8, 2015. The Tactical Fund's investment objective is to generate capital appreciation. Class A and Class I of the Tactical Fund commenced operations on May 2, 2016.
Consolidation of Subsidiary – The consolidated financial statements of the Macro Fund include the financial statements of DGM AEX Strategy LLC (“DGM”) as of and for the year and period ended, April 30, 2017 and April 30, 2016, respectively. DGM is a Delaware limited liability company that was organized as a limited liability company in September 2015. DGM’s operations are subject to regulation under the Commodity Exchange Act, administered by the Commodity Futures Trading Commission (“CFTC”). DGM is a “Commodity Pool”, as defined in CFTC regulations. The general manager of DGM is P/E Global LLC (“Manager”) and is registered with the Securities and Exchange Commission as an investment adviser, and is also registered with the CFTC as a commodity pool operator and commodity trading adviser. The Manager has selected P/E Investments LLC (the “Trading Advisor”), a related entity, as DGM’s trading adviser. Beginning December 17, 2015 through April 30, 2017, the Macro Fund was a non‐voting member of DGM and owned 100% of its outstanding net assets. Shares of DGM may be subscribed or redeemed on any business day with one day’s prior written notice subject to certain timing restrictions. The Manager may waive restrictions on timing or minimum amounts of capital contributions. The Manager owns all of DGM’s management shares which are the only shares entitled to vote. All inter‐company balances, revenues, and expenses have been eliminated in consolidation.
2. SUMMARY OF SIGNIFICANT ACCOUNTING POLICIES
The following is a summary of significant accounting policies followed by the Funds in preparation of their financial statements. These policies are in conformity with accounting principles generally accepted in the United States of America (“GAAP”). The preparation of financial statements requires management to make estimates and assumptions that affect the reported amounts of assets and liabilities and disclosure of contingent assets and liabilities at the date of the financial statements and the reported amounts of income and expenses for the period. Actual results could differ from those estimates. Each Fund is an investment company and accordingly follows the investment company accounting and reporting guidance of the Financial Accounting Standards Board (FASB) Accounting Standard Codification Topic 946 "Financial Services – Investment Companies" including FASB Accounting Standard Update ASU 2013‐08.
Security Valuation – Securities listed on an exchange are valued at the last reported sale price at the close of the regular trading session of the primary exchange on the business day the value is being determined, or in the case of securities listed on NASDAQ at the NASDAQ Official Closing Price (“NOCP”). In the absence of a sale such securities shall be valued at the
33

CMG Funds NOTES TO FINANCIAL STATEMENTS (Continued) April 30, 2017
mean between the current bid and ask prices on the primary exchange on the day of valuation. Investments valued in currencies other than the U.S. dollar are converted to U.S. dollars using exchange rates obtained from pricing services. Futures and future options are valued at the final settled price or, in the absence of a settled price, at the last sale price on the day of valuation. Exchange traded options, futures and options on futures are valued at the final settle price or, in the absence of a settle price, at the last sale price on the day of valuation. Short‐term debt obligations having 60 days or less remaining until maturity, at time of purchase, may be valued at amortized cost. The Macro Fund’s investments in the private investment fund is presented at fair value as determined by the adviser. The Macro Fund’s private investment fund is subject to the terms and conditions of the respective operating agreements and offering memorandums, as appropriate. In accordance with GAAP, as a practical expedient, the fair value of the Fund’s ownership in private investment fund is determined based on the Fund’s pro‐rata interest in the net assets of each private investment fund. The private investment fund values its underlying investments at fair value in accordance with policies established by such private investment fund, as described in each of their financial statements and offering memorandums. The Macro Fund’s valuation method utilizes financial information supplied by each private investment fund and is net of management and incentive fees or allocations payable to the private investment fund’s manager pursuant to the private investment fund’s pertinent agreements. This investment is classified as Level 2 investments as they can be redeemed daily at fair value. Valuation of Fund of Funds ‐ The Funds may invest in portfolios of open‐end or closed‐end investment companies (the “underlying funds”). Underlying open‐end investment companies are valued at their respective net asset values as reported by such investment companies. The underlying funds value securities in their portfolios for which market quotations are readily available at their market values (generally the last reported sale price) and all other securities and assets at their fair value by the methods established by the Boards of the underlying funds. The shares of many closed‐end investment companies, after their initial public offering, frequently trade at a price per share, which is different than the net asset value per share. The difference represents a market premium or market discount of such shares. There can be no assurances that the market discount or market premium on shares of any closed‐end investment company purchased by the Funds will not change. Exchange Traded Funds ‐ The Funds may invest in exchange traded funds (“ETFs”). ETFs are a type of fund bought and sold on a securities exchange. An ETF trades like common stock and represents a fixed portfolio of securities. The risks of owning an ETF generally reflect the risks of owning the underlying securities they are designed to track, although the lack of liquidity on an ETF could result in it being more volatile. Additionally, ETFs have fees and expenses that reduce their value. ETF, Mutual Fund and Exchange Traded Note (“ETN”) Risk ‐ ETFs, mutual funds and ETNs are subject to investment advisory fees or management fees and other expenses, which are indirectly paid by each Fund. Each are subject to specific risks, depending on investment strategy. Also, each may be subject to leverage risk, which may magnify losses. ETNs are also subject to default risks. A Fund may hold securities, such as private investments, interests in commodity pools, other non‐traded securities or temporarily illiquid securities, for which market quotations are not readily available or are determined to be unreliable. These securities will be valued using the “fair value” procedures approved by the Trust’s Board of Trustees (“Board”). The Board has delegated execution of these procedures to a fair value team composed of one or more representatives from each of the (i) Trust, (ii) administrator, and (iii) adviser and/or sub‐adviser. The team may also enlist third party consultants such as a valuation specialist at a public accounting firm, valuation consultant or financial officer of a security issuer on an as‐needed basis to assist in determining a security‐specific fair value. The Board has also engaged a third party valuation firm to attend valuation meetings held by the Trust, review minutes of such meetings, and report to the Board on a quarterly basis. The Board reviews and ratifies the execution of this process and the resultant fair value prices at least quarterly to assure the process produces reliable results. Fair Valuation Process – As noted above, the fair value team is composed of one or more representatives from each of the (i) Trust, (ii) administrator, and (iii) adviser and/or sub‐advisers. The applicable investments are valued collectively via inputs
34
CMG Funds NOTES TO FINANCIAL STATEMENTS (Continued) April 30, 2017
from the fair value team. For example, fair value determinations are required for the following securities: (i) securities for which market quotations are insufficient or not readily available on a particular business day (including securities for which there is a short and temporary lapse in the provision of a price by the regular pricing source), (ii) securities for which, in the judgment of the adviser or sub‐adviser, the prices or values available do not represent the fair value of the instrument. Factors which may cause the adviser or sub‐adviser to make such a judgment include, but are not limited to, the following: only a bid price or an ask price is available; the spread between bid and ask prices is substantial; the frequency of sales; the thinness of the market; the size of reported trades; and actions of the securities markets, such as the suspension or limitation of trading; (iii) securities determined to be illiquid; (iv) securities with respect to which an event that will affect the value thereof has occurred since the closing prices were established on the principal exchange on which they are traded, but prior to a Fund’s calculation of its net asset value. Specifically, interests in commodity pools or managed futures pools are valued on a daily basis by reference to the closing market prices of each futures contract or other asset held by a pool, as adjusted for pool expenses. Restricted or illiquid securities, such as private investments or non‐traded securities are valued via inputs from the adviser or sub‐adviser based upon the current bid for the security from two or more independent dealers or other parties reasonably familiar with the facts and circumstances of the security (who should take into consideration all relevant factors as may be appropriate under the circumstances). If the adviser or sub‐adviser is unable to obtain a current bid from such independent dealers or other independent parties, the fair value team shall determine the fair value of such security using the following factors: (i) the type of security; (ii) the cost at date of purchase; (iii) the size and nature of the Fund's holdings; (iv) the discount from market value of unrestricted securities of the same class at the time of purchase and subsequent thereto; (v) information as to any transactions or offers with respect to the security; (vi) the nature and duration of restrictions on disposition of the security and the existence of any registration rights; (vii)how the yield of the security compares to similar securities of companies of similar or equal creditworthiness; (viii) the levelof recent trades of similar or comparable securities; (ix) the liquidity characteristics of the security; (x) current marketconditions; and (xi) the market value of any securities into which the security is convertible or exchangeable.
Each Fund utilizes various methods to measure the fair value of most of its investments on a recurring basis. GAAP establishes a hierarchy that prioritizes inputs to valuation methods. The three levels of input are:
Level 1 – Unadjusted quoted prices in active markets for identical assets and liabilities that the Funds have the ability to access.
Level 2 – Observable inputs other than quoted prices included in Level 1 for the asset or liability, either directly or indirectly. These inputs may include quoted prices for the identical instrument in an inactive market, prices for similar instruments, interest rates, prepayment speeds, credit risk, yield curves, default rates and similar data.
Level 3 – Unobservable inputs for the asset or liability, to the extent relevant observable inputs are not available, representing the Funds’ own assumptions about the assumptions a market participant would use in valuing the asset or liability, and would be based on the best information available.
The availability of observable inputs can vary from security to security and is affected by a wide variety of factors, including, for example, the type of security, whether the security is new and not yet established in the marketplace, the liquidity of markets, and other characteristics particular to the security. To the extent that valuation is based on models or inputs that are less observable or unobservable in the market, the determination of fair value requires more judgment. Accordingly, the degree of judgment exercised in determining fair value is greatest for instruments categorized in Level 3.
The inputs used to measure fair value may fall into different levels of the fair value hierarchy. In such cases, for disclosure purposes, the level in the fair value hierarchy within which the fair value measurement falls in its entirety, is determined based on the lowest level input that is significant to the fair value measurement in its entirety.
The inputs or methodology used for valuing securities are not necessarily an indication of the risk associated with investing in those securities. The following tables summarize the inputs used as of April 30, 2017 for the Funds’ assets and liabilities measured at fair value:
35

CMG Funds NOTES TO FINANCIAL STATEMENTS (Continued) April 30, 2017
Mauldin Fund: Level 1 Level 2 Level 3 Total
Assets*
Exchange‐Traded Funds 10,360,893$ ‐$ ‐$ 10,360,893$
Exchange‐Traded Notes 235,771 ‐ ‐ 235,771
Short‐Term Investments 120,526 ‐ ‐ 120,526
Total Assets 10,717,190$ ‐$ ‐$ 10,717,190$
Bond Fund: Level 1 Level 2 Level 3 Total
Assets*
Mutual Fund 16,125,843$ ‐$ ‐$ 16,125,843$
Exchange‐Traded Funds 2,814,883 ‐ ‐ 2,814,883
Short‐Term Investments 146,801 ‐ ‐ 146,801
Total Assets 19,087,527$ ‐$ ‐$ 19,087,527$
Macro Fund: Level 1 Level 2 Level 3 Total
Assets*
Exchange‐Traded Fund 5,317,256$ ‐$ ‐$ 5,317,256$
Private Investment Fund ‐ 2,847,516 ‐ 2,847,516
Short‐Term Investments 1,032,151 ‐ ‐ 1,032,151
Total Assets 6,349,407$ 2,847,516$ ‐$ 9,196,923$
Level 1 Level 2 Level 3 Total
Liabilities*
Derivative Instruments** 147,762$ ‐$ ‐$ 147,762$
Total Liabilities 147,762$ ‐$ ‐$ 147,762$
Tactical Fund: Level 1 Level 2 Level 3 Total
Assets*
Exchange‐Traded Funds 42,984,175$ ‐$ ‐$ 42,984,175$
Short‐Term Investments 1,640,984 ‐ ‐ 1,640,984
Total Assets 44,625,159$ ‐$ ‐$ 44,625,159$
*Refer to the Portfolios of Investments for industry classifications.**Derivative instruments include cumulative net unrealized loss on futures contracts open at April 30, 2017. The Funds did not hold Level 3 securities during the year.
There were no transfers between Level 1 and Level 2 during the current year presented. It is the Funds’ policy to record transfers into or out of Level 1 and Level 2 at the end of the reporting period.
Futures Contracts – The Funds are subject to equity risk in the normal course of pursuing their investment objectives. The Funds may purchase or sell futures contracts in order to gain exposure to certain markets or currencies. Upon entering into a futures contract with a broker, the Funds are required to deposit in a segregated account a specified amount of cash or U.S. government securities. Futures contracts are valued daily and unrealized gains or losses are recorded in a “variation margin” account. Periodically, the Funds receive from or pay to the broker a specified amount of cash based upon changes in the variation margin account. When a contract is closed, the Funds recognize a realized gain or loss. Futures contracts have market risks, including the risk that the change in the value of the contract may not correlate with changes in the value of the underlying securities or currencies. With futures contracts, there is minimal counterparty credit risk to the Funds since futures are exchange traded and the exchange’s clearinghouse, as counterparty to all exchange traded futures, guarantees the futures against default. Futures contracts outstanding at period end are included in the Funds’ Portfolios of Investments.
36

CMG Funds NOTES TO FINANCIAL STATEMENTS (Continued) April 30, 2017
Options Transactions – The Funds are subject to equity price risk in the normal course of pursuing their investment objectives and may purchase or sell options to help hedge against risk. When the Funds write put and call options, an amount equal to the premium received is included in the Statements of Assets and Liabilities as a liability. The amount of the liability is subsequently marked‐to‐market to reflect the current market value of the option. If an option expires on its stipulated expiration date or if the Funds enter into a closing purchase transaction, a gain or loss is realized. If a written call option is exercised, a gain or loss is realized for the sale of the underlying security and the proceeds from the sale are increased by the premium originally received. As writer of an option, the Funds have no control over whether the option will be exercised and, as a result, retain the market risk of an unfavorable change in the price of the security underlying the written option.
The Funds may purchase put and call options. Put options are purchased to hedge against a decline in the value of securities held in the Funds’ portfolios. If such a decline occurs, the put options will permit a Fund to sell the securities underlying such options at the exercise price, or to close out the options at a profit. The premium paid for a put or call option plus any transaction costs will reduce the benefit, if any, realized by the Funds upon exercise of the option, and, unless the price of the underlying security rises or declines sufficiently, the option may expire worthless to the Funds. In addition, in the event that the price of the security in connection with which an option was purchased moves in a direction favorable to a Fund, the benefits realized by the Fund as a result of such favorable movement will be reduced by the amount of the premium paid for the option and related transaction costs. Written and purchased options are non‐income producing securities. With purchased options, there is minimal counterparty risk to a Fund since these options are exchange traded and the exchange’s clearinghouse, as counterparty to all exchange traded options, guarantees against a possible default.
Offsetting of Financial Assets and Derivative Assets ‐ The Funds’ policy is to recognize a net asset or liability equal to the net appreciation (depreciation) of the derivative. The following tables show additional information regarding derivatives and the offsetting of assets and liabilities at April 30, 2017:
Macro Fund:
Liabi l i ties :
Description
Gross Amounts
of Recognized
Liabi l i ties
Gross Amounts
Offset in the
Statement of
Assets &
Liabi l i ties
Net Amounts
Presented in
the Statement
of Assets &
Liabi l i ties
Financia l
Instruments
Col latera l
Pledged/Received Net Amount
Futures contracts 147,762$ ‐$ 147,762$ ‐$ 147,762$ ‐$
Tota l 147,762$ ‐$ 147,762$ ‐$ 147,762$ ‐$
Gross Amounts Not Offset in the
Statement of Assets & Liabi l i ties
Derivatives Disclosure – Fair Values of Derivative Instruments in the Funds as of April 30, 2017:
Macro Fund:
Statements of Assets and Liabilities
Contract Type/
Primary Risk Exposure Balance Sheet Location Value
Futures on equity contracts 174,113$ *
Futures on interest rate contracts (15,206) *
Futures on currency contracts (306,669) *
Total (147,762)$
Due to Broker ‐ Variation Margin
Due to Broker ‐ Variation Margin
Due to Broker ‐ Variation Margin
*Derivative instruments include cumulative unrealized loss on futures contracts open at April 30, 2017.
37

CMG Funds NOTES TO FINANCIAL STATEMENTS (Continued) April 30, 2017
The effect of Derivative Instruments on the Statements of Operations for the year ended April 30, 2017: Mauldin Fund:
Change in
Statement of Unrealized
Operations Realized Gain Appreciation or
Contract Type/ or (Loss) on (Depreciation)
Primary Risk Exposure Derivatives on Derivatives
Futures on equity
contracts (79,204)$ 33,838$
Options on equity
purchased contracts (264,466) (5,288)
written contracts 132,068 3,128
Total (211,602)$ 31,678$
Unrealized Appreciation (Depreciation) on Option Contracts Purchased
Unrealized Appreciation (Depreciation) on Options Contracts Written
Unrealized Appreciation (Depreciation) on Futures Contracts
Net Realized Gain (Loss) on Futures Contracts/ Net Change in
Location of Gain or (Loss) On
Derivatives
Net Realized Gain (Loss) on Options Contracts Purchased/ Net Change in
Net Realized Gain (Loss) on Options Contracts Written/ Net Change in
Bond Fund:
Change in
Statement of Unrealized
Operations Realized Gain Appreciation or
Contract Type/ or (Loss) on (Depreciation)
Primary Risk Exposure Derivatives on Derivatives
Options on equity
purchased contracts (16,992)$ (38,484)$
written contracts 465 21,818
Total (16,527)$ (16,666)$
Unrealized Appreciation (Depreciation) on Option Contracts Purchased
Unrealized Appreciation (Depreciation) on Options Contracts Written
Location of Gain or (Loss) On
Derivatives
Net Realized Gain (Loss) on Options Contracts Purchased/ Net Change in
Net Realized Gain (Loss) on Options Contracts Written/ Net Change in
Macro Fund:
Change in
Statement of Unrealized
Operations Realized Gain Appreciation or
Contract Type/ or (Loss) on (Depreciation)
Primary Risk Exposure Derivatives on Derivatives
Futures on equity
contracts (305,082)$ 275,830$
Futures on interest
rate contracts (415,770) 134,307
Futures on currency
contracts 818,509 166,777
Total 97,657$ 576,914$
Unrealized Appreciation (Depreciation) on Futures Contracts
Unrealized Appreciation (Depreciation) on Futures Contracts
Net Realized Gain (Loss) on Futures Contracts/ Net Change in
Unrealized Appreciation (Depreciation) on Futures Contracts
Net Realized Gain (Loss) on Futures Contracts/ Net Change in
Location of Gain or (Loss) On
Derivatives
Net Realized Gain (Loss) on Futures Contracts/ Net Change in
The derivative instruments outstanding as of April 30, 2017 as disclosed in each Fund’s Portfolio of Investments and the amount of realized and change in unrealized gains and losses on derivative instruments during the period as disclosed in each Fund’s Statement of Operations serves as an indicator of the volume of derivative activity for the Funds.
38

CMG Funds NOTES TO FINANCIAL STATEMENTS (Continued) April 30, 2017
Security Transactions and Investment Income – Investment security transactions are accounted for on a trade date basis. Cost is determined and gains and losses are based upon the specific identification method for both financial statement and Federal income tax purposes. Dividend income is recorded on the ex‐dividend date and interest income is recorded on an accrual basis. Purchase discounts and premiums on securities are accreted and amortized over the life of the respective securities. Foreign Currency Translations – All assets and liabilities denominated in foreign currencies are translated into U.S. dollars based on the rate of exchange of such currencies against U.S. dollars on the date of valuation. Purchases and sales of securities and income and expenses are translated at the rate of exchange quoted on the respective date that such transactions are recorded. The Funds do not isolate the portion of the results of operations resulting from changes in foreign exchange rates on investments from the fluctuations arising from changes in market prices of securities held. Expenses – Expenses of the Trust that are directly identifiable to a specific fund are charged to that fund. Expenses, which are not readily identifiable to a specific fund, are allocated in such a manner as deemed equitable, taking into consideration the nature and type of expense and the relative sizes of the funds in the Trust. Organizational Costs – Organizational costs of $6,805 were charged to expenses as incurred in the Tactical Fund. Deferred organizational costs incurred by the Fund of $6,028 were treated as deferred charges and will be amortized over a 12 month period using the straight line method. Federal Income Taxes – The Funds intend to continue to comply with the requirements of Subchapter M of the Internal Revenue Code applicable to regulated investment companies and will distribute all of their taxable income, if any, to shareholders. Accordingly, no provision for Federal income taxes is required in the financial statements. The Funds recognize the tax benefits of uncertain tax positions only when the position is “more likely than not” to be sustained assuming examination by tax authorities. Management has analyzed the Funds’ tax positions and has concluded that no liability for unrecognized tax benefits should be recorded related to uncertain tax positions taken on returns filed for open tax years ended April 30, 2014 to April 30, 2016, or expected to be taken in the Funds’ April 30, 2017 year‐end tax returns. The Funds identify their major tax jurisdictions as U.S. Federal, Nebraska and foreign jurisdictions where the Funds make significant investments. The Funds are not aware of any tax positions for which it is reasonably possible that the total amounts of unrecognized tax benefits will change materially in the next twelve months. Distributions to Shareholders – Distributions from investment income and net realized capital gains, if any, are declared and paid at least annually and are recorded on the ex‐dividend date. The character of income and gains to be distributed is determined in accordance with income tax regulations, which may differ from GAAP. These “book/tax” differences are considered either temporary (e.g., deferred losses, mark‐to‐market on open Section 1256 contracts) or permanent in nature. To the extent these differences are permanent in nature, such amounts are reclassified within the composition of net assets based on their Federal tax‐basis treatment; temporary differences do not require reclassification. These reclassifications have no effect on net assets, results from operations or net asset value per share of the Funds. Indemnification – The Trust indemnifies its officers and trustees for certain liabilities that may arise from the performance of their duties to the Trust. Additionally, in the normal course of business, the Funds enter into contracts that contain a variety of representations and warranties and which provide general indemnities. The Funds’ maximum exposure under these arrangements is unknown, as this would involve future claims that may be made against the Funds that have not yet occurred. However, based on experience, the risk of loss due to these warranties and indemnities appears to be remote. 3. INVESTMENT ADVISORY AGREEMENT AND TRANSACTIONS WITH RELATED PARTIES Advisory Fees – Pursuant to an investment advisory agreement between the adviser and the Trust, with respect to the Funds (the “Advisory Agreement”), investment advisory services are provided to the Funds by CMG Capital Management Group,
39

CMG Funds NOTES TO FINANCIAL STATEMENTS (Continued) April 30, 2017
Inc. (the “Adviser”). Under the terms of the Advisory Agreement, the Adviser receives monthly fees calculated at an annual rate of 1.05% (1.25% through March 10, 2017), 0.95%, 1.00% and 0.75% of the average daily net assets of the Mauldin Fund, Bond Fund, Macro Fund and Tactical Fund, respectively. For the year ended April 30, 2017, the Adviser earned advisory fees of $85,756 for the Mauldin Fund, $231,572 for the Bond Fund, $123,526 for the Macro Fund and $165,810 for the Tactical Fund. The Adviser manages a portion of the Funds’ portfolios directly and may allocate the remaining balance of the Funds’ assets among the Funds’ sub‐advisers. The Mauldin Fund’s sub‐adviser is Mauldin Solutions, LLC. Prior to March 11, 2017, AlphaSimplex Group, LLC was the sub‐adviser. The Adviser pays each sub‐adviser a portion of its advisory fee. The Funds do not directly pay the sub‐advisers. The Adviser has contractually agreed to waive 0.25% of its management fee for the Macro Fund at least through August 31, 2017. The total management fees contractually waived by the Adviser for the year ended, April 30, 2017 amounted to $30,882. DGM Management Fee: DGM will pay the Manager a management fee based on 0.30147% per month (3.62% per annum) of the net asset value of DGM. Management fees were $107,103 for the year ended, April 30, 2017, of which $7,387 was due as of April 30, 2017. DGM Performance Fee: DGM may also pay the Manager a performance fee equal to twenty percent (20%) of the increase, if any, in the net asset value per share of DGM (after calculation and accrual of the management fees) determined as of the last business day of each month over the highest net asset value per share in any prior month, multiplied by the number of shares outstanding on the valuation date. The performance fees were $0 for the year ended April 30, 2017. Distributor – The distributor of the Funds is Northern Lights Distributors, LLC (the “Distributor”). The Trust has adopted, on behalf of the Funds, the Trust’s Master Distribution and Shareholder Servicing Plan (the “Plan”), as amended, pursuant to Rule 12b‐1 under the 1940 Act, to pay for certain distribution activities and shareholder services. Under the Plan, the Mauldin Fund may pay up to 0.25% for Class A shares, the Bond Fund may pay up to 0.40% for Class A shares, the Macro Fund may pay up to 0.25% for Class A shares, and the Tactical Fund may pay up to 0.25% for Class A shares per year of its average daily net assets for such distribution and shareholder service activities. During the year ended April 30, 2017, $8,189, $2,490, $30 and $48,602 were accrued under the Plan for the Mauldin Fund, Bond Fund, Macro Fund, and Tactical Fund, respectively. As of April 30, 2017, the Board has not implemented the Plan with respect to the Class I shares of the Funds and no distribution fees have been accrued against the net assets of that class for the year ended April 30, 2017. The Distributor acts as the Funds’ principal underwriter in a continuous public offering of the Funds’ shares. For the year ended April 30, 2017, the Distributor received underwriter commissions of $3,778 for sales of Class A shares, of which $505 was retained by the principal underwriter or other affiliated broker‐dealers. In addition, certain affiliates of the Distributor provide services to the Funds as follows: Gemini Fund Services, LLC (“GFS”) – an affiliate of the Distributor, provides administration, fund accounting, and transfer agent services to the Trust. Pursuant to an administrative servicing agreement with GFS, each Fund pays GFS customary fees based on aggregate net assets of the Funds as described in the servicing agreement for providing administration, fund accounting, and transfer agency services to the Funds. In accordance with this agreement, GFS pays for all other operating expenses for the Funds, including but not limited to legal fees, audit fees, compliance services and custody fees. As of April 30, 2017, the amounts owed to GFS were $10,395, $8,706, $19,549 and $12,218 for the Mauldin Fund, Bond Fund, Macro Fund and Tactical Fund, respectively. GFS waived $10,077 in administration fee minimums in the Mauldin Fund for a year beginning in March 2017. A Trustee and certain officers of the Trust are also officers of GFS, and are not paid any fees directly by the Funds for serving in such capacities.
Northern Lights Compliance Services, LLC (“NLCS”) – NLCS, an affiliate of GFS and the Distributor, provides a Chief Compliance Officer to the Trust, as well as related compliance services, pursuant to a consulting agreement between NLCS and the Trust. Under the terms of such agreement, NLCS receives customary fees from the Funds.
40

CMG Funds NOTES TO FINANCIAL STATEMENTS (Continued) April 30, 2017
Blu Giant, LLC (“Blu Giant”) – Blu Giant, an affiliate of GFS and the Distributor, provides EDGAR conversion and filing services as well as print management services for the Funds on an ad‐hoc basis. For the provision of these services, Blu Giant receives customary fees from the Funds.
4. INVESTMENT TRANSACTIONS
The cost of purchases and proceeds from the sale of securities, other than short‐term investments and U.S. Government securities, for the year ended April 30, 2017 amounted to $18,958,005 and $16,569,974, respectively, for the Mauldin Fund, $294,744,177 and $308,346,565, respectively, for the Bond Fund, $0 and $1,698,633, respectively, for the Macro Fund, and $155,765,511 and $113,560,003, respectively, for the Tactical Fund.
5. OPTION CONTRACTS WRITTEN
The number of option contracts written and the premiums received by the Funds during the year ended April 30, 2017 were as follows:
Number of Premiums Number of Premiums
Put Options Contracts Received Contracts Received
Options outstanding, beginning of year 414 20,308$ 900 67,282$
Options written 3,506 259,302 1,700 165,418
Options closed (3,920) (279,610) (2,600) (232,700)
Options expired ‐ ‐ ‐ ‐
Options outstanding, end of year ‐ ‐$ ‐ ‐$
Mauldin Fund Bond Fund
6. INVESTMENTS IN AFFILIATED COMPANIES
The fund listed as an affiliate on the Macro Fund’s consolidated portfolio of investments is considered an affiliate because it is under common control with DGM. Global Macro Strategy LLC’s investment objective is similar to that of the Macro Fund and invests in a diversified portfolio of foreign currency, equity index, and government bond‐linked futures contracts. There is no public trading market for the shares of Global Macro Strategy LLC and shares have limited transferability.
Transactions during the year with companies which are affiliates are as follows:
7. DISTRIBUTIONS TO SHAREHOLDERS AND TAX COMPONENTS OF CAPITAL
The tax character of distributions paid during the years ended April 30, 2017 and April 30, 2016 were as follows:
Description
Value‐
Beginning of
Year Purchases Sales Proceeds
Interest
Income
Realized
Gain/Loss
Change in
Unrealized
Gain/Loss
Value ‐ End
of Year
Global Macro Strategy LLC 3,436,367$ ‐$ (725,000)$ ‐$ (76,587)$ 212,736$ 2,847,516$ Shares ‐ End
of Year
3,161
41

CMG Funds NOTES TO FINANCIAL STATEMENTS (Continued) April 30, 2017
As of April 30, 2017, the components of accumulated earnings/ (deficit) on a tax basis were as follows:
The difference between book basis and tax basis undistributed net investment income/(loss), accumulated net realized gain/(loss), and unrealized appreciation/(depreciation) from investments is primarily attributable to the tax deferral of losses on wash sales, tax adjustments for partnerships, and the mark‐to‐market on open 1256 futures contracts. Late year losses incurred after December 31 within the fiscal year are deemed to arise on the first business day of the following fiscal year for tax purposes. The Funds incurred and elected to defer such late year losses were as follows:
At April 30, 2017, the Funds had capital loss carry forwards for federal income tax purposes available to offset future capital gains as follows:
For the year ended April 30, 2017:
Ordinary Long‐Term
Income Capital Gains Total
CMG Mauldin Solutions Core Fund ‐$ 48,011$ 48,011$
CMG Tactical Bond Fund 627,073 ‐ 627,073
CMG Global Macro Strategy Fund ‐ ‐ ‐
CMG Tactical All Asset Strategy Fund 229,853 ‐ 229,853
For the year ended April 30, 2016:
Ordinary Long‐Term Return of Capital
Income Capital Gains Capital Total
CMG Mauldin Solutions Core Fund 61,144$ ‐$ ‐$ 61,144$
CMG Tactical Bond Fund 821,146 ‐ 214,590 1,035,736
CMG Global Macro Strategy Fund ‐ ‐ ‐ ‐
42

CMG Funds NOTES TO FINANCIAL STATEMENTS (Continued) April 30, 2017
Permanent book and tax differences, primarily attributable to the book/tax basis treatment of foreign currency gains/(losses), net operating losses and short‐term capital gains, the reclassification of Fund distributions and tax adjustments for partnerships, grantor trusts, C‐Corporation return of capital distributions and passive foreign investment companies, resulted in reclassifications for the Funds for the year ended April 30, 2017 as follows:
8. UNDERLYING INVESTMENT IN OTHER INVESTMENT COMPANIES The Bond Fund currently invests a portion of its assets in the PIMCO High Yield Fund ‐ Institutional Shares (“PIMCO”). The Bond Fund may redeem its investments from PIMCO at any time if the Adviser determines that it is in the best interest of the Bond Fund and its shareholders to do so. The performance of the Bond Fund may be directly affected by the performance of PIMCO. The financial statements of PIMCO, including the portfolio of investments, can be found at the SEC website www.sec.gov and should be read in conjunction with the Bond Fund’s financial statements. As of April 30, 2017, the percentage of the Bond Fund’s net assets invested in PIMCO was 84.1%. The Macro Fund currently invests a portion of its assets in the SPDR Bloomberg Barclays 1‐3 Month T‐Bill ETF (“ETF”). The Macro Fund may sell investments in ETF at any time if the Adviser determines that it is in the best interest of the Macro Fund and its shareholders to do so. The performance of the Macro Fund may be directly affected by the performance of ETF. The financial statements of ETF, including the portfolio of investments, can be found at the SEC website www.sec.gov and should be read in conjunction with the Macro Fund’s financial statements. As of April 30, 2017, the percentage of the Macro Fund’s net assets invested in ETF was 47.0%. 9. NEW ACCOUNTING PRONOUNCEMENT On October 13, 2016, the Securities and Exchange Commission amended existing rules intended to modernize reporting and disclosure of information. These amendments relate to Regulation S‐X which sets forth the form and content of financial statements. At this time, management is evaluating the implications of adopting these amendments and their impact on the financial statements and accompanying notes. 10. SUBSEQUENT EVENTS Subsequent events after the date of the Statements of Assets and Liabilities have been evaluated through the date the financial statements were issued. Management has concluded that there is no impact requiring adjustment or disclosure in the financial statements other than the following. The Board adopted a plan of liquidation on April 21, 2017 for the Macro Fund. The Macro Fund was closed and all outstanding shares were redeemed on May 26, 2017.
Paid Undistributed UndistributedIn Ordinary Net Realized
Capital Income (Loss) Gains (Loss)
CMG Mauldin Solutions Core Fund (13,857)$ 120,051$ (106,194)$
CMG Global Macro Strategy Fund (740,564) 457,641 282,923
CMG Tactical All Asset Strategy Fund (1,847) 4,256 (2,409)
43

REPORT OF INDEPENDENT REGISTERED PUBLIC ACCOUNTING FIRM To the Board of Trustees of Northern Lights Fund Trust and the Shareholders of CMG Mauldin Solutions Core Fund, CMG Tactical Bond Fund, CMG Global Macro Strategy Fund, and CMG Tactical All Asset Strategy Fund We have audited the accompanying statements of assets and liabilities of CMG Mauldin Solutions Core Fund (formerly CMG Global Equity Fund), and CMG Tactical Bond Fund, each a series of shares of beneficial interest in Northern Lights Fund Trust (the “Funds”), including the portfolios of investments, as of April 30, 2017, and the related statements of operations for the year then ended, the statements of changes in net assets for each of the years in the two-year period then ended and the financial highlights for each of the years or periods presented. We have also audited the accompanying consolidated statement of assets and liabilities of the CMG Global Macro Strategy Fund, a series of shares of beneficial interest in Northern Lights Fund Trust, including the consolidated portfolio of investments, as of April 30, 2017, and the related consolidated statement of operations for the year then ended and the consolidated statements of changes in net assets and consolidated financial highlights for the year then ended and for the period December 8, 2015 (commencement of operations) through April 30, 2016. We have also audited the accompanying statement of asset and liabilities of the CMG Tactical All Asset Strategy Fund, a series of shares of beneficial interest in Northern Lights Fund Trust, including the portfolio of investments, as of April 30, 2017, and the related statements of operations and changes in net assets and the financial highlights for the period May 2, 2016 (commencement of operations) through April 30, 2017. These financial statements and financial highlights are the responsibility of the Funds’ management. Our responsibility is to express an opinion on these financial statements and financial highlights based on our audits. We did not audit the financial statements for the year ended April 30, 2017 of DGM AEX Strategy LLC, a wholly-owned subsidiary of CMG Global Macro Strategy Fund, whose statements reflect net assets of $2,420,923 as of April 30, 2017 and total revenue of $5,292 for the year then ended. Those statements were audited by other auditors whose reports have been furnished to us, and our opinion, insofar as it relates to the amounts included for DGM AEX Strategy LLC, is based solely on the reports of the other auditors. We conducted our audits in accordance with the standards of the Public Company Accounting Oversight Board (United States). Those standards require that we plan and perform the audits to obtain reasonable assurance about whether the financial statements and financial highlights are free of material misstatement. An audit includes examining, on a test basis, evidence supporting the amounts and disclosures in the financial statements. Our procedures included confirmation of securities owned as of April 30, 2017 by correspondence with the custodian, brokers, and other parties or by other appropriate auditing procedures where replies from brokers were not received. An audit also includes assessing the accounting principles used and significant estimates made by management, as well as evaluating the overall financial statement presentation. We believe that our audits and the report of other auditors provide a reasonable basis for our opinion.
44

In our opinion, the financial statements and financial highlights referred to above present fairly, in all material respects, the financial position of CMG Mauldin Solutions Core Fund and CMG Tactical Bond Fund, as of April 30, 2017, the results of their operations for the year then ended, the changes in their net assets for each of the years in the two-year period then ended, and their financial highlights for each of the years and periods presented, in conformity with accounting principles generally accepted in the United States of America. Also in our opinion, based on our audits and the reports of other auditors, the consolidated financial statements and financial highlights referred to above present fairly in all material respect, the consolidated financial position of the CMG Global Macro Strategy Fund, as of April 30, 2017, the consolidated results of its operations for the year then ended and the consolidated statements of changes in net assets and its consolidated financial highlights for the year then ended and for the period December 8, 2015 through April 30, 2016, in conformity with accounting principles generally accepted in the United States of America. Also, in our opinion, the financial statements and financial highlights referred to above present fairly, in all material respects, the financial position of CMG Tactical All Asset Strategy as of April 30, 2017, the results of its operations, the changes in its net assets and its financial highlights for the period May 2, 2016 through April 30, 2017, in conformity with accounting principles generally accepted in the United States of America.
BBD, LLP
Philadelphia, Pennsylvania June 28, 2017
45

CMG Funds EXPENSE EXAMPLES (Unaudited)
April 30, 2017
As a shareholder of the Funds, you incur two types of costs: (1) transaction costs, including sales charges (loads) on purchases; (2) ongoing costs, including management fees; distribution and/or service (12b‐1) fees; and other Fund expenses. This example is intended to help you understand your ongoing costs (in dollars) of investing in the Funds and to compare these costs with the ongoing costs of investing in other mutual funds.
The example is based on an investment of $1,000 invested at the beginning of the period and held for the entire period from November 1, 2016 through April 30, 2017.
Actual Expenses
The “Actual” line in the table below provides information about actual account values and actual expenses. You may use the information below, together with the amount you invested, to estimate the expenses that you paid over the period. Simply divide your account value by $1,000 (for example, an $8,600 account value divided by $1,000 = 8.6), then multiply the result by the number in the table under the heading entitled “Expenses Paid During Period” to estimate the expenses you paid on your account during this period.
Hypothetical Example for Comparison Purposes
The “Hypothetical” line in the table below provides information about hypothetical account values and hypothetical expenses based on a Fund’s actual expense ratio and an assumed rate of return of 5% per year before expenses, which is not the Fund’s actual return. The hypothetical account values and expenses may not be used to estimate the actual ending account balances or expenses you paid for the period. You may use this information to compare this 5% hypothetical example with the 5% hypothetical examples that appear in the shareholder reports of other funds.
Please note that the expenses shown in the table are meant to highlight your ongoing costs only and do not reflect any transactional costs such as front‐end or contingent deferred sales charges (loads). Therefore, the table is useful in comparing ongoing costs only, and will not help you determine the relative total costs of owning different funds. In addition, if these transactional costs were included, your costs would have been higher.
Class A
Fund's
Annualized
Expense Ratio
Beginning
Account Value
11/1/16
Ending
Account Value
4/30/17
Expenses
Paid During
Period *
Ending
Account Value
4/30/17
Expenses
Paid During
Period *
Mauldin Fund 3.33% $1,000.00 $1,075.40 $17.14 $1,008.28 $16.58
Bond Fund 1.75% $1,000.00 $1,026.10 $8.79 $1,016.18 $8.75
Macro Fund 3.27% $1,000.00 $1,064.70 $16.74 ** $1,008.58 $16.29
Tactical Fund 1.39% $1,000.00 $1,034.90 $7.01 $1,017.91 $6.95
Class I
Mauldin Fund 2.76% $1,000.00 $1,077.10 $14.21 $1,011.11 $13.76
Bond Fund 1.40% $1,000.00 $1,028.00 $7.04 $1,017.85 $7.00
Macro Fund 3.02% $1,000.00 $1,067.00 $15.48 ** $1,009.82 $15.05
Tactical Fund 1.13% $1,000.00 $1,036.70 $5.72 $1,019.18 $5.67
Actual
Hypothetical
(5% return before expenses)
* Expenses are equal to the average account value over the period, multiplied by the Funds’ annualizedexpense ratio, multiplied by the number of days in the six‐month period ended April 30, 2017 (181) divided bythe number of days in the fiscal year (365).** Ratios include the expenses of DGM AEX Strategy LLC.
46

CMG Funds Renewal of Advisory Agreement (Unaudited) April 30, 2017
CMG Global Equity Fund, CMG Long/Short Fund, CMG Global Macro Strategy Fund, and CMG Tactical Bond Fund (Adviser – CMG Capital Management Group, Inc.)*
In connection with the regular meeting held on December 6-7, 2016 of the Board of Trustees (the “Trustees” or the “Board”) of the Northern Lights Fund Trust (the “Trust”), including a majority of the Trustees who are not “interested persons,” as that term is defined in the Investment Company Act of 1940, as amended, discussed the renewal of an investment advisory agreement (the “Advisory Agreement”) between CMG Capital Management Group, Inc. (“CMG”) and the Trust, with respect to the CMG Global Equity Fund, CMG Long/Short Fund, CMG Global Macro Strategy Fund, and CMG Tactical Bond Fund (each a “Fund”, and collectively the “Funds”). In considering the approval of the Advisory Agreement, the Board received materials specifically relating to the Advisory Agreement.
The Trustees were assisted by independent legal counsel throughout the Advisory Agreement review process. The Trustees relied upon the advice of independent legal counsel and their own business judgment in determining the material factors to be considered in evaluating the Advisory Agreement and the weight to be given to each such factor. The conclusions reached by the Trustees were based on a comprehensive evaluation of all of the information provided and were not the result of any one factor. Moreover, each Trustee may have afforded different weight to the various factors in reaching his conclusions with respect to the Advisory Agreement.
Nature, Extent and Quality of Services. The Trustees noted that CMG managed approximately $378 million in assets directly and consulted on an additional $508 million while specializing in structuring and managing tactical investment strategies through separately managed accounts, mutual funds, and variable annuities for a wide array of clients. The Trustees reviewed the background information of the key investment professionals servicing the Funds and noted their satisfaction with the team’s experience managing tactical strategies in equities, fixed income, and long short investments. The Trustees reviewed the adviser’s investment process with respect to each Fund. The Trustees acknowledged that the adviser had over a decade of experience conducting due diligence on third party managers, analyzing their investment strategies, providing ongoing trade oversight, monitoring and reviewing performance, business operations, and compliance. The Trustees reviewed the adviser’s broker-dealer selection approach noting they take into consideration various qualitative service factors relevant to providing best execution. The Trustees noted that the adviser reported no material compliance issues to the Board during the past year. The Trustees acknowledged that the adviser had a solid risk management culture and noted the relationships between the adviser and sub-advisers appeared to be working well. The Trustees concluded that CMG Capital should continue to deliver consistent quality service to the CMG Funds for the benefit of the shareholders.
Performance.
CMG Global Equity Fund. The Trustees noted that the Fund’s performance over the past year underperformed its peer group, its adviser selected benchmark, as well as its assigned Morningstar category. They further noted that the Fund’s level of underperformance was consistent over the two and three year periods as well, and that in each of these periods, the Fund had shown negative performance. The Trustees acknowledged that over the past year, the Fund had captured less market
47

CMG Funds Renewal of Advisory Agreement (Unaudited) (Continued) April 30, 2017
upside as compared to its Morningstar category, but had also captured less market downside. The Trustees concluded that this demonstrated the adviser’s ability to reduce the Fund’s volatility, despite the Fund’s poor performance. The Trustees concluded that the adviser should be retained to give it the opportunity to demonstrate better performance for shareholders but requested that the adviser provide the Board with an updated performance report for the Fund at the March Board meeting.
CMG Global Macro Strategy Fund. The Trustees noted that the Fund had reported a negative return for the year while also underperforming its peer group, its adviser selected benchmark, and its assigned Morningstar category for that period. They further noted their belief that while the Fund had experienced negative performance and intra-year volatility, the adviser had positioned the Fund to provide total returns over a full market cycle. The Trustees concluded that the adviser should be given the opportunity to demonstrate better performance for shareholders for another year in order to fully report on benchmarks and comparative performance.
CMG Long/Short Fund. The Trustees considered the performance of the Fund, noting that it significantly underperformed its peer group average, its benchmark index, and its assigned Morningstar category average over the 1-year, 2-year, and 3-year periods. The Trustees discussed that the adviser acknowledged the fact that the Fund’s strategy had not worked well, and was reviewing potential changes. The Trustees concluded that, based on the small size of the Fund and the degradation of performance and assets, the adviser should be given the opportunity to implement a new strategy for the Fund, but must provide the Board with an updated performance report at its Board meeting in March.
CMG Tactical Bond Fund. The Trustees noted that the Fund produced a positive return during the past one year period, but also underperformed its peer group average, its adviser selected benchmark, and its assigned Morningstar category during the same period. The Trustees recognized that the Fund was managed using a trend following strategy and noted that the adviser had acknowledged the fact that the Fund was exposed to whipsaw market moves. The Trustees concluded that, based on the Fund’s short-term performance, the adviser should be given the opportunity to demonstrate positive performance for shareholders over a full market cycle.
Fees and Expenses.
CMG Global Equity Fund. The Trustees noted that the adviser charges an advisory fee of 1.25%, which was higher than its peer group average and its Morningstar category average, but further noted that it was well within the range of both. The Trustees discussed the fact that the higher fees can be considered partly the result of the active volatility management component of the strategy. The Trustees noted that the net expense ratio of the Fund was higher than the highest net expense ratio within its peer group, and higher than its Morningstar category, but was within the range of net expense ratios in the Morningstar category. The Trustees considered the adviser’s assertion that the relatively small size of the Fund affected the net expense ratio comparison. After discussion, the Trustees concluded that the advisory fee charged by CMG was reasonable.
CMG Global Macro Strategy Fund. The Trustees noted that the adviser charged an advisory fee of 1.00%, but earned a fee of 0.75% after expense waiver, both of which were lower than both its peer group average and its Morningstar category average. The Trustees noted that the net expense ratio of the Fund was higher than the highest net expense ratio within its peer group, and higher than its
48

CMG Funds Renewal of Advisory Agreement (Unaudited) (Continued) April 30, 2017
Morningstar category, but was within the range of net expense ratios in the Morningstar category. The Trustees considered the adviser’s assertion that the relatively small size of the Fund affected the net expense ratio comparison. After discussion, the Trustees concluded that the advisory fee charged by CMG was reasonable.
CMG Long/Short Fund. The Trustees noted that the adviser charged an advisory fee of 1.00%, which was higher than both its peer group average and its Morningstar category average, but well within the range of both. The Trustees noted that the net expense ratio of the Fund was higher than the highest net expense ratio within its peer group, and higher than its Morningstar category average, but was within the range of net expense ratios in the Morningstar category. The Trustees considered the adviser’s assertion that the relatively small size of the Fund affected the net expense ratio comparison. After discussion, the Trustees concluded that the advisory fee charged by CMG was reasonable.
CMG Tactical Bond Fund. The Trustees noted that the adviser charges an advisory fee of 0.95%, which was higher than both its peer group average and its Morningstar category average. The Trustees noted that the net expense ratio of the Fund was slightly higher than the net expense ratio average of its peer group, and higher than its Morningstar category, but was well within the range of both metrics. After discussion, the Trustees concluded that the advisory fee charged by CMG was reasonable.
Economies of Scale. The Trustees noted that the adviser anticipates that each Fund would benefit from economies of scale in terms of lower administration and other operating costs once the assets in the Funds reached $325 million in the aggregate. The Trustees agreed with the adviser’s assessment that each Fund’s current asset levels were not high enough to support breakpoints at this time. After discussion, the Trustees agreed that based on the current and anticipated size of each Fund, asset levels do not warrant breakpoints at this time, but the adviser’s economies of scale would be revisited at the next renewal and as the size of either Fund materially increases.
Profitability. The Trustees considered the profits realized by the adviser in connection with the advisory services rendered to each Fund and whether the amount of profit is a fair entrepreneurial profit with respect to the advisory services provided to each Fund. The Trustees also considered the benefits realized by the adviser from other activities related to each Fund, and noted that the adviser received a small amount of 12b-1 fees to offset distribution expenses for CMG Global. The Trustees concluded that based on the profitability information provided by the adviser, the adviser realized a loss from its relationship with each of the Funds.
Conclusion. Having requested and received such information from the adviser as the Trustees believed to be reasonably necessary to evaluate the terms of the advisory agreement, and as assisted by the advice of independent counsel, the Trustees concluded that the advisory fee was reasonable and that renewal of the advisory agreement was in the best interests of the shareholders of the Funds.
*Due to the timing of the contract renewal schedule, these deliberations may or may not relate to the current performance results of the Funds.
49

CMG Funds Renewal of Advisory Agreement (Unaudited) (Continued) April 30, 2017
CMG Mauldin Solutions Core Fund (Sub-Adviser – Mauldin Solutions, LLC)*
In connection with the regular meeting held on March 1-2, 2017 of the Board of Trustees (the
“Trustees” or the “Board”) of the Northern Lights Fund Trust (the “Trust”), including a majority of the Trustees who are not “interested persons,” as that term is defined in the Investment Company Act of 1940, as amended, discussed the renewal of an sub advisory agreement (the “Sub-Advisory Agreement”) between Mauldin Solutions, LLC (“Mauldin”) and the Trust, with respect to the CMG Mauldin Solutions Core Fund (the “Fund”). In considering the approval of the Sub-Advisory Agreement, the Board received materials specifically relating to the Sub-Advisory Agreement.
The Trustees were assisted by independent legal counsel throughout the Sub-Advisory
Agreement review process. The Trustees relied upon the advice of independent legal counsel and their own business judgment in determining the material factors to be considered in evaluating the Sub-Advisory Agreement and the weight to be given to each such factor. The conclusions reached by the Trustees were based on a comprehensive evaluation of all of the information provided and were not the result of any one factor. Moreover, each Trustee may have afforded different weight to the various factors in reaching his conclusions with respect to the Sub-Advisory Agreement.
Nature, Extent and Quality of Service. The Trustees observed that Mauldin was founded in 1999 and was part of a group of firms whose purpose was to provide various financial and investment services, under the management of John Mauldin. They reviewed the background information of the personnel that would be responsible for sub-advising the Fund, noting that the sub-adviser's principal, John Mauldin, is experienced with alternative investments and hedge funds, and is a well-known financial authority, analyst, best-selling author, and contributor to various financial news publications and financial news networks. The Trustees acknowledged that Mauldin would conduct research, evaluations, and oversight of a group of signal providers, recommending asset allocations and blending strategies in order to build the Fund's portfolio. The Trustees also acknowledged that Mauldin would conduct periodic due diligence on existing and potential signal providers. The Trustees recognized that Mauldin would evaluate signal providers on a variety of factors including cost of securities, performance, implementation of strategy, and impact to the Fund's overall strategy, taking steps to replace any signal provider that does not meet expectations. The Trustees confirmed that the adviser would retain responsibility for trade execution, broker-dealer selection, and monitoring compliance with the Fund’s investment limitations. The Trustees observed that Mauldin reported no litigation or compliance issues over the past 36 months. The Board concluded that Mauldin had the potential to provide quality service to the Fund, Adviser, and the Fund’s shareholders.
Performance. The Trustees considered the proposed revisions to the Fund’s strategy. The
Trustees discussed the nature of the sub-adviser’s strategy and the types of assets used to execute that strategy. They considered the projected performance of the strategy as compared to a blended benchmark over the 1-year period ended December 31, 2016. The Trustees discussed Mauldin’s lack of historical performance, but recognized that the adviser’s supervisory relationship with Mauldin through the sub-advisory agreement was a significant factor in their deliberations. After discussion, the Trustees concluded that the sub-adviser had the potential to provide reasonable performance for shareholders.
Fees and Expenses. The Trustees noted the proposed sub-advisory fee, and observed that
Mauldin did not manage any similar accounts to which the proposed fee could be compared. The
50

CMG Funds Renewal of Advisory Agreement (Unaudited) (Continued) April 30, 2017
Trustees considered the resources to be devoted to the Fund by Mauldin and the payments to be made by Mauldin to signal providers, including the adviser. After discussion, the Trustees concluded that the proposed sub-advisory fee was reasonable.
Economies of Scale. The Trustees considered whether it is likely that the sub-adviser would realize economies of scale with respect to the sub-advisory services provided to the Fund during the initial period of the agreement. The Trustees agreed that this was primarily an adviser level issue and should be considered with respect to the overall advisory contract, taking into consideration the impact of the sub-advisory expense. After discussion, it was the consensus of the Trustees that the lack of breakpoints at the sub-advisory fee level was acceptable.
Profitability. The Trustees reviewed the profitability analysis provided by the sub-adviser, noting that it anticipated realizing a loss over the first year and a small profit over the second year in connection with its relationship with the adviser and the Fund. They agreed that the amount of projected profit appeared reasonable in terms of actual dollars and percentage of revenue. The Trustees concluded that Mauldin’s projected profitability was not excessive.
Conclusion. Having requested and received such information from Mauldin as the Trustees believed to be reasonably necessary to evaluate the terms of the sub-advisory agreement, and as assisted by the advice of counsel, the Trustees concluded that the fee structure was reasonable and that approval of the sub-advisory agreement was in the best interests of the adviser, the Fund and its shareholders.
*Due to the timing of the contract renewal schedule, these deliberations may or may not relate to thecurrent performance results of the Fund.
51

CMG Funds SUPPLEMENTAL INFORMATION (Unaudited)
April 30, 2017
4/30/17 – NLFT_v5
The following is a list of the Trustees and executive officers of the Trust and each person’s principal occupation over the last five years. Unless otherwise noted, the address of each Trustee and Officer is 17605 Wright Street, Suite 2, Omaha, Nebraska 68130.
Independent Trustees
Name, Address and Year of Birth
Position/Term of Office***
Principal Occupation During the Past Five Years
Number of Portfolios in
Fund Complex**** Overseen by
Trustee
Other Directorships held by Trustee During the Past Five Years
Mark Garbin Born in 1951
Trustee Since 2013
Managing Principal, Coherent Capital Management LLC (since 2007).
4 Northern Lights Fund Trust (for series not affiliated with the Funds since 2013); Two Roads Shared Trust (since 2012); Forethought Variable Insurance Trust (since 2013); Northern Lights Variable Trust (since 2013); OHA Mortgage Strategies Fund (offshore), Ltd. (since 2014); Altegris KKR Commitments Master Fund (since 2014) previously, Altegris KKR Commitments Fund (2014-2016)
Mark D. Gersten Born in 1950
Trustee Since 2013
Independent Consultant (since 2012); Senior Vice President – Global Fund Administration Mutual Funds & Alternative Funds, AllianceBernstein LP (1985 – 2011).
4 Northern Lights Fund Trust (for series not affiliated with the Funds since 2013); Northern Lights Variable Trust (since 2013); Two Roads Shared Trust (since 2012); Altegris KKR Commitments Master Fund (since 2014); Ramius Archview Credit and Distressed Fund (since 2015); previously, Schroder Global Series Trust (2012 to 02-2017) and Altegris KKR Commitments Fund (2014-2016)
Anthony J. Hertl Born in 1950
Trustee Since 2005; Chairman of the Board since 2013
Consultant to small and emerging businesses (since 2000).
4 Northern Lights Fund Trust (for series not affiliated with the Funds since 2005); Alternative Strategies Fund (since 2010); Satuit Capital Management Trust (since 2007); Northern Lights Variable Trust (since 2006); previously, AdvisorOne Funds (2004-2013); Greenwich Advisers Trust (2007- 2011); Global Real Estate Fund (2008-2011); The World Funds Trust (2010-2013)
Gary W. Lanzen Born in 1954
Trustee Since 2005
Retired since 2012. Formerly, Founder, President, and Chief Investment Officer, Orizon Investment Counsel, Inc.
4 Northern Lights Fund Trust (for series not affiliated with the Funds since 2005); AdvisorOne Funds (since
52

CMG Funds SUPPLEMENTAL INFORMATION (Unaudited)(Continued)
April 30, 2017
4/30/17 – NLFT_v5
(2000-2012). 2003); Alternative Strategies Fund (since 2010); Northern Lights Variable Trust (since 2006); previously, CLA Strategic Allocation Fund (2014-2015)
John V. Palancia Born in 1954
Trustee Since 2011
Retired since 2011. Formerly, Director of Futures Operations, Merrill Lynch, Pierce, Fenner & Smith Inc. (1975-2011).
4 Northern Lights Fund Trust (for series not affiliated with the Funds since 2011); Northern Lights Variable Trust (since 2011); Northern Lights Fund Trust III (since 2012); Alternative Strategies Fund (since 2012)
Mark H. Taylor Born in 1964
Trustee Since 2007; Chairman of the Audit Committee since 2013
Andrew D. Braden Professor of Accounting and Auditing, Weatherhead School of Management, Case Western Reserve University (since 2009); President, Auditing Section of the American Accounting Association (2012-2015); Former member of the AICPA Auditing Standards Board, AICPA (2008-2011).
4 Northern Lights Fund Trust (for series not affiliated with the Funds since 2007); Alternative Strategies Fund (since 2010); Northern Lights Fund Trust III (since 2012); Northern Lights Variable Trust (since 2007); previously, Lifetime Achievement Mutual Fund, Inc. (2007-2012)
Interested Trustees and Officers
Name, Address and Year of Birth
Position/Term of Office***
Principal Occupation During the Past Five Years
Number of Portfolios in Fund Complex**** Overseen by Trustee
Other Directorships held by Trustee During the Past Five Years
Andrew Rogers* 80 Arkay Drive Hauppauge, NY 11788 Born in 1969
Trustee Since 2013*****
President of the Trust (2006-2017); Chief Executive Officer, Gemini Alternative Funds, LLC (2013 – April 2017); Chief Executive Officer, Gemini Hedge Fund Services, LLC (2013 – April 2017); Chief Executive Officer, Gemini Fund Services, LLC (2012 – April 2017); President and Manager, Gemini Fund Services, LLC (2006 - 2012); Formerly President and Manager, Blu Giant, LLC (2004 - 2011).
4 Northern Lights Fund Trust (for series not affiliated with the Funds since 2013); Northern Lights Variable Trust (since 2013)
53

CMG Funds SUPPLEMENTAL INFORMATION (Unaudited)(Continued)
April 30, 2017
4/30/17 – NLFT_v5
Kevin E. Wolf 80 Arkay Drive Hauppauge, NY 11788 Born in 1969
President Since 2017
President, Gemini Fund Services, LLC (since 2012); Treasurer of the Trust (2006-2017); Director of Fund Administration, Gemini Fund Services, LLC (2006 - 2012); and Vice-President, Blu Giant, (2004 - 2013).
N/A N/A
James Colantino 80 Arkay Drive Hauppauge, NY 11788 Born in 1969
Treasurer Since 2017
Assistant Treasurer of the Trust (2006-2017); Senior Vice President - Fund Administration (2012-Present); Vice President (2004 - 2012), Gemini Fund Services, LLC.
N/A N/A
Stephanie Shearer 80 Arkay Drive Hauppauge, NY 11788 Born in 1979
Secretary** Since 2017
Assistant Secretary of the Trust (2012-2017);Senior Paralegal, Gemini Fund Services, LLC (since 2013); Paralegal, Gemini Fund Services, LLC (2010-2013); Junior Paralegal, Gemini Fund Services, LLC (2008-2010); Legal Assistant, Gemini Fund Services, LLC (2007-2008).
N/A N/A
Lynn Bowley 17605 Wright Street Suite 2, Omaha, NE 68130 Born in 1958
Chief Compliance Officer Since 2007
Senior Compliance Officer of Northern Lights Compliance Services, LLC (since 2007).
N/A N/A
*Andrew Rogers resigned from his position as President of the Trust effective June 1, 2017. **James Ash resigned from his position as Secretary of the Trust effective February 24, 2017. ***The term of office for each Trustee and officer listed above will continue indefinitely until the individual resigns or is removed.**** As of May 31, 2017, the Trust was comprised of 83 active portfolios managed by unaffiliated investment advisers. The term “FundComplex” applies only to the Funds. The Funds do not hold themselves out as related to any other series within the Trust for investmentpurposes, nor do they share the same investment adviser with any other series. *****Andrew Rogers is an “Interested Trustee” of the Trust as that term is defined under the 1940 Act, because of his affiliation with Gemini Fund Services, LLC, the Trust’s Administrator, Fund Accountant and Transfer Agent.
The Funds’ SAI includes additional information about the Trustees and is available free of charge, upon request, by calling toll-free at 1-866-CMG-9456.
54

PRIVACY NOTICE
NORTHERN LIGHTS FUND TRUST Rev. February 2014
FACTS WHAT DOES NORTHERN LIGHTS FUND TRUST DO WITH YOUR PERSONAL INFORMATION?
Why? Financial companies choose how they share your personal information. Federal law gives consumers the right to limit some, but not all sharing. Federal law also requires us to tell you how we collect, share, and protect your personal information. Please read this notice carefully to understand what we do.
What? The types of personal information we collect and share depends on the product or service that you have with us. This information can include:
Social Security number and wire transfer instructions account transactions and transaction history investment experience and purchase history
When you are no longer our customer, we continue to share your information as described in this notice.
How? All financial companies need to share customers’ personal information to run their everyday business. In the section below, we list the reasons financial companies can share their customers’ personal information; the reasons Northern Lights Fund Trust chooses to share; and whether you can limit this sharing.
Reasons we can share your personal information:
Does Northern Lights Fund Trust share information?
Can you limit this sharing?
For our everyday business purposes - such as to process your transactions, maintain your account(s), respond to court orders and legal investigations, or report to credit bureaus.
YES NO
For our marketing purposes - to offer our products and services to you. NO We don’t share
For joint marketing with other financial companies. NO We don’t share
For our affiliates’ everyday business purposes - information about your transactions and records.
NO We don’t share
For our affiliates’ everyday business purposes - information about your credit worthiness.
NO We don’t share
For nonaffiliates to market to you NO We don’t share
QUESTIONS? Call 1-402-493-4603
55

PRIVACY NOTICE
NORTHERN LIGHTS FUND TRUST
Page 2
What we do:
How does Northern Lights Fund Trust protect my personal information?
To protect your personal information from unauthorized access and use, we use security measures that comply with federal law. These measures include computer safeguards and secured files and buildings.
Our service providers are held accountable for adhering to strict policies and procedures to prevent any misuse of your nonpublic personal information.
How does Northern Lights Fund Trust collect my personal information?
We collect your personal information, for example, when you
open an account or deposit money direct us to buy securities or direct us to sell your securities seek advice about your investments
We also collect your personal information from others, such as credit bureaus, affiliates, or other companies.
Why can’t I limit all sharing? Federal law gives you the right to limit only:
sharing for affiliates’ everyday business purposes – information aboutyour creditworthiness.
affiliates from using your information to market to you. sharing for nonaffiliates to market to you.
State laws and individual companies may give you additional rights to limit sharing.
Definitions
Affiliates Companies related by common ownership or control. They can be financial and nonfinancial companies. Northern Lights Fund Trust does not share with its affiliates.
Nonaffiliates Companies not related by common ownership or control. They can be financial and nonfinancial companies. Northern Lights Fund Trust does not share with nonaffiliates so they can
market to you.
Joint marketing A formal agreement between nonaffiliated financial companies that together market financial products or services to you. Northern Lights Fund Trust doesn’t jointly market.
56

CMG FUNDS
Adviser CMG Capital Management Group, Inc. 1000 Continental Drive, Suite 570
King of Prussia, PA 19406
Sub‐Adviser CMG Mauldin
Solutions Core Fund
Mauldin Solutions, LLC 2900 McKinnon # 1708
Dallas, TX 75201
Administrator Gemini Fund Services, LLC 17605 Wright Street, Suite 2
Omaha, NE 68130
\
How to Obtain Proxy Voting Information Information regarding how the Funds voted proxies relating to portfolio securities for the most recent 12 month period ended June 30th as well as a description of the policies and procedures that the Funds used to determine how to vote proxies is available without charge, upon request, by calling 1‐866‐CMG‐9456 or by referring to the Securities and Exchange Commission’s (“SEC”) website at http://www.sec.gov.
How to Obtain 1st and 3rd Fiscal Quarter Portfolio Holdings The Funds file their complete schedule of portfolio holdings with the SEC for the first and third quarters of each fiscal year on Form N‐Q. Form N‐Q is available on the SEC’s website at http://www.sec.gov and may be reviewed and copied at the SEC’s Public Reference Room in Washington, DC (1‐800‐
SEC‐0330). The information on Form N‐Q is available without charge, upon request, by calling 1‐866‐CMG‐9456.
CMG Funds 17605 Wright Street •Suite 2 • Omaha, NE 68130
1‐866‐CMG‐9456