Annual Report - CITB€¦ · • High standards of health and safety • Industry Activity....
64
Annual Report 2005-06 Incorporating the 2006-07 Annual Training Plan
Transcript of Annual Report - CITB€¦ · • High standards of health and safety • Industry Activity....

Annual Report2005-06
Incorporating the 2006-07Annual Training Plan

Purpose, Vision and Values 3
2005-06 Highlights 4
Report of the Presiding Member & CEO 6
Directors 8
CITB Strategic Framework/Board Structure 9
Construction Industry Training Fund (CITF) 10
2005-06 Annual Training Report 12
Current Worker Program 14
Entry Level Training Program 18
Research and Planning 22
South Australian Construction Industry Snapshot 24
Governance, Finance and Administration 27
Doorways 2 Construction 28
Annual Training Plan for 2006-07 and CITB Forward View 30
Annual Training Plan 2006-07 - Current Worker Program 32
Annual Training Plan 2006-07 - Entry Level Training 34
Corporate Governance 36
Certification 42
Financial Statements 44
2
Contents

Purpose
The CITB was established by the enactment of the
Construction Industry Training Fund Act (1993) by
the South Australian Parliament, and came into
existence on 1 September of that year.
The cover page of the Act explains its purpose as:
‘An Act to establish a fund to be used to improve
the quality of training in the building and
construction industry; to establish the Construction
Industry Training Board to administer the fund and
coordinate appropriate training; to provide for the
imposition and collection of a levy for the purposes
of the fund, and other purposes.’
Functions
The Act specifies the CITB’s functions which
include:
• to act as a principal adviser to the relevant State
and Federal Ministers on any matter relating to
training in the building and construction industry
• to administer the Construction Industry Training
Fund (CITF)
• to prepare training plans in accordance with
the Act
• to generally coordinate training and personnel
development within the building and
construction industry
• to promote increased productivity career
opportunities personal satisfaction and OH&S
within the industry through training
• to review and evaluate employment related
training programs to ensure that they meet the
training and skill requirements of the industry
• to ensure a more equitable distribution of effort
amongst employers in relation to employment-
related training in the building and construction
industry
• to initiate, carry out, support or promote
research into the training and personnel needs
of the building and construction industry
• to liaise with educational, professional and
training bodies (in either the public or private
sectors) in relation to training and personnel
development within the building and
construction industry, and
• to promote, undertake or support programs
designed to facilitate the international exchange
of information relevant to training or personnel
development within the building and
construction industry.
3
purpose, vision, values
CITB
Values
• Integrity
• Leadership and Innovation
• Teamwork
• Open Communication
• Customer Satisfaction
• Quality of Service
CITB
Mission
‘To support the
South Australian building
construction industry
by providing leadership
in training and skills
development
for its workforce’
CITB Vision Statement
2005-08
The South Australian Building
and Construction industry is
characterised by:
• A training culture across all
sectors of the industry
• A highly skilled workforce
• High standards of health
and safety

• Industry Activity. Construction industry activity
in 2005-06 again exceeded previous records, with
levy collection exceeding forecasts by a
significant margin. The mix of projects also
exhibited a change, with commercial activity
increasing as a proportion of the total while
housing eased. The housing sector did not have
the marked downturns seen in the eastern
states.
• Increased Funding. CITB increased
the level of funding made available on
an ‘across the board’ basis in order to stimulate
greater uptake of training.
A further 10% increase was affected in January
2006.
• Training Activity Consolidated. Despite
increased funding, Current Worker training
activity eased during the year when compared to
2004-05. No single reason could be pointed to by
the training providers on the ‘front line’ of
delivery, but rather a combination of factors,
including:
• Industry working at full capacity with limited
opportunities for training.
• Uncertainty about the future of some
programs – particularly the ‘Greencard’
generic site induction program, which it was
thought might be superseded by a national
program. To date this has not occurred.
• A timing lag in the receipt of new apprentice
funding claims. Apprentice and trainee
support is the largest component of the
training budget. As new and broadened
access was phased in, communicating the
changes to a new and previously untapped
market proved to be a significant challenge,
delaying the receipt of claims relative to our
planned expectations.
• Training Satisfaction / Effectiveness. Results of
the annual post-training evaluation survey
indicate improved outcomes for participants
across all measures of training effectiveness. So
whilst the number of training places has
decreased, it does not appear to be related to
dissatisfaction with CITB funded training.
• Apprentice Funding. The CITB introduced a new
more inclusive apprentice funding policy from 1
July 2005. All employers of apprentices within
the building and construction industry can now
access funding support targeted at progressive
completion of their Contract of Training, and for
the maintenance of a record of on-job training
log book. Uptake was slow initially reflecting the
communication challenge facing CITB.
• Doorways 2 Construction. Doorways 2
Construction (D2C) is in its seventh year. It has
achieved excellent brand recognition in the
secondary school sector, and indeed interstate.
Our counterpart in Queensland is to operate the
D2C program under licence from July 2006. In
South Australia, as at 30 June 2006, the D2C
program embraced twenty five ‘clusters’
covering seventy schools with more than 565
participants.
• Apprentice / Trainee Numbers. Apprentice and
Trainee numbers funded by the CITB continued
to grow in 2005-06. As at 30 June 2006, there
had been 2338 apprentices supported by CITB
funding. There are more eligible employers out
there and a continuing challenge for CITB is to
improve communication and awareness of
funding assistance available to encourage
current and potential employers. The biggest
limitation on the growth of apprentice numbers
is the preparedness of self- employed
contractors to take them on.
• Industry Training Places. In 2005-06, the CITB
funded 20 241 training places,
at a cost to the CITB of $3.039M.
• Innovation and Contingency Program. The CITB
set aside $500K in 2005-06 to support
alternative / innovative forms of training delivery
in areas of skill shortage and in regional
locations. Some key outcomes included:
• Bricklayers. Flexible Construction and
Training Australia conducted a very successful
introductory program for a group of
unemployed people ranging from school
leavers to mature age individuals. Almost all
secured either an apprenticeship or full-time
employment as a result. One of the trainees,
Victor Jara, a mature aged participant went on
to win a Learning Achievement Award for self
development, sponsored by the local council.
• Plumbers. A very successful Regional
Plumbing pre-employment program was
conducted in the South East for aspiring
plumbers. The program was initiated by local
employers in conjunction with local private
4
2005-06 Highlights

5
CITB Executive on site at an Innovations Program Activity. Back Row: (from left) Jim Baff (FCTA), Mary Marsland (Chair of the CITB), Len Warren (Manager Training Programs) and Paul Ladams (FCTA) Front Row: (from left) Tristian Smith and Steve Larkins (CEO of the CITB).
and metropolitan training providers working
closely with local job placement organisation.
Of the eleven participants in the program,
seven went on to work in the industry, with
five as plumbing apprentices.
• Workforce Development Seminar. CITB, in its
contracted capacity with DFEEST as the
Construction Industry Skills Board, conducted a
very well-received Workforce Development
Seminar at the National Wine Centre on 31 May
2006. Key topics covered included:
• The challenges facing the industry,
particularly in respect of the demand for
skilled people into the future.
• Competition in the labour market from the
Mining and Defence sectors.
• Opportunities on offer through infrastructure
development to support other industry
sectors.
• The major challenge facing the sector is the
looming impact of the retirement of ‘Baby
Boomer’ tradespeople in the next five to ten
years. We need to further boost the numbers
of new entrants from all sources.

2005-06 saw a continuation of robust growth in the
levels of activity taking place in the South Australian
construction industry. This growth was not uniform, nor
did it conform to the mix of activity seen in recent years.
There was a decline in activity in the housing sector,
but this was more than offset by growth in the
commercial and civil sectors.
The CITB introduced significant change to a number of
funding programs in order to extend the reach of CITB
resources and to broaden the range of training
supported.
Apprentice and Trainee Support Measures
In July 2005, CITB support to apprentices was extended
to include employers of direct indentured apprentices
in addition to those employed by Group Training
Schemes. This took place in three tranches; First Years
from 1 July 2005, Second Years from 1 January 2006
and now all direct indenture apprentices attract funding
support for their employers.
The provision of apprentice support to all employees,
not just Group Training Schemes, marking a significant
shift in what had been long established CITB policy.
Direct indentured apprentices represent some 60% of
the total number of apprentices in training, which
means the longer term financial implications of this
change are significant. The change increases the
workload for the CITB, but achieves better coverage of
the total industry workforce. Instead of nine points of
contact covering some 1700 apprentices, we are now
dealing with more than 500 separate employer
contacts, a number which is set to grow as more
current and potential direct indenture employers are
contacted.
Taxation of Employer Incentives
We are also faced with an ‘efficiency’ problem. Having
extended incentives to direct incentive employers, we
find that the Commonwealth is harvesting a proportion
of these funds through income tax.
Innovation & Contingency Program
The CITB introduced its Innovation and Contingency
funding program in 2005-06. This was used to support
alternative methods of training delivery in skill shortage
areas and in regional locations. While initial uptake was
more muted than we had hoped, with some initiatives
being held over until 2006-07, the results that were
returned were judged as very successful. The CITB will
be continuing these arrangements in 2006-07.
Funding Rate Increase
Because of the apparent decline in training activity
evident in the first half of the Financial Year, the CITB
instituted an increase in the rate of funding support
‘mid year’ at 1 January 2006. Despite this, the number
of training places was less than expected.
Our research reinforces this view, suggesting that price
is just one of the elements in the decision to train,
whether it be at an enterprise or an individual level.
Doorways 2 Construction (D2C)
D2C has been a real success story for both the South
Australian construction industry and the South
Australian secondary school system through the CITB’s
partnership with the Department of Education and
Children’s Services (DECS). It has continued to grow in
response to increasing demand and as a highly valued
pathway to a career in the construction industry.
6
Report of the Presiding Member and CEO
Steve Larkins, Chief Executive Officer
Mary Marsland,Presiding Member

A ‘Hiring Incentive’ has been introduced, attached to
graduates of the D2C program and paid to an employer
who hires a D2C student under a Contract of Training.
D2C graduates have a better than average record of
completing their qualifications. CITB wants to
encourage prospective employers to source future
apprentices from the D2C program.
CITB recently signed a licence agreement with the
Queensland Building Construction Industry Training
Fund to operate the program in Queensland. We have
strong links with our counterpart Training Funds in
Queensland, Western Australia, Tasmania and the
Australian Capital Territory through the Australian
Forum of Construction Industry Training Funds. We are
actively sharing career information resources, and the
results of our various training initiatives.
Acknowledging Service
Four people who had rendered significant service to the
CITB over many years moved on in 2005-06.
Directors Graeme Lawler and Brenton Gardner
resigned after seven and five years service respectively.
Two staff members, Marcus d’Assumpcao and Mike
Farran also left the CITB this year. Marcus was, at the
time of his resignation, the longest serving staff
member with more than ten years service mainly in the
Research Plans and Training Policy area.
Mike Farran was the inaugural incumbent of the
Department of Children’s Services (DECS) scholarship
position. Under this arrangement DECS and CITB
share the cost of the position as a ‘secondment’ from
the Department. Mike did a great job in developing and
consolidating D2C’s standing in the Education and
Industry arenas.
Looking Forward
As identified in our seminar of 31 May, the major
challenge facing the industry is the retirement of the
Baby Boomer component of the workforce.
To respond we need to
• Maximise new entrant numbers
• Continually improve the skills base of the existing
workforce
• Tap into the significant resource of disengaged
and displaced workers from other sectors of
the economy.
We plan to reinforce the success of D2C. The constraint
to its growth is not a lack
of interest from young people. It is about getting
potential employers to hire them. To that extent D2C is
linked closely with our Apprentice and Trainee Support
policies.The major challenge facing the industry is
communicating with and convincing self-employed
contractors of the benefits and support available for
hiring an apprentice. This can be either directly, (Direct
Indenture) or through a Group Training Scheme.
While there is strong emphasis on attracting young
people to the industry, we cannot afford to ignore the
need to call on mature age people of all kinds. The
nature of our workforce is changing as some industries
recede in importance and others are emerging. There
are many skilled people who with some re-skilling can
transition from one industry sector to another.
We need to be flexible in offering such people the
opportunity to take their part in the South Australian
building and construction industry.
With a significant increase in the numbers of
apprentices and their employers now eligible for CITB
funding, the potential call on resources is significant.
CITB is in a very strong financial position, and has
adopted a Five Year forward financial plan to support
the Board’s training objectives. The Board is confident
that the breadth of programs and the resource base we
have available to support them is both sustainable and
capable of meeting the industry’s training needs for the
foreseeable future.
7
Graeme Lawler Brenton Gardner Marcus d’Assumpaco Mike Farran

8
directors
The directors of the Board as at 30 June 2006 were:
Mary Marsland PSM, BARCH, FRAIA -Independent
Presiding Member
Members and their deputies
representing the interests of employers
in the Building and construction industry
Steven Hall MIPA, MAIE, JP - Director Industrial
Plumbing Services Pty Ltd
(Deputy: Larry Moore – National Electric
Communication Association (NECA))
Robert N Stewart MNIA MAICD - Chief Executive
Officer Master Builders Association of SA Inc.
(Deputy: David Callan - Master Builders
Association of SA)
Peter Harrland BESTEC FIE (Aust), BE (Hons) -
Director. (Deputy: Bryan Moulds – Property Council
of Australia)
Roderick Fyfe - Chief Executive Officer, Civil
Contractors Federation SA Branch Assoc Dip Civil
Eng. (Deputy: Linda Ellis – Civil Contractors
Federation)
Vacant Position - Mr Brenton Gardner resigned
with effect from Feb 2006. His former Deputy Mr
Robert Harding, attended Board Meetings at the
invitation of the Board as an observer, until such
time as a replacement appointment was made by
the Minister
Members and their deputies
representing the interests of employees
in the building and construction industry
Robert Geraghty - Secretary Communications,
Electrical, Electronic, Energy, Information, Postal,
Plumbing and Allied Services Union of Australia
(CEPU) (Deputy: Douglas Buchanan – CEPU)
Martin J O’Malley - Secretary CFMEU
(Deputy: Bentley E Carslake - Construction,
Forestry, Mining and Energy Union)
Wayne Hanson - Australian Workers Union
(Deputy: Chris Nesbitt – Australian Workers Union)
Members representing the Vocational
Education and Training Sector
Fiona O’Connor MA(Hons), Dip Ed - Director,
Traineeship & Apprenticeship Services -
Department of Further Education, Employment,
Science & Technology (DFEEST)
(Deputy: Christine Harrison – DFEEST)
Romana Wereszczak - Executive Director,
Transport Distribution Training SA PhD.Ed, MEd,
BEd, Grad. Dip Ed. Admin. (Deputy: Sally Jeremic –
Training and Skills Commission)
Above: CITB Board meet with the Hon Paul Caica MP, Minister for Employment, Training and Further Education

9
The Boards strategic intent is expressed in the
graphic representation below.
Strategic Intent
Support and Promote Career Opportunities
The future of the industry depends very much on its
ability to attract, train and retain people of all ages
with the skills demanded by the industry.
While particular focus is on the recruitment of young
people, of equal importance is the need to retain
those workers already in the industry through up-
skilling and cross-skilling in order to meet the
emerging needs of the industry and its customers.
The CITB covers the entire spectrum through its two
key programs, the Entry Level Training (ELT) and
Current Worker (CW) programs.
Enhance Workforce Productivity
It has long been recognised that skills development
is a key component of workforce productivity. Uptake
of training is a good measure of the extent to which
the workforce skills base is being developed. With a
total of over 20 000 training places recorded against
a workforce of some
55 000, this ratio is one of the highest in the country
in any industry.
Purchase Training Outcomes
The CITB has resolved that the best way to assure
the success of its funding support is to focus on the
attainment of agreed training outcomes as the
condition of any funding support.
Optimise Information Exploitation
The best decisions are those that are
as fully informed as possible. To
ensure the Board is provided with the
necessary information, the CITB
operates three key mechanisms:
• The Research program - to provide
empirical evidence for informed
decision making
• Information Management - internal
systems data collection and use
• Information exchange - collaborative research and
projects of mutual interest add to the CITB’s
knowledge bank.
Review and Evaluation of CITB Activities
Improvement is achieved first by measuring what is
done, and then identifying and implementing means
by which improvement may be attained. There are
two strands to this; audit functions and the
monitoring and measuring of training outcomes.
This is addressed by compliance management of
training providers, and by conducting independent
surveys of training participants and employers
against a range of criteria.
Develop Income Diversification
A key implied objective of the CITB is to reduce the
cyclical vulnerability of training activity to reductions
in available funding so that long-term objectives can
be better met with greater certainty of funding
streams for recipients.
Staff, Systems and Policies
The CITB’s operations are interlinked with and
underpinned by its management, administration and
support systems. These represent a significant
investment by the stakeholder community and are
subject to on-going review and refinement.
Infrastructure improvement is effected through the
capital budget, and the CITB invests in the
development of its staff in order to maximise
organisational effectiveness.
CITB Strategic Framework/Board Structure
Governance, Administration & Management Support Systems
Support and Promote Career
Opportunities
Enhance Workforce
Productivity
Purchase Training
Outcomes
Optimise Information Exploitation
Review and Evaluation of CITB Activities
Develop Income
Diversification
Mission:To support the South Australian building and construction industry by
providing leadership in training and skills development for its workforce.

Construction Training Funds
Construction Training Funds of various kinds
operate in the ACT, Tasmania, Queensland,
Western Australia and South Australia.
Construction Training Funds also operate in a
number of other countries, notably the UK and
many Commonwealth countries.
The individual State and Territory funds are the
largest sources of non-Government funding for
training in the building and construction industry
and represent the largest sources of non-
Government funding for training across all
industries. Collectively, they generate $70 million
annually. Together, these organisations support the
training of over 80 000 industry employees each
year. In addition, a further 80 000 apprentices and
17 500 trainees are supported on a national basis.
School-based apprentices and trainees account for
a further 3000 participants in building and
construction industry training.
The South Australian Levy - How it Works
In South Australia, the Construction Industry Training
Fund (CITF) levy is imposed at the rate of 0.25% of
the estimated value of each construction project over
$15 000 undertaken in SA. The levy is paid by the
end-consumer of construction services, either
directly or on their behalf by the builder or prime
contractor.
There are exemptions from the levy, such as
construction carried out on Commonwealth land,
and activities such as mining, petroleum processing
and power generation.
In general terms, the levy applies to everything from
a home renovation to the building of a new hotel or
office building on North Terrace, and road
developments ranging from Local Council roadworks
to projects of the scale of the Port River Expressway.
The levy can be paid manually over the counter at
Local Council offices and the CITB, or on-line at the
CITB website www.citb.org.au.
Chart A maps levy collections against construction
activity in SA. The value of industry work done has
been sourced from the Australian Bureau of
Statistics (ABS).
10
Construction Industry Training Fund (CITF)
-
2.00
4.00
6.00
8.00
10.00
12.00
14.00
1995 1996 1997 1998 1999 2000 2001 2002 2003 2004 2005 2006
-
1,000.0
2,000.0
3,000.0
4,000.0
5,000.0
Chart A - SA Industry Levy Collections and
Construction Work Done ($M)
Levy Collections ($Millions) Construction Work Done ($Millions)
Le
vy (
$M
)
Wo
rk D
on
e ($
M)
Source: CITB, ABS. 8755.0 Construction work done, states and territories, chain V-1 measures.

11
Economic Pulse
Levy collections are a good indicator of economic
activity. Payment of the levy takes place prior to
approval, and precedes the actual conduct of the
work. It is thus a leading indicator of construction
activity.
We all know that construction activity is cyclic, and
sooner or later the growth trend line evident for
the past seven years will turn downwards again.
Despite a forecasted decline in industry activity
over the past two years, the opposite has been
evident. The industry and therefore levy collection
remained buoyant, albeit with different patterns
emerging.
The Construction industry is comprised of three
main sectors which are defined in the Act. In
simple terms they are as follows:
• Housing - Any permanent structure in which
people live (but not including hotels, nursing
homes and the like)
• Commercial - All other roofed construction
• Civil - Unroofed construction.
Housing is traditionally the largest in terms of
activity, but it is also the most subject to cyclical
variation. Many trades and skills ‘migrate’ across
sectors, particularly between Housing and
Commercial. Chart B shows the attribution of
levies collected in 2005-06.
Chart B - Levy Collections by Sector ($M)$11.65M Total
Housing49%
Civil14%
Commercial37%

The CITB is required to prepare Training Plans for
submission to the Minister as one of its prescribed
functions under the Construction Industry Training
Fund Act 1993.
The Annual Training Plan outlines the funding
programs and associated resources, which forms
the basis of the training activity in each reporting
year.
The 2005-06 Annual Training Plan focussed on
encouraging individuals and employers to commit
to skill development for the benefit of the industry
and the careers of those who work in it. The
Annual Training Plan has been based for a number
of years, on two key elements:
• Current Worker program, aimed at facilitating
skill and career development for existing
workers in the immediate to medium term.
• Entry Level Training program, which seeks to
encourage and develop a foundation of skills for
the longer term. This program offers incentives
and funding for apprenticeship/ traineeship
tuition, progressive completion of contracts of
training, and maintenance of on-job training
records.
The 2005-06 ATP saw the introduction of a new
initiative, the Innovation and Contingency program.
This is aimed at supporting training in a range of
skill shortage areas and in regional locations,
using innovative training delivery techniques.
Chart C details Actual v Budget expenditure for
2005-06. Chart D illustrates the attribution of
expenditure by sectors.
For the second year in succession, levy collections
exceeded expectations. The industry downturn that
had been widely anticipated did not eventuate.
Rising house prices, offset by a slight downturn in
the total number of commencements, and
increased activity in the commercial and civil
sectors contributed to increased levy collections.
The major factor in variation against budget in
2005-06 was a lower than anticipated uptake of
training. There were three elements to this:
• High levels of industry activity combined with a
tight labour market have contributed to the
perception that ‘we are too busy to train’.
• Uncertainty around the future of the ‘Green
Card’ site induction program. It was to have
been replaced by a national standard program
which has so far failed to eventuate. This is
significant because ‘Green Card’ is a high
volume course within the Current Worker
program.
• Problems in communicating broadened access
to funds to Direct Indenture Employers. Since
extending employer incentives beyond the Group
Training Schemes we are now dealing with a
much larger population of employers, many of
whom have lower or even negligible awareness
of the availability of these incentives.
• This ‘awareness gap’ created a timing lag which
contributed to the underspend in the Entry Level
Training program.
CITB has taken a range of steps to counter this in
the 2006-07 training year.
12
2005-06 Annual Training Report
Chart C - Budget v Actual Expenditure2005-06 ($M)
10.8
0.3
1.1
4.54.9
0.3
1.0
8.7
4.0
3.4
0
2
4
6
8
10
12
Current Worker Entry Level
Training
Planning &
Research
Governance &
Admin.
Total
Budget
Actual
$M
Chart D - Direct Training Expenditure
by Sector
Housing41%
Civil19%
Commercial40%

13
Achievement Against the 2005-06 Annual Training Plan
Key Points 05-06 Budget 05-06 Actual
Revenue $9.49M $11.65M
Direct Training Expenditure $8.81M $6.87M
Current Worker Program
% of fund allocated/expended 45% 47%
% Entry Level Training allocation 55% 54.3%
Number of training places 23 000 20 041
Total Current Worker expenditure $3.83M $3.04M
Entry Level Training (ELT) program
% of fund allocated/expended 55% 53%
Number of Tuition Funding places 1968 1293
Tuition Funding expenditure $0.65M $0.54M
Number of apprentices receiving Completion Funding 1840 1300
Completion Funding expenditure $1.91M $1.42M
Number of apprentices receiving On-Job Funding 1840 1844
On-Job Funding expenditure $1.91M $1.69M
Total number of apprentices supported by ELT program 2500 2338
Total Entry Level Training expenditure $4.47M $3.65M
Innovation & Contingency program
Total Innovations and Contingency expenditure $0.50M $0.18M

14
Current Worker Program 2005-06
Objectives
1 To improve skill levels
and workplace
performance,
increase safety
awareness and
practice, and facilitate
career opportunities
3 To facilitate training
participation by
identified groups in the
industry
2 To extend training
effort amongst
employers
Strategies
• Fund skill development
and recognition
activities for eligible
workers in partnership
with service providers
• Utilise a network of
Registered Training
Organisations to deliver
selected training within
a sound quality
management
framework
• Encourage and support
enterprises to invest in
training and skill
development
• Provide advice to
enterprises on funding
and resources available
for special needs groups
• Positive impact of
funding on the decisions
by enterprises and
individuals to undertake
training
• Increase in the number
of construction industry
enterprises accessing
CITB sponsored training
• 25% of training
participants are from
non-metropolitan areas
• Increase in the number
of construction industry
enterprises accessing
alternative targeted
funding
Outcomes
• 90% satisfaction rating
of training outcomes by
participants and
enterprises
• Increased application of
skills learnt on
workplace performance,
safety, and career
opportunities as
reported by participants
and enterprises
Status
✓
✓
✓
✓
✗
?
The Current Worker program is a key element of the
CITB’s approach ‘to promote increased productivity,
career opportunities, personal satisfaction and
occupational health and safety within the building and
construction industry through training;’ as prescribed
in the Construction Industry Training Fund Act 1993.
The CITB implements the Current Worker program
through a range of support funding subsidies to
Registered Training Organisations (RTO) in order to
reduce the cost of training to industry. The RTOs
provide training, assessment and other services to
the industry, in accordance with guidelines
established by the Joint Sector Advisory and the
Training Policy Committee.
All CITB support funding is premised on the
successful attainment of industry agreed training
outcomes, delivered and monitored under the
auspices of a quality assurance process such as the
Australian Quality Training Framework (AQTF).
In 2005-06, the Current Worker program generated
over 20 000 training places with funding expenditure
of $3.04M. The distribution of training places in the
Current Worker Program, by course category is
shown at Chart E.
Expenditure in the Current Worker program against
the skill categories within the program are shown in
Chart F.

Training places over time are illustrated at Chart G.
When compared with the previous year, there has
been some 4000 fewer training places in the Current
Worker program. Decreases in training places have
been evident across all course categories although
increased expenditure has been edivent in business
management (up to 13% from 6%) and construction
management (up to 12% from 6%) categories.
Outcome Performance
✓ 90% satisfaction of training outcomes by
participants and enterprises
Independent, post training evaluation, commissioned
by the CITB provides a measure of the effectiveness
and satisfaction of training supported by CITB funds.
94% of surveyed training participants and their
employers indicated that their ‘training had been
worthwhile’.
✓ Increased application of skills learnt on
workplace performance, safety and career
opportunities
The greatest gains in training effectiveness appear to
be related to participants now having improved
decision making abilities and increased job
opportunities. This could be related to the increase in
training in business and construction management
this year, as well as a buoyant labour market.
Safety is a major industry concern and continues to
be a priority skill area supported by the CITB. It is
therefore comforting to know that ‘increased
awareness of OH&S issues’ continues to be the
number one rated measure of participants’ training
effectiveness.
OH&S attracts a significant amount of effort primarily
through the Green Card industry generic induction
course. Half of all training places were on OH&S
courses. Greencard alone represented 31.7% of all
training places in 2005-06, a slight decrease from the
previous year (33.7%), but still a significant proportion
of training places.
✓ Positive impact of funding on the decisions by
enterprises and individuals to undertake training
Results of the annual post-training evaluation survey
indicate improved outcomes for participants across
all measures of training effectiveness. So whilst the
number of training places has decreased, this does
not appear to be related to dissatisfaction with the
Current Worker training program.
15
Construction Management
8%
Business Management
6%
Other5%
OH&S50%
ConstructionSkills31%
Chart E - Current Worker Training Places By Course Category
19,565
15,490
23,644 22,604
24,558 24,562
20,241
-
5,000
10,000
15,000
20,000
25,000
2000 2001 2002 2003 2004 2005 2006
Chart G - Current Worker Training Places
Chart F - Current Worker Expenditure By Course Category
ConstructionSkills 48%
ConstructionManagement
12% BusinessManagement
13%
OH&S20%
Other7%

Chart H illustrates survey outcomes from Current
Worker course participants in 2004-05 and 2005-06.
Chart I illustrates the differences in perceptions from
this year’s survey between employers and employees
as to the benefits of training.
✗ Increase in the number of construction industry
enterprises accessing CITB sponsored training
In 2005-06, requests were received from RTOs for a
significant expansion of Current Worker places. The
Board endorsed the increase in training places and
increased the support funding per place from 1st
January 2006.
By March, it was clear that the forecast training
requirement was not going to be realised. A key
reason cited by many RTOs was that their clients
‘were too busy to train’. Resources were
subsequently re-allocated, and despite the increase
in support funding, the target number of training
places in the Annual Training Plan was not met by the
end of financial year 2006.
A key conclusion from this exercise was that whilst
CITB can influence the supply and price of training in
the South Australian construction industry, demand
for training is driven by factors other than price.
These include demand for new skills influenced by
changing technology and building practices, the
strength of the labour market, and the amount of
work available in the market place.
✓ 25% of training participants are from non-
metropolitan areas
Regional delivery is encouraged by the CITB through
the regional allowance scheme. However, in some
cases it can be difficult to achieve the necessary
economies of scale and so participants may have to
travel to metropolitan areas to access training of their
choice. So whilst 32.7% of CITB funded training is
undertaken by individuals who reside outside of the
metropolitan area, only 17% of training is delivered in
regional areas.
Chart J indicates the area of residence of training
participants.
? Increase in the number of construction industry
enterprises accessing alternative targeted
funding
The CITB provides guidance and assistance to
individuals and enterprises seeking to access specific
funding provided by other agencies, including State
and Commonwealth Government departments.
An example of this is the provision of assistance to an
enterprise to access Language and Literacy support
through the Commonwealth WELL program.
Language and Literacy remains a major concern in
the industry particularly with the recent attention give
to skilled migration. Language skills are a crucial
ingredient in the creation and maintenance of a safe
working environment.
CITB does not have the capacity to accurately track
actual uptake of funding provided by other agencies
so a conclusive measure was not available.
16
Current Worker Program 2005-06 (Cont’D)
Chart H - Effectiveness of Training 2005-06 & 2004-05
3.0
3.4
3.3
3.3
3.5
3.6
3.7
3.8
4.0
3.2
3.5
3.6
3.6
3.7
3.8
3.8
3.9
4.1
1 2 3 4 5
Increased volume of work
Increased quality of work
Increased job opportunities
Greater input into decision making
Increased ability to maintain employment
Fewer OHS incidents
Increased confidence in abilities
More confidence in work environment
Increased awareness of OHS
2005-06
2004-05
1 = Strongly disagree
3 = Neutral 5 = Strongly agree

17
Chart I - Training Outcomes 2005-06
40.8
42.1
53.0
55.0
58.6
63.2
63.9
68.3
75.8
93.7
34.0
42.2
46.8
66.7
70.9
66.7
68.8
74.5
81.9
94.2
20 30 40 50 60 70 80 90 100
Increased promotional opportunities
Increased volume of work output
Increased quality of work output
Increased self-esteem
Greater input into decision making
Increased ability to maintain employment
Fewer OH&S incidents
Increased confidence in own abilities
Increased awareness of OH&S
Training was worthwhile
% Who agreed with the statement
EmployersEmployees
Chart J - Training Places By Region of Residence 2005-06
Yorke
2.3%
Eyre
2.2%
Fleurieu
2.1%Other
16.9%
Northern Regional
1.8% Port Pirie
1.8%
Mid North
1.4%
Murraylands
2.4%
BarossaLight1.7%
Adelaide Hills
4.9%
Riverland2.0%
Northern Adelaide
5.5%Limestone Coast
3.5%
Metropolitan
67.3%
Kangaroo Is
0.3%
Whyalla
0.9%

18
Entry Level Training Program
2 To improve the quality
of workplace learning
and training of
apprentices and
trainees
Objectives
1 To maximise the
uptake and
completion of industry
qualifications by new
entrants
3 To facilitate training
participation by
identified groups in the
industry
3 To encourage
prospective new
entrants in schools
and the community
to enter careers in
the industry
Strategies
For apprentices and
trainees under contracts
of training
• Provide financial
support
to off-set the cost of
their tuition fees
• Provide financial
incentives to employers
to ensure their
apprentices and
trainees receive a broad
range of on-job
experiences consistent
with their training plans
For prospective new
entrants:
• Provide information and
advice on training and
careers to schools and
the community that
promote construction
careers
• Support schools and
community groups to
provide a positive
experience of the
industry
to prospective new
entrants
Improved skill level and
completion rates of new
entrants
• Provide advice to
enterprises on funding
and resources available
for special needs groups
• An increase in the
awareness and
acceptance of careers
amongst school
students and final year
apprentices and
trainees
• 25% of training
participants are from
non-metropolitan areas
• Increase in the number
of construction industry
enterprises accessing
alternative targeted
funding
Outcomes
• Improved skill level and
completion rates of new
entrants
Status
✓
✓
?

19
Above: Tatachilla D2C Students visit Platinum Apartments, Glenelg 2006
Objectives
4 To raise awareness
of safe work amongst
apprentices and
trainees
5 To expand career
options of those about
to complete their
contracts of training
6 To support the
induction of identified
groups
into the industry
Strategies
• Encourage apprentices
and trainees in their
final years to take up
training opportunities
that develop skills for
business and licensing
requirements
• Ensure that apprentices
and trainees are
supported in safety
training available to the
industry
• Assist training providers
and employers to access
funding for identified
groups
• Increase in the
incidence of training
providers and employers
accessing alternative
targeted funding
Outcomes
• Increased uptake of
safety and other Board
approved training by
apprentices and
trainees
Status
✓
✓

Implementation
The Entry Level Training (ELT) program comprises
three key elements:
1. Career Information Initiatives
2. Doorways 2 Construction (D2C) VET in Schools
program
3. Apprentice and Trainee Support (ATS)
program. This is the largest element in terms
of coverage and resourcing. ATS is further
divided into three components:
• Tuition Funding to support apprentice’s ongoing
training fees; paid to the apprentice.
• Completions Funding to support progressive
completion of the Contract of Training; paid to
the employer.
• On-job Funding to support on-job skill
development; paid to the employer.
The ELT program was subject to major change in
2005-06, in that access to funding was extended
beyond just Group Training Organisations to all
employers of eligible apprentices, with a focus on
outcomes.
The ELT program is guided by input from the Entry
Level Training Reference Committee (ELTRC) in
relation to Careers Information and Doorways 2
Construction. The ELTRC fosters linkages with
training providers, schools and industry. The
Training Policy Committee (TPC) has oversight of
the implementation of all the ELT programs on
behalf of the Board.
Outcome Performance
✓ Improved skill level and completion rates of
new entrants
The continued growth and development of
apprentice and traineeship commencements is
encouraging.
• In 2005-06 the number of apprentices listed with
Group Training Organisations increased by 257 to
1779. Reflecting the changed access
arrangements a total of 131 apprentices directly
indentured with employers, were also funded for
the first time. This figure represents claims paid,
there are another 400 plus registrations that will
attract payment in the second half of 2006. This
figure is expected to expand rapidly as
awareness is improved.The increase in
apprentice/ traineeships engaged by the industry
is reflected in Chart K CITB Funded Apprentice
Places Over Time.
✓ An increase in the awareness and acceptance of
construction careers amongst school students
and final year apprentices and trainees
In 2005-06 there was an increasing level of interest
in participation in the Doorways 2 Construction
program. Because of a desire to ensure that
students completing the program have the best
chance possible of gaining employment in the
industry, numbers in the program are contained at
around the 550 mark. Students are now screened
prior to entry into the D2C program.
CITB is looking to improve awareness of the D2C
program among the self-employed contracting
community, who provide the bulk of apprentice
employment. D2C is a pool of work-ready, low-risk
apprentice candidates who have base skills that
make them instantly productive. History
demonstrates that they are also more likely to
complete their Contract of Training than an
apprentice commencing from a ‘cold start’ with no
previous exposure to the industry.
Final year apprentices and trainees have been
granted greater access to Current Worker funded
course during the year, aimed at supporting the
transition to licensed independent contractor. Their
training in a range of small business qualifications
and licenses is indicative that they intend to remain
in the industry.
20
Entry Level Training Program
(CONT’D)
Above: Trainee Bricklayers.

✓ An increase in the incidence of training
providers and employers accessing alternative
targeted funding
This objective links to accessing funding provided
by other agencies in order to achieve specific
outcomes. CITB directs inquiries where appropriate
to such agencies but cannot track actual uptake.
In 2005-06 the CITB initiated its own alternative
targeted funding through the introduction of
Innovations and Contingency program. Uptake in
its first year of operation was modest but
encouraging with a number of very successful
results.
Several of the RTOs accessed Innovations and
Contingency funding to provide pre-apprenticeship
programs in the areas of bricklaying, plumbing,
wet-trades and plant operators. These programs
involved forty six participants, delivered by four
training providers. Some 85% of participants had
successful employment outcomes as a result of
this funding initiative.
✓ An increased uptake of safety and other Board
approved training by apprentices and trainees
During the 2005-06 financial year, 889 apprentices
accessed OH&S related courses, an increase of
18% on the previous year.
The Board has made available a range of courses
to apprentices and trainees addressing
competencies not covered under their Contract of
Training but which contribute towards licensing or
to the capacity of a graduating apprentice to
operate as an independent contractor. This is to be
further expanded in 2006-07.
21
Above: Trainees from FCTA’s Innovative Mature Age Pre-employment program for bricklayers.

Under the CITF Act the Board is required to
conduct or commission research to help in
decision making, policy formulation and advisory
functions. The research activities take a number of
different forms – ranging from desk research to
face-to-face industry consultation. Research
activities complement the Board’s role in
evaluating and reviewing its programs.
During the 2005-06 financial year, CITB
commissioned one major research activity, the
Post-training evaluation survey. This research
enables CITB to measure the effectiveness of its
training programs, and findings are included
throughout this annual report.
This survey shows that there is increasing
satisfaction with the training from both course
participants and their employers and supervisors.
Furthermore, training has resulted in positive
outcomes in terms of career opportunities, safety
awareness and safety incidents and work
performance generally. So despite a reduction in
the number of participants accessing CITB funded
training this year, the increase satisfaction leads
us to conclude that the decline in training places
funded is not related to dissatisfaction with CITB
funded training.
CITB also utilises in-house information and
industry intelligence to measure and evaluate its
training programs. For example, the budgeted
allocations for the Current Worker program course
categories have been projected for the 2006-07
Annual Training Program by utilising current
training trends. Developments are underway to
further enhance these with a redesign of the
internal IT system to ensure that program
effectiveness is measured throughout the year.
Industry Skills Board
Following the demise of Industry Training Advisory
Boards (ITABs) in 2002 with the withdrawal of
Commonwealth funding, the State Government
sought to replace the function they had performed.
Nine Industry Skills Boards (ISB) were created to
align with a similar structure implemented at a
national level around Industry Skills Councils.
The CITB was designated the Construction Industry
Skills Board in December 2004.
The purpose of the Industry Skills Boards is to
work with industry, community and government to
develop industry specific workforce plans, identify
workforce trends and emerging skill needs. These
Boards, focus on issues relating to career advice,
and the attraction and retention of a skilled
workforce.
Key functions of the Industry Skills Boards are to:
• Provide industry intelligence and strategic advice
on current and emerging skill and workforce
development needs from both employer and
employee perspectives.
• Promote the importance of integrating skill
development and business development.
• Advocate South Australian industry’s views in the
development, implementation and review of
nationally recognised training products and
services.
• Promote the advantages to be gained from
education, recognised training and lifelong
learning for all South Australians.
• Provide advice on the recognition of skills and
qualifications gained overseas.
As part of its performance agreement with the
Department of Further Education, Employment,
Science and Technology, the CITB developed and
implemented a range of activities to meet its
obligation as the Construction Industry Skills
Board.
Key Construction ISB activities conducted during
2005-06 are highlighted below:
• Developed a website located at
www.constructionskills.com.au
dedicated to workforce development.
• Established governance and advisory structures,
and industry networks.
• Facilitated consultation between government
and industry on workforce development related
issues, including Training Package consultation.
• Conducted an annual industry skills board
forum.
• Commenced a workforce development project
with the civil sector to build the capacity of plant
operators for the industry.
• Developed a framework for skill recognition.
The website was released in May 2006, and
provides CITB with the means to facilitate strategic
linkages between industry, government and
22
Research and Planning

educational institutions to ensure that learning is
relevant to current and emerging industry needs.
This website acts as a vehicle to collate and
disseminate workforce related issues from
attraction and recruitment through to training and
retention. Pertinent information contained on the
website includes relevant Training Package
information, careers information, industry statistics
and linkages with peak industry bodies and
Industry Skills Councils. The website also
promotes the Doorways 2 Construction program as
a key entry point into the industry for South
Australians.
23
Above: Industry Skills Board website
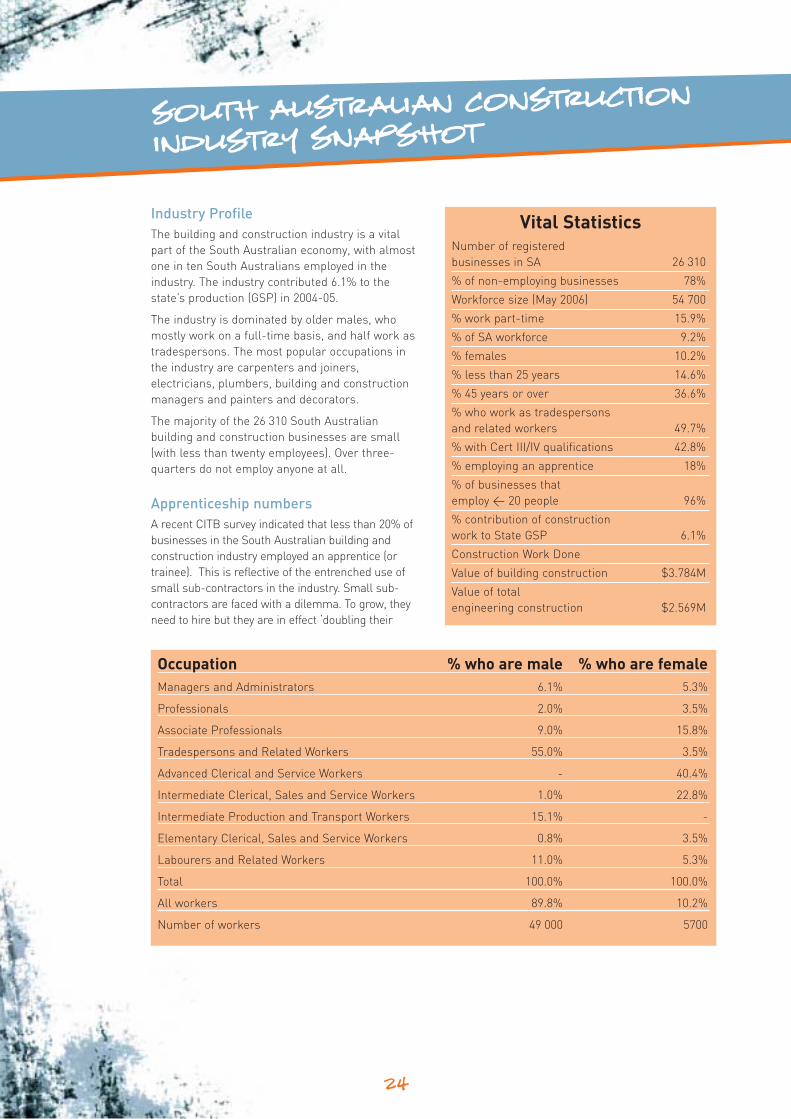
Industry Profile
The building and construction industry is a vital
part of the South Australian economy, with almost
one in ten South Australians employed in the
industry. The industry contributed 6.1% to the
state’s production (GSP) in 2004-05.
The industry is dominated by older males, who
mostly work on a full-time basis, and half work as
tradespersons. The most popular occupations in
the industry are carpenters and joiners,
electricians, plumbers, building and construction
managers and painters and decorators.
The majority of the 26 310 South Australian
building and construction businesses are small
(with less than twenty employees). Over three-
quarters do not employ anyone at all.
Apprenticeship numbers
A recent CITB survey indicated that less than 20% of
businesses in the South Australian building and
construction industry employed an apprentice (or
trainee). This is reflective of the entrenched use of
small sub-contractors in the industry. Small sub-
contractors are faced with a dilemma. To grow, they
need to hire but they are in effect ‘doubling their
24
South Australian Construction
Industry Snapshot
Vital StatisticsNumber of registered
businesses in SA 26 310
% of non-employing businesses 78%
Workforce size (May 2006) 54 700
% work part-time 15.9%
% of SA workforce 9.2%
% females 10.2%
% less than 25 years 14.6%
% 45 years or over 36.6%
% who work as tradespersons
and related workers 49.7%
% with Cert III/IV qualifications 42.8%
% employing an apprentice 18%
% of businesses that
employ < 20 people 96%
% contribution of construction
work to State GSP 6.1%
Construction Work Done
Value of building construction $3.784M
Value of total
engineering construction $2.569M
Occupation % who are male % who are female
Managers and Administrators 6.1% 5.3%
Professionals 2.0% 3.5%
Associate Professionals 9.0% 15.8%
Tradespersons and Related Workers 55.0% 3.5%
Advanced Clerical and Service Workers - 40.4%
Intermediate Clerical, Sales and Service Workers 1.0% 22.8%
Intermediate Production and Transport Workers 15.1% -
Elementary Clerical, Sales and Service Workers 0.8% 3.5%
Labourers and Related Workers 11.0% 5.3%
Total 100.0% 100.0%
All workers 89.8% 10.2%
Number of workers 49 000 5700

workforce’ and increasing their cost base. CITB
incentives are aimed at reducing such barriers.
Chart L graphs Construction Industry Labour Force
and Apprentices In-training. This shows that
apprentices categorised as ‘construction
tradespersons’, electricians and refrigeration/air-
conditioning apprentices are the highest for some
time – driven largely by the sustained high level of
activity enjoyed by the industry. The increase mirrors
the overall growth in employment in the industry.
Chart M graphs the number of commencements of
construction tradespersons and electrical and
refrigeration/air-conditioning apprenticeships by year.
25
Chart L - SA Construction Industry Apprentice Commencements
0
100
200
300
400
500
600
700
800
900
1000
1994-5 1995-6 1996-7 1997-8 1998-9 1999-0 2000-1 2001-2 2002-3 2003-4 2004-5
Construction trades
Electricians/Refrig.
Source: NCVER (ASCO =44) (ASCO = 4311, 4312), SA
Chart L graphs the numbers of apprentices in training (excluding electrical apprentices who are funded by
the CITB).
Chart M Construction Industry Labour Force and Apprentices In-training
0
250
500
750
1000
1250
1500
1750
2000
2250
2500
2750
0.0
10.0
20.0
30.0
40.0
50.0
60.0
Construction tradespersons in-training
Electricians/Refrig. in-trainingLabour Force
Source: NCVER (ASCO =44) (ASCO = 4311, 4312) SA, ABS Labour force Construction industry SA 6291.0.55.003
Ap
pre
nti
ces I
n-t
rain
ing
La
bo
ur
forc
e (
00
0’s
)
Se
p-9
4
Ma
r-9
5
Se
p-9
5
Ma
r-9
6
Se
p-9
6
Ma
r-9
7
Se
p-9
7
Ma
r-9
8
Se
p-9
8
Ma
r-9
9
Se
p-9
9
Ma
r-0
0
Se
p-0
0
Ma
r-0
1
Se
p-0
1
Ma
r-0
2
Se
p-0
2
Ma
r-0
3
Se
p-0
3
Ma
r-0
4
Se
p-0
4
Ma
r-0
5
Se
p-0
5
Ma
r-0
6

Workforce
Size
As illustrated in Chart M, the workforce has started
to stabilise, growing by less than 1000 workers to
54 700 in the twelve months to May 2006. This
makes it the sixth largest employer in the state,
and the fourth largest full-time employer. Only
Manufacturing, Retail Trade, Health and
Community Services have more full-time workers
than the construction industry.
Gender
There are significant differences in occupations by
gender, as illustrated in the table below:
Men have a distinct preference for the trades and
labouring occupations in the construction industry.
Women are better represented in the clerical, sales
and service areas, but are increasingly being better
represented in the associate professionals’ area.
This data does not reflect the unpaid contribution
of many independent tradespeople’s spouses who
play vital roles in business administration.
Age Profile
The building and construction industry is
continuing to age. Last year 32% of the building
and construction industry was aged 45 and over,
this year it has increased to 36.6%. The heavy
physical demands required for many occupations in
the industry means that many workers retire
around this age, which has implications for
maintaining the existing workforce size.
Some 14.6% of those who work in the industry are
aged less than 25 years, which is lower than for
other industries (17.6%). This has significant
implications for replacing retiring workers.
Safety
The SA building and construction industry made
2474 WorkCover claims in the 2004-05 financial
year, representing 6.6% of all claims made in that
year. Given that the industry employs 9.2% of the
state’s workforce, the anecdotal reputation as an
‘unsafe industry’ is over stated.
Educational Profile
In terms of qualifications, the construction industry
has the highest proportion of ‘skilled vocational
qualifications’ but a lower proportion in every other
educational qualification level. This is not
surprising given the strong presence of ‘trades’
people in the industry.
Geographical distribution
About 25% of the workforce resides in non-
metropolitan areas of the state.
26
South Australian Construction
Industry Snapshot (Cont’d)
13.6%13.1%
12.9%
12.1%11.5%
10.1%
9.0%
0.0%
2.0%
4.0%
6.0%
8.0%
10.0%
12.0%
14.0%
2000 2001 2002 2003 2004 2005 2006
Chart N - Administration Expenses as % of Budget Expenditure over Time

Implementation
The CEO is responsible for maximising compliance with
the Act and for effective use of the fund. A compliance
management program is in place and regular evaluation
of the effectiveness of CITB funded training programs is
conducted throughout the year. Internal procedures are
regularly assessed for their currency and efficiency to
ensure most effective use of CITB funds.
Regular reports in relation to compliance, funded
training outcomes and internal policies and procedures
are provided to the Board.
Performance Outcomes
✓ Quarterly reports are provided to the Board and the
sectors on the budget/ actual progress
• The Board receives monthly reports analysing the
financial performance of the fund, in particular,
achievements against the Board’s budget targets.
This information is communicated to stakeholders
through scheduled Sector Standing Committee
Meetings.
✓ Compliance by the industry to the satisfaction of the
Board
• The Board has an annual compliance program that
involves the auditing, by an external audit firm, of a
number of significant projects to ensure that the levy
paid is in accordance with the CITF Act. The Board
receives a report on the outcome of the Compliance
program on a monthly basis.
• Board officers monitor all completed projects with a
value in excess of $250 000 to ascertain if a refund is
due to the project owner or if the project owner owes
an additional levy amount.
• These activities result in adjustments in the form of
refunds or the collection of additional levies
depending on whether the project completes either
over or under the original estimate.
✓ Unqualified audit opinion by Auditor General
• As required under the CITF Act the financial
statements of the Board have been audited by the
Auditor General of South Australia. The auditor’s
unqualified audit opinion is included with the 2005-06
financial statements.
✓ Total cost of this program not to exceed 11% of
budgeted expenditure
• The total cost of this program for the 2005-06
financial year was $0.97M, or 9.0% of budgeted
expenditure ($10.79M). When measured against
actual expenditure for the year, program costs
represented 11.6% of total expenditure ($8.34M).
• Chart N illustrates the changes in Finance and
Admin costs over time.
27
Objectives
• To monitor the
performance of the
fund
• To ensure the Board
and the fund are
administered in
accordance with the
CITF Act and other
relevant legislation
• To ensure compliance
with the requirements
to pay the levy
• To maximise the
effective use of
the fund
• To maximise the
efficiency of
administration
Strategies
• Continued refinement of
internal administrative
procedures
Outcomes
• Quarterly reports are
provided to the Board
and the sectors on
budget/actual progress
• Compliance by the
industry to the
satisfaction of the Board
• Unqualified audit
opinion by Auditor
General
• Total cost of this
program not to exceed
11% of budgeted
expenditure
Status
✓
✓
✓
✓
Governance, Finance and Administration

28
Doorways 2 construction
Doorways 2 Construction – A leader in VET
in Schools
Doorways 2 Construction, or D2C as it is commonly
referred to, is South Australia’s premier Vocational
Education and Training (VET) in schools program for
the building and construction industry. Indeed in
terms of the number of participants that have taken
part in the program, successful outcomes and the
duration over which it has been running, it is
arguably one of the most successful such programs
of its kind anywhere in Australia.
D2C was initiated in direct response to the increased
need to encourage young people to consider the
building and construction industry as a career option,
improve the entry level training opportunities and
promote career pathways, and to create positive
image of the building and construction industry. Its
intent was to support the recruitment and induction
of young people into the building and construction
industry.
The industry vision for D2C is ‘to have a sustainable,
nationally recognised VET in Schools initiative, that is
a program of first choice for schools and students,
and is recognised by industry as the doorway to
employment in the industry’.
D2C is well on its way to achieving this vision. Since
it commenced operations in 2000 with six fledgling
programs, it has grown to twenty six programs
spread across South Australia and has established
an enviable reputation for innovation and quality at
both a state and national level.
The program is a general introduction to the industry
for students, built around practical hands on
experience in a workplace setting. It provides a solid
foundation of skill, knowledge and experience, which
articulates into a range of vocational training courses
and is the introduction for many career pathways.
Aims of Doorways 2 Construction
• Create more awareness of building and
construction among young people.
• Provide students with accurate information about
career opportunities and the tools necessary to
successfully seek work in the industry.
• Develop basic skills that students can take into the
industry.
Results
Increased employment of D2C students in the
industry.
A destination survey is conducted between March
and April of each year, of the previous year’s cohort
of D2C participants. Chart O illustrates D2C
participant destinations from the 2005 school year.
The survey of 2005 students found that 60% had
gained employment in, pre-vocational training
relating to the building and construction industry. A
majority were in apprenticeships.
A total of 24% of participants elected to continue at
school to complete Year 12 before making the
transition to work.
The CITB will in future be able to track those that
choose to enter the industry on completion of Year 12.
Chart O - Doorways 2 Construction Student Destinations 2005 School Year
Another Industry
9%
Seeking Employment
2%
TeritaryStudies
3%
Carpentry
10%
Other B/C employment
22%
ContinuedSecondary Education
24%
Wall & Floor Tiling1%
Glazing
Roof Tiler<1%
Painting1%
Cabinet Making2%
Construction Pre Vocational
1%
Electricall%
Plumbing6%
Plastering1%
Roof Plumbing<1%
Bricklaying1%

Participants make great apprentices
Trade Secret: D2C
Ron is a master painter of over forty years
experience.
He thought he had seen just about everything.
However, he received a very pleasant surprise when
he agreed to take a young D2C student, Ryan
Paterson, who he gave an offer of work experience.
So impressed was Ron with his young charge, he has
now taken him on as a full-time apprentice, received
his financial incentives from the CITB and is currently
lobbying for more support from the State Government
for young people interested in the building and
construction industry. Since then Ron has written to
the CITB, Mike Rann, Jane Lomax-Smith and his
local member Lea Stevens to give the D2C Program
the support he believes it needs.
True to his word, Ron is about to banner his trailer
with the CITB logo to advertise the program.
‘Ryan still has a fair bit of training to do to become a
top tradesman, but for the short time he has been
painting he would put a lot of tradesman to shame’.
Ron wrote.
Ron’s plans for the future offer a valuable lesson for
other sub contractors. Ron is planning his own exit
strategy to enable ‘graceful retirement’ while
progressively transitioning the business to Ryan over
the coming years. Ron plans to ‘slow down’ rather
than ‘shut down’, as would have been the case had he
not taken Ryan on in the first place. They are even
planning to take on another apprentice, with a
Doorways 2 Construction graduate as the preferred
option.
Ron has become a champion of the D2C program and
whenever possible promotes it wherever he goes.
29
Above: Ryan Paterson and Ron Deguet

The 2006-07 Annual Training Plan has been prepared
in accordance with the requirements of the CITF Act,
taking into consideration CITB’s financial position,
and likely training demand from the building and
construction industry.
The focus of the plan is to continue to attract and
support new entrants to the industry, and to
encourage individuals and employers to commit to
skills development for the benefit of the industry and
the careers of individuals within it.
The 2006-07 Annual Training Plan has been
developed against a backdrop of increased levy
collection, an anticipated housing industry decline
offset by increased building activity in the
commercial and civil sectors.
Levy revenues are expected to moderate in 2006-07,
but accumulated surpluses from previous years
(Strategic reserve) gives CITB the confidence to put
in place an ambitious, but sustainable Plan for 2006-
07 and beyond.
The development of the Plan and the establishment
of the underpinning policy settings have been
achieved through extensive industry consultation,
overseen by the Board. A key feature of the Plan this
year is an attempt to more closely align objectives,
strategies and outcomes with the Act.
The Plan builds on the successes of established
programs and aims to consolidate more recent
initiatives.
The Board has maintained its well established
guidance of providing 55% of Training Funds to the
Entry Level Training program and 45% to the Current
Worker Training program.
The CITB also continues the ‘Innovation and
Contingency’ funding program to support special
skill development projects, including mentoring and
pre-employment programs in a range of skill
shortage areas.
The Board will operate two programs to cater for
existing workers and new entrants. Total direct
funding available for the programs will be $11M. The
approximate sectoral attributions of the total funding
available for the two programs remains unchanged
from 2005-06 as shown below.
The Board will retain a provision of up to $500 000 in
2006-07 as the Innovation and Contingency Program
to be applied to special skill development projects as
needed.
It is important to note that the Strategic Reserve will
be drawn down in order to fund a sustained high
level of training activity over the next five years. A
Prudential Reserve is maintained at level consistent
with a construct designed to ensure that the Board is
able to meet likely extant and contingent liabilities.
30
Annual Training Plan For 2006-07 and CITB Forward View
Chart P illustrates the provisional allocation of resources within the Current Worker program by course
category.
Chart P - Current Worker Funds Allocations 2006-07
Other4%
Core Construction50%
Construction Management
13%
Safety21%
Business Planning and
Management12%

31
Sector attributions of funding
Civil Commercial Housing Total
Current Worker Program 13% 15% 17% 45%
Entry Level Training 5% 17% 33% 55%
Total 18% 32% 50% 100%
Chart Q - CITB Expenditure By Program 2006-07
$13.92M Total
Entry Level Training47%
Current Worker Training
37%
Research2%
Collection Costs3%
Governance & Admin
7%Innovation & Contingency
4%
Chart R is a graphical representation of the Board’s Five Year Plan.
Chart R - Five Year Plan 2007-11
-4.00
-2.00
0.00
2.00
4.00
6.00
8.00
10.00
12.00
14.00
16.00
Levy Revenue 11.65 10.47 10.82 11.23 11.69 12.13
Training Expenditure 6.87 10.86 10.71 10.55 10.64 11.26
Net Equity 13.89 11.52 10.35 9.68 9.30 8.64
Strategic Reserve 7.65 5.97 4.78 4.06 3.59 2.64
Net Surplus / (Deficit) 3.79 ( 2.08) ( 1.17) ( 0.67) ( 0.38) ( 0.66)
2006 2007 2008 2009 2010 2011
$M
Chart Q shows planned expenditure across budget programs, including the Innovation and Contingency
program.

32
Annual Training Plan 2006-07
Program 1 - Current Worker Program
2 To improve
workplace
productivity and
performance by
developing and
maintaining a highly
skilled and
accredited
workforce
Objectives
1 To facilitate, support
and promote a
training culture
across the industry
• Balanced regional training provision
and delivery
• An increased application of skills
learnt
• Improved levels of awareness of the
importance of training and the
means by which it can be accessed
Outcomes
• A greater uptake of training,
measured by hours of training and
numbers of training places
• Provide training which is accessible
to all, regardless of geographic
location
• Broaden and develop the skills base
of the industry workforce
3 To ensure a more
equitable distribution
of effort amongst
enterprises in relation
to employment-
related training in the
industry
• An increase in the number of
recognised current competencies
(RCCs) funded
• An increase in the number of new
enterprises accessing training funds
• Promote skill development at the
enterprise level to encourage
enterprises to invest and participate
in training
• The workforce has a broader skills-
base which keeps pace with
changing technologies and industry
requirements
• Address changing techniques,
technology, regulation and
compliance applicable to the
industry
• An increase in the proportion of the
workforce with recognised AQF
qualifications
• Improve the proportion of the
workforce with recognised
qualifications by supporting the
uptake of skills recognition
processes
• Promote to, and broadly engage
stakeholders and enterprises
regarding the benefits of training to
the industry
Strategies
• Reduce the cost of training to
industry by subsidising endorsed
training programs delivered by CITB
approved Registered Training
Organisations

33
Objectives OutcomesStrategies
4 To enhance career
opportunities and
broaden workforce
employability through
training
• The skills of the workforce meet
industry requirements
• Promote and support the up-skilling
and cross-skilling of the existing
workforce and those returning to the
industry
5 To facilitate the
development and
adoption of safe work
practices across the
industry
• A demonstrated commitment to
training in the area of safer work
practices
• Ensure that the industry and its
workforce are supported in all
aspects of safe work practices,
through training.
• A safer working environment
through training
• Promote increased OH&S within the
industry through training
• The level of training activity is
balanced against present and
projected economic trends
• Liaise with key stakeholders in
relation to training and personnel
development requirements
Above: Induction Day.

34
Annual Training Plan 2006-07
(CONT’D)
Program 1 - Entry Level Program
2 To encourage
enterprises to take on
apprentices and
trainees in approved
vocations
Objectives
1 To encourage
prospective new
entrants in schools
and the community to
consider careers in
the industry
• Maintenance of a population of
appropriately qualified, committed
and enthusiastic teachers delivering
D2C
• An increase in the proportion of D2C
participants gaining contracts of
training
• An increased interest by schools and
the community in the D2C program
Outcomes
• An increased awareness and
acceptance of building industry
careers amongst school students
• Encourage support and engage the
teaching community in the delivery of
D2C through the provision of
scholarships
• Provide financial incentives to
enterprises taking on D2C graduates
under contracts of training
• Apprentice and trainee
commencements in approved vocations
are consistent with 10 year long term
trend
• Provide financial incentives to
enterprises for placing apprentices
and trainees in approved vocations
• Increased awareness of financial and
tangible benefits of employing
under contracts of training
• Develop a marketing plan to contact
potential employers not currently
involved in apprenticeship programs
• Support schools and community
groups to provide a positive experience
of the industry to prospective new
entrants through involvement in the
D2C program
Strategies
• Provide information and advice on
training and careers to schools and
the community that promote
construction careers
3 To maximise the
proportion of new
entrants undertaking
approved vocational
qualifications
• The levels of apprentices and
trainees in approved vocations in-
training are sufficient to maintain the
industry workforce at required levels
• Provide financial support to off-set the
cost of tuition fees for apprentices and
trainees under contracts of training in
approved vocations
• Provide financial incentives to
enterprises to support the completion
of approved vocational qualifications
• An increase in the proportion of new
entrants in approved vocations gaining
formal recognition of their skills
• Encourage new entrants to have
relevant skills acknowledged through a
formal recognition framework

35
4 To improve the quality
of workplace learning
and training of
apprentices and
trainees in approved
vocations
• A wider acceptance and adoption of
on-the-job recognised training
• Provide financial incentives to
enterprises to ensure their apprentices
and trainees in approved vocations
receive a broad range of on-the-job
experiences consistent with their
training plans
5 To raise awareness of
safe work practices
amongst apprentices
and trainees
in approved vocations
• Participation levels in approved
OH&S specific training is consistent
with workforce numbers
• Ensure that D2C participants,
apprentices and trainees in approved
vocations are supported in safety
training available to the industry
• An increase in the number of recently
completed apprentices in approved
vocations gaining appropriate
licenses
• Encourage and support apprentices
and trainees in their final years to take
up training opportunities that develop
skills for business and licensing
requirements
Objectives OutcomesStrategies
Above: D2C Site Visit.

Board Meetings
The Board of the CITB met on 11 occasions during
2005-06.
Board Attendance Record
Meetings Meetings
Eligible Attended
to Attend
Mary Marsland 11 9
Martin O’Malley 11 7
Deputy: Ben Carslake 4 1
Robert Stewart 11 7
Deputy: David Callan 4 3
Graeme Lawler
(resigned October 2005) 3 0
Deputy: Bob Osborne 3 0
Roderick Fyfe
(appointed February 2006) 5 3
Deputy: Linda Ellis 2 0
Brenton Gardner
(resigned February 2006) 6 5
Deputy: Robert Harding 1 1
Steve Hall 11 11
Deputy: Larry Moore 0 0
Robert Geraghty 11 8
Deputy: Douglas Buchanan 3 2
Peter Harrland 11 10
Deputy: Bryan Moulds 1 0
Fiona O’Connor 11 9
Deputy: Christine Harrison 2 0
Romana Wereszczak 11 9
Deputy: Sally Jeremic 2 0
Wayne Hanson 11 0
Deputy: Chris Nesbitt 11 1
A high non-attendance record by a deputy may
reflect the Board’s formal policy that requires a
written apology from the Member and provision of
a full briefing to their Deputy prior to the meeting.
A deputy may therefore not always be able to
attend a meeting for which they are indicated as
being eligible. This policy operates to ensure the
Board fulfils its responsibilities to the Deputy in
preparing him/her for informed and effective
involvement in the meeting.
Regional Meetings
No Regional Meetings were held during the 2005-
06 Financial Year.
Annual Training Plan Approval
The CITB 2005-06 Annual Training Plan (ATP) was
prepared in accordance with Section 32 of the SA
CITF Act 1993 and approval of that plan was given,
by the SA Minister for Employment, Training and
Further Education on 28 June 2006.
Authorisations
Authorised officers are appointed in accordance
with Section 33 of the SA Construction Industry
Fund (CITF) Act 1993. The Chief Executive Officer,
Mr Steve Larkins, the Chief Finance Officer, Mr
Malcolm Davey and Mr Jim Gouskos of Moore
Stephens retained their appointments.
Delegations
At its meeting on 21 July 2005 the Board agreed to
delegate authority to develop remedial action to the
TPC and management in order to enable timely
action in the early New Year.
The Board agreed to delegate the endorsement of
Training Packages to the TPC on the
recommendation of Stream Committees.
At its meeting on 20 October 2005 the Board
delegated to the CEO, approval authority for any
changes to the qualifications schedule in the ELT
policy, where the qualification is within one of the
construction industry training packages.
The Board agreed that the approval of all other
qualifications be made by the TPC.
The Board delegated to the CEO the authority to
prepare routine letters of support that do not
involve any financial commitments by the CITB.
At its meeting on 24 November 2005 the Board
agreed to delegate approval of submissions for the
Contingency and Innovation Funding Options for
2005-06 that meet the objectives to the CEO within
extant financial delegations.
All delegations are monitored and recorded in a
schedule.
36
Corporate Governance

Conflicts of Interest – Disclosure by
Board Members
During the term of this report, a Register of
Interests was maintained whereby members record
in advance any interests which may conflict with
those of the CITB in certain circumstances.
Nil reported.
Planning Framework
The planning framework of the CITB incorporates
several internal systems including:
• Board Strategic Planning Forum and the CITB
Strategic Plan
• Business Planning and the Annual Training Plan
(endorsed by Minister)
• Staff Performance Management System
• Information Management / E Business systems
and procedures
• A rolling review of policies and procedures
CITB Advisory Committees 30 June 2005
The building and construction industry is generally
divided into three sectors representing Civil,
Commercial, and Housing Construction. The Board
of the CITB forms sub committees in each of these
areas as well as a Specialist Services Standing
Committee. These committees meet approximately
bi-monthly (or on an as needs basis) and are
comprised of an agreed membership of people
within the relevant industry groups.
Statutory Authority Compliance
Reporting Requirements
Overseas Travel
No overseas travel was funded by the CITB in
2005-06.
Contracts Exceeding $4M
The CITB did not enter into any contracts in excess
of $4M or which extended beyond the Financial
Year.
Staff Employment
The CITB is tasked with administering the
Construction Industry Training Fund Act, 1993.
However it is not an agency or instrumentality of
the Crown. CITB staff are not Public Servants and
are employed under either individual contracts or
the terms of an entity-specific Enterprise.
This does not include the Vocational Education and
Learning officer which is a DECS position recorded
to CITB on a last share arrangement.
Bargaining Agreement
The Enterprise Agreement is based on the SA
Clerks’ Award.
Negotiations and pre-approval processes for the
CITB Enterprise Agreement 2006 were largely
completed as at 30 June 2006. Approval and
implementation have subsequently been effected
without issue.
PSM Act Employment conditions do not apply to
CITB staff and managers.
Financial Performance
The Auditor-General’s unqualified report on the
Financial Statements of the CITB is at page 49 of
this document.
Fraud
No incidence of fraud was detected in the CITB
during 2005-06. A risk management plan is in
place and is monitored on a regular basis. A
system of financial delegations and counter-
signatories applies to all financial transactions.
Consultants
Consulting services are used primarily in
augmenting the research capabilities of the CITB.
Details of consulting services engaged are provided
in the notes to the Financial Statements.
Freedom of Information (FOI)
A Freedom of Information Statement is available on
the CITB Website. There were no FOI requests
lodged with the CITB during the reporting year.
37

38
Corporate Governance (CONT’d)
Staffing Structure
As at 30 June 2006
Chief Executive Officer
Steve Larkins
Chief Financial Officer
Malcolm Davey
Manager Research
and Planning
Alison Anlezark
Manager
Training Programs
Len Warren
PA/Executive Assistant
Suzi Prsa
Accountant
Peter Doyle
Project
Officer Industry
Skills Board
Stephen Secomb
Training Contracts
Officer
Kylie Clarke
Careers and
Vocational Learning
Officer/D2C
Steve Birnie*
Reception/
Levy Collections
Lauren Whelan
Finance/
Compliance Officer
Maxine Burgess
Training
Claims Officer
Jennie Goodwin
Entry Level
Training Admin
Officer
Jodie Ponton
*Seconded from Department of Education and Children’s Services.

39
Board Committees
As at 30 June 2006
Finance and Audit CommitteeSteven Hall (Chair)VacantRobert GeraghtyRomana WereszczakWayne Hanson
Training Policy CommitteePeter Harrland (Chair)Robert StewartMartin O'MalleyFiona O’ConnorRoderick Fyfe
Committee Membership
As at 30 June 2006
Board
Remuneration
Training Policy
Committee
Joint Sector
Advisory CommitteeELT Reference
Committee
Housing Commercial Civil Services
Working Parties
as required
Finance & Audit
Committee

Advisory Committees*Indicates non-voting members, interested parties only
Joint Sector Advisory Committee (as at 30 June 2006)Name Nominating Body/Group
Robert Harding (Chair) Housing Sector Standing Sub-Committee
Larry Moore Specialist Services Working Party
Bernie Biggs Housing Sector Standing Sub-Committee
Harry Ennis Commercial Sector Standing Sub-Committee
David Thompson Commercial Sector Standing Sub-Committee
Mike Quinn Civil Sector Standing Sub-Committee
Allan Wilkey Civil Sector Standing Sub-Committee
Robert Farnham* Specialist Services Working Party (Resigned 14 June 2006)
Civil Sector Standing Sub-Committee (as at 30 June 2006)
Name Nominating Body/Group
Geoff Allen (Chair) Housing Industry Association
Alison Scheffler* Civil Skills Technology Centre
Allan Wilkey Civil Contractors Federation SA
Mike Quinn Civil Contractors Federation SA
Chris Nesbitt Australian Workers Union
Ken Shinkfield Civil Contractors Federation SA
Roderick Fyfe* Civil Contractors Federation SA
David Mangan Australian Asphalt and Pavement Association
David Thompson Master Builders Association
Helen Voigt* Master Builders Association
Sandy Semmens Local Government Association
Martin O’Malley Construction, Forestry, Mining and Energy Union
Peter Rusk* Bardavcol
Commercial Sector Standing Sub-Committee (as at 30 June 2006)
Name Nominating Body/Group
Keith Bleechmore (Chair) Air Conditioning and Mechanical Contractors Association
Harry Ennis Construction, Forestry, Mining and Energy Union
Mal Aubrey Group Training Australia
David Thompson Master Builders Association
Winfred Hughes* Master Builders Association
Helen Voigt* Master Builders Association
Bernie Biggs Building Industry Specialist Contractors Association
Andrew Hapek Master Painters Association
Robert Farnham* Plumbing Industry Association (Resigned 14 June 2006)
Christopher Rankin Air conditioning and Mechanical Contractors Association
Peter Jolley* PEER Training
40
Corporate Governance (CONT’d)

Housing Sector Standing Sub-Committee (as at 30 June 2006)
Name Nominating Body/Group
Robert Harding (Chair) Housing Industry Association
Grant Robinson Housing Industry Association
Winifred Hughes Master Builders Association
David Thompson Master Builders Association
Helen Voigt* Master Builders Association
Bernie Biggs Building Industry Specialist Contractors Association of SA
Larry Moore National Electrical and Communications Association
Aaron Cartledge Construction, Forestry, Mining and Energy Union
Linda Ellis Civil Contractors Federation SA
Robert Farnham* Plumbing Industry Association(Resigned 14 June 2006)
Peter Jolley* PEER Training
Len Lawson* TAFE SA
Specialist Services Working Party (as at 30 June 2006)
Name Nominating Body/Group
Larry Moore (Chair) National Electrical and Communications Association
Christopher Rankin Air conditioning and Mechanical Contractors Association / Better Heating and Cooling Bureau
Keith Bleechmore Air Conditioning and Mechanical Contractors Association and Fire Contractors AA / National Fire Industry Association
Robert Farnham* Plumbing Industry Association (Resigned 14 June 2006)
Robert Geraghty Communications, Electrical Plumbing Union - Electrical
Doug Buchanan Communications, Electrical Plumbing Union - Plumbing
Stephen Vandborg* TAFE SA
Entry Level Training Reference Committee (as at 30 June 2006)
Name Nominating Body/Group
Robert Stewart (Chair) Master Builders Association
Mike Rundell Brimblecome Builders
Adam Turnbull Scott Salisbury Homes
Michael Wakefield Traineeship and Apprenticeship Services
Paul Willis Senior Secondary Assessment Board of SA
Keith Darwin Futures Connect
Tony Baulderstone Bardavcol
Paul Klepczynski Torrens Valley Institute of TAFE
John Yorston Westside Mechanical Contracting P/L
Stephen Inglis Senior Secondary Assessment Board of SA
Vacant Construction, Forestry, Mining and Energy Union
41

42
Certificate by Board Members,
CEO & Principal Accounting Officer
To the best of our knowledge and belief, we certify that
a. the financial statements are in accordance with the accounts and records of the authority and give an
accurate indication of the financial transactions of the authority for the year then ended;
b. are presenting fairly, in accordance with the Treasurer’s Instructions promulgated under the provisions
of the Public Finance and Audit Act 1987, applicable Accounting Standards and other mandatory
professional reporting requirements in Australia, the financial position of the entity as at the reporting
date and the result of its operations and its cash flows for the year then ended; and
c. that internal controls over financial reporting have been effective throughout the reporting period.
Dated 3 October 2006
__________________________
Mary Marsland
Presiding Member
__________________________
Stephen L Larkins
Chief Executive Officer
__________________________
Steven Hall
Board Member
__________________________
Malcolm Davey
Chief Financial Officer
(Principal Accounting Officer)

43
Auditor-General’s Report on the
Financial Statements of the CITB

44
Income Statementfor the Year Ended 30 June 2006
Note Total Total
2006 2005
$’000 $’000
INCOME
Revenues from industry levies 11 652 9 999
Interest revenues 671 483
Grants from SA Government 5 150 144
Other revenues 6 51 55
Total Income 12 524 10 681
EXPENSES
Administration Expenses
Employee benefits costs 7 394 422
Collection Agents fees 55 58
Depreciation and amortisation expense 8 44 63
Occupancy 51 60
Net loss from the disposal of assets 9 - 11
Other 345 323
Total Administration Expenses 889 937
TRAINING EXPENSES
Employee benefits cost 7 352 284
Promotion 106 20
Training Claims 6 867 6 784
Depreciation and amortisation expense 8 40 42
Occupancy 46 37
Other 228 11
Research 35 45
Total Training Expenses 7 674 7 324
GRANT EXPENSES
Employee benefits cost 7 78 45
Depreciation and amortisation expense 8 9 7
Occupancy 10 6
Other 78 32
Total Grant Expenses 175 90
Total Expenses 8 738 8 351
Net Surplus 3 786 2 330

45
Balance Sheetfor the Year Ended 30 June 2006
Note Total Total
2006 2005
$’000 $’000
CURRENT ASSETS
Cash and cash equivalents 12 2 707 1 380
Receivables 13 570 603
Other financial assets 14 11 244 8 853
Total Current Assets 14 521 10 836
NON-CURRENT ASSETS
Property, plant and equipment 15 167 149
Intangible assets 16 34 76
Total Non-Current Assets 201 225
Total Assets 14 722 11 061
CURRENT LIABILITIES
Training expenditure approved but not yet paid 344 353
Payables 17 445 532
Short-term and long-term employee benefits 18 43 53
Total Current Liabilities 832 938
NON-CURRENT LIABILITIES
Payables 17 - 2
Long-term employee benefits 18 - 17
Total Non-Current Liabilities - 19
Total Liabilities 832 957
Net Assets 13 890 10 104
EQUITY
Reserve 7 650 4 800
Retained earnings 6 240 5 304
Total Equity 13 890 10 104
Commitments for expenditure 19
Contingent assets and liabilities 20

46
Statement of changes in equityfor the Year Ended 30 June 2006
Strategic Retained Total
Reserves Earnings $’000
$’000
Balance at 30 June 2004 2 960 4 814 7 774
Net Surplus for 2004-05 - 2 330 2 330
Transfer to Strategic Reserve 1 840 (1 840) -
Total recognised
income/expense for 2004-05 1 840 490 2 330
Balance at 30 June 2005 4 800 5 304 10 104
Net Surplus for 2005-06 - 3 786 3 786
Transfer to Strategic Reserve 2 850 (2 850) -
Total recognised
income/expense for 2005-06 2 850 936 3 786
Balance at 30 June 2006 7 650 6 240 13 890

47
cash flow Statementfor the Year Ended 30 June 2006
Note 2006 2005
Inflows Inflows
(Outflows) (Outflows)
$’000 $’000
CASH FLOWS FROM OPERATING ACTIVITIES
Cash Inflows
Receipts from Industry training levies 11 661 9 993
Interest received 271 104
GST receipts on receivables 18 21
GST input tax credits 367 600
Other receipts 215 175
Cash generated from operations 12 532 10 893
Cash Outflows
Employee benefit payments (851) (752)
Training expenditure (7 036) (6 319
GST payments on purchases (374) (626)
Other payments (883) (1 008)
Cash used in operations (9 144) (8 705)
Net Cash provided by operating activities 21(b) 3 388 2 188
CASH FLOWS FROM INVESTING ACTIVITIES
Cash Inflows
Proceeds from term deposits 74 578 46 956
Proceeds from sale of plant and equipment - 22
Cash generated from investing activities 74 578 46 978
Cash Outflows
Purchase of investments (76 570) (48 955)
Payment for plant and equipment (69) (145)
Cash used in investing activities (76 639) (49 100)
Net Cash (used in) Investing Activities (2 061) (2 122)
Net increase in cash and cash equivalents 1 327 66
Cash and cash equivalents at beginning of financial year1 380 1 314
Cash and cash equivalents at end of financial year 21(a) 2 707 1 380

48
Notes to and Forming Part of
the Financial Statements
1 GENERAL
Objectives of the CITB
The Construction Industry Training Board (Board) is established under the Construction Industry
Training Fund Act 1993 (CITF Act).
The Board’s responsibilities include:
• management and administration of the Construction Industry Training Fund and the South
Australian Industry Training Advisory Body;
• to act as a principal adviser to the Minister for Employment, Training and Further Education
and the Minister for Education, Science and Training for the Commonwealth on training related
matters for the Building and Construction Industry in South Australia;
• preparation of training plans;
• co-ordination of training and review and evaluation of employment related training programs.
The Fund collects revenue by way of a levy of 0.25 percent of the value of building and
construction work. This revenue is invested back into the industry in the form of expenditure on
training.
2 SUMMARY OF SIGNIFICANT ACCOUNTING POLICIES
a) Basis of Accounting
The financial report is a general purpose financial report. The accounts have been prepared in
accordance with applicable Australian Accounting Standards (AASB) and Treasurer’s Instructions
and Accounting Policy Statements promulgated under the provision of the Public Finance and Audit
Act, 1987 (PFAA), and the requirements of the Construction Industry Training Fund Act, 1993.
The PFAA and Treasurer’s Instructions are legislative provisions governing the preparation of
financial statements and take precedence over Australian Accounting Standards.
Accounting Policy Statements issued pursuant to Treasurer’s Instructions may modify or clarify
accounting standards application, disclosure, format and wording to provide certainty and to ensure
consistency and appropriate reporting across the public sector.
Where modification is required and has a material effect upon the reported results, details of that
modification and the resulting financial effect are disclosed in the notes.
These financial statements are the first statements to be prepared in accordance with Australian
equivalents to International Financial Reporting Standards (AIFRS).
AASB 1 First time adoption of AIFRS has been applied in preparing these statements. Previous
financial statements were prepared in accordance with Australian Generally Accepted Accounting
Principles.
Reconciliations explaining the transition to AIFRS as at 1 July 2004 and 30 June 2005 are at note 4.
The Construction Industry Training Board’s Income Statement, Balance Sheet and Statement of
Changes in Equity have been prepared on an accrual basis and are in accordance with historical
cost convention.
The Cash Flow Statement has been prepared on a cash basis.
The financial report has been prepared on a twelve month operating cycle and presented in
Australian currency.

49
b) Comparative Figures
The presentation and classification of items in the financial report are consistent with prior periods
except where a specific Accounting Policy Statement or Australian Accounting Standard have
required a change.
Comparative figures have been restated on an AIFRS basis. The comparatives have been restated to
assist users’ understanding of the current reporting period and do not replace the original financial
report for the preceding period.
Note 4 provides a detailed analysis of comparative amounts that have been reclassified as a result
of adoption of AIFRS.
c) Rounding
All amounts in the financial statements have been rounded to the nearest thousand dollars
($’000).
d) Taxation
The Board is exempt from Income Tax in terms of subsection 23(d) of the Income Tax Assessment
Act 1936, as amended. The Board is liable for Payroll Tax, Fringe Benefits Tax and Goods and
Services Tax.
Income, expenses and assets are recognised net of the amount of GST except where the amount
of GST incurred by the Board as a purchaser is not recoverable from the Australian Taxation
Office. Receivables and payables are stated with the amount of GST included.
e) Income and Expenses
Income and expense are recognised in the Board’s Income Statement when and only when it is
probable the flow of economic benefit to or from the entity will occur and can be reliably measured.
Industry levies are recognised as income when the Board obtains control of the levies. Control is
normally obtained upon their receipt by the Board or its collection agents.
Interest revenue is recognised as it accrues.
Grant monies for specific projects are recognised as revenue when the Board obtains control over
the asset. Control over theses revenues is normally obtained upon receipt. However, where specific
conditions relating to the grant are not met and the amount is required to be repaid, a liability is
recognised in the Income Statement as a result of a present obligation arising to the grantor.
Income from the disposal of non current assets is recognised when control of the asset has
passed to the buyer and is determined by comparing proceeds with carrying amount.
f) Current and Non-Current Classification
Assets and liabilities are characterised as current or non-current in nature. The Board has a
clearly defined operating cycle of twelve months. Assets that are sold, consumed or realised as
part of the normal operating cycle even when they are not expected to be realised within twelve
months after the reporting date have been classified as current assets or current liabilities. All
other assets and liabilities are classified as non-current.
Where asset and liability line items combine amounts expected to be realised within twelve
months and more than twelve months, the Board has separately disclosed the amounts expected
to be recovered or settled after more than twelve months.
for the Year Ended 30 June 2006

50
Notes to and Forming Part of
the Financial Statements
g) Cash and Cash Equivalents
Cash and cash equivalents recorded in the cash flow statement includes cash on hand, cash at
bank and deposits held at call.
Cash is measured at nominal value.
h) Receivables
Receivables in respect of accrued levy revenue and debtors are due for settlement within 30 days
and are recorded at their recoverable amount. At the end of each reporting period the receivable
balances are reviewed and a provision is raised in respect of any balance where recovery is
considered doubtful.
i) Other Financial Assets
Other Financial Assets comprise term deposits held to maturity for periods of three months and
greater.
In accordance with the Accounting Policy Statements contained in the Accounting Policy
Framework IV Financial asset and Liability Framework, the Board measures financial assets at
historical cost.
j) Non-Current Asset Acquisition and Recognition
Assets are recorded at cost plus any incidental cost involved in the acquisition.
The Board capitalises all non-current assets with a value of one thousand dollars
($1 000) or more.
k) Impairment
All non-current tangible and intangible assets are tested for indication of impairment at each
reporting date. Where there is an indication of impairment, the recoverable amount is estimated.
An amount by which the asset’s carrying amount exceeds the recoverable amount is recorded as
an impairment loss.
Impairment is generally limited to where an asset’s depreciation is materially understated or
where the replacement cost is falling.
l) Depreciation and Amortisation of Non-Current Assets
All non-current assets, having a limited useful life, are systematically depreciated/amortised over
their useful lives in a manner that reflects the consumption of their service potential.
Amortisation is used in relation to intangible assets such as software, while depreciation is
applied to physical assets such as property, plant and equipment.
Depreciation of non-current assets is calculated on a straight-line basis for each class of
depreciable asset so as to write off the cost of the asset over its expected useful life.
The depreciation rates used for each class of depreciable asset are set out as follows: -
• Furniture and fittings 20 percent
• Computer equipment 25 percent
• Office machines 20 percent
• Motor vehicles 15 percent
• Leasehold Improvements 35 percent
• Computer Software 25 percent

51
m) Accrued Levy Income
Accrued levy income includes all amounts held by collection agents at balance date.
n) Investments
Investments represent investments in term deposits. Interest revenue is brought to account on
an accrual basis.
o) Training Expenditure Approved But Not Yet Paid
Training expenses are recognised as an expense in the financial year that the expenditure was
approved. The balance of unexpended training approval is included in the Balance Sheet as
“Training Expenditure Approved But Not Yet Paid”.
p) Payables
Payables include creditors, accrued expenses and employment on-costs.
Creditors represent the amounts owing for goods and services received prior to the end of the
reporting period that are unpaid at the end of the reporting period.
Accrued expenses represent goods and services provided by other parties during the period that
are unpaid at the end of the reporting period and where an invoice has not been received at the
end of the reporting period.
Employment on-costs include superannuation contributions, payroll tax and workers
compensation premiums with respect to outstanding liabilities for salaries and wages, long
service leave and annual leave.
q) Employee Benefits
Employee benefits comprise entitlements for salaries and wages, annual leave and long service
leave. Provision has been made in the Financial Statements, where stated, for the Board’s
liability for employee benefits arising from services rendered by employees to balance date.
Long-term employee benefits are measured at present value and short-term employee benefits
are measured at nominal values. Payroll tax, superannuation and workers’ compensation
insurance premiums are classified as payables.
Salaries and Wages
Liability for salaries and wages are measured as the amount unpaid at reporting date at
remuneration rates current at reporting date.
Annual Leave
Provision has been made for the unused component of annual leave at balance date. The
provision has been calculated at nominal amounts based on projected salary rates. Related on-
costs are reported as payables.
Sick Leave
Under an Enterprise Bargaining Agreement taking effect from 1 July 2004, employees who are
party to the Agreement are entitled to accrue a maximum of twenty five percent (25%) of their
Sick Leave Entitlement.
Long Service Leave
In calculating long service leave entitlements the Board has used a benchmark of five years as
an approximation of the present value of expected future payments of the long service leave
liability. Related on-costs are reported as payables.
Superannuation
The Board has contributed nine percent of the employees’ base salary into a prescribed
for the Year Ended 30 June 2006

52
Notes to and Forming Part of
the Financial Statements
superannuation fund. This amount represents the Board’s full liability for the year. The liability for
superannuation is included in employment on-costs.
r) Leases
The Board leases premises for its administrative and operating activities. The lease is classified
as a non-cancellable operating lease and lease payments are included as expenditure in equal
instalments over the accounting periods covered by the respective lease term.
s) Insurance
The Board has arranged through it’s brokers to insure all major risks of the Board. The excess
payable under policies varies depending on each class of insurance held.
t) Strategic Reserve
The Board has provided for a reserve to address any strategic needs that may arise which the
Board considers warrant an allocation of funds.
3 FINANCIAL RISK MANAGEMENT
The Board is exposed to a variety of financial risks, credit risk and liquidity risk.
The Board has non-interest bearing assets (cash on hand and receivables) and liabilities (payables)
and interest bearing assets (cash and cash equivalents and investments).
The Board has no significant concentration of credit risk.
Investments are in the form of term deposits with approved banking institutions.
In relation to liquidity/funding risk, the continued existence of the Board in its present form, is
dependent on Government policy.
4 CHANGES IN ACCOUNTING POLICY
The Board has adopted AIFRS for the first time for the year ended 30 June 2006.
The adoption of AIFRS has not resulted in any material adjustments to the Income Statement or
Cash Flow Statement.
In accordance with AASB 138 Intangible Assets, the Board has classified software that is integral
to the systems as an intangible asset.
5 GRANTS
2006 2005
$’000 $’000
Industry Skills Board 130 135
Other Research Projects 20 9
150 144

53
for the Year Ended 30 June 2006
6 OTHER REVENUES
2006 2005
$’000 $’000
Sale of Publications 27 20
Sundry Revenue 24 35
Total 51 55
7 EMPLOYEE BENEFITS COST
2006 2005
$’000 $’000
Salaries and Wages 650 629
Long Service Leave (1) (5)
Annual Leave 50 49
Employment on-costs-superannuation 61 49
Employment on-costs-other 38 20
Board Fees 26 9
Total 824 751
Remuneration of Employees
The number of employees whose total remuneration was within the following bands:
2006 2005
Number of Number of
Employees Employees
$100,001 - $110,000 1 -
$110,001 - $120,000 - 1
$120,001 - $130,000 1 -
Total 2 1
The table includes all employees who received remuneration of $100,000 or more during the year.
Remuneration of employees reflects all costs of employment including salaries and wages,
superannuation contributions, fringe benefits tax and any salary sacrifice benefits. The total
remuneration for these employees was $230 thousand ($118 thousand).
Remuneration of Directors
Total income received, or due and receivable during the financial year by Directors was $26 thousand
($9 thousand). The number of Directors whose income from the entity falls within the following band is:
2006 2005
$0 - $10,000 - 1
$20,001 - $30,000 1 -
Total 1 1
The difference between 2005 and 2006 was due to a delay in formalisation of payments for 2005
service.

54
Notes to and Forming Part of
the Financial Statements
8 DEPRECIATION AND AMORTISATION
The aggregate amounts of depreciation expensed during the reporting period for each class of
depreciable asset are as follows:
2006 2005
$’000 $’000
Furniture and fittings 1 2
Computer equipment 19 38
Computer Software 42 49
Office machines 6 7
Motor vehicles 15 9
Leasehold improvements 10 7
Total 93 112
9 NET LOSS FROM DISPOSAL OF ASSETS
2006 2005
$’000 $’000
Proceeds from disposal of assets - 22
Net book value of assets disposed - 33
Net loss from disposal of assets - 11
10 TRANSACTIONS WITH SOUTH AUSTRALIAN GOVERNMENT
There have been no transactions with the South Australian Government greater than $100,000
other than those disclosed on the Income Statement.
11 AUDITOR’S REMUNERATION
2006 2005
$’000 $’000
Audit fees paid/payable to the
Auditor-General’s Department 31 29
No other services were provided by the Auditor-General.
12 CASH AND CASH EQUIVALENTS
2006 2005
$’000 $’000
Current Investments
Cash on hand 1 1
Cash at bank 413 258
Bank Deposit at Call 2 293 1 121
Total Current Investments 2 707 1 380
The cash at bank and deposit at call are interest bearing
at average rates at 30 June of 5.45% ( 4.75%).

55
for the Year Ended 30 June 2006
13 RECEIVABLES
2006 2005
$’000 $’000
Current
Accrued levy revenue 412 385
Accrued interest 38 38
Trade debtors 44 79
Sundry debtors 4 17
Prepayments 15 10
GST receivables 57 74
Total Current Receivables 570 603
Interest Rate and Credit Risk
Receivables are raised for all levies, goods and services for which payment has not been received.
Receivables are normally settled within 30 days. Trade receivables, prepayments and accrued
revenues are non-interest bearing. Other than recognised in the provision for doubtful debts, it is not
anticipated that counterparties will fail to discharge their obligations. The carrying amount of
receivables approximates net fair value due to being received on demand. In addition, there is no
concentration of risk.
14 OTHER FINANCIAL ASSETS
The investments of the Board at balance date comprise:
2006 2005
$’000 $’000
Current Investments
Westpac Term Deposits 46 44
National Australia Bank Term Deposits 11 198 8 809
Total Current Investments 11 244 8 853
The deposits are held to maturity and have an average
fixed interest rate at 30 June of 5.97% (5.55%).

56
Notes to and Forming Part of
the Financial Statements
15 PLANT AND EQUIPMENT
a) Plant and equipment:
2006 2006 2005 2005
$’000 $’000 $’000 $’000
Furniture and fittings at cost 35 35
Less: Accumulated depreciation (34) 1 (33) 2
Computer equipment at cost 128 126
Less: Accumulated depreciation (90) 38 (71) 55
Office machines at cost 33 33
Less: Accumulated depreciation (27) 6 (21) 12
Motor vehicles at cost 130 63
Less: Accumulated depreciation (20) 110 (5) 58
Leasehold Improvements 29 29
Less: Accumulated depreciation (17) 12 (7) 22
Total Plant and Equipment 167 149
b) Reconciliation of Plant and Equipment
The following table shows the movement of plant and equipment during the current reporting
period.
Furn Comp Office Motor Leasehld Total
& Fittings Equip Machs Vehicles Imprvmt 2006
$'000 $'000 $'000 $'000 $'000
Gross Value at 1 July 2005 35 126 33 63 29 286
Plus: Purchase of assets - 2 - 67 - 69
Gross value at 30 June 2006 35 128 33 130 29 355
Accumulated depreciation at
1 July 2005 33 71 21 5 7 137
Depreciation charge for the year 1 19 6 15 10 51
Accumulated depreciation at
30 June 2006 34 90 27 20 17 188
Net book value as at 30 June 2006 1 38 6 110 12 167

57
for the Year Ended 30 June 2006
The following table shows the movement of plant and equipment during the reporting period
ended 30 June 2005.
Furn Comp Office Motor Leasehld Total
& Fittings Equip Machs Vehicles Imprvmt 2005
$'000 $'000 $'000 $'000 $'000
Gross Value at 1 July 2004 35 297 42 41 - 415
Plus: Purchase of assets - 53 - 63 29 145
Less: Disposal of assets - (224) (9) (41) - (274)
Gross value at 30 June 2005 35 126 33 63 29 286
Accumulated depreciation at
1 July 2004 31 253 22 9 - 315
Disposals - (220) (8) (13) - (241)
Depreciation charge for the year 2 38 7 9 7 63
Accumulated depreciation at
30 June 2005 33 71 21 5 7 137
Net book value as at 30 June 2005 2 55 12 58 22 149
16 INTANGIBLE ASSETS
a) Intangible Assets:
2006 2006 2005 2005
$’000 $’000 $’000 $’000
Computer software 402 402
Less: Accumulated amortisation (368) 34 (326) 76
Total Intangible Assets 34 76
b) Reconciliation of Intangible Assets
The following table shows the movement of intangible assets during the current reporting period.
Computer Total
Software 2006
$’000 $’000
Gross Value at 1 July 2005 402 402
Gross value at 30 June 2006 402 402
Accumulated depreciation at 1 July 2005 326 326
Depreciation charge for the year 42 42
Accumulated depreciation at 30 June 2006 368 368
Net book value as at 30 June 2006 34 34

58
Notes to and Forming Part of
the Financial Statements
The following table shows the movement of intangible assets during the reporting period ended 30
June 2005.
Computer Total
Software 2005
$’000 $’000
Gross Value at 1 July 2004 447 447
Less: Disposal of assets (45) (45)
Gross value at 30 June 2005 402 402
Accumulated depreciation at 1 July 2004 322 322
Disposals (45) (45)
Depreciation charge for the year 49 49
Accumulated depreciation at 30 June 2005 326 326
Net book value as at 30 June 2005 76 76
17 PAYABLES
2006 2005
$’000 $’000
Current
Accrued expenses 437 504
Trade Creditors - 13
GST Collections 2 8
Employment on-costs 6 7
445 532
Non Current
Employment on-costs - 2
The aggregate payable liability recognised and included in the financial statements is as follows:
2006 2005
$’000 $’000
Current 445 532
Non-current - 2
445 534
Interest Rate and Credit Risk
Creditors and accruals are raised for all amounts billed but not paid. Sundry creditors are
normally settled within 30 days. Employment on-costs are settled when the respective employee
benefits that they relate are discharged. All payables are non-interest bearing. The carrying
amount of payables approximates net fair value due to the amounts being payable on demand.

59
for the Year Ended 30 June 2006
18 EMPLOYEE BENEFITS
2006 2005
$’000 $’000
Current
Annual Leave 37 33
Short-term Long Service Leave - 5
Sick Leave Provision 6 5
Accrued Salaries and Wages - 10
43 53
Non Current
Long-term Long Service Leave - 17
The aggregate employee benefits and oncost liability recognised and included in the financial
statements is as follows:
2006 2005
$’000 $’000
Current 49 60
Non-current - 19
49 79
19 EXPENDITURE COMMITMENTS
Operating lease commitments
Commitments under non-cancellable operating leases at the reporting date are not recognised as
liabilities in the financial report and are payable as follows:
2006 2005
$’000 $’000
Operating Leases
Not later than one year 94 91
Later than one year but not later than five years 8 102
Aggregate lease expenditure contracted for
at balance date but not provided for (including GST) 102 193
GST included in the Operating Lease commitments 10 18
The lease for office accommodation is a non-cancellable lease, with rental payable monthly in
advance. Lease payments are subject to an annual increase of four percent.
20 CONTINGENT ASSETS AND LIABILITIES
As at reporting date the Board is not aware of any contingent assets or liabilities.

60
Notes to and Forming Part of
the Financial Statements
21 CASH FLOW RECONCILIATION
a) Reconciliation of Cash and Cash Equivalents
2006 2005
$’000 $’000
Cash Flow Statement 2 707 1 380
Balance Sheet 2 707 1 380
b) Reconciliation of Net Surplus to Net Cash provided by Operating Activities
2006 2005
$’000 $’000
Net Surplus 3 786 2 330
Depreciation and amortisation expenses 93 112
Interest on term deposits (399) (357)
Loss on disposal of assets - 11
(Decrease) in employee benefits (27) (1)
Decrease (Increase) in debtors and accrued levy income 39 (18)
(Increase) in accrued interest - (22)
(Decrease)Increase in payables (89) 96
(Increase) in GST Paid (6) (5)
(Decrease)Increase in training liability (9) 42
Net Cash provided by Operating Activities 3 388 2 188
22 CONSULTANTS FEES
2006 2005
$’000 $’000
Total expenditure on consultants 28 16
23 RELATED PARTY DISCLOSURES
a) Directors of the Construction Industry Training Board
The Directors of the Construction Industry Training Board appointed for the period from 1 July
2005 to 30 June 2006 were:
Mary Marsland Chairperson
Fiona O’Connor
Graham Lawler Resigned November 2005
Martin O’Malley
Robert Stewart
Brenton Gardner Resigned February 2006
Steven Hall
Robert Geraghty
Wayne Hanson
Romana Wereszcak
Peter Harrland
Roderick Fyfe Appointed February 2006

61
b) Transactions with Director – Related Entities
During the year training funds were allocated to associated entities of the Directors of the
Construction Industry Training Board. Such transactions were within terms and conditions no
more favourable than those available on similar transactions with other parties.
for the Year Ended 30 June 2006

62
NOTES

63
NOtes

64
ABN 39 817 133 546
Business Address:5 Greenhill Road Wayville SA5034
Postal Address:PO Box 1227 Unley SA5061
Phone Number: 08 8172 9500Fax Number: 08 8172 9501
Website: www.citb.org.auEmail: [email protected]
ISSN - 1444-0652
www.citb.org.au