ANNUAL REPORT - Bombay Stock Exchange Secretary N.K. Sethia Registered Office 'Park Plaza' 71, Park...
155
Kanoria Chemicals Industries Limited & KCI ANNUAL REPORT 2016-17
Transcript of ANNUAL REPORT - Bombay Stock Exchange Secretary N.K. Sethia Registered Office 'Park Plaza' 71, Park...
Kanoria ChemicalsIndustries Limited&
KCI
ANNUALREPORT
2016-17
Company Secretary
N.K. Sethia
Registered Office
'Park Plaza'71, Park StreetKolkata – 700 016CIN: L24110WB1960PLC024910Phone: +91-33-40313200Fax: +91-33-40313220Email: [email protected]
Group Chief Financial Officer
N. K. Nolkha
Auditors
Singhi & Co.161, Sarat Bose RoadKolkata - 700 026
Bankers
DBS Bank LimitedHDFC Bank LimitedYes Bank Limited

BOARD OFDIRECTORS
Mr. R.V. Kanoria Mrs. M. Kanoria Mr. H.K. Khaitan
Mr. Amitav Kothari Mr. Ravinder Nath Mr. G. Parthasarathy
Prof. S.L. Rao Mr. A. Vellayan Mr. S.V. Kanoria
Kanoria Chemicals & Industries Limited
Annual Report 2016-17

TABLE OFCONTENTS
CHAIRMAN'S STATEMENT
THE YEAR IN REVIEW
NEW FRONTIERS
VALUE
DIRECTOR’S REPORT
REPORT ON CORPORATE GOVERNANCE
GENERAL SHAREHOLDERS’ INFORMATION
INDEPENDENT AUDITOR’S REPORT
BALANCE SHEET
STATEMENT OF PROFIT & LOSS
STATEMENT OF CHANGES IN EQUITY
CASH FLOW STATEMENT
CONSOLIDATED BALANCE SHEET
CONSOLIDATED STATEMENT OF PROFIT & LOSS
CONSOLIDATED STATEMENT OF CHANGES IN EQUITY
CONSOLIDATED CASH FLOW STATEMENT
03
05
09
13
17
38
47
54
60
61
62
63
108
109
110
111
01
Kanoria Chemicals & Industries Limited
Annual Report 2016-17

There is a new found condence in India and the country's
macroeconomic indicators are strong. The perceptions amongst the
overseas investing community remain positive and strong. Foreign
direct investment is owing in. The Government is making serious
attempts towards ease of doing business and inter-state competition
amongst the states is helping this process.
Private investment, however, continues to remain sluggish. It seems
that the impact of the unparalleled move of demonetisation of high
currency notes is yet to completely wear off. The implementation of GST
augurs well for the future, both in terms of simplifying tax regime as well
as improving compliance. The short term impact, however, of both the
demonetisation as well as the GST is likely to delay the revival in private
investments. Ination seems to be well under control and expected
easing of monetary policy and fall in interest rates will further stimulate
growth.
After the divestment of our Chlor Alkali business, the Company had
diversied into electronic automotive components, textiles and
renewable energy. The electronic automotive components business,
headquartered in Switzerland, has shown continuous growth. During
the year, there was remarkable turnaround in protability and going
forward, the business shows promise with a full order book for the next
three years. The Company's strategy is to realign its focus on
development of products, concentrating primarily on concept lighting. It
is also embarking on its second phase expansion project at its
production facilities in the Czech Republic.
The textiles business in Africa is suffering from the pangs of gestation.
Production and quality have improved substantially, however in the
absence of a yet to develop upstream garmenting industry, margins are
under severe pressure and losses continue. Fresh investment in
garmenting industry is happening in Ethiopia, however, it will take time
for this effect to be felt.
With regard to our chemical business, technological upgradation of the
production facilities at Ankleshwar is on the way and a single-stream
Formaldehyde Plant replacing older plants will be commissioned by
September this year. The focus at our Vishakhapatnam facilities is on
value added products including phenolic resins. The Company is also
looking at a third manufacturing location to cater to the demand of its
existing customers who are expanding their capacities in that location.
In the renewable energy segment, Government policy on Renewable
Purchase Obligation Scheme continues to be weakly implemented and
there is inadequate enforcement of obligation to purchase Renewable
Energy Certicates (RECs). Further, the prices of RECs were unilaterally
reduced without commensurate adjustment in the number of RECs.
This is being collectively contested through the Green Energy
Association and the Indian Wind Power Association, the two concerned
trade bodies in India and the matter is in the Supreme Court of India.
In the coming year, chemicals and automotive electronics businesses
should continue to perform well, while the textiles business will
continue to be under pressure. We are however, condent that the
Company is in a strong position to leverage the positive sentiments in
the Indian economy and its stable macroeconomic environment.
03
R. V KanoriaChairman & Managing Director
CHAIRMAN’S STATEMENT
Kanoria Chemicals & Industries Limited
Annual Report 2016-17
THE YEARIN REVIEW
The year 2016-17 witnessed relatively at economic growth and a weak
impetus in industrial production. There was, however, a newfound
condence in corporate India as a result of government initiatives for
improving the ease of doing business.
A signicant reform that unfolded during the year was the rolling out of the
Goods & Services Tax (GST). Indian business is adapting to this change.
Once the initial hiccups are ironed out, a nationwide GST is not only
expected to provide a homogenous Indian market, but also result in
efciencies in tax administration that should boost economic growth.
The other disruptive and bold action of the government during the year was
the demonetisation of high denomination currency notes. The effects of this
are yet to settle down and the extent of impact of this action on the economy
has been difcult to measure. Private investment, which has remained
sluggish, is expected to improve with better capacity utilization, the
maturing of GST, restoration of cash in the system after demonetisation,
and, in particular, expected fall in interest rates, now that ination is
under control.
The Company continued to build its strengths on the foundations of a
constant vigil on costs, good governance, ethical business practices and
sustainable policies.
The diversication initiatives of the Company are described in the
subsequent section titled 'New Frontiers'.
MANAGEMENT DISCUSSION & ANALYSIS
Financial Performance with respect to Operational Performance
During the year under review, Revenue from Operations decreased
marginally from Rs. 3,298 million to Rs. 3,274 million. The Prot before tax
and exceptional items, however, grew by 23% from Rs. 223 million in the
previous year to Rs. 275 million in the current nancial year. The Company
following conservative principles of accounting booked a loss of Rs. 184
million towards write down in the values of Solar Power RECs on the basis of
notication issued by the Central Electricity Regulatory Commission
reducing the oor price of RECs and the same has been shown as
Exceptional Item in the Statement of Prot & Loss. After accounting for MAT
Credit entitlement pertaining to earlier years, the Prot for the year grew by
10% from Rs. 170 million in the previous year to Rs. 187 million in the
current year. The Total Comprehensive Income grew by 26% to Rs. 189
million as against Rs. 149 million in the previous year. The Earnings per
Share for the year was Rs. 4.28.
At Consolidated level, Revenue of APAG Holding AG (APAG), the Switzerland
based subsidiary of the Company engaged in Electronic Automotive
increased by 35% from Rs. 2,682 million to Rs. 3,615 million. Kanoria
Africa Textiles plc (KAT), the other major subsidiary of the Company also
started commercial production during the year and had Revenue from
Operations of Rs. 449 million. The total Consolidated Revenue from
Operations grew by 23% to Rs. 7,337 million as against Rs. 5,979 million in
the previous year. The Segment Result of APAG improved signicantly from
a loss of Rs. 213 million in the previous year to a Prot of Rs. 19 million in
the current year. KAT incurred a loss of Rs. 276 million in its rst year of
operation and as a result the Company incurred a Consolidated Total
Comprehensive Loss of Rs. 233 million (of this Rs. 144 million attributable
to the Shareholders of the Company) as against Rs. 91 million (attributable
to the Shareholders of the Company) in the previous year.
Alco Chemicals Segment
Industry structure and development
The Division of the Company produces Formaldehyde and other value
added products, including Pentaerythritol, Hexamine, Sodium Formate,
Acetaldehyde and Phenolic Resins.
The Company's Formaldehyde plants use the FORMOX process, a world
class Formaldehyde manufacturing technology with lower operational cost
and higher product purity compared to competitors. The Company is the
only Indian manufacturer operating on this technology.
The Pentaerythritol and Hexamine manufacturing technologies have been
developed in-house by the Company. Over many years, these have been
(and continue to be) rened to compete globally on cost and quality.
For Phenolic Resins, the Company has entered into manufacturing and
technology collaborations with Hexion Inc. - the global leader in thermoset
resins, and ASK Chemicals – a global player in foundry solutions and
resins. These collaborations have happened as a result of the Company's
state-of-the-art resin production plant, and are enabling it to add
specialized, high-value products to the manufacturing portfolio.
Opportunities
Ÿ Currently, the Company is only able to service Formaldehyde
consumers in the West (from the Ankleshwar plant) and East (from the
Vizag plant) of India. This is due to the high cost of transporting
Formaldehyde, making it unviable beyond a radius of about 800km.
The Company has an opportunity to supply to consumers in the South
and North, by setting up new plants. Large new manufacturing
capacities for wood products (big consumers of Formaldehyde), are
scheduled to be operational in the next three years, in the South and
North. This will substantially increase demand.
Ÿ Phenolic resins are used in a wide variety of applications, such as
foundries, refractories, abrasives, adhesives, grinding tools,
composites and more. There is great potential for developing high
value resins through continuous research.
Ÿ Technology upgradation to increase production and reduce costs.
Kanoria Chemicals & Industries Limited
05
Annual Report 2016-17

Threats
Ÿ Lack of enforcement of the Renewable Purchase Obligation scheme.
Ÿ Lack of visibility in the future of the Renewable Energy Certicate (REC)
mechanism.
Performance
The operations of the Solar Power Division improved over the previous year.
Choice of technology for the project resulted in the Division to be amongst
projects with the highest performance ratio in the country.
Outlook
Ÿ The Division expects stable operations to continue.
Ÿ Expectation that the government will improve enforcement of the
Renewable Purchase Obligation leading to better REC sales.
Quality Accreditation and OHSAS
During the year, both manufacturing units of the Company at Ankleshwar
and Vishakhapatnam renewed the ISO 9001 certication for quality
management systems, the ISO 14001 certication for environment
management systems and practices, and OHSAS 18001 certication for
organizational health and safety systems.
Safety and Environment
During 2016-17, the Company maintained its safety record and it remained
an accident free year at all units.
Proactive practices in managing and protecting the environment ensured
control on wastage and recycling resources.
Risks and Concerns
Currently, the Company perceives the following main business risks:
Ÿ Threat from cheap imports and dumping by other countries negatively
impacts domestic prices and could reduce margins.
Threats
Ÿ Cheaper imports of Pentaerythritol or Hexamine could reduce margins.
Ÿ Rapid and drastic uctuations in Methanol and Phenol prices could
lead to uctuating margins, and possibly have a negative overall
impact on protability due to inventory carrying risk.
Performance
The operations of the Alco Chemicals Division remained stable during the
year. Production and sale of Formaldehyde improved over the previous year.
Outlook
Ÿ Higher growth in the manufacturing sector expected to improve
demand for Alco Chemicals in the country.
Ÿ The Government's focus on infrastructure and affordable housing
should result in increasing overall demand for Formaldehyde,
Pentaerythritol, Hexamine and Phenolic resins.
Ÿ An ongoing shift in the wood products industry towards the organized
sector, may result in greater demand for higher quality, higher
concentration Formaldehyde that is cheaper to transport.
Ÿ No signicant improvement in margins.
Solar Power Segment
Industry structure and development
The Company's Solar Power Division located at Village Bap in Jodhpur
District in the state of Rajasthan is engaged in the generation of power from
solar energy using Photo Voltaic (PV) technology. The project was set up
under the Renewable Energy Certicate (REC) scheme.
Opportunities
Ÿ With the Government's ambitious targets for renewable energy
generation, about 230 acres of unused land owned by the Company
near an operational solar energy generation plant is a valuable asset.
Ÿ Easier revenue ow by enforcement of Renewable Purchase Obligation
(RPO) scheme.
Solar Panels, Jodhpur
06
Kanoria Chemicals & Industries Limited
Annual Report 2016-17

Ÿ Extreme volatility in prices of raw materials and other inputs could lead
to uctuating margins, and possibly have a negative overall impact on
protability on higher inventory carrying risk.
Ÿ Government's weak enforcement of the Renewable Purchase
Obligation and the uncertainty on the future of the Renewable Energy
Certicate (REC) mechanism.
Internal Control Systems and Adequacy
An adequate system of internal control is in place. The assets, buildings,
plant and machinery, vehicles and stocks of the Company are insured,
including for loss of prots.
The key elements of the control system are:
Ÿ Clear and well dened organisation structure and limits of
nancial authority.
Ÿ Corporate policies for nancial reporting, accounting, information
security, investment appraisal and corporate governance.
Ÿ Annual budgets and business plan, identifying key risks
and opportunities.
Ÿ Internal audit for reviewing all aspects of laid down systems and
procedures as well as risks and control.
Ÿ Risk Management Committee that monitors and reviews all risk and
control issues.
Human Resource and Industrial RelationsKCI has consistently stressed on people development and the role played by
its human resources in inculcating organisational excellence in the
competitive and fast changing business environment. The Company adopts
good HR practices to impart excellence, fairness and transparency in all its
operations. Each employee is guided by a detailed Code of Conduct that
helps the organisation to achieve its goals in an ethical manner. KCI
regularly conducts training programmes for different levels of employees to
ensure mapping of job requirement and skills base.
The industrial relations climate of the Company continues to remain
harmonious and cordial with focus on improving productivity, quality
and safety.
The number of persons permanently employed by the Company as atst31 March 2017 was 319.
Statement in this 'Management Discussion and Analysis' describing the Company's objectives, projections, estimates, expectations or predictions may be 'forward looking statements' within the meaning of applicable securities laws and regulations. Actual results could differ materially from those expressed or implied. Important factors that could make a difference to the Company's operations include global and Indian demand supply conditions, nished goods prices, feed stock availability and prices, cyclical demand and pricing in the Company's principal markets, changes in Government regulations, tax regimes, economic developments within India and the countries within which the Company conducts business and other factors such as litigation and labour negotiations.
Cautionary Statement
Resin Plant, Vizag
07
Kanoria Chemicals & Industries Limited
Annual Report 2016-17

NEWFRONTIERS
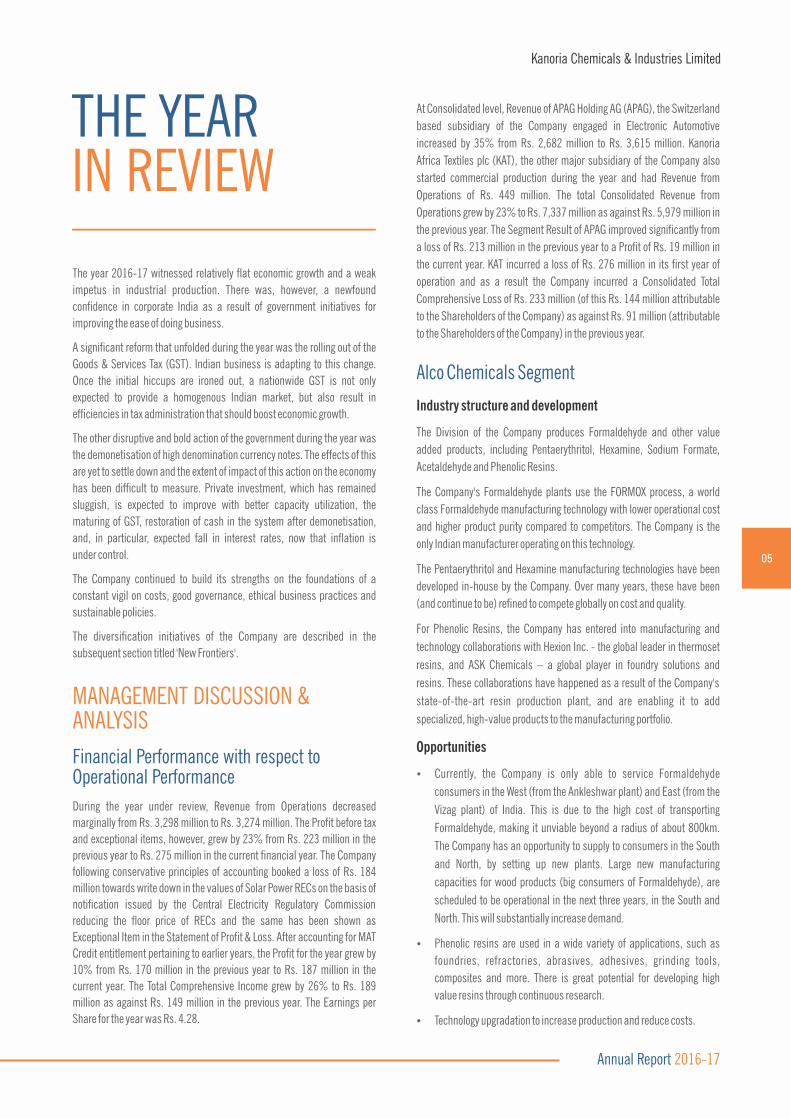
RENEWABLE ENERGYThe Company's initiative in the standalone renewable energy generation
began in the year 2012. The grid-interactive solar photovoltaic technology
based power plant of the Company at Phalodi in Jodhpur district in the state
of Rajasthan continued to operate with one of the highest performance
ratios in the country. The total generation capacity of the plant is 5.0 MW.
The plant is equipped with dual axis tracking system in 2.5 MW capacity,
which ensures capture of maximum solar radiation by orienting the
modules to face the sun at all times.
The renewable energy sector, however, continues to face policy
implementation and procedural difculties. The Renewable Purchase
Obligation Scheme continues to be weakly implemented which has
compelled the Company to write down the value of unsold Renewable
Energy Certicates (RECs) in its books. The Government also reduced the
prices of RECs without commensurate adjustment in the number of RECs
held. This is being collectively contested by the renewable energy industry
through the concerned trade bodies, the Green Energy Association and the
Indian Wind Power Association. A case is pending in the Supreme Court of
India challenging the order of the Central Electricity Regulatory Commission
and trading of RECs remains suspended. Further growth in the sector will
depend on government policy and judicious regulation.
TEXTILESIn terms of diversifying its product mix and reaching out to new geographies, the Company embarked on setting up an integrated denim manufacturing unit in Ethiopia, Africa. The composite plant staring with spinning and ending with processing and nal production of fabric was inaugurated by the Honourable Prime Minister of the Federal Democratic Republic of Ethiopia in the year 2015.
The project is equipped with comprehensive waste treatment and management systems and non-polluting electric boilers, making it a zero efuent facility, and one of the rst Green Denim plants in the world.
Solar Panels, Jodhpur
Fabric manufacturing at Kanoria Africa Textiles plc, Ethiopia
09
Kanoria Chemicals & Industries Limited
Annual Report 2016-17
Setting up the Greeneld project was a challenging exercise as it was both a
new geography and a new industry. The venture continues to be under
pressure despite improved production and quality during the year.
Ethiopia has the potential to be a major garmenting exporter as a result of
government initiatives. The industry, however, is yet to take off. World class
garment export parks have been created and substantial investment is
coming into the country for garmenting. The demand for denim fabrics, as
well as margins on these fabrics, is expected to increase once these fabrics
are converted to garments within Ethiopia. The country enjoys the
provisions of African Growth & Opportunity Act (AGOA) wherein it has duty
free access to both US as well as European markets.
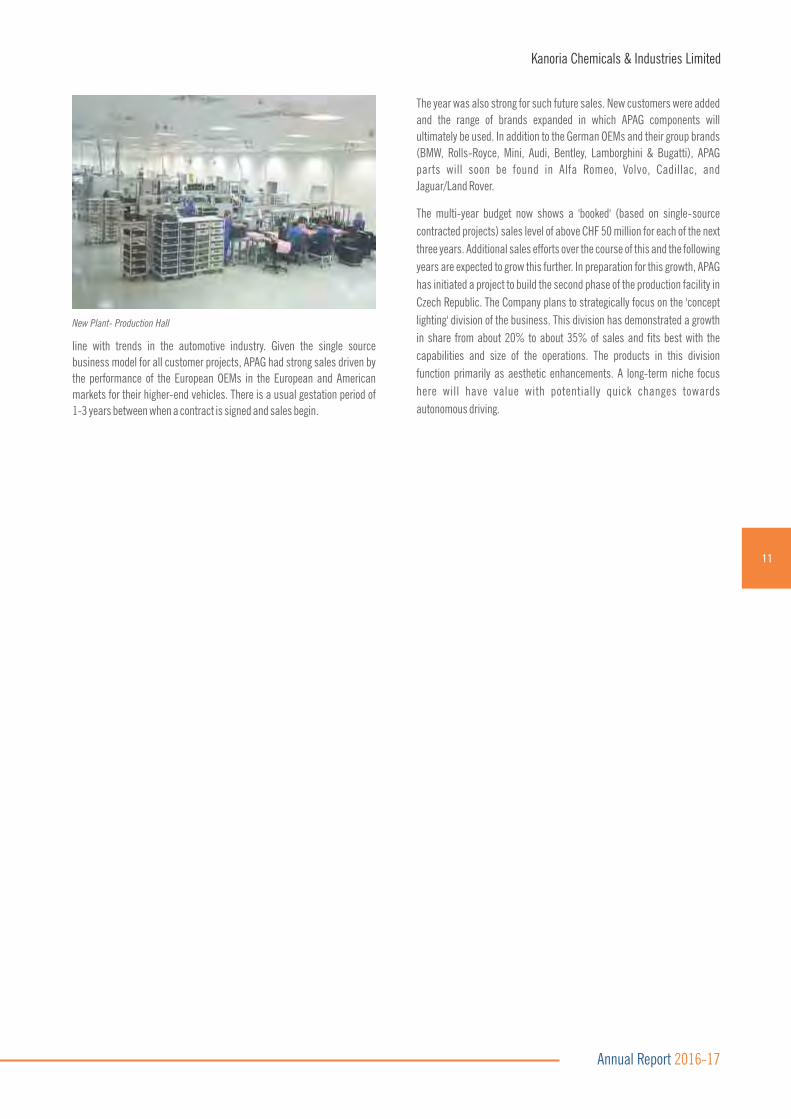
AUTOMOTIVE & INDUSTRIALELECTRONICSAPAG Elektronik, a subsidiary company of Kanoria Chemicals & Industries
Limited, is engaged in design, development and sale of electronic and
mechatronic modules and control devices for the automotive, consumer
goods, power tool electronics and building automation industries. The
designing and engineering facility of the Company is located in Switzerland,
and the manufacturing facility is located in the Czech Republic.
During the year, APAG Electronik witnessed the rst returns from the
investment in growth, the focus on quality, and strategic steps to remain in
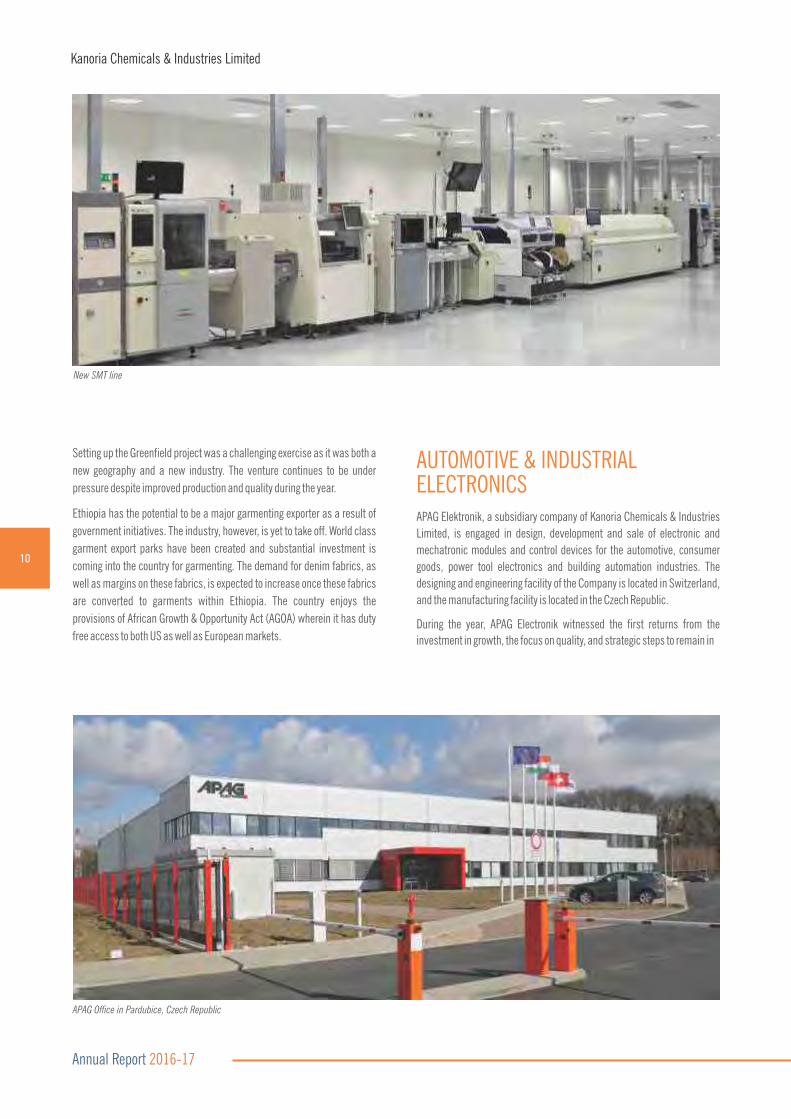
New SMT line
APAG Office in Pardubice, Czech Republic
10
Kanoria Chemicals & Industries Limited
Annual Report 2016-17
New Plant- Production Hall
11
Kanoria Chemicals & Industries Limited
line with trends in the automotive industry. Given the single source
business model for all customer projects, APAG had strong sales driven by
the performance of the European OEMs in the European and American
markets for their higher-end vehicles. There is a usual gestation period of
1-3 years between when a contract is signed and sales begin.
The year was also strong for such future sales. New customers were added
and the range of brands expanded in which APAG components will
ultimately be used. In addition to the German OEMs and their group brands
(BMW, Rolls-Royce, Mini, Audi, Bentley, Lamborghini & Bugatti), APAG
parts will soon be found in Alfa Romeo, Volvo, Cadillac, and
Jaguar/Land Rover.
The multi-year budget now shows a 'booked' (based on single-source
contracted projects) sales level of above CHF 50 million for each of the next
three years. Additional sales efforts over the course of this and the following
years are expected to grow this further. In preparation for this growth, APAG
has initiated a project to build the second phase of the production facility in
Czech Republic. The Company plans to strategically focus on the 'concept
lighting' division of the business. This division has demonstrated a growth
in share from about 20% to about 35% of sales and ts best with the
capabilities and size of the operations. The products in this division
function primarily as aesthetic enhancements. A long-term niche focus
here will have value with potentially quick changes towards
autonomous driving.
Annual Report 2016-17


VALUE
Kanoria Chemicals & Industries Limited
Revenue from Operations
3000
4000
5000
6000
7000
8000
2012-13 2013-14 2014-15 2015-16* 2016-17*
3,714
5,309
5,979
7,337
5,414
`m
illio
n
Operating and Net Prot
Operating Prot Net Prot
2012-13 2013-14 2014-15 2015-16* 2016-17*
79
390
837
337
530
123
469 524
(237)(72)
1000
800
600
400
200
0
-200
-400
`m
illio
n
13
Kanoria Chemicals & Industries Limited
Annual Report 2016-17

0
8
10
2012-13 2013-14 2014-15 2015-16* 2016-17*
1.48
2.82
7.71
`
6
4
2
-2
-4
-6
-8
(1.65) (5.42)
Earning per Share
14
Kanoria Chemicals & Industries Limited
0
2000
5000
10000
2012-13 2013-14 2014-15 2015-16* 2016-17*
4,6905,409
5,839
8,519
5,336
`m
illio
n
1000
3000
4000
6000
70008000
9000
Gross Block
Annual Report 2016-17
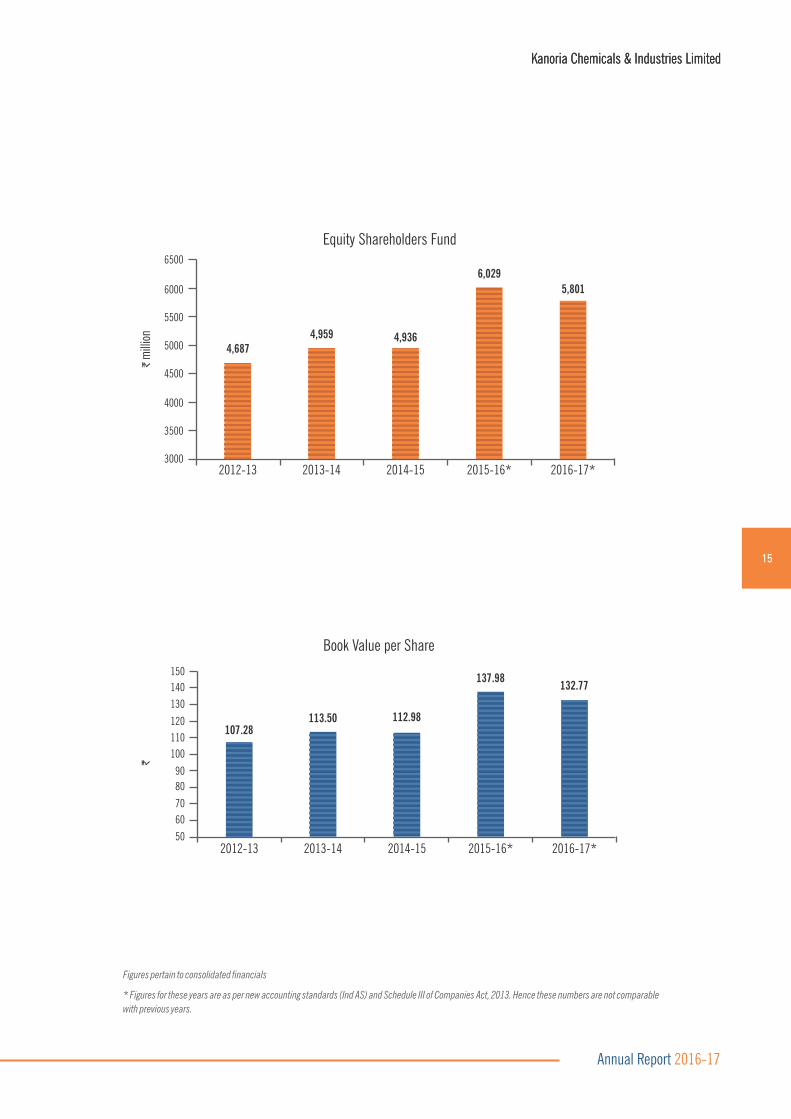
Equity Shareholders Fund
2012-13 2013-14 2014-15 2015-16* 2016-17*
3500
4000
4500
5500
6000
6500
`m
illio
n
5000
3000
4,9364,687
4,959
6,029
5,801
Figures pertain to consolidated financials
* Figures for these years are as per new accounting standards (Ind AS) and Schedule III of Companies Act, 2013. Hence these numbers are not comparable
with previous years.
2012-13 2013-14 2014-15 2015-16* 2016-17*
150
140
130
120
110
100
90
80
70
50
107.28113.50 112.98
137.98132.77
60
`
Book Value per Share
Kanoria Chemicals & Industries Limited
15
Kanoria Chemicals & Industries Limited
Annual Report 2016-17


DIRECTOR’SREPORT
TO THE SHARE HOLDERS
Your Directors have pleasure in presenting the fty seventh Annual Report, along with the Audited Accounts of the Company for the nancial year ended st31 March 2017.
Detailed information on the performance of your Company appears in the Annual Report. A discussion on the operations of the Company is given in the sections
titled 'Year in Review' and 'New Frontiers'. Some of the statutory disclosures, however, appear in this Report. Read along with the other sections, this would
provide a comprehensive overview of the Company's performance and plans.
FINANCIAL RESULTSst
The nancial performance of the Company for the year ended 31 March 2017 is summarised below:
Par�culars 2016-2017 2015-2016
Total Income 3,500.41 3,508.83
Profit before Deprecia�on, Finance Cost, Tax and Excep�onal items 512.15 540.90
Deprecia�on and Amor�sa�on expenses 204.32 210.08
Finance Costs 32.67 107.55
Excep�onal items 184.17 ̶
Profit before Tax 90.99 223.27
Tax expenses 96.21 (53.39)
Profit for the year 187.20 169.88
Other Comprehensive income for the year, net of tax 1.49 (20.60)
Total Comprehensive income for the year 188.69 149.28
OVERVIEW
Ongoing technological upgradation in the Formaldehyde plant at Ankleshwar and a focus on value added products in Vishakhapatnam are expected to improve
the performance of the chemicals business of the Company. During the year under review, however, sluggish market conditions coupled with high volatility in raw
material prices kept margins under pressure in the division.
In the solar power segment, generation continues to be good. The Government, however, has changed the pricing of Renewable Energy Certicates (RECs) which
has compelled the Company to write down the value of unsold RECs in its books. A case is pending in the Supreme Court of India challenging the order of the
Central Electricity Regulatory Commission. In the meantime, trading of RECs remains suspended.
A brief description of the operations of the subsidiaries of the Company appears later in this report.
MATERIAL CHANGES AND COMMITMENTS
No material changes and commitments have occurred after the close of the nancial year 2016-17 till the date of this Report, which affect the nancial position of
the Company.
17
Kanoria Chemicals & Industries Limited
(`in million)
Annual Report 2016-17

18
Kanoria Chemicals & Industries Limited
DIVIDEND
The Board of Directors recommends, for consideration of the shareholders at the Annual General Meeting, a Dividend @ 30% (Rs. 1.50 per share) on Equity st Shares of Rs. 5/- each for the nancial year ended 31 March 2017.
CREDIT RATINGS
Credit Analysis & Research Limited (CARE) has revised the credit rating for the long-term bank facilities of the Company to CARE A+ (Single A Plus) from the
existing rating of CARE AA- (Double A Minus).
CARE has reafrmed the existing CARE A1+ (A One Plus) ratings for the short-term bank facilities and Commercial Paper.
CONSOLIDATED FINANCIAL STATEMENT
As per the SEBI (Listing Obligations and Disclosure Requirements) Regulations, 2015 and provisions of the Companies Act, 2013, the audited Consolidated stFinancial Statement for the year ended 31 March 2017 has been annexed with the Annual Report.
DEPOSITS
During the year under review, the Company has not accepted any deposits from the public and that as at the end of the year there were no outstanding deposits
under Section 73 of the Companies Act, 2013 read with the Companies (Acceptance of Deposits) Rules, 2014.
INTERNAL FINANCIAL CONTROL
The Company has in place adequate internal nancial controls with respect to nancial statements. The policies and procedures adopted by the Company ensure
prevention and detection of frauds and errors, accuracy and completeness of the records and timely preparation of reliable nancial statements. No reportable
material weakness in the design or operation was observed during the year.
DIRECTORS AND KEY MANAGERIAL PERSONNELthDuring the year, at the 56 AGM of the Company, the shareholders approved the appointment of Shri S. V. Kanoria (DIN: 02097441) as a Director with effect from
st1 April 2016 and also as a Wholetime Director of the Company for a period of three years with effect from that date.
Smt. Madhuvanti Kanoria (DIN: 00142146) retires by rotation at the ensuing AGM, under the applicable provisions of the Companies Act, 2013, and being eligible,
offers herself for appointment as a Director of the Company.
None of the Directors of the Company is disqualied for being appointed as a Director, as specied in Section 164(2) of the Companies Act, 2013.
Additional information pursuant to SEBI (Listing Obligations and Disclosure Requirements) Regulations, 2015 (“Listing Regulations, 2015”) in respect of Director
seeking re-appointment is given in the AGM Notice of the Company.
DECLARATION BY INDEPENDENT DIRECTORS
The Company has received declaration from all the Independent Directors of the Company, conrming that they meet the criteria of independence, as prescribed
under the Companies Act, 2013 and the SEBI (Listing Obligations and Disclosure Requirements) Regulations, 2015.
PERFORMANCE EVALUATION
The Company has framed the criteria for performance evaluation of Independent Directors, the Board, the Board Committees and other individual Directors.
Criteria for performance evaluation of the Chairman & Managing Director, Executive Director and Non-Independent Director have also been framed.
The criteria for performance evaluation of Directors among others includes factors such as preparation, participation, engagement, personality and conduct,
value addition, strategic planning and vision, team spirit and consensus building, leadership quality, understanding and focus on key business issues,
independent thinking and judgment, quality of analysis, experience and business wisdom, management qualities, awareness, motivation, integrity, ethics and
receptivity. The criteria for evaluating the Board's functioning/effectiveness inter alia includes its structure, strategic review, business performance review,
internal controls, process and procedures.
On the basis of the criteria framed, a process was followed by the Board for evaluating the performance of individual Directors, its own performance and its
Committees. The Nomination and Remuneration Committee also evaluated the performance of every individual Director. The Independent Directors in their
separate Meeting also carried out the performance evaluation of the Chairman & Managing Director, Executive Director and other non-independent Director as
well as the Board of the Company. The Directors expressed overall satisfaction on the performance and functioning of the Board, its Committees and
the Directors.
Annual Report 2016-17

19
Kanoria Chemicals & Industries Limited
FAMILIARISATION PROGRAMMES
The details of programmes to familiarise the Independent Directors with the Company, their roles, rights, responsibilities in the Company, nature of the industry in which the Company operates, business model/procedures/processes of the Company, etc. through various programmes are put on the website of the Company and can be accessed at the link: http://www.kanoriachem.com/images/FamPro.pdf.
NUMBER OF MEETINGS OF BOARD OF DIRECTORS
During the Financial Year 2016-17, the Company held four Meetings of the Board of Directors. The details of the Meetings and attendance of each of the Directors thereat are provided in the Report on Corporate Governance forming part of the Annual Report. The maximum gap between any two consecutive Board Meetings did not exceed 120 days.
AUDIT COMMITTEE
The Audit Committee of the Company comprises of Shri Amitav Kothari, Shri H. K. Khaitan and Prof. S. L. Rao, Independent Directors, and Shri R. V. Kanoria, Chairman & Managing Director of the Company. Shri Amitav Kothari is the Chairman of the Committee. The terms of reference of the Committee have been provided in the Corporate Governance Report.
STAKEHOLDERS' RELATIONSHIP COMMITTEE
The Stakeholders Relationship Committee of the Company comprises of Shri H. K. Khaitan and Shri Amitav Kothari, Independent Directors and Shri S. V. Kanoria, Wholetime Director of the Company. Shri H. K. Khaitan is the Chairman of the Committee. The terms of reference of the Committee have been provided in the Corporate Governance Report.
NOMINATION AND REMUNERATION COMMITTEE
The Nomination and Remuneration Committee of the Company comprises of Prof. S. L. Rao, Shri H. K. Khaitan, Shri Ravinder Nath and Shri G. Parthasarathy, Independent Directors, and Shri R. V. Kanoria, Chairman & Managing Director of the Company. Prof. S. L. Rao is the Chairman of the Committee. The terms of reference of the Committee have been provided in the Corporate Governance Report.
The Board of Directors of the Company, based on the recommendation of the Nomination and Remuneration Committee, has formulated the Nomination and Remuneration Policy, which contains the matters with regard to criteria for appointment of Directors and determining Directors' independence and policy on remuneration for Directors, Senior Managerial Personnel and other employees, and the same may be accessed at the Company's website at the link: http://www.kanoriachem.com/images/NomRemPol.pdf.
CORPORATE SOCIAL RESPONSIBILITY COMMITTEE
The Corporate Social Responsibility Committee of the Company comprises of Smt. Madhuvanti Kanoria, Shri R. V. Kanoria, Managing Director and Shri H. K. Khaitan, an Independent Director. Smt. Madhuvanti Kanoria is the Chairperson of the Committee. The terms of reference of the Committee have been provided in the Corporate Governance Report.
CORPORATE SOCIAL RESPONSIBILITY
The Company acts as a good Corporate Citizen and as its philosophy always strive to conduct its business in inclusive, sustainable, socially responsible, ethical manner and to continuously work towards improving quality of life of the communities. The Company has in place a Corporate Social Responsibility Policy (CSR Policy) indicating the activities to be undertaken by the Company. The Corporate Social Responsibility Policy of the Company enables it to continue to make responsible contribution towards welfare of the society.
Initially, the Company has identied the following focus areas of engagement:
Ÿ Promoting education, including special education and employment enhancing vocational skills especially among children, women, elderly and the differently abled and livelihood enhancement projects.
Ÿ Empowering women, setting up homes and hostels for women and orphans; setting up old age homes, day care centres and such other facilities for senior citizens.
The Company may also undertake other need based initiatives in compliance with Schedule VII to the Companies Act, 2013.
The CSR Policy may be accessed on the Company's website at the link: http://www.kanoriachem.com/images/CSRPol.pdf.
During the year, the Company has spent Rs. 2.31 million on the CSR activities.
The Annual Report on the CSR activities, pursuant to Rule 8 of the Companies (Corporate Social Responsibility Policy) Rules, 2014 is provided as
Annexure to this Report.
Annual Report 2016-17
20
MANAGEMENT DISCUSSION AND ANALYSIS
Management Discussion and Analysis is a part of the Annual Report.
SUBSIDIARIES
APAG Holding AG (“APAG”), Switzerland and Pipri Limited are the wholly owned subsidiaries of the Company. Kanoria Africa Textiles Plc, Ethiopia is a subsidiary of
the Company. During the year, APAG formed APAG Elektronik S. De R.L. De C.V., Mexico and APAG Services S. De R.L. De C.V., Mexico with its 100% shareholding.
APAG Elektronik AG, APAG Elektronik s.r.o, CoSyst Control Systems GmbH, APAG Elektronik LLC, APAG Elektronik S. De R.L. De C.V. and APAG Services S. De R.L.
De C.V., the wholly owned subsidiaries of APAG Holding AG, are the step-down subsidiaries of the Company.
The Electronic Automotive segment, operating under the APAG group, has shown healthy growth in protability. During the year, the business demonstrated its
rst returns from investments made in growth, in focus on quality and in strategic steps to remain in line with trends in the automotive industry. Given the single
source business model for all customer projects, this business had strong sales driven by the performance of the European OEMs in the European and American
markets for their higher-end vehicles. The order books are full for the next three years. There is a usual gestation period of 1-3 years between when a contract is
signed and sales begin. The year was also strong for such future sales. New customers were added and apart from its existing customers, BMW, Rolls-Royce,
Mini, Audi, Bentley, Lamborghini & Bugatti, the components manufactured by this business will soon be found in Alfa Romeo, Volvo, Cadillac, and Jaguar/Land
Rover. In preparation for this growth, the project to build second phase of production facilities in the Czech Republic is under way. The plan is to focus on “concept
lighting” division of the business. This is a long term niche focus that will have value even with potentially quick changes happening towards autonomous driving.
Kanoria Africa Textiles plc continued to be under severe pressure and despite improved production and quality, continued to make signicant losses. Though
Ethiopia promises to be a major garmenting exporter as a result of the initiatives of the Government of Ethiopia, this industry is yet to take off. World class garment
export parks have been created and substantial investment is coming into the country for garmenting. The demand for denim fabrics produced by Kanoria Africa
Textiles plc, as well as margins on these fabrics, is expected to increase once these fabrics are converted to garments within Ethiopia itself. Ethiopia enjoys the
provisions of African Growth & Opportunity Act (AGOA) wherein it has duty free access to both US as well as European markets. It is expected that Kanoria Africa
Textiles plc will continue to make losses also during the year 2017-18.
A report on the performance and nancial position of the subsidiaries of the Company, as per the Companies Act, 2013, is provided in the Annual Report and
hence, the same is not repeated here for the sake of brevity.
The Policy for determining Material Subsidiaries as approved by the Board may be accessed on the Company's website at the link:
http://www.kanoriachem.com/images/MatSub.pdf.
PARTICULARS OF LOANS GIVEN, INVESTMENTS MADE, GUARANTEES GIVEN ANDSECURITIES PROVIDED
Details of loans given, investments made, guarantees given and securities provided as covered under the provisions of Section 186 of the Companies Act, 2013
are given in the Note Nos. 31 and 35 of the Standalone Financial Statements.
CONTRACTS AND ARRANGEMENTS WITH RELATED PARTIES
All contracts / arrangements / transactions entered by the Company during the nancial year with related parties were in the ordinary course of business and on
arm's length basis. None of the transactions with any of the related parties were in conict with the Company's interest. The Company had not entered into any
transaction with related parties during the year which could be considered material, in terms of materiality threshold for the related party transactions.
The Policy on Related Party Transactions as approved by the Board may be accessed on the Company's website at the l ink:
http://www.kanoriachem.com/images/RelPar.pdf.
VIGIL MECHANISM
The Company promotes ethical behaviour in all its business activities and has put in place a mechanism of reporting illegal or unethical behaviour. In compliance
with the provisions of Section 177(9) of the Companies Act, 2013 and the Listing Regulations, 2015, the Company has in place a Whistle Blower Policy for its
Directors and Employees to report concerns about unethical behaviour, actual or suspected fraud or violation of applicable laws and regulations and the
Company's Codes of Conduct. The reportable matters may be reported to the Audit Committee through the Nodal Ofcer and, in exceptional cases, may also be
reported to the Chairman of the Audit Committee. The condentiality of those reporting violations is maintained and they are not subjected to any discriminatory
practice. During the year under review, no employee was denied access to the Audit Committee.
The Whistle Blower Policy may be accessed on the Company's website at the link: http://www.kanoriachem.com/images/WhiBlo.pdf.
Kanoria Chemicals & Industries Limited
Annual Report 2016-17

21
CORPORATE GOVERNANCEThe Company adheres to good governance practices. Corporate Governance at KCI extends to all stakeholders and is embodied in every business decision. The
Company places prime importance on reliable nancial information, integrity, transparency, empowerment and compliance with the law in letter and spirit. While
Management Discussion and Analysis Report that is an annexure to the Directors' Report, appears in the Section titled Year in Review in the Annual Report, the
Corporate Governance Report and the Certicate from the Auditors of the Company conrming compliance of the conditions of Corporate Governance are annexed
hereto and form a part of the Directors' Report.
There is a conscious effort to ensure that the values enshrined in the Codes of Conduct for the Directors and Senior Management Personnel and the Employees
respectively, are followed in true spirit across all levels of the Company.
EXTRACT OF ANNUAL RETURN stThe extract of Annual Return of the Company as on the nancial year ended 31 March 2017 is given in Form no. MGT- 9 as an Annexure to this Report.
AUDITORS AND AUDITORS' REPORTAs per the provisions of Section 139 of the Companies Act, 2013, the term of M/s. Singhi & Company, Chartered Accountants, the current Statutory Auditors of the
thCompany, will end at the conclusion of the ensuing 57 Annual General Meeting of the Company. thThe Board of Directors of the Company at its Meeting held on 30 May 2017, on the recommendation of the Audit Committee, has made its recommendation for the
appointment of M/s. Jitendra K Agarwal & Associates, Chartered Accountants (Firm Registration No. 318086E), as the Statutory Auditors of the Company at the th thensuing 57 Annual General Meeting (“AGM”), to hold ofce as such for a term of 5 years commencing from the conclusion of the 57 AGM till the conclusion of the
nd62 AGM. M/s. Jitendra K Agarwal & Associates have consented and conrmed their eligibility for appointment as the Auditors of the Company.
The Auditors' Report given by M/s. Singhi & Co. does not contain any qualication, reservation, adverse remark or disclaimer.
FRAUD REPORTINGDuring the year under review, the Auditors have not reported any matter under Section 143 (12) of the Companies Act, 2013, therefore no detail is required to be
disclosed under Section 134 (3) (ca) of the Act.
COST AUDITORS Pursuant to Section 148 of the Companies Act, 2013, the Board has, on the recommendation of the Audit Committee, approved the appointment of M/s N. D. Birla
& Co., Cost Accountants (Firm Registration No. 000028), Ahmedabad, as the Cost Auditors for conducting the audit of the cost records of the Company for the stnancial year ending on 31 March 2018, at a remuneration of Rs. 1,45,000/- (Rupees One Lakh Forty Five Thousand only) plus applicable taxes and
reimbursement of travelling and out of pocket expenses to be incurred in the course of cost audit.
SECRETARIAL AUDITORPursuant to Section 204 of the Companies Act, 2013 and the Companies (Appointment and Remuneration of Managerial Personnel) Rules, 2014, the Board had
appointed M/s Vinod Kothari & Co., Practising Company Secretaries (UIN: P1996WB042300), to conduct Secretarial Audit of the Company for the nancial year
2016-17. The Secretarial Audit Report for the nancial year 2016-17 is provided as an Annexure to this Report. The Report does not contain any qualication,
reservation, adverse remark or disclaimer.
RISK MANAGEMENTThe Company's management systems, organizational structures, processes, codes of conduct together form the basis of risk management system that governs
and manages associated risks.The Risk Management Committee of the Company assesses the signicant risks that might impact the achievement of the
Company's objectives and develops risk management strategies to mitigate/minimise identied risks and designs appropriate risk management procedures.
CONSERVATION OF ENERGY, TECHNOLOGY ABSORPTION AND FOREIGN EXCHANGE
EARNINGS/OUTGOAs required under Section 134 of the Companies Act, 2013 and the rules framed thereunder, the statement containing necessary information in respect of
conservation of energy, technology absorption, foreign exchange earnings and outgo is provided in the Annexure to this Report.
EMPLOYEES INFORMATION AND RELATED DISCLOSURES
As required under Section 197(12) of the Companies Act, 2013 read with the Rules 5(1), 5(2) and 5(3) of the Companies (Appointment and Remuneration of
Managerial Personnel) Rules, 2014, disclosures of remuneration and other details/particulars of the Directors and employees of the Company are provided in the
Annexure to this Report.
Kanoria Chemicals & Industries Limited
Annual Report 2016-17

22
SAFETY AND ENVIRONMENTThe Company is committed to sustainable development and a safe workplace. Its approach to environment management is guided by the principle of provision of
safe working environment through continuous up-gradation of technologies, prevention of pollution and conservation of resources and recycling waste.
As a result of its sustained compliance to Health, Safety, Environment and Quality standards, the Company's Alco Chemical Divisions at Ankleshwar and
Vishakhapatnam are ISO 9001, 14001 and OHSAS 18001 certied.
The Company has a documented Health & Safety Policy that is displayed and communicated to all employees at plant locations. With the view to achieve a 'Zero
Accidents' status, the Company has developed health and safety procedures as well as safety targets and objectives.
The Company also lays thrust on renewable energy sources and solar energy.
HUMAN RESOURCES DEVELOPMENT AND INDUSTRIAL RELATIONSThe Company's human resource development is founded on a strong set of values. The policies seek to instil spirit of trust, transparency and dignity among all
employees. The Company continues to provide ongoing training to its employees at different levels.
Industrial relations with the employees and workers across all locations of the Company continued to be cordial during the year.
DIRECTORS' RESPONSIBILITY STATEMENTTo the best of their knowledge and belief and according to the information and explanations obtained by them, your Directors make the following statements in
terms of Section 134(5) of the Companies Act, 2013: st a) that in the preparation of the annual nancial statements for the year ended 31 March, 2017, the applicable accounting standards have been
followed along with proper explanation relating to material departures, if any;
b) that such accounting policies have been selected and applied consistently and judgement and estimates have been made that are reasonable and stprudent so as to give a true and fair view of the state of affairs of the Company as at 31 March, 2017 and of the prot of the Company for the year
ended on that date;
c) that proper and sufcient care has been taken for the maintenance of adequate accounting records in accordance with the provisions of the
Companies Act, 2013 for safeguarding the assets of the Company and for preventing and detecting fraud and other irregularities:
d) that the annual nancial statements have been prepared on a going concern basis;
e) that proper internal nancial controls to be followed by the Company have been laid down and that the nancial controls are adequate and are
operating effectively; and
f) that proper systems have been devised to ensure compliance with the provisions of all applicable laws and that such systems were adequate and
operating effectively.
DISCLOSURE UNDER THE SEXUAL HARASSMENT OF WOMEN AT WORKPLACE
(PREVENTION, PROHIBITION AND REDRESSAL) ACT, 2013During the year under review, no case was led pursuant to the Sexual Harassment of Women at Workplace (Prevention, Prohibition and Redressal) Act, 2013.
DETAILS OF SIGNIFICANT AND MATERIAL ORDERS PASSED BY THE REGULATORS /
COURTS / TRIBUNALSDuring the year under review, no signicant or material orders were passed by the Regulators or Courts or Tribunals which impact the going concern status and
Company's operations in future.
ACKNOWLEDGEMENTSYour Directors acknowledge with gratitude the commitment and dedication of the employees for their untiring personal efforts as well as their collective
contributions at all levels that have led to the growth and success of the Company. The Directors would like to thank other stakeholders including lenders and
business associates who have continued to provide support and encouragement.
For and on behalf of the Board
Registered Office 'Park Plaza' 71, Park Street Kolkata 700 016
thDate: 30 May 2017
R. V. Kanoria
Chairman & Managing Director
DIN:00003792
Kanoria Chemicals & Industries Limited
Annual Report 2016-17

2323
1. A brief outline of the Company's CSR Policy, including overview of projects or programmes proposed to be undertaken and a reference to the web-link to the CSR policy and projects or programs.
Please refer to the Sec�on on Corporate Social Responsibility in the Board's Report.
2. The Composi�on of the CSR Commi�ee. Please refer to the Corporate Governance Report for the composi�on of the Corporate Social Responsibility Commi�ee.
3. Average net profit of the Company for last three financial years Rs. 115.07 million.
4. Prescribed CSR Expenditure (two per cent of the amount as in item 3 above)
Rs. 2.31 million
5. Details of CSR spent during the financial year.
(a) Total amount to be spent for the financial year; Rs. 2.31 million.
(b) Amount unspent, if any; NIL.
(c) Manner in which the amount spent during the financial year Details are given below.
1 2 3 4 5 6 7 8
Sl. No CSR project or ac�vity iden�fied
Sector in which the Project is covered
Projects or programs(1) Local area or other(2) Specify the State and District where projects or programs were undertaken
Amount outlay (budget) project or program wise
Amount spent on the project or programsSub-heads:(1) Direct expenditure on projects or programs.(2) Overheads
Cumula�ve expenditure upto the repor�ng period
Amount spent: Direct or through implemen�ng agency
1) Voca�onal Training to Students
Promo�on of Educa�on -Employment enhancing Skills
1) Local Area2) VGTK, Sewa Rural,Jhagadia Dist: Bharuch, Gujarat
Rs.0.02 Million Direct ExpenditureRs.0.02 Million
Rs.0.02 Million Direct
2) Skill Development of Youth in Rural/Tribal area.
Promo�on of Educa�on
1) Local Area2) VGTK, Sewa Rural, JhagadiaDist: Bharuch, Gujarat
Rs.0.20 Million Direct ExpenditureRs.0.20 Million
Rs.0.20 Million Through implemen�ng agency
3) Se�ng Up Computer Lab, Providing Projector and Improvement of facili�es
Promo�on of Educa�on
1) Other2) Madhav Vidyapeeth, Kakadkui,Dist: NarmadaGujarat
Rs.0.77 Million Direct ExpenditureRs.0.77 Million
Rs.0.77 Million Direct
4) Se�ng Up Tailoring Training Centre
Empowering Women through employment enhancing Skill Training
1) Other2) Madhav Vidyapeeth, Kakadkui,Dist: NarmadaGujarat
Rs.0.41 Million Direct ExpenditureRs.0.41 Million
Rs.0.41 Million Direct
5) Rural Medical Camp Contribu�on
Preven�ve Health Care in Tribal/Rural Area
(1) Local Area(2) Katpor, Tal: Hansot, Dist: BharuchGujarat
Rs.0.05 Million Direct ExpenditureRs.0.05 Million
Rs.0.05 Million Through implemen�ng agencies
[Pursuant to clause (o) of sub-section (3) of Section 134 of the Companies Act, 2013 and Rule 8 of the Companies (Corporate Social Responsibility Policy) Rules, 2014]
ANNEXURE TO THE DIRECTORS' REPORT
ANNUAL REPORT ON CSR ACTIVITIES
Kanoria Chemicals & Industries Limited
Annual Report 2016-17

1 2 3 4 5 6 7 8
Sl. No CSR project or ac�vity iden�fied
Sector in which the Project is covered
Projects or programs(1) Local area or otherSpecify the State and District where projects or programs were undertaken
Amount outlay (budget) project or program wise
Amount spent on the project or programsSub-heads:(1) Direct expenditure on projects or programs.Overheads
Cumula�ve expenditure upto the repor�ng period
Amount spent: Direct or through implemen�ng agency
6) Providing Quality Educa�on in Rural School
Promo�on of Educa�on
1) Local AreaVisakhapatnam2) Parvada Mandal VisakhapatnamAndhra Pradesh
Rs.0.86 Million Direct ExpenditureRs.0.86 Million
Rs.0.86 Million Through implemen�ng agency
Grand Total Rs. 2.31 Million Rs. 2.31 Million Rs. 2.31 Million
6. Details of implemen�ng agencies In addi�on to CSR ac�vi�es undertaken directly by the Company, it has also implemented CSR projects through NGOs/Associa�on such as Sewa Rural, Jhagadia, Ankleshwar, Lions Club of Ankleshwar, Ankleshwar Industries Associa�on and M. V. Founda�on, Secunderabad, Telangana.
7. In case the Company has failed to spend the 2% of the average net profit of the last three years or any part thereof, the Company shall provide reasons for not spending the amount in the Board Report.
NA
8. Responsibility Statement of the CSR Commi�ee that the implementa�on and monitoring of Corporate Social Responsibility Policy is in compliance with CSR objec�ves and Policy of the Company.
The CSR Commi�ee confirms that the implementa�on and monitoring of Corporate Social Responsibility Policy, is in compliance with CSR objec�ves and Policy of the Company.
Registered Office 'Park Plaza' 71, Park Street Kolkata 700 016
thDate: 30 May 2017
Madhuvanti KanoriaChairperson, CSR Committee
DIN:00142146
R. V. KanoriaChairman & Managing Director
DIN:0003792
Kanoria Chemicals & Industries Limited
24
Annual Report 2016-17

2325
Kanoria Chemicals & Industries Limited
[Pursuant to section 92(3) of the Companies Act, 2013 and Rule 12(1) of the Companies (Management and Administration) Rules, 2014]
ANNEXURE TO THE DIRECTORS' REPORT
Form No. MGT-9 | EXTRACT OF ANNUAL RETURNAs on the financial year ended on 31.03.2017
(i) CIN L24110WB1960PLC024910
(ii) Registra�on Date 17.12.1960
(iii) Name of the Company KANORIA CHEMICALS AND INDUSTRIES LIMITED
(iv) Category / Sub-Category of the Company PUBLIC LIMITED COMPANY/LIMITED BY SHARES
(v) Address of the Registered office and contact details “PARK PLAZA”, SOUTH BLOCK ,7TH FLOOR71, PARK STREET, KOLKATA -700016 PHONE : (033) 4031 3200, FAX : (033) 4031 3220
(vi) Whether listed company (Yes / No) YES
(vii) Name, Address and Contact details of Registrar and Transfer Agent, if any
C B MANAGEMENT SERVICES PVT LTDP-22, BONDEL ROAD, KOLKATA - 700019 PHONE : (033) 40116700 / 2280 6692 (3 lines), FAX : (033) 40116739
I. REGISTRATION AND OTHER DETAILS
II. PRINCIPAL BUSINESS ACTIVITIES OF THE COMPANY All the business activities contributing 10 % or more of the total turnover of the company are stated below:-
Sl. No. Name and Descrip�on of main products/Services NIC Code of the Product/Service % to total turnover of the Company
1 Formaldehyde 37% 20119 43.07
2 Pentaerithritol 20119 29.09
3 Hexamine 20119 13.56
III. PARTICULARS OF HOLDING, SUBSIDIARY AND ASSOCIATE COMPANIESSl. No. Name and Address of the Company CIN/GLN Holding /
Subsidiary / Associate
% of shares held Applicable Sec�on
1 Vardhan Limited thKCI Plaza,7 Floor
23C Ashutosh Chowdhury Avenue Kolkata- 700 019
U14293WB1947PLC015833 Holding 59.81% 2(46)
2 Pipri LimitedPark Plaza,South Block71 Park StreetKolkata-700 016
U67120WB1977PLC031082 Subsidiary 100% 2(87)
3 APAG Holding AGLindenstrasse 26,CH-8008 ZurichSwitzerland
Foreign Subsidiary
100% 2(87)
4 APAG Elektronik AGRingstrasse 148600 DübendorfSwitzerland
Wholly owned subsidiary of APAG Holding AG
- 2(87)
5 APAG Elektronik s.r.o.U Panasonic 396530 06 Pardubice Czech Republic
Wholly owned subsidiary of APAG Holding AG
- 2(87)
Annual Report 2016-17

26
Kanoria Chemicals & Industries Limited
IV. SHARE HOLDING PATTERN (Equity Share Capital Breakup as percentage of Total Equity) (i) Category-wise Share Holding
Category of Shareholders No. of Shares held at the beginning of the year(As on 01.04.2016)
No. of Shares held at the end of the year(As on 31.03.2017)
% Change during
theyearDemat Physical Total % of Total
SharesDemat Physical Total % of Total
Shares
A. PROMOTERS
(1) INDIAN
(a) Individual / HUF 1,585,386 0 1,585,386 3.63 1,585,386 0 1,585,386 3.63 0.00
(b) Central Govt. 0 0 0 0.00 0 0 0 0.00 0.00
(c) State Govt.(s) 0 0 0 0.00 0 0 0 0.00 0.00
(d) Bodies Corporate 30,498,899 0 30,498,899 69.81 30,498,899 0 30,498,899 69.81 0.00
(e) Banks / FI 0 0 0 0.00 0 0 0 0.00 0.00
(f) Any Other (Specify) 0 0 0 0.00 0 0 0 0.00 0.00
Sub-total (A) (1) 32,084,285 0 32,084,285 73.44 32,084,285 0 32,084,285 73.44 0.00
(2) FOREIGN
(a) NRIs – Individuals 434,739 0 434,739 0.99 434,739 0 434,739 0.99 0.00
(b) Other – Individuals 0 0 0 0.00 0 0 0 0.00 0.00
(c) Bodies Corporate 0 0 0 0.00 0 0 0 0.00 0.00
(d) Bank / FI 0 0 0 0.00 0 0 0 0.00 0.00
(e) Any Other (Specify) 0 0 0 0.00 0 0 0 0.00 0.00
Sub-total (A) (2) 434,739 0 434,739 0.99 434,739 0 434,739 0.99 0.00
Total Shareholding of Promoter (A) = (A) (1) + (A) (2)
32,519,024 0 32,519,024 74.43 32,519,024 0 32,519,024 74.43 0.00
B. PUBLIC SHAREHOLDING
(1) INSTITUTIONS
(a) Mutual Funds 2,100 28,500 30,600 0.07 2,100 28,500 30,600 0.07 0.00
(b) Banks / FI 78,003 1,125 79,128 0.18 63,149 1,125 64,274 0.15 (0.03)
(c) Central Govt. 0 0 0 0.00 0 0 0 0.00 0.00
(d) State Govt.(s) 0 0 0 0.00 0 0 0 0.00 0.00
(e) Venture Capital Funds 0 0 0 0.00 0 0 0 0.00 0.00
(f) Insurance Companies 2,000 0 2,000 0.00 2,000 0 2,000 0.00 0.00
(g) FIIs 0 18,300 18,300 0.04 0 18,300 18,300 0.04 0.00
(h) Foreign Venture Capital funds 0 0 0 0.00 0 0 0 0.00 0.00
(I) Any Other (Specify) 0 0 0 0.00 0 0 0 0.00 0.00
Sub-total (B) (1) 82,103 47,925 130,028 0.29 67,249 47,925 115,174 0.26 (0.03)
Sl. No. Name and Address of the Company CIN/GLN Holding / Subsidiary / Associate
% of shares held Applicable Sec�on
6 CoSyst Control Systems GmbHMar�n-Albert, Str. 1, 90491 Nürnberg, Germany
Wholly owned subsidiary of APAG Holding AG
- 2(87)
7 APAG Elektronik LLC2675 Bellingham Dr., Troy, MI 48083, United States
Wholly owned subsidiary of APAG Holding AG
- 2(87)
8 APAG Elektronik S. de R.L. de C.V.Calle Ecuaador No.4, Col. Lomas de Queretaro76190 Queretaro, QRO, Mexico
Wholly owned subsidiary of APAG Holding AG
- 2(87)
9 APAG Services S. de R.L. de C.V.Calle Ecuaador No.4, Col. Lomas de Queretaro76190 Queretaro, QRO, Mexico
Wholly owned subsidiary of APAG Holding AG
- 2(87)
10 Kanoria Africa Tex�les PLCKirkos Sub City, Woreda 09, House No. 687, Amanelwa Building, Room No. 403,Wello Sefer, Addis Ababa, Ethiopia
Foreign Subsidiary
78.68% 2(87)
Annual Report 2016-17

Category of Shareholders No. of Shares held at the beginning of the year(As on 01.04.2016)
No. of Shares held at the end of the year(As on 31.03.2017)
% Change during the
yearDemat Physical Total % of Total
SharesDemat Physical Total % of Total
Shares
(2) NON - INSTITUTIONS
(a) Bodies Corporate
(i) Indian 1,633,597 37,278 1,670,875 3.82 1,805,718 37,278 1,842,996 4.22 0.40
(ii) Overseas 0 0 0 0.00 0 0 0 0.00 0.00
(b) Individuals
(i) Individual shareholders holding nominal capital upto Rs. 1 lakh
6,838,596 455,977 7,294,573 16.70 7,072,304 435,528 7,507,832 17.18 0.48
(ii) Individual shareholders holding nominal share capitalin excess of Rs.1 lakh
1,145,542 30,000 1,175,542 2.69 746,039 30,000 776,039 1.78 (0.91)
(c) Any Other (Specify)
NRI 412,323 21,945 434,268 0.99 551,541 21,945 573,486 1.31 0.32
Clearing Members 156,993 0 156,993 0.36 56,970 0 56,970 0.13 (0.23)
Trust 177,073 0 177,073 0.41 169,879 0 169,879 0.39 (0.02)
Other Directors & Rela�ves 18,328 1 18,329 0.04 15,304 1 15,305 0.03 (0.01)
Unclaimed Suspense A/c 116,628 0 116,628 0.27 116,628 0 116,628 0.27 0.00
Sub-total (B) (2) 10,499,080 545,201 11,044,281 25.28 10,534,383 524,752 11,059,135 25.31 0.03
Total Public Shareholding (B) = (B) (1) + (B) (2) 10,581,183 593,126 11,174,309 25.57 10,601,632 572,677 11,174,309 25.57 0.00
C. Shares held by Custodians for GDRs & ADRs
0 0 0 0.00 0 0 0 0.00 0.00
GRAND TOTAL (A+B+C) 43,100,207 593,126 43,693,333 100.00 43,120,656 572,677 43,693,333 100.00 0.00
27
Kanoria Chemicals & Industries Limited
(ii) Shareholding of Promoters and Promoter Group
Sl. No.
Shareholder's Name Shareholding at the beginning of the year(As on 01.04.2016)
Shareholding at the end of the year(As on 31.03.2017)
% Change in shareholding
during theyearNo. of Shares % of total
shares of the Company
% of shares pledged /
encumbered to total shares
No. of Shares % of totalshares of the
Company
% of shares pledged /
encumbered to total shares
1 Vardhan Limited 26,133,872 59.81 0.00 26,133,872 59.81 0.00 0.00
2Kir�vardhan Finvest Services Ltd
1,154,907 2.64 0.00 1,154,907 2.64 0.00 0.00
3R V Investment & Dealers Ltd
3,210,120 7.35 0.00 3,210,120 7.35 0.00 0.00
4 Rajya Vardhan Kanoria 434,985 1.00 0.00 461,481 1.06 0.00 0.06
5 Shyam Sundar Kanoria 15,000 0.03 0.00 0 0.00 0.00 (0.03)
6 Shyam Sundar Kanoria 11,496 0.03 0.00 0 0.00 0.00 (0.03)
7 Saumya Vardhan Kanoria 556,440 1.27 0.00 556,440 1.27 0.00 0.00
8 Anand Vardhan Kanoria 434,739 0.99 0.00 434,739 0.99 0.00 0.00
9 Sheela Devi Kanoria 12,144 0.03 0.00 12,144 0.03 0.00 0.00
10 Madhuvan� Kanoria 498,321 1.14 0.00 498,321 1.14 0.00 0.00
11 Anjana Somany 27,000 0.06 0.00 27,000 0.06 0.00 0.00
12 Abhishek Somany 30,000 0.07 0.00 30,000 0.07 0.00 0.00
Total 32,519,024 74.43 0.00 32,519,024 74.43 0.00 0.00
Annual Report 2016-17
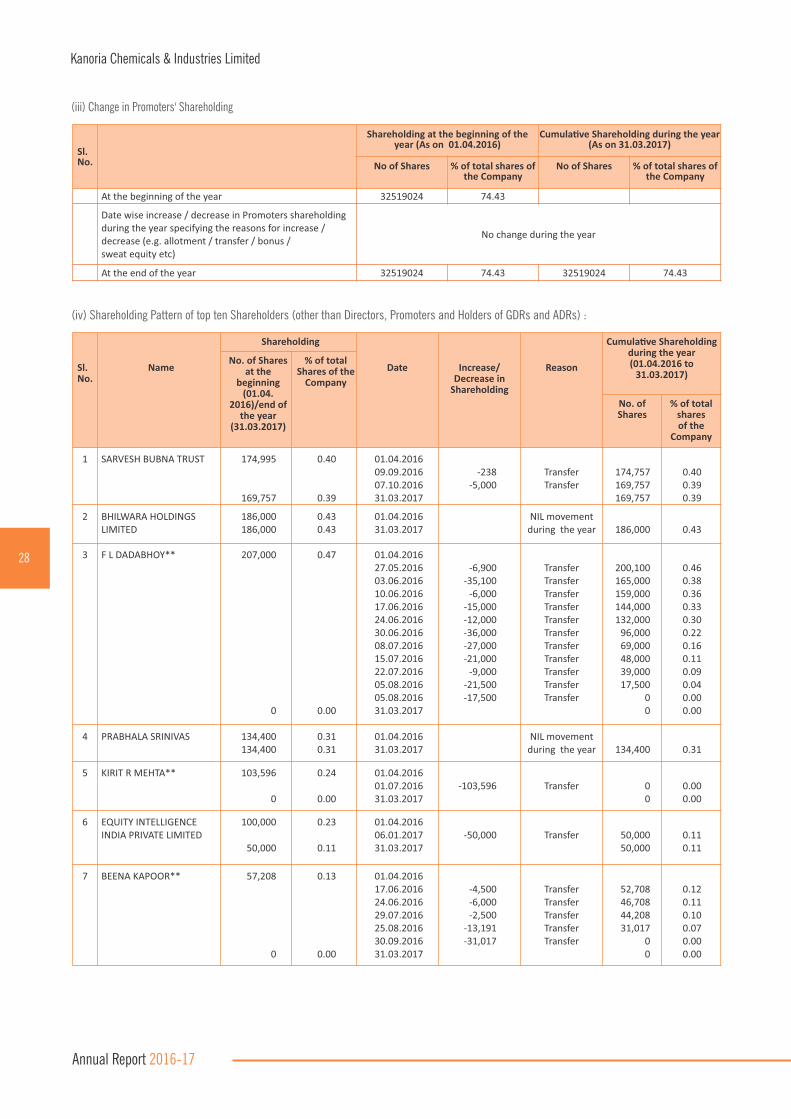
(iv) Shareholding Pattern of top ten Shareholders (other than Directors, Promoters and Holders of GDRs and ADRs) :
Sl. No.
Name
Shareholding
Date Increase/ Decrease in
Shareholding
Reason
Cumula�ve Shareholding during the year (01.04.2016 to
31.03.2017)
No. of Shares at the
beginning (01.04.
2016)/end of the year
(31.03.2017)
% of total Shares of the
Company
No. ofShares
% of total sharesof the
Company
1 SARVESH BUBNA TRUST 174,995
169,757
0.40
0.39
01.04.201609.09.201607.10.201631.03.2017
-238-5,000
TransferTransfer
174,757169,757169,757
0.400.390.39
2 BHILWARA HOLDINGS LIMITED
186,000186,000
0.430.43
01.04.201631.03.2017
NIL movement during the year 186,000 0.43
3 F L DADABHOY** 207,000
0
0.47
0.00
01.04.201627.05.201603.06.201610.06.201617.06.201624.06.201630.06.201608.07.201615.07.201622.07.201605.08.201605.08.201631.03.2017
-6,900-35,100
-6,000-15,000-12,000-36,000-27,000-21,000
-9,000-21,500-17,500
TransferTransferTransferTransferTransferTransferTransferTransferTransferTransferTransfer
200,100165,000159,000144,000132,000
96,00069,00048,00039,00017,500
00
0.460.380.360.330.300.220.160.110.090.040.000.00
4 PRABHALA SRINIVAS 134,400134,400
0.310.31
01.04.201631.03.2017
NIL movement during the year 134,400 0.31
5 KIRIT R MEHTA** 103,596
0
0.24
0.00
01.04.201601.07.201631.03.2017
-103,596 Transfer 00
0.000.00
6 EQUITY INTELLIGENCE INDIA PRIVATE LIMITED
100,000
50,000
0.23
0.11
01.04.201606.01.201731.03.2017
-50,000 Transfer 50,00050,000
0.110.11
7 BEENA KAPOOR** 57,208
0
0.13
0.00
01.04.201617.06.201624.06.201629.07.201625.08.201630.09.201631.03.2017
-4,500-6,000-2,500
-13,191-31,017
TransferTransferTransferTransferTransfer
52,70846,70844,20831,017
00
0.120.110.100.070.000.00
(iii) Change in Promoters' Shareholding
Sl. No.
Shareholding at the beginning of the year (As on 01.04.2016)
Cumula�ve Shareholding during the year (As on 31.03.2017)
No of Shares % of total shares of the Company
No of Shares % of total shares of the Company
At the beginning of the year 32519024 74.43
Date wise increase / decrease in Promoters shareholding during the year specifying the reasons for increase / decrease (e.g. allotment / transfer / bonus /sweat equity etc)
No change during the year
At the end of the year 32519024 74.43 32519024 74.43
Kanoria Chemicals & Industries Limited
28
Annual Report 2016-17

Sl. No.
Name
Shareholding
Date Increase/ Decrease in
Shareholding
Reason
Cumula�ve Shareholding during the year (01.04.2016 to
31.03.2017)
No. of Shares at the
beginning (01.04.
2016)/end of the year
(31.03.2017)
% of total Shares of the
Company
No. ofShares
% of total sharesof the
Company
8 Mahima Stocks Private Limited**
200,000
0
0.46
0.00
01.04.201616.12.201613.01.201720.01.201727.01.201731.03.2017
50,25349,74750,000
-350,000
TransferTransferTransferTransfer
250,253300,000350,000
00
0.570.690.800.000.00
9 M Prasad & Co. Limited** 174,520
0
0.40
0.00
01.04.201607.10.201614.10.201628.10.201610.03.201731.03.2017
-10,000-5,000-5,000
-154,520
TransferTransferTransferTransfer
164,520159,520154,520
00
0.380.370.350.000.00
10 Pres�ge Traders Private Limited
58,50058,500
0.130.13
01.04.201631.03.2017
NIL movement during the year 58,500 0.13
11 Chartered Finance & Leasing Limited*
0
350,000
0.00
0.80
01.04.201603.02.201731.03.2017
350,000 Transfer 350,000350,000
0.800.80
12 Monet Securi�es Private Limited*
0
154,758
0.00
0.35
01.04.201615.04.201609.09.201624.03.201731.03.2017
3,018-2,780
154,520
TransferTransferTransfer
3,018238
154,758154,758
0.010.000.350.35
13 Panna Kirit Mehta* 0
103,596
0.00
0.24
01.04.201608.07.201631.03.2017
103,596 Transfer 103,596103,596
0.240.24
14 Seya Scaria* 0
65,500
0.00
0.15
01.04.201629.04.201606.05.201620.05.201627.05.201610.06.201617.06.201624.06.201605.08.201625.08.201602.09.201609.09.201616.09.201607.10.201625.11.201602.12.201609.12.201630.12.201631.03.2017
2,0002,0006,5004,0008,0005,0005,0002,6424,8582,0003,0003,7411,0002,5003,2594,9795,021
TransferTransferTransferTransferTransferTransferTransferTransferTransferTransferTransferTransferTransferTransferTransferTransferTransfer
2,0004,000
10,50014,50022,50027,50032,50035,14240,00042,00045,00048,74149,74152,24155,50060,47965,50065,500
0.000.010.020.030.050.060.070.080.090.100.100.110.110.120.130.140.150.15
15 Atam Kumar* 50,42650,426
0.120.12
01.04.201631.03.2017
NIL movement during the year 50,426 0.12
* Not in the list of Top 10 shareholders as on 1.4.2016. The same has been shown above since the shareholder was one of the Top 10 shareholders as on 31.3.2017.
** Ceased to be in the list of Top 10 shareholders as on 31.3.2017. The same has been shown above since the shareholder was one of the Top 10 shareholders as on 1.4.2016.
29
Kanoria Chemicals & Industries Limited
Annual Report 2016-17
Sl. No.
Name
Shareholding
Date Increase/ Decrease in
Shareholding
Reason
Cumula�ve Shareholding during the year (01.04.2016 to
31.03.2017)
No. of Shares at the
beginning (01.04.
2016)/end of the year
(31.03.2017)
% of total Shares of the
Company
No. ofShares
% of total sharesof the
Company
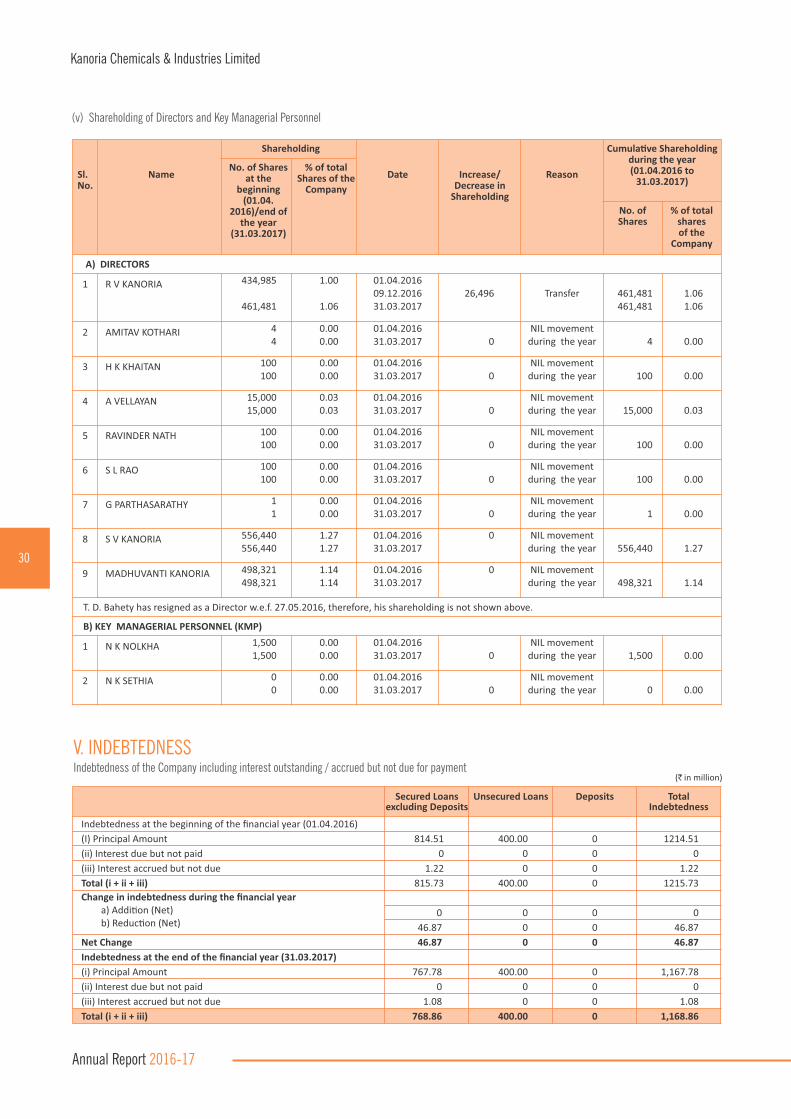
A) DIRECTORS
1 R V KANORIA 434,985
461,481
1.00
1.06
01.04.201609.12.201631.03.2017
26,496 Transfer 461,481461,481
1.061.06
2 AMITAV KOTHARI 44
0.000.00
01.04.201631.03.2017 0
NIL movement during the year 4 0.00
3 H K KHAITAN 100100
0.000.00
01.04.201631.03.2017 0
NIL movement during the year 100 0.00
4 A VELLAYAN 15,00015,000
0.030.03
01.04.201631.03.2017 0
NIL movement during the year 15,000 0.03
5 RAVINDER NATH 100100
0.000.00
01.04.201631.03.2017 0
NIL movement during the year 100 0.00
6 S L RAO 100100
0.000.00
01.04.201631.03.2017 0
NIL movement during the year 100 0.00
7 G PARTHASARATHY 11
0.000.00
01.04.201631.03.2017 0
NIL movement during the year 1 0.00
8 S V KANORIA 556,440 556,440
1.271.27
01.04.201631.03.2017
0 NIL movement during the year 556,440 1.27
9 MADHUVANTI KANORIA 498,321498,321
1.141.14
01.04.201631.03.2017
0 NIL movement during the year 498,321 1.14
T. D. Bahety has resigned as a Director w.e.f. 27.05.2016, therefore, his shareholding is not shown above.
B) KEY MANAGERIAL PERSONNEL (KMP)
1 N K NOLKHA 1,5001,500
0.000.00
01.04.201631.03.2017 0
NIL movement during the year 1,500 0.00
2 N K SETHIA 00
0.000.00
01.04.201631.03.2017 0
NIL movement during the year 0 0.00
(v) Shareholding of Directors and Key Managerial Personnel
V. INDEBTEDNESSIndebtedness of the Company including interest outstanding / accrued but not due for payment
Secured Loans excluding Deposits
Unsecured Loans Deposits TotalIndebtedness
Indebtedness at the beginning of the financial year (01.04.2016)
(I) Principal Amount 814.51 400.00 0 1214.51
(ii) Interest due but not paid 0 0 0 0
(iii) Interest accrued but not due 1.22 0 0 1.22
Total (i + ii + iii) 815.73 400.00 0 1215.73
Change in indebtedness during the financial year a) Addi�on (Net) b) Reduc�on (Net)
0 0 0 0
46.87 0 0 46.87
Net Change 46.87 0 0 46.87
Indebtedness at the end of the financial year (31.03.2017)
(i) Principal Amount 767.78 400.00 0 1,167.78
(ii) Interest due but not paid 0 0 0 0
(iii) Interest accrued but not due 1.08 0 0 1.08
Total (i + ii + iii) 768.86 400.00 0 1,168.86
Kanoria Chemicals & Industries Limited
30
(`in million)
Annual Report 2016-17

VI. REMUNERATION OF DIRECTORS AND KEY MANAGERIAL PERSONNELA) Remuneration to Managing Director, Whole-time Directors and/or Manager
Sl.No.
Par�culars of Remunera�on Name of MD/WTD/ManagerTotal Amount
R V Kanoria S V Kanoria T D Bahety
ManagingDirector
Whole�meDirector
Whole�meDirector (Term as
such ended on 19.05.2016)
1 Gross Salarya) Salary as per provision contained in Sec�on 17 (1) of the Income Tax Act, 1961b) Value of Perquisites u/s. 17 (2) of the Income Tax Act, 1961c) Profits in lieu of salary u/s 17(3) of the Income-tax Act, 1961
13.39 4.80 2.50 20.69
0.39 0.04 0.03 0.46
0 0 0 0
2 Stock Op�on 0 0 0 0
3 Sweat Equity 0 0 0 0
4 CommissionAs % of ProfitOthers, specify
0 0 0 0
0 0 0 0
5 Others, Please Specify – (Company's contribu�on to PF) 1.00 0.36 0.05 1.41
Total (A) 14.78 5.20 2.58 22.56
Ceiling as per the Act Rs. 3.23 million, being 10% of the NetProfits of the Company as per Sec�on 198of the Companies Act, 2013
B) Remuneration to Other Directors
1. Independent Directors
Par�culars of Remunera�onName of Directors Total Amount
Amitav Kothari
H K Khaitan Ravinder Nath
G Pathasarathy
S L Rao A Vellayan
Fees for a�ending Board/commi�ee mee�ngs 0.29 0.32 0.17 0.17 0.16 0.05 1.16
Commission 0 0 0 0 0 0 0
Other, Please specify 0 0 0 0 0 0 0
Total (B) (1) 0.29 0.32 0.17 0.17 0.16 0.05 1.16
2. Other Non Executive Directors
Par�culars of Remunera�on Name of Director Total Amount
Madhuvan� Kanoria
Fees for a�ending board/commi�ee mee�ng 0.20 0.20
Commission 0 0
Other, Please specify 0 0
Total (B) (2) 0.20 0.20
Total (B)=(B1)+(B2) 1.36
Total Managerial Remunera�on (A+B) 23.92
Overall Ceiling as per the Act Rs. 3.55 million, being 11% of the Net Profits as per Sec�on 198 of the Companies Act, 2013
31
Kanoria Chemicals & Industries Limited
(`in million)
(`in million)
(`in million)
Annual Report 2016-17

C) Remuneration to Key Managerial Personnel other than MD / Manager / WTD
Sl. No. Par�culars of Remunera�on Key Managerial Personnel Total Amount
N K Nolkha N K Sethia
Group Chief Financial Officer
Company Secretary
1 Gross Salarya) Salary as per provision contained in
Sec�on 17 (1) of the Income Tax Act, 1961b) Value of Perquisites u/s. 17 (2) of the
Income Tax Act, 1961c) Profits in lieu of salary u/s 17(3) of the
Income-tax Act, 1961
4.75 2.10 6.85
0.22 0.11 0.33
0 0 0
2 Stock Op�on 0 0 0
3 Sweat Equity 0 0 0
4 CommissionAs % of ProfitOthers, specify
0 0 0
0 0 0
5 Others, Please Specify – (Company's contribu�on to PF) 0.28 0.13 0.41
Total (C) 5.25 2.34 7.59
VII. PENALTIES / PUNISHMENT / COMPOUDNING OF OFFENCES Against the Company, Directors and other Ofcers in Defaults under the Companies Act, 2013 : NONE
Registered Office'Park Plaza' 71, Park StreetKolkata-700 016
thDate: 30 May 2017
For and on behalf of the Board
R.V. Kanoria Chairman & Managing Director
DIN:00003792
Kanoria Chemicals & Industries Limited
32
(`in million)
Annual Report 2016-17
To,
The Members,
Kanoria Chemicals & Industries Limited
“Park Plaza”, 71 Park Street,
Kolkata-700016
We have conducted the Secretarial Audit of the compliance of applicable statutory provisions and adherence to good corporate practices by
Kanoria Chemicals & Industries Limited (hereinafter called “the Company”). Secretarial Audit was conducted in a manner that provided us a reasonable basis for
evaluating the corporate conducts/ statutory compliances and expressing our opinion thereon.
Based on our verication of the Company's books, papers, minute books, forms, returns led and other records maintained by the Company as per Annexure- A
(hereinafter referred to as “Books and Papers”) and also the information provided by the Company, its ofcers, Registrar & Share transfer agents during the
conduct of secretarial audit, we hereby report that in our opinion, the Company has, during the period covered by our audit, that is to say, from April 01, 2016 to
March 31, 2017 (hereinafter referred to as “Audit Period”), complied with the statutory provisions listed hereunder and also that the Company has proper board-
processes and compliance-mechanism in place to the extent, in the manner and subject to the reporting made hereinafter:
We have examined the Books and Papers maintained by the Company for the Audit Period according to the provisions of:
1. The Companies Act, 2013 (“the Act”) and the rules made thereunder including any re-enactment thereof;
2. The Securities Contracts (Regulation) Act, 1956 ('SCRA') and the rules made thereunder;
3. The Depositories Act, 1996 and the regulations and bye-laws framed thereunder;
4. Foreign Exchange Management Act, 1999 and the rules and regulations made thereunder to the extent of Overseas Direct Investment, Foreign Direct
Investment and External Commercial Borrowings;
5. The following Regulations and guidelines prescribed under the Securities Exchange Board of India Act, 1992 ('SEBI Act'):
a) SEBI (Substantial Acquisition of Shares and Takeovers) Regulations, 2011 ('SAST Regulation');
b) SEBI (Listing Obligations and Disclosure Requirements) Regulations, 2015 (“the LODR Regulations, 2015”);
c) SEBI (Registrar to an issue and Share Transfer Agents) Regulations, 1993 regarding the Companies Act and dealing with client);
d) SEBI (Prohibition of Insider Trading) Regulations, 2015 (“the PIT Regulations, 2015”);
e) Securities and Exchange Board of India (Depositories and Participants) Regulations, 1996 and rules made thereunder;
f) SEBI (Issue of Capital and Disclosure Requirements) Regulations, 2009 (“SEBI (ICDR) Regulations, 2009”)
6. Laws specically applicable to the industry to which the Company belongs, as identied by the management, that is to say:
i. Petroleum Act, 1934;
ii. Poison Act, 1919; and
iii. Indian Explosive Act, 1884
We have also examined compliance with the applicable clauses of the following:
a) Secretarial Standards 1 and 2 issued by the Institute of Company Secretaries of India;
b) The Listing Agreement entered into by the Company with BSE Limited and National Stock Exchange of India Limited.
Having regard to the compliance system prevailing in the Company and on examination on test –check basis, of the relevant documents and records in pursuance
thereof relating to the Audit Period, we report that the Company has complied with the provisions of the Act, Rules, Regulations, Guidelines, etc. mentioned above.
Management Responsibility:
1. Maintenance of secretarial records is the responsibility of the management of the Company. Our responsibility is to express an opinion on these
secretarial records based on our audit;
2. We have followed the audit practices and the processes as were appropriate to obtain reasonable assurance about the correctness of the contents of the
secretarial records. The verication was done on test basis to ensure that correct facts are reected in secretarial records. We believe that the processes
and practices, we followed provide a reasonable basis for our opinion;
33
Kanoria Chemicals & Industries Limited
[Pursuant to Section 204(1) of the Companies Act, 2013 and Rule no.9 of the Companies (Appointment and Remuneration Personnel) Rules, 2014]
ANNEXURE TO THE DIRECTORS' REPORT
Form No. MR-3SECRETARIAL AUDIT REPORT FOR THE FINANCIAL YEAR ENDED ON MARCH 31, 2017
Annual Report 2016-17

3. We have not veried the correctness and appropriateness of nancial records and Books of Accounts of the Company;
4. Wherever required, we have obtained the Management Representation about the compliance of laws, rules and regulations and happening of events etc;
5. The compliance of the provisions of Corporate and other applicable laws, rules, regulations, standards is the responsibility of management. Our examination
was limited to the verication of procedure on test basis;
6. The Secretarial Audit Report is neither an assurance as to the future viability of the Company nor of the efcacy or effectiveness with which the management
has conducted the affairs of the Company.
We report that the Board of Directors of the Company is duly constituted with proper balance of Executive Directors, Non-Executive Directors and Independent Directors. The changes in the composition of the Board of Directors that took place during the Period under review were carried out in compliance with the provisions of the Act.
Adequate notice is given to all directors to schedule the Board Meetings, agenda and detailed notes on agenda were sent at least seven days in advance, and a system exists for seeking and obtaining further information and clarications on the agenda items before the Meeting and for meaningful participationat the Meeting.
We further report that based on the information provided by the Company during the conduct of the audit and also on the review of quarterly compliance reports by Company Secretary taken on record by the Board of Directors of the Company, in our opinion, adequate systems and processes and control mechanisms exist in the Company to monitor and ensure compliance with other applicable general laws.
We further report that there are adequate systems and processes in the Company (commensurate with the size and operations of the Company) to monitor and ensure compliance with applicable laws, rules, regulations and guidelines.
We further report that during the Audit Period, the Company has not incurred any specic event that can have a major bearing on the Company's affairs in pursuance of the above referred laws, rules, regulations, guidelines, standards, etc.
Place: Kolkata thDate: 30 May, 2017
For M/s Vinod Kothari & Company
Practicing Company Secretaries
Arun Kumar Maitra
Partner
Membership No: A3010
CP No.: 14490
LIST OF DOCUMENTS
1. Corporate Matters
1.1 Minutes books of the following meetings were provided in original
1.1.1 Board Meeting
1.1.2 Audit Committee
1.1.3 Nomination and Remuneration Committee
1.1.4 Stakeholders Relationship Committee
1.1.5 Corporate Social Responsibility Committee
1.1.6 Risk Management Committee
1.1.7 General Meeting
1.2 Agenda papers for Board Meeting along with Notice
1.3 Annual Report for the Financial Year 2015-2016
1.4 Memorandum and Articles of Association
1.5 Disclosures under the Act and Listing Regulations
1.6 Policies framed under the Act and Listing Regulations;
1.7 Documents pertaining to Listing Agreement/ Listing Regulations compliance;
1.8 Documents pertaining to proof of payment of Dividend;
1.9 Registers maintained under the Act;
1.10 Forms and Returns led with MCA and RBI
1.11 Questionnaires duly lled for specic laws
1.12 Documents under SEBI (Prohibition of Insider Trading) Regulations, 2015
1.13 Disclosures under SEBI (Substantial Acquisition of Shares and Takeovers) Regulations, 2011
ANNEXURE - A
34
Kanoria Chemicals & Industries Limited
Annual Report 2016-17

ANNEXURE TO THE DIRECTORS' REPORT
Particulars of Energy Conservation, Technology Absorption and Foreign Exchange Earnings and Outgo requiredunder the Companies (Accounts) Rules, 2014
(A) Conservation of Energy
(i) The steps taken for conservation of energy:
Major energy conservation initiative taken during the nancial year 2016-17:
Ÿ Replaced the blower to reduce power consumption.
Ÿ Replaced the vaporizer with new design to reduce steam consumption
Ÿ Installed LED lights.
Ÿ Replaced the pumps of Boiler Feed Water, Methanol Transfer, Raw Water and DM Water with energy efcient pumps.
(ii) The steps taken by the Company for utilizing alternate sources of energy: NIL
(iii) The capital investment on energy conservation equipments: Rs. 3.82 million
(B) Technology Absorption
(i) The efforts made towards technology absorption: NIL
(ii) The benets derived like product improvement, cost reduction, product development or import substitution: NIL
(iii) In case of imported technology (imported during the last three years reckoned from the beginning of the nancial year):
(a) The details of technology imported Technological upgrada�on of Formaldehyde process from Johnson Ma�hey Formox, Sweden
(b) The year of import 2015-16
(c) Whether the technology been fully absorbed Under implementa�on
(d) If not fully absorbed, areas where absorp�on has not taken place, and the reasons thereof
Not Applicable
(iv) The expenditure incurred on Research and Development:-
Capital Expenditure 0.04
Revenue Expenditure 4.56
(C) Foreign Exchange Earnings and Outgo
(`in million)
Foreign Exchange earned in terms of actual inflows during the year 164.50
Foreign Exchange outgo in terms of actual ou�lows during the year 527.63
(`in million)
For and on behalf of the Board
R.V. Kanoria
Chairman & Managing Director
DIN:00003792
Registered Office
'Park Plaza'
71, Park Street
Kolkata-700 016thDate: 30 May 2017
35
Kanoria Chemicals & Industries Limited
Annual Report 2016-17
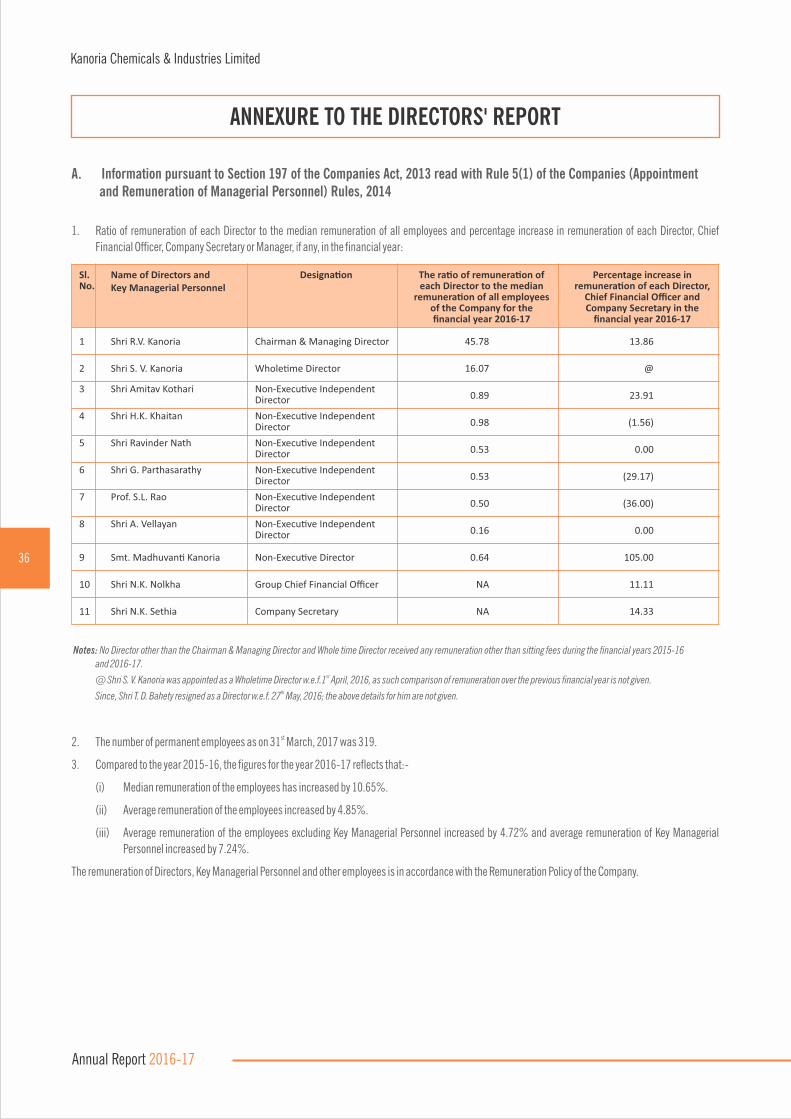
1. Ratio of remuneration of each Director to the median remuneration of all employees and percentage increase in remuneration of each Director, Chief
Financial Ofcer, Company Secretary or Manager, if any, in the nancial year:
ANNEXURE TO THE DIRECTORS' REPORT
A. Information pursuant to Section 197 of the Companies Act, 2013 read with Rule 5(1) of the Companies (Appointment and Remuneration of Managerial Personnel) Rules, 2014
Sl. No.
Name of Directors andKey Managerial Personnel
Designa�on The ra�o of remunera�on ofeach Director to the median
remunera�on of all employeesof the Company for thefinancial year 2016-17
Percentage increase in remunera�on of each Director,
Chief Financial Officer and Company Secretary in the
financial year 2016-17
1 Shri R.V. Kanoria Chairman & Managing Director 45.78 13.86
2 Shri S. V. Kanoria Whole�me Director 16.07 @
3 Shri Amitav Kothari Non-Execu�ve Independent Director 0.89 23.91
4 Shri H.K. Khaitan Non-Execu�ve Independent Director 0.98 (1.56)
5 Shri Ravinder Nath Non-Execu�ve Independent Director 0.53 0.00
6 Shri G. Parthasarathy Non-Execu�ve Independent Director 0.53 (29.17)
7 Prof. S.L. Rao Non-Execu�ve Independent Director 0.50 (36.00)
8 Shri A. Vellayan Non-Execu�ve Independent Director 0.16 0.00
9 Smt. Madhuvan� Kanoria Non-Execu�ve Director 0.64 105.00
10 Shri N.K. Nolkha Group Chief Financial Officer NA 11.11
11 Shri N.K. Sethia Company Secretary NA 14.33
Notes: No Director other than the Chairman & Managing Director and Whole time Director received any remuneration other than sitting fees during the financial years 2015-16
and 2016-17.st
@ Shri S. V. Kanoria was appointed as a Wholetime Director w.e.f.1 April, 2016, as such comparison of remuneration over the previous financial year is not given.th Since, Shri T. D. Bahety resigned as a Director w.e.f. 27 May, 2016; the above details for him are not given.
36
Kanoria Chemicals & Industries Limited
Annual Report 2016-17
st2. The number of permanent employees as on 31 March, 2017 was 319.
3. Compared to the year 2015-16, the gures for the year 2016-17 reects that:-
(i) Median remuneration of the employees has increased by 10.65%.
(ii) Average remuneration of the employees increased by 4.85%.
(iii) Average remuneration of the employees excluding Key Managerial Personnel increased by 4.72% and average remuneration of Key Managerial
Personnel increased by 7.24%.
The remuneration of Directors, Key Managerial Personnel and other employees is in accordance with the Remuneration Policy of the Company.

Top 10 Employees in terms of remuneration drawn
B. Particulars of employees pursuant to provisions of Section 197 (12) of the Companies Act, 2013, read with Rules 5 (2) and (3) of the Companies (Appointment and Remuneration of Managerial Personnel) Rules, 2014
Sl. No.
Name and Age Designa�on Remunera�on(Rs.)
Qualifica�on and Experience Date of Joining
Last Employment
3 N. K. Nolkha(50 Years)
Group Chief Financial Officer
5,282,864 B. Com (Hons), ACA(29 Years)
02.04.1991 G. R. Magnets Limited, Manager (Finance & Legal)
4 Arun Kumar Agarwal (58 Years)
Chief Execu�ve –Chemicals Business
5,273,408 B. Com (Hons), FCA, ACS(35 Years)
01.10.1990 Jayshree Tea &Industries Limited
5 S. V. Kanoria(35 Years)
Whole�me Director 5,160,000 MS in Computer Science(13 Years)
21.08.2006 Morgan Stanley, USA
6 I A P S Murthy(53 Years)
Vice President - Works 4,095,218 Ph.D - Chemistry(23 Years)
4.11.2011 S I Group India Limited,GM - Opera�ons.
7 Anil D Mishra(46 Years)
Sr. General Manager (EHS)
2,757,352 M. Tech. (Environment)(20 Years)
20.12,2004 Khemani Dis�lleries Pvt. Limited
8 Vaidehi Kanoria(33 Years)
General Manager – Human Resource
2,658,720 B.Sc. (Economics)(9 Years)
21.09.2010 Gallery Espace Art
9 Sanjay Kumar Ojha(45 Years)
Vice President (Works) 2,372,112 B.E. (Mechanical)(20 Years)
11.06.2007 United Phosphorus Limited
10 B. Panangadan(55 Years)
Asst. Vice President - Business Development
2,339,184 PG Diploma in Financial Mgmt,B. Tech - Electrical Engg.
(32 Years)
01.09.2011 K S Oils Limited, DGM
Notes: Remuneration includes Salary, House Rent Allowance, Company's contribution to Provident Fund, Leave Travel Assistance, Medical and other facilities, as applicable.
All the appointments are on employment agreement basis, except for executive Directors which are contractual.
Shri R. V. Kanoria, Chairman & Managing Director is spouse of Smt. Madhuvanti Kanoria and father of Shri S. V. Kanoria, Directors of the Company. Shri S. V. Kanoria is son of
Shri R. V. Kanoria and Smt. Madhuvanti Kanoria, Directors of the Company. Smt. Vaidehi Kanoria is wife of Shri S. V. Kanoria and daughter in law of Shri R. V. Kanoria and
Smt. Madhuvanti Kanoria, Directors of the Company.
For and on behalf of the Board
R.V. Kanoria
Chairman & Managing Director
DIN:00003792
Registered Office
'Park Plaza'
71, Park Street
Kolkata-700 016thDate: 30 May 2017
(i) Employees in receipt of remuneration aggregating to not less than Rs. 1.02 Crore per annum or Rs. 8.5 Lakh per month
Sl. No.
Name and Age Designa�on Remunera�on(Rs.)
Qualifica�on and Experience Date of Joining
Last Employment
1 R. V. Kanoria(62 years)
Chairman & Managing Director
14,704,854 B.Sc., MBA (Hons)(43 Years)
10.01.1983 -
2 T. D. Bahety(76 Years)
#Whole�me Director $2,588,585 B. Sc. Chemistry (Hons), Jute Technologist
(58 Years)
08.09.1988 Has�ngs Mill,General Manager
The gures are on mercantile basis.# th Tenure as Wholetime Director ended on 19 May, 2016.$ Amount is for part of the year - from 01.04.2016 to 19.05.2016 and includes retiremental benets of Rs.1,804,000 at the end of tenure.
(ii) Other Employees
37
Kanoria Chemicals & Industries Limited
Annual Report 2016-17
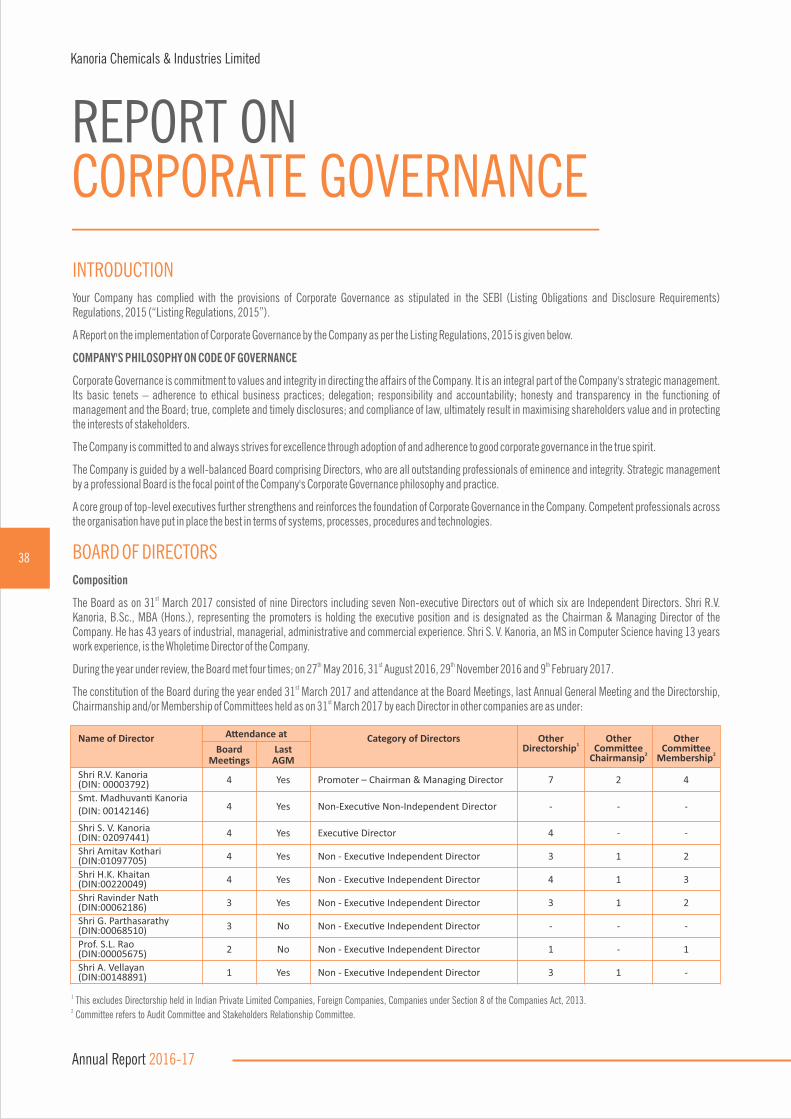
REPORT ONCORPORATE GOVERNANCE
INTRODUCTION
Your Company has complied with the provisions of Corporate Governance as stipulated in the SEBI (Listing Obligations and Disclosure Requirements) Regulations, 2015 (“Listing Regulations, 2015”).
A Report on the implementation of Corporate Governance by the Company as per the Listing Regulations, 2015 is given below.
COMPANY'S PHILOSOPHY ON CODE OF GOVERNANCE
Corporate Governance is commitment to values and integrity in directing the affairs of the Company. It is an integral part of the Company's strategic management. Its basic tenets – adherence to ethical business practices; delegation; responsibility and accountability; honesty and transparency in the functioning of management and the Board; true, complete and timely disclosures; and compliance of law, ultimately result in maximising shareholders value and in protecting the interests of stakeholders.
The Company is committed to and always strives for excellence through adoption of and adherence to good corporate governance in the true spirit.
The Company is guided by a well-balanced Board comprising Directors, who are all outstanding professionals of eminence and integrity. Strategic management by a professional Board is the focal point of the Company's Corporate Governance philosophy and practice.
A core group of top-level executives further strengthens and reinforces the foundation of Corporate Governance in the Company. Competent professionals across the organisation have put in place the best in terms of systems, processes, procedures and technologies.
BOARD OF DIRECTORS
Composition
stThe Board as on 31 March 2017 consisted of nine Directors including seven Non-executive Directors out of which six are Independent Directors. Shri R.V. Kanoria, B.Sc., MBA (Hons.), representing the promoters is holding the executive position and is designated as the Chairman & Managing Director of the Company. He has 43 years of industrial, managerial, administrative and commercial experience. Shri S. V. Kanoria, an MS in Computer Science having 13 years work experience, is the Wholetime Director of the Company.
th st th thDuring the year under review, the Board met four times; on 27 May 2016, 31 August 2016, 29 November 2016 and 9 February 2017.
stThe constitution of the Board during the year ended 31 March 2017 and attendance at the Board Meetings, last Annual General Meeting and the Directorship, stChairmanship and/or Membership of Committees held as on 31 March 2017 by each Director in other companies are as under:
Name of Director A�endance at Category of Directors Other 1Directorship
Other Commi�ee
2Chairmansip
Other Commi�ee
2MembershipBoard
Mee�ngsLast
AGM
Shri R.V. Kanoria(DIN: 00003792) 4 Yes Promoter – Chairman & Managing Director 7 2 4
Smt. Madhuvan� Kanoria (DIN: 00142146) 4 Yes Non-Execu�ve Non-Independent Director - - -
Shri S. V. Kanoria (DIN: 02097441) 4 Yes Execu�ve Director 4 - -
Shri Amitav Kothari(DIN:01097705) 4 Yes Non - Execu�ve Independent Director 3 1 2
Shri H.K. Khaitan(DIN:00220049) 4 Yes Non - Execu�ve Independent Director 4 1 3
Shri Ravinder Nath(DIN:00062186) 3 Yes Non - Execu�ve Independent Director 3 1 2
Shri G. Parthasarathy(DIN:00068510) 3 No Non - Execu�ve Independent Director - - -
Prof. S.L. Rao(DIN:00005675) 2 No Non - Execu�ve Independent Director 1 - 1
Shri A. Vellayan(DIN:00148891) 1 Yes Non - Execu�ve Independent Director 3 1 -
1 This excludes Directorship held in Indian Private Limited Companies, Foreign Companies, Companies under Section 8 of the Companies Act, 2013. 2 Committee refers to Audit Committee and Stakeholders Relationship Committee.
38
Kanoria Chemicals & Industries Limited
Annual Report 2016-17
Notes
i Smt. Madhuvanti Kanoria is spouse of Shri R. V. Kanoria. Shri S. V. Kanoria, Wholetime Director, is son of Shri R. V. Kanoria and Smt. Madhuvanti Kanoria. None
of the other Directors is related to any other Director on the Board.
ii None of the Directors has any business relationship with the Company.
iii The Company has a woman Director on its Board of Directors.
iv None of the Directors received any loans and advances from the Company during the year.
v None of the Directors holds Directorships in more than the permissible number of companies under the Companies Act, 2013 or
Directorships/Membership/Chairmanship of Board Committees as permissible under Regulations 25 and 26 of the Listing Regulations, 2015.
vi All the Directors have certied that they are not disqualied for appointment as a Director in any company.
vii Additional information pursuant to the Listing Regulations, 2015 in respect of Director seeking appointment/re-appointment is given in the AGM Notice.
Responsibilities
The Board's prime concentration is on strategy, policy and control, delegation of power and specifying approvals that remain in the Board's domain besides review
of corporate performance and reporting to shareholders. The Board and Management's roles are clearly demarcated.
The Management is required to:
a) provide necessary inputs to assist the Board in its decision making process in respect of the Company's strategies, policies, performance targets and
code of conduct;
b) manage day-to-day affairs of the Company to achieve targets and goals set by the Board in the best possible manner;
c) implement all policies and the code of conduct as approved by the Board;
d) provide timely, accurate, substantive and material information, including on all nancial matters and any exceptions, to the Board and/or its Committees;
e) ensure strict compliance with all applicable laws and regulations; and
f) implement sound and effective internal control systems.
The management and the conduct of the affairs of the Company lie with the Managing Director who heads the management team.
Role of Independent Directors
The Independent Directors play an important role in deliberations and decision-making at the Board Meetings and bring to the Company wide experiences in their
respective elds. They also contribute in signicant measure to Board Committees. Their independent role vis-à-vis the Company means that they have a special
contribution to make in situations where they add a broader perspective by ensuring that the interests of all stakeholders are kept in acceptable balance and in
providing an objective view in instances where a (potential) conict of interests may arise between stakeholders.
Meetings of Independent Directors
The Company's Independent Directors meet at least once in every nancial year without the presence of Executive Directors or Management Personnel. During the thyear under review, one Meeting of Independent Directors was held on 9 February 2017, wherein the Independent Directors carried out the performance
evaluation of the Chairman & Managing Director, Executive Director and other non-independent Director as well as the Board of the Company. The Meeting also
assessed the quality, quantity and timeliness of the ow of information by the Management of the Company to the Board of Directors.
Familiarisation Programmes for Board Members
The Board Members are provided with necessary documents, reports and internal policies to enable them to familiarise with the Company's procedures and
practices. Periodic presentations are made at the Board and Board Committees, on business and performance updates of the Company. Relevant statutory
changes encompassing important laws are regularly made available to the Directors. Efforts are also made to familiarise the Directors about the Company, their
roles, rights, responsibility in the Company, nature of the industry in which the Company operates, business model/procedures/processes of the Company, etc.
through various programmes including plant visits. The details of the familiarisation programmes for Independent Directors are put on the website of the
Company and can be accessed at the link: www.kanoriachem.com/images/FamPro.pdf.
BOARD MEETINGS
Selection of Agenda Items for Board Meetings
i) The Company holds a minimum of four Board Meetings in each year, which are pre-scheduled after the end of each nancial quarter. The gap between two
Meetings is not more than 120 days. Apart from the four pre-scheduled Board Meetings, additional Board Meetings are convened by giving appropriate notice
to address the specic needs of the Company.
39
Kanoria Chemicals & Industries Limited
Annual Report 2016-17

ii) All divisions and departments in the Company are encouraged to plan their functions well in advance, particularly with regard to matters requiring discussion
and approval by the Board or by Committees. All such matters are communicated to the Company Secretary in advance so that these may be included in the
Agenda for the Board or Committee Meetings.
iii) At the beginning of each meeting of the Board, the Chairman & Managing Director briefs the Board members about the key developments relating to
the Company.
iv) At each of the four pre-scheduled Board Meetings, managers are invited to make presentations on the major business segments and operations of the
Company before taking on record the results of the Company for the preceding nancial quarter. Sufcient support information is provided to the Board in
advance for all strategic matters of signicance pertaining to expansion plans, nancing and diversications. These are discussed and deliberated in detail
at the Board level.
v) Among others, the following items are placed at the Board Meetings for the consideration/review/approval of the Board:
- Annual Operating Plans and Budgets and any updates.
- Capital Budgets and any updates.
- Quarterly results of the Company and its Business Segments.
- Minutes of Meetings of the Board Committees.
- The information on recruitment and remuneration of senior ofcers just below the Board level, including appointment or removal of Chief Financial
Ofcer and the Company Secretary.
- Show cause, demand, prosecution notices and penalty notices, which are materially important
- Fatal or serious accidents, dangerous occurrences, any material efuent or pollution problems.
- Any material default in nancial obligations to and by the Company, or substantial non payment for goods sold by the Company.
- Any issue, which involves possible public or product liability claims of substantial nature, including any judgement or order which, may have passed
strictures on the conduct of the Company or taken an adverse view regarding another enterprise that can have negative implications on the Company.
- Details of any Joint Venture or Collaboration Agreement.
- Transactions that involve substantial payment towards goodwill, brand equity, or intellectual property.
- Signicant labour problems and their proposed solutions. Any signicant development in Human Resources/ Industrial Relations front like signing of
wage agreement, implementation of Voluntary Retirement Scheme etc.
- Sale of material nature of investments, subsidiaries, assets, which is not in normal course of business.
- Quarterly details of foreign exchange exposures and the steps taken by management to limit the risks of adverse exchange rate movement, if material.
- Non-compliance of any regulatory, statutory or listing requirements and shareholders service such as non-payment of dividend, delay in share
transfer etc.
In addition, the other matters requiring the Board's consideration/review/approval, from time to time, are also placed at the Board Meetings. The Board's annual
agenda includes recommending dividend, determining Directors who shall retire by rotation and recommending appointment/reappointment of Directors and
Auditors, authentication of annual accounts and approving the Directors' Report, long term strategic plans for the Company and the principal issues that the
Company expects to face in the future. The Board also considers/approves the other matters as required to be considered/approved by the Board as per the
Companies Act, 2013 and the Listing Regulations, 2015. Board Meetings also note and review the functions of its Committees.
The Chairman of the Board and the Company Secretary in consultation with other concerned persons in senior management nalise the agenda papers for the
Board Meeting. Directors have access to the Company Secretary's support for all information of the Company and are free to suggest inclusion of any matter
in the Agenda.
Board Material Distributed in Advance
i) Agenda Papers are circulated to the Directors in advance. All material information is incorporated in the Agenda Papers for facilitating meaningful and
focussed discussions at the Meeting. Where it is not practicable to attach any documents to the Agenda, the same are placed on the table at the Meeting with
specic reference to this effect in the Agenda.
ii) In special and exceptional circumstances, additional or supplementary items on the Agenda are permitted to be taken at the Meeting.
Recording Minutes of Proceedings at Board and/or Committee Meetings
The Company Secretary records the minutes of the proceedings of each Board and Committee Meeting. Draft Minutes are circulated to all the members of the
Board for their comments. The Minutes of proceedings of a Meeting are entered in the Minutes Book within 30 days from the conclusion of the Meeting.
40
Kanoria Chemicals & Industries Limited
Annual Report 2016-17

Compliance
The Company Secretary while preparing the agenda, notes on agenda and minutes of the Meetings, ensures adherence to the applicable provisions of law
including the Companies Act 2013, Secretarial Standards and the Listing Regulations, 2015.
BOARD COMMITTEES
To enable better and focussed attention on the affairs of the Company, the Board delegates specic matters to its Committees. These Committees also prepare
the groundwork for decision-making and report at the subsequent Board Meetings. No matter, however, is left to the nal decision of any Committee, which under
the law or the Articles may not be delegated by the Board or may require the Board's explicit approval. Minutes of the Committee Meetings are circulated to all
Directors and discussed at the Board Meetings.
Audit Committee
The Audit Committee comprises of Shri Amitav Kothari, Shri H. K. Khaitan and Prof. S. L. Rao, Independent Directors, and Shri R. V. Kanoria, Chairman & Managing
Director of the Company. Shri Amitav Kothari is the Chairman of the Committee. The Members of the Committee have requisite knowledge of nance, accounts
and Company law.
The Audit Committee's constitution, terms of reference and role are in compliance with the Companies Act, 2013 and the Listing Regulations, 2015. The terms of
reference of the Audit Committee inter alia include the following:
a) Recommendation for appointment, remuneration and terms of appointment of Auditors of the company;
b) Approval of payment to Statutory Auditors for rendering of any other services;
c) Review and monitor the Auditor's independence and performance, and effectiveness of audit process;
d) Reviewing with the Management, the Annual Financial Statement and the Auditors Report thereon before submission to the Board for approval.
e) Reviewing, with the Management, the quarterly Financial Statement before submission to the Board for approval.
f) Oversight of the Company's nancial reporting process and the disclosure of its nancial information to ensure that the nancial statement is correct,
sufcient and credible.
g) Approval or any subsequent modication of transactions of the Company with related parties;
h) Scrutiny of inter-corporate loans and investments;
i) Valuation of undertakings or assets of the Company, wherever it is necessary;
j) Evaluation of internal nancial controls and risk management systems;
k) Monitoring the end use of funds raised through public offers and related matters;
l) Review of appointment, removal and terms of remuneration of Internal Auditor.
m) Review of Internal Audit Reports and follow up of any signicant ndings therein;
n) Discussion with Statutory Auditors post-audit to ascertain any area of concern;
o) To review the functioning of the Whistle Blower mechanism;
p) Approval of appointment of CFO (i.e., the whole-time Finance Director or any other person heading the nance function or discharging that function) after
assessing the qualications, experience and background, etc. of the candidate.
In addition, to carry out any other function as may be referred, from time to time, by the Board of Directors or enforced by any statutory notication/amendment or
modication as may be applicable.
The Company Secretary acts as the Secretary of the Audit Committee.
During the nancial year 2016-17, the Committee met four times; on 27th May 2016, 31st August 2016, 29th November 2016 and 9th February 2017.
Attendance of Members at Audit Committee Meetings held during the year 2016-17:
Name of Director No. of Mee�ngs a�ended
Shri Amitav Kothari 4
Shri R. V. Kanoria 4
Shri H.K. Khaitan 4
Prof. S. L. Rao 2
stThe Chairman of the Audit Committee was present at the last Annual General Meeting held on 1 September, 2016.
41
Kanoria Chemicals & Industries Limited
Annual Report 2016-17
Stakeholders Relationship Committee
The Stakeholders Relationship Committee comprises of Shri H. K. Khaitan and Shri Amitav Kothari, Independent Directors and Shri S. V. Kanoria, Wholetime
Director of the Company. Shri H. K. Khaitan is the Chairman of the Committee.
The Committee's constitution, terms of reference and role are in compliance with the Companies Act, 2013 and the Listing Regulations, 2015,
which comprise the following:-
i. To consider and resolve the grievances of security holders of the Company, including complaints related to transfer of shares, non-receipt of balance sheet,
non-receipt of declared dividends.
ii. To carry out any other function as is referred to the Committee by the Board of Directors from time to time or enforced by any statutory notication/amendment
or modication as may be applicable.
Shri N.K. Sethia, Company Secretary and Compliance Ofcer under the relevant regulations, has been delegated authority to attend to Share transfer formalities
at least once in a fortnight.
There were no pending share transfers as at the end of the nancial year 2016-17, except sub-judice matters, which would be solved on nal disposal
by Hon'ble Courts.
During the year under review, the Company attended to most of the stakeholders' correspondence within a period of seven days from the date of the
receipt of such correspondence.
During the year, two complaints were received. At the end of the year, one complaint was pending which has since also been resolved.
stDuring the nancial year 2016-17, the Committee met on 31 August 2016, wherein all the Members were present.
Nomination and Remuneration Committee
The Nomination and Remuneration Committee comprises of Prof. S. L. Rao, Shri H. K. Khaitan, Shri G. Parthasarathy and Shri Ravinder Nath, Independent
Directors and Shri R. V. Kanoria, the Chairman & Managing Director of the Company. Prof S. L. Rao is the Chairman of the Committee.
The Nomination and Remuneration Committee's constitution, terms of reference and role are in compliance with the Companies Act, 2013 and the Listing
Regulations, 2015. The terms of reference of the Nomination and Remuneration Committee inter alia include the following:-
i. Identication of persons who are qualied to become Directors and who may be appointed in senior management in accordance with the criteria laid down,
recommend to the Board their appointment and removal and carry out evaluation of every Director's performance.
ii. Formulation of the criteria for determining qualications, positive attributes and independence of a Director and recommend to the Board a policy, relating to the remuneration for the directors, key managerial personnel and other employees and ensure that:-
a. the level and composition of remuneration is reasonable and sufcient to attract, retain and motivate Directors of the quality required to run the company successfully;
b. relationship of remuneration to performance is clear and meets appropriate performance benchmarks; and
c. remuneration to Directors, Key Managerial Personnel and senior management involves a balance between xed and incentive pay reecting short and long-term performance objectives appropriate to the working of the company and its goals.
iii. To formulate criteria for performance evaluation of Independent Directors and the Board;
iv. Devising a policy on Board diversity;
In addition, to carry out any other function as may be referred, from time to time, by the Board of Directors or enforced by any statutory notication/amendment or modication as may be applicable.
thDuring the nancial year 2016-17, the Committee met on 9 February 2017 wherein all the Members were present.
The Chairman of the Nomination and Remuneration Committee authorised Shri H. K. Khaitan to represent him at the last Annual General Meeting held on 1st September, 2016.
The Board of Directors of the Company, based on the recommendation of the Nomination and Remuneration Committee, has formulated the Nomination and Remuneration Policy, which contains the matters with regard to criteria for appointment of Directors and determining Directors independence and policy on remuneration for Directors, Senior Managerial Personnel and other employees.
Criteria for Appointment of Directors
In evaluating the suitability of a person and recommending to the Board his appointment as a Director of the Company, the Nomination and Remuneration
Committee may take into account and ascertain factors such as:
i. Personal and professional ethics, integrity and values
ii. Educational and professional background
iii Willingness to devote sufcient time and energy in carrying out the duties and responsibilities effectively
42
Kanoria Chemicals & Industries Limited
Annual Report 2016-17
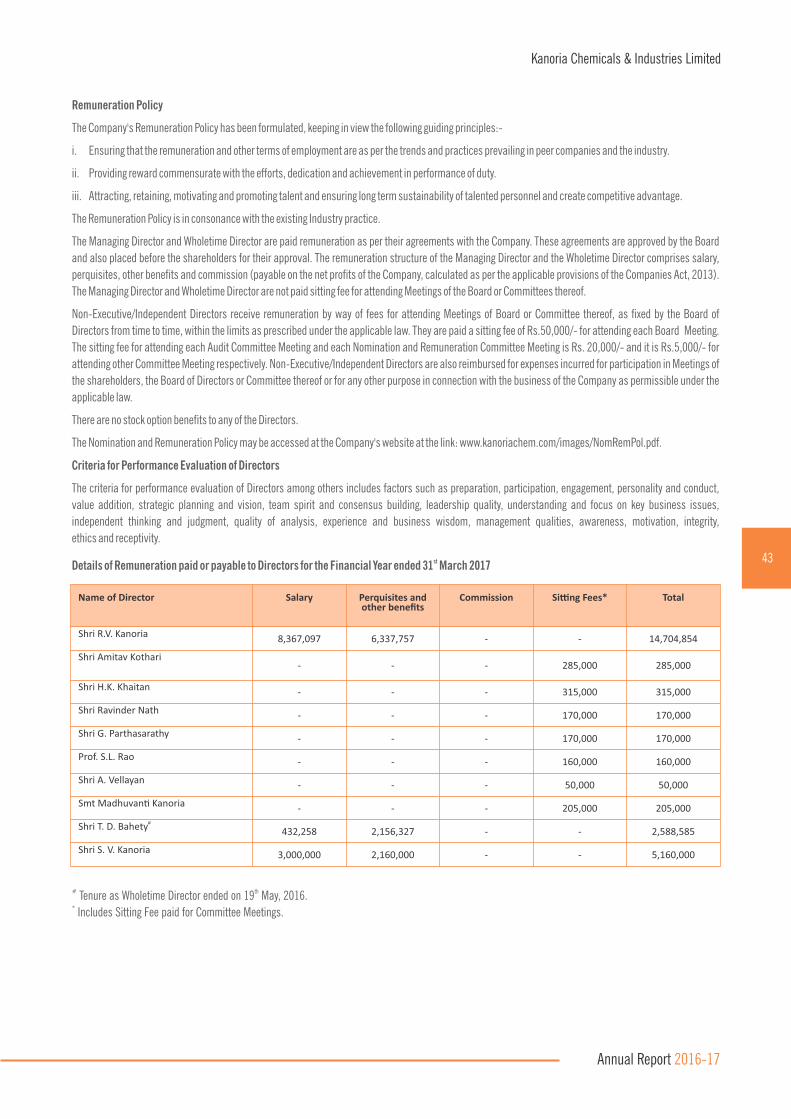
Remuneration Policy
The Company's Remuneration Policy has been formulated, keeping in view the following guiding principles:-
i. Ensuring that the remuneration and other terms of employment are as per the trends and practices prevailing in peer companies and the industry.
ii. Providing reward commensurate with the efforts, dedication and achievement in performance of duty.
iii. Attracting, retaining, motivating and promoting talent and ensuring long term sustainability of talented personnel and create competitive advantage.
The Remuneration Policy is in consonance with the existing Industry practice.
The Managing Director and Wholetime Director are paid remuneration as per their agreements with the Company. These agreements are approved by the Board
and also placed before the shareholders for their approval. The remuneration structure of the Managing Director and the Wholetime Director comprises salary,
perquisites, other benets and commission (payable on the net prots of the Company, calculated as per the applicable provisions of the Companies Act, 2013).
The Managing Director and Wholetime Director are not paid sitting fee for attending Meetings of the Board or Committees thereof.
Non-Executive/Independent Directors receive remuneration by way of fees for attending Meetings of Board or Committee thereof, as xed by the Board of
Directors from time to time, within the limits as prescribed under the applicable law. They are paid a sitting fee of Rs.50,000/- for attending each Board Meeting.
The sitting fee for attending each Audit Committee Meeting and each Nomination and Remuneration Committee Meeting is Rs. 20,000/- and it is Rs.5,000/- for
attending other Committee Meeting respectively. Non-Executive/Independent Directors are also reimbursed for expenses incurred for participation in Meetings of
the shareholders, the Board of Directors or Committee thereof or for any other purpose in connection with the business of the Company as permissible under the
applicable law.
There are no stock option benets to any of the Directors.
The Nomination and Remuneration Policy may be accessed at the Company's website at the link: www.kanoriachem.com/images/NomRemPol.pdf.
Criteria for Performance Evaluation of Directors
The criteria for performance evaluation of Directors among others includes factors such as preparation, participation, engagement, personality and conduct,
value addition, strategic planning and vision, team spirit and consensus building, leadership quality, understanding and focus on key business issues,
independent thinking and judgment, quality of analysis, experience and business wisdom, management qualities, awareness, motivation, integrity,
ethics and receptivity.
stDetails of Remuneration paid or payable to Directors for the Financial Year ended 31 March 2017
Name of Director Salary Perquisites and other benefits
Commission Si�ng Fees* Total
Shri R.V. Kanoria 8,367,097 6,337,757 - - 14,704,854
Shri Amitav Kothari- - - 285,000 285,000
Shri H.K. Khaitan - - - 315,000 315,000
Shri Ravinder Nath - - - 170,000 170,000
Shri G. Parthasarathy - - - 170,000 170,000
Prof. S.L. Rao - - - 160,000 160,000
Shri A. Vellayan - - - 50,000 50,000
Smt Madhuvan� Kanoria - - - 205,000 205,000#Shri T. D. Bahety 432,258 2,156,327 - - 2,588,585
Shri S. V. Kanoria 3,000,000 2,160,000 - - 5,160,000
# th Tenure as Wholetime Director ended on 19 May, 2016.* Includes Sitting Fee paid for Committee Meetings.
43
Kanoria Chemicals & Industries Limited
Annual Report 2016-17
Details of Agreement
For termination of agreement, the Company and the Whole time Director are required to give a notice of three months or three months' salary in lieu thereof.
Equity Shares of the Company held by Directors
The Directors, who held the Equity Shares of the Company as on 31st March 2017 are Shri R.V. Kanoria (461,481), Smt. Madhuvanti Kanoria (498,321),
Shri S. V. Kanoria (556,440), Shri A. Vellayan (15,000), Shri H. K. Khaitan (100), Prof. S. L. Rao (100), Shri Ravinder Nath (100), Shri Amitav Kothari (4) and
Shri G. Parthasarathy (1).
Corporate Social Responsibility Committee
The Corporate Social Responsibility Committee comprises of Smt. Madhuvanti Kanoria, Director, Shri R. V. Kanoria, Managing Director and Shri H. K. Khaitan, an
Independent Director. Smt. Madhuvanti Kanoria is the Chairperson of the Committee.
The Committee's constitution, terms of reference and role are in compliance with the provisions of the Companies Act, 2013.
The terms of reference of the Corporate Social Responsibility Committee comprise the following:-
i. To formulate and recommend to the Board, a Corporate Social Responsibility Policy which shall indicate the activities to be undertaken by the Company as
specied in Schedule VII to the Companies Act, 2013;
ii. To recommend to the Board the amount of expenditure to be incurred on the activities as referred to in clause ( i ) above;
iii. To monitor the Corporate Social Responsibility Policy of the Company from time to time.
In addition, to carry out any other function as may be referred from time to time by the Board of Directors or enforced by any statutory notication/amendment or
modication as may be applicable.
th thDuring the nancial year 2016-17, the Committee met two times: on 27 May 2016 and 29 November 2016, wherein all the Members were present.
The CSR Policy may be accessed at the Company's website at the link: www.kanoriachem.com/images/CSRPol.pdf.
Finance Committee
The Finance Committee comprises of Shri R.V. Kanoria, Managing Director, Shri H.K. Khaitan, Shri Amitav Kothari, Independent Directors and Shri S. V. Kanoria,
Wholetime Director. Shri R. V. Kanoria is the Chairman of the Committee.
The Committee determines on behalf of the Board, the matters relating to Debentures, Term Loans, Commercial Paper and any other types of Financial Assistance
from Financial Institutions, Banks, Mutual Funds and Others, creation of securities and allotment of securities etc. and other matters related and
incidental therewith.
In addition, the Committee also carries out any other function as may be referred from time to time by the Board of Directors. During the nancial year 2016-17,
no Meeting of the Committee was held.
OTHER COMMITTEE
Risk Management Committee
The Risk Management Committee of the Company comprises of Shri R. V. Kanoria, Managing Director, Shri S. V. Kanoria, Wholetime Director, Shri H. K. Khaitan,
Independent Director, Shri N.K. Nolkha - Group Chief Financial Ofcer and Shri Arun Agarwal - Chief Executive - Chemical Business. Shri R. V. Kanoria is the
Chairman of the Committee.
The Risk Management Committee assesses the signicant risks that might impact the achievement of the Company's objectives and develops risk management
strategies to mitigate/minimise identied risks and designs appropriate risk management procedures.
th During the year under review, the Committee met on 29 November 2016.
Name From To Tenure
Shri R.V. Kanoria 10.01.2015 09.01.2018 3 years
Shri S.V. Kanoria 01.04.2016 31.03.2019 3 years
44
Kanoria Chemicals & Industries Limited
Annual Report 2016-17

GENERAL BODY MEETINGS
The last three Annual General Meetings of the Company were held as per details given below:
There was no resolution passed through Postal Ballot during the year under review. At the ensuing Annual General Meeting, there is no resolution proposed to be
passed by Postal Ballot.
SUBSIDIARY COMPANIES
The Audit Committee reviews the nancial statements, particularly the investments made by the subsidiary companies. The minutes of the Board Meetings of the
subsidiary companies are placed at the Board Meetings of the Company.
The Policy for determining Material Subsidiaries as approved by the Board may be accessed on the Company's website at the link:
www.kanoriachem.com/images/MatSub.pdf.
DISCLOSURES:
RELATED PARTY TRANSACTIONS
During the year under review, the Company had not entered into any material transaction with any of its related parties. All contracts / arrangements /
transactions entered by the Company during the nancial year with related parties were in the ordinary course of business and on arm's length basis.
None of the transactions with any of the related parties were in conict with the Company's interest. Suitable disclosure as required by the Indian Accounting
Standards (Ind AS 24) has been made in the Note No. 36 to the Standalone Financial Statements, forming part of the Annual Report There are no pecuniary
relationships or transactions with the non-executive Director and Independent Directors. The Policy on Related Party Transactions as approved by the Board of
Directors may be accessed on the Company's website at the link: www.kanoriachem.com/images/RelPar.pdf.
MEANS OF COMMUNICATION
The quarterly and annual nancial results were taken on record and approved within the prescribed time limits. The approved results were thereafter sent to the
Stock Exchanges and also posted on website of the Company for the information of shareholders/investors.
The nancial results were also published in leading dailies “Business Standard” (English Daily all editions) and “Ei Samay” (vernacular language - Bengali
newspaper) within 48 hours of the Meeting.
As the Company publishes its half-yearly results in English newspapers having nationwide circulation and in a vernacular language (Bengali), the details of
nancial performance is not sent individually to each shareholder of the Company.
The Company issues ofcial press releases to the print media from time to time and also updates Analysts on the activities of the Company.
The Company has its own website www.kanoriachem.com where information about the Company is displayed and regularly updated. An e-mail ID
[email protected] has been created and displayed on the Company's website for the purpose of interaction including registering complaints
by the investors.
MANAGEMENT DISCUSSION AND ANALYSIS
Management Discussion and Analysis is a part of the Annual Report.
CEO AND CFO CERTIFICATION
As required under Regulation 17(8) of the Listing Regulations, 2015, the Managing Director and the Group Chief Financial Ofcer of the Company have certied to
the Board regarding review of nancial statement for the year under review, compliance with the accounting standards and applicable laws and regulations,
maintenance of internal control for nancial reporting and accounting policies.
Year Date Time Venue No. of Special Resolu�on(s) passed
2015-16 st1 September 2016 10.30 A. M 'Shripa� Singhania Hall',Rotary Sadan,
94/2 Chowringhee Road,Kolkata-700 020
1
2014-15 st1 September 2015 10.30 A. M 1
2013-14 th5 September 2014 10.30 A. M 3
45
Kanoria Chemicals & Industries Limited
Annual Report 2016-17

CODE OF CONDUCT
The Company has Codes of Conduct for its Directors and Senior Management Personnel as well as for its other Employees. The Codes of Conduct are available on
the Company's website.
It is conrmed that all the Board Members and Senior Management Personnel of the Company have afrmed their compliance with the Company's Code of
Conduct for Directors and Senior Management Personnel for the nancial year 2016-17, as required under Regulation 26(3) of the Listing Regulations, 2015 and
a declaration to this effect signed by the Chairman & Managing Director forms part of the Annual Report.
WHISTLE BLOWER POLICY
In compliance with provisions of Section 177(9) of the Companies Act, 2013 and the Listing Regulations, 2015, the Company has in place a Whistle Blower Policy
for its Directors and Employees to report concerns about unethical behaviour, actual or suspected fraud or violation of applicable laws and regulations and the
Company's Codes of Conduct. The reportable matters may be reported to the Audit Committee through the Nodal Ofcer and, in exceptional cases, may also be
reported to the Chairman of the Audit Committee. During the year under review, no employee was denied access to the Audit Committee.
UNCLAIMED SHARES
Pursuant to Regulation 39 of the Listing Regulations, 2015, regarding the procedure to be adopted for unclaimed shares issued in physical form and remaining
unclaimed, the Company has a separate “Unclaimed Suspense Account.” The particulars of Unclaimed Suspense Account are as follows:
No. of Shareholders No. of Shares
Aggregate number of shareholders and outstanding shares lying in the Unclaimed Suspense Account at the beginning of the year
193 116,628
Number of shareholders who approached the Company for transfer of shares from the Unclaimed Suspense Account during the year
- -
Number of shareholders to whom shares were transferred from the Unclaimed Suspense Account during the year
- -
Aggregate number of shareholders and outstanding shares lying in the Unclaimed Suspense Account at the end of the year. The vo�ng rights on these shares shall remain frozen �ll the righ�ul owner of such shares claims the shares.
193 116,628
COMPLIANCE OF MATTERS RELATED TO CAPITAL MARKETS
There has been no non-compliance, penalties or strictures imposed on the Company by Stock Exchanges or SEBI or any other Statutory Authorities, on any matter
related to capital markets during the last three years.
Compliance of Mandatory and Non-mandatory Provisions of the Code
(A) The Company has complied with all the mandatory requirements of the Listing Regulations, 2015.
(B) Following is the status of the compliance with the non-mandatory requirements of the said Regulations:
i. Audit Opinion:
During the year under review, the Auditors have expressed their unmodied opinion on the nancial statements of the Company.
ii. Reporting of Internal Auditor:
The Internal Auditor reports directly to the Audit Committee. The same is reported by brieng the Audit Committee through observations, review,
comments and recommendations etc. in the Internal Audit Reports by the Internal Auditor of the Company.
COMPLIANCE CERTIFICATE OF THE AUDITORS
The Statutory Auditors' Certicate that the Company has complied with the conditions of Corporate Governance as stipulated in the Listing Regulations, 2015 is
annexed hereto.
46
Kanoria Chemicals & Industries Limited
Annual Report 2016-17

GENERAL SHAREHOLDERS' INFORMATION
1. Annual General Mee�ng— Date and �me— Venue
th4 September 2017 at 2.30 P. M. 'Shripa� Singhania Hall', Rotary Sadan,94/2 Chowringhee Road, Kolkata-700 020
2. Financial Year Financial Calendar 2017-18(tenta�ve and subject to change)— Financial Results for the:
th quarter ending 30 June 2017th quarter ending 30 September 2017st quarter ending 31 December 2017
st year ending 31 March 2018
— Annual General Mee�ng 2017-18
st st1 April to 31 March
)) Within 45 days of end of respec�ve quarter)
thBy 30 May 2018
By September 2018
3. Date of Book Closure th th29 August 2017 to 4 September 2017 (both days inclusive)
4. Dividend Payment Date thOn or a�er 11 September 2017 (subject to shareholders' approval)
5. Lis�ng on Stock Exchanges Na�onal Stock Exchange of India Ltd.'Exchange Plaza'Bandra-Kurla Complex, Bandra (E)Mumbai - 400 051www.nseindia.com
BSE LimitedP. J. Towers,Dalal Street, FortMumbai - 400 001www.bseindia.com
Note: Lis�ng fee for the year 2017-18 has been paid to the above Stock Exchanges.
6. Stock Code:BSE Ltd.Na�onal Stock Exchange of India Ltd.
50 6525KANORICHEM
7. Stock Price Data (in Rs./per share)
Months NSE* BSE*
High Low High Low
April 2016 70.90 53.15 70.60 53.35
May 2016 74.00 60.30 74.35 52.20
June 2016A pril 2 016 76.50 57.85 75.65 57.00
July 2016 74.00 67.10 74.00 67.00
August 2016 75.40 64.05 75.40 64.80
September 2016 70.00 63.00 69.90 62.80
October 2016 94.50 63.25 94.30 64.85
November 2016 91.95 63.50 91.75 63.80
December 2016 76.00 62.65 75.90 63.00
January 2017 79.80 65.50 79.50 65.70
February 2017 77.00 69.00 76.65 68.30
March 2017 73.90 67.00 73.90 67.45
* Source: Website of NSE and BSE
47
Kanoria Chemicals & Industries Limited
Annual Report 2016-17

8. Registrar and Share Transfer Agent C. B. Management Services (P) LimitedP-22, Bondel Road, Kolkata –700 019Phone : (033) 22806692, 40116700Fax : (033) 40116739Email : [email protected]
9. (a) Share Transfer System The share transfers which are received in physical form are processed within the prescribed �me from the date of receipt, subject to the documents being valid and complete in all respects.
Details of the share transfers during the year 2016-17:
No. of valid share transfer applica�ons received,processed and registered 53
No. of shares transferred 5,458
No. of share transfers in process as on 31.03.2017 NIL
No. of shares dematerialised 20,506
No. of shares rematerialized 57
(b) Dematerialisa�on of Shares and liquidity Depositories:Na�onal Securi�es Depository Limited, Mumbai and Central Depository Services (India) Limited, Mumbai. The Equity Shares of the Company are compulsorily traded and se�led through Stock Exchanges only in the dematerialised form.
A total of 43,120,656 Equity Shares of the Company represen�ng 98.69% of the Share Capital are dematerialised as on 31st March 2017.
Under the Depository System, Interna�onal Securi�es Iden�fica�on Number (ISIN) allo�ed to the Company's Equity Shares is INE 138C01024.
Shares held in the dematerialised form are electronically transferred by the Depository Par�cipant and the Company is informed periodically by the Depositories about the beneficiary holdings to enable the Company to send corporate communica�on, dividend etc.
The requests received for dematerialisa�on are processed within a period of 10 days from the date of receipt of request provided they are in order in every respect.
The Annual Custody Fee for the nancial year 2017-18 has been paid by the Company to both the Depositories i.e. National Securities Depository Limited (NSDL)
and Central Depository Services (India) Limited (CDSL) with whom it has established connectivity.
0.00
10.00
20.00
30.00
40.00
50.00
60.00
70.00
80.00
90.00
100.00
KC
I Sh
are
Pri
ces
(Rs.
)
0
5000
10000
15000
20000
25000
30000
35000
BSE
Se
nse
x
KCI Share Prices/BSE Sensex (Monthly High/Low)
April’16
May’16
June’16
July’16
Aug’16
Sept’16
Oct’16
Nov’16
Dec’16
Jan’17
Feb’17
Mar’17
BSE Sensex-High BSE Sensex-Low
Share Price- High Share Price- Low
48
Kanoria Chemicals & Industries Limited
Annual Report 2016-17
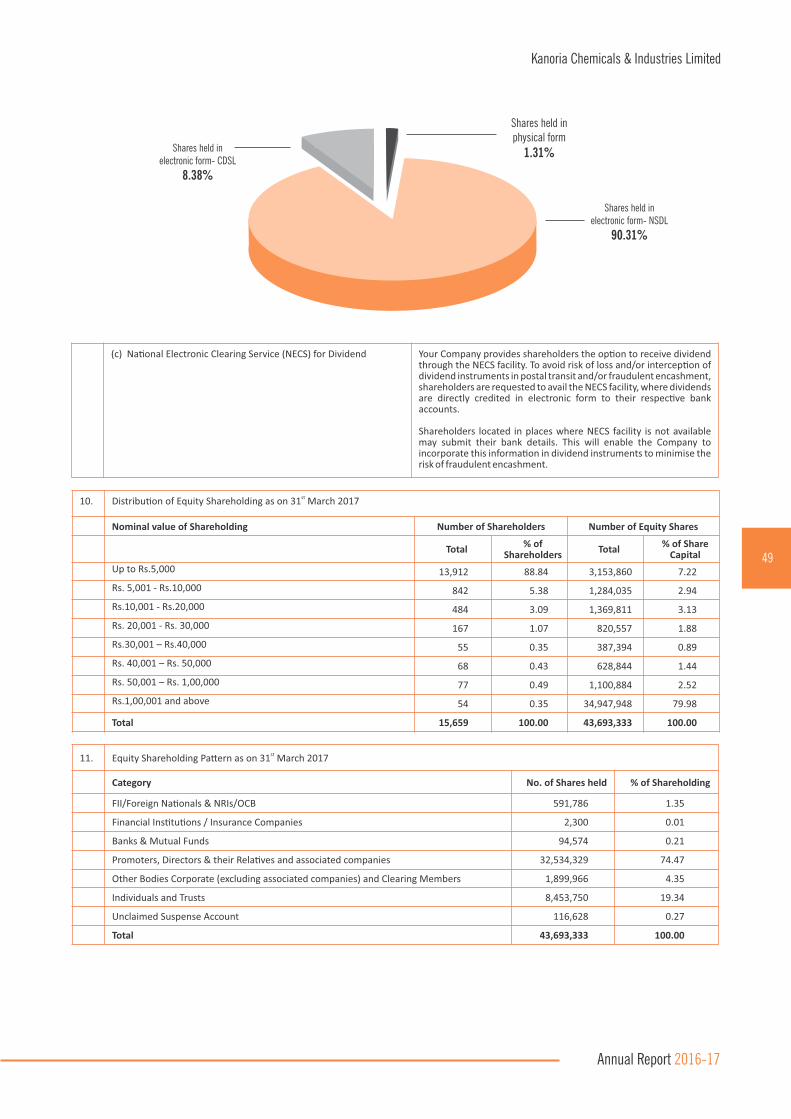
(c) Na�onal Electronic Clearing Service (NECS) for Dividend Your Company provides shareholders the op�on to receive dividend through the NECS facility. To avoid risk of loss and/or intercep�on of dividend instruments in postal transit and/or fraudulent encashment, shareholders are requested to avail the NECS facility, where dividends are directly credited in electronic form to their respec�ve bank accounts.
Shareholders located in places where NECS facility is not available may submit their bank details. This will enable the Company to incorporate this informa�on in dividend instruments to minimise the risk of fraudulent encashment.
10. stDistribu�on of Equity Shareholding as on 31 March 2017
Nominal value of Shareholding Number of Shareholders Number of Equity Shares
Total% of
ShareholdersTotal
% of Share Capital
Up to Rs.5,000 13,912 88.84 3,153,860 7.22
Rs. 5,001 - Rs.10,000 842 5.38 1,284,035 2.94
Rs.10,001 - Rs.20,000 484 3.09 1,369,811 3.13
Rs. 20,001 - Rs. 30,000 167 1.07 820,557 1.88
Rs.30,001 – Rs.40,000 55 0.35 387,394 0.89
Rs. 40,001 – Rs. 50,000 68 0.43 628,844 1.44
Rs. 50,001 – Rs. 1,00,000 77 0.49 1,100,884 2.52
Rs.1,00,001 and above 54 0.35 34,947,948 79.98
Total 15,659 100.00 43,693,333 100.00
11. stEquity Shareholding Pa�ern as on 31 March 2017
Category No. of Shares held % of Shareholding
FII/Foreign Na�onals & NRIs/OCB 591,786 1.35
Financial Ins�tu�ons / Insurance Companies 2,300 0.01
Banks & Mutual Funds 94,574 0.21
Promoters, Directors & their Rela�ves and associated companies 32,534,329 74.47
Other Bodies Corporate (excluding associated companies) and Clearing Members 1,899,966 4.35
Individuals and Trusts 8,453,750 19.34
Unclaimed Suspense Account 116,628 0.27
Total 43,693,333 100.00
Shares held in electronic form- CDSL
8.38%
Shares held in physical form
1.31%
Shares held in electronic form- NSDL
90.31%
49
Kanoria Chemicals & Industries Limited
Annual Report 2016-17
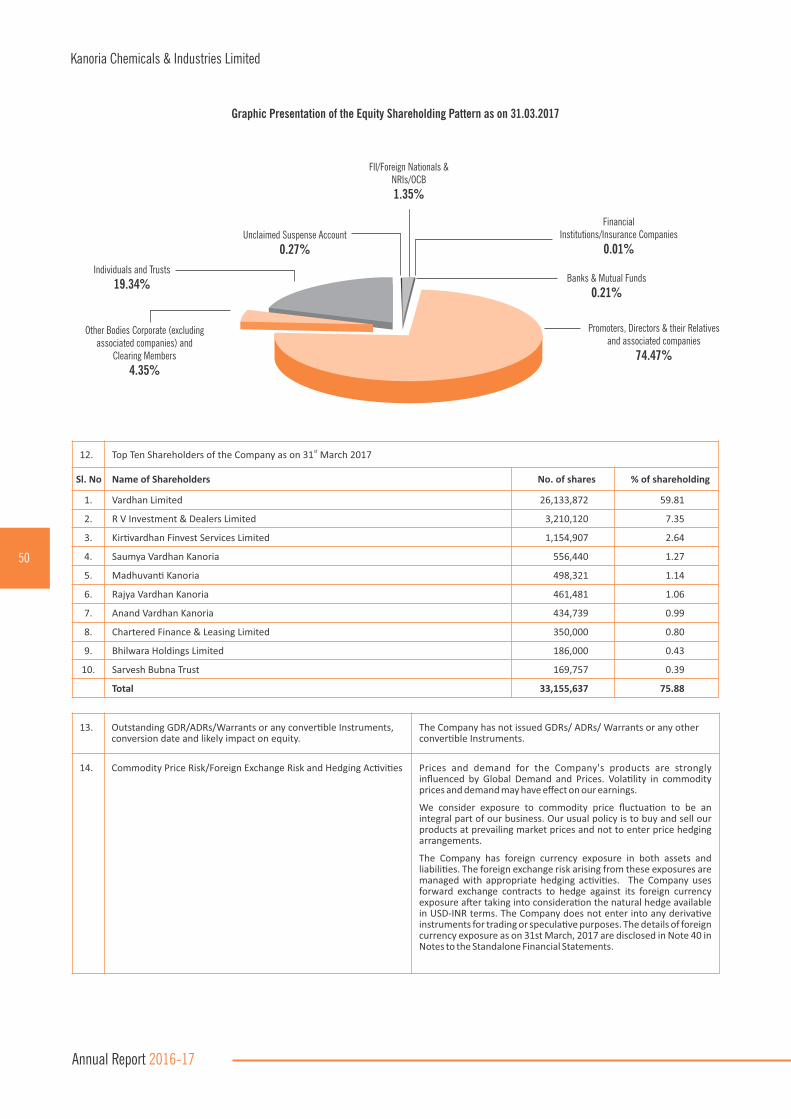
12.stTop Ten Shareholders of the Company as on 31 March 2017
Sl. No Name of Shareholders No. of shares % of shareholding
1. Vardhan Limited 26,133,872 59.81
2. R V Investment & Dealers Limited 3,210,120 7.35
3. Kir�vardhan Finvest Services Limited 1,154,907 2.64
4. Saumya Vardhan Kanoria 556,440 1.27
5. Madhuvan� Kanoria 498,321 1.14
6. Rajya Vardhan Kanoria 461,481 1.06
7. Anand Vardhan Kanoria 434,739 0.99
8. Chartered Finance & Leasing Limited 350,000 0.80
9. Bhilwara Holdings Limited 186,000 0.43
10. Sarvesh Bubna Trust 169,757 0.39
Total 33,155,637 75.88
13. Outstanding GDR/ADRs/Warrants or any conver�ble Instruments, conversion date and likely impact on equity.
The Company has not issued GDRs/ ADRs/ Warrants or any other conver�ble Instruments.
14. Commodity Price Risk/Foreign Exchange Risk and Hedging Ac�vi�es Prices and demand for the Company's products are strongly influenced by Global Demand and Prices. Vola�lity in commodity prices and demand may have effect on our earnings.
We consider exposure to commodity price fluctua�on to be an integral part of our business. Our usual policy is to buy and sell our products at prevailing market prices and not to enter price hedging arrangements.
The Company has foreign currency exposure in both assets and liabili�es. The foreign exchange risk arising from these exposures are managed with appropriate hedging ac�vi�es. The Company uses forward exchange contracts to hedge against its foreign currency exposure a�er taking into considera�on the natural hedge available in USD-INR terms. The Company does not enter into any deriva�ve instruments for trading or specula�ve purposes. The details of foreign currency exposure as on 31st March, 2017 are disclosed in Note 40 in Notes to the Standalone Financial Statements.
Graphic Presentation of the Equity Shareholding Pattern as on 31.03.2017
Promoters, Directors & their Relativesand associated companies
74.47%
Banks & Mutual Funds
0.21%
FinancialInstitutions/Insurance Companies
0.01%
Fll/Foreign Nationals &NRIs/OCB
1.35%
Unclaimed Suspense Account
0.27%
Individuals and Trusts
19.34%
Other Bodies Corporate (excludingassociated companies) and
Clearing Members
4.35%
50
Kanoria Chemicals & Industries Limited
Annual Report 2016-17
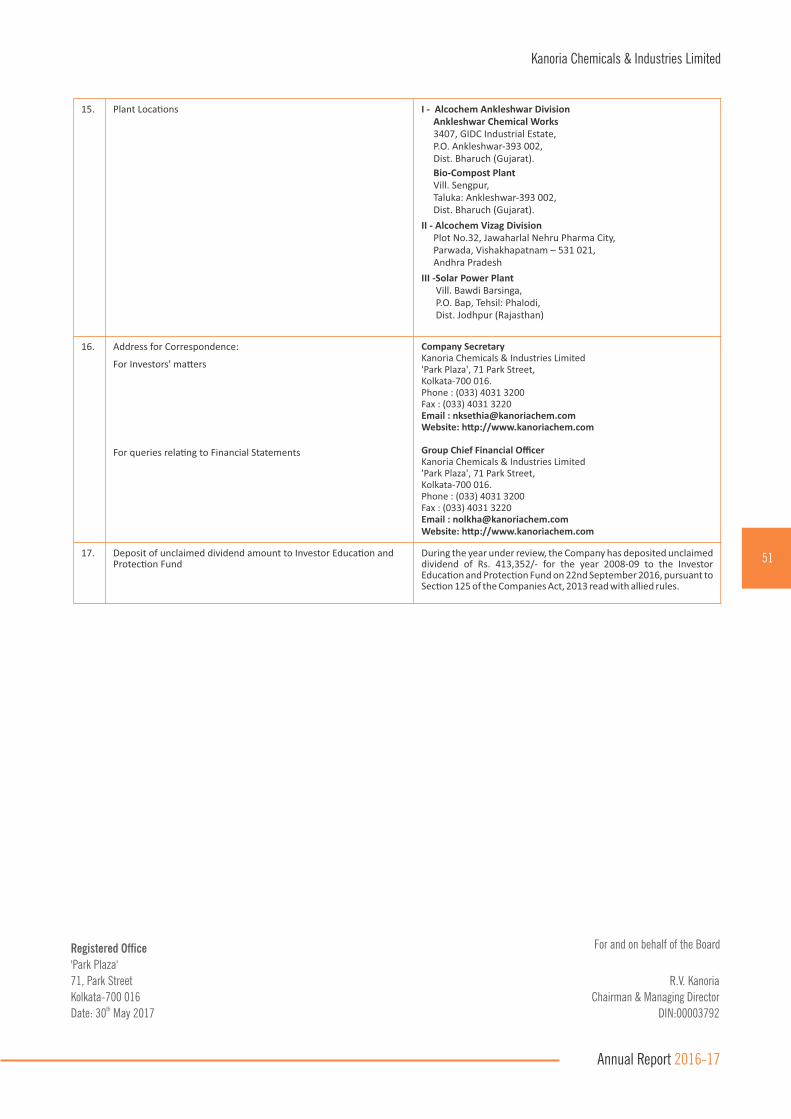
15. Plant Loca�ons I - Alcochem Ankleshwar Division Ankleshwar Chemical Works 3407, GIDC Industrial Estate, P.O. Ankleshwar-393 002, Dist. Bharuch (Gujarat).
Bio-Compost Plant Vill. Sengpur, Taluka: Ankleshwar-393 002, Dist. Bharuch (Gujarat).
II - Alcochem Vizag Division Plot No.32, Jawaharlal Nehru Pharma City, Parwada, Vishakhapatnam – 531 021, Andhra Pradesh
III -Solar Power Plant Vill. Bawdi Barsinga, P.O. Bap, Tehsil: Phalodi, Dist. Jodhpur (Rajasthan)
16. Address for Correspondence:
For Investors' ma�ers
For queries rela�ng to Financial Statements
Company SecretaryKanoria Chemicals & Industries Limited'Park Plaza', 71 Park Street,Kolkata-700 016.Phone : (033) 4031 3200 Fax : (033) 4031 3220 Email : [email protected]: h�p://www.kanoriachem.com
Group Chief Financial OfficerKanoria Chemicals & Industries Limited'Park Plaza', 71 Park Street,Kolkata-700 016.Phone : (033) 4031 3200 Fax : (033) 4031 3220 Email : [email protected]: h�p://www.kanoriachem.com
17. Deposit of unclaimed dividend amount to Investor Educa�on and Protec�on Fund
During the year under review, the Company has deposited unclaimed dividend of Rs. 413,352/- for the year 2008-09 to the Investor Educa�on and Protec�on Fund on 22nd September 2016, pursuant to Sec�on 125 of the Companies Act, 2013 read with allied rules.
For and on behalf of the Board
R.V. Kanoria
Chairman & Managing Director
DIN:00003792
Registered Office
'Park Plaza'
71, Park Street
Kolkata-700 016thDate: 30 May 2017
51
Kanoria Chemicals & Industries Limited
Annual Report 2016-17

(Regulation 34, read with Schedule V(D) of the SEBI (Listing Obligations and Disclosure Requirements) Regulations, 2015)
This is to conrm that the Company has adopted a Code of Conduct for its Directors and Senior Management Personnel (“Code”) and that the same is available on
the website of the Company, www.kanoriachem.com
I hereby declare that all the Board Members and Senior Management Personnel have afrmed their compliance with the aforesaid Code for the Financial Year stended 31 March 2017.
For and on behalf of the Board
R.V. Kanoria
Chairman & Managing Director
DIN:00003792
Registered Office
'Park Plaza'
71, Park Street
Kolkata-700 016thDate: 30 May 2017
DECLARATION AFFIRMING COMPLIANCE WITH THE CODE OF CONDUCT
52
Kanoria Chemicals & Industries Limited
Annual Report 2016-17

To the Members of
Kanoria Chemicals & Industries Limited
1. We have examined the compliance of conditions of Corporate Governance by Kanoria Chemicals & Industries Limited (“the Company”), for stthe year ended on 31 March, 2017, as stipulated in Regulations 17 to 27 and clauses (b) to (i) of Regulation 46(2) and para C and D of Schedule V
to the SEBI (Listing Obligations and Disclosure Requirements) Regulations, 2015 (the “Listing Regulations”).
Managements' Responsibility
2. The compliance of conditions of Corporate Governance is the responsibility of the Management. This responsibility includes the design,
implementation and maintenance of internal control and procedures to ensure compliance with the conditions of the Corporate Governance
stipulated in the Listing Regulations.
Auditor's Responsibility
3. Our responsibility is limited to examining the procedures and implementation thereof, adopted by the Company for ensuring compliance with the
conditions of the Corporate Governance. It is neither an audit nor an expression of opinion on the nancial statements of the Company.
4. We have examined the books of account and other relevant records and documents maintained by the Company for the purposes of providing
reasonable assurance on the compliance with Corporate Governance requirements by the Company.
5. We have carried out an examination of the relevant records of the Company in accordance with the Guidance Note on Certication of Corporate
Governance issued by the Institute of the Chartered Accountants of India (the “ICAI”), the Standards on Auditing specied under Section 143(10)
of the Companies Act 2013, in so far as applicable for the purpose of this certicate and as per the Guidance Note on Reports or Certicates for
Special Purposes issued by the ICAI which requires that we comply with the ethical requirements of the Code of Ethics issued by the ICAI.
6. We have complied with the relevant applicable requirements of the Standard on Quality Control (SQC) 1, Quality Control for Firms that Perform
Audits and Reviews of Historical Financial Information, and Other Assurance and Related Services Engagements.
Opinion
7. Based on our examination of the relevant records and according to the information and explanations provided to us and the representations
provided by the Management, we certify that the Company has complied with the conditions of Corporate Governance as stipulated in
Regulations 17 to 27 and clauses (b) to (i) of Regulation 46(2) and para C and D of Schedule V to the Listing Regulations during the year endedst31 March, 2017.
8. We state that such compliance is neither an assurance as to the future viability of the Company nor the efciency or effectiveness with which the
Management has conducted the affairs of the Company.
For Singhi & Co.
Chartered Accountants
(Firm's Registration No. 302049E)
(Anurag Singhi)
Partner
(Membership No. 66274)
Place: New DelhithDate: 30 May, 2017
INDEPENDENT AUDITOR'S CERTIFICATE ON CORPORATE GOVERNANCE
53
Kanoria Chemicals & Industries Limited
Annual Report 2016-17

INDEPENDENT AUDITOR'S REPORT
TO THE MEMBERS OF KANORIA CHEMICALS & INDUSTRIES LIMITED
REPORT ON THE STANDALONE INDIAN ACCOUNTING STANDARDS (IND AS) FINANCIAL STATEMENTS
We have audited the accompanying standalone Ind AS nancial statements of KANORIA CHEMICALS & INDUSTRIES LIMITED ('the Company'), which comprise stthe Balance Sheet as at 31 March 2017, the Statement of Prot and Loss (including Other Comprehensive Income), the Cash Flow Statement and the Statement
of Changes in Equity for the year then ended, and a summary of signicant accounting policies and other explanatory information.
MANAGEMENT'S RESPONSIBILITY FOR THE STANDALONE FINANCIAL STATEMENTS
The Company's Board of Directors is responsible for the matters stated in Section 134(5) of the Companies Act, 2013 (“the Act”) with respect to the preparation of
these standalone nancial statements that give a true and fair view of the nancial position, nancial performance (including other comprehensive income), cash
ows and changes in equity of the Company in accordance with the accounting principles generally accepted in India, including the Indian Accounting Standards
specied in the Companies (Indian Accounting Standard) Rules, 2015 (as amended) under Section 133 of the Act. This responsibility also includes maintenance
of adequate accounting records in accordance with the provisions of the Act for safeguarding of the assets of the Company and for preventing and detecting frauds
and other irregularities; selection and application of appropriate accounting policies; making judgments and estimates that are reasonable and prudent; and
design, implementation and maintenance of adequate internal nancial controls, that were operating effectively for ensuring the accuracy and completeness of
the accounting records, relevant to the preparation and presentation of the Standalone Ind AS nancial statements that give a true and fair view and are free from
material misstatement, whether due to fraud or error.
AUDITOR'S RESPONSIBILITY
Our responsibility is to express an opinion on these standalone Ind AS nancial statements based on our audit.
We have taken into account the provisions of the Act and the rules made thereunder, including the accounting and auditing standards and matters which are
required to be included in the audit report under the provisions of the Act and the Rules made thereunder.
We conducted our audit of the Standalone Ind AS nancial Statements in accordance with the Standards on Auditing specied under Section 143(10) of the Act
and other applicable authoritative pronouncements issued by the Institute of Chartered Accountants of India. Those Standards and pronouncements require that
we comply with ethical requirements and plan and perform the audit to obtain reasonable assurance about whether the Standalone Ind AS nancial statements
are free from material misstatement.
An audit involves performing procedures to obtain audit evidence about the amounts and the disclosures in the Standalone Ind AS nancial statements. The
procedures selected depend on the auditor's judgment, including the assessment of the risks of material misstatement of the Standalone Ind AS nancial
statements, whether due to fraud or error. In making those risk assessments, the auditor considers internal nancial control relevant to the Company's
preparation of the Standalone Ind AS nancial statements that give a true and fair view in order to design audit procedures that are appropriate in the
circumstances. An audit also includes evaluating the appropriateness of the accounting policies used and the reasonableness of the accounting estimates made
by the Company's Directors, as well as evaluating the overall presentation of the Standalone Ind AS nancial statements.
We believe that the audit evidence we have obtained is sufcient and appropriate to provide a basis for our audit opinion on the Standalone Ind AS
nancial statements.
OPINION
In our opinion and to the best of our information and according to the explanations given to us, the aforesaid Standalone Ind AS nancial statements give the
information required by the Act in the manner so required and give a true and fair view in conformity with the accounting principles generally accepted in India, of stthe state of affairs of the Company as at 31 March 2017 and its prot (including other comprehensive income), its cash ows and the changes in equity for the
year ended on that date.
OTHER MATTER
stThe corresponding nancial information of the Company as at and for the year ended March 31 , 2016 and the transition date opening balance sheet as atst stApril 1 , 2015 included in these Standalone Ind AS nancial statements, are based on the previously issued nancial statements for the years ended March 31 ,
st2016 and March 31 , 2015, prepared in accordance with the Companies (Accounting Standards) Rules, 2006 (as amended) which were audited by us, on which
54
Kanoria Chemicals & Industries Limited
Annual Report 2016-17
th thwe expressed an unmodied opinion in our audit report dated May 27 , 2016 and May 27 , 2015 respectively. These nancial statements have been adjusted for
differences in accounting principles to comply with Ind AS and such adjustments on transition to Ind AS which has been approved by the Company's Board of
Directors have been audited by us.
Our opinion is not modied in respect of this matter.
REPORT ON OTHER LEGAL AND REGULATORY REQUIREMENTS
1. As required by the Companies (Auditor's Report) Order, 2016 (“the Order”) issued by the Central Government of India in terms of sub-section (11) of section
143 of the Act, we give in the Annexure 'A' a statement on the matters specied in the paragraph 3 and 4 of the Order, to the extent applicable.
2. As required by Section 143 (3) of the Act, we report that:
a. we have sought and obtained all the information and explanations which to the best of our knowledge and belief were necessary for the purposes of
our audit;
b. in our opinion proper books of account as required by law have been kept by the Company so far as it appears from our examination of those books;
c. the Balance Sheet, the Statement of Prot and Loss (including Other Comprehensive Income), the cash ow statement and the Statement of changes in
Equity dealt with by this Report are in agreement with the books of account;
d. in our opinion, the aforesaid Standalone Ind AS nancial statements comply with the Indian Accounting Standards specied under Section 133 of the Act;
st e. on the basis of the written representations received from the directors as on 31 March 2017 taken on record by the Board of Directors, none of the stdirectors is disqualied as on 31 March 2017 from being appointed as a director in terms of Section 164 (2) of the Act;
f. with respect to the adequacy of the internal nancial controls over nancial reporting of the Company and the operating effectiveness of such controls,
refer to our separate Report in Annexure 'B'; and
g. with respect to the other matters to be included in the Auditor's Report in accordance with Rule 11 of the Companies (Audit and Auditors) Rules, 2014, (as
amended), in our opinion and to the best of our information and according to the explanations given to us:
st i. the Company has disclosed the impact of pending litigation as at 31 March 2017 on its nancial position in its Standalone Ind AS nancial
statement - Refer Note No. 30 to the Standalone Ind AS nancial statements;
st ii. the Company has long term contracts including derivative contracts as at 31 March, 2017 for which there were no material foreseeable losses;
iii. there has been no delay in transferring amounts, required to be transferred, to the Investor Education and Protection Fund by the company, except
for Rs. 0.55 million which is held in abeyance due to pending legal cases.
iv. The Company has provided requisite disclosures in the Standalone Ind AS nancial statements as to holdings as well as dealings in Specied Bank th thNotes during the period from November 8 , 2016 to December 30 , 2016. Based on the audit procedures and relying on the management
representation, we report that the disclosures are in accordance with books of account maintained by the Company and produced to us by the
Management. Refer Note No 11A.
INDEPENDENT AUDITOR'S REPORT
For Singhi & Co.
Chartered Accountants
Firm's Registration No. 302049E
(Anurag Singhi)
Partner
Membership No.66274
Place : New Delhi thDate : 30 May, 2017
55
Kanoria Chemicals & Industries Limited
Annual Report 2016-17

The Annexure referred to in our Independent Auditors' Report to the members of the Company on the Standalone Ind AS financial statements for stthe year ended 31 March 2017, we report that:
i. (a) The Company has maintained proper records showing full particulars, including quantitative details and situation of xed assets.
(b) As per the information and explanations given to us, physical verication of xed assets have been carried out in terms of the phased program of
verication of its xed assets adopted by the Company and no material discrepancies were noticed on such verication. In our opinion, the frequency
of verication is reasonable having regard to size of the Company and nature of its business.
(c) According to the information and explanations given to us and on the basis of our examination of the records of the Company, the title deeds of
immovable properties are held in the name of the Company:
ii. As per the information and explanations given to us, the inventories have been physically veried at reasonable intervals during the year by the management
and no material discrepancies between book stock and physical stock have been found.
iii. The Company has not granted any loans, secured or unsecured to companies, rms, limited liability partnership or other parties listed in the register
maintained under Section 189 of the Companies Act, 2013. Accordingly the provisions of paragraph 3(III), 3(III)(a) to 3(III)(c) of the said order
are not applicable.
iv. In our opinion and according to the information and explanations given to us, the Company has complied with the provisions of Section 185 and 186 of the
Act, with respect to loans and investments made during the year.
v. The Company has not accepted any deposit from the public within the meaning of section 73, 74, 75 and 76 of the Act and Rules framed thereunder to the
extent notied.
vi. We have broadly reviewed the books of accounts maintained by Company in respect of product, where pursuant to the rule made by the Central Government
of India the maintenance of cost records has been prescribed under section 148 (1) of the Companies Act 2013 and are of the opinion that, prima facie, the
prescribed records have been maintained. We have not, however, made a detailed examination of the records with a view to determine whether they are
accurate or complete.
vii. (a) According to the information and explanations given to us and on the basis of our examination of the records of the Company, the Company is generally
regular in depositing undisputed statutory dues including provident fund, employee's state insurance, income tax, sales tax, service tax, duty of
customs, duty of excise, value added tax, cess and other statutory dues with the appropriate authorities. According to the information and
explanations given to us, no undisputed amounts are payable in respect of provident fund, employees' state insurance, income tax, sales tax, service sttax, duty of customs, duty of excise, value added tax, cess and other material statutory dues were in arrears as at 31 March 2017 for a period of more
than six months from the date they became payable.
(b) According to the information and explanation given to us, the dues of sales tax, income tax, duty of customs, duty of excise, service tax and value added sttax which have not been deposited on account of any dispute and the forum where the dispute is pending as on 31 March, 2017 are as under :-
ANNEXURE-A TO THE INDEPENDENT AUDITORS' REPORT
Name of the statute Nature of Dues Amount(Rs. in millions)
Year Forum where dispute is pending
The Central Excise Act, 1944 Excise Duty 2.10 Feb-12 to May-16 Commissioner (A) – Central Excise, Surat
Excise Duty 3.82 Apr-10 to Feb-16 Commissioner (A) – Central Excise, Visakhapatnam
The Service Tax under the Finance Act, 1994
Service Tax 3.30 Apr-2009 to Aug-2012 CESTAT - Hyderabad
The Indian Stamp Act, 1899 Stamp Duty 3.19 2011-12 Rajasthan High Court
56
Kanoria Chemicals & Industries Limited
Annual Report 2016-17
viii. According to the records of the Company examined by us and the information and explanations provided to us, the Company has not defaulted in repayment
of loans or borrowings to any Financial Institutions or Banks or dues to debenture holders. Further as at the Balance sheet date the Company does not have
any loans or borrowing from the Government.
ix. The company has not raised any money by way of initial public offer or further public offer including debt instruments during the year. Further, the Company
has not raised any Term Loan during the year and hence the paragraph 3(ix) of the order is not applicable.
x. During the course of our examination of the books and records of the Company, carried out in accordance with the generally accepted auditing practice in
India, and according to the information and explanations given to us, we have neither come across any instances of material fraud by the Company or on
the Company by its ofcers or employees noticed or reported during year nor have been informed of any such case by the Management.
xi. According to the information and explanations given to us and based on our examination of the records of the Company, the Company has paid/provided for
managerial remuneration in accordance with the requisite approvals mandated by the provisions of section 197 read with Schedule V to the Act.
xii. The Company is not a Nidhi Company. Accordingly, paragraph 3(xii) of the Order is not applicable.
xiii. According to the information and explanations given to us and based on our examination of the records of the Company, transactions with the related
parties are in compliance with sections 177 and 188 of the Act where applicable and details of such transactions have been disclosed in the Standalone Ind
AS nancial statements as required by the applicable Indian Accounting Standards.
xiv. According to the information and explanations given to us and based on our examination of the records of the Company, the Company has not made any
preferential allotment or private placement of shares or fully or partly convertible debentures during the year. Accordingly paragraph 3(xiv) of the Order is
not applicable to the Company.
xv. According to the information and explanations given to us and based on our examination of the records of the Company, the Company has not entered into
non-cash transactions with directors or persons connected with him. Accordingly, paragraph 3(xv) of the Order is not applicable.
xvi. The Company is not required to be registered under section 45-IA of the Reserve Bank of India Act, 1934. Accordingly, paragraph 3(xvi) of the Order is not
applicable to the Company.
ANNEXURE-A TO THE INDEPENDENT AUDITORS' REPORT
For Singhi & Co.
Chartered Accountants
Firm's Registration No. 302049E
(Anurag Singhi)
Partner
Membership No.66274
Place : New Delhi thDate : 30 May, 2017
57
Kanoria Chemicals & Industries Limited
Annual Report 2016-17
Report on the Internal Financial Controls under Clause (i) of Sub-section 3 of Section 143 of the Companies Act, 2013 (“the Act”)
stWe have audited the internal nancial controls over nancial reporting of KANORIA CHEMICALS & INDUSTRIES LIMITED (“the Company”) as of 31 March
2017 in conjunction with our audit of the standalone Ind AS nancial statements of the Company for the year ended on that date.
MANAGEMENT'S RESPONSIBILITY FOR INTERNAL FINANCIAL CONTROLS
The Company's management is responsible for establishing and maintaining internal nancial controls based on the internal control over nancial reporting
criteria established by the Company considering the essential components of internal control stated in the Guidance Note on Audit of Internal Financial Controls
over Financial Reporting issued by the Institute of Chartered Accountants of India ('ICAI'). These responsibilities include the design, implementation and
maintenance of adequate internal nancial controls that were operating effectively for ensuring the orderly and efcient conduct of its business, including
adherence to company's policies, the safeguarding of its assets, the prevention and detection of frauds and errors, the accuracy and completeness of the
accounting records, and the timely preparation of reliable nancial information, as required under the Companies Act, 2013.
AUDITOR'S RESPONSIBILITY
Our responsibility is to express an opinion on the Company's internal nancial controls over nancial reporting based on our audit. We conducted our audit in
accordance with the Guidance Note on Audit of Internal Financial Controls over Financial Reporting (the “Guidance Note”) and the Standards on Auditing, issued
by ICAI and deemed to be prescribed under section 143(10) of the Companies Act, 2013, to the extent applicable to an audit of internal nancial controls, both
applicable to an audit of Internal Financial Controls and both issued by the Institute of Chartered Accountants of India. Those Standards and the Guidance Note
require that we comply with ethical requirements and plan and perform the audit to obtain reasonable assurance about whether adequate internal nancial
controls over nancial reporting was established and maintained and if such controls operated effectively in all material respects.
Our audit involves performing procedures to obtain audit evidence about the adequacy of the internal nancial controls system over nancial reporting and their
operating effectiveness. Our audit of internal nancial controls over nancial reporting included obtaining an understanding of internal nancial controls over
nancial reporting, assessing the risk that a material weakness exists, and testing and evaluating the design and operating effectiveness of internal control based
on the assessed risk. The procedures selected depend on the auditor's judgment, including the assessment of the risks of material misstatement of the
standalone Ind AS nancial statements, whether due to fraud or error.
We believe that the audit evidence we have obtained is sufcient and appropriate to provide a basis for our audit opinion on the Company's internal nancial
controls system over nancial reporting.
MEANING OF INTERNAL FINANCIAL CONTROLS OVER FINANCIAL REPORTING
A company's internal nancial control over nancial reporting is a process designed to provide reasonable assurance regarding the reliability of nancial reporting
and the preparation of standalone Ind AS nancial statements for external purposes in accordance with generally accepted accounting principles. A company's
internal nancial control over nancial reporting includes those policies and procedures that:
(1) pertain to the maintenance of records that, in reasonable detail, accurately and fairly reect the transactions and dispositions of the assets of
the company;
(2) provide reasonable assurance that transactions are recorded as necessary to permit preparation of nancial statements in accordance with
generally accepted accounting principles, and that receipts and expenditures of the company are being made only in accordance with authorizations
of management and directors of the company; and
(3) provide reasonable assurance regarding prevention or timely detection of unauthorized acquisition, use, or disposition of the company's assets that
could have a material effect on the nancial statements.
ANNEXURE - B TO THE INDEPENDENT AUDITOR'S REPORT
58
Kanoria Chemicals & Industries Limited
Annual Report 2016-17
INHERENT LIMITATIONS OF INTERNAL FINANCIAL CONTROLS OVER FINANCIAL REPORTING
Because of the inherent limitations of internal nancial controls over nancial reporting, including the possibility of collusion or improper management override of
controls, material misstatements due to error or fraud may occur and not be detected. Also, projections of any evaluation of the internal nancial controls over
nancial reporting to future periods are subject to the risk that the internal nancial control over nancial reporting may become inadequate because of changes
in conditions, or that the degree of compliance with the policies or procedures may deteriorate.
OPINION
In our opinion, the Company has, in all material respects, an adequate internal nancial controls system over nancial reporting and such internal nancial stcontrols over nancial reporting were operating effectively as at 31 March 2017, based on the internal control over nancial reporting criteria established by the
Company considering the essential components of internal control stated in the Guidance Note on Audit of Internal Financial Controls Over Financial Reporting
issued by the Institute of Chartered Accountants of India.
ANNEXURE - B TO THE INDEPENDENT AUDITOR'S REPORT
For Singhi & Co.
Chartered Accountants
Firm's Registration No. 302049E
(Anurag Singhi)
Partner
Membership No.66274
Place : New Delhi thDate : 30 May, 2017
59
Kanoria Chemicals & Industries Limited
Annual Report 2016-17

BALANCE SHEETstAs at 31 March 2017
Notes stAs at 31 March 2017 stAs at 31 March 2016 stAs at 1 April 2015Par�culars
ASSETS
Non-Current Assets
(a) Property, Plant and Equipment 4A 3,615.80 3,645.87 3,655.26
(b) Capital Work-in-Progress 265.15 153.01 7.65
(c) Other Intangible Assets 4B 3.98 4.01 0.31 (d) Financial Assets
(i) Investments 5A 1,807.71 1,952.11 2,389.37
(ii) Loans 6 692.76 532.49 277.00
(iii) Others 7 16.55 16.76 17.10
(e) Other Non-Current Assets 8 38.32 4.93 24.56
Total Non-Current Assets 6,440.27 6,309.18 6,371.25
Current Assets
(a) Inventories 9 322.56 270.25 376.62
(b) Financial Assets
(i) Investments 5B 30.82 281.57 226.93
(ii) Trade Receivables 10 551.91 414.81 395.72
(iii) Cash and Cash Equivalents 11A 5.88 47.64 5.45
(iv) Bank Balances other than above 11B 375.49 375.42 15.38
(v) Loans 6 44.06 30.11 23.44
(vi) Others 7 74.27 27.04 45.37
(c) Current Tax Assets (Net) 12 214.20 182.54 256.43
(d) Other Current Assets 8 234.03 318.50 293.50
Total Current Assets 1,853.22 1,947.88 1,638.84
Total Assets 8,293.49 8,257.06 8,010.09
EQUITY AND LIABILITIES
Equity
Equity Share Capital 13 218.49 218.49 218.49
Other Equity 14 5,925.15 5,815.34 5,744.70
Total Equity 6,143.64 6,033.83 5,963.19
Liabili�es
Non-Current Liabili�es(a) Financial Liabili�es
(i) Borrowings 15 289.36 476.17 285.66
(ii) Other financial liabili�es 16 14.85 7.67 -
(b) Long Term Provisions 17 57.66 46.37 44.33
(c) Deferred Tax Liabili�es (Net) 18A 522.05 634.92 635.50
Total Non-Current Liabili�es 883.92 1,165.13 965.49
Current Liabili�es(a) Financial Liabili�es
(i) Borrowings 19 722.51 530.64 540.49
(ii) Trade Payables 20 — — —
Total outstanding dues of Micro and small enterprises — — — —
Total outstanding dues of others — 253.68 183.06 282.76
(iii) Other financial liabili�es 16 255.18 307.77 236.57
(b) Other Current Liabili�es 21 8.45 11.00 7.40
(c) Provisions 17 26.11 25.63 14.19
Total Current Liabili�es 1,265.93 1,058.10 1,081.41
Total Liabili�es 2,149.85 2,223.23 2,046.90
Total Equity and Liabili�es 8,293.49 8,257.06 8,010.09
Significant accoun�ng policies 3
The accompanying notes are an integral part of the Financial Statements
As per our report annexedFor SINGHI & CO. For and on behalf of the Board,Chartered AccountantsFirm Registration No.302049E
Place: New Delhi th Date: 30 May, 2017
ANURAG SINGHI
N. K. NOLKHA N. K. SETHIA Group Chief Financial Ofcer Company Secretary
AMITAV KOTHARIDirector
R. V. KANORIA Managing Director
(DIN:01097705) (DIN:00003792)PartnerMembership No. 66274
(`in million)
60
Kanoria Chemicals & Industries Limited
Annual Report 2016-17

(`in million)
STATEMENT OF PROFIT AND LOSSstFor the year ended 31 March 2017
Par�culars Notes For the year endedst31 March 2017
For the year endedst31 March 2016
INCOME
Revenue from opera�ons 22 3,273.71 3,297.78
Other income 23 226.70 211.05
Total Income 3,500.41 3,508.83
EXPENSES
Cost of materials consumed 1,904.11 1,793.38
Purchase of stock-in-trade 29.42 16.41
Change in inventories of finished goods and work-in -progress (56.46) 19.08
Excise duty on sale of goods 317.07 328.08
Employee benefits expenses 24 205.85 199.33
Deprecia�on and amor�sa�on expenses 4A, 4B 204.32 210.08
Finance costs 25 32.67 107.55
Other expenses 26 588.27 611.65
Total expenses 3,225.25 3,285.56
Profit/(loss) before excep�onal items and tax 275.16 223.27
Excep�onal item 27 184.17 —
Profit/(loss) before tax 90.99 223.27
Tax expenses:
Current tax 14.99 62.45
MAT Credit en�tlement (14.99) (14.79)
MAT Credit en�tlement for earlier years (99.87) —
Deferred tax 3.66 3.65
Tax for earlier years — 2.08
Profit for the year 187.20 169.88
OTHER COMPREHENSIVE INCOME (OCI)
A (i) Items that will not be reclassified to Profit or Loss 28A (5.20) (7.11)
(ii) Income-tax rela�ng to items that will not be reclassified to profit & loss
2.25 2.19
B (i) Items that will be reclassified to Profit or Loss 28B 5.02 (17.73)
(ii) Income-tax rela�ng to items that will be reclassified to profit & loss
(0.58) 2.05
Other comprehensive income for the year, net of tax 1.49 (20.60)
Total Comprehensive Income for the year 188.69 149.28
Earning per share (INR) - Basic & Diluted 29 4.28 3.89
Significant accoun�ng policies 3
The accompanying notes are an integral part of the Financial Statements
As per our report annexedFor SINGHI & CO. For and on behalf of the Board,Chartered AccountantsFirm Registration No.302049E
Place: New Delhi th Date: 30 May, 2017
ANURAG SINGHI
N. K. NOLKHA N. K. SETHIA Group Chief Financial Ofcer Company Secretary
AMITAV KOTHARIDirector
R. V. KANORIA Managing Director
(DIN:01097705) (DIN:00003792)PartnerMembership No. 66274
(`in million)
61
Kanoria Chemicals & Industries Limited
Annual Report 2016-17
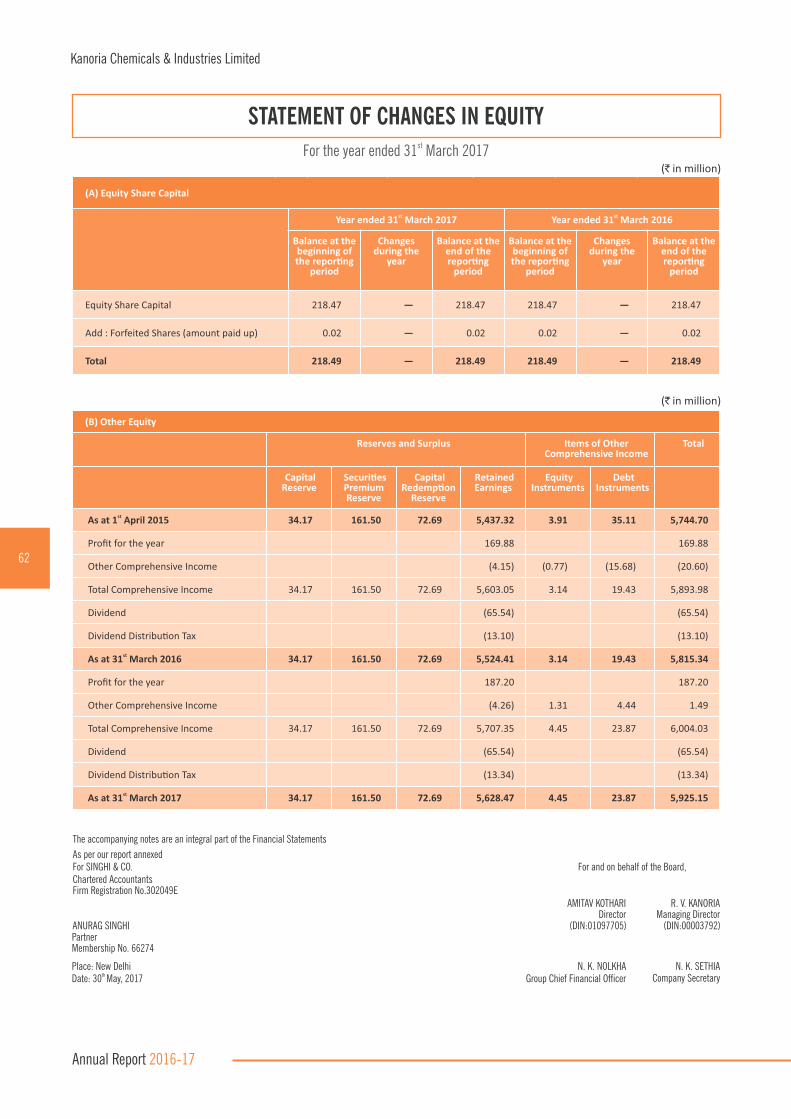
STATEMENT OF CHANGES IN EQUITY
(`in million)
stFor the year ended 31 March 2017
(A) Equity Share Capital
stYear ended 31 March 2017 stYear ended 31 March 2016
Balance at the beginning of the repor�ng
period
Changes during the
year
Balance at the end of the repor�ng
period
Balance at the beginning of the repor�ng
period
Changes during the
year
Balance at the end of the repor�ng
period
The accompanying notes are an integral part of the Financial Statements
As per our report annexedFor SINGHI & CO. For and on behalf of the Board,Chartered AccountantsFirm Registration No.302049E
Place: New Delhi th Date: 30 May, 2017
ANURAG SINGHI
N. K. NOLKHA N. K. SETHIA Group Chief Financial Ofcer Company Secretary
AMITAV KOTHARIDirector
R. V. KANORIA Managing Director
(DIN:01097705) (DIN:00003792)PartnerMembership No. 66274
Equity Share Capital 218.47 — 218.47 218.47 — 218.47
Add : Forfeited Shares (amount paid up) 0.02 — 0.02 0.02 — 0.02
Total 218.49 — 218.49 218.49 — 218.49
(B) Other Equity
Reserves and Surplus Items of Other Comprehensive Income
Total
Capital Reserve
Securi�es Premium Reserve
Capital Redemp�on
Reserve
Retained Earnings
Equity Instruments
Debt Instruments
stAs at 1 April 2015 34.17 161.50 72.69 5,437.32 3.91 35.11 5,744.70
Profit for the year 169.88 169.88
Other Comprehensive Income (4.15) (0.77) (15.68) (20.60)
Total Comprehensive Income 34.17 161.50 72.69 5,603.05 3.14 19.43 5,893.98
Dividend (65.54) (65.54)
Dividend Distribu�on Tax (13.10) (13.10)
stAs at 31 March 2016 34.17 161.50 72.69 5,524.41 3.14 19.43 5,815.34
Profit for the year 187.20 187.20
Other Comprehensive Income (4.26) 1.31 4.44 1.49
Total Comprehensive Income 34.17 161.50 72.69 5,707.35 4.45 23.87 6,004.03
Dividend (65.54) (65.54)
Dividend Distribu�on Tax (13.34) (13.34)
stAs at 31 March 2017 34.17 161.50 72.69 5,628.47 4.45 23.87 5,925.15
(`in million)
62
Kanoria Chemicals & Industries Limited
Annual Report 2016-17
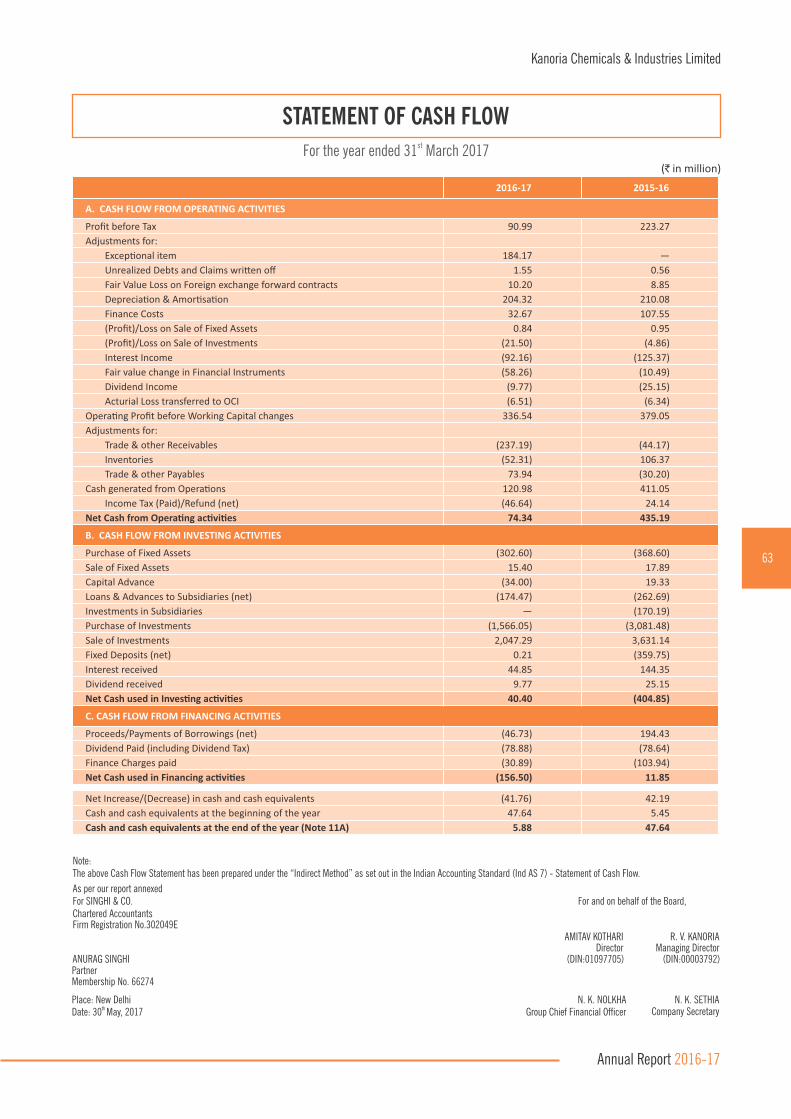
STATEMENT OF CASH FLOW
2016-17 2015-16
A. CASH FLOW FROM OPERATING ACTIVITIES
Profit before Tax 90.99 223.27
Adjustments for:
Excep�onal item 184.17 —
Unrealized Debts and Claims wri�en off 1.55 0.56
Fair Value Loss on Foreign exchange forward contracts 10.20 8.85
Deprecia�on & Amor�sa�on 204.32 210.08
Finance Costs 32.67 107.55
(Profit)/Loss on Sale of Fixed Assets 0.84 0.95
(Profit)/Loss on Sale of Investments (21.50) (4.86)
Interest Income (92.16) (125.37)
Fair value change in Financial Instruments (58.26) (10.49)
Dividend Income (9.77) (25.15)
Acturial Loss transferred to OCI (6.51) (6.34)
Opera�ng Profit before Working Capital changes 336.54 379.05
Adjustments for:
Trade & other Receivables (237.19) (44.17)
Inventories (52.31) 106.37
Trade & other Payables 73.94 (30.20)
Cash generated from Opera�ons 120.98 411.05
Income Tax (Paid)/Refund (net) (46.64) 24.14
Net Cash from Opera�ng ac�vi�es 74.34 435.19
B. CASH FLOW FROM INVESTING ACTIVITIES
Purchase of Fixed Assets (302.60) (368.60)
Sale of Fixed Assets 15.40 17.89
Capital Advance (34.00) 19.33
Loans & Advances to Subsidiaries (net) (174.47) (262.69)
Investments in Subsidiaries — (170.19)
Purchase of Investments (1,566.05) (3,081.48)
Sale of Investments 2,047.29 3,631.14
Fixed Deposits (net) 0.21 (359.75)
Interest received 44.85 144.35
Dividend received 9.77 25.15
Net Cash used in Inves�ng ac�vi�es 40.40 (404.85)
C. CASH FLOW FROM FINANCING ACTIVITIES
Proceeds/Payments of Borrowings (net) (46.73) 194.43
Dividend Paid (including Dividend Tax) (78.88) (78.64)
Finance Charges paid (30.89) (103.94)
Net Cash used in Financing ac�vi�es (156.50) 11.85
Net Increase/(Decrease) in cash and cash equivalents (41.76) 42.19
Cash and cash equivalents at the beginning of the year 47.64 5.45
Cash and cash equivalents at the end of the year (Note 11A) 5.88 47.64
(`in million)
stFor the year ended 31 March 2017
Note:The above Cash Flow Statement has been prepared under the “Indirect Method” as set out in the Indian Accounting Standard (Ind AS 7) - Statement of Cash Flow.
As per our report annexedFor SINGHI & CO. For and on behalf of the Board,Chartered AccountantsFirm Registration No.302049E
Place: New Delhi th Date: 30 May, 2017
ANURAG SINGHI
N. K. NOLKHA N. K. SETHIA Group Chief Financial Ofcer Company Secretary
AMITAV KOTHARIDirector
R. V. KANORIA Managing Director
(DIN:01097705) (DIN:00003792)PartnerMembership No. 66274
63
Kanoria Chemicals & Industries Limited
Annual Report 2016-17

NOTES TO THE FINANCIAL STATEMENTS
1. Corporate Information Kanoria Chemicals & Industries Limited (the Company) having its registered ofce at ‘Park Plaza’, 71 Park Street, Kolkata – 700 016, India is a Public
Limited Company incorporated and domiciled in India. The Equity Shares of the Company are listed on National Stock Exchange of India Ltd. and BSE
Ltd. The Company is primarily engaged in manufacture of Industrial Chemicals in India.
2. Basis of Preparation
A. Statement of compliance
These nancial statements have been prepared in accordance with the Indian Accounting Standards (Ind AS) as per the Companies (Indian Accounting Standards) Rules, 2015 (as amended) notied under Section 133 of Companies Act, 2013 (the Act) and other relevantprovisions of the Act.
st The nancial statements up to and for the year ended 31 March 2016 were prepared in accordance with the Accounting Standards notied under Section 133 of the Act read together with Rule 7 of the Companies (Accounts) Rules, 2014 (Previous GAAP) and other relevantprovisions of the Act.
These are the rst nancial statements prepared in accordance with Ind AS and therefore, Ind AS 101, First-time Adoption of Indian Accounting stStandards has been applied in preparation of opening Balance Sheet as at 1 April 2015, the date of transition to Ind AS. An explanation of how the
transition to Ind AS has affected the previously reported nancial position and nancial performance of the Company is provided in Note 43.
th These nancial statements have been approved for issue by the Board of Directors on 30 May 2017.
B. Functional and presentation currency
These nancial statements are presented in Indian Rupees (INR), which is also the Company’s functional currency. All amounts have been
rounded off to the nearest two decimals of millions, unless otherwise indicated.
C. Historical cost convention
The nancial statements have been prepared following accrual basis of accounting on a historical cost basis, except for the following which are
measured at fair value:
i. Certain nancial assets and liabilities
ii. Property, plant & equipment
iii. Dened benet plans
D. Fair value measurement
A number of Company’s accounting policies and disclosures require fair value measurement for both nancial and non-nancial assets
and liabilities.
All assets and liabilities for which fair value is measured or disclosed in the nancial statements are categorised within the fair value hierarchy,
based on the lowest level input that is signicant to the fair value measurement, as under:
i. Level 1 — Quoted (unadjusted) market prices in active markets for identical assets or liabilities
ii. Level 2 — Valuation techniques for which the lowest level input that is signicant to the fair value measurement is directly or
indirectly observable
iii. Level 3 — Valuation techniques for which the lowest level input that is signicant to the fair value measurement is unobservable
For assets and liabilities that are recognised in the nancial statements on a recurring basis, the Company determines whether transfers have
occurred between levels in the hierarchy by re-assessing categorisation, based on the lowest level input that is signicant to the fair value
measurement, at the end of each reporting period.
64
Kanoria Chemicals & Industries Limited
Annual Report 2016-17

The Company uses valuation techniques that are appropriate in the circumstances and for which sufcient data are available to measure fair
value, maximising the use of relevant observable inputs and minimising the use of unobservable inputs. External valuers are involved for
valuation of signicant assets and liabilities. Involvement of external valuers is decided upon annually by the Management. Selection criteria
include market knowledge, reputation, independence and whether professional standards are maintained. The Management decides, after
discussions with the Company’s external valuers, which valuation techniques and inputs to use for each case.
At each reporting date, the Management analyses the movements in the values of assets and liabilities which are required to be re-measured or
re-assessed as per the Company's accounting policies. For this analysis, the Management veries the major inputs applied in the latest
valuation by agreeing the information in the valuation computation to contracts and other relevant documents.
For the purpose of fair value disclosures, the Company has determined classes of assets and liabilities on the basis of the nature, characteristics
and risks of the asset or liability and the level of the fair value hierarchy as explained above.
E. Current versus non-current classification
The Company presents assets and liabilities in the balance sheet based on current/non-current classication.
An asset or liability is treated as current if it satises any of the following condition:
i. the asset/liability is expected to be realised/settled in normal operating cycle;
ii. the asset is intended for sale or consumption;
iii. the asset/liability is held primarily for the purpose of trading;
iv. the asset/liability is expected to be realised/settled within twelve months after the reporting period;
v. the asset is cash or cash equivalent unless restricted from being exchanged or used to settle a liability for at least twelve months after
the reporting period;
vi. in the case of a liability, the Company does not have an unconditional right to defer settlement of the liability for at least twelve months
after the reporting period
All other assets and liabilities are classied as non-current.
Deferred tax assets and liabilities are classied as non-current assets and liabilities.
The operating cycle is the time between the acquisition of assets for processing and their realisation in cash and cash equivalents. The
Company has identied twelve months as its operating cycle.
F. Use of estimates and judgements
In preparing these nancial statements, management has made judgements, estimates and assumptions that affect the application of
accounting policies and the reported amounts of assets, liabilities, income and expenses and the accompanying disclosures and disclosure of
contingent liabilities. Actual results may differ from these estimates.
Estimates and underlying assumptions are reviewed on an ongoing basis and are based on historical experience and other factors, including
expectation of future events that may have a nancial impact on the Company and that are believed to be reasonable under the circumstances.
The revisions in accounting estimates and assumptions are recognised prospectively.
Detailed information about estimates and judgements is included in Note 42.
3. Signicant Accounting Policy A. Foreign Currency Transactions
Foreign currency transactions are translated into the functional currency at the exchange rates on the date the transaction rst
qualies for recognition.
Monetary assets and liabilities denominated in foreign currencies are translated into the functional currency at the exchange rate at the reporting
date. Exchange difference arising on settlement or translation of monetary items are recognised in the Statement of Prot and Loss on net basis.
NOTES TO THE FINANCIAL STATEMENTS
65
Kanoria Chemicals & Industries Limited
Annual Report 2016-17

Non-monetary items that are measured in terms of historical cost in a foreign currency are translated using the exchange rates at the dates of the
initial transactions. Non-monetary items measured at fair value in a foreign currency are translated using the exchange rates at the date when
the fair value is determined. The gain or loss arising on translation of non-monetary items measured at fair value is treated in line with the
recognition of the gain or loss on the change in fair value of the item i.e., translation differences on items whose fair value gain or loss is
recognised in OCI or Statement of Prot and Loss are also recognised in OCI or Statement of Prot and Loss, respectively.
B. Property, Plant & Equipment
i. Recognition & Measurement
All items of property, plant and equipment (PPE) are stated at cost less accumulated depreciation and impairment, if any. Cost of an item of
PPE includes its purchase cost, non refundable taxes and duties, directly attributable cost of bringing the item to its working condition for its
intended use and borrowing cost if the recognition criteria is met.
Subsequent costs are included in an item of PPE‘s carrying value or recognised as a separate item, as appropriate, only when it is probable
that future economic benets associated with the item will ow to the Company and the cost of the item can be measured reliably. All other
repairs and maintenance are charged to the Statement of Prot and Loss during the reporting period in which they are incurred.
Capital work-in-progress is stated at cost.
An item of PPE or any signicant part thereof is derecognised upon disposal or when no future economic benets are expected from its use.
Any gain or loss on derecognition of an item of PPE is recognised in Statement of Prot and Loss.
ii. Transition to Ind AS
On transition to Ind AS the Company has elected to measure all items of PPE at fair value and use that as the deemed cost of such PPE.
iii. Depreciation methods, estimated useful lives and residual value
Depreciation on all items of PPE is calculated using the straight line method to allocate their cost, net of their residual value, over their
estimated useful lives as prescribed in Schedule II to the Act except for following items where useful life is considered as lower than that
prescribed based on internal technical assessment:
Depreciation on an item of PPE purchased/sold during the year is provided on pro-rata basis.
Freehold land is not depreciated.
The residual values are not more than 5% of the cost of an item of PPE.
Depreciation methods, useful lives and residual values are reviewed at the end of each nancial year and adjusted prospectively, if appropriate.
PPE/PPE Group Useful life
Effluent treatment plant Digester 15 years
Measuring instruments like flow meters, transmi�ers, level gauges etc. 10 years
Other Independent Instruments 15 years
NOTES TO THE FINANCIAL STATEMENTS
C. Intangible Assets
Intangible assets are initially measured at cost. Such intangible assets are subsequently measured at cost less accumulated amortisation and
impairment losses, if any.st On transition to Ind As the Company has elected to continue with the carrying value of all its intangible assets recognised as at 1 April 2015,
measured as per previous GAAP, and use that carrying value as the deemed cost of such intangible assets.
The Company amortises intangible assets with a nite useful life using the straight line method over the following periods :
Computer Softwares - 3 years
Amortisation methods, useful lives and residual values are reviewed at the end of each nancial year and adjusted prospectively, if appropriate.
66
Kanoria Chemicals & Industries Limited
Annual Report 2016-17
D. Lease Accounting
Leases are classied as nance leases whenever the terms of the lease transfer substantially all the risks and rewards of ownership to the
lessee. All other leases are classied as operating leases.
In respect of assets taken on operating lease, lease rentals are recognized as an expense in the Statement of Prot and Loss on straight line basis
over the lease term unless
i. another systematic basis is more representative of the time pattern in which the benet is derived from the leased asset; or
ii. the payments to the lessor are structured to increase in the line with expected general ination to compensate for the lessor’s expected
inationary cost increases
Leasehold land with perpetual right has been included in property plant & equipment.
E. Financial Instruments
A nancial instrument is any contract that gives rise to a nancial asset of one entity and a nancial liability or equity instrument of
another entity.
I. Financial Assets
Initial recognition and measurement:
The Company recognizes a nancial asset in its Balance Sheet when it becomes party to the contractual provisions of the instrument. All
nancial assets are recognized initially at fair value, plus in the case of nancial assets not recorded at fair value through prot or loss
(FVTPL), transaction costs that are attributable to the acquisition of the nancial asset.
Where the fair value of a nancial asset at initial recognition is different from its transaction price, the difference between the fair value and the
transaction price is recognized as a gain or loss in the Statement of Prot and Loss at initial recognition if the fair value is determined through a
quoted market price in an active market for an identical asset (i.e. level 1 input) or through a valuation technique that uses data from
observable markets (i.e. level 2 input).
In case the fair value is not determined using a level 1 or level 2 input as mentioned above, the difference between the fair value and
transaction price is deferred appropriately and recognized as a gain or loss in the Statement of Prot and Loss only to the extent that such gain
or loss arises due to a change in factor that market participants take into account when pricing the nancial asset.
However, trade receivables that do not contain a signicant nancing component are measured at transaction price.
Subsequent measurement:
For subsequent measurement, the Company classies a nancial asset in accordance with the below criteria:
a. The Company’s business model for managing the nancial asset and
b. The contractual cash ow characteristics of the nancial asset.
Based on the above criteria, the Company classies its nancial assets into the following categories:
i. Financial assets measured at amortized cost
ii. Financial assets measured at fair value through other comprehensive income (FVTOCI)
iii. Financial assets measured at fair value through prot or loss (FVTPL)
i. Financial assets measured at amortized cost:
A nancial asset is measured at the amortized cost if both the following conditions are met:
a) The Company’s business model objective for managing the nancial asset is to hold nancial assets in order to collect contractual cash
ows, and
b) The contractual terms of the nancial asset give rise on specied dates to cash ows that are solely payments of principal and interest on
the principal amount outstanding.
NOTES TO THE FINANCIAL STATEMENTS
67
Kanoria Chemicals & Industries Limited
Annual Report 2016-17
This category applies to certain investment in debt instruments, cash and bank balances, trade receivables, loans and other nancial assets
of the Company (Refer Note 38 for further details). Such nancial assets are subsequently measured at amortized cost using the effective
interest method.
Under the effective interest method, the future cash receipts are exactly discounted to the initial recognition value using the effective interest
rate. The cumulative amortization using the effective interest method of the difference between the initial recognition amount and the maturity
amount is added to the initial recognition value (net of principal repayments, if any) of the nancial asset over the relevant period of the
nancial asset to arrive at the amortized cost at each reporting date. The corresponding effect of the amortization under effective interest
method is recognized as interest income over the relevant period of the nancial asset. The same is included under other income in the
Statement of Prot and Loss.
The amortized cost of a nancial asset is also adjusted for loss allowance, if any.
ii. Financial assets measured at FVTOCI:
A nancial asset is measured at FVTOCI if both of the following conditions are met:
a) The Company’s business model objective for managing the nancial asset is achieved both by collecting contractual cash ows and selling
the nancial assets, and
b) The contractual terms of the nancial asset give rise on specied dates to cash ows that are solely payments of principal and interest on
the principal amount outstanding.
This category applies to certain investments in debt instruments (Refer Note 38 for further details). Such nancial assets are subsequently
measured at fair value at each reporting date. Fair value changes are recognized in the Other Comprehensive Income (OCI). However, the
Company recognizes interest income and impairment losses and its reversals in the Statement of Prot and Loss.
On Derecognition of such nancial assets, cumulative gain or loss previously recognized in OCI is reclassied from equity to Statement of Prot
and Loss.
Further, the Company, through an irrevocable election at initial recognition, has measured certain investments in equity instruments at FVTOCI
(Refer Note 38 for further details). The Company has made such election on an instrument by instrument basis. These equity instruments are
neither held for trading nor are contingent consideration recognized under a business combination. Pursuant to such irrevocable election,
subsequent changes in the fair value of such equity instruments are recognized in OCI. However, the Company recognizes dividend income from
such instruments in the Statement of Prot and Loss.
On Derecognition of such nancial assets, cumulative gain or loss previously recognized in OCI is not reclassied from the equity to Statement of
Prot and Loss. However, the Company may transfer such cumulative gain or loss into retained earnings within equity.
iii. Financial assets measured at FVTPL:
A nancial asset is measured at FVTPL unless it is measured at amortized cost or at FVTOCI as explained above. This is a residual category
applied to all other investments of the Company excluding investments in subsidiary companies (Refer Note 38 for further details). Such
nancial assets are subsequently measured at fair value at each reporting date. Fair value changes are recognized in the Statement of Prot
and Loss.
A nancial asset (or, where applicable, a part of a nancial asset or part of a group of similar nancial assets) is derecognized (i.e. removed
from the Company’s Balance Sheet) when any of the following occurs:
i. The contractual rights to cash ows from the nancial asset expires;
ii. The Company transfers its contractual rights to receive cash ows of the nancial asset and has substantially transferred all the risks
and rewards of ownership of the nancial asset;
iii. The Company retains the contractual rights to receive cash ows but assumes a contractual obligation to pay the cash ows without
material delay to one or more recipients under a ‘pass-through’ arrangement (thereby substantially transferring all the risks and
rewards of ownership of the nancial asset);
iv. The Company neither transfers nor retains substantially all risk and rewards of ownership and does not retain control over the
nancial asset.
NOTES TO THE FINANCIAL STATEMENTS
68
Kanoria Chemicals & Industries Limited
Annual Report 2016-17
In cases where Company has neither transferred nor retained substantially all of the risks and rewards of the nancial asset, but retains control
of the nancial asset, the Company continues to recognize such nancial asset to the extent of its continuing involvement in the nancial asset.
In that case, the Company also recognizes an associated liability. The nancial asset and the associated liability are measured on a basis that
reects the rights and obligations that the Company has retained.
On Derecognition of a nancial asset, (except as mentioned in ii above for nancial assets measured at FVTOCI), the difference between the
carrying amount and the consideration received is recognized in the Statement of Prot and Loss.
Impairment of financial assets:
The Company applies expected credit losses (ECL) model for measurement and recognition of loss allowance on the following:
i. Trade receivables
ii. Financial assets measured at amortized cost (other than trade receivables)
iii. Financial assets measured at fair value through other comprehensive income (FVTOCI)
In case of trade receivables, the Company follows a simplied approach wherein an amount equal to lifetime ECL is measured and recognized as
loss allowance.
In case of other assets (listed as ii and iii above), the Company determines if there has been a signicant increase in credit risk of the nancial
asset since initial recognition. If the credit risk of such assets has not increased signicantly, an amount equal to 12-month ECL is measured and
recognized as loss allowance. However, if credit risk has increased signicantly, an amount equal to lifetime ECL is measured and recognized as
loss allowance.
Subsequently, if the credit quality of the nancial asset improves such that there is no longer a signicant increase in credit risk since initial
recognition, the Company reverts to recognizing impairment loss allowance based on 12-month ECL.
ECL is the difference between all contractual cash ows that are due to the Company in accordance with the contract and all the cash ows that
the entity expects to receive (i.e., all cash shortfalls), discounted at the original effective interest rate.
Lifetime ECL are the expected credit losses resulting from all possible default events over the expected life of a nancial asset. 12-month ECL are
a portion of the lifetime ECL which result from default events that are possible within 12 months from the reporting date.
ECL are measured in a manner that they reect unbiased and probability weighted amounts determined by a range of outcomes, taking into
account the time value of money and other reasonable information available as a result of past events, current conditions and forecasts of future
economic conditions.
As a practical expedient, the Company uses a provision matrix to measure lifetime ECL on its portfolio of trade receivables. The provision matrix
is prepared based on historically observed default rates over the expected life of trade receivables and is adjusted for forward-looking estimates.
At each reporting date, the historically observed default rates and changes in the forward-looking estimates are updated.
ECL impairment loss allowance (or reversal) recognized during the period is recognized as income/ expense in the Statement of Prot and Loss
under the head ‘Other expenses’.
II. Financial Liabilities
Initial recognition and measurement:
The Company recognises a nancial liability in its Balance Sheet when it becomes party to the contractual provisions of the instrument. All nancial
liabilities are recognised initially at fair value minus, in the case of nancial liabilities not recorded at fair value through prot or loss (FVTPL),
transaction costs that are attributable to the acquisition of the nancial liability.
Where the fair value of a nancial liability at initial recognition is different from its transaction price, the difference between the fair value and the
transaction price is recognised as a gain or loss in the Statement of Prot and Loss at initial recognition if the fair value is determined through a
quoted market price in an active market for an identical asset (i.e. level 1 input) or through a valuation technique that uses data from observable
markets (i.e. level 2 input).
NOTES TO THE FINANCIAL STATEMENTS
69
Kanoria Chemicals & Industries Limited
Annual Report 2016-17
In case the fair value is not determined using a level 1 or level 2 input as mentioned above, the difference between the fair value and transaction
price is deferred appropriately and recognised as a gain or loss in the Statement of Prot and Loss only to the extent that such gain or loss arises due
to a change in factor that market participants take into account when pricing the nancial liability.
Subsequent measurement:
All nancial liabilities of the Company are subsequently measured at amortised cost using the effective interest method.
Under the effective interest method, the future cash payments are exactly discounted to the initial recognition value using the effective interest
rate. The cumulative amortisation using the effective interest method of the difference between the initial recognition amount and the maturity
amount is added to the initial recognition value (net of principal repayments, if any) of the nancial liability over the relevant period of the nancial
liability to arrive at the amortised cost at each reporting date. The corresponding effect of the amortisation under effective interest method is
recognised as interest expense over the relevant period of the nancial liability. The same is included under nance cost in the Statement of Prot
and Loss.
Derecognition:
A nancial liability is derecognised when the obligation under the liability is discharged or cancelled or expires. When an existing nancial liability is
replaced by another from the same lender on substantially different terms, or the terms of an existing liability are substantially modied, such an
exchange or modication is treated as the Derecognition of the original liability and the recognition of a new liability. The difference between the
carrying amount of the nancial liability derecognised and the consideration paid is recognised in the Statement of Prot and Loss.
F. Impairment
Assets that have an indenite useful life are not subject to amortisation and are tested for impairment annually and whenever there is an indication
that the asset may be impaired.
Assets that are subject to depreciation and amortisation and assets representing investments in subsidiary companies are reviewed for impairment,
whenever events or changes in circumstances indicate that carrying amount may not be recoverable. Such circumstances include, though are not
limited to, signicant or sustained decline in revenues or earnings and material adverse changes in the economic environment.
An impairment loss is recognised whenever the carrying amount of an asset or its cash generating unit (CGU) exceeds its recoverable amount. The
recoverable amount of an asset is the greater of its fair value less cost to sell and value in use. To calculate value in use, the estimated future cash
ows are discounted to their present value using a pre-tax discount rate that reects current market rates and the risk specic to the asset. For an
asset that does not generate largely independent cash inows, the recoverable amount is determined for the CGU to which the asset belongs. Fair
value less cost to sell is the best estimate of the amount obtainable from the sale of an asset in an arm’s length transaction between knowledgeable,
willing parties, less the cost of disposal.
Impairment losses, if any, are recognised in the Statement of Prot and Loss and included in depreciation and amortisation expense. Impairment
losses are reversed in the Statement of Prot and Loss only to the extent that the asset’s carrying amount does not exceed the carrying amount that
would have been determined if no impairment loss had previously been recognised.
G. Inventories
Inventories of raw materials, stores and spare parts, work in progress and nished goods are measured at lower of cost and net realisable value.
However, materials and other items held for use in production of inventories are not written down below cost if the nished goods in which they will be
used are expected to be sold at or above cost. In case of certain products, where cost cannot be ascertained reliably, the same are measured at net
realisable value.
Cost of raw materials, stores and spares include its purchase cost and other costs incurred in bringing them to their present location and condition.
Cost of work in progress and nished goods include direct materials, direct labour and appropriate proportion of variable and xed overheads, the
latter being allocated on the basis of normal operating capacity. Costs are assigned to individual item of inventory on weighted average method.
Net realisable value is the estimated selling price in the ordinary course of business less the estimated costs of completion and the estimated costs
necessary to make the sale.
NOTES TO THE FINANCIAL STATEMENTS
70
Kanoria Chemicals & Industries Limited
Annual Report 2016-17

H. Income Tax
Income Tax comprises current and deferred tax and is recognised in Statement of Prot and Loss except to the extent that it relates to an item
recognised in other comprehensive income or directly in equity. In this case, the tax is also recognised in other comprehensive income or in equity as
the case may be.
I. Current Tax
Current tax comprises the expected tax payable on the taxable income for the year and any adjustments to the tax payable in respect of previous
years. It is measured using tax rates and tax laws enacted or substantively enacted by the reporting date.
II. Deferred Tax
Deferred tax is recognised in respect of temporary differences between the carrying amounts of assets and liabilities for nancial reporting
purposes and the corresponding amounts used for taxation purposes. Deferred tax asset is also recognised in respect of carried forward tax losses
and unused tax credits.
Deferred Tax assets are recognised to the extent that it is probable that future taxable amounts will be available to utilise those temporary
differences, carried forward tax losses and unused tax credits.
Deferred Tax is measured at the tax rates that are expected to apply to the period when the asset is realised or the liability is settled, based on the
tax laws that have been enacted or substantively enacted by the reporting date.
Minimum Alternate Tax credit is recognised as deferred tax asset only when and to the extent there is convincing evidence that the Company will
pay normal income tax during the specied period. Such asset is reviewed at each Balance Sheet date and the carrying amount of the MAT credit
asset is written down to the extent there is no longer a convincing evidence to the effect that the Company will pay normal income tax during the
specied period.
The Company offsets current tax assets and current tax liabilities, where it has a legally enforceable right to set off the recognised amounts and where it intends either to settle on a net basis, or to realise the asset and settle the liability simultaneously. In case of deferred tax assets and deferred tax liabilities, the same are offset if the Company has a legally enforceable right to set off corresponding current tax assets against current tax liabilities and the deferred tax assets and deferred tax liabilities relate to income taxes levied by the same tax authorityon the Company.
I. Revenue Recognition
The Company recognises revenue when it is probable that future economic benets will ow to the Company and the amount of revenue can be reliably measured. Revenue is measured at the fair value of the consideration received or receivable.
The following specic recognition criteria must also be met for main revenue streams of the company for its recognition :
I. Revenue from Sale of Goods
Revenue from sale of goods is recognised when the signicant risks and rewards of ownership of the goods have passed to the buyer and includes excise duty and net of returns, trade allowances, rebates, value added taxes and amounts collected on behalf of third parties.
II. Renewable Energy Certificates (RECs)
RECs are recognised as accrued on the basis of notication issued by Central Electricity Regulatory Commission (CERC). Revenue from RECs is measured on the basis of actual sale price on transfer of RECs and on the basis of CERC prescribed oor price for RECs held by/accruedto the Company.
III. Industrial Incentives
Government grants in the nature of industrial incentives to compensate the Company for expenses are recognised when there is a reasonable assurance that the same will be received and are included in Statement of Prot and Loss as other operating revenue.
IV. Interest Income
Interest income from debt instruments is recognised on accrual basis using effective interest rate method applicable on such debt instrument.
NOTES TO THE FINANCIAL STATEMENTS
71
Kanoria Chemicals & Industries Limited
Annual Report 2016-17
V. Dividend
Dividend income is recognised when the Company’s right to receive the payment is established, which is generally when the shareholders
approve the dividend.
J. Employee Benefits
I. Short-term employee benefits
Short-term employee benet obligations are measured on an undiscounted basis and expensed as the relative service is provided. A liability is recognised for the amount expected to be paid e.g. towards bonus, if the Company has a present legal or constructive obligation to pay this amount as a result of past service provided by the employee, and the amount of obligation can be estimated reliably.
II. Defined contribution plan
Provident Fund, a dened contribution plan, is a post employment benet plan under which the Company pays contributions into a separate entity and has no legal or constructive obligation to pay further amounts. The Company recognises the contributions payable towards the provident fund as an expense in the Statement of Prot and Loss in the periods during which the related services are rendered by employees
III. Defined benefit plan
A dened benet plan is a post employment benet plan other than a dened contribution plan. The Company has unfunded Gratuity liability towards this which is provided on the basis of actuarial valuation made by an external valuer at the end of each nancial year using the projected unit credit method.
Remeasurements, comprising of actuarial gains and losses, the effect of the asset ceiling (if any, excluding interest) are immediately recognised in the balance sheet with corresponding debit or credit to Other Equity through OCI. Remeasurements are not classied to prot or loss in subsequent periods.
Net interest and changes in the present value of dened benet obligation resulting from plan amendments or curtailments are recognised in
prot or loss.
IV. Other long term employee benefits
The liabilities for earned leave are measured and provided on the basis of actuarial valuation made by an external valuer at the end of each
nancial year using the projected unit credit method. Remeasurement gains or losses are recognised in Statement of Prot and Loss in the
period in which they arise.
K. Borrowing Costs
Borrowing costs consists of interest and other costs incurred in connection with the borrowing of funds. Borrowing costs attributable to the
acquisition or construction of a qualifying asset that necessarily takes a substantial period of time to get ready for its intended use are capitalised as
part of the cost of the asset. Income earned on the temporary investment of specic borrowings pending their expenditure on qualifying assets is
deducted from the borrowings costs eligible for capitalisation. All other borrowing costs are expensed in the period in which they are incurred.
Transaction costs in respect of long-term borrowings are amortised over the tenor of respective loans using effective interest method. Borrowing
cost also includes exchange differences to the extent regarded as an adjustment to the borrowing costs.
L. Earnings per Share
Basic earnings per share is calculated by dividing the net prot or loss before OCI for the year attributable to equity shareholders by the weighted
average number of equity shares outstanding during the period.
Diluted earnings per share adjusts the gures used in determination of basic earnings per share to take into account the post tax effect of nance
costs associated with dilutive potential equity shares and the weighted average number of additional equity shares that would have been
outstanding assuming the issue of all dilutive potential equity shares.
M. Cash and Cash Equivalents
Cash and cash equivalent in the balance sheet comprise cash at banks and in hand and short term deposits with remaining maturity of 12 months
or less, which are subject to an insignicant risk of change in value.
NOTES TO THE FINANCIAL STATEMENTS
72
Kanoria Chemicals & Industries Limited
Annual Report 2016-17

N. Cash Dividend to Equity Shareholders
The Company recognises a liability to make distribution of cash dividend to equity shareholders of the Company when the distribution is approved
by the shareholders. A corresponding amount is recognised directly in equity.
O. Provisions
Provisions are recognised when the Company has a present legal or constructive obligation as a result of a past event, it is probable that an outow
of resources embodying economic benets will be required to settle the obligation and a reliable estimate can be made of the amount
of the obligation.
Where the effect of time value of money is material, provisions are measured at present value using a pre-tax discount rate that reects current
market assessment of the time value of money and risks specic to liability. The increase in the provision due to passage of time is recognised as
interest expense.
P. Contingent Liabilities and Assets
A contingent liability is a possible obligation that arises from past events whose existence will be conrmed by the occurrence or non-occurrence of
one or more uncertain future events beyond the control of the Company or a present obligation that is not recognised because it is not probable that
an outow of resources will be required to settle the obligation. The Company does not recognise a contingent liability but discloses its existence in
the nancial statements. Contingent assets are not recognised in the nancial statements.
Q. Segment Reporting
Operating segments are reported in a manner consistent with the internal reporting provided to the chief operating decision maker.
R. Events after Reporting date
Where events occurring after the Balance Sheet date provide evidence of conditions that existed at the end of the reporting period, the impact of
such events is adjusted within the nancial statements. Otherwise, events after the Balance Sheet date of material size or nature
are only disclosed.
S. Recent applicable Accounting pronouncements
Amendment to Ind AS issued but not yet effective
In March 2017, the Ministry of Corporate Affairs issued the Companies (Indian Accounting Standards) (Amendments) Rules, 2017, notifying stamendment to Ind AS 7, ‘Statement of cash ows’. The amendment is applicable to the Company for the reporting period beginning April 1 , 2017.
The amendments to Ind AS 7 requires the entities to provide disclosures that enable users of nancial statements to evaluate changes in liabilities
arising from nancing activities, including both changes arising from cash ows and non-cash changes, suggesting inclusion of a reconciliation
between the opening and closing balances in the Balance Sheet for liabilities arising from nancing activities, to meet the disclosure requirement.
The Company is evaluating the requirements of the amendment and the effect on the nancial statements is being evaluated.
NOTES TO THE FINANCIAL STATEMENTS
73
Kanoria Chemicals & Industries Limited
Annual Report 2016-17
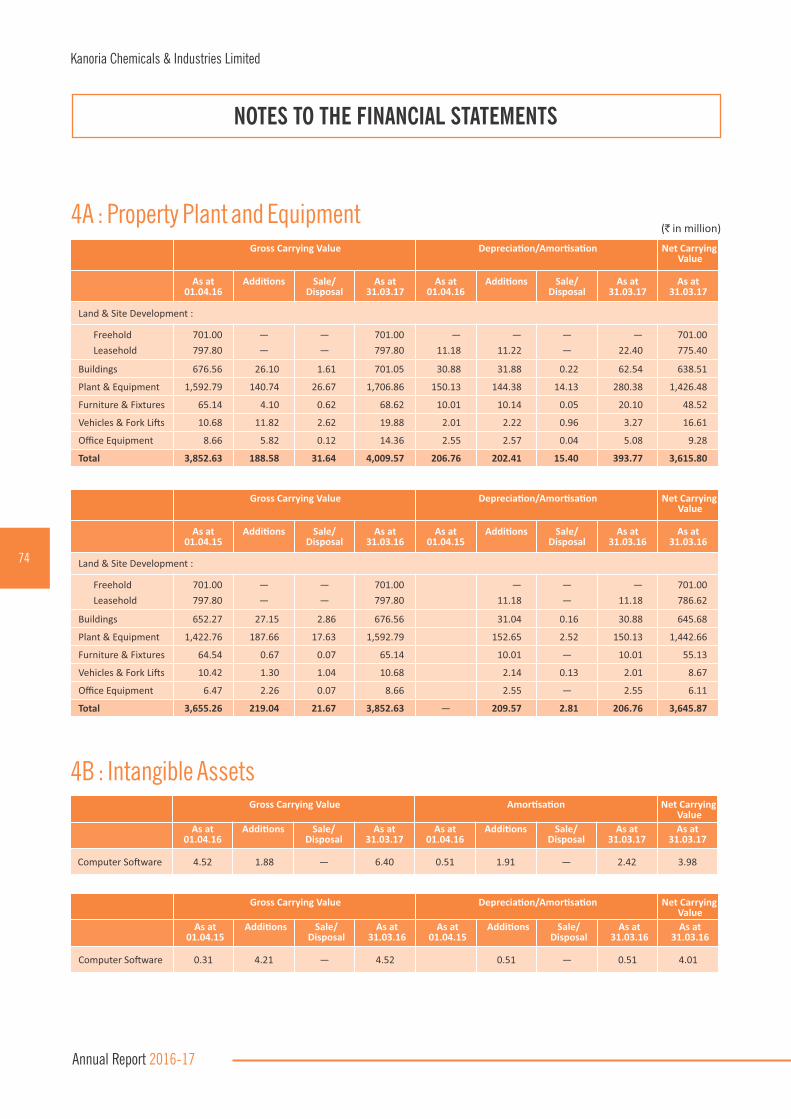
4A : Property Plant and Equipment
NOTES TO THE FINANCIAL STATEMENTS
Gross Carrying Value Deprecia�on/Amor�sa�on Net CarryingValue
As at 01.04.16
Addi�ons Sale/Disposal
As at 31.03.17
As at 01.04.16
Addi�ons Sale/ Disposal
As at 31.03.17
As at 31.03.17
Land & Site Development :
Freehold
Leasehold
701.00
797.80
—
—
—
—
701.00
797.80
—
11.18
—
11.22
—
—
—
22.40
701.00
775.40
Buildings 676.56 26.10 1.61 701.05 30.88 31.88 0.22 62.54 638.51
Plant & Equipment 1,592.79 140.74 26.67 1,706.86 150.13 144.38 14.13 280.38 1,426.48
Furniture & Fixtures 65.14 4.10 0.62 68.62 10.01 10.14 0.05 20.10 48.52
Vehicles & Fork Li�s 10.68 11.82 2.62 19.88 2.01 2.22 0.96 3.27 16.61
Office Equipment 8.66 5.82 0.12 14.36 2.55 2.57 0.04 5.08 9.28
Total 3,852.63 188.58 31.64 4,009.57 206.76 202.41 15.40 393.77 3,615.80
(`in million)
Gross Carrying Value Deprecia�on/Amor�sa�on Net CarryingValue
As at 01.04.15
Addi�ons Sale/Disposal
As at 31.03.16
As at 01.04.15
Addi�ons Sale/ Disposal
As at 31.03.16
As at 31.03.16
Land & Site Development :
Freehold
Leasehold
701.00
797.80
—
—
—
—
701.00
797.80
—
11.18
—
—
—
11.18
701.00
786.62
Buildings 652.27 27.15 2.86 676.56 31.04 0.16 30.88 645.68
Plant & Equipment 1,422.76 187.66 17.63 1,592.79 152.65 2.52 150.13 1,442.66
Furniture & Fixtures 64.54 0.67 0.07 65.14 10.01 — 10.01 55.13
Vehicles & Fork Li�s 10.42 1.30 1.04 10.68 2.14 0.13 2.01 8.67
Office Equipment 6.47 2.26 0.07 8.66 2.55 — 2.55 6.11
Total 3,655.26 219.04 21.67 3,852.63 — 209.57 2.81 206.76 3,645.87
4B : Intangible Assets Gross Carrying Value Amor�sa�on Net Carrying
Value
As at 01.04.16
Addi�ons Sale/Disposal
As at 31.03.17
As at 01.04.16
Addi�ons Sale/ Disposal
As at 31.03.17
As at 31.03.17
Computer So�ware 4.52 1.88 — 6.40 0.51 1.91 — 2.42 3.98
Gross Carrying Value Deprecia�on/Amor�sa�on Net CarryingValue
As at 01.04.15
Addi�ons Sale/Disposal
As at 31.03.16
As at 01.04.15
Addi�ons Sale/ Disposal
As at 31.03.16
As at 31.03.16
Computer So�ware 0.31 4.21 — 4.52 0.51 — 0.51 4.01
74
Kanoria Chemicals & Industries Limited
Annual Report 2016-17

5 : Investments
NOTES TO THE FINANCIAL STATEMENTS
Face ValueRs.
st 31 March 2017 st 31 March 2016 st 1 April 2015
Nos. Amount Nos. Amount Nos. Amount
(A) Non Current Investment
Investments at Cost
Equity Shares, Fully Paid (Unquoted)In Subsidiary Companies
Pipri Ltd. 10 4,650,550 48.01 4,650,550 48.01 4,650,550 48.01
APAG Holding AG, Switzerland CHF 1000 300 423.14 300 423.14 300 423.14
Kanoria Africa Tex�les PLC, Ethiopia (refer note no.41) ETB 10 22,386,068 529.24 22,386,068 529.24 16,967,000 359.06
Total Investments at Cost 1,000.39 1,000.39 830.21
Investments at Amor�sed Cost
Debenture/Bonds, Fully Paid (Unquoted)
21% Wadhwagroup Holdings Private Limited 16,667 — — — — 440 10.79
Total Investments at Amor�sed Cost — — 10.79
Investments at Fair Value through OCI
Equity Shares, Fully Paid (Quoted)
IFCI Ltd. 10 200 0.01 200 0.01 200 0.01
HDFC Bank Ltd. 2 2,500 3.61 2,500 2.68 2,500 2.56
Bank of India 10 9,000 1.25 9,000 0.87 9,000 1.76
Equity Shares, Fully Paid (Unquoted)
Enviro Technology Ltd. 10 10,000 0.10 10,000 0.10 10,000 0.10
Bharuch Enviro Infrastructure Ltd. 10 1,400 0.01 1,400 0.01 1,400 0.01
Mi�al Tower Premises Co-op. Society Ltd. 50 5 0.00 5 0.00 5 0.00
Narmada Clean Tech Limited 10 822,542 8.23 822,542 8.23 822,542 8.23
Woodlands Mul�speciality Hospital Limited 10 2,180 0.02 2,180 0.02 2,180 0.02
OPGS Power Gujarat Private Limited 0.1 — — 186,200 0.04 186,200 0.04
Debentures/Bonds, Fully Paid (Quoted)
8.48% NTPC Limited 1,000 — — 31,665 35.41 31,665 34.66
8.48% India Infrastructure Finance Company Limited 1,000 — — — — 100,000 109.50
8.5% Na�onal Highway Authority of India 1,000 100,000 117.95 100,000 112.15 100,000 109.73
8.68% Na�onal Housing Bank 5,000 10,000 59.78 10,000 56.82 10,000 55.66
11.6% ECL Finance Limited 1,000 — — — — 50,000 50.00
12.95% Cholamandalam Investment & Finance Company Ltd. 500,000 — — — — 100 52.02
11.9% India Infoline Finance Limited 1,000 — — — — 59,749 60.28
12.75% India Infoline Finance Limited 1,000 — — — — 50,000 52.25
11.85% Shriram City Union Finance Limited 1,000 — — — — 35,122 35.44
8.46% Rural Electrifica�on Corpora�on Ltd. 1,000,000 — — — — 21 22.92
8.48% Indian Railway Finance Corpora�on Ltd. 1,000,000 — — — — 50 54.74
Total Investments at Fair Value through OCI 190.96 216.34 649.93
(`in million)
75
Kanoria Chemicals & Industries Limited
Annual Report 2016-17

(`in million)
Face ValueRs.
st 31 March 2017 st 31 March 2016 st 1 April 2015
Nos. Amount Nos. Amount Nos. Amount
Investments at Fair Value through PL
Preference Shares, Fully Paid (Quoted)
16.06% Infrastucture Leasing & Financial services Limited 7,500 4,000 57.63 4,000 52.95 4,000 57.47
Mutual Funds (Quoted)
ICICI Pruden�al FMP Sr.69-1821 Days Plan I-Comula�ve 10 — — 5,000,000 63.52 5,000,000 58.90
HDFC FMP 1846 Days-Sr.27- Regular-Growth 10 — — 10,000,000 129.50 10,000,000 120.26
HDFC FMP 3360 Days-Sr.30- Regular-Growth 10 5,000,000 61.54 5,000,000 55.51 5,000,000 50.72
L&T FMP-VII (April 1124 DA)-Growth 10 — — — — 5,000,000 59.92
BSL Fixed Term Plan-Series IP (980 days)-Growth 10 — — — — 5,000,000 57.30
ICICI Pruden�al Discovery Fund- Dividend Reinvest 10 1,327,365 41.23 1,206,447 34.17 1,108,202 35.88
ICICI Focused Bluechip Equity Fund- Regular Dividend 10 — — — — 2,061,990 45.73
HDFC Small & Mid Cap Fund - Dividend Reinvest 10 — — — — 1,660,874 34.12
HDFC Equity Fund - Dividend Reinvest 10 — — — — 615,855 33.07
Reliance Vision Fund-Dividend 10 — — — — 750,510 36.30
Alterna�ve Investment Fund (Unquoted)
IIFL Real Estate Fund (Domes�c) Sr.1 16 485,955 7.79 485,955 8.35 485,955 35.04
IIFL Real Estate Fund (Domes�c) Sr.2 10 9,313,812 100.92 9,313,812 100.92 1,426,966 14.28
IIFL Real Estate Fund (Domes�c) Sr.3 10 10,000,000 106.02 10,000,000 100.01 — —
IIFL Income Opportuni�es Fund 1 9,936,715 6.52 9,936,715 12.62 9,936,715 100.42
IIFL Income Opportuni�es Fund Series-Special Situa�ons 8 4,776,976 45.89 4,776,976 53.26 2,721,410 28.15
IIFL Seed Venture Fund 10 1,663,948 23.62 681,300 7.50 — —
ICICI Pruden�al Real Estate AIF-II 100 373,935 40.65 373,935 37.57 — —
Chiratae Trust 100,000 40 3.25 20 1.48 — —
Equity Fund (Unquoted)
IIFL Assets Revival Fund 10 — — — — 3,865,706 73.44
IIFL Assets Revival Fund 2 10 4,523,997 59.68 2,500,000 25.00 — —
IIFL Na�onal Development Agenda Fund 8 4,922,035 61.62 4,922,035 53.02 4,922,035 57.44
Total Investments at Fair Value through PL 616.36 735.38 898.44
Total Non Current Investments (A) 1,807.71 1,952.11 2,389.37
NOTES TO THE FINANCIAL STATEMENTS
76
Kanoria Chemicals & Industries Limited
Annual Report 2016-17
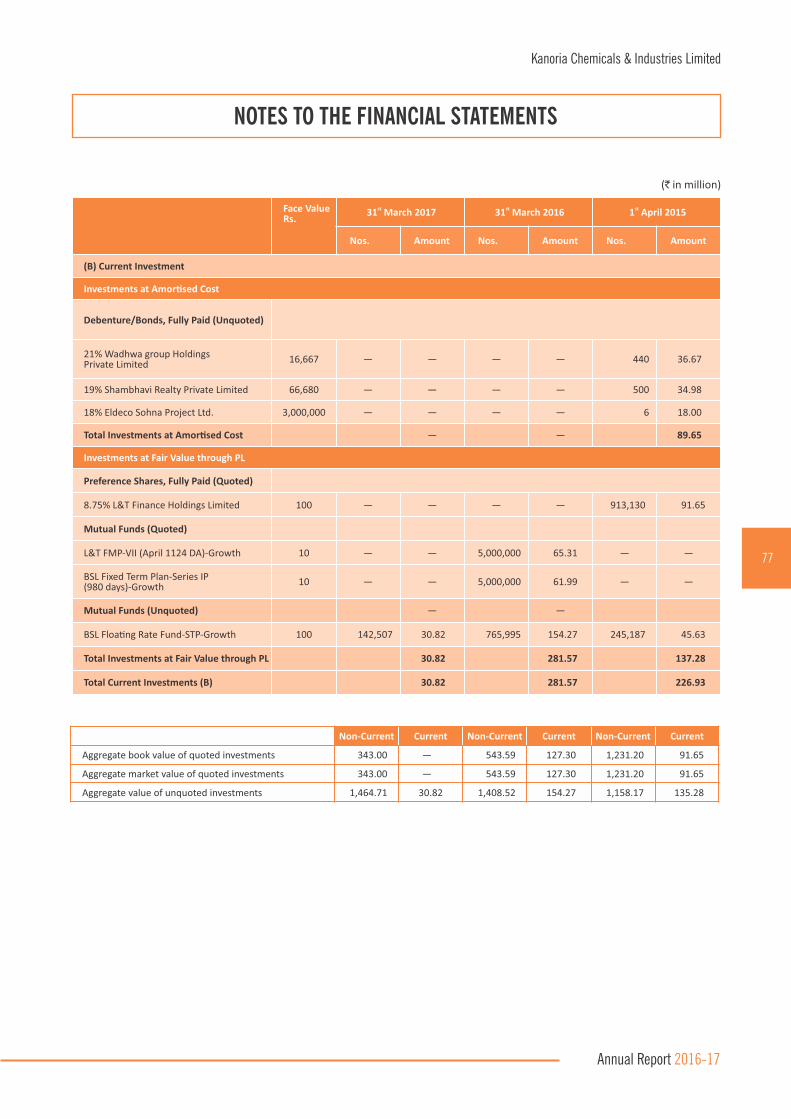
Face ValueRs.
st 31 March 2017 st 31 March 2016 st 1 April 2015
Nos. Amount Nos. Amount Nos. Amount
(B) Current Investment
Investments at Amor�sed Cost
Debenture/Bonds, Fully Paid (Unquoted)
21% Wadhwa group Holdings Private Limited 16,667 — — — — 440 36.67
19% Shambhavi Realty Private Limited 66,680 — — — — 500 34.98
18% Eldeco Sohna Project Ltd. 3,000,000 — — — — 6 18.00
Total Investments at Amor�sed Cost — — 89.65
Investments at Fair Value through PL
Preference Shares, Fully Paid (Quoted)
8.75% L&T Finance Holdings Limited 100 — — — — 913,130 91.65
Mutual Funds (Quoted)
L&T FMP-VII (April 1124 DA)-Growth 10 — — 5,000,000 65.31 — —
BSL Fixed Term Plan-Series IP (980 days)-Growth 10 — — 5,000,000 61.99 — —
Mutual Funds (Unquoted) — —
BSL Floa�ng Rate Fund-STP-Growth 100 142,507 30.82 765,995 154.27 245,187 45.63
Total Investments at Fair Value through PL 30.82 281.57 137.28
Total Current Investments (B) 30.82 281.57 226.93
(`in million)
Non-Current Current Non-Current Current Non-Current Current
Aggregate book value of quoted investments 343.00 — 543.59 127.30 1,231.20 91.65
Aggregate market value of quoted investments 343.00 — 543.59 127.30 1,231.20 91.65
Aggregate value of unquoted investments 1,464.71 30.82 1,408.52 154.27 1,158.17 135.28
NOTES TO THE FINANCIAL STATEMENTS
77
Kanoria Chemicals & Industries Limited
Annual Report 2016-17
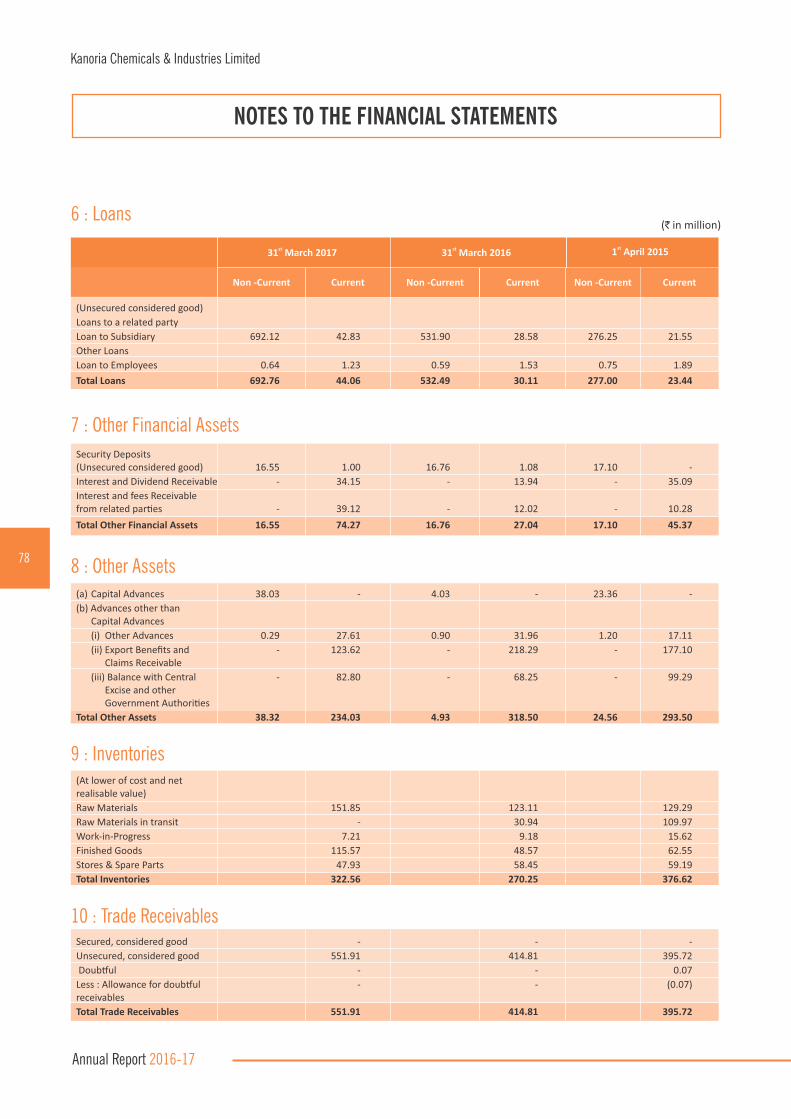
6 : Loans (`in million)
(Unsecured considered good)
Loans to a related party
Loan to Subsidiary 692.12 42.83 531.90 28.58 276.25 21.55
Other Loans
Loan to Employees 0.64 1.23 0.59 1.53 0.75 1.89
Total Loans 692.76 44.06 532.49 30.11 277.00 23.44
st1 April 2015
Non -Current Current Non -Current Non -CurrentCurrent Current
st31 March 2017 st31 March 2016
7 : Other Financial Assets
Security Deposits (Unsecured considered good) 16.55 1.00 16.76 1.08 17.10 -
Interest and Dividend Receivable - 34.15 - 13.94 - 35.09
Interest and fees Receivable from related par�es - 39.12 - 12.02 - 10.28
Total Other Financial Assets 16.55 74.27 16.76 27.04 17.10 45.37
8 : Other Assets(a) Capital Advances 38.03 - 4.03 - 23.36 -
(b) Advances other than Capital Advances
(i) Other Advances 0.29 27.61 0.90 31.96 1.20 17.11
(ii) Export Benefits and - 123.62 - 218.29 - 177.10 Claims Receivable
(iii) Balance with Central - 82.80 - 68.25 - 99.29 Excise and other Government Authori�es
Total Other Assets 38.32 234.03 4.93 318.50 24.56 293.50
9 : Inventories(At lower of cost and net realisable value)
Raw Materials 151.85 123.11 129.29
Raw Materials in transit - 30.94 109.97
Work-in-Progress 7.21 9.18 15.62
Finished Goods 115.57 48.57 62.55
Stores & Spare Parts 47.93 58.45 59.19
Total Inventories 322.56 270.25 376.62
NOTES TO THE FINANCIAL STATEMENTS
10 : Trade ReceivablesSecured, considered good - - -
Unsecured, considered good 551.91 414.81 395.72
Doub�ul - - 0.07
Less : Allowance for doub�ul - - (0.07) receivables
Total Trade Receivables 551.91 414.81 395.72
78
Kanoria Chemicals & Industries Limited
Annual Report 2016-17
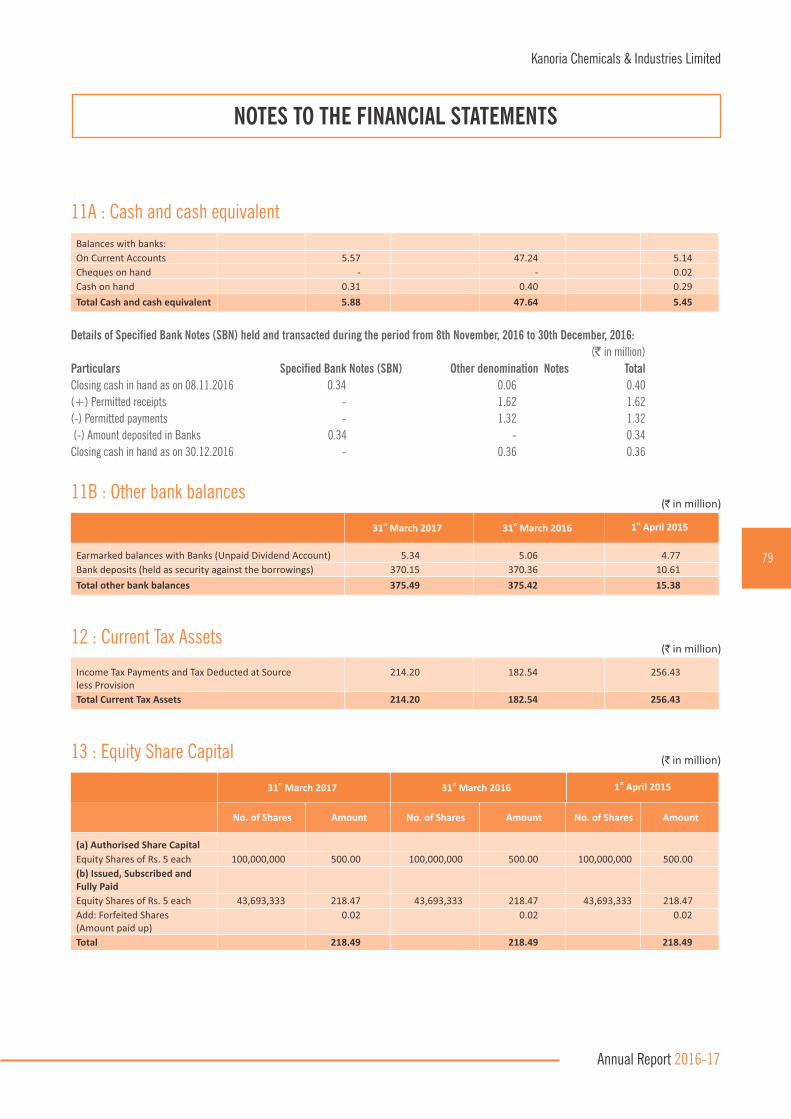
11A : Cash and cash equivalent
Balances with banks:
On Current Accounts 5.57 47.24 5.14
Cheques on hand - - 0.02
Cash on hand 0.31 0.40 0.29
Total Cash and cash equivalent 5.88 47.64 5.45
Details of Specified Bank Notes (SBN) held and transacted during the period from 8th November, 2016 to 30th December, 2016:
(`in million)
Particulars Specified Bank Notes (SBN) Other denomination Notes Total
Closing cash in hand as on 08.11.2016 0.34 0.06 0.40
(+) Permitted receipts - 1.62 1.62
(-) Permitted payments - 1.32 1.32
(-) Amount deposited in Banks 0.34 - 0.34
Closing cash in hand as on 30.12.2016 - 0.36 0.36
11B : Other bank balances(`in million)
Earmarked balances with Banks (Unpaid Dividend Account) 5.34 5.06 4.77
Bank deposits (held as security against the borrowings) 370.15 370.36 10.61
Total other bank balances 375.49 375.42 15.38
st1 April 2015st31 March 2017 st31 March 2016
12 : Current Tax Assets(`in million)
Income Tax Payments and Tax Deducted at Source 214.20 182.54 256.43 less Provision
Total Current Tax Assets 214.20 182.54 256.43
NOTES TO THE FINANCIAL STATEMENTS
13 : Equity Share Capital (`in million)
(a) Authorised Share Capital
Equity Shares of Rs. 5 each 100,000,000 500.00 100,000,000 500.00 100,000,000 500.00
(b) Issued, Subscribed and Fully Paid
Equity Shares of Rs. 5 each 43,693,333 218.47 43,693,333 218.47 43,693,333 218.47
Add: Forfeited Shares 0.02 0.02 0.02 (Amount paid up)
Total 218.49 218.49 218.49
st 1 April 2015
No. of Shares Amount No. of Shares No. of SharesAmount Amount
st31 March 2017 st31 March 2016
79
Kanoria Chemicals & Industries Limited
Annual Report 2016-17

(c) Terms/rights attached to Equity Shares
The Company has only one class of issued shares i.e. Equity Share having par value of Rs. 5 per share. Each holder of Equity Share is entitled to one vote per share and equal right for dividend. The dividend proposed by the Board of Directors is subject to the approval of shareholders in the ensuing Annual General Meeting, except in case of interim dividend. In the event of liquidation, the equity shareholders are eligible to receive the remaining assets of the Company after payment of all preferential amounts, in proportion to their shareholding.
(d) Shares held by holding company (`in million)
Vardhan Limited 26,133,872 130.67 26,133,872 130.67 26,133,872 130.67
st 1 April 2015
No. of Shares Amount No. of Shares No. of SharesAmount Amount
st31 March 2017 st31 March 2016
(e) Details of shareholders holding more than 5% shares in the company (`in million)
Vardhan Limited 26,133,872 59.81 26,133,872 59.81 26,133,872 59.81
R V Investment & Dealers Limited 3,210,120 7.35 3,210,120 7.35 3,210,120 7.35
st 1 April 2015
No. of Shares % holding No. of Shares No. of Shares% holding % holding
st31 March 2017 st31 March 2016Name of the Shareholder
(f) Shares reserved for issue under options
No Shares have been reserved for issue under options and contracts/commitments for the sale of shares/disinvestment as at the Balance Sheet date.
(g) The Company, during the year 2012-13, had bought back 12,603,167 Equity Shares of Rs. 5 each.
(h) None of the securities are convertible into shares at the end of the reporting period.
(i) No calls are unpaid by any Director or Ofcer of the Company during the year.
NOTES TO THE FINANCIAL STATEMENTS
14 : Other Equity (`in million)
Capital Reserve
As per last Balance Sheet 34.17 34.17 34.17
Capital Redemp�on Reserve
As per last Balance Sheet 72.69 72.69 72.69
Securi�es Premium Reserve
As per last Balance Sheet 161.50 161.50 161.50
Retained Earnings
As per last Balance Sheet 5,524.41 5,437.32
Add : Profit for the year 187.20 169.88
Add : Acturial gain/(loss) on defined benefit obliga�ons (4.26) (4.15)
Less : Dividend (Refer Note 33) (65.54) (65.54)
Less : Tax on Dividend (Refer Note 33) (13.34) 5,628.47 (13.10) 5,524.41 5,437.32
Other Comrehensive Income (OCI)
As per last Balance Sheet 22.57 39.02
Add : Movement in OCI (Net) during the year 5.75 28.32 (16.45) 22.57 39.02
Total Other Equity 5,925.15 5,815.34 5,744.70
st 1 April 2015 st31 March 2017 st31 March 2016
80
Kanoria Chemicals & Industries Limited
Annual Report 2016-17

(a) Loan of Rs.97.84 million is secured by rst charge and mortgage by deposit of title deeds of immovable properties and hypothecation of movable xed assets of Ankleshwar & Vizag Division, both present and future, repayable on 1st June, 2017. This loan carries interest at 3MSIBOR plus 150 bps.
(b) Loan of Rs.347.25 million is secured by xed deposit of of Rs. 359.70 million, repayable in six half yearly instalments beginning from 29th March, 2018. This loan carries interest at EURIBOR/USD LIBOR plus 105 bps.
NOTES TO THE FINANCIAL STATEMENTS
(`in million)15 : Non Current Borrowings
Term Loan
From Bank (Secured)
Foreign Currency Loan from 289.36 155.73 476.17 205.60 285.66 187.99 a Bank
Amount Disclosed under Other Financial Liabili�es (Refer Note 16) (155.73) (205.60) (187.99)
Total Non Current Borrowings 289.36 476.17 285.66
st 1 April 2015
Non -Current Current Non -Current Non -CurrentCurrent Current
st31 March 2017 st31 March 2016
16 : Other Financial Liabilities
Current maturi�es of Long
term debts - 155.73 - 205.60 - 187.99
Interest accrued but not due on borrowings - 1.08 - 1.22 - 1.47
Security Deposit - 5.14 - 5.45 - 3.54
Project liabili�es - 45.27 - 27.85 - 4.52
Unpaid Dividend - 5.34 - 5.05 - 4.77
Employee related liabili�es - 15.46 - 20.13 - 17.94
Other liabili�es 14.85 27.16 7.67 42.47 - 16.34
Total Other Financial Liabili�es 14.85 255.18 7.67 307.77 - 236.57
st1 April 2015
Non -Current Current Non -Current Non -CurrentCurrent Current
st31 March 2017 st31 March 2016
(`in million)
17 : Provisions
Provision for Gratuity 57.66 10.08 46.37 11.73 44.33 2.95
For Accrued Leave - 16.03 - 13.90 - 11.24
Total Provisions 57.66 26.11 46.37 25.63 44.33 14.19
st1 April 2015
Non -Current Current Non -Current Non -CurrentCurrent Current
st31 March 2017 st31 March 2016
(`in million)
81
Kanoria Chemicals & Industries Limited
Annual Report 2016-17
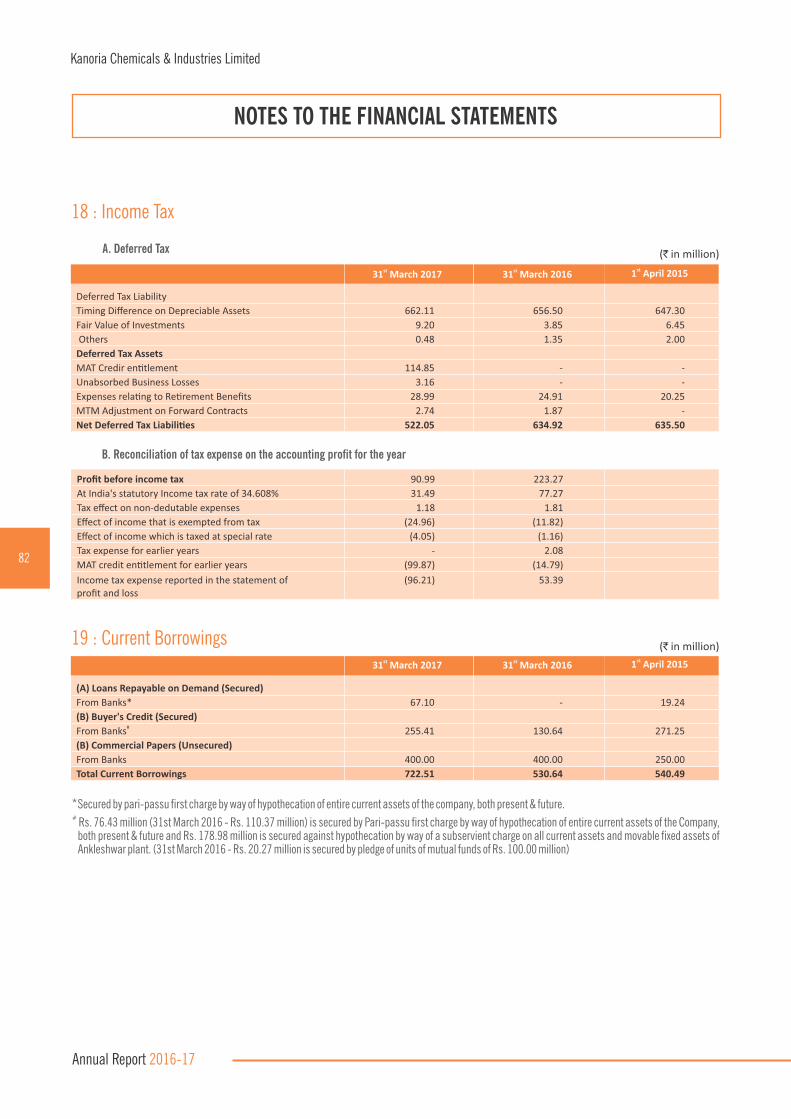
(`in million)
Deferred Tax Liability
Timing Difference on Depreciable Assets 662.11 656.50 647.30
Fair Value of Investments 9.20 3.85 6.45
Others 0.48 1.35 2.00
Deferred Tax Assets
MAT Credir en�tlement 114.85 - -
Unabsorbed Business Losses 3.16 - -
Expenses rela�ng to Re�rement Benefits 28.99 24.91 20.25
MTM Adjustment on Forward Contracts 2.74 1.87 -
Net Deferred Tax Liabili�es 522.05 634.92 635.50
st1 April 2015st31 March 2017 st31 March 2016
18 : Income Tax
NOTES TO THE FINANCIAL STATEMENTS
(`in million)
(A) Loans Repayable on Demand (Secured)
From Banks* 67.10 - 19.24
(B) Buyer's Credit (Secured)#From Banks 255.41 130.64 271.25
(B) Commercial Papers (Unsecured)
From Banks 400.00 400.00 250.00
Total Current Borrowings 722.51 530.64 540.49
st1 April 2015st31 March 2017 st31 March 2016
19 : Current Borrowings
*Secured by pari-passu rst charge by way of hypothecation of entire current assets of the company, both present & future.# Rs. 76.43 million (31st March 2016 - Rs. 110.37 million) is secured by Pari-passu rst charge by way of hypothecation of entire current assets of the Company,
both present & future and Rs. 178.98 million is secured against hypothecation by way of a subservient charge on all current assets and movable xed assets of Ankleshwar plant. (31st March 2016 - Rs. 20.27 million is secured by pledge of units of mutual funds of Rs. 100.00 million)
A. Deferred Tax
Profit before income tax 90.99 223.27
At India's statutory Income tax rate of 34.608% 31.49 77.27
Tax effect on non-dedutable expenses 1.18 1.81
Effect of income that is exempted from tax (24.96) (11.82)
Effect of income which is taxed at special rate (4.05) (1.16)
Tax expense for earlier years - 2.08
MAT credit en�tlement for earlier years (99.87) (14.79)
Income tax expense reported in the statement of (96.21) 53.39profit and loss
B. Reconciliation of tax expense on the accounting profit for the year
82
Kanoria Chemicals & Industries Limited
Annual Report 2016-17
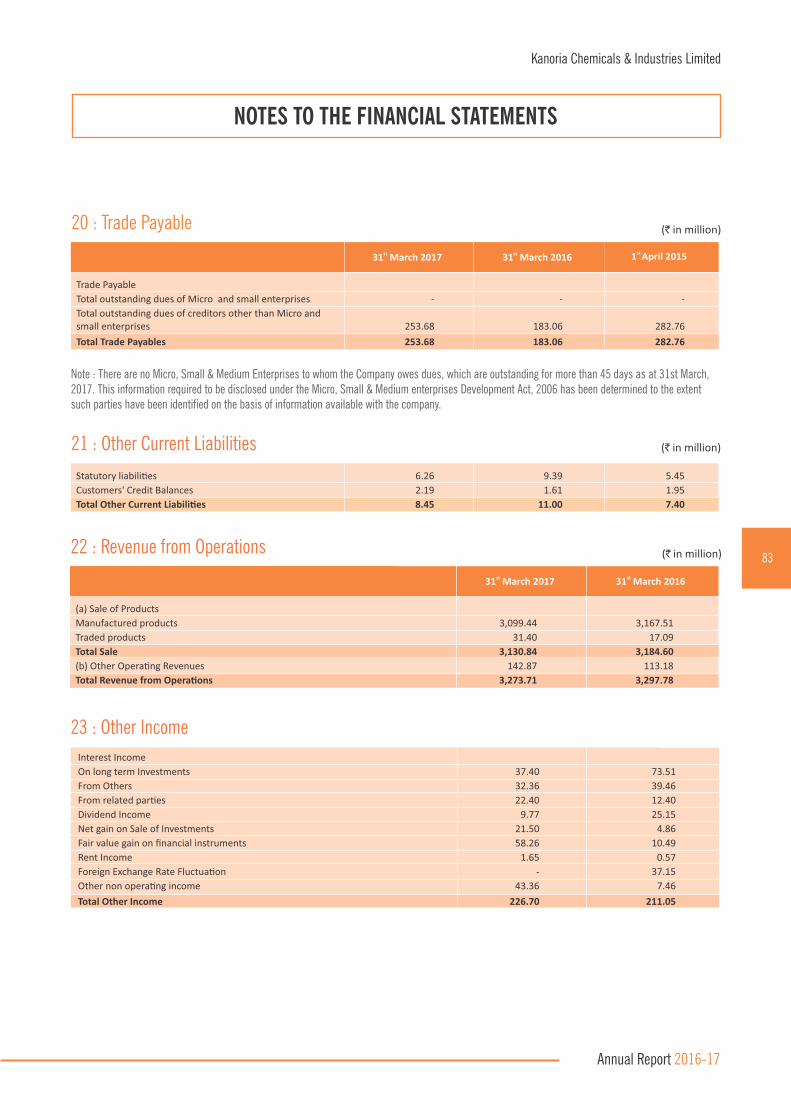
(`in million)
Trade Payable
Total outstanding dues of Micro and small enterprises - - -
Total outstanding dues of creditors other than Micro and small enterprises 253.68 183.06 282.76
Total Trade Payables 253.68 183.06 282.76
st 1 April 2015st31 March 2017 st31 March 2016
20 : Trade Payable
Note : There are no Micro, Small & Medium Enterprises to whom the Company owes dues, which are outstanding for more than 45 days as at 31st March, 2017. This information required to be disclosed under the Micro, Small & Medium enterprises Development Act, 2006 has been determined to the extent such parties have been identied on the basis of information available with the company.
Statutory liabili�es 6.26 9.39 5.45
Customers' Credit Balances 2.19 1.61 1.95
Total Other Current Liabili�es 8.45 11.00 7.40
21 : Other Current Liabilities (`in million)
NOTES TO THE FINANCIAL STATEMENTS
(a) Sale of Products
Manufactured products 3,099.44 3,167.51
Traded products 31.40 17.09
Total Sale 3,130.84 3,184.60
(b) Other Opera�ng Revenues 142.87 113.18
Total Revenue from Opera�ons 3,273.71 3,297.78
st31 March 2017 st31 March 2016
(a) Sale of Products
Manufactured products 3,099.44 3,167.51
Traded products 31.40 17.09
Total Sale 3,130.84 3,184.60
(b) Other Opera�ng Revenues 142.87 113.18
Total Revenue from Opera�ons 3,273.71 3,297.78
22 : Revenue from Operations (`in million)
(a) Sale of Products
Manufactured products 3,099.44 3,167.51
Traded products 31.40 17.09
Total Sale 3,130.84 3,184.60
(b) Other Opera�ng Revenues 142.87 113.18
Total Revenue from Opera�ons 3,273.71 3,297.78
Interest Income
On long term Investments 37.40 73.51
From Others 32.36 39.46
From related par�es 22.40 12.40
Dividend Income 9.77 25.15
Net gain on Sale of Investments 21.50 4.86
Fair value gain on financial instruments 58.26 10.49
Rent Income 1.65 0.57
Foreign Exchange Rate Fluctua�on - 37.15
Other non opera�ng income 43.36 7.46
Total Other Income 226.70 211.05
23 : Other Income
83
Kanoria Chemicals & Industries Limited
Annual Report 2016-17

st31 March 2017 st31 March 2016
Salaries, Wages, Bonus & Gratuity etc. 180.41 175.67
Contribu�on to Provident Fund 8.98 8.42
Welfare Expenses 16.46 15.24
Total Employess Benefits Expense 205.85 199.33
24 : Employee Benets Expense (`in million)
Interest expense 29.30 48.18
Bank/Finance charges 3.37 5.09
Exchange difference regarded as an adjustment to borrowing cost - 54.28
Total Finance Cost 32.67 107.55
25 : Finance Costs
Consump�on of Stores & Spare parts etc. 69.45 71.30
Other Manufacturing Expenses 18.29 23.66
Power & Fuel 234.92 277.20
Repairs to - Plant & Machinery 36.45 46.95
Buildings 1.70 4.24
Others 7.20 6.84
Water Charges & Cess 19.29 17.69
Rates & Taxes 6.65 4.42
Rent 7.39 6.87
Insurance 6.39 5.78
Legal and Professional Charges 28.54 15.83
Miscellaneous Expenses 43.33 36.74
CSR Expenditure 2.31 0.89
Foreign Exchange Rate Fluctua�on 4.02 -
Commission & Brokerage to Others 10.02 8.56
Freight, Handling & Other Charges 38.25 39.11
Directors' Fees 1.54 1.55
Travelling Expenses 15.07 12.57
Directors' Remunera�on 22.45 18.83
Provision for bad & doub�ul Debts & Advances (net) - (0.07)
Unrealized Debts and Claims wri�en off 1.55 0.56
Loss on Fixed Assets sold/discarded (Net) 0.84 0.95
Payment to Auditors 2.42 2.33
Fair Value Loss on Foreign exchange forward contracts 10.20 8.85
Total Other Expenses 588.27 611.65
Addi�onal Informa�on regarding Payment to Auditors
(a) Statutory Auditors
Audit Fees 0.80 0.80
For Cer�ficates & Others 1.06 1.09
For Travelling and out of pocket expenses 0.16 0.13
(b) Cost Auditors
Audit Fees 0.15 0.15
For Travelling and out of pocket expenses 0.10 0.03
(c) Tax Auditors
Audit Fees 0.15 0.13
Total payment to Auditors 2.42 2.33
26 : Other Expenses
NOTES TO THE FINANCIAL STATEMENTS
84
Kanoria Chemicals & Industries Limited
Annual Report 2016-17

st31 March 2017 st31 March 2016
Write down in the value of Renewable Energy Cer�ficates on reduc�on in floor price 184.17 -as no�fied by the Central Electricity Regulatory Commission
27 : Exceptional Item (`in million)
A. Items that will not be reclassified to Profit or Loss (PL) - 1. Actuarial gain/(loss) on Defined Benefit Obliga�ons (6.51) (6.34)
Income Tax Effect 2.25 2.19
2. Net gain/(loss) on FVTOCI Equity securi�es 1.31 (0.77)
Income Tax Effect - -Net OCI not to be reclassified to PL in subsequent periods (2.95) (4.92)
B. Items that will be reclassified to Profit or Loss (PL) - 1. Net gain/(loss) on FVTOCI debt securi�es 10.30 8.86
Income Tax Effect (1.19) (1.02)
2. (Gain)/loss transferred to PL upon Recycling of FVTOCI Debt Instruments (5.28) (26.59)
Income Tax Effect 0.61 3.07
Net OCI to be reclassified to PL in subsequent periods 4.44 (15.68)
Other Comprehensive Income for the year, net of tax 1.49 (20.60)
28 : Other comprehensive income (OCI)
Details for calcula�on of basic and diluted earning per share: Profit a�er tax as per Statement of Profit and Loss (Rs. In Mn) 187.20 169.88
Weighted average number of equity share 43,693,333 43,693,333
Basic and diluted earning per share (Rs.) (Face value Rs. 5 each) 4.28 3.89
29 : Earnings per share (EPS)
(i) Con�ngent Liabili�es (a) Claims/Disputed liabili�es not acknowledged as debt Excise Duty demands (paid Rs. 8.62 million) 17.84 6.60
Sales Tax demands (paid Rs. 0.43 million) 0.43 0.43
Income Tax demands (paid Rs. 55.54 million) 55.54 55.54
Other claims being disputed by the Company (paid Rs. 1.00 million) 4.19 4.19
(b) Outstanding Bank Guarantees 35.99 31.43
(ii) Commitments Es�mated amount of contracts remaining to be executed on capital account and not provided for 161.23 67.56
Advances paid 38.03 4.03
30 : Commitments and contingencies
NOTES TO THE FINANCIAL STATEMENTS
85
Kanoria Chemicals & Industries Limited
Annual Report 2016-17

st31 March 2017 st31 March 2016
32: During the year, the Company undertook CSR activities as follows:(`in million)
Cash dividends on equity shares declared and paid:Final dividend for the year ended on 31 March 2016 : INR 1.5 per share (31 March 2015: INR 1.5 per share) 65.54 65.54
DDT on final dividend 13.34 13.10
78.88 78.64
Proposed dividends on Equity shares:Final cash dividend for the year ended on 31 March 2017: INR 1.5 per share (31 March 2016: INR 1.5 per share) 65.54 65.54
DDT on proposed dividend 13.34 13.34
78.88 78.88
33 : Distribution made and proposed: (`in million)
31 : The Company has provided Corporate Guarantee to lenders for securing loans granted to its subsidiaries. An external valuer has carried out fair valuation of
the said corporate guarantee which does not result into any additional liability. The details of Corporate Guarantees are as under :
(a) Corporate Guarantee equivalent to Rs. 1,426.45 million (Previous year Rs. 1,459.32 million) given to Export-Import Bank of India for securing loan of Kanoria
Africa Textiles plc, Ethiopia (Outstanding loan US$ 21 million equivalent to Rs. 1,361.54 million)
(b) Corporate Guarantee equivalent to Rs. 276.99 million (Previous year Rs. 300.38 million) given to Ceskoslovenska obchodni banka, a.s.for securing loan of
APAG Elektronik s.r.o, Czech Republic (Outstanding loan Euro 2.61 million equivalent to Rs. 180.94 million)
Proposed dividends on equity shares are subject to approval at the annual general meeting and are not recognised as a liability (including DDT thereon) as stat 31 March 2017.
NOTES TO THE FINANCIAL STATEMENTS
Gross amount required to be spent by the Company during the year 2.31 0.59
Amount spent during the year on:Promo�on of Educa�on 1.85 0.89
Empowering women through employment enhancing skills 0.41 -
Preven�ve health care 0.05 - 2.31 0.89
86
Kanoria Chemicals & Industries Limited
Annual Report 2016-17

st31 March 2017 st31 March 2016
Gratuity Gratuity
1. Change in the Present Value of Obliga�on - Present Value of Obliga�on as at the beginning 58.10 47.28
- Current Service Cost 3.64 3.53
- Interest Expense or Cost 4.53 3.55
- Actuarial (gains) / losses arising from: change in demographic assump�ons - -
change in financial assump�ons 1.43 (1.01)
experience variance 5.07 7.35
- Past Service Cost - -
- Effect of change in foreign exchange rates - -
- Benefits paid (5.03) (2.60)
- Acquisi�ons Adjustment - -
- Effect of business combina�ons or disposals - -
- Present Value of Obliga�on as at the end 67.74 58.10
2. Expenses recognised in the statement of Profit & Loss
- Current Service Cost 3.64 3.53
- Interest Expense or Cost 4.53 3.55
- Actuarial (gains) / losses arising from: change in demographic assump�ons - -
change in financial assump�ons - - experience variance
- Past Service Cost - -
- Effect of change in foreign exchange rates- - -
- Acquisi�ons Adjustment - -
- Effect of business combina�ons or disposals
Total 8.17 7.08
3. Other Comprehensive Income - Actuarial (gains) / losses arising from:
change in demographic assump�ons - -
change in financial assump�ons 1.43 (1.01)
experience variance 5.07 7.35
Total 6.50 6.34
4. Actuarial Assump�ons
(a) Financial Assump�ons Discount rate (per annuam) 7.40% 7.80%
Salary growth rate (per annum) 7% 7%
(`in million)
34: Disclosures as required under Indian Accounting Standard 19 on "Employee Benets" A. Defined Benefit Plan
The Company has unfunded scheme for payment of gratuity to all eligible employees calculated at specied number of days of last drawn salary depending upon tenure of service for each year of completed service subject to minimum ve years of service payable at the time of separation upon superannuation or on exit otherwise.
The following tables summarise the components of net benet expense recognised in the statement of prot and loss and the funded status and amounts recognised in the balance sheet for the Post - retirement benet plans.
NOTES TO THE FINANCIAL STATEMENTS
87
Kanoria Chemicals & Industries Limited
Annual Report 2016-17

5. Sensitivity Analysis
The Sensitivity Analysis below has been determined based on reasonably possible change of the respective assumptions occurring at the end of the reporting period, while holding all other assumptions constant. These sensitivities show the hypothetical impact of a change in each of the listed assumptions in isolation. While each of these sensitivities holds all other assumptions constant, in practice such assumptions rarely change in isolation. For presenting the sensitivities, the present value of the Dened Benet Obligation has been calculated using the projected unit credit method at the end of the reporting period, which is the same as that applied in calculating the Dened Benet Obligation presented above. There was no change in the methods and assumptions used in the preparation of the Sensitivity Analysis from previous year.
The impact of Sensitivity analysis on Dened Benet Plan is given below:
st31 March 2017Par�culars st31 March 2016
Discount rate increase by 1% (64.30) (55.04)
Discount rate decrease by 1% 71.65 61.53
Salary Growth rate increase by 1% 71.63 61.52
Salary Growth rate decrease by 1% (64.25) (55.00)
(`in million)
B. Defined Contribution Plan
The Company contributes 12% of salary for all eligible employees towards Provident Fund managed either by approved trusts or by the Central Government and debit the same to statement of Prot and Loss. The provident fund set up by the employers, require interest shortfall to be met by the employers. The fund set up by the Company does not have existing decit of interest shortfall. The amount debited to Statement of Prot and Loss towards Provident Fund contribution during the year was Rs. 8.98 million (previous year Rs. 8.42 million).
35. Details of Loans given, Investment made, Guarantees given and Security provided under Section 186 (4) of the Companies Act, 2013.
Corporate Guarantees given are disclosed in Note No. 31 to the Financial Statements.
Name of the Company
Pipri Ltd.
APAG Holding AG
Kanoria Africa Tex�les Plc
APAG Holding AG
Kanoria Africa Tex�les Plc
Kanoria Africa Tex�les Plc
st 31 March 2017 st 31 March 2016 Rela�on
Subsidiary
Subsidiary
Subsidiary
Subsidiary
Subsidiary
Subsidiary
Nature
Investment in equity shares
Investment in equity shares
Investment in equity shares
Long Term Loans (Interest bearing)
Long Term Loans (Interest bearing)
Pledge of shares of Kanoria Africa
Tex�les Plc
Business
Acquisi�on
To setup green field tex�le plant
Capital Expenditure, Working Capital and
acquisi�on
Capital Expenditure and Working Capital
Borrowing by Kanoria Africa Tex�les Plc
from Export-Import Bank of India
48.01 48.01
423.14
705.05
450.11
280.10
705.05
705.05
488.12
43.79
705.05
423.14
Purpose
NOTES TO THE FINANCIAL STATEMENTS
88
Kanoria Chemicals & Industries Limited
Annual Report 2016-17

NOTES TO THE FINANCIAL STATEMENTS
36 : Related Party Disclosures(i) List of related parties and relatives with whom transaction taken place:
Rela�onship Name of the Related Par�es
Holding Company
Subsidiary Companies
Key Management Personnel (KMP)
Rela�ve of KMP
Enterprise over which KMP exercises significant influence
* Resigned on 27th May, 2016
1. Vardhan Limited
2. Pipri Limited
3. Kanoria Africa Tex�les PLC, Ethiopia
4. APAG Holding AG, Switzerland
5. APAG Elektronik AG, Switzerland
6. APAG Elektronik s.r.o., Czech Republic
7. CoSyst Control Systems GmbH, Germany
8. APAG Elektronik LLC, USA
9. APAG Elektronik S. De R.L. De C.V., Mexico
10. APAG Services S. De R.L. De C.V., Mexico
11. Mr. R. V. Kanoria - Chairman & Managing Director
12. Mr. S. V. Kanoria - Whole Time Director
13. Mr. Amitav Kothari - Director
14. Mr. H.K. Khaitan - Director
15. Mr. Ravinder Nath - Director
16. Mr. G. Parthasarathy - Director
17. Mr. S. L. Rao - Director
18. Mr. A. Vellayan - Director
19. Mrs. M. Kanoria - Director
20. Mr. T. D. Bahety - Whole Time Director*
21. Mr. A. V. Kanoria
22. Mrs. V. Kanoria
23. KPL Interna�onal Limited
24. Kanoria Employees’ Provident Fund Trust Post Employment Benefit Plan en�ty
89
Kanoria Chemicals & Industries Limited
Annual Report 2016-17
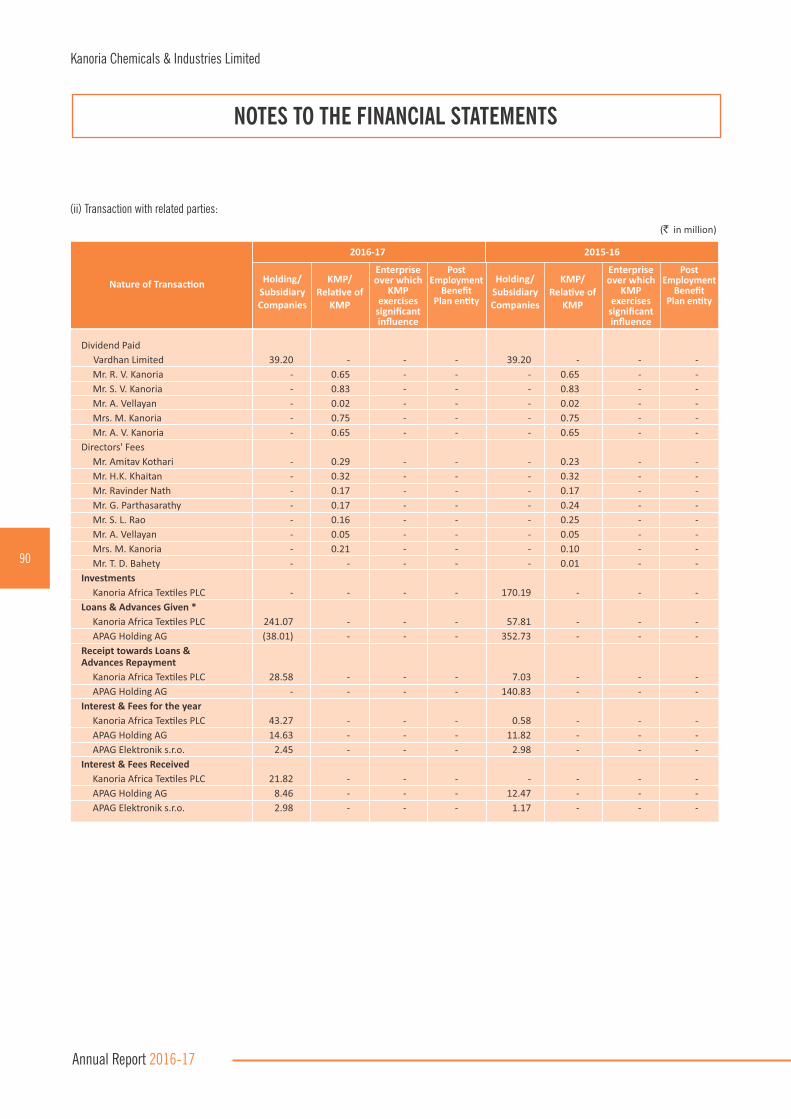
NOTES TO THE FINANCIAL STATEMENTS
(ii) Transaction with related parties:
2016-17
Nature of Transac�on
Dividend Paid
Vardhan Limited 39.20 - - - 39.20 - - -
Mr. R. V. Kanoria - 0.65 - - - 0.65 - -
Mr. S. V. Kanoria - 0.83 - - - 0.83 - -
Mr. A. Vellayan - 0.02 - - - 0.02 - -
Mrs. M. Kanoria - 0.75 - - - 0.75 - -
Mr. A. V. Kanoria - 0.65 - - - 0.65 - -
Directors' Fees
Mr. Amitav Kothari - 0.29 - - - 0.23 - -
Mr. H.K. Khaitan - 0.32 - - - 0.32 - -
Mr. Ravinder Nath - 0.17 - - - 0.17 - -
Mr. G. Parthasarathy - 0.17 - - - 0.24 - -
Mr. S. L. Rao - 0.16 - - - 0.25 - -
Mr. A. Vellayan - 0.05 - - - 0.05 - -
Mrs. M. Kanoria - 0.21 - - - 0.10 - -
Mr. T. D. Bahety - - - - - 0.01 - -
Investments
Kanoria Africa Tex�les PLC - - - - 170.19 - - -
Loans & Advances Given *
Kanoria Africa Tex�les PLC 241.07 - - - 57.81 - - -
APAG Holding AG (38.01) - - - 352.73 - - -
Receipt towards Loans & Advances Repayment
Kanoria Africa Tex�les PLC 28.58 - - - 7.03 - - -
APAG Holding AG - - - - 140.83 - - -
Interest & Fees for the year
Kanoria Africa Tex�les PLC 43.27 - - - 0.58 - - -
APAG Holding AG 14.63 - - - 11.82 - - -
APAG Elektronik s.r.o. 2.45 - - - 2.98 - - -
Interest & Fees Received
Kanoria Africa Tex�les PLC 21.82 - - - - - - -
APAG Holding AG 8.46 - - - 12.47 - - -
APAG Elektronik s.r.o. 2.98 - - - 1.17 - - -
2015-16
(` in million)
Holding/ Subsidiary Companies
KMP/ Rela�ve of
KMP
Enterprise over which
KMP exercises
significant influence
Post Employment
BenefitPlan en�ty
Holding/ Subsidiary Companies
KMP/ Rela�ve of
KMP
Enterprise over which
KMP exercises
significant influence
Post Employment
BenefitPlan en�ty
90
Kanoria Chemicals & Industries Limited
Annual Report 2016-17

NOTES TO THE FINANCIAL STATEMENTS
Name of the Related Par�es Name of the Related Par�es
Nature of Transac�on
Remunera�on
Mr. R. V. Kanoria - 14.70 - - - 12.92 - -
Mr. S. V. Kanoria - 5.16 - - - 4.89 - -
Mr. T. D. Bahety - 2.59 - - - 5.92 - -
Mrs. V. Kanoria - 2.66 - - - 2.37 - -
Commission Paid
KPL Interna�onal Limited - - 2.43 - - - 2.02 -
Rent received
KPL Interna�onal Limited - - 0.58 - - - 0.55 -
Contribu�on during the year(includes Employees' share and contribu�on)
Kanoria Employees’ Provident - - - 5.76 - - - 5.71 Fund Trust
stBalances as at 31 March
Investments
Kanoria Africa Tex�les PLC 529.24 - - - 529.24 - - -
APAG Holding AG 423.14 - - - 423.14 - - -
Loans & Advances
Kanoria Africa Tex�les PLC 284.85 - - - 72.36 - - -
APAG Holding AG 450.11 - - - 488.12 - - -
Interest and fees Receivable
Kanoria Africa Tex�les PLC 22.04 - - - 0.58 - - -
APAG Holding AG 14.63 - - - 8.46 - - -
APAG Elektronik s.r.o. 2.45 - - - 2.98 - - -
Remunera�on
Mr. S. V. Kanoria - - - - - 0.46 - -
Mrs. V. Kanoria - 0.26 - - - 0.23 - -
Maximum amount outstanding during the year Investments
Kanoria Africa Tex�les PLC 529.24 - - - 529.24 - - -
APAG Holding AG 423.14 - - - 423.14 - - -
Loans & Advances
Kanoria Africa Tex�les PLC 314.11 - - - 72.36 - - -
APAG Holding AG 488.12 - - - 488.12 - - -
Holding/ Subsidiary Companies
KMP/ Rela�ve of
KMP
Enterprise over which
KMP exercises
significant influence
Post Employment
BenefitPlan en�ty
Holding/ Subsidiary Companies
KMP/ Rela�ve of
KMP
Enterprise over which
KMP exercises
significant influence
Post Employment
BenefitPlan en�ty
(` in million)
* Includes foreign exchange rate uctuation
91
Kanoria Chemicals & Industries Limited
Annual Report 2016-17
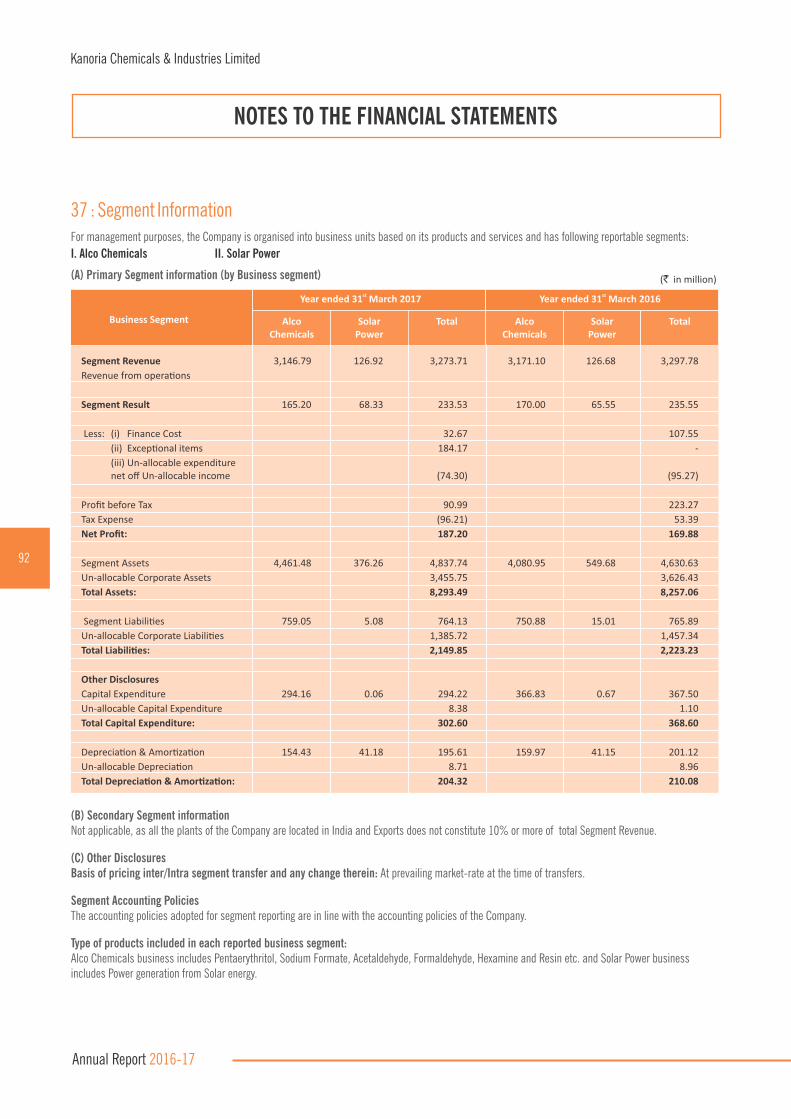
37 : Segment Information
NOTES TO THE FINANCIAL STATEMENTS
stYear ended 31 March 2017
Business Segment Alco Chemicals
Solar Power
Total Alco Chemicals
Solar Power
Total
Segment Revenue 3,146.79 126.92 3,273.71 3,171.10 126.68 3,297.78
Revenue from opera�ons
Segment Result 165.20 68.33 233.53 170.00 65.55 235.55
Less: (i) Finance Cost 32.67 107.55
(ii) Excep�onal items 184.17 -
(iii) Un-allocable expenditure net off Un-allocable income (74.30) (95.27)
Profit before Tax 90.99 223.27
Tax Expense (96.21) 53.39
Net Profit: 187.20 169.88
Segment Assets 4,461.48 376.26 4,837.74 4,080.95 549.68 4,630.63
Un-allocable Corporate Assets 3,455.75 3,626.43
Total Assets: 8,293.49 8,257.06
Segment Liabili�es 759.05 5.08 764.13 750.88 15.01 765.89
Un-allocable Corporate Liabili�es 1,385.72 1,457.34
Total Liabili�es: 2,149.85 2,223.23
Other Disclosures
Capital Expenditure 294.16 0.06 294.22 366.83 0.67 367.50
Un-allocable Capital Expenditure 8.38 1.10
Total Capital Expenditure: 302.60 368.60
Deprecia�on & Amor�za�on 154.43 41.18 195.61 159.97 41.15 201.12
Un-allocable Deprecia�on 8.71 8.96
Total Deprecia�on & Amor�za�on: 204.32 210.08
stYear ended 31 March 2016
For management purposes, the Company is organised into business units based on its products and services and has following reportable segments:
I. Alco Chemicals II. Solar Power
(A) Primary Segment information (by Business segment)
(B) Secondary Segment informationNot applicable, as all the plants of the Company are located in India and Exports does not constitute 10% or more of total Segment Revenue.
(C) Other DisclosuresBasis of pricing inter/Intra segment transfer and any change therein: At prevailing market-rate at the time of transfers.
Segment Accounting Policies The accounting policies adopted for segment reporting are in line with the accounting policies of the Company.
Type of products included in each reported business segment:Alco Chemicals business includes Pentaerythritol, Sodium Formate, Acetaldehyde, Formaldehyde, Hexamine and Resin etc. and Solar Power business includes Power generation from Solar energy.
(` in million)
92
Kanoria Chemicals & Industries Limited
Annual Report 2016-17
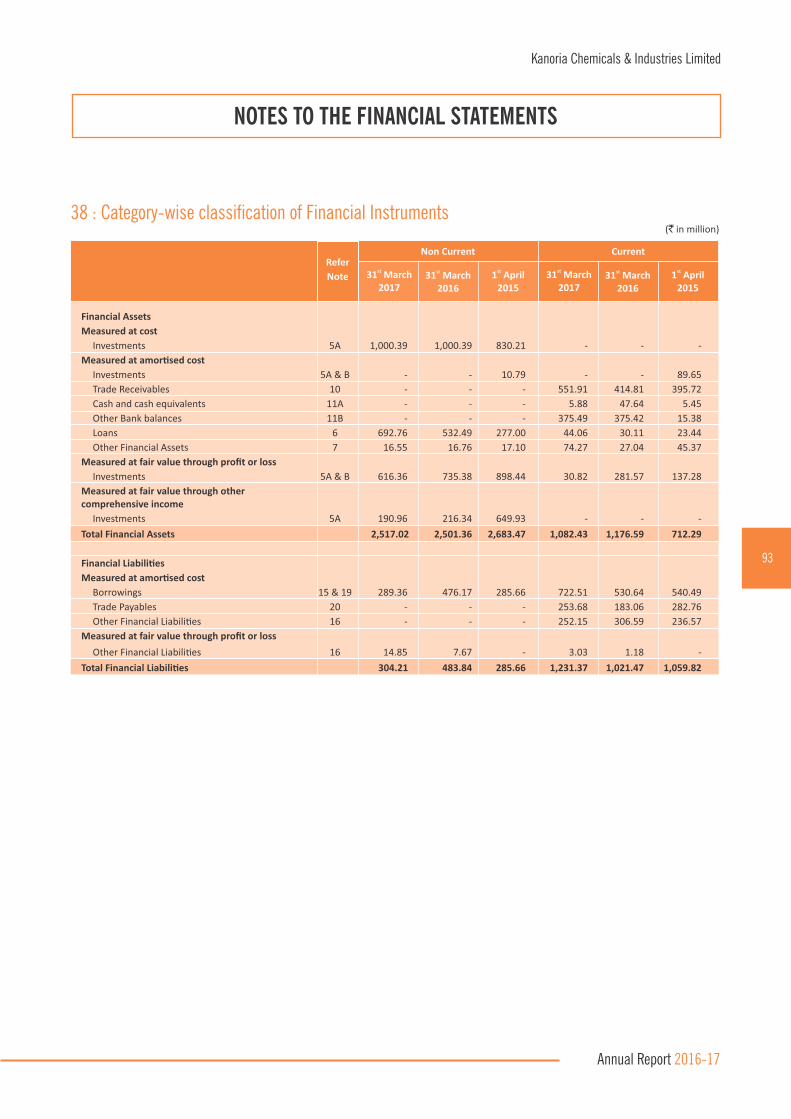
38 : Category-wise classication of Financial Instruments
NOTES TO THE FINANCIAL STATEMENTS
Non Current Current
Financial Assets
Measured at cost
Investments 5A 1,000.39 1,000.39 830.21 - - -
Measured at amor�sed cost
Investments 5A & B - - 10.79 - - 89.65
Trade Receivables 10 - - - 551.91 414.81 395.72
Cash and cash equivalents 11A - - - 5.88 47.64 5.45
Other Bank balances 11B - - - 375.49 375.42 15.38
Loans 6 692.76 532.49 277.00 44.06 30.11 23.44
Other Financial Assets 7 16.55 16.76 17.10 74.27 27.04 45.37
Measured at fair value through profit or loss
Investments 5A & B 616.36 735.38 898.44 30.82 281.57 137.28
Measured at fair value through othercomprehensive income
Investments 5A 190.96 216.34 649.93 - - -
Total Financial Assets 2,517.02 2,501.36 2,683.47 1,082.43 1,176.59 712.29
Financial Liabili�es
Measured at amor�sed cost
Borrowings 15 & 19 289.36 476.17 285.66 722.51 530.64 540.49
Trade Payables 20 - - - 253.68 183.06 282.76
Other Financial Liabili�es 16 - - - 252.15 306.59 236.57
Measured at fair value through profit or loss
Other Financial Liabili�es 16 14.85 7.67 - 3.03 1.18 -
Total Financial Liabili�es 304.21 483.84 285.66 1,231.37 1,021.47 1,059.82
Refer
Notest31 March 2016
st1 April 2015
st31 March 2017
st31 March 2016
st1 April 2015
st31 March 2017
(`in million)
93
Kanoria Chemicals & Industries Limited
Annual Report 2016-17

39 : Fair Value Measurements of Financial Instruments
The following table provides fair value measurement hierarchy of the Company's nancial assets and liabilities:
NOTES TO THE FINANCIAL STATEMENTS
(`in million)
94
Kanoria Chemicals & Industries Limited
Annual Report 2016-17
Financial assets measured at fair value through profit or loss
Quoted Preference shares 57.63 - -
Quoted Mutual funds 102.77 - -
Unquoted Mutual funds - 30.82 -
Unquoted Alternate Investment funds - 334.66 -
Unquoted Equity funds - 121.30 -
Financial assets measured at fair value through other
comprehensive income
Quoted Equity Shares 4.87 - -
Unquoted Equity Shares - - 8.36
Quoted Debentures/Bonds 177.73 - -
Financial liabili�es measured at fair value through profit or loss
Forward Exchange contract (Net) 17.88 - -
stFair value hierarchy as at 31 March 2017
Significant observable inputs (Level 2)
Significant unobservable inputs (Level 3)
Quoted prices in ac�ve markets (Level 1)
Financial assets/financial liabili�es
Financial assets measured at fair value through profit or loss Quoted Preference shares 52.95 - -
Quoted Mutual funds 410.00 - -
Unquoted Mutual funds - 154.27 -
Unquoted Alternate Investment funds - 321.71 -
Unquoted Equity funds - 78.02 -
Financial assets measured at fair value through other comprehensive income
Quoted Equity Shares 3.56 - -
Unquoted Equity Shares - - 8.40
Quoted Debentures/Bonds 204.38 - -
Financial liabili�es measured at fair value through profit or loss
Forward Exchange contract (Net) 8.85 - -
stFair value hierarchy as at 31 March 2016
Significant observable inputs (Level 2)
Significant unobservable inputs (Level 3)
Quoted prices in ac�ve markets (Level 1)
Financial assets/financial liabili�es
Financial assets measured at fair value through profit or loss Quoted Preference shares 149.12 - -
Quoted Mutual funds 532.20 - -
Unquoted Mutual funds - 45.63 -
Unquoted Alternate Investment funds - 177.89 -
Unquoted Equity funds - 130.88 -
Financial assets measured at fair value through other comprehensive income
Quoted Equity Shares 4.33 - -
Unquoted Equity Shares - - 8.40
Quoted Debentures/Bonds 637.20 - -
stFair value hierarchy as at 1 April 2015
Significant observable inputs (Level 2)
Significant unobservable inputs (Level 3)
Quoted prices in ac�ve markets (Level 1)
Financial assets/financial liabili�es
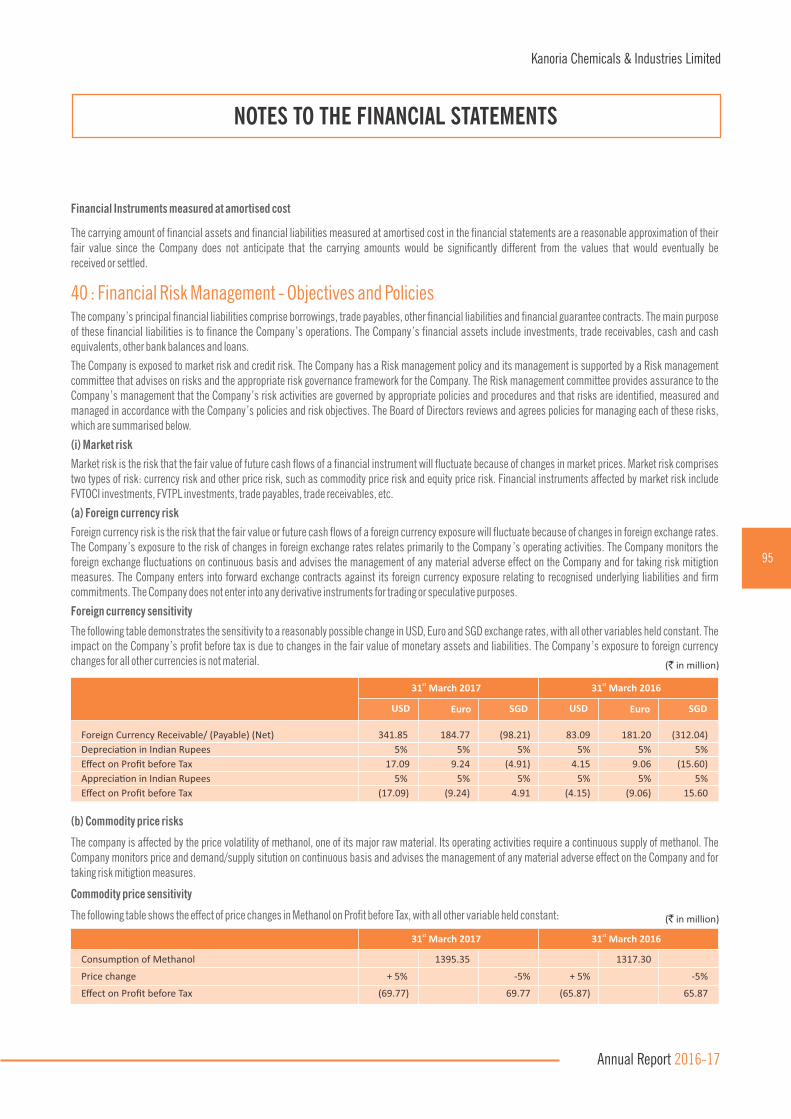
40 : Financial Risk Management - Objectives and PoliciesThe company’s principal nancial liabilities comprise borrowings, trade payables, other nancial liabilities and nancial guarantee contracts. The main purpose of these nancial liabilities is to nance the Company’s operations. The Company’s nancial assets include investments, trade receivables, cash and cash equivalents, other bank balances and loans.
The Company is exposed to market risk and credit risk. The Company has a Risk management policy and its management is supported by a Risk management committee that advises on risks and the appropriate risk governance framework for the Company. The Risk management committee provides assurance to the Company’s management that the Company’s risk activities are governed by appropriate policies and procedures and that risks are identied, measured and managed in accordance with the Company’s policies and risk objectives. The Board of Directors reviews and agrees policies for managing each of these risks, which are summarised below.
(i) Market risk
Market risk is the risk that the fair value of future cash ows of a nancial instrument will uctuate because of changes in market prices. Market risk comprises two types of risk: currency risk and other price risk, such as commodity price risk and equity price risk. Financial instruments affected by market risk include FVTOCI investments, FVTPL investments, trade payables, trade receivables, etc.
(a) Foreign currency risk
Foreign currency risk is the risk that the fair value or future cash ows of a foreign currency exposure will uctuate because of changes in foreign exchange rates. The Company’s exposure to the risk of changes in foreign exchange rates relates primarily to the Company ’s operating activities. The Company monitors the foreign exchange uctuations on continuous basis and advises the management of any material adverse effect on the Company and for taking risk mitigtion measures. The Company enters into forward exchange contracts against its foreign currency exposure relating to recognised underlying liabilities and rm commitments. The Company does not enter into any derivative instruments for trading or speculative purposes.
Foreign currency sensitivity
The following table demonstrates the sensitivity to a reasonably possible change in USD, Euro and SGD exchange rates, with all other variables held constant. The impact on the Company’s prot before tax is due to changes in the fair value of monetary assets and liabilities. The Company’s exposure to foreign currency changes for all other currencies is not material.
NOTES TO THE FINANCIAL STATEMENTS
st31 March 2017 st31 March 2016
Foreign Currency Receivable/ (Payable) (Net) 341.85 184.77 (98.21) 83.09 181.20 (312.04)
Deprecia�on in Indian Rupees 5% 5% 5% 5% 5% 5%
Effect on Profit before Tax 17.09 9.24 (4.91) 4.15 9.06 (15.60)
Apprecia�on in Indian Rupees 5% 5% 5% 5% 5% 5%
Effect on Profit before Tax (17.09) (9.24) 4.91 (4.15) (9.06) 15.60
Euro SGDUSD Euro SGDUSD
(b) Commodity price risks
The company is affected by the price volatility of methanol, one of its major raw material. Its operating activities require a continuous supply of methanol. The Company monitors price and demand/supply sitution on continuous basis and advises the management of any material adverse effect on the Company and for taking risk mitigtion measures.
(`in million)
Commodity price sensitivity
The following table shows the effect of price changes in Methanol on Prot before Tax, with all other variable held constant:
st31 March 2017 st31 March 2016
Consump�on of Methanol 1395.35 1317.30
Price change + 5% -5% + 5% -5%
Effect on Profit before Tax (69.77) 69.77 (65.87) 65.87
(`in million)
95
Kanoria Chemicals & Industries Limited
Annual Report 2016-17
Financial Instruments measured at amortised cost
The carrying amount of nancial assets and nancial liabilities measured at amortised cost in the nancial statements are a reasonable approximation of their fair value since the Company does not anticipate that the carrying amounts would be signicantly different from the values that would eventually bereceived or settled.

(c) Equity price risks
The Company’s listed and non-listed equity securities are susceptible to market price risk arising from uncertainties about future values of the investment securities. The Company manages the equity price risk through diversication and by placing limits on individual and total equity instruments/mutual funds. Reports on the investment portfolio are submitted to the Company’s management on a regular basis.
Equity price sensitivity
The following table shows the effect of price changes in quoted and unquoted equity shares (other than that in subsidiaries), quoted preference shares, quoted and unquoted equity mutual funds, unquoted alternative investment funds and unquoted equity funds.
(ii) Credit riks
Credit risk is the risk that counterparty will not meet its obligations under a nancial instrument or customer contract, leading to a nancial loss. The Company is exposed to credit risk from its operating activities (primarily trade receivables).
Trade receivables
An impairment analysis is performed at each reporting date on an individual basis for all the customers. In addition, a large number of minor receivables are grouped into homogenous groups and assessed for impairment collectively. The calculation is based on credit losses historical data. The maximum exposure to credit risk at the reporting date is the carrying value of trade receivables disclosed as the Company does not hold collateral as security. The Company has evaluated the concentration of risk with respect to trade receivables as low, as its customers are located in several jurisdictions and industries.
NOTES TO THE FINANCIAL STATEMENTS
st31 March 2017 st31 March 2016
Investment 568.05 498.81
Price change + 5% -5% + 5% -5%
Effect on Profit before Tax 28.40 (28.40) 24.94 (24.94)
(`in million)
(iii) Liquidity risk
Liquidity risk is the risk that Company will encounter difculty in raising funds to meet commitments associated with nancial instruments that are settled by delivering cash or another nancial asset. Liquidity risk may result from an inability to sell a nancial asset quickly at close to its fair value.
The Company has an established liquidity risk management framework for managing its short term, medium term and long term funding and liquidity management requirements. The Company's exposure to liquidity risk arises primarily from mismatches of the maturities of nancial asset and liabilities. The Company manages the liquidity risk by maintaining adequate funds in cash and cash equivalents. The Company also has adequate credit facilities agreed with banks to ensure that there is sufcient cash to meet all its normal operating commitments in a timely and cost-effective manner.
The table below analysis nancial liabilities of the Company into relevant maturity groupings based on the remaining period from the reporting date to the contractual maturity date. The amount disclosed in the table are the contractual undiscounted cash ow.
(`in million)
Less than 1 year Between 1 to 5 year Total Carrying valuestAs at 31 March, 2017
Borrowings (refer note 15 & 19) 878.42 289.36 1,167.78 1,167.60
Trade payable (refer note 20) 253.68 - 253.68 253.68
Other financial liabili�es (refer note 16) 99.45 14.85 114.30 114.30 stAs at 31 March, 2016
Borrowings (refer note 15 & 19) 738.16 476.35 1,214.51 1,212.41
Trade payable (refer note 20) 183.06 - 183.06 183.06
Other financial liabili�es (refer note 16) 102.17 7.67 109.84 109.84 stAs at 31 March, 2015
Borrowings (refer note 15 & 19) 732.34 287.76 1,020.10 1,014.14
Trade payable (refer note 20) 282.76 - 282.76 282.76
Other financial liabili�es (refer note 16) 48.58 - 48.58 48.58
96
Kanoria Chemicals & Industries Limited
Annual Report 2016-17
41: Capital ManagementThe Company's objective when managing capital (dened as net debt and equity) are to safeguard the Company's ability to continue as a going concern in order to provide returns to shareholders and benet for other stakeholders, while protecting and strengthening the balance sheet through the appropriate balance of debt and equity funding. The Company manages its capital structure and makes adjustments to it, in light of changes to economic conditions and strategic objectives of the Company. The Company's capital management, amongst other things, aims to ensure that it meets nancial covenants attached to the interest-bearing loans and borrowings that dene capital structure requirements. Breaches in meeting the nancial covenants would permit the bank to immediately call loans and borrowings. There have been no breaches in the nancial covenants of any interest-bearing loans and borrowing in the current period.
42: Signicant accounting judgements, estimates and assumptions
The preparation of the nancial statements requires management to make judgements, estimates and assumptions that affect the reported amounts of revenues, expenses, assets and liabilities, and the accompanying disclosures, and the disclosure of contingent liabilities. Uncertainty about these assumptions and estimates could result in outcomes that require a material adjustment to the carrying amount of assets or liabilities affected in future periods
(i) Judgements
In the process of applying the accounting policies, management has made the following judgements, which have the most signicant effect on the amounts recognised in the nancial statements:
(a) Equity Investments measured at FVTOCI
The company has exercised the option to measure investment in equity instruments, not held for trading at FVTOCI in accordance with Ind AS 109. It has exercised this irrevocable option for its class of quoted equity shares. The option renders the equity instruments elected to be measured at FVTOCI non recyclabe to PL.
(b) Business Model for Investment of Debt Instruments
For the purpose of measuring investments in debt instruments in accordance with Ind AS 109, the company has evaluated and determined that the business model for investments in quoted debentures and bonds is to collect the contractual cash ows and sell the nancial asset . Such nancial assets have been accordingly classied and measured at FVTOCI.
For the purpose of measuring investments in debt instruments in accordance with Ind AS 109, the company has evaluated and determined that the business model for investments in unquoted debentures and bonds is only to collect the contractual cash ows . Such nancial assets have been accordingly classied and measured at amortised cost.
(ii) Estimates and assumptions
The key assumptions concerning the future and other key sources of estimation uncertainty at the reporting date, that have a signicant risk of causing a material adjustment to the carrying amounts of assets and liabilities within the next nancial year, are described below. The Company based its assumptions and estimates on parameters available when the nancial statements were prepared. Existing circumstances and assumptions about future developments, however, may change due to market changes or circumstances arising that are beyond the control of the Company. Such changes are reected in the assumptions when they occur.
(a) Defined benefit plans
The cost of the dened benet gratuity plan and the present value of the gratuity obligation are determined using actuarial valuations. An actuarial valuation involves making various assumptions that may differ from actual developments in the future. These include the determination of the discount rate, future salary increases and mortality rates. Due to the complexities involved in the valuation and its long-term nature, a dened benet obligation is highly sensitive to changes in these assumptions. All assumptions are reviewed at each reporting date.
The parameter most subject to change is the discount rate. In determining the appropriate discount rate for plans operated in India, the management considers the interest rates of government bonds in currencies consistent with the currencies of the post-employment benet obligation.
(b) Fair value measurement of financial instruments
When the fair values of nancial assets and nancial liabilities recorded in the balance sheet cannot be measured based on quoted prices in active markets, their fair value is measured using valuation techniques including the DCF model. The inputs to these models are taken from observable markets where possible, but where this is not feasible, a degree of judgement is required in establishing fair values. Judgements include considerations of inputs such as liquidity risk, credit risk and volatility. Changes in assumptions about these factors could affect the reported fair value of nancial instruments.
NOTES TO THE FINANCIAL STATEMENTS
97
Kanoria Chemicals & Industries Limited
Annual Report 2016-17

(c) Depreciation / amortisation and useful lives of property plant and equipment / intangible assets
Property, plant and equipment / intangible assets are depreciated / amortised over their estimated useful lives, after taking into account estimated residual value. Management reviews the estimated useful lives and residual values of the assets annually in order to determine the amount of depreciation / amortisation to be recorded during any reporting period. The useful lives and residual values are based on the Company’s historical experience with similar assets and take into account anticipated technological changes. The depreciation / amortisation for future periods is revised if there are signicant changes from previous estimates.
(d) Impairment of non-financial assets
The Company assesses at each reporting date whether there is an indication that an asset may be impaired. If any indication exists, the Company estimates the asset’s recoverable amount. An asset’s recoverable amount is the higher of an asset’s or Cash Generating Units (CGU’s) fair value less costs of disposal and its value in use. Where the carrying amount of an asset or CGU exceeds its recoverable amount, the asset is considered impaired and is written down to its recoverable amount.
Determination of the recoverable amount involves management estimates on highly uncertain matters, such as commodity prices and their impact on markets and prices for upgraded products, development in demand, ination, operating expenses and tax and legal systems. The Company uses internal business plans, quoted market prices and the Company’s best estimate of commodity prices, currency rates, discount rates and other relevant information. A detailed forecast is developed for a period of three to ve years with projections thereafter. The Company does not include a general growth factor to volumes or cash ows for the purpose of impairment tests, however, cash ows are generally increased by expected ination and market recovery towards previously observed volumes is considered.
(e) Taxes
The Company calculates income tax expense based on reported income. Deferred income tax expense is calculated based on the differences between the carrying value of assets and liabilities for nancial reporting purposes and their respective tax basis that are considered temporary in nature. Valuation of deferred tax assets is dependent on management's assessment of future recoverability of the deferred benet. Expected recoverability may result from expected taxable income in the future, planned transactions or planned tax optimizing measures. Economic conditions may change and lead to a different conclusion regarding recoverability.
43: First-time adoption of Ind AS
The nancial statements up to and for the year ended 31 March 2016 were prepared in accordance with the Accounting Standards notied under Section 133 of
the Act read together with Rule 7 of the Companies (Accounts) Rules, 2014 (Previous GAAP) and other relevant provisions of the Act. This note explains the
principal adjustments made by the Company in restating its nancial statements prepared under Previous GAAP to that under Ind AS
Exemptions applied
Ind AS 101 - First-time adoption of Indian Accounting Standards, allows rst-time adopters certain exemptions from the retrospective application and exemption
from application of certain requirements of other Ind AS. The company has applied the following exemptions -
(i) The company has elected to measure all items of Property, plant and equipments at fair value at the date of transition to Ind AS. For the purpose of measurement
upon transition the company regards the fair value as deemed cost at the transition date, viz., 1 April 2015.
(ii) Appendix C to Ind AS 17 requires an entity to assess whether a contract or arrangement contains a lease. In accordance with Ind AS 17, this assessment should
be carried out at the inception of the contract or arrangement. However, the Company has used Ind AS 101 exemption and assessed all arrangements based for
embedded leases based on conditions in place as at the date of transition.
(iii) The Company has elected to continue with the carrying value of investment in subsidiaries as recognied in its Indian GAAP nancial statement as deemed cost,
except for one subsidiary - Kanoria Africa Textiles plc, where it has elected to fair value the investment and treat that as deemed cost at the transition date,
viz., 1 April 2015.
(iv) The Company has designated investment in equity instruments (other than investment in subsidairies) held at 1 April 2015 as fair value through Other
Comprehensive Income (OCI) investments.
(v) The estimates at 1 April 2015 and at 31 March 2016 are consistent with those made for the same dates in accordance with Indian GAAP (after adjustments to
reect any differences in accounting policies) apart from the following items where application of Indian GAAP did not require estimation:
a). FVTOCI - quoted and unquoted equity shares b). FVTOCI - debt securities
c). Impairment of nancial assets based on expected credit loss model
The estimates used by the Company to present these amounts in accordance with Ind AS reect conditions at 1 April 2015, the date of transition to Ind AS and
as of 31 March 2016.
NOTES TO THE FINANCIAL STATEMENTS
98
Kanoria Chemicals & Industries Limited
Annual Report 2016-17

stAs at 31 March 2016st As at 1 April 2015
ASSETS
Non-Current Assets
(a) Property, Plant and Equipment 1 2,215.27 1,430.60 3,645.87 2,199.38 1,455.88 3,655.26
(b) Capital Work-in-Progress 153.01 - 153.01 7.65 - 7.65
(c) Other Intangible Assets 4.02 (0.01) 4.01 0.31 - 0.31
(d) Financial Assets - - - - -
(i) Investments 2 & 3 2,043.84 (91.73) 1,952.11 2,408.99 (19.62) 2,389.37
(ii) Loans 532.48 0.01 532.49 277.00 - 277.00
(iii) Others 11 36.94 (20.18) 16.76 18.79 (1.69) 17.10
(e) Other Non-Current Assets 11 4.51 0.42 4.93 23.59 0.97 24.56
4,990.07 1,319.11 6,309.18 4,935.71 1,435.54 6,371.25
Current Assets
(a) Inventories 269.44 0.81 270.25 376.62 - 376.62
(b) Financial Assets - - - - - -
(i) Investments 3 254.05 27.52 281.57 226.50 0.43 226.93
(ii) Trade Receivables 414.81 - 414.81 395.72 - 395.72
(iii) Cash and Cash Equivalents 47.64 - 47.64 5.45 - 5.45
(iv) Bank Balances other than (iii) above 375.41 - 375.41 15.38 - 15.38
(v) Loans 30.12 - 30.12 23.44 - 23.44
(vi) Others 27.55 (0.51) 27.04 45.37 - 45.37
(c) Current Tax Assets (Net) 182.54 - 182.54 256.43 - 256.43
(d) Other Current Assets 9 317.94 0.56 318.50 292.95 0.55 293.50
1,919.50 28.38 1,947.88 1,637.86 0.98 1,638.84
Total Assets 6,909.57 1,347.49 8,257.06 6,573.57 1,436.52 8,010.09
EQUITY AND LIABILITIES
EQUITY
Equity Share Capital 218.49 - 218.49 218.49 - 218.49
Other Equity 1 to 6,8 4,812.43 1,002.91 5,815.34 4,678.32 1,066.38 5,744.70
Total Equity 5,030.92 1,002.91 6,033.83 4,896.81 1,066.38 5,963.19
Non-Current Liabili�es
(a) Financial Liabili�es
(i) Borrowings 8 476.35 (0.18) 476.17 287.76 (2.10) 285.66
(ii) Other financial liabili�es 7 23.71 (16.04) 7.67 1.62 (1.62) -
(b) Long Term Provisions 7 57.85 (11.48) 46.37 55.03 (10.70) 44.33
(c) Deferred Tax Liabili�es (Net) 6 194.06 440.86 634.92 180.79 454.71 635.50
751.97 413.16 1,165.13 525.20 440.29 965.49
Current Liabili�es
(a) Financial Liabili�es
(i) Borrowings 530.64 - 530.64 540.49 - 540.49
(ii) Trade Payables 183.06 - 183.06 282.76 - 282.76
(iii) Other financial liabili�es 7.8 308.96 (1.19) 307.77 238.78 (2.21) 236.57
(b) Other Current Liabili�es 11.00 - 11.00 7.40 - 7.40
(c) Provisions 5,7 93.02 (67.39) 25.63 82.13 (67.94) 14.19
1,126.68 (68.58) 1,058.10 1,151.56 (70.15) 1,081.41
Total Liabili�es 1,878.65 344.58 2,223.23 1,676.76 370.14 2,046.90
Total Equity and Liabili�es 6,909.57 1,347.49 8,257.06 6,573.57 1,436.52 8,010.09
Foot-notes Effect of
Transi�on to Ind AS
As per Ind AS Balance
Sheet
Previous GAAP
Effect of Transi�on to Ind AS
As per Ind AS Balance
Sheet
Previous GAAP
EFFECT OF IND AS ADOPTION ON THE BALANCE SHEETst stAs at 31 March 2016 and 1 April 2015.
(`in million)
99
Kanoria Chemicals & Industries Limited
Annual Report 2016-17

Income
Revenue from opera�ons 7 2,969.70 328.08 3,297.78
Other income 3,11 232.40 (21.35) 211.05
Total Income 3,202.10 306.73 3,508.83
Expenses
Cost of raw materials and components consumed 1,793.38 - 1,793.38 Purchase of traded goods 16.41 - 16.41
Change in inventories of finished goods
and work-in - progress 19.88 (0.80) 19.08
Excise duty on sale of goods 7 - 328.08 328.08
Employee benefits expenses 7,10 205.67 (6.34) 199.33
Deprecia�on and amor�sa�on expenses 184.11 25.97 210.08
Finance costs 4,8 103.70 3.85 107.55
Other expenses 4,11 602.94 8.71 611.65
Total expenses 2,926.09 359.47 3,285.56
Profit/(loss) before tax 276.01 (52.74) 223.27
Tax expenses:
1. Current tax 62.45 - 62.45
2. MAT (14.79) - (14.79)
3. Deferred tax 6 13.28 (9.63) 3.65
4. For earlier years 2.08 - 2.08
Profit for the year 212.99 (43.11) 169.88
Other comprehensive income (OCI)
A. Items that will not be reclassified to Profit or Loss (PL) -
1. Actuarial gain/(loss) on Defined Benefit Obliga�ons - (6.34) (6.34)
Income Tax Effect - 2.19 2.19
2. Net gain/(loss) on FVTOCI Equity securi�es - (0.77) (0.77)
Income Tax Effect - - -
Net OCI not to be reclassified to PL in
subsequent periods - (4.92) (4.92)
B. Items that will be reclassified to Profit or Loss (PL) -
1. Net gain/(loss) on FVTOCI debt securi�es - 8.86 8.86
Income Tax Effect - (1.02) (1.02)
2. (Gain)/loss transferred to PL upon Recycling of
FVTOCI Debt Instruments - (26.59) (26.59)
Income Tax Effect - 3.07 3.07
Net OCI to be reclassified to PL in subsequent periods - (15.68) (15.68)
Other Comprehensive Income for the year, net of tax - (20.60) (20.60)
Total Comprehensive Income for the year 212.99 (63.71) 149.28
Foot-notes
Effect of Transi�on to Ind AS
As per Ind AS Previous GAAP
EFFECT OF IND AS ADOPTION ON THE STATEMENT OF PROFIT AND LOSS stFor the year ended 31 March 2016
(`in million)
100
Kanoria Chemicals & Industries Limited
Annual Report 2016-17

This note explains the principal adjustments made by the company in restating its Indian GAAP nancial statements, including the balance sheet as at 1 April
2015 and the nancial statements as at and for the year ended 31 March 2016.
1. Property, Plant and Equipment
The Company has elected to measure all items of property, plant and equipment at fair value as deemed cost at the date of transition to Ind AS. Hence at the date
of transition to Ind AS, an increase in the value was recognised in property, plant and equipment with a corresponding credit to retained earnings.
2. Investment in Subsidiary
The Company has decided to measure Investment in one of its Subsidiary - Kanoria Africa Textiles plc at Fair Value as deemed cost on the date of transition. The
reduction in fair valuation has been credited in Investments with a corresponding impact taken to retained earnings.
3. Investments at Fair Value (FVTOCI and FVTPL financial assets)
Under Indian GAAP, the Company accounted for investments in quoted equity shares and long term investments in debt securities as investment measured at
cost less provision for other than temporary diminution in the value of investments. Under Ind AS, the Company has designated such investments as FVTOCI
investments. Ind AS requires FVTOCI investments to be measured at fair value. At the date of transition to Ind AS and as on 31 March 2016, difference between
the instrument's fair value and Indian GAAP carrying amount has been recognised in the OCI net of related deferred taxes.
Under Indian GAAP, the Company accounted for investments in unquoted equity shares, quoted preference shares, long term investments in mutual funds,
alternate investment funds and equity funds as investment measured at cost less provision for other than temporary diminution in the value of investments.
Under Ind AS, the Company has designated such investments as FVTPL investments. Ind AS requires FVTPL investments to be measured at fair value. At the date
of transition to Ind AS and as on 31 March 2016, difference between the instrument's fair value and Indian GAAP carrying amount has been recognised in Retained
earnings and statement of prot and loss respecively.
The difference between amortised cost and the Indian GAAP carrying amount has been recognised in retained earnings for investments measured at amortised
cost basis.
4. Derivative Instruments
The fair value of forward foreign exchange contracts is recognised under Ind AS, and was not recognised under Indian GAAP. The company was accounting for
derivate contracts under the Indian GAAP using AS 11 - 'Effects of Changes in Foreign Exchange Rates'. The difference between the fair value and the Indian GAAP
carrying amount has been recognised in retained earnings on the date of transition to Ind AS.
5. Dividend
Under Indian GAAP, proposed dividends including Dividend Distribution Taxes (DDT) are recognised as a liability in the period to which they relate, irrespective of
when they are declared. Under Ind AS, a proposed dividend is recognised as a liability in the period in which it is declared by the company (usually when approved
by shareholders in a general meeting) or paid.
In case of the Company, the declaration of dividend occurs after period end. Therefore, the liability recorded for dividend has been derecognised against retained stearnings on 1 April 2015.
6. Deferred tax
Indian GAAP requires deferred tax accounting using the income statement approach, which focuses on differences between taxable prots and accounting prots
for the period. Ind AS 12 requires entities to account for deferred taxes using the balance sheet approach, which focuses on temporary differences between the
carrying amount of an asset or liability in the balance sheet and its tax base. The application of Ind AS 12 approach has resulted in recognition of deferred tax on
new temporary differences which was not required under Indian GAAP.
In addition, the various transitional adjustments lead to temporary differences. Deferred tax adjustments are recognised in correlation to the underlying
transaction either in retained earnings or a separate component of equity.
ST STFOOTNOTES TO THE RECONCILIATION OF EQUITY AS AT 1 APRIL 2015 AND 31 MARCH 2016
STAND PROFIT OR LOSS FOR THE YEAR ENDED 31 MARCH 2016
101
Kanoria Chemicals & Industries Limited
Annual Report 2016-17
7. Re-classifications
The Company has made following re classication as per the requirements of Ind-AS:
i). Assets / liabilities which do not meet the denition of nancial asset / nancial liability have been reclassied to other asset / liability.
ii). Acturial gain/loss on long term employee benet plans are re-classied from prot and loss to OCI.
iii). Under Previous GAAP revenue from sale was shown net of excise duty, whereas under Ind AS this includes excise duty.
8. Borrowings
Under Indian GAAP, transaction costs incurred in connection with borrowings are amortised upfront and charged to prot or loss for the period. Under Ind AS,
transaction costs are included in the initial recognition amount of nancial liability and charged to prot or loss using the effective interest method.
9. Statement of cash flows
The transition from Indian GAAP to Ind AS has not had a material impact on the statement of cash ows.
10. Other comprehensive income
Under Indian GAAP, the Company has not presented other comprehensive income (OCI) separately. Hence, it has reconciled Indian GAAP prot or loss to prot or
loss as per Ind AS. Further, Indian GAAP prot or loss is reconciled to total comprehensive income as per Ind AS.
11. Security Deposit
The company has made a security deposit with a supplier as part of it's arrangement with the supplier. Under Indian GAAP, the deposit was carried at the
transaction value in the company's books. However, under Ind AS the company has measured the deposit at it's fair value by taking time value of money over the
life of the contract into consideration. The difference between the carrying value of the deposit under IGAAP and Ind AS has been adjusted as prepaid electricity
charges which is being amortised on a straight line basis over the life of contract.
As per our report annexed For SINGHI & CO.Chartered AccountantsFirm Registration No.302049E
For and on behalf of the Board,
AMITAV KOTHARIDirector
(DIN:01097705)
R. V. KANORIA Managing Director
(DIN:00003792)
N. K. NOLKHA Group Chief Financial Ofcer
N. K. SETHIACompany Secretary
ANURAG SINGHIPartnerMembership No. 66274
Place: New Delhi thDate: 30 May, 2017
ST STFOOTNOTES TO THE RECONCILIATION OF EQUITY AS AT 1 APRIL 2015 AND 31 MARCH 2016
STAND PROFIT OR LOSS FOR THE YEAR ENDED 31 MARCH 2016
44. Figures for the previous year have been regrouped/rearranged, wherever found necessary.
Signature to Note 1 to 44
102
Kanoria Chemicals & Industries Limited
Annual Report 2016-17
INDEPENDENT AUDITOR'S REPORT
TO THE MEMBERS OF KANORIA CHEMICALS & INDUSTRIES LIMITED
REPORT ON THE CONSOLIDATED INDIAN ACCOUNTING STANDARDS (IND AS) FINANCIAL STATEMENTS
We have audited the accompanying consolidated Ind AS nancial statements of KANORIA CHEMICALS & INDUSTRIES LIMITED (hereinafter referred to asst“the Company”) and its subsidiaries (collectively referred to as 'the Group') comprising of the Consolidated Balance Sheet as at 31 March 2017, the
Consolidated Statement of Prot and Loss (including other comprehensive income), Consolidated Cash Flow Statement and Consolidated Statement of Changes
in Equity for the year then ended, and a summary of signicant accounting policies and other explanatory information (hereinafter referred to as
“the Consolidated Ind AS Financial Statements”).
MANAGEMENT'S RESPONSIBILITY FOR THE CONSOLIDATED IND AS FINANCIAL STATEMENTS
The Company's Board of Directors is responsible for preparation of these consolidated Ind AS nancial statements in terms of the requirements of the Companies
Act, 2013 (“the Act”) that give a true and fair view of the consolidated nancial position, consolidated nancial performance including other comprehensive
income, consolidated cash ows and consolidated statement of changes in equity of the Group in accordance with the accounting principles generally accepted in
India, including the Indian Accounting Standards (Ind AS) prescribed under Section 133 of the Act, read with the relevant rules issued thereunder. The respective
Board of Directors / Management of the companies included in the Group is responsible for maintenance of adequate accounting records in accordance with the
provisions of the Act for safeguarding the assets of the Group and for preventing and detecting frauds and other irregularities; selection and application of
appropriate accounting policies; making judgments and estimates that are reasonable and prudent; and the design, implementation and maintenance of
adequate internal nancial controls, that were operating effectively for ensuring the accuracy and completeness of the accounting records, relevant to the
preparation and presentation of the consolidated Ind AS nancial statements that give a true and fair view and are free from material misstatement, whether due
to fraud or error, which have been used for the purpose of preparation of the consolidated Ind AS nancial statements by the Directors of the
Company, as aforesaid.
AUDITOR'S RESPONSIBILITY
Our responsibility is to express an opinion on these consolidated Ind AS nancial statements based on our audit. While conducting the audit, we have taken into
account the provisions of the Act, the accounting and auditing standards and matters which are required to be included in the audit report under the provisions of
the Act and the Rules made thereunder.
We conducted our audit of the consolidated Ind AS nancial statements in accordance with the Standards on Auditing specied under Section 143(10) of the Act
and other applicable authoritative pronouncements issued by the Institute of Chartered Accountants of India. Those Standards require that we comply with ethical
requirements and plan and perform the audit to obtain reasonable assurance about whether the consolidated Ind AS nancial statements are free
from material misstatement.
An audit involves performing procedures to obtain audit evidence about the amounts and the disclosures in the consolidated Ind AS nancial statements. The
procedures selected depend on the auditor's judgment, including the assessment of the risks of material misstatement of the consolidated Ind AS nancial
statements, whether due to fraud or error. In making those risk assessments, the auditor considers internal nancial control relevant to the Company's
preparation of the consolidated Ind AS nancial statements that give a true and fair view in order to design audit procedures that are appropriate in the
circumstances. An audit also includes evaluating the appropriateness of the accounting policies used and the reasonableness of the accounting estimates made
by the Company's Board of Directors, as well as evaluating the overall presentation of the consolidated Ind AS nancial statements.
We believe that the audit evidence obtained by us and the audit evidence obtained by the other auditor's in terms of their report referred to in sub-paragraph (3) of
the Other Matters paragraph below, other than the nancial statements as certied by the management and referred to sub paragraph (4) of the other matter
paragraph below, is sufcient and appropriate to provide a basis for our audit opinion on the consolidated Ind AS nancial statements.
OPINION
In our opinion and to the best of our information and according to the explanations given to us and based on the consideration of reports of other auditors on
separate nancial statements and on the other nancial information of the subsidiaries, the aforesaid consolidated Ind AS nancial statements give the
information required by the Act in the manner so required and give a true and fair view in conformity with the accounting principles generally accepted in India, of stthe consolidated state of affairs of the Group as at 31 March 2017 and their consolidated loss (including other comprehensive income), their consolidated cash
ows and the consolidated statement of changes in equity for the year ended on that date.
103
Kanoria Chemicals & Industries Limited
Annual Report 2016-17

INDEPENDENT AUDITOR'S REPORT
OTHER MATTERS
st 1. The corresponding nancial information of the Group as at and for the year ended March 31 , 2016 and the transition date opening balance sheet as at stApril 1 , 2015 included in these consolidated Ind AS nancial statements, are based on the previously issued Consolidated Financial Statements for
st stthe years ended March 31 , 2016 and March 31 , 2015, prepared in accordance with the Companies (Accounting Standards) Rules, 2006 (as th thamended) which were audited by us, on which we expressed an unmodied opinion in our audit report dated May 27 , 2016 and May 27 , 2015
respectively to the attached Consolidated Ind AS nancial statements. These consolidated Ind AS nancial statements have been adjusted for
differences in accounting principles to comply with Ind AS and such adjustments on transition to Ind AS which has been approved by the Company's
Board of Directors have been audited by us.
2. We did not audit the nancial statements of Pipri Ltd., an Indian subsidiary, whose nancial statements reect total assets of Rs. 164.64 million as at st31 March 2017, net assets of Rs.163.47 million, total revenues of Rs. 19.34 million and net cash outow of Rs 1.02 million for the year ended on that
date, as considered in the statements. The nancial statement have been audited by other auditor whose report has been furnished to us by the
management. These audited nancial statements have not been prepared in accordance with Indian Accounting Standards, as the subsidiary is Non
Banking Financial Company. These Financial Statement have been adjusted for difference in accounting principle to comply with the Ind AS nancial
Statement by the management of the Company. We have audited these Ind AS conversion adjustments made by the Company's management. Our
opinion on the consolidated nancial statements, insofar as it relates to the amounts and disclosures included in respect of the subsidiary, and our
report in terms of sub-section (3) of Section 143 of the Act, insofar as it relates to the aforesaid subsidiary, is based solely on the report of the other
auditor and the conversion adjustments prepared by the management of the Holding Company and audited by us.
3. We did not audit the consolidated nancial statement of APAG Holding AG and nancial Statement of Kanoria Africa Textiles PLC, the foreign stsubsidiaries whose nancial statements reect total assets of Rs. 5,135.49 million as at 31 March 2017, net assets of Rs. 281.86 million total
revenues of Rs. 4,115.01 million and net cash inow of Rs. 18.45 million for the year ended on that date, as considered in the consolidated Ind AS
nancial statements. These consolidated nancial statement/nancial statements/nancial information are audited as per the local law of the
respective countries. The Company's management has converted the nancial statements of these foreign subsidiaries from accounting principles
generally accepted in their respective countries to accounting principles generally accepted in India so as to comply with the Ind AS compliant nancial
statement. We have audited these conversion adjustments made by the Company's management. Our opinion on the consolidated nancial
statements in so far as it relates to the amounts included in respect of these foreign subsidiaries, is based solely on such nancial statement /nancial
information which have been converted into Ind AS nancial statement by the management and have been audited by us.
Our opinion on the consolidated Ind AS nancial statements, and our report on Other Legal and Regulatory Requirements below, is not modied in respect of the
above matters with respect to our reliance on the work done and the reports of the other auditors and the nancial statements / nancial information certied by
the Management.
REPORT ON OTHER LEGAL AND REGULATORY REQUIREMENTS
As required by Section 143 (3) of the Act, we report, to the extent applicable, that:
a. we have sought and obtained all the information and explanations which to the best of our knowledge and belief were necessary for the purposes of our
audit of the aforesaid consolidated nancial statements;
b. in our opinion proper books of account as required by law relating to preparation of the aforesaid consolidated nancial statements have been kept so
far as it appears from our examination of those books and the reports of the other auditors.
c. the consolidated balance sheet, the consolidated statement of prot and loss (including other comprehensive income), the consolidated cash ow
statement and the consolidated statement of changes in equity dealt with by this Report are in agreement with the relevant books of account
maintained for the purpose of preparation of the consolidated nancial statements;
d. in our opinion, the aforesaid consolidated nancial statements comply with the Indian Accounting Standards specied under Section 133 of the Act;
st e. on the basis of the written representations received from the directors of the Holding Company as on March 31 , 2017 taken on record by the Board of
Directors of the Holding Company and the reports of the statutory auditors of its subsidiary company incorporated in India, none of the directors of the stGroup companies incorporated in India is disqualied as on 31 March, 2017 from being appointed as a director in terms of Section 164 (2) of the Act;
104
Kanoria Chemicals & Industries Limited
Annual Report 2016-17

INDEPENDENT AUDITOR'S REPORT
f. with respect to the adequacy of the internal nancial controls over nancial reporting of the Group and the operating effectiveness of such controls,
refer to our separate Report in Annexure 'A'; and
g. with respect to the other matters to be included in the Auditor's Report in accordance with Rule 11 of the Companies (Audit and Auditors) Rules, 2014,
(as amended), in our opinion and to the best of our information and according to the explanations given to us and based on the consideration of the
report of the other auditors on separate nancial statements as also the other nancial information of the subsidiaries, as noted in the 'Other matter'
paragraph:
i. the consolidated nancial statements disclose the impact of pending litigation on the consolidated nancial position of the Group – Refer Note No. 30
to the consolidated nancial statements;
ii. The Group did not have any material foreseeable losses on long-term contracts including derivative contracts; and
iii. there has been no delay in transferring amounts, required to be transferred, to the Investor Education and Protection Fund by the Holding Company and
its subsidiary company, incorporated in India except for Rs. 0.55 million which is held in abeyance due to pending legal cases.
iv. In the consolidated nancial statements, holdings as well as dealings in Specied Bank Notes during the period from November 8, 2016 to
December 30, 2016 by the Company and its subsidiary incorporated in India has been requisitely disclosed, on the basis of information available with
the Company. Based on the audit procedures and relying on the management representation, we report that the disclosures are in accordance with
books of account maintained by the Company and its Subsidiary Company and produced to us by the Management and report of the other auditors -
Refer Note No 11A.
For Singhi & Co.
Chartered Accountants
Firm's Registration No. 302049E
(Anurag Singhi)
Partner
Membership No.66274
Place : New Delhi thDate : 30 May, 2017
105
Kanoria Chemicals & Industries Limited
Annual Report 2016-17

Report on the Internal Financial Controls under Clause (i) of Sub-section 3 of Section 143 of the Companies Act, 2013 (“the Act”)
We have audited the internal nancial controls over nancial reporting of KANORIA CHEMICALS & INDUSTRIES LIMITED (“the Holding Company”) and its stsubsidiary companies which are companies incorporated in India as of 31 March 2017 in conjunction with our audit of the consolidated nancial statements of
the Company for the year ended on that date.
MANAGEMENT'S RESPONSIBILITY FOR INTERNAL FINANCIAL CONTROLS
The Respective Board of Directors of the Holding Company and its subsidiary companies, which are companies incorporated in India, are responsible for
establishing and maintaining internal nancial controls based on the internal control over nancial reporting criteria established by the Company considering the
essential components of internal control stated in the Guidance Note on Audit of Internal Financial Controls over Financial Reporting issued by the Institute of
Chartered Accountants of India ('ICAI'). These responsibilities include the design, implementation and maintenance of adequate internal nancial controls that
were operating effectively for ensuring the orderly and efcient conduct of its business, including adherence to company's policies, the safeguarding of its assets,
the prevention and detection of frauds and errors, the accuracy and completeness of the accounting records, and the timely preparation of reliable nancial
information, as required under the Companies Act, 2013.
AUDITOR'S RESPONSIBILITY
Our responsibility is to express an opinion on the Company's internal nancial controls over nancial reporting based on our audit. We conducted our audit in
accordance with the Guidance Note on Audit of Internal Financial Controls over Financial Reporting (the “Guidance Note”) and the Standards on Auditing, issued
by ICAI and deemed to be prescribed under section 143 (10) of the Companies Act, 2013, to the extent applicable to an audit of internal nancial controls, both
issued by the Institute of Chartered Accountants of India. Those Standards and the Guidance Note require that we comply with ethical requirements and plan and
perform the audit to obtain reasonable assurance about whether adequate internal nancial controls over nancial reporting was established and maintained
and if such controls operated effectively in all material respects.
Our audit involves performing procedures to obtain audit evidence about the adequacy of the internal nancial controls system over nancial reporting and their
operating effectiveness. Our audit of internal nancial controls over nancial reporting included obtaining an understanding of internal nancial controls over
nancial reporting, assessing the risk that a material weakness exists, and testing and evaluating the design and operating effectiveness of internal control based
on the assessed risk. The procedures selected depend on the auditor's judgment, including the assessment of the risks of material misstatement of the nancial
statements, whether due to fraud or error.
We believe that the audit evidence we have obtained is sufcient and appropriate to provide a basis for our audit opinion on the Company's internal nancial
controls system over nancial reporting.
MEANING OF INTERNAL FINANCIAL CONTROLS OVER FINANCIAL REPORTING
A company's internal nancial control over nancial reporting is a process designed to provide reasonable assurance regarding the reliability of nancial reporting
and the preparation of nancial statements for external purposes in accordance with generally accepted accounting principles. A company's internal nancial
control over nancial reporting includes those policies and procedures that:
(1) pertain to the maintenance of records that, in reasonable detail, accurately and fairly reect the transactions and dispositions of the assets
of the company;
(2) provide reasonable assurance that transactions are recorded as necessary to permit preparation of nancial statements in accordance with generally
accepted accounting principles, and that receipts and expenditures of the company are being made only in accordance with authorizations of management
and directors of the company; and
(3) provide reasonable assurance regarding prevention or timely detection of unauthorized acquisition, use, or disposition of the company's assets that could
have a material effect on the nancial statements.
ANNEXURE-A TO THE INDEPENDENT AUDITORS' REPORT
106
Kanoria Chemicals & Industries Limited
Annual Report 2016-17

For Singhi & Co.
Chartered Accountants
Firm's Registration No. 302049E
(Anurag Singhi)
Partner
Membership No.66274
Place : New Delhi thDate : 30 May, 2017
INHERENT LIMITATIONS OF INTERNAL FINANCIAL CONTROLS OVER FINANCIAL REPORTING
Because of the inherent limitations of internal nancial controls over nancial reporting, including the possibility of collusion or improper management override of
controls, material misstatements due to error or fraud may occur and not be detected. Also, projections of any evaluation of the internal nancial controls over
nancial reporting to future periods are subject to the risk that the internal nancial control over nancial reporting may become inadequate because of changes
in conditions, or that the degree of compliance with the policies or procedures may deteriorate.
OPINION
In our opinion, the Holding Company and its subsidiary company, which are company incorporated in India, have, in all material respects, an adequate internal stnancial controls system over nancial reporting and such internal nancial controls over nancial reporting were operating effectively as at 31 March 2017,
based on the internal control over nancial reporting criteria established by the Company considering the essential components of internal control stated in the
Guidance Note on Audit of Internal Financial Controls Over Financial Reporting issued by the Institute of Chartered Accountants of India.
ANNEXURE-A TO THE INDEPENDENT AUDITORS' REPORT
107
Kanoria Chemicals & Industries Limited
Annual Report 2016-17

CONSOLIDATED BALANCE SHEET stAs at 31 March 2017
Notes stAs at 31 March 2017 stAs at 31 March 2016 stAs at 1 April 2015Par�culars
ASSETS
Non-Current Assets
(a) Property, Plant and Equipment 4A 6,922.49 4,594.27 4,495.15
(b) Capital Work-in-Progress 265.15 2,686.50 1,612.38(c) Goodwill on Consolida�on 4B 337.86 337.86 294.46
(d) Other Intangible Assets 4B 165.39 190.84 128.14(e) Financial Assets
(i) Investments 5 960.87 1,086.10 1,671.46
(ii) Loans 6 0.64 0.58 14.36
(iii) Others 7 22.52 16.76 17.10
(f) Other Non-Current Assets 8 40.35 20.94 117.35
Total Non-Current Assets 8,715.27 8,933.85 8,350.40
Current Assets
(a) Inventories 9 1,028.95 804.25 758.44
(b) Financial Assets
(i) Investments 5 41.08 288.99 248.96
(ii) Trade Receivables 10 1,144.10 876.91 747.45
(iii) Cash and Cash Equivalents 11A 157.43 181.75 332.32
(iv) Bank Balances other than above 11B 375.49 377.87 15.38
(v) Loans 6 1.26 4.36 5.14
(vi) Others 7 35.72 20.30 41.67
(c) Current Tax Assets (Net) 12 328.87 182.36 254.96
(d) Other Current Assets 8 400.29 577.60 519.18
Total Current Assets 3,513.19 3,314.39 2,923.50
Total Assets 12,228.46 12,248.24 11,273.90
EQUITY AND LIABILITIES
Equity
Equity Share Capital 13 218.49 218.49 218.49
Other Equity 14 5,582.12 5,810.17 5,940.36Equity a�ributable to equity holders of the parent 5,800.61 6,028.66 6,158.85
Non Controlling Interest 89.52 181.79 147.40
Total Equity 5,890.13 6,210.45 6,306.25
Liabili�es
Non-Current Liabili�es(a) Financial Liabili�es
(i) Borrowings 15 2,656.48 2,663.21 1,840.61
(ii) Other financial liabili�es 16 60.60 58.77 49.98
(b) Long Term Provisions 17 57.66 64.38 69.09
(c) Deferred Tax Liabili�es (Net) 18A 657.69 656.74 652.97
Total Non-Current Liabili�es 3,432.43 3,443.10 2,612.65
Current Liabili�es(a) Financial Liabili�es
(i) Borrowings 19 1,116.09 1,265.32 961.16
(ii) Trade Payables 20
Total outstanding dues of Micro and small enterprises — — —
Total outstanding dues of others 914.11 501.31 608.46
(iii) Other financial liabili�es 16 710.14 653.84 722.06
(b) Other Current Liabili�es 21 115.42 140.39 44.36
(c) Provisions 17 50.14 33.83 18.96
Total Current Liabili�es 2,905.90 2,594.69 2,355.00
Total Liabili�es 6,338.33 6,037.79 4,967.65
Total Equity and Liabili�es 12,228.46 12,248.24 11,273.90
Significant accoun�ng policies 3
The accompanying notes are an integral part of the Financial Statements.
As per our report annexed
For SINGHI & CO. For and on behalf of the Board,Chartered AccountantsFirm Registration No.302049E
Place: New Delhi th Date: 30 May, 2017
ANURAG SINGHI
N. K. NOLKHA N. K. SETHIA Group Chief Financial Ofcer Company Secretary
AMITAV KOTHARIDirector
R. V. KANORIA Managing Director
(DIN:01097705) (DIN:00003792)PartnerMembership No. 66274
(`in million)
108
Kanoria Chemicals & Industries Limited
Annual Report 2016-17
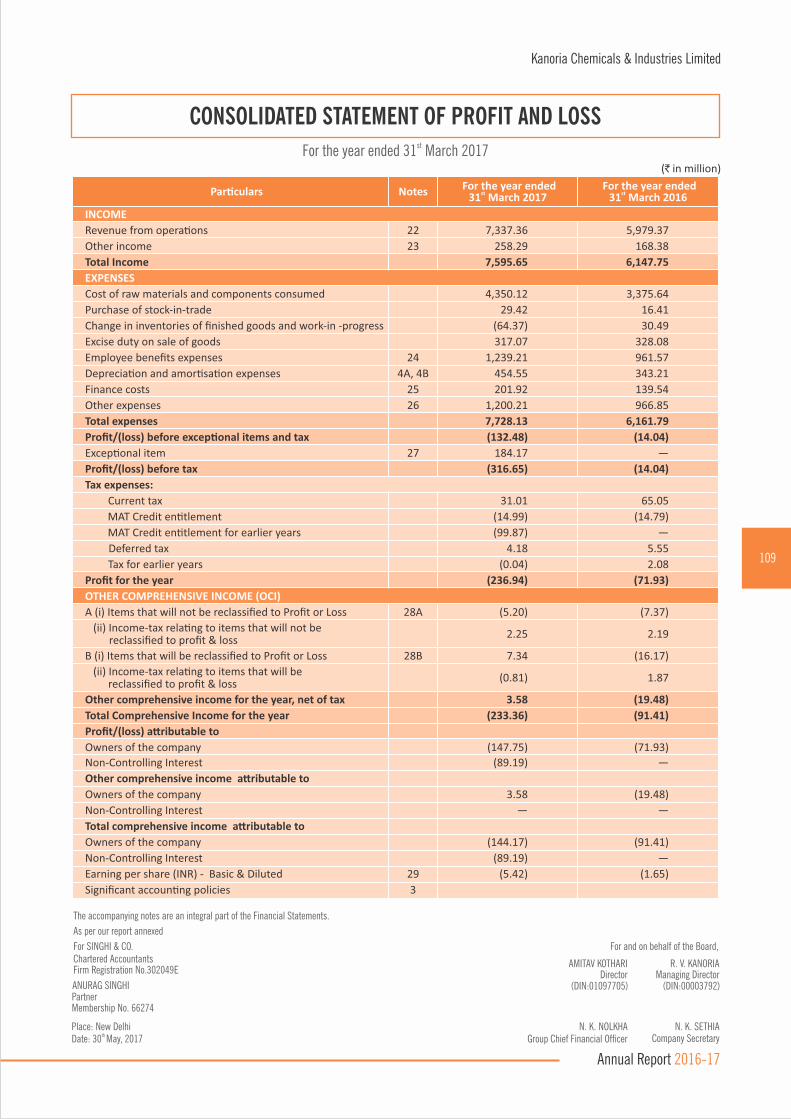
(`in million)
CONSOLIDATED STATEMENT OF PROFIT AND LOSSstFor the year ended 31 March 2017
Par�culars Notes For the year endedst31 March 2017
For the year endedst31 March 2016
INCOME
Revenue from opera�ons 22 7,337.36 5,979.37
Other income 23 258.29 168.38
Total Income 7,595.65 6,147.75
EXPENSES
Cost of raw materials and components consumed 4,350.12 3,375.64
Purchase of stock-in-trade 29.42 16.41
Change in inventories of finished goods and work-in -progress (64.37) 30.49
Excise duty on sale of goods 317.07 328.08
Employee benefits expenses 24 1,239.21 961.57
Deprecia�on and amor�sa�on expenses 4A, 4B 454.55 343.21
Finance costs 25 201.92 139.54
Other expenses 26 1,200.21 966.85
Total expenses 7,728.13 6,161.79
Profit/(loss) before excep�onal items and tax (132.48) (14.04)
Excep�onal item 27 184.17 —
Profit/(loss) before tax (316.65) (14.04)
Tax expenses:
Current tax 31.01 65.05
MAT Credit en�tlement (14.99) (14.79)
MAT Credit en�tlement for earlier years (99.87) —
Deferred tax 4.18 5.55
Tax for earlier years (0.04) 2.08
Profit for the year (236.94) (71.93)
OTHER COMPREHENSIVE INCOME (OCI)
A (i) Items that will not be reclassified to Profit or Loss 28A (5.20) (7.37)
(ii) Income-tax rela�ng to items that will not be reclassified to profit & loss
2.25 2.19
B (i) Items that will be reclassified to Profit or Loss 28B 7.34 (16.17)
(ii) Income-tax rela�ng to items that will bereclassified to profit & loss
(0.81) 1.87
Other comprehensive income for the year, net of tax 3.58 (19.48)
Total Comprehensive Income for the year (233.36) (91.41)
Profit/(loss) a�ributable to
Owners of the company (147.75) (71.93)
Non-Controlling Interest (89.19) —
Other comprehensive income a�ributable to
Owners of the company 3.58 (19.48)
Non-Controlling Interest — —
Total comprehensive income a�ributable to
Owners of the company (144.17) (91.41)
Non-Controlling Interest (89.19) —
Earning per share (INR) - Basic & Diluted 29 (5.42) (1.65)
Significant accoun�ng policies 3
(`in million)
The accompanying notes are an integral part of the Financial Statements.
As per our report annexed
For SINGHI & CO. For and on behalf of the Board,Chartered AccountantsFirm Registration No.302049E
Place: New Delhi th Date: 30 May, 2017
ANURAG SINGHI
N. K. NOLKHA N. K. SETHIA Group Chief Financial Ofcer Company Secretary
AMITAV KOTHARIDirector
R. V. KANORIA Managing Director
(DIN:01097705) (DIN:00003792)PartnerMembership No. 66274
109
Kanoria Chemicals & Industries Limited
Annual Report 2016-17

CONSOLIDATED STATEMENT OF CHANGES IN EQUITY
(`in million)
stFor the year ended 31 March 2017
(A) Equity Share Capital
stYear ended 31 March 2017 stYear ended 31 March 2016
Balance at the beginning of the repor�ng
period
Changes during the
year
Balance at the end of the repor�ng
period
Balance at the beginning of the repor�ng
period
Changes during the
year
Balance at the end of the repor�ng
period
Equity Share Capital 218.47 — 218.47 218.47 — 218.47
Add : Forfeited Shares (amount paid up) 0.02 — 0.02 0.02 — 0.02
Total 218.49 — 218.49 218.49 — 218.49
(B) Other Equity
A�ributable to the equity holders of the parent
Reserves and Surplus Items of Other Comprehensive
Income
Foreign Currency
Transla�on Reserve
Total Non Controlling
Interest
Total
Capital Reserve
Securi�es Premium Reserve
Capital Redemp�on
Reserve
Special Reserve
Retained Earnings
Equity Instruments
Debt Instruments
stAs at 1 April 2015 34.17 161.50 72.69 25.76 5,664.63 3.91 38.92 (61.22) 5,940.36 147.40 6,087.76
Profit for the year (71.93) (71.93) 34.39
Other Comprehensive Income (4.15) (0.77) (14.56) (19.48)
Total Comprehensive Income 34.17 161.50 72.69 25.76 5,588.55 3.14 24.36 (61.22) 5,848.95 181.79 6,030.74
Dividend (65.54) (65.54)
Dividend Distribu�on Tax (13.10) (13.10)
Transfer to Special Reserve 2.04 (2.04) _
Foreign Currency transla�on adjustment 26.80 13.06 39.86
stAs at 31 March 2016 34.17 161.50 72.69 27.80 5,534.67 3.14 24.36 (48.16) 5,810.17 181.79 5,991.96
Profit for the year (147.75) (147.75) (89.19)
Other Comprehensive Income (4.26) 1.31 6.53 3.58
Total Comprehensive Income 34.17 161.50 72.69 27.80 5,382.66 4.45 30.89 (48.16) 5,666.00 92.60 5,758.60
Dividend (65.54) (65.54)
Dividend Distribu�on Tax (13.34) (13.34)
Transfer to Special Reserve 2.04 (2.04) _
Foreign Currency transla�on adjustment 186.63 (191.63) (5.00) (3.08)
stAs at 31 March 2017 34.17 161.50 72.69 29.84 5,488.37 4.45 30.89 (239.79) 5,582.12 89.52 5,671.64
(`in million)
The accompanying notes are an integral part of the Financial Statements.
As per our report annexed
For SINGHI & CO. For and on behalf of the Board,Chartered AccountantsFirm Registration No.302049E
Place: New Delhi th Date: 30 May, 2017
ANURAG SINGHI
N. K. NOLKHA N. K. SETHIA Group Chief Financial Ofcer Company Secretary
AMITAV KOTHARIDirector
R. V. KANORIA Managing Director
(DIN:01097705) (DIN:00003792)PartnerMembership No. 66274
110
Kanoria Chemicals & Industries Limited
Annual Report 2016-17
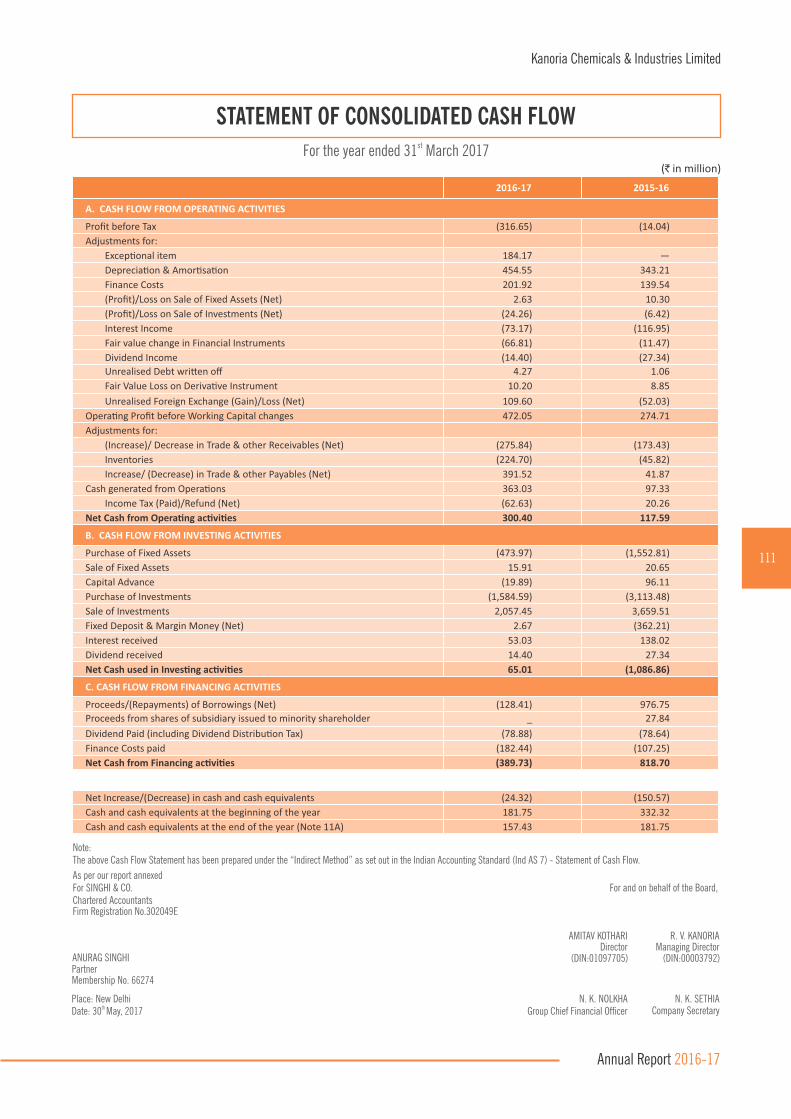
Note:The above Cash Flow Statement has been prepared under the “Indirect Method” as set out in the Indian Accounting Standard (Ind AS 7) - Statement of Cash Flow.
As per our report annexedFor SINGHI & CO. For and on behalf of the Board,Chartered AccountantsFirm Registration No.302049E
STATEMENT OF CONSOLIDATED CASH FLOW
2016-17 2015-16
A. CASH FLOW FROM OPERATING ACTIVITIES
Profit before Tax (316.65) (14.04)
Adjustments for:
Excep�onal item 184.17 —
Deprecia�on & Amor�sa�on 454.55 343.21
Finance Costs 201.92 139.54
(Profit)/Loss on Sale of Fixed Assets (Net) 2.63 10.30
(Profit)/Loss on Sale of Investments (Net) (24.26) (6.42)
Interest Income (73.17) (116.95)
Fair value change in Financial Instruments (66.81) (11.47)
Dividend Income (14.40) (27.34)
Unrealised Debt wri�en off 4.27 1.06
Fair Value Loss on Deriva�ve Instrument 10.20 8.85
Unrealised Foreign Exchange (Gain)/Loss (Net) 109.60 (52.03)
Opera�ng Profit before Working Capital changes 472.05 274.71
Adjustments for:
(Increase)/ Decrease in Trade & other Receivables (Net) (275.84) (173.43)
Inventories (224.70) (45.82)
Increase/ (Decrease) in Trade & other Payables (Net) 391.52 41.87
Cash generated from Opera�ons 363.03 97.33
Income Tax (Paid)/Refund (Net) (62.63) 20.26
Net Cash from Opera�ng ac�vi�es 300.40 117.59
B. CASH FLOW FROM INVESTING ACTIVITIES
Purchase of Fixed Assets (473.97) (1,552.81)
Sale of Fixed Assets 15.91 20.65
Capital Advance (19.89) 96.11
Purchase of Investments (1,584.59) (3,113.48)
Sale of Investments 2,057.45 3,659.51
Fixed Deposit & Margin Money (Net) 2.67 (362.21)
Interest received 53.03 138.02
Dividend received 14.40 27.34
Net Cash used in Inves�ng ac�vi�es 65.01 (1,086.86)
C. CASH FLOW FROM FINANCING ACTIVITIES
Proceeds/(Repayments) of Borrowings (Net) (128.41) 976.75
Proceeds from shares of subsidiary issued to minority shareholder _ 27.84
Dividend Paid (including Dividend Distribu�on Tax) (78.88) (78.64)
Finance Costs paid (182.44) (107.25)
Net Cash from Financing ac�vi�es (389.73) 818.70
Net Increase/(Decrease) in cash and cash equivalents (24.32) (150.57)
Cash and cash equivalents at the beginning of the year 181.75 332.32
Cash and cash equivalents at the end of the year (Note 11A) 157.43 181.75
(`in million)
stFor the year ended 31 March 2017
Place: New Delhi th Date: 30 May, 2017
ANURAG SINGHI
N. K. NOLKHA N. K. SETHIA Group Chief Financial Ofcer Company Secretary
AMITAV KOTHARIDirector
R. V. KANORIA Managing Director
(DIN:01097705) (DIN:00003792)PartnerMembership No. 66274
111
Kanoria Chemicals & Industries Limited
Annual Report 2016-17

NOTES TO THE CONSOLIDATED FINANCIAL STATEMENTS
1. Corporate Information Kanoria Chemicals & Industries Limited (the Company or Parent Company) having its registered ofce at ‘Park Plaza’, 71 Park Street,
Kolkata – 700 016, India is a Public Limited Company incorporated and domiciled in India. The Equity Shares of the Company are listed on National
Stock Exchange of India Ltd. and BSE Ltd. The Consolidated Financial Statements (CFS) comprise nancial statements of Kanoria Chemicals & stIndustries Ltd. and its subsidiaries (collectively the Group) as at and for the year ended 31 March 2017. The Group is primarily engaged in
manufacture of Industrial Chemicals, Electronic Automotive and Textiles.
2. Basis of Preparation A. Statement of compliance These Consolidated nancial Statements have been prepared in accordance with the Indian Accounting Standards (Ind AS) as per the Companies
(Indian Accounting Standards) Rules, 2015 (as amended) notied under Section 133 of Companies Act, 2013 (the Act) and other relevant
provisions of the Act.st The Consolidated nancial Statements up to and for the year ended 31 March 2016 were prepared in accordance with the Accounting Standards
notied under Section 133 of the Act read together with Rule 7 of the Companies (Accounts) Rules, 2014 (Previous GAAP) and other relevant
provisions of the Act.
These are the rst Consolidated nancial Statements prepared in accordance with Ind AS and therefore, Ind AS 101, First-time Adoption of Indian st Accounting Standards has been applied in preparation of opening Balance Sheet as at 1 April 2015, the date of transition to Ind AS. An
explanation of how the transition to Ind AS has affected the previously reported nancial position and nancial performance of the Group is
provided in Note 42.th These Consolidated nancial Statements have been approved for issue by the Board of Directors on 30 May 2017.
B. Principles of Consolidation
The consolidated nancial statements have been prepared on the following basis:
i. The nancial statements of the Company and its subsidiaries are combined on a line by line basis by adding together like items of assets,
liabilities, equity, incomes, expenses and cash ows, after fully eliminating intra-group balances and intra-group transactions.
ii. Prots or losses resulting from intra-group transactions that are recognised in assets, such as inventory and property, plant & equipment,
are eliminated in full.
iii. In case of foreign subsidiaries, revenue items are consolidated at the average monthly rate prevailing during the year. All assets and
liabilities are converted at rates prevailing at the end of the year. Any exchange difference arising on consolidation is recognised in the
Foreign Currency Translation Reserve.
iv. Offset (eliminate) the carrying amount of the parent’s investment in each subsidiary and the parent’s portion of equity of each subsidiary.
v. Non Controlling Interest’s share of prot / loss of consolidated subsidiaries for the year is identied and adjusted against the income of the
group in order to arrive at the net income attributable to shareholders of the Company.
vi. Non Controlling Interest’s share of net assets of consolidated subsidiaries is identied and presented in the Consolidated Balance Sheet
separate from liabilities and the equity of the Company’s shareholders.
C. Functional and presentation currency
These Consolidated nancial Statements are presented in Indian Rupees (INR), which is also the Parent Company’s functional currency. All
amounts have been rounded off to the nearest two decimals of millions, unless otherwise indicated.
D. Historical cost convention
The Consolidated nancial Statements have been prepared following accrual basis of accounting on a historical cost basis, except for the
following which are measured at fair value: i. Certain nancial assets and liabilities ii. Property, plant & equipment iii. Dened benet plans
112
Kanoria Chemicals & Industries Limited
Annual Report 2016-17

E. Fair value measurement
A number of Group’s accounting policies and disclosures require fair value measurement for both nancial and non-nancial
assets and liabilities.
All assets and liabilities for which fair value is measured or disclosed in the Consolidated nancial Statements are categorised within the fair
value hierarchy, based on the lowest level input that is signicant to the fair value measurement, as under:
i. Level 1 — Quoted (unadjusted) market prices in active markets for identical assets or liabilities
ii. Level 2 — Valuation techniques for which the lowest level input that is signicant to the fair value measurement is directly or
indirectly observable
iii. Level 3 — Valuation techniques for which the lowest level input that is signicant to the fair value measurement is unobservable
For assets and liabilities that are recognised in the Consolidated nancial Statements on a recurring basis, the Group determines whether
transfers have occurred between levels in the hierarchy by re-assessing categorisation, based on the lowest level input that is signicant to the
fair value measurement, at the end of each reporting period.
The Group uses valuation techniques that are appropriate in the circumstances and for which sufcient data are available to measure fair value,
maximising the use of relevant observable inputs and minimising the use of unobservable inputs. External valuers are involved for valuation of
signicant assets and liabilities. Involvement of external valuers is decided upon annually by the Management. Selection criteria include market
knowledge, reputation, independence and whether professional standards are maintained. The Management decides, after discussions with the
Group’s external valuers, which valuation techniques and inputs to use for each case.
At each reporting date, the Management analyses the movements in the values of assets and liabilities which are required to be re-measured or
re-assessed as per the Group's accounting policies. For this analysis, the Management veries the major inputs applied in the latest valuation by
agreeing the information in the valuation computation to contracts and other relevant documents.
For the purpose of fair value disclosures, the Group has determined classes of assets and liabilities on the basis of the nature, characteristics and
risks of the asset or liability and the level of the fair value hierarchy as explained above.
F. Current versus non-current classification
The Group presents assets and liabilities in the balance sheet based on current/non-current classication.
An asset or liability is treated as current if it satises any of the following condition:
i. the asset/liability is expected to be realised/settled in normal operating cycle;
ii. the asset is intended for sale or consumption;
iii. the asset/liability is held primarily for the purpose of trading;
iv. the asset/liability is expected to be realised/settled within twelve months after the reporting period;
v. the asset is Cash or cash equivalent unless restricted from being exchanged or used to settle a liability for at least twelve months after
the reporting period;
vi. in the case of a liability, the Group does not have an unconditional right to defer settlement of the liability for at least twelve months after
the reporting period;
All other assets and liabilities are classied as non-current.
Deferred tax assets and liabilities are classied as non-current assets and liabilities.
The operating cycle is the time between the acquisition of assets for processing and their realisation in cash and cash equivalents. The
Group has identied twelve months as its operating cycle.
NOTES TO THE CONSOLIDATED FINANCIAL STATEMENTS
113
Kanoria Chemicals & Industries Limited
Annual Report 2016-17

G. Use of estimates and judgements
In preparing these Consolidated nancial Statements, management has made judgements, estimates and assumptions that affect the
application of accounting policies and the reported amounts of assets, liabilities, income and expenses and the accompanying disclosures and
disclosure of contingent liabilities. Actual results may differ from these estimates.
Estimates and underlying assumptions are reviewed on an ongoing basis and are based on historical experience and other factors, including
expectation of future events that may have a nancial impact on the Company and that are believed to be reasonable under the circumstances.
The revisions in accounting estimates and assumptions are recognised prospectively.
Detailed information about estimates and judgements is included in Note 41.
3. Signicant Accounting Policy A. Foreign Currency Transactions
Foreign currency transactions are translated into the functional currency of each Company in the Group, at the exchange rates on the date the
transaction rst qualies for recognition.
Monetary assets and liabilities denominated in foreign currencies are translated into the functional currency at the exchange rate at the reporting
date. Exchange difference arising on settlement or translation of monetary items are recognised in the Consolidated Statement of Prot and Loss
on net basis.
Non-monetary items that are measured in terms of historical cost in a foreign currency are translated using the exchange rates at the dates of the
initial transactions. Non-monetary items measured at fair value in a foreign currency are translated using the exchange rates at the date when
the fair value is determined. The gain or loss arising on translation of non-monetary items measured at fair value is treated in line with the
recognition of the gain or loss on the change in fair value of the item i.e., translation differences on items whose fair value gain or loss is
recognised in OCI or Consolidated Statement of Prot and Loss are also recognised in OCI or Consolidated Statement of Prot
and Loss, respectively.
B. Property, Plant & Equipment
i. Recognition & Measurement
All items of property, plant and equipment (PPE) are stated at cost less accumulated depreciation and impairment, if any. Cost of an item of
PPE includes its purchase cost, non refundable taxes and duties, directly attributable cost of bringing the item to its working condition for its
intended use and borrowing cost if the recognition criteria is met.
Subsequent costs are included in an item of PPE‘s carrying value or recognised as a separate item, as appropriate, only when it is probable
that future economic benets associated with the item will ow to the Company and the cost of the item can be measured reliably. All other
repairs and maintenance are charged to the Consolidated Statement of Prot and Loss during the reporting period in which they are incurred.
Capital work-in-progress is stated at cost.
An item of PPE or any signicant part thereof is derecognised upon disposal or when no future economic benets are expected from its use.
Any gain or loss on derecognition of an item of PPE is recognised in Consolidated Statement of Prot and Loss.
ii. Transition to Ind AS
On transition to Ind AS the Company and one of its subsidiary has elected to measure all items of PPE at fair value and use that as the deemed
cost of such PPE.
iii. Depreciation methods, estimated useful lives and residual value
Depreciation on all items of PPE is calculated using the straight line method to allocate their cost, net of their residual value, over their
estimated useful lives as prescribed in Schedule II to the Act and/or based on the local requirements in respect of foreign subsidiaries.
Depreciation on an item of PPE purchased/sold during the year is provided on pro-rata basis.Freehold land is not depreciated.
NOTES TO THE CONSOLIDATED FINANCIAL STATEMENTS
114
Kanoria Chemicals & Industries Limited
Annual Report 2016-17

The residual values are not more than 5% of the cost of an item of PPE.
Depreciation methods, useful lives and residual values are reviewed at the end of each nancial year and adjusted prospectively, if appropriate.
C. Intangible Assets
IIntangible assets acquired are initially measured at cost. Such intangible assets are subsequently measured at cost less accumulated
amortisation and impairment losses, if any.
Internally generated development expenditure is capitalised as part of the cost of the resulting intangible assets only if the expenditure can be
measured reliably, the product or process is technically and commercially feasible, future economic benets are probable, and the Group
intends to and has sufcient resources to complete development and to use or sell the asset. Otherwise it is recognised in the Consolidated
Statement of Prot and Loss as incurred. Subsequent to initial recognition, the asset is measured at cost less accumulated amortisation and any
accumulated impairment losses
Goodwill is not amortised and is tested for impairment annually.
On transition to Ind As the Group has elected to continue with the carrying value of all its intangible assets recognised as at 1 April 2015,
measured as per previous GAAP, and use that carrying value as the deemed cost of such intangible assets.
The Group amortises intangible assets with a nite useful life using the straight line method over the following periods :
Computer Softwares - 3 years
Product Development - 5 years
Amortisation methods, useful lives and residual values are reviewed at the end of each nancial year and adjusted prospectively, if appropriate.
D. Lease Accounting
Leases are classied as nance leases whenever the terms of the lease transfer substantially all the risks and rewards of ownership to the lessee. All other leases are classied as operating leases.
In respect of assets taken on operating lease, lease rentals are recognized as an expense in the Consolidated Statement of Prot and Loss on straight line basis over the lease term unless
i. another systematic basis is more representative of the time pattern in which the benet is derived from the leased asset; or
ii. the payments to the lessor are structured to increase in the line with expected general ination to compensate for the lessor’s expected inationary cost increases
Leasehold land having perpetual rights are included in Property, plant and equipment.
E. Financial Instruments
A nancial instrument is any contract that gives rise to a nancial asset of one entity and a nancial liability or equity instrument of
another entity.
i. Financial Assets
Initial recognition and measurement:
The Group recognizes a nancial asset in its Balance Sheet when it becomes party to the contractual provisions of the instrument. All nancial assets are recognized initially at fair value, plus in the case of nancial assets not recorded at fair value through prot or loss (FVTPL), transaction costs that are attributable to the acquisition of the nancial asset.
Where the fair value of a nancial asset at initial recognition is different from its transaction price, the difference between the fair value and the transaction price is recognized as a gain or loss in the Consolidated Statement of Prot and Loss at initial recognition if the fair value is determined through a quoted market price in an active market for an identical asset (i.e. level 1 input) or through a valuation technique that uses data from observable markets (i.e. level 2 input).
In case the fair value is not determined using a level 1 or level 2 input as mentioned above, the difference between the fair value and transaction price is deferred appropriately and recognized as a gain or loss in the Consolidated Statement of Prot and Loss only to the extent that such gain or loss arises due to a change in factor that market participants take into account when pricing the nancial asset.
However, trade receivables that do not contain a signicant nancing component are measured at transaction price.
NOTES TO THE CONSOLIDATED FINANCIAL STATEMENTS
115
Kanoria Chemicals & Industries Limited
Annual Report 2016-17

Subsequent measurement:
For subsequent measurement, the Group classies a nancial asset in accordance with the below criteria:
a. The Group’s business model for managing the nancial asset and
b. The contractual cash ow characteristics of the nancial asset
Based on the above criteria, the Group classies its nancial assets into the following categories:
i. Financial assets measured at amortized cost
ii. Financial assets measured at fair value through other comprehensive income (FVTOCI)
iii. Financial assets measured at fair value through prot or loss (FVTPL)
i. Financial assets measured at amortized cost:
A nancial asset is measured at the amortized cost if both the following conditions are met:
a) The Group’s business model objective for managing the nancial asset is to hold nancial assets in order to collect contractual
cash ows, and
b) The contractual terms of the nancial asset give rise on specied dates to cash ows that are solely payments of principal and interest on
the principal amount outstanding.
This category applies to certain investment in debt instruments, cash and bank balances, trade receivables, loans and other nancial
assets of the Group (Refer Note 37 for further details). Such nancial assets are subsequently measured at amortized cost using the
effective interest method.
Under the effective interest method, the future cash receipts are exactly discounted to the initial recognition value using the effective interest
rate. The cumulative amortization using the effective interest method of the difference between the initial recognition amount and the maturity
amount is added to the initial recognition value (net of principal repayments, if any) of the nancial asset over the relevant period of the
nancial asset to arrive at the amortized cost at each reporting date. The corresponding effect of the amortization under effective interest
method is recognized as interest income over the relevant period of the nancial asset. The same is included under other income in the
Consolidated Statement of Prot and Loss.
The amortized cost of a nancial asset is also adjusted for loss allowance, if any.
ii. Financial assets measured at FVTOCI:
A nancial asset is measured at FVTOCI if both of the following conditions are met:
a) The Group’s business model objective for managing the nancial asset is achieved both by collecting contractual cash ows and selling the
nancial assets, and
b) The contractual terms of the nancial asset give rise on specied dates to cash ows that are solely payments of principal and interest on the
principal amount outstanding.
This category applies to certain investments in debt instruments (Refer Note 37 for further details). Such nancial assets are subsequently measured at fair value at each reporting date. Fair value changes are recognized in the Other Comprehensive Income (OCI). However, the Group recognizes interest income and impairment losses and its reversals in the Consolidated Statement of Prot and Loss.
On Derecognition of such nancial assets, cumulative gain or loss previously recognized in OCI is reclassied from equity to Consolidated Statement of Prot and Loss.
Further, the Group, through an irrevocable election at initial recognition, has measured certain investments in equity instruments at FVTOCI (Refer Note 37 for further details). The Group has made such election on an instrument by instrument basis. These equity instruments are neither held for trading nor are contingent consideration recognized under a business combination. Pursuant to such irrevocable election, subsequent changes in the fair value of such equity instruments are recognized in OCI. However, the Group recognizes dividend income from such instruments in the Consolidated Statement of Prot and Loss.
On Derecognition of such nancial assets, cumulative gain or loss previously recognized in OCI is not reclassied from the equity to Consolidated Statement of Prot and Loss. However, the Group may transfer such cumulative gain or loss into retained earnings within equity.
NOTES TO THE CONSOLIDATED FINANCIAL STATEMENTS
116
Kanoria Chemicals & Industries Limited
Annual Report 2016-17
iii. Financial assets measured at FVTPL:
A nancial asset is measured at FVTPL unless it is measured at amortized cost or at FVTOCI as explained above. This is a residual category
applied to all other investments of the Group excluding investments in subsidiary companies (Refer Note 37 for further details). Such nancial
assets are subsequently measured at fair value at each reporting date. Fair value changes are recognized in the Consolidated Statement of
Prot and Loss.
A nancial asset (or, where applicable, a part of a nancial asset or part of a group of similar nancial assets) is derecognized (i.e. removed
from the Group’s Balance Sheet) when any of the following occurs:
i. The contractual rights to cash ows from the nancial asset expires
ii. The Group transfers its contractual rights to receive cash ows of the nancial asset and has substantially transferred all the risks and
rewards of ownership of the nancial asset;
iii. The Group retains the contractual rights to receive cash ows but assumes a contractual obligation to pay the cash ows without material
delay to one or more recipients under a ‘pass-through’ arrangement (thereby substantially transferring all the risks and rewards of
ownership of the nancial asset);
iv. The Group neither transfers nor retains substantially all risk and rewards of ownership and does not retain control over the nancial asset.
In cases where Group has neither transferred nor retained substantially all of the risks and rewards of the nancial asset, but retains
control of the nancial asset, the Group continues to recognize such nancial asset to the extent of its continuing involvement in the
nancial asset. In that case, the Group also recognizes an associated liability. The nancial asset and the associated liability are measured
on a basis that reects the rights and obligations that the Group has retained.
On Derecognition of a nancial asset, (except as mentioned in ii above for nancial assets measured at FVTOCI), the difference between the
carrying amount and the consideration received is recognized in the Consolidated Statement of Prot and Loss.
Impairment of financial assets:
The Group applies expected credit losses (ECL) model for measurement and recognition of loss allowance on the following:
i. Trade receivables
ii. Financial assets measured at amortized cost (other than trade receivables)
iii. Financial assets measured at fair value through other comprehensive income (FVTOCI)
In case of trade receivables, the Group follows a simplied approach wherein an amount equal to lifetime ECL is measured and recognized as
loss allowance.
In case of other assets (listed as ii and iii above), the Group determines if there has been a signicant increase in credit risk of the nancial asset
since initial recognition. If the credit risk of such assets has not increased signicantly, an amount equal to 12-month ECL is measured and
recognized as loss allowance. However, if credit risk has increased signicantly, an amount equal to lifetime ECL is measured and recognized as
loss allowance.
Subsequently, if the credit quality of the nancial asset improves such that there is no longer a signicant increase in credit risk since initial
recognition, the Group reverts to recognizing impairment loss allowance based on 12-month ECL.
ECL is the difference between all contractual cash ows that are due to the Group in accordance with the contract and all the cash ows that the
entity expects to receive (i.e., all cash shortfalls), discounted at the original effective interest rate.
Lifetime ECL are the expected credit losses resulting from all possible default events over the expected life of a nancial asset. 12-month ECL are
a portion of the lifetime ECL which result from default events that are possible within 12 months from the reporting date.
ECL are measured in a manner that they reect unbiased and probability weighted amounts determined by a range of outcomes, taking into
account the time value of money and other reasonable information available as a result of past events, current conditions and forecasts of future
economic conditions.
NOTES TO THE CONSOLIDATED FINANCIAL STATEMENTS
117
Kanoria Chemicals & Industries Limited
Annual Report 2016-17

As a practical expedient, the Group uses a provision matrix to measure lifetime ECL on its portfolio of trade receivables. The provision matrix is
prepared based on historically observed default rates over the expected life of trade receivables and is adjusted for forward-looking estimates.
At each reporting date, the historically observed default rates and changes in the forward-looking estimates are updated.
ECL impairment loss allowance (or reversal) recognized during the period is recognized as income/ expense in the Consolidated Statement of Prot and Loss under the head ‘Other expenses’.
ii. Financial Liabilities
Initial recognition and measurement:
The Group recognises a nancial liability in its Balance Sheet when it becomes party to the contractual provisions of the instrument. All nancial liabilities are recognised initially at fair value minus, in the case of nancial liabilities not recorded at fair value through prot or loss (FVTPL), transaction costs that are attributable to the acquisition of the nancial liability.
Where the fair value of a nancial liability at initial recognition is different from its transaction price, the difference between the fair value and the transaction price is recognised as a gain or loss in the Consolidated Statement of Prot and Loss at initial recognition if the fair value is determined through a quoted market price in an active market for an identical asset (i.e. level 1 input) or through a valuation technique that uses data from observable markets (i.e. level 2 input).
In case the fair value is not determined using a level 1 or level 2 input as mentioned above, the difference between the fair value and transaction price is deferred appropriately and recognised as a gain or loss in the Consolidated Statement of Prot and Loss only to the extent that such gain or loss arises due to a change in factor that market participants take into account when pricing the nancial liability.
Subsequent measurement:
All nancial liabilities of the Group are subsequently measured at amortised cost using the effective interest method. Under the effective interest method, the future cash payments are exactly discounted to the initial recognition value using the effective interest rate. The cumulative amortisation using the effective interest method of the difference between the initial recognition amount and the maturity amount is added to the initial recognition value (net of principal repayments, if any) of the nancial liability over the relevant period of the nancial liability to arrive at the amortised cost at each reporting date. The corresponding effect of the amortisation under effective interest method is recognised as interest expense over the relevant period of the nancial liability. The same is included under nance cost in the Consolidated Statement of Prot and Loss.
Derecognition:
A nancial liability is derecognised when the obligation under the liability is discharged or cancelled or expires. When an existing nancial liability is replaced by another from the same lender on substantially different terms, or the terms of an existing liability are substantially modied, such an exchange or modication is treated as the Derecognition of the original liability and the recognition of a new liability. The difference between the carrying amount of the nancial liability derecognised and the consideration paid is recognised in the Consolidated Statement of Prot and Loss.
F. Impairment
Assets that have an indenite useful life are not subject to amortisation and are tested for impairment annually and whenever there is an indication that the asset may be impaired.
Assets that are subject to depreciation and amortisation and assets representing investments in subsidiary companies are reviewed for impairment, whenever events or changes in circumstances indicate that carrying amount may not be recoverable. Such circumstances include, though are not limited to, signicant or sustained decline in revenues or earnings and material adverse changes in the economic environment.
An impairment loss is recognised whenever the carrying amount of an asset or its cash generating unit (CGU) exceeds its recoverable amount. The recoverable amount of an asset is the greater of its fair value less cost to sell and value in use. To calculate value in use, the estimated future cash ows are discounted to their present value using a pre-tax discount rate that reects current market rates and the risk specic to the asset. For an asset that does not generate largely independent cash inows, the recoverable amount is determined for the CGU to which the asset belongs. Fair value less cost to sell is the best estimate of the amount obtainable from the sale of an asset in an arm’s length transaction between knowledgeable, willing parties, less the cost of disposal.
Impairment losses, if any, are recognised in the Consolidated Statement of Prot and Loss and included in depreciation and amortisation expense. Impairment losses are reversed in the Consolidated Statement of Prot and Loss only to the extent that the asset’s carrying amount does not exceed the carrying amount that would have been determined if no impairment loss had previously been recognised.
NOTES TO THE CONSOLIDATED FINANCIAL STATEMENTS
118
Kanoria Chemicals & Industries Limited
Annual Report 2016-17

G. Inventories
Inventories of raw materials, stores and spare parts, work in progress and nished goods are measured at lower of cost and net realisable value.
However, materials and other items held for use in production of inventories are not written down below cost if the nished goods in which they will be
used are expected to be sold at or above cost. In case of certain products, where cost cannot be ascertained reliably, the same are measured at net
realisable value.
Cost of raw materials, stores and spares include its purchase cost and other costs incurred in bringing them to their present location and condition.
Cost of work in progress and nished goods include direct materials, direct labour and appropriate proportion of variable and xed overheads, the
latter being allocated on the basis of normal operating capacity. Costs are assigned to individual item of inventory on FIFO/weighted average method,
as appropriate.
Net realisable value is the estimated selling price in the ordinary course of business less the estimated costs of completion and the estimated costs
necessary to make the sale.
H. Income Tax
Income Tax comprises current and deferred tax and is recognised in Consolidated Statement of Prot and Loss except to the extent that it relates to an
item recognised in other comprehensive income or directly in equity. In this case, the tax is also recognised in other comprehensive income or in equity
as the case may be.
i. Current Tax
Current tax comprises the expected tax payable on the taxable income for the year and any adjustments to the tax payable in respect of previous years. It is measured using applicable tax rates and tax laws enacted or substantively enacted by the reporting date.
ii. Deferred Tax
Deferred tax is recognised in respect of temporary differences between the carrying amounts of assets and liabilities for nancial reporting purposes and the corresponding amounts used for taxation purposes. Deferred tax asset is also recognised in respect of carried forward tax losses and unused tax credits.
Deferred Tax assets are recognised to the extent that it is probable that future taxable amounts will be available to utilise those temporary differences, carried forward tax losses and unused tax credits.
Deferred Tax is measured at the tax rates that are expected to apply to the period when the asset is realised or the liability is settled, based on the tax laws that have been enacted or substantively enacted by the reporting date.
Minimum Alternate Tax credit is recognised as deferred tax asset only when and to the extent there is convincing evidence that the Group will pay normal income tax during the specied period. Such asset is reviewed at each Balance Sheet date and the carrying amount of the MAT credit asset is written down to the extent there is no longer a convincing evidence to the effect that the Group will pay normal income tax during thespecied period.
The Group offsets current tax assets and current tax liabilities, where it has a legally enforceable right to set off the recognised amounts and where it intends either to settle on a net basis, or to realise the asset and settle the liability simultaneously. In case of deferred tax assets and deferred tax liabilities, the same are offset if the Group has a legally enforceable right to set off corresponding current tax assets against current tax liabilities and the deferred tax assets and deferred tax liabilities relate to income taxes levied by the same tax authority on the Group.
I. Revenue Recognition
The Group recognises revenue when it is probable that future economic benets will ow to the Group and the amount of revenue can be reliably measured. Revenue is measured at the fair value of the consideration received or receivable.
The following specic recognition criteria must also be met for main revenue streams of the Group for its recognition:
i. Revenue from Sale of Goods
Revenue from sale of goods is recognised when the signicant risks and rewards of ownership of the goods have passed to the buyer and
includes excise duty and net of returns, trade allowances, rebates, value added taxes and amounts collected on behalf of third parties.
NOTES TO THE CONSOLIDATED FINANCIAL STATEMENTS
119
Kanoria Chemicals & Industries Limited
Annual Report 2016-17

ii. Renewable Energy Certificates (RECs)
RECs are recognised as accrued on the basis of notication issued by Central Electricity Regulatory Commission (CERC). Revenue from RECs is
measured on the basis of actual sale price on transfer of RECs and on the basis of CERC prescribed oor price for RECs held by/accrued
to the Group.
iii. Industrial Incentives
Government grants in the nature of industrial incentives to compensate the Group for expenses are recognised when there is a reasonable
assurance that the same will be received and are included in Consolidated Statement of Prot and Loss as other operating revenue.
iv. Interest Income
Interest income from debt instruments is recognised on accrual basis using effective interest rate method applicable on such debt instrument.
v. Dividend
Dividend income is recognised when the Group’s right to receive the payment is established, which is generally when the shareholders approve
the dividend.
J. Employee Benefits
i. Short-term employee benefits
Short-term employee benet obligations are measured on an undiscounted basis and expensed as the relative service is provided. A liability is
recognised for the amount expected to be paid e.g. towards bonus, if the Group has a present legal or constructive obligation to pay this amount
as a result of past service provided by the employee, and the amount of obligation can be estimated reliably.
ii. Defined contribution plan
Provident Fund, a dened contribution plan, is a post employment benet plan under which the Group pays contributions into a separate entity
and has no legal or constructive obligation to pay further amounts. The Group recognises the contributions payable towards the provident fund as
an expense in the Consolidated Statement of Prot and Loss in the periods during which the related services are rendered by employees.
iii. Defined benefit plan
A dened benet plan is a post employment benet plan other than a dened contribution plan. The Group has unfunded Gratuity liability
towards this which is provided on the basis of actuarial valuation made by an external valuer at the end of each nancial year using the projected
unit credit method.
Remeasurements, comprising of actuarial gains and losses, the effect of the asset ceiling (if any, excluding interest) are immediately recognised
in the balance sheet with corresponding debit or credit to Other Equity through OCI. Remeasurements are not classied to prot or loss in
subsequent periods.
Net interest and changes in the present value of dened benet obligation resulting from plan amendments or curtailments are recognised in
prot or loss.
iv. Other long term employee benefits
The liabilities for earned leave are measured and provided on the basis of actuarial valuation made by an external valuer at the end of each
nancial year using the projected unit credit method. Remeasurement gains or losses are recognised in Consolidated Statement of Prot and
Loss in the period in which they arise.
K. Borrowing Costs
Borrowing costs consists of interest and other costs incurred in connection with the borrowing of funds. Borrowing costs attributable to the
acquisition or construction of a qualifying asset that necessarily takes a substantial period of time to get ready for its intended use are capitalised as
part of the cost of the asset. Income earned on the temporary investment of specic borrowings pending their expenditure on qualifying assets is
deducted from the borrowings costs eligible for capitalisation. All other borrowing costs are expensed in the period in which they are incurred.
NOTES TO THE CONSOLIDATED FINANCIAL STATEMENTS
120
Kanoria Chemicals & Industries Limited
Annual Report 2016-17
Transaction costs in respect of long-term borrowings are amortised over the tenor of respective loans using effective interest method. Borrowing
cost also includes exchange differences to the extent regarded as an adjustment to the borrowing costs.
L. Earnings per Share
Basic earnings per share is calculated by dividing the net prot or loss before OCI for the year attributable to equity shareholders by the weighted
average number of equity shares outstanding during the period.
Diluted earnings per share adjusts the gures used in determination of basic earnings per share to take into account the post tax effect of nance
costs associated with dilutive potential equity shares and the weighted average number of additional equity shares that would have been
outstanding assuming the issue of all dilutive potential equity shares.
M. Cash and cash equivalents
Cash and cash equivalent in the balance sheet comprise cash at banks and in hand and short term deposits with remaining maturity of 12 months
or less, which are subject to an insignicant risk of change in value.
N. Cash dividend to Equity shareholders
The Group recognises a liability to make distribution of cash dividend to equity shareholders of the Group when the distribution is approved by the
shareholders. A corresponding amount is recognised directly in equity.
O. Provisions
Provisions are recognised when the Group has a present legal or constructive obligation as a result of a past event, it is probable that an outow of
resources embodying economic benets will be required to settle the obligation and a reliable estimate can be made of the amount of the obligation.
Where the effect of time value of money is material, provisions are measured at present value using a pre-tax discount rate that reects current
market assessment of the time value of money and risks specic to liability. The increase in the provision due to passage of time is recognised as
interest expense.
P. Contingent Liabilities and Assets
A contingent liability is a possible obligation that arises from past events whose existence will be conrmed by the occurrence or non-occurrence of
one or more uncertain future events beyond the control of the Group or a present obligation that is not recognised because it is not probable that an
outow of resources will be required to settle the obligation. The Group does not recognise a contingent liability but discloses its existence in the
Consolidated nancial Statements. Contingent assets are not recognised in the Consolidated nancial Statements.
Q. Segment Reporting
Operating segments are reported in a manner consistent with the internal reporting provided to the chief operating decision maker.
R. Events after Reporting date
Where events occurring after the Balance Sheet date provide evidence of conditions that existed at the end of the reporting period, the impact of
such events is adjusted within the Consolidated nancial Statements. Otherwise, events after the Balance Sheet date of material size or nature are
only disclosed.
S. Recent applicable Accounting pronouncements
Amendment to Ind AS
In March 2017, the Ministry of Corporate Affairs issued the Companies (Indian Accounting Standards) (Amendments) Rules, 2017, notifying stamendment to Ind AS 7, ‘Statement of cash ows’. The amendment is applicable to the Group for the reporting period beginning April 1 , 2017.
The amendments to Ind AS 7 requires the entities to provide disclosures that enable users of Consolidated nancial Statements to evaluate
changes in liabilities arising from nancing activities, including both changes arising from cash ows and non-cash changes, suggesting inclusion
of a reconciliation between the opening and closing balances in the Balance Sheet for liabilities arising from nancing activities, to meet
the disclosure requirement.
The Group is evaluating the requirements of the amendment and the effect on the Consolidated nancial Statements is being evaluated.
NOTES TO THE CONSOLIDATED FINANCIAL STATEMENTS
121
Kanoria Chemicals & Industries Limited
Annual Report 2016-17

4A : Property Plant and Equipment
NOTES TO THE CONSOLIDATED FINANCIAL STATEMENTS
Gross Carrying Value Deprecia�on/Amor�sa�on Net CarryingValue
As at 01.04.16
Addi�ons Foreign Currency
Transla�on Adjustment
Sale/Disposal
As at 31.03.17
As at 01.04.16
Addi�ons Foreign Currency
Transla�on Adjustment
Sale/ Disposal
As at 31.03.17
As at 31.03.17
Land & Site Development :
Freehold 742.12 — (3.23) — 738.89 — — — — — 738.89
Leasehold 1,075.20 — (6.25) — 1,068.95 14.73 14.80 (0.19) — 29.34 1,039.61
Buildings 1,010.27 766.92 (42.76) 1.61 1,732.82 48.23 57.00 (2.38) 0.22 102.63 1,630.19
Plant & Equipment 2,052.75 2,008.01 (75.71) 27.90 3,957.15 333.47 277.07 (19.64) 15.36 575.54 3,381.61
Furniture & Fixtures 75.37 14.98 (0.74) 0.72 88.89 13.66 12.23 (0.33) 0.17 25.39 63.50
Vehicles & Fork Li�s 16.58 33.68 (0.87) 3.34 46.05 4.24 5.25 (0.30) 1.34 7.85 38.20
Office Equipment 103.61 19.08 (6.24) 15.60 100.85 67.30 21.90 (5.09) 13.75 70.36 30.49
Total 5,075.90 2,842.67 (135.80) 49.17 7,733.60 481.63 388.25 (27.93) 30.84 811.11 6,922.49
(`in million)
4B : Intangible Assets
Gross Carrying Value Deprecia�on/Amor�sa�on Net CarryingValue
As at 01.04.15
Addi�ons Foreign Currency
Transla�on Adjustment
Sale/Disposal
As at 31.03.16
As at 01.04.15
Addi�ons Foreign Currency
Transla�on Adjustment
Sale/ Disposal
As at 31.03.16
As at 31.03.16
Land & Site Development :
Freehold 736.99 — 5.13 — 742.12 — — — — — 742.12
Leasehold 1,059.55 — 15.65 — 1,075.20 — 14.53 0.20 — 14.73 1,060.47
Buildings 941.45 30.54 41.14 2.86 1,010.27 5.43 41.66 1.30 0.16 48.23 962.04
Plant & Equipment 1,787.42 283.42 50.15 68.24 2,052.75 147.60 204.35 22.63 41.11 333.47 1,719.28
Furniture & Fixtures 74.45 3.16 (2.17) 0.07 75.37 4.31 11.09 (1.74) 0.00 13.66 61.71
Vehicles & Fork Li�s 14.27 2.82 0.53 1.04 16.58 0.53 3.71 0.14 0.14 4.24 12.34
Office Equipment 72.85 22.56 9.13 0.93 103.61 33.96 28.15 6.06 0.87 67.30 36.31
Total 4,686.98 342.50 119.56 73.14 5,075.90 191.83 303.49 28.59 42.28 481.63 4,594.27
Gross Carrying Value Amor�sa�on Net CarryingValue
As at 01.04.16
Addi�ons Foreign Currency
Transla�on Adjustment
Sale/Disposal
As at 31.03.17
As at 01.04.16
Addi�ons Foreign Currency
Transla�on Adjustment
Sale/ Disposal
As at 31.03.17
As at 31.03.17
Goodwill 337.86 — — — 337.86 — — — — — 337.86
Computer So�ware 79.41 20.87 (5.63) 1.33 93.32 40.60 21.65 (4.07) 1.12 57.06 36.26
Product Development 345.79 31.78 (23.79) — 353.78 193.76 44.65 (13.76) — 224.65 129.13
Total 763.06 52.65 (29.42) 1.33 784.96 234.36 66.30 (17.83) 1.12 281.71 503.25
Gross Carrying Value Deprecia�on/Amor�sa�on Net Carrying Value
As at 01.04.15
Addi�ons Foreign Currency
Transla�on Adjustment
Sale/Disposal
As at 31.03.16
As at 01.04.15
Addi�ons Foreign Currency
Transla�on Adjustment
Sale/ Disposal
As at 31.03.16
As at 31.03.16
Goodwill 294.46 43.40 — — 337.86 — — — — — 337.86
Computer So�ware 46.19 27.31 6.48 0.57 79.41 17.94 19.73 3.41 0.48 40.60 38.81
Product Development 247.38 79.41 19.00 — 345.79 147.49 33.95 12.32 — 193.76 152.03
Total 588.03 150.12 25.48 0.57 763.06 165.43 53.68 15.73 0.48 234.36 528.70
1. Depreciation & Amortisation for previous year includes Depreciation & Amortisation on xed assets of Kanoria Africa Textiles PLC ̀ 5.47 million which is transferred to capital work-in-progress.st2. Additions and Depreciation & Amortization for previous year includes opening Gross Block and accumulated Depreciation & Amortization as on 1 April, 2015 of CoSyst Control Systems GmbH, a subsidiary of APAG
Holding AG of ̀ 15.55 million & ̀ 8.49 million respectively.
122
Kanoria Chemicals & Industries Limited
Annual Report 2016-17
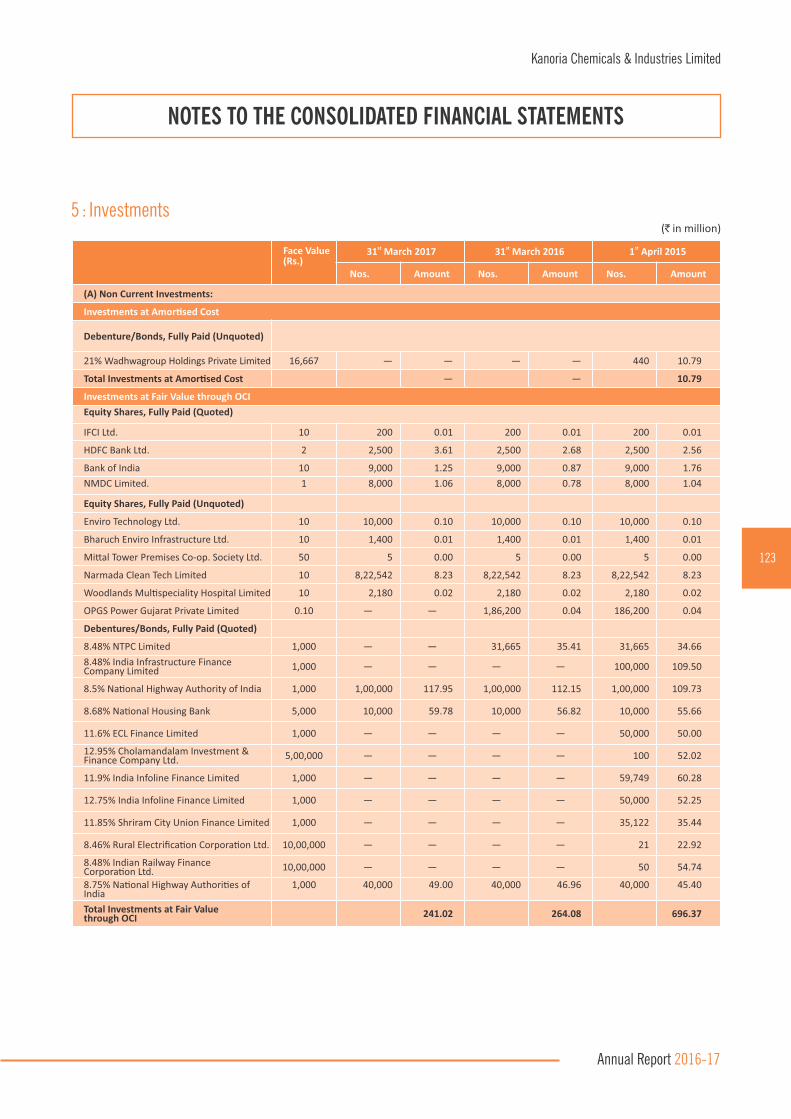
5 : Investments
NOTES TO THE CONSOLIDATED FINANCIAL STATEMENTS
Face Value(Rs.)
st 31 March 2017 st 31 March 2016 st 1 April 2015
Nos. Amount Nos. Amount Nos. Amount
(A) Non Current Investments:
Investments at Amor�sed Cost
Debenture/Bonds, Fully Paid (Unquoted)
21% Wadhwagroup Holdings Private Limited 16,667 — — — — 440 10.79
Total Investments at Cost Amor�sed — — 10.79
Investments at Fair Value through OCI
Equity Shares, Fully Paid (Quoted)
IFCI Ltd. 10 200 0.01 200 0.01 200 0.01
HDFC Bank Ltd. 2 2,500 3.61 2,500 2.68 2,500 2.56
Bank of India 10 9,000 1.25 9,000 0.87 9,000 1.76
NMDC Limited. 1 8,000 1.06 8,000 0.78 8,000 1.04
Equity Shares, Fully Paid (Unquoted)
Enviro Technology Ltd. 10 10,000 0.10 10,000 0.10 10,000 0.10
Bharuch Enviro Infrastructure Ltd. 10 1,400 0.01 1,400 0.01 1,400 0.01
Mi�al Tower Premises Co-op. Society Ltd. 50 5 0.00 5 0.00 5 0.00
Narmada Clean Tech Limited 10 8,22,542 8.23 8,22,542 8.23 8,22,542 8.23
Woodlands Mul�speciality Hospital Limited 10 2,180 0.02 2,180 0.02 2,180 0.02
OPGS Power Gujarat Private Limited 0.10 — — 1,86,200 0.04 186,200 0.04
Debentures/Bonds, Fully Paid (Quoted)
8.48% NTPC Limited 1,000 — — 31,665 35.41 31,665 34.66
8.48% India Infrastructure Finance Company Limited 1,000 — — — — 100,000 109.50
8.5% Na�onal Highway Authority of India 1,000 1,00,000 117.95 1,00,000 112.15 1,00,000 109.73
8.68% Na�onal Housing Bank 5,000 10,000 59.78 10,000 56.82 10,000 55.66
11.6% ECL Finance Limited 1,000 — — — — 50,000 50.00
12.95% Cholamandalam Investment & Finance Company Ltd. 5,00,000 — — — — 100 52.02
11.9% India Infoline Finance Limited 1,000 — — — — 59,749 60.28
12.75% India Infoline Finance Limited 1,000 — — — — 50,000 52.25
11.85% Shriram City Union Finance Limited 1,000 — — — — 35,122 35.44
8.46% Rural Electrifica�on Corpora�on Ltd. 10,00,000 — — — — 21 22.92
8.48% Indian Railway Finance Corpora�on Ltd. 10,00,000 — — — — 50 54.74
8.75% Na�onal Highway Authori�es of India
1,000 40,000 49.00 40,000 46.96 40,000 45.40
Total Investments at Fair Value through OCI 241.02 264.08 696.37
(`in million)
123
Kanoria Chemicals & Industries Limited
Annual Report 2016-17
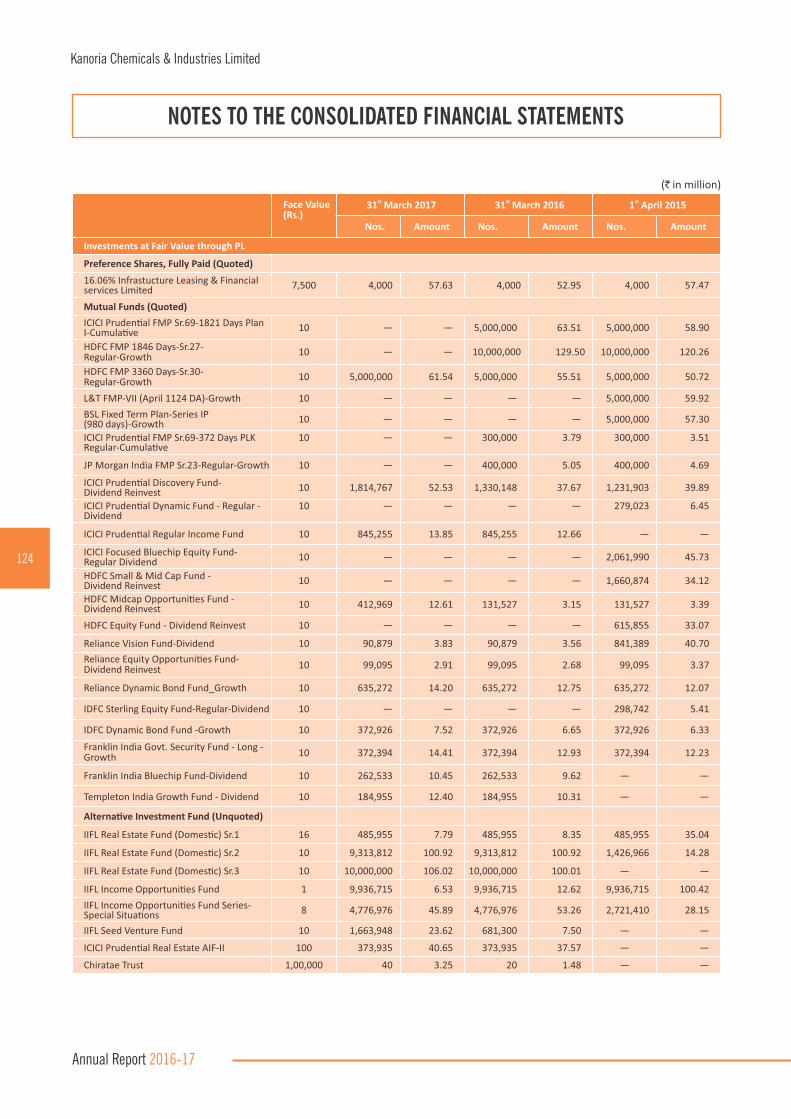
(`in million)
Face Value(Rs.)
st 31 March 2017 st 31 March 2016 st 1 April 2015
Nos. Amount Nos. Amount Nos. Amount
Investments at Fair Value through PL
Preference Shares, Fully Paid (Quoted)
16.06% Infrastucture Leasing & Financial services Limited 7,500 4,000 57.63 4,000 52.95 4,000 57.47
Mutual Funds (Quoted)
ICICI Pruden�al FMP Sr.69-1821 Days Plan I-Cumula�ve 10 — — 5,000,000 63.51 5,000,000 58.90
HDFC FMP 1846 Days-Sr.27- Regular-Growth 10 — — 10,000,000 129.50 10,000,000 120.26
HDFC FMP 3360 Days-Sr.30- Regular-Growth 10 5,000,000 61.54 5,000,000 55.51 5,000,000 50.72
L&T FMP-VII (April 1124 DA)-Growth 10 — — — — 5,000,000 59.92
BSL Fixed Term Plan-Series IP (980 days)-Growth 10 — — — — 5,000,000 57.30
ICICI Pruden�al FMP Sr.69-372 Days PLK Regular-Cumula�ve
10 — — 300,000 3.79 300,000 3.51
JP Morgan India FMP Sr.23-Regular-Growth 10 — — 400,000 5.05 400,000 4.69
ICICI Pruden�al Discovery Fund- Dividend Reinvest 10 1,814,767 52.53 1,330,148 37.67 1,231,903 39.89
ICICI Pruden�al Dynamic Fund - Regular - Dividend
10 — — — — 279,023 6.45
ICICI Pruden�al Regular Income Fund 10 845,255 13.85 845,255 12.66 — —
ICICI Focused Bluechip Equity Fund- Regular Dividend 10 — — — — 2,061,990 45.73
HDFC Small & Mid Cap Fund - Dividend Reinvest 10 — — — — 1,660,874 34.12
HDFC Midcap Opportuni�es Fund - Dividend Reinvest 10 412,969 12.61 131,527 3.15 131,527 3.39
HDFC Equity Fund - Dividend Reinvest 10 — — — — 615,855 33.07
Reliance Vision Fund-Dividend 10 90,879 3.83 90,879 3.56 841,389 40.70
Reliance Equity Opportuni�es Fund-Dividend Reinvest 10 99,095 2.91 99,095 2.68 99,095 3.37
Reliance Dynamic Bond Fund_Growth 10 635,272 14.20 635,272 12.75 635,272 12.07
IDFC Sterling Equity Fund-Regular-Dividend 10 — — — — 298,742 5.41
IDFC Dynamic Bond Fund -Growth 10 372,926 7.52 372,926 6.65 372,926 6.33
Franklin India Govt. Security Fund - Long - Growth 10 372,394 14.41 372,394 12.93 372,394 12.23
Franklin India Bluechip Fund-Dividend 10 262,533 10.45 262,533 9.62 — —
Templeton India Growth Fund - Dividend 10 184,955 12.40 184,955 10.31 — —
Alterna�ve Investment Fund (Unquoted)
IIFL Real Estate Fund (Domes�c) Sr.1 16 485,955 7.79 485,955 8.35 485,955 35.04
IIFL Real Estate Fund (Domes�c) Sr.2 10 9,313,812 100.92 9,313,812 100.92 1,426,966 14.28
IIFL Real Estate Fund (Domes�c) Sr.3 10 10,000,000 106.02 10,000,000 100.01 — —
IIFL Income Opportuni�es Fund 1 9,936,715 6.53 9,936,715 12.62 9,936,715 100.42
IIFL Income Opportuni�es Fund Series-Special Situa�ons 8 4,776,976 45.89 4,776,976 53.26 2,721,410 28.15
IIFL Seed Venture Fund 10 1,663,948 23.62 681,300 7.50 — —
ICICI Pruden�al Real Estate AIF-II 100 373,935 40.65 373,935 37.57 — —
Chiratae Trust 1,00,000 40 3.25 20 1.48 — —
NOTES TO THE CONSOLIDATED FINANCIAL STATEMENTS
124
Kanoria Chemicals & Industries Limited
Annual Report 2016-17

Face ValueRs.
st 31 March 2017 st 31 March 2016 st 1 April 2015
Nos. Amount Nos. Amount Nos. Amount
(B) Current Investment
Investments at Amor�sed Cost
Debenture/Bonds, Fully Paid (Unquoted)
21% Wadhwa group Holdings Private Limited 16,667 — — — — 500 36.67
19% Shambhavi Realty Private Limited 66,680 — — — — 440 34.98
18% Eldeco Sohna Project Ltd. 30,00,000 — — — — 6 18.00
Total Investments at Amor�sed Cost — — 89.65
Investments at Fair Value through PL
Preference Shares, Fully Paid (Quoted)
8.75% L&T Finance Holdings Limited 100 — — — — 913,130 91.65
Mutual Funds (Quoted)
L&T FMP-VII (April 1124 DA)-Growth 10 — — 5,000,000 65.31 — —
BSL Fixed Term Plan-Series IP (980 days)-Growth 10 — — 5,000,000 61.99 — —
Mutual Funds (Unquoted)
BSL Floa�ng Rate Fund-STP-Growth 100 142,507 30.82 765,995 154.27 245,187 45.63
Franklin India Ultra Short Bond Fund-SuperIns-Growth 10 460,987 10.26 365,265 7.42 1,188,382 22.03
Total Investments at Fair Value through PL 41.08 288.99 159.31
Total Current Investments (B) 41.08 288.99 248.96
(`in million)
Non-Current Current Non-Current Current Non-Current Current
Aggregate book value of quoted investments 496.54 — 677.97 127.30 1,354.29 91.65
Aggregate market value of quoted investments 496.54 — 677.97 127.30 1,354.29 91.65
Aggregate value of unquoted investments 464.33 41.08 408.13 161.69 317.17 157.31
NOTES TO THE CONSOLIDATED FINANCIAL STATEMENTS
Face Value(Rs.)
st 31 March 2017 st 31 March 2016 st 1 April 2015
Nos. Amount Nos. Amount Nos. Amount
Investments at Fair Value through PL
Equity Fund (Unquoted)
IIFL Assets Revival Fund 10 — — — — 3,865,706 73.44
IIFL Assets Revival Fund 2 10 4,523,997 59.68 2,500,000 25.00 — —
IIFL Na�onal Development Agenda Fund 8 4,922,035 61.62 4,922,035 53.02 4,922,035 57.44
Total Investments at Fair Value through PL 719.85 822.02 964.30
Total Non Current Investments (A) 960.87 1,086.10 1,671.46
(`in million)
125
Kanoria Chemicals & Industries Limited
Annual Report 2016-17

(`in million)
31 March 2017st 31 March 2016st 1 April 2015st
Non-Current Current Non-Current Current Non-Current Current
6 : Loans
(Unsecured considered good)
Other Loans
Loan to Employees 0.64 1.26 0.58 4.36 0.75 5.14
Loan to Others — — — — 13.61 —
Total Loans 0.64 1.26 0.58 4.36 14.36 5.14
7 : Other Financial Assets
Security Deposits (Unsecured considered good) 22.52 1.00 16.76 5.71 17.10 6.01
Interest and Dividend Receivable — 34.72 — 14.59 — 35.66
Total Other Financial Assets 22.52 35.72 16.76 20.30 17.10 41.67
8 : Other Assets
(a) Capital Advances 39.93 — 20.04 — 116.15 —
(b) Advances other than Capital Advances
(i) Other Advances 0.42 65.85 0.90 119.29 1.20 93.67
(ii) Export Benefits and Claims Receivable — 123.62 — 218.29 — 177.10
(iii) Balance with Central Excise and other Government Authori�es
— 210.82 — 240.02 — 248.41
Total Other Assets 40.35 400.29 20.94 577.60 117.35 519.18
9. Inventories
(At lower of cost and net realisable value)
Raw Materials 630.02 429.01 433.62
Raw Materials in transit — 30.94 109.97
Work-in-Progress 113.66 126.48 62.14
Finished Goods 229.28 158.20 93.16
Stores & Spare Parts 55.99 59.62 59.55
Total Inventories 1,028.95 804.25 758.44
10 : Trade Receivables
Secured, considered good — — —
Unsecured, considered good 1,144.10 876.91 747.45
Doub�ul 7.78 — 0.07
Less : Allowance for doub�ul receivables (7.78) — (0.07)
Total Trade Receivables 1,144.10 876.91 747.45
NOTES TO THE CONSOLIDATED FINANCIAL STATEMENTS
126
Kanoria Chemicals & Industries Limited
Annual Report 2016-17
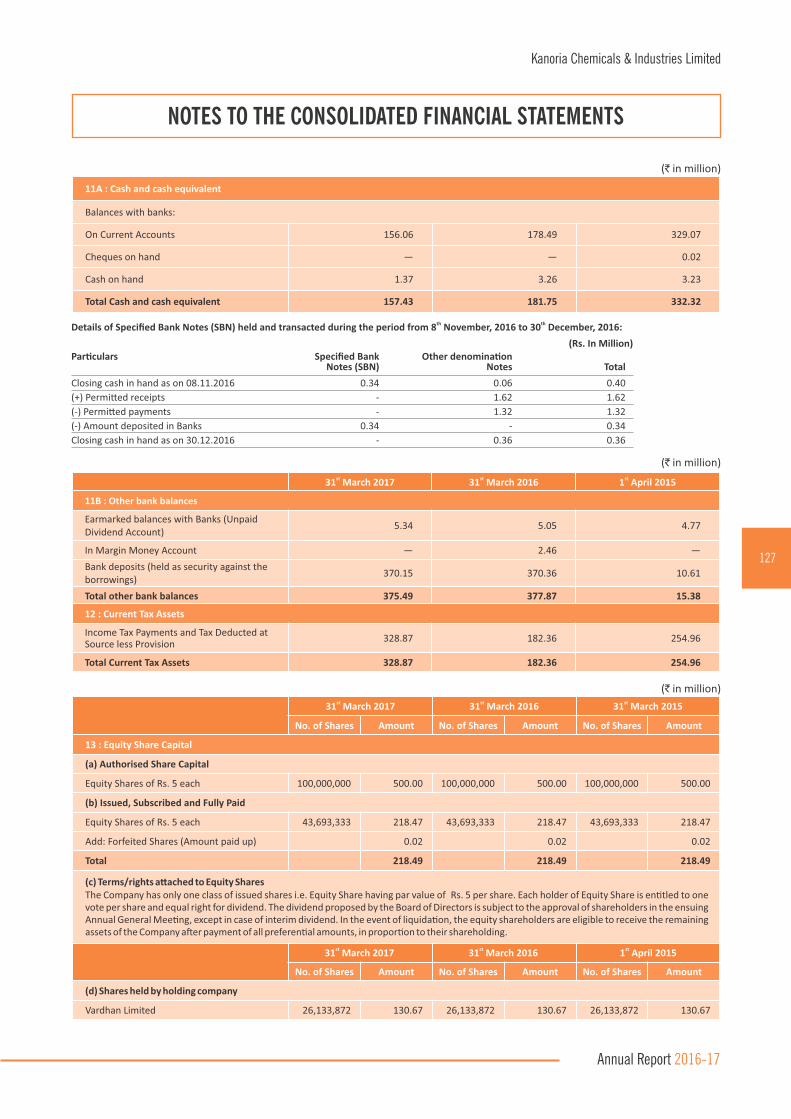
(`in million)
31 March 2017st31 March 2016st 1 April 2015st
11B : Other bank balances
Earmarked balances with Banks (Unpaid Dividend Account)
5.34 5.05 4.77
In Margin Money Account — 2.46 —
Bank deposits (held as security against the borrowings)
370.15 370.36 10.61
Total other bank balances 375.49 377.87 15.38
12 : Current Tax Assets
Income Tax Payments and Tax Deducted at Source less Provision
328.87 182.36 254.96
Total Current Tax Assets 328.87 182.36 254.96
31 March 2017st 31 March 2016st 31 March 2015st
No. of Shares Amount No. of Shares Amount No. of Shares Amount
13 : Equity Share Capital
(a) Authorised Share Capital
Equity Shares of Rs. 5 each 100,000,000 500.00 100,000,000 500.00 100,000,000 500.00
(b) Issued, Subscribed and Fully Paid
Equity Shares of Rs. 5 each 43,693,333 218.47 43,693,333 218.47 43,693,333 218.47
Add: Forfeited Shares (Amount paid up) 0.02 0.02 0.02
Total 218.49 218.49 218.49
(c) Terms/rights a�ached to Equity SharesThe Company has only one class of issued shares i.e. Equity Share having par value of Rs. 5 per share. Each holder of Equity Share is en�tled to one vote per share and equal right for dividend. The dividend proposed by the Board of Directors is subject to the approval of shareholders in the ensuing Annual General Mee�ng, except in case of interim dividend. In the event of liquida�on, the equity shareholders are eligible to receive the remaining assets of the Company a�er payment of all preferen�al amounts, in propor�on to their shareholding.
31 March 2017st 31 March 2016st 1 April 2015 st
No. of Shares Amount No. of Shares Amount No. of Shares Amount
(d) Shares held by holding company
Vardhan Limited 26,133,872 130.67 26,133,872 130.67 26,133,872 130.67
11A : Cash and cash equivalent
Balances with banks:
On Current Accounts 156.06 178.49 329.07
Cheques on hand — — 0.02
Cash on hand 1.37 3.26 3.23
Total Cash and cash equivalent 157.43 181.75 332.32
th thDetails of Specified Bank Notes (SBN) held and transacted during the period from 8 November, 2016 to 30 December, 2016:
(Rs. In Million)Par�culars Specified Bank Other denomina�on Notes (SBN) Notes Total
Closing cash in hand as on 08.11.2016 0.34 0.06 0.40
(+) Permi�ed receipts - 1.62 1.62
(-) Permi�ed payments - 1.32 1.32
(-) Amount deposited in Banks 0.34 - 0.34
Closing cash in hand as on 30.12.2016 - 0.36 0.36
(`in million)
(`in million)
NOTES TO THE CONSOLIDATED FINANCIAL STATEMENTS
127
Kanoria Chemicals & Industries Limited
Annual Report 2016-17

Name of the Shareholder 31 March 2017st 31 March 2016st 1 April 2015 st
No. of Shares % holding No. of Shares % holding No. of Shares % holding
Vardhan Limited 26,133,872 59.81 26,133,872 59.81 26,133,872 59.81
R V Investment & Dealers Limited 3,210,120 7.35 3,210,120 7.35 3,210,120 7.35
31 March 2017st31 March 2016st 1 April 2015st
14 : Other Equity
Capital Reserve As per last Balance Sheet 34.17 34.17 34.17
Capital Redemp�on Reserve As per last Balance Sheet 72.69 72.69 72.69
Securi�es Premium Reserve As per last Balance Sheet 161.50 161.50 161.50
Special Reserve
As per last Balance Sheet
Add : Transfer from Retained Earnings27.80
2.04 29.8425.76
2.04 27.80 25.76
Retained Earnings As per last Balance Sheet Add: Profit for the year Add: Acturial gain/(loss) on defined benefit obliga�ons Add: Foreign Currency Transla�on
adjustment Less: Transfer to Special Reserve Less: Dividend (Refer Note 31) Less : Tax on Dividend (Refer Note 31)
5,534.67(147.75)
(4.26)186.63(2.04)
(65.54)(13.34) 5,488.37
5,664.63(71.93)
(4.15)26.80(2.04)
(65.54)(13.10) 5,534.67 5,664.63
Foreign Currency Transla�on Reserve
As per last Balance Sheet
Add: Foreign Currency Transla�on
adjustment(48.16)
(191.63) (239.79)(61.22)
13.06 (48.16)(61.22)
Other Comrehensive Income (OCI) As per last Balance Sheet Add: Movement in OCI (Net) during the year
27.507.84 35.34
42.83(15.33) 27.50 42.83
Total Other Equity 5,582.12 5,810.17 5,940.36
(`in million)(e) Details of shareholders holding more than 5% shares in the company
(f) Shares reserved for issue under op�ons
No Shares have been reserved for issue under op�ons and contracts/commitments for the sale of shares/disinvestment as at theBalance Sheet date.
(g) The Company, during the year 2012-13, had bought back 12,603,167 Equity Shares of Rs. 5 each.
(h) None of the securi�es are conver�ble into shares at the end of the repor�ng period.
(i) No calls are unpaid by any Director or Officer of the Company during the year.
(`in million)
NOTES TO THE CONSOLIDATED FINANCIAL STATEMENTS
128
Kanoria Chemicals & Industries Limited
Annual Report 2016-17
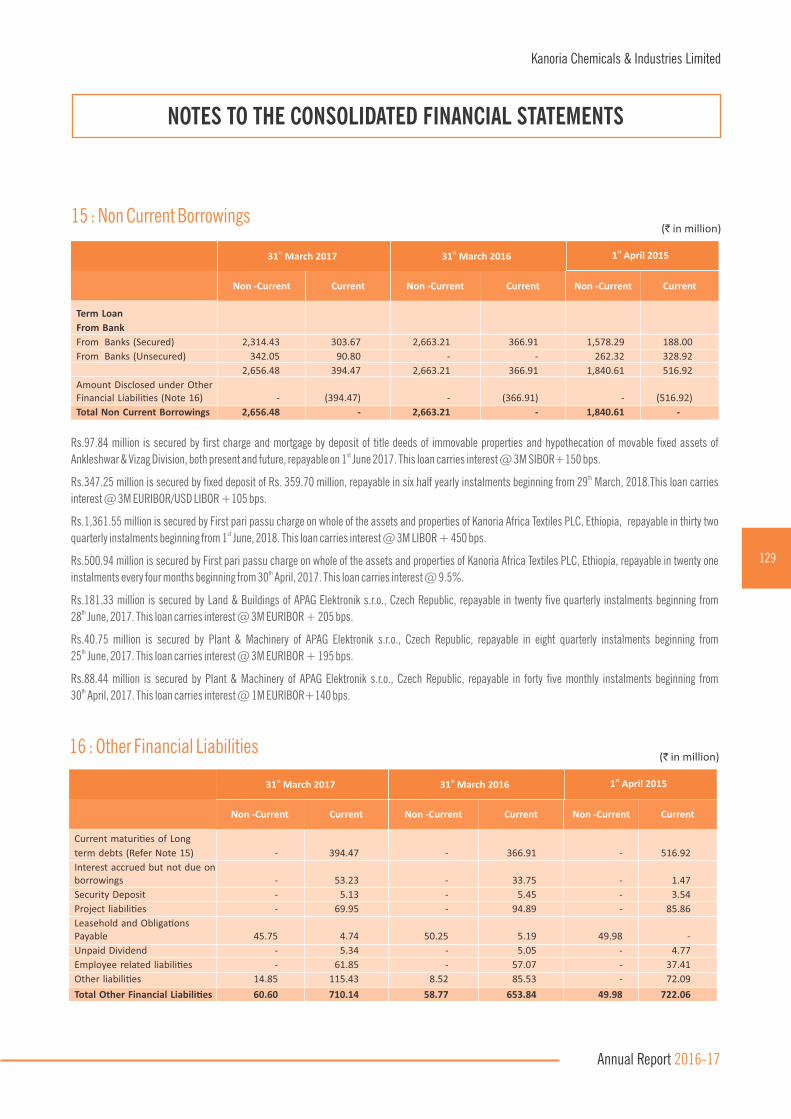
15 : Non Current Borrowings(`in million)
1 April 2015st
Non -Current Current Non -Current Non -CurrentCurrent Current
31 March 2017st
Term Loan
From Bank
From Banks (Secured) 2,314.43 303.67 2,663.21 366.91 1,578.29 188.00
From Banks (Unsecured) 342.05 90.80 - - 262.32 328.92
2,656.48 394.47 2,663.21 366.91 1,840.61 516.92
Amount Disclosed under Other Financial Liabili�es (Note 16) - (394.47) - (366.91) - (516.92)
Total Non Current Borrowings 2,656.48 - 2,663.21 - 1,840.61 -
31 March 2016st
Rs.97.84 million is secured by rst charge and mortgage by deposit of title deeds of immovable properties and hypothecation of movable xed assets of stAnkleshwar & Vizag Division, both present and future, repayable on 1 June 2017. This loan carries interest @ 3M SIBOR+150 bps.
thRs.347.25 million is secured by xed deposit of Rs. 359.70 million, repayable in six half yearly instalments beginning from 29 March, 2018.This loan carries
interest @ 3M EURIBOR/USD LIBOR +105 bps.
Rs.1,361.55 million is secured by First pari passu charge on whole of the assets and properties of Kanoria Africa Textiles PLC, Ethiopia, repayable in thirty two stquarterly instalments beginning from 1 June, 2018. This loan carries interest @ 3M LIBOR + 450 bps.
Rs.500.94 million is secured by First pari passu charge on whole of the assets and properties of Kanoria Africa Textiles PLC, Ethiopia, repayable in twenty one thinstalments every four months beginning from 30 April, 2017. This loan carries interest @ 9.5%.
Rs.181.33 million is secured by Land & Buildings of APAG Elektronik s.r.o., Czech Republic, repayable in twenty ve quarterly instalments beginning from th28 June, 2017. This loan carries interest @ 3M EURIBOR + 205 bps.
Rs.40.75 million is secured by Plant & Machinery of APAG Elektronik s.r.o., Czech Republic, repayable in eight quarterly instalments beginning fromth25 June, 2017. This loan carries interest @ 3M EURIBOR + 195 bps.
Rs.88.44 million is secured by Plant & Machinery of APAG Elektronik s.r.o., Czech Republic, repayable in forty ve monthly instalments beginning fromth30 April, 2017. This loan carries interest @ 1M EURIBOR+140 bps.
16 : Other Financial Liabilities(`in million)
st1 April 2015
Non -Current Current Non -Current Non -CurrentCurrent Current
st31 March 2017
Current maturi�es of Long
term debts (Refer Note 15) - 394.47 - 366.91 - 516.92
Interest accrued but not due on borrowings - 53.23 - 33.75 - 1.47
Security Deposit - 5.13 - 5.45 - 3.54
Project liabili�es - 69.95 - 94.89 - 85.86
Leasehold and Obliga�ons Payable 45.75 4.74 50.25 5.19 49.98 -
Unpaid Dividend - 5.34 - 5.05 - 4.77
Employee related liabili�es - 61.85 - 57.07 - 37.41
Other liabili�es 14.85 115.43 8.52 85.53 - 72.09
Total Other Financial Liabili�es 60.60 710.14 58.77 653.84 49.98 722.06
st31 March 2016
NOTES TO THE CONSOLIDATED FINANCIAL STATEMENTS
129
Kanoria Chemicals & Industries Limited
Annual Report 2016-17
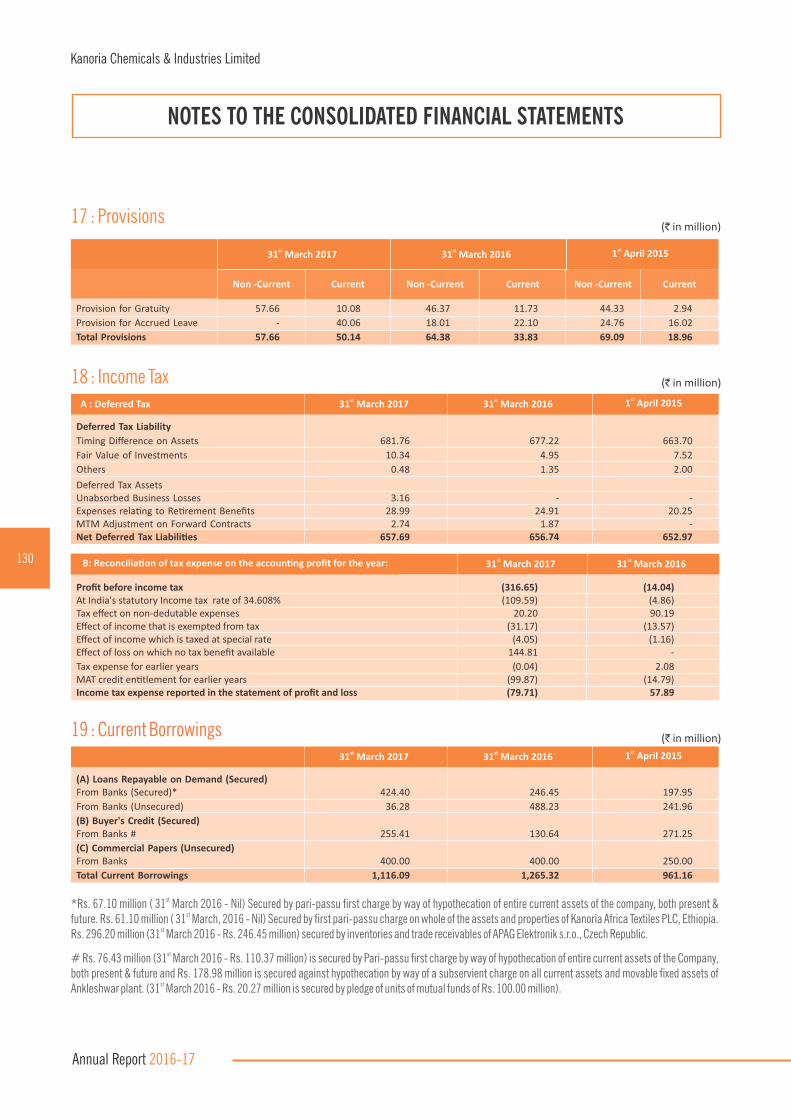
18 : Income Tax (`in million)
st31 March 2017
Deferred Tax Liability
Timing Difference on Assets 681.76 677.22 663.70
Fair Value of Investments 10.34 4.95 7.52
Others 0.48 1.35 2.00
Deferred Tax Assets Unabsorbed Business Losses 3.16 - - Expenses rela�ng to Re�rement Benefits 28.99 24.91 20.25 MTM Adjustment on Forward Contracts 2.74 1.87 - Net Deferred Tax Liabili�es 657.69 656.74 652.97
st31 March 2016A : Deferred Taxst1 April 2015
(a) Sale of Products
Manufactured products 3,099.44 3,167.51
Traded products 31.40 17.09
Total Sale 3,130.84 3,184.60
(b) Other Opera�ng Revenues 142.87 113.18
Total Revenue from Opera�ons 3,273.71 3,297.78
st31 March 2017 st31 March 2016
Profit before income tax (316.65) (14.04)At India's statutory Income tax rate of 34.608% (109.59) (4.86)Tax effect on non-dedutable expenses 20.20 90.19 Effect of income that is exempted from tax (31.17) (13.57)Effect of income which is taxed at special rate (4.05) (1.16)Effect of loss on which no tax benefit available 144.81 -
Tax expense for earlier years (0.04) 2.08 MAT credit en�tlement for earlier years (99.87) (14.79)Income tax expense reported in the statement of profit and loss (79.71) 57.89
B: Reconcilia�on of tax expense on the accoun�ng profit for the year:
19 : Current Borrowingsst31 March 2017
(A) Loans Repayable on Demand (Secured)From Banks (Secured)* 424.40 246.45 197.95
From Banks (Unsecured) 36.28 488.23 241.96
(B) Buyer's Credit (Secured)From Banks # 255.41 130.64 271.25
(C) Commercial Papers (Unsecured)From Banks 400.00 400.00 250.00
Total Current Borrowings 1,116.09 1,265.32 961.16
st31 March 2016st1 April 2015
st*Rs. 67.10 million ( 31 March 2016 - Nil) Secured by pari-passu rst charge by way of hypothecation of entire current assets of the company, both present & stfuture. Rs. 61.10 million ( 31 March, 2016 - Nil) Secured by rst pari-passu charge on whole of the assets and properties of Kanoria Africa Textiles PLC, Ethiopia.
stRs. 296.20 million (31 March 2016 - Rs. 246.45 million) secured by inventories and trade receivables of APAG Elektronik s.r.o., Czech Republic.
st# Rs. 76.43 million (31 March 2016 - Rs. 110.37 million) is secured by Pari-passu rst charge by way of hypothecation of entire current assets of the Company, both present & future and Rs. 178.98 million is secured against hypothecation by way of a subservient charge on all current assets and movable xed assets of
stAnkleshwar plant. (31 March 2016 - Rs. 20.27 million is secured by pledge of units of mutual funds of Rs. 100.00 million).
NOTES TO THE CONSOLIDATED FINANCIAL STATEMENTS
130
Kanoria Chemicals & Industries Limited
Annual Report 2016-17
(`in million)
17 : Provisions(`in million)
st1 April 2015
Non -Current Current Non -Current Non -CurrentCurrent Current
st31 March 2017
Provision for Gratuity 57.66 10.08 46.37 11.73 44.33 2.94
Provision for Accrued Leave - 40.06 18.01 22.10 24.76 16.02
Total Provisions 57.66 50.14 64.38 33.83 69.09 18.96
st31 March 2016

20 : Trade Payable(`in million)
st31 March 2017
Trade PayableTotal outstanding dues of Micro and small enterprises - - -
Total outstanding dues of creditors other than Micro and small enterprises 914.11 501.31 608.46
Total Trade Payables 914.11 501.31 608.46
st31 March 2016st1 April 2015
Note : There are no Micro, Small & Medium Enterprises to whom the Company owes dues, which are outstanding for more than 45 days as atst 31 March, 2017. This information required to be disclosed under the Micro, Small & Medium enterprises Development Act, 2006 has been determined to
the extent such parties have been identied on the basis of information available with the company.
21 : Other Current Liabilities (`in million)
st31 March 2017
Statutory liabili�es 82.56 115.70 40.60
Customers' Credit Balances 32.86 24.69 3.76
Total Other Current Liabili�es 115.42 140.39 44.36
st31 March 2016st1 April 2015
st31 March 2017 st31 March 2016
(`in million)22 : Revenue from Operations
(a) Sale of Products
Manufactured products 7,151.66 5,846.69
Traded products 31.40 17.09
Total Sale 7,183.06 5,863.78
(b) Other Opera�ng Revenues 154.30 115.59
Total Revenue from Opera�ons 7,337.36 5,979.37
st31 March 2017 st31 March 2016
Interest Income: On long term Investments 40.80 76.91
From Others 32.37 40.04
Dividend Income 14.40 27.34
Net gain on Sale of Investments 24.26 6.42
Fair value gain on financial instruments 66.81 11.47
Rent Income 1.65 0.57
Foreign Exchange Rate Fluctua�on 48.09 -
Other non opera�ng income 29.91 5.63
Total Other Income 258.29 168.38
23 : Other Income (`in million)
NOTES TO THE CONSOLIDATED FINANCIAL STATEMENTS
131
Kanoria Chemicals & Industries Limited
Annual Report 2016-17

st31 March 2017 st31 March 2016
(`in million)24 : Employee Benets Expense
Salaries, Wages, Bonus & Gratuity etc. 1,036.41 805.27
Contribu�on to Provident Fund 137.66 115.51
Welfare Expenses 65.14 40.79
Total Employee Benefits Expense 1,239.21 961.57
Interest expense 188.22 68.92
Bank/Finance charges 13.70 16.34
Exchange difference regarded as an adjustment to borrowing cost - 54.28
Total Finance Costs 201.92 139.54
25 : Finance Costs
Consump�on of Stores & Spare parts etc. 109.95 71.31
Other Manufacturing Expenses 207.82 117.74
Power & Fuel 284.42 292.83
Repairs to -
Plant & Machinery 51.00 62.99
Buildings 2.47 6.36
Others 14.83 17.69
Water Charges & Cess 19.29 17.69
Rates & Taxes 15.51 5.73
Rent 58.12 40.26
Insurance 22.08 18.71
Legal and Professional Charges 67.56 52.41
Research & Development Expenses - 12.41
Miscellaneous Expenses 134.15 109.93
CSR Expenditure 2.31 0.89
Foreign Exchange Rate Fluctua�on 30.77 (35.38)
Commission & Brokerage to Others 14.41 8.56
Freight, Handling & Other Charges 72.22 68.67
Directors' Fees 1.54 1.55
Travelling Expenses 48.49 47.76
Charity & Dona�ons 0.17 0.01
Sales Tax (net) 1.16 0.41
Directors' Remunera�on 22.45 18.83
Provision for bad & doub�ul Debts & Advances (net) (2.24) 0.35
Unrealized Debts and Claims wri�en off 4.27 1.06
Loss on Fixed Assets sold/discarded (Net) 2.63 10.30
Payment to Auditors 4.63 4.58
Fair Value Loss on Deriva�ve Instruments 10.20 8.85
Previous Years Adjustments (Net) - 4.35
Total Other Expenses 1,200.21 966.85
Addi�onal Informa�on regarding Payment to Auditors (a) Statutory Auditors Audit Fees 3.00 3.03
For Cer�ficates & Others 1.07 1.11
For Travelling and out of pocket expenses 0.16 0.13
(b) Cost Auditors
Audit Fees 0.15 0.15
For Travelling and out of pocket expenses 0.10 0.03
(c) Tax Auditors
Audit Fees 0.15 0.13 4.63 4.58
26 : Other Expenses
NOTES TO THE CONSOLIDATED FINANCIAL STATEMENTS
132
Kanoria Chemicals & Industries Limited
Annual Report 2016-17

st31 March 2017 st31 March 2016
Write down in the value of Renewable Energy Cer�ficates on reduc�on in floor price as
no�fied by the Central Electricity Regulatory Commission 184.17 -
27 : Exceptional Item (`in million)
A. Items that will not be reclassified to Profit or Loss (PL) - 1. Actuarial gain/(loss) on Defined Benefit Obliga�ons (6.51) (6.34)
Income Tax Effect 2.25 2.19
2. Net gain/(loss) on FVTOCI Equity securi�es 1.31 (1.03)
Income Tax Effect - -
Net OCI not to be reclassified to PL in subsequent periods (2.95) (5.18)
B. Items that will be reclassified to Profit or Loss (PL) -
1. Net gain/(loss) on FVTOCI debt securi�es 12.63 10.42
Income Tax Effect (1.42) (1.20)
2. (Gain)/loss transferred to PL upon Recycling of FVTOCI Debt Instruments (5.29) (26.59)
Income Tax Effect 0.61 3.07
Net OCI to be reclassified to PL in subsequent periods 6.53 (14.30)
Other Comprehensive Income for the year, net of tax 3.58 (19.48)
28 : Other comprehensive income (OCI)
Details for calcula�on of basic and diluted earning per share: Profit a�er tax as per Statement of Profit and Loss (236.94) (71.93)
Weighted average number of equity share (Numbers) 43,693,333 43,693,333
Basic and diluted earning per share (Rs.) (5.42) (1.65)
29 : Earnings per share (EPS)
(i) Con�ngent Liabili�es (a) Claims/Disputed liabili�es not acknowledged as debt Excise Duty demands (paid Rs. 8.62 million) 17.84 6.60
Sales Tax demands (paid Rs. 0.43 million) 0.43 0.43
Income Tax demands (paid Rs. 55.54 million) 55.54 55.54
Other claims being disputed by the Company (paid Rs. 1.00 million) 4.19 4.19
(b) Outstanding Bank Guarantees 35.99 31.43
(ii) Commitments Es�mated amount of contracts remaining to be executed on capital account and not provided for 163.13 83.57
Advances paid 39.93 20.04
30 :Commitments and contingencies
Cash dividends on equity shares declared and paid:stFinal dividend for the year ended on 31 March 2016 : INR 1.50 per share
st(31 March 2015: INR 1.5 per share) 65.54 65.54
DDT on final dividend 13.34 13.10
78.88 78.64
Proposed dividends on Equity shares:stFinal cash dividend for the year ended on 31 March 2017: INR 1.50 per share
(31 March 2016: INR 1.5 per share) 65.54 65.54
DDT on proposed dividend 13.34 13.34
78.88 78.88
31 :Distribution made and proposed
Proposed dividends on equity shares are subject to approval at the Annual General Meeting and are not recognised as a liability (including DDT thereon) as stat 31 March 2017.
NOTES TO THE CONSOLIDATED FINANCIAL STATEMENTS
133
Kanoria Chemicals & Industries Limited
Annual Report 2016-17

st31 March 2017 st31 March 2016
Gratuity Gratuity
1. Change in the Present Value of Obliga�on - Present Value of Obliga�on as at the beginning 58.10 47.28
- Current Service Cost 3.64 3.53
- Interest Expense or Cost 4.53 3.55
- Actuarial (gains) / losses arising from: change in demographic assump�ons - -
change in financial assump�ons 1.43 (1.01)
experience variance 5.07 7.35
- Past Service Cost - -
- Effect of change in foreign exchange rates - -
- Benefits paid (5.03) (2.60)
- Acquisi�ons Adjustment - -
- Effect of business combina�ons or disposals - -
- Present Value of Obliga�on as at the end 67.74 58.10
2. Expenses recognised in the statement of Profit & Loss
- Current Service Cost 3.64 3.53
- Interest Expense or Cost 4.53 3.55
- Actuarial (gains) / losses arising from: change in demographic assump�ons - -
change in financial assump�ons - -
experience variance - -
- Past Service Cost - -
- Effect of change in foreign exchange rates - -
- Acquisi�ons Adjustment - -
- Effect of business combina�ons or disposals - -
Total 8.17 7.08
3. Other Comprehensive Income- Actuarial (gains) / losses arising from: change in demographic assump�ons - -
change in financial assump�ons 1.43 (1.01)
experience variance 5.07 7.35
Total 6.50 6.34
4. Actuarial Assump�ons(a) Financial Assump�ons Discount rate (per annuam) 7.40% 7.80%
Salary growth rate (per annum) 7% 7%
(`in million)
32 : Disclosures as required under Indian Accounting Standard 19 on "Employee Benefits"
A. Defined Benefit Plan
The Company has unfunded scheme for payment of gratuity to all eligible employees calculated at specied number of days of last drawn salary depending upon tenure of service for each year of completed service subject to minimum ve years of service payable at the time of separation upon superannuation or on exit otherwise. Subsidiaries are not having dened benet plan scheme for its employees.
The following tables summarise the components of net benet expense recognised in the statement of prot and loss and the funded status and amounts recognised in the balance sheet for the Post - retirement benet plans as relates to parent only.
NOTES TO THE CONSOLIDATED FINANCIAL STATEMENTS
134
Kanoria Chemicals & Industries Limited
Annual Report 2016-17
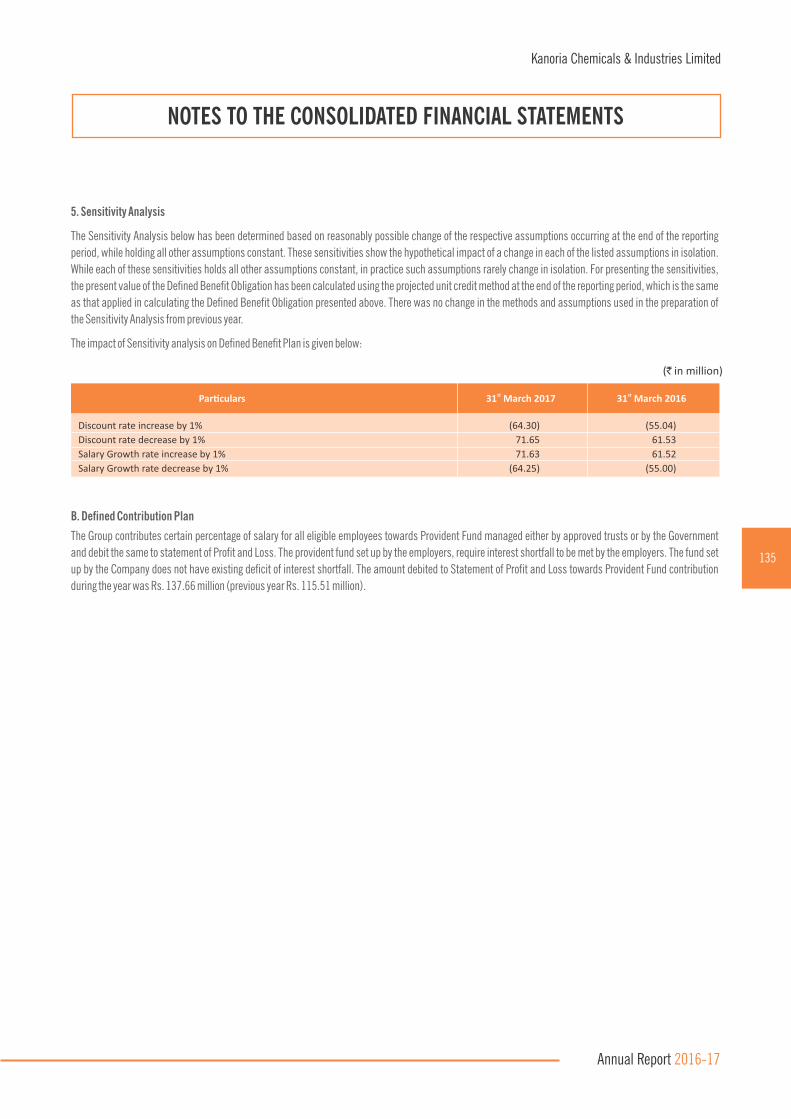
5. Sensitivity Analysis
The Sensitivity Analysis below has been determined based on reasonably possible change of the respective assumptions occurring at the end of the reporting
period, while holding all other assumptions constant. These sensitivities show the hypothetical impact of a change in each of the listed assumptions in isolation.
While each of these sensitivities holds all other assumptions constant, in practice such assumptions rarely change in isolation. For presenting the sensitivities,
the present value of the Dened Benet Obligation has been calculated using the projected unit credit method at the end of the reporting period, which is the same
as that applied in calculating the Dened Benet Obligation presented above. There was no change in the methods and assumptions used in the preparation of
the Sensitivity Analysis from previous year.
The impact of Sensitivity analysis on Dened Benet Plan is given below:
st31 March 2017Par�culars st31 March 2016
Discount rate increase by 1% (64.30) (55.04)
Discount rate decrease by 1% 71.65 61.53
Salary Growth rate increase by 1% 71.63 61.52
Salary Growth rate decrease by 1% (64.25) (55.00)
(`in million)
B. Defined Contribution Plan
The Group contributes certain percentage of salary for all eligible employees towards Provident Fund managed either by approved trusts or by the Government
and debit the same to statement of Prot and Loss. The provident fund set up by the employers, require interest shortfall to be met by the employers. The fund set
up by the Company does not have existing decit of interest shortfall. The amount debited to Statement of Prot and Loss towards Provident Fund contribution
during the year was Rs. 137.66 million (previous year Rs. 115.51 million).
NOTES TO THE CONSOLIDATED FINANCIAL STATEMENTS
135
Kanoria Chemicals & Industries Limited
Annual Report 2016-17
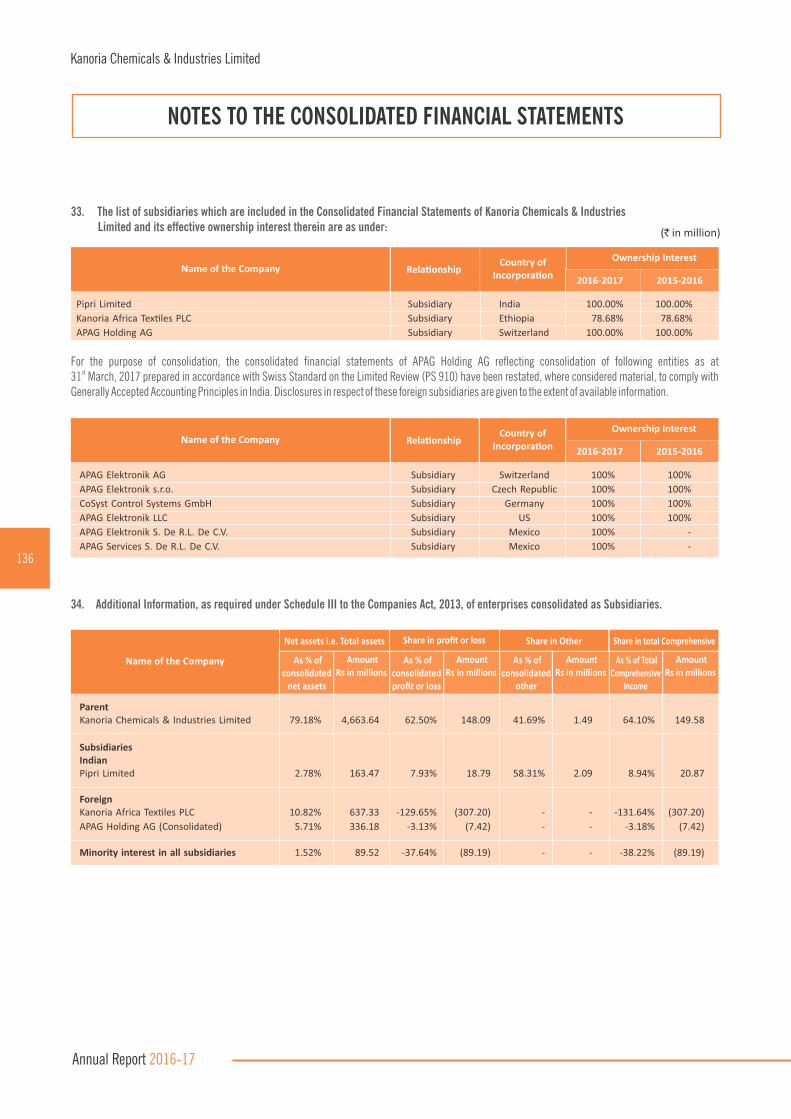
(`in million)
33. The list of subsidiaries which are included in the Consolidated Financial Statements of Kanoria Chemicals & Industries Limited and its effective ownership interest therein are as under:
Ownership InterestRela�onship
2016-2017
Country of Incorpora�on 2015-2016
Pipri Limited Subsidiary India 100.00% 100.00%
Kanoria Africa Tex�les PLC Subsidiary Ethiopia 78.68% 78.68%
APAG Holding AG Subsidiary Switzerland 100.00% 100.00%
Name of the Company
For the purpose of consolidation, the consolidated nancial statements of APAG Holding AG reecting consolidation of following entities as atst31 March, 2017 prepared in accordance with Swiss Standard on the Limited Review (PS 910) have been restated, where considered material, to comply with
Generally Accepted Accounting Principles in India. Disclosures in respect of these foreign subsidiaries are given to the extent of available information.
Ownership InterestRela�onship
2016-2017
Country of Incorpora�on 2015-2016
APAG Elektronik AG Subsidiary Switzerland 100% 100%
APAG Elektronik s.r.o. Subsidiary Czech Republic 100% 100%
CoSyst Control Systems GmbH Subsidiary Germany 100% 100%
APAG Elektronik LLC Subsidiary US 100% 100%
APAG Elektronik S. De R.L. De C.V. Subsidiary Mexico 100% -
APAG Services S. De R.L. De C.V. Subsidiary Mexico 100% -
Name of the Company
34. Additional Information, as required under Schedule III to the Companies Act, 2013, of enterprises consolidated as Subsidiaries.
ParentKanoria Chemicals & Industries Limited 79.18% 4,663.64 62.50% 148.09 41.69% 1.49 64.10% 149.58
SubsidiariesIndianPipri Limited 2.78% 163.47 7.93% 18.79 58.31% 2.09 8.94% 20.87
ForeignKanoria Africa Tex�les PLC 10.82% 637.33 -129.65% (307.20) - - -131.64% (307.20)
APAG Holding AG (Consolidated) 5.71% 336.18 -3.13% (7.42) - - -3.18% (7.42)
Minority interest in all subsidiaries 1.52% 89.52 -37.64% (89.19) - - -38.22% (89.19)
Name of the Company
Net assets i.e. Total assets Share in profit or loss Share in Other Share in total Comprehensive
As % of Total Comprehensive
Income
As % of consolidated
net assets
Amount Rs in millions
Amount Rs in millions
Amount Rs in millions
Amount Rs in millions
As % of consolidated profit or loss
As % of consolidated
other
NOTES TO THE CONSOLIDATED FINANCIAL STATEMENTS
136
Kanoria Chemicals & Industries Limited
Annual Report 2016-17
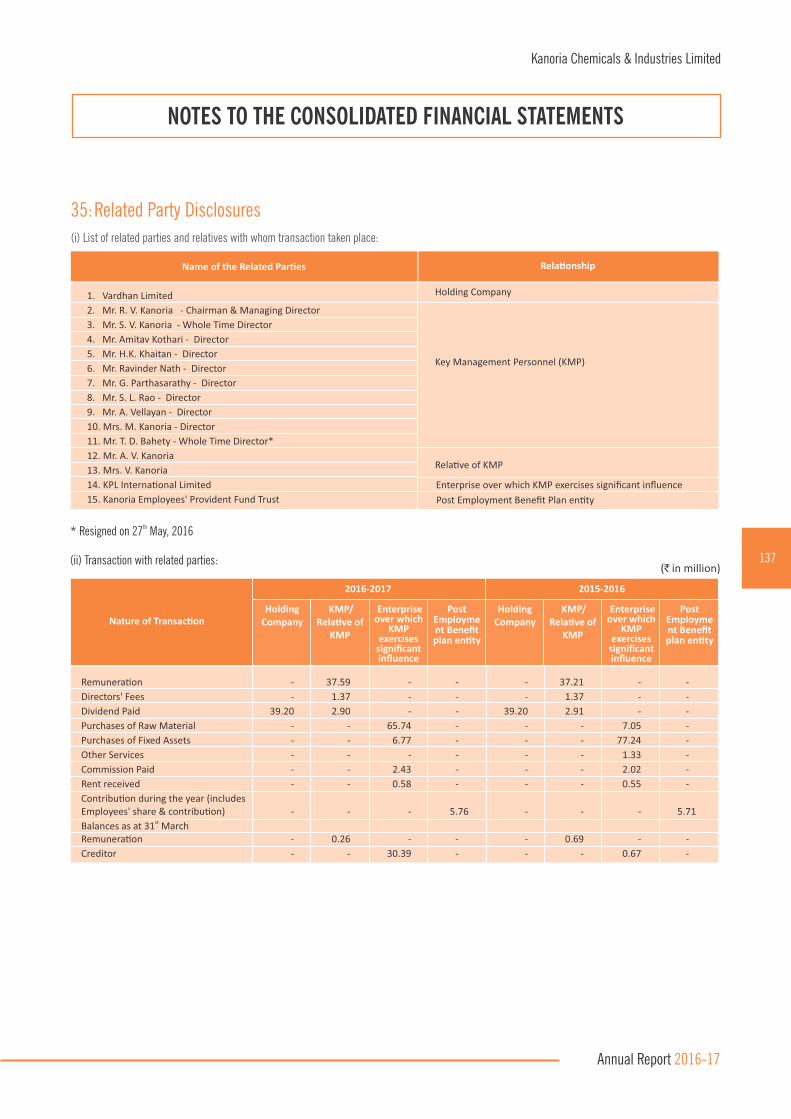
35: Related Party Disclosures
(i) List of related parties and relatives with whom transaction taken place:
Rela�onship Name of the Related Par�es
1. Vardhan Limited
2. Mr. R. V. Kanoria - Chairman & Managing Director
3. Mr. S. V. Kanoria - Whole Time Director
4. Mr. Amitav Kothari - Director
5. Mr. H.K. Khaitan - Director
6. Mr. Ravinder Nath - Director
7. Mr. G. Parthasarathy - Director
8. Mr. S. L. Rao - Director
9. Mr. A. Vellayan - Director
10. Mrs. M. Kanoria - Director
11. Mr. T. D. Bahety - Whole Time Director*
12. Mr. A. V. Kanoria
13. Mrs. V. Kanoria
14. KPL Interna�onal Limited
15. Kanoria Employees' Provident Fund Trust
Holding Company
Key Management Personnel (KMP)
Rela�ve of KMP
Post Employment Benefit Plan en�ty
th* Resigned on 27 May, 2016
Enterprise over which KMP exercises significant influence
2016-2017 2015-2016
Nature of Transac�onHolding
Company KMP/
Rela�ve of KMP
Enterprise over which
KMP exercises
significant influence
Post Employment Benefit plan en�ty
Holding Company
KMP/ Rela�ve of
KMP
Enterprise over which
KMP exercises
significant influence
Post Employment Benefit plan en�ty
Remunera�on - 37.59 - - - 37.21 - -
Directors' Fees - 1.37 - - - 1.37 - -
Dividend Paid 39.20 2.90 - - 39.20 2.91 - -
Purchases of Raw Material - - 65.74 - - - 7.05 -
Purchases of Fixed Assets - - 6.77 - - - 77.24 -
Other Services - - - - - - 1.33 -
Commission Paid - - 2.43 - - - 2.02 -
Rent received - - 0.58 - - - 0.55 -
Contribu�on during the year (includes Employees' share & contribu�on) - - - 5.76 - - - 5.71
stBalances as at 31 MarchRemunera�on - 0.26 - - - 0.69 - -
Creditor - - 30.39 - - - 0.67 -
(ii) Transaction with related parties:
NOTES TO THE CONSOLIDATED FINANCIAL STATEMENTS
137
Kanoria Chemicals & Industries Limited
Annual Report 2016-17
(`in million)

36: Segment Information (A) For management purposes, the Group is organised into business units based on its products and services and has following
reportable segments:
i. Alco Chemicals ii. Solar Power iii. Electronic Automotive iv. Textile v. Others
st Year ended 31 March 2017
Business Segment
Segment Revenue Revenue from opera�ons (net of excise) 3,146.79 126.92 3,614.55 449.10 - 7,337.36 3,171.10 126.68 2,681.59 - - 5,979.37
Segment Result 165.20 68.33 18.83 (276.41) 19.19 (4.86) 211.56 43.66 (213.25) - 11.34 53.31
Less: (i) Finance Cost 201.92 139.54
(ii) Excep�onal items 184.17 -
(iii) Other Un-allocable expenditure net off Un-allocable income (74.30) (72.19)
Profit before Tax (316.65) (14.04)
Tax Expense (79.71) 57.89
Net Profit: (236.94) (71.93)
Segment Assets 4,461.48 376.26 2,033.14 3,102.35 136.41 10,109.64 4,080.95 549.68 2,048.62 3,077.37 126.28 9,882.90
Un-allocable Corporate Assets 2,118.82 2,365.35
Total Assets: 12,228.46 12,248.24 Segment Liabili�es 759.05 5.08 1,696.96 2,495.80 - 4,956.89 750.88 15.01 1,662.22 2,287.65 - 4,715.76
Un-allocable Corporate Liabili�es 1,381.44 1,322.03
Total Liabili�es: 6,338.33 6,037.79
Other DiclosuresCapital Expenditure 294.16 0.06 143.61 27.78 - 465.61 366.83 0.67 269.68 910.66 - 1,547.84
Un-allocable Capital Expenditure 8.37 1.10
Total Capital Expenditure: 473.98 1,548.94 Deprecia�on & Amor�za�on 154.43 41.18 158.67 91.56 - 445.84 159.97 41.15 133.14 - - 334.26
Un-allocable Deprecia�on 8.71 8.95
Total Deprecia�on & Amor�za�on: 454.55 343.21
Alco Chemicals
Solar Power
Electronic Automo�ve
Others Total Tex�leAlco
Chemicals Solar
PowerElectronic
Automo�veOthers Total Tex�le
stYear ended 31 March 2017 stYear ended 31 March 2016
Segment Revenue 3,124.13 4,213.23 7,337.36 3,148.87 2,830.50 5,979.37
Segment Assets 7,034.57 5,193.89 12,228.46 7,070.01 5,178.23 12,248.24
Segment Liabili�es 2,145.57 4,192.76 6,338.33 2,061.83 3,975.96 6,037.79
Capital Expenditure 302.59 171.39 473.98 368.60 1,180.34 1,548.94
Rest of the World
TotalIndia Rest of the World
TotalIndiaGeographical Segment ====>
(B) Secondary Segment information
(`in million)
(`in million)
NOTES TO THE CONSOLIDATED FINANCIAL STATEMENTS
138
Kanoria Chemicals & Industries Limited
Annual Report 2016-17
stYear ended 31 March 2016

(C) Other Disclosures
Basis of pricing inter/Intra segment transfer and any change therein:
At prevailing market-rate at the time of transfers.
Segment Accounting Policies
The accounting policies adopted for segment reporting are in line with the accounting policies of the Company and its subsidiaries.
Type of products included in each reported business segment:
Alco Chemicals business includes Pentaerythritol, Sodium Formate, Acetaldehyde, Formaldehyde & Hexamine etc., Solar Power business includes Power generation from Solar energy, Textile business includes yarn & denim manufacturing, Electronic Automotive business includes electronic & mechatronic modules etc and others includes Financial Activities & others.
37 : Category-wise classication of Financial Instruments
Non Current Current
Financial AssetsMeasured at amor�sed costInvestments 5A&B - - 10.79 - - 89.65
Trade Receivables 10 - - - 1,144.10 876.91 747.45
Cash and cash equivalents 11A - - - 157.43 181.75 332.32
Other Bank balances 11B - - - 375.49 377.87 15.38
Loans 6 0.64 0.58 14.36 1.26 4.36 5.14
Other Financial Assets 7 22.52 16.76 17.10 35.72 20.30 41.67
Measured at fair value through profit or loss Investments 5A&B 719.85 822.02 964.30 41.08 288.99 159.31
Measured at fair value through other comprehensive income Investments 5A 241.02 264.08 696.37 - - -Total Financial Assets 984.03 1,103.44 1,702.92 1,755.08 1,750.18 1,390.92
Financial Liabili�es
Measured at amor�sed cost
Borrowings 15 & 19 2,656.48 2,663.21 1,840.61 1,116.09 1,265.32 961.16
Trade Payables 20 914.11 501.31 608.46
Other Financial Liabili�es 16 45.75 51.10 49.98 707.11 652.66 722.06
Measured at fair value through profit or lossOther Financial Liabili�es 16 14.85 7.67 - 3.03 1.18 -
Total Financial Liabili�es 2,717.08 2,721.98 1,890.59 2,740.34 2,420.47 2,291.68
Refer
Notest31 March 2016
st1 April 2015
st31 March 2017
st 31 March 2016
st1 April 2015
st31 March 2017
(`in million)
NOTES TO THE CONSOLIDATED FINANCIAL STATEMENTS
139
Kanoria Chemicals & Industries Limited
Annual Report 2016-17

38 : Fair Value Measurements of Financial InstrumentsThe following table provides fair value measurement hierarchy of the Group's nancial assets and liabilities:
stFair value hierarchy as at 31 March 2017
Financial assets measured at fair value through profit or loss
Quoted Preference shares 57.63 - -
Quoted Mutual funds 206.25 - -
Unquoted Mutual funds - 41.08 -
Unquoted Alternate Investment funds - 334.67 -
Unquoted Equity funds - 121.30 -
Financial assets measured at fair value through other
comprehensive income
Quoted Equity Shares 5.93 - -
Unquoted Equity Shares - - 8.36
Quoted Debentures/Bonds 226.73 - -
Financial liabili�es measured at fair value through profit or loss
Forward Exchange contract (Net) 17.88 - -
Significant observable inputs (Level 2)
Significant unobservable inputs (Level 3)
Quoted prices in ac�ve markets (Level 1)
Financial assets/financial liabili�es
(`in million)
stFair value hierarchy as at 31 March 2016
Financial assets measured at fair value through profit or loss Quoted Preference shares 52.95 - -
Quoted Mutual funds 496.64 - -
Unquoted Mutual funds - 161.69 -
Unquoted Alternate Investment funds - 321.72 -
Unquoted Equity funds - 78.02 -
Financial assets measured at fair value through other comprehensive income
Quoted Equity Shares 4.34 - -
Unquoted Equity Shares - - 8.40
Quoted Debentures/Bonds 251.33 - -
Financial liabili�es measured at fair value through profit or loss
Forward Exchange contract (Net) 8.85 - -
Significant observable inputs (Level 2)
Significant unobservable inputs (Level 3)
Quoted prices in ac�ve markets (Level 1)
Financial assets/financial liabili�es
NOTES TO THE CONSOLIDATED FINANCIAL STATEMENTS
140
Kanoria Chemicals & Industries Limited
Annual Report 2016-17

stFair value hierarchy as at 1 April 2015
Financial assets measured at fair value through profit or loss Quoted Preference shares 149.13 - -
Quoted Mutual funds 598.05 - -
Unquoted Mutual funds - 67.66 -
Unquoted Alternate Investment funds - 177.89 -
Unquoted Equity funds - 130.89 -
Financial assets measured at fair value through other comprehensive income
Quoted Equity Shares 5.38 - -
Unquoted Equity Shares - - 8.40
Quoted Debentures/Bonds 682.60 - -
Significant observable inputs (Level 2)
Significant unobservable inputs (Level 3)
Quoted prices in ac�ve markets (Level 1)
Financial assets/financial liabili�es
Financial Instruments measured at amortised cost
The carrying amount of nancial assets and nancial liabilities measured at amortised cost in the nancial statements are a reasonable approximation of their
fair value since the Group does not anicipate that the carrying amounts would be signicantly different from the values that would eventually be
received or settled.
39: Financial Risk Management - Objectives and Policies
The Group’s principal nancial liabilities comprise borrowings, trade payables, other nancial liabilities and nancial guarantee contracts. The main purpose of
these nancial liabilities is to nance the Group’s operations. The Group’s nancial assets include investments, trade receivables, cash and cash equivalents,
other bank balances and loans.
The Group is exposed to market risk and credit risk. The Group has a Risk management policy and its management is supported by a Risk management committee
that advises on risks and the appropriate risk governance framework for the Group. The Risk management committee provides assurance to the Group’s
management that the Group’s risk activities are governed by appropriate policies and procedures and that risks are identied, measured and managed in
accordance with the Group’s policies and risk objectives. The Board of Directors reviews and agrees policies for managing each of these risks, which are
summarised below.
(i) Market risk
Market risk is the risk that the fair value of future cash ows of a nancial instrument will uctuate because of changes in market prices. Market risk comprises
two types of risk: currency risk and other price risk, such as commodity price risk and equity price risk. Financial instruments affected by market risk include
FVTOCI investments, FVTPL investments, trade payables, trade receivables, etc.
(a) Foreign currency risk
Foreign currency risk is the risk that the fair value or future cash ows of a foreign currency exposure will uctuate because of changes in foreign exchange rates.
The Group’s exposure to the risk of changes in foreign exchange rates relates primarily to the Group’s operating activities. The Group monitors the foreign
exchange uctuations on continuous basis and advises the management of any material adverse effect on the Group and for taking risk mitigation measures. The
Group enters into forward exchange contracts against its foreign currency exposure relating to recognised underlying liabilities and rm commitments. The Group
does not enter into any derivative instruments for trading or speculative purposes.
Foreign currency sensitivity
The following table demonstrates the sensitivity to a reasonably possible change in USD, Euro and SGD exchange rates, with all other variables held constant. The
impact on the Group’s prot before tax is due to changes in the fair value of monetary assets and liabilities. The Group’s exposure to foreign currency changes for
all other currencies is not material.
(`in million)
NOTES TO THE CONSOLIDATED FINANCIAL STATEMENTS
141
Kanoria Chemicals & Industries Limited
Annual Report 2016-17

st31 March 2017 st31 March 2016
Foreign Currency Receivable/ (Payable) (Net) 341.85 184.77 (98.21) 83.09 181.20 (312.04)
Deprecia�on in Indian Rupees 5% 5% 5% 5% 5% 5%
Effect on Profit before Tax 17.09 9.24 (4.91) 4.15 9.06 (15.60)
Apprecia�on in Indian Rupees 5% 5% 5% 5% 5% 5%
Effect on Profit before Tax (17.09) (9.24) 4.91 (4.15) (9.06) 15.60
Euro SGDUSD Euro SGDUSD
(b) Commodity price risks
The Group is affected by the price volatility of methanol, one of its major raw material. Its operating activities require a continuous supply of methanol. The Group monitors price and demand/supply situation on continuous basis and advises the management of any material adverse effect on the Group and for taking risk mitigation measures.
Commodity price sensitivity
The following table shows the effect of price changes in Methanol on Prot before Tax, with all other variable held constant:
(ii) Credit risk
Credit risk is the risk that counterparty will not meet its obligations under a nancial instrument or customer contract, leading to a nancial loss. The Group is exposed to credit risk from its operating activities (primarily trade receivables).
Trade receivables
An impairment analysis is performed at each reporting date on an individual basis for all the customers. In addition, a large number of minor receivables are grouped into homogenous groups and assessed for impairment collectively. The calculation is based on credit losses historical data. The maximum exposure to credit risk at the reporting date is the carrying value of trade receivables disclosed as the Group does not hold collateral as security. The Group has evaluated the concentration of risk with respect to trade receivables as low, as its customers are located in several jurisdictions and industries.
(iii) Liquidity risk
Liquidity risk is the risk that Company will encounter difculty in raising funds to meet commitments associated with nancial instruments that are settled by delivering cash or another nancial asset. Liquidity risk may result from an inability to sell a nancial asset quickly at close to its fair value.
The Company has an established liquidity risk management framework for managing its short term, medium term and long term funding and liquidity management requirements. The Company's exposure to liquidity risk arises primarily from mismatches of the maturities of nancial asset and liabilities. The Company manages the liquidity risk by maintaining adequate funds in cash and cash equivalents. The Company also has adequate credit facilities agreed with banks to ensure that there is sufcient cash to meet all its normal operating commitments in a timely and cost-effective manner.
The table below analysis nancial liabilities of the Company into relevant maturity groupings based on the remaining period from the reporting date to the contractual maturity date. The amount disclosed in the table are the contractual undiscounted cash ow.
(`in million)
(`in million)
NOTES TO THE CONSOLIDATED FINANCIAL STATEMENTS
142
Kanoria Chemicals & Industries Limited
Annual Report 2016-17
st31 March 2017 st 31 March 2016
Consump�on of Methanol 1395.35 1317.30
Price change + 5% -5% + 5% -5%
Effect on Profit before Tax (69.77) 69.77 65.87 (65.87)
(c) Equity price risks
The Group’s listed and non-listed equity securities are susceptible to market price risk arising from uncertainties about future values of the investment securities. The Group manages the equity price risk through diversication and by placing limits on individual and total equity instruments/mutual funds. Reports on the investment portfolio are submitted to the Group’s management on a regular basis.
Equity price sensitivity
The following table shows the effect of price changes in quoted and unquoted equity shares (other than that in subsidiaries), quoted preference shares, quoted and unquoted equity mutual funds, unquoted alternative investment funds and unquoted equity funds.
st31 March 2017 st31 March 2016
Investment 610.22 522.10Price change + 5% -5% + 5% -5%
Effect on Profit before Tax 30.51 (30.51) 26.10 (26.10)
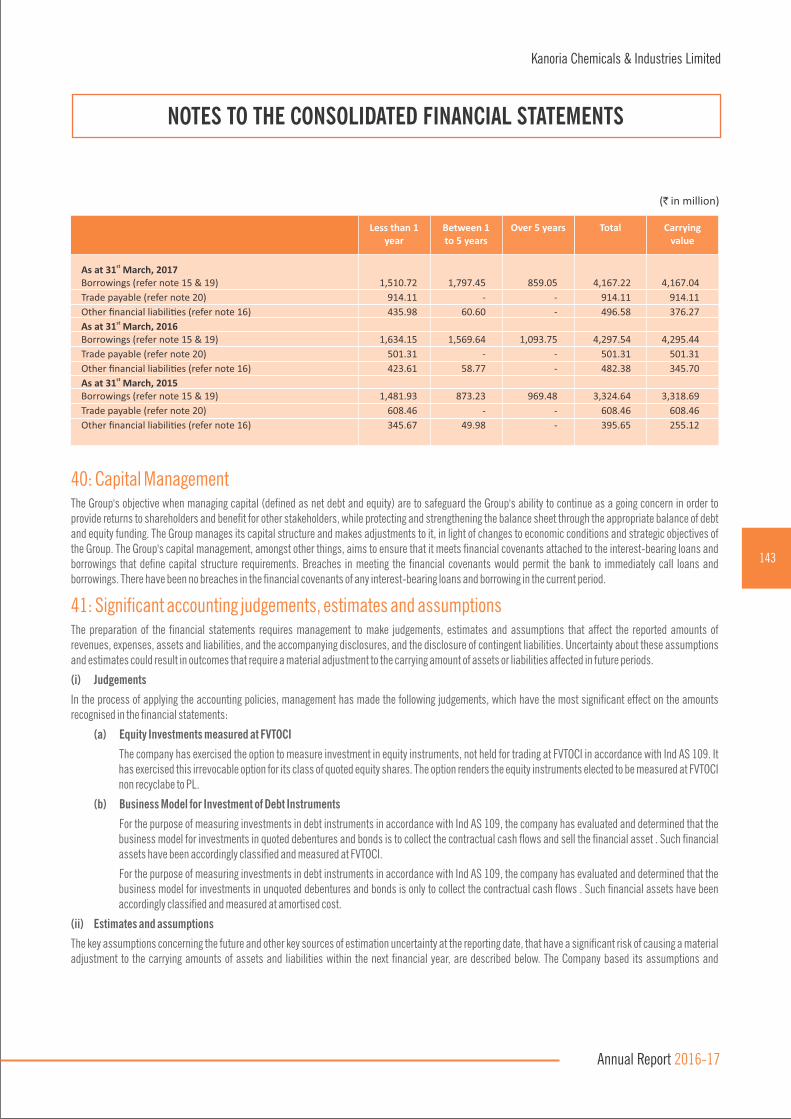
stAs at 31 March, 2017Borrowings (refer note 15 & 19) 1,510.72 1,797.45 859.05 4,167.22 4,167.04
Trade payable (refer note 20) 914.11 - - 914.11 914.11
Other financial liabili�es (refer note 16) 435.98 60.60 - 496.58 376.27 stAs at 31 March, 2016
Borrowings (refer note 15 & 19) 1,634.15 1,569.64 1,093.75 4,297.54 4,295.44
Trade payable (refer note 20) 501.31 - - 501.31 501.31
Other financial liabili�es (refer note 16) 423.61 58.77 - 482.38 345.70 stAs at 31 March, 2015
Borrowings (refer note 15 & 19) 1,481.93 873.23 969.48 3,324.64 3,318.69
Trade payable (refer note 20) 608.46 - - 608.46 608.46
Other financial liabili�es (refer note 16) 345.67 49.98 - 395.65 255.12
Between 1 to 5 years
Over 5 yearsLess than 1 year
Carrying value
Total
(`in million)
40: Capital ManagementThe Group's objective when managing capital (dened as net debt and equity) are to safeguard the Group's ability to continue as a going concern in order to provide returns to shareholders and benet for other stakeholders, while protecting and strengthening the balance sheet through the appropriate balance of debt and equity funding. The Group manages its capital structure and makes adjustments to it, in light of changes to economic conditions and strategic objectives of the Group. The Group's capital management, amongst other things, aims to ensure that it meets nancial covenants attached to the interest-bearing loans and borrowings that dene capital structure requirements. Breaches in meeting the nancial covenants would permit the bank to immediately call loans and borrowings. There have been no breaches in the nancial covenants of any interest-bearing loans and borrowing in the current period.
41: Signicant accounting judgements, estimates and assumptions The preparation of the nancial statements requires management to make judgements, estimates and assumptions that affect the reported amounts of revenues, expenses, assets and liabilities, and the accompanying disclosures, and the disclosure of contingent liabilities. Uncertainty about these assumptions and estimates could result in outcomes that require a material adjustment to the carrying amount of assets or liabilities affected in future periods.
(i) Judgements
In the process of applying the accounting policies, management has made the following judgements, which have the most signicant effect on the amounts recognised in the nancial statements:
(a) Equity Investments measured at FVTOCI
The company has exercised the option to measure investment in equity instruments, not held for trading at FVTOCI in accordance with Ind AS 109. It has exercised this irrevocable option for its class of quoted equity shares. The option renders the equity instruments elected to be measured at FVTOCI non recyclabe to PL.
(b) Business Model for Investment of Debt Instruments
For the purpose of measuring investments in debt instruments in accordance with Ind AS 109, the company has evaluated and determined that the business model for investments in quoted debentures and bonds is to collect the contractual cash ows and sell the nancial asset . Such nancial assets have been accordingly classied and measured at FVTOCI.
For the purpose of measuring investments in debt instruments in accordance with Ind AS 109, the company has evaluated and determined that the business model for investments in unquoted debentures and bonds is only to collect the contractual cash ows . Such nancial assets have been accordingly classied and measured at amortised cost.
(ii) Estimates and assumptions
The key assumptions concerning the future and other key sources of estimation uncertainty at the reporting date, that have a signicant risk of causing a material adjustment to the carrying amounts of assets and liabilities within the next nancial year, are described below. The Company based its assumptions and
NOTES TO THE CONSOLIDATED FINANCIAL STATEMENTS
143
Kanoria Chemicals & Industries Limited
Annual Report 2016-17

estimates on parameters available when the nancial statements were prepared. Existing circumstances and assumptions about future developments, however, may change due to market changes or circumstances arising that are beyond the control of the Company. Such changes are reected in the assumptions when they occur.
(a) Defined benefit plans
The cost of the dened benet gratuity plan and the present value of the gratuity obligation are determined using actuarial valuations. An actuarial valuation involves making various assumptions that may differ from actual developments in the future. These include the determination of the discount rate, future salary increases and mortality rates. Due to the complexities involved in the valuation and its long-term nature, a dened benet obligation is highly sensitive to changes in these assumptions. All assumptions are reviewed at each reporting date.
The parameter most subject to change is the discount rate. In determining the appropriate discount rate for plans operated in India, the management considers the interest rates of government bonds in currencies consistent with the currencies of the post-employment benet obligation. Further details about gratuity obligations are given in Note 32.
(b) Fair value measurement of financial instruments
When the fair values of nancial assets and nancial liabilities recorded in the balance sheet cannot be measured based on quoted prices in active markets, their fair value is measured using valuation techniques including the DCF model. The inputs to these models are taken from observable markets where possible, but where this is not feasible, a degree of judgement is required in establishing fair values. Judgements include considerations of inputs such as liquidity risk, credit risk and volatility. Changes in assumptions about these factors could affect the reported fair value of nancial instruments. Refer Note 38 for further disclosures.
42: First-time adoption of Ind ASstThese nancial statements, for the year ended 31 March 2017, are the rst the company has prepared in accordance with Ind AS. For periods up to and including
stthe year ended 31 March 2016, the company prepared its nancial statements in accordance with accounting standards notied under section 133 of the Companies Act 2013, read together with paragraph 7 of the Companies (Accounts) Rules, 2014 (Indian GAAP).
stAccordingly, the company has prepared nancial statements which comply with Ind AS applicable for periods ending on 31 March 2017, together with the stcomparative period data as at and for the year ended 31 March 2016, as described in the summary of signicant accounting policies. In preparing these nancial
ststatements, the company's opening balance sheet was prepared as at 1 April 2015, the company's date of transition to Ind AS.
Exemptions applied
Ind AS 101 allows rst-time adopters certain exemptions from the retrospective application of certain requirements under Ind AS. The company has applied the following exemptions -
(i) The company has elected to measure all items of land and site development, leashold land and site development, buildings and plant and equipment at fair value at the date of transition to Ind AS. For the purpose of measurement upon transition the company regards the fair value as deemed cost at the
sttransition date, viz., 1 April 2015.
(ii) Appendix C to Ind AS 17 requires an entity to assess whether a contract or arrangement contains a lease. In accordance with Ind AS 17, this assessment should be carried out at the inception of the contract or arrangement. However, the Company has used Ind AS 101 exemption and assessed all arrangements based for embedded leases based on conditions in place as at the date of transition.
st(iii) The Company has designated investment in equity instruments (other than investment in subsidairies) held at 1 April 2015 as fair value through Other Comprehensive Income (OCI) investments.
st st(iv) The estimates at 1 April 2015 and at 31 March 2016 are consistent with those made for the same dates in accordance with Indian GAAP (after adjustments to reect any differences in accounting policies) apart from the following items where application of Indian GAAP did not require estimation:
a. FVTOCI – unquoted equity shares
b. FVTOCI – debt securities
c. Impairment of nancial assets based on expected credit loss model
d. FVTPL - Unquoted Equity Shares stThe estimates used by the Company to present these amounts in accordance with Ind AS reect conditions at 1 April 2015, the date of transition to Ind AS and as
stof 31 March 2016.
NOTES TO THE CONSOLIDATED FINANCIAL STATEMENTS
144
Kanoria Chemicals & Industries Limited
Annual Report 2016-17

stAs at 31 March 2016st As at 1 April 2015
ASSETS
Non-Current Assets
(a) Property, Plant and Equipment 3,124.62 1,469.65 4,594.27 3,014.04 1,481.11 4,495.15
(b) Capital Work-in-Progress 2,871.90 (185.40) 2,686.50 1,815.52 (203.14) 1,612.38
(c) Goodwill 337.86 - 337.86 294.46 - 294.46
(d) Other Intangible Assets 190.72 0.12 190.84 128.16 (0.02) 128.14
(e) Financial Assets -
(i) Investments 1 985.00 101.10 1,086.10 1,496.83 174.63 1,671.46
(ii) Loans 0.58 - 0.58 14.36 - 14.36
(iii) Others 9 36.94 (20.18) 16.76 18.78 (1.68) 17.10
(f) Other Non-Current Assets 9 20.45 0.49 20.94 115.55 1.80 117.35
7,568.07 1,365.78 8,933.85 6,897.70 1,452.70 8,350.40 Current Assets (a) Inventories 802.58 1.67 804.25 757.86 0.58 758.44
(b) Financial Assets (i) Investments 1 261.14 27.85 288.99 247.50 1.46 248.96
(ii) Trade Receivables 876.83 0.08 876.91 747.45 - 747.45
(iii) Cash and Cash Equivalents 181.46 0.29 181.75 332.15 0.17 332.32
(iv) Bank Balances other than (iii) above 377.85 0.02 377.87 15.38 - 15.38
(v) Loans 4.34 0.02 4.36 5.12 0.02 5.14
(vi) Others 9 20.77 (0.47) 20.30 41.62 0.05 41.67
(c) Current Tax Assets (Net) 182.36 - 182.36 254.96 - 254.96
(d) Other Current Assets 9 576.59 1.01 577.60 517.97 1.21 519.18
3,283.92 30.47 3,314.39 2,920.01 3.49 2,923.50 Total Assets 10,851.99 1,396.25 12,248.24 9,817.71 1,456.19 11,273.90
EQUITY AND LIABILITIESEQUITY Equity Share Capital 218.49 - 218.49 218.49 - 218.49
Other Equity 1,2,3, 4,633.82 1,176.35 5,810.17 4,717.95 1,222.41 5,940.36
4,6,10
Equity a�ributable to equity holders of the parent 4,852.31 1,176.35 6,028.66 4,936.44 1,222.41 6,158.85
Non Controlling interests 186.97 (5.18) 181.79 159.13 (11.73) 147.40
Total Equity 5,039.28 1,171.17 6,210.45 5,095.57 1,210.68 6,306.25 Non-Current Liabili�es(a) Financial Liabili�es (i) Borrowings 6 2,650.37 12.84 2,663.21 1,831.07 9.54 1,840.61
(ii) Other financial liabili�es 5,10 210.18 (151.41) 58.77 190.41 (140.43) 49.98
(b) Long Term Provisions 5 75.87 (11.49) 64.38 79.78 (10.69) 69.09
(c) Deferred Tax Liabili�es (Net) 4 214.78 441.96 656.74 197.18 455.79 652.97
3,151.20 291.90 3,443.10 2,298.44 314.21 2,612.65 Current Liabili�es
(a) Financial Liabili�es (i) Borrowings 1,265.32 - 1,265.32 961.16 - 961.16
(ii) Trade Payables 501.28 0.03 501.31 607.89 0.57 608.46
(iii) Other financial liabili�es 5,6,10 653.54 0.30 653.84 723.44 (1.38) 722.06
(b) Other Current Liabili�es 140.15 0.24 140.39 44.30 0.06 44.36
(c) Provisions 3,5 101.22 (67.39) 33.83 86.91 (67.95) 18.96
2,661.51 (66.82) 2,594.69 2,423.70 (68.70) 2,355.00
Total Liabili�es 5,812.71 225.08 6,037.79 4,722.14 245.51 4,967.65 Total Equity and Liabili�es 10,851.99 1,396.25 12,248.24 9,817.71 1,456.19 11,273.90
Foot-notes Effect of
Transi�on to Ind AS
As per Ind AS Balance
Sheet
Previous GAAP
Effect of Transi�on to Ind AS
As per Ind AS Balance
Sheet
Previous GAAP
(`in million)
EFFECT OF IND AS ADOPTION ON THE CONSOLIDATED BALANCE SHEETst stAs on 31 March 2016 and 1 April 2015
145
Kanoria Chemicals & Industries Limited
Annual Report 2016-17

Income
Revenue from opera�ons 5 5,651.29 328.08 5,979.37
Other income 1,9 196.61 (28.23) 168.38
Total Income 5,847.90 299.85 6,147.75
ExpensesCost of raw materials and components consumed 3,375.64 - 3,375.64
Purchase of traded goods 16.41 - 16.41
Change in inventories of finished goods
and work-in-progress 31.30 (0.81) 30.49
Excise duty on sale of goods 5 - 328.08 328.08
Employee benefits expenses 5,8 967.91 (6.34) 961.57
Deprecia�on and amor�sa�on expenses 317.25 25.96 343.21
Finance costs 2,6,10 135.69 3.85 139.54
Other expenses 2,9 961.59 5.26 966.85
Total expenses 5,805.79 356.00 6,161.79
Profit/(loss) before tax 42.11 (56.15) (14.04)
Tax expenses: 1. Current tax 65.05 - 65.05
2. MAT (14.79) - (14.79)
3. Deferred tax 4 15.33 (9.78) 5.55
4. For earlier years 2.08 - 2.08 Profit for the year (25.56) (46.37) (71.93)
Other comprehensive income (OCI)A. Items that will not be reclassified to Profit or Loss (PL) - 1. Actuarial gain/(loss) on Defined Benefit
Obliga�ons 8 - (6.34) (6.34)
Income Tax Effect 4 - 2.19 2.19 2. Net gain/(loss) on FVTOCI Equity securi�es 1 - (1.03) (1.03)
Income Tax Effect - - -
Net OCI not to be reclassified to PL in subsequent periods - (5.18) (5.18)
B. Items that will be reclassified to Profit or Loss (PL) - 1. Net gain/(loss) on FVTOCI debt securi�es 8 - 10.42 10.42
Income Tax Effect 4 - (1.20) (1.20)
2. Exchange Differences on transla�on of foreign opera�ons - - -
Income Tax Effect - - -3. (Gain)/loss transferred to PL upon Recycling of
FVTOCI Debt Instruments 1 - (26.59) (26.59)
Income Tax Effect 4 - 3.07 3.07 Net OCI to be reclassified to PL in subsequent periods 8 - (14.30) (14.30)
Other Comprehensive Income for the year, net of tax - (19.48) (19.48)
Total Comprehensive Income for the year (25.56) (65.85) (91.41)
Foot-notes
Effect of Transi�on to Ind AS
As per Ind AS Previous GAAP
EFFECT OF IND AS ADOPTION ON THE CONSOLIDATED STATEMENTOF PROFIT AND LOSS
stFor the year ended 31 March 2016
146
Kanoria Chemicals & Industries Limited
Annual Report 2016-17
(`in million)
This note explains the principal adjustments made by the company in restating its Indian GAAP consolidated nancial statements, including the balance sheet as st stat 1 April 2015 and the nancial statements as at and for the year ended 31 March 2016.
1 Investments at Fair Value (FVTOCI and FVTPL financial assets)
Under Indian GAAP, the Company accounted for investments in quoted equity shares and long term investments in debt securities as investment measured at
cost less provision for other than temporary diminution in the value of investments. Under Ind AS, the Company has designated such investments as FVTOCI stinvestments. Ind AS requires FVTOCI investments to be measured at fair value. At the date of transition to Ind AS and as on 31 March 2016, difference between
the instrument's fair value and Indian GAAP carrying amount has been recognised in the OCI net of related deferred taxes.
Under Indian GAAP, the Company accounted for investments in unquoted equity shares, quoted preference shares, long term investments in mutual funds,
alternate investment funds and equity funds as investment measured at cost less provision for other than temporary diminution in the value of investments.
Under Ind AS, the Company has designated such investments as FVTPL investments. Ind AS requires FVTPL investments to be measured at fair value. At the date stof transition to Ind AS and as on 31 March 2016, difference between the instrument's fair value and Indian GAAP carrying amount has been recognised in
Retained earnings and statement of prot and loss respecively.
The difference between amortised cost and the Indian GAAP carrying amount has been recognised in retained earnings for investments measured at
amortised cost basis.
2 Derivative Instruments
The fair value of forward foreign exchange contracts is recognised under Ind AS, and was not recognised under Indian GAAP. The company was accounting for
derivate contracts under the Indian GAAP using AS 11 - 'Effects of Changes in Foreign Exchange Rates'. The difference between the fair value and the Indian GAAP
carrying amount has been recognised in retained earnings on the date of transition to Ind AS.
3 Dividend
Under Indian GAAP, proposed dividends including Dividend Distribution Taxes (DDT) are recognised as a liability in the period to which they relate, irrespective of
when they are declared. Under Ind AS, a proposed dividend is recognised as a liability in the period in which it is declared by the company (usually when approved
by shareholders in a general meeting) or paid.
In case of the Company, the declaration of dividend occurs after period end. Therefore, the liability recorded for dividend has been derecognised against retained stearnings on 1 April 2015.
4 Deferred tax
Indian GAAP requires deferred tax accounting using the income statement approach, which focuses on differences between taxable prots and accounting prots
for the period. Ind AS 12 requires entities to account for deferred taxes using the balance sheet approach, which focuses on temporary differences between the
carrying amount of an asset or liability in the balance sheet and its tax base. The application of Ind AS 12 approach has resulted in recognition of deferred tax on
new temporary differences which was not required under Indian GAAP.
5 Re-classifications
The Company has made following reclassication as per the requirements of Ind-AS:
i) Assets / liabilities which do not meet the denition of nancial asset / nancial liability have been reclassied to other asset / liability.
ii) Acturial gain/loss on long term employee benet plans are re-classied from prot and loss to OCI.
iii) Under Previous GAAP revenue from sale was shown net of excise duty, whereas under Ind AS this includes excise duty.
6 Borrowings
Under Indian GAAP, transaction costs incurred in connection with borrowings are amortised upfront and charged to prot or loss for the period. Under Ind AS,
transaction costs are included in the initial recognition amount of nancial liability and charged to prot or loss using the effective interest method.
st stFootnotes to the reconciliation of equity as at 1 April 2015 and 31 March 2016stand Profit or Loss for the year ended 31 March 2016
147
Kanoria Chemicals & Industries Limited
Annual Report 2016-17
NOTES TO THE CONSOLIDATED FINANCIAL STATEMENTS

For SINGHI & CO.Chartered AccountantsFirm Registration No.302049E
For and on behalf of the Board,
AMITAV KOTHARIDirector
(DIN:01097705)
R. V. KANORIA Managing Director
(DIN:00003792)
N. K. NOLKHA Group Chief Financial Ofcer
N. K. SETHIACompany Secretary
ANURAG SINGHIPartnerMembership No. 66274
Place: New Delhi thDate: 30 May, 2017
7 Statement of cash flows
The transition from Indian GAAP to Ind AS has not had a material impact on the statement of cash ows.
8 Other comprehensive income
Under Indian GAAP, the Company has not presented other comprehensive income (OCI) separately. Hence, it has reconciled Indian GAAP prot or loss to prot or
loss as per Ind AS. Further, Indian GAAP prot or loss is reconciled to total comprehensive income as per Ind AS.
9 Security Deposit
The company has made a security deposit with a supplier as part of it's arrangement with the supplier. Under Indian GAAP, the deposit was carried at the
transaction value in the company's books. However, under Ind AS the company has measured the deposit at it's fair value by taking time value of money over the
life of the contract into consideration. The difference between the carrying value of the deposit under IGAAP and Ind AS has been adjusted as prepaid electricity
charges which is being amortised on a straight line basis over the life of contract.
10 Lease Obligation liability
Under Indian GAAP, the Company accounted for long term liabilities at cost. Under Ind AS, such liabilities are classied as amortized cost. At the date of transition
to Ind AS and as on 31st March, 2016, difference between the liabilities' fair value and Previous GAAP carrying amount has been recognised in Retained earnings,
(liability head) and nance cost.
148
Kanoria Chemicals & Industries Limited
Annual Report 2016-17
st st Footnotes to the reconciliation of equity as at 1 April 2015 and 31 March 2016stand Profit or Loss for the year ended 31 March 2016
NOTES TO THE CONSOLIDATED FINANCIAL STATEMENTS
43. Figures for the previous year have been regrouped/rearranged, wherever found necessary.
Signature to Note 1 to 43

For and on behalf of the Board,
AMITAV KOTHARIDirector
(DIN:01097705)
R. V. KANORIA Managing Director
(DIN:00003792)
N. K. NOLKHA Group Chief Financial Ofcer
N. K. SETHIACompany Secretary
Place: New Delhi thDate: 30 May, 2017
Salient Features of Financial Statements of Subsidiary Companiesstfor the year ended 31 March, 2017,
pursuant to Companies Act, 2013
149
Kanoria Chemicals & Industries Limited
Annual Report 2016-17
Country of incorpora�on India Ethiopia Switzerland
Principal Business Ac�vites Investments Tex�le Electronic Automo�ve
Repor�ng Currency INR USD CHF
Exchange Rate as on 31.3.2017 Rs. 64.8386 Rs. 64.8559
(a) Equity Share Capital 46.51 933.68 19.46
(b) Other Equity 116.96 (513.71) (157.56)
(c) Total Assets 164.64 3,102.35 2,033.14
(d) Total Liabili�es 1.17 2,682.38 2,171.24
(e) Investments* 163.82 - -
(f) Turnover 19.34 449.09 3,614.55
(g) Profit/(Loss) before Taxa�on 19.19 (418.42) (8.41)
(h) Provision for Taxa�on 0.40 - 16.09
(i) Profit/(Loss) a�er Taxa�on 18.79 (418.42) (24.50)
(j) Other comprehensive income for the year, net of tax 2.08 - -
(k) Total comprehensive income for the year 20.87 (418.42) (24.50)
(l) Proposed Dividend - - -
(m)% of Shareholding 100.00% 78.68% 100.00%
Kanoria Africa Tex�les Plc
APAG Holding AG (Consolidated)
Pipri LimitedName of Subsidiaries
(`in million)
* Excluding Investment in Subsidiaries
Registered OfceKanoria Chemicals & Industries Limited'Park Plaza' , 71 Park Street, Kolkata - 700 016Tel: +91-33-22499472, 22499473, 22499474Fax: +91-33-22499466Email: [email protected]: www.kanoriachem.com
Kanoria ChemicalsIndustries Limited&
KCI