Annual Report BlueNile 2007
72
Blue Nile, Inc. 2007 Annual Report
-
Upload
simon-peter-noetzel -
Category
Documents
-
view
217 -
download
0
Transcript of Annual Report BlueNile 2007

8/3/2019 Annual Report BlueNile 2007
http://slidepdf.com/reader/full/annual-report-bluenile-2007 1/72
Blue Nile, Inc.
2007 Annual Report

8/3/2019 Annual Report BlueNile 2007
http://slidepdf.com/reader/full/annual-report-bluenile-2007 2/72

8/3/2019 Annual Report BlueNile 2007
http://slidepdf.com/reader/full/annual-report-bluenile-2007 3/72
705 Fifth Avenue South, Suite 900
Seattle, Washington 98104
April 18, 2008
To our Shareholders:
We started Blue Nile in 1999 with a few people, several telephones and computers, a website, and a dream of
transforming an industry and building a lasting brand. As we reflect on 2007, it is remarkable to think how far we
have come in making our dream a reality. Our unique business model allows us to offer unparalleled quality and
selection of products at an exceptional value. Increasingly, customers around the world are turning to the Blue Nile
brand for education, guidance, selection and service - the key tenets of the unique experience we provide.
Financially, 2007 was another extremely successful year for Blue Nile. We are pleased to report our continued
success in generating profitable growth and exceptional cash flow in our business. A few of our key financial
highlights for 2007 include:
• Revenue growth of 26.9% to $319.3 million;
• Net income increase of 33.6% to $17.5 million;
• Adjusted EBITDA1 increase of 31.4% to $29.9 million;
• Return on equity2 of 33.7%, up from 22.2% in 2006; and
• Free cash flow3 for the year of $36.6 million.
Utilizing a portion of the cash we generated this year, we repurchased $20 million of our stock, bringing our total
stock repurchases in the last three years to over $95 million. After these repurchases, we ended 2007 with over
$122 million of cash and cash equivalents, and no debt. We intend to continue to utilize our free cash flow to
opportunistically repurchase our stock in the coming years.
In addition to our strong financial results for 2007, we continued to take steps to aid in the future growth of our
business. During the year, we increased the size and capacity of our domestic fulfillment center and added to our
team across the business. We made significant progress in our international expansion efforts by launching two local
currency websites serving the Canadian and United Kingdom markets, and opening an operations center in Dublin,
Ireland, to service the United Kingdom and the greater European markets. Our international sales doubled in 2007
from the prior year to over $17 million. Looking forward, sales outside the United States will surely be an
increasingly important part of our business.
While 2007 was a very successful year for Blue Nile, since entering 2008, we have seen a softening in consumer
spending across all of retail. The jewelry sector, as a luxury category, has experienced a more pronounced impact
from this softening. With the current uncertainty in the economic environment, we have been cautious in our
expectations for 2008. Our belief in the strength of our business model, however, is unwavering; and we believe we
will emerge from any economic downturn with increased market share and a stronger financial position relative to
our competitors. We are financially strong, with a lean cost structure and a capital-efficient business model.
Additionally, we provide our customers with an exceptional value proposition, something that is likely to be a focus
for consumers during times of economic uncertainty. Our laser focus on delivering exceptional products at an
outstanding value, coupled with our discipline in running our business efficiently, will enable us to capture market
share and enhance our consumer experience while our competitors may be forced to pull back.
Our focus in 2008 remains true to our dream and is designed to strengthen our business regardless of the economic
environment. First, we plan to continue to enhance the Blue Nile customer experience. Our customers are at the
8/3/2019 Annual Report BlueNile 2007
http://slidepdf.com/reader/full/annual-report-bluenile-2007 4/72
heart of everything we do, and we plan to continuously raise the bar for ourselves. While physical retailers may be
forced to cut back in this area during economic downturns, we will continue to innovate across every element of the
customer experience. Whether it is an engagement ring that someone will wear for the rest of her life, or a pair of
diamond earrings that someone will treasure - we understand that our products represent significant events in the
lives of our customers. We are building lasting relationships with our customers one order at a time. Our repeat and
referral numbers speak to this relationship. In 2007, over half of our business was generated through repeat and
referral purchases. By enhancing the customer experience, we foster these relationships and drive these purchases.
Second, we will remain focused on maintaining our efficient and lean cost structure. Our operating modeldistinguishes us from our competition. Our SG&A as a percentage of sales was just over 13% in 2007. Our cost
structure does not require a network of stores or high overhead costs, which allows us to adapt to the economic
environment and to continue to allocate resources to enhance our customer experience. Our focus on controlling
costs is ingrained in our culture at Blue Nile, and we plan to continue to look for cost and efficiency improvements.
Third, we will continue to drive international growth. Early in 2008, we began shipping to 12 new countries in
Europe and Asia Pacific. Today, we are shipping to over 25 countries. We have had tremendous early success with
our international expansion efforts. Consumers in many countries have limited access to diamonds, and the
diamonds that they do have access to are priced at very high margins. We are excited about the international
opportunity, as we believe that our ability to offer over 60,000 high quality diamonds at an exceptional value will
resonate with consumers all over the world.
We are committed to creating long-term value for our shareholders, and we thank you for your continued support.We would also like to thank our exceptional employees. It is the passion, commitment and talent of our people that
enable us to execute with excellence.
Diane IrvinePresident and Chief Executive Officer
Mark VadonExecutive Chairman and Chairman of the Board
1Non-GAAPAdjusted EBITDA is defined as net income before income taxes, other income, net, depreciation, amortization and
stock-based compensation expense. Adjusted EBITDA for 2007 of $29.9 million is net income of $17.5 million plus income
taxes of $9.1 million, depreciation and amortization of $1.8 million and stock-based compensation of $5.7 million, less other
income, net of $4.2 million. Adjusted EBITDA for 2006 of $22.8 million is net income of $13.1 million plus income taxes of
$6.9 million, plus depreciation and amortization of $1.9 million and stock-based compensation of $4.3 million, less other
income, net of $3.4 million.
2Return on equity is defined as net income divided by average stockholders’ equity. Average stockholders’ equity is defined as
the sum of the stockholders’ equity balance on the last day of the prior fiscal year plus the stockholders’ equity balance at the end
of each fiscal quarter, divided by 5. Return on equity for 2007 is net income of $17.5 million divided by average stockholders’
equity of $51.8 million. Return on equity for 2006 is net income of $13.1 million divided by average stockholders’ equity of
$58.8 million.
3Non-GAAP free cash flow is defined as net cash provided by operating activities less cash outflows for purchases of fixed
assets, including internal use software and website development. Non-GAAP free cash flow for 2007 of $36.6 million is net cash
provided by operating activities of $41.5 million, less purchases of fixed assets, including internal-use software and website
development of $4.9 million.

8/3/2019 Annual Report BlueNile 2007
http://slidepdf.com/reader/full/annual-report-bluenile-2007 5/72
UNITED STATES SECURITIES AND EXCHANGE COMMISSIONWashington, D.C. 20549
FORM 10-K¥ ANNUAL REPORT PURSUANT TO SECTION 13 OR 15(d)
OF THE SECURITIES EXCHANGE ACT OF 1934
For the fiscal year ended December 30, 2007
OR
n TRANSITION REPORT PURSUANT TO SECTION 13 OR 15(d)
OF THE SECURITIES EXCHANGE ACT OF 1934
For the transition period from to
Commission file number 000-50763
Blue Nile, Inc.(Exact name of registrant as specified in its charter)
Delaware 91-1963165(State or other jurisdiction of
incorporation or organization)
(I.R.S. Employer
Identification No.)
705 Fifth Avenue South, Suite 900Seattle, Washington 98104
(206) 336-6700(Address and telephone number, including area code, of principal executive offices)
Securities registered pursuant to Section 12(b) of the Act:
Title of Each Class Name of Each Exchange on Which Registered
Common Stock, $.001 Par Value The NASDAQ Stock Market LLC
Securities registered pursuant to Section 12(g) of the Act:
None
Indicate by check mark if the registrant is a well-known seasoned issuer, as defined in Rule 405 of the Securities Act.YES ¥ NO n
Indicate by check mark if the registrant is not required to file reports pursuant to Section 13 or Section 15(d) of the Act.YES n NO ¥
Indicate by check mark whether the registrant (1) has filed all reports required to be filed by Section 13 or 15(d) of the SecuritiesExchange Act of 1934 during the preceding 12 months (or for such shorter period that the registrant was required to file such reports),and (2) has been subject to such filing requirements for the past 90 days. YES ¥ NO n
Indicate by check mark if disclosure of delinquent filers pursuant to Item 405 of Regulation S-K (§ 229.405 of this chapter) is notcontained herein, and will not be contained, to the best of registrant’s knowledge, in definitive proxy or information statementsincorporated by reference in Part III of this Form 10-K or any amendment to this Form 10-K. ¥
Indicate by check mark whether the registrant is a large accelerated filer, an accelerated filer, a non-accelerated filer, or a smallerreporting company. See the definitions of “large accelerated filer,” “accelerated filer” and “smaller reporting company” in Rule 12b(2)of the Exchange Act.
Large accelerated filer ¥ Accelerated filer nNon-accelerated filer n Smaller reporting company n
(do not check if a smaller reporting company)
Indicate by check mark whether the registrant is a shell company (as defined in Rule 12b-2 of the Exchange Act). YES n NO ¥
The aggregate market value of the voting stock held by nonaffiliates of the registrant at July 1, 2007 was approximately$894 million, based on the last trading price of $60.40 per share, excluding approximately 1.1 million shares held by directors andexecutive officers of the registrant. This calculation does not exclude shares held by organizations whose ownership exceeds 10% of theregistrant’s outstanding common stock as of July 1, 2007 that have represented on Schedule 13G filed with the Securities and ExchangeCommission that they are registered investment advisers or investment companies registered under Section 8 of the InvestmentCompany Act of 1940.
The number of shares outstanding of the registrant’s common stock as of February 15, 2008 was 15,769,665.
DOCUMENTS INCORPORATED BY REFERENCE
Portions of the Company’s definitive Proxy Statement to be filed with the Commission pursuant to Regulation 14A in connectionwith the 2008 Annual Meeting of Stockholders are incorporated by reference into Part III of this Annual Report on Form 10-K.

8/3/2019 Annual Report BlueNile 2007
http://slidepdf.com/reader/full/annual-report-bluenile-2007 6/72
BLUE NILE, INC.
ANNUAL REPORT ON FORM 10-K FOR THE FISCAL YEAR ENDED DECEMBER 30, 2007
Page
PART I
Item 1. Business . . . . . . . . . . . . . . . . . . . . . . . . . . . . . . . . . . . . . . . . . . . . . . . . . . . . . . . . . . . . . . . 3
Item 1A. Risk Factors . . . . . . . . . . . . . . . . . . . . . . . . . . . . . . . . . . . . . . . . . . . . . . . . . . . . . . . . . . . . 7Item 1B. Unresolved Staff Comments . . . . . . . . . . . . . . . . . . . . . . . . . . . . . . . . . . . . . . . . . . . . . . . . . 19
Item 2. Properties . . . . . . . . . . . . . . . . . . . . . . . . . . . . . . . . . . . . . . . . . . . . . . . . . . . . . . . . . . . . . . 19
Item 3. Legal Proceedings . . . . . . . . . . . . . . . . . . . . . . . . . . . . . . . . . . . . . . . . . . . . . . . . . . . . . . . . 20
Item 4. Submission of Matters to a Vote of Security Holders . . . . . . . . . . . . . . . . . . . . . . . . . . . . . . 20
PART II
Item 5. Market for Registrant’s Common Equity, Related Stockholder Matters and Issuer Purchasesof Equity Securities . . . . . . . . . . . . . . . . . . . . . . . . . . . . . . . . . . . . . . . . . . . . . . . . . . . . . . . 20
Item 6. Selected Consolidated Financial Data . . . . . . . . . . . . . . . . . . . . . . . . . . . . . . . . . . . . . . . . . . 22
Item 7. Management’s Discussion and Analysis of Financial Condition and Results of Operations . . . 24
Item 7A. Quantitative and Qualitative Disclosures About Market Risk . . . . . . . . . . . . . . . . . . . . . . . . . 31Item 8. Financial Statements and Supplementary Data . . . . . . . . . . . . . . . . . . . . . . . . . . . . . . . . . . . 32
Item 9. Changes in and Disagreements with Accountants on Accounting and Financial Disclosure . . . 56
Item 9A. Controls and Procedures . . . . . . . . . . . . . . . . . . . . . . . . . . . . . . . . . . . . . . . . . . . . . . . . . . . 56
Item 9B. Other Information . . . . . . . . . . . . . . . . . . . . . . . . . . . . . . . . . . . . . . . . . . . . . . . . . . . . . . . . 58
PART III
Item 10. Directors, Executive Officers and Corporate Governance. . . . . . . . . . . . . . . . . . . . . . . . . . . . 58
Item 11. Executive Compensation . . . . . . . . . . . . . . . . . . . . . . . . . . . . . . . . . . . . . . . . . . . . . . . . . . . 58
Item 12. Security Ownership of Certain Beneficial Owners and Management and Related StockholderMatters . . . . . . . . . . . . . . . . . . . . . . . . . . . . . . . . . . . . . . . . . . . . . . . . . . . . . . . . . . . . . . . . 58
Item 13. Certain Relationships and Related Transactions, and Director Independence . . . . . . . . . . . . . 58Item 14. Principal Accountant Fees and Services . . . . . . . . . . . . . . . . . . . . . . . . . . . . . . . . . . . . . . . . 58
PART IV
Item 15. Exhibits and Financial Statement Schedules . . . . . . . . . . . . . . . . . . . . . . . . . . . . . . . . . . . . . 59
SIGNATURES . . . . . . . . . . . . . . . . . . . . . . . . . . . . . . . . . . . . . . . . . . . . . . . . . . . . . . . . . . . . . . . . . . 60
EXHIBIT INDEX . . . . . . . . . . . . . . . . . . . . . . . . . . . . . . . . . . . . . . . . . . . . . . . . . . . . . . . . . . . . . . . . 62
2

8/3/2019 Annual Report BlueNile 2007
http://slidepdf.com/reader/full/annual-report-bluenile-2007 7/72
PART I
Item 1. Business
This Annual Report on Form 10-K contains forward-looking statements that involve many risks and
uncertainties. These statements relate to future events and our future performance, which are based on current
expectations, estimates, forecasts and projections about the industries in which we operate and the beliefs and
assumptions of our management as of the date of this filing. In some cases, you can identify forward-lookingstatements by terms such as “would,” “could,” “may,” “will,” “should,” “expect,” “intend,” “plan,” “antici-
pate,” “believe,” “estimate,” “predict,” “potential,” “targets,” “seek,” or “continue,” the negative of these
terms or other variations of such terms. In addition, any statements that refer to projections of our future
financial performance, our anticipated growth and trends in our business and other characterizations of future
events or circumstances, are forward-looking statements. These statements are only predictions based upon
assumptions made that are believed to be reasonable at the time, and are subject to risk and uncertainties.
Therefore, actual events or results may differ materially and adversely from those expressed in any forward-
looking statement. In evaluating these statements, you should specifically consider the risks described under
the caption “Item 1A Risk Factors” and elsewhere in this Form 10-K. These factors, and other factors, may
cause our actual results to differ materially from any forward-looking statements. Except as required by law,
we undertake no obligation to publicly update or revise any forward-looking statements, whether as a result of
new information, future events or otherwise.
Overview
We were incorporated as a Delaware corporation on March 18, 1999 as RockShop.com, Inc. On May 21,
1999, the Company purchased certain assets of Williams & Son, Inc., a Seattle jeweler, including a website
established by that business. In June 1999, we changed our name to Internet Diamonds, Inc. In November
1999, we launched the Blue Nile brand and changed our name to Blue Nile, Inc. We are a leading online
retailer of diamonds and fine jewelry that offers an exceptional customer experience including substantial
education, guidance, and value and have successfully built Blue Nile into a premium brand. Our principal
corporate offices are located in Seattle, Washington.
Our sales have grown substantially since inception. For the 2007 fiscal year, we reported net sales of
$319.3 million, an increase of 26.9% from 2006.
We have built a well respected consumer brand by employing an informative sales process that empowers
our customers while offering a broad selection of high quality jewelry at competitive prices. Our primary
website is located at www.bluenile.com. We also operate websites in the United Kingdom (www.bluenile.-
co.uk) and Canada (www.bluenile.ca). Our websites showcase thousands of independently certified diamonds
and styles of fine jewelry, including rings, wedding bands, earrings, necklaces, pendants, bracelets and
watches. We specialize in the customization of diamond jewelry with our “Build Your Own” feature that offers
customers the ability to customize diamond rings, pendants and earrings. We have developed an efficient
online cost structure and a unique supply solution that eliminates traditional layers of diamond wholesalers
and brokers, which generally allow us to purchase most of our product offerings at lower prices by avoiding
mark-ups imposed by those intermediaries. While we may selectively acquire diamond inventory that we
believe will be attractive to our customers, our supply solution enables us to purchase only those diamonds
that our customers have ordered. As a result, we are able to minimize the costs associated with carryingdiamond inventory and limit our risk of potential mark-downs.
The significant costs of diamonds and fine jewelry lead consumers to seek out substantial information and
trusted guidance throughout their purchasing process. Our websites and extensively trained customer service
representatives improve the traditional purchasing experience by providing education and detailed product
information that enable our customers to objectively compare diamonds and fine jewelry products and make
informed decisions. Our websites feature interactive search functionality that allows our customers to quickly
find the products that meet their needs from our broad selection of diamonds and fine jewelry.
3

8/3/2019 Annual Report BlueNile 2007
http://slidepdf.com/reader/full/annual-report-bluenile-2007 8/72
Growth Strategies
Our objective is to continue to grow our leadership position in our core business by offering exceptional
value to our customers through supply chain efficiencies, an efficient cost structure and a high quality
customer experience. We are pursuing the following strategies for future growth:
Focus on the Customer Experience
We continue to refine the customer service we provide in every step of the purchase process, from our
websites to our customer support, product quality and fulfillment operations. The Blue Nile customerexperience is designed to empower our customers with knowledge and confidence as they evaluate, select and
purchase diamonds and fine jewelry.
Increase Blue Nile Brand Awareness
We have established and are continuing to develop a brand based on trust, guidance and value, and we
believe our customers view Blue Nile as a trusted authority on diamonds and fine jewelry. Our goal is for
consumers to seek out the Blue Nile brand whenever they purchase high quality diamonds and fine jewelry.
Expand into International Markets
We have and will continue to selectively pursue opportunities in international markets in which we can
leverage our existing infrastructure and compelling value proposition. We are pursuing these opportunities
based on each market’s consumer spending on jewelry, adoption rate of online purchasing and competitivelandscape, among other factors. In August 2004, we launched a website in the United Kingdom,
www.bluenile.co.uk through which we offered a limited number of products. In September 2005, we began
offering customization tools on our U.K. website to provide customers with the ability to customize their
diamond jewelry products and to purchase wedding bands. In January 2005, we launched a website in Canada,
www.bluenile.ca, through which we offer diamond and jewelry products for sale. In May 2007, we updated
our U.K. and Canadian websites to transact in local currency and opened a fulfillment center in Dublin,
Ireland to serve our U.K. and E.U. customers. International sales totaled $17.2 million for the year ended
December 30, 2007 compared to $8.3 million for the year ended December 31, 2006, an increase of 108.1%.
Increase Supply Chain Efficiencies
We maintain mutually beneficial supply relationships designed to further enhance supply chain efficien-
cies and provide value to both our customers and suppliers. We actively interact with and provide feedback to
our supplier network to obtain the best possible selection of diamonds and fine jewelry for our customers.
Improve Operational Efficiencies
We have established and will continue to refine our scaleable, lower cost business model that enables
growth with less working capital requirements than traditional store-based jewelry retailers. We intend to
continue improving our profitability over time by leveraging our relatively fixed cost technology and
operations infrastructure as we seek to increase our net sales.
Expand Product Offerings
We have and will continue to selectively expand our jewelry offerings, in terms of both price points and
product mix, through additional customized and non-customized products. The online nature of our business
allows us to test new products and efficiently add promising new merchandise to our overall assortment.
Blue Nile’s Product Offerings and Supplier Relationships
Our merchandise consists of high quality diamonds and fine jewelry, with a particular focus on
engagement diamonds and settings. Our online business model, combined with the strength of our supplier
relationships, enables us to pursue a dynamic merchandising strategy. Our diamond supplier relationships allow
us to display suppliers’ diamond inventories on the Blue Nile websites for sale to consumers without holding
the diamonds in our inventory until the products are ordered by customers. Our agreements with suppliers are
typically multi-year arrangements that provide for certain diamonds to be offered online to consumers only
through the Blue Nile websites.
4

8/3/2019 Annual Report BlueNile 2007
http://slidepdf.com/reader/full/annual-report-bluenile-2007 9/72
Diamonds represent the most significant component of our product offerings. While we currently offer
thousands of independently certified diamonds, we aim to limit our diamond offerings to those possessing
characteristics associated with high quality merchandise. Accordingly, we offer diamonds with specified
characteristics in the areas of shape, cut, color, clarity and carat weight.
Customers may purchase customized diamond jewelry by selecting a diamond and then choosing from a
variety of ring, earring and pendant settings that are designed to match the characteristics of each individual
diamond. The customized product is then assembled and delivered to the customer, typically within three
business days.
We offer a broad range of fine jewelry products to complement our selection of high quality customized
diamond jewelry. Our selection includes diamond, platinum, gold, pearl and sterling silver jewelry and
accessories. Our fine jewelry assortment includes settings, wedding bands, earrings, necklaces, pendants,
bracelets and watches. We currently have relationships with fine jewelry and watch suppliers from which we
source our jewelry and watch merchandise. In the case of fine jewelry and watches, unlike most diamonds that
we sell, we typically take products into inventory before they are ordered by our customers.
Marketing
Our marketing strategy is designed to increase Blue Nile brand recognition, generate consumer traffic,
acquire customers, build a loyal customer base and promote repeat purchases. We believe our customers
generally seek high quality diamonds and fine jewelry from a trusted source in a non-intimidating
environment, where information, guidance, reputation, convenience and value are important characteristics.Our marketing and advertising efforts include online and offline initiatives, which primarily consist of search
engines, portals and targeted website advertising, affiliate programs, direct online marketing, and public
relations.
Customer Service and Support
A key element of our business strategy is our ability to provide a high level of customer service and
support. We augment our online information resources with knowledgeable, highly trained support staff
through our call center to give customers confidence in their purchases. Our diamond and jewelry consultants
are trained to provide guidance on all steps in the process of buying diamonds and fine jewelry, including,
among other things, the process for selecting an appropriate item, the purchase of that item, financing and
payment alternatives and shipping services. Our commitment to customers is reflected in both high service
levels that are provided by our extensively trained diamond and jewelry consultants, as well as in ourguarantees and policies. We prominently display all of our guarantees and policies on our websites to create
an environment of trust. These include policies relating to privacy, security, product availability, pricing,
shipping, refunds, exchanges and special orders. We generally offer a return policy of 30 days. We generally
do not extend credit to customers except through third-party credit cards.
Fulfillment Operations
Our fulfillment operations are designed to enhance value for our customers by fulfilling orders quickly,
securely and accurately. When an order for a customized diamond jewelry setting is received, any third-party
supplier who holds the diamond in inventory generally ships it to us, or to independent third-party jewelers
with whom we maintain ongoing relationships for assembly, within one business day. Upon receipt, the
merchandise is sent to assembly for setting and sizing, which is performed by our jewelers or independent
third-party jewelers. Each diamond is inspected upon arrival from our suppliers, and each finished setting orsizing is inspected prior to shipment to a customer. Prompt and secure delivery of our products is a high
priority, and we ship nearly all diamond and fine jewelry products via nationally recognized carriers. Loose
diamonds and customized diamond jewelry products may be shipped by Blue Nile or directly by our suppliers
or third-party jewelers to our customers.
Technology and Systems
Our technology systems use a combination of proprietary and licensed technologies. We focus our
internal development efforts on creating and enhancing the features and functionality of our websites and order
5

8/3/2019 Annual Report BlueNile 2007
http://slidepdf.com/reader/full/annual-report-bluenile-2007 10/72
processing and fulfillment systems to deliver a high quality customer experience. We license third-party
information technology systems for our financial reporting, inventory management, order fulfillment and
merchandising. We use redundant Internet carriers to minimize downtime. Our systems are monitored
continuously using third-party software, and an on-call team is staffed to respond to any emergencies or
unauthorized access in the technology infrastructure.
Seasonality
We generally experience seasonal fluctuations in demand for our products. Our quarterly sales areimpacted by various gift giving holidays including Valentine’s Day (first quarter), Mother’s Day (second
quarter) and Christmas/New Year’s (fourth quarter). As a result, our quarterly revenue is generally the lowest
in the third quarter (as a result of the lack of recognized gift giving holidays) and highest in the fourth quarter.
The fourth quarter accounted for approximately 35%, 36% and 36% of our net sales in the years ended
December 30, 2007, December 31, 2006 and January 1, 2006, respectively.
Competition
The diamond and fine jewelry retail market is intensely competitive and highly fragmented. Our primary
competition comes from online and offline retailers that offer products within the higher value segment of the
jewelry market. In the future, we may also compete with other retailers that move into the higher value
jewelry segment. Current or potential competitors include the following:
• independent jewelry stores;
• retail jewelry store chains;
• other online retailers that sell jewelry;
• department stores, chain stores and mass retailers;
• online auction sites;
• catalog and television shopping retailers; and
• discount superstores and wholesale clubs.
In addition to these competitors, we may face competition from suppliers of our products that decide to
sell directly to consumers, either through physical retail outlets or through an online store.
We believe that the principal competitive factors in our market are product selection and quality, customer
service and support, price, brand recognition, reputation, reliability and trust, website features and functional-
ity, convenience and delivery performance. We believe that we compete favorably in the market for diamonds
and fine jewelry by focusing on these factors.
Intellectual Property
We rely on general intellectual property law and contractual restrictions and to a limited extent,
copyrights and patents, to protect our proprietary rights and technology. These contractual restrictions include
confidentiality agreements, invention assignment agreements and nondisclosure agreements with employees,
contractors, suppliers and strategic partners. Despite the protection of general intellectual property law and our
contractual restrictions, it may be possible for a third-party to copy or otherwise obtain and use our intellectual
property without our authorization. In addition, we pursue the registration of our trademarks and service marksin the U.S. and certain other countries. However, effective intellectual property protection or enforcement may
not be available in every country in which our products and services are made available in the future. In the
United States and certain other countries, we have registered “Blue Nile,” “bluenile.com,” the BN logo and the
Blue Nile BN stylized logo as trademarks. We have also registered copyrights with respect to images and
information set forth on our websites and the computer codes incorporated in our websites and filed U.S. patent
applications relating to certain features of our websites. We also rely on technologies that we license from
third parties, particularly software solutions for financial reporting, inventory management, order fulfillment
and merchandising.
6

8/3/2019 Annual Report BlueNile 2007
http://slidepdf.com/reader/full/annual-report-bluenile-2007 11/72
Employees
At December 30, 2007, we employed 198 people, which included 191 full-time and 7 part-time
employees. We also utilize independent contractors and temporary personnel on a seasonal basis. Our
employees are not party to any collective bargaining agreement, and we have never experienced an organized
work stoppage. We believe our relations with our employees are good.
Available Information
We make available, free of charge, through our primary website, www.bluenile.com, our annual report onForm 10-K, quarterly reports on Form 10-Q, current reports on Form 8-K and any amendments to those
reports, as soon as reasonably practicable after electronically filing such material with or furnishing it to the
Securities and Exchange Commission (“SEC”). Our SEC reports as well as our corporate governance policies
and code of ethics can be accessed through the investor relations section of our website. The information
found on our website is not part of this or any other report filed with or furnished to the SEC. All of the
Company’s filings with the SEC may be obtained at the SEC’s Public Reference Room at 100 F Street, NE,
Washington, DC 20549. For information regarding the operation of the SEC’s Public Reference Room, please
contact the SEC at 1-800-SEC-0330. Additionally, the SEC maintains an Internet site that contains reports,
proxy and information statements and other information regarding issuers that file electronically with the SEC
at www.sec.gov. Amendments to, and waivers from, the code of ethics that applies to our principal executive
officer, principal financial officer and principal accounting officer, or persons performing similar functions,
and that relates to any element of the code of ethics definition enumerated in Item 406(b) of Regulation S-Kwill be disclosed at the website address provided above and, to the extent required by applicable regulations,
on a current report on Form 8-K.
Item 1A. Risk Factors
You should carefully consider the risks described below and elsewhere in this report, which could
materially and adversely affect our business, results of operations or financial condition. In those cases, the
trading price of our common stock could decline and you may lose all or part of your investment.
Our limited operating history makes it difficult for us to accurately forecast net sales and appropriately
plan our expenses.
We were incorporated in March 1999 and have a limited operating history. As a result, it is difficult to
accurately forecast our net sales and plan our operating expenses. We base our current and future expenselevels on our operating forecasts and estimates of future net sales. Net sales and operating results are difficult
to forecast because they generally depend on the volume and timing of the orders we receive, which are
uncertain. Additionally, our business is affected by general economic and business conditions in the U.S. and
internationally. A softening in net sales, whether caused by changes in customer preferences or a weakening in
the U.S. or global economies, may result in decreased revenue growth. Some of our expenses are fixed, and,
as a result, we may be unable to adjust our spending in a timely manner to compensate for any unexpected
shortfall in net sales. This inability could cause our net income in a given quarter to be lower than expected.
We also make certain assumptions when forecasting the amount of expense we expect related to our stock-
based compensation, which includes the expected volatility of our stock price, the expected life of options
granted and the expected rate of stock option forfeitures. These assumptions are partly based on historical
results. If actual results differ from our estimates, our net income in a given quarter may be lower than
expected.
We expect our quarterly financial results to fluctuate, which may lead to volatility in our stock price.
We expect our net sales and operating results to vary significantly from quarter to quarter due to a
number of factors, including changes in:
• demand for our products;
• the costs to acquire diamonds and precious metals;
• our ability to attract visitors to our websites and convert those visitors into customers;
7

8/3/2019 Annual Report BlueNile 2007
http://slidepdf.com/reader/full/annual-report-bluenile-2007 12/72
• general economic conditions, both domestically and internationally;
• our ability to retain existing customers or encourage repeat purchases;
• our ability to manage our product mix and inventory;
• wholesale diamond prices;
• consumer tastes and preferences for diamonds and fine jewelry;
• our ability to manage our operations;
• the extent to which we provide for and pay taxes;
• stock-based compensation expense as a result of the nature, timing and amount of stock options
granted, the underlying assumptions used in valuing these options, the estimated rate of stock option
forfeitures and other factors;
• advertising and other marketing costs;
• our, or our competitors’, pricing and marketing strategies;
• the introduction of competitive websites, products, price decreases or improvements;
• conditions or trends in the diamond and fine jewelry industry;
• conditions or trends in the Internet and e-commerce industry;
• the success of our geographic, service and product line expansions;
• foreign exchange rates;
• interest rates; and
• costs of expanding or enhancing our technology or websites.
As a result of the variability of these and other factors, our operating results in future quarters may be
below the expectations of public market analysts and investors. In this event, the price of our common stock
may decline.
Our revenues are influenced by general economic cycles.
Luxury products, such as diamonds and fine jewelry, are discretionary purchases for consumers. The
volume and dollar value of such purchases may significantly decrease during economic downturns. The
success of our business depends in part on many macroeconomic factors, including market downturns,consumer confidence, employment levels, salary levels, tax rates and credit availability, all of which affect
consumer spending and disposable income. Any reduction in consumer spending or disposable income would
harm our business and results of operations and may affect us more significantly than companies in other
industries and companies with a diversified product offering.
As a result of seasonal fluctuations in our net sales, our quarterly results may fluctuate and could be
below expectations.
We have experienced and expect to continue to experience seasonal fluctuations in our net sales. In
particular, a disproportionate amount of our net sales has been realized during the fourth quarter as a result of
the December holiday season, and we expect this seasonality to continue in the future. Approximately 35%,
36%, and 36% of our net sales in the years ended December 30, 2007, December 31, 2006 and January 1,
2006, respectively, were generated during the fourth quarter of each year. In anticipation of increased salesactivity during the fourth quarter, we may incur significant additional expenses, including higher inventory of
jewelry, higher net shipping cost due to complimentary upgrades, split-shipments, and additional long-zone
shipments necessary to ensure timely delivery for the holiday season and additional staffing in our fulfillment
and customer support operations. If we were to experience lower than expected net sales during any future
fourth quarter, it would have a disproportionately large impact on our operating results and financial condition
for that year. We also experience considerable fluctuations in net sales in periods proceeding other annual
occasions such as Valentine’s Day and Mother’s Day. In the future, our seasonal sales patterns may become
more pronounced, may strain our personnel and fulfillment activities and may cause a shortfall in net sales as
8
8/3/2019 Annual Report BlueNile 2007
http://slidepdf.com/reader/full/annual-report-bluenile-2007 13/72
compared to expenses in a given period, which would substantially harm our business and results of
operations.
Our failure to acquire quality diamonds and fine jewelry at commercially reasonable prices would result
in higher costs and lower net sales and damage our competitive position.
If we are unable to acquire quality diamonds and fine jewelry at commercially reasonable prices, our
costs may exceed our forecasts, our gross margins and operating results may suffer and our competitive
position could be damaged. The success of our business model depends, in part, on our ability to offer qualityproducts to customers at prices that are below those of traditional jewelry retailers. A majority of the world’s
supply of rough diamonds is controlled by a small number of diamond mining firms. As a result, any decisions
made to restrict the supply of rough diamonds by these firms to our suppliers could substantially impair our
ability to acquire diamonds at commercially reasonable prices, if at all. We do not currently have any direct
supply relationship with these firms. Our ability to acquire diamonds and fine jewelry is also substantially
dependent on our relationships with various suppliers. Approximately 21%, 21% and 25% of our payments to
our diamond and fine jewelry suppliers in the years ended December 30, 2007, December 31, 2006 and
January 1, 2006, respectively, were made to our top three suppliers. Our inability to maintain and expand these
and other future diamond and fine jewelry supply relationships on commercially reasonable terms or the
inability of our current and future suppliers to maintain arrangements for the supply of products sold to us on
commercially reasonable terms would substantially harm our business and results of operations.
Suppliers and manufacturers of diamonds as well as retailers of diamonds and diamond jewelry arevertically integrated and we expect they will continue to vertically integrate their operations either by
developing retail channels for the products they manufacture or acquiring sources of supply, including, without
limitation, diamond mining operations for the products that they sell. To the extent such vertical integration
efforts are successful, some of the fragmentation in the existing diamond supply chain could be eliminated,
our ability to obtain an adequate supply of diamonds and fine jewelry from multiple sources could be limited
and our competitors may be able to obtain diamonds at lower prices.
Our failure to meet customer expectations with respect to price would adversely affect our business and
results of operations.
Demand for our products has been highly sensitive to pricing changes. Changes in our pricing strategies
have had and may continue to have a significant impact on our net sales, gross margins and net income. In the
past, we have instituted retail price changes as part of our strategy to stimulate growth in net sales andoptimize gross profit. We may institute similar price changes in the future. Such price changes may not result
in an increase in net sales or in the optimization of gross profits. In addition, many external factors, including
the costs to acquire diamonds and precious metals and our competitors’ pricing and marketing strategies, can
significantly impact our pricing strategies. If we fail to meet customer expectations with respect to price in
any given period, our business and results of operations would suffer.
We may not succeed in continuing to establish the Blue Nile brand, which would prevent us from acquir-
ing customers and increasing our net sales.
A significant component of our business strategy is the continued establishment and promotion of the
Blue Nile brand. Due to the competitive nature of the online market for diamonds and fine jewelry, if we do
not continue to establish our brand and branded products, we may fail to build the critical mass of customers
required to substantially increase our net sales. Promoting and positioning our brand will depend largely onthe success of our marketing and merchandising efforts and our ability to provide a consistent, high quality
customer experience. To promote our brand and branded products, we have incurred and will continue to incur
substantial expense related to advertising and other marketing efforts.
A critical component of our brand promotion strategy is establishing a relationship of trust with our
customers, which we believe can be achieved by providing a high quality customer experience. In order to
provide a high quality customer experience, we have invested and will continue to invest substantial amounts
of resources in the development and functionality of our multiple websites, technology infrastructure,
fulfillment operations and customer service operations. Our ability to provide a high quality customer
9

8/3/2019 Annual Report BlueNile 2007
http://slidepdf.com/reader/full/annual-report-bluenile-2007 14/72
experience is also dependent, in large part, on external factors over which we may have little or no control,
including, without limitation, the reliability and performance of our suppliers, third-party jewelry assemblers,
third-party carriers and networking vendors. During our peak seasons, we rely on temporary employees to
supplement our full-time customer service and fulfillment employees. Temporary employees may not have the
same level of commitment to our customers as our full-time employees. If our customers are dissatisfied with
the quality of the products or the customer service they receive, or if we are unable to deliver products to our
customers in a timely manner or at all, our customers may stop purchasing products from us. We also rely on
third parties for information, including product characteristics and availability that we present to consumers onour websites, which may, on occasion, be inaccurate. Our failure to provide our customers with high quality
customer experiences for any reason could substantially harm our reputation and adversely impact our efforts
to develop Blue Nile as a trusted brand. The failure of our brand promotion activities could adversely affect
our ability to attract new customers and maintain customer relationships, and, as a result, substantially harm
our business and results of operations.
In order to increase net sales and to sustain or increase profitability, we must attract customers in a cost-
effective manner.
Our success depends on our ability to attract customers in a cost-effective manner. We have relationships
with providers of online services, search engines, directories and other websites and e-commerce businesses to
provide content, advertising banners and other links that direct customers to our websites. We rely on these
relationships as significant sources of traffic to our websites. Our agreements with these providers generally
have terms of one year or less. If we are unable to develop or maintain these relationships on acceptable
terms, our ability to attract new customers would be harmed. In addition, many of the parties with which we
have online-advertising arrangements could provide advertising services to other online or traditional retailers,
including retailers with whom we compete. As competition for online advertising has increased, the cost for
these services has also increased. A significant increase in the cost of the marketing vehicles upon which we
rely could adversely impact our ability to attract customers in a cost-effective manner and harm our business
and results of operations.
We face significant competition and may be unsuccessful in competing against current and future
competitors.
The retail jewelry industry is intensely competitive, and we expect competition in the sale of diamonds
and fine jewelry to increase and intensify in the future. Increased competition may result in price pressure,
reduced gross margins and loss of market share, any of which could substantially harm our business andresults of operations. Current and potential competitors include:
• independent jewelry stores;
• retail jewelry store chains, such as Tiffany & Co. and Bailey Banks & Biddle;
• other online retailers that sell jewelry, such as Amazon.com;
• department stores, chain stores and mass retailers, such as Nordstrom and Neiman Marcus;
• online auction sites, such as eBay;
• catalog and television shopping retailers, such as Home Shopping Network and QVC; and
• discount superstores and wholesale clubs, such as Wal-Mart and Costco Wholesale.
In addition to these competitors, we may face competition from suppliers of our products that decide to
sell directly to consumers, either through physical retail outlets or through online stores.
Many of our current and potential competitors have advantages over us, including longer operating
histories, greater brand recognition, existing customer and supplier relationships, and significantly greater
financial, marketing and other resources. In addition, traditional store-based retailers offer consumers the
ability to physically handle and examine products in a manner that is not possible over the Internet as well as
a more convenient means of returning and exchanging purchased products.
Some of our competitors seeking to establish an online presence may be able to devote substantially more
resources to website systems development and exert more leverage over the supply chain for diamonds and
10

8/3/2019 Annual Report BlueNile 2007
http://slidepdf.com/reader/full/annual-report-bluenile-2007 15/72
fine jewelry than we can. In addition, larger, more established and better capitalized entities may acquire,
invest or partner with traditional and online competitors as use of the Internet and other online services
increases. Our online competitors can duplicate many of the products, services and content we offer, which
could harm our business and results of operations.
We may be unsuccessful in further expanding our operations internationally.
To date, we have made limited international sales, but we have recently expanded our operations to
include a fulfillment operation in Ireland to serve customers acquired through our United Kingdom website.Additionally, we have increased our product offerings and marketing and sales efforts throughout Europe,
Canada and Asia Pacific and anticipate continuing to expand our international sales and operations in the
future either by expanding local versions of our website for foreign markets or through acquisitions or
alliances with third parties. Any international expansion plans we choose to undertake will increase the
complexity of our business, require attention from management and other personnel, cause additional strain on
our operations, technology systems, financial resources and our internal financial control and reporting
functions. Further, our expansion efforts may be unsuccessful. We have minimal experience in selling our
products in international markets and in conforming to the local cultures, standards or policies necessary to
successfully compete in those markets. Outside of the United Kingdom and Canada, we have very limited web
content localized for foreign markets and we cannot be certain that we will be able to expand our global
presence if we choose to further expand internationally. In addition, we may have to compete with retailers
that have more experience with local markets. Our ability to expand and succeed internationally may also belimited by the demand for our products, the ability of our brand to resonate with foreign consumers and the
adoption of electronic commerce in these markets. Different privacy, censorship and liability standards and
regulations and different intellectual property laws in foreign countries may prohibit expansion into such
markets or cause our business and results of operations to suffer.
Our current and future international operations may also fail to succeed due to other risks inherent in
foreign operations, including:
• the need to develop new supplier and jeweler relationships;
• international regulatory requirements and tariffs;
• difficulties in staffing and managing foreign operations;
• longer payment cycles from credit card companies;
• greater difficulty in accounts receivable collection;
• our reliance on third-party carriers for product shipments to our customers;
• risk of theft of our products during shipment;
• limited shipping and insurance options for us and our customers;
• potential adverse tax consequences;
• foreign currency exchange risk;
• lack of infrastructure to adequately conduct electronic commerce transactions or fulfillment operations;
• unclear foreign intellectual property protection laws;
• laws and regulations related to corporate governance and employee/employer relationships; pricecontrols or other restrictions on foreign currency;
• difficulties in obtaining export, import or other business licensing requirements;
• increased payment risk and greater difficulty addressing credit card fraud;
• consumer and data protection laws;
• lower levels of adoption or use of the Internet; and
• geopolitical events, including war and terrorism.
11

8/3/2019 Annual Report BlueNile 2007
http://slidepdf.com/reader/full/annual-report-bluenile-2007 16/72
Our failure to successfully expand our international operations may cause our business and results of
operations to suffer.
We rely on our suppliers, third-party carriers and third-party jewelers as part of our fulfillment process,
and these third parties may fail to adequately serve our customers.
We significantly rely on our suppliers to promptly ship us diamonds ordered by our customers. Any
failure by our suppliers to sell and ship such products to us in a timely manner will have an adverse effect on
our ability to fulfill customer orders and harm our business and results of operations. Our suppliers, in turn,rely on third-party carriers to ship diamonds to us, and in some cases, directly to our customers. We also rely
on third-party carriers for product shipments to our customers. We and our suppliers are therefore subject to
the risks, including employee strikes and inclement weather, associated with such carriers’ abilities to provide
delivery services to meet our and our suppliers’ shipping needs. In addition, for some customer orders we rely
on third-party jewelers to assemble the product. Our suppliers’, third-party carriers’ or third-party jewelers’
failure to deliver high-quality products to us or our customers in a timely manner or to otherwise adequately
serve our customers would damage our reputation and brand and substantially harm our business and results of
operations.
If our fulfillment operations are interrupted for any significant period of time, our business and results of
operations would be substantially harmed.
Our success depends on our ability to successfully receive and fulfill orders and to promptly and securely
deliver our products to our customers. Most of our inventory management, jewelry assembly, packaging,
labeling and product return processes are performed in a single fulfillment center located in the United States.
This facility is susceptible to damage or interruption from human error, fire, flood, power loss, telecommuni-
cations failure, terrorist attacks, acts of war, break-ins, earthquake and similar events. We have recently added
another fulfillment center in Ireland that would also be susceptible to these events. Our business interruption
insurance may be insufficient to compensate us for losses that may occur in the event operations at our
fulfillment centers are interrupted. We have recently expanded our existing fulfillment center located in the
United States. Any interruptions in our fulfillment center operations for any significant period of time,
including interruptions resulting from the expansion of our existing facility, could damage our reputation and
brand and substantially harm our business and results of operations.
We face the risk of theft of our products from inventory or during shipment.
We have experienced and may continue to experience theft of our products while they are being held in
our fulfillment centers or during the course of shipment to our customers by third-party shipping carriers. We
have taken steps to prevent such theft. However, if security measures fail, losses exceed our insurance
coverage or we are not able to maintain insurance at a reasonable cost, we could incur significant losses from
theft, which would substantially harm our business and results of operations.
If the single facility where substantially all of our computer and communications hardware is located
fails, our business, results of operations and financial condition would be harmed.
Our ability to successfully receive and fulfill orders and to provide high quality customer service depends
in part on the efficient and uninterrupted operation of our computer and communications systems. Substantially
all of the computer hardware necessary to operate our websites is located at a single leased facility. Oursystems and operations are vulnerable to damage or interruption from human error, fire, flood, power loss,
telecommunications failure, terrorist attacks, acts of war, break-ins, earthquake and similar events. We do not
presently have redundant systems in multiple locations and our business interruption insurance may be
insufficient to compensate us for losses that may occur. In addition, our servers are vulnerable to computer
viruses, denial of service attacks, physical or electronic break-ins and similar disruptions, which could lead to
interruptions, delays, loss of critical data, the inability to fulfill customer orders or the unauthorized disclosure
of confidential customer data. The occurrence of any of the foregoing risks could substantially harm our
business and results of operations.
12

8/3/2019 Annual Report BlueNile 2007
http://slidepdf.com/reader/full/annual-report-bluenile-2007 17/72
Our failure to protect confidential information of our customers and our network against security
breaches could damage our reputation and brand and substantially harm our business and results of
operations.
A significant barrier to online commerce and communications is the secure transmission of confidential
information over public networks. Our failure to prevent these security breaches could damage our reputation
and brand and substantially harm our business and results of operations. Currently, a majority of our sales are
billed to our customers’ credit card accounts directly. We rely on encryption and authentication technology
licensed from third parties to effect secure transmission of confidential information, including credit cardnumbers. Advances in computer capabilities, human errors, new discoveries in the field of cryptography or
other developments may result in a compromise or breach of the technology used by us to protect customer
transaction data. In addition, any party who is able to illicitly obtain a user’s password could access the
customer’s transaction data. An increasing number of websites and Internet companies have reported breaches
of their security. Any such compromise of our security could damage our reputation, business and brand and
expose us to a risk of loss or litigation and possible liability, which would substantially harm our business, and
results of operations. In addition, anyone who is able to circumvent our security measures could misappropri-
ate proprietary information or cause interruptions in our operations, damage our computers or those of our
users, or otherwise damage our reputation and business. These issues are likely to become more difficult as we
expand the number of countries in which we operate. We may need to expend significant resources to protect
against security breaches or to address problems caused by breaches.
We rely exclusively on the sale of diamonds and fine jewelry for our net sales, and demand for these
products could decline.
Our net sales and results of operations are highly dependent on the demand for diamonds and diamond
jewelry, particularly engagement rings. Should prevailing consumer tastes for diamonds decline or customs
with respect to engagement shift away from the presentation of diamond jewelry, demand for our products
would decline and our business and results of operations would be substantially harmed.
The significant cost of diamonds results in part from their scarcity. From time to time, attempts have been
made to develop and market synthetic stones and gems to compete in the market for diamonds and diamond
jewelry. We expect such efforts to continue in the future. If any such efforts are successful in creating
widespread demand for alternative diamond products, demand and price levels for our products would decline
and our business and results of operations would be substantially harmed.In recent years, increasing attention has been focused on “conflict” diamonds, which are diamonds
extracted from war-torn regions in Africa and sold by rebel forces to fund insurrection. Diamonds are, in some
cases, also believed to be used to fund terrorist activities in some regions. We support the Kimberley Process,
an international initiative intended to ensure diamonds are not illegally traded to fund conflict. As part of this
initiative, we require our diamond suppliers to sign a statement acknowledging compliance with the Kimberley
Process, and invoices received for diamonds purchased by us must include a certification from the vendor that
the diamonds are conflict free. In addition, we prohibit the use of our business or services for money
laundering or terrorist financing in accordance with the USA Patriot Act. Through these and other efforts, we
believe that the suppliers from whom we purchase our diamonds seek to exclude conflict diamonds from their
inventories. However, we cannot independently determine whether any diamond we offer was extracted from
these regions. Current efforts to increase consumer awareness of this issue and encourage legislative response
could adversely affect consumer demand for diamonds.
Consumer confidence is dependent, in part, on the certification of our diamonds by independent
laboratories. A decline in the quality of the certifications provided by these laboratories could adversely impact
demand for our products. Additionally, a decline in consumer confidence in the credibility of independent
diamond grading certifications could adversely impact demand for our diamond products.
Our jewelry offerings must reflect the tastes and preferences of a wide range of consumers whose
preferences may change regularly. Our strategy has been to offer primarily what we consider to be classic
styles of fine jewelry, but there can be no assurance that these styles will continue to be popular with
13

8/3/2019 Annual Report BlueNile 2007
http://slidepdf.com/reader/full/annual-report-bluenile-2007 18/72
consumers in the future. If the styles we offer become less popular with consumers and we are not able to
adjust our product offerings in a timely manner, our net sales may decline or fail to meet expected levels.
Our failure to effectively manage the growth in our operations may prevent us from successfully expand-
ing our business.
We have experienced, and in the future may experience, rapid growth in operations, which has placed,
and could continue to place, a significant strain on our operations, services, internal controls and other
managerial, operational and financial resources. To effectively manage future expansion, we will need tomaintain our operational and financial systems and managerial controls and procedures, which include the
following processes:
• transaction-processing and fulfillment;
• inventory management;
• customer support;
• management of multiple supplier relationships;
• operational, financial and managerial controls;
• reporting procedures;
• management of our facilities;
• recruitment, training, supervision, retention and management of our employees; and
• technology operations.
If we are unable to manage future expansion, our ability to provide a high quality customer experience
could be harmed, which would damage our reputation and brand and substantially harm our business and
results of operations.
The success of our business may depend on our ability to successfully expand our product offerings.
Our ability to significantly increase our net sales and maintain and increase our profitability may depend
on our ability to successfully expand our product lines beyond our current offerings. If we offer a new product
category that is not accepted by consumers, the Blue Nile brand and reputation could be adversely affected,
our net sales may fall short of expectations and we may incur substantial expenses that are not offset by
increased net sales. Expansion of our product lines may also strain our management and operational resources.
If we are unable to accurately manage our inventory of fine jewelry, our reputation and results of opera-
tions could suffer.
Except for loose diamonds, substantially all of the fine jewelry we sell is from our physical inventory.
Changes in consumer tastes for these products subject us to significant inventory risks. The demand for
specific products can change between the time we order an item and the date we receive it. If we under-stock
one or more of our products, we may not be able to obtain additional units in a timely manner on terms
favorable to us, if at all, which would damage our reputation and substantially harm our business and results
of operations. In addition, if demand for our products increases over time, we may be forced to increase
inventory levels. If one or more of our products does not achieve widespread consumer acceptance, we may be
required to take significant inventory markdowns, or may not be able to sell the product at all, which would
substantially harm our results of operations.
Repurchases of our common stock may not prove to be the best use of our cash resources.
On July 27, 2006, our board of directors authorized the repurchase of up to $50 million of Blue Nile, Inc.
common stock during the subsequent 24-month period following the approval date of such repurchases. On
February 6, 2008, our board of directors authorized the repurchase of up to an additional $100 million of Blue
Nile, Inc. common stock during the subsequent 24-month period following the approval date of the additional
repurchases. These repurchases and any repurchases we may make in the future may not prove to be at
optimal prices and our use of cash for the stock repurchase program may not prove to be the best use of our
cash resources and may adversely impact our future liquidity.
14

8/3/2019 Annual Report BlueNile 2007
http://slidepdf.com/reader/full/annual-report-bluenile-2007 19/72
We have foreign exchange risk.
The results of operations of our foreign subsidiary are exposed to foreign exchange rate fluctuations.
Upon translation from foreign currency into U.S. dollars, operating results may differ materially from
expectations, and we may record significant gains or losses. As we have expanded our international operations,
our exposure to exchange rate fluctuations has increased.
We rely on the services of our key personnel, any of whom would be difficult to replace.
We rely upon the continued service and performance of key technical, fulfillment and senior managementpersonnel. If we lose any of these personnel, our business could suffer. Competition for qualified personnel in
our industry is intense. We believe that our future success will depend on our continued ability to attract, hire
and retain key employees. Other than for our Executive Chairman, we do not have “key person” life insurance
policies covering any of our employees.
We have incurred significant operating losses in the past and may not be able to sustain profitability in
the future.
We experienced significant operating losses in each quarter from our inception in 1999 through the
second quarter of 2002. As a result, our business has a limited record of profitability and may not continue to
be profitable or increase profitability. If we are unable to acquire diamonds and fine jewelry at commercially
reasonable prices, if net sales decline or if our expenses otherwise exceed our expectations, we may not be
able to sustain or increase profitability on a quarterly or annual basis.
Failure to adequately protect or enforce our intellectual property rights could substantially harm our busi-
ness and results of operations.
We rely on a combination of patent, trademark, trade secret and copyright law and contractual restrictions
to protect our intellectual property. These afford only limited protection. Despite our efforts to protect and
enforce our proprietary rights, unauthorized parties have attempted and may in the future attempt to copy
aspects of our website features, compilation and functionality or to obtain and use information that we
consider as proprietary, such as the technology used to operate our websites, our content and our trademarks.
We have registered “Blue Nile,” “bluenile.com,” the BN logo and the Blue Nile BN stylized logo as
trademarks in the United States and in certain other countries. Our competitors have, and other competitors
may, adopt service names similar to ours, thereby impeding our ability to build brand identity and possibly
leading to consumer confusion. In addition, there could be potential trade name or trademark infringementclaims brought by owners of other registered trademarks or trademarks that incorporate variations of the term
Blue Nile or our other trademarks. Any claims or consumer confusion related to our trademarks could damage
our reputation and brand and substantially harm our business and results of operations.
We currently hold the bluenile.com, bluenile.co.uk and bluenile.ca Internet domain names and various
other related domain names. Domain names generally are regulated by Internet regulatory bodies. If we lose
the ability to use a domain name in a particular country, we would be forced to either incur significant
additional expenses to market our products within that country, including the development of a new brand and
the creation of new promotional materials and packaging, or elect not to sell products in that country. Either
result could substantially harm our business and results of operations. The regulation of domain names in the
United States and in foreign countries is subject to change. Regulatory bodies could establish additional top-
level domains, appoint additional domain name registrars or modify the requirements for holding domain
names. As a result, we may not be able to acquire or maintain the domain names that utilize the name BlueNile in all of the countries in which we currently or intend to conduct business.
Litigation or proceedings before the U.S. Patent and Trademark Office or similar international regulatory
agencies may be necessary in the future to enforce our intellectual property rights, to protect our trade secrets
and domain names and to determine the validity and scope of the proprietary rights of others. Any litigation or
adverse priority proceeding could result in substantial costs and diversion of resources and could substantially
harm our business and results of operations. We sell and intend to increasingly sell our products internation-
ally, and the laws of many countries do not protect our proprietary rights to as great an extent as do the laws
of the United States.
15

8/3/2019 Annual Report BlueNile 2007
http://slidepdf.com/reader/full/annual-report-bluenile-2007 20/72
Assertions by third parties of infringement by us of their intellectual property rights could result in signif-
icant costs and substantially harm our business and results of operations.
Third parties have, and may in the future, assert that we have infringed their technology or other
intellectual property rights. We cannot predict whether any such assertions or claims arising from such
assertions will substantially harm our business and results of operations. If we are forced to defend against any
infringement claims, whether they are with or without merit or are determined in our favor, we may face
costly litigation, diversion of technical and management personnel or product shipment delays. Furthermore,
the outcome of a dispute may be that we would need to develop non-infringing technology or enter intoroyalty or licensing agreements. Royalty or licensing agreements, if required, may be unavailable on terms
acceptable to us, or at all.
Increased product returns and the failure to accurately predict product returns could substantially harm
our business and results of operations.
We generally offer our customers an unconditional 30-day return policy that allows our customers to
return most products if they are not satisfied for any reason. We make allowances for product returns in our
financial statements based on historical return rates, trends and expectations. Actual merchandise returns are
difficult to predict and may differ from our allowances. Any significant increase in merchandise returns above
our allowances would substantially harm our business and results of operations.
Interruptions to our systems that impair customer access to our websites would damage our reputation
and brand and substantially harm our business and results of operations.
The satisfactory performance, reliability and availability of our websites, transaction processing systems
and network infrastructure are critical to our reputation and our ability to attract and retain customers and to
maintain adequate customer service levels. Any future systems interruptions or downtime or technical
difficulties that result in the unavailability of our websites or reduced order fulfillment performance could
result in negative publicity, damage our reputation and brand and cause our business and results of operations
to suffer. We may be susceptible to such disruptions in the future. We may also experience temporary system
interruptions for a variety of other reasons in the future, including power failures, failures of Internet service
and telecommunication providers, software or human errors or an overwhelming number of visitors trying to
reach our websites during periods of strong seasonal demand or promotions. Because we are dependent in part
on third parties for the implementation and maintenance of certain aspects of our systems and because some
of the causes of system interruptions may be outside of our control, we may not be able to remedy such
interruptions in a timely manner, or at all.
Purchasers of diamonds and fine jewelry may not choose to shop online, which would prevent us from
increasing net sales.
The online market for diamonds and fine jewelry is significantly less developed than the online market
for books, music, toys and other consumer products. If this market does not gain widespread acceptance, our
business may suffer. Our success will depend, in part, on our ability to attract consumers who have historically
purchased diamonds and fine jewelry through traditional retailers. Furthermore, we may have to incur
significantly higher and more sustained advertising and promotional expenditures or price our products more
competitively than we currently anticipate in order to attract additional online consumers to our websites and
convert them into purchasing customers. Specific factors that could prevent consumers from purchasing
diamonds and fine jewelry from us include:
• concerns about buying luxury products such as diamonds and fine jewelry without a physical storefront,
face-to-face interaction with sales personnel and the ability to physically handle and examine products;
• delivery time associated with Internet orders;
• product offerings that do not reflect consumer tastes and preferences;
• pricing that does not meet consumer expectations;
• concerns about the security of online transactions and the privacy of personal information;
• delayed shipments or shipments of incorrect or damaged products;
16
8/3/2019 Annual Report BlueNile 2007
http://slidepdf.com/reader/full/annual-report-bluenile-2007 21/72
• inconvenience associated with returning or exchanging Internet purchased items; and
• usability, functions and features of our websites.
If use of the Internet, particularly with respect to online commerce, does not continue to increase as rap-
idly as we anticipate, our business will be harmed.
Our future net sales and profits are substantially dependent upon the continued growth in the use of the
Internet as an effective medium of business and communication by our target customers. Internet use may not
continue to develop at historical rates and consumers may not continue to use the Internet and other onlineservices as a medium for commerce. Highly publicized failures by some online retailers to meet consumer
demands could result in consumer reluctance to adopt the Internet as a means for commerce, and thereby
damage our reputation and brand and substantially harm our business and results of operations.
In addition, the Internet may not be accepted as a viable long-term commercial marketplace for a number
of reasons, including:
• actual or perceived lack of security of information or privacy protection;
• possible disruptions, computer viruses, spyware, phishing, attacks or other damage to the Internet
servers, service providers, network carriers and Internet companies or to users’ computers; and
• excessive governmental regulation.
Our success will depend, in large part, upon third parties maintaining the Internet infrastructure to provide
a reliable network backbone with the speed, data capacity, security and hardware necessary for reliable Internet
access and services. Our business, which relies on a contextually rich website that requires the transmission of
substantial secure data, is also significantly dependent upon the availability and adoption of broadband Internet
access and other high speed Internet connectivity technologies.
Our failure to address risks associated with payment methods, credit card fraud and other consumer
fraud could damage our reputation and brand and may cause our business and results of operations to
suffer.
Under current credit card practices, we are liable for fraudulent credit card transactions because we do
not obtain a cardholder’s signature. We do not currently carry insurance against this risk. To date, we have
experienced minimal losses from credit card fraud, but we face the risk of significant losses from this type of
fraud as our net sales increase and as we expand internationally. Our failure to adequately control fraudulent
credit card transactions could damage our reputation and brand and substantially harm our business and resultsof operations. Additionally, for certain payment transactions, including credit and debit cards, we pay
interchange and other fees, which may increase over time and raise our operating costs and lower our
operating margins.
We rely on our relationship with a third-party consumer credit company to offer financing for the pur-
chase of our products.
The purchase of the diamond and fine jewelry products we sell is a substantial expense for many of our
customers. We currently rely on our relationship with a single financial institution to provide financing to our
customers. If we are unable to maintain this or other similar arrangements, we may not be able to offer
financing alternatives to our customers, which may reduce demand for our products and substantially harm our
business and results of operations.
We may undertake acquisitions to expand our business, which may pose risks to our business and dilute
the ownership of our existing stockholders.
A key component of our business strategy includes strengthening our competitive position and refining
the customer experience on our websites through internal development. However, from time to time, we may
selectively pursue acquisitions of businesses, technologies or services. Integrating any newly acquired
businesses, technologies or services may be expensive and time-consuming. To finance any acquisitions, it
may be necessary for us to raise additional funds through public or private financings. Additional funds may
not be available on terms that are favorable to us, and, in the case of equity financings, would result in
17

8/3/2019 Annual Report BlueNile 2007
http://slidepdf.com/reader/full/annual-report-bluenile-2007 22/72
dilution to our stockholders. If we do complete any acquisitions, we may be unable to operate such acquired
businesses profitably or otherwise implement our strategy successfully. If we are unable to integrate any newly
acquired entities or technologies effectively, our business and results of operations could suffer. The time and
expense associated with finding suitable and compatible businesses, technologies or services could also disrupt
our ongoing business and divert our management’s attention. Future acquisitions by us could also result in
large and immediate write-offs or assumptions of debt and contingent liabilities, any of which could
substantially harm our business and results of operations. We have no current plans, agreements or
commitments with respect to any such acquisitions.
Our failure to rapidly respond to technological change could result in our services or systems becoming
obsolete and substantially harm our business and results of operations.
As the Internet and online commerce industries evolve, we may be required to license emerging
technologies useful in our business, enhance our existing services, develop new services and technologies that
address the increasingly sophisticated and varied needs of our prospective customers and respond to
technological advances and emerging industry standards and practices on a cost-effective and timely basis. We
may not be able to successfully implement new technologies or adapt our websites, proprietary technologies
and transaction-processing systems to customer requirements or emerging industry standards. Our failure to do
so would substantially harm our business and results of operations. We may be required to upgrade existing
technologies or business applications, or implement new technologies or business applications. Our results of
operations may be affected by the timing, effectiveness and costs associated with the successful implementa-tion of any upgrades or changes to our systems and infrastructure.
Our net sales may be negatively affected if we are required to charge taxes on purchases.
We do not collect or have imposed upon us sales or other taxes related to the products we sell, except for
certain corporate level taxes, sales taxes with respect to purchases by customers located in the State of
Washington, and certain taxes required to be collected on sales to customers outside of the United States of
America. However, one or more states or foreign countries may seek to impose sales or other tax collection
obligations on us in the future. A successful assertion by one or more states or foreign countries that we
should be collecting sales or other taxes on the sale of our products could result in substantial tax liabilities
for past sales, discourage customers from purchasing products from us, decrease our ability to compete with
traditional retailers or otherwise substantially harm our business and results of operations.
Currently, decisions of the U.S. Supreme Court restrict the imposition of obligations to collect state andlocal sales and use taxes with respect to sales made over the Internet. However, implementation of the
restrictions imposed by these Supreme Court decisions is subject to interpretation by state and local taxing
authorities. While we believe that these Supreme Court decisions currently restrict state and local taxing
authorities outside the State of Washington from requiring us to collect sales and use taxes from purchasers
located within their jurisdictions, taxing authorities outside the State of Washington could disagree with our
interpretation of these decisions. Moreover, a number of states, as well as the U.S. Congress, have been
considering various initiatives that could limit or supersede the Supreme Court’s position regarding sales and
use taxes on Internet sales. If any state or local taxing jurisdiction were to disagree with our interpretation of
the Supreme Court’s current position regarding state and local taxation of Internet sales, or if any of these
initiatives were to address the Supreme Court’s constitutional concerns and result in a reversal of its current
position, we could be required to collect sales and use taxes from purchasers located in states other than
Washington. The imposition by state and local governments of various taxes upon Internet commerce couldcreate administrative burdens for us and could decrease our future net sales.
We may have exposure to greater than anticipated tax liabilities.
We are subject to income, payroll, duties and other taxes in both the United States and foreign
jurisdictions. In the ordinary course of our business, there are many transactions and calculations where the
ultimate tax determination is uncertain. Our determination of our tax liability is always subject to review by
applicable tax authorities. Any adverse outcome of such a review could have a negative effect on our operating
results and financial condition. Although we believe our estimates are reasonable, the ultimate tax outcome
18

8/3/2019 Annual Report BlueNile 2007
http://slidepdf.com/reader/full/annual-report-bluenile-2007 23/72
may differ from the amounts recorded in our financial statements and may materially affect our financial
results in the period or periods for which such determination is made.
Government regulation of the Internet and e-commerce is evolving and unfavorable changes could sub-
stantially harm our business and results of operations.
We are not currently subject to direct federal, state or local regulation other than regulations applicable to
businesses generally or directly applicable to retailing and online commerce. However, as the Internet becomes
increasingly popular, it is possible that laws and regulations may be adopted with respect to the Internet, whichmay impede the growth of the Internet or other online services. These regulations and laws may cover issues
such as taxation, advertising, intellectual property rights, freedom of expression, pricing, restrictions on
imports and exports, customs, tariffs, information security, privacy, data protection, content, distribution,
electronic contracts and other communications, the provision of online payment services, broadband residential
Internet access and the characteristics and quality of products and services. Further, the growth of online
commerce may prompt calls for more stringent consumer protection laws. Several states have proposed
legislation to limit the uses of personal user information gathered online or require online companies to
establish privacy policies. The Federal Trade Commission has also initiated action against at least one online
company regarding the manner in which personal information is collected from users and provided to third
parties. The adoption of additional privacy or consumer protection laws could create uncertainty in Internet
usage and reduce the demand for our products and services.
We are not certain how our business may be affected by the application of existing laws governing issuessuch as property ownership, copyrights, personal property, encryption and other intellectual property issues,
taxation, libel, obscenity, qualification to do business and export or import matters. The vast majority of these
laws were adopted prior to the advent of the Internet. As a result, they do not contemplate or address the
unique issues of the Internet and related technologies. Changes in laws intended to address these issues could
create uncertainty for those conducting online commerce. This uncertainty could reduce demand for our
products and services or increase the cost of doing business as a result of litigation costs or increased
fulfillment costs and may substantially harm our business and results of operations.
We may need to implement additional finance and accounting systems, procedures and controls as we
grow our business and organization and to satisfy new reporting requirements.
As a public reporting company, we are required to comply with the Sarbanes-Oxley Act of 2002 and the
related rules and regulations of the SEC, including expanded disclosures and accelerated reporting require-
ments and more complex accounting rules. Compliance with Section 404 of the Sarbanes-Oxley Act of 2002
and other requirements may increase our costs and require additional management time and resources. We
may need to continue to implement additional finance and accounting systems, procedures and controls to
satisfy new reporting requirements. If our internal control over financial reporting is determined to be
ineffective, investors could lose confidence in the reliability of our internal control over financial reporting,
which could adversely affect our stock price.
Item 1B. Unresolved Staff Comments
None.
Item 2. Properties
As of December 30, 2007, our operational facilities consist of three separate locations, a corporate
headquarters and fulfillment center located in Seattle, Washington and a fulfillment center located in Dublin,Ireland. Our corporate headquarters consists of approximately 24,000 square feet of office space and is subject
to a sub-lease that expires in April 2011. Our U.S. fulfillment center currently consists of approximately
27,000 square feet of warehouse space and is subject to a lease that expires in October 2011. Our Ireland
fulfillment center consists of approximately 10,000 square feet of combined office and warehouse space and is
subject to a lease expiring in December 2011. Certain of the leases include renewal provisions at the
Company’s option. We believe that the facilities housing our corporate headquarters and our fulfillment centers
will be adequate to meet our current requirements for our operations and that suitable additional or substitute
space will be available as needed.
19

8/3/2019 Annual Report BlueNile 2007
http://slidepdf.com/reader/full/annual-report-bluenile-2007 24/72
Item 3. Legal Proceedings
From time to time, we may be involved in litigation relating to claims rising out of our ordinary course
of business. As of February 15, 2008, we were not a party to any material legal proceedings.
Item 4. Submission of Matters to a Vote of Security Holders
No matters were submitted to a vote of security holders during the fiscal fourth quarter ended
December 30, 2007.
PART II
Item 5. Market for Registrant’s Common Equity, Related Stockholder Matters and Issuer Purchases of
Equity Securities
Market Information and Dividend Policy
Our Common Stock is quoted on The NASDAQ Stock Market LLC under the symbol “NILE.” On
February 15, 2008 we had approximately 48 stockholders based on the number of record holders.
The following table sets forth the high and low sales prices of our common stock for fiscal years 2007
and 2006. The quotations are as reported in published financial sources.
High Low
Fiscal year 2007:First Quarter . . . . . . . . . . . . . . . . . . . . . . . . . . . . . . . . . . . . . . . . . . . . . . . . . $ 42.45 $36.54
Second Quarter . . . . . . . . . . . . . . . . . . . . . . . . . . . . . . . . . . . . . . . . . . . . . . . $ 62.30 $40.53
Third Quarter . . . . . . . . . . . . . . . . . . . . . . . . . . . . . . . . . . . . . . . . . . . . . . . . $106.16 $60.69
Fourth Quarter . . . . . . . . . . . . . . . . . . . . . . . . . . . . . . . . . . . . . . . . . . . . . . . $103.69 $64.20
Fiscal year 2006:
First Quarter . . . . . . . . . . . . . . . . . . . . . . . . . . . . . . . . . . . . . . . . . . . . . . . . . $ 41.62 $29.21
Second Quarter . . . . . . . . . . . . . . . . . . . . . . . . . . . . . . . . . . . . . . . . . . . . . . . $ 37.65 $28.06
Third Quarter . . . . . . . . . . . . . . . . . . . . . . . . . . . . . . . . . . . . . . . . . . . . . . . . $ 37.86 $24.10
Fourth Quarter . . . . . . . . . . . . . . . . . . . . . . . . . . . . . . . . . . . . . . . . . . . . . . . $ 39.99 $33.05
We have not paid any cash dividends on our common stock since inception, and it is not anticipated that
cash dividends will be paid on shares of our common stock in the foreseeable future. Any future determinationto pay dividends will be at the discretion of our board of directors.
20

8/3/2019 Annual Report BlueNile 2007
http://slidepdf.com/reader/full/annual-report-bluenile-2007 25/72
Performance Measurement Comparison(1)
The following graph compares the total cumulative stockholder return on the Company’s common stock
with the total cumulative return of the Nasdaq Market Index and the RDG Internet Composite Index for the
period beginning on May 20, 2004, the date of the Company’s public offering, through December 30, 2007,
the Company’s 2007 fiscal year end. In previous years, the Company compared its total cumulative stockholder
return with the Hemscott Internet Software and Services Group Index. The Company has elected to replace it
with the RDG Internet Composite Index because the new index is more focused on like businesses. In this
transition year, the table below includes the comparative performance of the new index with the replacedindex. Historical stock price performance should not be relied upon as an indication of future stock price
performance.
COMPARISON OF CUMULATIVE TOTAL RETURN(2)
D O L L A R S
0
50
100
150
200
250
300
350
400
1 2 / 3 0 / 0
7
9 / 3 0 / 0 7
7 / 0 1 / 0 7
4 / 0 1 / 0 7
1 2 / 3 1 / 0
6
1 0 / 0 1 / 0
6
7 / 0 2 / 0 6
4 / 0 2 / 0 6
1 / 0 1 / 0 6
1 0 / 0 2 / 0
5
7 / 0 3 / 0 5
4 / 0 3 / 0 5
1 / 0 2 / 0 5
1 0 / 0 3 / 0
4
5 / 2 0 / 0 4
RDG INTERNET COMPOSITE INDEX
NASDAQ MARKET INDEX
HEMSCOTT INTERNET SOFTWARE & SERVICES GROUP INDEX
BLUE NILE, INC.
(1) This Section is not “soliciting material,” is not deemed “filed” with the SEC and is not to be incorporated
by reference in any filing of the Company under the 1933 Act or the 1934 Act whether made before or
after the date hereof and irrespective of any general incorporation language in any such filing.
(2) Assumes $100 was invested on May 20, 2004, at the closing price on the date of Blue Nile’s initial public
offering, in Blue Nile’s common stock and each index, and all dividends have been reinvested. No cash
dividends have been declared on Blue Nile’s common stock. Stockholder returns over the indicated period
should not be considered indicative of future stockholder returns.
Issuer Purchases of Equity Securities
On February 2, 2006, our board of directors authorized the repurchase of up to $100 million of Blue Nile,
Inc. common stock during the subsequent 24-month period following the approval date of such repurchase. On
July 27, 2006, our board of directors authorized the repurchase of up to an additional $50 million of Blue
Nile, Inc. common stock during the subsequent 24-month period following the approval date of the additional
repurchase. The shares may be repurchased from time to time in open market transactions or in negotiated
transactions off the market. The timing and amount of any shares repurchased is determined by the Company’s
management based on its evaluation of market conditions and other factors. Repurchases may also be made
21
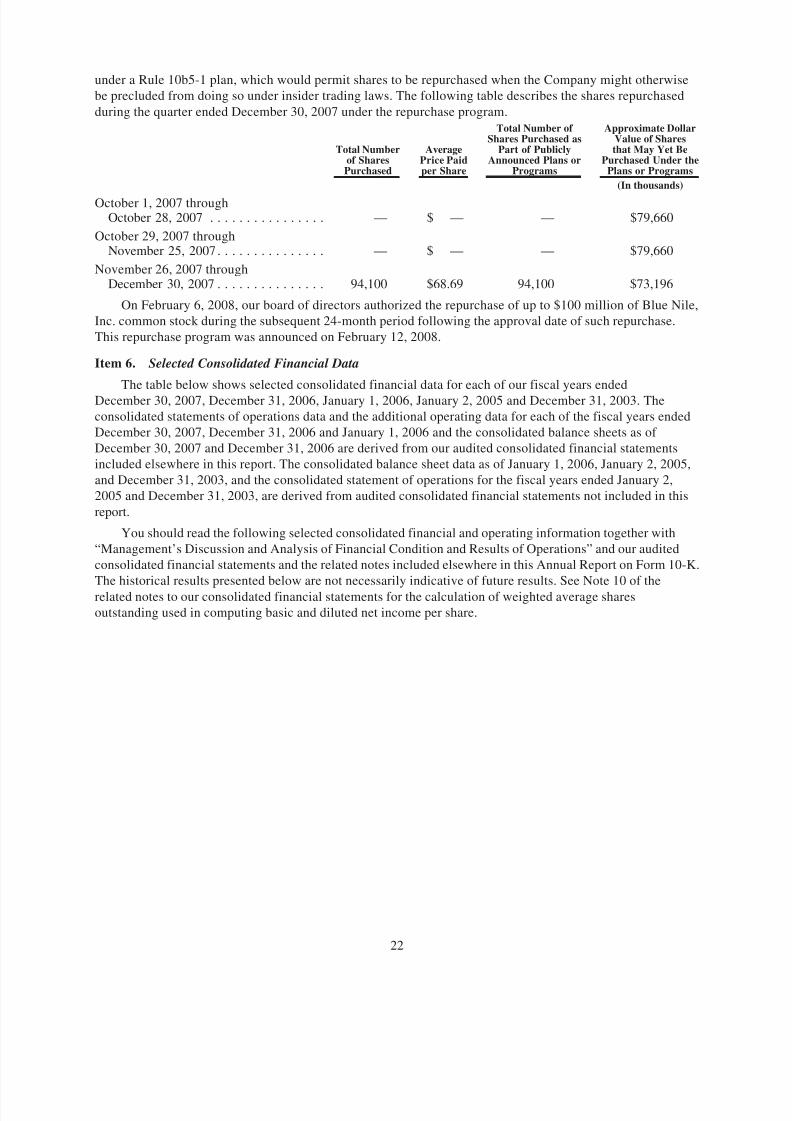
8/3/2019 Annual Report BlueNile 2007
http://slidepdf.com/reader/full/annual-report-bluenile-2007 26/72
under a Rule 10b5-1 plan, which would permit shares to be repurchased when the Company might otherwise
be precluded from doing so under insider trading laws. The following table describes the shares repurchased
during the quarter ended December 30, 2007 under the repurchase program.
Total Numberof Shares
Purchased
AveragePrice Paidper Share
Total Number of Shares Purchased as
Part of PubliclyAnnounced Plans or
Programs
Approximate DollarValue of Shares
that May Yet BePurchased Under the
Plans or Programs
(In thousands)
October 1, 2007 throughOctober 28, 2007 . . . . . . . . . . . . . . . . — $ — — $79,660
October 29, 2007 throughNovember 25, 2007 . . . . . . . . . . . . . . . — $ — — $79,660
November 26, 2007 throughDecember 30, 2007 . . . . . . . . . . . . . . . 94,100 $68.69 94,100 $73,196
On February 6, 2008, our board of directors authorized the repurchase of up to $100 million of Blue Nile,
Inc. common stock during the subsequent 24-month period following the approval date of such repurchase.
This repurchase program was announced on February 12, 2008.
Item 6. Selected Consolidated Financial Data
The table below shows selected consolidated financial data for each of our fiscal years ended
December 30, 2007, December 31, 2006, January 1, 2006, January 2, 2005 and December 31, 2003. The
consolidated statements of operations data and the additional operating data for each of the fiscal years ended
December 30, 2007, December 31, 2006 and January 1, 2006 and the consolidated balance sheets as of
December 30, 2007 and December 31, 2006 are derived from our audited consolidated financial statements
included elsewhere in this report. The consolidated balance sheet data as of January 1, 2006, January 2, 2005,
and December 31, 2003, and the consolidated statement of operations for the fiscal years ended January 2,
2005 and December 31, 2003, are derived from audited consolidated financial statements not included in this
report.
You should read the following selected consolidated financial and operating information together with
“Management’s Discussion and Analysis of Financial Condition and Results of Operations” and our audited
consolidated financial statements and the related notes included elsewhere in this Annual Report on Form 10-K.
The historical results presented below are not necessarily indicative of future results. See Note 10 of the
related notes to our consolidated financial statements for the calculation of weighted average shares
outstanding used in computing basic and diluted net income per share.
22
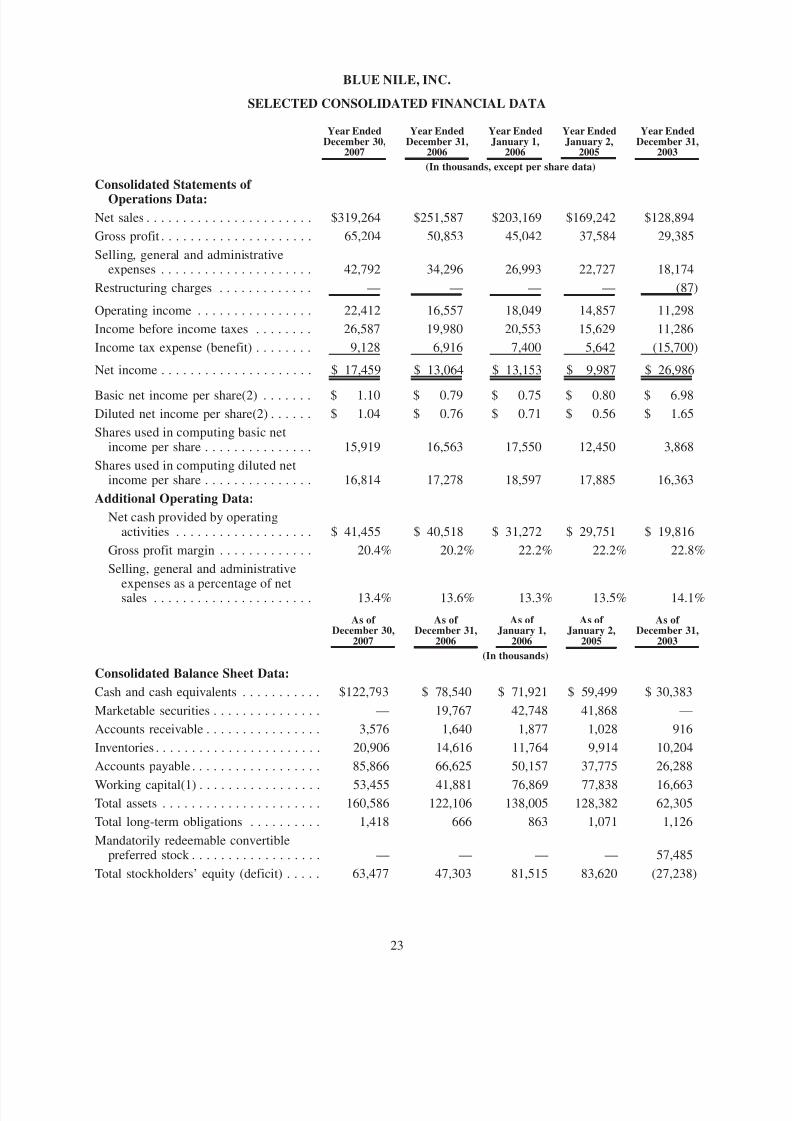
8/3/2019 Annual Report BlueNile 2007
http://slidepdf.com/reader/full/annual-report-bluenile-2007 27/72
BLUE NILE, INC.
SELECTED CONSOLIDATED FINANCIAL DATA
Year EndedDecember 30,
2007
Year EndedDecember 31,
2006
Year EndedJanuary 1,
2006
Year EndedJanuary 2,
2005
Year EndedDecember 31,
2003
(In thousands, except per share data)
Consolidated Statements of
Operations Data:
Net sales . . . . . . . . . . . . . . . . . . . . . . . $319,264 $251,587 $203,169 $169,242 $128,894
Gross profit . . . . . . . . . . . . . . . . . . . . . 65,204 50,853 45,042 37,584 29,385
Selling, general and administrativeexpenses . . . . . . . . . . . . . . . . . . . . . 42,792 34,296 26,993 22,727 18,174
Restructuring charges . . . . . . . . . . . . . — — — — (87)
Operating income . . . . . . . . . . . . . . . . 22,412 16,557 18,049 14,857 11,298
Income before income taxes . . . . . . . . 26,587 19,980 20,553 15,629 11,286
Income tax expense (benefit) . . . . . . . . 9,128 6,916 7,400 5,642 (15,700)
Net income . . . . . . . . . . . . . . . . . . . . . $ 17,459 $ 13,064 $ 13,153 $ 9,987 $ 26,986
Basic net income per share(2) . . . . . . . $ 1.10 $ 0.79 $ 0.75 $ 0.80 $ 6.98Diluted net income per share(2) . . . . . . $ 1.04 $ 0.76 $ 0.71 $ 0.56 $ 1.65
Shares used in computing basic netincome per share . . . . . . . . . . . . . . . 15,919 16,563 17,550 12,450 3,868
Shares used in computing diluted netincome per share . . . . . . . . . . . . . . . 16,814 17,278 18,597 17,885 16,363
Additional Operating Data:
Net cash provided by operatingactivities . . . . . . . . . . . . . . . . . . . $ 41,455 $ 40,518 $ 31,272 $ 29,751 $ 19,816
Gross profit margin . . . . . . . . . . . . . 20.4% 20.2% 22.2% 22.2% 22.8%
Selling, general and administrative
expenses as a percentage of netsales . . . . . . . . . . . . . . . . . . . . . . 13.4% 13.6% 13.3% 13.5% 14.1%
As of December 30,
2007
As of December 31,
2006
As of January 1,
2006
As of January 2,
2005
As of December 31,
2003
(In thousands)
Consolidated Balance Sheet Data:
Cash and cash equivalents . . . . . . . . . . . $122,793 $ 78,540 $ 71,921 $ 59,499 $ 30,383
Marketable securities . . . . . . . . . . . . . . . — 19,767 42,748 41,868 —
Accounts receivable . . . . . . . . . . . . . . . . 3,576 1,640 1,877 1,028 916
Inventories . . . . . . . . . . . . . . . . . . . . . . . 20,906 14,616 11,764 9,914 10,204
Accounts payable . . . . . . . . . . . . . . . . . . 85,866 66,625 50,157 37,775 26,288
Working capital(1) . . . . . . . . . . . . . . . . . 53,455 41,881 76,869 77,838 16,663Total assets . . . . . . . . . . . . . . . . . . . . . . 160,586 122,106 138,005 128,382 62,305
Total long-term obligations . . . . . . . . . . 1,418 666 863 1,071 1,126
Mandatorily redeemable convertiblepreferred stock . . . . . . . . . . . . . . . . . . — — — — 57,485
Total stockholders’ equity (deficit) . . . . . 63,477 47,303 81,515 83,620 (27,238)
23

8/3/2019 Annual Report BlueNile 2007
http://slidepdf.com/reader/full/annual-report-bluenile-2007 28/72
(1) Working capital consists of total current assets, including cash and cash equivalents, less total current
liabilities.
(2) On April 30, 2004, the Company effected a 1 for 2.5 reverse split of its common stock and mandatorily
redeemable convertible preferred stock. All shares and per share amounts and any other references to
shares included in the consolidated financial statements have been adjusted to reflect this split on a retro-
active basis.
Item 7. Management’s Discussion and Analysis of Financial Condition and Results of Operations
The following discussion should be read in conjunction with the consolidated financial statements and
related notes which appear elsewhere in this report. This discussion contains forward-looking statements that
involve risks and uncertainties. Our actual results could differ materially from those anticipated in these
forward-looking statements as a result of various factors, including those discussed below and elsewhere in
this report, particularly under the heading “Item 1A. Risk Factors.”
Management Overview
About Blue Nile
We were incorporated in 1999 and have become a leading online retailer of diamonds and fine jewelry
that offers an exceptional customer experience including substantial education, guidance and value. We havesuccessfully built Blue Nile into a premium brand.
Our financial focus is primarily on long-term, sustainable growth in free cash flow. 1 Non-GAAP free cash
flow is primarily driven by increasing our operating income and efficiently managing working capital and
capital expenditures. Increases in operating income primarily result from increases in sales through our
websites, improvements in operating margins and the efficient management of operating costs, offset by the
investments that we make in longer-term strategic initiatives.
Differentiating Factors and Value Proposition
We have built an innovative business model that delivers exceptional value and service to customers. We
have developed relationships with a large number of independent vendors with whom we have exclusive
agreements as an online retailer. Our unique inventory model allows us to offer our customers access to an
enormous selection of high quality diamonds. In most cases, we purchase diamonds from our suppliers onlywhen a customer has ordered them from us. As a result, we do not incur the significant costs typically
associated with carrying high levels of diamond inventory in physical retail.
As an online retailer, we do not incur most of the operating costs associated with physical retail stores,
including occupancy costs and related overhead. As a result, while our gross profit margins are lower than
those typically maintained by traditional diamond and fine jewelry retailers, we are able to realize relatively
higher operating income as a percentage of net sales. In the year ended December 30, 2007, we had a 20.4%
gross profit margin, as compared to what we believe to be gross profit margins of up to 50% or more by some
traditional retailers. Our lower gross profit margins result from lower retail prices that we offer to our
customers. We believe these lower prices, in turn, contribute to increased net sales.
Our efficient operating model provides for negative working capital benefits. Payments are received from
customers within a few days of their orders, but our vendor payment terms are typically in the 60-90 dayrange.
We have an obsessive focus on the customer. We develop our websites to offer easy to understand,
step-by-step guides to visualizing, evaluating, selecting and purchasing diamonds and fine jewelry. Our
customer support centers are staffed with non-commissioned product experts who offer advice and guidance to
24
1 Blue Nile defines free cash flow, a non-GAAP financial measure, as net cash provided by (used in)
operating activities less cash outflows for purchases of fixed assets, including internal use software and website
development.

8/3/2019 Annual Report BlueNile 2007
http://slidepdf.com/reader/full/annual-report-bluenile-2007 29/72
customers. We continue to invest in optimizing our fulfillment operations to ensure that our customized
products can be delivered within approximately three business days of order.
Among the key non-financial measures we review are customer feedback and customer satisfaction
ratings. We believe that maintaining high overall customer satisfaction is critical to our ongoing efforts to
promote the Blue Nile brand and to increase our net sales and net income. We actively solicit customer
feedback on our website functionality as well as on the entire purchase experience. To maintain a high level of
performance by our diamond and jewelry consultants, we also undertake an ongoing customer feedback
process.
Seasonality
We generally experience seasonal fluctuations in demand for our products. Our quarterly sales are
impacted by various gift giving holidays including Valentine’s Day (First Quarter), Mother’s Day (Second
Quarter) and Christmas / New Year’s (Fourth Quarter). As a result, our quarterly revenue is typically lowest in
the third quarter (as a result of the lack of recognized gift giving holidays) and highest in the fourth quarter.
Future Growth Opportunities
A customer’s first purchase from Blue Nile is often an engagement ring. Our goal is to provide an
unrivaled customer experience such that we become our customers’ jeweler for life. We have continued to
expand our product lines to include non-engagement diamond jewelry as well as other products such as pearls,
gemstones and various silver, gold and platinum offerings. Our satisfied customers are also an important
source of referrals that will help drive future growth.
We intend to selectively pursue opportunities in international markets in which we can leverage our
existing infrastructure and compelling value proposition. To-date, we have launched sites offering local
currency pricing in the United Kingdom and Canada. We will prioritize and pursue future opportunities based
on a number of factors, including but not limited to each market’s consumer spending on jewelry, adoption
rate of online purchasing and overall competitive landscape.
Critical Accounting Policies
The preparation of our consolidated financial statements requires that we make certain estimates and
judgments that affect amounts reported and disclosed in our consolidated financial statements and related
notes. We base our estimates on historical experience and on other assumptions that we believe to bereasonable under the circumstances. Actual results may differ from these estimates. The following are the
critical accounting policies that we believe require significant estimation and management judgment.
Revenue Recognition
We recognize revenue and the related gross profit on the date on which we estimate that customers have
received their products. As we require customer payment prior to order shipment, any payments received prior
to the customer receipt date are not recorded as revenue. We utilize our freight vendors’ tracking information
to determine when delivery has occurred, which is typically within one to three days after shipment. We
reduce revenue by a provision for returns, which is based on our historical product return rates, trends and
expectations. Our contracts with our suppliers generally allow us to return to our suppliers diamonds purchased
and returned by our customers.
Stock-based Compensation
We account for stock-based compensation in accordance with the fair value recognition provisions of
SFAS No. 123R (Revised 2004), “Share-Based Payment” (“SFAS 123R”). We use the Black-Scholes-Merton
option valuation model, which requires the input of highly subjective assumptions. These assumptions include
estimating the length of time employees will retain their vested stock options before exercising them
(“expected term”), the estimated volatility of the Company’s common stock price over the expected term, and
the number of options that will ultimately not complete their vesting requirements (“forfeitures”). Changes in
these assumptions can materially affect the estimate of the fair value of employee stock options and
25

8/3/2019 Annual Report BlueNile 2007
http://slidepdf.com/reader/full/annual-report-bluenile-2007 30/72
consequently, the related amount of stock-based compensation expense recognized in the consolidated
statements of operations.
The Company performed the following sensitivity analysis using changes in the expected term and
volatility that could be reasonably possible in the near term. If we assumed a six month change in the
expected term or a 500 basis point change in expected volatility, the value of a newly granted hypothetical
stock option would increase (decrease) by the following percentages:
Increase Decrease
Expected Term(1) . . . . . . . . . . . . . . . . . . . . . . . . . . . . . . . . . . . . . . . . . . . . . . . 5.7% (6.1)%
Expected Volatility(1) . . . . . . . . . . . . . . . . . . . . . . . . . . . . . . . . . . . . . . . . . . . . 9.2% (9.3%)
(1) Sensitivity to change in assumptions was determined using the Black-Scholes-Merton valuation model
compared to the following original assumptions: stock price and exercise price equal to the closing market
price of Blue Nile, Inc. common stock on December 28, 2007, expected term of 4.5 years, expected vola-
tility of 37.1%, expected dividend yield of 0.0% and a risk free investment rate of 4.3%.
Results of Operations
The following table presents our historical operating results for the periods indicated as a percentage of
net sales:
Year EndedDecember 30,2007
Year EndedDecember 31,2006
Year EndedJanuary 1,2006
Net sales . . . . . . . . . . . . . . . . . . . . . . . . . . . . . . . . . . . . . 100.0% 100.0% 100.0%
Gross profit . . . . . . . . . . . . . . . . . . . . . . . . . . . . . . . . . . . 20.4 20.2 22.2
Selling, general and administrative expenses . . . . . . . . . . . 13.4 13.6 13.3
Operating income . . . . . . . . . . . . . . . . . . . . . . . . . . . . . . 7.0 6.6 8.9
Other income (expense), net . . . . . . . . . . . . . . . . . . . . . . . 1.3 1.3 1.2
Income before income taxes . . . . . . . . . . . . . . . . . . . . . . . 8.3 7.9 10.1
Income tax expense . . . . . . . . . . . . . . . . . . . . . . . . . . . . . 2.8 2.7 3.6
Net income . . . . . . . . . . . . . . . . . . . . . . . . . . . . . . . . . . . 5.5% 5.2% 6.5%
The following describes certain line items set forth in our consolidated statement of operations:
Net Sales. Substantially all of our net sales consist of diamonds and fine jewelry sold via the Internet,
net of estimated returns. Historically, net sales have been higher in the fourth quarter as a result of higher
consumer spending during the holiday season. We expect this seasonal trend to continue in the foreseeable
future. We also generate net sales from shipping upgrades.
Gross Profit. Our gross profit consists of net sales less the cost of sales. Our cost of sales includes the
cost of merchandise sold to customers, inbound and outbound shipping costs, depreciation on assembly related
assets, insurance on shipments and the costs incurred to set diamonds into ring, earring and pendant settings,
including labor and related facilities costs. Our gross profit has fluctuated historically and we expect it to
continue to fluctuate based primarily on our product acquisition costs, product mix and pricing decisions.
Selling, General and Administrative Expenses. Our selling, general and administrative expenses consist
primarily of payroll and related benefit costs for our employees, stock-based compensation, marketing costs
and credit card fees. These expenses also include certain facility related costs, fulfillment, customer service,
technology and depreciation expenses, as well as professional fees and other general corporate expenses.
Fiscal Year. The Company’s fiscal year ends on the Sunday closest to December 31. Each fiscal year
consists of four 13-week quarters, with one extra week added in the fourth quarter every five to six years. Our
fiscal year 2008 will have one extra week in the fourth quarter as a result of our 4-4-5 retail reporting
calendar.
26
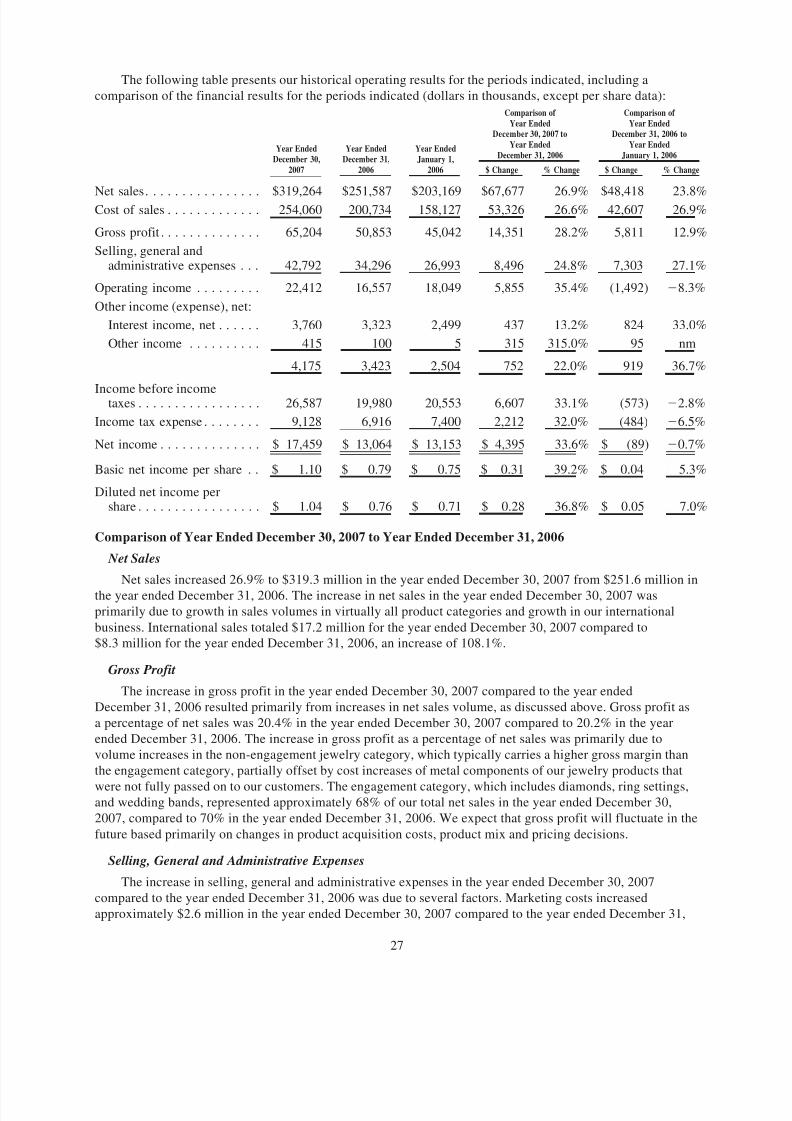
8/3/2019 Annual Report BlueNile 2007
http://slidepdf.com/reader/full/annual-report-bluenile-2007 31/72
The following table presents our historical operating results for the periods indicated, including a
comparison of the financial results for the periods indicated (dollars in thousands, except per share data):
Year EndedDecember 30,
2007
Year EndedDecember 31,
2006
Year EndedJanuary 1,
2006 $ Change % Change $ Change % Change
Comparison of Year Ended
December 30, 2007 toYear Ended
December 31, 2006
Comparison of Year Ended
December 31, 2006 toYear Ended
January 1, 2006
Net sales. . . . . . . . . . . . . . . . $319,264 $251,587 $203,169 $67,677 26.9% $48,418 23.8%Cost of sales . . . . . . . . . . . . . 254,060 200,734 158,127 53,326 26.6% 42,607 26.9%
Gross profit . . . . . . . . . . . . . . 65,204 50,853 45,042 14,351 28.2% 5,811 12.9%
Selling, general andadministrative expenses . . . 42,792 34,296 26,993 8,496 24.8% 7,303 27.1%
Operating income . . . . . . . . . 22,412 16,557 18,049 5,855 35.4% (1,492) 8.3%
Other income (expense), net:
Interest income, net . . . . . . 3,760 3,323 2,499 437 13.2% 824 33.0%
Other income . . . . . . . . . . 415 100 5 315 315.0% 95 nm
4,175 3,423 2,504 752 22.0% 919 36.7%
Income before incometaxes . . . . . . . . . . . . . . . . . 26,587 19,980 20,553 6,607 33.1% (573) 2.8%
Income tax expense . . . . . . . . 9,128 6,916 7,400 2,212 32.0% (484) 6.5%
Net income . . . . . . . . . . . . . . $ 17,459 $ 13,064 $ 13,153 $ 4,395 33.6% $ (89) 0.7%
Basic net income per share . . $ 1.10 $ 0.79 $ 0.75 $ 0.31 39.2% $ 0.04 5.3%
Diluted net income pershare . . . . . . . . . . . . . . . . . $ 1.04 $ 0.76 $ 0.71 $ 0.28 36.8% $ 0.05 7.0%
Comparison of Year Ended December 30, 2007 to Year Ended December 31, 2006
Net Sales
Net sales increased 26.9% to $319.3 million in the year ended December 30, 2007 from $251.6 million in
the year ended December 31, 2006. The increase in net sales in the year ended December 30, 2007 was
primarily due to growth in sales volumes in virtually all product categories and growth in our international
business. International sales totaled $17.2 million for the year ended December 30, 2007 compared to
$8.3 million for the year ended December 31, 2006, an increase of 108.1%.
Gross Profit
The increase in gross profit in the year ended December 30, 2007 compared to the year ended
December 31, 2006 resulted primarily from increases in net sales volume, as discussed above. Gross profit as
a percentage of net sales was 20.4% in the year ended December 30, 2007 compared to 20.2% in the year
ended December 31, 2006. The increase in gross profit as a percentage of net sales was primarily due to
volume increases in the non-engagement jewelry category, which typically carries a higher gross margin than
the engagement category, partially offset by cost increases of metal components of our jewelry products that
were not fully passed on to our customers. The engagement category, which includes diamonds, ring settings,and wedding bands, represented approximately 68% of our total net sales in the year ended December 30,
2007, compared to 70% in the year ended December 31, 2006. We expect that gross profit will fluctuate in the
future based primarily on changes in product acquisition costs, product mix and pricing decisions.
Selling, General and Administrative Expenses
The increase in selling, general and administrative expenses in the year ended December 30, 2007
compared to the year ended December 31, 2006 was due to several factors. Marketing costs increased
approximately $2.6 million in the year ended December 30, 2007 compared to the year ended December 31,
27

8/3/2019 Annual Report BlueNile 2007
http://slidepdf.com/reader/full/annual-report-bluenile-2007 32/72
2006 primarily due to increased spending in online marketing vehicles, such as search, affiliate channels,
online portals and other marketing initiatives to drive higher sales volumes. Payroll and related costs increased
approximately $2.2 million in the year ended December 30, 2007 compared to the year ended December 31,
2006 due to additional personnel and increased compensation costs. Stock-based compensation increased
approximately $1.3 million to $5.6 million compared to the year ended December 31, 2006 due to the number
and fair value of stock options expensed under SFAS 123R. Credit card processing fees increased approxi-
mately $1.3 million in the year ended December 30, 2007 compared to the year ended December 31, 2006 due
to the increase in sales volume. The increase in selling, general and administrative expenses also includes costsrelated to the establishment of our new international facility in Ireland. As a percentage of net sales, selling,
general and administrative expenses were 13.4% and 13.6% in the year ended December 30, 2007 and the
year ended December 31, 2006, respectively. The decrease in selling, general and administrative expenses as a
percentage of net sales in the year ended December 30, 2007 resulted primarily from our ability to leverage
our fixed cost base.
We expect selling, general and administrative expenses to increase in absolute dollars in future periods as
a result of our marketing efforts to drive increases in net sales, growth in our fulfillment and customer service
operations to support higher sales volumes and increases in credit card processing fees and other expenses to
support growth initiatives.
Other Income (Expense), Net
Other income (expense), net consists primarily of interest income. The increase of $0.4 million in interestincome in the year ended December 30, 2007 compared to the year ended December 31, 2006 was due to an
increase in the average cash balance partially offset by a decrease in interest rates during the year ended
December 30, 2007 compared to the year ended December 31, 2006.
Income Taxes
The effective income tax rate for the year ended December 30, 2007 was 34.3% as compared to 34.6%
for the year ended December 31, 2006. The December 30, 2007 effective tax rate reflects a benefit of
$0.1 million due to deferred tax asset adjustments.
Comparison of Year Ended December 31, 2006 to Year Ended January 1, 2006
Net Sales
Net sales increased 23.8% in 2006, reflecting sales volume growth in all product categories in ourdomestic and international markets.
Gross Profit
The increase in gross profit in the year ended December 31, 2006 compared to the year ended January 1,
2006 resulted primarily from increases in net sales volume, as discussed above. Gross profit as a percentage of
net sales was 20.2% in the year ended December 31, 2006 and 22.2% in the year ended January 1, 2006. The
decrease in gross profit as a percentage of net sales was primarily due to our lower diamond pricing strategy
that was implemented in the first quarter of 2006 to optimize gross profit, and to a lesser extent, cost increases
in gold, silver and platinum jewelry that were not fully passed on to our customers. Volume increases in the
non-engagement jewelry category, which typically carries a higher gross margin than engagement, partially
offset the decreases related to pricing. The engagement category represented approximately 70% of our total
net sales in the year ended December 31, 2006, compared to 72% in the year ended January 1, 2006.
Selling, General and Administrative Expenses
The increase in selling, general and administrative expenses in the year ended December 31, 2006
compared to the year ended January 1, 2006 was due to several factors. Stock-based compensation increased
approximately $4.0 million to $4.3 million, compared to $0.3 million in the year ended January 1, 2006, as a
result of the adoption of SFAS 123R. We recorded $4.1 million of stock-based compensation expense as a
result of the transition to accounting for stock-based compensation at fair value using the modified prospective
method in accordance with SFAS 123R. Of this amount, $4.0 million was recognized as selling, general and
28

8/3/2019 Annual Report BlueNile 2007
http://slidepdf.com/reader/full/annual-report-bluenile-2007 33/72
administrative expense and $75,000 was recognized as cost of sales. Marketing costs increased approximately
$2.3 million in the year ended December 31, 2006 compared to the year ended January 1, 2006 primarily due
to higher sales volume. Credit card processing fees increased approximately $1.0 million in the year ended
December 31, 2006 compared to the year ended January 1, 2006 due to the increase in sales volume. Payroll
and related costs increased approximately $0.7 million in the year ended December 31, 2006 compared to the
year ended January 1, 2006 due to additional personnel and increased compensation costs. These increases
were partially offset by lower contractor and consultant costs for the year ended December 31, 2006 compared
to the year ended January 1, 2006, which included costs related to the implementation of Sarbanes-Oxley 404.As a percentage of net sales, selling, general and administrative expenses were 13.6% and 13.3% in the year
ended December 31, 2006 and the year ended January 1, 2006, respectively. The increase in selling, general
and administrative expenses as a percentage of net sales in the year ended December 31, 2006 resulted
primarily from the addition of stock-based compensation expenses as a result of the implementation of
SFAS 123R, as discussed above.
Other Income (Expense), Net
Other income (expense), net consists primarily of interest income. The increase of $0.8 million in interest
income in the year ended December 31, 2006 compared to the year ended January 1, 2006 was due to an
increase in interest rates during fiscal 2006 compared to fiscal 2005, partially offset by a decrease in the
average cash balance in the fiscal 2006 compared to the fiscal 2005 as a result of share repurchases in 2006.
Income Taxes
The effective income tax rate for the year ended December 31, 2006 was 34.6% as compared to 36.0%
for the year ended January 1, 2006. This change in tax rate resulted from adjustments arising from the final
determination of our 2005 income tax expense and adjustments to deferred taxes for the year ended
December 31, 2006. During 2006, we fully utilized our net operating loss carryforwards for federal income tax
purposes.
Liquidity and Capital Resources
Since inception, we have funded our operations through cash generated by operations, the sale of equity
securities, subordinated indebtedness, credit facilities and capital lease obligations. The significant components
of our working capital are inventory and liquid assets such as cash, marketable securities and trade accounts
receivable, reduced by accounts payable and accrued expenses. Our business model provides certain beneficial
working capital characteristics. While we collect cash from sales to customers within several business days of the related sale, we typically have extended payment terms with our suppliers.
As of December 30, 2007, working capital totaled $53.5 million, including cash and cash equivalents of
$122.8 million and inventory of $20.9 million, partially offset by accounts payable of $85.9 million. Due to
the seasonal nature of our business, cash and cash equivalents, inventory and accounts payable are generally
higher in the fourth quarter, resulting in fluctuations in our working capital.
Net cash provided by operating activities was $41.5 million, $40.5 million and $31.3 million in the years
ended December 30, 2007, December 31, 2006, and January 1, 2006, respectively. The increase in cash
provided by operating activities in the year ended December 30, 2007 compared to the year ended
December 31, 2006 was primarily due to cash generated from net income of $17.5 million, non-cash stock-
based compensation expense of $5.8 million, tax benefits realized upon the exercise of stock options of
$6.8 million which represents the benefits realized for tax deductions in excess of stock compensation expenserelated to option exercises, and growth in accounts payable related to net sales growth and extended payment
terms with our suppliers. These increases were partially offset by an increase in inventory balances, the change
in deferred income taxes resulting from the utilization of our tax net operating losses and, to a lesser extent, a
higher accounts receivable balance due to settlement timing differences at December 30, 2007 compared to
December 31, 2006.
The increase in cash provided by operating activities in the year ended December 31, 2006 compared to
the year ended January 1, 2006 was primarily due to cash generated from net income of $13.1 million, non-
cash stock-based compensation expense of $4.4 million due to the adoption of SFAS 123R, tax benefits
29

8/3/2019 Annual Report BlueNile 2007
http://slidepdf.com/reader/full/annual-report-bluenile-2007 34/72
realized upon the exercise of stock options of $2.7 million, an increase in accrued liabilities, and growth in
accounts payable related to net sales growth and extended payment terms with our suppliers. These increases
were partially offset by an increase in inventory balances and the change in deferred income taxes resulting
from the utilization of our net operating loss carryforwards.
Net cash provided by investing activities was $15.0 million and $21.1 million in the years ended
December 30, 2007 and December 31, 2006, respectively, and was primarily related to the net sales of
marketable securities. Net cash used in investing activities was $2.1 million in the year ended January 1, 2006
and was primarily related to the net purchase of marketable securities.
Net cash used in financing activities in the year ended December 30, 2007 was $12.3 million, related
primarily to repurchases of our common stock. In the year ended December 30, 2007, we purchased
438,755 shares of our common stock for $20.0 million. Proceeds from stock option exercises and excess tax
benefits from stock option exercises partially offset the cash used to repurchase common shares. On February 2,
2006, the board of directors authorized the repurchase of up to $100 million of the Company’s common stock
within the 24-month period following the approval date of the repurchase program. This repurchase program
expired as of February 2, 2008. On July 27, 2006, the board of directors authorized the repurchase of up to
$50 million of the Company’s common stock within the 24-month period following the approval date of the
repurchase program. On February 6, 2008, our board of directors authorized the repurchase of up to an
additional $100 million of Blue Nile, Inc. common stock during the subsequent 24-month period following the
approval date of such additional repurchase. The shares may be repurchased from time to time in open market
transactions or in negotiated transactions off the market. The timing and amount of any shares repurchased is
determined by the Company’s management based on its evaluation of market conditions and other factors.
Repurchases may also be made under a Rule 10b5-1 plan, which would permit shares to be repurchased when
the Company might otherwise be precluded from doing so under insider trading laws.
Net cash used in financing activities in the year ended December 31, 2006 was $55.0 million relating
primarily to the repurchases of our common stock. In the year ended December 31, 2006, we purchased
approximately 1.8 million shares of our common stock for $57.4 million. The increase in net cash used in
financing activities in the year ended December 31, 2006 was partially offset by an increase in proceeds from
stock option exercises and excess tax benefits from stock option exercises. Beginning in the year ended
December 31, 2006, the excess tax benefits from stock option exercises were presented as operating cash
inflows in accordance with Emerging Issues Task Force Issue (“EITF”) No. 00-15, “Classification in the
Statement of Cash Flows of the Income Tax Benefit Received by a Company upon Exercise of a Nonqualified
Employee Stock Option” (“EITF 00-15”). Net cash used in financing activities in the year ended January 1,
2006 was $16.8 million related primarily to repurchases of Blue Nile, Inc. common stock under a repurchase
plan authorized by the board of directors in February 2005.
The following table summarizes our contractual obligations and the expected effect on liquidity and cash
flows as of December 30, 2007 (in thousands).
Contractual Obligations TotalLess Than
1 Year 1- 3 Years 4- 5 YearsOver 5Years
Operating leases . . . . . . . . . . . . . . . . . . . . . . . . . . . . . . $2,307 $ 509 $1,020 $486 $292
Financing obligation . . . . . . . . . . . . . . . . . . . . . . . . . . . 428 59 118 129 122
Purchase obligations(1) . . . . . . . . . . . . . . . . . . . . . . . . . 738 738 — — —
Purchase obligations(2) . . . . . . . . . . . . . . . . . . . . . . . . . 150 150 — — —
$3,623 $1,456 $1,138 $615 $414
(1) Includes open merchandise purchase orders at December 30, 2007.
(2) Includes commitments for advertising and marketing services at December 30, 2007.
We believe that cash and cash equivalents currently on hand as well as cash flows from operations will be
sufficient to continue our operations for the foreseeable future. While we anticipate that our cash flows from
operations will be sufficient to fund our operational requirements, future capital and operating requirements
30

8/3/2019 Annual Report BlueNile 2007
http://slidepdf.com/reader/full/annual-report-bluenile-2007 35/72
may change and will depend on many factors, including the level of our net sales, gross margin levels, pricing
decisions, the cost to acquire products, inventory levels, the expansion of our sales and marketing activities,
the cost of our fulfillment operations, infrastructure needs, potential investments in businesses or technologies
and continued market acceptance of our products. We could be required, or could elect, to seek additional
funding through a public or private equity or debt financing in the future, and this financing may not be
available on terms acceptable to us, or at all.
Off-Balance Sheet Arrangements
At December 30, 2007, we did not have any off-balance sheet arrangements or relationships with
unconsolidated entities or financial partnerships, such as entities often referred to as structured finance or
special purposes entities, which are typically established for the purpose of facilitating off-balance sheet
arrangements or other contractually narrow or limited purposes.
Impact of Inflation
The effect of inflation and changing prices on our operations was not significant during the periods
presented.
Item 7A. Quantitative and Qualitative Disclosures About Market Risk
Interest Rate Risk
We are exposed to market risk from changes in interest rates. The primary objective of our investmentactivities is to preserve principal while at the same time maximizing yields without significantly increasing
risk. To achieve this objective, we invest in short-term, high quality, interest bearing securities. Our
investments in debt securities are subject to interest rate risk. To minimize our exposure to an adverse shift in
interest rates, we invest in short-term securities and maintain an average maturity of one year or less. If
interest rates had averaged 1% more than they did in the year ended December 30, 2007, interest income for
the year would have increased approximately 19.8%, or $0.7 million. If interest rates had averaged 1% more
than they did in the year ended December 31, 2006, interest income for the year would have increased
approximately 21.5% or $0.7 million.
Foreign Currency Exchange Risk
The majority of our revenue, expense and capital expenditures are transacted in U.S. dollars. Commencing
in May 2007, sales transactions through our Canadian and U.K. websites are denominated in local currency,
subjecting us to foreign exchange risk from the transaction date to when the cash is ultimately converted toU.S. dollars. The impact of foreign currency exchange was not material to our results of operations for the
year ended December 30, 2007.
In addition, the functional currency of Blue Nile Jewellery, Ltd, (“Jewellery”) our Irish subsidiary, is the
Euro. Assets and liabilities of Jewellery are translated into U.S. dollars at the exchange rate prevailing at the
end of the period. Income and expenses are translated into U.S. dollars at an average exchange rate during the
period. Foreign currency gains and losses from the translation of Jewellery’s balance sheet and income
statement are included in other comprehensive income.
31

8/3/2019 Annual Report BlueNile 2007
http://slidepdf.com/reader/full/annual-report-bluenile-2007 36/72
Item 8. Financial Statements and Supplementary Data
Index to Consolidated Financial Statements
Page
Financial Statements
Reports of Independent Registered Public Accounting Firms . . . . . . . . . . . . . . . . . . . . . . . . . . . . . . . . . 33
Consolidated Balance Sheets, as of December 30, 2007 and December 31, 2006 . . . . . . . . . . . . . . . . . . 35Consolidated Statements of Operations, for the fiscal years ended December 30, 2007, December 31,
2006 and January 1, 2006 . . . . . . . . . . . . . . . . . . . . . . . . . . . . . . . . . . . . . . . . . . . . . . . . . . . . . . . . . 36
Consolidated Statements of Changes in Stockholders’ Equity, for the fiscal years ended December 30,2007, December 31, 2006 and January 1, 2006 . . . . . . . . . . . . . . . . . . . . . . . . . . . . . . . . . . . . . . . . . 37
Consolidated Statements of Cash Flows, for the fiscal years ended December 30, 2007, December 31,2006 and January 1, 2006 . . . . . . . . . . . . . . . . . . . . . . . . . . . . . . . . . . . . . . . . . . . . . . . . . . . . . . . . . 38
Notes to Consolidated Financial Statements. . . . . . . . . . . . . . . . . . . . . . . . . . . . . . . . . . . . . . . . . . . . . . 40
Selected Quarterly Financial Information (unaudited) . . . . . . . . . . . . . . . . . . . . . . . . . . . . . . . . . . . . . . . 53
Financial Statement Schedule
Schedule II, Valuation and Qualifying Accounts. . . . . . . . . . . . . . . . . . . . . . . . . . . . . . . . . . . . . . . . . 55
All other schedules are omitted because they are not applicable or the required information is shownin the financial statements or notes thereto.
32

8/3/2019 Annual Report BlueNile 2007
http://slidepdf.com/reader/full/annual-report-bluenile-2007 37/72
REPORT OF INDEPENDENT REGISTERED PUBLIC ACCOUNTING FIRM
To the Board of Directors and Stockholders of
Blue Nile, Inc.
Seattle, Washington
We have audited the accompanying consolidated balance sheets of Blue Nile, Inc. and subsidiaries (the
“Company”) as of December 30, 2007 and December 31, 2006, and the related consolidated statements of
operations, statements of changes in stockholder’s equity, and cash flows for each of the two fiscal years in
the period ended December 30, 2007. Our audits also included the financial statement schedule listed in the
Index at Item 15. These financial statements and financial statement schedule are the responsibility of the
Company’s management. Our responsibility is to express an opinion on the financial statements and financial
statement schedule based on our audits.
We conducted our audits in accordance with the standards of the Public Company Accounting Oversight
Board (United States). Those standards require that we plan and perform the audit to obtain reasonable
assurance about whether the financial statements are free of material misstatement. An audit includes
examining, on a test basis, evidence supporting the amounts and disclosures in the financial statements. An
audit also includes assessing the accounting principles used and significant estimates made by management, as
well as evaluating the overall financial statement presentation. We believe that our audits provide a reasonable
basis for our opinion.
In our opinion, such consolidated financial statements present fairly, in all material respects, the financial
position of Blue Nile, Inc. and subsidiaries as of December 30, 2007 and December 31, 2006, and the results
of their operations and their cash flows for each of the two years in the fiscal period ended December 30,
2007, in conformity with accounting principles generally accepted in the United States of America. Also, in
our opinion, such financial statement schedule, when considered in relation to the basic consolidated financial
statements taken as a whole, presents fairly, in all material respects, the information set forth therein.
As discussed in Note 6 to the consolidated financial statements, on January 2, 2006, the Company
changed its method of accounting for stock-based compensation upon adoption of Statement of Financial
Accounting Standards No. 123(R), Share-Based Payment.
As discussed in Note 1 to the consolidated financial statements, on December 31, 2006, the Company
initially applied the provisions of Staff Accounting Bulletin No. 108, Considering the Effects of Prior Year
Misstatements when Quantifying Misstatements in Current Year Financial Statements, and recorded a cumula-tive effect adjustment to beginning accumulated deficit in 2006.
We have also audited, in accordance with the standards of the Public Company Accounting Oversight
Board (United States), the Company’s internal control over financial reporting as of December 30, 2007, based
on the criteria established in Internal Control — Integrated Framework issued by the Committee of Sponsoring
Organizations of the Treadway Commission and our report dated February 26, 2008 expressed an unqualified
opinion on the Company’s internal control over financial reporting.
/s/ Deloitte & Touche LLP
Seattle, Washington
February 26, 2008
33

8/3/2019 Annual Report BlueNile 2007
http://slidepdf.com/reader/full/annual-report-bluenile-2007 38/72
REPORT OF INDEPENDENT REGISTERED PUBLIC ACCOUNTING FIRM
To the Board of Directors and Stockholders of Blue Nile, Inc.:
In our opinion, the consolidated financial statements listed in the accompanying index present fairly, in
all material respects, the financial position of Blue Nile, Inc. at January 1, 2006, the results of its operations
and its cash flows for the two years in the period ended January 1, 2006, in conformity with accounting
principles generally accepted in the United States of America. In addition, in our opinion, the financial
statement schedule for each of the two years in the period ended January 1, 2006 presents fairly, in all material
respects, the information set forth therein when read in conjunction with the related consolidated financial
statements. These financial statements and financial statement schedule are the responsibility of the Company’s
management. Our responsibility is to express an opinion on these financial statements and financial statement
schedule based on our audits. We conducted our audits of these statements in accordance with the standards of
the Public Company Accounting Oversight Board (United States). Those standards require that we plan and
perform the audit to obtain reasonable assurance about whether the financial statements are free of material
misstatement. An audit includes examining, on a test basis, evidence supporting the amounts and disclosures
in the financial statements, assessing the accounting principles used and significant estimates made by
management, and evaluating the overall financial statement presentation. We believe that our audits provide a
reasonable basis for our opinion.
/s/ PricewaterhouseCoopers LLP
Seattle, WA
March 13, 2006
34

8/3/2019 Annual Report BlueNile 2007
http://slidepdf.com/reader/full/annual-report-bluenile-2007 39/72
BLUE NILE, INC.
Consolidated Balance Sheets
(In thousands, except par value)
December 30,2007
December 31,2006
ASSETS
Current assets:Cash and cash equivalents . . . . . . . . . . . . . . . . . . . . . . . . . . . . . . . . . . . . . . . . $122,793 $ 78,540
Restricted cash . . . . . . . . . . . . . . . . . . . . . . . . . . . . . . . . . . . . . . . . . . . . . . . . — 117
Marketable securities . . . . . . . . . . . . . . . . . . . . . . . . . . . . . . . . . . . . . . . . . . . — 19,767
Trade accounts receivable . . . . . . . . . . . . . . . . . . . . . . . . . . . . . . . . . . . . . . . . 2,452 1,484
Other accounts receivable . . . . . . . . . . . . . . . . . . . . . . . . . . . . . . . . . . . . . . . . 1,124 156
Inventories . . . . . . . . . . . . . . . . . . . . . . . . . . . . . . . . . . . . . . . . . . . . . . . . . . . 20,906 14,616
Deferred income taxes . . . . . . . . . . . . . . . . . . . . . . . . . . . . . . . . . . . . . . . . . . . 799 598
Prepaids and other current assets . . . . . . . . . . . . . . . . . . . . . . . . . . . . . . . . . . . 1,072 740
Total current assets . . . . . . . . . . . . . . . . . . . . . . . . . . . . . . . . . . . . . . . . . . . 149,146 116,018
Property and equipment, net . . . . . . . . . . . . . . . . . . . . . . . . . . . . . . . . . . . . . . . . 7,601 3,391
Intangible assets, net . . . . . . . . . . . . . . . . . . . . . . . . . . . . . . . . . . . . . . . . . . . . . . 286 319
Deferred income taxes . . . . . . . . . . . . . . . . . . . . . . . . . . . . . . . . . . . . . . . . . . . . 3,489 2,285
Other assets . . . . . . . . . . . . . . . . . . . . . . . . . . . . . . . . . . . . . . . . . . . . . . . . . . . . 64 93
Total assets . . . . . . . . . . . . . . . . . . . . . . . . . . . . . . . . . . . . . . . . . . . . . . . . . $160,586 $122,106
LIABILITIES AND STOCKHOLDERS’ EQUITY
Current liabilities:
Accounts payable . . . . . . . . . . . . . . . . . . . . . . . . . . . . . . . . . . . . . . . . . . . . . . $ 85,866 $ 66,625
Accrued liabilities . . . . . . . . . . . . . . . . . . . . . . . . . . . . . . . . . . . . . . . . . . . . . . 9,549 7,315
Current portion of long-term financing obligation. . . . . . . . . . . . . . . . . . . . . . . 38 —
Current portion of deferred rent . . . . . . . . . . . . . . . . . . . . . . . . . . . . . . . . . . . . 238 197
Total current liabilities. . . . . . . . . . . . . . . . . . . . . . . . . . . . . . . . . . . . . . . . . 95,691 74,137
Long-term financing obligation, less current portion . . . . . . . . . . . . . . . . . . . . . . 880 —
Deferred rent, less current portion . . . . . . . . . . . . . . . . . . . . . . . . . . . . . . . . . . . . 538 666
Stockholders’ equity:
Preferred stock, $0.001 par value; 5,000 shares authorized, none issued andoutstanding . . . . . . . . . . . . . . . . . . . . . . . . . . . . . . . . . . . . . . . . . . . . . . . . .
Common stock, $0.001 par value; 300,000 shares authorized; 19,513 sharesand 19,073 shares issued, respectively; 15,973 shares and 15,972 sharesoutstanding, respectively . . . . . . . . . . . . . . . . . . . . . . . . . . . . . . . . . . . . . . . 20 19
Additional paid-in capital . . . . . . . . . . . . . . . . . . . . . . . . . . . . . . . . . . . . . . . . 134,207 115,751
Deferred compensation . . . . . . . . . . . . . . . . . . . . . . . . . . . . . . . . . . . . . . . . . . (3) (180)
Accumulated other comprehensive income (loss) . . . . . . . . . . . . . . . . . . . . . . . 75 (2)Retained earnings . . . . . . . . . . . . . . . . . . . . . . . . . . . . . . . . . . . . . . . . . . . . . . 24,569 7,110
Treasury stock, at cost; 3,540 shares and 3,101 shares outstanding,respectively . . . . . . . . . . . . . . . . . . . . . . . . . . . . . . . . . . . . . . . . . . . . . . . . . (95,391) (75,395)
Total stockholders’ equity . . . . . . . . . . . . . . . . . . . . . . . . . . . . . . . . . . . . . . 63,477 47,303
Total liabilities and stockholders’ equity . . . . . . . . . . . . . . . . . . . . . . . . . . . . $160,586 $122,106
The accompanying notes are an integral part of these consolidated financial statements
35

8/3/2019 Annual Report BlueNile 2007
http://slidepdf.com/reader/full/annual-report-bluenile-2007 40/72
BLUE NILE, INC.
Consolidated Statements of Operations
(In thousands, except per share data)
Year EndedDecember 30,
2007
Year EndedDecember 31,
2006
Year EndedJanuary 1,
2006
Net sales . . . . . . . . . . . . . . . . . . . . . . . . . . . . . . . . . . . . . . . . . . . . $319,264 $251,587 $203,169Cost of sales . . . . . . . . . . . . . . . . . . . . . . . . . . . . . . . . . . . . . . . . . 254,060 200,734 158,127
Gross profit . . . . . . . . . . . . . . . . . . . . . . . . . . . . . . . . . . . . . . . . . . 65,204 50,853 45,042
Selling, general and administrative expenses . . . . . . . . . . . . . . . . . . 42,792 34,296 26,993
Operating income . . . . . . . . . . . . . . . . . . . . . . . . . . . . . . . . . . . . . . 22,412 16,557 18,049
Other income (expense), net:
Interest income, net . . . . . . . . . . . . . . . . . . . . . . . . . . . . . . . . . . 3,760 3,323 2,499
Other income . . . . . . . . . . . . . . . . . . . . . . . . . . . . . . . . . . . . . . . 415 100 5
Total other income (expense), net . . . . . . . . . . . . . . . . . . . . . . 4,175 3,423 2,504
Income before income taxes . . . . . . . . . . . . . . . . . . . . . . . . . . . . . . 26,587 19,980 20,553
Income tax expense . . . . . . . . . . . . . . . . . . . . . . . . . . . . . . . . . . . . 9,128 6,916 7,400Net income . . . . . . . . . . . . . . . . . . . . . . . . . . . . . . . . . . . . . . . . . . $ 17,459 $ 13,064 $ 13,153
Basic net income per share . . . . . . . . . . . . . . . . . . . . . . . . . . . . . . . $ 1.10 $ 0.79 $ 0.75
Diluted net income per share . . . . . . . . . . . . . . . . . . . . . . . . . . . . . $ 1.04 $ 0.76 $ 0.71
The accompanying notes are an integral part of these consolidated financial statements
36

8/3/2019 Annual Report BlueNile 2007
http://slidepdf.com/reader/full/annual-report-bluenile-2007 41/72
BLUE NILE, INC.
Consolidated Statements of Changes in Stockholders’ Equity
(In thousands)
Shares Amount
AdditionalPaid-inCapital
DeferredStock
Compensation
Retained Earnings(Accumulated
Deficit)
AccumulatedOther
ComprehensiveIncome (Loss) Shares Amount
TotalStockholders’
Equity
Common Stock Treasury Stock
Balance, January 2, 2005 . . . . . . . . . . . . . 1 8,478 $18 $104,684 $(929) $(19,515) $ (2) (750) $ (636) $ 83,620Net income . . . . . . . . . . . . . . . . . . . — — — — 13,153 — — — 13,153Other comprehensive income (loss):Unrealized gain on marketable securities,
net of tax . . . . . . . . . . . . . . . . . . . — — — — — 7 — — 7
Total comprehensive income . . . . . . . . . — — — — — — — — 13,160Tax benefit from stock option exercises . . — — 1,190 — — — — — 1,190Amortization of deferred stock
compensation . . . . . . . . . . . . . . . . . — — — 312 — — — — 312Reversal of deferred compensation relating
to cancelled options . . . . . . . . . . . . . — — (137) 137 — — — — —Exercise of common stock options . . . . . 167 1 574 — — — — — 575Issuance of common stock to directors . . . 1 — 30 — — — — — 30Repurchase of common stock . . . . . . . . — — — — — — (565) (17,372) (17,372)
Balance, January 1, 2006 . . . . . . . . . . . . . 18,646 19 106,341 (480) (6,362) 5 (1,315) ( 18,008) 81,515Adjustment to beginning accumulated
deficit (Note 1) . . . . . . . . . . . . . . . . — — — — 408 — — — 408Net income . . . . . . . . . . . . . . . . . . . — — — — 13,064 — — — 13,064Other comprehensive income (loss):Unrealized loss on marketable securities,
net of tax . . . . . . . . . . . . . . . . . . . — — — — — (7) — — (7)
Total comprehensive income . . . . . . . . . — — — — — — — — 13,057Tax benefit from exercise of stock
options . . . . . . . . . . . . . . . . . . . . . — — 2,961 — — — — — 2,961Amortization of deferred stock
compensation . . . . . . . . . . . . . . . . . — — — 269 — — — — 269Reversal of deferred compensation relating
to cancelled options . . . . . . . . . . . . . — — (31) 31 — — — — —Exercise of common stock options . . . . . 425 — 2,251 — — — — — 2,251Issuance of common stock to directors . . . 2 — 94 — — — — — 94Stock-based compensation . . . . . . . . . . — — 4,135 — — — — — 4,135Repurchase of common stock . . . . . . . . — — — — — — (1,786) (57,387) (57,387)
Balance, December 31, 2006 . . . . . . . . . . 19,073 19 115,751 (180) 7,110 (2) (3,101) ( 75,395) 47,303Net income . . . . . . . . . . . . . . . . . . . — — — — 17,459 — — — 17,459Other comprehensive income (loss):Reclassification of unrealized loss, net of
tax . . . . . . . . . . . . . . . . . . . . . . . — — — — — 2 — — 2Foreign currency translation adjustment . . — — — — — 75 — — 75
Total comprehensive income. . . . . . . . . . . — — — — — — — — 17,536Tax benefit from exercise of stock
options . . . . . . . . . . . . . . . . . . . . . — — 6,848 — — — — — 6,848Amortization of deferred stock
compensation . . . . . . . . . . . . . . . . . — — — 172 — — — — 172Reversal of deferred compensation relating
to cancelled options . . . . . . . . . . . . . — — (5) 5 — — — — —Exercise of common stock options . . . . . 438 1 5,874 — — — — — 5,875Issuance of common stock to directors . . . 2 — 97 — — — — — 97Stock-based compensation . . . . . . . . . . — — 5,642 — — — — — 5,642Repurchase of common stock . . . . . . . . — — — — — — (439) (19,996) (19,996)
Balance, December 30, 2007 . . . . . . . . . . 1 9,513 $20 $134,207 $ (3) $ 24,569 $75 (3,540) $(95,391) $ 63,477
The accompanying notes are an integral part of these consolidated financial statements
37

8/3/2019 Annual Report BlueNile 2007
http://slidepdf.com/reader/full/annual-report-bluenile-2007 42/72
BLUE NILE, INC.
Consolidated Statements of Cash Flows
(In thousands)
Year EndedDecember 30,
2007
Year EndedDecember 31,
2006
Year EndedJanuary 1,
2006
Operating activities:Net income . . . . . . . . . . . . . . . . . . . . . . . . . . . . . . . . . . . . . . . $ 17,459 $ 13,064 $ 13,153
Adjustments to reconcile net income to net cash provided byoperating activities:
Depreciation and amortization . . . . . . . . . . . . . . . . . . . . . . . . 1,772 1,868 1,717
(Gain) loss on disposal of property and equipment . . . . . . . . . (8) 5 11
Stock-based compensation . . . . . . . . . . . . . . . . . . . . . . . . . . . 5,832 4,434 342
Deferred income taxes . . . . . . . . . . . . . . . . . . . . . . . . . . . . . (1,407) 2,654 5,872
Tax benefit from exercise of stock options . . . . . . . . . . . . . . . 6,848 2,739 1,190
Excess tax benefit from exercise of stock options . . . . . . . . . . (1,847) (172) —
Changes in assets and liabilities:
Receivables . . . . . . . . . . . . . . . . . . . . . . . . . . . . . . . . . . . . (1,935) 236 (849)Inventories . . . . . . . . . . . . . . . . . . . . . . . . . . . . . . . . . . . . (6,291) (2,852) (1,850)
Prepaid expenses and other assets . . . . . . . . . . . . . . . . . . . (306) 88 (41)
Accounts payable . . . . . . . . . . . . . . . . . . . . . . . . . . . . . . . 19,241 16,468 12,382
Accrued liabilities . . . . . . . . . . . . . . . . . . . . . . . . . . . . . . . 2,234 2,194 (452)
Deferred rent and other . . . . . . . . . . . . . . . . . . . . . . . . . . . (137) (208) (203)
Net cash provided by operating activities. . . . . . . . . . . . . . . . . . 41,455 40,518 31,272
Investing activities:
Purchases of property and equipment . . . . . . . . . . . . . . . . . . . . (4,897) (1,908) (1,072)
Proceeds from the sale of property and equipment . . . . . . . . . . . 23 1 8
Purchases of marketable securities . . . . . . . . . . . . . . . . . . . . . . (20,230) (75,030) (156,870)
Proceeds from the sale of marketable securities . . . . . . . . . . . . . 40,000 98,000 156,000
Transfers of restricted cash . . . . . . . . . . . . . . . . . . . . . . . . . . . . 120 2 (119)
Net cash provided by (used in) investing activities. . . . . . . . . . . 15,016 21,065 (2,053)
Financing activities:
Repurchase of common stock . . . . . . . . . . . . . . . . . . . . . . . . . . (19,996) (57,387) (17,372)
Proceeds from stock option exercises . . . . . . . . . . . . . . . . . . . . 5,875 2,251 575
Excess tax benefit from exercise of stock options . . . . . . . . . . . 1,847 172 —
Principal payments under long-term financing obligation . . . . . . (22) — —
Net cash used in financing activities . . . . . . . . . . . . . . . . . . . . . (12,296) (54,964) (16,797)
Effect of exchange rate changes on cash and cash equivalents . . 78 — —
Net increase in cash and cash equivalents . . . . . . . . . . . . . . . . . 44,253 6,619 12,422
Cash and cash equivalents, beginning of period . . . . . . . . . . . . . 78,540 71,921 59,499
Cash and cash equivalents, end of period. . . . . . . . . . . . . . . . . . $122,793 $ 78,540 $ 71,921
The accompany notes are an integral part of these consolidated financial statements
38

8/3/2019 Annual Report BlueNile 2007
http://slidepdf.com/reader/full/annual-report-bluenile-2007 43/72
BLUE NILE, INC.
Consolidated Statements of Cash Flows
(In thousands)
Year EndedDecember 30,
2007
Year EndedDecember 31,
2006
Year EndedJanuary 1,
2006
Supplemental disclosure of cash flow information:
Cash paid for income taxes . . . . . . . . . . . . . . . . . . . . . . . . . . . . . $3,894 $325 $328Cash paid for interest relating to long-term financing obligation . . $ 15 $ — $ —
Non-cash investing and financing activities:
Non-cash proceeds from the sale of property and equipment . . . . $ — $ — $ 21
Property additions financed by long-term financing obligation . . . $ 940 $ — $ —
The accompany notes are an integral part of these consolidated financial statements
39

8/3/2019 Annual Report BlueNile 2007
http://slidepdf.com/reader/full/annual-report-bluenile-2007 44/72
BLUE NILE, INC.
NOTES TO CONSOLIDATED FINANCIAL STATEMENTS
Note 1. Description of the Company and Summary of Significant Accounting Policies
The Company
Blue Nile, Inc. (the “Company”) is a leading online retailer of high quality diamonds and fine jewelry in
the United States. In addition to sales of diamonds, fine jewelry and watches, the Company provides guidanceand support to enable customers to more effectively learn about and purchase diamonds as well as classically
styled fine jewelry. The Company, a Delaware corporation, based in Seattle, Washington, was formed in March
1999. The Company maintains its primary website at www.bluenile.com. The Company also operates the
www.bluenile.co.uk and www.bluenile.ca websites.
Fiscal Year
The Company’s fiscal year ends on the Sunday closest to December 31. Each fiscal year consists of four
13-week quarters, with one extra week added in the fourth quarter every five to six years. The Company’s
fiscal year 2008 ending January 4, 2009 will have one extra week in the fourth quarter as a result of the
Company’s 4-4-5 retail reporting calendar.
ReclassificationsIn the year ended December 31, 2006, depreciation expense of $0.1 million was reclassified from selling,
general and administrative expenses to cost of sales. The reclassification had no impact on net income, net
cash provided by operating activities or shareholders’ equity as previously reported.
Basis of Presentation
In May 2007, the Company commenced operations at two new wholly-owned subsidiaries, Blue Nile
Worldwide, Inc. (“Worldwide”) and Blue Nile Jewellery, Ltd. (“Jewellery”). Worldwide is a Delaware
corporation located in Seattle, Washington. Jewellery is an Irish Limited company located in Ireland. The
consolidated financial statements include the balances of Blue Nile, Inc. and its subsidiaries for the entire
fiscal year. All significant intercompany transactions and balances are eliminated in consolidation.
Use of Estimates
The preparation of financial statements in conformity with accounting principles generally accepted in the
United States of America requires management to make estimates and assumptions that affect the reported
amounts of assets and liabilities, the disclosure of contingent assets and liabilities at the date of the financial
statements and the reported amounts of revenues and expenses during the reporting period. Some of the more
significant estimates include the allowance for sales returns and the estimated fair value of stock options
granted. Actual results could differ materially from those estimates.
Concentration of Risk
The Company maintains the majority of its cash and cash equivalents in accounts with three major
financial institutions in the United States of America, in the form of demand deposits, money market accounts
and other short-term investments. Deposits in these institutions may exceed the amounts of insurance providedon such deposits. The Company has not experienced any losses on its deposits of cash and cash equivalents.
The Company’s trade accounts receivable are derived from credit card purchases from customers and the
majority are typically settled within two business days.
The Company’s ability to acquire diamonds and fine jewelry is dependent on its relationships with various
suppliers from whom it purchases diamonds and fine jewelry. The Company has reached agreements with
certain suppliers to provide access to their inventories of diamonds for its customers, but the terms of these
agreements are limited and do not govern the purchase of diamonds for its inventory. The Company’s inability
to maintain these and other future diamond and fine jewelry supply relationships on commercially reasonable
40

8/3/2019 Annual Report BlueNile 2007
http://slidepdf.com/reader/full/annual-report-bluenile-2007 45/72
terms would cause its business to suffer and its revenues to decline. Purchase concentration by major supply
vendor is as follows:
December 30,
2007Payments
December 31,
2006Payments
January 1,
2006Payments
Year Ended
Vendor A . . . . . . . . . . . . . . . . . . . . . . . . . . . . . . . . . . . . . 8% 9% 11%
Vendor B . . . . . . . . . . . . . . . . . . . . . . . . . . . . . . . . . . . . . 7% 6% 9%
Vendor C . . . . . . . . . . . . . . . . . . . . . . . . . . . . . . . . . . . . . 6% 6% 5%
21% 21% 25%
Cash and Cash Equivalents
The Company considers all highly liquid investments with maturity of three months or less when
purchased to be cash equivalents.
Restricted Cash
The Company had no restricted cash at December 30, 2007. Restricted cash at December 31, 2006
consists of cash pledged as collateral for a letter of credit.
Marketable Securities
The Company’s marketable securities are classified as available-for-sale as defined by SFAS No. 115,
“Accounting for Certain Investments in Debt and Equity Securities” (“SFAS 115”). Realized gains or losses on
the sale of marketable securities are identified on a specific identification basis and are reflected as a
component of interest income or expense.
Marketable securities totaled $0 and $19.8 million at December 30, 2007 and December 31, 2006,
respectively. There were no realized gains or losses on the sales of marketable securities in the years ended
December 30, 2007, December 31, 2006 or January 1, 2006. Gross unrealized losses at December 31, 2006
were not significant.
Inventories
The Company’s diamond, fine jewelry and watch inventories are classified at the lower of cost or market,
using the specific identification method for diamonds and weighted average cost method for fine jewelry and
watches. The Company also lists loose diamonds on its websites that are typically not included in inventory
until the Company receives a customer order for those diamonds. Upon receipt of a customer order, the
Company purchases a specific diamond and records it in inventory until it is delivered to the customer, at
which time the revenue from the sale is recognized and inventory is relieved.
Property and Equipment
Property and equipment are stated at cost less accumulated depreciation. Maintenance and repairs are
expensed as incurred. Depreciation is calculated on a straight-line basis over the estimated useful lives of the
related assets. The cost and related accumulated depreciation of assets sold or otherwise disposed of is
41
BLUE NILE, INC.
NOTES TO CONSOLIDATED FINANCIAL STATEMENTS — (Continued)

8/3/2019 Annual Report BlueNile 2007
http://slidepdf.com/reader/full/annual-report-bluenile-2007 46/72
removed from the accounts and the related gain or loss is reported in the statement of operations. Estimated
useful lives by major asset category are as follows:
Asset Life (in years)
Computers and equipment . . . . . . . . . . . . . . . . . 3Software and website development . . . . . . . . . . . 2-5
Leasehold improvements . . . . . . . . . . . . . . . . . . Shorter of lease term or asset life
Building . . . . . . . . . . . . . . . . . . . . . . . . . . . . . . Shorter of lease term or asset life
Furniture and fixtures . . . . . . . . . . . . . . . . . . . . . 7
Capitalized Software
The Company capitalizes internally developed software costs and website development costs in accor-
dance with the provisions of Statement of Position 98-1, “Accounting for Costs of Computer Software
Developed or Obtained for Internal Use” (“SOP 98-1”) and EITF No. 00-2, “Accounting for Website
Development Costs” (“EITF 00-2”). Capitalized costs are amortized on a straight-line basis over the estimated
useful life of the software once it is available for use.
Impairment of Long-Lived Assets
The Company reviews the carrying value of its long-lived assets, including property and equipment,
whenever events or changes in circumstances indicate that the carrying value may not be recoverable. To the
extent the estimated future cash inflows attributable to the assets, less estimated future cash outflows, are less
than the carrying amount, an impairment loss would be recognized.
Intangible Assets
Intangible assets are recorded at cost and consist primarily of the costs incurred to acquire licenses and
other similar agreements with finite lives, which were acquired in October 2004. Amortization is calculated on
a straight-line basis over the estimated useful lives of the related assets, which range from 10 years to 17 years.
The carrying amount of these assets was $0.3 million, net of accumulated amortization of $0.1 million for theyears ended December 30, 2007 and December 31, 2006. Amortization expense related to intangible assets
was $33,000 in the year ended December 30, 2007. Amortization expense is estimated to be $33,000 in each
fiscal year for 2008 through 2012.
Fair Value of Financial Instruments
The carrying amounts for the Company’s cash, accounts receivable, accounts payable and accrued
liabilities approximate fair value due to their short maturities. Marketable securities are marked to market
through comprehensive income and are recorded at fair value.
Treasury Stock
Treasury stock is recorded at cost and consists of the repurchase of the Company’s common stock in theopen market, the repurchase of restricted common stock issued to founders and unvested stock issued to
employees in connection with early exercises of stock options.
Income Taxes
Deferred tax assets and liabilities are determined based on the differences between financial reporting and
tax bases of assets and liabilities and are measured using the tax rates that will be in effect when the
differences are expected to reverse. Future tax benefits, such as net operating loss carryforwards, are
recognized to the extent that realization of such benefits is considered to be more likely than not.
42
BLUE NILE, INC.
NOTES TO CONSOLIDATED FINANCIAL STATEMENTS — (Continued)
8/3/2019 Annual Report BlueNile 2007
http://slidepdf.com/reader/full/annual-report-bluenile-2007 47/72
Revenue Recognition
Net sales consist of products sold via the Internet and shipping revenue, net of estimated returns and
promotional discounts and excluding sales taxes. The Company recognizes revenue when all of the following
have occurred: persuasive evidence of an agreement with the customer exists, products are shipped and thecustomer takes delivery and assumes the risk of loss; the selling price is fixed or determinable and
collectibility of the selling price is reasonably assured. The Company evaluates the criteria outlined in EITF
No. 99-19, “Reporting Revenue Gross as a Principal versus Net as an Agent,” in determining whether it is
appropriate to record the gross amount of product sales and related costs or the net amount earned.
The Company requires payment at the point of sale. Amounts received prior to delivery of goods to
customers are not recorded as revenue. The Company offers a return policy of generally 30 days and provides
an allowance for sales returns during the period in which the sales are made. At December 30, 2007 and
December 31, 2006, the reserve for sales returns was $1.3 million and $1.2 million, respectively, and was
recorded as an accrued liability. Sales revenues and cost of sales reported in the consolidated statements of
operations are reduced to reflect estimated returns, which estimates are based on the Company’s historical
product return rates, trends and expectations.
The Company generally does not extend credit to customers, except through third party credit cards. Themajority of sales are through credit cards, and accounts receivable are composed primarily of amounts due
from financial institutions related to credit card sales. The Company does not maintain an allowance for
doubtful accounts because payment is typically received within two business days after the sale is complete.
Shipping and Handling Costs
The Company’s shipping and handling costs primarily include payments to third-parties for shipping
merchandise to the Company’s customers. Shipping and handling costs of $2.9 million, $2.8 million, and
$2.4 million in 2007, 2006, and 2005 were included in cost of sales.
Cost of Sales
Cost of sales consists of the cost of merchandise sold to customers, inbound and outbound shipping costs,
depreciation on assembly related costs, insurance on shipments and the costs incurred to set diamonds intoring, earring and pendant settings, including labor and related facility costs.
Selling, General and Administrative Expenses
Selling, general and administrative expenses consist primarily of payroll and related benefit costs for the
Company’s employees, stock-based compensation, marketing costs and credit card fees. These expenses also
include certain facility related costs, fulfillment, customer service, technology and depreciation expenses, as
well as professional fees and other general corporate expenses.
Fulfillment costs include costs incurred in operating and staffing the fulfillment center, including costs
attributable to: receiving, inspecting and warehousing inventories and picking, packaging and preparing
customers’ orders for shipment. Fulfillment costs in the years ended December 30, 2007, December 31, 2006
and January 1, 2006 were approximately $2.9 million, $2.4 million and $1.8 million, respectively.
The Company has procedures in place to detect and prevent credit card fraud since the Company hasexposure to losses from fraudulent charges. The Company records a reserve for fraud losses based on the
Company’s historical rate of such losses. This reserve is recorded as an accrued liability and amounted to
$0.1 million in the years ended December 30, 2007 and December 31, 2006.
Marketing
Marketing costs are expensed as incurred. Costs associated with web portal advertising contracts are
amortized over the period such advertising is expected to be used. Costs of advertising associated with radio,
print and other media are expensed when such services are used. Marketing expense for the years ended
43
BLUE NILE, INC.
NOTES TO CONSOLIDATED FINANCIAL STATEMENTS — (Continued)

8/3/2019 Annual Report BlueNile 2007
http://slidepdf.com/reader/full/annual-report-bluenile-2007 48/72
December 30, 2007, December 31, 2006 and January 1, 2006 was approximately $11.9 million, $9.7 million
and $7.6 million, respectively.
Segments
The Company has one operating segment, online retail jewelry. No foreign country or geographic areaaccounted for more than 10% of net sales or net income in any of the periods presented, and the Company
does not have any significant long-lived assets located in foreign countries.
Initial Adoption of Staff Accounting Bulletin No. 108
At December 31, 2006, the Company applied Staff Accounting Bulletin No. 108 (“SAB 108”), “Consid-
ering the Effects of Prior Year Misstatements when Quantifying Misstatements in Current Year Financial
Statements,” to two errors in the Company’s previously issued financial statements relating to deferred income
taxes. These errors were the result of the understatement of deferred tax assets related to net operating loss
carryforwards and fixed assets in the aggregate amount of $0.4 million that should have been recorded in 2003
($0.4 million) and 2004 ($54,000). Based on an analysis of the errors performed in accordance with SAB 108,
the Company has concluded that the effect of the errors is not material to any of the individual periods’
income statements or balance sheets in 2004 and 2005. As such, the Company has recorded the correction as acumulative effect adjustment to the fiscal year 2006 beginning accumulated deficit, as follows (in thousands):
Accumulated deficit, January 2, 2006, as reported . . . . . . . . . . . . . . . . . . . . . . . . . . . . . . . $(6,362)
Cumulative effect adjustment . . . . . . . . . . . . . . . . . . . . . . . . . . . . . . . . . . . . . . . . . . . . . . 408
Accumulated deficit, January 2, 2006, as restated. . . . . . . . . . . . . . . . . . . . . . . . . . . . . . . . $(5,954)
Foreign Currency Translation
The assets and liabilities of Jewellery have been translated to U.S. dollars using the exchange rates
effective on the balance sheet date, while income and expense accounts are translated at the average rates in
effect during the periods presented. The resulting translation adjustments are recorded in accumulated other
comprehensive income (loss).
Recent Accounting Pronouncements
In June 2006, the Financial Accounting Standards Board (“FASB”) ratified the consensus reached on
EITF No. 06-3 (“EITF 06-3”), “How Sales Taxes Collected from Customers and Remitted to Governmental
Authorities Should Be Presented in the Income Statement (That Is, Gross Versus Net Presentation).” The EITF
reached a consensus that a company may adopt a policy for presenting sales taxes on a gross or net basis. If
sales taxes are significant, the accounting policy should be disclosed and if sales taxes are presented gross, the
amounts included in revenue should be disclosed. EITF 06-3 is effective for the first interim or annual
reporting period beginning after December 15, 2006. The Company adopted EITF 06-3 on January 1, 2007.
The Company collects sales tax from customers and records these amounts on a net basis. The Company did
not modify our accounting policy in connection with the adoption of EITF 06-3; therefore, the adoption of this
EITF did not have an impact on the Company’s consolidated results of operations or financial condition.
In September 2006, the FASB issued SFAS No. 157, “Fair Value Measurements” (“SFAS 157”). SFAS 157establishes a common definition for fair value, establishes a framework for measuring fair value, and expands
disclosure about such fair value measurements. SFAS 157 is effective for fiscal years beginning after
November 15, 2007. In January 2008, the FASB issued FSP FAS 157-2 delaying the effective date of SFAS 157
by one year for nonfinancial assets and nonfinancial liabilities that are recognized or disclosed at fair value in
the financial statements on a nonrecurring basis. For these items, SFAS 157 will go into effect in fiscal years
beginning after November 15, 2008. The Company will apply this guidance to the first quarter of fiscal 2009.
The Company does not expect that the adoption of this statement will have a material impact on our
consolidated results of operations or financial condition.
44
BLUE NILE, INC.
NOTES TO CONSOLIDATED FINANCIAL STATEMENTS — (Continued)

8/3/2019 Annual Report BlueNile 2007
http://slidepdf.com/reader/full/annual-report-bluenile-2007 49/72
In February 2007, the FASB issued SFAS No. 159, “The Fair Value Option for Financial Assets and
Financial Liabilities” (“SFAS 159”). SFAS 159 permits all entities to elect to measure certain financial
instruments and other items at fair value with changes in fair value reported in earnings. SFAS 159 is effective
for fiscal years beginning after November 15, 2007. The Company does not expect that the adoption of this
statement will have a material impact on the Company’s consolidated results of operations or financialcondition.
Note 2. Inventories
Inventories consist of the following (in thousands):
December 30,2007
December 31,2006
Year Ended
Loose diamonds . . . . . . . . . . . . . . . . . . . . . . . . . . . . . . . . . . . . . . . . . . $ 690 $ 230
Fine jewelry, watches and other . . . . . . . . . . . . . . . . . . . . . . . . . . . . . . 20,216 14,386
$20,906 $14,616
Note 3. Property and Equipment
Property and equipment consist of the following (in thousands):
December 30,2007
December 31,2006
Year Ended
Computers and equipment . . . . . . . . . . . . . . . . . . . . . . . . . . . . . . . . . . $ 4,770 $ 4,369
Software and website development . . . . . . . . . . . . . . . . . . . . . . . . . . . . 6,225 6,002
Leasehold improvements . . . . . . . . . . . . . . . . . . . . . . . . . . . . . . . . . . . 5,312 2,103
Furniture and fixtures . . . . . . . . . . . . . . . . . . . . . . . . . . . . . . . . . . . . . . 753 590
Building . . . . . . . . . . . . . . . . . . . . . . . . . . . . . . . . . . . . . . . . . . . . . . . 940 —
18,000 13,064Less: accumulated depreciation. . . . . . . . . . . . . . . . . . . . . . . . . . . . . . . (10,399) (9,673)
Property and equipment, net . . . . . . . . . . . . . . . . . . . . . . . . . . . . . . . . . $ 7,601 $ 3,391
Capitalized software costs include external direct costs and internal direct labor and related employee
benefits costs of developing software for internal use. Amortization begins in the period in which the software
is ready for its intended use. The Company had $1.4 million and $1.3 million of unamortized computer
software and website development costs at December 30, 2007 and December 31, 2006, respectively. Total
depreciation expense was $1.8 million, $1.9 million and $1.7 million in the years ended December 30, 2007,
December 31, 2006 and January 1, 2006, respectively. Of this amount, depreciation and amortization of
capitalized software and website development costs was $0.6 million, $0.7 million and $0.5 million in the
years ended December 30, 2007, December 31, 2006 and January 1, 2006, respectively.
Note 4. Commitments and Contingencies
Leases
The Company leases its office and warehouse facilities under noncancelable lease agreements with initial
terms that generally range from 5 to 7 years. Certain of the leases include renewal provisions at the
Company’s option. At the inception of the lease, the Company evaluates each agreement to determine whether
the lease will be accounted for as an operating or capital lease. The term of the lease used for this evaluation
includes renewal option periods only in instances in which the exercise of the renewal option can be
reasonably assured and failure to exercise such option would result in an economic penalty. The leases contain
45
BLUE NILE, INC.
NOTES TO CONSOLIDATED FINANCIAL STATEMENTS — (Continued)

8/3/2019 Annual Report BlueNile 2007
http://slidepdf.com/reader/full/annual-report-bluenile-2007 50/72
rent escalation clauses and rent holidays, which are recorded on a straight-line basis over the lease term with
the difference between the rent paid and the straight-line rent recorded as a deferred rent liability. Lease
incentive payments received from the landlord are recorded as deferred rent liabilities and are amortized on a
straight-line basis over the lease term as a reduction in rent. At December 30, 2007 and December 31, 2006,
the deferred rent balance related to lease incentives was $0.7 million and $0.8 million, respectively.
During 2007, the Company made tenant improvements to its U.S. fulfillment center. In accordance with
EITF Issue No. 97-10, “The Effect of Lessee Involvement in Asset Construction” (“EITF 97-10”), the
Company recorded the building as property and equipment during the construction period. Upon completion,
the transaction did not meet the criteria for sale-leaseback accounting, and accordingly, has been recorded as
long-term financing obligation in accordance with SFAS No. 98, “Accounting for Leases” (“SFAS 98”).
Future minimum lease payments at December 30, 2007 are as follows (in thousands):
FinancingObligation
OperatingLeases
2008 . . . . . . . . . . . . . . . . . . . . . . . . . . . . . . . . . . . . . . . . . . . . . . . . . . . . . . $ 59 $ 509
2009 . . . . . . . . . . . . . . . . . . . . . . . . . . . . . . . . . . . . . . . . . . . . . . . . . . . . . . 59 510
2010 . . . . . . . . . . . . . . . . . . . . . . . . . . . . . . . . . . . . . . . . . . . . . . . . . . . . . . 59 510
2011 . . . . . . . . . . . . . . . . . . . . . . . . . . . . . . . . . . . . . . . . . . . . . . . . . . . . . . 61 327
2012 . . . . . . . . . . . . . . . . . . . . . . . . . . . . . . . . . . . . . . . . . . . . . . . . . . . . . . 68 159
Thereafter . . . . . . . . . . . . . . . . . . . . . . . . . . . . . . . . . . . . . . . . . . . . . . . . . . 122 292
Total minimum lease payments . . . . . . . . . . . . . . . . . . . . . . . . . . . . . . . . . . . $428 $2,307
Less: amounts representing interest . . . . . . . . . . . . . . . . . . . . . . . . . . . . . . . . (85)
Present value of minimum lease payments. . . . . . . . . . . . . . . . . . . . . . . . . . . 343
Residual value . . . . . . . . . . . . . . . . . . . . . . . . . . . . . . . . . . . . . . . . . . . . . . . 575
Less: current maturities. . . . . . . . . . . . . . . . . . . . . . . . . . . . . . . . . . . . . . . . . (38)
Total long-term financing obligation less current maturities . . . . . . . . . . . . . . $880
As of December 30, 2007, assets under the long-term financing obligation amounted to $0.9 million, net
of accumulated amortization of $70,000. Such assets are classified within property and equipment, net, in the
accompanying balance sheet. The residual value of the long-term financing obligation represents the estimated
fair value of the financing at the end of the Company’s lease term. Rent expense, which includes certain
common area maintenance costs, was approximately $0.5 million for the years ended December 30, 2007,
December 31, 2006 and January 1, 2006.
Litigation
The Company is party to various legal proceedings arising in the ordinary course of its business. It is notcurrently a party to any legal proceedings that management believes would have a material adverse effect on
the consolidated financial position or results of operations of the Company.
Note 5. Preferred Stock
The Company has 5,000,000 shares of undesignated preferred stock authorized for future issuance. Shares
of preferred stock may be issued from time to time in one or more series, with designations, preferences, and
limitations established by the Company’s board of directors.
46
BLUE NILE, INC.
NOTES TO CONSOLIDATED FINANCIAL STATEMENTS — (Continued)
8/3/2019 Annual Report BlueNile 2007
http://slidepdf.com/reader/full/annual-report-bluenile-2007 51/72
Note 6. Stock-Based Compensation
Stock Option Plans
The Company’s 1999 Equity Incentive Plan (“1999 Plan”) provides for the grant of incentive stock
options, non-statutory stock options, stock bonuses and restricted stock awards, which may be granted to
employees, including officers, non-employee directors and consultants. An aggregate of 3,310,400 shares of
common stock are reserved for issuance under the 1999 Plan. Options granted under the 1999 Plan generally
provide for 25% vesting on the first anniversary from the date of grant with the remainder vesting monthly
over three years and expire 10 years from the date of grant. Options granted under the 1999 Plan were
generally granted at fair value on the date of the grant. For options granted prior to February 2001, the options
included an early exercise provision that allowed early exercise of unvested stock options subject to a
repurchase right at original cost on unvested shares. As of May 19, 2004, the effective date of the Company’s
initial public offering, no additional awards were granted under the 1999 Plan.
The Company’s 2004 Equity Incentive Plan (“2004 Plan”) provides for the grant of non-statutory stock
options, restricted stock awards, stock appreciation rights, restricted stock units and other forms of equity
compensation, which may be granted to employees, including officers, non-employee directors and consultants.As of December 30, 2007, the Company reserved 3,584,807 shares of common stock for issuance under the
2004 Plan, which amount will be increased annually on the first day of each fiscal year, up to and including
2014, by five percent of the number of shares of common stock outstanding on such date unless a lower
number of shares is approved by the board of directors.
Options granted under the 2004 Plan generally provide for 25% vesting on the first anniversary from the
date of grant with the remainder vesting monthly over three years, and generally expire 10 years from the date
of grant. Options granted under the 2004 Plan are granted at fair value on the date of the grant.
The Company’s 2004 Non-Employee Directors’ Stock Option Plan (“Directors’ Plan”) provides for the
automatic grant of non-statutory stock options to purchase shares of common stock to non-employee directors.
As of December 30, 2007, the Company reserved 383,401 shares of common stock for issuance under the
Directors’ Plan, which amount will be increased annually on the first day of each fiscal year, up to andincluding 2014, by the number of shares of common stock subject to options granted during the prior calendar
year unless a lower number of shares is approved by the board of directors. There were 31,500 options granted
under this plan in the year ended December 30, 2007.
Employee Stock Purchase Plans
In April 2004, the Company adopted the 2004 Employee Stock Purchase Plan (the “Purchase Plan”). As
of December 30, 2007, 1,000,000 shares of common stock are authorized to be sold under the Purchase Plan.
Commencing on the first day of the fiscal year in which the Company first makes an offering under the plan,
this amount will be increased annually for 20 years. The increase in amount is the lesser of 320,000 shares or
one and one half percent of the number of shares of common stock outstanding on each such date, unless a
lower number of shares is approved by the board of directors. The Purchase Plan is intended to qualify as an
“employee stock purchase plan” within the meaning of Section 423 of the Internal Revenue Code. As of December 30, 2007, no shares of common stock have been offered for sale under the Purchase Plan.
Option Grants to Non-Employees
The Company accounts for equity instruments issued to non-employees in accordance with the provisions
of SFAS 123R and EITF Issue No. 96-18, “Accounting for Equity Instruments That Are Issued to Other Than
Employees for Acquiring, or in Conjunction with Selling, Goods or Services” (“EITF 96-18”). EITF 96-18
requires that such equity instruments be recorded at their fair value on the measurement date.
47
BLUE NILE, INC.
NOTES TO CONSOLIDATED FINANCIAL STATEMENTS — (Continued)

8/3/2019 Annual Report BlueNile 2007
http://slidepdf.com/reader/full/annual-report-bluenile-2007 52/72
Stock-Based Compensation Expense
Prior to January 2, 2006, the Company accounted for options granted under its employee compensation
plans using the intrinsic value method prescribed in Accounting Principles Board (“APB”) Opinion No. 25,
“Accounting for Stock Issued to Employees” (“APB 25”) and related interpretations including FASBInterpretation No. 44, “Accounting for Certain Transactions involving Stock Compensation, an interpretation
of APB Opinion No. 25.” Under APB 25, compensation expense was recognized for the difference between
the market price of the Company’s stock on the date of grant and the exercise price of the stock option. As
permitted by SFAS No. 123, “Accounting for Stock-Based Compensation” (“SFAS 123”), stock-based
compensation was included as a pro forma disclosure in the notes to the consolidated financial statements.
Effective January 2, 2006, the Company adopted the provisions of SFAS 123R using the modified-
prospective transition method for all stock options issued after becoming a public company. SFAS 123R
requires measurement of compensation cost for all options granted based on fair value on the date of grant and
recognition of compensation expense over the service period for those options expected to vest. Stock-based
compensation expense recorded for the years ended December 30, 2007 and December 31, 2006 include the
estimated expense for stock options granted on or subsequent to January 2, 2006, based on the grant date fair
value estimated in accordance with the provisions of SFAS 123R, and the estimated expense for the portionvesting in the period for options granted between March 11, 2004 (the date on which the Company was
considered to be a public company for accounting purposes) and January 2, 2006, based on the grant date fair
value estimated in accordance with the provisions of SFAS 123. Options granted prior to March 11, 2004 have
been accounted for using the prospective transition method, which requires that those options continue to be
accounted for under APB 25. As prescribed under the modified-prospective and prospective transition methods,
results for the prior periods have not been restated.
The following table shows the effect on net income and earnings per share had stock-based compensation
cost been recognized based upon the estimated fair value on the grant date of stock options granted between
March 11, 2004 and January 2, 2006 in accordance with SFAS 123 as amended by SFAS No. 148 “Accounting
for Stock-Based Compensation — Transition and Disclosure” (in thousands, except per share data):
Year Ended
January 1,2006
Net income, as reported. . . . . . . . . . . . . . . . . . . . . . . . . . . . . . . . . . . . . . . . . . . . . . . . . $13,153
Deduct: Stock-based compensation expense determined under fair-value-based method,net of tax . . . . . . . . . . . . . . . . . . . . . . . . . . . . . . . . . . . . . . . . . . . . . . . . . . . . . . . . . (1,878)
Pro forma net income . . . . . . . . . . . . . . . . . . . . . . . . . . . . . . . . . . . . . . . . . . . . . . . . . . $11,275
Income per share:
Basic — as reported . . . . . . . . . . . . . . . . . . . . . . . . . . . . . . . . . . . . . . . . . . . . . . . . . . . $ 0.75
Basic — pro forma . . . . . . . . . . . . . . . . . . . . . . . . . . . . . . . . . . . . . . . . . . . . . . . . . . . . $ 0.64
Diluted — as reported . . . . . . . . . . . . . . . . . . . . . . . . . . . . . . . . . . . . . . . . . . . . . . . . . . $ 0.71
Diluted — pro forma . . . . . . . . . . . . . . . . . . . . . . . . . . . . . . . . . . . . . . . . . . . . . . . . . . . $ 0.61
Disclosures for the years ended December 30, 2007 and December 31, 2006 are not presented because
the amounts are recognized in the consolidated financial statements.
Prior to the adoption of SFAS 123R, the Company presented all tax benefits resulting from the exercise
of stock options as operating cash inflows in the consolidated statements of cash flows, in accordance with the
provisions of EITF Issue No. 00-15. The tax benefits resulting from the exercise of stock options granted prior
to March 11, 2004 will continue to be reported as operating cash inflows in accordance with the prospective
transition method. SFAS 123R requires the benefits of tax deductions in excess of the compensation cost
48
BLUE NILE, INC.
NOTES TO CONSOLIDATED FINANCIAL STATEMENTS — (Continued)

8/3/2019 Annual Report BlueNile 2007
http://slidepdf.com/reader/full/annual-report-bluenile-2007 53/72
recognized for those options granted on or subsequent to March 11, 2004 to be classified as financing cash
inflows rather than operating cash inflows, on a prospective basis. This amount is shown as “Excess tax
benefit from exercise of stock options” on the consolidated statement of cash flows and amounted to
$1.8 million and $0.2 million for the years ended December 30, 2007 and December 31, 2006, respectively.
During the years ended January 2, 2005 and December 31, 2003, the Company issued options to certain
employees under the 1999 Plan with exercise prices which the board of directors, in good faith, determined to
be equal to the fair market value of the Company’s common stock but which were subsequently determined,
for accounting purposes, to be less than the fair market value of the Company’s common stock at the date of
grant. In accordance with the requirements of APB 25, the Company has recorded deferred stock-based
compensation for the difference between the exercise price of the stock option and the subsequently
determined fair market value of the Company’s stock at the grant date. In the years ended January 2, 2005 and
December 31, 2003, the Company recorded deferred stock-based compensation of $0.2 million and $1.4 mil-
lion, respectively, related to these options. This amount is being amortized over the vesting period of the
awards, generally four years. During the years ended December 30, 2007, December 31, 2006 and January 1,
2006, the Company recorded compensation expense of $0.2 million, $0.3 million and $0.3 million, respec-
tively, related to the amortization of deferred stock-based compensation.
The fair value of each stock option granted is estimated on the grant date using the Black-Scholes-Merton
option valuation model. The assumptions used to calculate the fair value of options granted are evaluated and
revised, as necessary, to reflect market conditions and the Company’s experience. The Company recognizes
compensation expense on a straight-line basis over the requisite service period for each stock option grant,
with forfeitures estimated at the date of grant based on the Company’s historical experience and future
expectations.
The following table represents total stock-based compensation expense recognized in the consolidated
financial statements (in thousands):
December 30,2007
December 31,2006
Year Ended
Stock option expense in selling, general and administrative expenses . . . $5,621 $4,257
Stock option expense in cost of sales . . . . . . . . . . . . . . . . . . . . . . . . . . 114 82
Total stock option expense on the consolidated statement of operations. . . . . . . . . . . . . . . . . . . . . . . . . . . . . . . . . . . . . . . . . . . $5,735 $4,339
Total related tax benefit . . . . . . . . . . . . . . . . . . . . . . . . . . . . . . . . . . . . $1,967 $1,501
Stock-based compensation capitalized . . . . . . . . . . . . . . . . . . . . . . . . . . $ 79 $ 64
Stock-based compensation capitalized is included in property and equipment, net, on the consolidated
balance sheet as a component of the cost capitalized for the development of software for internal use.
The fair value of the stock options was estimated at the grant date with the following weighted average
assumptions for the years ended December 30, 2007, December 31, 2006 and January 1, 2006:
December 30,2007
December 31,2006
January 1,2006
Year Ended
Expected term. . . . . . . . . . . . . . . . . . . . . . . . . . . . . . . . . . 4.5 years 4.5 years 4 years
Expected volatility . . . . . . . . . . . . . . . . . . . . . . . . . . . . . . . 37.1% 36.0% 44.6%
Expected dividend yield . . . . . . . . . . . . . . . . . . . . . . . . . . 0.0% 0.0% 0.0%
Risk-free interest rate . . . . . . . . . . . . . . . . . . . . . . . . . . . . 4.3% 5.0% 4.0%
Estimated fair value per option granted . . . . . . . . . . . . . . . $ 29.26 $ 11.86 $ 12.57
49
BLUE NILE, INC.
NOTES TO CONSOLIDATED FINANCIAL STATEMENTS — (Continued)

8/3/2019 Annual Report BlueNile 2007
http://slidepdf.com/reader/full/annual-report-bluenile-2007 54/72
• Expected Term — This is the estimated period of time until exercise and is based primarily on historical
experience for options with similar terms and conditions, giving consideration to future expectations.
The Company also considers the expected terms of other companies that have similar contractual terms,
expected stock volatility and employee demographics.
• Expected Volatility — This is based on the Company’s historical stock price volatility in combination
with the implied volatility of its exchange traded options.
• Expected Dividend Yield — The Company has not paid dividends in the past and does not expect to
pay dividends in the near future.
• Risk-Free Interest Rate — This is the rate on nominal U.S. Government Treasury Bills with lives
commensurate with the expected term of the options on the date of grant.
The following summarizes all stock option transactions from January 2, 2005, through December 30,
2007:
OptionsWeighted Average
Exercise Price
Weighted AverageRemaining
Contractual TermTotal
Intrinsic Value
(In thousands)
Balance, January 2, 2005 . . . . . . . . . . . . . . . . . 1,917 $11.26
Granted . . . . . . . . . . . . . . . . . . . . . . . . . . . . . . 546 32.14
Exercised. . . . . . . . . . . . . . . . . . . . . . . . . . . . . (167) 3.43
Canceled . . . . . . . . . . . . . . . . . . . . . . . . . . . . . (201) 26.80
Balance, January 1, 2006 . . . . . . . . . . . . . . . . . 2,095 15.84
Granted . . . . . . . . . . . . . . . . . . . . . . . . . . . . . . 585 31.49
Exercised. . . . . . . . . . . . . . . . . . . . . . . . . . . . . (425) 5.30
Canceled . . . . . . . . . . . . . . . . . . . . . . . . . . . . . (69) 26.94
Balance, December 31, 2006 . . . . . . . . . . . . . . 2,186 21.73
Granted . . . . . . . . . . . . . . . . . . . . . . . . . . . . . . 349 78.27
Exercised. . . . . . . . . . . . . . . . . . . . . . . . . . . . . (439) 13.40
Canceled . . . . . . . . . . . . . . . . . . . . . . . . . . . . . (59) 33.85
Balance, December 30, 2007 . . . . . . . . . . . . . . 2,037 $32.84 7.32 $80,611
Vested and expected to vest at December 30,2007 . . . . . . . . . . . . . . . . . . . . . . . . . . . . . . 1,853 $31.45 7.21 $75,611
Exercisable at December 30, 2007 . . . . . . . . . . 1,158 $20.22 6.38 $58,389
The aggregate intrinsic value in the table above is before applicable income taxes and represents the
amount optionees would have received if all options had been exercised on the last business day of the period
indicated, based on the Company’s closing stock price. Options granted during the years ended December 30,
2007, December 31, 2006 and January 1, 2006 have a weighted average grant date fair value of $29.26,
$11.86 and $12.57, respectively. Options granted in the years ended December 30, 2007, December 31, 2006and January 1, 2006 were granted with exercise prices equal to the market value on the date of grant.
The total intrinsic value of options exercised was $22.6 million and $12.1 million in the years ended
December 30, 2007 and December 31, 2006, respectively. As of December 30, 2007, the Company had total
unrecognized compensation costs related to unvested stock options of $13.3 million, before income taxes. The
Company expects to recognize this cost over a weighted average period of 2.6 years. During the years ended
December 30, 2007 and December 31, 2006, the total fair value of options vested was $5.8 million and
$4.3 million, respectively. The unrecognized compensation cost related to stock options granted subsequent to
March 11, 2004 will be adjusted for any future changes in the rate of estimated forfeitures. The unrecognized
50
BLUE NILE, INC.
NOTES TO CONSOLIDATED FINANCIAL STATEMENTS — (Continued)

8/3/2019 Annual Report BlueNile 2007
http://slidepdf.com/reader/full/annual-report-bluenile-2007 55/72
compensation cost related to stock options granted prior to March 11, 2004 and accounted for under the
prospective application method will be adjusted for actual forfeitures as they occur. The following table
summarizes information about stock options outstanding at December 30, 2007:
Range of Exercise Price Options
RemainingContractual
LifeExercise
Price OptionsWeighted Average
Exercise Price
Weighted Average
Outstanding
Exercisable
(In thousands) (In years) (In thousands)
$0.25 - $8.75 . . . . . . . . . . . . . . . . . . 467 4.90 $ 4.16 466 $ 4.15
$9.375 - $30.31 . . . . . . . . . . . . . . . . 425 6.74 29.12 328 29.05
$30.67 - $31.26 . . . . . . . . . . . . . . . . 442 8.42 31.26 156 31.26
$31.43 - $75.85 . . . . . . . . . . . . . . . . 436 7.92 37.76 207 33.87
$76.59 - $99.98 . . . . . . . . . . . . . . . . 267 9.67 83.55 1 80.30
2,037 7.32 32.84 1,158 20.22
Note 7. Common Stock
On February 2, 2006, the Company’s board of directors authorized the repurchase of up to $100 million
of Blue Nile, Inc. common stock during the subsequent 24-month period following the approval date of such
repurchases. On July 27, 2006, the Company’s board of directors authorized the repurchase of up to an
additional $50 million of Blue Nile, Inc. common stock during the subsequent 24-month period following the
approval date of such additional repurchase. In the year ended December 30, 2007, the Company repurchased
438,755 shares of the Company’s common stock for $20.0 million. In the year ended December 31, 2006, the
Company repurchased 1.8 million shares of the Company’s common stock for $57.4 million.
Note 8. Employee Benefit Plan
The Company has a defined contribution plan pursuant to Section 401(k) of the Internal Revenue Code
covering all eligible officers and employees. The Company provides a discretionary matching contribution,
which has generally been $0.50 for every $1.00 contributed by the employee up to 4% of each employee’ssalary. Such contributions were approximately $0.1 million for the years ended December 30, 2007,
December 31, 2006 and January 1, 2006.
Note 9. Income Taxes
The expense (benefit) for income taxes consists of the following (in thousands):
December 30,2007
December 31,2006
January 1,2006
Year Ended
Current income tax expense . . . . . . . . . . . . . . . . . . . . . . . . $ 3,685 $1,389 $ 335
Tax benefit from stock option exercises recorded inequity . . . . . . . . . . . . . . . . . . . . . . . . . . . . . . . . . . . . . . 6,848 2,961 1,190
Deferred income tax expense:Utilization of net operating loss . . . . . . . . . . . . . . . . . . . — 3,008 6,201
Other, net . . . . . . . . . . . . . . . . . . . . . . . . . . . . . . . . . . . (1,405) (442) (326)
Total income tax expense . . . . . . . . . . . . . . . . . . . . . . . . . $ 9,128 $6,916 $7,400
A reconciliation of the statutory Federal income tax rate to the effective tax rate is as follows:
Statutory Federal income tax rate . . . . . . . . . . . . . . . . . . . . 35.0% 35.0% 35.0%
51
BLUE NILE, INC.
NOTES TO CONSOLIDATED FINANCIAL STATEMENTS — (Continued)

8/3/2019 Annual Report BlueNile 2007
http://slidepdf.com/reader/full/annual-report-bluenile-2007 56/72
December 30,2007
December 31,2006
January 1,2006
Year Ended
Other, net . . . . . . . . . . . . . . . . . . . . . . . . . . . . . . . . . . . . . (0.7)% (0.4)% 1.0%
Effective tax rate . . . . . . . . . . . . . . . . . . . . . . . . . . . . . . . . 34.3% 34.6% 36.0%
Deferred income taxes reflect the net tax effect of temporary differences between amounts recorded for
financial reporting purposes and amounts used for tax purposes. The major components of deferred tax assets
are as follows (in thousands):
December 30,2007
December 31,2006
Year Ended
Deferred tax assets:
Current:
Reserves and allowances . . . . . . . . . . . . . . . . . . . . . . . . . . . . . . . . $ 544 $ 499
Deferred rent . . . . . . . . . . . . . . . . . . . . . . . . . . . . . . . . . . . . . . . . 78 68
Other . . . . . . . . . . . . . . . . . . . . . . . . . . . . . . . . . . . . . . . . . . . . . . 177 99
Noncurrent:
Stock options . . . . . . . . . . . . . . . . . . . . . . . . . . . . . . . . . . . . . . . . 2,800 1,395
Excess of book over tax depreciation and amortization. . . . . . . . . . 439 542
Deferred rent . . . . . . . . . . . . . . . . . . . . . . . . . . . . . . . . . . . . . . . . 188 233
Financing obligation . . . . . . . . . . . . . . . . . . . . . . . . . . . . . . . . . . . 308 —
Other . . . . . . . . . . . . . . . . . . . . . . . . . . . . . . . . . . . . . . . . . . . . . . 59 47
Gross deferred tax assets . . . . . . . . . . . . . . . . . . . . . . . . . . . . . . . . . . . 4,593 2,883
Noncurrent deferred tax liabilities:
Leased building . . . . . . . . . . . . . . . . . . . . . . . . . . . . . . . . . . . . . . (305) —
Net deferred tax assets . . . . . . . . . . . . . . . . . . . . . . . . . . . . . . . . . . . . . $4,288 $2,883
At January 1, 2006, the Company had net operating loss carryforwards for federal income tax purposes of
approximately $8.4 million. The net operating loss carryforwards were fully utilized during the year ended
December 31, 2006. Income taxes payable at December 30, 2007 and December 31, 2006 were $0.9 million
and $1.1 million, respectively, and were included in accrued liabilities.
The Company has not provided for deferred taxes on unremitted earnings of subsidiaries outside the
United States where such earnings are permanently reinvested. At December 30, 2007, unremitted earnings of
foreign subsidiaries were $60,000. If these earnings were distributed in the form of dividends or otherwise, the
Company would be subject to U.S. income taxes less an adjustment for applicable foreign tax credits.
Effective January 1, 2007, the Company adopted the provisions of FASB Interpretation No. 48, Account-
ing for Uncertainty in Income Taxes (“FIN 48”), which prescribes how a company should recognize, measure,present and disclose in its financial statements uncertain tax positions that the company has taken or expects
to take on a tax return.
The Company is no longer subject to U.S. federal or state income tax examinations by tax authorities for
years before 2004. The Company recognizes interest and penalties related to unrecognized tax benefits, if
incurred, in the Company’s provision for income taxes. The Company has evaluated material tax positions
taken on all open years and has concluded that material tax positions meet the “more likely than not” test as
set forth in FIN 48. As such, no liability for unrecognized tax benefits is considered necessary and no interest
or penalties have been accrued.
52
BLUE NILE, INC.
NOTES TO CONSOLIDATED FINANCIAL STATEMENTS — (Continued)

8/3/2019 Annual Report BlueNile 2007
http://slidepdf.com/reader/full/annual-report-bluenile-2007 57/72
The tax benefit realized for the tax deduction from stock option exercises totaled $7.5 million, $3.0 mil-
lion, and $1.2 million for the years ended December 30, 2007, December 31, 2006, and January 1, 2006,
respectively.
Note 10. Income Per ShareBasic net income per share is based on the weighted average number of common shares outstanding.
Diluted net income per share is based on the weighted average number of common shares and equivalents
outstanding. Common share equivalents included in the computation represent shares issuable upon assumed
exercise of outstanding stock options except when the effect of their inclusion would be antidilutive.
The following table sets forth the computation of basic and diluted net income per share (in thousands,
except per share data):
December 30,2007
December 31,2006
January 1,2006
Year Ended
Net income . . . . . . . . . . . . . . . . . . . . . . . . . . . . . . . . . . . . $17,459 $13,064 $13,153
Weighted average common shares outstanding . . . . . . . . . . 15,919 16,563 17,550Basic net income per share . . . . . . . . . . . . . . . . . . . . . . . . $ 1.10 $ 0.79 $ 0.75
Dilutive effect of stock options . . . . . . . . . . . . . . . . . . . . . 895 715 1,047
Common stock and common stock equivalents . . . . . . . . . . 16,814 17,278 18,597
Diluted net income per share . . . . . . . . . . . . . . . . . . . . . . . $ 1.04 $ 0.76 $ 0.71
The following is a summary of the securities outstanding during the respective periods that have been
excluded from the calculations because the effect on net income per share would have been antidilutive (in
thousands):
December 30,2007
December 31,2006
January 1,2006
Year Ended
Stock options . . . . . . . . . . . . . . . . . . . . . . . . . . . . . . . . . . 112 1,159 177
Note 11. Selected Quarterly Financial Information (unaudited)
Summarized quarterly financial information for fiscal years 2007 and 2006 is as follows (in thousands,
except per share data):
Q1 Q2 Q3 Q4
2007 quarter:
Net sales . . . . . . . . . . . . . . . . . . . . . . . . . . . . . . . . $67,910 $72,093 $67,355 $111,906
Gross profit . . . . . . . . . . . . . . . . . . . . . . . . . . . . . . 13,249 14,943 13,357 23,655
Net income . . . . . . . . . . . . . . . . . . . . . . . . . . . . . . . 3,163 3,781 2,972 7,543
Basic net income per share . . . . . . . . . . . . . . . . . . . 0.20 0.24 0.19 0.47
Diluted net income per share . . . . . . . . . . . . . . . . . . 0.19 0.23 0.18 0.45
53
BLUE NILE, INC.
NOTES TO CONSOLIDATED FINANCIAL STATEMENTS — (Continued)

8/3/2019 Annual Report BlueNile 2007
http://slidepdf.com/reader/full/annual-report-bluenile-2007 58/72
Q1 Q2 Q3 Q4
2006 quarter:
Net sales . . . . . . . . . . . . . . . . . . . . . . . . . . . . . . . . $50,694 $56,916 $53,248 $ 90,729
Gross profit . . . . . . . . . . . . . . . . . . . . . . . . . . . . . . 10,342 11,323 10,406 18,783Net income . . . . . . . . . . . . . . . . . . . . . . . . . . . . . . . 2,355 3,132 1,824 5,753
Basic net income per share . . . . . . . . . . . . . . . . . . . 0.14 0.19 0.11 0.36
Diluted net income per share . . . . . . . . . . . . . . . . . . 0.13 0.18 0.11 0.35
Note 12. Subsequent Event
On February 5, 2008, the board of directors of the Company authorized the repurchase of up to an
additional $100 million of the Company’s common stock during the subsequent 24 months. The repurchase
program was announced on February 12, 2008. The timing and amount of any shares repurchased will be
determined by the Company’s management based on its evaluation of market conditions and other factors.
Repurchases may also be made under a Rule 10b5-1 plan, which would permit shares to be repurchased when
the Company might otherwise be precluded from doing so under insider trading laws.
54
BLUE NILE, INC.
NOTES TO CONSOLIDATED FINANCIAL STATEMENTS — (Continued)

8/3/2019 Annual Report BlueNile 2007
http://slidepdf.com/reader/full/annual-report-bluenile-2007 59/72
BLUE NILE, INC.
SCHEDULE II
VALUATION AND QUALIFYING ACCOUNTS
Description
Balance atBeginningof Period
Chargedto Revenue,
Costs orExpenses Deductions(A)
Balance atEnd of Period
(In thousands)Year ended December 30, 2007
Reserve for sales returns . . . . . . . . . . . . . . . . . . . . . . . $1,179 $26,743 $(26,641) $1,281
Reserve for fraud . . . . . . . . . . . . . . . . . . . . . . . . . . . . . $ 105 $ 118 $ (93) $ 130
Year ended December 31, 2006
Reserve for sales returns . . . . . . . . . . . . . . . . . . . . . . . $ 976 $19,893 $(19,690) $1,179
Reserve for fraud . . . . . . . . . . . . . . . . . . . . . . . . . . . . . $ 151 $ (22) $ (24) $ 105
Year ended January 1, 2006
Reserve for sales returns . . . . . . . . . . . . . . . . . . . . . . . $ 988 $16,989 $(17,001) $ 976
Reserve for fraud . . . . . . . . . . . . . . . . . . . . . . . . . . . . . $ 152 $ 55 $ (56) $ 151
(A) Deductions for sales returns and fraud consist of actual sales returns and credit card chargebacks in each
period.
55
8/3/2019 Annual Report BlueNile 2007
http://slidepdf.com/reader/full/annual-report-bluenile-2007 60/72
Item 9. Changes in and Disagreements with Accountants on Accounting and Financial Disclosure
None.
Item 9A. Controls and Procedures
Disclosure Controls and Procedures
Disclosure controls and procedures are controls and other procedures designed to ensure that information
required to be disclosed by us in our periodic reports filed with the Securities and Exchange Commission(“SEC”) is recorded, processed, summarized and reported within the time periods specified by the SEC’s rules
and SEC reports. Disclosure controls and procedures include, without limitation, controls and procedures
designed to ensure that information required to be disclosed by an issuer in the reports that it files or submits
under the Act is accumulated and communicated to the issuer’s management, including its principal executive
and principal financial officers, or persons performing similar functions, as appropriate to allow timely
decisions regarding required disclosure.
As of the end of the period covered by this report, an evaluation was performed under the supervision
and with the participation of our management, including our chief executive officer and chief financial officer
(collectively, our “certifying officers”), of the effectiveness of the design and operation of our disclosure
controls and procedures.
Based on their evaluation, our certifying officers concluded that the Company’s disclosure controls andprocedures were effective at the reasonable assurance level as of the end of the period covered by this report.
Report of Management on Internal Control over Financial Reporting
Our management is responsible for establishing and maintaining adequate internal control over financial
reporting as defined in Rule 13a-15(f) under the Securities Exchange Act of 1934. Internal control over
financial reporting include those policies and procedures that (1) pertain to the maintenance of records that in
reasonable detail accurately and fairly reflect our transactions and dispositions of our assets; (2) provide
reasonable assurance that our transactions are recorded as necessary to permit preparation of financial
statements in accordance with generally accepted accounting principles, and that our receipts and expenditures
are being made only in accordance with appropriate authorizations; and (3) provide reasonable assurance
regarding prevention or timely detection of unauthorized acquisition, use or disposition of our assets that could
have a material effect on our financial statements.
Because of its inherent limitations, our internal control over financial reporting may not prevent or detect
misstatements. Also, projections of any evaluation of effectiveness to future periods are subject to the risk that
controls may become inadequate because of changes in conditions, or that the degree of compliance with the
policies or procedures may deteriorate.
Under the supervision and with the participation of our management, we assessed the effectiveness of our
internal control over financial reporting as of December 30, 2007, using the criteria set forth by the Committee
of Sponsoring Organizations of the Treadway Commission (COSO) in Internal Control — Integrated Frame-
work. Based on this assessment, management has concluded that our internal control over financial reporting
was effective at the “reasonable assurance” level as of December 30, 2007.
Deloitte & Touche LLP, an independent registered public accounting firm, has audited the effectiveness of
our internal control over financial reporting as of December 30, 2007, as stated in their audit report below.
Changes in Internal Control Over Financial Reporting
There were no changes in our internal control over financial reporting during the quarter ended
December 30, 2007, that our certifying officers concluded materially affected, or are reasonably likely to
materially affect, our internal control over financial reporting.
/s/ Diane M. Irvine /s/ Robin Easton
Chief Executive Officer and President Chief Financial Officer
56

8/3/2019 Annual Report BlueNile 2007
http://slidepdf.com/reader/full/annual-report-bluenile-2007 61/72
REPORT OF INDEPENDENT REGISTERED PUBLIC ACCOUNTING FIRM
To the Board of Directors and Stockholders of
Blue Nile, Inc.
Seattle, Washington
We have audited the internal control over financial reporting of Blue Nile, Inc. and subsidiaries (the
“Company”) as of December 30, 2007, based on the criteria established in Internal Control — Integrated
Framework issued by the Committee of Sponsoring Organizations of the Treadway Commission. TheCompany’s management is responsible for maintaining effective internal control over financial reporting and
for its assessment of the effectiveness of internal control over financial reporting. Our responsibility is to
express an opinion on the Company’s internal control over financial reporting based on our audit.
We conducted our audit in accordance with the standards of the Public Company Accounting Oversight
Board (United States). Those standards require that we plan and perform the audit to obtain reasonable
assurance about whether effective internal control over financial reporting was maintained in all material
respects. Our audit included obtaining an understanding of internal control over financial reporting, assessing
the risk that a material weakness exists, testing and evaluating the design and operating effectiveness of
internal control based on the assessed risk, and performing such other procedures as we considered necessary
in the circumstances. We believe that our audit provides a reasonable basis for our opinion.
A company’s internal control over financial reporting is a process designed by, or under the supervision
of, the company’s principal executive and principal financial officers, or persons performing similar functions,and effected by the company’s board of directors, management, and other personnel to provide reasonable
assurance regarding the reliability of financial reporting and the preparation of financial statements for external
purposes in accordance with generally accepted accounting principles. A company’s internal control over
financial reporting includes those policies and procedures that (1) pertain to the maintenance of records that,
in reasonable detail, accurately and fairly reflect the transactions and dispositions of the assets of the company,
(2) provide reasonable assurance that transactions are recorded as necessary to permit preparation of financial
statements in accordance with generally accepted accounting principles, and that receipts and expenditures of
the company are being made only in accordance with authorizations of management and directors of the
company, and (3) provide reasonable assurance regarding prevention or timely detection of unauthorized
acquisition, use, or disposition of the company’s assets that could have a material effect on the financial
statements.
Because of the inherent limitations of internal control over financial reporting, including the possibility of collusion or improper management override of controls, material misstatements due to error or fraud may not
be prevented or detected on a timely basis. Also, projections of any evaluation of the effectiveness of the
internal control over financial reporting to future periods are subject to the risk that the controls may become
inadequate because of changes in conditions, or that the degree of compliance with the policies or procedures
may deteriorate.
In our opinion, the Company maintained, in all material respects, effective internal control over financial
reporting as of December 30, 2007, based on the criteria established in Internal Control — Integrated
Framework issued by the Committee of Sponsoring Organizations of the Treadway Commission.
We have also audited, in accordance with the standards of the Public Company Accounting Oversight
Board (United States), the consolidated financial statements and financial statement schedule as of and for the
year ended December 30, 2007, of the Company and our report dated February 26, 2008, expressed an
unqualified opinion on those financial statements and financial statement schedule and includes explanatoryparagraphs regarding the Company’s adoption of Statement of Financial Accounting Standards No. 123(R),
Share-Based Payment , and Staff Accounting Bulletin No. 108 , Considering the Effects of Prior Year
Misstatements When Quantifying Misstatements in Current Year Financial Statements.
/s/ Deloitte & Touche LLP
Seattle, Washington
February 26, 2008
57

8/3/2019 Annual Report BlueNile 2007
http://slidepdf.com/reader/full/annual-report-bluenile-2007 62/72
Item 9B. Other Information
None.
PART III
Item 10. Directors, Executive Officers and Corporate Governance
The information required by this Item relating to our executive officers will be contained in our Proxy
Statement with respect to our 2008 Annual Meeting of Stockholders under the caption “Executive Officers”and is incorporated herein by reference. The information required by this Item relating to our directors and
nominees, including information with respect to audit committee financial experts and our code of ethics, will
be contained in our Proxy Statement with respect to our 2008 Annual Meeting of Stockholders under the
caption “Proposal 1 — Election of Directors” and is incorporated herein by reference. The information
required by this Item regarding compliance with Section 16(a) of the Securities Exchange Act will be
contained in our Proxy Statement with respect to our 2008 Annual Meeting of Stockholders under the caption
“Section 16(a) Beneficial Ownership Reporting Compliance” and is incorporated herein by reference. The
Proxy Statement will be filed with the Securities and Exchange Commission within 120 days of the end of our
fiscal year.
Item 11. Executive Compensation
The information required by this Item will be contained in our Proxy Statement with respect to our 2008Annual Meeting of Stockholders under the caption “Compensation of Executive Officers” and is incorporated
herein by reference. The Proxy Statement will be filed with the Securities and Exchange Commission within
120 days of the end of our fiscal year.
Item 12. Security Ownership of Certain Beneficial Owners and Management and Related Stockholder
Matters
The information required by this Item will be contained in our Proxy Statement with respect to our 2008
Annual Meeting of Stockholders under the captions “Security Ownership of Certain Beneficial Owners and
Management” and “Equity Compensation Plan Information” and is incorporated herein by reference. The
Proxy Statement will be filed with the Securities and Exchange Commission within 120 days of the end of our
fiscal year.
Item 13. Certain Relationships and Related Transactions, and Director IndependenceThe information required by this Item will be contained in our Proxy Statement with respect to our 2008
Annual Meeting of Stockholders under the caption “Certain Relationships and Related Transactions” and
“Proposal 1-Election of Directors” and is incorporated herein by reference. The Proxy Statement will be filed
with the Securities and Exchange Commission within 120 days of the end of our fiscal year.
Item 14. Principal Accountant Fees and Services
The information required by this Item will be contained in our Proxy Statement with respect to our 2008
Annual Meeting of Stockholders under the caption “Proposal 2 — Ratification of Selection of Independent
Auditors” and is incorporated herein by reference. The Proxy Statement will be filed with the Securities and
Exchange Commission within 120 days of the end of our fiscal year.
58

8/3/2019 Annual Report BlueNile 2007
http://slidepdf.com/reader/full/annual-report-bluenile-2007 63/72
PART IV
Item 15. Exhibits and Financial Statement Schedules
Index to Consolidated Financial Statements
a. The following documents are filed as part of this report:
Page
1. Financial Statements:Reports of Independent Registered Public Accounting Firms. . . . . . . . . . . . . . . . . . . . . . . . . 33
Consolidated Balance Sheets, as of December 30, 2007 and December 31, 2006 . . . . . . . . . . 35
Consolidated Statements of Operations, for the fiscal years ended December 30, 2007,December 31, 2006 and January 1, 2006 . . . . . . . . . . . . . . . . . . . . . . . . . . . . . . . . . . . . . 36
Consolidated Statements of Changes in Stockholders’ Equity, for the fiscal years endedDecember 30, 2007, December 31, 2006 and January 1, 2006 . . . . . . . . . . . . . . . . . . . . . . 37
Consolidated Statements of Cash Flows, for the fiscal years ended December 30, 2007,December 31, 2006 and January 1, 2006 . . . . . . . . . . . . . . . . . . . . . . . . . . . . . . . . . . . . . 38
Notes to Consolidated Financial Statements . . . . . . . . . . . . . . . . . . . . . . . . . . . . . . . . . . . . . 40
2. Financial Statement Schedules:
Schedule II, Valuation and Qualifying Accounts . . . . . . . . . . . . . . . . . . . . . . . . . . . . . . . . . . 55All other schedules are omitted because they are not applicable or the required information
is shown in the financial statements or notes thereto.
3. Exhibits:
The exhibits listed in the Index to Exhibits, which appears immediately following thesignature page and is incorporated herein by reference, are filed as part of this AnnualReport on Form 10-K.
59

8/3/2019 Annual Report BlueNile 2007
http://slidepdf.com/reader/full/annual-report-bluenile-2007 64/72
SIGNATURES
Pursuant to the requirements of Section 13 or 15(d) of the Securities Exchange Act of 1934, the registrant
has duly caused this report to be signed on its behalf by the undersigned, thereunto duly authorized.
Blue Nile, Inc.
(Registrant)
By /s/ Robin Easton
Robin Easton
Chief Financial Officer
(Principal Accounting and Financial Officer)
February 26, 2008
POWER OF ATTORNEY
KNOW ALL PERSONS BY THESE PRESENTS, that each person whose signature appears below
constitutes and appoints Diane M. Irvine and Robin Easton, and each or any one of them, his or her true andlawful attorney-in-fact and agent, with full power of substitution and resubstitution, for him or her and in his
or her name, place and stead, in any and all capacities, to sign any and all amendments (including posting
effective amendments) to this report, and to file the same, with all exhibits thereto, and other documents in
connection therewith, with the Securities and Exchange Commission, granting unto said attorneys-in-facts and
agents, and each of them, full power and authority to do and perform each and every act and thing requisite
and necessary to be done in connection therewith, as fully to all intents and purposes as he or she might or
could do in person, hereby ratifying and confirming all that said attorneys-in-fact and agents, or any of them,
or their or his or her substitutes or substitutes, may lawfully do or cause to be done by virtue hereof.
This report has been signed below by the following persons on behalf of the registrant and in the
capacities and on the dates indicated, pursuant to the requirements of the Securities Exchange Act of 1934.
By /s/ Diane M. IrvineDiane M. Irvine, Chief Executive Officer, President and
Director(Principal Executive Officer)
February 26, 2008
By /s/ Robin Easton
Robin Easton, Chief Financial Officer(Principal Accounting and Financial Officer)
February 26, 2008
By /s/ Mark C. Vadon
Mark C. Vadon, Executive Chairman and Director
February 26, 2008
By /s/ W. Eric Carlborg
W. Eric Carlborg, Director
February 26, 2008
By /s/ Joseph Jimenez
Joseph Jimenez, Director
February 26, 2008
By /s/ Michael Potter
Michael Potter, Director
February 26, 2008
60

8/3/2019 Annual Report BlueNile 2007
http://slidepdf.com/reader/full/annual-report-bluenile-2007 65/72
By /s/ Steve Scheid
Steve Scheid, Director
February 26, 2008
By /s/ Joanna A. Strober
Joanna A. Strober, Director
February 26, 2008
By /s/ Mary Alice Taylor
Mary Alice Taylor, Director
February 26, 2008
61

8/3/2019 Annual Report BlueNile 2007
http://slidepdf.com/reader/full/annual-report-bluenile-2007 66/72
EXHIBIT INDEX
The following exhibits are filed as part of this Annual Report on Form 10-K or are incorporated herein
by reference. Where an exhibit is incorporated by reference, the number in parentheses indicates the document
to which cross-reference is made. See the end of this exhibit index for a listing of cross-reference documents.
ExhibitNumber Description
3.1(1) Amended and Restated Certificate of Incorporation of Blue Nile, Inc.3.2(2) Amended and Restated Bylaws of Blue Nile, Inc.
3.3(3) Amendment to the Bylaws of Blue Nile, Inc.
4.1 Reference is made to Exhibits 3.1 and 3.2.
4.2(4) Specimen Stock Certificate.
4.3(2) Amended and Restated Investor Rights Agreement dated June 29, 2001 by and between BlueNile, Inc. and certain holders of Blue Nile, Inc.’s preferred stock.
10.1.1(2)* Blue Nile, Inc. Amended and Restated 1999 Equity Incentive Plan.
10.1.2(2)* Form of Stock Option Agreement pursuant to the Blue Nile, Inc. 1999 Equity Incentive Plan.
10.2.1(4)* Blue Nile, Inc. 2004 Non-Employee Directors’ Stock Option Plan.
10.2.2(7)* Form of Stock Option Agreement pursuant to the Blue Nile, Inc. 2004 Non-Employee Directors’
Stock Option Plan.10.3(2)* Blue Nile, Inc. 2004 Employee Stock Purchase Plan.
10.4.1(5)* Blue Nile, Inc. 2004 Equity Incentive Plan.
10.4.2(7)* Form of Stock Option Agreement pursuant to the 2004 Equity Incentive Plan.
10.4.3(6)* Blue Nile, Inc. Stock Grant Notice pursuant to the 2004 Equity Incentive Plan.
10.4.4(11)* Form of Restricted Stock Unit Grant Notice and Form of Award Agreement under the Blue Nile,Inc. 2004 Equity Incentive Plan.
10.5.1(5) Sublease Agreement, dated May 22, 2003, between Amazon.com Holdings, Inc. and theregistrant.
10.5.2(5) First Amendment to Sublease Agreement, dated July 3, 2003, between Amazon.com Holdings,Inc. and the registrant.
10.6.1(5) Lease, dated June 28, 2001, between Gull Industries, Inc. and the registrant.
10.6.2(5) First Amendment to Lease, dated December 11, 2002 between Gull Industries, Inc. and theregistrant.
10.6.3(5) Second Amendment to Lease, dated November 15, 2003, between Gull Industries, Inc. and theregistrant.
10.7(9) Commercial lease, dated July 21, 2006, between Gull Industries, Inc. and the registrant.
10.8(12)* Offer Letter with Diane M. Irvine, dated December 1, 1999.
10.9(2)* Offer Letter with Dwight Gaston, dated May 14, 1999.
10.10(2)* Offer Letter with Susan S. Bell, dated August 22, 2001.
10.11(2)* Offer Letter with Darrell Cavens, dated July 30, 1999.
10.12(10)* Offer Letter with Robin Easton, dated August 20, 2007.
10.13(5)* Form of Indemnification Agreement entered into between Blue Nile, Inc. and each of itsdirectors and executive officers.
10.14(8)* Blue Nile, Inc. Executive Officer Cash Incentive Program.
10.15(8)* Director Compensation.
21.1(13) Subsidiaries of the Registrant.
23.1(13) Consent of Deloitte & Touche LLP.
23.2(13) Consent of PricewaterhouseCoopers LLP.
24.1 Powers of Attorney of Officers and Directors signing this report (see page 60).
62

8/3/2019 Annual Report BlueNile 2007
http://slidepdf.com/reader/full/annual-report-bluenile-2007 67/72
ExhibitNumber Description
31.1(13) Certification of Chief Executive Officer Required Under Rule 13a-14(a) or Rule 15d-14(a) of theSecurities Exchange Act of 1934, as amended.
31.2(13) Certification of Principal Financial Officer Required Under Rule 13a-14(a) or Rule 15d-14(a) of the Securities Exchange Act of 1934, as amended.
32.1(14) Certification of Chief Executive Officer Required Under Rule 13a-14(b) or Rule 15d-14(b) of
the Securities Exchange Act of 1934, as amended, and 18 U.S.C. Section 1350.32.2(14) Certification of Principal Financial Officer Required Under Rule 13a-14(b) or Rule 15d-14(b) of
the Securities Exchange Act of 1934, as amended, and 18 U.S.C. Section 1350.
* Denotes a management contract or compensatory plan, contract or agreement, in which the Company’s
directors or executive officers may participate.
(1) Previously filed as Exhibit 3.1 to Blue Nile, Inc.’s Form 10-Q for the quarterly period ended July 4, 2004
(No. 000-50763), as filed with the Securities and Exchange Commission on August 6, 2004, and incorpo-
rated by reference herein.
(2) Previously filed as the like numbered exhibit to Blue Nile, Inc.’s Registration Statement on Form S-1
(No. 333-113494), as filed with the Securities and Exchange Commission on March 11, 2004, as
amended, and incorporated by reference herein.(3) Previously filed as Exhibit 3.2 to Blue Nile, Inc.’s Current Report on Form 8-K (No. 000-50763), as filed
with the Securities and Exchange Commission on February 7, 2008, and incorporated by reference
herein.
(4) Previously filed as Exhibit 10.1 to Blue Nile, Inc.’s Current Report on Form 8-K (No. 000-50763), as
filed with the Securities and Exchange Commission on June 19, 2006, and incorporated by reference
herein.
(5) Previously filed as the like numbered exhibit to Blue Nile, Inc.’s Registration Statement on Form S-1/A
(No. 333-113494), as filed with the Securities and Exchange Commission on April 19, 2004, as amended,
and incorporated by reference herein.
(6) Previously filed as Exhibit 10.1 to Blue Nile, Inc.’s Current Report on Form 8-K (No. 000-50763), as
filed with the Securities and Exchange Commission on December 13, 2004 and incorporated by referenceherein.
(7) Previously filed as the like numbered exhibit to Blue Nile, Inc’s Annual Report on Form 10-K
(No. 000-50763), as filed with the Securities and Exchange Commission on March 25, 2005 and incorpo-
rated by reference herein.
(8) Previously filed as Item 5.02 to Blue Nile, Inc.’s Current Report on Form 8-K (No. 000-50763), as filed
with the Securities and Exchange Commission on March 22, 2007, and incorporated by reference herein.
(9) Previously filed as Exhibit 10.1 to Blue Nile Inc’s Current Report on Form 8-K (No. 000-50763), as filed
with the Securities and Exchange Commission on July 27, 2006 and incorporated by reference herein.
(10) Previously filed as Exhibit 10.1 to Blue Nile, Inc.’s Current Report on Form 8-K (No. 000-50763), as
filed with the Securities and Exchange Commission on August 28, 2007, and incorporated by reference
herein.(11) Previously filed as Exhibit 10.2 to Blue Nile, Inc.’s Current Report on Form 8-K (No. 000-50763), as
filed with the Securities and Exchange Commission on June 29, 2007, and incorporated by reference
herein.
(12) Previously filed as Exhibit 10.7 to Blue Nile, Inc.’s Registration Statement on Form S-1
(No. 333-113494), as filed with the Securities and Exchange Commission on March 11, 2004, as
amended, and incorporated by reference herein.
(13) Filed herewith.
63

8/3/2019 Annual Report BlueNile 2007
http://slidepdf.com/reader/full/annual-report-bluenile-2007 68/72
(14) Filed herewith. The certifications attached as Exhibits 32.1 and 32.2 accompany this Annual Report on
Form 10-K pursuant to Section 906 of the Sarbanes-Oxley Act of 2002 and shall not be deemed “filed”
by Blue Nile, Inc. for purposes of Section 18 of the Securities Exchange Act of 1934, as amended.
64

8/3/2019 Annual Report BlueNile 2007
http://slidepdf.com/reader/full/annual-report-bluenile-2007 69/72
(This page intentionally left blank)

8/3/2019 Annual Report BlueNile 2007
http://slidepdf.com/reader/full/annual-report-bluenile-2007 70/72
(This page intentionally left blank)

8/3/2019 Annual Report BlueNile 2007
http://slidepdf.com/reader/full/annual-report-bluenile-2007 71/72
BOARD OF DIRECTORS
Mark Vadon, Chairman
Mary Alice Taylor, Lead Independent DirectorEric CarlborgDiane Irvine
Joseph JimenezMichael PotterSteve Scheid
Joanna Strober
SENIOR OFFICERS
Mark VadonExecutive Chairman
Diane IrvinePresident and Chief Executive Officer
Susan BellSenior Vice President
Darrell Cavens
Senior Vice President
Dwight GastonSenior Vice President
Terri Maupin Vice President of Finance, Controller andCorporate Secretary
Steven Gire Vice President of Technology
Lauren NeiswenderGeneral Counsel
Brian Watkins Vice President of Merchandising
Corporate Headquarters705 Fifth Avenue South, Suite 900Seattle, Washington 98104
206.336.6700
Annual Meeting of StockholdersMay 20, 2008 – 11:00 AM Pacific TimeWashington Athletic Club1325 Sixth AvenueSeattle, Washington 98101
Internet Website Addresswww.bluenile.com
Stock ListingThe NASDAQ Stock Market LLCTrading Symbol: NILE
Transfer Agent and RegistrarBNY Mellon Shareowner Service1.800.760.9115www.bnymellon.com/shareowner/isd
Independent Public AccountantsDeloitte & Touche LLP
925 Fourth Avenue, Suite 3300Seattle, Washington 98104
Corporate CounselCooley Godward LLPFive Palo Alto Square3000 El Camino RealPalo Alto, California 94306
Investor RelationsSecurities analysts, investment professionals, andstockholders should direct their questions to:
[email protected] or 206.336.6745
Public RelationsNews media should direct their inquiries to:[email protected] or 206.336.6755
CORPORATE INFORMATION
s

8/3/2019 Annual Report BlueNile 2007
http://slidepdf.com/reader/full/annual-report-bluenile-2007 72/72