
ANNUAL REPORT 2005mb.cision.com/Main/2876/9318278/54552.pdfPhoto: BITMAP (side 5, 12, 21, 22, 111),...
120
ANNUAL REPORT 2005
Transcript of ANNUAL REPORT 2005mb.cision.com/Main/2876/9318278/54552.pdfPhoto: BITMAP (side 5, 12, 21, 22, 111),...
ANNUAL REPORT 2005
Photo: BITMAP (side 5, 12, 21, 22, 111), Elisabeth Tønnessen (page 107), Tom Haga (page 112, 115) and Åshild Moen.
The Sparebank 1 SR-Bank Group 4
Highlights 6
Main figures 7
Key figures 7
The CEO's article 8
Annual report 2005 10
Annual accounts, table of contents 23
Auditor's report for 2005 92
The Audit Committee's
statement for 2005 92
Primary capital certificates 93
Key figures during the past years 96
A group willing and able
to contribute 98
Corporate governance 100
Risk and capital management 105
Corporate market division 110
The Retail market division 113
Overview of our offices 116
Governing bodies 117
Organisational chart (simplified) 118
TABLE OF CONTENTS

WHAT SEPARATES ONE BANK FROM ANOTHER? INTEREST RATES, FEES AND PRODUCTS ARE OFTEN THE SAME. BUT HAVE YOU ASKED YOUR BANK WHAT THEY WANT?
OR WHAT ROLE THEY WANT TO PLAY? OUR ANSWER IS SIMPLE. THE OBJECTIVE OF SPAREBANK 1 SR-BANK IS TO HELP CREATE VALUES FOR THE REGION WE ARE PART
OF, AND THE ONLY WAY IN WHICH WE CAN DO THIS IS THROUGH THE ACHIEVEMENTS OF OUR 942 EMPLOYEES. IT’S A MATTER OF WILL.
Agathe Høynes, Aina Nordfonn, Alet Due-Olsen, Alf Henning Myklebust, Alf Inge Riska, Alf Sigmund Østreim, Alf Sveinung Lie, Alfhild Vikse, Alv Østerhus, Alvhild Tofterå Berge,
Anders Rundhaug, Andrè Liodden, Anita Christine Gundersen, Anita Hodnefjell, Anita Raustøl, Anita Sørhus, Anita Torjussen, Anlaug Stormo, Ann Helen Mæle, Ann Jeanette
Sunde Olaussen, Ann Kristin Igland, Ann Kristin Rise, Annbjørg Omdahl, Anne-Christine Joys, Anne-Gro Holta, Anne Beate Hope, Anne Beth Høivik, Anne Beth Naustvik Økland,
Anne Brit Idsøe, Anne Brit Myklestad, Anne Brit Watne, Anne Elise Olsen, Anne Grete Gjerde, Anne Grete Skraastad, Anne Grete Svennevig, Anne Haukalid, Anne Havsø Tveit,
Anne Herabakke, Anne Irene Lea, Anne Isaksen, Anne Jelsa, Anne Jorun Hauge, Anne Judith Vik, Anne Karin Undheim, Anne Karin Østerhus, Anne Karine Weibell, Anne Kristin H.
Førland, Anne Krogedal, Anne Lea Hobberstad, Anne Lill Larsen, Anne Lise Aukland, Anne Lise Bjorheim, Anne Lise Krossgått Førre, Anne M Slettebø, Anne Margrethe Karlstad,
Anne Marie Nortveit, Anne Mathiassen Bjørnsen, Anne Nystrøm Kvale, Anne Siri Goa Sandve, Anne Synnøve Håversen, Anne Torhild Anfinsen, Anne Turid Landmark, Anne W
Salbo Hundhammer, Annett Viste Levik, Annette Eide, Annette Skaarstad Hansen, Anny Bergeland, Anny Klingsheim, Ansgar Steffensen, Arild Ask, Arild Engø, Arild Langberg
Johannessen, Arild Lauvsnes, Arild Netteland, Arild Nielsen, Arild Ree, Arlin Opsahl Mæland, Arne Geir Larsen, Arne Gjerde, Arne Kjærstad, Arne L. Lund, Arne Mo, Arne Tjelta,
Arnfinn Høigård, Arnhild Haddeland, Arnlaug Vistnes, Arnt Eivind Roth Halvorsen, Arthur Tengesdal, Arve Austestad, Arve Pedersen, Arvid Ek, Arvid Gjesdal, Arvid Solem, Asgaut
Fiskå, Aslaug Holgersen, Aslaug Irene Frafjord, Asle Ingebrethsen, Astrid Auestad, Astrid Børresen, Astrid Hauge Edland, Astrid Horpestad, Astrid Høyland, Astrid H. Throndsen,
Astrid M. Bolme, Astrid Norheim, Astrid Saurdal, Astrid Skjæveland, Atle Mortensen, Atle Nilsen, Atle Oftedal, Atle Wb Nilsen, Atle Øvestad, Aud Helene Nese, Aud Inger
Haugland, Aud Randi Sivertsen Sletten, Aud S. J. Jåsund, Audny Hellevik, Audun Remesvik, Beate Bjelland Rabben, Bendik Voll, Bent Terje Lie, Bente Due-Olsen, Bente Erevik
Svendsen, Bente Hope, Bente Ilona Grastveit, Bente Stokdal, Bente Øyhovden, Berit Helene Bjerga, Berit Johannessen, Berit Karin Gramstad, Berit Mihle Laugaland, Berit Nygård,
Berit Sandåker Olsen, Berit Sie Eltervåg, Berit Sola, Berit Storhaug Ravndal, Berit Vatnekvam, Berit Vestersjø, Bernt H. Berge, Bernt Ringodd, Bertha Auestad, Bess Grastveit, Beth
Karin Laugaland Sele, Bidun Berge Hansen, Birgitte Nordnes, Birgitte Wendelbo Johansen, Birte Wereide, Bjarte Sivertsen, Bjørg Byberg, Bjørg Espeland, Bjørg Haarr, Bjørg Ravnås
Knutsen, Bjørg Stangenes Nilsen, Bjørg Tordis Lunde, Bjørn Berland, Bjørn Håheim, Bjørn Jan Tesdal, Bjørn Kjetil Hellestræ, Bjørn Rossebø, Bjørn Rune Olsen, Bjørn Sanne, Bjørn
Sivertsen, Bjørn Steinar Surdal, Bjørn Stensland, Bjørn Sørlund, Bjørnar Jacobsen, Bodil Eia Folkvord, Bodil H. Nernes, Bodil Olsen, Bodil Sjøthun, Bodil Sømme Danielsen, Brit
Carlsen, Brit Helen Lie Hagen, Brit Jane Tolås, Brit Røstvik, Brit Thomsen, Brit Tone Harveland, Brith Ladsten Breivik, Britt Fagerland, Børge Espeland, Børge Henriksen, Børge
Severin Furuhaug, Børge Sørensen, Bård-Espen Krabbedal, Bård Birkeland, Bård Ellingsen, Camilla Gram, Carl Fredrik Hjelle, Catherine Hauge, Cathrine Brueland Andersen,
Cathrine Leiros, Cecilie Hjelmervik, Cecilie Lileng, Cecilie Vik, Christian Jacobsen, Christian Krag, Christiane E. Skage, Christina R. Lund, Christine Christiansen, Christine Gjerde
Kvalsund, Christine Wathne Seloter, Christoffer Inge Hovda, Corine Vollen Aulin, Dag Kristian Risa, Dag Strøm, Dag Sønsterud, Dagfinn Pedersen, Dajmi Egenæs Birkedal, Ebba
Marie Breivik, Edda Runarsdottir Hodnefjell, Edna Kallevik, Edvard Jekteberg, Edvard Aarsland, Egil Nygård, Egil Reed, Einar Foss Kvavik, Einar Jøssang, Einar Osmundsen, Eirik
Bjelland, Eirik Fausa, Eirik Thorsen, Eivind Pedersen, Elbjørg Husebø, Eli Fosse Orstad, Eli Lunde Wells, Eli Margrethe Hansen, Eli Nødland Knoph, Eli Øye, Elin Berne, Elin Bie
Egge, Elin Bue, Elin Falck-Jørgensen Gitlesen, Elin Garborg, Elin Klungtveit, Elin Schanche, Elin Sørung, Elisabet Salthe, Elisabeth Falch, Elisabeth Krogedal, Elisabeth Ree-Pedersen,
Elisabeth Østensen, Elisabeth Øvstebø, Elise Oliversen, Ellen Hansen Vestre, Ellen Iversen, Ellen Kristin Westbye, Ellen Marie Jespersen, Ellen Strømme, Elna Olena Ydstebø, Else
Eriksen, Else Juul, Else Karin Rossavik, Else Karin Solvik, Else Marie Jonsson, Else Marie Rønneberg Mcneil, Emmy Holmquist, Endre Mathias Gaard, Erik Hansen, Erik Larsen, Erik
Salte, Erlend Halsne, Erling Titlestad, Erling Trondsen, Erling Trædal, Erna Nilsen, Espen Solum, Eva Eliassen, Eva Wanvik, Eva Aalvik, Evy-Tone Håland, Evy Sagen, Fred
Humborstad, Fredrik Vik Jørgensen, Freidar Sagen, Frode Bø, Frode Gjedrem, Frode Handeland, Frode Kulien, Frode Ollestad, Frode Solheim, Frøydis Spetland, Gabriel Haugen,
Gaute Jacobsen, Gaute Thise Jacobsen, Geir Danielsen, Geir Gundersen, Geir Helge Tjordal, Geir Hoff, Geir Inge Lian, Geir Lie, Geir Olav Måland, Geir Rønhovde, Geir Tjentland,
Geir Aamdal, Gerd Bergum, Gerd Ellinor Eikje, Gerd Karin Snørteland, Gerd Oddny Sørhus, Gerd Soltvedt, Gerd Solveig Sande, Gerd Størkersen, Gerd Watland, Gerd Åsbø,
Gjermund Øren, Glenn Sæther, Greta Tungland, Grete Breisteinslien Olsen, Grete Elisabeth Eide, Grete Frøyland, Grete Oanæs Dahl, Grete Torarin Haga, Grete Ø. Aukland, Grethe
Berge Østhus, Grethe Eriksen, Grethe E. Gjerde, Grethe Iversen, Grethe N. Holm, Grethe S Schreuder, Gro Anita Nøkland, Gro Barka, Gro Berit Haferkamp, Gro Lillian Netland
Hulløen, Gro Tveit, Gry Berit Lundal, Gry L. Paulsen, Gry Soland, Gry Åmot Sjøvoll, Gudbjørg Hetland, Gunlaug Haugland, Gunn Haaland, Gunn Kristi Høgøy, Gunn Merete
Johansen, Gunn Nag Nordanger, Gunn Rygh, Gunn Smithson, Gunnar Eriksen, Gunnar Fatland, Gunnar Førland, Gunnar Kristiansen, Gunnar Nielsen, Gunnar Steinsson, Gunvor
Bergesen, Gunvor Bøe, Guri Aarrestad, Guro Edquist, Guttorm Sirnes, Gyrid Bakka, Gyro Eftestøl Naterstad, Gøran Heggen, Halfdan Meling, Hanne Berit Sunde, Hanne Iren
Sværen, Hanne Joa Jacobsen, Hanne Keth Qvale, Hanne Lise Lindløv, Hanne Synnøve Andreassen, Hanne Tove Østebøvik, Hanne Aanderaa Kristiansen, Hans Jacob Hornseth,
Hans Kristian Torske, Hans Petter Salvesen, Hans P. C. Hansen, Harald Grønnestad, Harald Skarveland, Harald Utvik Hamre, Harald Vorland, Hege Eriksen Nilsen, Hege
Kyllingstad, Hege Lind Tvedt, Hege M. Drarvik Olsnes, Hege O. Larsen, Heidi Høivik, Heidi Nag Flikka, Heinz Goldhahn, Helen Hellesvik, Helene Vaaland Eriksen, Helga
Undheim, Helga Vinje, Helge H. Helgø, Helge Ims, Helge Larsen, Helge Lennart Aarsheim, Helge Lindland, Helge Pollestad, Helge Thorsen, Helge Torjussen, Henning Stålesen,
Henry Bjørkelund, Herbert Lundervold, Hild Marit Torvestad, Hilde Grønhilder Kristiansen, Hilde Marie Djupevik, Hilde Netland, Hilde Sløgedal Stava, Hilde Thoresen Solvoll,
Hilde Tollefsen, Hugo Heitmann Hansen, Håkon Færaas, Håkon Løvslett, Håvard Norberg Bø, Håvard Øvregård, Idun Vagle, Ina Aurtun, Inge Nilson, Inge Reinertsen, Ingebjørg
Feria, Inger Alida Stangeland, Inger Håland Hinna, Inger Johanne Solberg, Inger Lise Ask, Inger Lise Jonassen, Inger Lise Leite, Inger Lise Løland, Inger Lise Tønnessen, Inger
Mathiassen, Inger Reidun Tjordal Underbakke, Inger Årsvoll Tuxen, Ingfrid Warhaug, Inglen Haugland, Ingolf Harkestad, Ingrid Fritzke Andresen, Ingrid N. Stueland, Ingrid
Skjæveland, Ingunn B. Mæland, Ingunn Mæhle, Ingunn Stokdal, Ingunn Sunnevåg, Ingvar Austrått, Ingve Henriksen, Ingve Lerang, Ingvild Fitje Håland, Irene Fjeldheim, Irene Goa,
Irene Nesbø, Ivar Skogen, Iver Tønnessen Mathiesen, Jacob Magne Kvinnsland, Jahn Fredrik Hoff, Jan Arild Sørbø, Jan Arne Puntervoll, Jan Audun Lutro, Jan Audun Pedersen, Jan
Eie, Jan Einar Thesen, Jan Erik Østbø, Jan Friestad, Jan Georg Byberg, Jan Inge Buer, Jan Inge Rasmussen, Jan Jørgen Larsen, Jan Kristian Byberg, Jan Michael Nilsen, Jan
Michaelsen, Jan Ove Wolff-Jakobsen, Jan Petter Mauland, Jan Petter Mikaelsen, Jan Sigve Løvold, Jan Tjelle, Jan Vidar Vestly, Jane Brit Tønnesen Ripland, Jane Cave, Jane Margon
Vølstad, Janne Anette Wold, Janne Bore, Janne Clausen, Janne Erfjord, Janne Eskeland, Janne Fjellvang, Janne Stangeland Rege, Jarl Endre Egeland, Joar Johnsen, Johan Bjørn
Hatleskog, Johan Bull-Njaa, Johannes Høynes, Johannes Vold, John Hov, John Instanes, John Lervik, John Aage Tisløv, Jonas Ytreland, Jone Omland, Jorunn Esther Oliversen,
Jorunn E. Helgøy, Jorunn Finnestad, Jorunn Jøssang, Jorunn Lilledal, Jorunn Nepstad, Jorunn Nordvik, Jorunn Pedersen Lima, Jorunn Reianes Tvedt, Jorunn Risanger, Jorunn
Simonsen, Jorunn Vadla, Jorunn Vestbøstad, Jostein Opsal, Judith Marie Taarland, Julianne Johansen, Julie Klepp, Jørgen Kristiansen, Kalle Naley, Karen Bergesen, Karen Elise
Stølsvik, Karen Strøm Olsen, Kari Ellingsen, Kari Foss, Kari Grødem, Kari Helen Tollefsen, Kari Helgøy, Kari Hoff, Kari Høyvik, Kari Håland, Kari Idsø, Karin Bråtane, Karina
Hobbesland, Karstein Øye, Karsten Helleberg, Kate Elin Gravdal, Kate Pallesen, Ken Bårdvik, Kenneth Dalaker, Ketil B. Askildsen, Kim Ingebretsen, Kirsten Andersen, Kirsten
Ehrhorn Bjerga, Kirsten Knutsen, Kirsten Siv Ellingsen, Kirsti Skoglie, Kirsti Windingstad Løvik, Kjell Birkeland, Kjell Hestvik, Kjell Otto Vikse, Kjell Rek, Kjellaug Håvarstein, Kjetil
Helgesen, Kjetil Helland, Kjetil Kiil Halvorsen, Kjetil Skjæveland, Kjetil Søyland, Kjetil Øygarden, Klara Marie Fiskå, Knut Einar Rovik, Knut Inge Houeland, Knut Jåsund, Knut Nesse,
Knut Sirevåg, Kristian Spanne, Kristian Sørhus, Kristian Ur, Kristin Gundersen Lund, Kristin H. Furuholt, Kristin Skaar Smines, Kristine Ree Espedal, Kåre Gundersen, Kåre Haga,
Kåre Idsøe, Kåre Mæland, Kåre Nils Hallberg, Kåre Aano, Laila Abrahamsen, Laila Berntsen, Laila Rasmussen, Laila Strøm Stange, Laila Vestbø Risa, Lars Arne Bleie, Lars
Enevoldsen, Lars Færevaag, Lars Magne Markhus, Lars Martin Andersen, Lars Meling Hultin, Lars Nærland, Lars Sletten, Lars Varhaug, Leif Bø, Leif E. Bjelland, Leif Inge Løland,
Leif Ole Terøy, Leif Tore Vika, Leiv Helge Kaldheim, Leiv Inge Stokka, Leiv Kåre Asbjørnsen, Leiv Vik, Lena Fidje, Lene Gravdal, Lene Hellestø, Lillian Vestre, Linda Hapnes, Linda
Helen Høie, Linda Lillebø Haugstad, Line Hillestad, Linn Danielsen Hordvik, Linn Vetrhus Lode, Lisbet Tellefsen, Lise Ravndal, Liv Grethe Bergjord, Liv Grethe Obrestad, Liv Helen
Pettersen, Liv Ingjerd Grude, Liv Jorunn Skåland, Liv Mykland, Liv Synnøve Jensen, Liv Tone Tou, Liv Tungland, Livar Dubland, Magnar Hobberstad, Magnar Sandanger, Magne Kr.
Haugland, Magnhild Henden, Magnhild Høiland, Magnus Bjorland, Mai Brit Hanasand, Margaret Sagvåg, Margareth Alfsvaag, Margareth Storesund, Margot Fauskanger, Margot
O. Kristoffersen, Margrete Engeberg, Margrete Nordvik, Margunn Bjørnøy, Margunn Herigstad, Margunn Haaland, Margunn Mikelsen, Mari-Anne Petersen, Marianne Bakke-
Andersen, Marianne Johanson, Marianne Kaada, Marianne Skårdal Austrått, Marianne Skaar, Marianne Thu Salvesen, Marie Brunes, Marie Rosseid Eikeland, Marit Bellesen, Marit
Gryte, Marit Halvorsen, Marit Hvidsten, Marit Idsøe Skarbøvik, Marit Kristin Brekke Fiskaaen, Marit Peggy Eie, Marit Simonsen Ohm, Marit Solberg, Marit Sørbø, Marit Thorsrud,
Marit Veshovde, Marita Fjelde, Marita Olsen, Marita Raaen, Marita Øpstad Naaden, Marius Richard Riise Johnsen, Marlin Furuløkken, Marta Sandvik, Martha H. Botnen, Martin
Henrichsen, Maryanne Skjerve, May Hilde Byberg, May Jorunn Vatnaland, May Kristiansen, May Kristin Enevoldsen, Meheret Dotche, Merete Gustavson, Merete Håland, Merethe
Annaniassen, Merethe Kristensen Jerstad, Merethe Olsen Bygland, Mette Stene, Mindor Jelsa, Mona Malde Pedersen, Monica Bakken, Monica Kristoffersen, Monica Lilleland,
Monica Tjora, Morten Erga, Morten Lange, Morten Roalsø, Møyfrid Mæland, Møyfrid Synnøve Fuglestad, Målfrid Tveit Fredriksen, Målfrid Voll, Nils Eie, Nils Inge Bokn, Nils Mikal
Emberland, Nils Mikal Hegrestad, Nina Christine Henriksen, Nina Elisabeth Mortensen, Nina F. Mydske, Nina Møll, Nina Sjøen, Nina Stange Jakobsen, Nina Werness, Norunn
Marie Nordbø, Odd Abrahamsen, Odd Arild Kvaløy, Odd Breistrand, Odd M. Langvik, Odd Terje Vadla, Oddfrid Warland, Oddny Aven, Oddny Hebnes, Oddny Johnsen, Oddrun
Tjeltveit, Oddvar Rettedal, Oddvar Skretting, Oddveig Lima, Ola Aspen, Olaug Nedrebø, Olav Handeland, Olav Håland, Olav Lande Rossebø, Olav Magne Gard, Olav Strand, Ole
Magnus Bækkelund, Ole Magnus Sirevåg, Ole Petter Dahl, Ole Sigbjørn Langeland, Ole Skjærseth, Ottar Varhaug, Ove Susort, Palma Flølo Ørevik, Peder Skåre, Per-Erik Larsen, Per
Arne Jacobsen, Per Egeland, Per Ingve Leidland, Per Magne Strømstad, Per Skibeli, Petter Linaae, Petter Ølberg, Pål Frøiland, Ragnar Tollisen, Ragnhild Hegrestad, Ragnhild
Røykenes, Ragnhild Åmodt, Randi Dale, Randi Eim, Randi Eim Johansen, Randi Kjær, Randi Lillebø Larsen, Randi Ravndal, Randi Torgersen, Randi Aase, Rasmus Kvassheim, Reidar
Graue, Reidar Haga, Reidar Lieng, Reidun Idland, Reidun Ingjerd Sand, Reidun Nordbø, Reidun Raustein, Reidun Thuestad, Rigmor Bø Austrått, Rita Solum, Roar Bjørnsen, Roar
Haualand, Roar Ullenes Olsen, Roger Abusland, Rolf Birkeland, Rolf Bjarne Lie, Rolf Egeland, Rolf Hansen, Rolf Inge Lura, Rolf Mikkelsen, Rolf Simonsen, Rolf Aarsheim, Roy
Fardal, Roy Helle, Roy Tønnessen, Rudi Vestvik, Runar Skarstein, Runar Aarekol, Rune Andersen, Rune Bertelsen, Rune Bjørlo, Rune Sleveland, Rune Vaage, Sally Lund-Andersen,
Saousen Ludvigsen, Seri Berge, Sigmund Bendiksen, Sigmund Bræk, Sigmund Traa, Signe Halvorsen, Signe Kristiansen, Signe Skeie, Sigrid Riskedal, Sigrunn Austrått, Sigrunn T.U.
Stangeland, Silje Rasmussen, Siri Lindås, Siri S Dalehaug, Siri Tansø, Siril Kristoffersen, Sissel Bolme Hamre, Sissel Fjermestad, Sissel Hagen, Sissel Johnsen, Sissel Rage, Sissel
Roa Hobberstad, Sissel Tønnessen, Siv Birkeland, Siv Hind, Siw Kristin Deisz, Sjur Andre Svihus, Sjur Eftevaag, Solbjørg Lima Skadberg, Solfrid Byberg, Solfrid Sæbø, Solveig
Haugsgjerd, Solveig Olsnes Romsøe, Stein Arne Pallesen, Stein Høiland, Stein Olav Tollaksen, Steinar Borgen, Steinar Stornes, Steinar Vestbø, Stian A. Wathne, Stian Dahl, Stian
Helgøy, Stian Miljeteig, Stian Simonsen, Stig Horsberg Eriksen, Stig Morten Nerheim, Stine Johannessen, Sturla Malde, Ståle Hoff, Ståle Rasmussen, Ståle Thomsen, Sune Svela
Madland, Svein Hauge, Svein Inge Sel, Svein Ivar Førland, Svein Nordbø, Svein Nåden, Svein Rosberg, Svein Rødland, Svein Tysdal, Svein Aarrestad, Sveinung Hestnes, Sverre
Aune, Sverre Bertelsen, Sverre Dahle, Synnøve Wathne, Terje Galta, Terje Gismervik, Terje Johnsen, Terje Krumsvik, Terje Lunde, Terje Torgersen, Terje Vareberg, Therese Håland
Haver, Thor-Christian Haugland, Thora Sæther, Thorbjørn Jacobsen, Thorbjørn Thorkildsen, Thore Lie, Thrine Seglem, Tina Erga, Tjalve Lekvam, Tom Andre Lund, Tom Håland,
Tom Leif Rusdal, Tom Lie, Tom Ove Horpestad, Tom Rune Tjelta, Tom Steinsvåg, Tommy Husebø Ramsvik, Tommy Sletten, Tone Johnsen, Tone Karlsen, Tone Solheim Grøsle,
Tone Tangnæs Schulze, Tone Thorsdalen, Tor Dahle, Tor Ege, Tor Harald Skien, Tor Martin Kristiansen, Tor Reidar Frøystein, Tor Salvesen, Tor Tollefsen, Tor Tveit, Tor Tveit
Aanestad, Tor Undset, Torbjørn Høie, Torbjørn Vasstveit, Tordis Haraldsen, Tordis Pedersen, Tordis Stenberg, Tore Drange, Tore Medhus, Tore Snørteland, Torfrid Baustad,
Torhild Bjørndal, Torhild Dyskeland, Torild Naaden, Torild Sæbø Salvesen, Torill Haaland, Torill Margrethe Bjelland, Tormod Roth, Torodd Varhaug, Torstein Plener, Torunn
Dyskeland, Torunn Synnøve Grude, Torvald Søiland, Tove Bjelland, Tove Christiansen, Tove Haaland, Tove Mette Mikkelsen, Tove Schilling, Trine Lise Mjåland, Trond Anton
Ringøen, Trond Haaverstein, Trond Larsen, Trond Ove Edland, Trond Rannestad, Trond Sandvik, Trond Stave, Trond Støldal, Trygve Jan Gundersen, Turid Frøyland, Turid Hansen,
Turid Holmen, Turid Larsen, Turid Røsdal, Turid T. Krone, Turid Vanvik, Venke Mæland, Veronica Varhaugvik, Vibeke Solheim, Vidar Grastveit, Vidar Høyvik, Vidar Plaszko, Vigleik
Sirnes, Wenche Andreassen, Wenche Endresen, Wenche Netland, Wenche Winge, Wiggo Gilje, Willy Nøstbakken, Willy Skjørestad, Øygunn Nødland Idsøe, Øystein Vestre, Øystein
Viland, Øyvind Bjørgengen, Øyvind Håheim, Øyvind Rege, Øyvind Rønnevik, Øyvind Sjøtrø, Øyvind Vestbø, Ågot Bratteli, Åse Eikesdal, Åse Gry Andreassen, Åse Holm, Åse Linda
Stava, Åse Rygg, Åse Venke Tjørhom, Åse Winnie Skjæveland, Åsmund Sirevåg, Aage Olsen, Aasta Kalstø
The Sparebank 1 SR-Bank
Group
HISTORY
Sparebanken Rogaland, the legal name of SpareBank 1 SR-
Bank, was established on 1 October 1976 by merging 22
savings banks to become the country’s first regional savings
bank. After 29 years of operations and merging of a total of 39
savings banks, the bank has become the region's leading
bank. In November 1996, Sparebanken Rogaland was party to
the formation of the SpareBank 1 alliance, a Nordic banking
and product partnership.
THE GROUP
In addition to the bank, the group consists of the financial
company SpareBank 1 SR-Finans AS, EiendomsMegler 1
Rogaland AS, SR Investering AS and the bank’s company for
active asset management, SR-Forvaltning ASA. The Group has
942 employees, and total assets of NOK 67.2 billion.
THE BANK
SpareBank 1 SR-Bank is the country's second largest savings
bank. The bank's market areas are Rogaland, Agder and
Sunnhordland, and the bank currently has 50 branch offices in
its market area. The head office is located in Stavanger.
The customer-directed activities are organised into a retail
market division and a retail market division.
Retail market
With 186,860 customers, SpareBank 1 SR-Bank is the leading
retail customer bank in Rogaland. In addition to retail
customers, the retail market division serves more than 8,600
small businesses and agricultural customers. The bank supplies
products and services in the fields of financing, placing of
investments, payments facilities, pensions, non-life insurance
and life assurance. At the end of 2005, SpareBank 1 SR-Bank
had 67,700 non-life insurance customers.
Corporate market
SpareBank 1 SR-Bank holds a solid position in the corporate
market. About 40% of all businesspeople in the bank’s traditional
market list SpareBank 1 SR-Bank as their main banking. Since
establishing itself in the Agder counties in the fall of 2002, the
bank has enjoyed a positive market trend. By the end of 2005,
Sparebank 1 SR-Bank had more than 200 corporate main
banking connection customers in Agder, and further healthy
growth is expected. In total, the bank’s corporate market
division serves approx. 4,200 customers in business and
public administration, in addition to the 8,600 small businesses
and agricultural customers served by the retail market division.
EIENDOMSMEGLER 1 ROGALAND AS
The EiendomsMegler 1 chain is the Norwegian market leader
in real estate brokerage. EiendomsMegler 1 Rogaland AS is
the largest firm in this chain, and a regional market leader. In
2005 the company brokered approximately 5,100 homes from
its 20 real estate offices in Rogaland and Agder. The company
has 120 employees. In addition to brokering homes,
EiendomsMegler 1 Rogaland AS has a separate division for
business and project brokering, a separate division for the
sale of new homes in Spain, as well as a division for brokering
homes in housing co-operatives.
SPAREBANK 1 SR-FINANS AS
SpareBank 1 SR-Finans AS is the leading leasing company in
Rogaland, with more than NOK 2.1 billion in total assets, and
23 employees. The company's offfices are located alongside
the bank’s corporate market division for Stavanger and Jæren
at Forus outside of Stavanger. Its main products are leasing
and car loans. The leasing portfolio consists of a wide range
of products, and the customers represent most of the region's
business sectors.
SR-FORVALTNING ASA
SR-Forvaltning ASA manages portfolios for approx. 1,900
external customers, and for SpareBank 1 SR-Bank and
SpareBank 1 SR-Bank’s pension fund. The objective of SR-
Forvaltning is to be a local alternative with a high level of
expertise in financial management. The company has total
assets of NOK 4.3 billion, and nine employees.
SR INVESTERING AS
SR Investering AS is the group's recently established company
4
SpareBank 1 SR-Bank Annual Report 2005

for investment in equity capital instruments. The company’s
objectiveis to invest in companies, ventures, private equity
and seed funds in order to contribute to long term value
creation in the group's market area. SR Investering AS has
initial assets of NOK 200 million.
THE SPAREBANK 1 ALLIANCE
The overall objective of the SpareBank 1 alliance is to develop,
procure, sell and supply financial services and products, as
well as exploiting economies of scale in the form of lower
costs and/or higher quality, giving the customer the best
advice and the best services at competitive terms. The
Norwegian banks in the alliance co-operate through the jointly
owned holding company SpareBank 1 Gruppen AS. In addition
to Sparebank 1 SR-Bank, the other participant banks are
Sparebanken 1 Nord-Norge, Sparebanken 1 Midt-Norge and
Samarbeidende Sparebanker AS (15 local savings banks in
eastern and northwest Norway). Other owners and partners
through the SpareBank 1 Gruppen AS include Förenings-
Sparbanken AB (publ) in Sweden and the Norwegian
Federation of Trade Unions (LO). SpareBank 1 Gruppen AS
owns the companies Bank 1 Oslo AS, SpareBank 1
Livsforsikring AS, SpareBank 1 Fondsforsikring AS, SpareBank
1 Skadeforsikring AS, Odin Forvaltning AS, SpareBank 1
Bilplan AS (19.9%) and First Securities ASA 24.5%).
OBJECTIVE OF SPAREBANK 1 SR-BANK
The objective of Sparebank 1 SR-Bank is the creation of value
for the region which we are part of.
VISION
"SpareBank 1 SR-Bank - the recommended bank"
STRATEGY
SpareBank 1 SR-Bank shall be a profitable and solid bank that
is attractive for customers, capital markets, primary capital
certificate owners and employees alike. This is to be ensured
through:
• A savings bank philosophy with a strong brand identity and
modern operations, in which values are created locally and
channelled back to the community
• A clear set of priorities based on customer needs and
profitability
• A market area consisting primarily of Rogaland, Agder and
Hordaland
• A considerable position in the savings and pension market
• Competent employees who are proud to work for
SpareBank 1 SR-Bank
5
Sparebank 1 SR-Bank group management team: Back row, from the left: Sveinung Hestnes (Deputy CEO), Tore Medhus (Executive Vice President
Corporate Market), Rolf Aarsheim (Executive Vice President Retail Market), Tor-Christian Haugland (Executive Vice President Public Relations).
Front row, from the left: Terje Vareberg (CEO), Frode Bø (Executive Vice President, Head of Risk Management), Svein Ivar Førland (Executive Vice
President, Business Support, IT and Security), Gro Tveit (Acting CFO) and Arild Langberg Johannessen (Executive Vice President, Human Resources).
Highlights
• Historically good results - high recoveries on losses and high return on financial investements
• Group profit before tax. NOK 1.096 mill (NOK 821 mill).
• Return on equity after tax: 24,7% (20,2%)
• Interest rate margin: 1,76% (2,03%)
• Net other operating income: NOK 925 mill (NOK 721 mill)
• Operating costs: NOK 1.012 mill (NOK 948 mill)
• Gross non-performing loans: NOK 130 mill (NOK 203 mill)
• Net recovered losses: NOK 70 million (Net losses NOK 81 million).
• 12 month growth in lending: +13,5% (+11,3%)
• 12 month growth in deposits from customers: 13,5 % (17,0 %)
• Dividend of NOK 14 (NOK 9,2) per PCC
• Allocation of NOK 92 mill (NOK 60 Mill) to the endowment fund
(Figures from corresponding period in 2004 in parenthesis)
6
SpareBank 1 SR-Bank Annual Report 2005
7
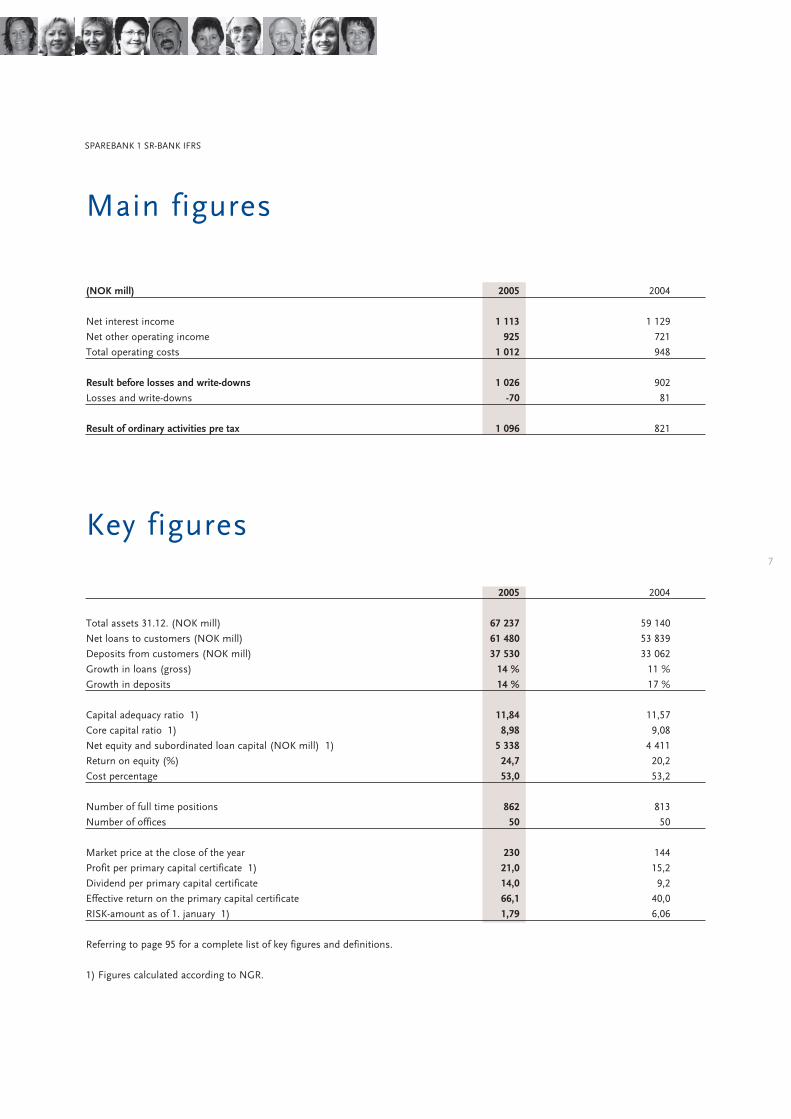
Main figures
(NOK mill) 2005 2004
Net interest income 1 113 1 129
Net other operating income 925 721
Total operating costs 1 012 948
Result before losses and write-downs 1 026 902
Losses and write-downs -70 81
Result of ordinary activities pre tax 1 096 821
Key figures
2005 2004
Total assets 31.12. (NOK mill) 67 237 59 140
Net loans to customers (NOK mill) 61 480 53 839
Deposits from customers (NOK mill) 37 530 33 062
Growth in loans (gross) 14 % 11 %
Growth in deposits 14 % 17 %
Capital adequacy ratio 1) 11,84 11,57
Core capital ratio 1) 8,98 9,08
Net equity and subordinated loan capital (NOK mill) 1) 5 338 4 411
Return on equity (%) 24,7 20,2
Cost percentage 53,0 53,2
Number of full time positions 862 813
Number of offices 50 50
Market price at the close of the year 230 144
Profit per primary capital certificate 1) 21,0 15,2
Dividend per primary capital certificate 14,0 9,2
Effective return on the primary capital certificate 66,1 40,0
RISK-amount as of 1. january 1) 1,79 6,06
Referring to page 95 for a complete list of key figures and definitions.
1) Figures calculated according to NGR.
SPAREBANK 1 SR-BANK IFRS

8
SpareBank 1 SR-Bank Annual Report 2005
2005 WAS A VERY GOOD YEAR FOR SPAREBANK 1 SR-BANK. Customer satisfaction with our products and
services has been further strengthened. The financial result places the bank among the best banks in Norway
and the Nordic countries and creates a solid foundation for further efforts for the benefit of the region.
What you
is what sets you apart from
the others.
Norway is in a broad-based and probably long-term positive
economic cycle. Good times require strong backs. This is why
it is important to emphasize the need for long-term thinking
and action. The foundation for the development of the region
over the next 10-15 years is being laid now.
In this perspective, one must stress the necessity of careful
attention to the forces which may move or shift the develop-
ment in a positive or negative direction. In 2006, IRIS and
Agder Research will present scenarios for the Rogaland and
Agder counties towards 2020. The objective of this effort is to
create a debate on the long-term forces in play and take
measures to strengthen and exploit positive effects and to
counter negative developments.
In our view, active and diverse ownership with a will to deve-
lop and invest is very important to business development and
the creation of new jobs in the region. SpareBank 1 SR-Bank is
an active partner in the dialogue to create ownership and
equity groups in the region. We were also among the initiators
of Energivekst AS, which has a total equity of NOK 700
million. This company has had a very positive development
and has prepared the foundation for a second phase in which
a further NOK 1.8 billion has been committed. The experien-
ces from Energivekst and the development of other ownership
groups in the region underline the will and importance of
private ownership for positive business development.
Commercialisation of research results is demanding, but we
need to succeed in this respect if we are to supply more
knowledge-based products and services in the future. The
challenge is often not access to capital per se, but combining
competent, industrially oriented capital and commercially
viable ideas.
With the new international division of labour, toll and technical
trade barriers are dismantled. Markets for goods and services
are becoming integrated across national boundaries. A
vigorous and competitive business environment in our region
will have to supply products and services with an even higher
knowledge content than today. This means that the products
must reach markets with a high willingness to pay. As Norway
is a member of the EU inner market, the sections of our
industry which are exposed to competition must have the
same external conditions as the industries in the countries
with which we compete.
As far as long-term measures are concerned, equal external
conditions are by far the most important factor for positive
business development.
There have been significant structural changes in the finance
industry over the last 10 years. As a result of earlier state-
controlled banks Kredittkassen and Fokus Bank being taken
over by foreign banks, SpareBank 1 SR-Bank is now the
country's second largest Norwegian-owned bank. We believe
the nation and the region are best served by a diversity of
players in the finance sector, with Norwegian players also
having a role to play.
In light of this, it is with some concern we note the burgeoning
initiatives from European commercial banks to change the
special arrangement for savings banks as self-owned
foundations. Norwegian savings banks ensure a wide-ranging
ownership across Norway and represent a local and regional
corrective to the national and international financial groups.
Through their chartered purpose to serve the public good, the
savings banks can re-allocate a share of the profits to worthy
causes in the local community. At present, there are 126
savings banks in Norway. The need for structural changes and
adaptation in the Norwegian banking sector will be continuous.
However, a basic principle must be that such changes take
place in accordance with the wishes of the local community
which has contributed to creating the values which are
retained as equity in the savings banks' funds.
This year, SpareBank 1 SR-Bank will celebrate its 30-year
anniversary as the first regional bank in Norway. We believe
that being a savings bank is founded upon a very good
business concept in which a local foundation is combined
with proximity and expertise in all relations with our customers.
SpareBank 1 SR-Bank has always aimed for profitability and
solidity when conducting its business. High profitability is
also a precondition for being able to play an active part as a
regional development partner with considerable civic involve-
ment. The position which the bank has achieved in its market
would have been difficult to attain without the binding co-
operation which has been established with other savings
banks through the SpareBank 1 alliance. It is with satisfaction
we note that more and more savings banks share our view
and we welcome Sparebanken Volda Ørsta into the alliance.
In 2005, the SpareBank 1 banks and SpareBank 1 Gruppen AS
have again achieved financial results which place the banks in
a class of their own, compared to other Norwegian banks. The
results confirm the contribution of our long-term cooperation
strategy in strengthening the individual bank's position in the
respective markets.
SpareBank 1 SR-Bank has, for several years, had a high degree
of operating efficiency, a profitability equal to the best, a high
degree of employee satisfaction and in 2005 a sick leave rate
of 2.8 per cent. Outstanding results are created by proud,
thriving and busy employees.
9
Stavanger, March 2006
Terje Vareberg
CEO
Annual report
2005
SpareBank 1 SR-Bank achieved a pre-tax group profit of NOK
1,096 million in 2005. This is an improvement of NOK 275
million from 2004. After tax, the profit was NOK 856 million,
an improvement of NOK 244 million from 2004. Return on
equity after tax was 24.7 per cent, compared to 20.2 per cent
in 2004.
The very strong result in 2005 is, in addition to fundamentally
sound banking operations, due to: low losses, payments
connected to the Finance Credit involvement, positive securities
gains and very positive contribution from the stake in
SpareBank 1 Gruppen AS.
The Board is very pleased with the results for 2005.
The 2005 annual accounts for the SpareBank 1 SR-Bank group
have been prepared according to IFRS. All group figures are
stated according to IFRS, while all parent bank figures are
stated according to Norwegian Accounting Standards (NGR).
Comparable figures for 2004 have been converted into IFRS in
the group accounts. For a more detailed description of IFRS
implementation, see the separate section in the annual report,
and the annual accounts.
The groups lendings increased by 13.5 per cent and deposits
increased by 13.5 per cent in 2005.
Deposits as measured in percentage of gross lending were
60.7 per cent by the end of the year.
Net interest received was NOK 1,135 million in 2005, down
NOK 16 million from 2004. The interest margin was 1.76 per
cent in 2005. This is a decline from 2.03 per cent in 2004.
Net commission income was NOK 377 million, up 10.6 per
cent in 2005. Income from financial investments, jointly
controlled businesses and other operating income increased
by NOK 168 million to NOK 548 million in 2005. This increase
was partly due to very strong results from SpareBank 1
Gruppen, as well as solid yield from the group's securities.
Other income (excluding capital gains on securities, dividend
and other income from ownership) amount to 36.5 per cent
of total income, compared to 34.5 per cent in 2004.
Costs increased by 6.8 per cent in 2005. The cost percentage
for the parent bank was 48.4, and 53.0 per cent for the group.
The group had net reverse losses of NOK 70 million,
compared to losses of NOK 81 million in 2004. Corrected for
reverse losses from on the Finance Credit involvement, the
regular loss costs in 2005 were NOK 6 million. Defaults have
been reduced by NOK 73 million in 2005 and were NOK 130
million by the end of the year (0.21 per cent of gross lending).
The Board proposes that of the annual profit of NOK 840
million in the parent bank, NOK 317 million be allocated to
dividend (NOK 14 per primary capital certificate), NOK 156
million be allocated to the equalisation fund, NOK 92 million
be allocated to the endowment fund and NOK 275 million be
allocated to the savings bank's fund.
DEVELOPMENT OF THE GROUP
SpareBank 1 SR-Bank continued making good progress in the
group's business areas in 2005. The group confirmed its
position as the market leader in Rogaland, both in the retail
and corporate markets, as well as in real estate brokering. At
the same time, the group has continued its positive develop-
ment in the Agder counties. In the spring of 2005, SpareBank
1 SR-Bank and EiendomsMegler 1 Rogaland AS opened a new
branch in Grimstad. In the first quarter of 2006, the bank will
open. In 2005, the group decided to expand its geographical
business area to also include Hordaland. In the spring of
2006, the group will open a branch in Bergen where banking,
real estate brokering and leasing will form part of the product
range. Key personnel have been hired and the localisation
decided.
The interaction between the retail market division, the
corporate market division, the subsidiaries and the bank's
special divisions for trading, cash management and insurance
is an important factor behind the strong results in 2005.
A low interest rate level combined with strengthened
10
SpareBank 1 SR-Bank Annual Report 2005
competition in loan products has weakened the interest mar-
gin. The growth in lending shows that there is still a high acti-
vity level in both the group's retail and corporate markets.
The new EU Capital Adequacy Directive Basel II is scheduled
for implementation in Norway from January 1 2007.
SpareBank 1 SR-Bank has high ambitions as regards risk
management in general and for adapting to the new capital
adequacy regime in particular. This is why SpareBank 1 SR-
Bank applied to the Financial Supervisory Authority of Norway
for permission to use internal measuring methods (Internal
Rating-Based Approach - Foundation) for credit risk and the
standard for operational risk management from 1 January
2007. An answer to the application from the Financial
Supervisory Authority of Norway is expected in the autumn of
2006. This is described in greater depth in a separate chapter
in the annual report.
The group reached its targets for 2005 with results well above
the target figure of 15 per cent return on equity after tax, 8 per
cent core capital and almost 12 per cent capital adequacy.
The bank's target of a 50 per cent cost income ratio in the
parent bank has also been reached. The cost income ratio in
the parent bank ended up at 48.4 per cent.
The Board believes it is important to the business community
that SpareBank 1 SR-Bank is a solid financial group with a
local attachment, which can supply necessary capital for
growth and development in the group's market areas,
primarily Rogaland, Agder and Hordaland. In order to
contribute further to the long-term creation of value in the
group's market areas, a new wholly owned investment
company, SR Investering AS, was established in late 2005.
At the same time, SpareBank 1 SR-Bank shows a social
commitment through support of local initiatives in culture,
sports and education. This is done through active use of the
bank's endowment fund. In 2005, a total of NOK 51 million
was granted from the endowment fund.
DEVELOPMENT IN THE GROUP'S MARKET AREAS
The rising economic cycle which has characterised the
Norwegian economy since the latter half of 2003 seems to
continue into 2006, if not as strongly as in 2005. 2005 was
characterised in part by low interest rates and increased
productivity, and in the latter half also by falling unemployment
and a general optimism both in the business community and
households. The export industries are also experiencing
positive development. The growth rate in the Norwegian
economy is high and there is much to indicate that we are
close to full use of capacity. The drop in unemployment rates
has been more marked in Rogaland than in Norway as a
whole. Increased employment in business and industry has
led to a tighter labour market. According to the Economic
Barometer for Rogaland, there is already a lack of qualified
personnel in some industries, and this can lead to increased
pressure on wages and slow growth. This has, among other
things, led to an increase in the use of foreign labour.
The Rogaland business community is experiencing good
times, and according to the Economic Barometer for
Rogaland the prevailing mood for 2006 is one of optimism.
The majority of the businesses expect higher turnover and
profitability in 2006 than in 2005. 40 per cent of the
businesses in the poll expected increased manning needs in
2006. In addition, the municipalities have increased their
hiring in 2005, and increased transfers of state funds are
expected to lead to a continuation of this trend also in 2006.
Oil investments are expected to reach record levels next year,
with a prognosis of almost NOK 93 billion. The increased
level of oil investment is to a large extent due to increased
interest in oil and gas recovery due to the strong rise in the
price of oil. The spillover effects are considerable for the
Norwegian economy in general and for Rogaland in particular.
The development noted in the Agder counties is not dissimilar
from what we see in Rogaland, with falling unemployment
rates, optimism in the business community and an increased
need for labour. Over the last year, unemployment has been
reduced by 30 per cent in Aust-Agder and 13 per cent in Vest-
Agder. The most predominant factors in this development is
growth in orders and new industry enterprises, which are
important in the Agder region.
The same trend is seen in Hordaland, and according to the
NHO (Confederation of Norwegian Enterprise) Economic
Barometer for Hordaland and Sogn og Fjordane, the optimism
in the business community is on the increase. In Hordaland,
an employment increase on the order of 5-6,000 people is
expected in 2006. The highest growth is expected in
construction, retail and business services. Most businesses
expect increased turnover and higher profitability, which will
most likely lead to increased investment.
By the end of December 2005, there were 5,190 completely
unemployed people in Rogaland, according to the Labour
Market Administration. This is 2.5 per cent of the labour
force, a reduction of 1,697 people compared to December
2004. With an unemployment rate of 2.5 per cent, the
unemployment rate in Rogaland is 0.5 percentage points
below the national average. Unemployment in Rogaland is
down 0.8 percentage points since December 2004, while the
corresponding national average is 0.6 percentage points. The
unemployment rate has been reduced in spite of high labour
immigration from the EEA area and a reduction in sick leave.
In the Agder counties, unemployment was reduced by 1,290
people in 2005, to 4,500 people by the end of the year. In
Vest-Agder and Aust-Agder, unemployment rates were 3.6 and
3.2 per cent, respectively. This puts the total unemployment
in the Agder counties somewhat above the national average.
However, unemployment in the Agder counties fell considerably
more than the national average.
According to Statistics Norway, there were 396,490 people
living in Rogaland at the end of the third quarter of 2005. The
population increased by 3,386 people (0.9 per cent) in the
three first quarters of 2005. Only Oslo and Akershus have a
higher population growth rate than Rogaland. It is the Jæren
municipalities, including Stavanger and Sandnes, which have
11
the highest growth rate in the county, measured in per cent.
The number of inhabitants in the Agder counties was 266,268
at the end of the third quarter of 2005. This is an increase of
1,396 (0.5 per cent) in the first three quarters of 2005. The
population growth rate in the Agder counties was somewhat
lower than the national average of 0.6 per cent in the same
period. There are large regional differences in the Agder
counties as well. Kristiansand has the highest growth,
measured in per cent.
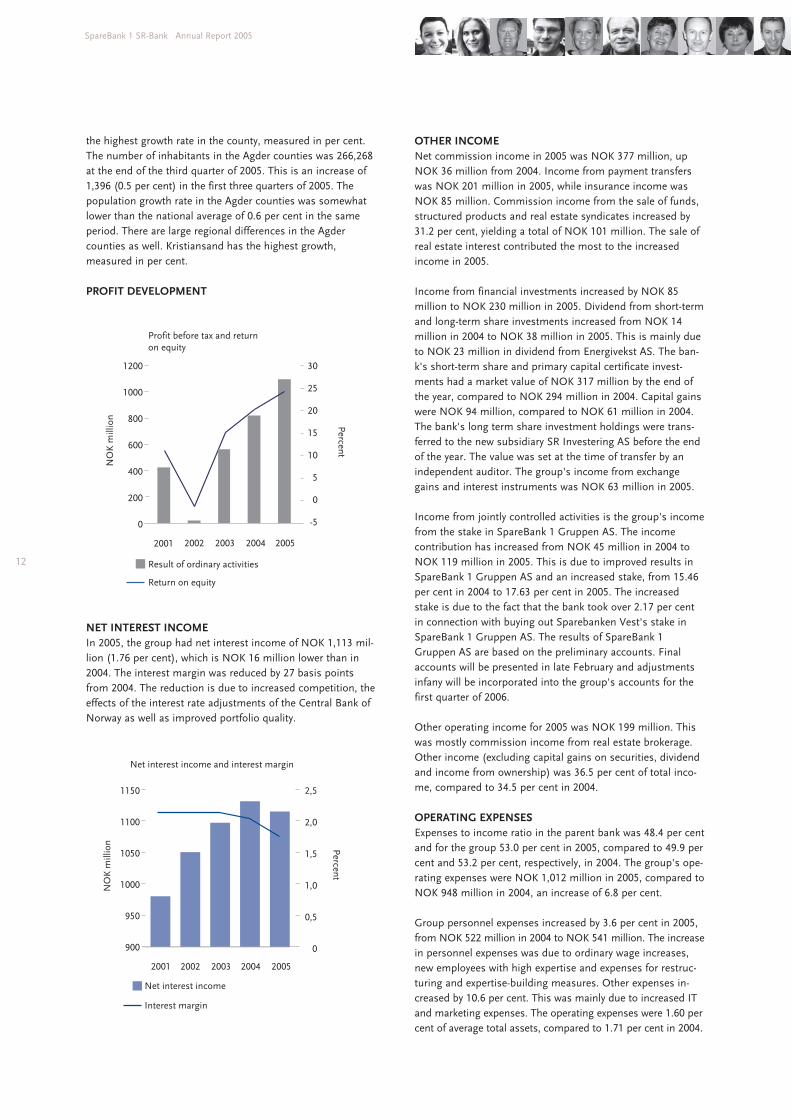
PROFIT DEVELOPMENT
NET INTEREST INCOME
In 2005, the group had net interest income of NOK 1,113 mil-
lion (1.76 per cent), which is NOK 16 million lower than in
2004. The interest margin was reduced by 27 basis points
from 2004. The reduction is due to increased competition, the
effects of the interest rate adjustments of the Central Bank of
Norway as well as improved portfolio quality.
OTHER INCOME
Net commission income in 2005 was NOK 377 million, up
NOK 36 million from 2004. Income from payment transfers
was NOK 201 million in 2005, while insurance income was
NOK 85 million. Commission income from the sale of funds,
structured products and real estate syndicates increased by
31.2 per cent, yielding a total of NOK 101 million. The sale of
real estate interest contributed the most to the increased
income in 2005.
Income from financial investments increased by NOK 85
million to NOK 230 million in 2005. Dividend from short-term
and long-term share investments increased from NOK 14
million in 2004 to NOK 38 million in 2005. This is mainly due
to NOK 23 million in dividend from Energivekst AS. The ban-
k's short-term share and primary capital certificate invest-
ments had a market value of NOK 317 million by the end of
the year, compared to NOK 294 million in 2004. Capital gains
were NOK 94 million, compared to NOK 61 million in 2004.
The bank's long term share investment holdings were trans-
ferred to the new subsidiary SR Investering AS before the end
of the year. The value was set at the time of transfer by an
independent auditor. The group's income from exchange
gains and interest instruments was NOK 63 million in 2005.
Income from jointly controlled activities is the group's income
from the stake in SpareBank 1 Gruppen AS. The income
contribution has increased from NOK 45 million in 2004 to
NOK 119 million in 2005. This is due to improved results in
SpareBank 1 Gruppen AS and an increased stake, from 15.46
per cent in 2004 to 17.63 per cent in 2005. The increased
stake is due to the fact that the bank took over 2.17 per cent
in connection with buying out Sparebanken Vest's stake in
SpareBank 1 Gruppen AS. The results of SpareBank 1
Gruppen AS are based on the preliminary accounts. Final
accounts will be presented in late February and adjustments
infany will be incorporated into the group's accounts for the
first quarter of 2006.
Other operating income for 2005 was NOK 199 million. This
was mostly commission income from real estate brokerage.
Other income (excluding capital gains on securities, dividend
and income from ownership) was 36.5 per cent of total inco-
me, compared to 34.5 per cent in 2004.
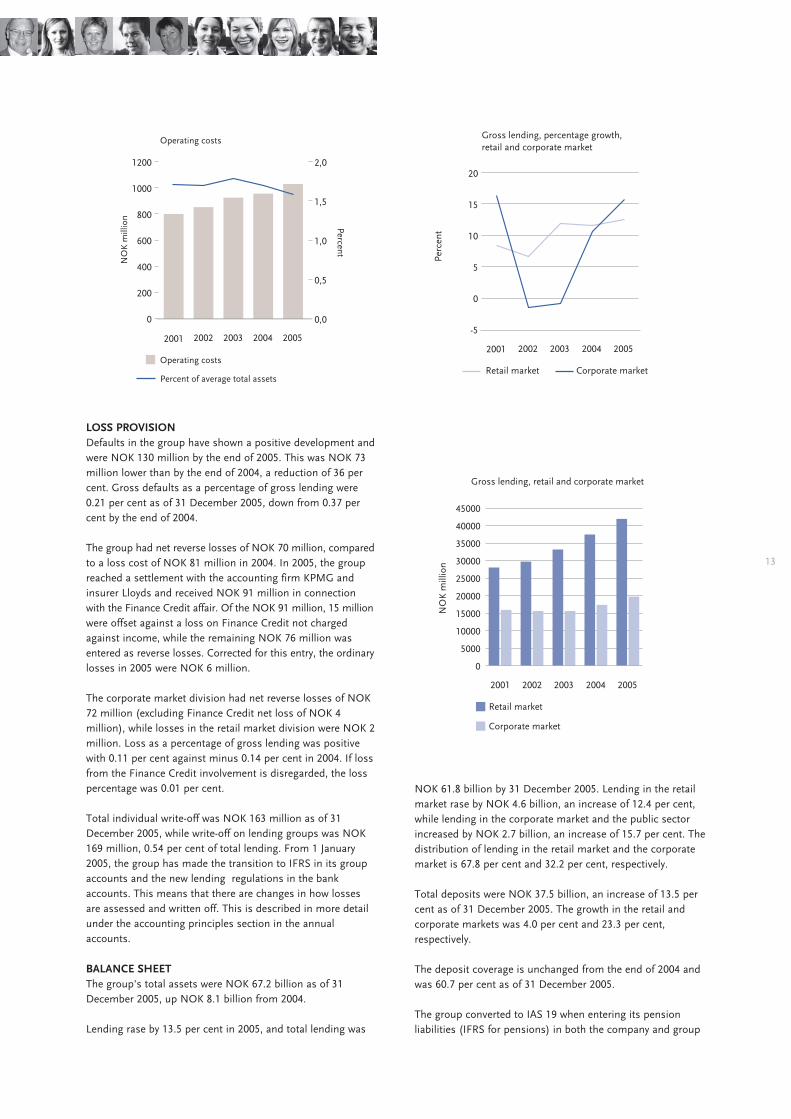
OPERATING EXPENSES
Expenses to income ratio in the parent bank was 48.4 per cent
and for the group 53.0 per cent in 2005, compared to 49.9 per
cent and 53.2 per cent, respectively, in 2004. The group's ope-
rating expenses were NOK 1,012 million in 2005, compared to
NOK 948 million in 2004, an increase of 6.8 per cent.
Group personnel expenses increased by 3.6 per cent in 2005,
from NOK 522 million in 2004 to NOK 541 million. The increase
in personnel expenses was due to ordinary wage increases,
new employees with high expertise and expenses for restruc-
turing and expertise-building measures. Other expenses in-
creased by 10.6 per cent. This was mainly due to increased IT
and marketing expenses. The operating expenses were 1.60 per
cent of average total assets, compared to 1.71 per cent in 2004.
12
SpareBank 1 SR-Bank Annual Report 2005
NO
K m
illio
n
Percent
Result of ordinary activities
Profit before tax and returnon equity
Return on equity
2002 2003 2004 20052001
Net interest income and interest margin
2002 2003 2004
NO
K m
illio
n Percent
2005
Net interest income
Interest margin
1150
1100
1050
1000
950
900
2001
LOSS PROVISION
Defaults in the group have shown a positive development and
were NOK 130 million by the end of 2005. This was NOK 73
million lower than by the end of 2004, a reduction of 36 per
cent. Gross defaults as a percentage of gross lending were
0.21 per cent as of 31 December 2005, down from 0.37 per
cent by the end of 2004.
The group had net reverse losses of NOK 70 million, compared
to a loss cost of NOK 81 million in 2004. In 2005, the group
reached a settlement with the accounting firm KPMG and
insurer Lloyds and received NOK 91 million in connection
with the Finance Credit affair. Of the NOK 91 million, 15 million
were offset against a loss on Finance Credit not charged
against income, while the remaining NOK 76 million was
entered as reverse losses. Corrected for this entry, the ordinary
losses in 2005 were NOK 6 million.
The corporate market division had net reverse losses of NOK
72 million (excluding Finance Credit net loss of NOK 4
million), while losses in the retail market division were NOK 2
million. Loss as a percentage of gross lending was positive
with 0.11 per cent against minus 0.14 per cent in 2004. If loss
from the Finance Credit involvement is disregarded, the loss
percentage was 0.01 per cent.
Total individual write-off was NOK 163 million as of 31
December 2005, while write-off on lending groups was NOK
169 million, 0.54 per cent of total lending. From 1 January
2005, the group has made the transition to IFRS in its group
accounts and the new lending regulations in the bank
accounts. This means that there are changes in how losses
are assessed and written off. This is described in more detail
under the accounting principles section in the annual
accounts.
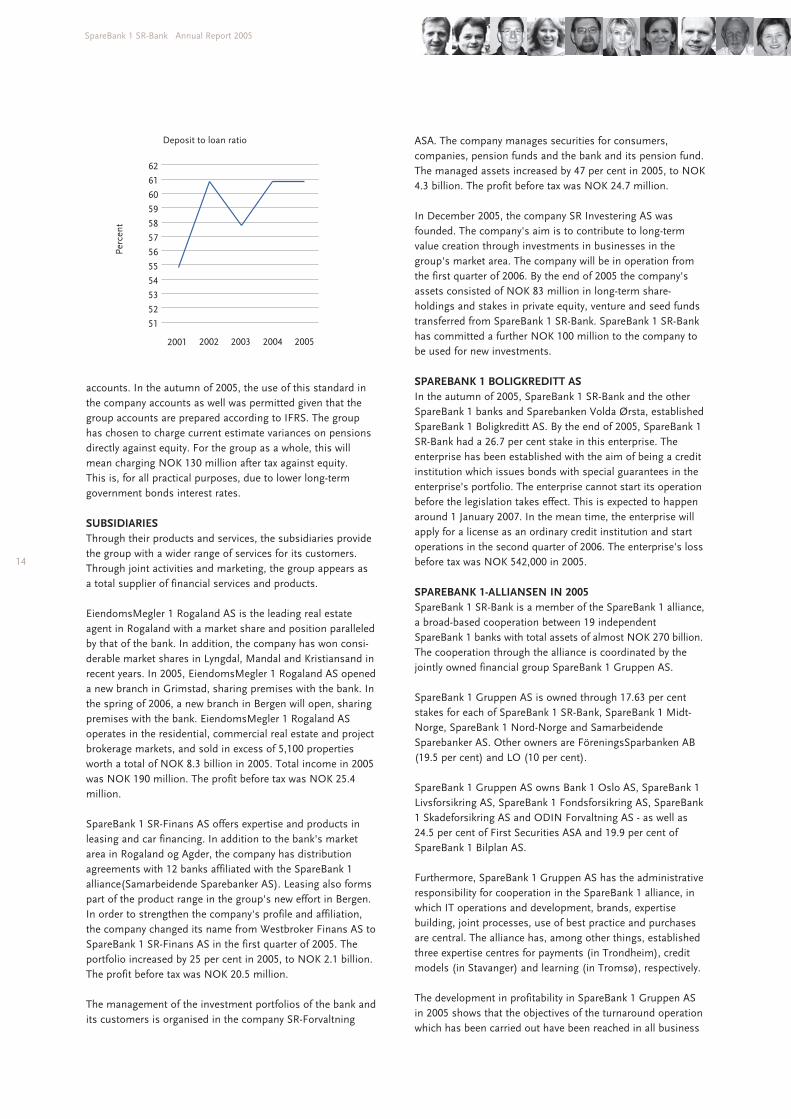
BALANCE SHEET
The group's total assets were NOK 67.2 billion as of 31
December 2005, up NOK 8.1 billion from 2004.
Lending rase by 13.5 per cent in 2005, and total lending was
NOK 61.8 billion by 31 December 2005. Lending in the retail
market rase by NOK 4.6 billion, an increase of 12.4 per cent,
while lending in the corporate market and the public sector
increased by NOK 2.7 billion, an increase of 15.7 per cent. The
distribution of lending in the retail market and the corporate
market is 67.8 per cent and 32.2 per cent, respectively.
Total deposits were NOK 37.5 billion, an increase of 13.5 per
cent as of 31 December 2005. The growth in the retail and
corporate markets was 4.0 per cent and 23.3 per cent,
respectively.
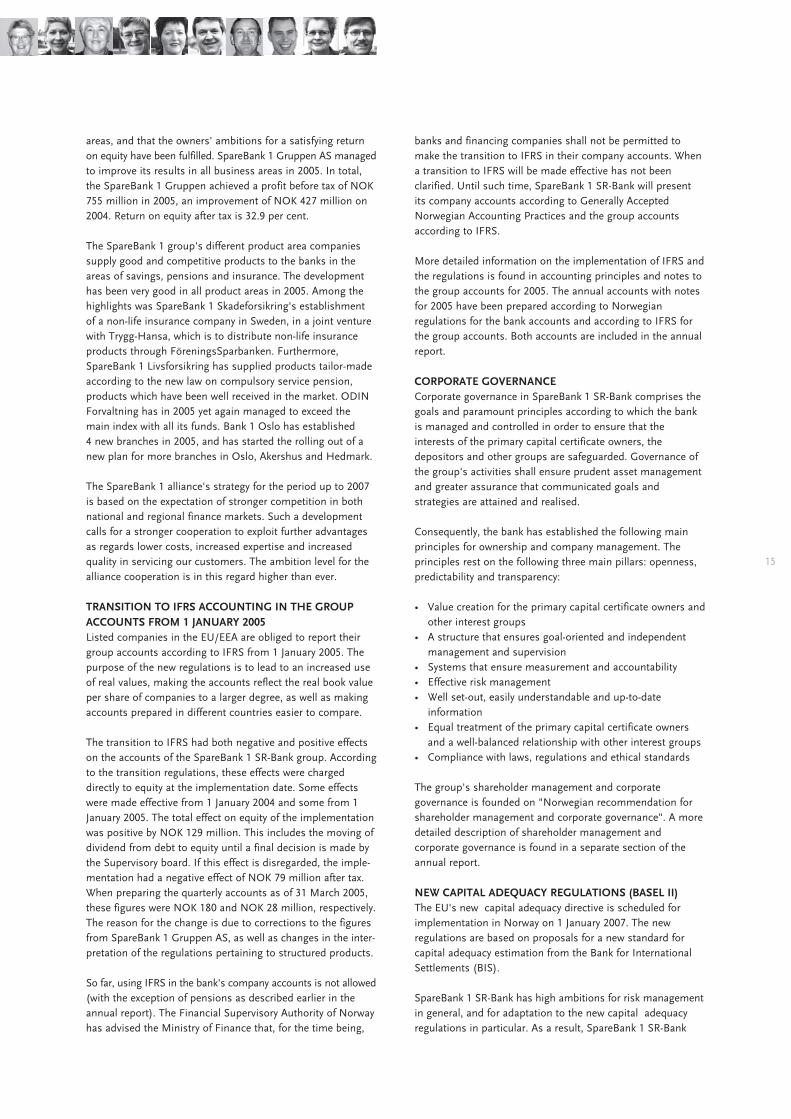
The deposit coverage is unchanged from the end of 2004 and
was 60.7 per cent as of 31 December 2005.
The group converted to IAS 19 when entering its pension
liabilities (IFRS for pensions) in both the company and group
13
Operating costs
Operating costs
Percent of average total assets
NO
K m
illio
n
Percent
20
15
10
5
0
-5
Gross lending, percentage growth,retail and corporate market
2002 2003 2004
Perc
ent
20052001
Retail market Corporate market
Gross lending, retail and corporate market
NO
K m
illio
n
Retail market
Corporate market
45000
40000
35000
30000
25000
20000
15000
10000
5000
0
2002 2003 2004 20052001
accounts. In the autumn of 2005, the use of this standard in
the company accounts as well was permitted given that the
group accounts are prepared according to IFRS. The group
has chosen to charge current estimate variances on pensions
directly against equity. For the group as a whole, this will
mean charging NOK 130 million after tax against equity.
This is, for all practical purposes, due to lower long-term
government bonds interest rates.
SUBSIDIARIES
Through their products and services, the subsidiaries provide
the group with a wider range of services for its customers.
Through joint activities and marketing, the group appears as
a total supplier of financial services and products.
EiendomsMegler 1 Rogaland AS is the leading real estate
agent in Rogaland with a market share and position paralleled
by that of the bank. In addition, the company has won consi-
derable market shares in Lyngdal, Mandal and Kristiansand in
recent years. In 2005, EiendomsMegler 1 Rogaland AS opened
a new branch in Grimstad, sharing premises with the bank. In
the spring of 2006, a new branch in Bergen will open, sharing
premises with the bank. EiendomsMegler 1 Rogaland AS
operates in the residential, commercial real estate and project
brokerage markets, and sold in excess of 5,100 properties
worth a total of NOK 8.3 billion in 2005. Total income in 2005
was NOK 190 million. The profit before tax was NOK 25.4
million.
SpareBank 1 SR-Finans AS offers expertise and products in
leasing and car financing. In addition to the bank's market
area in Rogaland og Agder, the company has distribution
agreements with 12 banks affiliated with the SpareBank 1
alliance(Samarbeidende Sparebanker AS). Leasing also forms
part of the product range in the group's new effort in Bergen.
In order to strengthen the company's profile and affiliation,
the company changed its name from Westbroker Finans AS to
SpareBank 1 SR-Finans AS in the first quarter of 2005. The
portfolio increased by 25 per cent in 2005, to NOK 2.1 billion.
The profit before tax was NOK 20.5 million.
The management of the investment portfolios of the bank and
its customers is organised in the company SR-Forvaltning
ASA. The company manages securities for consumers,
companies, pension funds and the bank and its pension fund.
The managed assets increased by 47 per cent in 2005, to NOK
4.3 billion. The profit before tax was NOK 24.7 million.
In December 2005, the company SR Investering AS was
founded. The company's aim is to contribute to long-term
value creation through investments in businesses in the
group's market area. The company will be in operation from
the first quarter of 2006. By the end of 2005 the company's
assets consisted of NOK 83 million in long-term share-
holdings and stakes in private equity, venture and seed funds
transferred from SpareBank 1 SR-Bank. SpareBank 1 SR-Bank
has committed a further NOK 100 million to the company to
be used for new investments.
SPAREBANK 1 BOLIGKREDITT AS
In the autumn of 2005, SpareBank 1 SR-Bank and the other
SpareBank 1 banks and Sparebanken Volda Ørsta, established
SpareBank 1 Boligkreditt AS. By the end of 2005, SpareBank 1
SR-Bank had a 26.7 per cent stake in this enterprise. The
enterprise has been established with the aim of being a credit
institution which issues bonds with special guarantees in the
enterprise's portfolio. The enterprise cannot start its operation
before the legislation takes effect. This is expected to happen
around 1 January 2007. In the mean time, the enterprise will
apply for a license as an ordinary credit institution and start
operations in the second quarter of 2006. The enterprise's loss
before tax was NOK 542,000 in 2005.
SPAREBANK 1-ALLIANSEN IN 2005
SpareBank 1 SR-Bank is a member of the SpareBank 1 alliance,
a broad-based cooperation between 19 independent
SpareBank 1 banks with total assets of almost NOK 270 billion.
The cooperation through the alliance is coordinated by the
jointly owned financial group SpareBank 1 Gruppen AS.
SpareBank 1 Gruppen AS is owned through 17.63 per cent
stakes for each of SpareBank 1 SR-Bank, SpareBank 1 Midt-
Norge, SpareBank 1 Nord-Norge and Samarbeidende
Sparebanker AS. Other owners are FöreningsSparbanken AB
(19.5 per cent) and LO (10 per cent).
SpareBank 1 Gruppen AS owns Bank 1 Oslo AS, SpareBank 1
Livsforsikring AS, SpareBank 1 Fondsforsikring AS, SpareBank
1 Skadeforsikring AS and ODIN Forvaltning AS - as well as
24.5 per cent of First Securities ASA and 19.9 per cent of
SpareBank 1 Bilplan AS.
Furthermore, SpareBank 1 Gruppen AS has the administrative
responsibility for cooperation in the SpareBank 1 alliance, in
which IT operations and development, brands, expertise
building, joint processes, use of best practice and purchases
are central. The alliance has, among other things, established
three expertise centres for payments (in Trondheim), credit
models (in Stavanger) and learning (in Tromsø), respectively.
The development in profitability in SpareBank 1 Gruppen AS
in 2005 shows that the objectives of the turnaround operation
which has been carried out have been reached in all business
14
SpareBank 1 SR-Bank Annual Report 2005
Deposit to loan ratio
2002 2003 2004
Perc
ent
20052001
areas, and that the owners' ambitions for a satisfying return
on equity have been fulfilled. SpareBank 1 Gruppen AS managed
to improve its results in all business areas in 2005. In total,
the SpareBank 1 Gruppen achieved a profit before tax of NOK
755 million in 2005, an improvement of NOK 427 million on
2004. Return on equity after tax is 32.9 per cent.
The SpareBank 1 group's different product area companies
supply good and competitive products to the banks in the
areas of savings, pensions and insurance. The development
has been very good in all product areas in 2005. Among the
highlights was SpareBank 1 Skadeforsikring's establishment
of a non-life insurance company in Sweden, in a joint venture
with Trygg-Hansa, which is to distribute non-life insurance
products through FöreningsSparbanken. Furthermore,
SpareBank 1 Livsforsikring has supplied products tailor-made
according to the new law on compulsory service pension,
products which have been well received in the market. ODIN
Forvaltning has in 2005 yet again managed to exceed the
main index with all its funds. Bank 1 Oslo has established
4 new branches in 2005, and has started the rolling out of a
new plan for more branches in Oslo, Akershus and Hedmark.
The SpareBank 1 alliance's strategy for the period up to 2007
is based on the expectation of stronger competition in both
national and regional finance markets. Such a development
calls for a stronger cooperation to exploit further advantages
as regards lower costs, increased expertise and increased
quality in servicing our customers. The ambition level for the
alliance cooperation is in this regard higher than ever.
TRANSITION TO IFRS ACCOUNTING IN THE GROUP
ACCOUNTS FROM 1 JANUARY 2005
Listed companies in the EU/EEA are obliged to report their
group accounts according to IFRS from 1 January 2005. The
purpose of the new regulations is to lead to an increased use
of real values, making the accounts reflect the real book value
per share of companies to a larger degree, as well as making
accounts prepared in different countries easier to compare.
The transition to IFRS had both negative and positive effects
on the accounts of the SpareBank 1 SR-Bank group. According
to the transition regulations, these effects were charged
directly to equity at the implementation date. Some effects
were made effective from 1 January 2004 and some from 1
January 2005. The total effect on equity of the implementation
was positive by NOK 129 million. This includes the moving of
dividend from debt to equity until a final decision is made by
the Supervisory board. If this effect is disregarded, the imple-
mentation had a negative effect of NOK 79 million after tax.
When preparing the quarterly accounts as of 31 March 2005,
these figures were NOK 180 and NOK 28 million, respectively.
The reason for the change is due to corrections to the figures
from SpareBank 1 Gruppen AS, as well as changes in the inter-
pretation of the regulations pertaining to structured products.
So far, using IFRS in the bank's company accounts is not allowed
(with the exception of pensions as described earlier in the
annual report). The Financial Supervisory Authority of Norway
has advised the Ministry of Finance that, for the time being,
banks and financing companies shall not be permitted to
make the transition to IFRS in their company accounts. When
a transition to IFRS will be made effective has not been
clarified. Until such time, SpareBank 1 SR-Bank will present
its company accounts according to Generally Accepted
Norwegian Accounting Practices and the group accounts
according to IFRS.
More detailed information on the implementation of IFRS and
the regulations is found in accounting principles and notes to
the group accounts for 2005. The annual accounts with notes
for 2005 have been prepared according to Norwegian
regulations for the bank accounts and according to IFRS for
the group accounts. Both accounts are included in the annual
report.
CORPORATE GOVERNANCE
Corporate governance in SpareBank 1 SR-Bank comprises the
goals and paramount principles according to which the bank
is managed and controlled in order to ensure that the
interests of the primary capital certificate owners, the
depositors and other groups are safeguarded. Governance of
the group's activities shall ensure prudent asset management
and greater assurance that communicated goals and
strategies are attained and realised.
Consequently, the bank has established the following main
principles for ownership and company management. The
principles rest on the following three main pillars: openness,
predictability and transparency:
• Value creation for the primary capital certificate owners and
other interest groups
• A structure that ensures goal-oriented and independent
management and supervision
• Systems that ensure measurement and accountability
• Effective risk management
• Well set-out, easily understandable and up-to-date
information
• Equal treatment of the primary capital certificate owners
and a well-balanced relationship with other interest groups
• Compliance with laws, regulations and ethical standards
The group's shareholder management and corporate
governance is founded on "Norwegian recommendation for
shareholder management and corporate governance". A more
detailed description of shareholder management and
corporate governance is found in a separate section of the
annual report.
NEW CAPITAL ADEQUACY REGULATIONS (BASEL II)
The EU's new capital adequacy directive is scheduled for
implementation in Norway on 1 January 2007. The new
regulations are based on proposals for a new standard for
capital adequacy estimation from the Bank for International
Settlements (BIS).
SpareBank 1 SR-Bank has high ambitions for risk management
in general, and for adaptation to the new capital adequacy
regulations in particular. As a result, SpareBank 1 SR-Bank
15
has applied to the Financial Supervisory Authority of Norway
for permission to employ internal rating methods (Internal
Rating Based Approach - Foundation) for credit risk from 1
January 2007. For the banks which secure approval and which
can use internal rating methods, the statutory minimum
requirement for capital adequacy for credit risk will be based
on the group's internal risk assessments from 2007. This will
make the statutory minimum requirement for capital adequacy
more risk sensitive, placing the capital adequacy requirement
in closer accordance with the risk in underlying portfolios. In
order to secure approval from the Financial Supervisory
Authority of Norway to use internal rating methods, the banks
must satisfy extensive requirements in relation to organisation,
expertise, risk models and risk management systems. The
Financial Supervisory Authority of Norway expects to complete
the main part of the review of the applications in the autumn
of 2006.
SpareBank 1 SR-Bank has an ambition to use the Standard
method for estimating minimum capital adequacy for
operational risk from 2007.
In accordance with the level of ambition regarding of risk
management mentioned above, SpareBank 1 SR-Bank has for
several years invested considerable means and resources in
the effort to further develop expertise, risk models and risk
management systems.
A separate department for risk management, independent of
the business units, has been established. The department
reports directly to the CEO. The department is responsible for
the group's risk models and for the further development of
efficient risk management systems. The department is further-
more responsible for independent risk assessment, risk
reporting and the overall risk monitoring in the group.
To further strengthen the risk area, the SpareBank 1 alliance
has established a separate expertise centre for credit models.
The centre is the alliance's internal specialist group for credit
models, and is responsible for customer rating, pricing, analysis
and portfolio management models. Both the risk management
department and the expertise centre for credit models are
independent of the business units. This ensures independence
in both the following up of risk and reporting.
SpareBank 1 SR-Bank expects long-term gains from the efforts
in the risk management area:
• Reduced volatility in results due to improved risk
management and credit quality
• Increased profitability due to improved profitability
and capital allocation models
• Improved usage of equity through capital minimalisation
corresponding better to the risk in the underlying
operations.
RISK MANAGEMENT IN SPAREBANK 1 SR-BANK
The risk management in SpareBank 1 SR-Bank is to support
the group's strategic development and the fulfilment of its
objectives. Furthermore, the risk management is to ensure
continued financial stability and responsible asset manage-
ment. This is to be achieved through:
• A strong risk culture, characterised by a high level of
consciousness on risk management
• A solid understanding of which risks drive earning and risk
costs, and through this creating a better foundation for
decisions
• Strive towards optimal capital usage within the approved
business strategy
• Avoid unexpected negative events which can damage the
group's operations and reputation in the market
• Exploitation of synergy and diversification effects
The group has a moderate risk profile where no single event
shall be capable of seriously harming the group's financial
position. The risk profile is described in the group's overall
risk strategy, and defined through target figures for:
• Rating: SpareBank 1 SR-Bank is rated by rating firms
Moody's Investors Service and Fitch Ratings
• Return on risk adjusted capital: Yield, adjusted for risk is to
be one of the most important strategic targets in the internal
governance of SpareBank 1 SR-Bank. This entails the
different business areas receiving capital according to the
estimated risk of the activities, and that a running
follow-up of the yield from these is conducted
• Expected loss: Describes the less amount statistically
expected over a 12-month period
• Risk - adjusted capital (financial capital): Describes how
much capital the group believes it needs to cover the actual
risk the group has assumed
• Regulatory capital: Describes the capital requirement based
on set government rates
The overall risk strategy is made operational through separate
risk strategies for credit risk, market risk, liquidity risk and
operational risk. The risk strategies are approved by the Board
16
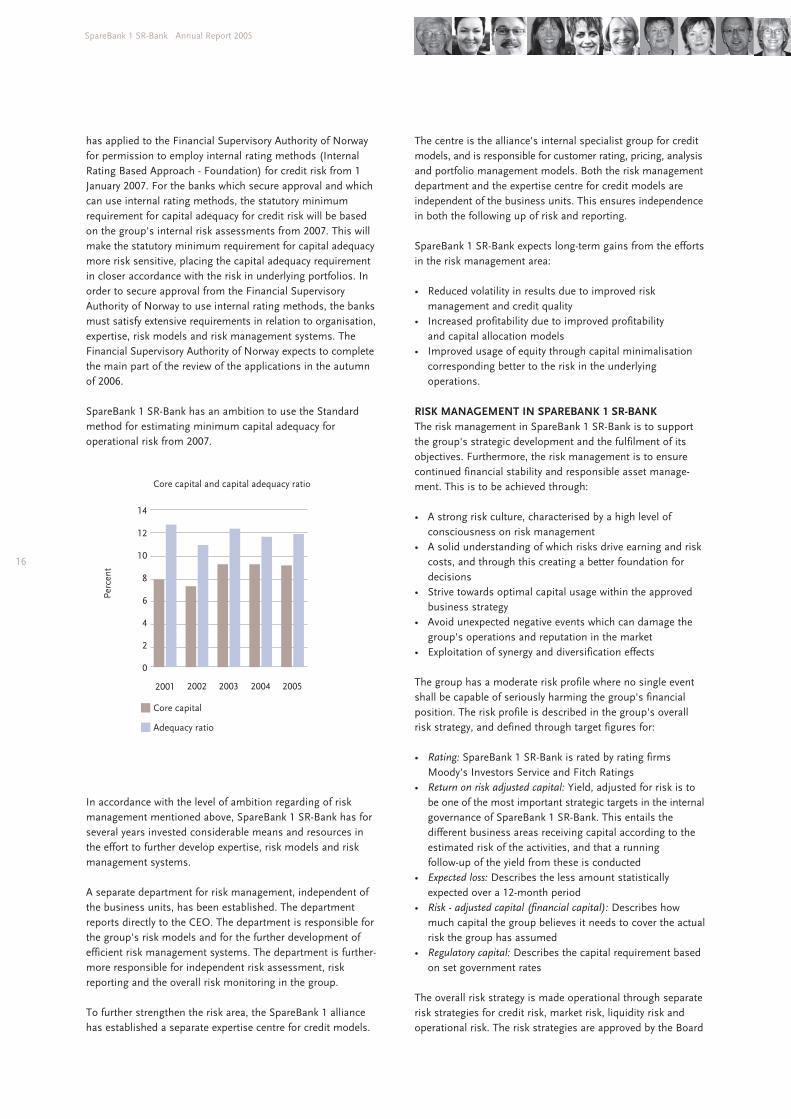
SpareBank 1 SR-Bank Annual Report 2005
Core capital and capital adequacy ratio
2002 2003 2004 20052001
Core capital
Adequacy ratio
and are reviewed at least annually or when circumstances so
indicate.
The group's risk exposure and risk development are followed
up on the management level through periodical reports to the
administration and the Board.
Credit risk
Credit risk is defined as the danger of loss resulting from
customers or opposite party not being able or willing to fulfil
their obligations to the group.
The group has a low risk profile in the credit area, and the risk
profile is defined through the group's credit strategy. The
credit strategy contains target figures for, inter alia, risk-
adjusted capital, yield, risk adjusted, expected loss and for
concentration risks in connection with industries or the size
of commitments. In connection with the granting of credit
and the following up of credit, separate rating models and
portfolio management systems are used for the different
areas.
The underlying credit risks in the corporate and retail markets
have developed in a positive direction in 2005. This is related
to the fact that the group has a restrictive policy in regard to
high-risk commitments, the positive economic development
in the group's market areas and the low interest rate level.
Market risk
Market risk is the risk of loss due to changes in observable
market variables such as interest rates, currency exchange
rates and securities rates. The risk of changes in securities
rates due to changes in general credit prices is also defined as
market risk. The management of market risk takes place
through defined frameworks for, among other things, share
investments, bonds and for positions in the interest rate and
currency markets, and monthly reports are made to the Board.
The frameworks are reviewed and approved by the Board at
least annually. The group has conservative guidelines for market
risk, well within the maximum limits set by the authorities.
Liquidity risk
Liquidity risk is the risk of the group not being able to refinance
its debt or not being able to finance an increase in its assets
without considerable extra costs. The management of the
group's financing structure is based on an overall liquidity
strategy which is reviewed and approved by the Board at least
annually. The liquidity strategy reflects the group's moderate
risk profile.
The liquidity risk is reduced through spreading deposits over
different markets, deposit sources, instruments and terms.
Customer deposits are the group's most important source
of financing, and the group's deposit coverage remains
unchanged at 60.7 per cent as of 31 December 2004 and 31
December 2005.
The group's liquidity as of 31 December 2005 was satisfactory.
By the end of the year, only 14 per cent of the total deposit
volume is scheduled for refinancing in 2006. There is an even
distribution of international and national sources of funding.
In addition, the group has undrawn committed revolving
credit facility of 270 million euro.
Operational risk
Operational risk is defined as the risk of loss resulting from:
• Human error and lack of expertise
• Failure in ICT systems
• Unclear policy, strategy or routines
• Crime and internal irregularities
• Other internal and external causes
The group's risk management is so efficient that no single
event caused by operational risk is to able to seriously harm
the groups financial position. The risk strategy for operational
risk is approved at least annually by the Board. The risk
strategy focuses on risk sensitive target figures for expected
loss and estimation of risk adjusted capital. The group has a
moderate risk profile for operational risk.
The group has reduced the operational risk in 2005 through
systematic risk analyses and implementation of new
precautionary measures. The group uses a separate system
for reporting and following up on undesirable events, making
the group able to continuously improve processes based on
these reports.
A more detailed description of the risk management and risk
exposure in SpareBank 1 SR-Bank is found in the notes and in
a separate section in the annual report.
CAPITAL MANAGEMENT
The objective of the capital management in Sparebank 1
SR-Bank is to ensure an efficient capital funding and employ-
ment as well as responsible capital coverage. This is to be
ensured through an adequate process for planning and
following up on the group's capital requirements.
• The process is risk driven and includes all significant types
of risk in the group
• The process is an integrated part of the business strategy,
the management process and the decision structure
• The process is future-oriented and stress tests are
conducted
• The process is based on recognised and adequate
methods and procedures for risk measurement
• Processes are reviewed regularly, and at least annually,
by the Board
The group's target is a core capital coverage of 8 per cent and
a capital coverage of 12 per cent. By the end of 2005, the group's
capital coverage was 11.84 per cent, of which 8.98 per cent
was core capital. The corresponding key figures for the parent
bank were 12.15 per cent and 9.21 per cent, respectively. In the
first quarter of 2005, a new non-perpetual subordinated loan
of 13 billion yen was raised in the market (NOK 771 million).
This replaced a non-perpetual subordinated loan of NOK 300
million which had a so-called step-up in September 2005.
17
There were not issued any new fund bonds in 2005. On 31
December 2005, the fund bonds contributed 1.12 percentage
points to the group's core capital coverage and capital
coverage. Up to 15 per cent of the core capital can consist of
fund bonds. Any sums beyond this are added to the capital
coverage as subordinated loans.
AUDIT
External audit
The group's external auditor is PricewaterhouseCoopers.
Internal audit
The internal audit has been outsourced to Ernst & Young. The
internal auditor reports to the Board of the group.
EMPLOYEES AND WORKING ENVIRONMENT
By the end of 2005, the group had 942 employees, equalling
862 man-years. Manning has been increased by 49 man-years
in 2005. This is due to a further effort in the customer-
oriented business and a strengthening of the group's risk
management. The largest increase in manning is in the
activities directed towards compulsory service pension, where
10 new employees have been hired. In addition, both the retail
and corporate market divisions have been strengthened.
The group conducted organisation and working environment
surveys in 2005, as in earlier years. The surveys showed that
the employees have a satisfactory relationship with the group.
The group is characterised by employees with a selling
attitude, an ability and a will to adapt and a desire to raise
their level of expertise further. Sickness absence has been
further reduced in 2005, and is still low compared to other
finance institutions. Sickness absence in 2005 was 2.8 per
cent, compared to 3.1 per cent in 2004. Long-term sickness
absence has been further reduced, partly through the
participation in the Inclusive Workplace scheme and solid
follow-up from management.
An active effort in health, safety and environment is still being
made, including a continuous strengthening of the bank's
security regime. The bank has not experienced robbery in
2005.
Input factors or production methods with noticeable
environmental effects are not in use. The group's effect on the
external environment is limited to materials and energy
necessary for the group to conduct its activities. A continuous
effort is made employing electronic communication internally
and externally, contributing to reduced paper consumption. In
the opinion of the Board, the activities create little pollution of
the external environment.
Management of the group's total expertise
The group is focused on a continuous enhancement of the
expertise of all employees. Expertise is seen as the interaction
of knowledge, skills and attitudes, and an effort is made to
continuously enhance all these factors. This entails all
employees being engaged in courses, training or self-study a
minimum of 5 per cent of their total working hours.
At present, the group has approx. 110 employees attending
expertise-raising college courses, of which 60 managers and
key employees are attending an 18-month management and
culture development program in a joint project with the BI
Norwegian School of Management. Recently, 40 managers
and key employees underwent an exam in the same program.
This is used as a common management platform in
SpareBank 1 SR-Bank.
In 2005, the group carried out an extensive mapping of the
expertise of each single employee in the areas of knowledge,
skills and attitudes, which will be used actively to enhance the
organisation's total expertise.
In 2005, approx NOK 11 million was set aside for expertise-
enhancing measures, in addition to time spent on these
measures.
Policy on the staff’s life phases
SpareBank 1 SR-Bank has adopted a policy in relation to
staff’s life phases that is intended to encourage older employees
to continue working longer. The Group’s objective is for the
average retirement age to rise from 60 to 63 by the end of
2006. In 2005, the average retirement age was 62 years.
Individual adjustments and flexibility are the policy instru-
ments used to achieve this. Annual health checks have been
introduced for all staff above the age of 58, as well as the offer
of exercise and individually tailored expertise enhancement. At
the age of 62, working hours and tasks are tailored to
individual requirements aming at postponing retirement age.
Equal opportunities
Women account for 55 per cent of the Group’s man-years.
This percentage has been stable in recent years.
The Group management consists of nine people, one woman
and eight men.
The average wage for bank employees is NOK 364,000, with
women’s and men’s average wages being NOK 331,000 and
402,000, respectively.
The Group recruited 71 new employees in 2005, of which 33
were women and 38 were men. There are 212 employees with
reduced working hours, working a total of 143 man-years.
Of these, 12 are men, accounting for 6.4 man-years, and
200 are women, accounting for 136.6 man-years.
The Group has worked to raise the percentage of women in
management positions for several years, and the following
measures have been implemented in recent years with a view
to, inter alia, promoting equal opportunities:
• Adopting the objective of increasing the percentage of
women in management positions to 40 per cent
• Establishment of a talent development programme, in
which most of the participants are women
• Accommodating flexible working conditions
18
SpareBank 1 SR-Bank Annual Report 2005
• Participation on the group management level in a
working group to increase female representation in the
finance industry
• Participation in FUTURA - development of future female
management talents in the finance industry
The efforts have resulted in the percentage of women in
management positions rising from 14 per cent to 32 per cent
over the past five years. The percentage remained stable from
2004 to 2005.
BANK ADVISORY COUNCILS
The bank advisory councils are intended to help identify
opportunities, and intercept signals regarding the bank’s
activities in the local market. They are made up of local
resource persons and are to act as advisers to the local offices
in their market work. SpareBank1 SR-Bank has local bank
advisory councils in the municipalities in which the bank is
represented, and the councils have been active in their work.
In 2005, the directors of the local bank advisory councils
attended a joint meeting, in which the bank’s management,
among other things, received valuable input in connection
with the bank’s exploitation and use of the endowment fund.
The bank advisory councils administer some of the bank’s
endowment funds, and have committed themselves to
ensuring that the funds are put to good use in the local
community.
PRIMARY CAPITAL
At the end of 2005, 10,361 holders of the bank’s primary
capital certificates were registered. This is an increase of 2,281
owners (equalling 28.2 per cent), since the end of 2004. The
percentage of primary capital certificates held by foreigners
was 19.4 per cent (14.4 per cent), while 44.8 per cent (47.2
per cent) were resident in Rogaland and Agder. At the end of
the year, the 20 largest owners controlled 32.1 per cent (30.3
per cent) of the primary capital.
36.1 per cent of the issued primary capital certificates were
traded in 2005. This is significantly above the figures for 2004,
when 27.2 per cent of the number of issued certificates were
traded. At the end of 2005, the price of the bank’s primary
capital certificates was NOK 230, compared to NOK 144 at
the end of 2004. Inclusive of the dividend paid, the bank’s
primary capital had an effective rate of return of 66.1 per cent
in 2005. For purposes of comparison, the primary capital
index at the Oslo Stock Exchange (GFBX) rose by 47.4 per
cent in 2005.
On 1 April 2005, the primary capital certificates were split in
two and this was followed by a capitalisation issue whereby
four certificates entitled owners to one new (free) certificate.
A total of 4,522,917 new primary capital certificates where
thus issued, and NOK 226,145,850 was transferred from the
equalisation fund to the primary capital. The total number of
primary capital certificates after the split and subsequent
capitalisation issue was 22,614,585.
During 2005 the bank made net purchases of 57,541 of its
own primary capital certificates, and at 31 December 2005
held 58,976 certificates. In 2005 the bank again took
advantage of its authorisation by the Supervisory Board to sell
its own primary capital certificates (146,447 in all) at a
discount to employees instead of increasing the primary
capital through an issue to employees. 652 employees now
hold primary capital certificates in SpareBank 1 SR-Bank. In
total, the employees have an ownership stake of 2.73 per cent.
Earnings per primary capital certificate in 2005 amounted to
NOK 21.0. Based on the bank’s dividend policy and other
considerations, the Board of Directors proposes paying a divi-
dend of NOK 14 per primary capital certificate for 2005. The
RISK amount (adjustment of original cost of capital) as at
1 January 2005 was fixed at NOK 6.06 per primary capital
certificate, while the amount as at 1 January 2006 was
calculated to be NOK 1.79 per certificate.
ENDOWMENT FUNDS
Pursuant to the (Norwegian) Saving Banks’ Act, the bank may
allocate a maximum of 25 per cent of the Saving Banks’
Guarantee Funds’ share of the profit to an endowment fund
for public benefit. The Board proposes to allocate NOK 92
million (equalling 25 per cent) to endowment funds for 2005.
CONTINUED OPERATIONS
Together with the implemented and planned measures, the
performance prospects and the macro-economic framework
conditions provide good conditions for the Group’s progress
in 2006. The core capital and the capital adequacy ratio signify
satisfactory solidity, and are well above the authorities’
requirements.
The annual report and accounts have been prepared with the
expectation of continued operations.
ALLOCATION OF THE ANNUAL PROFIT/DIVIDEND
The Board proposes that the annual profit for 2005 is
allocated as follows:
NOK Million
Profit for the year 840
Valuation difference fund 0
Available for distribution 840
Dividend (14 NOK per primary capital certificate) 317
Equalisation fund 156
The savings bank's fund 275
Endowment fund 92
Total allocations 840
PROSPECTS FOR 2006
The interest rate level stayed low through 2005 even if the
Central Bank of Norway increased interest rates twice, 0.5
percentage points in total. The Central Bank of Norway sig-
nals that the interest rate will increase somewhat in 2006, and
the market expects that the interest rate will rise 1 percentage
point from the present level by the end of 2006.
The economic prospects for most industries seem positive at
the entrance of 2006 and the Board expects high activity and
good results from the business community in 2006.
19
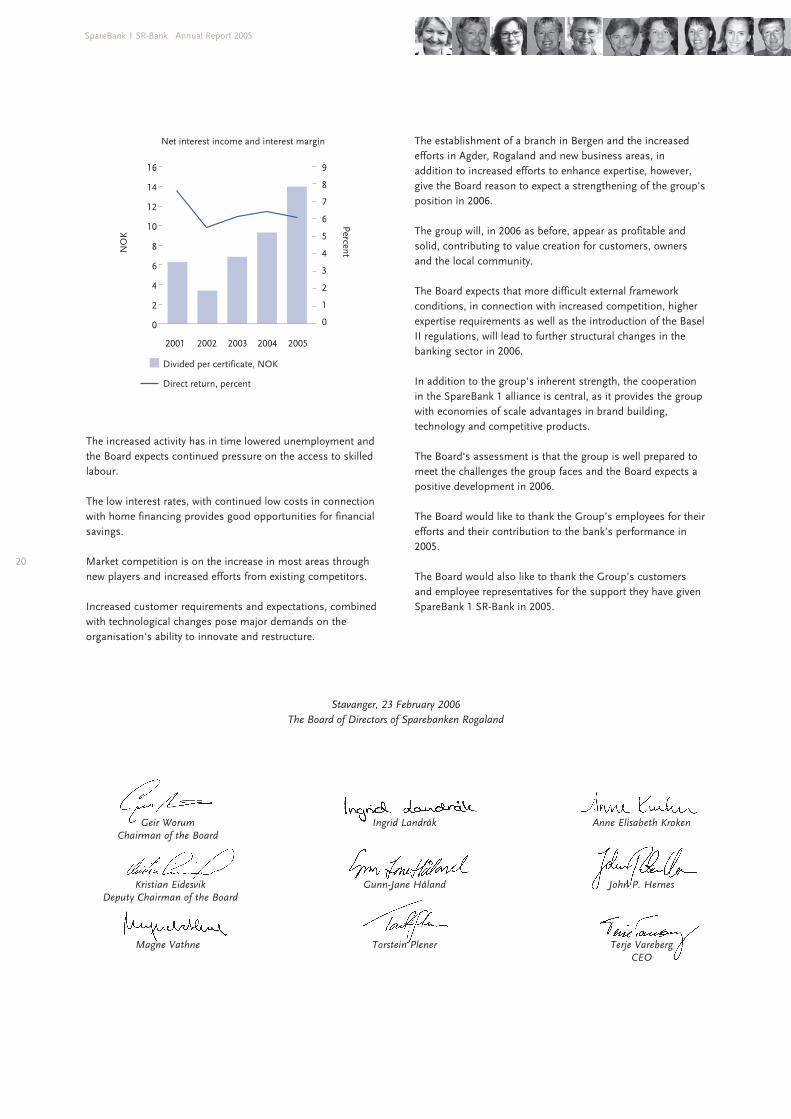
The increased activity has in time lowered unemployment and
the Board expects continued pressure on the access to skilled
labour.
The low interest rates, with continued low costs in connection
with home financing provides good opportunities for financial
savings.
Market competition is on the increase in most areas through
new players and increased efforts from existing competitors.
Increased customer requirements and expectations, combined
with technological changes pose major demands on the
organisation's ability to innovate and restructure.
The establishment of a branch in Bergen and the increased
efforts in Agder, Rogaland and new business areas, in
addition to increased efforts to enhance expertise, however,
give the Board reason to expect a strengthening of the group's
position in 2006.
The group will, in 2006 as before, appear as profitable and
solid, contributing to value creation for customers, owners
and the local community.
The Board expects that more difficult external framework
conditions, in connection with increased competition, higher
expertise requirements as well as the introduction of the Basel
II regulations, will lead to further structural changes in the
banking sector in 2006.
In addition to the group's inherent strength, the cooperation
in the SpareBank 1 alliance is central, as it provides the group
with economies of scale advantages in brand building,
technology and competitive products.
The Board's assessment is that the group is well prepared to
meet the challenges the group faces and the Board expects a
positive development in 2006.
The Board would like to thank the Group’s employees for their
efforts and their contribution to the bank’s performance in
2005.
The Board would also like to thank the Group’s customers
and employee representatives for the support they have given
SpareBank 1 SR-Bank in 2005.
20
SpareBank 1 SR-Bank Annual Report 2005
Stavanger, 23 February 2006
The Board of Directors of Sparebanken Rogaland
Geir Worum
Chairman of the Board
Ingrid Landråk Anne Elisabeth Kroken
Kristian Eidesvik
Deputy Chairman of the Board
Gunn-Jane Håland John P. Hernes
Magne Vathne Torstein Plener Terje Vareberg
CEO
Net interest income and interest margin
NO
K
Percent
Divided per certificate, NOK
Direct return, percent
16
14
12
10
8
6
4
2
0
2002 2003 2004 20052001

The Board of Directors
21
Geir Worum
Born in: 1947
Chairman of the Board
Elected for the first time in: 1999
Term of office until: 2006
Managing Director of
Woco AS, Haugesund
Chairman of the Board in the
following companies:
Oma Baatbyggeri AS and
subsidiaries
Oma Slipp og Mekaniske Verksted
Solve IT-Stavanger AS
Rasmussen Elektro AS
Teleconsult AS
Woco AS
Vikom AS
Karmsundgaten 77 AS
Director in the following companies:
Sinvest ASA
Data Design System ASA
Haugaland Gass AS
Simek AS
Kristian Eidesvik
Born in: 1945
Deputy Chairman of the board
Elected for the first time in: 1997
Term of office until: 2007
Ship owner, Bømlo
Director in :
Wilson AS
Green Reefers ASA
Caiano AS
Gunn-Jane Håland
Born in: 1963
Elected for the first time in: 2003
Term of office until: 2007
Asset Manager Oseberg, Petoro AS,
Stavanger

22
SpareBank 1 SR-Bank Annual Report 2005
Anne Elisabeth Kroken
Born in: 1962
Elected for the first time in: 2003
Term of office until: 2006
Attorney running her own law firm
John Peter Hernes
Born in: 1959
Elected for the first time in: 2001
Term of office until: 2007
General Manager, SåkornInVest, Forus
Chairman of the Baord in:
Kino 1 Stavanger/Sandnes AS
Director in:
OniX AS
Magne Vathne
Born in: 1944
Elected for the first time in 1998
Term of office until: 2006
Managing Director Coop Økonom BA,
Stavanger
Director in:
OBS AS
Coop Økonom BA
Marieroparken AS
Terje Vareberg
Born in: 1948
CEO SpareBank 1 SR-Bank
Chairman of the Board in:
Sparebankforeningen
SpareBank 1 Gruppen AS
IRIS AS
Deputy Chairman of the Board in:
Rogaland Teater
Torstein Plener
Born in: 1961
Elected for the first time in: 2000
Term of office until: 2006
Group employee representative in
SpareBank 1 SR-Bank
Director in:
SpareBank 1 Gruppen AS
Ingrid Landråk
Born in: 1970
Elected for the first time in: 2005
Term of office until: 2007
Controller
Revus Energy ASA
TABLE OF CONTENTS PAGE
INCOME STATEMENT 24
BALANCE SHEET 25
CASH FLOW STATEMENT 26
ACCOUNTING PRINCIPLES 27
NOTE 1 INTEREST INCOME AND INTEREST EXPENSE 30
NOTE 2 NET OTHER OPERATING INCOME 30
NOTE 3 WAGES AND GENERAL ADMINISTRATION
EXPENSES 31
NOTE 4 OTHER OPERATING EXPENSES 32
NOTE 5 WRITE-DOWN OF LOANS AND GUARANTEES 32
NOTE 6 LOSS/GAIN ON LONG TERM
FINANCIAL ASSETS 32
NOTE 7 TAXES 33
NOTE 8 ACCOUNTS RECEIVABLE FROM
CREDIT INSTITUTIONS 34
NOTE 9 CUSTOMER LENDING 34
NOTE 10 WRITE-DOWNS LENDING 34
NOTE 11 DEFAULTED, DOUBTFUL COMMITMENTS
AND NON-PERFORMING LOANS 35
NOTE 12 RISK CLASSIFICATION OF TOTAL LENDING 36
NOTE 13 LOSS ON LENDING AND GUARANTEES
DISTRIBUTED BY INDUSTRY 37
NOTE 14 CERTIFICATES AND BONDS 37
NOTE 15 SHARES AND OWNERSHIP 38
NOTE 16 TANGIBLE FIXED ASSETS 42
NOTE 17 OTHER ASSETS 42
PAGE
NOTE 18 PAYMENTS IN ADVANCE AND DEFERRED
INCOME 42
NOTE 19 DEBT TO CREDIT INSTITUTIONS 43
NOTE 20 CUSTOMER DEPOSITS 43
NOTE 21 BOND LOAN DEBT AND OTHER
LONG-TERM LOANS 43
NOTE 22 ALLOCATIONS TO LIABILITIES AND
EXPENSES 44
NOTE 23 PENSION SCHEMES 44
NOTE 24 SUBORDINATED LOAN CAPITAL 45
NOTE 25 PRIMARY CAPITAL, OWNERSHIP STRUCTURE
AND EQUITY MOVEMENTS 46
NOTE 26 GUARANTEES/SECURED DEBT 47
NOTE 27 CURRENCY POSITION AND CURRENCY
INTEREST AGREEMENTS 48
NOTE 28 CONDITIONAL COMMITMENTS 49
NOTE 29 DISTRIBUTION OF LENDING, GUARANTEES
AND DEPOSITS ACCORDING TO INDUSTRY
SECTOR AND GEOGRAPHIC AREA 49
NOTE 30 TRANSACTIONS WITH SUBSIDIARIES 49
NOTE 31 CAPITAL ADEQUACY RATIO 50
NOTE 32 REMAINING TERM OF THE LOAN AND
INTEREST RATE COMMITMENT TERM 51
NOTE 33 IMPLEMENTATION OF PENSION AND
NEW REGULATION RELATING TO LENDING 53
NOTE 34 RESTRICTED ASSETS 54
TABLE OF CONTENTS PAGE
INCOME STATEMENT 55
BALANCE SHEET 56
CONSOLIDATED SPECIFICATION OF INCOME,
EXPENSES AND VALUE CHANGES 57
STATEMENT OF CHANGES IN EQUITY 57
CASH FLOW STATEMENT 58
NOTE 1 GENERAL INFORMATION 59
NOTE 2 ACCOUNTING PRINCIPLES -
GROUP ACCOUNTS ACCORDING TO IFRS 59
NOTE 3 FINANCIAL RISK MANAGEMENT 63
NOTE 4 CRITICAL ESTIMATES AND ASSESSMENTS
REGARDING THE USE OF ACCOUNTING
PRINCIPLES 64
NOTE 5 SEGMENTS 66
NOTE 6 NET INTEREST INCOME 68
NOTE 7 NET FEE AND COMMISSION INCOME 69
NOTE 8 INCOME FROM OTHER FINANCIAL
INVESTMENTS 69
NOTE 9 OTHER OPERATING INCOME 69
NOTE 10 OPERATING EXPENSE 69
NOTE 11 INCOME TAX 71
NOTE 12 OTHER ASSETS 72
NOTE 13 PROPERTY, PLANT AND EQUIPMENT 72
NOTE 14 INTANGIBLE ASSETS 73
NOTE 15 ASSOCIATED COMPANIES AND
JOINT VENTURES 74
PAGE
NOTE 16 SECURITIES 75
NOTE 17 FINANCIAL DERIVATIVES 76
NOTE 18 CREDIT INSTITUTIONS -
LOANS AND DEPOSITS 77
NOTE 19 LOANS AND ADVANCES TO CUSTOMERS 77
NOTE 20 WRITE-DOWN OF LOANS AND
GUARANTEES DUE TO IMPAIRMENT 79
NOTE 21 DEPOSITS FROM CUSTOMERS 80
NOTE 22 DEBT SECURITIES ISSUED 81
NOTE 23 SUBORDINATED LOAN CAPITAL 81
NOTE 24 OTHER LIABILITIES 82
NOTE 25 PENSIONS (WITH DIRECT RECOGNITION
CHANGES IN ESTIMATES) 83
NOTE 26 CAPITAL ADEQUACY 85
NOTE 27 RELATED PARTIES 86
NOTE 28 PRIMARY CAPITAL CERTIFICATES AND
OWNERSHIP STRUCTURE 86
NOTE 29 RESTRICTED FUNDS 87
NOTE 30 IFRS - IMPLEMENTATION 88
NOTE 31 EVENTS AFTER THE BALANCE
SHEET DATE 91
THE AUDITOR’S REPORT/
THE AUDIT COMMITTEE’S STATEMENT 92
PRIMARY CAPITAL CERTIFICATES 93
KEY FIGURES FROM THE PAST FIVE YEARS 96
IFRS
NGAAP
Annual accounts
23
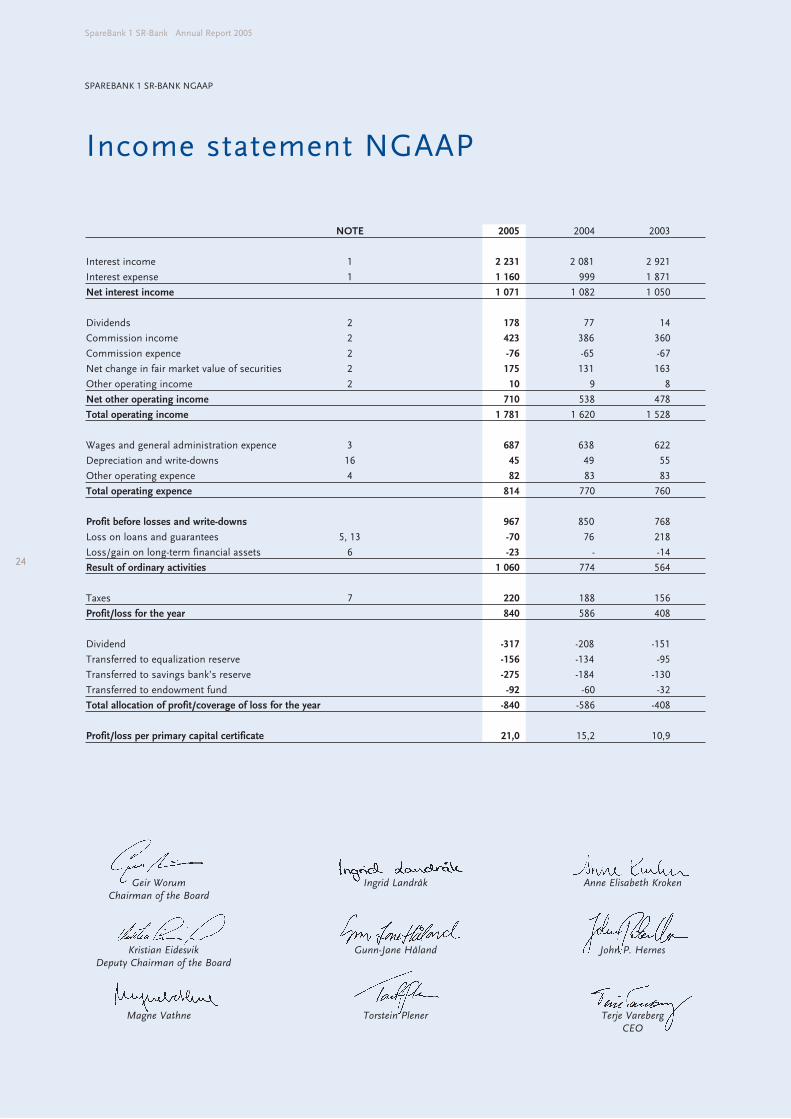
Income statement NGAAP
24
SpareBank 1 SR-Bank Annual Report 2005
Geir Worum
Chairman of the Board
Ingrid Landråk Anne Elisabeth Kroken
Kristian Eidesvik
Deputy Chairman of the Board
Gunn-Jane Håland John P. Hernes
Magne Vathne Torstein Plener Terje Vareberg
CEO
24
NOTE 2005 2004 2003
Interest income 1 2 231 2 081 2 921
Interest expense 1 1 160 999 1 871
Net interest income 1 071 1 082 1 050
Dividends 2 178 77 14
Commission income 2 423 386 360
Commission expence 2 -76 -65 -67
Net change in fair market value of securities 2 175 131 163
Other operating income 2 10 9 8
Net other operating income 710 538 478
Total operating income 1 781 1 620 1 528
Wages and general administration expence 3 687 638 622
Depreciation and write-downs 16 45 49 55
Other operating expence 4 82 83 83
Total operating expence 814 770 760
Profit before losses and write-downs 967 850 768
Loss on loans and guarantees 5, 13 -70 76 218
Loss/gain on long-term financial assets 6 -23 - -14
Result of ordinary activities 1 060 774 564
Taxes 7 220 188 156
Profit/loss for the year 840 586 408
Dividend -317 -208 -151
Transferred to equalization reserve -156 -134 -95
Transferred to savings bank’s reserve -275 -184 -130
Transferred to endowment fund -92 -60 -32
Total allocation of profit/coverage of loss for the year -840 -586 -408
Profit/loss per primary capital certificate 21,0 15,2 10,9
SPAREBANK 1 SR-BANK NGAAP
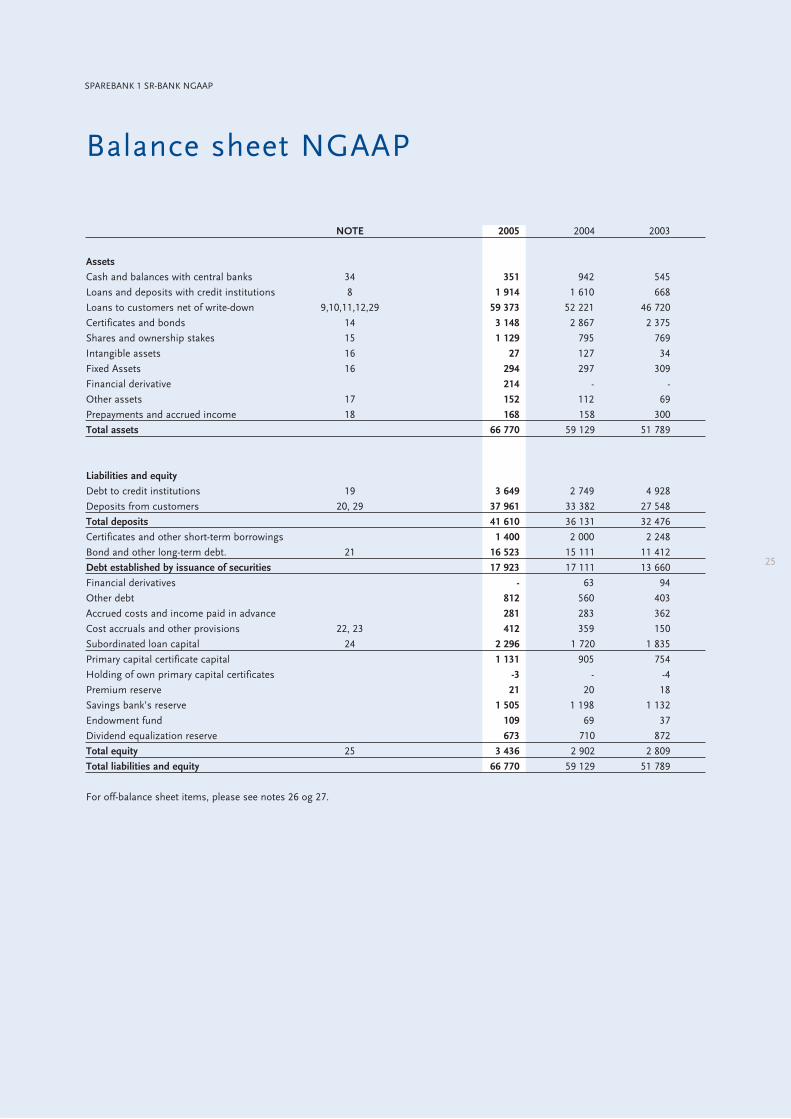
Balance sheet NGAAP
NOTE 2005 2004 2003
Assets
Cash and balances with central banks 34 351 942 545
Loans and deposits with credit institutions 8 1 914 1 610 668
Loans to customers net of write-down 9,10,11,12,29 59 373 52 221 46 720
Certificates and bonds 14 3 148 2 867 2 375
Shares and ownership stakes 15 1 129 795 769
Intangible assets 16 27 127 34
Fixed Assets 16 294 297 309
Financial derivative 214 - -
Other assets 17 152 112 69
Prepayments and accrued income 18 168 158 300
Total assets 66 770 59 129 51 789
Liabilities and equity
Debt to credit institutions 19 3 649 2 749 4 928
Deposits from customers 20, 29 37 961 33 382 27 548
Total deposits 41 610 36 131 32 476
Certificates and other short-term borrowings 1 400 2 000 2 248
Bond and other long-term debt. 21 16 523 15 111 11 412
Debt established by issuance of securities 17 923 17 111 13 660
Financial derivatives - 63 94
Other debt 812 560 403
Accrued costs and income paid in advance 281 283 362
Cost accruals and other provisions 22, 23 412 359 150
Subordinated loan capital 24 2 296 1 720 1 835
Primary capital certificate capital 1 131 905 754
Holding of own primary capital certificates -3 - -4
Premium reserve 21 20 18
Savings bank’s reserve 1 505 1 198 1 132
Endowment fund 109 69 37
Dividend equalization reserve 673 710 872
Total equity 25 3 436 2 902 2 809
Total liabilities and equity 66 770 59 129 51 789
For off-balance sheet items, please see notes 26 og 27.
25
SPAREBANK 1 SR-BANK NGAAP
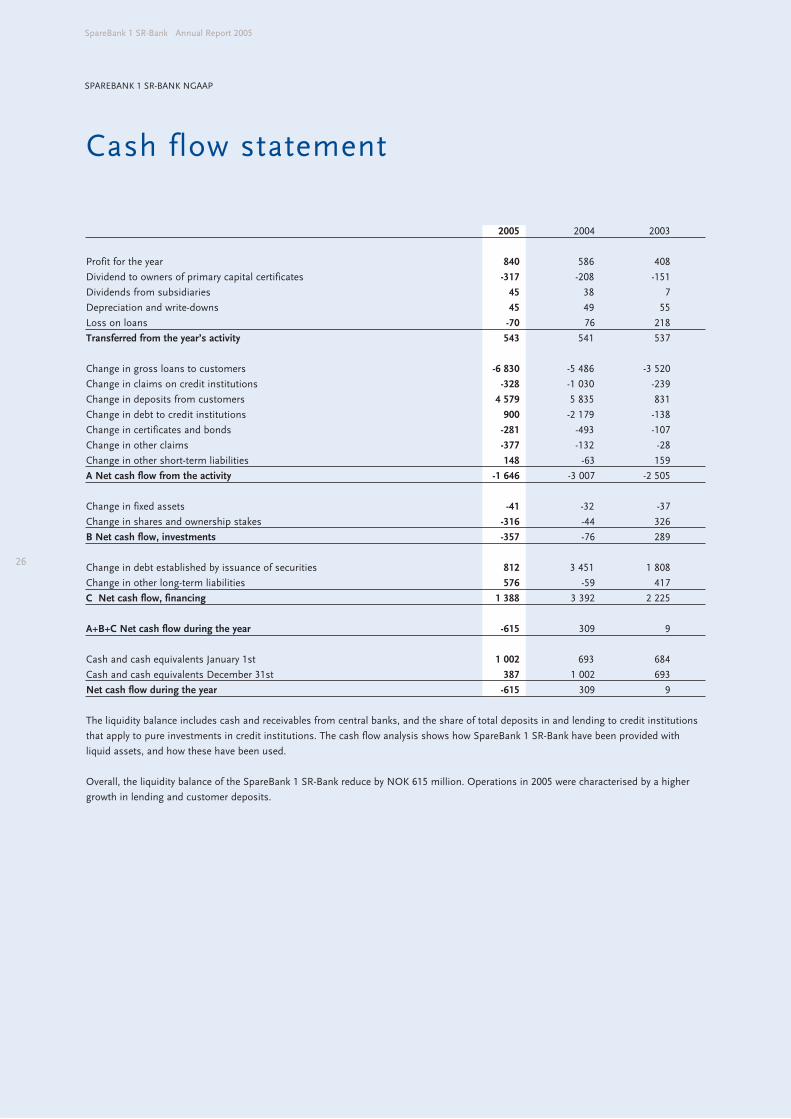
Cash flow statement
26
SpareBank 1 SR-Bank Annual Report 2005
2005 2004 2003
Profit for the year 840 586 408
Dividend to owners of primary capital certificates -317 -208 -151
Dividends from subsidiaries 45 38 7
Depreciation and write-downs 45 49 55
Loss on loans -70 76 218
Transferred from the year’s activity 543 541 537
Change in gross loans to customers -6 830 -5 486 -3 520
Change in claims on credit institutions -328 -1 030 -239
Change in deposits from customers 4 579 5 835 831
Change in debt to credit institutions 900 -2 179 -138
Change in certificates and bonds -281 -493 -107
Change in other claims -377 -132 -28
Change in other short-term liabilities 148 -63 159
A Net cash flow from the activity -1 646 -3 007 -2 505
Change in fixed assets -41 -32 -37
Change in shares and ownership stakes -316 -44 326
B Net cash flow, investments -357 -76 289
Change in debt established by issuance of securities 812 3 451 1 808
Change in other long-term liabilities 576 -59 417
C Net cash flow, financing 1 388 3 392 2 225
A+B+C Net cash flow during the year -615 309 9
Cash and cash equivalents January 1st 1 002 693 684
Cash and cash equivalents December 31st 387 1 002 693
Net cash flow during the year -615 309 9
The liquidity balance includes cash and receivables from central banks, and the share of total deposits in and lending to credit institutions
that apply to pure investments in credit institutions. The cash flow analysis shows how SpareBank 1 SR-Bank have been provided with
liquid assets, and how these have been used.
Overall, the liquidity balance of the SpareBank 1 SR-Bank reduce by NOK 615 million. Operations in 2005 were characterised by a higher
growth in lending and customer deposits.
SPAREBANK 1 SR-BANK NGAAP
Accounting principles
GENERAL
The annual accounts for 2005 have been prepared in accordance
with the applicable laws, regulations and generally accepted
accounting practices in Norway. Unless otherwise stated, all
amounts are given in NOK million.
As of 1 January 2005, SpareBank 1 SR-Bank made a transition to
using IFRS (International Financial Reporting Standards) in its
group accounts. As of yet, IFRS is not permitted for use in the
bank's accounts. The 2005 annual accounts for the SpareBank 1
SR-Bank parent bank have therefore been prepared according to
Generally Accepted Norwegian Accounting Practice, while the
SpareBank 1 SR-Bank group accounts have been made according
to IFRS. Separate IFRS group accounts have been prepared with
notes and accounting principles presented in the annual report.
As of January 1 2005, SpareBank 1 SR-Bank made a transition to
using the new regulations relating to lending. This is in all
substantial aspects in accordance with the IAS 39 regulations
relating to lending and assessment of losses. The bank uses the
same interpretation of the regulations in its bank accounts, in
which the new regulations relating to lending are applied, and in
the group accounts, in which IAS 39 is applied. The figures for
2004 have not been converted according to the new standards in
the annual accounts.
SpareBank 1 SR-Bank has made a transition to using IAS 19
(IFRS pensions standard) when entering pension liabilities in
both the company and group accounts. In the autumn of 2005,
the use of this standard was permitted also in the Norwegian
accounts when the group accounts were presented according to
IFRS. This change took effect from 1 January 2004, making the
2004 and 2005 figures comparable.
In addition, we refer to the separate note in the company's
annual accounts for further details regarding the implementation
of these changes in the regulations.
CONSOLIDATION OF SUBSIDIARIES
Investments in subsidiaries are presented according to the equity
method of accounting in the company's accounts.
ASSOCIATED COMPANIES
Companies in which the bank holds long-term investment with
an interest between 20 and 50% and in which the bank has a
significant influence are defined as associated companies. Such
investments are assessed according to the equity method of
accounting in the company's accounts.
JOINT VENTURES
Joint ventures are financial undertakings regulated by an
agreement between the bank and one or more participants so
that the bank and the participants jointly control the undertaking.
No single participant has a controlling interest. In cooperation
with SpareBank 1 Nord-Norge, SpareBank 1 Midt-Norge, and
Samarbeidende Sparebanker AS, the bank owns SpareBank 1
Gruppen AS. The parties own 17.63 per cent each of the shares
in the company. In addition, the Swedish FöreningsSparbanken
AB owns 19.5% of the shares in the company, and the
Norwegian Federation of Trade Unions (LO) and federations
affiliated to LO own 10% of the shares. The governing structure
for the SpareBank 1 cooperation is regulated in an agreement
between the owners. In the company accounts of SpareBank 1
SR-Bank the shares in the SpareBank 1 Gruppen AS are assessed
according to the equity method.
ENTERING INCOME AND COSTS
Interest income and costs related to assets and liabilities
assessed at amortised cost are entered continuously in the profit
and loss statement based on an effective interest rate method.
All fees related to interest-bearing borrowing and lending are
included in the assessment of effective interest rate and
amortised over the expected term of the loan. Fees that are a
direct payment for performed services are entered as income
when they are acquired.
Pre-paid income and accrued, deferred costs at the end of the
year are periodised, and entered as liabilities in the balance
sheet. Accrued, deferred income is carried to income and entered
as a receivable in the balance sheet. Dividends from shares and
dividends from money market funds are entered as income the
year they are received. Dividends from shares and group
contributions minus deferred tax from subsidiaries, associated
companies and joint ventures are entered directly against book
interest in the relevant businesses. Profit/loss from the sale of
securities is calculated on the basis of the average cost of sold
securities. The purchase and sale of securities is entered at the
time of the settlement.
SHARES AND UNITS
Shares, primary capital certificates and shares in unit trusts that
are sold on the Stock Exchange or in a regulated market and
have good liquidity and dispersion of owners, are part of the
trading portfolio, and are assessed at market value on the
balance sheet date. If there is no continuous market, the value is
assessed on the basis of the company's methods of estimation.
Long-term share investments are assessed at initial cost. If the
real value is significantly lower than the initial cost, and the
decline in value is not considered to be temporary, the share is
written down to the real value. The write-down is reversed when
the basis for the write-down no longer exists.
CERTIFICATES AND BONDS
Certificates and bonds are classified as trading portfolio, and are
assessed at market value on the balance sheet date.
CURRENCY
Monetary assets and liabilities denominated in foreign currencies
27
SPAREBANK 1 SR-BANK NGAAP
28
SpareBank 1 SR-Bank Annual Report 2005
are translated into NOK, at the rate of exchange ruling at the
balance sheet date 31. December. The bank’s accounts receivable
and debts in foreign currency have been converted at middle
market prices at 31 December. Income and costs in foreign
currency have been translated to NOK according to the exchange
rates at the time of transaction. The currency items are largely
hedged by corresponding items on the opposite side of the
balance sheet, or with hedging items off the balance sheet.
FINANCIAL INSTRUMENTS
Financial instruments include transferable financial assets and
liability items, in addition to financial derivatives. Financial
instruments on the balance sheet include shareholdings, primary
capital certificates, bonds, certificates and units in money market
instruments, as well as financial derivatives. Financial derivatives
are agreements the bank enters into with financial institutions or
customers in order to determine financial values, either as
interest rate conditions, exchange rates or the value of equity
instruments for specific periods. Such agreements include
forward exchange contracts, interest swap agreements (currency
swaps), currency and interest options and forward rate
agreements (FRAs).
We distinguish between agreements that are part of own-account
trading in order to attain profit in connection with price differences
and price changes (the trading portfolio), and agreements that
are part of ordinary activities. At the time of signing the agree-
ment, interest and currency agreements are classified as part of
the trading portfolio or banking activities, depending on the
individual agreement. The trading portfolio consists of certificates
and bonds, shares and primary capital certificates on the bank's
balance sheet, as well as currency, interest and equity instruments
not included in the balance sheet.
Financial instruments which are part of the trading portfolio are
assessed according to the market value principle, and any
changes in market value are entered in the profit and loss
account under the item net capital gains/losses. Agreements
entered into in order to reduce the bank's risk exposure in
connection with interest rate and/or currency fluctuations on
balance sheet items are defined as hedging agreements.
In order for a currency or interest rate agreement to be defined
as a hedging agreement, the expected value development of the
hedging agreement must be closely linked to the balance sheet
item being secured. Income and costs relating to hedging
agreements and the appurtenant balance sheet items are accrued
and classified in the same manner.
GROSS LENDING TO CUSTOMERS
As of 1 January 2005, SpareBank 1 SR-Bank made a transition to
using the new regulations relating to lending in its parent bank
accounts. With the transition to the new regulations relating to
lending, new routines for entering losses on lending were
implemented. This resulted in earlier unspecified losses being
reduced by a significant amount and lending fees previously
entered as income and LTMs (long-term monitored) loans
previously entered in the balance sheet, were reversed at the date
of transition. All these entries were against equity.
Loans are entered at amortised cost using the effective interest
method.
Loss of value on gross lending and credits entered at
amortised cost
On each balance sheet date, the bank considers whether there is
objective proof of the value of a financial asset or group of
financial assets having been reduced. Loss of value of a financial
asset or a group of financial assets has been incurred if, and only
if, there is objective proof of loss of value. The loss of value must
be the result of one or more events which have occurred since
first entering the asset or group of assets in the accounts (a loss
event), and the result of the loss event (or events) must be
possible to measure in a reliable manner. Objective proof of the
value of a financial assets or group of financial assets being
reduced includes observable data made known to the bank
regarding the following loss events:
- Significant financial difficulties for the issuer or borrower.
- Breach of contract, e.g. non-payment of instalments or interest.
- The bank granting the borrower special terms on the basis of
financial or legal matters related to the borrower's financial
situation.
- The likelihood of a debtor having to enter debt negotiations or
other financial reorganisations
- Due to financial difficulties, the active markets for the financial
asset cease to exist, or
- observable data indicate a measurable reduction in future cash
flow from a group of financial assets since first entering them
in the accounts, even if the reduction is not yet fully linked to
one individual financial asset in the group, including:
• Unfavourable development in the payment status of the
debtors in the group, or
• national or local financial conditions which correlates with the
default of the assets in the group.
The bank will first consider whether there are individual objective
proof of loss of value for financial assets which are individually
significant. For financial assets which are not individually
significant, the objective proof of loss of value is assessed
individually or collectively. If the bank finds that there is no
objective proof of loss of value for an individually assessed
financial asset, significant or not, the asset is included in a group
of financial assets with the same credit risk characteristics. The
group is then assessed as a whole as regards loss of value.
Assets which are assessed individually as regards loss of value,
and in which a loss of value is being identified or is still identified,
are not included in a total assessment of loss of value.
If there is objective proof of a loss of value having occurred, the
size of the loss is estimated as the difference between the ente-
red value of the asset and the present value of estimated future
cash flows (excluding future credit losses not incurred), discounted
with the original effective interest rate of the financial asset. The
entered value of the asset is reduced using an appropriation
account, and the loss is entered in the profit and loss account.
Future cash flows from a group of financial assets, which are
assessed together as regards loss of value, are estimated based
on the contractual cash flows for the group as well as historic
losses for assets with a similar credit risk. Historic losses are
SPAREBANK 1 SR-BANK NGAAP
adjusted for present observable data in order to take into
consideration the effect of existing conditions which were not
present at the time when the historic losses were incurred, as
well as adjusting the effects of former conditions not existing at
present.
DEFAULTS/DOUBTFUL
A customer's overall commitment is considered to be in default,
and is included in the bank's list of commitments in default,
when the instalments and interest due have not been paid 90
days after the due date, or the credit ceiling has been exceeded
for 90 days or more.
WRITE-OFFS
When there is a predominant probability that the losses are final,
the losses are classified as write-offs. Write-offs covered by loss
allocations carried out previously are entered against the allocations.
Write-offs that are not provided for in the loss allocations, as well
as excess or insufficient provisions in relation to former loss
allocations, shall be entered in the profit and loss account.
SEIZED ASSETS
As part of the handling of loans and guarantees in default, the
bank sometimes seizes the assets that have been offered as
security for such commitments. In the event of seizing the assets,
they are valued at their estimated realisation value. Seized assets
that are to be realised are classified as current assets. Any losses/
gains in connection with the disposal or re-evaluation of such
assets are entered as a loss/reduction in losses on lending.
TANGIBLE FIXED ASSETS
Tangible fixed assets are entered at initial cost in the accounts,
plus former appreciation, minus write-downs and ordinary
accumulated depreciation. Ordinary depreciation is based on
cost and the depreciation is linear over the economic life of the
tangible assets. If the actual value of a tangible fixed asset is
significantly lower than the book value and the decrease in value
is not expected to be of a temporary nature, the asset will be
written down to its real value. The write-down is reversed when
the basis for the write-down is no longer present.
ISSUED BONDS AND OTHER BORROWING
Issued bonds are entered in the balance sheet at nominal value,
plus any premium and minus any discount. Premium is entered
as income, and discount is entered as cost according to plan as
an adjustment of the running interest costs up to the bond's
maturity, or, if applicable, up to the time of the first interest rate
adjustment. Any investment discount when issuing other long-
term loans is handled correspondingly. Direct costs in connection
with issuing bonds and other borrowings are entered according
to plan as an adjustment of the running interest cost until the
maturity of the bond or the loan.
SUBORDINATED LOANS/BOND FUNDS
Subordinated loans have lower priority than bond loans, and
therefore have a higher price. Non-perpetual subordinated loans
may make up 50% of the core capital in the capital adequacy
ratio, while perpetual subordinated loans can make up 100% of
the core capital.
Hybrid Tier 1 Perpetual Capital is a so-called "hybrid", ranked
between equity and subordinated loan as regards priority. Hybrid
Tier 1 Perpetual Capital is an interest-bearing security, but banks
are not obligated to pay interest in periods where no dividend is
paid, and the investor has no later claim to interest which has
not been paid, i.e. the interest is not accumulated. Hybrid Tier 1
Perpetual Capital can not make up more than 15 per cent of the
total core capital. The issuing of Hybrid Tier 1 Perpetual Capital
does not affect entered equity. Costs incurred from taking up the
loan are accrued over the term of the loan.
PENSION COMMITMENTS
In the autumn of 2005, publicly listed companies which use IFRS
in their group accounts were permitted to make the transition to
IFRS regulations as regards pensions in their company accounts.
SpareBank 1 SR-Bank and its subsidiaries did this, effective from
the 2005 annual accounts, with retroactive effect from 1 January
2004. At the implementation, the accumulated estimate deviation
as of 1 January 2004 were entered against equity. The standard
used for handling pensions in the accounts is IAS 19.
Pension expenses and pension commitments are calculated
according to linear earnings, based on assumptions regarding
discount rate, future wage and salaries adjustments, retirement
pensions and national insurance benefits, future return on
pension assets, as well as actuary assumptions regarding
mortality, voluntary retirement, etc. In the balance sheet, net
pension assets within the group scheme are presented as fixed
assets, while net uncovered pension commitments are classified
as long-term debt. The employer's national insurance contribution,
which accrues according to applicable rates, is also included in
the amount for uncovered pension commitments. Total net
pension expenses are classified under wages and salaries in the
profit and loss account, and include the period's earning of
entitlements to pension benefits and interest paid on liabilities,
minus the estimated return on pension funds.
SpareBank 1 SR-Bank has chosen to enter estimate deviations
directly against equity when they occur.
TAXES
The year's tax expense in the profit and loss account consists of
tax payable on income for the year, adjusted by excessive/
insufficient allocations in earlier years, as well as changes in
deferred tax. Deferred tax is calculated on the basis of temporary
differences between accounting and fiscal assets at the end of
the accounting year.
Nominal tax rates are used in the calculation. Positive and
negative differences are assessed against each other, and their
net result is shown in the balance sheet. Deferred tax assets arise
if there is a temporary difference giving rise to future tax deductions.
DEBT
Debt is entered at the price of taking up the loan. Interest is
continuously entered as cost in the profit and loss account.
BUSINESS AREAS
SpareBank 1 SR-Bank considers the bank's operations to be a
single business area.
29
SPAREBANK 1 SR-BANK NGAAP
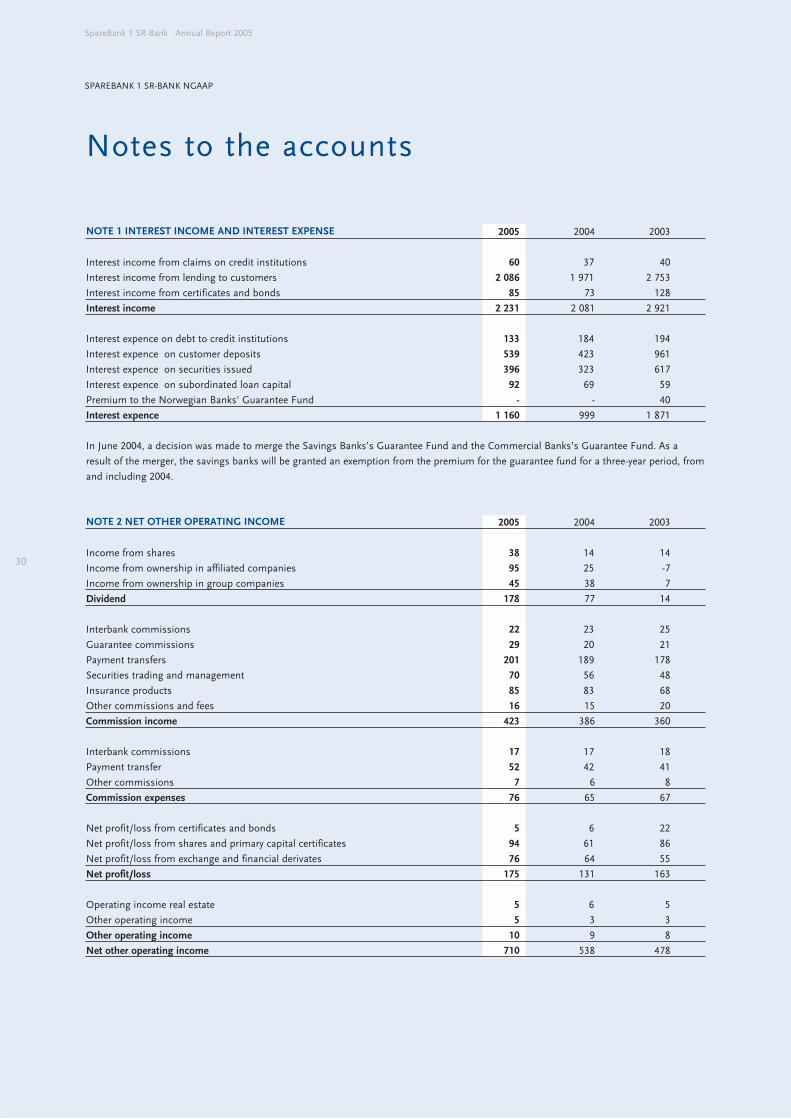
Notes to the accounts
30
SpareBank 1 SR-Bank Annual Report 2005
NOTE 1 INTEREST INCOME AND INTEREST EXPENSE 2005 2004 2003
Interest income from claims on credit institutions 60 37 40
Interest income from lending to customers 2 086 1 971 2 753
Interest income from certificates and bonds 85 73 128
Interest income 2 231 2 081 2 921
Interest expence on debt to credit institutions 133 184 194
Interest expence on customer deposits 539 423 961
Interest expence on securities issued 396 323 617
Interest expence on subordinated loan capital 92 69 59
Premium to the Norwegian Banks' Guarantee Fund - - 40
Interest expence 1 160 999 1 871
In June 2004, a decision was made to merge the Savings Banks’s Guarantee Fund and the Commercial Banks’s Guarantee Fund. As a
result of the merger, the savings banks will be granted an exemption from the premium for the guarantee fund for a three-year period, from
and including 2004.
NOTE 2 NET OTHER OPERATING INCOME 2005 2004 2003
Income from shares 38 14 14
Income from ownership in affiliated companies 95 25 -7
Income from ownership in group companies 45 38 7
Dividend 178 77 14
Interbank commissions 22 23 25
Guarantee commissions 29 20 21
Payment transfers 201 189 178
Securities trading and management 70 56 48
Insurance products 85 83 68
Other commissions and fees 16 15 20
Commission income 423 386 360
Interbank commissions 17 17 18
Payment transfer 52 42 41
Other commissions 7 6 8
Commission expenses 76 65 67
Net profit/loss from certificates and bonds 5 6 22
Net profit/loss from shares and primary capital certificates 94 61 86
Net profit/loss from exchange and financial derivates 76 64 55
Net profit/loss 175 131 163
Operating income real estate 5 6 5
Other operating income 5 3 3
Other operating income 10 9 8
Net other operating income 710 538 478
SPAREBANK 1 SR-BANK NGAAP
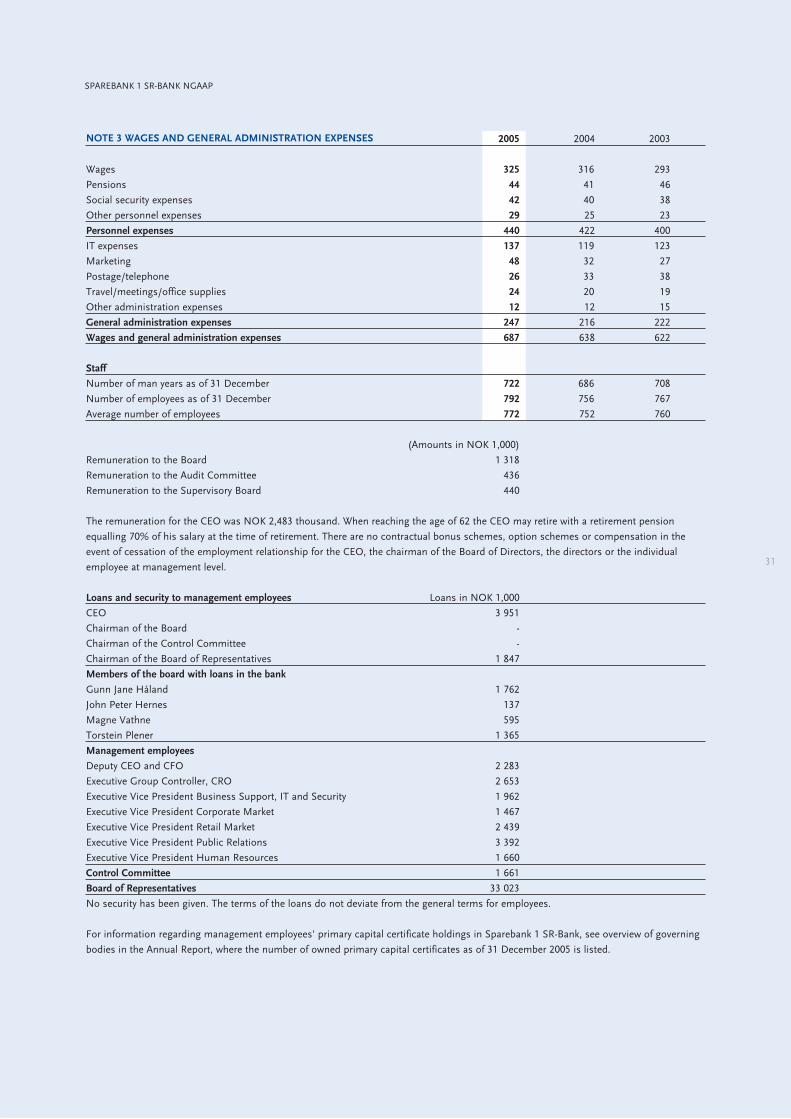
NOTE 3 WAGES AND GENERAL ADMINISTRATION EXPENSES 2005 2004 2003
Wages 325 316 293
Pensions 44 41 46
Social security expenses 42 40 38
Other personnel expenses 29 25 23
Personnel expenses 440 422 400
IT expenses 137 119 123
Marketing 48 32 27
Postage/telephone 26 33 38
Travel/meetings/office supplies 24 20 19
Other administration expenses 12 12 15
General administration expenses 247 216 222
Wages and general administration expenses 687 638 622
Staff
Number of man years as of 31 December 722 686 708
Number of employees as of 31 December 792 756 767
Average number of employees 772 752 760
(Amounts in NOK 1,000)
Remuneration to the Board 1 318
Remuneration to the Audit Committee 436
Remuneration to the Supervisory Board 440
The remuneration for the CEO was NOK 2,483 thousand. When reaching the age of 62 the CEO may retire with a retirement pension
equalling 70% of his salary at the time of retirement. There are no contractual bonus schemes, option schemes or compensation in the
event of cessation of the employment relationship for the CEO, the chairman of the Board of Directors, the directors or the individual
employee at management level.
Loans and security to management employees Loans in NOK 1,000
CEO 3 951
Chairman of the Board -
Chairman of the Control Committee -
Chairman of the Board of Representatives 1 847
Members of the board with loans in the bank
Gunn Jane Håland 1 762
John Peter Hernes 137
Magne Vathne 595
Torstein Plener 1 365
Management employees
Deputy CEO and CFO 2 283
Executive Group Controller, CRO 2 653
Executive Vice President Business Support, IT and Security 1 962
Executive Vice President Corporate Market 1 467
Executive Vice President Retail Market 2 439
Executive Vice President Public Relations 3 392
Executive Vice President Human Resources 1 660
Control Committee 1 661
Board of Representatives 33 023
No security has been given. The terms of the loans do not deviate from the general terms for employees.
For information regarding management employees' primary capital certificate holdings in Sparebank 1 SR-Bank, see overview of governing
bodies in the Annual Report, where the number of owned primary capital certificates as of 31 December 2005 is listed.
31
SPAREBANK 1 SR-BANK NGAAP
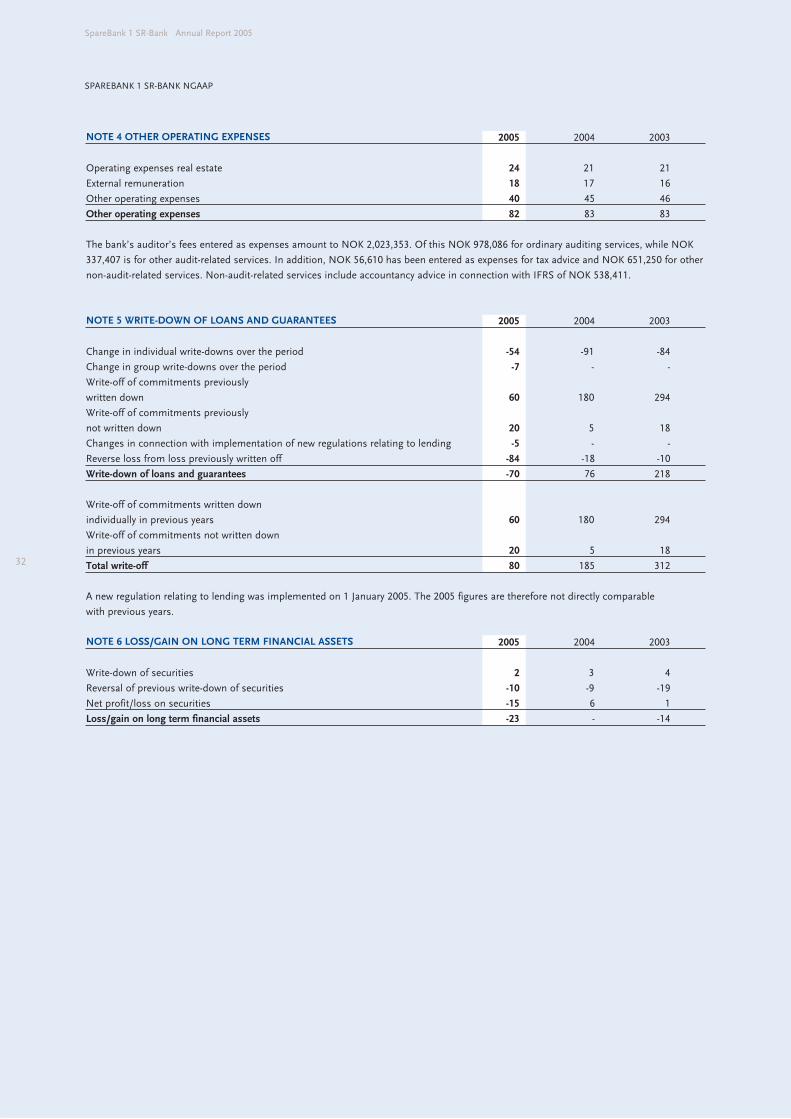
32
SpareBank 1 SR-Bank Annual Report 2005
NOTE 4 OTHER OPERATING EXPENSES 2005 2004 2003
Operating expenses real estate 24 21 21
External remuneration 18 17 16
Other operating expenses 40 45 46
Other operating expenses 82 83 83
The bank’s auditor’s fees entered as expenses amount to NOK 2,023,353. Of this NOK 978,086 for ordinary auditing services, while NOK
337,407 is for other audit-related services. In addition, NOK 56,610 has been entered as expenses for tax advice and NOK 651,250 for other
non-audit-related services. Non-audit-related services include accountancy advice in connection with IFRS of NOK 538,411.
NOTE 5 WRITE-DOWN OF LOANS AND GUARANTEES 2005 2004 2003
Change in individual write-downs over the period -54 -91 -84
Change in group write-downs over the period -7 - -
Write-off of commitments previously
written down 60 180 294
Write-off of commitments previously
not written down 20 5 18
Changes in connection with implementation of new regulations relating to lending -5 - -
Reverse loss from loss previously written off -84 -18 -10
Write-down of loans and guarantees -70 76 218
Write-off of commitments written down
individually in previous years 60 180 294
Write-off of commitments not written down
in previous years 20 5 18
Total write-off 80 185 312
A new regulation relating to lending was implemented on 1 January 2005. The 2005 figures are therefore not directly comparable
with previous years.
NOTE 6 LOSS/GAIN ON LONG TERM FINANCIAL ASSETS 2005 2004 2003
Write-down of securities 2 3 4
Reversal of previous write-down of securities -10 -9 -19
Net profit/loss on securities -15 6 1
Loss/gain on long term financial assets -23 - -14
SPAREBANK 1 SR-BANK NGAAP
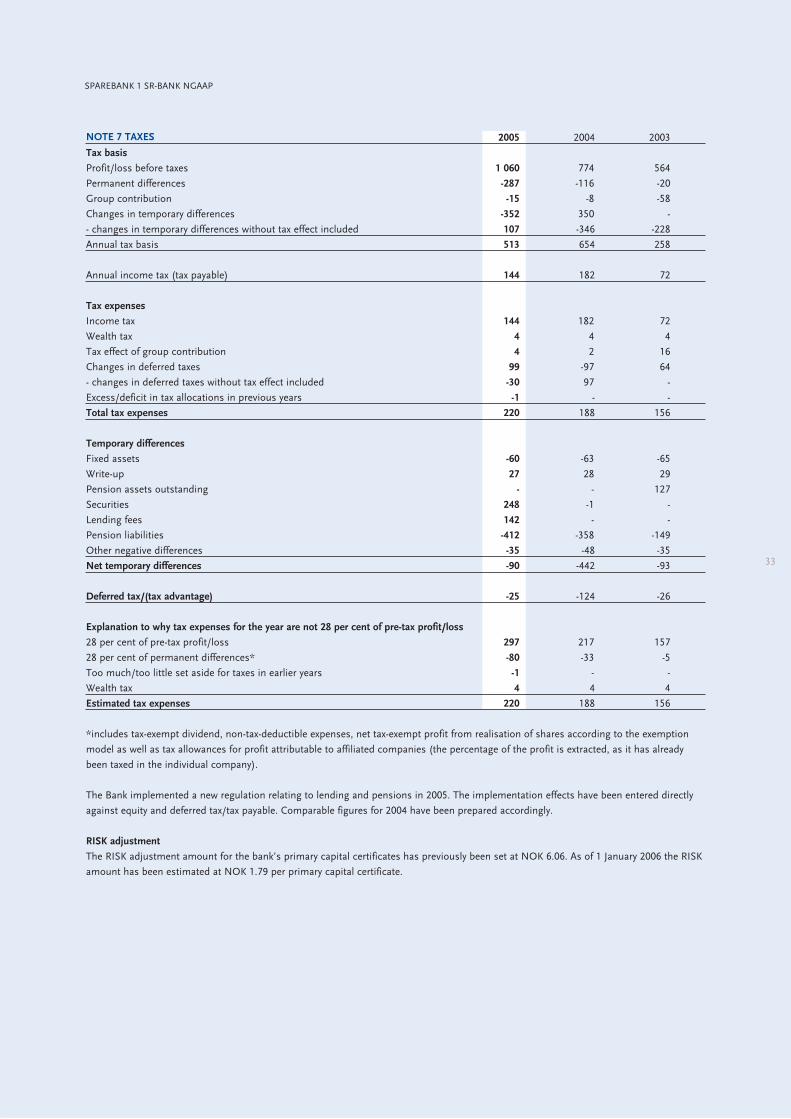
NOTE 7 TAXES 2005 2004 2003
Tax basis
Profit/loss before taxes 1 060 774 564
Permanent differences -287 -116 -20
Group contribution -15 -8 -58
Changes in temporary differences -352 350 -
- changes in temporary differences without tax effect included 107 -346 -228
Annual tax basis 513 654 258
Annual income tax (tax payable) 144 182 72
Tax expenses
Income tax 144 182 72
Wealth tax 4 4 4
Tax effect of group contribution 4 2 16
Changes in deferred taxes 99 -97 64
- changes in deferred taxes without tax effect included -30 97 -
Excess/deficit in tax allocations in previous years -1 - -
Total tax expenses 220 188 156
Temporary differences
Fixed assets -60 -63 -65
Write-up 27 28 29
Pension assets outstanding - - 127
Securities 248 -1 -
Lending fees 142 - -
Pension liabilities -412 -358 -149
Other negative differences -35 -48 -35
Net temporary differences -90 -442 -93
Deferred tax/(tax advantage) -25 -124 -26
Explanation to why tax expenses for the year are not 28 per cent of pre-tax profit/loss
28 per cent of pre-tax profit/loss 297 217 157
28 per cent of permanent differences* -80 -33 -5
Too much/too little set aside for taxes in earlier years -1 - -
Wealth tax 4 4 4
Estimated tax expenses 220 188 156
*includes tax-exempt dividend, non-tax-deductible expenses, net tax-exempt profit from realisation of shares according to the exemption
model as well as tax allowances for profit attributable to affiliated companies (the percentage of the profit is extracted, as it has already
been taxed in the individual company).
The Bank implemented a new regulation relating to lending and pensions in 2005. The implementation effects have been entered directly
against equity and deferred tax/tax payable. Comparable figures for 2004 have been prepared accordingly.
RISK adjustment
The RISK adjustment amount for the bank’s primary capital certificates has previously been set at NOK 6.06. As of 1 January 2006 the RISK
amount has been estimated at NOK 1.79 per primary capital certificate.
33
SPAREBANK 1 SR-BANK NGAAP
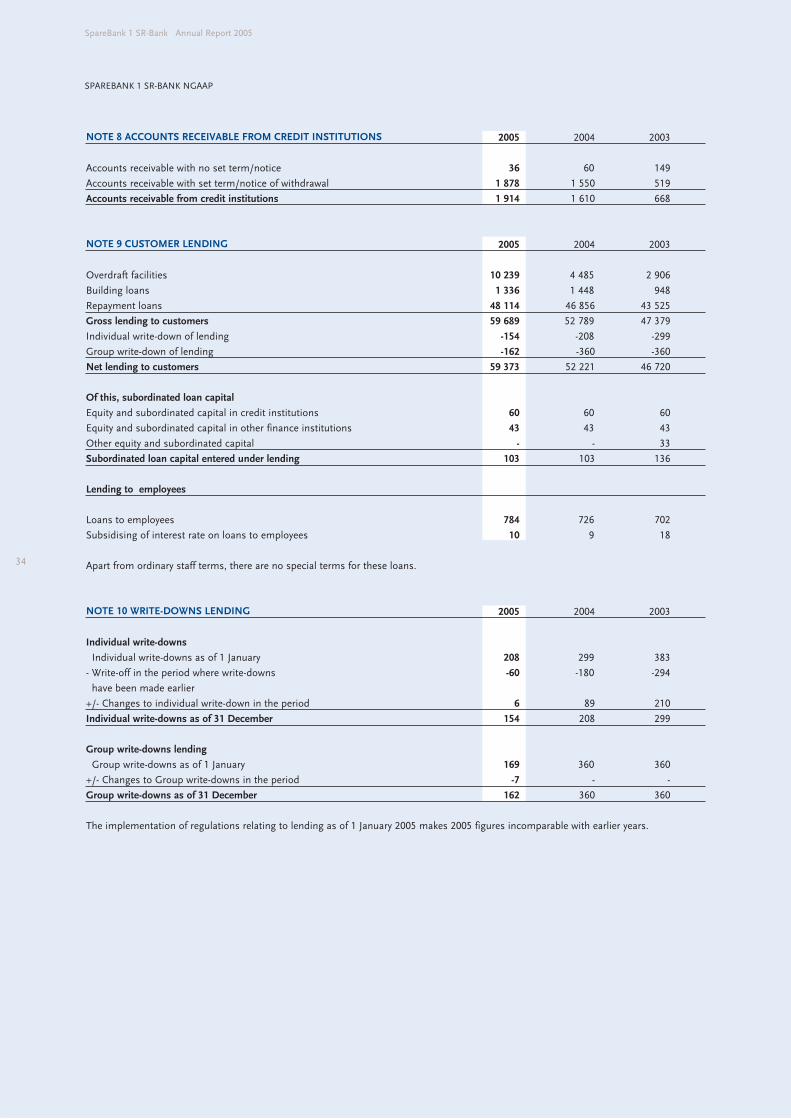
34
SpareBank 1 SR-Bank Annual Report 2005
NOTE 8 ACCOUNTS RECEIVABLE FROM CREDIT INSTITUTIONS 2005 2004 2003
Accounts receivable with no set term/notice 36 60 149
Accounts receivable with set term/notice of withdrawal 1 878 1 550 519
Accounts receivable from credit institutions 1 914 1 610 668
NOTE 9 CUSTOMER LENDING 2005 2004 2003
Overdraft facilities 10 239 4 485 2 906
Building loans 1 336 1 448 948
Repayment loans 48 114 46 856 43 525
Gross lending to customers 59 689 52 789 47 379
Individual write-down of lending -154 -208 -299
Group write-down of lending -162 -360 -360
Net lending to customers 59 373 52 221 46 720
Of this, subordinated loan capital
Equity and subordinated capital in credit institutions 60 60 60
Equity and subordinated capital in other finance institutions 43 43 43
Other equity and subordinated capital - - 33
Subordinated loan capital entered under lending 103 103 136
Lending to employees
Loans to employees 784 726 702
Subsidising of interest rate on loans to employees 10 9 18
Apart from ordinary staff terms, there are no special terms for these loans.
NOTE 10 WRITE-DOWNS LENDING 2005 2004 2003
Individual write-downs
Individual write-downs as of 1 January 208 299 383
- Write-off in the period where write-downs -60 -180 -294
have been made earlier
+/- Changes to individual write-down in the period 6 89 210
Individual write-downs as of 31 December 154 208 299
Group write-downs lending
Group write-downs as of 1 January 169 360 360
+/- Changes to Group write-downs in the period -7 - -
Group write-downs as of 31 December 162 360 360
The implementation of regulations relating to lending as of 1 January 2005 makes 2005 figures incomparable with earlier years.
SPAREBANK 1 SR-BANK NGAAP
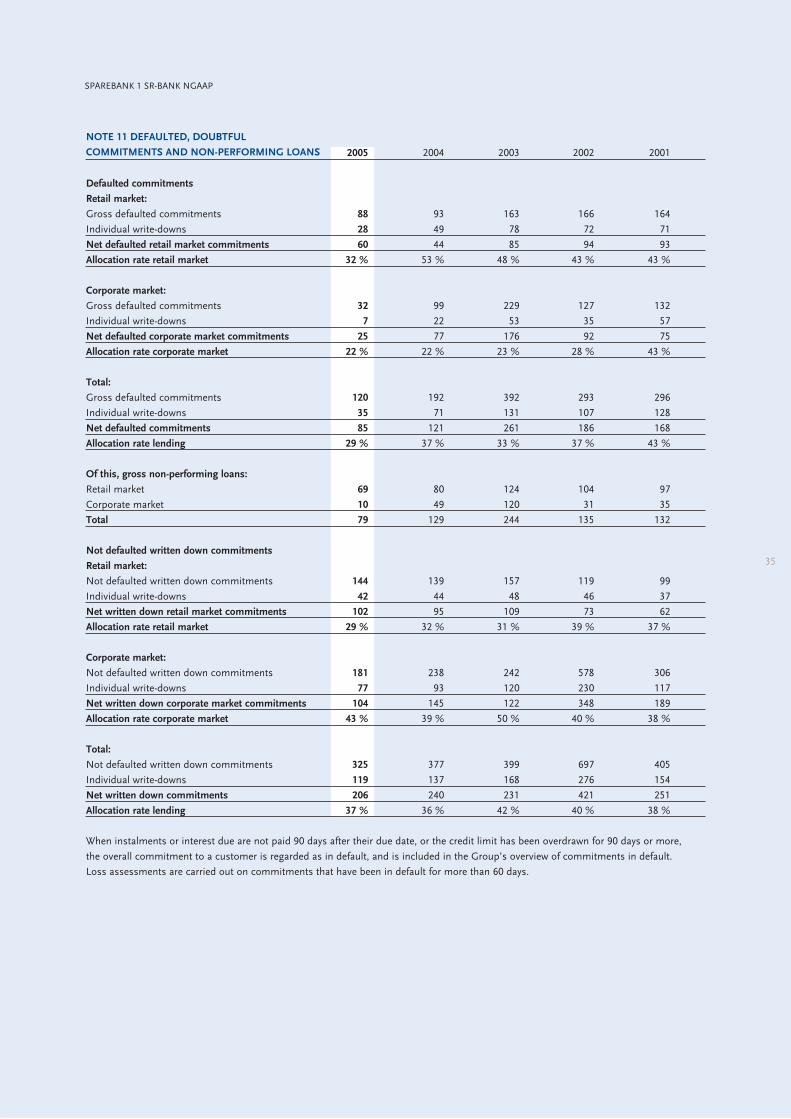
NOTE 11 DEFAULTED, DOUBTFUL
COMMITMENTS AND NON-PERFORMING LOANS 2005 2004 2003 2002 2001
Defaulted commitments
Retail market:
Gross defaulted commitments 88 93 163 166 164
Individual write-downs 28 49 78 72 71
Net defaulted retail market commitments 60 44 85 94 93
Allocation rate retail market 32 % 53 % 48 % 43 % 43 %
Corporate market:
Gross defaulted commitments 32 99 229 127 132
Individual write-downs 7 22 53 35 57
Net defaulted corporate market commitments 25 77 176 92 75
Allocation rate corporate market 22 % 22 % 23 % 28 % 43 %
Total:
Gross defaulted commitments 120 192 392 293 296
Individual write-downs 35 71 131 107 128
Net defaulted commitments 85 121 261 186 168
Allocation rate lending 29 % 37 % 33 % 37 % 43 %
Of this, gross non-performing loans:
Retail market 69 80 124 104 97
Corporate market 10 49 120 31 35
Total 79 129 244 135 132
Not defaulted written down commitments
Retail market:
Not defaulted written down commitments 144 139 157 119 99
Individual write-downs 42 44 48 46 37
Net written down retail market commitments 102 95 109 73 62
Allocation rate retail market 29 % 32 % 31 % 39 % 37 %
Corporate market:
Not defaulted written down commitments 181 238 242 578 306
Individual write-downs 77 93 120 230 117
Net written down corporate market commitments 104 145 122 348 189
Allocation rate corporate market 43 % 39 % 50 % 40 % 38 %
Total:
Not defaulted written down commitments 325 377 399 697 405
Individual write-downs 119 137 168 276 154
Net written down commitments 206 240 231 421 251
Allocation rate lending 37 % 36 % 42 % 40 % 38 %
When instalments or interest due are not paid 90 days after their due date, or the credit limit has been overdrawn for 90 days or more,
the overall commitment to a customer is regarded as in default, and is included in the Group’s overview of commitments in default.
Loss assessments are carried out on commitments that have been in default for more than 60 days.
35
SPAREBANK 1 SR-BANK NGAAP
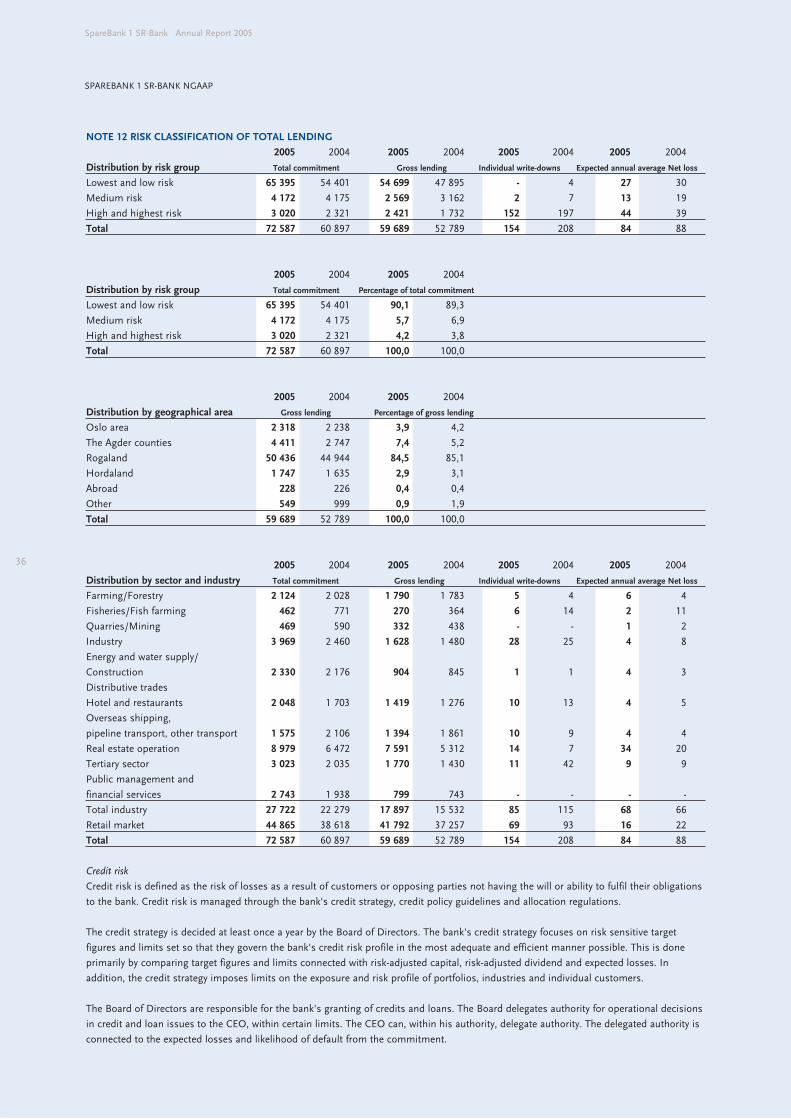
36
SpareBank 1 SR-Bank Annual Report 2005
SPAREBANK 1 SR-BANK NGAAP
NOTE 12 RISK CLASSIFICATION OF TOTAL LENDING
2005 2004 2005 2004 2005 2004 2005 2004
Distribution by risk group Total commitment Gross lending Individual write-downs Expected annual average Net loss
Lowest and low risk 65 395 54 401 54 699 47 895 - 4 27 30
Medium risk 4 172 4 175 2 569 3 162 2 7 13 19
High and highest risk 3 020 2 321 2 421 1 732 152 197 44 39
Total 72 587 60 897 59 689 52 789 154 208 84 88
2005 2004 2005 2004
Distribution by risk group Total commitment Percentage of total commitment
Lowest and low risk 65 395 54 401 90,1 89,3
Medium risk 4 172 4 175 5,7 6,9
High and highest risk 3 020 2 321 4,2 3,8
Total 72 587 60 897 100,0 100,0
2005 2004 2005 2004
Distribution by geographical area Gross lending Percentage of gross lending
Oslo area 2 318 2 238 3,9 4,2
The Agder counties 4 411 2 747 7,4 5,2
Rogaland 50 436 44 944 84,5 85,1
Hordaland 1 747 1 635 2,9 3,1
Abroad 228 226 0,4 0,4
Other 549 999 0,9 1,9
Total 59 689 52 789 100,0 100,0
2005 2004 2005 2004 2005 2004 2005 2004
Distribution by sector and industry Total commitment Gross lending Individual write-downs Expected annual average Net loss
Farming/Forestry 2 124 2 028 1 790 1 783 5 4 6 4
Fisheries/Fish farming 462 771 270 364 6 14 2 11
Quarries/Mining 469 590 332 438 - - 1 2
Industry 3 969 2 460 1 628 1 480 28 25 4 8
Energy and water supply/
Construction 2 330 2 176 904 845 1 1 4 3
Distributive trades
Hotel and restaurants 2 048 1 703 1 419 1 276 10 13 4 5
Overseas shipping,
pipeline transport, other transport 1 575 2 106 1 394 1 861 10 9 4 4
Real estate operation 8 979 6 472 7 591 5 312 14 7 34 20
Tertiary sector 3 023 2 035 1 770 1 430 11 42 9 9
Public management and
financial services 2 743 1 938 799 743 - - - -
Total industry 27 722 22 279 17 897 15 532 85 115 68 66
Retail market 44 865 38 618 41 792 37 257 69 93 16 22
Total 72 587 60 897 59 689 52 789 154 208 84 88
Credit risk
Credit risk is defined as the risk of losses as a result of customers or opposing parties not having the will or ability to fulfil their obligations
to the bank. Credit risk is managed through the bank's credit strategy, credit policy guidelines and allocation regulations.
The credit strategy is decided at least once a year by the Board of Directors. The bank's credit strategy focuses on risk sensitive target
figures and limits set so that they govern the bank's credit risk profile in the most adequate and efficient manner possible. This is done
primarily by comparing target figures and limits connected with risk-adjusted capital, risk-adjusted dividend and expected losses. In
addition, the credit strategy imposes limits on the exposure and risk profile of portfolios, industries and individual customers.
The Board of Directors are responsible for the bank's granting of credits and loans. The Board delegates authority for operational decisions
in credit and loan issues to the CEO, within certain limits. The CEO can, within his authority, delegate authority. The delegated authority is
connected to the expected losses and likelihood of default from the commitment.
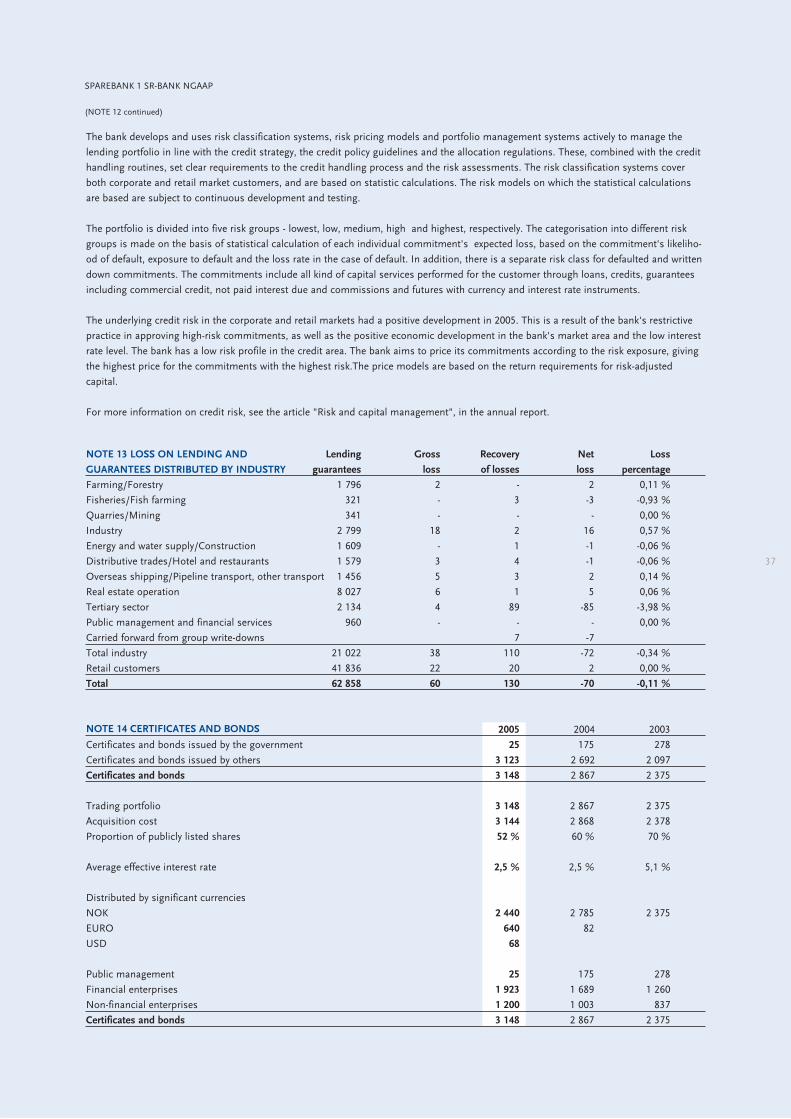
The bank develops and uses risk classification systems, risk pricing models and portfolio management systems actively to manage the
lending portfolio in line with the credit strategy, the credit policy guidelines and the allocation regulations. These, combined with the credit
handling routines, set clear requirements to the credit handling process and the risk assessments. The risk classification systems cover
both corporate and retail market customers, and are based on statistic calculations. The risk models on which the statistical calculations
are based are subject to continuous development and testing.
The portfolio is divided into five risk groups - lowest, low, medium, high and highest, respectively. The categorisation into different risk
groups is made on the basis of statistical calculation of each individual commitment's expected loss, based on the commitment's likeliho-
od of default, exposure to default and the loss rate in the case of default. In addition, there is a separate risk class for defaulted and written
down commitments. The commitments include all kind of capital services performed for the customer through loans, credits, guarantees
including commercial credit, not paid interest due and commissions and futures with currency and interest rate instruments.
The underlying credit risk in the corporate and retail markets had a positive development in 2005. This is a result of the bank's restrictive
practice in approving high-risk commitments, as well as the positive economic development in the bank's market area and the low interest
rate level. The bank has a low risk profile in the credit area. The bank aims to price its commitments according to the risk exposure, giving
the highest price for the commitments with the highest risk.The price models are based on the return requirements for risk-adjusted
capital.
For more information on credit risk, see the article "Risk and capital management", in the annual report.
NOTE 13 LOSS ON LENDING AND Lending Gross Recovery Net Loss
GUARANTEES DISTRIBUTED BY INDUSTRY guarantees loss of losses loss percentage
Farming/Forestry 1 796 2 - 2 0,11 %
Fisheries/Fish farming 321 - 3 -3 -0,93 %
Quarries/Mining 341 - - - 0,00 %
Industry 2 799 18 2 16 0,57 %
Energy and water supply/Construction 1 609 - 1 -1 -0,06 %
Distributive trades/Hotel and restaurants 1 579 3 4 -1 -0,06 %
Overseas shipping/Pipeline transport, other transport 1 456 5 3 2 0,14 %
Real estate operation 8 027 6 1 5 0,06 %
Tertiary sector 2 134 4 89 -85 -3,98 %
Public management and financial services 960 - - - 0,00 %
Carried forward from group write-downs 7 -7
Total industry 21 022 38 110 -72 -0,34 %
Retail customers 41 836 22 20 2 0,00 %
Total 62 858 60 130 -70 -0,11 %
NOTE 14 CERTIFICATES AND BONDS 2005 2004 2003
Certificates and bonds issued by the government 25 175 278
Certificates and bonds issued by others 3 123 2 692 2 097
Certificates and bonds 3 148 2 867 2 375
Trading portfolio 3 148 2 867 2 375
Acquisition cost 3 144 2 868 2 378
Proportion of publicly listed shares 52 % 60 % 70 %
Average effective interest rate 2,5 % 2,5 % 5,1 %
Distributed by significant currencies
NOK 2 440 2 785 2 375
EURO 640 82
USD 68
Public management 25 175 278
Financial enterprises 1 923 1 689 1 260
Non-financial enterprises 1 200 1 003 837
Certificates and bonds 3 148 2 867 2 375
37
SPAREBANK 1 SR-BANK NGAAP
(NOTE 12 continued)
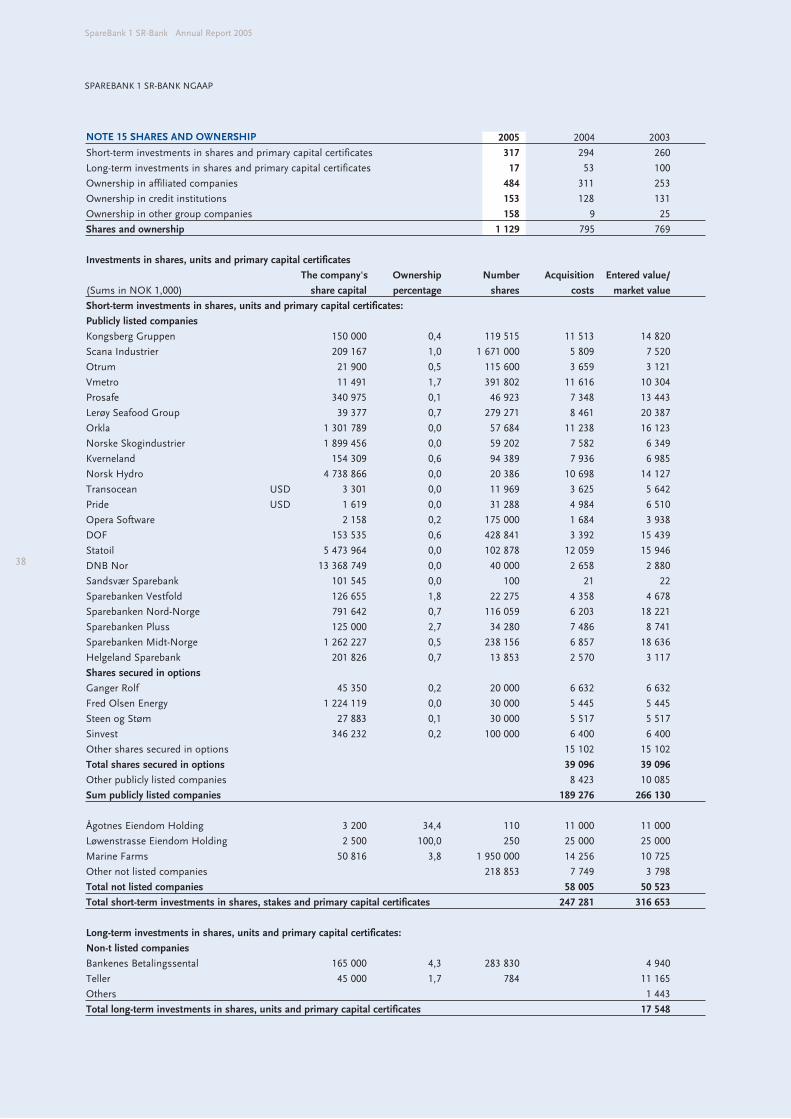
38
SpareBank 1 SR-Bank Annual Report 2005
NOTE 15 SHARES AND OWNERSHIP 2005 2004 2003
Short-term investments in shares and primary capital certificates 317 294 260
Long-term investments in shares and primary capital certificates 17 53 100
Ownership in affiliated companies 484 311 253
Ownership in credit institutions 153 128 131
Ownership in other group companies 158 9 25
Shares and ownership 1 129 795 769
Investments in shares, units and primary capital certificates
The company's Ownership Number Acquisition Entered value/
(Sums in NOK 1,000) share capital percentage shares costs market value
Short-term investments in shares, units and primary capital certificates:
Publicly listed companies
Kongsberg Gruppen 150 000 0,4 119 515 11 513 14 820
Scana Industrier 209 167 1,0 1 671 000 5 809 7 520
Otrum 21 900 0,5 115 600 3 659 3 121
Vmetro 11 491 1,7 391 802 11 616 10 304
Prosafe 340 975 0,1 46 923 7 348 13 443
Lerøy Seafood Group 39 377 0,7 279 271 8 461 20 387
Orkla 1 301 789 0,0 57 684 11 238 16 123
Norske Skogindustrier 1 899 456 0,0 59 202 7 582 6 349
Kverneland 154 309 0,6 94 389 7 936 6 985
Norsk Hydro 4 738 866 0,0 20 386 10 698 14 127
Transocean USD 3 301 0,0 11 969 3 625 5 642
Pride USD 1 619 0,0 31 288 4 984 6 510
Opera Software 2 158 0,2 175 000 1 684 3 938
DOF 153 535 0,6 428 841 3 392 15 439
Statoil 5 473 964 0,0 102 878 12 059 15 946
DNB Nor 13 368 749 0,0 40 000 2 658 2 880
Sandsvær Sparebank 101 545 0,0 100 21 22
Sparebanken Vestfold 126 655 1,8 22 275 4 358 4 678
Sparebanken Nord-Norge 791 642 0,7 116 059 6 203 18 221
Sparebanken Pluss 125 000 2,7 34 280 7 486 8 741
Sparebanken Midt-Norge 1 262 227 0,5 238 156 6 857 18 636
Helgeland Sparebank 201 826 0,7 13 853 2 570 3 117
Shares secured in options
Ganger Rolf 45 350 0,2 20 000 6 632 6 632
Fred Olsen Energy 1 224 119 0,0 30 000 5 445 5 445
Steen og Støm 27 883 0,1 30 000 5 517 5 517
Sinvest 346 232 0,2 100 000 6 400 6 400
Other shares secured in options 15 102 15 102
Total shares secured in options 39 096 39 096
Other publicly listed companies 8 423 10 085
Sum publicly listed companies 189 276 266 130
Ågotnes Eiendom Holding 3 200 34,4 110 11 000 11 000
Løwenstrasse Eiendom Holding 2 500 100,0 250 25 000 25 000
Marine Farms 50 816 3,8 1 950 000 14 256 10 725
Other not listed companies 218 853 7 749 3 798
Total not listed companies 58 005 50 523
Total short-term investments in shares, stakes and primary capital certificates 247 281 316 653
Long-term investments in shares, units and primary capital certificates:
Non-t listed companies
Bankenes Betalingssental 165 000 4,3 283 830 4 940
Teller 45 000 1,7 784 11 165
Others 1 443
Total long-term investments in shares, units and primary capital certificates 17 548
SPAREBANK 1 SR-BANK NGAAP
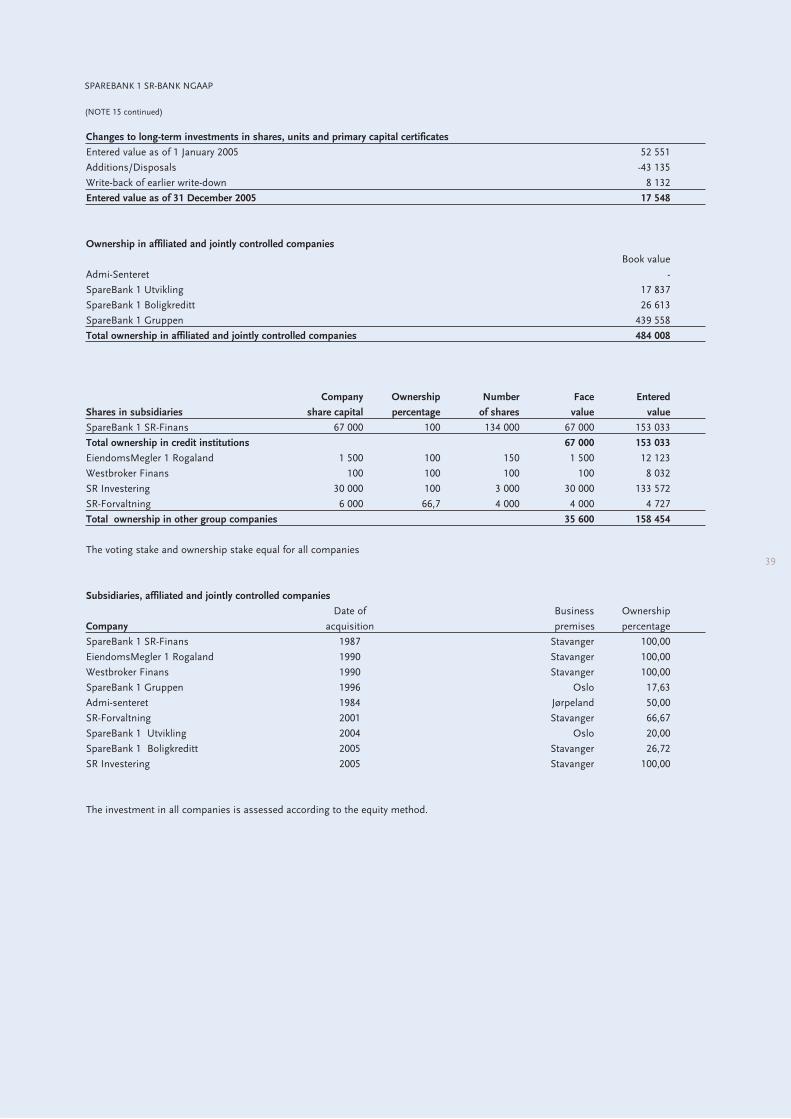
Changes to long-term investments in shares, units and primary capital certificates
Entered value as of 1 January 2005 52 551
Additions/Disposals -43 135
Write-back of earlier write-down 8 132
Entered value as of 31 December 2005 17 548
Ownership in affiliated and jointly controlled companies
Book value
Admi-Senteret -
SpareBank 1 Utvikling 17 837
SpareBank 1 Boligkreditt 26 613
SpareBank 1 Gruppen 439 558
Total ownership in affiliated and jointly controlled companies 484 008
Company Ownership Number Face Entered
Shares in subsidiaries share capital percentage of shares value value
SpareBank 1 SR-Finans 67 000 100 134 000 67 000 153 033
Total ownership in credit institutions 67 000 153 033
EiendomsMegler 1 Rogaland 1 500 100 150 1 500 12 123
Westbroker Finans 100 100 100 100 8 032
SR Investering 30 000 100 3 000 30 000 133 572
SR-Forvaltning 6 000 66,7 4 000 4 000 4 727
Total ownership in other group companies 35 600 158 454
The voting stake and ownership stake equal for all companies
Subsidiaries, affiliated and jointly controlled companies
Date of Business Ownership
Company acquisition premises percentage
SpareBank 1 SR-Finans 1987 Stavanger 100,00
EiendomsMegler 1 Rogaland 1990 Stavanger 100,00
Westbroker Finans 1990 Stavanger 100,00
SpareBank 1 Gruppen 1996 Oslo 17,63
Admi-senteret 1984 Jørpeland 50,00
SR-Forvaltning 2001 Stavanger 66,67
SpareBank 1 Utvikling 2004 Oslo 20,00
SpareBank 1 Boligkreditt 2005 Stavanger 26,72
SR Investering 2005 Stavanger 100,00
The investment in all companies is assessed according to the equity method.
39
SPAREBANK 1 SR-BANK NGAAP
(NOTE 15 continued)
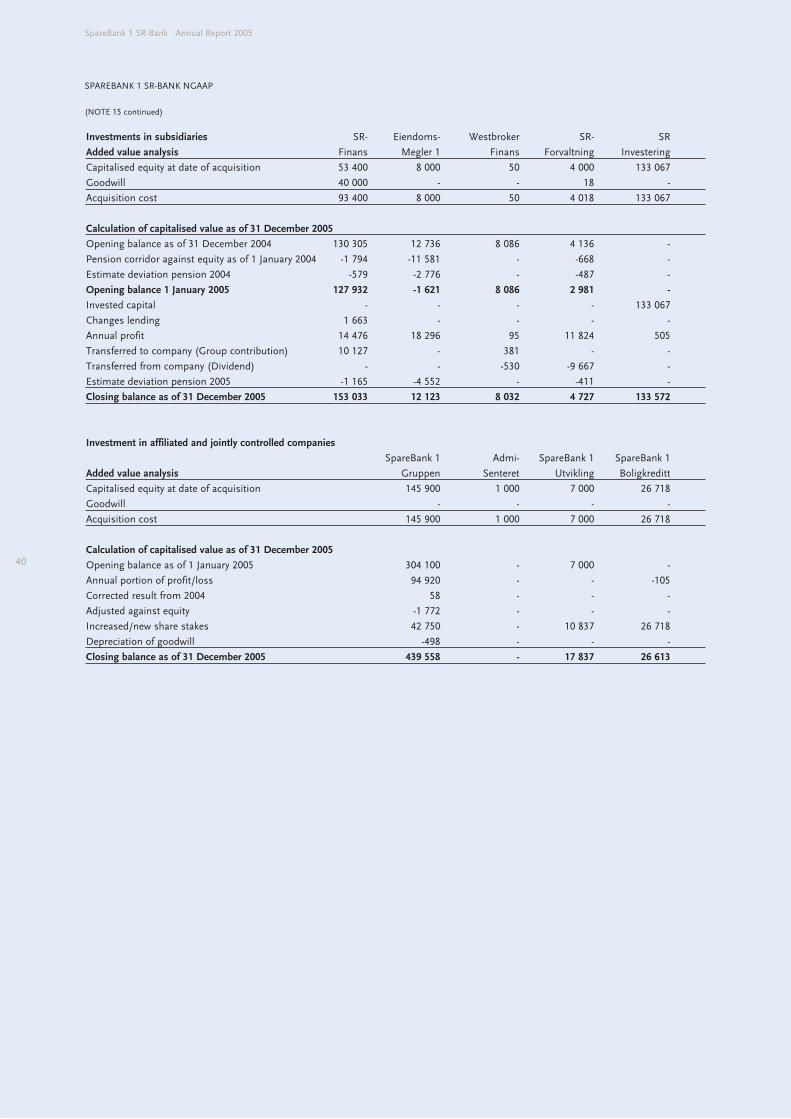
40
SpareBank 1 SR-Bank Annual Report 2005
Investments in subsidiaries SR- Eiendoms- Westbroker SR- SR
Added value analysis Finans Megler 1 Finans Forvaltning Investering
Capitalised equity at date of acquisition 53 400 8 000 50 4 000 133 067
Goodwill 40 000 - - 18 -
Acquisition cost 93 400 8 000 50 4 018 133 067
Calculation of capitalised value as of 31 December 2005
Opening balance as of 31 December 2004 130 305 12 736 8 086 4 136 -
Pension corridor against equity as of 1 January 2004 -1 794 -11 581 - -668 -
Estimate deviation pension 2004 -579 -2 776 - -487 -
Opening balance 1 January 2005 127 932 -1 621 8 086 2 981 -
Invested capital - - - - 133 067
Changes lending 1 663 - - - -
Annual profit 14 476 18 296 95 11 824 505
Transferred to company (Group contribution) 10 127 - 381 - -
Transferred from company (Dividend) - - -530 -9 667 -
Estimate deviation pension 2005 -1 165 -4 552 - -411 -
Closing balance as of 31 December 2005 153 033 12 123 8 032 4 727 133 572
Investment in affiliated and jointly controlled companies
SpareBank 1 Admi- SpareBank 1 SpareBank 1
Added value analysis Gruppen Senteret Utvikling Boligkreditt
Capitalised equity at date of acquisition 145 900 1 000 7 000 26 718
Goodwill - - - -
Acquisition cost 145 900 1 000 7 000 26 718
Calculation of capitalised value as of 31 December 2005
Opening balance as of 1 January 2005 304 100 - 7 000 -
Annual portion of profit/loss 94 920 - - -105
Corrected result from 2004 58 - - -
Adjusted against equity -1 772 - - -
Increased/new share stakes 42 750 - 10 837 26 718
Depreciation of goodwill -498 - - -
Closing balance as of 31 December 2005 439 558 - 17 837 26 613
SPAREBANK 1 SR-BANK NGAAP
(NOTE 15 continued)
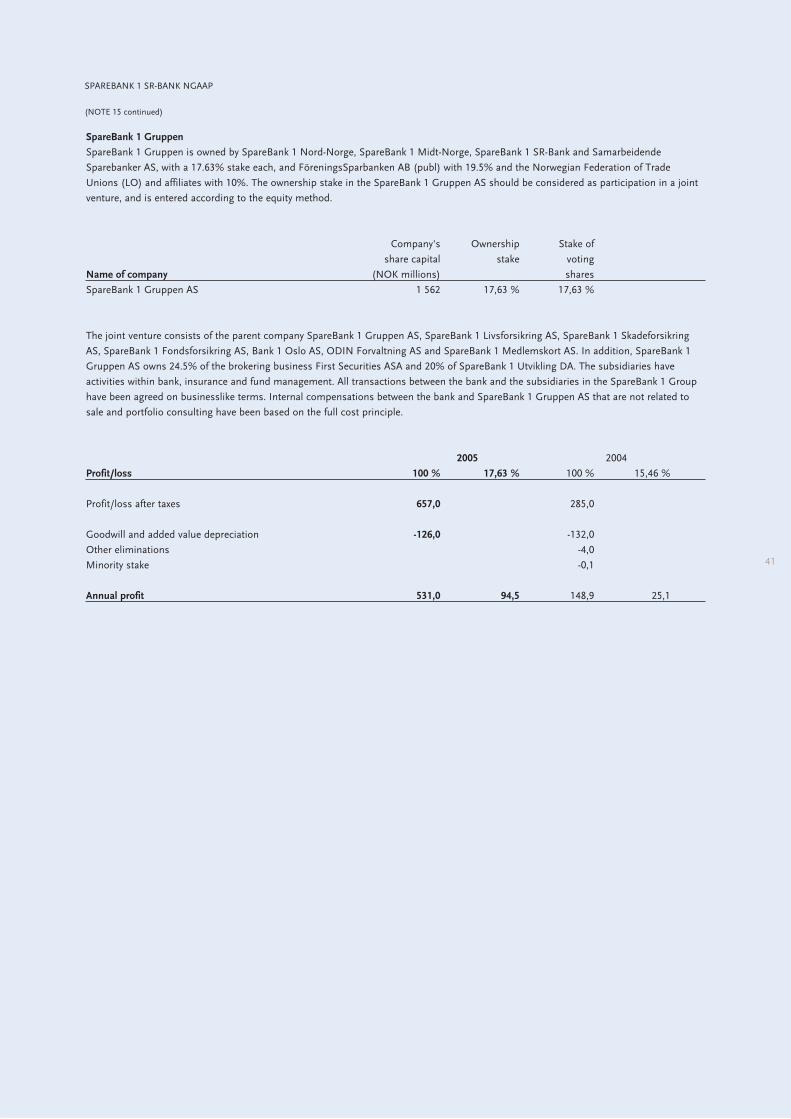
SpareBank 1 Gruppen
SpareBank 1 Gruppen is owned by SpareBank 1 Nord-Norge, SpareBank 1 Midt-Norge, SpareBank 1 SR-Bank and Samarbeidende
Sparebanker AS, with a 17.63% stake each, and FöreningsSparbanken AB (publ) with 19.5% and the Norwegian Federation of Trade
Unions (LO) and affiliates with 10%. The ownership stake in the SpareBank 1 Gruppen AS should be considered as participation in a joint
venture, and is entered according to the equity method.
Company's Ownership Stake of
share capital stake voting
Name of company (NOK millions) shares
SpareBank 1 Gruppen AS 1 562 17,63 % 17,63 %
The joint venture consists of the parent company SpareBank 1 Gruppen AS, SpareBank 1 Livsforsikring AS, SpareBank 1 Skadeforsikring
AS, SpareBank 1 Fondsforsikring AS, Bank 1 Oslo AS, ODIN Forvaltning AS and SpareBank 1 Medlemskort AS. In addition, SpareBank 1
Gruppen AS owns 24.5% of the brokering business First Securities ASA and 20% of SpareBank 1 Utvikling DA. The subsidiaries have
activities within bank, insurance and fund management. All transactions between the bank and the subsidiaries in the SpareBank 1 Group
have been agreed on businesslike terms. Internal compensations between the bank and SpareBank 1 Gruppen AS that are not related to
sale and portfolio consulting have been based on the full cost principle.
2005 2004
Profit/loss 100 % 17,63 % 100 % 15,46 %
Profit/loss after taxes 657,0 285,0
Goodwill and added value depreciation -126,0 -132,0
Other eliminations -4,0
Minority stake -0,1
Annual profit 531,0 94,5 148,9 25,1
41
SPAREBANK 1 SR-BANK NGAAP
(NOTE 15 continued)
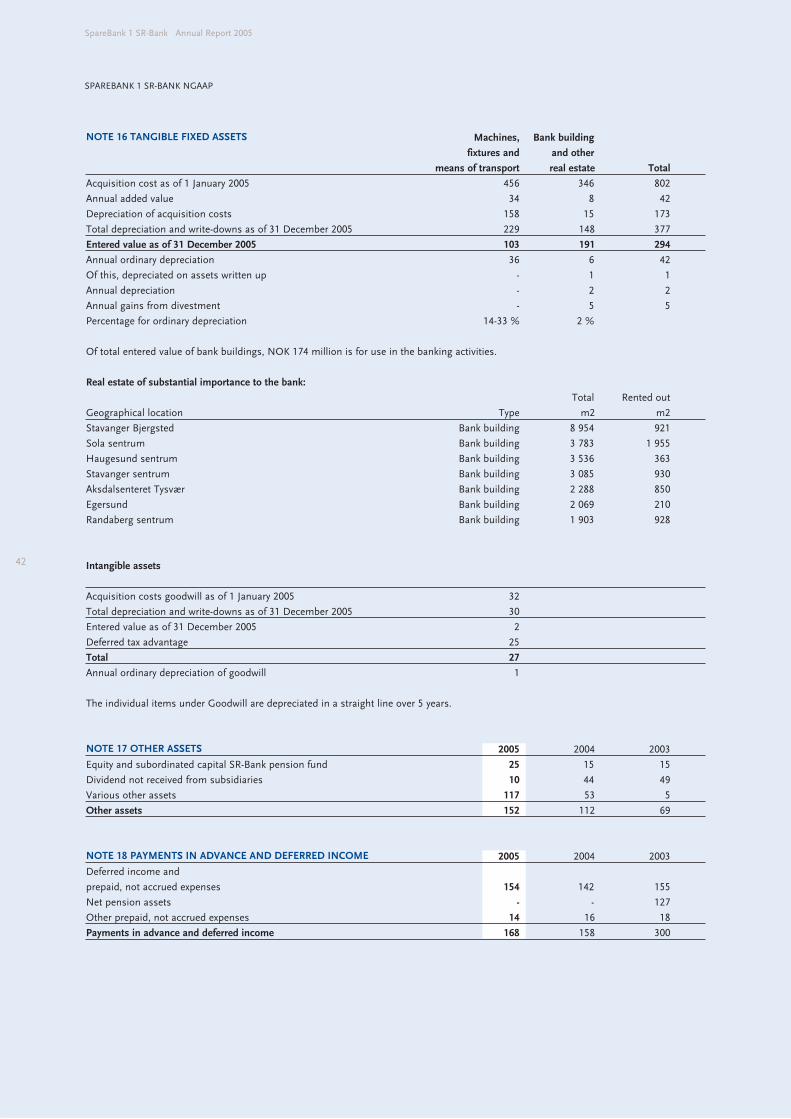
42
SpareBank 1 SR-Bank Annual Report 2005
NOTE 16 TANGIBLE FIXED ASSETS Machines, Bank building
fixtures and and other
means of transport real estate Total
Acquisition cost as of 1 January 2005 456 346 802
Annual added value 34 8 42
Depreciation of acquisition costs 158 15 173
Total depreciation and write-downs as of 31 December 2005 229 148 377
Entered value as of 31 December 2005 103 191 294
Annual ordinary depreciation 36 6 42
Of this, depreciated on assets written up - 1 1
Annual depreciation - 2 2
Annual gains from divestment - 5 5
Percentage for ordinary depreciation 14-33 % 2 %
Of total entered value of bank buildings, NOK 174 million is for use in the banking activities.
Real estate of substantial importance to the bank:
Total Rented out
Geographical location Type m2 m2
Stavanger Bjergsted Bank building 8 954 921
Sola sentrum Bank building 3 783 1 955
Haugesund sentrum Bank building 3 536 363
Stavanger sentrum Bank building 3 085 930
Aksdalsenteret Tysvær Bank building 2 288 850
Egersund Bank building 2 069 210
Randaberg sentrum Bank building 1 903 928
Intangible assets
Acquisition costs goodwill as of 1 January 2005 32
Total depreciation and write-downs as of 31 December 2005 30
Entered value as of 31 December 2005 2
Deferred tax advantage 25
Total 27
Annual ordinary depreciation of goodwill 1
The individual items under Goodwill are depreciated in a straight line over 5 years.
NOTE 17 OTHER ASSETS 2005 2004 2003
Equity and subordinated capital SR-Bank pension fund 25 15 15
Dividend not received from subsidiaries 10 44 49
Various other assets 117 53 5
Other assets 152 112 69
NOTE 18 PAYMENTS IN ADVANCE AND DEFERRED INCOME 2005 2004 2003
Deferred income and
prepaid, not accrued expenses 154 142 155
Net pension assets - - 127
Other prepaid, not accrued expenses 14 16 18
Payments in advance and deferred income 168 158 300
SPAREBANK 1 SR-BANK NGAAP
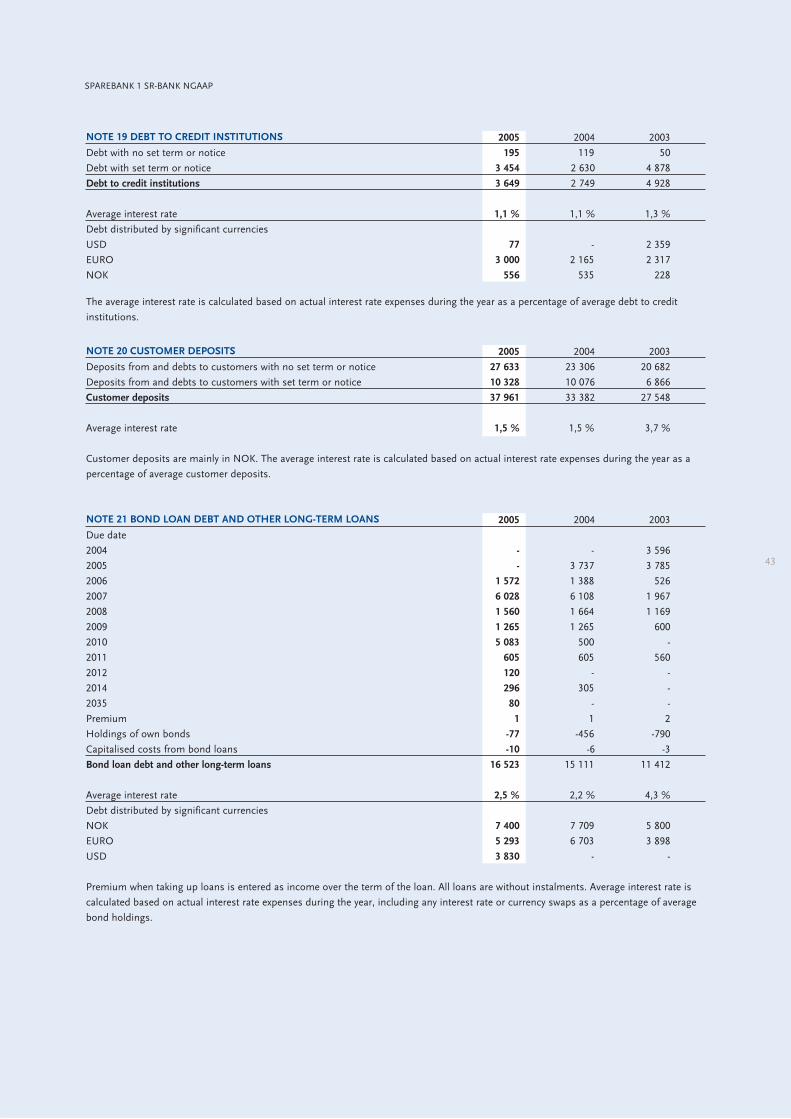
NOTE 19 DEBT TO CREDIT INSTITUTIONS 2005 2004 2003
Debt with no set term or notice 195 119 50
Debt with set term or notice 3 454 2 630 4 878
Debt to credit institutions 3 649 2 749 4 928
Average interest rate 1,1 % 1,1 % 1,3 %
Debt distributed by significant currencies
USD 77 - 2 359
EURO 3 000 2 165 2 317
NOK 556 535 228
The average interest rate is calculated based on actual interest rate expenses during the year as a percentage of average debt to credit
institutions.
NOTE 20 CUSTOMER DEPOSITS 2005 2004 2003
Deposits from and debts to customers with no set term or notice 27 633 23 306 20 682
Deposits from and debts to customers with set term or notice 10 328 10 076 6 866
Customer deposits 37 961 33 382 27 548
Average interest rate 1,5 % 1,5 % 3,7 %
Customer deposits are mainly in NOK. The average interest rate is calculated based on actual interest rate expenses during the year as a
percentage of average customer deposits.
NOTE 21 BOND LOAN DEBT AND OTHER LONG-TERM LOANS 2005 2004 2003
Due date
2004 - - 3 596
2005 - 3 737 3 785
2006 1 572 1 388 526
2007 6 028 6 108 1 967
2008 1 560 1 664 1 169
2009 1 265 1 265 600
2010 5 083 500 -
2011 605 605 560
2012 120 - -
2014 296 305 -
2035 80 - -
Premium 1 1 2
Holdings of own bonds -77 -456 -790
Capitalised costs from bond loans -10 -6 -3
Bond loan debt and other long-term loans 16 523 15 111 11 412
Average interest rate 2,5 % 2,2 % 4,3 %
Debt distributed by significant currencies
NOK 7 400 7 709 5 800
EURO 5 293 6 703 3 898
USD 3 830 - -
Premium when taking up loans is entered as income over the term of the loan. All loans are without instalments. Average interest rate is
calculated based on actual interest rate expenses during the year, including any interest rate or currency swaps as a percentage of average
bond holdings.
43
SPAREBANK 1 SR-BANK NGAAP
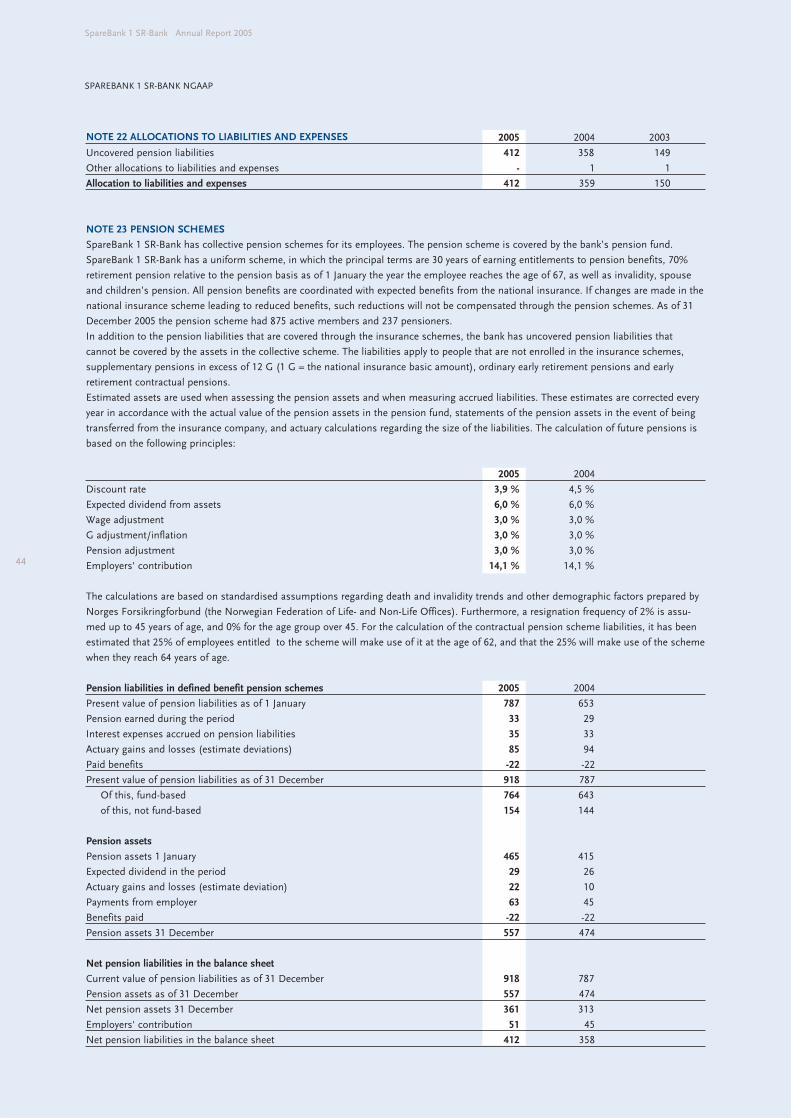
44
SpareBank 1 SR-Bank Annual Report 2005
NOTE 22 ALLOCATIONS TO LIABILITIES AND EXPENSES 2005 2004 2003
Uncovered pension liabilities 412 358 149
Other allocations to liabilities and expenses - 1 1
Allocation to liabilities and expenses 412 359 150
NOTE 23 PENSION SCHEMES
SpareBank 1 SR-Bank has collective pension schemes for its employees. The pension scheme is covered by the bank’s pension fund.
SpareBank 1 SR-Bank has a uniform scheme, in which the principal terms are 30 years of earning entitlements to pension benefits, 70%
retirement pension relative to the pension basis as of 1 January the year the employee reaches the age of 67, as well as invalidity, spouse
and children’s pension. All pension benefits are coordinated with expected benefits from the national insurance. If changes are made in the
national insurance scheme leading to reduced benefits, such reductions will not be compensated through the pension schemes. As of 31
December 2005 the pension scheme had 875 active members and 237 pensioners.
In addition to the pension liabilities that are covered through the insurance schemes, the bank has uncovered pension liabilities that
cannot be covered by the assets in the collective scheme. The liabilities apply to people that are not enrolled in the insurance schemes,
supplementary pensions in excess of 12 G (1 G = the national insurance basic amount), ordinary early retirement pensions and early
retirement contractual pensions.
Estimated assets are used when assessing the pension assets and when measuring accrued liabilities. These estimates are corrected every
year in accordance with the actual value of the pension assets in the pension fund, statements of the pension assets in the event of being
transferred from the insurance company, and actuary calculations regarding the size of the liabilities. The calculation of future pensions is
based on the following principles:
2005 2004
Discount rate 3,9 % 4,5 %
Expected dividend from assets 6,0 % 6,0 %
Wage adjustment 3,0 % 3,0 %
G adjustment/inflation 3,0 % 3,0 %
Pension adjustment 3,0 % 3,0 %
Employers' contribution 14,1 % 14,1 %
The calculations are based on standardised assumptions regarding death and invalidity trends and other demographic factors prepared by
Norges Forsikringforbund (the Norwegian Federation of Life- and Non-Life Offices). Furthermore, a resignation frequency of 2% is assu-
med up to 45 years of age, and 0% for the age group over 45. For the calculation of the contractual pension scheme liabilities, it has been
estimated that 25% of employees entitled to the scheme will make use of it at the age of 62, and that the 25% will make use of the scheme
when they reach 64 years of age.
Pension liabilities in defined benefit pension schemes 2005 2004
Present value of pension liabilities as of 1 January 787 653
Pension earned during the period 33 29
Interest expenses accrued on pension liabilities 35 33
Actuary gains and losses (estimate deviations) 85 94
Paid benefits -22 -22
Present value of pension liabilities as of 31 December 918 787
Of this, fund-based 764 643
of this, not fund-based 154 144
Pension assets
Pension assets 1 January 465 415
Expected dividend in the period 29 26
Actuary gains and losses (estimate deviation) 22 10
Payments from employer 63 45
Benefits paid -22 -22
Pension assets 31 December 557 474
Net pension liabilities in the balance sheet
Current value of pension liabilities as of 31 December 918 787
Pension assets as of 31 December 557 474
Net pension assets 31 December 361 313
Employers' contribution 51 45
Net pension liabilities in the balance sheet 412 358
SPAREBANK 1 SR-BANK NGAAP
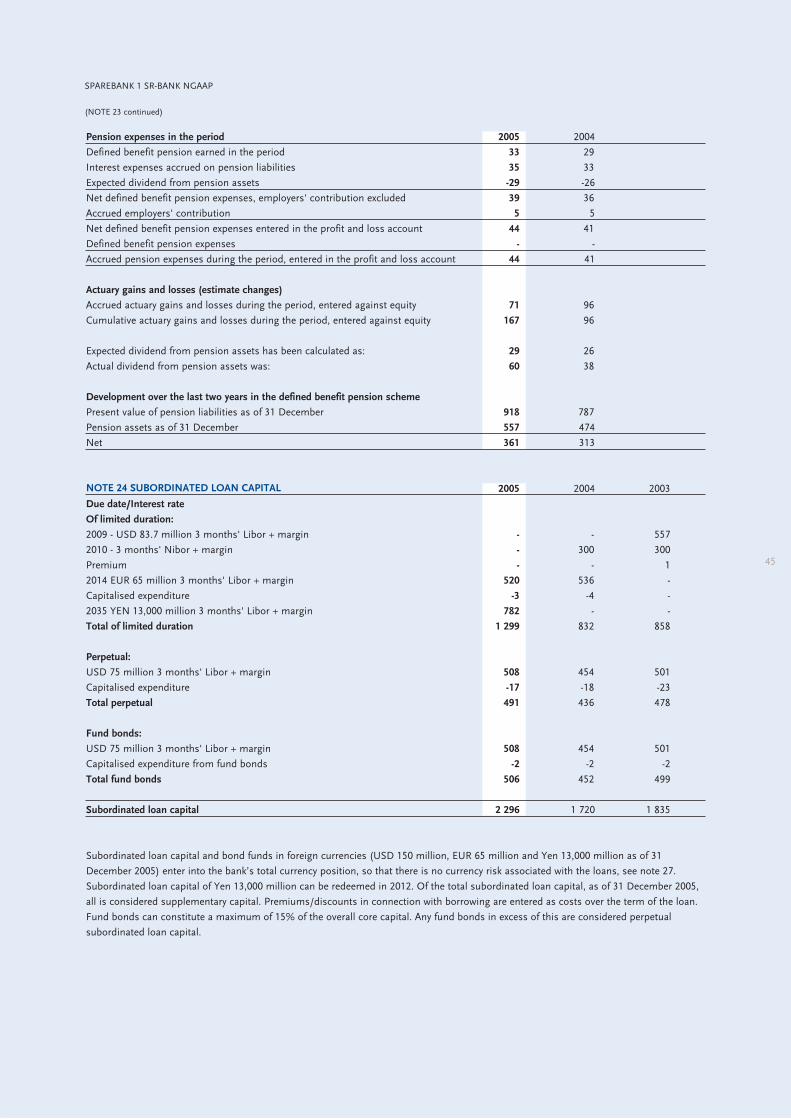
Pension expenses in the period 2005 2004
Defined benefit pension earned in the period 33 29
Interest expenses accrued on pension liabilities 35 33
Expected dividend from pension assets -29 -26
Net defined benefit pension expenses, employers' contribution excluded 39 36
Accrued employers' contribution 5 5
Net defined benefit pension expenses entered in the profit and loss account 44 41
Defined benefit pension expenses - -
Accrued pension expenses during the period, entered in the profit and loss account 44 41
Actuary gains and losses (estimate changes)
Accrued actuary gains and losses during the period, entered against equity 71 96
Cumulative actuary gains and losses during the period, entered against equity 167 96
Expected dividend from pension assets has been calculated as: 29 26
Actual dividend from pension assets was: 60 38
Development over the last two years in the defined benefit pension scheme
Present value of pension liabilities as of 31 December 918 787
Pension assets as of 31 December 557 474
Net 361 313
NOTE 24 SUBORDINATED LOAN CAPITAL 2005 2004 2003
Due date/Interest rate
Of limited duration:
2009 - USD 83.7 million 3 months' Libor + margin - - 557
2010 - 3 months' Nibor + margin - 300 300
Premium - - 1
2014 EUR 65 million 3 months' Libor + margin 520 536 -
Capitalised expenditure -3 -4 -
2035 YEN 13,000 million 3 months' Libor + margin 782 - -
Total of limited duration 1 299 832 858
Perpetual:
USD 75 million 3 months' Libor + margin 508 454 501
Capitalised expenditure -17 -18 -23
Total perpetual 491 436 478
Fund bonds:
USD 75 million 3 months' Libor + margin 508 454 501
Capitalised expenditure from fund bonds -2 -2 -2
Total fund bonds 506 452 499
Subordinated loan capital 2 296 1 720 1 835
Subordinated loan capital and bond funds in foreign currencies (USD 150 million, EUR 65 million and Yen 13,000 million as of 31
December 2005) enter into the bank’s total currency position, so that there is no currency risk associated with the loans, see note 27.
Subordinated loan capital of Yen 13,000 million can be redeemed in 2012. Of the total subordinated loan capital, as of 31 December 2005,
all is considered supplementary capital. Premiums/discounts in connection with borrowing are entered as costs over the term of the loan.
Fund bonds can constitute a maximum of 15% of the overall core capital. Any fund bonds in excess of this are considered perpetual
subordinated loan capital.
45
SPAREBANK 1 SR-BANK NGAAP
(NOTE 23 continued)
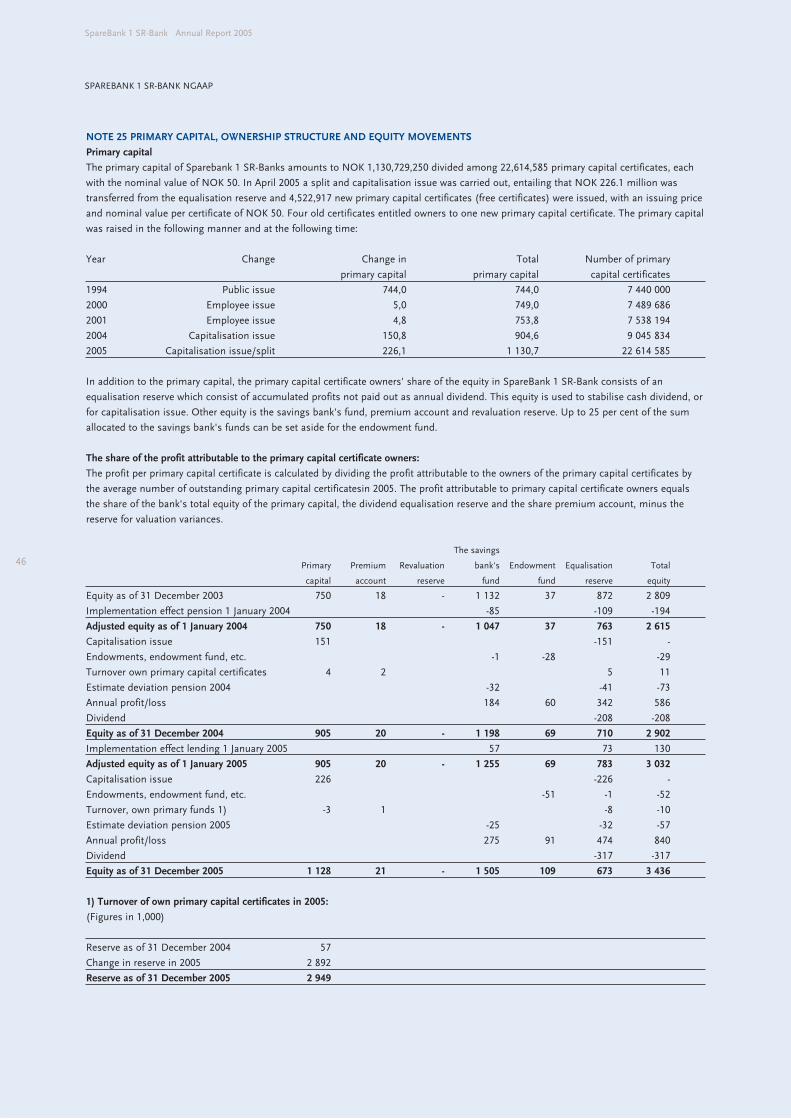
46
SpareBank 1 SR-Bank Annual Report 2005
NOTE 25 PRIMARY CAPITAL, OWNERSHIP STRUCTURE AND EQUITY MOVEMENTS
Primary capital
The primary capital of Sparebank 1 SR-Banks amounts to NOK 1,130,729,250 divided among 22,614,585 primary capital certificates, each
with the nominal value of NOK 50. In April 2005 a split and capitalisation issue was carried out, entailing that NOK 226.1 million was
transferred from the equalisation reserve and 4,522,917 new primary capital certificates (free certificates) were issued, with an issuing price
and nominal value per certificate of NOK 50. Four old certificates entitled owners to one new primary capital certificate. The primary capital
was raised in the following manner and at the following time:
Year Change Change in Total Number of primary
primary capital primary capital capital certificates
1994 Public issue 744,0 744,0 7 440 000
2000 Employee issue 5,0 749,0 7 489 686
2001 Employee issue 4,8 753,8 7 538 194
2004 Capitalisation issue 150,8 904,6 9 045 834
2005 Capitalisation issue/split 226,1 1 130,7 22 614 585
In addition to the primary capital, the primary capital certificate owners' share of the equity in SpareBank 1 SR-Bank consists of an
equalisation reserve which consist of accumulated profits not paid out as annual dividend. This equity is used to stabilise cash dividend, or
for capitalisation issue. Other equity is the savings bank's fund, premium account and revaluation reserve. Up to 25 per cent of the sum
allocated to the savings bank's funds can be set aside for the endowment fund.
The share of the profit attributable to the primary capital certificate owners:
The profit per primary capital certificate is calculated by dividing the profit attributable to the owners of the primary capital certificates by
the average number of outstanding primary capital certificatesin 2005. The profit attributable to primary capital certificate owners equals
the share of the bank's total equity of the primary capital, the dividend equalisation reserve and the share premium account, minus the
reserve for valuation variances.
The savings
Primary Premium Revaluation bank's Endowment Equalisation Total
capital account reserve fund fund reserve equity
Equity as of 31 December 2003 750 18 - 1 132 37 872 2 809
Implementation effect pension 1 January 2004 -85 -109 -194
Adjusted equity as of 1 January 2004 750 18 - 1 047 37 763 2 615
Capitalisation issue 151 -151 -
Endowments, endowment fund, etc. -1 -28 -29
Turnover own primary capital certificates 4 2 5 11
Estimate deviation pension 2004 -32 -41 -73
Annual profit/loss 184 60 342 586
Dividend -208 -208
Equity as of 31 December 2004 905 20 - 1 198 69 710 2 902
Implementation effect lending 1 January 2005 57 73 130
Adjusted equity as of 1 January 2005 905 20 - 1 255 69 783 3 032
Capitalisation issue 226 -226 -
Endowments, endowment fund, etc. -51 -1 -52
Turnover, own primary funds 1) -3 1 -8 -10
Estimate deviation pension 2005 -25 -32 -57
Annual profit/loss 275 91 474 840
Dividend -317 -317
Equity as of 31 December 2005 1 128 21 - 1 505 109 673 3 436
1) Turnover of own primary capital certificates in 2005:
(Figures in 1,000)
Reserve as of 31 December 2004 57
Change in reserve in 2005 2 892
Reserve as of 31 December 2005 2 949
SPAREBANK 1 SR-BANK NGAAP
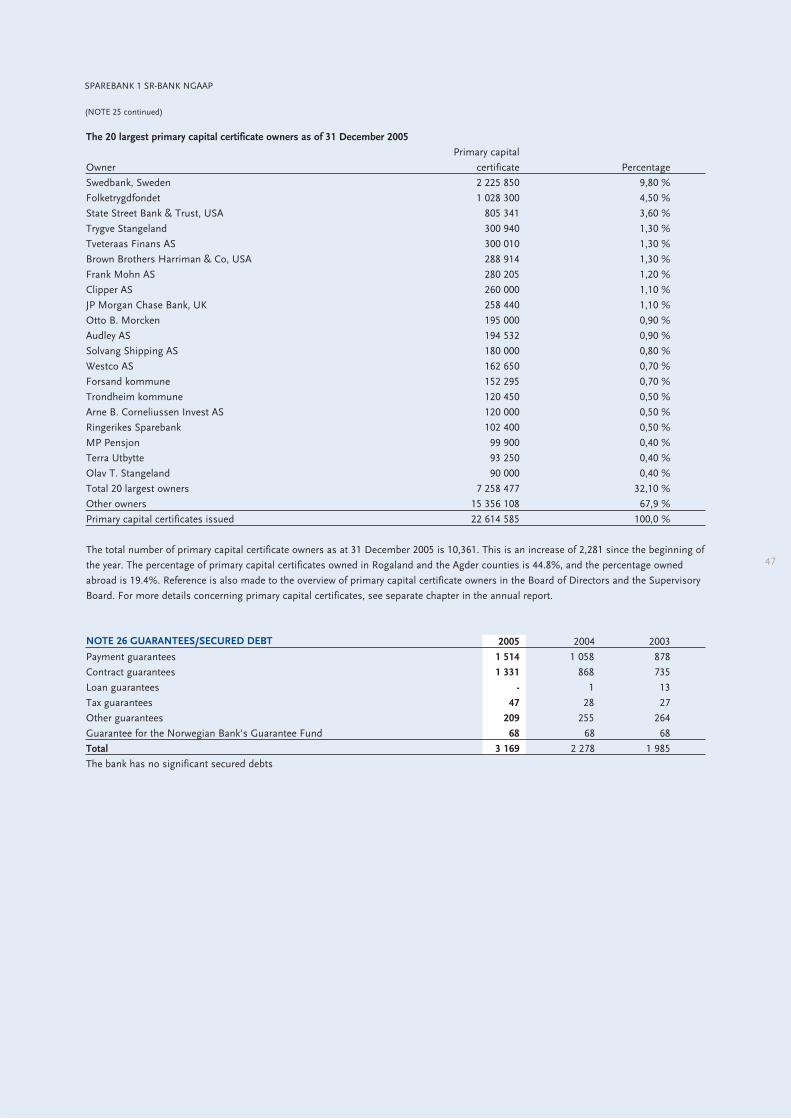
47
The 20 largest primary capital certificate owners as of 31 December 2005
Primary capital
Owner certificate Percentage
Swedbank, Sweden 2 225 850 9,80 %
Folketrygdfondet 1 028 300 4,50 %
State Street Bank & Trust, USA 805 341 3,60 %
Trygve Stangeland 300 940 1,30 %
Tveteraas Finans AS 300 010 1,30 %
Brown Brothers Harriman & Co, USA 288 914 1,30 %
Frank Mohn AS 280 205 1,20 %
Clipper AS 260 000 1,10 %
JP Morgan Chase Bank, UK 258 440 1,10 %
Otto B. Morcken 195 000 0,90 %
Audley AS 194 532 0,90 %
Solvang Shipping AS 180 000 0,80 %
Westco AS 162 650 0,70 %
Forsand kommune 152 295 0,70 %
Trondheim kommune 120 450 0,50 %
Arne B. Corneliussen Invest AS 120 000 0,50 %
Ringerikes Sparebank 102 400 0,50 %
MP Pensjon 99 900 0,40 %
Terra Utbytte 93 250 0,40 %
Olav T. Stangeland 90 000 0,40 %
Total 20 largest owners 7 258 477 32,10 %
Other owners 15 356 108 67,9 %
Primary capital certificates issued 22 614 585 100,0 %
The total number of primary capital certificate owners as at 31 December 2005 is 10,361. This is an increase of 2,281 since the beginning of
the year. The percentage of primary capital certificates owned in Rogaland and the Agder counties is 44.8%, and the percentage owned
abroad is 19.4%. Reference is also made to the overview of primary capital certificate owners in the Board of Directors and the Supervisory
Board. For more details concerning primary capital certificates, see separate chapter in the annual report.
NOTE 26 GUARANTEES/SECURED DEBT 2005 2004 2003
Payment guarantees 1 514 1 058 878
Contract guarantees 1 331 868 735
Loan guarantees - 1 13
Tax guarantees 47 28 27
Other guarantees 209 255 264
Guarantee for the Norwegian Bank's Guarantee Fund 68 68 68
Total 3 169 2 278 1 985
The bank has no significant secured debts
SPAREBANK 1 SR-BANK NGAAP
(NOTE 25 continued)
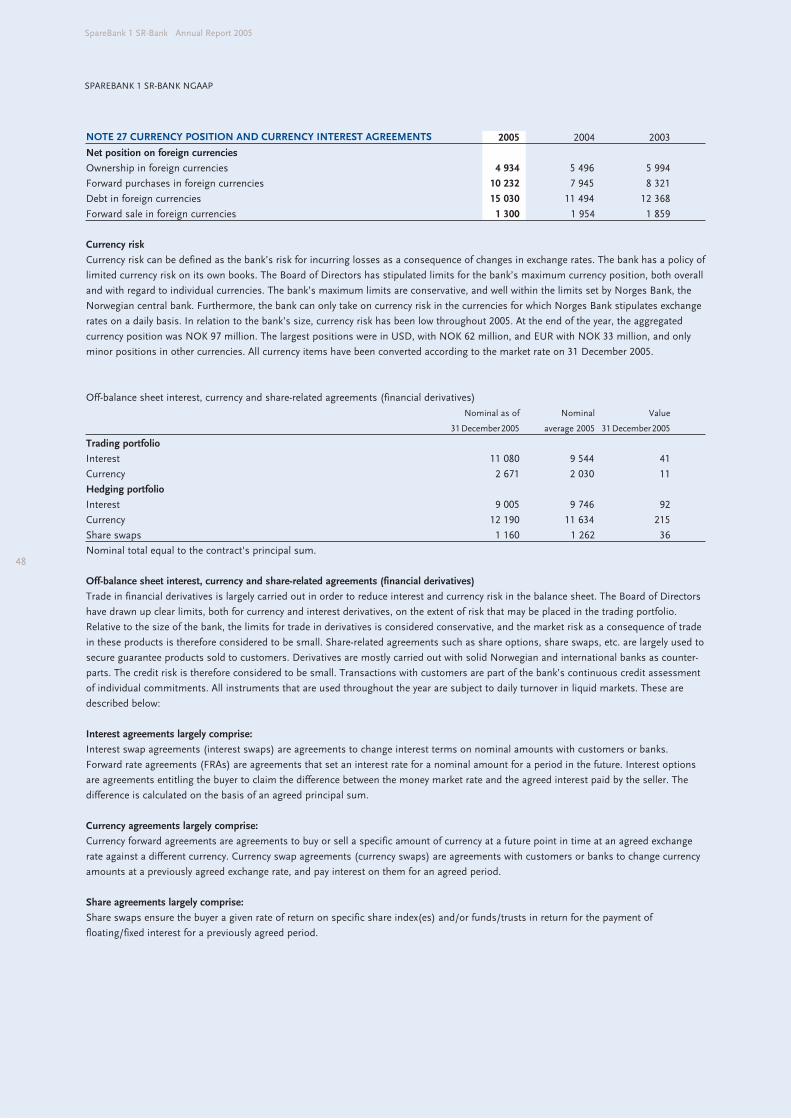
48
SpareBank 1 SR-Bank Annual Report 2005
NOTE 27 CURRENCY POSITION AND CURRENCY INTEREST AGREEMENTS 2005 2004 2003
Net position on foreign currencies
Ownership in foreign currencies 4 934 5 496 5 994
Forward purchases in foreign currencies 10 232 7 945 8 321
Debt in foreign currencies 15 030 11 494 12 368
Forward sale in foreign currencies 1 300 1 954 1 859
Currency risk
Currency risk can be defined as the bank’s risk for incurring losses as a consequence of changes in exchange rates. The bank has a policy of
limited currency risk on its own books. The Board of Directors has stipulated limits for the bank’s maximum currency position, both overall
and with regard to individual currencies. The bank’s maximum limits are conservative, and well within the limits set by Norges Bank, the
Norwegian central bank. Furthermore, the bank can only take on currency risk in the currencies for which Norges Bank stipulates exchange
rates on a daily basis. In relation to the bank’s size, currency risk has been low throughout 2005. At the end of the year, the aggregated
currency position was NOK 97 million. The largest positions were in USD, with NOK 62 million, and EUR with NOK 33 million, and only
minor positions in other currencies. All currency items have been converted according to the market rate on 31 December 2005.
Off-balance sheet interest, currency and share-related agreements (financial derivatives)
Nominal as of Nominal Value
31December2005 average 2005 31December2005
Trading portfolio
Interest 11 080 9 544 41
Currency 2 671 2 030 11
Hedging portfolio
Interest 9 005 9 746 92
Currency 12 190 11 634 215
Share swaps 1 160 1 262 36
Nominal total equal to the contract's principal sum.
Off-balance sheet interest, currency and share-related agreements (financial derivatives)
Trade in financial derivatives is largely carried out in order to reduce interest and currency risk in the balance sheet. The Board of Directors
have drawn up clear limits, both for currency and interest derivatives, on the extent of risk that may be placed in the trading portfolio.
Relative to the size of the bank, the limits for trade in derivatives is considered conservative, and the market risk as a consequence of trade
in these products is therefore considered to be small. Share-related agreements such as share options, share swaps, etc. are largely used to
secure guarantee products sold to customers. Derivatives are mostly carried out with solid Norwegian and international banks as counter-
parts. The credit risk is therefore considered to be small. Transactions with customers are part of the bank’s continuous credit assessment
of individual commitments. All instruments that are used throughout the year are subject to daily turnover in liquid markets. These are
described below:
Interest agreements largely comprise:
Interest swap agreements (interest swaps) are agreements to change interest terms on nominal amounts with customers or banks.
Forward rate agreements (FRAs) are agreements that set an interest rate for a nominal amount for a period in the future. Interest options
are agreements entitling the buyer to claim the difference between the money market rate and the agreed interest paid by the seller. The
difference is calculated on the basis of an agreed principal sum.
Currency agreements largely comprise:
Currency forward agreements are agreements to buy or sell a specific amount of currency at a future point in time at an agreed exchange
rate against a different currency. Currency swap agreements (currency swaps) are agreements with customers or banks to change currency
amounts at a previously agreed exchange rate, and pay interest on them for an agreed period.
Share agreements largely comprise:
Share swaps ensure the buyer a given rate of return on specific share index(es) and/or funds/trusts in return for the payment of
floating/fixed interest for a previously agreed period.
SPAREBANK 1 SR-BANK NGAAP
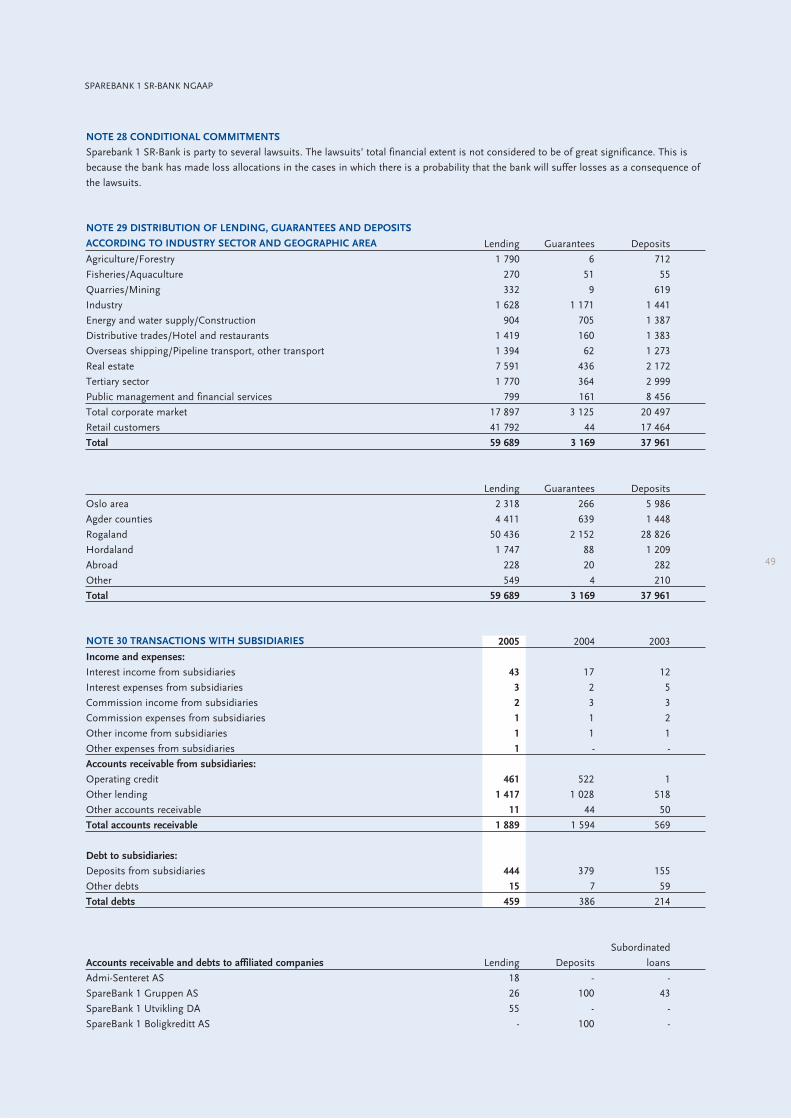
49
NOTE 28 CONDITIONAL COMMITMENTS
Sparebank 1 SR-Bank is party to several lawsuits. The lawsuits’ total financial extent is not considered to be of great significance. This is
because the bank has made loss allocations in the cases in which there is a probability that the bank will suffer losses as a consequence of
the lawsuits.
NOTE 29 DISTRIBUTION OF LENDING, GUARANTEES AND DEPOSITS
ACCORDING TO INDUSTRY SECTOR AND GEOGRAPHIC AREA Lending Guarantees Deposits
Agriculture/Forestry 1 790 6 712
Fisheries/Aquaculture 270 51 55
Quarries/Mining 332 9 619
Industry 1 628 1 171 1 441
Energy and water supply/Construction 904 705 1 387
Distributive trades/Hotel and restaurants 1 419 160 1 383
Overseas shipping/Pipeline transport, other transport 1 394 62 1 273
Real estate 7 591 436 2 172
Tertiary sector 1 770 364 2 999
Public management and financial services 799 161 8 456
Total corporate market 17 897 3 125 20 497
Retail customers 41 792 44 17 464
Total 59 689 3 169 37 961
Lending Guarantees Deposits
Oslo area 2 318 266 5 986
Agder counties 4 411 639 1 448
Rogaland 50 436 2 152 28 826
Hordaland 1 747 88 1 209
Abroad 228 20 282
Other 549 4 210
Total 59 689 3 169 37 961
NOTE 30 TRANSACTIONS WITH SUBSIDIARIES 2005 2004 2003
Income and expenses:
Interest income from subsidiaries 43 17 12
Interest expenses from subsidiaries 3 2 5
Commission income from subsidiaries 2 3 3
Commission expenses from subsidiaries 1 1 2
Other income from subsidiaries 1 1 1
Other expenses from subsidiaries 1 - -
Accounts receivable from subsidiaries:
Operating credit 461 522 1
Other lending 1 417 1 028 518
Other accounts receivable 11 44 50
Total accounts receivable 1 889 1 594 569
Debt to subsidiaries:
Deposits from subsidiaries 444 379 155
Other debts 15 7 59
Total debts 459 386 214
Subordinated
Accounts receivable and debts to affiliated companies Lending Deposits loans
Admi-Senteret AS 18 - -
SpareBank 1 Gruppen AS 26 100 43
SpareBank 1 Utvikling DA 55 - -
SpareBank 1 Boligkreditt AS - 100 -
SPAREBANK 1 SR-BANK NGAAP
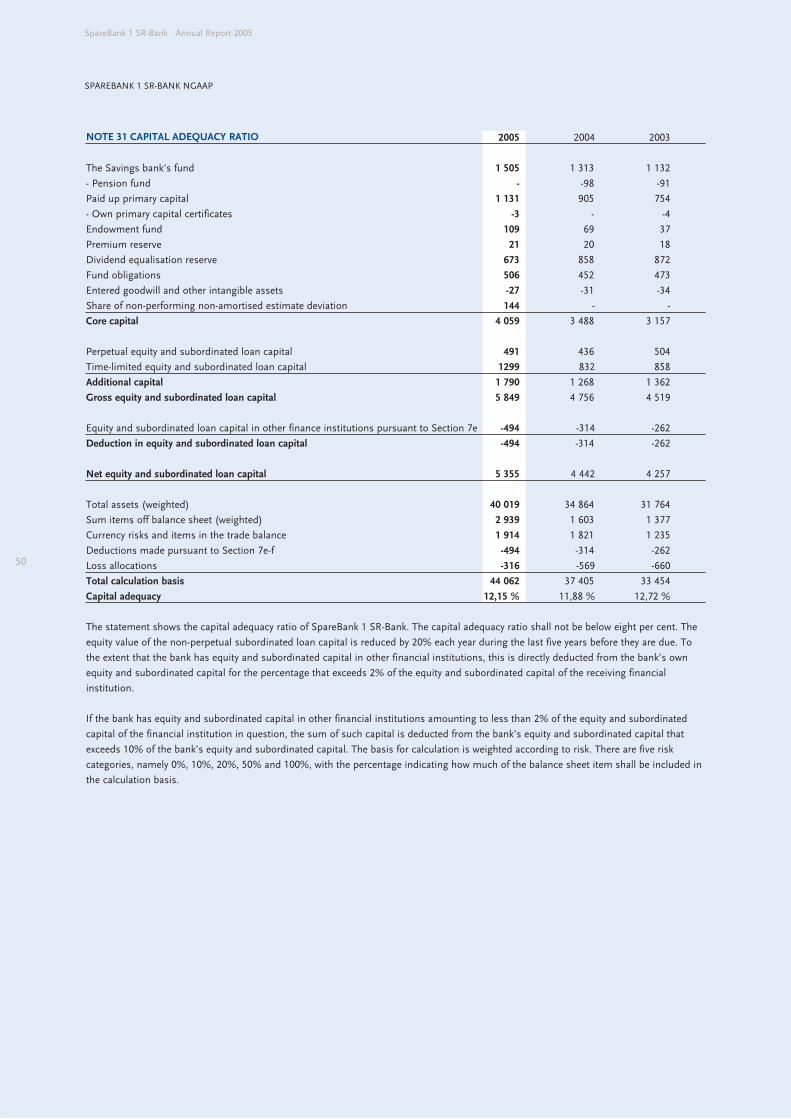
50
SpareBank 1 SR-Bank Annual Report 2005
NOTE 31 CAPITAL ADEQUACY RATIO 2005 2004 2003
The Savings bank's fund 1 505 1 313 1 132
- Pension fund - -98 -91
Paid up primary capital 1 131 905 754
- Own primary capital certificates -3 - -4
Endowment fund 109 69 37
Premium reserve 21 20 18
Dividend equalisation reserve 673 858 872
Fund obligations 506 452 473
Entered goodwill and other intangible assets -27 -31 -34
Share of non-performing non-amortised estimate deviation 144 - -
Core capital 4 059 3 488 3 157
Perpetual equity and subordinated loan capital 491 436 504
Time-limited equity and subordinated loan capital 1299 832 858
Additional capital 1 790 1 268 1 362
Gross equity and subordinated loan capital 5 849 4 756 4 519
Equity and subordinated loan capital in other finance institutions pursuant to Section 7e -494 -314 -262
Deduction in equity and subordinated loan capital -494 -314 -262
Net equity and subordinated loan capital 5 355 4 442 4 257
Total assets (weighted) 40 019 34 864 31 764
Sum items off balance sheet (weighted) 2 939 1 603 1 377
Currency risks and items in the trade balance 1 914 1 821 1 235
Deductions made pursuant to Section 7e-f -494 -314 -262
Loss allocations -316 -569 -660
Total calculation basis 44 062 37 405 33 454
Capital adequacy 12,15 % 11,88 % 12,72 %
The statement shows the capital adequacy ratio of SpareBank 1 SR-Bank. The capital adequacy ratio shall not be below eight per cent. The
equity value of the non-perpetual subordinated loan capital is reduced by 20% each year during the last five years before they are due. To
the extent that the bank has equity and subordinated capital in other financial institutions, this is directly deducted from the bank’s own
equity and subordinated capital for the percentage that exceeds 2% of the equity and subordinated capital of the receiving financial
institution.
If the bank has equity and subordinated capital in other financial institutions amounting to less than 2% of the equity and subordinated
capital of the financial institution in question, the sum of such capital is deducted from the bank’s equity and subordinated capital that
exceeds 10% of the bank’s equity and subordinated capital. The basis for calculation is weighted according to risk. There are five risk
categories, namely 0%, 10%, 20%, 50% and 100%, with the percentage indicating how much of the balance sheet item shall be included in
the calculation basis.
SPAREBANK 1 SR-BANK NGAAP
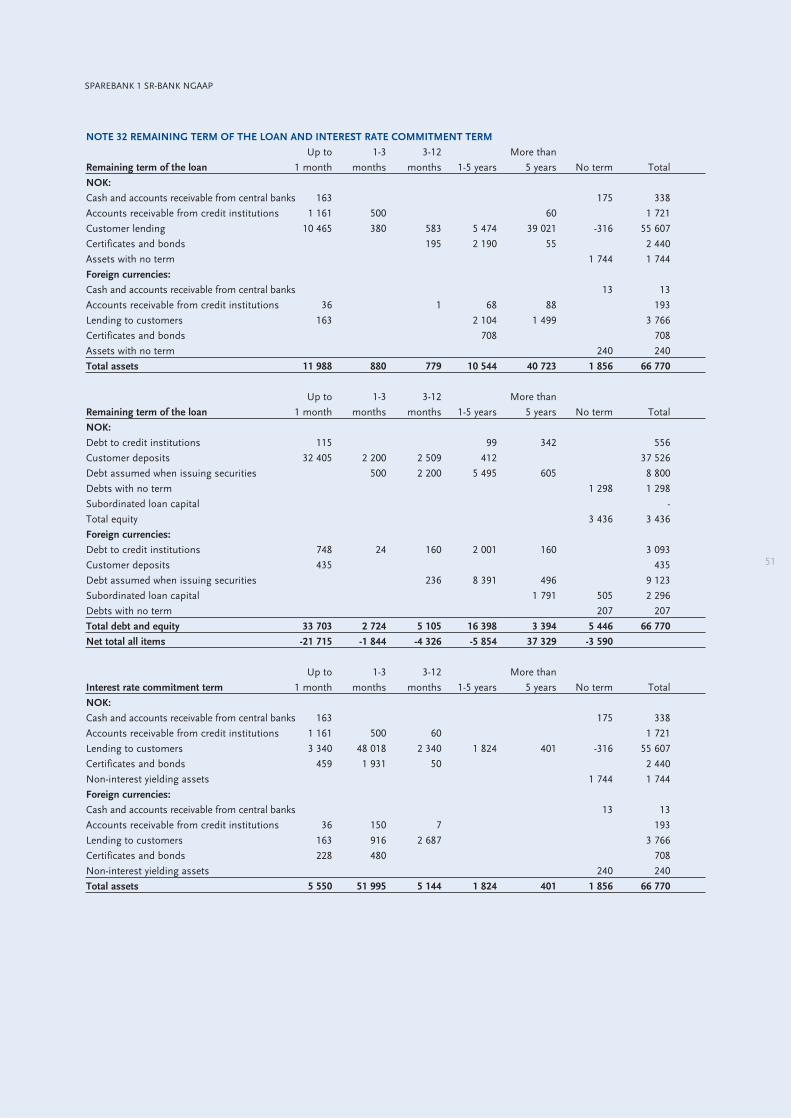
NOTE 32 REMAINING TERM OF THE LOAN AND INTEREST RATE COMMITMENT TERM
Up to 1-3 3-12 More than
Remaining term of the loan 1 month months months 1-5 years 5 years No term Total
NOK:
Cash and accounts receivable from central banks 163 175 338
Accounts receivable from credit institutions 1 161 500 60 1 721
Customer lending 10 465 380 583 5 474 39 021 -316 55 607
Certificates and bonds 195 2 190 55 2 440
Assets with no term 1 744 1 744
Foreign currencies:
Cash and accounts receivable from central banks 13 13
Accounts receivable from credit institutions 36 1 68 88 193
Lending to customers 163 2 104 1 499 3 766
Certificates and bonds 708 708
Assets with no term 240 240
Total assets 11 988 880 779 10 544 40 723 1 856 66 770
Up to 1-3 3-12 More than
Remaining term of the loan 1 month months months 1-5 years 5 years No term Total
NOK:
Debt to credit institutions 115 99 342 556
Customer deposits 32 405 2 200 2 509 412 37 526
Debt assumed when issuing securities 500 2 200 5 495 605 8 800
Debts with no term 1 298 1 298
Subordinated loan capital -
Total equity 3 436 3 436
Foreign currencies:
Debt to credit institutions 748 24 160 2 001 160 3 093
Customer deposits 435 435
Debt assumed when issuing securities 236 8 391 496 9 123
Subordinated loan capital 1 791 505 2 296
Debts with no term 207 207
Total debt and equity 33 703 2 724 5 105 16 398 3 394 5 446 66 770
Net total all items -21 715 -1 844 -4 326 -5 854 37 329 -3 590
Up to 1-3 3-12 More than
Interest rate commitment term 1 month months months 1-5 years 5 years No term Total
NOK:
Cash and accounts receivable from central banks 163 175 338
Accounts receivable from credit institutions 1 161 500 60 1 721
Lending to customers 3 340 48 018 2 340 1 824 401 -316 55 607
Certificates and bonds 459 1 931 50 2 440
Non-interest yielding assets 1 744 1 744
Foreign currencies:
Cash and accounts receivable from central banks 13 13
Accounts receivable from credit institutions 36 150 7 193
Lending to customers 163 916 2 687 3 766
Certificates and bonds 228 480 708
Non-interest yielding assets 240 240
Total assets 5 550 51 995 5 144 1 824 401 1 856 66 770
51
SPAREBANK 1 SR-BANK NGAAP
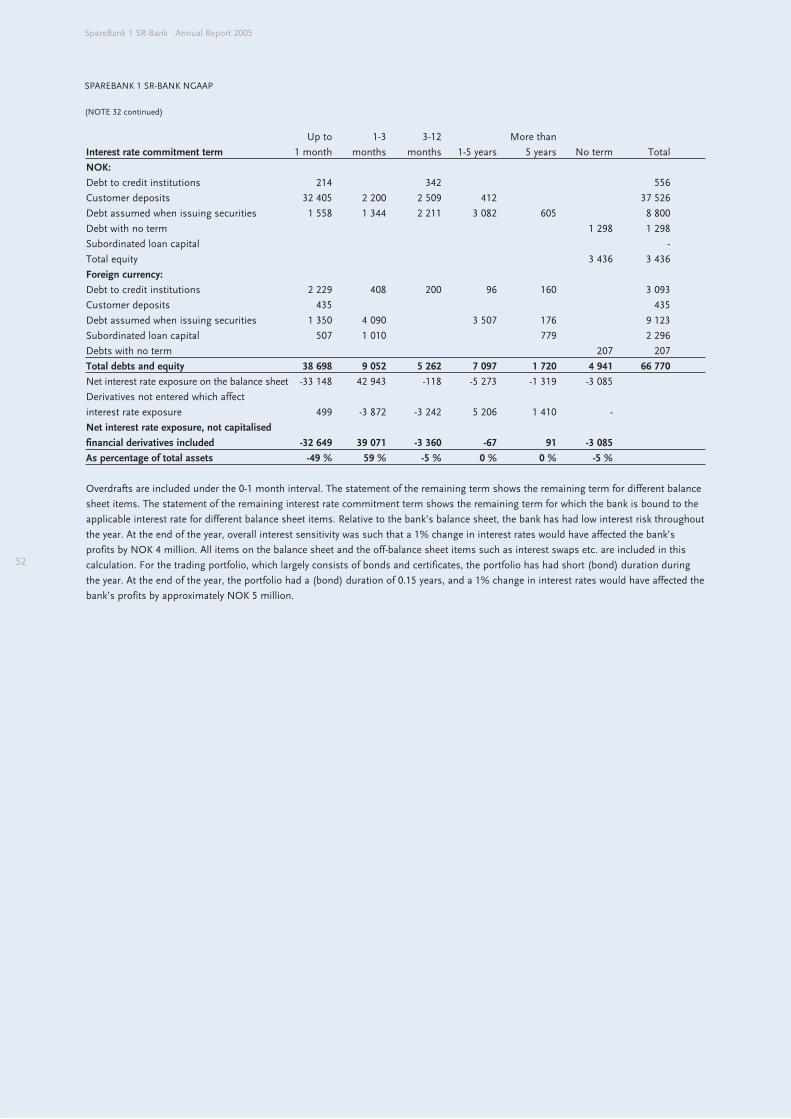
52
SpareBank 1 SR-Bank Annual Report 2005
Up to 1-3 3-12 More than
Interest rate commitment term 1 month months months 1-5 years 5 years No term Total
NOK:
Debt to credit institutions 214 342 556
Customer deposits 32 405 2 200 2 509 412 37 526
Debt assumed when issuing securities 1 558 1 344 2 211 3 082 605 8 800
Debt with no term 1 298 1 298
Subordinated loan capital -
Total equity 3 436 3 436
Foreign currency:
Debt to credit institutions 2 229 408 200 96 160 3 093
Customer deposits 435 435
Debt assumed when issuing securities 1 350 4 090 3 507 176 9 123
Subordinated loan capital 507 1 010 779 2 296
Debts with no term 207 207
Total debts and equity 38 698 9 052 5 262 7 097 1 720 4 941 66 770
Net interest rate exposure on the balance sheet -33 148 42 943 -118 -5 273 -1 319 -3 085
Derivatives not entered which affect
interest rate exposure 499 -3 872 -3 242 5 206 1 410 -
Net interest rate exposure, not capitalised
financial derivatives included -32 649 39 071 -3 360 -67 91 -3 085
As percentage of total assets -49 % 59 % -5 % 0 % 0 % -5 %
Overdrafts are included under the 0-1 month interval. The statement of the remaining term shows the remaining term for different balance
sheet items. The statement of the remaining interest rate commitment term shows the remaining term for which the bank is bound to the
applicable interest rate for different balance sheet items. Relative to the bank’s balance sheet, the bank has had low interest risk throughout
the year. At the end of the year, overall interest sensitivity was such that a 1% change in interest rates would have affected the bank’s
profits by NOK 4 million. All items on the balance sheet and the off-balance sheet items such as interest swaps etc. are included in this
calculation. For the trading portfolio, which largely consists of bonds and certificates, the portfolio has had short (bond) duration during
the year. At the end of the year, the portfolio had a (bond) duration of 0.15 years, and a 1% change in interest rates would have affected the
bank’s profits by approximately NOK 5 million.
SPAREBANK 1 SR-BANK NGAAP
(NOTE 32 continued)
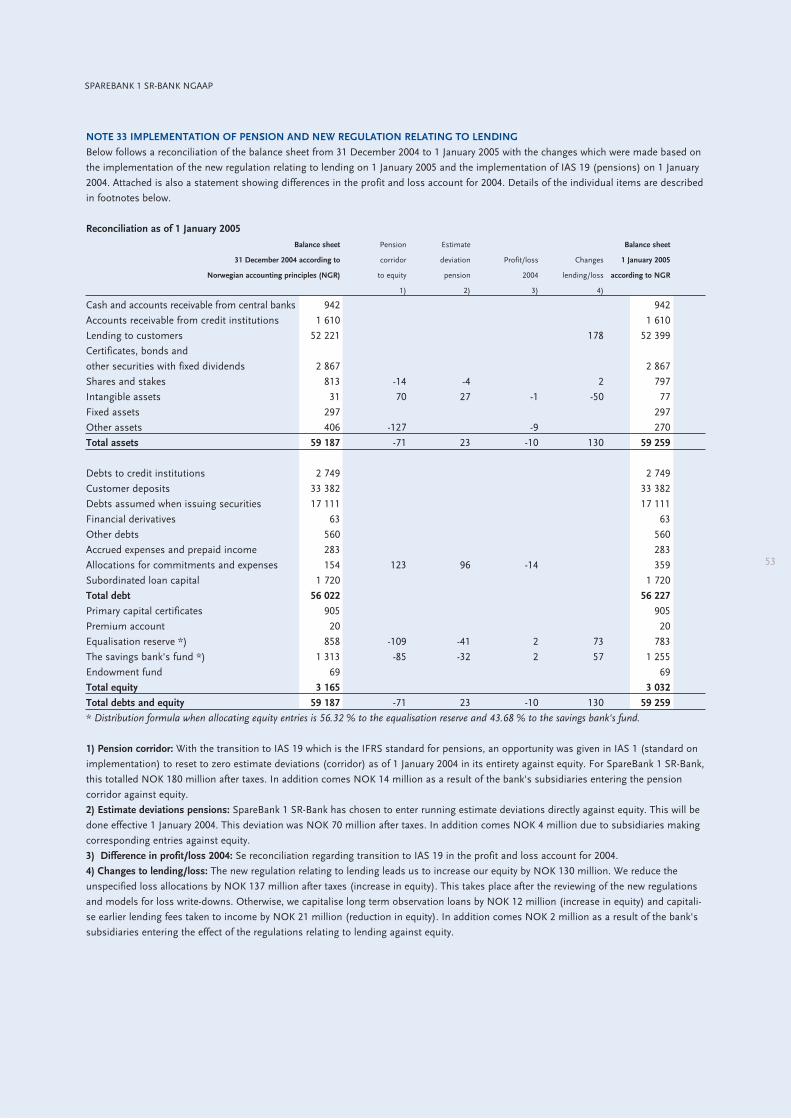
53
NOTE 33 IMPLEMENTATION OF PENSION AND NEW REGULATION RELATING TO LENDING
Below follows a reconciliation of the balance sheet from 31 December 2004 to 1 January 2005 with the changes which were made based on
the implementation of the new regulation relating to lending on 1 January 2005 and the implementation of IAS 19 (pensions) on 1 January
2004. Attached is also a statement showing differences in the profit and loss account for 2004. Details of the individual items are described
in footnotes below.
Reconciliation as of 1 January 2005
Balance sheet Pension Estimate Balance sheet
31 December 2004 according to corridor deviation Profit/loss Changes 1 January 2005
Norwegian accounting principles (NGR) to equity pension 2004 lending/loss according to NGR
1) 2) 3) 4)
Cash and accounts receivable from central banks 942 942
Accounts receivable from credit institutions 1 610 1 610
Lending to customers 52 221 178 52 399
Certificates, bonds and
other securities with fixed dividends 2 867 2 867
Shares and stakes 813 -14 -4 2 797
Intangible assets 31 70 27 -1 -50 77
Fixed assets 297 297
Other assets 406 -127 -9 270
Total assets 59 187 -71 23 -10 130 59 259
Debts to credit institutions 2 749 2 749
Customer deposits 33 382 33 382
Debts assumed when issuing securities 17 111 17 111
Financial derivatives 63 63
Other debts 560 560
Accrued expenses and prepaid income 283 283
Allocations for commitments and expenses 154 123 96 -14 359
Subordinated loan capital 1 720 1 720
Total debt 56 022 56 227
Primary capital certificates 905 905
Premium account 20 20
Equalisation reserve *) 858 -109 -41 2 73 783
The savings bank's fund *) 1 313 -85 -32 2 57 1 255
Endowment fund 69 69
Total equity 3 165 3 032
Total debts and equity 59 187 -71 23 -10 130 59 259
* Distribution formula when allocating equity entries is 56.32 % to the equalisation reserve and 43.68 % to the savings bank's fund.
1) Pension corridor: With the transition to IAS 19 which is the IFRS standard for pensions, an opportunity was given in IAS 1 (standard on
implementation) to reset to zero estimate deviations (corridor) as of 1 January 2004 in its entirety against equity. For SpareBank 1 SR-Bank,
this totalled NOK 180 million after taxes. In addition comes NOK 14 million as a result of the bank's subsidiaries entering the pension
corridor against equity.
2) Estimate deviations pensions: SpareBank 1 SR-Bank has chosen to enter running estimate deviations directly against equity. This will be
done effective 1 January 2004. This deviation was NOK 70 million after taxes. In addition comes NOK 4 million due to subsidiaries making
corresponding entries against equity.
3) Difference in profit/loss 2004: Se reconciliation regarding transition to IAS 19 in the profit and loss account for 2004.
4) Changes to lending/loss: The new regulation relating to lending leads us to increase our equity by NOK 130 million. We reduce the
unspecified loss allocations by NOK 137 million after taxes (increase in equity). This takes place after the reviewing of the new regulations
and models for loss write-downs. Otherwise, we capitalise long term observation loans by NOK 12 million (increase in equity) and capitali-
se earlier lending fees taken to income by NOK 21 million (reduction in equity). In addition comes NOK 2 million as a result of the bank's
subsidiaries entering the effect of the regulations relating to lending against equity.
SPAREBANK 1 SR-BANK NGAAP
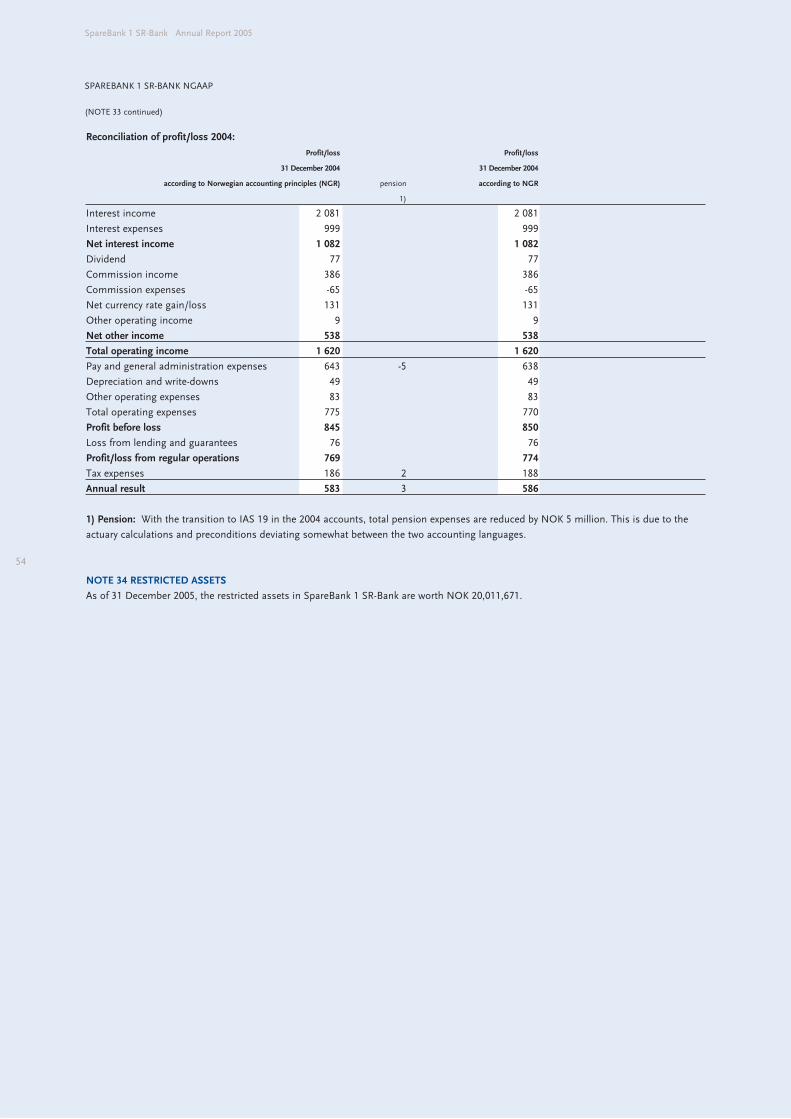
54
SpareBank 1 SR-Bank Annual Report 2005
Reconciliation of profit/loss 2004:
Profit/loss Profit/loss
31 December 2004 31 December 2004
according to Norwegian accounting principles (NGR) pension according to NGR
1)
Interest income 2 081 2 081
Interest expenses 999 999
Net interest income 1 082 1 082
Dividend 77 77
Commission income 386 386
Commission expenses -65 -65
Net currency rate gain/loss 131 131
Other operating income 9 9
Net other income 538 538
Total operating income 1 620 1 620
Pay and general administration expenses 643 -5 638
Depreciation and write-downs 49 49
Other operating expenses 83 83
Total operating expenses 775 770
Profit before loss 845 850
Loss from lending and guarantees 76 76
Profit/loss from regular operations 769 774
Tax expenses 186 2 188
Annual result 583 3 586
1) Pension: With the transition to IAS 19 in the 2004 accounts, total pension expenses are reduced by NOK 5 million. This is due to the
actuary calculations and preconditions deviating somewhat between the two accounting languages.
NOTE 34 RESTRICTED ASSETS
As of 31 December 2005, the restricted assets in SpareBank 1 SR-Bank are worth NOK 20,011,671.
SPAREBANK 1 SR-BANK NGAAP
(NOTE 33 continued)
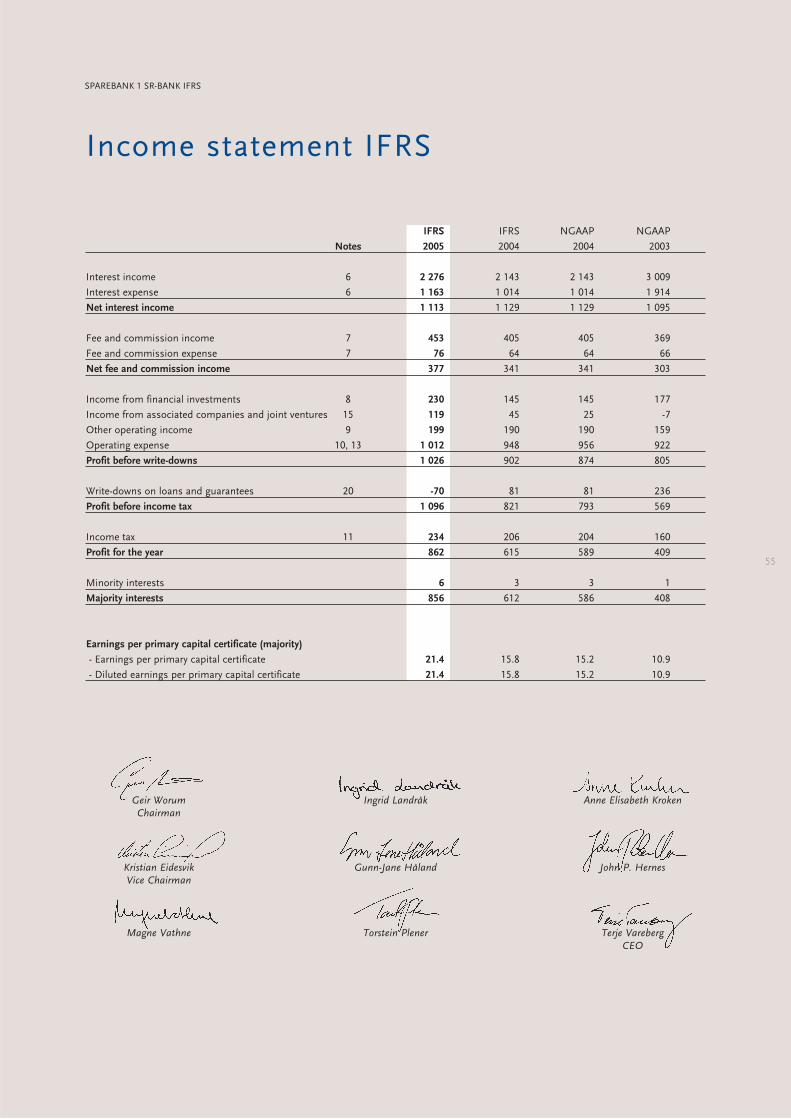
55
Income statement IFRS
IFRS IFRS NGAAP NGAAP
Notes 2005 2004 2004 2003
Interest income 6 2 276 2 143 2 143 3 009
Interest expense 6 1 163 1 014 1 014 1 914
Net interest income 1 113 1 129 1 129 1 095
Fee and commission income 7 453 405 405 369
Fee and commission expense 7 76 64 64 66
Net fee and commission income 377 341 341 303
Income from financial investments 8 230 145 145 177
Income from associated companies and joint ventures 15 119 45 25 -7
Other operating income 9 199 190 190 159
Operating expense 10, 13 1 012 948 956 922
Profit before write-downs 1 026 902 874 805
Write-downs on loans and guarantees 20 -70 81 81 236
Profit before income tax 1 096 821 793 569
Income tax 11 234 206 204 160
Profit for the year 862 615 589 409
Minority interests 6 3 3 1
Majority interests 856 612 586 408
Earnings per primary capital certificate (majority)
- Earnings per primary capital certificate 21.4 15.8 15.2 10.9
- Diluted earnings per primary capital certificate 21.4 15.8 15.2 10.9
SPAREBANK 1 SR-BANK IFRS
Geir Worum
Chairman
Ingrid Landråk Anne Elisabeth Kroken
Kristian Eidesvik
Vice Chairman
Gunn-Jane Håland John P. Hernes
Magne Vathne Torstein Plener Terje Vareberg
CEO
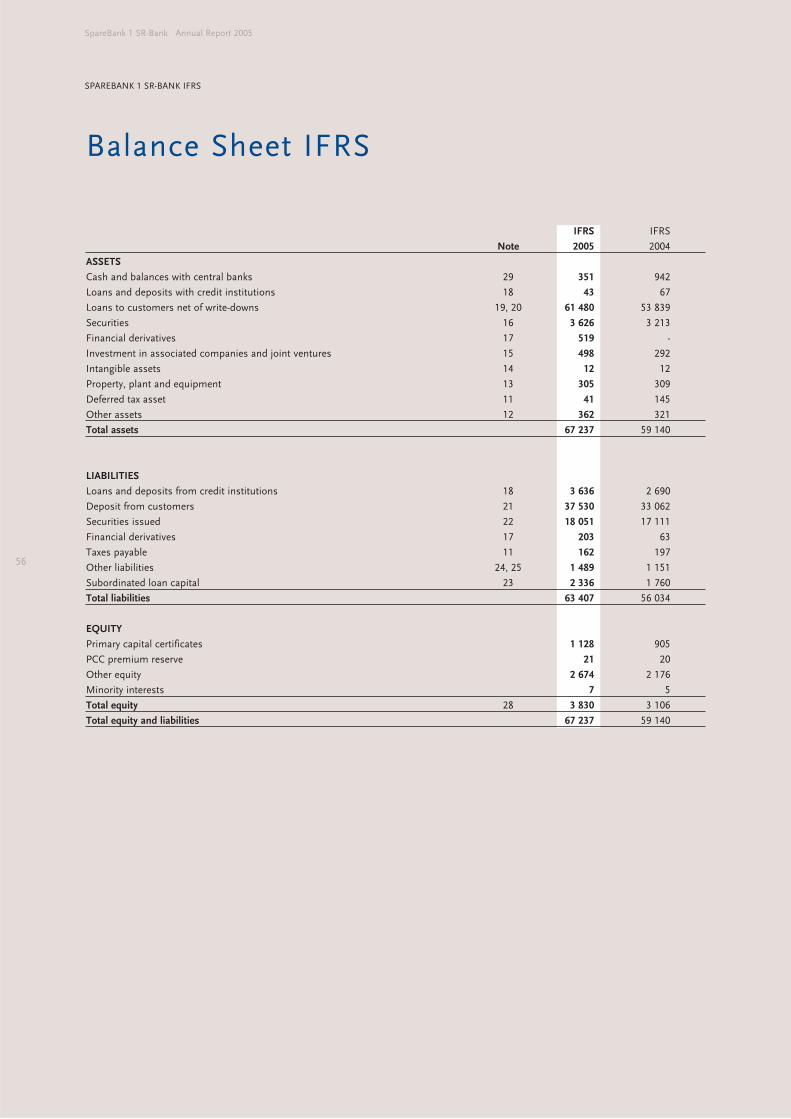
56
SpareBank 1 SR-Bank Annual Report 2005
SPAREBANK 1 SR-BANK IFRS
Balance Sheet IFRS
IFRS IFRS
Note 2005 2004
ASSETS
Cash and balances with central banks 29 351 942
Loans and deposits with credit institutions 18 43 67
Loans to customers net of write-downs 19, 20 61 480 53 839
Securities 16 3 626 3 213
Financial derivatives 17 519 -
Investment in associated companies and joint ventures 15 498 292
Intangible assets 14 12 12
Property, plant and equipment 13 305 309
Deferred tax asset 11 41 145
Other assets 12 362 321
Total assets 67 237 59 140
LIABILITIES
Loans and deposits from credit institutions 18 3 636 2 690
Deposit from customers 21 37 530 33 062
Securities issued 22 18 051 17 111
Financial derivatives 17 203 63
Taxes payable 11 162 197
Other liabilities 24, 25 1 489 1 151
Subordinated loan capital 23 2 336 1 760
Total liabilities 63 407 56 034
EQUITY
Primary capital certificates 1 128 905
PCC premium reserve 21 20
Other equity 2 674 2 176
Minority interests 7 5
Total equity 28 3 830 3 106
Total equity and liabilities 67 237 59 140
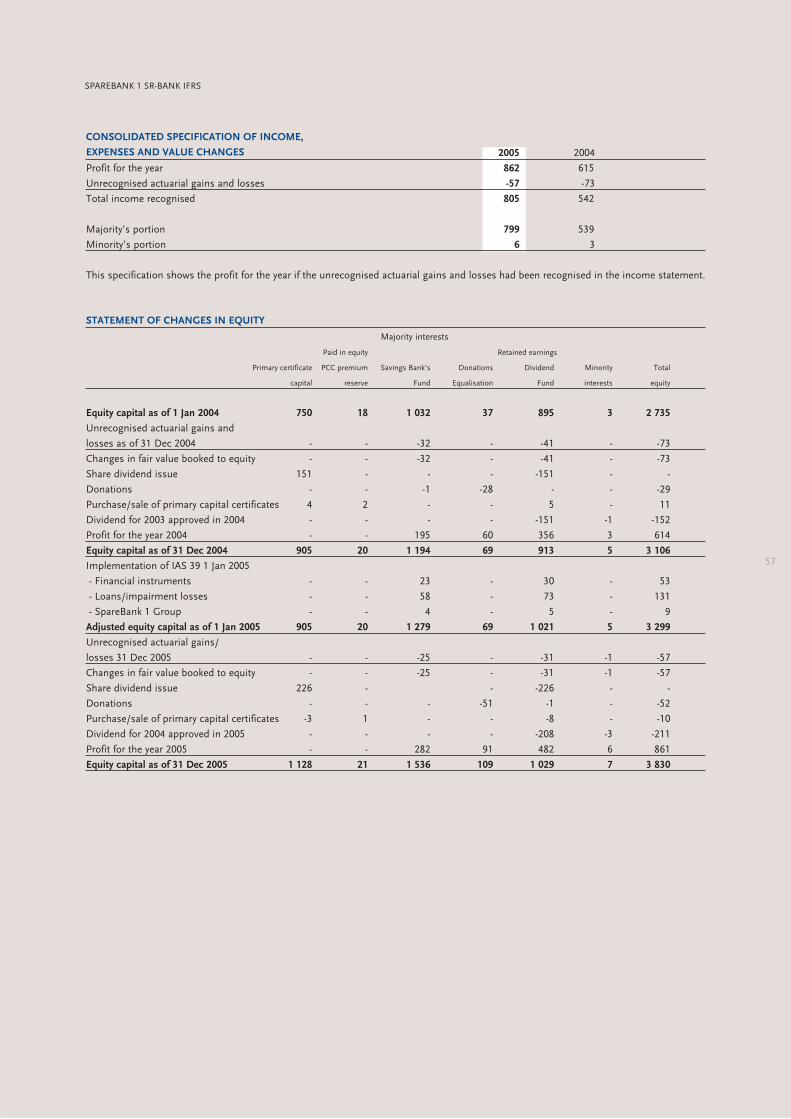
57
CONSOLIDATED SPECIFICATION OF INCOME,
EXPENSES AND VALUE CHANGES 2005 2004
Profit for the year 862 615
Unrecognised actuarial gains and losses -57 -73
Total income recognised 805 542
Majority’s portion 799 539
Minority’s portion 6 3
This specification shows the profit for the year if the unrecognised actuarial gains and losses had been recognised in the income statement.
STATEMENT OF CHANGES IN EQUITY
Majority interests
Paid in equity Retained earnings
Primary certificate PCC premium Savings Bank’s Donations Dividend Minority Total
capital reserve Fund Equalisation Fund interests equity
Equity capital as of 1 Jan 2004 750 18 1 032 37 895 3 2 735
Unrecognised actuarial gains and
losses as of 31 Dec 2004 - - -32 - -41 - -73
Changes in fair value booked to equity - - -32 - -41 - -73
Share dividend issue 151 - - - -151 - -
Donations - - -1 -28 - - -29
Purchase/sale of primary capital certificates 4 2 - - 5 - 11
Dividend for 2003 approved in 2004 - - - - -151 -1 -152
Profit for the year 2004 - - 195 60 356 3 614
Equity capital as of 31 Dec 2004 905 20 1 194 69 913 5 3 106
Implementation of IAS 39 1 Jan 2005
- Financial instruments - - 23 - 30 - 53
- Loans/impairment losses - - 58 - 73 - 131
- SpareBank 1 Group - - 4 - 5 - 9
Adjusted equity capital as of 1 Jan 2005 905 20 1 279 69 1 021 5 3 299
Unrecognised actuarial gains/
losses 31 Dec 2005 - - -25 - -31 -1 -57
Changes in fair value booked to equity - - -25 - -31 -1 -57
Share dividend issue 226 - - -226 - -
Donations - - - -51 -1 - -52
Purchase/sale of primary capital certificates -3 1 - - -8 - -10
Dividend for 2004 approved in 2005 - - - - -208 -3 -211
Profit for the year 2005 - - 282 91 482 6 861
Equity capital as of 31 Dec 2005 1 128 21 1 536 109 1 029 7 3 830
SPAREBANK 1 SR-BANK IFRS
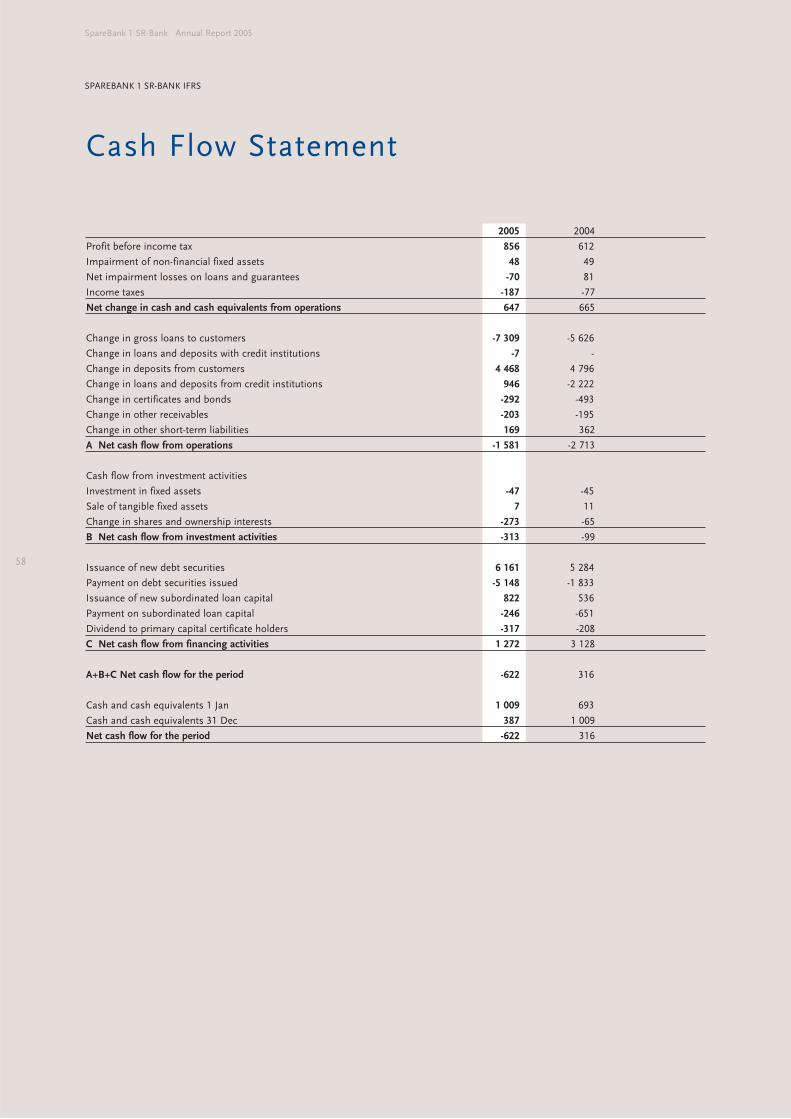
58
SpareBank 1 SR-Bank Annual Report 2005
SPAREBANK 1 SR-BANK IFRS
Cash Flow Statement
2005 2004
Profit before income tax 856 612
Impairment of non-financial fixed assets 48 49
Net impairment losses on loans and guarantees -70 81
Income taxes -187 -77
Net change in cash and cash equivalents from operations 647 665
Change in gross loans to customers -7 309 -5 626
Change in loans and deposits with credit institutions -7 -
Change in deposits from customers 4 468 4 796
Change in loans and deposits from credit institutions 946 -2 222
Change in certificates and bonds -292 -493
Change in other receivables -203 -195
Change in other short-term liabilities 169 362
A Net cash flow from operations -1 581 -2 713
Cash flow from investment activities
Investment in fixed assets -47 -45
Sale of tangible fixed assets 7 11
Change in shares and ownership interests -273 -65
B Net cash flow from investment activities -313 -99
Issuance of new debt securities 6 161 5 284
Payment on debt securities issued -5 148 -1 833
Issuance of new subordinated loan capital 822 536
Payment on subordinated loan capital -246 -651
Dividend to primary capital certificate holders -317 -208
C Net cash flow from financing activities 1 272 3 128
A+B+C Net cash flow for the period -622 316
Cash and cash equivalents 1 Jan 1 009 693
Cash and cash equivalents 31 Dec 387 1 009
Net cash flow for the period -622 316
59
Notes
NOTE 1 GENERAL INFORMATION
The Group, SpareBank 1 SR-Bank, is comprised of the parent
bank, SpareBank 1 SR-Bank, and its subsidiaries: SpareBank 1
SR-Finans AS, EiendomsMegler 1 Rogaland AS, SR Investering
AS and SR Forvaltning ASA. SpareBank 1 SR-Bank owns 26.7
percent of SpareBank 1 Boligkreditt AS which is accounted for as
an associated company in accordance with the equity method in
the Group accounts. SpareBank 1 Utvikling DA, which the Group
owns 20 percent of, is accounted for in the same way. SpareBank
1 SR-Bank owns 17.63 percent of SpareBank 1 Gruppen AS, and
this ownership interest is accounted for as a joint venture in
accordance with the equity method in the consolidated financial
statements.
SpareBank 1 SR-Bank’s headquarters are located in Stavanger.
The Bank has 50 offices in the counties of Rogaland, Vest-Agder
and Aust-Agder. Some of the offices are shared with
EiendomsMegler 1 Rogaland AS. All subsidiaries have
headquarters in Stavanger.
The Group’s main activities are sales and brokerage of financial
products and services, as well as leasing and brokerage of
property.
The Group’s annual accounts were approved by the parent
bank’s Board of Directors on 30 March 2006.
NOTE 2 ACCOUNTING PRINCIPLES – GROUP ACCOUNTS
ACCORDING TO IFRS
BASIS OF CONSOLIDATION
The 2005 group accounts for SpareBank 1 SR-Bank (”the Bank”)
have been prepared in accordance with International Financial
Reporting Standards (IFRS). These include interpretations from
the International Financial Reporting Interpretations Committee
(IFRIC) and the preceding interpretations committee, the
Standing Interpretations Committee (SIC).
The basis for accounting for the group accounts is historic cost
with the following modifications: financial assets available for
sale, financial derivatives and assets and financial liabilities
carried at fair value through profit or loss.
The annual accounts have been prepared in accordance with
IFRS and interpretations that are mandatory for annual accounts
prepared as of 31 December 2005 with additional changes due to
IAS 19 and IAS 39 as described below.
There are a number of new standards, changes to existing
standards and interpretations that are expected to be mandatory
for the Group in 2006. IFRS encourages early adoption where
possible, therefore the Group decided to implement the following
non-compulsory standards in 2005:
• IAS 19 (Amendment) – Employee Benefits (from 1 January
2006). The revised standard allows unrecognised actuarial
gains and losses to be recognised directly through the Group’s
equity. The Group has chosen to implement the revised
standard effective 1 January 2004, with comparable figures for
2004 changed accordingly.
• IAS 39 (Amendment) – The Fair Value Option (from 1 January
2006) The revised standard alters the definition of financial
instruments classified as fair value through profit or loss and
limits the option to designate financial instruments to this
category. The Bank has chosen to implement the revised
standard as of 1 January 2005. This implies a portion of the
Group’s liabilities in the form of bonds are carried at fair value
as well as structured products being carried at fair value. In
addition, fixed interest rate lending is carried at fair value.
Of the remaining standards, revisions and interpretations
effective for annual periods on or after 1 January 2006, the
following will impact the Group:
• IAS 39 and IFRS 4 (Amendment) – Financial Guarantee
Contracts (from 1 January 2006) The revised standard requires
financial guarantee contracts to be initially recognized at fair
value and subsequently measured at the highest of (i) the
remaining non-amortised amount related to fees received but
not yet recognised in the income statement and (ii) the
expected expenses related to the settlement of the liability on
the balance sheet date.
• IFRS 7 (New Standard) – Financial Instruments: Disclosures
and a revision of IAS 1 – Presentation of Financial Statements
– Capital Disclosures (from 1 January 2007) The revised
edition of IFRS 7 requires new disclosures in order to improve
information about financial instruments. The standard
replaces IAS 30 and expands the information requirements of
IAS 32. The standard goes beyond the current reporting
requirements and requires that information is given in a
qualitative and quantitative nature about the risk exposure
arising from financial instruments. Changes in IAS 1 require
further information about the Group’s capital as well as how
that capital is managed.
• IFRIC 4 – Determining whether an Arrangement contains a
lease (from 1 January 2006) IFRIC 4 requires an assessment of
whether an agreement contains elements of leasing based on
the agreement’s underlying intent.
Management is working to clarify the impacts of the above-
mentioned changes to the Group’s financial reporting.
SPAREBANK 1 SR-BANK IFRS
60
SpareBank 1 SR-Bank Annual Report 2005
SPAREBANK 1 SR-BANK IFRS
FIRST TIME ADOPTION OF IFRS
As of 1 January 2005 it was mandatory for all publicly-listed
groups within the EU (including EEC-countries) to prepare
quarterly and annual accounts in accordance with International
Financial Reporting Standards (IFRS). SpareBank 1 SR-Bank has
prepared its quarterly and annual group accounts for 2005 in
accordance with IFRS.
Conversion to IFRS has been done retrospectively as of 1 January
2004. Comparable figures for one year are shown in the income
statement, balance sheet and notes with the exception of items
related to IAS 39 which are exempt from the requirement of
presenting comparable figures. For the Bank, the same applies to
items related to lending/loan impairment, shares and other
financial instruments. For these items comparable figures are
presented in accordance with Norwegian Generally Accepted
Accounting Principles (NGAAP).
For further details on implementation impacts, see Note 30 –
IFRS implementation.
REPORTING CURRENCY
The reporting currency is Norwegian kroner (NOK), which is the
Bank’s functional currency. All amounts are presented in NOK
million unless otherwise stated.
CONSOLIDATION
The annual accounts for the Group include the accounts for the
Bank and all subsidiaries. Subsidiaries are defined as companies
in which the Bank has a controlling interest, in other words, the
ability to govern the financial and operational principles of the
company in order to obtain benefits from the company’s activities.
Subsidiaries are consolidated from the point of acquisition, being
the date that the Group obtained control, and continue to be
consolidated until the date that such control ceases.
Upon achieving a controlling interest in a company (business
combination), all identifiable assets and liabilities are
incorporated in the balance sheet on the basis of their fair value
in accordance with IFRS 3. Any positive differences between the
cost of acquisition and fair value of identifiable assets and
liabilities are recognised as goodwill, whereas any negative
differences are recognised as income. The Bank has not applied
IFRS 3 retrospectively to all business combinations implemented
before 1 January 2004.
All transactions between Group companies are eliminated in the
group accounts. The minority’s share of the Group’s profit/loss
is presented on a separate line under profit/loss after tax in the
income statement. The minority’s share of equity is shown as a
separate item.
ASSOCIATED COMPANIES
An associate is a company where the Bank has significant
interest, typically defined as owning 20 percent or more of the
company’s shares. Associates are booked according to the equity
method of accounting. Investments are initially measured in the
balance sheet at cost and adjusted thereafter for changes in the
Bank’s share of net assets in the associate. The Bank’s share of
the associate’s profit/loss is recognised in the income statement.
The Bank owns 20 percent of Sparebank Utvikling DA with the
remaining ownership divided among other banks within
SpareBank 1-alliansen and SpareBank 1 Gruppen AS. This
investment is booked as an associate. The Bank also owns 26.7
percent of SpareBank 1 Boligkreditt AS which is also defined as
an associate.
JOINT VENTURES
A joint venture can consist of jointly-controlled operations, assets
and/or companies. Joint-control implies that the Bank shares
control with other parties governed by an agreement. Joint
ventures are presented in accordance with the equity method of
accounting.
SpareBank 1 SR-Bank, SpareBank 1 Midt-Norge, SpareBank 1
Nord-Norge and Samarbeidende Sparebanker AS each own 17.63
percent of SpareBank 1 Gruppen AS. Other owners include
FöreningsSparbanken AB (19.5 percent) and LO (10 percent).
The governance structure of the SpareBank 1-joint venture is
regulated by an agreement between its owners. The Bank
classifies its ownership interest in SpareBank 1 Gruppen AS as a
joint venture which is presented according to the equity method
of accounting.
LOANS AND IMPAIRMENT ALLOWENCES
The Group implemented IAS 39 with respect to loans and
impairment allowances as of 1 January 2005. As a result of the
transition, new routines were established for the impairment of
loans, and the amortisation of lending fees over the loans expected
repayment period was implemented. This resulted in a substantial
reduction in previously booked unspecified losses, the reversal of
lending fees previously recognised as income, and bad debt
under long-term supervision were carried in the balance sheet.
All of these impacts were recognised directly through equity.
Loans are carried at amortised cost in accordance with IAS 39.
Amortised cost is defined as acquisition cost less any repayments
of the principal amount, plus or minus cumulative amortisation
as a result of the application of the effective interest rate method,
and less any reductions for impairment and uncollectibiliy. The
effective rate of interest is the rate of interest which discounts the
estimated future cash flows during the expected repayment
period for a given financial instrument.
Loans in the parent Bank’s financial statements are measured
according to the same principles as applied to the consolidated
financial statements, as NGAAP lending regulations dated 21
December 2004 adopted basically the same principles as IFRS
(see FSA Norway circular nr 10/2005).
Loans to customer with fixed interest are carried at fair value.
Profit or losses as a result of changes in fair value are recognised
through the income statement as a change in fair value. Accrued
interest and premiums/discounts are recognised as interest
61
income. Risk exposure related to fixed interest rate loans is
managed through the use of interest rate swaps which are
measured at fair value. The Bank has the opinion that fair value
in the balance sheet for fixed interest rate loans provides more
relevant information about these items.
IMPAIRMENT OF FINANCIAL ASSETS
On each balance sheet date the Group considers whether there is
objective evidence indicating impairment in value of individual
financial asset or group of assets. Impairment loss is recognised
only if there is objective evidence that the present value of an
asset or group of assets has been reduced, based on discounted
future cash flows. Impairment may be a result of one or several
events occurring after initial recognition (an impairment event)
and the results of the event (or events) must also be able to be
measured reliably. Objective evidence indicating a loss in value
of a financial asset or group of assets includes observable data
brought to the Group’s attention for the following impairment
events:
- Significant financial difficulty of the issuer or obligor
- Breach of contract, such as a default or delinquency in interest
or principal payments
- The Group, for economic or legal reasons relating to the
borrower’s financial difficulty, granting to the borrower a
concession that the lender would not otherwise consider
- It becoming probable that the borrower will enter bankruptcy
or other financial reorganisation
- The disappearance of an active market for that financial asset
because of financial difficulties
- Observable data indicating that there is a measurable decrease
in the estimated future cash flows from a group of financial
assets since the initial recognition of those assets, although
the decrease cannot yet be identified with the individual
financial assets in the group, including:
• Adverse changes in the payment status of borrowers in the
group or
• National or local economic conditions that correlate with
defaults on the assets in the group
The Group first considers whether there exists objective evidence
of impairment of financial assets which are individually signifi-
cant. Objective evidence of impairment related to financial assets
which are not significant is assessed individually or in groups. If
there is no evidence of impairment for an individually assessed
asset, significant or not, the asset is included in a group of
financial assets with similar credit risk characteristics. The group
is then evaluated collectively for possible impairment losses.
Assets which are assessed individually with respect to impair-
ment in value, and where a loss in value is being identified or is
still identified, are not included in groups of financial assets for
assessment of group impairment losses.
If there is objective evidence that an impairment event have
taken place, the size of the impairment loss is calculated as the
difference between the asset’s book value and the present value
of estimated future cash flows, excluding future losses on loans
which are not yet incurred, discounted with the financial asset’s
original effective interest rate. The book value of the asset is
reduced by use of an allowance account and the loss is
recognised in the income statement.
Future cash flows from a group of financial assets which are
collectively assessed with respect to impairment are estimated
based on contractual cash flows for the group including historical
losses from assets with similar credit risk. Historical losses are
adjusted for existing observable data in order to take into
account effects of circumstances which did not exist when the
historical losses were incurred, as well as effects of previous
circumstances which do not exist at the balance sheet date.
IMPAIRMENT IN VALUE OF LOANS CARRIED AT FAIR VALUE
On each balance sheet date the Group considers whether there
are objective evidence that the value of a financial asset or group
of financial assets carried at fair value through profit or loss is
subject to impairment. Loss as a consequence of impairment is
recognised through profit or loss in the period they occur.
NON-PERFORMING LOANS AND LOANS AT RISK
A loan or commitment is regarded as in default (and is included
in the Bank’s record of defaulted loans) when instalments and
interest payments have not been made within 90 days after
maturity, or when credit limits have been exceeded for 90 days or
more. Loans and commitments that are not in default, but where
the customer’s financial circumstances are likely to lead to losses
for the Bank, are classified as at risk.
CONFIRMED LOSSES
Losses are classified as confirmed when it is highly probable that
they will occur. Confirmed losses covered by previous individual
write-downs are recognised against these write-downs.
Confirmed losses which are not covered by write-downs, as well
as positive or negative differences with respect to previous
write-downs are recognised in the income statement.
REPOSSESSED ASSETS
In cases of defaulted loans and guarantees, the Bank may
repossess assets that have been provided as collateral for such
commitments. Such assets are assessed at their estimated fair
value at the time of repossession and the value of the loan is
adjusted accordingly. Repossessed assets which are held for sale
are included in the balance sheet as current assets or fixed assets
held for sale and are measured in accordance with relevant IFRS
standards (normally IAS 16, IAS 38, IAS 39 or IFRS 5).
LEASING
Financial leases are classified as loans and measured at
amortised cost. All fixed payments in the leasing period are
included in the calculation of the agreement’s effective interest
rate. The Bank does not have sale and lease-back contracts with
respect to property, plant and equipment.
SECURITIES
Securities consist of shares, equity instruments, bonds and
certificates. Shares and equity instruments are classified either as
at fair value through profit or loss or as available for sale. Bonds
and certificates are classified either as at fair value through profit
or loss or as held-to-maturity.
SPAREBANK 1 SR-BANK IFRS
62
SpareBank 1 SR-Bank Annual Report 2005
SPAREBANK 1 SR-BANK IFRS
All financial instruments that are classified at fair value trough
profit or loss are measured at fair value, and any change in fair
value is recognised as income from financial investments.
Shares classified as available for sale are measured at fair value
in the balance sheet, and changes in fair value except for
impairment are booked directly to equity.
Bonds and certificates classified as held-to-maturity are
measured at amortised cost in accordance with the effective
interest rate method (see reference in the Loans paragraph).
DERIVATIVES AND HEDGING
Derivatives include currency and interest-rate derivatives as well
as derivate instruments related to structured products.
Derivatives are measured at fair value, and any change in fair
value is recognised through profit or loss, unless designated for
hedging. The Bank assesses and documents the effectiveness of
hedging, both at the time of initial recognition and on an ong-
oing basis. For fair-value hedges, both the hedging instrument
and the hedged item are measured at fair value, and any changes
in fair value are recognised through profit or loss. Gains related
to structured products with a capital guarantee, including initial
fees and structural gains, are recognised as day one profits.
Structural gains are calculated by discounting the Bank’s option
premiums and liabilities (guaranteed capital) using the swap
curve.
GOODWILL
Goodwill is the result of a positive difference between the price
paid for an acquisition and the fair value of assets and liabilities,
both tangible an intangible, acquired at the time of the acquisition.
Goodwill resulting from acquisitions of associated companies is
recognised in the balance sheet together with the investment.
Goodwill is not amortised, but is subject to an annual impair-
ment test aimed at identifying possible impairment losses in
accordance with IAS 36. Impairment testing is made at the level
of the smallest identifiable cash-generating unit.
PROPERTY, PLANT AND EQUIPMENT
Tangible, fixed assets consist of property, plant and equipment.
Property and equipment are measured at historical cost less
depreciation and write-downs. Land is measured at historical
cost less write-downs. Historical cost includes all expenses
directly related to the acquisition of the asset. Historical cost,
less any residual value, is allocated over the asset’s estimated
economical life using a straight line depreciation method.
All properties or parts thereof owned by the Bank for generating
rental income or increase in value are classified as investment
property. Where part of the property is used by the Bank for its
own activities, the rented portion of the property is treated as an
investment property if the areas are physically separate. The Bank
has chosen to measure investment property according to the
cost model.
LONG-TERM LOANS
Loans are initially measured at fair value plus directly attributable
transaction costs. Loans are subsequently measured at
amortised cost. Any difference between cost of acquisition and
cost of settlement at maturity is accrued over the loan period
using the effective interest rate method.
PENSIONS
The Group’s companies have different pension schemes. The
schemes are secured through payments to insurance companies
or pension funds, and determined by actuarial calculations.
A defined benefit plan is a pension plan which entitles employees
to a defined future benefit when reaching the retirement age and
is usually determined by such factors as age, years of
employment and salary. The pension liability recognised in the
balance sheet is the present value of the defined liability less the
fair value of pension funds. The liability is calculated each year by
independent actuaries. The present value of future contributions
is calculated by discounting future pensions’ payments using the
interest rate of Norwegian state bonds adjusted for differences in
maturity.
From 2005 it is allowed to recognise certain actuarial gains and
losses directly to equity in accordance with IAS 19, a principle the
Bank has chosen to implement.
CONTINGENT LIABILITIES
The Bank issues financial guarantees in the course of its usual
business. Potential write-downs are considered in the same
process as for impairment on loans using the same principles
and are reported collectively (see Note 19). Provisions for
contingent liabilities are made if the liability is more likely than
not to materialise and the financial consequences can be measured
reliably. Information about contingent liabilities, which do not
satisfy the criteria for recognition in the balance sheet, is given in
notes if significant. Provisions for restructuring expenses are
made when the Bank has a contractual or legal obligation.
SUBORDINATED LOANS AND PERPETUAL SUBORDINATED
LOAN CAPITAL
Subordinated loans have priority after all other liabilities.
Subordinated loans with fixed maturity can be included with 50
percent of core capital in the calculation of capital adequacy,
whereas perpetual subordinated loans can be included with up to
100 percent of core capital. Subordinated loans are classified as
liabilities in the balance sheet and are measured at amortised
cost in accordance with other long-term loans.
Some of the Bank’s perpetual subordinated loan capital securities
has a nominal interest rate, but the Bank is not obliged to make
interest rate payments for periods without dividend payments,
and the investor cannot claim payments for interest at a later
date (e.g., interest does not accumulate). These perpetual sub-
ordinated loan capital securities have been approved to be part
of the core capital within a limit of 15 percent of total core capital.
The FSA in Norway can require such subordinated loan capital
securities to be written down in proportion with equity if the
bank’s core capital ratio falls below 5 percent or if total capital
ratio falls below 6 percent. Write-down of subordinated loan
63
capital securities must be reversed before dividend payments can
be made to shareholders or equity is increased. These sub-
ordinated loan capital securities are recognised in the balance
sheet as other long-term liabilities at amortised cost.
DIVIDENDS
Dividends on primary capital certificates are recognised as equity
until the dividends have been finally approved by the bank’s
Board of Representatives.
INTEREST INCOME AND INTEREST EXPENSE
Interest income and interest expense related to assets and
liabilities which are measured at amortised cost are recognised in
the income statement using the effective interest rate method.
The book value of the financial asset or liability carried at
amortised cost is equal to the present value of expected cash
flows over the maturity period of a financial asset or a financial
liability, discounted by the effective interest rate. Calculating the
effective interest rate entails making an estimate of future cash
flows, without taking possible future losses into account. The
calculation includes, amongst others, fees, transaction costs,
premiums and discounts.
If a financial asset is written down based on an impairment
calculation, a new effective interest rate is calculated based on
adjusted estimated cash flows. The market interest rate on debt
instruments measured at fair value is classified as interest
income or interest expense, whereas the effect of a change in
interest rate is classified as income from financial investments.
COMMISSION INCOME AND COMMISSION EXPENSE
Commission income and expense is generally accrued in
accordance with the delivery/receipt of a service. Fees related to
interest-bearing instruments are not recognised as commission,
but are included in the calculation of the effective interest rate
and accrued accordingly. Advisory fees are accrued in accordance
with the agreement, typically at the time the service is delivered.
The same applies to day-to-day administrative services. Fees and
charges related to sale or brokerage of financial instruments,
property or other investment objects that do not generate
balance sheet items in the Bank’s accounts, are recognised when
the transaction is completed.
TRANSACTIONS AND BALANCE SHEET ITEMS IN FOREIGN
CURRENCY
Transactions in foreign currencies are converted to Norwegian
kroner using the exchange rates at the date of the transaction.
Gains and losses related to completed transactions or to the
conversion of holdings of cash or cash equivalents in foreign
currency are recognised through profit or loss. Gains and losses
on non monetary items are included in the profit and loss in the
same way as the corresponding balance sheet item.
TAXES
Tax expense (tax income) is the aggregate amount included in
the determination of profit or loss for the period in respect of
current tax and deferred tax. Current tax is the amount of income
taxes payable (recoverable) in respect of the taxable profit
(tax loss) for a period.
Deferred tax is measured in the balance sheet according to the
liability method in accordance with IAS 12. Deferred tax asset or
liability is calculated based on all temporary differences, which
arise as a difference between the carrying amount and tax base of
assets and liabilities on the balance sheet date. However,
deferred tax asset or liability is not recognised with respect to
items that are recognised for the first time and do not affect
financial or taxable profit. Deferred tax asset is calculated for tax
losses carried forward. Deferred tax asset is recognised only to
the extent that it is probable that the Bank will generate future
taxable profits that make it possible to utilize accumulated tax
losses.
SEGMENT REPORTING
A business segment is a distinguishable component of an entity
that is engaged in providing an individual product or service or a
group of related products or services and that is subject to risks
and returns that are different from those of other business
segments Business segments are discussed in Note 5.
EVENTS AFTER THE BALANCE SHEET DATE
The annual accounts are published after they have been
approved by the Board of Directors. The Board of
Representatives and regulatory authorities can refuse to approve
the published annual accounts but cannot change them.
Events occurring up to the time when the annual accounts are
approved for publication and which involve issues which were
already known at the balance sheet date, will form part of the
basis of information for determining accounting estimates and
will thereby be fully reflected in the annual accounts. Events
which were not known on the balance sheet date will be reported
if significant.
The annual accounts were prepared under the assumption that
the Bank is a going-concern. This assumption was valid
according to the Board of Director’s opinion at the time the
financial statements were submitted for approval. The Board’s
proposal for dividend payments is shown in the annual report
and the note specifying changes in equity. Proposed dividends
are classified as equity until final approval
NOTE 3 FINANCIAL RISK MANAGEMENT
STRATEGY FOR USING FINANCIAL INSTRUMENTS
The Group uses financial instruments in order to reduce risk
arising during the ordinary course of banking activities, including
customer activities and funding. The use of financial instruments
is limited to those where risk and market value are measurable
and can be monitored through the Group’s systems for
performance measurement and risk management.
CREDIT RISK
Credit risk is defined as the risk of loss due to customers or
SPAREBANK 1 SR-BANK IFRS
64
SpareBank 1 SR-Bank Annual Report 2005
SPAREBANK 1 SR-BANK IFRS
other counterparties not having the ability or willingness to fulfil
their obligations towards the Group. Credit risk is managed
through the Group’s credit strategy, credit policies and allocation
guidelines.
Sparebank 1 SR-Bank’s credit strategy is approved at least
annually by the Board of Directors. The Group’s credit strategy
focuses on key risk indicators and provides a framework for
maintaining an appropriate and effective risk profile for all credit
risks. This is primarily achieved by linking key indicators and
credit limits to risk-adjusted capital, risk-adjusted return and
expected losses. In addition, the credit strategy limits exposure
and risk profile on portfolio level, industries and individual
customers.
The Board of Directors are responsible for the Group’s loan and
credit approvals. The Board of Directors delegates authority,
within limits, to the CEO, who has operational responsibility for
decision-making in loan and credit issues. The CEO can further
delegate authority. Delegated authority is related to the loan and
commitment’s expected loss and probability of default.
The Group has developed and actively uses a system for risk
classification, a risk pricing model and a portfolio system for
managing its portfolio of loans in line with the credit strategy,
credit policies and allocation guidelines. In conjunction with
guidelines relating to credit process routines, these guidelines
constitute clear requirements as to how credit issues are handled
and risk assessments carried out. The risk classification system
covers private as well as corporate customers, and it is based on
statistical calculations. The risk models underlying statistical
calculations are subject to continuous development and testing.
The portfolio is divided into five risk groups – lowest, low,
medium, high and highest risk respectively. Categorisation into
risk group is based on a statistical calculation of each loan and
commitment’s expected loss, based upon the probability of
default with the resulting exposure and extent of losses. In
addition, there is a separate risk category for loans which are
already defaulted upon and written down. Loans and
commitments consist of all types of financial services provided
to the customer, such as loans, credit, guarantees including
letters of credit, accrued but not yet paid interest and
commission, and currency and interest rate derivates.
The underlying credit risk in both the corporate and private
portfolios has shown a positive development in 2005. This is
explained by the Group’s restrictive practice of taking on new
high risk exposures, a positive economic development in the
Group’s geographic market and low interest rate levels. The
Group has a low risk profile in its credit portfolios.
The Group endeavours to price loans and commitments based
on risk exposure, so that customers with the highest risk have
the highest price. The pricing model is based on the Group’s
required return on risk-adjusted capital.
For further information about credit risk, see the article “Risk-
and capital management”.
MARKET RISK
Market risk is defined as the risk of loss due to changes in
observable market variables such as interest rates, currency
rates, and stock market prices. The risk of changes in market
prices of securities caused by changes in general credit prices is
also considered a market risk.
Market risk is mainly caused by the Group’s investments in
bonds, certificates and shares, and as a consequence of activities
carried out to support ordinary banking activities, such as
funding and interest and currency trading.
CURRENCY RISK
Currency risk is the risk of loss due to changes in currency rates.
The Group measures currency risk based on net positions in
each individual currency, and has a low currency risk compared
to the size of the Group’s tier 1 and tier 2 capital.
INTEREST RATE RISK
Interest rate risk is the risk of loss as a result of changes in
interest rates. The risk arises mainly in relation to fixed-rate loans
and funding through fixed-rate securities. The Group measures
interest rate risk as the potential gain or loss as a result of
parallel shifts in the interest rate curve. The risk of non-parallel
shifts is managed by the establishment of limits for maximum
exposure per repricing period.
RISK RELATED TO EXCHANGE RATES
There is a risk of loss related to changes in the market price of
bonds, certificates and equity instruments which the Group has
invested in.
LIQUIDITY RISK
Liquidity risk is defined as the risk of the Group not being able to
re-finance their liabilities or finance an increase in assets without
incurring significant additional costs. Management of the
Group’s financial structure is based on a liquidity strategy which
is assessed and approved by the Board of Directors at least
annually. Liquidity risk is reduced by diversifying loans through
different markets, funding sources, instruments and maturity
periods.
ASSET MANAGEMENT
The Group provides asset management services to customers.
Assets held on behalf of customers under agreements about
asset management are not consolidated in the Group’s financial
statements.
65
NOTE 4 CRITICAL ESTIMATES AND ASSESSMENTS
REGARDING THE USE OF ACCOUNTING PRINCIPLES
LOSSES ON LOANS AND GUARANTEES
The Bank assesses its entire loans and guarantees portfolio of
corporate customers each year. Large exposures, defaulted loans
and high risk exposures are subject to quarterly assessment.
Loans to private customers are subject to evaluation when in
default for more than 60 days. Larger defaulted loans are
evaluated on a quarterly basis.
The Bank’s risk classification systems are described under
Financial risk management.
Write-down is made on individual loans and guarantees if there
is objective evidence of a loss event which can be identified on
individual exposures, and the objective evidence cause reduced
future cash flow for repayment of the loan. Objective evidence
may be default, bankruptcy, illiquidity and other significant
financial difficulties.
Individual write-downs due to impairment are calculated as the
difference between the loan’s book value and present value of
discounted cash flows based on the effective interest rate at the
time of initial write-down. Subsequent changes in interest rates
are taken into account for loan agreements with floating interest
rates to the degree these changes will affect the expected cash
flow.
Group write-downs due to impairment are calculated on sub-
groups of loans where there is objective evidence indicating a
reduction in future cash flows to repay the loans, and where it is
not possible to assess all exposures on an individual basis or
where it is not possible to identify evidence at contract level.
Objective evidence for groups of loans can consist of a negative
development in credit risk classification, information about a
negative development in the value of assets pledged as collateral,
profitability in a particular industry or group of debtors’
repayment ability. The consequences of developments in groups
of debtors’ repayment ability and in the value of assets pledged
as collateral will be analysed using the Bank’s analytical tools,
statistical methods including historical information and
probability of default, percentages of recoverable amounts and
other known information. Some portfolios of smaller loans such
as consumer loans and private overdrafts will be assessed based
upon statistical methods.
The assessment of individual and group write-downs due to
impairment will always include a considerable degree of
subjective judgement. Predictions based on historical
information can always be proven incorrect because of the
uncertainty of the relevance of historical data. In many cases,
assets pledged as collateral are not sold in the most effective
markets and, therefore, the stipulation of their fair value may be
subject to considerable uncertainty.
FAIR VALUE OF EQUITY INSTRUMENTS
Financial assets classified as fair value through profit or loss are
normally quoted in active markets and fair value is determined
with reasonable certainty. For financial assets classified as
available for sale this is not necessarily the case. Accordingly,
disclosures of fair value in the notes for assets and liabilities
measured at amortised cost may be estimates based on
discounted future cash flows, multiplier analysis or other
calculation methods. Such methods can be subject to significant
uncertainty. With the exception of a few quoted shares, the
Norwegian stock market is considered to have poor liquidity.
Share prices will under most circumstances be the last known
transaction price.
FAIR VALUE OF FINANCIAL DERIVATIVES
The fair value of financial derivatives is usually determined by
using valuation methods where the price of the underlying
object, for example interest and currency rates, is obtained from
the market. In the case of share options, volatility will either be
observable implicit volatility or calculated volatility based on
historical share price movements for the underlying instrument.
If the Bank’s risk position is approximately neutral, mid-prices
will be used. As an example, a neutral interest rate risk position
can exist when the net exposure for a repricing interval is
approximately zero. For other exposures the relevant bid/ask
price is used for determining the fair value of financial
instruments.
For financial derivatives where the counterpart has a weaker
credit rating than the Bank, the price will reflect any underlying
credit risk. To the extent that market prices are obtained from
transactions with a lower credit risk, this will be taken into
account by amortising the price difference measured against
such transactions with a lower credit risk, over the maturity period.
PENSIONS
Net pension liability and pension cost are based upon a series of
estimates, including return on pension funds, future interest and
inflation rates, development in wage rates, turnover, development
in the basic social security amount (’G’), the general develop-
ment in the number of persons receiving disability benefits and
life expectancy. Uncertainty is to a great extent related to gross
liabilities and not to net liabilities as shown on the balance sheet.
Changes in estimates as a consequence of the abovementioned
parameters will be recognised through equity to the extent
allowed by IAS 19.
SPAREBANK 1 SR-BANK IFRS
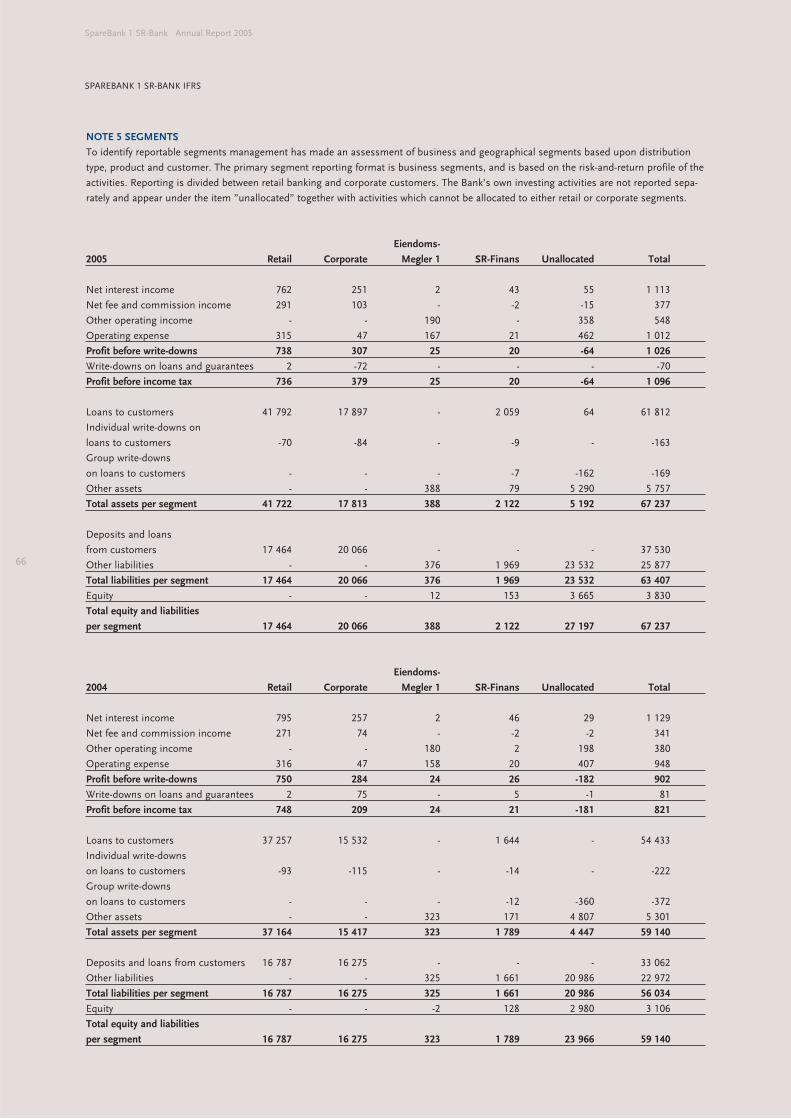
66
SpareBank 1 SR-Bank Annual Report 2005
SPAREBANK 1 SR-BANK IFRS
NOTE 5 SEGMENTS
To identify reportable segments management has made an assessment of business and geographical segments based upon distribution
type, product and customer. The primary segment reporting format is business segments, and is based on the risk-and-return profile of the
activities. Reporting is divided between retail banking and corporate customers. The Bank’s own investing activities are not reported sepa-
rately and appear under the item ”unallocated” together with activities which cannot be allocated to either retail or corporate segments.
Eiendoms-
2005 Retail Corporate Megler 1 SR-Finans Unallocated Total
Net interest income 762 251 2 43 55 1 113
Net fee and commission income 291 103 - -2 -15 377
Other operating income - - 190 - 358 548
Operating expense 315 47 167 21 462 1 012
Profit before write-downs 738 307 25 20 -64 1 026
Write-downs on loans and guarantees 2 -72 - - - -70
Profit before income tax 736 379 25 20 -64 1 096
Loans to customers 41 792 17 897 - 2 059 64 61 812
Individual write-downs on
loans to customers -70 -84 - -9 - -163
Group write-downs
on loans to customers - - - -7 -162 -169
Other assets - - 388 79 5 290 5 757
Total assets per segment 41 722 17 813 388 2 122 5 192 67 237
Deposits and loans
from customers 17 464 20 066 - - - 37 530
Other liabilities - - 376 1 969 23 532 25 877
Total liabilities per segment 17 464 20 066 376 1 969 23 532 63 407
Equity - - 12 153 3 665 3 830
Total equity and liabilities
per segment 17 464 20 066 388 2 122 27 197 67 237
Eiendoms-
2004 Retail Corporate Megler 1 SR-Finans Unallocated Total
Net interest income 795 257 2 46 29 1 129
Net fee and commission income 271 74 - -2 -2 341
Other operating income - - 180 2 198 380
Operating expense 316 47 158 20 407 948
Profit before write-downs 750 284 24 26 -182 902
Write-downs on loans and guarantees 2 75 - 5 -1 81
Profit before income tax 748 209 24 21 -181 821
Loans to customers 37 257 15 532 - 1 644 - 54 433
Individual write-downs
on loans to customers -93 -115 - -14 - -222
Group write-downs
on loans to customers - - - -12 -360 -372
Other assets - - 323 171 4 807 5 301
Total assets per segment 37 164 15 417 323 1 789 4 447 59 140
Deposits and loans from customers 16 787 16 275 - - - 33 062
Other liabilities - - 325 1 661 20 986 22 972
Total liabilities per segment 16 787 16 275 325 1 661 20 986 56 034
Equity - - -2 128 2 980 3 106
Total equity and liabilities
per segment 16 787 16 275 323 1 789 23 966 59 140
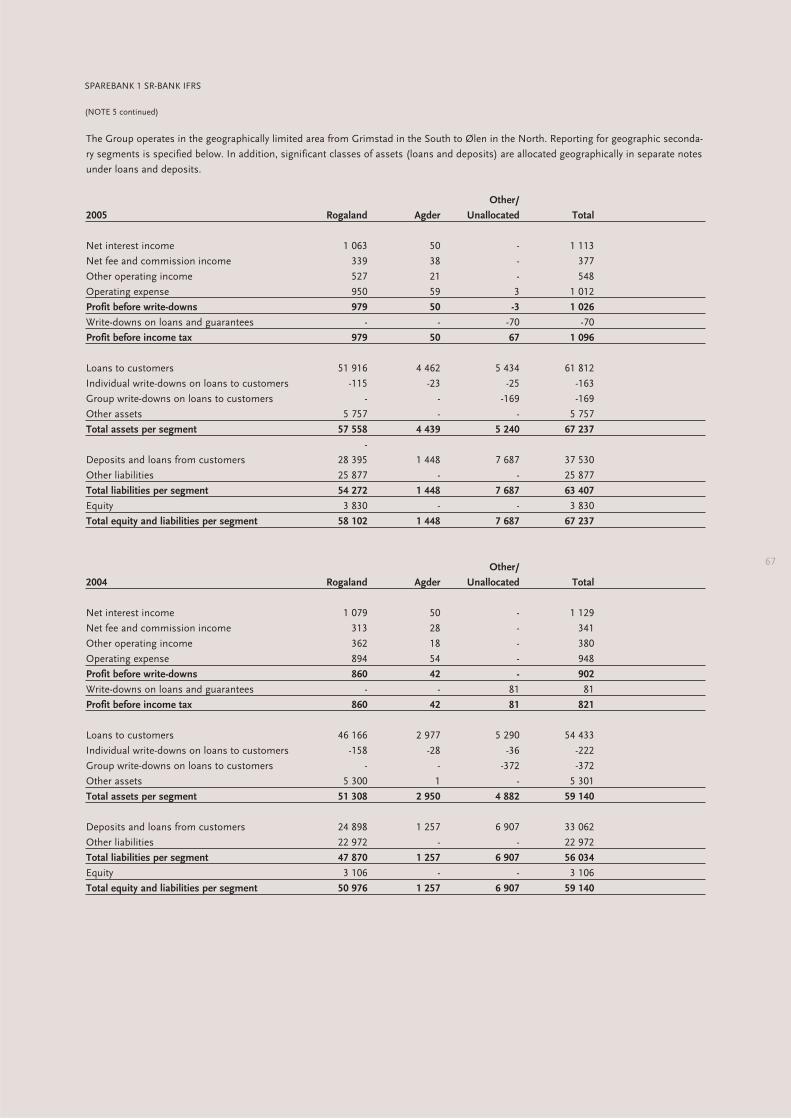
67
The Group operates in the geographically limited area from Grimstad in the South to Ølen in the North. Reporting for geographic seconda-
ry segments is specified below. In addition, significant classes of assets (loans and deposits) are allocated geographically in separate notes
under loans and deposits.
Other/
2005 Rogaland Agder Unallocated Total
Net interest income 1 063 50 - 1 113
Net fee and commission income 339 38 - 377
Other operating income 527 21 - 548
Operating expense 950 59 3 1 012
Profit before write-downs 979 50 -3 1 026
Write-downs on loans and guarantees - - -70 -70
Profit before income tax 979 50 67 1 096
Loans to customers 51 916 4 462 5 434 61 812
Individual write-downs on loans to customers -115 -23 -25 -163
Group write-downs on loans to customers - - -169 -169
Other assets 5 757 - - 5 757
Total assets per segment 57 558 4 439 5 240 67 237
-
Deposits and loans from customers 28 395 1 448 7 687 37 530
Other liabilities 25 877 - - 25 877
Total liabilities per segment 54 272 1 448 7 687 63 407
Equity 3 830 - - 3 830
Total equity and liabilities per segment 58 102 1 448 7 687 67 237
Other/
2004 Rogaland Agder Unallocated Total
Net interest income 1 079 50 - 1 129
Net fee and commission income 313 28 - 341
Other operating income 362 18 - 380
Operating expense 894 54 - 948
Profit before write-downs 860 42 - 902
Write-downs on loans and guarantees - - 81 81
Profit before income tax 860 42 81 821
Loans to customers 46 166 2 977 5 290 54 433
Individual write-downs on loans to customers -158 -28 -36 -222
Group write-downs on loans to customers - - -372 -372
Other assets 5 300 1 - 5 301
Total assets per segment 51 308 2 950 4 882 59 140
Deposits and loans from customers 24 898 1 257 6 907 33 062
Other liabilities 22 972 - - 22 972
Total liabilities per segment 47 870 1 257 6 907 56 034
Equity 3 106 - - 3 106
Total equity and liabilities per segment 50 976 1 257 6 907 59 140
SPAREBANK 1 SR-BANK IFRS
(NOTE 5 continued)
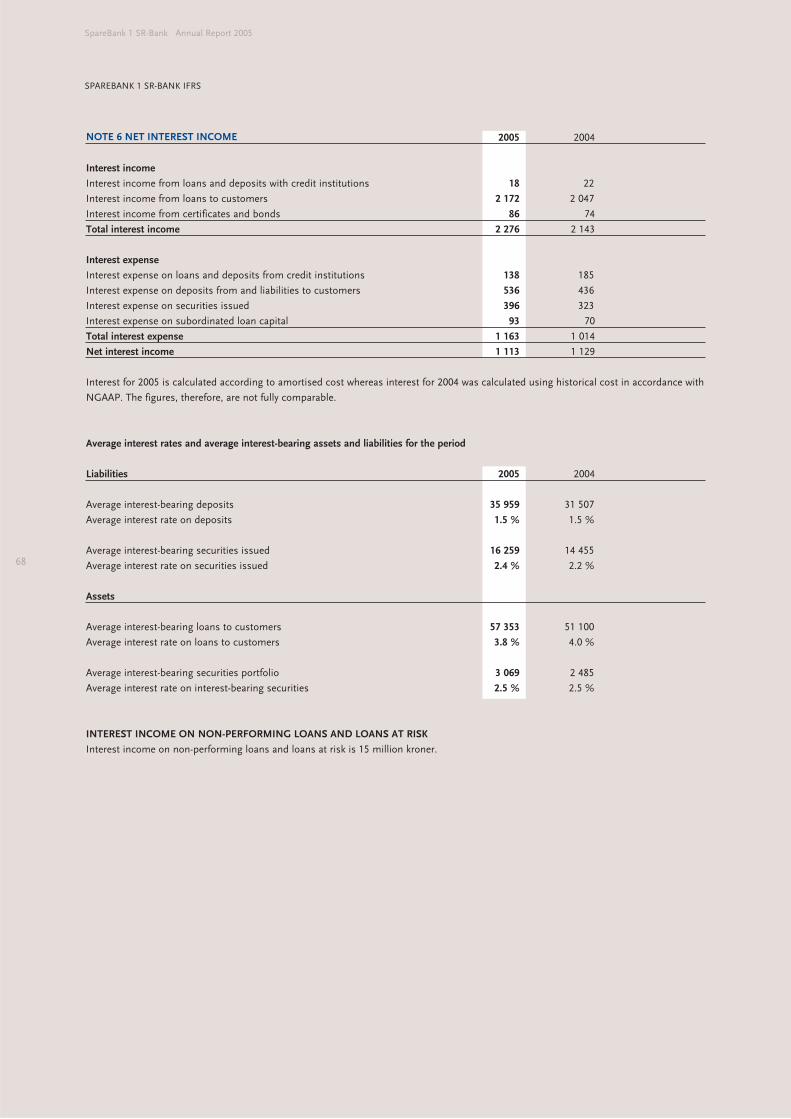
68
SpareBank 1 SR-Bank Annual Report 2005
SPAREBANK 1 SR-BANK IFRS
NOTE 6 NET INTEREST INCOME 2005 2004
Interest income
Interest income from loans and deposits with credit institutions 18 22
Interest income from loans to customers 2 172 2 047
Interest income from certificates and bonds 86 74
Total interest income 2 276 2 143
Interest expense
Interest expense on loans and deposits from credit institutions 138 185
Interest expense on deposits from and liabilities to customers 536 436
Interest expense on securities issued 396 323
Interest expense on subordinated loan capital 93 70
Total interest expense 1 163 1 014
Net interest income 1 113 1 129
Interest for 2005 is calculated according to amortised cost whereas interest for 2004 was calculated using historical cost in accordance with
NGAAP. The figures, therefore, are not fully comparable.
Average interest rates and average interest-bearing assets and liabilities for the period
Liabilities 2005 2004
Average interest-bearing deposits 35 959 31 507
Average interest rate on deposits 1.5 % 1.5 %
Average interest-bearing securities issued 16 259 14 455
Average interest rate on securities issued 2.4 % 2.2 %
Assets
Average interest-bearing loans to customers 57 353 51 100
Average interest rate on loans to customers 3.8 % 4.0 %
Average interest-bearing securities portfolio 3 069 2 485
Average interest rate on interest-bearing securities 2.5 % 2.5 %
INTEREST INCOME ON NON-PERFORMING LOANS AND LOANS AT RISK
Interest income on non-performing loans and loans at risk is 15 million kroner.
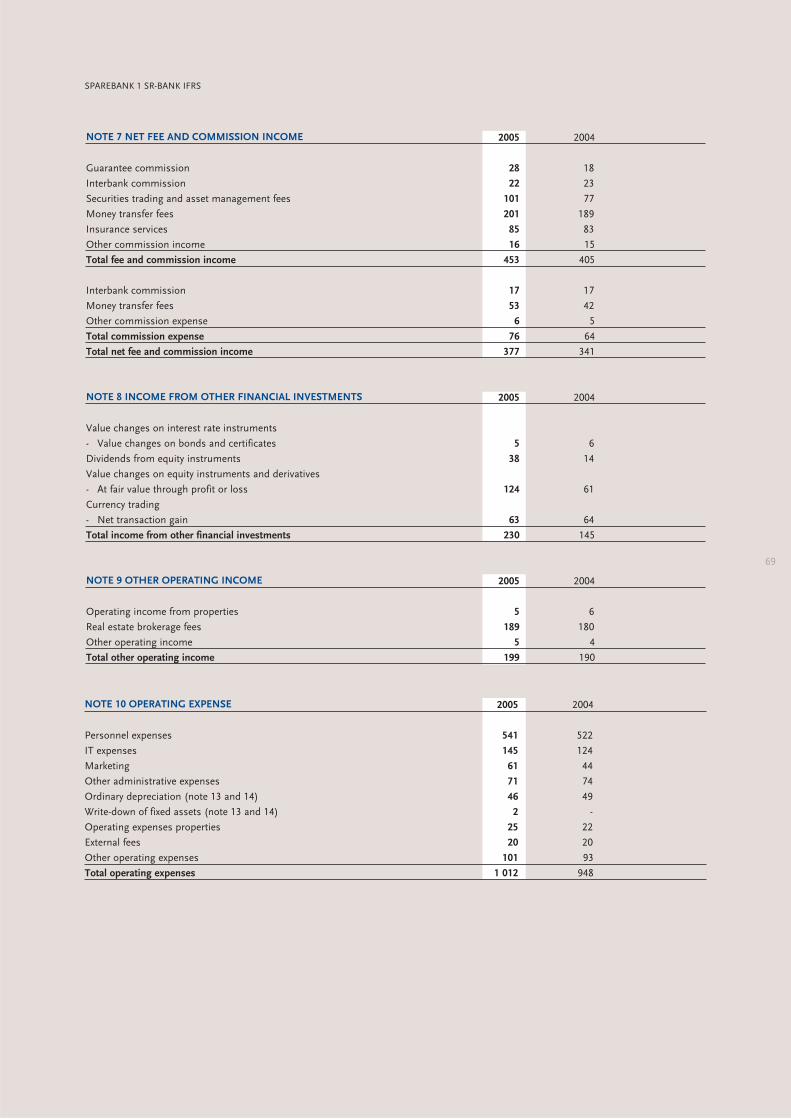
69
NOTE 7 NET FEE AND COMMISSION INCOME 2005 2004
Guarantee commission 28 18
Interbank commission 22 23
Securities trading and asset management fees 101 77
Money transfer fees 201 189
Insurance services 85 83
Other commission income 16 15
Total fee and commission income 453 405
Interbank commission 17 17
Money transfer fees 53 42
Other commission expense 6 5
Total commission expense 76 64
Total net fee and commission income 377 341
NOTE 8 INCOME FROM OTHER FINANCIAL INVESTMENTS 2005 2004
Value changes on interest rate instruments
- Value changes on bonds and certificates 5 6
Dividends from equity instruments 38 14
Value changes on equity instruments and derivatives
- At fair value through profit or loss 124 61
Currency trading
- Net transaction gain 63 64
Total income from other financial investments 230 145
NOTE 9 OTHER OPERATING INCOME 2005 2004
Operating income from properties 5 6
Real estate brokerage fees 189 180
Other operating income 5 4
Total other operating income 199 190
SPAREBANK 1 SR-BANK IFRS
NOTE 10 OPERATING EXPENSE 2005 2004
Personnel expenses 541 522
IT expenses 145 124
Marketing 61 44
Other administrative expenses 71 74
Ordinary depreciation (note 13 and 14) 46 49
Write-down of fixed assets (note 13 and 14) 2 -
Operating expenses properties 25 22
External fees 20 20
Other operating expenses 101 93
Total operating expenses 1 012 948
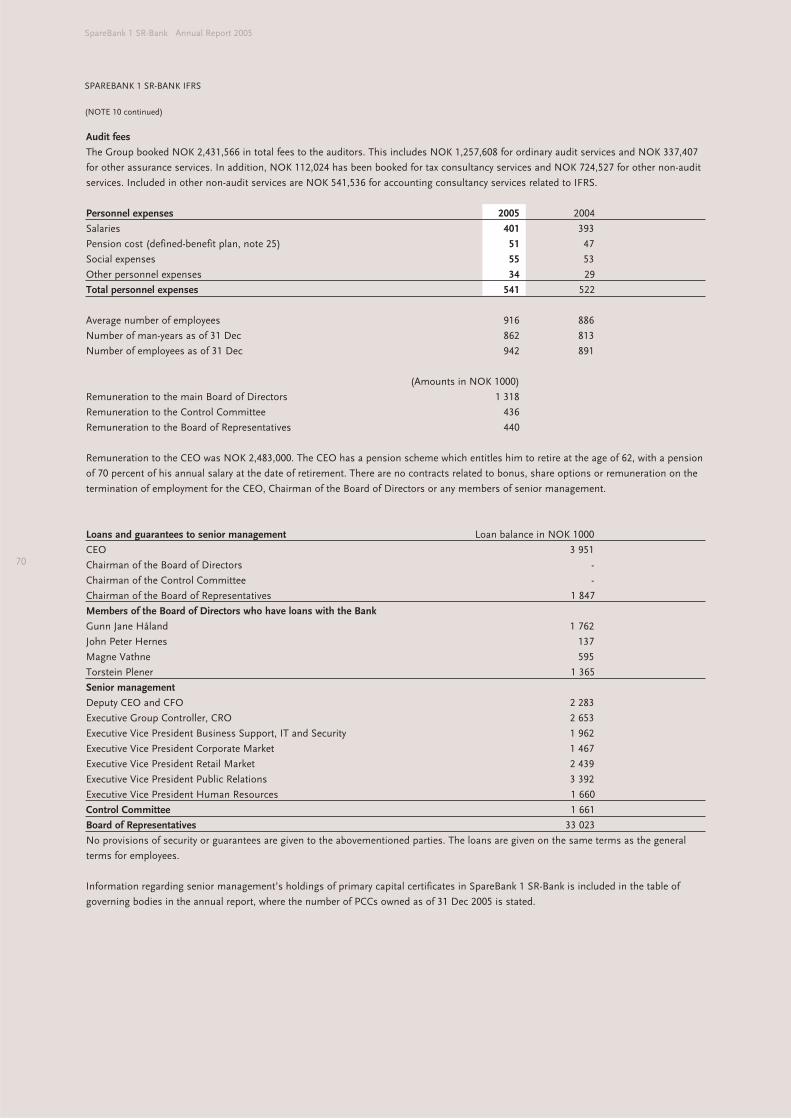
70
SpareBank 1 SR-Bank Annual Report 2005
SPAREBANK 1 SR-BANK IFRS
Audit fees
The Group booked NOK 2,431,566 in total fees to the auditors. This includes NOK 1,257,608 for ordinary audit services and NOK 337,407
for other assurance services. In addition, NOK 112,024 has been booked for tax consultancy services and NOK 724,527 for other non-audit
services. Included in other non-audit services are NOK 541,536 for accounting consultancy services related to IFRS.
Personnel expenses 2005 2004
Salaries 401 393
Pension cost (defined-benefit plan, note 25) 51 47
Social expenses 55 53
Other personnel expenses 34 29
Total personnel expenses 541 522
Average number of employees 916 886
Number of man-years as of 31 Dec 862 813
Number of employees as of 31 Dec 942 891
(Amounts in NOK 1000)
Remuneration to the main Board of Directors 1 318
Remuneration to the Control Committee 436
Remuneration to the Board of Representatives 440
Remuneration to the CEO was NOK 2,483,000. The CEO has a pension scheme which entitles him to retire at the age of 62, with a pension
of 70 percent of his annual salary at the date of retirement. There are no contracts related to bonus, share options or remuneration on the
termination of employment for the CEO, Chairman of the Board of Directors or any members of senior management.
Loans and guarantees to senior management Loan balance in NOK 1000
CEO 3 951
Chairman of the Board of Directors -
Chairman of the Control Committee -
Chairman of the Board of Representatives 1 847
Members of the Board of Directors who have loans with the Bank
Gunn Jane Håland 1 762
John Peter Hernes 137
Magne Vathne 595
Torstein Plener 1 365
Senior management
Deputy CEO and CFO 2 283
Executive Group Controller, CRO 2 653
Executive Vice President Business Support, IT and Security 1 962
Executive Vice President Corporate Market 1 467
Executive Vice President Retail Market 2 439
Executive Vice President Public Relations 3 392
Executive Vice President Human Resources 1 660
Control Committee 1 661
Board of Representatives 33 023
No provisions of security or guarantees are given to the abovementioned parties. The loans are given on the same terms as the general
terms for employees.
Information regarding senior management’s holdings of primary capital certificates in SpareBank 1 SR-Bank is included in the table of
governing bodies in the annual report, where the number of PCCs owned as of 31 Dec 2005 is stated.
(NOTE 10 continued)
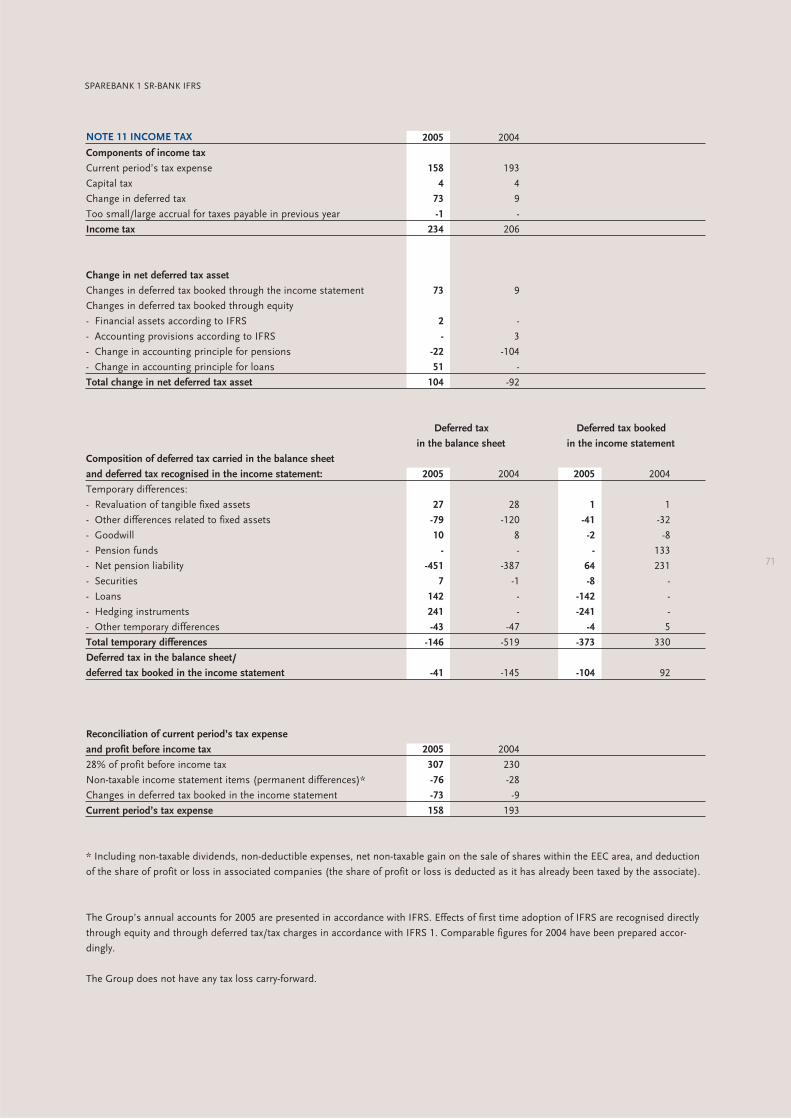
71
SPAREBANK 1 SR-BANK IFRS
NOTE 11 INCOME TAX 2005 2004
Components of income tax
Current period’s tax expense 158 193
Capital tax 4 4
Change in deferred tax 73 9
Too small/large accrual for taxes payable in previous year -1 -
Income tax 234 206
Change in net deferred tax asset
Changes in deferred tax booked through the income statement 73 9
Changes in deferred tax booked through equity
- Financial assets according to IFRS 2 -
- Accounting provisions according to IFRS - 3
- Change in accounting principle for pensions -22 -104
- Change in accounting principle for loans 51 -
Total change in net deferred tax asset 104 -92
Deferred tax Deferred tax booked
in the balance sheet in the income statement
Composition of deferred tax carried in the balance sheet
and deferred tax recognised in the income statement: 2005 2004 2005 2004
Temporary differences:
- Revaluation of tangible fixed assets 27 28 1 1
- Other differences related to fixed assets -79 -120 -41 -32
- Goodwill 10 8 -2 -8
- Pension funds - - - 133
- Net pension liability -451 -387 64 231
- Securities 7 -1 -8 -
- Loans 142 - -142 -
- Hedging instruments 241 - -241 -
- Other temporary differences -43 -47 -4 5
Total temporary differences -146 -519 -373 330
Deferred tax in the balance sheet/
deferred tax booked in the income statement -41 -145 -104 92
Reconciliation of current period’s tax expense
and profit before income tax 2005 2004
28% of profit before income tax 307 230
Non-taxable income statement items (permanent differences)* -76 -28
Changes in deferred tax booked in the income statement -73 -9
Current period’s tax expense 158 193
* Including non-taxable dividends, non-deductible expenses, net non-taxable gain on the sale of shares within the EEC area, and deduction
of the share of profit or loss in associated companies (the share of profit or loss is deducted as it has already been taxed by the associate).
The Group’s annual accounts for 2005 are presented in accordance with IFRS. Effects of first time adoption of IFRS are recognised directly
through equity and through deferred tax/tax charges in accordance with IFRS 1. Comparable figures for 2004 have been prepared accor-
dingly.
The Group does not have any tax loss carry-forward.
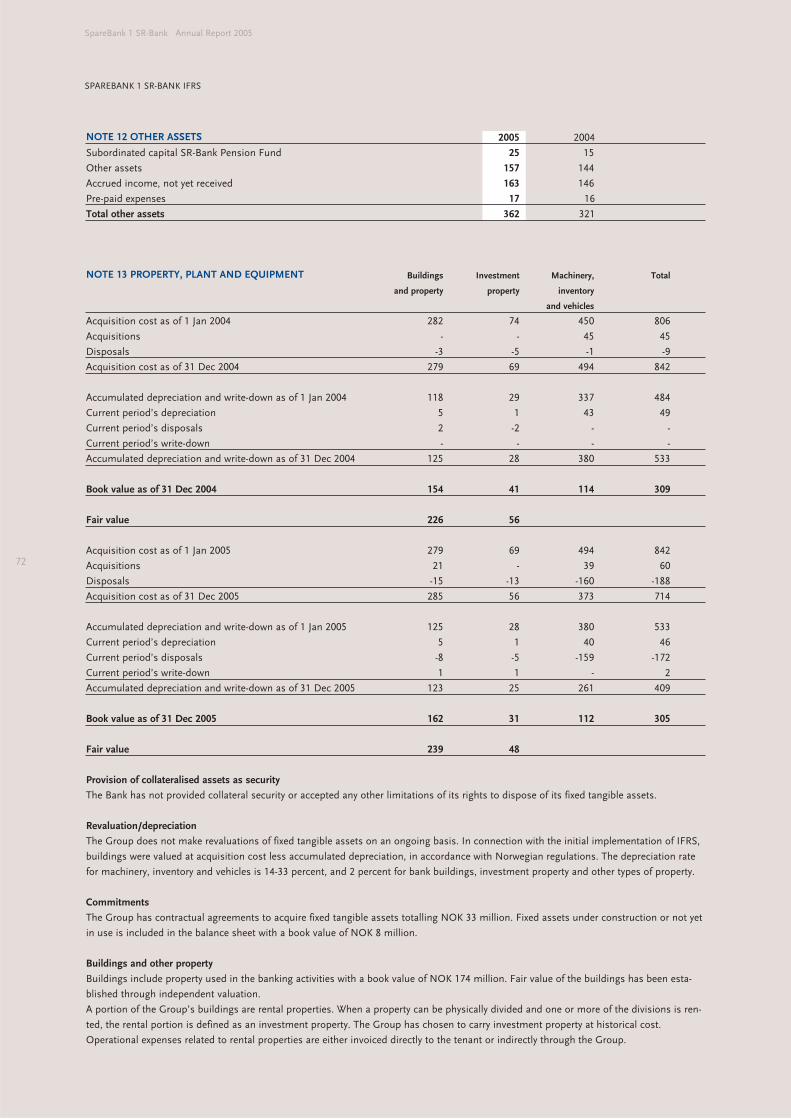
72
SpareBank 1 SR-Bank Annual Report 2005
SPAREBANK 1 SR-BANK IFRS
NOTE 12 OTHER ASSETS 2005 2004
Subordinated capital SR-Bank Pension Fund 25 15
Other assets 157 144
Accrued income, not yet received 163 146
Pre-paid expenses 17 16
Total other assets 362 321
NOTE 13 PROPERTY, PLANT AND EQUIPMENT Buildings Investment Machinery, Total
and property property inventory
and vehicles
Acquisition cost as of 1 Jan 2004 282 74 450 806
Acquisitions - - 45 45
Disposals -3 -5 -1 -9
Acquisition cost as of 31 Dec 2004 279 69 494 842
Accumulated depreciation and write-down as of 1 Jan 2004 118 29 337 484
Current period’s depreciation 5 1 43 49
Current period’s disposals 2 -2 - -
Current period’s write-down - - - -
Accumulated depreciation and write-down as of 31 Dec 2004 125 28 380 533
Book value as of 31 Dec 2004 154 41 114 309
Fair value 226 56
Acquisition cost as of 1 Jan 2005 279 69 494 842
Acquisitions 21 - 39 60
Disposals -15 -13 -160 -188
Acquisition cost as of 31 Dec 2005 285 56 373 714
Accumulated depreciation and write-down as of 1 Jan 2005 125 28 380 533
Current period’s depreciation 5 1 40 46
Current period’s disposals -8 -5 -159 -172
Current period’s write-down 1 1 - 2
Accumulated depreciation and write-down as of 31 Dec 2005 123 25 261 409
Book value as of 31 Dec 2005 162 31 112 305
Fair value 239 48
Provision of collateralised assets as security
The Bank has not provided collateral security or accepted any other limitations of its rights to dispose of its fixed tangible assets.
Revaluation/depreciation
The Group does not make revaluations of fixed tangible assets on an ongoing basis. In connection with the initial implementation of IFRS,
buildings were valued at acquisition cost less accumulated depreciation, in accordance with Norwegian regulations. The depreciation rate
for machinery, inventory and vehicles is 14-33 percent, and 2 percent for bank buildings, investment property and other types of property.
Commitments
The Group has contractual agreements to acquire fixed tangible assets totalling NOK 33 million. Fixed assets under construction or not yet
in use is included in the balance sheet with a book value of NOK 8 million.
Buildings and other property
Buildings include property used in the banking activities with a book value of NOK 174 million. Fair value of the buildings has been esta-
blished through independent valuation.
A portion of the Group’s buildings are rental properties. When a property can be physically divided and one or more of the divisions is ren-
ted, the rental portion is defined as an investment property. The Group has chosen to carry investment property at historical cost.
Operational expenses related to rental properties are either invoiced directly to the tenant or indirectly through the Group.
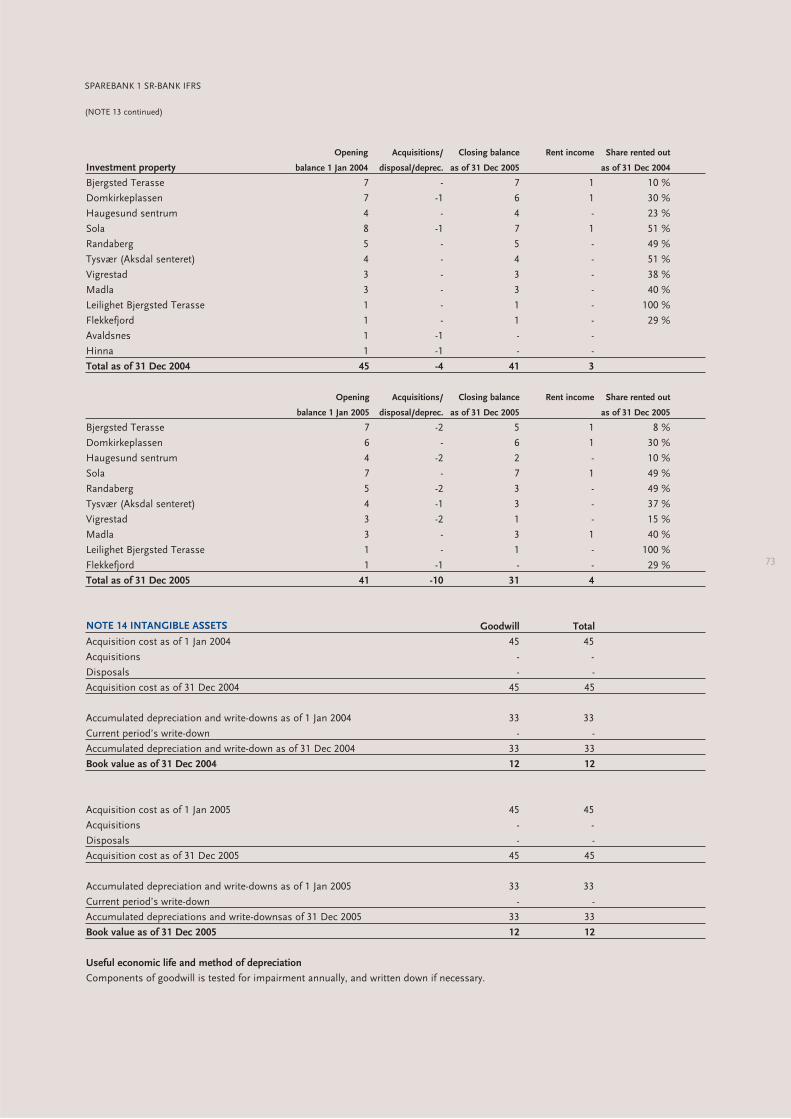
73
SPAREBANK 1 SR-BANK IFRS
Opening Acquisitions/ Closing balance Rent income Share rented out
Investment property balance 1 Jan 2004 disposal/deprec. as of 31 Dec 2005 as of 31 Dec 2004
Bjergsted Terasse 7 - 7 1 10 %
Domkirkeplassen 7 -1 6 1 30 %
Haugesund sentrum 4 - 4 - 23 %
Sola 8 -1 7 1 51 %
Randaberg 5 - 5 - 49 %
Tysvær (Aksdal senteret) 4 - 4 - 51 %
Vigrestad 3 - 3 - 38 %
Madla 3 - 3 - 40 %
Leilighet Bjergsted Terasse 1 - 1 - 100 %
Flekkefjord 1 - 1 - 29 %
Avaldsnes 1 -1 - -
Hinna 1 -1 - -
Total as of 31 Dec 2004 45 -4 41 3
Opening Acquisitions/ Closing balance Rent income Share rented out
balance 1 Jan 2005 disposal/deprec. as of 31 Dec 2005 as of 31 Dec 2005
Bjergsted Terasse 7 -2 5 1 8 %
Domkirkeplassen 6 - 6 1 30 %
Haugesund sentrum 4 -2 2 - 10 %
Sola 7 - 7 1 49 %
Randaberg 5 -2 3 - 49 %
Tysvær (Aksdal senteret) 4 -1 3 - 37 %
Vigrestad 3 -2 1 - 15 %
Madla 3 - 3 1 40 %
Leilighet Bjergsted Terasse 1 - 1 - 100 %
Flekkefjord 1 -1 - - 29 %
Total as of 31 Dec 2005 41 -10 31 4
NOTE 14 INTANGIBLE ASSETS Goodwill Total
Acquisition cost as of 1 Jan 2004 45 45
Acquisitions - -
Disposals - -
Acquisition cost as of 31 Dec 2004 45 45
Accumulated depreciation and write-downs as of 1 Jan 2004 33 33
Current period’s write-down - -
Accumulated depreciation and write-down as of 31 Dec 2004 33 33
Book value as of 31 Dec 2004 12 12
Acquisition cost as of 1 Jan 2005 45 45
Acquisitions - -
Disposals - -
Acquisition cost as of 31 Dec 2005 45 45
Accumulated depreciation and write-downs as of 1 Jan 2005 33 33
Current period’s write-down - -
Accumulated depreciations and write-downsas of 31 Dec 2005 33 33
Book value as of 31 Dec 2005 12 12
Useful economic life and method of depreciation
Components of goodwill is tested for impairment annually, and written down if necessary.
(NOTE 13 continued)
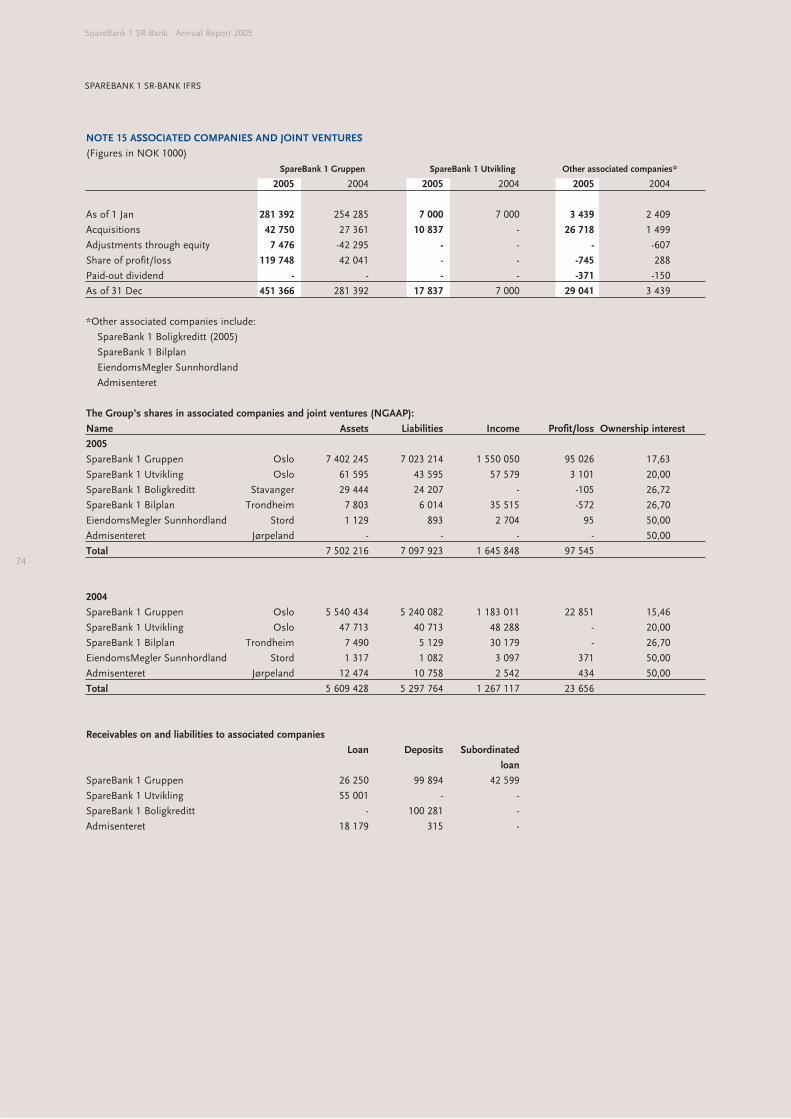
74
SpareBank 1 SR-Bank Annual Report 2005
SPAREBANK 1 SR-BANK IFRS
NOTE 15 ASSOCIATED COMPANIES AND JOINT VENTURES
(Figures in NOK 1000)
SpareBank 1 Gruppen SpareBank 1 Utvikling Other associated companies*
2005 2004 2005 2004 2005 2004
As of 1 Jan 281 392 254 285 7 000 7 000 3 439 2 409
Acquisitions 42 750 27 361 10 837 - 26 718 1 499
Adjustments through equity 7 476 -42 295 - - - -607
Share of profit/loss 119 748 42 041 - - -745 288
Paid-out dividend - - - - -371 -150
As of 31 Dec 451 366 281 392 17 837 7 000 29 041 3 439
*Other associated companies include:
SpareBank 1 Boligkreditt (2005)
SpareBank 1 Bilplan
EiendomsMegler Sunnhordland
Admisenteret
The Group’s shares in associated companies and joint ventures (NGAAP):
Name Assets Liabilities Income Profit/loss Ownership interest
2005
SpareBank 1 Gruppen Oslo 7 402 245 7 023 214 1 550 050 95 026 17,63
SpareBank 1 Utvikling Oslo 61 595 43 595 57 579 3 101 20,00
SpareBank 1 Boligkreditt Stavanger 29 444 24 207 - -105 26,72
SpareBank 1 Bilplan Trondheim 7 803 6 014 35 515 -572 26,70
EiendomsMegler Sunnhordland Stord 1 129 893 2 704 95 50,00
Admisenteret Jørpeland - - - - 50,00
Total 7 502 216 7 097 923 1 645 848 97 545
2004
SpareBank 1 Gruppen Oslo 5 540 434 5 240 082 1 183 011 22 851 15,46
SpareBank 1 Utvikling Oslo 47 713 40 713 48 288 - 20,00
SpareBank 1 Bilplan Trondheim 7 490 5 129 30 179 - 26,70
EiendomsMegler Sunnhordland Stord 1 317 1 082 3 097 371 50,00
Admisenteret Jørpeland 12 474 10 758 2 542 434 50,00
Total 5 609 428 5 297 764 1 267 117 23 656
Receivables on and liabilities to associated companies
Loan Deposits Subordinated
loan
SpareBank 1 Gruppen 26 250 99 894 42 599
SpareBank 1 Utvikling 55 001 - -
SpareBank 1 Boligkreditt - 100 281 -
Admisenteret 18 179 315 -
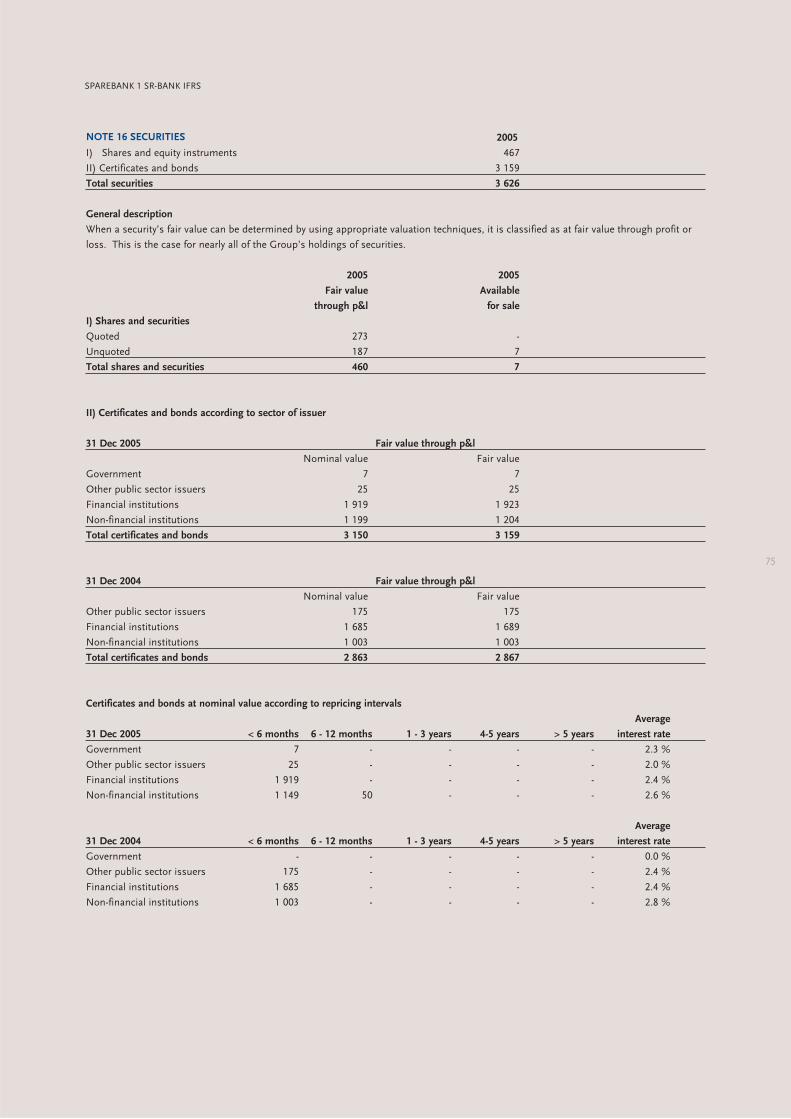
75
SPAREBANK 1 SR-BANK IFRS
NOTE 16 SECURITIES 2005
I) Shares and equity instruments 467
II) Certificates and bonds 3 159
Total securities 3 626
General description
When a security’s fair value can be determined by using appropriate valuation techniques, it is classified as at fair value through profit or
loss. This is the case for nearly all of the Group’s holdings of securities.
2005 2005
Fair value Available
through p&l for sale
I) Shares and securities
Quoted 273 -
Unquoted 187 7
Total shares and securities 460 7
II) Certificates and bonds according to sector of issuer
31 Dec 2005 Fair value through p&l
Nominal value Fair value
Government 7 7
Other public sector issuers 25 25
Financial institutions 1 919 1 923
Non-financial institutions 1 199 1 204
Total certificates and bonds 3 150 3 159
31 Dec 2004 Fair value through p&l
Nominal value Fair value
Other public sector issuers 175 175
Financial institutions 1 685 1 689
Non-financial institutions 1 003 1 003
Total certificates and bonds 2 863 2 867
Certificates and bonds at nominal value according to repricing intervals
Average
31 Dec 2005 < 6 months 6 - 12 months 1 - 3 years 4-5 years > 5 years interest rate
Government 7 - - - - 2.3 %
Other public sector issuers 25 - - - - 2.0 %
Financial institutions 1 919 - - - - 2.4 %
Non-financial institutions 1 149 50 - - - 2.6 %
Average
31 Dec 2004 < 6 months 6 - 12 months 1 - 3 years 4-5 years > 5 years interest rate
Government - - - - - 0.0 %
Other public sector issuers 175 - - - - 2.4 %
Financial institutions 1 685 - - - - 2.4 %
Non-financial institutions 1 003 - - - - 2.8 %
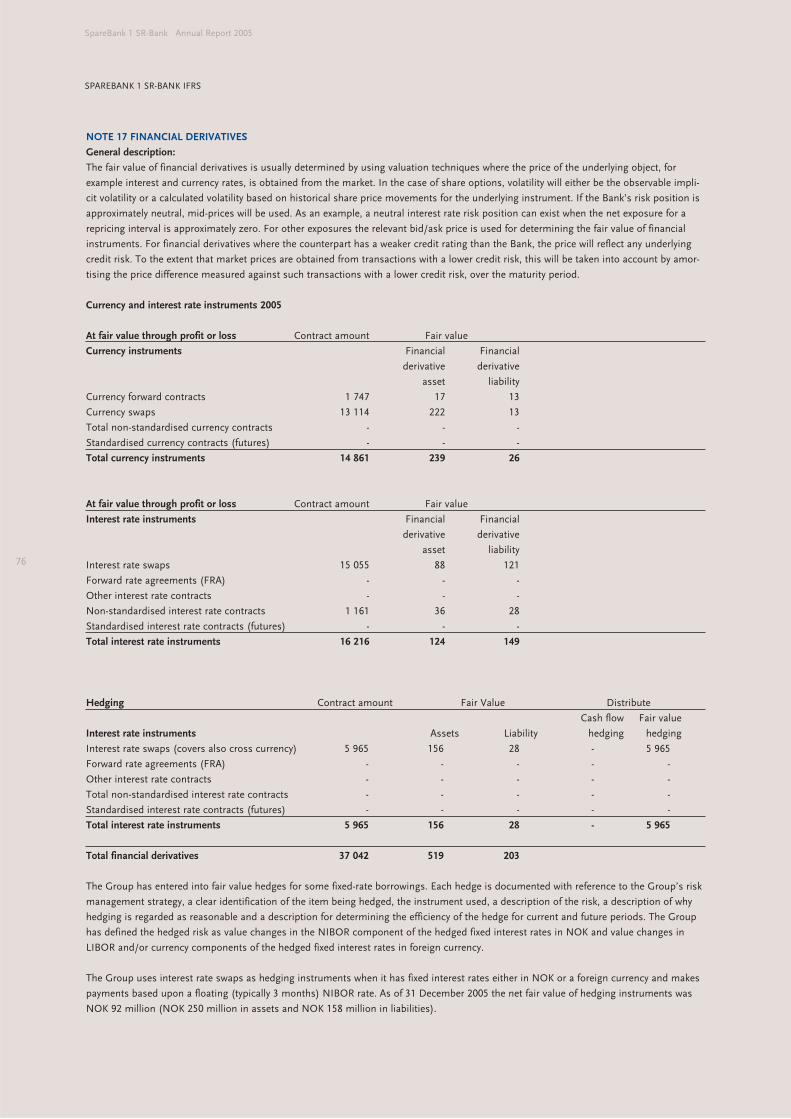
76
SpareBank 1 SR-Bank Annual Report 2005
SPAREBANK 1 SR-BANK IFRS
NOTE 17 FINANCIAL DERIVATIVES
General description:
The fair value of financial derivatives is usually determined by using valuation techniques where the price of the underlying object, for
example interest and currency rates, is obtained from the market. In the case of share options, volatility will either be the observable impli-
cit volatility or a calculated volatility based on historical share price movements for the underlying instrument. If the Bank’s risk position is
approximately neutral, mid-prices will be used. As an example, a neutral interest rate risk position can exist when the net exposure for a
repricing interval is approximately zero. For other exposures the relevant bid/ask price is used for determining the fair value of financial
instruments. For financial derivatives where the counterpart has a weaker credit rating than the Bank, the price will reflect any underlying
credit risk. To the extent that market prices are obtained from transactions with a lower credit risk, this will be taken into account by amor-
tising the price difference measured against such transactions with a lower credit risk, over the maturity period.
Currency and interest rate instruments 2005
At fair value through profit or loss Contract amount Fair value
Currency instruments Financial Financial
derivative derivative
asset liability
Currency forward contracts 1 747 17 13
Currency swaps 13 114 222 13
Total non-standardised currency contracts - - -
Standardised currency contracts (futures) - - -
Total currency instruments 14 861 239 26
At fair value through profit or loss Contract amount Fair value
Interest rate instruments Financial Financial
derivative derivative
asset liability
Interest rate swaps 15 055 88 121
Forward rate agreements (FRA) - - -
Other interest rate contracts - - -
Non-standardised interest rate contracts 1 161 36 28
Standardised interest rate contracts (futures) - - -
Total interest rate instruments 16 216 124 149
Hedging Contract amount Fair Value Distribute
Cash flow Fair value
Interest rate instruments Assets Liability hedging hedging
Interest rate swaps (covers also cross currency) 5 965 156 28 - 5 965
Forward rate agreements (FRA) - - - - -
Other interest rate contracts - - - - -
Total non-standardised interest rate contracts - - - - -
Standardised interest rate contracts (futures) - - - - -
Total interest rate instruments 5 965 156 28 - 5 965
Total financial derivatives 37 042 519 203
The Group has entered into fair value hedges for some fixed-rate borrowings. Each hedge is documented with reference to the Group’s risk
management strategy, a clear identification of the item being hedged, the instrument used, a description of the risk, a description of why
hedging is regarded as reasonable and a description for determining the efficiency of the hedge for current and future periods. The Group
has defined the hedged risk as value changes in the NIBOR component of the hedged fixed interest rates in NOK and value changes in
LIBOR and/or currency components of the hedged fixed interest rates in foreign currency.
The Group uses interest rate swaps as hedging instruments when it has fixed interest rates either in NOK or a foreign currency and makes
payments based upon a floating (typically 3 months) NIBOR rate. As of 31 December 2005 the net fair value of hedging instruments was
NOK 92 million (NOK 250 million in assets and NOK 158 million in liabilities).
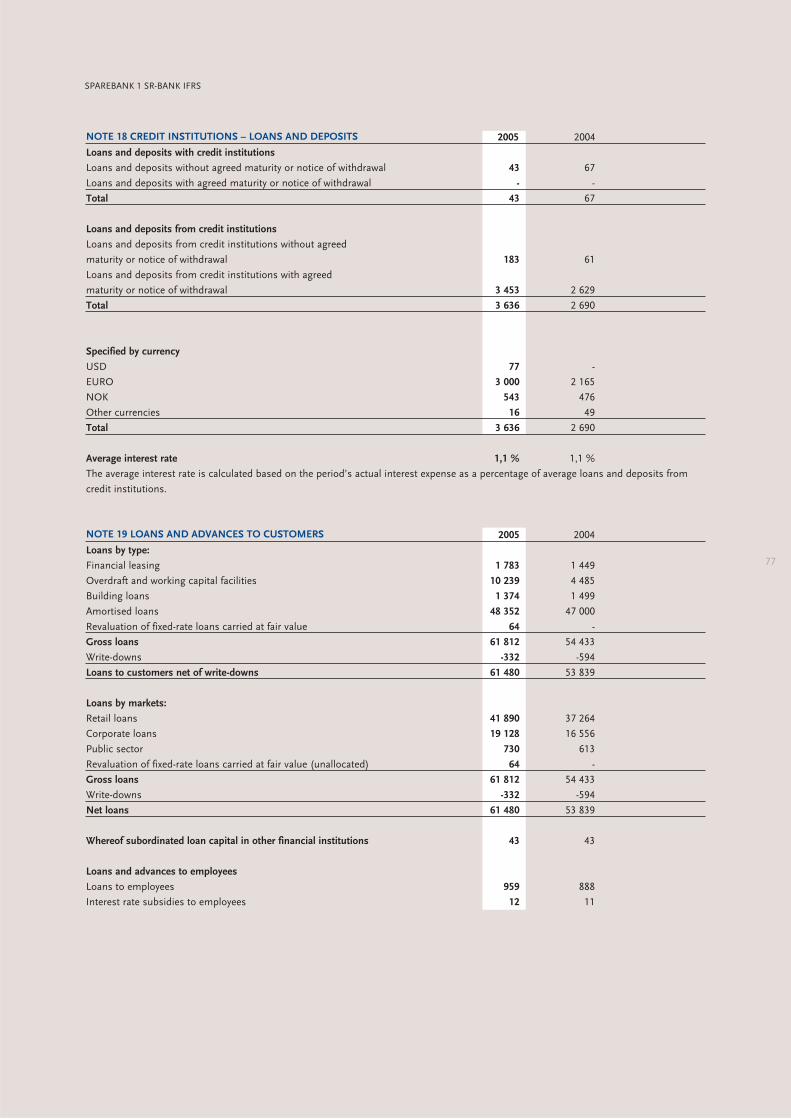
77
SPAREBANK 1 SR-BANK IFRS
NOTE 18 CREDIT INSTITUTIONS – LOANS AND DEPOSITS 2005 2004
Loans and deposits with credit institutions
Loans and deposits without agreed maturity or notice of withdrawal 43 67
Loans and deposits with agreed maturity or notice of withdrawal - -
Total 43 67
Loans and deposits from credit institutions
Loans and deposits from credit institutions without agreed
maturity or notice of withdrawal 183 61
Loans and deposits from credit institutions with agreed
maturity or notice of withdrawal 3 453 2 629
Total 3 636 2 690
Specified by currency
USD 77 -
EURO 3 000 2 165
NOK 543 476
Other currencies 16 49
Total 3 636 2 690
Average interest rate 1,1 % 1,1 %
The average interest rate is calculated based on the period’s actual interest expense as a percentage of average loans and deposits from
credit institutions.
NOTE 19 LOANS AND ADVANCES TO CUSTOMERS 2005 2004
Loans by type:
Financial leasing 1 783 1 449
Overdraft and working capital facilities 10 239 4 485
Building loans 1 374 1 499
Amortised loans 48 352 47 000
Revaluation of fixed-rate loans carried at fair value 64 -
Gross loans 61 812 54 433
Write-downs -332 -594
Loans to customers net of write-downs 61 480 53 839
Loans by markets:
Retail loans 41 890 37 264
Corporate loans 19 128 16 556
Public sector 730 613
Revaluation of fixed-rate loans carried at fair value (unallocated) 64 -
Gross loans 61 812 54 433
Write-downs -332 -594
Net loans 61 480 53 839
Whereof subordinated loan capital in other financial institutions 43 43
Loans and advances to employees
Loans to employees 959 888
Interest rate subsidies to employees 12 11
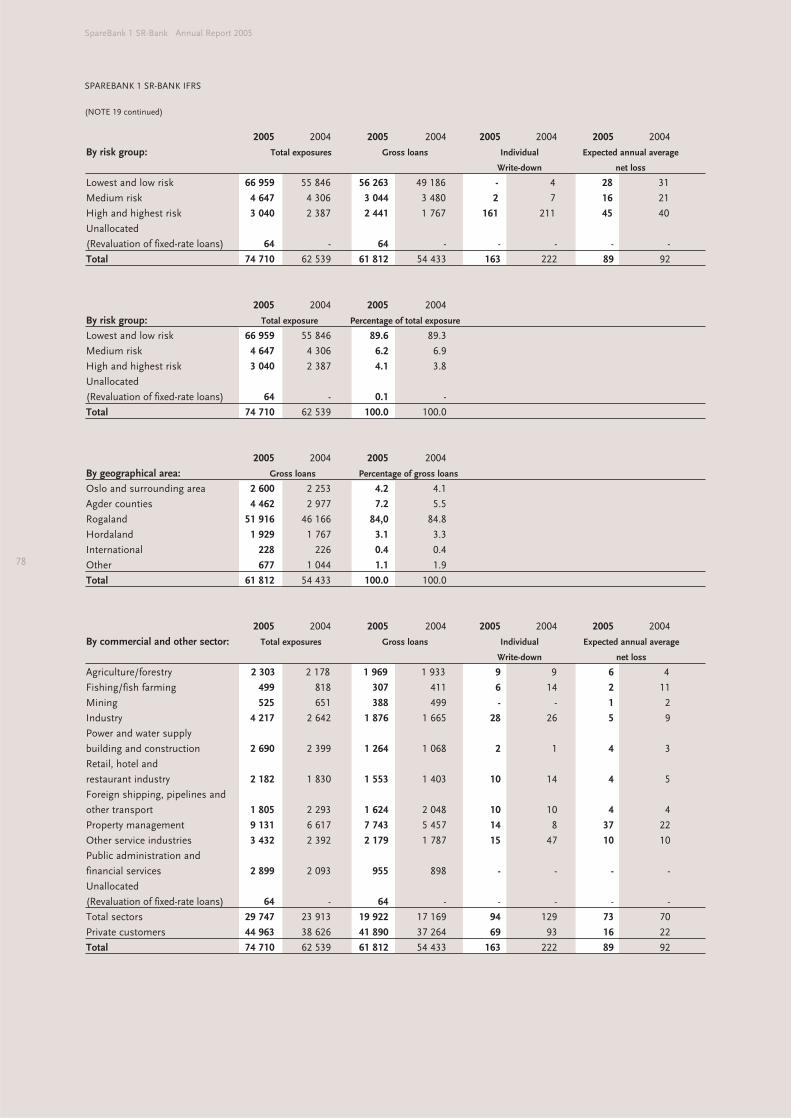
78
SpareBank 1 SR-Bank Annual Report 2005
SPAREBANK 1 SR-BANK IFRS
2005 2004 2005 2004 2005 2004 2005 2004
By risk group: Total exposures Gross loans Individual Expected annual average
Write-down net loss
Lowest and low risk 66 959 55 846 56 263 49 186 - 4 28 31
Medium risk 4 647 4 306 3 044 3 480 2 7 16 21
High and highest risk 3 040 2 387 2 441 1 767 161 211 45 40
Unallocated
(Revaluation of fixed-rate loans) 64 - 64 - - - - -
Total 74 710 62 539 61 812 54 433 163 222 89 92
2005 2004 2005 2004
By risk group: Total exposure Percentage of total exposure
Lowest and low risk 66 959 55 846 89.6 89.3
Medium risk 4 647 4 306 6.2 6.9
High and highest risk 3 040 2 387 4.1 3.8
Unallocated
(Revaluation of fixed-rate loans) 64 - 0.1 -
Total 74 710 62 539 100.0 100.0
2005 2004 2005 2004
By geographical area: Gross loans Percentage of gross loans
Oslo and surrounding area 2 600 2 253 4.2 4.1
Agder counties 4 462 2 977 7.2 5.5
Rogaland 51 916 46 166 84,0 84.8
Hordaland 1 929 1 767 3.1 3.3
International 228 226 0.4 0.4
Other 677 1 044 1.1 1.9
Total 61 812 54 433 100.0 100.0
2005 2004 2005 2004 2005 2004 2005 2004
By commercial and other sector: Total exposures Gross loans Individual Expected annual average
Write-down net loss
Agriculture/forestry 2 303 2 178 1 969 1 933 9 9 6 4
Fishing/fish farming 499 818 307 411 6 14 2 11
Mining 525 651 388 499 - - 1 2
Industry 4 217 2 642 1 876 1 665 28 26 5 9
Power and water supply
building and construction 2 690 2 399 1 264 1 068 2 1 4 3
Retail, hotel and
restaurant industry 2 182 1 830 1 553 1 403 10 14 4 5
Foreign shipping, pipelines and
other transport 1 805 2 293 1 624 2 048 10 10 4 4
Property management 9 131 6 617 7 743 5 457 14 8 37 22
Other service industries 3 432 2 392 2 179 1 787 15 47 10 10
Public administration and
financial services 2 899 2 093 955 898 - - - -
Unallocated
(Revaluation of fixed-rate loans) 64 - 64 - - - - -
Total sectors 29 747 23 913 19 922 17 169 94 129 73 70
Private customers 44 963 38 626 41 890 37 264 69 93 16 22
Total 74 710 62 539 61 812 54 433 163 222 89 92
(NOTE 19 continued)
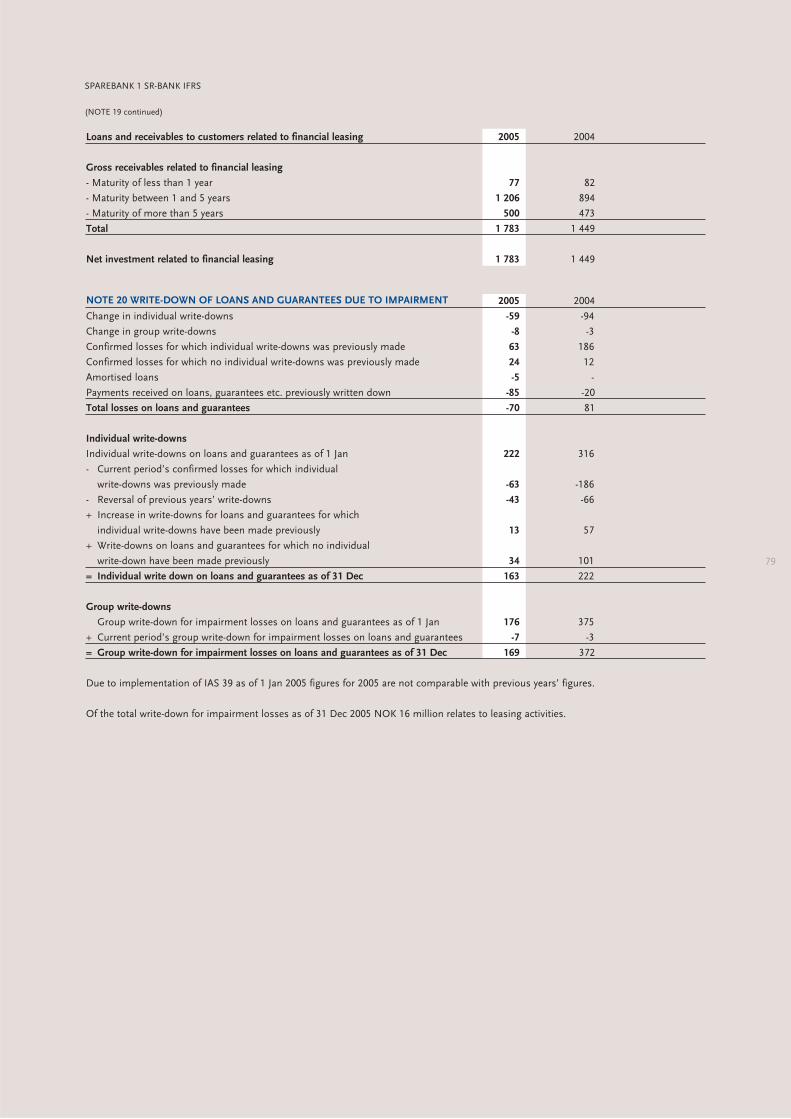
79
NOTE 20 WRITE-DOWN OF LOANS AND GUARANTEES DUE TO IMPAIRMENT 2005 2004
Change in individual write-downs -59 -94
Change in group write-downs -8 -3
Confirmed losses for which individual write-downs was previously made 63 186
Confirmed losses for which no individual write-downs was previously made 24 12
Amortised loans -5 -
Payments received on loans, guarantees etc. previously written down -85 -20
Total losses on loans and guarantees -70 81
Individual write-downs
Individual write-downs on loans and guarantees as of 1 Jan 222 316
- Current period’s confirmed losses for which individual
write-downs was previously made -63 -186
- Reversal of previous years’ write-downs -43 -66
+ Increase in write-downs for loans and guarantees for which
individual write-downs have been made previously 13 57
+ Write-downs on loans and guarantees for which no individual
write-down have been made previously 34 101
= Individual write down on loans and guarantees as of 31 Dec 163 222
Group write-downs
Group write-down for impairment losses on loans and guarantees as of 1 Jan 176 375
+ Current period’s group write-down for impairment losses on loans and guarantees -7 -3
= Group write-down for impairment losses on loans and guarantees as of 31 Dec 169 372
Due to implementation of IAS 39 as of 1 Jan 2005 figures for 2005 are not comparable with previous years’ figures.
Of the total write-down for impairment losses as of 31 Dec 2005 NOK 16 million relates to leasing activities.
Loans and receivables to customers related to financial leasing 2005 2004
Gross receivables related to financial leasing
- Maturity of less than 1 year 77 82
- Maturity between 1 and 5 years 1 206 894
- Maturity of more than 5 years 500 473
Total 1 783 1 449
Net investment related to financial leasing 1 783 1 449
SPAREBANK 1 SR-BANK IFRS
(NOTE 19 continued)
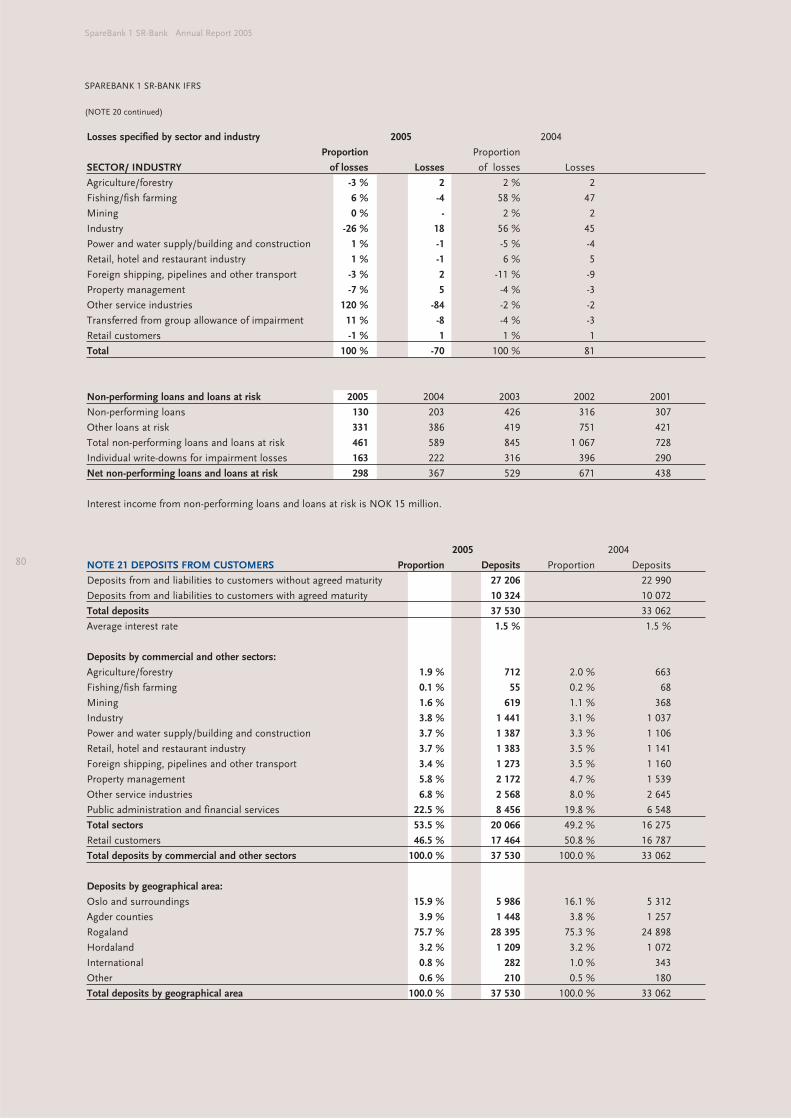
80
SpareBank 1 SR-Bank Annual Report 2005
SPAREBANK 1 SR-BANK IFRS
Losses specified by sector and industry 2005 2004
Proportion Proportion
SECTOR/ INDUSTRY of losses Losses of losses Losses
Agriculture/forestry -3 % 2 2 % 2
Fishing/fish farming 6 % -4 58 % 47
Mining 0 % - 2 % 2
Industry -26 % 18 56 % 45
Power and water supply/building and construction 1 % -1 -5 % -4
Retail, hotel and restaurant industry 1 % -1 6 % 5
Foreign shipping, pipelines and other transport -3 % 2 -11 % -9
Property management -7 % 5 -4 % -3
Other service industries 120 % -84 -2 % -2
Transferred from group allowance of impairment 11 % -8 -4 % -3
Retail customers -1 % 1 1 % 1
Total 100 % -70 100 % 81
Non-performing loans and loans at risk 2005 2004 2003 2002 2001
Non-performing loans 130 203 426 316 307
Other loans at risk 331 386 419 751 421
Total non-performing loans and loans at risk 461 589 845 1 067 728
Individual write-downs for impairment losses 163 222 316 396 290
Net non-performing loans and loans at risk 298 367 529 671 438
Interest income from non-performing loans and loans at risk is NOK 15 million.
2005 2004
NOTE 21 DEPOSITS FROM CUSTOMERS Proportion Deposits Proportion Deposits
Deposits from and liabilities to customers without agreed maturity 27 206 22 990
Deposits from and liabilities to customers with agreed maturity 10 324 10 072
Total deposits 37 530 33 062
Average interest rate 1.5 % 1.5 %
Deposits by commercial and other sectors:
Agriculture/forestry 1.9 % 712 2.0 % 663
Fishing/fish farming 0.1 % 55 0.2 % 68
Mining 1.6 % 619 1.1 % 368
Industry 3.8 % 1 441 3.1 % 1 037
Power and water supply/building and construction 3.7 % 1 387 3.3 % 1 106
Retail, hotel and restaurant industry 3.7 % 1 383 3.5 % 1 141
Foreign shipping, pipelines and other transport 3.4 % 1 273 3.5 % 1 160
Property management 5.8 % 2 172 4.7 % 1 539
Other service industries 6.8 % 2 568 8.0 % 2 645
Public administration and financial services 22.5 % 8 456 19.8 % 6 548
Total sectors 53.5 % 20 066 49.2 % 16 275
Retail customers 46.5 % 17 464 50.8 % 16 787
Total deposits by commercial and other sectors 100.0 % 37 530 100.0 % 33 062
Deposits by geographical area:
Oslo and surroundings 15.9 % 5 986 16.1 % 5 312
Agder counties 3.9 % 1 448 3.8 % 1 257
Rogaland 75.7 % 28 395 75.3 % 24 898
Hordaland 3.2 % 1 209 3.2 % 1 072
International 0.8 % 282 1.0 % 343
Other 0.6 % 210 0.5 % 180
Total deposits by geographical area 100.0 % 37 530 100.0 % 33 062
(NOTE 20 continued)
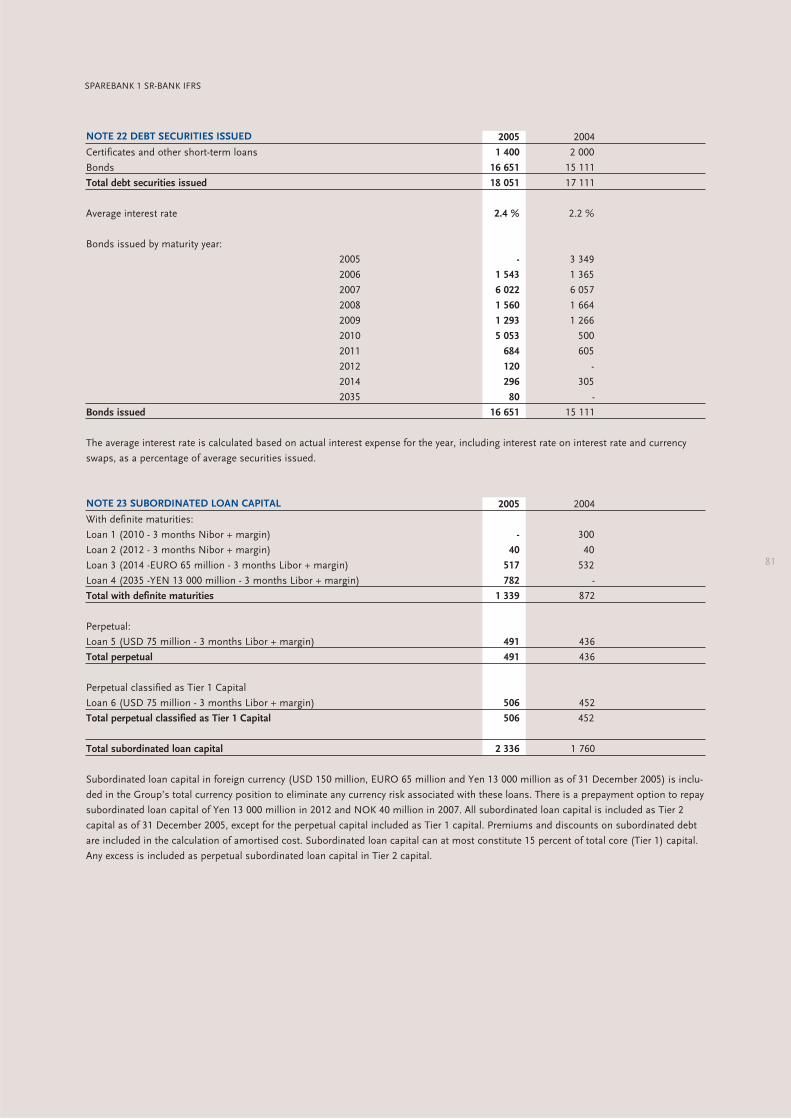
81
NOTE 22 DEBT SECURITIES ISSUED 2005 2004
Certificates and other short-term loans 1 400 2 000
Bonds 16 651 15 111
Total debt securities issued 18 051 17 111
Average interest rate 2.4 % 2.2 %
Bonds issued by maturity year:
2005 - 3 349
2006 1 543 1 365
2007 6 022 6 057
2008 1 560 1 664
2009 1 293 1 266
2010 5 053 500
2011 684 605
2012 120 -
2014 296 305
2035 80 -
Bonds issued 16 651 15 111
The average interest rate is calculated based on actual interest expense for the year, including interest rate on interest rate and currency
swaps, as a percentage of average securities issued.
NOTE 23 SUBORDINATED LOAN CAPITAL 2005 2004
With definite maturities:
Loan 1 (2010 - 3 months Nibor + margin) - 300
Loan 2 (2012 - 3 months Nibor + margin) 40 40
Loan 3 (2014 -EURO 65 million - 3 months Libor + margin) 517 532
Loan 4 (2035 -YEN 13 000 million - 3 months Libor + margin) 782 -
Total with definite maturities 1 339 872
Perpetual:
Loan 5 (USD 75 million - 3 months Libor + margin) 491 436
Total perpetual 491 436
Perpetual classified as Tier 1 Capital
Loan 6 (USD 75 million - 3 months Libor + margin) 506 452
Total perpetual classified as Tier 1 Capital 506 452
Total subordinated loan capital 2 336 1 760
Subordinated loan capital in foreign currency (USD 150 million, EURO 65 million and Yen 13 000 million as of 31 December 2005) is inclu-
ded in the Group’s total currency position to eliminate any currency risk associated with these loans. There is a prepayment option to repay
subordinated loan capital of Yen 13 000 million in 2012 and NOK 40 million in 2007. All subordinated loan capital is included as Tier 2
capital as of 31 December 2005, except for the perpetual capital included as Tier 1 capital. Premiums and discounts on subordinated debt
are included in the calculation of amortised cost. Subordinated loan capital can at most constitute 15 percent of total core (Tier 1) capital.
Any excess is included as perpetual subordinated loan capital in Tier 2 capital.
SPAREBANK 1 SR-BANK IFRS
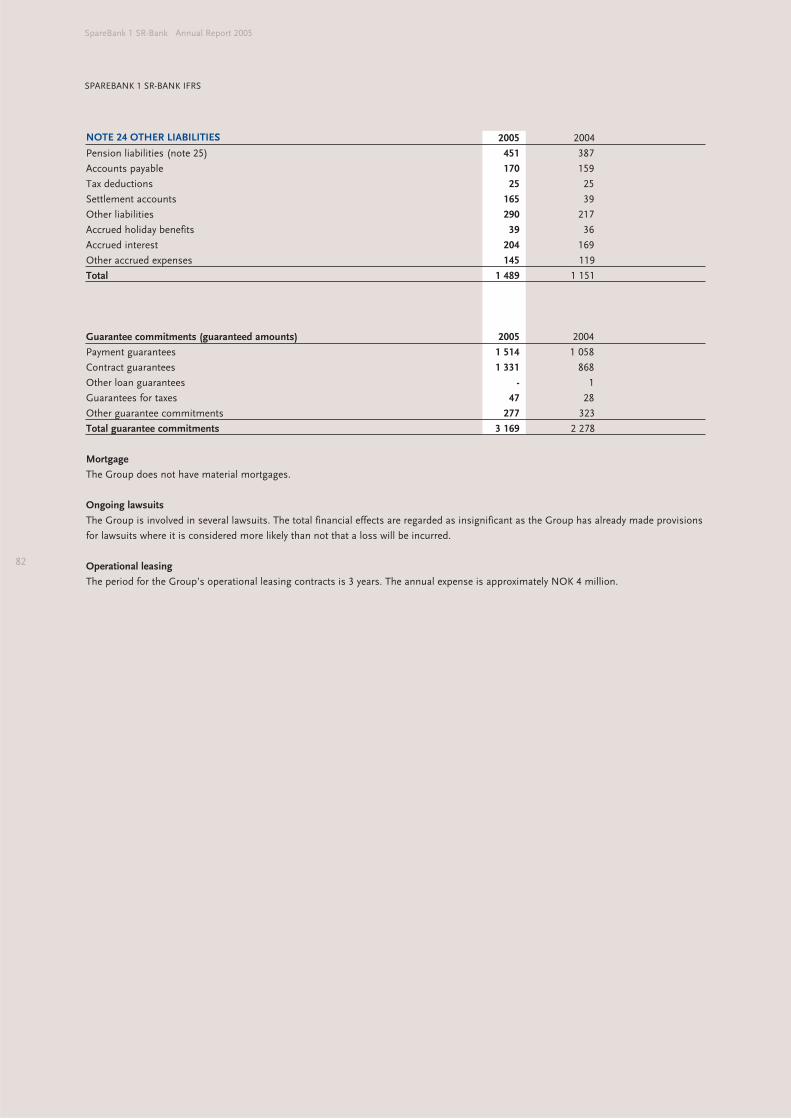
82
SpareBank 1 SR-Bank Annual Report 2005
SPAREBANK 1 SR-BANK IFRS
NOTE 24 OTHER LIABILITIES 2005 2004
Pension liabilities (note 25) 451 387
Accounts payable 170 159
Tax deductions 25 25
Settlement accounts 165 39
Other liabilities 290 217
Accrued holiday benefits 39 36
Accrued interest 204 169
Other accrued expenses 145 119
Total 1 489 1 151
Guarantee commitments (guaranteed amounts) 2005 2004
Payment guarantees 1 514 1 058
Contract guarantees 1 331 868
Other loan guarantees - 1
Guarantees for taxes 47 28
Other guarantee commitments 277 323
Total guarantee commitments 3 169 2 278
Mortgage
The Group does not have material mortgages.
Ongoing lawsuits
The Group is involved in several lawsuits. The total financial effects are regarded as insignificant as the Group has already made provisions
for lawsuits where it is considered more likely than not that a loss will be incurred.
Operational leasing
The period for the Group’s operational leasing contracts is 3 years. The annual expense is approximately NOK 4 million.
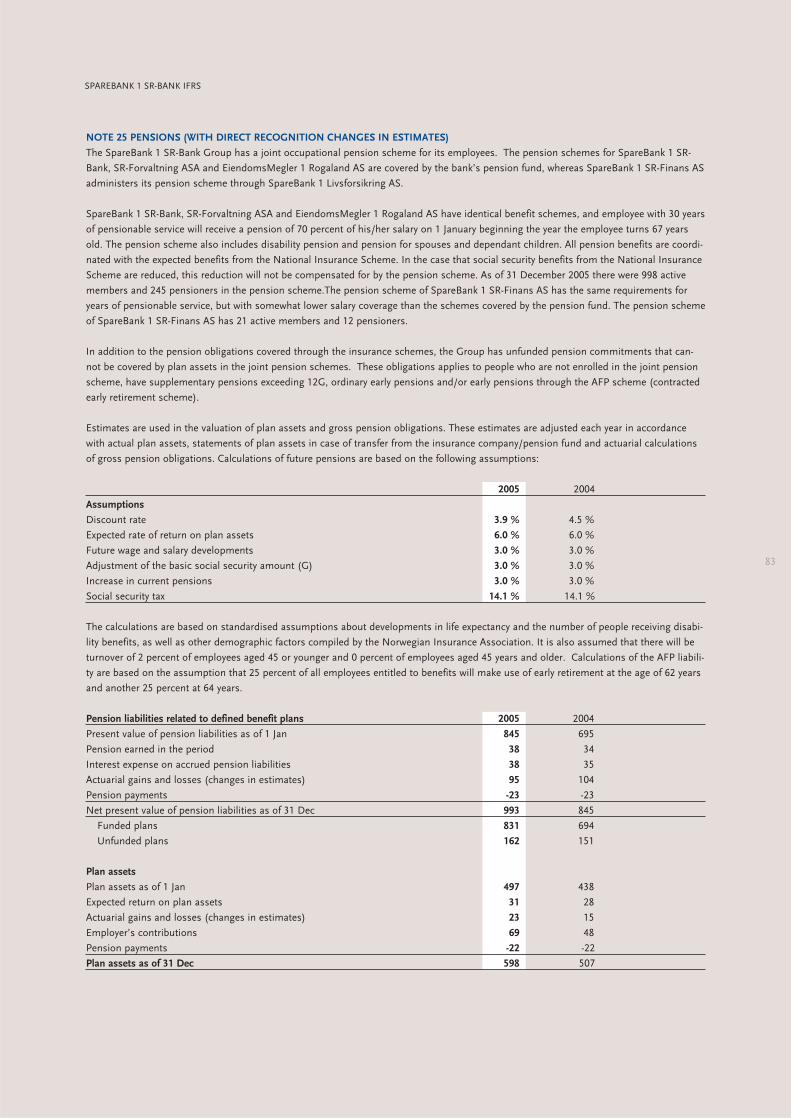
83
NOTE 25 PENSIONS (WITH DIRECT RECOGNITION CHANGES IN ESTIMATES)
The SpareBank 1 SR-Bank Group has a joint occupational pension scheme for its employees. The pension schemes for SpareBank 1 SR-
Bank, SR-Forvaltning ASA and EiendomsMegler 1 Rogaland AS are covered by the bank’s pension fund, whereas SpareBank 1 SR-Finans AS
administers its pension scheme through SpareBank 1 Livsforsikring AS.
SpareBank 1 SR-Bank, SR-Forvaltning ASA and EiendomsMegler 1 Rogaland AS have identical benefit schemes, and employee with 30 years
of pensionable service will receive a pension of 70 percent of his/her salary on 1 January beginning the year the employee turns 67 years
old. The pension scheme also includes disability pension and pension for spouses and dependant children. All pension benefits are coordi-
nated with the expected benefits from the National Insurance Scheme. In the case that social security benefits from the National Insurance
Scheme are reduced, this reduction will not be compensated for by the pension scheme. As of 31 December 2005 there were 998 active
members and 245 pensioners in the pension scheme.The pension scheme of SpareBank 1 SR-Finans AS has the same requirements for
years of pensionable service, but with somewhat lower salary coverage than the schemes covered by the pension fund. The pension scheme
of SpareBank 1 SR-Finans AS has 21 active members and 12 pensioners.
In addition to the pension obligations covered through the insurance schemes, the Group has unfunded pension commitments that can-
not be covered by plan assets in the joint pension schemes. These obligations applies to people who are not enrolled in the joint pension
scheme, have supplementary pensions exceeding 12G, ordinary early pensions and/or early pensions through the AFP scheme (contracted
early retirement scheme).
Estimates are used in the valuation of plan assets and gross pension obligations. These estimates are adjusted each year in accordance
with actual plan assets, statements of plan assets in case of transfer from the insurance company/pension fund and actuarial calculations
of gross pension obligations. Calculations of future pensions are based on the following assumptions:
2005 2004
Assumptions
Discount rate 3.9 % 4.5 %
Expected rate of return on plan assets 6.0 % 6.0 %
Future wage and salary developments 3.0 % 3.0 %
Adjustment of the basic social security amount (G) 3.0 % 3.0 %
Increase in current pensions 3.0 % 3.0 %
Social security tax 14.1 % 14.1 %
The calculations are based on standardised assumptions about developments in life expectancy and the number of people receiving disabi-
lity benefits, as well as other demographic factors compiled by the Norwegian Insurance Association. It is also assumed that there will be
turnover of 2 percent of employees aged 45 or younger and 0 percent of employees aged 45 years and older. Calculations of the AFP liabili-
ty are based on the assumption that 25 percent of all employees entitled to benefits will make use of early retirement at the age of 62 years
and another 25 percent at 64 years.
Pension liabilities related to defined benefit plans 2005 2004
Present value of pension liabilities as of 1 Jan 845 695
Pension earned in the period 38 34
Interest expense on accrued pension liabilities 38 35
Actuarial gains and losses (changes in estimates) 95 104
Pension payments -23 -23
Net present value of pension liabilities as of 31 Dec 993 845
Funded plans 831 694
Unfunded plans 162 151
Plan assets
Plan assets as of 1 Jan 497 438
Expected return on plan assets 31 28
Actuarial gains and losses (changes in estimates) 23 15
Employer’s contributions 69 48
Pension payments -22 -22
Plan assets as of 31 Dec 598 507
SPAREBANK 1 SR-BANK IFRS
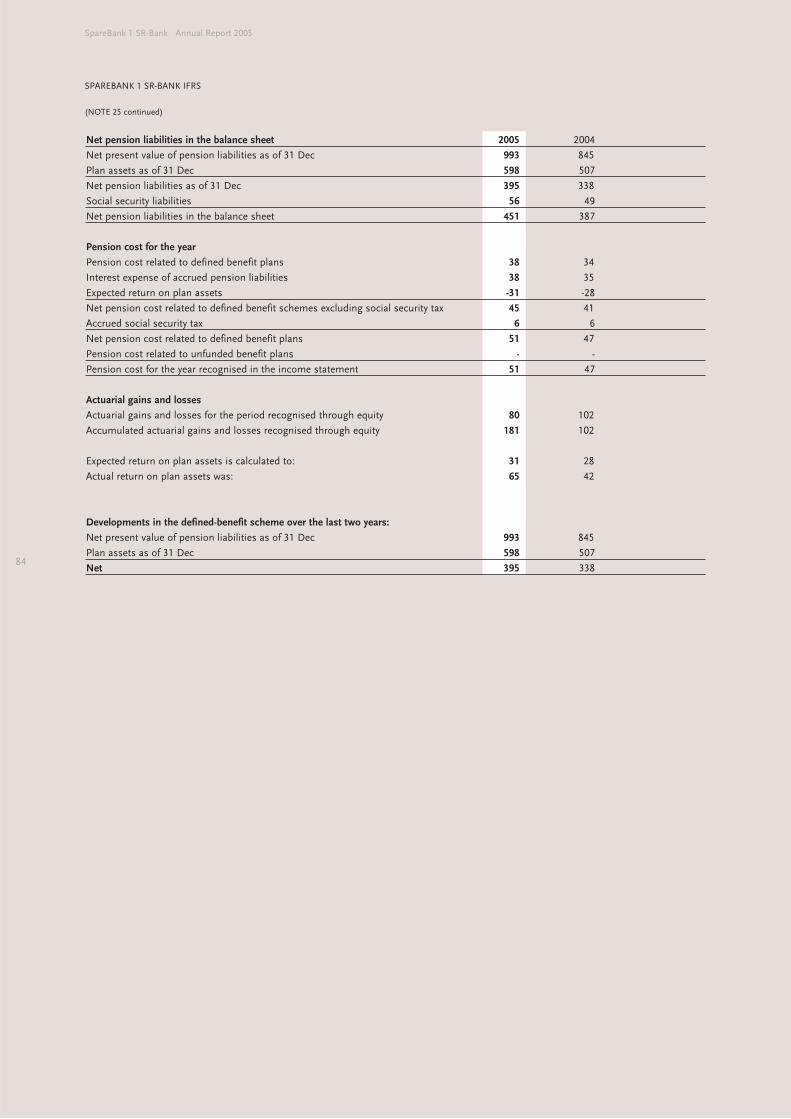
84
SpareBank 1 SR-Bank Annual Report 2005
SPAREBANK 1 SR-BANK IFRS
Net pension liabilities in the balance sheet 2005 2004
Net present value of pension liabilities as of 31 Dec 993 845
Plan assets as of 31 Dec 598 507
Net pension liabilities as of 31 Dec 395 338
Social security liabilities 56 49
Net pension liabilities in the balance sheet 451 387
Pension cost for the year
Pension cost related to defined benefit plans 38 34
Interest expense of accrued pension liabilities 38 35
Expected return on plan assets -31 -28
Net pension cost related to defined benefit schemes excluding social security tax 45 41
Accrued social security tax 6 6
Net pension cost related to defined benefit plans 51 47
Pension cost related to unfunded benefit plans - -
Pension cost for the year recognised in the income statement 51 47
Actuarial gains and losses
Actuarial gains and losses for the period recognised through equity 80 102
Accumulated actuarial gains and losses recognised through equity 181 102
Expected return on plan assets is calculated to: 31 28
Actual return on plan assets was: 65 42
Developments in the defined-benefit scheme over the last two years:
Net present value of pension liabilities as of 31 Dec 993 845
Plan assets as of 31 Dec 598 507
Net 395 338
(NOTE 25 continued)
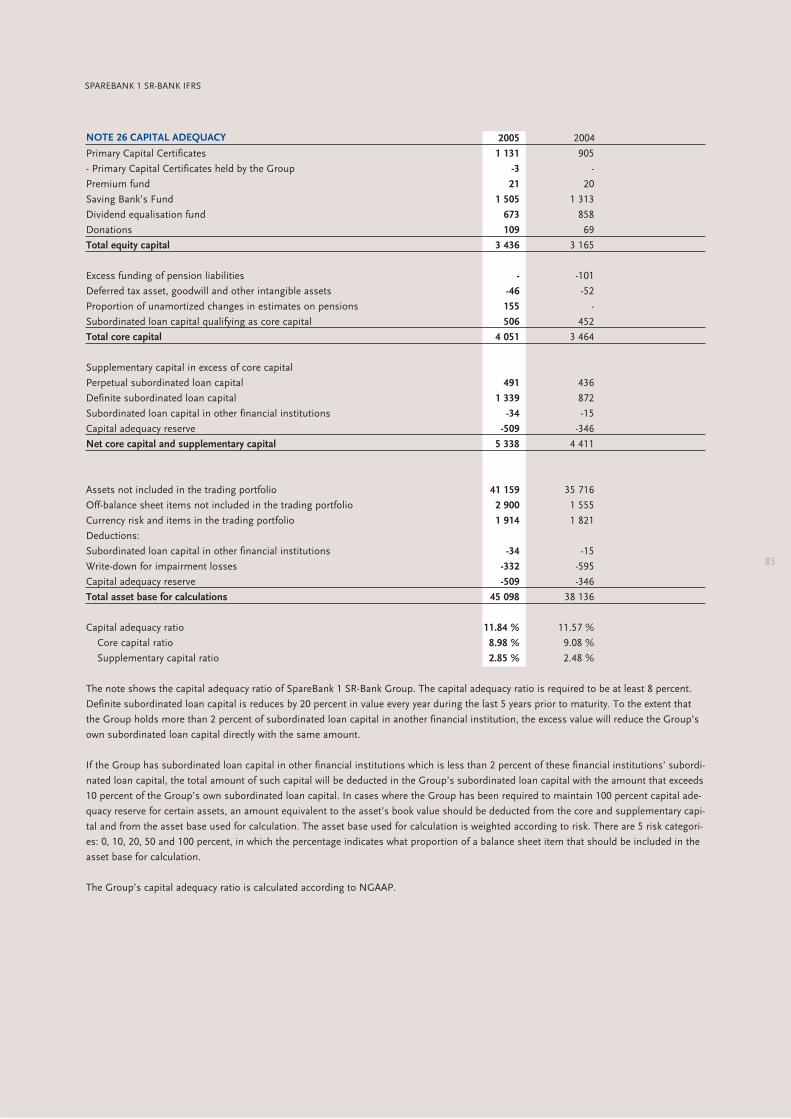
85
NOTE 26 CAPITAL ADEQUACY 2005 2004
Primary Capital Certificates 1 131 905
- Primary Capital Certificates held by the Group -3 -
Premium fund 21 20
Saving Bank’s Fund 1 505 1 313
Dividend equalisation fund 673 858
Donations 109 69
Total equity capital 3 436 3 165
Excess funding of pension liabilities - -101
Deferred tax asset, goodwill and other intangible assets -46 -52
Proportion of unamortized changes in estimates on pensions 155 -
Subordinated loan capital qualifying as core capital 506 452
Total core capital 4 051 3 464
Supplementary capital in excess of core capital
Perpetual subordinated loan capital 491 436
Definite subordinated loan capital 1 339 872
Subordinated loan capital in other financial institutions -34 -15
Capital adequacy reserve -509 -346
Net core capital and supplementary capital 5 338 4 411
Assets not included in the trading portfolio 41 159 35 716
Off-balance sheet items not included in the trading portfolio 2 900 1 555
Currency risk and items in the trading portfolio 1 914 1 821
Deductions:
Subordinated loan capital in other financial institutions -34 -15
Write-down for impairment losses -332 -595
Capital adequacy reserve -509 -346
Total asset base for calculations 45 098 38 136
Capital adequacy ratio 11.84 % 11.57 %
Core capital ratio 8.98 % 9.08 %
Supplementary capital ratio 2.85 % 2.48 %
The note shows the capital adequacy ratio of SpareBank 1 SR-Bank Group. The capital adequacy ratio is required to be at least 8 percent.
Definite subordinated loan capital is reduces by 20 percent in value every year during the last 5 years prior to maturity. To the extent that
the Group holds more than 2 percent of subordinated loan capital in another financial institution, the excess value will reduce the Group’s
own subordinated loan capital directly with the same amount.
If the Group has subordinated loan capital in other financial institutions which is less than 2 percent of these financial institutions’ subordi-
nated loan capital, the total amount of such capital will be deducted in the Group’s subordinated loan capital with the amount that exceeds
10 percent of the Group’s own subordinated loan capital. In cases where the Group has been required to maintain 100 percent capital ade-
quacy reserve for certain assets, an amount equivalent to the asset’s book value should be deducted from the core and supplementary capi-
tal and from the asset base used for calculation. The asset base used for calculation is weighted according to risk. There are 5 risk categori-
es: 0, 10, 20, 50 and 100 percent, in which the percentage indicates what proportion of a balance sheet item that should be included in the
asset base for calculation.
The Group’s capital adequacy ratio is calculated according to NGAAP.
SPAREBANK 1 SR-BANK IFRS
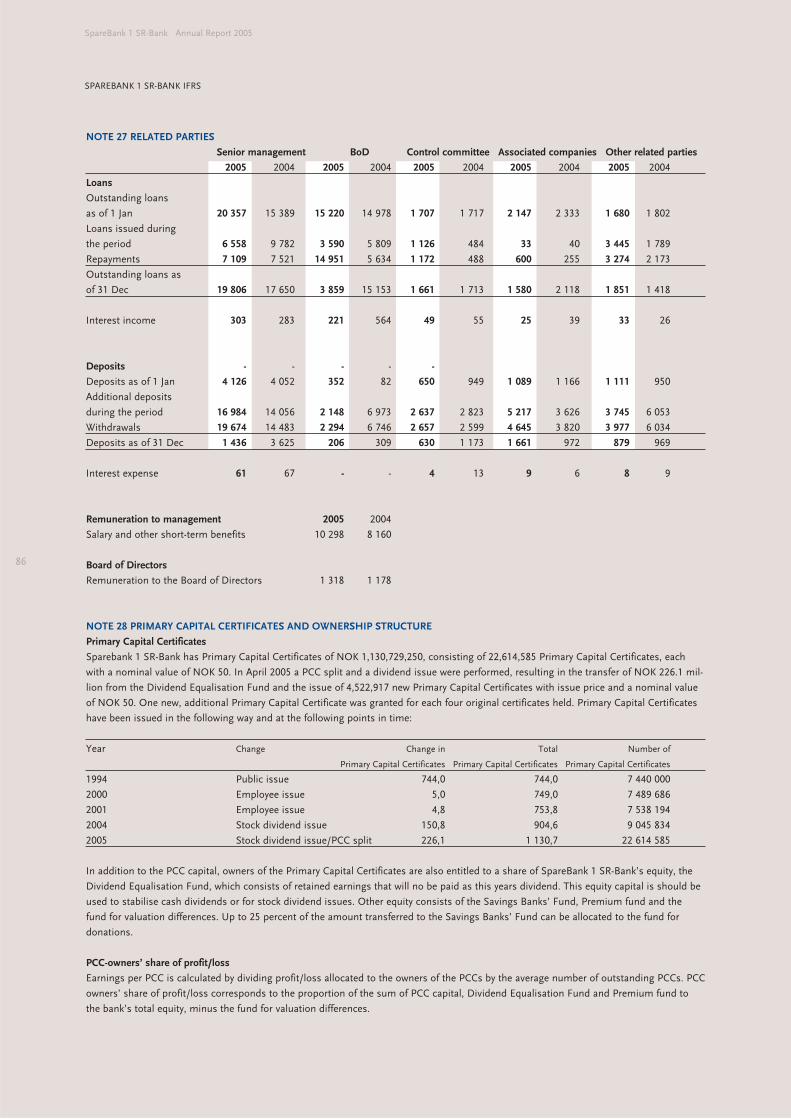
86
SpareBank 1 SR-Bank Annual Report 2005
SPAREBANK 1 SR-BANK IFRS
NOTE 27 RELATED PARTIES
Senior management BoD Control committee Associated companies Other related parties
2005 2004 2005 2004 2005 2004 2005 2004 2005 2004
Loans
Outstanding loans
as of 1 Jan 20 357 15 389 15 220 14 978 1 707 1 717 2 147 2 333 1 680 1 802
Loans issued during
the period 6 558 9 782 3 590 5 809 1 126 484 33 40 3 445 1 789
Repayments 7 109 7 521 14 951 5 634 1 172 488 600 255 3 274 2 173
Outstanding loans as
of 31 Dec 19 806 17 650 3 859 15 153 1 661 1 713 1 580 2 118 1 851 1 418
Interest income 303 283 221 564 49 55 25 39 33 26
Deposits - - - - -
Deposits as of 1 Jan 4 126 4 052 352 82 650 949 1 089 1 166 1 111 950
Additional deposits
during the period 16 984 14 056 2 148 6 973 2 637 2 823 5 217 3 626 3 745 6 053
Withdrawals 19 674 14 483 2 294 6 746 2 657 2 599 4 645 3 820 3 977 6 034
Deposits as of 31 Dec 1 436 3 625 206 309 630 1 173 1 661 972 879 969
Interest expense 61 67 - - 4 13 9 6 8 9
Remuneration to management 2005 2004
Salary and other short-term benefits 10 298 8 160
Board of Directors
Remuneration to the Board of Directors 1 318 1 178
NOTE 28 PRIMARY CAPITAL CERTIFICATES AND OWNERSHIP STRUCTURE
Primary Capital Certificates
Sparebank 1 SR-Bank has Primary Capital Certificates of NOK 1,130,729,250, consisting of 22,614,585 Primary Capital Certificates, each
with a nominal value of NOK 50. In April 2005 a PCC split and a dividend issue were performed, resulting in the transfer of NOK 226.1 mil-
lion from the Dividend Equalisation Fund and the issue of 4,522,917 new Primary Capital Certificates with issue price and a nominal value
of NOK 50. One new, additional Primary Capital Certificate was granted for each four original certificates held. Primary Capital Certificates
have been issued in the following way and at the following points in time:
Year Change Change in Total Number of
Primary Capital Certificates Primary Capital Certificates Primary Capital Certificates
1994 Public issue 744,0 744,0 7 440 000
2000 Employee issue 5,0 749,0 7 489 686
2001 Employee issue 4,8 753,8 7 538 194
2004 Stock dividend issue 150,8 904,6 9 045 834
2005 Stock dividend issue/PCC split 226,1 1 130,7 22 614 585
In addition to the PCC capital, owners of the Primary Capital Certificates are also entitled to a share of SpareBank 1 SR-Bank’s equity, the
Dividend Equalisation Fund, which consists of retained earnings that will no be paid as this years dividend. This equity capital is should be
used to stabilise cash dividends or for stock dividend issues. Other equity consists of the Savings Banks’ Fund, Premium fund and the
fund for valuation differences. Up to 25 percent of the amount transferred to the Savings Banks’ Fund can be allocated to the fund for
donations.
PCC-owners’ share of profit/loss
Earnings per PCC is calculated by dividing profit/loss allocated to the owners of the PCCs by the average number of outstanding PCCs. PCC
owners’ share of profit/loss corresponds to the proportion of the sum of PCC capital, Dividend Equalisation Fund and Premium fund to
the bank’s total equity, minus the fund for valuation differences.
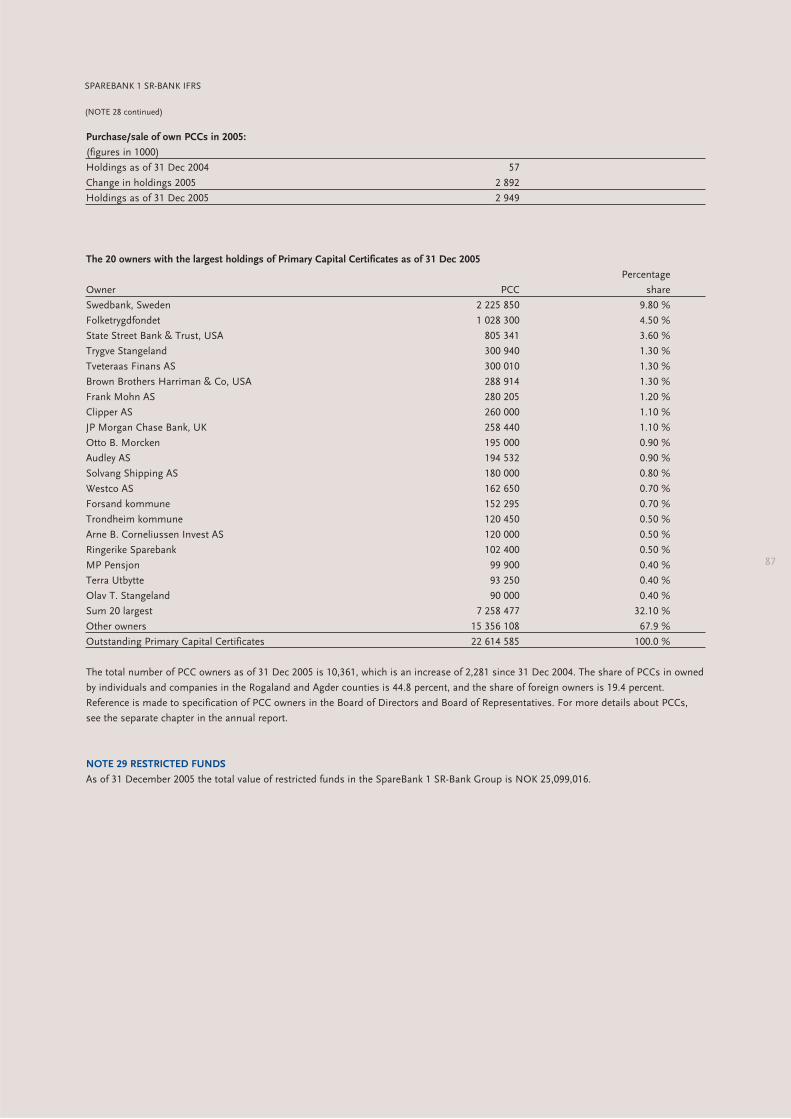
87
Purchase/sale of own PCCs in 2005:
(figures in 1000)
Holdings as of 31 Dec 2004 57
Change in holdings 2005 2 892
Holdings as of 31 Dec 2005 2 949
The 20 owners with the largest holdings of Primary Capital Certificates as of 31 Dec 2005
Percentage
Owner PCC share
Swedbank, Sweden 2 225 850 9.80 %
Folketrygdfondet 1 028 300 4.50 %
State Street Bank & Trust, USA 805 341 3.60 %
Trygve Stangeland 300 940 1.30 %
Tveteraas Finans AS 300 010 1.30 %
Brown Brothers Harriman & Co, USA 288 914 1.30 %
Frank Mohn AS 280 205 1.20 %
Clipper AS 260 000 1.10 %
JP Morgan Chase Bank, UK 258 440 1.10 %
Otto B. Morcken 195 000 0.90 %
Audley AS 194 532 0.90 %
Solvang Shipping AS 180 000 0.80 %
Westco AS 162 650 0.70 %
Forsand kommune 152 295 0.70 %
Trondheim kommune 120 450 0.50 %
Arne B. Corneliussen Invest AS 120 000 0.50 %
Ringerike Sparebank 102 400 0.50 %
MP Pensjon 99 900 0.40 %
Terra Utbytte 93 250 0.40 %
Olav T. Stangeland 90 000 0.40 %
Sum 20 largest 7 258 477 32.10 %
Other owners 15 356 108 67.9 %
Outstanding Primary Capital Certificates 22 614 585 100.0 %
The total number of PCC owners as of 31 Dec 2005 is 10,361, which is an increase of 2,281 since 31 Dec 2004. The share of PCCs in owned
by individuals and companies in the Rogaland and Agder counties is 44.8 percent, and the share of foreign owners is 19.4 percent.
Reference is made to specification of PCC owners in the Board of Directors and Board of Representatives. For more details about PCCs,
see the separate chapter in the annual report.
NOTE 29 RESTRICTED FUNDS
As of 31 December 2005 the total value of restricted funds in the SpareBank 1 SR-Bank Group is NOK 25,099,016.
SPAREBANK 1 SR-BANK IFRS
(NOTE 28 continued)
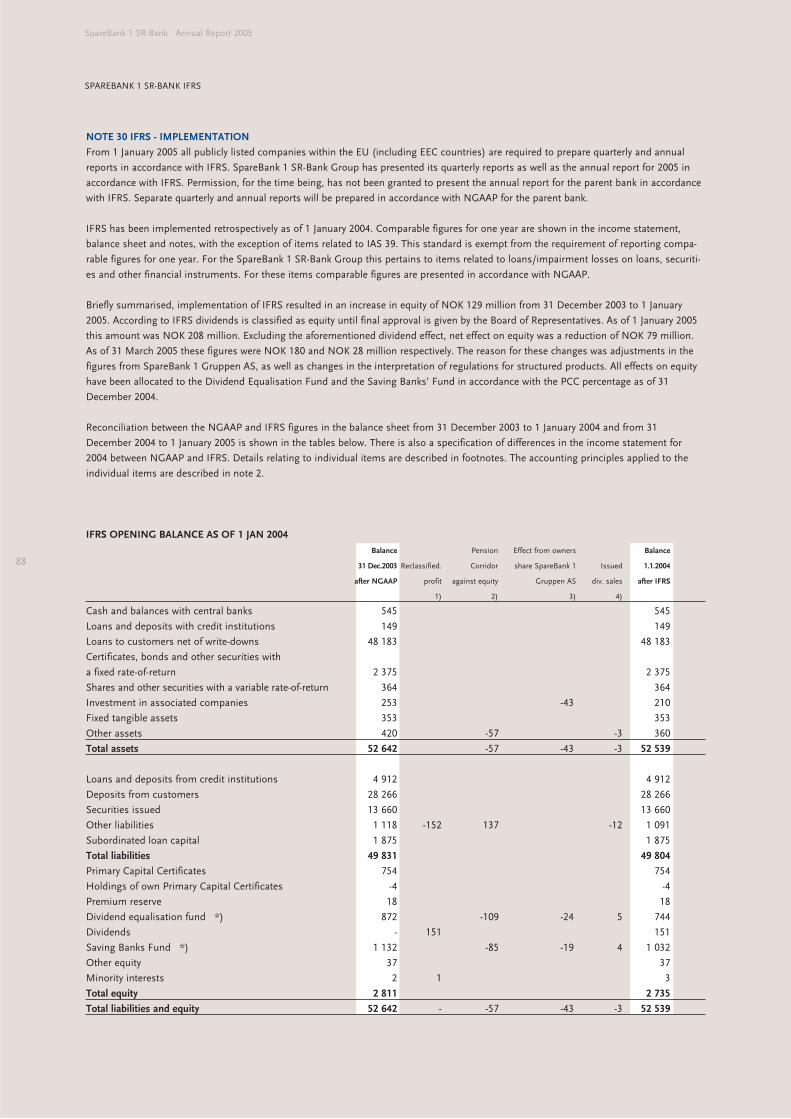
88
SpareBank 1 SR-Bank Annual Report 2005
SPAREBANK 1 SR-BANK IFRS
NOTE 30 IFRS - IMPLEMENTATION
From 1 January 2005 all publicly listed companies within the EU (including EEC countries) are required to prepare quarterly and annual
reports in accordance with IFRS. SpareBank 1 SR-Bank Group has presented its quarterly reports as well as the annual report for 2005 in
accordance with IFRS. Permission, for the time being, has not been granted to present the annual report for the parent bank in accordance
with IFRS. Separate quarterly and annual reports will be prepared in accordance with NGAAP for the parent bank.
IFRS has been implemented retrospectively as of 1 January 2004. Comparable figures for one year are shown in the income statement,
balance sheet and notes, with the exception of items related to IAS 39. This standard is exempt from the requirement of reporting compa-
rable figures for one year. For the SpareBank 1 SR-Bank Group this pertains to items related to loans/impairment losses on loans, securiti-
es and other financial instruments. For these items comparable figures are presented in accordance with NGAAP.
Briefly summarised, implementation of IFRS resulted in an increase in equity of NOK 129 million from 31 December 2003 to 1 January
2005. According to IFRS dividends is classified as equity until final approval is given by the Board of Representatives. As of 1 January 2005
this amount was NOK 208 million. Excluding the aforementioned dividend effect, net effect on equity was a reduction of NOK 79 million.
As of 31 March 2005 these figures were NOK 180 and NOK 28 million respectively. The reason for these changes was adjustments in the
figures from SpareBank 1 Gruppen AS, as well as changes in the interpretation of regulations for structured products. All effects on equity
have been allocated to the Dividend Equalisation Fund and the Saving Banks’ Fund in accordance with the PCC percentage as of 31
December 2004.
Reconciliation between the NGAAP and IFRS figures in the balance sheet from 31 December 2003 to 1 January 2004 and from 31
December 2004 to 1 January 2005 is shown in the tables below. There is also a specification of differences in the income statement for
2004 between NGAAP and IFRS. Details relating to individual items are described in footnotes. The accounting principles applied to the
individual items are described in note 2.
IFRS OPENING BALANCE AS OF 1 JAN 2004
Balance Pension Effect from owners Balance
31 Dec.2003 Reclassified. Corridor share SpareBank 1 Issued 1.1.2004
after NGAAP profit against equity Gruppen AS div. sales after IFRS
1) 2) 3) 4)
Cash and balances with central banks 545 545
Loans and deposits with credit institutions 149 149
Loans to customers net of write-downs 48 183 48 183
Certificates, bonds and other securities with
a fixed rate-of-return 2 375 2 375
Shares and other securities with a variable rate-of-return 364 364
Investment in associated companies 253 -43 210
Fixed tangible assets 353 353
Other assets 420 -57 -3 360
Total assets 52 642 -57 -43 -3 52 539
Loans and deposits from credit institutions 4 912 4 912
Deposits from customers 28 266 28 266
Securities issued 13 660 13 660
Other liabilities 1 118 -152 137 -12 1 091
Subordinated loan capital 1 875 1 875
Total liabilities 49 831 49 804
Primary Capital Certificates 754 754
Holdings of own Primary Capital Certificates -4 -4
Premium reserve 18 18
Dividend equalisation fund *) 872 -109 -24 5 744
Dividends - 151 151
Saving Banks Fund *) 1 132 -85 -19 4 1 032
Other equity 37 37
Minority interests 2 1 3
Total equity 2 811 2 735
Total liabilities and equity 52 642 - -57 -43 -3 52 539
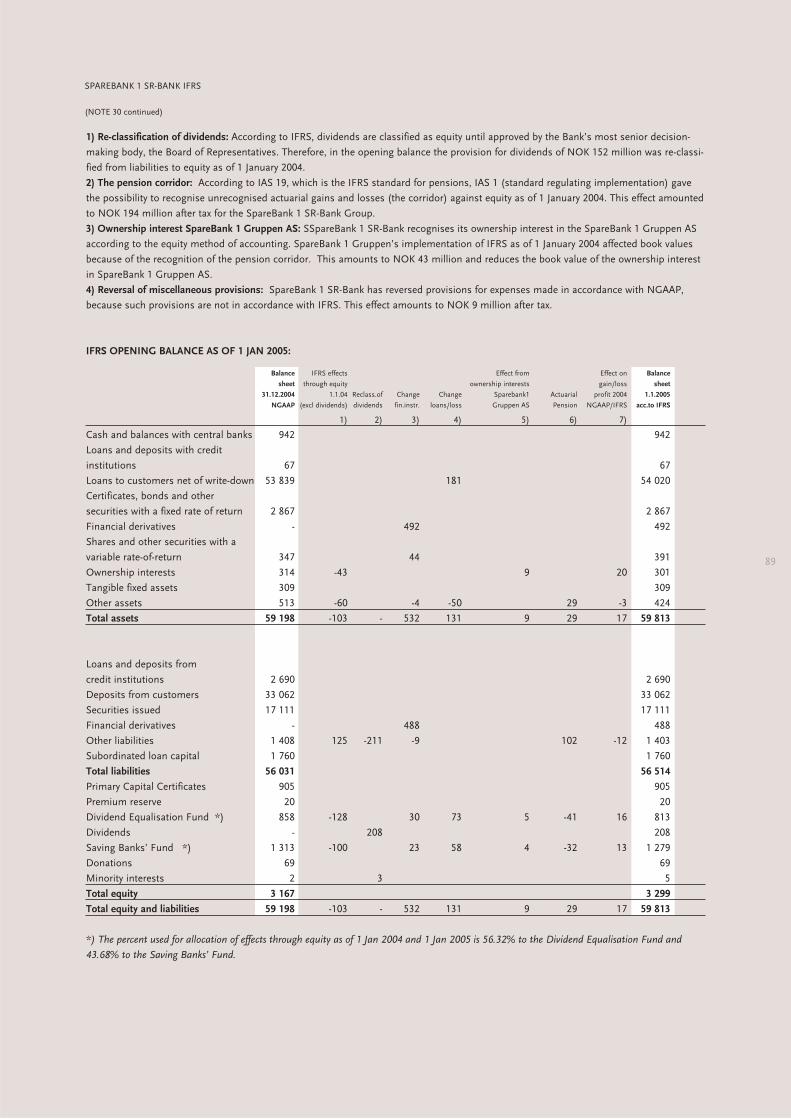
89
1) Re-classification of dividends: According to IFRS, dividends are classified as equity until approved by the Bank’s most senior decision-
making body, the Board of Representatives. Therefore, in the opening balance the provision for dividends of NOK 152 million was re-classi-
fied from liabilities to equity as of 1 January 2004.
2) The pension corridor: According to IAS 19, which is the IFRS standard for pensions, IAS 1 (standard regulating implementation) gave
the possibility to recognise unrecognised actuarial gains and losses (the corridor) against equity as of 1 January 2004. This effect amounted
to NOK 194 million after tax for the SpareBank 1 SR-Bank Group.
3) Ownership interest SpareBank 1 Gruppen AS: SSpareBank 1 SR-Bank recognises its ownership interest in the SpareBank 1 Gruppen AS
according to the equity method of accounting. SpareBank 1 Gruppen’s implementation of IFRS as of 1 January 2004 affected book values
because of the recognition of the pension corridor. This amounts to NOK 43 million and reduces the book value of the ownership interest
in SpareBank 1 Gruppen AS.
4) Reversal of miscellaneous provisions: SpareBank 1 SR-Bank has reversed provisions for expenses made in accordance with NGAAP,
because such provisions are not in accordance with IFRS. This effect amounts to NOK 9 million after tax.
IFRS OPENING BALANCE AS OF 1 JAN 2005:
Balance IFRS effects Effect from Effect on Balance
sheet through equity ownership interests gain/loss sheet
31.12.2004 1.1.04 Reclass.of Change Change Sparebank1 Actuarial profit 2004 1.1.2005
NGAAP (excl dividends) dividends fin.instr. loans/loss Gruppen AS Pension NGAAP/IFRS acc.to IFRS
1) 2) 3) 4) 5) 6) 7)
Cash and balances with central banks 942 942
Loans and deposits with credit
institutions 67 67
Loans to customers net of write-down 53 839 181 54 020
Certificates, bonds and other
securities with a fixed rate of return 2 867 2 867
Financial derivatives - 492 492
Shares and other securities with a
variable rate-of-return 347 44 391
Ownership interests 314 -43 9 20 301
Tangible fixed assets 309 309
Other assets 513 -60 -4 -50 29 -3 424
Total assets 59 198 -103 - 532 131 9 29 17 59 813
Loans and deposits from
credit institutions 2 690 2 690
Deposits from customers 33 062 33 062
Securities issued 17 111 17 111
Financial derivatives - 488 488
Other liabilities 1 408 125 -211 -9 102 -12 1 403
Subordinated loan capital 1 760 1 760
Total liabilities 56 031 56 514
Primary Capital Certificates 905 905
Premium reserve 20 20
Dividend Equalisation Fund *) 858 -128 30 73 5 -41 16 813
Dividends - 208 208
Saving Banks’ Fund *) 1 313 -100 23 58 4 -32 13 1 279
Donations 69 69
Minority interests 2 3 5
Total equity 3 167 3 299
Total equity and liabilities 59 198 -103 - 532 131 9 29 17 59 813
*) The percent used for allocation of effects through equity as of 1 Jan 2004 and 1 Jan 2005 is 56.32% to the Dividend Equalisation Fund and
43.68% to the Saving Banks’ Fund.
SPAREBANK 1 SR-BANK IFRS
(NOTE 30 continued)
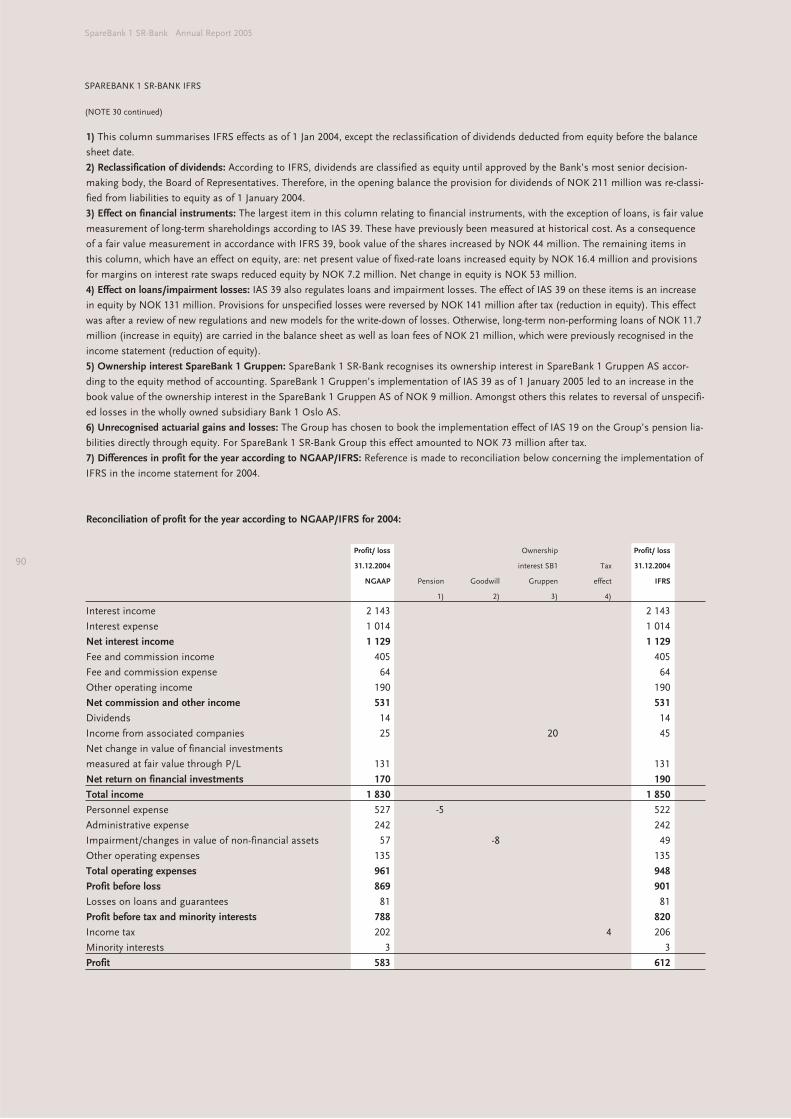
90
SpareBank 1 SR-Bank Annual Report 2005
SPAREBANK 1 SR-BANK IFRS
1) This column summarises IFRS effects as of 1 Jan 2004, except the reclassification of dividends deducted from equity before the balance
sheet date.
2) Reclassification of dividends: According to IFRS, dividends are classified as equity until approved by the Bank’s most senior decision-
making body, the Board of Representatives. Therefore, in the opening balance the provision for dividends of NOK 211 million was re-classi-
fied from liabilities to equity as of 1 January 2004.
3) Effect on financial instruments: The largest item in this column relating to financial instruments, with the exception of loans, is fair value
measurement of long-term shareholdings according to IAS 39. These have previously been measured at historical cost. As a consequence
of a fair value measurement in accordance with IFRS 39, book value of the shares increased by NOK 44 million. The remaining items in
this column, which have an effect on equity, are: net present value of fixed-rate loans increased equity by NOK 16.4 million and provisions
for margins on interest rate swaps reduced equity by NOK 7.2 million. Net change in equity is NOK 53 million.
4) Effect on loans/impairment losses: IAS 39 also regulates loans and impairment losses. The effect of IAS 39 on these items is an increase
in equity by NOK 131 million. Provisions for unspecified losses were reversed by NOK 141 million after tax (reduction in equity). This effect
was after a review of new regulations and new models for the write-down of losses. Otherwise, long-term non-performing loans of NOK 11.7
million (increase in equity) are carried in the balance sheet as well as loan fees of NOK 21 million, which were previously recognised in the
income statement (reduction of equity).
5) Ownership interest SpareBank 1 Gruppen: SpareBank 1 SR-Bank recognises its ownership interest in SpareBank 1 Gruppen AS accor-
ding to the equity method of accounting. SpareBank 1 Gruppen’s implementation of IAS 39 as of 1 January 2005 led to an increase in the
book value of the ownership interest in the SpareBank 1 Gruppen AS of NOK 9 million. Amongst others this relates to reversal of unspecifi-
ed losses in the wholly owned subsidiary Bank 1 Oslo AS.
6) Unrecognised actuarial gains and losses: The Group has chosen to book the implementation effect of IAS 19 on the Group’s pension lia-
bilities directly through equity. For SpareBank 1 SR-Bank Group this effect amounted to NOK 73 million after tax.
7) Differences in profit for the year according to NGAAP/IFRS: Reference is made to reconciliation below concerning the implementation of
IFRS in the income statement for 2004.
Reconciliation of profit for the year according to NGAAP/IFRS for 2004:
Profit/ loss Ownership Profit/ loss
31.12.2004 interest SB1 Tax 31.12.2004
NGAAP Pension Goodwill Gruppen effect IFRS
1) 2) 3) 4)
Interest income 2 143 2 143
Interest expense 1 014 1 014
Net interest income 1 129 1 129
Fee and commission income 405 405
Fee and commission expense 64 64
Other operating income 190 190
Net commission and other income 531 531
Dividends 14 14
Income from associated companies 25 20 45
Net change in value of financial investments
measured at fair value through P/L 131 131
Net return on financial investments 170 190
Total income 1 830 1 850
Personnel expense 527 -5 522
Administrative expense 242 242
Impairment/changes in value of non-financial assets 57 -8 49
Other operating expenses 135 135
Total operating expenses 961 948
Profit before loss 869 901
Losses on loans and guarantees 81 81
Profit before tax and minority interests 788 820
Income tax 202 4 206
Minority interests 3 3
Profit 583 612
(NOTE 30 continued)

91
1) Pension: As an effect of implementing IAS 19 in the consolidated Group accounts for 2004 pension costs were reduced by NOK 4.7 milli-
on. This was due to different actuarial assumptions used in the two accounting frameworks.
2) Goodwill: According to IFRS goodwill is not depreciated, as it is under NGAAP, but is subject to an impairment test. This implies that
there is no goodwill depreciation in the IFRS annual accounts for 2004 and profit for the year is NOK 8.2 million higher than according to
NGAAP.
3) Ownership interest SpareBank 1 Gruppen AS: There is a difference in profit for the year between NGAAP and IFRS for SpareBank 1
Gruppen AS. The main difference is related to depreciation of goodwill in accordance with NGAAP, but not in accordance with IFRS.
According to IFRS goodwill is subject to an impairment test. As a consequence the profit according to IFRS is NOK 19.6 million higher
than according to NGAAP.
4) Taxes: Income tax will be different due to changes in taxable profit for the year, as mentioned above (ownership interest in SpareBank 1
Gruppen AS is included after tax).
NOTE 31 EVENTS AFTER THE BALANCE SHEET DATE
There have been no events after the balance sheet date of 31 December 2005 that has had an effect on the Group’s annual accounts.
SPAREBANK 1 SR-BANK IFRS
(NOTE 30 continued)
92
SpareBank 1 SR-Bank Annual Report 2005
Auditor’s report for 2005 We have audited the annual financial statements of
Sparebanken Rogaland as of December 31, 2005, showing a
profit of NOK 840 million for the parent company and a profit
of NOK 862 million for the group. We have also audited the
information in the directors' report concerning the financial
statements, the going concern assumption, and the proposal
for the allocation of the profit. The annual financial statements
comprise the financial statements of the parent company and
the group. The financial statements of the parent company
comprise the balance sheet, the statements of income and
cash flows and the accompanying notes. The financial state-
ments of the group comprise the balance sheet, the statement
of income and cash flows, the statement of changes in equity
and the accompanying notes. The regulations of the Norwegian
accounting act and accounting standards, principles and
practices generally accepted in Norway have been applied in
the preparation of the financial statements of the parent
company. IFRSs as adopted by the EU have been applied in
the preparation of the financial statements of the group.
These financial statements are the responsibility of the
Company’s Board of Directors and Managing Director. Our
responsibility is to express an opinion on these financial
statements and on other information according to the require-
ments of the Norwegian Act on Auditing and Auditors.
We conducted our audit in accordance with laws, regulations
and auditing standards and practices generally accepted in
Norway, including standards on auditing adopted by The
Norwegian Institute of Public Accountants. These auditing
standards require that we plan and perform the audit to
obtain reasonable assurance about whether the financial
statements are free of material misstatement. An audit inclu-
des examining, on a test basis, evidence supporting the
amounts and disclosures in the financial statements. An audit
also includes assessing the accounting principles used and
significant estimates made by management, as well as
evaluating the overall financial statement presentation. To the
extent required by law and auditing standards an audit also
comprises a review of the management of the Company's
financial affairs and its accounting and internal control
systems. We believe that our audit provides a reasonable
basis for our opinion.
In our opinion,
• the financial statements of the parent company have been
prepared in accordance with the law and regulations and
give a true and fair view of the financial position of the
company as of December 31, 2005, and the results of its
operations and its cash flows for the year then ended, in
accordance with accounting standards, principles and
practices generally accepted in Norway
• the financial statements of the group have been prepared
in accordance with the law and regulations and give a
true and fair view of the financial position of the group as
of December 31, 2005, and the results of its operations
and its cash flows and the changes in equity for the year
then ended, in accordance with IFRSs as adopted by the EU
• the company's management has fulfilled its duty to produce
a proper and clearly set out registration and documentation
of accounting information in accordance with the law and
good bookkeeping practice in Norway
• the information in the directors' report concerning the
financial statements, the going concern assumption, and
the proposal for the allocation of the profit are consistent
with the financial statements and comply with the law and
regulations
The Audit Committee’s statement for 2005The Audit Committee has carried out its duties in accordance
with the (Norwegian) Saving Banks Act and the instructions
for the committee. The bank’s activities in 2005 were in
accordance with the (Norwegian) Saving Banks Act, the
bank’s Articles of Association, and other provisions the bank
is obliged to follow.
The annual report and accounts have been submitted in
accordance with the regulations of the (Norwegian) Saving
Banks Act and of the Norwegian Banking, Insurance and
Securities Commission. The Supervisory Board may adopt the
profit and loss account and the balance sheet as the bank’s
accounts for 2005.
Stavanger, 23 February 2006
PricewaterhouseCoopers AS
Torbjørn Larsen, State Authorised Public Accountant (Norway)
Kåre HansenOdd Rune Torstrup
Chairman
Odd Broshaug
Svein Hodnefjell Vigdis Wiik Jacobsen
Note: This translation from
Norwegian has been prepared for
information purposes only.
Stavanger, 17 March 2006
Primary capital
certificates
PRIMARY CAPITAL
At the end of 2005 SpareBank 1 SR-Bank’s primary capital
amounted to NOK 1,128 million, dispersed on 22,555,609
outstanding pcc’s, each with a nominal value of NOK 50. The
number of issued certificates is 22,614,585. In addition, the
capital of the equalisation reserve attributable to the primary
capital certificate owners was NOK 673 million, as well as
NOK 21 million of the share premium account.
On 1 April 2005, the primary capital certificates were split in
two and this was followed by a capitalisation issue whereby
four certificates entitled owners to one new (free) certificate.
A total of 4,522,917 new primary capital certificates where
thus issued, and NOK 226,145,850 was transferred from the
equalisation reserve to the primary capital. The total number
of primary capital certificates after the split and subsequent
capitalisation issue was 22,614,585.
DIVIDEND POLICY
The financial objective of Sparebanken Rogaland is to attain
profits giving good, stable return on the bank’s total equity,
thus creating values for the primary capital certificate owners
by delivering competitive dividends and value appreciation on
the primary capital certificates. The bank’s profit for the year
will be divided between the primary capital certificate owners
and the savings bank’s fund in concurrence with their
respective percentage of the bank’s equity. In the pro rata
distribution between cash dividend and the equalisation
reserve, there may be variations due to emphasis placed on
consideration of the bank’s equity development.
The profit per primary capital certificate for 2005 was NOK 21.
Based on the bank’s dividend policy and other assessments,
the Board proposes paying a dividend of NOK 14 per primary
capital certificate for 2005.
INVESTOR POLICY
The bank place great emphasis on presenting correct,relevant
and updated information on the bank’s development and
results in order to ensure a high level of confidence in the
investor market. The bank communicates information through
quarterly investor presentations, web pages, press releases
and accounting reports. The bank regularly gives presentations
to international partners, lenders and investors, mainly in
London.
INFORMATION ADDRESSES
SpareBank 1 SR-Bank is also accessible via the Internet, with
information for investors, media and the broker business:
• SpareBank 1 SR-Bank’s homepage is www.sr-bank.no
• Other links for financial data: www.huginonline.no
FINANCIAL CALENDAR FOR 2006
• Ex dividend date: 31 March 2006
• First quarter: 27 April 2006
• Second quarter: 8 August 2006
• Third quarter: 26 October 2006
• The accounting figures for 2006 will be published in
February 2007
OWNERSHIP
It is the objective of SpareBank 1 SR-Bank to attain good
liquidity in its primary capital certificates, and attain a high
level of owner diversification, representing customers and
regional investors, as well as Norwegian and foreign
institutions. Over the course of 2005, the bank has bought net
57,541 own primary capital certificates and as of 31 December
2005 the bank had a reserve of 58,976 primary capital
certificates. The bank uses purchase and sale of its own
primary capital certificates as a measure to improve liquidity.
In 2005, as in previous years, the bank made use of the
authority from the Supervisory Board to sell its own primary
capital certificates (a total of 146,447 certificates) to its
employees at a discount, instead of increasing the primary
capital in connection with an employee placement.
93
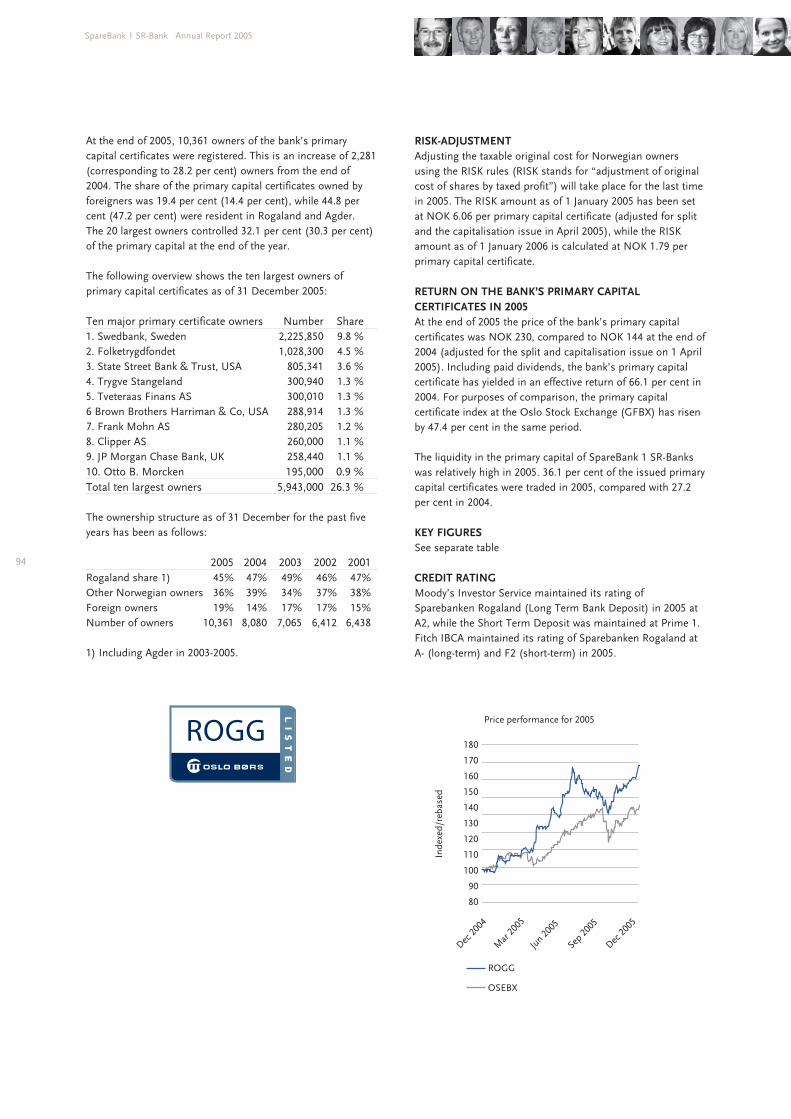
At the end of 2005, 10,361 owners of the bank’s primary
capital certificates were registered. This is an increase of 2,281
(corresponding to 28.2 per cent) owners from the end of
2004. The share of the primary capital certificates owned by
foreigners was 19.4 per cent (14.4 per cent), while 44.8 per
cent (47.2 per cent) were resident in Rogaland and Agder.
The 20 largest owners controlled 32.1 per cent (30.3 per cent)
of the primary capital at the end of the year.
The following overview shows the ten largest owners of
primary capital certificates as of 31 December 2005:
Ten major primary certificate owners Number Share
1. Swedbank, Sweden 2,225,850 9.8 %
2. Folketrygdfondet 1,028,300 4.5 %
3. State Street Bank & Trust, USA 805,341 3.6 %
4. Trygve Stangeland 300,940 1.3 %
5. Tveteraas Finans AS 300,010 1.3 %
6 Brown Brothers Harriman & Co, USA 288,914 1.3 %
7. Frank Mohn AS 280,205 1.2 %
8. Clipper AS 260,000 1.1 %
9. JP Morgan Chase Bank, UK 258,440 1.1 %
10. Otto B. Morcken 195,000 0.9 %
Total ten largest owners 5,943,000 26.3 %
The ownership structure as of 31 December for the past five
years has been as follows:
2005 2004 2003 2002 2001
Rogaland share 1) 45% 47% 49% 46% 47%
Other Norwegian owners 36% 39% 34% 37% 38%
Foreign owners 19% 14% 17% 17% 15%
Number of owners 10,361 8,080 7,065 6,412 6,438
1) Including Agder in 2003-2005.
RISK-ADJUSTMENT
Adjusting the taxable original cost for Norwegian owners
using the RISK rules (RISK stands for “adjustment of original
cost of shares by taxed profit”) will take place for the last time
in 2005. The RISK amount as of 1 January 2005 has been set
at NOK 6.06 per primary capital certificate (adjusted for split
and the capitalisation issue in April 2005), while the RISK
amount as of 1 January 2006 is calculated at NOK 1.79 per
primary capital certificate.
RETURN ON THE BANK’S PRIMARY CAPITAL
CERTIFICATES IN 2005
At the end of 2005 the price of the bank’s primary capital
certificates was NOK 230, compared to NOK 144 at the end of
2004 (adjusted for the split and capitalisation issue on 1 April
2005). Including paid dividends, the bank’s primary capital
certificate has yielded in an effective return of 66.1 per cent in
2004. For purposes of comparison, the primary capital
certificate index at the Oslo Stock Exchange (GFBX) has risen
by 47.4 per cent in the same period.
The liquidity in the primary capital of SpareBank 1 SR-Banks
was relatively high in 2005. 36.1 per cent of the issued primary
capital certificates were traded in 2005, compared with 27.2
per cent in 2004.
KEY FIGURES
See separate table
CREDIT RATING
Moody’s Investor Service maintained its rating of
Sparebanken Rogaland (Long Term Bank Deposit) in 2005 at
A2, while the Short Term Deposit was maintained at Prime 1.
Fitch IBCA maintained its rating of Sparebanken Rogaland at
A- (long-term) and F2 (short-term) in 2005.
94
SpareBank 1 SR-Bank Annual Report 2005
Price performance for 2005
Inde
xed/
reba
sed
Dec 20
04
Dec 20
05
Mar
2005
Jun 20
05
Sep 20
05
ROGG
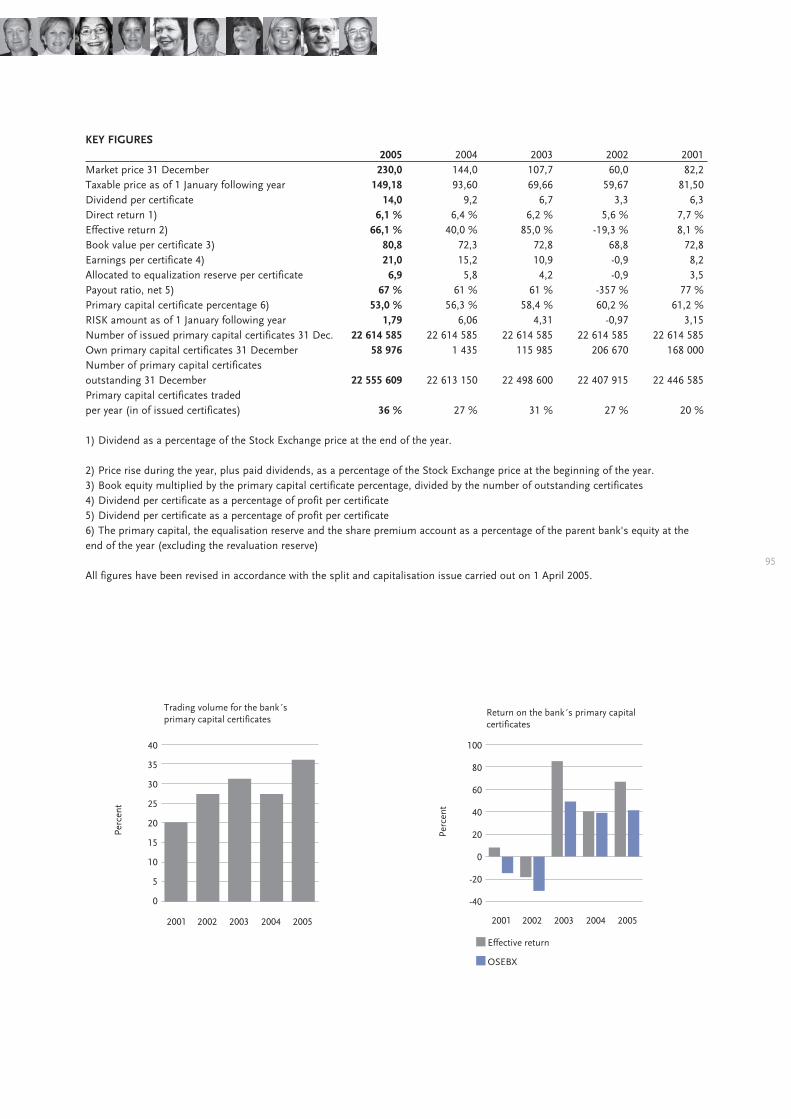
95
KEY FIGURES
2005 2004 2003 2002 2001
Market price 31 December 230,0 144,0 107,7 60,0 82,2
Taxable price as of 1 January following year 149,18 93,60 69,66 59,67 81,50
Dividend per certificate 14,0 9,2 6,7 3,3 6,3
Direct return 1) 6,1 % 6,4 % 6,2 % 5,6 % 7,7 %
Effective return 2) 66,1 % 40,0 % 85,0 % -19,3 % 8,1 %
Book value per certificate 3) 80,8 72,3 72,8 68,8 72,8
Earnings per certificate 4) 21,0 15,2 10,9 -0,9 8,2
Allocated to equalization reserve per certificate 6,9 5,8 4,2 -0,9 3,5
Payout ratio, net 5) 67 % 61 % 61 % -357 % 77 %
Primary capital certificate percentage 6) 53,0 % 56,3 % 58,4 % 60,2 % 61,2 %
RISK amount as of 1 January following year 1,79 6,06 4,31 -0,97 3,15
Number of issued primary capital certificates 31 Dec. 22 614 585 22 614 585 22 614 585 22 614 585 22 614 585
Own primary capital certificates 31 December 58 976 1 435 115 985 206 670 168 000
Number of primary capital certificates
outstanding 31 December 22 555 609 22 613 150 22 498 600 22 407 915 22 446 585
Primary capital certificates traded
per year (in of issued certificates) 36 % 27 % 31 % 27 % 20 %
1) Dividend as a percentage of the Stock Exchange price at the end of the year.
2) Price rise during the year, plus paid dividends, as a percentage of the Stock Exchange price at the beginning of the year.
3) Book equity multiplied by the primary capital certificate percentage, divided by the number of outstanding certificates
4) Dividend per certificate as a percentage of profit per certificate
5) Dividend per certificate as a percentage of profit per certificate
6) The primary capital, the equalisation reserve and the share premium account as a percentage of the parent bank's equity at the
end of the year (excluding the revaluation reserve)
All figures have been revised in accordance with the split and capitalisation issue carried out on 1 April 2005.
Trading volume for the bank´sprimary capital certificates
2002 2003 2004
Perc
ent
20052001
Return on the bank´s primary capitalcertificates
2002 2003 2004
Perc
ent
2005
Effective return
OSEBX
2001
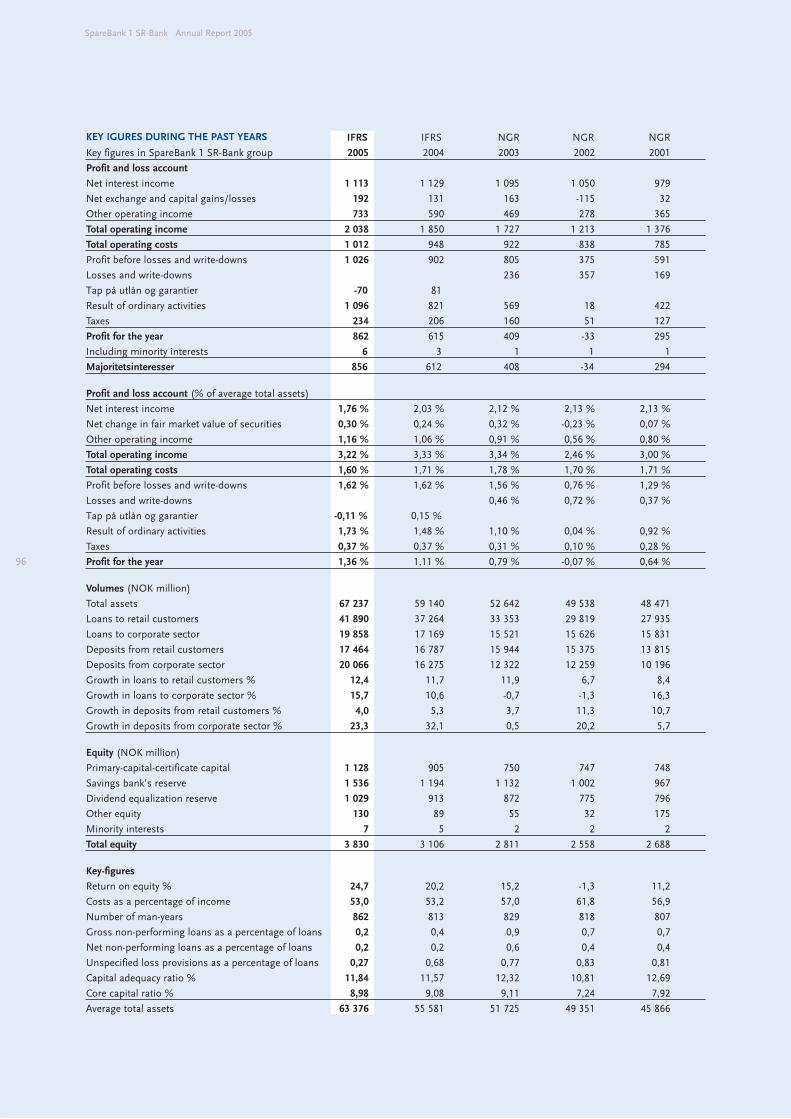
SpareBank 1 SR-Bank Annual Report 2005
KEY IGURES DURING THE PAST YEARS IFRS IFRS NGR NGR NGR
Key figures in SpareBank 1 SR-Bank group 2005 2004 2003 2002 2001
Profit and loss account
Net interest income 1 113 1 129 1 095 1 050 979
Net exchange and capital gains/losses 192 131 163 -115 32
Other operating income 733 590 469 278 365
Total operating income 2 038 1 850 1 727 1 213 1 376
Total operating costs 1 012 948 922 838 785
Profit before losses and write-downs 1 026 902 805 375 591
Losses and write-downs 236 357 169
Tap på utlån og garantier -70 81
Result of ordinary activities 1 096 821 569 18 422
Taxes 234 206 160 51 127
Profit for the year 862 615 409 -33 295
Including minority interests 6 3 1 1 1
Majoritetsinteresser 856 612 408 -34 294
Profit and loss account (% of average total assets)
Net interest income 1,76 % 2,03 % 2,12 % 2,13 % 2,13 %
Net change in fair market value of securities 0,30 % 0,24 % 0,32 % -0,23 % 0,07 %
Other operating income 1,16 % 1,06 % 0,91 % 0,56 % 0,80 %
Total operating income 3,22 % 3,33 % 3,34 % 2,46 % 3,00 %
Total operating costs 1,60 % 1,71 % 1,78 % 1,70 % 1,71 %
Profit before losses and write-downs 1,62 % 1,62 % 1,56 % 0,76 % 1,29 %
Losses and write-downs 0,46 % 0,72 % 0,37 %
Tap på utlån og garantier -0,11 % 0,15 %
Result of ordinary activities 1,73 % 1,48 % 1,10 % 0,04 % 0,92 %
Taxes 0,37 % 0,37 % 0,31 % 0,10 % 0,28 %
Profit for the year 1,36 % 1,11 % 0,79 % -0,07 % 0,64 %
Volumes (NOK million)
Total assets 67 237 59 140 52 642 49 538 48 471
Loans to retail customers 41 890 37 264 33 353 29 819 27 935
Loans to corporate sector 19 858 17 169 15 521 15 626 15 831
Deposits from retail customers 17 464 16 787 15 944 15 375 13 815
Deposits from corporate sector 20 066 16 275 12 322 12 259 10 196
Growth in loans to retail customers % 12,4 11,7 11,9 6,7 8,4
Growth in loans to corporate sector % 15,7 10,6 -0,7 -1,3 16,3
Growth in deposits from retail customers % 4,0 5,3 3,7 11,3 10,7
Growth in deposits from corporate sector % 23,3 32,1 0,5 20,2 5,7
Equity (NOK million)
Primary-capital-certificate capital 1 128 905 750 747 748
Savings bank’s reserve 1 536 1 194 1 132 1 002 967
Dividend equalization reserve 1 029 913 872 775 796
Other equity 130 89 55 32 175
Minority interests 7 5 2 2 2
Total equity 3 830 3 106 2 811 2 558 2 688
Key-figures
Return on equity % 24,7 20,2 15,2 -1,3 11,2
Costs as a percentage of income 53,0 53,2 57,0 61,8 56,9
Number of man-years 862 813 829 818 807
Gross non-performing loans as a percentage of loans 0,2 0,4 0,9 0,7 0,7
Net non-performing loans as a percentage of loans 0,2 0,2 0,6 0,4 0,4
Unspecified loss provisions as a percentage of loans 0,27 0,68 0,77 0,83 0,81
Capital adequacy ratio % 11,84 11,57 12,32 10,81 12,69
Core capital ratio % 8,98 9,08 9,11 7,24 7,92
Average total assets 63 376 55 581 51 725 49 351 45 866
96
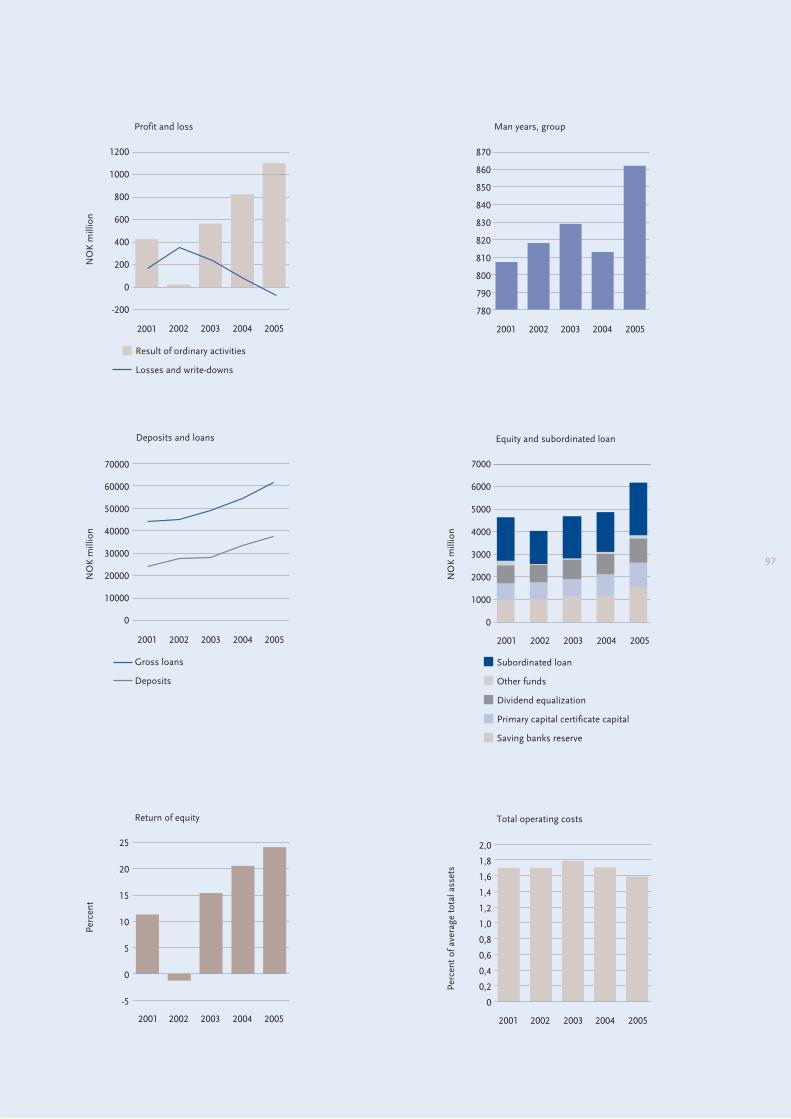
2002 2003 2004 20052001
Man years, group
Equity and subordinated loanN
OK
mill
ion
Subordinated loan
Other funds
Dividend equalization
Primary capital certificate capital
Saving banks reserve
Total operating costs
2002 2003 2004
Perc
ent o
f ave
rage
tota
l ass
ets
20052001
Deposits and loans
NO
K m
illio
n
Gross loans
Deposits
Profit and loss
NO
K m
illio
n
Result of ordinary activities
Losses and write-downs
Return of equity
2002 2003 2004
Perc
ent
20052001
97
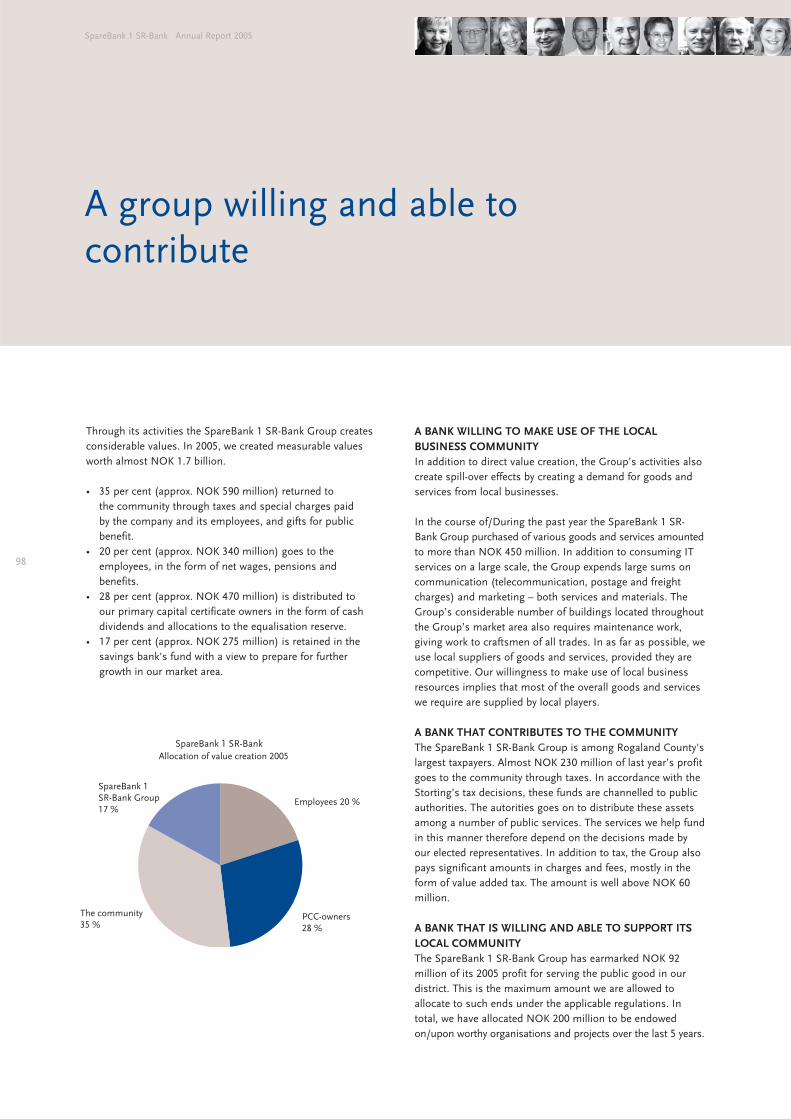
A group willing and able to
contribute
Through its activities the SpareBank 1 SR-Bank Group creates
considerable values. In 2005, we created measurable values
worth almost NOK 1.7 billion.
• 35 per cent (approx. NOK 590 million) returned to
the community through taxes and special charges paid
by the company and its employees, and gifts for public
benefit.
• 20 per cent (approx. NOK 340 million) goes to the
employees, in the form of net wages, pensions and
benefits.
• 28 per cent (approx. NOK 470 million) is distributed to
our primary capital certificate owners in the form of cash
dividends and allocations to the equalisation reserve.
• 17 per cent (approx. NOK 275 million) is retained in the
savings bank's fund with a view to prepare for further
growth in our market area.
A BANK WILLING TO MAKE USE OF THE LOCAL
BUSINESS COMMUNITY
In addition to direct value creation, the Group’s activities also
create spill-over effects by creating a demand for goods and
services from local businesses.
In the course of/During the past year the SpareBank 1 SR-
Bank Group purchased of various goods and services amounted
to more than NOK 450 million. In addition to consuming IT
services on a large scale, the Group expends large sums on
communication (telecommunication, postage and freight
charges) and marketing – both services and materials. The
Group’s considerable number of buildings located throughout
the Group’s market area also requires maintenance work,
giving work to craftsmen of all trades. In as far as possible, we
use local suppliers of goods and services, provided they are
competitive. Our willingness to make use of local business
resources implies that most of the overall goods and services
we require are supplied by local players.
A BANK THAT CONTRIBUTES TO THE COMMUNITY
The SpareBank 1 SR-Bank Group is among Rogaland County's
largest taxpayers. Almost NOK 230 million of last year’s profit
goes to the community through taxes. In accordance with the
Storting’s tax decisions, these funds are channelled to public
authorities. The autorities goes on to distribute these assets
among a number of public services. The services we help fund
in this manner therefore depend on the decisions made by
our elected representatives. In addition to tax, the Group also
pays significant amounts in charges and fees, mostly in the
form of value added tax. The amount is well above NOK 60
million.
A BANK THAT IS WILLING AND ABLE TO SUPPORT ITS
LOCAL COMMUNITY
The SpareBank 1 SR-Bank Group has earmarked NOK 92
million of its 2005 profit for serving the public good in our
district. This is the maximum amount we are allowed to
allocate to such ends under the applicable regulations. In
total, we have allocated NOK 200 million to be endowed
on/upon worthy organisations and projects over the last 5 years.
98
SpareBank 1 SR-Bank Annual Report 2005
Allocation of value creation 2005
Employees 20 %
PCC-owners28 %
The community35 %
SpareBank 1 SR-Bank Group17 %
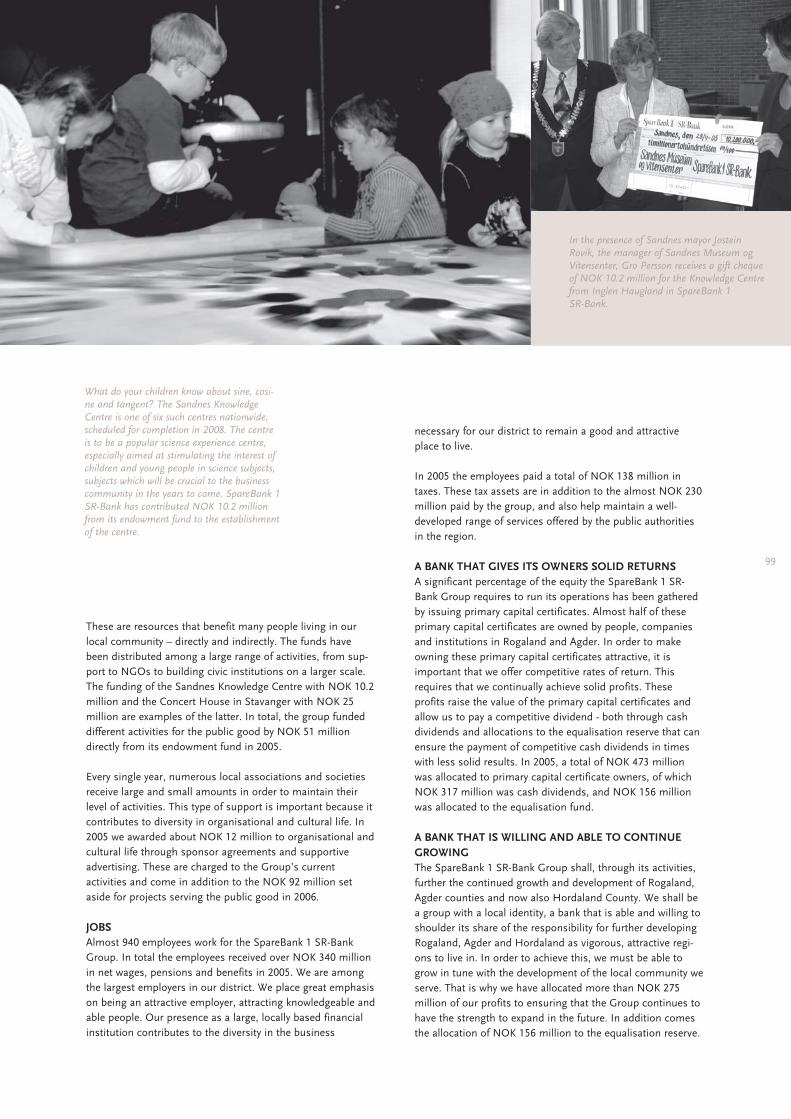
These are resources that benefit many people living in our
local community – directly and indirectly. The funds have
been distributed among a large range of activities, from sup-
port to NGOs to building civic institutions on a larger scale.
The funding of the Sandnes Knowledge Centre with NOK 10.2
million and the Concert House in Stavanger with NOK 25
million are examples of the latter. In total, the group funded
different activities for the public good by NOK 51 million
directly from its endowment fund in 2005.
Every single year, numerous local associations and societies
receive large and small amounts in order to maintain their
level of activities. This type of support is important because it
contributes to diversity in organisational and cultural life. In
2005 we awarded about NOK 12 million to organisational and
cultural life through sponsor agreements and supportive
advertising. These are charged to the Group’s current
activities and come in addition to the NOK 92 million set
aside for projects serving the public good in 2006.
JOBS
Almost 940 employees work for the SpareBank 1 SR-Bank
Group. In total the employees received over NOK 340 million
in net wages, pensions and benefits in 2005. We are among
the largest employers in our district. We place great emphasis
on being an attractive employer, attracting knowledgeable and
able people. Our presence as a large, locally based financial
institution contributes to the diversity in the business
necessary for our district to remain a good and attractive
place to live.
In 2005 the employees paid a total of NOK 138 million in
taxes. These tax assets are in addition to the almost NOK 230
million paid by the group, and also help maintain a well-
developed range of services offered by the public authorities
in the region.
A BANK THAT GIVES ITS OWNERS SOLID RETURNS
A significant percentage of the equity the SpareBank 1 SR-
Bank Group requires to run its operations has been gathered
by issuing primary capital certificates. Almost half of these
primary capital certificates are owned by people, companies
and institutions in Rogaland and Agder. In order to make
owning these primary capital certificates attractive, it is
important that we offer competitive rates of return. This
requires that we continually achieve solid profits. These
profits raise the value of the primary capital certificates and
allow us to pay a competitive dividend - both through cash
dividends and allocations to the equalisation reserve that can
ensure the payment of competitive cash dividends in times
with less solid results. In 2005, a total of NOK 473 million
was allocated to primary capital certificate owners, of which
NOK 317 million was cash dividends, and NOK 156 million
was allocated to the equalisation fund.
A BANK THAT IS WILLING AND ABLE TO CONTINUE
GROWING
The SpareBank 1 SR-Bank Group shall, through its activities,
further the continued growth and development of Rogaland,
Agder counties and now also Hordaland County. We shall be
a group with a local identity, a bank that is able and willing to
shoulder its share of the responsibility for further developing
Rogaland, Agder and Hordaland as vigorous, attractive regi-
ons to live in. In order to achieve this, we must be able to
grow in tune with the development of the local community we
serve. That is why we have allocated more than NOK 275
million of our profits to ensuring that the Group continues to
have the strength to expand in the future. In addition comes
the allocation of NOK 156 million to the equalisation reserve.
99
In the presence of Sandnes mayor Jostein
Rovik, the manager of Sandnes Museum og
Vitensenter, Gro Persson receives a gift cheque
of NOK 10.2 million for the Knowledge Centre
from Inglen Haugland in SpareBank 1
SR-Bank.
What do your children know about sine, cosi-
ne and tangent? The Sandnes Knowledge
Centre is one of six such centres nationwide,
scheduled for completion in 2008. The centre
is to be a popular science experience centre,
especially aimed at stimulating the interest of
children and young people in science subjects,
subjects which will be crucial to the business
community in the years to come. SpareBank 1
SR-Bank has contributed NOK 10.2 million
from its endowment fund to the establishment
of the centre.
Corporate governance
The corporate governance of SpareBank 1 SR-Bank include the
goals and main principles according to which the Group is
managed and controlled in order to ensure that the interests
of the primary capital certificate owners, the depositors, and
other groups are safeguarded. The management of the
Group’s operations shall ensure prudent asset management
and greater assurance that communicated goals and
strategies are attained and realised.
SpareBank 1 SR-Bank has therefore adopted the following
overall principles for stockholder management and corporate
governance. These are built on the three principal pillars of
openness, predictability and transparency.
• Creation of value for the primary capital certificate owners
and other interest groups
• A structure that ensures goal-oriented and independent
management and control
• Systems that ensure measurement and accountability
• Effective risk management
• Well set-out, easily understandable and up-to-date
information
• Equal treatment of primary capital certificate owners and
well-balanced relations with other interest groups
• Compliance with laws, regulations and ethical standards
• The Group’s corporate governance are based on the
recommendations provided in the “Norwegian Code of
Practice for Corporate Governance”
VALUE CREATION FOR PRIMARY CAPITAL CERTIFICATE
OWNERS AND OTHER INTEREST GROUPS
SpareBank 1 SR-Bank's dividend policy:
”The financial objective of Sparebanken Rogaland’s activities is to
attain profits giving good and stable return on the bank’s total
funds, thus creating values for the primary capital certificate
owners through competitive dividends and value appreciation for
the primary capital certificates. The bank’s profit for the year will
be divided between the primary capital certificate owners and the
saving bank’s reserve, in concurrence with their respective
percentage of the bank’s equity. In the pro rata distribution bet-
ween cash dividend and the equalisation reserve, there may be
variations in the emphasis on the bank’s equity development.”
The required return on net capital is equivalent to the net
long-term government bond rate, with the addition of six
percentage points for risk premium.
A STRUCTURE THAT SECURES GOAL-ORIENTED AND
INDEPENDENT MANAGEMENT AND CONTROL
The Group’s management structure is founded on the bank’s
vision, goals, strategies and value base.
Management and control include all processes and control
measures implemented by the Group’s management in order
to ensure effective business operations and implementation of
the Group’s strategies. In order to create greater assurance that
primary capital certificate owners and the other interest groups
receive correct information on business and financial matters,
the Group has several independent supervisory bodies.
The Group’s management and supervisory bodies therefore
have their respective tasks and objectives, and the roles and
responsibility of the various bodies are ultimately defined by
(Norwegian) law, regulations and the Articles of Association.
MANAGEMENT BODIES
The Supervisory Board
The Supervisory Board’s principal tasks include the following:
• Supervising the Board of Directors’ management of
operations
• Adopting the accounts
• Election of members to the bank’s Board of Directors,
the Audit Committee and the Election Committee
• Choosing an external auditor
In joint meetings with the Board of Directors, the Supervisory
Board makes decisions on the following matters:
• Appointment of the Chief Executive Officer
• Establishing and shutting down branch offices in
municipalities where the bank does not have its principal
office, other branches or department offices
100
SpareBank 1 SR-Bank Annual Report 2005
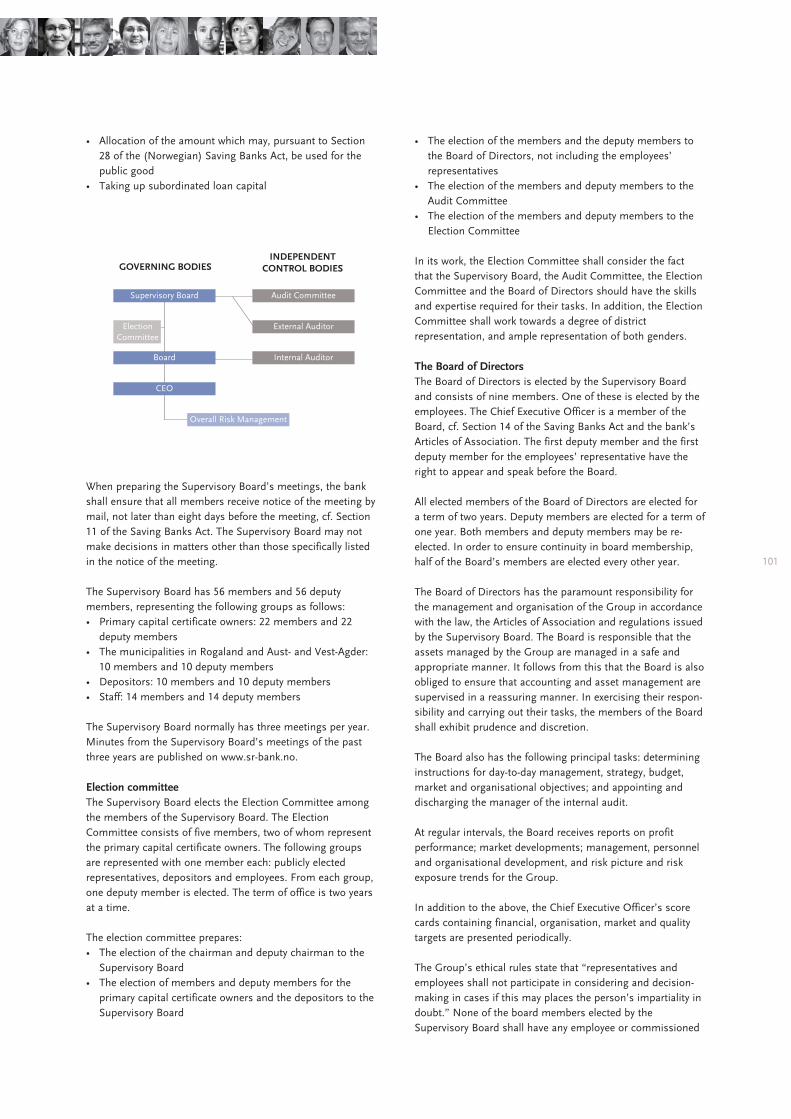
• Allocation of the amount which may, pursuant to Section
28 of the (Norwegian) Saving Banks Act, be used for the
public good
• Taking up subordinated loan capital
When preparing the Supervisory Board’s meetings, the bank
shall ensure that all members receive notice of the meeting by
mail, not later than eight days before the meeting, cf. Section
11 of the Saving Banks Act. The Supervisory Board may not
make decisions in matters other than those specifically listed
in the notice of the meeting.
The Supervisory Board has 56 members and 56 deputy
members, representing the following groups as follows:
• Primary capital certificate owners: 22 members and 22
deputy members
• The municipalities in Rogaland and Aust- and Vest-Agder:
10 members and 10 deputy members
• Depositors: 10 members and 10 deputy members
• Staff: 14 members and 14 deputy members
The Supervisory Board normally has three meetings per year.
Minutes from the Supervisory Board’s meetings of the past
three years are published on www.sr-bank.no.
Election committee
The Supervisory Board elects the Election Committee among
the members of the Supervisory Board. The Election
Committee consists of five members, two of whom represent
the primary capital certificate owners. The following groups
are represented with one member each: publicly elected
representatives, depositors and employees. From each group,
one deputy member is elected. The term of office is two years
at a time.
The election committee prepares:
• The election of the chairman and deputy chairman to the
Supervisory Board
• The election of members and deputy members for the
primary capital certificate owners and the depositors to the
Supervisory Board
• The election of the members and the deputy members to
the Board of Directors, not including the employees’
representatives
• The election of the members and deputy members to the
Audit Committee
• The election of the members and deputy members to the
Election Committee
In its work, the Election Committee shall consider the fact
that the Supervisory Board, the Audit Committee, the Election
Committee and the Board of Directors should have the skills
and expertise required for their tasks. In addition, the Election
Committee shall work towards a degree of district
representation, and ample representation of both genders.
The Board of Directors
The Board of Directors is elected by the Supervisory Board
and consists of nine members. One of these is elected by the
employees. The Chief Executive Officer is a member of the
Board, cf. Section 14 of the Saving Banks Act and the bank’s
Articles of Association. The first deputy member and the first
deputy member for the employees’ representative have the
right to appear and speak before the Board.
All elected members of the Board of Directors are elected for
a term of two years. Deputy members are elected for a term of
one year. Both members and deputy members may be re-
elected. In order to ensure continuity in board membership,
half of the Board’s members are elected every other year.
The Board of Directors has the paramount responsibility for
the management and organisation of the Group in accordance
with the law, the Articles of Association and regulations issued
by the Supervisory Board. The Board is responsible that the
assets managed by the Group are managed in a safe and
appropriate manner. It follows from this that the Board is also
obliged to ensure that accounting and asset management are
supervised in a reassuring manner. In exercising their respon-
sibility and carrying out their tasks, the members of the Board
shall exhibit prudence and discretion.
The Board also has the following principal tasks: determining
instructions for day-to-day management, strategy, budget,
market and organisational objectives; and appointing and
discharging the manager of the internal audit.
At regular intervals, the Board receives reports on profit
performance; market developments; management, personnel
and organisational development, and risk picture and risk
exposure trends for the Group.
In addition to the above, the Chief Executive Officer’s score
cards containing financial, organisation, market and quality
targets are presented periodically.
The Group’s ethical rules state that “representatives and
employees shall not participate in considering and decision-
making in cases if this may places the person’s impartiality in
doubt.” None of the board members elected by the
Supervisory Board shall have any employee or commissioned
101
Supervisory Board
ElectionCommittee
Board
Audit Committee
External Auditor
Internal Auditor
CEO
Overall Risk Management
GOVERNING BODIESINDEPENDENT
CONTROL BODIES
relationship to the Group beyond their office as
representatives.
When considering commitments in which the Board members
hold office or are stakeholders, the person in question shall
declare himself or herself disqualified and leave the meeting.
The members of the Board are defined as primary insiders,
and must comply with the Group’s regulations with regard to
acquiring primary capital certificates in SpareBank 1 SR-Bank
and the SpareBank 1 Alliance banks. This also applies to the
purchase of shares in companies that are in a customer
relationship with SpareBank 1 SR-Bank.
Pursuant to Norwegian law, the Board of Directors is jointly
responsible for the decisions made. In view of this, the Board
has not appointed any standing sub-committees. Instead, the
Board appoints ad hoc committees as required. These prepare
individual cases for consideration by the Board, for instance
in connection with considering remuneration schemes in the
organisation.
The Board members receive an annual remuneration that is
determined by the Supervisory Board. No remuneration is
paid in addition to this. Further information on remuneration
and loans to Board members is supplied in the annual
accounts.
The Board’s work is regulated in the Board Regulations, and
annual plans are drawn up for the Board’s work. Every year,
the Board assesses its work. This self-assessment evaluates
work procedures, case processing, meeting structure and the
priority given to various issues.
As a rule, the Board has eleven meetings per year.
The Chief Executive Officer
The Chief Executive Officer is responsible for the day-to-day
management of the Group’s operations in accordance with
the law, the Articles of Association, authorities and
instructions. Cases that are of an unusual nature in relation
to the Group’s activities or are of great significance are
presented to the Board.
If provided with authority by the Board, or if waiting for a
board decision would imply a significant disadvantage to the
Group, the Chief Executive Officer may, however, decide
certain matters.
The Chief Executive Officer shall implement the Group’s
strategy, as well as, in cooperation with the Board, further
develop its strategy.
Every month, the Chief Executive Officer briefs the Board on
the Group’s operations, its position and profit performance,
and participates as a member of the board in the Board’s
consideration of cases. The Board annually stipulates the
salary and other remuneration to the Chief Executive Officer.
SUPERVISING BODIES
Unit for overall risk management
The unit is independent of the customer units, and is
responsible for:
• Further development of the Group’s overall risk
management framework
• Overall risk management and follow-up
A separate controller function has been set up to cover the
areas of credit risk, operational risk and currency and finance
risk.
The Audit Committee
The Audit Committee is elected by the Supervisory Board and
consists of five members and two deputy members. The
members’ term of office is two years. The Audit Committee’s
chairman is elected by the Audit Committee.
The Audit Committee shall supervise that the Group’s operati-
ons are conducted in an appropriate and reassuring manner
in accordance with the law and regulations, Articles of
Association, guidelines determined by the Supervisory Board,
as well as orders from the Financial Supervisory Authority of
Norway.
The Audit Committee normally has 11 meetings per year.
The External Auditor
The external auditor’s principal task is to assess whether the
Group’s annual accounts have been submitted in accordance
with laws and regulations. The external auditor shall also
assess whether the assets are managed in a reassuring
manner and with prudent supervision. The external auditor is
chosen by the Supervisory Board.
The external auditor reports to the Supervisory Board and the
Audit Committee on these matters.
The Internal Auditor
The internal audit is a board and management tool for
monitoring that the risk management processes are goal-
oriented, effective, and working as planned. The Group’s inter-
nal audit operations are handled by an external supplier of
audit services, ensuring independence, expertise and capacity.
In terms of the organisation the internal audit reports to the
Board. The internal audit’s reports and recommendations on
improving the Group’s risk management are continually
reviewed in the Group.
Systems that ensure measurement and accountability
Effective management by objectives is necessary to help the
Group continually measure whether it is attaining its strategic
objectives. The Group has developed guidelines and effective
measured values according to which the business units are
measured and managed. Other effective management tools
used in the Group are strategic planning, forecasting and
budget management.
Accountability is ensured through clear communication of
102
SpareBank 1 SR-Bank Annual Report 2005
business plans and adopted objectives to the employees. This
is carried out via clearly defined roles, responsibilities and
expectations, in which the managers are made accountable
for goal attainment within the various fields of responsibility.
Remuneration schemes are based on the management’s and
employees’ performance in relation to these measured values
EFFECTIVE RISK MANAGEMENT
Effective risk management is an important factor in assuring
that the Group attains its strategic objectives. Risk manage-
ment is an integrated part of the management’s decision-
making processes, and a crucial factor in organisation,
procedures and systems.
The Group carries out analyses, management and follow-up of
significant risks as part of its continuous risk management
process. This is to ensure that its operations are in accordance
with the approved risk profile and adopted strategies. The
Board and the management review the Group’s risk profile at
least once per year with regard to strategic, operational and
transactional matters. At regular intervals, the development of
the risk picture is reported to the Chief Executive Officer and
the Board.
WELL SET-OUT, EASILY UNDERSTANDABLE AND
UP-TO-DATE INFORMATION
Well set-out, easily understandable and up-to-date information
cements the relationship of trust among the owners, the
Board and the management, and ensures that the Group’s
interest groups are continuously given the opportunity to
assess the Group and relate to it at the same time.
The Group’s information policy therefore emphasises an
extensive dialogue with various interest groups. Openness,
dependability and transparency are essential in this dialogue.
SpareBank 1 SR-Bank also gives importance to inspiring the
investor market with trust through correct, relevant and up-
do-date information on the Group’s performance and results.
Quarterly investor presentations are held in order to keep the
market informed. In addition, the Group regularly gives
presentations for international partners, lenders and
investors. All quarterly reports, press releases and
presentations are available on www.sr-bank.no.
EQUAL TREATMENT OF PRIMARY CAPITAL CERTIFICATE
OWNERS AND A WELL-BALANCED RELATIONSHIP WITH
OTHER INTEREST GROUPS
General
The Group’s relations with its interest groups, including
primary capital certificate owners, depositors, lenders,
customers, employees and society at large, shall build on the
bank’s vision, goals, strategies and value base. The value base
shall be realised through a long-term approach, openness,
and honesty, and by acting responsibly, showing respectful-
ness, and willingness and ability to improve.
Primary capital certificate owners
The Board’s most important objective is to safeguard the
Group’s, and thus the primary capital certificate owners’,
long-term interests in all connections and regards.
The Group shall, through continuous dialogue, give all prima-
ry capital certificate owners the opportunity of expressing their
views on the bank’s operations and development. The Group’s
profile shall give it trustworthiness and predictability in the
market, and it shall aim for long-term and competitive rates of
return. In order to ensure a balanced and correct valuation of
the primary capital certificates, SpareBank 1 SR-Bank shall
provide the market with relevant and extensive information.
Depositors
One of the Board’s principal tasks is to secure the depositors’
assets. This shall be done through financial development,
resulting in prudent asset management, and not taking any
risks that are greater than is prudent on the basis of the
Group’s earnings and capital adequacy ratio.
Lenders
Through the overarching objective of solid and sound bank
operations that enable the Group to meet its future
commitments, the Group’s strategy for liquidity management
attends to the Group’s as well as the lenders’ interests. In
addition, the strategy shall help reduce the likelihood of
questions being raised or uncertainty emerging regarding the
Group’s solidity.
Customers
In order to create the best possible foundation for the
Group’s development, the Group shall engage in active
dialogue with its customers. This shall be part of normal
customer contact. In addition, user surveys and customer
panels will be used. All customer contact shall be based on
business-like principles, the Group’s value base, ethical
guidelines and the vision of the recommended bank.
By giving the value base a concrete, practical meaning in day-
to-day life, the Group wishes to promote collaboration among
its various employees and units – with the objective of
providing its customers with optimum solutions, and high
quality of service.
It is the Board’s responsibility to ensure that the Group
facilitates and maintains effective, appropriate and ethically
justifiable products and advice, thus building the best pos-
sible customer relations.
The employees
The Group’s value base states how the Group’s employees
shall act with a view to ethics and conduct. Management and
collaboration are rooted in the Group’s value base, procedures,
guidelines and work regulations. In order to succeed, all the
employees shall have expertise and quality in everything they
do.
The Group shall have a corporate culture that supports and
further develops the organisation’s employees to become a
dynamic winning team. The Group places great emphasis on
103
a corporate culture that promotes well-being, pleasure in
work, and a good working environment. This is measured
through quarterly surveys.
The Group’s employees shall act in a dependable manner,
have high ethical standards and show respect for the bank’s
tradition as a regional and locally-rooted savings bank.
Security for employees and customers is designed with a view
to protecting the employees and customers against physical
and mental harm, as well as protecting the assets the Group
manages.
Social responsibility
With its regional identity and its network of branches,
SpareBank 1 SR-Bank is an integrated part of the local com-
munity, and is actively involved in creating and participating
in local and regional meeting places. Profitability is a precon-
dition for contributing to local development projects. As a
savings bank, SpareBank 1 SR-Bank is able to allocate parts of
its profits for the benefit of the public good by placing them in
the bank’s endowment fund. This is used purposefully to
promote growth and development in the region.
Gifts and sponsor contributions shall be grounded in the
bank’s vision and business idea, and shall be distributed in a
manner that supports wide coverage and diversity.
COMPLIANCE WITH LAWS, REGULATIONS AND
ETHICAL STANDARDS
Ethics and morals are important preconditions for long-term
profitability and goal attainment. Compliance with laws,
regulations and ethical standards are further preconditions for
sound bank operations. The Group has drawn up ethical
guidelines and internal instructions for own transactions and
insider trading. The instructions describe the laws and
regulations that apply to all employees, temporary staff and
representatives, both internally and in relation to the Group’s
interest groups. The ethical guidelines are communicated
clearly within the organisation and define desirable and
undesirable conduct. All employees are bound to
confidentiality and shall sign a promise of confidentiality.
The obligation to maintain confidentiality shall not impede
employees from notifying the appropriate bodies if there are
matters within the Group that they assume to be in breach of
applicable laws, regulations and instructions. If employees
become aware of matters that are in breach of regulations,
this shall be reported to the immediate superior. The promise
of confidentiality and the ethical guidelines are re-examined by
all employees every other year through a verification of their
understanding, acceptance and compliance. Breach of the
guidelines and routines are not accepted, and serious matters
are automatically reported to the police.
The Group’s intranet contains a security gateway that deals
with regulations and emergency preparedness plans.
104
SpareBank 1 SR-Bank Annual Report 2005
For several years, SpareBank 1 SR-Bank has put substantial
resources into developing methods, processes and risk
management systems on a par with the top comparable
international banks.
The Group’s risk management shall sustain the Group’s
strategic development and goal achievement. Risk manage-
ment shall also ensure financial stability and prudent asset
management. This shall be attained through:
• A sound risk culture, characterised by a high level of risk
management awareness
• A good understanding of which risks that drive earnings
and risk costs, and, create a better decisionmaking basis
• Aim for optimum capital allocation within the adopted
business strategy
• Avoiding unexpected negative events that could be
detrimental to the Group’s operations and market reputation
• Utilising of synergy and diversification effects
The Group has a moderate risk profile. According to the
profile, no single event shall be able to damage the Group’s
financial position seriously. The Group has the objective of at
least maintaining its current international rating. This is to
encure long-term, good access to ordinary funding from the
capital markets. The size of the Group’s subordinated capital
corresponds with this ambition.
The Group’s risk is quantified in calculations of expected loss
and the need for risk-adjusted capital (economicial capital)
in order to cover unexpected loss. Expected loss and risk-
adjusted capital are calculated for all principal risk categories,
and for all the Group’s business areas. Expected loss describes
the amount the Group must, statistically, expect to lose over
a twelve-month period. Risk-adjusted capital describes how
much capital the Group believes it will require in order to
cover the actual risk it has assumed. As safeguarding against
all losses is impossible, the Group has stipulated that the
risk-adjusted capital shall cover 99.9% of all possible,
unexpected loss. Statistical methods have been used for
calculating expected loss and risk-adjusted capital, but in
some cases the calculations nevertheless require expert
opinions.
The return on risk-adjusted capital is one of the most
important strategic performance indicators in the internal
management of SpareBank 1 SR-Bank. This implies that the
business units receive capital in accordance to the calculated
risks related to the business, and that return on capital is
monitored continuously. Calculating risk-adjusted capital
allows the Group to compare risk across risk categories and
business units. In addition, risk is measured and followed up
through measuring, among other things, limit use and
important portfolio risk indicators.
The Group follows up overall risk exposure and risk develop-
ment through periodical risk reports to the management and
the Board of Directors. The risk management department
carries out the overall risk monitoring and reporting. The
department is independent of the Group’s various business
units. Independent risk reporting is an important risk
management principle in SpareBank 1 SR-Bank.
RESPONSIBILITY FOR RISK MANAGEMENT
AND CONTROL
Risk management and control are a part of SpareBank 1 SR-
Bank’s management of operations described in the chapter
“Corporate governance.” Great weight has been attached to
responsibility through personal authorities, and independence
among the business units and organisational units
monitoring the business units. In order to ensure effective
risk management in SpareBank 1 SR-Bank, the responsibility
is divided among different roles in the organisation, as shown
in the diagram below:
105
Risk and capital management
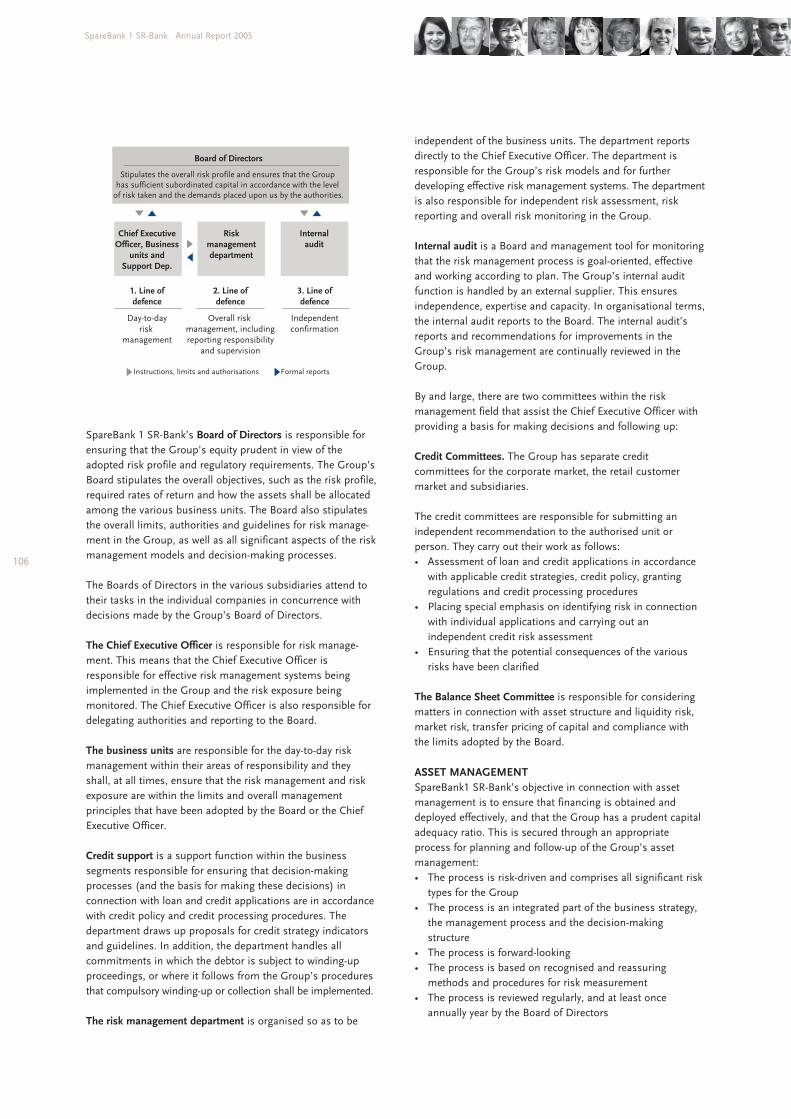
SpareBank 1 SR-Bank’s Board of Directors is responsible for
ensuring that the Group’s equity prudent in view of the
adopted risk profile and regulatory requirements. The Group’s
Board stipulates the overall objectives, such as the risk profile,
required rates of return and how the assets shall be allocated
among the various business units. The Board also stipulates
the overall limits, authorities and guidelines for risk manage-
ment in the Group, as well as all significant aspects of the risk
management models and decision-making processes.
The Boards of Directors in the various subsidiaries attend to
their tasks in the individual companies in concurrence with
decisions made by the Group’s Board of Directors.
The Chief Executive Officer is responsible for risk manage-
ment. This means that the Chief Executive Officer is
responsible for effective risk management systems being
implemented in the Group and the risk exposure being
monitored. The Chief Executive Officer is also responsible for
delegating authorities and reporting to the Board.
The business units are responsible for the day-to-day risk
management within their areas of responsibility and they
shall, at all times, ensure that the risk management and risk
exposure are within the limits and overall management
principles that have been adopted by the Board or the Chief
Executive Officer.
Credit support is a support function within the business
segments responsible for ensuring that decision-making
processes (and the basis for making these decisions) in
connection with loan and credit applications are in accordance
with credit policy and credit processing procedures. The
department draws up proposals for credit strategy indicators
and guidelines. In addition, the department handles all
commitments in which the debtor is subject to winding-up
proceedings, or where it follows from the Group’s procedures
that compulsory winding-up or collection shall be implemented.
The risk management department is organised so as to be
independent of the business units. The department reports
directly to the Chief Executive Officer. The department is
responsible for the Group’s risk models and for further
developing effective risk management systems. The department
is also responsible for independent risk assessment, risk
reporting and overall risk monitoring in the Group.
Internal audit is a Board and management tool for monitoring
that the risk management process is goal-oriented, effective
and working according to plan. The Group’s internal audit
function is handled by an external supplier. This ensures
independence, expertise and capacity. In organisational terms,
the internal audit reports to the Board. The internal audit’s
reports and recommendations for improvements in the
Group’s risk management are continually reviewed in the
Group.
By and large, there are two committees within the risk
management field that assist the Chief Executive Officer with
providing a basis for making decisions and following up:
Credit Committees. The Group has separate credit
committees for the corporate market, the retail customer
market and subsidiaries.
The credit committees are responsible for submitting an
independent recommendation to the authorised unit or
person. They carry out their work as follows:
• Assessment of loan and credit applications in accordance
with applicable credit strategies, credit policy, granting
regulations and credit processing procedures
• Placing special emphasis on identifying risk in connection
with individual applications and carrying out an
independent credit risk assessment
• Ensuring that the potential consequences of the various
risks have been clarified
The Balance Sheet Committee is responsible for considering
matters in connection with asset structure and liquidity risk,
market risk, transfer pricing of capital and compliance with
the limits adopted by the Board.
ASSET MANAGEMENT
SpareBank1 SR-Bank’s objective in connection with asset
management is to ensure that financing is obtained and
deployed effectively, and that the Group has a prudent capital
adequacy ratio. This is secured through an appropriate
process for planning and follow-up of the Group’s asset
management:
• The process is risk-driven and comprises all significant risk
types for the Group
• The process is an integrated part of the business strategy,
the management process and the decision-making
structure
• The process is forward-looking
• The process is based on recognised and reassuring
methods and procedures for risk measurement
• The process is reviewed regularly, and at least once
annually year by the Board of Directors
106
SpareBank 1 SR-Bank Annual Report 2005
Board of Directors
Stipulates the overall risk profile and ensures that the Group has sufficient subordinated capital in accordance with the level
of risk taken and the demands placed upon us by the authorities.
Chief ExecutiveOfficer, Business
units andSupport Dep.
Riskmanagementdepartment
Internalaudit
1. Line ofdefence
Day-to-dayrisk
management
2. Line ofdefence
Overall risk management, includingreporting responsibility
and supervision
3. Line ofdefence
Independentconfirmation
Instructions, limits and authorisations Formal reports
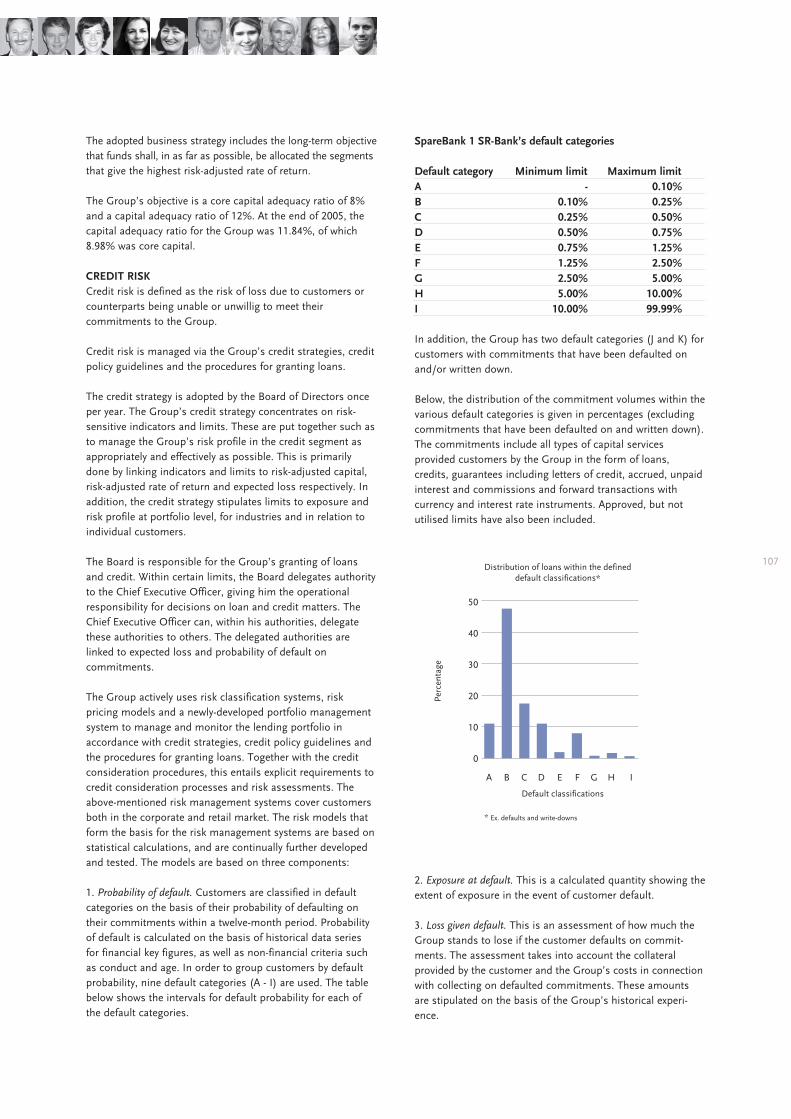
The adopted business strategy includes the long-term objective
that funds shall, in as far as possible, be allocated the segments
that give the highest risk-adjusted rate of return.
The Group’s objective is a core capital adequacy ratio of 8%
and a capital adequacy ratio of 12%. At the end of 2005, the
capital adequacy ratio for the Group was 11.84%, of which
8.98% was core capital.
CREDIT RISK
Credit risk is defined as the risk of loss due to customers or
counterparts being unable or unwillig to meet their
commitments to the Group.
Credit risk is managed via the Group’s credit strategies, credit
policy guidelines and the procedures for granting loans.
The credit strategy is adopted by the Board of Directors once
per year. The Group’s credit strategy concentrates on risk-
sensitive indicators and limits. These are put together such as
to manage the Group’s risk profile in the credit segment as
appropriately and effectively as possible. This is primarily
done by linking indicators and limits to risk-adjusted capital,
risk-adjusted rate of return and expected loss respectively. In
addition, the credit strategy stipulates limits to exposure and
risk profile at portfolio level, for industries and in relation to
individual customers.
The Board is responsible for the Group’s granting of loans
and credit. Within certain limits, the Board delegates authority
to the Chief Executive Officer, giving him the operational
responsibility for decisions on loan and credit matters. The
Chief Executive Officer can, within his authorities, delegate
these authorities to others. The delegated authorities are
linked to expected loss and probability of default on
commitments.
The Group actively uses risk classification systems, risk
pricing models and a newly-developed portfolio management
system to manage and monitor the lending portfolio in
accordance with credit strategies, credit policy guidelines and
the procedures for granting loans. Together with the credit
consideration procedures, this entails explicit requirements to
credit consideration processes and risk assessments. The
above-mentioned risk management systems cover customers
both in the corporate and retail market. The risk models that
form the basis for the risk management systems are based on
statistical calculations, and are continually further developed
and tested. The models are based on three components:
1. Probability of default. Customers are classified in default
categories on the basis of their probability of defaulting on
their commitments within a twelve-month period. Probability
of default is calculated on the basis of historical data series
for financial key figures, as well as non-financial criteria such
as conduct and age. In order to group customers by default
probability, nine default categories (A - I) are used. The table
below shows the intervals for default probability for each of
the default categories.
SpareBank 1 SR-Bank’s default categories
Default category Minimum limit Maximum limit
A - 0.10%
B 0.10% 0.25%
C 0.25% 0.50%
D 0.50% 0.75%
E 0.75% 1.25%
F 1.25% 2.50%
G 2.50% 5.00%
H 5.00% 10.00%
I 10.00% 99.99%
In addition, the Group has two default categories (J and K) for
customers with commitments that have been defaulted on
and/or written down.
Below, the distribution of the commitment volumes within the
various default categories is given in percentages (excluding
commitments that have been defaulted on and written down).
The commitments include all types of capital services
provided customers by the Group in the form of loans,
credits, guarantees including letters of credit, accrued, unpaid
interest and commissions and forward transactions with
currency and interest rate instruments. Approved, but not
utilised limits have also been included.
2. Exposure at default. This is a calculated quantity showing the
extent of exposure in the event of customer default.
3. Loss given default. This is an assessment of how much the
Group stands to lose if the customer defaults on commit-
ments. The assessment takes into account the collateral
provided by the customer and the Group’s costs in connection
with collecting on defaulted commitments. These amounts
are stipulated on the basis of the Group’s historical experi-
ence.
107Distribution of loans within the defined
default classifications*
Perc
enta
ge
Default classifications
Ex. defaults and write-downs
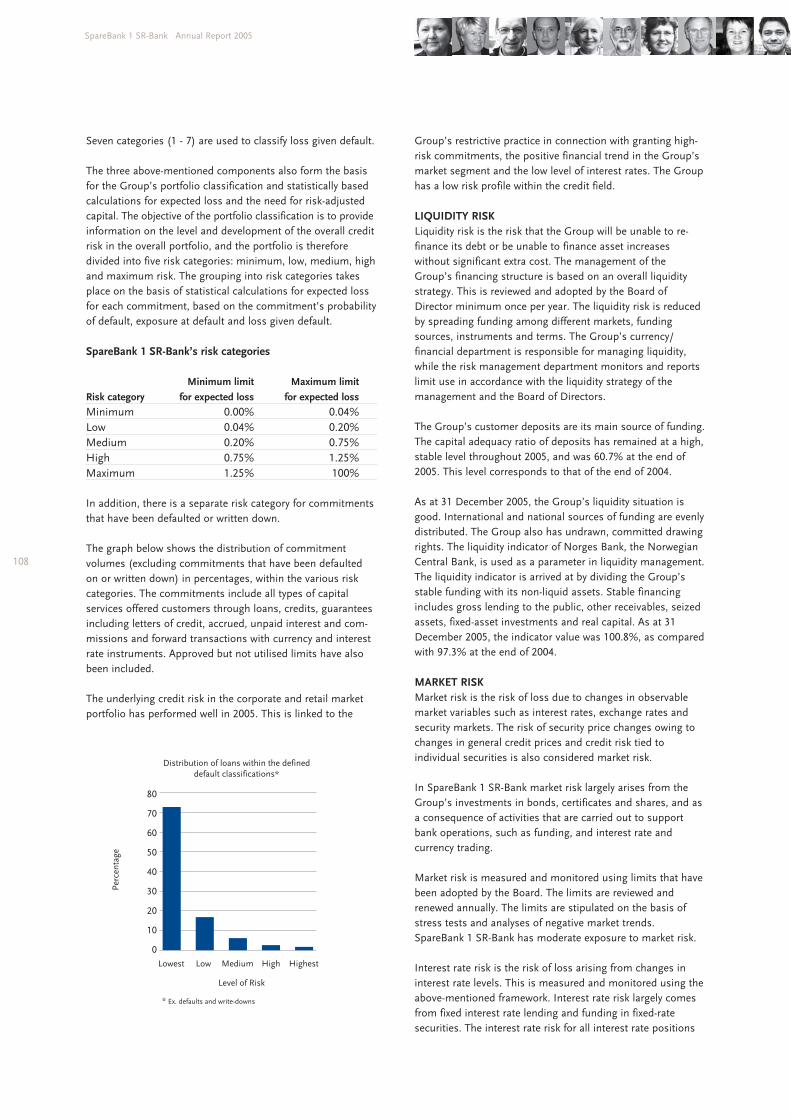
Seven categories (1 - 7) are used to classify loss given default.
The three above-mentioned components also form the basis
for the Group’s portfolio classification and statistically based
calculations for expected loss and the need for risk-adjusted
capital. The objective of the portfolio classification is to provide
information on the level and development of the overall credit
risk in the overall portfolio, and the portfolio is therefore
divided into five risk categories: minimum, low, medium, high
and maximum risk. The grouping into risk categories takes
place on the basis of statistical calculations for expected loss
for each commitment, based on the commitment’s probability
of default, exposure at default and loss given default.
SpareBank 1 SR-Bank’s risk categories
Minimum limit Maximum limit
Risk category for expected loss for expected loss
Minimum 0.00% 0.04%
Low 0.04% 0.20%
Medium 0.20% 0.75%
High 0.75% 1.25%
Maximum 1.25% 100%
In addition, there is a separate risk category for commitments
that have been defaulted or written down.
The graph below shows the distribution of commitment
volumes (excluding commitments that have been defaulted
on or written down) in percentages, within the various risk
categories. The commitments include all types of capital
services offered customers through loans, credits, guarantees
including letters of credit, accrued, unpaid interest and com-
missions and forward transactions with currency and interest
rate instruments. Approved but not utilised limits have also
been included.
The underlying credit risk in the corporate and retail market
portfolio has performed well in 2005. This is linked to the
Group’s restrictive practice in connection with granting high-
risk commitments, the positive financial trend in the Group’s
market segment and the low level of interest rates. The Group
has a low risk profile within the credit field.
LIQUIDITY RISK
Liquidity risk is the risk that the Group will be unable to re-
finance its debt or be unable to finance asset increases
without significant extra cost. The management of the
Group’s financing structure is based on an overall liquidity
strategy. This is reviewed and adopted by the Board of
Director minimum once per year. The liquidity risk is reduced
by spreading funding among different markets, funding
sources, instruments and terms. The Group’s currency/
financial department is responsible for managing liquidity,
while the risk management department monitors and reports
limit use in accordance with the liquidity strategy of the
management and the Board of Directors.
The Group’s customer deposits are its main source of funding.
The capital adequacy ratio of deposits has remained at a high,
stable level throughout 2005, and was 60.7% at the end of
2005. This level corresponds to that of the end of 2004.
As at 31 December 2005, the Group’s liquidity situation is
good. International and national sources of funding are evenly
distributed. The Group also has undrawn, committed drawing
rights. The liquidity indicator of Norges Bank, the Norwegian
Central Bank, is used as a parameter in liquidity management.
The liquidity indicator is arrived at by dividing the Group’s
stable funding with its non-liquid assets. Stable financing
includes gross lending to the public, other receivables, seized
assets, fixed-asset investments and real capital. As at 31
December 2005, the indicator value was 100.8%, as compared
with 97.3% at the end of 2004.
MARKET RISK
Market risk is the risk of loss due to changes in observable
market variables such as interest rates, exchange rates and
security markets. The risk of security price changes owing to
changes in general credit prices and credit risk tied to
individual securities is also considered market risk.
In SpareBank 1 SR-Bank market risk largely arises from the
Group’s investments in bonds, certificates and shares, and as
a consequence of activities that are carried out to support
bank operations, such as funding, and interest rate and
currency trading.
Market risk is measured and monitored using limits that have
been adopted by the Board. The limits are reviewed and
renewed annually. The limits are stipulated on the basis of
stress tests and analyses of negative market trends.
SpareBank 1 SR-Bank has moderate exposure to market risk.
Interest rate risk is the risk of loss arising from changes in
interest rate levels. This is measured and monitored using the
above-mentioned framework. Interest rate risk largely comes
from fixed interest rate lending and funding in fixed-rate
securities. The interest rate risk for all interest rate positions
108
SpareBank 1 SR-Bank Annual Report 2005
Distribution of loans within the defineddefault classifications*
Perc
enta
ge
Level of Risk
Ex. defaults and write-downs
Lowest Low Medium High Highest
can be expressed by looking at the change in value of interest
rate instruments in the event of an interest rate change of
1%. The Group’s analyses show the effect of the above-menti-
oned change in interest rates for different term limits, and
there are separate limits for interest rate exposure within the
individual periods. Interest terms on the Group’s instruments
are usually short and its interest rate risk is therefore low.
Exchange rate risk is the risk of loss caused by exchange rate
changes. The Group measures currency risk in net positions
in different currencies. The limits for exchange rate risk are
defined as limits for maximum aggregated currency positions
and maximum positions in individual currencies. The Group’s
currency risk is well within the position limit stated in the
regulations, and the currency risk is low.
Security price risk is the risk of loss following from changes in
the value of the Group’s investments in bonds, certificates
and equity securities. The value of these securities depends
on factors that are specific to the individual issuers and on
general market fluctuations. The Group’s risk exposure to this
form of risk is governed by maximum investment limits for
the various portfolios.
OPERATIONAL RISK
Operational risk can be defined as the risk of loss following
from:
• Human error and inadequate expertise
• ICT system failure
• Imprecise policy, strategy or procedures
• Crime and internal irregularities
• Other internal and external causes
The Group’s risk management and monitoring processes are
so effective that no single operational risk event shall be able
to seriously damage the Group’s financial position.
The risk strategy for operational risk is approved minimum
once per year by the Board of Directors. The risk strategy
concentrates on risk-sensitive indicators, such as expected
loss and calculations of risk-adjusted capital. The Group has
a moderate operational risk profile.
Through the use of systematic risk analyses and implementation
of new, preventive measures, the Group has reduced its
operational risk in 2005. The Group uses its own system for
reporting and follow-up of undesired events, so that the
Group can, on the basis of these reports, continually improve
its processes.
New rules for capital adequacy ratio (Basel II)
It is planned that the EU’s new directive for capital adequacy
ratio will be introduced to Norway as of 1 January 2007. The
new regulatory framework is based on proposals for a new
standard for capital adequacy ratios from the Bank for
International Settlements (BIS). The new regulatory frame-
work will allow banks with sound risk management and risk
management systems to use their own models in calculating
capital adequacy ratio.
SpareBank 1 SR-Bank gives great importance to risk manage-
ment and adapting to the new capital adequacy ratio
regulations. SpareBank 1 SR-Bank has therefore applied to the
Financial Supervisory Authority of Norway for permission to
allow internal measuring methods (Internal Rating Based
Approach - Foundation) for credit risk as of 1 January 2007.
For those banks that are approved and are given permission
to use internal measurement methods, the regulatory
minimum requirement for capital adequacy ratio as of 2007
will be based on the bank’s internal risk assessments. This
will make the regulatory minimum requirement for capital
adequacy ratio more risk-sensitive, so that the capital
adequacy ratio will correspond better with the risk in the
underlying portfolios. In order to be approved and be given
permission to use internal measuring methods by the
Financial Supervisory Authority, the banks must satisfy
extensive requirements with regard to organisation, expertise,
risk models and risk management systems. The Financial
Supervisory Authority plans to have completed most of the
application reviews by the autumn of 2006.
It is SpareBank 1 SR-Bank’s ambition to use the standard
method for calculating the minimum capital adequacy ratio
for operational risk from 2007.
In accordance with this ambition for risk management,
SpareBank 1 SR-Bank has over several years invested
considerable funds and resources in the work to further
develop expertise, risk models and risk management systems,
all with a view to adapting to the above-mentioned
requirements.
The department for risk management has the overall
responsibility for risk picture follow-up and reporting in the
Group and the further development of risk management
systems. In order to further strengthen the risk area, the
SpareBank 1 Alliance has set up a special Centre of Excellence
for Credit Models. This is the Alliance’s own professional
community for credit models. The Competence Centre is
responsible for rating, pricing, analysis and portfolio
management models for all the SpareBank 1 banks. Both the
department for risk management and the Centre of Excellence
for Credit Models are independent of the business units. This
ensures independence in risk follow-up and reporting.
SpareBank 1 SR-Bank expects long-term gains from its invest-
ment in risk management:
• Lower performance volatility, as a result of improved risk
management and better credit quality
• Increased profits, as a result of better profitability and
capital allocation models.
• Better application of equity, in that the minimum capital
adequacy ratio will correspond more closely to risk in the
underlying operations.
109
Corporate market
division
FACTS
Number of customers: approx. 4,200
Growth in lending: 16.5 per cent
Growth in deposits: 27.7 per cent
Gross lending: MNOK 15,419
Deposits: MNOK 16,225
EVENTS IN 2005
SpareBank 1 SR-Bank had strong growth in the number of
new corporate customers, both in Rogaland and the Agder
counties.
The group has strengthened its position in most business
segments, especially in real estate brokering through the
development and facilitation for sale of real estate projects.
The target group is investors looking for long-term placements.
The group strengthened its position in leasing and special
financing, under the direction of SpareBank 1 SR-Finans AS.
Sale of mandatory occupational pension to corporate
customers is an important focus area. Resources allocated to
this effort have been increased significantly in 2005.
The group has made a systematic effort to further enhance its
employees' expertise, in order to be even better prepared to
meet the customers' needs for advice and follow-up.
WE CREATE VALUES AT THE LOCAL LEVEL
The business market division serves customers from
Hordaland in the north to Aust-Agder in the south. We are
represented in the market by our six regional business market
divisions and 50 local offices. In addition, customers are
served via our website (www.sr-bank.no) and through a newly-
established corporate customer centre (tel. +47 02008), where
telephone and email are the most important channels. In
total, SpareBank 1 SR-Bank has business relations with 9,700
business customers, including the SME segment.
STRATEGY
It is the objective of SpareBank 1 SR-Bank to help our customers
create values. In this manner we want to help put into practice
the bank’s vision of being "the recommended bank." We
believe in being present at the local level, and being well
acquainted with the region we serve. SpareBank 1 SR-Bank is
the only local financial group with a full range of products.
EMPLOYEES
Overall, the corporate market division employs 125 man-years.
This includes 23 employees in SpareBank 1 SR-Finans AS and
6 employees working with the sale of commercial real estate
in Eiendomsmegler 1 Rogaland AS. 33 of the employees are
women. There are four women in managerial positions. In
2005, 23 new man-years with a high level of expertise were
recruited externally, of which 8 are employed in the corporate
insurance market department, which is affiliated with the
bank's pension market efforts.
CUSTOMERS AND MARKETS
We have more than 4,200 customers in the business market
division. Overall, more than 40 per cent of the businesses in
Rogaland are our customers. The number of corporate market
customers in Agder has risen to 200 since we started our
business there in earnest in the autumn of 2002. In 2005, it
was decided that SpareBank 1 SR-Bank will open a branch in
Bergen. This will increase our availability for corporate market
customers in Hordaland.
The corporate market division has experienced growth in all
segments, most notably in the large customer segment,
where several of the listed companies in the region have
chosen SpareBank 1 SR-Bank as their new main bank. Among
the bank's existing customers, a large proportion of them are
small businesses with a need for traditional and standardised
financial products and services. In 2005, it was decided to
make a special effort towards this segment. SpareBank 1 SR-
Bank is increasing its focus on product development and
allocating resources to local branches, close to where the
customers do their business.
110
SpareBank 1 SR-Bank Annual Report 2005
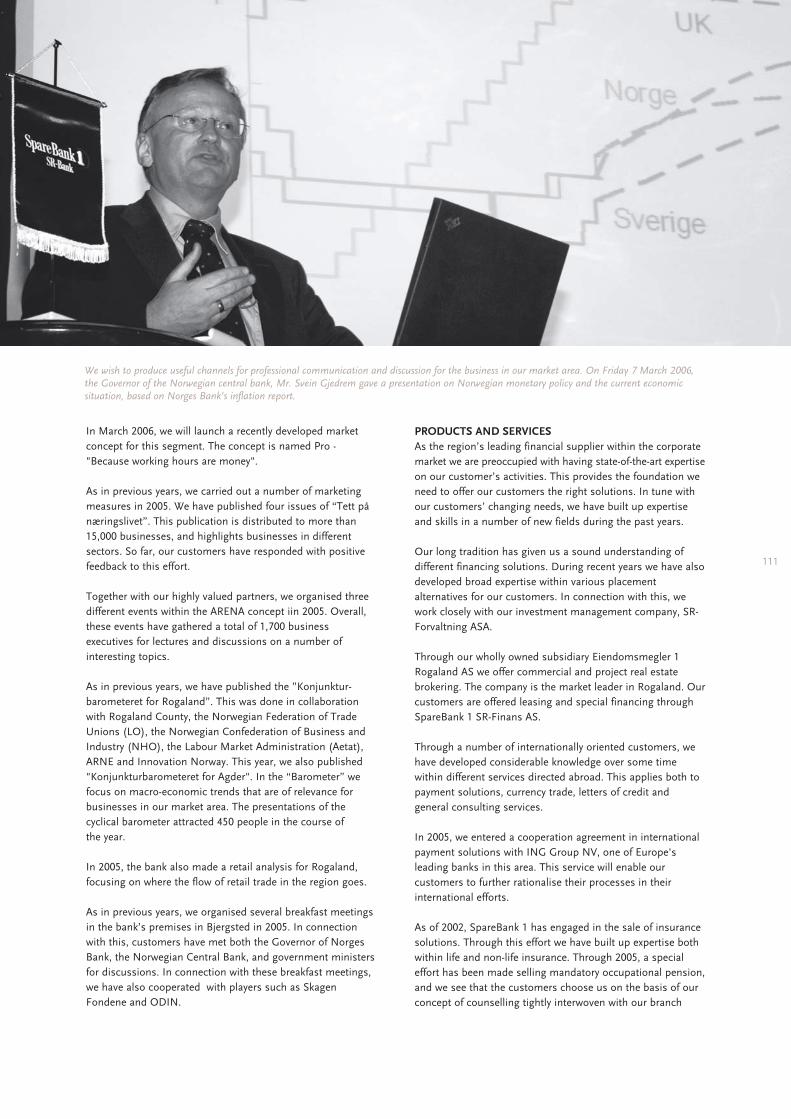
In March 2006, we will launch a recently developed market
concept for this segment. The concept is named Pro -
"Because working hours are money".
As in previous years, we carried out a number of marketing
measures in 2005. We have published four issues of “Tett på
næringslivet”. This publication is distributed to more than
15,000 businesses, and highlights businesses in different
sectors. So far, our customers have responded with positive
feedback to this effort.
Together with our highly valued partners, we organised three
different events within the ARENA concept iin 2005. Overall,
these events have gathered a total of 1,700 business
executives for lectures and discussions on a number of
interesting topics.
As in previous years, we have published the ”Konjunktur-
barometeret for Rogaland”. This was done in collaboration
with Rogaland County, the Norwegian Federation of Trade
Unions (LO), the Norwegian Confederation of Business and
Industry (NHO), the Labour Market Administration (Aetat),
ARNE and Innovation Norway. This year, we also published
"Konjunkturbarometeret for Agder". In the “Barometer” we
focus on macro-economic trends that are of relevance for
businesses in our market area. The presentations of the
cyclical barometer attracted 450 people in the course of
the year.
In 2005, the bank also made a retail analysis for Rogaland,
focusing on where the flow of retail trade in the region goes.
As in previous years, we organised several breakfast meetings
in the bank’s premises in Bjergsted in 2005. In connection
with this, customers have met both the Governor of Norges
Bank, the Norwegian Central Bank, and government ministers
for discussions. In connection with these breakfast meetings,
we have also cooperated with players such as Skagen
Fondene and ODIN.
PRODUCTS AND SERVICES
As the region’s leading financial supplier within the corporate
market we are preoccupied with having state-of-the-art expertise
on our customer’s activities. This provides the foundation we
need to offer our customers the right solutions. In tune with
our customers’ changing needs, we have built up expertise
and skills in a number of new fields during the past years.
Our long tradition has given us a sound understanding of
different financing solutions. During recent years we have also
developed broad expertise within various placement
alternatives for our customers. In connection with this, we
work closely with our investment management company, SR-
Forvaltning ASA.
Through our wholly owned subsidiary Eiendomsmegler 1
Rogaland AS we offer commercial and project real estate
brokering. The company is the market leader in Rogaland. Our
customers are offered leasing and special financing through
SpareBank 1 SR-Finans AS.
Through a number of internationally oriented customers, we
have developed considerable knowledge over some time
within different services directed abroad. This applies both to
payment solutions, currency trade, letters of credit and
general consulting services.
In 2005, we entered a cooperation agreement in international
payment solutions with ING Group NV, one of Europe's
leading banks in this area. This service will enable our
customers to further rationalise their processes in their
international efforts.
As of 2002, SpareBank 1 has engaged in the sale of insurance
solutions. Through this effort we have built up expertise both
within life and non-life insurance. Through 2005, a special
effort has been made selling mandatory occupational pension,
and we see that the customers choose us on the basis of our
concept of counselling tightly interwoven with our branch
111
We wish to produce useful channels for professional communication and discussion for the business in our market area. On Friday 7 March 2006,
the Governor of the Norwegian central bank, Mr. Svein Gjedrem gave a presentation on Norwegian monetary policy and the current economic
situation, based on Norges Bank’s inflation report.
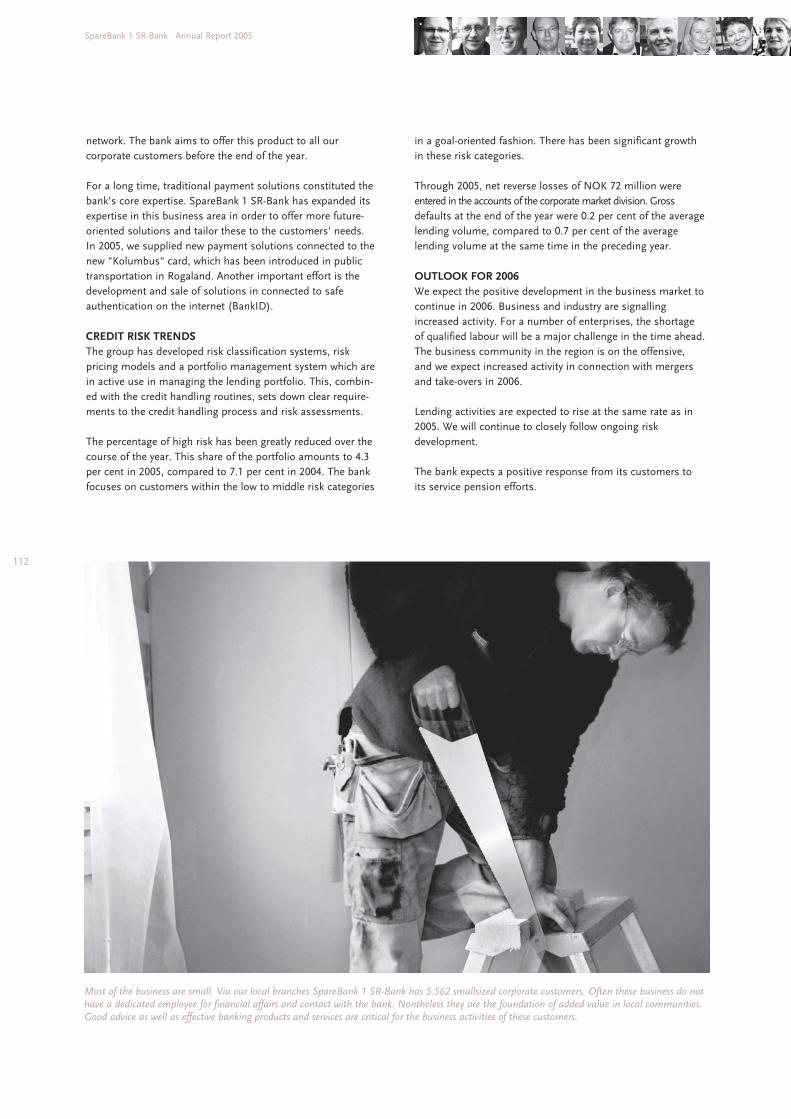
network. The bank aims to offer this product to all our
corporate customers before the end of the year.
For a long time, traditional payment solutions constituted the
bank’s core expertise. SpareBank 1 SR-Bank has expanded its
expertise in this business area in order to offer more future-
oriented solutions and tailor these to the customers' needs.
In 2005, we supplied new payment solutions connected to the
new "Kolumbus" card, which has been introduced in public
transportation in Rogaland. Another important effort is the
development and sale of solutions in connected to safe
authentication on the internet (BankID).
CREDIT RISK TRENDS
The group has developed risk classification systems, risk
pricing models and a portfolio management system which are
in active use in managing the lending portfolio. This, combin-
ed with the credit handling routines, sets down clear require-
ments to the credit handling process and risk assessments.
The percentage of high risk has been greatly reduced over the
course of the year. This share of the portfolio amounts to 4.3
per cent in 2005, compared to 7.1 per cent in 2004. The bank
focuses on customers within the low to middle risk categories
in a goal-oriented fashion. There has been significant growth
in these risk categories.
Through 2005, net reverse losses of NOK 72 million were
entered in the accounts of the corporate market division. Gross
defaults at the end of the year were 0.2 per cent of the average
lending volume, compared to 0.7 per cent of the average
lending volume at the same time in the preceding year.
OUTLOOK FOR 2006
We expect the positive development in the business market to
continue in 2006. Business and industry are signalling
increased activity. For a number of enterprises, the shortage
of qualified labour will be a major challenge in the time ahead.
The business community in the region is on the offensive,
and we expect increased activity in connection with mergers
and take-overs in 2006.
Lending activities are expected to rise at the same rate as in
2005. We will continue to closely follow ongoing risk
development.
The bank expects a positive response from its customers to
its service pension efforts.
112
SpareBank 1 SR-Bank Annual Report 2005
Most of the business are small. Via our local branches SpareBank 1 SR-Bank has 5.562 smallsized corporate customers. Often these business do not
have a dedicated employee for financial affairs and contact with the bank. Nontheless they are the foundation of added value in local communities.
Good advice as well as effective banking products and services are critical for the business activities of these customers.
FACTS
Number of retail customers with SpareBank 1 SR-Bank
as their main banking connection: 186,860
Number of agricultural customers: 3,009
Number of small and medium-sized businesses: 5,562
Number of clubs and associations: 2,192
Number of customers with savings agreements: 22,100
Number of customers with investments
in ODIN funds: 41,408
Number of customers with general insurance: 67,700
Lending: NOK 43,118 million
Deposits: NOK 20,819 million
Off-balance sheet savings investments: NOK 8,351 million
STRATEGY
SpareBank 1 SR-Bank is construed as a professional advisor
and total supplier of financial services with a product range
which covers the customers' needs through the different
phases of their lives. The development of services and
products adapted to ever more differentiated customer needs
is given a high level of priority in the organisation. The bank's
multi-channel strategy is designed to give the customers a
feeling of familiarity, a high degree of availability and effective
interaction between the channels. Internet and telephonic
banking, a call centre and, in time, mobile services are under
continuous development, and are at the forefront of the
market in terms of quality.
Close interaction between the different business units in the
group and the product suppliers provide the customers with
added value and consequently increased business volumes.
The pension, savings and investment market is growing fast.
The effort to attain a higher profile in this market is given
priority.
MULTI-CHANNEL BANK - THE CUSTOMER'S CHOICE
At the end of the year, SpareBank 1 SR-Bank had 50 branch
offices which form the core of its distribution network. At the
recommendation of the bank, more and more customers are
using a combination of our Internet and telephone banking
facilities and our call centre to handle simple, everyday
banking transactions. Our call centre handles all incoming
calls and communication via the Internet bank. During 2005,
we saw a strong growth in electronic communication, which
will continue to increase strongly in the time ahead. Customer
satisfaction is high among call centre users.
EMPLOYEES
At the end of 2005, the Retail market division had 440
employees, of which 62 per cent were women and 38 per cent
were men. This is an increase of 7 man-years from 2004. The
average employee is 45 years old. In managerial positions,
there are 16 women.
The financial advisors in the branch network are close to the
customers, know their local community well, have a high level
of expertise and actively seek out the customers for follow up.
Together with the financial advisors in the branch network,
the advisors in the call centre play an increasingly important
role in connection with giving advice via email and telephone.
The group has made a systematic effort to streamline
operations and adapt its expertise to changed customer
behaviour patterns tending towards increased self-service.
One of our objectives is to offer increased expertise and
capacity for advisory and proactive sales efforts.
EVENTS IN 2005
Further development of the branch network:
• Opening a new branch in Grimstad in May 2005
• Decision to establish a new branch in Farsund in March 2006
• Preparing for opening a new branch in Bergen in May 2006
• New contract with Avinor regarding the operation of
a branch at Sola Airport. This branch represents
something new as regards bank branches in Norwegian
airports.
113
The Retail market
division
New business areas/products:
• Car mortgages were launched by SpareBank 1
SR-Finans AS in May 2005 and are distributed in the Retail
market division with very good results
• Investment fund account with insurance element and fund
switch without tax payment was launched by SpareBank 1
Liv AS in May. Sales have been good
• A new youth concept was launched in June, based on 30
customer focus groups. More than 500 youths helped
outline the premises for the development of the concept,
which was very well received
• Loans with an interest rate cap, were launched in early
summer. This is a product which complements our product
range in financing without having yielded any large
volumes as of yet
• The compulsory service pension effort was initiated in
close cooperation with the Corporate market division
• The sale of shares in 4 real estate syndicates was facilitated
in cooperation with the Corporate market division.
The target group is customers who want a diversified and
long-term investment portfolio.
• New products for the Norwegian Confederation of
Trade Unions (LO) customers (LO Favør Bil og Hjem)
were launched in June and were well received in the market
FINANCIAL DEVELOPMENT
The division's profitability is good, with a risk-adjusted
dividend of 23.8 per cent after taxes. Volume growth in the
balance sheet, good cross-sales, very low losses and good
cost control characterise the development. For further
segment information, see Note 5 in the IFRS accounts.
DEPOSITS AND LENDING
A growth in deposits of 4 per cent is satisfactory when seen in
connection with the low interest rate level. Due to changes in
the regulations on wealth tax, customers transferred NOK 250
millions to money market funds in December. The 12.4 per
cent growth in lending was 1 percentage point below total
market growth. Due to fiercer competition, price adjustments
were made in the spring which created growth for the rest of
the year. Margins have been under pressure and have fallen
by a total of 47 basis points. An interest rate buffer of five per
cent is used in the liquidity assessments of set to the
customers, which is in the upper market range, leading to a
somewhat subdued growth in certain segments. The pressure
on the margins has been compensated through increased
growth. The effort to secure other operating income and
maintain good cost control remains a priority.
OTHER OPERATING INCOME
The growth in total other income was 7.5 per cent, or NOK 20
million. The income from payment transactions shows a
moderate growth of 1.3 per cent due to a decline in manual
services and consequent growth in self-service, very low-priced
electronic services. This trend will continue. Insurance income
showed a growth of 0.6 per cent, NOK 0.4 million. Strong
price pressure and reduced bonus in connection with the loss
ratio have given weaker growth than expected. The income
from the savings and investment segment has grown by 31
per cent, or NOK 16.8 million, which is satisfactory.
DEFAULTS AND LOSSES
Gross defaults have been at a stable and historically low level
throughout the year, and were 0.33 per cent in December.
Low interest rate levels, stable and low unemployment rates
combined with close follow-up of the customers are the main
causes. Losses have been marginal, NOK 2 million, or 0.02
per cent of the lending portfolio. The quality of the portfolio is
good.
EXTERNAL CONDITIONS
The Norges Bank key interest rate has increased from 1.75 per
cent to 2.25 per cent over two interest rate adjustments of
0.25 percentage points each in 2005. The rise, combined with
signals for further adjustments in 2006 of up to 1 percentage
point, has not had any tangible effect on the optimism of
Norwegian households, something which is amply illustrated
by the strong growth in borrowing. The share market rising
39.65 per cent has led to many selling off shares to secure
profits and finance the purchase of capital goods and holiday
homes and improving their homes.
SUMMARY OF THE DIVISION'S SUB-AREAS
Retail customers
The number of customers who define SpareBank 1 SR-Bank
as their main banking connection has increased by a total of
2,980, to 192,412. Approximately 50 per cent of the growth
comes in the Agder counties. The development is satisfactory,
and particularly so, when taking into account the increasingly
fierce competition from new and existing players. Customer
satisfaction is at a high and stable level.
Agriculture
Structural changes and large turnover of properties, farming
land and milk quotas have characterised 2005. Demand has
been larger than supply and changed tax regulations coming
into force in 2006 have boosted this development and has
lead to strong pressure on prices.
Increased prices on agricultural properties are a challenge to
both farmers who are considering larger investments and for
the bank as a qualified advisor and financial backer.
For the tomato sector and the pork production sector, 2005
was a far better year than 2004. No forms of production have
been especially exposed in 2005, but the pressure on product
prices is generally increasing. The ongoing WTO negotiations
make the need for restructuring more obvious. The need for
capital is ever increasing and the expertise in relation to
evaluating customers and projects is an important driver in
order to be seen as the recommended agricultural bank in our
market areas. The bank has taken a clear position in the debate
on the development of agriculture as an industry. The bank's
market position has been further strengthened in 2005.
The Small business market
About 5,562 small businesses are connected to the Retail
market division through the individual branch offices. The
114
SpareBank 1 SR-Bank Annual Report 2005
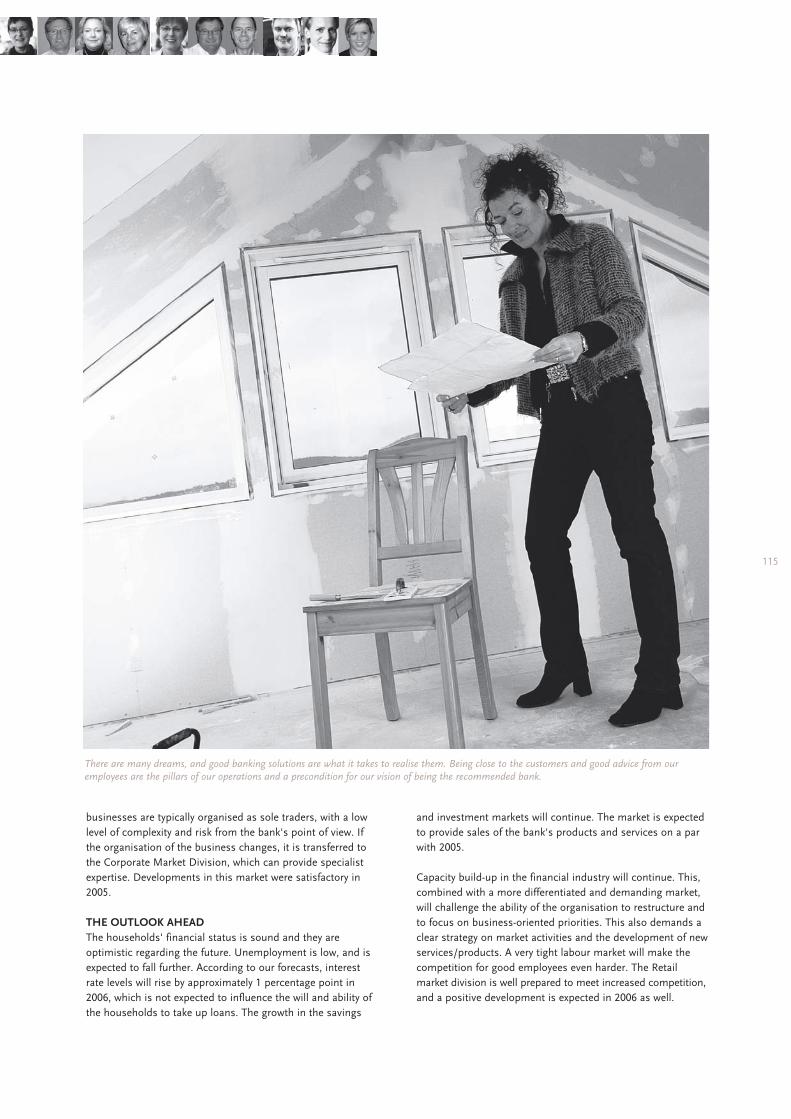
businesses are typically organised as sole traders, with a low
level of complexity and risk from the bank's point of view. If
the organisation of the business changes, it is transferred to
the Corporate Market Division, which can provide specialist
expertise. Developments in this market were satisfactory in
2005.
THE OUTLOOK AHEAD
The households' financial status is sound and they are
optimistic regarding the future. Unemployment is low, and is
expected to fall further. According to our forecasts, interest
rate levels will rise by approximately 1 percentage point in
2006, which is not expected to influence the will and ability of
the households to take up loans. The growth in the savings
and investment markets will continue. The market is expected
to provide sales of the bank's products and services on a par
with 2005.
Capacity build-up in the financial industry will continue. This,
combined with a more differentiated and demanding market,
will challenge the ability of the organisation to restructure and
to focus on business-oriented priorities. This also demands a
clear strategy on market activities and the development of new
services/products. A very tight labour market will make the
competition for good employees even harder. The Retail
market division is well prepared to meet increased competition,
and a positive development is expected in 2006 as well.
115
There are many dreams, and good banking solutions are what it takes to realise them. Being close to the customers and good advice from our
employees are the pillars of our operations and a precondition for our vision of being the recommended bank.
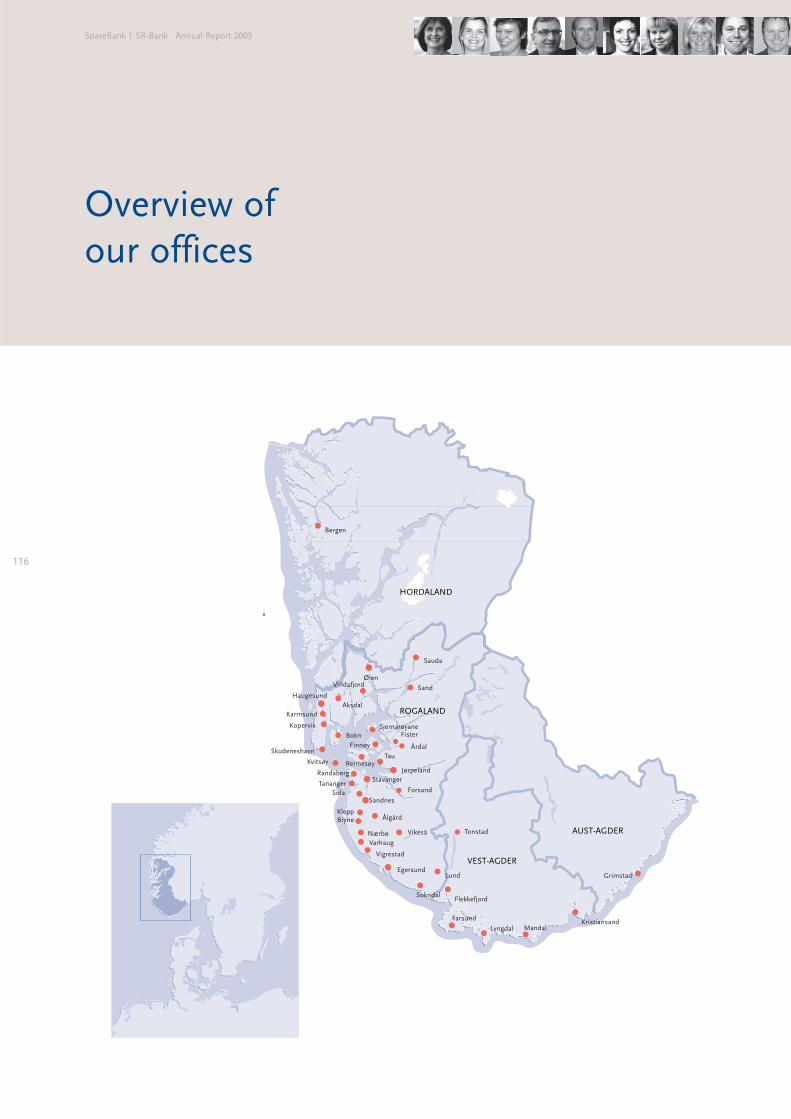
Overview of
our offices
116
SpareBank 1 SR-Bank Annual Report 2005
Sauda
Sand
ØlenVindafjord
Fister
Årdal
Jørpeland
Tau
Forsand
Vikeså Tonstad
Ålgård
Sandnes
Aksdal
Haugesund
Karmsund
Kopervik
Bokn
Sjernarøyane
Rennesøy
Finnøy
Kvitsøy
Sola
Tananger
RandabergStavanger
KleppBryne
Nærbø
Varhaug
Vigrestad
EgersundLund
SokndalFlekkefjord
Farsund
Lyngdal MandalKristiansand
Bergen
Grimstad
Skudeneshavn
117
The Supervisory Board
(The figures in the brackets state how many primary capital
certificates the person in question owned in the Sparebanken
Rogaland as at 31 December 2005. We have also included pri-
mary capital certificates owned by close family members and
known companies in which the person has decisive influence,
cf. Section 1-2 of the Companies Act. We have also included
primary capital certificates belonging to the institution that
has elected the person as its representative.)
Members elected by primary capital certificate owners
Andersson Bjarne, Oslo (1 028 300)
Apeland Bjørn, Tysvær (81 785)
Egenäs Ulf, Sverige (2 225 850)
Erevik Alf, Hønefoss (106 900)
Gudmestad Martha, Stavanger (50)
Haugan Finn, Trondheim (20 870)
Hedberg Per, Stavanger (47 597)
Hystad Anne Elise, Karmøy (5 100)
Jacobsen Trygve, Stavanger (173 672)
Kolnes Mona Iren, Stavanger (4 900)
Kræmer Hanne Karoline, Tromsø (13 450)
Larre Erik Sture, Oslo (49 500)
Nysted Terje, Forsand (152 295)
Næsheim Birte, Stavanger (10 800)
Næss Knut, Jørpeland (188 000)
Skjæveland Randi Larsen, Stavanger (25 400)
Risa Bjarne, Nærbø (8 250)
Risa Einar, Leder, Stavanger (30 000)
Stangeland Torbjørg, Sola (110 000)
Stave Torill, Oslo (261 500)
Tandberg Øyvind Andreas, Hønefoss
Tveteraas Kristine, Oslo (300 010)
Members elected from and by the depositors
Bakke Synnøve I., Hauge i Dalane
Byberg Odd, Klepp
Hansen Kåre, Egersund
Hovland Mandrup, Aksdal
Igland Karl Endre, Lyngdal
Nordtveit Sølvi Lysen, Vats
Reke Mette, Sola (600)
Valskår Terje, Kløfta
Vaage Anbjørn, Suldal
Østensjø Inger, Stavanger (900)
Members appointed by the municipalities
Alvestad Svein Ove, Bokn (966)
Eikeland Peder, Bjerkreim
Fredriksen Kjell H., Egersund
Haram Per, Stavanger (600)
Hidle Terjer, Nord Hidle (960)
Maudal Arne, Forsand
Sølhusvik Lars Johan, Haugesund
Søyland Svein Kj., Gjesdal
Aarenes Hans Greger, Flekkefjord
Aass Tor Syvert, Nærbø
Members elected from and by the employees
Berland Bjørn, Stavanger (2 387)
Clausen Janne, Mandal
Ellingsen Kirsten Siv, Stavanger (282)
Erga Morten, Jæren
Halvorsen Arnt Eivind Roth, Finnøy (1 222)
Hamre Harald Utvik, Stavanger (2 089)
Hegrestad Ragnhild, Egersund (1 400)
Kvale Anne Nystrøm, Stavanger (2 207)
Markhus Lars Magne, Stavanger (4 737)
Solheim Vibeke, Stavanger (722)
Throndsen Astrid H., Finnøy (947)
Trædal Erling, Ølen (1 269)
Wells Eli Lunde, Stavanger (1 237)
Østhus Grethe Berge, Vedavågen
The Board of Directors
General Manager Geir Worum, Chairman of the Board
Ship ownerr Kristian Eidesvik, Deputy Chairman
of the Board (3 000)
Managing Director John Peter Hernes
Controller Ingrid Landråk
Managing Director Magne Vathne
Attorney Anne Elisabeth Kroken
Asset manager Gunn Jane Håland
CEO Terje Vareberg (22 669)
Employee representative Torstein Plener (2 527)
Deputy member for the employees (regulary attends board
meetings) Birte Wereide (1 441)
Deputy member (regulary attends board meetings)
Lise Hansson
The Audit Committee
Attorney Odd Rune Torstrup, Chairman of the Board
Head of Division Odd Broshaug, Deputy Chairman
of the Board
Manager Svein Hodnefjell
Exploration Manager Vigdis Wiik Jacobsen
Technical director Kåre Hansen
Group management
CEO Terje Vareberg (22 669)
Deputy CEO, CFO Sveinung Hestnes (2 117)
Acting CFO Gro Tveit (1 507)
Executive Group Controller, CRO Frode Bø (365)
Executive Vice President Retail Market Rolf Aarsheim (4 847)
Executive Vice President Corporate Market Tore Medhus (2 907)
Executive Vice President Human Resources
Arild Langberg Johannessen (2 507)
Executive Vice President Public Relations
Thor-Christian Haugland (842)
Executive Vice President, Business Support, IT and Security
Svein Ivar Førland (1 302)
External auditor
PricewaterhouseCoopers DA
Attn. state-authorised public accountant Torbjørn Larsen
Governing bodies
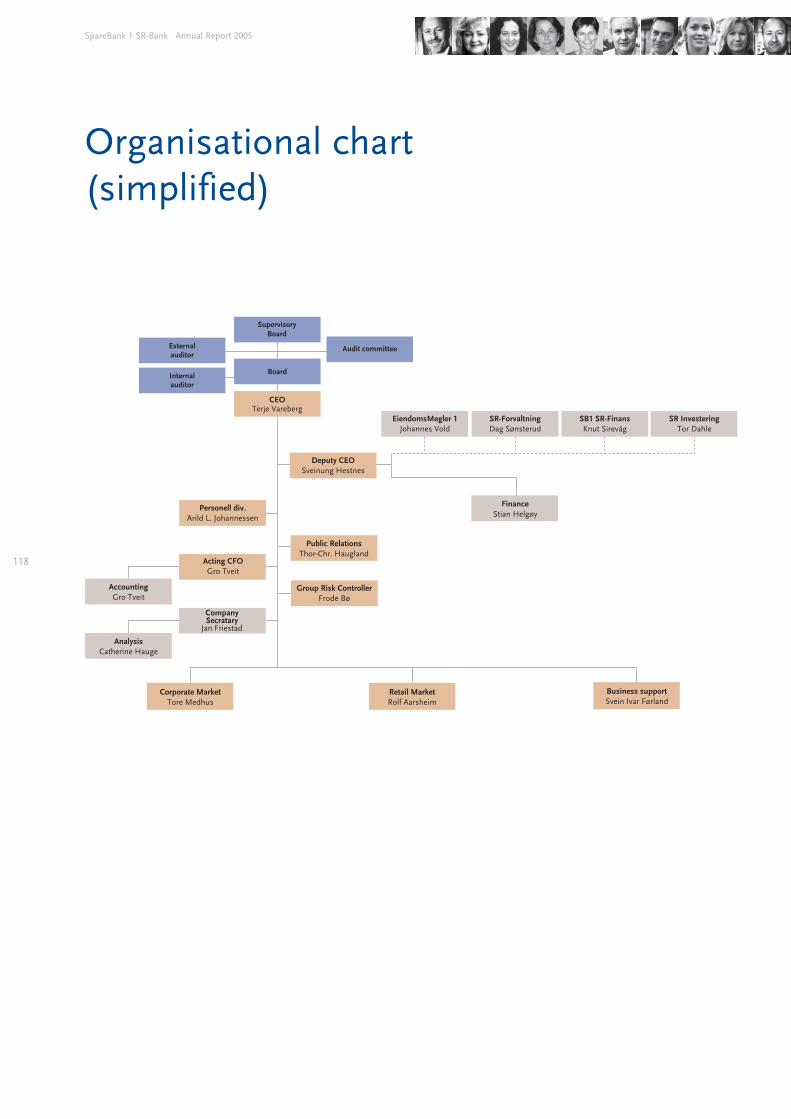
Organisational chart
(simplified)
118
SpareBank 1 SR-Bank Annual Report 2005
Board
Externalauditor
Internalauditor
CompanySecratary
SupervisoryBoard
CEO
Jan Friestad
Sveinung Hestnes
Terje Vareberg
Audit committee
Deputy CEO
Stian HelgøyFinance
Arild L. JohannessenPersonell div.
Thor-Chr. HauglandPublic Relations
Gro TveitActing CFO
Frode BøGroup Risk Controller
Gro TveitAccounting
Catherine HaugeAnalysis
Johannes VoldEiendomsMegler 1
Dag SønsterudSR-Forvaltning
Knut SirevågSB1 SR-Finans
Tor DahleSR Investering
Tore MedhusCorporate Market
Rolf AarsheimRetail Market
Svein Ivar FørlandBusiness support

SpareBank 1 SR-Bank
CENTRAL SWITCHBOARD +47 02002
HEAD OFFICE/ADMINISTRATION:
Bjergsted Terrasse 1, P.O. Box 218
4001 Stavanger, Norway
Fax +47 51 88 22 78
E-mail: [email protected]
Website: www.sr-bank.no
Melvæ
r&L
ien Th
e Idea En
trepreneu
r Prin
t: Bryn
e Offset


![[Morten Tønnessen] Utopian Realism 2009](https://static.fdocuments.in/doc/165x107/577d399c1a28ab3a6b9a2e04/morten-tonnessen-utopian-realism-2009.jpg)


![[Morten Tønnessen] 'Tell Me, Where is Morality Bred?' (the Semioethics Interviews I, John Deely)](https://static.fdocuments.in/doc/165x107/577d399c1a28ab3a6b9a2dff/morten-tonnessen-tell-me-where-is-morality-bred-the-semioethics.jpg)
