Annual Report and Financial Statements Year ended 31 … - 2015... · 2016-05-25 · Annual Report...
68
Marex Financial Limited Annual Report and Financial Statements Year ended 31 December 2015 Registration Number: 05613061
Transcript of Annual Report and Financial Statements Year ended 31 … - 2015... · 2016-05-25 · Annual Report...

Marex Financial Limited
Annual Report and Financial Statements
Year ended 31 December 2015
Registration Number: 05613061

Marex Financial Limited TABLE OF CONTENTS
Directors’ Report .................................................................................................................................................... 1
Directors’ Responsibility Statement ....................................................................................................................... 5
Strategic Report ...................................................................................................................................................... 6
Independent Auditor’s Report .............................................................................................................................. 21
Income Statement ................................................................................................................................................. 23
Statement of Other Comprehensive Income ......................................................................................................... 23
Statement of Financial Position ............................................................................................................................ 24
Statement of Changes in Equity ............................................................................................................................ 26
Cash Flow Statement ............................................................................................................................................ 27
Notes to the Financial Statements ......................................................................................................................... 29

Marex Financial Limited COMPANY INFORMATION
Country of Incorporation England and Wales
Legal Form Private limited company
Directors I T Lowitt
S H Sparke
S Van Den Born
R S Watts
Company Secretary N R Edwards
Registered Office 155 Bishopsgate London EC3M 3TQ
Auditor Deloitte LLP Hill House 1 Little New Street London EC4A 3TR
Bankers Lloyds Bank plc 25 Gresham Street London EC2V 7HN
Bank Leumi (UK) plc 20 Stratford Place London W1C 1BG
HSBC Bank plc Level 19 8 Canada Square London E14 5HQ

Marex Financial Limited DIRECTORS’ REPORT
The directors present their report and audited financial statements of Marex Financial Limited (‘MFL’, ‘the Company’ or ‘the firm’) for the year ended 31 December 2015. The Company is a wholly owned subsidiary of Marex Spectron Group (the ‘Group’or ‘Marex Spectron’).
About Marex Financial Limited
Marex Financial Limited is a leading independent global commodities brokerage headquartered in London with a global network spanning Asia and North America, with dominant market shares in many major agricultural, metal and energy products.
Our mission is to ensure that we offer our clients superior access to liquidity in global commodity markets, on exchange or off exchange. Our business is integrated, truly global and prudently managed.
We offer electronic and voice broking services, with state of the art networks to facilitate complex trading strategies for our clients. We provide insight and know-how, based on decades of experience, a vast market data set and the latest analytic tools.
While commodity markets form the core of our business, we have responded to client demand for broader services and have active, successful teams broking financial futures and options. We also have a division that provides a full suite of services to trading firms who need to outsource infrastructure, support operations and the management of electronic trading solutions.
The firm has a broad range of clients including commodity producers and consumers, banks, hedge funds, asset managers, brokers, commodity trading advisors and professional traders.
We are members of the London Metal Exchange (‘the LME’), where we are a Category 1 Member and Ring Dealer; the CME Group of exchanges (‘the CME’), the Intercontinental Exchange group of exchanges (‘ICE’) and many others.
We are regulated in the UK by the Financial Conduct Authority (‘the FCA’, which also regulates our Group under consolidated supervision).
Chief Executive Officer review
Over the past few years, we have solidified and advanced our market position in our core businesses, globally. Despite the very challenging market backdrop of declining commodity prices, evidenced by the 56% decline in the Bloomberg Commodity Index from 175 in April 2011 to 78 in December 2015 (matching the lows of 1999) we have steadily increased our operating income. In 2013, at a Group level, we posted an operating loss of $9 million; in 2014 we generated an operating profit of $15 million, which increased a further 50% to $23 million in 2015.
This strongly positive operating profit trajectory at the Group level is the result of successfully offsetting revenue attrition with cost efficiencies, and exiting unprofitable activity at both the business and desk level. In 2015, despite $10 million less revenue than 2013, we made almost $32 million more operating profit before tax (‘PBT’). Around one third of this profit improvement is due to exiting underperforming businesses; the remaining two thirds is due to improvement in our core.
Marex Financial Limited, as a principal subsidiary of the Group, holds 78% of the total assets, contributed 64% ($221 million) of the revenue and 40% ($9 million) of the PBT in 2015. This is a 125% increase in PBT ($4 million) from 2014.
Our specific competence is in Commodities brokerage and trading, and our leading franchises have found ways, despite the environment, to grow.
In Metals, the firm continues to consolidate its position as a leading liquidity provider on the LME, steadily increasing an already strong market share. Significant structural change in the Metals market, driven in large part by pricing changes at the LME, pose a considerable challenge to market participants. By being adaptable and nimble we are finding ways to take advantage of conditions to enhance our franchise.
Agriculturals have been growing the brokerage element of the business to offset increasingly challenging trading conditions. Sugar has been a particularly successful venture in 2015 and we continue to be a leader in the cocoa and coffee options markets.
ProTrader has rationalised its cost and pricing structure, added to its product set, and has had success attracting new teams.
1

Marex Financial Limited DIRECTORS’ REPORT (CONTINUED)
Chief Executive Officer Review (continued)
In Financial Futures and Options, we are performing well in a very difficult environment and the new teams we have attracted are making good progress.
Importantly, this business growth has been accomplished within a culture that emphasises ethics, prudence and responsibility, and which is supported by rigorous compliance processes. We believe the best businesses must operate with high integrity to be successful over the long term.
Support and Control is at the heart of our business operations. Here we have steadily and prudently improved cost efficiency and the quality of our support for the businesses. If one remains disciplined around costs, there are economies of scale in our business and this has been an important driver of our improved profitability.
We have also strengthened our liquidity and capital in recent years. Net Group liquidity, which is the difference before our sources and all uses of liquidity, averaged $184 million in 2014 and increased to $213 million in 2015, due in part to unusually high aggregation benefits. Marex Financial Limited contributes more than 90% of Group’s Liquidity. Our year-end regulatory capital surplus in 2015 for the Group was $113 million versus $76 million in 2014, of which the Company had a year-end regulatory surplus of $91 million versus $71 million in 2014.
Conclusion
The Executive Team and I are pleased with our progress in 2015 and remain ambitious and optimistic for the firm’s prospects going forward. We will continue to focus on ensuring that Marex Spectron is the place where we serve the firm’s clients differentially well, and where talented and hard-working professionals want to build their careers. We intend to expand where we have competitive advantage in Commodities brokerage and trading to add products and teams to grow our core franchises.
2

Marex Financial Limited DIRECTORS’ REPORT (CONTINUED)
Directors
The following directors have held office throughout the year and to the date of this report, except where noted:
Appointed Resigned
I T Lowitt
K D C Nutt 23 July 2015
S H Sparke
J P Wall 8 January 2016
S Van Den Born 1 March 2016
R S Watts 30 March 2016
Indemnity of directors
Each director is indemnified out of the assets of the Company against all costs, charges, losses and liabilities incurred by them in the proper exercise of their duties. Directors who have resigned during the year also benefit from the same indemnity arrangement. In addition, the directors are covered by an insurance policy.
Directors’ statement as to disclosure of information to the Auditor
Each of the persons, who is a director at the date of approval of this report, confirms that:
so far as he is aware, there is no relevant audit information of which the Company’s auditor is unaware; and
that he has taken all the steps that he / she ought to have taken as a director in order to make himself / herself aware of any relevant audit information and to establish that the Company’s auditor is aware of that information.
This confirmation is given and should be interpreted in accordance with the provisions of s418 of the Companies Act 2006.
Charitable and political contributions
Marex Financial Limited maintains a $100,000 per annum fund to support employees in their charitable fundraising activities. It does this by donating 50% of the sum raised by the employee to the chosen charities. In order to ensure that the fund can be accessed by as many employees as possible, donations from the company are capped at $2,500 per fundraising event. The total charitable donations from this programme were $28,995 during the year ended 31 December 2015 (2014: $58,000).
No contributions were made for political purposes during the year (2014: $nil).
Foreign exchange
The following foreign exchange rates have been used in the preparation of these financial statements:
2015 2014
Average rate Year-end rate Average rate Year-end rate
GBP / USD 1.5248 1.4738 1.6458 1.5575
USD / EUR 1.1031 1.0855 1.3206 1.2098
Going concern
After reviewing the annual budget, liquidity requirements, plans and financial arrangements the directors are satisfied that the Company have adequate resources to continue to operate for the foreseeable future and for at least 12 months from the date of signing of the balance sheet and confirm that the Company is a going concern. For this reason they continue to adopt the going concern basis in the preparation of these financial statements.
3


Marex Financial Limited DIRECTORS’ RESPONSIBILITY STATEMENT
Company law requires the directors to prepare financial statements for each financial year. Under that law the directors have elected to prepare the financial statements in accordance with International Financial Reporting Standards (‘IFRSs’) as adopted by the European Union. In accordance with company law, the directors must not approve the financial statements unless they are satisfied that they give a true and fair view of the state of affairs of the Company and of the profit or loss of the Company for that period.
In preparing these financial statements, International Accounting Standard (‘IAS’) 1 requires directors to:
properly select and apply accounting policies;
present information, including accounting policies, in a manner that provides relevant, reliable,comparable and understandable information;
provide additional disclosures when compliance with the specific requirements in IFRSs are insufficientto enable users to understand the impact of particular transactions, other events and conditions on theCompany’s financial position and financial performance; and
make an assessment of the Company’s ability to continue as a going concern.
The directors are responsible for keeping adequate accounting records that are sufficient to show and explain the Company’s transactions and disclose with reasonable accuracy at any time the financial position of the Company and enable them to ensure that the financial statements comply with the Companies Act 2006. They are also responsible for safeguarding the assets of the Company and, hence, for taking reasonable steps for the prevention and detection of fraud and other irregularities.
The directors are responsible for the maintenance and integrity of the corporate and financial information included on the Company’s website. Legislation in the United Kingdom governing the preparation and dissemination of financial statements may differ from legislation in other jurisdictions.
5

Marex Financial Limited STRATEGIC REPORT
Review of financial performance
Overview
Marex Financial Limited has faced challenging market conditions over the past number of years. The Bloomberg Commodity Index (‘BCI’) ended the financial year at 78.6, declining almost 25% from 104.3 at the start of the year and is at levels comparable to those experienced back in May 1999.
Since May 1999, the BCI increased by over 196% to an all-time high point of 233.0, in June 2008, before retreating 50% to 117.2 by the end of that year as a result of the Global Financial Crisis. Following the turmoil, the commodity markets rallied peaking at 175.4, a 50% increase, in April 2011. However, since then, the BCI has experienced steady erosion, declining almost 97 points or 55% to the year-end position of 78.6.
In terms of volatility, in both 2014 and 2015, the BCI was 24% down on the long-term average. Declining prices and declining volatility challenged the firm’s clients and the business.
The Company was also subject to a number of additional challenges including: increased regulation; prevailing low interest rates across all major world economies; and reduced trading and broking opportunities.
Despite the backdrop of declining global commodity prices and a challenging market environment, Marex Financial Limited reported an operating profit of $9.0 million for the year ended 31 December 2015, $5.0 million (125.0%) higher than the prior year. Whilst revenues were $22.5 million (9.2%) lower compared to 2014, the Company’s costs were reduced by $27.5 million (11.5%) as the firm has exited underperforming businesses and activity and dramatically improved cost efficiency.
2015 v 2014
2015
$ million 2014
$ million
Increase / (decrease)
$ million
Increase / (decrease)
%
Revenue 221.3 243.8 (22.5) (9.2%)
Expenses (212.3) (239.8) 27.5 (11.5%)
Operating profit 9.0 4.0 5.0 125.0%
6

Marex Financial Limited STRATEGIC REPORT (CONTINUED)
Review of financial performance (continued)
Overview (continued)
2015 v 2014
2015
$ million 2014
$ million
Increase / (decrease)
$ million
Increase / (decrease)
%
Operating profit 9.0 4.0 5.0 125.0%
Net finance (1.3) (0.6) (0.7) 116.7%
Profit before taxation excluding one-time items
7.7
3.4
4.3
126.5%
Eden goodwill impairment (3.0) (1.6) (1.4) 87.5%
Leasehold dilapidations (0.5) - (0.5) n.m.
Dividend income 2.3 - 2.3 n.m.
One-time items (1.2) (1.6) 0.4 (25.0%)
Profit before taxation 6.5 1.8 4.7 261.1%
Current year tax (charge) / credit (4.8) (1.3) (3.5) 269.2%
Deferred tax credit / (charge) (0.1) (0.1) - n.m.
Taxation (4.9) (1.4) (3.5) 250.0%
Profit after taxation 1.6 0.4 1.2 300.0%
Profit before tax was $6.5 million for the year, compared to $1.8 million for 2014.
There are a number of one-time items impacting results in both 2014 and 2015. In 2015, the Company took a further $3.0 million impairment charge (2014: $1.6 million), reflecting ongoing performance issues in Securities in the face of market headwinds and regulatory burdens, against the goodwill associated with the 2011 purchase of Eden Financial Limited (‘Eden’) fully impairing the goodwill balance for that investment. Also, as the Company prepares to exit a property in 2016, the Company provided $0.5 million (2014: $nil) in respect of expected costs associated with leasehold dilapidations.
Excluding the effect of one-time items, the Company’s profit before tax was $7.7 million, an improvement of $4.3 million (126.5%) on the prior year.
7

Marex Financial Limited STRATEGIC REPORT (CONTINUED)
Review of financial performance (continued)
Overview (continued)
Net finance includes an increase in charges associated with the Company’s revolving credit facility of $1.0 million representing the full year cost of the facility first entered into in June 2014.
Overall, management earnings before interest, tax, depreciation and amortisation (‘management EBITDA’), increased by $7.1 million (65.1%) year-on-year.
2015 v 2014
2015
$ million 2014
$ million
Increase / (decrease)
$ million
Increase / (decrease)
%
Profit before taxation 6.5 1.8 4.7 261.1%
Adjustments:
Depreciation and amortisation 3.8 5.1 (1.3) (25.5%)
Finance income (0.5) (0.3) (0.2) 66.7%
Finance expense 1.9 0.9 1.0 111.1%
Sub-total 11.7 7.5 4.2 56.0%
Management non-operating items in operating profit 6.3 3.4 2.9 85.3%
Management EBITDA 18.0 10.9 7.1 65.1%
8

Marex Financial Limited STRATEGIC REPORT (CONTINUED)
Review of financial performance (continued)
Business review
The Company is organised into four business segments across three geographic regions. Gross revenues were $221.3 million representing a decrease of $22.4 million (9.2%) when compared to 2014.
2015 ($ million) North America Europe Asia Total
Commodities 1.6 90.6 13.4 105.6
Futures and Securities - 24.5 - 24.5
Market Access - 78.4 - 78.4
Other - 12.8 - 12.8
Revenue 1.6 206.3 13.4 221.3
2014 ($ million) North America Europe Asia Total
Commodities 3.0 94.3 13.5 110.8
Futures and Securities 0.2 28.6 - 28.8
Market Access - 87.7 - 87.7
Other - 16.5 - 16.5
Revenue 3.2 227.1 13.5 243.8
The Directors also review the Company’s performance on a net revenue basis. Gross revenue is reduced by Cost of Trade of $95.7 million (2014: $96.3 million) and net finance and other income of $2.6 million credit (2014: $0.5 million credit).
Consequently, the segmental analysis of net revenue is as follows:
2015 ($ million) North America Europe Asia Total
Commodities 0.8 63.4 8.6 72.8
Futures and Securities - 22.1 - 22.1
Market Access - 18.3 - 18.3
Other - 15.0 - 15.0
Net revenue 0.8 118.8 8.6 128.2
2014 ($ million) North America Europe Asia Total
Commodities 2.3 71.7 9.7 83.7
Futures and Securities 0.1 25.4 - 25.5
Market Access - 22.4 - 22.4
Other - 16.4 - 16.4
Net revenue 2.4 135.9 9.7 148.0
9

Marex Financial Limited STRATEGIC REPORT (CONTINUED)
Business review (continued)
Commodities net revenue decreased by $10.9 million (13.0%)
Metals
Metals continue to consolidate its position as a leading liquidity provider on the LME, steadily increasing an already strong market share (17% of 2015 volumes and consistently ranked number 1 or 2 on the exchange). The level of change in the market, driven in large part by the new owners of the LME and additional regulation, poses a considerable challenge, as does the backdrop of declining metals prices. However, the business has found ways to take advantage of others exiting the market to consolidate our position.
Net revenues declined $11.6 million (18.6%). This was mainly due to a reduction in trading activity while net commission was broadly flat, despite an increase in fees payable to the LME from 42% of gross commission in 2014 to 49% in 2015.
Agriculturals
Agriculturals increased net revenues by $0.7 million (3.4%) year-on-year. Sugar has been a particularly successful venture and the desk continues to be a leader in the cocoa and coffee markets. Increased volatility in the macroeconomic environment was driven by a variety of factors: unusual weather conditions caused by the ‘El Niño’ effect driving the cocoa bull market; weakening of Emerging Markets currencies, which reduced the price of some key commodities (i.e. Brazilian Real affecting the world price of coffee and sugar); and the consolidation of trading houses and increased strength of financing banks.
Futures and Securities net revenue decreased by $3.4 million (13.3%)
Financial Futures and Options (‘FFO’)
FFO performed well in a very difficult environment and the new teams that the firm has attracted are making good progress. Substantial decreases in interest rate futures volatility, in 2015, were responsible for a decline in performance with a decrease in net revenue of $2.5 million (18.7%).
Securities
In 2015, the Securities business generated net revenue of $6.4 million (a reduction of 13.5% compared to 2014). The profitable Equity Finance business has partially offset losses in other parts of the business which were subscale. After the year end, the Directors decided to exit the Securities business following the continued underperformance of the business and the impairment of the remaining goodwill associated with Eden.
Market Access decreased by $4.1 million (18.3%)
ProTrader
ProTrader has rationalised its cost and pricing structure, added to its product set, and has had success attracting new teams in an extremely competitive landscape. Operating profit improved from $1.5 million to $1.8 million, this year, due to cost reductions offsetting a contraction in revenues. Revenues decreased due to a reduction in the number of traders and lower market volumes.
Direct Market Access (‘DMA’)
DMA desks were restructured during the latter part of 2014 into the early part of 2015. The effect of this has been to improve operating profit by $2.6 million.
10
Marex Financial Limited STRATEGIC REPORT (CONTINUED)
Balance sheet
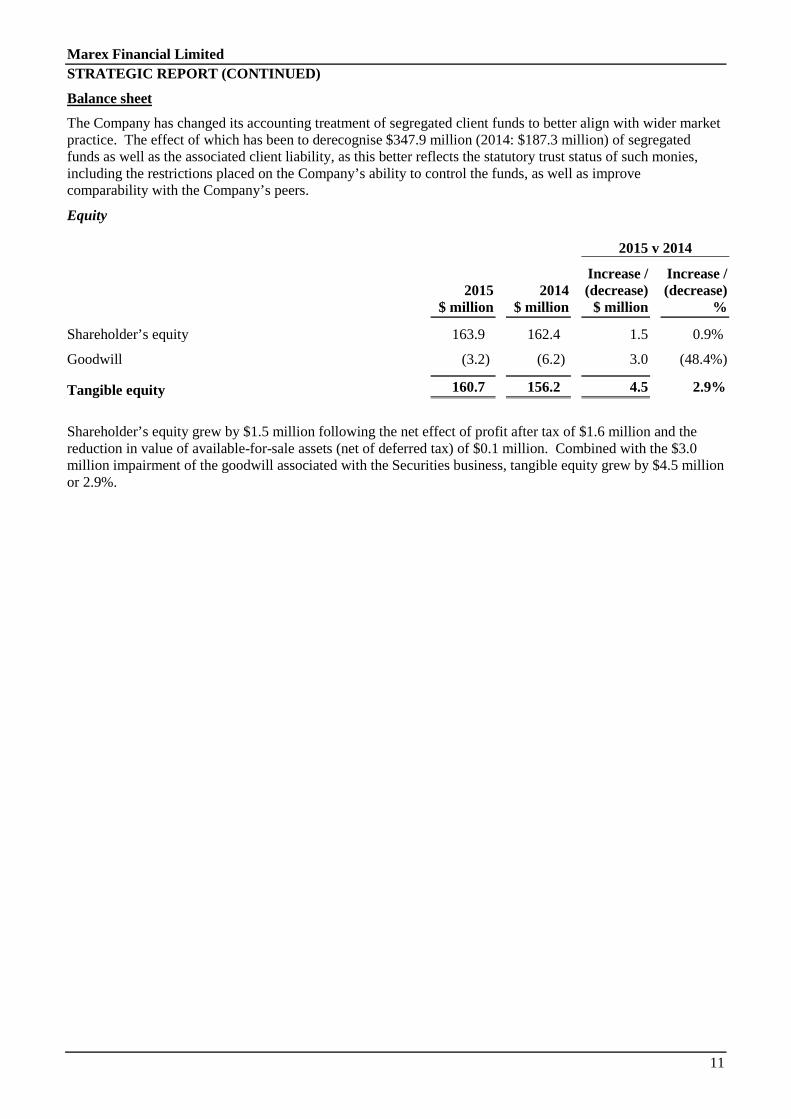
The Company has changed its accounting treatment of segregated client funds to better align with wider market practice. The effect of which has been to derecognise $347.9 million (2014: $187.3 million) of segregated funds as well as the associated client liability, as this better reflects the statutory trust status of such monies, including the restrictions placed on the Company’s ability to control the funds, as well as improve comparability with the Company’s peers.
Equity
2015 v 2014
2015 $ million
2014 $ million
Increase / (decrease)
$ million
Increase / (decrease)
%
Shareholder’s equity 163.9 162.4 1.5 0.9%
Goodwill (3.2) (6.2) 3.0 (48.4%)
Tangible equity 160.7 156.2 4.5 2.9%
Shareholder’s equity grew by $1.5 million following the net effect of profit after tax of $1.6 million and the reduction in value of available-for-sale assets (net of deferred tax) of $0.1 million. Combined with the $3.0 million impairment of the goodwill associated with the Securities business, tangible equity grew by $4.5 million or 2.9%.
11

Marex Financial Limited STRATEGIC REPORT (CONTINUED)
Balance sheet (continued)
2015 2014
$ million Assets Liabilities Assets Liabilities
Cash and cash equivalents 133.3 - 134.9 -
Financial instruments – held to maturity (Treasuries) 119.5 - 60.0 -
Warrant inventory 15.9 - - -
Repurchase agreements - (18.9) - -
Credit facility - - - (25.0)
Liquid resources 268.7 (18.9) 194.9 (25.0)
Trade receivables 576.7 - 498.5 -
Other receivables 12.0 - 84.2 -
Trade payables - (604.2) - (465.3)
Other payables - (88.6) - (146.1)
Trade and other receivables / (payables) 588.7 (692.8) 582.7 (611.4)
Financial instruments assets 4.9 - 12.2 -
Financial instruments liabilities - (3.5) - (10.3)
Matched principle broking (FX and bullion)
4.9
(3.5)
12.2
(10.3)
Net tax assets / (liabilities) 0.5 - - (3.6)
Provisions - (0.9) - (0.7)
Non-current assets 14.0 - 17.4 -
14.5 (0.9) 17.4 (4.3)
876.8 (716.1) 807.2 (651.0)
Tangible equity 160.7 156.2
Overall, total assets on the balance sheet have increased by $65.2 million (8.0%) year-on-year. Trade payables, representing client activity, grew $138.0 million from $465.2 million to $604.2 million as at 31 December 2015. Margin requirements with exchanges also increased, but to a lesser extent, as the Company posted an additional $78.2 million of collateral from $498.5 million to $576.7 million at the year end.
12

Marex Financial Limited STRATEGIC REPORT (CONTINUED)
Balance sheet (continued)
Deployment of equity
While cash and cash equivalents was essentially flat year-on-year, the Company increased its liquid resources by $79.9 million, mainly in US Treasuries, to $119.5 million (up $59.5 million for 2015, of which $18.9 million were repo’d) and purchased $15.9 million of warrant inventory (which can be liquidated in one to two days).
2015 v 2014
2015
$ million 2014
$ million
Increase / (decrease)
$ million
Increase / (decrease)
%
Cash and cash equivalents 133.3 134.9 (1.6) (1.2%)
Financial instruments – held to maturity (Treasuries) 119.5 60.0 59.5 99.2%
Warrant inventory 15.9 - 15.9 n.m.
Repurchase agreements (18.9) - (18.9) n.m.
Credit facility - (25.0) 25.0 (100.0%)
Liquid resources 249.8 169.9 79.9 47.0%
Trade and other receivables 576.7 498.5 78.2 15.7%
Trade and other payables (604.2) (465.3) (138.9) 29.9%
Net trade receivables (27.5) 33.2 (60.7) (182.8%)
Financial instruments assets 4.9 12.2 (7.3) (59.8%)
Financial instruments liabilities (3.5) (10.3) 6.8 (66.0%)
Matched principle broking (FX and bullion)
1.4
1.9
(0.5)
(26.3%)
Other receivables 12.0 84.2 (72.2) (85.7%)
Other payables (88.6) (146.1) 57.5 (39.4%)
Net tax assets / (liabilities) 0.5 (3.6) 4.1 (113.9%)
Provisions (0.9) (0.7) (0.2) 28.6%
Non-current assets 14.0 17.4 (3.4) (19.5%)
(63.0) (48.8) (14.2) 29.1%
160.7 156.2 4.5 2.9%
Liquidity
In addition to cash and unencumbered US Treasuries, the firm includes in its Liquid Resources its warrant inventory and house forward profits on the LME. These are included within Liquidity Resources as Group Treasury is able to convert these to cash on a trade date plus one-day basis. Forward profits on LME arise from closed out house positions that are in the money, but the cash is not received until the position finally settles. However, the firm is able to utilise these profits as part of its collateral requirements at the LME or if in excess to requirements, can be sold or factored.
13

Marex Financial Limited STRATEGIC REPORT (CONTINUED)
Regulatory capital
The Company has maintained its strong capital base throughout the year as well as at the balance sheet date.
As at 31 December 2015, the Company had a total capital requirement of $59.3 million (2014: $77.4 million) and capital resources of $149.8 million (2014: $148.0 million) equating to an excess of $90.5 million (2014: $70.6 million) and a solvency ratio of 252% (2014: 192%).
The average capital requirement for the year was $84.0 million (2014: $93.9 million), supported by $149.8 million (2014: $148.0 million) of regulatory capital resources and, therefore, the average surplus was $65.8 million (2014: $54.1million).
Return on assets
The return on assets as required by Article 90 of the Capital Requirements Directive as at 31 December 2015 is 5% (2014: 2%). The return on assets reflects the Company’s operating profit of $9.0 million (2014: $4.0 million) as a percentage of the net assets $163.9 million (2014: $162.4 million).
14

Marex Financial Limited STRATEGIC REPORT (CONTINUED)
Overview of risk management
Effective risk management is at the core of the Company’s business operations. In place are clear risk management objectives which are delivered through established risk management processes. The Company views risk management as a key factor in delivering its strategic business aims and objectives whilst ensuring its long-term sustainability and effective corporate governance. Business strategy, risk strategy and risk appetite are all linked to ensure that decision making across the Company reflects the correct approach to risk and that it is in line with the risk appetite and risk strategy of the organisation.
The Company places reliance on the overall risk management function of the Marex Spectron Group Limited.
Excellence in risk management is at the core of Marex Spectron’s business operations. The Group has stringent risk management procedures and a well-established risk management processes. Marex Financial Limited views risk management as a key factor in delivering its strategic business aims and objectives whilst ensuring its long-term sustainability and effective corporate governance.
Business strategy, risk strategy and risk appetite are all aligned to ensure that decision making across the Group reflects the correct approach to risk. By taking into account the risks posed across each of the business lines, the effective management of capital and liquidity within Marex Financial Limited is optimised. The Marex Spectron Enterprise Wide Risk Management (‘EWRM’) framework sets out the risk management approach and consists of the following eight key components:
15

Marex Financial Limited STRATEGIC REPORT (CONTINUED)
Governance structure
Marex Spectron’s risk governance model underpins how the risk management structure is directed across the Group.
In pursuit of effective risk governance, a ‘Three Lines of Defence’ model has been adopted in conjunction with a strong risk culture, good communication and understanding and a strong sense of risk awareness across the Group:
the first line of defence covers the controls in place to deal with and manage the day-to-day risk management within the business units, support functions and embedded operational risk staff;
the second line of defence consists of the specialist control functions which make up the risk management infrastructure of the Company; and
the third line of defence is Marex Financial Limited’s internal audit function auditing and covering all aspects of both the first and second lines of defence.
16

Marex Financial Limited STRATEGIC REPORT (CONTINUED)
Risk control and reporting framework
There is a clearly defined suite of risk tools, processes, policies and procedures in place that allow for the successful monitoring and control of the risks of the Company and a clearly defined escalation and reporting process to senior management and other key staff within the Company.
The control framework consists of the following components:
Risk policy framework
Marex Spectron’s policy framework sets out the rules and guidelines for drafting, approving, communicating, implementing, embedding and monitoring compliance for all risk related policies across the Company. The policy framework defines the key policies necessary to manage all risks arising within each risk category across the Company and aims to deliver a focused and consistent enterprise wide view of risk. Specific policies and procedures have been implemented to address each of the principal risks, see below. The process and methodology for addressing each risk may differ depending on the relevant business unit.
The policy framework sets the minimum standards for how each risk is:
identified – the method used to identify risk exposures;
measured – how the likelihood, severity and impact / quantum of those risks is measured;
managed – how minimum standards are set to manage the risks;
controlled – the controls in place to help mitigate the risks;
reported – how the risks are communicated, reported, and escalated; and
assured – how the risk management process is overseen by an independent function.
17

Marex Financial Limited STRATEGIC REPORT (CONTINUED)
Internal audit
Marex Spectron has an internal audit function and this represents the Company’s third line of defence providing independent assurance to senior management and the Board. The objectives of Internal Audit are to assess the effectiveness of the Company’s risk management, internal controls and governance process; whether operational and financial controls are appropriate and consistently applied; the effectiveness of internal controls for the safeguarding of assets; the reliability and integrity of management information; and the adequacy of processes to ensure compliance with applicable laws and regulations.
Principal risks and uncertainties
The Company faces a variety of risks that are inherent in its normal course of business. The following are deemed to be the principal risks and uncertainties that could affect Marex Financial Limited’s activities:
Credit risk
Credit risk refers to the risk of loss arising when a third party who owes Marex Financial Limited money, securities or other assets and fails to perform on their contractual obligations arising from their activities with the Company. This situation may arise due to their lack of liquidity, bankruptcy, operational failure as well as other reasons. In addition, a failure or concerns regarding default of a large financial institution could lead to liquidity problems, losses or subsequent defaults by other institutions which could, subsequently, adversely affect the Company.
This risk is mitigated by the robust client approval process, the taking of collateral and the continual and real time monitoring of clients / counterparties and their exposures. Most clients are required to pre-fund their obligations to the Company, but a small subset are granted credit facilities following detailed qualitative and quantitative analysis and approval by the Marex Spectron’s Credit Committee and, if necessary, the Board Risk Committee. Concentrations of risk are carefully monitored and controlled, whether they are the result of a single client or counterparty, geography, sector, market or product and remedial action is taken where either a risk appetite level is approached / breached or where considered necessary for other reasons.
Market risk
Market risk refers to the risk that a change in the level of one or more market prices, rates, indices, implied volatilities (the price volatility of the underlying instrument imputed from option prices) or other market factors, will result in losses for a position. It is also directly impacted by the liquidity in the markets in which the instruments are traded. As the instruments are recognised at fair value, those changes are directly reported in income.
The price level or volatility of the markets in which Marex Financial Limited operates can adversely affect its ability to meet its business objectives and earnings. The Board has clearly defined its risk appetite for market risk and a variety of measurement methodologies, including Value at Risk (‘VaR’), scenario analysis and stress testing are used to quantify and assess the levels of market risk to which the Company is exposed and to ensure that it remains within the defined risk appetite.
The Company’s overall exposure to market risk is mitigated by its operation as an intermediary on most transactions. As an intermediary, Marex Financial Limited aims to minimise its market risk by matching buyers and sellers. However, from time-to-time, the Company will take the risk of a given trade onto its own books within pre-defined parameters and risk limits which are monitored and controlled by the Risk Department.
Although Marex Financial Limited may, from time-to-time, hold metal warrants, the market risk in this activity is largely eliminated or minimised by hedging these warrants using spot and forward trades on the LME.
Foreign currency risk
As the majority of the revenue and assets and liabilities of the Company are generated in US Dollars, Marex Financial Limited is subject to minimal structural currency risk.
Interest rate risk
Marex Financial Limited is exposed to interest rate risk on cash and investment balances it holds, client balances and bank borrowings. The Company’s view is that the main interest rate risk is derived from interest bearing deposits, in which it invests surplus funds, and bank borrowings.
18

Marex Financial Limited STRATEGIC REPORT (CONTINUED)
Operational risk
Operational risk is the risk of loss arising through failures associated with personnel, processes or systems, or from external events. It is inherent in every business organisation and covers a wide spectrum of issues. Operational risk is managed through systems and procedures in which processes are documented, independently authorised, and transactions are monitored and reconciled. The Company maintains disaster recovery and business continuity facilities to support its activities and the invocation of these facilities is regularly tested.
Liquidity risk
Marex Financial Limited defines liquidity risk as the failure to meet its day-to-day capital and cash flow requirements. Liquidity risk is assessed and managed under the Individual Liquidity Adequacy Assessment (‘ILAA’) and liquidity risk framework. The Company’s liquidity could be impaired by an inability to sell assets or unforeseen outflows of cash or collateral. This situation may arise due to circumstances beyond the Marex Financial Limited’s control, such as general market disruption or an operational problem that affects third parties or the Company or even by the perception amongst market participants that the Company is experiencing greater liquidity risk.
The Company’s ability to sell assets may be further impaired if other market participants are seeking to sell similar assets at the same time, as is likely to occur in a liquidity or other market crisis.
To mitigate liquidity risk, Marex Financial Limited has implemented robust cash management policies and procedures that monitor liquidity daily to ensure that the Company has sufficient resources to meet its margin requirement at clearing houses and third party brokers. There are strict guidelines in relation to products and duration into which excess liquidity can be invested.
Excess liquidity is invested in highly liquid instruments, such as cash deposits with financial institutions for a period of less than three months and US Treasuries with a maturity of up to two years.
The financial liabilities are based upon rates set on a daily basis, apart from the Company financing of the warrant positions and the credit facility where the rates are set for the term of the loan and / or repo. For assets not marked-to-market, there is no material difference between their carrying value and fair value.
In the event of a liquidity issue arising, Marex Financial Limited has recourse to existing global cash resources and also has a $50 million committed revolving credit facility as additional contingency funding.
Compliance and legal risk
Compliance or regulatory risk arises from a failure or inability to comply with the laws, regulations or codes applicable specifically to the financial services industry. Non-compliance can lead to fines, public reprimands, enforced suspensions of services or, in extreme cases, withdrawal of authorisation to operate.
The Group is subject to authorisation by the LME, the CME, ICE, the NYSE Euronext and Eurex. Marex Financial Limited is regulated in the UK by the FCA.
Legal risk can also arise through litigation or the failure of contractual documentation when relied upon. Litigation risk is hard to completely eliminate, but the Company mitigates this risk through its transparent and considered approach to the activities which it undertakes. The failure of contractual documentation when relied upon is mitigated by using market standard documents wherever possible and ensuring that bespoke or amended documentation is thoroughly reviewed by the Legal Department and / or external counsel.
Business and strategic risk
This risk is defined as the impact of a change or a failure to change Marex Financial Limited’s business model which impacts its ability to meet its strategic or financial objectives. It is mitigated by the Board and its Executive Committee regularly reviewing the Company’s regulatory and business environment, the performance of its business lines, the level of investment in new and existing activities, and its remuneration policy.
19


INDEPENDENT AUDITOR’S REPORT TO THE MEMBERS OF MAREX FINANCIAL LIMITED
We have audited the financial statements for Marex Financial Limited for the year 31 December 2015 which comprise the income the statement, the statement of other comprehensive income, the statement of financial position, the statement of changes in equity, the cash flow statement and the related notes 1 to 29. The financial reporting framework that has been applied in their preparation is applicable law and International Financial Reporting Standards (‘IFRSs’) as adopted by the European Union and, as regards the Company financial statements, as applied in accordance with the provisions of the Companies Act 2006.
This report is made solely to the Company’s members, as a body, in accordance with Chapter 3 of Part 16 of the Companies Act 2006. Our audit work has been undertaken so that we might state to the Company’s members those matters we are required to state to them in an auditor’s report and for no other purpose. To the fullest extent permitted by law, we do not accept or assume responsibility to anyone other than the Company and the Company’s members as a body, for our audit work, for this report, or for the opinions we have formed.
Respective responsibilities of directors and auditor
As explained more fully in the Directors’ Responsibilities Statement, the directors are responsible for the preparation of the financial statements and for being satisfied that they give a true and fair view. Our responsibility is to audit and express an opinion on the financial statements in accordance with applicable law and International Standards on Auditing (UK and Ireland). Those standards require us to comply with the Auditing Practices Board’s Ethical Standards for Auditors.
Scope of the audit of the financial statements
An audit involves obtaining evidence about the amounts and disclosures in the financial statements sufficient to give reasonable assurance that the financial statements are free from material misstatement, whether caused by fraud or error. This includes an assessment of: whether the accounting policies are appropriate to the Company’s and the Company’s circumstances and have been consistently applied and adequately disclosed; the reasonableness of significant accounting estimates made by the directors; and the overall presentation of the financial statements. In addition, we read all the financial and non-financial information in the annual report to identify material inconsistencies with the audited financial statements and to identify any information that is apparently materially incorrect based on, or materially inconsistent with, the knowledge acquired by us in the course of performing the audit. If we become aware of any apparent material misstatements or inconsistencies we consider the implications for our report.
Opinion on financial statements
In our opinion:
give a true and fair view of the state of the company's affairs as at 31 December 2015 and of its profit forthe year then ended;
have been properly prepared in accordance with IFRSs as adopted by the European Union; and
have been prepared in accordance with the requirements of the Companies Act 2006.
21


Marex Financial Limited INCOME STATEMENT FOR THE YEAR ENDED 31 DECEMBER 2015
Notes 2015
$’000 2014
$’000
Revenue 2 221,305 243,764
Operating expenses (212,285) (239,776)
Provision for bad and doubtful debts 15 - 15
Operating profit 3 9,020 4,003
Other income 6 2,278 29
Other expense 6 (3,450) (1,632)
Finance income 7 538 270
Finance expense 7 (1,854) (855)
Profit before taxation 8(b) 6,532 1,815
Tax 8(a) (4,916) (1,349)
Profit after taxation 1,616 466
STATEMENT OF OTHER COMPREHENSIVE INCOME FOR THE YEAR ENDED 31 DECEMBER 2015
Notes 2015
$’000 2014
$’000
Profit after taxation 1,616 466
Other comprehensive income
Loss on revaluation of investments – available-for-sale 11(a) (166) (222)
Deferred tax on revaluation of investments – available-for-sale 8(d) 66 28
Other comprehensive loss, net of tax (100) (194)
Total comprehensive income 1,516 272
All operations are continuing for the current and prior years.
The notes on pages 29 to 65 form part of these financial statements.
23

Marex Financial Limited STATEMENT OF FINANCIAL POSITION FOR THE YEAR ENDED 31 DECEMBER 2015
Notes
2015
$’000
2014 Restated
$’000
Assets
Non-current assets
Property, plant and equipment 9 2,859 5,550
Goodwill 10 3,243 6,243
Other intangible assets 10 316 803
Investments in subsidiaries 11(b) 5,997 5,997
Investments – available-for-sale 11(a) 4,098 4,264
Financial instruments – held to maturity 14 40,936 -
Financial instruments – held to maturity, pledged as collateral 14 44,093 -
Deferred tax 8(d) 701 731
Total non-current assets 102,243 23,588
Current assets
Inventory 12 15,870 -
Financial instruments – fair value through profit or loss 13 4,936 12,182
Financial instruments – held to maturity 14 9,999 59,988
Financial instruments – held to maturity, pledged as collateral 14 24,496 -
Trade and other receivables 15 588,719 582,651
Corporation tax 483 1,572
Cash and cash equivalents 133,349 134,862
Total current assets 777,852 791,255
Total assets 880,095 814,843
Liabilities
Current liabilities
Financial instruments 13 3,542 10,252
Trade and other payables 17 692,857 611,347
Repurchase agreements 18,938 -
Short-term borrowings 18 - 25,000
Corporation tax - 5,195
Provisions 19 891 698
Total current liabilities 716,228 652,492
Total liabilities 716,228 652,492
Total net assets 163,867 162,351
24


Marex Financial Limited STATEMENT OF CHANGES IN EQUITY AND MOVEMENTS IN RESERVES FOR THE YEAR ENDED 31 DECEMBER 2015
Share capital
$’000
Share premium
$’000
Retained earnings
$’000
Reval-uation
reserve $’000
Total $’000
At 1 January 2014 160,050 5,940 (3,871) (40) 162,079
Profit for the year - - 466 - 466
Loss on revaluation of investments – available-for-sale - - - (222) (222)
Deferred tax on revaluation of investments – available-for-sale - - - 28 28
At 31 December 2014 and 1 January 2015
160,050
5,940
(3,405)
(234)
162,351
Profit for the year - - 1,616 - 1,616
Loss on revaluation of investments – available-for-sale - - - (166) (166)
Deferred tax on revaluation of investments – available-for-sale - - - 66 66
At 31 December 2015 160,050 5,940 (1,789) (334) 163,867
The notes on pages 29 to 65 form part of these financial statements.
26

Marex Financial Limited CASH FLOW STATEMENT FOR THE YEAR ENDED 31 DECEMBER 2015
Notes
2015
$’000
2014 Restated
$’000
Profit before tax 6,532 1,815
Adjustment to reconcile profit before tax to net cash flows:
Depreciation of property, plant and equipment 3, 9 3,285 4,251
Amortisation of intangible assets 3, 10 560 877
Impairment of goodwill 6, 10 3,000 1,632
Loss on disposal of property, plant and equipment - 48
Increase / (decrease) in provisions 19 193 (888)
Operating cash flows before changes in working capital 13,570 7,735
Working capital adjustments:
(Increase) / decrease in trade and other receivables (7,868) 89,824
Increase / (decrease) in trade and other payables 73,014 (73,957)
Increase in inventory (15,870) -
Decrease in financial instruments – assets 7,246 5,493
Decrease in financial instruments – liabilities (6,710) (2,286)
(Increase) / decrease in financial assets – held to maturity (59,536) 6
Cash inflow from operating activities 3,846 26,815
Corporation tax received 1,370 3,766
Net cash inflow from operating activities 5,216 30,581
The notes on pages 29 to 65 form part of these financial statements.
27

Marex Financial Limited CASH FLOW STATEMENT FOR THE YEAR ENDED 31 DECEMBER 2015 (CONTINUED)
Notes
2015
$’000
2014 Restated
$’000
Investing activities
Purchase of property, plant and equipment 9 (594) (1,391)
Purchase of intangible assets 10 (73) (475)
Net cash flow from investing activities (667) (1,866)
Financing activities
Repurchase agreements 18,938 -
(Decrease) / Increase in short-term borrowings (25,000) 25,000
Net cash flow from financing activities (6,062) 25,000
Net (decrease) / increase in cash and cash equivalents (1,513) 53,715
2015
$’000
2014 Restated
$’000
Cash and cash equivalents
Cash available on demand and short-term deposits at 1 January 134,862 81,147
(Decrease) / increase in cash (1,513) 53,715
Cash and cash equivalents at 31 December 133,349 134,862
The notes on pages 29 to 65 form part of these financial statements.
28

Marex Financial Limited NOTES TO THE FINANCIAL STATEMENTS FOR THE YEAR ENDED 31 DECEMBER 2015
1. ACCOUNTING POLICIES
(a) Basis of preparation
Basis of accounting
The financial statements of the Company have been prepared in accordance with International Financial Reporting Standards (‘IFRS’) as issued by the International Accounting Standards Board (‘IASB’) as well as interpretations issued by the IFRS Interpretations Committee (‘IFRIC’) as endorsed by the European Union (‘EU’).
The financial statements have been prepared on a going concern basis and under the historical cost basis except for fair value through profit and loss and available-for-sale (‘AFS’) financial instruments which are measured at fair value.
The principal accounting policies adopted in the preparation of the financial statements are set out below and have been consistently applied during the years presented unless otherwise stated.
Rounding of amounts
The amounts in this financial report have been rounded to the nearest thousand, unless otherwise stated.
Consolidation exemption
The Company is exempt by virtue of section 405 of the Companies Act 2006 from the requirement to prepare consolidated financial statements because the Company is a wholly-owned subsidiary of Marex Spectron Group Limited, which is incorporated in England and Wales. The financial statements present information about the Company as an individual undertaking and not about its Group.
Changes in accounting policies (see note 27)
Previously segregated client funds (which comprise client funds held in segregated client money accounts) were held on the Company’s statement of financial position within cash and cash equivalents. The corresponding liabilities to clients and counterparties were included within trade and other payables.
Segregated client funds have been excluded from the Company’s statement of financial position in order to better reflect the statutory trust status of such monies, including the restrictions placed on the Company’s ability to control the funds, as well as increase the comparability with the Company’s peers.
(b) Revenue
Revenue is recognised when it is probable that the economic benefits will flow to the Company and the revenue can be reliably measured. Revenue is measured at the fair value of the consideration received or receivable taking into account any trade discounts and volume rebates granted by the Company.
Revenue comprises the following:
execution and clearing commissions, which are recognised on a trade date basis;
metals trading and broking, energy broking and foreign exchange trading activity where the Company acts as principal, which is typically recognised on a fair value basis whereby movements in fair values of the position are recognised in the income statement;
desk facilities fees, licence and software fees, which are recognised on an accrual basis; and
net interest directly relating to the trading activities of the Company.
In accordance with accepted practice, those financial instruments held for trading purposes are fair valued and subsequent gains and losses are recognised in the income statement.
(c) Dividend income
Revenue is recognised when the Company’s right to receive the payment is established, which is when shareholders approve the dividend.
29

Marex Financial Limited NOTES TO THE FINANCIAL STATEMENTS FOR THE YEAR ENDED 31 DECEMBER 2015 (CONTINUED)
1. ACCOUNTING POLICIES (CONTINUED)
(d) Finance income and expense
Finance income is earned on balances held at exchanges, clearing houses, banks and brokers, and on overdrawn client balances. Finance expenses are paid on overdrawn accounts with brokers and exchanges, client and counterparty balances and short-term borrowings. Finance income and expenses are recognised on an amortised cost basis using the effective interest rate (‘EIR’) method.
(e) Employee benefits
Short-term employee benefits
Short-term employee benefits are expense as the related service is provided. A liability is recognised for the amount expected to be paid if the Company has a present legal or constructive obligation to pay this amount as a result of past service provided by the employee and the obligation can be estimated reliably.
Retirement benefits: defined contribution schemes
The Company operates a defined contribution scheme. Contributions are charged to the income statement in the year to which they relate.
(f) Foreign currency translation
The Company financial statements are presented in US Dollars (‘USD’), which is the Company’s functional and presentational currency.
Transactions entered into in a currency other than the currency of the primary economic environment in which they operate (the ‘functional currency’) are recorded at the rates ruling when the transactions occur. Foreign currency monetary assets and liabilities are translated at the rates ruling at the reporting date. Exchange differences arising on the retranslation of unsettled monetary assets and liabilities are similarly recognised immediately in the income statement.
(g) Taxation
Taxes on profits are reflected in the financial statements in accordance with IAS 12, Income Taxes, and represent management’s best assessment of estimated current and future taxes to be paid.
Income tax expense for the period comprises current and deferred tax. Income tax is recognised in the income statement except to the extent that it relates to items recognised in other comprehensive income or directly in equity, in which case tax is also recognised in other comprehensive income or directly in equity.
Current tax expense is the amount of tax estimated to be payable or recoverable in respect of the taxable income or loss of a period as well as adjustments in respect of previous periods. Current tax is calculated on the basis of the tax laws and rates enacted or substantively enacted at the balance sheet date.
Deferred tax represents the amount of income taxes payable or recoverable in respect of temporary differences, unused tax losses and unused tax credits. Deferred tax is recognised in respect of temporary differences between the tax bases of assets and liabilities and their carrying amounts in the financial statements subject to the following exceptions.
Deferred tax is not accounted for if it arises from the initial recognition of goodwill or from the initial recognition of an asset or liability in a transaction other than a business combination that at the time of the transaction affects neither accounting nor taxable profit or loss.
Deferred tax assets are recognised for all deductible temporary differences, carry forward of unused tax credits and unused tax losses to the extent that it is probable that future taxable profits will be available against which the deductible temporary differences and carried forward unused tax credits and unused tax losses can be utilised. Deferred tax assets are reviewed at each balance sheet date and are reduced to the extent that it is no longer probable that sufficient taxable profits will be available to allow all or part of the deferred tax assets to be utilised.
30

Marex Financial Limited NOTES TO THE FINANCIAL STATEMENTS FOR THE YEAR ENDED 31 DECEMBER 2015 (CONTINUED)
1. ACCOUNTING POLICIES (CONTINUED)
(g) Taxation (continued)
Deferred tax is provided on temporary differences associated with investments in subsidiaries, branches, associates and interests in joint ventures, except where the timing of the reversal of the temporary difference is controlled by the group and it is probable that the temporary differences will not reverse in the foreseeable future.
Deferred tax is determined using tax laws and rates that have been enacted or substantively enacted at the balance sheet date and are expected to apply when the related deferred tax asset is realised or the deferred tax liability is settled.
Current tax assets and liabilities are offset only where the entity has a legally enforceable right to set off the recognised amounts and intends to settle on a net basis or simultaneously.
Deferred tax assets and deferred tax liabilities are offset if a legally enforceable right exists to set off current tax assets against current tax liabilities and the deferred taxes relate to the same taxable entity and the same taxation authority.
In financial statements current tax is presented as part of current assets or liabilities and deferred tax as part of non-current assets or liabilities.
(h) Current versus non-current distinction
The Company presents assets and liabilities in the statement of financial position based on current / non-current classification. An asset is current when it is:
expected to be realised or consumed in the normal operating cycle;
expected to be realised within twelve months after the reporting period, or;
cash or cash equivalents unless restricted from being exchanged or used to settle a liability for at least twelve months after the reporting period.
All other assets are classified as non-current.
A liability is current when it is:
expected to be settled in the normal operating cycle;
expected to be settled within twelve months after the reporting period, or;
there is no unconditional right to defer the settlement of the liability for at least twelve months after the reporting period.
All other liabilities are classified as non-current.
(i) Leases
Where substantially all of the risks and rewards incidental to ownership are retained by the lessor (an ‘operating lease’), the total rentals payable under the lease are recognised in the income statement on a straight-line basis over the lease term.
(j) Borrowing costs
Borrowing costs consist of interest and other costs that are incurred in connection with the borrowing of funds and are expensed over the period of the borrowing facility.
(k) Property, plant and equipment
Property, plant and equipment are stated at cost, net of accumulated depreciation and accumulated impairment losses.
As well as the purchase price, cost includes directly attributable costs and the estimated present value of any future costs of dismantling and removing items. The corresponding liability is recognised within provisions.
31

Marex Financial Limited NOTES TO THE FINANCIAL STATEMENTS FOR THE YEAR ENDED 31 DECEMBER 2015 (CONTINUED)
1. ACCOUNTING POLICIES (CONTINUED)
(k) Property, plant and equipment (continued)
Any gain or loss on disposal of an item of property, plant and equipment is recognised in the income statement.
Depreciation is provided on property, plant and equipment to write off the carrying value of items over their expected useful economic lives. The depreciation rates used for each class of asset are as follows:
Leasehold improvements Over the remaining length of the lease or 20% per annum straight-line, where appropriate
Furniture, fixtures and fittings 20 to 50% per annum straight-line
Computer equipment 20 to 50% per annum straight-line
Depreciation methods, useful lives and residual values are reviewed at each reporting date and adjusted if appropriate.
(l) Intangible assets and goodwill
Goodwill
Goodwill arises on the acquisition of subsidiaries, joint ventures and associates and represents the excess of the cost of the acquisition (including the fair value of deferred and contingent consideration) of a business combination, over the share in the fair value of identifiable assets, liabilities and contingent liabilities acquired. Cost comprises the fair values of assets given, liabilities assumed and equity instruments issued, plus any direct costs of acquisition.
Goodwill has an indefinite useful life and is measured at cost less any accumulated impairment losses. It is tested for impairment annually and whenever there is an indicator of impairment. Where the carrying value exceeds the higher of the value in use or fair value less cost to sell, an impairment loss is recognised in the income statement.
Internally generated intangible assets (software development costs)
Expenditure on internally generated intangible assets is only capitalised if it can be demonstrated that:
it is technically feasible to develop the product for it to be sold;
adequate resources are available to complete the development;
there is an intention to complete and sell the product;
the Company is able to sell the product;
sale of the product will generate future economic benefits; and
expenditure on the project can be measured reliably.
Capitalised development costs are measured at cost less any accumulated amortisation and any accumulated impairment losses. Amortisation is calculated on a straight-line basis over estimated useful lives of 2 to 5 years, which represents the period that the Company expects to benefit from selling the products developed, and is recognised in the income statement.
Development expenditure not satisfying the above criteria at expenditure and the research phase of internal projects is recognised in the income statement as incurred.
Software licenses
Software licences have a finite useful economic life, of 2 to 5 years with, the option of renewal at the end of this period. It is amortised in the income statement on a straight-line basis over the period of the licence.
32

Marex Financial Limited NOTES TO THE FINANCIAL STATEMENTS FOR THE YEAR ENDED 31 DECEMBER 2015 (CONTINUED)
1. ACCOUNTING POLICIES (CONTINUED)
(m) Impairment of non-financial assets
Impairment tests on goodwill and other intangible assets with indefinite useful lives are undertaken annually. Other non-financial assets are subject to impairment tests whenever events or changes in circumstances indicate that their carrying amount may not be recoverable. Where the carrying value of an asset exceeds its recoverable amount (i.e. the higher of value in use and fair value less costs to sell), the asset is written down accordingly.
The impairment test is carried out on the asset’s cash-generating unit (i.e. the lowest group of assets in which the asset belongs for which there are separately identifiable cash flows).
An impairment loss in respect of goodwill is not reversed. For other assets, an impairment loss is reversed only to the extent that the asset’s carrying amount does not exceed the carrying amount that would have been determined, net of depreciation or amortisation, if no impairment loss had been recognised.
Impairment losses are recognised in the income statement.
(n) Impairment of financial assets
The Company assesses, at each reporting date, whether there is objective evidence that a financial asset or group of financial assets is impaired. An impairment exists if one or more events that has occurred since the initial recognition of the asset (an incurred ‘loss event’), has an impact on the estimated future cash flows of the financial asset or group of financial assets that can be reliably estimated. Evidence of impairment may include indicators that the debtors or a group of debtors is experiencing significant difficulty or the probability that they will enter bankruptcy. The impairment is measured as the difference between the financial assets carrying amount and the present value of estimated future cash flows discounted at the assets EIR and included in the income statement.
(o) Financial instruments
Financial assets
The Company classifies its financial assets into one of the following categories, depending on the purpose for which the asset was acquired. The Company’s accounting policy for each category is as follows:
Fair value through profit or loss: this category includes financial assets held for trading. They are carried in the balance sheet at fair value with changes in fair value recognised in the income statement.
Loans and receivables: these assets are non-derivative financial assets with fixed or determinable payments that are not quoted in an active market. They arise principally through the provision of goods and services to customers (‘trade debtors’), but also incorporate other types of contractual monetary asset. They are carried at amortised cost using the EIR method less provision for any impairment.
Available-for-sale: these assets comprise the Company’s strategic investments in entities not qualifying as subsidiaries, associates or jointly controlled entities, and investments in memberships, seats and interests in investment exchanges. They are carried at fair value with changes in fair value recognised in other comprehensive income. Fair values of quoted investments are based on current prices. If the market for a financial asset is not active, and for unlisted securities, the Company establishes fair value by using the latest available trade price adjusted as necessary to reflect current market conditions.
Held to maturity: held to maturity investments are financial assets with fixed or determinable payments and fixed maturities where the Company has the intention and ability to hold to maturity. These assets are measured at amortised cost, calculated taking into account any premium and discount on acquisition. The amortisation is included in the income statement.
33

Marex Financial Limited NOTES TO THE FINANCIAL STATEMENTS FOR THE YEAR ENDED 31 DECEMBER 2015 (CONTINUED)
1. ACCOUNTING POLICIES (CONTINUED)
(o) Financial instruments (continued)
A financial asset is derecognised when the contractual rights from the financial asset expire, or when the contractual right to benefit from the future cash flow of that asset has been transferred. The Company derecognises a financial asset when it substantially transfers all the risks and rewards of ownership.
Financial liabilities
The Company classifies its financial liabilities into one of two categories depending on the purpose for which the liability was assumed. The Company’s accounting policy for each category is as follows:
Fair value through profit or loss: this category includes financial instruments held for trading. They are carried in the balance sheet at fair value with changes in fair value recognised in the Income Statement.
Other financial liabilities: other financial liabilities include the following items:
trade and other payables and other short-term monetary liabilities are recognised at amortised cost.
bank borrowings, such interest bearing liabilities are subsequently measured at amortised cost using the EIR method, which ensures that any interest expense over the period to repayment is at a constant rate on the balance of the liability carried in the statement of financial position.
A financial liability is derecognised when the obligation under the liability is discharged, cancelled or expires. In circumstances where a financial liability is replaced by the same lender yet the contractual terms are substantially different or modified, the original financial liability will be derecognised at the point of contractual exchange and the new financial liability recognised.
Offsetting of financial assets and liabilities
Financial assets and liabilities are offset and the net amount reported in the statement of financial position if there is a currently enforceable legal right to offset the recognised amounts and there is an intention and ability to settle on a net basis, or to realise the assets and liabilities simultaneously.
Specific instruments
Secured payables under repurchase agreements
When the Company sells a financial asset and simultaneously enters into an agreement to repurchase the same or a similar asset at a fixed price on a future date (repurchase agreement), the arrangement is accounted for as a secured borrowing and is recognised in the statement of financial position as a payable under a repurchase agreement, and the underlying asset continues to be recognised in the financial statements.
Secured payables under repurchase agreements are subsequently measured at amortised cost.
Investments
Investments in subsidiaries are measure at cost less provision for any impairment.
(p) Cash and cash equivalents
Cash and cash equivalents in the statement of financial position comprise cash at banks and on hand, and short-term deposits.
(q) Cash and non-cash distribution
The Company recognises a liability to make cash or non-cash distributions to equity holders of the parent when the distribution is authorised and the distribution is no longer at the discretion of the Company. As per the corporate laws in the United Kingdom, a distribution is authorised when it is approved by the shareholders. A corresponding amount is recognised directly in equity.
34

Marex Financial Limited NOTES TO THE FINANCIAL STATEMENTS FOR THE YEAR ENDED 31 DECEMBER 2015 (CONTINUED)
1. ACCOUNTING POLICIES (CONTINUED)
(q) Cash and non-cash distribution (continued)
Non-cash distributions are measured at the fair value of the assets to be distributed with fair value re-measurement recognised directly in equity. Upon distribution of non-cash assets, any difference between the carrying amount of the liability and the carrying amount of the assets distributed is recognised in the income statement.
(r) Client money
As required by the UK FCA’s Client Assets Sourcebook rules, the Company maintains certain balances on behalf of clients with banks, exchanges, clearing houses and brokers in segregated accounts. These amounts and the related liabilities to clients, whose recourse is limited to segregated accounts, are not included in the Company’s statement of financial position as the Company is not beneficially entitled thereto.
(s) Provisions
Provisions are recognised when the Company has a present obligation (legal or constructive) as a result of a past event, it is probable that an outflow of resources embodying economic benefits will be required to settle the obligation and a reliable estimate can be made of the amount of the obligation. When the Company expects some or all of a provision to be reimbursed, for example, under an insurance contract, the reimbursement is recognised as a separate asset, but only when the reimbursement is virtually certain. The expense relating to a provision is presented in the income statement.
(t) Critical accounting estimates and judgements
The Company makes estimates and assumptions regarding the future. Estimates and judgements are continually evaluated based on historical experience and other factors, including expectations of future events that are believed to be reasonable under the circumstances. In the future, actual experience may differ from these estimates and assumptions. The estimates and assumptions that have a significant risk of causing a material adjustment to the carrying amounts of assets and liabilities within the next financial year are discussed below.
Impairment of non-financial assets
The Company’s impairment testing for goodwill and non-financial assets with indefinite useful lives is based on the fair value less costs of disposal. The fair value less costs of disposal calculation is based on available data from similar assets or observable market prices less incremental costs for disposing of the assets and is estimated by using the EBITDA multiples derived from adjusting comparative peer multiples. This multiple is applied to the most recent Board approved financial budgets.
Fair value of financial instruments
The Company determines the fair value of financial instruments that are not quoted, based on estimates using present values or other valuation techniques. Those techniques are significantly affected by the assumptions used, including discount rates and estimates of future cash flows. Where market prices are not readily available, fair value is either based on estimates obtained from independent experts or quoted market prices of comparable instruments. In that regard, the derived fair value estimates cannot be substantiated by comparison with independent markets and, in many cases, may not be capable of being realised immediately.
Useful lives of intangible assets and property, plant and equipment
Intangible assets and property, plant and equipment are amortised or depreciated over their useful economic lives. Useful economic lives are based on estimates of the period that the assets will generate revenue, which are periodically reviewed for continued appropriateness. Changes to estimates can result in significant variations in the carrying value and amounts charged to the income statement in specific periods.
35

Marex Financial Limited NOTES TO THE FINANCIAL STATEMENTS FOR THE YEAR ENDED 31 DECEMBER 2015 (CONTINUED)
1. ACCOUNTING POLICIES (CONTINUED)
(u) New and amended standards and interpretations
Newly effective standards effective for years ending on or after 31 December 2015 are as follows:
Defined Benefit Plans: Employee Contributions (Amendments to IAS 19)
Annual Improvements to IFRSs 2010-2012 Cycle – various standards
Annual Improvements to IFRSs 2011-2013 Cycle – various standards
The Company have no transactions that would be affected by these new amendments above.
The following standards are not yet effective, but available for early adoption:
IFRS 9 Financial Instruments:
IFRS 9 amends the classification, measurement and impairment of financial instruments and general hedge accounting requirements. The adoption of IFRS 9 will have an impact on the classification and measurement of the Company’s financial assets, but will not have an impact on classification and measurements of the Company’s financial liabilities. IFRS 9 is not effective until 1 July 2018.
IFRS 15 Revenue from Contracts with Customers:
IFRS 15 contains new requirements for the recognition of revenue and additional disclosures. Under IFRS 15, revenue is recognised at the amount that reflects the consideration to which the entity expects to be entitled in exchange for transferring goods or services to a customer. IFRS 15 is not mandatory until 1 July 2017. However, the IASB has deferred adoption to 1 July 2018.
Other amendments and existing standards that are not yet effective, but available for early adoption, which are not expected to result in significant changes to the Company’s accounting policies or have a significant impact on the financial statements are:
IFRS 14 Regulatory Deferral Accounts
Accounting for Acquisitions of Interests in Joint Operations (Amendments to IFRS 11)
Agriculture: Bearer Plants (Amendments to IAS 16 and IAS 41)
New and amended standards and interpretations
Equity Method in Separate Financial Statements (Amendments to IAS 27)
Sale or Contribution of Assets between an Investor and its Associate or Joint Venture (Amendments to IFRS 10 and IAS 28)
Annual Improvements to IFRSs 2012 – 2014 Cycle – various standards
Disclosure Initiative (Amendments to IAS 1)
Clarification of Acceptable Methods of Depreciation and Amortisation (Amendments to IAS 16 and IAS 38)
Investment Entities: Applying the Consolidation (Amendments to IFRS 10, IFRS 12 and IAS 28)
The Company intends to adopt the applicable standards when they become effective. The directors do not expect the adoption of the Standards and Interpretations will have a material impact on the Company in future periods.
36

Marex Financial Limited NOTES TO THE FINANCIAL STATEMENTS FOR THE YEAR ENDED 31 DECEMBER 2015 (CONTINUED)
2. REVENUE
2015
$’000 2014
$’000
Commission income 158,727 167,524
Trading income 34,084 41,723
Desk fees and market data 7,291 9,517
Net interest income 2,943 3,255
Other income 18,260 21,745
221,305 243,764
2015 North America
$’000 Europe
$’000 Asia
$’000 Total $’000
Commodities 1,604 90,634 13,393 105,631
Futures and Securities 43 24,466 - 24,509
Market Access - 78,404 - 78,404
Other - 12,761 - 12,761
Revenue 1,647 206,265 13,393 221,305
2014 North America
$’000 Europe
$’000 Asia
$’000 Total $’000
Commodities 2,998 94,344 13,455 110,797
Futures and Securities 143 28,634 - 28,777
Market Access - 87,649 - 87,649
Other 11 16,530 - 16,541
Revenue 3,152 227,157 13,455 243,764
37

Marex Financial Limited NOTES TO THE FINANCIAL STATEMENTS FOR THE YEAR ENDED 31 DECEMBER 2015 (CONTINUED)
3. OPERATING PROFIT
This has been arrived at after charging:
Notes 2015
$’000 2014
$’000
Staff costs 5 72,206 82,566
Depreciation 9 3,285 4,251
Amortisation 10 560 877
Payments under operating leases 7,529 7,369
Foreign exchange losses / (gains) 596 (65)
Management recharges – in 4,745 4,298
4. AUDITOR’S REMUNERATION
2015
$’000 2014
$’000
Fees for the audit of the company 186 1,228
In 2014, the Company paid audit fees on behalf of the other entities which is disclosed above. Audit fees for the Company for the year ended 31 December 2014 were $323,989.
5. STAFF COSTS
Note 2015
$’000 2014
$’000
Aggregate wages and salaries 62,103 74,242
Employer’s National Insurance Contributions and similar taxes 7,697 5,653
Short-term monetary benefits 1,367 1,628
Defined pension cost 1,039 1,043
Total staff costs 3 72,206 82,566
The average monthly number of employees, including directors, during the year to 31 December 2015 was 333 (2014: 355).
As at 31 December 2015, there were contributions totalling $172,000 (2014: $213,000) payable to the defined contribution pension scheme by the Company.
38

Marex Financial Limited NOTES TO THE FINANCIAL STATEMENTS FOR THE YEAR ENDED 31 DECEMBER 2015 (CONTINUED)
6. OTHER INCOME AND EXPENSE
Notes 2015
$’000 2014
$’000
Other income
Dividends received 2,276 29
Other 2 -
2,278 29
Other expense
Leasehold dilapidations provisions 19 (450) -
Impairment of goodwill 10 (3,000) (1,632)
(3,450) (1,632)
7. FINANCE INCOME AND EXPENSE
2015
$’000 2014
$’000
Finance income
Bank interest receivable 538 270
Finance expense
Bank interest payable (1,854) (855)
Included in bank interest expenses, above, are credit facility expenses of $1,774,000 (2014: $797,000). For further details on the credit facility, refer to note 18.
39

Marex Financial Limited NOTES TO THE FINANCIAL STATEMENTS FOR THE YEAR ENDED 31 DECEMBER 2015 (CONTINUED)
8. TAXATION
(a) Tax charge
Notes 2015
$’000 2014
$’000
Current tax
UK corporation tax on profit for the year 1,381 1,005
Adjustment in respect of prior years 3,438 249
4,819 1,254
Deferred tax
Origination and reversal of temporary differences 29 (193)
Adjustment in respect of prior years 68 288
8(d) 97 95
Tax charge for the year 8(b) 4,916 1,349
(b) Reconciliation between tax expense and profit before tax
The tax assessed for the year is higher (2014: higher) than the standard rate of corporation tax in the UK 20.25% (2014: 21.50%). The standard rate of corporation tax in the UK reduced from 21% to 20% from 1 April 2015. Accordingly UK corporation tax for this accounting period has been calculated at 20.25% of the estimated assessable profits for the period. Finance (No. 2) Act 2015 enacted reductions in the UK corporation tax rate to 19% with effect from 1 April 2017 and 18% with effect from 1 April 2020. These reductions in the tax rate will impact the current tax charge in future periods.
Note 2015
$’000 2014
$’000
Profit before tax 6,532 1,815
Expected tax charge based on the standard rate of corporation tax in the UK of 20.25% (2014: 21.50%)
1,323 390
Explained by:
Income not subject to tax (461) (6)
Expenses not deductible for tax purposes 550 348
Foreign exchange and other differences (2) 80
Prior year adjustments 3,506 537
Tax charge for the year 8(a) 4,916 1,349
(c) Amounts recognised in other comprehensive income
Amounts directly recognised in the statement of other comprehensive income relate to available-for-sale financial assets. The amount recognised in 2015 is a deferred tax credit of $66,000 (2014: deferred tax credit of $28,000).
40

Marex Financial Limited NOTES TO THE FINANCIAL STATEMENTS FOR THE YEAR ENDED 31 DECEMBER 2015 (CONTINUED)
8. TAXATION (CONTINUED)
(d) Deferred tax
Notes 2015
$’000 2014
$’000
Revaluation of investments – available-for-sale (628) (694)
Depreciation in excess of capital allowances 1,329 1,425
Total deferred tax asset 701 731
At 1 January 731 798
Charged to the income statement
8(a) (97) (95)
Credited to the revaluation reserve 8(c) 66 28
Foreign exchange differences and other 1 -
At 31 December 701 731
The reduction in the main rate of UK corporation tax to 21% from 1 April 2014 and to 20% from 1 April 2015 was substantively enacted on 2 July 2013. Deferred tax balances have been calculated at the effective tax rate ruling at the balance sheet date. Finance (No. 2) Act 2015 enacted reductions in the UK corporation tax rate to 19% with effect from 1 April 2017 and 18% with effect from 1 April 2020. These future changes to corporation tax rates have not been recognised in the deferred tax charge and closing deferred tax position.
(e) Unrecognised deferred tax assets
The company has unrecognised deferred tax assets in respect of employee compensation deductions of $5,306,000 (2014: $5,607,000). The potential deferred tax asset at 20% is $1,061,000 (2014: $1,178,000). These assets have not been recognised as it is not foreseeable when a tax deduction will arise.
41

Marex Financial Limited NOTES TO THE FINANCIAL STATEMENTS FOR THE YEAR ENDED 31 DECEMBER 2015 (CONTINUED)
9. PROPERTY, PLANT AND EQUIPMENT
Note
Leasehold improve-
ments $’000
Computer equipment
$’000
Furniture, fixtures
and fittings $’000
Total $’000
Cost
At 1 January 2015 6,496 12,493 3,258 22,247
Additions 122 425 47 594
Disposals - (8) - (8)
At 31 December 2015 6,618 12,910 3,305 22,833
Depreciation
At 1 January 2015 4,062 10,269 2,366 16,697
Charge for the year 3 1,403 1,334 548 3,285
Disposals - (8) - (8)
At 31 December 2015 5,465 11,595 2,914 19,974
Net book value
At 31 December 2015 1,153 1,315 391 2,859
At 31 December 2014 2,434 2,224 892 5,550
42

Marex Financial Limited NOTES TO THE FINANCIAL STATEMENTS FOR THE YEAR ENDED 31 DECEMBER 2015 (CONTINUED)
10. GOODWILL AND OTHER INTANGIBLE ASSETS
Notes Goodwill
$’000
Software development and licences
$’000 Total $’000
Cost
At 1 January 2015 12,902 5,949 18,851
Additions - 73 73
At 31 December 2015 12,902 6,022 18,924
Impairment provisions and amortisation
At 1 January 2015 6,659 5,146 11,805
Charge for the year 3, 6 3,000 560 3,560
At 31 December 2015 9,659 5,706 15,365
Net book value
At 31 December 2015 3,243 316 3,559
At 31 December 2014 6,243 803 7,046
(a) Goodwill impairment testing
For the purpose of impairment testing, goodwill has been allocated to the cash generating units (‘CGUs’) which represent the level at which management monitors and manages goodwill:
Pro-Trader 2015
$’000
Total 2015
$’000
Goodwill 3,243 3,243
The Company performed the annual impairment test as at 31 December 2015 and 2014. In assessing whether impairment is required, the carrying value of the CGU is compared with the recoverable amount which is determined by fair value less cost of disposal.
(b) Key assumptions
The fair value less cost of disposal is determined by applying an earnings multiple to the future cash flows of each CGU arising in future periods which is based on the most recent Group Board approved financial budgets for 2016.
The earnings (earnings before interest, tax depreciation and amortisation or ‘EBITDA’) multiples applied are derived from comparable peer multiples.
43

Marex Financial Limited NOTES TO THE FINANCIAL STATEMENTS FOR THE YEAR ENDED 31 DECEMBER 2015 (CONTINUED)
11. INVESTMENTS
(a) Listed and unlisted investments – available-for-sale
2015
$’000 2014
$’000
As at 1 January 4,264 4,334
Revaluation loss (166) (70)
As at 31 December 4,098 4,264
Listed investments 793 776
Unlisted investments 3,305 3,488
4,098 4,264
Investments comprise shares and seats held in clearing houses which are deemed relevant to the Company’s trading activities and are classified as available-for-sale financial assets and recorded at fair value with changes in fair value reported in equity. The fair value of these investments is determined as the latest available traded price.
(b) Investments in subsidiaries
2015
$’000 2014
$’000
As at 1 January and 31 December 5,997 5,997
The subsidiaries of the Company as at 31 December 2015 are as follows:
Subsidiaries Held Directly
Name Country of
incorporation Class
Proportion of ownership interest Nature of business
Carlton Commodities 2004 LLP
United Kingdom Partnership interest
N/A Commodity and option trading
Nanolytics Capital Advisors Limited
United Kingdom Ordinary shares
100% Appointed representative
Xeram SA Switzerland Ordinary shares
100% In liquidation
All subsidiaries have a financial year end of 31 December with the exception of Carlton Commodities 2004 LLP which has a year end of 31 March.
44

Marex Financial Limited NOTES TO THE FINANCIAL STATEMENTS FOR THE YEAR ENDED 31 DECEMBER 2015 (CONTINUED)
12. INVENTORY
The Company holds physical metal, in the form of London Metal Exchange warrants, measured at fair value. These are generally held on a short-term basis.
13. FINANCIAL INSTRUMENTS – CURRENT
Current asset and current liability financial instruments at fair value through profit or loss comprise over-the-counter (‘OTC’) foreign exchange and precious metal contracts that are transacted on behalf of customers on a matched principal basis.
14. FINANCIAL INSTRUMENTS – HELD TO MATURITY
Held to maturity financial instruments comprise US Treasuries with maturity dates from January 2016 to November 2017.
15. TRADE AND OTHER RECEIVABLES
2015
$’000 2014
$’000
Amounts due from exchanges, clearing houses and other counterparties
576,740 498,482
Amounts due from group undertakings 5,837 68,297
Loans receivable 802 1,033
Other tax and social security taxes - 8,556
Other debtors 419 697
Prepayments 4,921 5,586
588,719 582,651
Included in amounts due from exchanges, clearing houses and other counterparties is $279,906,000 (2014: credit of $24,241,000) which is classified as fair value through profit and loss.
Amounts due from exchanges, clearing houses and other counterparties are stated after deducting impairment provisions of $4,839,000 (2014: $4,823,000).
Reconciliation of the movement in provisions for bad and doubtful debts
2015
$’000 2014
$’000
As at 1 January 4,823 4,922
Charged to the income statement - (15)
Bad debts written off - (67)
Foreign exchange revaluation 16 (17)
As at 31 December 4,839 4,823
45

Marex Financial Limited NOTES TO THE FINANCIAL STATEMENTS FOR THE YEAR ENDED 31 DECEMBER 2015 (CONTINUED)
16. CLIENT MONEY
The Company maintains certain balances on behalf of clients with banks, exchanges, clearing houses and brokers in segregated accounts in accordance with the UK FCA’s Client Assets Sourcebook rules.
The balance as at 31 December 2015, which is not recognised on the Company’s balance sheet, was $347,912,000 (2014:$187,326,000).
17. TRADE AND OTHER PAYABLES
2015
$’000
2014 Restated
$’000
Amounts due to exchanges, clearing houses and other counterparties
604,177 465,225
Amounts due to group undertakings 47,643 105,331
Other tax and social security taxes 1,432 2,097
Accruals and deferred income 33,220 38,473
Other creditors 6,385 221
692,857 611,347
18. SHORT-TERM BORROWING
2015
$’000 2014
$’000
Revolving credit facility - 25,000
The Company has an annually committed credit agreement with a current revolving loan facility of up to $50,000,000 with a renewal date of 5 June 2016.
The credit agreement contains certain financial and other covenants. The Company was in compliance with all applicable covenants throughout the year and as at 31 December 2015. Interest on the amount utilised is charged at LIBOR + 250 basis points and on the unutilised portion at 100 basis points.
46

Marex Financial Limited NOTES TO THE FINANCIAL STATEMENTS FOR THE YEAR ENDED 31 DECEMBER 2015 (CONTINUED)
19. PROVISIONS
Onerous lease
$’000
Leasehold dilapidations
$’000 Total $’000
As at 1 January 2015 363 335 698
Movement in the year:
Arising during the year - 450 450
Utilised during the year (214) (15) (229)
Foreign exchange revaluation (25) (3) (28)
(239) 432 193
As at 31 December 2015 124 767 891
Onerous lease provisions relate to the excess of rent payable over rents receivable on sublet office space. Inherent uncertainties in measuring the provision relate to estimates of the amount of rent that will be received in the future on vacant property and estimating future rents on property where the current sub-lease is of a shorter duration than the head lease.
Leasehold dilapidations relate to the estimated cost of returning a leasehold property to its original state at the end of the lease in accordance with the lease terms. The main uncertainty relates to estimating the cost that will be incurred at the end of the lease.
20. SHARE CAPITAL
Issued and fully paid Issued and full paid
2015
Number 2015
$’000 2014
Number 2014
$’000
Ordinary shares of $1.65 each 97,000,001 160,050 97,000,001 160,050
160,050 160,050
47

Marex Financial Limited NOTES TO THE FINANCIAL STATEMENTS FOR THE YEAR ENDED 31 DECEMBER 2015 (CONTINUED)
21. RESERVES
The following describes the nature and purpose of each reserve within total equity.
Reserves Description
Share capital Amount subscribed for share capital at nominal value.
Share premium Amount of consideration received over and above par value of shares.
Retained earnings Cumulative net gains and losses recognised in the income statement and the statement of other comprehensive income.
Revaluation reserve Cumulative unrealised gains on investments in exchanges that are held as available-for-sale are recognised in equity.
22. LEASE COMMITMENTS
The Company has entered into commercial leases on its properties.
The lessee has the option of renewal on each of these leases subject to negotiation between the Company, as lessee, and each landlord in the period preceding the expiration of each lease. There were no restrictions placed upon the lessee by entering into these leases.
The total future minimum lease payments are due as follows:
2015
$’000 2014
$’000
Not later than one year 6,154 6,649
Later than one year and not later than five years 8,406 15,049
14,560 21,698
The Company is expected to receive a total of $282,000 in future minimum sublease payments under non-cancellable subleases (2014: $675,000).
23. DIVIDENDS PAID AND PROPOSED
The Company did not declare or make any dividend payments during the year ended 31 December 2015 (2014: $nil).
24. RELATED PARTIES TRANSACTIONS
(a) Parent and ultimate controlling party
The immediate parent undertaking is Marex Spectron Group Limited, a private limited company incorporated in England and Wales, in whose consolidated financial statements the Company is included. These consolidated financial statements are available from its registered office at 155 Bishopsgate, London EC2M 3TQ. The ultimate controlling party of the Company is Amphitryon Limited, a company incorporated in Jersey, Channel Islands.
48

Marex Financial Limited NOTES TO THE FINANCIAL STATEMENTS FOR THE YEAR ENDED 31 DECEMBER 2015 (CONTINUED)
24. RELATED PARTIES TRANSACTIONS (CONTINUED)
(b) Key Management Personnel
The remuneration paid to directors for their services to the Company was as follows:
2015
$’000 2014
$’000
Aggregate wages and salaries 4,012 4,385
Short-term monetary benefits 23 25
Defined pension cost 6 12
4,041 4,422
The remuneration of the highest paid director for his services to the Company was $1,910,000 (2014: $2,000,000). No pension contributions (2014: $nil) were made on his behalf whilst he was a director of the Company. Amounts paid to directors in respect of loss of office were $1,046,000 (2014: $nil).
As at 31 December 2015, there was 1 director in the Company’s defined contribution scheme (2014: 2).
The remuneration paid to other Key Management Personnel for their services to the Company was as follows:
2015
$’000 2014
$’000
Aggregate wages and salaries 4,205 4,862
Short-term monetary benefits 26 34
Defined pension cost 46 41
4,277 4,937
(c) Key Management Personnel transactions
The Company made loans to certain directors relating to tax payments associated with equity awards amounting to $145,873 (2014: $154,157). In addition, the Company made loans to certain senior current and former employees relating to tax payments associated with equity awards of $397,675 (2014: $420,263). The loans are non-interest bearing and will be repayable under the terms of the equity award arising at the liquidating event.
49

Marex Financial Limited NOTES TO THE FINANCIAL STATEMENTS FOR THE YEAR ENDED 31 DECEMBER 2015 (CONTINUED)
24. RELATED PARTIES TRANSACTIONS (CONTINUED)
(d) Balances with other group undertakings
Amounts owed from related
parties 2015
$’000
Amounts owed to related
parties 2015
$’000
Amounts owed from related
parties 2014
$’000
Amounts owed to related
parties 2014
$’000
Marex Spectron Group Limited - 26,640 53,114 -
Marex Spectron International Limited - 10,396 10,526 59,450
Marex North America LLC - 919 3,376 -
Marex Hong Kong Limited - 2,077 - 1,416
Spectron Services Limited 4,949 - - 27,397
EasyScreen Limited 616 - 544 -
Marex USA Limited - 832 - 1,615
4GP Leases Limited - 306 - -
Marex Services Limited 75 - - 6,423
Marex Trading Services (Gibraltar) Limited - 332 - 4,704
Carlton Commodities 2004 LLP - 3,482 - -
Nanolytics Capital Advisors Limited - 169 - 275
Spectron Energy Inc. - 1,097 - 687
Marex Spectron Asia Pte Limited 196 - 663 -
Spectron Energy (Asia) Pte Limited - 1,217 - 1,068
Xeram SA - 176 - 2,214
Marex Spectron Securities LLC 1 - 74 -
Marex Clearing Services DMCC - - - 82
5,837 47,643 68,297 105,331
50

Marex Financial Limited NOTES TO THE FINANCIAL STATEMENTS FOR THE YEAR ENDED 31 DECEMBER 2015 (CONTINUED)
24. RELATED PARTIES TRANSACTIONS (CONTINUED)
(e) Transactions with other group undertakings
Amounts included in
operating profit 2015
$’000
Amounts included in
operating profit 2014
$’000
Marex Spectron Group Limited 243 339
Marex Spectron International Limited (22,625) (16,014)
Marex North America LLC 24,662 4,240
Marex Hong Kong Limited 4,335 4,949
Spectron Services Limited 4,055 (672)
EasyScreen Limited 783 (1,410)
Marex USA Limited (1) (5,212)
Marex Trading Services (Gibraltar) Limited 296 421
Nanolytics Capital Advisors Limited (6) -
Spectron Energy Inc. (982) (1,103)
Marex Spectron Asia Pte Limited (638) 29
Spectron Energy (Asia) Pte Limited 29 (166)
Marex Clearing Services DMCC - 59
10,151 (14,540)
51

Marex Financial Limited NOTES TO THE FINANCIAL STATEMENTS FOR THE YEAR ENDED 31 DECEMBER 2015 (CONTINUED)
25. FINANCIAL RISK MANAGEMENT OBJECTIVES AND POLICIES
The Company’s activities expose it to a number of financial risks including credit risk, market risk, operational risk and liquidity risk as discussed in the strategic report.
The Company manages these risks through various control mechanisms and its approach to risk management is both prudent and evolving.
Overall responsibility for risk management rests with the Group Board. Dedicated resources within the risk department control and manage the exposures of the Company’s own positions, the positions of its clients and its exposures to its counterparties as well as operational exposures, within the risk appetite set by the Group Board.
(a) Credit risk
Credit risk in the Company principally arises from cash and cash equivalents deposited with third party institutions, exposures from transactions and balances with exchanges and clearing houses, and exposures resulting from transactions and balances relating to customers and counterparties, some of which have been granted credit lines.
The Company only makes treasury deposits with banks and financial institutions that have received approval from the Group’s Executive Credit Risk Committee. These deposits are also subject to counterparty limits with respect to concentration and maturity.
The Company’s exposure to customer and counterparty transactions and balances is managed through the Group’s credit policies and, where appropriate, the use of initial and variation margin credit limits in conjunction with overall position limits for all customers and counterparties. These exposures are monitored both intraday and overnight. The limits are set by the Group’s Credit Risk Committee through a formalised process.
The maximum credit risk exposure relating to financial assets is represented by the carrying value as at the balance sheet date.
52

Marex Financial Limited NOTES TO THE FINANCIAL STATEMENTS FOR THE YEAR ENDED 31 DECEMBER 2015 (CONTINUED)
25. FINANCIAL RISK MANAGEMENT OBJECTIVES AND POLICIES (CONTINUED)
(a) Credit risk (continued)
Credit quality
The table below does not take into account collateral held.
2015
$’000 2014
$’000
AA and above 81,761 16,212
AA- 135,537 102,871
A+ 39,668 32,001
A 90,751 103,746
A- 2,719 85
BBB+ 64 -
Lower and unrated 511,075 524,890
861,575 779,805
2015
$’000 2014
$’000
Financial assets
Investments – available-for-sale 4,098 4,264
Financial instruments – fair value through profit or loss 4,936 12,182
Inventory 15,870 -
Financial instruments – held to maturity 119,524 59,988
Amounts due from exchanges, clearing houses and other counterparties 576,740 498,482
Amounts due from group companies 5,837 68,297
Loans receivable 802 1,033
Other debtors 419 697
Cash and cash equivalents 133,349 134,862
Total 861,575 779,805
53

Marex Financial Limited NOTES TO THE FINANCIAL STATEMENTS FOR THE YEAR ENDED 31 DECEMBER 2015 (CONTINUED)
25. FINANCIAL RISK MANAGEMENT OBJECTIVES AND POLICIES (CONTINUED)
(a) Credit risk (continued)
Past due, but not impaired trade and other receivables ageing analysis
2015
$’000 2014
$’000
Less than 30 days 578 544
30 – 60 days 480 352
61 – 90 days 163 234
91 – 120 days 112 86
More than 120 days 333 452
Total 1,666 1,668
Unnimpaired amounts that are past due are still collectible in full, based on historical payment behaviour and extensive analysis of customer credit risk, including underlying customers’ credit ratings if they are available.
(b) Market risk
The Company’s activities expose it to financial risks primarily generated through foreign exchange, interest rate and commodity market price exposures which are outlined in the strategic report.
Market risk sensitivity
As principally an intermediary, the Company’s market risk exposure is modest. It manages this market risk exposure using appropriate risk management techniques within pre-defined and independently monitored parameters and limits.
The Company uses a range of tools to monitor and limit market risk exposures. These include VaR, sensitivity analysis and stress testing.
(c) Foreign currency risk
As the majority of the revenue and asset and liabilities of the Company are generated in US Dollars, the Company is subject to minimal structural currency risk.
Foreign exchange sensitivity
The majority of the Company’s net assets are in US Dollars which minimises the effect exchange rate fluctuations will have on overall net assets.
(d) Interest rate risk
The Company is exposed to interest rate risk on cash, investments, derivatives, client balances and bank borrowings.
The Company’s view is that the main interest rate risk is derived from interest bearing deposits, in which the Company invests surplus funds, and bank borrowings.
The Company’s exposure to interest rate fluctuations is limited through the offset that exists between the bulk of its interest bearing assets and interest bearing liabilities. Since the return paid on client liabilities is generally reset to prevailing market interest rates on an overnight basis, the Company is only exposed for the time it takes to reset its investments which are held at rates fixed for a maturity which does not exceed three months, with the exception of US Treasuries which have a maturity of up to two years.
54

Marex Financial Limited NOTES TO THE FINANCIAL STATEMENTS FOR THE YEAR ENDED 31 DECEMBER 2015 (CONTINUED)
25. FINANCIAL RISK MANAGEMENT OBJECTIVES AND POLICIES (CONTINUED)
(e) Operational risk
Operational risk is the risk of loss arising through failures associated with personnel, processes or systems, or from external events. It is inherent in every business organisation and covers a wide spectrum of issues. Operational risk is managed through systems and procedures in which processes are documented, authorisation is independent, and transactions are monitored and reconciled.
The Company maintains disaster recovery or contingency facilities to support operations and ensure business continuity. The invocation of these facilities is regularly tested.
Compliance or regulatory risk arises from a failure or inability to comply with the laws, regulations or codes applicable specifically to the Company. Non-compliance can lead to fines, public reprimands, enforced suspensions of services, or in extreme cases, withdrawal of authorisation to operate.
The Company is subject to authorisation by the LME, NLX, DGCX, London Stock Exchange, ICE Futures and Eurex. The Company is regulated in the UK by the FCA (which also regulates our Group).
Geographical risk arises from the physical separation of some elements from the central control locations. Internal control failure is the risk arising from the inadequacy or breakdown of critical internal control processes.
(f) Concentration risk
In order to avoid excessive concentrations of risk with respect to bank counterparties the Company maintains a diversified portfolio of cash accounts in accordance with the Group Board’s risk appetite.
To mitigate the concentration of credit risk exposure to a particular single customer or counterparty or group of affiliated customers or counterparties, the Company monitors these exposures carefully and ensures that these remain within pre-defined limits and the large exposures limits determined by appropriate regulatory rules.
Further concentration risk controls are in place to limit exposure to clients or counterparties within single countries of origin and operation through specific country credit risk limits as set by the Group Board’s Risk Committee.
The largest concentration of cash balances as at 31 December 2015 was 94% (2014: 54%) to a US based, AA- rated global banking group (2014: US based, AA- rated global banking group).
The largest concentration of exposures to exchanges, clearing houses and other counterparties exposures as at 31 December 2015 was 54% (2014: 51%) to a non-rated global clearing house (2014: non-rated global clearing house).
(g) Liquidity risk
The Company defines liquidity risk as the failure to meet its day-to-day capital and cash flow requirements. Liquidity risk is assessed and managed under the Individual Liquidity Adequacy Assessment (‘ILAA’) and Liquidity Risk Framework. To mitigate liquidity risk the Company has implemented robust cash management policies and procedures that monitor liquidity daily to ensure that the Company has sufficient resources to meet its margin requirement at clearing houses and third party brokers. In the event of a liquidity issue arising, the Company has recourse to existing global cash resources, after which it could draw down on a $50million committed revolving credit facility as an additional contingency funding.
There are strict guidelines followed in relation to products and duration into which excess liquidity can be invested. Excess liquidity is invested in highly liquid instruments, such as cash deposits with financial institutions for a period of less than three months and US Treasuries with a maturity of up to two years.
The financial liabilities are based upon rates set on a daily basis, apart from the financing of the warrant positions and the credit facility where the rates are set for the term of the loan. For assets not marked-to-market there is no material difference between the carrying value and fair value.
55

Marex Financial Limited NOTES TO THE FINANCIAL STATEMENTS FOR THE YEAR ENDED 31 DECEMBER 2015 (CONTINUED)
25. FINANCIAL RISK MANAGEMENT OBJECTIVES AND POLICIES (CONTINUED)
(g) Liquidity risk (continued)
Liquidity risk exposures
2015 On demand
$’000
Less than 3 months
$’000
3 to 12 months
$’000 1 to 5 years
$’000 Total $’000
Financial instruments – fair value through profit or loss - 2,982 327 233 3,542
Amounts due to exchanges, clearing houses and other counterparties 604,177 - - - 604,177
Amounts due to group undertakings 47,643 - - - 47,643
Accruals and deferred income - 33,220 - - 33,220
Other tax and social security taxes - 1,432 - - 1,432
Other creditors - 6,385 - - 6,385
Repurchase agreements - 18,938 - - 18,938
Total 651,820 62,957 327 233 715,337
2014 On demand
$’000
Less than 3 months
$’000
3 to 12 months
$’000 1 to 5 years
$’000 Total $’000
Financial instruments – fair value through profit or loss - 8,625 1,627 - 10,252
Amounts due to exchanges, clearing houses and other counterparties 465,225 - - - 465,225
Amounts due to group undertakings 105,331 - - - 105,331
Accruals and deferred income - 38,279 194 - 38,473
Other tax and social security taxes - 2,097 - - 2,097
Other creditors - 221 - - 221
Short-term borrowings 25,000 - - - 25,000
Total 595,556 49,222 1,821 - 646,599
56

Marex Financial Limited NOTES TO THE FINANCIAL STATEMENTS FOR THE YEAR ENDED 31 DECEMBER 2015 (CONTINUED)
25. FINANCIAL RISK MANAGEMENT OBJECTIVES AND POLICIES (CONTINUED)
(h) Value at risk (‘VaR’)
VaR is a technique that estimates the potential losses that could occur on risk positions as a result of movements in market rates and prices over a specified time horizon and to a given level of confidence.
The VaR model used by the Company is based upon the Monte Carlo simulation technique. This model derives plausible future scenarios from past series of recorded market rates and prices, taking account of inter-relationships between different markets and rates, including interest rates and foreign exchange rates. The model also incorporates the effect of option features on the underlying exposures.
The Monte Carlo simulation model used by the Company incorporates the following features:
5,000 simulations using a variance covariance matrix;
simulations generated using geometric Brownian motion;
an exceptional decay factor is applied across an estimation period of 250 days; and
VaR is calculated to a 1 day, 99.75% one tail confidence level.
The Company validates the VaR by comparing to alternative risk measures, for example, scenario analysis and exchange initial margins as well as the back testing of calculated results against actual profit and loss.
Although a valuable guide to risk, VaR should always be viewed in the context of its limitations, for example:
the use of historical data as a proxy for estimating future events may not encompass all potential events, particularly those which are extreme in nature;
the use of a 1 day holding period assumes that all positions can be liquidated or hedged in 1-day. This may not fully reflect the market risk arising at times of severe liquidity stress, when a 1-day holding period may be insufficient to liquidate or hedge all positions fully;
the use of a 99.75% confidence level, by definition, does not take into account losses that might occur beyond this level of confidence;
the VaR, disclosed below, is calculated on the basis of exposures outstanding at the close of business and therefore does not necessarily reflect intra-day exposure; and
VaR is unlikely to reflect loss potential on exposures that only arise under significant market moves.
The Company recognises these limitations by augmenting its VaR limits with other position and sensitivity limit structures. The Company also applies a wide range of stress testing, both on individual portfolios and on the Company’s consolidated positions. The VaR as at 31 December 2015 was $662,000 (2014: $832,000) and the average monthly VaR for the year ended 31 December 2015 was $1,091,000 (2014: $1,427,000).
(i) Capital management
For the purpose of the Company’s capital management, capital includes issued share capital, share premium and all other equity reserves attributable to the equity holders of the parent. The primary objective of the Company’s capital management is to maximise the shareholder value.
In order to achieve this overall objective, the Company’s capital management, amongst other things, aims to ensure that it meets financial covenants attached to the interest-bearing loans and borrowings that define capital structure requirements. Breaches in meeting the financial covenant would permit the bank to immediately call loans and borrowings. There have been no breaches in the financial covenants of any interest-bearing loans and borrowing in the current year.
No changes were made in objectives, policies or processes for managing capital during the year.
57

Marex Financial Limited NOTES TO THE FINANCIAL STATEMENTS FOR THE YEAR ENDED 31 DECEMBER 2015 (CONTINUED)
26. FAIR VALUE MEASUREMENTS
(a) Valuation techniques and significant unobservable inputs
When measuring the fair value of an asset or a liability, the Company uses observable market data as far as possible. Fair values are categorised into different levels in a fair value hierarchy based on the inputs used in the valuation techniques as follows:
Level 1: quoted (unadjusted) prices in active markets for identical assets or liabilities;
Level 2: other techniques for which all inputs which have a significant effect on the recorded fair value are observable, either directly or indirectly; and
Level 3: techniques which use inputs which have a significant effect on the recorded fair value that are not based on observable market data (unobservable inputs).
If the inputs used to measure the fair value of an asset or a liability fall into different levels of the fair value hierarchy, then the fair value measurement is categorised in its entirety in the same level of the fair value hierarchy as the lowest level input that is significant to the entire measurement.
In measuring Level 2 and Level 3 fair values, including the significant unobservable inputs used the specific valuation techniques are:
Level 2
Forward foreign exchange and commodity contracts – the fair values are based on broker quotes. Similar contracts are traded in an active market and the quotes reflect the actual transactions in similar instruments.
Unlisted investments – the fair values are based on the market value with reference to the latest available traded price as at 31 December 2015. No significant observable inputs have been used.
Level 3
There are no Level 3 instruments.
Transfers between fair value levels
The Company recognises transfers between levels of fair value hierarchy at the end of the reporting period during which the change has occurred.
58

Marex Financial Limited NOTES TO THE FINANCIAL STATEMENTS FOR THE YEAR ENDED 31 DECEMBER 2015 (CONTINUED)
26. FAIR VALUE MEASUREMENTS (CONTINUED)
(b) Fair value and book value
Some of the Company’s assets are carried at fair value or contract amounts that approximate fair value.
Set out, below, is an analysis of the carrying amounts and fair value of the Company’s financial instruments. Due to the nature of the underlying assets, the carrying value approximates fair value.
2015
$’000 2014
$’000
Financial assets at fair value through the income statement:
Inventory 15,870 -
Amounts due from exchanges, clearing houses and other counterparties 279,906 (24,241)
Financial instruments – fair value through profit orloss 4,936 12,182
300,712 (12,059)
Available-for-sale at fair value through other comprehensive income:
Investments 4,098 4,264
4,098 4,264
At amortised cost:
Non-current assets
Financial instruments – held to maturity 40,936 -
Financial instruments – held to maturity pledged as collateral 44,093 -
Current assets
Financial instruments – held to maturity 9,999 59,988
Financial instruments – held to maturity pledged as collateral 24,496 -
Amounts due from exchanges, clearing houses and other counterparties 296,834 522,723
Amounts due from group undertakings 5,837 68,297
Other debtors 419 697
Other taxes and social security - 8,556
Loans receivable 802 1,033
Cash and cash equivalents 133,349 134,862
556,765 796,156
Total 861,575 788,361
59

Marex Financial Limited NOTES TO THE FINANCIAL STATEMENTS FOR THE YEAR ENDED 31 DECEMBER 2015 (CONTINUED)
26. FAIR VALUE MEASUREMENTS (CONTINUED)
(b) Fair value and book value (continued)
2015
$’000 2014
$’000
Financial liabilities:
Financial instruments 3,542 10,252
3,542 10,252
At amortised cost:
Amounts due to exchanges, clearing houses and other counterparties 604,177 465,225
Amounts due to group undertakings 47,643 105,331
Accruals and deferred income 33,220 38,473
Repurchase agreements 18,938 -
Other creditors 6,385 221
Other taxes and social security 1,432 2,097
Short-term borrowings - 25,000
Provisions 891 698
712,686 637,045
Total 716,228 647,297
60

Marex Financial Limited NOTES TO THE FINANCIAL STATEMENTS FOR THE YEAR ENDED 31 DECEMBER 2015 (CONTINUED)
26. FAIR VALUE MEASUREMENTS (CONTINUED)
(c) Fair value hierarchy
The following table shows an analysis of the financial assets and liabilities recorded at fair value shown in accordance with the fair value hierarchy:
2015
$’000 2014
$’000
Level 1
Inventory 15,870 -
Amounts due from exchanges, clearing houses and other counterparties 279,906 (24,241)
Financial instruments – fair value through profit or loss (assets) - 12,182
Financial instruments – fair value through profit or loss (liabilities) - (10,252)
Investments (listed) 793 776
296,569 (21,535)
Level 2
Financial instruments – fair value through profit or loss (assets) 4,936 -
Financial instruments – fair value through profit or loss (liabilities) (3,542) -
Investments (unlisted) 3,305 100
4,699 100
Level 3
Investments (unlisted) - 3,388
- 3,388
Total 301,268 (18,047)
61

Marex Financial Limited NOTES TO THE FINANCIAL STATEMENTS FOR THE YEAR ENDED 31 DECEMBER 2015 (CONTINUED)
26. FAIR VALUE MEASUREMENTS (CONTINUED)
(d) Financial instruments subject to offsetting, enforceable master netting arrangements and similar agreements
As a member of the LME, the Company is subject to the settlement and margining rules of LME Clear. The majority of products transacted by the Company are LME forward contracts. LME forwards that are in-the-money do not settle in cash until maturity (‘prompt’) date, while the Company is required to post margin to cover loss-making contracts daily. In accordance with the LME Clear rules, the Company is able to utilise forward profits to satisfy daily margin requirements and are set-off against loss-making contracts, and are presented on a net basis in the balance sheet.
The effect of offsetting is disclosed, below:
2015
Gross amount
$’000
Amount set-off $’000
Net amount
presented $’000
Financial inst-
ruments $’000
Cash collateral (received) / pledged
$’000
Net amount
$’000
Financial assets
Amounts due from exchanges, clearing houses and other counterparties 1,096,224 (519,484) 576,740 - - 576,740
Financial liabilities
Amounts due from exchanges, clearing houses and other counterparties 1,123,661 (519,484) 604,177 - - 604,177
2014
Gross amount
$’000
Amount set-off $’000
Net amount
presented $’000
Financial inst-
ruments $’000
Cash collateral (received) / pledged
$’000
Net amount
$’000
Financial assets
Amounts due from exchanges, clearing houses and other counterparties 1,035,692 537,210 498,482 - - 498,482
Financial liabilities
Amounts due from exchanges, clearing houses and other counterparties 1,002,435 537,210 465,225 - - 465,225
62

Marex Financial Limited NOTES TO THE FINANCIAL STATEMENTS FOR THE YEAR ENDED 31 DECEMBER 2015 (CONTINUED)
27. RESTATEMENTS
Voluntary change in accounting policy
Previously segregated client funds (which comprise client funds held in segregated client money accounts) were held on the Company’s statement of financial position within cash and cash equivalents. The corresponding liabilities to clients and counterparties were included in trade and other payables.
Segregated client funds have been excluded from the Company’s statement of financial position in order to better reflect the statutory trust status of such monies, including the restrictions placed on the Company’s ability to control the funds, as well as increase comparability with the Company’s peers.
The impact of the voluntary change in accounting policy on the financial statements is disclosed below:
31 December 2014
Previously Reported
$’000
Adjustments for change in
accounting policy $’000
Restated $’000
Assets
Non-current assets 23,588 - 23,588
Current assets 978,581 (187,326) 791,255
Adjusted for derecognition of client money:
Cash and cash equivalents 322,188 (187,326) 134,862
Total assets 1,002,169 (187,326) 814,843
Liabilities
Current liabilities (839,818) 187,326 (652,492)
Adjusted for derecognition of client money:
Trade and other payables (798,673) 187,326 (611,347)
Non-current liabilities - - -
Total liabilities (839,818) 187,326 (652,492)
Net assets 162,351 - 162,351
63

Marex Financial Limited NOTES TO THE FINANCIAL STATEMENTS FOR THE YEAR ENDED 31 DECEMBER 2015 (CONTINUED)
27. RESTATEMENTS (CONTINUED)
Voluntary change in accounting policy (continued)
1 January 2014
Previously Reported
$’000
Adjustments for change in
accounting policy $’000
Restated $’000
Assets
Non-current assets 28,667 - 28,667
Current assets 1,023,237 (190,521) 832,716
Adjusted for derecognition of client money:
Cash and cash equivalents 271,668 (190,521) 81,147
Total assets 1,051,904 (190,521) 861,383
Liabilities
Current liabilities (889,825) 190,521 (699,304)
Adjusted for derecognition of client money:
Trade and other payables (875,701) 190,521 (685,180)
Non-current liabilities - - -
Total liabilities (889,825) 190,521 (699,304)
Net assets 162,079 - 162,079
28. POST BALANCE SHEET EVENTS
The directors are not aware of any other matter or circumstance that has occurred since the end of the financial year and the date of this report not otherwise dealt with in this report that has significantly affected or may significantly affect the operations of the Company, the results of those operations or the state of affairs of the Company in subsequent financial years.
64

Marex Financial Limited COUNTRY-BY-COUTNRY REPORTING FOR THE YEAR ENDED 31 DECEMBER 2015
29. COUNTRY-BY-COUNTRY REPORTING
The disclosure has been prepared in accordance with The Capital Requirements (Country by Country Reporting) Regulation 2013, which came into effect on 1 January 2014. Marex Financial Limited is the only institution (as defined by the EU Capital Requirements Regulation) within the Marex Spectron Group. Marex Financial Limited is regulated by the FCA on a solo basis and has the following subsidiaries:
Carlton Commodities 2004 LLP (unregulated);
Nanolytics Capital Advisors Limited (unregulated);
Marex Spectron Securities LLP (unregulated, dormant); and
Xeram SA (unregulated, dormant).
Legal entity Geographical location Nature of activity
Marex Financial Limited
UK Commodities and financial instruments broker and clearer
Carlton Commodities 2004 LLP
UK Commodity and option trading
Nanolytics Capital Advisors Limited
UK Appointed representative
(a) Disclosure – For the year ended 31 December 2015
Legal entity on a consolidated basis
No. employees
Revenue $’000
Profit before tax
$’000
Taxation received
$’000
Public subsidies received
$’000
Marex Financial Limited 333 227,231 6,439 (1,370) -
(b) Disclosure – For the year ended 31 December 2014
Legal entity on a consolidated basis
No. employees
Revenue $’000
Profit before tax
$’000
Taxation received
$’000
Public subsidies received
$’000
Marex Financial Limited 355 248,245 1,815 (3,768) -
65