Annual Report and Financial Statements 2006files.investis.com/pzc/reports/annual report...
88
Annual Report and Financial Statements 2006
Transcript of Annual Report and Financial Statements 2006files.investis.com/pzc/reports/annual report...

Annual Report and Financial Statements 2006

01 Introduction02 Chairman’s Statement04 Group Structure and Principle Activities06 Directors Report 06 Financial Highlights 10 Business Review: Africa 14 Business Review: Asia 18 Business Review: Europe 22 Communications
INTRODUCTION | ANNUAL REPORT 2006 | 01
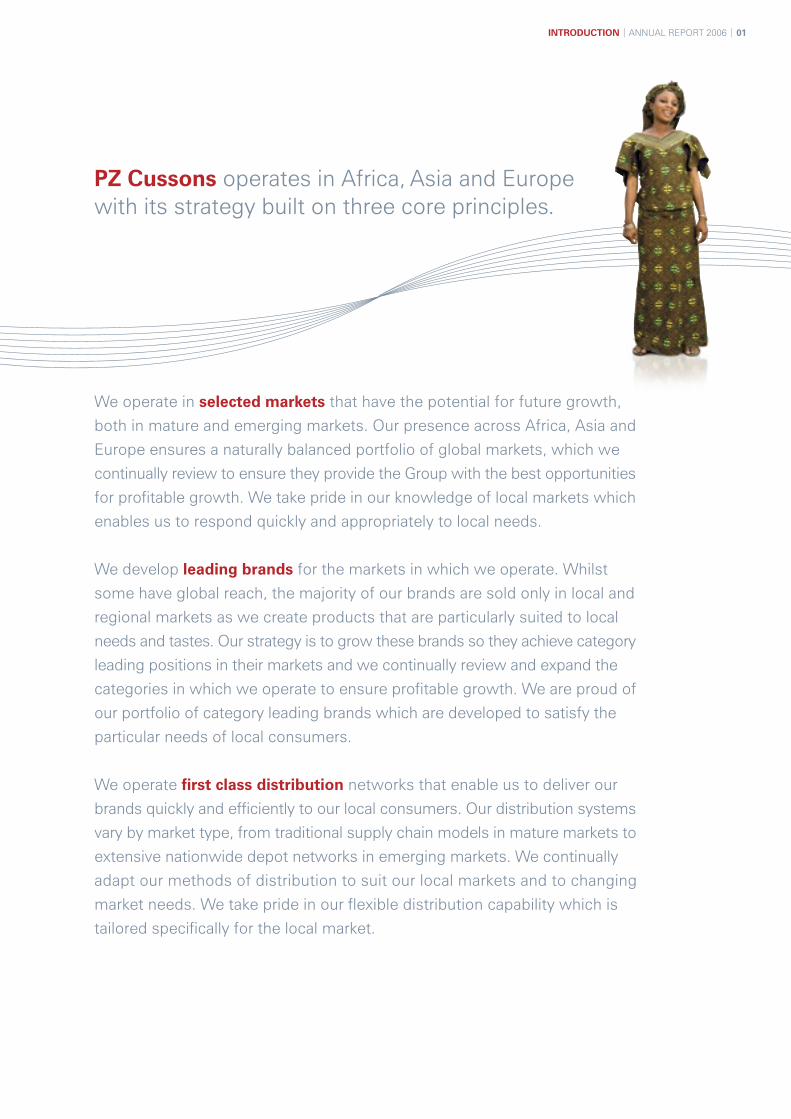
PZ Cussons operates in Africa, Asia and Europe with its strategy built on three core principles.
We operate in selected markets that have the potential for future growth,
both in mature and emerging markets. Our presence across Africa, Asia and
Europe ensures a naturally balanced portfolio of global markets, which we
continually review to ensure they provide the Group with the best opportunities
for profitable growth. We take pride in our knowledge of local markets which
enables us to respond quickly and appropriately to local needs.
We develop leading brands for the markets in which we operate. Whilst
some have global reach, the majority of our brands are sold only in local and
regional markets as we create products that are particularly suited to local
needs and tastes. Our strategy is to grow these brands so they achieve category
leading positions in their markets and we continually review and expand the
categories in which we operate to ensure profitable growth. We are proud of
our portfolio of category leading brands which are developed to satisfy the
particular needs of local consumers.
We operate first class distribution networks that enable us to deliver our
brands quickly and efficiently to our local consumers. Our distribution systems
vary by market type, from traditional supply chain models in mature markets to
extensive nationwide depot networks in emerging markets. We continually
adapt our methods of distribution to suit our local markets and to changing
market needs. We take pride in our flexible distribution capability which is
tailored specifically for the local market.

02 | ANNUAL REPORT 2006 | CHAIRMAN’S STATEMENT
Welcome. 2006 has been another year of successful development of the Group.

CHAIRMAN’S STATEMENT | ANNUAL REPORT 2006 | 03
2006 has been another year of successful development of the Group with operating profit before exceptional items reaching £60.2 million, an increase of 13%.
This excellent performance is as a result of continuing to target specific markets with growth potential, in particular Nigeria, as well as pursuing a margin improvement programme across the Group.
Highlights in the year have been as follows:• Successful completion of the milk factory in Nigeria,
constructed with Glanbia Plc, with sales of milk exceeding expectations.
• Significant growth in our electrical goods business with Haier in Nigeria with further expansion of the product range.
• Commissioning of the new bar soap factory in Thailand.• Completion of the restructuring of our Eastern
European business.• Commencement of roll-out of the Charles Worthington
brand into the UK nationwide trade.
At a corporate level, following approval of the enfranchisement of the ‘A’ non-voting shares and the repayment of the preference share capital in June 2005, the board is now proposing to shareholders that a share split is undertaken to further improve the liquidity of the company’s shares. Shareholders will be asked to vote on this at the forthcoming annual general meeting with further details provided in the enclosed circular.
Turning now to the board of directors, 2006 has been a year of transition with the retirement of long serving directors and the appointment of new directors to the board, who are well equipped to deal with the exciting opportunities ahead.
Nigel Green retired as Group Chief Executive on 31st May 2006. During his highly successful ten year tenure Group revenue increased from £360 million to £540 million and pre-exceptional profitability from £19 million to £63 million. Whilst focusing on specific markets the Group has gone into significant new areas of activity. All of this has been achieved utilising the Group’s own resources and he leaves behind a strong balance sheet as well as an impressive management development programme out of which will come our leaders of tomorrow.
I should like to take this opportunity to thank Nigel for his very substantial contribution and wish him and his wife, Jane, a long and happy retirement.
John Spyridoulias retired as Technical Director on 28th February 2006 after 30 years with the Group. John has maintained the very high technical standards the Group has always been fortunate enough to enjoy and I wish him and his wife, Vaso, a very enjoyable retirement.
Alex Kanellis succeeded Nigel as Group Chief Executive on 1st June 2006 and was joined on 1st January 2006 on the board by Brandon Leigh as Finance Director and Chris Davis as Regional Director, Africa.
Our strategic focus remains on growth and margin improvement in selected markets, and the Group’s success continues to be achieved as a result of the hard work and dedication of all our staff throughout the PZ Cussons Group. In this respect, I would like to thank all of them very much indeed.
Anthony J GreenChairman

The PZ Cussons Group operates in Africa, Asia and Europe, in both mature and emerging markets.
Nigeria
Chief executive:Panos Varelas
Managing directors:Christos Giannopoulos (Soaps and detergents), Ray Murphy (Health and beauty), Tolis Loizos (HPZ), Con Gendis (Nutricima), Adewale Raji (Distribution)
Number of employees: 5,450
Locations: Head office in Lagos, manufacturing units in Ilupeju, Ikorodu and Aba
Activities: Manufacture and marketing of soaps, detergents, toiletries, feminine hygiene products, pharmaceuticals, packaging materials, electrical goods and milk
Ghana
Managing director: Meletis Glentzes
Number of employees: 540
Locations: Head office in Accra
Activities: Manufacture and marketing of soaps, toiletries, cosmetics and pharmaceuticals
Kenya
Managing director:George Sotiropoulos
Number of employees: 520
Locations: Head office in Nairobi
Activities: Manufacture and marketing of soaps, toiletries, medicaments and household products
United Kingdom
Managing director:Chris How
Number of employees: 350
Locations: Head office in Manchester
Activities: Manufacture and marketing of soaps, toiletries and household products
Greece
Managing director:George Kostianis
Number of employees: 190
Locations: Head office in Athens
Activities: Manufacture and marketing of olive oils, margarines and cooking fats
04 | ANNUAL REPORT 2006 | GROUP STRUCTURE AND PRINCIPAL ACTIVITIES

GROUP STRUCTURE AND PRINCIPAL ACTIVITIES | ANNUAL REPORT 2006 | 05
Poland
Managing director:Stephen Murphy
Number of employees: 460
Locations: Head office in Warsaw
Activities: Manufacture and marketing of detergents, soaps and toiletries
Indonesia
Managing directors: Panos Mouchteros and Dimitri Papadimitriou
Number of employees: 2,600
Locations: Head office in Jakarta
Activities: Manufacture and marketing of soaps, toiletries, baby products, powders, shampoos and lotions
Thailand
Managing director:Richard Shepherd
Number of employees: 990
Locations: Head office in Bangkok
Activities: Manufacture and marketing of soaps, toiletries and dishwashing liquids
Australia
Managing director:George Fatouros
Number of employees: 280
Locations: Head office in Melbourne
Activities: Manufacture and marketing of household detergents, bar soaps and toiletries
United Arab Emirates
Country manager:Huw Morris
Number of employees: 10
Locations: Head office in Jebel Ali Freezone of Dubai
Activities: Marketing and distribution of soaps and toiletries

The directors submit their report and the audited
financial statements of the Group for the year ended
31st May 2006.
Revenue increased by 12% to £539.9m from £480.1m.
Operating profit* increased by 13% to £60.2m from £53.5m.
Profit before tax before exceptional items increased by 9% to £63.6m from £58.1m.
Profit before tax after exceptional items increased by 15% to £61.2m from £53.4m.
Adjusted basic EPS* increased by 13% to 88.96p from 78.51p.
A net operating charge of £2.4m (2005: £4.7m) for exceptional items.
Net funds** at 31st May 2006 reduced to £51.9m from £74.0m after £15.5m repayment of preference share capital.
Proposed dividend increase for the year of 10.1% to 38.80p from 35.25p.
Post year-end announcement of planned investment in a new UK liquids factory and further expansion of the Nigeria milk joint venture.
Proposed ten for one share split.
† The purpose of these financial highlights, and following business reviews, are to help stakeholders understand how management analyse the development, performance and position of the Group. In preparing the financial highlights and business reviews, directors have not sought to comply with the ASB’s 2006 Reporting Statement on OFRs.
* Before exceptional items. ** Net funds, above and hereafter, is defined as cash, short-term deposits and current asset investments
less borrowings.
Revenue (£m)
2006 2005
Africa 211.8 159.4
Asia 113.9 107.7
Europe 214.2 213.0
Total 539.9 480.1
Operating profits – before exceptional items
����
���� ���� ����
����
�
��
��
��
��
��
��
��
���� ���� ���� ���� ����
����
�
��
��
��
��
��
��
������ ���
����������������������
���� ���� ���� ���� ����
����������������������
��������
���� ����
����
���� ���� ���� ���� ���� ���� ���� ���� ���� ����
��������
��������
����
�����
����
����
����
����
�
��
��
��
��
��
��
��
��
���������
���������������������������������������������������
�
��
��
��
���
06 | ANNUAL REPORT 2006 | FINANCIAL HIGHLIGHTS
This year’s Highlights† at a glance
Net funds (£m)
2006 2005
Cash at bankand in hand 25.9 14.9
Deposits 39.9 50.8
Current assetinvestments 2.2 16.2
Overdrafts (11.9 ) (0.3 )
Loans duewithin one year (2.1 ) (4.9 )
Loans dueafter one year (2.1 ) (2.7 )
Net funds 51.9 74.0
Operating profit (£m)*
2006 2005
Africa 25.1 20.8
Asia 12.5 11.9
Europe 22.6 20.8
Total 60.2 53.5

FINANCIAL HIGHLIGHTS | ANNUAL REPORT 2006 | 07
Financial position – overviewThe Group’s balance sheet remains strong with net funds at 31st May 2006 of £51.9 million (2005: £74.0 million). Major expenditure in the year included £15.5 million incurred on the repayment of preference share capital and further investment in capital expenditure and working capital, principally in Nigeria. Cash generated from mature market operations effectively funds investment in emerging markets. In addition, the Group’s equity investment portfolio was liquidated during the year to generate funds, principally for the investment in Nigeria.
Key performance indicatorsIn terms of performance, the Group targets its regions on delivery of operating profit in absolute terms as well as delivering ongoing improvement in operating margins. Margin improvement initiatives continue in all markets to counter further cost increases and the impact of the weak dollar.
In terms of cashflow, the Group targets its operating units on delivery of cashflows in absolute terms as well as improvements in working capital measures. This is to offset ongoing pressure on working capital due to growth across all businesses.
Financial performance – overviewOperating profit before exceptional items rose by 13% to £60.2 million (2005: £53.5 million) on revenue up 12% to £539.9 million (2005: £480.1 million). This reflected good performances in all key territories, particularly Nigeria, and the elimination of losses incurred last year in Russia.
Mature marketsIn mature markets, trade has been strong as a result of successful brand development although this has required a higher level of investment to grow our brands in an increasingly competitive environment. Pressure on margins has continued with zero or negative inflation on selling prices as well as cost increases on materials, utilities and freight largely as a result of higher commodity and oil prices.
Emerging marketsIn emerging markets, growth has largely arisen from our continued success in Nigeria, where both the underlying business and new projects have contributed to increased profitability. However, pressure on selling prices has been evident, particularly in the more mature product categories where competition is increasing. The highlight of the year was the successful completion of the milk factory in Nigeria, constructed ahead of schedule in conjunction with Glanbia Plc, with sales of milk exceeding expectations.
Profit before tax – before exceptional items
����
���� ���� ����
����
�
��
��
��
��
��
��
��
���� ���� ���� ���� ����
����
�
��
��
��
��
��
��
������ ���
����������������������
���� ���� ���� ���� ����
����������������������
��������
���� ����
����
���� ���� ���� ���� ���� ���� ���� ���� ���� ����
��������
��������
����
�����
����
����
����
����
�
��
��
��
��
��
��
��
��
���������
���������������������������������������������������
�
��
��
��
���
Adjusted basic EPS – before exceptional items
����
���� ���� ����
����
�
��
��
��
��
��
��
��
���� ���� ���� ���� ����
����
�
��
��
��
��
��
��
������ ���
����������������������
���� ���� ���� ���� ����
����������������������
��������
���� ����
����
���� ���� ���� ���� ���� ���� ���� ���� ���� ����
��������
��������
����
�����
����
����
����
����
�
��
��
��
��
��
��
��
��
���������
���������������������������������������������������
�
��
��
��
���
Net funds
����
���� ���� ����
����
�
��
��
��
��
��
��
��
���� ���� ���� ���� ����
����
�
��
��
��
��
��
��
������ ���
����������������������
���� ���� ���� ���� ����
����������������������
��������
���� ����
����
���� ���� ���� ���� ���� ���� ���� ���� ���� ����
��������
��������
����
�����
����
����
����
����
�
��
��
��
��
��
��
��
��
���������
���������������������������������������������������
�
��
��
��
���

Financial highlights (continued)
Final costs of £6.5 million in relation to the closure of the Nottingham factory. A conditional contract for the sale of the site has now been signed and the net proceeds will appear as exceptional income in the year when the contract becomes unconditional, which is expected to take place within two years of the balance sheet date.
Costs of £3.1 million in relation to the rationalisation of the Group’s smaller operations, being the Cameroun business which has been put up for sale and the USA operation which has been converted from direct sales to a licence arrangement.
Income of £5.3 million as a result of recoveries from ECGD (Export Credit Guarantee Department) of bad debts written off several years ago, which have now been recovered as a result of Nigeria’s settlement with the Paris Club of creditors.
Net income of £1.9 million as a result of the disposal of the Polish liquids and creams factory, the closure of which was announced last year.
TaxationThe effective tax rate before exceptional items was lower than the previous year at 29.2% (2005: 30.5%) mainly due to the new Nigerian ventures being initially eligible for tax free status.
*** These items have been disclosed separately in the Group’s consolidated income statement, while a definition of exceptional items is given in note 1 to the financial statements.
New projectsPost year-end the Group has announced two significant new projects:
In the UK, the Group is planning construction of a new, purpose built liquids factory to provide additional capacity to meet the long-term supply needs of our growing UK business. The new factory will be located close to the current site in North Manchester which will close when production fully transfers across to the new site in 2008. Net costs of the project are estimated at £15 million over the next two years, which should be funded by the proceeds from the UK factory sites in Nottingham and Manchester.
In Nigeria, PZ Cussons and Glanbia are pleased to announce agreement to further investment in their joint venture with an expansion of the current milk factory to provide additional capacity. Plans to invest in the development of further nutritional products are at an advanced stage. Work to extend the current factory will commence later this year, with completion expected in 2008. The Group’s share of this cost will be approximately £5 million.
Exceptional items ***Exceptional items in the year totalled to a net charge of £2.4 million to operating profit in the consolidated income statement comprising the following:
08 | ANNUAL REPORT 2006 | FINANCIAL HIGHLIGHTS

FINANCIAL HIGHLIGHTS | ANNUAL REPORT 2006 | 09
IFRSThis is the first set of annual financial statements prepared under International Financial Reporting Standards (IFRS). Further details are provided in the notes to the financial statements.
OutlookThe Group’s focus on selected markets, leading brands and first class distribution continues to provide a clear strategy for the future. Over the next year, the Group will be pursuing growth in all businesses as well as continuing a sustained margin improvement programme to counter ongoing pressures on both selling prices and costs.
The current economic and political stability in Nigeria has greatly assisted our growth and encouraged our recent new investments. With our plans for future expansion we look forward to the continuation of this situation after the forthcoming elections in the spring of 2007.
The balance sheet remains strong with all projects currently being financed from Group net funds.
Trading to date has been in line with management expectations. With a clear strategy and continuing cadre of experienced senior management the directors face the future with confidence.
DividendThe board is recommending a dividend increase of 10.1% for the year with a proposed final dividend of 29.50p (2005: 26.60p) per share for a total of 38.80p (2005: 35.25p).
Enfranchisement and preference share repaymentIn June 2005, shareholder approval was given for the enfranchisement of the ‘A’ non-voting shares and the repayment of the preference shares by a reduction of share capital which has now been completed. As part of the enfranchisement, a compensatory bonus issue, on the basis of one new ordinary share for every ten ordinary shares held by each ordinary shareholder, was made on 29th June 2005. This has resulted in dividends being paid on an enhanced number of shares.
Proposed share splitThe board is now proposing to shareholders that a share split is undertaken to further improve the liquidity of the company’s shares. A proposal, therefore, of a share split of ten shares per one share currently in issue is to be considered as a resolution at the forthcoming annual general meeting. Further details can be found in the separate circular containing the notice of meeting which will be posted to shareholders with the Annual Report and Financial Statements.

Africa. With over 100 years experience of trading in Africa we are proud of the knowledge of local markets and consumers we have developed, which has resulted in a strong portfolio of local brands.
Our passion to grow these brands and develop innovative products in response to local needs has delivered success in the emerging markets of Africa.
Soaps and detergents
The soaps and detergents portfolio forms the backbone of the African business and includes laundry and toilet soap and bulk and branded detergents.
Health and beauty
This unit has a variety of strong local brands which includes haircare and skincare products, medicated rubs and pharmaceutical products. Pan-regional development of these brands is bringing benefits to the African region as a whole.
Electrical goods
This unit sells electrical goods manufactured with our Chinese partner Haier such as fridges, freezers and air conditioning units sold under the brand name Haier Thermocool. Expansion of the product range has begun with the launch of televisions and DVD players.
10 | ANNUAL REPORT 2006 | BUSINESS REVIEW: AFRICA

BUSINESS REVIEW: AFRICA | ANNUAL REPORT 2006 | 11
Distribution
One of our key strengths in Africa is our extensive network of depots and factories in Nigeria. In order to ensure that the Group maintains and develops this strength, distribution has been placed in its own business unit.
Food and nutrition
The food and nutrition unit, which manufactures milk products with our joint venture partner Glanbia Plc in the newly commissioned factory, has been a significant success story for the Group in the year.

Performance in Nigeria has been strong with both revenue
and profitability up on the previous year. The division of the
business into separate business units, carried out during 2005,
has proved very successful in its first full year of operation,
with increased focus brought to each of the following areas:
• Soaps and detergents
• Health and beauty
• Electrical goods (HPZ)
• Milk and nutrition (Nutricima)
• Distribution
PZ Cussons and Glanbia are pleased to announce agreement to further investment in their joint venture with an expansion of the current milk factory to provide further capacity. Plans to invest in the development of further nutritional products are at an advanced stage. Work to extend the current factory will commence later this year, with completion expected in 2008. The Group’s share of this cost will be approximately £5 million.
The Nigerian currency has remained steady against the dollar during the year as a result of continued political and economic stability, although the weakness of the dollar against sterling in the second half has negatively impacted results in that period.
The Nigerian business concluded a rights issue in the year resulting in further investment from the UK of circa £20 million which took the Group’s holding to approximately 61%.
Strong brand renovation across the core portfolios of soaps, detergents, health and beauty resulted in improved revenue and profitability despite higher costs and increased competition.
Growth in sales of fridges, freezers and air conditioners continued with significant increases in both revenue and profitability compared to the prior year. Further growth is expected from the expansion of current distribution and the introduction of further electrical products to the range.
The highlight of the year was the successful completion of the milk factory which was constructed ahead of schedule in conjunction with Glanbia Plc, with sales of milk in the year exceeding expectations. Sales of both powdered milk and evaporated milk have been made under the brand name ‘Nunu’ and have been very well received in the market.
12 | ANNUAL REPORT 2006 | BUSINESS REVIEW: AFRICA
Premier
Premier toilet soap is a mild and gentle soap suitable for the whole family. It works hard to leave your skin fresh and clean, and is available in West Africa.

BUSINESS REVIEW: AFRICA | ANNUAL REPORT 2006 | 13
Funds raised are being used for the capital investment programme which is focused on four key areas:
• Expansion of production capacities• Improvements to factory infrastructures• Installation of gas power generation
capability• Investment in nationwide depot network
This investment not only provides a sound capital investment platform for the future but also compliments the continuing margin improvement programme to counter ongoing cost increases.
Revenue and profitability in Ghana and Kenya are ahead of last year as a result of both growth and margin improvement. African brands are being ‘pan-regionalised’ to leverage the strength of the brands and to maximise efficiencies, with haircare being selected as the first such pan-regional project.
Distribution
Our extensive network of depots in Nigeria allows us to respond rapidly to market demand.
Nunu
Powdered and evaporated milk products are manufactured with our joint venture partner Glanbia Plc, and are available throughout Nigeria.
Haier Thermocool
Electrical goods such as fridges, freezers, televisions and air conditioning units manufactured with our Chinese joint venture partner Haier are sold under the Haier Thermocool brand throughout Nigeria.
Robb
Robb mentholated rub is a decongestant, giving rapid relief to muscular aches and pains, and is available in West Africa.

Asia. A key feature of our Asian region is our first-class distribution network in emerging markets, which enables us to deliver our strong brand ranges efficiently across these territories.
Babycare
The region has a number of products falling within this category such as soaps, lotions, shampoos, talcum powder and rubs. These products are distributed under strong local brands, which are in category leading positions in their marketplaces, demonstrating the effectiveness of the Group’s strategy of developing leading local brands to suit the needs of local consumers.
14 | ANNUAL REPORT 2006 | BUSINESS REVIEW: ASIA

BUSINESS REVIEW: ASIA | ANNUAL REPORT 2006 | 15
Household and detergents
This region has a diverse range of products falling within this category. Examples include detergents, manual dishwash products and automatic dishwash products. Strong brand renovation in the year has been driven by our inherent knowledge of the local markets in which we operate.
Personal care and soap
Products falling within this category include soaps, deodorants, body washes, talcum powders and colognes. The diverse product range is distributed to the vast Asian market through our first class distribution networks in Indonesia, Thailand and Australia.
Group sourcing centre
The new world class manufacturing facility in Thailand will help service the bar soap requirements of our UK and Australian markets, following the strategic closure of our Nottingham plant in the year.

Cussons Baby
Cussons Baby is a comprehensive range of products which gently care for and protect your baby whilst offering excellent value for money.
Radiant
Radiant’s power-packed laundry detergent granules lift out the toughest dirt and stains for brilliant whites and unbeatable colours, and are sold throughout Australia.
Imperial Leather
The global Imperial Leather brand, which is associated with personal wash products, has a high profile in Asia through sales of bar soap.
Australia continues to contribute significantly to the Group with excellent
innovation across its product portfolio of detergent, dishwash and personal
care brands. Radiant has maintained its position as a top two brand in the
laundry category through creative technical developments such as adding
UV protection to its formulation.
16 | ANNUAL REPORT 2006 | BUSINESS REVIEW: ASIA

BUSINESS REVIEW: ASIA | ANNUAL REPORT 2006 | 17
Morning Fresh continues to be a significant brand in both the automatic and manual dishwash market. The company’s total dishwash share has grown with the acquisition of the Trix manual dishwash brand in May 2005.
The integration of this brand into the business is progressing to plan with all production now brought in-house. Whilst profitability of the total Australia business improved year on year, raw material and freight cost increases impacted on the business performance.
Consumer disposable income in Indonesia declined during the year as a result of significant increases in the price of oil following the withdrawal of government subsidies. Despite this, revenue and
profitability were maintained at last year’s level due to consumer loyalty to the product portfolio, and in particular the baby range where Cussons Baby continues to hold the number one position in terms of market share. A significant margin improvement programme was rolled out during the year to counter the effects of both competition and cost increases.
In the other Asian units, Thailand, Malaysia and the Middle East, revenue and profitability were maintained at last year’s level.
Thai factory
The new Thai soap factory hasopened in the year on schedule,and is a key link in our globalsupply chain.

Europe. Our desire to grow our leading brands has resulted in significant activity in brand renovation, with product relaunches and the introduction of innovative new variants in the competitive European market.
Household and detergents
This product category includes concentrated dishwash, detergent powders and fabric conditioners. The Group’s strategy to grow its brands has been evidenced in the year by the introduction of new variants and improvements to product formulations.
Personal care and soap
Within this category are household leading brands including products such as shower gels, bath foams and soap. There has been significant activity in the year to relaunch brands and repackage products to satisfy the needs of local consumers, and also to maintain and enhance our market positions.
18 | ANNUAL REPORT 2006 | BUSINESS REVIEW: EUROPE

BUSINESS REVIEW: EUROPE | ANNUAL REPORT 2006 | 19
Haircare
This category includes quality haircare products from shampoos and conditioners through to styling products. Products within this range have been subject to our continuous review of distribution methods this year, which will provide benefit to our local markets next year.
Food and nutrition
This product category consists of edible oils and spreads. Our continuous product review has seen new products launched in the year along with a small brand acquisition, demonstrating our commitment to create products suited to local needs and tastes.

In the UK, whilst the market remains competitive with continued pressure
on selling prices, additional investment in brand development resulted in
good performance.
Imperial Leather shower gel
This luxurious shower gel contains a special balance of cleansers and skin conditioners with refreshing fragrances to leave your skin feeling clean and cared for.
The Imperial Leather shower range was relaunched with exciting new fragrances and supported by a nationwide media campaign. The Original Source brand, purchased in 2002, has been completely renovated with distinctive packaging and has been favourably received by the consumer. The Carex range continues to be strong with the bathroom variants, launched last year, performing well.
A decision was taken earlier this year to expand the distribution of the Charles Worthington brand into the nationwide trade. The supply into all key retailers has now begun with significant in-store displays being rolled out over the coming months. Initial feedback from both the trade and the consumer is very favourable.
The Nottingham factory has now closed ahead of schedule and all bar soap is being supplied from the newly constructed Thailand factory which is operating to plan.
20 | ANNUAL REPORT 2006 | BUSINESS REVIEW: EUROPE

BUSINESS REVIEW: EUROPE | ANNUAL REPORT 2006 | 21
A conditional contract for the sale of the Nottingham site has now been signed with completion expected within two years.
The Group is planning construction of a new, purpose built liquids factory to provide additional capacity to meet the long-term supply needs of our growing UK business. The new factory will be located close to the current site in North Manchester which will close when production fully transfers across to the new site in 2008. Net costs of the project are estimated at £15 million over the next two years, which should be funded by the proceeds from the UK factory sites in Nottingham and Manchester.
The restructuring programme for the business in Poland, announced last year, has been successfully completed with losses of the unit now eliminated following the withdrawal of a direct presence in
the Russian market. The cost base of the domestic operation has been considerably reduced through closure of the liquids and creams factory in Warsaw, which was sold prior to the year-end, and through overhead reduction at the head office.
Whilst the Polish market remains extremely competitive, successful brand renovation of the ‘E’ detergent and Luksja soap ranges has resulted in improved margins.
Both revenue and margins in Greece have improved in the year. The portfolio of products has been expanded with the launch of Minerva Benecol margarine and the purchase of a small local pomace oil brand. The core Minerva olive oil range will also be relaunched later in the year.
E
E is a range of high quality, good value detergent powders and fabric conditioners available in Poland.
Minerva
An olive oil with a delicate flavour, golden green colour and the aroma of freshly picked olives, manufactured in Greece for over 100 years.
Charles Worthington
The Charles Worthington haircare range offers a number of products to provide the solution for every haircare need.

22 | ANNUAL REPORT 2006 | COMMUNICATIONS
Group-wide initiatives. The long-term people development plan is
continuing with the objective of improving the quality of management and
staff both from within and from external recruitment. All Group companies
have now embraced the programme and management are targeted on
key performance objectives for people development.
The year has seen significant activity in Group-wide communications
following the successful completion of a Group virtual private network that
went live in 2005.
The Group is now concluding a major IT infrastructure review in order to
determine the optimum supply of services through our private network
with the further investment identified scheduled to be rolled out over the
next few years.

COMMUNICATIONS | ANNUAL REPORT 2006 | 23

Report of the Directors (continued)
24 | ANNUAL REPORT 2006 | REPORT OF THE DIRECTORS
FINANCIAL STATEMENTS | ANNUAL REPORT 2006 | 25
26 Report of the Directors Continued31 Report on Directors’ Remuneration35 Corporate Governance38 Corporate Social Responsibility 40 Independent Auditors’ Report on the Consolidated Financial Statements41 Consolidated Income Statement41 Consolidated Statement of Recognised Income and Expense42 Consolidated Balance Sheet43 Consolidated Cash Flow Statement44 Notes to the Consolidated Financial Statements74 Five Year Financial Record75 Independent Auditors’ Report on the Company Financial Statements76 Company Balance Sheet77 Notes to the Company Financial Statements

26 | ANNUAL REPORT 2006 | FINANCIAL STATEMENTS
REPORT OF THE DIRECTORS CONTINUED
Principal activitiesThe principal activities of the Group are the manufacture and distribution of soaps, detergents, toiletries, pharmaceuticals, electrical goods and milk products. The subsidiary undertakings and joint ventures principally affecting the profits, liabilities or assets of the Group are listed in note 32 of the consolidated financial statements.
DividendsThe directors recommend a final dividend of 29.50p (2005: 26.60p) per ordinary share to be paid on 27th September 2006 to ordinary shareholders on the register on 25th August 2006 which together with the interim dividend of 9.30p (2005: 8.65p) paid on 6th April 2006, makes a total of 38.80p for the year (2005: 35.25p).
Political and charitable contributionsCharitable contributions in the United Kingdom during the year amounted to £50,000 (2005: £53,000). No political contributions were made (2005: Nil).
Research and developmentThe Group maintains in-house facilities for research and development in the United Kingdom, Poland, Indonesia, West Africa and Australia; in addition, research and development is sub-contracted to approved external organisations. Currently all such expenditure is charged against profit in the year in which it is incurred, as it does not meet the criteria for capitalisation under IAS 38 ‘Intangible assets’.
Payment of suppliersIt is the responsibility of the management of each operating unit within the Group to agree appropriate terms of business with suppliers upon entering into binding contracts, and to adhere to these payment terms provided the relevant goods or services have been supplied in accordance with the contracts.
Employment of disabled personsDuring the year the Group has maintained its policy of providing equal opportunities for the appropriate employment, training and development of disabled persons.
Employee informationThe Group recognises the benefits of keeping employees informed of the progress of the business and of involving them in their company’s performance. The methods of achieving such involvement are different in each company and country and have been developed over the years by local management working with local employees in ways which suit their particular needs and environment, with the active encouragement of the parent organisation.
AuditorsIn the case of each of the persons who are directors of the company at the date when this report was approved:
• So far as each of the directors is aware, there is no relevant audit information (as defined by the Companies Act 1985) of which the company’s auditors are unaware; and
• Each of the directors has taken all the steps that he ought to have taken as director to make himself aware of any relevant audit information and to establish that the company’s auditors are aware of that information.
The auditors Deloitte & Touche LLP have signified their willingness to continue in office and a resolution for their re-appointment will be proposed at the forthcoming annual general meeting.
FINANCIAL STATEMENTS | ANNUAL REPORT 2006 | 27
REPORT OF THE DIRECTORS CONTINUED
Enhanced Business ReviewThe functional performance of the Group, along with an analysis of KPIs is provided on pages 6 to 21. The additional information required to be disclosed in the Enhanced Business Review is shown below.
Principal risks and uncertainties facing the GroupThe Group’s business activities, financial condition, results of operations or the company’s share price could be affected by any or all of the following risks or uncertainties:
Political and economic stabilityThe Group conducts a significant portion of its operations outside the UK in developing markets which have an increased risk of political and economical instability; however the Group has a diverse geographic portfolio in order to help mitigate the risk that could arise in any one particular territory.
Foreign currency and treasury riskThe international range of the Group’s activities gives rise to both transactional exchange rate risk and translation exposure when the results, assets and liabilities of foreign subsidiaries are translated into sterling.
The Group requires its operating units to hedge their material transaction exposures on sales and purchases conducted in currencies other than their functional currencies. The Group’s main foreign currency exposure relates to US dollar trade balances.
The Group does not actively hedge its translation exposures as these are of an accounting rather than a cash nature, however the international spread of the Group’s operations itself reduces dependence on individual currencies.
The Group maintains a centralised treasury function which operates on a non-speculative basis in accordance with policies and procedures approved by the board of directors. The aim of this function is to mitigate the effects of any adverse movements in exchange rates and interest rates on the Group’s financial results.
The Group maintains a substantial net funds position (as defined on page 6). Net funds at 31st May 2006 were £51.9 million (2005: £74.0 million), an analysis of which is provided in the Financial Highlights. These principally comprise short and medium-term deposits and borrowings. This mix of funds allows the Group flexibility in optimising its central funding position and the ability to act promptly to counteract any adverse movements in interest rates in its overseas territories.
Raw materialsThe Group’s profitability depends on the cost of raw materials from around the world, which exposes it to price and supply fluctuation. Key items, such as oils and fats, packaging materials and energy are subject to fluctuations in price and availability. The Group does take measures to protect against the short-term impact of these fluctuations and shortfalls; however, failure to recover higher costs or shortfalls in availability could have a negative impact on profits.
Change in accounting policiesDuring the year, the company adopted International Financial Reporting Standards for the first time. Details of the adjustments on transition can be found in note 31 of the consolidated financial statements.

28 | ANNUAL REPORT 2006 | FINANCIAL STATEMENTS
REPORT OF THE DIRECTORS CONTINUED
DirectorsMr D C Godwin retired from the board on 30th September 2005 and Mr J T J Steel was appointed a non-executive director on 1st October 2005.
Messrs C G Davis and B H Leigh were appointed to the board on 1st January 2006.
Mr J Spyridoulias retired from the board on 28th February 2006.
Mr C N Green retired from the board on 31st May 2006.
In accordance with the company’s articles of association, Mr C G Davis, Mr B H Leigh and Mr J T J Steel now retire as directors and, being eligible, offer themselves for election at the annual general meeting.
The directors retiring by rotation are Mr G A Kanellis and Mr P J Smyth who, being eligible, offer themselves for re-election.
Executive directors at 1st August 2006:Mr A J GreenChairman (age 55)He joined the company in 1975 and was appointed to the board in 1990 becoming Chairman in 1993.
Mr A G Calder Deputy Chairman (age 59)He joined the company in 1996 and was appointed to the board in 1998 becoming Deputy Chairman in January 2006.
Mr G A Kanellis Chief Executive (age 41)Was appointed Chief Executive in June 2006. He joined the company in 1993 and was appointed to the board in 2003.
Mr C G Davis Regional Director – Africa (age 44)He joined the company in 1993 and was appointed to the board in 2006.
Mr B H Leigh Finance Director (age 35)He joined the company in 1997 and was appointed to the board in 2006.
Mr C Nicoloulias Regional Director – Pacific (age 59)He joined the company in 1970 and was appointed to the board in 2000 having held a number of senior positions with the Group in Africa and Asia.
Mr J Pantelireis Group Sourcing Director (age 52)He joined the company in 1982 and was appointed to the board in 2005 having held a number of senior positions with the Group.
Mr P J Smyth Technical Director (age 52)He joined the company in 1978 and was appointed to the board in 1998 having held a number of senior positions with the Group in Europe and Australia.
Non-executive directors at 1st August 2006:Mr J D M Smith (age 66)Was for many years an executive director of BTR Plc. Appointed to the board in 2000, Mr Smith is the senior non-executive director.
Mr D W Lewis (age 61)A former partner of Addleshaw Goddard. Appointed to the board in 2004, Mr Lewis is a non-executive member of the Addleshaw Goddard Governance Board.
Mr R H Sellers OBE (age 60)A chartered accountant and formerly the chief executive and deputy chairman of British Vita Plc. Appointed to the board in 2001.
Mr J T J Steel (age 46)A chartered accountant and head of Corporate Finance at Arbuthnot Securities. Appointed to the board in 2005.
REPORT OF THE DIRECTORS CONTINUED
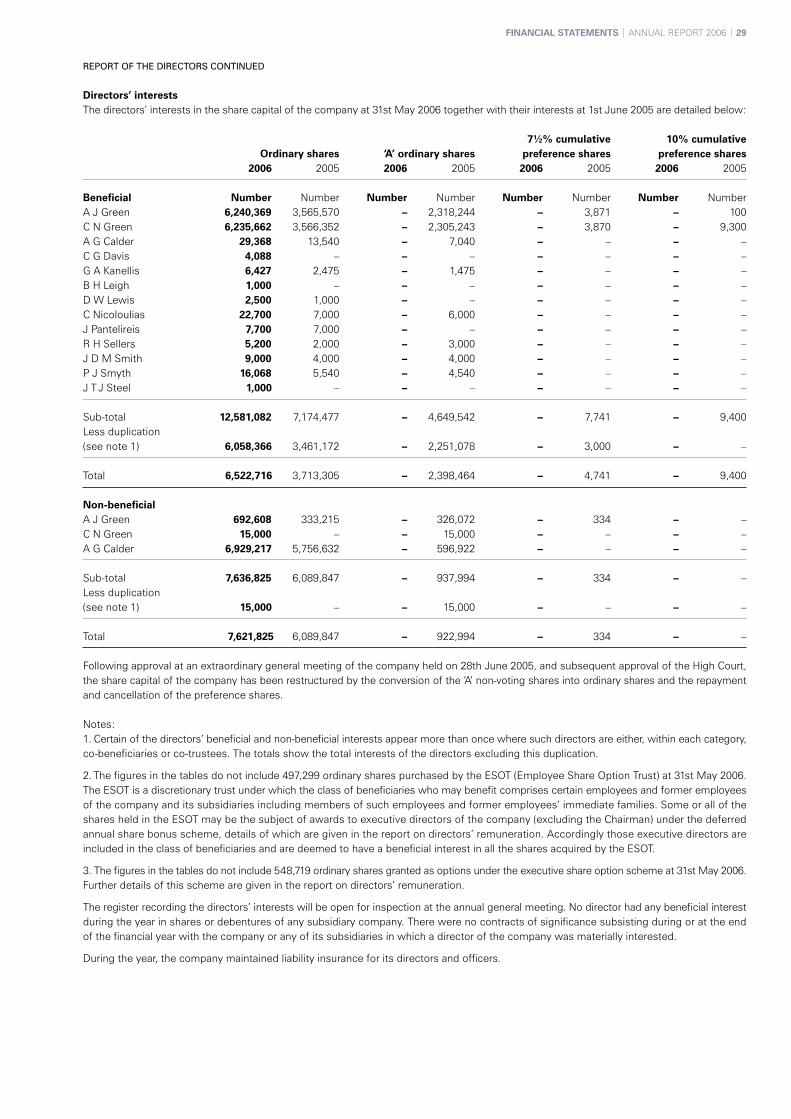
Directors’ interestsThe directors’ interests in the share capital of the company at 31st May 2006 together with their interests at 1st June 2005 are detailed below:
7½% cumulative 10% cumulative Ordinary shares ‘A’ ordinary shares preference shares preference shares 2006 2005 2006 2005 2006 2005 2006 2005
Beneficial Number Number Number Number Number Number Number NumberA J Green 6,240,369 3,565,570 – 2,318,244 – 3,871 – 100C N Green 6,235,662 3,566,352 – 2,305,243 – 3,870 – 9,300A G Calder 29,368 13,540 – 7,040 – – – –C G Davis 4,088 – – – – – – –G A Kanellis 6,427 2,475 – 1,475 – – – –B H Leigh 1,000 – – – – – – –D W Lewis 2,500 1,000 – – – – – –C Nicoloulias 22,700 7,000 – 6,000 – – – –J Pantelireis 7,700 7,000 – – – – – –R H Sellers 5,200 2,000 – 3,000 – – – –J D M Smith 9,000 4,000 – 4,000 – – – –P J Smyth 16,068 5,540 – 4,540 – – – –J T J Steel 1,000 – – – – – – –
Sub-total 12,581,082 7,174,477 – 4,649,542 – 7,741 – 9,400Less duplication(see note 1) 6,058,366 3,461,172 – 2,251,078 – 3,000 – –
Total 6,522,716 3,713,305 – 2,398,464 – 4,741 – 9,400
Non-beneficialA J Green 692,608 333,215 – 326,072 – 334 – –C N Green 15,000 – – 15,000 – – – –A G Calder 6,929,217 5,756,632 – 596,922 – – – –
Sub-total 7,636,825 6,089,847 – 937,994 – 334 – –Less duplication(see note 1) 15,000 – – 15,000 – – – –
Total 7,621,825 6,089,847 – 922,994 – 334 – –
Following approval at an extraordinary general meeting of the company held on 28th June 2005, and subsequent approval of the High Court, the share capital of the company has been restructured by the conversion of the ‘A’ non-voting shares into ordinary shares and the repayment and cancellation of the preference shares.
Notes:1. Certain of the directors’ beneficial and non-beneficial interests appear more than once where such directors are either, within each category, co-beneficiaries or co-trustees. The totals show the total interests of the directors excluding this duplication.
2. The figures in the tables do not include 497,299 ordinary shares purchased by the ESOT (Employee Share Option Trust) at 31st May 2006. The ESOT is a discretionary trust under which the class of beneficiaries who may benefit comprises certain employees and former employees of the company and its subsidiaries including members of such employees and former employees’ immediate families. Some or all of the shares held in the ESOT may be the subject of awards to executive directors of the company (excluding the Chairman) under the deferred annual share bonus scheme, details of which are given in the report on directors’ remuneration. Accordingly those executive directors are included in the class of beneficiaries and are deemed to have a beneficial interest in all the shares acquired by the ESOT.
3. The figures in the tables do not include 548,719 ordinary shares granted as options under the executive share option scheme at 31st May 2006. Further details of this scheme are given in the report on directors’ remuneration.
The register recording the directors’ interests will be open for inspection at the annual general meeting. No director had any beneficial interest during the year in shares or debentures of any subsidiary company. There were no contracts of significance subsisting during or at the end of the financial year with the company or any of its subsidiaries in which a director of the company was materially interested.
During the year, the company maintained liability insurance for its directors and officers.
FINANCIAL STATEMENTS | ANNUAL REPORT 2006 | 29

30 | ANNUAL REPORT 2006 | FINANCIAL STATEMENTS
REPORT OF THE DIRECTORS CONTINUED
Other substantial interestsThe register maintained by the company under section 211 of the Companies Act 1985 disclosed the following interests in the shares of the company held at 31st July 2006:
Number of shares %
J B Zochonis 6,061,958 14.14Zochonis Charitable Trust 4,936,504 11.51Hunter Hall Investment Management 2,895,530 6.75Mrs C M Green Settlement 2,032,828 4.74J B Zochonis Settlement 1,992,713 4.65Sun Life Unit Assurance Ltd 1,365,686 3.19
Special business at the annual general meeting
The resolutions that will be proposed at the annual general meeting on 25th September 2006 are set out in the separate Notice of Annual General Meeting dated 24th August 2006.
Purchase of own sharesNo shares were purchased during the period from 1st June 2005 to 31st July 2006 (2005: Nil), other than the repayment of preference shares discussed on page 9, and the acquisitions undertaken by the ESOT.
By order of the board of directors
B H LEIGH – Secretary1st August 2006

REPORT ON DIRECTORS’ REMUNERATION
This report has been prepared in accordance with the Directors’ Remuneration Report Regulations 2002 and satisfies the requirements of the Listing Rules of the Financial Services Authority. A resolution to approve the report will be proposed at the annual general meeting.
The table on directors’ emoluments and information on the deferred annual share bonus scheme, the executive share option scheme and directors’ pensions constitute audited information.
Remuneration committeeThe members of the committee during the year were Messrs D C Godwin (retired 30th September 2005), D W Lewis, R H Sellers, J D M Smith (Chairman) and J T J Steel (joined 1st October 2005).
The members are all non-executive directors of the company. They are independent, have no conflicts of interest and no day-to-day involvement in running the business. The remuneration of the non-executive directors is determined by the executive directors. The committee was advised during the year by New Bridge Street Consultants, London, in relation to salary levels, the deferred annual share bonus scheme and the executive share option scheme.
Policy on executive directors’ remunerationThe employment conditions, pay and benefits are intended to reward and motivate directors in a manner which reflects the global and competitive nature of the Group’s business and to be sufficient to attract and retain persons of high calibre.
Elements of the remuneration package are as follows:
• Basic salary and benefits
• Participation in the deferred annual share bonus scheme
• Participation in the executive share option scheme
• Pension benefits from the executive directors’ scheme
Basic salary and benefitsSalaries are reviewed annually by the remuneration committee. The review takes account of individual performance, company performance, external surveys and remuneration levels in a range of companies of comparable size, geographical spread and market sector.
Taxable benefits, which are subject to periodic review, include health insurance and car benefits.
Deferred annual share bonus schemeAs part of the Group’s focus on improved operating performance, a deferred annual share bonus scheme was introduced with effect from 1st June 2000 for main board executive directors (excluding the Chairman) and certain key subsidiary directors. The award of a bonus to a maximum of 50% of salary is dependent upon the achievement of operating profit targets and will normally be received by the directors following three years of continuing employment from the date of the award. The award will be made in a combination of cash and shares which are purchased in the market and retained in an employee trust until they are issued to the directors.
Bonuses to be awarded for acheivement of targets for the current financial year are included in the directors’ remuneration table on page 33 and are calculated using the market value at 31st May 2006 of £14.50 per share.
Further details of the employee trust are given in note 26 of the consolidated financial statements.
Executive share option schemeAn executive share option scheme was introduced with effect from 1st June 2003. This emphasises the board’s commitment to ensuring the interests of senior executives are clearly aligned with shareholders’ interests. Key points of the scheme are as follows:
• Senior executives (excluding the Chairman) will be granted options to buy shares at the market value of the shares when the options are granted. This means that executives will only benefit under the scheme to the extent that shareholders benefit through increases in the share price.
• The value of shares under options granted to an executive in any financial year will be limited to a maximum of 1.5 times basic salary. Options granted to executives have not exceeded one times basic salary.
• The exercise of options granted will be subject to performance conditions based on the company’s normalised earnings per share growth relative to inflation over three or four financial years. The following targets will apply:
Proportion of option grant exercisable Performance conditions (average annual growth in excess of inflation in earnings per share)
33% RPI + 3% pa
33% – 66% (pro rata) RPI + 3% to 5% pa
66% – 100% (pro rata) RPI + 5% to 7% pa
FINANCIAL STATEMENTS | ANNUAL REPORT 2006 | 31

32 | ANNUAL REPORT 2006 | FINANCIAL STATEMENTS
REPORT ON DIRECTORS’ REMUNERATION CONTINUED
• The remuneration committee will review the performance conditions each time options are granted, in order to ensure that they remain challenging in the context of the company’s long-term budgets, and may impose different conditions provided they are suitably challenging.
• With effect from 1st June 2006 options granted will no longer be subject to retesting in the fourth year following grant.
Details of options granted to directors are as follows:
The third grant of options took place on 8th September 2005. The exercise price for these options, equal to the market value at the date of the grant, is £12.98, and is applicable to all directors. Options are normally exercisable between three and ten years from the date of grant. There have been no other grants of options during the year and no variations to the terms and conditions or performance criteria during the year.
Restated * balance Options Options Balance Option at 1st granted exercised at 31st priceOrdinary shares June 2005 during year during year May 2006 range (£)
C N Green 68,922 – – 68,922 7.47-11.04A G Calder 55,644 21,572 – 77,216 7.47-12.98C G Davis 13,064 6,290 – 19,354 7.47-12.98G A Kanellis 38,606 18,490 – 57,096 7.47-12.98B H Leigh 9,881 5,874 – 15,755 7.47-12.98C Nicoloulias 50,977 – – 50,977 7.47-11.04 J Pantelireis – 13,867 – 13,867 12.98P J Smyth 43,008 15,871 – 58,879 7.47-12.98 J Spyridoulias 40,092 – – 40,092 7.47-11.04
The market price of ordinary shares at 31st May 2006 was £14.50, and the range during the year was £11.55 to £16.74.
*Following the enfranchisement of the ‘A’ ordinary shares and the compensatory bonus issue of ordinary shares, the number of shares subject to share options has been adjusted accordingly.
REPORT ON DIRECTORS’ REMUNERATION CONTINUED
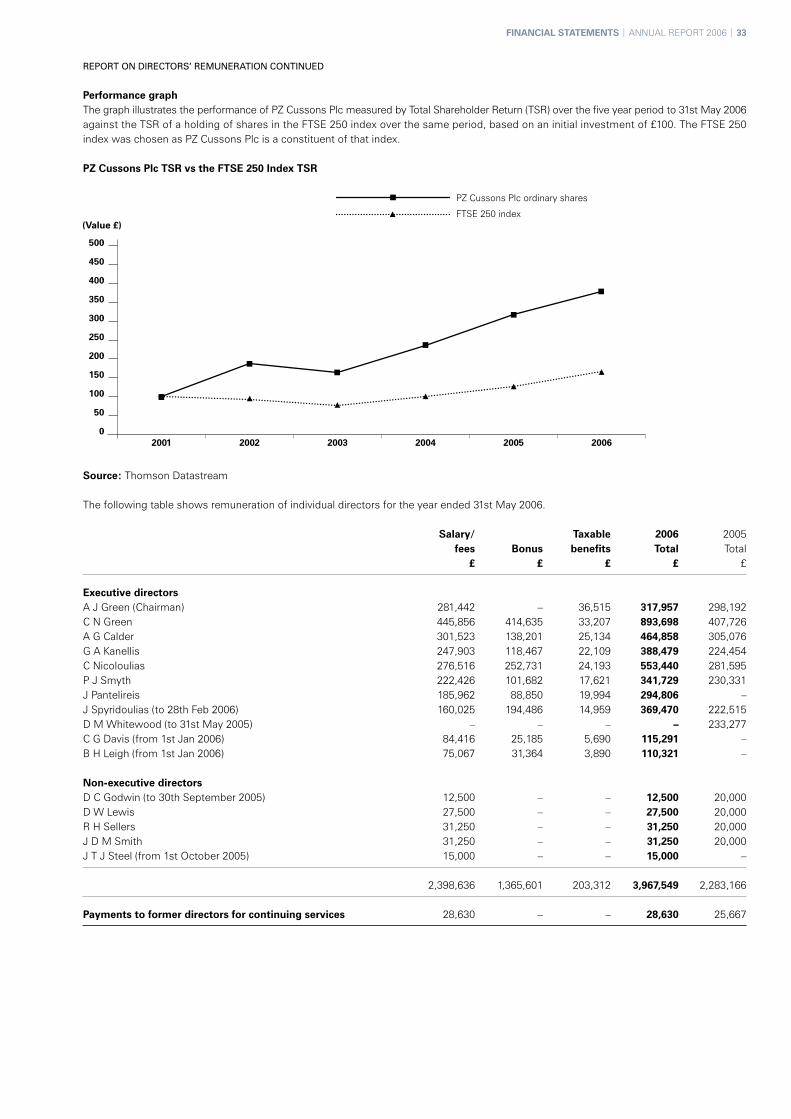
Performance graphThe graph illustrates the performance of PZ Cussons Plc measured by Total Shareholder Return (TSR) over the five year period to 31st May 2006 against the TSR of a holding of shares in the FTSE 250 index over the same period, based on an initial investment of £100. The FTSE 250 index was chosen as PZ Cussons Plc is a constituent of that index.
PZ Cussons Plc TSR vs the FTSE 250 Index TSR
Source: Thomson Datastream
The following table shows remuneration of individual directors for the year ended 31st May 2006.
Salary/ Taxable 2006 2005 fees Bonus benefits Total Total £ £ £ £ £
Executive directorsA J Green (Chairman) 281,442 – 36,515 317,957 298,192C N Green 445,856 414,635 33,207 893,698 407,726A G Calder 301,523 138,201 25,134 464,858 305,076G A Kanellis 247,903 118,467 22,109 388,479 224,454C Nicoloulias 276,516 252,731 24,193 553,440 281,595P J Smyth 222,426 101,682 17,621 341,729 230,331J Pantelireis 185,962 88,850 19,994 294,806 –J Spyridoulias (to 28th Feb 2006) 160,025 194,486 14,959 369,470 222,515D M Whitewood (to 31st May 2005) – – – – 233,277C G Davis (from 1st Jan 2006) 84,416 25,185 5,690 115,291 –B H Leigh (from 1st Jan 2006) 75,067 31,364 3,890 110,321 –
Non-executive directorsD C Godwin (to 30th September 2005) 12,500 – – 12,500 20,000D W Lewis 27,500 – – 27,500 20,000R H Sellers 31,250 – – 31,250 20,000J D M Smith 31,250 – – 31,250 20,000J T J Steel (from 1st October 2005) 15,000 – – 15,000 –
2,398,636 1,365,601 203,312 3,967,549 2,283,166
Payments to former directors for continuing services 28,630 – – 28,630 25,667
FINANCIAL STATEMENTS | ANNUAL REPORT 2006 | 33

34 | ANNUAL REPORT 2006 | FINANCIAL STATEMENTS
REPORT ON DIRECTORS’ REMUNERATION CONTINUED
Pension benefitsThe executive directors’ pension scheme provides benefits of up to two thirds salary (subject to a scheme specific earnings cap), dependants’ pensions and lump sum payments in the event of death in service. Benefits in kind are not pensionable. All the executive directors at 31st May 2006 are members of the scheme. Benefits in respect of each executive director are given in the table below:
Gross Increase in Total Value of net Value of Value of Total increase accrued accrued increase in accrued accrued change in in accrued pension net pension at accrual over pension at pension at value during pension of inflation (a) 31.05.06 period (b) 31.05.05 31.05.06 period (c) £ £ £ £ £ £ £
A J Green 14,683 10,324 159,995 129,000 1,847,000 2,206,000 345,000C N Green 42,750 37,072 232,013 447,000 2,198,000 2,945,000 724,000A G Calder 16,880 12,865 150,719 195,000 1,976,000 2,455,000 465,000C G Davis 1,483 1,483 1,483 7,000 – 12,000 7,000G A Kanellis 9,920 8,329 62,939 47,000 322,000 455,000 120,000B H Leigh 15,385 14,918 30,946 74,000 74,000 172,000 89,000C Nicoloulias 11,444 6,534 175,111 116,000 3,308,000 3,501,000 179,000J Pantelireis 27,273 25,653 81,266 282,000 565,000 932,000 356,000P J Smyth 9,043 6,271 101,433 63,000 933,000 1,133,000 189,000J Spyridoulias 15,733 14,361 140,423 286,000 2,446,000 2,861,000 408,000
Notes:1. Pension accruals shown are the amounts which would be paid annually on retirement based on service to the end of the year and salary at 31st May 2006.
2. Transfer values have been calculated in accordance with version 9.2 of guidance note GN11 issued by the actuarial profession.
3. The value of net increase (b) represents the incremental value to the director of his service during the year, calculated on the assumption that service terminated at the year end. It is based on the accrued pension increase (a) after deducting the director’s contribution.
4. The change in the transfer value (c) includes the effect of fluctuations in the transfer value due to factors beyond the control of the company and directors, such as gilt yield movements. It is calculated after deducting the director’s contribution.
5. Voluntary contributions paid by directors and resulting benefits are not shown.
6. The total accrued pension as at 31st May 2006 and the value of accrued pension at 31st May 2005 and 31st May 2006 shown for Messrs Calder and Smyth include benefits resulting from transfers into the plan.
7. Mr J Spyridoulias retired on 28th February 2006. The above figures are based on the change to Mr Spyridoulias’s accrued benefits between 31st May 2005 and 28th February 2006. On retirement, Mr Spyridoulias received an annual pension of £110,859 and a cash lump sum of £315,951.
8. Mr C N Green retired on 31st May 2006. The above figures are based on the change to Mr Green’s accrued benefits between 31st May 2005 and 31st May 2006. On retirement, Mr Green received an annual pension of £178,378 and a cash lump sum of £114,879. In addition, he received benefits from his voluntary contributions and a cash lump sum of £475,082 (net of the recovery charge) in respect of benefits earned in excess of the Lifetime Allowance.
9. The company provides unfunded, unapproved pension benefits for Messrs Calder and Smyth as their benefits would have been subject to the Inland Revenue earnings cap, introduced by the Finance Act 1989 had the earnings cap not been abolished by the Finance Act 2004. The funded benefits payable to these directors remain subject to a scheme specific earnings cap calculated in a similar manner to the abolished statutory earnings cap.
Service contractsExecutive directors have one year rolling service contracts. No executive director, including those proposed for re-election, has a service contract with a notice period in excess of one year or containing any provision for pre-determined compensation on termination exceeding one year’s salary and benefits in kind. Non-executive directors do not have service contracts but are appointed for initial periods of three years, normally renewable on a similar basis.
By order of the board of directors
J D M Smith1st August 2006

CORPORATE GOVERNANCE
The board is committed to meeting the standards of good corporate governance set out in the Combined Code on corporate governance published by the Financial Reporting Council in July 2003. This report, together with the report on directors’ remuneration describes how the board applied the Code during the year under review.
DirectorsThe board is responsible for the Group’s strategic development, monitoring its business objectives and maintaining a system of effective corporate governance.
The board of directors has twelve members comprising the Chairman, the chief executive, six other executive directors and four non-executive directors. The names of the directors together with their biographical details are set out in the report of the directors. The differing roles of the Chairman and chief executive are acknowledged. The Chairman is primarily responsible for the running of the board and ensuring that it is supplied in a timely manner with sufficient information to enable it to discharge its duties. The chief executive is responsible for coordinating the running of the business and implementing Group strategy. The executive directors’ service contracts and the letters setting out the terms of appointment of the non-executive directors are available for inspection at the company’s registered office during normal business hours and at the annual general meeting.
The non-executive directors are all considered to be independent of management and free from any business or other relationship that could materially interfere with the exercise of their independent judgement. Mr D W Lewis is a former partner of Addleshaw Goddard, who act as legal advisors to the company, and is also a non-executive member of the Addleshaw Goddard Governance Board. Mr Lewis does not and has not participated in any way in the provision of services by Addleshaw Goddard to PZ Cussons. In addition, in order that his independence is not compromised, if at any time the board or a committee of the board is considering any matter concerning Addleshaw Goddard, it has been agreed that Mr Lewis will withdraw from that meeting until such matters have been dealt with. The senior independent non-executive director is Mr J D M Smith. In his capacity as senior independent director Mr Smith is available to shareholders if they have concerns which contact through the normal channels of Chairman, chief executive or finance director has failed to resolve or for which such contact is inappropriate.
The board has a documented schedule of matters reserved for its decision, including approval of the Group’s strategy, annual budgets, material agreements and major capital commitments, approval of annual and interim results, material acquisitions and disposals and entering into material joint ventures and partnerships. The board met formally four times during the year and will meet further as necessary to consider specific matters. All the directors were in attendance at each meeting other than for the meeting held on 28th July 2005 for which Mr G A Kanellis and Mr D C Godwin did not attend.
Directors can take independent professional advice where necessary at the company’s expense and have access to the services of the company secretary who is responsible for ensuring that board procedures and all applicable rules and regulations are followed. During the year, the company maintained liability insurance for its directors and officers.
There is a formal induction process for directors including visits to principal sites and meetings with operating management. Directors may take additional training where necessary as part of their continuing development at the expense of the company.
A formal review of the board and board committee performance is carried out annually. The Chairman’s performance is reviewed by the non-executive directors led by the senior independent director and takes into account the views of the executive directors. The performance of the non-executive directors is evaluated by the Chairman, in consultation with the executive directors. The remuneration committee reviews executive directors’ performance with guidance from the Chairman and the chief executive except in the case of the chief executive’s performance where it is reviewed by the Chairman and the remuneration committee. The directors submit themselves for election at the annual general meeting following their appointment and thereafter by rotation, at least once every three years. The review process in 2006 concluded that all directors continue to contribute effectively and with proper commitment, devoting adequate time to carry out their duties.
The board has established a number of standing committees to which various matters are delegated according to defined terms of reference. The terms of reference of the committees are available, on request, from the registered office of the company and will also be available through the company’s website.
Nomination committeeThe nomination committee is responsible for regularly reviewing the structure, size and composition of the board and identifying and recommending appropriate candidates for membership of the board when vacancies arise. The committee members are Mr A J Green (committee Chairman), Mr G A Kanellis and the four independent non-executive directors, Mr D W Lewis, Mr R H Sellers, Mr J D M Smith and Mr J T J Steel. In considering an appointment the nomination committee evaluates the balance of skills, knowledge and experience of the board and prepares a description of the role and capabilities required for a particular appointment. External search agencies or open advertising will be used where this is appropriate. Short-listed candidates will then be invited to interview with members of the committee and, if recommended by the committee, will be invited to meet other board members before any decision is taken relating to the appointment. The committee met three times during the year and all the committee members were in attendance at each meeting.
FINANCIAL STATEMENTS | ANNUAL REPORT 2006 | 35
36 | ANNUAL REPORT 2006 | FINANCIAL STATEMENTS
CORPORATE GOVERNANCE CONTINUED
Remuneration committeeThe remuneration committee is responsible for reviewing and recommending the framework and policy for remuneration of the Chairman, executive directors and senior executives, which the board as a whole is responsible for approving. The committee members are the four independent non-executive directors, Mr D W Lewis, Mr R H Sellers, Mr J D M Smith (committee Chairman) and Mr J T J Steel. Once approved, the remuneration committee is responsible for evaluating the performance and determining specific remuneration packages for the Chairman and each executive director. The Chairman and executive directors are responsible for the agreement of non-executive directors’ remuneration. The committee met three times during the year and all the committee members were in attendance at each meeting.
Audit committeeThe audit committee is responsible for reviewing, on behalf of the board, the Group’s accounting and financial policies and its disclosure practices and internal controls. It is also responsible for overseeing all matters associated with the appointments, terms, remuneration and performance of the external auditors and for reviewing the scope and results of the audit and its cost effectiveness. These responsibilities are discharged at the audit committee meetings and through regular reports from the internal audit function. The audit committee comprises the four independent non-executive directors, Mr D W Lewis, Mr R H Sellers (committee Chairman), Mr J D M Smith and Mr J T J Steel and meets regularly with the external auditors. Mr R H Sellers, a qualified chartered accountant, brings recent and relevant financial experience to the audit committee. The audit committee met three times during the year and all the committee members were in attendance at each meeting.
As mentioned, one of the duties of the audit committee is to make recommendations to the board in relation to the appointment of the external auditors. A number of factors are taken into account by the committee in assessing whether to recommend the auditors for reappointment. These include the quality of the reports provided to the audit committee and the board and the level of understanding demonstrated of the Group’s business.
The Group has a policy governing the conduct of non-audit work by the auditors. The auditors are permitted to provide non-audit services that are not, or are not perceived to be, in conflict with auditor independence, providing they have the skill, competence and integrity to carry out the work and are considered to be the most appropriate to undertake such work in the best interests of the Group. Activities that may be perceived to be in conflict with the role of the external auditors must be submitted to the committee for approval prior to engagement, regardless of the amounts involved. All assignments are monitored by the committee.
Details of the amounts paid to the external auditors during the year for audit and other services are set out in the notes to the financial statements.
Risk management committeeThe risk management committee is responsible for identifying significant risks and ensuring, where possible, that action is taken to mitigate these risks. This is achieved by an ongoing review which includes identifying all risks faced by the Group and assessing those risks, and ensuring that appropriate control measures are put in place. Plans are developed and implemented to eliminate, reduce or transfer these risks where practicable. The committee is also responsible for reviewing the risk management and control process within the Group.
The committee comprises senior management from within the business and receives input from professional advisers. It met twice during the year and regularly reports to the board. In addition, the board undertakes annually a formal review of the risk management process and the performance of the risk management committee.
RemunerationDetails of directors’ remuneration are set out in the report on directors’ remuneration.
Accountability and audit
Directors’ responsibilities in relation to financial statementsThe directors are responsible for preparing the Annual Report and the financial statements. The directors are required to prepare financial statements for the Group in accordance with International Financial Reporting Standards (IFRS) but have elected to continue to prepare financial statements for the company in accordance with United Kingdom Generally Accepted Accounting Practice (UK GAAP). Company law requires the directors to prepare the consolidated financial statements of the Group in accordance with IFRS, the Companies Act 1985 and Article 4 of the lAS Regulation. As a result of the election to continue to prepare the company’s financial statements in accordance with UK GAAP, company law requires the directors to prepare the financial statements for the company in accordance with UK GAAP and the Companies Act 1985. Under IFRS, International Accounting Standard 1 requires that financial statements present fairly for each financial year the company’s financial position, financial performance and cash flows. Under UK GAAP, Financial Reporting Standard 3 requires the financial statements to be prepared on a basis which gives a true and fair view of the company’s financial position and profit or loss.
Both UK GAAP and IFRS therefore require the faithful representation of the effects of transactions, other events and conditions in accordance with the definitions and recognition criteria for assets, liabilities, income and expenses. In virtually all circumstances, a fair presentation will be achieved by compliance with all applicable International Financial Reporting Standards or, in the case of the company financial statements, UK GAAP.

CORPORATE GOVERNANCE CONTINUED
Directors are also required to:
• properly select and apply accounting policies;
• present information, including accounting policies, in a manner that provides relevant, reliable, comparable and understandable information; and
• provide additional disclosures when compliance with the specific requirements in IFRS is insufficient to enable users to understand the impact of particular transactions, other events and conditions on the entity’s financial position and financial performance.
The directors are responsible for keeping proper accounting records which disclose with reasonable accuracy at any time the financial position of the company, for safeguarding the assets, for taking reasonable steps for the prevention and detection of fraud and other irregularities and for the preparation of a directors’ report and directors’ remuneration report which comply with the requirements of the Companies Act 1985. The directors are responsible for the maintenance and integrity of the company website. Legislation in the United Kingdom governing the preparation and dissemination of financial statements may differ from legislation in other jurisdictions.
Going concernAfter undertaking an appropriate review, the directors believe that the Group has adequate resources to continue in operational existence for the foreseeable future. For this reason the directors continue to adopt the going concern basis in preparing the financial statements.
Internal controlThe board is responsible for the Group’s system of internal control and for reviewing its effectiveness. Such a system is designed to manage rather than eliminate the risk of failure to achieve business objectives and can only provide reasonable and not absolute assurances against material misstatement or loss.
The board is of the view that there is an ongoing process for identifying, evaluating and managing the Group’s significant risks, that it has been in place for the year ended 31st May 2006 and up to the date of the Annual Report and Financial Statements, that it is regularly reviewed by the board and that it accords with the Turnbull guidance for directors on the Combined Code.
The process includes:
• Frequent communication between the board and subsidiary management on all critical business issues.
• Regular visits to operating units by the board, head office management and internal audit.
• A detailed system of budgeting, reporting and forecasting.
• Regular review by the board of a risk management document produced by the risk management committee.
At its May and July 2006 meetings, the board carried out the annual assessment of internal control for the year to 31st May 2006 by considering documentation from the executive committee, risk management committee and internal audit function as well as taking into consideration events since the year end.
The company continues to take steps to embed internal control and risk management further into the operations of the business and to deal with areas of improvement which come to the attention of management and the board. The Group has ethical guidelines and a defined fraud reporting process which are issued with the Group Internal Control Manual.
Relations with shareholdersThe company has periodic discussions with institutional shareholders on a range of issues affecting the Group’s performance. All shareholders, including private investors, have an opportunity to present questions to the board at the annual general meeting and the directors are available to meet informally with shareholders after the meeting. The company responds throughout the year to correspondence received from shareholders on a wide range of issues and a subscription e-mail service is available for all interested parties through the company’s website enabling access to company notifications and news releases.
Compliance statementThe directors consider that, throughout the accounting period, the company complied with the provisions of section 1 of the Combined Code as published in July 2003 and contained in the rules of the UK Listing Authority with the following exception:
Code Provision A.3.2:
The board recognises that the Code specifies that at least half of the members on the board (excluding the Chairman) should be independent non-executive directors. Throughout the year the board comprised the Chairman, a total of seven executive directors and four non-executive directors determined by the board to be independent and whose respective backgrounds clearly indicate that they are of sufficient calibre and number for their views to carry significant weight in the board’s decisions.
FINANCIAL STATEMENTS | ANNUAL REPORT 2006 | 37

38 | ANNUAL REPORT 2006 | FINANCIAL STATEMENTS
CORPORATE SOCIAL RESPONSIBILITY
PZ Cussons is committed to running its business with integrity and with care insofar as the social and environmental impact of our activities is concerned. We aim to make a positive impact on society through the products we manufacture and sell, through our commercial operations and through the voluntary contributions we make to the community.
Corporate social responsibility (CSR) is a traditional value for the PZ Cussons organisation and is key to the way the company operates throughout the world. Through competitive employment policies we add value into the areas in which we operate by helping to meet the differing product needs of customers in developing countries and investing in more efficient production technologies and systems.
PZ Cussons takes regular account of the significance of social, ethical and environmental (SEE) matters to the business of the company and we have ensured the availability of adequate information to assess and manage SEE issues. The company strives to maintain the highest standards of ethical conduct and corporate responsibility to ensure that reputable business practices are applied worldwide and ethical issues are dealt with in an effective and transparent manner. There is a strong emphasis throughout the organisation on commitment, trust, teamwork, personal accountability and commercial acumen.
The environmentPZ Cussons takes regular account of the significance of environmental matters to the business of the company and has identified and assessed risks arising from its operations both to the environment and to the company’s short and long-term value. PZ Cussons is committed to playing its part in protecting the environment, for the benefit of its employees and the public at large. The company has ensured and will continue to ensure that it complies with environmental laws and regulations and will continue to identify the environmental impacts of the business and find effective ways of reducing them.
We continue to implement systems to enable the measurement of certain environmental indicators, such as energy and water use, emissions to air or water and waste generation and we design our new and upgraded plants and processes to be energy efficient and low maintenance. We also work closely with relevant local water authorities in order to identify potential water saving methods. In the UK the company has focused on waste collection and recycling to improve the management of our waste and to improve recycling.
Our manufacturing processes, facilities, distribution practices and products are designed to minimise the effect on the environment. The company ensures that the design and development of new products take into account the potential environmental impact of production and appropriate measures are taken to contain such impacts.
The company will continue to provide the guidance necessary to ensure high standards are achieved at our manufacturing sites around the world whilst promoting continuous improvement based on careful risk assessment and comprehensive management systems. During recent years there have been major factory operating and efficiency improvements throughout the Group as we move towards world class manufacturing excellence.
Health and safetyPZ Cussons aims to maintain a safe workplace at all locations in which it operates. We continue to ensure that our business activities are undertaken in a responsible manner and in accordance with the relevant statutory legislation and that employees at all levels participate in the development, promotion and maintenance of a safe and healthy working environment for employees, visitors and the public. The company employs health and safety specialists and, where appropriate, provides on-site medical facilities for employees.
The company continues to monitor and increase standards of health and safety at work through risk assessment, safety audits, formal incident investigation and training. Our investment in plant and equipment enables us to modernise designs and operate safer and more efficient processes.
Employment and staff developmentAs an international group, and particularly bearing in mind our operations in developing countries, we focus resource on the employment and development of local staff with the intention of assisting both our operations in those countries and the local community. Employees are involved at all levels of decision-making throughout the Group with effective communication via regular consultation groups and briefings. Training is vital to ensuring continuous improvements in performance and over the past year employees of all grades have received training through a wide range of courses.
The employment policies of the Group embody the principles of equal opportunity, training and development and rewards appropriate to local markets which are tailored to meet the needs of its business and the areas in which they operate. This includes procedures to support the Group’s policy that disabled persons shall be considered for appropriate employment and subsequent training and career development. The company continues to share valuable experience and best practice within the Group through employee secondment.
PZ Cussons (UK) Limited is accredited with the Investor In People Award, recognising our commitment in developing our people in line with business needs. Our appraisal-based progression systems ensure that individual needs are continually assessed.

CORPORATE SOCIAL RESPONSIBILITY CONTINUED
Community and charityWe support a range of charitable causes, both in the UK and overseas, mainly through a UK based shareholding trust and additional contributions are made through staff time and gifts in kind. PZ Cussons continues to provide assistance and donations to significant global fund-raising initiatives and recognises its responsibility to the communities in which it operates. We are committed to establishing and maintaining strong relationships with community groups, particularly in developing markets.
Product safetyPZ Cussons is committed to understanding issues involving safety associated with our products and supplying safe products to consumers. Human safety assessments for personal care products are carried out under the Cosmetic Products Directive. We also have in place more general guidelines relating to product safety, covering raw material use, labelling and packaging requirements.
Animal testingNone of our products are tested on animals. We support the development and acceptance of alternative methods that reduce or replace the use of animals in product safety evaluation. We are in regular contact with our suppliers to ensure that our values on this subject are shared and where feasible they work to similar standards.
Development of CSR reportingCorporate social responsibility is acknowledged at the highest level at PZ Cussons and the board has reviewed and fully endorsed the CSR review. We are continuing to focus on establishing practices that will allow us to manage and monitor our social and environmental impacts in greater detail to enable us to further develop our corporate social responsibility reporting.
FINANCIAL STATEMENTS | ANNUAL REPORT 2006 | 39
40 | ANNUAL REPORT 2006 |FINANCIAL STATEMENTS
INDEPENDENT AUDITORS’ REPORT TO THE MEMBERS OF PZ CUSSONS PLC
We have audited the group financial statements of PZ Cussons Plc for the year ended 31st May 2006 which comprise the consolidated income statement, the consolidated balance sheet, the consolidated cash flow statement, the consolidated statement of recognised income and expense and the related notes 1 to 32. These group financial statements have been prepared under the accounting policies set out therein. We have also audited the information in the directors’ remuneration report that is described as having been audited.
We have reported separately on the individual company financial statements of PZ Cussons Plc for the year ended 31st May 2006.
This report is made solely to the company’s members, as a body, in accordance with section 235 of the Companies Act 1985. Our audit work has been undertaken so that we might state to the company’s members those matters we are required to state to them in an auditors’ report and for no other purpose. To the fullest extent permitted by law, we do not accept or assume responsibility to anyone other than the company and the company’s members as a body, for our audit work, for this report, or for the opinions we have formed.
Respective responsibilities of directors and auditorsThe directors’ responsibilities for preparing the annual report, the directors’ remuneration report and the group financial statements in accordance with applicable law and International Financial Reporting Standards (IFRSs) as adopted for use in the European Union are set out in the statement of directors’ responsibilities.
Our responsibility is to audit the group financial statements and the part of the directors’ remuneration report described as having been audited in accordance with relevant United Kingdom legal and regulatory requirements and International Standards on Auditing (UK and Ireland).
We report to you our opinion as to whether the group financial statements give a true and fair view, in accordance with the relevant financial reporting framework, and whether the group financial statements and the part of the directors’ remuneration report described as having been audited have been properly prepared in accordance with the Companies Act 1985 and Article 4 of the IAS Regulation. We report to you whether in our opinion the information given in the directors’ report is consistent with the group financial statements. We also report to you if we have not received all the information and explanations we require for our audit, or if information specified by law regarding directors’ transactions with the company and other members of the group is not disclosed.
We also report to you if, in our opinion, the company has not complied with any of the four directors’ remuneration disclosure requirements specified for our review by the Listing Rules of the Financial Services Authority. These comprise the amount of each element in the remuneration package and information on share options, details of long-term incentive schemes, and money purchase and defined benefit schemes. We give a statement, to the extent possible, of details of any non-compliance.
We review whether the corporate governance statement reflects the company’s compliance with the nine provisions of the 2003 FRC Combined Code specified for our review by the Listing Rules of the Financial Services Authority, and we report if it does not. We are not required to consider whether the board’s statement on internal control covers all risks and controls, or form an opinion on the effectiveness of the group’s corporate governance procedures or its risk and control procedures.
We read the directors’ report and the other information contained in the annual report for the above year as described in the contents section including the unaudited part of the directors’ remuneration report and we consider the implications for our report if we become aware of any apparent misstatements or material inconsistencies with the group financial statements.
Basis of audit opinionWe conducted our audit in accordance with International Standards on Auditing (UK and Ireland) issued by the Auditing Practices Board. An audit includes examination, on a test basis, of evidence relevant to the amounts and disclosures in the group financial statements and the part of the directors’ remuneration report described as having been audited. It also includes an assessment of the significant estimates and judgements made by the directors in the preparation of the group financial statements, and of whether the accounting policies are appropriate to the group’s circumstances, consistently applied and adequately disclosed.
We planned and performed our audit so as to obtain all the information and explanations which we considered necessary in order to provide us with sufficient evidence to give reasonable assurance that the group financial statements and the part of the directors’ remuneration report described as having been audited are free from material misstatement, whether caused by fraud or other irregularity or error. In forming our opinion we also evaluated the overall adequacy of the presentation of information in the group financial statements and the part of the directors’ remuneration report described as having been audited.
OpinionIn our opinion:• the group financial statements give a true and fair view, in accordance with IFRSs as adopted for use in the European Union, of the state of
the group’s affairs as at 31st May 2006 and of its profit for the year then ended;
• the group financial statements and the part of the directors’ remuneration report described as having been audited have been properly prepared in accordance with the Companies Act 1985 and Article 4 of the IAS Regulation; and
• the information given in the directors’ report is consistent with the group financial statements.
Separate opinion in relation to IFRSAs explained in note 1 of the group financial statements, the group, in addition to complying with its legal obligation to comply with IFRSs as adopted for use in the European Union, has also complied with the IFRSs as issued by the International Accounting Standards Board. Accordingly, in our opinion the financial statements give a true and fair view, in accordance with IFRSs, of the state of the group’s affairs as at 31st May 2006 and of its profit for the year then ended.
DELOITTE & TOUCHE LLPChartered Accountants and Registered AuditorsManchester1st August 2006
Notes: An audit does not provide assurance on the maintenance and integrity of the website, including controls used to achieve this, and in particular on whether any changes may have occurred to the financial statements since first published. These matters are the responsibility of the directors but no control procedures can provide absolute assurance in this area.
Legislation in the United Kingdom governing the preparation and dissemination of financial statements differs from legislation in other jurisdictions.
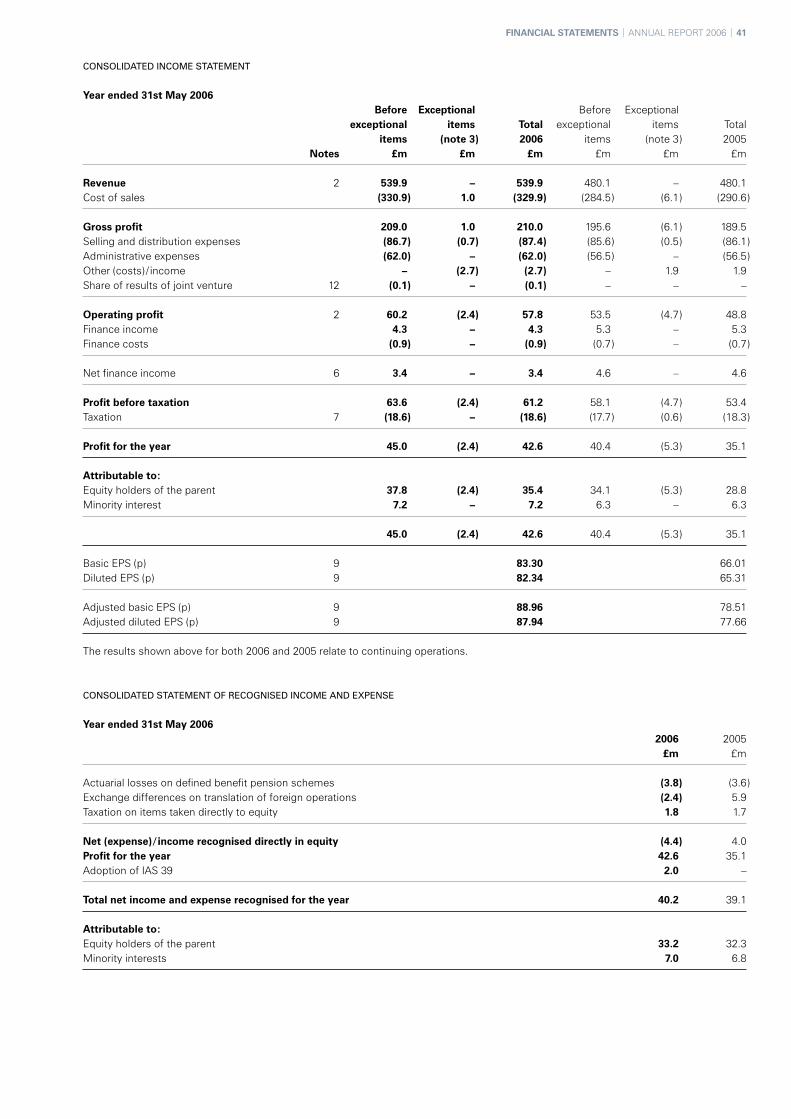
CONSOLIDATED INCOME STATEMENT
Year ended 31st May 2006 Before Exceptional Before Exceptional exceptional items Total exceptional items Total items (note 3 ) 2006 items (note 3 ) 2005 Notes £m £m £m £m £m £m
Revenue 2 539.9 – 539.9 480.1 – 480.1Cost of sales (330.9 ) 1.0 (329.9 ) (284.5 ) (6.1 ) (290.6 )
Gross profit 209.0 1.0 210.0 195.6 (6.1 ) 189.5Selling and distribution expenses (86.7 ) (0.7 ) (87.4 ) (85.6 ) (0.5 ) (86.1 )Administrative expenses (62.0 ) – (62.0 ) (56.5 ) – (56.5 )Other (costs)/ income – (2.7 ) (2.7 ) – 1.9 1.9Share of results of joint venture 12 (0.1 ) – (0.1 ) – – –
Operating profit 2 60.2 (2.4 ) 57.8 53.5 (4.7 ) 48.8Finance income 4.3 – 4.3 5.3 – 5.3Finance costs (0.9 ) – (0.9 ) (0.7 ) – (0.7 )
Net finance income 6 3.4 – 3.4 4.6 – 4.6
Profit before taxation 63.6 (2.4 ) 61.2 58.1 (4.7 ) 53.4Taxation 7 (18.6 ) – (18.6 ) (17.7 ) (0.6 ) (18.3 )
Profit for the year 45.0 (2.4 ) 42.6 40.4 (5.3 ) 35.1
Attributable to:Equity holders of the parent 37.8 (2.4 ) 35.4 34.1 (5.3 ) 28.8Minority interest 7.2 – 7.2 6.3 – 6.3
45.0 (2.4 ) 42.6 40.4 (5.3 ) 35.1
Basic EPS (p) 9 83.30 66.01Diluted EPS (p) 9 82.34 65.31
Adjusted basic EPS (p) 9 88.96 78.51Adjusted diluted EPS (p) 9 87.94 77.66
The results shown above for both 2006 and 2005 relate to continuing operations.
CONSOLIDATED STATEMENT OF RECOGNISED INCOME AND EXPENSE
Year ended 31st May 2006 2006 2005 £m £m
Actuarial losses on defined benefit pension schemes (3.8 ) (3.6 )Exchange differences on translation of foreign operations (2.4 ) 5.9Taxation on items taken directly to equity 1.8 1.7
Net (expense)/income recognised directly in equity (4.4 ) 4.0Profit for the year 42.6 35.1Adoption of IAS 39 2.0 –
Total net income and expense recognised for the year 40.2 39.1
Attributable to:Equity holders of the parent 33.2 32.3Minority interests 7.0 6.8
FINANCIAL STATEMENTS | ANNUAL REPORT 2006 | 41

42 | ANNUAL REPORT 2006 | FINANCIAL STATEMENTS
CONSOLIDATED BALANCE SHEET
At 31st May 2006 31st May 31st May 2006 2005 Notes £m £m
AssetsNon-current assetsGoodwill and other intangible assets 10 54.0 54.1Property, plant and equipment 11 140.1 139.3 Investments in joint ventures 12 – 0.1Other investments 13 0.8 0.5Receivables 15 0.1 0.1Non-current assets held for sale 11 1.3 –Retirement benefit surplus 23 23.4 23.1
219.7 217.2
Current assetsInventories 14 142.7 128.9Receivables and prepayments 15 87.2 70.6Investments 16 2.2 16.2 Cash and short-term deposits 17 65.8 65.7Current taxation receivable 2.7 1.5
300.6 282.9
Total assets 520.3 500.1
LiabilitiesCurrent liabilitiesBorrowings 18 (14.0 ) (5.2 )Trade and other payables 19 (83.8 ) (81.9 )Current taxation payable (13.3 ) (11.4 )Provisions 22 (1.9 ) –
(113.0 ) (98.5 )
Non-current liabilitiesBorrowings 18 (2.1 ) (2.7 )Other liabilities 20 (3.6 ) (5.8 )Deferred tax liabilities 21 (24.6 ) (25.1 )UK retirement benefit obligation 23 (30.5 ) (27.9 )Provisions 22 (8.1 ) (12.1 )
(68.9 ) (73.6 )
Total liabilities (181.9 ) (172.1 )
Net assets 338.4 328.0
EquityOrdinary share capital 24 4.3 4.1 Preference share capital 24 – 7.9Capital redemption reserve 25 0.7 0.7Revaluation reserve 25 27.3 28.1Other reserve 26 (2.9 ) (1.1 )Equity reserve 25 0.8 0.4 Currency translation reserve 25 3.3 5.5Retained earnings 25 258.5 245.4
Equity attributable to equity holders of the parent 292.0 291.0Equity minority interest 25 46.4 37.0
Total equity 338.4 328.0
The financial statements were approved by the board of directors and authorised for issue. They were signed on its behalf by:
A J GREEN G A KANELLIS1st August 2006

CONSOLIDATED CASH FLOW STATEMENT
Year ended 31st May 2006 Year to Year to 31st May 31st May 2006 2005 Notes £m £m
Operating activitiesCash generated from operations 27 35.8 53.9Taxation (18.3 ) (18.7 )
Net cash flow from operating activities 17.5 35.2
Investing activitiesInvestment income received 8.5 7.1Purchase of property, plant and equipment (25.5 ) (18.3 )Sale of property, plant and equipment 10.2 19.2Purchase of intangible assets (0.2 ) (6.0 )Purchase of subsidiaries, including overdrafts acquired – (24.5 )Net cash balances disposed of with subsidiary undertaking (0.4 ) (0.2 )Payments to acquire interests in joint ventures – (0.5 )Purchase of non-current asset investments (0.3 ) –Purchase of current asset investments – (9.3 )Sale of current asset investments 14.0 8.6Loans to joint ventures – (6.2 )
Net cash flow from investing activities 6.3 (30.1 )
Financing activitiesInterest paid (0.9 ) (0.6 )Preference dividends paid (0.1 ) (0.8 )Dividends paid to minority shareholders in subsidiary companies (2.5 ) (1.9 )Purchase of shares for ESOT (2.6 ) (0.3 )Ordinary dividends paid (15.2 ) (13.1 )Net (decrease)/ increase in short-term borrowings (3.4 ) 2.8Cash received from minority shareholders in respect of rights issue 5.3 –Repayment of preference share capital (15.5 ) –
Net cash flow from financing activities (34.9 ) (13.9 )
Net decrease in cash and cash equivalents (11.1 ) (8.8 )Cash and cash equivalents at the beginning of the year 17 65.4 73.6Effect of foreign exchange rates (0.4 ) 0.6
Cash and cash equivalents at the end of the year 17 53.9 65.4
FINANCIAL STATEMENTS | ANNUAL REPORT 2006 | 43

44 | ANNUAL REPORT 2006 | FINANCIAL STATEMENTS
NOTES TO THE CONSOLIDATED FINANCIAL STATEMENTS
General informationPZ Cussons Plc is a company incorporated in the United Kingdom under the Companies Act 1985. The address of the registered office is: PZ Cussons House, Bird Hall Lane, Stockport, SK3 0XN.
These financial statements are presented in pounds sterling because that is the currency of the primary economic environment in which the Group operates. Foreign operations are included in accordance with the policies set out in note 1.
1 Accounting policiesThe financial statements have been prepared in accordance with International Financial Reporting Standards (IFRS) as adopted for use in the European Union (EU), including International Accounting Standards (IAS) and interpretations issued by the International Financial Reporting Interpretations Committee (IFRIC). Results for the comparative period have been restated under IFRS as adopted for use in the EU, with the exception of IAS 32 ‘Financial instruments: disclosure and presentation’ and IAS 39 ‘Financial instruments: recognition and measurement’, which were adopted with an effective date of 1st June 2005. Practice is continuing to evolve on the application and interpretation of IFRS. Further standards may be issued by the International Accounting Standards Board (IASB) and standards currently in issue and endorsed by the EU may be subject to interpretations issued by the IFRIC.
IFRS, as adopted by the EU, differs in certain respects from IFRS as issued by the International Accounting Standards Board (IASB). However, the consolidated financial statements for the periods presented would be no different had the Group applied IFRS as issued by the IASB. References to IFRS hereafter should be construed as references to IFRS as adopted by the EU.
The preparation of financial statements, in conformity with generally accepted accounting principles under IFRS, requires management to make estimates and assumptions that affect the reported amounts of assets and liabilities at the date of the financial statements and the reported amounts of revenues and expenses during the reporting period. Although these estimates are based on management’s best knowledge of the amount, event or actions, actual results ultimately may differ from those estimates.
The disclosures required by IFRS 1 ‘First-time adoption of International Financial Reporting Standards’ concerning the transition from UK GAAP (United Kingdom Generally Accepted Accounting Practice) to IFRS are given in note 31 of the consolidated financial statements.
The financial statements have been prepared on a historical cost basis.
Basis of consolidationThe consolidated financial statements incorporate the financial statements of PZ Cussons Plc and entities controlled by PZ Cussons Plc (its subsidiaries) made up to 31st May each year. Control is achieved where the company has the power to govern the financial and operating policies of an investee entity so as to obtain benefits from its activities.
On acquisition, the assets and liabilities and contingent liabilities of a subsidiary are measured at their fair values at the date of acquisition. Any excess of the cost of acquisition over the fair values of the identifiable net assets acquired is recognised as goodwill. Any deficiency of the cost of acquisition below the fair values of the identifiable net assets acquired (i.e. discount on acquisition) is credited to profit and loss in the period of acquisition.
The total profits or losses of subsidiaries are included in the consolidated income statement and the interest of minority shareholders is stated at the minority’s proportion of the fair values of the assets and liabilities recognised. Subsequently, losses applicable to the minority in excess of the minority’s interest in the subsidiary’s equity are allocated against the interests of the Group except to the extent that the minority has a binding obligation and is able to make an additional investment to cover the losses.
The results of subsidiaries acquired or disposed of during the year are included in the consolidated income statement from the effective date of acquisition or up to the effective date of disposal, as appropriate.
Where necessary, the accounts of the overseas subsidiaries are adjusted to conform to the Group’s accounting policies. All intra-group transactions, balances, income and expenses are eliminated on consolidation.
Operating profitOperating profit is the profit of the Group before finance income, finance costs and taxation.

NOTES TO THE CONSOLIDATED FINANCIAL STATEMENTS CONTINUED
1 Accounting policies continued
Exceptional itemsThe Group has adopted a columnar income statement format which seeks to highlight significant items within the Group results for the period. Such items are considered by the directors to be exceptional in nature rather than being representative of the underlying trading of the Group, and may include such items as restructuring costs, material impairments of non-current assets, material profits and losses on disposal of property, plant and equipment and profit or loss on disposal or termination of operations. The directors apply judgement in assessing the particular items, which by virtue of their scale and nature should be disclosed in the middle column of the income statement and notes to the financial statements as “Exceptional items“. The directors believe that the separate disclosure of these items is relevant to an understanding of the Group’s financial performance.
Business combinationsThe acquisition of subsidiaries is accounted for using the purchase method. The cost of the acquisition is measured at the aggregate of the fair values, at the date of exchange, of assets given, liabilities incurred or assumed, and equity instruments issued by the Group in exchange for control of the acquiree, plus any costs directly attributable to the business combination. The acquiree’s identifiable assets, liabilities and contingent liabilities that meet the conditions for recognition under IFRS 3 ‘Business combinations’ are recognised at their fair values at the acquisition date, except for non-current assets (or disposal groups) that are classified as held for sale in accordance with IFRS 5, ‘Non-current assets held for sale and discontinued operations’, which are recognised and measured at fair value less costs to sell.
Interests in joint venturesA joint venture is a contractual arrangement whereby the Group and other parties undertake an economic activity that is subject to joint control, that is when the strategic financial and operating policy decisions relating to the activities require the unanimous consent of the parties sharing control. Joint venture arrangements that involve the establishment of a separate entity in which each venturer has an interest are referred to as jointly controlled entities. The Group reports its interests in jointly controlled entities using the equity method of accounting, rather than proportional consolidation. Under IAS 28 ‘Investments in associates’ and IAS 31 ’Interests in joint ventures’, a single figure for results is presented as a separate item on the face of the income statement as part of profit before tax within operating profit, while a single figure is disclosed for the Group share of net assets within fixed asset investments.
Intangible assets
GoodwillGoodwill arising on the acquisition of a subsidiary or a jointly controlled entity represents the excess of the cost of acquisition over the Group’s interest in the net fair value of the identifiable assets, liabilities and contingent liabilities of the subsidiary or jointly controlled entity recognised at the date of acquisition. If, after reassessment, the Group’s interest in the net fair value of the acquiree’s identifiable assets, liabilities and contingent liabilities exceeds the cost of the business combination, the excess is recognised immediately in profit or loss. The interest of minority shareholders in the acquiree is initially measured at the minority’s proportion of the net fair value of the assets, liabilities and contingent liabilities recognised.
Goodwill is initially recognised as an asset and is subsequently measured at cost less any accumulated impairment losses. Goodwill is reviewed for impairment at least annually.
For the purpose of impairment testing, goodwill is allocated to each of the Group’s cash-generating units expected to benefit from the synergies of the combination. Cash-generating units to which goodwill has been allocated are tested for impairment annually, or more frequently when there is an indication that the unit may be impaired. If the recoverable amount of the cash-generating unit is less than the carrying amount of the unit, the impairment loss is allocated first to reduce the carrying amount of any goodwill allocated to the unit and then to the other assets of the unit pro-rata on the basis of the carrying amount of each asset in the unit. An impairment loss recognised for goodwill is not reversed in a subsequent period. On disposal of a subsidiary or a jointly controlled entity, the attributable amount of goodwill is included in the determination of the profit or loss on disposal.
Goodwill arising on acquisitions before the date of transition has been retained at the previous UK GAAP amounts. Goodwill written off to reserves under UK GAAP prior to 1998 has not been reinstated and is not included in determining any subsequent profit or loss on disposal.
Other intangible assetsAn acquired brand is only recognised on the balance sheet where it is supported by a registered trademark, where brand earnings are separately identifiable and the brand could be sold separately from the rest of the business.
Brands acquired as part of a business combination are recorded in the balance sheet at fair value at the date of acquisition. Purchased brands are recorded at purchase cost. Brands currently held are not amortised as the directors believe they have indefinite lives. In accordance with IAS 36 ‘Impairment of assets’, the brands are tested for impairment annually, and whenever there is an indication that the asset may be impaired. Any impairment is recognised immediately in profit or loss.
Where an impairment loss subsequently reverses, the carrying amount of the asset is increased to the revised estimate of its recoverable amount, but so that the increased carrying amount does not exceed the carrying amount that would have been determined had no impairment loss been recognised for the asset in prior years. A reversal of an impairment loss is recognised immediately as income.
FINANCIAL STATEMENTS | ANNUAL REPORT 2006 | 45

46 | ANNUAL REPORT 2006 | FINANCIAL STATEMENTS
NOTES TO THE CONSOLIDATED FINANCIAL STATEMENTS CONTINUED
1 Accounting policies continued
Non-current assets held for saleNon-current assets and disposal groups are classified as held for sale if their carrying amount will be recovered through a sale transaction rather than through continuing use. This condition is regarded as met only when the sale is highly probable and the asset (or disposal group) is available for immediate sale in its present condition.
Management must be committed to the sale, which should be expected to qualify for recognition as a completed sale within one year from the date of classification. Non-current assets (and disposal groups) classified as held for sale are measured at the lower of the assets’ previous carrying amount and fair value less costs to sell.
Revenue recognitionRevenue is measured at the fair value of the consideration received or receivable and represents amounts receivable for goods and services provided in the normal course of business, net of discounts, rebates and sales related taxes but including interest receivable on sales on extended credit and income from the provision of technical services and agreements. Sales of goods are recognised when title has passed and the significant risks and rewards of ownership have been transferred.
Dividend income from investments is recognised when the shareholders’ rights to receive payment have been established.
LeasingLeases are classified as finance leases whenever the terms of the lease transfer substantially all the risks and rewards of ownership to the lessee. All other leases are classified as operating leases.
Rentals payable under operating leases are charged to profit or loss on a straight-line basis over the term of the relevant lease. Benefits received and receivable as an incentive to enter into an operating lease are also spread on a straight-line basis over the lease term.
Foreign currenciesThe individual financial statements of each Group entity are presented in the currency of the primary economic environment in which the entity operates (its functional currency). For the purpose of the consolidated financial statements, the results and financial position of each entity are expressed in sterling, which is the functional currency of the company, and the presentation currency for the consolidated financial statements.
In preparing the financial statements of the individual entities, transactions in currencies other than the entity’s functional currency are recorded at the actual rate of exchange prevailing on the dates of the transactions. At each balance sheet date, monetary assets and liabilities that are denominated in foreign currencies are retranslated at the rates prevailing at the balance sheet date.
Foreign exchange gains and losses arising from the settlement of foreign currency transactions and from the translation of monetary assets and liabilities denominated in foreign currencies are recognised in the income statement. Exchange differences arising on non-monetary assets and liabilities are recognised directly in equity.
In order to hedge its exposure to certain foreign exchange risks, the Group enters into forward contracts.
On consolidation, the assets and liabilities of the Group’s overseas operations are translated at exchange rates prevailing on the balance sheet date. Income and expense items are translated at the average exchange rates for the period unless exchange rates fluctuate significantly. Cumulative foreign currency translation differences arising on the translation and consolidation of foreign operations’ income statements and balance sheets denominated in foreign currencies are recorded as a separate component of equity. Applying the exemption under IFRS 1 ‘First-time adoption of International Financial Reporting Standards’, the Group has set the currency reserve to zero at 1st June 2004, the date of transition to IFRS and measured and recorded separately in that currency reserve all cumulative foreign currency translation differences arising after that date. On disposal of a foreign operation the cumulative translation differences will be transferred to the income statement in the period of the disposal as part of the gain or loss on disposal.
Borrowing costsBorrowing costs are recognised in profit or loss in the period in which they are incurred.
Government grantsGovernment grants related to property, plant and equipment are reflected in the balance sheet as deferred income and credited to the income statement over the useful lives of the assets concerned. At 31st May 2006, all government grants received had been fully amortised. Grants previously recognised are subject to fulfilment of ongoing conditions.

NOTES TO THE CONSOLIDATED FINANCIAL STATEMENTS CONTINUED
1 Accounting policies continued
Employee benefits
Retirement benefit obligationsThe Group operates retirement benefit schemes in the United Kingdom and for most overseas countries in which it carries on business. Those in the United Kingdom are defined benefit schemes; overseas schemes vary in detail depending on local practice.
In respect of the defined benefit schemes, the cost of providing benefits is determined using the Projected Unit Credit Method, with full actuarial valuations being carried out every three years or more frequently should a material change occur in any of the schemes. Actuarial gains and losses are recognised in full in the period in which they occur. They are recognised outside profit and loss and presented in the statement of recognised income and expense.
Past service cost is recognised immediately to the extent that the benefits are already vested, and otherwise amortised on a straight-line basis over the average period until the benefits become vested.
The retirement benefit obligation recognised in the balance sheet represents the present value of the defined benefit obligation as adjusted for unrecognised past service cost, and as reduced by the fair value of scheme assets. Any asset resulting from this calculation is limited to past service cost, plus the present value of available refunds and reductions in future contributions to the plan.
Payments to defined contribution retirement benefit schemes are charged as an expense as they fall due.
Share-based paymentsThe Group operates a deferred annual share bonus scheme and an executive share option scheme for senior executives, both of which involve equity-settled share-based payments. In accordance with the transitional provisions, IFRS 2 ‘Share-based payments’ has been applied to all grants of equity instruments after 7th November 2002 that were unvested as of 1st June 2005.
Equity-settled share-based payments under the executive share option scheme are measured at fair value (excluding the effect of non-market based vesting conditions) at the date of grant. The fair value determined at the grant date is expensed on a straight-line basis over the vesting period. Fair value is measured using the Black-Scholes pricing model. The expected life used in the model has been adjusted, based on management’s best estimate, for the effects of non-transferability, exercise restrictions and behavioural considerations.
The cost to the company of making awards under the deferred annual share bonus scheme is charged to the income statement over the period to which the performance relates.
TaxationIncome tax expense represents the sum of the tax currently payable and deferred tax.
The tax currently payable is based on taxable profit for the year. Taxable profit differs from net profit as reported in the income statement because it excludes items of income or expense that are taxable or deductible in other years and it further excludes items that are never taxable or deductible. The Group’s liability for current tax is calculated using tax rates that have been enacted or substantively enacted by the balance sheet date.
Deferred tax is the tax expected to be payable or recoverable on differences between the carrying amounts of assets and liabilities in the financial statements and the corresponding tax bases used in the computation of taxable profit, and is accounted for using the balance sheet liability method. Deferred tax liabilities are generally recognised for all taxable temporary differences and deferred tax assets are recognised to the extent that it is probable that taxable profits will be available against which deductible temporary differences can be utilised. Such assets and liabilities are not recognised if the temporary difference arises from goodwill or from the initial recognition (other than in a business combination) of other assets and liabilities in a transaction that affects neither the tax profit nor the accounting profit.
Deferred tax liabilities are recognised for taxable temporary differences arising on investments in subsidiaries and interests in joint ventures, except where the Group is able to control the reversal of the temporary difference and it is probable that the temporary difference will not reverse in the foreseeable future.
The carrying amount of deferred tax assets is reviewed at each balance sheet date and reduced to the extent that it is no longer probable that sufficient taxable profits will be available to allow all or part of the asset to be recovered.
Deferred tax is calculated at the tax rates that are expected to apply in the period when the liability is settled or the asset is realised. Deferred tax is charged or credited in the income statement, except when it relates to items charged or credited to equity, in which case the deferred tax is also dealt with in equity.
Deferred tax assets and liabilities are offset when there is a legally enforceable right to set off current tax assets against current tax liabilities and when they relate to income taxes levied by the same taxation authority and the Group intends to settle its current tax liabilities on a net basis.
FINANCIAL STATEMENTS | ANNUAL REPORT 2006 | 47

48 | ANNUAL REPORT 2006 | FINANCIAL STATEMENTS
NOTES TO THE CONSOLIDATED FINANCIAL STATEMENTS CONTINUED
1 Accounting policies continued
Property, plant and equipmentLand and buildings held for use in the production or supply of goods or services, or for administration purposes, are stated in the balance sheet at deemed cost at the date of transition to IFRS less accumulated depreciation and any accumulated impairment losses. All other assets are stated at historical cost less accumulated depreciation and accumulated impairment losses.
Plant and machinery and fixtures and fittings are stated at cost less accumulated depreciation and any recognised impairment loss.
Depreciation is charged so as to write off the cost or valuation of assets, other than land, over their estimated useful lives, using the straight-line method, on the following basis:
Freehold buildings at rates not less than 2%
Leasehold buildings at rates which will reduce the book valueto nil on or before the termination of the leases with a minimum of 2%
Plant and machinery not less than 10%
Fixtures, fittings and vehicles not less than 20%
In the case of major projects depreciation is provided from the date the project in question is brought into use.
The gain or loss arising on the disposal or retirement of an asset is determined as the difference between the sales proceeds and the carrying amount of the asset and is recognised in profit or loss for the period.
InventoriesInventories are stated at the lower of cost and estimated net realisable value. Cost comprises direct materials and where applicable, direct labour costs and those overheads that have been incurred in bringing the inventories to their present location and condition. Cost is calculated using the FIFO method. Net realisable value represents the estimated selling price less all estimated costs of completion and costs to be incurred in marketing, selling and distribution.
Research and developmentResearch and development expenditure is charged against profits in the year in which it is incurred, unless it meets the criteria for capitalisation set out in IAS 38 ‘Intangible assets’.
Cash and cash equivalentsCash and cash equivalents includes cash at bank and in hand plus short-term deposits less overdrafts. Short-term deposits have a maturity of less than three months from the date of acquisition. Bank overdrafts are repayable on demand and form an integral part of the Group’s cash management.
Financial instrumentsFinancial assets and financial liabilities are recognised on the Group’s balance sheet when the Group becomes a party to the contractual provisions of the instrument.
Derivative financial instrumentsThe Group’s activities expose it primarily to the financial risks of changes in foreign exchange rates. The Group uses derivative financial instruments (primarily foreign currency forward contracts) to hedge its risks associated with foreign currency fluctuations relating to certain firm commitments and forecasted transactions.
The occasional use of financial derivatives is governed by the Group’s policies approved by the board of directors, which provide written principles in the use of financial derivatives consistent with the Group’s risk management strategy. The Group does not use derivative financial instruments for speculative purposes.

NOTES TO THE CONSOLIDATED FINANCIAL STATEMENTS CONTINUED
1 Accounting policies continued
Derivative financial instruments (up to 31st May 2005)Under UK GAAP, when the Group entered into currency swaps to manage its exposure to fluctuations in currency rates, principal amounts were revalued at exchange rates ruling at the date of the Group balance sheet and included in the sterling value of debt. In order for such swaps to have qualified for hedge accounting, the forward contract /currency swap must have related to an existing asset, liability or firm commitment, have been in the same currency as the hedged item and have reduced the risk of foreign currency exchange movements to the Group’s operations. Where they did, exchange gains and losses were taken directly to reserves and included in the statement of total recognised gains and losses in accordance with SSAP 20 ‘Foreign currency translation’.
Derivative financial instruments (from 1st June 2005) Derivative financial instruments are initially measured at fair value at the contract date, and are remeasured to fair value at subsequent reporting dates. Changes in the fair value of derivative financial instruments that are designated and effective as hedges of future cash flows are recognised directly in equity, and any ineffective portion is recognised immediately in the income statement.
Borrowings (up to 31st May 2005)Prior to 1st June 2005, borrowings were stated at proceeds, net of direct issue costs. The issue costs of debt instruments were amortised at a constant rate over the life of the instrument.
Borrowings (from 1st June 2005)Interest-bearing bank loans and overdrafts are recorded at the proceeds received, net of direct issue costs. Finance charges, including premiums payable on settlement or redemption and direct issue costs, are accounted for on an accrual basis through the income statement using the effective interest method and are added to the carrying amount of the instrument to the extent they are not settled in the period in which they arise.
Trade receivablesTrade receivables do not carry any interest and are stated at their nominal value as reduced by appropriate allowances for estimated irrecoverable amounts.
Trade payablesTrade payables are not interest bearing and are stated at their nominal value.
Financial liabilities and equityFinancial liabilities and equity instruments are classified according to the substance of the contractual arrangements entered into. An equity instrument is any contract that evidences a residual interest in the assets of the Group after deducting all of its liabilities.
InvestmentsInvestments (other than interests in joint ventures) are recognised and derecognised on a trade date when a purchase or sale of an investment is under a contract whose terms require delivery of the investment within the timeframe established by the market concerned, and are initially measured at cost, including transaction costs.
Investments are classified as either held-to-maturity, held-for-trading, loans and receivables or available-for-sale. Held-to-maturity investments and loans and receivables are measured at amortised cost. Held-for-trading and available-for-sale investments are measured at subsequent reporting dates at fair value. Where securities are held-for-trading purposes, gains and losses arising from changes in fair value are included in net profit or loss for the period. For available-for-sale investments, gains and losses arising from changes in fair value are recognised directly in equity, until the security is disposed of or is determined to be impaired, at which time the cumulative gain or loss previously recognised in equity is included in the net profit or loss for the period.
ProvisionsProvisions are recognised when the Group has a present obligation as a result of a past event, and it is probable that the Group will be required to settle that obligation. Provisions are measured at the directors’ best estimate of the expenditure required to settle the obligation at the balance sheet date. Provisions for restructuring costs are recognised when the Group has a detailed formal plan for the restructuring that has been communicated to affected parties.
Critical accounting policies and key sources of estimation uncertainty Estimates and accounting judgements are continually evaluated and are based on historical experience and other factors, including expectations of future events that are believed to be reasonable under the circumstances.
The preparation of financial statements under IFRS requires management to make assumptions and estimates about future events. The resulting accounting estimates will, by definition, differ from the actual results. The assumptions and estimates that have a significant risk of causing a material adjustment to the carrying amount of assets and liabilities within the next financial year are as follows:
FINANCIAL STATEMENTS | ANNUAL REPORT 2006 | 49

50 | ANNUAL REPORT 2006 | FINANCIAL STATEMENTS
NOTES TO THE CONSOLIDATED FINANCIAL STATEMENTS CONTINUED
1 Accounting policies continued
Accounting for intangible assetsThe Group records all acquired intangible assets at fair value. Intangible assets are not amortised but are subject, at a minimum, to annual tests for impairment. Determining whether intangible assets are impaired requires an estimation of the value in use of the cash-generating units to which the intangible asset has been allocated. The value in use calculation requires management to estimate the future cash flows expected to arise from the cash-generating unit and a suitable discount rate in order to calculate present value. Details of key estimates are discussed in note 10.
Retirement benefitsThe Group operates three main UK retirement benefit schemes, which are independent of the Group’s finances. Actuarial valuations are carried out as determined by the trustees at intervals of not more than three years. The retirement benefit cost under IAS 19 is assessed in accordance with the advice of a firm of actuaries based on the latest actuarial valuation and assumptions determined by the actuary. The assumptions are based on information supplied to the actuary by the company, supplemented by discussions between the actuary and management. The assumptions are disclosed in note 23. Operating results are affected by the actuarial assumptions used. These assumptions include discount rates, mortality rates, inflation rates and expected long-term rates of return on assets and may differ from actual results due to changing market and economic conditions and longer or shorter lives of participants.
Standards and interpretationsAt the date of authorisation of these financial statements, the following standards and interpretations, which have not been applied in these financial statements, were in issue but not yet effective. The directors anticipate that the adoption of these standards and interpretations will have no material impact on the Group’s financial statements. The directors anticipate that the Group will adopt these standards and interpretations on their effective dates:
• IAS 1 Amendment ‘Capital disclosures’, is effective for periods commencing on or after 1st January 2007;
• IAS 39 Amendment ‘Cashflow hedge accounting of forecast intragroup transactions’, issued in April 2005, is effective for periods commencing on or after 1st January 2006;
• IAS 39 Amendment ‘The fair value option’, issued in June 2005, is effective for periods commencing on or after 1st January 2006;
• IAS 39 Amendment ‘Financial guarantee contracts’, issued in August 2005, is effective for periods commencing on or after 1st January 2006;
• IAS 21 Amendment ‘The effects of changes in foreign exchange rates – net investment in a foreign operation’, issued in December 2005 is effective for periods commencing on or after 1st April 2006;
• IFRS 7 ‘Financial instruments: disclosures’, issued in August 2005, is effective for periods commencing on or after 1st January 2007 and introduces new disclosures to improve the information about financial instruments;
• IFRIC 4, ‘Determining whether an arrangement contains a lease’, issued in December 2004, is effective for periods commencing on or after 1st January 2006 and requires the determination of whether an arrangement is or contains a lease to be based on the substance of the arrangement;
• IFRIC 8 ‘Scope of IFRS 2’, issued in January 2006, is effective for periods commencing on or after 1st May 2006; and
• IFRIC 9 ‘Reassessment of embedded derivatives’, issued in March 2006, is effective for periods commencing on or after 1st June 2006.
Interpretations in issue but not considered relevant to the activities of the Group are as follows:
• IFRIC 1 ‘Changes in existing decommissioning, restoration and similar liabilities’;
• IFRIC 2 ‘Members’ shares in cooperative entities and similar instruments’;
• IFRIC 5 ‘Rights to interests arising from decommissioning, restoration and environmental rehabilitation funds’;
• IFRIC 6 ‘Liabilities arising from participating in a specific market – waste electrical and electronic equipment’; and
• IFRIC 7 ‘Applying the restatement approach under IAS 29 ‘Financial reporting in hyperinflationary economies”.
2 Segmental analysisThe Group’s primary segment reporting is by geographic sector with business sector reporting being the secondary format. The Group has three geographical sectors which are based on the location of customers and consist of Africa, Asia and Europe. The Group has one main business sector, being toiletries and household products.

NOTES TO THE CONSOLIDATED FINANCIAL STATEMENTS CONTINUED
2 Segmental analysis continued
Geographic segments Africa Asia Europe Eliminations Total2006 £m £m £m £m £m
Total gross segment revenue 211.9 116.8 355.4 (144.2 ) 539.9Inter segment revenue (0.1 ) (2.9 ) (141.2 ) 144.2 –
Revenue 211.8 113.9 214.2 – 539.9
Segmental operating profit before exceptional items 25.1 12.5 22.6 – 60.2Exceptional items (note 3) (0.5 ) (0.2 ) (1.7 ) – (2.4 )
Segmental operating profit 24.6 12.3 20.9 – 57.8
2005
Total gross segment revenue 159.5 108.7 329.9 (118.0 ) 480.1Inter segment revenue (0.1 ) (1.0 ) (116.9 ) 118.0 –
Revenue 159.4 107.7 213.0 – 480.1
Segmental operating profit before exceptional items 20.8 11.9 20.8 – 53.5Exceptional items (note 3) – (3.4 ) (1.3 ) – (4.7 )
Segmental operating profit 20.8 8.5 19.5 – 48.8
Africa Asia Europe Total2006 £m £m £m £m
Segment assets 196.3 86.0 238.0 520.3Segment liabilities (31.1) (23.2) (127.6) (181.9)Capital additions 14.6 6.8 3.5 24.9Depreciation and amortisation (4.6) (2.7) (8.2) (15.5)Impairment losses recognised in income – – (3.3 ) (3.3 )
2005
Segment assets 156.6 78.4 265.1 500.1Segment liabilities (29.4) (21.9) (120.8) (172.1)Capital additions 5.7 12.6 6.3 24.6Depreciation and amortisation (4.2) (2.9) (8.6) (15.7)Impairment losses recognised in income – – – –
For management reporting purposes the results for the USA are included in the Europe segment and hence a consistent presentation has been adopted in the above analysis. The share of results of joint venture of £0.1 million (2005: nil) and investments in joint ventures of nil (2005: £0.1 million) are included in the Africa segment in the above analysis.
Business segmentsThe following table provides an analysis of the Group’s revenue by business segment, irrespective of the origin of the goods:
Revenue by business segment 2006 2005 £m £m
Toiletries and household 435.8 416.9Other 104.1 63.2
Total 539.9 480.1
The following is an analysis of the carrying amount of segment assets and additions to property, plant and equipment and intangible assets, analysed by the business segment in which the assets are located. Additions to property, Carrying amount of plant and equipment segment assets and intangible assets 2006 2005 2006 2005 £m £m £m £m
Toiletries and household 461.2 448.8 23.8 24.2Other 59.1 51.3 1.1 0.4
Total 520.3 500.1 24.9 24.6
Trading between segments is carried out on an arm’s-length basis and transactions are priced accordingly. External market prices are used where available.
FINANCIAL STATEMENTS | ANNUAL REPORT 2006 | 51

52 | ANNUAL REPORT 2006 | FINANCIAL STATEMENTS
NOTES TO THE CONSOLIDATED FINANCIAL STATEMENTS CONTINUED
3 Exceptional items
Year to 31st May 2006 Profit before Profit after taxation Taxation taxationExceptional items included within operating profit: Effect on: £m £m £m
Restructuring of UK operations (i) (6.5 ) 1.6 (4.9 )Restructuring of smaller overseas operations (ii) (3.1 ) – (3.1 )Profit on disposal of property, plant and equipment (iii) 1.9 – 1.9Income from bad debts previously written off (iv) 5.3 (1.6 ) 3.7
Total (2.4 ) – (2.4 )
(i) Restructuring of UK operationsA decision was taken in the previous financial year to close the soap manufacturing factory in Nottingham and transfer the production to PZ Cussons Thailand. The exceptional charge to the consolidated income statement of £6.5 million comprises impairment provisions for plant and machinery of £3.3 million and other associated restructuring costs of £3.2 million.
(ii) Restructuring of smaller overseas operationsCosts of £3.1 million in relation to the rationalisation of the Group’s smaller operations, being the Cameroun business which has been put up for sale and the USA operation which has been converted from direct sale to a licence arrangement.
(iii) Profit on disposal of property, plant and equipmentDuring the year, the sale of the Group’s liquids and creams factory in Warsaw resulted in an exceptional gain on disposal of £1.9 million.
(iv) Income from bad debts previously written offIncome of £5.3 million has been recognised in the year as a result of recoveries from ECGD of bad debts written off several years ago, which have now been recovered as a result of Nigeria’s settlement with the Paris Club of creditors.
Year to 31st May 2005 Profit before Profit after taxation Taxation taxationExceptional items included within operating profit: Effect on: £m £m £m
Restructuring of UK operations (i) (4.9 ) 1.5 (3.4 )Restructuring of Polish operations (ii) (1.7 ) – (1.7 )Profit on disposal of property, plant and equipment (iii) 5.3 (2.1 ) 3.2Loss on disposal of operation (iv) (3.4 ) – (3.4 )
Total (4.7 ) (0.6 ) (5.3 )
(i) Restructuring of UK operationsDuring the year ended 31st May 2005, a decision was taken to close the soap manufacturing factory in Nottingham and transfer the production to PZ Cussons Thailand. The charge to the consolidated income statement of £4.9 million comprised provisions for redundancy and other associated restructuring costs.
(ii) Restructuring of Polish operationsDuring the year ended 31st May 2005 a restructuring program was undertaken in Poland to rationalise the Group’s Eastern European operations. This involved the withdrawal from Russia and a decision to close the liquids and creams factory in Warsaw resulting in exceptional costs of £1.7 million.
(iii) Profit on disposal of property, plant and equipment During the year ended 31st May 2005, the sales of both the Group’s Bury warehouse and UK head office were completed resulting in exceptional operating profits totalling £5.3 million.
(iv) Loss on disposal of operationAs a result of continuing losses in the Chinese operating unit, a decision was made during 2005 to dispose of the business. This resulted in an exceptional loss on sale during the year ended 31st May 2005 of £3.4 million.

NOTES TO THE CONSOLIDATED FINANCIAL STATEMENTS CONTINUED
4 Profit for the yearProfit for the year has been arrived at after charging/ (crediting): 2006 2005 £m £m
Net foreign exchange gains (0.9 ) (0.3 )Research and development costs 3.9 3.4Amortisation of government grants (0.4 ) (0.5 )Depreciation of property, plant and equipment 15.5 15.7Profit on disposal of property, plant and equipment (5.4 ) (9.4 )Raw and packaging materials and goods purchased for resale 291.3 246.2 Operating lease rentals 1.1 –Employee costs (note 5) 75.7 73.6Auditors’ remuneration (see below) 0.6 0.8
A more detailed analysis of auditors’ remuneration on a worldwide basis is provided below: 2006 2005 £m £m
Audit fees 0.4 0.3Tax advisory – 0.1Tax compliance 0.1 0.1Other services 0.1 0.3
Total 0.6 0.8
Other services in 2006 relate to miscellaneous advisory work. Other services in 2005 include fees paid to Deloitte Hong Kong LLP in relation to the disposal of the Chinese business unit amounting to £0.2 million which are included in loss on sale of operations in the consolidated income statement.
In addition to the amounts above, fees were paid to the Group’s auditors in respect of their audit of the Group’s UK retirement benefit schemes totalling £16,000 (2005: £15,000).
5 Directors and employees
Employee costsThe average monthly number of employees (including executive directors) was as follows: 2006 2005 Number Number
Production 6,091 6,969Selling and distribution 2,778 2,777Administration 1,508 1,486
10,377 11,232
The costs incurred in respect of the above were as follows: 2006 2005 £m £m
Wages and salaries 64.4 61.1Social security and other costs 5.6 5.5Post-employment benefits 5.7 7.0
75.7 73.6
Directors’ remunerationThe costs incurred by subsidiary companies in respect of the directors, who are regarded as the key management personnel, were as follows:
2006 2005 £m £m
Fees to non-executive directors 0.1 0.1Wages and salaries 2.3 2.0Bonus 1.4 –Benefits 0.2 0.2Social security and other costs 0.3 0.2Post-employment benefits 0.9 0.7Share-based payments 0.4 0.3
Total 5.6 3.5
No directors’ costs were incurred by the parent company.
FINANCIAL STATEMENTS | ANNUAL REPORT 2006 | 53

54 | ANNUAL REPORT 2006 | FINANCIAL STATEMENTS
NOTES TO THE CONSOLIDATED FINANCIAL STATEMENTS CONTINUED
6 Net finance income 2006 2005 £m £m
Current asset investment income:Net investment gains 2.7 3.0Interest and dividends receivable 1.6 2.3
4.3 5.3Interest payable on bank loans and overdrafts (0.9 ) (0.7 )
3.4 4.6
7 Taxation 2006 2005 £m £m
Current tax 18.1 20.3Deferred tax 0.5 (2.0 )
Total tax charge 18.6 18.3
UK corporation tax is calculated at 30% (2005: 30%) of the estimated assessable profit for the year. Taxation for other jurisdictions is calculated at the rates prevailing in the respective jurisdictions.
The tax charge for the year can be reconciled to the profit per the consolidated income statement as follows:
2006 2005 £m £m
Profit before tax 61.2 53.4
Tax at the UK corporation tax rate of 30% (2005: 30%) 18.4 16.0Tax effect of expenses that are not deductible in determining taxable profit 1.3 2.1Tax effect of timing differences on which deferred tax is not provided (0.2 ) (0.1 )Tax effect of utilisation of tax losses not recognised (0.8 ) 1.8Effect of different tax rates of subsidiaries in overseas jurisdictions (0.7 ) (1.2 )Sale of properties – 0.5Prior period adjustment 0.6 (0.8 )
Tax charge for the year 18.6 18.3
8 Dividends 2006 2005 £m £m
Amounts recognised as distributions to ordinary shareholders in the year comprise:Final dividend for the year ended 31st May 2005 of 26.60p (2004: 23.95p) per ordinary share 11.3 9.6Interim dividend for the year ended 31st May 2006 of 9.30p (2005: 8.65p) per ordinary share 3.9 3.5
15.2 13.1
Amounts recognised as distributions to preference shareholders in the year comprise:7½% cumulative preference shares – 0.110% cumulative preference shares 0.1 0.7
0.1 0.8
Total amount recognised as distributions to shareholders in the year 15.3 13.9
Proposed final dividend for the year ended 31st May 2006 of 29.50p (2005: 26.60p) per share 12.5 11.3
The proposed final dividends for the years ended 31st May 2005 and 31st May 2006 were subject to approval by shareholders at the annual general meeting and hence have not been included as liabilities in these financial statements at 31st May 2005 and 31st May 2006 respectively.
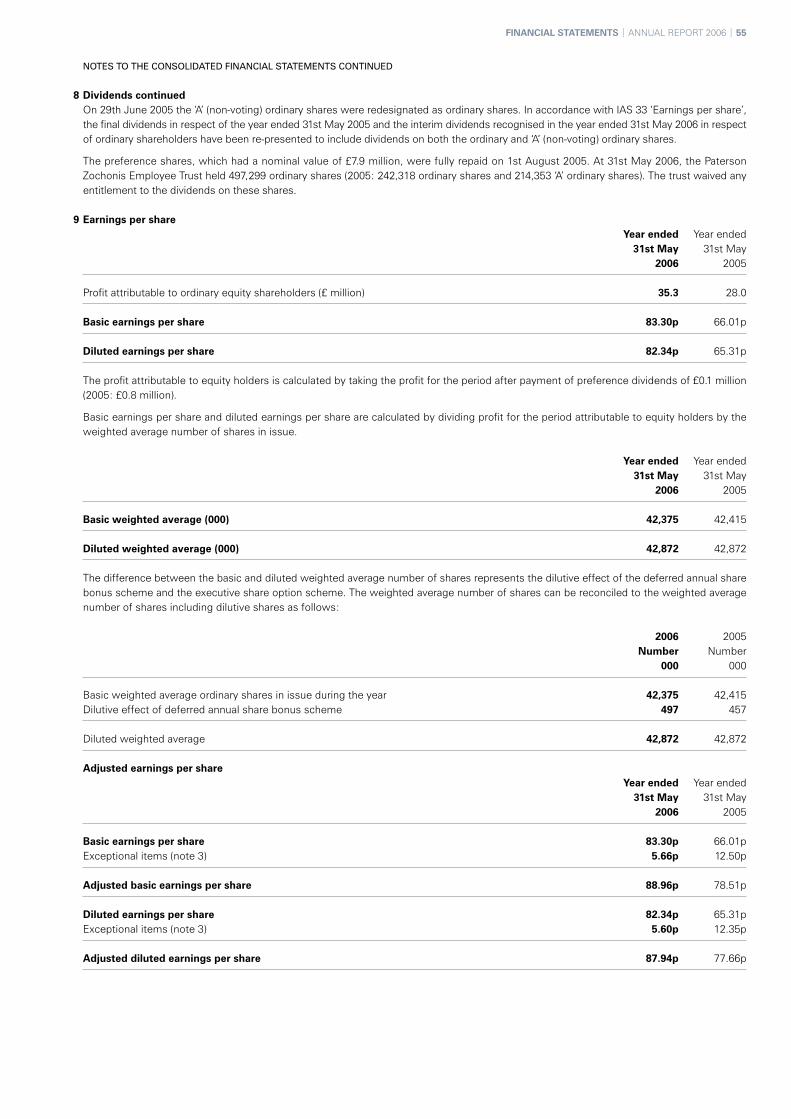
NOTES TO THE CONSOLIDATED FINANCIAL STATEMENTS CONTINUED
8 Dividends continuedOn 29th June 2005 the ‘A’ (non-voting) ordinary shares were redesignated as ordinary shares. In accordance with IAS 33 ‘Earnings per share’, the final dividends in respect of the year ended 31st May 2005 and the interim dividends recognised in the year ended 31st May 2006 in respect of ordinary shareholders have been re-presented to include dividends on both the ordinary and ‘A’ (non-voting) ordinary shares.
The preference shares, which had a nominal value of £7.9 million, were fully repaid on 1st August 2005. At 31st May 2006, the Paterson Zochonis Employee Trust held 497,299 ordinary shares (2005: 242,318 ordinary shares and 214,353 ‘A’ ordinary shares). The trust waived any entitlement to the dividends on these shares.
9 Earnings per share Year ended Year ended 31st May 31st May 2006 2005
Profit attributable to ordinary equity shareholders (£ million) 35.3 28.0
Basic earnings per share 83.30p 66.01p
Diluted earnings per share 82.34p 65.31p
The profit attributable to equity holders is calculated by taking the profit for the period after payment of preference dividends of £0.1 million (2005: £0.8 million).
Basic earnings per share and diluted earnings per share are calculated by dividing profit for the period attributable to equity holders by the weighted average number of shares in issue.
Year ended Year ended 31st May 31st May 2006 2005
Basic weighted average (000) 42,375 42,415
Diluted weighted average (000) 42,872 42,872
The difference between the basic and diluted weighted average number of shares represents the dilutive effect of the deferred annual share bonus scheme and the executive share option scheme. The weighted average number of shares can be reconciled to the weighted average number of shares including dilutive shares as follows:
2006 2005 Number Number 000 000
Basic weighted average ordinary shares in issue during the year 42,375 42,415Dilutive effect of deferred annual share bonus scheme 497 457
Diluted weighted average 42,872 42,872
Adjusted earnings per share Year ended Year ended 31st May 31st May 2006 2005
Basic earnings per share 83.30p 66.01pExceptional items (note 3) 5.66p 12.50p
Adjusted basic earnings per share 88.96p 78.51p
Diluted earnings per share 82.34p 65.31pExceptional items (note 3) 5.60p 12.35p
Adjusted diluted earnings per share 87.94p 77.66p
FINANCIAL STATEMENTS | ANNUAL REPORT 2006 | 55

56 | ANNUAL REPORT 2006 | FINANCIAL STATEMENTS
NOTES TO THE CONSOLIDATED FINANCIAL STATEMENTS CONTINUED
9 Earnings per share continuedAdjusted basic and diluted earnings per share figures are calculated by dividing adjusted profit for the year by the weighted average number of shares in issue. The adjusted profit for the year is as follows:
2006 2005 £m £m
Profit attributable to ordinary equity shareholders 35.3 28.0Exceptional items (note 3) 2.4 5.3
Adjusted profit 37.7 33.3
On 29th June 2005 the ‘A’ (non-voting) ordinary shares were redesignated as ordinary shares such that those ‘A’ (non-voting) ordinary shares were enfranchised. There was also a compensatory bonus issue to ordinary shareholders on the basis of one new share for every ten ordinary shares held. In accordance with IAS 33 ‘Earnings per share’, the comparative figures for 31st May 2005 have been re-presented to include both the ordinary and ‘A’ ordinary shares.
10 Goodwill and other intangible assets Other intangible Goodwill assets Total £m £m £m
CostAt 1st June 2004 – 9.8 9.8
Acquisitions 8.8 29.3 38.1Additions – 6.2 6.2
At 31st May 2005 8.8 45.3 54.1
Currency retranslation – (0.3 ) (0.3 )Additions – 0.2 0.2
At 31st May 2006 8.8 45.2 54.0
Intangible assets include the Group’s acquired brands: Charles Worthington, Original Source and Trix.
Goodwill and intangible assets, which have indefinite useful lives, are subject to annual impairment testing, or more frequent testing if there are indications of impairment. The recoverable amounts of the cash-generating units (CGUs) are determined from value-in-use calculations that use amounts from approved budgets and plans over a period of 5 years (2005: 5 years). The discount rate applied to the cashflow projections was 8.5% (2005: 8.5%). The average growth rate used of 11% was based on industry growth rates.
Intangible assets and goodwill are allocated to the appropriate CGU identified, which is directly driven by the brand of product. The net book value of goodwill and intangible assets by these CGUs was as follows:
Year ended Year ended 31st May 31st May 2006 2005 £m £m
Original Source 9.8 9.8Charles Worthington 38.1 38.1Trix 5.9 6.2Other 0.2 –
Total 54.0 54.1
There were no impairments of goodwill or intangible assets identified during the year or the prior year.

NOTES TO THE CONSOLIDATED FINANCIAL STATEMENTS CONTINUED
11 Property, plant and equipment Fixtures, Assets in Land and Plant and fittings and course of buildings machinery vehicles construction Total £m £m £m £m £m
CostAt 1st June 2004 88.1 143.9 26.7 6.9 265.6
Currency retranslation 2.6 3.5 0.7 0.1 6.9Acquisitions – 0.3 0.3 – 0.6Additions 1.5 5.0 3.3 8.6 18.4Disposals (12.9 ) (14.1 ) (2.9 ) – (29.9 )Reclassifications 0.5 3.3 1.0 (4.8 ) –
At 31st May 2005 79.8 141.9 29.1 10.8 261.6
Currency retranslation 0.6 0.2 0.2 (0.1 ) 0.9Additions 0.3 1.0 2.5 20.9 24.7Disposals (3.2 ) (9.9 ) (2.4 ) – (15.5 )Reclassifications 3.6 10.8 1.8 (16.2 ) –
At 31st May 2006 81.1 144.0 31.2 15.4 271.7
Depreciation and amounts written offAt 1st June 2004 0.3 98.6 20.1 – 119.0
Currency retranslation – 2.6 0.7 – 3.3Acquisitions – 0.1 0.1 – 0.2Charge for the year 1.9 10.6 3.2 – 15.7Disposals (0.3 ) (13.1 ) (2.5 ) – (15.9 )
At 31st May 2005 1.9 98.8 21.6 – 122.3
Currency retranslation – (0.1 ) – – (0.1 )Charge for the year 1.9 10.1 3.5 – 15.5Disposals (0.2 ) (8.7 ) (1.8 ) – (10.7 )Impairment charge (note 3) – 3.3 – – 3.3
At 31st May 2006 3.6 103.4 23.3 – 130.3
Net book valuesAt 31st May 2006* 77.5 40.6 7.9 15.4 141.4
At 31st May 2005 77.9 43.1 7.5 10.8 139.3
At 31st May 2004 87.8 45.3 6.6 6.9 146.6
At 31st May 2006, the Group had entered into commitments for the acquisition of property, plant and equipment amounting to £4.4 million (2005: £8.0 million). At 31st May 2006, the Group had entered into capital commitments of £0.2 million (2005: £0.4 million) in relation to its interests in joint ventures and the Group’s share in the capital commitments of the joint venture was £0.1 million (2005: £0.2 million).
Included in the assets above are £1.3 million (2005: nil) of assets which have been categorised as non-current assets held for sale. The directors’ expectation is that the assets, which are included in the Africa segment, and which predominantly relate to the manufacturing site in Cameroun, will be sold within 12 months of the balance sheet date. The assets were being actively marketed at 31st May 2006. There was no adjustment to the carrying value of these assets on categorisation as held for sale.
The impairment charge of £3.3 million has been included in the cost of sales line of the income statement and in the Europe segment. The impairment charge has been calculated based on the assets’ value in use at 31st May 2006, which is nil following the closure of the Nottingham factory.
*This comprises £140.1 million classed as property, plant and equipment and £1.3 million classed as non-current assets held for sale.
FINANCIAL STATEMENTS | ANNUAL REPORT 2006 | 57
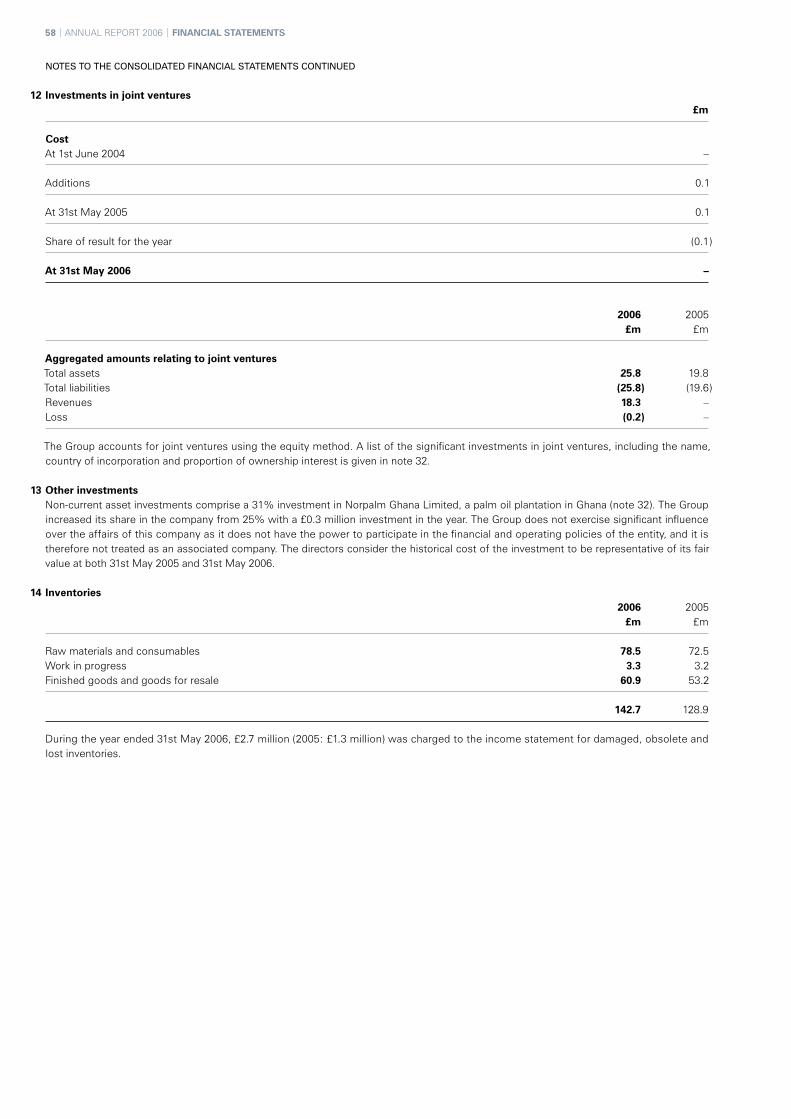
58 | ANNUAL REPORT 2006 | FINANCIAL STATEMENTS
NOTES TO THE CONSOLIDATED FINANCIAL STATEMENTS CONTINUED
12 Investments in joint ventures £m
Cost At 1st June 2004 –
Additions 0.1
At 31st May 2005 0.1
Share of result for the year (0.1 )
At 31st May 2006 –
2006 2005 £m £m
Aggregated amounts relating to joint venturesTotal assets 25.8 19.8Total liabilities (25.8 ) (19.6 )Revenues 18.3 – Loss (0.2 ) –
The Group accounts for joint ventures using the equity method. A list of the significant investments in joint ventures, including the name, country of incorporation and proportion of ownership interest is given in note 32.
13 Other investmentsNon-current asset investments comprise a 31% investment in Norpalm Ghana Limited, a palm oil plantation in Ghana (note 32). The Group increased its share in the company from 25% with a £0.3 million investment in the year. The Group does not exercise significant influence over the affairs of this company as it does not have the power to participate in the financial and operating policies of the entity, and it is therefore not treated as an associated company. The directors consider the historical cost of the investment to be representative of its fair value at both 31st May 2005 and 31st May 2006.
14 Inventories 2006 2005 £m £m
Raw materials and consumables 78.5 72.5Work in progress 3.3 3.2Finished goods and goods for resale 60.9 53.2
142.7 128.9
During the year ended 31st May 2006, £2.7 million (2005: £1.3 million) was charged to the income statement for damaged, obsolete and lost inventories.

NOTES TO THE CONSOLIDATED FINANCIAL STATEMENTS CONTINUED
15 Receivables and prepayments
Receivables due within one year 2006 2005 £m £m
Trade receivables 58.8 45.1Amounts owed by joint ventures 11.8 9.9Overseas taxation recoverable 0.8 0.5Other receivables, including deposits 9.4 10.1Prepayments and accrued income 6.4 5.0
87.2 70.6
Receivables due after more than one year 2006 2005 £m £m
Other receivables 0.1 0.1
The Group’s credit risk is primarily attributable to its trade receivables. The amounts shown in the balance sheet are net of allowances for doubtful receivables, which totalled £4.6 million at 31st May 2006 (2005: £3.9 million). Trade receivables do not carry interest. Allowances are estimated by management based on past default experience and their assessment of the current economic environment. The Group has no significant concentration of credit risk, with exposure spread over a large number of customers in a number of different countries.
The average credit period taken on sales ranges from 16 days to 84 days due to the differing nature of trade receivables in the Group’s geographical segments.
16 Current asset investments 2006 2005 £m £m
Listed – 14.0Unlisted 2.2 2.2
2.2 16.2
Market value of listed investments – 16.8
17 Cash and short-term deposits 2006 2005 £m £m
Cash at bank and in hand 25.9 14.9Deposits 39.9 50.8
Cash and short-term deposits 65.8 65.7Less: bank overdrafts (included in borrowings, note 18) (11.9 ) (0.3 )
Cash and cash equivalents 53.9 65.4
The effective interest rate on short-term deposits during the year ended 31st May 2006 was 3.4% (2005: 3.1%).
FINANCIAL STATEMENTS | ANNUAL REPORT 2006 | 59

60 | ANNUAL REPORT 2006 | FINANCIAL STATEMENTS
NOTES TO THE CONSOLIDATED FINANCIAL STATEMENTS CONTINUED
18 Borrowings 2006 2005 £m £m
Bank loans and overdrafts due within one year 14.0 5.2Bank loans and overdrafts due after one year 2.1 2.7
16.1 7.9
The borrowings are repayable as follows: 2006 2005 £m £m
Within one year 14.0 5.2From one to two years 2.1 2.7
16.1 7.9
On total borrowings, interest rates are 4.95% (2005: 4.95%) on £4.2 million (2005: £2.7 million) of borrowings, with floating rates on £11.9 million (2005: £5.2 million).
Bank overdrafts are repayable on demand. The weighted average rate of interest on bank overdrafts was 7.3% (2005: 5.9%). Bank overdrafts are at floating rates of interest and hence expose the Group to cashflow interest rate risk.
At 31st May 2006, the Group had undrawn overdraft facilities of £93 million (2005: £90 million) available to it.
The Group’s borrowings were denominated in the following currencies:
2006 2006 2006 2006 2006 2006 Sterling Thai Baht Naira Aus Dollar Other Total £m £m £m £m £m £m
Analysis of borrowings by currency:Bank overdrafts 9.0 – 2.8 – 0.1 11.9Bank loans – 4.2 – – – 4.2
9.0 4.2 2.8 – 0.1 16.1
2005 2005 2005 2005 2005 2005 Sterling Thai Baht Naira Aus Dollar Other Total £m £m £m £m £m £m
Analysis of borrowings by currency:Bank overdrafts 0.3 – – – – 0.3Bank loans 3.6 2.7 – 1.3 – 7.6
3.9 2.7 – 1.3 – 7.9
The functional currency of the majority of Group entities is local currency. Debt raised in currencies other than sterling is, in most cases, raised in the functional currency of the entity raising the debt.

NOTES TO THE CONSOLIDATED FINANCIAL STATEMENTS CONTINUED
18 Borrowings continued
Financial instruments and risk managementThe primary financial risk faced by the Group is exchange rate risk. The board has reviewed and agreed policies for management of this risk, as summarised below. The board has also approved all of the classes of financial instruments that may be used by the Group. The Group’s treasury function, which is authorised to conduct the day-to-day treasury activities of the Group, reports at least annually to the board. The occasional use of financial derivatives is governed by the Group’s policies approved by the board, which provide written principles on the use of financial derivatives.
All of the Group’s activities involve analysis, acceptance and management of some degree of risk or combination of risks. The most important types of financial risk are credit risk, liquidity risk and market risk. Market risks include foreign exchange, interest rate and equity price risks.
The Group’s risk management policies are designed to identify and analyse these risks, to set appropriate risk limits and controls and to monitor the risks and limits continually by means of reliable and up-to-date systems. The Group modifies and enhances its risk management policies and systems to reflect changes in markets and products. The Audit Committee, under authority delegated by the board, formulates high level Group risk management policy, monitors risk and receives reports that allow it to review the effectiveness of the Group’s risk management policies.
Credit risk managementCredit risk is the risk that financial loss arises from the failure of a customer or counterparty to meet its obligations under a contract. It arises principally from lending, trade finance, treasury and leasing activities. The Group has dedicated standards, policies and procedures to control and monitor all such risks. Although the Group is potentially exposed to credit loss in the event of non-performance by counterparties, such credit risk is controlled through credit rating reviews of the counterparties and by limiting the total amount of exposure to any one party. The Group does not believe it is exposed to any material concentrations of credit risk.
Liquidity managementThe Group maintains a strong liquidity position and manages the liquidity profile of its assets, liabilities and commitments so that cashflows are appropriately balanced and all funding obligations are met when due.
Market risk managementMarket risk is the risk that movements in market rates, including foreign exchange rates, interest rates, equity and commodity prices will reduce the Group’s income or the value of its portfolios. The management of market risk is undertaken using risk limits approved by the finance directors under delegated authority.
The Group’s activities expose it to the financial risks of changes in foreign currency exchange rates. However, subsidiary undertakings only occasionally make significant sales or purchases in currencies other than their functional currencies and hence on rare occasions the Group enters into foreign currency forward contracts to manage these exposures.
The Group did not enter into any material derivative instruments during the year or the prior year and there were no open derivative instruments at 31st May 2006 or 31st May 2005.
Financial instruments utilised by the Group during the years ended 31st May 2006 and 31st May 2005, together with information regarding the methods and assumptions used to calculate fair values, can be summarised as follows:
Current and non-current investmentsIn accordance with IAS 39 ‘Financial Instruments: Recognition and Measurement’, unlisted investments are held in the Group’s balance sheet at cost because their fair value cannot be measured reliably due to the lack of quoted market prices.
The carrying value of the Group’s listed investments, which are classified as held-for-trading, is nil (2005: £14.0 million). At 31st May 2005 investments were measured at cost less amounts written off in accordance with UK GAAP.
Current assets and liabilitiesFinancial instruments included within current assets and liabilities (excluding cash and borrowings) are generally short-term in nature and accordingly their fair values approximate to their book values.
Borrowings and cashThe carrying values of cash and short-term borrowings approximate to their fair values because of the short-term maturity of these instruments. The fair value of long-term borrowings at 31st May 2006 is estimated to not be materially different to its carrying value.
The financial instruments held by the Group do not, either individually or as a class, create a potentially significant exposure to market, credit, liquidity or cash flow interest rate risk.
FINANCIAL STATEMENTS | ANNUAL REPORT 2006 | 61

62 | ANNUAL REPORT 2006 | FINANCIAL STATEMENTS
NOTES TO THE CONSOLIDATED FINANCIAL STATEMENTS CONTINUED
19 Trade and other payables 2006 2005 £m £m
Trade creditors 41.4 41.7Amounts owed to joint ventures 0.2 – Overseas income tax 5.3 5.1Other taxation and social security 2.9 1.8Other creditors 10.1 10.7Accruals and deferred income 23.9 22.6
83.8 81.9
Trade and other payables comprise amounts outstanding for trade purchases and ongoing costs. The average credit period taken for trade purchases is 46 days (2005: 53 days).
20 Other liabilities 2006 2005 £m £m
Overseas income tax – 0.7Other creditors 2.1 3.2Accruals and deferred income 1.5 1.9
3.6 5.8
21 Deferred tax Revaluation Property, Retirement of property, Other Share plant and benefit plant and timing Business -based equipment obligations equipment differences combinations payments Total £m £m £m £m £m £m £m
At 1st June 2004 (9.3 ) 1.7 (16.2 ) 3.8 – – (20.0)Charge to income – – – 1.9 – 0.1 2.0Charge to equity – 1.1 0.6 – – – 1.7 On acquisition – – – – (8.8 ) – (8.8 )
At 31st May 2005 (9.3 ) 2.8 (15.6 ) 5.7 (8.8 ) 0.1 (25.1 )Adoption of IAS 39 – – – (0.8 ) – – (0.8 )
At 1st June 2005 (9.3 ) 2.8 (15.6 ) 4.9 (8.8 ) 0.1 (25.9 )Charge to income 0.1 – – (0.7 ) – 0.1 (0.5 )Charge to equity – 0.8 1.0 – – – 1.8Currency translation 0.1 – (0.1 ) – – – –
At 31st May 2006 (9.1 ) 3.6 (14.7 ) 4.2 (8.8 ) 0.2 (24.6 )
Certain deferred tax assets and liabilities have been offset in accordance with IAS 12 ‘Income taxes’. The following is the analysis of the deferred tax balances (after offset) for financial reporting purposes.
2006 2005 £m £m
Deferred tax assets 4.6 3.4Deferred tax liabilities (29.2 ) (28.5 )
(24.6 ) (25.1 )
At the balance sheet date, the Group has unused tax losses of £6.5 million (2005: £8.0 million) available for offset against future profits. A deferred tax asset has been recognised in respect of £0.5 million (2005: £0.8 million) on the basis of future expected profitability. Of the £6.0 million (2005: £7.2 million) of unrecognised deferred tax assets, £4.5 million (2005: £5.7 million) relates to unused tax losses which will expire by 2010 (2005: 2010). The remaining £1.5 million (2005: £1.5 million) have an indefinite life. Temporary differences arising in connection with interests in associates and joint ventures are not significant.

NOTES TO THE CONSOLIDATED FINANCIAL STATEMENTS CONTINUED
22 Provisions Retirement benefits and similar obligations Others Total £m £m £m
At 1st June 2005 7.1 5.0 12.1Currency retranslation (0.2 ) – (0.2 )Income statement 2.0 (0.1 ) 1.9Utilised in the year (1.4 ) (2.4 ) (3.8 )
At 31st May 2006 7.5 2.5 10.0
Other provisions at 31st May 2006 include UK restructuring provisions of £1.9 million (2005: nil), which are included in current provisions in the Group’s balance sheet. The movement of £1.9 million relates to amounts charged to the income statement. The timing of outflows of economic benefits in relation to non-current provisions is dependent predominantly on the retirement dates of employees.
23 Retirement benefits
OverviewThe company operates retirement benefit schemes for most of its United Kingdom and overseas subsidiaries.
The following three defined benefit schemes are the Group’s main schemes, which are based and administered in the UK:
• Main staff plan – for all eligible UK based staff, excluding PZ Cussons Plc executive directors.
• Directors plan – for PZ Cussons Plc executive directors.
• Expatriate plan – for all eligible expatriate staff based outside the UK.
Employees within these schemes are provided with defined benefits based on service and final salary. The assets of the schemes are administered by trustees and are held in trust funds independent of the company.
The Group also operates an unfunded, unapproved retirement benefit scheme. The cost of the unfunded, unapproved retirement benefit scheme is included in the total pension cost, on a basis consistent with IAS 19 ‘Employee benefits’ and the assumptions set out below. In accordance with these unfunded arrangements, the Group has made payments to former directors of £0.2 million in total in the year ended 31st May 2006 (2005: nil).
The last triennial actuarial valuations of the schemes administered in the UK were performed by independent professional actuaries at 1st June 2003 using the projected unit method of valuation.
The Group’s balance sheet at 31st May 2006 reflects a pension surplus of £23.4 million (2005: £23.1 million) in respect of the Expatriate plan, and combined deficits in the Staff and Directors’ plans of £24.8 million (2005: £25.1 million) and £5.7 million (2005: £2.8 million) respectively.
For the year to 31st May 2006 the total defined benefit pension cost arising from the three schemes amounted to £3.4 million (2005: £4.6 million).
The major financial assumptions used by the actuary were as follows:
31st May 31st May 2006 2005
Rate of increase in salaries 3.70% 4.70%Rate of increase in retirement benefits in payment 2.70% 2.70%Discount rate 5.10% 5.10%Inflation assumption 2.70% 2.70%
FINANCIAL STATEMENTS | ANNUAL REPORT 2006 | 63

64 | ANNUAL REPORT 2006 | FINANCIAL STATEMENTS
NOTES TO THE CONSOLIDATED FINANCIAL STATEMENTS CONTINUED
23 Retirement benefits continuedThe assets in the schemes and the expected rates of return were:
31st May 31st May 2006 2005 £m £m
Equities 6.70% 117.7 6.40% 97.2Bonds 4.50% 93.5 4.20% 90.4Cash 4.25% 3.8 4.00% 7.1
Total fair value of scheme assets 215.0 194.7Present value of scheme liabilities (222.1 ) (199.5 )
Deficit in the schemes (7.1 ) (4.8 )Related deferred tax asset 2.1 1.5
Net retirement benefit deficit (5.0 ) (3.3 )
To develop the expected long-term rate of return on assets assumptions, the company considered the level of expected returns on risk-free investments, the historic level of the risk premium associated with the other asset class in which the portfolio is invested, and the expectations for future returns of each class of asset. The expected return for each class of asset was then weighted based on the actual asset allocation to develop the expected long-term return on assets assumption for the portfolio. The actual return on plan assets was £21.9 million (2005: £20.8 million).
The net retirement benefit expense before taxation recognised in the income statement in respect of the defined benefit schemes is summarised as follows:
31st May 31st May 2006 2005 £m £m
Current service cost (4.8 ) (4.7 )Past service cost (0.5 ) – Expected return on scheme assets 10.3 10.3Interest cost (10.2 ) (10.2 )Curtailment gain 1.8 –
Net retirement benefit expense before taxation (3.4 ) (4.6 )
All above amounts are all recognised in the Group’s income statement before arriving at operating profit.
The reconciliation of the opening and closing balance sheet position is as follows:
Year to Year to 31st May 31st May 2006 2005 £m £m
Deficit at beginning of year (4.8 ) (1.1)Expenses recognised in the consolidated income statement (3.4 ) (4.6 )Contributions paid 4.7 4.4Net return on assets / liabilities 0.2 0.1Actuarial loss (3.8 ) (3.6)
Net deficit at end of year (7.1 ) (4.8)
Analysed between:Retirement benefit surplus 23.4 23.1Retirement benefit obligation (30.5 ) (27.9)
Actuarial gains and losses are recognised directly in the statement of recognised income and expense. At 31st May 2006, a cumulative pre-tax loss of £7.4 million (2005: £3.6 million) was recorded directly in the statement of recognised income and expense.
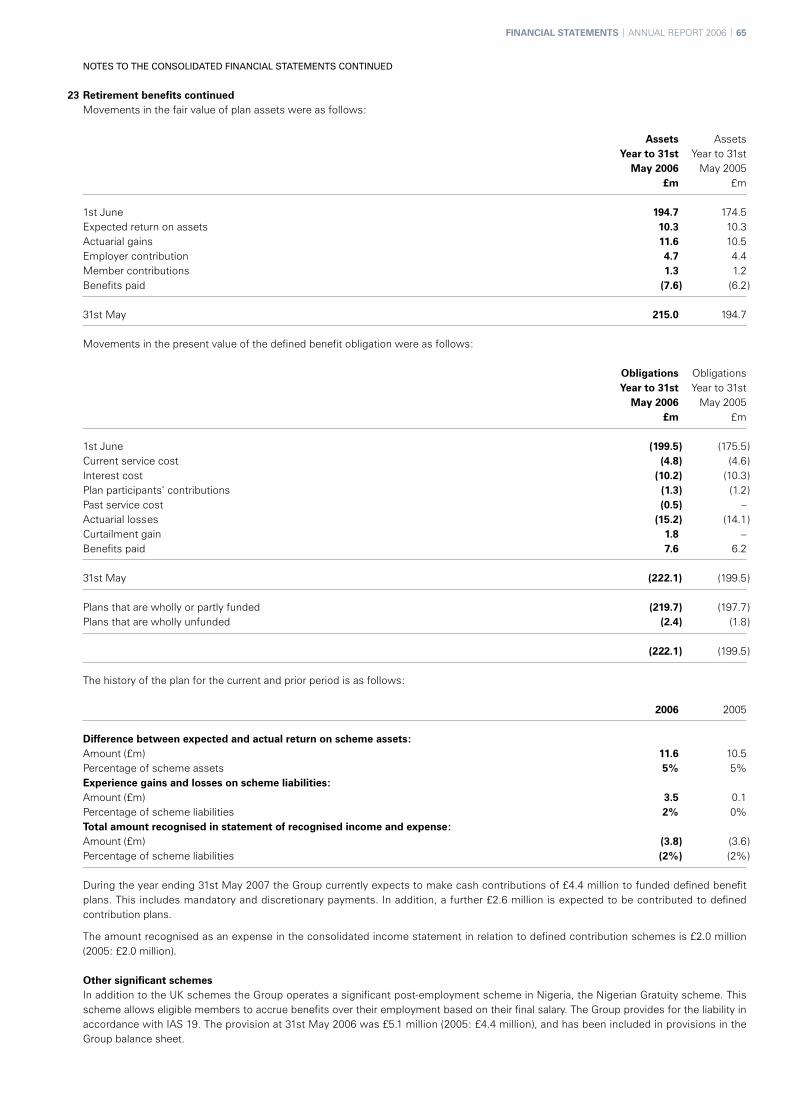
NOTES TO THE CONSOLIDATED FINANCIAL STATEMENTS CONTINUED
23 Retirement benefits continuedMovements in the fair value of plan assets were as follows:
Assets Assets Year to 31st Year to 31st May 2006 May 2005 £m £m
1st June 194.7 174.5Expected return on assets 10.3 10.3Actuarial gains 11.6 10.5Employer contribution 4.7 4.4Member contributions 1.3 1.2Benefits paid (7.6 ) (6.2 )
31st May 215.0 194.7
Movements in the present value of the defined benefit obligation were as follows:
Obligations Obligations Year to 31st Year to 31st May 2006 May 2005 £m £m
1st June (199.5 ) (175.5 )Current service cost (4.8 ) (4.6 )Interest cost (10.2 ) (10.3 )Plan participants’ contributions (1.3 ) (1.2 )Past service cost (0.5 ) –Actuarial losses (15.2 ) (14.1 )Curtailment gain 1.8 –Benefits paid 7.6 6.2
31st May (222.1 ) (199.5 )
Plans that are wholly or partly funded (219.7 ) (197.7 )Plans that are wholly unfunded (2.4 ) (1.8 )
(222.1 ) (199.5 )
The history of the plan for the current and prior period is as follows:
2006 2005
Difference between expected and actual return on scheme assets:Amount (£m) 11.6 10.5Percentage of scheme assets 5% 5%Experience gains and losses on scheme liabilities:Amount (£m) 3.5 0.1Percentage of scheme liabilities 2% 0%Total amount recognised in statement of recognised income and expense: Amount (£m) (3.8 ) (3.6 )Percentage of scheme liabilities (2% ) (2% )
During the year ending 31st May 2007 the Group currently expects to make cash contributions of £4.4 million to funded defined benefit plans. This includes mandatory and discretionary payments. In addition, a further £2.6 million is expected to be contributed to defined contribution plans.
The amount recognised as an expense in the consolidated income statement in relation to defined contribution schemes is £2.0 million (2005: £2.0 million).
Other significant schemesIn addition to the UK schemes the Group operates a significant post-employment scheme in Nigeria, the Nigerian Gratuity scheme. This scheme allows eligible members to accrue benefits over their employment based on their final salary. The Group provides for the liability in accordance with IAS 19. The provision at 31st May 2006 was £5.1 million (2005: £4.4 million), and has been included in provisions in the Group balance sheet.
FINANCIAL STATEMENTS | ANNUAL REPORT 2006 | 65

66 | ANNUAL REPORT 2006 | FINANCIAL STATEMENTS
NOTES TO THE CONSOLIDATED FINANCIAL STATEMENTS CONTINUED
24 Share capital 2006 2005 Number Amount Numbe r Amount 000 £m 000 £m
Authorised:Ordinary shares:Ordinary shares of 10p each 57,000 5.7 25,000 2.5‘A’ (non-voting) ordinary shares of 10p each – – 25,000 2.5
57,000 5.7 50,000 5.0
Preference shares:7½% cumulative preference shares of £1 each – – 800 0.810% cumulative preference shares of £1 each – – 7,500 7.5
– – 8,300 8.3
Total authorised share capital 5.7 13.3
Allotted, called up and fully paid:Ordinary shares:Ordinary shares of 10p each 42,872 4.3 21,429 2.1‘A’ (non-voting) ordinary shares of 10p each – – 19,300 2.0
42,872 4.3 40,729 4.1
Preference shares:7½% cumulative preference shares of £1 each – – 782 0.810% cumulative preference shares of £1 each – – 7,116 7.1
– – 7,898 7.9
Total called up share capital 4.3 12.0
On 29th June 2005 the ‘A’ ordinary shares were redesignated as ordinary shares. There was also a compensatory bonus issue to ordinary shareholders on the basis of one new ordinary share for every ten ordinary shares held. The preference shares, which had a nominal value of £7,898,001, were fully repaid on 1st August 2005. At 31st May 2006, the company had only one class of ordinary shares, which carry no rights to fixed dividends. The preference shares and ‘A’ shares in issue at 31st May 2005 did not carry any rights to fixed dividends.

NOTES TO THE CONSOLIDATED FINANCIAL STATEMENTS CONTINUED
25 Statement of changes in shareholders’ equity
Currency Capital Share Revaluation translation redemption Equity Retained Other Minority capital reserve reserve reserve reserve earnings reserve interests Total £m £m £m £m £m £m £m £m £m
At 31st May 2004 12.0 30.0 – 0.7 0.1 230.6 (1.0 ) 33.8 306.2Net income recognised for the period – – – – – 28.8 – 6.3 35.1Currency retranslation – – 5.5 – – – – 0.4 5.9Ordinary dividends – – – – – (13.1 ) – – (13.1 )Preference dividends – – – – – (0.8 ) – – (0.8 )Realisation of revaluation surplus – (2.4 ) – – – 2.4 – – –Change in deferred tax liability on revalued properties – 0.5 – – – – – 0.1 0.6Shares purchased for ESOT – – – – – – (0.3 ) – (0.3 )Shares to be awarded from ESOT – – – – – – 0.2 – 0.2Share-based payments – – – – 0.3 – – – 0.3Sale of subsidiary undertakings – – – – – – – (1.2 ) (1.2 )Minority interest dividend paid – – – – – – – (2.4 ) (2.4 )Actuarial losses on defined benefitschemes (net of tax) – – – – – (2.5 ) – – (2.5 )
At 31st May 2005 12.0 28.1 5.5 0.7 0.4 245.4 (1.1 ) 37.0 328.0Adoption of IAS 39 – – – – – 2.0 – – 2.0
At 1st June 2005 12.0 28.1 5.5 0.7 0.4 247.4 (1.1 ) 37.0 330.0Net income recognisedfor the period – – – – – 35.4 – 7.2 42.6Currency retranslation – – (2.2 ) – – – – (0.2 ) (2.4 )Ordinary dividends – – – – – (15.2 ) – – (15.2 )Preference dividends – – – – – (0.1 ) – – (0.1 )Realisation of revaluation surplus – (1.8 ) – – – 1.8 – – –Release of deferred tax provision on disposed properties – 0.3 – – – – – – 0.3Change in deferred tax liability on revalued properties – 0.7 – – – – – – 0.7Shares purchased for ESOT – – – – – – (2.6 ) – (2.6 )Shares to be awarded from ESOT – – – – – – 0.8 – 0.8Share-based payments – – – – 0.4 – – – 0.4Minority interest dividend paid – – – – – – – (2.9 ) (2.9 )Actuarial losses on defined benefit schemes (net of tax) – – – – – (3.0 ) – – (3.0 )Compensatory bonus issue 0.2 – – – – (0.2 ) – – –Repayment of preference share capital (7.9 ) – – – – (7.6 ) – – (15.5 )Increased investment – – – – – – – 5.3 5.3
At 31st May 2006 4.3 27.3 3.3 0.7 0.8 258.5 (2.9 ) 46.4 338.4
The revaluation reserve arises from the Group’s decision to adopt the transitional provisions of IFRS 1 ‘First-time adoption of IFRS’ and to treat the previous revalued amounts in relation to properties as deemed cost at 1st June 2004, the date of transition to IFRS.
Transaction costs of £0.8 million (2005: nil) have been accounted for as a deduction from equity.
The amounts in respect of the redemption of preference share capital were initially recognised in a special reserve, but were subsequently transferred to retained earnings.
FINANCIAL STATEMENTS | ANNUAL REPORT 2006 | 67

68 | ANNUAL REPORT 2006 | FINANCIAL STATEMENTS
NOTES TO THE CONSOLIDATED FINANCIAL STATEMENTS CONTINUED
26 Other reserve Shares Charged Net held in to income book trust Cost statement value Number (000) £m £m £m
At 31st May 2004 548 4.1 (3.1 ) 1.0Shares purchased 26 0.3 – 0.3Shares transferred out (118 ) – – – Shares to be awarded – – (0.2 ) (0.2 )
At 31st May 2005 456 4.4 (3.3 ) 1.1Compensatory bonus issue 24 – – – Shares purchased 142 2.6 – 2.6Shares transferred out (125 ) – – – Shares to be awarded – – (0.8 ) (0.8 )
At 31st May 2006 497 7.0 (4.1 ) 2.9
The Group’s other reserve relates to the Employee Share Option Trust (ESOT).
The ESOT purchases shares to fund the deferred annual share bonus scheme, details of which are provided in the report on directors’ remuneration. These shares are to be awarded for the achievement of annual targets, and are normally received by directors after three years of continuing employment from the date of grant.
At 31st May 2006, the trust held 497,299 ordinary shares with a market value of £7,210,835. The trust has waived any entitlement to dividends in respect of all the shares it holds.
27 Reconciliation of operating profit to cash generated from operations 2006 2005 £m £m
Profit before tax 61.2 53.4Adjustment for finance income (3.4 ) (4.6 )
Operating profit 57.8 48.8
Depreciation and adjustments on disposals 10.1 6.3Loss on sale or termination of operations – 3.3Add back charge for shares purchased for ESOT 0.8 0.2Impairment of tangible fixed assets 3.3 –
Operating cash flows before movements in working capital 72.0 58.6 Movements in working capital:Inventories (14.0 ) (13.4 )Receivables (18.2 ) 6.7Payables (1.9 ) (3.4 )Provisions (2.1 ) 5.4
Cash generated from operations 35.8 53.9
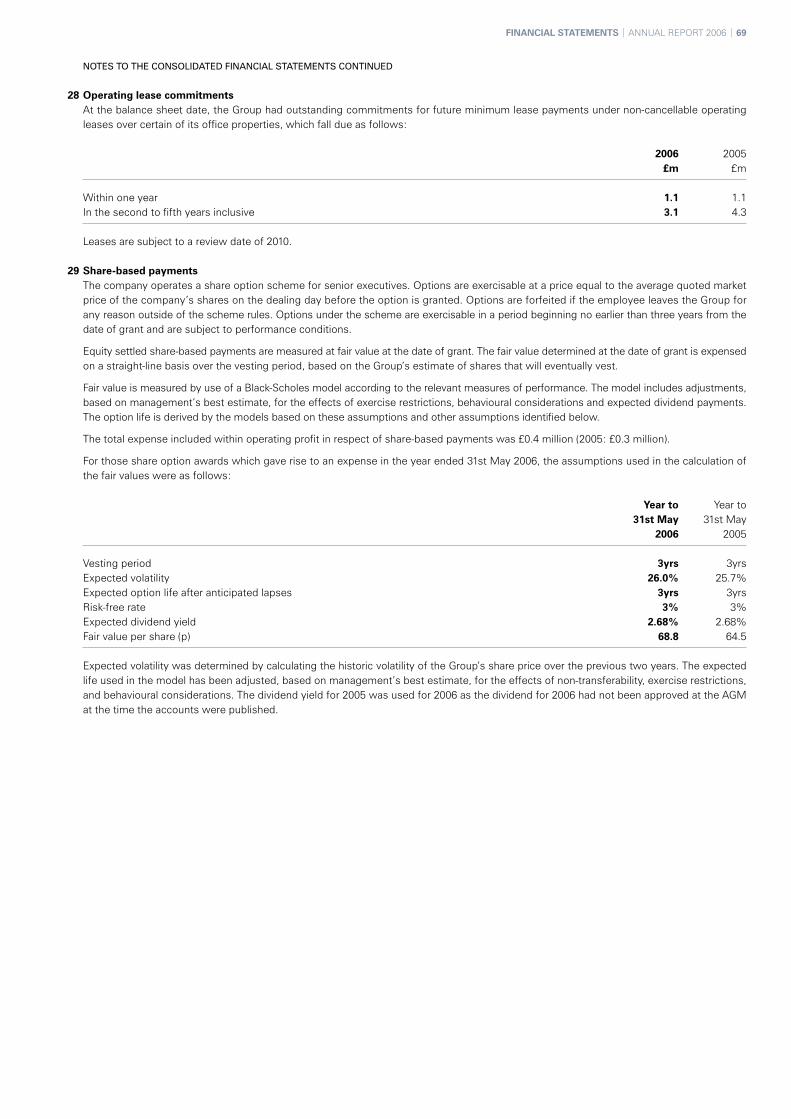
NOTES TO THE CONSOLIDATED FINANCIAL STATEMENTS CONTINUED
28 Operating lease commitmentsAt the balance sheet date, the Group had outstanding commitments for future minimum lease payments under non-cancellable operating leases over certain of its office properties, which fall due as follows:
2006 2005 £m £m
Within one year 1.1 1.1In the second to fifth years inclusive 3.1 4.3
Leases are subject to a review date of 2010.
29 Share-based paymentsThe company operates a share option scheme for senior executives. Options are exercisable at a price equal to the average quoted market price of the company’s shares on the dealing day before the option is granted. Options are forfeited if the employee leaves the Group for any reason outside of the scheme rules. Options under the scheme are exercisable in a period beginning no earlier than three years from the date of grant and are subject to performance conditions.
Equity settled share-based payments are measured at fair value at the date of grant. The fair value determined at the date of grant is expensed on a straight-line basis over the vesting period, based on the Group’s estimate of shares that will eventually vest.
Fair value is measured by use of a Black-Scholes model according to the relevant measures of performance. The model includes adjustments, based on management’s best estimate, for the effects of exercise restrictions, behavioural considerations and expected dividend payments. The option life is derived by the models based on these assumptions and other assumptions identified below.
The total expense included within operating profit in respect of share-based payments was £0.4 million (2005: £0.3 million).
For those share option awards which gave rise to an expense in the year ended 31st May 2006, the assumptions used in the calculation of the fair values were as follows:
Year to Year to 31st May 31st May 2006 2005
Vesting period 3yrs 3yrsExpected volatility 26.0% 25.7%Expected option life after anticipated lapses 3yrs 3yrsRisk-free rate 3% 3%Expected dividend yield 2.68% 2.68%Fair value per share (p) 68.8 64.5
Expected volatility was determined by calculating the historic volatility of the Group’s share price over the previous two years. The expected life used in the model has been adjusted, based on management’s best estimate, for the effects of non-transferability, exercise restrictions, and behavioural considerations. The dividend yield for 2005 was used for 2006 as the dividend for 2006 had not been approved at the AGM at the time the accounts were published.
FINANCIAL STATEMENTS | ANNUAL REPORT 2006 | 69

70 | ANNUAL REPORT 2006 | FINANCIAL STATEMENTS
NOTES TO THE CONSOLIDATED FINANCIAL STATEMENTS CONTINUED
29 Share-based payments continuedThe movement in total outstanding options in respect of the share option scheme is provided below:
Weighted Number average of share exercise options price £
Outstanding at 1st June 2004* 282,826 7.47Granted* 217,810 11.04
Outstanding at 31st May 2005* 500,636 9.02Exercisable at 31st May 2005* – –
Outstanding at 1st June 2005* 500,636 9.02Granted 125,339 12.98Exercised (18,614 ) 7.47Lapsed (58,642 ) 9.15
Outstanding at 31st May 2006* 548,719 9.97Exercisable at 31st May 2006 – –
*restated for enfranchisement on 29th June 2005 when ‘A’ ordinary shares were redesignated as ordinary shares.
Weighted average Price / share exercise £ price £
Range of prices:31st May 2006 7.47-12.98 9.9731st May 2005 7.47-11.04 9.02
Weighted Number average of share contract options term (years)
Weighted average contractual remaining life:31st May 2006 548,719 3.1331st May 2005 500,636 3.77
The weighted average share price on the date of exercise was £13.00. There were no options outstanding at 31st May 2006 or 31st May 2005 that are outside of the scope of IFRS 2 ‘Share-based payments’.
30 Related party transactionsThe following related party transactions were entered into by subsidiary companies during the year under the terms of a joint venture agreement with Glanbia Plc:
• At 31st May 2006 the outstanding balance receivable from Milk Ventures (UK) Ltd was £7.7 million (2005: £7.7 million). At 31st May 2006 the Group also had an outstanding balance payable to Milk Ventures (UK) Limited of £0.2 million (2005: nil).
• The Group sourced and then sold fixed assets and raw materials to Nutricima Ltd to the value of £20.8 million (2005: £14.6 million). At 31st May 2006 the amount outstanding from Nutricima Ltd was £4.1 million (2005: £2.2 million).
• Nutricima Ltd sold £18.3 million of goods to Paterson Zochonis Industries Plc (2005: nil).
• All trading balances will be settled in cash.
• There were no provisions for doubtful related party receivables at 31st May 2006 (2005: nil) and no charges to the income statement in respect of doubtful related party receivables (2005: nil).
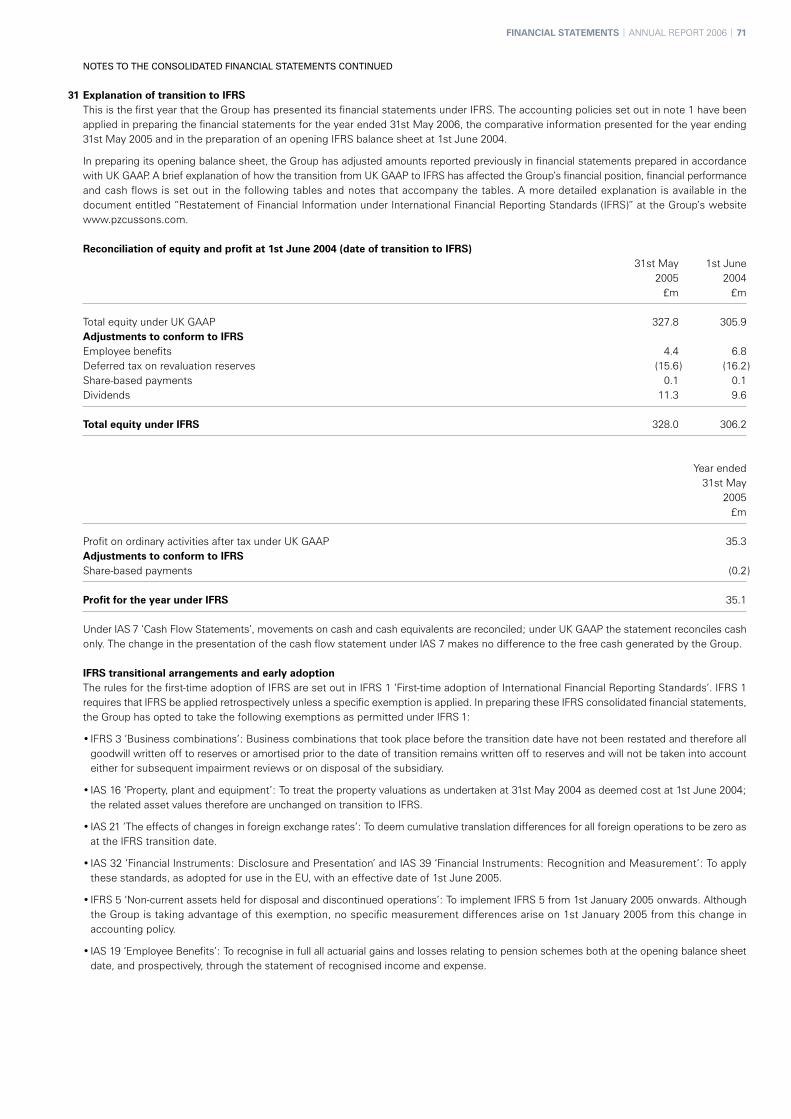
NOTES TO THE CONSOLIDATED FINANCIAL STATEMENTS CONTINUED
31 Explanation of transition to IFRSThis is the first year that the Group has presented its financial statements under IFRS. The accounting policies set out in note 1 have been applied in preparing the financial statements for the year ended 31st May 2006, the comparative information presented for the year ending 31st May 2005 and in the preparation of an opening IFRS balance sheet at 1st June 2004.
In preparing its opening balance sheet, the Group has adjusted amounts reported previously in financial statements prepared in accordance with UK GAAP. A brief explanation of how the transition from UK GAAP to IFRS has affected the Group’s financial position, financial performance and cash flows is set out in the following tables and notes that accompany the tables. A more detailed explanation is available in the document entitled “Restatement of Financial Information under International Financial Reporting Standards (IFRS)” at the Group’s website www.pzcussons.com.
Reconciliation of equity and profit at 1st June 2004 (date of transition to IFRS) 31st May 1st June 2005 2004 £m £m
Total equity under UK GAAP 327.8 305.9Adjustments to conform to IFRSEmployee benefits 4.4 6.8Deferred tax on revaluation reserves (15.6 ) (16.2 )Share-based payments 0.1 0.1Dividends 11.3 9.6
Total equity under IFRS 328.0 306.2
Year ended 31st May 2005 £m
Profit on ordinary activities after tax under UK GAAP 35.3Adjustments to conform to IFRSShare-based payments (0.2 )
Profit for the year under IFRS 35.1
Under IAS 7 ‘Cash Flow Statements’, movements on cash and cash equivalents are reconciled; under UK GAAP the statement reconciles cash only. The change in the presentation of the cash flow statement under IAS 7 makes no difference to the free cash generated by the Group.
IFRS transitional arrangements and early adoptionThe rules for the first-time adoption of IFRS are set out in IFRS 1 ‘First-time adoption of International Financial Reporting Standards’. IFRS 1 requires that IFRS be applied retrospectively unless a specific exemption is applied. In preparing these IFRS consolidated financial statements, the Group has opted to take the following exemptions as permitted under IFRS 1:
• IFRS 3 ‘Business combinations’: Business combinations that took place before the transition date have not been restated and therefore all goodwill written off to reserves or amortised prior to the date of transition remains written off to reserves and will not be taken into account either for subsequent impairment reviews or on disposal of the subsidiary.
• IAS 16 ‘Property, plant and equipment’: To treat the property valuations as undertaken at 31st May 2004 as deemed cost at 1st June 2004; the related asset values therefore are unchanged on transition to IFRS.
• IAS 21 ‘The effects of changes in foreign exchange rates’: To deem cumulative translation differences for all foreign operations to be zero as at the IFRS transition date.
• IAS 32 ‘Financial Instruments: Disclosure and Presentation’ and IAS 39 ‘Financial Instruments: Recognition and Measurement’: To apply these standards, as adopted for use in the EU, with an effective date of 1st June 2005.
• IFRS 5 ‘Non-current assets held for disposal and discontinued operations’: To implement IFRS 5 from 1st January 2005 onwards. Although the Group is taking advantage of this exemption, no specific measurement differences arise on 1st January 2005 from this change in accounting policy.
• IAS 19 ‘Employee Benefits’: To recognise in full all actuarial gains and losses relating to pension schemes both at the opening balance sheet date, and prospectively, through the statement of recognised income and expense.
FINANCIAL STATEMENTS | ANNUAL REPORT 2006 | 71

72 | ANNUAL REPORT 2006 | FINANCIAL STATEMENTS
NOTES TO THE CONSOLIDATED FINANCIAL STATEMENTS CONTINUED
Summary of the effects of IFRS adoptionThe principal impacts of IFRS on the Group’s 2005 financial statements were as follows:
• Recognition of the Group’s obligations and surpluses in relation to its defined benefit retirement benefit schemes;
• Recognition of a charge for the fair value of share-based compensation plans;
• Recognition of deferred taxation liabilities on the revaluation of property, plant and equipment; and
• Recognition of dividends only when they are declared rather than when proposed.
In terms of the 2005 results, reported profits decreased under IFRS, mainly because of the charge to the income statement in relation to share-based payments. Reported net assets increased under IFRS, as a result of the net impact of the reversal of dividends and the recognition of additional deferred tax liabilities.
Explanation of adjustments to conform to IFRSThe significant changes as a result of the transition to IFRS and of adopting the IFRS Group accounting policies are described below:
Employee benefitsUnder UK GAAP the Group accounted for its defined benefit schemes under SSAP 24 which spread the cost of retirement pensions and related benefits over the periods benefiting from the employees’ services.
Under IAS 19 ‘Employee benefits’, the balance sheet reflects the full value of the retirement benefit scheme surplus / deficit. The Group has elected to recognise all actuarial gains and losses directly in equity through the statement of recognised income and expense. The charge to the income statement in respect of retirement benefit schemes includes current and past service costs. As a result of the impact of IAS 19, the Group’s equity increased by £4.4 million and there was no impact on the income statement charge for the year ended 31st May 2005.
Share optionsUnder UK GAAP, a charge to the profit and loss account was made in respect of share-based compensation schemes based on the intrinsic value of the awards. Under IFRS 2 ‘Share-based payment’, a charge to the income statement representing the fair value of outstanding equity instruments granted to employees under the share-based payment scheme, is recognised over the vesting period of the instrument.
The Group’s share-based compensation scheme is a performance-related share option scheme. Under UK GAAP, there was no charge for these share-based compensation schemes because they are either Inland Revenue approved (and therefore specifically excluded from the requirement to record a charge) or have an intrinsic value of nil as the option price is set at the market value at the date of grant. The Group has taken up the option under IFRS 1 ‘First-time adoption of International Financial Reporting Standards’ permitting companies to apply IFRS 2 only to equity instruments granted after 7th November 2002 that had not vested prior to 1st June 2005. As a result, the share-based compensation charge in respect of equity settled compensation was £0.2 million for the year ended 31st May 2005.
Deferred taxUnder UK GAAP, deferred taxation was provided in full on timing differences which result in an obligation at the balance sheet date to pay more tax, or a right to pay less tax, at a future date, at rates expected to apply when they crystallise based on current tax rates and law at the balance sheet date. Deferred taxation was not provided on timing differences arising from the revaluation of fixed assets where there was no commitment to sell the asset.
Under IAS 12 ‘Income taxes’, deferred tax is provided in full on all taxable temporary differences. Consequently, IFRS is generally more comprehensive in the requirement to recognise deferred taxation. For example, deferred tax is provided on the revaluation of fixed assets and rolled over capital gains regardless of whether there is a commitment to sell the asset. Deferred tax is also provided when brands are acquired through the purchase of shares, regardless of whether there is an intention to sell the brands or not.
The impact of IAS 12 adoption was a reduction in net assets of £15.6 million at 31st May 2005 as a result of recognising additional deferred tax liabilities, principally in relation to revalued properties.
DividendsUnder UK GAAP, dividends proposed were provided for in the period to which they related.
Under IAS 10 ‘Post-balance sheet events’, proposed dividends do not meet the definition of a liability until such time as they have been approved. The requirement to provide for dividends only when they have been approved resulted in an increase in total equity of £9.6 million at the opening balance sheet date and an increase of £11.3 million at 31st May 2005.

NOTES TO THE CONSOLIDATED FINANCIAL STATEMENTS CONTINUED
32 Subsidiaries, joint ventures and non-current asset investmentsDetails of the company’s subsidiaries at 31st May 2006 are as follows:
Parent Proportion Incorporated company’s of votingCompany Operation in: interest interest
PZ Cussons Australia Pty Ltd Manufacturing Australia †100% †100%Sipca SA Manufacturing Cameroun †99% †99%PZ Cussons Middle East and South Asia FZE Distribution Dubai †100% †100%Charles Worthington Hair and Beauty Ltd Holding company England *100% *100%FC Ltd Manufacturing England †100% †100%PZ Cussons (Holdings) Ltd Holding company England *100% *100%PZ Cussons (International) Ltd Provision of services to Group companies England *100% *100%PZ Cussons (UK) Ltd Manufacturing England †100% †100%PZ Cussons Ghana Ltd Holding company Ghana †90% †90%PZ Cussons Industries (Ghana) Ltd Manufacturing Ghana †90% †90%Minerva SA Manufacturing Greece *100% *100%PT Cussons Distributor Indonesia Distribution Indonesia †100% †100%PT PZ Cussons Indonesia Manufacturing Indonesia †100% †100%PZ Cussons East Africa Ltd Manufacturing Kenya †100% †100%HPZ Ltd1 Manufacturing Nigeria †46% †46%Paterson Zochonis Industries Plc Manufacturing Nigeria †61% †61%PZ Cussons Polska SA Manufacturing Poland †99% †99%PZ Cussons (Thailand) Ltd Manufacturing Thailand †100% †100%
1HPZ Ltd is 75% owned by Paterson Zochonis Industries Plc and is therefore consolidated.
Parent Incorporated company’sJoint venture companies in: interest
Milk Ventures (UK) Ltd Holding company England †50%Nutricima Ltd Manufacturing Nigeria †50%
Milk Ventures (UK) Ltd is owned on a 50:50 basis by PZ Cussons (Holdings) Ltd and Glanbia Holdings Ltd, and owns 100% of a Nigerian subsidiary, Nutricima Ltd.
Parent Incorporated company’sNon-current asset investments in: interest
Norpalm Ghana Ltd Manufacturing Ghana †31%
*Shares held by the parent company†Shares held by a subsidiary
FINANCIAL STATEMENTS | ANNUAL REPORT 2006 | 73

74 | ANNUAL REPORT 2006 | FINANCIAL STATEMENTS
FIVE YEAR RECORD
IFRS UK GAAP 2006 2005 2004 2003 2002Year to 31st May £m £m £m £m £m
Operating profit before exceptional items 60.2 53.5 54.1 54.7 46.8Net investment income / interest payable 3.4 4.6 4.7 (3.5 ) 2.4
Profit before taxation and exceptional items 63.6 58.1 58.8 51.2 49.2Exceptional items (2.4 ) (4.7) 1.2 – –
Profit before taxation 61.2 53.4 60.0 51.2 49.2Taxation (18.6 ) (18.3 ) (18.2 ) (16.9 ) (16.3 )
Profit for the year 42.6 35.1 41.8 34.3 32.9
Attributable to:Equity holders of the parent 35.4 28.8 38.3 30.6 29.1Minority interests 7.2 6.3 3.5 3.7 3.8
Net assets attributable to ordinary shareholders 292.0 291.0 259.6 243.4 253.2
Per ordinary share:
Basic earnings 83.30p 66.01p 88.62p 68.36p 62.41p
Adjusted basic earnings 88.96p 78.51p 81.53p 68.36p 62.41p
Dividend (interim and final declared post year-end) 38.80p 35.25p 32.00p 29.00p 26.25p
Net assets 681p 714p 637p 598p 590p
Times cover – after exceptional items 2.1 1.9 2.8 2.4 2.4
Times cover – before exceptional items 2.3 2.2 2.5 2.4 2.4
The amounts disclosed for 2004 and earlier periods are stated on the basis of UK GAAP because it is not practicable to restate amounts for periods prior to the date of transition to IFRS. The principal differences between UK GAAP and IFRS’s are explained in note 31 to the consolidated financial statements which provides an explanation of the transition to IFRS.
On 29th June 2005 the ‘A’ (non-voting) ordinary shares were redesignated as ordinary shares. There was also a compensatory bonus to ordinary shareholders on the basis of one new ordinary share for every ten ordinary shares held. In accordance with IAS 33 ‘Earnings per share’ the comparative figures have been re-presented to include both the ordinary and ‘A’ ordinary shares.

COMPANY FINANCIAL STATEMENTS
Independent Auditors’ Report to the Members of PZ Cussons PlcWe have audited the individual company financial statements of PZ Cussons Plc for the year ended 31st May 2006 which comprise the balance sheet and the related notes 1 to 9. These individual company financial statements have been prepared under the accounting policies set out therein.
The corporate governance statement and the directors’ remuneration report are included in the Group annual report of PZ Cussons Plc for the year ended 31st May 2006. We have reported separately on the Group financial statements of PZ Cussons Plc for the year ended 31st May 2006 and on the information in the directors’ remuneration report that is described as having been audited.
This report is made solely to the company’s members, as a body, in accordance with section 235 of the Companies Act 1985. Our audit work has been undertaken so that we might state to the company’s members those matters we are required to state to them in an auditors’ report and for no other purpose. To the fullest extent permitted by law, we do not accept or assume responsibility to anyone other than the company and the company’s members as a body, for our audit work, for this report, or for the opinions we have formed.
Respective responsibilities of directors and auditorsThe directors’ responsibilities for preparing the annual report and the individual company financial statements in accordance with applicable law and United Kingdom Accounting Standards (United Kingdom Generally Accepted Accounting Practice) are set out in the statement of directors’ responsibilities.
Our responsibility is to audit the individual company financial statements in accordance with relevant United Kingdom legal and regulatory requirements and International Standards on Auditing (UK and Ireland).
We report to you our opinion as to whether the individual company financial statements give a true and fair view, in accordance with the relevant financial reporting framework, and whether the individual company financial statements have been properly prepared in accordance with the Companies Act 1985. We report to you whether in our opinion the directors’ report is consistent with the individual company financial statements. We also report to you if the company has not kept proper accounting records, if we have not received all the information and explanations we require for our audit, or if information specified by law regarding directors’ remuneration and other transactions is not disclosed.
We read the directors’ report and the other information contained in the annual report for the above year as described in the contents section and consider the implications for our report if we become aware of any apparent misstatements or material inconsistencies with the individual company financial statements.
Basis of audit opinionWe conducted our audit in accordance with International Standards on Auditing (UK and Ireland) issued by the Auditing Practices Board. An audit includes examination, on a test basis, of evidence relevant to the amounts and disclosures in the individual company financial statements. It also includes an assessment of the significant estimates and judgements made by the directors in the preparation of the individual company financial statements, and of whether the accounting policies are appropriate to the company’s circumstances, consistently applied and adequately disclosed.
We planned and performed our audit so as to obtain all the information and explanations which we considered necessary in order to provide us with sufficient evidence to give reasonable assurance that the individual company financial statements are free from material misstatement, whether caused by fraud or other irregularity or error. In forming our opinion we also evaluated the overall adequacy of the presentation of information in the individual company financial statements.
OpinionIn our opinion:
• the individual company financial statements give a true and fair view, in accordance with United Kingdom Generally Accepted Accounting Practice, of the state of the company’s affairs as at 31st May 2006;
• the individual company financial statements have been properly prepared in accordance with the Companies Act 1985; and
• the information given in the directors’ report is consistent with the financial statements.
DELOITTE & TOUCHE LLPChartered Accountants and Registered AuditorsManchester1st August 2006
Notes: An audit does not provide assurance on the maintenance and integrity of the website, including controls used to achieve this, and in particular on whether any changes may have occurred to the financial statements since first published. These matters are the responsibility of the directors but no control procedures can provide absolute assurance in this area.
Legislation in the United Kingdom governing the preparation and dissemination of financial statements differs from legislation in other jurisdictions.
FINANCIAL STATEMENTS | ANNUAL REPORT 2006 | 75
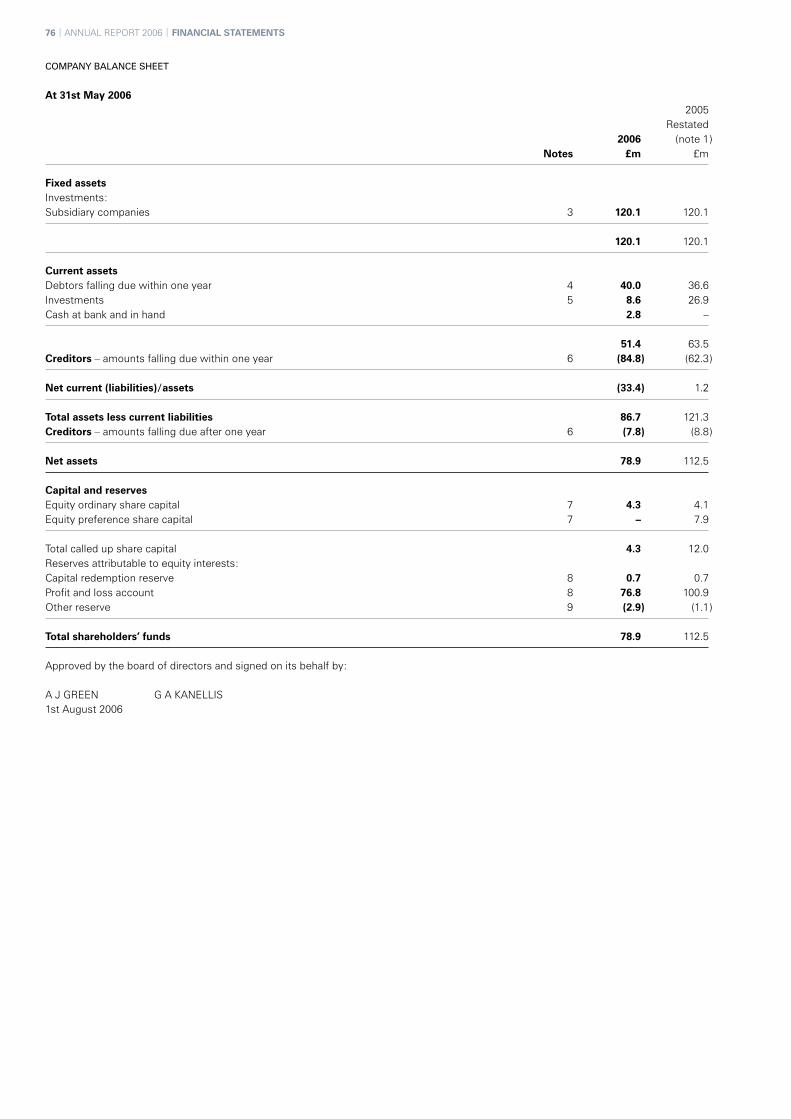
76 | ANNUAL REPORT 2006 | FINANCIAL STATEMENTS
COMPANY BALANCE SHEET
At 31st May 2006 2005 Restated 2006 (note 1 ) Notes £m £m
Fixed assetsInvestments:Subsidiary companies 3 120.1 120.1
120.1 120.1
Current assetsDebtors falling due within one year 4 40.0 36.6Investments 5 8.6 26.9Cash at bank and in hand 2.8 –
51.4 63.5Creditors – amounts falling due within one year 6 (84.8 ) (62.3 )
Net current (liabilities)/assets (33.4 ) 1.2
Total assets less current liabilities 86.7 121.3Creditors – amounts falling due after one year 6 (7.8 ) (8.8 )
Net assets 78.9 112.5
Capital and reservesEquity ordinary share capital 7 4.3 4.1Equity preference share capital 7 – 7.9
Total called up share capital 4.3 12.0Reserves attributable to equity interests:Capital redemption reserve 8 0.7 0.7Profit and loss account 8 76.8 100.9Other reserve 9 (2.9 ) (1.1 )
Total shareholders’ funds 78.9 112.5
Approved by the board of directors and signed on its behalf by:
A J GREEN G A KANELLIS1st August 2006

NOTES TO THE COMPANY FINANCIAL STATEMENTS
Basis of preparationThe accounts have been prepared in accordance with the Companies Act 1985 and United Kingdom Generally Accepted Accounting Practice (UK GAAP), under the historical cost convention adjusted to include the periodic revaluation of properties. As permitted by section 230 of Companies Act 1985, an entity profit and loss account is not included as part of the published consolidated financial statements of PZ Cussons Plc. The loss for the financial year dealt with in the accounts of the parent company is £1.0 million (2005: £3.4 million profit).
No cash flow statement has been included as the cash flows of the company are included in the consolidated financial statements of PZ Cussons Plc which are publicly available. The consolidated financial statements of PZ Cussons Plc have been prepared in accordance with International Financial Reporting Standards.
The company has no employees (2005: nil). No costs were incurred by the company in respect of employees or directors (2005: nil). Amounts paid to the company’s auditors in respect of the statutory audit were £5,000 (2005: £5,000).
Accounting policiesThe principal accounting policies applied under UK GAAP are detailed below. They have all been applied consistently throughout the year and the preceding year, with the exception of the adoption in the current year of several new Financial Reporting Standards, which are described in note 1.
Foreign currenciesAssets and liabilities are translated at exchange rates prevailing at the date of the company balance sheet.
Taxation and deferred taxationCurrent tax including UK corporation tax is provided at amounts expected to be paid or recovered using the tax rates and laws that have been enacted or substantively enacted by the balance sheet date.
Deferred taxation is provided in full on timing differences that result in an obligation at the balance sheet date to pay more tax, or a right to pay less tax, at a future date, at rates expected to apply when they crystallise based on current tax rates and law. Timing differences arise from the inclusion of items of income and expenditure in taxation computations in periods different from those in which they are included in financial statements. Deferred tax is not provided on timing differences arising from the revaluation of fixed assets where there is no binding contract to dispose of these assets, nor on unremitted earnings where there is no binding commitment to remit these earnings. Deferred tax assets are recognised to the extent that it is regarded as more likely than not that they will be recovered. Deferred tax assets and liabilities are not discounted.
Borrowing costsBorrowing costs are not capitalised; they are recognised in profit or loss in the period in which they are incurred.
Financial instrumentsFinancial assets and financial liabilities are recognised on the company’s balance sheet when the company becomes a party to the contractual provisions of the instrument.
Borrowings (up to 31st May 2005)Prior to 1st June 2005, borrowings were stated at proceeds received, net of direct issue costs. The issue costs of debt instruments were amortised at a constant rate over the life of the instrument.
Borrowings (from 1st June 2005)Interest-bearing bank loans and overdrafts are recorded at the proceeds received, net of direct issue costs. Finance charges, including premiums payable on settlement or redemption and direct issue costs, are accounted for on an accrual basis through the profit and loss account using the effective interest method and are added to the carrying amount of the instrument to the extent they are not settled in the period in which they arise.
The company has not entered into any transactions involving derivative instruments.
Financial liabilities and equityFinancial liabilities and equity instruments are classified according to the substance of the contractual arrangements entered into. An equity instrument is any contract that evidences a residual interest in the assets of the Group after deducting all of its liabilities.
FINANCIAL STATEMENTS | ANNUAL REPORT 2006 | 77

78 | ANNUAL REPORT 2006 | FINANCIAL STATEMENTS
NOTES TO THE COMPANY FINANCIAL STATEMENTS CONTINUED
Current asset investmentsInvestments (other than interests in joint ventures) are recognised and derecognised on a trade date when a purchase or sale of an investment is under a contract whose terms require delivery of the investment within the timeframe established by the market concerned, and are initially measured at cost, including transaction costs.
Investments are classified as either held-to-maturity, held-for-trading, loans and receivables or available-for-sale. Held-to-maturity investments and loans and receivables are measured at amortised cost. Held-for-trading and available-for-sale investments are measured at subsequent reporting dates at fair value. Where securities are held for trading purposes, gains and losses arising from changes in fair value are included in net profit or loss for the period. For available-for-sale investments, gains and losses arising from changes in fair value are recognised directly in equity, until the security is disposed of or is determined to be impaired, at which time the cumulative gain or loss previously recognised in equity is included in the net profit or loss for the period.
Investments in subsidiariesInvestments in subsidiaries are held at cost, less any provision for impairment.
Critical accounting policies and estimation uncertaintiesNone of the above accounting policies are considered to be critical to the financial statements of the company. There are no significant areas of estimation uncertainty.
1 New accounting policiesThe company has adopted the following accounting standards in the year:
• Financial Reporting Standard No. 21 ‘Events after the Balance Sheet Date’ (FRS 21). The major effect of FRS 21 is to change the approach to dividends declared after the balance sheet date in respect of the year under review such that these dividends are no longer accrued for at the balance sheet. As a result of adopting FRS 21, the company’s creditors due within less than one year at 31st May 2005 decreased by £11.3 million.
• The adoption of Financial Reporting Standard No. 17 ‘Retirement benefits’ (FRS 17). FRS 17 had no impact on the company’s profit or net assets.
• Financial Reporting Standard No. 23 ‘The Effects of Changes in Foreign Exchange Rates’ (FRS 23). FRS 23 sets out additional guidance on the translation method for transactions in foreign currencies and on determining the functional and presentation currencies. The adoption of FRS 23 had no effect on the company’s profit or net assets.
• Financial Reporting Standard No. 25 ‘Financial Instruments: Disclosure and Presentation’ (FRS 25). FRS 25 sets out the requirements for the presentation of, and disclosures relating to, financial instruments. The adoption of FRS 25 had no effect on the company’s profit or net assets; disclosures complying with the requirements of FRS 25 are included in the financial statements.
• Financial Reporting Standard No. 26 ‘Financial Instruments: Measurement’ (FRS 26). FRS 26 sets out requirements for measurement, recognition and derecognition of financial instruments. The adoption of FRS 26 had no effect on the company’s profit or net assets.
• Financial Reporting Standard No. 28 ‘Corresponding Amounts’ (FRS 28). FRS 28 sets out the requirements for the disclosure of corresponding amounts for items shown in an entity’s primary financial statements and the notes to the financial statements. The adoption of FRS 28 had no effect upon the company’s profit or net assets.
• FRS 25 and FRS 26 allow companies to opt to apply these standards from the date of the opening balance sheet of the first period reported under the standards without restating the comparative period. The company has chosen this option.
In addition to the impact on the financial statements of the adoption of new Financial Reporting Standards, certain balances held in the company’s balance sheet at 31st May 2005 have been reclassified from pension fund prepayments (£1.2 million), pension fund accrual and deferred income (£6.5 million), accruals and deferred income (£0.6 million) and deferred tax provisions (£0.3 million) to amounts payable to Group companies (£6.2 million).
These reclassifications have been made as, in the opinion of the directors, the revised presentation more fairly reflects the nature of these balances.

NOTES TO THE COMPANY FINANCIAL STATEMENTS CONTINUED
2 Dividends
2006 2005 £m £m
Amounts recognised as distributions to ordinary shareholders in the year comprise:Final dividend for the year ended 31st May 2005 of 26.60p (2004: 23.95p) per ordinary share 11.3 9.6Interim dividend for the year ended 31st May 2006 of 9.30p (2005: 8.65p) per ordinary share 3.9 3.5
15.2 13.1
Amounts recognised as distributions to preference shareholders in the year comprise:7½% cumulative preference shares – 0.110% cumulative preference shares 0.1 0.7
0.1 0.8
Total amount recognised as distributions to shareholders in the year 15.3 13.9
Proposed final dividend for the year ended 31st May 2006 of 29.50p (2005: 26.60p) per share 12.5 11.3
The proposed final dividends for the years ended 31st May 2005 and 31st May 2006 were subject to approval by shareholders at the annual general meeting and hence have not been included as liabilities in these financial statements at 31st May 2005 and 31st May 2006 respectively.
On 29th June 2005 the ‘A’ ordinary shares were redesignated as ordinary shares. The final dividends in respect of the year ended 31st May 2005 and the interim dividends recognised in the year ended 31st May 2006 in respect of ordinary shareholders have been re-presented to include dividends on both the ordinary and ‘A’ ordinary shares.
The preference shares, which had a nominal value of £7.9 million, were fully repaid on 1st August 2005.
At 31st May 2006, the Paterson Zochonis Employee Trust held 497,299 ordinary shares (2005: 242,318 ordinary shares and 214,353 ‘A’ ordinary shares). The trust waived any entitlement to the dividends on these shares.
3 Investments in subsidiaries
Shares Loans Total £m £m £m
Cost at 1st June 2005 and 31st May 2006 120.3 4.4 124.7
Provisions at 1st June 2005 and 31st May 2006 (4.6) – (4.6)
Net book value at 1st June and 31st May 2006 115.7 4.4 120.1
Details of the company’s direct subsidiaries at 31st May 2006 are as follows:
Parent Proportion Incorporated company’s of votingSubsidiary companies Operation in: interest interest
Charles Worthington Hair and Beauty Ltd Holding company England 100% 100%PZ Cussons (Holdings) Ltd Holding company England 100% 100%PZ Cussons (International) Ltd Provision of services to Group companies England 100% 100%Minerva SA Manufacturing Greece 100% 100%
FINANCIAL STATEMENTS | ANNUAL REPORT 2006 | 79

80 | ANNUAL REPORT 2006 | FINANCIAL STATEMENTS
NOTES TO THE COMPANY FINANCIAL STATEMENTS CONTINUED
4 Debtors 2005 2006 Restated £m £m
Amounts owed by Group companies 37.5 33.7United Kingdom corporation tax recoverable 2.1 1.1Overseas taxation recoverable 0.1 0.1Prepayments and accrued income 0.3 1.7
40.0 36.6
5 Current asset investments 2006 2005 £m £m
Unlisted 0.3 0.3Deposits 8.3 26.6
8.6 26.9
6 Creditors 2005 2006 Restated £m £m
Due within one yearBorrowings – 3.8Amounts owed to Group companies 83.6 56.6United Kingdom corporation tax – 0.7Other creditors 1.0 1.0Accruals and deferred income 0.2 0.2
84.8 62.3
Due after one yearAmounts owed to Group companies 6.2 6.2Other creditors 1.6 2.6
7.8 8.8
Amounts owed to Group companies are repayable after five years.
At 31st May 2006, the company had undrawn overdraft facilities of £40.0 million (2005: £39.8 million) available to it. There are no committed facilities at 31st May 2006 (2005: £0.2 million). The company’s borrowings at 31st May 2005 were all denominated in sterling.

NOTES TO THE COMPANY FINANCIAL STATEMENTS CONTINUED
6 Creditors continued
Financial instruments and risk managementThe company is not exposed to significant levels of financial risk. The company does not enter into derivative financial instruments.
Financial instruments utilised by the company during the years ended 31st May 2006 and 31st May 2005, together with information regarding the methods and assumptions used to calculate fair values, can be summarised as follows:
Current asset investmentsIn accordance with FRS 25 ‘Financial Instruments: Recognition and Measurement’, unlisted investments are held in the company’s balance sheet at cost because their fair value cannot be measured reliably due to the lack of quoted market prices.
Current assets and liabilitiesFinancial instruments included within current assets and liabilities (excluding cash and borrowings) are generally short-term in nature and accordingly their fair values approximate to their book values.
BorrowingsThe carrying values of cash and short-term borrowings and current asset investments approximate to their fair values because of the short-term maturity of these instruments.
The financial instruments held by the company do not, either individually or as a class, create a potentially significant exposure to market, credit, liquidity or cash flow interest rate risk.
7 Share capital 2006 2005 Number Amount Number Amount 000 £m 000 £m
Authorised:Ordinary shares:Ordinary shares of 10p each 57,000 5.7 25,000 2.5‘A’ (non-voting) ordinary shares of 10p each – – 25,000 2.5
57,000 5.7 50,000 5.0
Preference shares:7½% cumulative preference shares of £1 each – – 800 0.810% cumulative preference shares of £1 each – – 7,500 7.5
– – 8,300 8.3
Total authorised share capital 5.7 13.3
Allotted, called up and fully paid:Ordinary shares:Ordinary shares of 10p each 42,872 4.3 21,429 2.1‘A’ (non-voting) ordinary shares of 10p each – – 19,300 2.0
42,872 4.3 40,729 4.1
Preference shares:7½% cumulative preference shares of £1 each – – 782 0.810% cumulative preference shares of £1 each – – 7,116 7.1
– – 7,898 7.9
Total called up share capital 4.3 12.0
On 29th June 2005 the ‘A’ (non-voting) ordinary shares were redesignated as ordinary shares. There was also a compensatory bonus issue to ordinary shareholders on the basis of one new ordinary share for every ten ordinary shares held. The preference shares, which had a nominal value of £7,898,001, were fully repaid on 1st August 2005. At 31st May 2006, the company had only one class of ordinary shares, which carry no rights to fixed dividends. The preference shares and ‘A’ shares in issue at 31st May 2005 did not carry any rights to fixed dividends.
FINANCIAL STATEMENTS | ANNUAL REPORT 2006 | 81

82 | ANNUAL REPORT 2006 | FINANCIAL STATEMENTS
NOTES TO THE COMPANY FINANCIAL STATEMENTS CONTINUED
8 Reserves and movements in shareholders’ funds Called up Capital Profit share redemption and loss Other capital reserve account reserve Total £m £m £m £m £m
At 31st May 2005 as previously reported 12.0 0.7 89.6 (1.1 ) 101.2On adoption of FRS 21 – – 11.3 – 11.3
At 1st June 2005 as restated 12.0 0.7 100.9 (1.1 ) 112.5
Loss for the financial year – – (1.0 ) – (1.0 )Shares purchased for ESOT – – – (2.6 ) (2.6 )Shares to be awarded from ESOT – – – 0.8 0.8Repayment of preference share capital (7.9 ) – (7.6 ) – (15.5 )Compensatory bonus issue 0.2 – (0.2 ) – –Dividends paid – – (15.3 ) – (15.3 )
At 31st May 2006 4.3 0.7 76.8 (2.9 ) 78.9
Transaction costs of £0.8 million (2005: nil) have been accounted for as a deduction from equity.
The amounts in respect of the redemption of preference share capital were initially recognised in a special reserve, but were subsequently transferred to retained earnings.
On 29th June 2005 the ‘A’ (non-voting) ordinary shares were redesignated as ordinary shares. There was a compensatory bonus issue to ordinary shareholders on the basis of one new ordinary share for every ten ordinary shares. The preference shares, which had a nominal value of £7,898,001, were fully repaid on 1st August 2005. At 31st May 2006, the company had only one class of ordinary shares, which carry no rights to fixed dividends. The preference shares and ‘A’ (non-voting) shares in issue at 31st May 2005 did not carry any rights to fixed dividends.
9 Other reserve Charged Shares to profit Net held in and loss book trust Cost account value Number (000) £m £m £m
At 31st May 2004 548 4.1 (3.1 ) 1.0Shares purchased 26 0.3 – 0.3Shares transferred out (118) – – –Shares to be awarded – – (0.2 ) (0.2 )
At 31st May 2005 456 4.4 (3.3 ) 1.1Compensatory bonus issue 24 – – –Shares purchased 142 2.6 – 2.6Shares transferred out (125 ) – – –Shares to be awarded – – (0.8 ) (0.8 )
At 31st May 2006 497 7.0 (4.1 ) 2.9
The company’s other reserve relates to the Employee Share Option Trust (ESOT).
The ESOT purchases shares to fund the deferred annual share bonus scheme, details of which are provided in the report on directors’ remuneration. These shares are to be awarded for the achievement of annual targets, and are normally received by directors after three years of continuing employment from the date of grant.
At 31st May 2006, the trust held 497,299 ordinary shares with a market value of £7,210,835. The trust has waived any entitlement to dividends in respect of all the shares it holds.
NOTES TO THE COMPANY FINANCIAL STATEMENTS CONTINUED
Further statutory and other information
Health and safetyPZ Cussons aims to maintain a safe workplace at all locations in which it operates. We continue to ensure that our business activities are undertaken in a responsible manner and in accordance with the relevant statutory legislation and that employees at all levels participate in the development, promotion and maintenance of a safe and healthy working environment for employees, visitors and the public. The company employs health and safety specialists and, where appropriate, provides on-site medical facilities for employees.
The company continues to monitor and increase standards of health and safety at work through risk assessment, safety audits, formal incident investigation and training. Our investment in plant and equipment enables us to modernise designs and operate safer and more efficient processes.
Employment and staff developmentAs an international group, and particularly bearing in mind our operations in developing countries, we focus resource on the employment and development of local staff with the intention of assisting both our operations in those countries and the local community. Employees are involved at all levels of decision-making throughout the Group with effective communication via regular consultation groups and briefings. Training is vital to ensuring continuous improvements in performance and over the past year employees of all grades have received training through a wide range of courses.
The employment policies of the Group embody the principles of equal opportunity, training and development and rewards appropriate to local markets which are tailored to meet the needs of its businesses and the areas in which they operate. This includes procedures to support the Group’s policy that disabled persons shall be considered for appropriate employment and subsequent training and career development. The company continues to share valuable experience and best practice within the Group through employee secondment.
Community and charityWe support a range of charitable causes, both in the UK and overseas, mainly through a UK based shareholding trust and additional contributions are made through staff time and gifts in kind. PZ Cussons continues to provide assistance and donations to significant global fund-raising initiatives and recognises its responsibility to the communities in which it operates. We are committed to establishing and maintaining strong relationships with community groups, particularly in developing markets.
Auditors A resolution will be proposed at the annual general meeting on 25th September 2006 for the reappointment of Deloitte & Touche LLP as auditors of PZ Cussons Plc. The present appointment will end at the conclusion of the annual general meeting.
Directors’ report of PZ Cussons PlcFor the purposes of section 234 of the Companies Act 1985, the Directors’ report of PZ Cussons Plc for the year ended 31st May 2006 compromises this page and the information contained in the Report of the Directors on pages 6 to 30 and the Report on Directors’ remuneration on pages 31 to 34.
FINANCIAL STATEMENTS | ANNUAL REPORT 2006 | 83

84 | ANNUAL REPORT 2006 | FINANCIAL STATEMENTS

Registered officePZ Cussons HouseBird Hall LaneStockport SK3 0XN
Registered numberCompany registered number 19457
RegistrarsComputershare Investor Services PLCPO Box 82The PavilionsBridgwater RoadBristol BS99 7NH
Company secretaryB H Leigh
Information about PZ Cussons Plc and a full copy of the Annual Report and Financial Statements
can be found on our websitewww.pzcussons.com

Designed by The ChasePhotography by Michael Heffernan and Getty Images