Annual Report and Financial Statements - dfcu Bank€¦ · dfcu Group 2017 Annual Report and...
161
Driving Growth through Service & Technology Making More Possible Annual Report and Financial Statements 2017
Transcript of Annual Report and Financial Statements - dfcu Bank€¦ · dfcu Group 2017 Annual Report and...

Driving Growththrough Service & Technology
Making More Possible
Annual Report and Financial Statements2017
Our missiondfcu seeks to grow shareholder value
while playing a key role in transforming the economy and enhancing the well-
being of the society. Through our dynamic and responsive teams, we will provide
innovative financial solutions and maintain the highest level of customer service and
professional integrity.
Our visionTo be the preferred financial institution,
providing a broad range of quality products to our chosen customer segments.
Culture competencies
1. Focus on staff and customers2. Courage
3. Transparency4. Stewardship
5. Collective effort6. Decisiveness
7. Pride and Passion
Table of Contentsdfcu Group 2017 Annual Report and Financial Statements
Who we are iv
Our purpose v
Board of directors vi
Women business advisory council viii
Senior management team ix
List of acronyms and financial definitions x
Financial highlights of the year xii
Business Updates
Rights issue xiii
Driving growth through service and technology xiv
Driving the economic transformation of women xvi
Creating opportunities for business success xvii
Partnerships transforming agriculture in Uganda xviii
Promoting greater financial inclusion xx
Other business highlights xxi
Blue Thunder Culture update xxiv
Empowering and supporting our communities xxvi
Reports
Financial overview 2017 xxvii
Chairman's report xxxii
Business risk report xxxvii
Corporate governance xliii
Sustainability report l
Looking ahead lxiii
Financial Statements 1-94
1
2
3
4
5
6
dfc
u G
roup 2
017
Annual
Rep
ort
an
d F
inan
cial
Sta
tem
ents
iv
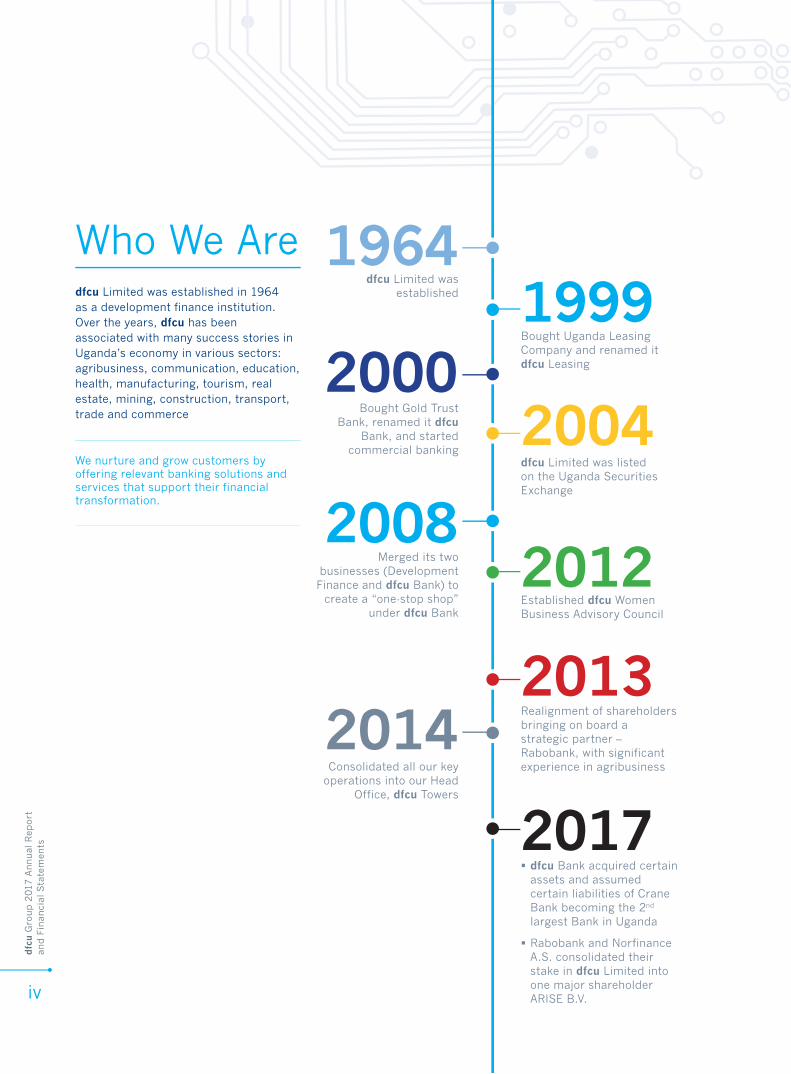
Who We Are 19641999
20002004
20122008
2013
2017
2014
dfcu Limited was established
Bought Uganda Leasing Company and renamed it dfcu Leasing
Bought Gold Trust Bank, renamed it dfcu
Bank, and started commercial banking
dfcu Limited was listed on the Uganda Securities Exchange
Realignment of shareholders bringing on board a strategic partner – Rabobank, with significant experience in agribusiness
§ dfcu Bank acquired certain assets and assumed certain liabilities of Crane Bank becoming the 2nd largest Bank in Uganda
§ Rabobank and Norfinance A.S. consolidated their stake in dfcu Limited into one major shareholder ARISE B.V.
Consolidated all our key operations into our Head
Office, dfcu Towers
Established dfcu Women Business Advisory Council
Merged its two businesses (Development Finance and dfcu Bank) to
create a “one-stop shop” under dfcu Bank
We nurture and grow customers by offering relevant banking solutions and services that support their financial transformation.
dfcu Limited was established in 1964 as a development finance institution. Over the years, dfcu has been associated with many success stories in Uganda’s economy in various sectors: agribusiness, communication, education, health, manufacturing, tourism, real estate, mining, construction, transport, trade and commerce
dfc
u G
roup 2
017
Annual
Rep
ort
an
d F
inan
cial
Sta
tem
ents
v
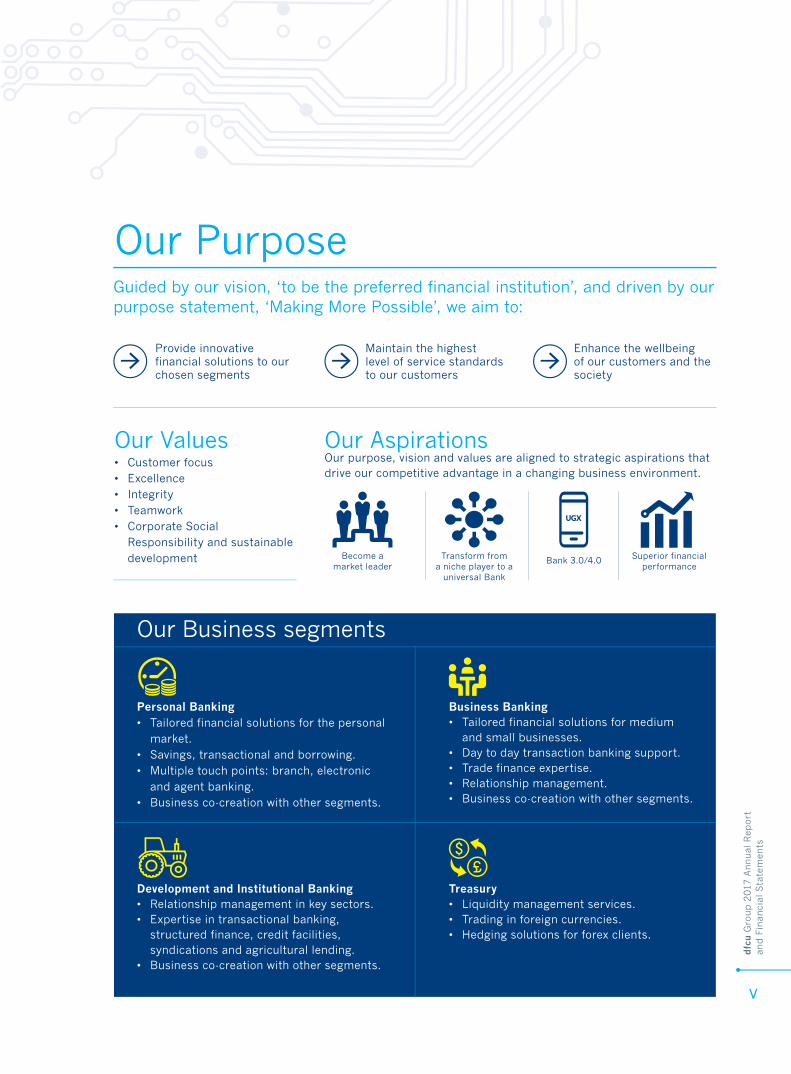
Guided by our vision, ‘to be the preferred financial institution’, and driven by our purpose statement, ‘Making More Possible’, we aim to:
Provide innovative financial solutions to our chosen segments
• Customer focus• Excellence• Integrity• Teamwork• Corporate Social
Responsibility and sustainable development
Our purpose, vision and values are aligned to strategic aspirations that drive our competitive advantage in a changing business environment.
Personal Banking• Tailored financial solutions for the personal
market.• Savings, transactional and borrowing.• Multiple touch points: branch, electronic
and agent banking.• Business co-creation with other segments.
Development and Institutional Banking• Relationship management in key sectors.• Expertise in transactional banking,
structured finance, credit facilities, syndications and agricultural lending.
• Business co-creation with other segments.
Business Banking• Tailored financial solutions for medium
and small businesses.• Day to day transaction banking support.• Trade finance expertise.• Relationship management.• Business co-creation with other segments.
Treasury • Liquidity management services.• Trading in foreign currencies. • Hedging solutions for forex clients.
Maintain the highest level of service standards to our customers
Enhance the wellbeing of our customers and the society
Our Values
Our Business segments
Our Aspirations
Become a market leader
Transform from a niche player to a
universal Bank
Bank 3.0/4.0 Superior financial performance
Our Purpose
dfc
u G
roup 2
017
Annual
Rep
ort
an
d F
inan
cial
Sta
tem
ents
vi
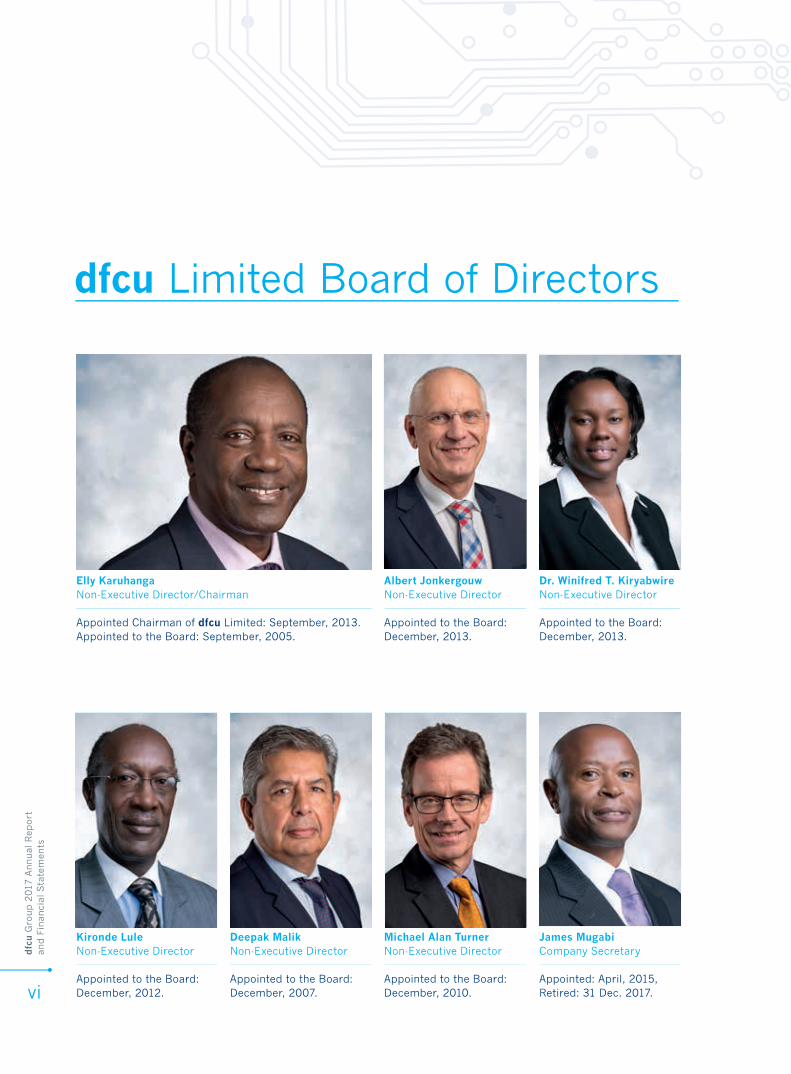
dfcu Limited Board of Directors
Elly KaruhangaNon-Executive Director/Chairman
Appointed Chairman of dfcu Limited: September, 2013.Appointed to the Board: September, 2005.
Albert JonkergouwNon-Executive Director
Appointed to the Board:December, 2013.
Dr. Winifred T. KiryabwireNon-Executive Director
Appointed to the Board:December, 2013.
Kironde LuleNon-Executive Director
Appointed to the Board:December, 2012.
Deepak MalikNon-Executive Director
Appointed to the Board:December, 2007.
Michael Alan TurnerNon-Executive Director
Appointed to the Board:December, 2010.
James MugabiCompany Secretary
Appointed: April, 2015,Retired: 31 Dec. 2017.
dfc
u G
roup 2
017
Annual
Rep
ort
an
d F
inan
cial
Sta
tem
ents
vii
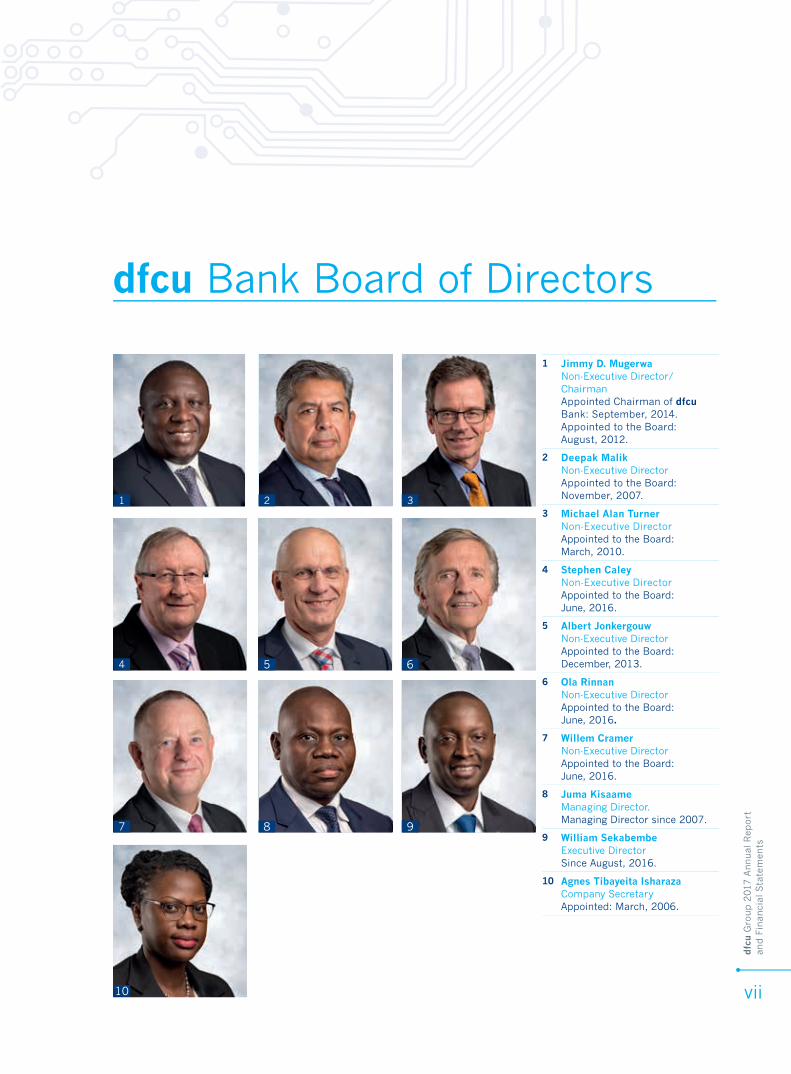
dfcu Bank Board of Directors
5
3
4 6
98
1
10
7
2
1 Jimmy D. MugerwaNon-Executive Director/ ChairmanAppointed Chairman of dfcu Bank: September, 2014. Appointed to the Board: August, 2012.
2 Deepak MalikNon-Executive DirectorAppointed to the Board:November, 2007.
3 Michael Alan TurnerNon-Executive DirectorAppointed to the Board:March, 2010.
4 Stephen CaleyNon-Executive DirectorAppointed to the Board: June, 2016.
5 Albert JonkergouwNon-Executive DirectorAppointed to the Board:December, 2013.
6 Ola RinnanNon-Executive DirectorAppointed to the Board: June, 2016.
7 Willem CramerNon-Executive DirectorAppointed to the Board: June, 2016.
8 Juma KisaameManaging Director.Managing Director since 2007.
9 William SekabembeExecutive DirectorSince August, 2016.
10 Agnes Tibayeita IsharazaCompany SecretaryAppointed: March, 2006.
dfc
u G
roup 2
017
Annual
Rep
ort
an
d F
inan
cial
Sta
tem
ents
viii
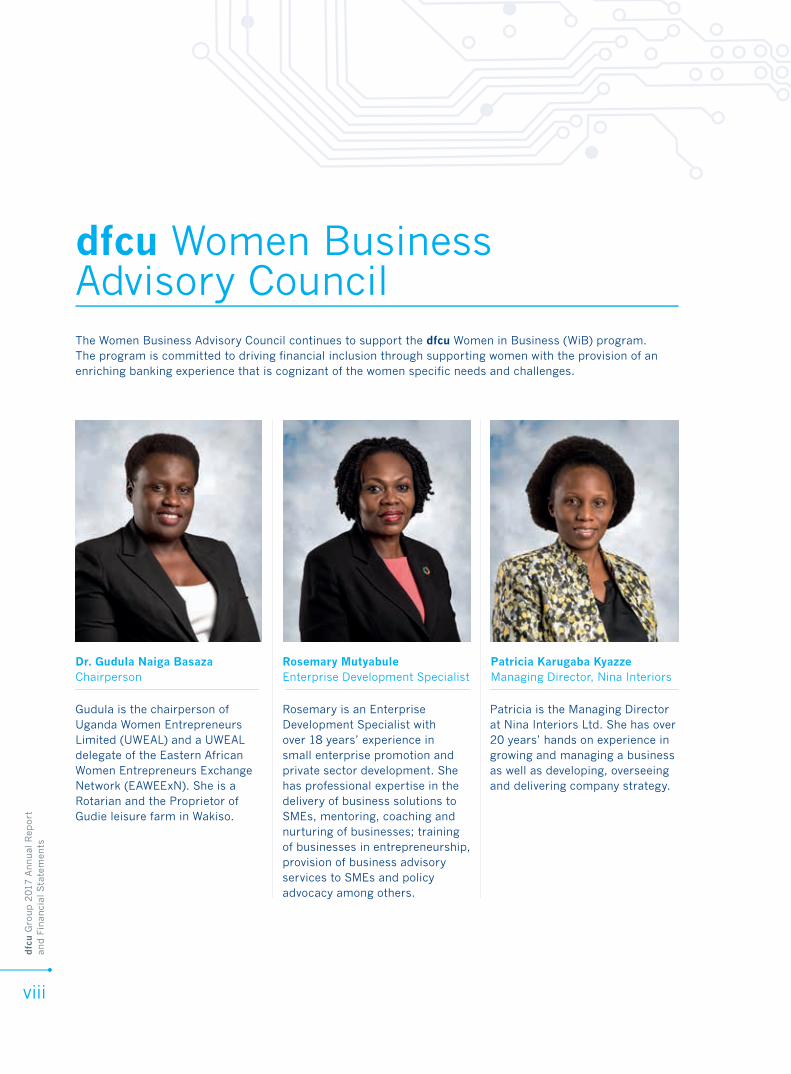
dfcu Women Business Advisory CouncilThe Women Business Advisory Council continues to support the dfcu Women in Business (WiB) program. The program is committed to driving financial inclusion through supporting women with the provision of an enriching banking experience that is cognizant of the women specific needs and challenges.
Gudula is the chairperson of Uganda Women Entrepreneurs Limited (UWEAL) and a UWEAL delegate of the Eastern African Women Entrepreneurs Exchange Network (EAWEExN). She is a Rotarian and the Proprietor of Gudie leisure farm in Wakiso.
Rosemary is an Enterprise Development Specialist with over 18 years’ experience in small enterprise promotion and private sector development. She has professional expertise in the delivery of business solutions to SMEs, mentoring, coaching and nurturing of businesses; training of businesses in entrepreneurship, provision of business advisory services to SMEs and policy advocacy among others.
Patricia is the Managing Director at Nina Interiors Ltd. She has over 20 years’ hands on experience in growing and managing a business as well as developing, overseeing and delivering company strategy.
Rosemary MutyabuleEnterprise Development Specialist
Dr. Gudula Naiga BasazaChairperson
Patricia Karugaba KyazzeManaging Director, Nina Interiors
dfc
u G
roup 2
017
Annual
Rep
ort
an
d F
inan
cial
Sta
tem
ents
ix
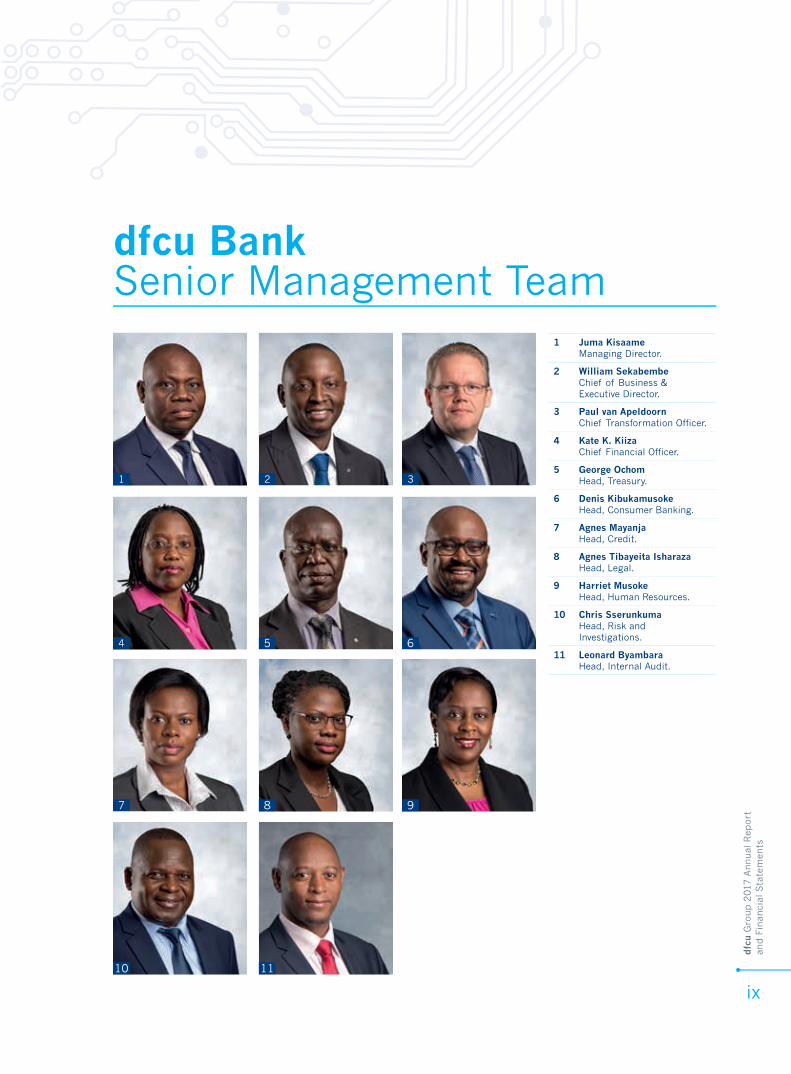
dfcu Bank Senior Management Team
5
3
9
4 6
10
8
1
11
7
2
1 Juma KisaameManaging Director.
2 William SekabembeChief of Business & Executive Director.
3 Paul van ApeldoornChief Transformation Officer.
4 Kate K. KiizaChief Financial Officer.
5 George OchomHead, Treasury.
6 Denis KibukamusokeHead, Consumer Banking.
7 Agnes MayanjaHead, Credit.
8 Agnes Tibayeita IsharazaHead, Legal.
9 Harriet MusokeHead, Human Resources.
10 Chris SserunkumaHead, Risk and Investigations.
11 Leonard ByambaraHead, Internal Audit.
dfc
u G
roup 2
017
Annual
Rep
ort
an
d F
inan
cial
Sta
tem
ents
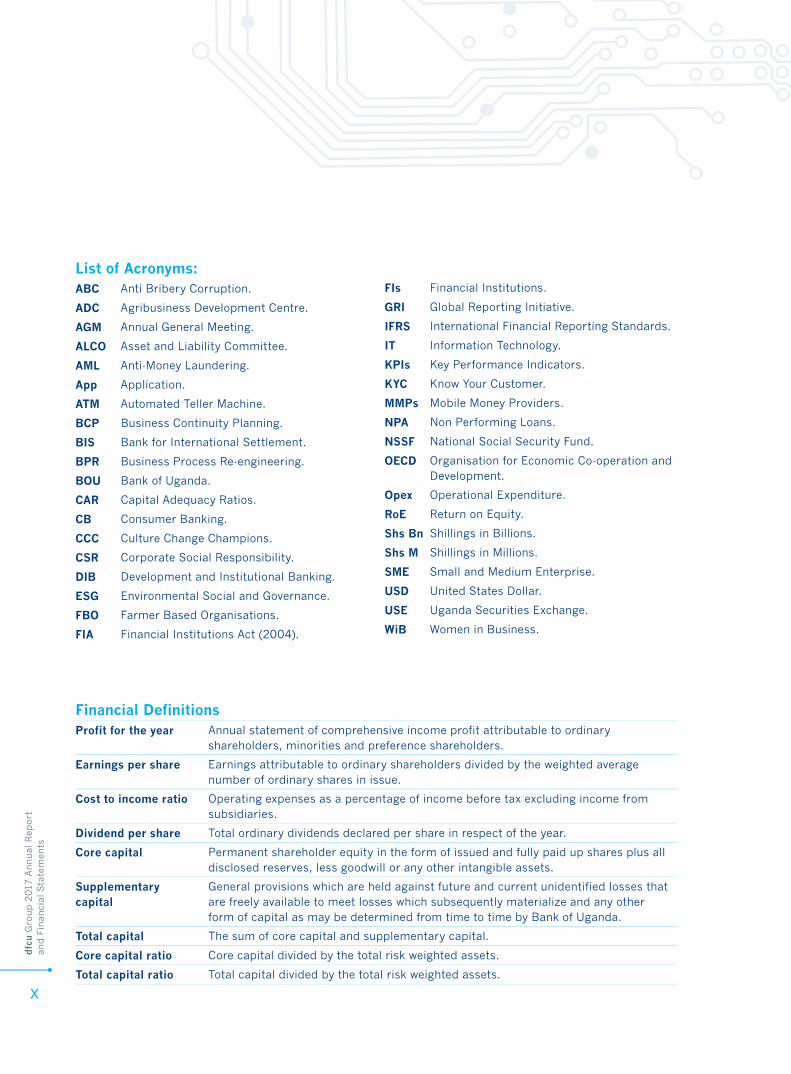
x
List of Acronyms:ABC Anti Bribery Corruption.
ADC Agribusiness Development Centre.
AGM Annual General Meeting.
ALCO Asset and Liability Committee.
AML Anti-Money Laundering.
App Application.
ATM Automated Teller Machine.
BCP Business Continuity Planning.
BIS Bank for International Settlement.
BPR Business Process Re-engineering.
BOU Bank of Uganda.
CAR Capital Adequacy Ratios.
CB Consumer Banking.
CCC Culture Change Champions.
CSR Corporate Social Responsibility.
DIB Development and Institutional Banking.
ESG Environmental Social and Governance.
FBO Farmer Based Organisations.
FIA Financial Institutions Act (2004).
Financial Definitions
Profit for the year Annual statement of comprehensive income profit attributable to ordinary shareholders, minorities and preference shareholders.
Earnings per share Earnings attributable to ordinary shareholders divided by the weighted average number of ordinary shares in issue.
Cost to income ratio Operating expenses as a percentage of income before tax excluding income from subsidiaries.
Dividend per share Total ordinary dividends declared per share in respect of the year.
Core capital Permanent shareholder equity in the form of issued and fully paid up shares plus all disclosed reserves, less goodwill or any other intangible assets.
Supplementary capital
General provisions which are held against future and current unidentified losses that are freely available to meet losses which subsequently materialize and any other form of capital as may be determined from time to time by Bank of Uganda.
Total capital The sum of core capital and supplementary capital.
Core capital ratio Core capital divided by the total risk weighted assets.
Total capital ratio Total capital divided by the total risk weighted assets.
FIs Financial Institutions.
GRI Global Reporting Initiative.
IFRS International Financial Reporting Standards.
IT Information Technology.
KPIs Key Performance Indicators.
KYC Know Your Customer.
MMPs Mobile Money Providers.
NPA Non Performing Loans.
NSSF National Social Security Fund.
OECD Organisation for Economic Co-operation and Development.
Opex Operational Expenditure.
RoE Return on Equity.
Shs Bn Shillings in Billions.
Shs M Shillings in Millions.
SME Small and Medium Enterprise.
USD United States Dollar.
USE Uganda Securities Exchange.
WiB Women in Business.

dfc
u G
roup 2
017
Annual
Rep
ort
an
d F
inan
cial
Sta
tem
ents
xi
Highlightsof the year

dfc
u G
roup 2
017
Annual
Rep
ort
an
d F
inan
cial
Sta
tem
ents
xii
2017 2016 2015 2014 2013
Statement of comprehensive income (Shs’ m)
Interest income 347,001 217,155 182,974 163,278 150,604
Net interest income 215,451 133,241 108,232 103,289 96,163
Non-interest income 39,655 29,305 25,002 20,852 20,116
Credit impairment charge 48,652 17,830 11,690 10,490 13,414
Operating expenses 189,520 96,900 89,531 78,309 64,381
Profit before tax 147,816 58,363 46,922 56,561 45,070
Profit after tax 106,892 45,325 35,290 42,109 34,601
Statement of financial position (shs’ m)
Loans and advances 1,334,611 834,827 808,047 680,679 623,800
Total assets 3,057,476 1,745,640 1,651,629 1,424,742 1,226,062
Customer deposits 1,987,118 1,134,731 914,951 822,877 700,285
Borrowings 483,446 328,527 491,914 384,023 340,489
Shareholders’ equity 532,338 249,652 215,131 191,541 161,160
Capital adequacy
Core capital ratio 19% 20% 16% 19% 18%
Total capital ratio 23% 27% 23% 27% 25%
Risk weighed assets (shs’ m) 1,975,505 1,072,574 1,010,866 870,035 814,983
Share statistics
Number of shares in issue (in millions) 784 497 497 497 497
Earnings per share 189.33 91.16 70.98 84.69 69.59
Dividends per share 68.24 25.19 21.73 23.53 17.84
Financial Highlights
Shs 532.3 Bn Shareholders’ equity2016: Shs 249.6 Bn+113%
Shs 1,334.6 Bn Loans and advances2016: Shs 834.8 Bn+60%
Shs 1,987.1 BnCustomer deposits2016: Shs 1,134.7 Bn+75%
Shs 347.0 BnInterest income2016: Shs 217.1 Bn+60%
Shs 3,057.4 BnTotal Assets2016: Shs 1,745.6 Bn+75%
Shs 106.8 BnProfit after tax2016: Shs 45.3 Bn+136%
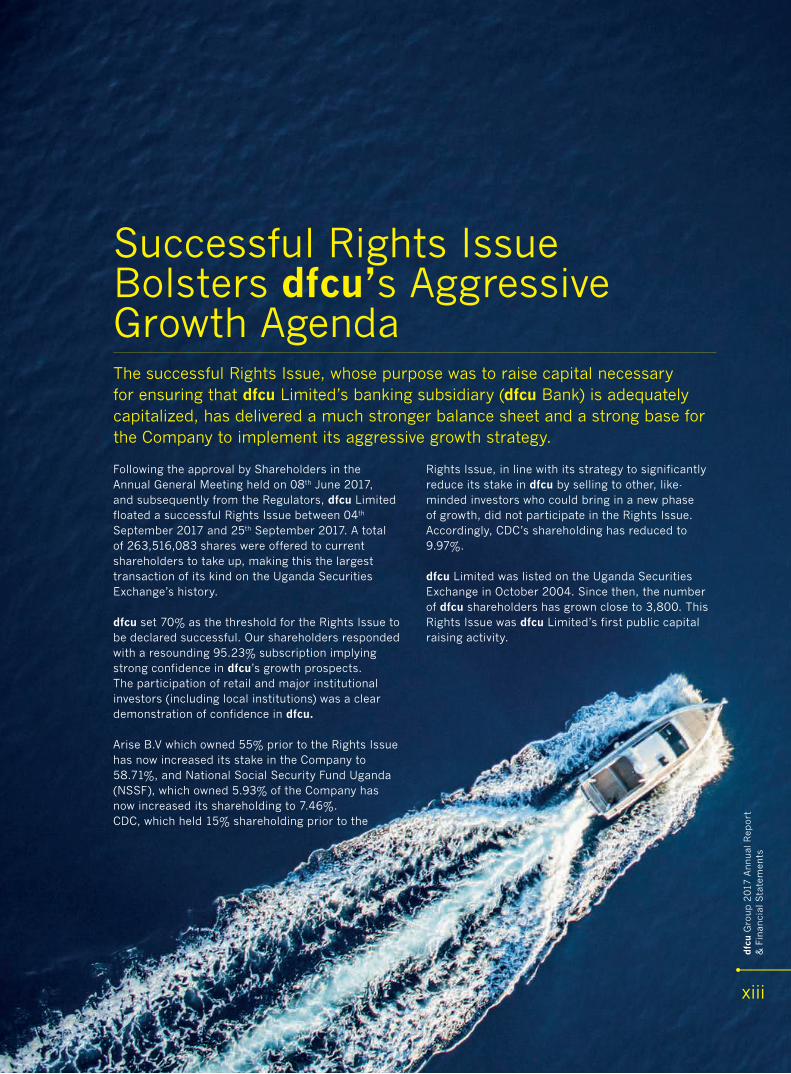
Successful Rights Issue Bolsters dfcu’s AggressiveGrowth Agenda
Following the approval by Shareholders in the Annual General Meeting held on 08th June 2017, and subsequently from the Regulators, dfcu Limited floated a successful Rights Issue between 04th September 2017 and 25th September 2017. A total of 263,516,083 shares were offered to current shareholders to take up, making this the largest transaction of its kind on the Uganda Securities Exchange’s history.
dfcu set 70% as the threshold for the Rights Issue to be declared successful. Our shareholders responded with a resounding 95.23% subscription implying strong confidence in dfcu’s growth prospects. The participation of retail and major institutional investors (including local institutions) was a clear demonstration of confidence in dfcu.
Arise B.V which owned 55% prior to the Rights Issue has now increased its stake in the Company to 58.71%, and National Social Security Fund Uganda (NSSF), which owned 5.93% of the Company has now increased its shareholding to 7.46%. CDC, which held 15% shareholding prior to the
Rights Issue, in line with its strategy to significantly reduce its stake in dfcu by selling to other, like-minded investors who could bring in a new phase of growth, did not participate in the Rights Issue. Accordingly, CDC’s shareholding has reduced to 9.97%.
dfcu Limited was listed on the Uganda Securities Exchange in October 2004. Since then, the number of dfcu shareholders has grown close to 3,800. This Rights Issue was dfcu Limited’s first public capital raising activity.
The successful Rights Issue, whose purpose was to raise capital necessary for ensuring that dfcu Limited’s banking subsidiary (dfcu Bank) is adequately capitalized, has delivered a much stronger balance sheet and a strong base for the Company to implement its aggressive growth strategy.
dfc
u G
roup 2
017
Annual
Rep
ort
&
Fin
anci
al S
tate
men
ts
xiii

Driving Growth throughService and TechnologyWhile people will always need banking and other financial services, how they interact with and access these services has changed significantly with the advent of technology.
Technology is the backbone of business innovation and all enterprises, big or small, are looking to leverage this enabler in order to maintain the competitive edge in the market.
The financial services sector has not been left behind; the pace of digital adoption has surpassed expectations in recent years and this trend is likely to accelerate further. The increasing role of technology has heightened customer expectations while transforming the manner in which customers interact with financial institutions.
Our aspiration is to transform dfcu to become the ‘Next Generation’ Bank, through leveraging technology, including the current and emerging transformational trends, to bring value to our customers. We are exploiting technology to facilitate faster and convenient processes, and reduce transaction costs. In addition, the use of technology provides organisational benefits in terms of efficiency and our ability to respond to an evolving operating environment.
dfc
u G
roup 2
017
Annual
Rep
ort
&
Fin
anci
al S
tate
men
ts
xiv
CHANGING DAY TO DAY BANKINGThe exponential growth in mobile phone usage and the massive adoption of the internet is transforming customer habits and expectations, including what customers demand from their banks. Customers today want everything to be as rapid, close-to-hand and immediate. We are responding to these evolving customer trends by transforming our digital presence, providing simpler, seamless interactions across online and mobile.
We rolled out a new e-banking platform under the flagship name of dfcu QuickBanking. The new platform is a robust Omni-channel that allows the customer to navigate across mobile and online effortlessly using the same credentials, and without much of a fuss. We also introduced the dfcu QuickApp that allows customers to literally do all their banking activities on the go.
SIMPLIFYING PAYMENTSOur e-payment platforms allow customers to conveniently settle their bills without going through the hassle of writing cheques or visiting the branch. Of major significance is the introduction of the bulk payments feature on the dfcu QuickConnect, the Business Internet Banking platform. In addition to bulk payments, customers are also able to make transfers, pay taxes and NSSF remittances, among other activities.
With dfcu Schoolpay, we have made school fees and tuition payments paperless.
A secure and complete payment solution, Schoolpay allows parents to make school fees/tuition payments online and on mobile using a unique payment registration number.
NEW CORE BANKING SYSTEMWe enhanced our operational capability with the new upgraded core banking platform to Finacle 10. The upgraded core banking system gives us a firm base upon which to expand, innovate and increase automation of our end-to-end customer journeys.
MANAGING CUSTOMER RELATIONSHIPS BETTERAny technological advancement meant to enhance customer experience is never complete without a proportionate focus on customer relationships and how they are managed. In this regard, we have realigned and introduced a new customer segmentation model to better serve and innovate new tailored solutions.
LOOKING AHEADLooking forward, the ever charging technological advances mean we cannot say we have hit the ceiling. We will continue to focus on the use of technology for the benefit of our customers, delivering what matters to provide the best value.
Innovation in new digital servicesAs part of our digital strategy, a number of unique innovations are being rolled out across our digital ecosystem. These include the following:• Digital branches• Intelligent ATMs• Agent Banking• Savings App
• Mobile loans• Instant Account opening• mVisa
Improving transaction speedOur Business process redesign and automation project is at the fore of our innovations for one major purpose; simple and efficient processes allow us to deliver financial solutions to our customers faster and cheaper. Several of our operational, credit and on boarding processes are being automated with the objective of increasing transaction velocity.
Partnering with leading technology providersAs we integrate into our customers’ digital lives, we are collaborating with an ever broader range of global partners, bringing exciting new opportunities to our clients across all of our business lines. One such partnership is with FinForward - an acceleration program where global Fintech companies, Financial Institutions (FIs) and Mobile Money Providers (MMPs) in Africa are matched and integrated. By joining FinForward, we expect to accelerate the process of getting new and innovative technologies into production. The speed of introduction of new innovative products and services will be much faster.
...the pace of digital adoption has surpassed expectations in recent years and this trend is likely to accelerate further.
dfc
u G
roup 2
017
Annual
Rep
ort
&
Fin
anci
al S
tate
men
ts
xv
dfc
u G
roup 2
017
Annual
Rep
ort
an
d F
inan
cial
Sta
tem
ents
xvi
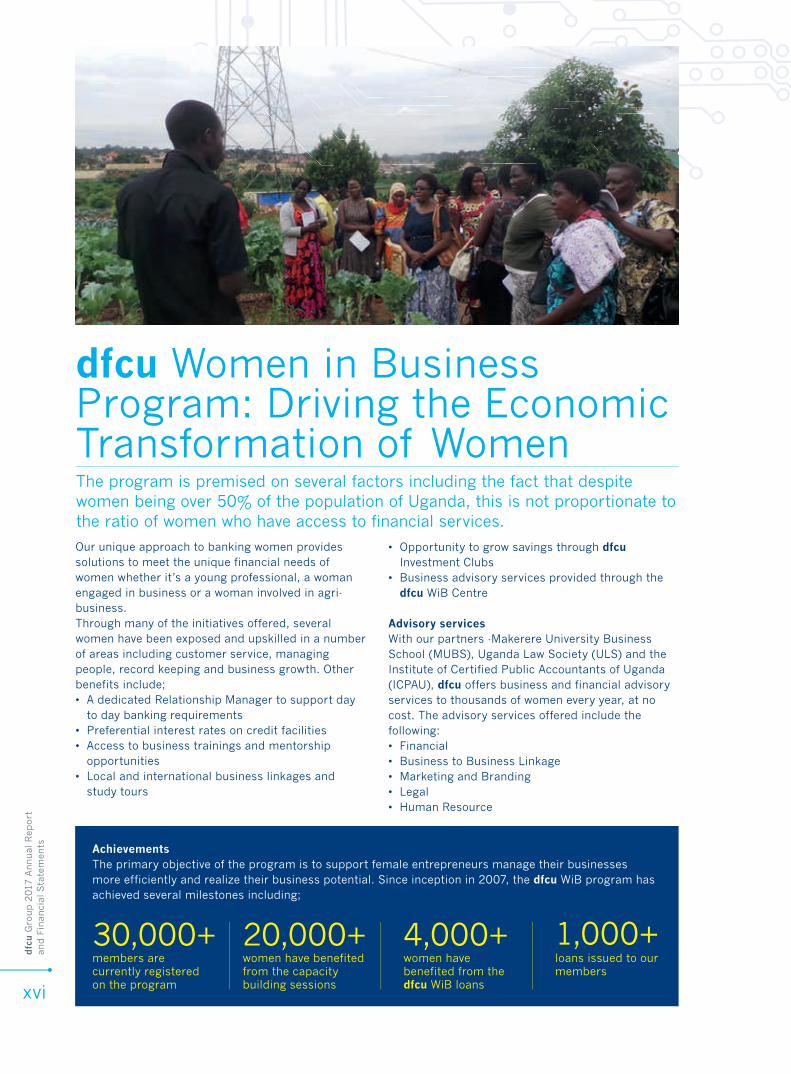
Our unique approach to banking women provides solutions to meet the unique financial needs of women whether it’s a young professional, a woman engaged in business or a woman involved in agri- business.Through many of the initiatives offered, several women have been exposed and upskilled in a number of areas including customer service, managing people, record keeping and business growth. Other benefits include;• A dedicated Relationship Manager to support day
to day banking requirements• Preferential interest rates on credit facilities• Access to business trainings and mentorship
opportunities • Local and international business linkages and
study tours
• Opportunity to grow savings through dfcu Investment Clubs
• Business advisory services provided through the dfcu WiB Centre
Advisory services With our partners -Makerere University Business School (MUBS), Uganda Law Society (ULS) and the Institute of Certified Public Accountants of Uganda (ICPAU), dfcu offers business and financial advisory services to thousands of women every year, at no cost. The advisory services offered include the following:• Financial• Business to Business Linkage• Marketing and Branding• Legal• Human Resource
dfcu Women in Business Program: Driving the Economic Transformation of WomenThe program is premised on several factors including the fact that despite women being over 50% of the population of Uganda, this is not proportionate to the ratio of women who have access to financial services.
AchievementsThe primary objective of the program is to support female entrepreneurs manage their businesses more efficiently and realize their business potential. Since inception in 2007, the dfcu WiB program has achieved several milestones including;
members are currently registered on the program
women have benefited from the capacity building sessions
women have benefited from the dfcu WiB loans
loans issued to our members
30,000+ 20,000+ 4,000+ 1,000+

dfc
u G
roup 2
017
Annual
Rep
ort
an
d F
inan
cial
Sta
tem
ents
xvii
With SMEs constituting about 90% of the private sector, employing over 2.5 million people, it is clear that they play a vital role in the development of the Ugandan economy. What is also clear is that with Uganda’s ranking as the most entrepreneurial country in the world, SMEs present tremendous opportunity to further the country’s economic growth, constraints notwithstanding.
A collaborative effort to boost the competiveness of the SME sector in general is the silver bullet to ensuring they thrive in what is a constantly evolving economic environment.
It is against this background that dfcu, in partnership with the Monitor Publications, sponsored the Top 100 Medium Sized Companies Survey (SME Top 100).
The SME Top 100 provided the platform for dfcu to create infinite possibilities. Hundreds of businesses had the opportunity to learn from each other, engage policymakers on their contribution to the economy, benchmark themselves against other business operations and much more. This initiative will go a long way in boosting the skillset of the selected companies, eventually translating to improved business practices and increased profitability.
Creating Opportunities for Business SuccessSmall and Medium Enterprises (SMEs) in Uganda face major hurdles when it comes to accessing finance. The most significant barriers are that many SMEs are not fully formalised, lack sufficient management quality and often face compliance and governance challenges.

The dfcu journey to unlocking finance opportunities for small holder farmers is one built on the strength of partnerships.
Farmer based organisations (FBO’s) that have potential to contribute to the agricultural value chain now have a chance of improving their operations and ultimately becoming bankable. The organisations that currently lack technical or structural capacity to operate in a sustainable way are now receiving technical support from the Agribusiness Development Centre (ADC) with the backing of dfcu and the Rabobank Foundation. Both dfcu and Rabobank Foundation have injected a combined USD 2.8 million (two million eight hundred thousand US dollars) for the next five years to support ADC’s activities in Uganda.
Set up in September 2017, ADC provides management training, governance and financial skills to strengthen farmer-based organizations in efficiency and creating economies of scale.dfcu provides tailor-made products for the farmers, and with the capacity building delivered through the ADC, the small holder farmers will be more eligible for financing to support their transformation.
dfcu also continues to support The Best Farmer Competition, which is a great platform to show case our ambition and commitment in the sector. The learnings and business linkages acquired from the competition are helping farmers to broaden their view on agriculture as a viable and profitable economic activity.
Partnerships Transforming Agriculture in Uganda
dfc
u G
roup 2
017
Annual
Rep
ort
&
Fin
anci
al S
tate
men
ts
xviii

$2.8m 2017Both dfcu and Rabobank Foundation have injected a combined USD 2.8 million for the next five years to support the ADC’s activities in Uganda.
ADC was set up in September, to provides management training, governance and financial skills to strengthen farmer-based organizations in efficiency and creating economies of scale.
dfc
u G
roup 2
017
Annual
Rep
ort
&
Fin
anci
al S
tate
men
ts
xix
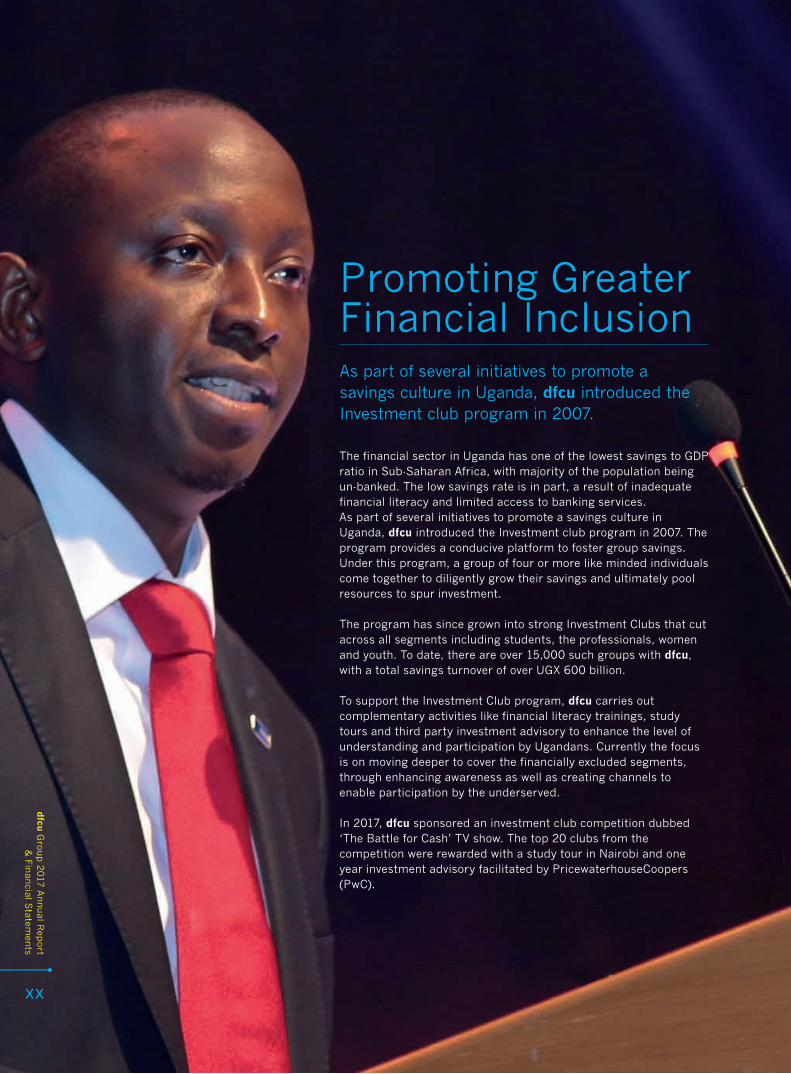
Promoting Greater Financial InclusionAs part of several initiatives to promote a savings culture in Uganda, dfcu introduced the Investment club program in 2007.
The financial sector in Uganda has one of the lowest savings to GDP ratio in Sub-Saharan Africa, with majority of the population being un-banked. The low savings rate is in part, a result of inadequate financial literacy and limited access to banking services.As part of several initiatives to promote a savings culture in Uganda, dfcu introduced the Investment club program in 2007. The program provides a conducive platform to foster group savings. Under this program, a group of four or more like minded individuals come together to diligently grow their savings and ultimately pool resources to spur investment.
The program has since grown into strong Investment Clubs that cut across all segments including students, the professionals, women and youth. To date, there are over 15,000 such groups with dfcu, with a total savings turnover of over UGX 600 billion.
To support the Investment Club program, dfcu carries out complementary activities like financial literacy trainings, study tours and third party investment advisory to enhance the level of understanding and participation by Ugandans. Currently the focus is on moving deeper to cover the financially excluded segments, through enhancing awareness as well as creating channels to enable participation by the underserved.
In 2017, dfcu sponsored an investment club competition dubbed ‘The Battle for Cash’ TV show. The top 20 clubs from the competition were rewarded with a study tour in Nairobi and one year investment advisory facilitated by PricewaterhouseCoopers (PwC).
dfcu
Gro
up 2
017
Annual R
eport
& F
inan
cial Statem
ents
xx

1. Head, Consumer Banking Denis Kibukamusoke (left) hands over a cheque worth UGX. 7.5 million to the Best Youth Group, Surveyors Investment Club.
2. Top 20 dfcu Investment Clubs attend a workshop facilitated by Kenya Association of Investment Groups (KAIG) during the study tour trip in Nairobi.
3. Geneber Outspan Organic scoops the top prize of UGX. 25 million in Season One of the Investment Club Challenge.
4. Flag off of the Top 20 dfcu Investment Clubs for the study tour in Nairobi.
1 2
3
dfc
u G
roup 2
017
Annual
Rep
ort
&
Fin
anci
al S
tate
men
ts
xxi
4
dfc
u G
roup 2
017
Annual
Rep
ort
an
d F
inan
cial
Sta
tem
ents
xxii
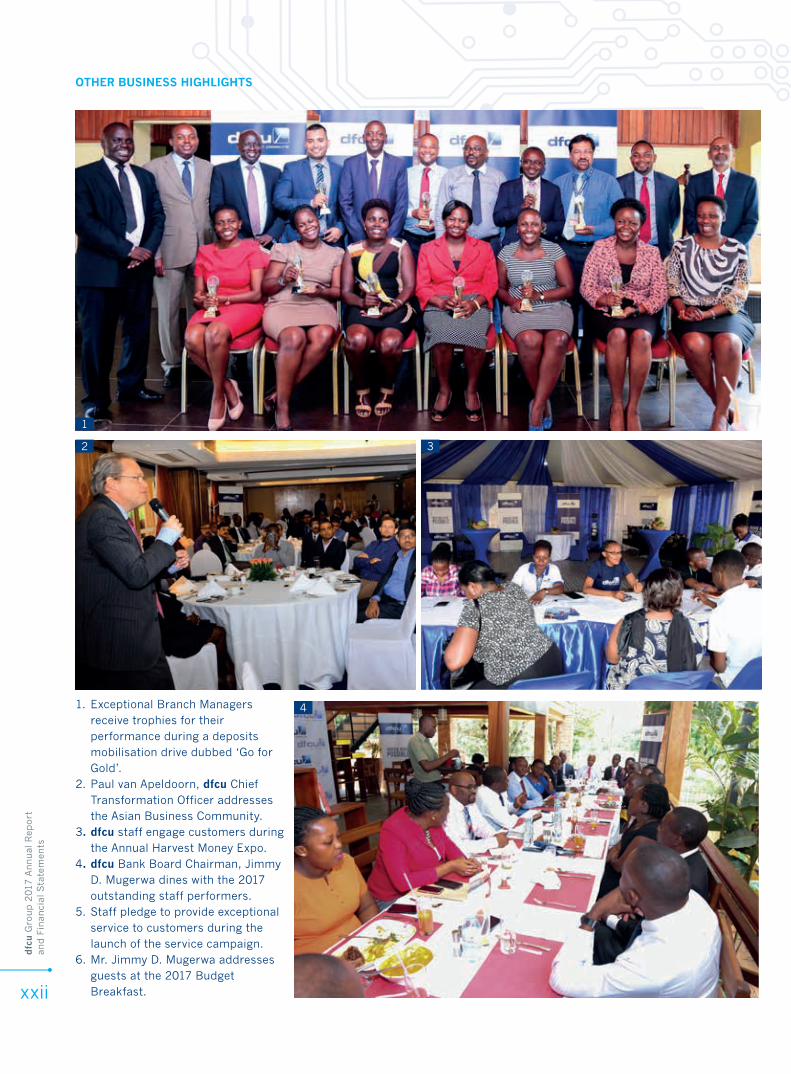
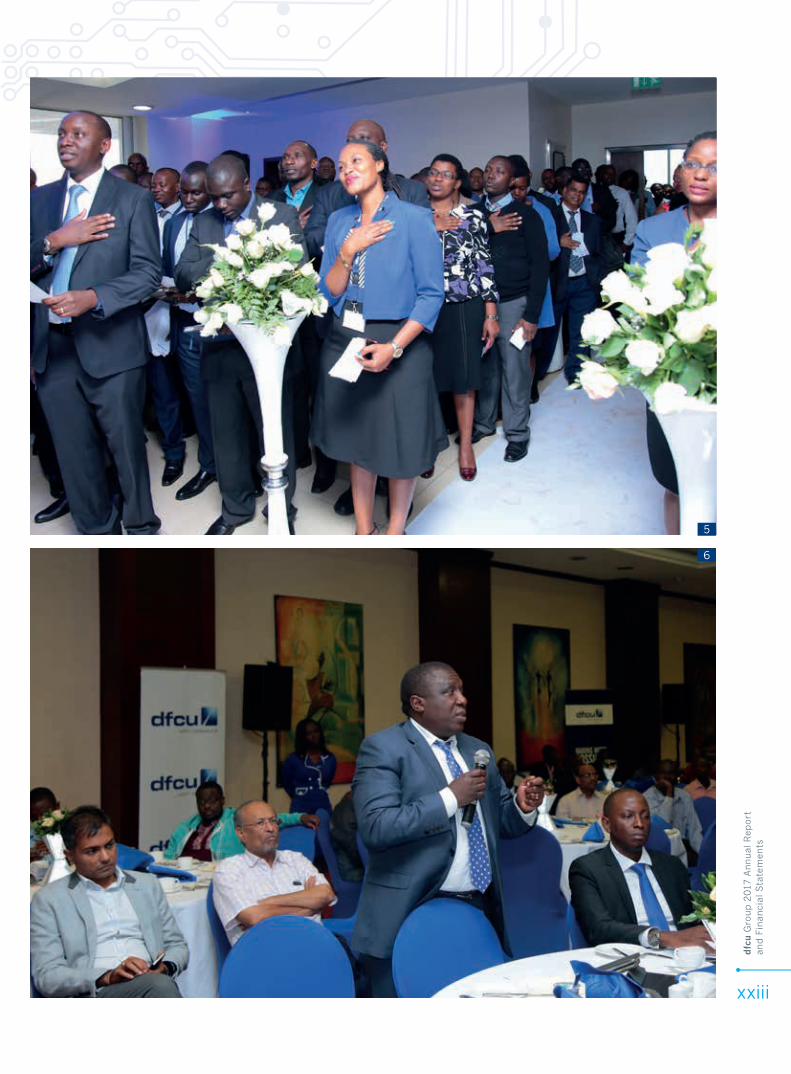
OTHER BUSINESS HIGHLIGHTS
1. Exceptional Branch Managers receive trophies for their performance during a deposits mobilisation drive dubbed ‘Go for Gold’.
2. Paul van Apeldoorn, dfcu Chief Transformation Officer addresses the Asian Business Community.
3. dfcu staff engage customers during the Annual Harvest Money Expo.
4. dfcu Bank Board Chairman, Jimmy D. Mugerwa dines with the 2017 outstanding staff performers.
5. Staff pledge to provide exceptional service to customers during the launch of the service campaign.
6. Mr. Jimmy D. Mugerwa addresses guests at the 2017 Budget Breakfast.
1
2 3
4
dfc
u G
roup 2
017
Annual
Rep
ort
an
d F
inan
cial
Sta
tem
ents
xxiii
5
6
dfc
u G
roup 2
017
Annual
Rep
ort
an
d F
inan
cial
Sta
tem
ents
xxiv
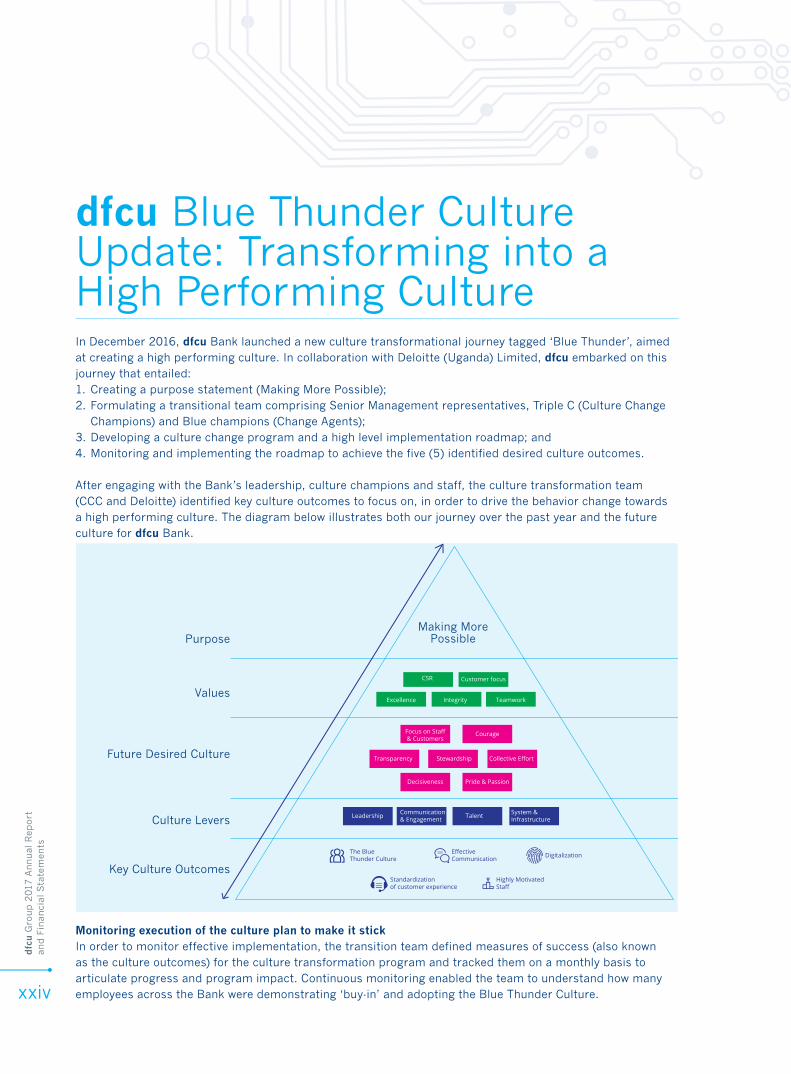
In December 2016, dfcu Bank launched a new culture transformational journey tagged ‘Blue Thunder’, aimed at creating a high performing culture. In collaboration with Deloitte (Uganda) Limited, dfcu embarked on this journey that entailed:1. Creating a purpose statement (Making More Possible); 2. Formulating a transitional team comprising Senior Management representatives, Triple C (Culture Change
Champions) and Blue champions (Change Agents); 3. Developing a culture change program and a high level implementation roadmap; and4. Monitoring and implementing the roadmap to achieve the five (5) identified desired culture outcomes.
After engaging with the Bank’s leadership, culture champions and staff, the culture transformation team (CCC and Deloitte) identified key culture outcomes to focus on, in order to drive the behavior change towards a high performing culture. The diagram below illustrates both our journey over the past year and the future culture for dfcu Bank.
dfcu Blue Thunder Culture Update: Transforming into a High Performing Culture
Monitoring execution of the culture plan to make it stickIn order to monitor effective implementation, the transition team defined measures of success (also known as the culture outcomes) for the culture transformation program and tracked them on a monthly basis to articulate progress and program impact. Continuous monitoring enabled the team to understand how many employees across the Bank were demonstrating ‘buy-in’ and adopting the Blue Thunder Culture.
DigitalizationThe Blue Thunder Culture
Standardizationof customer experience
EffectiveCommunication
Highly MotivatedStaff
CSR Customer focus
Excellence
Focus on Staff& Customers
Courage
Transparency
Decisiveness Pride & Passion
Collective EffortStewardship
Leadership Talent System & Infrastructure
Communication& Engagement
Integrity Teamwork
Key Culture Outcomes
Culture Levers
Future Desired Culture
Values
PurposeMaking More
Possible
dfc
u G
roup 2
017
Annual
Rep
ort
an
d F
inan
cial
Sta
tem
ents
xxv
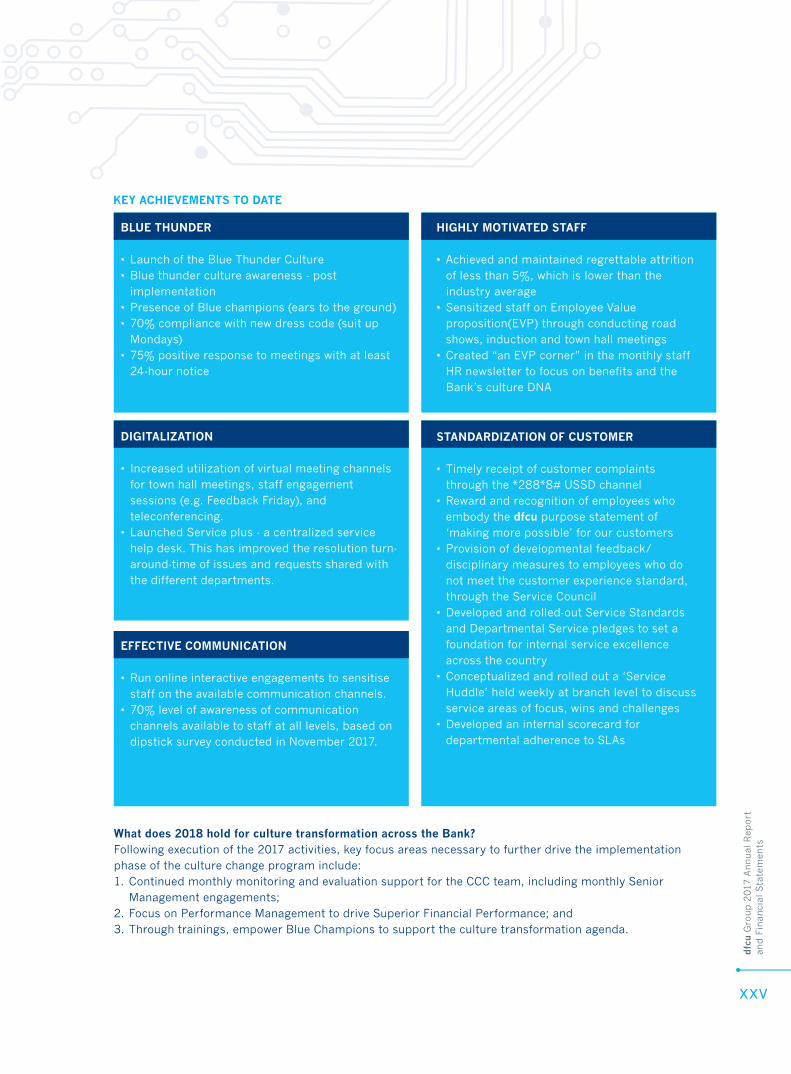
KEY ACHIEVEMENTS TO DATE
BLUE THUNDER • Launch of the Blue Thunder Culture• Blue thunder culture awareness - post
implementation• Presence of Blue champions (ears to the ground) • 70% compliance with new dress code (suit up
Mondays)• 75% positive response to meetings with at least
24-hour notice
DIGITALIZATION • Increased utilization of virtual meeting channels
for town hall meetings, staff engagement sessions (e.g. Feedback Friday), and teleconferencing.
• Launched Service plus - a centralized service help desk. This has improved the resolution turn-around-time of issues and requests shared with the different departments.
EFFECTIVE COMMUNICATION • Run online interactive engagements to sensitise
staff on the available communication channels.• 70% level of awareness of communication
channels available to staff at all levels, based on dipstick survey conducted in November 2017.
HIGHLY MOTIVATED STAFF • Achieved and maintained regrettable attrition
of less than 5%, which is lower than the industry average
• Sensitized staff on Employee Value proposition(EVP) through conducting road shows, induction and town hall meetings
• Created “an EVP corner” in the monthly staff HR newsletter to focus on benefits and the Bank’s culture DNA
STANDARDIZATION OF CUSTOMER • Timely receipt of customer complaints
through the *288*8# USSD channel• Reward and recognition of employees who
embody the dfcu purpose statement of ‘making more possible’ for our customers
• Provision of developmental feedback/disciplinary measures to employees who do not meet the customer experience standard, through the Service Council
• Developed and rolled-out Service Standards and Departmental Service pledges to set a foundation for internal service excellence across the country
• Conceptualized and rolled out a ‘Service Huddle’ held weekly at branch level to discuss service areas of focus, wins and challenges
• Developed an internal scorecard for departmental adherence to SLAs
What does 2018 hold for culture transformation across the Bank?Following execution of the 2017 activities, key focus areas necessary to further drive the implementation phase of the culture change program include: 1. Continued monthly monitoring and evaluation support for the CCC team, including monthly Senior
Management engagements; 2. Focus on Performance Management to drive Superior Financial Performance; and 3. Through trainings, empower Blue Champions to support the culture transformation agenda.

In addition to fulfilling our mandate of supporting individuals and businesses directly, we also look for ways to make a positive contribution beyond our core business. In particular, we are committed to supporting the communities in which we operate through a range of education and community investment focused initiatives.
As one of the top tier financial institutions in Uganda, we continued to play a key role in the financial education and inclusion of the community. Our Women in Business program continued to support the entrepreneurial spirit and enhance the stability of families, while our Investment Clubs provided a sustainable approach to promoting the savings culture in the community through trainings, peer education and provision of relevant solutions. In 2017, over 3800 groups benefited from financial inclusion workshops and trainings.
We continued to support the ‘Uganda’s Best Farmer Program in collaboration with our partners - the Dutch Embassy, Vision Group and KLM Airlines. Over the past four years, we have contributed over Ushs 900 million towards this program, which is playing a key role in improving the quality of farming practices in Uganda through educative farm tours, trainings and farmer exchange programs in the Netherlands.
As one of the local community initiatives, we supported the redevelopment of a three class room block at Nakivubo Blue Primary School, thus providing a decent learning environment to 240 less privileged children.
As dfcu we also recognise the impact and importance of sport, in particular football, in our communities. In 2017, we committed a two year Ushs 300 million sponsorship to a local football club, Vipers SC which has a strong heritage at empowering communities through sports development. We also donated 1000 bags of cement towards the refurbishment of Pece Sports Stadium in Northern Uganda.
As a key player in the banking sector, we recognised that we have a responsibility to support and uplift the communities in which we operate.
Empowering and Supporting Our Communities
BEFORE AFTER
dfcu
Gro
up 2
017
Annual R
eport
& F
inan
cial Statem
ents
xxvi
dfc
u G
roup 2
017
Annual
Rep
ort
an
d F
inan
cial
Sta
tem
ents
xxvii
Highlights underpinning our results for the year include;• Assumption of some assets and liabilities of
former Crane Bank;• Strong growth of customer deposits• Investment in human capital• Improved trade finance products• Broadening revenue base through new income
streams.
Below is a brief review of the movements in the statement of comprehensive income and the statement of financial position. All financial disclosures herein are based on the International Financial Reporting Standards (IFRS), and the guidelines of the Financial Institutions Act (2004) as amended in 2016.
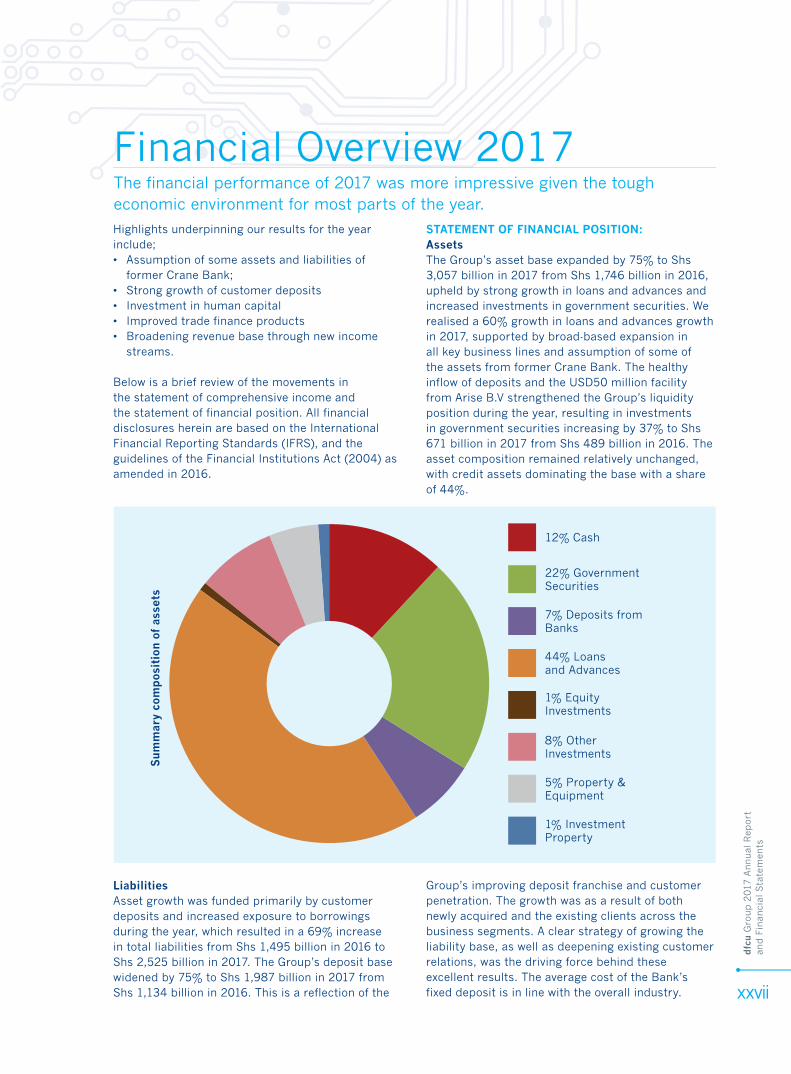
STATEMENT OF FINANCIAL POSITION:AssetsThe Group’s asset base expanded by 75% to Shs 3,057 billion in 2017 from Shs 1,746 billion in 2016, upheld by strong growth in loans and advances and increased investments in government securities. We realised a 60% growth in loans and advances growth in 2017, supported by broad-based expansion inall key business lines and assumption of some of the assets from former Crane Bank. The healthy inflow of deposits and the USD50 million facility from Arise B.V strengthened the Group’s liquidity position during the year, resulting in investments in government securities increasing by 37% to Shs 671 billion in 2017 from Shs 489 billion in 2016. The asset composition remained relatively unchanged, with credit assets dominating the base with a share of 44%.
The financial performance of 2017 was more impressive given the tough economic environment for most parts of the year.
Financial Overview 2017S
um
mar
y co
mp
osit
ion
of a
sset
s
12% Cash
22% Government Securities
7% Deposits from Banks
44% Loans and Advances
1% Equity Investments
8% OtherInvestments
5% Property & Equipment
1% Investment Property
LiabilitiesAsset growth was funded primarily by customer deposits and increased exposure to borrowings during the year, which resulted in a 69% increase in total liabilities from Shs 1,495 billion in 2016 to Shs 2,525 billion in 2017. The Group’s deposit base widened by 75% to Shs 1,987 billion in 2017 from Shs 1,134 billion in 2016. This is a reflection of the
Group’s improving deposit franchise and customer penetration. The growth was as a result of both newly acquired and the existing clients across the business segments. A clear strategy of growing the liability base, as well as deepening existing customer relations, was the driving force behind these excellent results. The average cost of the Bank’s fixed deposit is in line with the overall industry.
dfc
u G
roup 2
017
Annual
Rep
ort
an
d F
inan
cial
Sta
tem
ents
xxviii
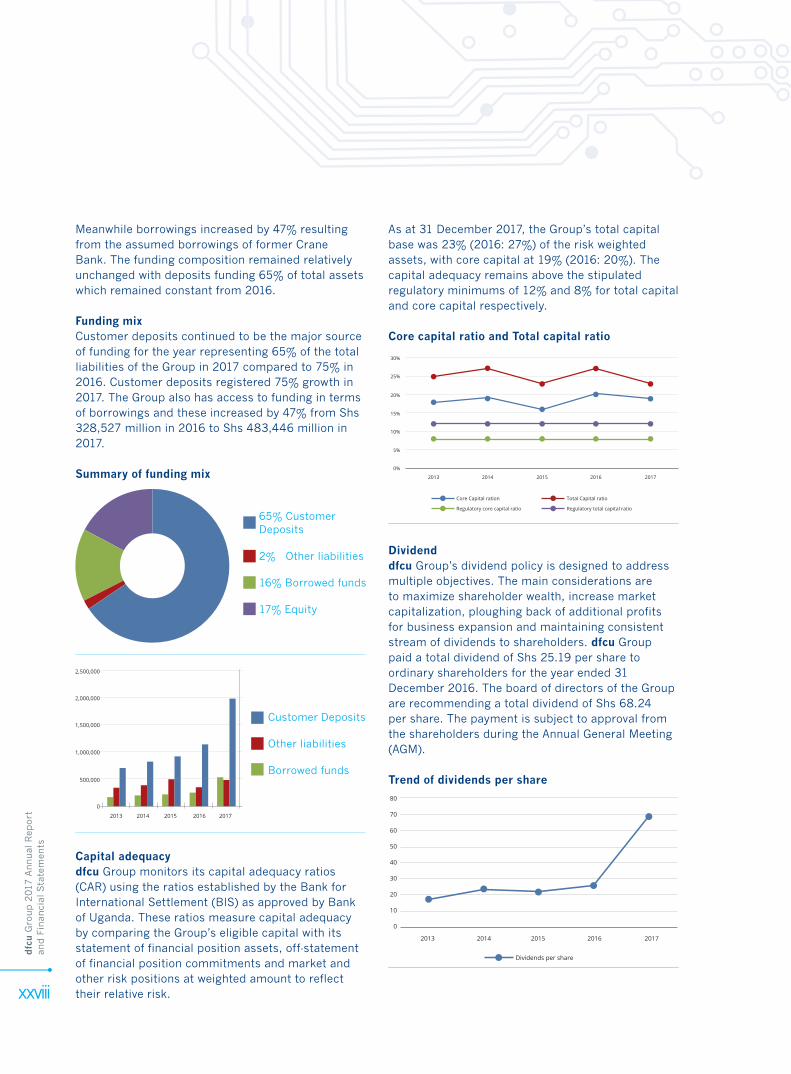
Meanwhile borrowings increased by 47% resulting from the assumed borrowings of former Crane Bank. The funding composition remained relatively unchanged with deposits funding 65% of total assets which remained constant from 2016.
Funding mixCustomer deposits continued to be the major source of funding for the year representing 65% of the total liabilities of the Group in 2017 compared to 75% in 2016. Customer deposits registered 75% growth in 2017. The Group also has access to funding in terms of borrowings and these increased by 47% from Shs 328,527 million in 2016 to Shs 483,446 million in 2017.
Summary of funding mix
Capital adequacydfcu Group monitors its capital adequacy ratios (CAR) using the ratios established by the Bank for International Settlement (BIS) as approved by Bank of Uganda. These ratios measure capital adequacy by comparing the Group’s eligible capital with its statement of financial position assets, off-statement of financial position commitments and market and other risk positions at weighted amount to reflect their relative risk.
As at 31 December 2017, the Group’s total capital base was 23% (2016: 27%) of the risk weighted assets, with core capital at 19% (2016: 20%). The capital adequacy remains above the stipulated regulatory minimums of 12% and 8% for total capital and core capital respectively.
Core capital ratio and Total capital ratio
Dividenddfcu Group’s dividend policy is designed to address multiple objectives. The main considerations are to maximize shareholder wealth, increase market capitalization, ploughing back of additional profits for business expansion and maintaining consistent stream of dividends to shareholders. dfcu Group paid a total dividend of Shs 25.19 per share to ordinary shareholders for the year ended 31 December 2016. The board of directors of the Group are recommending a total dividend of Shs 68.24 per share. The payment is subject to approval from the shareholders during the Annual General Meeting (AGM).
Trend of dividends per share
2% Other liabilities
16% Borrowed funds
17% Equity
65% Customer Deposits
2013
0
500,000
1,000,000
1,500,000
2,000,000
2,500,000
2014 2015 2016 2017
Customer Deposits
Other liabilities
Borrowed funds
2013
Core Capital ration
0%
5%
10%
15%
20%
25%
30%
2014 2015 2016 2017
Regulatory core capital ratio
Total Capital ratio
Regulatory total capital ratio
2013 2014 2015 2016 2017
Dividends per share
80
70
60
50
40
30
20
10
0
dfc
u G
roup 2
017
Annual
Rep
ort
an
d F
inan
cial
Sta
tem
ents
xxix
Statement of comprehensive income:Net interest incomeNet interest income-the principal source of income from the Group’s operations reached Shs 215,451 million, registering a 62% increase from Shs 133,241 million in 2016. This income performance was largely driven by investment of excess liquidity into higher yielding Investment securities, placements and customer lending.
Non-interest income dfcu Group’s non-interest income arises from trading financing activities, transactional fees, funds transfer charges, revaluation of currency positions and income on foreign transactions. Non-interest income grew by 35% from Shs 29,305 million in 2016 to Shs 39,655 million in 2017. The growth was driven by higher transaction volumes arising out of increased customer base.
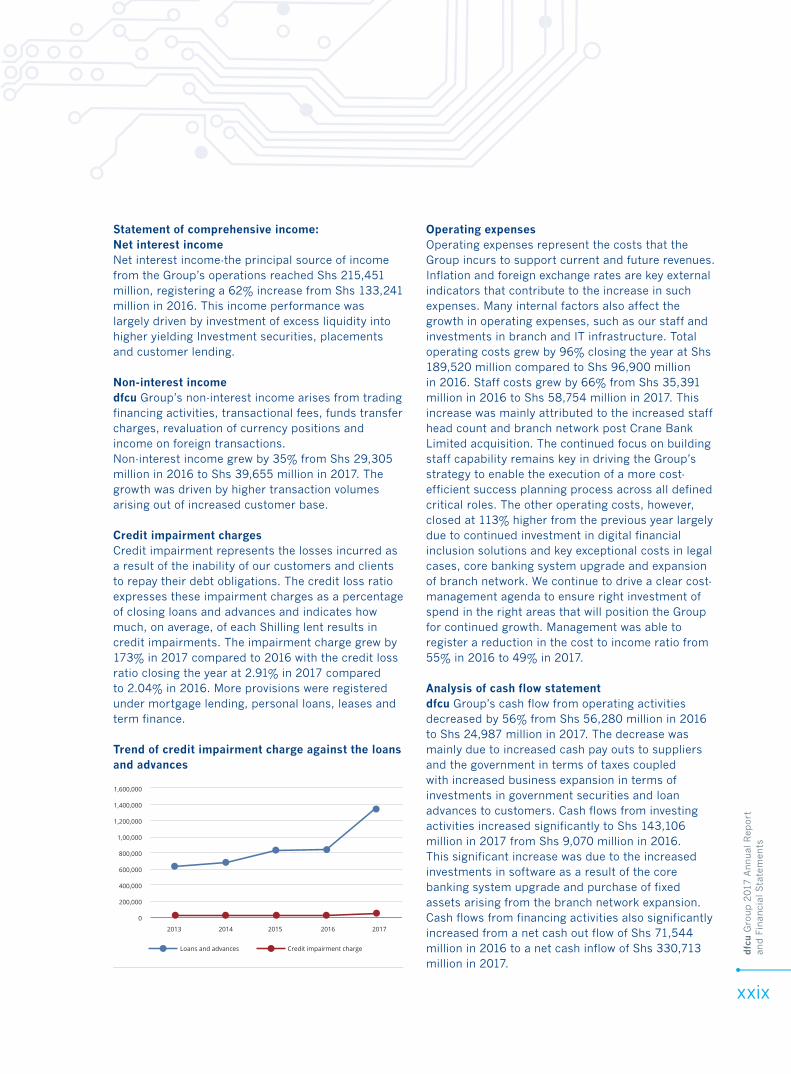
Credit impairment chargesCredit impairment represents the losses incurred as a result of the inability of our customers and clients to repay their debt obligations. The credit loss ratio expresses these impairment charges as a percentage of closing loans and advances and indicates how much, on average, of each Shilling lent results in credit impairments. The impairment charge grew by 173% in 2017 compared to 2016 with the credit loss ratio closing the year at 2.91% in 2017 compared to 2.04% in 2016. More provisions were registered under mortgage lending, personal loans, leases and term finance.
Trend of credit impairment charge against the loans and advances
Operating expensesOperating expenses represent the costs that the Group incurs to support current and future revenues. Inflation and foreign exchange rates are key external indicators that contribute to the increase in such expenses. Many internal factors also affect the growth in operating expenses, such as our staff and investments in branch and IT infrastructure. Total operating costs grew by 96% closing the year at Shs 189,520 million compared to Shs 96,900 million in 2016. Staff costs grew by 66% from Shs 35,391 million in 2016 to Shs 58,754 million in 2017. This increase was mainly attributed to the increased staff head count and branch network post Crane Bank Limited acquisition. The continued focus on building staff capability remains key in driving the Group’s strategy to enable the execution of a more cost-efficient success planning process across all defined critical roles. The other operating costs, however, closed at 113% higher from the previous year largely due to continued investment in digital financial inclusion solutions and key exceptional costs in legal cases, core banking system upgrade and expansion of branch network. We continue to drive a clear cost-management agenda to ensure right investment of spend in the right areas that will position the Group for continued growth. Management was able to register a reduction in the cost to income ratio from 55% in 2016 to 49% in 2017.
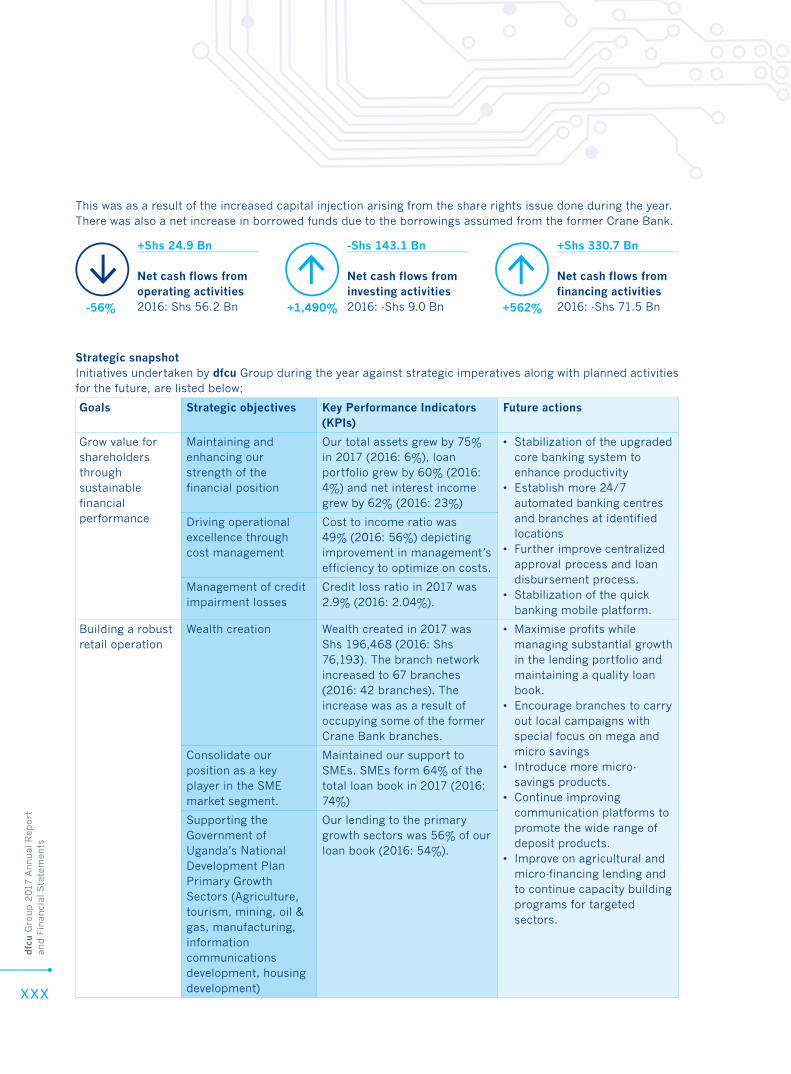
Analysis of cash flow statementdfcu Group’s cash flow from operating activities decreased by 56% from Shs 56,280 million in 2016 to Shs 24,987 million in 2017. The decrease was mainly due to increased cash pay outs to suppliers and the government in terms of taxes coupled with increased business expansion in terms of investments in government securities and loan advances to customers. Cash flows from investing activities increased significantly to Shs 143,106 million in 2017 from Shs 9,070 million in 2016. This significant increase was due to the increased investments in software as a result of the core banking system upgrade and purchase of fixed assets arising from the branch network expansion.Cash flows from financing activities also significantly increased from a net cash out flow of Shs 71,544 million in 2016 to a net cash inflow of Shs 330,713 million in 2017.
2013 2014 2015 2016 2017
Loans and advances Credit impairment charge
1,600,000
1,400,000
1,200,000
1,00,000
800,000
600,000
400,000
200,000
0
dfc
u G
roup 2
017
Annual
Rep
ort
an
d F
inan
cial
Sta
tem
ents
xxx
Goals Strategic objectives Key Performance Indicators (KPIs)
Future actions
Grow value for shareholders through sustainable financial performance
Maintaining and enhancing our strength of the financial position
Our total assets grew by 75% in 2017 (2016: 6%), loan portfolio grew by 60% (2016: 4%) and net interest income grew by 62% (2016: 23%)
• Stabilization of the upgraded core banking system to enhance productivity
• Establish more 24/7 automated banking centres and branches at identified locations
• Further improve centralized approval process and loan disbursement process.
• Stabilization of the quick banking mobile platform.
Driving operational excellence through cost management
Cost to income ratio was 49% (2016: 56%) depicting improvement in management’s efficiency to optimize on costs.
Management of credit impairment losses
Credit loss ratio in 2017 was 2.9% (2016: 2.04%).
Building a robust retail operation
Wealth creation Wealth created in 2017 was Shs 196,468 (2016: Shs 76,193). The branch network increased to 67 branches (2016: 42 branches). The increase was as a result of occupying some of the former Crane Bank branches.
• Maximise profits while managing substantial growth in the lending portfolio and maintaining a quality loan book.
• Encourage branches to carry out local campaigns with special focus on mega and micro savings
• Introduce more micro-savings products.
• Continue improving communication platforms to promote the wide range of deposit products.
• Improve on agricultural and micro-financing lending and to continue capacity building programs for targeted sectors.
Consolidate our position as a key player in the SME market segment.
Maintained our support to SMEs. SMEs form 64% of the total loan book in 2017 (2016: 74%)
Supporting the Government of Uganda’s National Development Plan Primary Growth Sectors (Agriculture, tourism, mining, oil & gas, manufacturing, information communications development, housing development)
Our lending to the primary growth sectors was 56% of our loan book (2016: 54%).
Strategic snapshotInitiatives undertaken by dfcu Group during the year against strategic imperatives along with planned activities for the future, are listed below;
This was as a result of the increased capital injection arising from the share rights issue done during the year. There was also a net increase in borrowed funds due to the borrowings assumed from the former Crane Bank.
+Shs 24.9 Bn
Net cash flows from operating activities2016: Shs 56.2 Bn
-Shs 143.1 Bn
Net cash flows from investing activities2016: -Shs 9.0 Bn
+Shs 330.7 Bn
Net cash flows from financing activities2016: -Shs 71.5 Bn+562%+1,490%-56%
dfc
u G
roup 2
017
Annual
Rep
ort
an
d F
inan
cial
Sta
tem
ents
xxxi
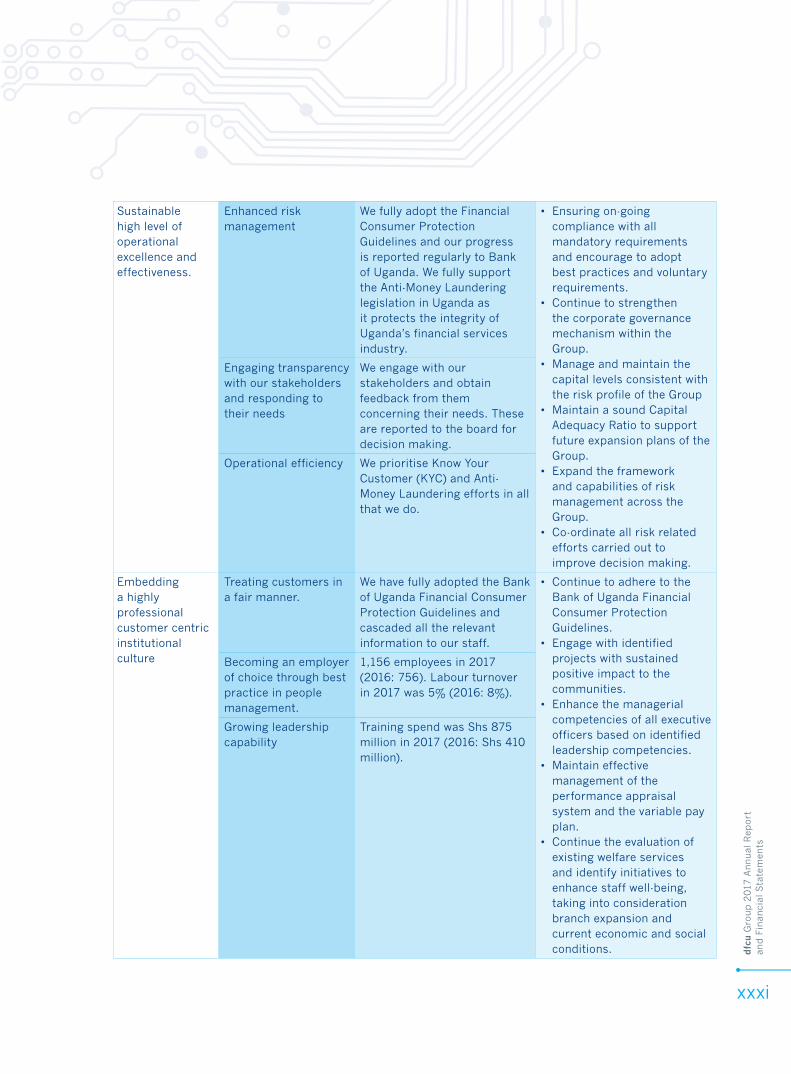
Sustainable high level of operational excellence and effectiveness.
Enhanced risk management
We fully adopt the Financial Consumer Protection Guidelines and our progress is reported regularly to Bank of Uganda. We fully support the Anti-Money Laundering legislation in Uganda as it protects the integrity of Uganda’s financial services industry.
• Ensuring on-going compliance with all mandatory requirements and encourage to adopt best practices and voluntary requirements.
• Continue to strengthen the corporate governance mechanism within the Group.
• Manage and maintain the capital levels consistent with the risk profile of the Group
• Maintain a sound Capital Adequacy Ratio to support future expansion plans of the Group.
• Expand the framework and capabilities of risk management across the Group.
• Co-ordinate all risk related efforts carried out to improve decision making.
Engaging transparency with our stakeholders and responding to their needs
We engage with our stakeholders and obtain feedback from them concerning their needs. These are reported to the board for decision making.
Operational efficiency We prioritise Know Your Customer (KYC) and Anti-Money Laundering efforts in all that we do.
Embedding a highly professional customer centric institutional culture
Treating customers in a fair manner.
We have fully adopted the Bank of Uganda Financial Consumer Protection Guidelines and cascaded all the relevant information to our staff.
• Continue to adhere to the Bank of Uganda Financial Consumer Protection Guidelines.
• Engage with identified projects with sustained positive impact to the communities.
• Enhance the managerial competencies of all executive officers based on identified leadership competencies.
• Maintain effective management of the performance appraisal system and the variable pay plan.
• Continue the evaluation of existing welfare services and identify initiatives to enhance staff well-being, taking into consideration branch expansion and current economic and social conditions.
Becoming an employer of choice through best practice in people management.
1,156 employees in 2017 (2016: 756). Labour turnover in 2017 was 5% (2016: 8%).
Growing leadership capability
Training spend was Shs 875 million in 2017 (2016: Shs 410 million).
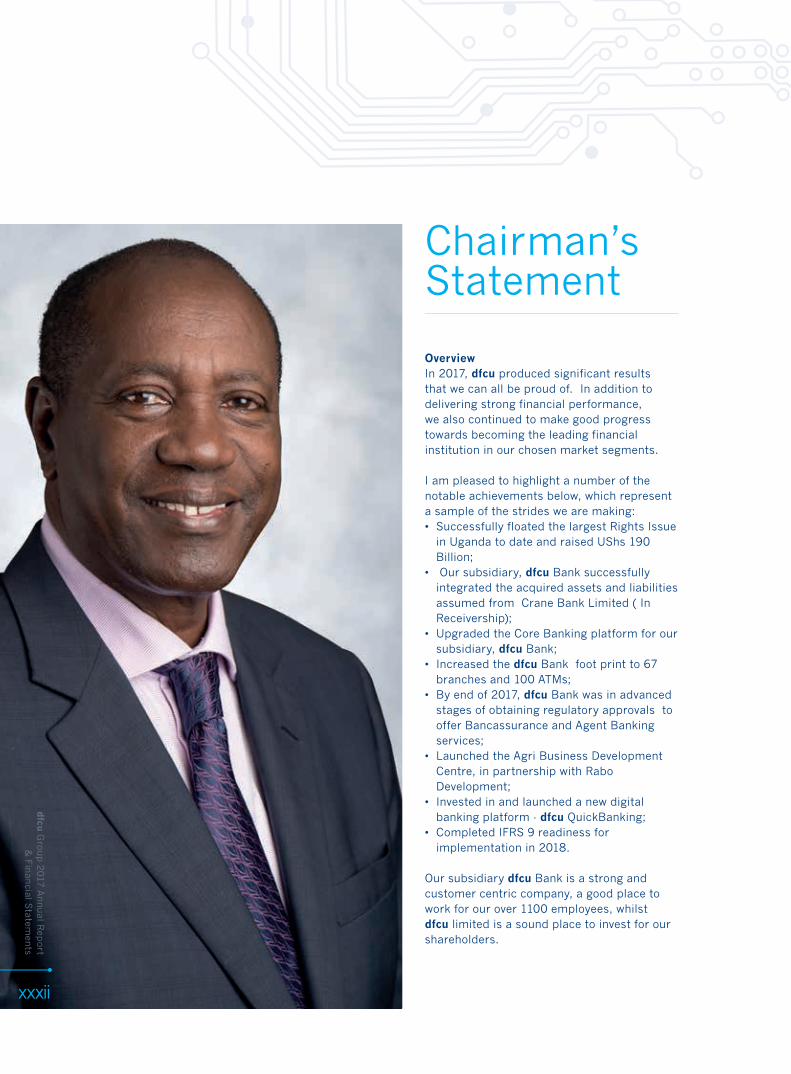
OverviewIn 2017, dfcu produced significant results that we can all be proud of. In addition to delivering strong financial performance, we also continued to make good progress towards becoming the leading financial institution in our chosen market segments.
I am pleased to highlight a number of the notable achievements below, which represent a sample of the strides we are making:• Successfully floated the largest Rights Issue
in Uganda to date and raised UShs 190 Billion;
• Our subsidiary, dfcu Bank successfully integrated the acquired assets and liabilities assumed from Crane Bank Limited ( In Receivership);
• Upgraded the Core Banking platform for our subsidiary, dfcu Bank;
• Increased the dfcu Bank foot print to 67 branches and 100 ATMs;
• By end of 2017, dfcu Bank was in advanced stages of obtaining regulatory approvals to offer Bancassurance and Agent Banking services;
• Launched the Agri Business Development Centre, in partnership with Rabo Development;
• Invested in and launched a new digital banking platform - dfcu QuickBanking;
• Completed IFRS 9 readiness for implementation in 2018.
Our subsidiary dfcu Bank is a strong and customer centric company, a good place to work for our over 1100 employees, whilst dfcu limited is a sound place to invest for our shareholders.
Chairman’s Statement
dfcu
Gro
up 2
017
Annual R
eport
& F
inan
cial Statem
ents
xxxii
dfc
u G
roup 2
017
Annual
Rep
ort
an
d F
inan
cial
Sta
tem
ents
xxxiii
The Economic and Regulatory environmentOverall, domestic economic conditions improved during the year, supported by easing of the monetary policy, growth in public spending and continued strengthening in the global economy.
The domestic economy is projected to grow at an annual rate of 5 per cent in the Financial Year 2017/18, which is higher than the 4 per cent recorded in 2016/17. However, growth has not been even across all sectors, with private investment and private sector credit remaining subdued.
The Uganda Shilling continued to edge lower against all major currencies on account of a widening current account deficit. During the year, domestic inflation remained controlled, and was well within the 5% Bank of Uganda target, with a positive medium term outlook.Commercial bank interest rates continued to ease, in response to the accommodative monetary policy stance, though sluggishly and with a lag.
In the medium term, economic growth is projected to accelerate at a faster pace boosted by public investments, growth in consumption and the current stimulatory monetary policy. A considerable amount of public infrastructure works are planned or underway, particularly the oil related investments.
The Banking EnvironmentThe financial soundness indicators of the banking system improved. The non-performing loan to total loan ratio reduced from 10.5% in December 2016 to 5.6% in December 2017. The Uganda Bankers Association, working with its members, has set up an asset recovery corporation, jointly owned by the banks. This will help banks to remedy the challenge of bad loans.
Private sector credit growth, a leading indicator of the financial sector’s contribution to economic activity, remained subdued with gross loans and advances increasing by only 1.8% in the year to September 2017. The downward trend in non-performing loans and the sustained monetary easing by the Central Bank should encourage banks to ease their lending policies and thereby enable an acceleration of credit growth in 2018. On the other
hand however, banks expect to tighten non-price terms and conditions including, the size of the loan, collateral requirements and maturity of the loan as they implement stricter provisioning standards required under IFRS9 and guard against inadequate security.
While the advent of financial technology companies (Fintechs) and digital financial platforms like mobile money was initially seen as competition to the banking sector, to the contrary, these technological advancements have funneled more customers into the formal financial system. As a result, the number of accounts in commercial banks have increased from 4.5 million as at June 2015 to 7.4 million as at June 2017. This growth will continue to be driven by the increasing collaboration between the Banks, telcos and Fintechs to offer convenient and affordable services for the mass market. As digital financial services become an increasingly prominent feature of the banking market, the sharing of joint platforms by banks offers the potential to generate significant costs savings, which can be passed on to customers.
At the end of 2016, one of the largest banks in Uganda, Crane Bank, went into statutory management, which action the Central Bank attributed to its to heavy weight of high non-performing loans and low profitability. The final resolution of this situation by the Central Bank resulted in our subsidiary, dfcu Bank acquiring some of the assets and assuming some of the liabilities of Crane Bank Limited ( In Receivership) in January 2017, after emerging as the successful bidder in the said process. Consequently there was no loss of depositors’ funds and public confidence in the safety of the banking sector was maintained.
the number of accounts in commercial banks have increased from 4.5 million as at June 2015 to 7.4 million as at June 2017.
dfc
u G
roup 2
017
Annual
Rep
ort
an
d F
inan
cial
Sta
tem
ents
xxxiv
Following the amendment of the Financial Institutions Act 2016 to allow banks engage in insurance services (amongst others), the Insurance Regulatory Authority (IRA) has so far issued licences to eight banks granting them permission to sell insurance products. Our subsidiary dfcu Bank will accordingly introduce a suit of tailored made insurance products during the course of 2018.
The Central Bank issued Agent Banking regulations in mid-2017. Several banks, including dfcu Bank, finalised their plans for full scale roll out in 2018.
Operating and financial resultsFor the 2017 financial year, net profit after tax was Ushs 106.89 Billion, up 136% from prior year. In line with the positive performance total revenues for the year were Ushs 517. 54 Billion, a growth of 101% compared to 2016. This was partly driven by significant growth in the key income lines.
Your Board proposed a final dividend of Ushs 68.24 per share, up from Ushs 25.19 for the prior year. In total, Ushs 51.05 Billion is being returned to shareholders as dividends.
Return on equity for the year was 20% up from 18% in 2016. Earnings per share surged to Ushs189.33 from Ushs 91.16 in the prior year.
Despite the increased size of our business, the Group’s cost-to-income ratio reduced by 7% to 49%.
It is important to note that the financials were prepared in line with IFRS 3 (Business Combinations) and take into account the fair value of:• Tangible assets and liabilities from the Crane Bank
acquisition;• Intangible benefits including core deposits and
customer relationships.The detail of the financial results and performance indicators can be found in the subsequent pages of this report.
The Strategic agendaOver the past five decades, we have supported the transformation of individuals and businesses by building on our deep financial competence and developing leading innovative solutions. We have an attractive market position and strong capabilities that hold potential for solid future growth.
Our market growth ambitions will continue to be driven by the following strategic aspirations:• Become the market leader.• Transform our subsidiary dfcu Bank from a niche
player to universal bank.• Continued investment in the digital agenda so that
the Group is positioned to seize the opportunities of the future.
• Deliver superior financial performance to our shareholders.
We understand that it will take resilience to fully achieve our strategic agenda, and are deeply committed to our journey because we believe that the focus we are driving will make us a more competitive organisation.
Delivering value to our shareholdersOne of the key mandates of your Board is to evaluate and support opportunities that grow shareholder value.
In January 2017, our wholly owned subsidiary, dfcu Bank Limited, acquired some of the assets and assumed some liabilities of the former Crane Bank Limited (in receivership). This was a great opportunity which your Board carefully considered and made a conscious decision to pursue.The key highlights of the transaction were:• an increase in branch network from 43 to 67 with
over 100 ATMs;• grew active customer base to over half a million;• enhanced our skills base and capacity as a result
of staff integration.
Following the acquisition, the post integrationbalance sheet as at 31st December 2017 reflects total assets of Ushs 3.06 trillion (2016: Ushs 1.76 trillion), net advances of Ushs 1.33 trillion (2016: Ushs 0.84 trillion) and customer deposits of Ushs 1.99 trillion (2016: Ushs 1.13 trillion). The balance sheet as at 31 December 2017 also takes into account the fair valued acquired assets and assumed liabilities.
The acquisition, which firmly places our subsidiary dfcu Bank among the top three banks in the market in terms of total assets, will accelerate the growth of the Group and result in transforming it from a niche to universal player with superior financial performance and significantly enhanced shareholder value.

dfc
u G
roup 2
017
Annual
Rep
ort
an
d F
inan
cial
Sta
tem
ents
xxxv
Capital and fundingThe acquisition of some of the assets and assumed liabilities of the former Crane Bank Limited (in receivership), required that dfcu Bank capital requirements for the future be shored up. The Company took a decision to provide the additional capital required by the Bank. The capital injection was funded by a short-term bridging loan facility of USD 50 million from our largest shareholder Arise B.V.
Upon the approval by Shareholders in the Annual General Meeting held on 08 June 2017, the Board, in line with its objective to ensure that the Bank is adequately capitalised, resolved to raise Ushs 200 billion through a Rights Issue, to repay the loan.
A total of 263,516,083 shares were offered to current shareholders to take up, making this the largest transaction of its kind on the Uganda Securities Exchange’s history. Our shareholders responded with a resounding 95.23% subscription implying strong confidence in the Company’s growth prospects.
Driving productivity and efficiencyProductivity remains critical to our long-termsuccess. We constantly analyse our businesses, to unlock efficiencies, and find new ways to reduce turnaround times, minimise errors, and lower unit costs.
The Group invested in an upgraded core banking system for its subsidiary dfcu Bank. The upgraded core banking platform provides a firm base upon which to expand, innovate and increase automation of end-to-end customer journeys.
To support the efficiency agenda, implementation of the business process improvements identified in the ongoing Business Process Re-engineering (BPR) project commenced. A number of critical processes are being automated to deliver leaner, simpler, easier, faster, highly efficient and effective methods of work.
Responding to technological changeThe financial services industry is going through one of the most significant periods of change we have seen in many years, and we are responding accordingly. Bank branch transactions are tapering as increasingly our customers prefer the convenience and ease of digital channels. We expect the digital revolution to naturally lead to a lower foot print of our physical branch network in the coming years.Through our subsidiary, dfcu Bank, we are providing customers with more ways to bank than ever before. We rolled out a new e-banking platform under the flagship name of Quick Banking, and will introduce dfcu Agent Banking during 2018. We are collaborating with several innovative partners, with whom we will meet our aspiration of becoming the ‘bank for the future’.
Our investment in technology also serves to achieve the broader goal of financial inclusion within the community. This means scaling up our digital and mobile capabilities to make our products and services easily accessible.
Preparing the organisation for long-term successWe are building our workforce to adapt to changing customer behaviour and expectations. To this end, dfcu embarked on a cultural transformation journey with the belief that no business can succeed without human transformation. As part of this journey, a set of cultural competences were introduced including: • Focus on staff and customers• Courage• Transparency• Stewardship• Collective Effort• Decisiveness• Pride and passion
In 2018, the focus will be to further drive the implementation phase of the culture change program.
Corporate Governance and Board changesSound and effective corporate governance is essential for the long-term success of the Company and the execution of our strategic vision. The Board is collectively responsible for delivering this long-term success and sustaining shareholder value.

dfc
u G
roup 2
017
Annual
Rep
ort
an
d F
inan
cial
Sta
tem
ents
xxxvi
We continued with the established governance framework and oversight organs of the board committees to ensure the Group remained stable and focused on delivering on the strategy.
Further details relating to the Board and the conduct of its affairs are set out in the Corporate Governance section of this report on page xliii.
Our involvement with the communityIn addition to fulfilling our responsibility to support individuals and businesses directly, we believe we are accountable for creating a positive social impact in the communities where we operate.
We continued to drive our financial education agenda through dfcu Bank’s Women in Business and Investment Club programmes. Over 3,800 groups benefited from financial inclusion workshops and trainings.
During the year, dfcu Bank and Rabo Development launched the Agribusiness Development Centre (ADC) to support the transformation of Farmer based organisations. A combined sum of USD 2.8 million has been committed towards ADC activities for the next five years. We also continued to sponsor the Best Farmer program, towards which we have contributed over Ushs 900 million.
Looking ahead We are optimistic about the economy, whose prospects are underpinned by the implementation of significant infrastructure projects and a renewed momentum in the oil and gas sector.
The increased size of our subsidiary, dfcu Bank, allows it to effectively compete and take advantage of the anticipated growth in the Ugandan economy.
Our focus for the next three years is to:• implement business process re-engineering;• implement our channel strategy including
relaunching our internet and mobile banking platforms, agency banking and other new offerings;
• diversify the deposit mix with focus on growing cheap liabilities;
• grow a diversified quality loan portfolio; • implement the culture change programme to
enhance staff productivity.
AcknowledgmentI would like to take this opportunity to thank my fellow directors for their dedication and commitment over the past twelve months. I also express my appreciation to our shareholders for their commitment in 2017, and confidence they have about the future of our Company.
I recognize the confidence that customers place in dfcu and commit that we will continue to put you first as we invest in our future mutual success.
Finally, none of the progress made in 2017 would have been possible without the dedicated efforts of our employees, and I want to extend my gratitude for their hard work as well.
Elly Karuhanga,Chairman, Board of Directors

The Group’s methodology to risk management, underpinned by our Risk Appetite Framework, is aimed at embedding a risk-aware culture in all decision-making, and a pledge to managing risk in a proactive and effective manner. This includes the early identification and evaluation of risks, the management and mitigation of risks before they crystalize, and dealing with them effectively in the event they manifest. Accountability for risk management is clear throughout the Group and is a key performance area for management and staff.The current financial year has seen further maturity of the risk management framework with emphasis on testing of key controls across the business units.
RISK GOVERNANCE - (OUR RISK APPETITE FRAMEWORK)Strategic direction and risk appetiteThe Board of Directors determines the strategic direction of the Group and agrees the nature and extent of the risks it is willing to take to achieve its strategic objectives. To ensure that the strategic direction chosen by the business represents the best of the strategic options open to it, the Board is
supported by the Group’s Senior Management. This function exists to facilitate and inform the Board’s assessment of the risk landscape and development of potential strategies by which it can drive long-term shareholder value. On an annual basis the Group’s Senior Management develops an in-depth fact base in a consistent format which outlines the market attractiveness, competitive position and financial performance. These are then used to facilitate debate as to the level and type of risk that the Board finds appropriate in the pursuit of its strategic objectives. The strategy, once fully defined, considered and approved by the Board helps to communicate the risk appetite and expectations of the organisation both internally and externally.
The ultimate responsibility for the Group’s risk management rests with the Board. Having determined and communicated the appropriate level of risk for the business, the Board established and maintains a risk management system to identify, assess, manage and monitor risks which could threaten the existence of the company or have a significant impact on the achievement of its strategic objectives.
Successful management of existing and emerging risks is critical to the long-term success of our business and to the achievement of our strategic objectives. In order to seize market opportunities and leverage the potential for success, risk must be accepted to a reasonable degree. Risk management is therefore an integral component of the Group’s Corporate Governance.
Business Risk Report
dfc
u G
roup 2
017
Annual
Rep
ort
&
Fin
anci
al S
tate
men
ts
xxxvii
dfc
u G
roup 2
017
Annual
Rep
ort
an
d F
inan
cial
Sta
tem
ents
xxxviii
This risk management system includes an internally-published risk management policy (Risk Appetite framework) which helps to reinforce the tone set from the top on risk, by instilling an appropriate risk culture in the organisation whereby employees are expected to be risk aware, control minded and ‘do the right thing’. The policy provides a formal structure for risk management to embed it in the fabric of the business.
The Board delegates its risk-related responsibilities primarily to specialized committees which then focus on different aspects of risk management, and it receives regular updates on the key risks of the company in comparison to risk appetite and defined goals.
Senior management is responsible for risk management under the oversight of the Board. This is done through policies and procedures and together with an effective structure to support the execution and implementation of those policies. Management of risk is the responsibility of all staff at all levels. Officers within individual Business Units retain primary responsibility for managing the risk originating from their operations. However, overall responsibility for ensuring effective controls and compliance lies with the Risk Management function.
The effectiveness of the Risk Management SystemThe Risk team regularly reports to the Board Risk and Credit Committee on the performance and effectiveness of the risk management system.
Ad hoc risk reportingWhilst there is a formal process in place aligned to reporting to the Board on risks and risk management on a quarterly basis, the process of risk identification, assessment and response is continuous and therefore if required, risks can be reported outside of the quarterly process if events dictate that this is necessary and appropriate. Ideally such ad hoc reporting is performed by the business unit or function which is closest to the risk, but it can be performed by the Risk Management team if necessary.
The Board Audit Committee receives assurance from Internal Audit through its program of audits over a selection of principal risks and business transformation initiatives most critical to the Group’s continued success.
The conclusion from all of the above assurance work is that the risk management system has functioned effectively throughout the year and there have been no significant failings or weaknesses identified. Of course there is always room for improvement, and hence, the Risk Champions and the Group Risk team have continued to work together on risk management actions plans for the businesses.
PRINCIPAL RISKS There are some principal risks which are inherent to the banking sector and all businesses in the sector are exposed to them. For these inherent risks we have controls, processes and procedures in place to mitigate each risk to either minimise the likelihood of the event occurring and / or minimise the impact if it does occur. These risks are on our risk radar and we regularly monitor the risks, the controls and the risk landscape to ensure that the risk score stays stable and in line with our risk appetite in each case.
Furthermore, the banking industry is fast-paced and competitive, with changes in consumer tastes and preferences evolving all the time, operating in a dynamic economy. As a result, the Group always has to adapt to the changing environment, and it is this process of constant change which generally gives rise to a number of principal risks which we have to actively manage in order to bring the risk into line with our overall risk appetite.
The risks listed below are the principal risks that could materially impact our ability to serve our customers and/or deliver our strategy, and the actions we are taking to mitigate these risks. These risks are not listed in order of materiality and the section should be read in conjunction with the Notes to the Financial Statements relevant to Risk Management.
Credit RiskCredit risk is the risk that the company will suffer a financial loss from counterparty’s failure to pay interest, repay capital or meet a commitment as it falls due. The company’s credit risk arises mainly from its lending activities to customers but also from interbank lending and investment in securities.
dfc
u G
roup 2
017
Annual
Rep
ort
an
d F
inan
cial
Sta
tem
ents
xxxix
The risk and its impact What are we doing about it?
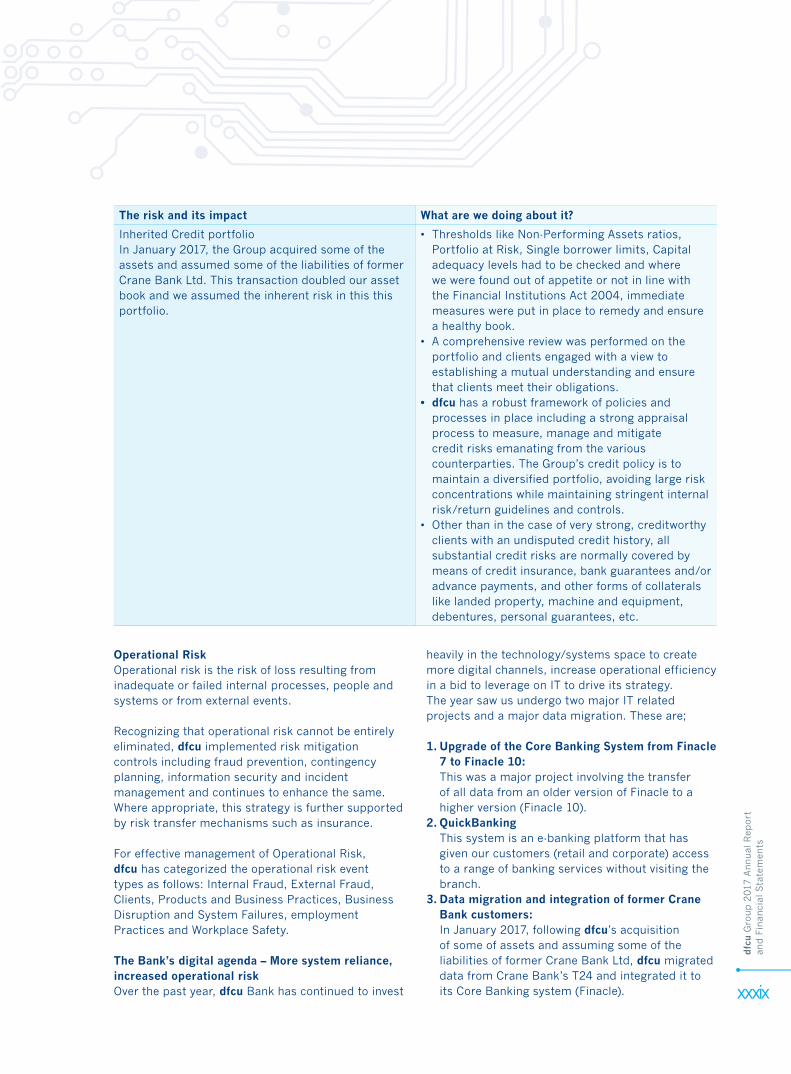
Inherited Credit portfolio In January 2017, the Group acquired some of the assets and assumed some of the liabilities of former Crane Bank Ltd. This transaction doubled our asset book and we assumed the inherent risk in this this portfolio.
• Thresholds like Non-Performing Assets ratios, Portfolio at Risk, Single borrower limits, Capital adequacy levels had to be checked and where we were found out of appetite or not in line with the Financial Institutions Act 2004, immediate measures were put in place to remedy and ensure a healthy book.
• A comprehensive review was performed on the portfolio and clients engaged with a view to establishing a mutual understanding and ensure that clients meet their obligations.
• dfcu has a robust framework of policies and processes in place including a strong appraisal process to measure, manage and mitigate credit risks emanating from the various counterparties. The Group’s credit policy is to maintain a diversified portfolio, avoiding large risk concentrations while maintaining stringent internal risk/return guidelines and controls.
• Other than in the case of very strong, creditworthy clients with an undisputed credit history, all substantial credit risks are normally covered by means of credit insurance, bank guarantees and/or advance payments, and other forms of collaterals like landed property, machine and equipment, debentures, personal guarantees, etc.
Operational RiskOperational risk is the risk of loss resulting from inadequate or failed internal processes, people and systems or from external events.
Recognizing that operational risk cannot be entirely eliminated, dfcu implemented risk mitigation controls including fraud prevention, contingency planning, information security and incident management and continues to enhance the same. Where appropriate, this strategy is further supported by risk transfer mechanisms such as insurance.
For effective management of Operational Risk, dfcu has categorized the operational risk event types as follows: Internal Fraud, External Fraud, Clients, Products and Business Practices, Business Disruption and System Failures, employment Practices and Workplace Safety.
The Bank’s digital agenda – More system reliance, increased operational riskOver the past year, dfcu Bank has continued to invest
heavily in the technology/systems space to create more digital channels, increase operational efficiency in a bid to leverage on IT to drive its strategy.The year saw us undergo two major IT related projects and a major data migration. These are;
1. Upgrade of the Core Banking System from Finacle 7 to Finacle 10:This was a major project involving the transfer of all data from an older version of Finacle to a higher version (Finacle 10).
2. QuickBankingThis system is an e-banking platform that has given our customers (retail and corporate) access to a range of banking services without visiting the branch.
3. Data migration and integration of former Crane Bank customers: In January 2017, following dfcu’s acquisition of some of assets and assuming some of the liabilities of former Crane Bank Ltd, dfcu migrated data from Crane Bank’s T24 and integrated it to its Core Banking system (Finacle).
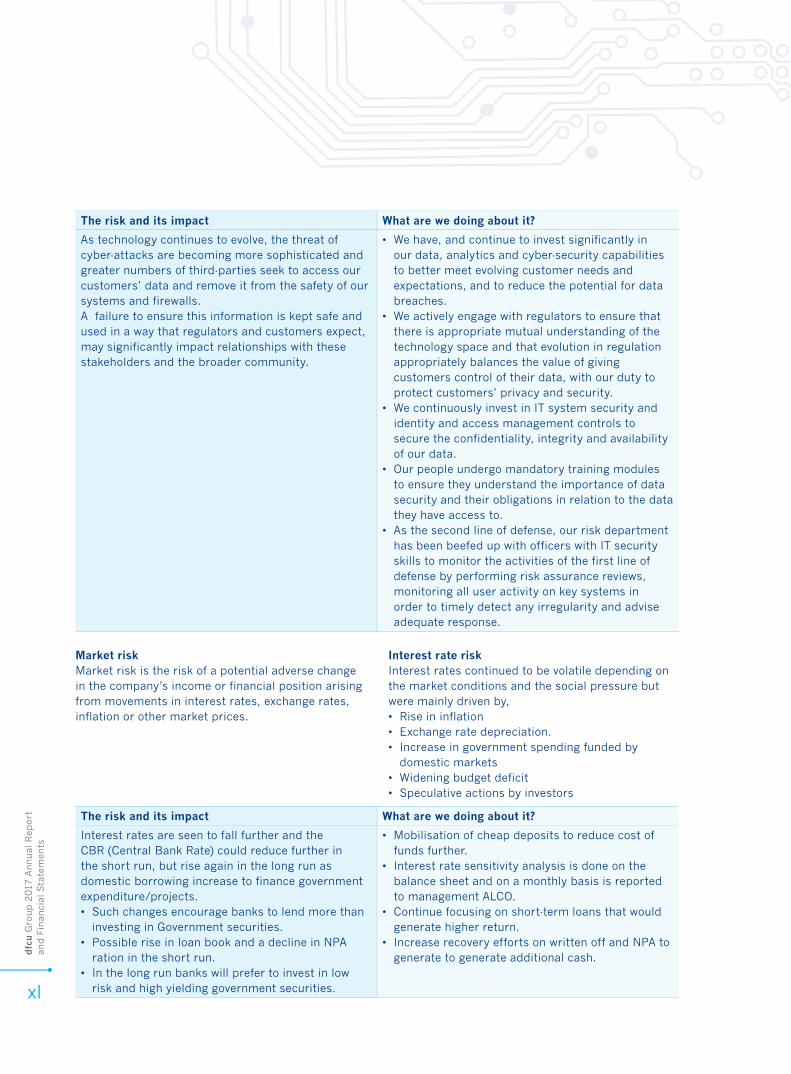
dfc
u G
roup 2
017
Annual
Rep
ort
an
d F
inan
cial
Sta
tem
ents
xl
The risk and its impact What are we doing about it?
As technology continues to evolve, the threat of cyber-attacks are becoming more sophisticated and greater numbers of third-parties seek to access our customers’ data and remove it from the safety of our systems and firewalls. A failure to ensure this information is kept safe and used in a way that regulators and customers expect, may significantly impact relationships with these stakeholders and the broader community.
• We have, and continue to invest significantly in our data, analytics and cyber-security capabilities to better meet evolving customer needs and expectations, and to reduce the potential for data breaches.
• We actively engage with regulators to ensure that there is appropriate mutual understanding of the technology space and that evolution in regulation appropriately balances the value of giving customers control of their data, with our duty to protect customers’ privacy and security.
• We continuously invest in IT system security and identity and access management controls to secure the confidentiality, integrity and availability of our data.
• Our people undergo mandatory training modules to ensure they understand the importance of data security and their obligations in relation to the data they have access to.
• As the second line of defense, our risk department has been beefed up with officers with IT security skills to monitor the activities of the first line of defense by performing risk assurance reviews, monitoring all user activity on key systems in order to timely detect any irregularity and advise adequate response.
Market risk Market risk is the risk of a potential adverse change in the company’s income or financial position arising from movements in interest rates, exchange rates, inflation or other market prices.
Interest rate riskInterest rates continued to be volatile depending on the market conditions and the social pressure but were mainly driven by, • Rise in inflation • Exchange rate depreciation. • Increase in government spending funded by
domestic markets • Widening budget deficit • Speculative actions by investors
The risk and its impact What are we doing about it?
Interest rates are seen to fall further and the CBR (Central Bank Rate) could reduce further in the short run, but rise again in the long run as domestic borrowing increase to finance government expenditure/projects. • Such changes encourage banks to lend more than
investing in Government securities. • Possible rise in loan book and a decline in NPA
ration in the short run.• In the long run banks will prefer to invest in low
risk and high yielding government securities.
• Mobilisation of cheap deposits to reduce cost of funds further.
• Interest rate sensitivity analysis is done on the balance sheet and on a monthly basis is reported to management ALCO.
• Continue focusing on short-term loans that would generate higher return.
• Increase recovery efforts on written off and NPA to generate to generate additional cash.
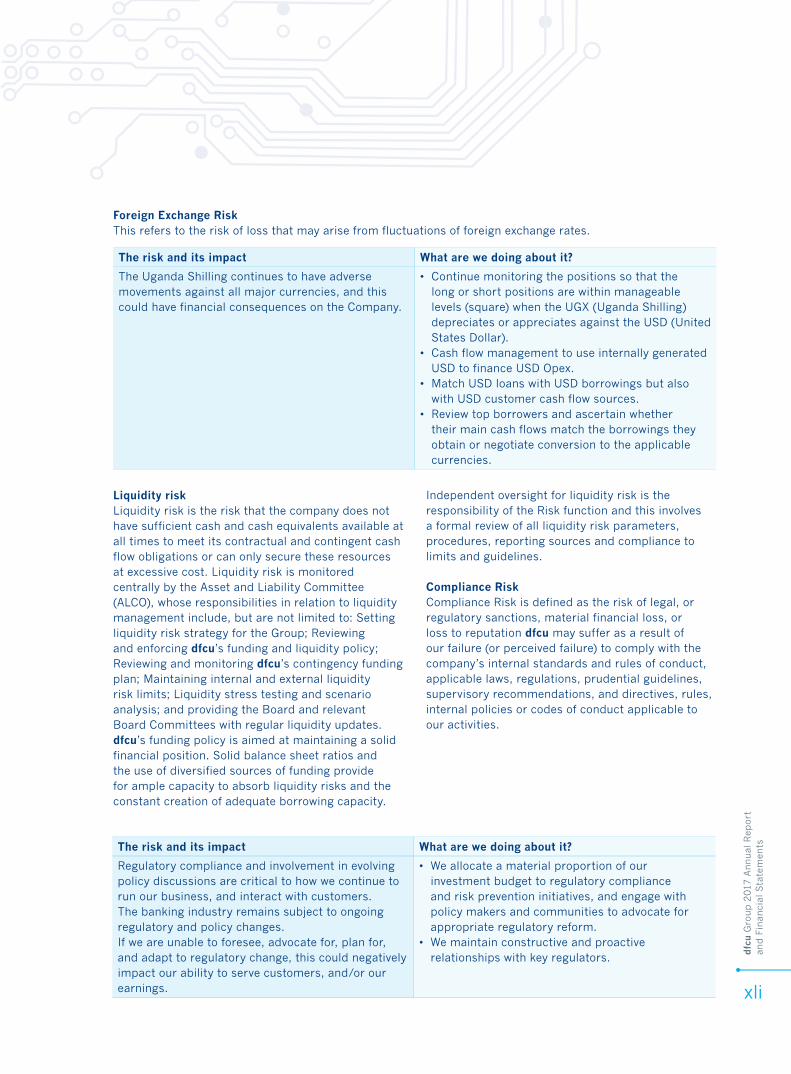
dfc
u G
roup 2
017
Annual
Rep
ort
an
d F
inan
cial
Sta
tem
ents
xli
Foreign Exchange RiskThis refers to the risk of loss that may arise from fluctuations of foreign exchange rates.
The risk and its impact What are we doing about it?
The Uganda Shilling continues to have adverse movements against all major currencies, and this could have financial consequences on the Company.
• Continue monitoring the positions so that the long or short positions are within manageable levels (square) when the UGX (Uganda Shilling) depreciates or appreciates against the USD (United States Dollar).
• Cash flow management to use internally generated USD to finance USD Opex.
• Match USD loans with USD borrowings but also with USD customer cash flow sources.
• Review top borrowers and ascertain whether their main cash flows match the borrowings they obtain or negotiate conversion to the applicable currencies.
Liquidity risk Liquidity risk is the risk that the company does not have sufficient cash and cash equivalents available at all times to meet its contractual and contingent cash flow obligations or can only secure these resources at excessive cost. Liquidity risk is monitored centrally by the Asset and Liability Committee (ALCO), whose responsibilities in relation to liquidity management include, but are not limited to: Setting liquidity risk strategy for the Group; Reviewing and enforcing dfcu’s funding and liquidity policy; Reviewing and monitoring dfcu’s contingency funding plan; Maintaining internal and external liquidity risk limits; Liquidity stress testing and scenario analysis; and providing the Board and relevant Board Committees with regular liquidity updates. dfcu’s funding policy is aimed at maintaining a solid financial position. Solid balance sheet ratios and the use of diversified sources of funding provide for ample capacity to absorb liquidity risks and the constant creation of adequate borrowing capacity.
Independent oversight for liquidity risk is the responsibility of the Risk function and this involves a formal review of all liquidity risk parameters, procedures, reporting sources and compliance to limits and guidelines.
Compliance Risk Compliance Risk is defined as the risk of legal, or regulatory sanctions, material financial loss, or loss to reputation dfcu may suffer as a result of our failure (or perceived failure) to comply with the company’s internal standards and rules of conduct, applicable laws, regulations, prudential guidelines, supervisory recommendations, and directives, rules, internal policies or codes of conduct applicable to our activities.
The risk and its impact What are we doing about it?
Regulatory compliance and involvement in evolving policy discussions are critical to how we continue to run our business, and interact with customers.The banking industry remains subject to ongoing regulatory and policy changes.If we are unable to foresee, advocate for, plan for, and adapt to regulatory change, this could negatively impact our ability to serve customers, and/or our earnings.
• We allocate a material proportion of our investment budget to regulatory compliance and risk prevention initiatives, and engage with policy makers and communities to advocate for appropriate regulatory reform.
• We maintain constructive and proactive relationships with key regulators.
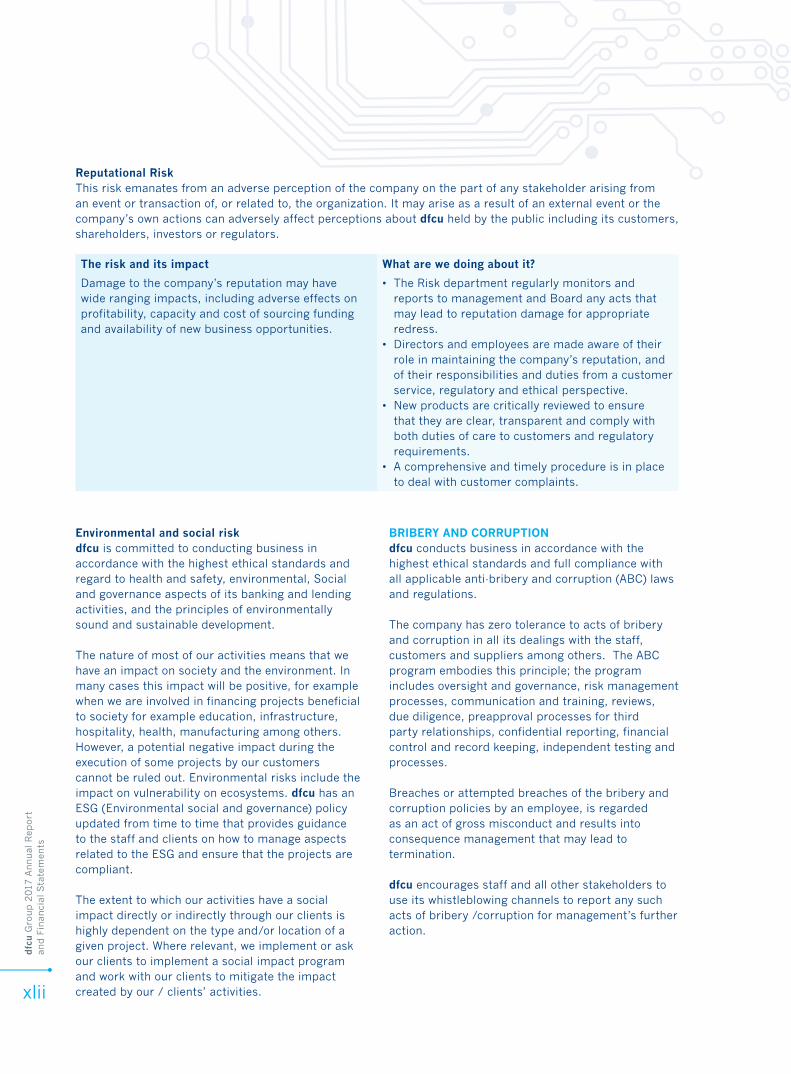
dfc
u G
roup 2
017
Annual
Rep
ort
an
d F
inan
cial
Sta
tem
ents
xlii
Reputational RiskThis risk emanates from an adverse perception of the company on the part of any stakeholder arising from an event or transaction of, or related to, the organization. It may arise as a result of an external event or the company’s own actions can adversely affect perceptions about dfcu held by the public including its customers, shareholders, investors or regulators.
The risk and its impact What are we doing about it?
Damage to the company’s reputation may have wide ranging impacts, including adverse effects on profitability, capacity and cost of sourcing funding and availability of new business opportunities.
• The Risk department regularly monitors and reports to management and Board any acts that may lead to reputation damage for appropriate redress.
• Directors and employees are made aware of their role in maintaining the company’s reputation, and of their responsibilities and duties from a customer service, regulatory and ethical perspective.
• New products are critically reviewed to ensure that they are clear, transparent and comply with both duties of care to customers and regulatory requirements.
• A comprehensive and timely procedure is in place to deal with customer complaints.
Environmental and social riskdfcu is committed to conducting business in accordance with the highest ethical standards and regard to health and safety, environmental, Social and governance aspects of its banking and lending activities, and the principles of environmentally sound and sustainable development.
The nature of most of our activities means that we have an impact on society and the environment. In many cases this impact will be positive, for example when we are involved in financing projects beneficial to society for example education, infrastructure, hospitality, health, manufacturing among others. However, a potential negative impact during the execution of some projects by our customers cannot be ruled out. Environmental risks include the impact on vulnerability on ecosystems. dfcu has an ESG (Environmental social and governance) policy updated from time to time that provides guidance to the staff and clients on how to manage aspects related to the ESG and ensure that the projects are compliant.
The extent to which our activities have a social impact directly or indirectly through our clients is highly dependent on the type and/or location of a given project. Where relevant, we implement or ask our clients to implement a social impact program and work with our clients to mitigate the impact created by our / clients’ activities.
BRIBERY AND CORRUPTIONdfcu conducts business in accordance with the highest ethical standards and full compliance with all applicable anti-bribery and corruption (ABC) laws and regulations.
The company has zero tolerance to acts of bribery and corruption in all its dealings with the staff, customers and suppliers among others. The ABC program embodies this principle; the program includes oversight and governance, risk management processes, communication and training, reviews, due diligence, preapproval processes for third party relationships, confidential reporting, financial control and record keeping, independent testing and processes.
Breaches or attempted breaches of the bribery and corruption policies by an employee, is regarded as an act of gross misconduct and results into consequence management that may lead to termination.
dfcu encourages staff and all other stakeholders to use its whistleblowing channels to report any such acts of bribery /corruption for management’s further action.
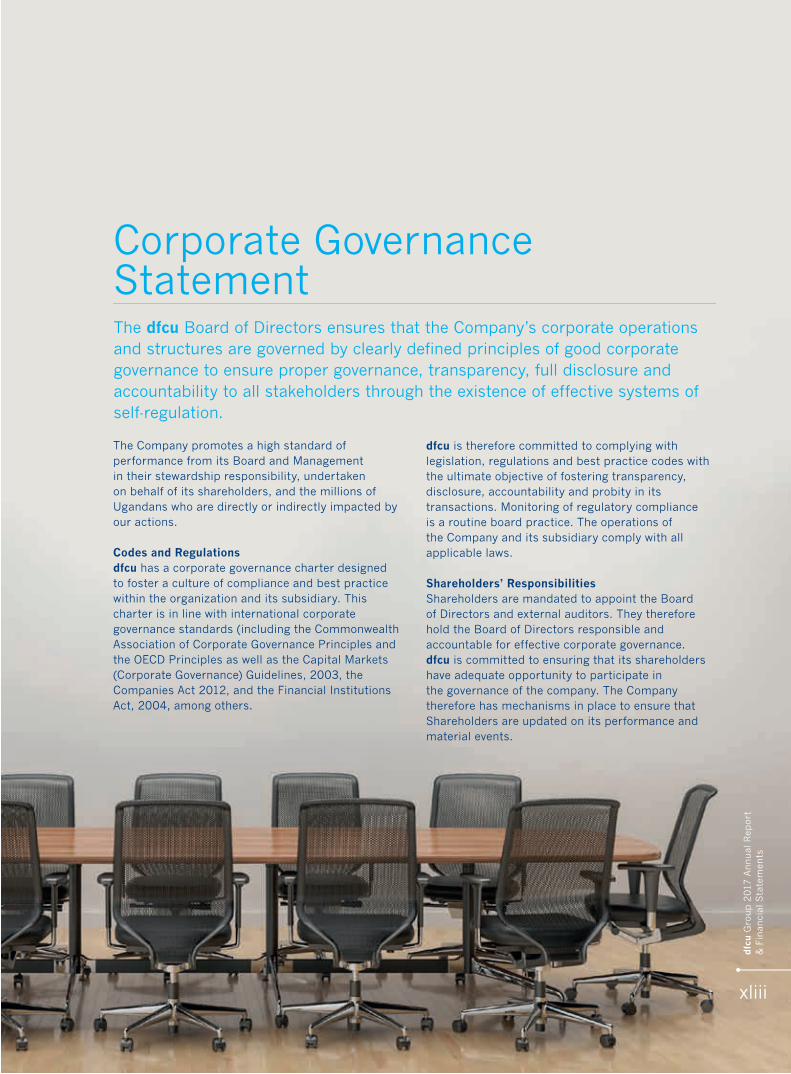
The Company promotes a high standard of performance from its Board and Management in their stewardship responsibility, undertaken on behalf of its shareholders, and the millions of Ugandans who are directly or indirectly impacted by our actions.
Codes and Regulationsdfcu has a corporate governance charter designed to foster a culture of compliance and best practice within the organization and its subsidiary. This charter is in line with international corporate governance standards (including the Commonwealth Association of Corporate Governance Principles and the OECD Principles as well as the Capital Markets (Corporate Governance) Guidelines, 2003, the Companies Act 2012, and the Financial Institutions Act, 2004, among others.
dfcu is therefore committed to complying with legislation, regulations and best practice codes with the ultimate objective of fostering transparency, disclosure, accountability and probity in its transactions. Monitoring of regulatory compliance is a routine board practice. The operations of the Company and its subsidiary comply with all applicable laws.
Shareholders’ ResponsibilitiesShareholders are mandated to appoint the Board of Directors and external auditors. They therefore hold the Board of Directors responsible and accountable for effective corporate governance. dfcu is committed to ensuring that its shareholders have adequate opportunity to participate in the governance of the company. The Company therefore has mechanisms in place to ensure that Shareholders are updated on its performance and material events.
The dfcu Board of Directors ensures that the Company’s corporate operations and structures are governed by clearly defined principles of good corporate governance to ensure proper governance, transparency, full disclosure and accountability to all stakeholders through the existence of effective systems of self-regulation.
Corporate Governance Statement
dfc
u G
roup 2
017
Annual
Rep
ort
&
Fin
anci
al S
tate
men
ts
xliii
dfc
u G
roup 2
017
Annual
Rep
ort
an
d F
inan
cial
Sta
tem
ents
xliv
Shareholders are encouraged to attend Annual General Meetings as well as any such meeting as may be scheduled by the Board of Directors for the purpose of providing their input in the Company’s operations.
Board of DirectorsThe Board is responsible for overseeing the management of the business and affairs of the Company on behalf of the shareholders. The Board, which is multi-skilled, acts as the ultimate decision-making body of the Company, except in those matters reserved for the shareholders under the Companies Act and the Memorandum and Articles of Association.
The Board is collectively responsible for the following, among others:• to protect the interests of shareholders and
other stakeholders of the Company, and to take these into account in directing the affairs of the Company;
• to determine the aims of the Company, review, provide input into and approve business plans, strategy, structures, policies and investments, and ensure achievement of the Company’s objectives;
• to provide oversight to and supervise management of the Company’s operations and ensure the establishment of effective internal control systems;
• to establish systems that ensure that the Company is managed with integrity and complies with all legal and regulatory requirements and that it conducts its business in accordance with high ethical standards;
Appointment of DirectorsIn choosing directors, the Company seeks individuals who are of high integrity and passionate about the sectors the Company is involved with. Further attention is given to the need to attract suitably qualified individuals with an appropriate balance of skills and exposure (both local and international) in various areas including financial, operational, risk management, digital and corporate governance, amongst others.
The appointment of directors is governed by the Company’s Memorandum and Articles of Association. Directors are appointed by shareholders in a general meeting. The Board may fill vacancies on the Board pending the general meeting.
Such directors are required to retire and submit themselves to election by the next general meeting. The general meeting is availed with the required particulars about directors due for election to guide its decision. These particulars include the nominee director’s qualifications amongst others. Nominee directors must declare any conflicts of interest for due consideration.
The Board members’ nominee identification and vetting process is conducted by the Board’s Nominations Committee.
Nominee directors of the subsidiary, dfcu Bank, are required by law to be cleared by the Central Bank which conducts a rigorous vetting process including a “fit and proper test” prior to issuance of its no objection to the appointment.
As at the end of 2017, the Board of Directors of dfcu Limited comprised six (6) non-executive directors including the Chairman.
On the other hand, dfcu Bank Limited, which is a fully owned subsidiary of dfcu Limited had nine (9) directors, seven (7) of whom are non-executive and two (2) executive directors.
The Directors who served on the dfcu Limited Board during the year under review are listed on Page vi whilst those who served on the Bank Board are listed on Page vii.
Board MeetingsThe Board meets routinely as provided for in the Company’s Articles of Association. To facilitate efficient decision making, senior management and third party professionals may be in attendance on a need basis. As a matter of course, all directors are required to declare any conflicts of interest prior to the commencement of each meeting for due consideration, if any.
Board meetings are held quarterly. During the year of review, the Board of Directors of dfcu Limited held 4 meetings. The Board of directors of its subsidiary dfcu Bank Limited similarly held 4 meetings during the year. The Board members’ attendance was as follows:
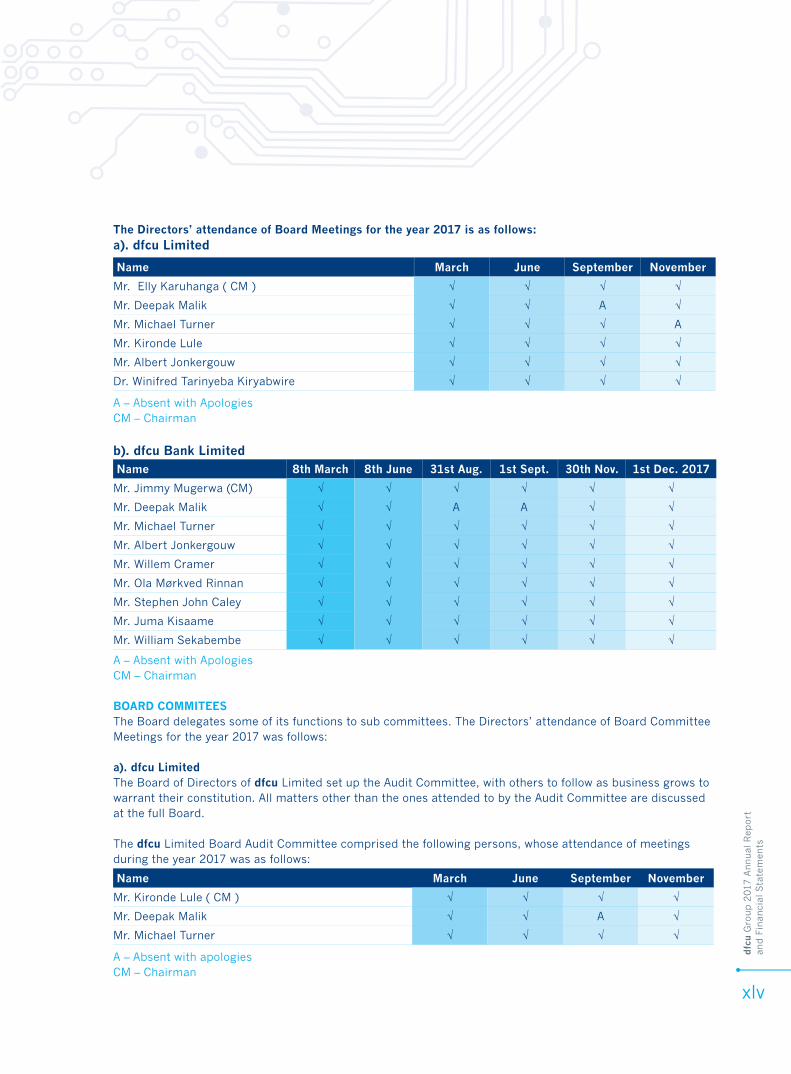
dfc
u G
roup 2
017
Annual
Rep
ort
an
d F
inan
cial
Sta
tem
ents
xlv
Name 8th March 8th June 31st Aug. 1st Sept. 30th Nov. 1st Dec. 2017
Mr. Jimmy Mugerwa (CM) √ √ √ √ √ √
Mr. Deepak Malik √ √ A A √ √
Mr. Michael Turner √ √ √ √ √ √
Mr. Albert Jonkergouw √ √ √ √ √ √
Mr. Willem Cramer √ √ √ √ √ √
Mr. Ola Mørkved Rinnan √ √ √ √ √ √
Mr. Stephen John Caley √ √ √ √ √ √
Mr. Juma Kisaame √ √ √ √ √ √
Mr. William Sekabembe √ √ √ √ √ √
A – Absent with ApologiesCM – Chairman
BOARD COMMITEES The Board delegates some of its functions to sub committees. The Directors’ attendance of Board Committee Meetings for the year 2017 was follows:
a). dfcu LimitedThe Board of Directors of dfcu Limited set up the Audit Committee, with others to follow as business grows to warrant their constitution. All matters other than the ones attended to by the Audit Committee are discussed at the full Board.
The dfcu Limited Board Audit Committee comprised the following persons, whose attendance of meetings during the year 2017 was as follows:
Name March June September November
Mr. Kironde Lule ( CM ) √ √ √ √
Mr. Deepak Malik √ √ A √
Mr. Michael Turner √ √ √ √
b). dfcu Bank Limited
A – Absent with apologiesCM – Chairman
Name March June September November
Mr. Elly Karuhanga ( CM ) √ √ √ √
Mr. Deepak Malik √ √ A √
Mr. Michael Turner √ √ √ A
Mr. Kironde Lule √ √ √ √
Mr. Albert Jonkergouw √ √ √ √
Dr. Winifred Tarinyeba Kiryabwire √ √ √ √
The Directors’ attendance of Board Meetings for the year 2017 is as follows:a). dfcu Limited
A – Absent with ApologiesCM – Chairman
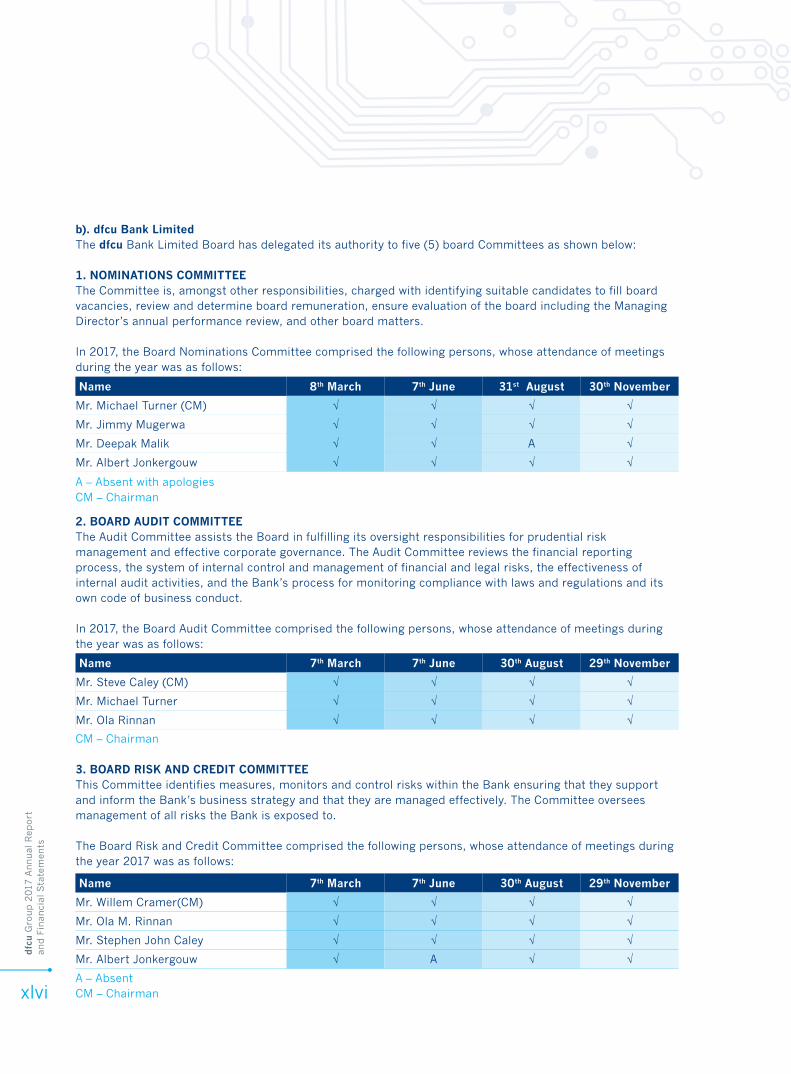
dfc
u G
roup 2
017
Annual
Rep
ort
an
d F
inan
cial
Sta
tem
ents
xlvi
Name 8th March 7th June 31st August 30th November
Mr. Michael Turner (CM) √ √ √ √
Mr. Jimmy Mugerwa √ √ √ √
Mr. Deepak Malik √ √ A √
Mr. Albert Jonkergouw √ √ √ √
2. BOARD AUDIT COMMITTEEThe Audit Committee assists the Board in fulfilling its oversight responsibilities for prudential risk management and effective corporate governance. The Audit Committee reviews the financial reporting process, the system of internal control and management of financial and legal risks, the effectiveness of internal audit activities, and the Bank’s process for monitoring compliance with laws and regulations and its own code of business conduct.
In 2017, the Board Audit Committee comprised the following persons, whose attendance of meetings during the year was as follows:
Name 7th March 7th June 30th August 29th November
Mr. Steve Caley (CM) √ √ √ √
Mr. Michael Turner √ √ √ √
Mr. Ola Rinnan √ √ √ √
b). dfcu Bank LimitedThe dfcu Bank Limited Board has delegated its authority to five (5) board Committees as shown below:
1. NOMINATIONS COMMITTEEThe Committee is, amongst other responsibilities, charged with identifying suitable candidates to fill board vacancies, review and determine board remuneration, ensure evaluation of the board including the Managing Director’s annual performance review, and other board matters.
In 2017, the Board Nominations Committee comprised the following persons, whose attendance of meetings during the year was as follows:
3. BOARD RISK AND CREDIT COMMITTEEThis Committee identifies measures, monitors and control risks within the Bank ensuring that they support and inform the Bank’s business strategy and that they are managed effectively. The Committee oversees management of all risks the Bank is exposed to.
The Board Risk and Credit Committee comprised the following persons, whose attendance of meetings during the year 2017 was as follows:
Name 7th March 7th June 30th August 29th November
Mr. Willem Cramer(CM) √ √ √ √
Mr. Ola M. Rinnan √ √ √ √
Mr. Stephen John Caley √ √ √ √
Mr. Albert Jonkergouw √ A √ √
A – Absent with apologiesCM – Chairman
CM – Chairman
A – Absent CM – Chairman
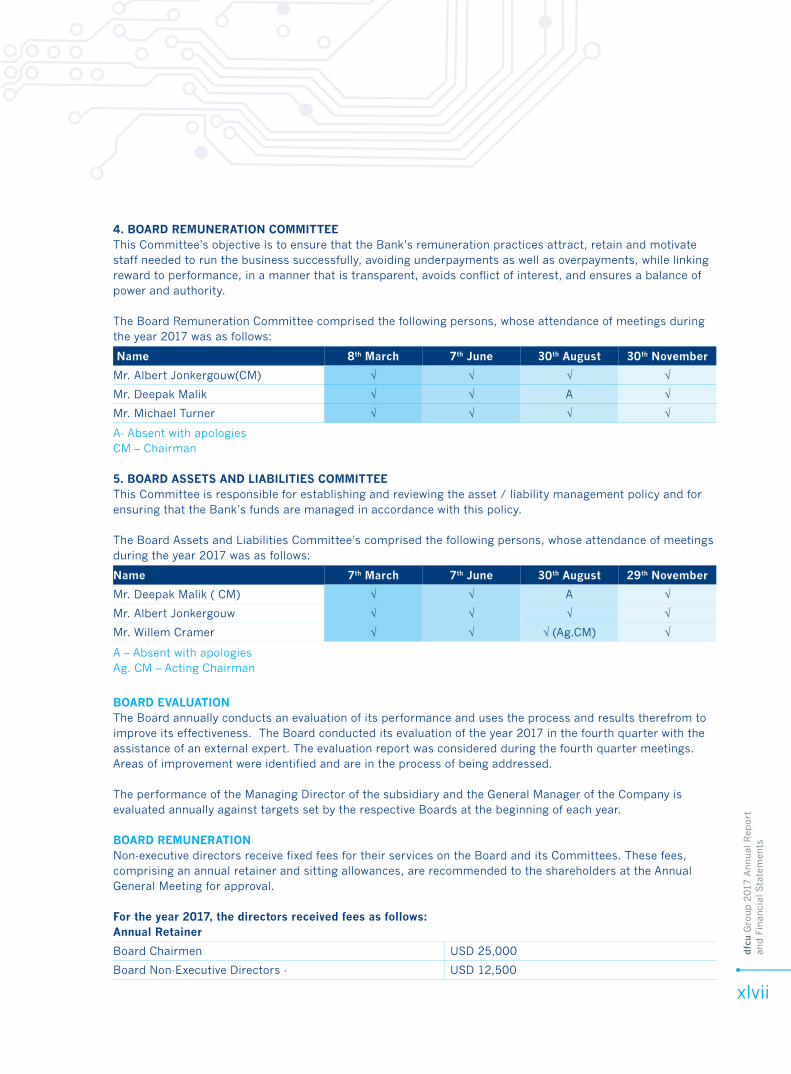
dfc
u G
roup 2
017
Annual
Rep
ort
an
d F
inan
cial
Sta
tem
ents
xlvii
4. BOARD REMUNERATION COMMITTEEThis Committee’s objective is to ensure that the Bank’s remuneration practices attract, retain and motivate staff needed to run the business successfully, avoiding underpayments as well as overpayments, while linking reward to performance, in a manner that is transparent, avoids conflict of interest, and ensures a balance of power and authority.
The Board Remuneration Committee comprised the following persons, whose attendance of meetings during the year 2017 was as follows:
Name 8th March 7th June 30th August 30th November
Mr. Albert Jonkergouw(CM) √ √ √ √
Mr. Deepak Malik √ √ A √
Mr. Michael Turner √ √ √ √
A- Absent with apologies CM – Chairman
5. BOARD ASSETS AND LIABILITIES COMMITTEEThis Committee is responsible for establishing and reviewing the asset / liability management policy and for ensuring that the Bank’s funds are managed in accordance with this policy.
The Board Assets and Liabilities Committee’s comprised the following persons, whose attendance of meetings during the year 2017 was as follows:
Name 7th March 7th June 30th August 29th November
Mr. Deepak Malik ( CM) √ √ A √
Mr. Albert Jonkergouw √ √ √ √
Mr. Willem Cramer √ √ √ (Ag.CM) √
A – Absent with apologiesAg. CM – Acting Chairman
BOARD EVALUATIONThe Board annually conducts an evaluation of its performance and uses the process and results therefrom to improve its effectiveness. The Board conducted its evaluation of the year 2017 in the fourth quarter with the assistance of an external expert. The evaluation report was considered during the fourth quarter meetings. Areas of improvement were identified and are in the process of being addressed.
The performance of the Managing Director of the subsidiary and the General Manager of the Company is evaluated annually against targets set by the respective Boards at the beginning of each year.
BOARD REMUNERATIONNon-executive directors receive fixed fees for their services on the Board and its Committees. These fees, comprising an annual retainer and sitting allowances, are recommended to the shareholders at the Annual General Meeting for approval.
For the year 2017, the directors received fees as follows:Annual Retainer
Board Chairmen USD 25,000
Board Non-Executive Directors - USD 12,500
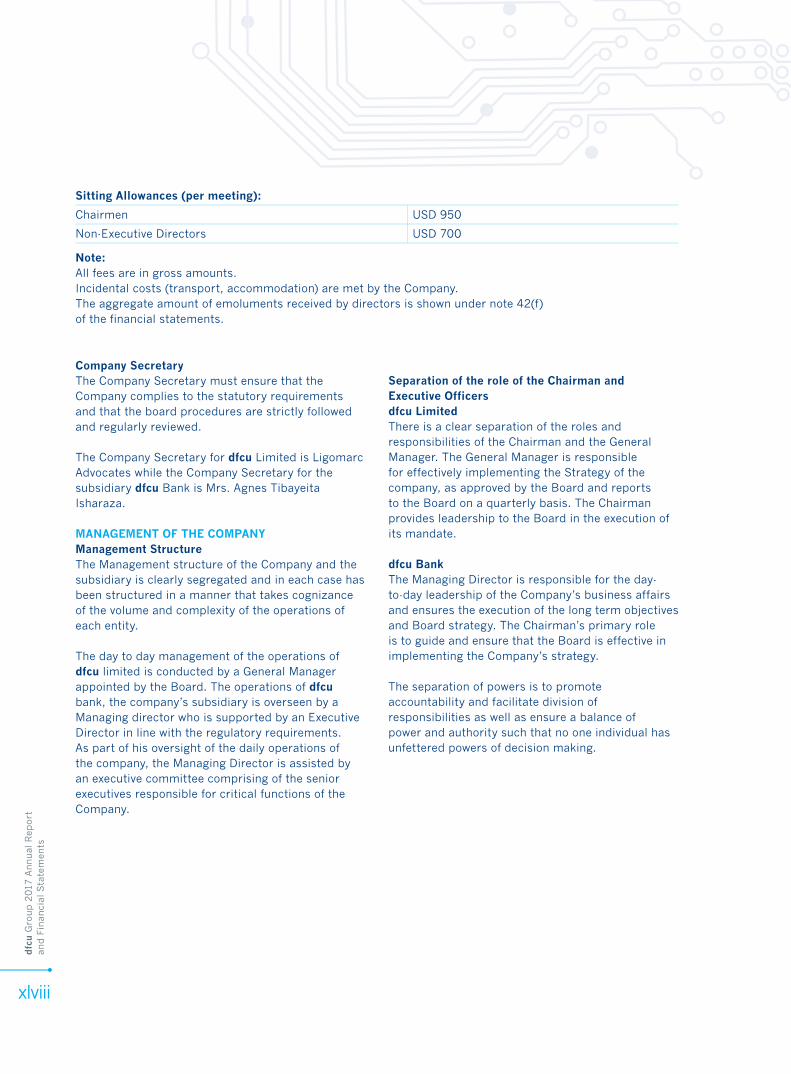
dfc
u G
roup 2
017
Annual
Rep
ort
an
d F
inan
cial
Sta
tem
ents
xlviii
Company SecretaryThe Company Secretary must ensure that the Company complies to the statutory requirements and that the board procedures are strictly followed and regularly reviewed.
The Company Secretary for dfcu Limited is Ligomarc Advocates while the Company Secretary for the subsidiary dfcu Bank is Mrs. Agnes Tibayeita Isharaza.
MANAGEMENT OF THE COMPANYManagement StructureThe Management structure of the Company and the subsidiary is clearly segregated and in each case has been structured in a manner that takes cognizance of the volume and complexity of the operations of each entity.
The day to day management of the operations of dfcu limited is conducted by a General Manager appointed by the Board. The operations of dfcu bank, the company’s subsidiary is overseen by a Managing director who is supported by an Executive Director in line with the regulatory requirements. As part of his oversight of the daily operations of the company, the Managing Director is assisted by an executive committee comprising of the senior executives responsible for critical functions of the Company.
Separation of the role of the Chairman and Executive Officersdfcu LimitedThere is a clear separation of the roles and responsibilities of the Chairman and the General Manager. The General Manager is responsible for effectively implementing the Strategy of the company, as approved by the Board and reports to the Board on a quarterly basis. The Chairman provides leadership to the Board in the execution of its mandate.
dfcu BankThe Managing Director is responsible for the day-to-day leadership of the Company’s business affairs and ensures the execution of the long term objectives and Board strategy. The Chairman’s primary role is to guide and ensure that the Board is effective in implementing the Company’s strategy.
The separation of powers is to promote accountability and facilitate division of responsibilities as well as ensure a balance of power and authority such that no one individual has unfettered powers of decision making.
Sitting Allowances (per meeting):
Chairmen USD 950
Non-Executive Directors USD 700
Note:All fees are in gross amounts.Incidental costs (transport, accommodation) are met by the Company.The aggregate amount of emoluments received by directors is shown under note 42(f) of the financial statements.
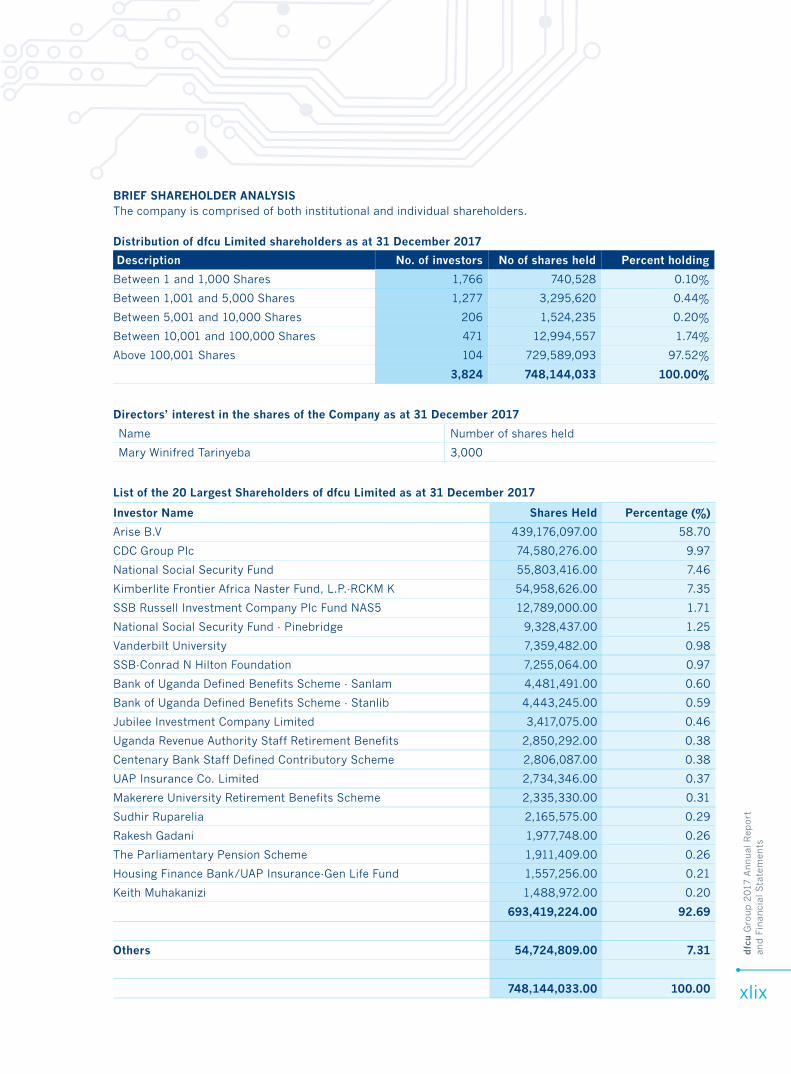
dfc
u G
roup 2
017
Annual
Rep
ort
an
d F
inan
cial
Sta
tem
ents
xlix
List of the 20 Largest Shareholders of dfcu Limited as at 31 December 2017
Description No. of investors No of shares held Percent holding
Between 1 and 1,000 Shares 1,766 740,528 0.10%
Between 1,001 and 5,000 Shares 1,277 3,295,620 0.44%
Between 5,001 and 10,000 Shares 206 1,524,235 0.20%
Between 10,001 and 100,000 Shares 471 12,994,557 1.74%
Above 100,001 Shares 104 729,589,093 97.52%
3,824 748,144,033 100.00%
Directors’ interest in the shares of the Company as at 31 December 2017
Name Number of shares held
Mary Winifred Tarinyeba 3,000
Investor Name Shares Held Percentage (%)
Arise B.V 439,176,097.00 58.70
CDC Group Plc 74,580,276.00 9.97
National Social Security Fund 55,803,416.00 7.46
Kimberlite Frontier Africa Naster Fund, L.P.-RCKM K 54,958,626.00 7.35
SSB Russell Investment Company Plc Fund NAS5 12,789,000.00 1.71
National Social Security Fund - Pinebridge 9,328,437.00 1.25
Vanderbilt University 7,359,482.00 0.98
SSB-Conrad N Hilton Foundation 7,255,064.00 0.97
Bank of Uganda Defined Benefits Scheme - Sanlam 4,481,491.00 0.60
Bank of Uganda Defined Benefits Scheme - Stanlib 4,443,245.00 0.59
Jubilee Investment Company Limited 3,417,075.00 0.46
Uganda Revenue Authority Staff Retirement Benefits 2,850,292.00 0.38
Centenary Bank Staff Defined Contributory Scheme 2,806,087.00 0.38
UAP Insurance Co. Limited 2,734,346.00 0.37
Makerere University Retirement Benefits Scheme 2,335,330.00 0.31
Sudhir Ruparelia 2,165,575.00 0.29
Rakesh Gadani 1,977,748.00 0.26
The Parliamentary Pension Scheme 1,911,409.00 0.26
Housing Finance Bank/UAP Insurance-Gen Life Fund 1,557,256.00 0.21
Keith Muhakanizi 1,488,972.00 0.20
693,419,224.00 92.69
Others 54,724,809.00 7.31
748,144,033.00 100.00
BRIEF SHAREHOLDER ANALYSIS The company is comprised of both institutional and individual shareholders.
Distribution of dfcu Limited shareholders as at 31 December 2017
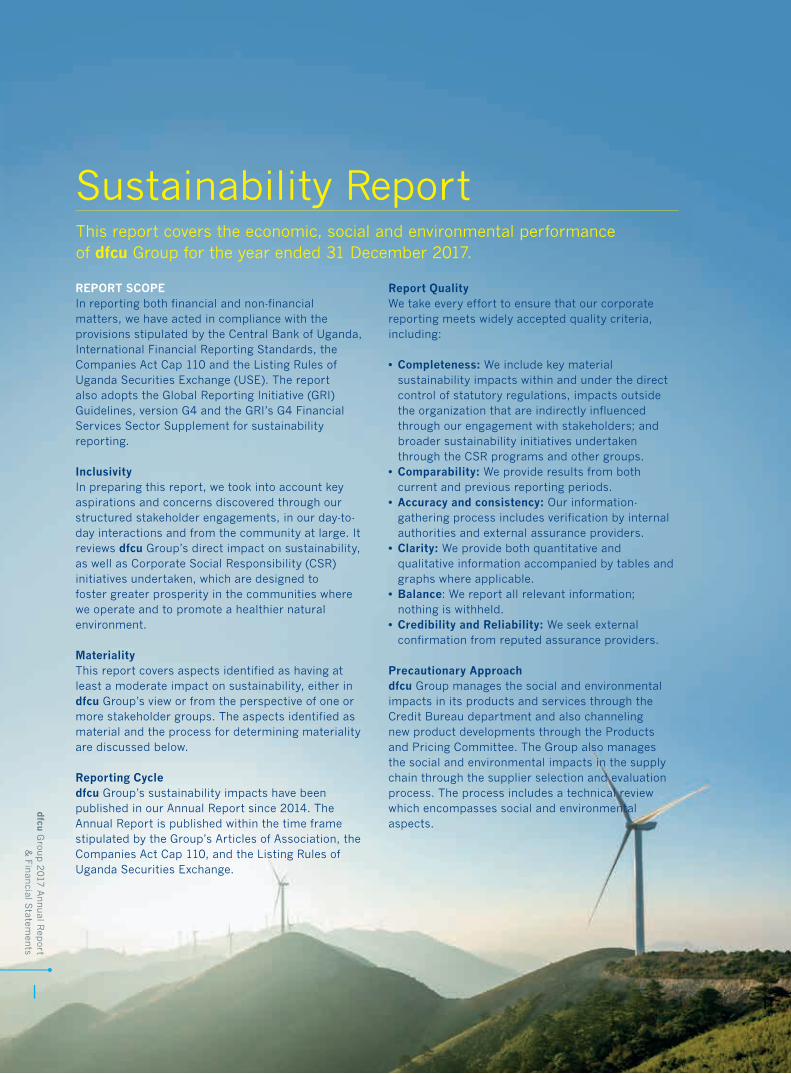
REPORT SCOPEIn reporting both financial and non-financial matters, we have acted in compliance with the provisions stipulated by the Central Bank of Uganda, International Financial Reporting Standards, the Companies Act Cap 110 and the Listing Rules of Uganda Securities Exchange (USE). The report also adopts the Global Reporting Initiative (GRI) Guidelines, version G4 and the GRI’s G4 Financial Services Sector Supplement for sustainability reporting.
InclusivityIn preparing this report, we took into account key aspirations and concerns discovered through our structured stakeholder engagements, in our day-to-day interactions and from the community at large. It reviews dfcu Group’s direct impact on sustainability, as well as Corporate Social Responsibility (CSR) initiatives undertaken, which are designed to foster greater prosperity in the communities where we operate and to promote a healthier natural environment.
MaterialityThis report covers aspects identified as having at least a moderate impact on sustainability, either in dfcu Group’s view or from the perspective of one or more stakeholder groups. The aspects identified as material and the process for determining materiality are discussed below.
Reporting Cycledfcu Group’s sustainability impacts have been published in our Annual Report since 2014. The Annual Report is published within the time frame stipulated by the Group’s Articles of Association, the Companies Act Cap 110, and the Listing Rules of Uganda Securities Exchange.
Report QualityWe take every effort to ensure that our corporate reporting meets widely accepted quality criteria, including:
• Completeness: We include key material sustainability impacts within and under the direct control of statutory regulations, impacts outside the organization that are indirectly influenced through our engagement with stakeholders; and broader sustainability initiatives undertaken through the CSR programs and other groups.
• Comparability: We provide results from both current and previous reporting periods.
• Accuracy and consistency: Our information-gathering process includes verification by internal authorities and external assurance providers.
• Clarity: We provide both quantitative and qualitative information accompanied by tables and graphs where applicable.
• Balance: We report all relevant information; nothing is withheld.
• Credibility and Reliability: We seek external confirmation from reputed assurance providers.
Precautionary Approachdfcu Group manages the social and environmental impacts in its products and services through the Credit Bureau department and also channeling new product developments through the Products and Pricing Committee. The Group also manages the social and environmental impacts in the supply chain through the supplier selection and evaluation process. The process includes a technical review which encompasses social and environmental aspects.
This report covers the economic, social and environmental performance of dfcu Group for the year ended 31 December 2017.
Sustainability Report
dfcu
Gro
up 2
017
Annual R
eport
& F
inan
cial Statem
ents
l
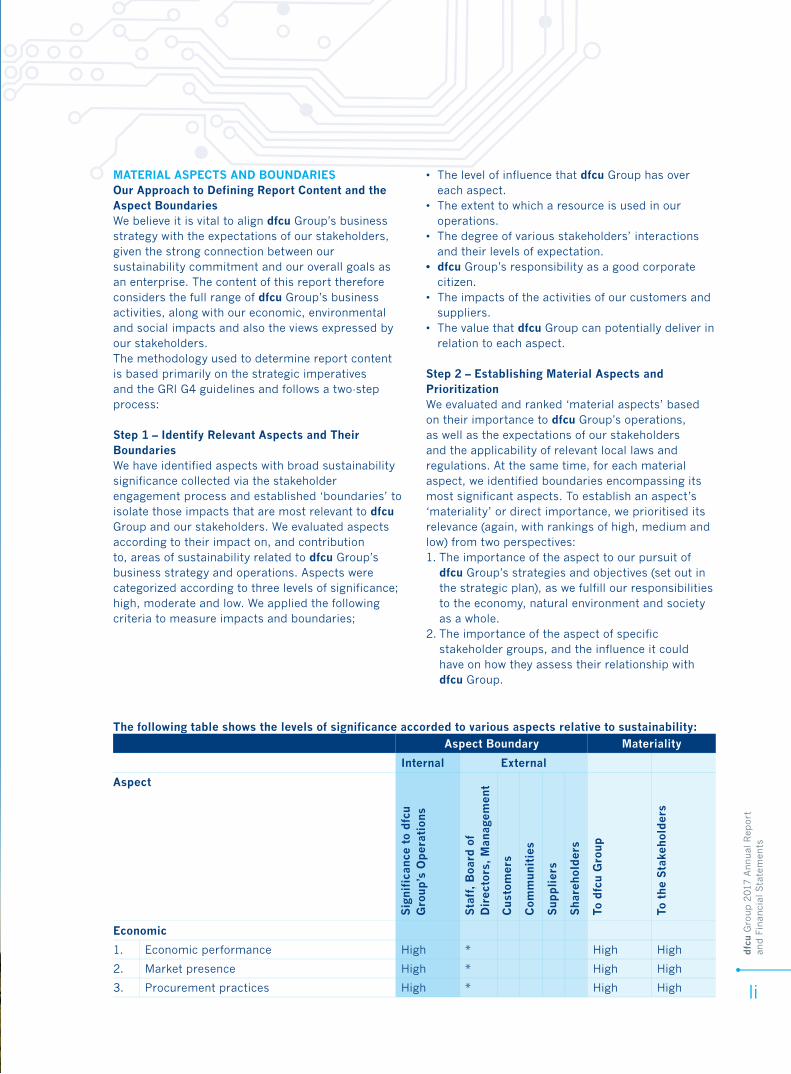
dfc
u G
roup 2
017
Annual
Rep
ort
an
d F
inan
cial
Sta
tem
ents
li
MATERIAL ASPECTS AND BOUNDARIESOur Approach to Defining Report Content and the Aspect BoundariesWe believe it is vital to align dfcu Group’s business strategy with the expectations of our stakeholders, given the strong connection between our sustainability commitment and our overall goals as an enterprise. The content of this report therefore considers the full range of dfcu Group’s business activities, along with our economic, environmental and social impacts and also the views expressed by our stakeholders.The methodology used to determine report content is based primarily on the strategic imperatives and the GRI G4 guidelines and follows a two-step process:
Step 1 – Identify Relevant Aspects and Their BoundariesWe have identified aspects with broad sustainability significance collected via the stakeholder engagement process and established ‘boundaries’ to isolate those impacts that are most relevant to dfcu Group and our stakeholders. We evaluated aspects according to their impact on, and contribution to, areas of sustainability related to dfcu Group’s business strategy and operations. Aspects were categorized according to three levels of significance; high, moderate and low. We applied the following criteria to measure impacts and boundaries;
• The level of influence that dfcu Group has over each aspect.
• The extent to which a resource is used in our operations.
• The degree of various stakeholders’ interactions and their levels of expectation.
• dfcu Group’s responsibility as a good corporate citizen.
• The impacts of the activities of our customers and suppliers.
• The value that dfcu Group can potentially deliver in relation to each aspect.
Step 2 – Establishing Material Aspects and PrioritizationWe evaluated and ranked ‘material aspects’ based on their importance to dfcu Group’s operations, as well as the expectations of our stakeholders and the applicability of relevant local laws and regulations. At the same time, for each material aspect, we identified boundaries encompassing its most significant aspects. To establish an aspect’s ‘materiality’ or direct importance, we prioritised its relevance (again, with rankings of high, medium and low) from two perspectives:1. The importance of the aspect to our pursuit of
dfcu Group’s strategies and objectives (set out in the strategic plan), as we fulfill our responsibilities to the economy, natural environment and society as a whole.
2. The importance of the aspect of specific stakeholder groups, and the influence it could have on how they assess their relationship with dfcu Group.
Aspect Boundary Materiality
Internal External
Aspect
Sig
nif
ican
ce t
o dfc
u G
roup’s
Op
erat
ions
Sta
ff,
Boa
rd o
f D
irec
tors
, M
anag
emen
t
Cust
omer
s
Com
munit
ies
Sup
pli
ers
Shar
ehol
der
s
To d
fcu
Gro
up
To t
he
Sta
kehol
der
s
Economic
1. Economic performance High * High High
2. Market presence High * High High
3. Procurement practices High * High High
The following table shows the levels of significance accorded to various aspects relative to sustainability:
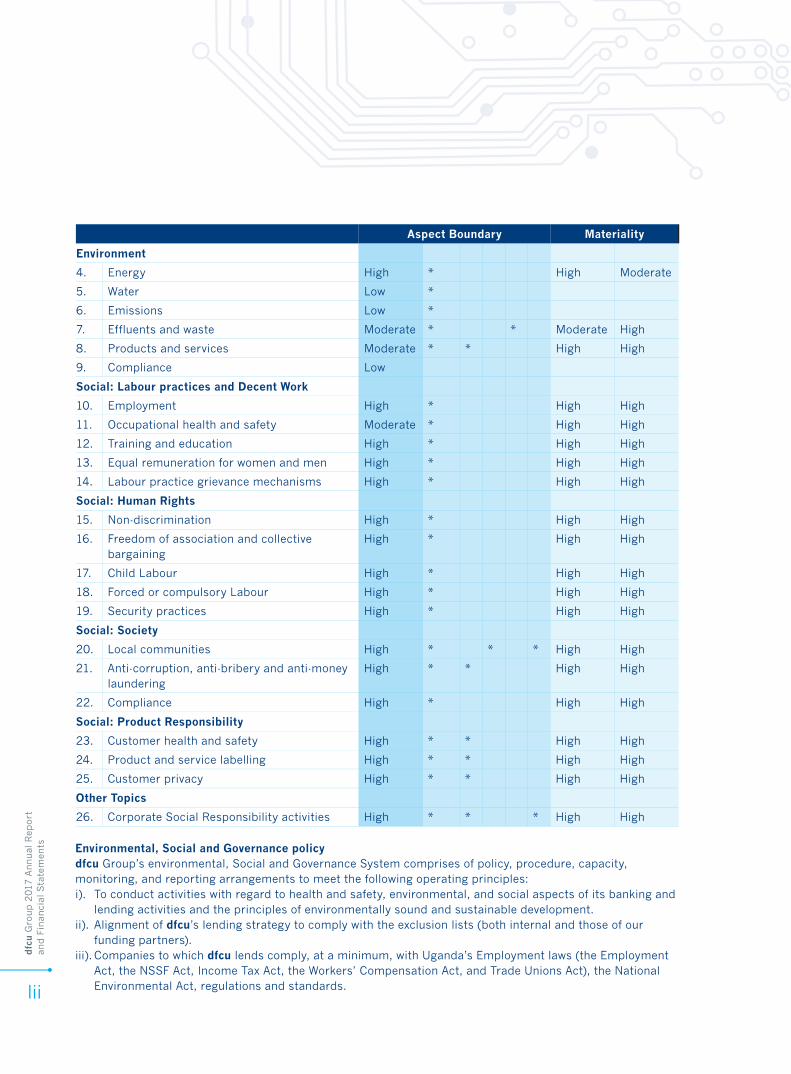
dfc
u G
roup 2
017
Annual
Rep
ort
an
d F
inan
cial
Sta
tem
ents
lii
Environment
4. Energy High * High Moderate
5. Water Low *
6. Emissions Low *
7. Effluents and waste Moderate * * Moderate High
8. Products and services Moderate * * High High
9. Compliance Low
Social: Labour practices and Decent Work
10. Employment High * High High
11. Occupational health and safety Moderate * High High
12. Training and education High * High High
13. Equal remuneration for women and men High * High High
14. Labour practice grievance mechanisms High * High High
Social: Human Rights
15. Non-discrimination High * High High
16. Freedom of association and collective bargaining
High * High High
17. Child Labour High * High High
18. Forced or compulsory Labour High * High High
19. Security practices High * High High
Social: Society
20. Local communities High * * * High High
21. Anti-corruption, anti-bribery and anti-money laundering
High * * High High
22. Compliance High * High High
Social: Product Responsibility
23. Customer health and safety High * * High High
24. Product and service labelling High * * High High
25. Customer privacy High * * High High
Other Topics
26. Corporate Social Responsibility activities High * * * High High
Environmental, Social and Governance policydfcu Group’s environmental, Social and Governance System comprises of policy, procedure, capacity, monitoring, and reporting arrangements to meet the following operating principles: i). To conduct activities with regard to health and safety, environmental, and social aspects of its banking and
lending activities and the principles of environmentally sound and sustainable development.ii). Alignment of dfcu’s lending strategy to comply with the exclusion lists (both internal and those of our
funding partners).iii). Companies to which dfcu lends comply, at a minimum, with Uganda’s Employment laws (the Employment
Act, the NSSF Act, Income Tax Act, the Workers’ Compensation Act, and Trade Unions Act), the National Environmental Act, regulations and standards.
Aspect Boundary Materiality
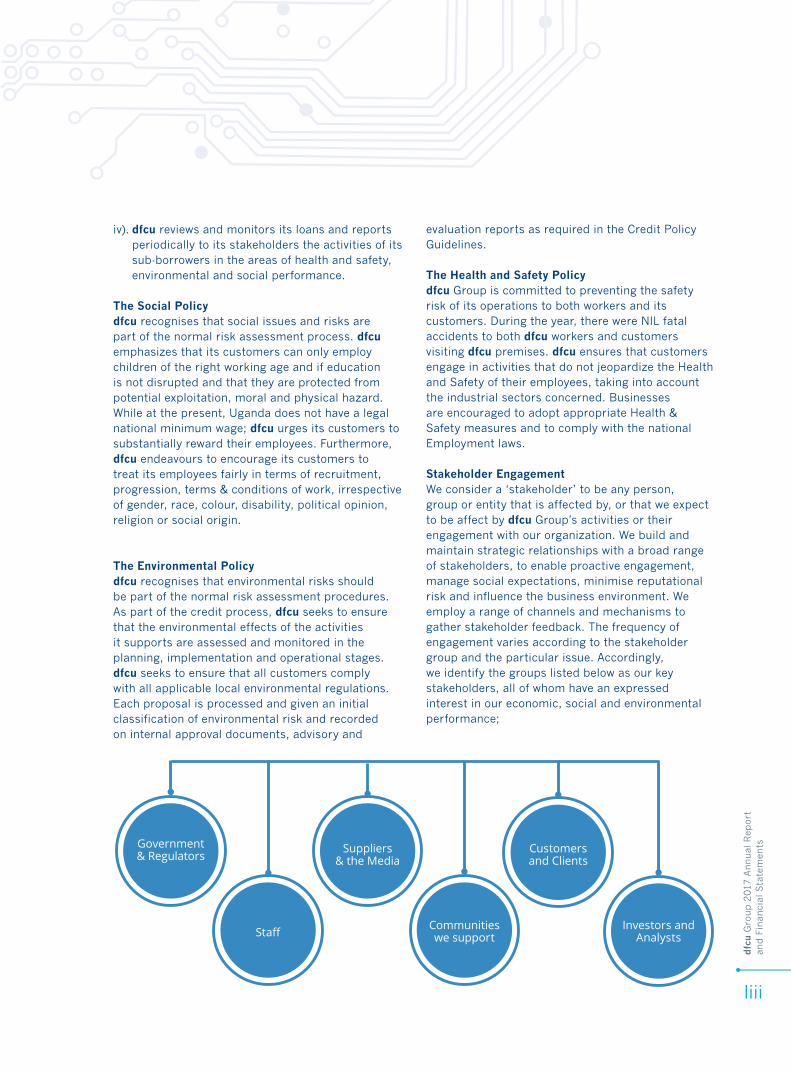
dfc
u G
roup 2
017
Annual
Rep
ort
an
d F
inan
cial
Sta
tem
ents
liii
iv). dfcu reviews and monitors its loans and reports periodically to its stakeholders the activities of its sub-borrowers in the areas of health and safety, environmental and social performance.
The Social Policydfcu recognises that social issues and risks are part of the normal risk assessment process. dfcu emphasizes that its customers can only employ children of the right working age and if education is not disrupted and that they are protected from potential exploitation, moral and physical hazard. While at the present, Uganda does not have a legal national minimum wage; dfcu urges its customers to substantially reward their employees. Furthermore, dfcu endeavours to encourage its customers to treat its employees fairly in terms of recruitment, progression, terms & conditions of work, irrespective of gender, race, colour, disability, political opinion, religion or social origin.
The Environmental Policydfcu recognises that environmental risks should be part of the normal risk assessment procedures. As part of the credit process, dfcu seeks to ensure that the environmental effects of the activities it supports are assessed and monitored in the planning, implementation and operational stages. dfcu seeks to ensure that all customers comply with all applicable local environmental regulations. Each proposal is processed and given an initial classification of environmental risk and recorded on internal approval documents, advisory and
evaluation reports as required in the Credit Policy Guidelines.
The Health and Safety Policydfcu Group is committed to preventing the safety risk of its operations to both workers and its customers. During the year, there were NIL fatal accidents to both dfcu workers and customers visiting dfcu premises. dfcu ensures that customers engage in activities that do not jeopardize the Health and Safety of their employees, taking into account the industrial sectors concerned. Businesses are encouraged to adopt appropriate Health & Safety measures and to comply with the national Employment laws.
Stakeholder EngagementWe consider a ‘stakeholder’ to be any person, group or entity that is affected by, or that we expect to be affect by dfcu Group’s activities or their engagement with our organization. We build and maintain strategic relationships with a broad range of stakeholders, to enable proactive engagement, manage social expectations, minimise reputational risk and influence the business environment. We employ a range of channels and mechanisms to gather stakeholder feedback. The frequency of engagement varies according to the stakeholder group and the particular issue. Accordingly, we identify the groups listed below as our key stakeholders, all of whom have an expressed interest in our economic, social and environmental performance;
Government& Regulators
Staff
Suppliers& the Media
Communitieswe support
Customersand Clients
Investors andAnalysts
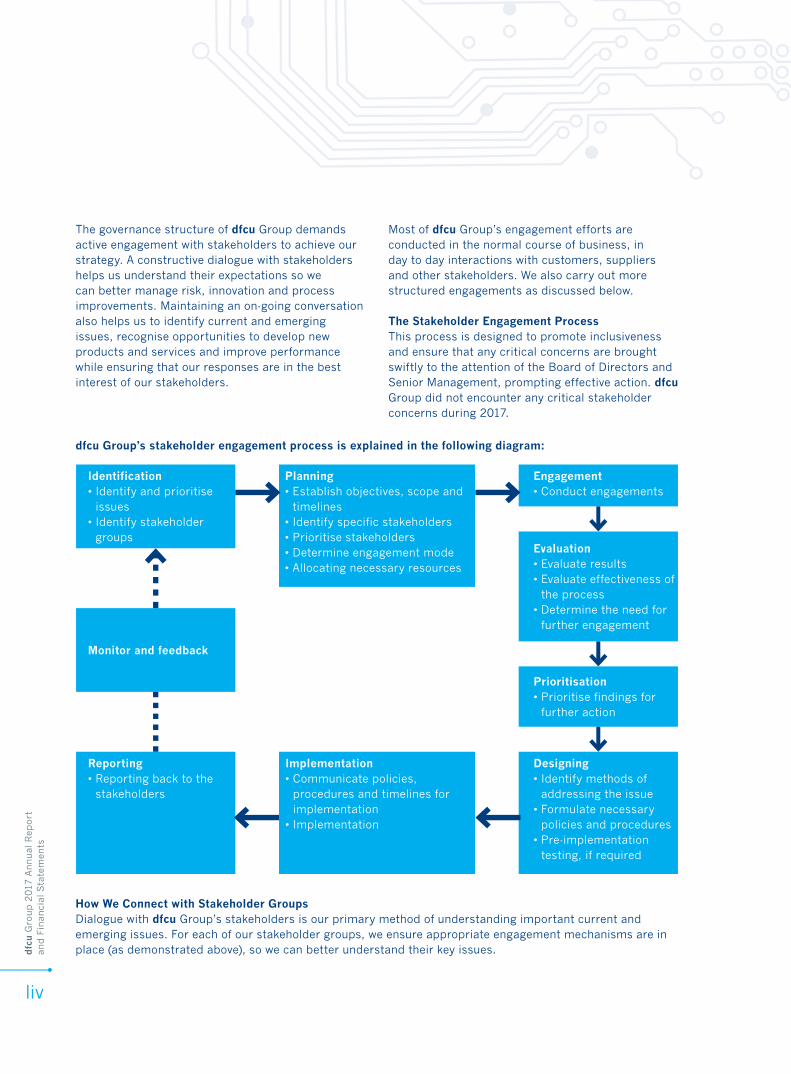
dfc
u G
roup 2
017
Annual
Rep
ort
an
d F
inan
cial
Sta
tem
ents
liv
The governance structure of dfcu Group demands active engagement with stakeholders to achieve our strategy. A constructive dialogue with stakeholders helps us understand their expectations so we can better manage risk, innovation and process improvements. Maintaining an on-going conversation also helps us to identify current and emerging issues, recognise opportunities to develop new products and services and improve performance while ensuring that our responses are in the best interest of our stakeholders.
Most of dfcu Group’s engagement efforts are conducted in the normal course of business, in day to day interactions with customers, suppliers and other stakeholders. We also carry out more structured engagements as discussed below.
The Stakeholder Engagement ProcessThis process is designed to promote inclusiveness and ensure that any critical concerns are brought swiftly to the attention of the Board of Directors and Senior Management, prompting effective action. dfcu Group did not encounter any critical stakeholder concerns during 2017.
dfcu Group’s stakeholder engagement process is explained in the following diagram:
Identification• Identify and prioritise
issues• Identify stakeholder
groups
Engagement• Conduct engagements
Evaluation• Evaluate results• Evaluate effectiveness of
the process• Determine the need for
further engagement
Prioritisation• Prioritise findings for
further action
Designing• Identify methods of
addressing the issue• Formulate necessary
policies and procedures• Pre-implementation
testing, if required
Implementation• Communicate policies,
procedures and timelines for implementation
• Implementation
Reporting• Reporting back to the
stakeholders
Monitor and feedback
Planning• Establish objectives, scope and
timelines• Identify specific stakeholders• Prioritise stakeholders• Determine engagement mode• Allocating necessary resources
How We Connect with Stakeholder GroupsDialogue with dfcu Group’s stakeholders is our primary method of understanding important current and emerging issues. For each of our stakeholder groups, we ensure appropriate engagement mechanisms are in place (as demonstrated above), so we can better understand their key issues.
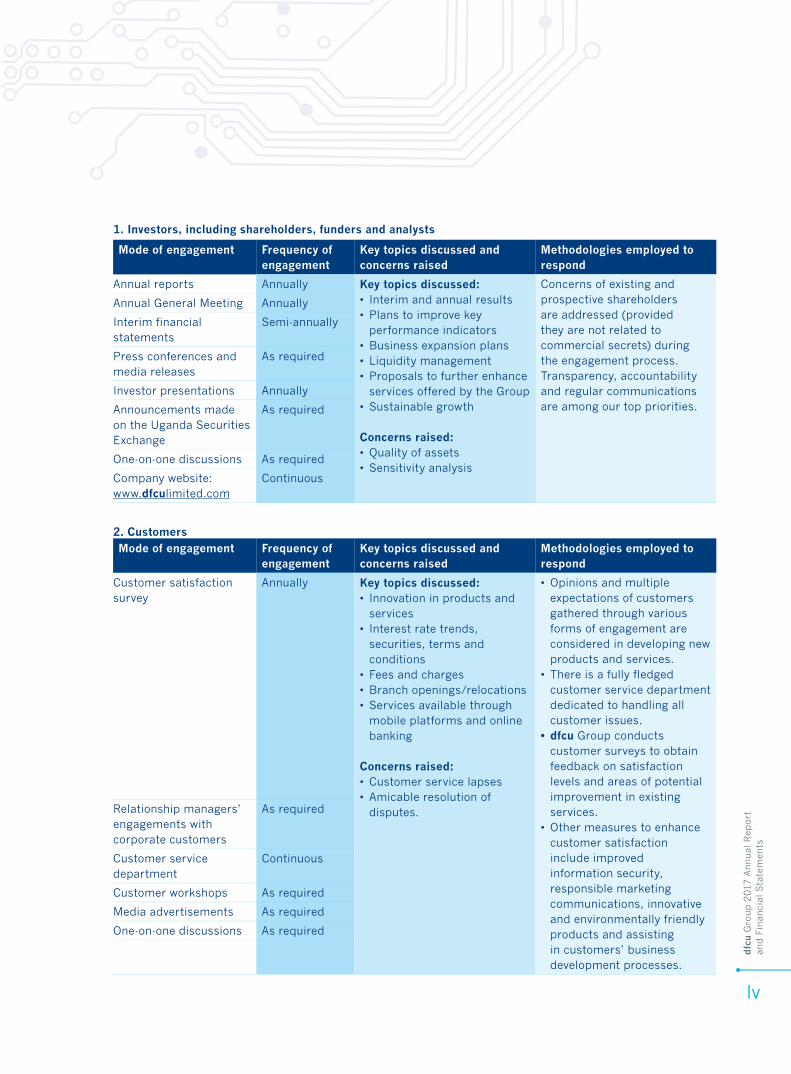
dfc
u G
roup 2
017
Annual
Rep
ort
an
d F
inan
cial
Sta
tem
ents
lv
Mode of engagement Frequency of engagement
Key topics discussed and concerns raised
Methodologies employed to respond
Customer satisfaction survey
Annually Key topics discussed:• Innovation in products and
services• Interest rate trends,
securities, terms and conditions
• Fees and charges• Branch openings/relocations• Services available through
mobile platforms and online banking
Concerns raised:• Customer service lapses• Amicable resolution of
disputes.
• Opinions and multiple expectations of customers gathered through various forms of engagement are considered in developing new products and services.
• There is a fully fledged customer service department dedicated to handling all customer issues.
• dfcu Group conducts customer surveys to obtain feedback on satisfaction levels and areas of potential improvement in existing services.
• Other measures to enhance customer satisfaction include improved information security, responsible marketing communications, innovative and environmentally friendly products and assisting in customers’ business development processes.
Relationship managers’ engagements with corporate customers
As required
Customer service department
Continuous
Customer workshops As required
Media advertisements As required
One-on-one discussions As required
Mode of engagement Frequency of engagement
Key topics discussed and concerns raised
Methodologies employed to respond
Annual reports Annually Key topics discussed:• Interim and annual results• Plans to improve key
performance indicators• Business expansion plans• Liquidity management• Proposals to further enhance
services offered by the Group• Sustainable growth
Concerns raised:• Quality of assets• Sensitivity analysis
Concerns of existing and prospective shareholders are addressed (provided they are not related to commercial secrets) during the engagement process. Transparency, accountability and regular communications are among our top priorities.
Annual General Meeting Annually
Interim financial statements
Semi-annually
Press conferences and media releases
As required
Investor presentations Annually
Announcements made on the Uganda Securities Exchange
As required
One-on-one discussions As required
Company website: www.dfculimited.com
Continuous
1. Investors, including shareholders, funders and analysts
2. Customers
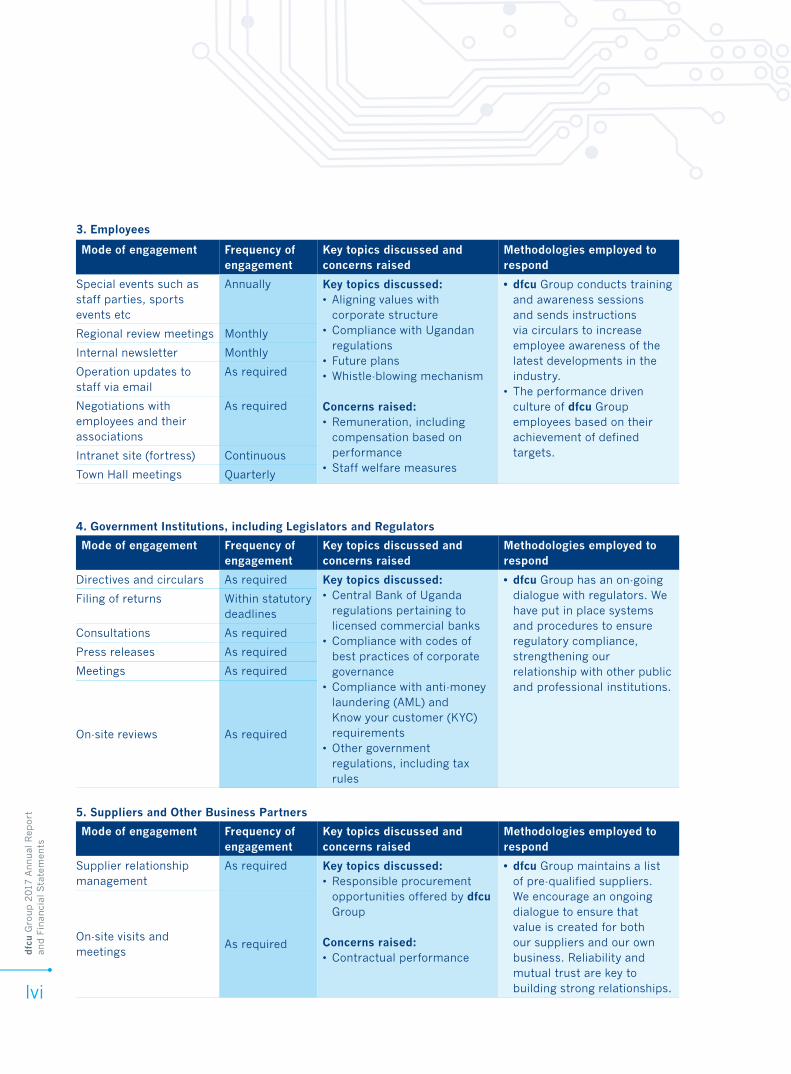
dfc
u G
roup 2
017
Annual
Rep
ort
an
d F
inan
cial
Sta
tem
ents
lvi
Mode of engagement Frequency of engagement
Key topics discussed and concerns raised
Methodologies employed to respond
Special events such as staff parties, sports events etc
Annually Key topics discussed:• Aligning values with
corporate structure• Compliance with Ugandan
regulations• Future plans• Whistle-blowing mechanism
Concerns raised:• Remuneration, including
compensation based on performance
• Staff welfare measures
• dfcu Group conducts training and awareness sessions and sends instructions via circulars to increase employee awareness of the latest developments in the industry.
• The performance driven culture of dfcu Group employees based on their achievement of defined targets.
Regional review meetings Monthly
Internal newsletter Monthly
Operation updates to staff via email
As required
Negotiations with employees and their associations
As required
Intranet site (fortress) Continuous
Town Hall meetings Quarterly
Mode of engagement Frequency of engagement
Key topics discussed and concerns raised
Methodologies employed to respond
Directives and circulars As required Key topics discussed: • Central Bank of Uganda
regulations pertaining to licensed commercial banks
• Compliance with codes of best practices of corporate governance
• Compliance with anti-money laundering (AML) and Know your customer (KYC) requirements
• Other government regulations, including tax rules
• dfcu Group has an on-going dialogue with regulators. We have put in place systems and procedures to ensure regulatory compliance, strengthening our relationship with other public and professional institutions.
Filing of returns Within statutory deadlines
Consultations As required
Press releases As required
Meetings As required
On-site reviews As required
Mode of engagement Frequency of engagement
Key topics discussed and concerns raised
Methodologies employed to respond
Supplier relationship management
As required Key topics discussed:• Responsible procurement
opportunities offered by dfcu Group
Concerns raised:• Contractual performance
• dfcu Group maintains a list of pre-qualified suppliers. We encourage an ongoing dialogue to ensure that value is created for both our suppliers and our own business. Reliability and mutual trust are key to building strong relationships.
On-site visits and meetings
As required
3. Employees
4. Government Institutions, including Legislators and Regulators
5. Suppliers and Other Business Partners
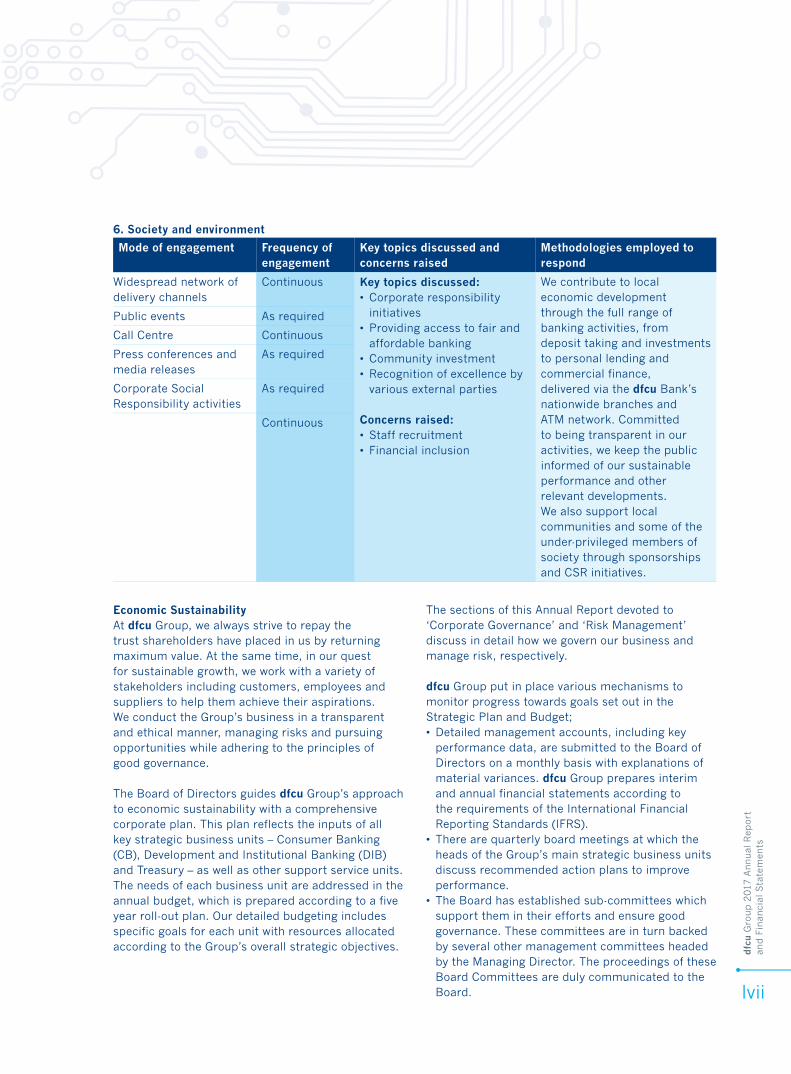
dfc
u G
roup 2
017
Annual
Rep
ort
an
d F
inan
cial
Sta
tem
ents
lvii
Mode of engagement Frequency of engagement
Key topics discussed and concerns raised
Methodologies employed to respond
Widespread network of delivery channels
Continuous Key topics discussed:• Corporate responsibility
initiatives• Providing access to fair and
affordable banking• Community investment• Recognition of excellence by
various external parties
Concerns raised:• Staff recruitment• Financial inclusion
We contribute to local economic development through the full range of banking activities, from deposit taking and investments to personal lending and commercial finance, delivered via the dfcu Bank’s nationwide branches and ATM network. Committed to being transparent in our activities, we keep the public informed of our sustainable performance and other relevant developments. We also support local communities and some of the under-privileged members of society through sponsorships and CSR initiatives.
Public events As required
Call Centre Continuous
Press conferences and media releases
As required
Corporate Social Responsibility activities
As required
Continuous
6. Society and environment
Economic SustainabilityAt dfcu Group, we always strive to repay the trust shareholders have placed in us by returning maximum value. At the same time, in our quest for sustainable growth, we work with a variety of stakeholders including customers, employees and suppliers to help them achieve their aspirations. We conduct the Group’s business in a transparent and ethical manner, managing risks and pursuing opportunities while adhering to the principles of good governance.
The Board of Directors guides dfcu Group’s approach to economic sustainability with a comprehensive corporate plan. This plan reflects the inputs of all key strategic business units – Consumer Banking (CB), Development and Institutional Banking (DIB) and Treasury – as well as other support service units. The needs of each business unit are addressed in the annual budget, which is prepared according to a five year roll-out plan. Our detailed budgeting includes specific goals for each unit with resources allocated according to the Group’s overall strategic objectives.
The sections of this Annual Report devoted to ‘Corporate Governance’ and ‘Risk Management’ discuss in detail how we govern our business and manage risk, respectively.
dfcu Group put in place various mechanisms to monitor progress towards goals set out in the Strategic Plan and Budget;• Detailed management accounts, including key
performance data, are submitted to the Board of Directors on a monthly basis with explanations of material variances. dfcu Group prepares interim and annual financial statements according to the requirements of the International Financial Reporting Standards (IFRS).
• There are quarterly board meetings at which the heads of the Group’s main strategic business units discuss recommended action plans to improve performance.
• The Board has established sub-committees which support them in their efforts and ensure good governance. These committees are in turn backed by several other management committees headed by the Managing Director. The proceedings of these Board Committees are duly communicated to the Board.
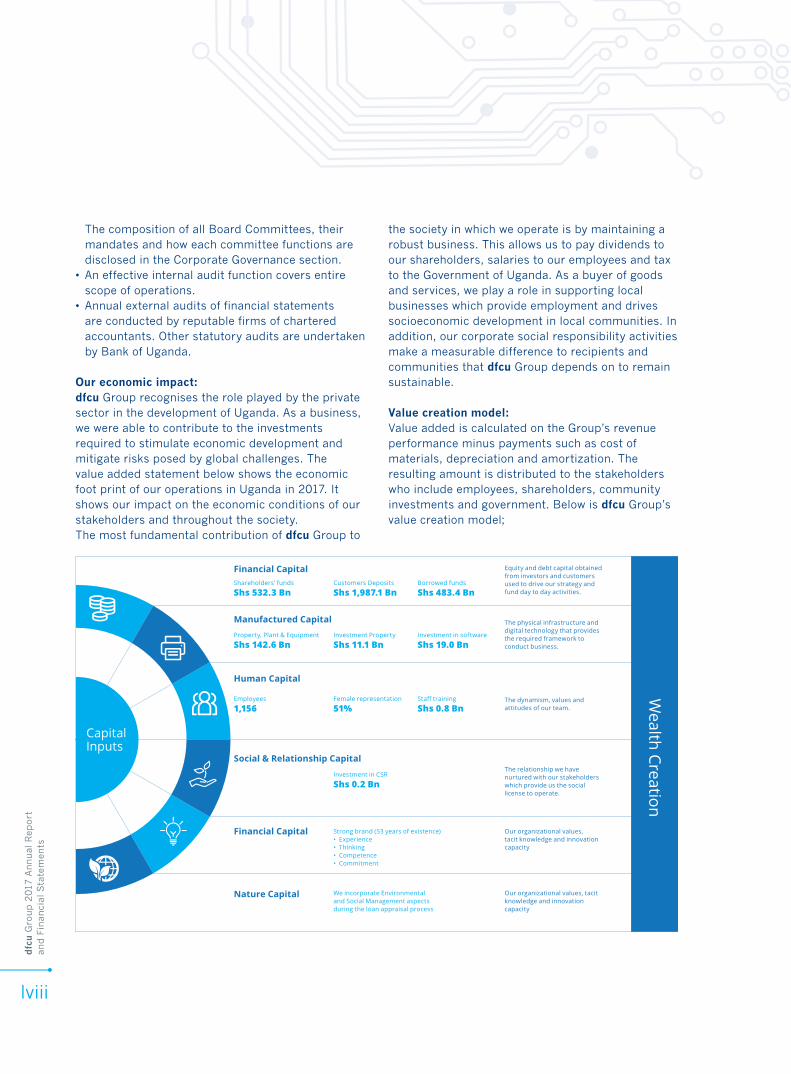
dfc
u G
roup 2
017
Annual
Rep
ort
an
d F
inan
cial
Sta
tem
ents
lviii
The composition of all Board Committees, their mandates and how each committee functions are disclosed in the Corporate Governance section.
• An effective internal audit function covers entire scope of operations.
• Annual external audits of financial statements are conducted by reputable firms of chartered accountants. Other statutory audits are undertaken by Bank of Uganda.
Our economic impact:dfcu Group recognises the role played by the private sector in the development of Uganda. As a business, we were able to contribute to the investments required to stimulate economic development and mitigate risks posed by global challenges. The value added statement below shows the economic foot print of our operations in Uganda in 2017. It shows our impact on the economic conditions of our stakeholders and throughout the society.The most fundamental contribution of dfcu Group to
the society in which we operate is by maintaining a robust business. This allows us to pay dividends to our shareholders, salaries to our employees and tax to the Government of Uganda. As a buyer of goods and services, we play a role in supporting local businesses which provide employment and drives socioeconomic development in local communities. In addition, our corporate social responsibility activities make a measurable difference to recipients and communities that dfcu Group depends on to remain sustainable.
Value creation model:Value added is calculated on the Group’s revenue performance minus payments such as cost of materials, depreciation and amortization. The resulting amount is distributed to the stakeholders who include employees, shareholders, community investments and government. Below is dfcu Group’s value creation model;
Equity and debt capital obtained from investors and customers used to drive our strategy and fund day to day activities.
The physical infrastructure and digital technology that provides the required framework to conduct business.
The dynamism, values and attitudes of our team.
The relationship we have nurtured with our stakeholders which provide us the social license to operate.
Our organizational values, tacit knowledge and innovation capacity
Strong brand (53 years of existence)• Experience• Thinking• Competence• Commitment
Our organizational values, tacit knowledge and innovation capacity
We incorporate Environmental and Social Management aspects during the loan appraisal process
Shareholders’ funds
Shs 532.3 BnCustomers Deposits
Shs 1,987.1 BnBorrowed funds
Shs 483.4 Bn
Property, Plant & Equipment
Shs 142.6 BnInvestment Property
Shs 11.1 BnInvestment in software
Shs 19.0 Bn
Employees
1,156Female representation
51%Staff training
Shs 0.8 Bn
Investment in CSR
Shs 0.2 Bn
CapitalInputs
Wealth Creation
Financial Capital
Manufactured Capital
Human Capital
Social & Relationship Capital
Financial Capital
Nature Capital
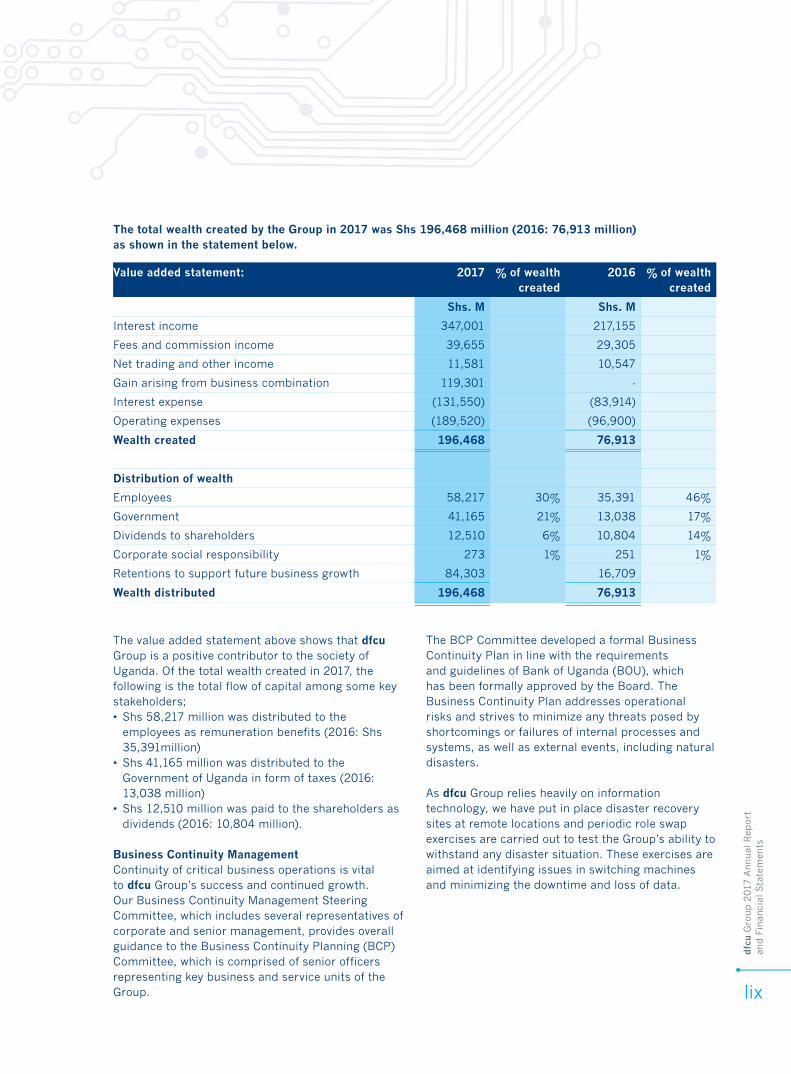
dfc
u G
roup 2
017
Annual
Rep
ort
an
d F
inan
cial
Sta
tem
ents
lix
The value added statement above shows that dfcu Group is a positive contributor to the society of Uganda. Of the total wealth created in 2017, the following is the total flow of capital among some key stakeholders;• Shs 58,217 million was distributed to the
employees as remuneration benefits (2016: Shs 35,391million)
• Shs 41,165 million was distributed to the Government of Uganda in form of taxes (2016: 13,038 million)
• Shs 12,510 million was paid to the shareholders as dividends (2016: 10,804 million).
Business Continuity ManagementContinuity of critical business operations is vital to dfcu Group’s success and continued growth. Our Business Continuity Management Steering Committee, which includes several representatives of corporate and senior management, provides overall guidance to the Business Continuity Planning (BCP) Committee, which is comprised of senior officers representing key business and service units of the Group.
The BCP Committee developed a formal Business Continuity Plan in line with the requirements and guidelines of Bank of Uganda (BOU), which has been formally approved by the Board. The Business Continuity Plan addresses operational risks and strives to minimize any threats posed by shortcomings or failures of internal processes and systems, as well as external events, including natural disasters.
As dfcu Group relies heavily on information technology, we have put in place disaster recovery sites at remote locations and periodic role swap exercises are carried out to test the Group’s ability to withstand any disaster situation. These exercises are aimed at identifying issues in switching machines and minimizing the downtime and loss of data.
Value added statement: 2017 % of wealth created
2016 % of wealth created
Shs. M Shs. M
Interest income 347,001 217,155
Fees and commission income 39,655 29,305
Net trading and other income 11,581 10,547
Gain arising from business combination 119,301 -
Interest expense (131,550) (83,914)
Operating expenses (189,520) (96,900)
Wealth created 196,468 76,913
Distribution of wealth
Employees 58,217 30% 35,391 46%
Government 41,165 21% 13,038 17%
Dividends to shareholders 12,510 6% 10,804 14%
Corporate social responsibility 273 1% 251 1%
Retentions to support future business growth 84,303 16,709
Wealth distributed 196,468 76,913
The total wealth created by the Group in 2017 was Shs 196,468 million (2016: 76,913 million) as shown in the statement below.
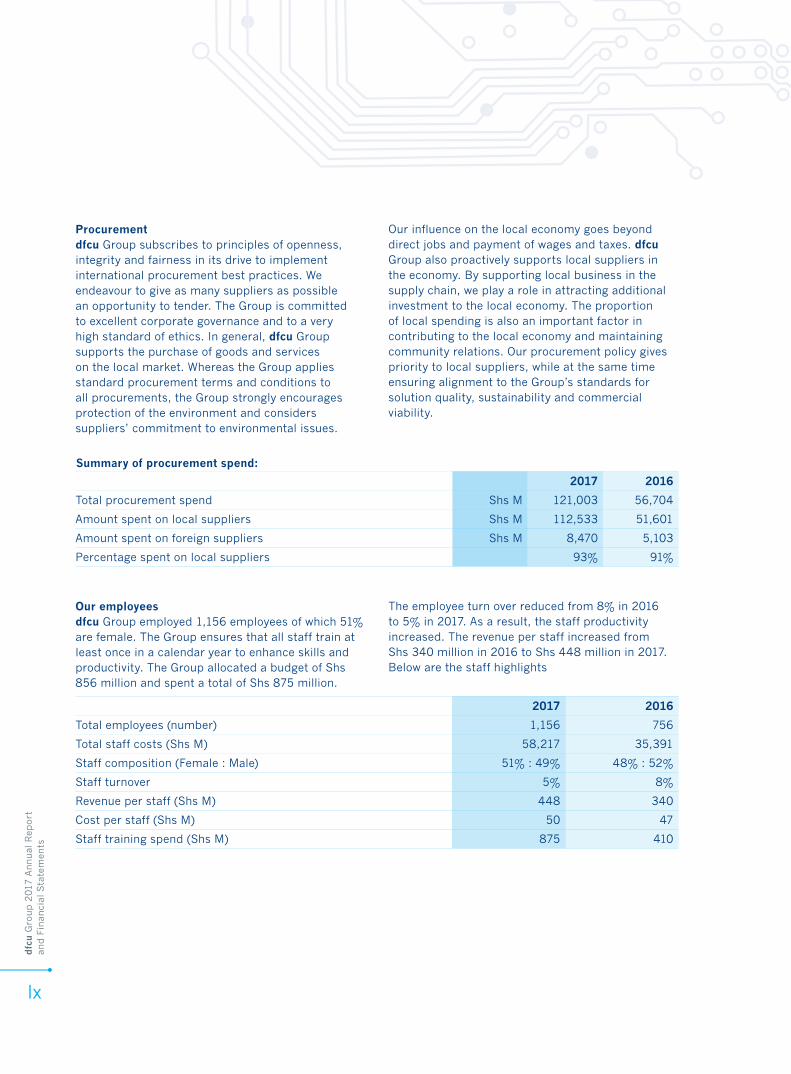
dfc
u G
roup 2
017
Annual
Rep
ort
an
d F
inan
cial
Sta
tem
ents
lx
Procurementdfcu Group subscribes to principles of openness, integrity and fairness in its drive to implement international procurement best practices. We endeavour to give as many suppliers as possible an opportunity to tender. The Group is committed to excellent corporate governance and to a very high standard of ethics. In general, dfcu Group supports the purchase of goods and services on the local market. Whereas the Group applies standard procurement terms and conditions to all procurements, the Group strongly encourages protection of the environment and considers suppliers’ commitment to environmental issues.
Our influence on the local economy goes beyond direct jobs and payment of wages and taxes. dfcu Group also proactively supports local suppliers in the economy. By supporting local business in the supply chain, we play a role in attracting additional investment to the local economy. The proportion of local spending is also an important factor in contributing to the local economy and maintaining community relations. Our procurement policy gives priority to local suppliers, while at the same time ensuring alignment to the Group’s standards for solution quality, sustainability and commercial viability.
2017 2016
Total procurement spend Shs M 121,003 56,704
Amount spent on local suppliers Shs M 112,533 51,601
Amount spent on foreign suppliers Shs M 8,470 5,103
Percentage spent on local suppliers 93% 91%
Our employeesdfcu Group employed 1,156 employees of which 51% are female. The Group ensures that all staff train at least once in a calendar year to enhance skills and productivity. The Group allocated a budget of Shs 856 million and spent a total of Shs 875 million.
The employee turn over reduced from 8% in 2016 to 5% in 2017. As a result, the staff productivity increased. The revenue per staff increased from Shs 340 million in 2016 to Shs 448 million in 2017. Below are the staff highlights
Summary of procurement spend:
2017 2016
Total employees (number) 1,156 756
Total staff costs (Shs M) 58,217 35,391
Staff composition (Female : Male) 51% : 49% 48% : 52%
Staff turnover 5% 8%
Revenue per staff (Shs M) 448 340
Cost per staff (Shs M) 50 47
Staff training spend (Shs M) 875 410
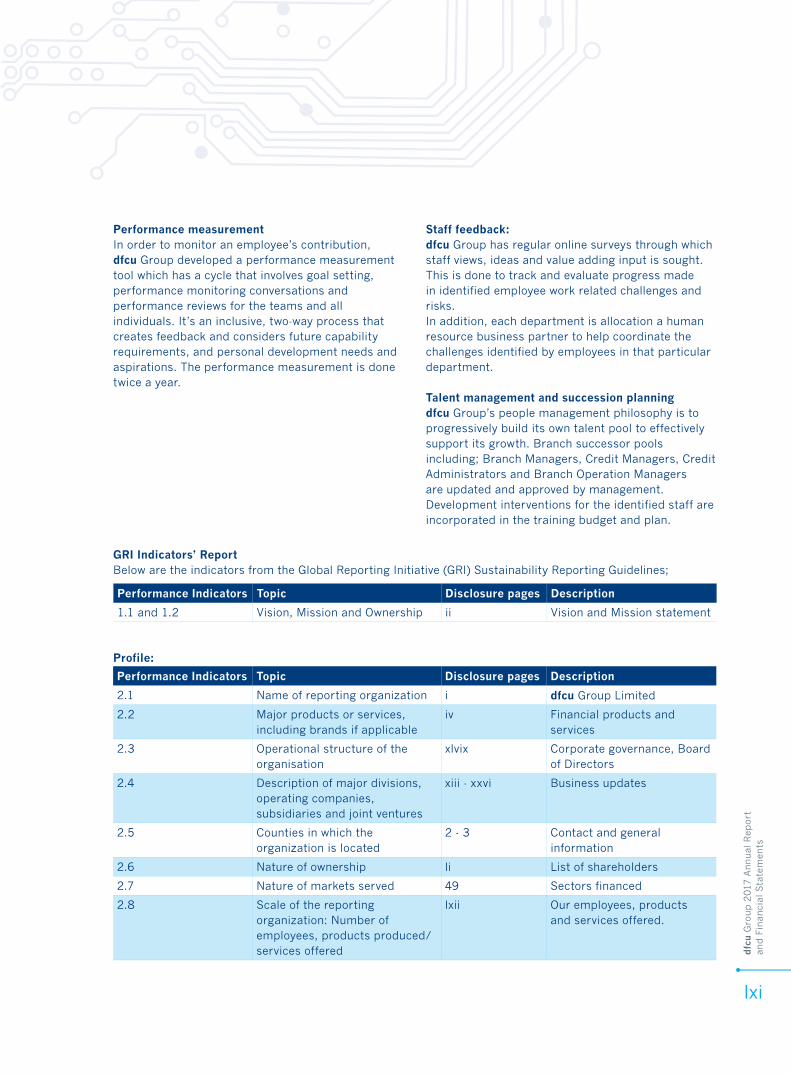
dfc
u G
roup 2
017
Annual
Rep
ort
an
d F
inan
cial
Sta
tem
ents
lxi
Performance measurementIn order to monitor an employee’s contribution, dfcu Group developed a performance measurement tool which has a cycle that involves goal setting, performance monitoring conversations and performance reviews for the teams and all individuals. It’s an inclusive, two-way process that creates feedback and considers future capability requirements, and personal development needs and aspirations. The performance measurement is done twice a year.
Staff feedback:dfcu Group has regular online surveys through which staff views, ideas and value adding input is sought. This is done to track and evaluate progress made in identified employee work related challenges and risks. In addition, each department is allocation a human resource business partner to help coordinate the challenges identified by employees in that particular department.
Talent management and succession planningdfcu Group’s people management philosophy is to progressively build its own talent pool to effectively support its growth. Branch successor pools including; Branch Managers, Credit Managers, Credit Administrators and Branch Operation Managers are updated and approved by management. Development interventions for the identified staff are incorporated in the training budget and plan.
Performance Indicators Topic Disclosure pages Description
1.1 and 1.2 Vision, Mission and Ownership ii Vision and Mission statement
Performance Indicators Topic Disclosure pages Description
2.1 Name of reporting organization i dfcu Group Limited
2.2 Major products or services, including brands if applicable
iv Financial products and services
2.3 Operational structure of the organisation
xlvix Corporate governance, Board of Directors
2.4 Description of major divisions, operating companies, subsidiaries and joint ventures
xiii - xxvi Business updates
2.5 Counties in which the organization is located
2 - 3 Contact and general information
2.6 Nature of ownership li List of shareholders
2.7 Nature of markets served 49 Sectors financed
2.8 Scale of the reporting organization: Number of employees, products produced/services offered
lxii Our employees, products and services offered.
GRI Indicators’ ReportBelow are the indicators from the Global Reporting Initiative (GRI) Sustainability Reporting Guidelines;
Profile:
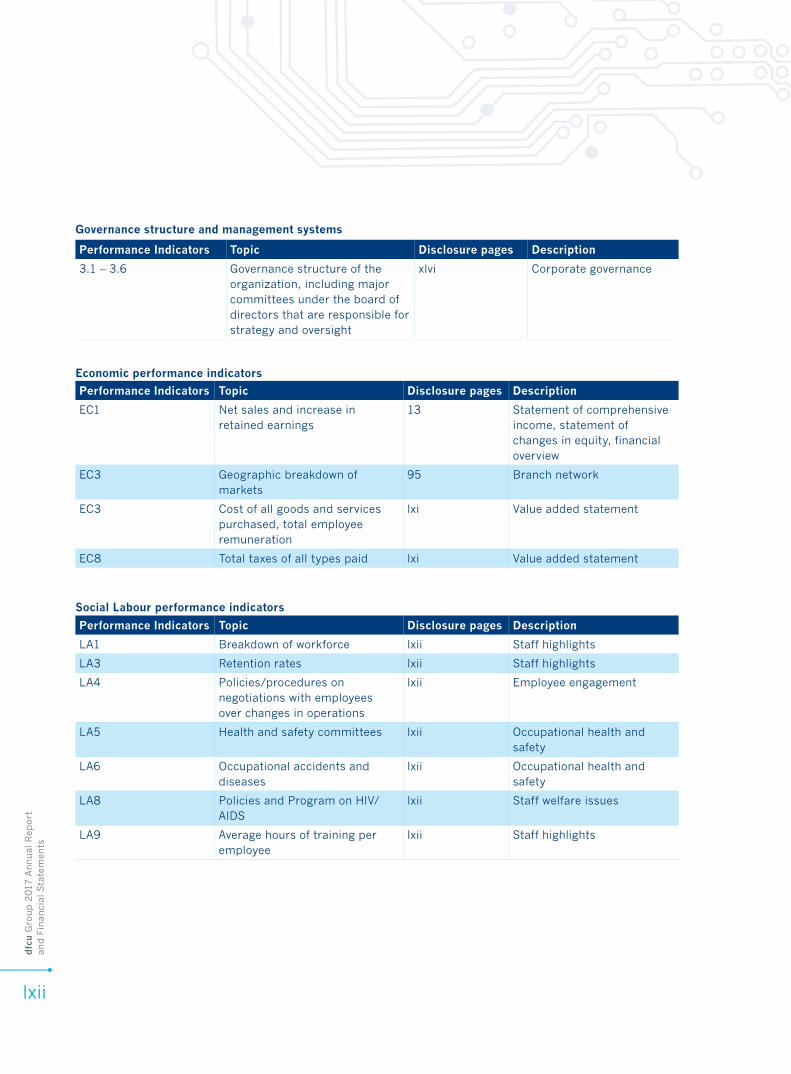
dfc
u G
roup 2
017
Annual
Rep
ort
an
d F
inan
cial
Sta
tem
ents
lxii
Performance Indicators Topic Disclosure pages Description
3.1 – 3.6 Governance structure of the organization, including major committees under the board of directors that are responsible for strategy and oversight
xlvi Corporate governance
Performance Indicators Topic Disclosure pages Description
EC1 Net sales and increase in retained earnings
13 Statement of comprehensive income, statement of changes in equity, financial overview
EC3 Geographic breakdown of markets
95 Branch network
EC3 Cost of all goods and services purchased, total employee remuneration
lxi Value added statement
EC8 Total taxes of all types paid lxi Value added statement
Performance Indicators Topic Disclosure pages Description
LA1 Breakdown of workforce lxii Staff highlights
LA3 Retention rates lxii Staff highlights
LA4 Policies/procedures on negotiations with employees over changes in operations
lxii Employee engagement
LA5 Health and safety committees lxii Occupational health and safety
LA6 Occupational accidents and diseases
lxii Occupational health and safety
LA8 Policies and Program on HIV/AIDS
lxii Staff welfare issues
LA9 Average hours of training per employee
lxii Staff highlights
Governance structure and management systems
Economic performance indicators
Social Labour performance indicators

We remain committed to continuing the execution of our strategy and realising our vision of becoming the preferred financial solutions provider in the market segments where we operate.
Driving sustainable growthAs one of Uganda’s large financial services player, we understand the importance of supporting the country’s economic transformation. Through optimization of our large balance sheet and the range of customer offerings, we will continue to drive sustainable growth and value for all stakeholders.
Implementing our channel strategyWe will continue to build the strength of our multichannel model by responding to the evolving ways in which our customers are choosing to interact with us. As customers increasingly choose digital channels for day to day banking needs, we will scale up our investment in the development of new digital solutions. As part of our strategy, we will also continue to develop mutual partnerships to accelerate our efforts within the digital space.
Becoming more efficientdfcu is on a transformation journey. The ramp up phase of this journey was completed at the end of 2017 and we are now moving into the execution phase. In 2018, the focus will be on implementing the second phase of the Business Process Re-engineering (BPR) project. The ambition is that our processes, IT infrastructure, operations, distribution channels etc., will be revamped to achieve agile, simpler and faster operations.
Transforming ways of workingOur staff are crucial to the implementation of our strategic aspirations. Ensuring a high–performing organization with the skill set needed to match increasing customer expectations and the changing environment in which we operate remains a key priority. We will continue to implement the dfcu culture change programme to drive staff productivity.
The evolving trends in the market create many opportunities for us to strengthen our position and deliver long-term value for all our shareholders.
Looking Ahead
dfc
u G
roup 2
017
Annual
Rep
ort
&
Fin
anci
al S
tate
men
ts
lxiii
dfcu Group Director’s report and Consolidated
Financial statements
for the year ended31 December 2017
Group information 2
Directors’ report 4
Statement of directors’ responsibilities 6
Independent auditors’ report 7-11
Financial statements:
Consolidated statement of comprehensive income 12
Company statement of comprehensive income 13
Consolidated statement of financial position 14
Company statement of financial position 15
Consolidated statement of changes in equity 16
Company statement of changes in equity 17
Consolidated statement of cash flows 18
Company statement of cash flows 19
Notes 20–94
Contents
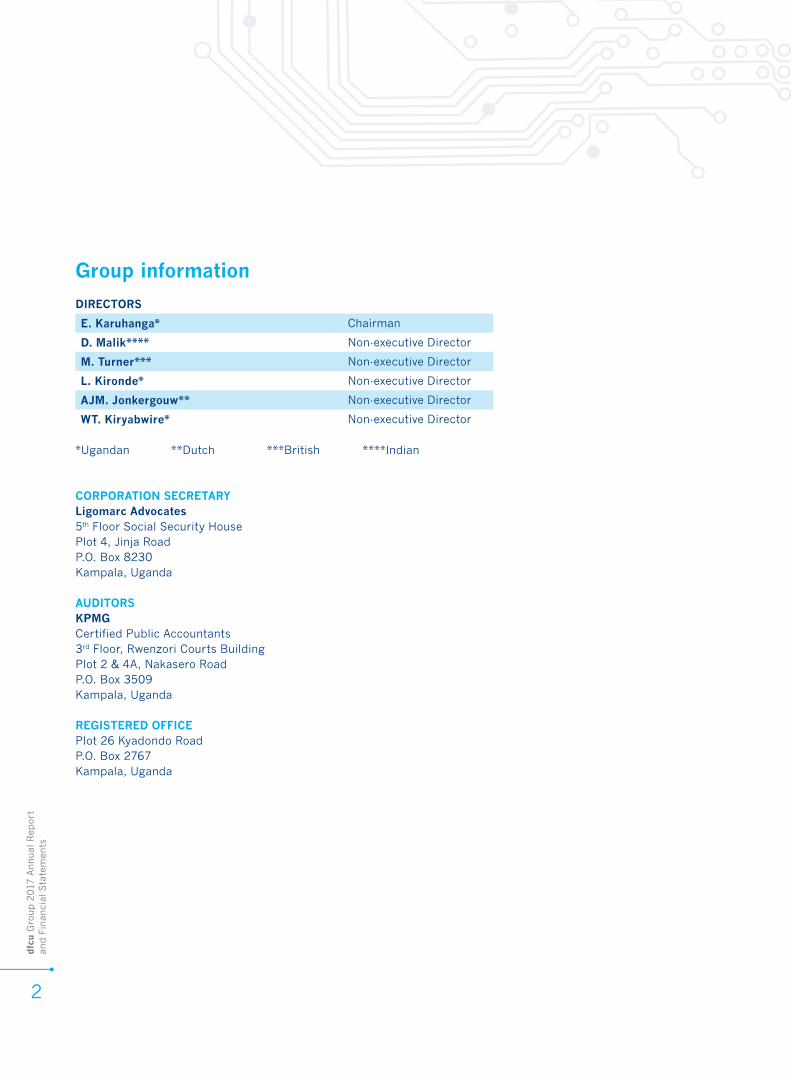
dfc
u G
roup 2
017
Annual
Rep
ort
an
d F
inan
cial
Sta
tem
ents
2
Group information
DIRECTORS
E. Karuhanga* Chairman
D. Malik**** Non-executive Director
M. Turner*** Non-executive Director
L. Kironde* Non-executive Director
AJM. Jonkergouw** Non-executive Director
WT. Kiryabwire* Non-executive Director
*Ugandan **Dutch ***British ****Indian
CORPORATION SECRETARYLigomarc Advocates5th Floor Social Security House Plot 4, Jinja RoadP.O. Box 8230 Kampala, Uganda
AUDITORSKPMGCertified Public Accountants3rd Floor, Rwenzori Courts BuildingPlot 2 & 4A, Nakasero RoadP.O. Box 3509Kampala, Uganda
REGISTERED OFFICEPlot 26 Kyadondo RoadP.O. Box 2767 Kampala, Uganda
dfc
u G
roup 2
017
Annual
Rep
ort
an
d F
inan
cial
Sta
tem
ents
3
Main Correspondent Banks
Citibank N.A New YorkInternational ServicesCitibank N.A New York399 Park Avenue, New York, NY10043 U.S.A
Citibank N.A LondonInternational ServicesCitibank N.A LondonCitigroup Centre, Canada square,Canary Wharf, London E14 5LB
First Rand Bank6th Floor, 1 Merchant Place,Corner Fredman & Rivonia RoadSanton, South Africa
Bank of ChinaZhongyin Tower,Yincheng Zhong RoadShangai, China
Kenya Commercial Bank Kencom House, Moi Avenue,Nairobi, Kenya
dfcu Bank LimitedPlot 26, Kyadondo RoadP.O. Box 70, Kampala, Uganda
Group’s Solicitors
Kenneth AkampuriraAdvocate & Commissioner for OathsGround Floor, Lourdel TowersPlot 1, Lourdel Road P.O. Box 2658,Kampala, Uganda
Karuhanga, Tabaro & AssociatesSolicitors & AdvocatesGround Floor, Esami House Plot 52, Bombo RoadP.O. Box 37366, Kampala, Uganda
Kabayiza, Kavuma, Mugerwa & Ali AdvocatesPlot 11, Bandali Close, BugolobiP.O. Box 36362,Kampala, Uganda
AF Mpanga 4th Floor, dfcu TowersPlot 26, Kyadondo Road, NakaseroP.O. Box 1520, Kampala, Uganda
Ligomarc Advocates5th Floor, Social Security House Plot 4, Jinja RoadP.O. Box 8230, Kampala, Uganda
KSMO Advocates5th Floor, Crested TowersPlot 17, Hannington RoadP.O. Box 23064,Kampala, Uganda
Sebalu & Lule Advocates & Legal ConsultantsS&L ChambersPlot 14, Mackinnon Road, NakaseroP.O. Box 2255,Kampala, Uganda
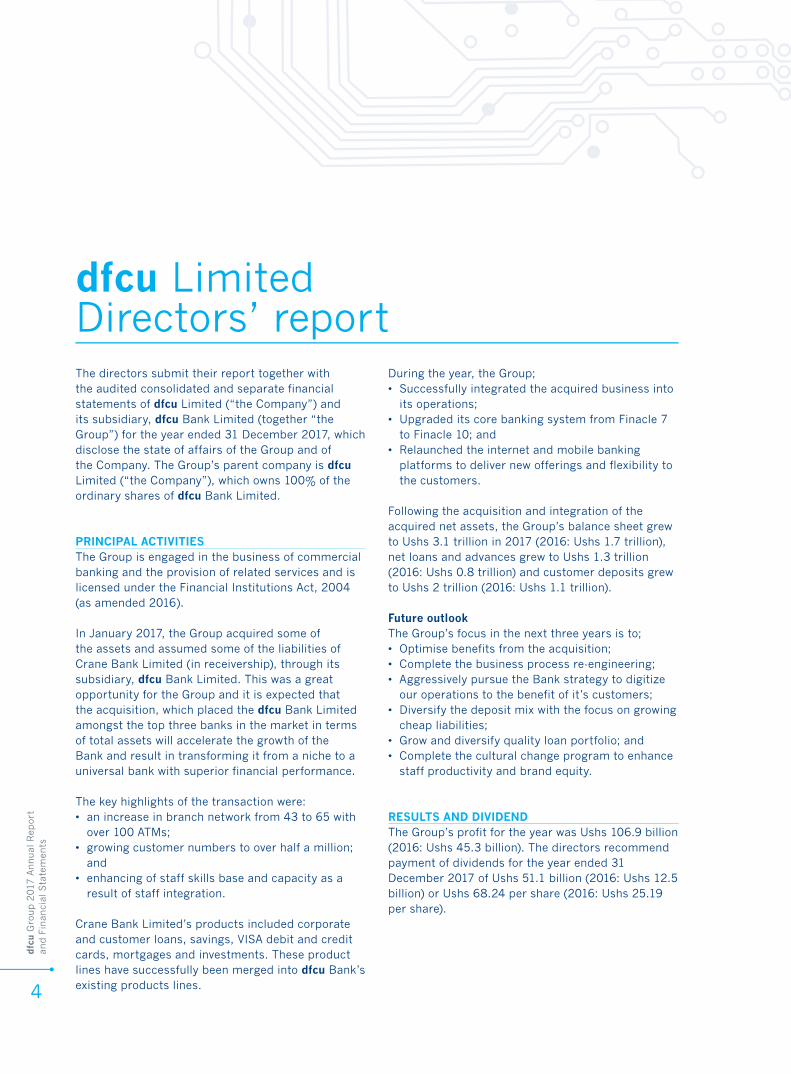
dfc
u G
roup 2
017
Annual
Rep
ort
an
d F
inan
cial
Sta
tem
ents
4
The directors submit their report together with the audited consolidated and separate financial statements of dfcu Limited (“the Company”) and its subsidiary, dfcu Bank Limited (together “the Group”) for the year ended 31 December 2017, which disclose the state of affairs of the Group and of the Company. The Group’s parent company is dfcu Limited (“the Company”), which owns 100% of the ordinary shares of dfcu Bank Limited.
PRINCIPAL ACTIVITIESThe Group is engaged in the business of commercial banking and the provision of related services and is licensed under the Financial Institutions Act, 2004 (as amended 2016).
In January 2017, the Group acquired some of the assets and assumed some of the liabilities of Crane Bank Limited (in receivership), through its subsidiary, dfcu Bank Limited. This was a great opportunity for the Group and it is expected that the acquisition, which placed the dfcu Bank Limited amongst the top three banks in the market in terms of total assets will accelerate the growth of the Bank and result in transforming it from a niche to a universal bank with superior financial performance.
The key highlights of the transaction were:• an increase in branch network from 43 to 65 with
over 100 ATMs; • growing customer numbers to over half a million;
and • enhancing of staff skills base and capacity as a
result of staff integration.
Crane Bank Limited’s products included corporate and customer loans, savings, VISA debit and credit cards, mortgages and investments. These product lines have successfully been merged into dfcu Bank’s existing products lines.
During the year, the Group;• Successfully integrated the acquired business into
its operations;• Upgraded its core banking system from Finacle 7
to Finacle 10; and• Relaunched the internet and mobile banking
platforms to deliver new offerings and flexibility to the customers.
Following the acquisition and integration of the acquired net assets, the Group’s balance sheet grew to Ushs 3.1 trillion in 2017 (2016: Ushs 1.7 trillion), net loans and advances grew to Ushs 1.3 trillion (2016: Ushs 0.8 trillion) and customer deposits grew to Ushs 2 trillion (2016: Ushs 1.1 trillion).
Future outlookThe Group’s focus in the next three years is to;• Optimise benefits from the acquisition;• Complete the business process re-engineering;• Aggressively pursue the Bank strategy to digitize
our operations to the benefit of it’s customers;• Diversify the deposit mix with the focus on growing
cheap liabilities;• Grow and diversify quality loan portfolio; and• Complete the cultural change program to enhance
staff productivity and brand equity.
RESULTS AND DIVIDENDThe Group’s profit for the year was Ushs 106.9 billion (2016: Ushs 45.3 billion). The directors recommend payment of dividends for the year ended 31 December 2017 of Ushs 51.1 billion (2016: Ushs 12.5 billion) or Ushs 68.24 per share (2016: Ushs 25.19 per share).
dfcu LimitedDirectors’ report
dfc
u G
roup 2
017
Annual
Rep
ort
an
d F
inan
cial
Sta
tem
ents
5
DIRECTORSDuring the financial year and up to the date of this report, other than as disclosed in Note 42 to the consolidated and separate financial statements, no director has received or become entitled to receive any benefit other than directors’ fees and amounts received under employment contracts for executive directors. The aggregate amount of emoluments for directors’ services rendered in the financial year is disclosed in Note 42 of the consolidated and separate financial statements.
Neither at the end of the financial year nor at any time during the year did there exist any arrangement to which the Group is a party whereby directors might acquire benefits by means of the acquisition of shares in or debentures of the Group.
The directors who held office during the year and to the date of this report are set out on page 1.
COMPANY REGISTRARThe registrar of the Company is Deloitte (Uganda) Limited located at the address below:
Plot 1 Lumumba Avenue3rd Floor Rwenzori HouseP.O. Box 10314Kampala, Uganda
AUDITORSThe external auditors, KPMG, being eligible for re-appointment have expressed willingness to continue in office in accordance with Section 167(2) of the Companies Act of Uganda and Section 62(1) of the Financial Institutions Act 2004 (as amended 2016).
ISSUE OF FINANCIAL STATEMENTS The consolidated and separate financial statements were authorised for issue in accordance with a resolution of the directors dated 28 March 2018.
By order of the Board
Ligomarc Advocates5th Floor Social Security House Plot 4, Jinja RoadP O Box 8230 Kampala, Uganda
COMPANY SECRETARY Date: 28 March 2018
dfc
u G
roup 2
017
Annual
Rep
ort
an
d F
inan
cial
Sta
tem
ents
6
The Group’s directors are responsible for the preparation and fair presentation of the consolidated and separate financial statements, comprising the consolidated and separate statement of financial position as at 31 December 2017, and the consolidated and separate statements of comprehensive income, changes in equity and cash flows for the year then ended, and the notes to the consolidated and separate financial statements, which include a summary of significant accounting policies, in accordance with International Financial Reporting Standards, the Companies Act of Uganda and Financial Institutions Act 2004 (as amended 2016) and for such internal controls as the directors determine is necessary to enable the preparation of the consolidated and separate financial statements that are free from material misstatement, whether due to fraud or error.
The directors’ responsibility includes: designing, implementing and maintaining internal control relevant to the preparation and fair presentation of these financial statements that are free from material misstatement, whether due to fraud or error; selecting and applying appropriate accounting policies; and making accounting estimates that are reasonable in the circumstances.
Under the Companies Act of Uganda, the directors are required to prepare consolidated and separate financial statements for each year that give a true and fair view of the state of affairs of the Group and company as at the end of the financial year and of the operating results of the Group and Company for that year. It also requires the directors to ensure the Group and Company keep proper accounting records that disclose with reasonable accuracy the financial position of the Group and Company.
The directors accept responsibility for the consolidated and separate financial statements set out on pages 20 to 94 which have been prepared using appropriate accounting policies supported by reasonable and prudent judgments and estimates,
in conformity with International Financial Reporting Standards, the Financial Institutions Act 2004 (as amended 2016) and Companies Act of Uganda. The directors are of the opinion that the consolidated and separate financial statements give a true and fair view of the state of the financial affairs and the profit and cash flows for the year ended 31 December 2017. The directors further accept responsibility for the maintenance of accounting records that may be relied upon in the preparation of the consolidated and separate financial statements, as well as adequate systems of internal financial control.
The directors have made an assessment of the Group’s and Company’s ability to continue as a going concern and have no reason to believe the business will not be a going concern for the next twelve months from the date of this statement.
Approval of the consolidated and separate financial statementsThe consolidated and separate financial statements, as indicated above, were approved by the board of directors on 28 March 2018 and were signed on its behalf by:
Director
Director
Secretary
Date: 28 March 2018
Statement of Directors’Responsibilities
dfc
u G
roup 2
017
Annual
Rep
ort
an
d F
inan
cial
Sta
tem
ents
7
Independentauditors’ report
OPINION
We have audited the consolidated and separate financial statements of dfcu Limited ( the “Group and Company”), set out on pages 20 to 94, which comprise the consolidated and separate statement of financial position as at 31 December 2017, and the consolidated and separate statements of comprehensive income, changes in equity and cash flows for the year then ended, and notes to the consolidated and separate financial statements, including a summary of significant accounting policies and other explanatory information.In our opinion, the accompanying consolidated and separate financial statements give a true and fair view of the consolidated and separate financial position of dfcu Limited as at 31 December 2017, and of its consolidated and separate financial performance and consolidated and separate cash flows for the year then ended in accordance with International Financial Reporting Standards, the Companies Act of Uganda and the Financial Institutions Act, 2004 (as amended in 2016).
BASIS FOR OPINION
We conducted our audit in accordance with International Standards on Auditing (ISAs). Our responsibilities under those standards are further described in the Auditor’s Responsibilities for the Audit of the Consolidated and Separate Financial Statements section of our report. We are independent of the Group and Company in accordance with the International Ethics Standards Board for Accountants’ Code of Ethics for Professional Accountants (IESBA Code) together with the ethical requirements that are relevant to our audit of the consolidated and separate financial statements in Uganda, and we have fulfilled our other ethical responsibilities in accordance with these requirements and the IESBA Code. We believe that the audit evidence we have obtained is sufficient and appropriate to provide a basis for our opinion.
KEY AUDIT MATTERS
Key audit matters are those matters that, in our professional judgment, were of most significance in our audit of the consolidated and separate financial statements of the current period. These matters were addressed in the context of our audit of the consolidated and separate financial statements as a whole, and in forming our opinion thereon, and we do not provide a separate opinion on these matters. There are no key audit matters reported for the separate financial statements. These key audit matters are applicable to the consolidated financial statements.
To the members of dfcu LimitedReport on the audit of the consolidated and separate financial statements
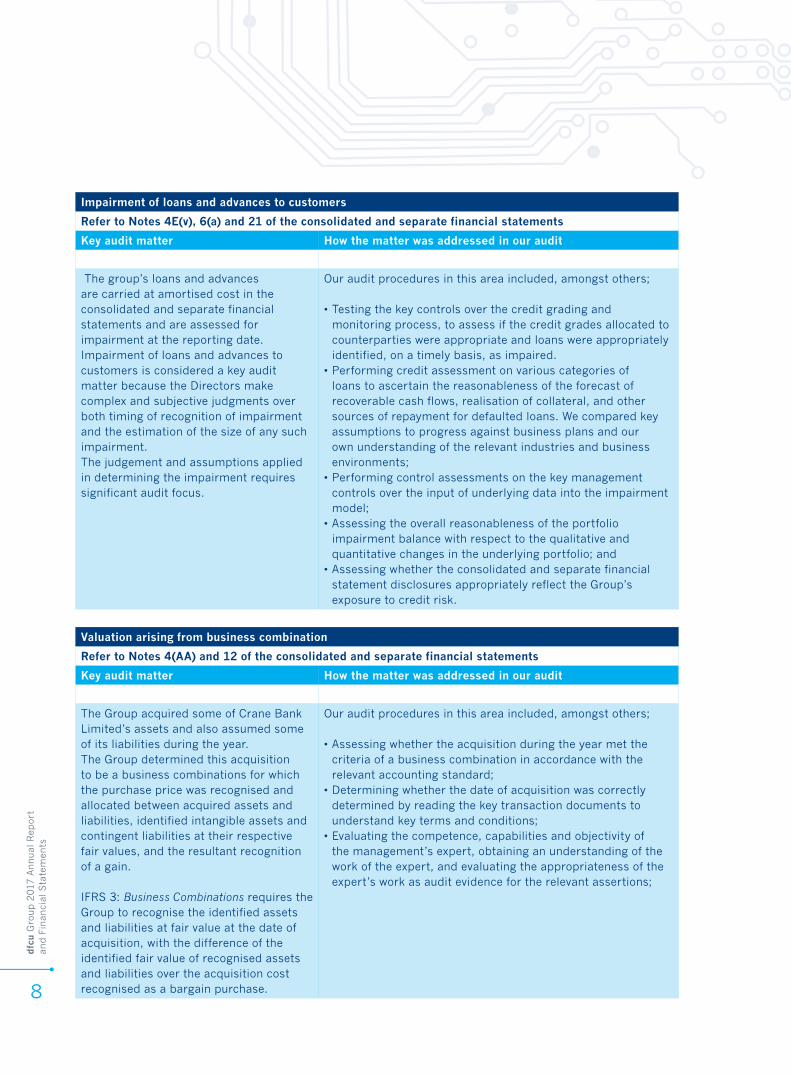
dfc
u G
roup 2
017
Annual
Rep
ort
an
d F
inan
cial
Sta
tem
ents
8
Impairment of loans and advances to customers
Refer to Notes 4E(v), 6(a) and 21 of the consolidated and separate financial statements
Key audit matter How the matter was addressed in our audit
The group’s loans and advances are carried at amortised cost in the consolidated and separate financial statements and are assessed for impairment at the reporting date.Impairment of loans and advances to customers is considered a key audit matter because the Directors make complex and subjective judgments over both timing of recognition of impairment and the estimation of the size of any such impairment.The judgement and assumptions applied in determining the impairment requires significant audit focus.
Our audit procedures in this area included, amongst others;
• Testing the key controls over the credit grading and monitoring process, to assess if the credit grades allocated to counterparties were appropriate and loans were appropriately identified, on a timely basis, as impaired.
• Performing credit assessment on various categories of loans to ascertain the reasonableness of the forecast of recoverable cash flows, realisation of collateral, and other sources of repayment for defaulted loans. We compared key assumptions to progress against business plans and our own understanding of the relevant industries and business environments;
• Performing control assessments on the key management controls over the input of underlying data into the impairment model;
• Assessing the overall reasonableness of the portfolio impairment balance with respect to the qualitative and quantitative changes in the underlying portfolio; and
• Assessing whether the consolidated and separate financial statement disclosures appropriately reflect the Group’s exposure to credit risk.
Valuation arising from business combination
Refer to Notes 4(AA) and 12 of the consolidated and separate financial statements
Key audit matter How the matter was addressed in our audit
The Group acquired some of Crane Bank Limited’s assets and also assumed some of its liabilities during the year. The Group determined this acquisition to be a business combinations for which the purchase price was recognised and allocated between acquired assets and liabilities, identified intangible assets and contingent liabilities at their respective fair values, and the resultant recognition of a gain.
IFRS 3: Business Combinations requires the Group to recognise the identified assets and liabilities at fair value at the date of acquisition, with the difference of the identified fair value of recognised assets and liabilities over the acquisition cost recognised as a bargain purchase.
Our audit procedures in this area included, amongst others;
• Assessing whether the acquisition during the year met the criteria of a business combination in accordance with the relevant accounting standard;
• Determining whether the date of acquisition was correctly determined by reading the key transaction documents to understand key terms and conditions;
• Evaluating the competence, capabilities and objectivity of the management’s expert, obtaining an understanding of the work of the expert, and evaluating the appropriateness of the expert’s work as audit evidence for the relevant assertions;

dfc
u G
roup 2
017
Annual
Rep
ort
an
d F
inan
cial
Sta
tem
ents
9
Significant judgement is applied in the identification of any intangible assets acquired and contingent liabilities assumed in the transaction.
Significant assumptions and estimates are also used in the determination of the fair values of the identified assets acquired and liabilities assumed in the transaction.Management engaged an independent valuer (“management’s expert”) to issue a valuation report on the fair values of the identified assets and liabilities at the acquisition date. The purchase price allocation (“PPA”) exercise was completed and the gain from the transaction amounting to Ushs 119,301 million at the acquisition date was recognised.
• Engaging our valuation expert (“auditors’ expert”) to review the assets and liabilities valuation reports and the reasonableness of the underlying key assumptions;
• Evaluating the competence, capabilities and objectivity of the auditors’ expert, and the adequacy of the work performed by the auditors’ expert; and
• Assessing and corroborating the adequacy and appropriateness of the disclosures made in the consolidated financial statements.
Information technology systems and controls
Refer to Note 5G of the consolidated and separate financial statements
Key audit matter How the matter was addressed in our audit
During the year, the Group upgraded its Core Banking System to Finacle 10 which supports banking operations. The system also has interfaces with other key business systems within the IT environment.The implementation of a new system has an inherent risk of loss of integrity of key financial data being migrated, and the breakdown in operation or monitoring of IT dependent controls within critical operations business processes and recording of transactions, which could lead to financial errors or misstatements and inaccurate financial reporting.The Group’s business operations are heavily dependent on the new system and there is an inherent risk that automated accounting procedures and related IT dependent manual controls may not be designed and operating effectively.We have determined the system upgrade as a key audit matter due to the extensive procedures that were required to obtain sufficient and appropriate audit evidence over the completeness and accuracy of data migration.
Our audit procedures in this area included, amongst others;
• Examining the governance framework over the Group’s IT organisation and the controls over program development and changes, access to programs and data and IT operations, including compensating controls where required;
• Assessing and testing the design and operating effectiveness of the controls over the continued integrity of both the old and the new system that were relevant to the Group’s operations during the year. Where necessary we also carried out direct tests of certain aspects of the security of the Group’s IT systems including access management and segregation of duties;
• Re-performing selected automated computations and comparing our results with those from the system and the general ledger;
• Testing the significant system interfaces to ensure the accuracy and completeness of the data transfer. Our procedures included assessing and testing the General IT control environment, including IT access and segregation of duties, as well as IT dependent controls within critical business processes; and
• Assessing and testing controls specifically established over the implementation process and migration of key financial data from the legacy to the new operating system, and performing walk through to collaborate this.
dfc
u G
roup 2
017
Annual
Rep
ort
an
d F
inan
cial
Sta
tem
ents
10
OTHER INFORMATION
The directors are responsible for the other information. The other information comprises the information included in Group information, the Directors’ report, the Statement of Directors’ Responsibilities and Supplementary Information which we obtained prior to the date of this report, and the Annual Report, which is expected to be made available to us after that date. The other information does not include the consolidated and separate financial statements and our auditors’ report thereon. Our opinion on the consolidated and separate financial statements does not cover the other information and we do not express any form of assurance conclusion thereon. In connection with our audit of the consolidated and separate financial statements, our responsibility is to read the other information and, in doing so, consider whether the other information is materially inconsistent with the consolidated and separate financial statements or our knowledge obtained in the audit, or otherwise appears to be materially misstated.
If, based on the work we have performed on the other information obtained prior to the date of this auditors’ report, we conclude that there is a material misstatement of this other information, we are required to report that fact. We have nothing to report in this regard.
DIRECTOR’S RESPONSIBILITIES FOR THE CONSOLIDATED AND SEPARATE FINANCIAL STATEMENTS
As stated on page 6, the directors are responsible for the preparation of the consolidated and separate financial statements that give a true and view in accordance with International Financial Reporting Standards and in the manner required by the Companies Act of Uganda and the Financial Institutions Act, 2004 (as amended in 2016), and for such internal control as the directors determine is necessary to enable the preparation of the consolidated and separate financial statements that are free from material misstatements, whether due to fraud or error.
In preparing the consolidated and separate financial statements, the directors are responsible for assessing the Group’s and Company’s ability to continue as a going concern, disclosing, as applicable, matters related to going concern and using the going concern basis of accounting unless the directors either intend to liquidate the Group and/or the Company to cease operations, or have no realistic alternative but to do so. The directors are responsible for overseeing the Group’s and Company’s financial reporting process.
AUDITORS’ RESPONSIBILITIES FOR THE AUDIT OF THE CONSOLIDATED AND SEPARATE FINANCIAL STATEMENTS
Our objectives are to obtain reasonable assurance about whether the consolidated and separate financial statements as a whole are free from material misstatement, whether due to fraud or error, and to issue an auditors’ report that includes our opinion. Reasonable assurance is a high level of assurance, but is not a guarantee that an audit conducted in accordance with ISAs will always detect a material misstatement when it exists. Misstatements can arise from fraud or error and are considered material if, individually or in the aggregate, they could reasonably be expected to influence the economic decisions of users taken on the basis of these consolidated and separate financial statements.As part of an audit in accordance with ISAs, we exercise professional judgment and maintain professional scepticism throughout the audit. We also: • Identify and assess the risks of material
misstatement of the consolidated and separate financial statements, whether due to fraud or error, design and perform audit procedures responsive to those risks, and obtain audit evidence that is sufficient and appropriate to provide a basis for our opinion. The risk of not detecting a material misstatement resulting from fraud is higher than for one resulting from error, as fraud may involve collusion, forgery, intentional omissions, misrepresentations, or the override of internal control.
dfc
u G
roup 2
017
Annual
Rep
ort
an
d F
inan
cial
Sta
tem
ents
11
• Obtain an understanding of internal control relevant to the audit in order to design audit procedures that are appropriate in the circumstances, but not for the purpose of expressing an opinion on the effectiveness of the Group’s and Company’s internal control.
• Evaluate the appropriateness of accounting policies used and the reasonableness of accounting estimates and related disclosures made by the directors.
• Conclude on the appropriateness of the directors’ use of the going concern basis of accounting and based on the audit evidence obtained, whether a material uncertainty exists related to events or conditions that may cast significant doubt on the Group’s and Company’s ability to continue as a going concern. If we conclude that a material uncertainty exists, we are required to draw attention in our auditors’ report to the related disclosures in the consolidated and separate financial statements or, if such disclosures are inadequate, to modify our opinion. Our conclusions are based on the audit evidence obtained up to the date of our auditor’s report. However, future events or conditions may cause the Group and/or the Company to cease to continue as a going concern.
• Evaluate the overall presentation, structure and content of the consolidated and separate financial statements, including the disclosures, and whether the consolidated and separate financial statements represent the underlying transactions and events in a manner that achieves fair presentation.
We communicate with the directors regarding, among other matters, the planned scope and timing of the audit and significant audit findings, including any significant deficiencies in internal control that we identify during our audit.
We also provide directors with a statement that we have complied with relevant ethical requirements regarding independence, and to communicate with them all relationships and other matters that may reasonably be thought to bear on our independence, and where applicable, related safeguards.
From the matters communicated with directors, we determine those matters that were of most significance in the audit of the consolidated and separate financial statements of the current period and are therefore the key audit matters. We describe these matters in our auditors’ report unless law or regulation precludes public disclosure about the matter or when, in extremely rare circumstances, we determine that a matter should not be communicated in our report because the adverse consequences of doing so would reasonably be expected to outweigh the public interest benefits of such communication.
REPORT ON OTHER LEGAL AND REGULATORY REQUIREMENTS
As required by the Companies Act of Uganda we report to you, based on our audit, that:i. We have obtained all the information and
explanations, which to the best of our knowledge and belief were necessary for the purpose of our audit;
ii. In our opinion, proper books of account have been kept by the Group, so far as appears from our examination of those books; and
iii. The consolidated and separate statements of financial position and comprehensive income are in agreement with the books of account.
The engagement partner responsible for the audit resulting in this independent auditors’ report is CPA Benson Ndung’u - P0116.
KPMGCertified Public Accountants3rd Floor, Rwenzori courtsPlot 2 & 4A, Nakasero RoadP.O. Box 3509Kampala, Uganda
Date: 28 March 2018
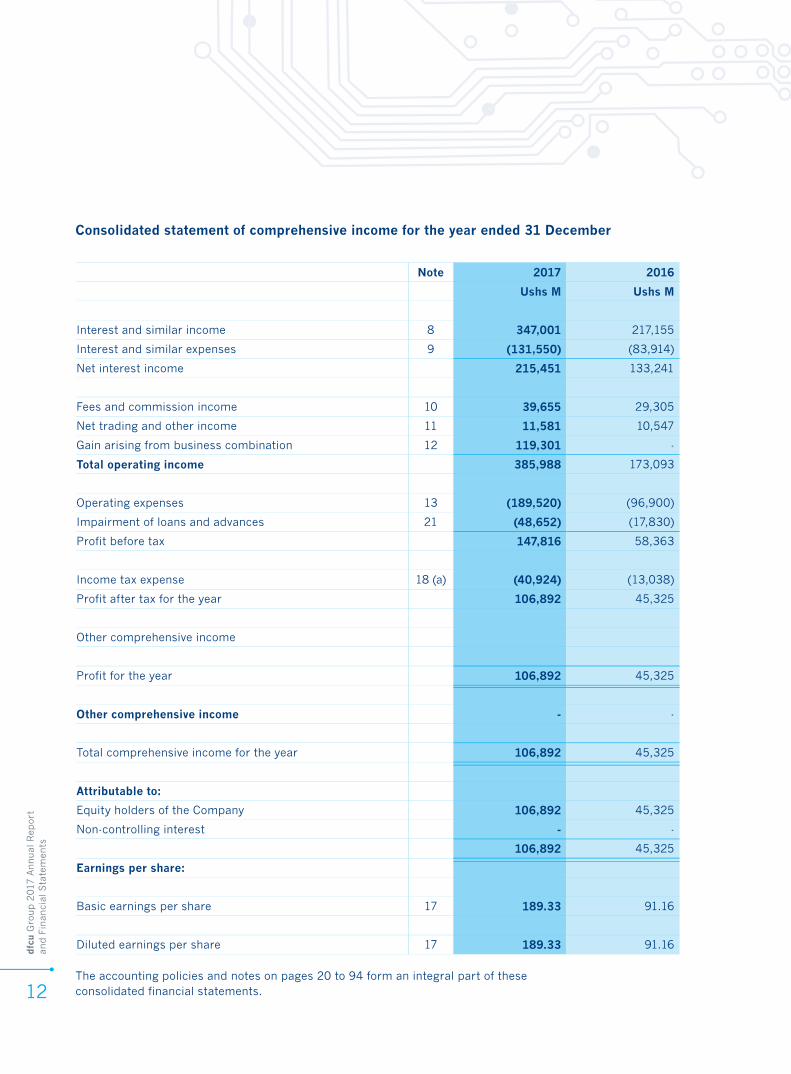
dfc
u G
roup 2
017
Annual
Rep
ort
an
d F
inan
cial
Sta
tem
ents
12
Note 2017 2016
Ushs M Ushs M
Interest and similar income 8 347,001 217,155
Interest and similar expenses 9 (131,550) (83,914)
Net interest income 215,451 133,241
Fees and commission income 10 39,655 29,305
Net trading and other income 11 11,581 10,547
Gain arising from business combination 12 119,301 -
Total operating income 385,988 173,093
Operating expenses 13 (189,520) (96,900)
Impairment of loans and advances 21 (48,652) (17,830)
Profit before tax 147,816 58,363
Income tax expense 18 (a) (40,924) (13,038)
Profit after tax for the year 106,892 45,325
Other comprehensive income
Profit for the year 106,892 45,325
Other comprehensive income - -
Total comprehensive income for the year 106,892 45,325
Attributable to:
Equity holders of the Company 106,892 45,325
Non-controlling interest - -
106,892 45,325
Earnings per share:
Basic earnings per share 17 189.33 91.16
Diluted earnings per share 17 189.33 91.16
Consolidated statement of comprehensive income for the year ended 31 December
The accounting policies and notes on pages 20 to 94 form an integral part of these consolidated financial statements.
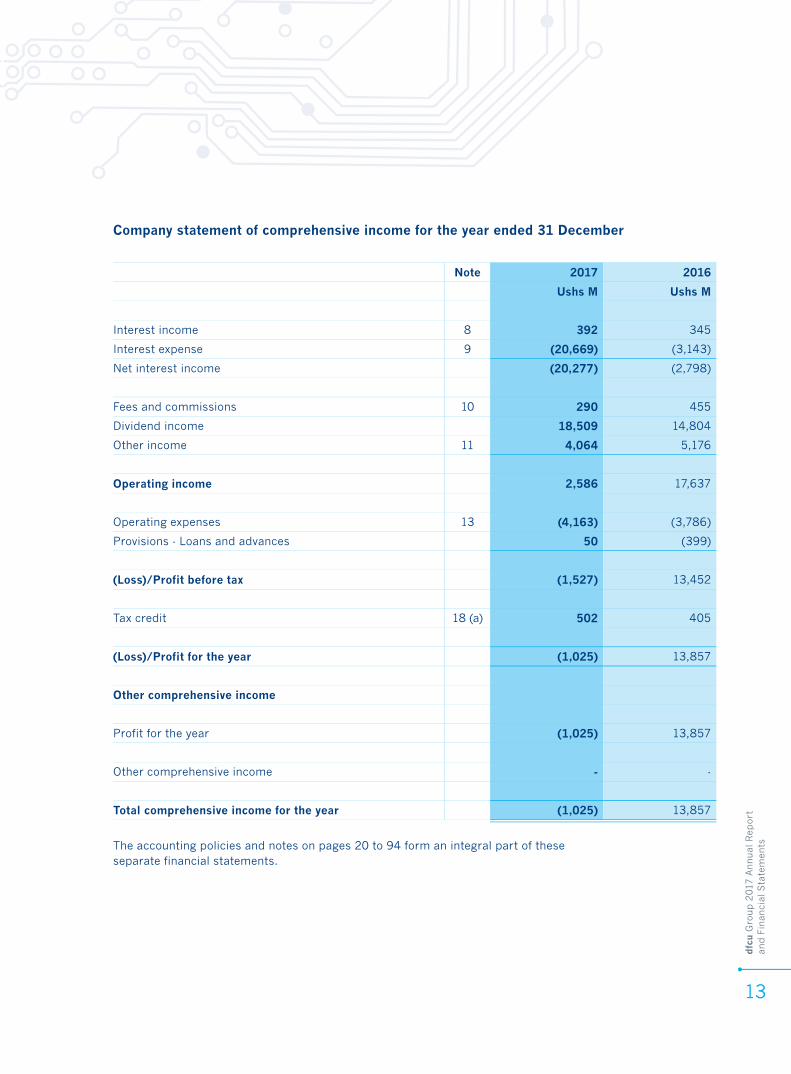
dfc
u G
roup 2
017
Annual
Rep
ort
an
d F
inan
cial
Sta
tem
ents
13
Company statement of comprehensive income for the year ended 31 December
The accounting policies and notes on pages 20 to 94 form an integral part of these separate financial statements.
Note 2017 2016
Ushs M Ushs M
Interest income 8 392 345
Interest expense 9 (20,669) (3,143)
Net interest income (20,277) (2,798)
Fees and commissions 10 290 455
Dividend income 18,509 14,804
Other income 11 4,064 5,176
Operating income 2,586 17,637
Operating expenses 13 (4,163) (3,786)
Provisions - Loans and advances 50 (399)
(Loss)/Profit before tax (1,527) 13,452
Tax credit 18 (a) 502 405
(Loss)/Profit for the year (1,025) 13,857
Other comprehensive income
Profit for the year (1,025) 13,857
Other comprehensive income - -
Total comprehensive income for the year (1,025) 13,857
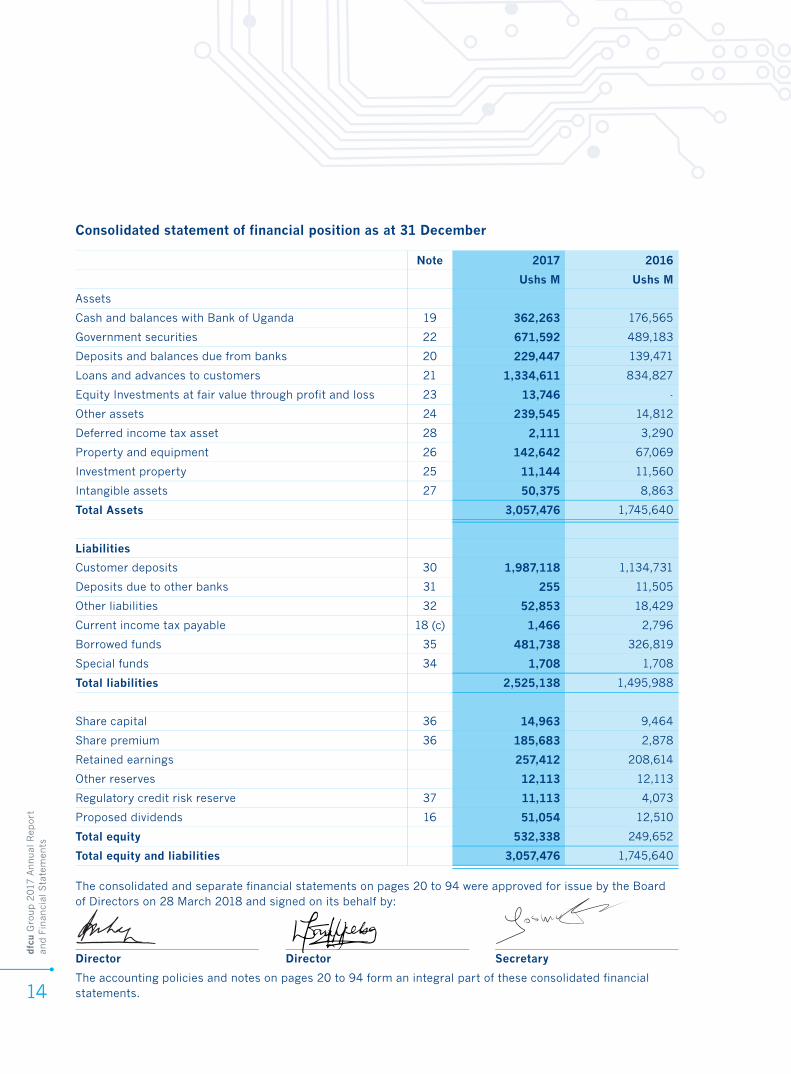
dfc
u G
roup 2
017
Annual
Rep
ort
an
d F
inan
cial
Sta
tem
ents
14
Note 2017 2016
Ushs M Ushs M
Assets
Cash and balances with Bank of Uganda 19 362,263 176,565
Government securities 22 671,592 489,183
Deposits and balances due from banks 20 229,447 139,471
Loans and advances to customers 21 1,334,611 834,827
Equity Investments at fair value through profit and loss 23 13,746 -
Other assets 24 239,545 14,812
Deferred income tax asset 28 2,111 3,290
Property and equipment 26 142,642 67,069
Investment property 25 11,144 11,560
Intangible assets 27 50,375 8,863
Total Assets 3,057,476 1,745,640
Liabilities
Customer deposits 30 1,987,118 1,134,731
Deposits due to other banks 31 255 11,505
Other liabilities 32 52,853 18,429
Current income tax payable 18 (c) 1,466 2,796
Borrowed funds 35 481,738 326,819
Special funds 34 1,708 1,708
Total liabilities 2,525,138 1,495,988
Share capital 36 14,963 9,464
Share premium 36 185,683 2,878
Retained earnings 257,412 208,614
Other reserves 12,113 12,113
Regulatory credit risk reserve 37 11,113 4,073
Proposed dividends 16 51,054 12,510
Total equity 532,338 249,652
Total equity and liabilities 3,057,476 1,745,640
The consolidated and separate financial statements on pages 20 to 94 were approved for issue by the Board of Directors on 28 March 2018 and signed on its behalf by:
The accounting policies and notes on pages 20 to 94 form an integral part of these consolidated financial statements.
Consolidated statement of financial position as at 31 December
Director Director Secretary
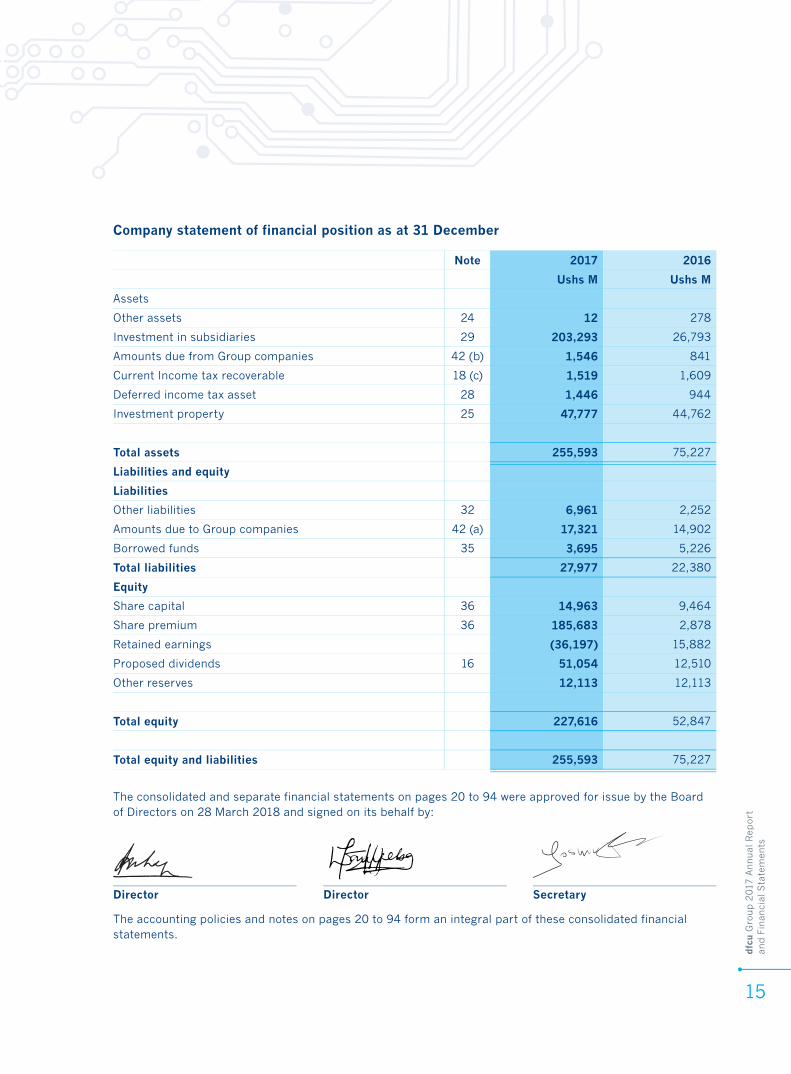
dfc
u G
roup 2
017
Annual
Rep
ort
an
d F
inan
cial
Sta
tem
ents
15
The consolidated and separate financial statements on pages 20 to 94 were approved for issue by the Board of Directors on 28 March 2018 and signed on its behalf by:
The accounting policies and notes on pages 20 to 94 form an integral part of these consolidated financial statements.
Company statement of financial position as at 31 December
Director Director Secretary
Note 2017 2016
Ushs M Ushs M
Assets
Other assets 24 12 278
Investment in subsidiaries 29 203,293 26,793
Amounts due from Group companies 42 (b) 1,546 841
Current Income tax recoverable 18 (c) 1,519 1,609
Deferred income tax asset 28 1,446 944
Investment property 25 47,777 44,762
Total assets 255,593 75,227
Liabilities and equity
Liabilities
Other liabilities 32 6,961 2,252
Amounts due to Group companies 42 (a) 17,321 14,902
Borrowed funds 35 3,695 5,226
Total liabilities 27,977 22,380
Equity
Share capital 36 14,963 9,464
Share premium 36 185,683 2,878
Retained earnings (36,197) 15,882
Proposed dividends 16 51,054 12,510
Other reserves 12,113 12,113
Total equity 227,616 52,847
Total equity and liabilities 255,593 75,227
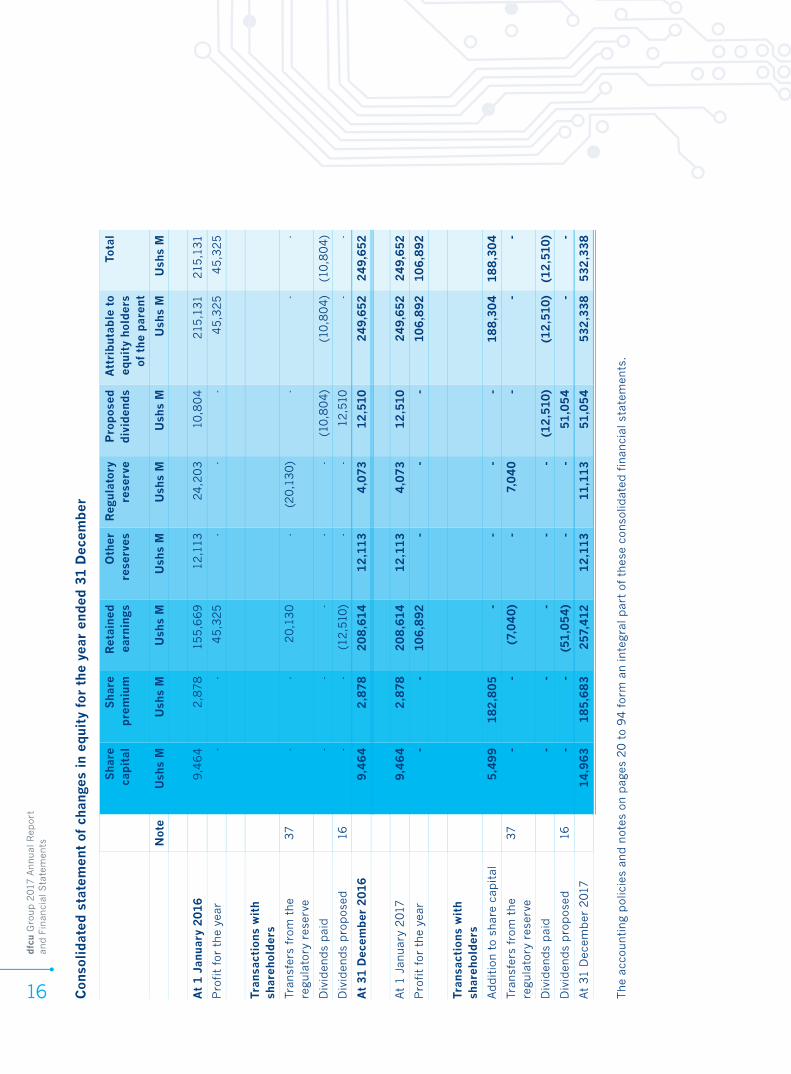
dfc
u G
roup 2
017
Annual
Rep
ort
an
d F
inan
cial
Sta
tem
ents
16
Shar
e ca
pit
al
Shar
e pre
miu
m
Ret
ained
ea
rnin
gsO
ther
re
serv
esR
egul
ator
y re
serv
eP
rop
osed
div
iden
ds
Att
rib
uta
ble
to
equi
ty h
older
s of
the
par
ent
Tota
l
Not
eU
shs
MU
shs
MU
shs
MU
shs
MU
shs
MU
shs
MU
shs
MU
shs
M
At
1 J
anuar
y 2
016
9,4
64
2,8
78
155,6
69
12,1
1324,2
03
10,8
04
215
,131
215
,131
Pro
fit
for
the
year
--
45,3
25
--
-4
5,3
25
45,3
25
Tran
sact
ions
wit
h sh
areh
older
s
Tran
sfer
s fr
om t
he
regula
tory
res
erve
37
--
20,1
30
-(2
0,1
30)
--
-
Div
iden
ds
pai
d-
--
--
(10,8
04)
(10,8
04)
(10,8
04)
Div
iden
ds
pro
pos
ed16
--
(12,5
10)
--
12,5
10-
-
At
31 D
ecem
ber
2016
9,4
64
2,8
78
20
8,6
14
12
,11
34
,073
12
,510
24
9,6
52
24
9,6
52
At
1 J
anuar
y 2
017
9,4
64
2,8
78
20
8,6
14
12
,11
34
,073
12
,510
24
9,6
52
24
9,6
52
Pro
fit
for
the
year
--
10
6,8
92
--
-10
6,8
92
10
6,8
92
Tran
sact
ions
wit
h sh
areh
older
s
Addit
ion t
o sh
are
capit
al5,4
99
18
2,8
05
--
--
18
8,3
04
18
8,3
04
Tran
sfer
s fr
om t
he
regula
tory
res
erve
37
--
(7,0
40
)-
7,0
40
--
-
Div
iden
ds
pai
d-
--
--
(12
,510
)(1
2,5
10
)(1
2,5
10
)
Div
iden
ds
pro
pos
ed16
--
(51
,05
4)
--
51
,05
4-
-
At
31 D
ecem
ber
201
71
4,9
63
18
5,6
83
257,
41
21
2,1
13
11
,11
351
,05
4532
,33
8532
,33
8
Con
soli
dat
ed s
tate
men
t of
cha
nge
s in
equi
ty f
or t
he
year
ended
31 D
ecem
ber
The
acco
unti
ng
pol
icie
s an
d n
otes
on p
ages
20 t
o 9
4 f
orm
an inte
gra
l p
art
of t
hes
e co
nso
lidat
ed f
inan
cial
sta
tem
ents
.
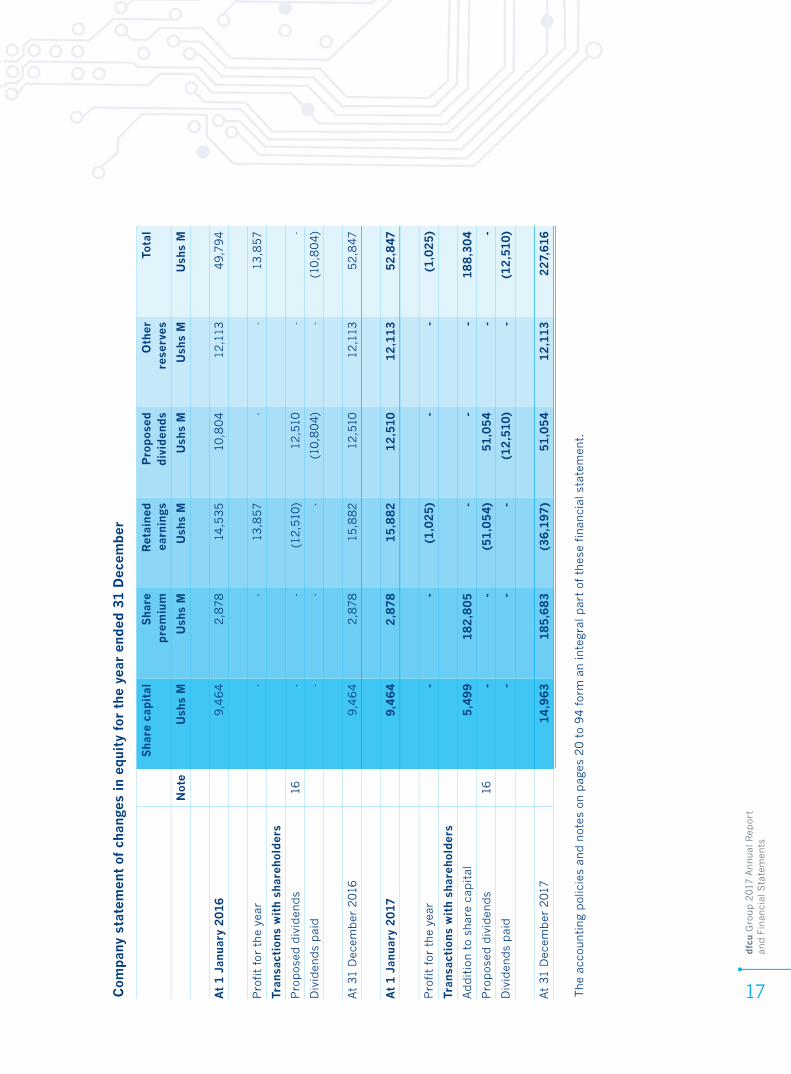
dfc
u G
roup 2
017
Annual
Rep
ort
an
d F
inan
cial
Sta
tem
ents
17Com
pan
y st
atem
ent
of c
hange
s in
equi
ty f
or t
he
year
ended
31 D
ecem
ber
The
acco
unti
ng
pol
icie
s an
d n
otes
on p
ages
20 t
o 9
4 f
orm
an inte
gra
l p
art
of t
hes
e finan
cial
sta
tem
ent.
Shar
e ca
pit
al
Shar
e pre
miu
m
Ret
ained
ea
rnin
gsP
rop
osed
div
iden
ds
Oth
er
rese
rves
Tota
l
Not
eU
shs
MU
shs
MU
shs
MU
shs
MU
shs
MU
shs
M
At
1 J
anuar
y 2
016
9,4
64
2,8
78
14,5
35
10,8
04
12,1
1349,7
94
Pro
fit
for
the
year
--
13,8
57
--
13,8
57
Tran
sact
ions
wit
h sh
areh
older
s
Pro
pos
ed d
ivid
ends
16-
-(1
2,5
10)
12,5
10-
-
Div
iden
ds
pai
d-
--
(10,8
04)
-(1
0,8
04)
At
31 D
ecem
ber
201
69,4
64
2,8
78
15,8
82
12,5
1012,1
1352,8
47
At
1 J
anuar
y 2
017
9,4
64
2,8
78
15,8
82
12
,510
12
,11
352
,847
Pro
fit
for
the
year
--
(1,0
25
)-
-(1
,02
5)
Tran
sact
ions
wit
h sh
areh
older
s
Addit
ion t
o sh
are
capit
al5,4
99
18
2,8
05
--
-1
88
,30
4
Pro
pos
ed d
ivid
ends
16-
-(5
1,0
54)
51
,05
4-
-
Div
iden
ds
pai
d-
--
(12
,510
)-
(12
,510
)
At
31 D
ecem
ber
201
71
4,9
63
18
5,6
83
(36
,197
)51
,05
41
2,1
13
22
7,616
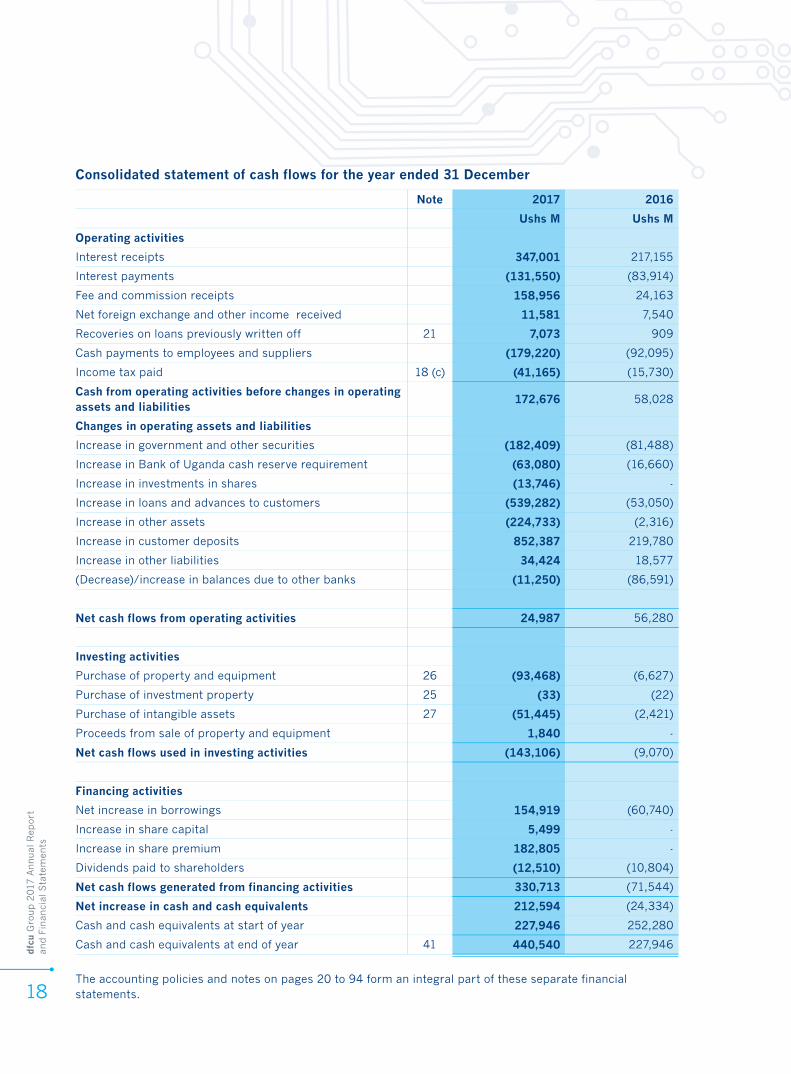
dfc
u G
roup 2
017
Annual
Rep
ort
an
d F
inan
cial
Sta
tem
ents
18
Note 2017 2016
Ushs M Ushs M
Operating activities
Interest receipts 347,001 217,155
Interest payments (131,550) (83,914)
Fee and commission receipts 158,956 24,163
Net foreign exchange and other income received 11,581 7,540
Recoveries on loans previously written off 21 7,073 909
Cash payments to employees and suppliers (179,220) (92,095)
Income tax paid 18 (c) (41,165) (15,730)
Cash from operating activities before changes in operating assets and liabilities
172,676 58,028
Changes in operating assets and liabilities
Increase in government and other securities (182,409) (81,488)
Increase in Bank of Uganda cash reserve requirement (63,080) (16,660)
Increase in investments in shares (13,746) -
Increase in loans and advances to customers (539,282) (53,050)
Increase in other assets (224,733) (2,316)
Increase in customer deposits 852,387 219,780
Increase in other liabilities 34,424 18,577
(Decrease)/increase in balances due to other banks (11,250) (86,591)
Net cash flows from operating activities 24,987 56,280
Investing activities
Purchase of property and equipment 26 (93,468) (6,627)
Purchase of investment property 25 (33) (22)
Purchase of intangible assets 27 (51,445) (2,421)
Proceeds from sale of property and equipment 1,840 -
Net cash flows used in investing activities (143,106) (9,070)
Financing activities
Net increase in borrowings 154,919 (60,740)
Increase in share capital 5,499 -
Increase in share premium 182,805 -
Dividends paid to shareholders (12,510) (10,804)
Net cash flows generated from financing activities 330,713 (71,544)
Net increase in cash and cash equivalents 212,594 (24,334)
Cash and cash equivalents at start of year 227,946 252,280
Cash and cash equivalents at end of year 41 440,540 227,946
The accounting policies and notes on pages 20 to 94 form an integral part of these separate financial statements.
Consolidated statement of cash flows for the year ended 31 December
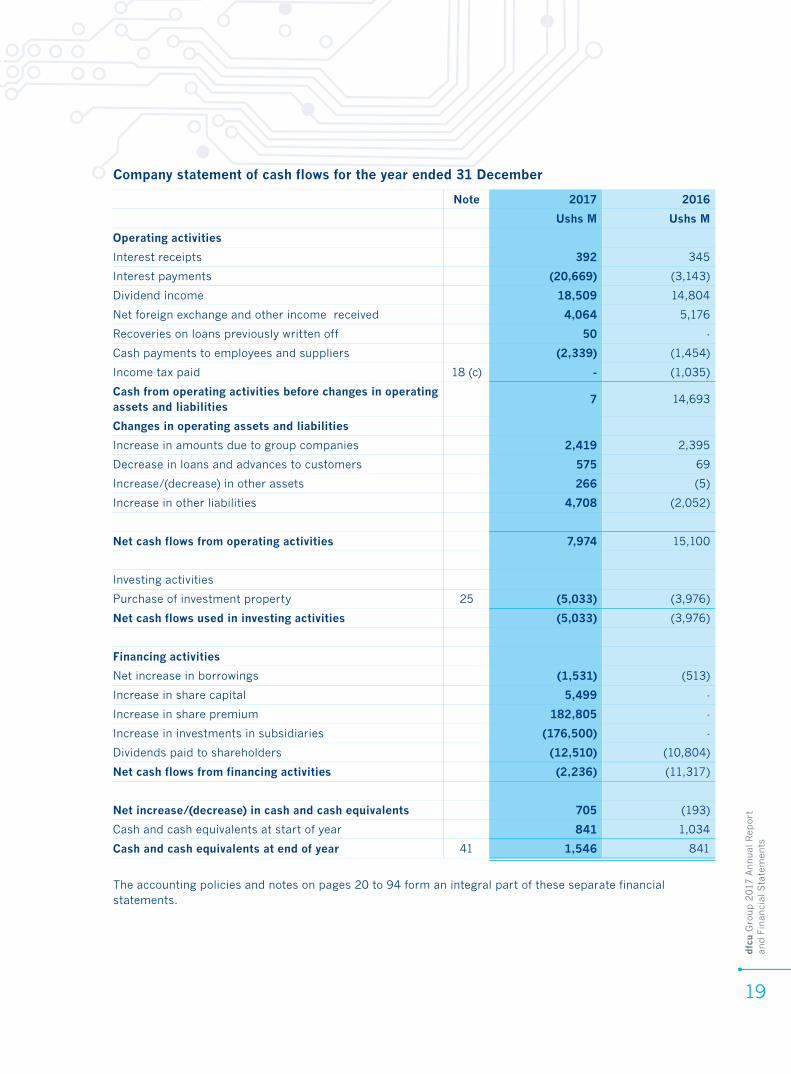
dfc
u G
roup 2
017
Annual
Rep
ort
an
d F
inan
cial
Sta
tem
ents
19
The accounting policies and notes on pages 20 to 94 form an integral part of these separate financial statements.
Company statement of cash flows for the year ended 31 December
Note 2017 2016
Ushs M Ushs M
Operating activities
Interest receipts 392 345
Interest payments (20,669) (3,143)
Dividend income 18,509 14,804
Net foreign exchange and other income received 4,064 5,176
Recoveries on loans previously written off 50 -
Cash payments to employees and suppliers (2,339) (1,454)
Income tax paid 18 (c) - (1,035)
Cash from operating activities before changes in operating assets and liabilities
7 14,693
Changes in operating assets and liabilities
Increase in amounts due to group companies 2,419 2,395
Decrease in loans and advances to customers 575 69
Increase/(decrease) in other assets 266 (5)
Increase in other liabilities 4,708 (2,052)
Net cash flows from operating activities 7,974 15,100
Investing activities
Purchase of investment property 25 (5,033) (3,976)
Net cash flows used in investing activities (5,033) (3,976)
Financing activities
Net increase in borrowings (1,531) (513)
Increase in share capital 5,499 -
Increase in share premium 182,805 -
Increase in investments in subsidiaries (176,500) -
Dividends paid to shareholders (12,510) (10,804)
Net cash flows from financing activities (2,236) (11,317)
Net increase/(decrease) in cash and cash equivalents 705 (193)
Cash and cash equivalents at start of year 841 1,034
Cash and cash equivalents at end of year 41 1,546 841
dfc
u G
roup 2
017
Annual
Rep
ort
an
d F
inan
cial
Sta
tem
ents
20
1. GENERAL INFORMATION
dfcu Limited (‘the Company’) is incorporated in Uganda under the Companies Act of Uganda (Cap 110) as a public limited liability company and is domiciled in Uganda. Some of the company’s shares are listed on the Uganda Securities Exchange (USE. It is domiciled in Uganda and the address of its registered office is:Plot 26 Kyadondo RoadP.O. Box 2767 Kampala, Uganda.
For the Companies Act of Uganda reporting purposes, the balance sheet is represented by the consolidated and separate statement of financial position and the profit and loss account is represented by the consolidated and separate statement of comprehensive income in these consolidated and separate financial statements.
2. BASIS OF PREPARATION
The consolidated and separate financial statements have been prepared in accordance with and comply with the International Financial Reporting Standards (IFRS). They were authorised for issue by the Group’s board of directors on 28 March 2018. Details of the Group’s accounting policies are included in Note 4The consolidated and separate financial statements are presented in Uganda Shillings (Ushs), which is the Group’s functional currency. All amounts have been rounded to the nearest million (Ushs M), unless otherwise indicated.The measurement basis applied is the historical cost basis, except where otherwise stated in the accounting policies included in Note 4.The preparation of consolidated and separate financial statements in conformity with IFRS requires the use of estimates and assumptions. It also requires management to exercise its judgement in the process of applying the Group’s accounting policies. The areas involving a higher degree of judgement or complexity, or where assumptions and estimates are significant to the consolidated and separate financial statements, are disclosed in Note 6.
3. STANDARDS ISSUED BUT NOT YET EFFECTIVE
A number of new standards are effective for annual periods beginning after 1 January 2017 and earlier application is permitted; however, the Group has not early adopted the new or amended standards in preparing these consolidated and separate financial statements. The following standards are expected to have a material impact on the Group’s consolidated and separate financial statements in the period of initial recognition.
a). IFRS 9 Financial InstrumentsIn July 2014, the IASB issued the final version of IFRS 9 Financial Instruments Standard, which brings together the classification and measurement, impairment and hedge accounting phases of the IASB’s project to replace IAS 39 Financial Instruments: Recognition and Measurement. The standard is effective for the annual period beginning on or after 1 January 2018 with early adoption permitted.In October 2017, the IASB issued Prepayment Features with Negative Compensation (Amendments to IFRS 9). The amendments are effective for annual periods beginning on or after 1 January 2019, with early adoption permitted.
Project governanceThe Group structured its IFRS 9 implementation project in such a way as to effectively enable the delivery of the IFRS 9 requirements across the Group. The IFRS 9 implementation project team provided direction to the project, monitored the project’s progress, and identified required interventions and project interdependencies with other Bank initiatives. The Group appointed Kin Analytics and PwC Uganda to develop the model framework and IFRS 9 provision calculation tools for all of its financial assets.In order to ensure appropriate board oversight, the IFRS 9 project team reports on its activities, status and outcomes to the Board Risk and Credit Committee.
dfc
u G
roup 2
017
Annual
Rep
ort
an
d F
inan
cial
Sta
tem
ents
21
The Group’s IFRS 9 implementation project is mainly driven by the credit department. The implementation of the project included an impact assessment exercise as at 30 September 2017, which was used to test the Group’s readiness for the transition to IFRS 9. The results of the exercise were assessed by the external auditor to assist management in determining the Group’s readiness and the results and findings were communicated to both the Board and Executive Committee.
ApplicationThe Group will apply IFRS 9 as issued in July 2014 initially on 1 January 2018 and will early adopt the amendments to IFRS 9 on the same date. The Group will not restate comparatives on initial application of IFRS 9, but will provide detailed transitional disclosures in accordance with the amended requirements of IFRS 7 Financial Instruments: Disclosures and IAS 8 Accounting Policies, Changes in Accounting Estimates and Errors. Any change in carrying amounts from the initial application of IFRS 9 will be recognized in equity.
Based on the assessment undertaken to date, the total estimated adjustment (net of tax) of the adoption of IFRS 9 on the opening balance of the Group’s equity at 1 January 2018 is approximately Ushs 30.52 billion, representing:• an increase of approximately Ushs 43.6 billion
related to impairment requirements (see (iii)); and • an increase of approximately Ushs 13.08 billion
related to deferred tax impact.There will be no quantitative impact of the changes in classification and measurement of the financial assets and financials liabilities of the Group.The above assessment is preliminary because not all transition work has been finalized. The actual impact of adopting IFRS 9 on 1 January 2018 may change because:• IFRS 9 will require the Group to revise its
accounting processes and internal control and these changes are not yet complete;
• Although parallel runs were carried out in the second half of 2017, the new systems and associated controls in place have not been operational for a more extended period;
• The Group has not finalized the testing and assessment of controls over the news IT systems and changes to its governance framework;
• The Group is refining and finalizing the models for ECL calculations;
• The new accounting policies, assumptions, judgements and estimation techniques employed are subject to change until the Group finalizes its first consolidated financial statements that include the date of initial application.
i). Classification and measurementIFRS 9 contains a new classification and measurement approach for financial assets that reflects the business model in which assets are managed and their cash flow characteristics. IFRS 9 includes three principal classification categories for financial assets: measured at amortised cost, fair value through other comprehensive income (FVOCI) and fair value through profit and loss (FVTPL). It eliminates the existing IAS 39 categories of held to maturity, loans and receivables and available for sale.A financial asset is measured at amortised cost if it meets both of the following conditions and is not designated as at FVTPL:• it is held within a business model whose objective
is to hold assets to collect contractual cash flows; and
• its contractual terms give rise on specified dates to cash flows that are solely payments of principal and interest (SPPI) on the principal amount outstanding.
A financial asset is measured at FVOCI only if it meets both of the following conditions and is not designated as at FVTPL:• it is held within a business model whose objective
is achieved by both collecting contractual cash flows and selling financial assets; and
• its contractual terms give rise on specified dates to cash flows that are solely payments of principal and interest on the principal amount outstanding.
On initial recognition of an equity investment that is not held for trading, the Group may irrevocably elect to present subsequent changes in fair value in OCI. This election is made on an investment-by-investment basis.
dfc
u G
roup 2
017
Annual
Rep
ort
an
d F
inan
cial
Sta
tem
ents
22
All financial assets not classified as measured at amortised cost or FVOCI as described above are measured at FVTPL. In addition, on initial recognition the Group may irrevocably designate a financial asset that otherwise meets the requirements to be measured at amortised cost or at FVOCI as at FVTPL if doing so eliminates or significantly reduces an accounting mismatch that would otherwise arise.A financial asset is classified into one of these categories on initial recognition. See (vi) for the transition requirements relating to classification of financial assets.
Under IFRS 9, derivatives embedded in contracts where the host is a financial asset in the scope of IFRS 9 are not separated. Instead, the hybrid financial instrument as a whole is assessed for classification.
Financial assets that are held for trading and those that are managed and whose performance is evaluated on a fair value basis will be measured at FVTPL because they are neither held to collect contractual cash flows nor held both to collect contractual cash flows and to sell financial assets.
Assessment whether contractual cash flows are solely payments of principal and interestFor the purposes of this assessment, ‘principal’ is defined as the fair value of the financial asset on initial recognition. ‘Interest’ is defined as consideration for the time value of money, for the credit risk associated with the principal amount outstanding during a particular period of time and for other basic lending risks and costs (e.g. liquidity risk and administrative costs) as well as a profit margin.In assessing whether the contractual cash flows are solely payments of principal and interest the Group will consider the contractual terms of the instrument. This will include assessing whether the financial asset contains a contractual term that could change the timing or amount of contractual cash flows such that it would not meet this condition.
In making the assessment, the Group will consider:• contingent events that would change the amount
and timing of cash flows;• leverage features;• prepayment and extension terms;• terms that limit the Group’s claim to cash flows
from specified assets - e.g. non-recourse asset arrangements; and
• features that modify consideration for the time value of money- e.g. periodic reset of interest rates.
Interest rates on certain retail loans made by the Group are based on standard variable rates (SVRs) that are set at the discretion of the Group. SVRs are generally based on a central bank rate in a particular jurisdiction and also include a discretionary spread. In these cases, the Group will assess whether the discretionary feature is consistent with the SPPI criterion by considering a number of factors, including whether:• the borrowers are able to prepay the loans without
significant penalties;• the market competition ensures that interest rates
are consistent between banks; and• any regulatory or customer protection framework
is in place that requires banks to treat customers fairly.
All of the Group’s retail loans and certain fixed-rate corporate loans contain prepayment features.A prepayment feature is consistent with the SPPI criterion if the prepayment amount substantially represents unpaid amounts of principal and interest on the principal amount outstanding, which may include reasonable compensation for early termination of the contract.
In addition, a prepayment feature is treated as consistent with this criterion if a financial asset is acquired or originated at a premium or discount to its contractual par amount, the prepayment amount substantially represents the contractual par amount plus accrued (but unpaid) contractual interest (which may also include reasonable compensation for early termination), and the fair value of the prepayment feature is insignificant on initial recognition.
dfc
u G
roup 2
017
Annual
Rep
ort
an
d F
inan
cial
Sta
tem
ents
23
Impact assessmentThe standard will affect the classification and measurement of financial assets held as at 1 January 2018 as follows.• Trading assets which are classified as held-for-
trading and measured at FVTPL under IAS 39, will also be measured at FVTPL under IFRS 9.
• Loans and advances to banks and to customers that are classified as loans and receivables and measured at amortised cost under IAS 39 will in general also be measured at amortised cost under IFRS 9.
• Held-to-maturity investment securities measured at amortised cost under IAS 39 will in general also be measured at amortised cost under IFRS 9.
• Loans and advances to customers and investment securities that are designated as at FVTPL under IAS 39 will in general continue to be measured at FVTPL under IFRS 9.
ii). Impairment, financial assets, loan commitments and financial guarantee contracts IFRS 9 replaces the ‘incurred loss’ model in IAS 39 with a forward-looking ‘expected credit loss’ model. This will require considerable judgement over how changes in economic factors affect ECLs, which will be determined on a probability-weighted basis.The new impairment model applies to the following financial instruments that are not measured at FVTPL:• financial assets that are debt instruments;• lease receivables; and• loan commitments and financial guarantee
contracts issued (previously, impairment was measured under IAS 37 Provisions, Contingent Liabilities and Contingent Assets).
Under IFRS 9, no impairment loss is recognised on equity investments.IFRS 9 requires a loss allowance to be recognised at an amount equal to either 12-month ECLs or lifetime ECLs. Lifetime ECLs are the ECLs that result from all possible default events over the expected life of a financial instrument, whereas 12-month ECLs are the portion of ECLs that result from default events that are possible within the 12 months after the reporting date.
The Group will recognise loss allowances at an amount equal to lifetime ECLs, except in the following cases, for which the amount recognised will be 12-month ECLs:• debt investment securities that are determined
to have low credit risk at the reporting date. The Group considers a debt security to have low credit risk when its credit risk rating is equivalent to the globally understood definition of ‘investment-grade’; and
• other financial instruments (other than lease receivables) for which credit risk has not increased significantly since initial recognition.
The impairment requirements of IFRS 9 are complex and require management judgements, estimates and assumptions, particularly in the following areas, which are discussed in detail below:• assessing whether the credit risk of an instrument
has increased significantly since initial recognition; and
• incorporating forward-looking information into the measurement of ECLs.
Measurement of Expected Credit Losses (ECLs)ECLs are measured as the probability-weighted present value of expected cash shortfalls over the remaining expected life of the financial instrument. The measurement of ECLs will be based primarily on the product of the instrument’s probability of default (PD), loss given default (LGD), and exposure at default (EAD).
The ECL model contains a three-stage approach that is based on the change in the credit quality of assets since initial recognition;• Stage 1: If, at the reporting date, the credit risk
of non-impaired financial instruments has not increased significantly since initial recognition, these financial instruments are classified in Stage 1, and a loss allowance that is measured, at each reporting date, at an amount equal to 12-month expected credit losses is recorded.
• Stage 2: When there is a significant increase in credit risk since initial recognition, these non-impaired financial instruments are migrated to Stage 2, and a loss allowance that is measured, at each reporting date, at an amount equal to lifetime
dfc
u G
roup 2
017
Annual
Rep
ort
an
d F
inan
cial
Sta
tem
ents
24
expected credit losses is recorded. In subsequent reporting periods, if the credit risk of the financial instrument improves such that there is no longer a significant increase in credit risk since initial recognition, the ECL model requires reverting to recognition of 12-month expected credit losses based on the Company’s policy on curing of loans
• When one or more events that have a detrimental impact on the estimated future cash flows of a financial asset have occurred, the financial asset is considered credit-impaired and is migrated to Stage 3, and an allowance equal to lifetime expected losses continues to be recorded or the financial asset is written off.
Interest income is calculated on the gross carrying amount of the financial assets in Stages 1 and 2 and on the net carrying amount of the financial assets in Stage 3.
ECLs are a probability-weighted estimate of credit losses and will be measured as follows: • financial assets that are not credit-impaired at
the reporting date: the present value of all cash shortfalls - i.e. the difference between the cash flows due to the entity in accordance with the contract and the cash flows that the Group expects to receive;
• financial assets that are credit-impaired at the reporting date: the difference between the gross carrying amount and the present value of estimated future cash flows;
• undrawn loan commitments: the present value of the difference between the contractual cash flows that are due to the Group if the commitment is drawn down and the cash flows that the Group expects to receive; and
• financial guarantee contracts: the present value of the expected payments to reimburse the holder less any amounts that the Group expects to recover.
Financial assets that are credit-impaired are defined by IFRS 9 in a similar way to financial assets that are impaired under IAS 39 (see Note 4E (v)).
Significant increase in credit riskUnder IFRS 9, when determining whether the credit risk (i.e. risk of default) on a financial instrument has increased significantly since initial recognition, the Group will consider reasonable and supportable information that is relevant and available without undue cost or effort, including both quantitative and qualitative information and analysis based on the Group’s historical experience, expert credit assessment and forward-looking information.Assessing whether credit risk has increased significantly since initial recognition of a financial instrument requires identifying the date of initial recognition of the instrument.
Definition of defaultWhile default is not specifically defined by IFRS 9, the Group has aligned the determination of default with its existing internal credit risk management definitions and approaches. Default is determined as occurring at the earlier of:• when either, based on subjective evidence, the
counterparty is considered to be unlikely to pay amounts due on the due date or shortly thereafter without recourse to actions such as realisation of security; or
• when the counterparty is past due for more than 90 days (or, in the case of overdraft facilities in excess of the current limit).
• In some cases, additional specific criteria are set according to the nature of the lending product.
Determining whether credit risk has increased significantlyThe Group has established a framework that incorporates both quantitative and qualitative information to determine whether the credit risk on a particular financial instrument has increased significantly since initial recognition. The framework aligns with the Group’s internal credit risk management process.The Group will deem the credit risk of a particular exposure to have increased significantly since initial recognition if;• Quantitative; the counterparty is past due for more
than 30 days;• Qualitative; the account has been restructured for
financial distress reasons; and

dfc
u G
roup 2
017
Annual
Rep
ort
an
d F
inan
cial
Sta
tem
ents
25
• Qualitative; the expected outlook for the specific sector or industry and other relevant available information.
In certain instances, using its expert credit judgement and, where possible, relevant historical experience, the Group may determine that an exposure has undergone a significant increase in credit risk if particular qualitative factors indicate so and those indicators may not be fully captured by its quantitative analysis on a timely basis.
As a backstop, and as required by IFRS 9, the Group will presumptively consider that a significant increase in credit risk occurs no later than when an asset is more than 30 days past due. The Group will determine days past due by counting the number of days since the earliest elapsed due date in respect of which full payment has not been received.
The Group will monitor the effectiveness of the criteria used to identify significant increases in credit risk by regular reviews to confirm that:• the criteria are capable of identifying significant
increases in credit risk before an exposure is in default;
• the criteria do not align with the point in time when an asset becomes 30 days past due;
• the average time between the identification of a significant increase in credit risk and default appears reasonable;
• exposures are not generally transferred directly from 12-month ECL measurement to credit-impaired; and
• there is no unwarranted volatility in loss allowance from transfers between 12-month ECL and lifetime ECL measurements.
Modified financial assetsThe contractual terms of a loan may be modified for a number of reasons, including changing market conditions, customer retention and other factors not related to a current or potential credit deterioration of the customer. An existing loan whose terms have been modified may be derecognised and the renegotiated loan recognised as a new loan at fair value.
Under IFRS 9, when the terms of a financial asset are modified and the modification does not result in derecognition, the determination of whether the asset’s credit risk has increased significantly reflects comparison of:• the remaining lifetime PD at the reporting date
based on the modified terms; with• the remaining lifetime PD estimated based on data
on initial recognition and the original contractual terms.
The Group renegotiates loans to customers in financial difficulties (referred to as ‘forbearance activities’) to maximise collection opportunities and minimise the risk of default. Under the Group’s forbearance policy, loan forbearance is granted on a selective basis if the debtor is currently in default on its debt or if there is a high risk of default, there is evidence that the debtor made all reasonable efforts to pay under the original contractual terms and the debtor is expected to be able to meet the revised terms.The revised terms usually include extending the maturity, changing the timing of interest payments and amending the terms of loan covenants. Both retail and corporate loans are subject to the forbearance policy. The Group Credit Committee regularly reviews reports on forbearance activities.For financial assets modified as part of the Group’s forbearance policy see Note 4E (vi), the estimate of PD will reflect whether the modification has improved or restored the Group’s ability to collect interest and principal and the Group’s previous experience of similar forbearance action. As part of this process, the Group will evaluate the borrower’s payment performance against the modified contractual terms and consider various behavioral indicators.Generally, forbearance is a qualitative indicator of default and credit impairment and expectations of forbearance are relevant to assessing whether there is a significant increase in credit risk Note 4E (vi). Following forbearance, a customer needs to demonstrate consistently good payment behaviour over one year before the exposure is no longer considered to be in default/credit-impaired or the PD is considered to have decreased such that the loss allowance reverts to being measured at an amount equal to 12-month ECLs.
dfc
u G
roup 2
017
Annual
Rep
ort
an
d F
inan
cial
Sta
tem
ents
26
Inputs into measurement of ECLsThe key inputs into the measurement of ECLs are the term structures of the following variables:• PD;• loss given default (LGD); and• exposure at default (EAD).
These parameters will be derived from internally developed statistical models and other historical data that leverage regulatory models. They will be adjusted to reflect forward-looking information as described below.PD estimates are estimates at a certain date, which will be calculated based on statistical rating models and assessed using rating tools tailored to the various categories of counterparties and exposures.These statistical models will be based on internally compiled data comprising both quantitative and qualitative factors. Where it is available, market data may also be used to derive the PD for large corporate counterparties. If a counterparty or exposure migrates between rating classes, then this will lead to a change in the estimate of the associated PD. PDs will be estimated considering the contractual maturities of exposures and estimated prepayment rates.
LGD is the magnitude of the likely loss if there is a default. The Group will estimate LGD parameters based on the history of recovery rates of claims against defaulted counterparties. The LGD models will consider the structure, collateral, seniority of the claim, counterparty industry and recovery costs of any collateral that is integral to the financial asset. For loans secured by retail property, loan-to-value (LTV) ratios are likely to be a key parameter in determining LGD. LGD estimates will be calibrated for different economic scenarios and, for real estate lending, to reflect possible changes in property prices. They will be calculated on a discounted cash flow basis using the effective interest rate as the discounting factor.
EAD represents the expected exposure in the event of a default. The Group will derive the EAD from the current exposure to the counterparty and potential changes to the current amount allowed under the contract, including amortisation, and prepayments.
The EAD of a financial asset will be the gross carrying amount at default. For lending commitments and financial guarantees, the EAD will consider the amount drawn, as well as potential future amounts that may be drawn or repaid under the contract, which will be estimated based on historical observations and forward-looking forecasts. For some financial assets, the Group will determine EAD by modelling the range of possible exposure outcomes at various points in time using scenario and statistical techniques.
As described above, and subject to using a maximum of a 12-month PD for financial assets for which credit risk has not significantly increased, the Group will measure ECLs considering the risk of default over the maximum contractual period (including any borrower’s extension options) over which it is exposed to credit risk, even if, for risk management purposes, the Group considers a longer period. The maximum contractual period extends to the date at which the Group has the right to require repayment of an advance or terminate a loan commitment or guarantee.
For portfolios in respect of which the Group has limited historical data, external benchmark information will be used to supplement the internally available data. The portfolios for which external benchmark information represents a significant input into measurement of ECLs are as follows.
External benchmarks used
Exposure PD
Government Securities
Ushs 729.8 billion
2.8% (Moody’s default study)
dfc
u G
roup 2
017
Annual
Rep
ort
an
d F
inan
cial
Sta
tem
ents
27
Forward-looking information Under IFRS 9, the Group will incorporate forward-looking information into both its assessment of whether the credit risk of an instrument has increased significantly since initial recognition and its measurement of ECLs. The Group will formulate a ‘base case’ view of the future direction of relevant economic variables and a representative range of other possible forecast scenarios based on advice from the Group Market Risk Committee and economic experts and consideration of a variety of external actual and forecast information. This process will involve developing two or more additional economic scenarios and considering the relative probabilities of each outcome. External information may include economic data and forecasts published by governmental bodies and monetary authorities, supranational organisations such as the Organisation for Economic Co-operation and Development and the International Monetary Fund, and selected private sector and academic forecasters.
The base case will represent a most-likely outcome and be aligned with information used by the Group for other purposes, such as strategic planning and budgeting. The other scenarios will represent more optimistic and more pessimistic outcomes. The Group has developed a probability weighted forward looking macro-economic framework based on the Group’s economic expectations, industry and sub-sector-specific expectations, as well as expert management judgement.
Impact assessmentThe most significant impact on the Group’s consolidated and separate financial statements from the implementation of IFRS 9 is expected to result from the new impairment requirements. Impairment losses will increase and become more volatile for financial instruments in the scope of the IFRS 9 impairment model.The Group has estimated that, on the adoption of IFRS 9 at 1 January 2018, the impact of the increase in loss allowances will be approximately Ushs 43.6 billion reduction in the Group’s equity reserves. Loss allowances on unsecured products with longer expected lives will be most affected by the new
impairment requirements. It is estimated that the IFRS 9 impairment provision will exceed the FIA provisions by approximately Ushs 32.5 billion, which will decrease the Group’s core capital by 1.88% and will still be sufficient to foster the dfcu Bank Limited’s growth prospects. The revised impairment model is expected to have material financial impact on the existing impairment provisions previously recognized in terms of the requirements of IAS 39 as well as increase volatility in the recognition of impairment losses going forward. It is estimated that the increase on IAS 39 impairment provisions will be in the region of Ushs 43.6 billion.
iii). Classification - Financial liabilitiesIFRS 9 largely retains the existing requirements in IAS 39 for the classification of financial liabilities.However, under IAS 39 all fair value changes of financial liabilities designated as at FVTPL are recognised in profit or loss, whereas under IFRS 9 these fair value changes will generally be presented as follows:• the amount of the change in the fair value that is
attributable to changes in the credit risk of the liability will be presented in OCI; and
• the remaining amount of the change in the fair value will be presented in profit or loss.
iv). Derecognition and contract modificationIFRS 9 incorporates the requirements of IAS 39 for the de-recognition of financial assets and financial liabilities without substantive amendments.However, it contains specific guidance for the accounting when the modification of a financial instrument not measured at FVTPL does not result in derecognition. Under IFRS 9, the Group will recalculate the gross carrying amount of the financial asset {or the amortised cost of the financial liability) by discounting the modified contractual cash flows at the original effective interest rate and recognise any resulting adjustment as a modification gain or loss in profit or loss. Under IAS 39, the Group does not recognise any gain or loss in profit or loss on modifications of financial liabilities and non-distressed financial assets that do not lead to their de-recognition.
dfc
u G
roup 2
017
Annual
Rep
ort
an
d F
inan
cial
Sta
tem
ents
28
The Group expects an immaterial impact from adopting these new requirements.
v). DisclosuresIFRS 9 will require extensive new disclosures, in particular about hedge accounting, credit risk and ECLs.
vi). TransitionChanges in accounting policies resulting from the adoption of IFRS 9 will generally be applied retrospectively, except as described below.• The Group will take advantage of the exemption
allowing it not to restate comparative information for prior periods with respect to classification and measurement (including impairment) changes. Differences in the carrying amounts of financial assets and financial liabilities resulting from the adoption of IFRS 9 will generally be recognised in retained earnings and reserves as at 1 January 2018.
• The following assessments have to be made on the basis of the facts and circumstances that exist at the date of initial application.
• The determination of the business model within which a financial asset is held.
• The designation and revocation of previous designations of certain financial assets and financial liabilities as measured at FVTPL.
• The designation of certain investments in equity instruments not held for trading as at FVOCI.
• For a financial liability designated as at FVTPL, the determination of whether presenting the effects of changes in the financial liability’s credit risk in OCI would create or enlarge an accounting mismatch in profit or loss.
• If a debt investment security has low credit risk at 1 January 2018, then the Group will determine that the credit risk on the asset has not increased significantly since initial recognition.
b). Clarifications to IFRS 15: Revenue from Contracts with Customers
IFRS 15 establishes a comprehensive framework for determining whether, how much and when revenue is recognised. It replaces existing revenue recognition guidance, including IAS 18 Revenue, IAS 11 Construction Contracts and IFRIC 13 Customer Loyalty Programmes.These amendments to the Revenue Standard, which was issued in 2014, do not change the underlying principles of the Standard but clarify how those principles should be applied. The amendments clarify how to:• identify a performance obligation (the promise to
transfer a good or a service to a customer) in a contract;
• determine whether a company is a principal (the provider of a good or service) or an agent (responsible for arranging for the good or service to be provided); and
• determine whether the revenue from granting a licence should be recognised at a point in time or over time.
In addition to the clarifications, the amendments include two additional reliefs to reduce cost and complexity for a company when it first applies the new Standard.
The amendments are effective for annual periods beginning on or after 1 January 2018, with early application permitted.
The Group is assessing the potential impact on its consolidated and separate financial statements resulting from the amendments. So far, the Group does not expect any significant impact. c). IFRS 16: LeasesThe changes under IFRS 16 are significant and will predominantly affect lessees, the accounting for which is substantially reformed. The lessor accounting requirements contained in IFRS 16’s predecessor, IAS 17 will remain largely unchanged. The main impact on lessees is that almost all leases will go on balance sheet.
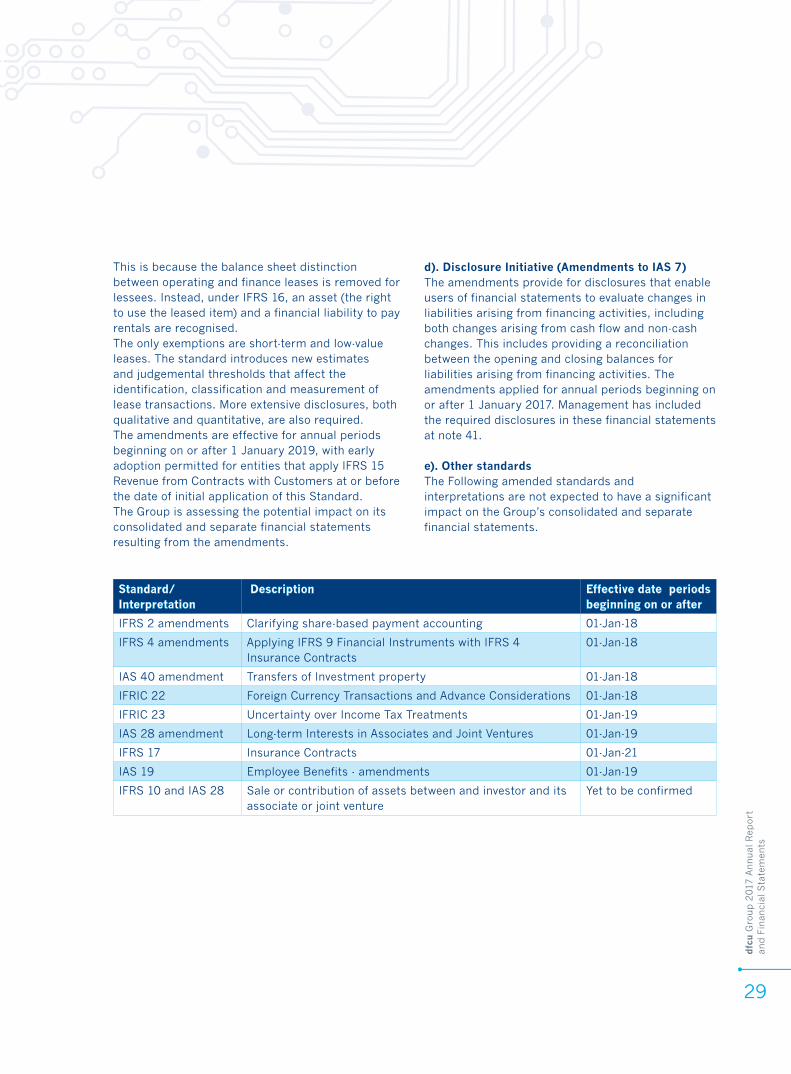
dfc
u G
roup 2
017
Annual
Rep
ort
an
d F
inan
cial
Sta
tem
ents
29
This is because the balance sheet distinction between operating and finance leases is removed for lessees. Instead, under IFRS 16, an asset (the right to use the leased item) and a financial liability to pay rentals are recognised. The only exemptions are short-term and low-value leases. The standard introduces new estimates and judgemental thresholds that affect the identification, classification and measurement of lease transactions. More extensive disclosures, both qualitative and quantitative, are also required.The amendments are effective for annual periods beginning on or after 1 January 2019, with early adoption permitted for entities that apply IFRS 15 Revenue from Contracts with Customers at or before the date of initial application of this Standard. The Group is assessing the potential impact on its consolidated and separate financial statements resulting from the amendments.
d). Disclosure Initiative (Amendments to IAS 7)The amendments provide for disclosures that enable users of financial statements to evaluate changes in liabilities arising from financing activities, including both changes arising from cash flow and non-cash changes. This includes providing a reconciliation between the opening and closing balances for liabilities arising from financing activities. The amendments applied for annual periods beginning on or after 1 January 2017. Management has included the required disclosures in these financial statements at note 41.
e). Other standardsThe Following amended standards and interpretations are not expected to have a significant impact on the Group’s consolidated and separate financial statements.
Standard/Interpretation
Description Effective date periods beginning on or after
IFRS 2 amendments Clarifying share-based payment accounting 01-Jan-18
IFRS 4 amendments Applying IFRS 9 Financial Instruments with IFRS 4 Insurance Contracts
01-Jan-18
IAS 40 amendment Transfers of Investment property 01-Jan-18
IFRIC 22 Foreign Currency Transactions and Advance Considerations 01-Jan-18
IFRIC 23 Uncertainty over Income Tax Treatments 01-Jan-19
IAS 28 amendment Long-term Interests in Associates and Joint Ventures 01-Jan-19
IFRS 17 Insurance Contracts 01-Jan-21
IAS 19 Employee Benefits - amendments 01-Jan-19
IFRS 10 and IAS 28 Sale or contribution of assets between and investor and its associate or joint venture
Yet to be confirmed
dfc
u G
roup 2
017
Annual
Rep
ort
an
d F
inan
cial
Sta
tem
ents
30
A. CONSOLIDATION
The consolidated financial statements comprise the financial statements of dfcu Limited and its subsidiary, dfcu Bank Limited as at 31 December 2017.Subsidiaries are all entities (including structured entities) over which the Group has control. The Group controls an entity when the Group is exposed to, or has rights to, variable returns from its involvement with the entity and has the ability to affect those returns through its power over the entity. Subsidiaries are fully consolidated from the date on which control is transferred to the Group. They are deconsolidated from the date that control ceases.The Group applies the acquisition method of accounting to account for business combinations. The consideration transferred for the acquisition of a subsidiary is the fair values of the assets transferred, the liabilities incurred to the former owners of the acquiree and the equity interests issued by the Group. The consideration transferred includes the fair value of any asset or liability resulting from a contingent consideration arrangement. Identifiable assets acquired and liabilities and contingent liabilities assumed in a business combination are measured initially at their fair values at the acquisition date. The Group recognises any non-controlling interest in the acquiree on an acquisition-by-acquisition basis, either at fair value or at the non-controlling interest’s proportionate share of the recognised amounts of acquiree’s identifiable net assets.
Acquisition-related costs are expensed as incurred. If the business combination is achieved in stages, the acquisition date carrying value of the acquirer’s previously held equity interest in the acquiree is remeasured to fair value at the acquisition date; any gains or losses arising from such remeasurement are recognised in profit or loss.
Any contingent consideration to be transferred by the Group is recognised at fair value at the acquisition date. Subsequent changes to the fair value of the contingent consideration that is deemed to be an asset or liability is recognised in accordance with IAS 39 either in profit or loss or as a change to other comprehensive income. Contingent consideration that is classified as equity is not remeasured, and its subsequent settlement is accounted for within equity.The excess of the consideration transferred the amount of any non-controlling interest in the acquiree and the acquisition-date fair value of any previous equity interest in the acquiree over the fair value of the identifiable net assets acquired is recorded as goodwill. If the total of consideration transferred, non-controlling interest recognised and previously held interest measured is less than the fair value of the net assets of the subsidiary acquired in the case of a bargain purchase, the difference is recognised directly in profit or loss.
The purchase method of accounting is used to account for the acquisition of subsidiaries by the Group. The cost of an acquisition is measured as the fair value of the assets given, equity instruments issued and liabilities incurred or assumed at the date of exchange, plus costs directly attributable to the acquisition. Identifiable assets acquired and liabilities and contingent liabilities assumed in a business combination are measured initially at their fair values at the acquisition date, irrespective of the extent of any minority interest. When group acquires or disposes any interest in an existing subsidiary and there is no change in control, all transactions with non-controlling interests are recorded in equity.Inter-company transactions, balances, income and expenses on transactions between group companies are eliminated. Profits and losses resulting from intercompany transactions that are recognised in assets are also eliminated.
4.Summary of significant accounting policies

dfc
u G
roup 2
017
Annual
Rep
ort
an
d F
inan
cial
Sta
tem
ents
31
Accounting policies of subsidiaries have been changed where necessary to ensure consistency with the policies adopted by the Group.
Separate financial statementsIn the separate financial statements, investments in subsidiaries and associates are accounted for at cost less impairment. Cost is adjusted to reflect changes in consideration arising from contingent consideration amendments. Cost also includes direct attributable costs of investment. Dividend income is recognised when the right to receive payment is established.
B. BORROWING COSTS
General and specific borrowing costs directly attributable to the acquisition, construction or production of qualifying assets, which are assets that necessarily take a substantial period of time to get ready for their intended use or sale, are added to the cost of those assets, until such time as the assets are substantially ready for their intended use or sale. Investment income earned on the temporary investment of specific borrowings pending their expenditure on qualifying assets is deducted from the borrowing costs eligible for capitalisation. All other borrowing costs are recognised in profit or loss in the period in which they are incurred.
Specific borrowings are funds borrowed specifically for the purpose of obtaining a qualifying asset. For specific borrowings, the actual costs incurred are capitalised. If the entity temporarily reinvests some funds, investment income earned should be deducted from the borrowing costs eligible for capitalisation. All borrowings that are not specific represent general borrowings. Costs eligible for capitalisation are calculated by applying a capitalisation rate to the expenditures on qualifying assets. The capitalisation rate is the weighted average of the borrowing costs applicable to the borrowings of the entity that are outstanding during the period. The amount of borrowing costs eligible for capitalisation is always limited to the amount of actual borrowing costs incurred during the period.
Where the parent company finances the construction of a qualifying asset using an intra-group loan, the capitalisation rate is adjusted to reflect how the qualifying asset was financed from the perspective of the group as a whole.
C. OPERATING INCOME
i). Interest income and expense Revenue is recognised to the extent that it is probable that economic benefits will flow to the Group and the revenue can be measured reliably. Interest income and expense are recognised in profit or loss for all interest bearing instruments at amortised cost using the effective interest method. The effective interest method is a method of calculating the amortised cost of a financial asset or a financial liability and of allocating the interest income or interest expense over the relevant period. The effective interest rate is the rate that exactly discounts estimated future cash payments or receipts through the expected life of the financial instrument or, when appropriate, a shorter period to the net carrying amount of the financial asset or financial liability. The calculation includes all fees paid or received between parties to the contract that are an integral part of the effective interest rate, transaction costs and all other premiums or discounts. Transaction costs include incremental costs that are directly attributable to the acquisition or issue of a financial asset or financial liability.
Interest income and expense on all trading assets and liabilities are considered to be incidental to the bank’s trading operations and are presented together with all other changes in the fair value of trading assets and liabilities in net trading income.
Fair value changes on other derivatives held for risk management purposes, and other financial assets and financial liabilities carried at fair value through profit or loss, are presented in net income from other financial instruments at fair value through profit or loss in the statement of comprehensive income.
dfc
u G
roup 2
017
Annual
Rep
ort
an
d F
inan
cial
Sta
tem
ents
32
ii.Fees and commissionFees and commission income and expense that are integral to the effective interest rate on a financial asset or financial liability are included in the measurement of the effective interest rate as above.Other fees and commission income – including account servicing fees, investment management fees, sales commission, placement fees and syndication fees – are recognised as the related services are performed. If a loan commitment is not expected to result in the draw-down of a loan, then the related loan commitment fees are recognised on a straight-line basis over the commitment period.Other fees and commission expense relate mainly to transaction and service fees, which are expensed as the services are received.
D. FOREIGN CURRENCY TRANSLATION
Items included in the consolidated and separate financial statements are measured using the currency of the primary economic environment in which the entity operates (`the functional currency’). The consolidated and separate financial statements are presented in Uganda Shillings which is the Group’s functional currency. Foreign currency transactions are translated into the functional currency using exchange rates prevailing at the dates of the transactions or valuation where items are re-measured. Foreign exchange gains and losses resulting from the settlement of such transactions and from the translation at year-end exchange rates of monetary assets and liabilities denominated in foreign currencies are recognised in profit or loss. Foreign exchange gains and losses that relate to borrowings and cash and cash equivalents are presented in profit or loss within `net foreign exchange income’. Changes in the fair value of monetary securities denominated in foreign currency classified as available-for-sale are analysed between translation differences resulting from changes in the amortised cost of the security and other changes in the carrying amount of the security. Translation differences related to changes in amortised cost are recognised in profit or loss, and other changes in carrying amount are recognised in other comprehensive income.
E. FINANCIAL ASSETS AND LIABILITIES
i. RecognitionA financial instrument is a contract that gives rise to both a financial asset of one enterprise and a financial liability of another enterprise. Financial instruments held by the Group include balances with Bank of Uganda, loans and advances, investments in government securities, balances with banks, deposits, derivatives and group balances.
The Group initially recognises loans and advances, deposits, debt securities issued and subordinated liabilities on the date on which they are originated. All other financial instruments (including regular-way purchases and sales of financial assets) are recognised on the trade date, which is the date on which the Group becomes a party to the contractual provisions of the instrument.
A financial asset or financial liability is measured initially at fair value plus, for an item not at fair value through profit or loss, transaction costs that are directly attributable to its acquisition or issue.
ii. ClassificationManagement determines the appropriate classification of its financial instruments at the time of purchase and re-evaluates its portfolio on a regular basis to ensure that all financial instruments are appropriately classified. The classification of financial instruments at initial recognition depends on the purpose and the management’s intention for which the financial instruments were acquired and their characteristics.• Held for trading assets and liabilities are those
assets and liabilities that the Group acquires or incurs principally for the purpose of selling or repurchasing in the near term, or holds as part of a portfolio that is managed together for short-term profit or position taking.
• Held-to-maturity investments are non-derivative assets with fixed or determinable payments and fixed maturity that the Group has the positive intent and ability to hold to maturity, and which are not designated at fair value through profit or loss or available-for-sale.
dfc
u G
roup 2
017
Annual
Rep
ort
an
d F
inan
cial
Sta
tem
ents
33
• Loans and advances and amounts due from banks are recognised when cash is advanced to borrowers. Loans and advances are non-derivative financial assets with fixed or determinable payments that are not quoted in an active market. They arise when the Group provides money, goods or services directly to a debtor with no intention of trading the receivable.
• Financial liabilities: The Group classifies its financial liabilities other than guarantees and loan commitments as measured at amortised cost or fair value through profit and loss.
iii. MeasurementInitial measurement of financial instrumentsAll financial instruments are measured initially at their fair value plus transaction costs, except in the case of financial assets and financial liabilities recorded at fair value through profit or loss, which are recorded at fair value.
Subsequent measurement of financial instrumentsa. Amortised cost measurement The ‘amortised cost’ of a financial asset or financial liability is the amount at which the financial asset or financial liability is measured at initial recognition, minus principal repayments, plus or minus the cumulative amortisation using the effective interest method of any difference between the initial amount recognised and the maturity amount, minus any reduction for impairment.
b. Fair value measurement ‘Fair value’ is the price that would be received to sell an asset or paid to transfer a liability in an orderly transaction between market participants at the measurement date in the principal or, in its absence, the most advantageous market to which the Group has access at that date. The fair value of a liability reflects its non-performance risk. When available, the Group measures the fair value of an instrument using the quoted price in an active market for that instrument. A market is regarded as active if transactions for the asset or liability take place with sufficient frequency and volume to provide pricing information on an ongoing basis.
If there is no quoted price in an active market, then the Group uses valuation techniques that maximise the use of relevant observable inputs and minimise the use of unobservable inputs. The chosen valuation technique incorporates all of the factors that market participants would take into account in pricing a transaction. The best evidence of the fair value of a financial instrument at initial recognition is normally the transaction price – i.e. the fair value of the consideration given or received. If the Group determines that the fair value at initial recognition differs from the transaction price and the fair value is evidenced neither by a quoted price in an active market for an identical asset or liability nor based on a valuation technique that uses only data from observable markets, then the financial instrument is initially measured at fair value, adjusted to defer the difference between the fair value at initial recognition and the transaction price. Subsequently, that difference is recognised in profit or loss on an appropriate basis over the life of the instrument but no later than when the valuation is wholly supported by observable market data or the transaction is closed out.
If an asset or a liability measured at fair value has a bid price and an ask price, then the Group measures assets and long positions at a bid price and liabilities and short positions at an ask price.Portfolios of financial assets and financial liabilities that are exposed to market risk and credit risk that are managed by the Group on the basis of the net exposure to either market or credit risk are measured on the basis of a price that would be received to sell a net long position (or paid to transfer a net short position) for a particular risk exposure. Those portfolio-level adjustments are allocated to the individual assets and liabilities on the basis of the relative risk adjustment of each of the individual instruments in the portfolio. The fair value of a demand deposit is not less than the amount payable on demand, discounted from the first date on which the amount could be required to be paid.
The Group recognises transfers between levels of the fair value hierarchy as of the end of the reporting period during which the change has occurred.
dfc
u G
roup 2
017
Annual
Rep
ort
an
d F
inan
cial
Sta
tem
ents
34
iv. De-recognition of financial instrumentsa.Financial assetsA financial asset (or, where applicable a part of a financial asset or part of a group of similar financial assets) is derecognised when:• The rights to receive cash flows from the asset
have expired; or• The Group has transferred its rights to receive
cash flows from the asset or has assumed an obligation to pay the received cash flows in full without material delay to a third party under a ‘pass-through’ arrangement; and either:i). The Group has transferred substantially all the
risks and rewards of the asset; orii). The Group has neither transferred nor retained
substantially all the risks and rewards of the asset, but has transferred control of the asset.
When the Group has transferred its rights to receive cash flows from an asset or has entered into a pass-through arrangement, and has neither transferred nor retained substantially all the risks and rewards of the asset nor transferred control of the asset, the asset is recognised to the extent of the Group’s continuing involvement in the asset. In that case, the Group also recognises an associated liability. The transferred asset and the associated liability are measured on a basis that reflects the rights and obligations that the Group has retained.
Continuing involvement that takes the form of a guarantee over the transferred asset is measured at the lower of the original carrying amount of the asset and the maximum amount of consideration that the Group could be required to repay.
b. Financial liabilitiesA financial liability is derecognised when the obligation under the liability is discharged or cancelled or expires. Where an existing financial liability is replaced by another from the same lender on substantially different terms, or the terms of an existing liability are substantially modified, such an exchange or modification is treated as a de-recognition of the original liability and the recognition of a new liability, and the difference in the respective carrying amounts is recognised in profit or loss.
v. Identification and measurement of impairmentAt each reporting date the Group assesses whether there is objective evidence that financial assets not carried at fair value through profit or loss are impaired. Financial assets are impaired when objective evidence demonstrates that a loss event has occurred after the initial recognition of the asset, and that the loss event has an impact on the future cash flows on the asset that can be estimated reliably. The Group considers evidence of impairment at both a specific asset and collective level. All individually significant financial assets are assessed for specific impairment. All significant assets found not to be specifically impaired are then collectively assessed for any impairment that may have incurred but not yet identified. Assets that are not individually significant are then collectively assessed for impairment by grouping together financial assets (carried at amortised cost) with similar risk characteristics.Objective evidence that a financial asset or group of assets is impaired includes observable data that comes to the attention of the Group about the following loss events:a. significant financial difficulty of the issuer or
obligor;b. a breach of contract, such as default or
delinquency in interest or principal repayments;c. the Group granting to the borrower, for economic
or legal reasons relating to the borrower’s financial difficulty, a concession that the lender would not otherwise consider;
d. it becomes probable that the borrower will enter bankruptcy or other financial difficulty;
e. the disappearance of an active market for that financial asset because of financial difficulties.
f. observable data indicating that there is a measurable decrease in the estimated future cash flows from a group of financial assets since the initial recognition of those assets, although the decrease cannot yet be identified with the individual financial assets in the group, including: i). adverse changes in the payment status of
borrowers in the group; orii). National or local economic conditions that
correlate with defaults on the assets in the group.
dfc
u G
roup 2
017
Annual
Rep
ort
an
d F
inan
cial
Sta
tem
ents
35
The Group first assesses whether objective evidence of impairment exists individually for all financial assets. If the Group determines no objective evidence of impairment exists for an individually assessed financial asset, whether significant or not, it includes the asset in a group of financial assets with similar credit risk characteristics and collectively assesses them for impairment.
Assets that are individually assessed for impairment and for which an impairment loss is or continues to be recognised are not included in a collective assessment of impairment.If there is objective evidence that an impairment loss on loans, advances and receivables or held-to-maturity assets carried at amortised cost has been incurred, the amount of the loss is measured as the difference between the asset’s carrying amount and the present value of estimated future cash flows (excluding future credit losses that have not been incurred) discounted at the financial instrument’s original effective interest rate. The carrying amount of the asset is reduced through the use of an allowance account and the amount of the loss is recognised in profit or loss. If a loan or held-to-maturity asset has a variable interest rate, the discount rate for measuring any impairment loss is the current effective interest rate determined under the contract.
The calculation of the present value of the estimated future cash flows of a collateralised financial asset reflects the cash flows that may result from foreclosure less costs for obtaining and selling the collateral, whether or not foreclosure is probable.
For the purposes of a collective evaluation of impairment, financial assets are grouped on the basis of similar credit risk characteristics (i.e. on the basis of the Group’s business and product segments). Those characteristics are relevant to the estimation of future cash flows for groups of such assets by being indicative of the debtors’ ability to pay all amounts due according to the contractual terms of the assets being evaluated.
Future cash flows in a group of financial assets that are collectively evaluated for impairment are estimated on the basis of the contractual cash flows of the assets in the group and historical loss experience for assets with credit risk characteristics similar to those in the group. Historical loss experience is adjusted on the basis of current observable data to reflect the effects of current conditions that did not affect the period on which the historical loss experience is based and to remove the effects of conditions in the historical period that do not exist currently.
Financial Institutions Act 2004 of Uganda requirementsIn addition to the measurement of impairment losses on loans and advances in accordance with International Financial Reporting Standards as set out above, the Group is also required by the Financial Institutions Act, 2004 to estimate losses on loans and advances as follows:
i. A specific provision for those loans and advances considered to be non-performing based on criteria and classification of such loans and advances established by the Financial Institutions Credit
Classification Regulations, 2005, as follows:a. substandard assets with arrears period between
90 and 179 days – 20%;b. doubtful assets with arrears period between 180
days and 359 days – 50%;c. loss assets with arrears period over 360 days –
100%.In addition to the arrears period, banks must follow subjective criteria in arriving at the classification attributable to the assets.
ii. A general provision of at least 1% of their total outstanding credit facilities net of specific provisions.
Where provisions for impairment of loans andadvances determined in accordance with theFinancial Institutions Act, 2004 exceed amounts determined in accordance with IFRS, the excess is taken to a regulatory reserve as an appropriation of retained earnings.
dfc
u G
roup 2
017
Annual
Rep
ort
an
d F
inan
cial
Sta
tem
ents
36
Otherwise, the regulatory reserve is reduced to the extent that the provision for impairment determined in accordance with IFRS exceeds that determined in accordance with the Financial Institutions Act, 2004 and the amount taken back to retained earnings.
When a loan is uncollectible, it is written off against the related allowance for loan impairment. Such loans are written off after all the necessary procedures have been completed and the amount of the loss has been determined. Subsequent recoveries of amounts previously written off decrease the charge for loan impairment in profit or loss.
If, in a subsequent period, the amount of the impairment loss decreases and the decrease can be related objectively to an event occurring after the impairment was recognised (such as an improvement in the debtor’s credit rating), the previously recognised impairment loss is reversed by adjusting the allowance account. The amount of the reversal is recognized in profit or loss.
vi. Renegotiated loansWhere possible, the Group seeks to restructure loans rather than to take possession of collateral. This may involve extending the payment arrangements and the agreement of new loan conditions. Once the terms have been renegotiated any impairment is measured using the original effective interest rate as calculated before the modification of terms and the loan is no longer considered past due. Management continuously reviews renegotiated loans to ensure that all criteria are met and that future payments are likely to occur. The loans continue to be subject to an individual or collective impairment assessment, calculated using the loan’s original effective interest rate.
vii. OffsettingFinancial assets and liabilities are offset and the net amount reported in the consolidated and separate statement of financial position when and only when, there is a legally enforceable right to set off the recognised amounts and there is an intention to settle on a net basis, or realise the asset and settle the liability simultaneously.
Income and expense are presented on a net basis only when permitted under IFRS or from gains and losses arising from a group of similar transactions such as the Group’s trading activity.
viii. Staff loansIn the normal course of business, the Group advances loans to employees at below market rate. These loans are measured initially at fair value. The favourable loan term offered to employees are dependent on the continued employment and therefore relate to services to be rendered in future periods. The interest benefit is forfeited if the employee leaves the Group. The benefit is a long term benefit to the employees and the discount arising from the difference between the nominal value and the market value is treated as a prepayment and expensed in profit or loss in the period in which the services are rendered.
dfc
u G
roup 2
017
Annual
Rep
ort
an
d F
inan
cial
Sta
tem
ents
37
F. PROPERTY AND EQUIPMENT
i. Recognition and measurementEquipment is stated at cost, net of accumulated depreciation and/or accumulated impairment losses, if any. Cost includes expenditures that are directly attributable to the acquisition of the asset. The cost of self-constructed assets includes the cost of materials and direct labour, any other costs directly attributable to bringing the asset to a working condition for its intended use, and the costs of dismantling and removing the items and restoring the site on which they are located. Purchased software that is integral to the functionality of the related equipment is capitalised as part of that equipment.
If significant parts of an item of property or equipment have different useful lives, then they are accounted for as separate items (major components) of property and equipment. Land and buildings are measured at fair value less accumulated depreciation on buildings and impairment losses recognised after the date of the revaluation. Valuations are performed frequently to ensure that the fair value of a revalued asset does not differ materially from its carrying amount. Any revaluation surplus is credited to the asset revaluation reserve in equity through other comprehensive income, except to the extent that it reverses a revaluation decrease of the same asset previously recognised in profit or loss, in which case the increase is recognised in profit or loss. A revaluation deficit is recognised in the profit or loss, except to the extent that it offsets an existing surplus on the same asset recognised in the asset revaluation reserve.
An annual transfer from the asset revaluation reserve to retained earnings is made for the difference between depreciation based on the revalued carrying amount of the assets and depreciation based on the assets original cost. Additionally, accumulated depreciation as at the revaluation date is eliminated against the gross carrying amount of the asset and the net amount is restated to the revalued amount of the asset.
Upon disposal, any revaluation reserve relating to the particular asset being sold is transferred to retained earnings.An item of property and equipment is derecognised upon disposal or when no future economic benefits are expected from its use or disposal. Any gain or loss arising on de-recognition of the asset (calculated as the difference between the net disposal proceeds and the carrying amount of the asset) is included in profit or loss in the year the asset is derecognised.
ii. Subsequent costSubsequent expenditure is capitalised only when it is probable that the future economic benefits of the expenditure will flow to the Group. Ongoing repairs and maintenance are expensed as incurred.
iii. DepreciationDepreciation is calculated to write off the cost of items of property and equipment less their estimated residual values using the straight-line method over their estimated useful lives, and is generally recognised in profit or loss. Leased assets are depreciated over the shorter of the lease term and their useful lives unless it is reasonably certain that the Group will obtain ownership by the end of the lease term. Land is not depreciated. The estimated useful lives of significant items of property and equipment are as follows:
Buildings 40 years
Furniture, fittings and equipment
6 – 7 years
Computer equipment 3 – 4 years
Motor vehicles 4 years
Work-in-progress Not depreciated
Leasehold improvements are amortised over the shorter of the estimated useful life of the improvements, and the remaining lease term.
Management and directors review the residual value and useful life of an asset at the year end and any change considered to be appropriate in accounting estimate is prospectively recorded through profit or loss.
dfc
u G
roup 2
017
Annual
Rep
ort
an
d F
inan
cial
Sta
tem
ents
38
G. INTANGIBLE ASSETS
i. Recognition and measurementa. GoodwillGoodwill arising on the acquisition of subsidiaries is measured at cost less accumulated impairment lossess.
b. Other intangible assetsIntangible assets acquired separately are measured on initial recognition at cost. Following initial recognition, intangible assets are carried at cost less any accumulated amortisation and accumulated impairment losses, if any. Internally generated intangible assets, excluding capitalised development costs, are not capitalized and expenditure is reflected in profit or loss in the year in which the expenditure is incurred. The useful lives of intangible assets are assessed as either finite or indefinite.
ii. Subsequent expenditureSubsequent expenditure is capitalized only when it increases the future economic benefits embodied in the specific asset to which it relates. All other expenditure on internally generated goodwill and brands, is recognised in profit or loss as incurred.
iii. AmortisationIntangible assets with finite lives are amortized over their useful economic lives using the straight line method and are assessed for impairment whenever there is an indication that the intangible asset may be impaired. The amortization period and the amortization method for an intangible asset with a finite useful life is reviewed at least at the end of each reporting period. Changes in the expected useful life or the expected pattern of consumption of future economic benefits embodied in the asset is accounted for by changing the amortization period or method, as appropriate, and are treated as changes in accounting estimates. The amortization expense on intangible assets with finite lives is recognised in profit or loss in the expense category consistent with the function of the intangible assets. Amortisation methods, residual values and useful lives are reviewed at each reporting period and adjusted if appropriate. Goodwill is not amortised.
iv. Derecognition An item of intangible assets is derecognized upon disposal or when no future economic benefits are expected from its use or disposal. Gains or losses arising from derecognition of an intangible asset are measured as the difference between the net disposal proceeds and the carrying amount of the asset and are recognized profit or loss when the asset is derecognized.
H. INCOME TAX
Income tax expense comprises current and deferred tax. It is recognised in profit or loss except to the extent that it relates to items recognised directly in equity or in OCI.
i. Current tax Current tax comprises the expected tax payable or receivable on the taxable income or loss for the year and any adjustment to the tax payable or receivable in respect of previous years. The amount of current tax payable or receivable is the best estimate of the tax amount expected to be paid or received that reflects uncertainty related to income taxes, if any. It is measured using tax rates enacted or substantively enacted at the reporting date. Current tax also includes any tax arising from dividends.
ii. Deferred taxDeferred tax is recognised in respect of temporary differences between the carrying amounts of assets and liabilities for financial reporting purposes and the amounts used for taxation purposes.
Deferred tax assets are recognised for unused tax losses, unused tax credits and deductible temporary differences to the extent that it is probable that future taxable profits will be available against which they can be used. Future taxable profits are determined based on business plans for the Group and the reversal of temporary differences. Deferred tax assets are reviewed at each reporting date and are reduced to the extent that it is no longer probable that the related tax benefit will be realised; such reductions are reversed when the probability of future taxable profits improves.

dfc
u G
roup 2
017
Annual
Rep
ort
an
d F
inan
cial
Sta
tem
ents
39
Unrecognised deferred tax assets are reassessed at each reporting date and recognised to the extent that it has become probable that future taxable profits will be available against which they can be used.Deferred tax is measured at the tax rates that are expected to be applied to temporary differences when they reverse, using tax rates enacted or substantively enacted at the reporting date.The measurement of deferred tax reflects the tax consequences that would follow the manner in which the Group expects, at the reporting date, to recover or settle the carrying amount of its assets and liabilities.
Deferred tax assets and liabilities are offset if there is a legally enforceable right to offset current tax liabilities and assets, and they relate to taxes levied by the same tax authority on the same taxable entity, or on different tax entities, but they intend to settle current tax liabilities and assets on a net basis or their tax assets and liabilities will be realised simultaneously.
Additional taxes that arise from the distribution of dividends by the Group are recognised at the same time as the liability to pay the related dividend is recognised. These amounts are generally recognised in profit or loss because they generally relate to income arising from transactions that were originally recognised in profit or loss.
iii. Tax exposuresIn determining the amount of current and deferred tax, the Group considers the impact of tax exposures, including whether additional taxes and interest may be due. This assessment relies on estimates and assumptions and may involve a series of judgments about future events. New information may become available that causes the Group to change its judgment regarding the adequacy of existing tax liabilities; such changes to tax liabilities would impact tax expense in the period in which such a determination is made.
I. CASH AND CASH EQUIVALENTS
For the purposes of the consolidated statement of cash flows, cash and cash equivalents comprise balances with less than 90 days to maturity from the acquisition date and include: cash and balances with the Central Bank, treasury bills and other eligible bills. Cash and cash equivalents excludes the cash reserves requirement held with Bank of Uganda.Cash and cash equivalents are carried at amortised cost in the consolidated statement of financial position.
J. EMPLOYEE BENEFITS
i). Retirement benefit obligationsThe Group operates a defined contribution pension scheme for all its eligible employees in dfcu Limited and dfcu Bank Limited. The scheme is administered by a Board of Trustees and is funded from contributions from both the Group companies and employees. A defined contribution plan is a pension plan under which the Group pays fixed contributions into a separate entity. The Group has no legal or constructive obligations to pay further contributions if the fund does not hold sufficient assets to pay all employees the benefits relating to employee service in the current and prior periods.
The Group and all its employees also contribute to the National Social Security Fund, which is a defined contribution scheme. The Group’s contributions to the defined contribution pension scheme are charged to profit or loss in the year to which they relate.
ii). Other entitlementsShort-term benefits consist of salaries, bonuses and any non-monetary benefits such as medical aid contributions and free services; they exclude termination benefits.
Short-term employee benefit obligations are measured on an undiscounted basis and are expensed as the related service is provided. A provision is recognised for the amount expected to be paid under a short-term cash bonus only if the Group has a present legal or constructive obligation
dfc
u G
roup 2
017
Annual
Rep
ort
an
d F
inan
cial
Sta
tem
ents
40
to pay this amount as a result of past services provided by the employee and if the obligation can be measured reliably.
The estimated monetary liability for employees’ accrued annual leave entitlement at the reporting date is recognised as an expense accrual.
K. LEASES
Leases in which a significant portion of the risks and rewards of ownership are retained by the lessor are classified as operating leases. Leases where the lessee assumes substantially all the risks and rewards incidental to ownership are classified as finance leases. Similarly leases of assets under which the lessor retains a significant portion of the risks and rewards of ownership are classified as operating leases.
i. With the Group Company as lesseeTo date, all leases entered into by the Group are operating leases. Payments made under operating leases are charged to the income statement on a straight-line basis over the period of the lease. Lease incentives received are recognised as an integral part of the total lease expense, over the term of the lease.
ii. With the Group Company as lessorWhen assets are leased out under a finance lease, the present value of the lease payments is recognised as a receivable. The difference between the gross receivable and the present value of the receivable is recognised as unearned finance income. Lease income is recognised over the term of the lease using the net investment method (before income tax), which reflects a constant periodic rate of return.
L. SEGMENT REPORTING
Operating segments are reported in a manner consistent with the internal reporting provided to the chief operating decision-maker (CODM). The CODM, who is responsible for allocating resources and assessing performance of the operating segments, has been identified as the Executive Management Board.
M. OFFSETTING
Financial assets and liabilities are offset and the net amount reported in the consolidated and separate statement of financial position when there is a legally enforceable right to set off the recognised amounts and there is an intention to settle on a net basis, or realise the asset and settle the liability simultaneously.
N. DIVIDENDS
Dividends on ordinary shares are recognised as a liability and charged to equity in the period in which they are declared. Proposed dividends are shown as a separate component of equity until declared.
O. DIVIDEND INCOME
Dividends are recognised as income in the period in which the right to receive payment is established.
P. EARNINGS PER SHARE
The Group presents basic and diluted earnings per share (EPS) data for its ordinary shares. Basic EPS is calculated by dividing the profit or loss attributable to ordinary shareholders of the Group by the weighted average number of ordinary shares outstanding during the period. Diluted EPS is determined by adjusting the profit or loss attributable to ordinary shareholders and the weighted average number of ordinary shares outstanding for the effects of all any potentially dilutive ordinary shares which comprise share options granted to employees
dfc
u G
roup 2
017
Annual
Rep
ort
an
d F
inan
cial
Sta
tem
ents
41
Q. FINANCIAL GUARANTEES AND LOAN COMMITMENTS
Financial guarantees are contracts that require the Group to make specified payments to reimburse the holder for a loss it incurs because a specified debtor fails to make payment when due in accordance with the terms of a debt instrument. Such financial guarantees are given to banks, financial institutions and other bodies on behalf of customers to secure loans, overdrafts and other facilities.Loan commitments are firm commitments to provide credit under pre-specified terms and conditions.
Financial guarantee liabilities or loan commitments to provide a loan at below market interest rate are initially recognised at their fair value, and the initial fair value is amortised over the life of the financial guarantee or commitment. The liability is subsequently carried at the higher of this amortised amount and the present value of any expected payment to settle the liability when a payment under the guarantee has become probable. Financial guarantees and loan commitments are included within other liabilities.
R. CONTINGENT LIABILITIES
Letters of credit, acceptances, guarantees and performance bonds are accounted for as off consolidated statement of financial position transactions and disclosed as contingent liabilities. Estimates of the outcome and financial effect of contingent liabilities is made by management based on the information available up to the date the consolidated and separate financial statements are approved for issue by the directors. Any expected loss is charged to profit or loss.
S. TRADING ASSETS AND LIABILITIES
Trading assets and liabilities’ are those assets and liabilities that the Group acquires or incurs principally for the purpose of selling or repurchasing in the near term, or holds as part of a portfolio that is managed together for short-term profit or position taking.
Trading assets and liabilities are initially recognised and subsequently measured at fair value in the consolidated statement of financial position, with transaction costs recognised in profit or loss. All changes in fair value are recognised as part of net trading income in profit or loss. Trading assets and liabilities are not reclassified subsequent to their initial recognition, except that non-derivative trading assets, other than those designated at fair value through profit or loss on initial recognition, may be reclassified out of the fair value through profit or loss – i.e. trading – category if they are no longer held for the purpose of being sold or repurchased in the near term and the following conditions are met.• If the financial asset would have met the definition
of loans and receivables (if the financial asset had not been required to be classified as held-for-trading at initial recognition), then it may be reclassified if the Group has the intention and ability to hold the financial asset for the foreseeable future or until maturity.
• If the financial asset would not have met the definition of loans and receivables, then it may be reclassified out of the trading category only in rare circumstances.
T. IMPAIRMENT OF NON-FINANCIAL ASSETS
At each reporting date, the Group reviews the carrying amounts of its non-financial assets (other than deferred tax assets) to determine whether there is any indication of impairment. If any such indication exists, then the asset’s recoverable amount is estimated.
For impairment testing, assets are grouped together into the smallest group of assets that generates cash inflows from continuing use that is largely independent of the cash inflows of other assets or CGUs. Goodwill arising from a business combination is allocated to CGUs or groups of CGUs that are expected to benefit from the synergies of the combination.
The ‘recoverable amount’ of an asset or CGU is the greater of its value in use and its fair value less costs to sell. ‘Value in use’ is based on the estimated
dfc
u G
roup 2
017
Annual
Rep
ort
an
d F
inan
cial
Sta
tem
ents
42
future cash flows, discounted to their present value using a pre-tax discount rate that reflects current market assessments of the time value of money and the risks specific to the asset or CGU.
An impairment loss is recognised if the carrying amount of an asset or CGU exceeds its recoverable amount. The Group’s corporate assets do not generate separate cash inflows and are used by more than one CGU. Corporate assets are allocated to CGUs on a reasonable and consistent basis and tested for impairment as part of the testing of the CGUs to which the corporate assets are allocated.
Impairment losses are recognised in profit or loss. They are allocated first to reduce the carrying amount of any goodwill allocated to the CGU, and then to reduce the carrying amounts of the other assets in the CGU on a pro rata basis.An impairment loss in respect of goodwill is not reversed. For other assets, an impairment loss is reversed only to the extent that the asset’s carrying amount does not exceed the carrying amount that would have been determined, net of depreciation or amortisation, if no impairment loss had been recognised.
U. OTHER RESERVES
In accordance with the terms and conditions of certain grants received by the Group, amounts are recognised in profit or loss and then appropriated from retained earnings to non-distributable reserves. The non-distributable reserve is set aside by the directors for the purpose of meeting any future deficit in Capital.
V. SPECIAL FUNDS
Special funds represent liabilities created under the terms of borrowing agreements with various international lending organisations. The Group holds these funds, utilizing and disbursing them as directed by the Government of Uganda. The unutilized balances on these funds are presented as liabilities on the statement of financial position.
W. MANAGED FUNDS
Managed funds represent amounts received from the Government of Uganda for on-lending to specific third parties in accordance with the terms and conditions of each managed fund. The Group does not bear the credit risk related to the lent funds. The liability related to such funds is presented in the statement of financial position net of the carrying value of the respective managed assets.
X. PROVISIONS
A provision is recognised if, as a result of a past event, the Group has a present legal or constructive obligation that can be estimated reliably, and it is probable that an outflow of economic benefits will be required to settle the obligation. Provisions are determined by discounting the expected future cash flows at a pre-tax rate that reflects current market assessments of the time value of money and, where appropriate, the risks specific to the liability. The unwinding of the discount is recognised as a finance cost.i. Restructuring
A provision for restructuring is recognised when the Group has approved a detailed and formal restructuring plan, and the restructuring either has commenced or has been announced publicly. Future operating losses are not provided for.
ii. Onerous contractsA provision for onerous contracts is recognised when the expected benefits to be derived by the Group from a contract are lower than the unavoidable cost of meeting its obligations under the contract. The provision is measured at the present value of the lower of the expected cost of terminating the contract and the expected net cost of continuing with the contract. Before a provision is established, the Group recognises any impairment loss on the assets associated with that contract.
iii. Bank leviesA provision for bank levies is recognised when the condition that triggers the payment of the levy is met. If a levy obligation is subject to a minimum activity threshold so that the obligating event is reaching a minimum activity, then a provision is
dfc
u G
roup 2
017
Annual
Rep
ort
an
d F
inan
cial
Sta
tem
ents
43
recognised when that minimum activity threshold is reached.
Y. CONTRACT LEASE DISBURSEMENTS
Contract lease disbursements represent payments that are made under finance lease agreements prior to delivery of the leased asset(s) to the borrower. Interest is accrued on these payments and recognised as income. Once the equipment is delivered, the lessee has the option to pay cash for the interest accrued or to add the interest onto the finance lease as part of the gross amount due.
Z. COMPARATIVES
Where necessary the comparative figures have been adjusted to conform to changes in presentation in the current year.
AA. Business combinationThe Group accounts for business combinations using the acquisition method when control is transferred to the Group. The consideration transferred in the acquisition is generally measured at fair value, as are the identifiable net assets acquired. Any goodwill that arises is recognised and tested annually for impairment. Any gain on a bargain purchase is recognised in profit or loss immediately. Transaction costs are expensed as incurred, except if related to the issue of debt or equity securities.The consideration transferred does not include amounts related to the settlement of pre-existing relationships. Such amounts are generally recognised in profit or loss. Any contingent consideration is measured at fair value at the date of acquisition. If an obligation to pay contingent consideration that meets the definition of a financial instrument is classified as equity, then it is not remeasured and settlement is accounted for within equity. Otherwise, other contingent consideration is remeasured at fair value at each reporting date and subsequent changes in the fair value of the contingent consideration are recognised in profit or loss.
BB. Investment securities Investment securities are initially measured at fair value plus, in the case of investment securities not at fair value through profit or loss, incremental direct transaction costs, and subsequently accounted for depending on their classification as either held to maturity, fair value through profit or loss, or available-for-sale.
i. Held-to-maturity Held-to-maturity investments’ are non-derivative assets with fixed or determinable payments and fixed maturity that the Group has the positive intent and ability to hold to maturity, and which are not designated as at fair value through profit or loss or as available-for-sale.
Held-to-maturity investments are carried at amortised cost using the effective interest method, less any impairment losses. A sale or reclassification of a more than insignificant amount of held-to-maturity investments would result in the reclassification of all held-to-maturity investments as available-for-sale, and would prevent the Group from classifying investment securities as held-to-maturity for the current and the following two financial years. However, sales and reclassifications in any of the following circumstances would not trigger a reclassification:• sales or reclassifications that are so close to
maturity that changes in the market rate of interest would not have a significant effect on the financial asset’s fair value;
• sales or reclassifications after the Group has collected substantially all of the asset’s original principal; and
• sales or reclassifications that are attributable to non-recurring isolated events beyond the Group’s control that could not have been reasonably anticipated.
ii. Held for tradingThe Group designates some investment securities at fair value, with fair value changes recognised immediately in profit or loss.
dfc
u G
roup 2
017
Annual
Rep
ort
an
d F
inan
cial
Sta
tem
ents
44
CC. Investment propertyProperty held for long term rental yields and not occupied by the Group is classified as investment property. A portion of the property at Plot 26 Kyadondo is occupied by the Company’s subsidiary, dfcu Bank Limited, and is classified as property, plant and equipment in the consolidated and separate financial statements. The remaining portion is held for long term rental yields and is accounted for as investment property.
An investment property is defined under IAS 40, Investment property, as a property (land or a building or part of a building or both) held (by the owner or by the lessee under a finance lease) to earn rentals or for capital appreciation or both, rather than for:• use in the production or supply of goods or
services or for administrative purposes; or• sale in the ordinary course of business.
Investment property is measured at cost less accumulated depreciation.
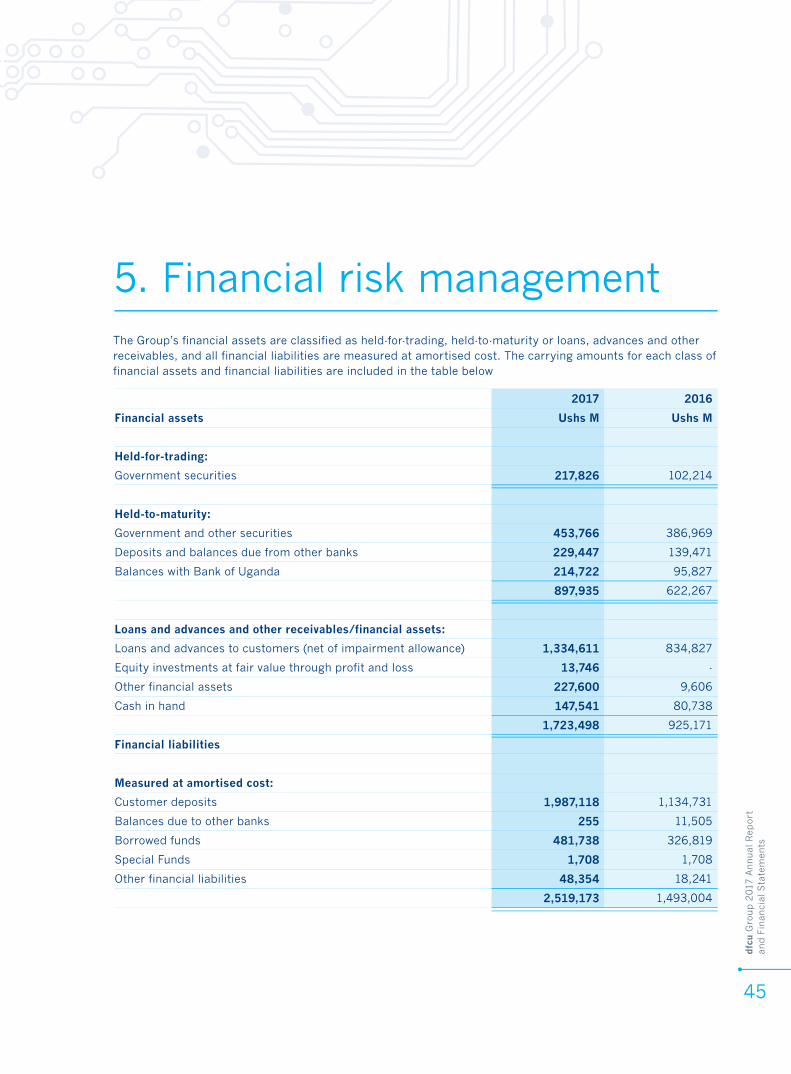
dfc
u G
roup 2
017
Annual
Rep
ort
an
d F
inan
cial
Sta
tem
ents
45
The Group’s financial assets are classified as held-for-trading, held-to-maturity or loans, advances and other receivables, and all financial liabilities are measured at amortised cost. The carrying amounts for each class of financial assets and financial liabilities are included in the table below
5. Financial risk management
2017 2016
Financial assets Ushs M Ushs M
Held-for-trading:
Government securities 217,826 102,214
Held-to-maturity:
Government and other securities 453,766 386,969
Deposits and balances due from other banks 229,447 139,471
Balances with Bank of Uganda 214,722 95,827
897,935 622,267
Loans and advances and other receivables/financial assets:
Loans and advances to customers (net of impairment allowance) 1,334,611 834,827
Equity investments at fair value through profit and loss 13,746 -
Other financial assets 227,600 9,606
Cash in hand 147,541 80,738
1,723,498 925,171
Financial liabilities
Measured at amortised cost:
Customer deposits 1,987,118 1,134,731
Balances due to other banks 255 11,505
Borrowed funds 481,738 326,819
Special Funds 1,708 1,708
Other financial liabilities 48,354 18,241
2,519,173 1,493,004
dfc
u G
roup 2
017
Annual
Rep
ort
an
d F
inan
cial
Sta
tem
ents
46
5A STRATEGY IN USING FINANCIAL INSTRUMENTSBy their nature, the Group’s activities are principally related to the use of financial instruments. The Group accepts deposits from customers at both fixed and floating rates, and for various periods, and seeks to earn above-average interest margins by investing these funds in high-quality assets. The Group seeks to increase these margins by consolidating short-term funds and lending for longer periods at higher rates, while maintaining sufficient liquidity to meet all claims that might fall due.
The Group also seeks to raise its interest margins by obtaining above-average margins, net of allowances, through lending to commercial and retail borrowers with a range of credit standings. Such exposures involve not just on-consolidated statement of financial position loans and advances; the Group also enters into guarantees and other commitments such as letters of credit, and performance and other bonds.
The Group also trades in financial instruments. The Board places trading limits on the level of exposure that can be taken in relation to both overnight and intra-day market positions.
The fair value gains or losses arising from trading in financial instruments are recognised in profit or loss under interest and similar income.
Foreign exchange and interest rate exposures and associated derivatives are normally economically hedged by entering into counterbalancing positions, thereby controlling the variability in the net cash amounts required to liquidate market positions.
5B CREDIT RISKThe Group takes on exposure to credit risk, which is the risk that a counter party will cause a financial loss to the Group by failing to pay amounts in full when due. Impairment allowances are provided for losses that have been incurred at the reporting date. Credit risk is the most important risk for the Group’s business. Therefore management carefully manages the exposure to credit risk. Credit exposures arise principally in lending and investment activities. There is also credit risk in off-consolidated statement of financial position financial instruments, such as loan commitments. Credit risk management and control is centralised in the credit risk management team, which reports regularly to management and the Board.
The Group structures the levels of credit risk it undertakes by placing limits on the amount of risk accepted in relation to one borrower, or groups of borrowers, and to industry segments. Such risks are monitored on a revolving basis and subject to annual or more frequent review.
Exposure to credit risk is managed through regular analysis of the ability of borrowers and potential borrowers to meet interest and capital repayment obligations and by changing lending limits where appropriate. Exposure to credit risk is also managed in part by obtaining collateral and corporate and personal guarantees, but a portion is personal lending where no such facilities can be obtained.
Credit related commitments:The primary purpose of these instruments is to ensure that funds are available to a customer as required. Guarantees and standby letters of credit represent irrevocable assurances that the Group will make payments in the event that a customer cannot meet its obligations to third parties. The Group’s policy is to hold cash cover for most of the commitments and hence the credit risk arising from such commitments is less than for direct borrowing. Documentary and commercial letters of credit, which are written undertakings by the Group on behalf of a customer authorising a third party to draw drafts on the Group up to a stipulated amount under specific terms and conditions, are collateralised
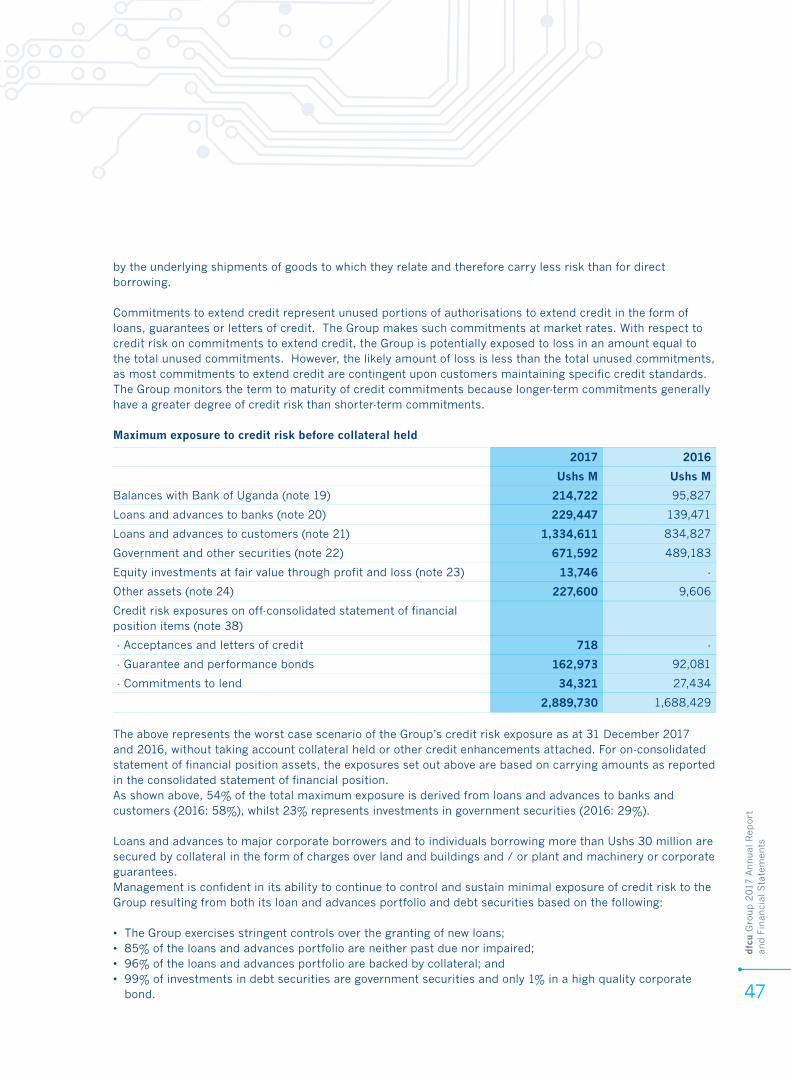
dfc
u G
roup 2
017
Annual
Rep
ort
an
d F
inan
cial
Sta
tem
ents
47
by the underlying shipments of goods to which they relate and therefore carry less risk than for direct borrowing.
Commitments to extend credit represent unused portions of authorisations to extend credit in the form of loans, guarantees or letters of credit. The Group makes such commitments at market rates. With respect to credit risk on commitments to extend credit, the Group is potentially exposed to loss in an amount equal to the total unused commitments. However, the likely amount of loss is less than the total unused commitments, as most commitments to extend credit are contingent upon customers maintaining specific credit standards. The Group monitors the term to maturity of credit commitments because longer-term commitments generally have a greater degree of credit risk than shorter-term commitments.
Maximum exposure to credit risk before collateral held
2017 2016
Ushs M Ushs M
Balances with Bank of Uganda (note 19) 214,722 95,827
Loans and advances to banks (note 20) 229,447 139,471
Loans and advances to customers (note 21) 1,334,611 834,827
Government and other securities (note 22) 671,592 489,183
Equity investments at fair value through profit and loss (note 23) 13,746 -
Other assets (note 24) 227,600 9,606
Credit risk exposures on off-consolidated statement of financial position items (note 38)
- Acceptances and letters of credit 718 -
- Guarantee and performance bonds 162,973 92,081
- Commitments to lend 34,321 27,434
2,889,730 1,688,429
The above represents the worst case scenario of the Group’s credit risk exposure as at 31 December 2017 and 2016, without taking account collateral held or other credit enhancements attached. For on-consolidated statement of financial position assets, the exposures set out above are based on carrying amounts as reported in the consolidated statement of financial position. As shown above, 54% of the total maximum exposure is derived from loans and advances to banks and customers (2016: 58%), whilst 23% represents investments in government securities (2016: 29%).
Loans and advances to major corporate borrowers and to individuals borrowing more than Ushs 30 million are secured by collateral in the form of charges over land and buildings and / or plant and machinery or corporate guarantees.Management is confident in its ability to continue to control and sustain minimal exposure of credit risk to the Group resulting from both its loan and advances portfolio and debt securities based on the following:
• The Group exercises stringent controls over the granting of new loans;• 85% of the loans and advances portfolio are neither past due nor impaired;• 96% of the loans and advances portfolio are backed by collateral; and• 99% of investments in debt securities are government securities and only 1% in a high quality corporate
bond.
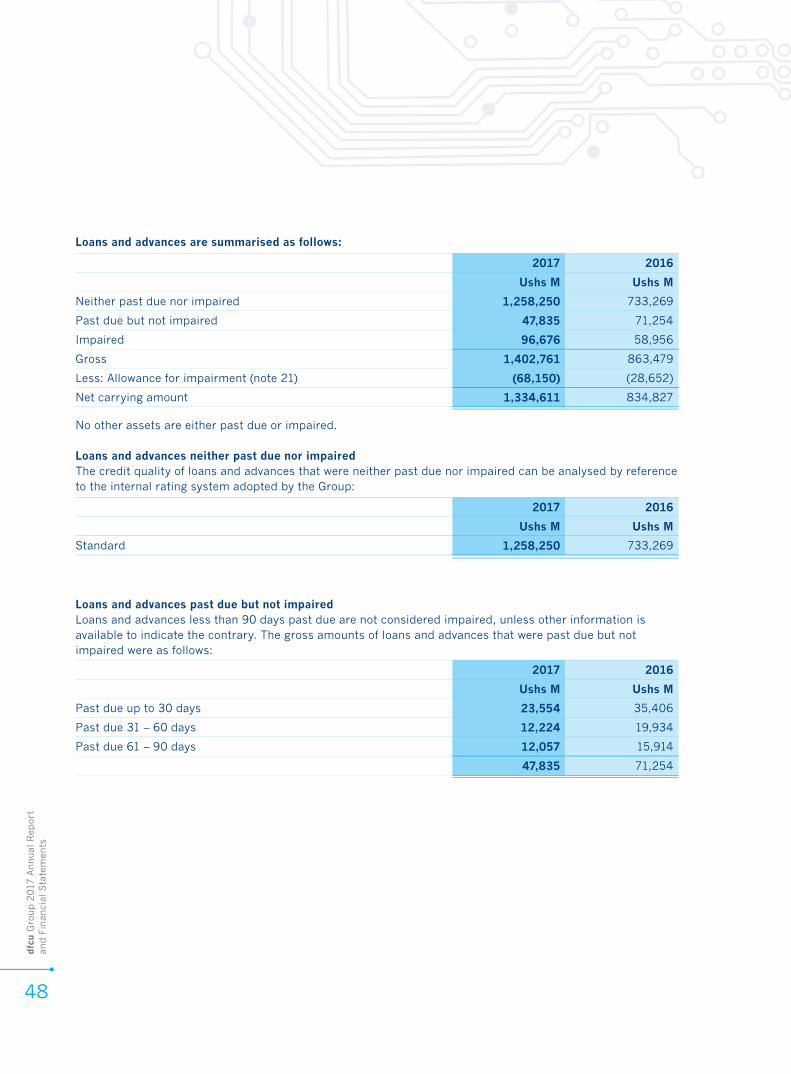
dfc
u G
roup 2
017
Annual
Rep
ort
an
d F
inan
cial
Sta
tem
ents
48
No other assets are either past due or impaired.
Loans and advances neither past due nor impairedThe credit quality of loans and advances that were neither past due nor impaired can be analysed by reference to the internal rating system adopted by the Group:
Loans and advances past due but not impaired Loans and advances less than 90 days past due are not considered impaired, unless other information is available to indicate the contrary. The gross amounts of loans and advances that were past due but not impaired were as follows:
2017 2016
Ushs M Ushs M
Standard 1,258,250 733,269
2017 2016
Ushs M Ushs M
Past due up to 30 days 23,554 35,406
Past due 31 – 60 days 12,224 19,934
Past due 61 – 90 days 12,057 15,914
47,835 71,254
Loans and advances are summarised as follows:
2017 2016
Ushs M Ushs M
Neither past due nor impaired 1,258,250 733,269
Past due but not impaired 47,835 71,254
Impaired 96,676 58,956
Gross 1,402,761 863,479
Less: Allowance for impairment (note 21) (68,150) (28,652)
Net carrying amount 1,334,611 834,827
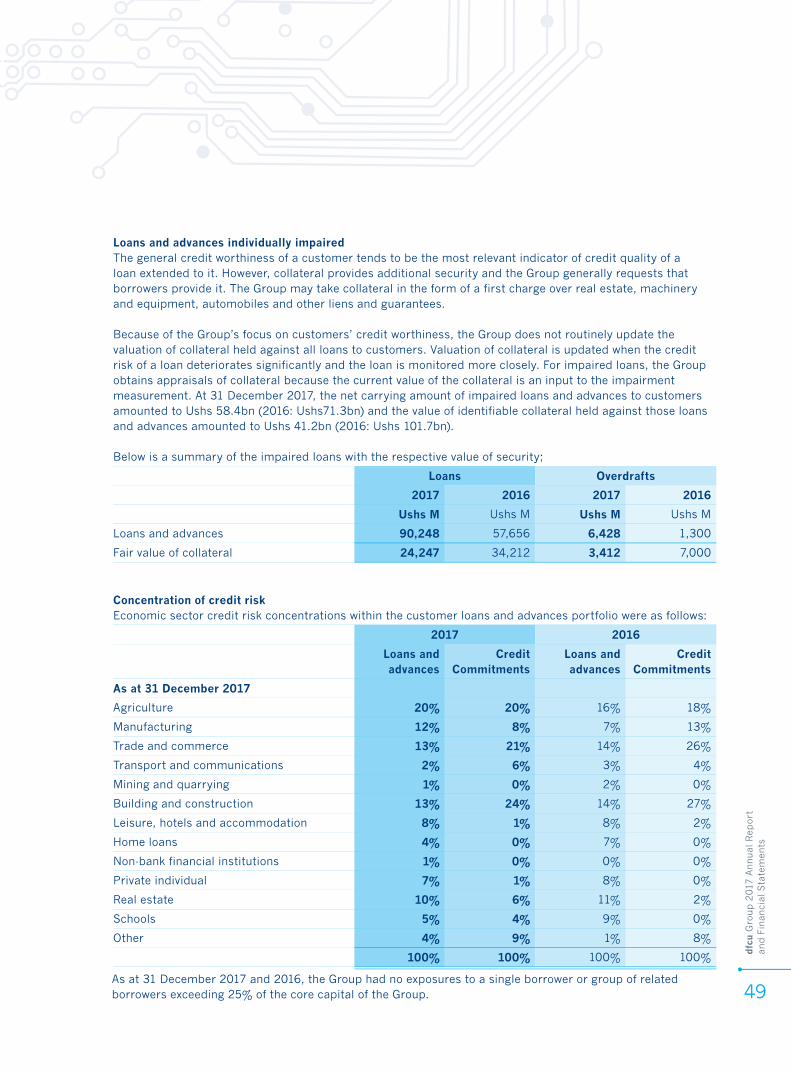
dfc
u G
roup 2
017
Annual
Rep
ort
an
d F
inan
cial
Sta
tem
ents
49
Loans and advances individually impairedThe general credit worthiness of a customer tends to be the most relevant indicator of credit quality of a loan extended to it. However, collateral provides additional security and the Group generally requests that borrowers provide it. The Group may take collateral in the form of a first charge over real estate, machinery and equipment, automobiles and other liens and guarantees.
Because of the Group’s focus on customers’ credit worthiness, the Group does not routinely update the valuation of collateral held against all loans to customers. Valuation of collateral is updated when the credit risk of a loan deteriorates significantly and the loan is monitored more closely. For impaired loans, the Group obtains appraisals of collateral because the current value of the collateral is an input to the impairment measurement. At 31 December 2017, the net carrying amount of impaired loans and advances to customers amounted to Ushs 58.4bn (2016: Ushs71.3bn) and the value of identifiable collateral held against those loans and advances amounted to Ushs 41.2bn (2016: Ushs 101.7bn).
Below is a summary of the impaired loans with the respective value of security;
Loans Overdrafts
2017 2016 2017 2016
Ushs M Ushs M Ushs M Ushs M
Loans and advances 90,248 57,656 6,428 1,300
Fair value of collateral 24,247 34,212 3,412 7,000
Concentration of credit riskEconomic sector credit risk concentrations within the customer loans and advances portfolio were as follows:
2017 2016
Loans and advances
Credit Commitments
Loans and advances
Credit Commitments
As at 31 December 2017
Agriculture 20% 20% 16% 18%
Manufacturing 12% 8% 7% 13%
Trade and commerce 13% 21% 14% 26%
Transport and communications 2% 6% 3% 4%
Mining and quarrying 1% 0% 2% 0%
Building and construction 13% 24% 14% 27%
Leisure, hotels and accommodation 8% 1% 8% 2%
Home loans 4% 0% 7% 0%
Non-bank financial institutions 1% 0% 0% 0%
Private individual 7% 1% 8% 0%
Real estate 10% 6% 11% 2%
Schools 5% 4% 9% 0%
Other 4% 9% 1% 8%
100% 100% 100% 100%
As at 31 December 2017 and 2016, the Group had no exposures to a single borrower or group of related borrowers exceeding 25% of the core capital of the Group.

dfc
u G
roup 2
017
Annual
Rep
ort
an
d F
inan
cial
Sta
tem
ents
50
5C LIQUIDITY RISK Liquidity risk is the risk that the Group is unable to meet payment obligations associated with its financial liabilities as they fall due and to replace funds when they are withdrawn.
The Group is exposed to daily calls on its available cash resources from overnight deposits, current accounts, maturing deposits, and calls on cash settled contingencies. The Group does not maintain cash resources to meet all of these needs as experience shows that a minimum level of reinvestment of maturing funds can be predicted with a high level of certainty. The Board sets limits on the minimum proportion of maturing funds available to meet such calls and on the minimum level of inter-bank and other borrowing facilities that should be in place to cover withdrawals at unexpected levels of demand.
The Group’s objective to managing liquidity is to ensure that there will always be sufficient liquidity to meet its liabilities and other obligations when they fall due under both normal and stressed conditions in line with the Group’s Assets and Liabilities Management (ALM) policies without incurring unacceptable losses or risking damage to the Group’s reputation.ALM policies are approved by the Group’s Assets and Liabilities Board Committee (ALCO) and the Board of Directors. The purpose of ALCO is to stipulate and monitor the business philosophy of the Group as to the cost, structure and mix of assets and liabilities to maximise profitability within acceptable set risk limits.
The table below summarises the net position as at 31 December 2017 and 31 December 2016 based on contractual maturity.
Net position as at 31 December 2017
Months Up to 1 month
1-3months
3-12months
>1years
Long / (short) Gap (470,171) (121,380) 206,361 510,725
Long / (short) Cumulative Gap (470,171) (591,551) (385,190) 125,535
Cumulative Gap / Total Assets (15%) (19%) (13%) 4%
Months Up to 1 month
1-3months
3-12months
>1years
Long / (short) Gap (342,674) (69,968) 120,215 333,504
Long / (short) Cumulative Gap (342,674) (412,641) (292,427) 41,077
Cumulative Gap / Total Assets (11%) (13%) (10%) 1%
Net position as at 31 December 2016

dfc
u G
roup 2
017
Annual
Rep
ort
an
d F
inan
cial
Sta
tem
ents
51
The following are the remaining contractual maturities financial liabilities at the reporting date. The amounts are gross and undiscounted, and include contractual interest payments and exclude the impact of netting agreements.
Contractual Cash flows
2017 Carrying Amount
Total Up to 1 month
1-3 1 months
3 – 12 1 months
Over 1 year
Ushs M Ushs M Ushs M Ushs M Ushs M
Liabilities
Customer deposits 1,987,118 (2,031,464) (1,291,080) (288,578) (421,767) (30,039)
Other liabilities 52,853 (52,853) (42,932) (2,292) (2,478) (5,151)
Balances due to other banks 255 (255) (255) - - -
Borrowed funds 481,738 (574,252) (2,008) (11,813) (103,628) (456,803)
Special funds 1,708 (1,708) (1,708) - - -
Total liabilities 2,523,672 (2,660,532) (1,337,983) (302,683) (527,873) (491,993)
Contractual Cash flows
2016 Carrying Amount
Total Up to 1 month
1-3 1 months
3 – 12 1 months
Over 1 year
Ushs M Ushs M Ushs M Ushs M Ushs M
Liabilities
Customer deposits 1,134,731 (1,153,140) (768,647) (173,567) (191,835) (19,091)
Other liabilities 18,429 (18,429) (9,814) (4,325) (1,661) (2,629)
Balances due to other banks 11,505 (11,592) (11,592) - - -
Borrowed funds 326,819 (414,582) (30,748) (5,271) (97,571) (280,992)
Special funds 1,708 (1,708) (1,708) - - -
Total liabilities 1,493,192 (1,599,451) (822,509) (183,163) (291,067) (302,712)
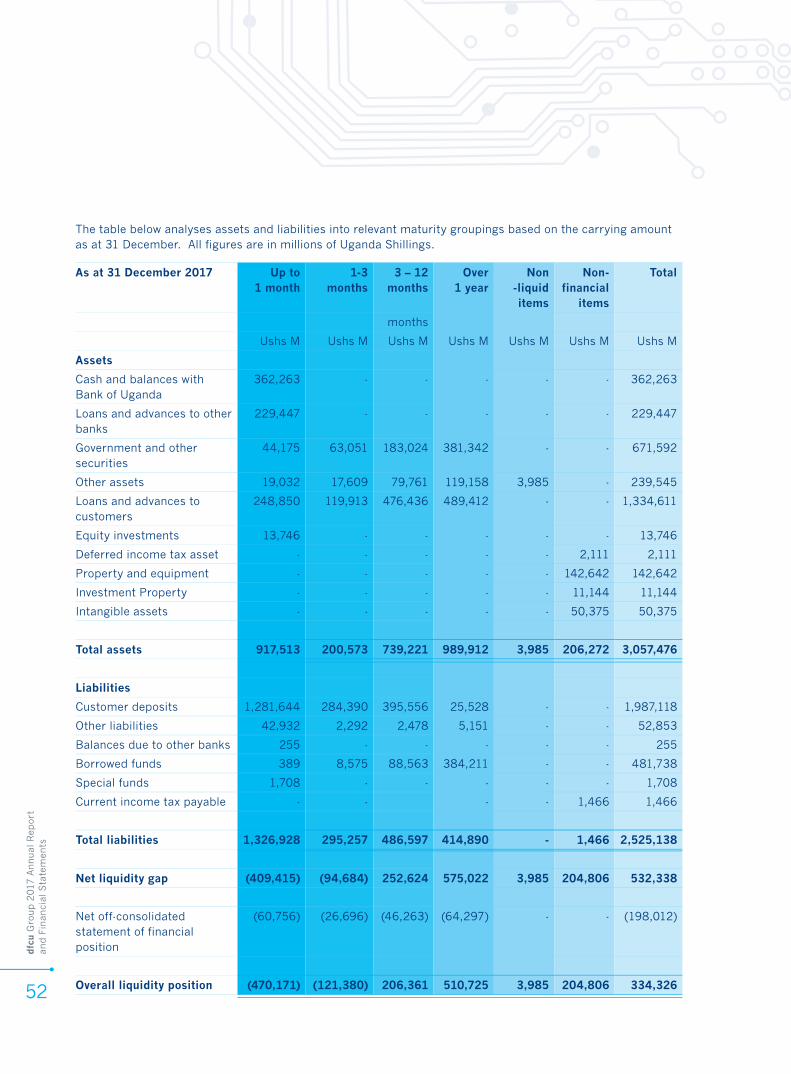
dfc
u G
roup 2
017
Annual
Rep
ort
an
d F
inan
cial
Sta
tem
ents
52
As at 31 December 2017 Up to 1 month
1-3months
3 – 12 months
Over 1 year
Non -liquid items
Non-financial
items
Total
months
Ushs M Ushs M Ushs M Ushs M Ushs M Ushs M Ushs M
Assets
Cash and balances with Bank of Uganda
362,263 - - - - - 362,263
Loans and advances to other banks
229,447 - - - - - 229,447
Government and other securities
44,175 63,051 183,024 381,342 - - 671,592
Other assets 19,032 17,609 79,761 119,158 3,985 - 239,545
Loans and advances to customers
248,850 119,913 476,436 489,412 - - 1,334,611
Equity investments 13,746 - - - - - 13,746
Deferred income tax asset - - - - - 2,111 2,111
Property and equipment - - - - - 142,642 142,642
Investment Property - - - - - 11,144 11,144
Intangible assets - - - - - 50,375 50,375
Total assets 917,513 200,573 739,221 989,912 3,985 206,272 3,057,476
Liabilities
Customer deposits 1,281,644 284,390 395,556 25,528 - - 1,987,118
Other liabilities 42,932 2,292 2,478 5,151 - - 52,853
Balances due to other banks 255 - - - - - 255
Borrowed funds 389 8,575 88,563 384,211 - - 481,738
Special funds 1,708 - - - - - 1,708
Current income tax payable - - - - 1,466 1,466
Total liabilities 1,326,928 295,257 486,597 414,890 - 1,466 2,525,138
Net liquidity gap (409,415) (94,684) 252,624 575,022 3,985 204,806 532,338
Net off-consolidated statement of financial position
(60,756) (26,696) (46,263) (64,297) - - (198,012)
Overall liquidity position (470,171) (121,380) 206,361 510,725 3,985 204,806 334,326
The table below analyses assets and liabilities into relevant maturity groupings based on the carrying amount as at 31 December. All figures are in millions of Uganda Shillings.
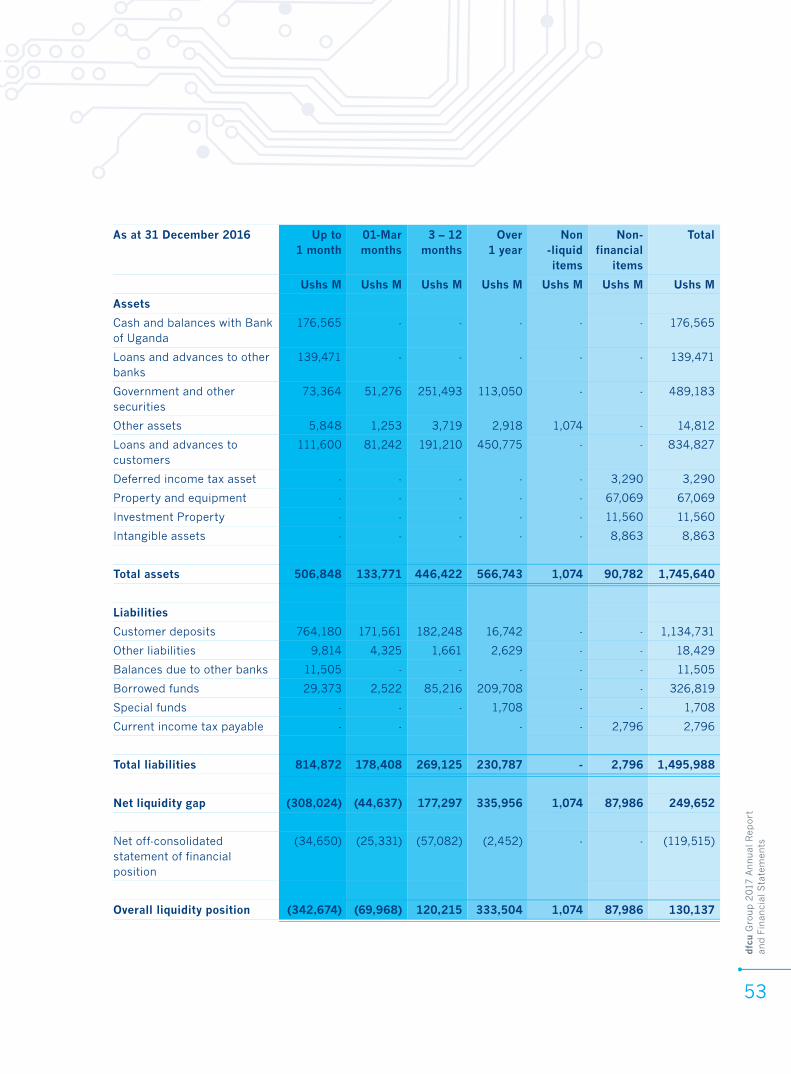
dfc
u G
roup 2
017
Annual
Rep
ort
an
d F
inan
cial
Sta
tem
ents
53
As at 31 December 2016 Up to 1 month
01-Marmonths
3 – 12 months
Over1 year
Non -liquid items
Non-financial
items
Total
Ushs M Ushs M Ushs M Ushs M Ushs M Ushs M Ushs M
Assets
Cash and balances with Bank of Uganda
176,565 - - - - - 176,565
Loans and advances to other banks
139,471 - - - - - 139,471
Government and other securities
73,364 51,276 251,493 113,050 - - 489,183
Other assets 5,848 1,253 3,719 2,918 1,074 - 14,812
Loans and advances to customers
111,600 81,242 191,210 450,775 - - 834,827
Deferred income tax asset - - - - - 3,290 3,290
Property and equipment - - - - - 67,069 67,069
Investment Property - - - - - 11,560 11,560
Intangible assets - - - - - 8,863 8,863
Total assets 506,848 133,771 446,422 566,743 1,074 90,782 1,745,640
Liabilities
Customer deposits 764,180 171,561 182,248 16,742 - - 1,134,731
Other liabilities 9,814 4,325 1,661 2,629 - - 18,429
Balances due to other banks 11,505 - - - - - 11,505
Borrowed funds 29,373 2,522 85,216 209,708 - - 326,819
Special funds - - - 1,708 - - 1,708
Current income tax payable - - - - 2,796 2,796
Total liabilities 814,872 178,408 269,125 230,787 - 2,796 1,495,988
Net liquidity gap (308,024) (44,637) 177,297 335,956 1,074 87,986 249,652
Net off-consolidated statement of financial position
(34,650) (25,331) (57,082) (2,452) - - (119,515)
Overall liquidity position (342,674) (69,968) 120,215 333,504 1,074 87,986 130,137
dfc
u G
roup 2
017
Annual
Rep
ort
an
d F
inan
cial
Sta
tem
ents
54
5D MARKET RISKMarket risk is the risk that changes in market prices, which include currency exchange rates, interest rates and equity prices will affect the fair value or future cash flows of a financial instrument. Market risk arises from open positions in interest rates and foreign currencies, both of which are exposed to general and specific market movements and changes in the level of volatility. The objective of market risk management is to manage and control market risk exposures within acceptable limits, while optimizing the return on risk. Overall responsibility for managing market risks rests with the ALCO. The Treasury Department is responsible for the detailed risk management policies (subject to review and approval by ALCO) and for the day to day implementation of those policies.
i). Foreign currency riskThe Group takes on exposure to the effects of fluctuations in the prevailing foreign currency exchange rates on its financial position and cash flows. The Board sets limits on the level of exposure by currency and in total for both overnight and intra-day positions, counter party limits and stop loss limits, which are monitored daily by treasury with senior management oversight. The Group’s ALCO reviews on a monthly basis the net foreign exchange position of the Group. As at 31 December 2017, the Group had a net foreign exchange position of Ushs 25,691 million (2016: Ushs 31,619 million).
The Group’s profit before income tax/ equity would decrease/ increase by Ushs 4,986 million (2016: Ushs 43 million) were the Ushs: US$ foreign exchange rate to change by 20% (2016: 20%). This variation in profitability is measured by reference to foreign currency exposures existing at year end. Movements in the foreign exchange rates for GBP and EURO would not have a material impact on the Group’s results
The table below summarises the Group’s exposure to foreign currency risk as at 31 December 2017. Included in the table are the Group’s assets and liabilities categorized by currency. All figures are in millions of Uganda Shillings.

dfc
u G
roup 2
017
Annual
Rep
ort
an
d F
inan
cial
Sta
tem
ents
55
As at 31 December 2017 USD Ushs M
GBP Ushs M
EURO Ushs M
USHS Ushs M
Non-financial
items
TOTAL
Assets
Cash and balances with Bank of Uganda
53,288 5,525 10,456 292,994 - 362,263
Loans and advances to other banks
204,021 1,239 2,344 21,843 - 229,447
Government and other securities - - - 671,592 - 671,592
Equity investments - - - 13,746 - 13,746
Other assets 529 1 - 239,015 - 239,545
Loans and advances to customers 629,525 6 9 705,071 - 1,334,611
Deferred income tax asset - - - - 2,111 2,111
Property and equipment - - - - 142,642 142,642
Investment Property - - - - 11,144 11,144
Intangible assets - - - - 50,375 50,375
Total assets 887,363 6,771 12,809 1,944,261 206,272 3,057,476
Liabilities
Customer deposits 564,027 4,033 11,140 1,407,918 - 1,987,118
Balance due to other banks - - - 255 - 255
Other liabilities 23,018 182 2,026 27,627 - 52,853
Borrowed funds 275,388 - - 206,350 - 481,738
Special funds - - - 1,708 - 1,708
Current income tax payable - - - - 1,466 1,466
Total liabilities 862,433 4,215 13,166 1,643,858 1,466 2,525,138
Net on- consolidated statement of financial position items
24,930 2,556 (357) 300,403 204,806 532,338
Net off-consolidated statement of financial position items
(50,621) - - (147,391) - (198,012)
Overall open position (25,691) 2,556 (357) 153,012 204,806 334,326

dfc
u G
roup 2
017
Annual
Rep
ort
an
d F
inan
cial
Sta
tem
ents
56
As at 31 December 2016 USDUshs M
GBP Ushs M
EUROUshs M
USHSUshs M
Non-financial
items
TOTAL Ushs M
Assets
Cash and balances with Bank of Uganda
57,848 2,000 2,872 113,845 - 176,565
Loans and advances to other banks
125,010 1,098 11,146 2,217 - 139,471
Government and other securities - - - 489,183 - 489,183
Other assets 668 - - 14,144 - 14,812
Loans and advances to customers
411,387 4 2 423,434 - 834,827
Deferred income tax asset - - - - 3,290 3,290
Property and equipment - - - - 67,069 67,069
Investment Property - - - - 11,560 11,560
Intangible assets - - - - 8,863 8,863
Total assets 594,913 3,102 14,020 1,042,823 90,782 1,745,640
Liabilities
Customer deposits 340,688 3,092 10,624 780,327 - 1,134,731
Balance due to other banks - - - 11,505 - 11,505
Other liabilities 7,976 7 3,154 7,292 - 18,429
Borrowed funds 246,463 - - 80,356 - 326,819
Special funds - - - 1,708 - 1,708
Current income tax payable - - - - 2,796 2,796
Total liabilities 595,127 3,099 13,778 881,188 2,796 1,495,988
Net on-consolidated statement of financial position items
(214) 3 242 161,635 87,986 249,652
Net off-consolidated statement of financial position items
(31,405) - - (88,110) - (119,515)
Overall open position (31,619) 3 242 73,525 87,986 130,137
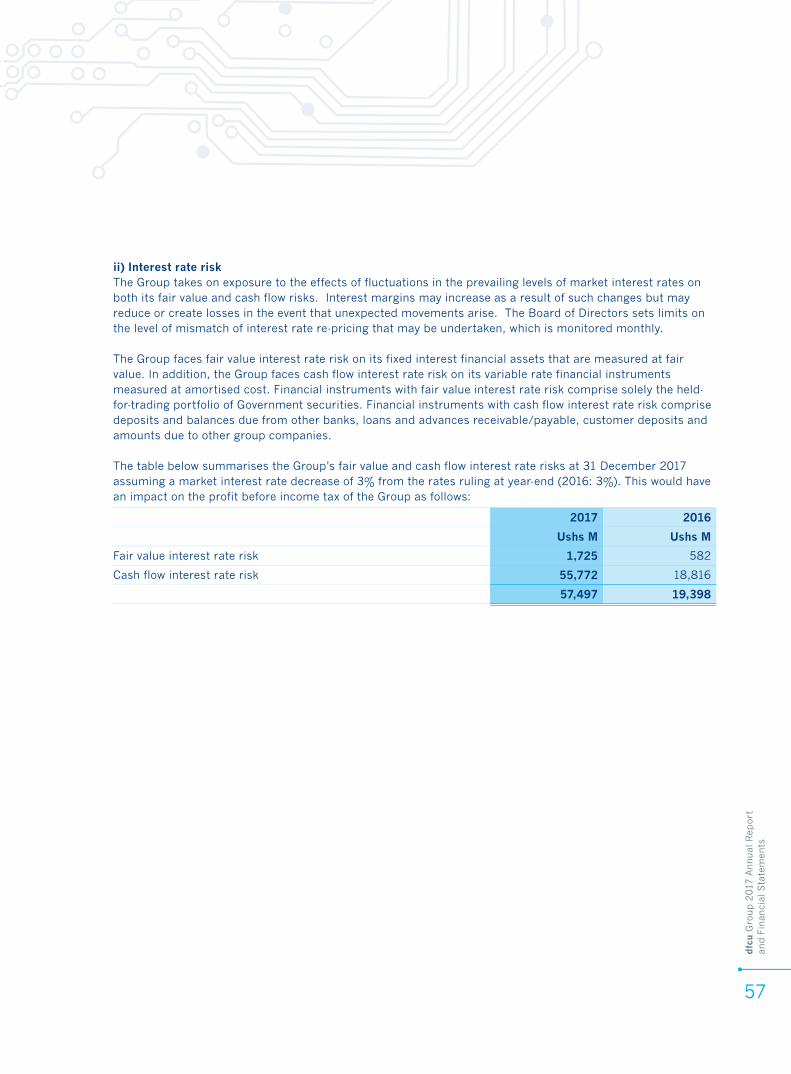
dfc
u G
roup 2
017
Annual
Rep
ort
an
d F
inan
cial
Sta
tem
ents
57
ii) Interest rate riskThe Group takes on exposure to the effects of fluctuations in the prevailing levels of market interest rates on both its fair value and cash flow risks. Interest margins may increase as a result of such changes but may reduce or create losses in the event that unexpected movements arise. The Board of Directors sets limits on the level of mismatch of interest rate re-pricing that may be undertaken, which is monitored monthly.
The Group faces fair value interest rate risk on its fixed interest financial assets that are measured at fair value. In addition, the Group faces cash flow interest rate risk on its variable rate financial instruments measured at amortised cost. Financial instruments with fair value interest rate risk comprise solely the held-for-trading portfolio of Government securities. Financial instruments with cash flow interest rate risk comprise deposits and balances due from other banks, loans and advances receivable/payable, customer deposits and amounts due to other group companies. The table below summarises the Group’s fair value and cash flow interest rate risks at 31 December 2017 assuming a market interest rate decrease of 3% from the rates ruling at year-end (2016: 3%). This would have an impact on the profit before income tax of the Group as follows:
2017 2016
Ushs M Ushs M
Fair value interest rate risk 1,725 582
Cash flow interest rate risk 55,772 18,816
57,497 19,398
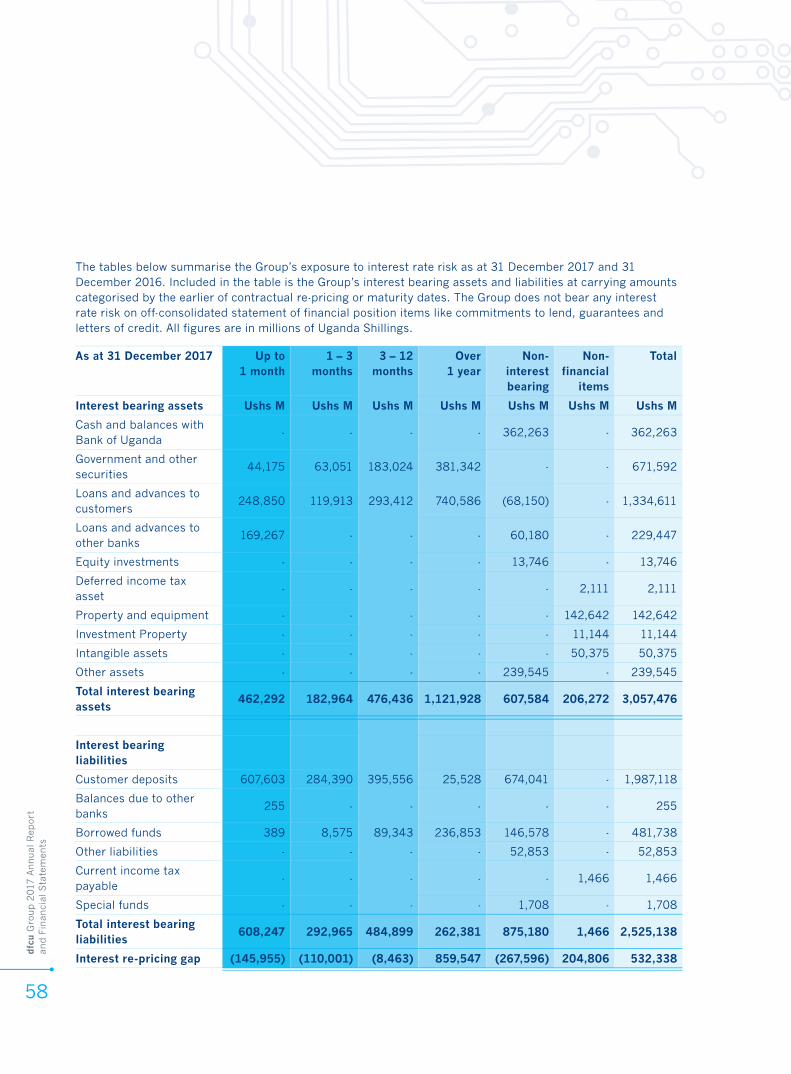
dfc
u G
roup 2
017
Annual
Rep
ort
an
d F
inan
cial
Sta
tem
ents
58
As at 31 December 2017 Up to1 month
1 – 3months
3 – 12months
Over 1 year
Non- interest bearing
Non-financial
items
Total
Interest bearing assets Ushs M Ushs M Ushs M Ushs M Ushs M Ushs M Ushs M
Cash and balances with Bank of Uganda
- - - - 362,263 - 362,263
Government and other securities
44,175 63,051 183,024 381,342 - - 671,592
Loans and advances to customers
248,850 119,913 293,412 740,586 (68,150) - 1,334,611
Loans and advances to other banks
169,267 - - - 60,180 - 229,447
Equity investments - - - - 13,746 - 13,746
Deferred income tax asset
- - - - - 2,111 2,111
Property and equipment - - - - - 142,642 142,642
Investment Property - - - - - 11,144 11,144
Intangible assets - - - - - 50,375 50,375
Other assets - - - - 239,545 - 239,545
Total interest bearing assets
462,292 182,964 476,436 1,121,928 607,584 206,272 3,057,476
Interest bearing liabilities
Customer deposits 607,603 284,390 395,556 25,528 674,041 - 1,987,118
Balances due to other banks
255 - - - - - 255
Borrowed funds 389 8,575 89,343 236,853 146,578 - 481,738
Other liabilities - - - - 52,853 - 52,853
Current income tax payable
- - - - - 1,466 1,466
Special funds - - - - 1,708 - 1,708
Total interest bearing liabilities
608,247 292,965 484,899 262,381 875,180 1,466 2,525,138
Interest re-pricing gap (145,955) (110,001) (8,463) 859,547 (267,596) 204,806 532,338
The tables below summarise the Group’s exposure to interest rate risk as at 31 December 2017 and 31 December 2016. Included in the table is the Group’s interest bearing assets and liabilities at carrying amounts categorised by the earlier of contractual re-pricing or maturity dates. The Group does not bear any interest rate risk on off-consolidated statement of financial position items like commitments to lend, guarantees and letters of credit. All figures are in millions of Uganda Shillings.
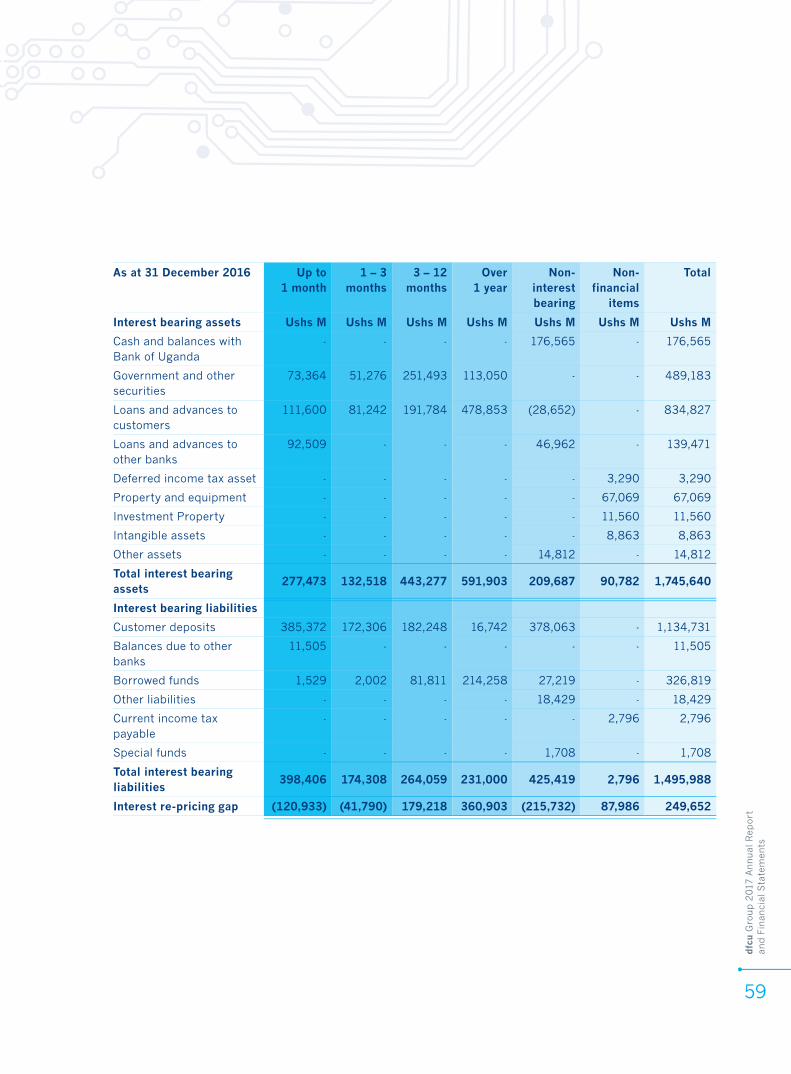
dfc
u G
roup 2
017
Annual
Rep
ort
an
d F
inan
cial
Sta
tem
ents
59
As at 31 December 2016 Up to1 month
1 – 3months
3 – 12months
Over1 year
Non- interest bearing
Non-financial
items
Total
Interest bearing assets Ushs M Ushs M Ushs M Ushs M Ushs M Ushs M Ushs M
Cash and balances with Bank of Uganda
- - - - 176,565 - 176,565
Government and other securities
73,364 51,276 251,493 113,050 - - 489,183
Loans and advances to customers
111,600 81,242 191,784 478,853 (28,652) - 834,827
Loans and advances to other banks
92,509 - - - 46,962 - 139,471
Deferred income tax asset - - - - - 3,290 3,290
Property and equipment - - - - - 67,069 67,069
Investment Property - - - - - 11,560 11,560
Intangible assets - - - - - 8,863 8,863
Other assets - - - - 14,812 - 14,812
Total interest bearing assets
277,473 132,518 443,277 591,903 209,687 90,782 1,745,640
Interest bearing liabilities
Customer deposits 385,372 172,306 182,248 16,742 378,063 - 1,134,731
Balances due to other banks
11,505 - - - - - 11,505
Borrowed funds 1,529 2,002 81,811 214,258 27,219 - 326,819
Other liabilities - - - - 18,429 - 18,429
Current income tax payable
- - - - - 2,796 2,796
Special funds - - - - 1,708 - 1,708
Total interest bearing liabilities
398,406 174,308 264,059 231,000 425,419 2,796 1,495,988
Interest re-pricing gap (120,933) (41,790) 179,218 360,903 (215,732) 87,986 249,652
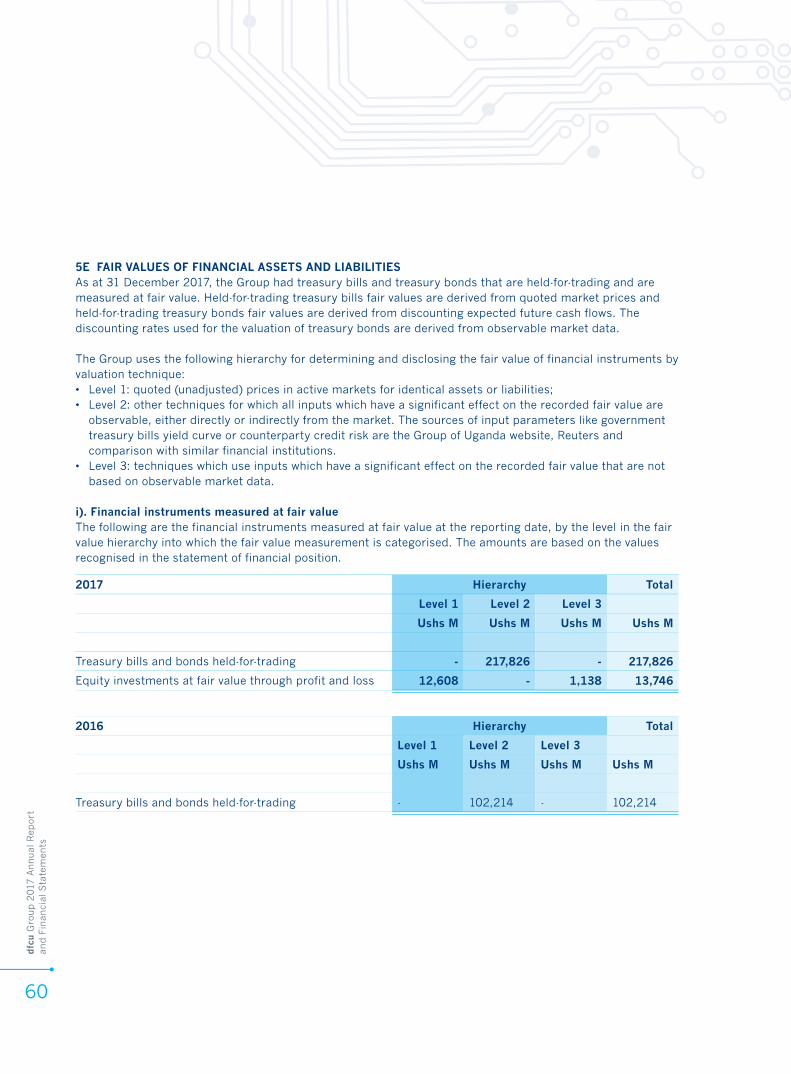
dfc
u G
roup 2
017
Annual
Rep
ort
an
d F
inan
cial
Sta
tem
ents
60
5E FAIR VALUES OF FINANCIAL ASSETS AND LIABILITIESAs at 31 December 2017, the Group had treasury bills and treasury bonds that are held-for-trading and are measured at fair value. Held-for-trading treasury bills fair values are derived from quoted market prices and held-for-trading treasury bonds fair values are derived from discounting expected future cash flows. The discounting rates used for the valuation of treasury bonds are derived from observable market data.
The Group uses the following hierarchy for determining and disclosing the fair value of financial instruments by valuation technique:• Level 1: quoted (unadjusted) prices in active markets for identical assets or liabilities;• Level 2: other techniques for which all inputs which have a significant effect on the recorded fair value are
observable, either directly or indirectly from the market. The sources of input parameters like government treasury bills yield curve or counterparty credit risk are the Group of Uganda website, Reuters and comparison with similar financial institutions.
• Level 3: techniques which use inputs which have a significant effect on the recorded fair value that are not based on observable market data.
i). Financial instruments measured at fair valueThe following are the financial instruments measured at fair value at the reporting date, by the level in the fair value hierarchy into which the fair value measurement is categorised. The amounts are based on the values recognised in the statement of financial position.
2017 Hierarchy Total
Level 1 Level 2 Level 3
Ushs M Ushs M Ushs M Ushs M
Treasury bills and bonds held-for-trading - 217,826 - 217,826
Equity investments at fair value through profit and loss 12,608 - 1,138 13,746
2016 Hierarchy Total
Level 1 Level 2 Level 3
Ushs M Ushs M Ushs M Ushs M
Treasury bills and bonds held-for-trading - 102,214 - 102,214
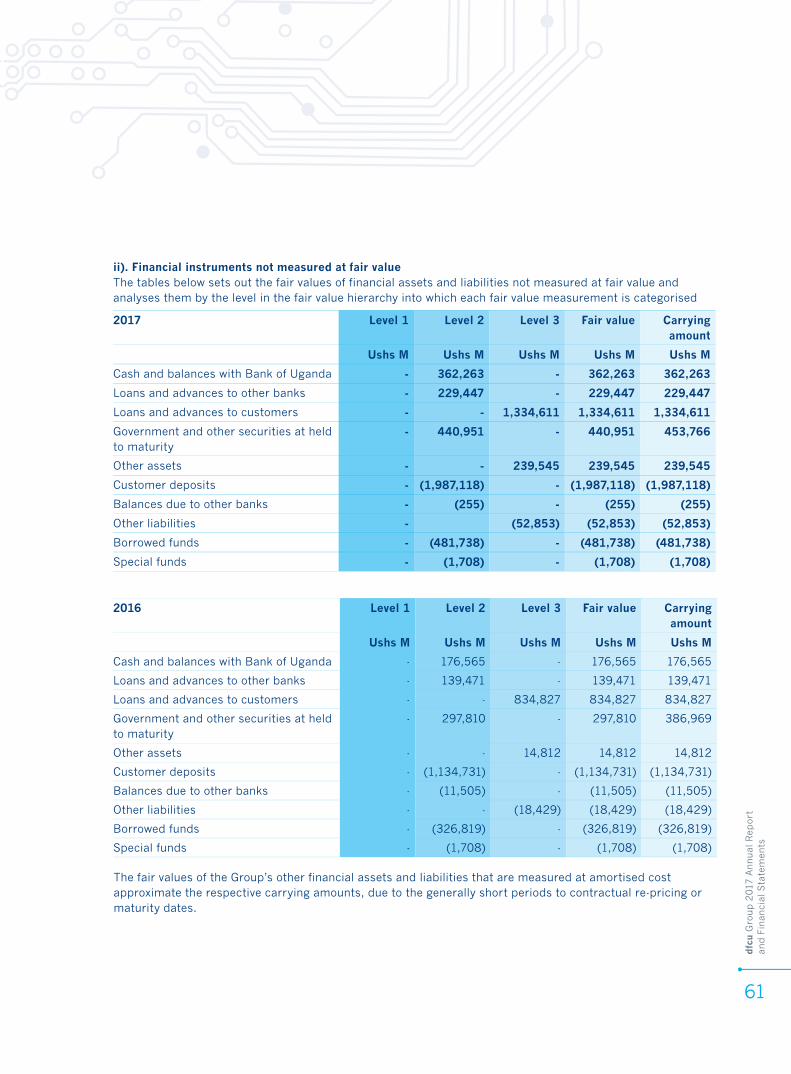
dfc
u G
roup 2
017
Annual
Rep
ort
an
d F
inan
cial
Sta
tem
ents
61
2017 Level 1 Level 2 Level 3 Fair value Carrying amount
Ushs M Ushs M Ushs M Ushs M Ushs M
Cash and balances with Bank of Uganda - 362,263 - 362,263 362,263
Loans and advances to other banks - 229,447 - 229,447 229,447
Loans and advances to customers - - 1,334,611 1,334,611 1,334,611
Government and other securities at held to maturity
- 440,951 - 440,951 453,766
Other assets - - 239,545 239,545 239,545
Customer deposits - (1,987,118) - (1,987,118) (1,987,118)
Balances due to other banks - (255) - (255) (255)
Other liabilities - (52,853) (52,853) (52,853)
Borrowed funds - (481,738) - (481,738) (481,738)
Special funds - (1,708) - (1,708) (1,708)
ii). Financial instruments not measured at fair valueThe tables below sets out the fair values of financial assets and liabilities not measured at fair value and analyses them by the level in the fair value hierarchy into which each fair value measurement is categorised
2016 Level 1 Level 2 Level 3 Fair value Carrying amount
Ushs M Ushs M Ushs M Ushs M Ushs M
Cash and balances with Bank of Uganda - 176,565 - 176,565 176,565
Loans and advances to other banks - 139,471 - 139,471 139,471
Loans and advances to customers - - 834,827 834,827 834,827
Government and other securities at held to maturity
- 297,810 - 297,810 386,969
Other assets - - 14,812 14,812 14,812
Customer deposits - (1,134,731) - (1,134,731) (1,134,731)
Balances due to other banks - (11,505) - (11,505) (11,505)
Other liabilities - - (18,429) (18,429) (18,429)
Borrowed funds - (326,819) - (326,819) (326,819)
Special funds - (1,708) - (1,708) (1,708)
The fair values of the Group’s other financial assets and liabilities that are measured at amortised cost approximate the respective carrying amounts, due to the generally short periods to contractual re-pricing or maturity dates.
dfc
u G
roup 2
017
Annual
Rep
ort
an
d F
inan
cial
Sta
tem
ents
62
5F CAPITAL MANAGEMENTThe Group’s objectives when managing capital, which is a broader concept than the ‘equity’ on the consolidated statement of financial positions, are:• To comply with the capital requirements set by Bank of Uganda;• To safeguard the Group’s ability to continue as a going concern, so that it can continue to provide returns
for shareholders and benefits for other stakeholders; and• To maintain a strong capital base to support the development of its business.
Capital adequacy and use of regulatory capital are monitored regularly by management employing techniques based on the guidelines developed by the Basel Committee, as adapted and implemented by Bank of Uganda for supervisory purposes under the Financial Institutions Act, 2004 (FIA). The required information on capital adequacy is filed with Bank of Uganda on a quarterly basis.As of 31 December 2017, Bank of Uganda regulations require each bank to: 1. have a minimum paid up capital unimpaired by losses of Ushs 25 billion (2016:Ushs 25 billion); 2. maintain core capital of not less than 8% of risk weighted assets and off-consolidated statement of financial
position items; and 3. maintain total capital of not less than 12% of risk weighted assets plus risk weighted off-consolidated
statement of financial position items.
The Group’s total regulatory capital is divided into two tiers:• Tier 1 capital (core capital): share capital, share premium, plus retained earnings less goodwill and similar
intangible assets, investments in unconsolidated subsidiaries and future income tax benefits.• Tier 2 capital (supplementary capital): revaluation reserves, general provisions for losses not exceeding
1.25% of risk weighted assets, subordinated debt not exceeding 50% of Tier 1 capital and hybrid capital instruments. Qualifying Tier 2 capital is Limited to 100% of Tier 1 capital.
The risk weighted assets are measured by means of a hierarchy of four risk weights classified according to the nature of – and reflecting an estimate of the credit risk associated with - each asset and counterparty. A similar treatment is adopted for off-consolidated statement of financial position exposure, with some adjustments to reflect the more contingent nature of the potential losses. The table below summarises the composition of regulatory capital and the ratios of the Group:
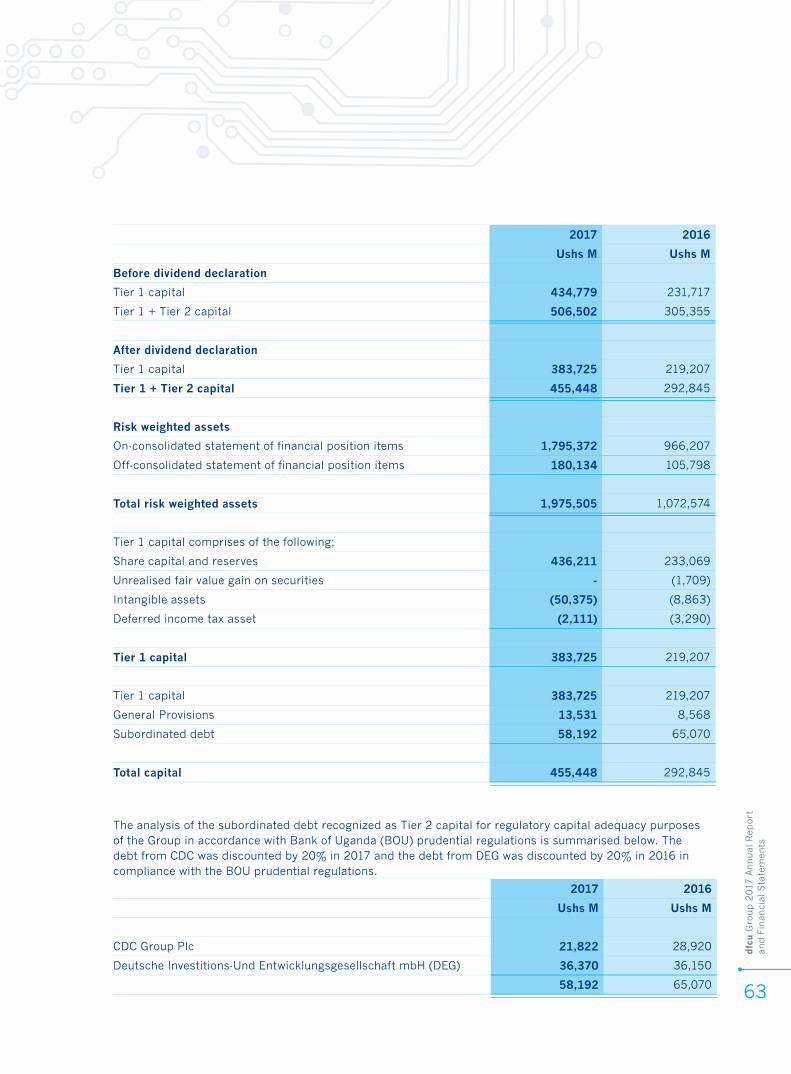
dfc
u G
roup 2
017
Annual
Rep
ort
an
d F
inan
cial
Sta
tem
ents
63
The analysis of the subordinated debt recognized as Tier 2 capital for regulatory capital adequacy purposes of the Group in accordance with Bank of Uganda (BOU) prudential regulations is summarised below. The debt from CDC was discounted by 20% in 2017 and the debt from DEG was discounted by 20% in 2016 in compliance with the BOU prudential regulations.
2017 2016
Ushs M Ushs M
Before dividend declaration
Tier 1 capital 434,779 231,717
Tier 1 + Tier 2 capital 506,502 305,355
After dividend declaration
Tier 1 capital 383,725 219,207
Tier 1 + Tier 2 capital 455,448 292,845
Risk weighted assets
On-consolidated statement of financial position items 1,795,372 966,207
Off-consolidated statement of financial position items 180,134 105,798
Total risk weighted assets 1,975,505 1,072,574
Tier 1 capital comprises of the following;
Share capital and reserves 436,211 233,069
Unrealised fair value gain on securities - (1,709)
Intangible assets (50,375) (8,863)
Deferred income tax asset (2,111) (3,290)
Tier 1 capital 383,725 219,207
Tier 1 capital 383,725 219,207
General Provisions 13,531 8,568
Subordinated debt 58,192 65,070
Total capital 455,448 292,845
2017 2016
Ushs M Ushs M
CDC Group Plc 21,822 28,920
Deutsche Investitions-Und Entwicklungsgesellschaft mbH (DEG) 36,370 36,150
58,192 65,070
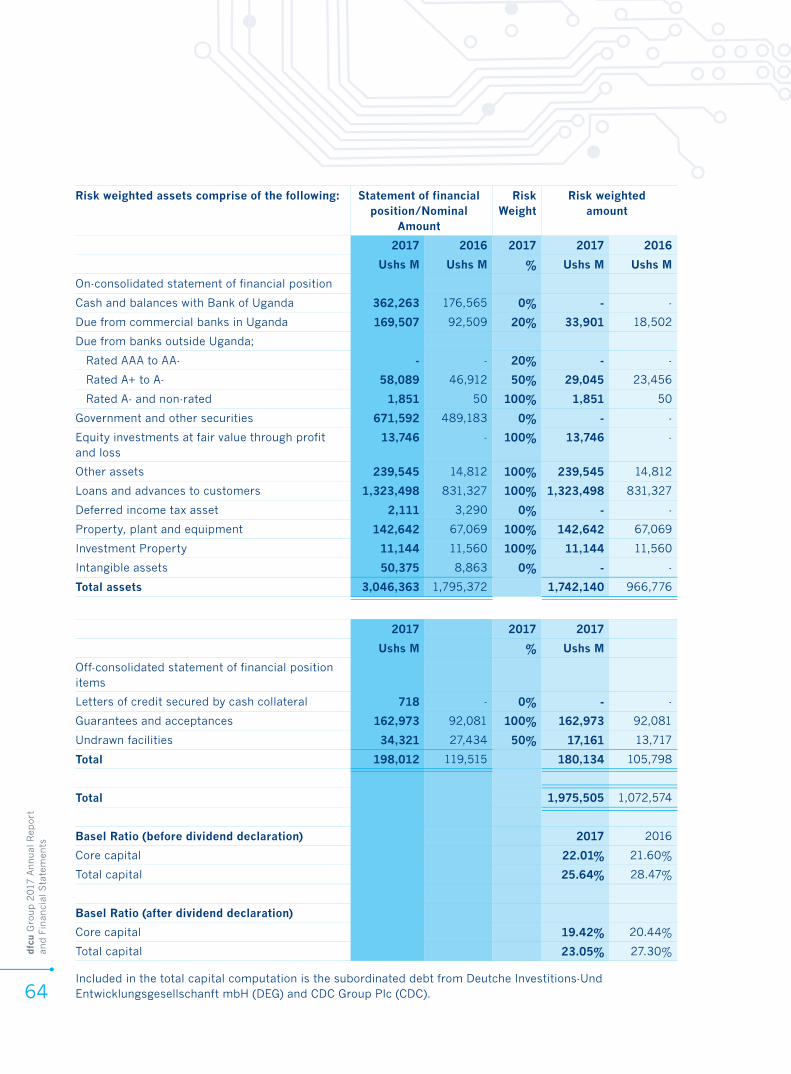
dfc
u G
roup 2
017
Annual
Rep
ort
an
d F
inan
cial
Sta
tem
ents
64Included in the total capital computation is the subordinated debt from Deutche Investitions-Und Entwicklungsgesellschanft mbH (DEG) and CDC Group Plc (CDC).
Risk weighted assets comprise of the following: Statement of financial position/Nominal
Amount
Risk Weight
Risk weighted amount
2017 2016 2017 2017 2016
Ushs M Ushs M % Ushs M Ushs M
On-consolidated statement of financial position
Cash and balances with Bank of Uganda 362,263 176,565 0% - -
Due from commercial banks in Uganda 169,507 92,509 20% 33,901 18,502
Due from banks outside Uganda;
Rated AAA to AA- - - 20% - -
Rated A+ to A- 58,089 46,912 50% 29,045 23,456
Rated A- and non-rated 1,851 50 100% 1,851 50
Government and other securities 671,592 489,183 0% - -
Equity investments at fair value through profit and loss
13,746 - 100% 13,746 -
Other assets 239,545 14,812 100% 239,545 14,812
Loans and advances to customers 1,323,498 831,327 100% 1,323,498 831,327
Deferred income tax asset 2,111 3,290 0% - -
Property, plant and equipment 142,642 67,069 100% 142,642 67,069
Investment Property 11,144 11,560 100% 11,144 11,560
Intangible assets 50,375 8,863 0% - -
Total assets 3,046,363 1,795,372 1,742,140 966,776
2017 2017 2017
Ushs M % Ushs M
Off-consolidated statement of financial position items
Letters of credit secured by cash collateral 718 - 0% - -
Guarantees and acceptances 162,973 92,081 100% 162,973 92,081
Undrawn facilities 34,321 27,434 50% 17,161 13,717
Total 198,012 119,515 180,134 105,798
Total 1,975,505 1,072,574
Basel Ratio (before dividend declaration) 2017 2016
Core capital 22.01% 21.60%
Total capital 25.64% 28.47%
Basel Ratio (after dividend declaration)
Core capital 19.42% 20.44%
Total capital 23.05% 27.30%

dfc
u G
roup 2
017
Annual
Rep
ort
an
d F
inan
cial
Sta
tem
ents
65
5G OPERATIONAL RISK MANAGEMENTOperational risk is the risk of loss resulting from inadequate or failed internal processes, people and systems or from external events.
Recognizing that operational risk cannot be entirely eliminated, the Group implemented risk mitigation controls including fraud prevention, contingency planning, information security and incident management and continues to enhance the same. Where appropriate, this strategy is further supported by risk transfer mechanisms such as insurance. Over the past year, the Group has continued to invest heavily in technology/systems to create more digital channels, increase operational efficiency in a bid to leverage on IT to drive its strategy.
The Group underwent two major IT related projects and a major data migration during the year. These included;i. Upgrade of the Core Banking System from
Finacle 7 to Finacle 10:This was a major project involving the transfer of all data from an older version of Finacle to a higher version (Finacle 10)
ii. EbankIT: This system is an e-banking platform (Quick banking) that has given the customers (retail and corporate) access to a range of banking services without visiting the branch.
iii. Data migration and integration of former Crane Bank Ltd customers: In January 2017, following the Group’s acquisition of some of assets and assuming some of the liabilities of former Crane Bank Limited, the Group migrated data from Crane Bank’s T24 and integrated it to its Core Banking system (Finacle).As technology continues to evolve, the threat of cyber-attacks is becoming more sophisticated and greater numbers of third-parties seek to access the Group’s customers’ data and remove it from the safety of the Group’s systems and firewalls.A failure to ensure this information is kept safe and used in a way that regulators and customers expect, may significantly impact relationships with these stakeholders and the broader community.The Group has put in place measures to address the operational risks as highlighted below;• The Group has and continues to invest
significantly in data, analytics and cyber-security capabilities to better meet evolving customer needs and expectations, and to reduce the potential for data breaches.
• The Group actively engages with regulators
to ensure that there is appropriate mutual understanding of the technology space and that evolution in regulation appropriately balances the value of giving customers control of their data, with the Group’s duty to protect customers’ privacy and security.
• The Group continuously invests in IT system security and identifies and accesses management controls to secure the confidentiality, integrity and availability of the Group’s data.
• The employees undergo mandatory training modules to ensure they understand the importance of data security and their obligations in relation to the data they have access to.
• As the second line of defense, the Group’s risk department was boosted with officers with IT security skills to monitor the activities of the first line of defense by performing risk assurance reviews, monitoring all user activity on key systems in order to timely detect any irregularity and advise adequate response.
6. CRITICAL ACCOUNTING ESTIMATES AND JUDGEMENTS IN APPLYING ACCOUNTING POLICIES
The preparation of the consolidated and separate financial statements in conformity with International Financial Reporting Standards requires management to make judgements, estimates and assumptions that affect the application of policies and reported amounts of assets and liabilities, and disclosure of contingent assets and liabilities at the date of consolidated and separate financial statements and reported amounts of revenues and expenses during the reported period. The estimates and associated assumptions are based on historical experiences, the results of which form the basis of making the judgments about the carrying values and liabilities that are not readily apparent from other sources. Actual results ultimately may differ from these estimates.
The Group makes estimates and assumptions that could materially affect the reported amounts of assets and liabilities within the next financial year. Estimates and judgements are continually evaluated and are based on historical experience and other factors, including expectations of future events that are believed to be reasonable under the circumstances.
dfc
u G
roup 2
017
Annual
Rep
ort
an
d F
inan
cial
Sta
tem
ents
66
a). Impairment losses on loans and advancesThe Group reviews its loan portfolios to assess impairment at least on a monthly basis. In determining whether an impairment loss should be recorded in profit or loss, the Group makes judgements as to whether there is any observable data indicating that there is a measurable decrease in the estimated future cash flows from a portfolio of loans before the decrease can be identified with an individual loan in that portfolio. This evidence may include observable data indicating that there has been an adverse change in the payment status of borrowers in a group, or national or local economic conditions that correlate with defaults on assets in the group. Management uses estimates based on historical loss experience for assets with credit risk characteristics and objective evidence of impairment similar to those in the portfolio when scheduling its future cash flows. The methodology and assumptions used for estimating both the amount and timing of future cash flows are reviewed regularly to reduce any differences between loss estimates and actual loss experience. Refer to note 21 for more information.
b). Income taxesThe Group is subject to various government taxes under the tax laws of Uganda. Significant estimates and judgments are required in determining the provision for taxes on certain transactions. For these transactions, the ultimate tax determination is uncertain during the ordinary course of business. Where the final tax outcome of these matters is different from the amounts that were initially recorded, such differences will impact profit or loss. Refer to note 17 for more information.
c). Fair value of financial instrumentsWhere the fair value of the financial assets and financial liabilities recorded in the consolidated and separate statement of financial position cannot be determined from active markets, they are determined using valuation techniques including discounted cash flows models. The inputs to these models are taken from observable markets where possible, but where this is not feasible, a degree of judgment is required in establishing fair values. The judgments include considerations of inputs such as liquidity risk, credit risk and volatility.
Changes in assumptions about these factors could affect the reported fair value of financial instruments. Refer to note 4E for more information.
d). Valuation of assets in business combinationThe determination of fair value of the consideration transferred and the net assets acquired and liabilities assumed as a result of a business combination requires significant judgement and estimates. Management used a valuation expert to determine the fair value of the transactions. The fair valuation techniques used to determine the fair value is disclosed in Note 12.
e). Going concernThe Group’s directors have made an assessment of the Group’s ability to continue as a going concern and are satisfied that the Group has the resources to continue in business for the foreseeable future. Furthermore, the directors are not aware of any material uncertainties that may cast significant doubt upon the Group’s ability to continue as a going concern. Therefore, the consolidated and separate financial statements continue to be prepared on the going concern basis.
7. SEGMENT INFORMATION
For management purposes, the Group is organised into business units based on their products and services, and has two reportable operating segments as follows:• dfcu Limited, which is the holding company that is
listed on the Uganda Stock Exchange. • dfcu Bank Limited; this is the commercial banking
segment which provides innovative products and superior service levels catering for customer needs in the areas of savings and investment products, personal and current accounts, personal credit, corporate credit, trade finance, foreign exchange trading, money market transfers, etc. It also consists of a development finance segment which provides medium and long term finance to private sectors in Uganda. The sectors include agro processing, education, health, manufacturing, transport, hospitality industry, tourism and construction.
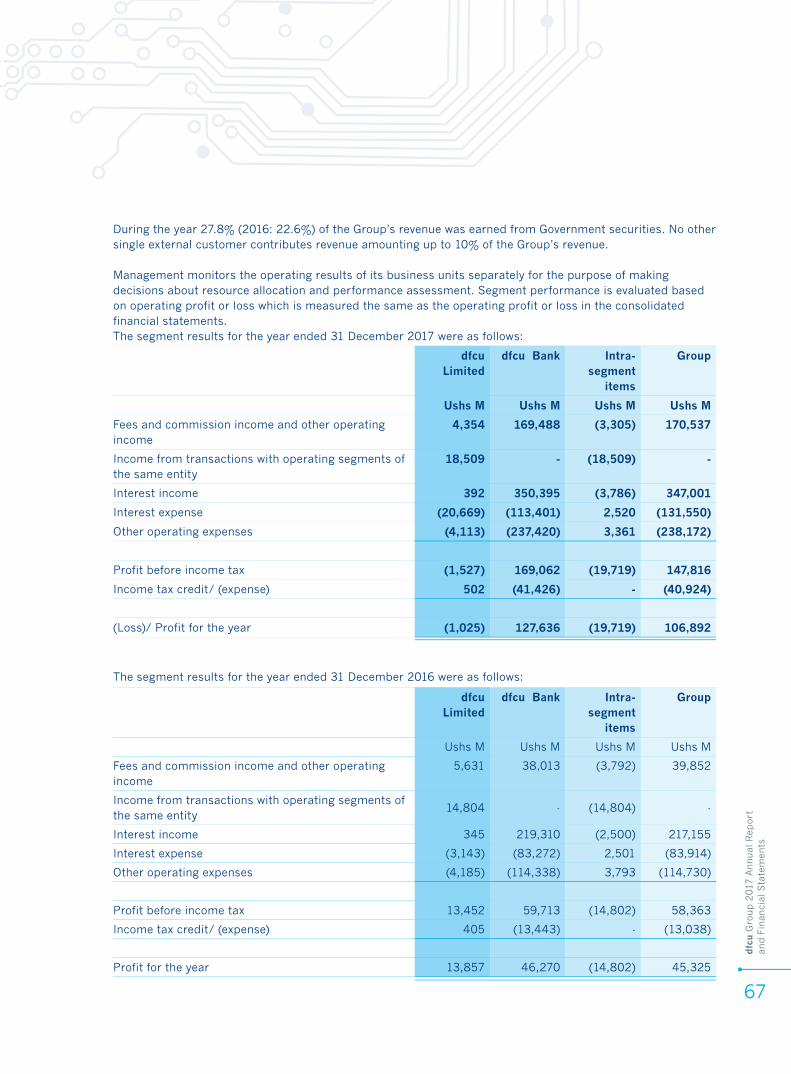
dfc
u G
roup 2
017
Annual
Rep
ort
an
d F
inan
cial
Sta
tem
ents
67
During the year 27.8% (2016: 22.6%) of the Group’s revenue was earned from Government securities. No other single external customer contributes revenue amounting up to 10% of the Group’s revenue.
Management monitors the operating results of its business units separately for the purpose of making decisions about resource allocation and performance assessment. Segment performance is evaluated based on operating profit or loss which is measured the same as the operating profit or loss in the consolidated financial statements.The segment results for the year ended 31 December 2017 were as follows:
dfcu Limited
dfcu Bank Intra-segment
items
Group
Ushs M Ushs M Ushs M Ushs M
Fees and commission income and other operating income
5,631 38,013 (3,792) 39,852
Income from transactions with operating segments of the same entity
14,804 - (14,804) -
Interest income 345 219,310 (2,500) 217,155
Interest expense (3,143) (83,272) 2,501 (83,914)
Other operating expenses (4,185) (114,338) 3,793 (114,730)
Profit before income tax 13,452 59,713 (14,802) 58,363
Income tax credit/ (expense) 405 (13,443) - (13,038)
Profit for the year 13,857 46,270 (14,802) 45,325
dfcu Limited
dfcu Bank Intra-segment
items
Group
Ushs M Ushs M Ushs M Ushs M
Fees and commission income and other operating income
4,354 169,488 (3,305) 170,537
Income from transactions with operating segments of the same entity
18,509 - (18,509) -
Interest income 392 350,395 (3,786) 347,001
Interest expense (20,669) (113,401) 2,520 (131,550)
Other operating expenses (4,113) (237,420) 3,361 (238,172)
Profit before income tax (1,527) 169,062 (19,719) 147,816
Income tax credit/ (expense) 502 (41,426) - (40,924)
(Loss)/ Profit for the year (1,025) 127,636 (19,719) 106,892
The segment results for the year ended 31 December 2016 were as follows:
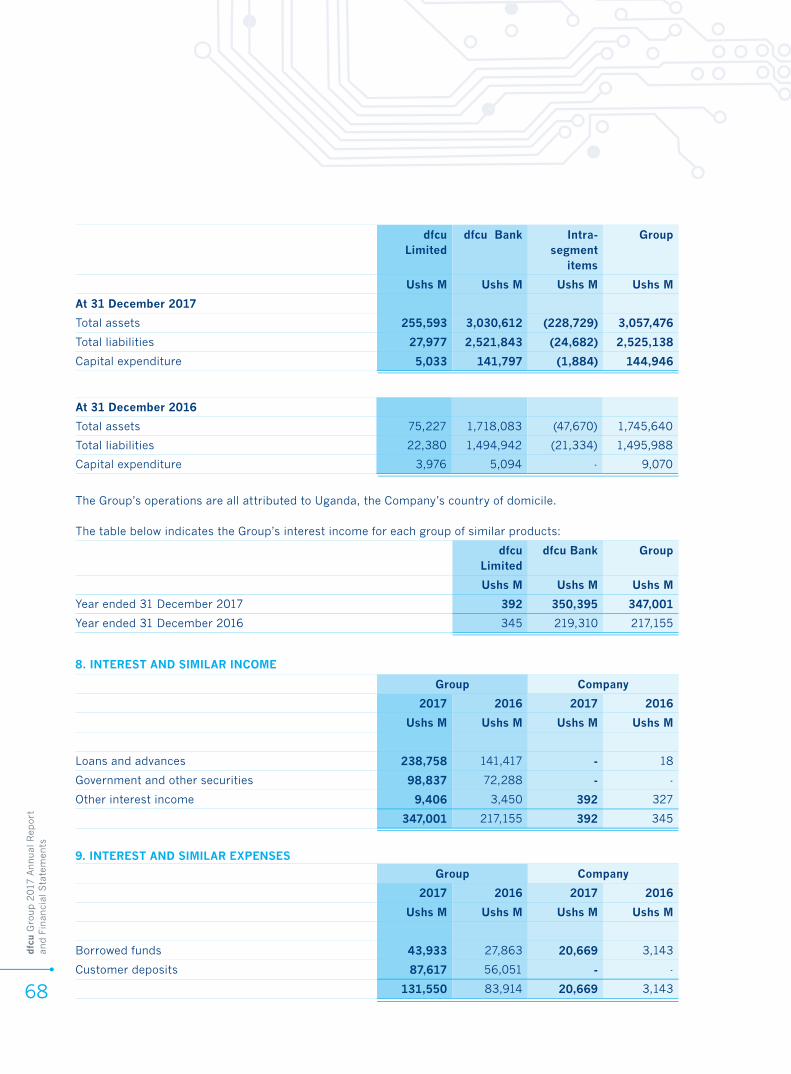
dfc
u G
roup 2
017
Annual
Rep
ort
an
d F
inan
cial
Sta
tem
ents
68
dfcu Limited
dfcu Bank Intra-segment
items
Group
Ushs M Ushs M Ushs M Ushs M
At 31 December 2017
Total assets 255,593 3,030,612 (228,729) 3,057,476
Total liabilities 27,977 2,521,843 (24,682) 2,525,138
Capital expenditure 5,033 141,797 (1,884) 144,946
At 31 December 2016
Total assets 75,227 1,718,083 (47,670) 1,745,640
Total liabilities 22,380 1,494,942 (21,334) 1,495,988
Capital expenditure 3,976 5,094 - 9,070
8. INTEREST AND SIMILAR INCOME
9. INTEREST AND SIMILAR EXPENSES
Group Company
2017 2016 2017 2016
Ushs M Ushs M Ushs M Ushs M
Borrowed funds 43,933 27,863 20,669 3,143
Customer deposits 87,617 56,051 - -
131,550 83,914 20,669 3,143
Group Company
2017 2016 2017 2016
Ushs M Ushs M Ushs M Ushs M
Loans and advances 238,758 141,417 - 18
Government and other securities 98,837 72,288 - -
Other interest income 9,406 3,450 392 327
347,001 217,155 392 345
The Group’s operations are all attributed to Uganda, the Company’s country of domicile.
The table below indicates the Group’s interest income for each group of similar products:
dfcu Limited
dfcu Bank Group
Ushs M Ushs M Ushs M
Year ended 31 December 2017 392 350,395 347,001
Year ended 31 December 2016 345 219,310 217,155
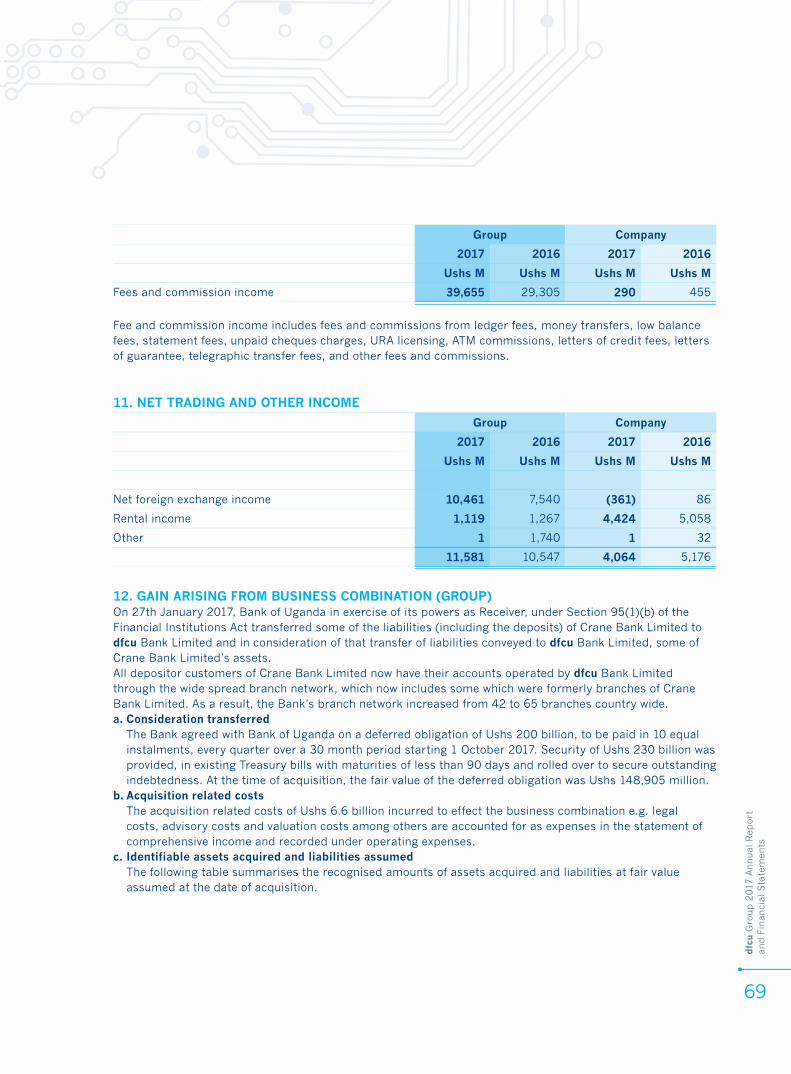
dfc
u G
roup 2
017
Annual
Rep
ort
an
d F
inan
cial
Sta
tem
ents
69
Group Company
2017 2016 2017 2016
Ushs M Ushs M Ushs M Ushs M
Fees and commission income 39,655 29,305 290 455
Group Company
2017 2016 2017 2016
Ushs M Ushs M Ushs M Ushs M
Net foreign exchange income 10,461 7,540 (361) 86
Rental income 1,119 1,267 4,424 5,058
Other 1 1,740 1 32
11,581 10,547 4,064 5,176
Fee and commission income includes fees and commissions from ledger fees, money transfers, low balance fees, statement fees, unpaid cheques charges, URA licensing, ATM commissions, letters of credit fees, letters of guarantee, telegraphic transfer fees, and other fees and commissions.
11. NET TRADING AND OTHER INCOME
12. GAIN ARISING FROM BUSINESS COMBINATION (GROUP)On 27th January 2017, Bank of Uganda in exercise of its powers as Receiver, under Section 95(1)(b) of the Financial Institutions Act transferred some of the liabilities (including the deposits) of Crane Bank Limited to dfcu Bank Limited and in consideration of that transfer of liabilities conveyed to dfcu Bank Limited, some of Crane Bank Limited’s assets.All depositor customers of Crane Bank Limited now have their accounts operated by dfcu Bank Limited through the wide spread branch network, which now includes some which were formerly branches of Crane Bank Limited. As a result, the Bank’s branch network increased from 42 to 65 branches country wide.a. Consideration transferred
The Bank agreed with Bank of Uganda on a deferred obligation of Ushs 200 billion, to be paid in 10 equal instalments, every quarter over a 30 month period starting 1 October 2017. Security of Ushs 230 billion was provided, in existing Treasury bills with maturities of less than 90 days and rolled over to secure outstanding indebtedness. At the time of acquisition, the fair value of the deferred obligation was Ushs 148,905 million.
b. Acquisition related costsThe acquisition related costs of Ushs 6.6 billion incurred to effect the business combination e.g. legal costs, advisory costs and valuation costs among others are accounted for as expenses in the statement of comprehensive income and recorded under operating expenses.
c. Identifiable assets acquired and liabilities assumedThe following table summarises the recognised amounts of assets acquired and liabilities at fair value assumed at the date of acquisition.
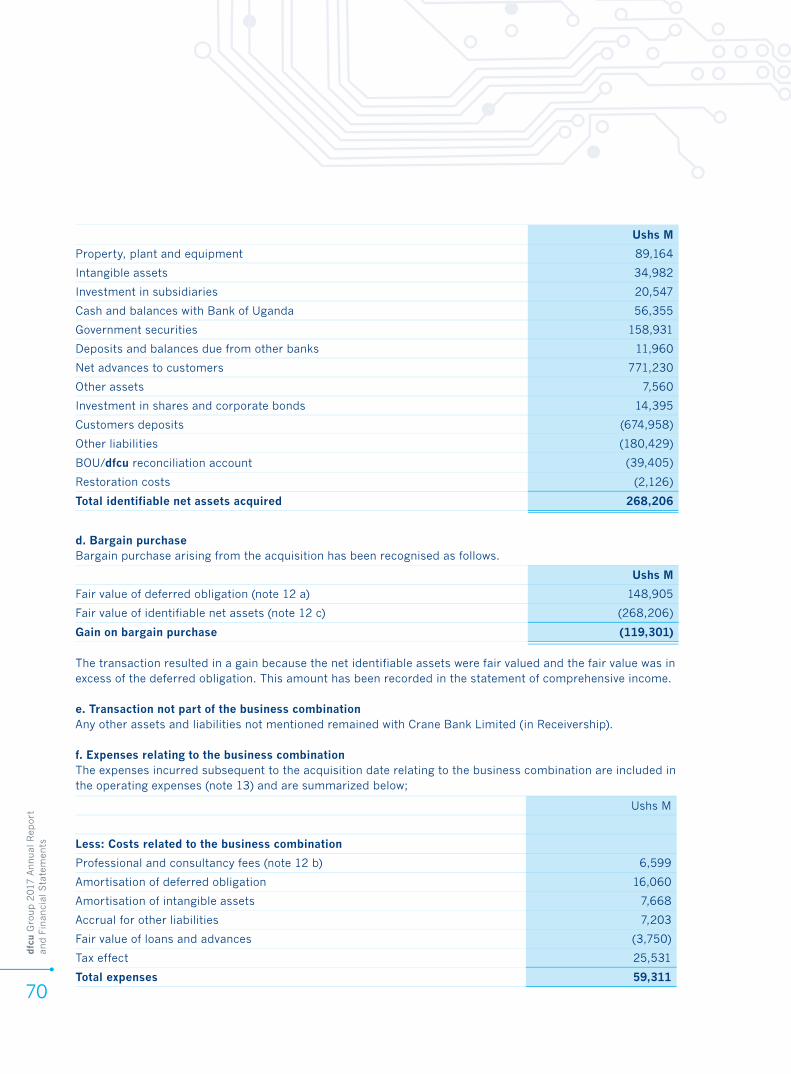
dfc
u G
roup 2
017
Annual
Rep
ort
an
d F
inan
cial
Sta
tem
ents
70
Ushs M
Less: Costs related to the business combination
Professional and consultancy fees (note 12 b) 6,599
Amortisation of deferred obligation 16,060
Amortisation of intangible assets 7,668
Accrual for other liabilities 7,203
Fair value of loans and advances (3,750)
Tax effect 25,531
Total expenses 59,311
d. Bargain purchaseBargain purchase arising from the acquisition has been recognised as follows.
Ushs M
Fair value of deferred obligation (note 12 a) 148,905
Fair value of identifiable net assets (note 12 c) (268,206)
Gain on bargain purchase (119,301)
The transaction resulted in a gain because the net identifiable assets were fair valued and the fair value was in excess of the deferred obligation. This amount has been recorded in the statement of comprehensive income.
e. Transaction not part of the business combinationAny other assets and liabilities not mentioned remained with Crane Bank Limited (in Receivership).
f. Expenses relating to the business combination The expenses incurred subsequent to the acquisition date relating to the business combination are included in the operating expenses (note 13) and are summarized below;
Ushs M
Property, plant and equipment 89,164
Intangible assets 34,982
Investment in subsidiaries 20,547
Cash and balances with Bank of Uganda 56,355
Government securities 158,931
Deposits and balances due from other banks 11,960
Net advances to customers 771,230
Other assets 7,560
Investment in shares and corporate bonds 14,395
Customers deposits (674,958)
Other liabilities (180,429)
BOU/dfcu reconciliation account (39,405)
Restoration costs (2,126)
Total identifiable net assets acquired 268,206
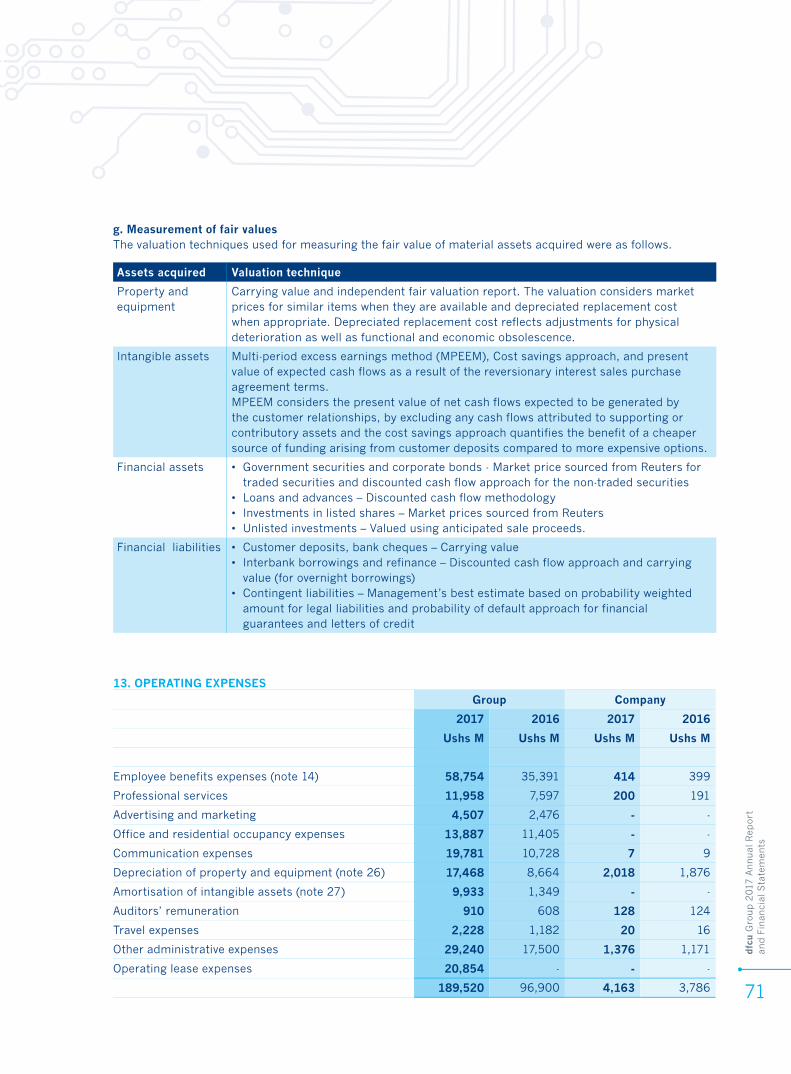
dfc
u G
roup 2
017
Annual
Rep
ort
an
d F
inan
cial
Sta
tem
ents
71
Assets acquired Valuation technique
Property and equipment
Carrying value and independent fair valuation report. The valuation considers market prices for similar items when they are available and depreciated replacement cost when appropriate. Depreciated replacement cost reflects adjustments for physical deterioration as well as functional and economic obsolescence.
Intangible assets Multi-period excess earnings method (MPEEM), Cost savings approach, and present value of expected cash flows as a result of the reversionary interest sales purchase agreement terms.MPEEM considers the present value of net cash flows expected to be generated by the customer relationships, by excluding any cash flows attributed to supporting or contributory assets and the cost savings approach quantifies the benefit of a cheaper source of funding arising from customer deposits compared to more expensive options.
Financial assets • Government securities and corporate bonds - Market price sourced from Reuters for traded securities and discounted cash flow approach for the non-traded securities
• Loans and advances – Discounted cash flow methodology• Investments in listed shares – Market prices sourced from Reuters• Unlisted investments – Valued using anticipated sale proceeds.
Financial liabilities • Customer deposits, bank cheques – Carrying value • Interbank borrowings and refinance – Discounted cash flow approach and carrying
value (for overnight borrowings)• Contingent liabilities – Management’s best estimate based on probability weighted
amount for legal liabilities and probability of default approach for financial guarantees and letters of credit
Group Company
2017 2016 2017 2016
Ushs M Ushs M Ushs M Ushs M
Employee benefits expenses (note 14) 58,754 35,391 414 399
Professional services 11,958 7,597 200 191
Advertising and marketing 4,507 2,476 - -
Office and residential occupancy expenses 13,887 11,405 - -
Communication expenses 19,781 10,728 7 9
Depreciation of property and equipment (note 26) 17,468 8,664 2,018 1,876
Amortisation of intangible assets (note 27) 9,933 1,349 - -
Auditors’ remuneration 910 608 128 124
Travel expenses 2,228 1,182 20 16
Other administrative expenses 29,240 17,500 1,376 1,171
Operating lease expenses 20,854 - - -
189,520 96,900 4,163 3,786
g. Measurement of fair valuesThe valuation techniques used for measuring the fair value of material assets acquired were as follows.
13. OPERATING EXPENSES
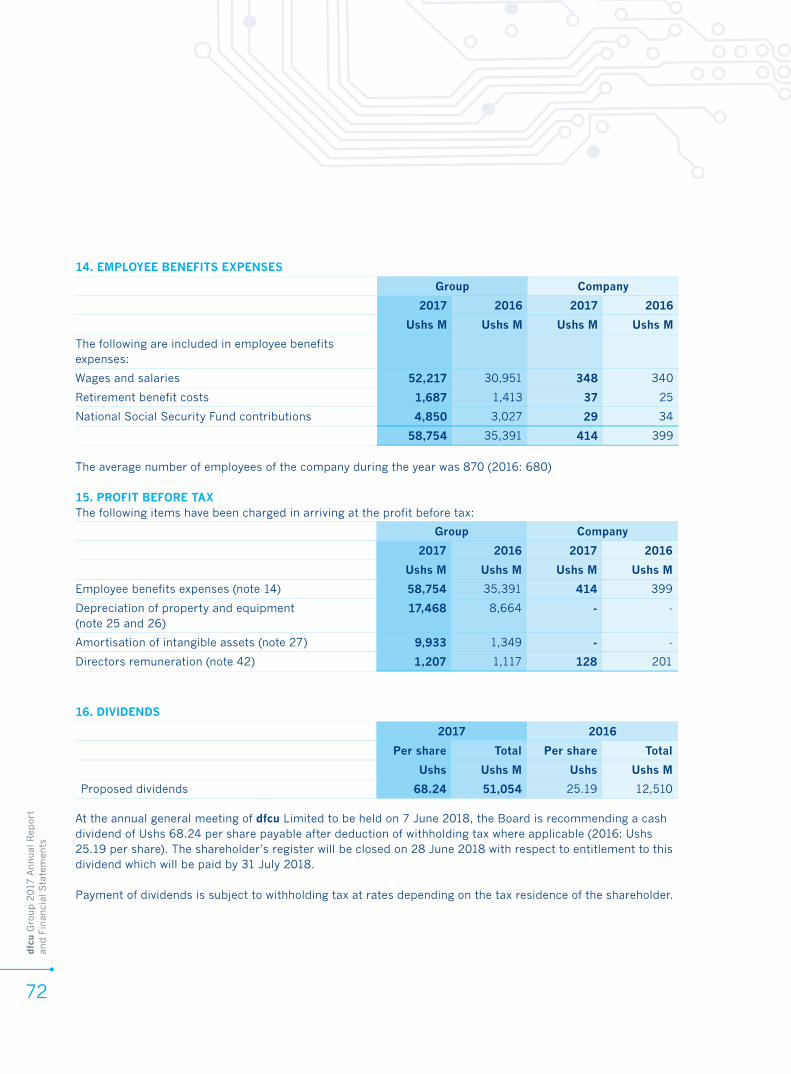
dfc
u G
roup 2
017
Annual
Rep
ort
an
d F
inan
cial
Sta
tem
ents
72
14. EMPLOYEE BENEFITS EXPENSES
Group Company
2017 2016 2017 2016
Ushs M Ushs M Ushs M Ushs M
The following are included in employee benefits expenses:
Wages and salaries 52,217 30,951 348 340
Retirement benefit costs 1,687 1,413 37 25
National Social Security Fund contributions 4,850 3,027 29 34
58,754 35,391 414 399
The average number of employees of the company during the year was 870 (2016: 680)
15. PROFIT BEFORE TAXThe following items have been charged in arriving at the profit before tax:
Group Company
2017 2016 2017 2016
Ushs M Ushs M Ushs M Ushs M
Employee benefits expenses (note 14) 58,754 35,391 414 399
Depreciation of property and equipment (note 25 and 26)
17,468 8,664 - -
Amortisation of intangible assets (note 27) 9,933 1,349 - -
Directors remuneration (note 42) 1,207 1,117 128 201
2017 2016
Per share Total Per share Total
Ushs Ushs M Ushs Ushs M
Proposed dividends 68.24 51,054 25.19 12,510
At the annual general meeting of dfcu Limited to be held on 7 June 2018, the Board is recommending a cash dividend of Ushs 68.24 per share payable after deduction of withholding tax where applicable (2016: Ushs 25.19 per share). The shareholder’s register will be closed on 28 June 2018 with respect to entitlement to this dividend which will be paid by 31 July 2018.
Payment of dividends is subject to withholding tax at rates depending on the tax residence of the shareholder.
16. DIVIDENDS
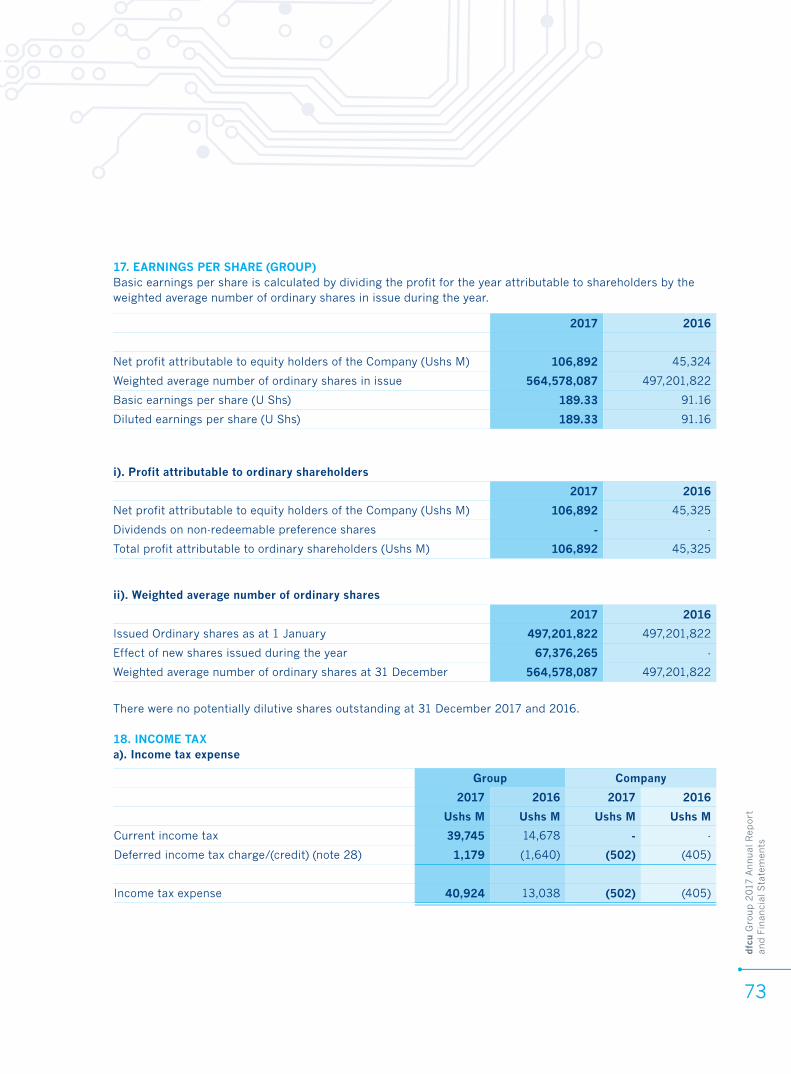
dfc
u G
roup 2
017
Annual
Rep
ort
an
d F
inan
cial
Sta
tem
ents
73
2017 2016
Net profit attributable to equity holders of the Company (Ushs M) 106,892 45,324
Weighted average number of ordinary shares in issue 564,578,087 497,201,822
Basic earnings per share (U Shs) 189.33 91.16
Diluted earnings per share (U Shs) 189.33 91.16
i). Profit attributable to ordinary shareholders
2017 2016
Net profit attributable to equity holders of the Company (Ushs M) 106,892 45,325
Dividends on non-redeemable preference shares - -
Total profit attributable to ordinary shareholders (Ushs M) 106,892 45,325
ii). Weighted average number of ordinary shares
2017 2016
Issued Ordinary shares as at 1 January 497,201,822 497,201,822
Effect of new shares issued during the year 67,376,265 -
Weighted average number of ordinary shares at 31 December 564,578,087 497,201,822
17. EARNINGS PER SHARE (GROUP)Basic earnings per share is calculated by dividing the profit for the year attributable to shareholders by the weighted average number of ordinary shares in issue during the year.
There were no potentially dilutive shares outstanding at 31 December 2017 and 2016.
18. INCOME TAX a). Income tax expense
Group Company
2017 2016 2017 2016
Ushs M Ushs M Ushs M Ushs M
Current income tax 39,745 14,678 - -
Deferred income tax charge/(credit) (note 28) 1,179 (1,640) (502) (405)
Income tax expense 40,924 13,038 (502) (405)
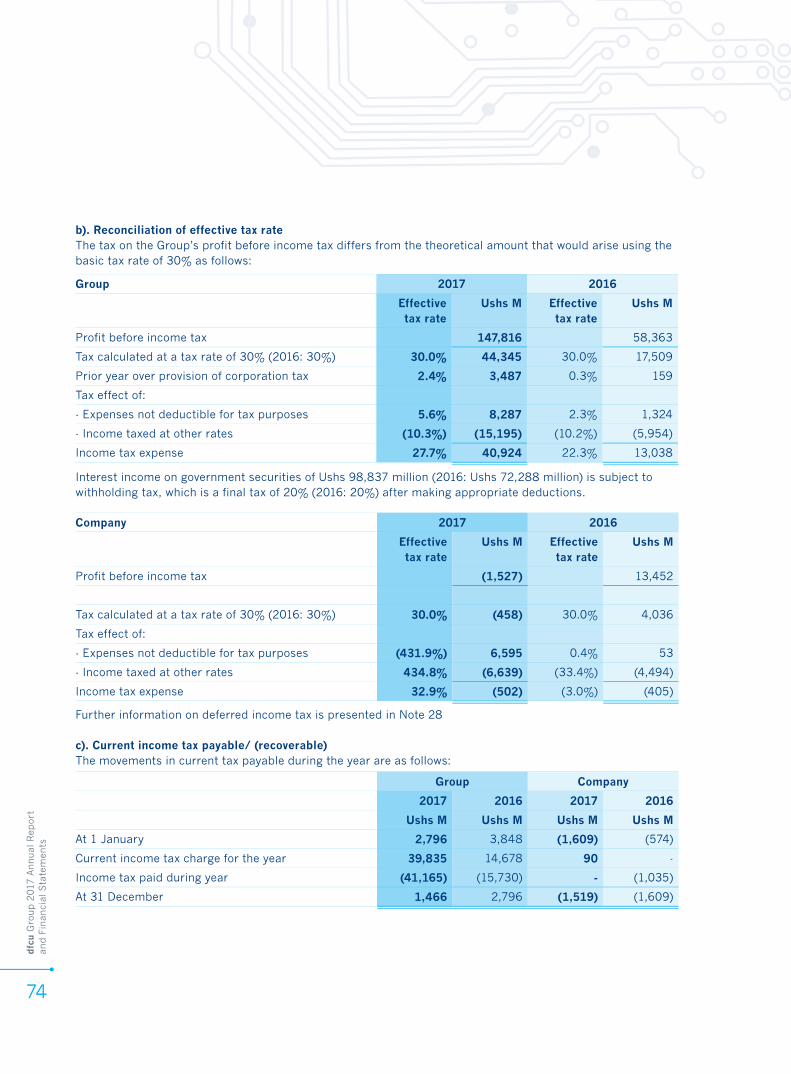
dfc
u G
roup 2
017
Annual
Rep
ort
an
d F
inan
cial
Sta
tem
ents
74
b). Reconciliation of effective tax rate The tax on the Group’s profit before income tax differs from the theoretical amount that would arise using the basic tax rate of 30% as follows:
Interest income on government securities of Ushs 98,837 million (2016: Ushs 72,288 million) is subject to withholding tax, which is a final tax of 20% (2016: 20%) after making appropriate deductions.
Further information on deferred income tax is presented in Note 28
c). Current income tax payable/ (recoverable)The movements in current tax payable during the year are as follows:
Group Company
2017 2016 2017 2016
Ushs M Ushs M Ushs M Ushs M
At 1 January 2,796 3,848 (1,609) (574)
Current income tax charge for the year 39,835 14,678 90 -
Income tax paid during year (41,165) (15,730) - (1,035)
At 31 December 1,466 2,796 (1,519) (1,609)
Company 2017 2016
Effective tax rate
Ushs M Effective tax rate
Ushs M
Profit before income tax (1,527) 13,452
Tax calculated at a tax rate of 30% (2016: 30%) 30.0% (458) 30.0% 4,036
Tax effect of:
- Expenses not deductible for tax purposes (431.9%) 6,595 0.4% 53
- Income taxed at other rates 434.8% (6,639) (33.4%) (4,494)
Income tax expense 32.9% (502) (3.0%) (405)
Group 2017 2016
Effective tax rate
Ushs M Effective tax rate
Ushs M
Profit before income tax 147,816 58,363
Tax calculated at a tax rate of 30% (2016: 30%) 30.0% 44,345 30.0% 17,509
Prior year over provision of corporation tax 2.4% 3,487 0.3% 159
Tax effect of:
- Expenses not deductible for tax purposes 5.6% 8,287 2.3% 1,324
- Income taxed at other rates (10.3%) (15,195) (10.2%) (5,954)
Income tax expense 27.7% 40,924 22.3% 13,038
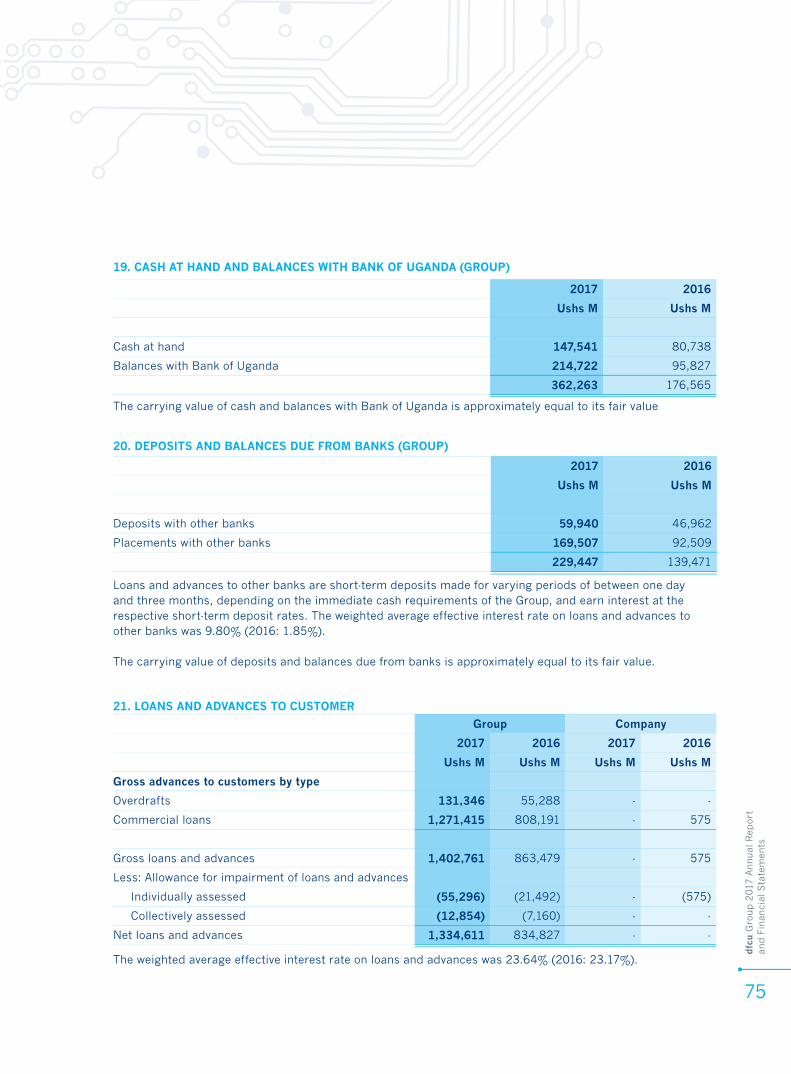
dfc
u G
roup 2
017
Annual
Rep
ort
an
d F
inan
cial
Sta
tem
ents
75
19. CASH AT HAND AND BALANCES WITH BANK OF UGANDA (GROUP)
2017 2016
Ushs M Ushs M
Cash at hand 147,541 80,738
Balances with Bank of Uganda 214,722 95,827
362,263 176,565
2017 2016
Ushs M Ushs M
Deposits with other banks 59,940 46,962
Placements with other banks 169,507 92,509
229,447 139,471
Loans and advances to other banks are short-term deposits made for varying periods of between one day and three months, depending on the immediate cash requirements of the Group, and earn interest at the respective short-term deposit rates. The weighted average effective interest rate on loans and advances to other banks was 9.80% (2016: 1.85%).
The carrying value of deposits and balances due from banks is approximately equal to its fair value.
20. DEPOSITS AND BALANCES DUE FROM BANKS (GROUP)
21. LOANS AND ADVANCES TO CUSTOMER
Group Company
2017 2016 2017 2016
Ushs M Ushs M Ushs M Ushs M
Gross advances to customers by type
Overdrafts 131,346 55,288 - -
Commercial loans 1,271,415 808,191 - 575
Gross loans and advances 1,402,761 863,479 - 575
Less: Allowance for impairment of loans and advances
Individually assessed (55,296) (21,492) - (575)
Collectively assessed (12,854) (7,160) - -
Net loans and advances 1,334,611 834,827 - -
The weighted average effective interest rate on loans and advances was 23.64% (2016: 23.17%).
The carrying value of cash and balances with Bank of Uganda is approximately equal to its fair value
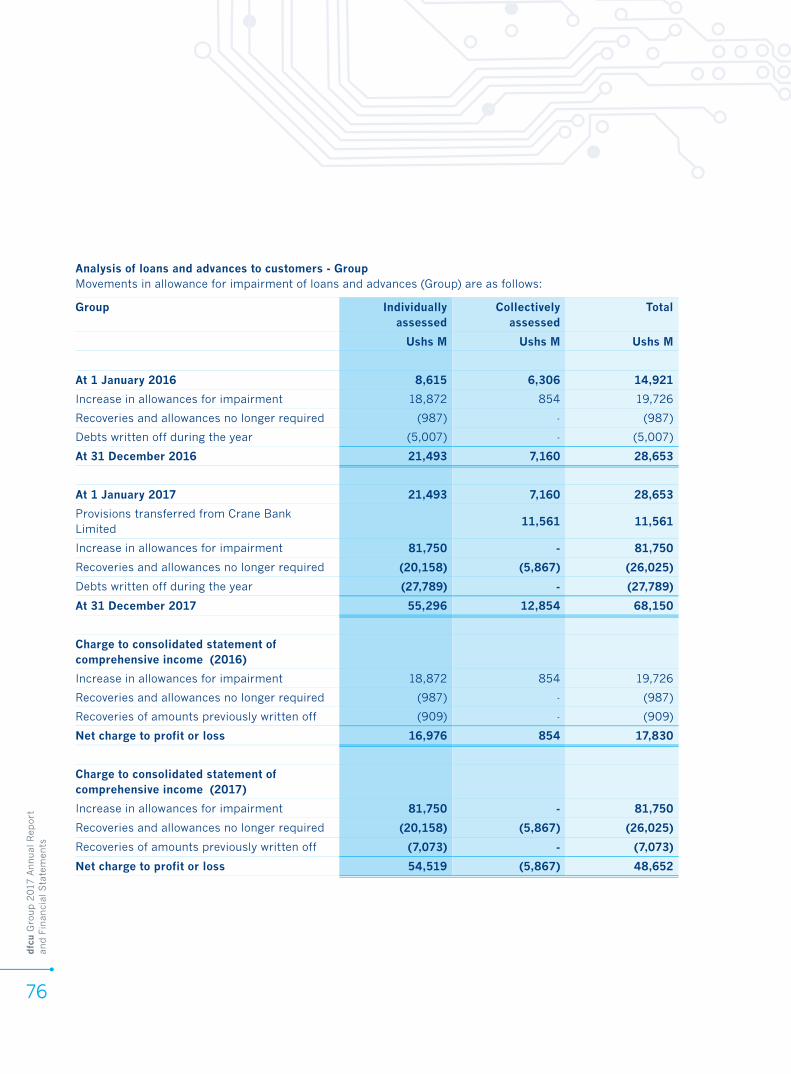
dfc
u G
roup 2
017
Annual
Rep
ort
an
d F
inan
cial
Sta
tem
ents
76
Group Individually assessed
Collectively assessed
Total
Ushs M Ushs M Ushs M
At 1 January 2016 8,615 6,306 14,921
Increase in allowances for impairment 18,872 854 19,726
Recoveries and allowances no longer required (987) - (987)
Debts written off during the year (5,007) - (5,007)
At 31 December 2016 21,493 7,160 28,653
At 1 January 2017 21,493 7,160 28,653
Provisions transferred from Crane Bank Limited
11,561 11,561
Increase in allowances for impairment 81,750 - 81,750
Recoveries and allowances no longer required (20,158) (5,867) (26,025)
Debts written off during the year (27,789) - (27,789)
At 31 December 2017 55,296 12,854 68,150
Charge to consolidated statement of comprehensive income (2016)
Increase in allowances for impairment 18,872 854 19,726
Recoveries and allowances no longer required (987) - (987)
Recoveries of amounts previously written off (909) - (909)
Net charge to profit or loss 16,976 854 17,830
Charge to consolidated statement of comprehensive income (2017)
Increase in allowances for impairment 81,750 - 81,750
Recoveries and allowances no longer required (20,158) (5,867) (26,025)
Recoveries of amounts previously written off (7,073) - (7,073)
Net charge to profit or loss 54,519 (5,867) 48,652
Analysis of loans and advances to customers - GroupMovements in allowance for impairment of loans and advances (Group) are as follows:
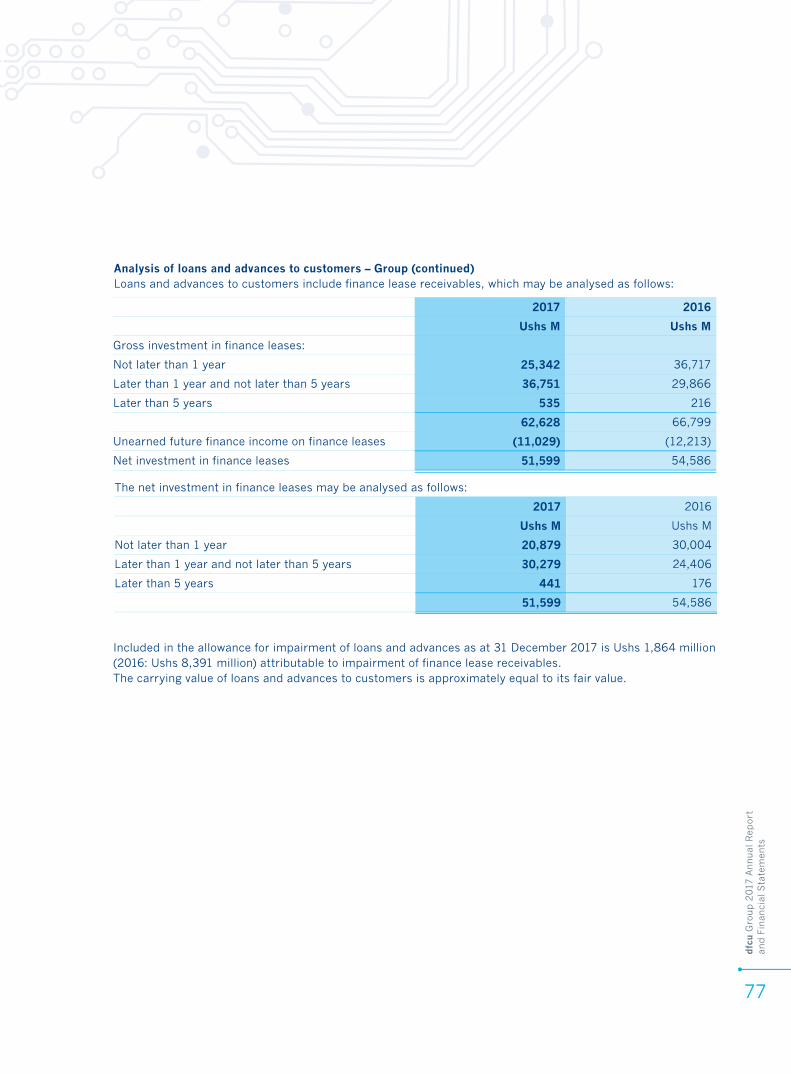
dfc
u G
roup 2
017
Annual
Rep
ort
an
d F
inan
cial
Sta
tem
ents
77
The net investment in finance leases may be analysed as follows:
2017 2016
Ushs M Ushs M
Not later than 1 year 20,879 30,004
Later than 1 year and not later than 5 years 30,279 24,406
Later than 5 years 441 176
51,599 54,586
Included in the allowance for impairment of loans and advances as at 31 December 2017 is Ushs 1,864 million (2016: Ushs 8,391 million) attributable to impairment of finance lease receivables.The carrying value of loans and advances to customers is approximately equal to its fair value.
Analysis of loans and advances to customers – Group (continued)Loans and advances to customers include finance lease receivables, which may be analysed as follows:
2017 2016
Ushs M Ushs M
Gross investment in finance leases:
Not later than 1 year 25,342 36,717
Later than 1 year and not later than 5 years 36,751 29,866
Later than 5 years 535 216
62,628 66,799
Unearned future finance income on finance leases (11,029) (12,213)
Net investment in finance leases 51,599 54,586
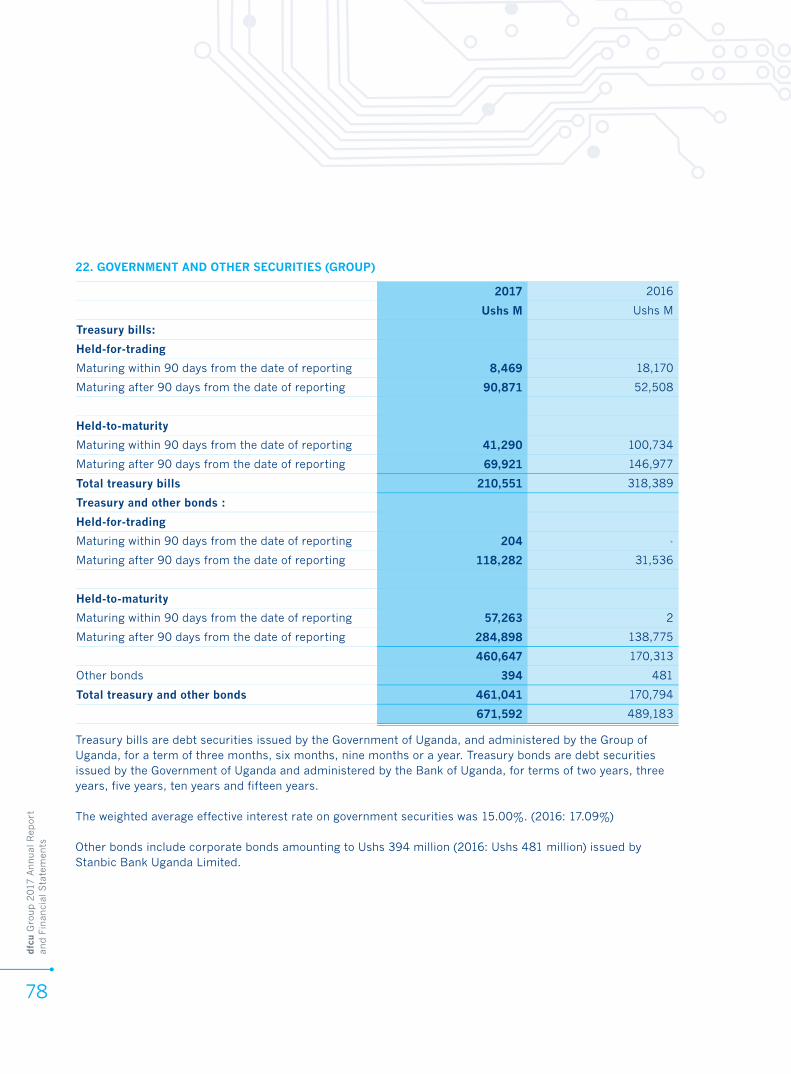
dfc
u G
roup 2
017
Annual
Rep
ort
an
d F
inan
cial
Sta
tem
ents
78
Treasury bills are debt securities issued by the Government of Uganda, and administered by the Group of Uganda, for a term of three months, six months, nine months or a year. Treasury bonds are debt securities issued by the Government of Uganda and administered by the Bank of Uganda, for terms of two years, three years, five years, ten years and fifteen years.
The weighted average effective interest rate on government securities was 15.00%. (2016: 17.09%)
Other bonds include corporate bonds amounting to Ushs 394 million (2016: Ushs 481 million) issued by Stanbic Bank Uganda Limited.
22. GOVERNMENT AND OTHER SECURITIES (GROUP)
2017 2016
Ushs M Ushs M
Treasury bills:
Held-for-trading
Maturing within 90 days from the date of reporting 8,469 18,170
Maturing after 90 days from the date of reporting 90,871 52,508
Held-to-maturity
Maturing within 90 days from the date of reporting 41,290 100,734
Maturing after 90 days from the date of reporting 69,921 146,977
Total treasury bills 210,551 318,389
Treasury and other bonds :
Held-for-trading
Maturing within 90 days from the date of reporting 204 -
Maturing after 90 days from the date of reporting 118,282 31,536
Held-to-maturity
Maturing within 90 days from the date of reporting 57,263 2
Maturing after 90 days from the date of reporting 284,898 138,775
460,647 170,313
Other bonds 394 481
Total treasury and other bonds 461,041 170,794
671,592 489,183
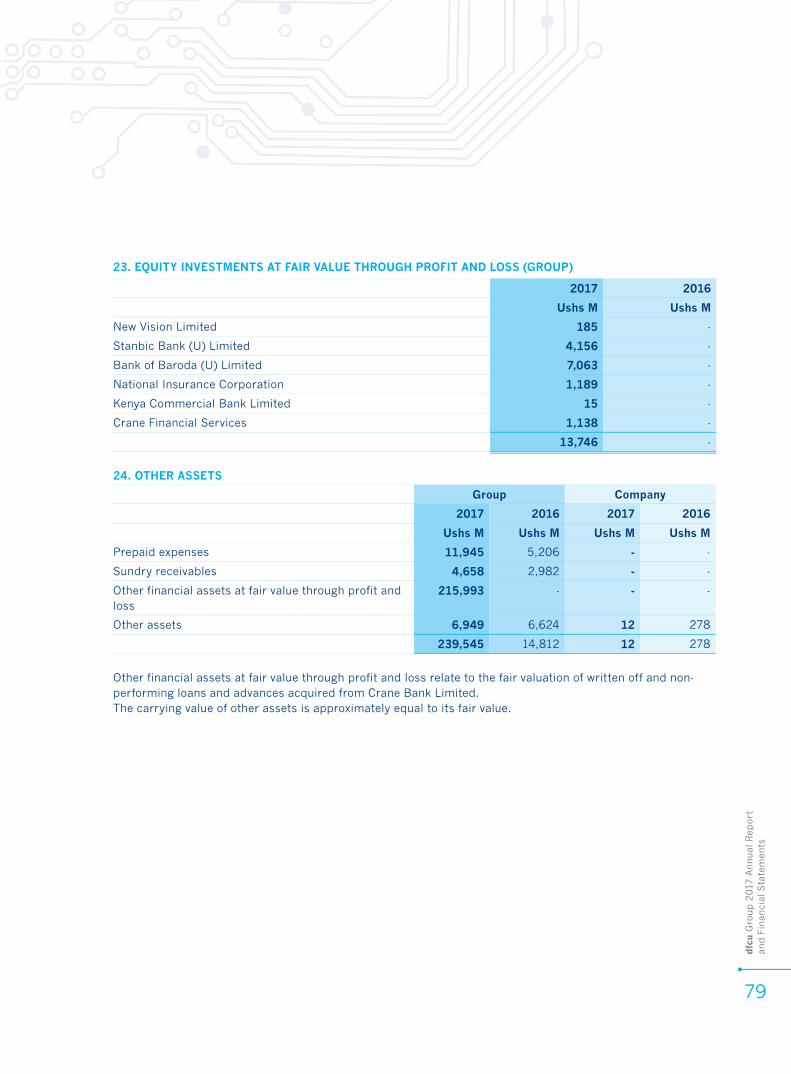
dfc
u G
roup 2
017
Annual
Rep
ort
an
d F
inan
cial
Sta
tem
ents
79
2017 2016
Ushs M Ushs M
New Vision Limited 185 -
Stanbic Bank (U) Limited 4,156 -
Bank of Baroda (U) Limited 7,063 -
National Insurance Corporation 1,189 -
Kenya Commercial Bank Limited 15 -
Crane Financial Services 1,138 -
13,746 -
Group Company
2017 2016 2017 2016
Ushs M Ushs M Ushs M Ushs M
Prepaid expenses 11,945 5,206 - -
Sundry receivables 4,658 2,982 - -
Other financial assets at fair value through profit and loss
215,993 - - -
Other assets 6,949 6,624 12 278
239,545 14,812 12 278
Other financial assets at fair value through profit and loss relate to the fair valuation of written off and non-performing loans and advances acquired from Crane Bank Limited.The carrying value of other assets is approximately equal to its fair value.
23. EQUITY INVESTMENTS AT FAIR VALUE THROUGH PROFIT AND LOSS (GROUP)
24. OTHER ASSETS

dfc
u G
roup 2
017
Annual
Rep
ort
an
d F
inan
cial
Sta
tem
ents
80
Group Company
2017 2016 2017 2016
Ushs M Ushs M Ushs M Ushs M
At 1 January 11,560 12,086 44,762 42,662
Additions at cost 33 22 5,033 3,976
Accumulated depreciation (449) (548) (2,018) (1,876)
At 31 December 2017 11,144 11,560 47,777 44,762
Amount allocated to investment property 11,144 11,560
Amount allocated to property and equipment 36,633 33,202
Total property and equipment 47,777 44,762
25. INVESTMENT PROPERTYInvestment property comprises land and buildings at Plot 26 Kyadondo Road, Kampala. This property is held for its rental and capital appreciation. The investment property has been stated on the historical cost basis.
During 2016, the Company resolved to make available for rent to third parties, that part of the property that is not utilised by dfcu Bank Limited. Consequently, that part of the property is held for rental purposes and has been reclassified to investment property in the consolidated financial statements as shown below. In the stand alone financial statements of the Company, the entire property is held for rental purposes and is therefore retained as investment property in those financial statements.
The fair value of the Investment property for the Group is Ushs 12,829 (2016: Ushs 14,204) and for the Company is Ushs 55,820 (2016: Ushs 55,091).
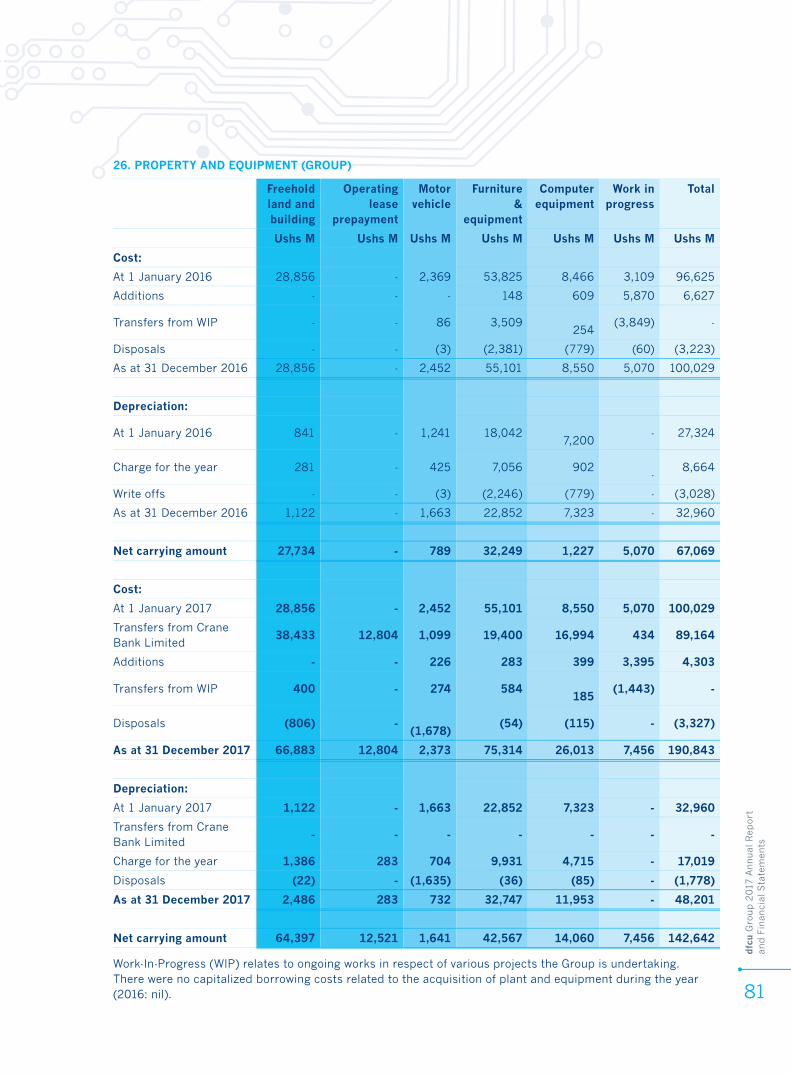
dfc
u G
roup 2
017
Annual
Rep
ort
an
d F
inan
cial
Sta
tem
ents
81
Freehold land and building
Operating lease
prepayment
Motor vehicle
Furniture &
equipment
Computer equipment
Work in progress
Total
Ushs M Ushs M Ushs M Ushs M Ushs M Ushs M Ushs M
Cost:
At 1 January 2016 28,856 - 2,369 53,825 8,466 3,109 96,625
Additions - - - 148 609 5,870 6,627
Transfers from WIP - - 86 3,509
254 (3,849) -
Disposals - - (3) (2,381) (779) (60) (3,223)
As at 31 December 2016 28,856 - 2,452 55,101 8,550 5,070 100,029
Depreciation:
At 1 January 2016 841 - 1,241 18,042 7,200
- 27,324
Charge for the year 281 - 425 7,056 902
- 8,664
Write offs - - (3) (2,246) (779) - (3,028)
As at 31 December 2016 1,122 - 1,663 22,852 7,323 - 32,960
Net carrying amount 27,734 - 789 32,249 1,227 5,070 67,069
Cost:
At 1 January 2017 28,856 - 2,452 55,101 8,550 5,070 100,029
Transfers from Crane Bank Limited
38,433 12,804 1,099 19,400 16,994 434 89,164
Additions - - 226 283 399 3,395 4,303
Transfers from WIP 400 - 274 584
185 (1,443) -
Disposals (806) -
(1,678) (54) (115) - (3,327)
As at 31 December 2017 66,883 12,804 2,373 75,314 26,013 7,456 190,843
Depreciation:
At 1 January 2017 1,122 - 1,663 22,852 7,323 - 32,960
Transfers from Crane Bank Limited
- - - - - - -
Charge for the year 1,386 283 704 9,931 4,715 - 17,019
Disposals (22) - (1,635) (36) (85) - (1,778)
As at 31 December 2017 2,486 283 732 32,747 11,953 - 48,201
Net carrying amount 64,397 12,521 1,641 42,567 14,060 7,456 142,642
26. PROPERTY AND EQUIPMENT (GROUP)
Work-In-Progress (WIP) relates to ongoing works in respect of various projects the Group is undertaking. There were no capitalized borrowing costs related to the acquisition of plant and equipment during the year (2016: nil).
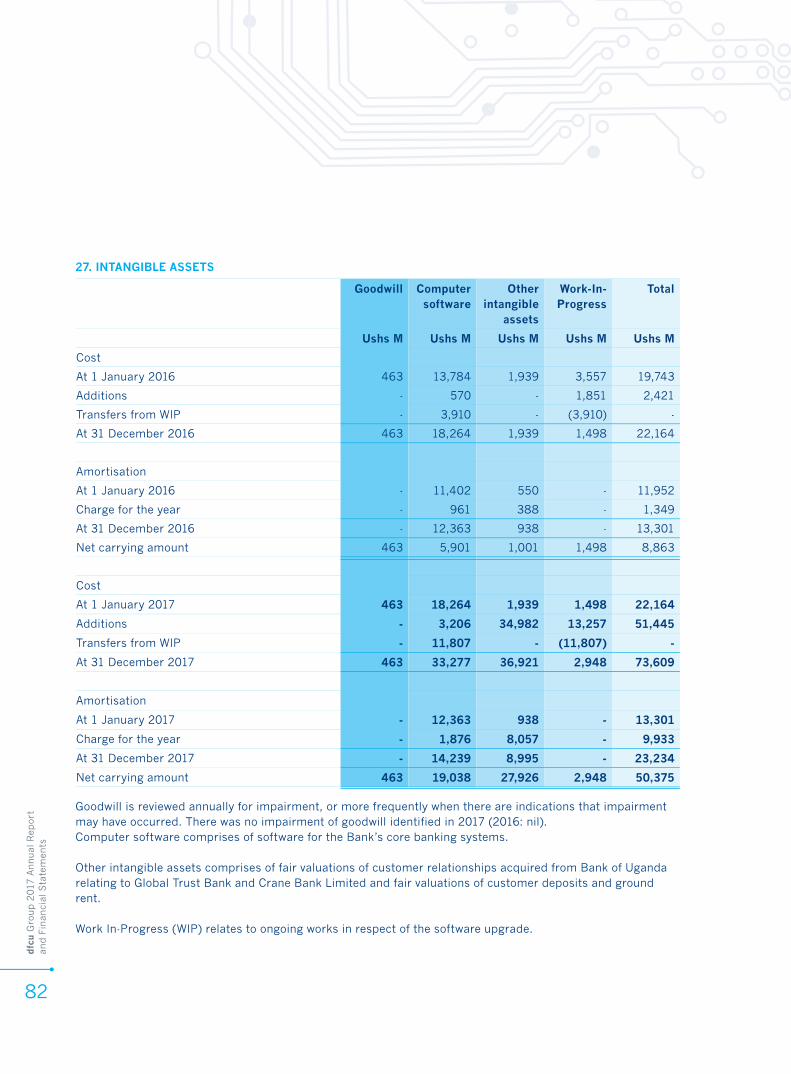
dfc
u G
roup 2
017
Annual
Rep
ort
an
d F
inan
cial
Sta
tem
ents
82
Goodwill is reviewed annually for impairment, or more frequently when there are indications that impairment may have occurred. There was no impairment of goodwill identified in 2017 (2016: nil). Computer software comprises of software for the Bank’s core banking systems.
Other intangible assets comprises of fair valuations of customer relationships acquired from Bank of Uganda relating to Global Trust Bank and Crane Bank Limited and fair valuations of customer deposits and ground rent.
Work In-Progress (WIP) relates to ongoing works in respect of the software upgrade.
Goodwill Computer software
Other intangible
assets
Work-In-Progress
Total
Ushs M Ushs M Ushs M Ushs M Ushs M
Cost
At 1 January 2016 463 13,784 1,939 3,557 19,743
Additions - 570 - 1,851 2,421
Transfers from WIP - 3,910 - (3,910) -
At 31 December 2016 463 18,264 1,939 1,498 22,164
Amortisation
At 1 January 2016 - 11,402 550 - 11,952
Charge for the year - 961 388 - 1,349
At 31 December 2016 - 12,363 938 - 13,301
Net carrying amount 463 5,901 1,001 1,498 8,863
Cost
At 1 January 2017 463 18,264 1,939 1,498 22,164
Additions - 3,206 34,982 13,257 51,445
Transfers from WIP - 11,807 - (11,807) -
At 31 December 2017 463 33,277 36,921 2,948 73,609
Amortisation
At 1 January 2017 - 12,363 938 - 13,301
Charge for the year - 1,876 8,057 - 9,933
At 31 December 2017 - 14,239 8,995 - 23,234
Net carrying amount 463 19,038 27,926 2,948 50,375
27. INTANGIBLE ASSETS
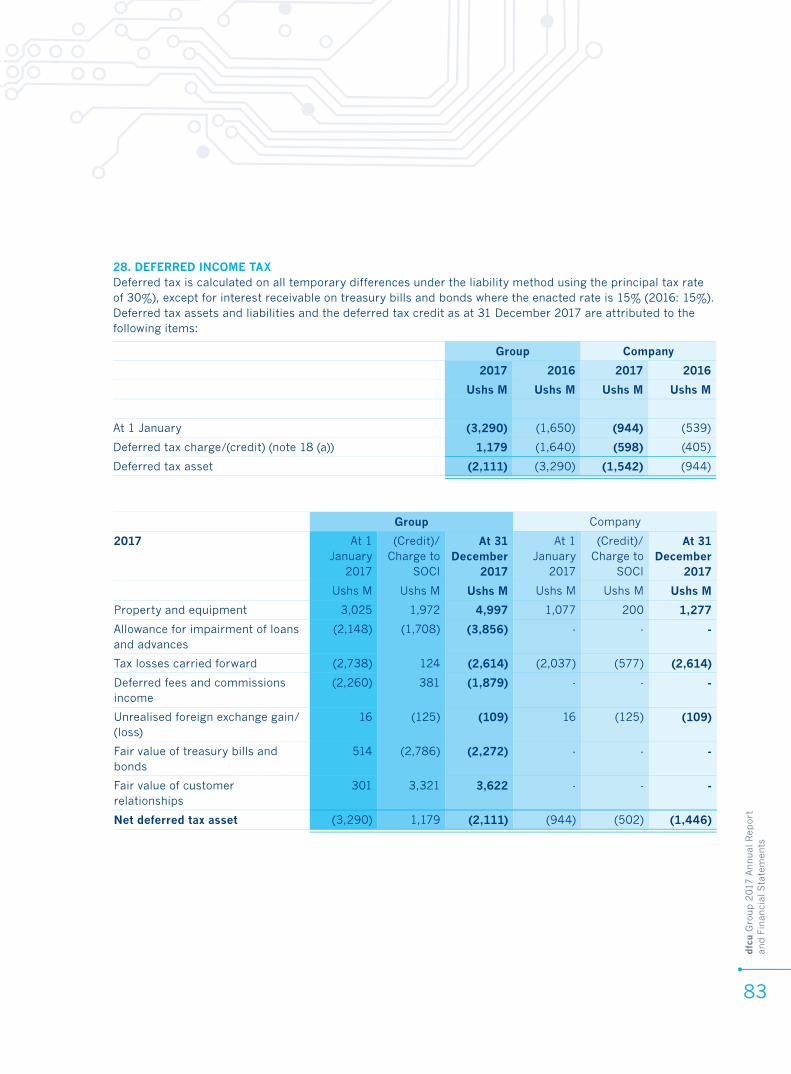
dfc
u G
roup 2
017
Annual
Rep
ort
an
d F
inan
cial
Sta
tem
ents
83
28. DEFERRED INCOME TAXDeferred tax is calculated on all temporary differences under the liability method using the principal tax rate of 30%), except for interest receivable on treasury bills and bonds where the enacted rate is 15% (2016: 15%). Deferred tax assets and liabilities and the deferred tax credit as at 31 December 2017 are attributed to the following items:
Group Company
2017 2016 2017 2016
Ushs M Ushs M Ushs M Ushs M
At 1 January (3,290) (1,650) (944) (539)
Deferred tax charge/(credit) (note 18 (a)) 1,179 (1,640) (598) (405)
Deferred tax asset (2,111) (3,290) (1,542) (944)
Group Company
2017 At 1 January
2017
(Credit)/ Charge to
SOCI
At 31 December
2017
At 1 January
2017
(Credit)/ Charge to
SOCI
At 31 December
2017
Ushs M Ushs M Ushs M Ushs M Ushs M Ushs M
Property and equipment 3,025 1,972 4,997 1,077 200 1,277
Allowance for impairment of loans and advances
(2,148) (1,708) (3,856) - - -
Tax losses carried forward (2,738) 124 (2,614) (2,037) (577) (2,614)
Deferred fees and commissions income
(2,260) 381 (1,879) - - -
Unrealised foreign exchange gain/(loss)
16 (125) (109) 16 (125) (109)
Fair value of treasury bills and bonds
514 (2,786) (2,272) - - -
Fair value of customer relationships
301 3,321 3,622 - - -
Net deferred tax asset (3,290) 1,179 (2,111) (944) (502) (1,446)
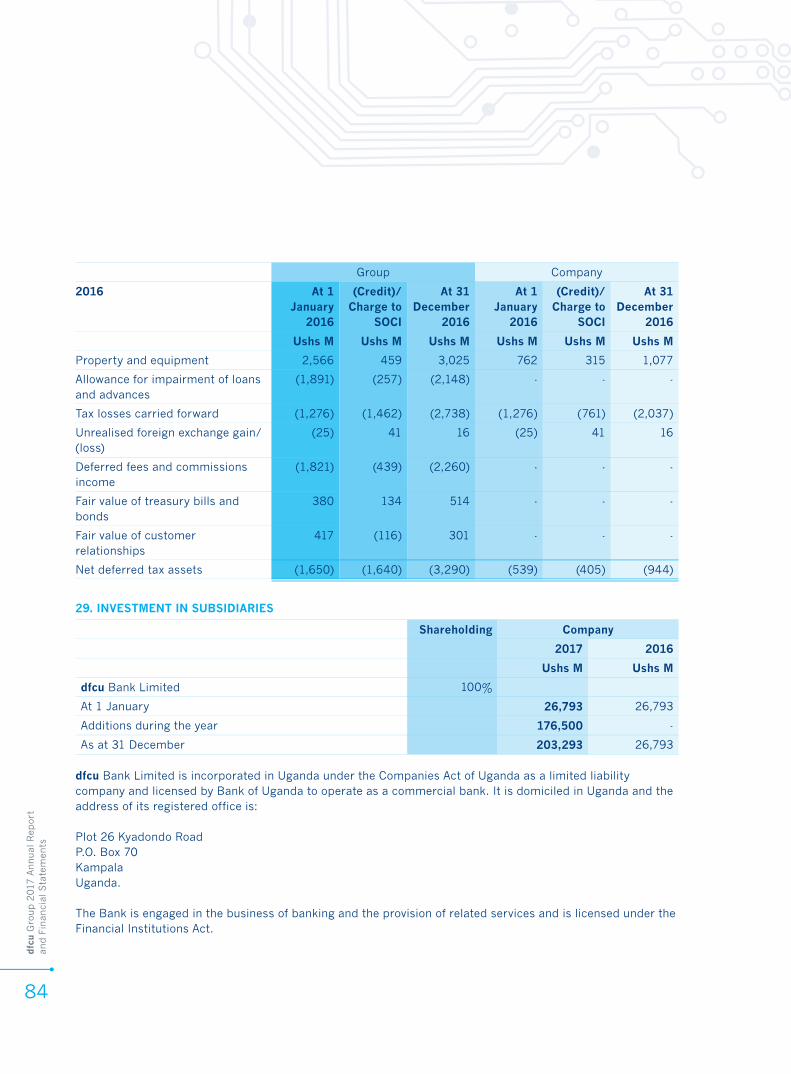
dfc
u G
roup 2
017
Annual
Rep
ort
an
d F
inan
cial
Sta
tem
ents
84
Group Company
2016 At 1 January
2016
(Credit)/ Charge to
SOCI
At 31 December
2016
At 1 January
2016
(Credit)/ Charge to
SOCI
At 31 December
2016
Ushs M Ushs M Ushs M Ushs M Ushs M Ushs M
Property and equipment 2,566 459 3,025 762 315 1,077
Allowance for impairment of loans and advances
(1,891) (257) (2,148) - - -
Tax losses carried forward (1,276) (1,462) (2,738) (1,276) (761) (2,037)
Unrealised foreign exchange gain/(loss)
(25) 41 16 (25) 41 16
Deferred fees and commissions income
(1,821) (439) (2,260) - - -
Fair value of treasury bills and bonds
380 134 514 - - -
Fair value of customer relationships
417 (116) 301 - - -
Net deferred tax assets (1,650) (1,640) (3,290) (539) (405) (944)
Shareholding Company
2017 2016
Ushs M Ushs M
dfcu Bank Limited 100%
At 1 January 26,793 26,793
Additions during the year 176,500 -
As at 31 December 203,293 26,793
dfcu Bank Limited is incorporated in Uganda under the Companies Act of Uganda as a limited liability company and licensed by Bank of Uganda to operate as a commercial bank. It is domiciled in Uganda and the address of its registered office is:
Plot 26 Kyadondo RoadP.O. Box 70 KampalaUganda.
The Bank is engaged in the business of banking and the provision of related services and is licensed under the Financial Institutions Act.
29. INVESTMENT IN SUBSIDIARIES
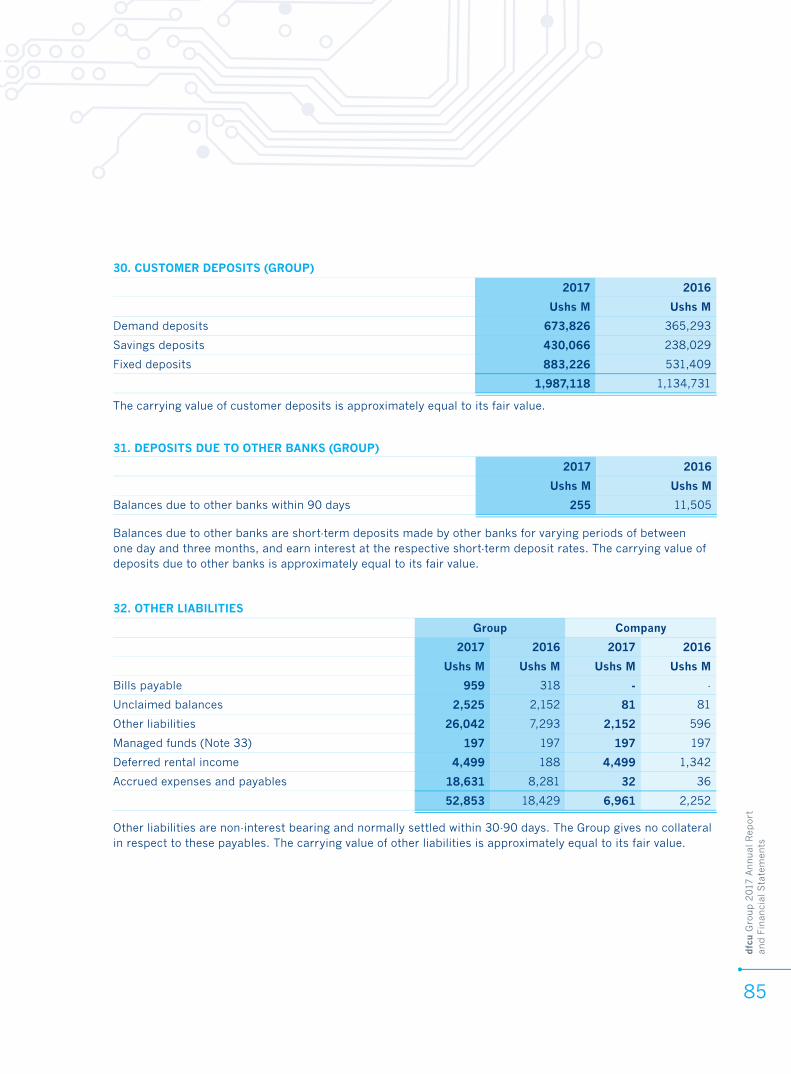
dfc
u G
roup 2
017
Annual
Rep
ort
an
d F
inan
cial
Sta
tem
ents
85
30. CUSTOMER DEPOSITS (GROUP)
2017 2016
Ushs M Ushs M
Demand deposits 673,826 365,293
Savings deposits 430,066 238,029
Fixed deposits 883,226 531,409
1,987,118 1,134,731
31. DEPOSITS DUE TO OTHER BANKS (GROUP)
2017 2016
Ushs M Ushs M
Balances due to other banks within 90 days 255 11,505
Balances due to other banks are short-term deposits made by other banks for varying periods of between one day and three months, and earn interest at the respective short-term deposit rates. The carrying value of deposits due to other banks is approximately equal to its fair value.
Group Company
2017 2016 2017 2016
Ushs M Ushs M Ushs M Ushs M
Bills payable 959 318 - -
Unclaimed balances 2,525 2,152 81 81
Other liabilities 26,042 7,293 2,152 596
Managed funds (Note 33) 197 197 197 197
Deferred rental income 4,499 188 4,499 1,342
Accrued expenses and payables 18,631 8,281 32 36
52,853 18,429 6,961 2,252
32. OTHER LIABILITIES
Other liabilities are non-interest bearing and normally settled within 30-90 days. The Group gives no collateral in respect to these payables. The carrying value of other liabilities is approximately equal to its fair value.
The carrying value of customer deposits is approximately equal to its fair value.
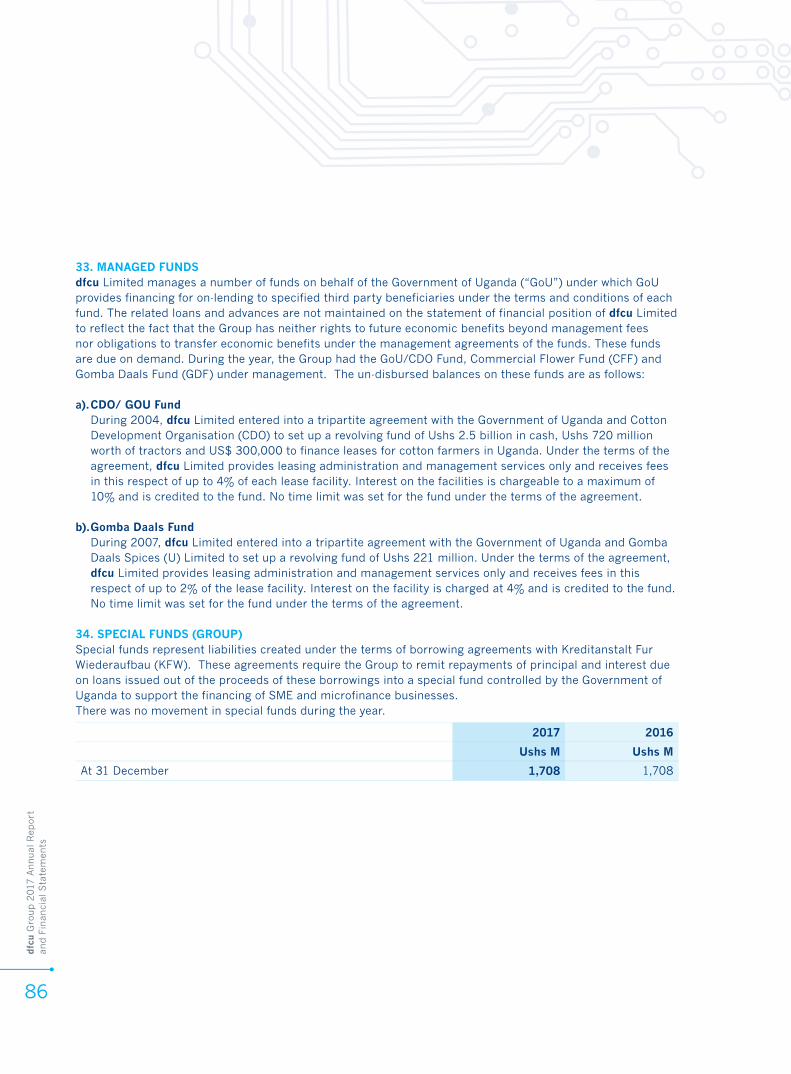
dfc
u G
roup 2
017
Annual
Rep
ort
an
d F
inan
cial
Sta
tem
ents
86
33. MANAGED FUNDSdfcu Limited manages a number of funds on behalf of the Government of Uganda (“GoU”) under which GoU provides financing for on-lending to specified third party beneficiaries under the terms and conditions of each fund. The related loans and advances are not maintained on the statement of financial position of dfcu Limited to reflect the fact that the Group has neither rights to future economic benefits beyond management fees nor obligations to transfer economic benefits under the management agreements of the funds. These funds are due on demand. During the year, the Group had the GoU/CDO Fund, Commercial Flower Fund (CFF) and Gomba Daals Fund (GDF) under management. The un-disbursed balances on these funds are as follows:
a). CDO/ GOU FundDuring 2004, dfcu Limited entered into a tripartite agreement with the Government of Uganda and Cotton Development Organisation (CDO) to set up a revolving fund of Ushs 2.5 billion in cash, Ushs 720 million worth of tractors and US$ 300,000 to finance leases for cotton farmers in Uganda. Under the terms of the agreement, dfcu Limited provides leasing administration and management services only and receives fees in this respect of up to 4% of each lease facility. Interest on the facilities is chargeable to a maximum of 10% and is credited to the fund. No time limit was set for the fund under the terms of the agreement.
b). Gomba Daals FundDuring 2007, dfcu Limited entered into a tripartite agreement with the Government of Uganda and Gomba Daals Spices (U) Limited to set up a revolving fund of Ushs 221 million. Under the terms of the agreement, dfcu Limited provides leasing administration and management services only and receives fees in this respect of up to 2% of the lease facility. Interest on the facility is charged at 4% and is credited to the fund. No time limit was set for the fund under the terms of the agreement.
34. SPECIAL FUNDS (GROUP)Special funds represent liabilities created under the terms of borrowing agreements with Kreditanstalt Fur Wiederaufbau (KFW). These agreements require the Group to remit repayments of principal and interest due on loans issued out of the proceeds of these borrowings into a special fund controlled by the Government of Uganda to support the financing of SME and microfinance businesses.There was no movement in special funds during the year.
2017 2016
Ushs M Ushs M
At 31 December 1,708 1,708
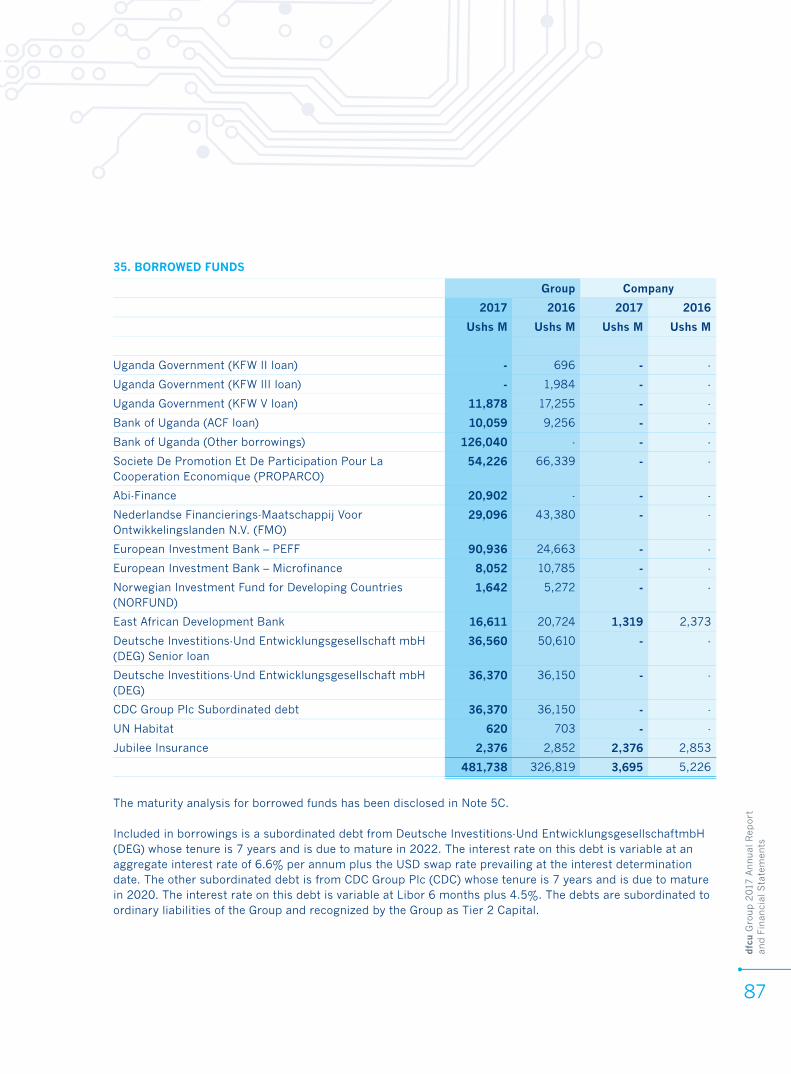
dfc
u G
roup 2
017
Annual
Rep
ort
an
d F
inan
cial
Sta
tem
ents
87
Group Company
2017 2016 2017 2016
Ushs M Ushs M Ushs M Ushs M
Uganda Government (KFW II loan) - 696 - -
Uganda Government (KFW III loan) - 1,984 - -
Uganda Government (KFW V loan) 11,878 17,255 - -
Bank of Uganda (ACF loan) 10,059 9,256 - -
Bank of Uganda (Other borrowings) 126,040 - - -
Societe De Promotion Et De Participation Pour La Cooperation Economique (PROPARCO)
54,226 66,339 - -
Abi-Finance 20,902 - - -
Nederlandse Financierings-Maatschappij Voor Ontwikkelingslanden N.V. (FMO)
29,096 43,380 - -
European Investment Bank – PEFF 90,936 24,663 - -
European Investment Bank – Microfinance 8,052 10,785 - -
Norwegian Investment Fund for Developing Countries (NORFUND)
1,642 5,272 - -
East African Development Bank 16,611 20,724 1,319 2,373
Deutsche Investitions-Und Entwicklungsgesellschaft mbH (DEG) Senior loan
36,560 50,610 - -
Deutsche Investitions-Und Entwicklungsgesellschaft mbH (DEG)
36,370 36,150 - -
CDC Group Plc Subordinated debt 36,370 36,150 - -
UN Habitat 620 703 - -
Jubilee Insurance 2,376 2,852 2,376 2,853
481,738 326,819 3,695 5,226
The maturity analysis for borrowed funds has been disclosed in Note 5C.
Included in borrowings is a subordinated debt from Deutsche Investitions-Und EntwicklungsgesellschaftmbH (DEG) whose tenure is 7 years and is due to mature in 2022. The interest rate on this debt is variable at an aggregate interest rate of 6.6% per annum plus the USD swap rate prevailing at the interest determination date. The other subordinated debt is from CDC Group Plc (CDC) whose tenure is 7 years and is due to mature in 2020. The interest rate on this debt is variable at Libor 6 months plus 4.5%. The debts are subordinated to ordinary liabilities of the Group and recognized by the Group as Tier 2 Capital.
35. BORROWED FUNDS

dfc
u G
roup 2
017
Annual
Rep
ort
an
d F
inan
cial
Sta
tem
ents
88
Tenure (years)
Interest rate
Fixed / variable
Currency
Uganda Government (KFW II loan) 15 0.00% Fixed Ushs
Uganda Government (KFW III loan) 15 0.00% Fixed Ushs
Uganda Government (KFW V loan) 6 0.00% Fixed Ushs
Bank of Uganda (ACF loan) 8 0.00% Fixed Ushs
Bank of Uganda (Other borrowings) 3 0.00% Fixed Ushs
Societe De Promotion Et De Participation Pour La Cooperation Economique (PROPARCO)
7 3.75% Variable USD
Abi-Finance Limited 7 12.50% Fixed Ushs
Nederlandse Financierings-Maatschappij Voor Ontwikkelingslanden N.V. (FMO)
7 12.67% Variable Ushs
FMO - USD 7 3.58% Variable USD
European Investment Bank-PEFF USD 10 5.23% Fixed USD
European Investment Bank-PEFF UGX 10 11.93% Fixed Ushs
European Investment Bank-Microfinance 7 10.26% Fixed Ushs
NORFUND Senior loan 1 10 18.77% Variable Ushs
East African Development Bank 7 12.00% Fixed Ushs
Deutsche Investitions-Und Entwicklungsgesellschaft mbH (DEG) Subordinated debt
7 8.57% Variable USD
Deutsche Investitions-Und Entwicklungsgesellschaft mbH (DEG) Senior loan
5 3.70% Variable USD
CDC Group Plc 7 4.85% Variable USD
UN Habitat 15 2.00% Fixed Ushs
Company Tenure (years)
Interest rate
Fixed / variable
Currency
East African Development Bank 7 19.50% Fixed Ushs
Jubilee Insurance 5 6.38% Fixed USD
35. BORROWED FUNDS (CONTINUED)The terms and conditions relating to borrowings are tabulated below:
All the borrowed funds are unsecured.The carrying value of borrowed funds is approximately equal to its fair value.
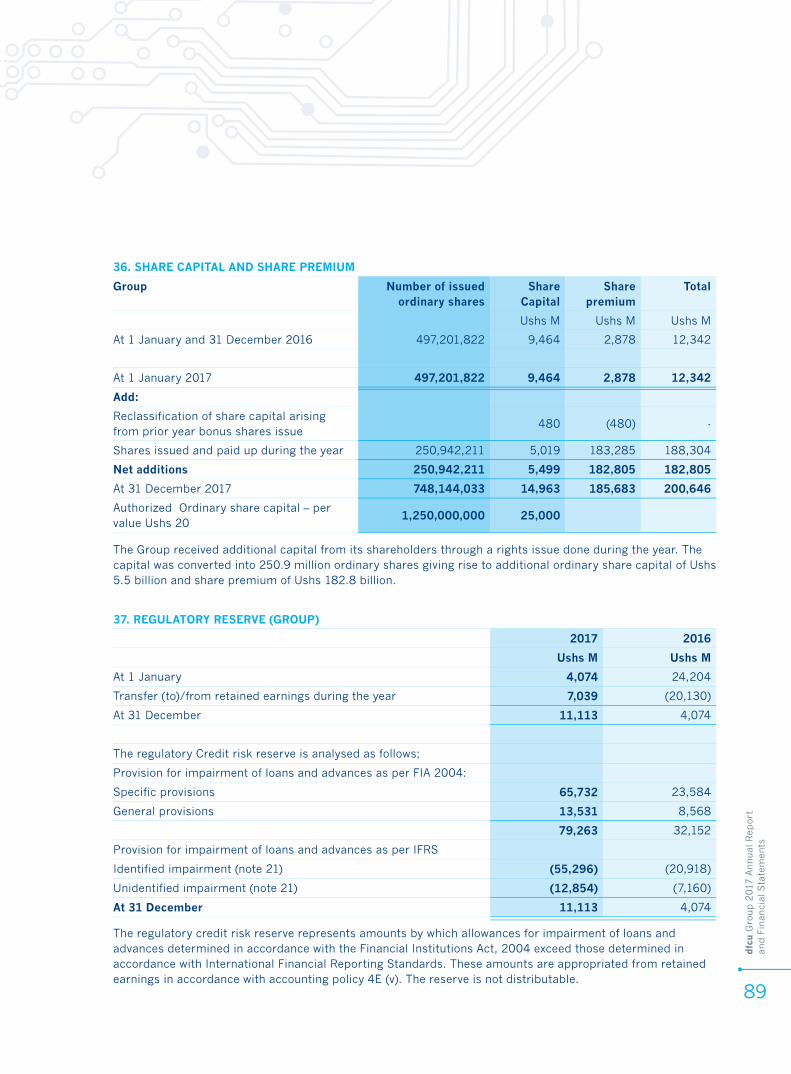
dfc
u G
roup 2
017
Annual
Rep
ort
an
d F
inan
cial
Sta
tem
ents
89
36. SHARE CAPITAL AND SHARE PREMIUM
Group Number of issued ordinary shares
Share Capital
Share premium
Total
Ushs M Ushs M Ushs M
At 1 January and 31 December 2016 497,201,822 9,464 2,878 12,342
At 1 January 2017 497,201,822 9,464 2,878 12,342
Add:
Reclassification of share capital arising from prior year bonus shares issue
480 (480) -
Shares issued and paid up during the year 250,942,211 5,019 183,285 188,304
Net additions 250,942,211 5,499 182,805 182,805
At 31 December 2017 748,144,033 14,963 185,683 200,646
Authorized Ordinary share capital – per value Ushs 20
1,250,000,000 25,000
The Group received additional capital from its shareholders through a rights issue done during the year. The capital was converted into 250.9 million ordinary shares giving rise to additional ordinary share capital of Ushs 5.5 billion and share premium of Ushs 182.8 billion.
2017 2016
Ushs M Ushs M
At 1 January 4,074 24,204
Transfer (to)/from retained earnings during the year 7,039 (20,130)
At 31 December 11,113 4,074
The regulatory Credit risk reserve is analysed as follows;
Provision for impairment of loans and advances as per FIA 2004:
Specific provisions 65,732 23,584
General provisions 13,531 8,568
79,263 32,152
Provision for impairment of loans and advances as per IFRS
Identified impairment (note 21) (55,296) (20,918)
Unidentified impairment (note 21) (12,854) (7,160)
At 31 December 11,113 4,074
37. REGULATORY RESERVE (GROUP)
The regulatory credit risk reserve represents amounts by which allowances for impairment of loans and advances determined in accordance with the Financial Institutions Act, 2004 exceed those determined in accordance with International Financial Reporting Standards. These amounts are appropriated from retained earnings in accordance with accounting policy 4E (v). The reserve is not distributable.

dfc
u G
roup 2
017
Annual
Rep
ort
an
d F
inan
cial
Sta
tem
ents
90
38. OFF-CONSOLIDATED STATEMENT OF FINANCIAL POSITION FINANCIAL INSTRUMENTS, CONTINGENT LIABILITIES AND COMMITMENTS (GROUP)
In common with other banks, the subsidiary of the Company, dfcu Bank Limited (the Bank), conducts business involving acceptances, letters of credit, guarantees, performance bonds and indemnities. The majority of these facilities are offset by corresponding obligations of third parties.
40. OTHER CONTINGENT LIABILITIES (GROUP)The Group is a defendant in various legal actions in the normal course of business. The total estimated contingent liability arising from these cases is Ushs 2.9 billion (2016: Ushs 0.9 billion). Through legal advice management has determined that total expected losses to the Group are Ushs 3.3 billion (2016: Ushs 1.8 billion) for which a provision has been made in the consolidated financial statements. In the opinion of directors and after taking appropriate legal advice, no significant additional losses are expected to arise from these cases.
2017 2016
Ushs M Ushs M
Contingent liabilities and commitments
Acceptances and letters of credit 718 -
Guarantee and performance bonds 162,973 92,081
Undrawn formal stand-by facilities, credit lines and other commitments to lend
34,321 27,434
198,012 119,515
39. OPERATING LEASE COMMITMENTS (GROUP)The Group leases a number of property where the branches are located under operating leases. The leases run for varying periods with an option to renew the lease after that date. The lease payments are based on market rental values. At 31 December, the future minimum lease payments under non-cancelable leases were payable as follows:
2017 2016
Ushs M Ushs M
Not later than one year 608 240
Between 1 year and 2 years 6,576 2,600
Between 2 years and 5 years 5,744 2,271
Over 5 years 2,050 811
14,978 5,922
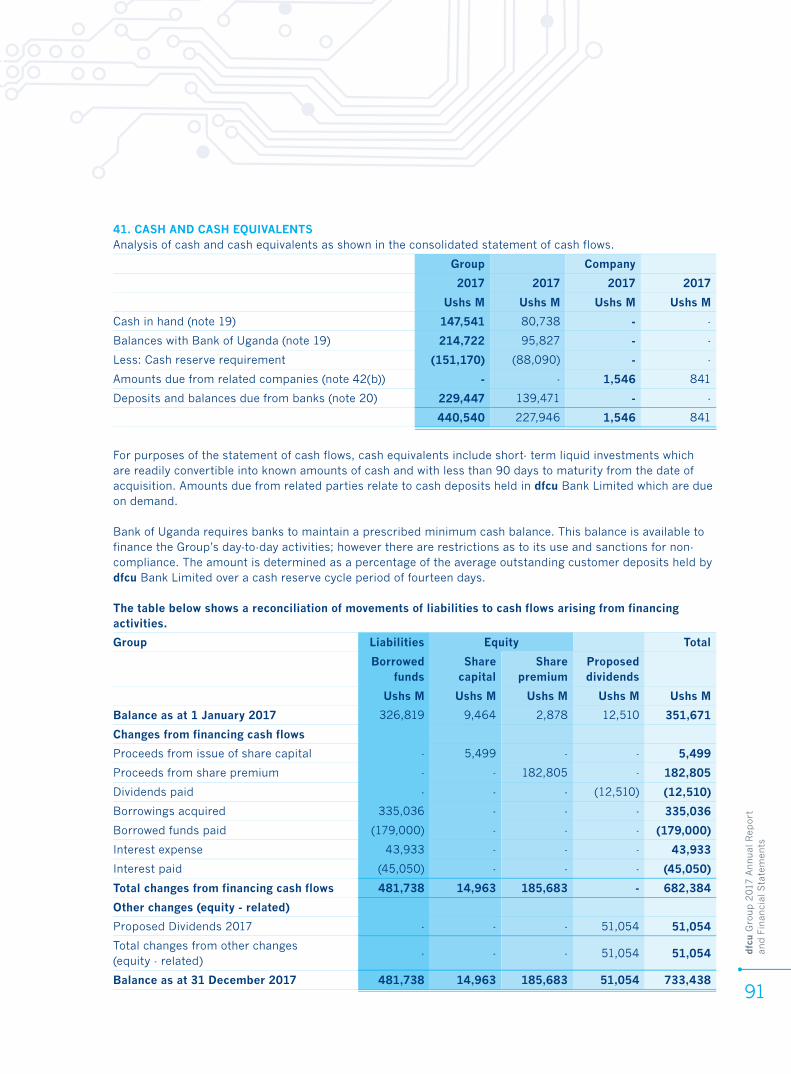
dfc
u G
roup 2
017
Annual
Rep
ort
an
d F
inan
cial
Sta
tem
ents
91
41. CASH AND CASH EQUIVALENTSAnalysis of cash and cash equivalents as shown in the consolidated statement of cash flows.
Group Company
2017 2017 2017 2017
Ushs M Ushs M Ushs M Ushs M
Cash in hand (note 19) 147,541 80,738 - -
Balances with Bank of Uganda (note 19) 214,722 95,827 - -
Less: Cash reserve requirement (151,170) (88,090) - -
Amounts due from related companies (note 42(b)) - - 1,546 841
Deposits and balances due from banks (note 20) 229,447 139,471 - -
440,540 227,946 1,546 841
For purposes of the statement of cash flows, cash equivalents include short- term liquid investments which are readily convertible into known amounts of cash and with less than 90 days to maturity from the date of acquisition. Amounts due from related parties relate to cash deposits held in dfcu Bank Limited which are due on demand.
Bank of Uganda requires banks to maintain a prescribed minimum cash balance. This balance is available to finance the Group’s day-to-day activities; however there are restrictions as to its use and sanctions for non-compliance. The amount is determined as a percentage of the average outstanding customer deposits held by dfcu Bank Limited over a cash reserve cycle period of fourteen days.
The table below shows a reconciliation of movements of liabilities to cash flows arising from financing activities.
Group Liabilities Equity Total
Borrowedfunds
Sharecapital
Share premium
Proposeddividends
Ushs M Ushs M Ushs M Ushs M Ushs M
Balance as at 1 January 2017 326,819 9,464 2,878 12,510 351,671
Changes from financing cash flows
Proceeds from issue of share capital - 5,499 - - 5,499
Proceeds from share premium - - 182,805 - 182,805
Dividends paid - - - (12,510) (12,510)
Borrowings acquired 335,036 - - - 335,036
Borrowed funds paid (179,000) - - - (179,000)
Interest expense 43,933 - - - 43,933
Interest paid (45,050) - - - (45,050)
Total changes from financing cash flows 481,738 14,963 185,683 - 682,384
Other changes (equity - related)
Proposed Dividends 2017 - - - 51,054 51,054
Total changes from other changes (equity - related)
- - - 51,054 51,054
Balance as at 31 December 2017 481,738 14,963 185,683 51,054 733,438
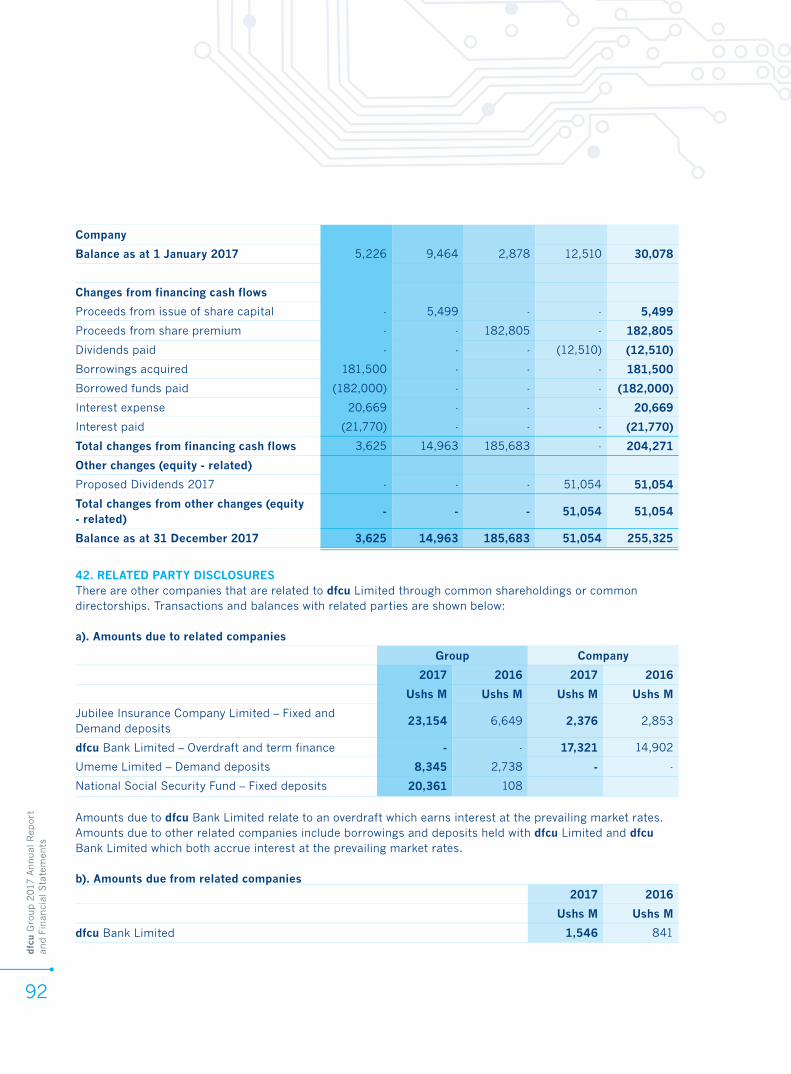
dfc
u G
roup 2
017
Annual
Rep
ort
an
d F
inan
cial
Sta
tem
ents
92
42. RELATED PARTY DISCLOSURESThere are other companies that are related to dfcu Limited through common shareholdings or common directorships. Transactions and balances with related parties are shown below:
a). Amounts due to related companies
Group Company
2017 2016 2017 2016
Ushs M Ushs M Ushs M Ushs M
Jubilee Insurance Company Limited – Fixed and Demand deposits
23,154 6,649 2,376 2,853
dfcu Bank Limited – Overdraft and term finance - - 17,321 14,902
Umeme Limited – Demand deposits 8,345 2,738 - -
National Social Security Fund – Fixed deposits 20,361 108
Amounts due to dfcu Bank Limited relate to an overdraft which earns interest at the prevailing market rates. Amounts due to other related companies include borrowings and deposits held with dfcu Limited and dfcu Bank Limited which both accrue interest at the prevailing market rates.
b). Amounts due from related companies
Company
Balance as at 1 January 2017 5,226 9,464 2,878 12,510 30,078
Changes from financing cash flows
Proceeds from issue of share capital - 5,499 - - 5,499
Proceeds from share premium - - 182,805 - 182,805
Dividends paid - - - (12,510) (12,510)
Borrowings acquired 181,500 - - - 181,500
Borrowed funds paid (182,000) - - - (182,000)
Interest expense 20,669 - - - 20,669
Interest paid (21,770) - - - (21,770)
Total changes from financing cash flows 3,625 14,963 185,683 - 204,271
Other changes (equity - related)
Proposed Dividends 2017 - - - 51,054 51,054
Total changes from other changes (equity - related)
- - - 51,054 51,054
Balance as at 31 December 2017 3,625 14,963 185,683 51,054 255,325
2017 2016
Ushs M Ushs M
dfcu Bank Limited 1,546 841

dfc
u G
roup 2
017
Annual
Rep
ort
an
d F
inan
cial
Sta
tem
ents
93
e). Key management compensation
Group Company
2017 2016 2017 2016
Ushs M Ushs M Ushs M Ushs M
Salaries and other short-term employment benefits 5,196 5,339 207 260
Post-employment benefits 621 579 35 -
5,817 5,918 242 260
d). Deposits by directors (Group)
2017 2016
Ushs M Ushs M
At 1 January 734 121
Net increase/(decrease) (665) 613
At 31 December 69 734
The interest expense there on is Ushs 0.5 million (2016: Ushs 0.4 million).
c). Borrowings due to shareholders
CDC Group Plc (CDC) 36,370 36,150
CDC Group Plc (CDC) holds a 9.80% shareholding in dfcu Limited. As at 31 December 2017, there were outstanding borrowings due to CDC.
Advances to customers include loans to directors and loans to employees as follows:• At 31 December 2017, advances to employees amounted to Ushs 16,753 million (2016: Ushs 15,072 million). • At 31 December 2017, there were no advances to directors and companies controlled by directors or closely
connected persons (2016: Ushs Nil).
2017 2016
Ushs M Ushs M
Interest income earned on advances to employees and directors / companies connected to directors
2,396 1,916
These include deposits held in dfcu Bank Limited which are due on demand and earn interest at the prevailing market rates.
2017 2016
Ushs M Ushs M
Interest expense incurred
Interest expense incurred 392 327
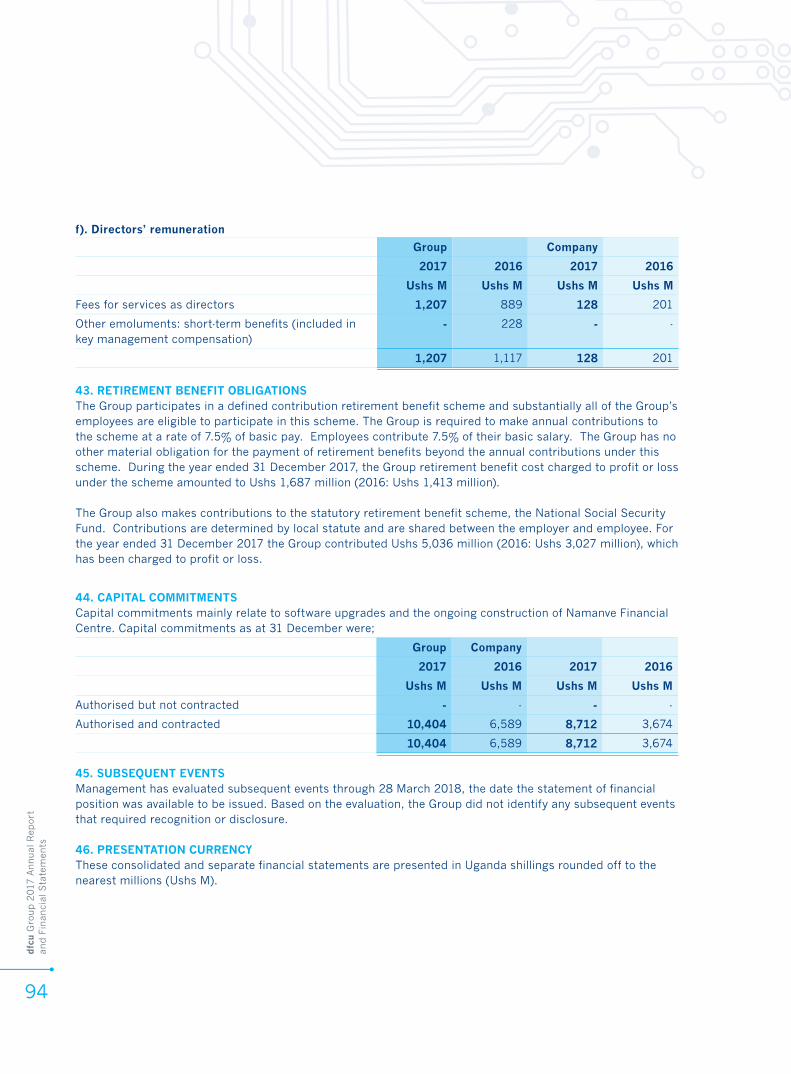
dfc
u G
roup 2
017
Annual
Rep
ort
an
d F
inan
cial
Sta
tem
ents
94
43. RETIREMENT BENEFIT OBLIGATIONSThe Group participates in a defined contribution retirement benefit scheme and substantially all of the Group’s employees are eligible to participate in this scheme. The Group is required to make annual contributions to the scheme at a rate of 7.5% of basic pay. Employees contribute 7.5% of their basic salary. The Group has no other material obligation for the payment of retirement benefits beyond the annual contributions under this scheme. During the year ended 31 December 2017, the Group retirement benefit cost charged to profit or loss under the scheme amounted to Ushs 1,687 million (2016: Ushs 1,413 million).
The Group also makes contributions to the statutory retirement benefit scheme, the National Social Security Fund. Contributions are determined by local statute and are shared between the employer and employee. For the year ended 31 December 2017 the Group contributed Ushs 5,036 million (2016: Ushs 3,027 million), which has been charged to profit or loss.
45. SUBSEQUENT EVENTSManagement has evaluated subsequent events through 28 March 2018, the date the statement of financial position was available to be issued. Based on the evaluation, the Group did not identify any subsequent events that required recognition or disclosure.
46. PRESENTATION CURRENCYThese consolidated and separate financial statements are presented in Uganda shillings rounded off to the nearest millions (Ushs M).
f). Directors’ remuneration
44. CAPITAL COMMITMENTSCapital commitments mainly relate to software upgrades and the ongoing construction of Namanve Financial Centre. Capital commitments as at 31 December were;
Group Company
2017 2016 2017 2016
Ushs M Ushs M Ushs M Ushs M
Authorised but not contracted - - - -
Authorised and contracted 10,404 6,589 8,712 3,674
10,404 6,589 8,712 3,674
Group Company
2017 2016 2017 2016
Ushs M Ushs M Ushs M Ushs M
Fees for services as directors 1,207 889 128 201
Other emoluments: short-term benefits (included in key management compensation)
- 228 - -
1,207 1,117 128 201
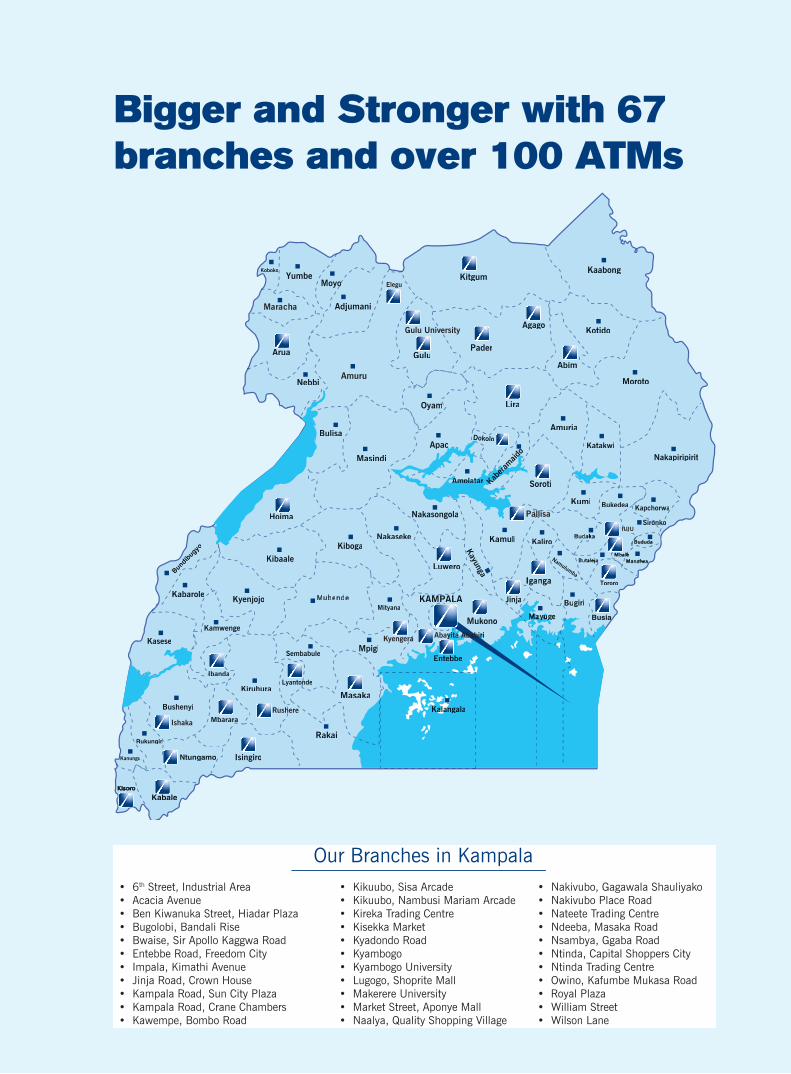
dfc
u G
roup 2
017
Annual
Rep
ort
an
d F
inan
cial
Sta
tem
ents
95
Bigger and Stronger with 67 branches and over 100 ATMs
Ishaka
Rushere
Amuru
IUIU
Kyengera
Gulu University
Abayita Ababiri

dfc
u G
roup 2
017
Annual
Rep
ort
an
d F
inan
cial
Sta
tem
ents
96
Notes

dfc
u G
roup 2
017
Annual
Rep
ort
an
d F
inan
cial
Sta
tem
ents
2
dfc
u G
roup 2
017
Annual
Rep
ort
an
d F
inan
cial
Sta
tem
ents
2
Plot 26, Kyadondo RoadP.O. Box 2767 Kampala UgandaTEL: +256 414 351 000 +256 312 300 152www.dfculimited.com