annual report 2002remaining focused on our vision, we plan our growth... annual report 2002

Annual Report and Financial Statements 2017
HSS Hire Group plc
HS
S H
ire Gro
up plc A
nnual Report and Financial S
tatements 2017

Our Rental segment comprises rental income earned from HSS owned tools and equipment and directly related revenue e.g. resale, transport and other ancillary revenues. Through our core HSS brand and specialist brands of ABird, All Seasons Hire, Apex and UK Platforms, we can offer customers access to a wide range of owned equipment categories which can be delivered or picked up nationwide from our national network of Customer Distribution Centres (CDCs) and local branches.
The HSS Hire Group is a leading provider of tools, equipment and related services in the UK and Ireland. Our nationwide network ensures easy access to an extensive range that has grown to include specialist capabilities including power solutions business, ABird and powered access provider, UK Platforms.
Focused on delivering Safety, Value, Availability and Support, we work predominantly with ‘business-to-business’ customers in the ‘fit-out, maintain and operate’ sectors. We are dedicated to helping them all work safely, efficiently and cost-effectively.
In addition to our financial performance, this Report provides you with an overview of our Strategic Review which was undertaken and presented during 2017. This has allowed us to develop a clear plan going forward, which will restore the business to historic levels of performance, delever the Group and make us more resilient.
The conclusions of our Strategic Review have been used to define three new strategic priorities for the Group which are as follows:
Delever the GroupRead more p7
Repair the Tool Hire businessRead more p8
Strengthen the Group’s commercial propositionRead more p8
Our Services segment directly complements our Rental offering and comprises income from the Group’s third party supplier rehire business (HSS OneCall) and HSS Training. In addition to trading directly with customers, together with our Rental offering, these businesses allow us to provide a true one-stop-shop tool and equipment hire and related service offering to our customers across the UK.
Rental Services

1
Strategic ReportOur Business and Our Performance1 Highlights and Contents
2 Our Business at a Glance
4 Chairman’s Statement
6 Chief Executive Officer’s Strategic Review
10 Our Business Model
12 Our Key Performance Indicators
14 Principal Risks and Uncertainties
18 Financial Review
22 Corporate Responsibility
Corporate GovernanceGovernance28 Chairman’s Introduction
30 Board of Directors
32 Corporate Governance
37 Audit Committee Report
40 Market Disclosure Committee Report
40 Nomination Committee Report
42 Directors’ Remuneration Report
50 Other Statutory Disclosures
53 Directors’ Responsibility Statement
Financial Statements56 Independent Auditor’s Report
61 Consolidated Income Statement
62 Consolidated Statement of Comprehensive Income
63 Consolidated Statement of Financial Position
64 Consolidated Statement of Changes in Equity
65 Consolidated Statement of Cash Flows
66 Notes to the Consolidated Financial Statements
104 Company Statement of Financial Position
105 Company Statement of Changes in Equity
106 Notes to the Company Financial Statements
109 Three Year Summary
Additional Information110 Shareholder Information
111 Company Information
112 Definitions and Glossary
Highlights
Decisive management action returned Group to profit in H2 after challenging H1
Revenue
£335.8mFY16: £342.4m
Adjusted EBITDA
£48.9mFY16: £68.6m
Adjusted EBITA
£1.8mFY16: £20.5m
Operating loss
(£71.4)mFY16: (£2.7)m
Reported EPS (basic and diluted)
(49.96)pFY16: loss of (11.18)p
Adjusted EPS (diluted)
(5.68)pFY16: earnings of 2.94p
Core utilisation (LTM)
50%FY16: 50%
Specialist utilisation (LTM)
73%FY16: 75%
Find out more in our Financial Review on page 18
This Report contains certain forward-looking statements with respect to the operations, strategy, performance, financial condition and growth opportunities of the Group.
By their nature, these statements involve uncertainty and are based on assumptions and involve risks, uncertainties and other factors that could cause actual results and developments to differ materially from those anticipated. The forward-looking statements reflect knowledge and information available at the date of preparation of this Report and, other than in accordance with its legal and regulatory obligations, HSS Hire Group plc undertakes no obligation to update these forward-looking statements. Nothing in this Report should be construed as a profit forecast.
HSS Hire Group plc Annual Report and Financial Statements 2017S
trategic Report
Corporate G
overnanceFinancial S
tatements
Additional Inform
ation

BranchCDC (Customer distribution centres)
CDC
Strategic Report
Our Business at a Glance
Our storyThe HSS Hire Group is a leading provider of tools, equipment and related services in the UK and Ireland. Our nationwide network ensures easy access to an extensive range that has grown to include specialist capabilities including power solutions business, ABird and powered access provider, UK Platforms.
Focused on delivering Safety, Value, Availability and Support, we work predominantly with ‘business-to-business’ customers in the ‘fit-out’, maintain and operate sectors. We are dedicated to helping them all work safely, efficiently and cost-effectively.
Our team of HSSers are the reason we are able to deliver a hire experience that, we believe, is the best in the industry so we are committed to making sure they have the skills and support they need to flourish.
We take a responsible approach to the way we conduct all business activities and we are ISO 9001, ISO 14001, OHSAS 18001, CHAS and SafeHire Certified.
We are delighted to share our story with you.
Our network: UK and IrelandDuring 2017 we closed a number of branches across the network due to lower Rental revenue growth and a loss of focus on our Tool Hire business.
We now have branches in more than 250 locations, and following recent network reconfiguration changes, we will now be able to provide a greater availability of services to our customers across the UK and Ireland. This will include the expansion of test and run into all HSS branches and customer distribution centres (CDCs) and more intensive repair into a number of strategically located workshop CDCs. In addition the workshop CDCs will link to a national cross dock centre in Oxford that will enable the overnight movement kit to service our customers delivery requirements between all of our CDCs in England and Wales.
Other B2B accounts
Key accountsCash
% by revenue
40
7
52
Key accounts
£135.8mOther B2B accounts
£175.9mCash accounts
£24.1m
Sales
£335.8m
Locations
>250
HSS Hire Group plc Annual Report and Financial Statements 20172

3
Our products
Core businesses
Provides an extensive range of tools and equipment for hire across over 1,600 product lines.
Our sourcing division works with over 300 approved hire partners, providing a range of specialist equipment.
Offers training on over 260 industry-accredited courses throughout the UK and Ireland through one of our Centres of Excellence.
Specialist businesses
Specialist powered access providers operating on a national basis, supplying the latest technology in access platforms to the construction, facilities management and service sectors.
Our specialist generator hire businesses are leading providers of temporary power equipment and operate throughout the UK.
Operating on a national basis, specialising in the supply and installation of temporary, large-scale heating and cooling equipment across a wide range of business sectors.
Our valuesAcross the business we have committed employees who live our core values, they are how we do business. They support the delivery of our culture and strategy throughout the organisation.
Safety
Availability
Value
Support
Safety is our priority and we work hard to ensure the safety of our customers and the equipment we hire to them as well as supporting their own progress towards ‘Zero Harm’ and ‘Target Zero’ goals. We drive safer product design throughout our supply chain – such as the unique anti-entrapment system Activ’Shield on our UK Platform diesel booms – and we ensure that every single bit of kit is robustly maintained and tested through strictly controlled processes before every hire so it is always safe to use. Our dedicated training division, HSS Training, offers over 260 industry-recognised technical and safety courses that cover equipment operation and safe working practices.
Making sure our customers have ready availability of the kit they need, when and where they need it is key to our service offering, enabling us to guarantee that they can order by 7pm and get by noon the next day. We have a multi-channel offer that includes online and call centre ordering for delivery or collection as well as a strategically positioned branch network, stocked with the most popular kit ready to take away.
To make sure our customers receive value from their hire, we work with them to drive down ‘the true cost of hire’ – providing reliable equipment and an excellent service as well as helping them to understand, manage and control their costs. We continue to invest in our fully transactional e-commerce platform and Remote Fleet Management systems, which help customers to better manage hire volumes and durations as well as saving them time. In 2017, we continued to underpin our commitment to value with a simplified pricing structure.
Supporting our customers is about making life easier for them. We offer a range of hire-related services to help our customers and which includes a Managed Service Provider offer that enables us to manage the complex supply chains of some of our larger customers. We also support our customers by ensuring that – from recruiting the right people to providing them with ongoing training and development – our colleagues are better equipped with the skills and knowledge they need to provide an excellent hire service.
Colleagues
c.2,900
HSS Hire Group plc Annual Report and Financial Statements 2017S
trategic Report
Corporate G
overnanceFinancial S
tatements
Additional Inform
ation

Strategic Report
Chairman’s Statement
Board priorities for 2018 Following on from the findings of our Strategic Review, we identified three areas of focus for 2018: reduce the Group’s debt to manageable levels; Repair and revitalise the Tool Hire business; and Strengthen our commercial proposition across the Group.
Alan PetersonChairman
Dear shareholder,
Following decisive action taken by the Group Board and senior management during 2017, we have seen a significant improvement in our performance in the second half of the financial year and we will now build upon this momentum by implementing our clear strategic priorities.
Delever the Group
Repair and revitalise the Tool Hire business
Strengthen the Group’s commercial proposition
HSS Hire Group plc Annual Report and Financial Statements 20174

5
Strategic Review and progress madeWe conducted a thorough, all-encompassing Strategic Review, reviewing the profitability of each customer, product and branch, as well as the most efficient operating model to support our business going forward.
To this end there are three clear areas of focus for the year ahead:
1 Delever the Group
2 Repair and revitalise the Tool Hire business
3 Strengthen the Group’s commercial proposition
I am encouraged by the outcome of the Strategic Review, the findings of which we presented in December 2017, and am confident that the delivery of these three priorities will improve Group profitability in 2018 and beyond.
We have already made good progress in the implementation of the strategy, and we are on track to deliver the annualised savings of £10m-£14m, which we presented in December.
As we communicated as part of the Strategic Review in December 2017, an agreement was reached in principle with Unipart at the end of 2017 and was finalised on 13 February 2018. This allows us to make significant changes to our supply chain, in order to optimise our network. The National Distribution and Engineering Centre model was initially envisaged to support a much larger branch network. Based on the size of our current network, this model is no longer cost-effective. We therefore decided to move testing and some engineering back into the network and as a consequence, significantly reduce distribution costs. These changes have been positively received and will lead to improved product availability and contribute annualised cost savings of around £11m of the total anticipated cost savings stated above. These changes resulted in an exceptional cost of £41m, which includes various one off payments in 2018 and cash payments of £33.8m over the following seven year period.
Our resultsWe have seen an improving trend in our performance in the second half of the financial year, with strong Adjusted EBITA growth compared with the first half. These improving trends are demonstrated by our underlying rental revenue growth where we report 1.1% growth in H2 17 compared to H2 16. This underlying measure strips out the impact of branch closures in the two years, business divestments in 2017, the effect of week 53 in 2016, and rental revenues and disposal proceeds arising from the material asset disposals made in 2016. This was augmented by continued
growth in our services segment revenue and contribution which delivered 11.1% and 13.5% growth respectively in H2 17 compared to H2 16. Our relentless focus on cost reduction led to our overheads in Q4 17 being £3.3m below the level in Q1 17. However, notwithstanding these improvements we have made, year on year revenue decreased by 2% to £335.8m, with a decline in rental, which was impacted by operating model changes in 2016 and branch closures, offset by a growth in services, generating an Adjusted EBITA of £1.8m and Return on Capital Employed (ROCE) of 0.9%.
Our results are discussed in more detail in the Financial Review on pages 18 to 21.
Our Board and management teamIn June we welcomed the appointment of Steve Ashmore as our CEO. He brings considerable leadership experience to bear and consistent delivery of growth and value in a range of industries. Steve previously held a number of senior roles at Exel, the supply chain and third party logistics provider, and was UK Managing Director at Wolseley, the £2.0bn revenue distributor of plumbing and heating products and supplier of building materials. More recently he was the UK Managing Director of Brammer, the specialist distributor of industrial products.
On behalf of the Board, I would like to thank John Gill, who stepped down as CEO in May, for his considerable contribution over more than eight years at the Company.
GovernanceWe are committed to high standards of corporate governance and as such, I am pleased to announce that the Group has complied with the UK Corporate Governance Code (the Code) during 2017.
During the year, and continuing into 2018, the Group has assessed and is implementing changes as required in preparation for the General Data Protection Regulation (GDPR) becoming law. This year also saw the introduction of the Criminal Finances Act, placing increased emphasis on controls to prevent the facilitation of tax evasion. The Board has given top level commitment to this, including a new policy, a risk assessment and bespoke e-learning training modules. We also continued to monitor the Group’s policies and procedures in respect of the Modern Slavery Act.
Our peopleI continue to be extremely impressed with the motivation, can-do attitude and achievement of HSS people across our Group, which is reflected in our consistently high customer satisfaction scores. I am very confident that with their support, HSS will be successful in delivering on our strategic priorities and building upon the momentum of the second half of 2017.
Corporate responsibility Our primary responsibility is to always ensure the safety of HSS colleagues and customers, and the Board remains fully committed to providing a safe environment for all. We also pay close attention to reducing the impact we have on the environment and in the role that we play as a community business across the UK and Ireland.
RefinancingWe announced in February 2018 that we had agreed with our lenders to extend the £80m Revolving Credit Facility (RCF), which will now expire on 6 July 2019. Under the terms of the agreement, if the Group has not completed a refinancing by 30 September 2018, the facility will expire at the option of the lenders on 30 April 2019. Management continues to make good progress towards refinancing the Group and expects to complete this during 2018.
We have prepared the accounts on a going concern basis as the Board is confident that the Group will be able to refinance these debt facilities well in advance of their maturity dates.
DividendThe Board is focused on reducing net debt and, after careful consideration of the performance of the Group during the year, and in line with the clear priorities set out in our Strategic Review, believes it is in the best interests of the shareholders of the Group, to not pay a final dividend in respect of 2017.
Looking aheadThe positive trading momentum in the second half of the financial year has continued into 2018. Underlying revenue grew by 6% in the first quarter of 2018 against prior year with underlying rental revenue growing 3% and our already actioned cost initiatives are delivering benefits as expected. Based on this positive start to the new financial year we expect the LTM Adjusted EBITDA at the end of March to be around £54m with the first quarter Adjusted EBITDA being more than 50% higher than the previous year. This clearly benefits the net leverage ratio of the Group, which has reduced to 4.3x as at the end of Q1 18. Looking forward we expect Net Leverage to reduce to 3.2x following the implementation of the identified strategic actions.
Our focus will be on developing a leaner operation, improving product availability and enhancing customer service, and reducing our debt to manageable levels. We will continue to drive operational efficiency across the Group, improving profitability and returns, and growing a profitable share of the market.
Alan PetersonChairman 5 April 2018
HSS Hire Group plc Annual Report and Financial Statements 2017S
trategic Report
Corporate G
overnanceFinancial S
tatements
Additional Inform
ation

Strategic Report
Chief Executive Officer’s Strategic Review
Focused on executing the Group’s new strategy
After a difficult start to 2017, I am pleased with how the business responded in the second half of the year. Having joined the Group in June, I instigated a thorough strategic review process, the results of which have given us clear direction and an ambition to restore the business to historic levels of performance. I look forward to building upon this as we look ahead to 2018 and beyond.
Steve AshmoreChief Executive Officer
HSS Hire Group plc Annual Report and Financial Statements 20176

7
Overview of our new strategy
Strategy ReviewIdentified three clear strategic priorities
Immediate action
2018 & beyondCapture growth opportunity
Given us a thorough understanding of the business
A clear route map of how to return HSS to historical performance levels
Delever the Group
Repair the Tool Hire business
Strengthen commercial proposition
Cost reduction programme
Optimise branch performance
Rationalise product base
Improve customer profitability
Customer segmentation
Geographic focus
Sales channel development
35,000 customers, 1,600 products and 250 locations. We focused on a number of areas including profitability, the cost of our operations, processes we have in place, and the market opportunity.
Find out more about Our Business Model on page 10
My initial perceptions reaffirmedWe presented our findings of the Strategic Review on 7 December 2017. The review not only highlighted areas of focus, but also reaffirmed my initial perceptions. We have a strong brand having served our customers for 60 years and our NPS score is above market average. Within our chosen markets we are joint number 2 in the UK tool and equipment rental market by revenue, we have good national coverage and we operate primarily in the highly attractive ‘repair, maintain and operate’ segment of the market. The 2,900 employees across the Group are committed and knowledgeable, and were named winners of the UK customer experience award in 2016. Our business model is innovative and forward thinking, with multi-channel digital technology, and a healthy network of branches which allow for high levels of utilisation of our stock across the Group.
Find out more in our Financial Review on pages 18 to 21
Our new strategyUpon completion of the review, we identified three key strategic priorities: Delever the Group, Repair the Tool Hire business and Strengthen the Group’s commercial proposition.
Overview of my first year I was honoured to be asked to lead HSS Hire. It is a business with a strong brand and leading positions in its chosen markets across the UK and Ireland. Having worked in the industry for many years, I have always admired HSS, so when the opportunity arose to lead this fantastic organisation, it was an opportunity not to be missed.
I arrived at a challenging time for the Group, and it was evident that a lot of work needed to be done. In some areas within the business we were experiencing reduced margins, the new distribution network had led to lower rental revenue growth and there was a loss of focus on our Tool Hire business. Repairing each of these areas will take time and we must continue to remain focused on the task in hand, as we implement changes across the Group and our business evolves.
Notwithstanding these challenges, I continue to strongly believe that there remains huge potential at HSS. Over the past few months I have spent a lot of time with different parts of the business, and have been incredibly impressed by the motivation, achievements and commitment of HSS people across our Group.
Our wide ranging strategic reviewDuring the year, we engaged an independent third party to work with the HSS management team to undertake the most extensive Strategic Review of the business to date. The review was wide ranging in scope and involved the analysis of 20 million contract lines, more than
DeleverDuring 2017 we took a number of cost reduction actions which resulted in us delivering annualised savings of £13m compared with the Q1 FY17 runrate. This was achieved through working with our suppliers to reduce costs, reducing our central headcount, closing 55 branches, and network efficiencies.
The Strategic Review announced in December 2017 outlined initiatives to reduce costs by a further £10m-£14m on an annualised basis, including up to £10m related to changes in the supply chain model. We were therefore pleased to announce in February 2018 that agreement had been finalised to make these changes enabling c.£11m of cost benefit, £1m higher than the amounts originally communicated. The changes are expected to give rise to a net cash outflow of approximately £3m in 2018 followed by net cash savings of approximately £8m annually over the following seven years.
Last but not least, we will drive further efficiencies across the business through eliminating duplication in some areas and simplifying our processes. This should generate savings of between £3m-£4m. Full implementation of each of these cost saving initiatives will take time and is not going to happen overnight; however, we have a clear plan in place and are focused on executing these changes in order to reduce the leverage of our business.
1
2
3
HSS Hire Group plc Annual Report and Financial Statements 2017S
trategic Report
Corporate G
overnanceFinancial S
tatements
Additional Inform
ation

Strategic Report
Chief Executive Officer’s Strategic Review continued
RepairThree key areas to repair the Tool Hire business were identified: customer, product and branch.
CustomerTaking customer first, we have identified several areas where we can work with our customers to look at ways in which we can improve the customer experience that we are able to offer them. We want to improve our utilisation rates and ensure that we are always in a position to fulfil the needs and requirements of each and every one of our customers.
ProductOn occasions, highly valuable products have been commodity-priced with certain customers. There has also been inconsistent pricing within product categories and we have seen circumstances where the stock profile does not match the profit opportunity. A lot of work has been done to introduce smart pricing to reflect asset utilisation and service, and we are looking at improving discount effectiveness and rationalising ranges, as well as ensuring that we optimise our fleet size.
BranchWe closed a number of branches over the last year or so, and now feel that our network is of a size which is flexible and that we are comfortable with. It is a network which can be adapted and modified accordingly as we remain ever vigilant to market conditions. However, when we look at the branches, there is a variety of differing performance across the business which needs to be resolved. We are therefore looking at a number of areas where we can improve, to ensure that all our branches are contributing as efficiently and effectively as they possibly can.
StrengthenThe third and final strategic priority is to strengthen the Group’s commercial proposition. The actions being taken here are around customer segmentation, geographic focus and sales channel development. Taking customer segmentation first, customers have different needs and therefore we have to respond in different ways. We have to ensure that the products we can offer are relevant for those customer segments. For geographic focus, we know the areas where driving initiatives will be much more advantageous for us. Our target areas have been identified, and we have begun working through these and will continue to do so over the medium to long term. Further progress has also been made on developing our sales channels, with investment having been made to improve our digital capabilities. This will help to enhance and improve the proposition and customer experience that we are able to offer.
Our marketThe size of our addressable market for tool hire, powered access and power generation hire in the UK is in the region of £1.9bn. The market has grown by 1-2% CAGR since 2013 and is expected to grow at a similar rate over the next three years1. The market is highly fragmented with the vast majority of registered hire companies employing fewer than 50 staff and serving their local geography often from one, and usually from fewer than ten locations. The Group is one of a small number of ‘nationals’. We are placed second or third in each of our three primary markets with between 9-14% market share.
The Group has a large and diverse customer base and operates across a diverse set of end markets. This provides us with some protection against cyclical trends that are evident in some sectors, such as construction. Our main customer groups are in the facilities management, retail operations, commercial fit-out, property, utilities and waste, infrastructure and energy supply services sectors. We also work with charities, government entities, house builders and construction contractors.
The European Rental Association notes that the ‘UK market is relatively concentrated’ but this is in contrast to the fragmented and less mature markets of continental Europe. It estimates that the larger rental players with between 50 and 250 employees are 50% of the UK market. In our view there is room for further market consolidation to create scale rental players able to deliver further efficiency benefits for customers, and enhanced returns to shareholders.
Management teamThe executive team in place at HSS is relatively new in terms of tenure, with Paul Quested, Chief Financial Officer, being the longest-serving executive having joined the business in August 2016. Notwithstanding this limited time within the executive team, I have been very encouraged since joining the business in June, by the dedication and commitment of the management team, and the strength and depth of the experience which we have across the Group. I am very confident that with their support, we will be successful in delivering on our strategic priorities set out in December.
1 AMA market research estimates.
HSS Hire Group plc Annual Report and Financial Statements 20178

9
2018 and beyondThe Strategic Review has been a massive step forward for us and gives us a real understanding of our business. We have a clear map forward, with steps identified to deliver significant change in performance within HSS. The strategy has been reset, with three levers: Delever the Group, Repair the Tool Hire business and Strengthen the Group’s commercial proposition. Our immediate focus in 2018 is to undertake a number of cost reduction actions which will create a leaner operation, but we have to get the balance right and get this business working effectively and efficiently. We must get the branch optimisation right, lifting levels of profitability not only across the network, but also more widely across the entire business.
Over the next few years, we will be examining our customer segmentation; deploying and working with our teams in areas where we see the most profitable opportunities is key. We will also continue to develop our sales channels, maximising our digital competitive advantage to increase the use and mix of innovative low-cost channels.
Steve AshmoreChief Executive Officer 5 April 2018
Market opportunityAttractive markets
Tool hire Powered access Power generation
Size of addressable market
£1.1bn £430m £350m
Market share1 14% 12% 9%
Position in market Joint 2 3 3
Expected growth rate2 1-2% 2% 1%
Competitive advantage → Store footprint → Brand trust → Product offering and quality
→ Knowledgeable staff
→ Customer base → Scale → Specialist expertise
→ Customer base → Scale → Specialist expertise
1 Estimate based on AMA market research.2 2017-2020.
→ Diverse end markets
→ Leadership positions
→ High barriers to entry
→ Large and diverse customer base
Example opportunities in Tool Hire market
£1.1bn market14% total market share
A
B
C
D
E
F
G
H
I
J
K
L
MNO
P
→ Diverse end markets
→ Leadership positions
→ High barriers to entry
→ Large and diverse customer base
Example opportunities
Low Level Powered Access Growing market, driven by safety legislation. Potential for margin improvement
Lighting Growing faster than overall market, driven by safety requirements for better lit spaces and declining operating costs from more efficient technology
Access Health and safety regulations are putting more emphasis on quality of equipment
Heating, Cooling, Drying A segment where we have good penetration, strong differentiation and good margins
HSS market share
Product categoriesA
HSS Hire Group plc Annual Report and Financial Statements 2017S
trategic Report
Corporate G
overnanceFinancial S
tatements
Additional Inform
ation

Strategic Report
Our Business Model
We aim to maximise the utilisation of our hire fleet by ensuring it is well maintained, safe, serviced and available to our customers wherever and whenever they need it. Our operational network comprises our CDCs and local branches.
Build long-term relationships
Our customers We work with a wide range of customers from tradespeople to large businesses operating across the UK. At the heart of building and developing these relationships is recognition of what our customers value and our ability to innovate our service offerings to deliver mutually beneficial outcomes.
>90%B2B customers
>35,000Live accounts
Our suppliersWe work closely with leading equipment suppliers to source the broad range of tools and equipment that our customers rely on for their projects. The strength of these relationships has resulted in product innovation – including the development of our award-winning anti-entrapment device, Activ’Shield, for our powered access fleet.
>200Suppliers
Our partnersWe have developed strong long-term relationships with other, typically specialist, plant and equipment hire businesses to support the rehire services we offer via HSS OneCall. This enables us to expand the range of products we offer our customers and drives sales for our partners.
>300 Partners
Our valuesOur focus is on what matters most to our customers:
Safety
Value
Availability
Support
Our strategic priorities
1 Delever the Group
2 Repair the Tool Hire business
3 Strengthen commercial proposition
Our strategic enablersGuided by our values, our strategy is realised through a focus on our three strategic enablers:
A strong commercial management framework
The right tools to support decision making
Incentivised and motivated team
Purchase and source products
We invest in our hire fleet throughout the year, constantly reviewing product developments, customer demand and opportunities to refine our hire fleet offering. This includes assessing whether it would be more capital efficient to purchase hire fleet or source it through a trusted rehire provider.
£118.6mNBV of hire fleet
Build the right team
Our people are at the heart of our business model, and key to the delivery of our leading customer service proposition. Our excellent customer appreciation levels testify to the skill, motivation and drive of our workforce at all levels within our business.
44NPS score
Find out more Corporate Responsibility on pages 22 to 25
Find out more Our Board of Directors on pages 30 and 31
Re-invest
HSS Hire Group plc Annual Report and Financial Statements 201710

11
Deliver valueCustomersOur business model is designed to make sure we deliver the right kit and services at the right time and in the right place for our customers, enabling them to focus 100% on their projects.
44NPS score
ShareholdersOur focus on enhanced operational and capital efficiency means we can increase profitability and drive shareholder returns.
EmployeesThrough our training and development programmes, we offer our people continued personal development opportunities regardless of their gender, background or origin.
37%Managerial roles filled through internal candidates.
SocietyEquipment hire is inherently more sustainable than individual ownership of tools and equipment. By making our service offering increasingly cost-effective and easy to use we are contributing directly to society.
Maximise equipment utilisation
We operate in a capital-intensive industry where it is important to drive asset utilisation, with sensible pricing control and discipline, to generate returns on our investment. The innovation and cost efficiencies implemented in our operating model through 2017 are designed to help us further enhance our utilisation rates.
50%Core utilisation
73%Specialist utilisation
Drive operational efficiency
In early 2018 we made some changes to the distribution network to drive operational efficiency, moving the test and repair of all fast moving products back into our branches, closer to HSS’s customers.
Find out more Financial Review on pages 18 to 21
Create added-value services
In addition to our core rental offering we have developed value-added services such as outsourced equipment management, specialist training courses and online e-commerce and reporting systems to support our customers.
>260industry-recognised courses
Find out more Our Business Model on page 10
Drive capital efficiency
Moving test and repair back into our regional CDCs and branches, enables us to drive capital efficiency and target enhanced utilisation rates and improve availability for our customers. Combined with the ‘recycling’ credentials of our refurbishment centre, this increases the returns we can generate on our capital investment.
Find out more Financial Review on pages 18 to 21
HSS Hire Group plc Annual Report and Financial Statements 2017S
trategic Report
Corporate G
overnanceFinancial S
tatements
Additional Inform
ation

Strategic Report
Our Key Performance Indicators
FinancialKPI Importance of KPI FY17 performance Track record
Group revenue Simplest measure of the ongoing growth of the Group’s sales from which profits can be generated and shareholder value created.
See Financial Review page 19
£335.8mFY16: £342.4m
FY17Growth
£335.8m 1.9%
9.6%
9.7%
FY16 £342.4m
FY15 £312.3m
Rental and related revenues
Simplest measure of the ongoing growth of the Core Hire Business’ sales from which profits can be generated and shareholder value created.
See Financial Review page 19
£247.8mFY16: £262.8m
FY17 £247.8m
FY16 £262.8m
FY15 £262.9m
Growth5.7%
level
0.5%
Adjusted EBITDAand margin
Widely recognised measure of profitability before amortisation, impacts of depreciation policies, capital structure (interest and tax) and exceptional costs. Metric also used in leverage and covenant calculations.
See Financial Review page 20
£48.9m14.6% margin
FY17 £48.9m
FY16 £68.6m
FY15 £71.0m
Margin14.6%
20.0%
22.7%
Adjusted EBITAand margin
Measure of profitability before amortisation, impacts of capital structure (interest and tax) and exceptional costs.
See Financial Review page 20
£1.8m0.5% margin
FY17 £1.8m
FY16 £20.5m
FY15 £20.3m
Margin0.5%
6.0%
6.5%
Adjusted EPS(diluted)
Measure of adjusted profitability per share. Widely recognised measure of shareholder value (profit) being generated by a business excluding non-recurring or exceptional items and amortisation and after charging the prevailing rate of corporation tax.
See Financial Review page 21
(5.68)pFY16: down 8.62p per share
FY17 (5.68)p
FY16 2.94p
FY15 3.20p
Return on CapitalEmployed (ROCE)
Measure of the return-generating ability of the business adopted at the direction of the Remuneration Committee.
See Financial Review page 21
1.0%FY16: 9.7%
FY17 1.0%
FY16 9.7%
FY15 11.2%
Leverage Measure of net debt present in the business, expressed as a multiple of Adjusted EBITDA.
See Financial Review page 21
4.8xFY16: 3.2x
FY17 4.8x
FY16 3.2x
FY15 3.1x
Fleet investment Measure of investment in hire fleet. Excludes assets acquired through acquisition.
See Financial Review page 21
£25.8mFY16: £27.3m
FY17 £25.4m
FY16 £27.3m
FY15 £65.0m
Denotes key performance indicators which are considered when assessing FY17 Executive Director remuneration (see pages 42 and 43).
HSS Hire Group plc Annual Report and Financial Statements 201712

13
PerformanceKPI Importance of KPI FY17 performance Track record
Utilisation (Core) Useful measure as to how effectively we have employed capital invested in our Core hire fleet. Assessed over the last 12 months. Should be considered in tandem with ROCE to assess whether assets are being profitability deployed.
See Financial Review page 19
50%level with FY16
FY17 50%
FY16 50%
FY15 48%
Utilisation (Specialist)
Useful measure as to how effectively we have employed capital invested in our Specialist hire fleet. Assessed over the last 12 months. Should be considered in tandem with ROCE to assess whether assets are being profitability deployed.
See Financial Review page 19
73%FY16: 75%
FY17 73%
FY16 75%
FY15 76%
ResponsibilityKPI Importance of KPI FY17 performance Track record
RIDDORs Widely recognised measure of safety in the workplace. Safety is at the heart of how HSS operates.
See Corporate Responsibility page 25
0.39FY16: 0.40
FY17 0.39
FY16 0.40
FY15 0.48
Carbon emissions in our built environment (kg CO2 per m2)
As we pursue our new strategy we recognise we have a duty to do so in a manner where our impact on the environment is minimised. We therefore track our carbon emissions per m2.
See Corporate Responsibility pages 23 and 24
30kg CO2FY16: 36kg CO2
FY17 30
FY16 36
FY15 43
HSS Hire Group plc Annual Report and Financial Statements 2017S
trategic Report
Corporate G
overnanceFinancial S
tatements
Additional Inform
ation
Strategic Report
Principal Risks and UncertaintiesManaging riskThe Board sets the strategic priorities for the Group and the KPIs and performance monitoring relating to these priorities, and establishes the risk appetite.
Overall responsibility for the Group’s risk management lies with the Chief Executive Officer (CEO) and Chief Financial Officer (CFO), who have ownership of risk in reporting to the Board of Directors.
The Group then manages its risk through a group risk register which is maintained by the Risk and Assurance Director. This is subject to quarterly review by both the Executive Management Team and the Audit Committee, where changes to the risk landscape, risk ratings and assurance activity are discussed and necessary action and changes agreed.
A risk-based internal audit programme is in place to ensure assurance activity is targeted at key risk areas, as identified below. Risk-based assurance work is then reported to the Audit Committee on a quarterly basis for review. In addition the Risk and Assurance Director reports to the Executive Board and the senior management team on a monthly basis to review the findings of risk-based assurance activity and investigation, provided by the internal audit and Health, Safety, Environment and Quality (HSEQ) teams.
2017 risk management developmentsThrough 2017 the Group has continued to improve its approach to the management of risk, which is now a quarterly agenda item for the Executive Management Team to review.
→ The Risk and Assurance Director held one-to-one sessions with the Executive Management Team and senior management to improve risk management culture in the Group.
→ Improvements in the monitoring of risk and identification of risk trends by enhancing the measurable indicators on the key risks.
→ Increased training to improve the ownership of risk at Executive Management level. This was noted in last year’s Annual Report.
2018 planned improvements to risk management processIn 2018 the internal audit team is working with individual departments to document risks and opportunities relating to their role in the corporate strategy.
→ A dedicated project management office has been set up to oversee strategy work streams, monitoring performance against plan and tracking and mitigating risks.
→ Assurance work will be revised in line with the new operating model, focusing on profitability, key controls and areas of risk.
→ Increased cross working of assurance teams to support the strategy and to ensure we are focused on quality, environment and health and safety.
Principal risks and strategyThe Board has carried out a robust assessment of the principal financial and operating risks facing the Group, based on its three strategic priorities:
→ Delever the Group
→ Repair the Tool Hire business
→ Strengthen the Group’s commercial proposition
These risks, how they have changed and how they are mitigated are shown in the table opposite.
HSS Hire Group plc Annual Report and Financial Statements 201714

15
Key risk Description and impact Mitigation Risk change
Macroeconomic conditions
An economic downturn in the UK and Ireland may adversely affect the Group’s revenue and operating results by decreasing the demand for its services and the prices it may charge.
The Brexit referendum result has caused economic uncertainty with potential short-term and long-term effects on demand for services within the Group’s industry and broad customer base.
The Group focuses on the ‘fit-out, maintain and operate’ markets, which are less cyclical, less discretionary and have a larger proportion of recurring spend than the new-build construction sector. While the Group is not isolated from the construction sector, it focuses on the non-construction portion of the market, with specific exposure in the facilities management, operations, commercial fit-out, property, utilities and waste, infrastructure and energy services operations.
Unchanged
Competitor challenge
The Group’s industry is highly competitive, and competition may increase. The equipment rental industry is highly fragmented, with competitors ranging from national equipment rental companies to smaller multi-regional companies and small, independent businesses operating in a limited number of locations. Competition in the market has led to frequent excess capacity and resultant pricing pressure.
The Group is ranked second or third in each of our three primary markets and the resulting economies of scale enable it to be highly competitive, whilst the fragmented nature of the market may offer consolidation opportunities.
The Group’s national presence, effective distribution service model and well-maintained fleet provide improved customer availability.
Unchanged
Distribution Network
The provision of the Group’s expected service levels depends on its ability to transport its hire fleet across its network in a timely and cost-effective manner, and on the successful operation of its Customer Distribution Centres “CDCs” and branch network.
The Group has a flexible distribution model incorporating CDCs which support the branch network. Performance is monitored continually to identify areas where we can improve the cost and the efficiency of the network.
Unchanged
IT infrastructure The Group requires an IT system that is appropriately resourced to support the business, Any IT system malfunction may affect the ability to manage its operations and distribute its hire fleet and service to customers, affecting revenue and reputation.
A cyber security attack on the business systems could lead to a potential loss of confidential information and disrupt the business’ transactions with customers and suppliers.
The current IT system has been fully reviewed to ensure that it is the best possible option to optimise the success of the Group’s strategy.
Disaster recovery tests are carried out on a regular basis. Firewalls are in place to protect against malicious attempts to penetrate the IT environment. Penetration testing is carried out on a regular basis to detect weaknesses in our IT and cyber security. Software has been implemented to identify any malicious attack.
Unchanged
HSS Hire Group plc Annual Report and Financial Statements 2017S
trategic Report
Corporate G
overnanceFinancial S
tatements
Additional Inform
ation

Strategic Report
Principal Risks and Uncertainties continued
Key risk Description and impact Mitigation Risk change
Insufficient liquidity headroom
Some of the Group’s customers may have liquidity issues and ultimately may not be able to fulfil the terms of their rental agreements with the Group. Bad debts and credit losses can also arise due to service issues or fraud.
Unauthorised, incorrect or fraudulent payments could be made, leading to financial loss or delays in payment which could adversely affect the relationship with suppliers and lead to a disruption in supply.
Continuing losses of the Group or delays in the implementation of cost savings may lead to a lack of liquidity.
The Group is focused on working capital management and KPIs are reviewed regularly.
The Group runs extensive credit checking for its account customers and maintains strict credit control over its diversified customer base.
The Group’s investigation team conducts proactive and reactive work in order to minimise the Group’s exposure to fraud.
Payments and amendments should only be made in line with a regularly reviewed authorisation matrix.
The Group has a clear strategy, supported with detailed project plans, to return to historic levels of profitability. The successful implementation of these plans is underpinned by a Programme Management Office which has been set up to ensure each project is delivered on time and realises the expected benefits.
The management is working with appointed debt advisers, to ensure that the future capital structure, as part of the refinancing process, provides sufficient liquidity for the Group.
Increased in 2017 due to higher outstanding debtor days following the relocation of the credit control function from London to Manchester and, looking forward to 2018, an element of the cash costs associated with the network change arising before the benefits fully accrue.
Equipment supply, maintenance and availability
The reliable supply of safe and good-quality equipment is critical for delivering our customer promise; unavailable or unreliable equipment can reduce potential revenue and drive additional costs into the business.
The Group is dependent upon its relationships with key suppliers to obtain equipment and other services on acceptable terms. Any disruption in supply could affect its ability to provide its customers with expected service levels, increasing the risk of lost customers or reduced trading levels.
The changes in the way we operate can impact the availability of supply during implementation.
The Group makes every effort to evaluate its counterparties prior to entering into significant procurement contracts and seeks to maintain a range of suppliers.
Refining the Group’s operating model during the year, and the right balance of centralised and decentralised responsibilities have been established.
The 2018 operational plan is based on improving the availability of equipment and the efficiency of our operating model to drive profitability.
Unchanged
HSS Hire Group plc Annual Report and Financial Statements 201716

17
Key risk Description and impact Mitigation Risk change
Customer retention and brand reputation
A decline in the Group’s customer service levels could result in a loss of customers and market share.
The Group’s business depends on strong brands and any failure to maintain, protect and enhance its brands could have an adverse effect on its ability to grow the business.
The Group is looking to improve regional interaction in areas such as customer care in 2018.
The Group invests in areas such as marketing, community relations and colleague training, aimed at delivering the highest standards of customer service and colleague engagement.
The Group actively engages in online advertisements and email communications, and engages on a regular basis in public relations and sponsorship activities to promote its brands and its business.
Unchanged
Outsourcing of services
The Group outsources certain activities of its business to third parties.
If any third parties become unable or refuse to fulfil their obligations, or violate laws or regulations, there could be a negative impact on the Group’s operations or it could lead to adverse publicity and a decline in demand.
Outsourcing of services by the Group is subject to stringent procurement and service criteria and all contracts are subject to demanding service level agreements which are closely monitored and enforced.
Performance and quality metrics and KPIs are tracked throughout the life of contracts.
Reduced in 2017 as operating model was refined.
Inability to attract and retain and train personnel
Turnover of members of the Group’s management and colleagues and its ability to attract, train and retain key personnel may affect its ability to efficiently manage its business and execute its strategy.
The Group has established and maintains competitive pay and benefit packages, as well as the right working environment for its colleagues. Training for colleagues is provided within branches of excellence.
The Group is reviewing colleague incentives in 2018.
Unchanged
Legal and regulatory requirements
Failure to comply with laws or regulation, such as the Companies Act 2006, accounting regulations, health and safety law, the Bribery Act 2010 or the Road Traffic Act, leading to material misstatement and potential legal, financial and reputational liabilities for non-compliance.
Robust governance within the Group, including a strong financial structure, with adequate assurance provision from internal and external audit. Additional assurance and support is provided by a fully skilled HSEQ team and an internal group investigation team.
Unchanged
HSS Hire Group plc Annual Report and Financial Statements 2017S
trategic Report
Corporate G
overnanceFinancial S
tatements
Additional Inform
ation
Strategic Report
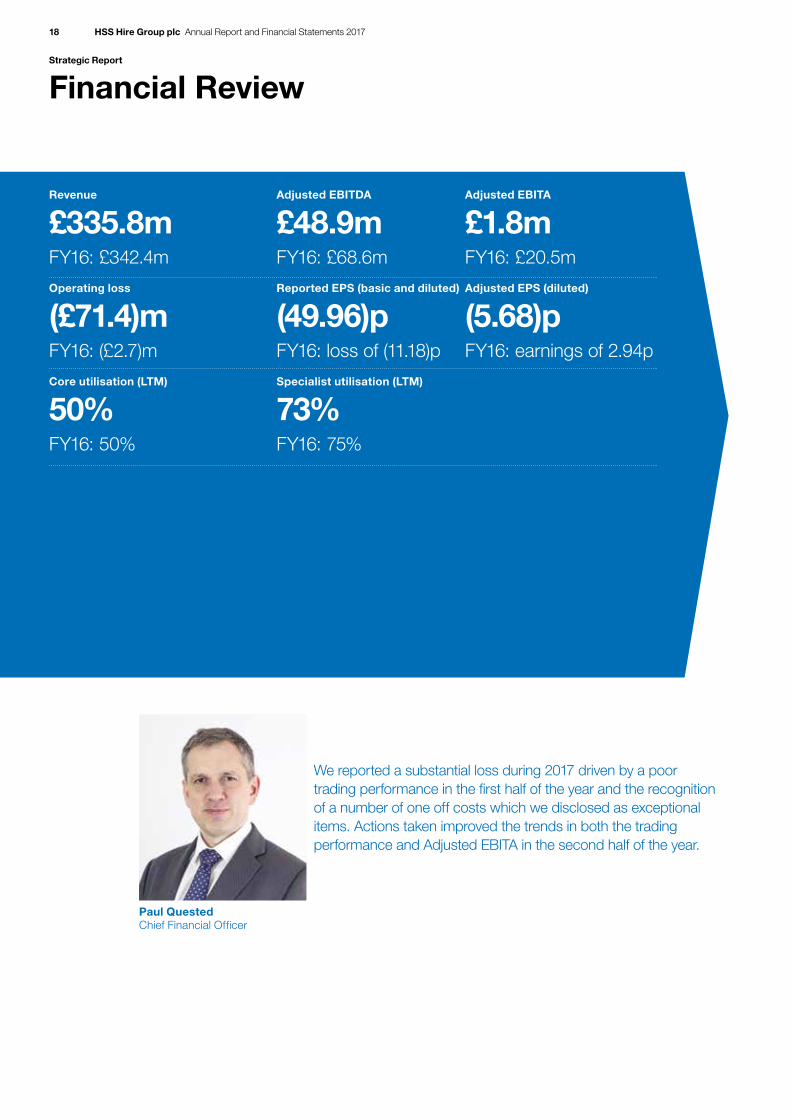
Financial Review
We reported a substantial loss during 2017 driven by a poor trading performance in the first half of the year and the recognition of a number of one off costs which we disclosed as exceptional items. Actions taken improved the trends in both the trading performance and Adjusted EBITA in the second half of the year.
Revenue
£335.8mFY16: £342.4m
Adjusted EBITDA
£48.9mFY16: £68.6m
Adjusted EBITA
£1.8mFY16: £20.5m
Operating loss
(£71.4)mFY16: (£2.7)m
Reported EPS (basic and diluted)
(49.96)pFY16: loss of (11.18)p
Adjusted EPS (diluted)
(5.68)pFY16: earnings of 2.94p
Core utilisation (LTM)
50%FY16: 50%
Specialist utilisation (LTM)
73%FY16: 75%
Paul Quested Chief Financial Officer
HSS Hire Group plc Annual Report and Financial Statements 201718

19
OverviewThe first half of 2017 was heavily impacted by changes to the operating model in the prior financial year, with a higher cost base and reduced availability during these changes, adversely impacting Rental revenue. This led to an Adjusted EBITA loss of £7.3m in the first half of the year.
Decisive management action taken has delivered like for like Rental revenue growth of 1.1% in H2 17, and reduced annualised costs by £13m against the Q1 17 run rate. This led to Adjusted EBITA profit of £9.1m in H2 17.
We also completed our Strategic Review with the clear actions to Delever the Group, Repair the Tool Hire Business and Strengthen the Group’s Commercial proposition.
I am confident that these are the right steps to build on the momentum of H2 17 performance and deliver sustainable and improved profitability.
RevenueGroup revenue declined by 1.9% to £335.8m (FY16: £342.4m) behind the anticipated UK tool and equipment hire market growth rate for 2017 as estimated by the ERA. The main drivers of this result were:
→ FY17 was a normal 52 week year whilst FY16 was a 53 week period;
→ Another year of strong growth in our Services revenues, up 10.6% year on year to £88.0m, mainly driven by performance in our rehire business, HSS OneCall, augmented with further growth from our HSS Training business; and
→ A reduction of 5.7% in Rental and related revenues, to £247.8m which were negatively impacted by the establishment of the new operating model during the second half of FY16 and the first half of FY17. Rental and related revenues were further impacted by the decision to close a total of 73 branches since Q3 of FY16. Our performance on rental and related revenues improved in the second half of FY17.
Revenue and revenue growth are two of our KPIs as, combined with estimates of market size and growth rates, they provide us with a measure of our market share. We underperformed the UK tool and equipment hire market during the year for the reasons set out.
Segmental performance Rental and related revenuesOur Rental revenues were down 5.7% year on year at £247.8m (FY16: £262.8m) and accounted for 73.8% of Group revenue (FY16: 76.8%). Performance in the first half of the year, particularly amongst our small and medium customers in England and Wales, was affected by the implementation of our new operating model, including the set-up of the NDEC, which caused disruption to availability. This did not affect the second half of the year.
Contribution, defined as revenue less cost of sales (excluding depreciation and exceptional items), distribution costs and directly attributable costs of £158.1m (FY16: £179.4m) was 11.9% lower year on year reflecting both a change in revenue mix, and a growth in operating cost coming from the new operating model which had been designed for a larger-sized branch network.
LTM core utilisation remained level at 50% (FY16: 50%) and LTM specialist brand utilisation was lower at 73% (FY16: 75%). These are both KPIs. As a consequence of management action taken, our utilisation rates have improved through the second half of 2017, being ahead of the same period in 2016 at 53% for core equipment and 75% for specialist brands.
ServicesServices revenues increased by 10.6% to £88.0m (FY16: £79.6m) and accounted for 26.2% (FY16: 23.2%) of Group revenues. This was principally due to strong growth in HSS OneCall and the continued development of HSS Training. Our Services revenues benefited from existing and new key account contracts where our one-stop-shop offering has provided clear market differentiation.
Contribution from Services grew by 15.1% to £11.9m (FY16: £10.3m), slightly ahead of the revenue growth rate, reflecting further margin improvement achieved using the existing teams and infrastructure to support increased levels of activity.
Financial highlights
Revenue Contribution1 Adjusted EBITDA2 Adjusted EBITA2 Operating loss2
£m 2017 2016 2017 2016 2017 2016 2017 2016 2017 2016
Rental £247.8m £262.8m £158.1m £179.4m
Services £88.0m £79.6m £11.9m £10.3m
Group £335.8m £342.4m £169.9m £189.7m £48.9m £68.6m £1.8m £20.5m (£71.4m) (£2.7m)
1 Contribution is defined as revenue less cost of sales (excluding depreciation and exceptional items), distribution costs and directly attributable costs (for each segment).2 These measures are not reported on a segmental basis because branch and selling costs, central costs and exceptional items (non-finance) are allocated centrally rather
than to each reportable segment.
HSS Hire Group plc Annual Report and Financial Statements 2017S
trategic Report
Corporate G
overnanceFinancial S
tatements
Additional Inform
ation

Strategic Report
Financial Review continued
CostsOur cost analysis set out below is on a reported basis and therefore includes exceptional investment associated with our operating model change. Year on year variances driven by such costs are identified in the commentary.
Our cost of sales increased by £9.1m (6.2%) during the year to £154.3m, mainly reflecting the growth in our Services revenues (principally HSS OneCall and HSS Training) and the associated third party supply costs incurred to support this activity. This also included £0.2m of exceptional costs compared with £3.4m in 2016. The high level of exceptional costs in 2016 related to changes in our operating model and the identification as part of that process of some aged resale stock that required impairment. A change in depreciation rates on one class of product during the year has led to an increase in depreciation charge of £0.8m. Changes to depreciation rates made during FY 16 led to a decreased charge of £4.2m during that year.
Our distribution costs increased by £1.0m (2.3%) from £45.1m to £46.1m. Within this exceptional costs were £0.1m compared with £1.3m in FY16. The higher exceptional costs in FY16 relate largely to the dual running costs as the Group migrated its activities to the NDEC whilst running its existing network in parallel.
Our administrative expenses grew by £51.7m (33.1%) to £207.7m (FY16: £156.0m). Exceptional costs accounted for a £53.8m increase year on year. The current year exceptional items include £40.7m network reconfiguration costs relating to the agreement with Unipart to terminate the NDEC contract. Additionally, the cost of onerous leases increased by £2.4m to £6.9m reflecting an increased number of branch closures year on year. The onerous lease provisions represent the discounted value of future rent payments on properties we are not trading from until lease expiry. There was an impairment of property, plant & machinery in closed branches of £8.3m. Looking forwards the Group incurred £3.7m of costs relating to delivering a cost reduction programme, £1.0m on senior management changes, £1.2m conducting its Strategic Review and £0.7m on preparatory refinancing expenses. Administrative expenses also include the £4.9m loss on disposal of the Reintec and TecServ cleaning equipment and maintenance businesses which were sold in November 2017.
Adjusted EBITDA and Adjusted EBITAOur Adjusted EBITDA for 2017 was £48.9m, 28.8% lower than in FY16 (£68.6m) driven by the decline in Rental and related revenues and the increased costs associated with the NDEC. Whilst this was offset by Services revenue growth, this was at a lower margin.
As a result, the Group’s Adjusted EBITDA margin for FY17 was 14.6% (FY16: 20.0%). Adjusted EBITDA and margin are included in our KPIs.
Our Adjusted EBITA declined to £1.8m (FY16: £20.5m). The significant reduction was driven by the higher costs of our operating network and our performance on rental and related revenue during the first half of the year. The business made an Adjusted EBITA loss in the first half of the year but returned to Adjusted EBITA profit in the second half.
This combined with a growth in lower margin Services revenue led to a reduction in EBITA margin to 0.5% (FY16: 6.0%) Adjusted EBITA and margin are included in our KPIs).
Other operating incomeOther operating income reflects the income received from the sub-letting of non-trading stores. This decreased by £0.3m year on year as the portfolio of non-trading stores fully or partially sub-let reduced. We continually assess our portfolio to identify revenue opportunities or to pursue attractive lease surrender opportunities as and when they arise.
Operating lossOur operating loss increased from £2.7m in 2016 to £71.9m in 2017, driven by lower revenue and increased operating costs including £66.6m of exceptional costs.
The £49.6m growth in exceptional items to £66.6m (FY16: £17.0m), and the reduction in Adjusted EBITDA from £68.6m to £48.9m driven by lower Rental revenue and the increased network costs accounts for the majority of this decline.
Exceptional itemsWe have incurred significant one off expenditure in a number of areas of the business as we seek to make cost reductions in order to take the business forward in the coming years. These totalled £66.6m. The majority of these exceptional items had no cash flow impact during 2017.
Branch closures led to onerous lease provisions of £6.9m (FY16: £4.5m). The cost included adjustments to expected future sub-let income from these closed properties and other properties that the
group has closed in previous years. Sub-let income from vacant properties declined from £1.1m to £0.9m.
Impairments of £8.3m were recorded in respect of closed branches (FY16: £nil).
In the first half of the year the Group started a cost reduction programme alongside the branch closures. This included making refinements to how the network operated and reductions in headcount. The total cost was £3.7m and this included a property impairment of £1.2m as head office functions were centralised in Manchester. Total average headcount across the Group reduced from 3,254 to 3,006.
Following the appointment of Steve Ashmore in June 2017 we announced in August 2017 that we would be undertaking a Strategic Review and we engaged an independent third party to assist. We believe that this was the most extensive review and analysis of the business ever conducted. The costs of this were £1.2m. We announced the outcome of this review in December 2017.
When we announced the outcome of our Strategic Review we identified significant cost savings that would be made. Principal to this was to save between £7m and £10m on an annualised basis from making changes to our supply chain model. In December 2017 heads of terms were agreed with Unipart to make significant changes to how we managed our centralised engineering at the NDEC. We will bring the Test and Run activity for high-volume products back into our branch network with repair and maintenance consolidated into regional distribution centres. Unipart will remain responsible for our spare parts warehousing and will provide cross-docking space to enable us to rebalance our fleet across the network. A formal agreement with Unipart was announced in February 2018 and an exceptional cost of £40.7m is recorded in the year. This represents an impairment of fixed assets of £1.9m, an intangible asset impairment of £1.2m, the write off of a security deposit of £4.5m, and the provision for termination payments and an onerous contract of £32.6m. Of the total provision created £9.6m will be payable in 2018 with the balance payable between in broadly equal annual amounts each year to 2026.
In November 2017 we sold our non-core Reintec and TecServ cleaning equipment hire and maintenance businesses for proceeds net of costs of £1.2m giving rise to a loss on disposal of £4.9m.
HSS Hire Group plc Annual Report and Financial Statements 201720

21
Finance costs Net finance expense (finance expenses less finance income) reduced to £13.7m (FY16: £14.7m). Drawings on our RCF increased during the year whilst our finance lease liability reduced. The reduction was driven by the financial period being one week shorter and a reduction in the interest unwind on discounted provisions.
TaxationThe Group generated a net tax credit of £5.2m compared with a credit of £0.1m in FY16. The Group made an overall loss for tax purposes in the UK, and the charge represents current tax suffered in Ireland offset by a £4.9m deferred tax credit arising from the offset of tax losses against the previously recognised deferred tax liability on intangible assets.
Reported and adjusted earnings per shareOur basic and diluted reported loss per share increased to 46.96p (FY16: loss of 11.18p). This was due to the larger loss generated in the year, partially offset by an increase in the weighted average number of shares from 154.8m to 170.3m shares as a result of the share placing completed in December 2016.
Our basic adjusted earnings per share, being profit before amortisation and exceptional costs less tax at the prevailing rate of corporation tax divided by the weighted average number of shares, moved from 2.98p in FY16 to a loss of 5.68p in FY17. Our diluted adjusted earnings per share, calculated in the same manner as basic adjusted earnings per share but with the weighted average number of shares increased to reflect LTIP and Sharesave options, was also a loss of 5.68p (FY16: 2.94p). These reflect the significant reduction in Adjusted EBITA in FY17 compared with FY16, which was driven by our performance in the first half of the year. Adjusted EPS (diluted) is one of our KPIs and is also used to assess Executive Director remuneration.
Capital expenditureFixed asset additions in the year were £34.5m, a £7.9m or 18.6% decline year on year. Within this £25.8m was spent on hire fleet (2016: £27.3m) reflecting another managed reduction of spend in these areas after two years of significant expenditure and including the capital efficiency benefit of centralising engineering activity into fewer locations. The remaining £8.7m was spent on non-hire additions (land, buildings, plant and machinery) (2016: £15.1m). The changes to the Group’s operating model centred on the NDEC were designed to support enhanced capital and operational
efficiency across the Group. We do not anticipate a material increase in our 2018 capital expenditure requirements due to efficiency gains through our fast moving products being tested in branches and more targeted investment using insight from the Strategic Review. Fleet investment is one of our KPIs.
Return on Capital Employed (ROCE)Our ROCE for FY17 was 0.9% compared with 9.7% for FY16. ROCE is calculated as Adjusted EBITA divided by the total of average total assets (excluding intangible assets and cash) less average current liabilities (excluding current debt items). Adjusted EBITA dropped by more than 90% during the year whilst the average capital employed by the Group decreased by 10.0% from the level calculated at the end of 2016, reflecting depreciation and asset disposals being higher than capital expenditure. This is one of our KPIs and is also used to assess Executive Director remuneration.
Cash generated from/utilised in operationsCash generated from operating activities was £10.1m for FY17, a decrease of £16.5m over the prior year (FY16: £26.6m). This reflects the reduction in profits which was offset by a planned reduction in hire fleet asset capital expenditure and an improvement in working capital compared with FY16.
Leverage and net debtNet debt (stated gross of issue costs) increased by £13.4m to £232.8m (FY16: £219.4m).
As at 30 December 2017 the Group had access to £29.8m of combined liquidity from available cash and undrawn committed borrowing facilities. Our leverage, calculated as net debt divided by Adjusted EBITDA, increased from 3.2x in FY16 to 4.8x at the end of FY17. This was primarily due to the lower Adjusted EBITDA generated in FY17. Leverage or Net Debt Ratio is one of our KPIs and is also used to assess Executive Director remuneration.
Use of alternative performance measures to assess and monitor performanceIn addition to the statutory figures reported in accordance with IFRS, we use alternative performance measures (APMs) to assess the Group’s ongoing performance. The main APMs we use are Adjusted EBITDA, Adjusted EBITA, Adjusted profit before tax, Adjusted earnings per share, leverage (or Net Debt Ratio) and ROCE, all of which are included in our key performance indicators as set out on pages 12 and 13.
We believe that Adjusted EBITDA, a widely used and reported metric amongst listed and private companies, presents a ‘cleaner’ view of the Group’s operating profitability in each year by excluding exceptional costs associated with non-recurring projects or events, finance costs, tax charges and non-cash accounting elements such as depreciation and amortisation.
Additionally analysts and investors assess our operating profitability using the Adjusted EBITA metric, which treats depreciation charges as an operating cost to reflect the capital-intensive nature of the sector in which we operate. This metric is used to calculate any annual bonuses payable to Executive Directors.
Analysts and investors also assess our earnings per share using an Adjusted earnings per share measure, calculated by dividing an adjusted profit after tax by the weighted average number of shares in issue over the period. This approach aims to show the implied underlying earnings of the Group. The Adjusted profit before tax figure comprises the reported loss before tax of the business with amortisation and exceptional costs added back. This amount is then reduced by an illustrative tax charge at the prevailing rate of corporation tax (currently 19%) to give an adjusted profit after tax. Adjusted earnings per share is used as a performance metric for the vesting of 2016 LTIP and 2017 market value option awards.
The calculation of Adjusted EBITDA and Adjusted EBITA can vary between companies, and a reconciliation of Adjusted EBITDA and Adjusted EBITA to operating profit/(loss) and Adjusted profit before tax to loss before tax is provided on the face of the Group’s income statement. A reconciliation of reported loss per share to Adjusted earnings per share is provided in note 10 of the accounts.
In accordance with broader market practice we comment on the amount of net debt in the business by reference to leverage (or Net Debt Ratio), which is the multiple of our Adjusted EBITDA that the net debt represents. This metric is also used in the calculation of any annual bonuses payable to Executive Directors.
We use ROCE to assess the return (the Adjusted EBITA) that we generate on the average tangible fixed assets and average working capital employed in each year. We exclude all elements of net debt from this calculation. This metric is also used as a performance metric for the vesting of 2016 LTIP awards.
Paul Quested Chief Financial Officer 5 April 2018
HSS Hire Group plc Annual Report and Financial Statements 2017S
trategic Report
Corporate G
overnanceFinancial S
tatements
Additional Inform
ation

Strategic Report
Corporate Responsibility
As a large national company, we are aware that we have responsibilities to our customers, our colleagues and our local communities, as well as to the wider economy and the environment. We build on the sustainable nature of our business model with an equally responsible approach to how we conduct our business activities, both inside and outside of our organisation.
Our primary responsibility is, as always, safety – of our colleagues, our customers and of the equipment we hire – and making sure that HSS is a safe place for people to work in and to hire from. We are also focused on ensuring that we operate with transparency and integrity, and on delivering a sound economic performance whilst reducing our impact on the environment, supporting our colleagues and our customers, and playing a positive role in our local communities.
1
Economic performance and governanceA responsible company generates and shares wealth in order to perform for its stakeholders – delivering a financial return for shareholders as well as ensuring continuity of supply and support for its customers and secure employment and development for its colleagues. As this Report details, HSS generated revenues of £335.8m which was shared amongst the various stakeholders in our business including our suppliers and their own supply chains, our colleagues and investors, the government and our local communities as well as a retained element to help fund future investment and growth.
We operate with integrity and transparency to ensure the highest levels of environmental and social governance with a strong management team and robust governance structures in place. We work to – and are audited against – a number of external accreditations, including the British ISO standards for health and safety and the environment. We are Safe Hire accredited and members of the British Safety Council. We are also FORS accredited for our commercial vehicle fleet.
Full details of our corporate governance are set out in pages 28 to 36 of this Report
2
Listening to our customers We recognise that HSS plays an important and vital role in the supply chain and operations of our customers, so we take a responsible approach towards ensuring that we deliver a service which meets their expectations. Part of this commitment includes surveying our customers at all levels and industries on a regular basis to assess the service they receive from us, and where they believe there is scope to improve. For a number of years we have partnered with TNS to conduct thorough, impartial NPS interviews with our customer base twice each year. This insight has directly impacted our strategy and operations, and led to positive change which improves the hire experience we offer our customers. The NPS score we achieved this year is significantly higher than the industry benchmark of 21.
NPS score
44(2016: 42)
Our full Corporate Responsibility Report is published at www.hsshiregroup.com/corporate-responsibility and the following pages summarise our activities and achievements.
HSS Hire Group plc Annual Report and Financial Statements 201722

23
3
Reducing environmental impact through our product lifecycleThere are environmental and social impacts at every stage of the product lifecycle of all the equipment in our fleet, so we are committed to sourcing, operating and disposing of our equipment in the most responsible way possible. Our innovative, purpose-built refurbishment centre in Manchester has provided the capacity for us to significantly increase our refurbishment capability, and in 2017 we further increased the number of machines going through the centre each year.
Machines refurbished through centre
604(2016: 526)
Replacement value of refurbished equipment
£7.2m(2016: £5.32m)
4
Reducing environmental impact though our operations We work responsibly to limit potential negative environmental impacts which arise from our day-to-day business operations. We are committed to driving energy efficiency within our built environment as well as through our operational networks. We work to, and are accredited against, industry recognised environmental standards, and work hard to regulate our use of natural resources, reduce polluting emissions and minimise waste.
We are accredited to ISO and OHSAS standards:
→ 9001 Quality
→ 14001 Environment
→ 18001 Health and Safety Policy (OHSAS)
From April 2018 the 9001 and 14001 accreditations will be audited against the revised standards criteria. The OHSAS 18001 standard is transferring to the new ISO 45001 standard later in 2018. We are currently working towards our reaccreditation.
Greenhouse gas emissionsThe Group reports on all of the emission sources required under the Large and Medium-sized Companies and Groups (Accounts and Reports) Regulations 2008 as amended in 2013. We use GHG Protocol Corporate Accounting and Reporting Standard data gathered to fulfil the reporting requirements under the CRC energy efficiency scheme and Defra conversion factors to calculate all building and transport emissions within the three reporting scopes:
→ all direct greenhouse gas emissions from sources owned or controlled by the Company;
→ indirect greenhouse gas emissions from the consumption of purchased electricity, heat or steam; and
→ other indirect emissions; here we report business travel.
Unless otherwise stated all data is provided for the period 1 April 2016 to 31 March 2017. This reporting period does not cover the same period covered by the Financial Statements, but has been adopted to allow the majority of data used to be actual recorded data rather than estimated consumption.
The total emissions produced by the Group during this period were 27,853.8 TCO2 (2016: 28,116).
ESOSThe UK Government established ESOS (the Energy Savings Opportunity Scheme) to implement Article 8 (4 to 6) of the EU Energy Efficiency Directive (2012/27/EU). The ESOS Regulations 2014 give effect to the scheme and the Environment Agency is the UK scheme administrator. ESOS is a mandatory energy assessment scheme for organisations in the UK that meet the qualification criteria.
65 kWh/m2
Group electricity usage (2016: 69 kWh/m2)
30kgcarbon emissions per m2 (2016: 36)
84%commercial waste diverted from landfill (2016: 68%)
HSS Hire Group plc Annual Report and Financial Statements 2017S
trategic Report
Corporate G
overnanceFinancial S
tatements
Additional Inform
ation

Strategic Report
Corporate Responsibility continued
2017 2016
ConsumptionConversion
factorEmissions
(TCO2) ConsumptionConversion
factorEmissions
(TCO2)
Scope 1 emissions
Fuel combustion 934,187 kWh 0.183645 176 2,515,448 kWh 0.18407 480
Company vehicles 4,557,734 litres 2.19697 18,687 4,956,014 litres 2.5839 12,829
Leeds bunkered diesel 160,159 litres 0.24592 39.4 209,000 litres 2.5839 540
Fugitive emissions1 22,380 litres 1.50938 33.8 16,335 litres 0.21468 24.7
Scope 2 emissions
Purchased electricity 14,480,788 kWh 0.44662 6,540 14,127,033 kWh 0.49636 7,012
Scope 3 emissions
Business travel2 7,903,725 miles 0.30088 2,378 24,355,118 miles 0.293416 7,794
Total greenhouse gas emissions 27,854 28,116
The methodologies used to calculate the information in the greenhouse gas emissions table are set out below.
Emission category Methodology
Fuel combustions (gas data for HSS building portfolio)
Based on CRC statements provided by gas suppliers for the period 1 April 2016 to 31 March 2017.
Company vehicle emissions Collated using data from fuel card provider and direct purchase records for cars and commercial vehicles in litres converted according to Defra guidelines.
Leeds bunkered diesel fuel Collated with the use of internal purchase order records converted according to Defra guidelines.
Fugitive emissions Collated with the use of internal purchase order records converted according to Defra guidelines.
Purchased electricity (for HSS building portfolio)
Based on CRC statements provided by electricity suppliers for the period 1 April 2016 to 31 March 2017.
Business travel Collated from expensed mileage claims and converted according to Defra guidelines.
1 2016 fugitive emissions have been restated as a result of a discrepancy in last year’s calculations.2 The significant difference in business travel figures between 2017 and 2016 is as a result of discrepancies in the 2016 data.
HSS Hire Group plc Annual Report and Financial Statements 201724

25
5
ColleaguesCentral to the successful delivery of our strategy are our people. Our colleagues make HSS, so we are committed to ensuring we create a diverse workforce, representative of the communities in which we operate. Colleague safety is our utmost priority, and we aim to provide for and protect their wellbeing and invest in their training and development to ensure that they are both appropriately skilled and motivated. In 2017 we were pleased to see a continued reduction in RIDDOR occurrences thanks in part to an increased internal focus on safe working practices. Our commitment to offering continued training and development for our colleagues at all levels saw us move to a blended approach to learning, encompassing training courses delivered online, through the management population, as well as more traditional classroom or depot-based learning. Colleagues involved in professional diploma or certification programmes are allowed time away from their roles to complete these each year.
As at 30 December 2017, 15% of all of our colleagues were female. Despite this figure being in line with many other companies in our industry, we recognise the need to improve this. Our gender pay gap report has demonstrated our commitment to rewarding all colleagues at a fair and equal level regardless of gender.
6
CommunitiesOur extensive branch and operations network allows us to play a part in hundreds of communities across the UK and Ireland, and we are committed to making a positive impact wherever we can. Our head office in Manchester regularly holds dress down days to raise money for our charity partners, and we donate the 5p charge from all our carrier bags to Dementia UK. We are also committed to supporting educational efforts in our communities and offer work placements in our head office support teams to students from some of the local universities.
Approval of the Strategic ReportThe Strategic Report on pages 2 to 25 was approved by the Board of Directors on 5 April 2018 and is signed on its behalf by:
Steve AshmoreDirector 5 April 2018
RIDDOR
0.39(2016: 0.40)
Women
15%(FY16: 17%)
Gender pay gap
8%
HSS Hire Group plc Annual Report and Financial Statements 2017S
trategic Report
Corporate G
overnanceFinancial S
tatements
Additional Inform
ation

26 HSS Hire Group plc Annual Report and Financial Statements 2017

27
Corporate Governance28 Chairman’s Introduction
30 Board of Directors
32 Corporate Governance
37 Audit Committee Report
40 Market Disclosure Committee Report
40 Nomination Committee Report
42 Directors’ Remuneration Report
50 Other Statutory Disclosures
53 Directors’ Responsibility Statement
Strategic R
eportC
orporate Governance
Financial Statem
entsA
dditional Information
HSS Hire Group plc Annual Report and Financial Statements 2017

Corporate Governance
Chairman’s Introduction
Ensuring good governance is an integral part of our businessOn behalf of the Board, I am pleased to present the corporate governance report for the 2017 financial year.
This part of the Annual Report provides an overview of the Group’s existing approach to corporate governance and how we continue to evolve our corporate governance structure(s) to better mitigate risk and ensure compliance with prevailing legislation on an ongoing basis. Reports from the Chairs of each of the sub-committees of the Board (the Audit, Nomination, Market Disclosure and Remuneration Committees) are included in the following pages and outline the work and initiatives each has undertaken during the year.
During the course of 2017 we saw a number of changes take place within the Company; however, our vision that corporate governance should form the backbone of our culture remains unchanged. We have strong governance structures through our Committees, systems and policies and together these contribute to our day-to-day activities, the protection of our assets and the delivery of our business plan.
Alan PetersonChairman
28 HSS Hire Group plc Annual Report and Financial Statements 2017

29
The main corporate governance issues addressed by the Board or one of the four sub-committees of the Board during the year were as follows:
Strategic ReviewDuring 2017, the Board engaged with an independent party to work with HSS management, to undertake the most extensive review of the business to date. Three key Strategic priorities were identified;
1 Delever the Group
2 Repair the Tool Hire business
3 Strengthen commercial proposition
As a result of our findings, a number of cost control initiatives have been implemented. This is to ensure that the business is operating as efficiently and effectively as possible, and that it is well placed to recover from its disappointing performance in the first half of 2017 and improve shareholder returns.
The Board remains confident that the changes implemented will position the business to drive improved earnings per share. Our focus in 2017 has been firmly on cost control, operational and capital efficiency and driving a clear competitive advantage from our enhanced customer proposition.
Board evaluationWe completed our 2017 internal Board and Committee evaluation in early 2018. Further details on this process and its findings are provided in the Nomination Committee report on pages 40 and 41.
The Nomination Committee is recommending that all Board Directors are re-elected at our Annual General Meeting (AGM).
Senior management reorganisationIn early 2017, we made further appointments to our senior leadership team, including a Group HR Director and a Chief Commercial Officer, the latter being specifically focused on reinvigorating our core Rental and related revenue growth. In June 2017 we appointed Steve Ashmore as our new CEO, replacing John Gill who stepped down from the Group, having served for eight years in the Company.
Legislative/regulatory change and related training for colleaguesThe Directors and senior management are informed of notable legal and regulatory changes via a combination of internal legal and audit professionals and also via external advisers. During 2017 and continuing into 2018, the Group has assessed and is implementing changes as required in preparation for the GDPR becoming law in 2018. 2017 also saw the introduction of the Criminal Finances Act, placing increased emphasis on controls to prevent the facilitation of tax evasion. HSS has given top level commitment to this, including a new policy, a risk assessment and bespoke e-learning training modules. The Group has also continued to monitor its policies and procedures in respect of the Modern Slavery Act 2015 and will publish an anti-slavery and human trafficking statement for FY17 during 2018. The Group released its gender pay gap report which shows a gap of 8.2%, significantly lower than the national average of 18.1%. We are committed to creating a fair and equal reward structure across our workforce, regardless of gender.
Equality and diversity policyThe Group’s equality and diversity policy applies across all levels of the business, including at Board level, and is designed to reflect the importance that we believe promoting equal opportunities and diversity plays in the long-term success of HSS.
Currently we have one female Non-Executive Director, meaning 50% of our Independent Non-Executive Directors are female and 17% of the Board is female. Further detail on the gender split for senior management and employees is provided within the Strategic Report on page 25.
Based on our annual Board evaluation we believe that the current mix of experience, background and perspectives amongst the Directors contributes to the effectiveness of the Board as a whole; however, we recognise that female representation and diversity at Board level remains limited and represents continuing development opportunities for the Group.
As and when Director or senior management appointments are being made or succession planning is being undertaken, all candidates are considered on merit and against objective criteria, with due regard for the benefits of diversity on the Board and amongst the senior management team, including gender.
Further details on our approach to equality and diversity can be found on page 25 and within our Corporate Responsibility Report available for download at www.hsshiregroup.com/corporate-responsibility.
Looking aheadThe implementation of the findings from our Strategic Review and the new management team give me great confidence that we have assembled a strong operational team and an experienced Board, both of which will drive the long-term success of the business.
In December, the management team presented the findings of the Strategic Review, which determined that the current size of the network, 255 locations, was the appropriate level for the Group. This was much lower than originally envisaged when the NDEC was set up and therefore the network was no longer cost-effective. On this basis, the testing of fast moving core hire fleet has been moved back into the branch network with engineering consolidated into a number of CDCs, ensuring continued high product utilisation and capital efficiency.
As a Board we remain confident that the changes we have implemented through this period, and continue to implement, will position the business to drive improved shareholder returns in what remains a competitive and fragmented marketplace.
I once again look forward to meeting shareholders at our next AGM, which will be held at 11.00am on 21 June 2018 at Hilton Garden Inn, Hatton Cross.
Alan PetersonChairman 5 April 2018
Strategic R
eportC
orporate Governance
Financial Statem
entsA
dditional Information
HSS Hire Group plc Annual Report and Financial Statements 2017

Corporate Governance
Board of Directors
Alan Peterson Chairman
Alan Peterson has served as the Group’s Chairman since December 2012. He also served as the Group’s Chairman between 2004 and 2007. Alan’s experience over the last 25 years includes involvement in a number of public and private equity-backed businesses across the UK, Europe and North America. He has held the role of chief executive officer and chairman in a number of manufacturing, industrial and retail companies, including Enterprise Group plc, Azelis Holding SA, Rockware Group and Meyer International plc. He is also the chairman of BBI Group Holding Limited.
Alan became 3i’s first Industrialist in Residence in 2001, serving until 2005.
Alan also chairs the Board’s Nomination Committee.
Steve Ashmore Chief Executive Officer
Steve Ashmore joined the Group as Chief Executive Officer in June 2017. He brings in considerable leadership experience and consistent delivery of growth and value in a range of industries complementary to HSS, including building product supply, logistics and distribution.
Steve previously held a number of senior roles at Exel, the supply chain and third party logistics provider, before working in a number of senior leadership positions, including uk managing director, at Wolseley, the £2.0bn revenue distributor of plumbing and heating products and supplier of building materials. Before joining HSS he was the UK managing director of Brammer, the specialist distributor of industrial products.
Paul Quested Chief Financial Officer
Paul Quested joined the Group as Chief Financial Officer in August 2016. Before joining the Group, he was chief corporate development officer for Electrocomponents plc and had held a number of senior positions within Electrocomponents, including those of global strategy director, general manager (RS UK) and head of finance (RS UK).
Prior to Electrocomponents, Paul worked at InBev for ten years, where his roles included planning & performance management director. Before InBev, he worked at Coopers & Lybrand where he was an audit manager for TSE 100 clients.
30 HSS Hire Group plc Annual Report and Financial Statements 2017

31
Amanda Burton Senior Independent Non-Executive DirectorAmanda Burton is an independent non-executive director of Countryside Properties plc and the Skipton Building Society. She chairs the Remuneration Committee for Countryside Properties plc and is a member of the Remuneration Committee at the Skipton Group. Amanda is also the chair of the Battersea Dogs and Cats Home. Until December 2014, she served as the chief operating officer of Clifford Chance LLP. She was also previously the senior independent non-executive director of Galliford Try plc, Monitise plc and a non-executive director of Fresca Group Limited.
Amanda is a member of the Board’s Audit and Nomination Committees and chairs both the Remuneration Committee and the Market Disclosure Committee.
Doug Robertson Independent Non-Executive DirectorDoug Robertson was appointed as a non-executive director and chair of the Audit Committee of Zotefoams plc in August 2017. He retired as finance director of SIG plc on 31 January 2017. He was previously finance director of Umeco plc from 2007 until 2011, and finance director of Seton House Group Limited from 2002 until 2007. He has also held a variety of divisional finance director roles within Williams plc and was previously managing director of Tesa Group, Chubb’s hotel security division.
Doug is a member of the Board’s Nomination and Remuneration Committees and chairs the Audit Committee.
Thomas Sweet-Escott Non-Executive Director
Tom Sweet-Escott co-founded Exponent Private Equity in 2004. He is primarily responsible for investments in the financial services sector and also serves on the board of the Bullitt group of companies. He has previously served on the boards of Trainline plc, V.Group and Lowell, and worked for 3i in London and Madrid.
Strategic R
eportC
orporate Governance
Financial Statem
entsA
dditional Information
HSS Hire Group plc Annual Report and Financial Statements 2017

Corporate Governance
Corporate Governance
Compliance with the Corporate Governance CodeThe Board is committed to high standards of corporate governance and as such has complied with the UK Corporate Governance Code (the Code) during the FY17 reporting year, noting the following:
The Code recommends that at least half the Board of Directors of a UK-listed company, excluding the Chairman, should comprise Independent Non-Executive Directors. Independence is determined by ensuring that, apart from receiving their fees for acting as Directors, Non-Executive Directors do not have any other material relationship or transactions with the Group, its promoters, its management or its subsidiaries, which in the judgement of the Board may affect their independence of judgement.
Thomas Sweet-Escott, a Non-Executive Director, is not considered to be independent for the purposes of the Code as he represents Exponent Private Equity (Exponent) and related investors (the Exponent Shareholders), who currently control 50.3% of the Company’s issued shares.
Code Provision B.1.2 provides that a smaller company should have at least two Independent Non-Executive Directors. A smaller company is one that is below the FTSE 350 throughout the year immediately prior to the reporting year, which is the case in respect of the Company. Therefore, as at 30 December 2017, the Company is compliant with the requirements of the Code in this respect. On 22 January 2015, the Company, Exponent and the Exponent Shareholders entered into a Relationship Agreement which regulates the ongoing relationship between them. The principal purpose of this agreement is to ensure that the Company and its subsidiaries are capable of carrying on their business independently of Exponent and the Exponent Shareholders and that any transactions and relationships between them are at arm’s length and on normal commercial terms.
The Code is publicly available at the following web address: www.frc.org.uk/Our-Work/Publications/Corporate-Governance/UK-Corporate-Governance-Code-April-2016.pdf
LeadershipKey roles and responsibilities
Chairman Alan Peterson
Responsible for: → ensuring that the conduct of the Group is in accordance with high standards of integrity and probity, and in accordance with all appropriate governance codes;
→ the leadership and overall effectiveness of the Board, and ensuring that there is appropriate delegation from the Board to executive management;
→ ensuring a clear structure for the operation of the Board and its Committees; → setting the Board agenda in conjunction with the Company Secretary, Chief Executive Officer and Chief Financial Officer;
→ ensuring that the Board receives accurate, relevant and timely information about the Group’s affairs; and → ensuring clear two-way communication with shareholders.
Chief Executive Officer Steve Ashmore
Responsible for: → developing the Group’s strategy for consideration and approval by the Board; → implementing the agreed strategy; → day-to-day management of the Group’s operations; and → being accountable to, and reporting to, the Board on the performance of the business.
Senior Independent Non-Executive Director Amanda Burton
Responsible for: → being an alternative contact for shareholders at Board level other than the Chairman; → acting as a sounding board for the Chairman; → if required, being an intermediary for Non-Executive Directors’ concerns; and → reviewing the Chairman’s performance.
The Senior Independent Non-Executive Director carries out the duties of a Senior Independent Director for the purposes of compliance with the Code.
Board and Committee structure
The Board focuses on: → leadership; → risk assessment and management; → strategy; → performance; and → monitoring safety, values and standards.
In addition there is a formal schedule of matters reserved for the Board.The Committees each have full terms of reference which can be found on the Company’s website at www.hsshiregroup.com/investor-relations/corporate-governance.
Non-Executive DirectorsThe number of Non-Executive Directors and their range of skills and experience is kept under review and was formally reviewed as part of the Board evaluation (see page 41).
32 HSS Hire Group plc Annual Report and Financial Statements 2017

33
Attendance at Board and Committee meetings of which each Director is a member held between 1 January 2017 and 30 December 2017
Director BoardAudit
CommitteeRemuneration
CommitteeNomination Committee
Executive Directors
Steve Ashmore1 11/11 – – –
John Gill2 4/4 – – –
Paul Quested 16/16 – – –
Non-Executive Directors
Alan Peterson 16/16 – – 2/2
Amanda Burton 15/16 8/8 7/7 2/2
Doug Robertson 15/16 8/8 7/7 2/2
Thomas Sweet-Escott 14/16 – – –
1 Steve Ashmore was appointed as a Director with effect from 1 June 2017. 2 John Gill resigned as a Director with effect from 23 May 2017.
Governance framework
Alan PetersonChairman
Role:
→ Ensure effectiveness of the Board → Ensure corporate governance compliance → Ensure effective Board Committee structure → Ensure effective communications
The BoardComprises six Directors, of which four are Non-Executive, two of which, Amanda Burton and Doug Robertson, are considered independent. The Board is supported by the Company Secretary.
Role:
→ Lead the Group → Oversee risk management and internal controls → Oversee strategy → Oversee the executive management → Monitor performance → Set values and standards
Executive managementChief Executive Officer, Chief Financial Officer, Chief Commercial Officer, Group HR Director, and Managing Director of Scotland and Ireland.
Role:
→ Implement Group strategy → Operational management of the Group
Company SecretaryDaniel Joll
Role:
→ Support and advise the Board and Committees
→ Daniel is also a member of the executive management team
Audit CommitteeComprises Independent Non-Executive Directors, chaired by Doug Robertson, supported by the Company Secretary.
Role:
→ Monitor financial reporting → Monitor audit → Monitor effectiveness of risk management and internal controls
Find out more Audit Committee Report pages 37 to 39
Remuneration CommitteeComprises Independent Non-Executive Directors, chaired by Amanda Burton, supported by the Company Secretary.
Role:
→ Determine and review appropriate Board and senior executive remuneration policies and structures
→ Determine appropriate remuneration packages for Board and senior executives
Find out more Directors’ Remuneration Report pages 42 to 49
Nomination CommitteeComprises Non-Executive Directors, including two Independent Non-Executive Directors, chaired by Alan Peterson, supported by the Company Secretary.
Role:
→ Advise the Board on composition, membership and succession planning
→ Advise the Board on appointments
Find out more Nomination Committee Report pages 40 to 41
Market Disclosure CommitteeChaired by Amanda Burton, plus the Chief Executive Officer, supported by the Company Secretary.
Role:
→ Ensure compliance with disclosure requirements
Find out more Market Disclosure Committee Report page 40
Strategic R
eportC
orporate Governance
Financial Statem
entsA
dditional Information
HSS Hire Group plc Annual Report and Financial Statements 2017

Corporate Governance
All the individuals who were Directors as at 30 December 2017 offer themselves for re-election at the next AGM of HSS Hire Group plc to be held at 11.00am on 21 June 2018 at Hilton Garden Inn, Hatton Cross.
The biographical details of each of the Directors, including details of their other directorships and relevant skills and experience, are on pages 30 and 31 of this Annual Report and are also set out in the Notice of AGM.
The Board recommends that shareholders approve the resolutions to be proposed at the AGM relating to the re-election of all of the Directors.
Terms and conditions and time commitmentsThe Chairman and Non-Executive Directors are all appointed pursuant to formal letters of appointment which outline, amongst other details, the remuneration and term of appointment for each Director.
The Chairman devotes such time to the affairs of the Company as is required by his duties. In addition, in 2017, the Non-Executive Directors devoted their time in carrying out their duties, which included attendance at meetings as reflected in the above table.
In order to facilitate proper debate and consideration, all Directors are expected to attend Board and Committee meetings to which they are invited in person.
The Executive Directors of the Company may attend certain meetings of the Committees at the invitation of the Chairman of the respective Committee. These attendances are not recorded in the table set out above.
Conflicts of interestExponent and the Exponent Shareholders currently control 50.3% of the Company’s issued shares.
Thomas Sweet-Escott is a partner at Exponent and Alan Peterson has a long-standing business relationship with Exponent and is chairman and/or a director of BBI Group Holding Limited, BBI Acquisition Limited, EAGLE SPV 2 Limited and EAGLE SPV 3 Limited, all of which are Exponent portfolio companies. The Group trades on an arm’s length basis with certain Exponent portfolio companies.
Amanda Burton is a Non-Executive Director of the parent company of a customer of the Group.
The Board has satisfied itself that such customer is not material enough to create a potential conflict of interest. In the event that HSS’s relationship with any customers or other companies where any of the Directors are also appointed as directors becomes material by virtue of their trade with the Group or another business reason, the relevant Director would be expected to declare their connection to the customer/company and the Board would assess whether a conflict of interest arises and the appropriate action to be taken. Save as set out above, there are no current or potential conflicts of interest between any duties owed by the Directors or senior management to the Company and their private interests or other duties.
Any Directors’ conflicts of interest are declared to the Board and recorded by the Company Secretary.
EffectivenessBoard compositionThe Board and Committees are considered to have an appropriate range of experience, skills and knowledge to fulfil their duties. Profiles of each of the members of the Board are provided on pages 30 and 31.
The four Non-Executive Directors, Alan Peterson, Amanda Burton, Doug Robertson and Thomas Sweet-Escott, represent a majority of Board members and provide a broad range of skills and experience.
The two Executive Directors, Steve Ashmore and Paul Quested, bring a variety of sector experience to the Board. Amanda Burton and Doug Robertson are considered independent. They are members of the Audit, Remuneration and Nomination Committees of the Board. Both the Market Disclosure and Remuneration Committees are chaired by an Independent Non-Executive Director, Amanda Burton. The Audit Committee is chaired by an Independent Non-Executive Director, Doug Robertson.
Appointments to the BoardThe Nomination Committee, which is composed entirely of Non-Executive Directors, is responsible for any future appointments to the Board. The Nomination Committee is chaired by the Chairman of the Board, Alan Peterson. By virtue of the fact that the majority of its members are Independent Non-Executive Directors, the Nomination Committee is considered independent.
Overview of Board’s work during 2017The Board met 16 times during 2017.
Regular agenda items for the Board included, and will include in 2018:
→ operational and financial performance;
→ health and safety;
→ risk management and the risk register;
→ internal policies and procedures – introduction, review, monitoring;
→ reviewing, setting and approving strategy;
→ finance and banking arrangements;
→ major capital expenditure; and
→ evaluation of acquisition/disposal opportunities.
Ad hoc and specific items reviewed by the Board during the year included, and will include in 2018:
→ the Annual Report and Accounts;
→ the Interim (half-year) Report and Accounts;
→ the quarterly reporting required under the reporting requirements of the Notes together with any associated trading updates;
→ RNS releases relating to Directorate changes (as applicable); and
→ approval of the annual budget.
The Board delegates authority to the following Committees:
→ Audit Committee;
→ Remuneration Committee;
→ Nomination Committee; and
→ Market Disclosure Committee.
Board evaluationInternal evaluation of the Board and of our sub-committees was carried out as detailed on page 41.
Corporate Governance continued
34 HSS Hire Group plc Annual Report and Financial Statements 2017

35
Board trainingAs part of induction, any new Directors receive training from the Company’s sponsors/brokers in relation to their responsibilities as a Director of a listed company. The Board also receives regular updates on legal and regulatory developments through the course of a financial year as reflected in the Chairman’s Introduction on page 29.
Access to information and supportThe Board is provided with an agenda and supporting papers and documentation ahead of each Board and/or Committee meeting to allow them time to read, review and consider the information and analysis presented. The Board also has access to the Company Secretary and can request independent advice at the Company’s expense where they believe it is appropriate and valuable to do so. Senior management are also frequently invited to present at Board meetings as deemed appropriate, and the Board can access such colleagues at any time.
AccountabilityFinancial and business reportingThe Directors are responsible for preparing the Annual Report and the Financial Statements in accordance with applicable law and regulations, and as set out in the Directors’ Responsibility Statement (see page 53), the Board considers that the Annual Report and Accounts, taken as a whole, is fair, balanced and understandable and provides the information necessary for shareholders to assess HSS’s position and performance, business model and strategy.
Risk management and internal controlThe Board has overall responsibility for determining the nature and extent of the principal risks it is willing to take to achieve its strategic objectives and for establishing and maintaining a sound system of risk management and internal control, and then reviewing its effectiveness.
The principal risks and uncertainties facing the Company and how these are being managed/mitigated are detailed on pages 14 to 17.
The Group’s risk management and internal control system is designed to manage the risks facing the Group and safeguard its assets. No system of internal control can provide absolute assurance against material misstatement or loss. The Group’s system is designed to provide the Directors with reasonable assurance that issues are identified on a timely basis and are dealt with appropriately.
The Audit Committee (whose composition, remit and report are set out on page 33 and pages 37 to 39) assists the Board in reviewing the effectiveness of the Group’s risk management and internal controls, including financial, operational and compliance controls and risk management systems. This is carried out with the assistance of the Chief Financial Officer and the Risk and Assurance Director which is supported by the findings of specific projects/investigations completed by the internal audit team, the findings of which are presented to the Audit Committee during the financial year.
WhistleblowingThe Company has a formal whistleblowing process, whereby any colleague may, in complete anonymity, contact certain nominated members of senior management to raise any concerns. These concerns are then investigated independently and the results shared with the whistleblower for further discussion if appropriate/possible. This process is communicated to all colleagues at least annually to their home addresses, and the policy and relevant details are also made available to colleagues on a dedicated section of the Group intranet, HSS World.
Modern Slavery Act 2015The Group published its Modern Slavery Act statement for the financial year ended 31 December 2016 on its website in 2017.
Going concern and long-term viability statement Note 1(g) of the Financial Statements sets out the basis on which the Directors continue to adopt the going concern basis in preparing the Annual Report and Accounts.
In summary, taking into account the adequacy of the Group’s debt facilities, current and future developments and the principal risks and uncertainties (see pages 14 to 17), and after making appropriate enquiries, the Directors have a reasonable expectation that the Group has adequate resources to continue in operational existence for the foreseeable future. Accordingly they continue to adopt the going concern basis in preparing the Financial Statements included within this Annual Report.
In accordance with provision C.2.2 of the UK Corporate Governance Code 2014, the Directors have assessed the viability of the Group over a three-year period, taking into account the Group’s current position, strategic plans, and the potential impact of the principal risks and uncertainties documented on pages 14 to 17. Based on this assessment, and all other matters considered and reviewed at Board level during the year, the Directors confirm that they have a reasonable expectation that the Group will be able to continue in operation and meet its liabilities as they fall due over the period to 26 December 2020.
Whilst the Directors have no reason to believe the Group is not viable over a longer period they have determined that three years is the appropriate time over which to provide the viability statement because:
→ it reflects a period over which the Directors can have a reasonable view of the future in the context of the market environment in which the Group operates; and
→ it is consistent with the time covered by the Group’s current strategic plans and model.
The Group’s annual budgeting and forecasting process involves the preparation of an annual budget, and a rolling three-year strategic model that also includes planned strategic actions and other specific assumptions regarding revenue growth, cost trends and capital expenditure across the Group.
Where appropriate, sensitivity analysis is undertaken to test the resilience of the Group to various scenarios. Whilst all of the principal risks and uncertainties were considered, the following were considered in greater detail during the sensitivity analysis: macroeconomic conditions and competitor challenge, in addition to a changing cost profile.
The principal effects assessed, together with their impact on the Group’s Financial Statements, were therefore:
→ reductions in Rental and related revenue growth rates (market or company specific) and the associated impacts on capital expenditure requirements and the Group’s variable cost base;
→ delays in the achievement of network change cost savings;
→ delays in achieving other planned cost reductions;
→ increases in costs at a higher rate than currently planned;
→ lower liquidity levels due to an increase in debtor days; and
→ changes in finance cost – LIBOR increases, affecting the cost of the Revolving Credit Facility.
Strategic R
eportC
orporate Governance
Financial Statem
entsA
dditional Information
HSS Hire Group plc Annual Report and Financial Statements 2017

Corporate Governance
In addition to the mitigating factors identified on pages 15 to 17, the Board noted that: the Group has a diversified customer base; a history of winning new customers; and low customer concentration with only one customer currently accounting for more than 10% of revenues and the top 20 customers accounting for less than 30% of revenues. Alongside this the Group has a continuous profile of lease expiries that allows a material portion of the portfolio to be exited in any one year and the Group’s ability to match capital investment to customer demand acts to support cash generation.
With regard to sources of finance, the Board has no reason to believe the Group will not be able to refinance the Group’s existing £136m senior secured notes and RCF before they become repayable in 2019. The Directors reiterate their intention to refinance these facilities before they become current in July 2018 and to provide the Group with a capital structure with increased levels of liquidity.
Statement on disclosure of information to the auditorThe Directors who held office as at 5 April 2018 each confirm that:
→ a) so far as the Director is aware, there is no relevant audit information of which the Company’s auditor is unaware; and
→ b) he/she has taken all the steps that he/she ought to have taken as a Director in order to make himself/herself aware of any relevant audit information and to establish that the Company’s auditor is aware of that information.
This confirmation is given and should be interpreted in accordance with the provisions of Section 418 of the Companies Act 2006.
RemunerationThe Remuneration and Audit Committees are composed exclusively of Independent Non-Executive Directors, able to judge and achieve an appropriate balance between incentivising Executive Directors and the potential impact on the Company’s risk profile.
The Remuneration Committee (whose composition, remit and report are set out on page 33 and pages 42 to 49) sets the policy for and terms of executive remuneration.
Relations with shareholders and other capital providersShareholder engagement The Board remains committed to communicating with shareholders and stakeholders in a clear and open manner, and seek to ensure effective engagement through the Company’s website, its public announcements, the AGM and other investor relations activities.
In addition to its ongoing reporting obligations, the Company undertakes a programme of meetings with existing and/or potential institutional investors and equity analysts, led by the Chief Executive Officer and Chief Financial Officer. These meetings, together with investor feedback collected via our brokers, enable the Company to assess prevailing analyst and investor sentiment and to obtain external feedback on how the Group’s performance and strategy are perceived and considered. A summary report on investor interaction and feedback is provided to each Board meeting through the year to keep the wider Board informed of these activities and findings.
During 2017 there have been a total of over 80 such meetings/presentations, including quarterly results presentations and a Strategy Update presentation held in December.
As well as such meetings and announcements, teleconference calls are held with institutional investors and analysts throughout the year; copies of relevant presentation materials are made available on the Company’s website to the extent they differ from the latest publicly released results presentations.
All Directors are expected to attend the AGM, providing shareholders with the opportunity to question them about issues relating to the Group, either during the meeting or informally afterwards. The Non-Executive Directors are available for discussion with shareholders on matters under their areas of responsibility either in person at the AGM or at any other time via the Company Secretary.
The Company reports its financial results to shareholders twice a year, with the publication of its Annual and Half-Year Financial Reports. Shorter, less detailed trading updates are also provided to the market on a quarterly basis.
The Company also produces quarterly financial reports consolidated at the Hero Acquisitions Limited group level to meet the reporting obligations of the Notes issued in February 2014. The Notes are held within HSS Financing plc, a wholly owned direct subsidiary of Hero Acquisitions Limited, itself a wholly owned subsidiary of HSS Hire Group plc. The quarterly reports are therefore principally of use to noteholders as they provide information on the financial performance of the Notes’ guarantor group rather than the Company and Group. To aid shareholders’ understanding of the difference between Hero Acquisitions Limited’s and HSS Hire Group plc’s consolidated results, the Company provides the afore mentioned trading updates for HSS Hire Group plc on a quarterly basis.
All of the above mentioned reports are made available for download to noteholders and shareholders in the investor relations section of the Company’s website, www.hsshiregroup.com/investor-relations.
Significant shareholdersBased on TR-1 notifications received from the parties who hold 3% or more of the issued share capital of the Company as at 5 April 2018 are as follows:
Name
Number of ordinary
shares of 1p % holding
Exponent1 85,681,709 50.34%
Toscafund Asset Management LLP2 45,812,070 26.92%
Standard Life Capital Partners LLP 13,958,979 8.20%
1 Comprises shareholdings held by Exponent Private Equity Partners GP II, LP (UK) and Exponent Havana Co-Investment GP Limited Partners (UK).
2 Comprises shareholdings held by the Tosca Mid-Cap fund, the Tosca Opportunity fund and the Micro-Cap Units fund.
Details of Directors’ interests in the Company’s ordinary share capital are provided in the Directors’ Remuneration Report on pages 42 to 49.
Annual General MeetingThe Company’s AGM will be held at 11.00am on 21 June 2018 at Hilton Garden Inn, Hatton Cross. All shareholders are invited to the Company’s AGM, at which they will have the opportunity to put questions to the Board. Details of the resolutions proposed and being voted on are provided in the Notice of AGM provided to shareholders and also available for download on the Group’s website, www.hsshiregroup.com.
Relations with other capital providersAs part of the reporting requirements of the Notes we report consolidated results for the Hero Acquisitions Limited group to noteholders on a quarterly basis. This includes a conference call, where noteholders have the opportunity to speak with the Chief Executive Officer and Chief Financial Officer.
Corporate Governance continued
36 HSS Hire Group plc Annual Report and Financial Statements 2017

37
Audit Committee Report
Doug RobertsonCommittee Chairman
Dear shareholderOn behalf of the Audit Committee (the Committee), I am pleased to present our report for the 2017 financial year.
The Committee has reviewed the contents of the 2017 Annual Report and Accounts and advised the Board that it considers the Report to be fair, balanced and understandable and provides the information necessary for shareholders to assess the Company’s position and performance, business model and strategy.
Roles and responsibilitiesThe Committee has responsibility for overseeing the financial reporting and internal financial and risk management controls of the Company, as well as maintaining an appropriate relationship with the external auditor and reporting its findings and recommendations to the Board.
The Committee’s full terms of reference can be found on the Company’s website at www.hsshiregroup.com/investor-relations/corporate-governance. A summary of its key responsibilities include:
→ receiving and reviewing the Annual Report and Accounts and half-yearly Financial Statements and all related public financial announcements, and advising the Board on whether the Annual Report and Accounts are fair, balanced and understandable;
→ receiving and reviewing reports from the external auditor;
→ monitoring the external auditor’s effectiveness and independence and approving their appointment and their terms of engagement;
→ monitoring the effectiveness of the Group’s risk management system;
→ reviewing the effectiveness of the Group’s system of internal financial controls and internal control and compliance systems, and advising the Board as appropriate; and
→ overseeing the Group’s procedures for detecting fraud and whistleblowing arrangements.
Core activitiesThe Committee met eight times in 2017. All members attended these meetings.
The Committee’s core activities during 2017 included, and will include in 2018:
→ reviewing and enhancing disclosure in areas of judgement of estimates within the notes to the Financial Statements;
→ reviewing internal control systems and policies;
→ regular review of the work and findings of the internal audit function;
→ considering risk management systems;
→ reviewing the risk register; and
→ meeting with the external auditors, agreeing their audit plan and assessing their findings.
Strategic R
eportC
orporate Governance
Financial Statem
entsA
dditional Information
HSS Hire Group plc Annual Report and Financial Statements 2017

Corporate Governance
Audit Committee Report continued
Ad hoc activitiesSpecific additional work streams undertaken by the Committee during the year included responding to a thematic review of the Group’s 2016 accounts by the Financial Reporting Council. Positive feedback on the presentation and disclosure in the accounts was received and minor recommendations for improvement have been noted and acted upon. Additionally, the Committee has considered the impact upon the Group of the Anti-facilitation of Tax Evasion implications of the 2017 Criminal Finances Act which will come into force during 2018.
External financial reportingThe Committee is responsible for monitoring and reviewing the Financial Statements and reviewing compliance with legal, regulatory and statutory requirements, giving due consideration to the provisions of the Code.
The Committee reviewed the annual and interim Financial Statements and trading updates released during the year with particular focus on the following significant areas:
→ hire stock existence and valuation;
→ carrying value of goodwill and other intangible and tangible assets;
→ revenue recognition – cut-off, sales rebates and credit note provisions;
→ onerous lease provisions
→ management assessment of going concern; and
→ exceptional items.
These areas are identified as significant due to their complexity, size, level of judgement required and/or potential impact on the Financial Statements and our strategy.
An overview of each of these areas is set out below:
Hire stock existence and valuationRental income earned on materials and equipment held for hire which is owned by the Group (hire stock) is a large component of the Group’s revenues. As such the existence of hire stock is important to the ongoing ability of the Group to generate revenue from its assets. Certain of the Group’s funding arrangements are also linked to specific assets or asset classes. The Committee has therefore given careful consideration to the controls in place to verify the physical existence and appropriate valuation of hire stock together with the processes for verifying the reliability of the accounting systems and records, and has concluded that appropriate systems are in place.
Carrying value of goodwill and other intangible and tangible assetsThe carrying value of goodwill, intangible and tangible assets was reviewed at the year end. A consistent methodology is applied to each of the individual cash-generating units, taking account of market outlook, risk-adjusted discounted future cash flows, sensitivities and other factors which may have a bearing on impairment considerations. As a result of this work the Committee has concluded that no impairment provisions are required.
Revenue recognition – cut-off, revenue-related rebates and credit note provisionsThe Committee examined the procedures and controls in place to ensure that the reporting and recognition of revenue, especially for open hires over the year end, and also whether the recognition of any revenue-related rebate accruals or credit note provisions is appropriate and complete.
Onerous lease provisionsThe Committee reviewed with management the basis of property-related provisions for properties that the Group no longer utilises (dark stores), including the estimates and judgements applied by management in assessing the existence and level of provision. The Committee assesses that the approach adopted is reasonable.
Going concernThe accounts have been prepared on a going concern basis. The Group has made losses during the financial year and operated with a limited amount of headroom on its main banking facilities throughout 2017. The Senior Secured Notes and the Revolving Credit Facility are both due for repayment during 2019 and the Committee has reviewed the cash flow forecasts and sensitivity analysis and has satisfied itself that the business will be able to refinance these obligations and that accordingly it is appropriate to adopt the going concern assumption in the preparation of the accounts.
Exceptional itemsThe Committee reviewed with management the expenses classified as exceptional during the year, which included the significant provision made in respect of the onerous agreement with Unipart following the decision to modify the NDEC agreement and to move the maintenance of fast moving products back into the branch and distribution centre network. The loss on sale of the TecServ and Reintec businesses has been included as an exceptional item. Additionally exceptional items included one off costs relating to cost reduction projects and preparatory work for the debt refinancing that the Group will complete during 2018 and onerous leases on dark stores and associated asset impairments. The Committee assesses that the approach adopted in respect of exceptional items is appropriate.
External auditorThe Committee oversees the Group’s relationship with the external auditor (BDO) and formally reviews the relationship, policies and procedures to ensure its independence. BDO’s also reports to the Committee on the steps it has taken through the year to safeguard its independence and to comply with the relevant professional and regulatory requirements. The BDO partner in charge of the audit is Kieran Storan. He has held this role for three years. The maximum term for which he can perform this role is five years.
BDO has been auditor to certain companies within the Group for 14 years since its appointment in respect of the 2004 year end, with the lead audit partner being rotated on a regular basis, most recently in 2015. The last tender for the audit of HSS Hire Service Group Limited and its subsidiaries occurred in 2005.
38 HSS Hire Group plc Annual Report and Financial Statements 2017

39
BDO has been auditor to the Public Interest Entity, HSS Hire Group plc for three years, following its incorporation in January 2015. It is the Group’s intention to put the audit of the Public Interest Entity out to tender at least once every ten years. The Company has therefore complied with the relevant provisions of the Competition and Markets Authority Final Order on the statutory audit market and the Statutory Auditors and Third Country Auditors Regulations 2016 (SI 2016/649) and the transitional arrangements therein for the year ended 30 December 2017.
During the year the Committee has reviewed and agreed the scope of BDO’s work, its audit fees and terms of engagement for the half-year interim results review and full-year FY17 audit. The fees for audit services paid to BDO are set out in note 6 of the Financial Statements.
The Committee also reviewed the effectiveness of the external audit process during the year. This assessment was based on the Committee’s interaction with BDO at Committee meetings and through feedback from the Group Finance team on its interaction with BDO. As a result of this exercise, the Committee has satisfied itself that BDO continues to provide an effective external audit service to the Company and its subsidiaries and the Committee has made a recommendation to the Board that a resolution for the re-appointment of BDO be proposed at the AGM.
Non-audit work and independenceThe Committee maintains a policy for non-audit services provided by the Group’s external auditor which segregates services into Permitted Engagements, Excluded Engagements and Potential Engagements. The policy is available on the Group’s website at www.hsshiregroup.com/investor-relations/corporate-governance. The policy is designed to ensure that in the event the Group’s external auditor is engaged to provide non-audit services the provision of those services does not impair nor can it be seen to impair the external auditor’s independence and objectivity.
During 2017, BDO provided non-audit-related services to the Group, principally to support the preparatory work undertaken for the debt refinancing project which will complete during 2018. Notwithstanding this the Committee concluded that the independence of the auditor has not been compromised in any way. The fees for non-audit services paid to BDO are set out in note 6 of the Financial Statements.
Risk management and internal controlsAn overview of the Company’s approach to risk, risk management and internal controls through 2017, together with a summary of the principal risks facing the Group, is provided on pages 14 to 17.
During 2017 the Committee reviewed the overall risk management and internal control framework, the work and role of the internal audit team and the underlying process for capturing and reporting risk and control data. This assessment was assisted through the provision of various documents through the year by the Chief Financial Officer, Risk and Assurance Director and other senior personnel in the head office functions. These documents include, but were not limited to: quarterly risk management summary documents, which assess any changes in risk profiles, descriptions and ratings through the year; and quarterly summaries of work completed and work planned by the internal audit team, assessing both areas of risk and the existing controls in place.
As a result of this review, and the work streams undertaken through the year, the Committee has satisfied itself that the Group has an appropriate risk management and internal control framework in place. This work will continue in 2018.
WhistleblowingThe Committee believes that appropriate arrangements and policies are in place to facilitate the proportionate and independent investigation of, and implementation of, appropriate follow-up action in relation to confidential concerns raised by staff via the whistleblowing process (see page 35).
Meeting scheduleThe Committee meets at least three times a year at appropriate times in the financial reporting and audit cycle. Additional meetings can be scheduled where deemed necessary by the Chairman. The external auditor, Chief Financial Officer and Risk and Assurance Director are normally invited to attend a number of these meetings. Other members of the senior management team attend as invited and as appropriate to the content matter being discussed.
Doug Robertson Committee Chairman 5 April 2018
Strategic R
eportC
orporate Governance
Financial Statem
entsA
dditional Information
HSS Hire Group plc Annual Report and Financial Statements 2017

Corporate Governance
Market Disclosure Committee Report
Nomination Committee Report
Amanda Burton Committee Chair
Dear shareholderOn behalf of the Market Disclosure Committee (the Committee), I am pleased to present our report for the 2017 financial year.
Roles and responsibilitiesThe Committee’s full terms of reference can be found on the Company’s website at www.hsshiregroup.com/investor-relations/corporate-governance. A summary of its key responsibilities include:
→ ensuring that the Company complies with its disclosure obligations under the Market Abuse Regulation and the Disclosure and Transparency Rules;
→ considering certain information and deciding whether such information is insider information and whether it gives rise to an obligation to make an announcement; and
→ reviewing any announcement the Company proposes to make, other than an announcement of a routine nature or that has been considered by the Board.
ActivitiesThe Committee met on one occasion in 2017 to carry out routine business. Otherwise, there were no occasions during the year when the Committee was required to meet, since all disclosure and announcement matters were considered by the full Board.
Meeting scheduleThe Committee will meet as often as is deemed necessary, and at short notice if required.
Amanda Burton Committee Chair 5 April 2018
Dear shareholderOn behalf of the Nomination Committee (the Committee), I am pleased to present our report for the 2017 financial year.
Roles and responsibilitiesThe Committee’s full terms of reference can be found on the Company’s website at www.hsshiregroup.com/investor-relations/corporate-governance. A summary of its key responsibilities include overseeing:
→ Board and senior management appointments, to evaluate the balance of skills, knowledge, experience, independence and diversity on the Board;
→ Board composition, including the balance of Executive and Non-Executive Directors;
→ succession planning;
→ strategic issues and commercial changes affecting the Group and the market in which it operates; and
→ Board and sub-committee performance evaluation.
Alan Peterson Committee Chairman
40 HSS Hire Group plc Annual Report and Financial Statements 2017

41
Our approachThe Committee’s primary purpose is to ensure that the Group has the best possible leadership and clear plans for Director succession. Its primary focus is therefore to concentrate upon the strength of the Board and the selection of the best candidates for posts, based on objective criteria.
Policy on diversityIn performing its activities through the year, the Committee has applied the Group’s equality and diversity policy, which it believes is appropriate for application at all levels of the business, including Board and senior management appointments and/or succession planning. Further detail on the Group’s equality and diversity policy is provided on page 29.
ActivitiesThe Committee had two scheduled meetings in 2017 to deal with routine business, as well as liaising on ad hoc matters (such as directorate changes) arising over the course of the year.
At the meeting held in March 2017, the findings of the internal Board evaluation in respect of FY16 were considered and resulting actions, as reported in the 2016 Annual Report, were agreed.
At the meeting held in July 2017, senior management potential and succession planning were discussed, the Committee acknowledging that the new Chief Executive Officer has only been in the role since June 2017 and therefore needed some time to review matters. The Committee also undertook an annual review of its terms of reference and agreed that they remained appropriate for the business. The Committee’s terms of reference can be found on the Company’s website at www.hsshiregroup.com/investor-relations/corporate-governance.
The Group engaged with Blackwood Recruitment LLP (Blackwood), an external search consultancy firm, to assist in the search for its new Chief Executive Officer. The Group has previously engaged with Blackwood in relation to other senior management roles and for the purposes of the external Board evaluation carried out in 2015. The Group continues to maintain an arm’s length relationship with Blackwood.
So far in 2018 one meeting has been held, in March, to discuss findings and agree actions following the 2017 internal Board evaluation.
The actions for 2017 agreed by the Committee have been reviewed by the Committee and also by the Board, noting in particular as follows:
→ Composition of the Board – the Company remains compliant in terms of number of Independent Non-Executive Directors and it was agreed that the number of Directors and balance on the Board remains appropriate at the current time.
→ Board meetings – there had been a better balance of discussion between operational and strategic matters during 2017, largely driven by the Strategic Review undertaken by the Company.
→ Communication – the Board members considered that the reporting and quality of information provided had significantly improved.
→ Succession planning – there had been a number of senior appointments and some new senior roles created in the Company during 2017, but no significant progress had been made as regards Director succession during 2017, partly as a result of recent changes at that level. It had been noted, in particular, that there were increased numbers of female colleagues in senior roles in the organisation, as a result of both promotions and external appointments.
Board evaluationThe FY17 Board evaluation comprised an internal evaluation of the Board using feedback collated from Board members’ responses to an evaluation questionnaire. The questionnaire addressed the key requirements of the Code in relation to the Board and its sub-committees, including each Committee’s terms of reference, composition and frequency of meetings. Additional questions focused on leadership, the relationship between the Executive and Non-Executive Directors, the role of the Chairman, issues of material importance concerning the Group and information on the Group’s risk management systems. The responses to the questionnaire were discussed by the Committee and the Board, with the Committee determining any required actions following the evaluation.
Following a discussion of the responses, the Committee considered it appropriate to focus on the following actions areas during 2018:
→ Succession planning – the Committee determined that, since limited progress had been made in this area during FY17, it should remain an area of focus for the Committee during FY18. The Committee agreed to work proactively with the Chief Executive to progress this during the financial year and review further at the end of the year.
→ Board meetings – the Committee agreed that there was now a better balance of discussion at Board level between operational matters and strategic matters. The Committee determined that it was important to continue to review progress on implementation of the Strategic Review in order to maintain momentum in this area.
→ Post-implementation reviews – the Committee determined the importance of looking back, as well as forwards, to review important decisions taken around acquisitions, material contracts and other matters in order to draw out what had been successful, what had been less so and to take those learnings forward.
Meeting scheduleIn 2018, the Committee has scheduled meetings in March and September and any additional meetings will be arranged as required.
Alan Peterson Committee Chairman 5 April 2018
Strategic R
eportC
orporate Governance
Financial Statem
entsA
dditional Information
HSS Hire Group plc Annual Report and Financial Statements 2017

Corporate Governance
Directors’ Remuneration Report
No performance bonuses were awarded to Directors in a year where we missed our financial targets. Following the recruitment of Steve Ashmore as our CEO, the Company received shareholder approval to grant an exceptional Long Term Incentive Plan award to the Executive Directors and the wider leadership team outside of the approved policy. This award will vest over a four-year period to the end of FY20 and will require a significant turnaround in performance in order to vest.
Amanda Burton Committee Chair
Dear shareholderI am pleased to present, on behalf of the Board, our Directors’ Remuneration Report in respect of the year ended 30 December 2017.
The Group’s Directors’ Remuneration Policy was approved at the FY16 AGM with a vote in favour of 99.96% and can be reviewed in the FY15 Annual Report available at hssannualreport2015.com.
The Annual Report on Remuneration, which provides details of the remuneration earned by Directors in FY17 and how we intend to apply the Directors’ Remuneration Policy in FY18, is available on page 44. At the FY18 AGM, to be held on 21 June 2018, the Annual Report on Remuneration will be subject to an advisory vote.
The Committee’s terms of reference can be found on the Company’s website at www.hsshiregroup.com/investor-relations/corporate-governance.
How we link executive remuneration to our strategyWe take a disciplined approach to executive remuneration, ensuring that we incentivise and reward the right behaviours to support the overall strategy of the Group. Our executive remuneration arrangements are designed to support the Group’s strategic priorities. In the summary below, we have highlighted how certain elements of the Directors’ Remuneration Policy relate to those strategic priorities.
The culture of our business means that we seek to ensure we have the same approach to reward for all our colleagues where appropriate and therefore have designed a reward framework which we can cascade consistently and one which is relevant not only for our Executive Directors but also for our senior team who participate in the Annual Bonus and the Long Term Incentive Plan (LTIP).
Annual bonus Focus on profitability and growth: The two principal performance measures for the annual bonus last year were Adjusted EBITA and Net Leverage Ratio (Net Debt/Adjusted EBITDA) reflecting our focus on cash-generative profitable growth and a healthy balance sheet. For FY18 the Committee has introduced a third measure based on growth in core hire rental revenue. This new measure emphasises to our annual bonus participants the focus on a return to growing and developing an important part of our business. This will account for 30% of the bonus, balanced against a profit measure (30% of the bonus) and our Net Leverage Ratio measure (30% of the bonus), and the Committee considers that these provide a balanced and appropriate approach for FY18. The Committee has also changed the profit measure from EBITA to EBITDA to make it consistent with our Leverage Ratio measure. Finally recognising the importance of health and safety which is a key part of our values and how we operate, the Committee has introduced a specific health and safety measure relating to the reduction in RIDDORs which will equate to 10% of the bonus.
Executive Directors are required to defer the part of the award earned (if any) in excess of 50% of the maximum award into shares over a two-year period. The additional two-year holding period provides further alignment with shareholders and a longer-term focus on creating sustained value for the business.
42 HSS Hire Group plc Annual Report and Financial Statements 2017

43
LTIP Awards granted with three-year performance targets which reflect the Group’s focus on profitability, growth and operational efficiency. The additional two-year holding period provides further alignment with shareholders and a longer-term focus on creating sustained value for the business.
In FY17 we made special awards of market value options to our senior management team to directly align reward to our strategic plan. This was an exceptional award, which was in place of the LTIP, and for which we sought shareholder approval. Further details are provided below and on page 45.
FY17 performance and annual bonus outcomeThe FY17 annual bonus was subject to Adjusted EBITA performance as regards 80% of the overall opportunity and Net Leverage Ratio (Net Debt/Adjusted EBITDA) performance as regards 20% of the overall opportunity. The threshold Adjusted EBITA and Net Leverage Ratio targets were not achieved based on FY17 performance. Accordingly no element of the bonus has been earned.
The Company’s first long-term incentive awards were granted under the LTIP in April 2016 and therefore there was no vesting during the year.
FY17 long term incentive awardThe Company received shareholder approval (support in favour was over 97%) via an Extraordinary General Meeting (EGM) on 10 August 2017 to grant an exceptional long term incentive award to the Executive Directors (and the wider leadership team) outside of the current Directors’ Remuneration policy. The awards, which are structured as market value share options, will vest subject to the achievement of a challenging EPS performance measures over a four year period through to the end of FY20. A one year holding period will apply post-vesting. The awards have been designed to align the variable remuneration of the Executive Directors (and the wider leadership team) with strong financial and business performance, promoting the long term success of the Company and the creation of long term shareholder value. Steve Ashmore and Paul Quested were granted awards with a face value equal to 460% and 320% of salary respectively. Further details are set out on page 45.
Reward for FY18Executive Director salariesIn line with the salary review timetable for all other employees, the Executive Directors’ base salaries were reviewed in June 2017. Paul Quested’s salary was maintained at the same level as in FY16 in line with salaries in the wider workforce which had no increase. Steve Ashmore was appointed as CEO on 1 June 2017 and did not receive a salary increase in FY17. This timetable will be followed again in June 2018, with any changes taking effect from 1 July 2018. Any increase is expected to be modest and in line with the range of salary increases awarded to other employees in the Group.
Annual bonusNo changes are proposed to the maximum opportunity or structure of the annual bonus although as outlined above the performance measures have been extended. The overall bonus opportunity will remain at 100% of salary. The annual bonus will be subject to core hire rental revenue growth (30% of the overall opportunity), Adjusted EBITDA performance (30% of the overall opportunity), Net Leverage Ratio (30% of the overall opportunity) and a reduction in RIDDORs (10% of the overall opportunity). The Committee considers that these measures are aligned with the key areas of focus for the senior team over the next 12 months.
LTIPIt is the Committee’s intention to grant LTIP awards with a maximum opportunity of 125% of salary in line with our Policy. LTIP awards will vest subject to performance over a three-year period ending with FY20. The performance measures are currently under review. The Committee is mindful of the impact of the refinancing on the Group’s three-year plan numbers and has therefore decided to wait until this has been agreed before setting the targets for the FY18 LTIP. Full details of the targets will be provided in the FY18 Directors’ Remuneration Report. The LTIP awards will include a two-year holding period following the end of the performance period.
ConclusionI hope that you will agree that these proposals are appropriate to the circumstances of the business and the challenges it has faced in FY17 and are fully aligned to the strategy over the next three years, and that you will support the resolution being proposed at the FY18 AGM in relation to the Directors’ Remuneration Report.
Amanda Burton Committee Chair 5 April 2018
At a glance summary: Executive Directors’ remuneration
→ No salary increases awarded in July 2017 in line with wider workforce (see page 48).
→ No annual bonus to be paid in respect of FY17 (see page 45).
→ Grant of exceptional long-term incentive award in FY17 following shareholder approval at EGM (see page 45) measured over four years with a further one-year holding period.
→ FY18 annual bonus award opportunity equal to 100% of salary subject to Core Hire rental revenue growth (30%), Adjusted EBITDA (30%), Net Leverage Ratio (30%) and a reduction in RIDDORs (10%) (see page 48). Any bonus earned above 50% deferred into shares for two years.
→ Salaries for FY18 will be considered in June at the same time as for the wider workforce. Any increase will be in line with the range of increases awarded to other employees.
→ Maximum FY18 LTIP award opportunity equal to 125% of salary and subject a two-year holding period following the performance period (see page 48).
→ FY18 LTIP awards are subject to a two-year holding period following the performance period (see page 48).
Strategic R
eportC
orporate Governance
Financial Statem
entsA
dditional Information
HSS Hire Group plc Annual Report and Financial Statements 2017

Corporate Governance
Annual Report on RemunerationThe following section provides detail in respect of remuneration paid to Directors during the year in line with the Remuneration Policy approved by shareholders at the FY16 AGM.
Single figure tableThe following table sets out total remuneration for each Director in respect of FY17 and FY16:
Salary and fees £000s
Benefits £000s
Annual bonus £000s
LTIP £000s
Pension £000s
Total remuneration £000s
FY17 FY16 FY17 FY16 FY17 FY16 FY17 FY16 FY17 FY16 FY17 FY16
Executive Directors
John Gill1 128 326 8 22 – – – – 14 33 150 381
Steve Ashmore2 210 – 12 – – – – – 18 – 240 –
Steve Trowbridge3 – 68668 – 10 – (16) – – – 7 – 69
Paul Quested4 260 99 24 10 – – – – 24 3 308 112
Non-Executive Directors
Alan Peterson 150 150 – – – – – – – – 150 150
Amanda Burton 50 50 – – – – – – – – 50 50
Douglas Robertson 50 50 – – – – – – – – 50 50
Neil Sachdev5 – 68628 – – – – – – – – – 28
Thomas Sweet-Escott6 40 40 – – – – – – – – 40 40
Total (Executive and Non-Executive Directors) 888 811 44 42 – (16) – – 56 43 988 880
1 John Gill resigned as a CEO with effect from 23 May 2017. The figures in the table above for FY17 therefore reflect his remuneration earned from the start of FY17 until the date of his resignation as a Director.
2 Steve Ashmore was appointed as CEO with effect from 1 June 2017. The figures in the table above for FY17 therefore reflect his remuneration earned from this date until the end of FY17.
3 Steve Trowbridge resigned as a CFO with effect from 20 April 2016. The figures in the table above for FY16 therefore reflect his remuneration earned from the start of FY16 until this date.
4 Paul Quested was appointed as CFO with effect from 22 August 2016. The figures in the table above for FY16 therefore reflect his remuneration earned from this date until the end of FY16.
5 Neil Sachdev resigned as a Director on 20 April 2016, effective from 15 June 2016, the date on which the FY16 AGM was held. The figures in the table above reflect his remuneration earned from the start of the FY16 year until the 15 June 2016, his effective date of resignation as a Director.
6 Thomas Sweet-Escott’s fee is paid directly to Exponent.
The figures in these single figure tables above are derived from the following:
Salary and fees
The amount of salary/fees received in the year (up to the date of resignation as a Director in the case of Directors who left during the year or from the date of appointment for Directors who joined during the year).
Benefits The taxable value of benefits received in the year (up to the date of resignation as a Director in the case of Directors who left during the year or from the date of appointment for Directors who joined during the year). These are principally medical insurance, company car or car allowance and SAYE options granted during FY16. SAYE options are valued based on the difference between the market value of the shares at grant and the exercise price and, subject to the rule of the scheme, will ordinarily vest on 1 January 2020 and be exercisable for a period of six months.
Annual bonus
The annual bonus is the cash value of the bonus earned in respect of the year (up to the date of resignation as a Director in the case of Directors who left during the year or from the date of appointment for Directors who joined during the year). The bonus for the full financial year is disclosed on the next page.
Pension The pension figure represents the Company’s contributions to the defined contribution scheme and any cash payment in lieu of pension contributions made in the year (up to the date of resignation as a Director in the case of Directors who left during the year or from the date of appointment for Directors who joined during the year).
Directors’ Remuneration Report continued
44 HSS Hire Group plc Annual Report and Financial Statements 2017

45
Additional disclosures in respect of the single figure tableBase salaryDetails of annual base salaries for Executive Directors for FY17 and FY16 are set out below.
Base salary at
30 December 2017
£000s
Base salary at
31 December 2016
£000s
Executive DirectorsJohn Gill1 – 326Steve Ashmore2 360 –Paul Quested 260 260
1 John Gill resigned as a Director with effect from 23 May 2017. 2 Steve Ashmore was appointed as CEO with effect from 1 June 2017.
FY17 annual bonus Executive Directors were awarded a maximum bonus opportunity equal to 100% of base salary subject to Adjusted EBITA performance as regards 80% of the overall opportunity and Net Leverage Ratio (Net Debt/Adjusted EBITDA) performance as regards 20% of the overall opportunity. These performance measures aligned reward with the key areas of focus over FY17.
In the event that Executive Directors are awarded an annual bonus in excess of 50% of the maximum annual bonus opportunity for that year, they are required to defer any annual bonus award earned in excess of 50% of the maximum award into shares over a two-year period. Deferred shares are not subject to any additional performance measures after the application of the performance measures which determines the amount of annual bonus award earned.
The following table sets out the bonuses earned by the Executive Directors for FY17 and how this reflects performance for the year.
Performance measure
Proportion of bonus
determined by measure
Target performance
Maximum performance
Actual performance
Bonus earned (% of salary)
Adjusted EBITA 80% £22.0m £24.0m £1.8m 0%Net Leverage Ratio (Net Debt/Adjusted EBITDA) 20% 2.8x 2.7x 4.8x 0%
FY17 long-term incentives The Company received shareholder approval via an EGM on 10 August 2017 to grant an exceptional long-term incentive award to the Executive Directors (and the wider leadership team) outside of the current Directors’ Remuneration Policy. The awards, which are structured as market value share options, will vest subject to the achievement of a challenging EPS performance measure over a four-year period ending with FY20. A one-year holding period will apply post-vesting. The awards have been designed to align the variable remuneration of the Executive Directors (and the wider leadership team) with strong financial and business performance, promoting the long-term success of the Company and the creation of long-term shareholder value.
Details of the long-term incentive awards granted to Executive Directors in FY17 are set out below.
Type of awardNumber of
shares Face value
at grant1,2 Exercise price
% of award vesting at threshold
Performance period
Steve Ashmore LTIP 2,849,708 £1,624,334 57p 25% 4 yearsSteve Ashmore CSOP3 55,555 £30,000 54p 25% 4 years
460% of salaryPaul Quested LTIP 1,404,094 £800,334 57p 25% 4 yearsPaul Quested CSOP3 55,555 £30,000 54p 25% 4 years
320% of salary
1 The average share price over the three-month period prior to the grant date (31 August 2017) was used to determine the face value of the LTIP award.2 The average share price over the five dealing days prior to the grant date (31 August 2017) was used to determine the face value of the Company Share Option Plan
(CSOP) award.3 A proportion of the awards were granted in the form of HMRC tax-qualifying market value share options which are subject to the same performance measures as apply
to the LTIP awards.
The long-term incentive awards are subject to an EPS performance measure assessed over a period of four financial years starting with FY17 as follows:
FY20 Adjusted EPS
Vesting percentage
Threshold 11.5p 25%Target 13p 50%Maximum 16p 100%
Straight-line vesting in between points. No vesting below threshold performance.
No LTIP awards vested in respect of performance in the year.
Strategic R
eportC
orporate Governance
Financial Statem
entsA
dditional Information
HSS Hire Group plc Annual Report and Financial Statements 2017

Corporate Governance
Payments made to former Directors during the yearJohn Gill resigned as a Director with effect from 23 May 2017.
As announced by the Company on 22 May 2017, it was agreed that John Gill would receive a payment in lieu of notice of £381,849 in accordance with his service agreement and £45,000 by way of compensation for the termination of his service agreement. The payment was made in instalments and would be reduced in the event that he commenced another role prior to the expiry of his notice period. The reduction is up to 50% of the basic salary or fee earned under the alternative role. John Gill subsequently advised the Company that he had commenced another role and this has reduced the potential amount payable by £4,811. Total payments under this arrangement made to John Gill up to 30 December 2017 were £285,122.
John Gill did not receive any annual bonus payment in respect of FY16 and will not receive any annual bonus payment in respect of FY17. His SAYE options have lapsed in full, but his FY16 LTIP awards did not and will vest if the performance conditions are satisfied, pro-rata for his period of service.
The Company made a payment of £2,640 in respect of John Gill’s legal fees relating to his resignation as a Director.
Directors’ share interestsThe Committee has adopted a shareholding guideline for Executive Directors in accordance with which the Chief Executive Officer is required to build up and maintain a shareholding in the Company at least equivalent in value to 200% of annual salary, and other Executive Directors are required to build up and maintain a shareholding in the Company equivalent in value to 125% of annual salary. The Chief Executive Officer held no shares in the Company and has until 31 May 2022 to build his shareholding to 125% of his annual salary (and 200% of his annual salary as soon as possible following 31 May 2022). Since joining the Group in August 2016 the Chief Financial Officer has built his shareholding in the Company from 0% to 15% of annual salary and under the guidelines has until 21 August 2021 to build his shareholding to 125% of his annual salary.
The interests of the Directors and their connected persons in the Company’s ordinary shares as at 30 December 2017 (or, if earlier, the date on which the Director resigned from the Board) were as follows:
TypeOwned outright
Unvested and subject to
performance conditions
Unvested and not subject to performance
conditions
Total as at 30 December
20171
Executive Directors
John Gill (resigned 23 May 2017) Shares 1,491,189 – – 1,491,189
2016 LTIP (nil-cost share options)2 – 388,095 – –
2016 CSOP options3 – 35,714 – –
2016 SAYE options4 – – 15,597 –
Steve Ashmore Shares – – – –
2017 LTIP (market value share options)5 – 2,849,708 – 2,849,708
2017 CSOP options6 – 55,555 – 55,555
Paul Quested Shares 47,000 – – 47,000
2016 LTIP (nil-cost share options)2 – 263,376 – 263,376
2016 SAYE options4 – – 15,597 15,597
2017 LTIP (market value share options)5 – 1,404,094 – 1,404,094
2017 CSOP options6 – 55,555 – 55,555
Non-Executive Directors
Alan Peterson Shares 937,217 – – 937,217
Amanda Burton Shares 35,714 – – 35,714
Douglas Robertson Shares 9,523 – – 9,523
1 Or, if earlier, the date of resignation from the Board, which applies to John Gill. 2 FY16 LTIP awards will vest subject to performance over a three-year period ending with FY18.3 FY16 CSOP options granted at an exercise price of 84p per share and will vest subject to performance over a three-year period ending with FY18.4 FY16 SAYE options granted at an exercise price of 57.7p per share.5 FY17 LTIP awards granted at an exercise price of 57p will vest subject to performance over a four-year period ending with FY20.6 FY17 CSOP options granted at an exercise price of 54p per share will vest subject to performance over a four-year period ending with FY20.
Directors’ Remuneration Report continued
46 HSS Hire Group plc Annual Report and Financial Statements 2017

47
As at 5 April 2018, the Company has not been advised of any changes to the interests of the Directors and their connected persons as set out in this table.
Thomas Sweet-Escott holds no direct interest in the Company’s ordinary shares. However, he has an indirect interest in the Company’s ordinary shares as a result of his interest in Exponent.
The disclosures on Directors’ remuneration set out on pages 44 to 47 above have been audited as required by the Companies Act 2006.
Performance graph and historical Chief Executive Officer remuneration outcomesThe graph below shows the total shareholder return (TSR) performance for the Company’s shares in comparison with the FTSE SmallCap Index for the period from Admission to 30 December 2017. The Company is a constituent of this Index and as such it has been selected as an appropriate comparator group. For the purposes of the graph, TSR has been calculated as the percentage change during the period in the market price of the shares, assuming that dividends are reinvested. The graph shows the value, by 30 December 2017, of £100 invested in the Group over the period compared with £100 invested in the FTSE SmallCap Index.
0
30
60
90
120
150
Feb 15 Dec 17Oct 15Jun 15 Feb 16 Oct 16Jun 16 Feb 17 Oct 17Jun 17
FTSE SmallCap
Tota
l sha
reho
lder
retu
rn (r
ebas
ed to
100
)
HSS
Strategic R
eportC
orporate Governance
Financial Statem
entsA
dditional Information
HSS Hire Group plc Annual Report and Financial Statements 2017

Corporate Governance
The table below shows details of the total remuneration, annual bonus and LTIP vesting (as a percentage of the maximum opportunity) for the Chief Executive Officer for FY15 to FY17:
CEO
Total remuneration
£000s
Annual bonus as a % of
maximum opportunity
LTIP as a % of
maximum opportunity1
FY15/Chris Davies2 297 – N/A
FY15/John Gill3 90 7.1% N/A
FY16/John Gill3 381 – N/A
FY17/John Gill3 150 – N/A
FY17/Stephen Ashmore4 240 – N/A
1 No LTIP vested in respect of performance in FY16 or FY17.2 The table shows the remuneration for Chris Davies in the period from the start
of FY15 until he resigned as a Director with effect from 25 September 2015.3 The table shows the remuneration for John Gill in the period from the date of
his appointment as CEO with effect from 25 September 2015 until he resigned as a Director with effect from 23 May 2017.
4 The table shows the remuneration for Steve Ashmore in the period from the date of his appointment as CEO with effect from 1 June 2017 until the end of FY17.
CEO pay increase in relation to all employeesThe table below sets out, in relation to salary, taxable benefits and annual bonus, the percentage change in pay for the CEO and the average percentage change for the wider workforce. For these purposes, the wider workforce includes all Group employees who were continuously employed by the Group during FY17 and FY16 but excludes Executive and Non-Executive Directors. Whilst the table below shows a 6.1% increase in CEO pay, this reflects the differential in salary between the new and outgoing CEO. Steve Ashmore has not received a pay rise since his appointment.
CEO CEOWider
workforce
Salary1 3.6% Nil2
Benefits1,3 -9.1% Nil
Annual bonus N/A4 N/A4
1 For the purposes of the above table, salary and benefits for FY17 is based on a combination of the salary and benefits received by Steve Ashmore and John Gill in FY17.
2 The wider workforce received no pay rises during the year except for where team members were promoted, took on additional responsibilities or received a rise in line with National Minimum Wage legislation.
3 Taxable value of benefits received in the year comprising medical insurance and company car or car allowance.
4 No annual bonuses were awarded in respect of FY16 or FY17.
Spend on pay and distributions to shareholdersThe following table sets out the overall expenditure on pay (as a whole across the organisation) and the amount of distributions to shareholders in the form of dividends and share buybacks in respect of FY16 and FY17. No dividend was paid during FY17 as the Board is focused on reducing net debt and, after careful consideration of significant cash investments made during 2016 and the Strategic Review and associated cost reductions announced in December 2017, believes it is in the best interests of the shareholders to not pay dividends at the present time.
£000s
Year ended 30 December
2017
Year ended 31 December
2016Percentage
change
Dividends – 1,764 N/A
Overall expenditure on pay 89,712 92,588 -3.1%
Implementation of Directors’ Remuneration Policy for FY18Information on how the Company intends to implement the Directors’ Remuneration Policy for FY18 is set out below.
Salary/fees and benefitsIn line with the salary review timetable for all other employees, the Executive Directors’ base salaries will be reviewed during June 2018, with any changes taking effect from 1 July 2018. Non-Executive Directors’ fees will be reviewed during the year. Any increase to any Executive Director’s salary or Non-Executive Director’s fee is expected to be modest and will be in line with the range of salary increases awarded to other employees in the Group.
Annual bonusThe maximum annual bonus opportunity for FY18 will remain at 100% of salary. The bonus will be subject to stretching performance measures based on core hire rental revenue growth (30% of the overall opportunity), Adjusted EBITDA performance (30% of the overall opportunity), Net Leverage Ratio (30% of the overall opportunity) and a reduction in RIDDORs (10% of the overall opportunity).
The Committee considers that the performance targets should remain confidential to the Company as they give our competitors an insight into our plans and expectations. However, each of the targets (which have been set by reference to the FY18 budget and require outperformance of the budget for the maximum bonus to be earned) will be fully disclosed in the FY18 Directors’ Remuneration Report on the same basis as the FY17 disclosure set out on page 45.
LTIPIt is the Committee’s intention to grant FY18 LTIP awards on the same basis as the FY16 LTIP awards were made. The maximum opportunity will be 125% of salary which is set out in the Directors’ Remuneration Policy. The performance measures are currently under review. The Committee is mindful of the impact of the refinancing on the Group’s three-year plan numbers and has therefore decided to wait until this has been agreed before setting the targets for the 2018 LTIP. Full details of the targets will be provided in the 2018 Directors’ Remuneration Report. The LTIP awards will include a two-year holding period following the end of the performance period.
Statement of voting at last AGM and EGMThe following table sets out actual voting in respect of the resolutions to approve the Remuneration Policy and Annual Report on Remuneration at the Company’s AGM:
Resolution Votes for% of vote
Votes against
% of vote
Votes withheld
Remuneration Policy (FY16 AGM) 113,407,717 99.96 41,198 0.04 476
Annual Report on Remuneration (FY17 AGM) 135,332,906 99.86 195,585 0.14 2,000
Directors’ Remuneration Report continued
48 HSS Hire Group plc Annual Report and Financial Statements 2017

49
The following table sets out actual voting in respect of the resolution to grant an exceptional long-term incentive award to the Executive Directors outside of the current Directors’ Remuneration Policy at the EGM:
ResolutionVotes
for% of vote
Votes against
% of vote
Votes withheld
FY17 exceptional long-term incentive award 134,418,334 97.97 2,782,111 2.03 3,190
Service contractsExecutive Directors’ service contracts are on a rolling basis and may be terminated on 12 months’ notice by the Company or the Executive. Service contracts for new Executive Directors will generally be limited to 12 months’ notice by the Company.
As noted above, Steve Ashmore joined the Company as CEO on 1 June 2017. His service contract is in line with the provisions on service contracts in the Directors’ Remuneration Policy.
All Non-Executive Directors have initial fixed-term agreements with the Company of no more than three years.
Details of the Directors’ service contracts and notice periods are set out below:
Name Commencement Notice periodUnexpired term of
service contract
S Ashmore 1 June 2017 12 months1 N/A1
P Quested 22 August 2016 12 months1 N/A1
A Peterson 9 February 2015 N/A2 3.25 years4
A Burton 9 January 2015 N/A2 3.25 years4
D Robertson 9 January 2015 N/A2 3.25 years4
T Sweet-Escott 9 January 2015 N/A3 3.25 years4
1 Executive Directors’ service contracts are on a rolling basis and have no defined expiry date.
2 Initial letter of appointment expired on 9 January 2018. A new letter of appointment was executed on 29 March 2018 for a further three-year term, subject to re-election at the AGM.
3 Under the Relationship Agreement, Exponent is able to appoint a Non-Executive Director to the Board for so long as the Exponent Shareholders are entitled to exercise or to control the exercise of 10% or more of the votes able to be cast on all or substantially all matters at general meetings of the Company. Mr Sweet-Escott is Exponent’s current appointee. His contract commenced on 9 February 2015 and expired on 9 February 2018. A new three-year letter of appointment was executed on 29 March 2018 subject to re-election at the AGM or, if earlier, at the point that the Exponent Shareholders are entitled to exercise or to control the exercise of less than 10% of the votes able to be cast.
4 Calculated from 30 December 2017 to the expiry date of each letter of appointment.
Consideration by the Directors of matters relating to Directors’ remunerationThe Remuneration Committee is composed of the Company’s Independent Non-Executive Directors, Amanda Burton (Chair) and Doug Robertson.
The Remuneration Committee meets as often as is deemed necessary, but in any event at least three times a year. The Committee’s key responsibilities include:
→ reviewing the appropriateness of the Group’s Remuneration Policy;
→ considering all elements of individual remuneration for the executive management team, including base salary, bonuses and performance-related pay, discretionary payments, pension contributions, benefits in kind and share options or their equivalents;
→ formulating performance criteria in relation to performance-related pay;
→ reviewing terms and conditions and ensuring clawback or other provisions are in place so as not to reward failure;
→ administering Company share schemes as required; and
→ ensuring compliance with Code and disclosure requirements.
Advisers to the Remuneration CommitteeDuring FY17, the Committee received independent advice from Deloitte LLP in relation to the Committee’s consideration of matters relating to Directors’ remuneration. Deloitte’s fees for this advice during the year were £22,020 (FY16: £40,860), charged on a time and disbursements basis or fixed fee depending on the nature of the project. Deloitte also provided advice to the Company during the year in relation to share plans. Deloitte is a founder member of the Remuneration Consultants Group and as such voluntarily operates under its Code of Conduct in relation to executive remuneration in the UK. The Remuneration Committee is satisfied that all advice received was objective and independent.
ApprovalThis Report was approved by the Board on 5 April 2018 and signed on its behalf by:
Amanda Burton Chair of the Remuneration Committee 5 April 2018
Strategic R
eportC
orporate Governance
Financial Statem
entsA
dditional Information
HSS Hire Group plc Annual Report and Financial Statements 2017

Corporate Governance
The table below details where certain other information, which forms part of the Directors’ report, can be found within this Annual Report:
InformationLocation within Annual Report
Dividends Chairman’s Statement (page 5)
Directors’ powers Page 50
Directors’ indemnities Page 50
Statement on disclosure of information to the auditor
Corporate Governance (page 53)
Greenhouse gas emissions Corporate Responsibility (page 24)
Political donations and expenditure Page 50
Financial instruments Page 50
Events and developments impacting the Company Page 50
Branches outside the UK Page 50
Acquisition of own shares Page 50
Equality and diversity Page 50
Employee involvement Page 51
Impact of change of control/ takeover bid Page 51
Directors’ interests Directors’ Remuneration Report (page 46)
Share capital Note 20 to the Financial Statements (page 96)
Restrictions on share transfers Page 51
Significant shareholders Relations with shareholders (page 36)
Shares with special rights with regard to control of the Company Page 51
Shares related to employee share schemes Page 51
Voting rights and restrictions Page 51
Agreements between holders of securities Page 52
Appointment and replacement of Directors Page 52
Amendments to the Company’s Articles of Association Page 52
Directors’ powersAt the AGM to be held on 21 June 2018, shareholders will be asked to renew the Directors’ power to allot shares, grant rights to subscribe for or convert any security into shares or buy back shares in the Company and to renew the disapplication of pre-emption rights.
Directors’ indemnitiesIn addition to the indemnity provisions in their Articles of Association, the Company and other Group companies have entered into a direct indemnity agreement with each of the Directors and certain other officers or senior employees of the
Group. These indemnities constitute qualifying indemnities for the purposes of the Companies Act 2006 (the Act) and remain in force at the date of approval of this Report without any payment having been made under them. The Company also maintains Directors’ and officers’ liability insurance which gives appropriate cover for legal action brought against its Directors.
Political donations and expenditureAt the AGM held on 14 June 2017, the Company and its subsidiaries were authorised to make certain political donations or incur political expenditure. No political expenditure was made by the Company or its subsidiaries during the FY17 year (FY16: £nil).
Financial instrumentsInformation on the Group’s financial risk management objectives and policies and the exposure of the Group to market risk, credit risk, liquidity risk and cash flow risk is provided in note 22 of the Financial Statements on pages 99 and 100.
Events and developments impacting the Company The likely future developments of the Company and Group are referred to in the Chief Executive Officer’s Review on page 9 in the Strategic Report.
Branches outside the UKThe Company has no branches outside the UK and Ireland, as defined in Section 1046(3) of the Act.
Acquisition of own sharesAt the AGM held on 14 June 2017, the Company was authorised to make market purchases of up to 15,476,190 or 10% of the current ordinary shares in issue. The Company has made no purchases of its own ordinary shares pursuant to this authority. This authority expires at the close of the 2018 AGM of the Company on 21 June 2018. A special resolution will be proposed at this year’s AGM to authorise the Company to make market purchases of up to 17,020,714 (10% of issued share capital of 170,207,142) ordinary shares.
Equality and diversityThe Group is committed to developing all colleagues and encourages everyone to progress and develop. All training is based on each colleague’s individual development needs and the requirements of the role. Provisions are made to ensure that all part-time colleagues have equal opportunities to undertake development and training.
The Group’s policy is to recruit and promote based on an individual’s skills, qualifications, experience and ability to do the job. No applicant, whether internal or external, will be discriminated against in respect of age, sex, sexual orientation, disability, race, religion, or beliefs, or on any other criteria unrelated to an individual’s ability to perform in the role.
If an employee becomes disabled during employment, the Group makes every effort to enable them to continue in employment by making reasonable adjustments in the workplace and providing retraining for alternative work where necessary.
The Group is committed to ensuring that the abilities of all of its colleagues are recognised and valued at all levels of the organisation through:
→ focusing on what people can do rather than on what they cannot;
→ challenging stereotypes about people with disabilities; and
→ making appropriate adjustments in the workplace to support colleagues with disabilities to achieve their full career potential.
Other StatutoryDisclosures
50 HSS Hire Group plc Annual Report and Financial Statements 2017

51
The Group will not include any discriminatory or subjective criteria in job descriptions or job advertisements. All recruitment will be made solely on the basis of competence and skill. Where an applicant has a disability (as defined by the Disability Discrimination Act 1995) consideration will be given as to whether any adjustments can be made to accommodate individual requirements.
The Group is committed to ensuring that the diversity of the communities served is reflected at all levels within the workforce and that an understanding and awareness of diversity is promoted in all training and development material.
Performance reviews are completed with every colleague and focus on measuring job performance and each individual’s training requirements.
Employee involvementThe Company uses a combination of ways to communicate with employees including, but not limited to: the intranet (HSS World) that is regularly updated and available on PCs at all locations; its internal newsletter (HIYA!), that reports on recent news, developments, initiatives and events in the business which is circulated a minimum of four times annually and delivered to all locations; and a weekly email ‘bulletin’ supplementing this with operational and functional information, that is required to be printed and displayed on all notice boards where colleagues may not have immediate access to email. Meetings and conference calls also form a regular communication channel across the Group. The method of information dissemination adopted depends on the information being made available to employees and the associated confidentiality requirements. The Company also sends correspondence of high importance by mail to employees’ home addresses.
Employees are consulted formally on issues where their interests are affected via consultation processes led by management and are asked to give feedback. Colleagues are also invited to raise issues via the online communications forum ‘Yammer’ and receive feedback.
Focus groups have also been carried out at key Group locations, to discuss employee engagement and gain more detailed feedback from employees.
The Company’s financial results and performance are regularly communicated via a number of mechanisms, for example the update and provision of information to senior colleagues on the same day that announcements are made to investors at the half-year and full-year and supplements in the Company newsletter HIYA! At the senior colleague conference calls, there is an opportunity to ask questions of the executive. Blogs and announcements ares also made Company-wide from our CEO via email providing the top-level results and factors contributing to our performance.
Impact of change of control/takeover bidThere are no agreements between the Company and its Directors or employees providing for compensation for loss of office or employment (whether through resignation, purported redundancy or otherwise) that occurs because of a change of control/takeover bid.
A number of the Group’s funding agreements contain change of control provisions. These are summarised in the table below:
Funding agreement Summary of change of control provision
Senior secured notes Following a change of control the Group would be required to offer to repurchase all outstanding Notes at a purchase price in cash equal to 101% of the principal amount redeemed on the date of purchase plus accrued and unpaid interest, if any, to the date of purchase.
Revolving Credit Facility Following a change of control all outstanding amounts, together with accrued interest, would become immediately due and payable.
Finance leases (from various finance providers)
Certain of the Group’s finance leases have conditions where a change of control could lead to early repayment.
Restrictions on share transfersCertificated sharesThe Board may, in its absolute discretion, refuse to register the transfer of a certificated share which is not a fully paid share, provided that the refusal does not prevent dealings in shares in the Company from taking place on an open and proper basis. The Board may also refuse to register the transfer of a certificated share unless the instrument of transfer is (i) lodged, duly stamped (if stampable), at the office or at another place appointed by the Board accompanied by the certificate for the share to which it relates and such other evidence as the Board may reasonably require to show the right of the transferor to make the transfer; (ii) is in respect of one class of share only; and (iii) is in favour of not more than four transferees.
Uncertificated sharesSubject to the provisions of the Uncertificated Securities Regulations 2001, the Board may permit the holding of shares in any class of shares in uncertificated form and the transfer of title to shares in that class by means of a relevant system and may determine that any class of shares shall cease to be a participating security.
Shares with special rights with regard to control of the CompanyThere are no shares in issue with special rights with regard to control of the Company.
Shares related to employee share schemesNo shares have been issued in relation to employee share schemes, although options have been issued under the Sharesave scheme (as detailed earlier).
Voting rights and restrictionsSubject to the rights or restrictions set out below or detailed in the Notice of AGM, on a show of hands every member who is present in person shall have one vote and on a poll every member present in person or by proxy shall have one vote for every share of which he is the holder.
No member shall be entitled to vote at any general meeting in respect of a share unless all monies presently payable by him in respect of that share have been paid.
Strategic R
eportC
orporate Governance
Financial Statem
entsA
dditional Information
HSS Hire Group plc Annual Report and Financial Statements 2017

Corporate Governance
If at any time the Board is satisfied that any member, or any other person appearing to be interested in shares held by such member, has been duly served with a notice under Section 793 of the Act and is in default for the prescribed period in supplying to the Company the information thereby required, or, in purported compliance with such a notice, has made a statement which is false or inadequate in a material respect, then the Board may, in its absolute discretion at any time thereafter by notice to such member, direct that, in respect of the shares in relation to which the default occurred, the member shall not be entitled to attend or vote either personally or by proxy at a general meeting or at a separate meeting of the holders of that class of shares or on a poll.
The Notice of AGM specifies deadlines for exercising voting rights and appointing a proxy or proxies to vote in relation to resolutions to be passed at the AGM. All proxy votes are counted and the numbers for, against or withheld in relation to each resolution are announced at the AGM and published on the Company’s website after the meeting.
Under the Financial Conduct Authority (FCA) rules, the election or re-election by the shareholders of an Independent Non-Executive Director must be approved by an ordinary resolution of the shareholders and separately approved by those shareholders who are not controlling shareholders (the independent shareholders).
As a result, by virtue of Exponent’s 50.3% shareholding in the Company, any votes by Exponent on any resolutions relating to the election or re-election of Independent Non-Executive Director(s) will not be counted for the purposes of approving those resolutions.
Agreements between holders of securitiesThe Company is not aware of any agreements between holders of securities that may result in restrictions on the transfer of securities or on voting rights.
Appointment and replacement of DirectorsUnless otherwise determined by ordinary resolution, the number of Directors shall be not less than two but shall not be subject to any maximum in number. Directors may be appointed by ordinary resolution of shareholders or by the Board.
Under the Relationship Agreement, Exponent is able to appoint a Non-Executive Director to the Board for so long as the Exponent Shareholders are entitled to exercise or to control the exercise of 10% or more of the votes able to be cast on all or substantially all matters at general meetings of the Company. Mr Sweet-Escott is the current appointee. In addition, in accordance with the Relationship Agreement, Exponent has appointed an observer to attend Board meetings.
At every AGM all Directors at the date of the Notice of AGM shall retire from office and resolutions for the re-appointment of those Directors who wish to be re-appointed shall be put to the meeting. All appointments are subject to the Company’s Articles of Association and the annual re-election by shareholders.
The Company may remove any Director from office, and appoint another person in place of a Director removed from office, both by ordinary resolution.
A person ceases to be a Director as soon as:
→ he/she ceases to be a Director by virtue of any provision of the Act or is prohibited from being a Director by law;
→ he/she is subject to a bankruptcy order or compounds with his/her creditors generally;
→ he/she becomes physically or mentally incapable of acting as a Director and may remain so for more than three months;
→ he/she resigns or retires;
→ he/she is absent for more than six consecutive months without permission of the Board from meetings of the Board held during that period and the Board resolves that his/her office be vacated; or
→ he/she receives notice signed by not less than three-quarters of the other Directors stating that that person should cease to be a Director.
Amendments to the Company’s Articles of AssociationThe Company’s Articles of Association may only be amended by the passing of a special resolution at a general meeting of shareholders.
Daniel Joll Company Secretary 5 April 2018
Disclosures required by Listing Rule 9.8Listing Rule 9.8 requires that certain information is disclosed within the Annual Report. The table below sets out the required information and its location within this document, where applicable.
Listing Rule Information Location
LR 9.8.4(R)(4) Long-term incentive schemes
Remuneration Directors’ Report (pages 42 to 49)
LR 9.8.4(R)(14) Agreement with controlling shareholders
Page 52 (see below)
No further LR 9.8.4 disclosures are required.
As required by LR 9.2.2AR (2)(a) the Company has entered into a Relationship Agreement with Exponent (see page 36 for further details on this agreement). The Board of Directors confirms that:
→ the Company has complied with the independence provisions included in this Relationship Agreement;
→ so far as the Company is aware, Exponent and its associates have complied with the independence provisions included within the Relationship Agreement; and
→ so far as the Company is aware, Exponent has complied with the procurement obligation included within the Relationship Agreement.
This Statement in respect of LR 9.2.2AR (2)(a) was approved by the Board of Directors on 5 April 2018 and is signed on its behalf by:
Steve AshmoreDirector 5 April 2018
Other Statutory Disclosurescontinued
52 HSS Hire Group plc Annual Report and Financial Statements 2017

53
Directors’ Responsibility StatementThe Directors are responsible for preparing the Annual Report and the Financial Statements in accordance with applicable law and regulations.
Company law requires the Directors to prepare Financial Statements for each financial year. Under that law the Directors are required to prepare the Group Financial Statements in accordance with International Financial Reporting Standards (IFRSs) as adopted by the EU and Article 4 of the International Accounting Standards (IAS) Regulation and have elected to prepare the Company Financial Statements in accordance with United Kingdom Generally Accepted Accounting Practice (United Kingdom Accounting standards and applicable law). Under company law the Directors must not approve the Financial Statements unless they are satisfied that they give a true and fair view of the state of affairs of the Group and Company and of the profit or loss for the Group for that period.
In preparing the Financial Statements, the Directors are required to:
→ select suitable accounting policies and then apply them consistently;
→ make judgements and accounting estimates that are reasonable and prudent;
→ state whether IFRSs as adopted by the EU have been followed, subject to any material departures disclosed and explained in the Financial Statements;
→ prepare the Financial Statements on the going concern basis unless it is inappropriate to presume that the Group or parent Company will continue in business; and
→ prepare a Directors’ Report, a Strategic Report and Directors’ Remuneration Report which comply with the requirements of the Companies Act 2006.
The Directors are responsible for keeping adequate accounting records that are sufficient to show and explain the Company’s transactions and disclose with reasonable accuracy at any time the financial position of the Company and enable them to ensure that the Financial Statements comply with the Companies Act 2006 and, as regards the Group Financial Statements, Article 4 of the IAS Regulation. They are also responsible for safeguarding the assets of the Company and hence for taking reasonable steps for the prevention and detection of fraud and other irregularities.
The Directors are responsible for ensuring the Annual Report and the Financial Statements are made available on a website. Financial Statements are published on the Company’s website in accordance with legislation in the UK governing the preparation and dissemination of Financial Statements, which may vary from legislation in other jurisdictions. The maintenance and integrity of the Company’s website is the responsibility of the Directors. The Directors’ responsibility also extends to the ongoing integrity of the Financial Statements contained therein.
Directors’ responsibilities pursuant to Disclosure and Transparency Rule around Periodic Financial Reporting (DTR4)Each of the Directors, whose names and functions are detailed on pages 30 and 31, confirms that to the best of his or her knowledge:
→ the Group Financial Statements have been prepared in accordance with IFRSs as adopted by the European Union and Article 4 of the IAS Regulation and give a true and fair view of the assets, liabilities, financial position and profit and loss of the Group; and
→ the Annual Report includes a fair review of the development and performance of the business and the financial position of the Group and the parent Company, together with a description or the principal risks and uncertainties that they face.
This Responsibility Statement was approved by the Board of Directors on 5 April 2018 and is signed on its behalf by:
Steve Ashmore Director 5 April 2018
Approval of the Directors’ ReportThe Directors’ Report on pages 26 to 53 was approved by the Board of Directors on 5 April 2018 and is signed on its behalf by:
Steve Ashmore Director 5 April 2018
Strategic R
eportC
orporate Governance
Financial Statem
entsA
dditional Information
HSS Hire Group plc Annual Report and Financial Statements 2017

HSS Hire Group plc Annual Report and Financial Statements 201754

55
Financial Statements56 Independent Auditor’s Report
61 Consolidated Income Statement
62 Consolidated Statement of Comprehensive Income
63 Consolidated Statement of Financial Position
64 Consolidated Statement of Changes in Equity
65 Consolidated Statement of Cash Flows
66 Notes to the Consolidated Financial Statements
104 Company Statement of Financial Position
105 Company Statement of Changes in Equity
106 Notes to the Company Financial Statements
109 Three Year Summary
Strategic R
eportC
orporate Governance
Financial Statem
entsA
dditional Information
HSS Hire Group plc Annual Report and Financial Statements 2017

Financial Statements
OpinionWe have audited the financial statements of HSS Hire Group plc (the ‘parent company’) and its subsidiaries (the ‘group’) for the year ended 30 December 2017 which comprise the Consolidated income statement, the Consolidated statement of comprehensive income, the Consolidated and Company statement of financial position, the Consolidated and Company statement of changes in equity, the Consolidated statement of cash flows, and notes to the financial statements, including a summary of significant accounting policies. The financial reporting framework that has been applied in the preparation of the Group Financial Statements is applicable law and International Financial Reporting Standards (IFRSs) as adopted by the European Union. The financial reporting framework that has been applied in the preparation of the parent company financial statements is applicable law and UK Accounting Standards including Financial Reporting Standard 101 “Reduced Disclosure Framework” (“UK Generally Accepted Accounting Practice”).
In our opinion the financial statements:
→ give a true and fair view of the state of the group’s and of the parent company’s affairs as at 30 December 2017 and of the group’s loss for the year then ended;
→ the group financial statements have been properly prepared in accordance with IFRSs as adopted by the European Union;
→ the parent company financial statements have been properly prepared in accordance with UK Generally Accepted Accounting Practice; and
→ the financial statements have been prepared in accordance with the requirements of the Companies Act 2006; and, as regards the group financial statements, Article 4 of the IAS Regulation.
Basis for opinionWe conducted our audit in accordance with International Standards on Auditing (UK) (ISAs (UK)) and applicable law. Our responsibilities under those standards are further described in the Auditor’s responsibilities for the audit of the financial statements section of our report. We are independent of the parent company and the group in accordance with the ethical requirements that are relevant to our audit of the financial statements in the UK, including the FRC’s Ethical Standard as applied to listed public interest entities, and we have fulfilled our other ethical responsibilities in accordance with these requirements. We believe that the audit evidence we have obtained is sufficient and appropriate to provide a basis for our opinion.
Use of our reportThis report is made solely to the parent company’s members, as a body, in accordance with Chapter 3 of Part 16 of the Companies Act 2006. Our audit work has been undertaken so that we might state to the parent company’s members those matters we are required to state to them in an auditor’s report and for no other purpose. To the fullest extent permitted by law, we do not accept or assume responsibility to anyone other than the parent company and the parent company’s members as a body, for our audit work, for this report, or for the opinions we have formed.
Conclusions relating to principal risks, going concern and viability statementWe have nothing to report in respect of the following information in the annual report, in relation to which the ISAs (UK) require us to report to you whether we have anything material to add or draw attention to:
→ the disclosures in the annual report set out on pages 14 to 17 that describe the principal risks and explain how they are being managed or mitigated;
→ the directors’ confirmation set out on page 14 in the annual report that they have carried out a robust assessment of the principal risks facing the group, including those that would threaten its business model, future performance, solvency or liquidity;
→ the directors’ statement set out on page 35 in the financial statements about whether the directors considered it appropriate to adopt the going concern basis of accounting in preparing the financial statements and the directors’ identification of any material uncertainties to the group and the parent company’s ability to continue to do so over a period of at least twelve months from the date of approval of the financial statements;
→ whether the directors’ statement relating to going concern required under the Listing Rules in accordance with Listing Rule 9.8.6R(3) is materially inconsistent with our knowledge obtained in the audit; or
→ the directors’ explanation set out on page 35 in the annual report as to how they have assessed the prospects of the group, over what period they have done so and why they consider that period to be appropriate, and their statement as to whether they have a reasonable expectation that the group will be able to continue in operation and meet its liabilities as they fall due over the period of their assessment, including any related disclosures drawing attention to any necessary qualifications or assumptions.
Key audit mattersKey audit matters are those matters that, in our professional judgment, were of most significance in our audit of the financial statements of the current period and include the most significant assessed risks of material misstatement (whether or not due to fraud) that we identified. These matters included those which had the greatest effect on: the overall audit strategy, the allocation of resources in the audit; and directing the efforts of the engagement team. These matters were addressed in the context of our audit of the financial statements as a whole, and in forming our opinion thereon, and we do not provide a separate opinion on these matters.
Independent Auditor’s Report to the members of HSS Hire Group plc
56 HSS Hire Group plc Annual Report and Financial Statements 2017

57
Matter Our response
Existence and valuation of hire stockHire stock represents over 1 million items which have a high frequency of movement in individual assets through asset purchases, hires, disposals and transfers around the branch network. As such there is inherent difficulty in maintaining accurate fixed asset registers. Judgement is required in ensuring that depreciation charges are accurately calculated, having regard to economic useful lives and residual values, together with the impact of renovation work undertaken on specific classes of assets.
Refer to page 38 (Audit Committee Report), pages 68 and 69 (accounting policy) and page 90 (financial disclosures).
Our audit work in respect of this area included the identification and testing of the operating effectiveness of key controls in respect of the existence and value of hire stock, including the authorisation of additions, the use of unique asset identification numbers, and the reconciliation of the fixed asset registers to the accounting records.
We attended a sample of the hire stock asset counts to test the effectiveness of controls and performed test counts ourselves in order to ensure the accuracy of the counting performed, and therefore the existence of assets. We also tested that the records from the counts had been used to update both the fixed asset register and the accounting ledgers.
We selected a sample of assets acquired in the year and agreed the amounts recorded on the fixed asset registers to invoices.
Using data analytical and reperformance techniques we recalculated the depreciation, additions and disposals in the fixed asset registers for the current year, and reconciled this to the charge included in the accounting ledgers. We reviewed for the principal asset classes the useful economic lives and residual values applied by management by reference to historic data on disposal values and the achieved lives of assets.
We evaluated the capitalisation of the renovation work undertaken and tested for a sample of the assets that their useful lives had been extended by reference to their continuing hire.
We evaluated the adequacy of the Group’s disclosures of the judgements and estimates utilised in assessing the valuation.
Carrying value of goodwill and other intangible assetsManagement performs an annual impairment review of goodwill, which also covers the carrying value of other intangible assets and property plant and equipment. The annual impairment review relies on significant estimation and judgement in selection of the key inputs which can have a significant impact of the calculated net present value for each Cash Generating Unit (CGU).
There is a risk that the estimates and judgements used in the impairment review for each CGU, which include areas such as forecast cash flows, discount rates, and growth rates are inappropriate and that an impairment charge may be required.
Refer to page 38 (Audit Committee Report), pages 69 and 70 (accounting policy) and pages 88 and 89 (financial disclosures).
Our audit procedures included detailed testing of the Directors’ impairment testing model for each CGU performed in the year. For each of the key inputs to the impairment model we reviewed managements’ assumptions by reference to Board approved budgets, historical trends, and reviewed the sensitivity analysis performed. We challenged management on their forecasts for revenue, costs and EBITDA in the impairment model particularly in light of the recent trading performance and operational model changes. In addition, we performed our own additional sensitivity analysis in respect of the key assumptions which included assessing by how much each assumption would need to change for an impairment to arise. We utilised our own valuation specialists, particularly around the appropriateness of the discount rates used by the directors comparing this against the cost of capital for the Group and other comparable companies in the industry.
We evaluated the adequacy of the Group’s disclosures in respect of the impairment testing, the inputs used and the sensitivity of the outcomes of the assessment to changes in key assumptions to validate that these adequately reflected the inherent risks in the valuations.
Strategic R
eportC
orporate Governance
Financial Statem
entsA
dditional Information
HSS Hire Group plc Annual Report and Financial Statements 2017

Financial Statements
Matter Our response
Revenue recognitionThere is a risk that revenue is incorrectly calculated or recorded in the wrong period.
Revenue is accrued in the financial statements for hire equipment out on hire over the year end. There is a risk that accrued revenue may be incorrectly calculated.
There is also a risk that rebates payable to customers may be omitted or incorrectly calculated, and that credit note provisions may be incorrectly calculated.
In view of the potential for error or for management override of controls we consider this to be an area in which there is a significant risk of material misstatement in the financial statements.
Refer to page 38 (Audit Committee Report), pages 70, 73 and 74 (accounting policies) and page 91 (financial disclosures).
Our audit work in respect of this area included the identification and testing of the operating effectiveness of key controls over revenue recognition. In respect of the front of house system we performed a reconciliation of revenue between that system and the accounting records.
We obtained the calculations of accrued revenue at the year end and the underlying data, and we recalculated a sample included in accrued revenue. For a sample of items we checked that there was a subsequent invoice to a third party and that the revenue recognition criteria used are in accordance with the stated accounting policy and in line with IFRS.
We tested the calculation of rebates payable for a sample of customers by reference to sales data and the underlying agreements, compared rebates by customer against those payable in previous years and investigated the reasons for significant variances, and considered the rebate arrangements in place with major new customers won in the year.
We obtained the calculations of the credit note provisions at the year end and the underlying data for the credit notes issued in the year and the related invoices and confirmed the accuracy of the period taken to issue credit notes. We considered the credit note provision together with the bad debt provision which separately assesses the level of provision against receivables that are overdue for payment. We also considered the historic experience of trends in the issue of credit notes. Based on this we recalculated the credit note provision using our own estimates.
We evaluated the adequacy of the Group’s disclosures in relation to the estimation of the credit note provision.
Onerous lease provisionsThe group has a significant number of property related provisions relating to the ongoing lease obligations of properties that the group no longer utilises in the business. The completeness and accuracy of the provisions involve management judgement and estimates in assessing the likelihood of mitigating future lease costs as a result of break clauses or sub-letting of the properties as well as other unavoidable costs and the appropriateness of discount rate used.
Refer to page 38 (Audit Committee Report), page 73 (accounting policy) and page 94 (financial disclosures).
Our audit work involved checking a sample of the movements in provisions against prior years and obtaining and verifying explanations for material movements. For any newly created onerous lease provisions we reviewed and considered with management the basis of the provisions made, including a review of the lease terms in place.
We challenged management on the evaluation of future expected costs, assumptions used for break clauses and subletting and the basis of the discount rate applied.
We evaluated the adequacy of the Group’s disclosures in relation to the judgements and estimates used in the estimation of the onerous lease provision.
Exceptional itemsThe group has classified a number of expenses as exceptional during the year, including the expected costs arising from the Network Reconfiguration, the cost reduction programme, onerous leases on non-trading stores and impairments of property, plant and equipment arising as a consequence, losses on sales of businesses, preparatory refinancing costs, Senior Management changes and costs of the strategic review. The identification and allocation of costs and income to exceptional items involves management estimation and judgement.
Refer to page 38 (Audit Committee Report), page 74 (accounting policy) and pages 78 to 81 (financial disclosures).
We have obtained a breakdown of the costs classified by the group as exceptional and checked that they are in accordance with the accounting policy in respect of exceptional items. We have challenged management as to the basis of the allocation of these costs, and ensured that adequate disclosure was made of that basis within the financial statements. We have tested a sample of the costs to backing documentation and schedules.
In respect of restructuring provisions relating to the Network Reconfiguration we have assessed whether the criteria of IAS 37 Provisions, Contingent Assets and Contingent Liabilities, were met as at the year end, and reviewed the underlying contracts and agreements to evaluate the calculation of the onerous element of the provision.
We have evaluated the adequacy of the Group’s disclosures in relation to the exceptional items.
In addition, as in all our audits, we have addressed the risk of management override of internal controls including evaluating whether there was evidence of bias by the Directors that represented a risk of material misstatement due to fraud.
Independent Auditor’s Report to the members of HSS Hire Group plc continued
58 HSS Hire Group plc Annual Report and Financial Statements 2017
59
Our application of materiality and an overview of the scope of our audit We apply the concept of materiality both in planning and performing our audit, and in evaluating the effect of misstatements. We consider materiality to be the magnitude by which misstatements, including omissions, could influence the economic decisions of reasonable users that are taken on the basis of the financial statements.
We determined materiality for the group as a whole to be maintained at £1,000,000 (2016: £1,000,000) given the volatility of the results for the year and the similar levels of trading activities in 2016 and 2017 and having regard to the overall group loss. Materiality represents 5.4% of the group loss before tax and exceptional items disclosed in note 4. Materiality in 2016 was determined with reference to a benchmark of the group profit before amortisation of intangibles, interest and tax and exceptional items and represented 4.9% of that figure.
Materiality for the parent company was set at £900,000, being 90% of group materiality.
Performance materiality was set at 75% of materiality for the group audit, and 60% for the parent company. In setting the level of performance materiality we considered a number of factors including the expected total value of known and likely misstatements (based on past experience and other factors) and management’s attitude towards proposed adjustments.
Component materialityWe set materiality for each component of the group based on a percentage of between 19% and 90% of group materiality dependent on the size and our assessment of the risk of material misstatement of that component. Component materiality ranged from £190,000 to £900,000. In the audit of each component, we further applied performance materiality levels of 60% to 75% of the component materiality to our testing to ensure that the risk of errors exceeding component materiality was appropriately mitigated.
We agreed with the Audit Committee that we would report to the Committee all individual audit differences in excess of £50,000. We also agreed to report differences below these thresholds that, in our view, warranted reporting on qualitative grounds.
An overview of the scope of our auditThe group’s accounting process is structured around a group finance function at its office in Heathrow, and at its head office in Manchester, which also act as a shared service finance centre for all of its UK companies. The group also maintains local finance teams for its Ireland operation and for part of one of its UK operations.
The group’s operating companies vary significantly in size, and we identified eleven reporting units at the year end which had non- trivial external transactions, seven of which, in our view required an audit of their complete financial information due to their size or risk characteristics. These seven units comprise over 90% of group turnover and over 90% of group gross assets.
All audit work on the seven units was performed by us, the group audit team. Our work on the other units comprised analytical procedures and certain tests of detail. This gave us the evidence we needed for our opinion on the group financial statements.
Other informationThe directors are responsible for the other information. The other information comprises the information included in the annual report other than the financial statements and our auditor’s report thereon. Our opinion on the financial statements does not cover the other information and, except to the extent otherwise explicitly stated in our report, we do not express any form of assurance conclusion thereon. In connection with our audit of the financial statements, our responsibility is to read the other information and, in doing so, consider whether the other information is materially inconsistent with the financial statements or our knowledge obtained in the audit or otherwise appears to be materially misstated. If we identify such material inconsistencies or apparent material misstatements, we are required to determine whether there is a material misstatement in the financial statements or a material misstatement of the other information. If, based on the work we have performed, we conclude that there is a material misstatement of the other information, we are required to report that fact.
We have nothing to report in this regard.
In this context, we also have nothing to report in regard to our responsibility to specifically address the following items in the other information and to report as uncorrected material misstatements of the other information where we conclude that those items meet the following conditions:
→ Fair, balanced and understandable (set out on page 35) – the statement given by the directors that they consider the annual report and financial statements taken as a whole is fair, balanced and understandable and provides the information necessary for shareholders to assess the group’s performance, business model and strategy, is materially inconsistent with our knowledge obtained in the audit; or
→ Audit committee reporting (set out on pages 37 to 39) – the section describing the work of the audit committee does not appropriately address matters communicated by us to the audit committee is materially inconsistent with our knowledge obtained in the audit; or
→ Directors’ statement of compliance with the UK Corporate Governance Code (set out on page 32) – the parts of the directors’ statement required under the Listing Rules relating to the company’s compliance with the UK Corporate Governance Code containing provisions specified for review by the auditor in accordance with Listing Rule 9.8.10R(2) do not properly disclose a departure from a relevant provision of the UK Corporate Governance Code.
Strategic R
eportC
orporate Governance
Financial Statem
entsA
dditional Information
HSS Hire Group plc Annual Report and Financial Statements 2017

Financial Statements
Opinions on other matters prescribed by the Companies Act 2006In our opinion, the part of the directors’ remuneration report to be audited has been properly prepared in accordance with the Companies Act 2006.
In our opinion, based on the work undertaken in the course of the audit:
→ the information given in the strategic report and the directors’ report for the financial year for which the financial statements are prepared is consistent with the financial statements and
→ the strategic report and the directors’ report have been prepared in accordance with applicable legal requirements.
Matters on which we are required to report by exceptionIn the light of the knowledge and understanding of the group and the parent company and its environment obtained in the course of the audit, we have not identified material misstatements in the strategic report or the directors’ report.
We have nothing to report in respect of the following matters in relation to which the Companies Act 2006 requires us to report to you if, in our opinion:
→ adequate accounting records have not been kept by the parent company, or returns adequate for our audit have not been received from branches not visited by us; or
→ the parent company financial statements and the part of the directors’ remuneration report to be audited are not in agreement with the accounting records and returns; or
→ certain disclosures of directors’ remuneration specified by law are not made; or
→ we have not received all the information and explanations we require for our audit.
Responsibilities of directorsAs explained more fully in the directors’ responsibilities statement set out on page 53, the directors are responsible for the preparation of the financial statements and for being satisfied that they give a true and fair view, and for such internal control as the directors determine is necessary to enable the preparation of financial statements that are free from material misstatement, whether due to fraud or error.
In preparing the financial statements, the directors are responsible for assessing the group’s and the parent company’s ability to continue as a going concern, disclosing, as applicable, matters related to going concern and using the going concern basis of accounting unless the directors either intend to liquidate the group or the parent company or to cease operations, or have no realistic alternative but to do so.
Auditor’s responsibilities for the audit of the financial statementsOur objectives are to obtain reasonable assurance about whether the financial statements as a whole are free from material misstatement, whether due to fraud or error, and to issue an auditor’s report that includes our opinion. Reasonable assurance is a high level of assurance, but is not a guarantee that an audit conducted in accordance with ISAs (UK) will always detect a material misstatement when it exists. Misstatements can arise from fraud or error and are considered material if, individually or in the aggregate, they could reasonably be expected to influence the economic decisions of users taken on the basis of these financial statements.
A further description of our responsibilities for the audit of the financial statements is located on the Financial Reporting Council’s website at: www.frc.org.uk/auditorsresponsibilities. This description forms part of our auditor’s report.
Other matters which we are required to addressFollowing the recommendation of the audit committee, we were appointed by the Board of Directors to audit the financial statements for the year ending 30 December 2015 and subsequent financial periods. In respect of the financial year ended 31 December 2017 we were reappointed by resolution of the members of the company at the annual general meeting held on 14 June 2017. The period of total uninterrupted engagement is 3 years, covering the years ending 31 December 2015 to 31 December 2017 for the Company.
Non-audit services prohibited by the FRC’s Ethical Standard were not provided to the group or the parent company and we remain independent of the group and the parent company in conducting our audit.
Our audit opinion is consistent with the additional report to the audit committee.
Kieran Storan (Senior Statutory Auditor)For and on behalf of BDO LLP, Statutory Auditor London UK 5 April 2018
BDO LLP is a limited liability partnership registered in England and Wales (with registered number OC305127).
Independent Auditor’s Report to the members of HSS Hire Group plc continued
60 HSS Hire Group plc Annual Report and Financial Statements 2017

61
Note
Year ended 30 December
2017£000s
Year ended 31 December
2016£000s
Revenue 2 335,780 342,410
Cost of sales (154,289) (145,232)
Gross profit 181,491 197,178
Distribution costs (46,140) (45,091)
Administrative expenses (207,652) (155,969)
Other operating income 3 882 1,151
Operating loss (71,419) (2,731)
Adjusted EBITDA1 2 48,944 68,638
Less: Depreciation1 (47,159) (48,175)
Adjusted EBITA1 1,785 20,463
Less: Exceptional items 4 (66.567) (16,957)
Less: Amortisation1 11 (6,637) (6,237)
Operating loss (71,419) (2,731)
Net finance expense 5 (13,743) (14,686)
Loss before tax (85,162) (17,417)
Adjusted (loss)/profit before tax (11,958) 5,777
Less: Exceptional items 4 (66,567) (16,957)
Less: Amortisation 11 (6,637) (6,237)
Loss before tax (85,162) (17,417)
Income tax credit 9 5,240 104
Loss for the financial year (79,922) (17,313)
Loss attributable to:
Owners of the company (79,922) (17,313)
Loss per share (pence)
Basic and diluted loss per share 10 (46.96) (11.18)
Adjusted basic earnings per share2 10 (5.68) 2.98
Adjusted diluted earnings per share2 10 (5.68) 2.94
1 Adjusted EBITDA is defined as operating profit before depreciation, amortisation and exceptional items. For this purpose depreciation and amortisation includes the net book value of hire stock losses and write offs, and the net book value of other fixed asset disposals less the proceeds on those disposals. Adjusted EBITA is defined as operating profit before amortisation and exceptional items.
2 Adjusted earnings per share is defined as profit before tax with amortisation and exceptional costs added back less tax at the prevailing rate of corporation tax divided by the weighted average number of ordinary shares.
The notes on pages 66 to 103 form part of these Financial Statements.
Consolidated Income StatementFor the year ended 30 December 2017
Strategic R
eportC
orporate Governance
Financial Statem
entsA
dditional Information
HSS Hire Group plc Annual Report and Financial Statements 2017

Financial Statements
Year ended 30 December
2017£000s
Year ended 31 December
2016£000s
Loss for the financial period (79,922) (17,313)
Items that may be reclassified to profit or loss:
Foreign currency translation differences arising on consolidation of foreign operations 104 1,533
Other comprehensive profit for the period, net of tax 104 1,533
Total comprehensive loss for the period (79,818) (15,780)
Attributable to owners of the Company (79,818) (15,780)
The notes on pages 66 to 103 form part of these Financial Statements.
Consolidated Statement of Comprehensive IncomeFor the year ended 30 December 2017
62 HSS Hire Group plc Annual Report and Financial Statements 2017

63
Note
30 December 2017
£000s
31 December 2016
£000s
ASSETS
Non-current assets
Intangible assets 11 172,509 178,755
Property, plant and equipment 12 150,915 178,473
Deferred tax assets 19 358 780
323,782 358,008
Asset held for resale 8 28 1,500 –
Current assets
Inventories 13 5,519 7,898
Trade and other receivables 14 96,503 103,744
Cash 15 2,151 15,211
104,173 126,853
Total assets 429,455 484,861
LIABILITIES
Current liabilities
Trade and other payables 16 (82,452) (89,150)
Borrowings 17 (69,000) (66,000)
Provisions 18 (16,684) (6,431)
Current tax liabilities (90) (501)
(168,226) (162,082)
Non-current liabilities
Trade and other payables 16 (14,105) (17,266)
Borrowings 17 (134,242) (133,212)
Provisions 18 (36,510) (10,712)
Deferred tax liabilities 19 (2,800) (8,203)
(187,657) (169,393)
Total liabilities (355,883) (331,475)
Net assets 73,572 153,386
EQUITY
Share capital 20 1,702 1,702
Merger reserve 97,780 97,780
Foreign exchange translation reserve 425 321
Retained (deficit)/earnings (26,335) 53,583
Total equity attributable to owners of the group 73,572 153,386
The notes on pages 66 to 103 form part of these Financial Statements.
The financial statements were approved and authorised for issue by the Board of Directors on 5 April 2018 and were signed on its behalf by:
P QuestedDirector 5 April 2018
Consolidated Statement of Financial PositionAt 30 December 2017
Strategic R
eportC
orporate Governance
Financial Statem
entsA
dditional Information
HSS Hire Group plc Annual Report and Financial Statements 2017

Financial Statements
NoteShare capital
£000s
Merger reserve
£000s
Foreign exchange
translationreserve
£000s
Retained earnings/
(deficit)£000s
Total equity£000s
At 1 January 2017 1,702 97,780 321 53,583 153,386
Total comprehensive loss for the period
Loss for the period – – – (79,922) (79,922)
Foreign currency translation differences arising on consolidation of foreign operations – – 104 – 104
Total comprehensive loss for the period – – 104 (79,922) (79,818)
Transactions with owners recorded directly in equity
Share based payment charge – – – 4 4
At 30 December 2017 1,702 97,780 425 (26,335) 73,572
Share capital £000s
Merger reserve£000s
Foreign exchange translation
reserve£000s
Retained earnings
£000sTotal equity
£000s
At 26 December 2015 1,548 85,376 (1,212) 72,557 158,269
Total comprehensive loss for the period
Loss for the period – – – (17,313) (17,313)
Foreign currency translation differences arising on consolidation of foreign operations – – 1,533 – 1,533
Total comprehensive loss for the period – – 1,533 (17,313) (15,780)
Transactions with owners recorded directly in equity
New share issue for cash 20 154 12,800 – – 12,954
Share issue costs 20 – (396) – – (396)
Share based payment charge – – – 103 103
Dividends paid – – – (1,764) (1,764)
At 31 December 2016 1,702 97,780 321 53,583 153,386
The notes on pages 66 to 103 form part of these Financial Statements.
Consolidated Statement of Changes in EquityFor the year ended 30 December 2017
64 HSS Hire Group plc Annual Report and Financial Statements 2017

65
Note
Year ended 30 December
2017£000s
Year ended 31 December
2016£000s
Cash flows from operating activities
Loss before income tax (85,162) (17,417)
Adjustments for:
– Amortisation 6,637 6,237
– Depreciation 37,006 37,729
– Accelerated depreciation relating to hire stock customer losses, hire stock write offs 10,066 9,762
– Impairment of property, plant and equipment 11,230 –
– Impairment of intangible assets 1,239 –
– Loss on disposal of property, plant and equipment 87 684
– Loss on disposal of intangible assets 3 –
– Loss on disposal of subsidiary 4,919 –
– Share based payment charge 4 103
– Finance income – (3)
– Finance expense 13,743 14,689
Changes in working capital (excluding the effects of acquisitions and exchange differences on consolidation):
– Inventories 804 1,197
– Trade and other receivables 6,560 (5,717)
– Trade and other payables (5,764) 2,571
– Provisions 31,504 (1,187)
Net cash flows from operating activities before changes in hire equipment 32,876 48,648
Purchase of hire equipment (22,787) (22,085)
Cash generated from operating activities 10,089 26,563
Net interest paid (12,494) (12,974)
Income tax paid (59) (373)
Net cash (utilised)/generated from operating activities (2,464) 13,216
Cash flows from investing activities
Proceeds on disposal of businesses, net of cash disposed of 1,138 –
Purchases of non hire property, plant, equipment and software (7,260) (16,804)
Net cash used in investing activities (6,122) (16,804)
Cash flows from financing activities
Proceeds from the issue of ordinary share capital 20 – 12,954
Share issue costs 20 – (170)
Proceeds from borrowings 18,000 31,000
Repayments of borrowings (15,000) (11,000)
Cash received from refinancing hire stock 5,030 –
Capital element of finance lease payments (12,504) (12,498)
Dividends paid 26 – (1,764)
Net cash received from financing activities (4,474) 18,522
Net (decrease)/increase in cash (13,060) 14,934
Cash at the start of the period 15,211 277
Cash at the end of the period 15 2,151 15,211
The notes on pages 66 to 103 form part of these Financial Statements.
Consolidated Statement of Cash FlowsFor the year ended 30 December 2017
Strategic R
eportC
orporate Governance
Financial Statem
entsA
dditional Information
HSS Hire Group plc Annual Report and Financial Statements 2017

Financial Statements
1. Accounting policiesa) Reporting entityThe Company is incorporated and domiciled in the United Kingdom. These Consolidated Financial Statements comprise the Company and its subsidiaries (the Group). The Group is primarily involved in providing tool and equipment hire and related services in the United Kingdom and the Republic of Ireland. HSS Hire Group Limited was incorporated on 7 January 2015 as a private company limited by shares in the United Kingdom and re-registered as a public limited company on 19 January 2015. The Company listed its shares on the London Stock Exchange on 9 February 2015. The Group and Company Financial Statements were approved by the Board of Directors on 5 April 2018.
b) Statement of complianceThe Group Financial Statements of HSS Hire Group plc have been prepared in accordance with International Financial Reporting Standards as adopted by the European Union (IFRS) and the Companies Act 2006.
The Directors have taken advantage of the option within section 390 of the Companies Act 2006 to prepare their Financial Statements up to a date seven days either side of the Company’s accounting reference date of 31 December, and these accounts therefore cover the period from 1 January 2017 to 30 December 2017 (2016: 27 December 2015 to 31 December 2016).
c) Functional and presentational currencyThese Financial Statements are presented in pounds Sterling (£), which is the Group’s presentational currency. The functional currency of the parent and subsidiaries is pounds sterling, except for those that are incorporated in the Republic of Ireland, which have the euro as their functional currency. All amounts have been rounded to the nearest thousand, unless otherwise indicated.
d) Basis of preparationThese Financial Statements have been prepared on a historical cost basis with the exception of derivative financial instruments, which are measured at fair value on each reporting date. The accounting policies set out below have been applied consistently to all periods presented in these Financial Statements.
e) New accounting standards and accounting standards not yet effectiveThere were no new IFRSs or IFRICs that had to be implemented during the year that significantly affect these Financial Statements.
Standards effective in future periodsThe following new standards, amendments and interpretations to existing standards, which are applicable to the Group, have been published and are mandatory for the Group’s accounting periods beginning on or after 1 January 2018.
→ IFRS 15 Revenue from Contracts with Customers, which provides guidance on the recognition, timing and measurement of revenue, and is effective for periods beginning on or after 1 January 2018.
→ IFRS 16 Leases, which sets out the principles for the recognition, measurement, presentation and disclosure of leases, effective for periods beginning on or after 1 January 2019.
→ IFRS 9 Financial Instruments, which replaces IAS39 Financial Instruments: Recognition and Measurement in its entirety, and is effective for periods beginning on or after 1 January 2018.
IFRS 15 Revenue from Contracts with Customers: This will replace IAS 18 which covers revenue arising from the sale of goods and the rendering of services and IAS 11 which covers construction contracts. The new standard is based on the principle that revenue is recognised when control of a good or service transfers to a customer. The standard permits either a full retrospective or a modified retrospective approach for the adoption. The Group will adopt the new standard from 31 December 2017. The Group is of the opinion that IFRS 15 does not have any material impact on the financial statements as what is required by the standard is already applied as accounting policy by the Group. The Group also confirm that it does not expect to restate or recognise the cumulative effect to the previous year’s Financial Statements as at the date of the application of IFRS 15.
IFRS 16 Leases: The Group is in the process of assessing the impact that the application of IFRS 16 will have on the Financial Statements, but it is expected to be material given the number of operating leases the Group has entered into, as detailed in note 23. IFRS 16 will require the Group to recognise a liability and right of use asset for the majority of the leases currently treated as operating. This will affect fixed assets, current and non-current liabilities, and the measurement and disclosure of expenses associated with the leases (depreciation and interest expense compared to operating lease rentals currently). The standard will also impact a number of statutory measures such as operating profit and cash generated from operations and alternative non-IFRS financial performance measures used by the Group. It is not practicable to provide a reasonable estimate of the effects of the adoption of IFRS 16 until a detailed review has been completed, given the complexity of the standard and volume of leases. The full impact of IFRS 16 will greatly depend on the facts and circumstances at the time of adoption. Accounting requirements for lessors are substantially unchanged from IAS 17. The group will adopt the standard from 30 December 2018.
IFRS 9 Financial Instruments addresses the classification, measurement and de-recognition of financial assets and financial liabilities, introduces new rules for hedge accounting and a new impairment model for financial assets. The Group will adopt IFRS 9 from 31 December 2017. The standard introduces:
→ New requirements for the classification and measurement of financial assets and financial liabilities
→ A new model for recognising provisions based on expected credit losses; and
→ Simplified hedge accounting by aligning hedge accounting more closely with an entity’s risk management methodology.
The adoption of IFRS 9 is unlikely to have a material impact on the consolidated results of the Group.
Notes to the Consolidated Financial StatementsFor the year ended 30 December 2017
66 HSS Hire Group plc Annual Report and Financial Statements 2017

67
1. Accounting policies continuedf) Critical accounting estimates and judgementsIn preparing these Financial Statements, management has made judgements, estimates and assumptions that affect the application of the Group’s accounting policies and the reported amount of assets, liabilities, income, expenses and other disclosures. The estimates and underlying assumptions are based on historical experience and various other factors that are believed to be reasonable under the circumstances. The estimates and underlying assumptions are reviewed on an ongoing basis.
Changes in accounting estimates may be necessary if there are changes in the circumstances on which the estimate was based, or as a result of new or further information. Such changes are recognised in the period in which the estimate is revised.
Key assumptions about the future and key sources of estimation uncertainty that have a risk of causing a material adjustment to the carrying value of assets and liabilities over the next year are set out below.
EstimatesUseful economic life and residual value of assets – see note 1(k)
Impairment of goodwill, intangible assets and property, plant and equipment – see note 1(l)
Onerous lease provision – see note 1(y)
Dilapidations provisions – see note 1(y)
Restructuring provisions – see note 1(y)
JudgementsRecoverability of trade receivables – see note 1(o)
Onerous contract provision – see note 1(y)
Exceptional items – see note 1(cc)
g) Going concernNote 22 includes the Group’s objectives, policies and processes for capital management and for financial risk management including market risk, credit risk, liquidity risk and asset risk.
The directors have also considered the adequacy of the Group’s debt facilities with specific regard to the following factors:
→ there is no requirement to redeem any of the senior secured notes until 1 August 2019.
→ The borrowings under the revolving credit facility are not due for repayment until 6 July 2019, unless the Group has not refinanced the senior secured notes by 30 September 2018 when the revolving credit facility may become, at the option of the lenders, repayable on 30 April 2019.
→ the terms and financial covenants relating to the revolving credit facility secured by the Group, as detailed in notes 17 and 22.
The Group’s forecasts and projections, taking account of reasonably possible changes in trading performance, and senior debt and interest repayments falling due, as detailed in note 17, show that the Group is expected to be able to operate within the level of its current facilities for the foreseeable future.
After reviewing the above, taking into account current and future developments and principal risks and uncertainties, and making appropriate enquiries, the directors have a reasonable expectation that the Group has adequate resources to continue in operational existence for the foreseeable future. Accordingly they continue to adopt the going concern basis in preparing these Financial Statements.
h) Basis of consolidationSubsidiaries are all entities over which the Company has control. The Company controls an entity when it is exposed to, or has rights to, variable returns from its involvement with the entity and has the ability to affect those returns through its power over the entity. Subsidiaries are fully consolidated from the date on which control is transferred.
Unless merger accounting has been adopted in specific circumstances, the Group applies the acquisition method to account for business combinations. The consideration transferred for the acquisition of a subsidiary is the fair value of the assets transferred, the liabilities incurred to former owners of the acquiree and the equity interests issued by the Group. The consideration transferred includes the fair value of any asset or liability resulting from a contingent consideration arrangement. Identifiable assets acquired and liabilities and contingent liabilities assumed in a business combination are measured initially at their fair values at the acquisition date. Acquisition-related costs are expensed as incurred.
If the business combination is achieved in stages, the acquisition date carrying value of the acquirer’s previously held equity interest in the acquiree is re-measured to fair value at the acquisition date. Any gains or losses arising from such re-measurement are recognised in the profit or loss.
Any contingent consideration is measured at fair value at the acquisition date. If the contingent consideration is classified as equity then it is not re-measured and settlement is accounted for within equity. Otherwise, subsequent changes in the fair value of contingent consideration are recognised in profit or loss.
Strategic R
eportC
orporate Governance
Financial Statem
entsA
dditional Information
HSS Hire Group plc Annual Report and Financial Statements 2017

Financial Statements
1. Accounting policies continuedh) Basis of consolidation continuedInter-company transactions, balances and unrealised gains on transactions between Group companies are eliminated on consolidation.
i) Segment reportingIFRS 8 Operating segments requires operating segments to be reported in a manner consistent with the internal reporting provided to the chief operating decision maker. The chief operating decision maker, who is responsible for allocating resources and assessing performance of the operating segments, has been identified as the management team, including the Chief Executive Officer, Chief Financial Officer and Chief Commercial Officer. Details of the Group’s segments are given in note 2.
j) Foreign currency translationForeign currency transactions are translated into an entity’s functional currency using the exchange rates prevailing at the dates of the transactions or valuation where items are re-measured. Foreign currency translation gains and losses resulting from the settlement of such transactions and from the translation at year-end exchange rates of monetary assets and liabilities denominated in foreign currencies are recognised in the income statement. Foreign currency translation gains and losses that relate to borrowings and cash and cash equivalents are presented in the income statement within finance income or finance expense. All other foreign currency translation gains and losses are presented in the income statement within administrative expenses.
The assets and liabilities of foreign operations, including goodwill and fair value adjustments arising on consolidation, are translated to the Group’s presentational currency, Sterling, at foreign currency exchange rates ruling at the reporting date.
The revenues and expenses of foreign operations are translated at an average rate for the period, which approximates the foreign currency exchange rates ruling at the dates of the transactions. Exchange differences arising from the translation of foreign operations are reported in other comprehensive income. Where required, any translation into the Group’s presentational currency follows the policy for foreign operations.
k) Property, plant and equipmentUse of estimates – useful economic life and residual value of assets The Group’s policy for applying useful economic lives and residual values of assets has been determined through applying historical experience and taking into consideration the nature of assets and their intended use, and achieved values on sale when disposed.
The net book value of materials and equipment held for hire was £118.6 million at 30 December 2017 (2016: £133.9 million) and the related depreciation charge was £29.0 million (2016: £27.9 million). The majority of hire stock items are given no residual value. Certain plant (powered access and power generation) have residual values of between 10% and 20% of original cost.
No sensitivity analysis has been given in relation to the useful economic life and residual value of assets held for hire due to the volume of the items involved and the complexities of the current system used by the group to record property, plant and equipment. Instead, the directors regularly review useful economic lives and residual values to ensure that the depreciation charge is appropriate. The Group will also be introducing a new property, plant and equipment recording system during 2018 which will be able to capture additional data to the one that is currently in use. Land and buildings comprise leasehold and freehold branches, workshops and offices, and are stated at cost, less depreciation or provision for impairment where appropriate. Land is not depreciated and depreciation on other assets is calculated using the straight-line method to allocate their cost or revalued amounts to their residual values over their estimated useful lives, as follows:
Material and equipment held for hire:
Tools and general equipment Two to ten years
Powered access Five to ten years
Power generation Five to ten years
Climate control Two to ten years
Non-hire assets:
Leasehold properties with less than fifty years unexpired Over unexpired period of lease
Freehold buildings and long leasehold properties Over fifty years
Plant and machinery Two to ten years
The Group reviews its depreciation policy annually. The effect of changes in the depreciation rates applied to specific assets in 2017 has resulted in an increase in depreciation charge of £0.8 million (2016: a reduction of £4.2 million).
Materials and equipment held for hire purposes are stated at cost, less depreciation or provision for impairment where appropriate. Materials and equipment are written off over their useful economic life to the asset’s residual value which is estimated at between 20% of cost and nil. Residual values are only applied to powered access and power generation assets. Profits or losses arising when customers are invoiced for loss of equipment held for hire purposes are calculated by reference to average written down values.
Notes to the Consolidated Financial Statements continuedFor the year ended 30 December 2017
68 HSS Hire Group plc Annual Report and Financial Statements 2017

69
1. Accounting policies continuedk) Property, plant and equipment continuedGains and losses on disposals of materials and equipment held for hire are calculated as the difference between the proceeds received and the carrying amount of the asset and are recognised in profit or loss.
Impairment reviews are undertaken whenever events or changes in circumstances indicate the carrying value of property, plant and equipment may not be recoverable. If the fair value of a tangible asset is estimated to be less than its carrying amount, the carrying amount is reduced to its recoverable amount. Where an impairment loss subsequently reverses, the carrying amount is increased to the revised estimate, but restricted so that the increased amount does not exceed the carrying amount that would have been determined had no impairment loss been recognised in prior years. Any impairment losses or reversals are recognised immediately in the income statement.
l) Intangible assetsUse of estimates – impairment of goodwill, intangible assets and property, plant and equipment These assets are reviewed annually or more frequently if there is an indication of impairment to ensure that they are not carried above their estimated recoverable amounts. To assess if any impairment exists, estimates are made of the future cash flows expected to result from the use of the asset and its eventual disposal. Actual outcomes could vary from such estimates of discounted future cash flows. Such calculations require assumptions related to the appropriate discount rate, the long term growth rate and also short term performance and cash flows. The directors consider historic performance as well as referencing to external information to arrive at these assumptions. Further details of the impairment reviews undertaken, assumptions and sensitivities are given in note 11.
GoodwillGoodwill arises on the acquisition of subsidiaries and represents the difference between the fair value of the consideration transferred and the fair value of the acquired assets, liabilities and contingent liabilities.
Impairment of goodwill For the purpose of impairment testing, goodwill acquired in a business combination is allocated to each of the cash generating units (CGUs), or groups of CGUs that is expected to benefit from the synergies of the combination. A CGU is the smallest group of assets that generates cash inflows from continuing use that are largely independent of the cash flows of other assets or CGUs.
Goodwill impairment reviews are undertaken annually. The carrying value of goodwill is compared to the recoverable amount, which is the higher of value in use and the fair value less costs of disposal. Any impairment is recognised immediately as an expense and is not subsequently reversed.
Intangible assets acquired on acquisitionWhen an acquisition is completed intangible assets are separately identified from goodwill and measured at fair value. Brands are valued using the relief from royalty method. Customer relationships are valued using the excess of earnings method.
The HSS brand was first established in the late 1950s, and therefore given its longevity the directors consider the HSS brand to have an indefinite life and it is not therefore amortised, but instead subjected to annual impairment testing using the relief from royalty methodology to calculate the fair value of the brand.
All other brands and customer relationships are amortised on a straight-line basis over their useful economic life. The directors have assessed the brands of ABird, UK Platforms and Apex and estimated that they have useful economic lives of 20 years. The directors have estimated the customer relationship intangible assets recognised on the acquisition of Hero Acquisitions Limited and Apex Generators Limited as having useful economic lives of 10 years. Amortisation is charged to administrative expenses.
Software development costsCosts associated with maintaining computer software programmes are recognised as an expense as incurred. Development costs that are directly attributable to the design and testing of identifiable and unique software products controlled by the Group are recognised as intangible assets when the following criteria are met:
→ it is technically feasible to complete the software product so that it will be available for use;
→ management intends to complete the software product and use or sell it;
→ there is an ability to use or sell the software product;
→ it can be demonstrated how the software product will generate probable future economic benefits;
→ adequate technical, financial and other resources to complete the development and to use or sell the software product are available; and
→ the expenditure attributable to the software product during its development can be reliably measured.
Computer software development costs recognised as assets are amortised over their estimated useful lives, which does not exceed four years.
Strategic R
eportC
orporate Governance
Financial Statem
entsA
dditional Information
HSS Hire Group plc Annual Report and Financial Statements 2017
Financial Statements
1. Accounting policies continuedOther intangible assetsOther intangible assets that are acquired by the Group that have finite useful lives are measured at cost less accumulated amortisation and any accumulated impairment losses. Other intangible assets are amortised over their useful economic life, and the amortisation charge is included within administrative expenses.
Impairment of intangible assets (excluding goodwill and intangible assets with indefinite lives)Impairment reviews are undertaken whenever events or changes in circumstances indicate their carrying value may not be recoverable. If the fair value of an intangible asset is estimated to be less than its carrying amount, the carrying amount is reduced to its recoverable amount. Where an impairment loss subsequently reverses, the carrying amount is increased to the revised estimate, but restricted so that the increased amount does not exceed the carrying amount that would have been determined had no impairment loss been recognised in prior years. Any impairment losses or reversals are recognised immediately in the income statement.
m) Derivative financial instrumentsHistorically the Group has used a derivative financial instrument to manage its exposure to interest rate risk. Derivatives are initially recognised at fair value on the date a derivative contract is entered into and are subsequently re-measured at their fair value at each reporting date. The resulting gain or loss is recognised in profit or loss immediately. Derivatives are carried as financial assets when the fair value is positive and as financial liabilities when the fair value is negative.
A derivative is presented as a non-current asset or non-current liability if the remaining maturity of the instrument is more than one year and is not expected to be realised or settled within one year. Where this is not the case, derivatives are presented as current assets or current liabilities. The Group did not have any derivative financial instruments in the current or prior year.
n) InventoriesInventories are stated at the lower of cost and net realisable value. Net realisable value is the estimated selling price in the ordinary course of business, less applicable variable selling expenses. Provision is made for those inventory items where the net realisable value is estimated to be lower than cost. Net realisable value is based on both historical experience and assumptions regarding estimated future sales value.
o) Trade receivablesJudgements – recoverability of trade receivables Judgements are required in assessing the recoverability of overdue trade receivables and determining whether a provision against those receivables is required. The Group monitors the risk profile of debtors and makes provisions for amounts that may not be recoverable based on past default experience and the directors’ assessment of the economic environment. The recoverability of overdue receivables is considered together with the sales credit note provision. The Group makes provision for credit notes raised and expected to be raised after the end of the reporting period that relate to customer invoices raised before the end of the period, net of any impairment charges relating to the customer invoices. The Group’s bad debt and credit note provision is disclosed in note 14.
Trade and other receivables are recognised initially at fair value, which is deemed to be the transaction price. Subsequently, trade and other receivables are measured at amortised cost using the effective interest method, less any provision for impairment.
Impairment provisions are recognised when there is objective evidence that the Group will be unable to collect all of the amounts due under the terms receivable, the amount of such provision being the difference between the net carrying amount and the present value of the future expected cash flows associated with the impaired receivables. On confirmation that the trade receivable will not be collectable, the gross carrying value of the asset is written off against the associated provision.
p) CashIn the statement of cash flows, cash and cash equivalents includes cash in hand, deposits held at call with banks, other short term highly liquid investments with maturities of three months or less and bank overdrafts. In the statement of financial position, bank overdrafts are shown within borrowings in current liabilities.
q) Share capital and reservesOrdinary sharesFinancial instruments used by the Group are classified as equity only to the extent that they do not meet the definition of a financial asset or a financial liability. The Group’s ordinary shares and preference shares are classified as equity instruments. Incremental costs directly attributable to the issue of ordinary shares are recognised as a deduction from equity, net of any tax effects.
Retained earnings/accumulated deficitCumulative net gains and losses recognised in the income statement.
Foreign exchange reserve This is the amount of gains/losses arising on retranslating the net assets of overseas operations into sterling. In prior years, the balance was included in retained earnings but the directors have decided to show it in a separate component of equity this year. The 2016 comparative has been restated accordingly.
Notes to the Consolidated Financial Statements continuedFor the year ended 30 December 2017
70 HSS Hire Group plc Annual Report and Financial Statements 2017

71
1. Accounting policies continuedDividendsDividends on ordinary share capital are recognised as a liability in the Group’s Financial Statements in the period in which they are declared by the Company. In the case of interim dividends, these are considered to be declared when they are paid and in the case of final dividends these are declared when authorised by the shareholders.
Merger reserveThe merger reserve is the amount arising on the difference between the nominal value of the shares issued on the merger and the carrying value of the interest in the subsidiary. The merger reserve arose in 2015 when the Group underwent a capital reconstruction in advance of its initial public offering on 9 February 2015, and increased during 2016 via acquisition of a ‘cash box’ company.
r) Trade and other payablesTrade payables are obligations to pay for goods or services that have been acquired in the ordinary course of business from suppliers. Trade payables are recognised initially at fair value and subsequently measured at amortised cost. Trade payables are classified as current liabilities if payment is due within one year or less, otherwise they are presented as non-current liabilities.
s) BorrowingsBorrowings are recognised initially at fair value, net of transaction costs incurred. Borrowings are subsequently carried at amortised cost; any difference between the proceeds (net of transaction costs) and the redemption value is recognised in the income statement over the period of the borrowings using the effective interest method.
Fees paid on the establishment of loan facilities are recognised as transaction costs of the loan to the extent that it is probable that some or all of the facility will be drawn down. In this case, the fee is deferred until the draw-down occurs. To the extent there is no evidence that it is probable that some or all of the facility will be drawn down, the fee is capitalised as a pre-payment for liquidity services and amortised over the period of the facility to which it relates.
t) Cost of sales, distribution costs and administrative expensesCost of sales includes direct costs associated with the Group’s principal business of equipment hire. Such costs include hire stock rehire, cost of reselling plant and equipment, maintenance, depreciation, amortisation and asset write-off and disposals. Distribution expenses comprise vehicle costs and transport wages. Administrative expenses comprise principally staff and property costs and costs of acquisitions.
u) Non-IFRS financial measuresEarnings before interest, taxation, depreciation and amortisation (EBITDA) and Adjusted EBITDA, earnings before interest, tax and amortisation (EBITA) and Adjusted EBITAEBITDA, Adjusted EBITDA, EBITA and Adjusted EBITA are non-IFRS and non-Generally Accepted Accounting Practice (GAAP) performance measures used by the directors and management to assess the operating performance of the Group.
→ EBITDA is defined as operating profit before depreciation, and amortisation. For this purpose depreciation includes the net book value of hire stock losses and write offs, and the net book value of other fixed asset disposals less the proceeds on those disposals. Exceptional items are excluded from EBITDA to calculate Adjusted EBITDA.
→ EBITA is defined by the Group as operating profit before amortisation. Exceptional items are excluded from EBITA to calculate Adjusted EBITA.
The Group discloses Adjusted EBITDA and Adjusted EBITA as supplemental non-IFRS financial performance measures because the directors believe they are useful metrics by which to compare the performance of the business from period to period and such measures similar to Adjusted EBITDA and Adjusted EBITA are broadly used by analysts, rating agencies and investors in assessing the performance of the Group. Accordingly, the directors believe that the presentation of Adjusted EBITDA and Adjusted EBITA provides useful information to users of the Financial Statements.
As these are non-IFRS measures, Adjusted EBITDA and Adjusted operating profit measures used by other entities may not be calculated in the same way and are hence not directly comparable.
v) Finance income and expenseFinance income comprises interest receivable on cash balances.
Finance expense comprises interest payable on borrowings, interest payable on finance leases, amortisation and write-off of debt issuance costs and the unwinding of the discount on non-current provisions.
Interest is recognised in profit or loss as it accrues, using the effective interest rate. Interest payable on borrowings includes a charge in respect of attributable transaction costs, which are recognised in profit or loss over the period of the borrowings on an effective interest basis. The interest expense component of finance lease payments is recognised in the income statement using the lease’s implicit interest rate.
Strategic R
eportC
orporate Governance
Financial Statem
entsA
dditional Information
HSS Hire Group plc Annual Report and Financial Statements 2017

Financial Statements
1. Accounting policies continuedw) Current and deferred income taxThe tax expense for the period comprises current and deferred tax. Tax is recognised in the income statement, except to the extent that it relates to items recognised in other comprehensive income or directly in equity. In this case, the tax is also recognised in other comprehensive income or directly in equity, respectively.
The current income tax charge is calculated on the basis of the tax laws enacted or substantively enacted at the statement of financial position date. Management periodically evaluates positions taken in tax returns with respect to situations in which applicable tax regulation is subject to interpretation. It establishes provisions where appropriate on the basis of amounts expected to be paid to the tax authorities.
Deferred income tax is recognised on temporary differences arising between the tax bases of assets and liabilities and their carrying amounts in the statement of financial position. However, deferred tax liabilities are not recognised if they arise from the initial recognition of goodwill. Deferred income tax is not accounted for if it arises from initial recognition of an asset or liability in a transaction other than a business combination that at the time of the transaction affects neither accounting nor taxable profit or loss. Deferred income tax is determined using tax rates (and laws) that have been enacted or substantively enacted by the statement of financial position date and are expected to apply when the related deferred income tax asset is realised or the deferred income tax liability is settled.
Deferred income tax assets are recognised only to the extent that it is probable that future taxable profit will be available against which the temporary differences can be utilised.
Deferred income tax liabilities are provided on taxable temporary differences arising from investments in subsidiaries, except for deferred income tax liabilities where the timing of the reversal of the temporary difference is controlled by the Group and it is probable that the temporary difference will not reverse in the foreseeable future.
Deferred income tax assets are recognised on deductible temporary differences arising from investments in subsidiaries only to the extent that it is probable the temporary difference will reverse in the future and there is sufficient taxable profit available against which the temporary difference can be utilised. Deferred income tax assets and liabilities are offset when there is a legally enforceable right to offset current tax assets against current tax liabilities and when the deferred income taxes assets and liabilities relate to income taxes levied by the same taxation authority on either the same taxable entity or different taxable entities where there is an intention to settle the balances on a net basis.
x) Employee benefitsShort term employee benefitsShort-term employee benefits are expensed as the related service is provided. A liability is recognised for the amount expected to be paid if the Group has a present legal or constructive obligation to pay this amount as a result of past service provided by the employee and the obligation can be estimated reliably.
Pension obligationsThe Group operates employee optional stakeholder retirement and death benefit schemes. Both employees and employers are required to make contributions, with the employer’s contributions for each employee determined by the level of contribution made by the employee and the employee’s length of service within the Group or subsidiary company. The employer’s contributions are charged to profit and loss in the year in which the contributions are due.
Termination benefitsTermination benefits are payable when employment is terminated by the Group before the normal retirement date, or whenever an employee accepts voluntary redundancy in exchange for these benefits. The Group recognises termination benefits at the earlier of the following dates: (a) when the Group can no longer withdraw the offer of those benefits; and (b) when the entity recognises costs for a restructuring that is within the scope of IAS 37 Provisions, Contingent Liabilities and Contingent Assets and involves the payment of termination benefits. In the case of an offer made to encourage voluntary redundancy, the termination benefits are measured based on the number of employees expected to accept the offer. Benefits falling due more than 1 year after the end of the reporting period are discounted to their present value.
Share based payments Share based payment transactions in which the Group receives goods or services as consideration for its own equity instruments are accounted for as equity-settled share based payments. The grant date fair value of the share based payment granted to employees is recognised as an employee expense, with a corresponding increase in equity, over the period that the employee becomes unconditionally entitled to the awards. The fair value of the options granted is measured using an option valuation model where required, taking into account the terms and conditions upon which the options were granted and is charged to the income statement on a straight-line basis over the vesting period of the award.
The amount recognised as an expense is adjusted to reflect the actual number of awards for which the related service and non-market vesting conditions are expected to be met, such that the amount ultimately recognised as an expense is based on the number of awards that do meet the related service and non-market performance conditions at the vesting date.
Notes to the Consolidated Financial Statements continuedFor the year ended 30 December 2017
72 HSS Hire Group plc Annual Report and Financial Statements 2017

73
1. Accounting policies continuedy) ProvisionsUse of estimates – onerous leasesProvisions have been made for onerous leases on non-trading stores associated with the Group’s property portfolio. The carrying amount of the onerous lease provision will be affected by changes in the discount rate. The discount rate used to calculate these provisions is based on UK gilt yields to approximate a risk free rate and as at 30 December 2017 was 0.752% (2016: 0.48 %). The interest rate used in discounting the cash flows is reviewed annually. Further details of the assumptions and sensitivities are given in note 18.
The need for provisions for onerous leases against non-trading stores, measured net of expected rental income, is assessed when the leased property becomes vacant and is no longer used in the operations of the Group or when a decision has formally been made to do so. These provisions are recognised on a lease by lease basis. The determination of the onerous lease provision requires management, in conjunction with its third party property advisers, to make estimates about the ultimate cost to the Group, including the nature, timings and cost of exiting a lease, and any additional unavoidable costs, and the level of sublease income, if applicable.
The actual costs and timing of cash flows are dependent on future events and market conditions. Any difference between management estimates and actual costs is accounted for in the period when such determination is made.
Provisions for onerous leases, restructuring costs and legal claims are recognised when:
→ the Group has a present legal or constructive obligation as a result of past events;
→ it is probable that an outflow of resources will be required to settle the obligation; and
→ the amount has been reliably estimated.
Use of estimates – dilapidations provisionsLeasehold dilapidations relate to the estimated cost of returning a leasehold property to its original state at the end of the lease in accordance with the lease terms. The cost is recognised as depreciation of leasehold improvements over the remaining term of the lease. The main uncertainty relates to estimating the cost that will be incurred at the end of the lease. Provisions for dilapidations are estimated based on surveyors’ reports where available and remaining properties are covered by estimates based on gross internal area. The Group’s dilapidation provision is disclosed in note 18.
Provisions for dilapidation are recognised in full when the related facilities are installed. A corresponding amount equivalent to the provision is also recognised as part of the cost of the related property. The timing and amounts of future cash flows related to lease dilapidations are subject to uncertainty. The provision recognised is based on management’s experience and understanding of the commercial retail property market and third party surveyors’ reports commissioned for specific properties in order to best estimate the future outflow of funds, requiring the exercise of judgement applied to existing facts and circumstances, which can be subject to change. The amount recognised is the estimated cost of dilapidations, discounted to its net present value, and since the cash outflow can take place many years in the future, the carrying amount of the provision is reviewed regularly and adjusted to take account of changing facts and circumstances, including, the age and condition of the property, experience of actual spending, third party surveyors’ reports commissioned for specific properties, the Group’s specific lease obligations, market practice generally and any agreements specifically reached with landlords in respect of any given property. Changes in the estimated timing of dilapidations or dilapidations cost estimates are dealt with prospectively by recording an adjustment to the provision, and a corresponding adjustment to property, plant and equipment. The unwinding of the discount on the dilapidations provision is included as a finance expense.
Use of estimates – restructuring provisionsRestructuring provisions comprise lease termination penalties and employee termination payments. Provisions are not recognised for future operating losses. Provisions are measured at the present value of the expenditures expected to be required to settle the obligation using a pre-tax rate that reflects current market assessments of the time value of money and the risks specific to the obligation.
Judgements – onerous contract provisions Contracts are considered to be onerous when cash is paid to a third party but the Group derives no economic benefit. In the case of the Group’s relationship with Unipart, following the agreement to cease the NDEC in December 2017 and the subsequent revisions to the contracts between the parties, £33.8 million will be payable over the period 2018 to 2026 for which the Group will receive no services. Accordingly this has been treated as an onerous contract.
z) Revenue recognitionThe Group’s activities consist of supplying hire and equipment services within the UK and the Republic of Ireland. Revenue is measured at the fair value of the consideration received or receivable, and represents amounts receivable for goods and services supplied, including compensation for damaged or lost hire stock, stated net of discounts, rebates, returns and value added taxes.
Strategic R
eportC
orporate Governance
Financial Statem
entsA
dditional Information
HSS Hire Group plc Annual Report and Financial Statements 2017

Financial Statements
1. Accounting policies continuedThe Group recognises revenue when the amount of revenue can be reliably measured and when it is probable that future economic benefits will flow to the entity. Revenue is recognised as follows:
→ hire and rehire activities: over the period of hire on a straight-line basis;
→ resale and ancillary revenue to hire including fuel and consumables:
when the significant risks and rewards of ownership have been transferred to the buyer;
→ ex-hire fleet asset sales: when the significant risks and rewards of ownership have been transferred to the buyer;
→ damaged/lost hire stock compensation: when the loss or damage is identified; and
→ training course and support services: when a right to consideration arises on the delivery of the training course or support service.
aa) LeasesAssets held under finance leases, which are leases where substantially all the risks and rewards of ownership of the asset have transferred to the Group, and hire purchase contracts are capitalised in the balance sheet and are depreciated over the shorter of useful life and lease term with any impairment being recognised in accumulated depreciation. Leased assets are recorded at an amount equal to the lower of its fair value and the present value of the minimum lease payments at the inception of finance leases. The capital elements of future obligations under leases and hire purchase contracts are included in liabilities in the statement of financial position and analysed between current and non-current amounts. The interest elements of the obligations are charged to the income statement over the periods of the leases and hire purchase contracts so as to produce a constant periodic rate of interest on the remaining balance of the liability.
Leases where the lessor retains substantially all the risks and rewards of ownership are classified as operating leases. Operating lease rentals are charged to the income statement on a straight-line basis over the lease term.
Lease incentives are recorded as a liability and then recognised over the lease term on a straight-line basis in the income statement as a reduction of rental expense.
bb) Fair value measurementA number of the Group’s accounting policies and disclosures require the determination of fair value, for both financial and non-financial assets and liabilities. Set out below is an analysis of the valuation method of the Group’s financial instruments.
The different levels in the fair value hierarchy have been defined as follows:
→ Level 1: quoted (unadjusted) prices in active markets for identical assets or liabilities;
→ Level 2: inputs other than quoted prices included within level 1 that are observable, for the asset or liability, either directly (i.e. as prices) or indirectly (i.e. derived from prices); and
→ Level 3: inputs for the asset or liability that are not based on observable market data (unobservable inputs).
Fair values have been determined for measurement purposes based on the following methods:
Derivative instruments (level 2)The fair values of interest rate swaps are calculated as the present value of the estimated future cash flows based on the terms and maturity of each contract and using market interest rates as applicable for a similar instrument at the measurement date. Fair values reflect the credit risk of the instrument and include adjustments to take account of the credit risk of the Group entity and counterparty where appropriate.
The fair value of interest rate swap contracts are calculated by management based on external valuations received from the Group’s bankers and are based on anticipated future interest yields.
cc) Exceptional itemsJudgements – exceptional items The Group has classified a number of income statement items as exceptional during the year because of their size or nature or because they are non-recurring.
Exceptional items are disclosed separately in the income statement where it is necessary to do so to provide further understanding of the underlying financial performance of the Group. Exceptional items are items of income or expense that have been shown separately due to the significance of their nature or amount. During the year ended 30 December 2017 these include the cost of onerous leases (net of sub-let rental income) and the impairment of fixed assets related to closed branches, the cost reduction programme, senior management changes, preparatory refinancing costs, the strategic review and the costs of the network reconfiguration. Additionally in 2016 exceptional costs included the cost of the establishment of the National Distribution and Engineering Centre (NDEC), pre-opening costs, IPO fees and a resale stock impairment.
These are more fully discussed in note 4 and in our Financial Review.
Notes to the Consolidated Financial Statements continuedFor the year ended 30 December 2017
74 HSS Hire Group plc Annual Report and Financial Statements 2017
75
2. Segment reportingThe Group’s operations are segmented into the following reportable segments:
→ Rental and related revenue; and
→ Services.
Rental and related revenue comprises the rental income earned from owned tools and equipment, including powered access, power generation, cleaning and HVAC assets, together with directly related revenue such as resale (fuel and other consumables) transport and other ancillary revenues.
Services comprise the Group’s rehire business known as HSS OneCall and HSS Training. HSS OneCall provides customers with a single point of contact for the hire of products that are not typically held within HSS’ fleet and are obtained from approved third party partners and HSS Training provides customers with specialist safety training across a wide range of products and sectors.
Contribution is defined as segment operating profit before branch and selling costs, central costs, depreciation, amortisation and exceptional items.
All segment revenue, operating profit, assets and liabilities are attributable to the principal activity of the Group being the provision of tool and equipment hire and related services in, and to customers in, the United Kingdom and the Republic of Ireland. The Group has one customer which accounts for more than 10% of Group turnover (2016: Nil).
Strategic R
eportC
orporate Governance
Financial Statem
entsA
dditional Information
HSS Hire Group plc Annual Report and Financial Statements 2017

Financial Statements
Notes to the Consolidated Financial Statements continuedFor the year ended 30 December 2017
2. Segment reporting continued
Year ended 30 December 2017
Rental (and related
revenue)£000s
Services£000s
Central£000s
Total£000s
Total revenue from external customers 247,770 88,010 – 335,780
Contribution 158,063 11,877 – 169,940
Branch and selling costs – – (82,422) (82,442)
Central costs – – (38,574) (38,574)
Adjusted EBITDA 48,944
Less: Exceptional items – – (66,567) (66,567)
Less: Depreciation and amortisation (41,842) (311) (11,643) (53,796)
Operating loss (71,419)
Net finance expenses (13,743)
Loss before tax (85,162)
Rental (and related
revenue)£000s
Services£000s
Central£000s
Total£000s
Additions to non-current assets
Property, plant and equipment 25,763 24 8,726 34,513
Intangibles – 200 2,657 2,857
Non-current assets net book value
Property, plant and equipment 118,643 224 32,048 150,915
Intangibles 165,960 290 6,259 172,509
Unallocated corporate assets
Asset held for resale – – 1,500 1,500
Non-current deferred tax assets 358 358
Current assets 104,173 104,173
Current liabilities (168,226) (168,226)
Non-current liabilities (187,657) (187,657)
73,572
76 HSS Hire Group plc Annual Report and Financial Statements 2017

77
2. Segment reporting continued
Year ended 31 December 2016
Rental (and related
revenue)£000s
Services£000s
Central£000s
Total£000s
Total revenue from external customers 262,817 79,593 – 342,410
Contribution 179,429 10,317 – 189,746
Branch and selling costs – – (89,294) (89,294)
Central costs – – (31,814) (31,814)
Adjusted EBITDA 68,638
Less: Exceptional items – – (16,957) (16,957)
Less: Depreciation and amortisation (40,572) (267) (13,573) (54,412)
Operating loss (2,731)
Net finance expenses (14,686)
Loss before tax (17,417)
Rental (and related
revenue)£000s
Services£000s
Central£000s
Total£000s
Additions to non-current assets
Property, plant and equipment 27,337 115 14,945 42,397
Intangibles – 149 4,590 4,739
Acquired on acquisitions
Intangibles – – – –
Non-current assets net book value
Property, plant and equipment 133,922 387 44,164 178,473
Intangibles 169,748 542 8,465 178,755
Unallocated corporate assets
Non-current deferred tax assets 780 780
Current assets 126,853 126,853
Current liabilities (162,082) (162,082)
Non-current liabilities (169,393) (169,393)
153,386
Strategic R
eportC
orporate Governance
Financial Statem
entsA
dditional Information
HSS Hire Group plc Annual Report and Financial Statements 2017

Financial Statements
Notes to the Consolidated Financial Statements continuedFor the year ended 30 December 2017
3. Other operating income
Year ended 30 December
2017£000s
Year ended 31 December
2016£000s
Other operating income 882 1,151
882 1,151
Other operating income includes £0.9 million (2016: £1.2 million) in respect of sub-let rental income received on vacant properties, which has been recognised within exceptional items (note 4).
4. Exceptional items Items of income or expense have been shown as exceptional either because of their size or nature or because they are non-recurring.
During the year ended 30 December 2017 the group has incurred a number of exceptional items.
In the first half of the year the Group identified the need to reduce its cost base. A cost reduction programme identified annualised savings of £13 million, based on the Q1 2017 run-rate, to be achieved through a number of initiatives including closing branches, making efficiencies in the network and reducing headcount. This led to redundancy costs and provisions being made for onerous leases and the impairment of property plant and equipment.
Following the appointment of the new CEO the Group carried out a strategic review. In December 2017 it was announced that this had identified further annualised savings of between £10 million and £14 million to be achieved through a network reconfiguration and further headcount savings. This led to the recognition of an onerous contract, asset impairments and redundancy costs.
Additionally to this the Group sold a business which was not considered core to its new strategy and incurred costs relating to reviewing the available options ahead of the planned refinancing of the Group’s borrowings during 2018.
As a result, during the period ended 30 December 2017, the Group has recognised total exceptional items of £66.6 million analysed as follows:
Included in cost of sales
£000s
Included in distribution
costs£000s
Included in administrative
expenses£000s
Included in other
operating income
£000s
Year ended 30 December
2017£000s
Onerous leases – – 6,903 – 6,903
Impairment of property, plant and equipment – – 8,279 – 8,279
Business divesture – – 4,919 – 4,919
Cost reduction programme 176 131 3,432 – 3,739
Senior management changes – – 1,031 – 1,031
Strategic review – – 1,172 – 1,172
Network reconfiguration – – 40,692 – 40,692
Preparatory refinancing costs – – 714 – 714
Sub-let rental income on onerous leases – – – (882) (882)
Total exceptional items 176 131 67,142 (882) 66,567
78 HSS Hire Group plc Annual Report and Financial Statements 2017

79
4. Exceptional items continuedDuring the year ended 31 December 2016, the Group recognised total exceptional costs of £17.0 million, analysed as follows:
Included in cost of sales
£000s
Included in distribution
costs£000s
Included in administrative
expenses£000s
Included in other
operating income£000s
Year ended 31 December
2016£000s
NDEC exceptional costs
Project management, design, set-up 508 – 2,560 – 3,068
Parallel running 1,036 1,128 4,130 – 6,294
Non-recurring transitional engineering costs 125 – 226 – 351
Branch and CDC closure redundancies 162 163 116 – 441
Total NDEC exceptional costs 1,831 1,291 7,032 – 10,154
Onerous leases – – 4,492 – 4,492
Group restructuring 15 5 1,622 – 1,642
Resale stock impairment 1,552 – – – 1,552
Pre-opening costs – 8 172 – 180
Cost reduction programme – – – – –
IPO fees – – 74 – 74
Acquisitions – – – – –
Sub-let rental income on onerous leases – – – (1,137) (1,137)
Total exceptional items 3,398 1,304 13,392 (1,137) 16,957
An analysis of the amount presented as exceptional items in the consolidated income statement is given below.
Onerous leases: branch and distribution centre closure The number of branches has been reduced to remove less profitable locations with activity centralised into fewer locations. 55 branches were closed during the year (2016: 30). An exceptional cost of £6.9 million relating to onerous leases and dilapidations costs has been recorded in the year ended 30 December 2017 (2016: £4.5 million). Sub-let rental income on onerous leases for the year amounted to £0.9 million (2016 £1.1 million).
Impairment of closed branch property, plant and equipmentFollowing the branch closures management have conducted an impairment review of property plant and equipment in closed branches to determine what can be reused across the network. During the year ended 30 December 2017 an impairment of £8.3 million has been recorded, (2016: £nil).
Strategic R
eportC
orporate Governance
Financial Statem
entsA
dditional Information
HSS Hire Group plc Annual Report and Financial Statements 2017

Financial Statements
Notes to the Consolidated Financial Statements continuedFor the year ended 30 December 2017
4. Exceptional items continuedCost reduction programmeThe Group announced plans in the first half of the financial year 2017 to deliver significant cost reductions primarily by reducing head office headcount by redundancy and restructuring costs at the NDEC to drive operational efficiencies in the supply chain. Included in these costs is an asset impairment relating to the closure of the former head office in Mitcham and associated relocation costs of transferring transactional activity to the new head office in Manchester. During the year ended 30 December 2017 costs of £3.7 million are included as exceptional items relating to the cost reduction programme (2016: £nil).
Senior management changesDuring the first half of the year a number of senior management changes happened including the recruitment of a new Chief Executive Officer. Termination costs, legal fees and recruitment costs totalled £1.0 million (2016: £nil).
Strategic reviewFollowing the appointment of the new Chief Executive Officer, a thorough Strategic Review was carried out by the Group. Non-recurring third party consultancy costs of £1.2 million were incurred for the period ended 30 December 2017 to support this review (2016: £nil).
Network reconfigurationThe Strategic Review identified operational efficiencies that could be achieved through reconfiguring the Group’s supply chain model. Potential annual savings of between £7 million and £10 million were identified by moving the testing and repair of all fast-moving products closer to HSS’s customers, using the Group’s existing network of distribution centres and branches. In addition to the cost savings, these changes are expected to improve asset utilisation and availability of product.
To realise these benefits, agreement was reached with Unipart who operated the Group’s National Distribution and Engineering Centre (NDEC) to terminate the remaining 8 year term of the contract. In terminating this contract the Group will make cash payments of £33.8 million over the period 2018 to 2026 as compensation to Unipart. In aggregate a discounted provision of £32.6 million has been made for these payments. Included in the above are one off cash payments of £6.5 million which will be made in 2018 to cover the immediate restructuring costs associated with the change, including redundancy, site decommissioning and exit costs from operating leases.
The Group has impaired fixed assets of £1.9 million and software intangibles of £1.2 million relating to the operation of the NDEC. The Group has also impaired a security deposit of £4.5 million paid to Unipart prior to the opening of the NDEC as this will not be repaid.
The total provision for network reconfiguration, including £0.5 million of legal costs, recorded within exceptional items amounts to £40.7 million (2016: £nil).
Business divestureThe Group sold businesses not considered core to the strategy. The Reintec branded fleet of cleaning machines and the associated Tecserv equipment maintenance business were sold on 16 November 2017 for a consideration of £1.5 million. After transaction costs, net proceeds were £1.2 million. This gave rise to a loss of £4.9 million including goodwill written off of £0.8 million. Further details on the disposal can be found in note 24.
Preparatory refinancing costsIncluded within exceptional items for the period ended 30 December 2017 is an exceptional cost of £0.7 million in respect of preparatory costs for the refinancing of the Senior Secured Notes and the Revolving Credit Facility which are due for repayment in 2019. The Group expects to complete this refinancing in 2018.
Group restructuring costsIn parallel with the implementation of the NDEC the Group changed its operating model during 2016 to a new Divisional structure. This resulted in a reduction in headcount leading to a redundancy cost of £1.6 million for the year ended 31 December 2016 which was included within administrative expenses.
Resale stock impairmentAs part of the NDEC set up and branch and distribution centre closures, inventory held for sale was centralised into fewer locations leading to an inventory impairment of £1.6 million which was included within cost of sales in the year ended 31 December 2016.
Pre-opening costsIncluded in exceptional items for the year ended 31 December 2016 were £0.2 million of costs relating to new branch openings and relocations. These amounts have been included within administrative expenses.
IPO feesIncluded in exceptional items for the year ended 31 December 2016 were £0.1 million of fees relating to the IPO in February 2015 and related to professional adviser and broker fees, which were included within administrative expenses.
80 HSS Hire Group plc Annual Report and Financial Statements 2017

81
4. Exceptional items continuedNDEC establishmentDuring the year ended 31 December 2016, the Group incurred exceptional costs of £10.2 million establishing operations at the National Distribution and Engineering Centre (“NDEC”). The NDEC was a centralised engineering and replenishment centre set up to serve our branch and distribution network replacing the former hub and spoke model deployed by the Group.
A dedicated project team oversaw these changes. Associated costs incurred amounted to £3.1 million.
As branches and distribution centres rolled into the NDEC, there was a period of increased costs due to the operation of both the new and old models in parallel. The Group determined that a reasonable approximation of these parallel running inefficiencies to be the total costs incurred in operating the NDEC up to the point where 50% of operational volumes were processed through the NDEC rather than the original branch and distribution network. Accordingly all related NDEC costs until October 2016 were treated as exceptional costs, which amounted to £6.2 million.
As part of the restructuring a number of branches and distribution centres were closed. This led to redundancy costs of £0.5 million.
Given the scale and complexity in the operational change, the decision was made in the 4th quarter 2016 to redesign certain aspects of the project. These non-recurring transitional engineering costs amounted to £0.4 million.
5. Finance income and expense
Year ended 30 December
2017£000s
Year ended 31 December
2016£000s
Interest received on cash deposits – (3)
Finance income – (3)
Bank loans and overdrafts 2,118 2,039
Senior secured notes 9,155 9,331
Finance leases 1,392 1,792
Interest unwind on discounted provisions 31 484
Debt issue costs 1,047 1,043
Finance expense 13,743 14,689
Net finance expense 13,743 14,686
Strategic R
eportC
orporate Governance
Financial Statem
entsA
dditional Information
HSS Hire Group plc Annual Report and Financial Statements 2017

Financial Statements
Notes to the Consolidated Financial Statements continuedFor the year ended 30 December 2017
6. Operating lossOperating loss is stated after charging/(crediting):
Year ended 30 December
2017£000s
Year ended 31 December
2016£000s
Amortisation of intangible assets 6,637 6,237
Depreciation of property, plant and equipment 37,006 37,729
Accelerated depreciation relating to hire stock customer losses, hire stock write offs and other asset disposals 10,153 10,446
Loss on disposal of businesses 4,919 –
Impairment of tangible assets 11,230 –
Impairment of intangible assets 1,239 –
Loss on disposal of intangible assets 3 –
Operating lease rentals:
– land and buildings 19,907 19,463
– motor vehicles 8,821 9,393
– hire stock 1,742 748
Sub-lease rental income (882) (1,151)
Foreign currency translation gains (116) 85
Year ended 30 December
2017£000s
Year ended 31 December
2016£000s
Auditors’ remuneration
– audit of Group and Company financial statements 61 58
– audit of subsidiary financial statements 214 232
– other audit related assurance services 50 –
– corporate finance services 230 –
– taxation compliance services 2 –
557 290
82 HSS Hire Group plc Annual Report and Financial Statements 2017

83
7. EmployeesThe average number of people employed by the Group (including directors) during the year was as follows:
Year ended 30 December
2017Number
Year ended 31 December
2016Number
Headcount
Distribution 566 593
Hire stock and inventory maintenance 391 391
Sales and administration 2,109 2,270
3,066 3,254
The aggregate remuneration costs of these employees were as follows:
Year ended 30 December
2017£000s
Year ended 31 December
2016£000s
Staff costs
Wages and salaries 79,994 83,434
Social security costs 8,228 7,386
Pension costs 1,486 1,665
Share based payment expense 4 103
89,712 92,588
IAS 24 Related party transactions (IAS 24) requires the Group to disclose all transactions and outstanding balances with the Group’s key management personnel. IAS 24 defines key management personnel as those persons having authority and responsibility for planning, directing and controlling the activities of the entity, directly or indirectly, including any director (whether executive or otherwise) of that entity.
The key management personnel of the Group comprise the directors along with senior managers from central support services and divisional and regional operations.
The aggregate remuneration costs of key management personnel were as follows:
Year ended 30 December
2017£000s
Year ended 31 December
2016£000s
Wages and salaries 2,506 1,905
Employer’s national insurance contributions and similar taxes 305 243
Compensation for loss of office 720 –
Other pension costs 118 99
Share based payment expense 4 103
3,653 2,350
At 30 December 2017 there were no amounts due to key management personnel (2016: £nil).
Strategic R
eportC
orporate Governance
Financial Statem
entsA
dditional Information
HSS Hire Group plc Annual Report and Financial Statements 2017

Financial Statements
Notes to the Consolidated Financial Statements continuedFor the year ended 30 December 2017
8. Directors’ remunerationThe remuneration costs of the Company’s directors were:
Year ended 30 December
2017£000s
Year ended 31 December
2016£000s
Directors’ remuneration
Aggregate emoluments 932 853
Bonuses not paid – (16)
Pension costs 56 43
Directors’ emoluments 988 880
Share-based payment expense – 25
Total emoluments 988 905
Compensation for loss of office of £0.4 million is being paid by instalments to a former director and has been fully accrued during the year ended 30 December 2017 (2016: £nil).
The remuneration of the highest paid director was:
Year ended 30 December
2017£000s
Year ended 31 December
2016£000s
Highest paid director
Aggregate emoluments 284 348
Pension costs 24 33
Directors’ emoluments 308 381
Share-based payment expense – 20
Total emoluments 308 401
9. Income tax credit(a) Analysis of expense/(credit) in the year
Year ended 30 December
2017£000s
Year ended 31 December
2016£000s
Current tax charge
UK corporation tax on the loss for the year 486 389
Adjustments in respect of prior years (788) 26
Total current tax (credit)/charge (302) 415
Deferred tax credit
Deferred tax (credit)/charge for the year (4,889) 443
Deferred tax charge impact of change in tax rate – (961)
Adjustments in respect of prior years (49) (1)
Total deferred tax credit (see note 19) (4,938) (519)
Income tax credit (5,240) (104)
84 HSS Hire Group plc Annual Report and Financial Statements 2017

85
9. Income tax (credit)/expense continued(b) Factors affecting the income tax expense/(credit) in the yearThe tax assessed on the loss for the year differs from the standard UK corporation rate of tax. The differences are explained below:
Year ended 30 December
2017£000s
Year ended 31 December
2016£000s
Loss before tax (85,162) (17,417)
Loss before tax multiplied by the standard rate of corporation tax of 19.25% (2016: 20%) (16,394) (3,483)
Effects of:
Expenses not deductible for tax purposes 1,076 501
Adjustments in respect of prior years (838) 25
Difference in foreign tax rate 444 389
Unprovided deferred tax movements on short term temporary differences and capital allowance timing differences 10,472 3,425
Impact of change in tax rates – (961)
Income tax credit (5,240) (104)
(c) Factors that may affect future tax chargeThe standard rate of corporation tax in the UK changed from 20% to 19% with effect from 1 April 2017. The Group’s losses for the year ended 30 December 2017 were taxed at an effective rate of 19.25%.
The Group has an unrecognised deferred tax asset relating to temporary timing differences on plant and equipment, intangible assets and provisions of £18.2 million (2016: £14.8 million) and relating to losses £6.9 million (2016: £1.4 million).
These potential deferred tax assets have not been recognised on the basis that it is not sufficiently certain when taxable profits that can be utilised to absorb the reversal of the temporary difference will be made in the future.
The corporation tax main rate is 19% for the years starting 1 April 2017, 2018 and 2019 and at 18% for the year starting 1 April 2020. The tax rate for the year starting 1 April 2021 is 17%.
Strategic R
eportC
orporate Governance
Financial Statem
entsA
dditional Information
HSS Hire Group plc Annual Report and Financial Statements 2017

Financial Statements
Notes to the Consolidated Financial Statements continuedFor the year ended 30 December 2017
10. Earnings per share
Year ended 30 December 2017
Loss after tax
£000s
Weighted average
number of shares
000s
Loss per sharepence
Basic and diluted loss per share (79,922) 170,207 (46.96)
Potentially dilutive securities – – –
Diluted earnings per share (79,922) 170,207 (46.96)
Year ended 31 December 2016
Loss after tax£000s
Weighted average
number of shares1
000s
Loss per share
pence
Basic and diluted loss per share (17,313) 154,887 (11.18)
1 The ordinary shares issued on 28 December 2016 (see note 20) had no material impact on the weighted average number of shares for the year ended 31 December 2016.
Basic loss per share is calculated by dividing the result attributable to equity holders by the weighted average number of ordinary shares in issue for that period.
Diluted loss per share is calculated using the loss for the year divided by the weighted average number of shares outstanding assuming the conversion of its potentially dilutive equity derivatives outstanding, being nil cost share options (LTIP shares) and Sharesave Scheme share options, as disclosed in note 21. All of the Group’s potentially dilutive equity derivative securities were anti-dilutive for the year ended 30 December 2017 for the purpose of diluted loss per share. There were no potentially dilutive equity derivative securities outstanding during the year ended 30 December 2017 for the purpose of diluted loss per share.
The following is a reconciliation between the basic loss per share and the Adjusted basic loss per share:
Year ended 30 December
2017
Year ended 31 December
2016
Basic and diluted loss per share (pence) (46.96) (11.18)
Add back:
Exceptional items per share1 39.11 10.95
Amortisation per share2 3.90 4.03
Tax per share (3.08) (0.07)
Charge:
Tax credit/(charge) at prevailing rate 1.35 (0.75)
Adjusted basic (loss)/earnings per share (pence) (5.68) 2.98
1 Exceptional items per share is calculated as total exceptional items divided by the weighted average number of shares in issue through the period.
2 Amortisation per share is calculated as the amortisation charge divided by the weighted average number of shares in issue through the period.
86 HSS Hire Group plc Annual Report and Financial Statements 2017

87
10. Earnings per share continuedThe following is a reconciliation between the basic and diluted loss per share and the adjusted diluted (loss)/earnings per share:
Year ended 30 December
2017
Year ended 31 December
2016
Basic and diluted loss per share (pence) (46.96) (11.18)
Add back:
Adjustment to basic loss per share for the impact of dilutive securities1 – 0.12
Exceptional items per share2 39.11 10.83
Amortisation per share3 3.90 3.98
Tax per share (3.08) (0.07)
Charge:
Tax credit/(charge) at prevailing rate 1.35 (0.74)
Adjusted diluted (loss)/earnings per share (pence) (5.68) 2.94
1 The LTIP and Sharesave share options (note 21) were dilutive for purposes of calculating adjusted diluted earnings per share for the year ended 31 December 2016. The LTIP, market value options and Sharesave share options were not dilutive in the year ended 30 December 2017.
2 Exceptional items per share is calculated as total finance and non-finance exceptional items divided by the diluted weighted average number of shares in issue through the period.
3 Amortisation per share is calculated as the amortisation charge divided by the diluted weighted average number of shares in issue through the period.
The weighted average number of shares for the purposes of calculating the adjusted diluted earnings per share are as follows:
Year ended 30 December
2017
Year ended 31 December
2016
Weighted average
number of shares
000s
Weighted average
number of shares
000s
Basic 170,207 154,887
LTIP share options (note 21) 1,383 1,256
Sharesave scheme options (note 21) 2,223 378
Market value options (note 21) 2,581 –
Diluted 176,394 156,521
There were no potentially dilutive equity derivative securities outstanding during the year ended 30 December 2017 for the purpose of adjusted diluted loss per share.
Strategic R
eportC
orporate Governance
Financial Statem
entsA
dditional Information
HSS Hire Group plc Annual Report and Financial Statements 2017

Financial Statements
Notes to the Consolidated Financial Statements continuedFor the year ended 30 December 2017
11. Intangible assets
Goodwill£000s
Customer relationships
£000sBrands
£000sSoftware
£000sTotal
£000s
Cost
At 31 December 2016 129,744 27,482 24,142 19,968 201,336
Foreign exchange differences 2 – – – 2
Additions – – – 2,857 2,857
Sale of business (755) (738) (40) (240) (1,773)
Disposals – – – (2,104) (2,104)
At 30 December 2017 128,991 26,744 24,102 20,481 200,318
Amortisation
At 31 December 2016 – 10,940 391 11,250 22,581
Charge for the period – 2,762 143 3,732 6,637
Impairment loss – – – 1,239 1,239
Sale of business – (356) (8) (183) (547)
Disposals – – – (2,101) (2,101)
At 30 December 2017 – 13,346 526 13,937 27,809
Net book value
At 30 December 2017 128,991 13,398 23,576 6,544 172,509
Goodwill£000s
Customer relationships
£000sBrands£000s
Software£000s
Total£000s
Cost
At 26 December 2015 130,171 27,044 24,142 14,999 196,356
Foreign exchange differences 11 – – – 11
Additions – – – 4,739 4,739
Transfers (438) 438 – 230 230
At 31 December 2016 129,744 27,482 24,142 19,968 201,336
Amortisation
At 26 December 2015 – 8,014 234 7,866 16,114
Charge for the period – 2,926 157 3,154 6,237
Disposals – – – 230 230
At 31 December 2016 – 10,940 391 11,250 22,581
Net book value
At 31 December 2016 129,744 16,542 23,751 8,718 178,755
At 26 December 2015 130,171 19,030 23,908 7,133 180,242
All goodwill arising on business combinations has been allocated to the Cash Generating Units (CGUs) that are expected to benefit from those business combinations. The Group tests goodwill and indefinite life brands annually for impairment.
88 HSS Hire Group plc Annual Report and Financial Statements 2017

89
11. Intangible assets continuedAnalysis of goodwill, indefinite life brands, other brands and customer relationships by cash generating units.
Goodwill£000s
Indefinite life brands£000s
Other brands£000s
Customer relationships
£000sTotal
£000s
Allocated to
HSS Core 111,497 21,900 299 11,793 145,489
Powered access 4,114 – 681 – 4,795
Climate control 7,327 – 462 1,044 8,833
Power generation 6,053 – 234 561 6,848
At 30 December 2017 128,991 21,900 1,676 13,398 165,965
Goodwill£000s
Indefinite life brands£000s
Other brands£000s
Customer relationships
£000sTotal
£000s
Allocated to
HSS Core 112,250 21,900 352 14,735 149,237
Powered access 4,114 – 725 – 4,839
Climate control 7,327 – 525 1,156 9,008
Power generation 6,053 – 249 651 6,953
At 31 December 2016 129,744 21,900 1,851 16,542 170,037
The remaining life of intangible assets other than goodwill and indefinite life brands is between three to seventeen years.
The Group tests goodwill and indefinite life brands for impairment annually or more frequently if there are indicators that impairment may have occurred. The recoverable amounts of the goodwill and indefinite life brands, which are allocated to cash generating units (CGUs), are estimated from value in use (VIU) calculations which model pre-tax cash flows for the next four years (2016: four years) together with a terminal value using a long term growth rate. The key assumptions underpinning the recoverable amounts of the CGUs tested for impairment are those regarding the discount rate, forecast revenue, EBITDA, and capital expenditure.
The key variables applied to the value in use calculations were determined as follows:
→ Cash flows were derived assuming future Group growth rates in the short to medium term (up to four years) of 2.5% for each of the CGUs (2016: between 6% and 4%). The directors believe that it is appropriate to lower the growth rate assumptions from previous years to reflect the focus of the business on cost reduction. The cash flow calculations are based upon the achievement of the cost savings identified from the network reconfiguration identified in the Strategic Review. The majority of the cost saving initiatives have already been both identified and implemented and the directors are confident of their delivery.
→ Cash flows beyond 2021 (ie after four years) have been determined based on a long term growth rate of 2.5% (2016: 2.5%).
→ A pre-tax discount rate of 10.0% (2016: 9.1%), calculated by reference to a market based weighted average cost of capital (WACC).
Whilst the delivery of the identified cost savings is critical to the cash flow projections that have been used, additionally, the directors’ cash flow projections are based on key assumptions about the performance of the Group, the UK tool hire market and the general UK macro-economic environment. An impairment may be identified if changes to any of these factors were significant, including underperformance of the Group against forecast, negative changes in the UK tool hire market, or a deterioration in the UK economy, which would cause the directors to reconsider their assumptions and revise their cash flow projections.
Based on this VIU modelling and impairment testing, the directors do not consider the goodwill and indefinite life brands assets carried in the balance sheet at 30 December 2017, for any of the CGUs, to be impaired.
For the CGU groupings listed in the table above in respect of goodwill and brands, excluding HSS Core, the directors’ sensitivity analysis does not result in an impairment charge. Given the level of headroom in VIU they show, the directors do not envisage reasonably possible changes to the key assumptions that would be sufficient to cause an impairment at this time.
In respect of HSS Core, at 30 December 2017, the headroom between VIU and carrying value of the related assets was £89.9 million. The directors’ sensitivity analysis with regard to HSS Core shows that an increase in the discount rate by 2.5%, to 12.5%, or a reduction in the long term growth rate to a decline of 2.2%, or a reduction in the short to medium term growth rate to a decline of 3.3% would eliminate the headroom shown. Additionally if planned cost savings from the Strategic Review are £6.2 million less than anticipated on an annual basis the headroom would be eliminated. The short to medium term growth rate reduction equates to a reduction in EBITDA of between £3 million to £6 million annually over the medium term.
Strategic R
eportC
orporate Governance
Financial Statem
entsA
dditional Information
HSS Hire Group plc Annual Report and Financial Statements 2017

Financial Statements
Notes to the Consolidated Financial Statements continuedFor the year ended 30 December 2017
12. Property, plant and equipment
Land & buildings
£000s
Plant & machinery
£000s
Materials & equipment
held for hire£000s
Total£000s
Cost
At 31 December 2016 69,187 58,673 247,295 375,155
Foreign exchange differences 16 65 620 701
Additions 6,664 2,086 25,763 34,513
Transferred to asset held for resale (3,806) – – (3,806)
Sale of business (93) (463) (5,504) (6,060)
Disposals (197) (79) (30,676) (30,952)
At 30 December 2017 71,771 60,282 237,498 369,551
Accumulated depreciation
At 31 December 2016 37,095 46,214 113,373 196,682
Foreign exchange differences 1 46 382 429
Charge for the year 4,382 3,669 28,955 37,006
Impairment loss 9,103 2,127 – 11,230
Transferred to asset held for resale (2,306) – – (2,306)
Sale of business (33) (409) (3,164) (3,606)
Disposals (127) (62) (20,610) (20,799)
At 30 December 2017 48,115 51,585 118,936 218,636
Net book value
At 30 December 2017 23,656 8,697 118,562 150,915
Land & buildings
£000s
Plant & machinery
£000s
Materials & equipment
held for hire£000s
Total£000s
Cost
At 26 December 2015 63,313 55,914 256,208 375,435
Foreign exchange differences 29 199 2,377 2,605
Additions 10,360 4,700 27,337 42,397
Disposals (4,515) (2,140) (38,627) (45,282)
At 31 December 2016 69,187 58,673 247,295 375,155
Accumulated depreciation
At 26 December 2015 35,258 44,016 112,948 192,222
Foreign exchange differences – 158 1,409 1,567
Charge for the year 6,266 3,582 27,881 37,729
Disposals (4,429) (1,542) (28,865) (34,836)
At 31 December 2016 37,095 46,214 113,373 196,682
Net book value
At 31 December 2016 32,092 12,459 133,922 178,473
At 26 December 2015 28,055 11,898 143,260 183,213
The net book value of materials and equipment held for hire includes an amount of £46.1 million (2016: £42.3 million) in respect of assets held under finance leases. The depreciation charge for assets held under finance leases in the year ended 30 December 2017 was £6.5 million (2016: £5.3 million).
90 HSS Hire Group plc Annual Report and Financial Statements 2017

91
13. Inventories
30 December 2017
£000s
31 December 2016
£000s
Inventories 3,455 5,016
Inventory spares 2,460 3,250
Total inventories 5,915 8,266
Provision for impairment (396) (368)
Inventories 5,519 7,898
30 December 2017
£000s
31 December 2016
£000s
Provision for impairment of inventories
Balance at the beginning of the year 368 340
Impairment provisions recognised during the year 28 28
Balance at the end of the year 396 368
The cost of inventories recognised as an expense and included in cost of sales is £25.2 million (2016: £26.7 million).
14. Trade and other receivables
30 December 2017
£000s
31 December 2016
£000s
Gross trade receivables 85,270 83,072
Less provision for impairment (4,429) (3,740)
Net trade receivables 80,841 79,332
Other debtors 271 679
Prepayments and accrued income 15,391 23,733
Total trade and other receivables 96,503 103,744
The provision for impairment of trade receivables is estimated based upon past default experience and the directors’ assessment of the current economic environment, including provisions for credit notes raised and expected to be raised after year end for customer invoices issued before year end (see note 1(o)). The overall provision for bad debts and credit notes amounts to 5.2% of trade receivables at 30 December 2017 (2016: 4.5%). A 0.5% increase in the rate of provision required would give rise to an increased provision of £0.4 million. The creation and release of bad debt receivables provision is charged/(credited) to administrative expenses in the income statement, and the credit note provision is charged/(credited) to revenue.
The following table details the movements in the provision for impairment of trade receivables.
30 December 2017
£000s
31 December 2016
£000s
Balance at the beginning of the period (3,740) (4,000)
Movement in provision (689) 260
Balance at the end of the period (4,429) (3,740)
The provision for impairment of trade receivables is comprised, as follows:
30 December 2017
£000s
31 December 2016
£000s
Bad debt provision (3,042) (2,286)
Credit note provision (1,387) (1,454)
(4,429) (3,740)
Strategic R
eportC
orporate Governance
Financial Statem
entsA
dditional Information
HSS Hire Group plc Annual Report and Financial Statements 2017

Financial Statements
Notes to the Consolidated Financial Statements continuedFor the year ended 30 December 2017
14. Trade and other receivables continued The ageing profile of debtors that are overdue but not impaired is:
30 December 2017
£000s
31 December 2016
£000s
Days overdue
1 to 30 days 5,926 4,919
31 to 60 days 3,180 2,885
61 to 90 days 2,053 1,625
Over 90 days 2,465 3,602
13,624 13,031
These amounts have not been impaired as there has not been a significant change in credit quality and the amounts are still considered recoverable.
15. Cash
30 December 2017
£000s
31 December 2016
£000s
Cash (statement of financial position) 2,151 15,211
Cash and cash equivalents 2,151 15,211
16. Trade and other payables
30 December 2017
£000s
31 December 2016
£000s
Current
Obligations under finance leases 11,892 11,448
Trade payables 39,729 52,505
Other taxes and social security costs 5,792 5,688
Other creditors 916 467
Accrued interest on borrowings 3,904 3,859
Accruals and deferred income 20,219 15,183
82,452 89,150
30 December 2017
£000s
31 December 2016
£000s
Non-current
Obligations under finance lease 14,105 17,266
14,105 17,266
Finance leases principally relate to hire fleet assets.
The maturity profile of the Group’s finance leases is as follows:
30 December 2017
£000s
31 December 2016
£000s
Less than one year 11,892 11,448
Two to five years 14,105 17,266
Over five years – –
25,997 28,714
92 HSS Hire Group plc Annual Report and Financial Statements 2017

93
16. Trade and other payables continuedThe following table gives a reconciliation of the minimum lease payments to the carrying value of the finance lease liabilities:
30 December 2017
£000s
31 December 2016
£000s
Less than one year 12,950 12,639
Two to five years 14,740 18,133
Over five years – –
27,690 30,772
Less future interest payments (1,693) (2,058)
Carrying value of lease liabilities 25,997 28,714
17. Borrowings
30 December 2017
£000s
31 December 2016
£000s
Current
Revolving credit facility 69,000 66,000
Bank overdraft – –
69,000 66,000
Non-current
Senior secured note 134,242 133,212
The nominal value of the Group’s loans at each reporting date is as follows:
30 December 2017
£000s
31 December 2016
£000s
Secured senior note 136,000 136,000
136,000 136,000
The secured senior note is a 6.75% fixed rate bond maturing in August 2019, and is listed on the Luxembourg stock exchange.
The Group’s Super Senior RCF is a revolving credit facility expiring in July 2019.
The Group’s Super Senior RCF and Senior Secured Notes are both secured on a shared basis by a first ranking lien over certain assets (comprising substantially all material assets of the Group). The Super Senior RCF shares its security with the Senior Secured Notes but shall get priority over any enforcement proceeds via a payment waterfall.
The interest rates on the Group’s variable interest loans are as follows:
30 December 2017
% above LIBOR
31 December 2016
% above LIBOR
Revolving credit facility 2.50% 2.25%
The interest rates on the Group’s fixed interest loans are as follows:
30 December 2017
Fixed rate
31 December 2016
Fixed rate
Secured senior note 6.75% 6.75%
The weighted average interest rate on the Group’s borrowings are as follows:
30 December 2017
31 December 2016
Weighted average interest rate on borrowings 5.32% 5.28%
Amounts under the Revolving Credit Facility are typically drawn for a one month borrowing period, with the interest set for each borrowing based upon LIBOR and a fixed margin.
Strategic R
eportC
orporate Governance
Financial Statem
entsA
dditional Information
HSS Hire Group plc Annual Report and Financial Statements 2017

Financial Statements
Notes to the Consolidated Financial Statements continuedFor the year ended 30 December 2017
17. Borrowings continuedThe Group’s Senior Secured Notes have the following maturity profile:
30 December 2017
£000s
31 December 2016
£000s
Less than one year 9,180 9,180
Two to five years 145,180 154,360
Over five years – –
154,360 163,540
Less interest cash flows:
Senior secured note (18,360) (27,540)
Total principal cash flows 136,000 136,000
The Group had undrawn committed borrowing facilities of £27.6 million at 30 December 2017 (2016: £27.0 million). Including net cash balances (note 15), the Group had access to £29.8 million of combined liquidity from available cash and undrawn committed borrowing facilities at 30 December 2017 (2016: £42.2 million).
18. Provisions
Onerous leases£000s
Dilapidations£000s
Onerous contracts
£000sTotal
£000s
At 31 December 2016 5,398 11,745 – 17,143
Additions 6,273 4,582 32,612 43,467
Utilised during the period (3,960) (1,885) – (5,845)
Unwind of provision (15) 46 – 31
Released, including disposal on sale of business (1,089) (513) – (1,602)
At 30 December 2017 6,607 13,975 32,612 53,194
Of which:
Current 2,763 4,310 9,611 16,684
Non current 3,844 9,665 23,001 36,510
6,607 13,975 32,612 53,194
At 26 December 2015 4,537 10,136 – 14,673
Additions 3,349 3,173 – 6,522
Utilised during the period (2,223) (1,460) – (3,683)
Unwind of provision 332 152 – 484
Released (597) (256) – (853)
At 31 December 2016 5,398 11,745 – 17,143
Of which:
Current 2,876 3,555 – 6,431
Non current 2,522 8,190 – 10,712
5,398 11,745 – 17,143
Onerous leasesProvisions for onerous leases relate to the current value of contractual liabilities for future rent and rates payments and other unavoidable costs on leasehold properties the Group no longer operationally uses. These liabilities, assessed on a lease by lease basis, are expected to arise over a period of up to 12 years with the weighted average being 3.5 years (2016: 2.8 years). They are stated net of existing and anticipated sub-let income based on management’s experience of the commercial retail property market in conjunction with specialist third party advice. The onerous lease provision has been discounted at a rate of 0.752% (2016: 0.478%). A 1% increase in the discount rate at 30 December 2017 would reduce the onerous lease provision by £0.1 million.
The amount of anticipated sub-let income for vacant properties included in the onerous lease provision amounted to £0.9 million at 30 December 2017 (2016: £2.3 million). Variations in the actual timings or amounts of sub-let income will lead to a commensurate increase or decrease in the amount of provision required in the future. If the Group failed to dispose of or sub-let any of these vacant properties prior to their lease expiry the provision would increase by £0.9 million at 30 December 2017 (2016: £2.3 million).
94 HSS Hire Group plc Annual Report and Financial Statements 2017

95
18. Provisions continuedDilapidationsThe dilapidations provision represents dilapidation costs in respect of the Group’s leasehold properties and will therefore arise over the lease lives of the Group’s properties, and comprises specific amounts based on surveyors’ reports on a property by property basis, where available. The remaining properties are covered by an estimate based on gross internal area. The weighted average dilapidations provision at 30 December 2017 was £5.10 per square foot (psf) (2016: £3.10 psf). Estimates for future dilapidations costs are regularly reviewed, and the increase in the cost of the provision psf reflects a change in the estimate of future cost based upon experience during the year ended 30 December 2017. A £0.50 psf increase in the dilapidations provision would lead to an increase in the provision at 30 December 2017 of £1.3 million.
The dilapidations provision has been discounted at a rate of 1.19% (2016: 1.45%) at 30 December 2017 based on 10 year UK gilt yields. A 1% increase in the discount rate at 30 December 2017 would decrease the dilapidations provision by £0.6 million and associated dilapidation fixed asset by £0.6 million, respectively.
Onerous contractThe onerous contract represents amounts payable in respect of the agreement reached between the Group and Unipart to terminate the contract to operate the NDEC. The Group will make total cash payments to Unipart of £33.8 million of which £9.6 million is payable in 2018. The obligations under this agreement will unwind over the period to 2026. The provision has been discounted at a rate of 1.19% at 30 December 2017 based on 10 year UK gilt yields. A 1% increase in the discount rate at 30 December 2017 would decrease the provision by £0.9 million.
19. Deferred taxDeferred tax is provided in full on taxable temporary differences under the liability method using applicable tax rates.
Tax losses£000s
Property, plant and
equipment and other
items£000s
Acquired intangible
assets£000s
Total£000s
At 31 December 2016 780 (1,204) (6,999) (7,423)
(Charge)/credit to the income statement (422) (1,078) 6,438 4,938
Sale of business – – 43 43
At 30 December 2017 (358) (2,282) (518) (2,442)
Deferred tax assets (358) – – (358)
Deferred tax liabilities – (2,282) (518) (2,800)
At 30 December 2017 (358) (2,282) (518) (2,442)
At 26 December 2015 1,900 (1,265) (8,577) (7,942)
(Charge)/credit to the income statement (1,120) 61 1,578 519
Arising on acquisition – – – –
At 31 December 2016 780 (1,204) (6,999) (7,423)
Deferred tax assets 780 – – 780
Deferred tax liabilities – (1,204) (6,999) (8,203)
At 31 December 2016 780 (1,204) (6,999) (7,423)
At 30 December 2017 £2.8 million (2016: £7.6 million) of the deferred tax liability is expected to crystallise after more than one year.
At 30 December 2017 the Group had an unrecognised deferred tax asset relating to trading losses of £6.9 million (2016: £1.4 million). Tax losses generated in the year have been offset against the previously recognised deferred tax liability on intangible assets resulting in a net credit to the income statement of £4.9 million (2016: £nil).
The Group also has an unrecognised deferred tax asset relating to temporary differences on plant and equipment, intangible assets and provisions of £18.2 million (2016: £14.8 million).
These potential deferred tax assets have not been recognised on the basis that it is not sufficiently certain when taxable profits that can be utilised to absorb the reversal of the temporary difference will occur in the future.
Strategic R
eportC
orporate Governance
Financial Statem
entsA
dditional Information
HSS Hire Group plc Annual Report and Financial Statements 2017

Financial Statements
Notes to the Consolidated Financial Statements continuedFor the year ended 30 December 2017
20. Share capitalNumber and nominal value of ordinary shares
Share capital Ordinary Number
Share capital Ordinary
£000s
At 31 December 2016 170,207,142 1,702
At 30 December 2017 170,207,142 1,702
Share capital Ordinary Number
Share capital Ordinary
£000s
At 26 December 2015 154,761,904 1,548
Issue of 15,445,238 ordinary shares of 1p each 15,445,238 154
At 31 December 2016 170,207,142 1,702
In December 2016, the Company issued 15,445,238 new ordinary shares of 1p each on 28 December 2016 at a placing price of 83.875p per share. The placing raised £13.0 million and the Company received cash proceeds of £12.78 million on 28 December 2016, net of expenses. The proceeds of the share issue were parcelled into the ‘cash box’ company which was then acquired by way of a share exchange in circumstances which qualified for merger relief and so avoided the need to recognise a share premium on the share issue. After additionally accounting for directly attributable expenses, the net amount booked to share capital and reserves was £12.55 million; £0.15 million allocated to nominal share capital and the excess of £12.4 million was recorded in the merger reserve account in equity. All shares are fully paid up.
21. Share based paymentsThe key points of each of the Group’s share schemes for grants up to 30 December 2017 are summarised below. All schemes are equity-settled. All disclosure relates to both the Group and the Company.
The Black-Scholes valuation model was used to determine the fair value of the share based payments issued by the Company. The expected volatility measured at the standard deviation of continuously compounded share returns was based on statistical analysis of the Company’s historical share price taking into account the Company’s historical volatility since Admission to the London Stock Exchange in 2015, and the historical volatility of a comparator group of companies listed on the London Stock Exchange operating in similar markets.
The total charge for the period relating to employee share-based payment plans during the year ended 30 December 2017 was £4,000 (2016: £103,000), all of which related to equity settled share-based payment transactions.
Market Value OptionsOn 31 August 2017 share awards were granted to eligible employees based on a maximum of 460% of base salary in the form of market value options over ordinary shares in the Company in accordance with the Company’s 2015 Long Term Incentive Plan (the “LTIP”). This was following approval by shareholders at a General Meeting on 10 August 2017. The Market Value Options were awarded on 31 August 2017 and will vest subject to performance conditions based on Earnings per Share and Return on Capital Employed measured over the period ending with the Company’s 2020 financial year. To the extent it vests, each award will, ordinarily, be released to the participant at the end of a further one year holding period.
On the same date, tax qualifying share options were granted as part of the Market Value Option awards (‘CSOP options’) via a Company Share Option Plan approved by HM Revenue & Customs (“HMRC”). Each CSOP is subject to the same performance targets as the Market Value Options apply to the CSOP options and they will vest and be released at the same time as them.
As such the total award to each individual comprises a bundled HMRC approved option in respect of the first £30,000 worth of an award, and an unapproved Market Value option award for amounts in excess of this HMRC limit. The table on page 96 reconciles the options outstanding.
96 HSS Hire Group plc Annual Report and Financial Statements 2017

97
21. Share based payments continued
Year ended 30 December
2017
Year ended 31 December
2016
Number of share
options
Number of share
options
Outstanding at beginning of period – –
Granted 7,076,202 –
Outstanding at end of period 7,076,202 –
Exercisable at end of period, number – –
Weighted average exercise price, pence 57 –
Weighted average remaining contractual life, years 3.3 –
Weighted average fair value of LTIP options granted, pence 13 –
CSOP optionsThe table below summaries the outstanding CSOP options:
Year ended 30 December
2017
Year ended 31 December
2016
Number of share
options
Number of share
options
Outstanding at beginning of period – –
Granted 666,660 –
Outstanding at end of period 666,660 –
Exercisable at end of period, number – –
Weighted average exercise price, pence 54 –
Weighted average remaining contractual life, years 3.3 –
Weighted average fair value of LTIP options granted, pence 14 –
Long Term Incentive PlanNo awards were made during 2017.
On 7 April 2016, share awards were granted to eligible employees based on a maximum of 100% of base salary in the form of nil-cost options over ordinary shares in the Company in accordance with the Company’s 2015 Long Term Incentive Plan (the ‘LTIP’). The LTIP awards will vest subject to performance conditions based on Earnings Per Share and Return on Capital Employed measured over the period ending with the Company’s 2018 financial year. To the extent it vests, each award will, ordinarily, be released to the participant at the end of a further two-year holding period.
On the same date, tax qualifying share options were granted as part of the LTIP awards (‘CSOP options’) via a Company Share Option Plan approved by HM Revenue & Customs (‘HMRC’). Each CSOP is subject to the same performance targets as apply to the nil-cost options part of the LTIP and will vest and be released at the same time as the nil-cost options. If a CSOP option is exercised as a gain, the number of shares that may be delivered under the associated LTIP award will be reduced at exercise by the same value to ensure that the total pre-tax value of the original LTIP award delivered to the participant is not increased by the grant of the CSOP option.
As such, the LTIP comprises a bundled HMRC approved option in respect of the first £30,000 worth of an award, and an unapproved LTIP award for amounts in excess of this HMRC limit. Therefore, the fair value of the award in aggregate is determined by reference to the market value of the original LTIP share awards at the date of grant.
Strategic R
eportC
orporate Governance
Financial Statem
entsA
dditional Information
HSS Hire Group plc Annual Report and Financial Statements 2017

Financial Statements
Notes to the Consolidated Financial Statements continuedFor the year ended 30 December 2017
21. Share based payments continuedThe table below reconciles the nil-cost LTIP share options outstanding:
Year ended 30 December
2017
Year ended 31 December
2016
Number of share
options
Number of share
options
Outstanding at beginning of period 1,640,364 –
Granted – 2,012,743
Exercised – –
Cancelled (400,742) (372,379)
Outstanding at end of period 1,239,622 1,640,364
Exercisable at end of period, number – –
Weighted average exercise price, pence – –
Weighted average remaining contractual life, years 8.3 9.3
Weighted average fair value of LTIP options granted, pence 80 80
LTIP nil-cost options are exercisable no later than the tenth anniversary of the date of grant. The fair value of the LTIP nil-cost options granted during 2016 was 80p, based on the market price of the ordinary shares at the date of grant, adjusted for dividends payable.
2016 3-year Sharesave Scheme (‘SAYE Plan’)On 4 November 2016, the Group offered all employees the opportunity to participate in the 2016 Sharesave Scheme, an SAYE plan (the ‘SAYE Plan’). The SAYE Plan enables participating employees to save anything from £5 to £250 per month over three years. At the end of the three years, the employee may use the amount saved to purchase HSS Hire Group plc shares at a discounted price (compared to the price on the date of issue) of 57.7p per share. Alternatively, the employee may, at their request, withdraw their savings and leave the SAYE Plan at any time. Participants will be eligible to exercise their awards between 3 and 3.5 years from the grant date.
No awards were made under the SAYE Plan during 2017.
The table below reconciles the SAYE Plan share options outstanding:
Year ended 30 December
2017
Year ended 31 December
2016
Number of share
options
Number of share
options
Outstanding at beginning of period 2,433,039 –
Granted – 2,459,867
Exercised – –
Cancelled (772,146) (26,828)
Outstanding at end of period 1,660,893 2,433,039
Exercisable at end of period, number – –
Weighted average exercise price, pence 57.7 57.7
Weighted average remaining contractual life, years 2.3 3.3
Weighted average fair value of SAYE Plan options granted, pence 23 23
98 HSS Hire Group plc Annual Report and Financial Statements 2017

99
21. Share based payments continuedThe fair value of equity-settled share options granted is estimated as at the date of grant, taking into account the terms and conditions upon which the awards were granted. The following table lists the inputs to the model used for the year ended 30 December 2017 and year ended 31 December 2016.
Year ended 30 December
2017
Year ended31 December
2016
Year ended30 December
2017
Year ended31 December
2016
Fair value inputsMarket value
optionsMarket value
optionsSharesave
schemeSharesave
scheme
Exercise price, pence 56.7 _ – 57.7
Share price on date of grant, pence 48.0 _ – 70.5
Expected term before option exercise, years 7.3 _ – 3.25
Risk free interest rate, % 0.77% _ – 0.28%
Expected dividend yield, % 2.37% _ – 1.6%
22. Financial instrumentsFinancial risk managementThe Group holds and uses financial instruments to finance its operations and to manage its interest rate and liquidity risks. The Group primarily finances its operations using share capital, revenue and borrowings.
The Group’s activities expose it to a variety of financial risks: market risk (interest rate risk and foreign exchange risk), credit risk and liquidity risk.
Risk management is carried out under policies approved by the board of directors. Financial risk management is carried out by the Chief Financial Officer under a policy approved by the board. The board approves written principles for overall risk management, as well as written policies covering specific areas, such as interest rate risk, credit risk and liquidity risk and receives regular reports on such matters. The Group does not engage in trading or speculative activities using derivative financial instruments.
Market riskMarket risk is the risk that may change prices, such as foreign exchange rates and interest rates. They will affect the Group’s income or the value of its holdings of financial instruments.
Interest rate riskInterest rate risk is the risk of a change in the Group’s cash flows due to a change in interest rates.
The Group’s fixed rate borrowings are now principally the Senior Secured Notes. In addition the Group enters into finance leases in respect of hire stock assets and these carry a fixed rate of interest set at lease inception.
The Group is only exposed to interest rate risk on its variable interest borrowings, such as the Revolving Credit Facility, the Group’s overdraft and other short term borrowings. The most recent inflation report from the Bank of England (February 2018) indicates that the market-implied path for the UK Bank Rate is now higher than reported in the February 2017 report, with base rates now at 0.5% and expected to reach 1% by the end of 2019. A year ago rates were not expected to reach 0.7% before Q1 2020. Despite this increase in the forecast the directors do not consider this to be a significant risk to the Group. The directors will continue to monitor developments in market interest rates on a regular basis. The effect of a 1% increase in interest rates on the Group’s variable loans would be to increase the interest charge by £0.7 million.
Interest rate sensitivityThe table below demonstrates the sensitivity to reasonably possible changes in interest rates on income and equity for the year when this movement is applied to the carrying value of financial assets and liabilities.
Profit before tax Equity
30 December 2017
£million
31 December 2016
£million
30 December 2017
£million
31 December 2016
£million
Effect on
100 basis points increase 0.7 0.7 0.7 0.7
200 basis points increase 1.4 1.4 1.4 1.4
Refinancing riskThe Group manages its refinancing risk by not letting its borrowings run to their maturity. There is a risk that market conditions might preclude a refinancing if this is not done. The existing Senior Secured Notes mature in 2019 and the Revolving Credit Facility expires shortly before. The Group maintains good relations with debt investors and has incurred £0.7m of exceptional expenses during the year exploring its options ahead of these refinancing obligations.
Strategic R
eportC
orporate Governance
Financial Statem
entsA
dditional Information
HSS Hire Group plc Annual Report and Financial Statements 2017

Financial Statements
Notes to the Consolidated Financial Statements continuedFor the year ended 30 December 2017
22. Financial instruments continuedForeign exchange riskForeign exchange risk is the risk of a change in the Group’s cash flows due to a change in foreign currency exchange rate. The Group is exposed to foreign currency exchange rate risk on the cash flows and carrying values of its Republic of Ireland subsidiaries. Given the relative small size of the Republic of Ireland operations compared to the Group the directors do not consider this to be a significant risk to the Group.
Credit riskCredit risk is the risk of financial loss to the Group if a customer or counter party to a financial instrument fails to meet its contractual obligations, and arises principally from the Group’s receivables from customers.
The directors consider the Group’s credit risk from cash, cash equivalents and deposits to be low as the Group only enters transactions with banks or financial institutions with a credit rating of A or above.
The Group has policies in place to manage potential credit risk from trade receivables. Customer credit terms are determined using independent ratings agency data and regularly updated to reflect any changes in customer circumstances or trading conditions. If no independent rating is available an internal assessment is made of the credit quality of the customer, taking into account their financial position and past trading history of the Group. The directors do not expect any significant losses of receivables that have not been provided for as shown in note 14.
Liquidity riskLiquidity risk is the risk that the Group will not be able to meet its financial obligations as they fall due. The Group finance department regularly monitors forecasts of the Group’s liquidity requirements to ensure it has sufficient cash to meet operational needs while maintaining sufficient headroom on its undrawn committed borrowing facilities (note 17) at all times so that borrowing limits or covenants on borrowing facilities are not breached.
The financial covenant in place on the Group’s revolving credit facility at 30 December 2017 is a minimum Adjusted EBITDA of £35 million on a rolling twelve month basis.
Asset riskAsset risk is the risk of loss or damage to an asset adding to financial loss to the Group. Customers may damage hire equipment if they don’t have the appropriate skills to use the equipment or lack a duty of care while using it. The cost of repairing or replacing the equipment can be substantial depending on the type of asset and in turn can lead to a loss of revenue until the asset is again available to be hired.
Capital managementThe Group relies on capital for organic and acquisitive growth, the purchase of rental equipment to replace equipment that has reached the end of its useful economic life and to secure and establish new rental locations and branches.
The Group defines capital as equity as shown in the statement of financial position plus net debt (total borrowings less cash) and seeks to achieve an acceptable return on gross capital.
The Group manages its capital structure using a number of measures and taking into account its future strategic plans. Such measures include ensuring the Group maintains sufficient liquidity and compliance with a bank covenant. In addition to the cash that the Group has generated from its operations, over recent years it has renegotiated its debt structure including the issue of a fixed interest rate bond, fixed term loan notes and secured shorter term bank borrowing through a revolving credit facility.
The principal bank covenant is to maintain an adjusted rolling EBITDA of £35.0 million. For the year ended 30 December 2017, Adjusted EBITDA was £48.9 million (2016: £68.6 million).
Fair valueAll financial assets at the balance sheet date which comprise trade and other receivables, cash and cash equivalents are classified as loans and receivables.
All financial liabilities which comprise trade and other payables, obligations under finance leases and borrowings are classified as financial liabilities at amortised cost.
The following table shows the fair value of financial assets and financial liabilities within the Group, including their level in the fair value hierarchy. It does not include fair value information for financial assets or financial liabilities not measured at fair value if the carrying amount is a reasonable approximation of fair value.
30 December 2017
£000s
31 December 2016
£000s
Financial liabilities
Senior secured note 128,778 137,700
128,778 137,700
The Senior secured notes are classified as Level 1 in the fair value hierarchy, as they are listed on the Luxembourg stock exchange and have been valued at their market value at the year end.
100 HSS Hire Group plc Annual Report and Financial Statements 2017

101
23. Commitments and contingenciesThe Group’s commitments under non-cancellable operating leases are set out below:
30 December 2017
£000s
31 December 2016
£000s
Land and buildings
Within one year 15,030 16,140
Between two and five years 45,316 48,447
After five years 33,084 35,562
93,430 100,149
Other
Within one year 9,074 9,142
Between two and five years 15,263 15,952
After five years 7 321
24,344 25,415
117,774 125,564
Other operating leases predominantly comprise hire stock assets and motor vehicles.
The Group’s future minimum sub-lease rental income expected to be received under non-cancellable operating leases is as follows:
30 December 2017
£000s
31 December 2016
£000s
Sub-lease rental income
Within one year 452 713
Between two and five years 1,121 1,181
After five years 403 274
1,976 2,168
24. Business disposalOn 16 November 2017, the Group sold its Reintec cleaning asset rental and Tecserv cleaning equipment and servicing businesses for a cash consideration net of costs of £1.2 million.
The table below shows the assets and liabilities disposed of:
Descriptions of assets and liabilities £000
Intangible assets 472
Property, plant and equipment 2,453
Inventories 1,575
Trade and other receivables 1,042
Cash 19
Trade and other payables (131)
Provisions (66)
Deferred tax liabilities (43)
5,321
Proceeds of disposal less transaction cost 1,157
Loss on disposal before goodwill written back (4,164)
Goodwill written back (755)
Loss on disposal (4,919)
Proceeds of disposal less costs 1,157
Cash disposed of (19)
Net cash inflow 1,138
Strategic R
eportC
orporate Governance
Financial Statem
entsA
dditional Information
HSS Hire Group plc Annual Report and Financial Statements 2017

Financial Statements
Notes to the Consolidated Financial Statements continuedFor the year ended 30 December 2017
25. Related party transactionsUltimate parent entityBy virtue of its majority shareholding the Group’s immediate and ultimate parent entity is Exponent Private Equity LLP. During the year entities managed by Exponent Private Equity LLP charged the Group fees of £42,725 (2016: £40,000) and £nil was outstanding at 30 December 2017 (2016: £nil). Additionally Exponent Private Equity invest in businesses whom the Group trade with. All transactions are carried out on an arm’s length basis and are immaterial to both parties.
Key management personnelRelated party transactions with key management personnel are disclosed in Note 7.
26. Dividends
Year ended 30 December
2017£000s
Year ended 31 December
2016£000s
Interim dividend of Nil (2016: 0.57p) per ordinary share paid during the year – 882
Final dividend of Nil (2016: 0.57p) per ordinary share paid during the year – 882
– 1,764
The Board continue to be focused on reducing net debt and, after careful consideration of the significant cash investments made during 2016 chose not to pay an interim dividend and in advance of the planned network changes in 2018 the Directors believe it is in the best interests of the shareholders for the Group to not pay a final dividend in respect of 2017. During the year ended 31 December 2016, the shareholders approved a final dividend of 0.57p per ordinary share, totalling £0.9 million in respect of the year ended 26 December 2015 which was subsequently paid on 4 July 2016. Additionally during the year ended 31 December 2016, the Directors paid an interim dividend of £0.9 million in October 2016.
27. Note supporting statement of cash flows
At 1 January
2017£000s
Cash Flows£000s
Other Non-cash
Movements£000s
At30 December
2017£000s
Cash 15,211 (13,060) – 2,151
Current borrowings (66,000) (3,000) – (69,000)
Non-current borrowings1 (133,212) – (1,030) (134,242)
Finance lease liabilities (28,714) 12,504 (9,787) (25,997)
Total (212,715) (3,556) (10,817) (227,089)
Accrued interest on borrowings (3,859) (12,494) 12,449 (3,904)
Debt issue cost1 (2,788) – 1,030 (1,758)
Net debt2 (219,362) (16,050) 2,662 (232,751)
1 Non-current borrowings are stated net of debt issue costs.2 HSS calculation of Net debt includes accrued interest on borrowings and excludes deduction for debt.
28. Post balance sheet eventsOn 11 January 2018 the sale of the former Mitcham Head Office, which closed in September 2017 as part of the cost reduction programme was completed for proceeds of £1.5 million. The property was an asset held for resale at 30 December 2017.
On 13 February 2018 the Group agreed an extension of the maturity date of its £80 million Revolving Credit Facility from 6 February 2019 to 6 July 2019. This resulted in an increase in the margin payable under the facility from 2.50% to 3.00%. There were no changes in covenants.
If the Group has not refinanced its senior secured notes by 30 September 2018, the £80 million revolving credit facility will become repayable at the option of the lenders on 30 April 2019.
102 HSS Hire Group plc Annual Report and Financial Statements 2017

103
29. Adjusted EBITDA and Adjusted EBITAAdjusted EBITDA is calculated as follows:
Year ended 30 December
2017£000s
Year ended 31 December
2016£000s
Operating loss (71,419) (2,731)
Add: Depreciation of property, plant and equipment 37,006 37,729
Add: Accelerated depreciation relating to hire stock customer losses, hire stock write offs and other asset disposals 10,153 10,446
Add: Amortisation 6,637 6,237
EBITDA (17,623) 51,681
Add: Exceptional items 66,567 16,957
Adjusted EBITDA 48,944 68,638
Adjusted EBITA is calculated as follows:
Year ended 30 December
2017£000s
Year ended 31 December
2016£000s
Operating loss (71,419) (2,731)
Add: Amortisation 6,637 6,237
EBITA (64,782) 3,506
Add: Exceptional items 66,567 16,957
Adjusted EBITA 1,785 20,463
Strategic R
eportC
orporate Governance
Financial Statem
entsA
dditional Information
HSS Hire Group plc Annual Report and Financial Statements 2017

Financial Statements
30 December 2017
31 December 2016
Note £000s £000s
ASSETS
Non-current assets
Investments 2 86,476 86,369
Other receivables 3 121,688 100,703
208,164 187,072
Current assets
Other receivables 3 22,587 18,784
Cash 19 12,786
22,606 31,570
Total assets 230,770 218,642
LIABILITIES
Current liabilities
Other payables 4 (16,016) (11,347)
(16,016) (11,347)
Total liabilities (16,016) (11,347)
Net assets 214,754 207,295
EQUITY
Share capital 5 1,702 1,702
Share premium 5 – –
Merger reserve 97,716 97,716
Retained surplus 6 115,336 107,877
Total surplus attributable to owners of the Company 214,754 207,295
As permitted by Section 408(3) of the Companies Act 2006, the Company’s income statement and statement of comprehensive income and related notes have not been presented.
The Company made a post-tax profit for the year of £7,459,000 (2016: £10,042,000).
The notes on pages 106 to 108 form part of these financial statements.
The financial statements were approved and authorised for issue by the Board of Directors on 5 April 2018 and were signed on its behalf by:
P QuestedDirector 5 April 2018
Company Statement of Financial PositionAt 30 December 2017
104 HSS Hire Group plc Annual Report and Financial Statements 2017

105
Company Statement of Changes in EquityFor the year ended 30 December 2017
Share capital£000s
Merger reserve
£000s
Retained earnings
£000sTotal equity
£000s
At 1 January 2017 1,702 97,716 107,877 207,295
Profit for the period – – 7,459 7,459
At 30 December 2017 1,702 97,716 115,336 214,754
Share capital£000s
Merger reserve
£000s
Retained earnings
£000sTotal equity
£000s
At 27 December 2015 1,548 85,312 99,496 186,356
Shares issued in the period for cash 154 12,800 – 12,954
Share issue costs – (396) – (396)
Share based payment – – 103 103
Dividend – – (1,764) (1,764)
Profit for the period – – 10,042 10,042
At 31 December 2016 1,702 97,716 107,877 207,295
The notes on pages 106 to 108 form part of these financial statements.
Strategic R
eportC
orporate Governance
Financial Statem
entsA
dditional Information
HSS Hire Group plc Annual Report and Financial Statements 2017

Financial Statements
1. Accounting policiesHSS Hire Group Plc (the ‘Company’) is a company incorporated and domiciled in the United Kingdom. The Company’s registered office is 76 Talbot Road, Old Trafford, Manchester, M16 0PQ.
a) Reporting entityHSS Hire Group Limited was incorporated on 7 January 2015 as a private company limited by shares in the United Kingdom and re-registered as a public limited company on 19 January 2015. The Company listed its shares on the London Stock Exchange on 9 February 2015.
The Company’s principal activity is to act as ultimate holding company for a group of companies whose principal activities are the supply and hire of equipment and associated services.
b) Statement of complianceThe Company financial statements have been prepared in accordance with Financial Reporting Standard 100 Application of Financial Reporting Requirements (“FRS 100”) and Financial Reporting Standard 101 Reduced Disclosure Framework (“FRS 101”) and the Companies Act 2006.
Disclosure exemptions adoptedIn preparing these financial statements the Company has taken advantage of all disclosure exemptions conferred by FRS 101. Therefore these financial statements do not include:
→ certain comparative information as otherwise required by EU endorsed IFRS;
→ certain disclosures regarding the company’s capital;
→ a statement of cash flows;
→ the effect of future accounting standards not yet adopted;
→ the disclosure of the remuneration of key management personnel; and
→ disclosure of related party transactions with other wholly owned members of the HSS Hire Group Plc group of companies.
In addition, and in accordance with FRS 101, further disclosure exemptions have been adopted because equivalent disclosures are included in the company’s consolidated financial statements. These financial statements do not include certain disclosures in respect of:
→ share based payments;
→ financial instruments (other than certain disclosures required as a result of recording financial Instruments at fair value); or
→ fair value measurement (other than certain disclosures required as a result of recording financial instruments at fair value).
The directors have taken advantage of the option within section 390 of the Companies Act 2006 to prepare their financial statements up to a date seven days either side of the Company’s accounting reference date of 31 December, and these accounts therefore cover the period from 1 January 2017 to 30 December 2017 (2016: 27 December 2015 to 31 December 2016).
The Company complies with the accounting policies defined in Note 1 to the Group consolidated statements on pages 66 to 103 except as noted below.
c) Merger reserveThe merger reserve is the amount arising on the difference between the nominal value of the shares issued on acquisition of the subsidiary companies and the Company value of the interest in subsidiaries. The merger reserve arises where more than 90% of the shares in a subsidiary are acquired and the consideration includes the issue of new shares by the Company, and therefore the Company adopts merger relief under the Companies Act 2006.
Notes to the Company Financial StatementsFor the year ended 30 December 2017
106 HSS Hire Group plc Annual Report and Financial Statements 2017

107
1. Accounting policies continuedd) InvestmentsInvestments in subsidiaries are included in the statement of financial position at cost less amounts written-off, representing impairment in value. Impairment charges are recorded if events or changes in circumstances indicate that the carrying value may not be recoverable.
As the investment in subsidiaries arose from a reorganisation of the group structure that satisfies the criteria set out in IAS 27 ‘Separate Financial Statements’, the cost of interest has been measured as the carrying amount of its share of the equity items shown in the separate financial statements of the original parent at the date of reorganisation.
2. Investments
£000s
At 31 December 2016 86,369
Additions 107
At 30 December 2017 86,476
Additions comprise share based payment charges in respect of equity settled share based payment awards offered to employees in subsidiary companies.
At 30 December 2017 the Company’s subsidiaries, including those held indirectly through direct subsidiaries, are:
Company HoldingCountry of incorporation Principal activity
Ordinary shares
held
Hampshire Topco Limited Direct United Kingdom Intermediate holding company 100%
Hampshire Midco Limited Indirect United Kingdom Intermediate holding company 100%
Hampshire Bidco Limited Indirect United Kingdom Intermediate holding company 100%
Hero Acquisitions Limited Indirect United Kingdom Intermediate holding company 100%
HSS Hire Service Holdings Limited Indirect United Kingdom Intermediate holding company 100%
HSS Hire Service Finance Limited Indirect United Kingdom Intermediate holding company 100%
Bannagroe Limited Indirect Republic of Ireland Intermediate holding company 100%
ABird Superior Limited Indirect United Kingdom Intermediate holding company 100%
HSS Hire Service Group Limited Indirect United Kingdom Hire and equipment services 100%
A1 Hire & Sales Limited Indirect United Kingdom Hire and equipment services 100%
Laois Hire Services Limited Indirect Republic of Ireland Hire and equipment services 100%
ABird Limited Indirect United Kingdom Hire and equipment services 100%
Apex Generators Limited Indirect United Kingdom Hire and equipment services 100%
UK Platforms Limited Indirect United Kingdom Hire and equipment services 100%
HSS Financing plc Indirect United Kingdom Financing 100%
HSS Training Limited Indirect United Kingdom Training services 100%
1st Collection Services Limited Indirect United Kingdom Administration of group debtors 100%
All Seasons Hire Limited Indirect United Kingdom Hire and equipment services 100%
HSS Hire Limited (Previously Reintec Limited) Indirect United Kingdom Intermediate holding company 100%
HSS Hire Trading Limited Indirect United Kingdom Dormant 100%
The registered office of the subsidiaries listed above is 76 Talbot Road, Old Trafford, Manchester, M16 0PQ, except for the following:
→ Apex Generators Ltd,125 West Regent Street, Glasgow, G2 2SA
→ Laois Hire Services Limited, Abbeyleix Road, Portlaoise, Co. Laois, Eire
→ Bannagroe Limited, Clonminam Industrial Estate, Portlaoise, Co. Laois, Eire
Strategic R
eportC
orporate Governance
Financial Statem
entsA
dditional Information
HSS Hire Group plc Annual Report and Financial Statements 2017

Financial Statements
Company Notes to the Financial Statements continuedFor the year ended 30 December 2017
3. Other receivables
Non-current
30 December 2017
£000s
31 December 2016
£000s
Amounts due from group undertakings 121,688 100,703
121,688 100,703
Current
30 December 2017
£000s
31 December 2016
£000s
Amounts due from group undertakings 22,558 18,763
Prepayments 29 21
22,587 18,784
Non-current amounts due from Group undertakings fall due in 2022 and carry a fixed interest rate of 10%.
Current amounts due from Group undertakings carry an interest rate of 3.75% above LIBOR.
4. Other payables: amounts falling due within one year
30 December 2017
£000s
31 December 2016
£000s
Amounts owed to group undertakings 15,893 11,084
Accruals and deferred income 121 71
Other creditors 2 192
16,016 11,347
5. Share capitalThe details of the Company’s share capital are set out in note 20 to the consolidated financial statements.
6. Profit and loss accountAs permitted by section 408 of the Companies Act 2006 the Company has elected not to present its own profit and loss account for the year. The auditors’ remuneration for audit and other services is disclosed in note 6 to the consolidated financial statements.
7. Related party transactionsThe Company’s related party transactions are set out in note 25 to the consolidated financial statements.
8. Financial instrumentsDetails of the Group’s financial instruments policies are set out in note 22 to the consolidated financial statements.
9. Employee and Director costsThe Directors are the only employees of the Company. Their costs are borne by a subsidiary company HSS Hire Service Group Limited. Details of the director’s remuneration are set out in note 8 to the consolidated financial statements.
108 HSS Hire Group plc Annual Report and Financial Statements 2017

109
Three Year SummaryFor the year ended 30 December 2017
2017 £000s
2016 £000s
2015 £000s
Income Statement
Revenue 335,780 342,410 312,333
Operating (loss)/profit (71,419) (2,731) 6,842
Net finance costs (13,743) (14,686) (20,682)
Loss before tax (85,162) (17,417) (13,840)
Tax 5,240 104 (405)
Loss after tax (79,922) (17,313) (14,245)
Adjusted EBITDA 48,944 68,638 71,047
Adjusted Depreciation (47,159) (48,175) (50,702)
Adjusted EBITA 1,785 20,463 20,345
Amortisation (6,637) (6,237) (4,981)
Operating (loss)/profit excluding exceptional items (4,852) 14,226 15,364
Exceptional items (66,567) (16,957) (8,522)
Operating (loss)/profit (71,419) (2,731) 6,842
Assets employed
Non-current assets 323,782 358,008 365,355
Assets held for resale 1,500 – –
Inventories 5,519 7,898 9,095
Trade and other receivables 96,503 103,744 97,585
Cash 2,151 15,211 1,812
429,455 484,861 473,847
Current borrowings (69,000) (66,000) (47,535)
Other current liabilities (99,226) (96,082) (93,578)
261,229 322,779 332,734
Non-current borrowings (134,242) (133,212) (132,189)
Other non-current liabilities (53,415) (36,181) (42,276)
Net assets 73,572 153,386 158,269
Net debt (232,751) (219,362) (218,111)
Net leverage ratio (Net debt/Adjusted EBITDA) 4.8 x 3.2 x 3.1 x
Capital expenditure 34,513 42,397 84,039
Average number of employees 3,066 3,254 3,344
Weighted average number of ordinary shares 170,207 154,887 144,534
Per Ordinary 1p share
Basic earnings (46.96) (11.18) (9.86)
Adjusted earnings (5.68) 2.98 3.20
HSS Hire Group Plc was incorporated on 7 January 2015 and listed its shares on the London Stock Exchange on 9 February 2015. Accordingly only three years of summary financial information are presented.
Strategic R
eportC
orporate Governance
Financial Statem
entsA
dditional Information
HSS Hire Group plc Annual Report and Financial Statements 2017

Additional information
110 HSS Hire Group plc Annual Report and Financial Statements 2017
Shareholder InformationAnnual General MeetingThe Company’s Annual General Meeting will be held at 11.00am on 21 June 2018 at Hilton Garden Inn, Hatton Cross, TW6 2SQ. Details of the Resolutions proposed and being voted on are provided in the Notice of AGM provided to shareholders and available for download at the Group website, www.hsshiregroup.com.
Share fraud and boiler room scamsMany companies have become aware that their shareholders have received unsolicited phone calls or correspondence concerning investment matters. Share scams are often run from ‘boiler rooms’ where fraudsters cold-call investors offering them worthless, overpriced or even non-existent shares.
These operations are commonly known as ‘boiler room fraud’. The ‘brokers’ (callers) can be very persistent and extremely persuasive. They often have websites to support their activities, their advice and the companies they purport to represent. A 2006 survey by the Financial Services Authority (FSA) reported that the average amount lost by an investor is around £20,000. It is not just novice investors that have been duped in this way; many of the victims have been successfully investing for several years.
Shareholders are cautioned to be very wary of any unsolicited advice, offers to buy shares at a discount, sell your shares at a premium or offers of free company reports.
If you are offered unsolicited investment advice, discounted shares, a premium price for shares you own, or free company or research reports, you should take these steps before handing over any money:
→ record the name of the person and organisation contacting you;
→ check the Financial Conduct Authority (FCA )Register at www.fca.org.uk/register to ensure they are properly authorised;
→ use the details on the FCA Register to contact the firm;
→ call the FCA Consumer Helpline on 0800 111 6768 if there are no contact details on the Register or you are told they are out of date;
→ if you receive telephone calls, emails, letters purporting to be from HSS Hire Group plc or from companies endorsed by HSS Hire Group plc and you are unsure if they are legitimate, please contact our shareholder helpline for clarification (0371 384 2030 or +44 (0)121 415 7047 (overseas)); and
→ if the caller persists, hang up.
Please note that should you use an unauthorised firm to buy or sell shares or other investments, you will not have access to the Financial Ombudsman Service or Financial Services Compensation Scheme (FSCS) if things go wrong.
If you are approached about a share scam you should tell the FCA using the online share fraud reporting form at www.fca.org.uk/consumers/report-scam-unauthorised-firm where you can find out about the latest investment scams. You can also call the FCA Consumer Helpline on 0800 111 6768.
If you have already paid money to share fraudsters you should contact Action Fraud on 0300 123 2040 or online at: www.actionfraud.police.uk/
Further information on this or similar activity can be found at www.cityoflondon.police.uk/citypolice within the Economic Crime section.
Forward-looking statementsThis document contains certain forward-looking statements concerning the Group’s business, financial condition, results of operations and certain of the Group’s plans, objectives, assumptions, projections, expectations or beliefs with respect to these items. Forward-looking statements are sometimes, but not always, identified by their use of a date in the future or such words as ‘anticipates’, ‘aims’, ‘due’, ‘could’, ‘may’, ‘will’, ‘should’, ‘expects’, ‘believes’, ‘intends’, ‘plans’, ‘potential’, ‘targets’, ‘goal’ or ‘estimates’.
Forward-looking statements involve known and unknown risks, uncertainties and other factors, which may cause the Group’s actual financial condition, performance and results to differ materially from the plans, goals, objectives and expectations set out in the forward-looking statements included in this document. Accordingly, readers are cautioned not to place undue reliance on forward-looking statements.
By their nature, forward-looking statements relate to events and depend on circumstances that will occur in the future and are inherently unpredictable. Such forward-looking statements should, therefore, be considered in light of various important factors that could cause actual results and developments to differ materially from those expressed or implied by these forward-looking statements. These factors include, among other things: changes in the economies and markets within which the Group operates; changes in the regulatory regime within which the Group operates; changes in interest and, to a lesser extent, exchange rates; the impact of competitor pricing behaviour; the occurrence of major operational problems; the loss of major customers; contingent liabilities; and the impact of legal or other proceedings against, or which otherwise affect, the Group.
No assurance can be given that the forward-looking statements in this document will be realised; actual events or results may differ materially as a result of risks and uncertainties facing the Group. Subject to compliance with applicable law and regulation, the Company does not intend to update the forward-looking statements in this document to reflect events or circumstances after the date of this document, and does not undertake any obligation to do so.
Financial Calendar
Annual General Meeting 11.00am, 21 June 2018

111S
trategic Report
Corporate G
overnanceFinancial S
tatements
Additional Inform
ationHSS Hire Group plc Annual Report and Financial Statements 2017
Company Information
Registered OfficeHSS Hire Group plc Oakland House 76 Talbot Road, Old Trafford Manchester, M16 0PQ
Email: [email protected] Website: www.hsshiregroup.com Registered number: England and Wales, No. 9378067
Company SecretaryDaniel Joll
Financial Advisers and StockbrokersJ.P. Morgan Cazenove 25 Bank Street Canary Wharf London, E14 5JP
Numis Securities Limited The London Stock Exchange Building 10 Paternoster Square London, EC4M 7LT
Legal AdvisersFreshfields Bruckhaus Deringer LLP 65 Fleet Street London, EC4Y 1HS
Independent AuditorsBDO LLP 55 Baker St London, W1U 7EU
BankersBarclays Bank plc One Churchill Place London, E14 5HP
HSBC Bank plc 8 Canada Square London, E14 5HQ
Financial Public RelationsTeneo Blue Rubicon 5th Floor 6 More London Place London, SE1 2DA
Trade Public RelationsFounded Partners Limited 185 Park Street London, SE1 9DY
RegistrarsEquiniti Limited Aspect House Spencer House Lancing West Sussex, BN99 6DA
Contact Centre: UK: 0371 384 2030 International: +44 (0)121 415 7047
Insurance BrokersMarsh Limited 1 Tower Place West Tower Place London, EC3R 5BU

Additional information
112 HSS Hire Group plc Annual Report and Financial Statements 2017
Definitions and Glossary
ABird or ABird Power Solutions ABird Superior Limited and its wholly owned subsidiary, ABird LimitedAct the Companies Act 2006, as amendedActivShield Bar a safety feature developed in conjunction with manufacturer Haulotte on the Group’s
platform access fleetAdjusted EBITA EBITA adjusted to add back exceptional itemsAdjusted EBITDA EBITDA adjusted to add back exceptional itemsAdjusted EPS measure of adjusted profitability per share. Widely recognised measure of shareholder value
(profit) being generated by a business excluding non-recurring or exceptional items and amortisation and after charging the prevailing rate of corporation tax
Admission the admission of the Shares to the premium listing segment of the Official List and to trading on the London Stock Exchange’s main market for listed securities
All Seasons Hire All Seasons Hire LimitedApex Apex Generators LimitedArticles the Articles of Association of the Company Average revenue per account customer
calculated by dividing the total revenue from account customers only in a year by the simple average of the opening and closing number of trading accounts
bn a billion or billions when used with a number or numbers and a currency unit e.g. £5.7bn denotes £5.7 billion pounds sterling
B2B business-to-businessCAGR Compounded Annual Growth rateCarbon emissions in our built environment
calculated as the total CO2 emissions from fuel combustion (a scope 1 emission) and purchased electricity (scope 2 emissions) of the Group in kg CO2 divided by the total m2 of the Group’s freehold and leasehold portfolio. Calculated for the period 1 April to 31 March in each year period in accordance with the reporting timeframe required for annual CRC submissions
Code see ‘Governance Code’Company HSS Hire Group plcCSOP Company Share Option PlanCRC energy efficiency scheme or CRC
a mandatory carbon emissions reduction scheme in the UK that applies to large non-energy-intensive organisations in the public and private sectors
Customer Distribution Centres or CDCs
locations across the UK from which we deliver items of our core hire equipment direct to customer sites, manage the collection of equipment from customer sites at the end of the hire period and undertake testing and repair of larger non-specialist equipment
Defra Department for Environment, Food and Environmental Affairs DTR4 Disclosure and Transparency Rule around Periodic Financial ReportingEBITA defined as operating profit before amortisation and exceptional itemsEBITDA defined as operating profit before depreciation, amortisation and exceptional items. For this
purpose depreciation includes the net book value of hire stock losses and write offs, and the net book value of other fixed asset disposals, less the proceeds of those disposals
ERP system enterprise resource planning software used to manage the business and automate certain day-to-day processes
EU European UnionExponent the investment funds managed by Exponent Private Equity LLP or, when otherwise indicated
or where the context otherwise requires, Exponent Private Equity LLP in its own rightExponent Shareholders Exponent Private Equity Partners GP II, LP, Exponent Havana Co-Investment Partners GP
Limited and Exponent Private Equity Founder Partner GP II LimitedFORS Fleet Operator Recognition SchemeGovernance Code the UK Corporate Governance Code issued by the Financial Reporting Council, as amended
from time to timeGroup together, HSS Hire Group plc and its direct or indirect subsidiaries Hampshire Topco Limited our parent company as at 27 December 2014 and up until 21 January 2015 when HSS Hire
Group plc became the new holding company of Hampshire Topco Limited and its subsidiaries through a share-for-share exchange. Havana Topco Limited was renamed Hampshire Topco Limited on 23 May 2014
HSEQ Health, Safety, Environment and QualityHSS used to refer to the group of companies within the HSS Hire GroupIAS International Accounting StandardsIFRS International Financial Reporting Standards, as adopted by the European Union

Initial public offering or IPO the initial public offering and admission of the ordinary share capital of HSS Hire Group plc to the premium listing segment of the Official List of the UK Listing Authority and to trading on London Stock Exchange’s main market for listed securities under the ticker ‘HSS’ on 9 February 2015
Ireland the Republic of IrelandLIBOR London Inter-bank Offered RateLive account a customer that has transacted with the Group in the prior 12 monthsLTIP Long-Term Incentive Plan. A reward system designed to reward employees’ long-term
performance by reference to defined performance conditions, which include Adjusted EPS and ROCE.
LTM Last Twelve MonthsLTM utilisation for our Core businesses utilisation is calculated as average units hired divided by average units
owned in a reporting month, then averaged over the relevant 52-week period (referred to as the last 12 months or ‘LTM’); for our specialist businesses utilisation represents the average utilisation rate of the specialist businesses included in the reporting period, calculated using the same method as for core utilisation at each business level.
m a million or millions when used with a number and a currency unit e.g. £70m denotes £70 million pounds sterling
MEWP Mobile Elevating Work PlatformMTS Mobile Traffic SolutionsNational Distribution and Engineering Centre or NDEC
Operation opened in Cowley, Oxfordshire in March 2016 to centralise and industrialise the testing, maintenance and repair of our fast moving Core hire fleet upon return from customer use. Once deemed fit-for-hire, equipment is moved back into the local branch and CDC network
NBV Net Book ValueNet debt the total indebtedness of the Group including senior secured notes (excluding debt issue
costs), investor loan notes (2014 only), finance leases, drawings on the Revolving Credit Facility, any accrued interest on these items and any overdraft net of any cash in the Group
Notes the £200m 6.75% senior secured notes due 2019 issued by HSS Financing plc in February 2014, which after a partial redemption in February 2015 were reduced to a balance of £136m
NPS Net Promoter Score®, a measure of willingness of customers to recommend a Company’s products or services to others
Official List the Official List of the FCARCF Revolving Credit FacilityReturn on assets or ROA calculated as Adjusted EBITA divided by the total of average total assets (excluding intangible
assets) subtracted by average current liabilitiesReturn on Capital Employed or ROCE
calculated as Adjusted EBITA divided by the total of average total assets (excluding intangible assets and cash) less average current liabilities (excluding current debt items)
Revolving Credit Facility or RCF the £80.0m super senior revolving credit facility made available pursuant to the Revolving Credit Facility Agreement
Revolving Credit Facility Agreement the revolving credit facility agreement governing the £80.0m super senior revolving credit facility dated 30 January 2014
RIDDOR(s) the Reporting of Injuries, Diseases and Dangerous Occurrences Regulations 1995. Within our KPIs we report our RIDDOR rate, which is calculated as: the number of RIDDOR incidents x 100,000, divided by the number of hours worked
RMI used to refer to services provided in the repair, maintain and improve markets, typically to the built environment
RNS Regulatory News Service SHEQ safety, health, environment and qualityTecServ TecServ Cleaning Equipment Services Limited (formerly Premiere FCM Limited)Trading account a customer account which has been active in the last 12 monthsTraining days per colleague calculated as the total training days completed by Group employees within the year, divided by
the average number of colleagues in the GroupUK the United Kingdom of Great Britain and Northern IrelandUK Platforms UK Platforms LimitedUnipart Group Unipart Group Limited

Registered office Oakland House 76 Talbot Road Old Trafford Manchester M16 0PQ
www.hsshiregroup.com
HS
S H
ire Gro
up plc A
nnual Report and Financial S
tatements 2017