ANNUAL REPORT - Amazon S3Corporate...FY15 FY15 FY15 FY14 FY14 FY14 FY18 1.2 7.7% FY17 295 182 142...
116
ANNUAL REPORT 2018
Transcript of ANNUAL REPORT - Amazon S3Corporate...FY15 FY15 FY15 FY14 FY14 FY14 FY18 1.2 7.7% FY17 295 182 142...
ANNUAL REPORT 2018ANNUAL REPORT 2018
Financial Highlights 02Chairman’s Review 04CEO’s Review 06Operational & Financial Review 08Global Operations 08North America 10Australia and New Zealand 12Europe 14
Global E-Recycling 16Spotlight – LMS Energy 18Spotlight – Sims Municipal Recycling 19Spotlight – Diversity 20Sustainability 22Board of Directors 26Financial Review 30Corporate Governance Statement 32Directors’ Report 33
Remuneration Report 36Financial Report 59Directors’ Declaration 106Independent Auditor’s Report 107Auditor’s Independence Declaration 110Shareholder Information 111Five-Year Trend Summary 112Corporate Directory IBC
CONTENTS
Sims Metal Management is one of the world’s leading metal and electronics recyclers with more than 250 facilities, including joint ventures operations, in 18 countries, and more than 5,000 employees globally. Our purpose is to put the planet first, and we are committed to closing the loop on recycling for a more sustainable future. Through this shared value, we will strengthen our partnerships with our suppliers and customers, establish an even greater presence in our communities and society, and continue to increase our economic value for shareholders.
FEMALE PARTICIPANTS INTHE TRAINEE MANAGEMENT PROGRAMME
33%MEGAWATT HOURS OF RENEWABLE ENERGY WASGENERATED BY LMS IN FY18
395,000
SIMS METAL MANAGEMENT LIMITED ANNUAL REPORT 2018
01SIMSMM.COMCONTENTS
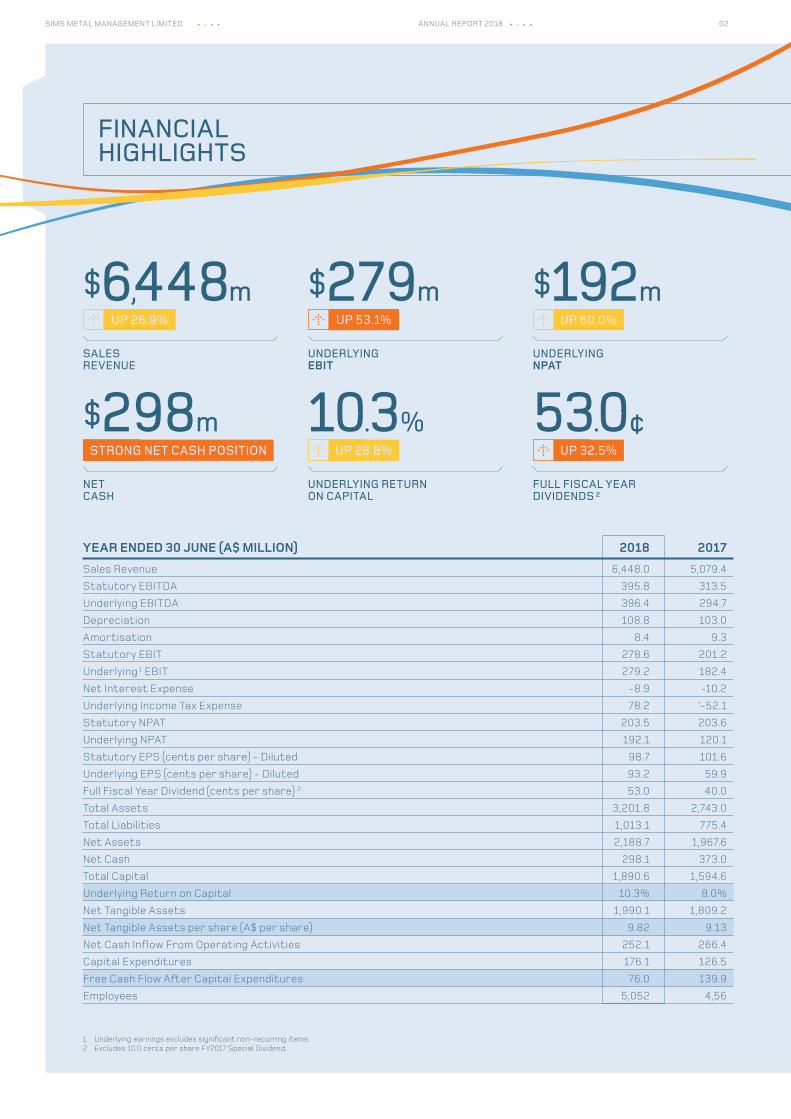
FINANCIAL HIGHLIGHTS
SALES REVENUE
UP 26.9%
$6,448m
NET CASH
STRONG NET CASH POSITION
$298 m
UNDERLYING EBIT
UNDERLYING RETURN ON CAPITAL
UNDERLYING NPAT
FULL FISCAL YEAR DIVIDENDS ²
UP 53.1%
UP 28.8%
UP 60.0%
UP 32.5%
$279 m
10.3 %
$192 m
53.0 ¢
YEAR ENDED 30 JUNE (A$ MILLION) 2018 2017Sales Revenue 6,448.0 5,079.4Statutory EBITDA 395.8 313.5Underlying EBITDA 396.4 294.7Depreciation 108.8 103.0Amortisation 8.4 9.3Statutory EBIT 278.6 201.2Underlying 1 EBIT 279.2 182.4Net Interest Expense -8.9 -10.2Underlying Income Tax Expense 78.2 ‘-52.1Statutory NPAT 203.5 203.6Underlying NPAT 192.1 120.1Statutory EPS (cents per share) - Diluted 98.7 101.6Underlying EPS (cents per share) - Diluted 93.2 59.9Full Fiscal Year Dividend (cents per share) 2 53.0 40.0Total Assets 3,201.8 2,743.0Total Liabilities 1,013.1 775.4Net Assets 2,188.7 1,967.6Net Cash 298.1 373.0Total Capital 1,890.6 1,594.6Underlying Return on Capital 10.3% 8.0%Net Tangible Assets 1,990.1 1,809.2Net Tangible Assets per share (A$ per share) 9.82 9.13Net Cash Inflow From Operating Activities 252.1 266.4Capital Expenditures 176.1 126.5Free Cash Flow After Capital Expenditures 76.0 139.9Employees 5,052 4,56
1 Underlying earnings excludes significant non-recurring items.2 Excludes 10.0 cents per share FY2017 Special Dividend.
02SIMS METAL MANAGEMENT LIMITED ANNUAL REPORT 2018
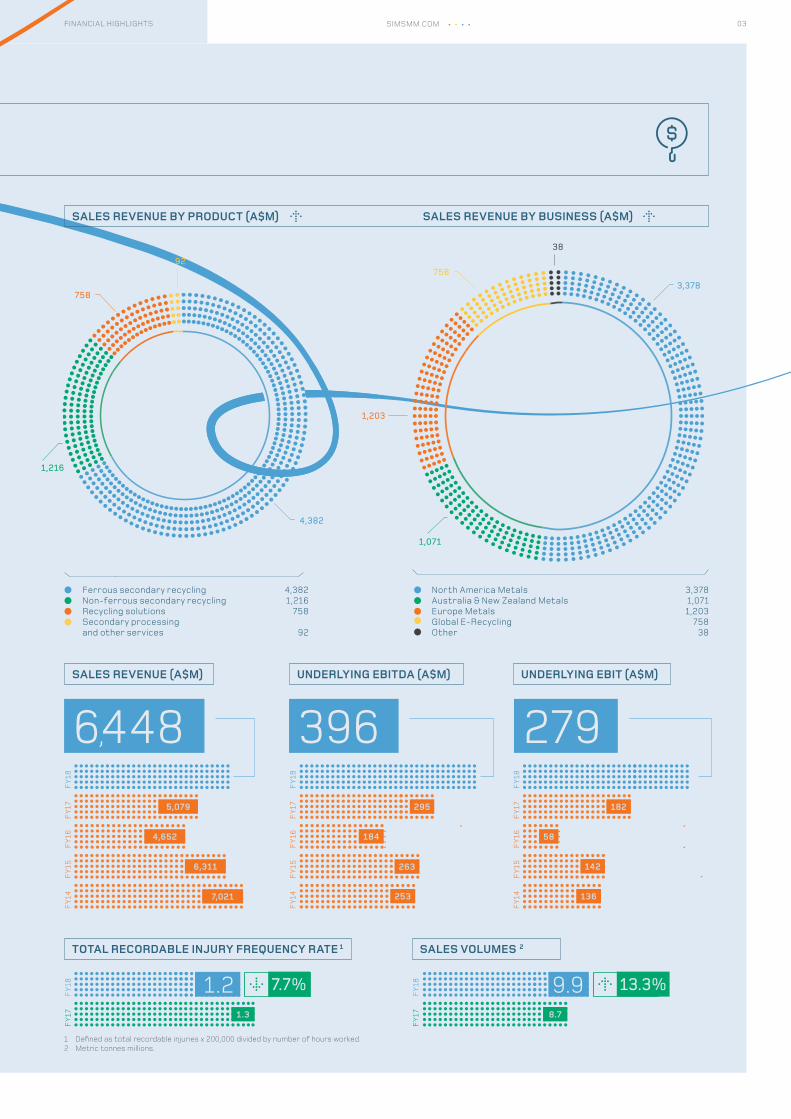
SALES REVENUE BY PRODUCT (A$M)
SALES REVENUE (A$M)
TOTAL RECORDABLE INJURY FREQUENCY RATE 1 SALES VOLUMES 2
UNDERLYING EBITDA (A$M) UNDERLYING EBIT (A$M)
SALES REVENUE BY BUSINESS (A$M)
6,448
Ferrous secondary recycling 4,382Non-ferrous secondary recycling 1,216Recycling solutions 758Secondary processing and other services 92
North America Metals 3,378Australia & New Zealand Metals 1,071Europe Metals 1,203Global E-Recycling 758Other 38
4,382
3,378758
1,216
1,071
9238
1,203
758
396 279
FY1
8
FY1
8
FY1
8
FY1
7
FY1
7
FY1
7
FY1
6
FY1
6
FY1
6
FY1
5
FY1
5
FY1
5
FY1
4
FY1
4
FY1
4
1.2 7.7%
FY1
8F
Y17
295 182
142
136
58
5,079
4,652
6,311
7,021
1.3
9.9 13.3%
FY1
8F
Y17 8.7
184
263
253
1 Defined as total recordable injuries x 200,000 divided by number of hours worked.2 Metric tonnes millions.
03SIMSMM.COMFINANCIAL HIGHLIGHTS
While the year-on-year improvement was not evident in every region, the improved results, with an increase in ordinary dividends and a strengthened balance sheet, highlights the value of our geographically diverse business.
Underlying Earnings Before Interest and Tax of $279.2 million was up 53 per cent over the prior year. Statutory Net Profit after Tax was $203.5 million, in line with the prior year, while Underlying Net Profit after Tax at $192.1 million was up 60 per cent. Ordinary FY 2018 dividends of 53.0 cents were higher than FY 2017 dividends, even after taking into account last fiscal year’s Special Dividend of 10.0 cents per share.
Looking behind these results, our business has had to navigate some significant external challenges brought about by the changing geo-political landscape, slowing economic growth and demand in some of our key markets, and a disrupted global trade environment. Nevertheless, the results bear testimony to our dedicated employees maintaining their commitment to continually improving our business processes, applying disciplined deployment of capital, and ensuring that service to our suppliers and customers remained at the highest standards; all the while working more safely than ever before in our Company’s 101 year history.
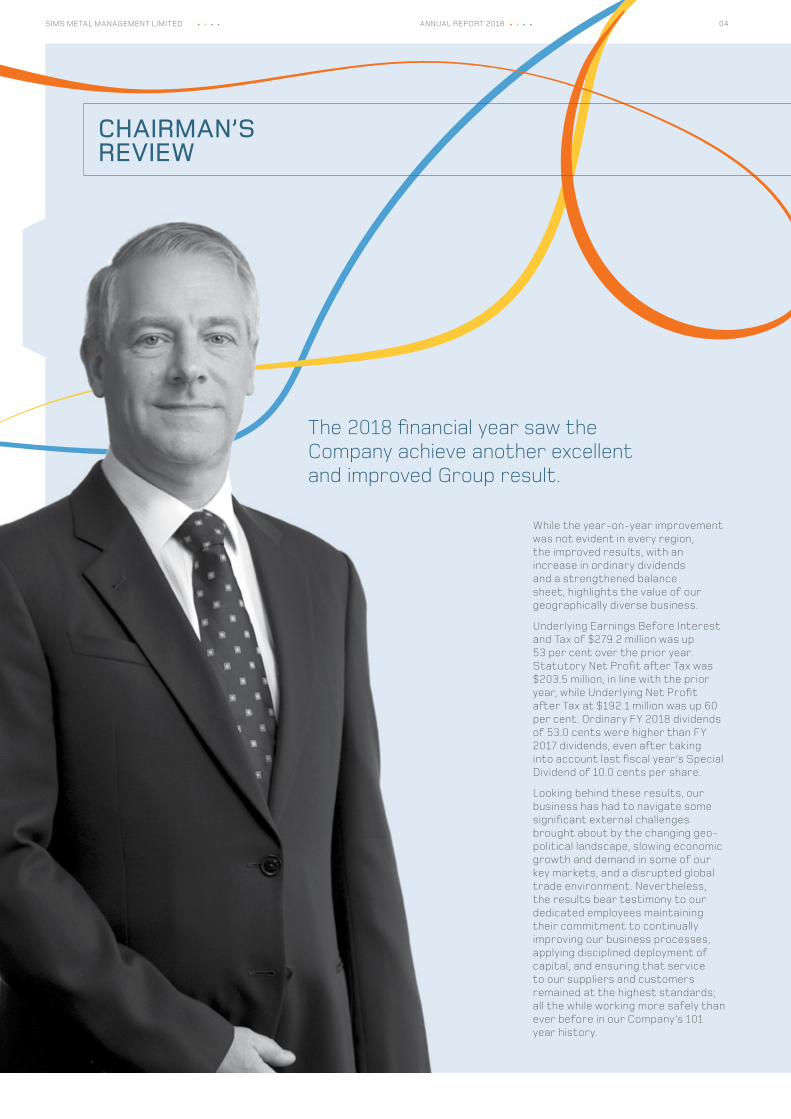
The 2018 financial year saw the Company achieve another excellent and improved Group result.
CHAIRMAN’SREVIEW
04SIMS METAL MANAGEMENT LIMITED ANNUAL REPORT 2018
directors and senior management. Over the past financial year, we have deliberately strengthened our senior leadership team in recognition of the increasing complexity and sophistication of the supply chains of which we are part. One of the trends we identified was the unwillingness for China to continue to be a dumping ground for the rest of the world. The Company positioned itself ahead of the changing legislative framework in that country. We are now benefiting from the capital that was invested to enhance the quality of our end products.
Safeguarding the environment in which we operate continues to be a measurable objective and our sustainability report sets out where we are on that journey. Climate presents both challenges and opportunities. In particular, as weather events become more intense, our facilities can be impacted. We are assessing the vulnerability of all our locations, while capital spending evaluations include an assessment of the potential for climate impact.
Growth in the ‘circular economy’ will continue to provide more opportunities for Sims to deploy capital so as to provide attractive solutions for our customers. As awareness of our position within this ‘circular economy’ becomes better articulated, and more widely known, we will strive to attract talent to harness this potential. These more sophisticated recycling solutions will create additional opportunities, but it is also incumbent upon us to ensure there is minimal dislocation and disruption to our existing work force caused by technological advances.
Given the many countries and nations in which we operate and employ, our work force is quite diverse. Moreover, the twelve members of our senior leadership team in themselves represent six different nationalities. But, unfortunately, gender diversity within our workforce is not where we would like it to be, with women
currently representing only 20 per cent of our over 5,000 employees. We have been working hard to ensure our workplaces are more appealing for women. Our approach to hiring is fair, our policies and working environment result in all employees feeling they are welcomed, and our remuneration is equal. We are committed to ensuring there is no harassment in the workplace and that, as an organisation, we support our workforce throughout their careers at Sims.
Over the past twelve months, directors visited eight operating sites and witnessed first-hand our safety culture in action. Safety is not just about ticking the boxes, it is at the foundation of everything we do, and this philosophy has to be embedded throughout the organisation. We strive for zero harm to our employees and members of the public. Fiscal year 2018 was the safest year in our Company’s history in terms of both injury rates and severity of injuries. However, until we eliminate injuries altogether, the Board and management will continue to take initiatives to improve our performance.
On behalf of the entire Board, I would like to thank all of our employees for their efforts over the past year, as well as our suppliers and customers for their support and trust.
Our aim is to build upon the momentum achieved across the Sims Group over the past several years.
Geoff Brunsdon Chairman
Reaching this milestone is no reason for our Company to be complacent about the future. Ensuring that we have the right foundations for continued prosperity is a priority for the Board and senior leadership team. Building on our history, we will continue to look at everything we do through the lens of our Company’s purpose which, put simply, is to put our planet first. We are convinced that by so doing, your Company will continue to prosper for the benefit of its shareholders, employees, the communities in which we operate, our suppliers and our customers. These groups are demanding that organisations accept more accountability for the way they interact with stakeholders and regulators, and governments are becoming more demanding in the way they interact with companies, not just in Australia, but in all the markets we serve.
The importance of strong corporate culture, and the role of boards in setting and monitoring culture, has never been in sharper focus than is the case today. The Hayne Royal Commission and the Australian Prudential Regulatory Authority review of the Commonwealth Bank have highlighted the importance of a board’s understanding of the cultural characteristics of their organisations, and in particular ensuring that company culture aligns with community expectations.
Sims operates in 18 countries and exports to customers in more than 50 countries. Ensuring that our conduct in all jurisdictions aligns with the highest ethical standards is a key priority for the Board and senior leadership team. This includes protecting the environment, fostering diversity, actively being involved in our communities, and conducting our business so we can adapt to changing markets and expectations.
Identifying threats to our business, as well as opportunities, is one of the key responsibilities for the
$ 279 m $ 204mUNDERLYING EARNINGSBefore Interest and Tax
STATUTORY NET PROFITAfter Tax
SIMSMM.COM 05CHAIRMAN’S REVIEW
CEO’SREVIEW
As an organization, we are dedicated to improving our products, services and processes on an ongoing basis. Through the disciplined DMAIC (Define, Measure, Analyze, Improve and Control) process, we’ve been able to ensure that the improvements we make are sustainable and that our processes are fit for purpose. This year, we established a Project Management Office (PMO) to define and establish a framework for managing the numerous projects we undertake annually. With the PMO in place, we’ve been able to standardize our approach to, and administration of, all the major projects in our pipeline.
Investing in new technology facilitated greater yields from our material recovery plants in fiscal year 2018. We implemented separation technology, which was important for Sims in the context of growth and also in managing changing customer requirements. Another challenge we faced, as do many other organizations, was ensuring that we kept abreast of our IT systems. We need to continually confirm that the architecture allows us to grow and use our systems to the fullest extent. To address those concerns, we developed the future roadmap for our organization so that we have a broad view of the current business systems and can determine their overall agility. We are modernizing and standardizing our systems across all regions through a targeted investment in engineering, IT and project management so that we can all be more effective. These process improvements will allow us to effectively manage our growth, strengthen our industry position, and leapfrog past the competition.
Safety remains our number one priority, and our safety performance during fiscal year 2018 was a testament to that. It was our safest year on record, and we had an ambitious goal of zero harm. We’ve made several cultural improvements throughout the Company to ensure a further reduction in safety infractions, but we still have room for improvement and will employ best practices across the region to ensure that we can meet our goal.
8% in fiscal year 2017 to 10.3%. We were very pleased with the strong improvement in profitability on the back of the performance of our North America and Australia & New Zealand operations, as well as the SA Recycling joint venture. The improved result was driven by underlying strong demand for ferrous and non-ferrous metals, improving metal margins, and enhanced material yields. The implementation of our internal initiatives delivered slightly more than $40 million in direct benefits to EBIT in fiscal year 2018.
Our capital program has been focused on two main areas; ongoing capital required to keep our assets in good working order, and growth capital. This spend included investment in a number of National Sword (a policy in China that has banned the importation of certain types of solid waste, as well as set strict contamination limits on recyclable materials) initiatives, including ICW (insulated copper wire) upgrades, cable granulation, and zorba separation plants, some of which will carry over into fiscal year 2019. These investments will contribute to our downstream strategy of producing better quality product for customers. In addition to internal growth spending, we will continue to investigate external growth opportunities, which fit our long-term strategic objectives and where we are confident significant shareholder value can be created. Growing the Company through our current core operations and markets is our first priority. Our recent acquisitions of Morley in the United Kingdom and the remaining 50% of Sims Pacific Metals joint venture in New Zealand provides a strong indication of our strategy to strengthen the core business.
Five years ago, we set a target of 10% return on capital, and I am delighted to report that we exceeded that objective.
Our financial results from fiscal year 2018 showed a solid increase across key metrics. This positive performance is due in large part to the diversity of our business model, the capital investments we made into our Company, and the hard work and dedication of each of our employees.
One of my key objectives during 2018 was to select a new management team, with leaders from diverse backgrounds who are capable of leading Sims Metal Management into the future. The diversity of their experience and thought has allowed us to be creative in addressing challenges, and more efficient in how we run the business.
We had a good year, but this team and I are not resting on our laurels; instead, we are focused on greater operational efficiencies and how we can reshape the corporate strategy to position Sims for even greater success. This year, we initiated a review of our strategy to determine how we can play the infinite game – building long-term value that can withstand the test of time. Together, we identified a clearly-defined statement of purpose that pays homage to Sims’ past, while establishing guiding principles for the future. It conveys what the organization stands for in historical, ethical, emotional and practical terms. As an aligned team, we can be even more focused on how we achieve our goals and transform our corporate culture. This journey will begin in earnest in fiscal year 2019 as we drive continuous improvement in our core business and evaluate promising new opportunities aligned with our strategic goals.
For the second consecutive year, the financial results highlighted significant year-over-year improvement, with our underlying return on capital increasing from
06SIMS METAL MANAGEMENT LIMITED ANNUAL REPORT 2018
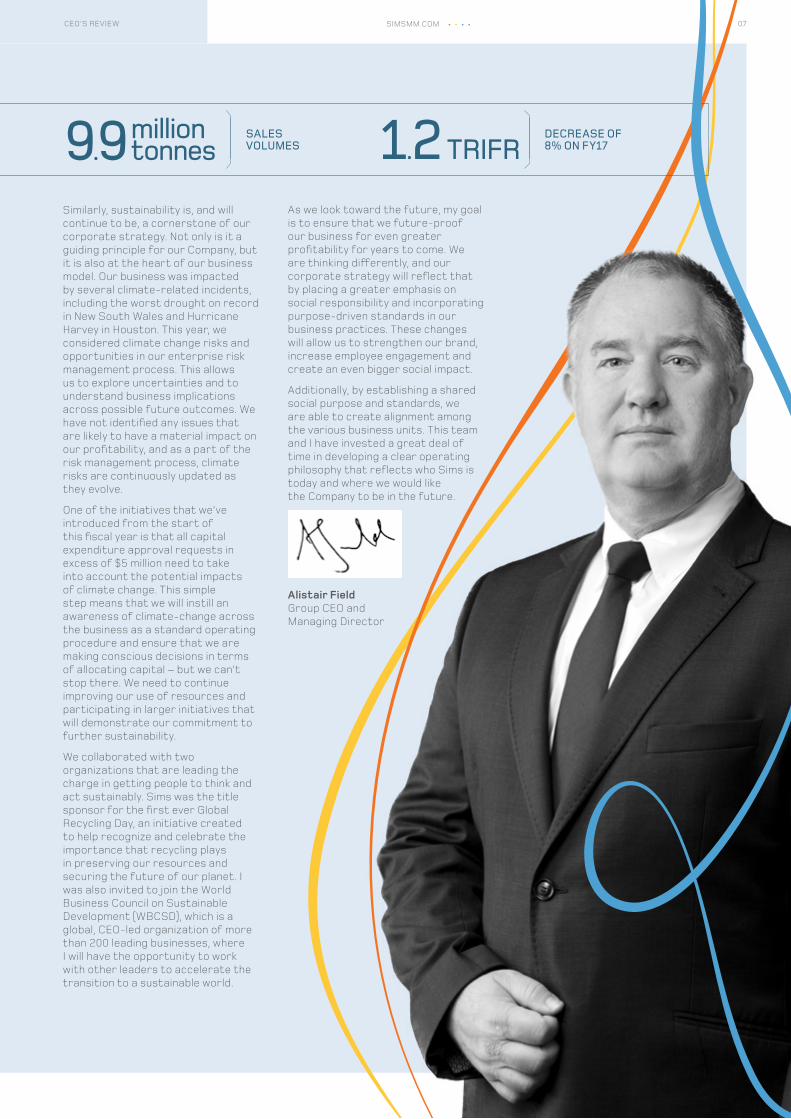
9.9 1.2 TRIFRSALES VOLUMES
DECREASE OF 8% ON FY17
million tonnes
Similarly, sustainability is, and will continue to be, a cornerstone of our corporate strategy. Not only is it a guiding principle for our Company, but it is also at the heart of our business model. Our business was impacted by several climate-related incidents, including the worst drought on record in New South Wales and Hurricane Harvey in Houston. This year, we considered climate change risks and opportunities in our enterprise risk management process. This allows us to explore uncertainties and to understand business implications across possible future outcomes. We have not identified any issues that are likely to have a material impact on our profitability, and as a part of the risk management process, climate risks are continuously updated as they evolve.
One of the initiatives that we’ve introduced from the start of this fiscal year is that all capital expenditure approval requests in excess of $5 million need to take into account the potential impacts of climate change. This simple step means that we will instill an awareness of climate-change across the business as a standard operating procedure and ensure that we are making conscious decisions in terms of allocating capital – but we can’t stop there. We need to continue improving our use of resources and participating in larger initiatives that will demonstrate our commitment to further sustainability.
We collaborated with two organizations that are leading the charge in getting people to think and act sustainably. Sims was the title sponsor for the first ever Global Recycling Day, an initiative created to help recognize and celebrate the importance that recycling plays in preserving our resources and securing the future of our planet. I was also invited to join the World Business Council on Sustainable Development (WBCSD), which is a global, CEO-led organization of more than 200 leading businesses, where I will have the opportunity to work with other leaders to accelerate the transition to a sustainable world.
As we look toward the future, my goal is to ensure that we future-proof our business for even greater profitability for years to come. We are thinking differently, and our corporate strategy will reflect that by placing a greater emphasis on social responsibility and incorporating purpose-driven standards in our business practices. These changes will allow us to strengthen our brand, increase employee engagement and create an even bigger social impact.
Additionally, by establishing a shared social purpose and standards, we are able to create alignment among the various business units. This team and I have invested a great deal of time in developing a clear operating philosophy that reflects who Sims is today and where we would like the Company to be in the future.
Alistair FieldGroup CEO and Managing Director
07SIMSMM.COMCEO’S REVIEW
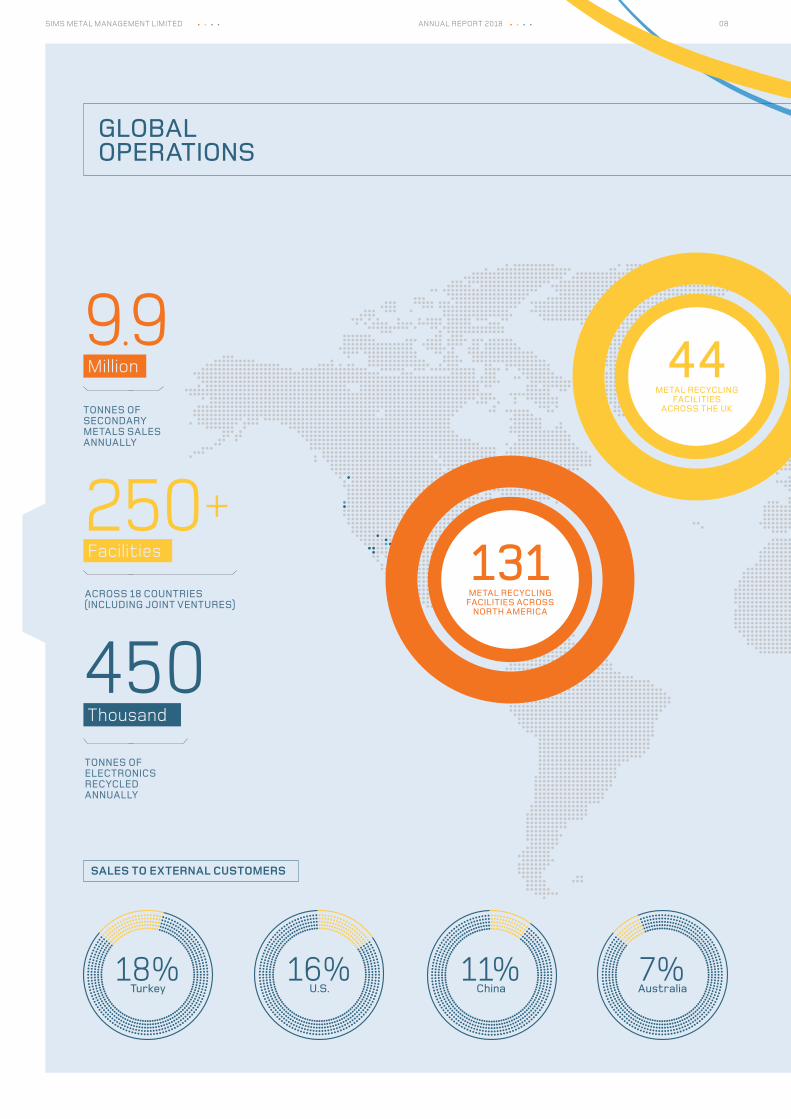
GLOBAL OPERATIONS
SALES TO EXTERNAL CUSTOMERS
16%U.S.
11%China
18%Turkey
7%Australia
TONNES OF SECONDARY METALS SALES ANNUALLY
9.9Million
TONNES OF ELECTRONICS RECYCLED ANNUALLY
450Thousand
ACROSS 18 COUNTRIES (INCLUDING JOINT VENTURES)
250+Facilities 131
METAL RECYCLING FACILITIES ACROSS
NORTH AMERICA
44METAL RECYCLING
FACILITIES ACROSS THE UK
16% 11%
08SIMS METAL MANAGEMENT LIMITED ANNUAL REPORT 2018
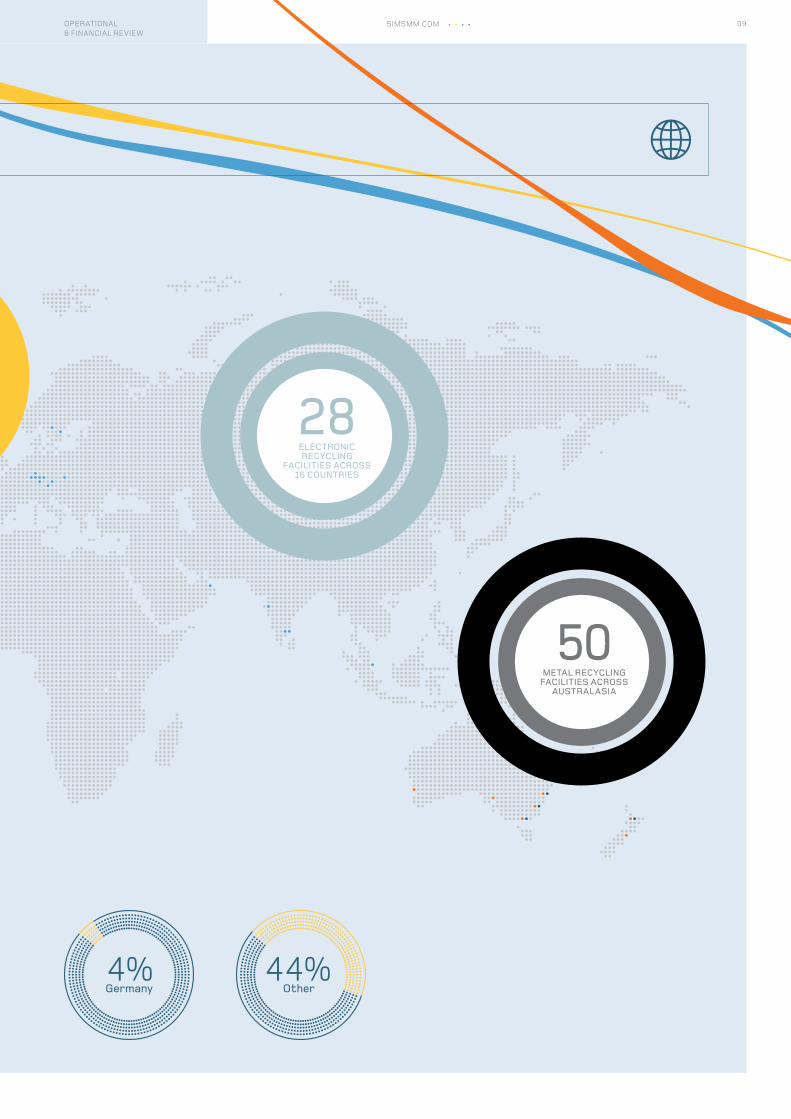
44%Other
4%Germany
28ELECTRONIC RECYCLING
FACILITIES ACROSS 16 COUNTRIES
50METAL RECYCLING
FACILITIES ACROSS AUSTRALASIA
4%
09OPERATIONAL & FINANCIAL REVIEW
SIMSMM.COM
NORTH AMERICA METALS
EXTERNAL OPERATINGENVIRONMENT
Strong economic growth extended across the entire financial year. Emerging in the second half of FY18 was the introduction by the US of tariffs on imported steel from several countries, including China and Turkey, and on a range of other products mainly targeting China’s trade surplus, which resulted in retaliatory tariffs on US exports of aluminium to China.
Higher metal prices and improved domestic demand contributed to an increase in US secondary metal volumes. Total US exports of ferrous secondary metals increased 23% in FY18 over FY17. Overall, the generation and collection of secondary metals in North America improved, led primarily by demand in export markets. On a trailing 12-month basis, at the end of March 2018, total US ferrous secondary metals collection volumes were 53 million tonnes, a 4% improvement over the prior corresponding period. While this is up from recent lows, it remains down 26% since early 2012.
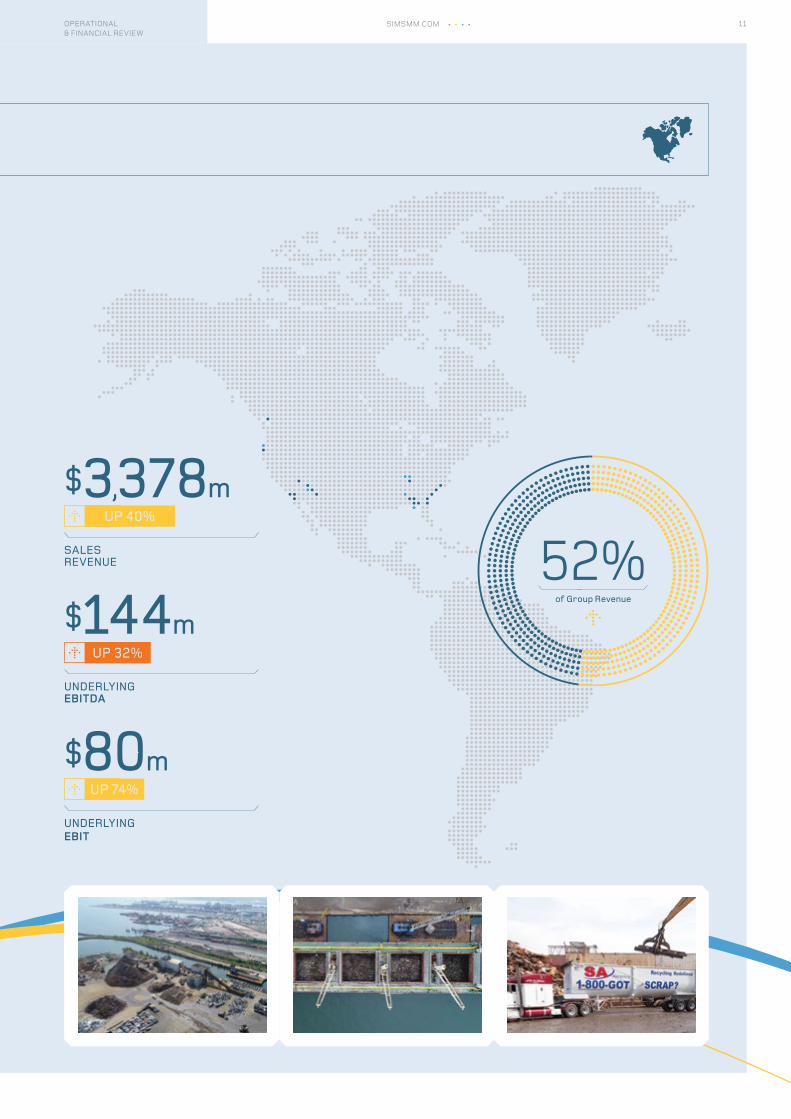
PERFORMANCESales revenue for North America Metals in FY18 was 40% higher compared to FY17. At constant currency, sales revenue was 44% higher compared to FY17. The increase was primarily due to higher average selling prices and higher sales volumes, which increased by 19%. The higher volumes were driven by strong export sales, which were up 35% over FY17.
Underlying EBIT was $80.3 million in FY18 compared to $46.1 million in FY17. At constant currency, underlying EBIT was $82.3 million. Rising volumes and higher metal prices supported wider metal margins across the supply chain, particularly in the Eastern region. Improvement in the metals business was partially offset by an underlying EBIT loss of $0.2 million from Sims Municipal Recycling, largely due to a significant decline in paper prices. The aggregate resultant 22% increase in North America Metals metal margin was partially offset by a 21% increase in controllable costs (both on a constant currency basis) driven by higher throughput and cost pressures stemming from a robust US economy.
GOING FORWARDThe major focus for North America Metals in FY19 is to complete the installation and commissioning of new state-of-the-art non-ferrous Metal Recovery Plants at the Company’s facilities in New Jersey and Chicago, both of which are due for completion in Q1 of FY19. Further, the installation of additional advanced downstream sorting technology for both copper and aluminium, to produce smelter-ready products throughout the US, is expected to be completed during FY19. The North America Metals business is also well placed to pursue earnings accretive growth initiatives.
INVESTMENT IN SA RECYCLING
SA Recycling (SAR), which is 50% owned by a North America Metals subsidiary, operates 74 facilities in the US. The Company’s share of results from SAR was $68.5 million in FY18, an increase of $42.2 million compared to FY17. The result from SAR improved in FY18 compared to FY17 due to higher sales volumes and higher average ferrous selling prices, as well as an increased profit share from recent acquisitions. At constant currency, equity accounted results from SAR increased 168%.
North America Metals is the Company’s largest business segment operating, with SA Recycling, 131 wholly-owned and joint venture facilities across the United States and Canada. In FY18, North America Metals accounted for 52% of the Group’s total sales revenue, with sales of 6.5 million tonnes of ferrous and non-ferrous secondary metal and 1,978 employees.
10SIMS METAL MANAGEMENT LIMITED ANNUAL REPORT 2018
SALES REVENUE
UP 40%
$3,378 m
UNDERLYING EBIT
UP 74%
$80 m
UNDERLYING EBITDA
UP 32%
$144 m
52%of Group Revenue
11OPERATIONAL & FINANCIAL REVIEW
SIMSMM.COM
AUSTRALIA & NEW ZEALAND METALS
EXTERNAL OPERATINGENVIRONMENT
Australia’s economy continued its long growth trajectory with the March 2018 quarter showing annual GDP growth at a healthy 3.1% on the back of a 1% increase for the quarter. Growth in exports accounted for almost half the growth in GDP, reflecting the strength of exports in mining commodities.
Sustained high levels of infrastructure spending continued to support strong domestic demand and production for steel in Australia and robust demand for ferrous secondary metals. Despite increased consumption from domestic mills, export demand remained steady, with the export of ferrous secondary metal volumes, based on Australian customs statistics, broadly unchanged for FY18 compared to FY17.
Notwithstanding the recent strong GDP data, business conditions in Australia were subdued, as strong public infrastructure spending was partially offset by a softer outlook for household consumption. Consumer confidence was adversely affected by revelations arising from the Hayne Royal Commission into the finance industry, and there were indications of credit tightening by the major lenders for housing.
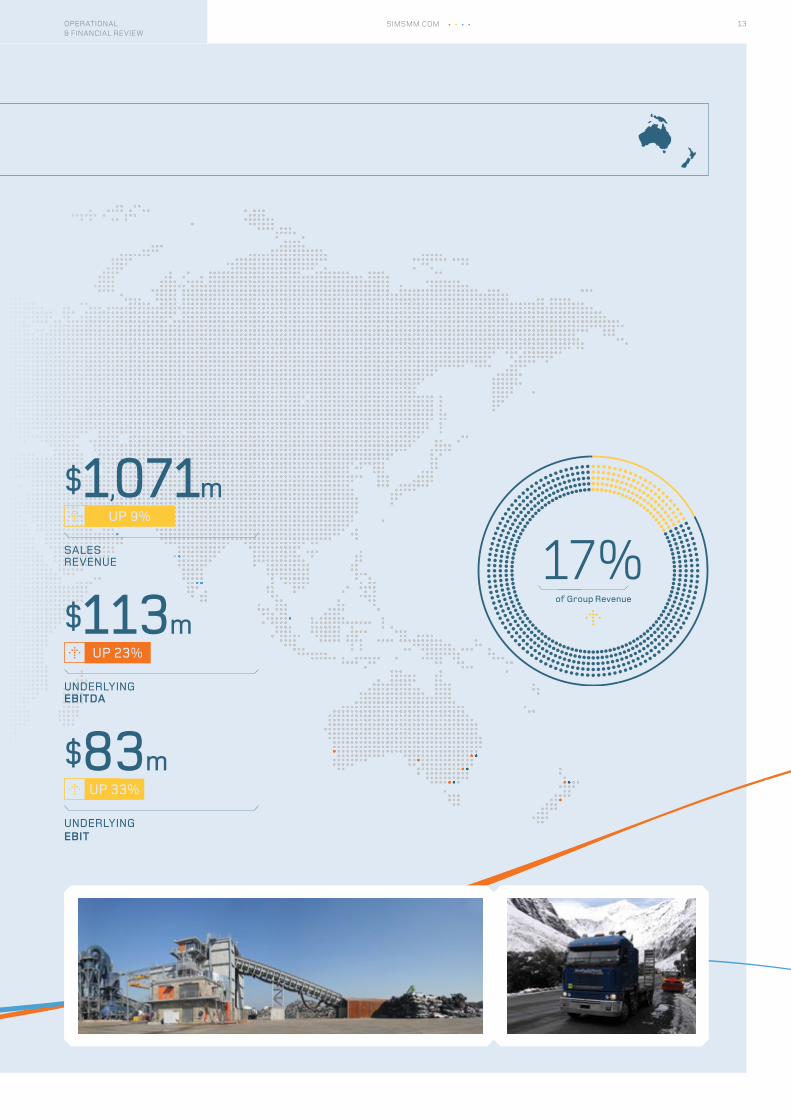
PERFORMANCESales revenue for ANZ Metals in FY18 was 9% higher compared to FY17. The increase was primarily due to higher average ferrous selling prices and sales volumes, the former of which increased by 7%.
Underlying EBIT of $83.4 million in FY18 was 33% higher compared to FY17. The stronger result over the prior year related to improved metal margins, assisted by improved operating yields and higher average selling prices, on steady sales volumes. FY18 underlying EBIT does not reflect results from the acquisition of the remaining 50% interest in Sims Pacific Metals, successfully completed at the end of June 2018.
GOING FORWARDANZ Metals in FY19 will focus on integrating the now wholly-owned Sims Pacific Metals business, which is the leading metal recycling business in New Zealand operating nine facilities, including two metal shredders across the North and South Islands. The business is supported by over 170 employees and handles approximately 350,000 tonnes of ferrous and non-ferrous secondary metals per annum. ANZ Metals will look at leveraging off this business to explore opportunities to further expand in the Pacific region.
Australia and New Zealand (ANZ) Metals is the leading metal recycler in Australasia operating 50 facilities across Australia, New Zealand, and Papua New Guinea, with 859 employees. In FY18, ANZ Metals accounted for 17% of the Group’s total sales revenue, with sales of 1.7 million tonnes of ferrous and non-ferrous secondary metal.
12SIMS METAL MANAGEMENT LIMITED ANNUAL REPORT 2018
of Group Revenue
17%SALES REVENUE
UP 9%
$1,071 m
UNDERLYING EBIT
UP 33%
$83 m
UNDERLYING EBITDA
UP 23%
$113 m
13OPERATIONAL & FINANCIAL REVIEW
SIMSMM.COM
EUROPE METALS
EXTERNAL OPERATINGENVIRONMENT
In the aftermath of the UK’s decision to leave the European Union in 2016, the pace of growth in the UK economy continued to be anaemic, with the 2018 March quarter GDP dropping to 0.2%, compared to the 2017 December quarter of 0.4%. Falling business investment, coupled with the weakest household spending in three years, contributed to the poor outcome.
Compared to the US dollar, the pound sterling strengthened over the course of FY18, dampening some of the positive benefits for export material, but, in the final two months of the fiscal year, the pound sterling fell approximately 8%. Demand for ferrous secondary metal from domestic steel mills also acted to impede material flows to export docks, particularly in the second half of FY18, where crude steel production increased 5% over the first six months of the fiscal year.
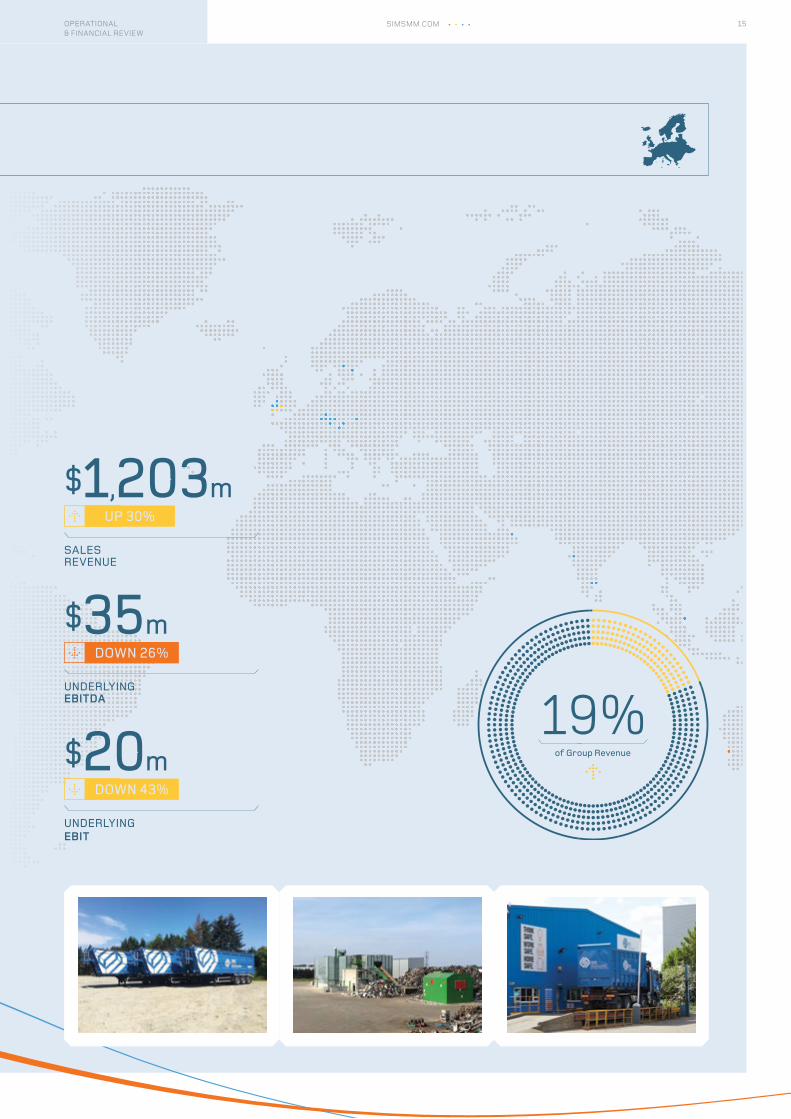
PERFORMANCESales revenue for Europe Metals in FY18 was 30% higher compared to FY17. At constant currency, sales revenue was 26% higher compared to FY17, primarily due to higher sales volumes, which increased by 6%, in part due to the acquisition of Morley Waste Traders and Lord and Midgley (Morley), a leading metal recycler with ten facilities across Yorkshire, during the second half of FY18.
Underlying EBIT of $20.1 million in FY18 was 43.2% lower compared to FY17. At constant currency, underlying EBIT was $19.4 million. Metal margins declined 4% on a constant currency basis as strong competition for input volumes more than offset higher sales volumes and average selling prices.
GOING FORWARDOne of the major foci of Europe Metals in FY19 is to improve the quality of secondary metal products that it provides to its customers. The business is undertaking, at a cost of $19 million, a refurbishment of its Avonmouth facility, which will improve throughput capabilities and product quality at this site.
Given that Europe Metals’ market share is still relatively modest, acquisition opportunities, such as Morley, that are complimentary to its existing geographic footprint, will be considered.
Europe Metals is one of the leading metals recyclers in the UK operating 44 facilities across the United Kingdom, with 690 employees. In FY18, Europe Metals accounted for 19% of the Group’s total sales revenue, with sales of 1.7 million tonnes of ferrous and non-ferrous secondary metal.
14SIMS METAL MANAGEMENT LIMITED ANNUAL REPORT 2018
of Group Revenue
19%
SALES REVENUE
UP 30%
$1,203 m
UNDERLYING EBIT
DOWN 43%
$20 m
UNDERLYING EBITDA
DOWN 26%
$35 m
15OPERATIONAL & FINANCIAL REVIEW
SIMSMM.COM
GLOBAL E-RECYCLING
EXTERNAL OPERATINGENVIRONMENT
Copper and precious metals, including gold, comprise the two primary commodities recovered from the electronics recycling process. During FY18, the price of copper increased significantly, lifting 25%, while average gold prices increased by 3% over the prior corresponding period. The benefit from improved commodity prices was primarily realised by Global E-Recycling in the second half of FY18.
Beyond commodity price movements, competitive and regulatory issues continued to be the primary driver for local market dynamics. In this regard, governmental sponsors and the regulatory environment for electronics recycling in the European Union, where the Group maintains the majority of its e-waste related operations, remained supportive advocates for the industry. In addition, data security concerns are having a meaningful impact on large corporations seeking secure recycling services.
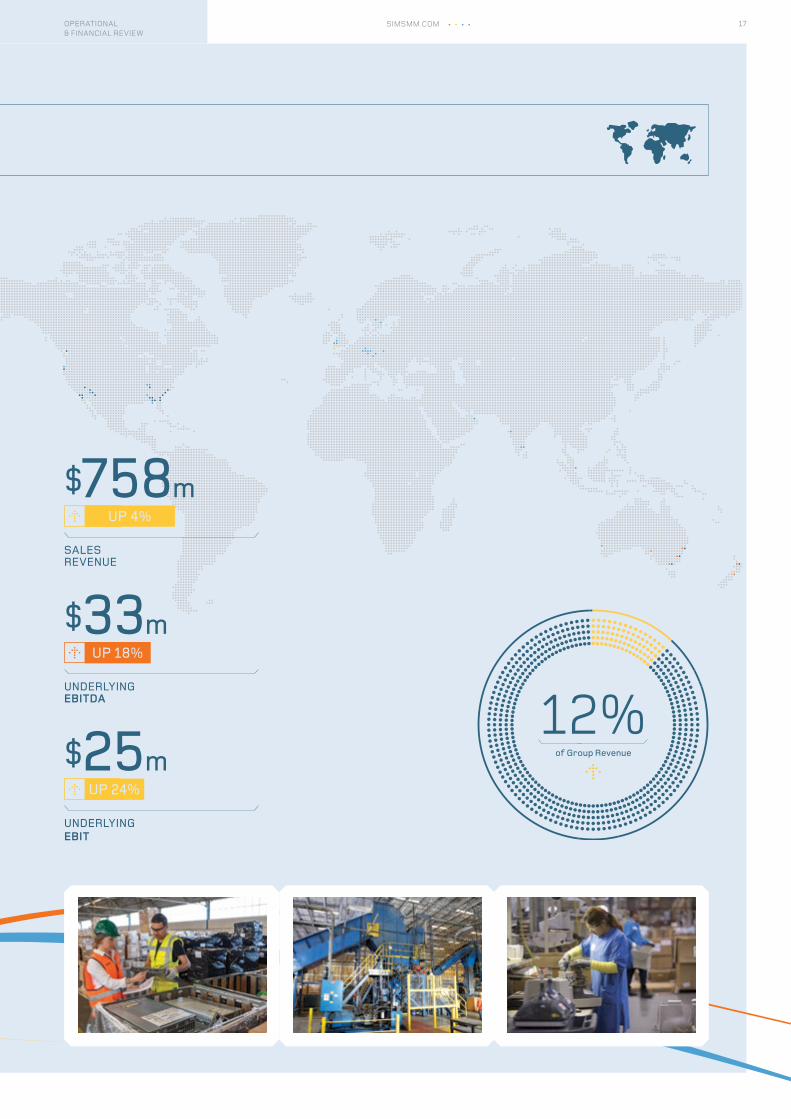
PERFORMANCESales revenue for Global E-Recycling in FY18 was 4% higher compared to FY17. At constant currency, sales revenue was 1% higher compared to FY17. Higher global copper and precious metals pricing supported increased revenues compared to FY17.
Underlying EBIT of $24.8 million in FY18 was 24% higher than FY17. At constant currency, underlying EBIT was $23.8 million. Global E-Recycling benefited from a strong second half performance, up 182% over the first half of FY18.
The majority of Global E-Recycling’s FY18 underlying EBIT improvement was attributed to US E-Recycling. On a constant currency basis, underlying EBIT for US E-Recycling was $6.8 million higher in FY18 than FY17, mainly attributable to the business’ resetting plan. The better performance in the US was partially offset by ongoing margin pressure in Continental Europe.
GOING FORWARDLeveraging off its global footprint, Global E-Recycling offers significant growth opportunities, particularly in the IT Asset Destruction segment, where large global businesses are keen to work with service providers capable of delivering secure asset destruction for large scale cloud storage servers.
Global E-Recycling, which operates under the name Sims Recycling Solutions (SRS), is a global leader in electronics reuse and recycling, with 28 facilities across 16 countries, and 1,420 employees. SRS provides disposition services for all types of retired electrical equipment to local, national and global customers in a wide variety of business sectors. In FY18, SRS accounted for 12% of the Group’s total sales revenue.
16SIMS METAL MANAGEMENT LIMITED ANNUAL REPORT 2018
of Group Revenue
12%
SALES REVENUE
UP 4%
$758 m
UNDERLYING EBIT
$25 m
UNDERLYING EBITDA
$33 mUP 18%
UP 24%
17OPERATIONAL & FINANCIAL REVIEW
SIMSMM.COM
SPOTLIGHT ON THE BUSINESS
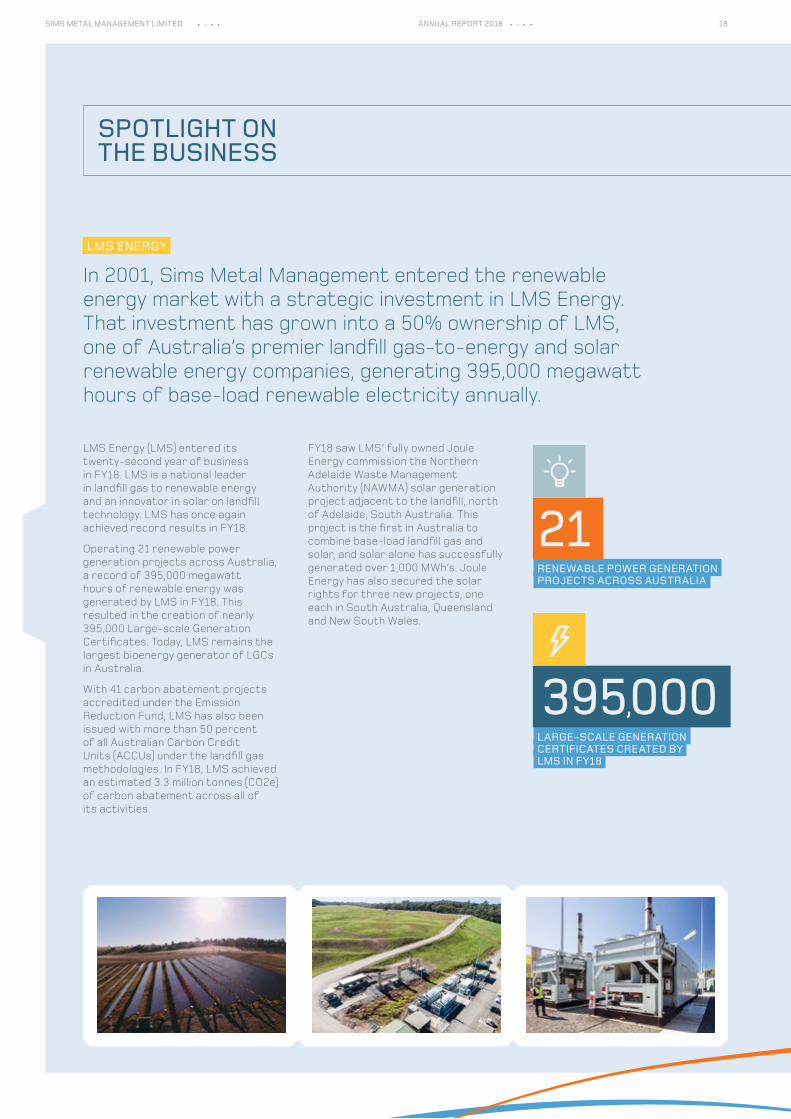
LMS Energy (LMS) entered its twenty-second year of business in FY18. LMS is a national leader in landfill gas to renewable energy and an innovator in solar on landfill technology. LMS has once again achieved record results in FY18.
Operating 21 renewable power generation projects across Australia, a record of 395,000 megawatt hours of renewable energy was generated by LMS in FY18. This resulted in the creation of nearly 395,000 Large-scale Generation Certificates. Today, LMS remains the largest bioenergy generator of LGCs in Australia.
With 41 carbon abatement projects accredited under the Emission Reduction Fund, LMS has also been issued with more than 50 percent of all Australian Carbon Credit Units (ACCUs) under the landfill gas methodologies. In FY18, LMS achieved an estimated 3.3 million tonnes (CO2e) of carbon abatement across all of its activities.
FY18 saw LMS’ fully owned Joule Energy commission the Northern Adelaide Waste Management Authority (NAWMA) solar generation project adjacent to the landfill, north of Adelaide, South Australia. This project is the first in Australia to combine base-load landfill gas and solar, and solar alone has successfully generated over 1,000 MWh’s. Joule Energy has also secured the solar rights for three new projects, one each in South Australia, Queensland and New South Wales.
RENEWABLE POWER GENERATIONPROJECTS ACROSS AUSTRALIA
LARGE-SCALE GENERATIONCERTIFICATES CREATED BY LMS IN FY18
21
395,000
LMS ENERGY
In 2001, Sims Metal Management entered the renewable energy market with a strategic investment in LMS Energy. That investment has grown into a 50% ownership of LMS, one of Australia’s premier landfill gas-to-energy and solar renewable energy companies, generating 395,000 megawatt hours of base-load renewable electricity annually.
18SIMS METAL MANAGEMENT LIMITED ANNUAL REPORT 2018
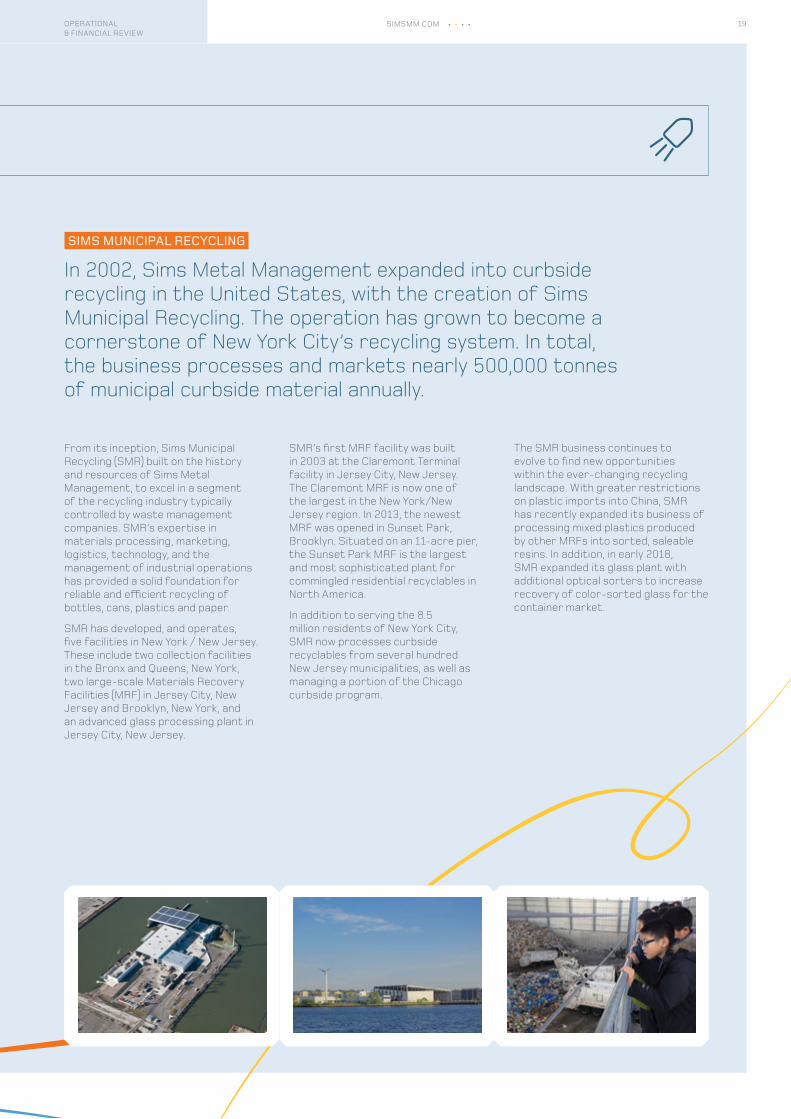
From its inception, Sims Municipal Recycling (SMR) built on the history and resources of Sims Metal Management, to excel in a segment of the recycling industry typically controlled by waste management companies. SMR’s expertise in materials processing, marketing, logistics, technology, and the management of industrial operations has provided a solid foundation for reliable and efficient recycling of bottles, cans, plastics and paper.
SMR has developed, and operates, five facilities in New York / New Jersey. These include two collection facilities in the Bronx and Queens, New York, two large-scale Materials Recovery Facilities (MRF) in Jersey City, New Jersey and Brooklyn, New York, and an advanced glass processing plant in Jersey City, New Jersey.
SMR’s first MRF facility was built in 2003 at the Claremont Terminal facility in Jersey City, New Jersey. The Claremont MRF is now one of the largest in the New York/New Jersey region. In 2013, the newest MRF was opened in Sunset Park, Brooklyn. Situated on an 11-acre pier, the Sunset Park MRF is the largest and most sophisticated plant for commingled residential recyclables in North America.
In addition to serving the 8.5 million residents of New York City, SMR now processes curbside recyclables from several hundred New Jersey municipalities, as well as managing a portion of the Chicago curbside program.
SIMS MUNICIPAL RECYCLING
In 2002, Sims Metal Management expanded into curbside recycling in the United States, with the creation of Sims Municipal Recycling. The operation has grown to become a cornerstone of New York City’s recycling system. In total, the business processes and markets nearly 500,000 tonnes of municipal curbside material annually.
The SMR business continues to evolve to find new opportunities within the ever-changing recycling landscape. With greater restrictions on plastic imports into China, SMR has recently expanded its business of processing mixed plastics produced by other MRFs into sorted, saleable resins. In addition, in early 2018, SMR expanded its glass plant with additional optical sorters to increase recovery of color-sorted glass for the container market.
19OPERATIONAL & FINANCIAL REVIEW
SIMSMM.COM
In FY18, Sims conducted a comprehensive review of its global, regional and local benefit programs to ensure that Sims’ policies are compliant with its diversity standards. As a result, Sims adopted a more inclusive Parental Leave Policy that supports birth mothers, birth fathers and adoptive parents.
Additionally, in this past year, in North America, the Company launched Women Working @ Sims, a series of focus groups designed to help inform Sims’ approach to attracting and retaining qualified women in a competitive industry. The focus groups were expanded to all regions and provided attendees with a forum to share information on the female experience at Sims. This feedback is being used to inform the Company’s future diversity and inclusion tactics.
Sims continues to deliver global Diversity and Inclusion training with an emphasis on local execution through its Respect & Inclusion @ Sims educational series. Thinking globally, and acting locally, allows Sims to set the tone for global governance, while adhering to the legislative guidelines and requirements in each country. The Company also tracks, monitors and measures diversity statistics for all applicants to determine future recruitment targets.
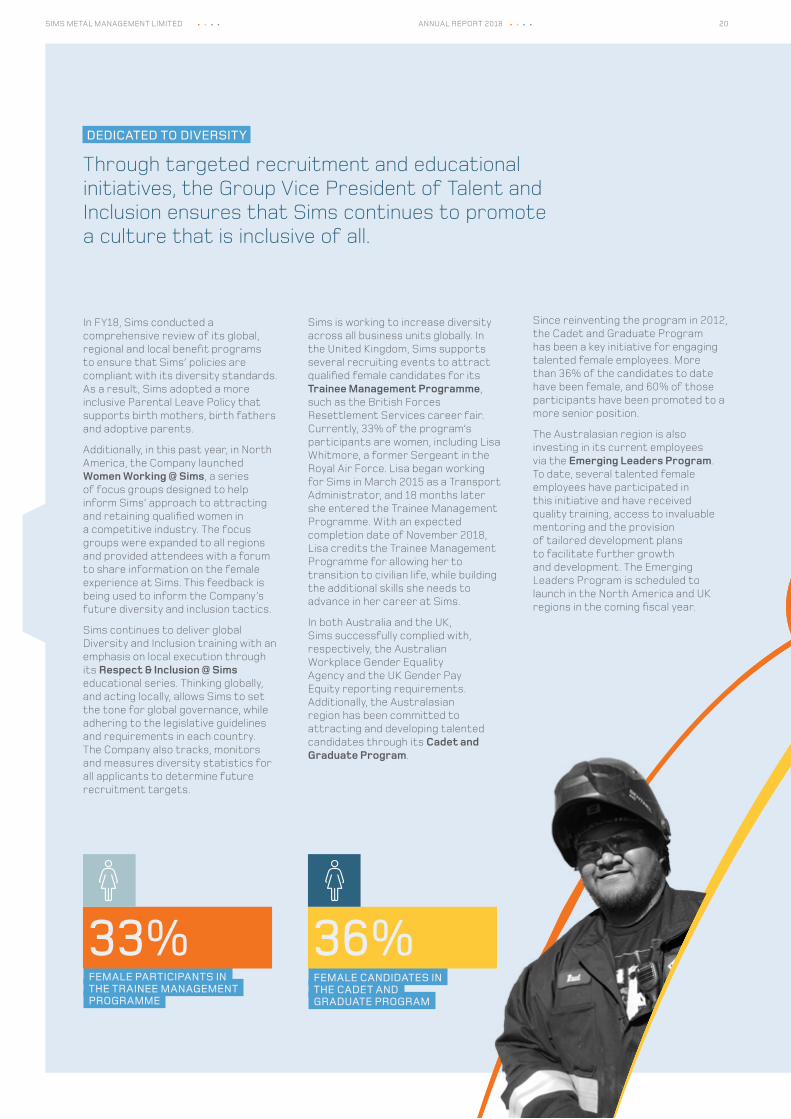
Sims is working to increase diversity across all business units globally. In the United Kingdom, Sims supports several recruiting events to attract qualified female candidates for its Trainee Management Programme, such as the British Forces Resettlement Services career fair. Currently, 33% of the program’s participants are women, including Lisa Whitmore, a former Sergeant in the Royal Air Force. Lisa began working for Sims in March 2015 as a Transport Administrator, and 18 months later she entered the Trainee Management Programme. With an expected completion date of November 2018, Lisa credits the Trainee Management Programme for allowing her to transition to civilian life, while building the additional skills she needs to advance in her career at Sims.
In both Australia and the UK, Sims successfully complied with, respectively, the Australian Workplace Gender Equality Agency and the UK Gender Pay Equity reporting requirements. Additionally, the Australasian region has been committed to attracting and developing talented candidates through its Cadet and Graduate Program.
Since reinventing the program in 2012, the Cadet and Graduate Program has been a key initiative for engaging talented female employees. More than 36% of the candidates to date have been female, and 60% of those participants have been promoted to a more senior position.
The Australasian region is also investing in its current employees via the Emerging Leaders Program. To date, several talented female employees have participated in this initiative and have received quality training, access to invaluable mentoring and the provision of tailored development plans to facilitate further growth and development. The Emerging Leaders Program is scheduled to launch in the North America and UK regions in the coming fiscal year.
DEDICATED TO DIVERSITY
Through targeted recruitment and educational initiatives, the Group Vice President of Talent and Inclusion ensures that Sims continues to promote a culture that is inclusive of all.
FEMALE PARTICIPANTS INTHE TRAINEE MANAGEMENT PROGRAMME
33%FEMALE CANDIDATES IN THE CADET AND GRADUATE PROGRAM
36%
20SIMS METAL MANAGEMENT LIMITED ANNUAL REPORT 2018
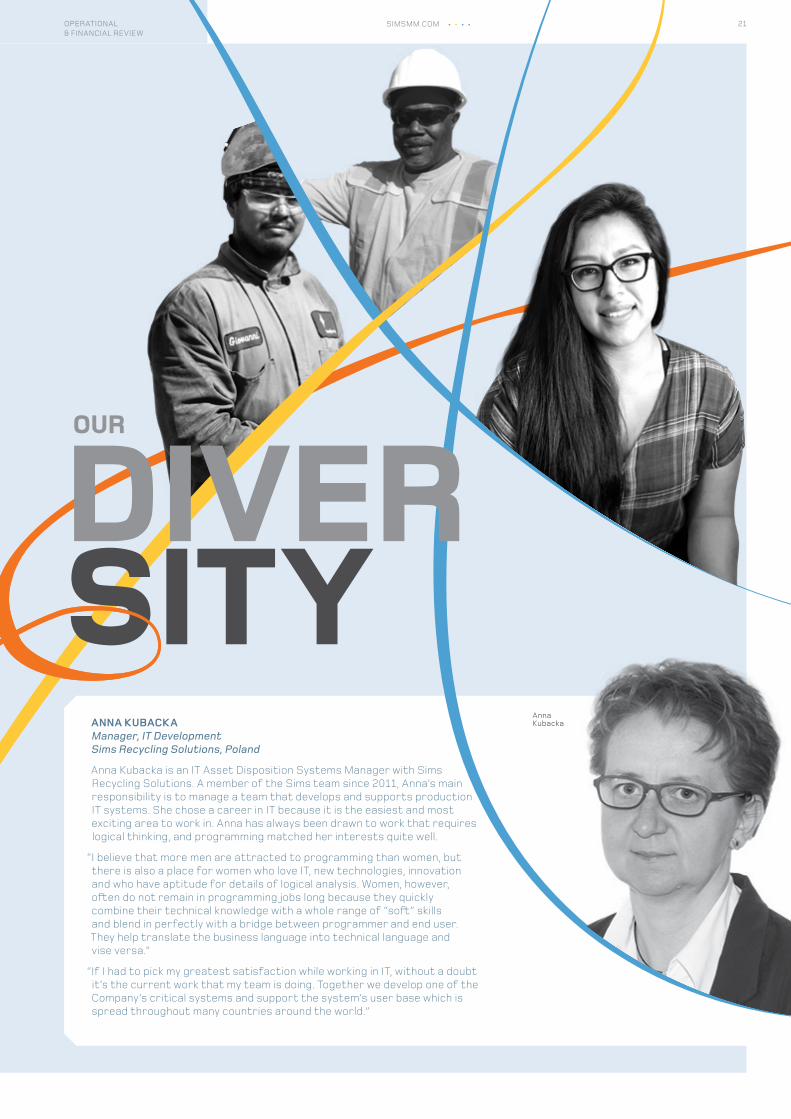
ANNA KUBACKAManager, IT DevelopmentSims Recycling Solutions, Poland
Anna Kubacka is an IT Asset Disposition Systems Manager with Sims Recycling Solutions. A member of the Sims team since 2011, Anna’s main responsibility is to manage a team that develops and supports production IT systems. She chose a career in IT because it is the easiest and most exciting area to work in. Anna has always been drawn to work that requires logical thinking, and programming matched her interests quite well.
“I believe that more men are attracted to programming than women, but there is also a place for women who love IT, new technologies, innovation and who have aptitude for details of logical analysis. Women, however, often do not remain in programming jobs long because they quickly combine their technical knowledge with a whole range of “soft” skills and blend in perfectly with a bridge between programmer and end user. They help translate the business language into technical language and vise versa.”
“If I had to pick my greatest satisfaction while working in IT, without a doubt it’s the current work that my team is doing. Together we develop one of the Company’s critical systems and support the system’s user base which is spread throughout many countries around the world.”
Anna Kubacka
SITYDIVEROUR
21OPERATIONAL & FINANCIAL REVIEW
SIMSMM.COM
SUSTAINABILITY
We are proud of our track record of sustainability leadership; however, we are continually raising the bar. During FY19, we will begin the process of establishing our next round of long-term sustainability goals.
GOVERNANCE: EMBEDDINGSUSTAINABILITY
For Sims Metal Management, sound corporate governance and transparency are the foundation of everything we do. Our Board members are so deeply concerned about sustainability that they signed a personal commitment promoting Sims’ sustainability posture. This was recognized as a leading practice by the National Association of Corporate Directors.
Strong corporate governance promotes the long-term interest of shareholders, strengthens accountability of the Board and the executive leadership team, and helps to affirm public trust in the Company. We aim to deliver outstanding value to our shareholders while also demonstrating our ongoing value to society. This, simply put, is the challenge for today’s leading companies globally.
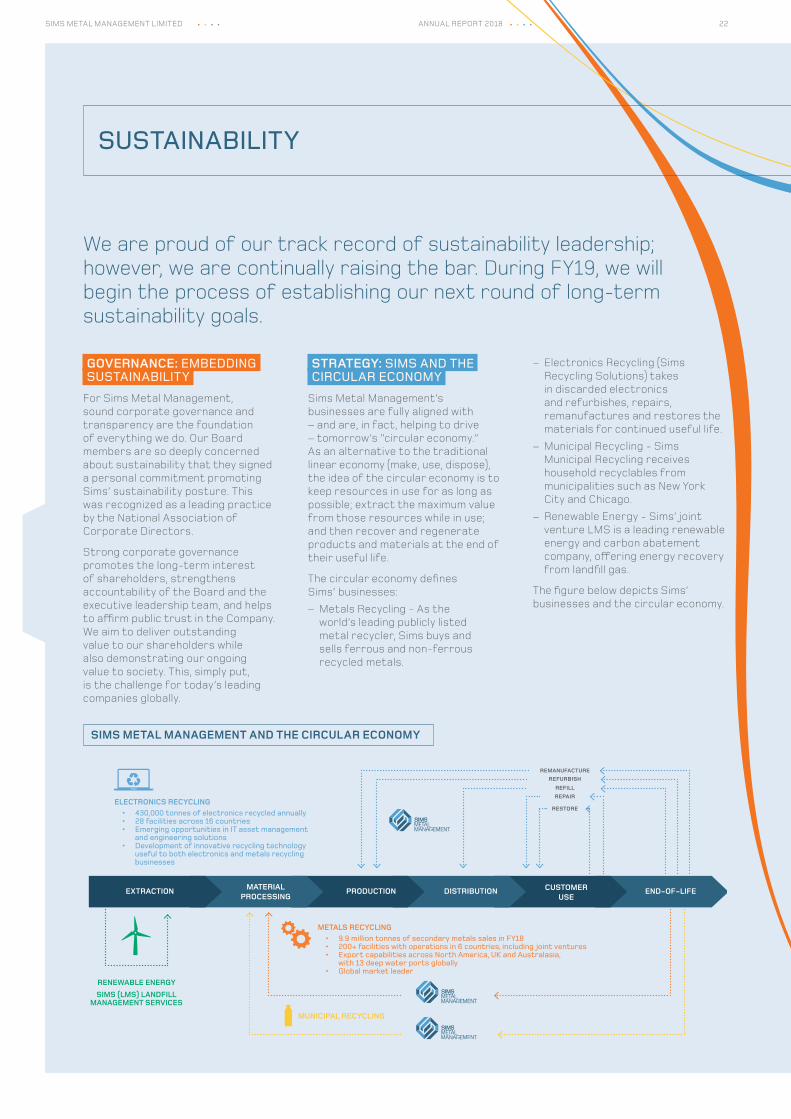
STRATEGY: SIMS AND THECIRCULAR ECONOMY
Sims Metal Management’s businesses are fully aligned with – and are, in fact, helping to drive – tomorrow’s “circular economy.” As an alternative to the traditional linear economy (make, use, dispose), the idea of the circular economy is to keep resources in use for as long as possible; extract the maximum value from those resources while in use; and then recover and regenerate products and materials at the end of their useful life.
The circular economy defines Sims’ businesses:– Metals Recycling - As the
world’s leading publicly listed metal recycler, Sims buys and sells ferrous and non-ferrous recycled metals.
– Electronics Recycling (Sims Recycling Solutions) takes in discarded electronics and refurbishes, repairs, remanufactures and restores the materials for continued useful life.
– Municipal Recycling - Sims Municipal Recycling receives household recyclables from municipalities such as New York City and Chicago.
– Renewable Energy - Sims’ joint venture LMS is a leading renewable energy and carbon abatement company, offering energy recovery from landfill gas.
The figure below depicts Sims’ businesses and the circular economy.
SIMS METAL MANAGEMENT AND THE CIRCULAR ECONOMY
22SIMS METAL MANAGEMENT LIMITED ANNUAL REPORT 2018
METALS RECYCLING• 9.9 million tonnes of secondary metals sales in FY18 • 200+ facilities with operations in 6 countries, including joint ventures • Export capabilities across North America, UK and Australasia, with 13 deep water ports globally • Global market leader
ELECTRONICS RECYCLING• 430,000 tonnes of electronics recycled annually • 28 facilities across 16 countries • Emerging opportunities in IT asset management and engineering solutions • Development of innovative recycling technology useful to both electronics and metals recycling businesses
MUNICIPAL RECYCLING
RENEWABLE ENERGYSIMS (LMS) LANDFILL
MANAGEMENT SERVICES
REMANUFACTUREREFURBISH
REFILLREPAIR
RESTORE
EXTRACTION MATERIALPROCESSING
CUSTOMERUSE
PRODUCTION DISTRIBUTION END-OF-LIFE
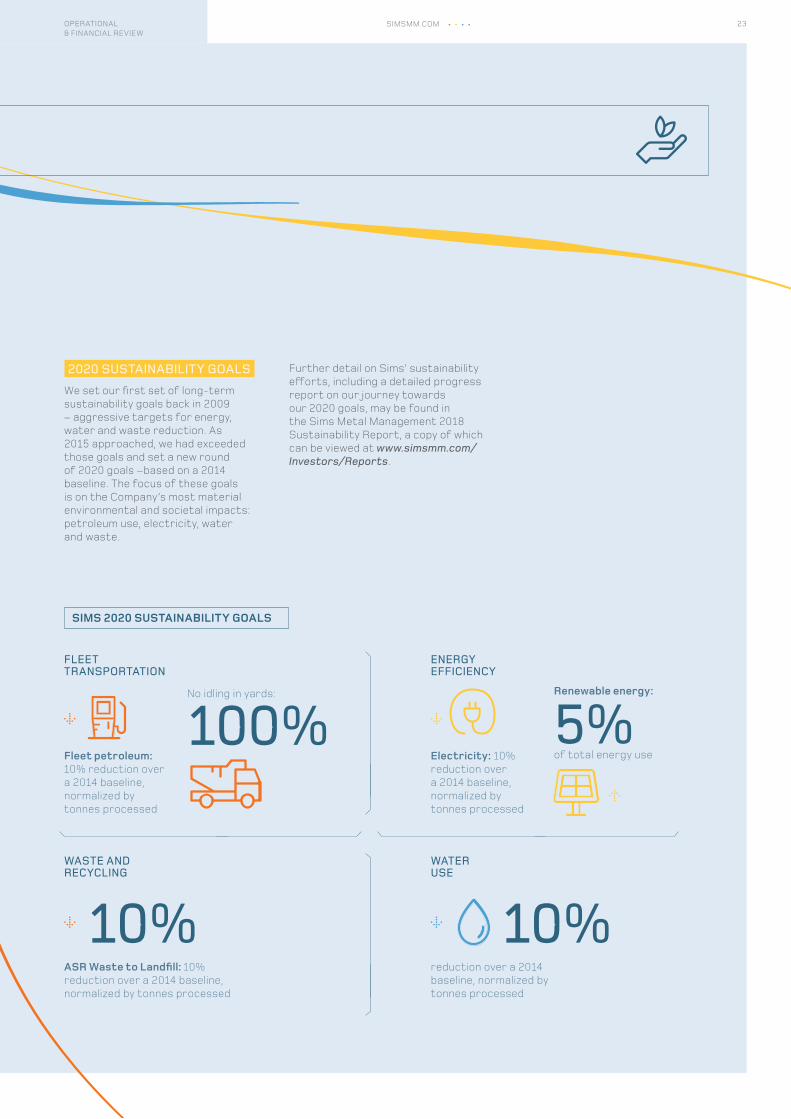
2020 SUSTAINABILITY GOALSWe set our first set of long-term sustainability goals back in 2009 – aggressive targets for energy, water and waste reduction. As 2015 approached, we had exceeded those goals and set a new round of 2020 goals –based on a 2014 baseline. The focus of these goals is on the Company’s most material environmental and societal impacts: petroleum use, electricity, water and waste.
Further detail on Sims’ sustainability efforts, including a detailed progress report on our journey towards our 2020 goals, may be found in the Sims Metal Management 2018 Sustainability Report, a copy of which can be viewed at www.simsmm.com/Investors/Reports.
SIMS 2020 SUSTAINABILITY GOALS
100%
10%
5%
10%
FLEET TRANSPORTATION
WASTE AND RECYCLING
ENERGY EFFICIENCY
WATER USE
Fleet petroleum: 10% reduction over a 2014 baseline, normalized by tonnes processed
ASR Waste to Landfill: 10% reduction over a 2014 baseline, normalized by tonnes processed
Electricity: 10% reduction over a 2014 baseline, normalized by tonnes processed
reduction over a 2014 baseline, normalized by tonnes processed
No idling in yards: Renewable energy:
of total energy use
23OPERATIONAL & FINANCIAL REVIEW
SIMSMM.COM
SAFETY FIRSTTHIS YEAR WAS THE SAFEST YEAR IN OUR COMPANY’S HISTORYEmployee health and safety will always be our highest priority. Sims is on a journey to become world class in health and safety. We have worked hard to develop a culture where employees are fully engaged in, and committed to, making Sims a safer place to work. While we continue to reduce the number of injured employees – even one incident is one too many.
During FY18, more than 80% of Sims’ locations were free of reportable injuries for more than a year. Additionally, there were no employee fatalities during the year. According to the most recent data from the United States Bureau of Labor Statistics in 2016, the average injury/illness recordable rate (per 200,000 hours worked) is 4.2 for metal recycling. By comparison, Sims’ injury and illness rate is 1.2. Over the past five years, we have reduced our recordable injuries by 57 percent and our lost workday injuries by 54 percent, and our performance continues to improve. Our goal is zero injuries, on and off the job, and we will never be satisfied until we achieve that.
LOOKING AHEADBusiness has always been a rapidly changing landscape. In today’s world, with restricted resources, global interconnectivity and population pressures on energy, waste and water, the ability to do more with less has become an imperative for survival. For Sims, three factors drive our near-term plans:– Operational Excellence: Our safety
performance is a strong indicator of Sims’ operational excellence. Outstanding performance starts within the plant boundaries – and we will continue to drive outstanding performance.
– Investor Alignment: Our sustainability discussion follows the structure of the Task Force on Climate-Related Financial Disclosure (TCFD). We support the TCFD guidance and will continue to align our disclosure and reporting with TCFD recommendations.
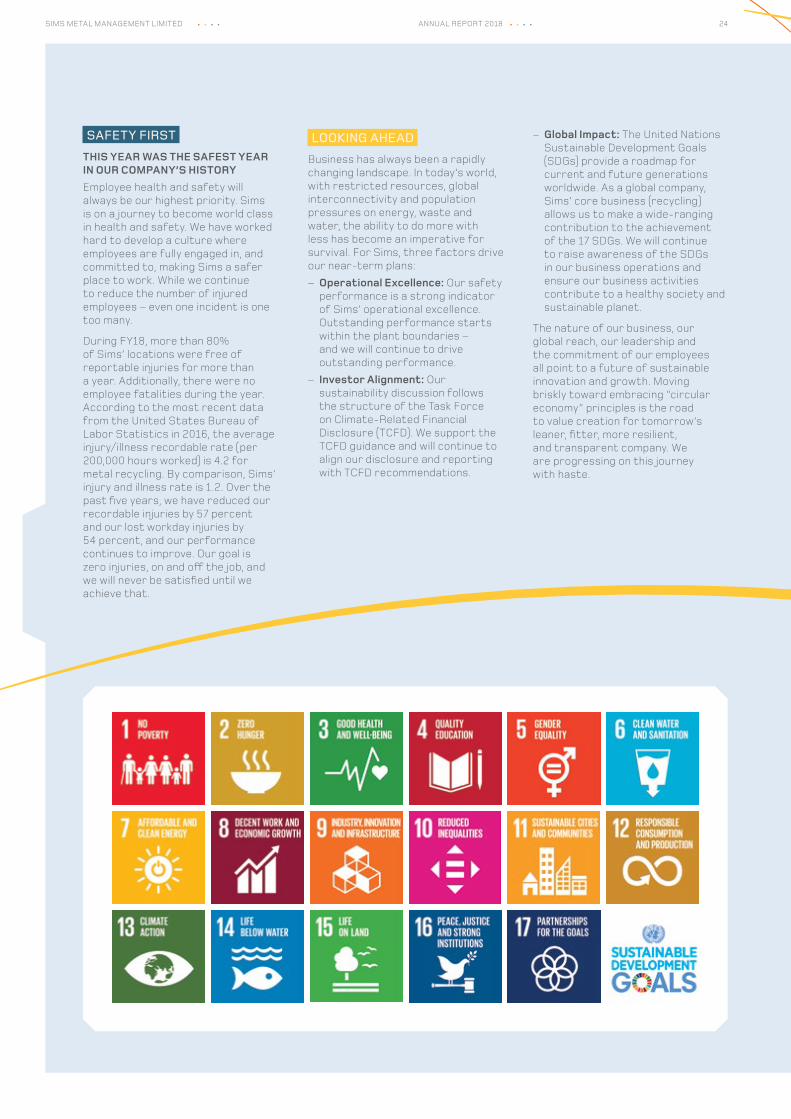
– Global Impact: The United Nations Sustainable Development Goals (SDGs) provide a roadmap for current and future generations worldwide. As a global company, Sims’ core business (recycling) allows us to make a wide-ranging contribution to the achievement of the 17 SDGs. We will continue to raise awareness of the SDGs in our business operations and ensure our business activities contribute to a healthy society and sustainable planet.
The nature of our business, our global reach, our leadership and the commitment of our employees all point to a future of sustainable innovation and growth. Moving briskly toward embracing “circular economy” principles is the road to value creation for tomorrow’s leaner, fitter, more resilient, and transparent company. We are progressing on this journey with haste.
24SIMS METAL MANAGEMENT LIMITED ANNUAL REPORT 2018
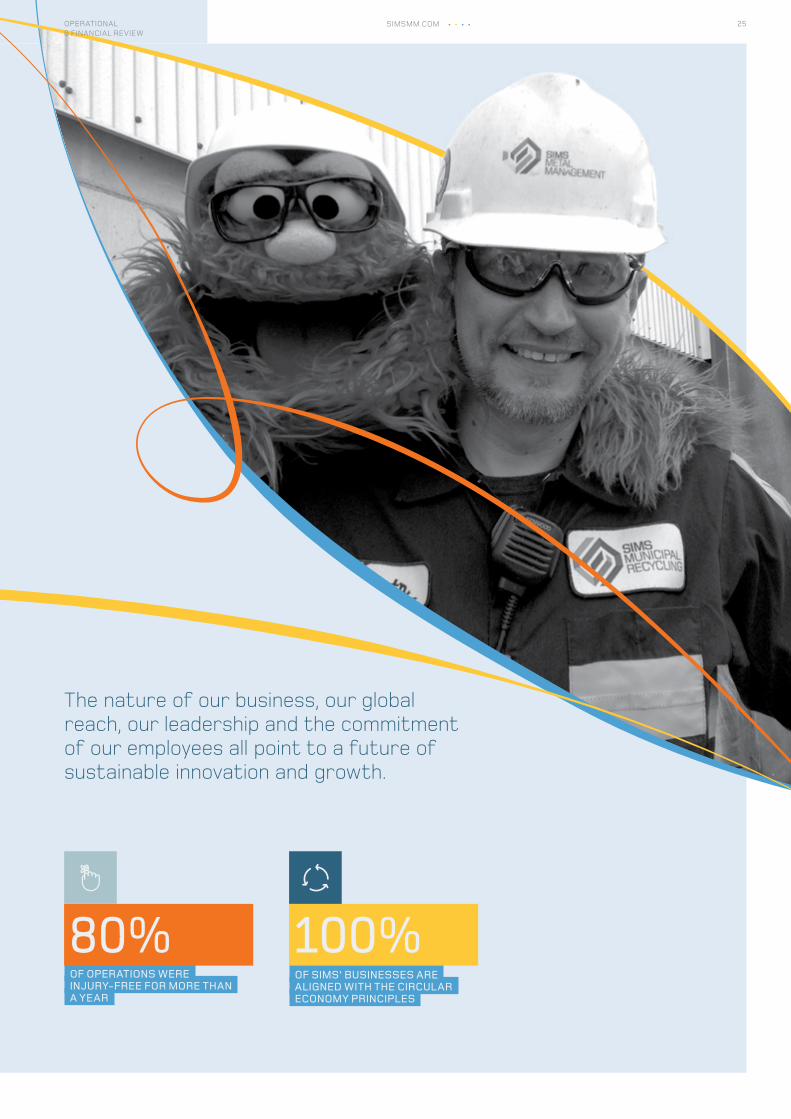
The nature of our business, our global reach, our leadership and the commitment of our employees all point to a future of sustainable innovation and growth.
OF OPERATIONS WERE INJURY-FREE FOR MORE THAN A YEAR
80%OF SIMS’ BUSINESSES ARE ALIGNED WITH THE CIRCULAR ECONOMY PRINCIPLES
100%
25OPERATIONAL & FINANCIAL REVIEW
SIMSMM.COM
Geoffrey N Brunsdon B Comm (age 60)Chairman and Independent non‑executive director
Mr Brunsdon was appointed as a director in November 2009, appointed Deputy Chairperson in September 2011 and appointed Chairperson of the Company on 1 March 2012. He is Chairperson of the Nomination/Governance Committee, and is a member of the Risk, Audit & Compliance Committee and the Remuneration Committee. Until June 2009, Mr Brunsdon was Managing Director and Head of Investment Banking of Merrill Lynch International (Australia) Limited. He is Chairman of APN Funds Management Limited (since November 2009) and MetLife Insurance Limited (since April 2011). He was a member of the listing committee of the Australian Securities Exchange between 1993 and 1997 and was a director of Sims Group Limited between 1999 and 2007. He is a Fellow of the Institute of Chartered Accountants, a Fellow of the Financial Services Institute of Australia and a Fellow of the Institute of Company Directors. Mr Brunsdon is also a director of the Wentworth Group of Concerned Scientists and Purves Environmental Custodians.
Robert J Bass MBA (age 69)Independent non‑executive director
Mr Bass was appointed as a director on 10 September 2013. He is Chairperson of the Risk, Audit & Compliance Committee, and is a member of the Nomination/Governance Committee and the Finance & Investment Committee. Mr Bass was formerly a partner at Deloitte & Touche from 1982, and Vice Chairman at Deloitte LLP from 2006, until his retirement in June 2012. He practiced at that firm for 39 years and was Lead Client Service Partner responsible for the development, planning, management, administration and delivery of services, including audits of consolidated financial statements to multinational clients in a variety of industries. Mr Bass is currently a director of Groupon Inc (since June 2012), Apex Tool Group (since December 2014) and Redfin (since October 2016) and is Chairman of the Audit Committee of these three companies and a member of the Compensation Committee of Groupon and member of Nomination/Governance Committee of Redfin. He is a graduate of Emory University and received an MBA from Columbia University. He is a Certified Public Accountant, New York and Connecticut, and a member of the American Institute of Certified Public Accountants and Connecticut State Society of Certified Public Accountants.
John T DiLacqua MBA (age 66)Independent non‑executive director
Mr DiLacqua was appointed as a director in September 2011. He is Chairperson of the Finance & Investment Committee, and is a member of the Risk, Audit & Compliance Committee and the Nomination/Governance Committee. Mr DiLacqua was formerly a director of Metal Management, Inc (since 2001), and was a director of Sims Metal Management Limited between March and November 2008. He was the Executive Chairman of Envirosource, Inc from May 2004 to December 2004 and had served as President and Chief Executive Officer of Envirosource from January 1999 to May 2004. From October 1997 to December 1998, Mr DiLacqua served as President of the US Ferrous Operations of Philip Metals, Inc, and, prior to that, from May 1994, as the President of Luria Brothers. He is a graduate of Temple University and received an MBA from Carnegie Mellon University. Mr DiLacqua is a Certified Public Accountant.
BOARD OF DIRECTORS
The Company seeks to ensure that the Board has a range of attributes necessary for the governance of a global organisation. The Board regularly reviews its skills and performance against the expectation that it will provide outstanding governance; have appropriate input to and development of strategy; establish and oversee a clear risk management framework; set challenging performance targets in all aspects of the Company’s activities; and understand the operations of the Company.
26SIMS METAL MANAGEMENT LIMITED ANNUAL REPORT 2018
Alistair Field (NHD) Mech Eng, MBA (age 54)Group Chief Executive Officer and Managing DirectorMr Field was appointed Group Chief Executive Officer and Managing Director of the Company on 3 August 2017. He is a member of the Safety, Health, Environment, Community & Sustainability Committee, the Nomination/Governance Committee and the Finance & Investment Committee. Mr Field joined the Company on 1 October 2015 as the Managing Director of ANZ Metals. He has more than 25 years of experience in the mining and manufacturing industries. He has held a number of senior leadership positions, including most recently as Director of Patrick Terminals & Logistics Division for Asciano Limited, and previously as Chief Operating Officer for Rio Tinto Alcan’s Bauxite and Alumina Division. Mr Field is a Mechanical Engineer with an MBA from the Henley Business School.
Georgia Nelson BS, MBA (age 68)Independent non‑executive director
Ms Nelson was appointed as a director in November 2014. She is a member of the Safety, Health, Environment, Community & Sustainability Committee and the Remuneration Committee. Ms Nelson provides consulting services through her company PTI Resources, LLC, on a variety of environmental and energy policy matters. Ms Nelson is the former founding president of Midwest Generation EME, LLC, an Edison International company with its corporate headquarters in Chicago. Previously, Ms Nelson was senior vice president of worldwide operations for Edison Mission Energy. Ms Nelson previously spent more than 25 years with Southern California Edison, a large US electric utility. Ms Nelson serves as a director of two publicly traded US corporations: Cummins Inc (CMI), a global engine and equipment manufacturer, and Ball Corporation (BLL), a global metals container manufacturing company, and one publicly traded Canadian corporation: TransAlta Corporation (TAC), a power generation and wholesale marketing company. Ms Nelson holds an MBA from the University of Southern California and a BS from Pepperdine University.
Deborah O’Toole LLB, MAICD (age 61)Independent non‑executive director
Ms O’Toole was appointed as a director in November 2014. She is Chairperson of the Remuneration Committee, and is a member of the Risk, Audit & Compliance Committee and the Finance & Investment Committee. Ms O’Toole has extensive executive experience across a number of sectors including over 20 years in the mining industry and, more recently, in transport and logistics which included managerial, operational and financial roles. She has been Chief Financial Officer in three ASX listed companies: M.I.M Holdings Limited, Queensland Cotton Holdings Limited and, most recently, Aurizon Holdings Limited. Ms O’Toole’s board experience includes directorships of the CSIRO, Norfolk Group, various companies in the MIM and Aurizon Groups, and Government and private sector advisory boards. She has acted as Chairperson of the Audit Committees of CSIRO, Norfolk Group and Pacific Aluminium. Ms O’Toole is a director of Alumina Limited (since December 2017), the Asciano Rail Group of Companies operating as Pacific National Rail, Credit Union Australia and the Wesley Research Institute.
27SIMSMM.COMOPERATIONAL & FINANCIAL REVIEW
Heather Ridout AO BEc (Hons) (age 64) Independent non‑executive director
Mrs Ridout was appointed as a director in September 2011. She is a member of the Safety, Health, Environment, Community & Sustainability Committee, the Remuneration Committee, the Risk, Audit & Compliance Committee and the Nomination/Governance Committee. Mrs Ridout is Chair of AustralianSuper – the largest pension fund in Australia; and a director of Australian Securities Exchange Limited (since August 2012). She also serves on the board of the Australian Chamber Orchestra and is a member of ASIC’s External Advisory Panel. Mrs Ridout was formerly the Chief Executive Officer of the Australian Industry Group from 2004 until her retirement in April 2012. Her previous appointments include being a Board member of the Reserve Bank of Australia between 2011 and 2017, a member of the Henry Tax Review panel, board member of Infrastructure Australia and the Australian Workforce and Productivity Agency, and a member of the Climate Change Authority and the Prime Minister’s Taskforce on Manufacturing. She has an economics degree, with honours, from the University of Sydney and in 2013 was awarded the rank of Officer of the Order of Australia (AO).
Tamotsu (Tom) Sato BA (age 66)Non‑independent non‑executive director
Mr Sato was appointed as a director in April 2013. He is Mitsui & Co., Ltd’s nominated director. Mr Sato is a member of the Finance & Investment Committee and the Safety, Health, Environment, Community & Sustainability Committee. He joined Mitsui in 1975 and held various positions mainly in the steel making raw materials business within that company including General Manager of Calgary office, Mitsui Canada, Executive Director of Mitsui Coal Holdings (2002-2004) based in Brisbane, General Manager of Tokyo Coal Division (2004-2006), Senior Vice President of Mitsui Singapore (2006-2009) responsible for Asia Pacific, and from 2009 until his retirement in 2013 he was the President & CEO of Mitsui Raw Materials Development based in New York.
James T Thompson BS (age 68)Independent non‑executive director
Mr Thompson was appointed as a director in November 2009. He is Chairperson of the Safety, Health, Environment, Community & Sustainability Committee, and is a member of the Finance & Investment Committee and the Remuneration Committee. Mr Thompson was, from 2004 until his retirement in 2007, Executive Vice President Commercial for The Mosaic Company, one of the world’s largest fertiliser companies, with sales of US$7 billion and some 8,000 employees, which is publicly traded on the New York Stock Exchange. Prior to that, he was engaged for 30 years in the steel industry from 1974–2004 in various roles at Cargill, Inc of Minnesota, United States, leading to the position of President of Cargill Steel Group from 1996–2004. During that period, Mr Thompson also served for a time as Co-Chairman of the North Star BlueScope Steel joint venture, and was a member of various industry boards, including AISI (American Iron and Steel Institute), SMA (Steel Manufacturers Institute) and MSCI (Metals Service Center Institute). He is currently a director of Hawkins, Inc, and serves as Chairman of the Board of Visitors of the University of Wisconsin School of Education. Mr Thompson has a BS from the University of Wisconsin Madison.
BOARD OF DIRECTORS
ANNUAL REPORT 2018 28SIMS METAL MANAGEMENT LIMITED ANNUAL REPORT 2017
29OPERATIONAL & FINANCIAL REVIEW
SIMSMM.COM
FINANCIALS2018
29
FINANCIAL REVIEW
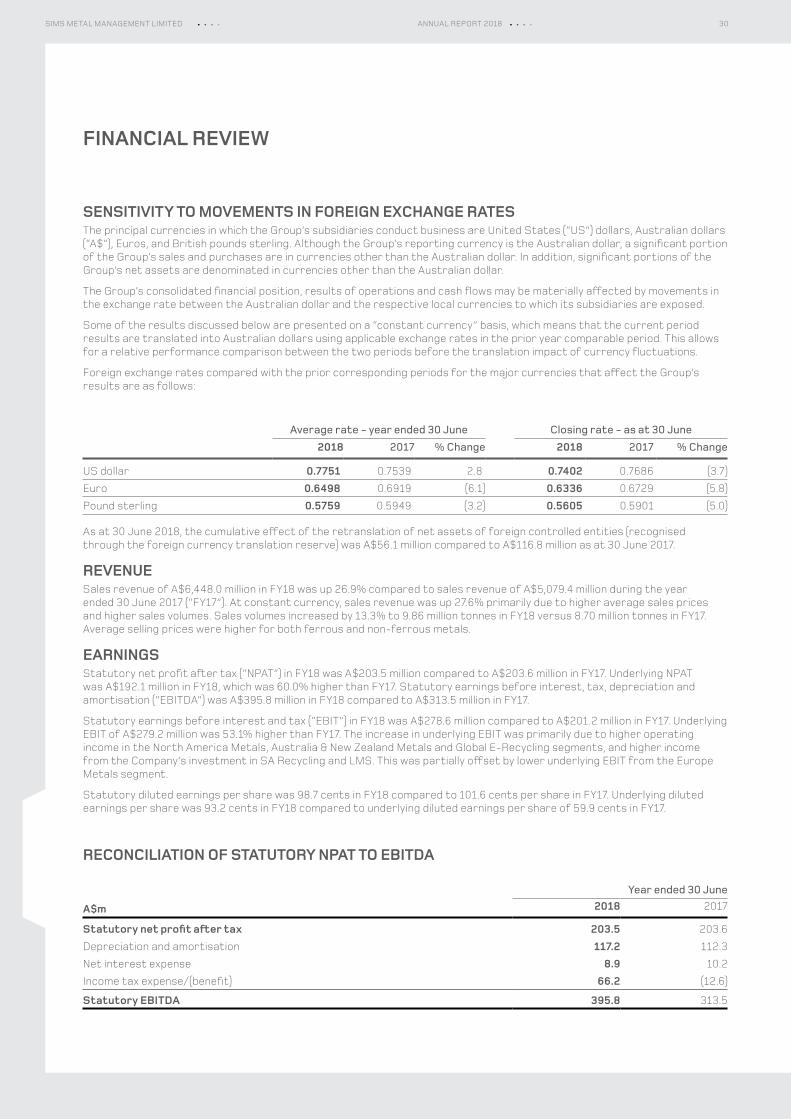
SENSITIVITY TO MOVEMENTS IN FOREIGN EXCHANGE RATESThe principal currencies in which the Group’s subsidiaries conduct business are United States (“US”) dollars, Australian dollars (“A$”), Euros, and British pounds sterling. Although the Group’s reporting currency is the Australian dollar, a significant portion of the Group’s sales and purchases are in currencies other than the Australian dollar. In addition, significant portions of the Group’s net assets are denominated in currencies other than the Australian dollar.
The Group’s consolidated financial position, results of operations and cash flows may be materially affected by movements in the exchange rate between the Australian dollar and the respective local currencies to which its subsidiaries are exposed.
Some of the results discussed below are presented on a “constant currency” basis, which means that the current period results are translated into Australian dollars using applicable exchange rates in the prior year comparable period. This allows for a relative performance comparison between the two periods before the translation impact of currency fluctuations.
Foreign exchange rates compared with the prior corresponding periods for the major currencies that affect the Group’s results are as follows:
Average rate - year ended 30 June Closing rate - as at 30 June2018 2017 % Change 2018 2017 % Change
US dollar 0.7751 0.7539 2.8 0.7402 0.7686 (3.7)
Euro 0.6498 0.6919 (6.1) 0.6336 0.6729 (5.8)
Pound sterling 0.5759 0.5949 (3.2) 0.5605 0.5901 (5.0)
As at 30 June 2018, the cumulative effect of the retranslation of net assets of foreign controlled entities (recognised through the foreign currency translation reserve) was A$56.1 million compared to A$116.8 million as at 30 June 2017.
REVENUESales revenue of A$6,448.0 million in FY18 was up 26.9% compared to sales revenue of A$5,079.4 million during the year ended 30 June 2017 (“FY17”). At constant currency, sales revenue was up 27.6% primarily due to higher average sales prices and higher sales volumes. Sales volumes increased by 13.3% to 9.86 million tonnes in FY18 versus 8.70 million tonnes in FY17. Average selling prices were higher for both ferrous and non-ferrous metals.
EARNINGSStatutory net profit after tax (“NPAT”) in FY18 was A$203.5 million compared to A$203.6 million in FY17. Underlying NPAT was A$192.1 million in FY18, which was 60.0% higher than FY17. Statutory earnings before interest, tax, depreciation and amortisation (“EBITDA”) was A$395.8 million in FY18 compared to A$313.5 million in FY17.
Statutory earnings before interest and tax (“EBIT”) in FY18 was A$278.6 million compared to A$201.2 million in FY17. Underlying EBIT of A$279.2 million was 53.1% higher than FY17. The increase in underlying EBIT was primarily due to higher operating income in the North America Metals, Australia & New Zealand Metals and Global E-Recycling segments, and higher income from the Company’s investment in SA Recycling and LMS. This was partially offset by lower underlying EBIT from the Europe Metals segment.
Statutory diluted earnings per share was 98.7 cents in FY18 compared to 101.6 cents per share in FY17. Underlying diluted earnings per share was 93.2 cents in FY18 compared to underlying diluted earnings per share of 59.9 cents in FY17.
RECONCILIATION OF STATUTORY NPAT TO EBITDA
Year ended 30 June
A$m 2018 2017
Statutory net profit after tax 203.5 203.6
Depreciation and amortisation 117.2 112.3
Net interest expense 8.9 10.2
Income tax expense/(benefit) 66.2 (12.6)
Statutory EBITDA 395.8 313.5
30SIMS METAL MANAGEMENT LIMITED ANNUAL REPORT 2018
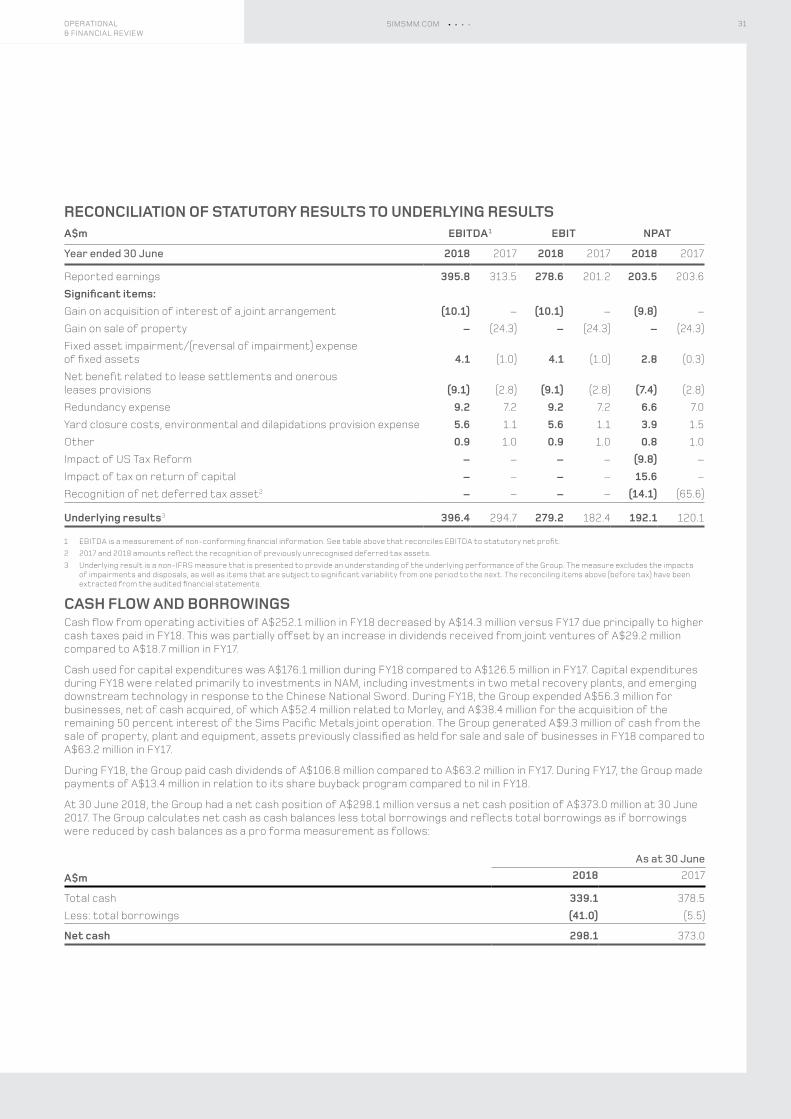
RECONCILIATION OF STATUTORY RESULTS TO UNDERLYING RESULTSA$m EBITDA1 EBIT NPAT
Year ended 30 June 2018 2017 2018 2017 2018 2017
Reported earnings 395.8 313.5 278.6 201.2 203.5 203.6
Significant items:Gain on acquisition of interest of a joint arrangement (10.1) – (10.1) – (9.8) –
Gain on sale of property – (24.3) – (24.3) – (24.3)
Fixed asset impairment/(reversal of impairment) expense of fixed assets 4.1 (1.0) 4.1 (1.0) 2.8 (0.3)
Net benefit related to lease settlements and onerous leases provisions (9.1) (2.8) (9.1) (2.8) (7.4) (2.8)
Redundancy expense 9.2 7.2 9.2 7.2 6.6 7.0
Yard closure costs, environmental and dilapidations provision expense 5.6 1.1 5.6 1.1 3.9 1.5
Other 0.9 1.0 0.9 1.0 0.8 1.0
Impact of US Tax Reform – – – – (9.8) –
Impact of tax on return of capital – – – – 15.6 –
Recognition of net deferred tax asset2 – – – – (14.1) (65.6)
Underlying results3 396.4 294.7 279.2 182.4 192.1 120.1
1 EBITDA is a measurement of non-conforming financial information. See table above that reconciles EBITDA to statutory net profit.2 2017 and 2018 amounts reflect the recognition of previously unrecognised deferred tax assets.3 Underlying result is a non-IFRS measure that is presented to provide an understanding of the underlying performance of the Group. The measure excludes the impacts
of impairments and disposals, as well as items that are subject to significant variability from one period to the next. The reconciling items above (before tax) have been extracted from the audited financial statements.
CASH FLOW AND BORROWINGSCash flow from operating activities of A$252.1 million in FY18 decreased by A$14.3 million versus FY17 due principally to higher cash taxes paid in FY18. This was partially offset by an increase in dividends received from joint ventures of A$29.2 million compared to A$18.7 million in FY17.
Cash used for capital expenditures was A$176.1 million during FY18 compared to A$126.5 million in FY17. Capital expenditures during FY18 were related primarily to investments in NAM, including investments in two metal recovery plants, and emerging downstream technology in response to the Chinese National Sword. During FY18, the Group expended A$56.3 million for businesses, net of cash acquired, of which A$52.4 million related to Morley, and A$38.4 million for the acquisition of the remaining 50 percent interest of the Sims Pacific Metals joint operation. The Group generated A$9.3 million of cash from the sale of property, plant and equipment, assets previously classified as held for sale and sale of businesses in FY18 compared to A$63.2 million in FY17.
During FY18, the Group paid cash dividends of A$106.8 million compared to A$63.2 million in FY17. During FY17, the Group made payments of A$13.4 million in relation to its share buyback program compared to nil in FY18.
At 30 June 2018, the Group had a net cash position of A$298.1 million versus a net cash position of A$373.0 million at 30 June 2017. The Group calculates net cash as cash balances less total borrowings and reflects total borrowings as if borrowings were reduced by cash balances as a pro forma measurement as follows:
As at 30 June
A$m 2018 2017
Total cash 339.1 378.5
Less: total borrowings (41.0) (5.5)
Net cash 298.1 373.0
31SIMSMM.COMOPERATIONAL & FINANCIAL REVIEW
The directors and management of the Company are committed to operating the Company’s business ethically and in a manner consistent with high standards of corporate governance. The directors consider the establishment and implementation of sound corporate governance practices to be a fundamental part of promoting investor confidence and creating value for shareholders, through prudent risk management and a culture which encourages ethical conduct, accountability and sound business practices.
A description of the Group’s corporate governance practices in place throughout the 2018 financial year is set out in the Corporate Governance Statement of the Company, a copy of which can be viewed at https://www.simsmm.com/investors/governance. The Corporate Governance Statement has been prepared with reference to the Corporate Governance Principles and Recommendations (3rd edition) published by the Australian Securities Exchange Corporate Governance Council. The Company has complied with the Recommendations. The Corporate Governance Statement has been approved by the board.
CORPORATE GOVERNANCE STATEMENT
32SIMS METAL MANAGEMENT LIMITED ANNUAL REPORT 2018

DIRECTORS’ REPORT
Your Directors present their report on the consolidated entity (referred to hereafter as the “Group”) consisting of Sims Metal Management Limited (the “Company”) and the entities it controlled at the end of, or during, the year ended 30 June 2018 (“FY18”).
PRINCIPAL ACTIVITIESThe principal activities of the Group during the financial year comprised (1) the buying, processing and selling of ferrous and non-ferrous recycled metals and (2) the provision of environmentally responsible solutions for the disposal of post-consumer electronic products, including IT assets recycled for commercial customers. The Group offers fee-for-service business opportunities in the environmentally responsible recycling of negative value materials including electrical and electronic equipment. The Group’s principal activities remain unchanged from the previous financial year.
OPERATING AND FINANCIAL REVIEWA review of the operations of the Group during the financial year and the results of those operations are set out in the Chairman’s and Chief Executive Officer’s Reviews on pages 04 to 07 and the Operational and Financial Review on pages 08 to 25.
NAMES AND PARTICULARS OF DIRECTORSThe names of the Directors of the Company during the financial year and up to the date of this report together with their qualifications and experience are provided on pages 26 to 28.*
COMPANY SECRETARIESFrank Moratti B Comm, LLB, MBA (Executive)Mr Moratti was appointed to the position of Company Secretary in 1997. Before joining the Company, he held positions of assistant company secretary/legal counsel in a number of publicly listed companies over a period of some 12 years and, prior to that, worked as a solicitor with a major legal practice.
Scott Miller BS, MS, JD, PEMr Miller was appointed to the position of Company Secretary in 2008. Since joining the Company in 1997, Mr Miller has held positions as legal counsel and manager for environmental affairs for North American operations, and is currently Acting General Counsel. Before joining the Company, he held positions at an environmental mediation firm, as an attorney with a major legal practice and as a consulting engineer.
DIRECTORS’ MEETINGSThe following table shows the actual board and committee meetings held during the financial year and the number of meetings attended by each Director:
Board of Directors
Risk, Audit & Compliance Committee
Safety, Health,
Environment, Community &
Sustainability Committee
Remuneration Committee
Finance & Investment Committee
Nomination/Governance Committee
Meetings held 11 6 5 5 6 4G Brunsdon 11 6 5 4
R Bass 11 6 6 4
G Claro* – – – -
J DiLacqua 11 6 6 4
A Field* 9 5 6 4
G Nelson 11 5 5
D O’Toole 11 5 5 6
H Ridout 10 6 5 5 4
T Sato 10 5 6
J Thompson 10 5 5 6
* Mr Claro resigned on 3 August 2017 having served as Group CEO since November 2013 and was succeeded by Mr Field.
33DIRECTORS’ REPORT SIMSMM.COM
DIRECTORS’ REPORT
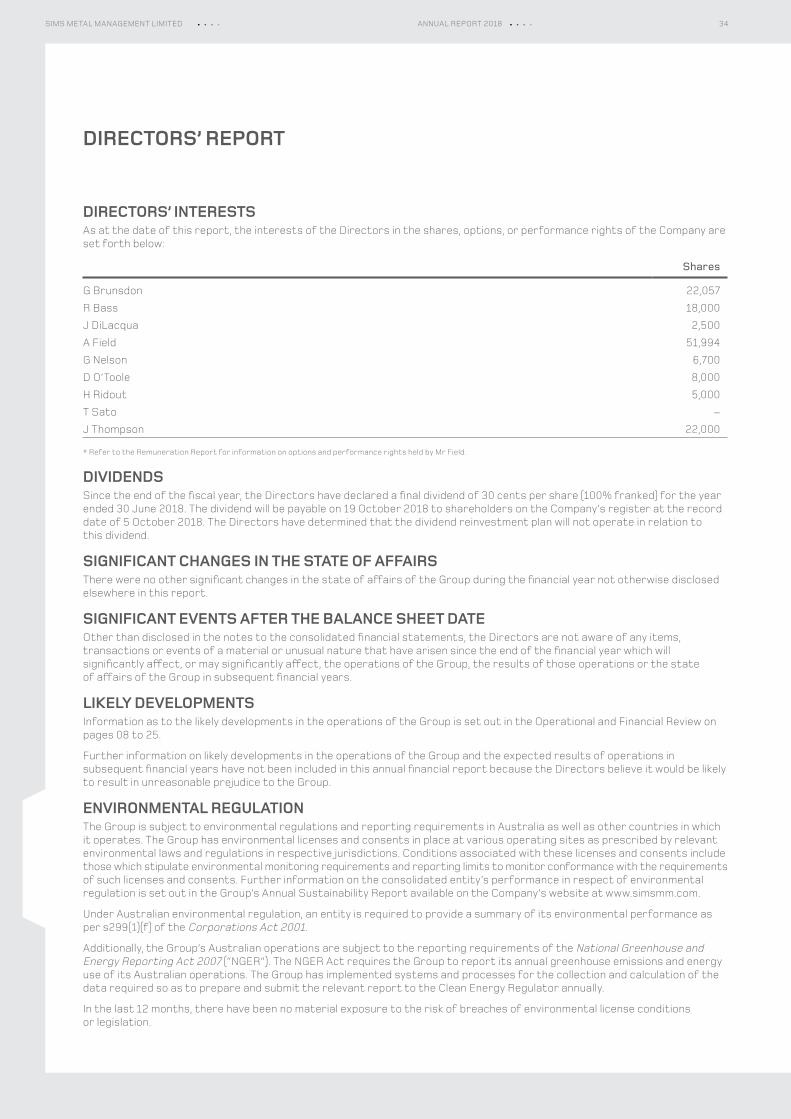
DIRECTORS’ INTERESTSAs at the date of this report, the interests of the Directors in the shares, options, or performance rights of the Company are set forth below:
Shares
G Brunsdon 22,057
R Bass 18,000
J DiLacqua 2,500
A Field 51,994
G Nelson 6,700
D O’Toole 8,000
H Ridout 5,000
T Sato –
J Thompson 22,000
* Refer to the Remuneration Report for information on options and performance rights held by Mr Field.
DIVIDENDSSince the end of the fiscal year, the Directors have declared a final dividend of 30 cents per share (100% franked) for the year ended 30 June 2018. The dividend will be payable on 19 October 2018 to shareholders on the Company’s register at the record date of 5 October 2018. The Directors have determined that the dividend reinvestment plan will not operate in relation to this dividend.
SIGNIFICANT CHANGES IN THE STATE OF AFFAIRSThere were no other significant changes in the state of affairs of the Group during the financial year not otherwise disclosed elsewhere in this report.
SIGNIFICANT EVENTS AFTER THE BALANCE SHEET DATEOther than disclosed in the notes to the consolidated financial statements, the Directors are not aware of any items, transactions or events of a material or unusual nature that have arisen since the end of the financial year which will significantly affect, or may significantly affect, the operations of the Group, the results of those operations or the state of affairs of the Group in subsequent financial years.
LIKELY DEVELOPMENTSInformation as to the likely developments in the operations of the Group is set out in the Operational and Financial Review on pages 08 to 25.
Further information on likely developments in the operations of the Group and the expected results of operations in subsequent financial years have not been included in this annual financial report because the Directors believe it would be likely to result in unreasonable prejudice to the Group.
ENVIRONMENTAL REGULATIONThe Group is subject to environmental regulations and reporting requirements in Australia as well as other countries in which it operates. The Group has environmental licenses and consents in place at various operating sites as prescribed by relevant environmental laws and regulations in respective jurisdictions. Conditions associated with these licenses and consents include those which stipulate environmental monitoring requirements and reporting limits to monitor conformance with the requirements of such licenses and consents. Further information on the consolidated entity’s performance in respect of environmental regulation is set out in the Group’s Annual Sustainability Report available on the Company’s website at www.simsmm.com.
Under Australian environmental regulation, an entity is required to provide a summary of its environmental performance as per s299(1)(f) of the Corporations Act 2001.
Additionally, the Group’s Australian operations are subject to the reporting requirements of the National Greenhouse and Energy Reporting Act 2007 (“NGER”). The NGER Act requires the Group to report its annual greenhouse emissions and energy use of its Australian operations. The Group has implemented systems and processes for the collection and calculation of the data required so as to prepare and submit the relevant report to the Clean Energy Regulator annually.
In the last 12 months, there have been no material exposure to the risk of breaches of environmental license conditions or legislation.
34SIMS METAL MANAGEMENT LIMITED ANNUAL REPORT 2018
CLIMATE CHANGE RAMIFICATIONSThe Company recognises that climate change could have meaningful impacts on the financial performance of the Group over time and has begun the process of identifying key risks and, where possible, commenced action to mitigate their impact.
The key risks identified centre around the potential for increased, and more extreme, weather events impacting: – Health and safety issues for employees operating on sites (extreme temperatures); – Inability to maintain standard operational hours at facilities (extreme temperatures); – Docks, material handling and the transportation of products (intense rain and wind); – Access to a reliable supply of electricity (extended heat waves); and – Reliable operation of critical data storage sites (flooding, extended heat waves).
These risks are currently not expected to have a material impact on the Company’s financial performance. However, effective from July 2018, all capex approvals over a threshold value require consideration of the impact of climate change as standard practice.
INSURANCE AND INDEMNIFICATION OF OFFICERSDuring the financial year, the Company had contracts in place insuring all Directors and Executives of the Company (and/or any subsidiary companies in which it holds greater than 50% of the voting shares), including Directors in office at the date of this report and those who served on the board during the year, against liabilities that may arise from their positions within the Company and its controlled entities, except where the liabilities arise out of conduct involving a lack of good faith. The Directors have not included details of the nature of the liabilities covered or the amount of the premium paid as such disclosure is prohibited under the terms of the contracts.
SHARE OPTIONS AND RIGHTSUnissued sharesAs of the date of this report, there are 8,400,890 share options outstanding and 5,321,869 rights outstanding in relation to the Company’s ordinary shares. Refer to note 26 of the consolidated financial statements for further details of the options and rights outstanding as at 30 June 2018. Option and right holders do not have any right, by virtue of the option or right, to participate in any share issue of the Company.
Shares issued as a result of the exercise of options and vesting of rightsDuring the financial year, there were 3,149,154 ordinary shares issued upon the exercise of share options and 1,356,894 ordinary shares issued in connection with the vesting of rights. Refer to note 26 of the consolidated financial statements for further details of shares issued pursuant to share-based awards. Subsequent to the end of the financial year and up to the date of this report, there have been 50,991 ordinary shares issued upon the exercise of share options and nil ordinary shares issued in connection with the vesting of rights.
NON‑AUDIT SERVICESThe Company may decide to employ its external auditor (Deloitte Touche Tohmatsu) on assignments additional to their statutory audit duties where the auditor’s expertise and experience with the Company and/or the Group are important.
Details of the amounts paid or payable to the auditor for audit and non-audit services provided during the financial year are set out in note 29 of the consolidated financial statements.
The Board has considered the position and, in accordance with advice received from the Risk, Audit & Compliance Committee, is satisfied that the provision of the non-audit services is compatible with the general standard of independence for auditors imposed by the Corporations Act 2001. The Directors are satisfied that the provision of non-audit services by the auditor, as set forth in note 29 of the consolidated financial statements, did not compromise the auditor independence requirements of the Corporations Act 2001 for the following reasons:
– all non-audit services have been reviewed by the Risk, Audit & Compliance Committee to ensure they do not impact the impartiality and objectivity of the auditor; and
– none of the services undermine the general principles relating to auditor independence as set out in APES 110 Code of Ethics for Professional Accountants.
AUDITOR’S INDEPENDENCE DECLARATIONThe auditor’s independence declaration as required under section 307C of the Corporations Act 2001 is set out on page 110 and forms part of the Directors’ Report for the year ended 30 June 2018.
ROUNDING OF AMOUNTSThe Company is a company of the kind referred to in ASIC Corporations (Rounding in Financials/Directors’ Reports) Instrument 2016/191, dated 24 March 2016, and in accordance with that Corporations Instrument amounts in the directors’ report and the financial statements are rounded off to the nearest tenth of a million dollars, unless otherwise indicated.
35DIRECTORS’ REPORT SIMSMM.COM
DIRECTORS’ REPORTREMUNERATION REPORT
INTRODUCTION FROM THE CHAIR OF THE REMUNERATION COMMITTEEDear Shareholders,
The Board and I would like to thank you for your continued investment and interest in Sims Metal Management Limited (Sims or Company). It continues to be my privilege to serve as Chair of the Remuneration Committee of the Board (Committee), working with a group of engaged and knowledgeable Board members and Sims’ Executives. I am pleased to introduce the Remuneration Report for the fiscal year ended 30 June 2018 (FY18).
During FY18, Sims made significant progress towards execution of its growth strategy and delivered meaningfully improved financial results. With an eye on creating long-term shareholder value, the Company’s new senior management team continued to focus on extracting maximum efficiencies from current operations, as well as targeting select growth opportunities.
FY18 Remuneration OverviewShareholders will recall the changes that were made to apply for FY18 including:
– Reduced potential quantum for the Return on Invested Capital (ROIC) Long Term Incentive (LTI) component;
– ROIC calculated as an average over the performance period;
– No time-vested Restricted Share Units (RSUs); and – An earnings gateway on the ROIC LTI component.
Following the executive leadership changes in the Company, a number of Executives took on new or expanded roles which resulted in changes to their remuneration.
Fixed RemunerationSeveral executives received increases in fixed remuneration reflective of new roles and expanded areas of responsibilities. Refer to Section 4.2 for specific percentage increases awarded to each Executive.
Short-Term Incentive (STI) paymentSims’ FY18 financial performance was strong. As a result, the Group Chief Executive Officer and Managing Director’s STI payment was 129% of target, and the other Executives’ STI payments ranged from 120% to 162% of target. In determining these payments, the Board considered achievement of individual Executives’ goals, including the outstanding performance in navigating through the transition of the Company’s executive leadership during the year.
Long-Term Incentive paymentThe Company’s Total Shareholder Return (TSR) over the three-year period to 30 June 2018 was 60.52%, placing the Company at the 73rd percentile within its LTI peer group. Consequently, 96.6% of target TSR awards granted during the fiscal year ended 30 June 2016 (FY16) will vest.
The Company’s ROIC was 11.76% in FY18, which was between the target and maximum ROIC performance hurdles set for the FY16 ROIC awards. Consequently, 187.0% of target FY16 ROIC awards will vest. Note that, flowing from last year’s changes, beginning with the FY18 LTI grants, the maximum vesting for ROIC awards is 100%, and ROIC performance will be measured as an average over the three-year performance period.
Remuneration refinements for the fiscal year ending 30 June 2019 (FY19)Following the changes made to our remuneration framework for FY18, the Committee worked with the new management team to take additional steps to refine our remuneration practices and programs for FY19. These were:
– STI plan: – Business Unit Executives will have their STI outcomes
more strongly aligned to the Company’s overall results, with the portion of their financial goals tied to Group (the Company and its subsidiaries) performance increasing from 25% to 50%.
– LTI plan: – Added one additional industry-related company
to the relative TSR comparator group. – Modified the vesting such that threshold vesting for
the TSR awards occurs where Sims’ TSR is at, or above, the 50th percentile of the TSR comparator group, versus the FY18 approach such that threshold vesting occurred at the 9th position of the TSR comparator group.
– Governance: – Adopted a clawback policy that provides the Board
with the ability to reduce or clawback vested and unvested STI or LTI awards offered on or after 1 July 2018 in circumstances where there has been fraud or serious misconduct on the part of a participant.
– The new Executive team has embarked on a Company-wide review of remuneration with a view to implementing a global job evaluation system to structure the Company’s remuneration framework consistent with modern global market practices.
I trust this Remuneration Report provides insights into the high priority the Board places on listening and responding to our shareholders. We are committed to serving your interests in FY19 and beyond, as we continue our efforts to align Executive remuneration with business objectives, and to deliver sustainable value to all our shareholders.
Yours sincerely,
Deborah O’Toole Remuneration Committee Chairperson [email protected]
36SIMS METAL MANAGEMENT LIMITED ANNUAL REPORT 2018
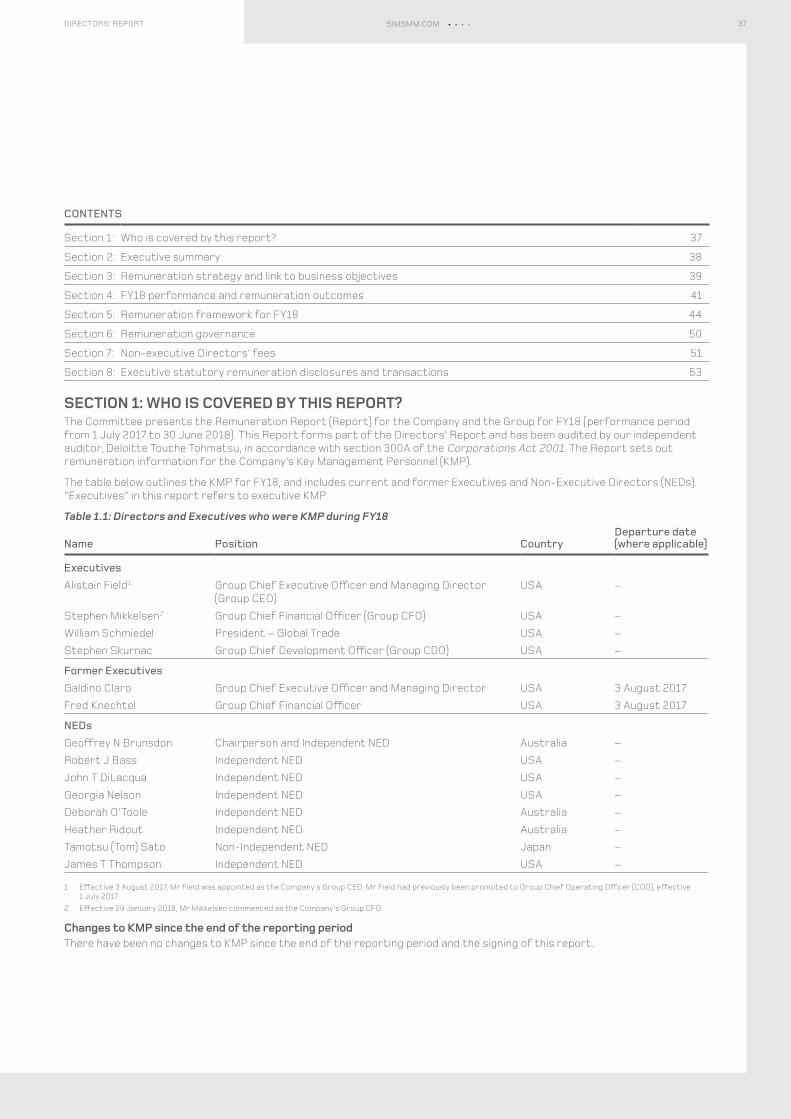
CONTENTS
Section 1: Who is covered by this report? 37
Section 2: Executive summary 38
Section 3: Remuneration strategy and link to business objectives 39
Section 4: FY18 performance and remuneration outcomes 41
Section 5: Remuneration framework for FY18 44
Section 6: Remuneration governance 50
Section 7: Non-executive Directors’ fees 51
Section 8: Executive statutory remuneration disclosures and transactions 53
SECTION 1: WHO IS COVERED BY THIS REPORT?The Committee presents the Remuneration Report (Report) for the Company and the Group for FY18 (performance period from 1 July 2017 to 30 June 2018). This Report forms part of the Directors’ Report and has been audited by our independent auditor, Deloitte Touche Tohmatsu, in accordance with section 300A of the Corporations Act 2001. The Report sets out remuneration information for the Company’s Key Management Personnel (KMP).
The table below outlines the KMP for FY18, and includes current and former Executives and Non-Executive Directors (NEDs). “Executives” in this report refers to executive KMP.
Table 1.1: Directors and Executives who were KMP during FY18
Name Position CountryDeparture date (where applicable)
ExecutivesAlistair Field 1 Group Chief Executive Officer and Managing Director
(Group CEO)USA –
Stephen Mikkelsen 2 Group Chief Financial Officer (Group CFO) USA –
William Schmiedel President – Global Trade USA –
Stephen Skurnac Group Chief Development Officer (Group CDO) USA –
Former ExecutivesGaldino Claro Group Chief Executive Officer and Managing Director USA 3 August 2017
Fred Knechtel Group Chief Financial Officer USA 3 August 2017
NEDsGeoffrey N Brunsdon Chairperson and Independent NED Australia –
Robert J Bass Independent NED USA –
John T DiLacqua Independent NED USA –
Georgia Nelson Independent NED USA –
Deborah O’Toole Independent NED Australia –
Heather Ridout Independent NED Australia –
Tamotsu (Tom) Sato Non-Independent NED Japan –
James T Thompson Independent NED USA –
1 Effective 3 August 2017, Mr Field was appointed as the Company’s Group CEO. Mr Field had previously been promoted to Group Chief Operating Officer (COO), effective 1 July 2017.
2 Effective 29 January 2018, Mr Mikkelsen commenced as the Company’s Group CFO.
Changes to KMP since the end of the reporting periodThere have been no changes to KMP since the end of the reporting period and the signing of this report.
37DIRECTORS’ REPORT SIMSMM.COM
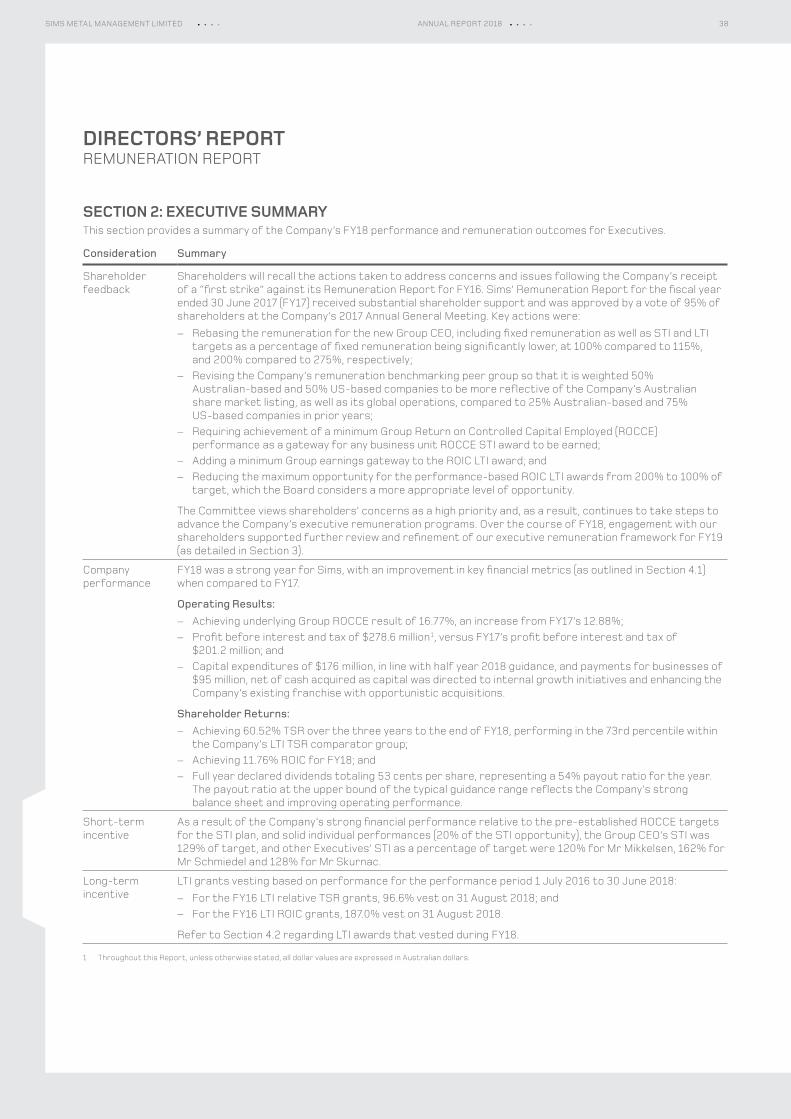
DIRECTORS’ REPORTREMUNERATION REPORT
SECTION 2: EXECUTIVE SUMMARYThis section provides a summary of the Company’s FY18 performance and remuneration outcomes for Executives.
Consideration Summary
Shareholder feedback
Shareholders will recall the actions taken to address concerns and issues following the Company’s receipt of a “first strike” against its Remuneration Report for FY16. Sims’ Remuneration Report for the fiscal year ended 30 June 2017 (FY17) received substantial shareholder support and was approved by a vote of 95% of shareholders at the Company’s 2017 Annual General Meeting. Key actions were:
– Rebasing the remuneration for the new Group CEO, including fixed remuneration as well as STI and LTI targets as a percentage of fixed remuneration being significantly lower, at 100% compared to 115%, and 200% compared to 275%, respectively;
– Revising the Company’s remuneration benchmarking peer group so that it is weighted 50% Australian-based and 50% US-based companies to be more reflective of the Company’s Australian share market listing, as well as its global operations, compared to 25% Australian-based and 75% US-based companies in prior years;
– Requiring achievement of a minimum Group Return on Controlled Capital Employed (ROCCE) performance as a gateway for any business unit ROCCE STI award to be earned;
– Adding a minimum Group earnings gateway to the ROIC LTI award; and – Reducing the maximum opportunity for the performance-based ROIC LTI awards from 200% to 100% of
target, which the Board considers a more appropriate level of opportunity.
The Committee views shareholders’ concerns as a high priority and, as a result, continues to take steps to advance the Company’s executive remuneration programs. Over the course of FY18, engagement with our shareholders supported further review and refinement of our executive remuneration framework for FY19 (as detailed in Section 3).
Company performance
FY18 was a strong year for Sims, with an improvement in key financial metrics (as outlined in Section 4.1) when compared to FY17.
Operating Results: – Achieving underlying Group ROCCE result of 16.77%, an increase from FY17’s 12.88%; – Profit before interest and tax of $278.6 million 1, versus FY17’s profit before interest and tax of
$201.2 million; and – Capital expenditures of $176 million, in line with half year 2018 guidance, and payments for businesses of
$95 million, net of cash acquired as capital was directed to internal growth initiatives and enhancing the Company’s existing franchise with opportunistic acquisitions.
Shareholder Returns: – Achieving 60.52% TSR over the three years to the end of FY18, performing in the 73rd percentile within
the Company’s LTI TSR comparator group; – Achieving 11.76% ROIC for FY18; and – Full year declared dividends totaling 53 cents per share, representing a 54% payout ratio for the year.
The payout ratio at the upper bound of the typical guidance range reflects the Company’s strong balance sheet and improving operating performance.
Short-term incentive
As a result of the Company’s strong financial performance relative to the pre-established ROCCE targets for the STI plan, and solid individual performances (20% of the STI opportunity), the Group CEO’s STI was 129% of target, and other Executives’ STI as a percentage of target were 120% for Mr Mikkelsen, 162% for Mr Schmiedel and 128% for Mr Skurnac.
Long-term incentive
LTI grants vesting based on performance for the performance period 1 July 2016 to 30 June 2018: – For the FY16 LTI relative TSR grants, 96.6% vest on 31 August 2018; and – For the FY16 LTI ROIC grants, 187.0% vest on 31 August 2018.
Refer to Section 4.2 regarding LTI awards that vested during FY18.
1 Throughout this Report, unless otherwise stated, all dollar values are expressed in Australian dollars.
38SIMS METAL MANAGEMENT LIMITED ANNUAL REPORT 2018
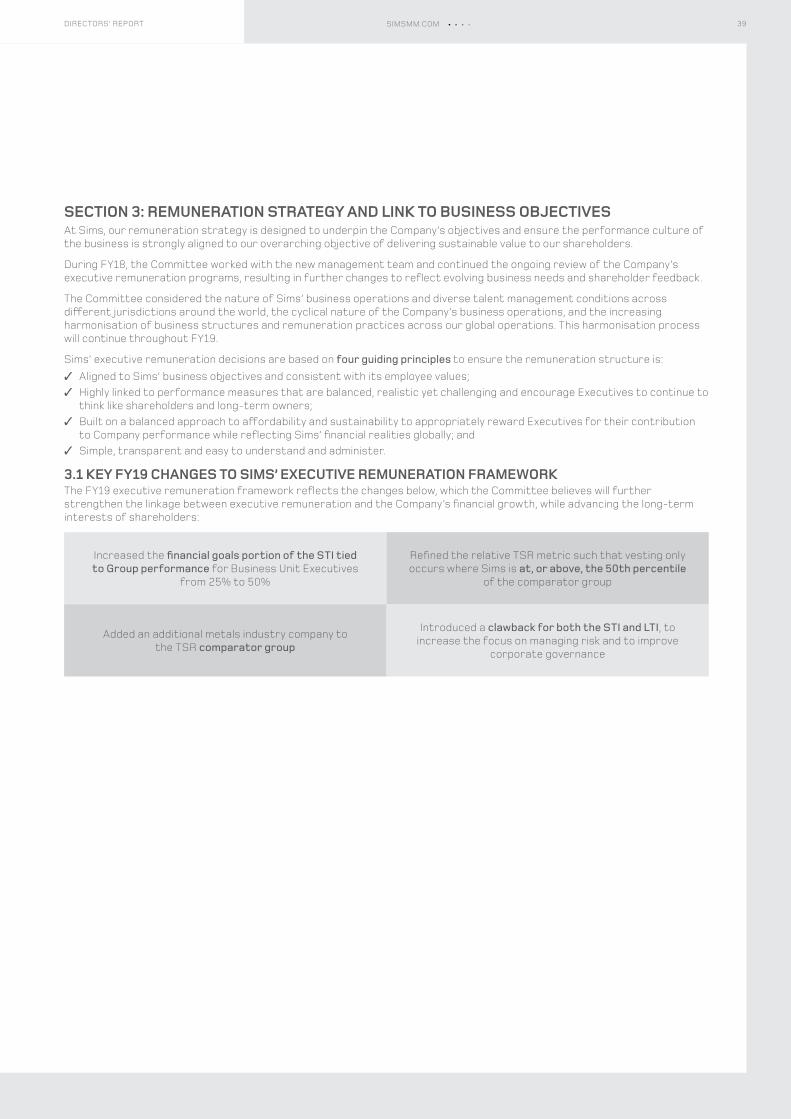
SECTION 3: REMUNERATION STRATEGY AND LINK TO BUSINESS OBJECTIVESAt Sims, our remuneration strategy is designed to underpin the Company’s objectives and ensure the performance culture of the business is strongly aligned to our overarching objective of delivering sustainable value to our shareholders.
During FY18, the Committee worked with the new management team and continued the ongoing review of the Company’s executive remuneration programs, resulting in further changes to reflect evolving business needs and shareholder feedback.
The Committee considered the nature of Sims’ business operations and diverse talent management conditions across different jurisdictions around the world, the cyclical nature of the Company’s business operations, and the increasing harmonisation of business structures and remuneration practices across our global operations. This harmonisation process will continue throughout FY19.
Sims’ executive remuneration decisions are based on four guiding principles to ensure the remuneration structure is: ✓ Aligned to Sims’ business objectives and consistent with its employee values; ✓ Highly linked to performance measures that are balanced, realistic yet challenging and encourage Executives to continue to
think like shareholders and long-term owners; ✓ Built on a balanced approach to affordability and sustainability to appropriately reward Executives for their contribution
to Company performance while reflecting Sims’ financial realities globally; and ✓ Simple, transparent and easy to understand and administer.
3.1 KEY FY19 CHANGES TO SIMS’ EXECUTIVE REMUNERATION FRAMEWORKThe FY19 executive remuneration framework reflects the changes below, which the Committee believes will further strengthen the linkage between executive remuneration and the Company’s financial growth, while advancing the long-term interests of shareholders:
Increased the financial goals portion of the STI tied to Group performance for Business Unit Executives
from 25% to 50%
Refined the relative TSR metric such that vesting only occurs where Sims is at, or above, the 50th percentile
of the comparator group
Added an additional metals industry company to the TSR comparator group
Introduced a clawback for both the STI and LTI, to increase the focus on managing risk and to improve
corporate governance
39DIRECTORS’ REPORT SIMSMM.COM
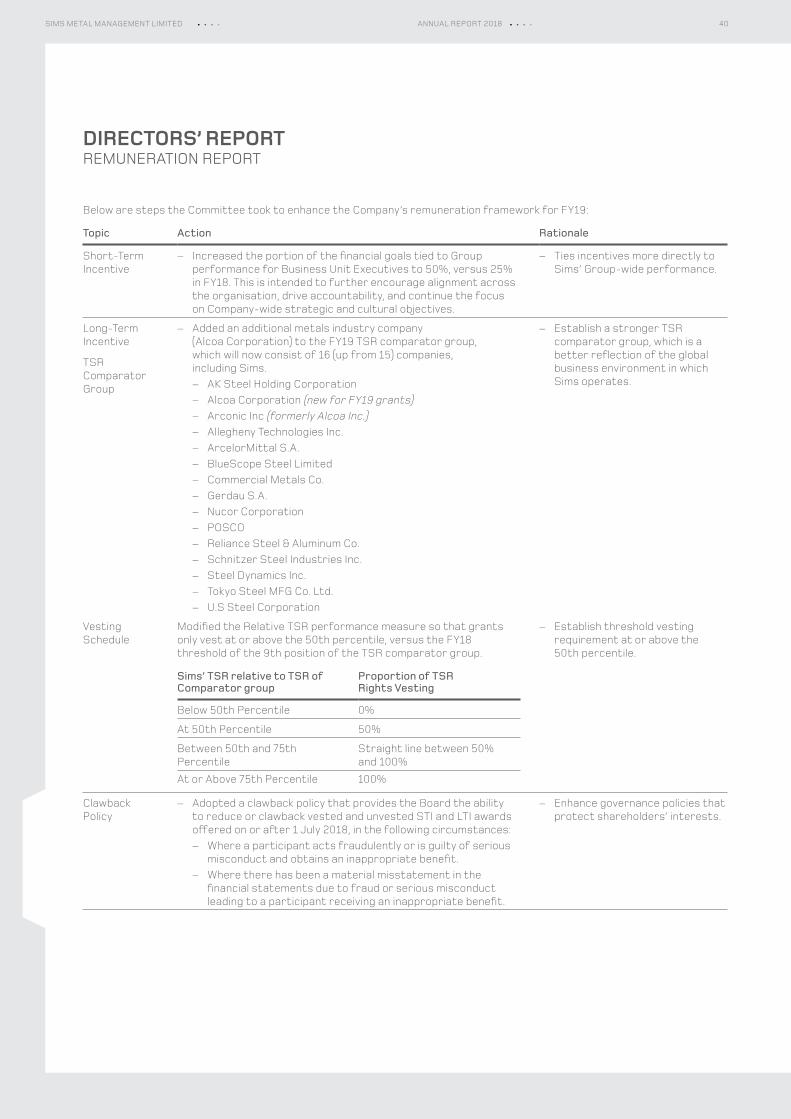
DIRECTORS’ REPORTREMUNERATION REPORT
Below are steps the Committee took to enhance the Company’s remuneration framework for FY19:
Topic Action Rationale
Short-Term Incentive
– Increased the portion of the financial goals tied to Group performance for Business Unit Executives to 50%, versus 25% in FY18. This is intended to further encourage alignment across the organisation, drive accountability, and continue the focus on Company-wide strategic and cultural objectives.
– Ties incentives more directly to Sims’ Group-wide performance.
Long-Term Incentive
TSR Comparator Group
– Added an additional metals industry company (Alcoa Corporation) to the FY19 TSR comparator group, which will now consist of 16 (up from 15) companies, including Sims.
– AK Steel Holding Corporation – Alcoa Corporation (new for FY19 grants) – Arconic Inc (formerly Alcoa Inc.) – Allegheny Technologies Inc. – ArcelorMittal S.A. – BlueScope Steel Limited – Commercial Metals Co. – Gerdau S.A. – Nucor Corporation – POSCO – Reliance Steel & Aluminum Co. – Schnitzer Steel Industries Inc. – Steel Dynamics Inc. – Tokyo Steel MFG Co. Ltd. – U.S Steel Corporation
– Establish a stronger TSR comparator group, which is a better reflection of the global business environment in which Sims operates.
Vesting Schedule
Modified the Relative TSR performance measure so that grants only vest at or above the 50th percentile, versus the FY18 threshold of the 9th position of the TSR comparator group.
Sims’ TSR relative to TSR of Comparator group
Proportion of TSRRights Vesting
Below 50th Percentile 0%
At 50th Percentile 50%
Between 50th and 75th Percentile
Straight line between 50% and 100%
At or Above 75th Percentile 100%
– Establish threshold vesting requirement at or above the 50th percentile.
Clawback Policy
– Adopted a clawback policy that provides the Board the ability to reduce or clawback vested and unvested STI and LTI awards offered on or after 1 July 2018, in the following circumstances:
– Where a participant acts fraudulently or is guilty of serious misconduct and obtains an inappropriate benefit.
– Where there has been a material misstatement in the financial statements due to fraud or serious misconduct leading to a participant receiving an inappropriate benefit.
– Enhance governance policies that protect shareholders’ interests.
40SIMS METAL MANAGEMENT LIMITED ANNUAL REPORT 2018
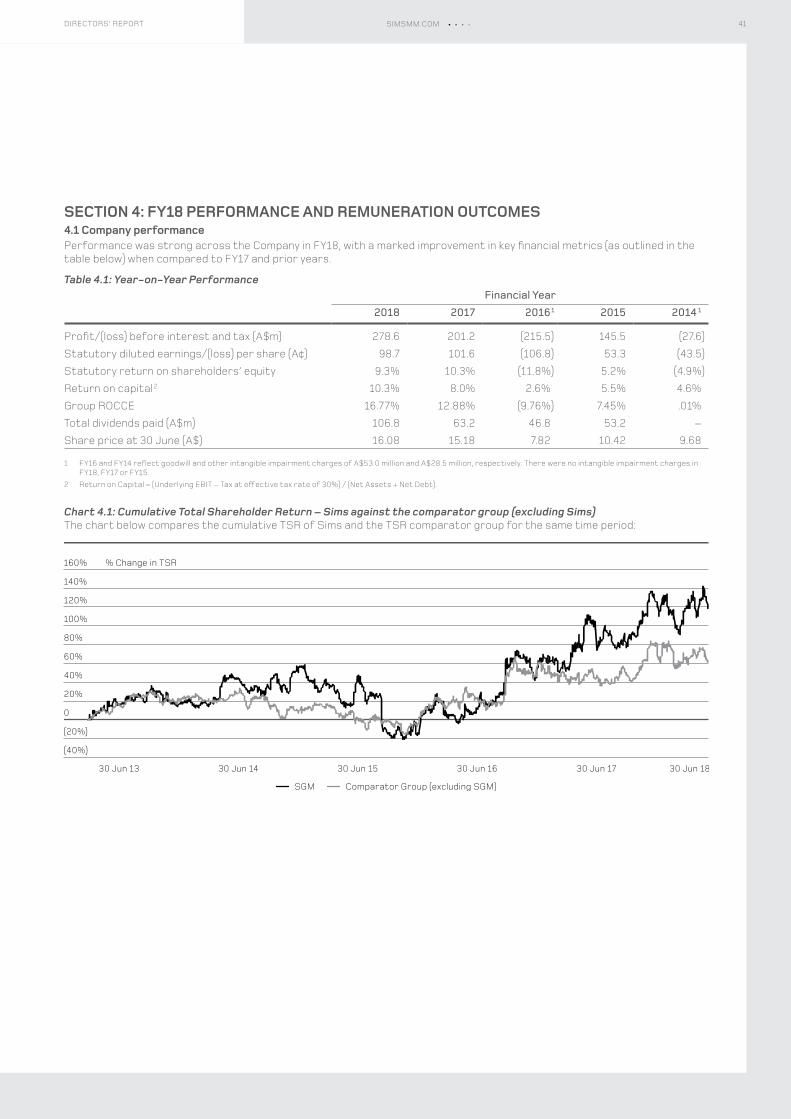
SECTION 4: FY18 PERFORMANCE AND REMUNERATION OUTCOMES4.1 Company performancePerformance was strong across the Company in FY18, with a marked improvement in key financial metrics (as outlined in the table below) when compared to FY17 and prior years.
Table 4.1: Year-on-Year PerformanceFinancial Year
2018 2017 2016 1 2015 2014 1
Profit/(loss) before interest and tax (A$m) 278.6 201.2 (215.5) 145.5 (27.6)
Statutory diluted earnings/(loss) per share (A¢) 98.7 101.6 (106.8) 53.3 (43.5)
Statutory return on shareholders’ equity 9.3% 10.3% (11.8%) 5.2% (4.9%)
Return on capital 2 10.3% 8.0% 2.6% 5.5% 4.6%
Group ROCCE 16.77% 12.88% (9.76%) 7.45% .01%
Total dividends paid (A$m) 106.8 63.2 46.8 53.2 –
Share price at 30 June (A$) 16.08 15.18 7.82 10.42 9.68
1 FY16 and FY14 reflect goodwill and other intangible impairment charges of A$53.0 million and A$28.5 million, respectively. There were no intangible impairment charges in FY18, FY17 or FY15.
2 Return on Capital = (Underlying EBIT – Tax at effective tax rate of 30%) / (Net Assets + Net Debt).
Chart 4.1: Cumulative Total Shareholder Return – Sims against the comparator group (excluding Sims)The chart below compares the cumulative TSR of Sims and the TSR comparator group for the same time period:
(40%)
(20%)
0
20%
40%
60%
100%
160%
120%
140%
80%
30 Jun 13 30 Jun 14 30 Jun 15 30 Jun 16 30 Jun 17 30 Jun 18
% Change in TSR
SGM Comparator Group (excluding SGM)
41DIRECTORS’ REPORT SIMSMM.COM
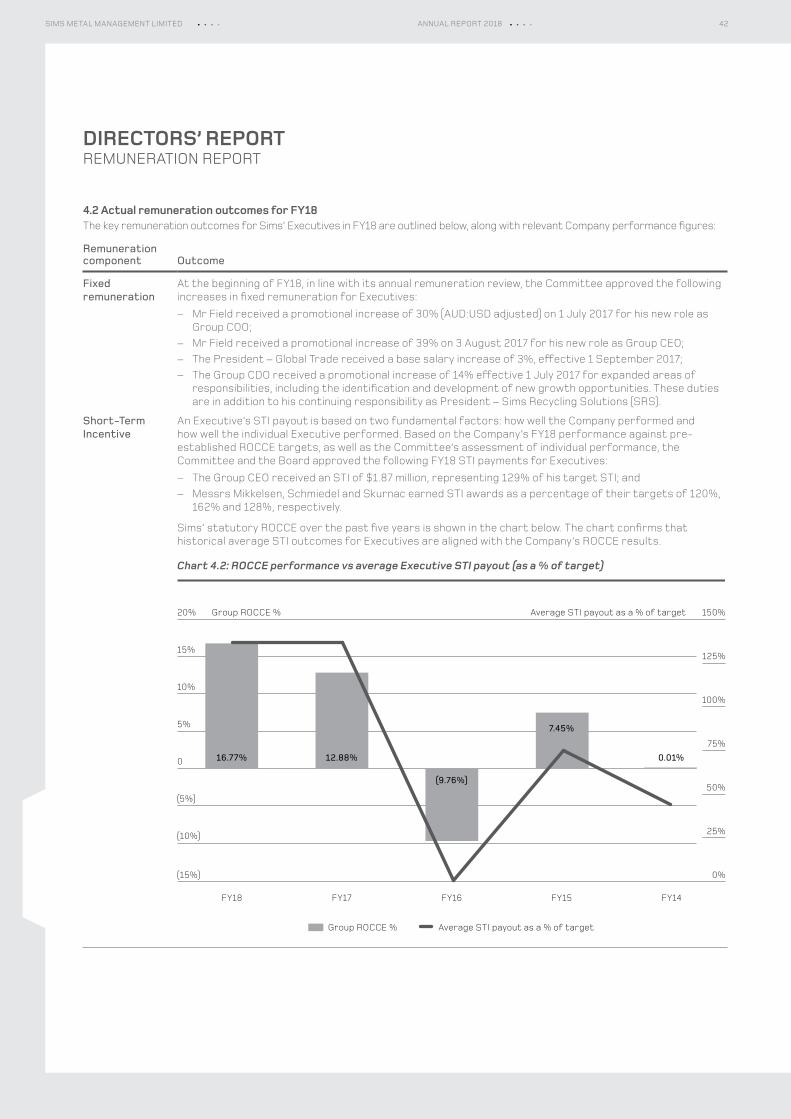
DIRECTORS’ REPORTREMUNERATION REPORT
4.2 Actual remuneration outcomes for FY18The key remuneration outcomes for Sims’ Executives in FY18 are outlined below, along with relevant Company performance figures:
Remuneration component Outcome
Fixed remuneration
At the beginning of FY18, in line with its annual remuneration review, the Committee approved the following increases in fixed remuneration for Executives:
– Mr Field received a promotional increase of 30% (AUD:USD adjusted) on 1 July 2017 for his new role as Group COO;
– Mr Field received a promotional increase of 39% on 3 August 2017 for his new role as Group CEO; – The President – Global Trade received a base salary increase of 3%, effective 1 September 2017; – The Group CDO received a promotional increase of 14% effective 1 July 2017 for expanded areas of
responsibilities, including the identification and development of new growth opportunities. These duties are in addition to his continuing responsibility as President – Sims Recycling Solutions (SRS).
Short-Term Incentive
An Executive’s STI payout is based on two fundamental factors: how well the Company performed and how well the individual Executive performed. Based on the Company’s FY18 performance against pre-established ROCCE targets, as well as the Committee’s assessment of individual performance, the Committee and the Board approved the following FY18 STI payments for Executives:
– The Group CEO received an STI of $1.87 million, representing 129% of his target STI; and – Messrs Mikkelsen, Schmiedel and Skurnac earned STI awards as a percentage of their targets of 120%,
162% and 128%, respectively.
Sims’ statutory ROCCE over the past five years is shown in the chart below. The chart confirms that historical average STI outcomes for Executives are aligned with the Company’s ROCCE results.
Chart 4.2: ROCCE performance vs average Executive STI payout (as a % of target)
Group ROCCE % Average STI payout as a % of target
FY18
7.45%
0.01%
FY17 FY16
Average STI payout as a % of targetGroup ROCCE %
FY15 FY14
0%
50%
25%
75%
100%
125%
150%
16.77% 12.88%
(9.76%)
(10%)
(15%)
(5%)
0
5%
10%
15%
20%
42SIMS METAL MANAGEMENT LIMITED ANNUAL REPORT 2018
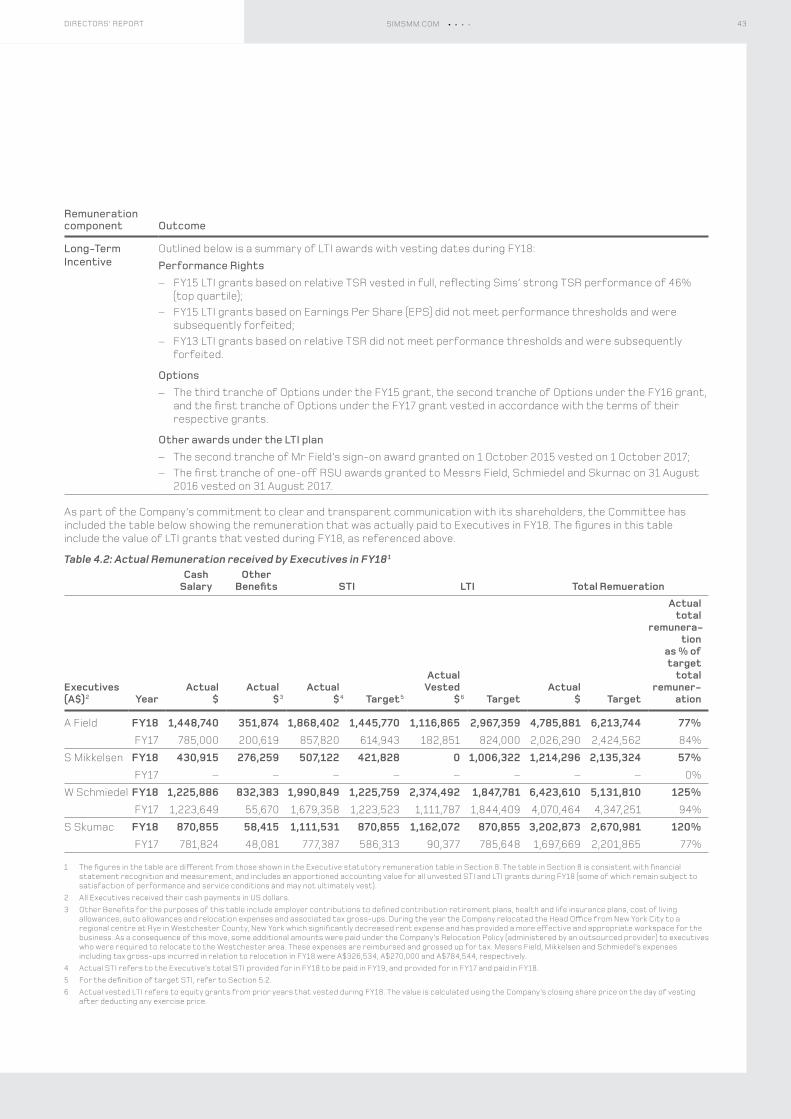
Remuneration component Outcome
Long-Term Incentive
Outlined below is a summary of LTI awards with vesting dates during FY18:Performance Rights
– FY15 LTI grants based on relative TSR vested in full, reflecting Sims’ strong TSR performance of 46% (top quartile);
– FY15 LTI grants based on Earnings Per Share (EPS) did not meet performance thresholds and were subsequently forfeited;
– FY13 LTI grants based on relative TSR did not meet performance thresholds and were subsequently forfeited.
Options – The third tranche of Options under the FY15 grant, the second tranche of Options under the FY16 grant,
and the first tranche of Options under the FY17 grant vested in accordance with the terms of their respective grants.
Other awards under the LTI plan – The second tranche of Mr Field’s sign-on award granted on 1 October 2015 vested on 1 October 2017; – The first tranche of one-off RSU awards granted to Messrs Field, Schmiedel and Skurnac on 31 August
2016 vested on 31 August 2017.
As part of the Company’s commitment to clear and transparent communication with its shareholders, the Committee has included the table below showing the remuneration that was actually paid to Executives in FY18. The figures in this table include the value of LTI grants that vested during FY18, as referenced above.
Table 4.2: Actual Remuneration received by Executives in FY18 1
Cash Salary
OtherBenefits STI LTI Total Remueration
Executives (A$) 2 Year
Actual$
Actual$ 3
Actual$ 4 Target 5
Actual Vested
$ 6 TargetActual
$ Target
Actual total
remunera‑tion
as % of target
total remuner‑
ation
A Field FY18 1,448,740 351,874 1,868,402 1,445,770 1,116,865 2,967,359 4,785,881 6,213,744 77%FY17 785,000 200,619 857,820 614,943 182,851 824,000 2,026,290 2,424,562 84%
S Mikkelsen FY18 430,915 276,259 507,122 421,828 0 1,006,322 1,214,296 2,135,324 57%FY17 – – – – – – – – 0%
W Schmiedel FY18 1,225,886 832,383 1,990,849 1,225,759 2,374,492 1,847,781 6,423,610 5,131,810 125%FY17 1,223,649 55,670 1,679,358 1,223,523 1,111,787 1,844,409 4,070,464 4,347,251 94%
S Skumac FY18 870,855 58,415 1,111,531 870,855 1,162,072 870,855 3,202,873 2,670,981 120%FY17 781,824 48,081 777,387 586,313 90,377 785,648 1,697,669 2,201,865 77%
1 The figures in the table are different from those shown in the Executive statutory remuneration table in Section 8. The table in Section 8 is consistent with financial statement recognition and measurement, and includes an apportioned accounting value for all unvested STI and LTI grants during FY18 (some of which remain subject to satisfaction of performance and service conditions and may not ultimately vest).
2 All Executives received their cash payments in US dollars.3 Other Benefits for the purposes of this table include employer contributions to defined contribution retirement plans, health and life insurance plans, cost of living
allowances, auto allowances and relocation expenses and associated tax gross-ups. During the year the Company relocated the Head Office from New York City to a regional centre at Rye in Westchester County, New York which significantly decreased rent expense and has provided a more effective and appropriate workspace for the business. As a consequence of this move, some additional amounts were paid under the Company’s Relocation Policy (administered by an outsourced provider) to executives who were required to relocate to the Westchester area. These expenses are reimbursed and grossed up for tax. Messrs Field, Mikkelsen and Schmiedel’s expenses including tax gross-ups incurred in relation to relocation in FY18 were A$326,534, A$270,000 and A$784,544, respectively.
4 Actual STI refers to the Executive’s total STI provided for in FY18 to be paid in FY19, and provided for in FY17 and paid in FY18.5 For the definition of target STI, refer to Section 5.2.6 Actual vested LTI refers to equity grants from prior years that vested during FY18. The value is calculated using the Company’s closing share price on the day of vesting
after deducting any exercise price.
43DIRECTORS’ REPORT SIMSMM.COM
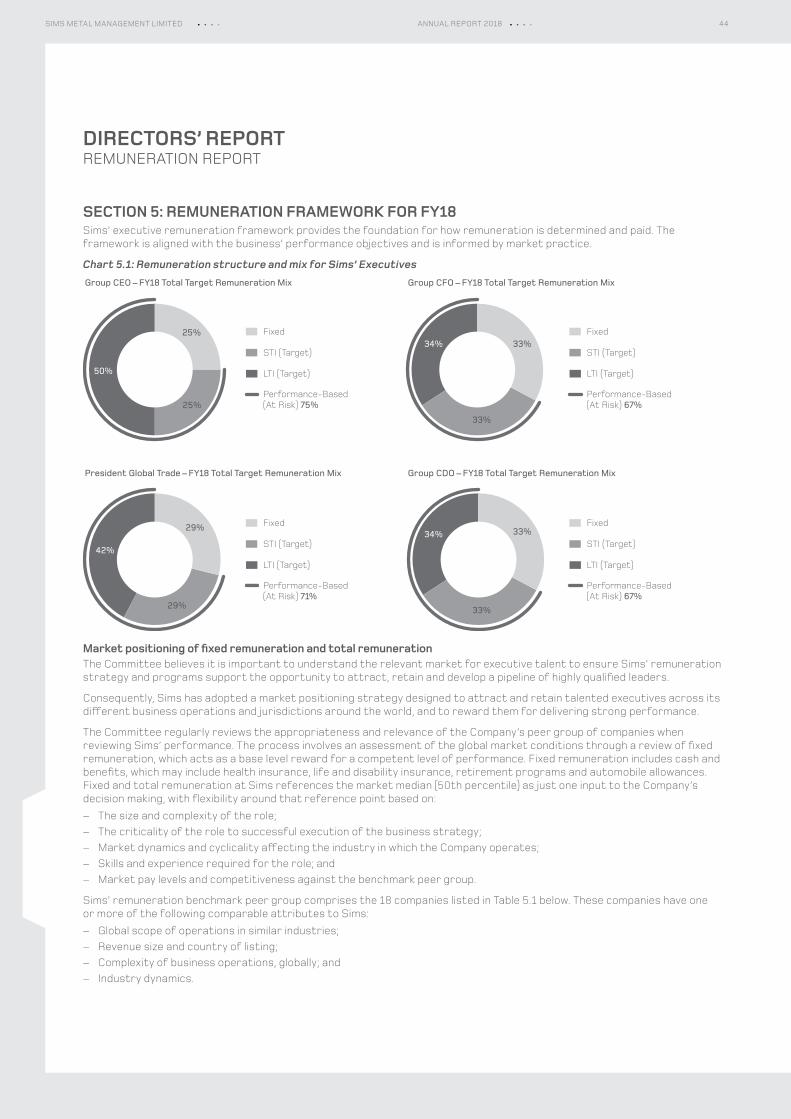
DIRECTORS’ REPORTREMUNERATION REPORT
SECTION 5: REMUNERATION FRAMEWORK FOR FY18Sims’ executive remuneration framework provides the foundation for how remuneration is determined and paid. The framework is aligned with the business’ performance objectives and is informed by market practice.
Chart 5.1: Remuneration structure and mix for Sims’ Executives
Fixed
STI (Target)
LTI (Target)
Performance-Based (At Risk) 75%
25%
25%
50%
33%
33%
34%
33%
33%
34%29%
29%
42%
Fixed
STI (Target)
LTI (Target)
Performance-Based(At Risk) 71%
Fixed
STI (Target)
LTI (Target)
Performance-Based(At Risk) 67%
Fixed
STI (Target)
LTI (Target)
Performance-Based(At Risk) 67%
Group CEO – FY18 Total Target Remuneration Mix Group CFO – FY18 Total Target Remuneration Mix
President Global Trade – FY18 Total Target Remuneration Mix Group CDO – FY18 Total Target Remuneration Mix
Market positioning of fixed remuneration and total remunerationThe Committee believes it is important to understand the relevant market for executive talent to ensure Sims’ remuneration strategy and programs support the opportunity to attract, retain and develop a pipeline of highly qualified leaders.
Consequently, Sims has adopted a market positioning strategy designed to attract and retain talented executives across its different business operations and jurisdictions around the world, and to reward them for delivering strong performance.
The Committee regularly reviews the appropriateness and relevance of the Company’s peer group of companies when reviewing Sims’ performance. The process involves an assessment of the global market conditions through a review of fixed remuneration, which acts as a base level reward for a competent level of performance. Fixed remuneration includes cash and benefits, which may include health insurance, life and disability insurance, retirement programs and automobile allowances. Fixed and total remuneration at Sims references the market median (50th percentile) as just one input to the Company’s decision making, with flexibility around that reference point based on:
– The size and complexity of the role; – The criticality of the role to successful execution of the business strategy; – Market dynamics and cyclicality affecting the industry in which the Company operates; – Skills and experience required for the role; and – Market pay levels and competitiveness against the benchmark peer group.
Sims’ remuneration benchmark peer group comprises the 18 companies listed in Table 5.1 below. These companies have one or more of the following comparable attributes to Sims:
– Global scope of operations in similar industries; – Revenue size and country of listing; – Complexity of business operations, globally; and – Industry dynamics.
44SIMS METAL MANAGEMENT LIMITED ANNUAL REPORT 2018
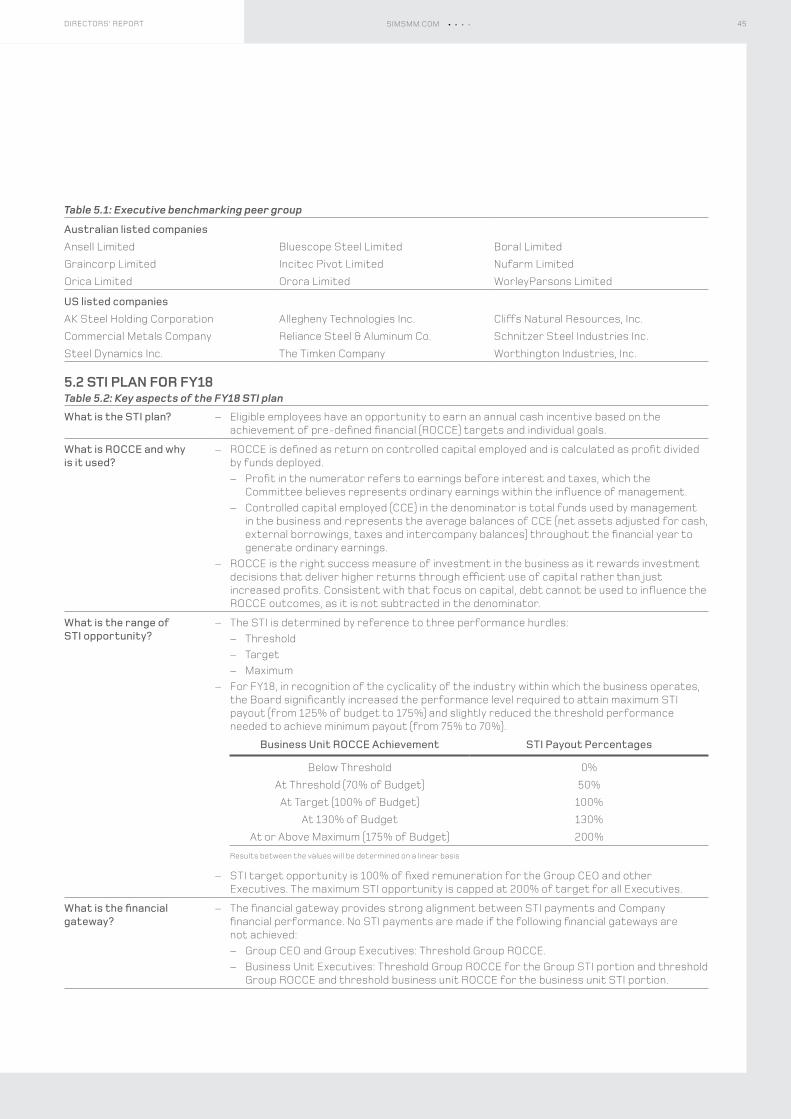
Table 5.1: Executive benchmarking peer group
Australian listed companiesAnsell Limited Bluescope Steel Limited Boral Limited
Graincorp Limited Incitec Pivot Limited Nufarm Limited
Orica Limited Orora Limited WorleyParsons Limited
US listed companiesAK Steel Holding Corporation Allegheny Technologies Inc. Cliffs Natural Resources, Inc.
Commercial Metals Company Reliance Steel & Aluminum Co. Schnitzer Steel Industries Inc.
Steel Dynamics Inc. The Timken Company Worthington Industries, Inc.
5.2 STI PLAN FOR FY18Table 5.2: Key aspects of the FY18 STI plan
What is the STI plan? – Eligible employees have an opportunity to earn an annual cash incentive based on the achievement of pre-defined financial (ROCCE) targets and individual goals.
What is ROCCE and why is it used?
– ROCCE is defined as return on controlled capital employed and is calculated as profit divided by funds deployed.
– Profit in the numerator refers to earnings before interest and taxes, which the Committee believes represents ordinary earnings within the influence of management.
– Controlled capital employed (CCE) in the denominator is total funds used by management in the business and represents the average balances of CCE (net assets adjusted for cash, external borrowings, taxes and intercompany balances) throughout the financial year to generate ordinary earnings.
– ROCCE is the right success measure of investment in the business as it rewards investment decisions that deliver higher returns through efficient use of capital rather than just increased profits. Consistent with that focus on capital, debt cannot be used to influence the ROCCE outcomes, as it is not subtracted in the denominator.
What is the range of STI opportunity?
– The STI is determined by reference to three performance hurdles: – Threshold – Target – Maximum
– For FY18, in recognition of the cyclicality of the industry within which the business operates, the Board significantly increased the performance level required to attain maximum STI payout (from 125% of budget to 175%) and slightly reduced the threshold performance needed to achieve minimum payout (from 75% to 70%).
Business Unit ROCCE Achievement STI Payout Percentages
Below Threshold 0%
At Threshold (70% of Budget) 50%
At Target (100% of Budget) 100%
At 130% of Budget 130%
At or Above Maximum (175% of Budget) 200%
Results between the values will be determined on a linear basis
– STI target opportunity is 100% of fixed remuneration for the Group CEO and other Executives. The maximum STI opportunity is capped at 200% of target for all Executives.
What is the financial gateway?
– The financial gateway provides strong alignment between STI payments and Company financial performance. No STI payments are made if the following financial gateways are not achieved:
– Group CEO and Group Executives: Threshold Group ROCCE. – Business Unit Executives: Threshold Group ROCCE for the Group STI portion and threshold
Group ROCCE and threshold business unit ROCCE for the business unit STI portion.
45DIRECTORS’ REPORT SIMSMM.COM
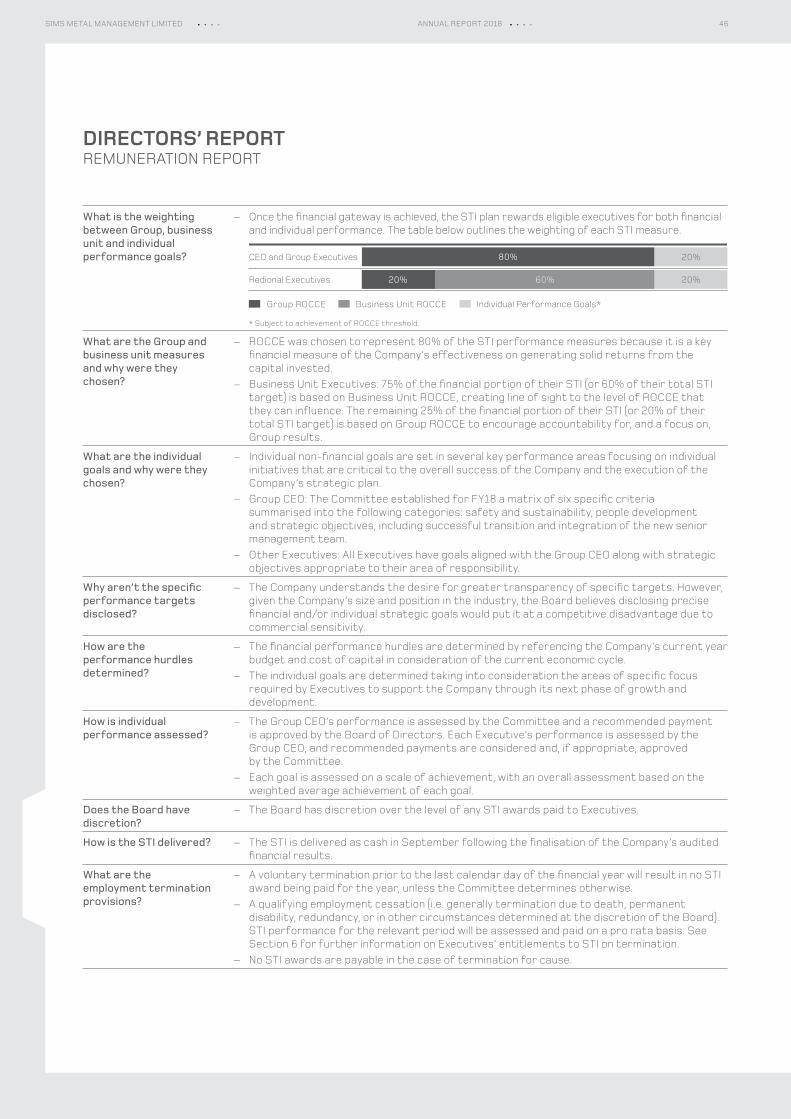
DIRECTORS’ REPORTREMUNERATION REPORT
What is the weighting between Group, business unit and individual performance goals?
– Once the financial gateway is achieved, the STI plan rewards eligible executives for both financial and individual performance. The table below outlines the weighting of each STI measure.
CEO and Group Executives
Redional Executives
Group ROCCE Business Unit ROCCE Individual Performance Goals*
80% 20%
20%60%20%
* Subject to achievement of ROCCE threshold.
What are the Group and business unit measures and why were they chosen?
– ROCCE was chosen to represent 80% of the STI performance measures because it is a key financial measure of the Company’s effectiveness on generating solid returns from the capital invested.
– Business Unit Executives: 75% of the financial portion of their STI (or 60% of their total STI target) is based on Business Unit ROCCE, creating line of sight to the level of ROCCE that they can influence. The remaining 25% of the financial portion of their STI (or 20% of their total STI target) is based on Group ROCCE to encourage accountability for, and a focus on, Group results.
What are the individual goals and why were they chosen?
– Individual non-financial goals are set in several key performance areas focusing on individual initiatives that are critical to the overall success of the Company and the execution of the Company’s strategic plan.
– Group CEO: The Committee established for FY18 a matrix of six specific criteria summarised into the following categories: safety and sustainability, people development and strategic objectives, including successful transition and integration of the new senior management team.
– Other Executives: All Executives have goals aligned with the Group CEO along with strategic objectives appropriate to their area of responsibility.
Why aren’t the specific performance targets disclosed?
– The Company understands the desire for greater transparency of specific targets. However, given the Company’s size and position in the industry, the Board believes disclosing precise financial and/or individual strategic goals would put it at a competitive disadvantage due to commercial sensitivity.
How are the performance hurdles determined?
– The financial performance hurdles are determined by referencing the Company’s current year budget and cost of capital in consideration of the current economic cycle.
– The individual goals are determined taking into consideration the areas of specific focus required by Executives to support the Company through its next phase of growth and development.
How is individual performance assessed?
– The Group CEO’s performance is assessed by the Committee and a recommended payment is approved by the Board of Directors. Each Executive’s performance is assessed by the Group CEO, and recommended payments are considered and, if appropriate, approved by the Committee.
– Each goal is assessed on a scale of achievement, with an overall assessment based on the weighted average achievement of each goal.
Does the Board have discretion?
– The Board has discretion over the level of any STI awards paid to Executives.
How is the STI delivered? – The STI is delivered as cash in September following the finalisation of the Company’s audited financial results.
What are the employment termination provisions?
– A voluntary termination prior to the last calendar day of the financial year will result in no STI award being paid for the year, unless the Committee determines otherwise.
– A qualifying employment cessation (i.e. generally termination due to death, permanent disability, redundancy, or in other circumstances determined at the discretion of the Board). STI performance for the relevant period will be assessed and paid on a pro rata basis. See Section 6 for further information on Executives’ entitlements to STI on termination.
– No STI awards are payable in the case of termination for cause.
46SIMS METAL MANAGEMENT LIMITED ANNUAL REPORT 2018
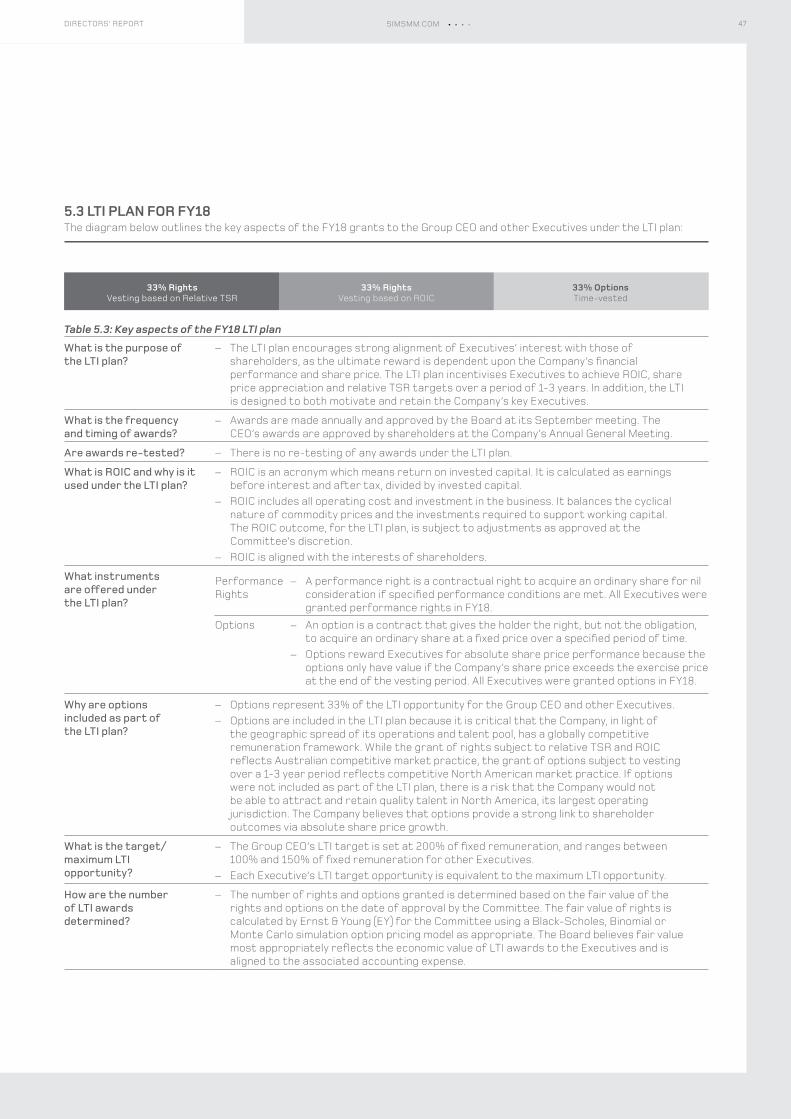
5.3 LTI PLAN FOR FY18The diagram below outlines the key aspects of the FY18 grants to the Group CEO and other Executives under the LTI plan:
33% OptionsTime-vested
33% RightsVesting based on ROIC
33% RightsVesting based on Relative TSR
Table 5.3: Key aspects of the FY18 LTI plan
What is the purpose of the LTI plan?
– The LTI plan encourages strong alignment of Executives’ interest with those of shareholders, as the ultimate reward is dependent upon the Company’s financial performance and share price. The LTI plan incentivises Executives to achieve ROIC, share price appreciation and relative TSR targets over a period of 1-3 years. In addition, the LTI is designed to both motivate and retain the Company’s key Executives.
What is the frequency and timing of awards?
– Awards are made annually and approved by the Board at its September meeting. The CEO’s awards are approved by shareholders at the Company’s Annual General Meeting.
Are awards re-tested? – There is no re-testing of any awards under the LTI plan.
What is ROIC and why is it used under the LTI plan?
– ROIC is an acronym which means return on invested capital. It is calculated as earnings before interest and after tax, divided by invested capital.
– ROIC includes all operating cost and investment in the business. It balances the cyclical nature of commodity prices and the investments required to support working capital. The ROIC outcome, for the LTI plan, is subject to adjustments as approved at the Committee’s discretion.
– ROIC is aligned with the interests of shareholders.
What instruments are offered under the LTI plan?
Performance Rights
– A performance right is a contractual right to acquire an ordinary share for nil consideration if specified performance conditions are met. All Executives were granted performance rights in FY18.
Options – An option is a contract that gives the holder the right, but not the obligation, to acquire an ordinary share at a fixed price over a specified period of time.
– Options reward Executives for absolute share price performance because the options only have value if the Company’s share price exceeds the exercise price at the end of the vesting period. All Executives were granted options in FY18.
Why are options included as part of the LTI plan?
– Options represent 33% of the LTI opportunity for the Group CEO and other Executives. – Options are included in the LTI plan because it is critical that the Company, in light of
the geographic spread of its operations and talent pool, has a globally competitive remuneration framework. While the grant of rights subject to relative TSR and ROIC reflects Australian competitive market practice, the grant of options subject to vesting over a 1-3 year period reflects competitive North American market practice. If options were not included as part of the LTI plan, there is a risk that the Company would not be able to attract and retain quality talent in North America, its largest operating jurisdiction. The Company believes that options provide a strong link to shareholder outcomes via absolute share price growth.
What is the target/maximum LTI opportunity?
– The Group CEO’s LTI target is set at 200% of fixed remuneration, and ranges between 100% and 150% of fixed remuneration for other Executives.
– Each Executive’s LTI target opportunity is equivalent to the maximum LTI opportunity.
How are the number of LTI awards determined?
– The number of rights and options granted is determined based on the fair value of the rights and options on the date of approval by the Committee. The fair value of rights is calculated by Ernst & Young (EY) for the Committee using a Black-Scholes, Binomial or Monte Carlo simulation option pricing model as appropriate. The Board believes fair value most appropriately reflects the economic value of LTI awards to the Executives and is aligned to the associated accounting expense.
47DIRECTORS’ REPORT SIMSMM.COM
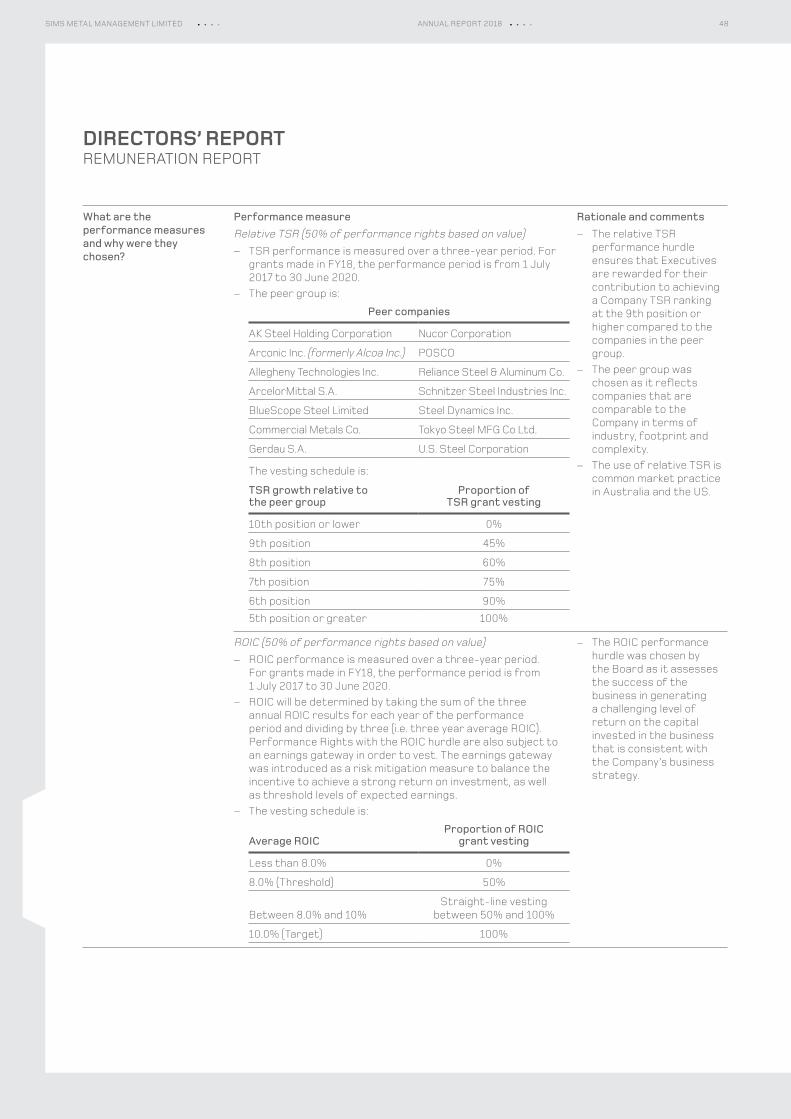
DIRECTORS’ REPORTREMUNERATION REPORT
What are the performance measures and why were they chosen?
Performance measureRelative TSR (50% of performance rights based on value)
– TSR performance is measured over a three-year period. For grants made in FY18, the performance period is from 1 July 2017 to 30 June 2020.
– The peer group is:
Peer companies
AK Steel Holding Corporation Nucor Corporation
Arconic Inc. (formerly Alcoa Inc.) POSCO
Allegheny Technologies Inc. Reliance Steel & Aluminum Co.
ArcelorMittal S.A. Schnitzer Steel Industries Inc.
BlueScope Steel Limited Steel Dynamics Inc.
Commercial Metals Co. Tokyo Steel MFG Co Ltd.
Gerdau S.A. U.S. Steel Corporation
The vesting schedule is:
TSR growth relative tothe peer group
Proportion of TSR grant vesting
10th position or lower 0%
9th position 45%
8th position 60%
7th position 75%
6th position 90%
5th position or greater 100%
Rationale and comments – The relative TSR
performance hurdle ensures that Executives are rewarded for their contribution to achieving a Company TSR ranking at the 9th position or higher compared to the companies in the peer group.
– The peer group was chosen as it reflects companies that are comparable to the Company in terms of industry, footprint and complexity.
– The use of relative TSR is common market practice in Australia and the US.
ROIC (50% of performance rights based on value) – ROIC performance is measured over a three-year period.
For grants made in FY18, the performance period is from 1 July 2017 to 30 June 2020.
– ROIC will be determined by taking the sum of the three annual ROIC results for each year of the performance period and dividing by three (i.e. three year average ROIC). Performance Rights with the ROIC hurdle are also subject to an earnings gateway in order to vest. The earnings gateway was introduced as a risk mitigation measure to balance the incentive to achieve a strong return on investment, as well as threshold levels of expected earnings.
– The vesting schedule is:
Average ROIC Proportion of ROIC
grant vesting
Less than 8.0% 0%
8.0% (Threshold) 50%
Between 8.0% and 10%Straight-line vesting
between 50% and 100%
10.0% (Target) 100%
– The ROIC performance hurdle was chosen by the Board as it assesses the success of the business in generating a challenging level of return on the capital invested in the business that is consistent with the Company’s business strategy.
48SIMS METAL MANAGEMENT LIMITED ANNUAL REPORT 2018
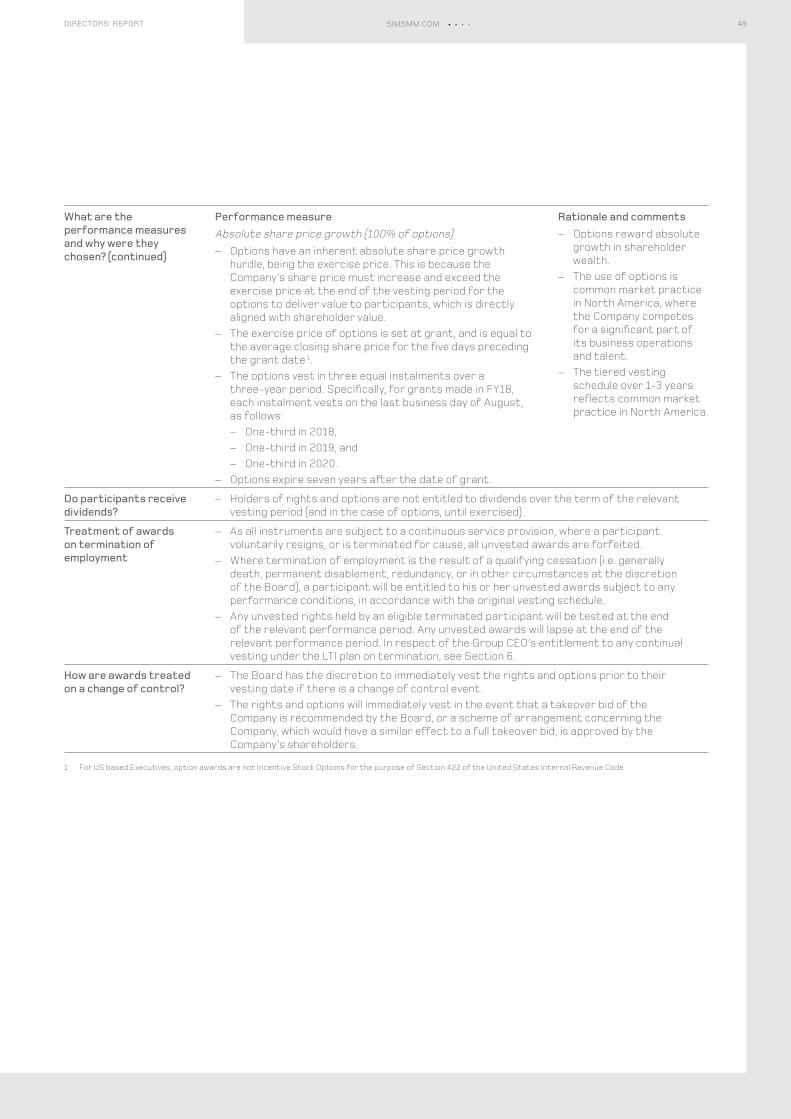
What are the performance measures and why were they chosen? (continued)
Performance measureAbsolute share price growth (100% of options)
– Options have an inherent absolute share price growth hurdle, being the exercise price. This is because the Company’s share price must increase and exceed the exercise price at the end of the vesting period for the options to deliver value to participants, which is directly aligned with shareholder value.
– The exercise price of options is set at grant, and is equal to the average closing share price for the five days preceding the grant date 1.
– The options vest in three equal instalments over a three-year period. Specifically, for grants made in FY18, each instalment vests on the last business day of August, as follows:
– One-third in 2018, – One-third in 2019, and – One-third in 2020.
– Options expire seven years after the date of grant.
Rationale and comments – Options reward absolute
growth in shareholder wealth.
– The use of options is common market practice in North America, where the Company competes for a significant part of its business operations and talent.
– The tiered vesting schedule over 1-3 years reflects common market practice in North America.
Do participants receive dividends?
– Holders of rights and options are not entitled to dividends over the term of the relevant vesting period (and in the case of options, until exercised).
Treatment of awards on termination of employment
– As all instruments are subject to a continuous service provision, where a participant voluntarily resigns, or is terminated for cause, all unvested awards are forfeited.
– Where termination of employment is the result of a qualifying cessation (i.e. generally death, permanent disablement, redundancy, or in other circumstances at the discretion of the Board), a participant will be entitled to his or her unvested awards subject to any performance conditions, in accordance with the original vesting schedule.
– Any unvested rights held by an eligible terminated participant will be tested at the end of the relevant performance period. Any unvested awards will lapse at the end of the relevant performance period. In respect of the Group CEO’s entitlement to any continual vesting under the LTI plan on termination, see Section 6.
How are awards treated on a change of control?
– The Board has the discretion to immediately vest the rights and options prior to their vesting date if there is a change of control event.
– The rights and options will immediately vest in the event that a takeover bid of the Company is recommended by the Board, or a scheme of arrangement concerning the Company, which would have a similar effect to a full takeover bid, is approved by the Company’s shareholders.
1 For US based Executives, option awards are not Incentive Stock Options for the purpose of Section 422 of the United States Internal Revenue Code.
49DIRECTORS’ REPORT SIMSMM.COM
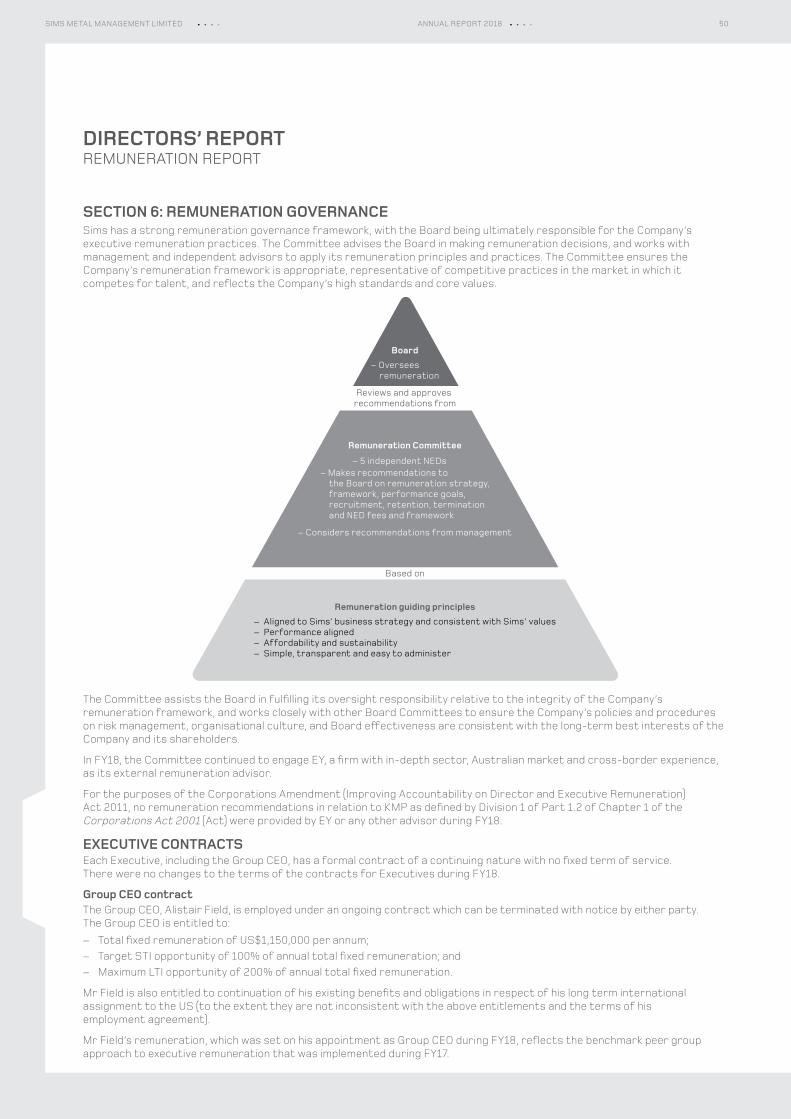
DIRECTORS’ REPORTREMUNERATION REPORT
SECTION 6: REMUNERATION GOVERNANCESims has a strong remuneration governance framework, with the Board being ultimately responsible for the Company’s executive remuneration practices. The Committee advises the Board in making remuneration decisions, and works with management and independent advisors to apply its remuneration principles and practices. The Committee ensures the Company’s remuneration framework is appropriate, representative of competitive practices in the market in which it competes for talent, and reflects the Company’s high standards and core values.
Remuneration Committee
Remuneration guiding principles
Reviews and approves recommendations from
Based on
Board
– Makes recommendations tothe Board on remuneration strategy,framework, performance goals,recruitment, retention, terminationand NED fees and framework
– Considers recommendations from management
– 5 independent NEDs
– Aligned to Sims’ business strategy and consistent with Sims' values– Performance aligned – Affordability and sustainability– Simple, transparent and easy to administer
– Overseesremuneration
The Committee assists the Board in fulfilling its oversight responsibility relative to the integrity of the Company’s remuneration framework, and works closely with other Board Committees to ensure the Company’s policies and procedures on risk management, organisational culture, and Board effectiveness are consistent with the long-term best interests of the Company and its shareholders.
In FY18, the Committee continued to engage EY, a firm with in-depth sector, Australian market and cross-border experience, as its external remuneration advisor.
For the purposes of the Corporations Amendment (Improving Accountability on Director and Executive Remuneration) Act 2011, no remuneration recommendations in relation to KMP as defined by Division 1 of Part 1.2 of Chapter 1 of the Corporations Act 2001 (Act) were provided by EY or any other advisor during FY18.
EXECUTIVE CONTRACTSEach Executive, including the Group CEO, has a formal contract of a continuing nature with no fixed term of service. There were no changes to the terms of the contracts for Executives during FY18.
Group CEO contractThe Group CEO, Alistair Field, is employed under an ongoing contract which can be terminated with notice by either party. The Group CEO is entitled to:
– Total fixed remuneration of US$1,150,000 per annum; – Target STI opportunity of 100% of annual total fixed remuneration; and – Maximum LTI opportunity of 200% of annual total fixed remuneration.
Mr Field is also entitled to continuation of his existing benefits and obligations in respect of his long term international assignment to the US (to the extent they are not inconsistent with the above entitlements and the terms of his employment agreement).
Mr Field’s remuneration, which was set on his appointment as Group CEO during FY18, reflects the benchmark peer group approach to executive remuneration that was implemented during FY17.
50SIMS METAL MANAGEMENT LIMITED ANNUAL REPORT 2018
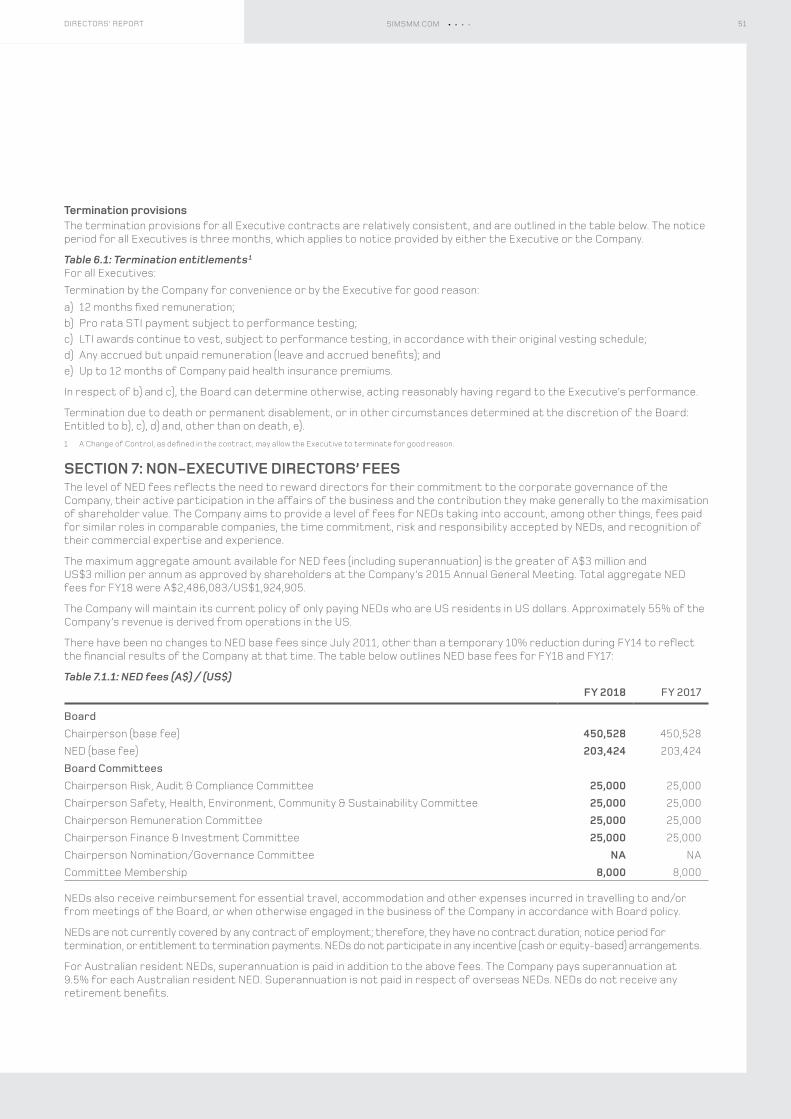
Termination provisionsThe termination provisions for all Executive contracts are relatively consistent, and are outlined in the table below. The notice period for all Executives is three months, which applies to notice provided by either the Executive or the Company.
Table 6.1: Termination entitlements 1
For all Executives:Termination by the Company for convenience or by the Executive for good reason:a) 12 months fixed remuneration;b) Pro rata STI payment subject to performance testing;c) LTI awards continue to vest, subject to performance testing, in accordance with their original vesting schedule;d) Any accrued but unpaid remuneration (leave and accrued benefits); ande) Up to 12 months of Company paid health insurance premiums.
In respect of b) and c), the Board can determine otherwise, acting reasonably having regard to the Executive’s performance.
Termination due to death or permanent disablement, or in other circumstances determined at the discretion of the Board: Entitled to b), c), d) and, other than on death, e).1 A Change of Control, as defined in the contract, may allow the Executive to terminate for good reason.
SECTION 7: NON‑EXECUTIVE DIRECTORS’ FEESThe level of NED fees reflects the need to reward directors for their commitment to the corporate governance of the Company, their active participation in the affairs of the business and the contribution they make generally to the maximisation of shareholder value. The Company aims to provide a level of fees for NEDs taking into account, among other things, fees paid for similar roles in comparable companies, the time commitment, risk and responsibility accepted by NEDs, and recognition of their commercial expertise and experience.
The maximum aggregate amount available for NED fees (including superannuation) is the greater of A$3 million and US$3 million per annum as approved by shareholders at the Company’s 2015 Annual General Meeting. Total aggregate NED fees for FY18 were A$2,486,083/US$1,924,905.
The Company will maintain its current policy of only paying NEDs who are US residents in US dollars. Approximately 55% of the Company’s revenue is derived from operations in the US.
There have been no changes to NED base fees since July 2011, other than a temporary 10% reduction during FY14 to reflect the financial results of the Company at that time. The table below outlines NED base fees for FY18 and FY17:
Table 7.1.1: NED fees (A$) / (US$)FY 2018 FY 2017
BoardChairperson (base fee) 450,528 450,528
NED (base fee) 203,424 203,424
Board CommitteesChairperson Risk, Audit & Compliance Committee 25,000 25,000
Chairperson Safety, Health, Environment, Community & Sustainability Committee 25,000 25,000
Chairperson Remuneration Committee 25,000 25,000
Chairperson Finance & Investment Committee 25,000 25,000
Chairperson Nomination/Governance Committee NA NA
Committee Membership 8,000 8,000
NEDs also receive reimbursement for essential travel, accommodation and other expenses incurred in travelling to and/or from meetings of the Board, or when otherwise engaged in the business of the Company in accordance with Board policy.
NEDs are not currently covered by any contract of employment; therefore, they have no contract duration, notice period for termination, or entitlement to termination payments. NEDs do not participate in any incentive (cash or equity-based) arrangements.
For Australian resident NEDs, superannuation is paid in addition to the above fees. The Company pays superannuation at 9.5% for each Australian resident NED. Superannuation is not paid in respect of overseas NEDs. NEDs do not receive any retirement benefits.
51DIRECTORS’ REPORT SIMSMM.COM
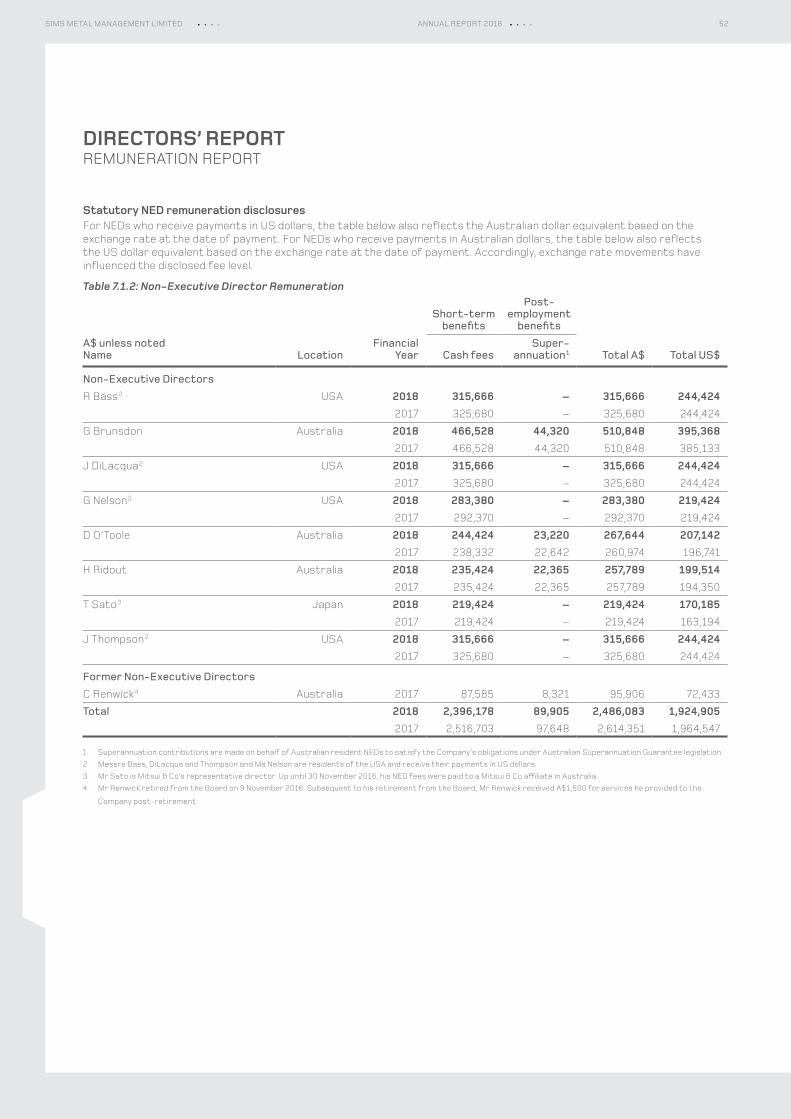
DIRECTORS’ REPORTREMUNERATION REPORT
Statutory NED remuneration disclosuresFor NEDs who receive payments in US dollars, the table below also reflects the Australian dollar equivalent based on the exchange rate at the date of payment. For NEDs who receive payments in Australian dollars, the table below also reflects the US dollar equivalent based on the exchange rate at the date of payment. Accordingly, exchange rate movements have influenced the disclosed fee level.
Table 7.1.2: Non-Executive Director Remuneration
A$ unless notedName Location
Financial Year
Short-term benefits
Post-employment
benefits
Total A$ Total US$Cash feesSuper-
annuation 1
Non-Executive DirectorsR Bass 2 USA 2018 315,666 – 315,666 244,424
2017 325,680 – 325,680 244,424
G Brunsdon Australia 2018 466,528 44,320 510,848 395,3682017 466,528 44,320 510,848 385,133
J DiLacqua 2 USA 2018 315,666 – 315,666 244,4242017 325,680 – 325,680 244,424
G Nelson 2 USA 2018 283,380 – 283,380 219,4242017 292,370 – 292,370 219,424
D O’Toole Australia 2018 244,424 23,220 267,644 207,1422017 238,332 22,642 260,974 196,741
H Ridout Australia 2018 235,424 22,365 257,789 199,5142017 235,424 22,365 257,789 194,350
T Sato 3 Japan 2018 219,424 – 219,424 170,1852017 219,424 – 219,424 163,194
J Thompson 2 USA 2018 315,666 – 315,666 244,4242017 325,680 – 325,680 244,424
Former Non-Executive DirectorsC Renwick 4 Australia 2017 87,585 8,321 95,906 72,433
Total 2018 2,396,178 89,905 2,486,083 1,924,9052017 2,516,703 97,648 2,614,351 1,964,547
1 Superannuation contributions are made on behalf of Australian resident NEDs to satisfy the Company’s obligations under Australian Superannuation Guarantee legislation.2 Messrs Bass, DiLacqua and Thompson and Ms Nelson are residents of the USA and receive their payments in US dollars.3 Mr Sato is Mitsui & Co’s representative director. Up until 30 November 2016, his NED fees were paid to a Mitsui & Co affiliate in Australia.4 Mr Renwick retired from the Board on 9 November 2016. Subsequent to his retirement from the Board, Mr Renwick received A$1,500 for services he provided to the
Company post-retirement.
52SIMS METAL MANAGEMENT LIMITED ANNUAL REPORT 2018
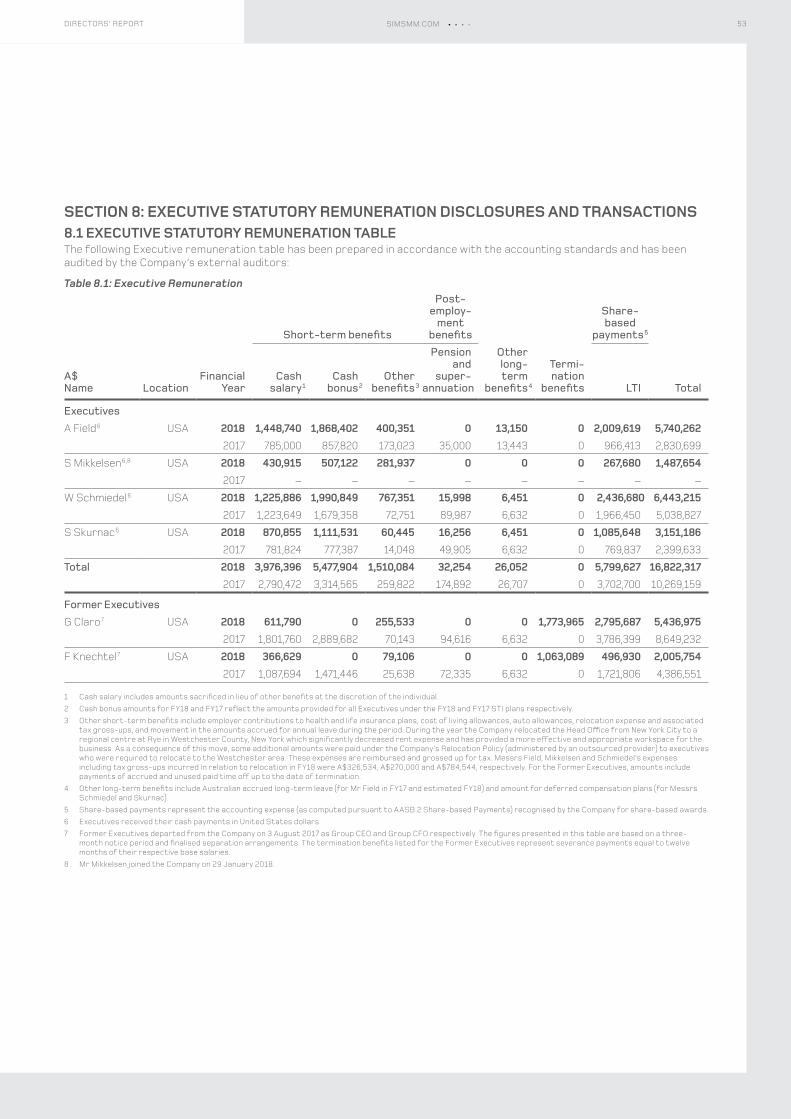
SECTION 8: EXECUTIVE STATUTORY REMUNERATION DISCLOSURES AND TRANSACTIONS8.1 EXECUTIVE STATUTORY REMUNERATION TABLEThe following Executive remuneration table has been prepared in accordance with the accounting standards and has been audited by the Company’s external auditors:
Table 8.1: Executive Remuneration
A$Name Location
Financial Year
Short-term benefits
Post-employ-
ment benefits
Otherlong-term
benefits 4
Termi-nation
benefits
Share-based
payments 5
TotalCash
salary 1Cash
bonus 2Other
benefits 3
Pension and
super-annuation LTI
ExecutivesA Field 6 USA 2018 1,448,740 1,868,402 400,351 0 13,150 0 2,009,619 5,740,262
2017 785,000 857,820 173,023 35,000 13,443 0 966,413 2,830,699
S Mikkelsen 6,8 USA 2018 430,915 507,122 281,937 0 0 0 267,680 1,487,6542017 – – – – – – – –
W Schmiedel 6 USA 2018 1,225,886 1,990,849 767,351 15,998 6,451 0 2,436,680 6,443,2152017 1,223,649 1,679,358 72,751 89,987 6,632 0 1,966,450 5,038,827
S Skurnac 6 USA 2018 870,855 1,111,531 60,445 16,256 6,451 0 1,085,648 3,151,1862017 781,824 777,387 14,048 49,905 6,632 0 769,837 2,399,633
Total 2018 3,976,396 5,477,904 1,510,084 32,254 26,052 0 5,799,627 16,822,3172017 2,790,472 3,314,565 259,822 174,892 26,707 0 3,702,700 10,269,159
Former ExecutivesG Claro 7 USA 2018 611,790 0 255,533 0 0 1,773,965 2,795,687 5,436,975
2017 1,801,760 2,889,682 70,143 94,616 6,632 0 3,786,399 8,649,232
F Knechtel 7 USA 2018 366,629 0 79,106 0 0 1,063,089 496,930 2,005,7542017 1,087,694 1,471,446 25,638 72,335 6,632 0 1,721,806 4,386,551
1 Cash salary includes amounts sacrificed in lieu of other benefits at the discretion of the individual.2 Cash bonus amounts for FY18 and FY17 reflect the amounts provided for all Executives under the FY18 and FY17 STI plans respectively.3 Other short-term benefits include employer contributions to health and life insurance plans, cost of living allowances, auto allowances, relocation expense and associated
tax gross-ups, and movement in the amounts accrued for annual leave during the period. During the year the Company relocated the Head Office from New York City to a regional centre at Rye in Westchester County, New York which significantly decreased rent expense and has provided a more effective and appropriate workspace for the business. As a consequence of this move, some additional amounts were paid under the Company’s Relocation Policy (administered by an outsourced provider) to executives who were required to relocate to the Westchester area. These expenses are reimbursed and grossed up for tax. Messrs Field, Mikkelsen and Schmiedel’s expenses including tax gross-ups incurred in relation to relocation in FY18 were A$326,534, A$270,000 and A$784,544, respectively. For the Former Executives, amounts include payments of accrued and unused paid time off up to the date of termination.
4 Other long-term benefits include Australian accrued long-term leave (for Mr Field in FY17 and estimated FY18) and amount for deferred compensation plans (for Messrs Schmiedel and Skurnac).
5 Share-based payments represent the accounting expense (as computed pursuant to AASB 2 Share-based Payments) recognised by the Company for share-based awards.6 Executives received their cash payments in United States dollars.7 Former Executives departed from the Company on 3 August 2017 as Group CEO and Group CFO respectively. The figures presented in this table are based on a three-
month notice period and finalised separation arrangements. The termination benefits listed for the Former Executives represent severance payments equal to twelve months of their respective base salaries.
8 Mr Mikkelsen joined the Company on 29 January 2018.
53DIRECTORS’ REPORT SIMSMM.COM
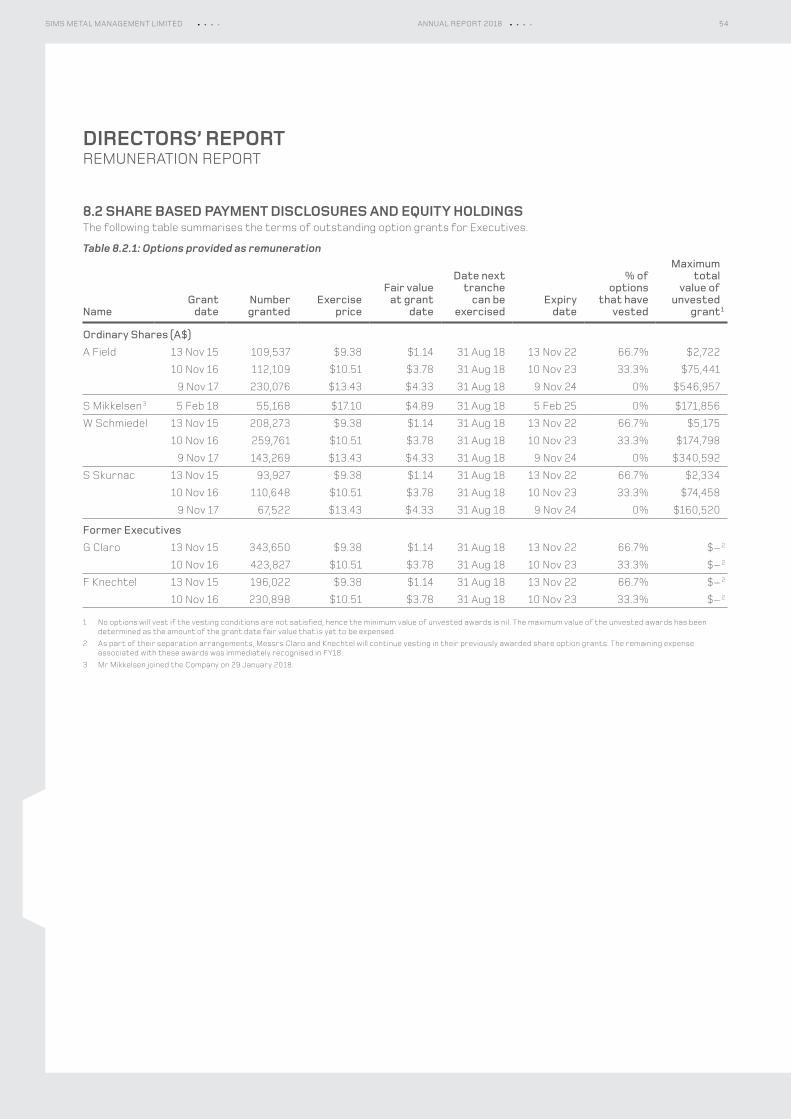
DIRECTORS’ REPORTREMUNERATION REPORT
8.2 SHARE BASED PAYMENT DISCLOSURES AND EQUITY HOLDINGSThe following table summarises the terms of outstanding option grants for Executives.
Table 8.2.1: Options provided as remuneration
NameGrant
dateNumber
grantedExercise
price
Fair value at grant
date
Date next tranche
can be exercised
Expirydate
% of options
that havevested
Maximumtotal
value of unvested
grant 1
Ordinary Shares (A$)A Field 13 Nov 15 109,537 $9.38 $1.14 31 Aug 18 13 Nov 22 66.7% $2,722
10 Nov 16 112,109 $10.51 $3.78 31 Aug 18 10 Nov 23 33.3% $75,441
9 Nov 17 230,076 $13.43 $4.33 31 Aug 18 9 Nov 24 0% $546,957
S Mikkelsen 3 5 Feb 18 55,168 $17.10 $4.89 31 Aug 18 5 Feb 25 0% $171,856
W Schmiedel 13 Nov 15 208,273 $9.38 $1.14 31 Aug 18 13 Nov 22 66.7% $5,175
10 Nov 16 259,761 $10.51 $3.78 31 Aug 18 10 Nov 23 33.3% $174,798
9 Nov 17 143,269 $13.43 $4.33 31 Aug 18 9 Nov 24 0% $340,592
S Skurnac 13 Nov 15 93,927 $9.38 $1.14 31 Aug 18 13 Nov 22 66.7% $2,334
10 Nov 16 110,648 $10.51 $3.78 31 Aug 18 10 Nov 23 33.3% $74,458
9 Nov 17 67,522 $13.43 $4.33 31 Aug 18 9 Nov 24 0% $160,520
Former ExecutivesG Claro 13 Nov 15 343,650 $9.38 $1.14 31 Aug 18 13 Nov 22 66.7% $– 2
10 Nov 16 423,827 $10.51 $3.78 31 Aug 18 10 Nov 23 33.3% $– 2
F Knechtel 13 Nov 15 196,022 $9.38 $1.14 31 Aug 18 13 Nov 22 66.7% $– 2
10 Nov 16 230,898 $10.51 $3.78 31 Aug 18 10 Nov 23 33.3% $– 2
1 No options will vest if the vesting conditions are not satisfied, hence the minimum value of unvested awards is nil. The maximum value of the unvested awards has been determined as the amount of the grant date fair value that is yet to be expensed.
2 As part of their separation arrangements, Messrs Claro and Knechtel will continue vesting in their previously awarded share option grants. The remaining expense associated with these awards was immediately recognised in FY18.
3 Mr Mikkelsen joined the Company on 29 January 2018.
54SIMS METAL MANAGEMENT LIMITED ANNUAL REPORT 2018
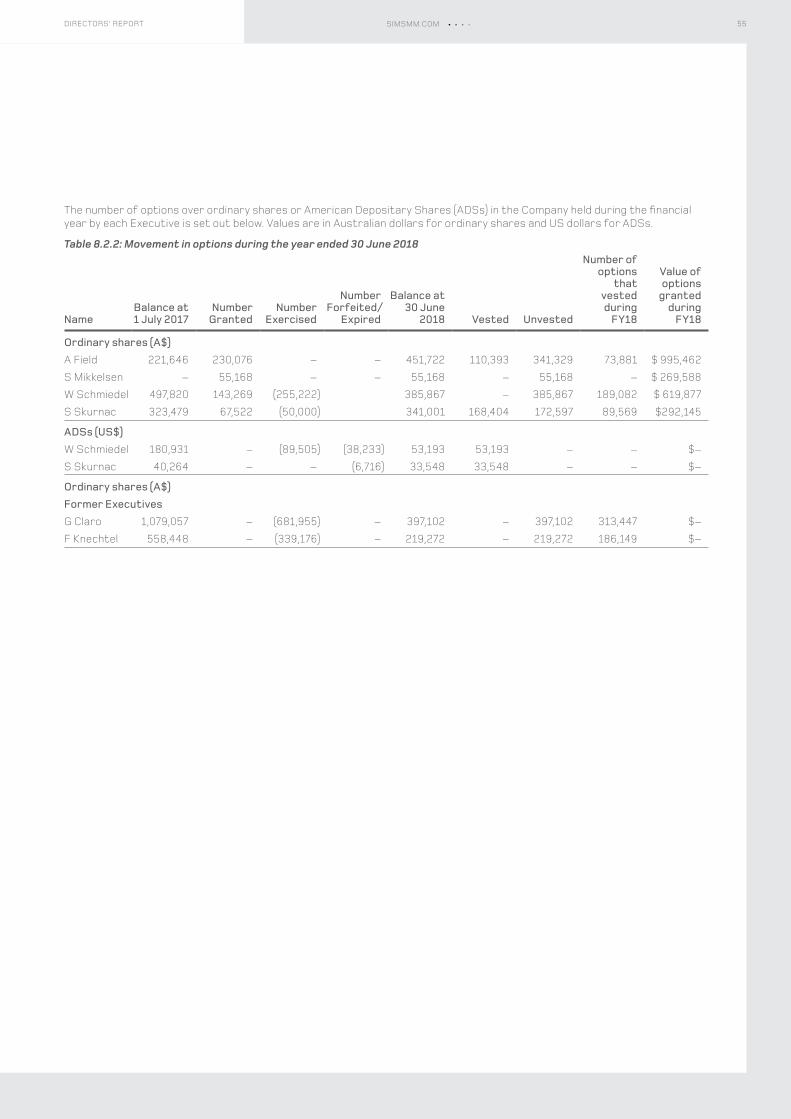
The number of options over ordinary shares or American Depositary Shares (ADSs) in the Company held during the financial year by each Executive is set out below. Values are in Australian dollars for ordinary shares and US dollars for ADSs.
Table 8.2.2: Movement in options during the year ended 30 June 2018
NameBalance at1 July 2017
Number Granted
Number Exercised
Number Forfeited/
Expired
Balance at 30 June
2018 Vested Unvested
Number of options
that vested during
FY18
Value of options
granted during
FY18
Ordinary shares (A$)A Field 221,646 230,076 – – 451,722 110,393 341,329 73,881 $ 995,462
S Mikkelsen – 55,168 – – 55,168 – 55,168 – $ 269,588
W Schmiedel 497,820 143,269 (255,222) 385,867 – 385,867 189,082 $ 619,877
S Skurnac 323,479 67,522 (50,000) 341,001 168,404 172,597 89,569 $292,145
ADSs (US$)W Schmiedel 180,931 – (89,505) (38,233) 53,193 53,193 – – $–
S Skurnac 40,264 – – (6,716) 33,548 33,548 – – $–
Ordinary shares (A$)Former ExecutivesG Claro 1,079,057 – (681,955) – 397,102 – 397,102 313,447 $–
F Knechtel 558,448 – (339,176) – 219,272 – 219,272 186,149 $–
55DIRECTORS’ REPORT SIMSMM.COM
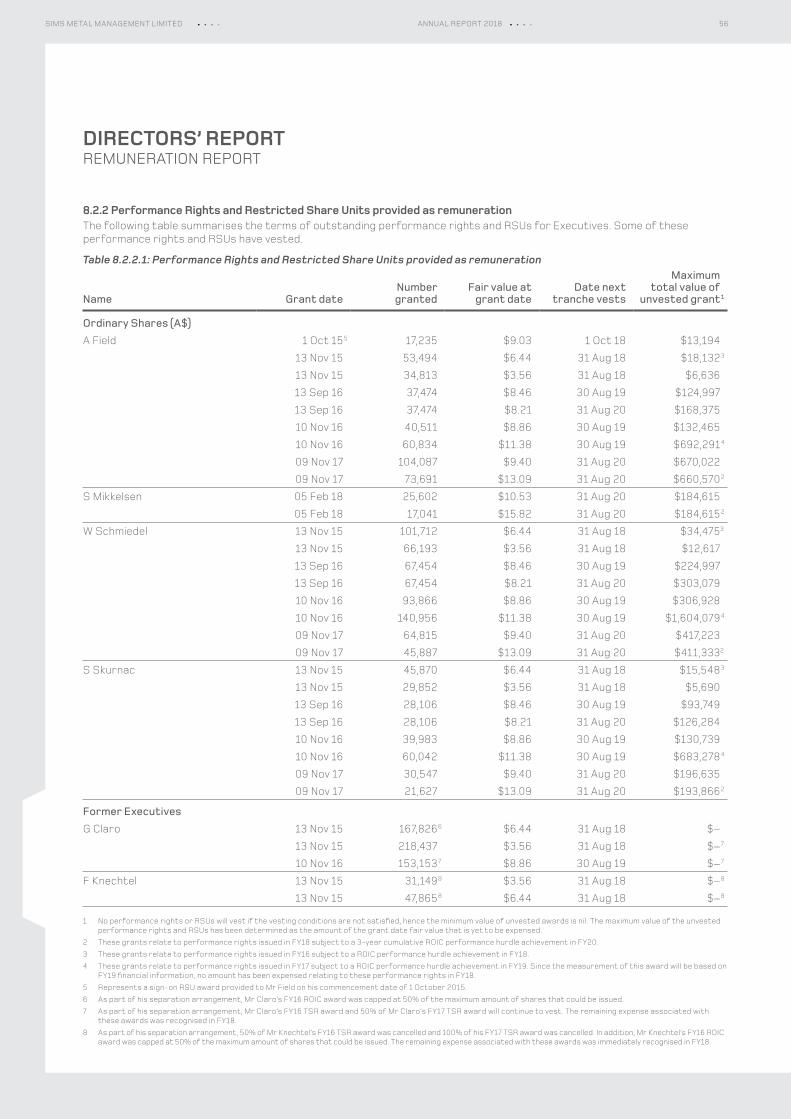
DIRECTORS’ REPORTREMUNERATION REPORT
8.2.2 Performance Rights and Restricted Share Units provided as remunerationThe following table summarises the terms of outstanding performance rights and RSUs for Executives. Some of these performance rights and RSUs have vested.
Table 8.2.2.1: Performance Rights and Restricted Share Units provided as remuneration
Name Grant dateNumber granted
Fair value at grant date
Date next tranche vests
Maximum total value of
unvested grant 1
Ordinary Shares (A$)A Field 1 Oct 15 5 17,235 $9.03 1 Oct 18 $13,194
13 Nov 15 53,494 $6.44 31 Aug 18 $18,132 3
13 Nov 15 34,813 $3.56 31 Aug 18 $6,636
13 Sep 16 37,474 $8.46 30 Aug 19 $124,997
13 Sep 16 37,474 $8.21 31 Aug 20 $168,375
10 Nov 16 40,511 $8.86 30 Aug 19 $132,465
10 Nov 16 60,834 $11.38 30 Aug 19 $692,291 4
09 Nov 17 104,087 $9.40 31 Aug 20 $670,022
09 Nov 17 73,691 $13.09 31 Aug 20 $660,570 2
S Mikkelsen 05 Feb 18 25,602 $10.53 31 Aug 20 $184,615
05 Feb 18 17,041 $15.82 31 Aug 20 $184,615 2
W Schmiedel 13 Nov 15 101,712 $6.44 31 Aug 18 $34,475
3
13 Nov 15 66,193 $3.56 31 Aug 18 $12,617
13 Sep 16 67,454 $8.46 30 Aug 19 $224,997
13 Sep 16 67,454 $8.21 31 Aug 20 $303,079
10 Nov 16 93,866 $8.86 30 Aug 19 $306,928
10 Nov 16 140,956 $11.38 30 Aug 19 $1,604,079 4
09 Nov 17 64,815 $9.40 31 Aug 20 $417,223
09 Nov 17 45,887 $13.09 31 Aug 20 $411,333
2
S Skurnac 13 Nov 15 45,870 $6.44 31 Aug 18 $15,548 3
13 Nov 15 29,852 $3.56 31 Aug 18 $5,690
13 Sep 16 28,106 $8.46 30 Aug 19 $93,749
13 Sep 16 28,106 $8.21 31 Aug 20 $126,284
10 Nov 16 39,983 $8.86 30 Aug 19 $130,739
10 Nov 16 60,042 $11.38 30 Aug 19 $683,278 4
09 Nov 17 30,547 $9.40 31 Aug 20 $196,635
09 Nov 17 21,627 $13.09 31 Aug 20 $193,866 2
Former ExecutivesG Claro 13 Nov 15 167,826 6 $6.44 31 Aug 18 $–
13 Nov 15 218,437 $3.56 31 Aug 18 $– 7
10 Nov 16 153,153 7 $8.86 30 Aug 19 $– 7
F Knechtel 13 Nov 15 31,149 8 $3.56 31 Aug 18 $– 8
13 Nov 15 47,865 8 $6.44 31 Aug 18 $– 8
1 No performance rights or RSUs will vest if the vesting conditions are not satisfied, hence the minimum value of unvested awards is nil. The maximum value of the unvested performance rights and RSUs has been determined as the amount of the grant date fair value that is yet to be expensed.
2 These grants relate to performance rights issued in FY18 subject to a 3-year cumulative ROIC performance hurdle achievement in FY20. 3 These grants relate to performance rights issued in FY16 subject to a ROIC performance hurdle achievement in FY18. 4 These grants relate to performance rights issued in FY17 subject to a ROIC performance hurdle achievement in FY19. Since the measurement of this award will be based on
FY19 financial information, no amount has been expensed relating to these performance rights in FY18.5 Represents a sign-on RSU award provided to Mr Field on his commencement date of 1 October 2015.6 As part of his separation arrangement, Mr Claro’s FY16 ROIC award was capped at 50% of the maximum amount of shares that could be issued.7 As part of his separation arrangement, Mr Claro’s FY16 TSR award and 50% of Mr Claro’s FY17 TSR award will continue to vest. The remaining expense associated with
these awards was recognised in FY18. 8 As part of his separation arrangement, 50% of Mr Knechtel’s FY16 TSR award was cancelled and 100% of his FY17 TSR award was cancelled. In addition, Mr Knechtel’s FY16 ROIC
award was capped at 50% of the maximum amount of shares that could be issued. The remaining expense associated with these awards was immediately recognised in FY18.
56SIMS METAL MANAGEMENT LIMITED ANNUAL REPORT 2018
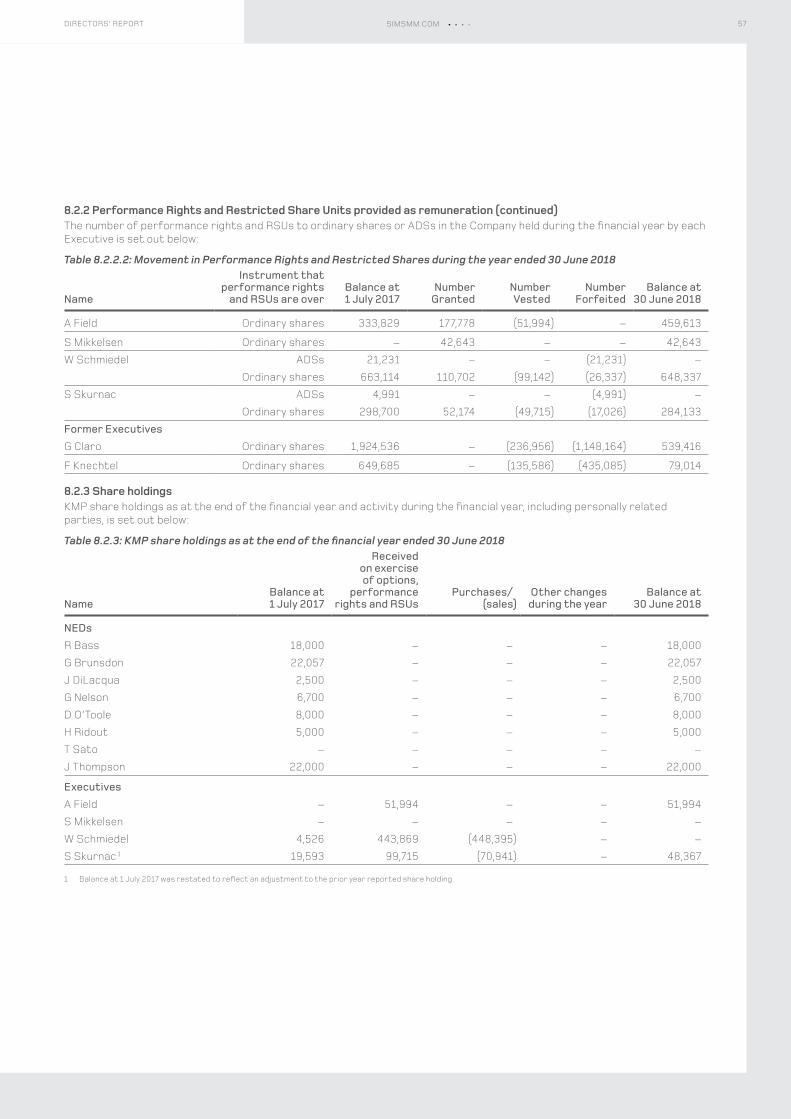
8.2.2 Performance Rights and Restricted Share Units provided as remuneration (continued)The number of performance rights and RSUs to ordinary shares or ADSs in the Company held during the financial year by each Executive is set out below:
Table 8.2.2.2: Movement in Performance Rights and Restricted Shares during the year ended 30 June 2018
Name
Instrument that performance rights
and RSUs are overBalance at1 July 2017
Number Granted
Number Vested
Number Forfeited
Balance at30 June 2018
A Field Ordinary shares 333,829 177,778 (51,994) – 459,613
S Mikkelsen Ordinary shares – 42,643 – – 42,643
W Schmiedel ADSs 21,231 – – (21,231) –
Ordinary shares 663,114 110,702 (99,142) (26,337) 648,337
S Skurnac ADSs 4,991 – – (4,991) –
Ordinary shares 298,700 52,174 (49,715) (17,026) 284,133
Former ExecutivesG Claro Ordinary shares 1,924,536 – (236,956) (1,148,164) 539,416
F Knechtel Ordinary shares 649,685 – (135,586) (435,085) 79,014
8.2.3 Share holdingsKMP share holdings as at the end of the financial year and activity during the financial year, including personally related parties, is set out below:
Table 8.2.3: KMP share holdings as at the end of the financial year ended 30 June 2018
NameBalance at1 July 2017
Received on exercise of options,
performance rights and RSUs
Purchases/ (sales)
Other changes during the year
Balance at30 June 2018
NEDsR Bass 18,000 – – – 18,000
G Brunsdon 22,057 – – – 22,057
J DiLacqua 2,500 – – – 2,500
G Nelson 6,700 – – – 6,700
D O’Toole 8,000 – – – 8,000
H Ridout 5,000 – – – 5,000
T Sato – – – – –
J Thompson 22,000 – – – 22,000
ExecutivesA Field – 51,994 – – 51,994
S Mikkelsen – – – – –
W Schmiedel 4,526 443,869 (448,395) – –
S Skurnac 1 19,593 99,715 (70,941) – 48,367
1 Balance at 1 July 2017 was restated to reflect an adjustment to the prior year reported share holding.
57DIRECTORS’ REPORT SIMSMM.COM
DIRECTORS’ REPORTREMUNERATION REPORT
8.3 OTHER TRANSACTIONS WITH KMPTransactions entered into with any KMP of the Group, including their personally related parties, are at normal commercial terms.
Mr Sato serves as the representative director for Mitsui & Co. In FY17, the Company paid to Mitsui & Co in NED fees of A$73,141 (FY18: nil) as up until 30 November 2016, his NED fees were paid to a Mitsui & Co affiliate in Australia.
8.4 LEGACY LTI GRANTSThe FY16 LTI award, consisting of a relative TSR and ROIC portions, was tested on 30 June 2018, following the end of the performance period as outlined in Section 4. Section 8.2. summarises LTI grants that remain unvested, as well as their vesting dates.
This report is made in accordance with a resolution of the Board of Directors and is signed for and on behalf of the Board of Directors.
G N Brunsdon A Field Chairperson Managing Director and Group CEO Sydney Rye, New York
24 August 2018 23 August 2018
58SIMS METAL MANAGEMENT LIMITED ANNUAL REPORT 2018
Consolidated Income Statements for the year ended 30 June 2018 60
Consolidated Statements of Comprehensive Income for the year ended 30 June 2018 61
Consolidated Statements of Financial Position as at 30 June 2018 62
Consolidated Statements of Changes in Equity for the year ended 30 June 2018 63
Consolidated Statements of Cash Flows for the year ended 30 June 2018 64
Notes to the Consolidated Financial StatementsOVERVIEW
1 Basis of preparation 65
FINANCIAL PERFORMANCE2 Segment information 66
3 Revenue and other income 68
4 Significant items 68
5 Expenses 69
6 Dividends 69
7 Earnings per share 69
ASSETS AND LIABILITIES8 Trade and other receivables 70
9 Inventories 70
10 Property, plant and equipment 71
11 Intangible assets 72
12 Income taxes 75
13 Trade and other payables 78
14 Provisions 79
15 Retirement benefit obligations 80
16 Other financial assets and liabilities 82
CAPITAL STRUCTURE AND RISK MANAGEMENT17 Cash and cash equivalents 83
18 Borrowings 84
19 Contributed equity 84
20 Reserves and accumulated deficit 85
21 Financial risk management 86
GROUP STRUCTURE22 Business disposals and business acquisitions 90
23 Subsidiaries 92
24 Interests in other entities 96
25 Parent entity information 98
OTHER DISCLOSURES26 Share-based payments 99
27 Key management personnel 102
28 Commitments and contingencies 103
29 Remuneration of auditors 103
30 New accounting standards not yet applicable 103
31 Assets held for sale 105
FINANCIAL REPORT CONTENTS
59FINANCIAL STATEMENTS SIMSMM.COM
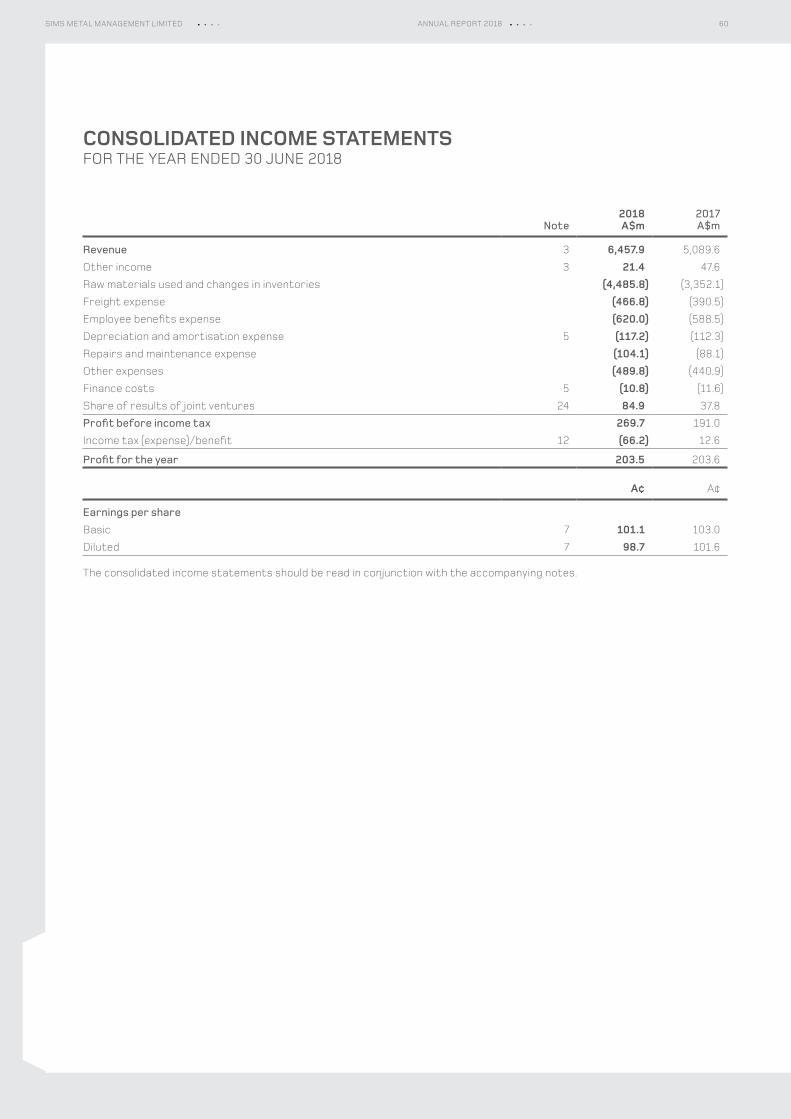
CONSOLIDATED INCOME STATEMENTSFOR THE YEAR ENDED 30 JUNE 2018
Note2018A$m
2017A$m
Revenue 3 6,457.9 5,089.6
Other income 3 21.4 47.6
Raw materials used and changes in inventories (4,485.8) (3,352.1)
Freight expense (466.8) (390.5)
Employee benefits expense (620.0) (588.5)
Depreciation and amortisation expense 5 (117.2) (112.3)
Repairs and maintenance expense (104.1) (88.1)
Other expenses (489.8) (440.9)
Finance costs 5 (10.8) (11.6)
Share of results of joint ventures 24 84.9 37.8
Profit before income tax 269.7 191.0
Income tax (expense)/benefit 12 (66.2) 12.6
Profit for the year 203.5 203.6
A¢ A¢
Earnings per shareBasic 7 101.1 103.0
Diluted 7 98.7 101.6
The consolidated income statements should be read in conjunction with the accompanying notes.
60SIMS METAL MANAGEMENT LIMITED ANNUAL REPORT 2018
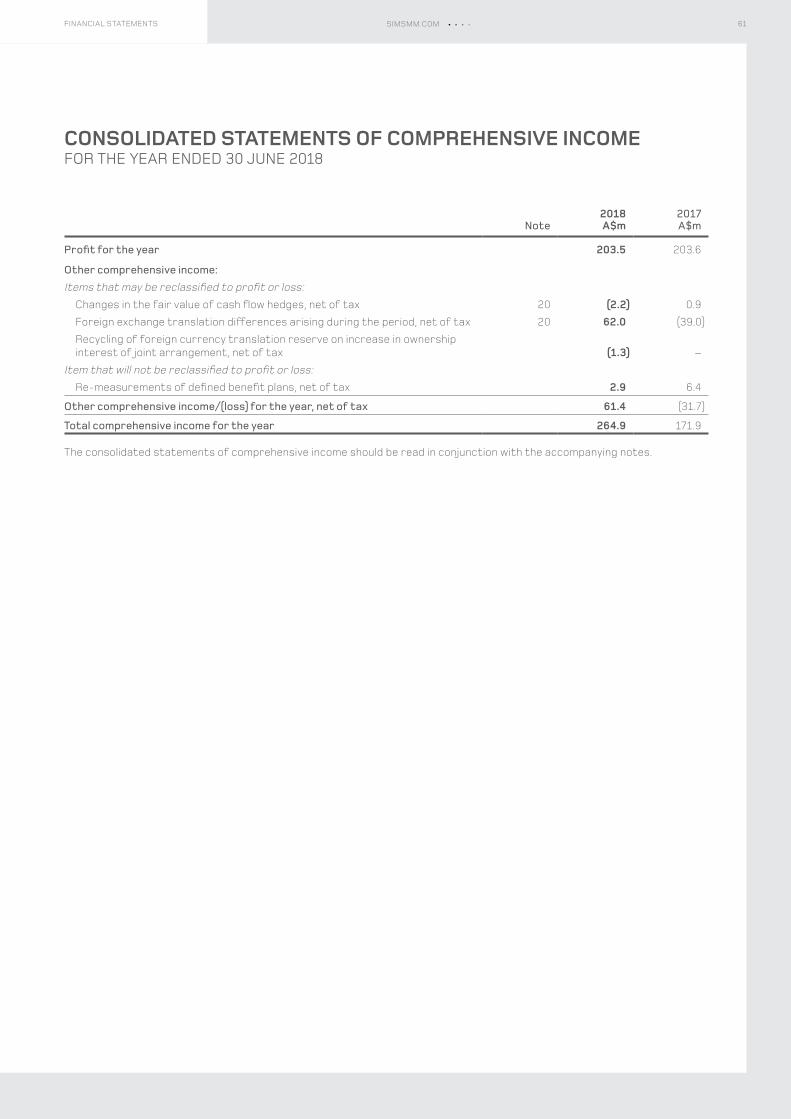
Note2018A$m
2017A$m
Profit for the year 203.5 203.6
Other comprehensive income:Items that may be reclassified to profit or loss: Changes in the fair value of cash flow hedges, net of tax 20 (2.2) 0.9
Foreign exchange translation differences arising during the period, net of tax 20 62.0 (39.0)
Recycling of foreign currency translation reserve on increase in ownership interest of joint arrangement, net of tax (1.3) –
Item that will not be reclassified to profit or loss: Re-measurements of defined benefit plans, net of tax 2.9 6.4
Other comprehensive income/(loss) for the year, net of tax 61.4 (31.7)
Total comprehensive income for the year 264.9 171.9
The consolidated statements of comprehensive income should be read in conjunction with the accompanying notes.
CONSOLIDATED STATEMENTS OF COMPREHENSIVE INCOME FOR THE YEAR ENDED 30 JUNE 2018
61FINANCIAL STATEMENTS SIMSMM.COM
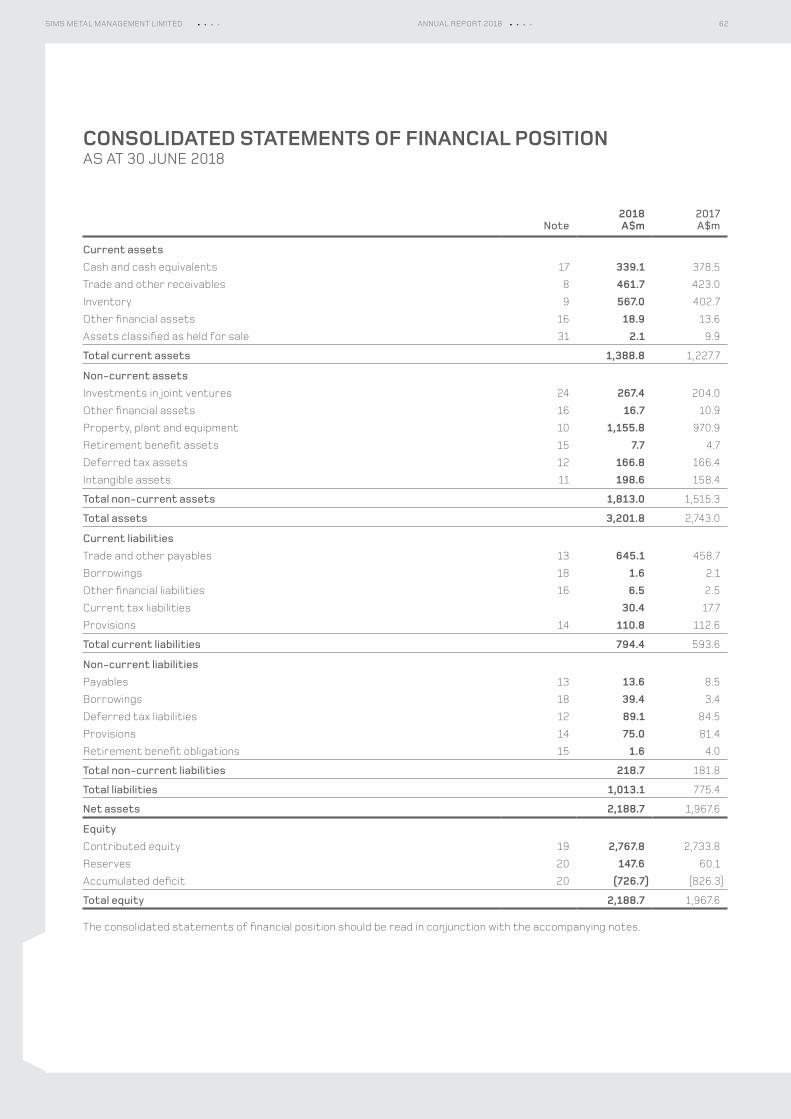
Note2018A$m
2017A$m
Current assetsCash and cash equivalents 17 339.1 378.5
Trade and other receivables 8 461.7 423.0
Inventory 9 567.0 402.7
Other financial assets 16 18.9 13.6
Assets classified as held for sale 31 2.1 9.9
Total current assets 1,388.8 1,227.7
Non-current assetsInvestments in joint ventures 24 267.4 204.0
Other financial assets 16 16.7 10.9
Property, plant and equipment 10 1,155.8 970.9
Retirement benefit assets 15 7.7 4.7
Deferred tax assets 12 166.8 166.4
Intangible assets 11 198.6 158.4
Total non-current assets 1,813.0 1,515.3
Total assets 3,201.8 2,743.0
Current liabilitiesTrade and other payables 13 645.1 458.7
Borrowings 18 1.6 2.1
Other financial liabilities 16 6.5 2.5
Current tax liabilities 30.4 17.7
Provisions 14 110.8 112.6
Total current liabilities 794.4 593.6
Non-current liabilitiesPayables 13 13.6 8.5
Borrowings 18 39.4 3.4
Deferred tax liabilities 12 89.1 84.5
Provisions 14 75.0 81.4
Retirement benefit obligations 15 1.6 4.0
Total non-current liabilities 218.7 181.8
Total liabilities 1,013.1 775.4
Net assets 2,188.7 1,967.6
EquityContributed equity 19 2,767.8 2,733.8
Reserves 20 147.6 60.1
Accumulated deficit 20 (726.7) (826.3)
Total equity 2,188.7 1,967.6
The consolidated statements of financial position should be read in conjunction with the accompanying notes.
CONSOLIDATED STATEMENTS OF FINANCIAL POSITION AS AT 30 JUNE 2018
62SIMS METAL MANAGEMENT LIMITED ANNUAL REPORT 2018
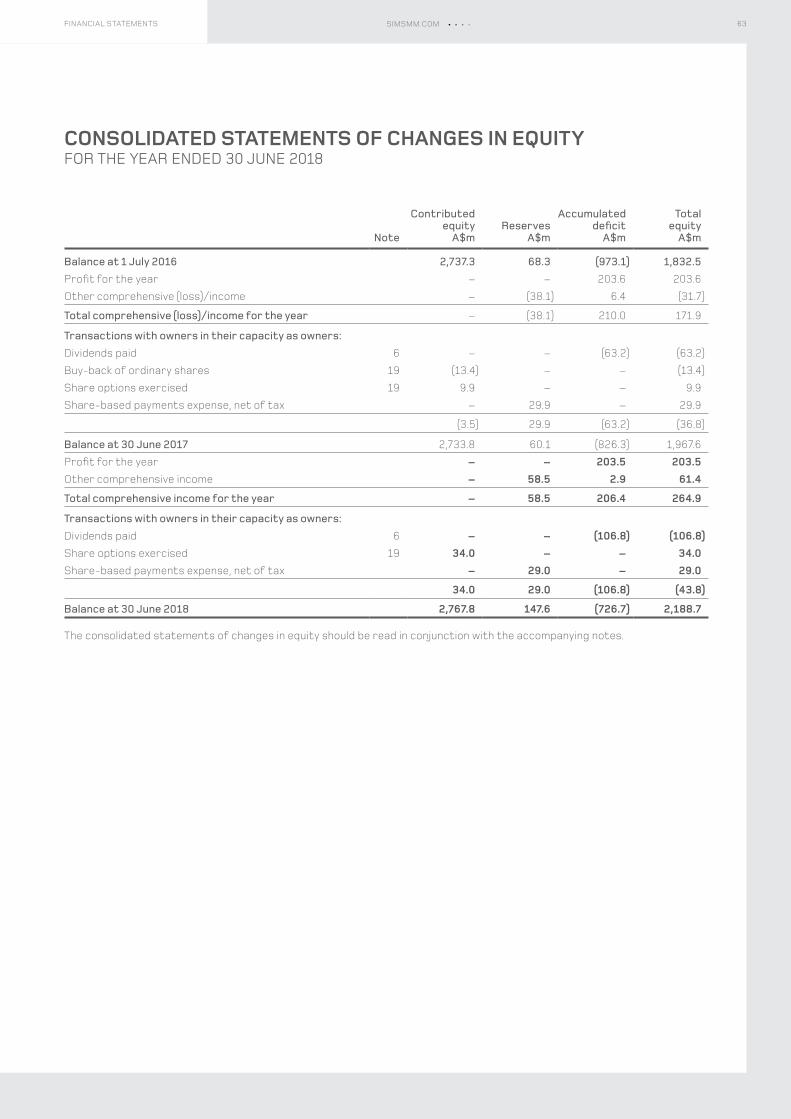
Note
Contributed equity
A$m Reserves
A$m
Accumulated deficit
A$m
Totalequity
A$m
Balance at 1 July 2016 2,737.3 68.3 (973.1) 1,832.5Profit for the year – – 203.6 203.6
Other comprehensive (loss)/income – (38.1) 6.4 (31.7)
Total comprehensive (loss)/income for the year – (38.1) 210.0 171.9
Transactions with owners in their capacity as owners:Dividends paid 6 – – (63.2) (63.2)
Buy-back of ordinary shares 19 (13.4) – – (13.4)
Share options exercised 19 9.9 – – 9.9
Share-based payments expense, net of tax – 29.9 – 29.9
(3.5) 29.9 (63.2) (36.8)
Balance at 30 June 2017 2,733.8 60.1 (826.3) 1,967.6
Profit for the year – – 203.5 203.5Other comprehensive income – 58.5 2.9 61.4
Total comprehensive income for the year – 58.5 206.4 264.9
Transactions with owners in their capacity as owners:Dividends paid 6 – – (106.8) (106.8)Share options exercised 19 34.0 – – 34.0Share-based payments expense, net of tax – 29.0 – 29.0
34.0 29.0 (106.8) (43.8)
Balance at 30 June 2018 2,767.8 147.6 (726.7) 2,188.7
The consolidated statements of changes in equity should be read in conjunction with the accompanying notes.
CONSOLIDATED STATEMENTS OF CHANGES IN EQUITY FOR THE YEAR ENDED 30 JUNE 2018
63FINANCIAL STATEMENTS SIMSMM.COM
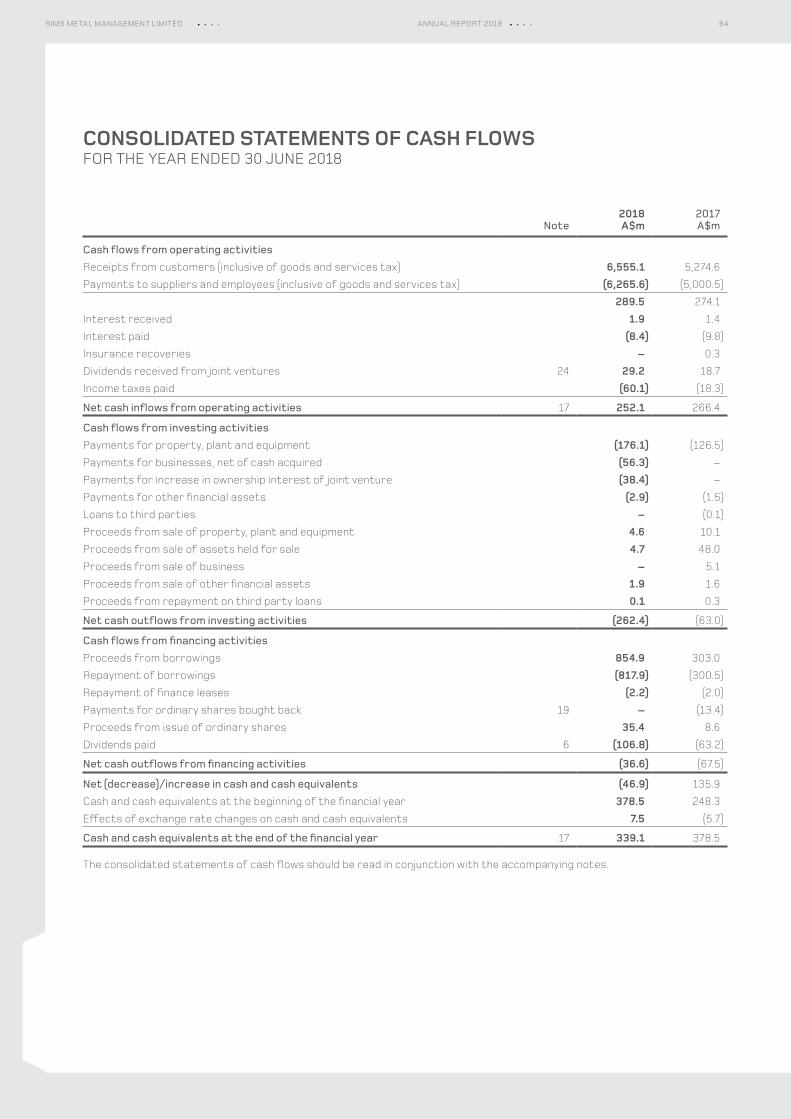
Note2018A$m
2017A$m
Cash flows from operating activitiesReceipts from customers (inclusive of goods and services tax) 6,555.1 5,274.6
Payments to suppliers and employees (inclusive of goods and services tax) (6,265.6) (5,000.5)
289.5 274.1
Interest received 1.9 1.4
Interest paid (8.4) (9.8)
Insurance recoveries – 0.3
Dividends received from joint ventures 24 29.2 18.7
Income taxes paid (60.1) (18.3)
Net cash inflows from operating activities 17 252.1 266.4
Cash flows from investing activitiesPayments for property, plant and equipment (176.1) (126.5)
Payments for businesses, net of cash acquired (56.3) –
Payments for increase in ownership interest of joint venture (38.4) –
Payments for other financial assets (2.9) (1.5)
Loans to third parties – (0.1)
Proceeds from sale of property, plant and equipment 4.6 10.1
Proceeds from sale of assets held for sale 4.7 48.0
Proceeds from sale of business – 5.1
Proceeds from sale of other financial assets 1.9 1.6
Proceeds from repayment on third party loans 0.1 0.3
Net cash outflows from investing activities (262.4) (63.0)
Cash flows from financing activitiesProceeds from borrowings 854.9 303.0
Repayment of borrowings (817.9) (300.5)
Repayment of finance leases (2.2) (2.0)
Payments for ordinary shares bought back 19 – (13.4)
Proceeds from issue of ordinary shares 35.4 8.6
Dividends paid 6 (106.8) (63.2)
Net cash outflows from financing activities (36.6) (67.5)
Net (decrease)/increase in cash and cash equivalents (46.9) 135.9
Cash and cash equivalents at the beginning of the financial year 378.5 248.3
Effects of exchange rate changes on cash and cash equivalents 7.5 (5.7)
Cash and cash equivalents at the end of the financial year 17 339.1 378.5
The consolidated statements of cash flows should be read in conjunction with the accompanying notes.
CONSOLIDATED STATEMENTS OF CASH FLOWS FOR THE YEAR ENDED 30 JUNE 2018
64SIMS METAL MANAGEMENT LIMITED ANNUAL REPORT 2018
OVERVIEW1 – BASIS OF PREPARATIONSims Metal Management Limited (the “Company”) is a for-profit company incorporated and domiciled in Australia. The consolidated financial statements for the year ended 30 June 2018 comprise the Company and its subsidiaries (together referred to as the “Group”) and the Group’s interest in joint ventures.
Basis of preparationThis general purpose financial report:
– has been prepared in accordance with Australian Accounting Standards, other authoritative pronouncements of the Australian Accounting Standards Board (“AASB”) and the Corporations Act 2001;
– has been prepared on the basis of historical cost, except for certain financial assets and liabilities which have been measured at fair value (note 21);
– complies with International Financial Reporting Standards as issued by the International Accounting Standards Board;
– is presented in Australian Dollars; – presents all values as rounded to the nearest tenth of
a million dollars, unless otherwise stated under ASIC Corporations (rounding in Financials/Directors’ Reports) Instrument 2016/191, dated 24 March 2016;
– adopts all new and amended Australian Accounting Standards and Interpretations issued by the AASB that are relevant to the Group and effective for reporting periods beginning on or after 1 July 2017, all of which did not have a material impact on the financial statements; and
– does not early adopt any Australian Accounting Standards and Interpretations that have been issued or amended but are not yet effective. Refer to note 30.
Basis of consolidationThe consolidated financial statements incorporate the financial statements of the Company and entities controlled by the Company and its subsidiaries.
In preparing the consolidated financial statements, all intercompany balances and transactions are eliminated.
The financial statements of controlled entities are included in the consolidated financial statements from the date that control commences until the date that control ceases.
Critical accounting estimates and judgementsThe preparation of the consolidated financial statements requires management to make judgements, estimates and assumptions about future events. Information on material estimates and judgements can be found in the following notes:
– Revenue (note 3) – Inventory (note 9) – Impairments (note 11)
CurrencyEach entity in the Group determines its own functional currency, reflecting the currency of the primary economic environment in which it operates.
TransactionsTransactions in foreign currencies are recorded at the rate of exchange ruling on the date of each transaction. At balance date, amounts payable and receivable in foreign currencies are converted at the rates of exchange ruling at that date with any resultant gain or loss recognised in the income statement.
TranslationThe financial statements of overseas subsidiaries are maintained in their functional currencies and are converted to the Group’s presentation currency as follows:
– assets and liabilities are translated at the rate of exchange as at balance date;
– income statements are translated at average exchange rates for the reporting period which approximate the rates ruling at the dates of the transactions; and
– all resultant exchange differences are recorded in the foreign currency translation reserve.
On consolidation, exchange differences arising from borrowings and any other currency instruments designated as hedges of investments in overseas subsidiaries, are transferred to the foreign currency translation reserve on a net of tax basis where applicable. When an overseas subsidiary is sold, the cumulative amount recognised in the foreign currency translation reserve relating to the subsidiary is recognised in the income statement as part of the gain or loss on sale.
NOTES TO THE CONSOLIDATED FINANCIAL STATEMENTSFOR THE YEAR ENDED 30 JUNE 2018
65FINANCIAL STATEMENTS SIMSMM.COM
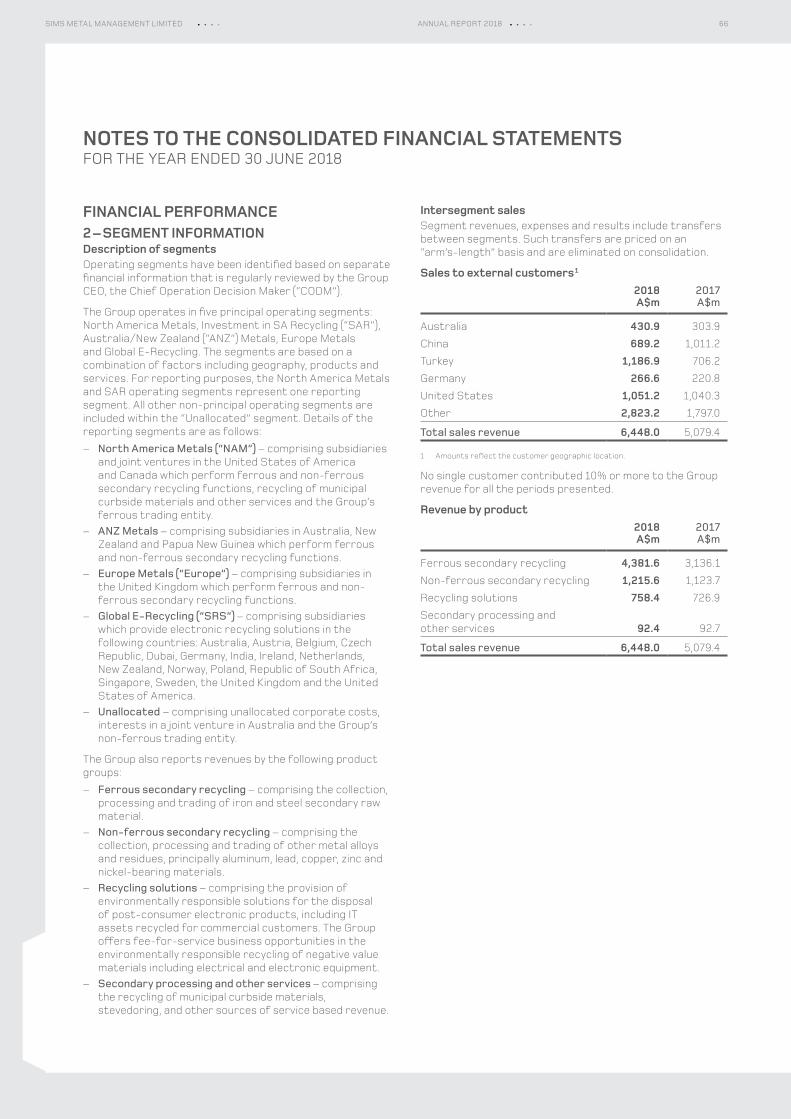
NOTES TO THE CONSOLIDATED FINANCIAL STATEMENTSFOR THE YEAR ENDED 30 JUNE 2018
FINANCIAL PERFORMANCE2 – SEGMENT INFORMATIONDescription of segmentsOperating segments have been identified based on separate financial information that is regularly reviewed by the Group CEO, the Chief Operation Decision Maker (“CODM”).
The Group operates in five principal operating segments: North America Metals, Investment in SA Recycling (“SAR”), Australia/New Zealand (“ANZ”) Metals, Europe Metals and Global E-Recycling. The segments are based on a combination of factors including geography, products and services. For reporting purposes, the North America Metals and SAR operating segments represent one reporting segment. All other non-principal operating segments are included within the “Unallocated” segment. Details of the reporting segments are as follows:
– North America Metals (“NAM”) – comprising subsidiaries and joint ventures in the United States of America and Canada which perform ferrous and non-ferrous secondary recycling functions, recycling of municipal curbside materials and other services and the Group’s ferrous trading entity.
– ANZ Metals – comprising subsidiaries in Australia, New Zealand and Papua New Guinea which perform ferrous and non-ferrous secondary recycling functions.
– Europe Metals (“Europe”) – comprising subsidiaries in the United Kingdom which perform ferrous and non-ferrous secondary recycling functions.
– Global E-Recycling (“SRS”) – comprising subsidiaries which provide electronic recycling solutions in the following countries: Australia, Austria, Belgium, Czech Republic, Dubai, Germany, India, Ireland, Netherlands, New Zealand, Norway, Poland, Republic of South Africa, Singapore, Sweden, the United Kingdom and the United States of America.
– Unallocated – comprising unallocated corporate costs, interests in a joint venture in Australia and the Group’s non-ferrous trading entity.
The Group also reports revenues by the following product groups:
– Ferrous secondary recycling – comprising the collection, processing and trading of iron and steel secondary raw material.
– Non-ferrous secondary recycling – comprising the collection, processing and trading of other metal alloys and residues, principally aluminum, lead, copper, zinc and nickel-bearing materials.
– Recycling solutions – comprising the provision of environmentally responsible solutions for the disposal of post-consumer electronic products, including IT assets recycled for commercial customers. The Group offers fee-for-service business opportunities in the environmentally responsible recycling of negative value materials including electrical and electronic equipment.
– Secondary processing and other services – comprising the recycling of municipal curbside materials, stevedoring, and other sources of service based revenue.
Intersegment salesSegment revenues, expenses and results include transfers between segments. Such transfers are priced on an “arm’s-length” basis and are eliminated on consolidation.
Sales to external customers 1
2018A$m
2017A$m
Australia 430.9 303.9
China 689.2 1,011.2
Turkey 1,186.9 706.2
Germany 266.6 220.8
United States 1,051.2 1,040.3
Other 2,823.2 1,797.0
Total sales revenue 6,448.0 5,079.4
1 Amounts reflect the customer geographic location.
No single customer contributed 10% or more to the Group revenue for all the periods presented.
Revenue by product2018A$m
2017A$m
Ferrous secondary recycling 4,381.6 3,136.1
Non-ferrous secondary recycling 1,215.6 1,123.7
Recycling solutions 758.4 726.9
Secondary processing and other services 92.4 92.7
Total sales revenue 6,448.0 5,079.4
66SIMS METAL MANAGEMENT LIMITED ANNUAL REPORT 2018
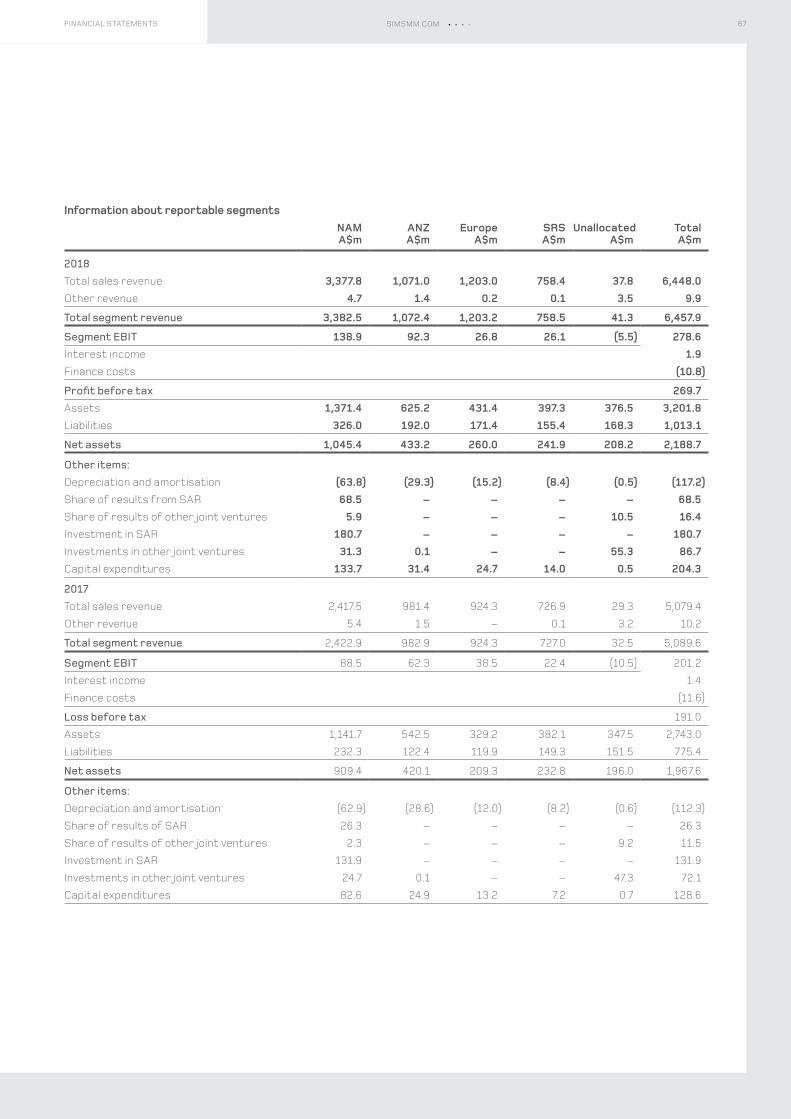
Information about reportable segmentsNAMA$m
ANZA$m
EuropeA$m
SRSA$m
UnallocatedA$m
TotalA$m
2018Total sales revenue 3,377.8 1,071.0 1,203.0 758.4 37.8 6,448.0Other revenue 4.7 1.4 0.2 0.1 3.5 9.9
Total segment revenue 3,382.5 1,072.4 1,203.2 758.5 41.3 6,457.9
Segment EBIT 138.9 92.3 26.8 26.1 (5.5) 278.6Interest income 1.9Finance costs (10.8)
Profit before tax 269.7Assets 1,371.4 625.2 431.4 397.3 376.5 3,201.8Liabilities 326.0 192.0 171.4 155.4 168.3 1,013.1
Net assets 1,045.4 433.2 260.0 241.9 208.2 2,188.7
Other items: Depreciation and amortisation (63.8) (29.3) (15.2) (8.4) (0.5) (117.2)Share of results from SAR 68.5 – – – – 68.5Share of results of other joint ventures 5.9 – – – 10.5 16.4Investment in SAR 180.7 – – – – 180.7Investments in other joint ventures 31.3 0.1 – – 55.3 86.7Capital expenditures 133.7 31.4 24.7 14.0 0.5 204.3
2017Total sales revenue 2,417.5 981.4 924.3 726.9 29.3 5,079.4
Other revenue 5.4 1.5 – 0.1 3.2 10.2
Total segment revenue 2,422.9 982.9 924.3 727.0 32.5 5,089.6
Segment EBIT 88.5 62.3 38.5 22.4 (10.5) 201.2
Interest income 1.4
Finance costs (11.6)
Loss before tax 191.0
Assets 1,141.7 542.5 329.2 382.1 347.5 2,743.0
Liabilities 232.3 122.4 119.9 149.3 151.5 775.4
Net assets 909.4 420.1 209.3 232.8 196.0 1,967.6
Other items: Depreciation and amortisation (62.9) (28.6) (12.0) (8.2) (0.6) (112.3)
Share of results of SAR 26.3 – – – – 26.3
Share of results of other joint ventures 2.3 – – – 9.2 11.5
Investment in SAR 131.9 – – – – 131.9
Investments in other joint ventures 24.7 0.1 – – 47.3 72.1
Capital expenditures 82.6 24.9 13.2 7.2 0.7 128.6
67FINANCIAL STATEMENTS SIMSMM.COM
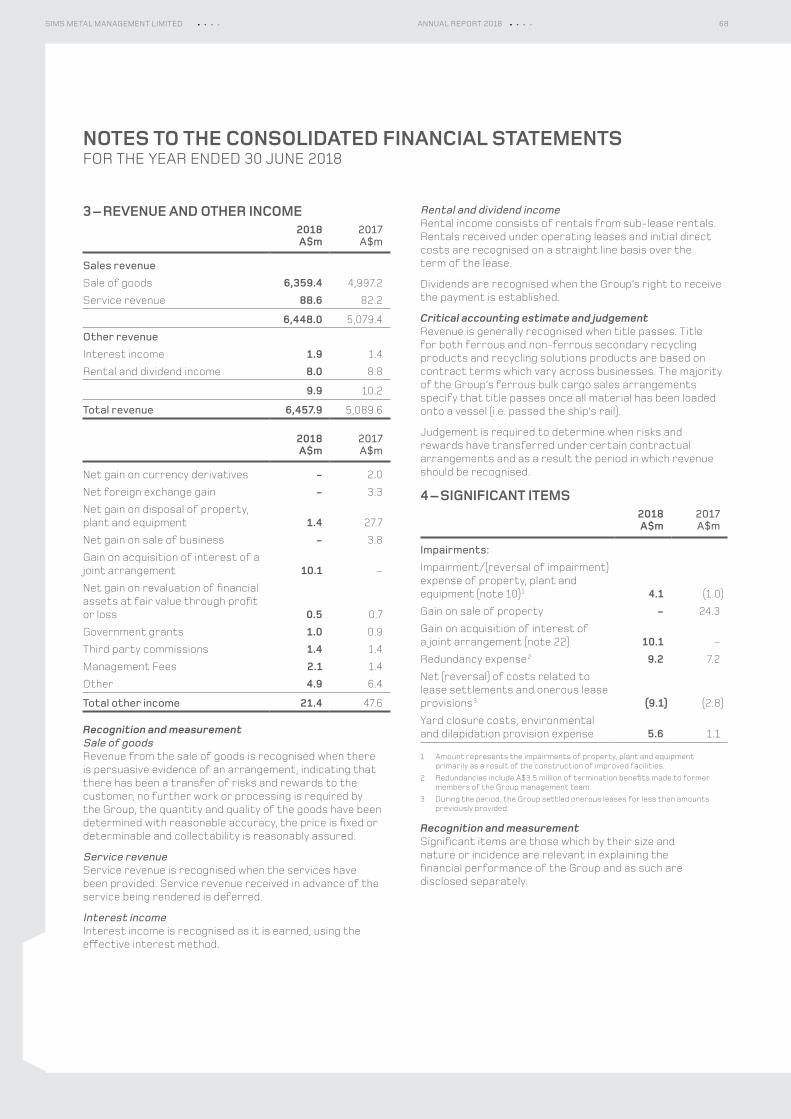
NOTES TO THE CONSOLIDATED FINANCIAL STATEMENTSFOR THE YEAR ENDED 30 JUNE 2018
3 – REVENUE AND OTHER INCOME2018A$m
2017A$m
Sales revenueSale of goods 6,359.4 4,997.2
Service revenue 88.6 82.2
6,448.0 5,079.4
Other revenueInterest income 1.9 1.4
Rental and dividend income 8.0 8.8
9.9 10.2
Total revenue 6,457.9 5,089.6
2018A$m
2017A$m
Net gain on currency derivatives ‑ 2.0
Net foreign exchange gain ‑ 3.3
Net gain on disposal of property, plant and equipment 1.4 27.7
Net gain on sale of business ‑ 3.8
Gain on acquisition of interest of a joint arrangement 10.1 –
Net gain on revaluation of financial assets at fair value through profit or loss 0.5 0.7
Government grants 1.0 0.9
Third party commissions 1.4 1.4
Management Fees 2.1 1.4
Other 4.9 6.4
Total other income 21.4 47.6
Recognition and measurementSale of goodsRevenue from the sale of goods is recognised when there is persuasive evidence of an arrangement, indicating that there has been a transfer of risks and rewards to the customer, no further work or processing is required by the Group, the quantity and quality of the goods have been determined with reasonable accuracy, the price is fixed or determinable and collectability is reasonably assured.
Service revenueService revenue is recognised when the services have been provided. Service revenue received in advance of the service being rendered is deferred.
Interest incomeInterest income is recognised as it is earned, using the effective interest method.
Rental and dividend incomeRental income consists of rentals from sub-lease rentals. Rentals received under operating leases and initial direct costs are recognised on a straight line basis over the term of the lease.
Dividends are recognised when the Group’s right to receive the payment is established.
Critical accounting estimate and judgementRevenue is generally recognised when title passes. Title for both ferrous and non-ferrous secondary recycling products and recycling solutions products are based on contract terms which vary across businesses. The majority of the Group’s ferrous bulk cargo sales arrangements specify that title passes once all material has been loaded onto a vessel (i.e. passed the ship’s rail).
Judgement is required to determine when risks and rewards have transferred under certain contractual arrangements and as a result the period in which revenue should be recognised.
4 – SIGNIFICANT ITEMS2018A$m
2017A$m
Impairments:Impairment/(reversal of impairment) expense of property, plant and equipment (note 10) 1 4.1 (1.0)
Gain on sale of property ‑ 24.3
Gain on acquisition of interest of a joint arrangement (note 22) 10.1 –
Redundancy expense 2 9.2 7.2
Net (reversal) of costs related to lease settlements and onerous lease provisions 3 (9.1) (2.8)
Yard closure costs, environmental and dilapidation provision expense 5.6 1.1
1 Amount represents the impairments of property, plant and equipment primarily as a result of the construction of improved facilities.
2 Redundancies include A$3.5 million of termination benefits made to former members of the Group management team.
3 During the period, the Group settled onerous leases for less than amounts previously provided.
Recognition and measurementSignificant items are those which by their size and nature or incidence are relevant in explaining the financial performance of the Group and as such are disclosed separately.
68SIMS METAL MANAGEMENT LIMITED ANNUAL REPORT 2018
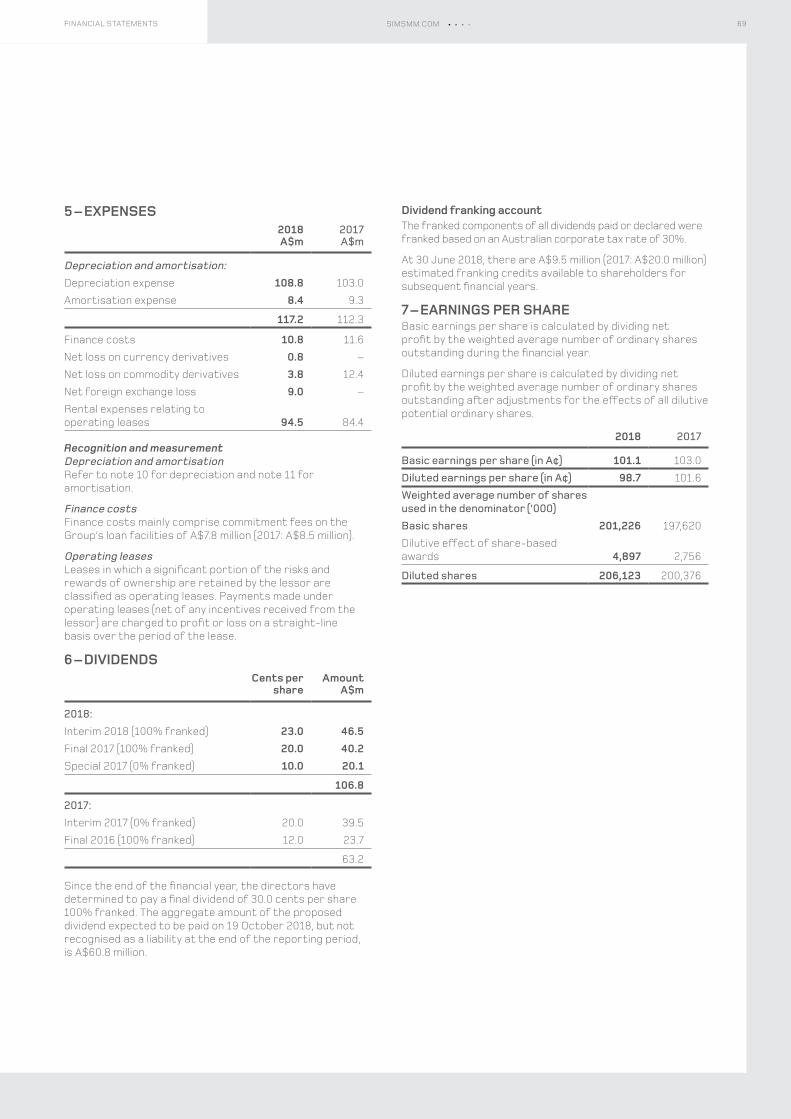
5 – EXPENSES2018A$m
2017A$m
Depreciation and amortisation:Depreciation expense 108.8 103.0
Amortisation expense 8.4 9.3
117.2 112.3
Finance costs 10.8 11.6
Net loss on currency derivatives 0.8 –
Net loss on commodity derivatives 3.8 12.4
Net foreign exchange loss 9.0 –
Rental expenses relating to operating leases 94.5 84.4
Recognition and measurementDepreciation and amortisationRefer to note 10 for depreciation and note 11 for amortisation.
Finance costsFinance costs mainly comprise commitment fees on the Group’s loan facilities of A$7.8 million (2017: A$8.5 million).
Operating leasesLeases in which a significant portion of the risks and rewards of ownership are retained by the lessor are classified as operating leases. Payments made under operating leases (net of any incentives received from the lessor) are charged to profit or loss on a straight-line basis over the period of the lease.
6 – DIVIDENDSCents per
shareAmount
A$m
2018:Interim 2018 (100% franked) 23.0 46.5Final 2017 (100% franked) 20.0 40.2Special 2017 (0% franked) 10.0 20.1
106.8
2017:Interim 2017 (0% franked) 20.0 39.5
Final 2016 (100% franked) 12.0 23.7
63.2
Since the end of the financial year, the directors have determined to pay a final dividend of 30.0 cents per share 100% franked. The aggregate amount of the proposed dividend expected to be paid on 19 October 2018, but not recognised as a liability at the end of the reporting period, is A$60.8 million.
Dividend franking accountThe franked components of all dividends paid or declared were franked based on an Australian corporate tax rate of 30%.
At 30 June 2018, there are A$9.5 million (2017: A$20.0 million) estimated franking credits available to shareholders for subsequent financial years.
7 – EARNINGS PER SHAREBasic earnings per share is calculated by dividing net profit by the weighted average number of ordinary shares outstanding during the financial year.
Diluted earnings per share is calculated by dividing net profit by the weighted average number of ordinary shares outstanding after adjustments for the effects of all dilutive potential ordinary shares.
2018 2017
Basic earnings per share (in A¢) 101.1 103.0
Diluted earnings per share (in A¢) 98.7 101.6
Weighted average number of shares used in the denominator (’000)Basic shares 201,226 197,620
Dilutive effect of share-based awards 4,897 2,756
Diluted shares 206,123 200,376
69FINANCIAL STATEMENTS SIMSMM.COM
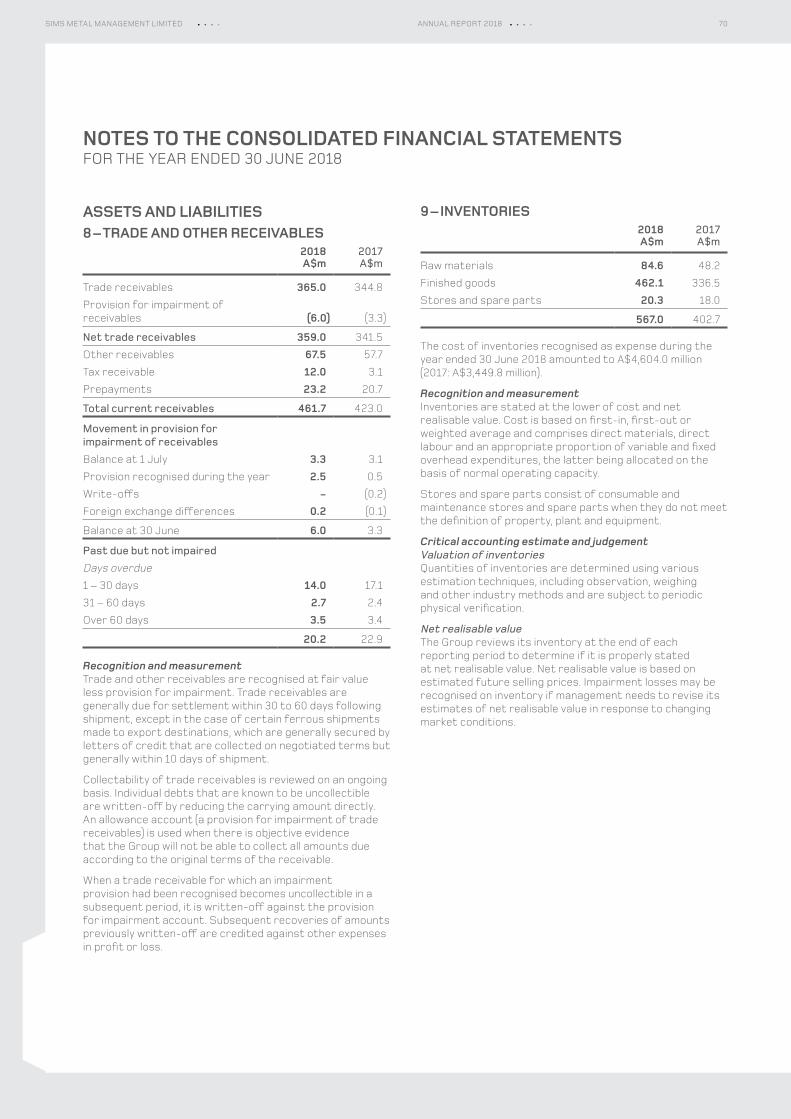
NOTES TO THE CONSOLIDATED FINANCIAL STATEMENTSFOR THE YEAR ENDED 30 JUNE 2018
ASSETS AND LIABILITIES8 – TRADE AND OTHER RECEIVABLES
2018A$m
2017A$m
Trade receivables 365.0 344.8
Provision for impairment of receivables (6.0) (3.3)
Net trade receivables 359.0 341.5
Other receivables 67.5 57.7
Tax receivable 12.0 3.1
Prepayments 23.2 20.7
Total current receivables 461.7 423.0
Movement in provision for impairment of receivablesBalance at 1 July 3.3 3.1
Provision recognised during the year 2.5 0.5
Write-offs ‑ (0.2)
Foreign exchange differences 0.2 (0.1)
Balance at 30 June 6.0 3.3
Past due but not impairedDays overdue1 – 30 days 14.0 17.1
31 – 60 days 2.7 2.4
Over 60 days 3.5 3.4
20.2 22.9
Recognition and measurementTrade and other receivables are recognised at fair value less provision for impairment. Trade receivables are generally due for settlement within 30 to 60 days following shipment, except in the case of certain ferrous shipments made to export destinations, which are generally secured by letters of credit that are collected on negotiated terms but generally within 10 days of shipment.
Collectability of trade receivables is reviewed on an ongoing basis. Individual debts that are known to be uncollectible are written-off by reducing the carrying amount directly. An allowance account (a provision for impairment of trade receivables) is used when there is objective evidence that the Group will not be able to collect all amounts due according to the original terms of the receivable.
When a trade receivable for which an impairment provision had been recognised becomes uncollectible in a subsequent period, it is written-off against the provision for impairment account. Subsequent recoveries of amounts previously written-off are credited against other expenses in profit or loss.
9 – INVENTORIES2018A$m
2017A$m
Raw materials 84.6 48.2
Finished goods 462.1 336.5
Stores and spare parts 20.3 18.0
567.0 402.7
The cost of inventories recognised as expense during the year ended 30 June 2018 amounted to A$4,604.0 million (2017: A$3,449.8 million).
Recognition and measurementInventories are stated at the lower of cost and net realisable value. Cost is based on first-in, first-out or weighted average and comprises direct materials, direct labour and an appropriate proportion of variable and fixed overhead expenditures, the latter being allocated on the basis of normal operating capacity.
Stores and spare parts consist of consumable and maintenance stores and spare parts when they do not meet the definition of property, plant and equipment.
Critical accounting estimate and judgementValuation of inventoriesQuantities of inventories are determined using various estimation techniques, including observation, weighing and other industry methods and are subject to periodic physical verification.
Net realisable valueThe Group reviews its inventory at the end of each reporting period to determine if it is properly stated at net realisable value. Net realisable value is based on estimated future selling prices. Impairment losses may be recognised on inventory if management needs to revise its estimates of net realisable value in response to changing market conditions.
70SIMS METAL MANAGEMENT LIMITED ANNUAL REPORT 2018
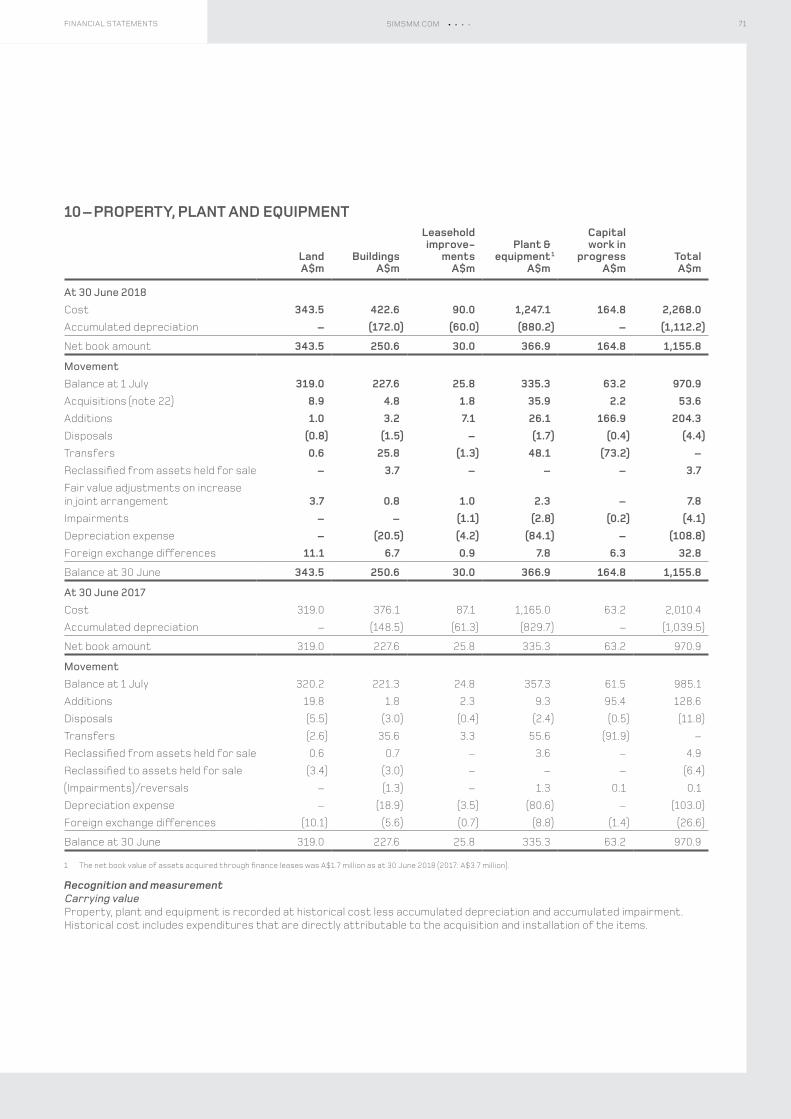
10 – PROPERTY, PLANT AND EQUIPMENT
LandA$m
BuildingsA$m
Leasehold improve‑
mentsA$m
Plant & equipment 1
A$m
Capital work in
progressA$m
TotalA$m
At 30 June 2018Cost 343.5 422.6 90.0 1,247.1 164.8 2,268.0Accumulated depreciation – (172.0) (60.0) (880.2) – (1,112.2)
Net book amount 343.5 250.6 30.0 366.9 164.8 1,155.8
MovementBalance at 1 July 319.0 227.6 25.8 335.3 63.2 970.9Acquisitions (note 22) 8.9 4.8 1.8 35.9 2.2 53.6Additions 1.0 3.2 7.1 26.1 166.9 204.3Disposals (0.8) (1.5) – (1.7) (0.4) (4.4)Transfers 0.6 25.8 (1.3) 48.1 (73.2) –Reclassified from assets held for sale – 3.7 – – – 3.7Fair value adjustments on increase in joint arrangement 3.7 0.8 1.0 2.3 – 7.8Impairments – – (1.1) (2.8) (0.2) (4.1)Depreciation expense – (20.5) (4.2) (84.1) – (108.8)Foreign exchange differences 11.1 6.7 0.9 7.8 6.3 32.8
Balance at 30 June 343.5 250.6 30.0 366.9 164.8 1,155.8
At 30 June 2017Cost 319.0 376.1 87.1 1,165.0 63.2 2,010.4
Accumulated depreciation – (148.5) (61.3) (829.7) – (1,039.5)
Net book amount 319.0 227.6 25.8 335.3 63.2 970.9
MovementBalance at 1 July 320.2 221.3 24.8 357.3 61.5 985.1
Additions 19.8 1.8 2.3 9.3 95.4 128.6
Disposals (5.5) (3.0) (0.4) (2.4) (0.5) (11.8)
Transfers (2.6) 35.6 3.3 55.6 (91.9) –
Reclassified from assets held for sale 0.6 0.7 – 3.6 – 4.9
Reclassified to assets held for sale (3.4) (3.0) – – – (6.4)
(Impairments)/reversals – (1.3) – 1.3 0.1 0.1
Depreciation expense – (18.9) (3.5) (80.6) – (103.0)
Foreign exchange differences (10.1) (5.6) (0.7) (8.8) (1.4) (26.6)
Balance at 30 June 319.0 227.6 25.8 335.3 63.2 970.9
1 The net book value of assets acquired through finance leases was A$1.7 million as at 30 June 2018 (2017: A$3.7 million).
Recognition and measurementCarrying valueProperty, plant and equipment is recorded at historical cost less accumulated depreciation and accumulated impairment. Historical cost includes expenditures that are directly attributable to the acquisition and installation of the items.
71FINANCIAL STATEMENTS SIMSMM.COM
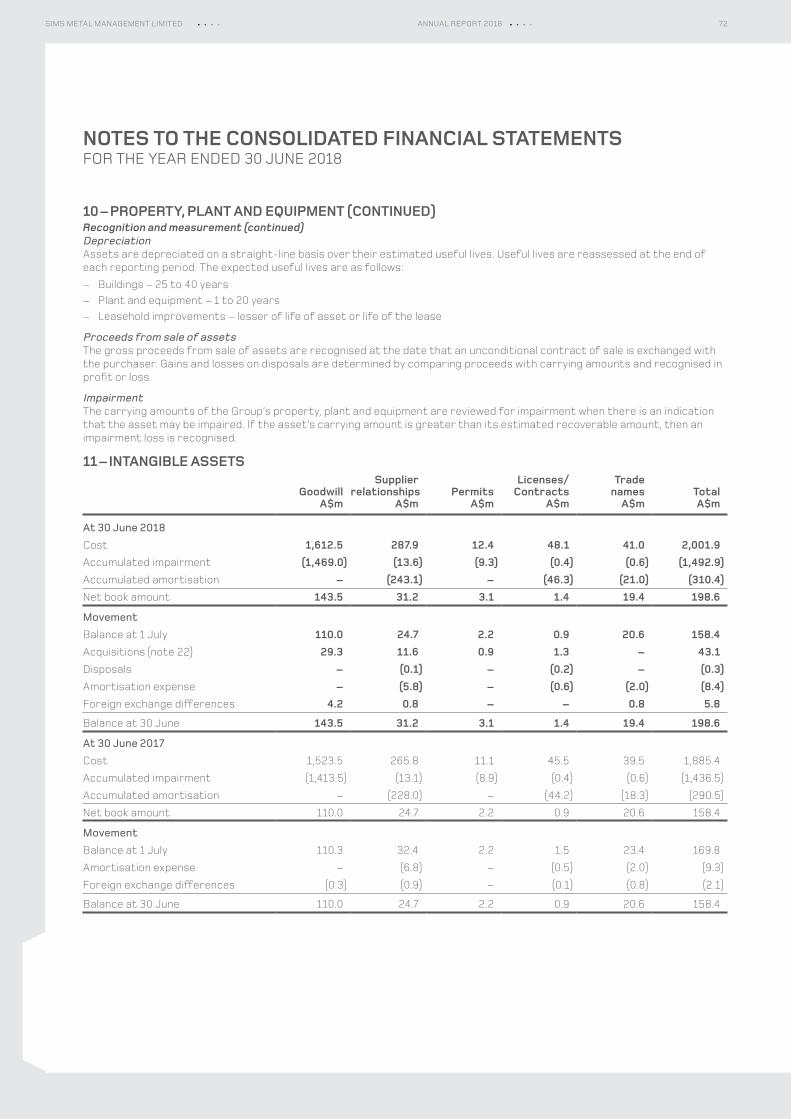
NOTES TO THE CONSOLIDATED FINANCIAL STATEMENTSFOR THE YEAR ENDED 30 JUNE 2018
10 – PROPERTY, PLANT AND EQUIPMENT (CONTINUED)Recognition and measurement (continued)DepreciationAssets are depreciated on a straight-line basis over their estimated useful lives. Useful lives are reassessed at the end of each reporting period. The expected useful lives are as follows:
– Buildings – 25 to 40 years – Plant and equipment – 1 to 20 years – Leasehold improvements – lesser of life of asset or life of the lease
Proceeds from sale of assetsThe gross proceeds from sale of assets are recognised at the date that an unconditional contract of sale is exchanged with the purchaser. Gains and losses on disposals are determined by comparing proceeds with carrying amounts and recognised in profit or loss.
ImpairmentThe carrying amounts of the Group’s property, plant and equipment are reviewed for impairment when there is an indication that the asset may be impaired. If the asset’s carrying amount is greater than its estimated recoverable amount, then an impairment loss is recognised.
11 – INTANGIBLE ASSETS
GoodwillA$m
Supplier relationships
A$mPermits
A$m
Licenses/Contracts
A$m
Trade names
A$mTotalA$m
At 30 June 2018Cost 1,612.5 287.9 12.4 48.1 41.0 2,001.9Accumulated impairment (1,469.0) (13.6) (9.3) (0.4) (0.6) (1,492.9)Accumulated amortisation – (243.1) – (46.3) (21.0) (310.4)Net book amount 143.5 31.2 3.1 1.4 19.4 198.6
MovementBalance at 1 July 110.0 24.7 2.2 0.9 20.6 158.4Acquisitions (note 22) 29.3 11.6 0.9 1.3 – 43.1Disposals – (0.1) – (0.2) – (0.3)Amortisation expense – (5.8) – (0.6) (2.0) (8.4)Foreign exchange differences 4.2 0.8 – – 0.8 5.8
Balance at 30 June 143.5 31.2 3.1 1.4 19.4 198.6
At 30 June 2017Cost 1,523.5 265.8 11.1 45.5 39.5 1,885.4
Accumulated impairment (1,413.5) (13.1) (8.9) (0.4) (0.6) (1,436.5)
Accumulated amortisation – (228.0) – (44.2) (18.3) (290.5)
Net book amount 110.0 24.7 2.2 0.9 20.6 158.4
MovementBalance at 1 July 110.3 32.4 2.2 1.5 23.4 169.8
Amortisation expense – (6.8) – (0.5) (2.0) (9.3)
Foreign exchange differences (0.3) (0.9) – (0.1) (0.8) (2.1)
Balance at 30 June 110.0 24.7 2.2 0.9 20.6 158.4
72SIMS METAL MANAGEMENT LIMITED ANNUAL REPORT 2018
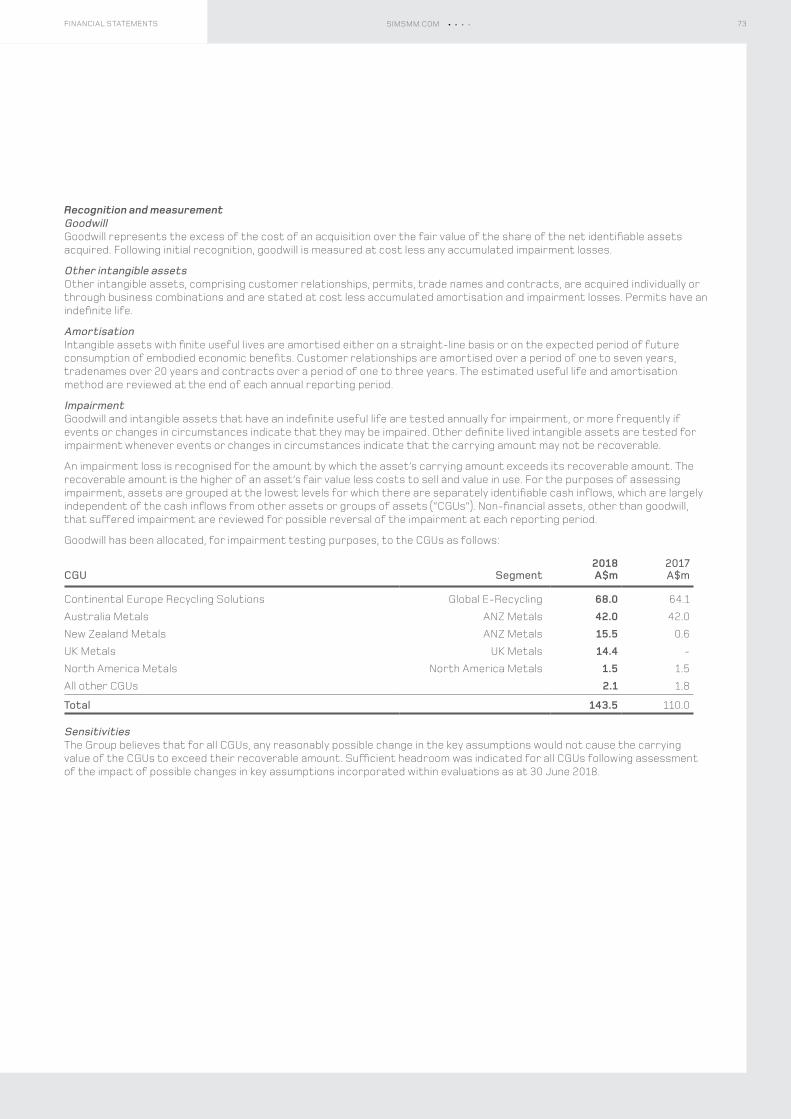
Recognition and measurementGoodwillGoodwill represents the excess of the cost of an acquisition over the fair value of the share of the net identifiable assets acquired. Following initial recognition, goodwill is measured at cost less any accumulated impairment losses.
Other intangible assetsOther intangible assets, comprising customer relationships, permits, trade names and contracts, are acquired individually or through business combinations and are stated at cost less accumulated amortisation and impairment losses. Permits have an indefinite life.
AmortisationIntangible assets with finite useful lives are amortised either on a straight-line basis or on the expected period of future consumption of embodied economic benefits. Customer relationships are amortised over a period of one to seven years, tradenames over 20 years and contracts over a period of one to three years. The estimated useful life and amortisation method are reviewed at the end of each annual reporting period.
ImpairmentGoodwill and intangible assets that have an indefinite useful life are tested annually for impairment, or more frequently if events or changes in circumstances indicate that they may be impaired. Other definite lived intangible assets are tested for impairment whenever events or changes in circumstances indicate that the carrying amount may not be recoverable.
An impairment loss is recognised for the amount by which the asset’s carrying amount exceeds its recoverable amount. The recoverable amount is the higher of an asset’s fair value less costs to sell and value in use. For the purposes of assessing impairment, assets are grouped at the lowest levels for which there are separately identifiable cash inflows, which are largely independent of the cash inflows from other assets or groups of assets (“CGUs”). Non-financial assets, other than goodwill, that suffered impairment are reviewed for possible reversal of the impairment at each reporting period.
Goodwill has been allocated, for impairment testing purposes, to the CGUs as follows:
CGU Segment2018A$m
2017A$m
Continental Europe Recycling Solutions Global E-Recycling 68.0 64.1
Australia Metals ANZ Metals 42.0 42.0
New Zealand Metals ANZ Metals 15.5 0.6
UK Metals UK Metals 14.4 -
North America Metals North America Metals 1.5 1.5
All other CGUs 2.1 1.8
Total 143.5 110.0
SensitivitiesThe Group believes that for all CGUs, any reasonably possible change in the key assumptions would not cause the carrying value of the CGUs to exceed their recoverable amount. Sufficient headroom was indicated for all CGUs following assessment of the impact of possible changes in key assumptions incorporated within evaluations as at 30 June 2018.
73FINANCIAL STATEMENTS SIMSMM.COM
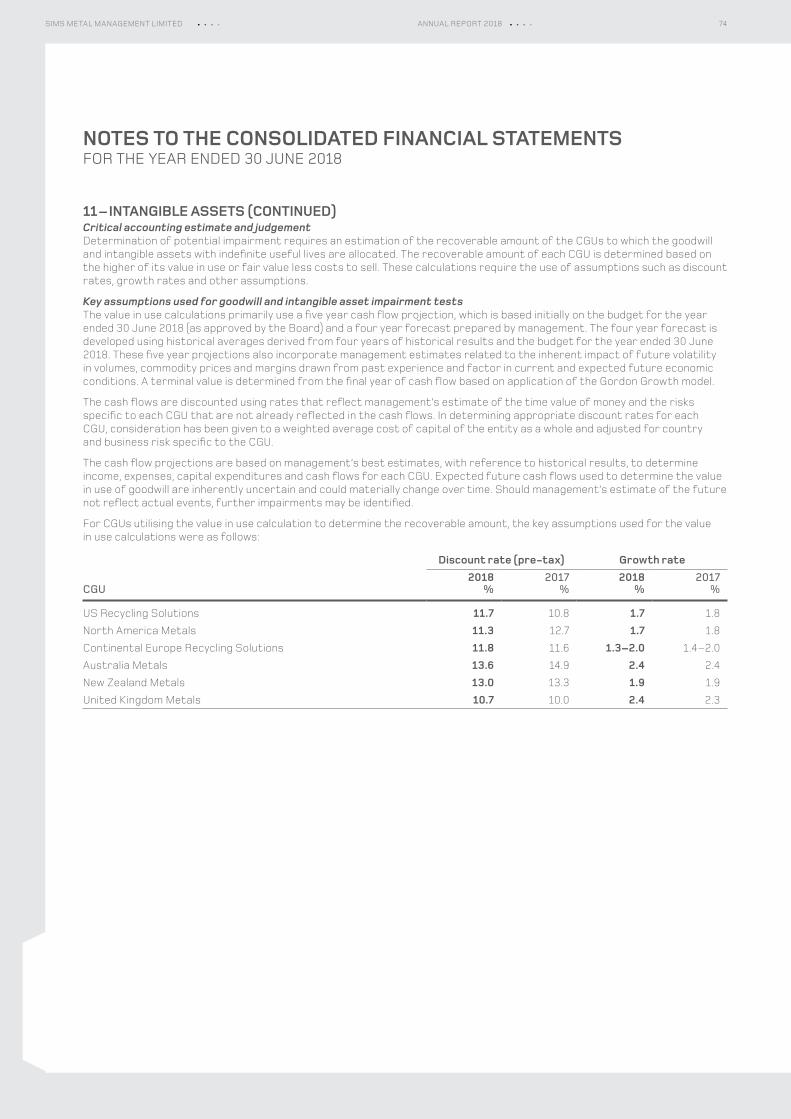
NOTES TO THE CONSOLIDATED FINANCIAL STATEMENTSFOR THE YEAR ENDED 30 JUNE 2018
11 – INTANGIBLE ASSETS (CONTINUED)Critical accounting estimate and judgementDetermination of potential impairment requires an estimation of the recoverable amount of the CGUs to which the goodwill and intangible assets with indefinite useful lives are allocated. The recoverable amount of each CGU is determined based on the higher of its value in use or fair value less costs to sell. These calculations require the use of assumptions such as discount rates, growth rates and other assumptions.
Key assumptions used for goodwill and intangible asset impairment testsThe value in use calculations primarily use a five year cash flow projection, which is based initially on the budget for the year ended 30 June 2018 (as approved by the Board) and a four year forecast prepared by management. The four year forecast is developed using historical averages derived from four years of historical results and the budget for the year ended 30 June 2018. These five year projections also incorporate management estimates related to the inherent impact of future volatility in volumes, commodity prices and margins drawn from past experience and factor in current and expected future economic conditions. A terminal value is determined from the final year of cash flow based on application of the Gordon Growth model.
The cash flows are discounted using rates that reflect management’s estimate of the time value of money and the risks specific to each CGU that are not already reflected in the cash flows. In determining appropriate discount rates for each CGU, consideration has been given to a weighted average cost of capital of the entity as a whole and adjusted for country and business risk specific to the CGU.
The cash flow projections are based on management’s best estimates, with reference to historical results, to determine income, expenses, capital expenditures and cash flows for each CGU. Expected future cash flows used to determine the value in use of goodwill are inherently uncertain and could materially change over time. Should management’s estimate of the future not reflect actual events, further impairments may be identified.
For CGUs utilising the value in use calculation to determine the recoverable amount, the key assumptions used for the value in use calculations were as follows:
CGU
Discount rate (pre‑tax) Growth rate2018
%2017
%2018
%2017
%
US Recycling Solutions 11.7 10.8 1.7 1.8
North America Metals 11.3 12.7 1.7 1.8
Continental Europe Recycling Solutions 11.8 11.6 1.3–2.0 1.4–2.0
Australia Metals 13.6 14.9 2.4 2.4
New Zealand Metals 13.0 13.3 1.9 1.9
United Kingdom Metals 10.7 10.0 2.4 2.3
74SIMS METAL MANAGEMENT LIMITED ANNUAL REPORT 2018
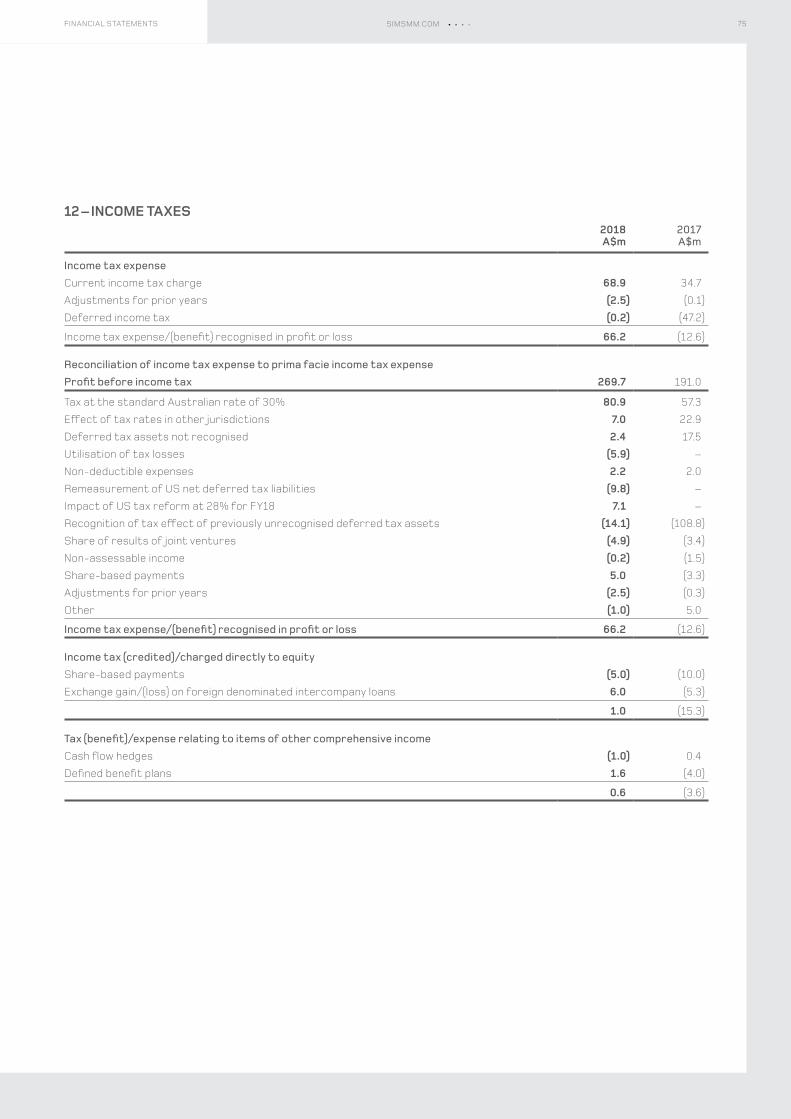
12 – INCOME TAXES2018A$m
2017A$m
Income tax expenseCurrent income tax charge 68.9 34.7
Adjustments for prior years (2.5) (0.1)
Deferred income tax (0.2) (47.2)
Income tax expense/(benefit) recognised in profit or loss 66.2 (12.6)
Reconciliation of income tax expense to prima facie income tax expenseProfit before income tax 269.7 191.0
Tax at the standard Australian rate of 30% 80.9 57.3
Effect of tax rates in other jurisdictions 7.0 22.9
Deferred tax assets not recognised 2.4 17.5
Utilisation of tax losses (5.9) –
Non-deductible expenses 2.2 2.0
Remeasurement of US net deferred tax liabilities (9.8) –
Impact of US tax reform at 28% for FY18 7.1 –
Recognition of tax effect of previously unrecognised deferred tax assets (14.1) (108.8)
Share of results of joint ventures (4.9) (3.4)
Non-assessable income (0.2) (1.5)
Share-based payments 5.0 (3.3)
Adjustments for prior years (2.5) (0.3)
Other (1.0) 5.0
Income tax expense/(benefit) recognised in profit or loss 66.2 (12.6)
Income tax (credited)/charged directly to equityShare-based payments (5.0) (10.0)
Exchange gain/(loss) on foreign denominated intercompany loans 6.0 (5.3)
1.0 (15.3)
Tax (benefit)/expense relating to items of other comprehensive incomeCash flow hedges (1.0) 0.4
Defined benefit plans 1.6 (4.0)
0.6 (3.6)
75FINANCIAL STATEMENTS SIMSMM.COM
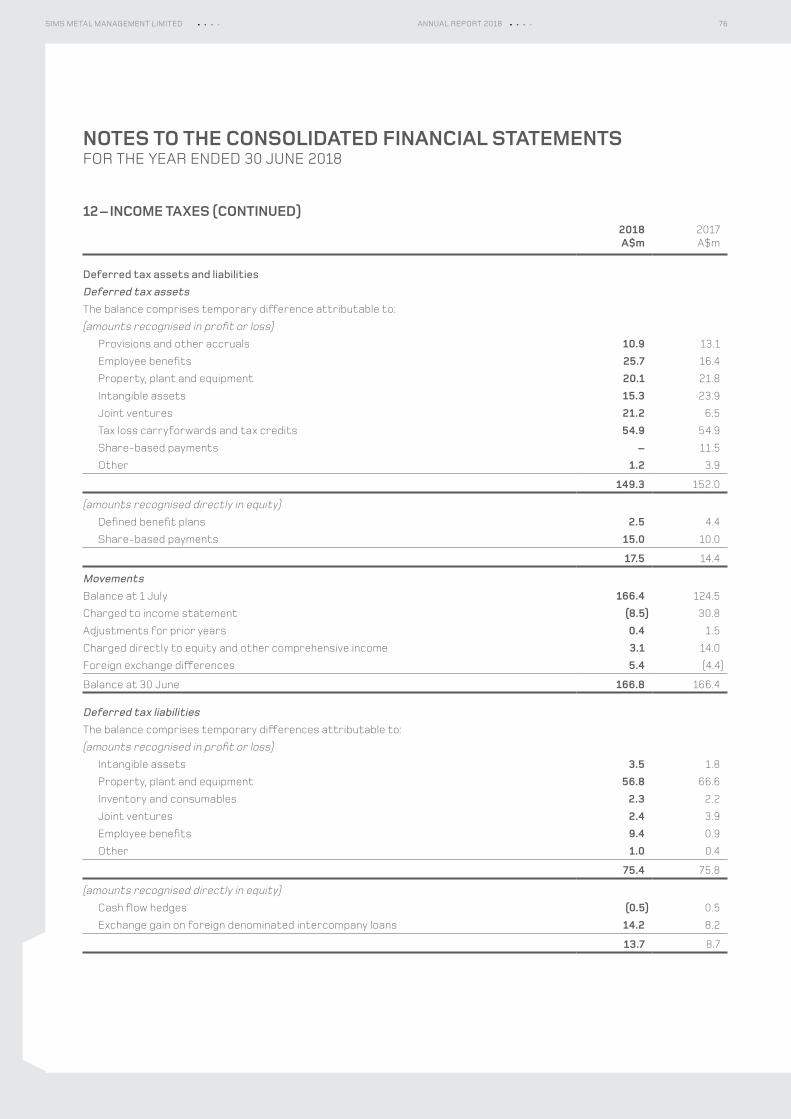
NOTES TO THE CONSOLIDATED FINANCIAL STATEMENTSFOR THE YEAR ENDED 30 JUNE 2018
12 – INCOME TAXES (CONTINUED)2018A$m
2017A$m
Deferred tax assets and liabilitiesDeferred tax assetsThe balance comprises temporary difference attributable to:
(amounts recognised in profit or loss)Provisions and other accruals 10.9 13.1
Employee benefits 25.7 16.4
Property, plant and equipment 20.1 21.8
Intangible assets 15.3 23.9
Joint ventures 21.2 6.5
Tax loss carryforwards and tax credits 54.9 54.9
Share-based payments – 11.5
Other 1.2 3.9
149.3 152.0
(amounts recognised directly in equity)Defined benefit plans 2.5 4.4
Share-based payments 15.0 10.0
17.5 14.4
MovementsBalance at 1 July 166.4 124.5
Charged to income statement (8.5) 30.8
Adjustments for prior years 0.4 1.5
Charged directly to equity and other comprehensive income 3.1 14.0
Foreign exchange differences 5.4 (4.4)
Balance at 30 June 166.8 166.4
Deferred tax liabilitiesThe balance comprises temporary differences attributable to:
(amounts recognised in profit or loss)Intangible assets 3.5 1.8
Property, plant and equipment 56.8 66.6
Inventory and consumables 2.3 2.2
Joint ventures 2.4 3.9
Employee benefits 9.4 0.9
Other 1.0 0.4
75.4 75.8
(amounts recognised directly in equity)Cash flow hedges (0.5) 0.5
Exchange gain on foreign denominated intercompany loans 14.2 8.2
13.7 8.7
76SIMS METAL MANAGEMENT LIMITED ANNUAL REPORT 2018
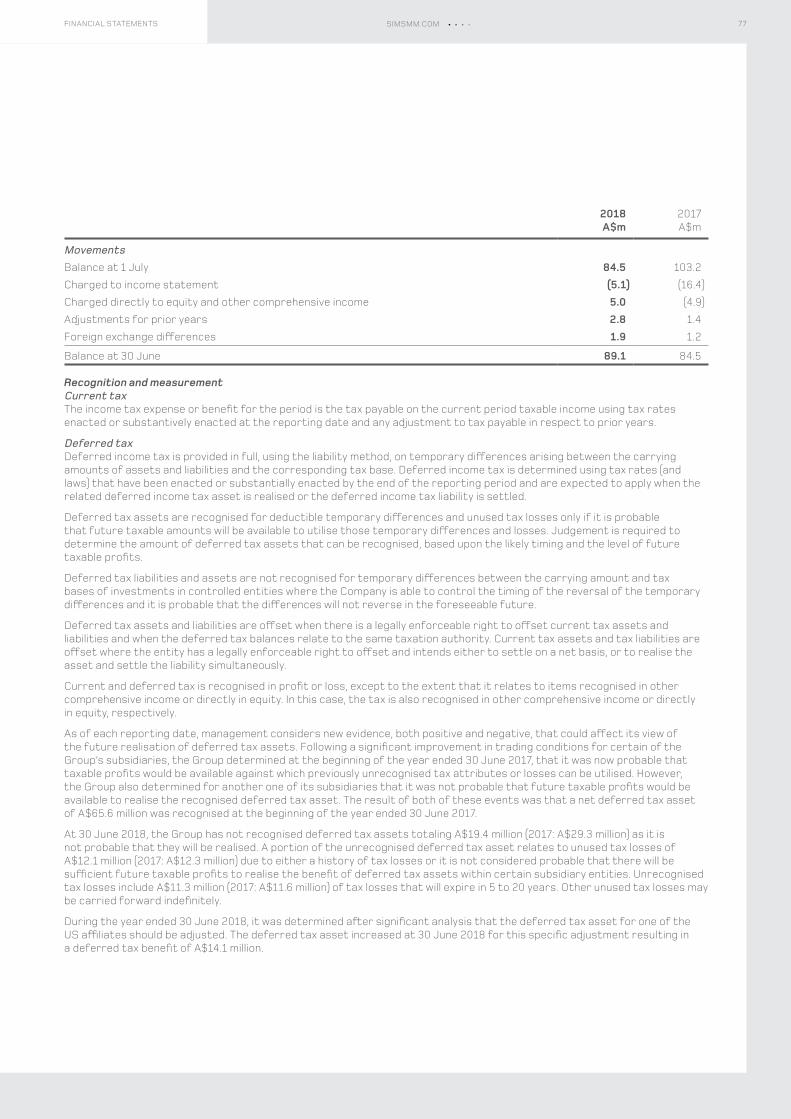
2018A$m
2017A$m
MovementsBalance at 1 July 84.5 103.2
Charged to income statement (5.1) (16.4)
Charged directly to equity and other comprehensive income 5.0 (4.9)
Adjustments for prior years 2.8 1.4
Foreign exchange differences 1.9 1.2
Balance at 30 June 89.1 84.5
Recognition and measurementCurrent taxThe income tax expense or benefit for the period is the tax payable on the current period taxable income using tax rates enacted or substantively enacted at the reporting date and any adjustment to tax payable in respect to prior years.
Deferred taxDeferred income tax is provided in full, using the liability method, on temporary differences arising between the carrying amounts of assets and liabilities and the corresponding tax base. Deferred income tax is determined using tax rates (and laws) that have been enacted or substantially enacted by the end of the reporting period and are expected to apply when the related deferred income tax asset is realised or the deferred income tax liability is settled.
Deferred tax assets are recognised for deductible temporary differences and unused tax losses only if it is probable that future taxable amounts will be available to utilise those temporary differences and losses. Judgement is required to determine the amount of deferred tax assets that can be recognised, based upon the likely timing and the level of future taxable profits.
Deferred tax liabilities and assets are not recognised for temporary differences between the carrying amount and tax bases of investments in controlled entities where the Company is able to control the timing of the reversal of the temporary differences and it is probable that the differences will not reverse in the foreseeable future.
Deferred tax assets and liabilities are offset when there is a legally enforceable right to offset current tax assets and liabilities and when the deferred tax balances relate to the same taxation authority. Current tax assets and tax liabilities are offset where the entity has a legally enforceable right to offset and intends either to settle on a net basis, or to realise the asset and settle the liability simultaneously.
Current and deferred tax is recognised in profit or loss, except to the extent that it relates to items recognised in other comprehensive income or directly in equity. In this case, the tax is also recognised in other comprehensive income or directly in equity, respectively.
As of each reporting date, management considers new evidence, both positive and negative, that could affect its view of the future realisation of deferred tax assets. Following a significant improvement in trading conditions for certain of the Group’s subsidiaries, the Group determined at the beginning of the year ended 30 June 2017, that it was now probable that taxable profits would be available against which previously unrecognised tax attributes or losses can be utilised. However, the Group also determined for another one of its subsidiaries that it was not probable that future taxable profits would be available to realise the recognised deferred tax asset. The result of both of these events was that a net deferred tax asset of A$65.6 million was recognised at the beginning of the year ended 30 June 2017.
At 30 June 2018, the Group has not recognised deferred tax assets totaling A$19.4 million (2017: A$29.3 million) as it is not probable that they will be realised. A portion of the unrecognised deferred tax asset relates to unused tax losses of A$12.1 million (2017: A$12.3 million) due to either a history of tax losses or it is not considered probable that there will be sufficient future taxable profits to realise the benefit of deferred tax assets within certain subsidiary entities. Unrecognised tax losses include A$11.3 million (2017: A$11.6 million) of tax losses that will expire in 5 to 20 years. Other unused tax losses may be carried forward indefinitely.
During the year ended 30 June 2018, it was determined after significant analysis that the deferred tax asset for one of the US affiliates should be adjusted. The deferred tax asset increased at 30 June 2018 for this specific adjustment resulting in a deferred tax benefit of A$14.1 million.
77FINANCIAL STATEMENTS SIMSMM.COM
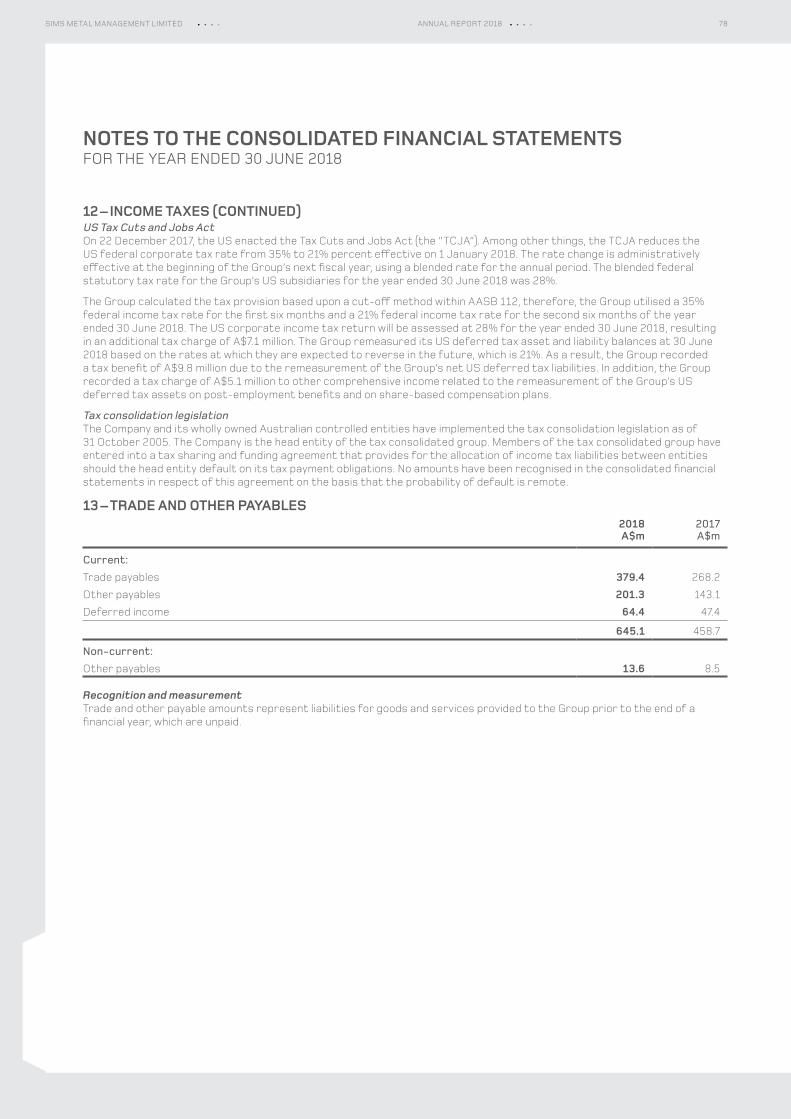
NOTES TO THE CONSOLIDATED FINANCIAL STATEMENTSFOR THE YEAR ENDED 30 JUNE 2018
12 – INCOME TAXES (CONTINUED)US Tax Cuts and Jobs ActOn 22 December 2017, the US enacted the Tax Cuts and Jobs Act (the “TCJA”). Among other things, the TCJA reduces the US federal corporate tax rate from 35% to 21% percent effective on 1 January 2018. The rate change is administratively effective at the beginning of the Group’s next fiscal year, using a blended rate for the annual period. The blended federal statutory tax rate for the Group’s US subsidiaries for the year ended 30 June 2018 was 28%.
The Group calculated the tax provision based upon a cut-off method within AASB 112, therefore, the Group utilised a 35% federal income tax rate for the first six months and a 21% federal income tax rate for the second six months of the year ended 30 June 2018. The US corporate income tax return will be assessed at 28% for the year ended 30 June 2018, resulting in an additional tax charge of A$7.1 million. The Group remeasured its US deferred tax asset and liability balances at 30 June 2018 based on the rates at which they are expected to reverse in the future, which is 21%. As a result, the Group recorded a tax benefit of A$9.8 million due to the remeasurement of the Group’s net US deferred tax liabilities. In addition, the Group recorded a tax charge of A$5.1 million to other comprehensive income related to the remeasurement of the Group’s US deferred tax assets on post-employment benefits and on share-based compensation plans.
Tax consolidation legislationThe Company and its wholly owned Australian controlled entities have implemented the tax consolidation legislation as of 31 October 2005. The Company is the head entity of the tax consolidated group. Members of the tax consolidated group have entered into a tax sharing and funding agreement that provides for the allocation of income tax liabilities between entities should the head entity default on its tax payment obligations. No amounts have been recognised in the consolidated financial statements in respect of this agreement on the basis that the probability of default is remote.
13 – TRADE AND OTHER PAYABLES2018A$m
2017A$m
Current:Trade payables 379.4 268.2
Other payables 201.3 143.1
Deferred income 64.4 47.4
645.1 458.7
Non-current:Other payables 13.6 8.5
Recognition and measurementTrade and other payable amounts represent liabilities for goods and services provided to the Group prior to the end of a financial year, which are unpaid.
78SIMS METAL MANAGEMENT LIMITED ANNUAL REPORT 2018
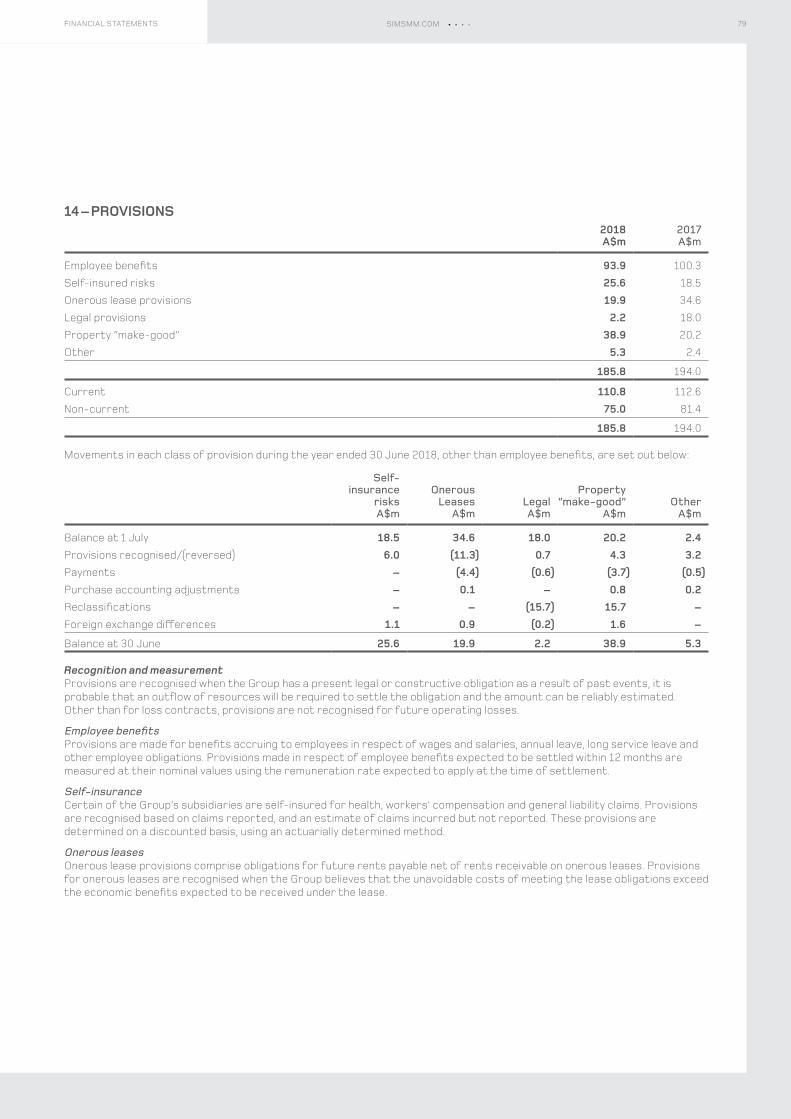
14 – PROVISIONS2018A$m
2017A$m
Employee benefits 93.9 100.3
Self-insured risks 25.6 18.5
Onerous lease provisions 19.9 34.6
Legal provisions 2.2 18.0
Property “make-good” 38.9 20.2
Other 5.3 2.4
185.8 194.0
Current 110.8 112.6
Non-current 75.0 81.4
185.8 194.0
Movements in each class of provision during the year ended 30 June 2018, other than employee benefits, are set out below:
Self-insurance
risksA$m
OnerousLeases
A$mLegalA$m
Property “make-good”
A$mOther
A$m
Balance at 1 July 18.5 34.6 18.0 20.2 2.4Provisions recognised/(reversed) 6.0 (11.3) 0.7 4.3 3.2Payments – (4.4) (0.6) (3.7) (0.5)Purchase accounting adjustments – 0.1 – 0.8 0.2Reclassifications – – (15.7) 15.7 –Foreign exchange differences 1.1 0.9 (0.2) 1.6 –
Balance at 30 June 25.6 19.9 2.2 38.9 5.3
Recognition and measurementProvisions are recognised when the Group has a present legal or constructive obligation as a result of past events, it is probable that an outflow of resources will be required to settle the obligation and the amount can be reliably estimated. Other than for loss contracts, provisions are not recognised for future operating losses.
Employee benefitsProvisions are made for benefits accruing to employees in respect of wages and salaries, annual leave, long service leave and other employee obligations. Provisions made in respect of employee benefits expected to be settled within 12 months are measured at their nominal values using the remuneration rate expected to apply at the time of settlement.
Self-insuranceCertain of the Group’s subsidiaries are self-insured for health, workers’ compensation and general liability claims. Provisions are recognised based on claims reported, and an estimate of claims incurred but not reported. These provisions are determined on a discounted basis, using an actuarially determined method.
Onerous leasesOnerous lease provisions comprise obligations for future rents payable net of rents receivable on onerous leases. Provisions for onerous leases are recognised when the Group believes that the unavoidable costs of meeting the lease obligations exceed the economic benefits expected to be received under the lease.
79FINANCIAL STATEMENTS SIMSMM.COM
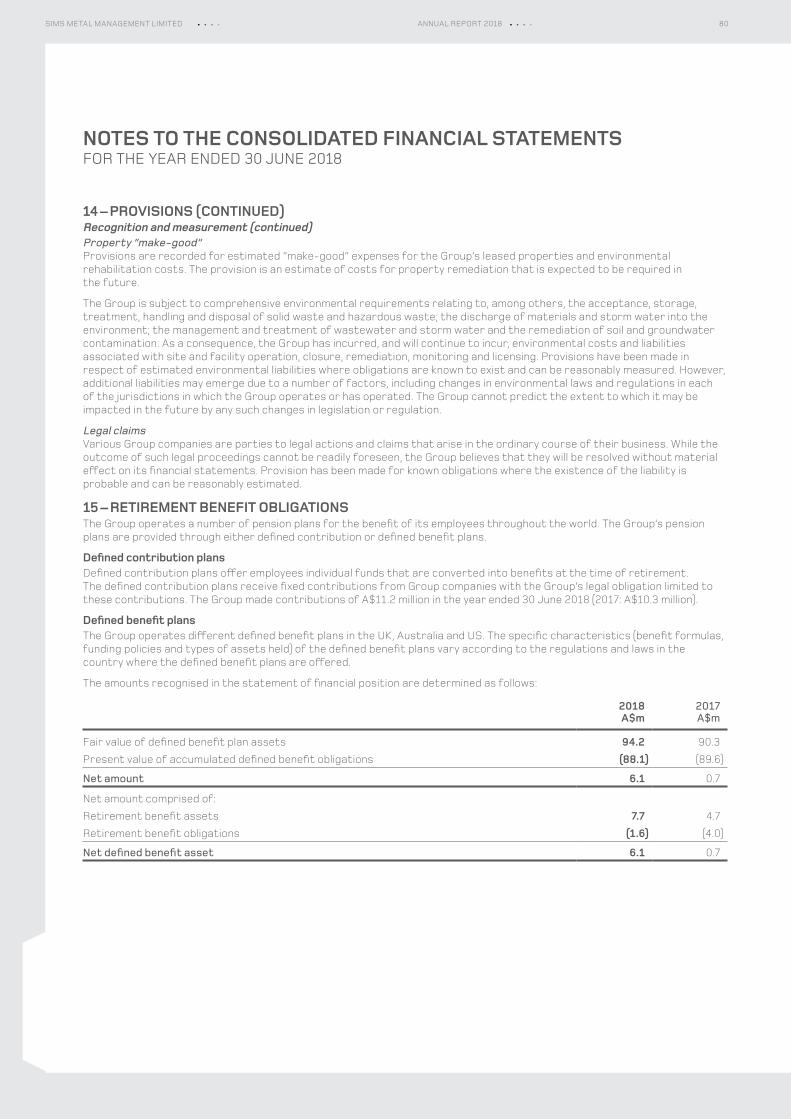
NOTES TO THE CONSOLIDATED FINANCIAL STATEMENTSFOR THE YEAR ENDED 30 JUNE 2018
14 – PROVISIONS (CONTINUED)Recognition and measurement (continued)Property “make-good”Provisions are recorded for estimated “make-good” expenses for the Group’s leased properties and environmental rehabilitation costs. The provision is an estimate of costs for property remediation that is expected to be required in the future.
The Group is subject to comprehensive environmental requirements relating to, among others, the acceptance, storage, treatment, handling and disposal of solid waste and hazardous waste; the discharge of materials and storm water into the environment; the management and treatment of wastewater and storm water and the remediation of soil and groundwater contamination. As a consequence, the Group has incurred, and will continue to incur, environmental costs and liabilities associated with site and facility operation, closure, remediation, monitoring and licensing. Provisions have been made in respect of estimated environmental liabilities where obligations are known to exist and can be reasonably measured. However, additional liabilities may emerge due to a number of factors, including changes in environmental laws and regulations in each of the jurisdictions in which the Group operates or has operated. The Group cannot predict the extent to which it may be impacted in the future by any such changes in legislation or regulation.
Legal claimsVarious Group companies are parties to legal actions and claims that arise in the ordinary course of their business. While the outcome of such legal proceedings cannot be readily foreseen, the Group believes that they will be resolved without material effect on its financial statements. Provision has been made for known obligations where the existence of the liability is probable and can be reasonably estimated.
15 – RETIREMENT BENEFIT OBLIGATIONSThe Group operates a number of pension plans for the benefit of its employees throughout the world. The Group’s pension plans are provided through either defined contribution or defined benefit plans.
Defined contribution plansDefined contribution plans offer employees individual funds that are converted into benefits at the time of retirement. The defined contribution plans receive fixed contributions from Group companies with the Group’s legal obligation limited to these contributions. The Group made contributions of A$11.2 million in the year ended 30 June 2018 (2017: A$10.3 million).
Defined benefit plansThe Group operates different defined benefit plans in the UK, Australia and US. The specific characteristics (benefit formulas, funding policies and types of assets held) of the defined benefit plans vary according to the regulations and laws in the country where the defined benefit plans are offered.
The amounts recognised in the statement of financial position are determined as follows:
2018A$m
2017A$m
Fair value of defined benefit plan assets 94.2 90.3
Present value of accumulated defined benefit obligations (88.1) (89.6)
Net amount 6.1 0.7
Net amount comprised of:
Retirement benefit assets 7.7 4.7
Retirement benefit obligations (1.6) (4.0)
Net defined benefit asset 6.1 0.7
80SIMS METAL MANAGEMENT LIMITED ANNUAL REPORT 2018
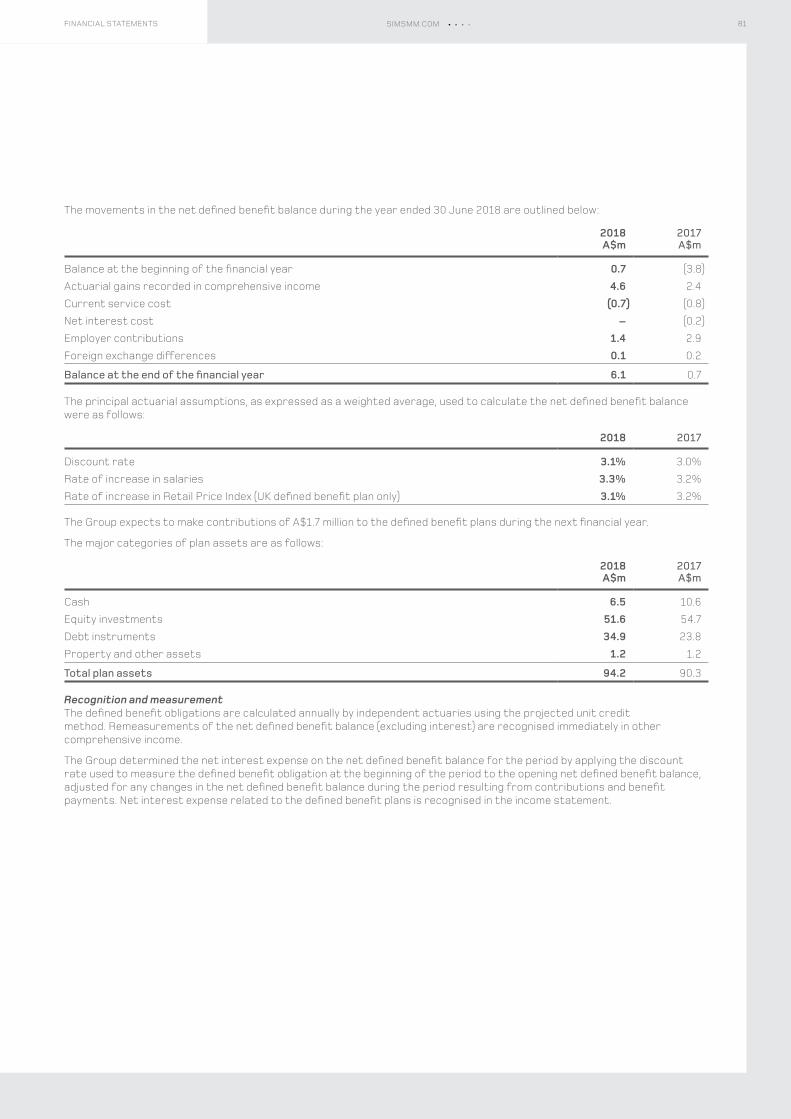
The movements in the net defined benefit balance during the year ended 30 June 2018 are outlined below:
2018A$m
2017A$m
Balance at the beginning of the financial year 0.7 (3.8)
Actuarial gains recorded in comprehensive income 4.6 2.4
Current service cost (0.7) (0.8)
Net interest cost – (0.2)
Employer contributions 1.4 2.9
Foreign exchange differences 0.1 0.2
Balance at the end of the financial year 6.1 0.7
The principal actuarial assumptions, as expressed as a weighted average, used to calculate the net defined benefit balance were as follows:
2018 2017
Discount rate 3.1% 3.0%
Rate of increase in salaries 3.3% 3.2%
Rate of increase in Retail Price Index (UK defined benefit plan only) 3.1% 3.2%
The Group expects to make contributions of A$1.7 million to the defined benefit plans during the next financial year.
The major categories of plan assets are as follows:
2018A$m
2017A$m
Cash 6.5 10.6
Equity investments 51.6 54.7
Debt instruments 34.9 23.8
Property and other assets 1.2 1.2
Total plan assets 94.2 90.3
Recognition and measurementThe defined benefit obligations are calculated annually by independent actuaries using the projected unit credit method. Remeasurements of the net defined benefit balance (excluding interest) are recognised immediately in other comprehensive income.
The Group determined the net interest expense on the net defined benefit balance for the period by applying the discount rate used to measure the defined benefit obligation at the beginning of the period to the opening net defined benefit balance, adjusted for any changes in the net defined benefit balance during the period resulting from contributions and benefit payments. Net interest expense related to the defined benefit plans is recognised in the income statement.
81FINANCIAL STATEMENTS SIMSMM.COM
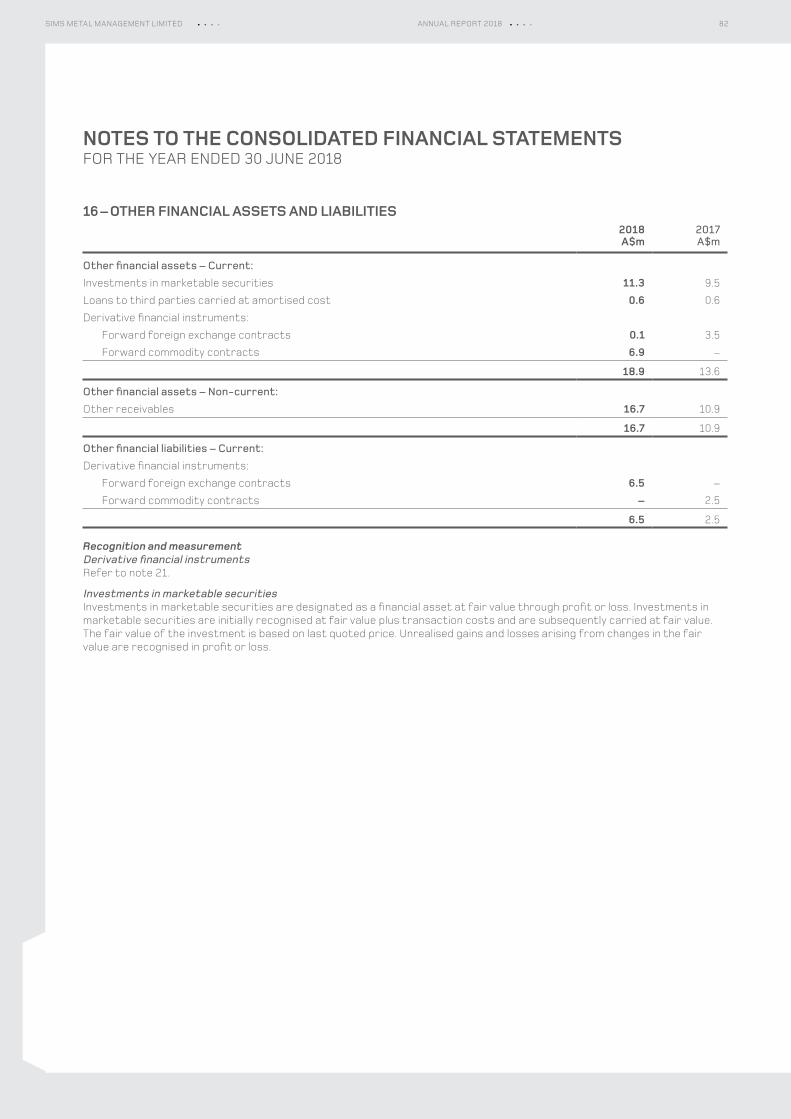
NOTES TO THE CONSOLIDATED FINANCIAL STATEMENTSFOR THE YEAR ENDED 30 JUNE 2018
16 – OTHER FINANCIAL ASSETS AND LIABILITIES2018A$m
2017A$m
Other financial assets – Current:Investments in marketable securities 11.3 9.5
Loans to third parties carried at amortised cost 0.6 0.6
Derivative financial instruments:
Forward foreign exchange contracts 0.1 3.5
Forward commodity contracts 6.9 –
18.9 13.6
Other financial assets – Non-current:Other receivables 16.7 10.9
16.7 10.9
Other financial liabilities – Current:Derivative financial instruments:
Forward foreign exchange contracts 6.5 –
Forward commodity contracts – 2.5
6.5 2.5
Recognition and measurementDerivative financial instrumentsRefer to note 21.
Investments in marketable securitiesInvestments in marketable securities are designated as a financial asset at fair value through profit or loss. Investments in marketable securities are initially recognised at fair value plus transaction costs and are subsequently carried at fair value. The fair value of the investment is based on last quoted price. Unrealised gains and losses arising from changes in the fair value are recognised in profit or loss.
82SIMS METAL MANAGEMENT LIMITED ANNUAL REPORT 2018
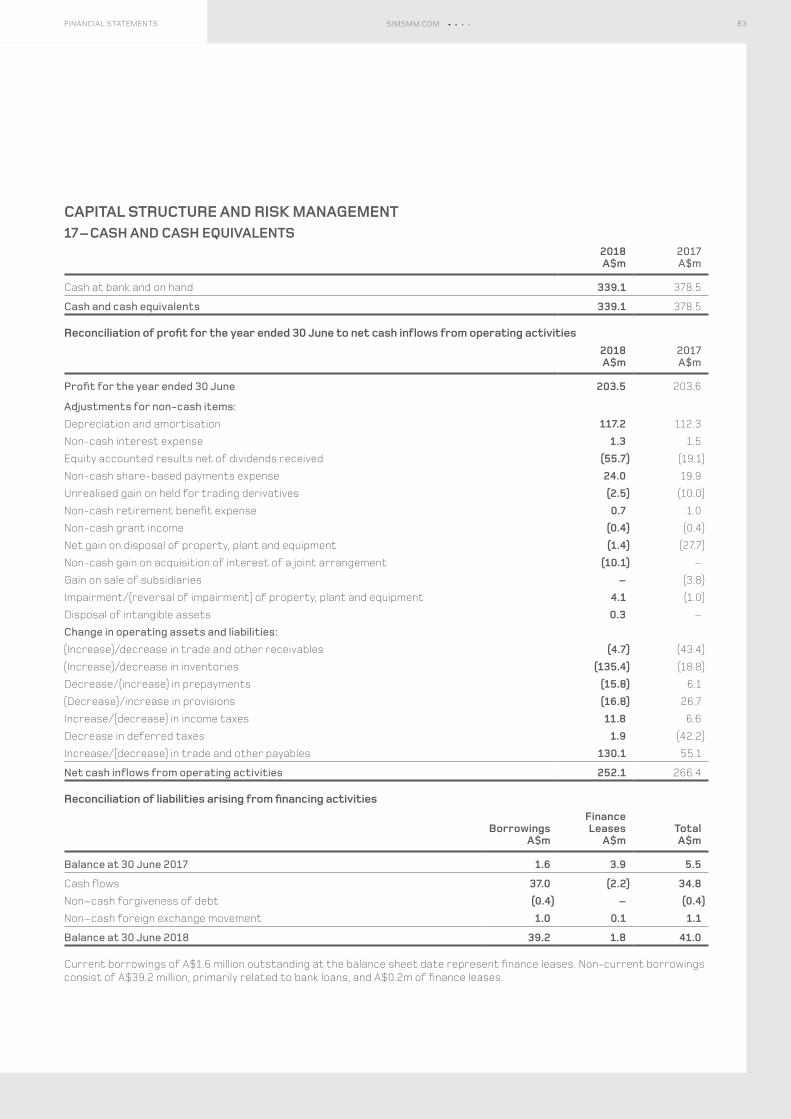
CAPITAL STRUCTURE AND RISK MANAGEMENT17 – CASH AND CASH EQUIVALENTS
2018A$m
2017A$m
Cash at bank and on hand 339.1 378.5
Cash and cash equivalents 339.1 378.5
Reconciliation of profit for the year ended 30 June to net cash inflows from operating activities2018A$m
2017A$m
Profit for the year ended 30 June 203.5 203.6
Adjustments for non-cash items: Depreciation and amortisation 117.2 112.3
Non-cash interest expense 1.3 1.5
Equity accounted results net of dividends received (55.7) (19.1)
Non-cash share-based payments expense 24.0 19.9
Unrealised gain on held for trading derivatives (2.5) (10.0)
Non-cash retirement benefit expense 0.7 1.0
Non-cash grant income (0.4) (0.4)
Net gain on disposal of property, plant and equipment (1.4) (27.7)
Non-cash gain on acquisition of interest of a joint arrangement (10.1) –
Gain on sale of subsidiaries – (3.8)
Impairment/(reversal of impairment) of property, plant and equipment 4.1 (1.0)
Disposal of intangible assets 0.3 –
Change in operating assets and liabilities:(Increase)/decrease in trade and other receivables (4.7) (43.4)
(Increase)/decrease in inventories (135.4) (18.8)
Decrease/(increase) in prepayments (15.8) 6.1
(Decrease)/increase in provisions (16.8) 26.7
Increase/(decrease) in income taxes 11.8 6.6
Decrease in deferred taxes 1.9 (42.2)
Increase/(decrease) in trade and other payables 130.1 55.1
Net cash inflows from operating activities 252.1 266.4
Reconciliation of liabilities arising from financing activities
BorrowingsA$m
FinanceLeases
A$mTotalA$m
Balance at 30 June 2017 1.6 3.9 5.5
Cash flows 37.0 (2.2) 34.8Non–cash forgiveness of debt (0.4) – (0.4)Non–cash foreign exchange movement 1.0 0.1 1.1
Balance at 30 June 2018 39.2 1.8 41.0
Current borrowings of A$1.6 million outstanding at the balance sheet date represent finance leases. Non-current borrowings consist of A$39.2 million, primarily related to bank loans, and A$0.2m of finance leases.
83FINANCIAL STATEMENTS SIMSMM.COM
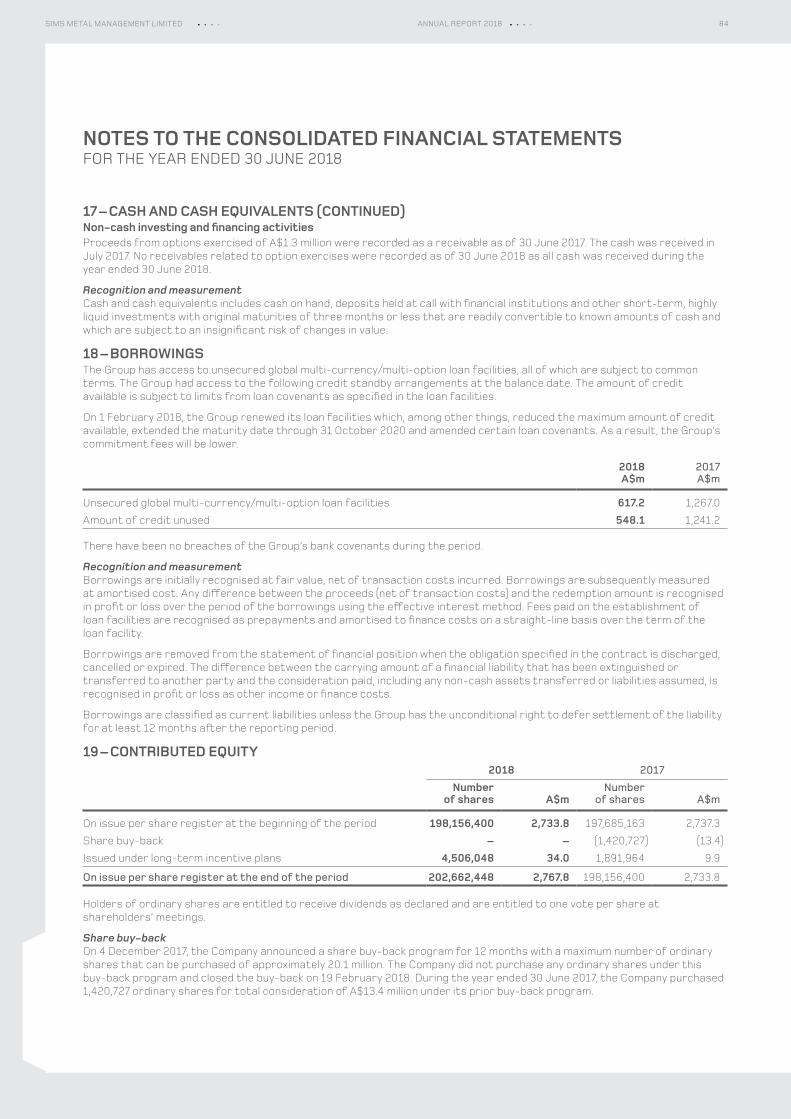
NOTES TO THE CONSOLIDATED FINANCIAL STATEMENTSFOR THE YEAR ENDED 30 JUNE 2018
17 – CASH AND CASH EQUIVALENTS (CONTINUED)Non‑cash investing and financing activitiesProceeds from options exercised of A$1.3 million were recorded as a receivable as of 30 June 2017. The cash was received in July 2017. No receivables related to option exercises were recorded as of 30 June 2018 as all cash was received during the year ended 30 June 2018.
Recognition and measurementCash and cash equivalents includes cash on hand, deposits held at call with financial institutions and other short-term, highly liquid investments with original maturities of three months or less that are readily convertible to known amounts of cash and which are subject to an insignificant risk of changes in value.
18 – BORROWINGSThe Group has access to unsecured global multi-currency/multi-option loan facilities, all of which are subject to common terms. The Group had access to the following credit standby arrangements at the balance date. The amount of credit available is subject to limits from loan covenants as specified in the loan facilities.
On 1 February 2018, the Group renewed its loan facilities which, among other things, reduced the maximum amount of credit available, extended the maturity date through 31 October 2020 and amended certain loan covenants. As a result, the Group’s commitment fees will be lower.
2018A$m
2017A$m
Unsecured global multi-currency/multi-option loan facilities 617.2 1,267.0
Amount of credit unused 548.1 1,241.2
There have been no breaches of the Group’s bank covenants during the period.
Recognition and measurementBorrowings are initially recognised at fair value, net of transaction costs incurred. Borrowings are subsequently measured at amortised cost. Any difference between the proceeds (net of transaction costs) and the redemption amount is recognised in profit or loss over the period of the borrowings using the effective interest method. Fees paid on the establishment of loan facilities are recognised as prepayments and amortised to finance costs on a straight-line basis over the term of the loan facility.
Borrowings are removed from the statement of financial position when the obligation specified in the contract is discharged, cancelled or expired. The difference between the carrying amount of a financial liability that has been extinguished or transferred to another party and the consideration paid, including any non-cash assets transferred or liabilities assumed, is recognised in profit or loss as other income or finance costs.
Borrowings are classified as current liabilities unless the Group has the unconditional right to defer settlement of the liability for at least 12 months after the reporting period.
19 – CONTRIBUTED EQUITY2018 2017
Numberof shares A$m
Numberof shares A$m
On issue per share register at the beginning of the period 198,156,400 2,733.8 197,685,163 2,737.3
Share buy-back – – (1,420,727) (13.4)
Issued under long-term incentive plans 4,506,048 34.0 1,891,964 9.9
On issue per share register at the end of the period 202,662,448 2,767.8 198,156,400 2,733.8
Holders of ordinary shares are entitled to receive dividends as declared and are entitled to one vote per share at shareholders’ meetings.
Share buy-backOn 4 December 2017, the Company announced a share buy-back program for 12 months with a maximum number of ordinary shares that can be purchased of approximately 20.1 million. The Company did not purchase any ordinary shares under this buy-back program and closed the buy-back on 19 February 2018. During the year ended 30 June 2017, the Company purchased 1,420,727 ordinary shares for total consideration of A$13.4 million under its prior buy-back program.
84SIMS METAL MANAGEMENT LIMITED ANNUAL REPORT 2018
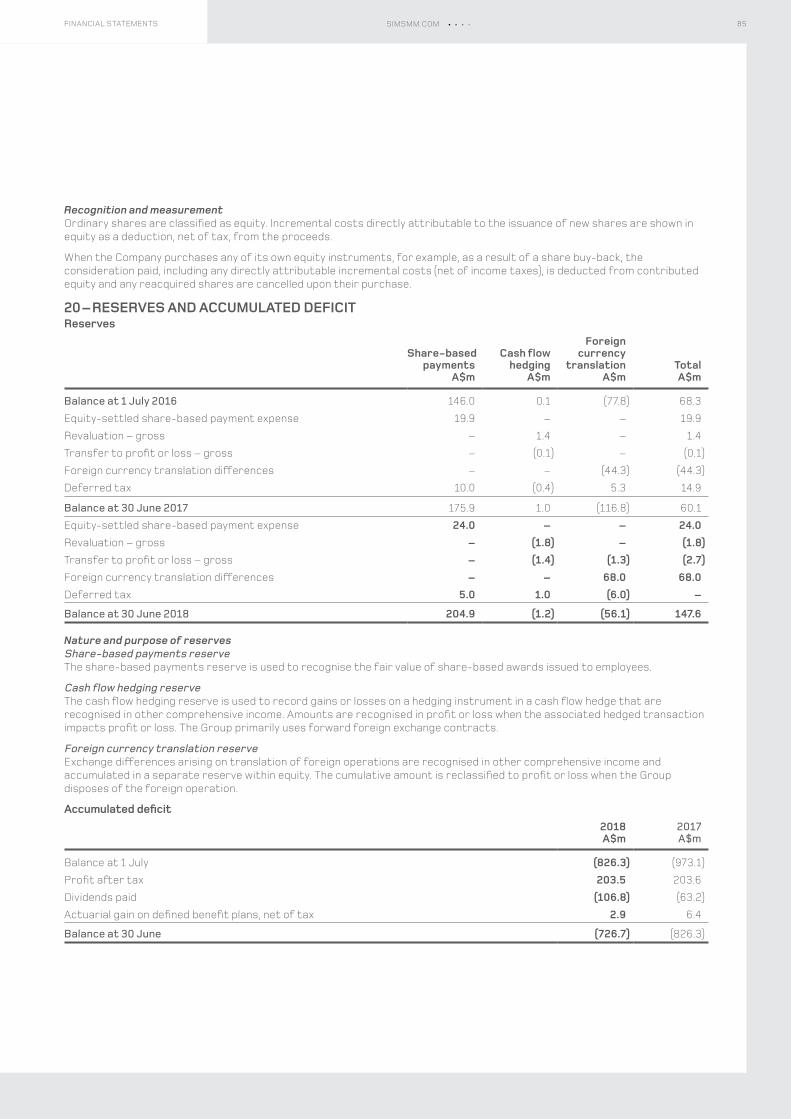
Recognition and measurementOrdinary shares are classified as equity. Incremental costs directly attributable to the issuance of new shares are shown in equity as a deduction, net of tax, from the proceeds.
When the Company purchases any of its own equity instruments, for example, as a result of a share buy-back, the consideration paid, including any directly attributable incremental costs (net of income taxes), is deducted from contributed equity and any reacquired shares are cancelled upon their purchase.
20 – RESERVES AND ACCUMULATED DEFICITReserves
Share‑basedpayments
A$m
Cash flowhedging
A$m
Foreigncurrency
translationA$m
TotalA$m
Balance at 1 July 2016 146.0 0.1 (77.8) 68.3
Equity-settled share-based payment expense 19.9 – – 19.9
Revaluation – gross – 1.4 – 1.4
Transfer to profit or loss – gross – (0.1) – (0.1)
Foreign currency translation differences – – (44.3) (44.3)
Deferred tax 10.0 (0.4) 5.3 14.9
Balance at 30 June 2017 175.9 1.0 (116.8) 60.1
Equity-settled share-based payment expense 24.0 – – 24.0Revaluation – gross – (1.8) – (1.8)Transfer to profit or loss – gross – (1.4) (1.3) (2.7)Foreign currency translation differences – – 68.0 68.0Deferred tax 5.0 1.0 (6.0) –
Balance at 30 June 2018 204.9 (1.2) (56.1) 147.6
Nature and purpose of reservesShare-based payments reserveThe share-based payments reserve is used to recognise the fair value of share-based awards issued to employees.
Cash flow hedging reserveThe cash flow hedging reserve is used to record gains or losses on a hedging instrument in a cash flow hedge that are recognised in other comprehensive income. Amounts are recognised in profit or loss when the associated hedged transaction impacts profit or loss. The Group primarily uses forward foreign exchange contracts.
Foreign currency translation reserveExchange differences arising on translation of foreign operations are recognised in other comprehensive income and accumulated in a separate reserve within equity. The cumulative amount is reclassified to profit or loss when the Group disposes of the foreign operation.
Accumulated deficit2018A$m
2017A$m
Balance at 1 July (826.3) (973.1)
Profit after tax 203.5 203.6
Dividends paid (106.8) (63.2)
Actuarial gain on defined benefit plans, net of tax 2.9 6.4
Balance at 30 June (726.7) (826.3)
85FINANCIAL STATEMENTS SIMSMM.COM
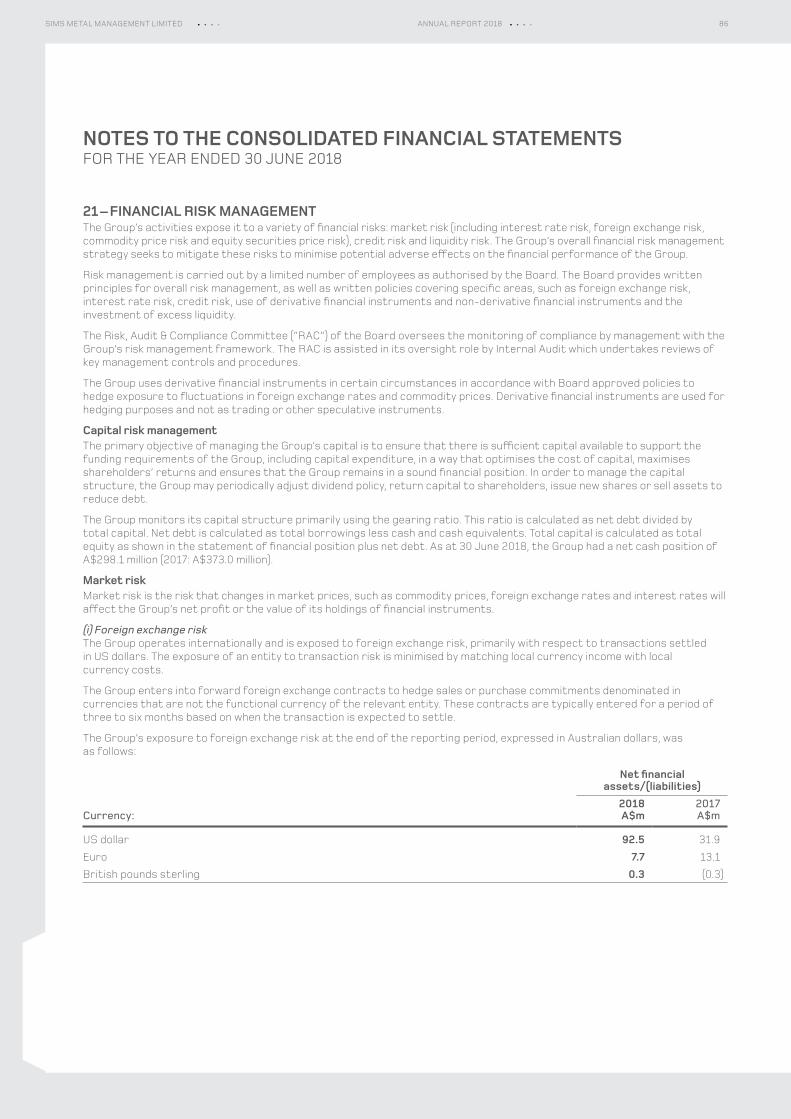
NOTES TO THE CONSOLIDATED FINANCIAL STATEMENTSFOR THE YEAR ENDED 30 JUNE 2018
21 – FINANCIAL RISK MANAGEMENTThe Group’s activities expose it to a variety of financial risks: market risk (including interest rate risk, foreign exchange risk, commodity price risk and equity securities price risk), credit risk and liquidity risk. The Group’s overall financial risk management strategy seeks to mitigate these risks to minimise potential adverse effects on the financial performance of the Group.
Risk management is carried out by a limited number of employees as authorised by the Board. The Board provides written principles for overall risk management, as well as written policies covering specific areas, such as foreign exchange risk, interest rate risk, credit risk, use of derivative financial instruments and non-derivative financial instruments and the investment of excess liquidity.
The Risk, Audit & Compliance Committee (“RAC”) of the Board oversees the monitoring of compliance by management with the Group’s risk management framework. The RAC is assisted in its oversight role by Internal Audit which undertakes reviews of key management controls and procedures.
The Group uses derivative financial instruments in certain circumstances in accordance with Board approved policies to hedge exposure to fluctuations in foreign exchange rates and commodity prices. Derivative financial instruments are used for hedging purposes and not as trading or other speculative instruments.
Capital risk managementThe primary objective of managing the Group’s capital is to ensure that there is sufficient capital available to support the funding requirements of the Group, including capital expenditure, in a way that optimises the cost of capital, maximises shareholders’ returns and ensures that the Group remains in a sound financial position. In order to manage the capital structure, the Group may periodically adjust dividend policy, return capital to shareholders, issue new shares or sell assets to reduce debt.
The Group monitors its capital structure primarily using the gearing ratio. This ratio is calculated as net debt divided by total capital. Net debt is calculated as total borrowings less cash and cash equivalents. Total capital is calculated as total equity as shown in the statement of financial position plus net debt. As at 30 June 2018, the Group had a net cash position of A$298.1 million (2017: A$373.0 million).
Market riskMarket risk is the risk that changes in market prices, such as commodity prices, foreign exchange rates and interest rates will affect the Group’s net profit or the value of its holdings of financial instruments.
(i) Foreign exchange riskThe Group operates internationally and is exposed to foreign exchange risk, primarily with respect to transactions settled in US dollars. The exposure of an entity to transaction risk is minimised by matching local currency income with local currency costs.
The Group enters into forward foreign exchange contracts to hedge sales or purchase commitments denominated in currencies that are not the functional currency of the relevant entity. These contracts are typically entered for a period of three to six months based on when the transaction is expected to settle.
The Group’s exposure to foreign exchange risk at the end of the reporting period, expressed in Australian dollars, was as follows:
Currency:
Net financialassets/(liabilities)
2018A$m
2017A$m
US dollar 92.5 31.9
Euro 7.7 13.1
British pounds sterling 0.3 (0.3)
86SIMS METAL MANAGEMENT LIMITED ANNUAL REPORT 2018
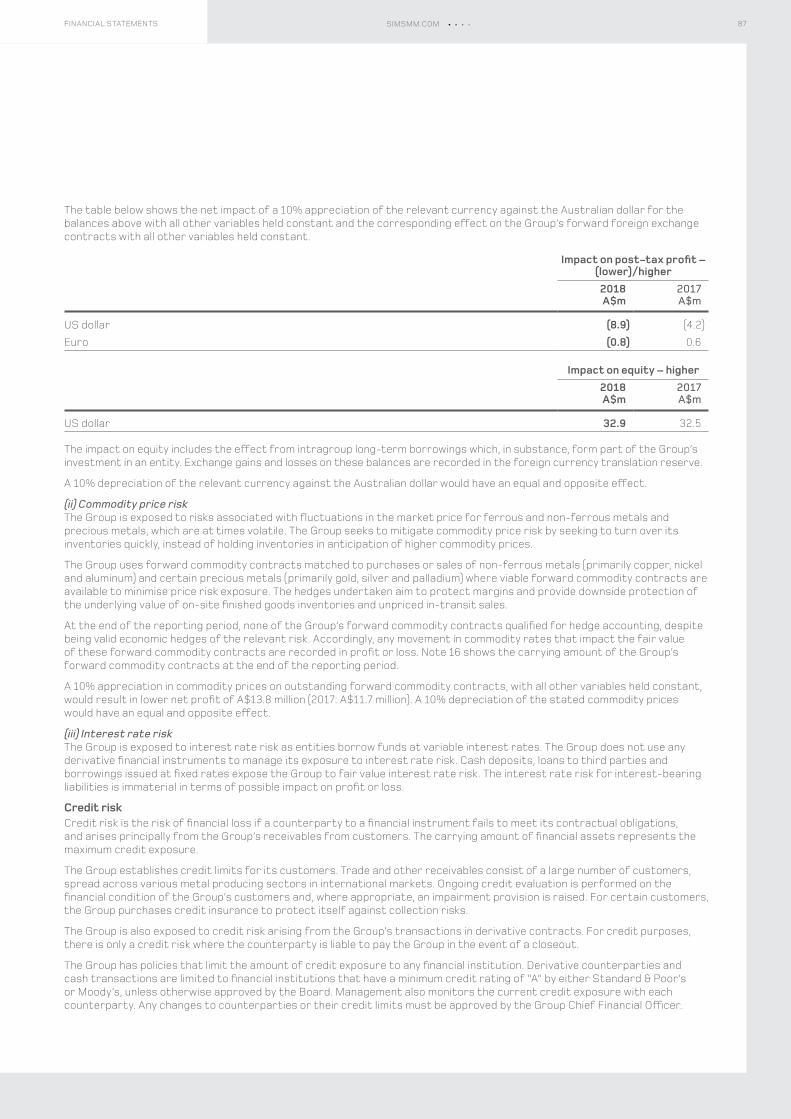
The table below shows the net impact of a 10% appreciation of the relevant currency against the Australian dollar for the balances above with all other variables held constant and the corresponding effect on the Group’s forward foreign exchange contracts with all other variables held constant.
Impact on post‑tax profit – (lower)/higher2018A$m
2017A$m
US dollar (8.9) (4.2)
Euro (0.8) 0.6
Impact on equity – higher2018A$m
2017A$m
US dollar 32.9 32.5
The impact on equity includes the effect from intragroup long-term borrowings which, in substance, form part of the Group’s investment in an entity. Exchange gains and losses on these balances are recorded in the foreign currency translation reserve.
A 10% depreciation of the relevant currency against the Australian dollar would have an equal and opposite effect.
(ii) Commodity price riskThe Group is exposed to risks associated with fluctuations in the market price for ferrous and non-ferrous metals and precious metals, which are at times volatile. The Group seeks to mitigate commodity price risk by seeking to turn over its inventories quickly, instead of holding inventories in anticipation of higher commodity prices.
The Group uses forward commodity contracts matched to purchases or sales of non-ferrous metals (primarily copper, nickel and aluminum) and certain precious metals (primarily gold, silver and palladium) where viable forward commodity contracts are available to minimise price risk exposure. The hedges undertaken aim to protect margins and provide downside protection of the underlying value of on-site finished goods inventories and unpriced in-transit sales.
At the end of the reporting period, none of the Group’s forward commodity contracts qualified for hedge accounting, despite being valid economic hedges of the relevant risk. Accordingly, any movement in commodity rates that impact the fair value of these forward commodity contracts are recorded in profit or loss. Note 16 shows the carrying amount of the Group’s forward commodity contracts at the end of the reporting period.
A 10% appreciation in commodity prices on outstanding forward commodity contracts, with all other variables held constant, would result in lower net profit of A$13.8 million (2017: A$11.7 million). A 10% depreciation of the stated commodity prices would have an equal and opposite effect.
(iii) Interest rate riskThe Group is exposed to interest rate risk as entities borrow funds at variable interest rates. The Group does not use any derivative financial instruments to manage its exposure to interest rate risk. Cash deposits, loans to third parties and borrowings issued at fixed rates expose the Group to fair value interest rate risk. The interest rate risk for interest-bearing liabilities is immaterial in terms of possible impact on profit or loss.
Credit riskCredit risk is the risk of financial loss if a counterparty to a financial instrument fails to meet its contractual obligations, and arises principally from the Group’s receivables from customers. The carrying amount of financial assets represents the maximum credit exposure.
The Group establishes credit limits for its customers. Trade and other receivables consist of a large number of customers, spread across various metal producing sectors in international markets. Ongoing credit evaluation is performed on the financial condition of the Group’s customers and, where appropriate, an impairment provision is raised. For certain customers, the Group purchases credit insurance to protect itself against collection risks.
The Group is also exposed to credit risk arising from the Group’s transactions in derivative contracts. For credit purposes, there is only a credit risk where the counterparty is liable to pay the Group in the event of a closeout.
The Group has policies that limit the amount of credit exposure to any financial institution. Derivative counterparties and cash transactions are limited to financial institutions that have a minimum credit rating of “A” by either Standard & Poor’s or Moody’s, unless otherwise approved by the Board. Management also monitors the current credit exposure with each counterparty. Any changes to counterparties or their credit limits must be approved by the Group Chief Financial Officer.
87FINANCIAL STATEMENTS SIMSMM.COM
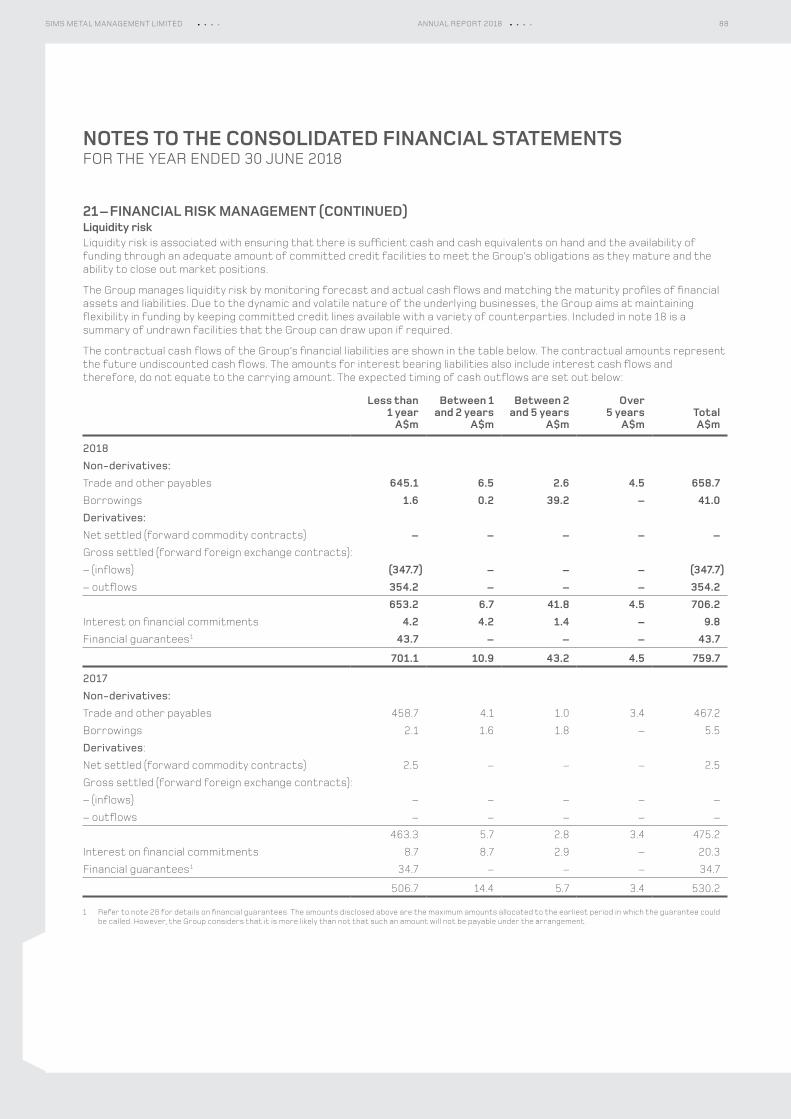
NOTES TO THE CONSOLIDATED FINANCIAL STATEMENTSFOR THE YEAR ENDED 30 JUNE 2018
21 – FINANCIAL RISK MANAGEMENT (CONTINUED)Liquidity riskLiquidity risk is associated with ensuring that there is sufficient cash and cash equivalents on hand and the availability of funding through an adequate amount of committed credit facilities to meet the Group’s obligations as they mature and the ability to close out market positions.
The Group manages liquidity risk by monitoring forecast and actual cash flows and matching the maturity profiles of financial assets and liabilities. Due to the dynamic and volatile nature of the underlying businesses, the Group aims at maintaining flexibility in funding by keeping committed credit lines available with a variety of counterparties. Included in note 18 is a summary of undrawn facilities that the Group can draw upon if required.
The contractual cash flows of the Group’s financial liabilities are shown in the table below. The contractual amounts represent the future undiscounted cash flows. The amounts for interest bearing liabilities also include interest cash flows and therefore, do not equate to the carrying amount. The expected timing of cash outflows are set out below:
Less than 1 year
A$m
Between 1 and 2 years
A$m
Between 2 and 5 years
A$m
Over 5 years
A$mTotalA$m
2018Non-derivatives:Trade and other payables 645.1 6.5 2.6 4.5 658.7Borrowings 1.6 0.2 39.2 – 41.0Derivatives: Net settled (forward commodity contracts) – – – – –Gross settled (forward foreign exchange contracts): – (inflows) (347.7) – – – (347.7)– outflows 354.2 – – – 354.2
653.2 6.7 41.8 4.5 706.2Interest on financial commitments 4.2 4.2 1.4 – 9.8Financial guarantees 1 43.7 – – – 43.7
701.1 10.9 43.2 4.5 759.7
2017Non-derivatives:Trade and other payables 458.7 4.1 1.0 3.4 467.2
Borrowings 2.1 1.6 1.8 – 5.5
Derivatives:
Net settled (forward commodity contracts) 2.5 – – – 2.5
Gross settled (forward foreign exchange contracts):
– (inflows) – – – – –
– outflows – – – – –
463.3 5.7 2.8 3.4 475.2
Interest on financial commitments 8.7 8.7 2.9 – 20.3
Financial guarantees 1 34.7 – – – 34.7
506.7 14.4 5.7 3.4 530.2
1 Refer to note 28 for details on financial guarantees. The amounts disclosed above are the maximum amounts allocated to the earliest period in which the guarantee could be called. However, the Group considers that it is more likely than not that such an amount will not be payable under the arrangement.
88SIMS METAL MANAGEMENT LIMITED ANNUAL REPORT 2018
Fair valueThe carrying amounts and estimated fair values of the Group’s financial assets and liabilities are materially the same.
The fair value of financial instruments traded on active markets (such as publicly traded derivatives and investments in marketable securities) is based on quoted market prices at the reporting date. These instruments are included in level 1.
The fair value of financial instruments that are not traded in an active market (such as forward foreign exchange contracts) is determined using readily observable broker quotes. These instruments are included in level 2.
There were no transfers between levels during the year.
Valuation of financial assets and liabilitiesFinancial instruments carried at fair value are classified by valuation method using the following hierarchy:
– Level 1 – quoted prices (unadjusted) in active markets for identical assets or liabilities; – Level 2 – inputs other than quoted prices included within Level 1 that are observable for the asset or liability, either directly
(as prices) or indirectly (derived from prices); – Level 3 – inputs for the asset or liability that are not based on observable market data (unobservable inputs).
Recognition and measurementDerivatives are initially recognised at fair value on the date a derivative contract is entered into and are subsequently remeasured to their fair value at each reporting date. The resulting gain or loss is recognised in profit or loss immediately unless the derivative is designated and effective as a hedging instrument, in which event the timing of the recognition in profit or loss depends on the nature of the hedge relationship.
Certain derivative instruments do not qualify for hedge accounting, despite being valid economic hedges of the relevant risks. Changes in the fair value of any derivative instrument that does not qualify for hedge accounting are recognised immediately in profit or loss and are included in other income or other expenses.
The Group documents, at the inception of the hedging transaction, the relationship between hedging instruments and hedged items, as well as its risk management objective and strategy for undertaking various hedge transactions. The Group also documents its assessment, both at hedge inception and on an ongoing basis, of whether the derivatives that are used in hedging transactions have been, and will continue to be, highly effective in offsetting changes in fair values or cash flows of hedged items.
(i) Fair value hedgeChanges in the fair value of derivatives that are designated and qualify as fair value hedges are recorded in profit or loss, together with any changes in the fair value of the hedged asset or liability that are attributable to the hedged risk.
(ii) Cash flow hedgeThe effective portion of changes in the fair value of derivatives that are designated and qualify as cash flow hedges are recognised in other comprehensive income and accumulated in the hedging reserve in equity. The gain or loss relating to the ineffective portion is recognised immediately in profit or loss. Amounts accumulated in equity are reclassified to profit or loss in the periods when the hedged item impacts profit or loss (for instance when the forecast sale that is hedged takes place). The gain or loss relating to the effective portion of forward foreign exchange contracts hedging export sales is recognised in profit or loss within revenue.
Where the hedged item is the cost of a non-financial asset or liability, such as a forecast transaction for the purchase of property, plant and equipment, the amounts recognised within other comprehensive income are transferred to the initial carrying amount of the non-financial asset or liability.
When a hedging instrument expires or is sold or terminated, or when a hedge no longer meets the criteria for hedge accounting, any cumulative gain or loss existing in equity at that time remains in equity and is recognised when the forecast transaction is ultimately recognised in profit or loss. When a forecast transaction is no longer expected to occur, the cumulative gains or losses that were deferred in equity are immediately transferred to profit or loss.
89FINANCIAL STATEMENTS SIMSMM.COM
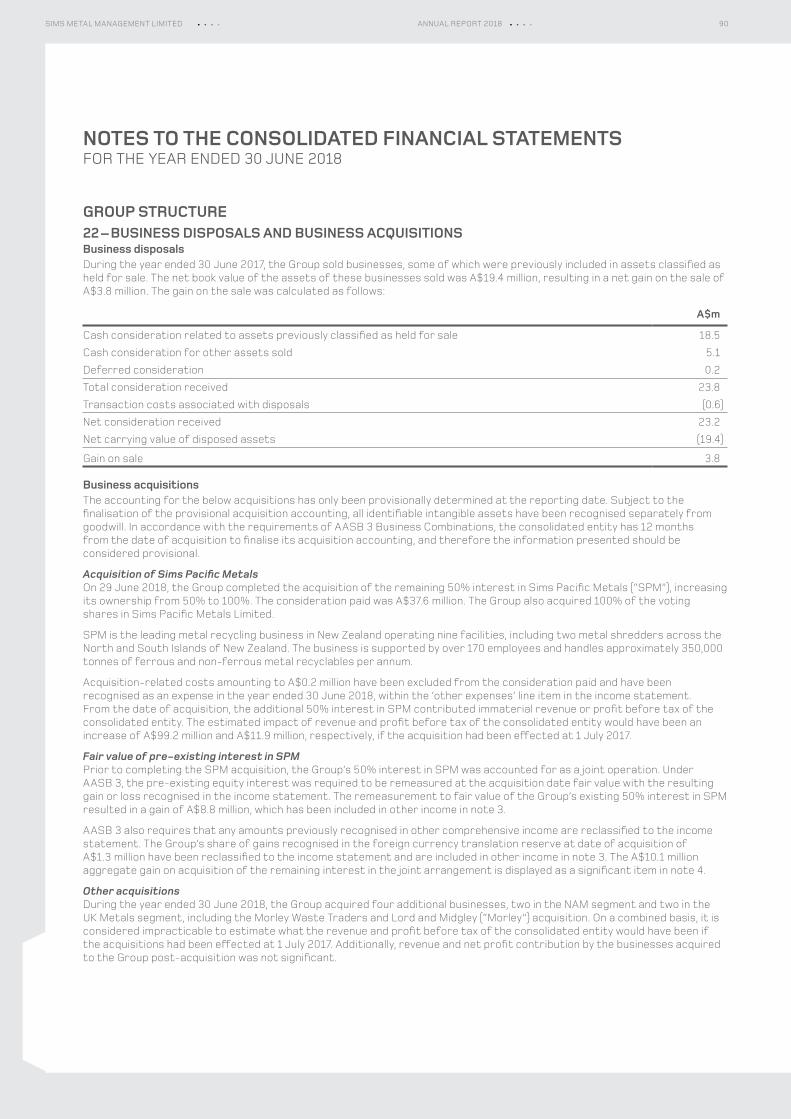
NOTES TO THE CONSOLIDATED FINANCIAL STATEMENTSFOR THE YEAR ENDED 30 JUNE 2018
GROUP STRUCTURE22 – BUSINESS DISPOSALS AND BUSINESS ACQUISITIONSBusiness disposalsDuring the year ended 30 June 2017, the Group sold businesses, some of which were previously included in assets classified as held for sale. The net book value of the assets of these businesses sold was A$19.4 million, resulting in a net gain on the sale of A$3.8 million. The gain on the sale was calculated as follows:
A$m
Cash consideration related to assets previously classified as held for sale 18.5
Cash consideration for other assets sold 5.1
Deferred consideration 0.2
Total consideration received 23.8
Transaction costs associated with disposals (0.6)
Net consideration received 23.2
Net carrying value of disposed assets (19.4)
Gain on sale 3.8
Business acquisitionsThe accounting for the below acquisitions has only been provisionally determined at the reporting date. Subject to the finalisation of the provisional acquisition accounting, all identifiable intangible assets have been recognised separately from goodwill. In accordance with the requirements of AASB 3 Business Combinations, the consolidated entity has 12 months from the date of acquisition to finalise its acquisition accounting, and therefore the information presented should be considered provisional.
Acquisition of Sims Pacific MetalsOn 29 June 2018, the Group completed the acquisition of the remaining 50% interest in Sims Pacific Metals (“SPM”), increasing its ownership from 50% to 100%. The consideration paid was A$37.6 million. The Group also acquired 100% of the voting shares in Sims Pacific Metals Limited.
SPM is the leading metal recycling business in New Zealand operating nine facilities, including two metal shredders across the North and South Islands of New Zealand. The business is supported by over 170 employees and handles approximately 350,000 tonnes of ferrous and non-ferrous metal recyclables per annum.
Acquisition-related costs amounting to A$0.2 million have been excluded from the consideration paid and have been recognised as an expense in the year ended 30 June 2018, within the ‘other expenses’ line item in the income statement. From the date of acquisition, the additional 50% interest in SPM contributed immaterial revenue or profit before tax of the consolidated entity. The estimated impact of revenue and profit before tax of the consolidated entity would have been an increase of A$99.2 million and A$11.9 million, respectively, if the acquisition had been effected at 1 July 2017.
Fair value of pre-existing interest in SPMPrior to completing the SPM acquisition, the Group’s 50% interest in SPM was accounted for as a joint operation. Under AASB 3, the pre-existing equity interest was required to be remeasured at the acquisition date fair value with the resulting gain or loss recognised in the income statement. The remeasurement to fair value of the Group’s existing 50% interest in SPM resulted in a gain of A$8.8 million, which has been included in other income in note 3.
AASB 3 also requires that any amounts previously recognised in other comprehensive income are reclassified to the income statement. The Group’s share of gains recognised in the foreign currency translation reserve at date of acquisition of A$1.3 million have been reclassified to the income statement and are included in other income in note 3. The A$10.1 million aggregate gain on acquisition of the remaining interest in the joint arrangement is displayed as a significant item in note 4.
Other acquisitionsDuring the year ended 30 June 2018, the Group acquired four additional businesses, two in the NAM segment and two in the UK Metals segment, including the Morley Waste Traders and Lord and Midgley (“Morley”) acquisition. On a combined basis, it is considered impracticable to estimate what the revenue and profit before tax of the consolidated entity would have been if the acquisitions had been effected at 1 July 2017. Additionally, revenue and net profit contribution by the businesses acquired to the Group post-acquisition was not significant.
90SIMS METAL MANAGEMENT LIMITED ANNUAL REPORT 2018
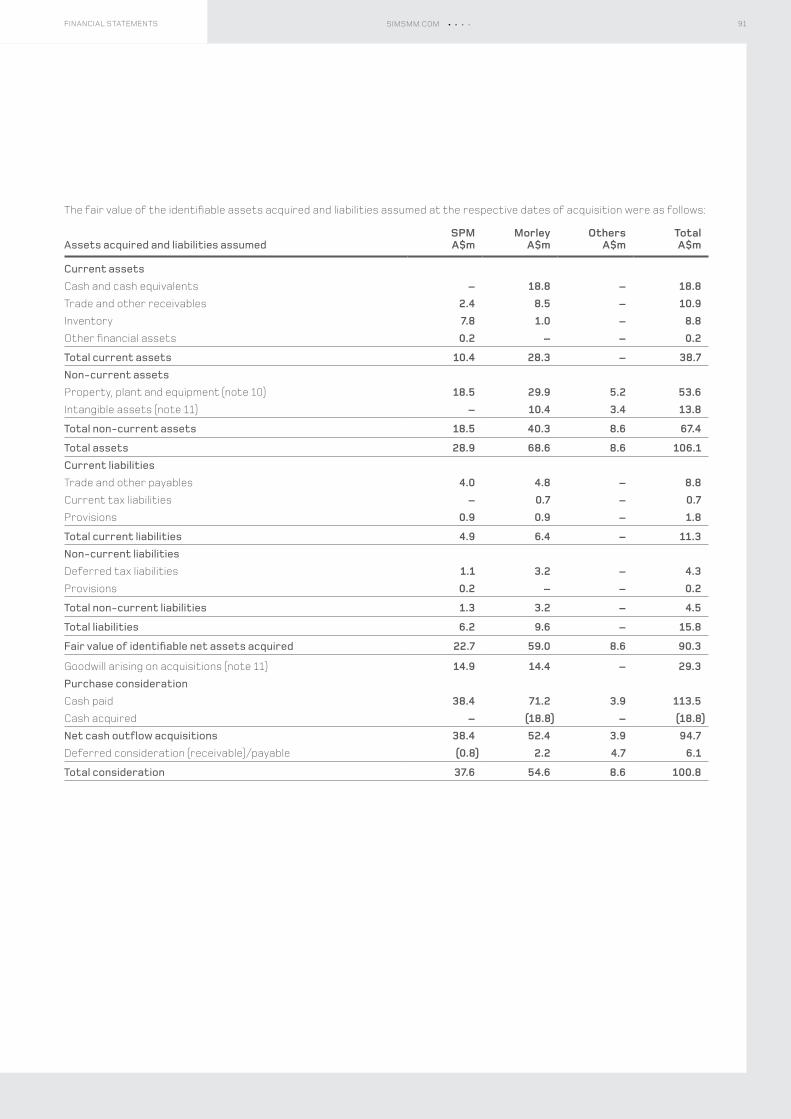
The fair value of the identifiable assets acquired and liabilities assumed at the respective dates of acquisition were as follows:
Assets acquired and liabilities assumedSPMA$m
MorleyA$m
OthersA$m
TotalA$m
Current assetsCash and cash equivalents – 18.8 – 18.8Trade and other receivables 2.4 8.5 – 10.9Inventory 7.8 1.0 – 8.8Other financial assets 0.2 – – 0.2
Total current assets 10.4 28.3 – 38.7Non-current assetsProperty, plant and equipment (note 10) 18.5 29.9 5.2 53.6Intangible assets (note 11) – 10.4 3.4 13.8
Total non-current assets 18.5 40.3 8.6 67.4
Total assets 28.9 68.6 8.6 106.1Current liabilitiesTrade and other payables 4.0 4.8 – 8.8Current tax liabilities – 0.7 – 0.7Provisions 0.9 0.9 – 1.8
Total current liabilities 4.9 6.4 – 11.3Non-current liabilitiesDeferred tax liabilities 1.1 3.2 – 4.3Provisions 0.2 – – 0.2
Total non-current liabilities 1.3 3.2 – 4.5
Total liabilities 6.2 9.6 – 15.8
Fair value of identifiable net assets acquired 22.7 59.0 8.6 90.3
Goodwill arising on acquisitions (note 11) 14.9 14.4 – 29.3Purchase considerationCash paid 38.4 71.2 3.9 113.5Cash acquired – (18.8) – (18.8)Net cash outflow acquisitions 38.4 52.4 3.9 94.7 Deferred consideration (receivable)/payable (0.8) 2.2 4.7 6.1
Total consideration 37.6 54.6 8.6 100.8
91FINANCIAL STATEMENTS SIMSMM.COM
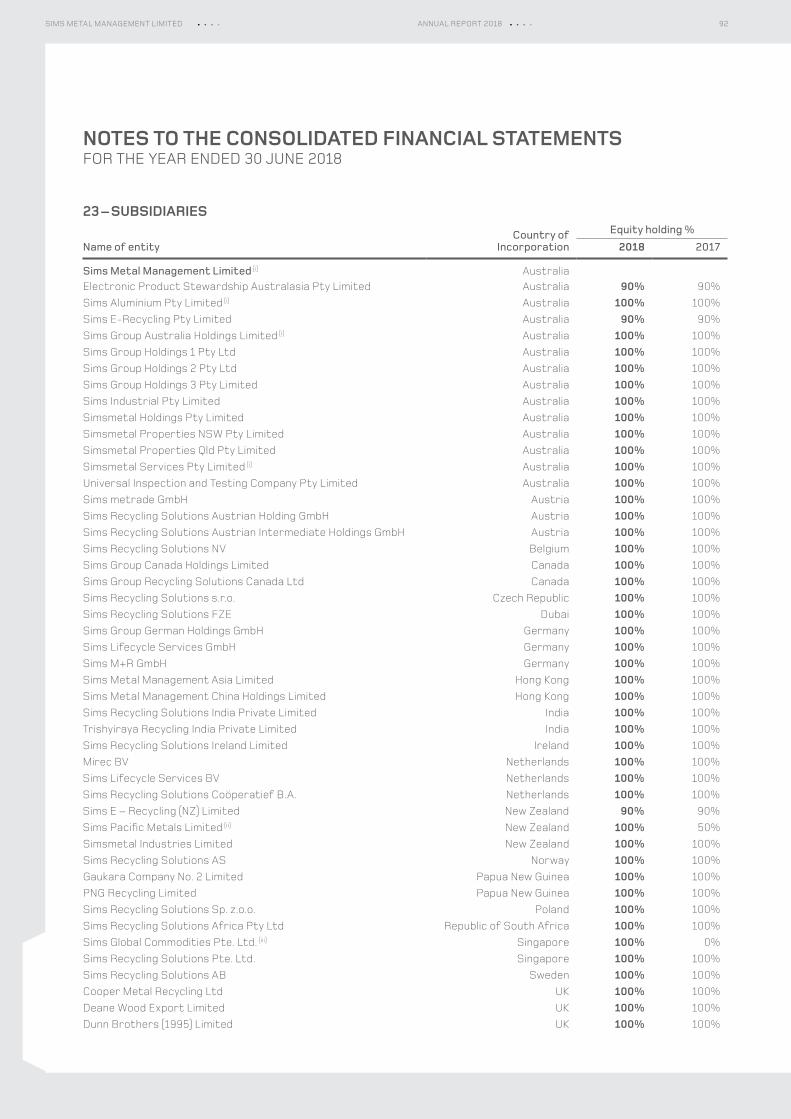
NOTES TO THE CONSOLIDATED FINANCIAL STATEMENTSFOR THE YEAR ENDED 30 JUNE 2018
23 – SUBSIDIARIES
Name of entityCountry of
IncorporationEquity holding %
2018 2017
Sims Metal Management Limited (i) AustraliaElectronic Product Stewardship Australasia Pty Limited Australia 90% 90%Sims Aluminium Pty Limited (i) Australia 100% 100%Sims E-Recycling Pty Limited Australia 90% 90%Sims Group Australia Holdings Limited (i) Australia 100% 100%Sims Group Holdings 1 Pty Ltd Australia 100% 100%Sims Group Holdings 2 Pty Ltd Australia 100% 100%Sims Group Holdings 3 Pty Limited Australia 100% 100%Sims Industrial Pty Limited Australia 100% 100%Simsmetal Holdings Pty Limited Australia 100% 100%Simsmetal Properties NSW Pty Limited Australia 100% 100%Simsmetal Properties Qld Pty Limited Australia 100% 100%Simsmetal Services Pty Limited (i) Australia 100% 100%Universal Inspection and Testing Company Pty Limited Australia 100% 100%Sims metrade GmbH Austria 100% 100%Sims Recycling Solutions Austrian Holding GmbH Austria 100% 100%Sims Recycling Solutions Austrian Intermediate Holdings GmbH Austria 100% 100%Sims Recycling Solutions NV Belgium 100% 100%Sims Group Canada Holdings Limited Canada 100% 100%Sims Group Recycling Solutions Canada Ltd Canada 100% 100%Sims Recycling Solutions s.r.o. Czech Republic 100% 100%Sims Recycling Solutions FZE Dubai 100% 100%Sims Group German Holdings GmbH Germany 100% 100%Sims Lifecycle Services GmbH Germany 100% 100%Sims M+R GmbH Germany 100% 100%Sims Metal Management Asia Limited Hong Kong 100% 100%Sims Metal Management China Holdings Limited Hong Kong 100% 100%Sims Recycling Solutions India Private Limited India 100% 100%Trishyiraya Recycling India Private Limited India 100% 100%Sims Recycling Solutions Ireland Limited Ireland 100% 100%Mirec BV Netherlands 100% 100%Sims Lifecycle Services BV Netherlands 100% 100%Sims Recycling Solutions Coöperatief B.A. Netherlands 100% 100%Sims E – Recycling (NZ) Limited New Zealand 90% 90%Sims Pacific Metals Limited (ii) New Zealand 100% 50%Simsmetal Industries Limited New Zealand 100% 100%Sims Recycling Solutions AS Norway 100% 100%Gaukara Company No. 2 Limited Papua New Guinea 100% 100%PNG Recycling Limited Papua New Guinea 100% 100%Sims Recycling Solutions Sp. z.o.o. Poland 100% 100%Sims Recycling Solutions Africa Pty Ltd Republic of South Africa 100% 100%Sims Global Commodities Pte. Ltd. (iii) Singapore 100% 0%Sims Recycling Solutions Pte. Ltd. Singapore 100% 100%Sims Recycling Solutions AB Sweden 100% 100%Cooper Metal Recycling Ltd UK 100% 100%Deane Wood Export Limited UK 100% 100%Dunn Brothers (1995) Limited UK 100% 100%
92SIMS METAL MANAGEMENT LIMITED ANNUAL REPORT 2018
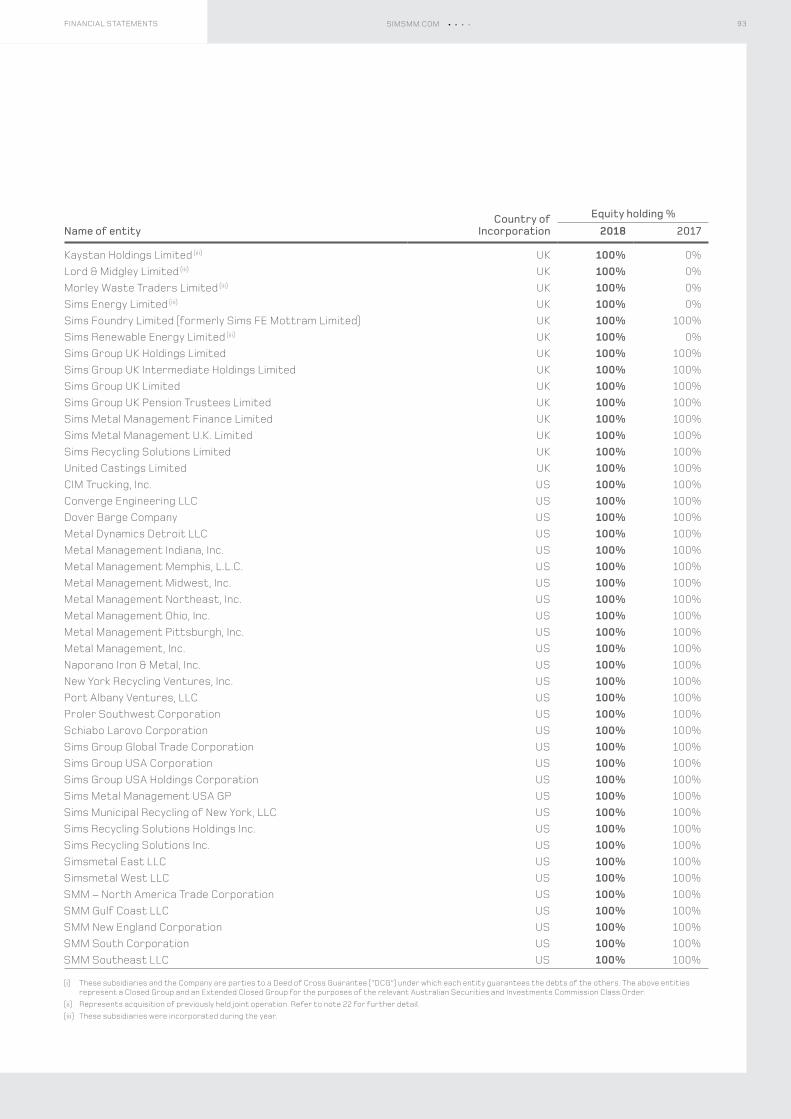
Name of entityCountry of
IncorporationEquity holding %
2018 2017
Kaystan Holdings Limited (iii) UK 100% 0%Lord & Midgley Limited (iii) UK 100% 0%Morley Waste Traders Limited (iii) UK 100% 0%Sims Energy Limited (iii) UK 100% 0%Sims Foundry Limited (formerly Sims FE Mottram Limited) UK 100% 100%Sims Renewable Energy Limited (iii) UK 100% 0%Sims Group UK Holdings Limited UK 100% 100%Sims Group UK Intermediate Holdings Limited UK 100% 100%Sims Group UK Limited UK 100% 100%Sims Group UK Pension Trustees Limited UK 100% 100%Sims Metal Management Finance Limited UK 100% 100%Sims Metal Management U.K. Limited UK 100% 100%Sims Recycling Solutions Limited UK 100% 100%United Castings Limited UK 100% 100%CIM Trucking, Inc. US 100% 100%Converge Engineering LLC US 100% 100%Dover Barge Company US 100% 100%Metal Dynamics Detroit LLC US 100% 100%Metal Management Indiana, Inc. US 100% 100%Metal Management Memphis, L.L.C. US 100% 100%Metal Management Midwest, Inc. US 100% 100%Metal Management Northeast, Inc. US 100% 100%Metal Management Ohio, Inc. US 100% 100%Metal Management Pittsburgh, Inc. US 100% 100%Metal Management, Inc. US 100% 100%Naporano Iron & Metal, Inc. US 100% 100%New York Recycling Ventures, Inc. US 100% 100%Port Albany Ventures, LLC US 100% 100%Proler Southwest Corporation US 100% 100%Schiabo Larovo Corporation US 100% 100%Sims Group Global Trade Corporation US 100% 100%Sims Group USA Corporation US 100% 100%Sims Group USA Holdings Corporation US 100% 100%Sims Metal Management USA GP US 100% 100%Sims Municipal Recycling of New York, LLC US 100% 100%Sims Recycling Solutions Holdings Inc. US 100% 100%Sims Recycling Solutions Inc. US 100% 100%Simsmetal East LLC US 100% 100%Simsmetal West LLC US 100% 100%SMM – North America Trade Corporation US 100% 100%SMM Gulf Coast LLC US 100% 100%SMM New England Corporation US 100% 100%SMM South Corporation US 100% 100%SMM Southeast LLC US 100% 100%
(i) These subsidiaries and the Company are parties to a Deed of Cross Guarantee (“DCG”) under which each entity guarantees the debts of the others. The above entities represent a Closed Group and an Extended Closed Group for the purposes of the relevant Australian Securities and Investments Commission Class Order.
(ii) Represents acquisition of previously held joint operation. Refer to note 22 for further detail.(iii) These subsidiaries were incorporated during the year.
93FINANCIAL STATEMENTS SIMSMM.COM
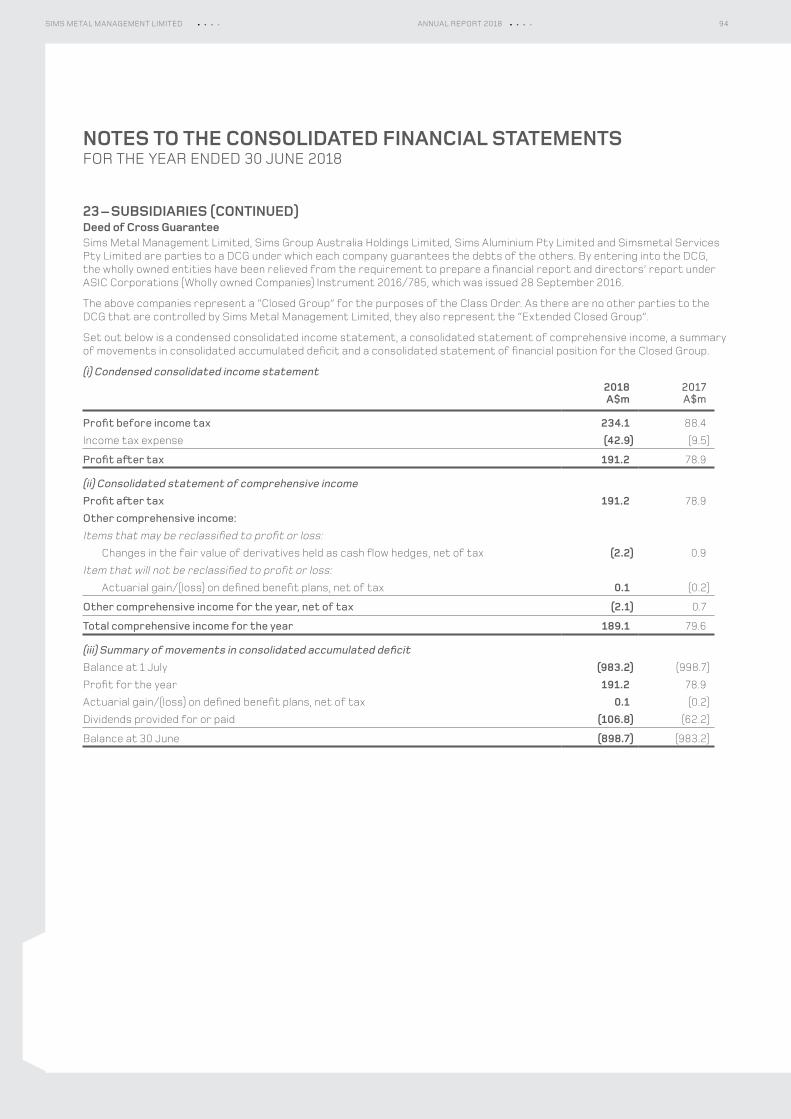
NOTES TO THE CONSOLIDATED FINANCIAL STATEMENTSFOR THE YEAR ENDED 30 JUNE 2018
23 – SUBSIDIARIES (CONTINUED)Deed of Cross GuaranteeSims Metal Management Limited, Sims Group Australia Holdings Limited, Sims Aluminium Pty Limited and Simsmetal Services Pty Limited are parties to a DCG under which each company guarantees the debts of the others. By entering into the DCG, the wholly owned entities have been relieved from the requirement to prepare a financial report and directors’ report under ASIC Corporations (Wholly owned Companies) Instrument 2016/785, which was issued 28 September 2016.
The above companies represent a “Closed Group” for the purposes of the Class Order. As there are no other parties to the DCG that are controlled by Sims Metal Management Limited, they also represent the “Extended Closed Group”.
Set out below is a condensed consolidated income statement, a consolidated statement of comprehensive income, a summary of movements in consolidated accumulated deficit and a consolidated statement of financial position for the Closed Group.
(i) Condensed consolidated income statement2018A$m
2017A$m
Profit before income tax 234.1 88.4
Income tax expense (42.9) (9.5)
Profit after tax 191.2 78.9
(ii) Consolidated statement of comprehensive incomeProfit after tax 191.2 78.9
Other comprehensive income:Items that may be reclassified to profit or loss: Changes in the fair value of derivatives held as cash flow hedges, net of tax (2.2) 0.9
Item that will not be reclassified to profit or loss: Actuarial gain/(loss) on defined benefit plans, net of tax 0.1 (0.2)
Other comprehensive income for the year, net of tax (2.1) 0.7
Total comprehensive income for the year 189.1 79.6
(iii) Summary of movements in consolidated accumulated deficitBalance at 1 July (983.2) (998.7)
Profit for the year 191.2 78.9
Actuarial gain/(loss) on defined benefit plans, net of tax 0.1 (0.2)
Dividends provided for or paid (106.8) (62.2)
Balance at 30 June (898.7) (983.2)
94SIMS METAL MANAGEMENT LIMITED ANNUAL REPORT 2018
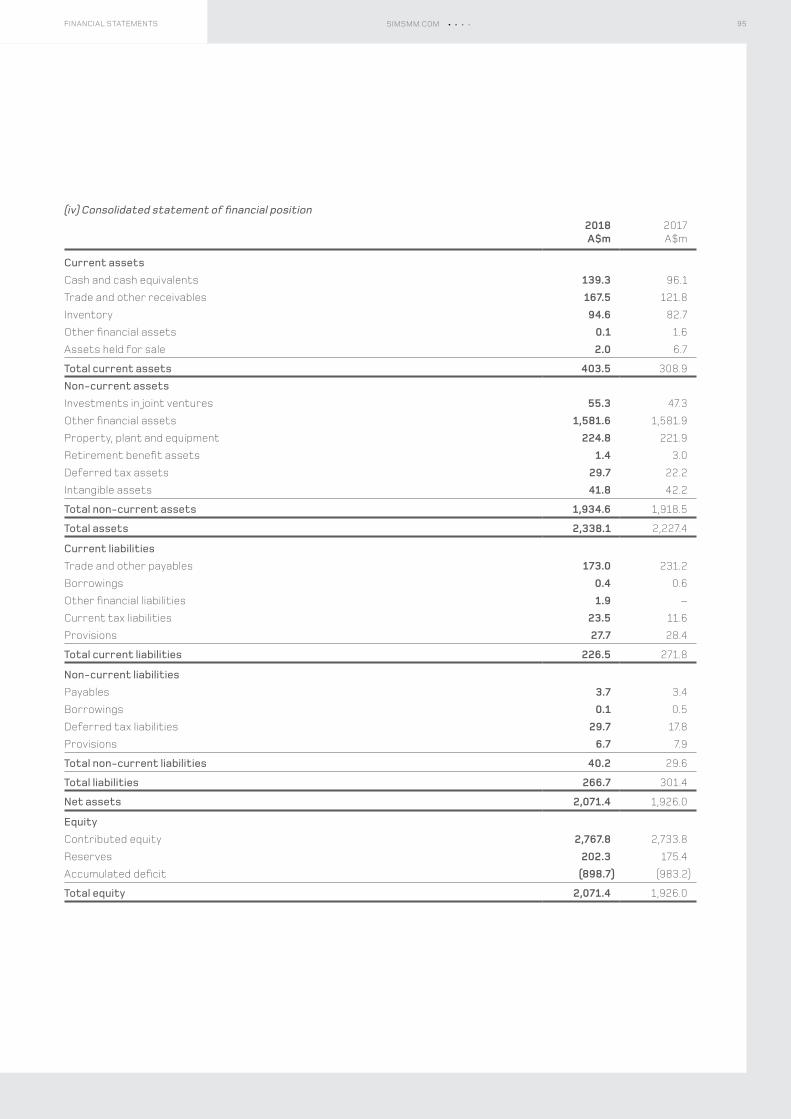
(iv) Consolidated statement of financial position2018A$m
2017A$m
Current assetsCash and cash equivalents 139.3 96.1
Trade and other receivables 167.5 121.8
Inventory 94.6 82.7
Other financial assets 0.1 1.6
Assets held for sale 2.0 6.7
Total current assets 403.5 308.9
Non-current assetsInvestments in joint ventures 55.3 47.3
Other financial assets 1,581.6 1,581.9
Property, plant and equipment 224.8 221.9
Retirement benefit assets 1.4 3.0
Deferred tax assets 29.7 22.2
Intangible assets 41.8 42.2
Total non-current assets 1,934.6 1,918.5
Total assets 2,338.1 2,227.4
Current liabilitiesTrade and other payables 173.0 231.2
Borrowings 0.4 0.6
Other financial liabilities 1.9 –
Current tax liabilities 23.5 11.6
Provisions 27.7 28.4
Total current liabilities 226.5 271.8
Non-current liabilitiesPayables 3.7 3.4
Borrowings 0.1 0.5
Deferred tax liabilities 29.7 17.8
Provisions 6.7 7.9
Total non-current liabilities 40.2 29.6
Total liabilities 266.7 301.4
Net assets 2,071.4 1,926.0
EquityContributed equity 2,767.8 2,733.8
Reserves 202.3 175.4
Accumulated deficit (898.7) (983.2)
Total equity 2,071.4 1,926.0
95FINANCIAL STATEMENTS SIMSMM.COM
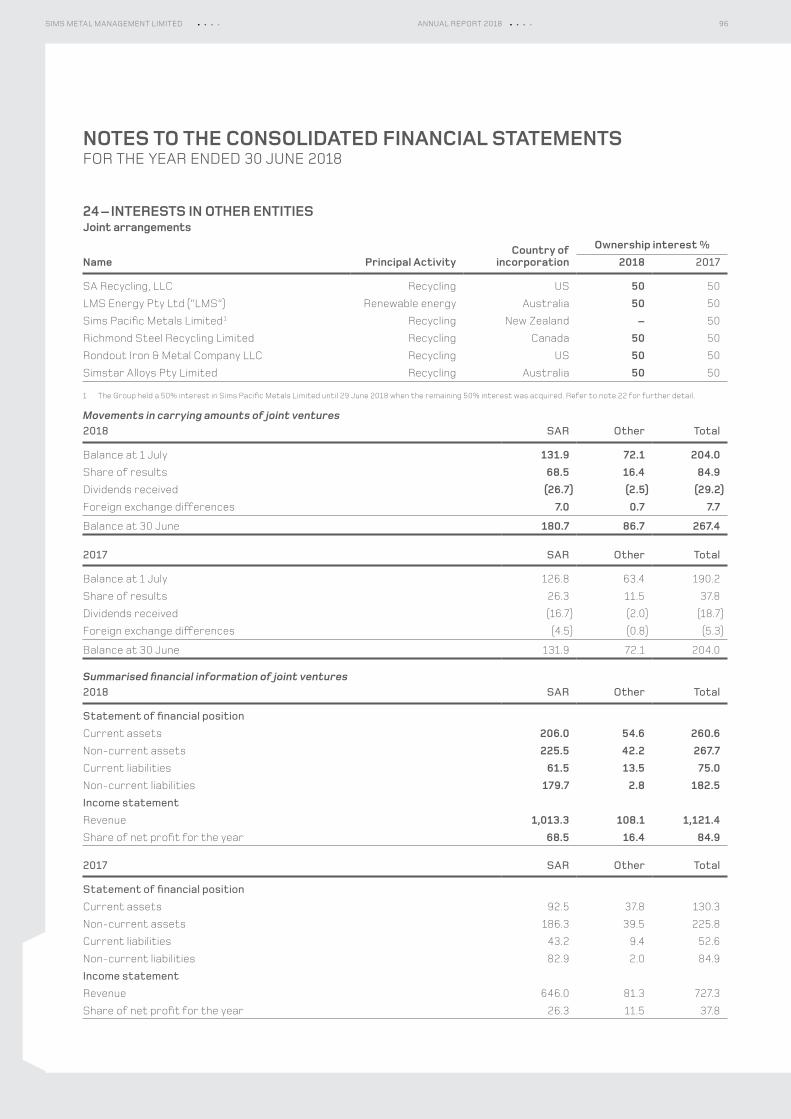
NOTES TO THE CONSOLIDATED FINANCIAL STATEMENTSFOR THE YEAR ENDED 30 JUNE 2018
24 – INTERESTS IN OTHER ENTITIESJoint arrangements
Name Principal ActivityCountry of
incorporationOwnership interest %
2018 2017
SA Recycling, LLC Recycling US 50 50
LMS Energy Pty Ltd (“LMS”) Renewable energy Australia 50 50
Sims Pacific Metals Limited 1 Recycling New Zealand – 50
Richmond Steel Recycling Limited Recycling Canada 50 50
Rondout Iron & Metal Company LLC Recycling US 50 50
Simstar Alloys Pty Limited Recycling Australia 50 50
1 The Group held a 50% interest in Sims Pacific Metals Limited until 29 June 2018 when the remaining 50% interest was acquired. Refer to note 22 for further detail.
Movements in carrying amounts of joint ventures2018 SAR Other Total
Balance at 1 July 131.9 72.1 204.0Share of results 68.5 16.4 84.9Dividends received (26.7) (2.5) (29.2)Foreign exchange differences 7.0 0.7 7.7
Balance at 30 June 180.7 86.7 267.4
2017 SAR Other Total
Balance at 1 July 126.8 63.4 190.2
Share of results 26.3 11.5 37.8
Dividends received (16.7) (2.0) (18.7)
Foreign exchange differences (4.5) (0.8) (5.3)
Balance at 30 June 131.9 72.1 204.0
Summarised financial information of joint ventures2018 SAR Other Total
Statement of financial positionCurrent assets 206.0 54.6 260.6Non-current assets 225.5 42.2 267.7Current liabilities 61.5 13.5 75.0Non-current liabilities 179.7 2.8 182.5Income statementRevenue 1,013.3 108.1 1,121.4Share of net profit for the year 68.5 16.4 84.9
2017 SAR Other Total
Statement of financial positionCurrent assets 92.5 37.8 130.3
Non-current assets 186.3 39.5 225.8
Current liabilities 43.2 9.4 52.6
Non-current liabilities 82.9 2.0 84.9
Income statementRevenue 646.0 81.3 727.3
Share of net profit for the year 26.3 11.5 37.8
96SIMS METAL MANAGEMENT LIMITED ANNUAL REPORT 2018
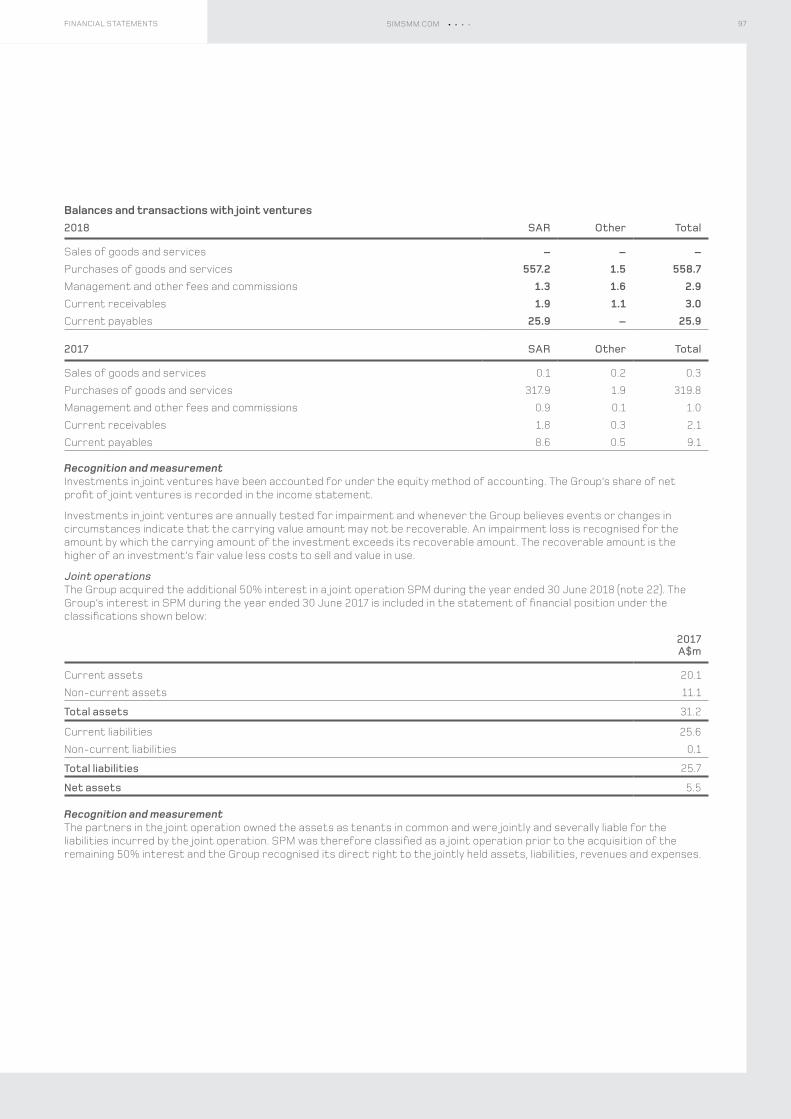
Balances and transactions with joint ventures2018 SAR Other Total
Sales of goods and services – – –Purchases of goods and services 557.2 1.5 558.7Management and other fees and commissions 1.3 1.6 2.9Current receivables 1.9 1.1 3.0Current payables 25.9 – 25.9
2017 SAR Other Total
Sales of goods and services 0.1 0.2 0.3
Purchases of goods and services 317.9 1.9 319.8
Management and other fees and commissions 0.9 0.1 1.0
Current receivables 1.8 0.3 2.1
Current payables 8.6 0.5 9.1
Recognition and measurementInvestments in joint ventures have been accounted for under the equity method of accounting. The Group’s share of net profit of joint ventures is recorded in the income statement.
Investments in joint ventures are annually tested for impairment and whenever the Group believes events or changes in circumstances indicate that the carrying value amount may not be recoverable. An impairment loss is recognised for the amount by which the carrying amount of the investment exceeds its recoverable amount. The recoverable amount is the higher of an investment’s fair value less costs to sell and value in use.
Joint operationsThe Group acquired the additional 50% interest in a joint operation SPM during the year ended 30 June 2018 (note 22). The Group’s interest in SPM during the year ended 30 June 2017 is included in the statement of financial position under the classifications shown below:
2017A$m
Current assets 20.1
Non-current assets 11.1
Total assets 31.2
Current liabilities 25.6
Non-current liabilities 0.1
Total liabilities 25.7
Net assets 5.5
Recognition and measurementThe partners in the joint operation owned the assets as tenants in common and were jointly and severally liable for the liabilities incurred by the joint operation. SPM was therefore classified as a joint operation prior to the acquisition of the remaining 50% interest and the Group recognised its direct right to the jointly held assets, liabilities, revenues and expenses.
97FINANCIAL STATEMENTS SIMSMM.COM
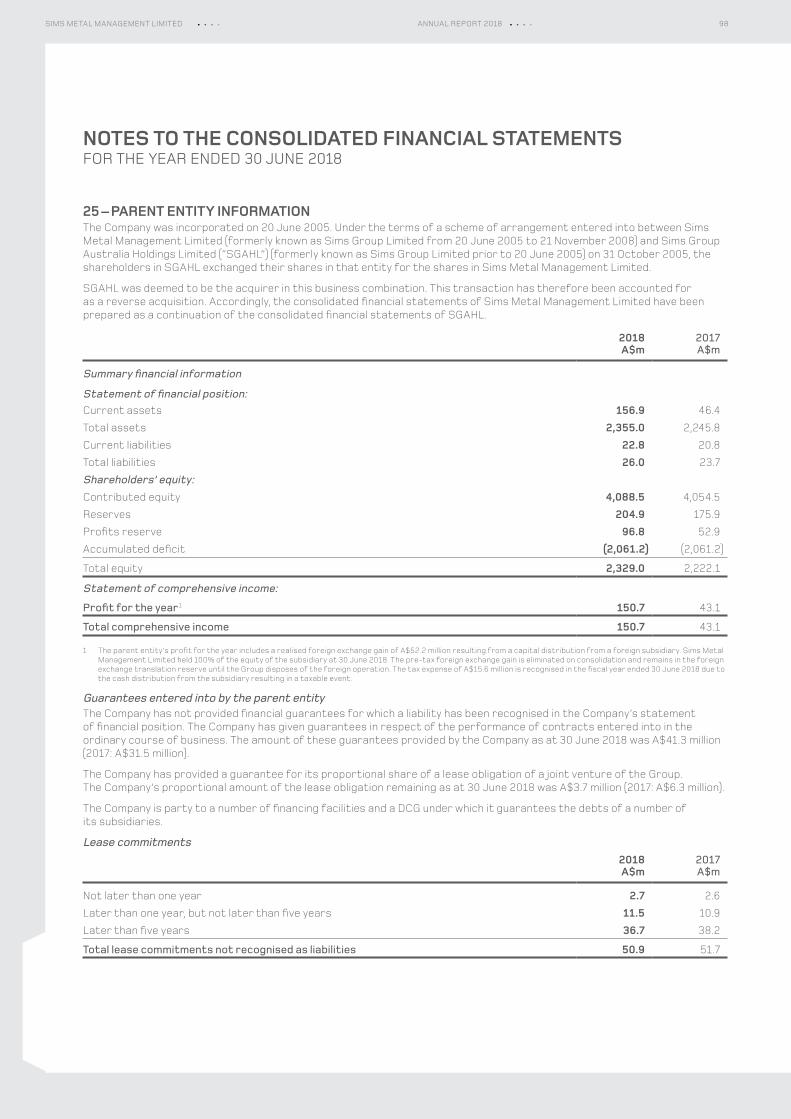
NOTES TO THE CONSOLIDATED FINANCIAL STATEMENTSFOR THE YEAR ENDED 30 JUNE 2018
25 – PARENT ENTITY INFORMATIONThe Company was incorporated on 20 June 2005. Under the terms of a scheme of arrangement entered into between Sims Metal Management Limited (formerly known as Sims Group Limited from 20 June 2005 to 21 November 2008) and Sims Group Australia Holdings Limited (“SGAHL”) (formerly known as Sims Group Limited prior to 20 June 2005) on 31 October 2005, the shareholders in SGAHL exchanged their shares in that entity for the shares in Sims Metal Management Limited.
SGAHL was deemed to be the acquirer in this business combination. This transaction has therefore been accounted for as a reverse acquisition. Accordingly, the consolidated financial statements of Sims Metal Management Limited have been prepared as a continuation of the consolidated financial statements of SGAHL.
2018A$m
2017A$m
Summary financial information
Statement of financial position:Current assets 156.9 46.4
Total assets 2,355.0 2,245.8
Current liabilities 22.8 20.8
Total liabilities 26.0 23.7
Shareholders’ equity:Contributed equity 4,088.5 4,054.5
Reserves 204.9 175.9
Profits reserve 96.8 52.9
Accumulated deficit (2,061.2) (2,061.2)
Total equity 2,329.0 2,222.1
Statement of comprehensive income:
Profit for the year 1 150.7 43.1
Total comprehensive income 150.7 43.1
1 The parent entity’s profit for the year includes a realised foreign exchange gain of A$52.2 million resulting from a capital distribution from a foreign subsidiary. Sims Metal Management Limited held 100% of the equity of the subsidiary at 30 June 2018. The pre-tax foreign exchange gain is eliminated on consolidation and remains in the foreign exchange translation reserve until the Group disposes of the foreign operation. The tax expense of A$15.6 million is recognised in the fiscal year ended 30 June 2018 due to the cash distribution from the subsidiary resulting in a taxable event.
Guarantees entered into by the parent entityThe Company has not provided financial guarantees for which a liability has been recognised in the Company’s statement of financial position. The Company has given guarantees in respect of the performance of contracts entered into in the ordinary course of business. The amount of these guarantees provided by the Company as at 30 June 2018 was A$41.3 million (2017: A$31.5 million).
The Company has provided a guarantee for its proportional share of a lease obligation of a joint venture of the Group. The Company’s proportional amount of the lease obligation remaining as at 30 June 2018 was A$3.7 million (2017: A$6.3 million).
The Company is party to a number of financing facilities and a DCG under which it guarantees the debts of a number of its subsidiaries.
Lease commitments2018A$m
2017A$m
Not later than one year 2.7 2.6
Later than one year, but not later than five years 11.5 10.9
Later than five years 36.7 38.2
Total lease commitments not recognised as liabilities 50.9 51.7
98SIMS METAL MANAGEMENT LIMITED ANNUAL REPORT 2018
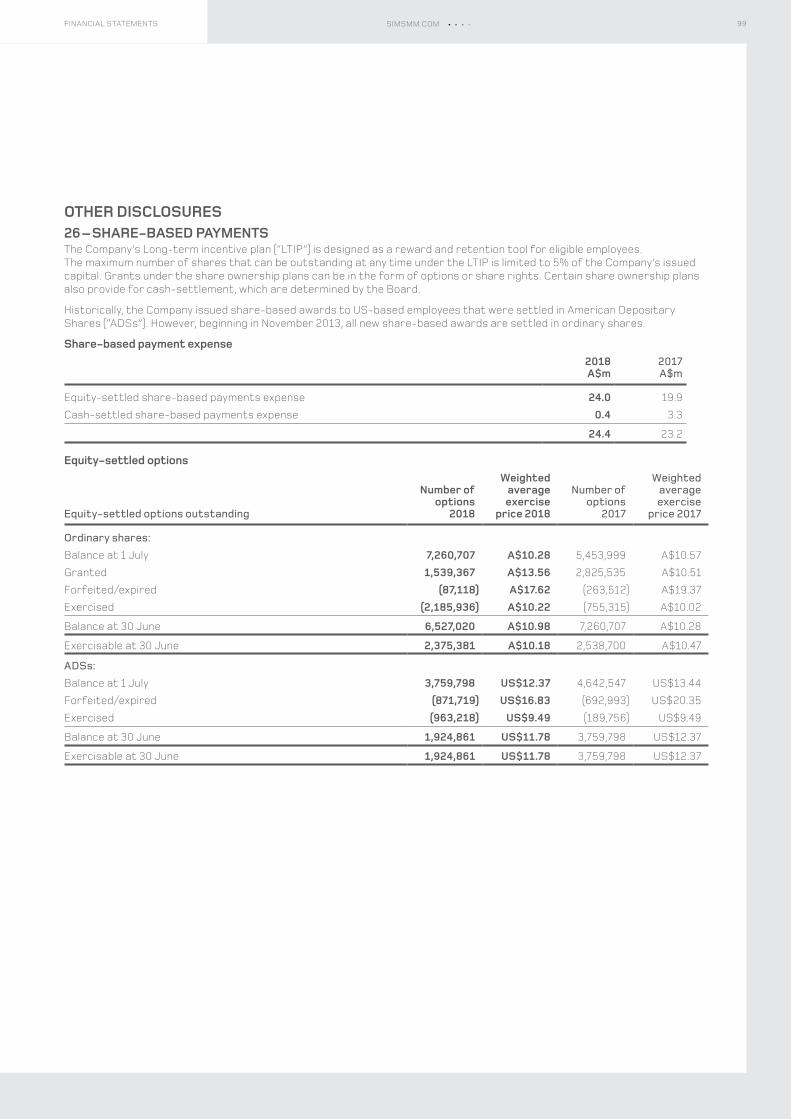
OTHER DISCLOSURES26 – SHARE‑BASED PAYMENTSThe Company’s Long-term incentive plan (“LTIP”) is designed as a reward and retention tool for eligible employees. The maximum number of shares that can be outstanding at any time under the LTIP is limited to 5% of the Company’s issued capital. Grants under the share ownership plans can be in the form of options or share rights. Certain share ownership plans also provide for cash-settlement, which are determined by the Board.
Historically, the Company issued share-based awards to US-based employees that were settled in American Depositary Shares (“ADSs”). However, beginning in November 2013, all new share-based awards are settled in ordinary shares.
Share‑based payment expense2018A$m
2017A$m
Equity-settled share-based payments expense 24.0 19.9
Cash-settled share-based payments expense 0.4 3.3
24.4 23.2
Equity‑settled options
Equity-settled options outstanding
Number of options
2018
Weighted average exercise
price 2018
Number of options
2017
Weighted average exercise
price 2017
Ordinary shares:Balance at 1 July 7,260,707 A$10.28 5,453,999 A$10.57
Granted 1,539,367 A$13.56 2,825,535 A$10.51
Forfeited/expired (87,118) A$17.62 (263,512) A$19.37
Exercised (2,185,936) A$10.22 (755,315) A$10.02
Balance at 30 June 6,527,020 A$10.98 7,260,707 A$10.28
Exercisable at 30 June 2,375,381 A$10.18 2,538,700 A$10.47
ADSs:Balance at 1 July 3,759,798 US$12.37 4,642,547 US$13.44
Forfeited/expired (871,719) US$16.83 (692,993) US$20.35
Exercised (963,218) US$9.49 (189,756) US$9.49
Balance at 30 June 1,924,861 US$11.78 3,759,798 US$12.37
Exercisable at 30 June 1,924,861 US$11.78 3,759,798 US$12.37
99FINANCIAL STATEMENTS SIMSMM.COM
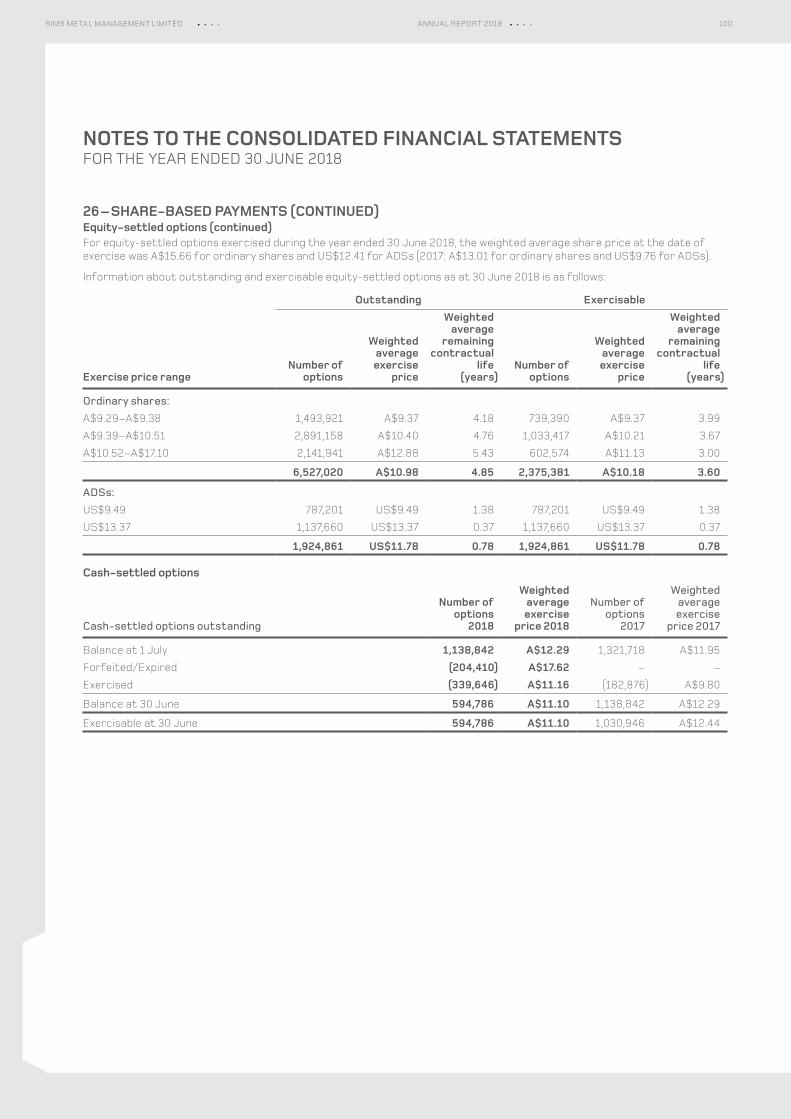
NOTES TO THE CONSOLIDATED FINANCIAL STATEMENTSFOR THE YEAR ENDED 30 JUNE 2018
26 – SHARE‑BASED PAYMENTS (CONTINUED)Equity‑settled options (continued)For equity-settled options exercised during the year ended 30 June 2018, the weighted average share price at the date of exercise was A$15.66 for ordinary shares and US$12.41 for ADSs (2017: A$13.01 for ordinary shares and US$9.76 for ADSs).
Information about outstanding and exercisable equity-settled options as at 30 June 2018 is as follows:
Exercise price range
Outstanding Exercisable
Number of options
Weighted average exercise
price
Weighted average
remaining contractual
life (years)
Number of options
Weighted average exercise
price
Weighted average
remaining contractual
life (years)
Ordinary shares:A$9.29–A$9.38 1,493,921 A$9.37 4.18 739,390 A$9.37 3.99
A$9.39–A$10.51 2,891,158 A$10.40 4.76 1,033,417 A$10.21 3.67
A$10.52–A$17.10 2,141,941 A$12.88 5.43 602,574 A$11.13 3.00
6,527,020 A$10.98 4.85 2,375,381 A$10.18 3.60
ADSs:US$9.49 787,201 US$9.49 1.38 787,201 US$9.49 1.38
US$13.37 1,137,660 US$13.37 0.37 1,137,660 US$13.37 0.37
1,924,861 US$11.78 0.78 1,924,861 US$11.78 0.78
Cash‑settled options
Cash-settled options outstanding
Number of options
2018
Weightedaverageexercise
price 2018
Number ofoptions
2017
Weightedaverage
exercise price 2017
Balance at 1 July 1,138,842 A$12.29 1,321,718 A$11.95
Forfeited/Expired (204,410) A$17.62 – –
Exercised (339,646) A$11.16 (182,876) A$9.80
Balance at 30 June 594,786 A$11.10 1,138,842 A$12.29
Exercisable at 30 June 594,786 A$11.10 1,030,946 A$12.44
100SIMS METAL MANAGEMENT LIMITED ANNUAL REPORT 2018
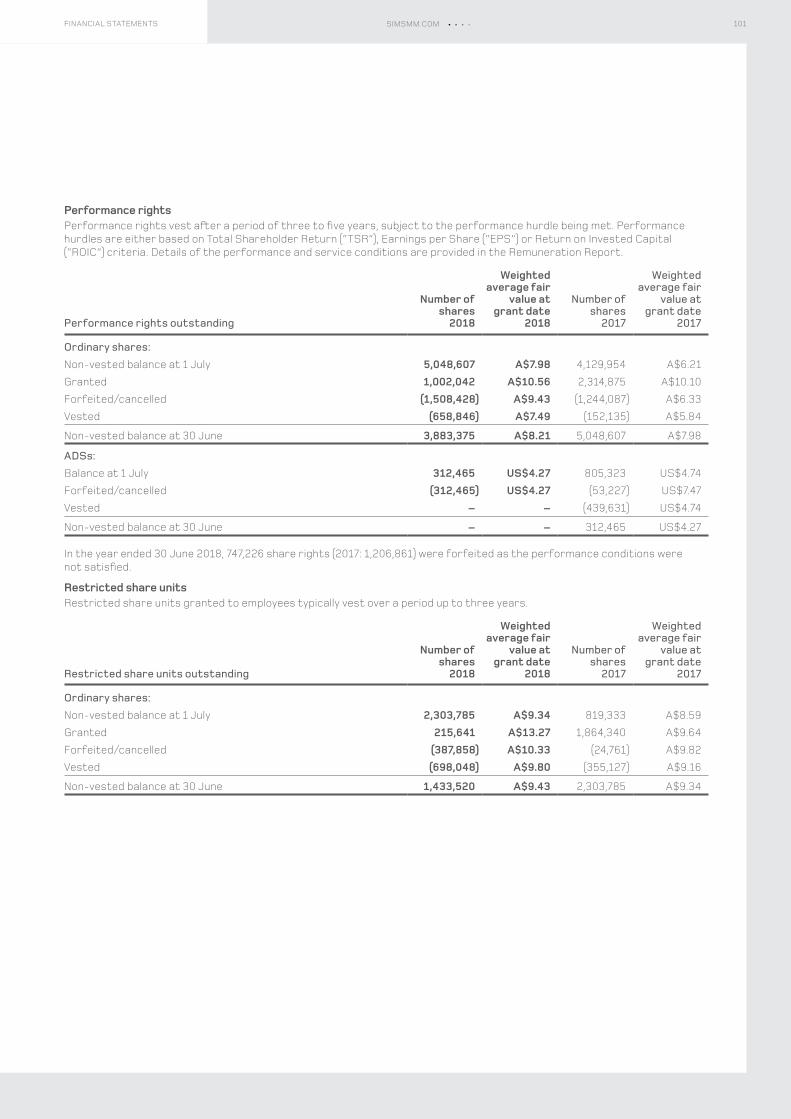
Performance rightsPerformance rights vest after a period of three to five years, subject to the performance hurdle being met. Performance hurdles are either based on Total Shareholder Return (“TSR”), Earnings per Share (“EPS”) or Return on Invested Capital (“ROIC”) criteria. Details of the performance and service conditions are provided in the Remuneration Report.
Performance rights outstanding
Number of shares
2018
Weighted average fair
value at grant date
2018
Number of shares
2017
Weighted average fair
value at grant date
2017
Ordinary shares:Non-vested balance at 1 July 5,048,607 A$7.98 4,129,954 A$6.21
Granted 1,002,042 A$10.56 2,314,875 A$10.10
Forfeited/cancelled (1,508,428) A$9.43 (1,244,087) A$6.33
Vested (658,846) A$7.49 (152,135) A$5.84
Non-vested balance at 30 June 3,883,375 A$8.21 5,048,607 A$7.98
ADSs:Balance at 1 July 312,465 US$4.27 805,323 US$4.74
Forfeited/cancelled (312,465) US$4.27 (53,227) US$7.47
Vested – – (439,631) US$4.74
Non-vested balance at 30 June – – 312,465 US$4.27
In the year ended 30 June 2018, 747,226 share rights (2017: 1,206,861) were forfeited as the performance conditions were not satisfied.
Restricted share unitsRestricted share units granted to employees typically vest over a period up to three years.
Restricted share units outstanding
Number of shares
2018
Weighted average fair
value at grant date
2018
Number of shares
2017
Weighted average fair
value at grant date
2017
Ordinary shares:Non-vested balance at 1 July 2,303,785 A$9.34 819,333 A$8.59
Granted 215,641 A$13.27 1,864,340 A$9.64
Forfeited/cancelled (387,858) A$10.33 (24,761) A$9.82
Vested (698,048) A$9.80 (355,127) A$9.16
Non-vested balance at 30 June 1,433,520 A$9.43 2,303,785 A$9.34
101FINANCIAL STATEMENTS SIMSMM.COM
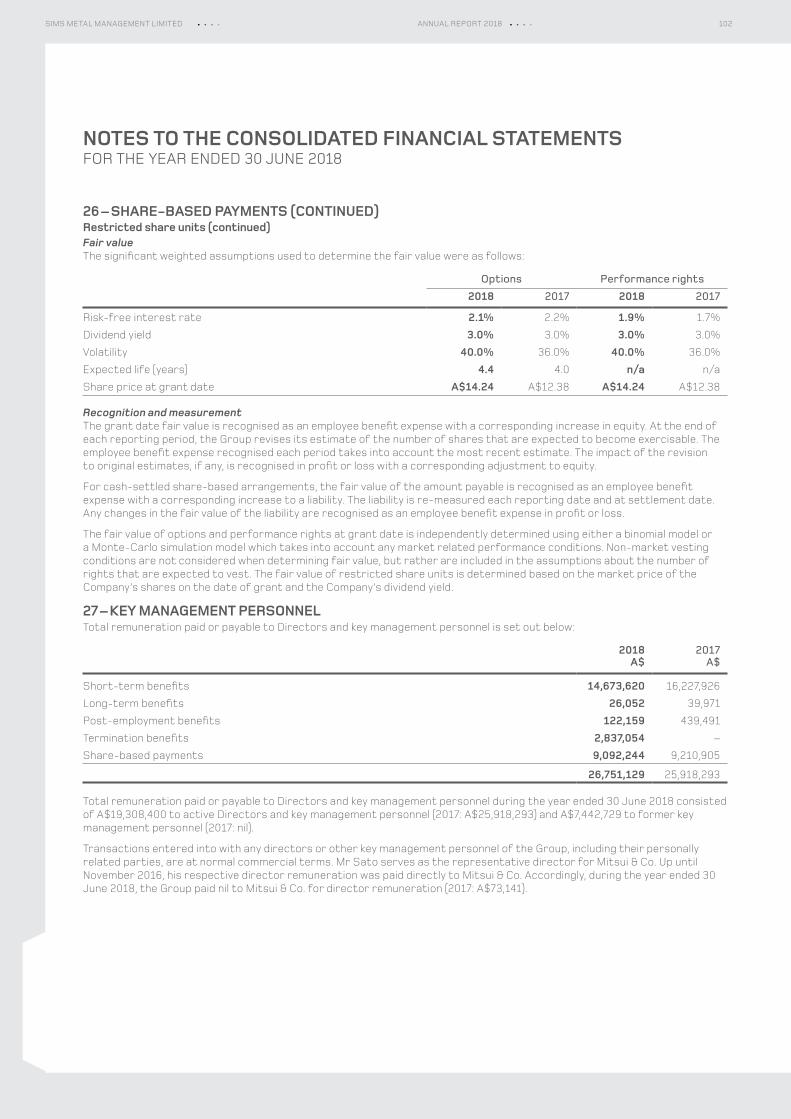
NOTES TO THE CONSOLIDATED FINANCIAL STATEMENTSFOR THE YEAR ENDED 30 JUNE 2018
26 – SHARE‑BASED PAYMENTS (CONTINUED)Restricted share units (continued)Fair valueThe significant weighted assumptions used to determine the fair value were as follows:
Options Performance rights2018 2017 2018 2017
Risk-free interest rate 2.1% 2.2% 1.9% 1.7%
Dividend yield 3.0% 3.0% 3.0% 3.0%
Volatility 40.0% 36.0% 40.0% 36.0%
Expected life (years) 4.4 4.0 n/a n/a
Share price at grant date A$14.24 A$12.38 A$14.24 A$12.38
Recognition and measurementThe grant date fair value is recognised as an employee benefit expense with a corresponding increase in equity. At the end of each reporting period, the Group revises its estimate of the number of shares that are expected to become exercisable. The employee benefit expense recognised each period takes into account the most recent estimate. The impact of the revision to original estimates, if any, is recognised in profit or loss with a corresponding adjustment to equity.
For cash-settled share-based arrangements, the fair value of the amount payable is recognised as an employee benefit expense with a corresponding increase to a liability. The liability is re-measured each reporting date and at settlement date. Any changes in the fair value of the liability are recognised as an employee benefit expense in profit or loss.
The fair value of options and performance rights at grant date is independently determined using either a binomial model or a Monte-Carlo simulation model which takes into account any market related performance conditions. Non-market vesting conditions are not considered when determining fair value, but rather are included in the assumptions about the number of rights that are expected to vest. The fair value of restricted share units is determined based on the market price of the Company’s shares on the date of grant and the Company’s dividend yield.
27 – KEY MANAGEMENT PERSONNELTotal remuneration paid or payable to Directors and key management personnel is set out below:
2018A$
2017A$
Short-term benefits 14,673,620 16,227,926
Long-term benefits 26,052 39,971
Post-employment benefits 122,159 439,491
Termination benefits 2,837,054 –
Share-based payments 9,092,244 9,210,905
26,751,129 25,918,293
Total remuneration paid or payable to Directors and key management personnel during the year ended 30 June 2018 consisted of A$19,308,400 to active Directors and key management personnel (2017: A$25,918,293) and A$7,442,729 to former key management personnel (2017: nil).
Transactions entered into with any directors or other key management personnel of the Group, including their personally related parties, are at normal commercial terms. Mr Sato serves as the representative director for Mitsui & Co. Up until November 2016, his respective director remuneration was paid directly to Mitsui & Co. Accordingly, during the year ended 30 June 2018, the Group paid nil to Mitsui & Co. for director remuneration (2017: A$73,141).
102SIMS METAL MANAGEMENT LIMITED ANNUAL REPORT 2018
28 – COMMITMENTS AND CONTINGENCIESCommitments
2018A$m
2017A$m
Operating leasesNot later than one year 84.7 78.5
Later than one year, but not later than five years 176.5 162.0
Later than five years 133.3 111.8
Total 394.5 352.3
Capital expendituresPayable within one year 47.9 44.4
The commitments included above also include the Group’s share relating to joint ventures.
GuaranteesThe Group has given guarantees in respect of the performance of contracts entered into in the ordinary course of business. The amounts of these guarantees provided by the Group, for which no amounts are recognised in the consolidated financial statements, as at 30 June 2018 was A$43.7 million (2017: A$34.7 million).
29 – REMUNERATION OF AUDITORS2018
A$’0002017
A$’000
Deloitte Touche Tohmatsu Australia:Audit and review of financial statements 1,929 1,777
Taxation services 10 31
Other assurance related services 40 80
1,979 1,888
Network firms of Deloitte Touche Tohmatsu Australia: Audit and review of financial statements 1,669 1,634
Taxation services 289 297
Other assurance related services 157 83
2,115 2,014
Total remuneration for Deloitte Touche Tohmatsu 4,094 3,902
30 – NEW ACCOUNTING STANDARDS NOT YET APPLICABLEAASB 9 Financial InstrumentsAASB 9 replaces AASB 139 Financial Instruments: Recognition and Measurement. The standard introduces new requirements for the classification, measurement and derecognition of financial assets and financial liabilities and sets out new hedge accounting requirements. The objective of AASB 9 is to establish principles for the financial reporting of financial assets and financial liabilities that will present relevant and useful information to users of financial statements for their assessment of the amounts, timing and uncertainty of the entity’s future cash flows. The new requirements for AASB 9 can be grouped into 1) classification and measurement of financial assets and liabilities, 2) impairment for financial assets, including a transition to expected credit losses for financial asset impairment considerations, and 3) introduction of new general hedge accounting requirements.
103FINANCIAL STATEMENTS SIMSMM.COM
NOTES TO THE CONSOLIDATED FINANCIAL STATEMENTSFOR THE YEAR ENDED 30 JUNE 2018
30 – NEW ACCOUNTING STANDARDS NOT YET APPLICABLE (CONTINUED)AASB 9 Financial Instruments (continued)The standard is effective for the Group on 1 July 2018. In preparation for adoption of AASB 9, the Group has undertaken an assessment of the classification and measurement impacts of the new standard and estimated the following impacts:
– The new standard is based on the concept that financial assets should be classified and measured at fair value, with changes in fair value recognised in profit and loss as they arise (“FVPL”), unless restrictive criteria are met for classifying and measuring the asset at either amortised cost or fair value through other comprehensive income. The Group does not expect the new standard to have a significant impact on the classification of financial assets or liabilities as the Group does not hold material financial assets or liabilities at FVPL. Refer to notes 16 and 21 for further information pertaining to financial assets and liabilities, including derivative financial instruments.
– AASB 9 allows more financial exposures to be hedged and establishes new criteria for hedge accounting that are somewhat less complex and more aligned with the way that entities manage their risks than under AASB 139. Certain derivative instruments, including the Group’s forward commodity contracts, do not qualify for hedge accounting despite being valid economic hedges of the relevant risks. Accordingly, any changes in fair value of the derivative instrument will continue to be recognised immediately in profit or loss and included in other income or other expense. The effective portion of changes in the fair value of derivatives that are designated and qualify as cash flow hedges will continue to be recognised in other comprehensive income and accumulated in the hedging reserve in equity.
– The new standard replaces the ‘incurred loss’ model in AASB 139 with a forward-looking expected credit losses “ECL” model. Under the ECL model, an entity calculates the allowance for credit losses by considering, on a discounted basis, the cash shortfalls it would incur in various default scenarios for prescribed future periods and multiplying the shortfalls by the probability of each scenario occurring. The Group has mechanisms in place to mitigate credit risk referenced in note 21. The mitigating factors in place have, in part, allowed the Group to historically incur insignificant or limited losses as compared to trade receivables. While the Group is assessing the impact of the ECL model in terms of disclosure, the quantitative impact is expected to be immaterial.
AASB 15 Revenue from Contracts with CustomersAASB 15 establishes a new, single revenue accounting model which replaces existing revenue recognition guidance and replaces AASB 118 Revenue. The concept of transfer of risks and rewards is replaced with the notion that revenue is recognised when a customer obtains control of a good or service, that is, when the customer has the ability to direct the use of and obtain the benefits from the good or service. Additionally, the standard introduces requirements regarding variable consideration, allocation of transaction price based on relative standalone selling price and the time value of money with respect to longer-term contracts.
An assessment has been conducted and has focused on understanding the key terms and conditions of contracts for the Group’s primary revenue streams. As described in note 2, these include ferrous and non-ferrous secondary recycling, recycling solutions and secondary processing and other services. Contractual terms for ferrous and non-ferrous secondary recycling revenue were assessed separately for export, domestic and brokerage arrangements. Other than noted below, no significant differences have been identified.
The Group sells a significant portion of its export ferrous material on cost and freight or cost, insurance and freight Incoterms. Under these arrangements, revenue from the sale of goods is recognised prior to when the vessel arrives at the destination port. In certain instances, the Group is responsible for providing shipping services, primarily freight, as a separate performance obligation relating to sale of goods transaction. These shipping services would not conclude until after the date at which control of the goods passes to the customer at the loading port. Under AASB 118 Revenue, the Group recognises such shipping revenue and associated costs upon loading the material. Under AASB 15, the Group may be required to recognise such shipping revenue over time. However, the impact of this is not expected to be material.
For all other revenue streams, revenue is currently recognised when performance obligations have been met as no further work or processing is required by the Group and the transaction price has been determined. Determination of transaction price occurs when the quantity and quality of the goods have been determined with reasonable accuracy, the price is fixed or determinable and collectability is reasonably assured. Accordingly, no material impact is expected resulting from the adoption of AASB 15.
AASB 15 is effective for the Group on 1 July 2018. The Group will adopt the modified transitional approach to implementation where any transitional adjustment is recognised in retained earnings at the date of implementation of the standard without restatement of prior balances. AASB 15 will only be applied to contracts that remain in force at the transition date.
104SIMS METAL MANAGEMENT LIMITED ANNUAL REPORT 2018
AASB 16 LeasesAASB 16 will primarily affect the accounting treatment of leases by lessees and will result in the recognition of almost all leases on the balance sheet. The standard removes the current distinction between operating and financing leases. The standard provides certain exemptions from recognising leases on the balance sheet, including where the underlying asset is of a low value or the lease term is less than 12 months. AASB 16 will replace AASB 117 Leases and will be effective for the Group on 1 July 2019.
Under AASB 16, the Group will be required to:(a) recognise right of use lease assets and lease liabilities on the balance sheet;(b) recognise depreciation of right of use lease assets and interest on lease liabilities over the lease term; and(c) separately present the principal amount of cash paid and interest in the cash flow statement as a financing activity.
To facilitate implementation in compliance with the standard, the Group is assessing implication of the standard including accounting policy, identification of data and system requirements and implementation approach and financial reporting impacts, including impact assessment. A project team has been assembled to oversee the transition process and a system has been identified to assist with compliance of the new standard as well as go forward automation of lease accounting.
While the Group has not yet finalised its assessment of the impact of the new standard on its consolidated financial statements, the new standard is expected to have significant impact on the amounts recognised in the Group’s consolidated statement of financial position. Total assets and liabilities on the balance sheet are expected to increase with a decrease in total net assets, due to the reduction of the capitalised asset being on a straight line basis while the liability reduces by the principal amount of repayments. As disclosed in note 28, at the reporting date, the Group has non-cancellable operating lease commitments of A$394.5 million. Additionally, interest expenses will be higher earlier in a lease’s life due to higher principal value causing variability over the course of a lease’s life. Finally, repayment of the principal portion of all lease liabilities will be classified as financing activities.
IFRIC 23 Uncertainty over Income Tax TreatmentsIFRIC 23 sets out how to determine the accounting tax position when there is uncertainty over income tax treatments. This interpretation requires an entity to determine if uncertain tax positions are assessed separately or as a group and then assess whether it is probable that a tax authority would accept an uncertain treatment utilised in the Company’s income tax filings. The Group has not yet performed a detailed assessment of this standard. However, this interpretation is not expected to be material to the Group. It is not practicable to provide a reasonable estimate of the financial effect until the Group completes the review. IFRIC 23 is effective for the Group on 1 July 2020.
31 – ASSETS HELD FOR SALEAssets held for sale at 30 June 2018 include excess property which the Group expects to sell within the next financial year.
During the year ended 30 June 2018, the Group sold assets with net book value totaling A$3.8 million which were classified as assets held for sale at 30 June 2017. This amount included the sale of a parcel of property in June 2017 with a net book value of A$3.1 million. The gain on sale of assets was not significant to the Group.
105FINANCIAL STATEMENTS SIMSMM.COM
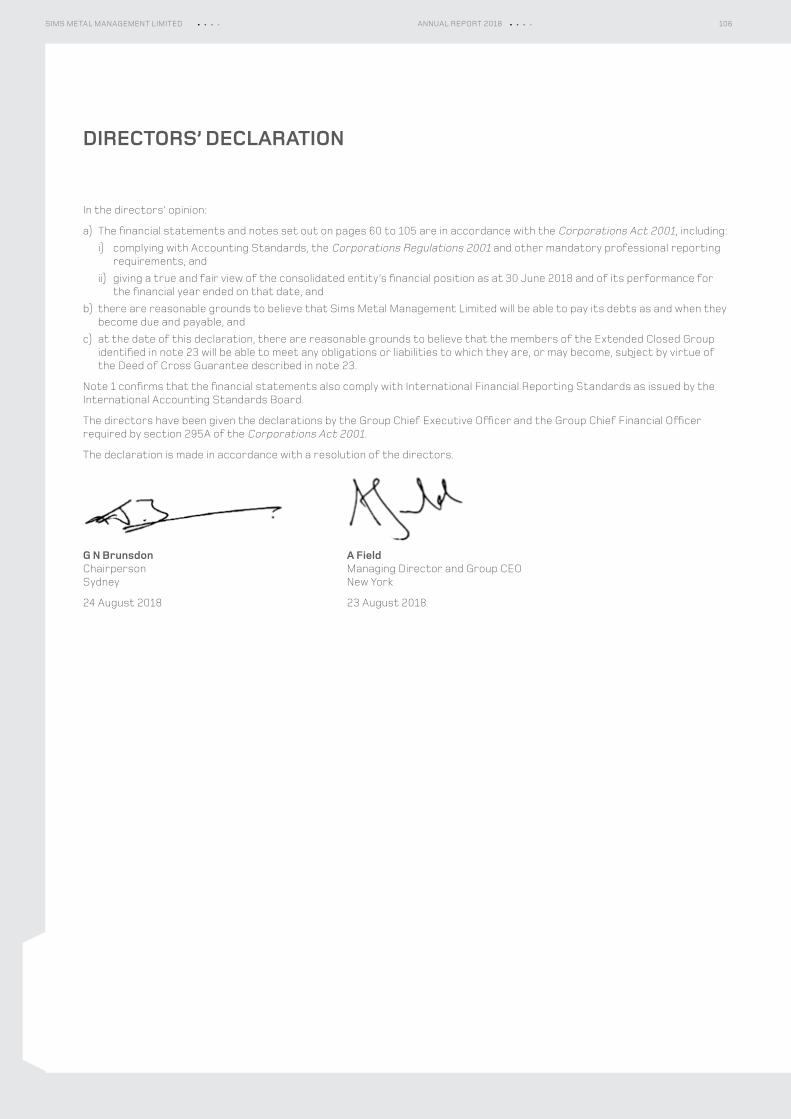
In the directors’ opinion:
a) The financial statements and notes set out on pages 60 to 105 are in accordance with the Corporations Act 2001, including: i) complying with Accounting Standards, the Corporations Regulations 2001 and other mandatory professional reporting
requirements, and ii) giving a true and fair view of the consolidated entity’s financial position as at 30 June 2018 and of its performance for
the financial year ended on that date, andb) there are reasonable grounds to believe that Sims Metal Management Limited will be able to pay its debts as and when they
become due and payable, andc) at the date of this declaration, there are reasonable grounds to believe that the members of the Extended Closed Group
identified in note 23 will be able to meet any obligations or liabilities to which they are, or may become, subject by virtue of the Deed of Cross Guarantee described in note 23.
Note 1 confirms that the financial statements also comply with International Financial Reporting Standards as issued by the International Accounting Standards Board.
The directors have been given the declarations by the Group Chief Executive Officer and the Group Chief Financial Officer required by section 295A of the Corporations Act 2001.
The declaration is made in accordance with a resolution of the directors.
G N Brunsdon A Field Chairperson Managing Director and Group CEO Sydney New York
24 August 2018 23 August 2018
DIRECTORS’ DECLARATION
106SIMS METAL MANAGEMENT LIMITED ANNUAL REPORT 2018
REPORT ON THE AUDIT OF THE FINANCIAL REPORTOpinionWe have audited the financial report of Sims Metal Management Limited (the “Company”) and its subsidiaries (the “Group”), which comprises the consolidated statement of financial position as at 30 June 2018, the consolidated income statement, the consolidated statement of comprehensive income, the consolidated statement of changes in equity and the consolidated statement of cash flows for the year then ended, and notes to the financial statements, including a summary of significant accounting policies, and the directors’ declaration.
In our opinion, the accompanying financial report of the Group is in accordance with the Corporations Act 2001, including:(i) giving a true and fair view of the Group’s financial position as at 30 June 2018 and of its financial performance for the year
then ended; and(ii) complying with Australian Accounting Standards and the Corporations Regulations 2001.
Basis for OpinionWe conducted our audit in accordance with Australian Auditing Standards. Our responsibilities under those standards are further described in the Auditor’s Responsibilities for the Audit of the Financial Report section of our report. We are independent of the Group in accordance with the auditor independence requirements of the Corporations Act 2001 and the ethical requirements of the Accounting Professional and Ethical Standards Board’s APES 110 Code of Ethics for Professional Accountants (the Code) that are relevant to our audit of the financial report in Australia. We have also fulfilled our other ethical responsibilities in accordance with the Code.
We confirm that the independence declaration required by the Corporations Act 2001, which has been given to the directors of the Company, would be in the same terms if given to the directors as at the time of this auditor’s report.
We believe that the audit evidence we have obtained is sufficient and appropriate to provide a basis for our opinion.
Key Audit MattersKey audit matters are those matters that, in our professional judgement, were of most significance in our audit of the financial report for the current period. These matters were addressed in the context of our audit of the financial report as a whole, and in forming our opinion thereon, and we do not provide a separate opinion on these matters.
Key Audit Matter How the scope of our audit responded to the Key Audit Matter
Carrying Value and Existence of InventoriesAt 30 June 2018, the Group’s Consolidated Statement of Financial Position includes inventories of A$567.0 million, which primarily consists of ferrous and non-ferrous scrap metals, as disclosed in Note 9.Inventories are stated at the lower of cost and net realisable value. Cost is determined by either the first-in-first-out method or the weighted average method and comprises direct purchase costs, direct labour and an appropriate portion of fixed and variable overhead costs.The nature of ferrous and non-ferrous inventories means significant judgement is required when determining the net realisable value, which considers current assessments of future demand and market conditions.Significant judgement is also required to estimate the ferrous quantities on hand. As disclosed in Note 9 ‘Inventories: Critical accounting estimate and judgement’ the quantity of inventory on hand is determined using various estimation techniques including observation and weighing.
Our procedures included, but were not limited to: – Evaluating the robustness of management’s processes
for determining valuation, net realisable value and existence of inventories, including testing controls on a test basis;
– Testing the existence of inventories by attending inventory counts conducted by management at material locations at or around year end and observing and challenging management’s process to determine the quantities on hand;
– Testing, on a sample basis, the specific inputs and allocation of costs in management’s models used to determine the weighted average cost of inventories;
– Testing, on a sample basis, the recoverability of ferrous and non-ferrous inventories through the recalculation of projected net realisable values based on current and forecast commodity prices; and
– Assessing the appropriateness of disclosures in the financial statements.
INDEPENDENT AUDITOR’S REPORTTO THE MEMBERS OF SIMS METAL MANAGEMENT LIMITED
Deloitte Touche Tohmatsu ABN 74 490 121 060Grosvenor Place 225 George Street Sydney NSW 2000PO Box N250 Grosvenor Place Sydney NSW 1220 AustraliaDX 10307SSE Tel: +61 (0) 2 9322 7000 Fax: +61 (0) 2 9322 7001 www.deloitte.com.au
Liability limited by a scheme approved under Professional Standards Legislation. Member of Deloitte Touche Tohmatsu Limited
107FINANCIAL STATEMENTS SIMSMM.COM
INDEPENDENT AUDITOR’S REPORTTO THE MEMBERS OF SIMS METAL MANAGEMENT LIMITED
Key Audit Matter How the scope of our audit responded to the Key Audit Matter
Revenue Recognition of Ferrous Secondary RecyclingRevenue recognition for the sale of goods is determined with reference to the product sold and the point at which risks and rewards are considered to be transferred as disclosed in Note 3 ‘Revenue and other income’.Individual ferrous secondary recycling bulk cargo sales are often individually material and, as disclosed in Note 2, is the product which generates the majority of revenue for the Company.Judgement is required to determine when risks and rewards have transferred under certain contractual arrangements. Whilst the majority of ferrous secondary recycling bulk cargo sales arrangements specify that title passes once all material has been loaded onto a vessel, for some ferrous secondary recycling bulk cargo sales, revenue recognition varies depending on the shipping terms used.
Our procedures included, but were not limited to: – Evaluating management’s processes and controls
in respect of the recognition of revenue of ferrous secondary recycling;
– Testing on a sample basis, the shipments occurring near to and after 30 June 2018 to supporting documentation. We assessed if revenue was appropriately recognised with reference to the following:
– the shipping terms contracted for the transaction; – the resulting point in time that risks and rewards are
considered to be transferred; and – evaluating whether the recognition of revenue was
in accordance with Group policy and accounting standards
– Assessing the appropriateness of disclosures in the financial statements.
Other InformationThe directors are responsible for the other information. The other information comprises the Directors’ Report and the Operational and Financial Review, which we obtained prior to the date of this auditor’s report, and also includes the following information which will be included in the Group’s annual report (but does not include the financial report and our auditor’s report thereon): the Chairman’s Review, CEO’s Review, Corporate Governance Statement and Other Information, which is expected to be made available to us after that date.
Our opinion on the financial report does not cover the other information and we do not and will not express any form of assurance conclusion thereon.
In connection with our audit of the financial report, our responsibility is to read the other information identified above and, in doing so, consider whether the other information is materially inconsistent with the financial report or our knowledge obtained in the audit, or otherwise appears to be materially misstated.
If, based on the work we have performed on the other information that we obtained prior to the date of this auditor’s report, we conclude that there is a material misstatement of this other information, we are required to report that fact. We have nothing to report in this regard.
When we read the Chairman’s Review, CEO’s Review, Corporate Governance Statement and Other Information, if we conclude that there is a material misstatement therein, we are required to communicate the matter to the directors and use our professional judgement to determine the appropriate action.
Responsibilities of the Directors for the Financial ReportThe directors of the Company are responsible for the preparation of the financial report that gives a true and fair view in accordance with Australian Accounting Standards and the Corporations Act 2001 and for such internal control as the directors determine is necessary to enable the preparation of the financial report that gives a true and fair view and is free from material misstatement, whether due to fraud or error.
In preparing the financial report, the directors are responsible for assessing the ability of the Group to continue as a going concern, disclosing, as applicable, matters related to going concern and using the going concern basis of accounting unless the directors either intend to liquidate the Group or to cease operations, or has no realistic alternative but to do so.
Auditor’s Responsibilities for the Audit of the Financial ReportOur objectives are to obtain reasonable assurance about whether the financial report as a whole is free from material misstatement, whether due to fraud or error, and to issue an auditor’s report that includes our opinion. Reasonable assurance is a high level of assurance, but is not a guarantee that an audit conducted in accordance with the Australian Auditing Standards will always detect a material misstatement when it exists. Misstatements can arise from fraud or error and are considered material if, individually or in the aggregate, they could reasonably be expected to influence the economic decisions of users taken on the basis of this financial report.
108SIMS METAL MANAGEMENT LIMITED ANNUAL REPORT 2018
As part of an audit in accordance with the Australian Auditing Standards, we exercise professional judgement and maintain professional scepticism throughout the audit. We also:
– Identify and assess the risks of material misstatement of the financial report, whether due to fraud or error, design and perform audit procedures responsive to those risks, and obtain audit evidence that is sufficient and appropriate to provide a basis for our opinion. The risk of not detecting a material misstatement resulting from fraud is higher than for one resulting from error, as fraud may involve collusion, forgery, intentional omissions, misrepresentations, or the override of internal control.
– Obtain an understanding of internal control relevant to the audit in order to design audit procedures that are appropriate in the circumstances, but not for the purpose of expressing an opinion on the effectiveness of the Group’s internal control.
– Evaluate the appropriateness of accounting policies used and the reasonableness of accounting estimates and related disclosures made by the directors.
– Conclude on the appropriateness of the directors’ use of the going concern basis of accounting and, based on the audit evidence obtained, whether a material uncertainty exists related to events or conditions that may cast significant doubt on the Group’s ability to continue as a going concern. If we conclude that a material uncertainty exists, we are required to draw attention in our auditor’s report to the related disclosures in the financial report or, if such disclosures are inadequate, to modify our opinion. Our conclusions are based on the audit evidence obtained up to the date of our auditor’s report. However, future events or conditions may cause the Group to cease to continue as a going concern.
– Evaluate the overall presentation, structure and content of the financial report, including the disclosures, and whether the financial report represents the underlying transactions and events in a manner that achieves fair presentation.
– Obtain sufficient appropriate audit evidence regarding the financial information of the entities or business activities within the Group to express an opinion on the financial report. We are responsible for the direction, supervision and performance of the Group audit. We remain solely responsible for our audit opinion.
We communicate with the directors regarding, among other matters, the planned scope and timing of the audit and significant audit findings, including any significant deficiencies in internal control that we identify during our audit.
We also provide the directors with a statement that we have complied with relevant ethical requirements regarding independence, and to communicate with them all relationships and other matters that may reasonably be thought to bear on our independence, and where applicable, related safeguards.
From the matters communicated with the directors, we determine those matters that were of most significance in the audit of the financial report of the current period and are therefore the key audit matters. We describe these matters in our auditor’s report unless law or regulation precludes public disclosure about the matter or when, in extremely rare circumstances, we determine that a matter should not be communicated in our report because the adverse consequences of doing so would reasonably be expected to outweigh the public interest benefits of such communication.
109FINANCIAL STATEMENTS SIMSMM.COM
INDEPENDENT AUDITOR’S REPORTTO THE MEMBERS OF SIMS METAL MANAGEMENT LIMITED
REPORT ON THE REMUNERATION REPORTOpinion on the Remuneration ReportWe have audited the Remuneration Report included in pages 36 to 58 of the Directors’ Report for the year ended 30 June 2018.
In our opinion, the Remuneration Report of Sims Metal Management Limited, for the year ended 30 June 2018, complies with section 300A of the Corporations Act 2001.
ResponsibilitiesThe directors of the Company are responsible for the preparation and presentation of the Remuneration Report in accordance with section 300A of the Corporations Act 2001. Our responsibility is to express an opinion on the Remuneration Report, based on our audit conducted in accordance with Australian Auditing Standards.
DELOITTE TOUCHE TOHMATSU
Don Pasquariello Partner Chartered Accountants
Sydney, 24 August 2018
AUDITOR’S INDEPENDENCE DECLARATIONIn accordance with section 307C of the Corporations Act 2001, I am pleased to provide the following declaration of independence to the directors of Sims Metal Management Limited.
As lead audit partner for the audit of the financial statements of Sims Metal Management Limited for the financial year ended 30 June 2018, I declare that to the best of my knowledge and belief, there have been no contraventions of:(i) the auditor independence requirements of the Corporations Act 2001 in relation to the audit; and(ii) any applicable code of professional conduct in relation to the audit.
Yours sincerely
DELOITTE TOUCHE TOHMATSU
Don Pasquariello Partner Chartered Accountants
Sydney, 24 August 2018
Liability limited by a scheme approved under Professional Standards Legislation. Member of Deloitte Touche Tohmatsu Limited
110SIMS METAL MANAGEMENT LIMITED ANNUAL REPORT 2018
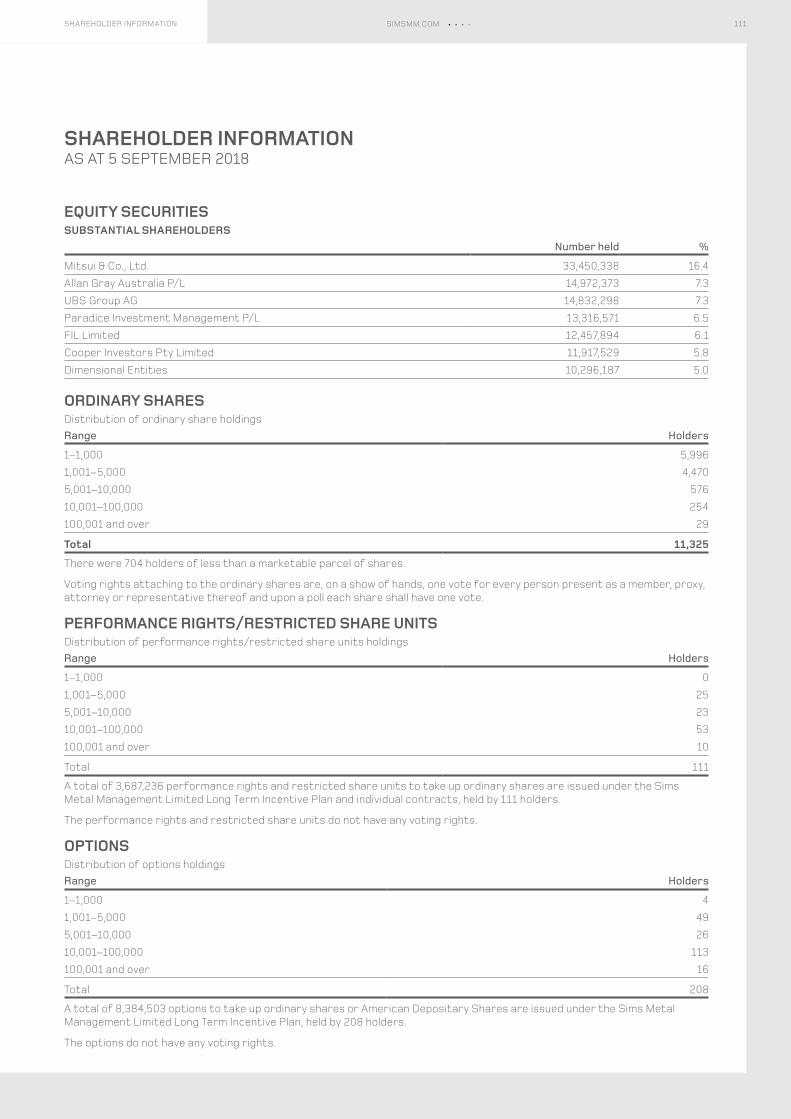
EQUITY SECURITIESSUBSTANTIAL SHAREHOLDERS
Number held %
Mitsui & Co., Ltd. 33,450,338 16.4
Allan Gray Australia P/L 14,972,373 7.3
UBS Group AG 14,832,298 7.3
Paradice Investment Management P/L 13,316,571 6.5
FIL Limited 12,457,894 6.1
Cooper Investors Pty Limited 11,917,529 5.8
Dimensional Entities 10,296,187 5.0
ORDINARY SHARESDistribution of ordinary share holdingsRange Holders
1–1,000 5,996
1,001–5,000 4,470
5,001–10,000 576
10,001–100,000 254
100,001 and over 29
Total 11,325
There were 704 holders of less than a marketable parcel of shares.
Voting rights attaching to the ordinary shares are, on a show of hands, one vote for every person present as a member, proxy, attorney or representative thereof and upon a poll each share shall have one vote.
PERFORMANCE RIGHTS/RESTRICTED SHARE UNITSDistribution of performance rights/restricted share units holdingsRange Holders
1–1,000 0
1,001–5,000 25
5,001–10,000 23
10,001–100,000 53
100,001 and over 10
Total 111
A total of 3,687,236 performance rights and restricted share units to take up ordinary shares are issued under the Sims Metal Management Limited Long Term Incentive Plan and individual contracts, held by 111 holders.
The performance rights and restricted share units do not have any voting rights.
OPTIONSDistribution of options holdingsRange Holders
1–1,000 4
1,001–5,000 49
5,001–10,000 26
10,001–100,000 113
100,001 and over 16
Total 208
A total of 8,384,503 options to take up ordinary shares or American Depositary Shares are issued under the Sims Metal Management Limited Long Term Incentive Plan, held by 208 holders.
The options do not have any voting rights.
SHAREHOLDER INFORMATIONAS AT 5 SEPTEMBER 2018
111SIMSMM.COMSHAREHOLDER INFORMATION
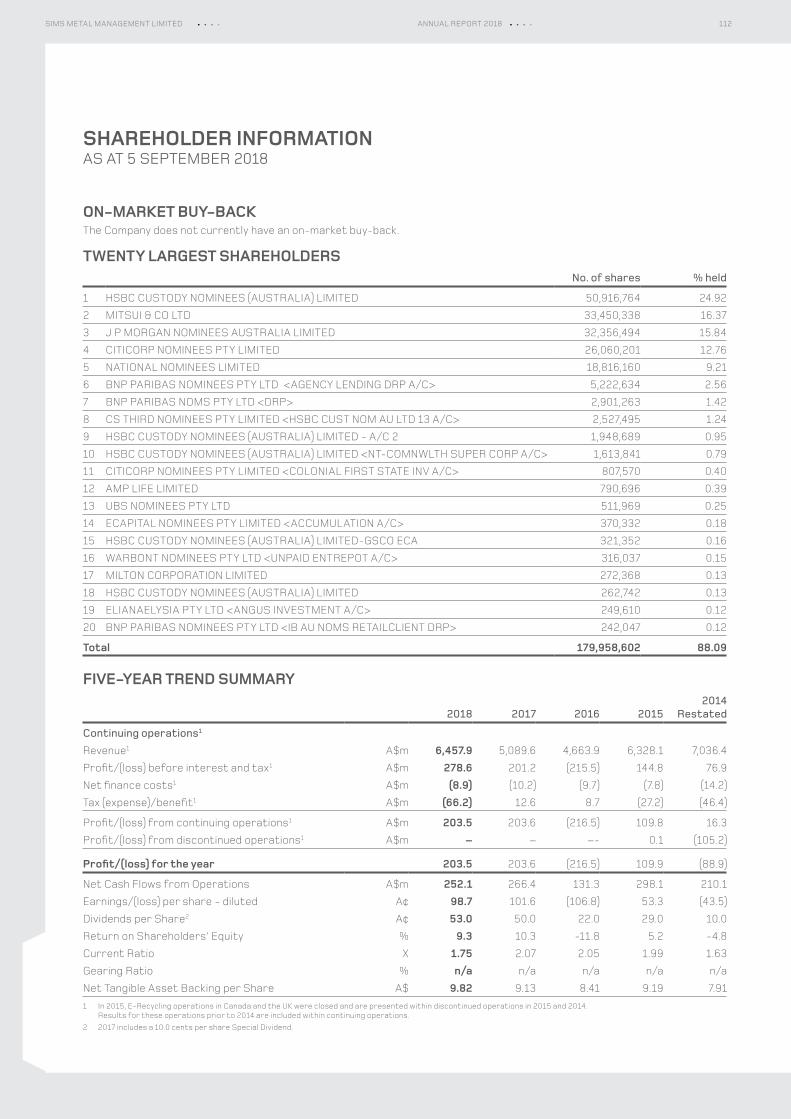
ON‑MARKET BUY‑BACKThe Company does not currently have an on-market buy-back.
TWENTY LARGEST SHAREHOLDERSNo. of shares % held
1 HSBC CUSTODY NOMINEES (AUSTRALIA) LIMITED 50,916,764 24.92
2 MITSUI & CO LTD 33,450,338 16.37
3 J P MORGAN NOMINEES AUSTRALIA LIMITED 32,356,494 15.84
4 CITICORP NOMINEES PTY LIMITED 26,060,201 12.76
5 NATIONAL NOMINEES LIMITED 18,816,160 9.21
6 BNP PARIBAS NOMINEES PTY LTD <AGENCY LENDING DRP A/C> 5,222,634 2.56
7 BNP PARIBAS NOMS PTY LTD <DRP> 2,901,263 1.42
8 CS THIRD NOMINEES PTY LIMITED <HSBC CUST NOM AU LTD 13 A/C> 2,527,495 1.24
9 HSBC CUSTODY NOMINEES (AUSTRALIA) LIMITED - A/C 2 1,948,689 0.95
10 HSBC CUSTODY NOMINEES (AUSTRALIA) LIMITED <NT-COMNWLTH SUPER CORP A/C> 1,613,841 0.79
11 CITICORP NOMINEES PTY LIMITED <COLONIAL FIRST STATE INV A/C> 807,570 0.40
12 AMP LIFE LIMITED 790,696 0.39
13 UBS NOMINEES PTY LTD 511,969 0.25
14 ECAPITAL NOMINEES PTY LIMITED <ACCUMULATION A/C> 370,332 0.18
15 HSBC CUSTODY NOMINEES (AUSTRALIA) LIMITED-GSCO ECA 321,352 0.16
16 WARBONT NOMINEES PTY LTD <UNPAID ENTREPOT A/C> 316,037 0.15
17 MILTON CORPORATION LIMITED 272,368 0.13
18 HSBC CUSTODY NOMINEES (AUSTRALIA) LIMITED 262,742 0.13
19 ELIANAELYSIA PTY LTD <ANGUS INVESTMENT A/C> 249,610 0.12
20 BNP PARIBAS NOMINEES PTY LTD <IB AU NOMS RETAILCLIENT DRP> 242,047 0.12
Total 179,958,602 88.09
FIVE‑YEAR TREND SUMMARY
2018 2017 2016 20152014
Restated
Continuing operations1
Revenue1 A$m 6,457.9 5,089.6 4,663.9 6,328.1 7,036.4
Profit/(loss) before interest and tax1 A$m 278.6 201.2 (215.5) 144.8 76.9
Net finance costs1 A$m (8.9) (10.2) (9.7) (7.8) (14.2)
Tax (expense)/benefit1 A$m (66.2) 12.6 8.7 (27.2) (46.4)
Profit/(loss) from continuing operations1 A$m 203.5 203.6 (216.5) 109.8 16.3
Profit/(loss) from discontinued operations1 A$m – – –- 0.1 (105.2)
Profit/(loss) for the year 203.5 203.6 (216.5) 109.9 (88.9)
Net Cash Flows from Operations A$m 252.1 266.4 131.3 298.1 210.1
Earnings/(loss) per share - diluted A¢ 98.7 101.6 (106.8) 53.3 (43.5)
Dividends per Share2 A¢ 53.0 50.0 22.0 29.0 10.0
Return on Shareholders’ Equity % 9.3 10.3 -11.8 5.2 -4.8
Current Ratio X 1.75 2.07 2.05 1.99 1.63
Gearing Ratio % n/a n/a n/a n/a n/a
Net Tangible Asset Backing per Share A$ 9.82 9.13 8.41 9.19 7.911 In 2015, E-Recycling operations in Canada and the UK were closed and are presented within discontinued operations in 2015 and 2014.
Results for these operations prior to 2014 are included within continuing operations.2 2017 includes a 10.0 cents per share Special Dividend.
SHAREHOLDER INFORMATIONAS AT 5 SEPTEMBER 2018
112SIMS METAL MANAGEMENT LIMITED ANNUAL REPORT 2018
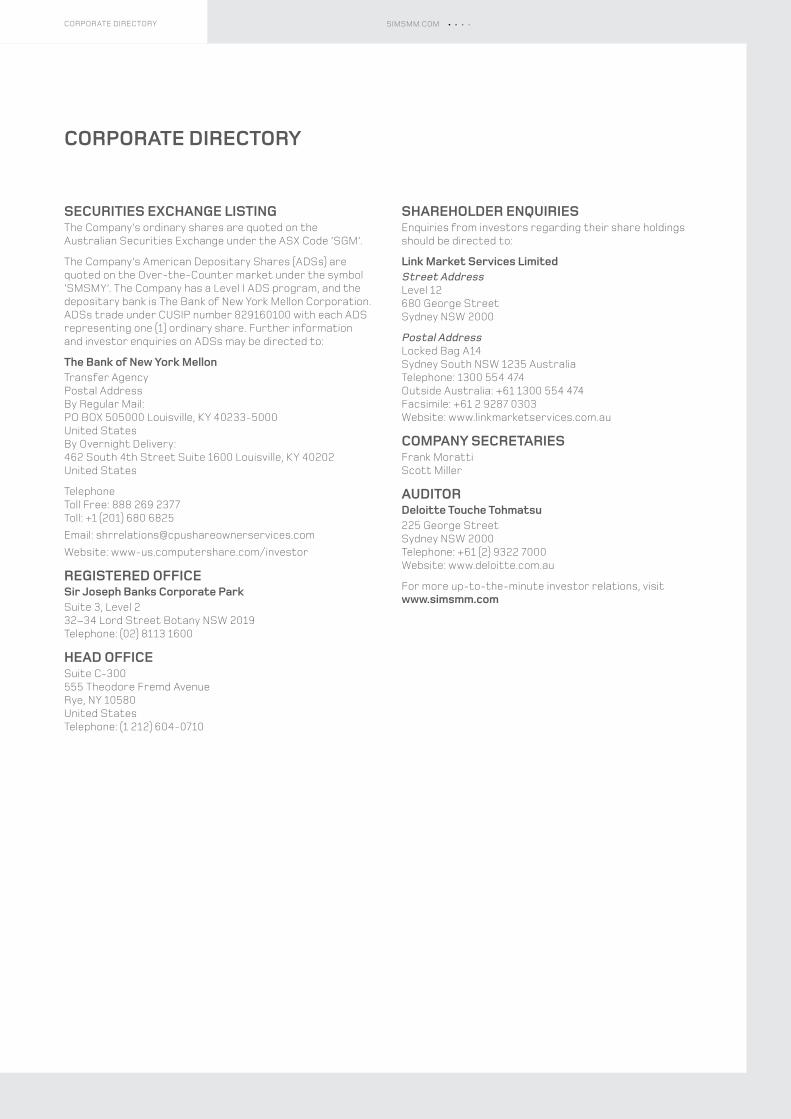
SECURITIES EXCHANGE LISTINGThe Company’s ordinary shares are quoted on the Australian Securities Exchange under the ASX Code ‘SGM’.
The Company’s American Depositary Shares (ADSs) are quoted on the Over-the-Counter market under the symbol ‘SMSMY’. The Company has a Level I ADS program, and the depositary bank is The Bank of New York Mellon Corporation. ADSs trade under CUSIP number 829160100 with each ADS representing one (1) ordinary share. Further information and investor enquiries on ADSs may be directed to:
The Bank of New York MellonTransfer Agency Postal Address By Regular Mail: PO BOX 505000 Louisville, KY 40233-5000 United States By Overnight Delivery: 462 South 4th Street Suite 1600 Louisville, KY 40202 United States
Telephone Toll Free: 888 269 2377 Toll: +1 (201) 680 6825Email: [email protected]: www-us.computershare.com/investor
REGISTERED OFFICESir Joseph Banks Corporate ParkSuite 3, Level 2 32–34 Lord Street Botany NSW 2019 Telephone: (02) 8113 1600
HEAD OFFICESuite C-300 555 Theodore Fremd Avenue Rye, NY 10580 United States Telephone: (1 212) 604-0710
SHAREHOLDER ENQUIRIESEnquiries from investors regarding their share holdings should be directed to:
Link Market Services LimitedStreet AddressLevel 12 680 George Street Sydney NSW 2000
Postal AddressLocked Bag A14 Sydney South NSW 1235 Australia Telephone: 1300 554 474 Outside Australia: +61 1300 554 474 Facsimile: +61 2 9287 0303 Website: www.linkmarketservices.com.au
COMPANY SECRETARIESFrank Moratti Scott Miller
AUDITORDeloitte Touche Tohmatsu225 George Street Sydney NSW 2000 Telephone: +61 (2) 9322 7000 Website: www.deloitte.com.au
For more up-to-the-minute investor relations, visit www.simsmm.com
CORPORATE DIRECTORY
SIMSMM.COMCORPORATE DIRECTORY
SIMSMM.COMSIMS METAL MANAGEMENT LIMITED ABN 69 114 838 630