Annual Sports Calender of VTU Inter Collegiate sports / Game for ...
AM
ER SP
OR
TS AN
NU
AL R
EPO
RT 2009
ANNUAL REPORT
YEARS
The Mountain Sports Company. www.salomon.com
Wilson is the world’s leading manufacturer of ball sports equipment.www.wilson.com
Precor is manufacturing and selling technically-advanced, premium-quality fitness equipment for the commercial and home markets.www.precor.com
Atomic is an industry leader in alpine skis and is a prominent player in cross-country skiing.www.atomicsnow.com
Suunto is a leading designer and manufacturer of sports precision instruments for a variety of sports like training, diving and outdoor.www.suunto.com
Mavic is a manufacturer of wheels, rims, pedals, computers, apparel and footwear for road cycling, mountain biking, triathlon and track racing.www.mavic.com
Arc’teryx is producing highly technical apparel, backpacks and harnesses for outdoor sports, hiking, climbing and snow sports.www.arcteryx.com
-
CONTENT
Amer Sports in brief ...................................... 2CEO’s review .................................................. 6Industry trends ............................................. 10Strategy ........................................................ 13Amer Sports’ key success factors ............... 16Financial targets .......................................... 18Key brands and brand management ........... 20 Business segment review ............................ 22Winter and Outdoor...................................... 24Ball Sports ................................................... 34Fitness ......................................................... 44 Sales ............................................................. 48Supply chain, IT and manufacturing ............ 50Research and development ......................... 53Human resources ........................................ 56Social responsibility ..................................... 60 Board of Directors report and financial statements .................................... 65 Corporate governance statement .............. 128Board of Directors ...................................... 136Executive Board ......................................... 138Remuneration ............................................ 142
Shares and shareholders .......................... 148Information for investors ........................... 152Publications and important dates ............. 156
Contact information ................................... 157 Brands
www.amersports.com
1
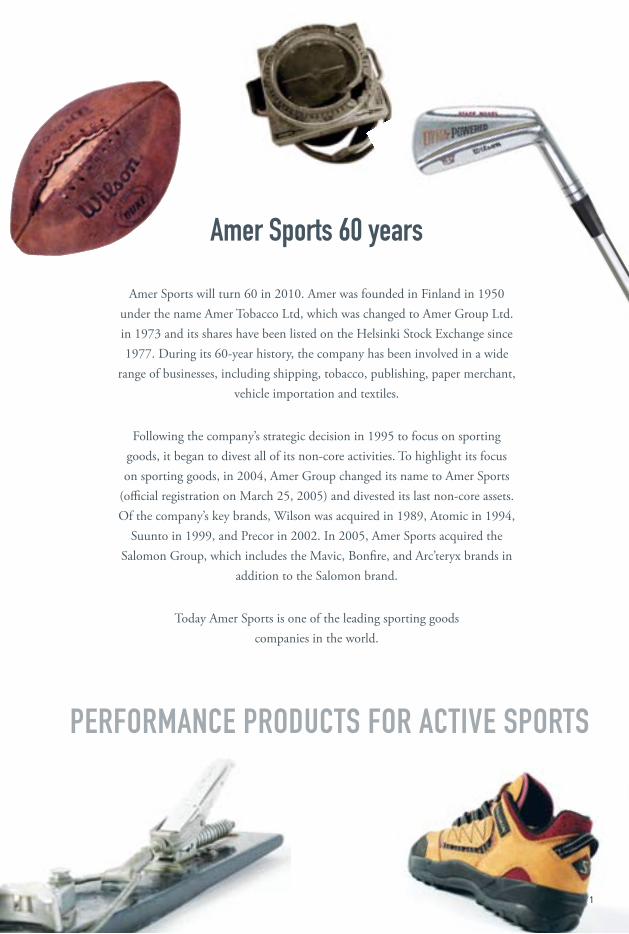
Amer Sports 60 years
Amer Sports will turn 60 in 2010. Amer was founded in Finland in 1950 under the name Amer Tobacco Ltd, which was changed to Amer Group Ltd. in 1973 and its shares have been listed on the Helsinki Stock Exchange since 1977. During its 60-year history, the company has been involved in a wide
range of businesses, including shipping, tobacco, publishing, paper merchant, vehicle importation and textiles.
Following the company’s strategic decision in 1995 to focus on sporting goods, it began to divest all of its non-core activities. To highlight its focus on sporting goods, in 2004, Amer Group changed its name to Amer Sports
(official registration on March 25, 2005) and divested its last non-core assets. Of the company’s key brands, Wilson was acquired in 1989, Atomic in 1994,
Suunto in 1999, and Precor in 2002. In 2005, Amer Sports acquired the Salomon Group, which includes the Mavic, Bonfire, and Arc’teryx brands in
addition to the Salomon brand.
Today Amer Sports is one of the leading sporting goods companies in the world.
2
Amer Sports is one of the leading sporting goods companies in the
world with a strong brand portfolio comprising Salomon, Wilson,
Precor, Atomic, Suunto, Mavic, and Arc’teryx,
as well as other complementary brands.
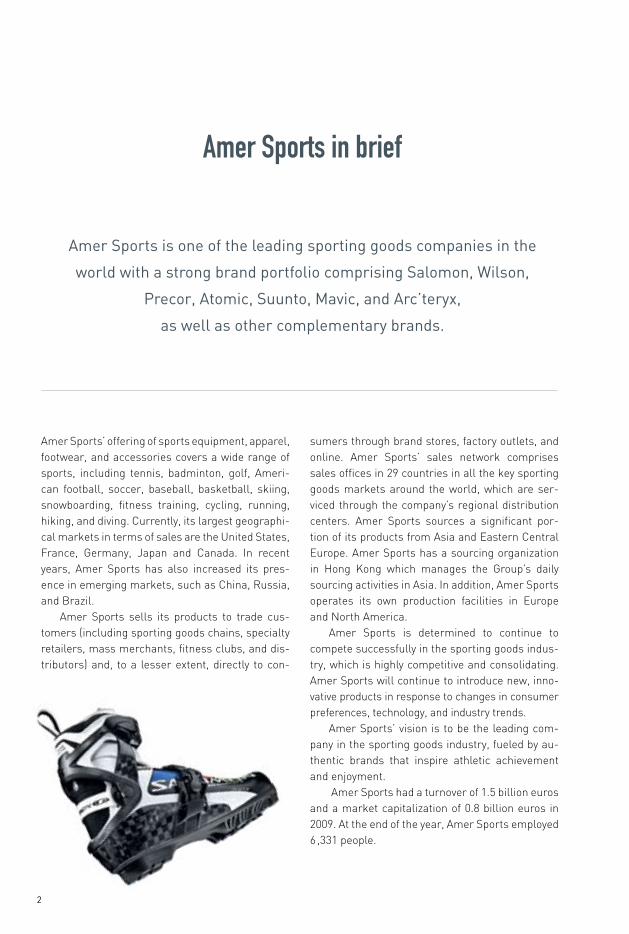
Amer Sports’ offering of sports equipment, apparel, footwear, and accessories covers a wide range of sports, including tennis, badminton, golf, Ameri-can football, soccer, baseball, basketball, skiing, snowboarding, fitness training, cycling, running, hiking, and diving. Currently, its largest geographi-cal markets in terms of sales are the United States, France, Germany, Japan and Canada. In recent years, Amer Sports has also increased its pres-ence in emerging markets, such as China, Russia, and Brazil.
Amer Sports sells its products to trade cus-tomers (including sporting goods chains, specialty retailers, mass merchants, fitness clubs, and dis-tributors) and, to a lesser extent, directly to con-
sumers through brand stores, factory outlets, and online. Amer Sports’ sales network comprises sales offices in 29 countries in all the key sporting goods markets around the world, which are ser-viced through the company’s regional distribution centers. Amer Sports sources a significant por-tion of its products from Asia and Eastern Central Europe. Amer Sports has a sourcing organization in Hong Kong which manages the Group’s daily sourcing activities in Asia. In addition, Amer Sports operates its own production facilities in Europe and North America.
Amer Sports is determined to continue to compete successfully in the sporting goods indus-try, which is highly competitive and consolidating. Amer Sports will continue to introduce new, inno-vative products in response to changes in consumer preferences, technology, and industry trends.
Amer Sports’ vision is to be the leading com-pany in the sporting goods industry, fueled by au-thentic brands that inspire athletic achievement and enjoyment.
Amer Sports had a turnover of 1.5 billion euros and a market capitalization of 0.8 billion euros in 2009. At the end of the year, Amer Sports employed 6 ,331 people.
Amer Sports in brief
3
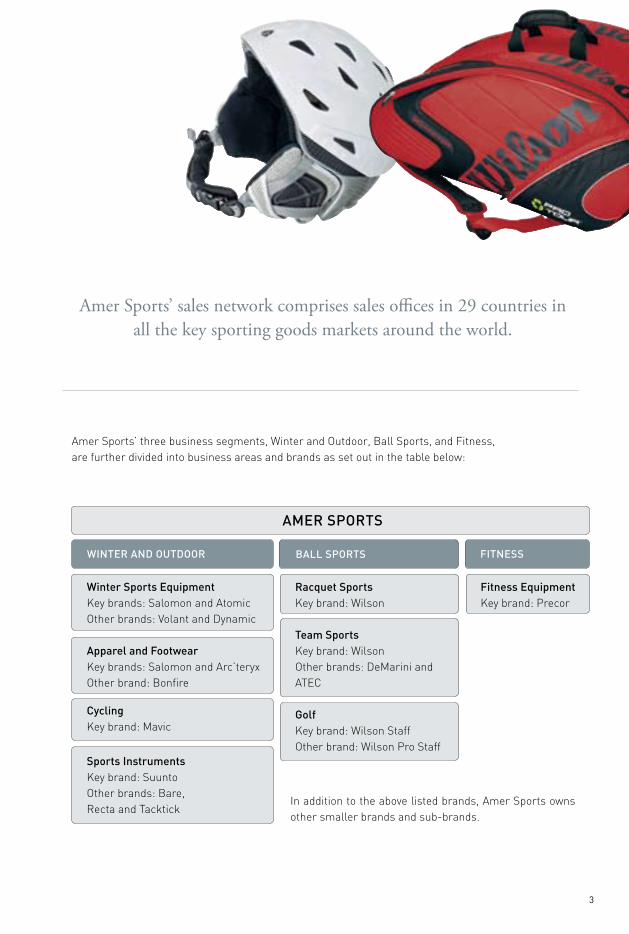
Amer Sports’ sales network comprises sales offices in 29 countries in all the key sporting goods markets around the world.
AMER SPORTS
WinTER And OuTdOOR BAll SPORTS FiTnESS
Winter Sports EquipmentKey brands: Salomon and AtomicOther brands: Volant and Dynamic
Apparel and FootwearKey brands: Salomon and Arc’teryxOther brand: Bonfire
CyclingKey brand: Mavic
Sports instrumentsKey brand: SuuntoOther brands: Bare, Recta and Tacktick
Racquet SportsKey brand: Wilson
Team SportsKey brand: WilsonOther brands: DeMarini and ATEC
GolfKey brand: Wilson StaffOther brand: Wilson Pro Staff
Fitness EquipmentKey brand: Precor
In addition to the above listed brands, Amer Sports owns other smaller brands and sub-brands.
Amer Sports’ three business segments, Winter and Outdoor, Ball Sports, and Fitness, are further divided into business areas and brands as set out in the table below:
4
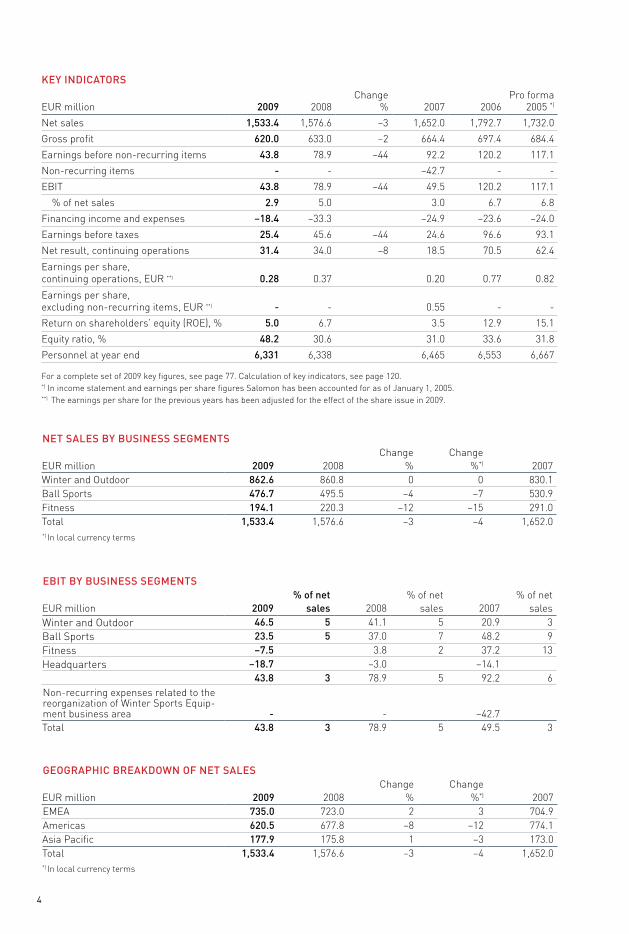
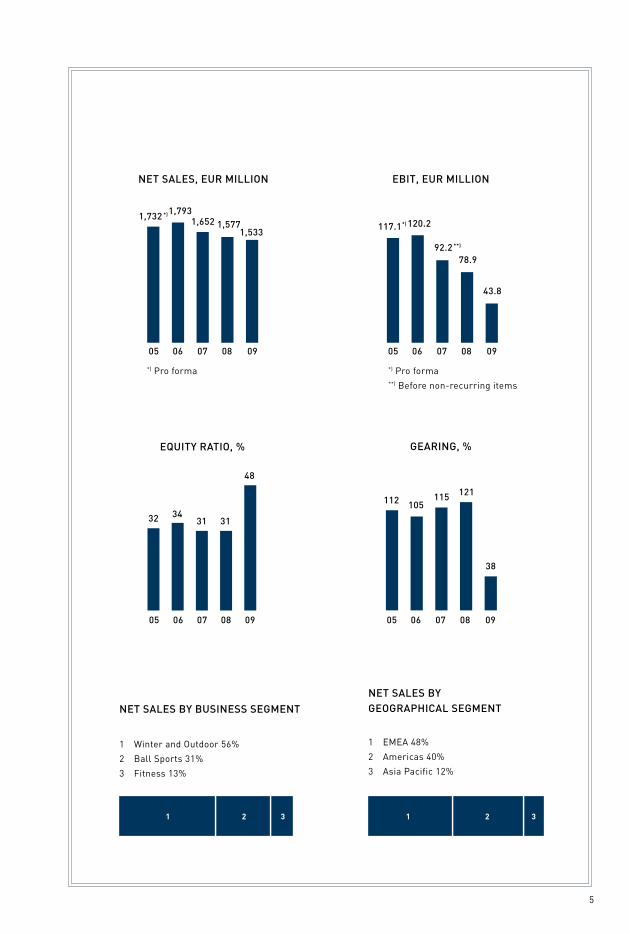
nET SAlES BY BuSinESS SEGMEnTS
EUR million 2009 2008Change
%Change
%*) 2007Winter and Outdoor 862.6 860.8 0 0 830.1Ball Sports 476.7 495.5 –4 –7 530.9Fitness 194.1 220.3 –12 –15 291.0Total 1,533.4 1,576.6 –3 –4 1,652.0*) In local currency terms
EBiT BY BuSinESS SEGMEnTS
2009% of net
sales 2008% of net
sales 2007% of net
salesEUR millionWinter and Outdoor 46.5 5 41.1 5 20.9 3Ball Sports 23.5 5 37.0 7 48.2 9Fitness –7.5 3.8 2 37.2 13Headquarters –18.7 –3.0 –14.1
43.8 3 78.9 5 92.2 6Non-recurring expenses related to the reorganization of Winter Sports Equip-ment business area - - –42.7Total 43.8 3 78.9 5 49.5 3
GEOGRAPHiC BREAKdOWn OF nET SAlES
EUR million 2009 2008Change
%Change
%*) 2007EMEA 735.0 723.0 2 3 704.9Americas 620.5 677.8 –8 –12 774.1Asia Pacific 177.9 175.8 1 –3 173.0Total 1,533.4 1,576.6 –3 –4 1,652.0*) In local currency terms
KEY indiCATORS
EUR million 2009 2008Change
% 2007 2006Pro forma
2005 *)
Net sales 1,533.4 1,576.6 –3 1,652.0 1,792.7 1,732.0
Gross profit 620.0 633.0 –2 664.4 697.4 684.4
Earnings before non-recurring items 43.8 78.9 –44 92.2 120.2 117.1
Non-recurring items - - –42.7 - -
EBIT 43.8 78.9 –44 49.5 120.2 117.1
% of net sales 2.9 5.0 3.0 6.7 6.8
Financing income and expenses –18.4 –33.3 –24.9 –23.6 –24.0
Earnings before taxes 25.4 45.6 –44 24.6 96.6 93.1
Net result, continuing operations 31.4 34.0 –8 18.5 70.5 62.4
Earnings per share, continuing operations, EUR **) 0.28 0.37 0.20 0.77 0.82
Earnings per share, excluding non-recurring items, EUR **) - - 0.55 - -
Return on shareholders’ equity (ROE), % 5.0 6.7 3.5 12.9 15.1
Equity ratio, % 48.2 30.6 31.0 33.6 31.8
Personnel at year end 6,331 6,338 6,465 6,553 6,667 For a complete set of 2009 key figures, see page 77. Calculation of key indicators, see page 120.*) In income statement and earnings per share figures Salomon has been accounted for as of January 1, 2005.**) The earnings per share for the previous years has been adjusted for the effect of the share issue in 2009.
1 2 3 1 2 3
5
nET SAlES BY GEOGRAPHiCAl SEGMEnT
1 EMEA 48%
2 Americas 40%
3 Asia Pacific 12%
nET SAlES BY BuSinESS SEGMEnT
1 Winter and Outdoor 56%
2 Ball Sports 31%
3 Fitness 13%
*) Pro forma**) Before non-recurring items
nET SAlES, EuR MilliOn
05 06 07 08 09
05 06 07 08 0905 06 07 08 09
05 06 07 08 09
1,5771,533
117.1 120.2
92.278.9
43.8
1,7931,652
EBiT, EuR MilliOn
GEARinG, %
121
38
112 105115
EquiTY RATiO, %
32 3431 31
1,732 *)
*)
**)
*) Pro forma
48
6
PEKKA PAAlAnnE
CEO’s review
The year 2009 was challenging for Amer Sports. The weak global economic situation and uncer-tainty about the performance of the financial markets affected our performance and the global sporting goods sector overall. In such uncertain times, the key objectives defined for 2009 were to rapidly strengthen our balance sheet and to retain our profitability. For the organization, these ob-jectives meant the prioritization of cash flow and strict expense control. Simultaneously, however, the implementation of projects related to acceler-ating growth and improving operational efficiency were continued. Likewise, investments in product development remained at the usual level. We also strengthened our organization in order to better respond to changes in the operating environment. In the weakened economic environment, net sales fell by four percent from the previous year. How-ever, there were significant differences in perfor-mance both in terms of business areas and geo-graphic regions.
The most positive progress was made in the Apparel and Footwear business area with 11 per-cent growth. The sales of footwear developed par-ticularly well, spearheaded by strong sales in the trail running category. Winter sports equipment sales reached the previous year’s levels. The good winter reduced trade inventories and compensated for the effect of the economic down turn on pre-orders for the 2009/10 season. In Cycling, net sales fell by 13 percent due to both the economic situa-tion and the temporary business disruption caused by the recall of R-Sys wheels.
The economic situation had a particularly ad-verse effect on diving instruments sales, while the demand for other sports instruments remained largely stable. In Ball Sports, sales fell by seven percent, and Fitness sales decreased by 15 per-cent. Both segments were particularly affected by decreased demand in the USA. Geographically, sales in the Americas fell by 12 percent. In EMEA, sales increased by three percent. In Asia Pacific,
The Group’s balance sheet is now strong and it gives
the company an opportunity to continue with the
implementation of its growth strategy once the
market situation improves.

7
The cornerstones of our growth strategy are leveraging our brands in realizing new growth opportunities, leveraging the growth potential of developing markets, increasing direct consumer contact, and the continuous flow of new, innovative products.
8
sales decreased by three percent. Sales increased in China, while in Japan, which remains our largest sales area in Asia, sales fell due to the weakened economic situation.
Our profitability decreased from 2008. EBIT was three percent of net sales, the worst in this decade. The drop in net sales could not be entirely compensated for with cost streamlining. Non-re-curring items also burdened the result more than in the previous year.
The cash flow from operating activities im-proved significantly. The aim was to release a total of EUR 100 million from inventories and receiv-ables in 2009. The program exceeded our expecta-tions and EUR 189 million was released from re-ceivables and inventories. Many of the measures taken will provide additional benefits in the coming years. I’m proud of the achievements and I wish to thank everyone who participated in the execu-tion of the program. In addition to the reduction of working capital, the balance sheet was strength-ened by the issue of a EUR 60 million hybrid bond early in the year, while in October, a share issue, authorized by the Extraordinary General Meeting with strong support from our shareholders, was undertaken, generating EUR 151.5 million of net proceeds. As a result of these measures, the in-terest bearing net debt of Amer Sports fell by EUR 333 million euros to EUR 283 million at the end of the year. Gearing fell to 38 percent from 121 per-cent at the end of 2008.
The key objective for 2010 is to improve our profitability. As of today, there are no signs of quick recovery of the sporting goods market, therefore improving our cost efficiency and the use of work-ing capital will remain our key short term priori-ties. Investments will be directed to areas with the best growth opportunities as well as to programs which will provide further scale benefits. A new group-wide program was launched at the begin-ning of 2010 to simplify our product offering. This program aims in coming years to further improve profitability and customer service as well as sup-port faster growth.
The Group’s balance sheet is now strong, pro-viding the company with the opportunity to con-tinue the implementation of our growth strategy once the market situation improves. The corner-stones of the growth strategy are: leveraging our key brands in realizing new growth opportunities, leveraging the growth potential of developing mar-kets, increasing direct consumer contact, and the continuous flow of new, innovative products.
Over the past decade Amer Sports has under-gone significant changes and has become a lead-ing global sporting goods company. With the ap-pointment of Heikki Takala as our new President and CEO, from April 1, 2010, the company will enter a new era.
We have strengthened our organization in order to better respond to changes in the
operating environment.

Vision
To be the industry’s leading sports company, fueled by
authentic brands that inspire athletic achievement and
enjoyment.
Vision
To be the industry’s leading sports company, fueled by
authentic brands that inspire athletic achievement and
enjoyment.
10
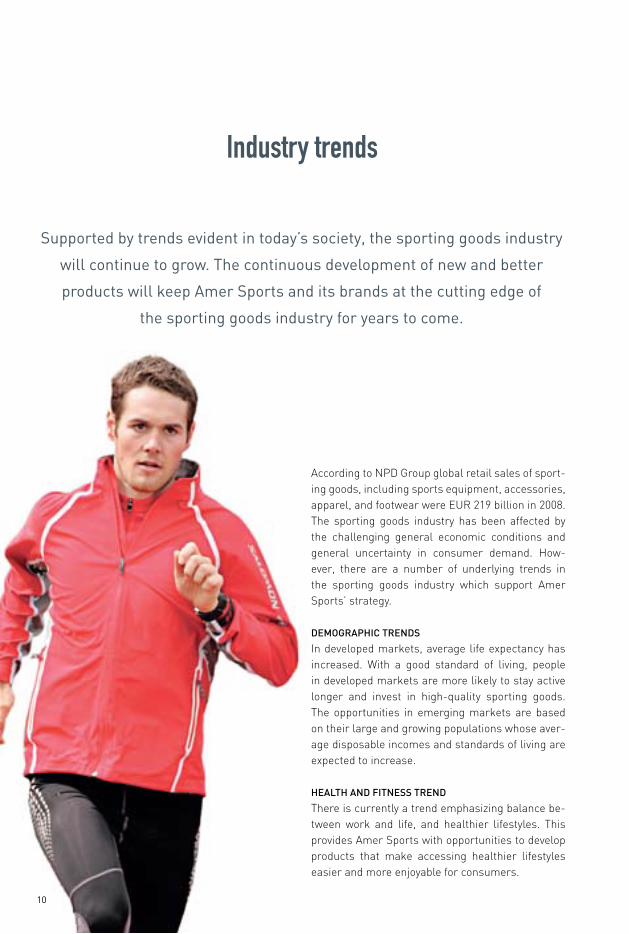
Industry trends
According to NPD Group global retail sales of sport-ing goods, including sports equipment, accessories, apparel, and footwear were EUR 219 billion in 2008. The sporting goods industry has been affected by the challenging general economic conditions and general uncertainty in consumer demand. How-ever, there are a number of underlying trends in the sporting goods industry which support Amer Sports’ strategy.
dEMOGRAPHiC TREndS
In developed markets, average life expectancy has increased. With a good standard of living, people in developed markets are more likely to stay active longer and invest in high-quality sporting goods. The opportunities in emerging markets are based on their large and growing populations whose aver-age disposable incomes and standards of living are expected to increase.
HEAlTH And FiTnESS TREnd
There is currently a trend emphasizing balance be-tween work and life, and healthier lifestyles. This provides Amer Sports with opportunities to develop products that make accessing healthier lifestyles easier and more enjoyable for consumers.
Supported by trends evident in today’s society, the sporting goods industry
will continue to grow. The continuous development of new and better
products will keep Amer Sports and its brands at the cutting edge of
the sporting goods industry for years to come.
11
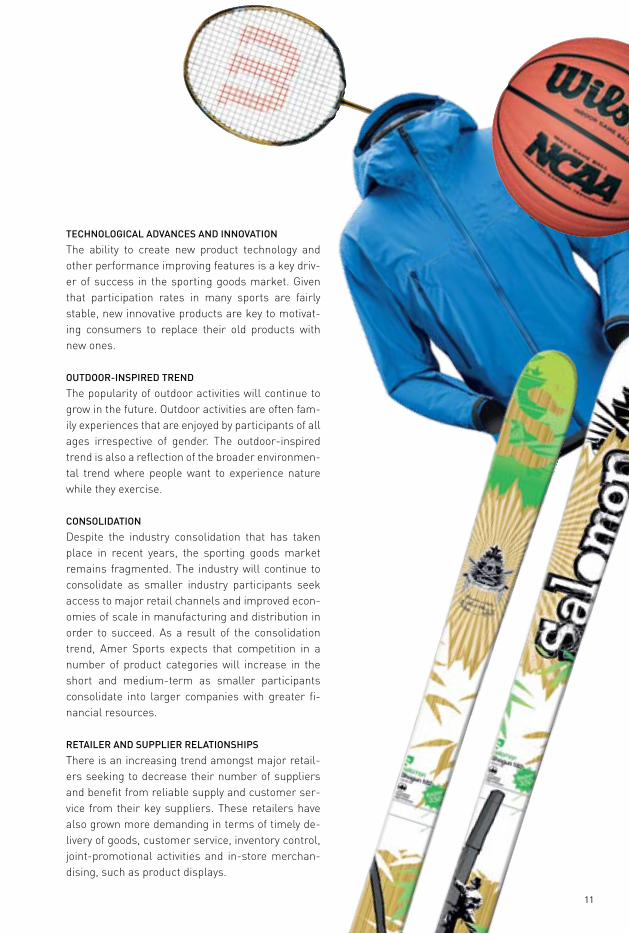
TECHnOlOGiCAl AdvAnCES And innOvATiOn
The ability to create new product technology and other performance improving features is a key driv-er of success in the sporting goods market. Given that participation rates in many sports are fairly stable, new innovative products are key to motivat-ing consumers to replace their old products with new ones.
OuTdOOR-inSPiREd TREnd
The popularity of outdoor activities will continue to grow in the future. Outdoor activities are often fam-ily experiences that are enjoyed by participants of all ages irrespective of gender. The outdoor-inspired trend is also a reflection of the broader environmen-tal trend where people want to experience nature while they exercise.
COnSOlidATiOn
Despite the industry consolidation that has taken place in recent years, the sporting goods market remains fragmented. The industry will continue to consolidate as smaller industry participants seek access to major retail channels and improved econ-omies of scale in manufacturing and distribution in order to succeed. As a result of the consolidation trend, Amer Sports expects that competition in a number of product categories will increase in the short and medium-term as smaller participants consolidate into larger companies with greater fi-nancial resources.
RETAilER And SuPPliER RElATiOnSHiPS
There is an increasing trend amongst major retail-ers seeking to decrease their number of suppliers and benefit from reliable supply and customer ser-vice from their key suppliers. These retailers have also grown more demanding in terms of timely de-livery of goods, customer service, inventory control, joint-promotional activities and in-store merchan-dising, such as product displays.
12
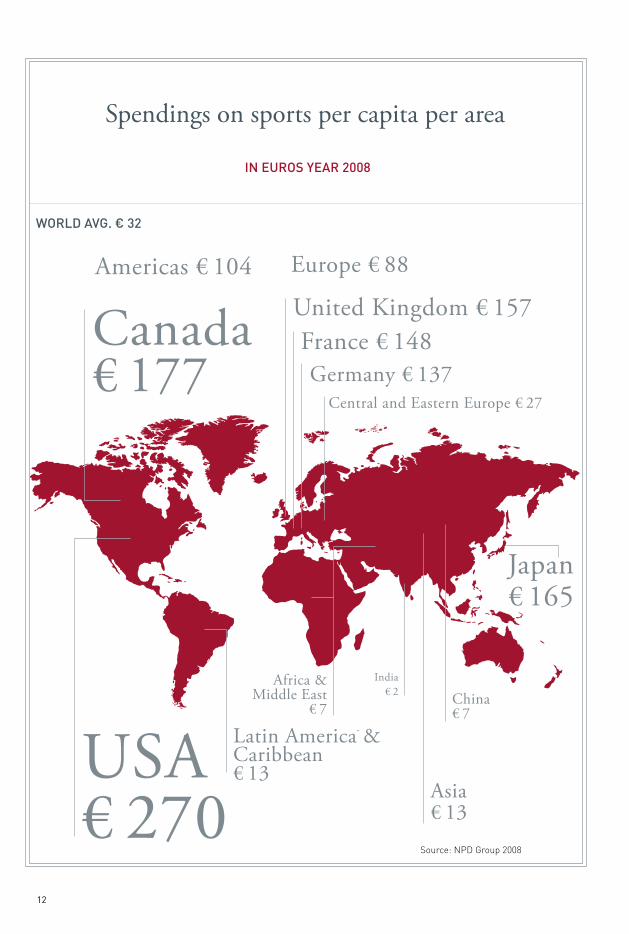
Spendings on sports per capita per area
WORld AvG. € 32
in EuROS YEAR 2008
Americas € 104
USA€ 270
Latin America & Caribbean€ 13
Europe € 88
Africa & Middle East
€ 7
Germany € 137Central and Eastern Europe € 27
France € 148United Kingdom € 157
India€ 2 China
€ 7
Japan € 165
Asia€ 13
Canada€ 177
Source: NPD Group 2008
13
Amer Sports’ strategy is based on sports, leisure-time activities, and well-being. Rising standards of living, the greater leisure-time people now en-joy, and growing awareness of the importance of physical and mental health open up future growth potential for the sports equipment industry. In ad-dition to profitable organic growth, Amer Sports is focused on finding and effectively harnessing synergy benefits as well as cooperation within the group.
In line with this strategy, Amer Sports will con-tinue to implement its growth strategy, of which the following are the cornerstones.
lEvERAGE KEY BRAndS TO FullY CAPTuRE
FuRTHER GROWTH OPPORTuniTiES
Amer Sports can further leverage its key brands by pursuing a number of strategic initiatives. For ex-ample, Amer Sports has launched a range of out-door apparel and footwear for trail running under the Salomon brand, tennis apparel and footwear under the Wilson brand, and Mavic cycling apparel and footwear to capture the growth trend in the apparel and footwear market. In addition, Suunto has in recent years expanded its offering of wris-top computers to the training and fitness category, including the targeting of the growing heart rate monitor segment. Another focus area has been to expand into protective equipment and enabling
gear, which complement Amer Sports’ sports equipment offering. Amer Sports intends to con-tinue to achieve organic growth by leveraging the customer loyalty of its key brands to launch new product lines within its core categories.
COnTinuE TO dEvElOP innOvATivE PROduCTS
As it is typical for the sporting goods industry, a substantial portion of Amer Sports’ net sales are generated each year by products that are in their first year of existence. Therefore, successful re-search and development is an important part of Amer Sports’ business, and the company seeks to continually introduce new technologically ad-vanced products that meet trade customers’ and consumers’ needs.
Amer Sports supports its brands with sig-nificant investment in research and development, which represented 3.4 percent of its net sales at the end of 2009. Amer Sports also maintains a pat-ent portfolio to protect its inventions.
FOCuS On FuRTHER ExPAndinG THE GEOGRAPHiCAl
REACH OF AMER SPORTS’ OPERATiOnS
Amer Sports intends to continue to expand the geographical reach of its operations. Some of Amer Sports’ brands have traditionally been stron-ger in certain specific geographic markets. For example, Precor is a well-recognized brand in the
Amer Sports’ strategic goal is to continue to strengthen its position as one
of the leading sporting goods companies in the world. Amer Sports aims
to further strengthen its position through a consumer-focused product
strategy, strong brands, innovative research and product development,
first-class customer service, and an efficient supply chain.
Strategy
14
United States, but a challenger in Europe, pro-viding it with growth opportunities in this region. Wilson has been successful in growing its sales in Latin America by focusing on soccer, the most popular sport in the region. In addition, Amer Sports believes that certain emerging markets, such as China, Russia, and Brazil, provide attrac-tive opportunities for growth as their standards of living improve and consumers’ disposable incomes grow. Amer Sports has already opened sales of-fices in these markets. As the retail infrastructure in most of the emerging markets is still undevel-oped, Amer Sports considers the opening of brand stores important in accelerating growth and gain-ing brand recognition in those markets as com-pared to developed markets that have traditionally been retailer driven.
inCREASE diRECT-TO-COnSuMER COnTACT
Like many other industries, the sporting goods business is changing as consumers have begun to desire more direct relationships with their favor-ite brands. In order to further promote its brands and access consumers directly, Amer Sports has adopted new multi-channel sales and integrated marketing strategies. These strategies involve opening additional brand stores and reaching out directly to consumers both via events and on the
dEvElOPEd MARKETS
COnSuMERS
• Wellnessandhealthylifestylestrend• Peoplelivinglonger,actingyounger• Importanceofwork-lifebalance• Increasedstandardsofliving• Informationsociety
TRAdE
• Channelcompetitionbetween • Traditional retail stores • Brand stores • Factory outlets • Rental business • E-commerce• Increasingprivatelabelbusinesses• Fromlocaltoregionalretailers
EMERGinG MARKETS
COnSuMERS
• Largeandgrowingpopulationbase• Increasingspendingpower
and free time• Owningthebestsportsequipment
is an indication of status and wealth • International brands stand out
TRAdE
• Retailinfrastructurestillemergingthrough domestic and international players
• Direct-to-consumerbusinessa necessity to gain distribution
• Brand stores • Shop-in-shops • Factory outlets
15
Internet. By opening brand stores and engaging with consumers directly, Amer Sports gains infor-mation regarding consumer behavior more effi-ciently, enabling it to better react to changes in the market, and develop more attractive products and marketing approaches based on direct consumer feedback.
FuRTHER iMPROvE OPERATiOnAl EFFiCiEnCY
Amer Sports plans to continue to improve its op-erational efficiency and profitability. For example, Amer Sports opened its Asian sourcing office in Hong Kong at the beginning of 2007 to integrate its Asian sourcing activities, and it will continue to pursue other opportunities to leverage the Group’s scale, bargaining position, and talent base in its sourcing activities. The company is also consider-ing further opportunities to centralize its logistics
and is in the process of implementing an integrated IT system, known as Global One, which is designed to harmonize its business processes. Amer Sports believes that the company can achieve significant further cost savings through these measures.
MAKE STRATEGiC ACquiSiTiOnS
And/OR divESTMEnTS
As part of its strategy to grow its business, Amer Sports will continue to consider acquiring com-panies that support its strategy, should attractive opportunities arise. Amer Sports believes that the most successful sporting goods companies will be those with a diversified and balanced portfolio of products that focus on creating strong global brands. To further focus its brand portfolio, Amer Sports may also consider divesting some of its brands in the future.
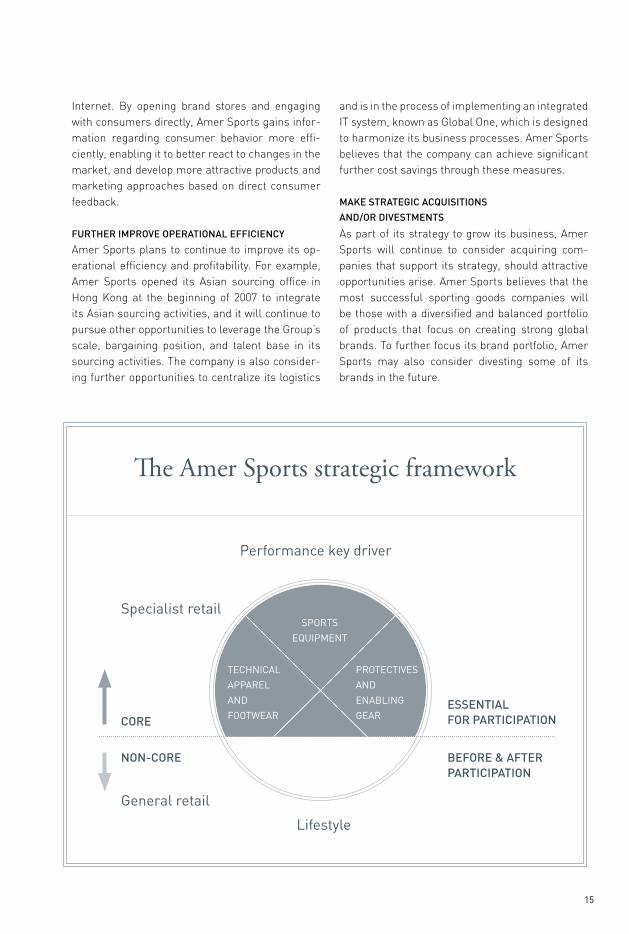
The Amer Sports strategic framework
Performance key driver
Specialist retail
nOn-CORE
CORE
General retail
Lifestyle
BEFORE & AFTER PARTiCiPATiOn
ESSEnTiAl FOR PARTiCiPATiOn
SPOrTS
EquiPMEnT
TEchnicAL
APPArEL
And
FOOTWEAr
PrOTEcTivES
And
EnABLinG
GEAr
SPOrTSWEAr
16
Amer Sports’ key success factors
PORTFOliO OF STROnG GlOBAl BRAndS
Each of Amer Sports’ brands is well recognized within its chosen sporting goods segment and many of Amer Sports’ key brands are among the most established brands in the markets where it operates. Amer Sports’ strong portfolio of global brands provides it with the opportunity to continu-ously launch new innovative products which both trade customers and consumers recognize and use.
BAlAnCEd PROduCT PORTFOliO
Amer Sports provides sporting goods for a wide variety of winter and summer, indoor and outdoor, and individual and team sports covering the core sports of the industry. The company’s broad port-folio makes it a year-round, full service supplier, allowing it to establish lasting business relation-ships with its trade customers.
GlOBAl PRESEnCE
Amer Sports’ global presence and diversified prod-uct portfolio helps it to balance the adverse impact of regional risks, including economic downturns, on the results of its operations. Although Amer Sports currently has a stronger presence in devel-oped markets, it also has sales offices and brand stores in emerging markets, such as China, Russia and Brazil.
ESTABliSHEd GlOBAl SAlES ORGAnizATiOn
Amer Sports has an established, global sales plat-form, which is designed to support its brands and is aimed at providing its trade customers with a high-level of customer service in all its product categories and market segments. Amer Sports’ comprehensive sales network also enables it to bring new products to markets simultaneously worldwide.
inTEGRATEd SuPPlY CHAin And
SOuRCinG ORGAnizATiOnS
In recent years, Amer Sports has focused on im-proving the efficiency of its operations by integrat-ing its supply chain and sourcing functions. Amer Sports’ more integrated supply chain and sourc-ing functions provide it with further cost savings through the continued implementation of the mea-sures.
innOvATivE RESEARCH And PROduCT dEvElOPMEnT
The sporting goods industry is typically character-ized by products that have a relatively short life cycle. Therefore, one of the keys to success in the sporting goods industry is to be able to introduce new, innovative products to market that consum-ers quickly adopt over competing products. Amer Sports is focused on developing and manufacturing technically-advanced products that are designed to
Amer Sports’ position as one of the leading sporting goods companies in
the world is based on the following key strengths:
17
improve the performance of all athletes, whether they are beginners or professionals, help them achieve their goals, and give them more enjoyment from their activity of choice.
POSiTiOnEd TO BEnEFiT
FROM lOnG-TERM dEMOGRAPHiC TREndS
Amer Sports is well-positioned to benefit from underlying general consumer and demographic trends which are driving growth in the sporting goods market. Among these trends is the increased general focus on health and wellness, coupled with an increase in leisure time, which have prompted consumers to expand their participation in sports and outdoor activities.
18
In its day-to-day operations, Amer Sports’ primary focus is to achieve organic growth through the development of innovative products, effective mar-keting, solid customer service, and an efficient supply chain. In addition, Amer Sports will con-tinue to be a participant in the structural changes taking place within the industry.
Amer Sports will consider making selective acquisitions that support the Amer Sports strategy, strengthen its position, and deliver shareholder value.
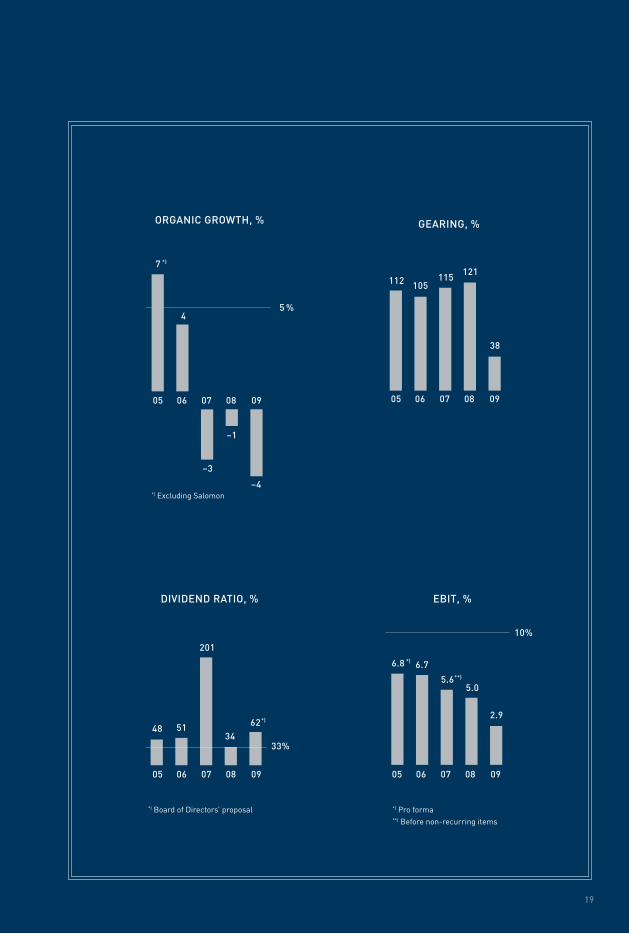
Amer Sports’ goal is consistent profitable growth. Profitability
enables Amer Sports to invest in product development and
marketing, which are essential tools in bolstering its position as
the global leader in the sports equipment industry.
Financial targets
AvERAGE ORGAniC GROWTH OF
5 PERCEnT PER AnnuM
Amer Sports’ objective is to deliver currency-neutral organic growth averaging five percent over the cycle and to outgrow its competitors in the com-petitive field.
EBiT OF AT lEAST 10 PERCEnT OF nET SAlES
Amer Sports’ target is to achieve EBIT of at least ten percent of net sales over the cycle. In addition, Amer Sports’ profitability should be better than that of other leading sports equipment companies world-wide.
OPTiMAl BAlAnCE SHEET STRuCTuRE
Amer Sports will use its balance sheet actively whilst avoiding excessively large financial risks.
dividEnT PAYOuT RATiO EquivAlEnT TO
AT lEAST 1/3 OF AnnuAl nET RESulT
Amer Sports wishes to been seen as a competi-tive investment that increases shareholder value through a combination of dividend payments and share price performance. Amer Sports pursues a progressive dividend policy reflecting its earnings performance, with the aim of distributing a divi-dend of at least one-third of its annual net result.
19
*) Excluding Salomon
ORGAniC GROWTH, %
33%
*) Board of directors’ proposal
dividEnd RATiO, %
*) Pro forma**) Before non-recurring items
EBiT, %
10%
05 06 07 08 0905 06 07 08 09
GEARinG, %
2.9
6.8 6.7
48 51
201
34
5.6
*)
**)
*)
5 %
05 06 07 08 0905 06 07 08 09
121
–4
112
7
105
4
115
–3
*)
–1
38
62
5.0

20
WinTER SPORTS EquiPMEnT
Salomon and Atomic are among the world’s most recognized winter sports brands. The brands com-plement each other in terms of their product of-ferings and main markets. The selection of winter sports equipment under the Salomon and Atomic brands includes: alpine skis, boots, bindings, poles, and helmets; cross-country skis, boots, bindings, and poles; and snowboards, snowboard boots, and snowboard bindings.
BAll SPORTS
Wilson is the world’s leading manufacturer of ball sports equipment in terms of market share. The Ball Sports segment has a diversified product portfolio, and its main sports are tennis, baseball, American football, golf, basketball, softball, bad-minton, and squash.
APPAREl And FOOTWEAR
The Salomon and Arc’teryx brands form the core of Amer Sports’ Apparel and Footwear business area. The global apparel and footwear market has in recent years benefited from the growing trend towards outdoor activities. Amer Sports has fo-cused on capitalizing on this trend by investing in technical apparel and footwear designed for out-door activities.
FiTnESS
Precor operates in the fitness equipment market, manufacturing and selling technically-advanced, premium-quality fitness equipment for the com-mercial and home markets. Its main products are aerobic exercise equipment and strength-training systems.
CYClinG
The Cycling business area of Amer Sports is op-erated through Mavic, a manufacturer of rims, wheels, pedals, apparel, and footwear for road cy-cling, mountain biking, triathlon, and track racing. Mavic is positioned in the high-end rim and wheel market.
SPORTS inSTRuMEnTS
Suunto designs and manufactures precision in-struments for a variety of sports, including diving, training, climbing, hiking, running, sailing, cycling, and golfing as well as diving instruments, com-passes, and precision instruments.
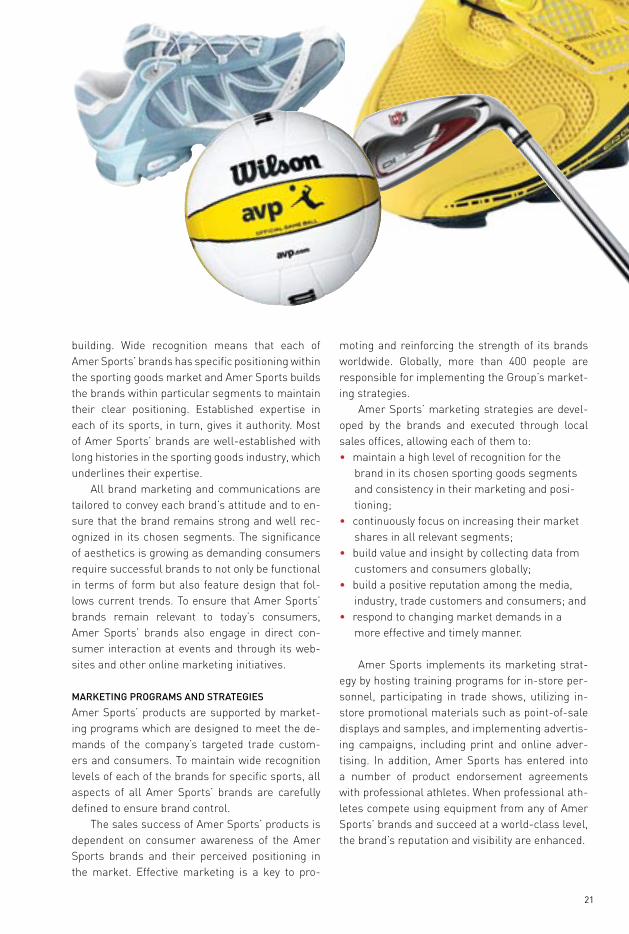
BRAnd MAnAGEMEnT
All of Amer Sports’ brands are built on the same four cornerstones: authenticity, authority, attitude, and aesthetics. Wide recognition and authority are at the core of Amer Sports’ operations and brand-
Key brands and brand management
Amer Sports is one of the leading sporting goods companies in the
world with a strong brand portfolio that includes Salomon, Wilson,
Precor, Atomic, Suunto, Mavic, and Arc’teryx, as well as other
complementary brands.
21
building. Wide recognition means that each of Amer Sports’ brands has specific positioning within the sporting goods market and Amer Sports builds the brands within particular segments to maintain their clear positioning. Established expertise in each of its sports, in turn, gives it authority. Most of Amer Sports’ brands are well-established with long histories in the sporting goods industry, which underlines their expertise.
All brand marketing and communications are tailored to convey each brand’s attitude and to en-sure that the brand remains strong and well rec-ognized in its chosen segments. The significance of aesthetics is growing as demanding consumers require successful brands to not only be functional in terms of form but also feature design that fol-lows current trends. To ensure that Amer Sports’ brands remain relevant to today’s consumers, Amer Sports’ brands also engage in direct con-sumer interaction at events and through its web-sites and other online marketing initiatives.
MARKETinG PROGRAMS And STRATEGiES
Amer Sports’ products are supported by market-ing programs which are designed to meet the de-mands of the company’s targeted trade custom-ers and consumers. To maintain wide recognition levels of each of the brands for specific sports, all aspects of all Amer Sports’ brands are carefully defined to ensure brand control.
The sales success of Amer Sports’ products is dependent on consumer awareness of the Amer Sports brands and their perceived positioning in the market. Effective marketing is a key to pro-
moting and reinforcing the strength of its brands worldwide. Globally, more than 400 people are responsible for implementing the Group’s market-ing strategies.
Amer Sports’ marketing strategies are devel-oped by the brands and executed through local sales offices, allowing each of them to:• maintain a high level of recognition for the
brand in its chosen sporting goods segments and consistency in their marketing and posi-tioning;
• continuously focus on increasing their market shares in all relevant segments;
• build value and insight by collecting data from customers and consumers globally;
• build a positive reputation among the media, industry, trade customers and consumers; and
• respond to changing market demands in a more effective and timely manner.
Amer Sports implements its marketing strat-egy by hosting training programs for in-store per-sonnel, participating in trade shows, utilizing in-store promotional materials such as point-of-sale displays and samples, and implementing advertis-ing campaigns, including print and online adver-tising. In addition, Amer Sports has entered into a number of product endorsement agreements with professional athletes. When professional ath-letes compete using equipment from any of Amer Sports’ brands and succeed at a world-class level, the brand’s reputation and visibility are enhanced.
22
Business segment review
.
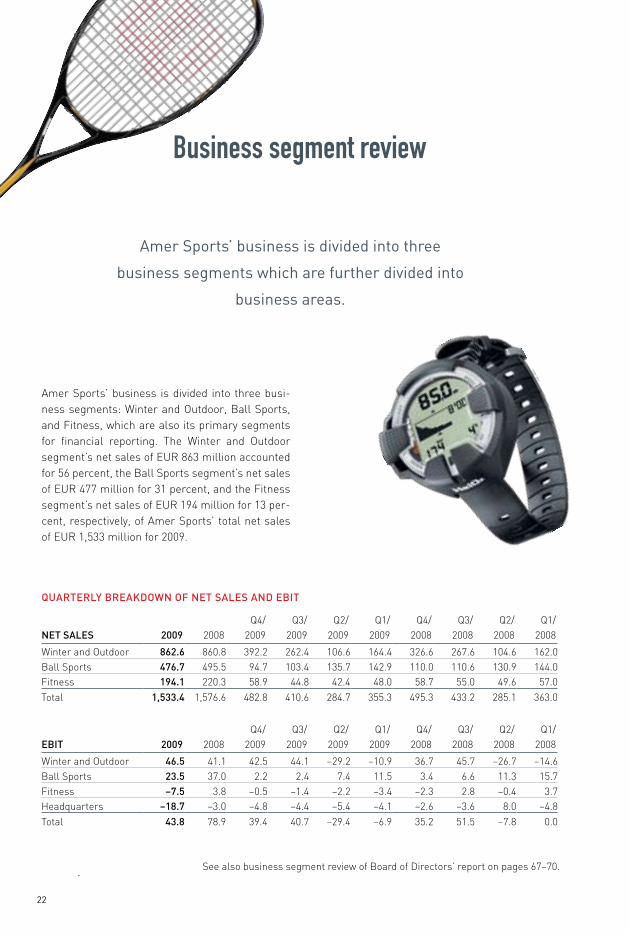
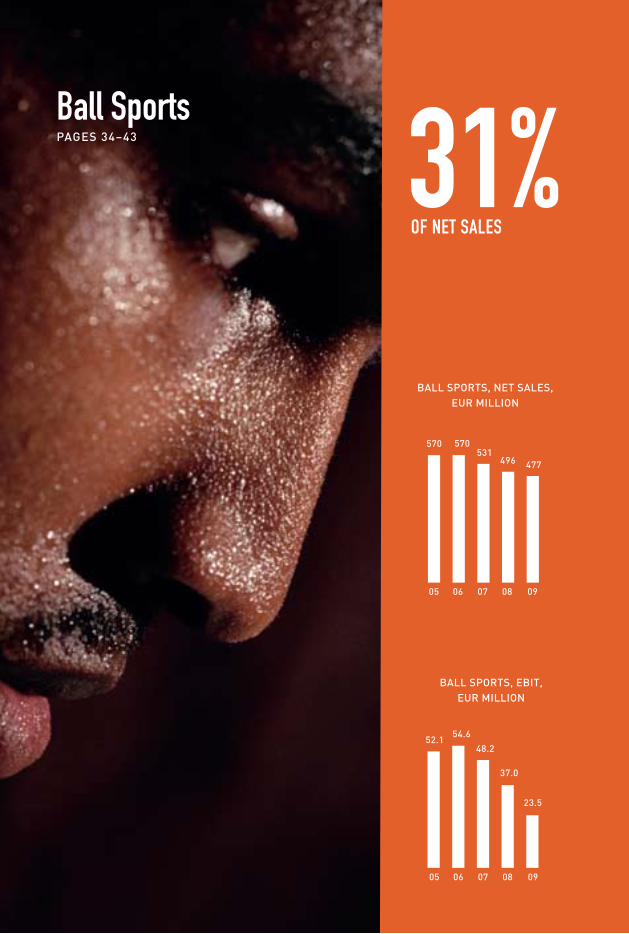
Amer Sports’ business is divided into three busi-ness segments: Winter and Outdoor, Ball Sports, and Fitness, which are also its primary segments for financial reporting. The Winter and Outdoor segment’s net sales of EUR 863 million accounted for 56 percent, the Ball Sports segment’s net sales of EUR 477 million for 31 percent, and the Fitness segment’s net sales of EUR 194 million for 13 per-cent, respectively, of Amer Sports’ total net sales of EUR 1,533 million for 2009.
Amer Sports’ business is divided into three
business segments which are further divided into
business areas.
quARTERlY BREAKdOWn OF nET SAlES And EBiT
Q4/ Q3/ Q2/ Q1/ Q4/ Q3/ Q2/ Q1/nET SAlES 2009 2008 2009 2009 2009 2009 2008 2008 2008 2008
Winter and Outdoor 862.6 860.8 392.2 262.4 106.6 164.4 326.6 267.6 104.6 162.0Ball Sports 476.7 495.5 94.7 103.4 135.7 142.9 110.0 110.6 130.9 144.0Fitness 194.1 220.3 58.9 44.8 42.4 48.0 58.7 55.0 49.6 57.0Total 1,533.4 1,576.6 482.8 410.6 284.7 355.3 495.3 433.2 285.1 363.0
Q4/ Q3/ Q2/ Q1/ Q4/ Q3/ Q2/ Q1/EBiT 2009 2008 2009 2009 2009 2009 2008 2008 2008 2008
Winter and Outdoor 46.5 41.1 42.5 44.1 –29.2 –10.9 36.7 45.7 –26.7 –14.6Ball Sports 23.5 37.0 2.2 2.4 7.4 11.5 3.4 6.6 11.3 15.7Fitness –7.5 3.8 –0.5 –1.4 –2.2 –3.4 –2.3 2.8 –0.4 3.7Headquarters –18.7 –3.0 –4.8 –4.4 –5.4 –4.1 –2.6 –3.6 8.0 –4.8Total 43.8 78.9 39.4 40.7 –29.4 –6.9 35.2 51.5 –7.8 0.0
See also business segment review of Board of Directors’ report on pages 67–70.
1 2 3 4 5 6 7 8
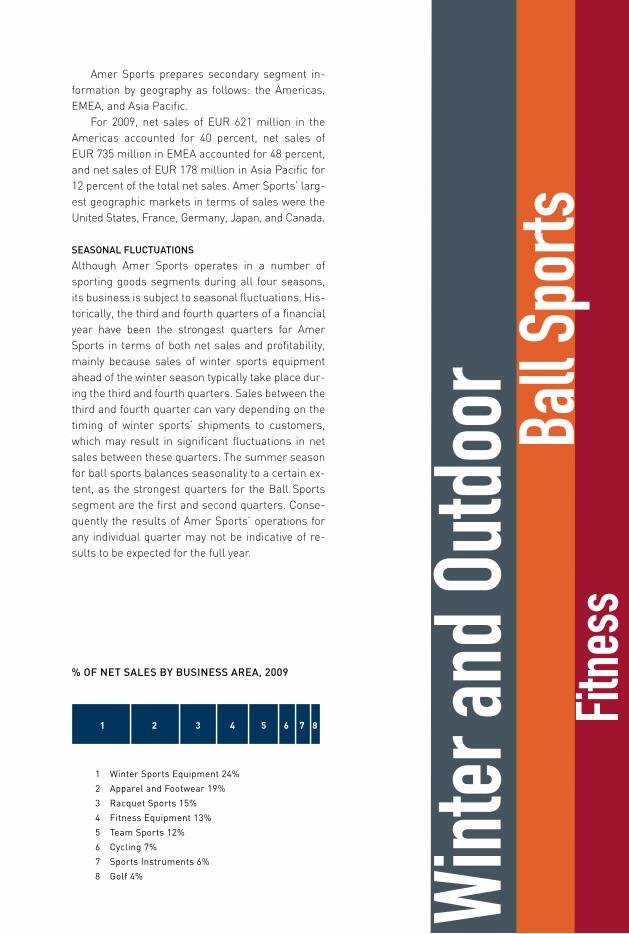
Amer Sports prepares secondary segment in-formation by geography as follows: the Americas, EMEA, and Asia Pacific.
For 2009, net sales of EUR 621 million in the Americas accounted for 40 percent, net sales of EUR 735 million in EMEA accounted for 48 percent, and net sales of EUR 178 million in Asia Pacific for 12 percent of the total net sales. Amer Sports’ larg-est geographic markets in terms of sales were the United States, France, Germany, Japan, and Canada.
SEASOnAl FluCTuATiOnS
Although Amer Sports operates in a number of sporting goods segments during all four seasons, its business is subject to seasonal fluctuations. His-torically, the third and fourth quarters of a financial year have been the strongest quarters for Amer Sports in terms of both net sales and profitability, mainly because sales of winter sports equipment ahead of the winter season typically take place dur-ing the third and fourth quarters. Sales between the third and fourth quarter can vary depending on the timing of winter sports’ shipments to customers, which may result in significant fluctuations in net sales between these quarters. The summer season for ball sports balances seasonality to a certain ex-tent, as the strongest quarters for the Ball Sports segment are the first and second quarters. Conse-quently the results of Amer Sports’ operations for any individual quarter may not be indicative of re-sults to be expected for the full year.
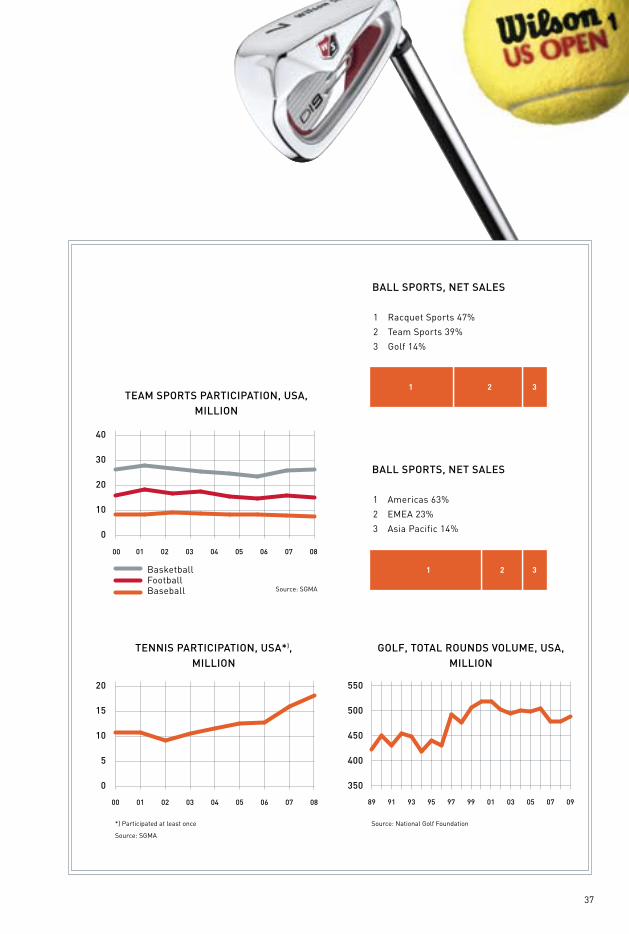
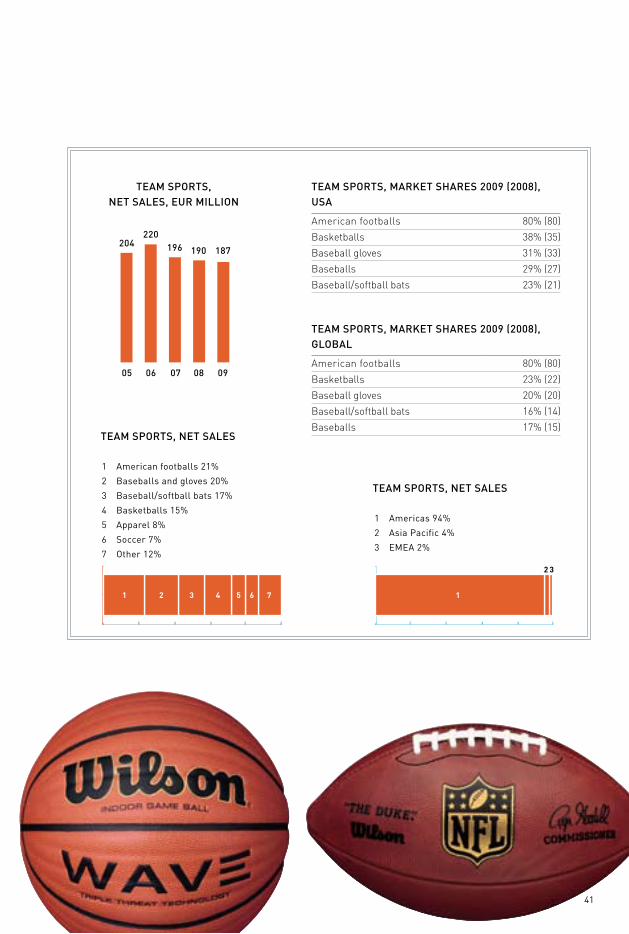
1 Winter Sports Equipment 24%
2 Apparel and Footwear 19%
3 racquet Sports 15%
4 Fitness Equipment 13%
5 Team Sports 12%
6 cycling 7%
7 Sports instruments 6%
8 Golf 4%
% OF nET SAlES BY BuSinESS AREA, 2009
24
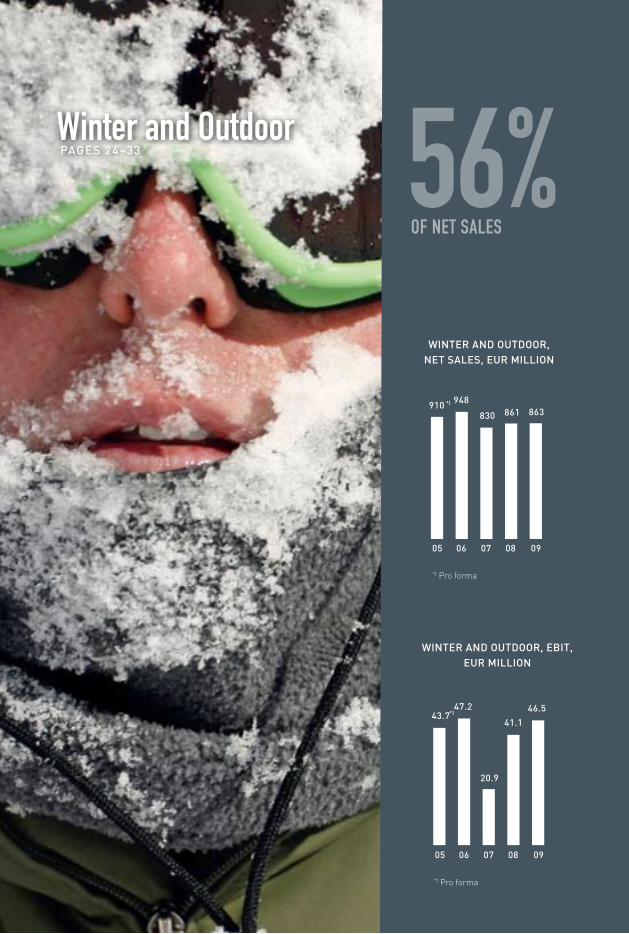
Winter and Outdoor PAGES 24–33
*) Pro forma
WinTER And OuTdOOR, nET SAlES, EuR MilliOn
05 06 07 08 09
910 948
830 861*)
WinTER And OuTdOOR, EBiT, EuR MilliOn
*) Pro forma
05 06 07 08 09
43.747.2
20.9
41.1
46.5*)
56%of NET SALES
863
25
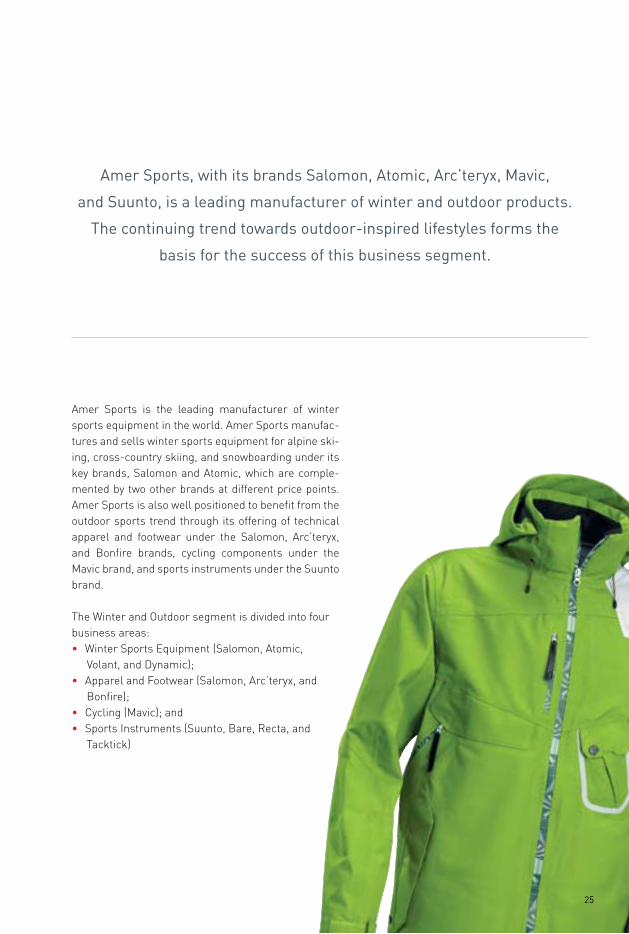
Amer Sports is the leading manufacturer of winter sports equipment in the world. Amer Sports manufac-tures and sells winter sports equipment for alpine ski-ing, cross-country skiing, and snowboarding under its key brands, Salomon and Atomic, which are comple-mented by two other brands at different price points. Amer Sports is also well positioned to benefit from the outdoor sports trend through its offering of technical apparel and footwear under the Salomon, Arc’teryx, and Bonfire brands, cycling components under the Mavic brand, and sports instruments under the Suunto brand.
The Winter and Outdoor segment is divided into four business areas:• Winter Sports Equipment (Salomon, Atomic,
Volant, and Dynamic);• Apparel and Footwear (Salomon, Arc’teryx, and
Bonfire);• Cycling (Mavic); and• Sports Instruments (Suunto, Bare, Recta, and
Tacktick)
Amer Sports, with its brands Salomon, Atomic, Arc’teryx, Mavic,
and Suunto, is a leading manufacturer of winter and outdoor products.
The continuing trend towards outdoor-inspired lifestyles forms the
basis for the success of this business segment.

1 2 3 4 1 2 3
08/0901/02 02/03 03/04 04/05 05/06 06/07 07/08 08/0901/02 02/03 03/04 04/05 05/06 06/07 07/08
26
After significant restructuring in 2008, 2009 was the first year for the winter sports business operating under its new structure.
PARTiCiPATiOn, SKiER dAYS in FRAnCE, MilliOn
PARTiCiPATiOn, SKiER dAYS in AuSTRiA, MilliOn
1 Winter Sports Equipment 43%
2 Apparel and Footwear 35%
3 cycling 12%
4 Sports instruments 10%
WinTER And OuTdOOR, nET SAlES
1 EMEA 68%
2 Americas 21%
3 Asia Pacific 11%
WinTER And OuTdOOR, nET SAlES
70
60
50
40
30
70
60
50
40
30
Source: http://www.sntf.org/files/ RecueilindicateursetAnalyses2009.pdf
Source: http://www.seilbahnen.at/presse/wirtschafts-daten/files/berichtsblaetter_tm_winter0809.pdf
KEY indiCATORS
EUR million 2009 2008Change,
%Change,
% *) 2007
Net sales
Winter Sports Equipment 371.7 378.9 –2 –1 394.2
Apparel and Footwear 304.7 277.9 10 11 229.4
Cycling 100.4 114.2 –12 –13 114.1
Sports Instruments 85.8 89.8 –4 –5 90.7
Discontinued operations - - 1.7
Net sales, total 862.6 860.8 0 0 830.1
EBIT 46.5 41.1 13 17 20.9
% of net sales 5.4 4.8 2.5
Personnel at year end 3,940 3,777 4 3,701
*) In local currency terms
08/0901/02 02/03 03/04 04/05 05/06 06/07 07/08
27
Business areas and brands
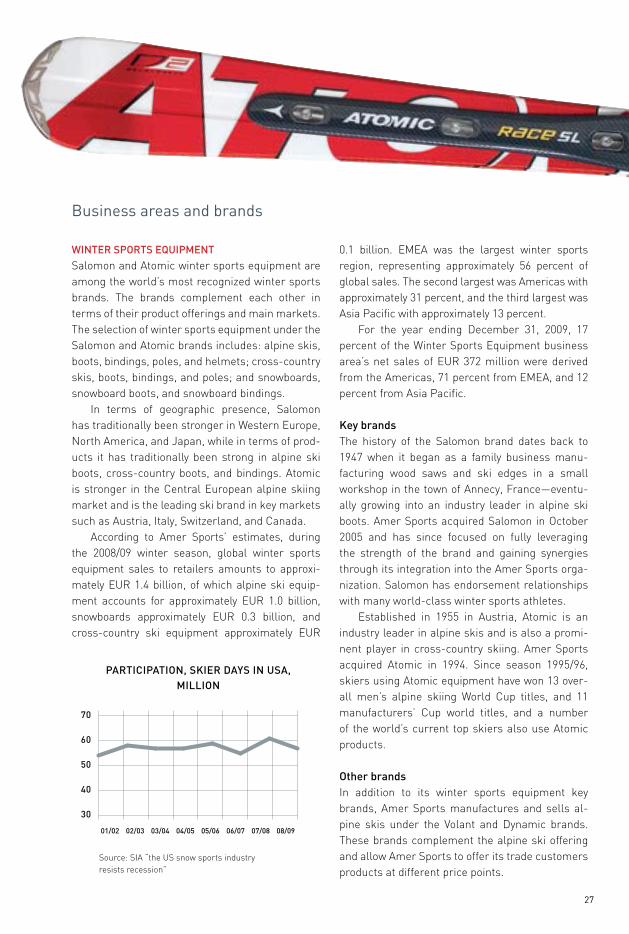
WinTER SPORTS EquiPMEnTSalomon and Atomic winter sports equipment are among the world’s most recognized winter sports brands. The brands complement each other in terms of their product offerings and main markets. The selection of winter sports equipment under the Salomon and Atomic brands includes: alpine skis, boots, bindings, poles, and helmets; cross-country skis, boots, bindings, and poles; and snowboards, snowboard boots, and snowboard bindings.
In terms of geographic presence, Salomon has traditionally been stronger in Western Europe, North America, and Japan, while in terms of prod-ucts it has traditionally been strong in alpine ski boots, cross-country boots, and bindings. Atomic is stronger in the Central European alpine skiing market and is the leading ski brand in key markets such as Austria, Italy, Switzerland, and Canada.
According to Amer Sports’ estimates, during the 2008/09 winter season, global winter sports equipment sales to retailers amounts to approxi-mately EUR 1.4 billion, of which alpine ski equip-ment accounts for approximately EUR 1.0 billion, snowboards approximately EUR 0.3 billion, and cross-country ski equipment approximately EUR
0.1 billion. EMEA was the largest winter sports region, representing approximately 56 percent of global sales. The second largest was Americas with approximately 31 percent, and the third largest was Asia Pacific with approximately 13 percent.
For the year ending December 31, 2009, 17 percent of the Winter Sports Equipment business area’s net sales of EUR 372 million were derived from the Americas, 71 percent from EMEA, and 12 percent from Asia Pacific.
Key brandsThe history of the Salomon brand dates back to 1947 when it began as a family business manu-facturing wood saws and ski edges in a small workshop in the town of Annecy, France—eventu-ally growing into an industry leader in alpine ski boots. Amer Sports acquired Salomon in October 2005 and has since focused on fully leveraging the strength of the brand and gaining synergies through its integration into the Amer Sports orga-nization. Salomon has endorsement relationships with many world-class winter sports athletes.
Established in 1955 in Austria, Atomic is an industry leader in alpine skis and is also a promi-nent player in cross-country skiing. Amer Sports acquired Atomic in 1994. Since season 1995/96, skiers using Atomic equipment have won 13 over-all men’s alpine skiing World Cup titles, and 11 manufacturers’ Cup world titles, and a number of the world’s current top skiers also use Atomic products.
Other brandsIn addition to its winter sports equipment key brands, Amer Sports manufactures and sells al-pine skis under the Volant and Dynamic brands. These brands complement the alpine ski offering and allow Amer Sports to offer its trade customers products at different price points.
PARTiCiPATiOn, SKiER dAYS in uSA, MilliOn
WinTER And OuTdOOR, nET SAlES
70
60
50
40
30
Source: SIA “the US snow sports industry resists recession”
1 2 31 2 3
28
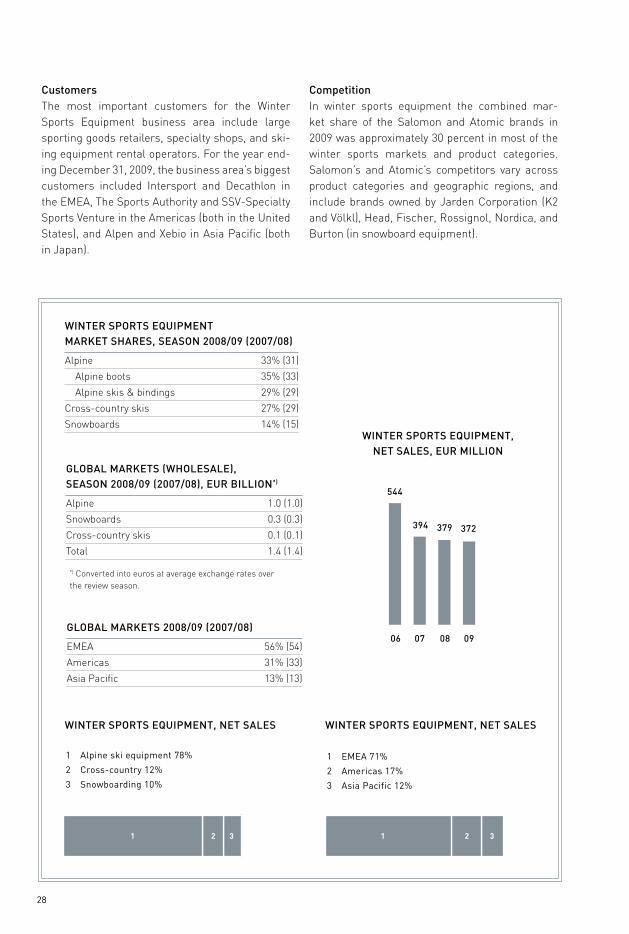
CustomersThe most important customers for the Winter Sports Equipment business area include large sporting goods retailers, specialty shops, and ski-ing equipment rental operators. For the year end-ing December 31, 2009, the business area’s biggest customers included Intersport and Decathlon in the EMEA, The Sports Authority and SSV-Specialty Sports Venture in the Americas (both in the United States), and Alpen and Xebio in Asia Pacific (both in Japan).
CompetitionIn winter sports equipment the combined mar-ket share of the Salomon and Atomic brands in 2009 was approximately 30 percent in most of the winter sports markets and product categories. Salomon’s and Atomic’s competitors vary across product categories and geographic regions, and include brands owned by Jarden Corporation (K2 and Völkl), Head, Fischer, Rossignol, Nordica, and Burton (in snowboard equipment).
1 Alpine ski equipment 78%
2 cross-country 12%
3 Snowboarding 10%
WinTER SPORTS EquiPMEnT, nET SAlES
1 EMEA 71%
2 Americas 17%
3 Asia Pacific 12%
WinTER SPORTS EquiPMEnT, nET SAlES
WinTER SPORTS EquiPMEnT, nET SAlES, EuR MilliOn
GlOBAl MARKETS (WHOlESAlE), SEASOn 2008/09 (2007/08), EuR BilliOn*)
Alpine 1.0 (1.0)
Snowboards 0.3 (0.3)
Cross-country skis 0.1 (0.1)
Total 1.4 (1.4)
*) Converted into euros at average exchange rates over the review season.
GlOBAl MARKETS 2008/09 (2007/08)
EMEA 56% (54)
Americas 31% (33)
Asia Pacific 13% (13)
WinTER SPORTS EquiPMEnT MARKET SHARES, SEASOn 2008/09 (2007/08)
Alpine 33% (31)
Alpine boots 35% (33)
Alpine skis & bindings 29% (29)
Cross-country skis 27% (29)
Snowboards 14% (15)
06 07 08 09
544
394 379 372

29
APPAREl And FOOTWEARThe Salomon and Arc’teryx brands form the core of Amer Sports’ Apparel and Footwear business area. The global apparel and footwear market has in recent years benefited from the growing trend towards outdoor activities and Amer Sports has fo-cused on capitalizing on this trend by investing in technical apparel and footwear designed for out-door activities.
The Salomon brand is a well established brand in all mountain sports activities, particularly in Europe. In North America, most Salomon apparel and footwear products are currently sold by spe-cialty shops and Amer Sports believes that there are further opportunities for increased sales of Salomon apparel and footwear in North America as well as in Asia. In line with its heritage in mountain sports, Salomon’s apparel offering focuses on four key areas: alpine and Nordic skiwear, trail running, and hiking. In footwear, Salomon focuses on shoes for trail running. As a result of its very progressive and innovative offerings, Salomon is the leader in the outdoor footwear market in Europe. Salomon apparel and footwear is visible in many mountain sports, including trail running, and has endorse-ment agreements with many top trail runners.
Arc’teryx was founded in Vancouver, Canada, in 1991 and is best known in North America, where, in 2009, more than half of its products were sold. Arc’teryx is focused on producing highly techni-cal apparel, backpacks, and harnesses for out-door sports, hiking, climbing, and snow sports. Its product offering is targeted at higher price points as many of its products have been produced us-ing advanced materials and highly technical com-
ponents. Amer Sports believes that the Arc’teryx brand has global growth potential through its unique positioning as a high-end outdoor brand. Amer Sports acquired Arc’teryx in 2005 as part of the Salomon Group.
For the year ending December 31, 2009, 26 per-cent of the Apparel and Footwear business area’s net sales of EUR 305 million were derived from the Americas, 69 percent from EMEA, and 5 percent from Asia Pacific.
Other brandsAmer Sports also manufactures and sells snow-board apparel under the Bonfire brand, which de-rives a substantial portion of its sales from North America, mainly through sales to snowboarding specialty stores. Amer Sports believes that Europe and Asia both represent future growth opportuni-ties for the brand. Amer Sports acquired Bonfire in 2005 as part of the Salomon Group.
CustomersThe most important customers for the Apparel and Footwear business area include sporting goods retailers and specialty shops. In 2009, the busi-ness area’s biggest customers included Intersport, Sport 2000, Decathlon, and Hervis in the EMEA and the REI in the United States. Amer Sports’ ap-parel and footwear brands and products provide it with a good opportunity to expand sales directly to consumers. This will involve the opening of brand stores and factory outlets as well as reaching out directly to consumers via the Internet.
1 2
1 2 3
30
CompetitionThe global apparel and footwear market is highly fragmented. Amer Sports’ brands Salomon, Arc’teryx, and Bonfire mainly compete with prod-ucts in the medium and high-price points. Its com-petitors within the apparel market include brands such as The North Face, Mountain Hardwear, Patagonia, Columbia, Burton, Norrona, Millet, and within the footwear market, The North Face, Merrell, Lowa, Columbia, and Keen.
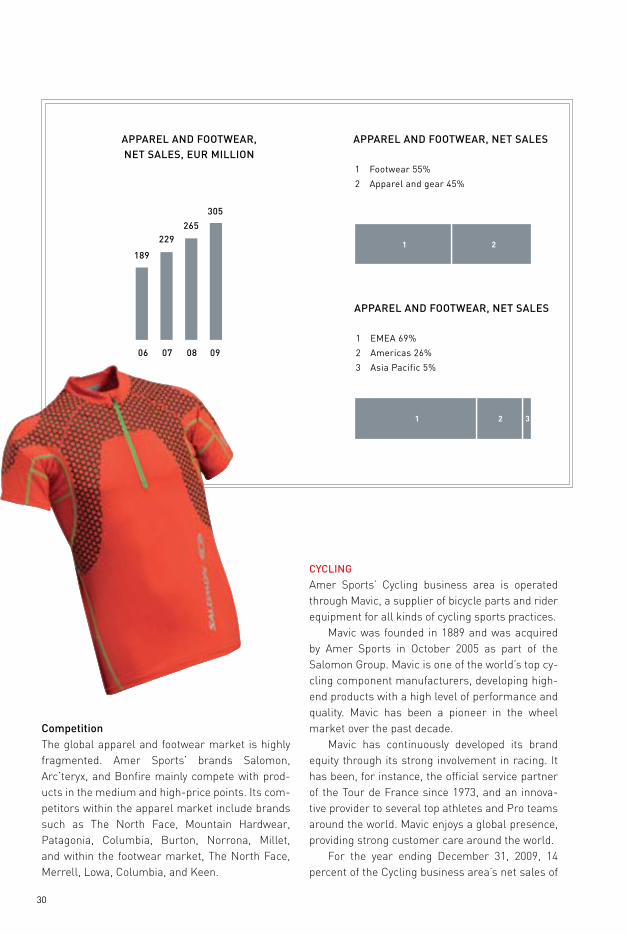
CYClinGAmer Sports’ Cycling business area is operated through Mavic, a supplier of bicycle parts and rider equipment for all kinds of cycling sports practices.
Mavic was founded in 1889 and was acquired by Amer Sports in October 2005 as part of the Salomon Group. Mavic is one of the world’s top cy-cling component manufacturers, developing high-end products with a high level of performance and quality. Mavic has been a pioneer in the wheel market over the past decade.
Mavic has continuously developed its brand equity through its strong involvement in racing. It has been, for instance, the official service partner of the Tour de France since 1973, and an innova-tive provider to several top athletes and Pro teams around the world. Mavic enjoys a global presence, providing strong customer care around the world.
For the year ending December 31, 2009, 14 percent of the Cycling business area’s net sales of
1 Footwear 55%
2 Apparel and gear 45%
APPAREl And FOOTWEAR, nET SAlES
1 EMEA 69%
2 Americas 26%
3 Asia Pacific 5%
APPAREl And FOOTWEAR, nET SAlES
APPAREl And FOOTWEAR, nET SAlES, EuR MilliOn
06 07 08 09
189
229265
305
1 2
3
1 2 3
31
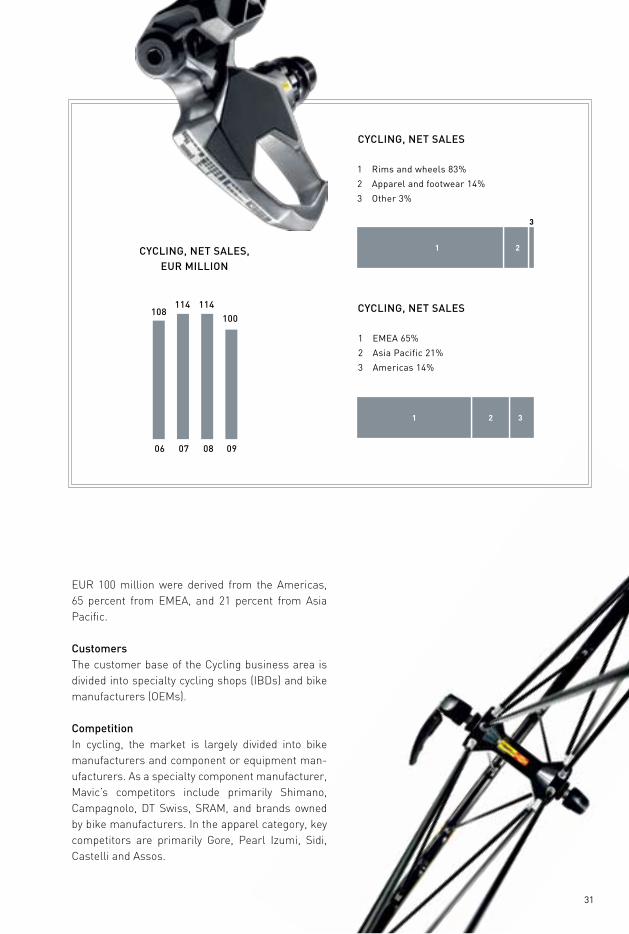
EUR 100 million were derived from the Americas, 65 percent from EMEA, and 21 percent from Asia Pacific.
CustomersThe customer base of the Cycling business area is divided into specialty cycling shops (IBDs) and bike manufacturers (OEMs).
CompetitionIn cycling, the market is largely divided into bike manufacturers and component or equipment man-ufacturers. As a specialty component manufacturer, Mavic’s competitors include primarily Shimano, Campagnolo, DT Swiss, SRAM, and brands owned by bike manufacturers. In the apparel category, key competitors are primarily Gore, Pearl Izumi, Sidi, Castelli and Assos.
06 07 08 09
108114 114
APPAREl And FOOTWEAR, nET SAlES
APPAREl And FOOTWEAR, nET SAlES
1 rims and wheels 83%
2 Apparel and footwear 14%
3 Other 3%
CYClinG, nET SAlES
1 EMEA 65%
2 Asia Pacific 21%
3 Americas 14%
CYClinG, nET SAlES
CYClinG, nET SAlES, EuR MilliOn
100

32
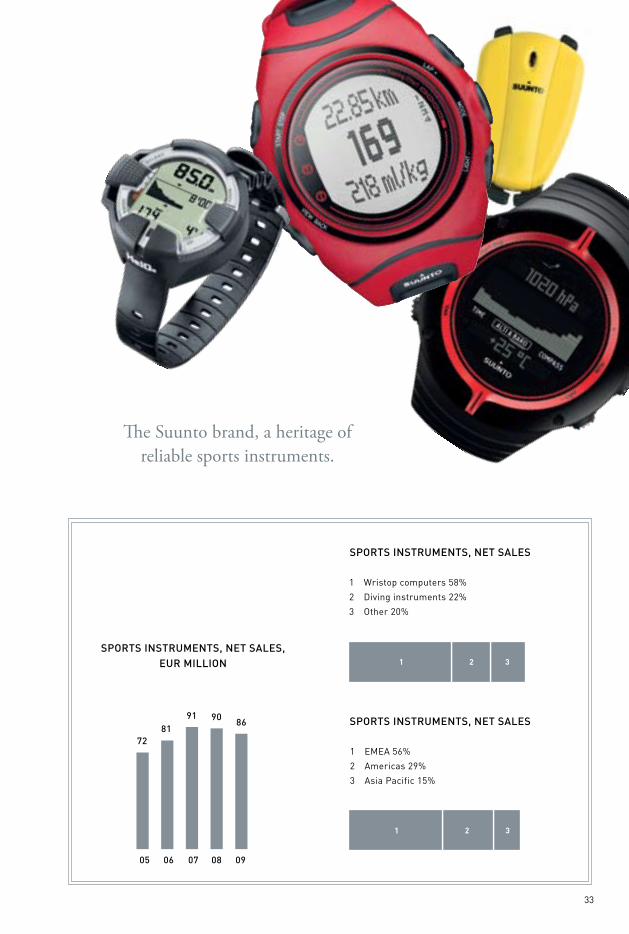
SPORTS inSTRuMEnTSSuunto designs and manufactures sports precision instruments for diving, training, mountaineering, hiking, sailing, as well as diving instruments and compasses, and other precision instruments.
Suunto was founded in Finland in 1936 when Tuomas Vohlonen invented the mass production method for the liquid-filled compass. Suunto has also manufactured diving instruments since the 1960s. Amer Sports acquired Suunto in 1999 and since then has expanded the brand’s product offer-ing. In 2009, Suunto launched its new Elementum watch series for the premium digital sports watch market.
For the year ending December 31, 2009, 29 percent of the Sports Instruments business area’s net sales of EUR 86 million were derived from the Americas, 56 percent from EMEA, and 15 percent from Asia Pacific.
Other brandsSuunto also manufactures and sells compasses under the Recta brand. Dive suits are manufac-tured under the Bare brand. In 2009, Suunto ac-quired Tacktick Ltd, a manufacturer of wireless marine sensors, instruments, and displays.
CustomersThe most important customers for the Sports In-struments business area include dive shops, out-door specialty shops, and large sporting goods retailers. In 2009, the business area’s biggest cus-tomers were Aqualung in the Americas and the EMEA for diving equipment as well as the REI in the Americas, and Intersport in the EMEA for out-door and training sports instruments.
CompetitionSuunto’s competitors vary across product catego-ries and include Polar and Garmin (training and outdoor) and Uwatec, Oceanic, and Mares (diving).
1 2 3
1 2 3
33
The Suunto brand, a heritage of reliable sports instruments.
1 Wristop computers 58%
2 diving instruments 22%
3 Other 20%
SPORTS inSTRuMEnTS, nET SAlES
1 EMEA 56%
2 Americas 29%
3 Asia Pacific 15%
SPORTS inSTRuMEnTS, nET SAlES
SPORTS inSTRuMEnTS, nET SAlES, EuR MilliOn
05 06 07 08 09
7281
91 90 86
34
Ball Sports PAGES 34–43
BAll SPORTS, nET SAlES, EuR MilliOn
05 06 07 08 09
570 570531
477
BAll SPORTS, EBiT,EuR MilliOn
05 06 07 08 09
52.154.6
48.2
37.0
496
23.5
31%of NET SALES
35
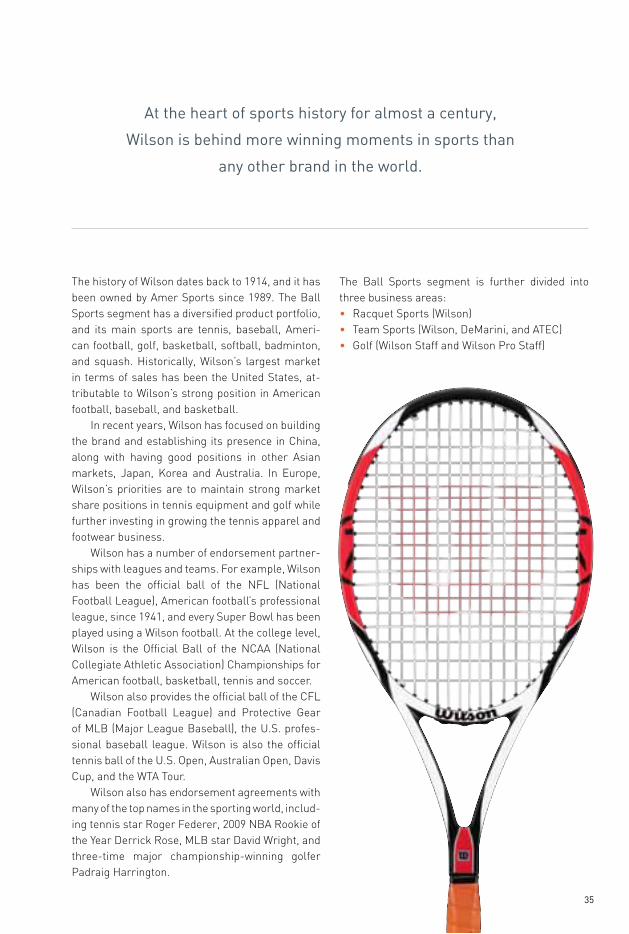
The history of Wilson dates back to 1914, and it has been owned by Amer Sports since 1989. The Ball Sports segment has a diversified product portfolio, and its main sports are tennis, baseball, Ameri-can football, golf, basketball, softball, badminton, and squash. Historically, Wilson’s largest market in terms of sales has been the United States, at-tributable to Wilson’s strong position in American football, baseball, and basketball.
In recent years, Wilson has focused on building the brand and establishing its presence in China, along with having good positions in other Asian markets, Japan, Korea and Australia. In Europe, Wilson’s priorities are to maintain strong market share positions in tennis equipment and golf while further investing in growing the tennis apparel and footwear business.
Wilson has a number of endorsement partner-ships with leagues and teams. For example, Wilson has been the official ball of the NFL (National Football League), American football’s professional league, since 1941, and every Super Bowl has been played using a Wilson football. At the college level, Wilson is the Official Ball of the NCAA (National Collegiate Athletic Association) Championships for American football, basketball, tennis and soccer.
Wilson also provides the official ball of the CFL (Canadian Football League) and Protective Gear of MLB (Major League Baseball), the U.S. profes-sional baseball league. Wilson is also the official tennis ball of the U.S. Open, Australian Open, Davis Cup, and the WTA Tour.
Wilson also has endorsement agreements with many of the top names in the sporting world, includ-ing tennis star Roger Federer, 2009 NBA Rookie of the Year Derrick Rose, MLB star David Wright, and three-time major championship-winning golfer Padraig Harrington.
The Ball Sports segment is further divided into three business areas:• Racquet Sports (Wilson)• Team Sports (Wilson, DeMarini, and ATEC)• Golf (Wilson Staff and Wilson Pro Staff)
At the heart of sports history for almost a century,
Wilson is behind more winning moments in sports than
any other brand in the world.

36
In recent years, Wilson has focused on building the brand and establishing its presence in China. In Europe, Wilson’s priorities are to maintain
strong market share positions in tennis equipment and golf while further investing in growing the tennis apparel and footwear business.
KEY indiCATORS
EUR million 2009 2008Change,
%Change,
% *) 2007
Net sales
Racquet Sports 222.7 227.0 –2 –5 236.0
Team Sports 187.3 189.9 –1 –6 195.5
Golf 66.7 78.6 –15 –16 99.4
Net sales, total 476.7 495.5 –4 –7 530.9
EBIT 23.5 37.0 –36 –40 48.2
% of net sales 4.9 7.5 9.1
Personnel at year end 1,586 1,731 –8 1,891
*) In local currency terms
1 2 3
1 2 3
01 02 03 04 05 06 07 0800
00 01 02 03 04 05 06 07 08 89 91 93 95 97 99 01 03 05 07 09
37
40
30
20
10
0
20
15
10
5
0
550
500
450
400
350
TEAM SPORTS PARTiCiPATiOn, uSA, MilliOn
TEnniS PARTiCiPATiOn, uSA*), MilliOn
GOlF, TOTAl ROundS vOluME, uSA, MilliOn
BasketballFootballBaseball
Source: national Golf Foundation
Source: SGMA
*) Participated at least once
Source: SGMA
1 racquet Sports 47%
2 Team Sports 39%
3 Golf 14%
BAll SPORTS, nET SAlES
1 Americas 63%
2 EMEA 23%
3 Asia Pacific 14%
BAll SPORTS, nET SAlES
38
Business areas and brands
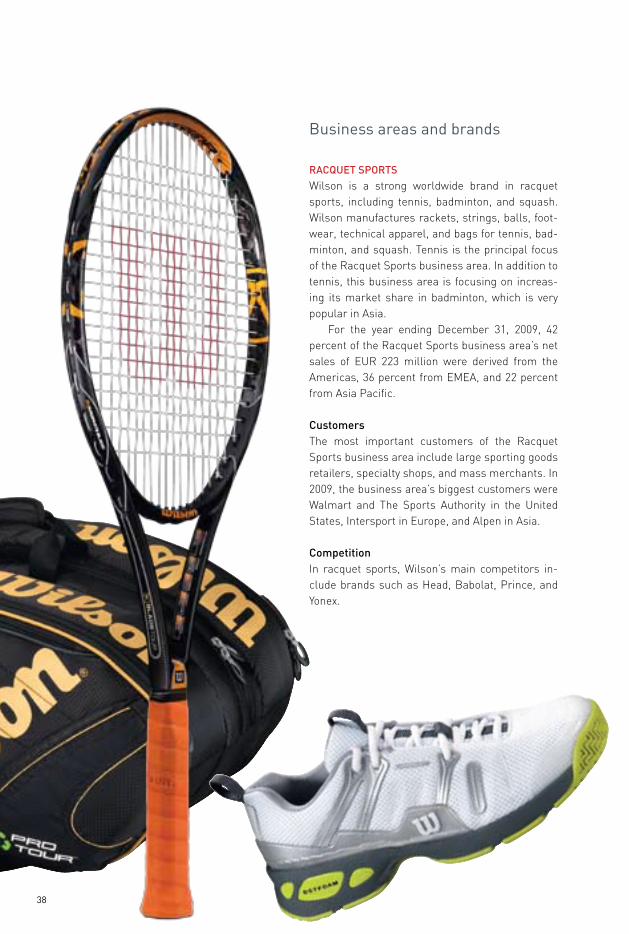
RACquET SPORTSWilson is a strong worldwide brand in racquet sports, including tennis, badminton, and squash. Wilson manufactures rackets, strings, balls, foot-wear, technical apparel, and bags for tennis, bad-minton, and squash. Tennis is the principal focus of the Racquet Sports business area. In addition to tennis, this business area is focusing on increas-ing its market share in badminton, which is very popular in Asia.
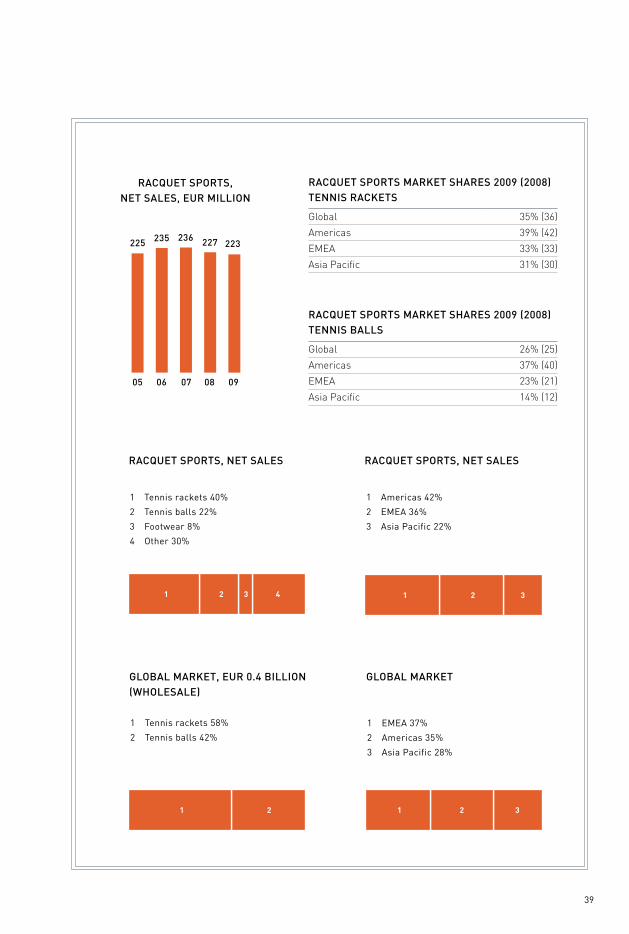
For the year ending December 31, 2009, 42 percent of the Racquet Sports business area’s net sales of EUR 223 million were derived from the Americas, 36 percent from EMEA, and 22 percent from Asia Pacific.
Customers The most important customers of the Racquet Sports business area include large sporting goods retailers, specialty shops, and mass merchants. In 2009, the business area’s biggest customers were Walmart and The Sports Authority in the United States, Intersport in Europe, and Alpen in Asia.
CompetitionIn racquet sports, Wilson’s main competitors in-clude brands such as Head, Babolat, Prince, and Yonex.
39
RACquET SPORTS MARKET SHARES 2009 (2008)TEnniS BAllS
Global 26% (25)
Americas 37% (40)
EMEA 23% (21)
Asia Pacific 14% (12)
RACquET SPORTS MARKET SHARES 2009 (2008)TEnniS RACKETS
Global 35% (36)
Americas 39% (42)
EMEA 33% (33)
Asia Pacific 31% (30)
1 2 3 4
1 2 1 2 3
1 2 3
1 Tennis rackets 40%
2 Tennis balls 22%
3 Footwear 8%
4 Other 30%
RACquET SPORTS, nET SAlES
1 Tennis rackets 58%
2 Tennis balls 42%
1 EMEA 37%
2 Americas 35%
3 Asia Pacific 28%
GlOBAl MARKET, EuR 0.4 BilliOn (WHOlESAlE)
GlOBAl MARKET
1 Americas 42%
2 EMEA 36%
3 Asia Pacific 22%
RACquET SPORTS, nET SAlES
RACquET SPORTS, nET SAlES, EuR MilliOn
05 06 07 08 09
225 235 236 227 223
40
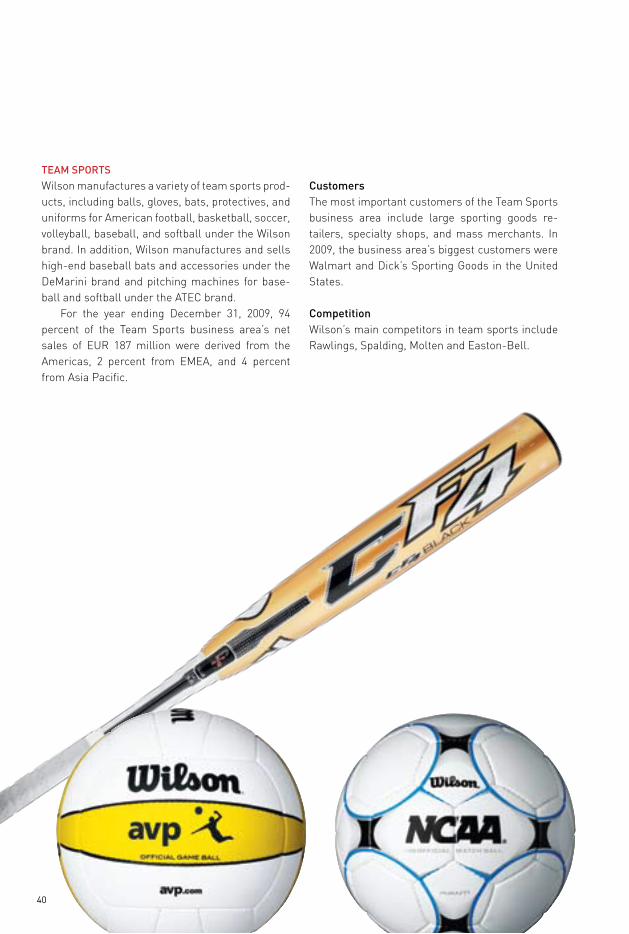
TEAM SPORTSWilson manufactures a variety of team sports prod-ucts, including balls, gloves, bats, protectives, and uniforms for American football, basketball, soccer, volleyball, baseball, and softball under the Wilson brand. In addition, Wilson manufactures and sells high-end baseball bats and accessories under the DeMarini brand and pitching machines for base-ball and softball under the ATEC brand.
For the year ending December 31, 2009, 94 percent of the Team Sports business area’s net sales of EUR 187 million were derived from the Americas, 2 percent from EMEA, and 4 percent from Asia Pacific.
CustomersThe most important customers of the Team Sports business area include large sporting goods re-tailers, specialty shops, and mass merchants. In 2009, the business area’s biggest customers were Walmart and Dick’s Sporting Goods in the United States.
CompetitionWilson’s main competitors in team sports include Rawlings, Spalding, Molten and Easton-Bell.
0 20 40 60 80 100
1 2 3 4 5 6 7
0 20 40 60 80 100
1
32
41
TEAM SPORTS, MARKET SHARES 2009 (2008), uSA
American footballs 80% (80)
Basketballs 38% (35)
Baseball gloves 31% (33)
Baseballs 29% (27)
Baseball/softball bats 23% (21)
TEAM SPORTS, MARKET SHARES 2009 (2008), GlOBAl
American footballs 80% (80)
Basketballs 23% (22)
Baseball gloves 20% (20)
Baseball/softball bats 16% (14)
Baseballs 17% (15)
1 American footballs 21%
2 Baseballs and gloves 20%
3 Baseball/softball bats 17%
4 Basketballs 15%
5 Apparel 8%
6 Soccer 7%
7 Other 12%
TEAM SPORTS, nET SAlES
1 Americas 94%
2 Asia Pacific 4%
3 EMEA 2%
TEAM SPORTS, nET SAlES
05 06 07 08 09
204220
196 190 187
TEAM SPORTS, nET SAlES, EuR MilliOn
42
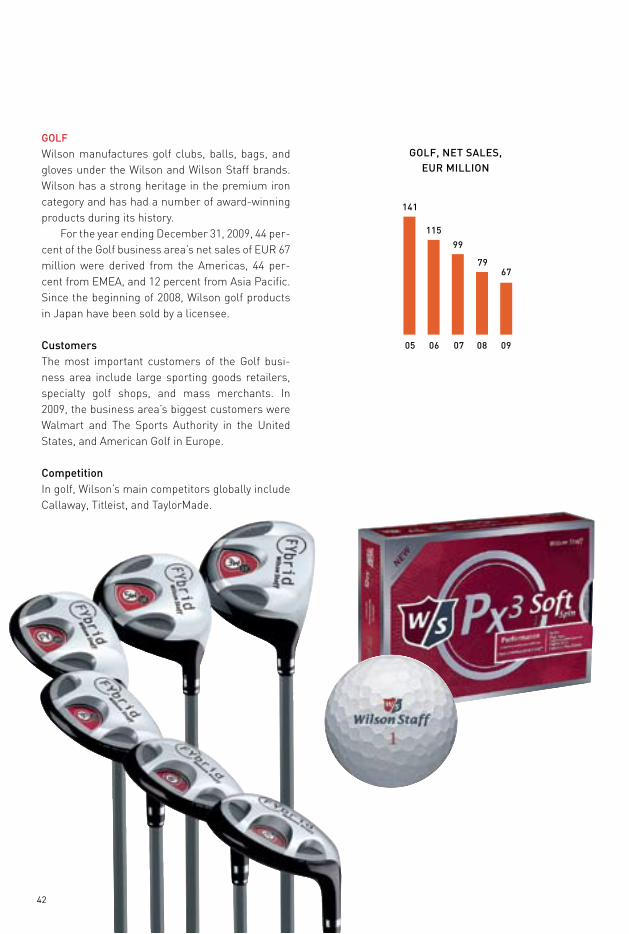
GOlFWilson manufactures golf clubs, balls, bags, and gloves under the Wilson and Wilson Staff brands. Wilson has a strong heritage in the premium iron category and has had a number of award-winning products during its history.
For the year ending December 31, 2009, 44 per-cent of the Golf business area’s net sales of EUR 67 million were derived from the Americas, 44 per-cent from EMEA, and 12 percent from Asia Pacific. Since the beginning of 2008, Wilson golf products in Japan have been sold by a licensee.
CustomersThe most important customers of the Golf busi-ness area include large sporting goods retailers, specialty golf shops, and mass merchants. In 2009, the business area’s biggest customers were Walmart and The Sports Authority in the United States, and American Golf in Europe.
CompetitionIn golf, Wilson’s main competitors globally include Callaway, Titleist, and TaylorMade.
141
115
99
7967
GOlF, nET SAlES, EuR MilliOn
05 06 07 08 09
0 20 40 60 80 100
1 2 3
0 20 40 60 80 100
1 2 3
0 20 40 60 80 100
1 2 3 4
43
0 20 40 60 80 100
1 2 3
4
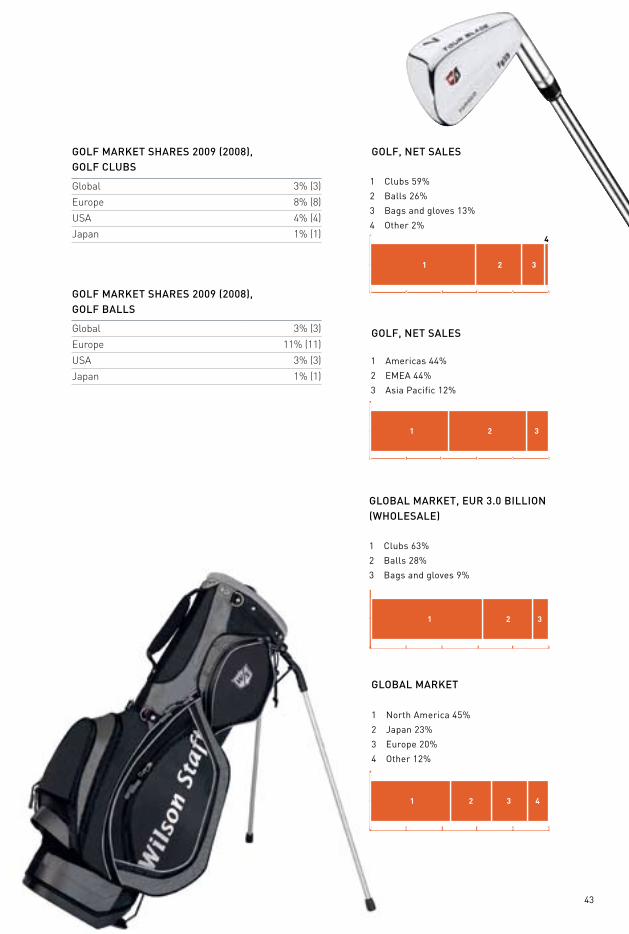
1 clubs 59%
2 Balls 26%
3 Bags and gloves 13%
4 Other 2%
GOlF, nET SAlES
1 Americas 44%
2 EMEA 44%
3 Asia Pacific 12%
GOlF, nET SAlES
GlOBAl MARKET, EuR 3.0 BilliOn (WHOlESAlE)
1 clubs 63%
2 Balls 28%
3 Bags and gloves 9%
GlOBAl MARKET
1 north America 45%
2 Japan 23%
3 Europe 20%
4 Other 12%
GOlF MARKET SHARES 2009 (2008), GOlF CluBS
Global 3% (3)
Europe 8% (8)
USA 4% (4)
Japan 1% (1)
GOlF MARKET SHARES 2009 (2008), GOlF BAllS
Global 3% (3)
Europe 11% (11)
USA 3% (3)
Japan 1% (1)

13%of NET SALES
Fitness PAGES 44–47
FiTnESS, EBiT, EuR MilliOn
05 06 07 08 09
31.134.8 37.2
–7.5
FiTnESS, nET SAlES, EuR MilliOn
05 06 07 08 09
252276
291
220194
3.8
45
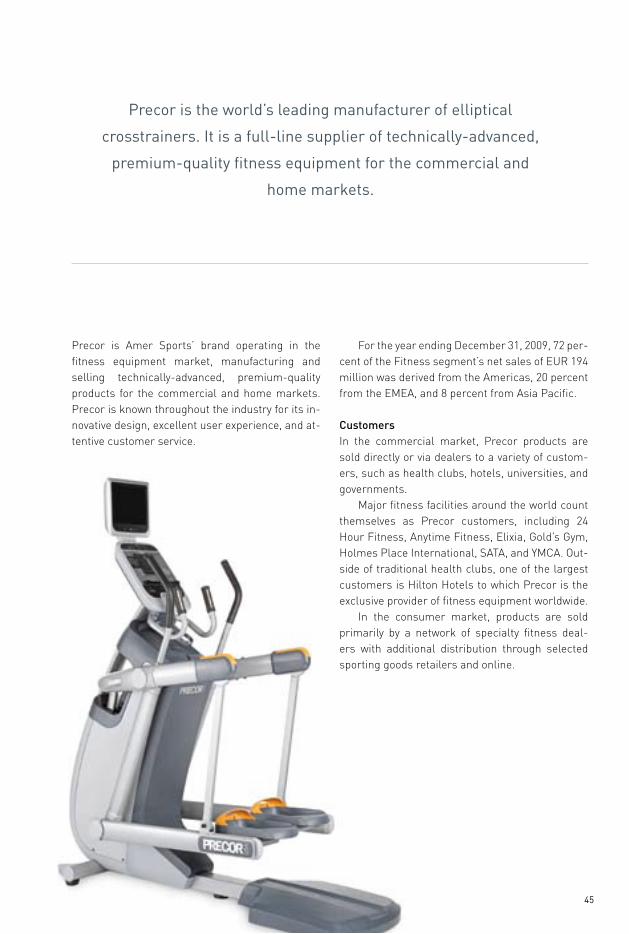
Precor is the world’s leading manufacturer of elliptical
crosstrainers. it is a full-line supplier of technically-advanced,
premium-quality fitness equipment for the commercial and
home markets.
Precor is Amer Sports’ brand operating in the fitness equipment market, manufacturing and selling technically-advanced, premium-quality products for the commercial and home markets. Precor is known throughout the industry for its in-novative design, excellent user experience, and at-tentive customer service.
For the year ending December 31, 2009, 72 per-cent of the Fitness segment’s net sales of EUR 194 million was derived from the Americas, 20 percent from the EMEA, and 8 percent from Asia Pacific.
CustomersIn the commercial market, Precor products are sold directly or via dealers to a variety of custom-ers, such as health clubs, hotels, universities, and governments.
Major fitness facilities around the world count themselves as Precor customers, including 24 Hour Fitness, Anytime Fitness, Elixia, Gold’s Gym, Holmes Place International, SATA, and YMCA. Out-side of traditional health clubs, one of the largest customers is Hilton Hotels to which Precor is the exclusive provider of fitness equipment worldwide.
In the consumer market, products are sold primarily by a network of specialty fitness deal-ers with additional distribution through selected sporting goods retailers and online.
02 03 04 05 06 07 08 09
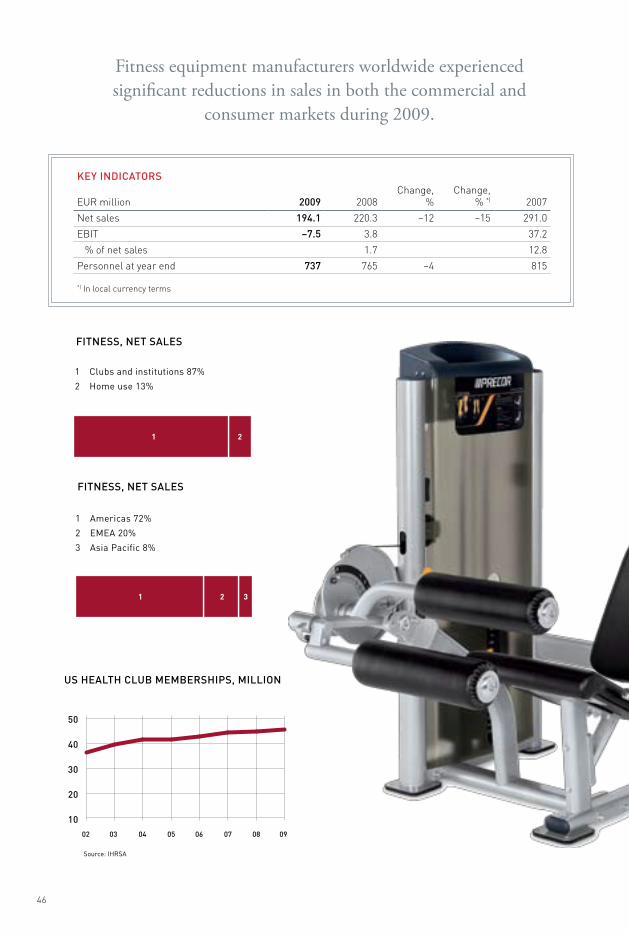
uS HEAlTH CluB MEMBERSHiPS, MilliOn
Source: ihrSA
50
40
30
20
10
46
1 2
1 2 3
1 Americas 72%
2 EMEA 20%
3 Asia Pacific 8%
FiTnESS, nET SAlES
1 clubs and institutions 87%
2 home use 13%
FiTnESS, nET SAlES
KEY indiCATORS
EUR million 2009 2008Change,
%Change,
% *) 2007
Net sales 194.1 220.3 –12 –15 291.0
EBIT –7.5 3.8 37.2
% of net sales 1.7 12.8
Personnel at year end 737 765 –4 815
*) In local currency terms
Fitness equipment manufacturers worldwide experienced significant reductions in sales in both the commercial and
consumer markets during 2009.
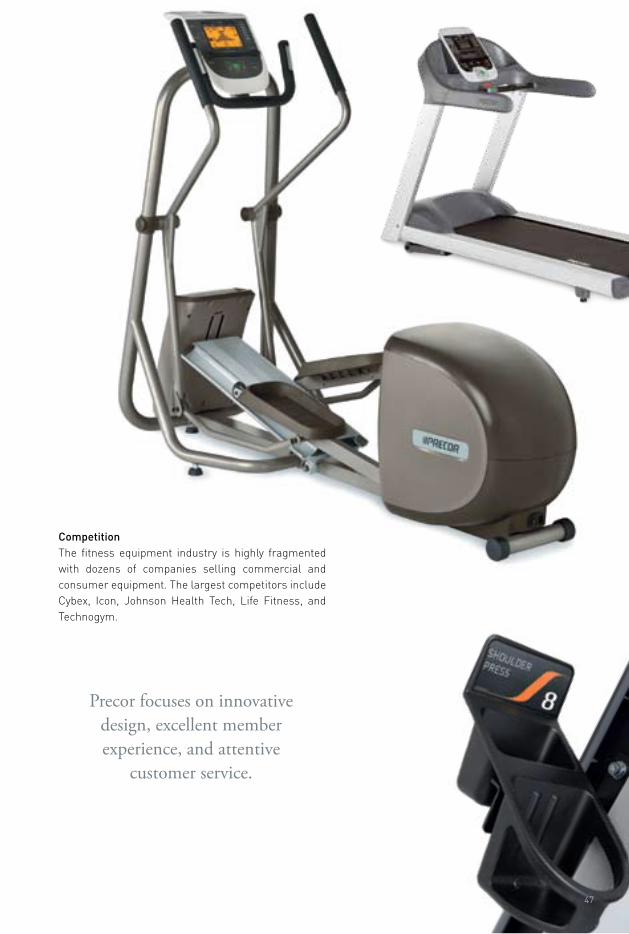
CompetitionThe fitness equipment industry is highly fragmented with dozens of companies selling commercial and consumer equipment. The largest competitors include Cybex, Icon, Johnson Health Tech, Life Fitness, and Technogym.
47
Precor focuses on innovative design, excellent member experience, and attentive
customer service.
48
Amer Sports has an established, global sales organization, which
is designed to support its brands and is aimed at providing its trade
customers with high-level customer service in all Amer Sports’ product
categories and market segments.
Sales
Amer Sports’ comprehensive sales network en-ables it to bring products to markets simultane-ously worldwide and allows it to stay in close con-tact with customers, allowing it to gain knowledge of local trends and establish long-term business relationships.
As of December 31, 2009, Amer Sports had sales offices in 29 countries worldwide. Most of these offices are operated as subsidiaries of Amer Sports. The sales organization is grouped into three large geographical segments: the Americas (including the United States, Canada, and Latin America), EMEA (Europe, Middle East, and Africa), and Asia Pacific (including Japan and Australia). The EMEA region is managed from Munich, Ger-many. In the United States, the Winter and Outdoor segment’s sales are managed from Ogden, Utah, Ball Sports from Chicago, Illinois, and Fitness from Woodinville, Washington. Asia Pacific is managed from Shanghai, China. In smaller markets, distri-bution is handled through independent importers and distributors who work closely with the Amer Sports global sales organization.
As of December 31, 2009, 2,064 people were employed in Amer Sports’ sales and distribution activities, representing approximately 32 percent of the company’s total employees.
Local sales offices are responsible for the sales, marketing, and distribution of Amer Sports’ branded products in their own markets. These of-fices have experience and specialized expertise in every type of sport covered by the company’s products. Furthermore, local personnel know their own markets, including the customer preferences in those markets. This knowledge allows them to adapt both product offerings and marketing to the needs and conditions of each market. This market know-how is also leveraged in research and prod-uct development in different business segments.
Amer Sports sells its products to trade cus-tomers (including sporting goods chains, specialty retailers, mass merchants, fitness clubs and dis-tributors) and, to a lesser extent, directly to con-sumers through brand stores, factory outlets, and the Internet.
A nEW MulTi-CHAnnEl SAlES STRATEGY
In response to a changing business environment where consumers have begun to demand more direct relationships with their favorite brands, Amer Sports has adopted a new multi-channel sales strategy. This strategy involves opening brand stores and factory outlets. As of 2009, Amer Sports’ branded products were sold through more than 100 brand stores and factory outlets. By
49
opening brand stores and engaging with consum-ers directly, Amer Sports can gain information on consumer behavior more efficiently, react better to changes in the market, and develop more attrac-tive products and marketing based on direct con-sumer feedback. Amer Sports uses factory outlets to sell previous seasons’ products.
Amer Sports has plans to open additional brand stores for Salomon apparel and footwear. Amer Sports expects that the number of brand shops and factory outlets will increase in future years. The multi-channel strategy also includes an online strategy. Amer Sports is assessing op-portunities to increase online sales, both directly to consumers and through selected e-tailers.
Currently, Amer Sports’ largest geographic markets in terms of sales are the United States, France, Germany, Japan, and Canada. In recent years, Amer Sports has also increased its pres-ence in emerging markets, such as China, Russia, and Brazil.
ESTABliSHEd GlOBAl SAlES PlATFORM
As it is typical for the sporting goods industry, a substantial portion of Amer Sports’ annual sales are generated each year by products that are in their first year of existence. This means that Amer Sports must anticipate consumer preferences to
compensate for the decline typically experienced in the sales of older products. Accordingly, Amer Sports’ research and development and supply chain groups face constant pressure to design, develop, source, and supply new products. The relatively short window of opportunity for launch-ing and selling new products also requires great expertise in forecasting demand and ensuring that supplies are ready and delivered during the critical selling periods. In particular, as many of Amer Sports’ product lines are seasonal, on-time delivery is essential for trade customers to have the products in stock ahead of the selling season. In addition, the rapid changeover in products cre-ates a need to monitor and manage the closeout of products both at the trade customer level and in Amer Sports’ own inventory.
Amer Sports’ global sales organization allows it to be close to its trade customers and consumers and gives it an advantage over its competitors in terms of customer service and cost-effectiveness.
50
Supply chain management encompasses all of Amer Sports’ business
functions from product innovation to product manufacturing to outbound
logistics like supply planning, manufacturing, procurement, and logistics.
iT management encompasses for all Amer Sports: SAP support,
extended business services, security and infrastructure.
Supply chain, IT and manufacturing
Reliable, efficient and timely supply chain manage-ment is an important part of Amer Sports’ strategy, and the company has continued to strengthen its supply chain organization in recent years. In 2008, Amer Sports created a new Supply Chain and In-formation Technology (SC&IT) function. The new function is responsible for managing the integrat-ed supply chain at the Group level. The function is divided into three integrated shared platforms (IT, sourcing, and distribution and transportation), and two communities of practice to roll out har-monized processes, tools, performance leadership and global programs. Sourcing in Asia is managed from the Group’s sourcing office in Hong Kong, and global IT and distribution and transportation from Amer Sports Munich office.
Amer Sports is in the process of further inte-grating its supply chain functions and continues to seek more synergies and opportunities. The aim of the ongoing integration process is to develop a worldwide, globally managed supply chain, de-signed to provide a high level of customer service at lower cost and inventory levels.
This process includes the following initiatives:• further integrating logistics and transportation
management;• broadening the role of Amer Sports’ Asian
sourcing organization to further leverage the Group’s scale, negotiating power, and talent base;
• further harmonizing global business processes and the rollout of a global enterprise resource planning (ERP) system (SAP) in the Group;
• harmonizing global inventory and product availability management through centrally-led sales and operation planning; and
• rolling out of the “Lean and Operations Excel-lence” methodology within Amer Sports and in its subcontractor operations.
2009 was year one for the newly created SC&IT team. During the year, the Lean and Operations practice, the global shared logistics platform and Amer Sports’ sourcing organization for apparel, footwear and accessories have been set up. We rolled out our harmonized SAP template in the four Nordic countries and focused very successfully to improve our inventory with a reduction of more than 30 percent at constant service level.

51
MAnuFACTuRinG And SOuRCinG
Amer Sports maintains its own production facili-ties in Austria, France, Finland, Canada, Bulgaria, and the United States.
In 2006 and 2008, Amer Sports restructured the production of its winter sports equipment. As a result, the manufacturing of Salomon’s and Atomic’s winter sports equipment was combined. The number of manufacturing sites was reduced from ten to six, including subcontractor sites. Amer Sports also acquired its Bulgarian sub-contractor. Salomon and Atomic skis, bindings and boots are now supplied through owned and subcontractor factories in Austria, Bulgaria, Romania, and Hungary. Amer Sports has also decided to move Precor’s fitness strength produc-tion unit from California to the more cost-effective state of North Carolina. This new plant is expected to be operational from early 2010.
Amer Sports purchases the raw materials it requires for its facilities from a number of sources. Amer Sports uses steel, rubber, and oil-based raw materials and components in its products. Such raw materials are used in the manufacture of plas-tic components for bindings and ski boots, carbon-fibers for rackets, and metal parts for fitness equipment, binding components and ski edges.
OuTSOuRCinG
Amer Sports has increasingly sought to outsource the production of end-products and components to gain operational efficiencies and cost-savings. Currently, Amer Sports outsources the majority of its manufacturing to subcontractors. Most of the apparel and footwear under the Salomon, Wilson, Arc’teryx, Mavic, and Bonfire brands are manufac-tured in Asia. In addition, Amer Sports outsources the manufacture of all racquet sports and golf as well as most team sports products.
location Products produced Brands produced Owned/leased
AustriaAlpine and cross-country skis;
snowboards Salomon, Atomic Owned
Canada Harnesses, apparel Arc’teryx Owned
France Cycling components Mavic Owned
Finland Sports instruments Suunto and Recta Leased
BulgariaAlpine and cross-country skis;
snowboards Salomon, Atomic Owned
United States Cardio fitness equipment Precor Leased
United States Strength equipment Precor Leased
United States Baseball bats DeMarini Owned
United States Pitching machines ATEC Leased
United States Apparel, uniforms Wilson Leased
United States Leather footballs Wilson Owned
United States Strength equipment Precor Leased (to open 2010)
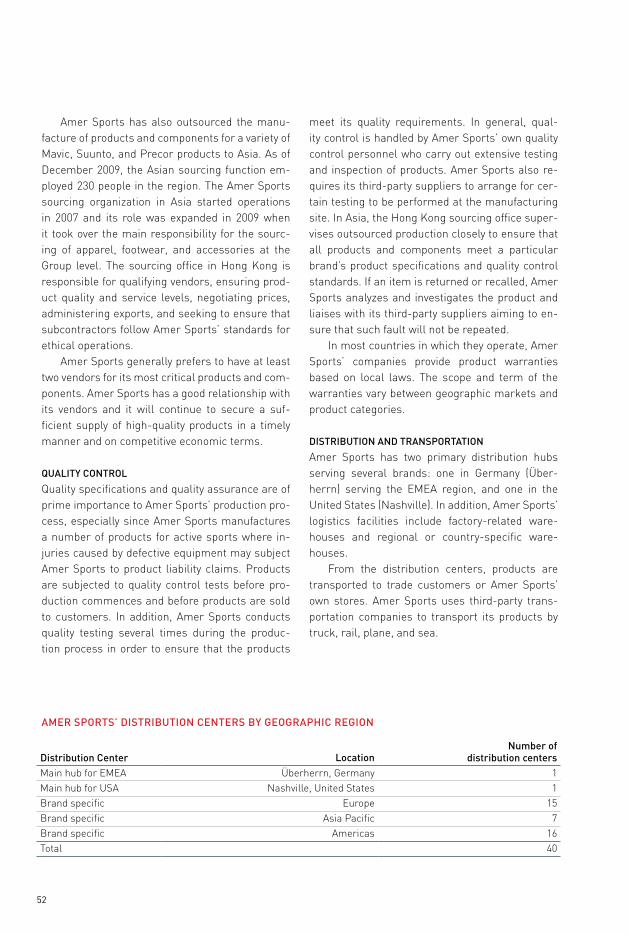
AMER SPORTS’ KEY PROduCTiOn FACiliTiES (including manufacturing facilities operated by third parties)
52
Amer Sports has also outsourced the manu-facture of products and components for a variety of Mavic, Suunto, and Precor products to Asia. As of December 2009, the Asian sourcing function em-ployed 230 people in the region. The Amer Sports sourcing organization in Asia started operations in 2007 and its role was expanded in 2009 when it took over the main responsibility for the sourc-ing of apparel, footwear, and accessories at the Group level. The sourcing office in Hong Kong is responsible for qualifying vendors, ensuring prod-uct quality and service levels, negotiating prices, administering exports, and seeking to ensure that subcontractors follow Amer Sports’ standards for ethical operations.
Amer Sports generally prefers to have at least two vendors for its most critical products and com-ponents. Amer Sports has a good relationship with its vendors and it will continue to secure a suf-ficient supply of high-quality products in a timely manner and on competitive economic terms.
quAliTY COnTROl
Quality specifications and quality assurance are of prime importance to Amer Sports’ production pro-cess, especially since Amer Sports manufactures a number of products for active sports where in-juries caused by defective equipment may subject Amer Sports to product liability claims. Products are subjected to quality control tests before pro-duction commences and before products are sold to customers. In addition, Amer Sports conducts quality testing several times during the produc-tion process in order to ensure that the products
meet its quality requirements. In general, qual-ity control is handled by Amer Sports’ own quality control personnel who carry out extensive testing and inspection of products. Amer Sports also re-quires its third-party suppliers to arrange for cer-tain testing to be performed at the manufacturing site. In Asia, the Hong Kong sourcing office super-vises outsourced production closely to ensure that all products and components meet a particular brand’s product specifications and quality control standards. If an item is returned or recalled, Amer Sports analyzes and investigates the product and liaises with its third-party suppliers aiming to en-sure that such fault will not be repeated.
In most countries in which they operate, Amer Sports’ companies provide product warranties based on local laws. The scope and term of the warranties vary between geographic markets and product categories.
diSTRiBuTiOn And TRAnSPORTATiOn
Amer Sports has two primary distribution hubs serving several brands: one in Germany (Über-herrn) serving the EMEA region, and one in the United States (Nashville). In addition, Amer Sports’ logistics facilities include factory-related ware-houses and regional or country-specific ware-houses.
From the distribution centers, products are transported to trade customers or Amer Sports’ own stores. Amer Sports uses third-party trans-portation companies to transport its products by truck, rail, plane, and sea.
distribution Center locationnumber of
distribution centersMain hub for EMEA Überherrn, Germany 1Main hub for USA Nashville, United States 1Brand specific Europe 15Brand specific Asia Pacific 7Brand specific Americas 16Total 40
AMER SPORTS’ diSTRiBuTiOn CEnTERS BY GEOGRAPHiC REGiOn
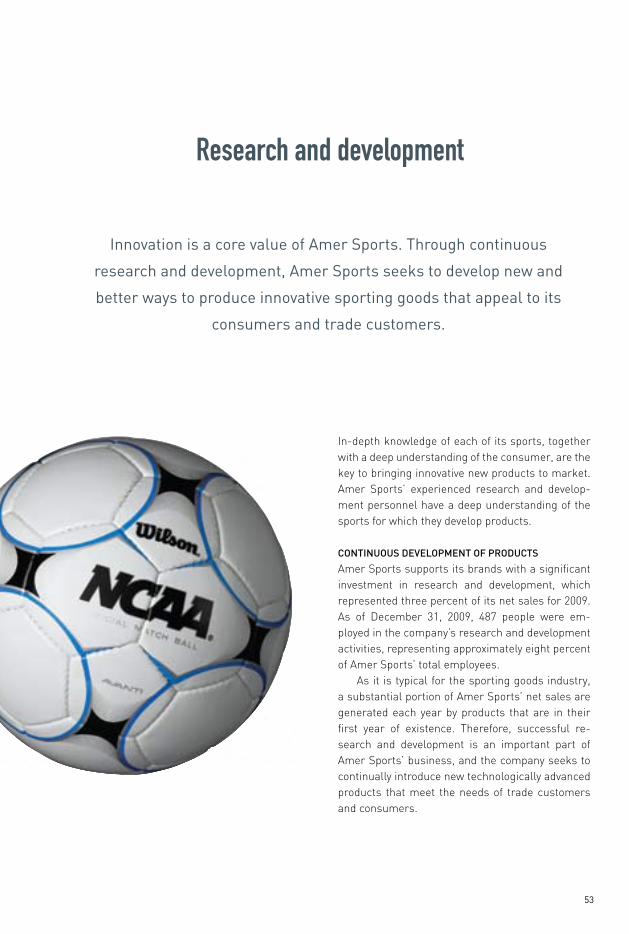
53
innovation is a core value of Amer Sports. Through continuous
research and development, Amer Sports seeks to develop new and
better ways to produce innovative sporting goods that appeal to its
consumers and trade customers.
Research and development
In-depth knowledge of each of its sports, together with a deep understanding of the consumer, are the key to bringing innovative new products to market. Amer Sports’ experienced research and develop-ment personnel have a deep understanding of the sports for which they develop products.
COnTinuOuS dEvElOPMEnT OF PROduCTS
Amer Sports supports its brands with a significant investment in research and development, which represented three percent of its net sales for 2009. As of December 31, 2009, 487 people were em-ployed in the company’s research and development activities, representing approximately eight percent of Amer Sports’ total employees.
As it is typical for the sporting goods industry, a substantial portion of Amer Sports’ net sales are generated each year by products that are in their first year of existence. Therefore, successful re-search and development is an important part of Amer Sports’ business, and the company seeks to continually introduce new technologically advanced products that meet the needs of trade customers and consumers.
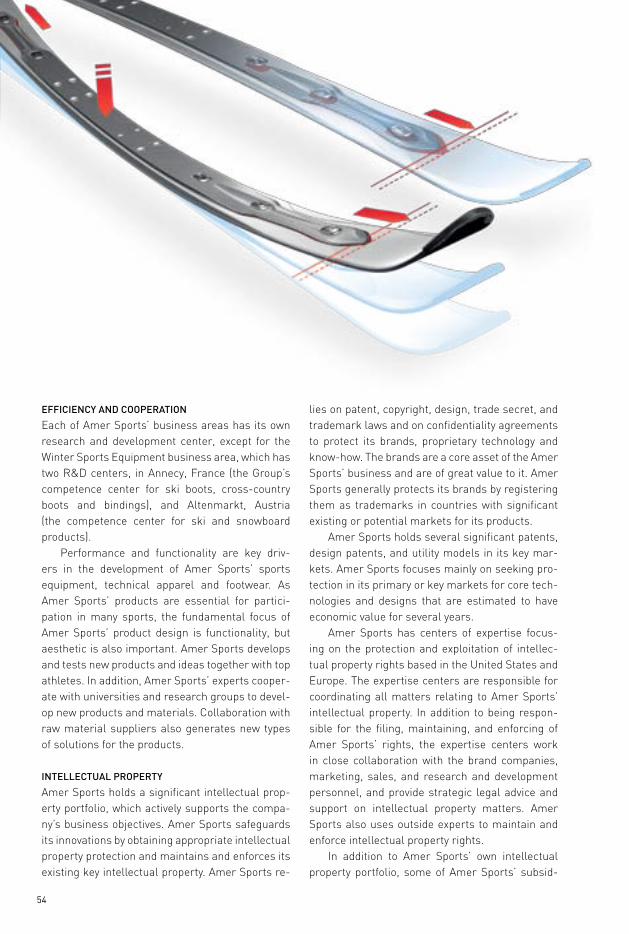
54
EFFiCiEnCY And COOPERATiOn
Each of Amer Sports’ business areas has its own research and development center, except for the Winter Sports Equipment business area, which has two R&D centers, in Annecy, France (the Group’s competence center for ski boots, cross-country boots and bindings), and Altenmarkt, Austria (the competence center for ski and snowboard products).
Performance and functionality are key driv-ers in the development of Amer Sports’ sports equipment, technical apparel and footwear. As Amer Sports’ products are essential for partici-pation in many sports, the fundamental focus of Amer Sports’ product design is functionality, but aesthetic is also important. Amer Sports develops and tests new products and ideas together with top athletes. In addition, Amer Sports’ experts cooper-ate with universities and research groups to devel-op new products and materials. Collaboration with raw material suppliers also generates new types of solutions for the products.
inTEllECTuAl PROPERTY
Amer Sports holds a significant intellectual prop-erty portfolio, which actively supports the compa-ny’s business objectives. Amer Sports safeguards its innovations by obtaining appropriate intellectual property protection and maintains and enforces its existing key intellectual property. Amer Sports re-
lies on patent, copyright, design, trade secret, and trademark laws and on confidentiality agreements to protect its brands, proprietary technology and know-how. The brands are a core asset of the Amer Sports’ business and are of great value to it. Amer Sports generally protects its brands by registering them as trademarks in countries with significant existing or potential markets for its products.
Amer Sports holds several significant patents, design patents, and utility models in its key mar-kets. Amer Sports focuses mainly on seeking pro-tection in its primary or key markets for core tech-nologies and designs that are estimated to have economic value for several years.
Amer Sports has centers of expertise focus-ing on the protection and exploitation of intellec-tual property rights based in the United States and Europe. The expertise centers are responsible for coordinating all matters relating to Amer Sports’ intellectual property. In addition to being respon-sible for the filing, maintaining, and enforcing of Amer Sports’ rights, the expertise centers work in close collaboration with the brand companies, marketing, sales, and research and development personnel, and provide strategic legal advice and support on intellectual property matters. Amer Sports also uses outside experts to maintain and enforce intellectual property rights.
In addition to Amer Sports’ own intellectual property portfolio, some of Amer Sports’ subsid-
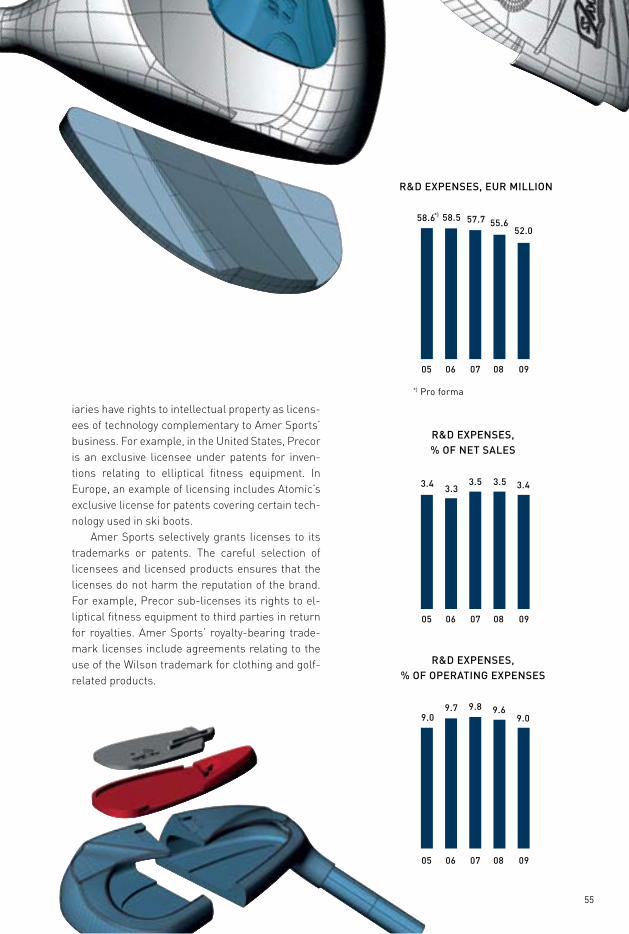
55
iaries have rights to intellectual property as licens-ees of technology complementary to Amer Sports’ business. For example, in the United States, Precor is an exclusive licensee under patents for inven-tions relating to elliptical fitness equipment. In Europe, an example of licensing includes Atomic’s exclusive license for patents covering certain tech-nology used in ski boots.
Amer Sports selectively grants licenses to its trademarks or patents. The careful selection of licensees and licensed products ensures that the licenses do not harm the reputation of the brand. For example, Precor sub-licenses its rights to el-liptical fitness equipment to third parties in return for royalties. Amer Sports’ royalty-bearing trade-mark licenses include agreements relating to the use of the Wilson trademark for clothing and golf-related products.
R&d ExPEnSES,% OF OPERATinG ExPEnSES
R&d ExPEnSES, EuR MilliOn
R&d ExPEnSES,% OF nET SAlES
*) Pro forma
05 06 07 08 09
05 06 07 08 09
05 06 07 08 09
58.6
9.0
58.5
9.7
57.7
9.8 9.69.0
*)
52.055.6
3.4 3.33.5 3.5 3.4
56
One of the key strengths of Amer Sports is our people, who
are proud of our products and motivated to increase our
business performance.
Amer Sports’ People
Amer Sports’ People Vision emphasizes that our passion and professionalism produces great per-formance and business success. The key drivers are ensuring and enabling Great Leaders who en-able Great People performance, positioning the right people in the right places in the right roles, and believing that proud people perform.
SuPPORTinG THE BuSinESS THROuGH
A FOCuSEd PEOPlE STRATEGY
Amer Sports’ People Strategy is designed to sup-port the corporate strategy and strategic business initiatives and focus areas. In 2009, the Amer Sports’ People Strategy was renewed in alignment with the business targets. The People Strategy focuses on supporting integration and common platforms, and its goals are to:• strengthen Amer Sports’ Leadership Excel-
lence and Talent Management;• create a strong performance culture and en-
sure a global consistent Performance Manage-ment process;
• develop and enhance the implementation of the Total Reward Strategy; and
• create strong Human Resources partnership.As a company with employees in 29 coun-
tries, the strengths of Amer Sports are our strong brands and organizational and cultural diversity, and most importantly, the passion and profession-
alism of our people. The aim is to increase busi-ness performance through this global network of competent and motivated people. A number of es-tablished practices and development projects are in place for the strategic people goals, and they are covered in the following chapters.
PASSiOn FOR THE BuSinESS
Our people are truly proud of our brands and prod-ucts. The passion for our business can be seen also in our Employee Engagement Survey, Pulse Meter. In 2009, we reached an all time high response rate of 80 percent. Also, the results were encouraging, showing improvements in the majority of our busi-nesses. For Amer Sports overall, our people rated highest the Employee Engagement, Performance Management, Growth & Development, and “My Manager” dimensions. On the basis of the survey, 76 percent of our employees are extremely satis-fied with the company as an employer.
The Pulse Meter is conducted regularly in Amer Sports. It strengthens organizational dialog and gives input to organizational and people devel-opment actions.
GREAT lEAdERS EnABlE SuCCESS
We expect our leaders to lead by example and cre-ate a company culture that through passion and professionalism drives business success. We em-
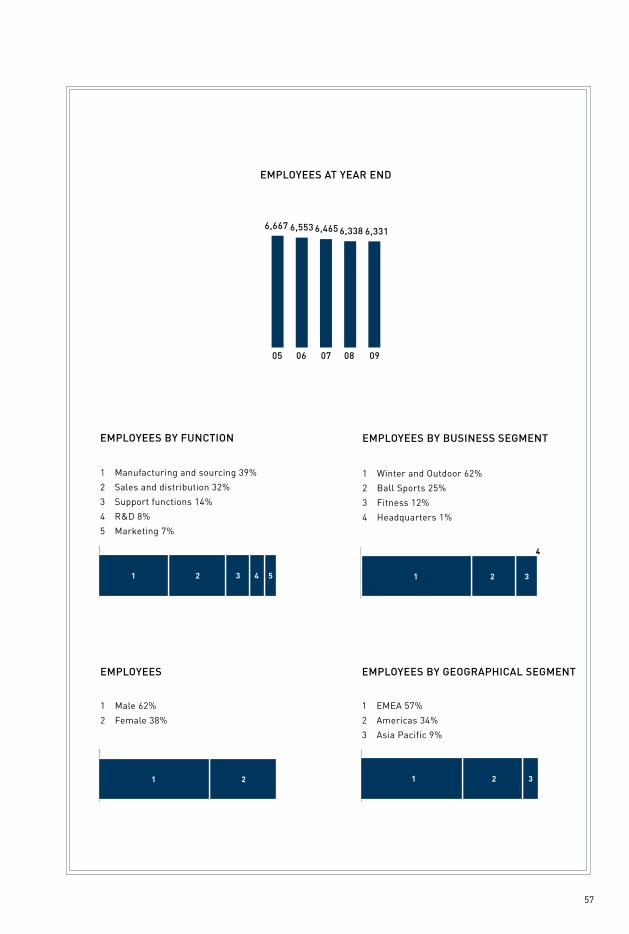
0 20 40 60 80 100
1 2 3
4
0 20 40 60 80 100
1 2
0 20 40 60 80 100
1 2 3 4 5
1 2 3
0 20 40 60 80 100
1 2 3
57
EMPlOYEES BY FunCTiOn
EMPlOYEES
EMPlOYEES BY BuSinESS SEGMEnT
EMPlOYEES BY GEOGRAPHiCAl SEGMEnT
1 Manufacturing and sourcing 39%
2 Sales and distribution 32%
3 Support functions 14%
4 r&d 8%
5 Marketing 7%
1 Male 62%
2 Female 38%
1 Winter and Outdoor 62%
2 Ball Sports 25%
3 Fitness 12%
4 headquarters 1%
1 EMEA 57%
2 Americas 34%
3 Asia Pacific 9%
EMPlOYEES AT YEAR End
05 06 07 08 09
6,667 6,553 6,465 6,338 6,331
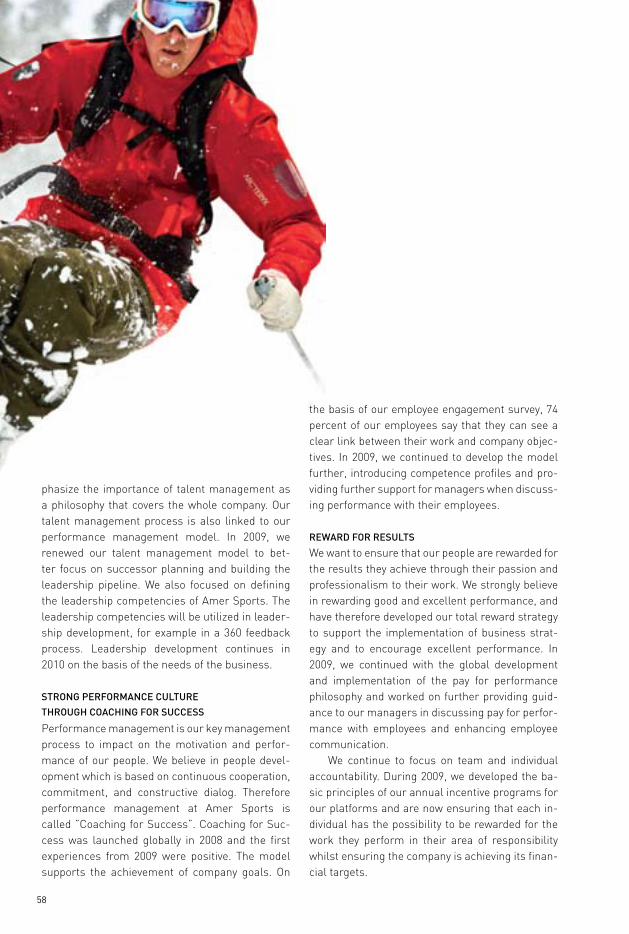
58
phasize the importance of talent management as a philosophy that covers the whole company. Our talent management process is also linked to our performance management model. In 2009, we renewed our talent management model to bet-ter focus on successor planning and building the leadership pipeline. We also focused on defining the leadership competencies of Amer Sports. The leadership competencies will be utilized in leader-ship development, for example in a 360 feedback process. Leadership development continues in 2010 on the basis of the needs of the business.
STROnG PERFORMAnCE CulTuRE
THROuGH COACHinG FOR SuCCESS
Performance management is our key management process to impact on the motivation and perfor-mance of our people. We believe in people devel-opment which is based on continuous cooperation, commitment, and constructive dialog. Therefore performance management at Amer Sports is called ”Coaching for Success”. Coaching for Suc-cess was launched globally in 2008 and the first experiences from 2009 were positive. The model supports the achievement of company goals. On
the basis of our employee engagement survey, 74 percent of our employees say that they can see a clear link between their work and company objec-tives. In 2009, we continued to develop the model further, introducing competence profiles and pro-viding further support for managers when discuss-ing performance with their employees.
REWARd FOR RESulTS
We want to ensure that our people are rewarded for the results they achieve through their passion and professionalism to their work. We strongly believe in rewarding good and excellent performance, and have therefore developed our total reward strategy to support the implementation of business strat-egy and to encourage excellent performance. In 2009, we continued with the global development and implementation of the pay for performance philosophy and worked on further providing guid-ance to our managers in discussing pay for perfor-mance with employees and enhancing employee communication.
We continue to focus on team and individual accountability. During 2009, we developed the ba-sic principles of our annual incentive programs for our platforms and are now ensuring that each in-dividual has the possibility to be rewarded for the work they perform in their area of responsibility whilst ensuring the company is achieving its finan-cial targets.

59
As we believe that proud people perform, we also need to ensure that our reward philosophy is competitive and our people are retained.
STREnGTHEnEd HuMAn RESOuRCES PARTnERSHiP
The Human Resources function at Amer Sports focuses on supporting integration and strategic platforms as well as ensuring professional and ef-fective management of employee relations. Hence, the Amer Sports Human Resources Mission is: “We partner proactively with our leaders to attract, retain, develop, and motivate our employees, and to create a high performing working culture. We enable business success.”
In 2009, the Global Human Resources Net-work was strengthened by a renewed operational model. The operational model consists of a regular meeting cycle, common People Key Performance Indicators, and clarified Human Resources re-
sponsibilities. The purpose is to add value to lo-cal level people management by focusing needed people management actions, to share information on people matters to support decision making, and to strengthen the common way of working.
At Amer Sports, we aim to ensure that we have the right people in the right places in the right roles. As our people move within the company, we want them all to be treated fairly and profes-sionally. Based on the Amer Sports integration strategy, inter-company transfers as well as job rotation are encouraged to maximize our internal talent potential. We prefer an internal candidate whenever appropriate and when the role require-ments are met.
Through our People Strategy we aim to ensure that our business is successful today as well as in the future.
60
Social responsibility
Today’s consumers, as well as our trade custom-ers, increasingly expect companies to meet their demands not only regarding product performance but also what materials they are made of and what type of conditions they are manufactured in. Amer Sports takes this responsibility very seriously. Each Amer Sports business reports to its respective board on matters of corporate social responsibility.
We segment our efforts into three separate areas: environmental actions, labor and workplace conditions, and charitable programs. A number of initiatives are currently on-going or being developed to ensure that Amer Sports continues to operate in a manner that our consumers, our customers and our employees can all be proud of.
EnviROnMEnTAl ACTiOnS
Amer Sports and our brand companies continued to develop numerous environmental programs in 2009, encouraged by the positive impacts of even minor actions. Following the examples from the previous year, we asked our employees to con-sider every element of their jobs and how they can improve their performance while reducing their environmental impact.
As many of our employees have happily noted, improvements can be achieved in our daily busi-
We implement our business strategy in an ethically and socially
responsible manner, always striving to improve our performance and to
meet the group’s economic, social, and environmental goals. We always
consider the social and environmental impacts of our efforts, whether
regarding product development or our daily business operations.
ness operations. Several Amer Sports companies launched initiatives to educate their employees about changing work habits, which resulted in the reduction of paper use, energy consumption, travel rationalization and increased recycling.
Reduced air travel became possible thanks to the increased use of an upgraded video confer-ence meeting system and travel rationalization programs. Identified cost savings in 2009 were as much as 30 percent at Wilson and 40 percent at Suunto compared to 2008. Companies managed to reduce paper consumption by reminding their staffs to use two-sided printing and simply avoid printing whenever possible. For example, at Amer Sports HQ in Helsinki, the reduction amounted to 23 percent less paper used. A new electronic document storage system at Precor resulted in the annual reduction of 216,000 sheets of paper and $26,000 in storage costs. To reduce electricity con-sumption, shortened hours for building air condi-tioning systems were implemented, and electric lighting was reduced where possible. Employees were also encouraged to switch off their room lights when leaving the office and to shut off their PC monitors during lunch.
Increased activity was also seen through par-ticipation in environmental associations. These
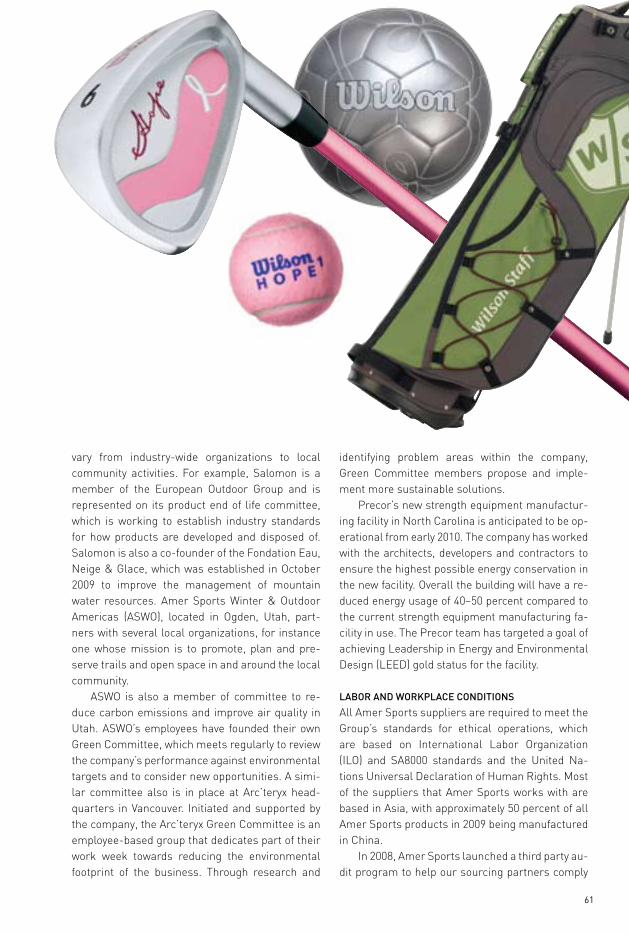
61
vary from industry-wide organizations to local community activities. For example, Salomon is a member of the European Outdoor Group and is represented on its product end of life committee, which is working to establish industry standards for how products are developed and disposed of. Salomon is also a co-founder of the Fondation Eau, Neige & Glace, which was established in October 2009 to improve the management of mountain water resources. Amer Sports Winter & Outdoor Americas (ASWO), located in Ogden, Utah, part-ners with several local organizations, for instance one whose mission is to promote, plan and pre-serve trails and open space in and around the local community.
ASWO is also a member of committee to re-duce carbon emissions and improve air quality in Utah. ASWO’s employees have founded their own Green Committee, which meets regularly to review the company’s performance against environmental targets and to consider new opportunities. A simi-lar committee also is in place at Arc’teryx head-quarters in Vancouver. Initiated and supported by the company, the Arc’teryx Green Committee is an employee-based group that dedicates part of their work week towards reducing the environmental footprint of the business. Through research and
identifying problem areas within the company, Green Committee members propose and imple-ment more sustainable solutions.
Precor’s new strength equipment manufactur-ing facility in North Carolina is anticipated to be op-erational from early 2010. The company has worked with the architects, developers and contractors to ensure the highest possible energy conservation in the new facility. Overall the building will have a re-duced energy usage of 40–50 percent compared to the current strength equipment manufacturing fa-cility in use. The Precor team has targeted a goal of achieving Leadership in Energy and Environmental Design (LEED) gold status for the facility.
lABOR And WORKPlACE COndiTiOnS
All Amer Sports suppliers are required to meet the Group’s standards for ethical operations, which are based on International Labor Organization (ILO) and SA8000 standards and the United Na-tions Universal Declaration of Human Rights. Most of the suppliers that Amer Sports works with are based in Asia, with approximately 50 percent of all Amer Sports products in 2009 being manufactured in China.
In 2008, Amer Sports launched a third party au-dit program to help our sourcing partners comply
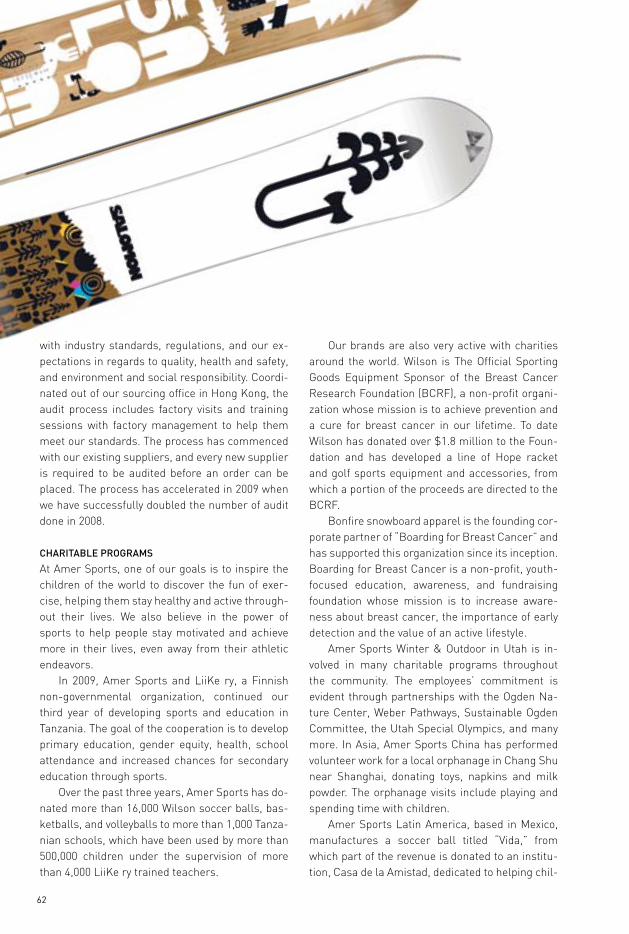
62
with industry standards, regulations, and our ex-pectations in regards to quality, health and safety, and environment and social responsibility. Coordi-nated out of our sourcing office in Hong Kong, the audit process includes factory visits and training sessions with factory management to help them meet our standards. The process has commenced with our existing suppliers, and every new supplier is required to be audited before an order can be placed. The process has accelerated in 2009 when we have successfully doubled the number of audit done in 2008.
CHARiTABlE PROGRAMS
At Amer Sports, one of our goals is to inspire the children of the world to discover the fun of exer-cise, helping them stay healthy and active through-out their lives. We also believe in the power of sports to help people stay motivated and achieve more in their lives, even away from their athletic endeavors.
In 2009, Amer Sports and LiiKe ry, a Finnish non-governmental organization, continued our third year of developing sports and education in Tanzania. The goal of the cooperation is to develop primary education, gender equity, health, school attendance and increased chances for secondary education through sports.
Over the past three years, Amer Sports has do-nated more than 16,000 Wilson soccer balls, bas-ketballs, and volleyballs to more than 1,000 Tanza-nian schools, which have been used by more than 500,000 children under the supervision of more than 4,000 LiiKe ry trained teachers.
Our brands are also very active with charities around the world. Wilson is The Official Sporting Goods Equipment Sponsor of the Breast Cancer Research Foundation (BCRF), a non-profit organi-zation whose mission is to achieve prevention and a cure for breast cancer in our lifetime. To date Wilson has donated over $1.8 million to the Foun-dation and has developed a line of Hope racket and golf sports equipment and accessories, from which a portion of the proceeds are directed to the BCRF.
Bonfire snowboard apparel is the founding cor-porate partner of “Boarding for Breast Cancer” and has supported this organization since its inception. Boarding for Breast Cancer is a non-profit, youth-focused education, awareness, and fundraising foundation whose mission is to increase aware-ness about breast cancer, the importance of early detection and the value of an active lifestyle.
Amer Sports Winter & Outdoor in Utah is in-volved in many charitable programs throughout the community. The employees’ commitment is evident through partnerships with the Ogden Na-ture Center, Weber Pathways, Sustainable Ogden Committee, the Utah Special Olympics, and many more. In Asia, Amer Sports China has performed volunteer work for a local orphanage in Chang Shu near Shanghai, donating toys, napkins and milk powder. The orphanage visits include playing and spending time with children.
Amer Sports Latin America, based in Mexico, manufactures a soccer ball titled “Vida,” from which part of the revenue is donated to an institu-tion, Casa de la Amistad, dedicated to helping chil-

63
dren with cancer. Amer Sports Latin America also sponsors the Special Olympics and the national Wheelchair Tennis Association.
For the past 10 years, the Salomon foundation has worked to facilitate the daily lives and social and professional reintegration of competitors and moun-tain workers who are physically handicapped due an accident or illness. It is the Salomon Foundation’s way to thank mountain professionals and com-petitors for their contributions to improving sports equipment and facilitating sporting activities.
In 2009, Suunto North America was a key spon-sor of the Love Hope Strength Foundation in their musical pilgrimage to the top of Mount Kilimanjaro. The climb raised money to help support critical cancer care and awareness in East Africa.
Precor’s “Precor Gives” program continues the company’s generous matching donations program for its employees.
Photo: Owen Fegan
64
Board of Directors report . . . . . . . . . . . . . . . . . . . . . . . . . . . .65
Five-year review . . . . . . . . . . . . . . . . . . . . . . . . . . . . . . . . . . . .77
Share capital and per share data . . . . . . . . . . . . . . . . . . . . . .78
Consolidated income statement . . . . . . . . . . . . . . . . . . . . . . .80
Consolidated cash flow statement . . . . . . . . . . . . . . . . . . . . .81
Consolidated balance sheet . . . . . . . . . . . . . . . . . . . . . . . . . .82
Consolidated statement of changes
in shareholders’ equity . . . . . . . . . . . . . . . . . . . . . . . . . . . . . .84
Notes to the consolidated financial statements . . . . . . . . . .86
Calculation of key indicators . . . . . . . . . . . . . . . . . . . . . . . . .120
Parent Company’s financial statements . . . . . . . . . . . . . . .121
Board of Directors report’s and financial
statements’ signatures . . . . . . . . . . . . . . . . . . . . . . . . . . . . .126
Auditors’ report . . . . . . . . . . . . . . . . . . . . . . . . . . . . . . . . . . .126
Board of Directors report and financial statements
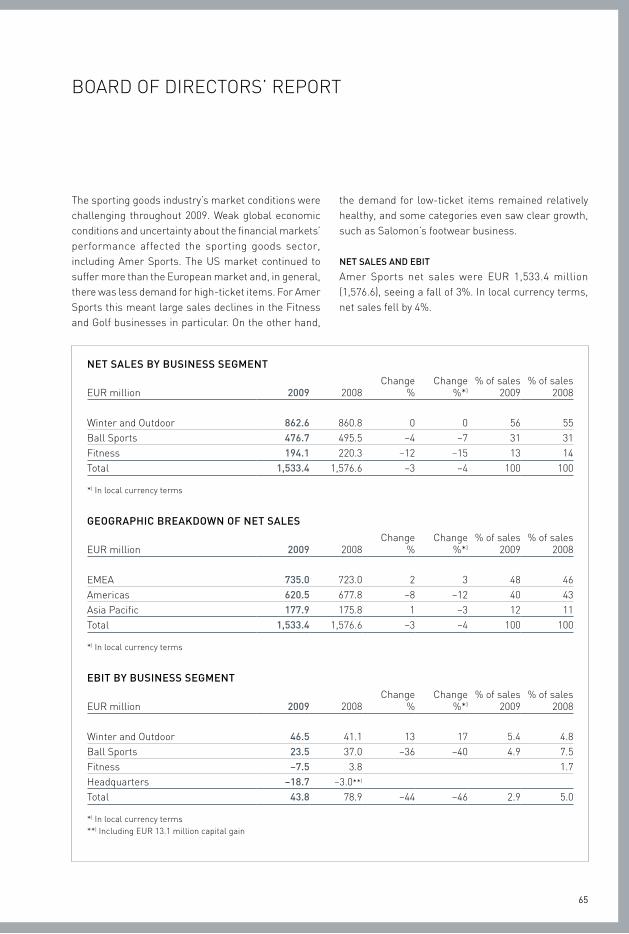
65
board of directors’ report
the sporting goods industry’s market conditions were challenging throughout 2009. Weak global economic conditions and uncertainty about the financial markets’ performance affected the sporting goods sector, including amer sports. the Us market continued to suffer more than the european market and, in general, there was less demand for high-ticket items. for amer sports this meant large sales declines in the fitness and Golf businesses in particular. on the other hand,
the demand for low-ticket items remained relatively healthy, and some categories even saw clear growth, such as salomon’s footwear business.
NET SALES AND EBIT
amer sports net sales were eUr 1,533.4 million (1,576.6), seeing a fall of 3%. in local currency terms, net sales fell by 4%.
NET SALES By BuSINESS SEgmENT
eUr million 2009 2008change
%change
%*)% of sales
2009% of sales
2008
Winter and outdoor 862.6 860.8 0 0 56 55ball sports 476.7 495.5 –4 –7 31 31fitness 194.1 220.3 –12 –15 13 14total 1,533.4 1,576.6 –3 –4 100 100
*) in local currency terms
gEogrAphIc BrEAkDowN of NET SALES
eUr million 2009 2008change
%change
%*)% of sales
2009% of sales
2008
eMea 735.0 723.0 2 3 48 46americas 620.5 677.8 –8 –12 40 43asia pacific 177.9 175.8 1 –3 12 11total 1,533.4 1,576.6 –3 –4 100 100
*) in local currency terms
EBIT By BuSINESS SEgmENT
eUr million 2009 2008change
%change
%*)% of sales
2009% of sales
2008
Winter and outdoor 46.5 41.1 13 17 5.4 4.8ball sports 23.5 37.0 –36 –40 4.9 7.5fitness –7.5 3.8 1.7Headquarters –18.7 –3.0**)
total 43.8 78.9 –44 –46 2.9 5.0
*) in local currency terms**) including eUr 13.1 million capital gain
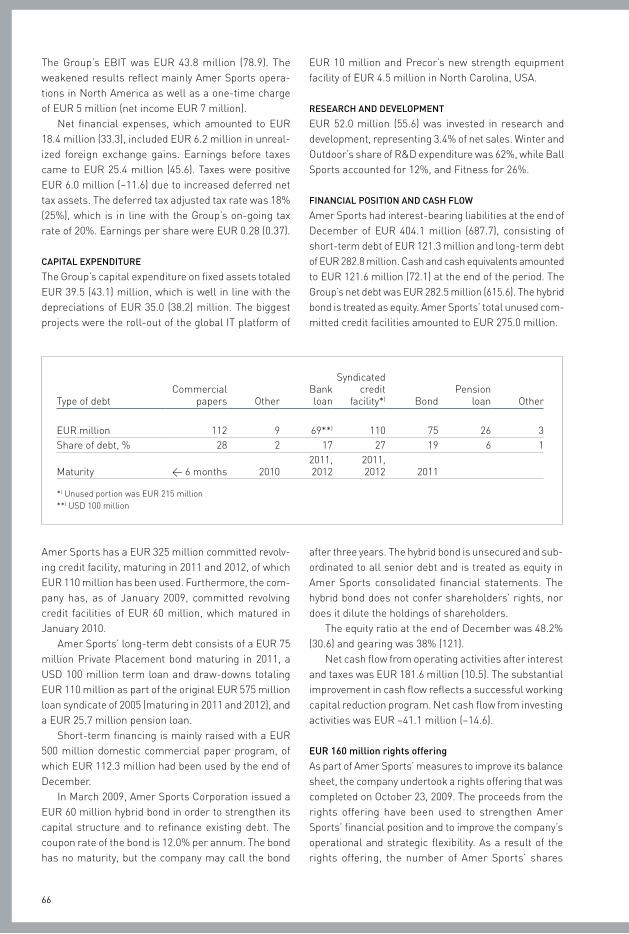
66
the Group’s ebit was eUr 43.8 million (78.9). the weakened results reflect mainly amer sports opera-tions in North america as well as a one-time charge of eUr 5 million (net income eUr 7 million).
Net financial expenses, which amounted to eUr 18.4 million (33.3), included eUr 6.2 million in unreal-ized foreign exchange gains. earnings before taxes came to eUr 25.4 million (45.6). taxes were positive eUr 6.0 million (–11.6) due to increased deferred net tax assets. the deferred tax adjusted tax rate was 18% (25%), which is in line with the Group’s on-going tax rate of 20%. earnings per share were eUr 0.28 (0.37).
cApITAL EXpENDITurE
the Group’s capital expenditure on fixed assets totaled eUr 39.5 (43.1) million, which is well in line with the depreciations of eUr 35.0 (38.2) million. the biggest projects were the roll-out of the global it platform of
eUr 10 million and precor’s new strength equipment facility of eUr 4.5 million in North carolina, Usa.
rESEArch AND DEVELopmENT
eUr 52.0 million (55.6) was invested in research and development, representing 3.4% of net sales. Winter and outdoor’s share of r&d expenditure was 62%, while ball sports accounted for 12%, and fitness for 26%.
fINANcIAL poSITIoN AND cASh fLow
amer sports had interest-bearing liabilities at the end of december of eUr 404.1 million (687.7), consisting of short-term debt of eUr 121.3 million and long-term debt of eUr 282.8 million. cash and cash equivalents amounted to eUr 121.6 million (72.1) at the end of the period. the Group’s net debt was eUr 282.5 million (615.6). the hybrid bond is treated as equity. amer sports’ total unused com-mitted credit facilities amounted to eUr 275.0 million.
type of debtcommercial
papers otherbankloan
syndicatedcredit
facility*) bondpension
loan other
eUr million 112 9 69**) 110 75 26 3share of debt, % 28 2 17 27 19 6 1
Maturity < 6 months 20102011,2012
2011,2012 2011
*) Unused portion was eUr 215 million**) Usd 100 million
amer sports has a eUr 325 million committed revolv-ing credit facility, maturing in 2011 and 2012, of which eUr 110 million has been used. furthermore, the com-pany has, as of January 2009, committed revolving credit facilities of eUr 60 million, which matured in January 2010.
amer sports’ long-term debt consists of a eUr 75 million private placement bond maturing in 2011, a Usd 100 million term loan and draw-downs totaling eUr 110 million as part of the original eUr 575 million loan syndicate of 2005 (maturing in 2011 and 2012), and a eUr 25.7 million pension loan.
short-term financing is mainly raised with a eUr 500 million domestic commercial paper program, of which eUr 112.3 million had been used by the end of december.
in March 2009, amer sports corporation issued a eUr 60 million hybrid bond in order to strengthen its capital structure and to refinance existing debt. the coupon rate of the bond is 12.0% per annum. the bond has no maturity, but the company may call the bond
after three years. the hybrid bond is unsecured and sub-ordinated to all senior debt and is treated as equity in amer sports consolidated financial statements. the hybrid bond does not confer shareholders’ rights, nor does it dilute the holdings of shareholders.
the equity ratio at the end of december was 48.2% (30.6) and gearing was 38% (121).
Net cash flow from operating activities after interest and taxes was eUr 181.6 million (10.5). the substantial improvement in cash flow reflects a successful working capital reduction program. Net cash flow from investing activities was eUr –41.1 million (–14.6).
Eur 160 million rights offering
as part of amer sports’ measures to improve its balance sheet, the company undertook a rights offering that was completed on october 23, 2009. the proceeds from the rights offering have been used to strengthen amer sports’ financial position and to improve the company’s operational and strategic flexibility. as a result of the rights offering, the number of amer sports’ shares
67
ment fell in local currency terms by 3%, snowboards fell by 10% and cross country increased by 22%.
the development of sales showed very different pat-terns in the key markets during 2009. the alpine and Nordic countries started to show signs of recovery with favorable weather conditions. the North american market continued to weaken whereas the asian mar-ket was flat. industry sales were relatively stable as a whole, at approximately eUr 1.4 billion: alpine ski equipment eUr 1.0 billion, snowboards eUr 0.3 billion, and cross-country ski equipment eUr 0.1 billion. the eMea continued to be the largest winter sports region representing 71% of global sales, followed by the amer-icas with 17%, and asia pacific with 12%.
after significant restructuring in 2008, 2009 was the first year for the Winter sports equipment business operating under its new structure. Winter sports equip-ment successfully completed its consolidation of the manufacturing sites from ten to six at the beginning of the year. in addition, the integration of the bulgarian ski factory, which was acquired in 2008, proceeded according to plan. the Winter sports equipment busi-ness area produced a positive result after a very chal-lenging period.
Apparel and footwear
Net sales in apparel and footwear increased by 11% in local currency terms to eUr 304.7 million (277.9). Net sales by product categories were as follows: footwear 55% and apparel and gear 45%. Net sales of footwear increased in local currency terms by 15%, and apparel and gear by 6%. the eMea continued to be the largest region representing 69% of global sales, followed by the americas with 26%, and asia pacific with 5%.
salomon strengthened its global position in the out-door footwear market in 2009. the main growth drivers were the trail running footwear and the new progres-sive hiking-backpacking offer. the unique positioning of salomon as the mountain apparel brand continued to generate positive results with sales growing faster than the market, especially in europe. ski apparel con-tinued to grow and salomon strengthened its position on the market. the apparel and footwear business is weighted towards the winter season. However, the out-door and trail-running spring/summer collections have continued to be the fastest growing categories.
despite a tough Us environment and high exposure in the Us market, arc’teryx managed to increase its sales. this was mainly driven by a successful spring/summer collection.
even though the Us was the toughest market in 2009, amer sports estimates that its apparel and foot-wear business area’s market share increased in the Us.
increased by 48,471,734 to 121,517,285 shares. the total net proceeds of the rights offering amounted to eUr 151.5 million.
BuSINESS SEgmENT rEVIEwS
wINTEr AND ouTDoor
eUr million 2009 2008change
%change
%*)
Net salesWinter sportsequipment 371.7 378.9 –2 –1apparel andfootwear 304.7 277.9 10 11cycling 100.4 114.2 –12 –13sports instruments 85.8 89.8 –4 –5
Net sales, total 862.6 860.8 0 0ebit 46.5 41.1 13 17personnel, dec. 31 3,940 3,777 4
*) in local currency terms
in 2009, Winter and outdoor’s net sales of eUr 862.6 million (860.8) were at last year’s level in local currency terms. the breakdown of net sales by business area was as follows: Winter sports equipment 43%, apparel and footwear 35%, cycling 12%, and sports instruments 10%. in 2009, the eMea accounted for 68% of net sales, the americas for 21%, and asia pacific for 11%.
eUr million 2009 2008change
%change
%*)
eMea 585.4 558.8 5 6
americas 181.1 202.3 –10 –12
asia pacific 96.1 99.7 –4 –6
total net sales 862.6 860.8 0 0
*) in local currency terms
the ebit of eUr 46.5 million (41.1) increased by 17% in local currency terms. the improvement reflects clearly better profitability in Winter sports equipment and the continued good level of profitability in apparel and footwear. the profitability of both cycling and sports instruments weakened mainly due to lower sales.
winter Sports Equipment
in 2009, Winter sports equipment’s net sales of eUr 371.7 million (378.9) were at last year’s level in local cur-rencies. the biggest product categories were alpine ski equipment, representing 78% of net sales, cross country 12%, and snowboards 10%. Net sales of alpine ski equip-
68
the outdoor trend remained strong and trail running as a category continued to gain popularity. the busi-ness area’s good profitability was maintained in 2009.
cycling
due to the challenging business climate in 2009, both independent bike dealers and bike manufacturers clearly reduced their inventories during the year. this resulted in a major fall in oeM orders and weak demand in the Us especially.
Mavic saw net sales fall in local currencies by 13% to eUr 100.4 million (114.2). the biggest product cat-egories were rims and wheels, representing 83% of net sales, and apparel and footwear 14%. Net sales of rims and wheels fell in local currency terms by 16%, and apparel and footwear by 3%. the distribution of cycling’s net sales by geographical areas was as follows: eMea 65%, asia pacific 21%, and the americas 14%.
at the beginning of 2009, Mavic decided to recall its r-sys front wheels and replace the original carbon spokes with a new and stronger construction. custom-ers appreciated the way this recall was managed, which showed Mavic’s continuous commitment to maintain-ing its strong brand image. improving the supply chain and maintain tight control of expenses were key focus areas in 2009. Mavic’s profitability weakened in 2009 due to lower sales volumes and the disruption caused by the recall of r-sys wheels.
on september 1, 2009, amer sports announced that it was exploring strategic alternatives in respect of its cycling business and that the review could result in the divestment of Mavic. amer sports evaluated several different options, and reached the conclusion that the divestment of Mavic would not be in the best interest of shareholders. instead amer sports will concentrate its efforts on further developing its cycling business.
Sports Instruments
Net sales of sports instruments fell by 5% in local cur-rency terms to eUr 85.8 million (89.8). over the years, wristop computers and diving instruments have con-sistently increased their share of suunto’s total net sales: reaching 80% of total business in 2009. Net sales of wristop computers increased in local currency terms by 3% and diving instruments fell by 13%. the distribu-tion of net sales by geographical areas was as follows: eMea 56%, the americas 29%, and asia pacific 15%. suunto’s profitability weakened in 2009.
in 2009, suunto entered the premium sports watch market with the suunto elementum collection.
winter and outdoor outlook 2010
the Winter and outdoor segment is well positioned to continue to improve its profitability. the apparel and footwear business area continues to extend its direct-to-consumer program and its profitability is expected to remain at a good level. Within Winter sports equip-ment, cycling and sports instruments the focus is on improving gross margins while maintaining tight cost control.
BALL SporTS
eUr million 2009 2008change
%change
%*)
Net salesracquet sports 222.7 227.0 –2 –5team sports 187.3 189.9 –1 –6Golf 66.7 78.6 –15 –16
Net sales, total 476.7 495.5 –4 –7ebit 23.5 37.0 –36 –40personnel, dec. 31 1,586 1,731 –8
*) in local currency terms
in 2009, ball sports net sales of eUr 476.7 million (495.5) fell by 7% in local currencies. the breakdown of net sales by business area was as follows: racquet sports 47%, team sports 39%, and Golf 14%. the americas generated 63% of net sales, eMea 23%, and asia pacific 14%.
eUr million 2009 2008change
%change
%*)
americas 298.7 316.9 –6 –10eMea 111.5 119.1 –6 –4asia pacific 66.5 59.5 12 4total 476.7 495.5 –4 –7
*) in local currency terms
the ebit of eUr 23.5 million (37.0) fell by 40% in local currency terms. the lower ebit was the result of revenue declines and lower margins driven by the recessionary environment. the americas and the Golf business area were impacted in particular. the 2009 revenue declines were also affected by the inventory destocking trend in retail.
racquet Sports
in local currencies, racquet sports’ net sales fell by 5% to eUr 222.7 million (227.0). the breakdown of rac-quet sports net sales by geographical areas was as fol-lows: the americas 42%, eMea 36% and asia pacific 22%. in local currencies, the americas saw a fall of 12%, eMea fell by 2% whereas asia pacific grew by 6%. the decline in the americas was driven by the poor economic

69
environment. the growth in asia pacific reflects a pos-itive development in both australia and Korea combined with the expanded distribution in china. racquet sports’ profitability remained at a good level.
for 2009, market trends remained stable for rac-quet sports. Wilson’s position as the leading tennis racket brand strengthened further. its strong racket brand position was leveraged to drive growth in tennis strings and accessories. the biggest product catego-ries were tennis rackets, representing 40% of net sales, and tennis balls 22%. Net sales of tennis rackets fell in local currency terms by 9%, and tennis balls were at last year’s level.
shipments of the new bLX racket line started in January 2010. roger federer, Juan Martin del potro, and Justine Henin debuted successfully the new tech-nology at the 2010 australian open.
Team Sports
in local currencies, team sports’ net sales fell by 6% to eUr 187.3 million (189.9). the breakdown of team sports net sales by geographical areas was as follows: the americas 94%, eMea 2% and asia pacific 4%. in local currencies, the americas fell by 6%, the eMea fell by 19% and asia grew by 25%. team sports’ profit-ability weakened due to revenue declines and lower margins driven by the recessionary environment.
the business environment in the americas remained challenging due to the economic environment and the inventory destocking trend by the trade. the growth in asia pacific was driven by Korea, where the baseball strategies have been successful. the biggest product categories were american footballs, represent-ing 21% of net sales, baseballs and gloves with 20%, baseball and softball bats with 17%, and basketballs with 15%. Net sales of american footballs fell in local currency terms by 10%, baseballs and gloves increased by 2%, baseball/softball bats were at last year’s level, and basketballs fell by 4%.
golf
in local currencies, Golf’s net sales fell by 16% to eUr 66.7 million (78.6). the breakdown of net sales by geo-graphical areas was: the americas 44%, eMea 44% and asia pacific 12%. in local currencies, the americas fell by 25%, the eMea fell by 4%, and asia pacific fell by 19%. the biggest product categories were clubs, represent-ing 59% of net sales, and balls 26%. Net sales of clubs fell in local currencies by 15%, and balls by 21%.
the golf equipment market remained very compet-itive. the overall market decline created a challenge for brands and retailers alike. Wilson Golf’s profitabil-ity was affected by the challenging market environ-ment.
Wilson Golf’s strategy is to focus on the iron cate-gory and the brand is committed to making the best irons in the industry. several new award-winning prod-ucts have been launched in 2010.
Ball Sports outlook 2010
a slight recovery is expected in the ball sports seg-ment, driven by retail distribution gains and assumed restocking due to low trade inventory levels. ball sports’ profitability is expected to improve mainly due to gross margin improvements and tight cost control.
fITNESS
eUr million 2009 2008change
%change
%*)
Net sales 194.1 220.3 –12 –15ebit –7.5 3.8personnel, dec. 31 737 765 –4
*) in local currency terms.
in 2009, fitness’ net sales fell by 15% in local cur-rencies to eUr 194.1 million (220.3). the americas accounted for 72% of net sales, eMea for 20%, and asia pacific for 8%.
eUr million 2009 2008change
%change
%*)
americas 140.7 158.8 –11 –15eMea 38.1 45.4 –16 –11asia pacific 15.3 16.1 –5 –19total 194.1 220.3 –12 –15
*) in local currency terms
ebit fell to eUr –7.5 million (3.8) due to the sharp fall in sales, which could not be fully offset by the cost reduction programs. in 2009 ebit included a bad debt provision of eUr 5 million.
fitness equipment manufacturers worldwide expe-rienced significant reductions in sales in both the com-mercial and consumer markets during 2009. of precor’s net sales, clubs and institutions represented 87% and home use was 13%.
the commercial business (clubs and institutions) fell by 14% in local currencies. a dependable driver of commercial equipment sales growth had been the opening of new facilities. With tightened credit markets and uncertain consumer spending, most fitness cus-tomers held off on expansion plans in 2009. Within existing facilities, a reduction in customer spending on extras such as personal training and pro-shop gear led to lower revenues, which in turn drove owners to cut expenses. Many chose to address expense cuts by deferring plans for new fitness equipment, preferring
70
to stretch the service life of their existing equipment. in the fourth quarter of 2009, commercial business saw a slight improvement as club operators increased their investments in new and replacement equipment.
the consumer (home use) business fell by 19% in local currencies. the market for consumer equipment experienced a second year of decline with the premium segment, where precor competes particularly, exposed to the broader trend of reduced discretionary spend-ing. financial weakness among specialty fitness deal-ers, the primary distribution channel for premium home equipment, magnified market challenges.
related to the construction of the new strength equipment production facility in North carolina, precor has had significant capital expenditures in 2009. the total amount is approximately eUr 4.5 million. the facility is now in use and will provide the required capacity for the recently launched selectorized strength lines and reduce manufacturing costs.
fitness outlook 2010
in the near-term the outlook for the industry is uncer-tain. However, as 2009 progressed sales became more predictable and, in the fourth quarter, precor returned to growth. precor has strengthened its position during the downturn by continuing market penetration of the aMt®, successfully launching two new lines of strength equipment, and winning key international hospitality accounts. precor is well positioned when demand returns in the fitness industry.
pErSoNNEL
at the end of december, the Group employed 6,331 people (6,338). the Group employed an average of 6,362 people (6,285) during the review period.
Dec. 31,2009
dec. 31,2008
change%
Winter and outdoor 3,940 3,777 4ball sports 1,586 1,731 –8fitness 737 765 –4Headquarters 68 65 5total 6,331 6,338
Dec. 31,2009
dec. 31,2008
change%
eMea 3,590 3,428 5americas 2,195 2,337 –6asia pacific 546 573 –5total 6,331 6,338
BoArD of DIrEcTorS AND
mANAgEmENT of ThE compANy
amer sports corporation reorganized its management model in 2009 by creating a single group-wide amer sports management team. the purpose of the new executive board is to strengthen the development and consistent execution of amer sports’ corporate strat-egy across all business areas and regions, driving Group integration, common goals, and the Group’s overall performance.
in 2009, the following new members were appointed to the executive board: Jean-Marc pambet, president of apparel and footwear; bernard Millaud, president of cycling; terhi Heikkinen, senior Vice president Human resources; and antti Jääskeläinen, chief development officer. due to the change, the amer sports executive team ceased to exist.
on december 22, 2009, amer sports board of direc-tors appointed Mr. Heikki takala (Msc) as amer sports’ president and ceo effective from april 1, 2010. roger talermo will continue in a special role assigned by amer sports board of directors until June 21, 2010, after which he will resign from the company. pekka paalanne, executive Vice president and deputy to the president and ceo was appointed as acting president and ceo from december 22, 2009, until March 31, 2010.
Amer Sports Executive Board members as of December
31, 2009:
pekka paalanne, acting president and ceo (decem-•ber 22, 2009–March 31, 2010)thomas ehrnrooth, senior Vice president sales and •channel ManagementVincent Wauters, senior Vice president supply •chain and information technologyterhi Heikkinen, senior Vice president Human •resourcesantti Jääskeläinen, chief development officer•chris considine, president of ball sports•paul byrne, president of fitness equipment•Juha pinomaa, president of sports instruments•Michael schineis, president of Winter sports • equipmentJean-Marc pambet, president of apparel and • footwearbernard Millaud, president of cycling•
amer sports’ executive board members are pre-sented in more detail at www.amersports.com
corporATE goVErNANcE STATEmENT
amer sports has issued its corporate Governance statement as a separate report. amer sports’ auditors
71
have checked that the statement has been issued and that the description of the main features of the internal control and risk management systems in relation to the financial reporting process is consistent with amer sports’ financial statements. the corporate Gover-nance code is publicly available on amer sports’ web-site www.amersports.com, in the corporate gover-nance section.
ShArES AND ShArEhoLDErS
the company’s paid-up share capital recorded in the trade register as of december 31, 2009 was eUr 292,182,204. on december 31, 2009, the company had a market capitalization of eUr 848.3 million (389.7), excluding own shares.
on october 23, 2009 the final outcome of amer sports’ rights offering showed that 48,070,466 shares, representing 99.2% of the total number of shares offered, were subscribed for with subscription rights. the remaining 401,268 shares were subscribed for without subscription rights. as a result of the rights offering, the number of amer sports’ shares increased on october 26, 2009, by 48,471,734 shares to 121,517,285 shares.
Amer Sports’ rights offering
a total of 48,471,734 new shares were subscribed for in amer sports’ rights offering. the subscription period for the offering ended on october 19, 2009. all the new shares were registered with the trade register on octo-ber 26, 2009. following the registration, the total num-ber of amer sports’ shares is 121,517,285 shares. the new shares include the right to dividends and other distributions as well as other shareholder rights, effec-tive from the registration date of october 26, 2009.
the highest price of the subscription rights on the oMX Helsinki stock exchange was eUr 2.15, and the lowest eUr 1.23, and the last trading price was eUr 2.11. in 2009, a total of 8.6 million shares were traded at a total price of eUr 13.1 million.
Trading in shares
over the course of the period, a total of 71.0 million (101.3) amer sports shares were traded on the NasdaQ oMX Helsinki exchange, to a total value of eUr 458.3 million (1,172.5). the share turnover was 76.4% (139.6) (of the average number of shares, excluding own shares).
at the close of the review period, the last trading in amer sports corporation shares was at eUr 7.00. the high for the period on the NasdaQ oMX Helsinki exchange was eUr 7.19, and the low eUr 3.67. the average share price was eUr 6.45.
mAjor ShArEhoLDErS, DEcEmBEr 31, 2009
(INcLuDES No NomINEE rEgISTrATIoNS)
shares% of shares
and votes
1 Maa- ja Vesitekniikan tuki ry. 5,000,000 4.12 Varma Mutual pension insur-
ance company 4,770,210 3.93 ilmarinen Mutual pension
insurance company 4,191,668 3.4
4 ilkka brotherus 2,681,179 2.2
5 the state pension fund 1,937,556 1.6
6 odin Norden 1,684,832 1.47 tapiola Mutual pension
insurance company 1,614,500 1.38 Mandatum Life insurance
company 1,609,680 1.3
9 odin finland 1,090,888 0.9
10 op-finland Value fund 1,025,000 0.8
at the end of december, amer sports had 13,342 registered shareholders (12,320). outside finland, own-ership and nominee registrations represented 52.6% (45.2%) of the shares. public sector entities owned 12.5%, households 12.4%, financial and insurance cor-porations 11.7%, non-profit institutions 8.2%, and pri-vate companies 2.3%. amer sports had 334,900 own shares, which are owned by amer sports international oy. the number of own shares corresponded to 0.3% of all amer sports shares.
major changes in holdings
amer sports corporation received information on feb-ruary 19, 2009, to the effect that Novator finland oy converted all of its NasdaQ oMX forward contracts into direct holdings in shares of amer sports corporation on february 18, 2009. after settlement of the NasdaQ oMX forward contracts concerning 7,000,000 shares in amer sports corporation, Novator finland oy then held 14,688,900 shares, representing 20.11% of the shares and voting rights in amer sports corporation. on July 2, 2009, amer sports corporation was notified that Novator finland oy had sold its entire holding of shares in the company.
amer sports corporation received information on february 19, 2009, to the effect that the danske bank a/s Helsinki branch’s share capital and voting rights in amer sports fell under 5% (1/20) on february 23, 2009, due to a transaction completed on february 18, 2009. the danske bank a/s Helsinki branch held then no shares in amer sports corporation.
the stock exchange announcements on major changes in shareholdings in 2009 can be found on the
72
amer sports Web pages at www.amersports.com/investors.
Disclosure of control
amer sports’ board of directors is not aware of any natural or legal persons who have control over the company or has information on these persons’ portion of the voting rights of the shares and of the total number of shares.
Agreements and arrangements relating to
shareholdings and use of voting rights
amer sports’ board of directors is not aware of any agreements or arrangements concerning the owner-ship of the company’s shares and the use of their voting rights.
Shareholdings of the Board of Directors and Executive
Board, December 31, 2009
shareholder shares
circle of acquaintances and controlled
corporations
Board of Directorsilkka brotherus 2,681,179 10,250Martin burkhalter 5,091christian fischer 5,091Hannu ryöppönen 3,375 14,175bruno sälzer 5,091anssi Vanjoki 23,416pirjo Väliaho 7,302
Executive Boardpaul byrne 0chris considine 7,150thomas ehrnrooth 22,500terhi Heikkinen 0antti Jääskeläinen 0bernard Millaud 6,875pekka paalanne 52,000Jean-Marc pambet 6,875Juha pinomaa 5,850 15Michael schineis 10,000Vincent Wauters 24,491totaL 2,866,286 24,440% of shares 2.36
including circle of acquaintances and con-trolled corporations 2,890,726% of shares 2.38
Exercise of warrants
the highest price of the 2004 warrants on the oMX Hel-sinki stock exchange was eUr 1.30, and the lowest eUr 0.11. in 2009, a total of 5,700 warrants were traded at a total price of eUr 4,609.
Amendments to the terms and conditions of the
warrant programs
pursuant to the terms and conditions of amer sports’ warrant programs, amer sports’ board of directors must amend the terms and conditions of the warrant programs to take into account the impact of the rights offering by adjusting the exercise price of the warrants and/or the number of shares that can be subscribed for through exercise of the warrants in a manner to be determined by the board of directors. on october 29, 2009, amer sports’ board of directors decided on such amendments. the terms and conditions of its publicly traded 2004 warrants were amended to the effect that each 2004 warrant entitles its holder to subscribe for five shares at the subscription price of eUr 9.44 per share.
rESoLuTIoNS of ThE gENErAL
mEETINgS of ShArEhoLDErS
amer sports’ annual General Meeting of shareholders, which was held on March 5, 2009, authorized the board of directors to decide on issuing new shares on the fol-lowing terms and conditions: New shares may be issued and the company’s own shares held by the com-pany may be conveyed against payment (“share issue against payment”) to the company’s shareholders in proportion to their current shareholdings in the com-pany. by virtue of the authorization, the board of direc-tors is entitled to decide on issuing a maximum of 7,000,000 new shares. the subscription price of the new shares shall be booked to the invested un-restricted equity reserve. the authorization to issue shares is valid for two years from the date of the deci-sion of the annual General Meeting.
on March 5, 2009, the annual General Meeting re-elected anssi Vanjoki, ilkka brotherus, pirjo Väliaho, Martin burkhalter, christian fischer, and bruno sälzer as members of the board of directors, and appointed Hannu ryöppönen as a new board member. the board’s term of service will run until the close of the 2010 annual General Meeting. the authorized public accountant pricewaterhousecoopers oy was elected to act as the company’s auditor. Jouko Malinen, autho-rized public accountant, was elected as the auditor in charge of the audit.
73
Extraordinary general meeting, September 23, 2009
the extraordinary General Meeting of amer sports’ shareholders held on september 23, 2009, authorized the board of directors to undertake a share issue for consideration in which the shareholders were entitled to subscribe for new shares in proportion to their exist-ing shareholdings. the board of directors was autho-rized to decide upon offering any shares that may remain unsubscribed for pursuant to the shareholders’ pre-emptive rights to parties determined by the board of directors. by virtue of the authorization, the board of directors was entitled to decide on issuing a maxi-mum of 150,000,000 new shares in the share issue. the board of directors was authorized to determine the other terms and conditions of the share issue. the authorization of the board of directors to undertake the share issue did not supersede or otherwise invali-date the share issue authorization granted to the board of directors by the annual General Meeting on March 5, 2009.
Authorization to repurchase or convey own shares
amer sports did not acquire any its own shares during 2009. amer sports’ board of directors does not have a valid authorization to acquire or dispose of amer sports’ own shares.
the documentation and press releases related to the meetings are available on the company’s website, at www.amersports.com.
SIgNIfIcANT rISkS AND uNcErTAINTIES
amer sports’ business is balanced by its broad portfo-lio of sports and brands as well as its presence in all major markets. amer sports corporation’s short-term risks are particularly associated with consumer demand in North america and europe and successful execution of its cost reduction and efficiency improve-ment measures.
for example, the following risks can potentially have an impact on the company’s development:• TheUnitedStatesrepresents40%oftheworld-wide
sporting goods market and approximately 40% of amer sports’ sales. there is a correlation between the demand for sporting goods and the development of Us retail sales. therefore, a change in overall Us retail sales can have an impact on amer sports’ business.
• Wintersportsequipmentrepresents24%ofAmersports’ sales. Weather conditions can have an impact on the company’s results. Historically, however, poor snow conditions in one region are compensated for by good snow conditions in another region.
• Achangeintheeuro’svaluevis-à-visothercurren-cies has an impact on amer sports’ results. the
impact, however, is limited due to the fact that the company’s euro–Us dollar position is relatively balanced.
• Despiteextensivetestingofitsproductsbeforemar-ket launch, the company cannot completely rule out the risk of product recalls and legal actions related to product liability. amer sports has standard insur-ance cover against the financial consequences of product recalls and product liability cases. product quality issues could harm amer sports’ reputation and, as a result, could have an adverse effect on its sales.
• LosingasignificantclientwouldaffectAmerSports’sales. However, this risk is limited because amer sports’ client base is diversified, with the five larg-est clients accounting for less than 10% of the com-pany’s annual sales.
• AmerSportsusessteel,rubber,andoil-basedrawmaterials and components in its products. price increases affecting these materials can have a neg-ative impact on product costs. amer sports typically introduces new products every year, which can, depending on the market situation, offset the impact of material cost increases.
• A large part of AmerSports’ production is out-sourced. the aim is to minimize the supply, quality, and price risks associated with purchasing. although the business areas audit their subcontrac-tors regularly, possible delivery problems or breaches of contract by subcontractors may have an impact on amer sports’ operations.
• AmerSports’mostimportantproductionfacilitiesare the Winter sports equipment factories in aus-tria and bulgaria, precor’s factory in the United states, and suunto factory in finland. in addition, amer sports has major factories in eastern europe, which are owned by subcontractors. amer sports’ most important distribution centers are located in Germany, austria, the United states, and france. any unexpected production or delivery breaks in these units would have a negative impact on the company’s business.
• Acharacteristicfeatureofthesportinggoodsindus-try is the need to protect intellectual property rights and disputes connected with them. the material impacts on amer sports’ financial position and operational result arising from pending litigation affecting the business areas and decisions of the authorities are assessed regularly, and current esti-mates are presented publicly when necessary.
• AmerSportshasgoodwill and intangible assetswith indefinite useful lives of eUr 453 million on its balance sheet, as at december 31, 2009, which is 62% of the company’s net equity. the valuation of
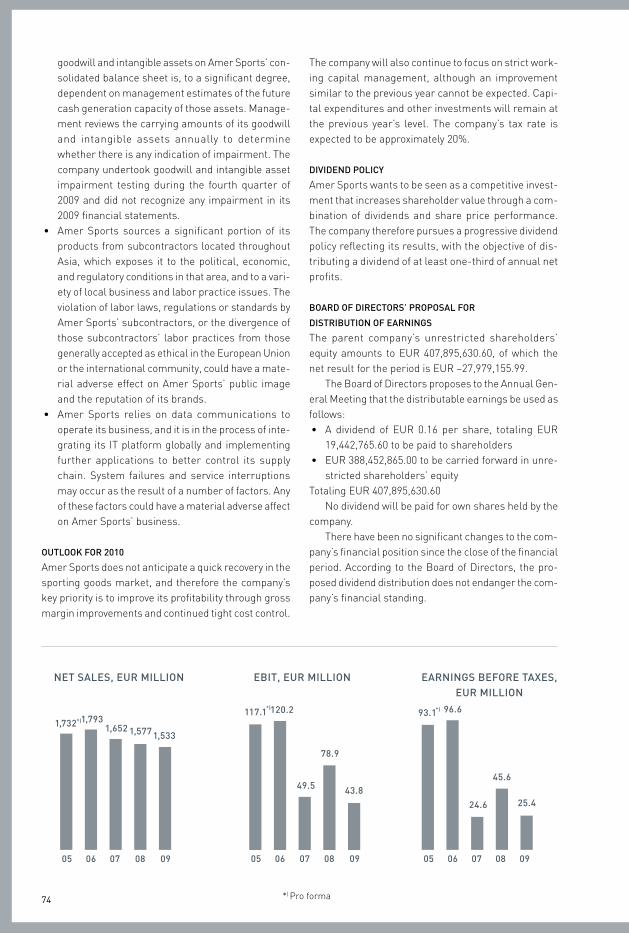
74
goodwill and intangible assets on amer sports’ con-solidated balance sheet is, to a significant degree, dependent on management estimates of the future cash generation capacity of those assets. Manage-ment reviews the carrying amounts of its goodwill and intangible assets annually to determine whether there is any indication of impairment. the company undertook goodwill and intangible asset impairment testing during the fourth quarter of 2009 and did not recognize any impairment in its 2009 financial statements.
• AmerSports sourcesa significant portion of itsproducts from subcontractors located throughout asia, which exposes it to the political, economic, and regulatory conditions in that area, and to a vari-ety of local business and labor practice issues. the violation of labor laws, regulations or standards by amer sports’ subcontractors, or the divergence of those subcontractors’ labor practices from those generally accepted as ethical in the european Union or the international community, could have a mate-rial adverse effect on amer sports’ public image and the reputation of its brands.
• AmerSports relies on data communications tooperate its business, and it is in the process of inte-grating its it platform globally and implementing further applications to better control its supply chain. system failures and service interruptions may occur as the result of a number of factors. any of these factors could have a material adverse affect on amer sports’ business.
ouTLook for 2010
amer sports does not anticipate a quick recovery in the sporting goods market, and therefore the company’s key priority is to improve its profitability through gross margin improvements and continued tight cost control.
the company will also continue to focus on strict work-ing capital management, although an improvement similar to the previous year cannot be expected. capi-tal expenditures and other investments will remain at the previous year’s level. the company’s tax rate is expected to be approximately 20%.
DIVIDEND poLIcy
amer sports wants to be seen as a competitive invest-ment that increases shareholder value through a com-bination of dividends and share price performance. the company therefore pursues a progressive dividend policy reflecting its results, with the objective of dis-tributing a dividend of at least one-third of annual net profits.
BoArD of DIrEcTorS’ propoSAL for
DISTrIBuTIoN of EArNINgS
the parent company’s unrestricted shareholders’ equity amounts to eUr 407,895,630.60, of which the net result for the period is eUr –27,979,155.99.
the board of directors proposes to the annual Gen-eral Meeting that the distributable earnings be used as follows:
a dividend of eUr 0.16 per share, totaling eUr •19,442,765.60 to be paid to shareholderseUr 388,452,865.00 to be carried forward in unre-•stricted shareholders’ equity
totaling eUr 407,895,630.60No dividend will be paid for own shares held by the
company.there have been no significant changes to the com-
pany’s financial position since the close of the financial period. according to the board of directors, the pro-posed dividend distribution does not endanger the com-pany’s financial standing.
*) pro forma
EArNINgS BEforE TAXES, Eur mILLIoN
05 06 07 08 09
NET SALES, Eur mILLIoN
05 06 07 08 09
1,577 1,5331,732 1,793
1,652*)
05 06 07 08 09
117.1 93.1120.2 96.6
49.5
24.6
78.9
43.845.6
25.4
EBIT, Eur mILLIoN
*) *)
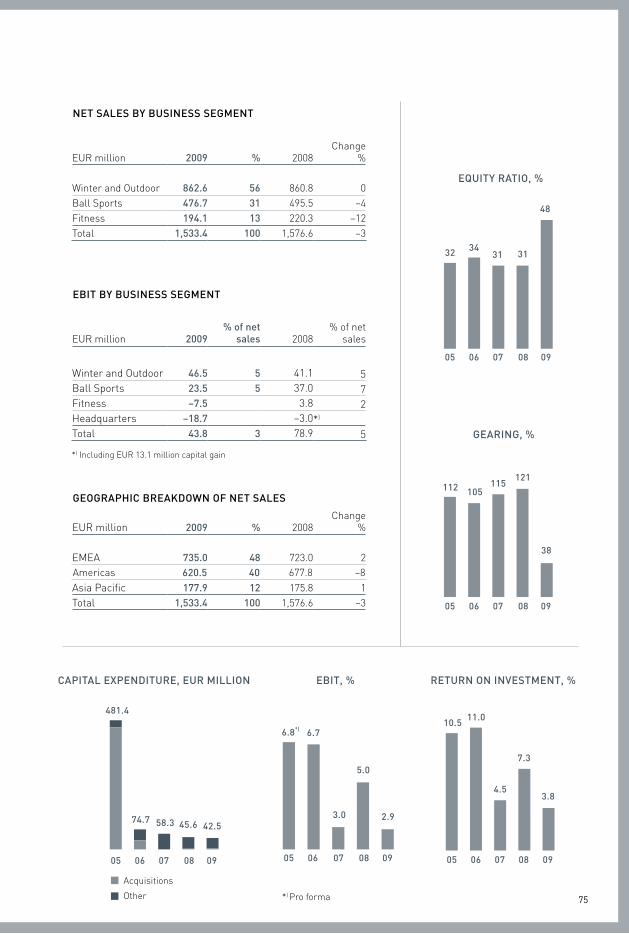
75
NET SALES By BuSINESS SEgmENT
eUr million 2009 % 2008change
%
Winter and outdoor 862.6 56 860.8 0ball sports 476.7 31 495.5 –4fitness 194.1 13 220.3 –12total 1,533.4 100 1,576.6 –3
EBIT By BuSINESS SEgmENT
eUr million 2009% of net
sales 2008% of net
sales
Winter and outdoor 46.5 5 41.1 5ball sports 23.5 5 37.0 7fitness –7.5 3.8 2Headquarters –18.7 –3.0*)
total 43.8 3 78.9 5
gEogrAphIc BrEAkDowN of NET SALES
eUr million 2009 % 2008change
%
eMea 735.0 48 723.0 2americas 620.5 40 677.8 –8asia pacific 177.9 12 175.8 1total 1,533.4 100 1,576.6 –3
EquITy rATIo, %
gEArINg, %
05 06 07 08 09
05 06 07 08 09
31
48
121
38
32
112
34
105
31
115
rETurN oN INVESTmENT, %
05 06 07 08 09
7.3
3.8
10.511.0
4.5
*) pro forma
EBIT, %
05 06 07 08 09
5.0
2.9
6.8 6.7
3.0
*)
cApITAL EXpENDITurE, Eur mILLIoN
05 06 07 08 09
45.6 42.5
481.4
74.7 58.3
acquisitions
other
*) including eUr 13.1 million capital gain

76
pErSoNNEL By BuSINESS SEgmENT At year end Average
2009 2008 2009 2008
Winter and outdoor 3,940 3,777 3,906 3,686
ball sports 1,586 1,731 1,665 1,720
fitness 737 765 720 816
Headquarters 68 65 71 63
total 6,331 6,338 6,362 6,285
pErSoNNEL By couNTry At year end
2009 2008
Usa 1,503 1,586france 970 1,015austria 795 711canada 554 605bulgaria 464 324finland 377 396Germany 302 310UK 195 200china 183 179Japan 164 171Mexico 83 88switzerland 71 72taiwan 68 70Malta 65 65russia 65 46spain 58 60brazil 55 58italy 53 54
australia 52 60
other countries 254 268total 6,331 6,338
quArTErLy NET SALES
I II III IV i ii iii iVeUr million 2009 2009 2009 2009 2008 2008 2008 2008
Winter and outdoor 164.4 106.6 262.4 329.2 162.0 104.6 267.6 326.6ball sports 142.9 135.7 103.4 94.7 144.0 130.9 110.6 110.0fitness 48.0 42.4 44.8 58.9 57.0 49.6 55.0 58.7total 355.3 284.7 410.6 482.8 363.0 285.1 433.2 495.3
EmpLoyEES AT yEAr END
05 06 07 08 09
6,338 6,3316,667 6,553 6,465
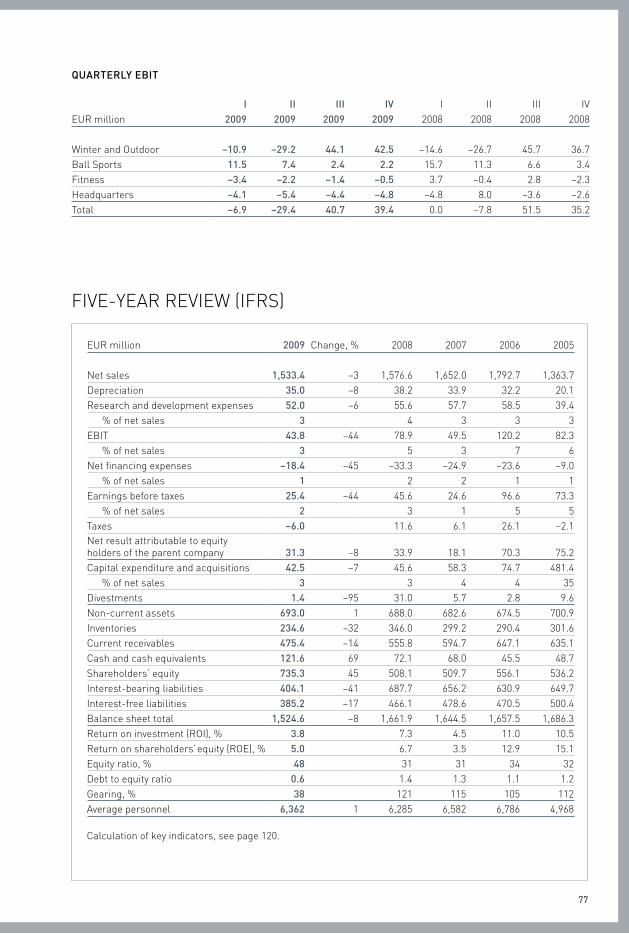
77
quArTErLy EBIT
I II III IV i ii iii iVeUr million 2009 2009 2009 2009 2008 2008 2008 2008
Winter and outdoor –10.9 –29.2 44.1 42.5 –14.6 –26.7 45.7 36.7ball sports 11.5 7.4 2.4 2.2 15.7 11.3 6.6 3.4fitness –3.4 –2.2 –1.4 –0.5 3.7 –0.4 2.8 –2.3Headquarters –4.1 –5.4 –4.4 –4.8 –4.8 8.0 –3.6 –2.6total –6.9 –29.4 40.7 39.4 0.0 –7.8 51.5 35.2
eUr million 2009 change, % 2008 2007 2006 2005
Net sales 1,533.4 –3 1,576.6 1,652.0 1,792.7 1,363.7depreciation 35.0 –8 38.2 33.9 32.2 20.1research and development expenses 52.0 –6 55.6 57.7 58.5 39.4
% of net sales 3 4 3 3 3ebit 43.8 –44 78.9 49.5 120.2 82.3
% of net sales 3 5 3 7 6Net financing expenses –18.4 –45 –33.3 –24.9 –23.6 –9.0
% of net sales 1 2 2 1 1earnings before taxes 25.4 –44 45.6 24.6 96.6 73.3
% of net sales 2 3 1 5 5taxes –6.0 11.6 6.1 26.1 –2.1Net result attributable to equity holders of the parent company 31.3 –8 33.9 18.1 70.3 75.2capital expenditure and acquisitions 42.5 –7 45.6 58.3 74.7 481.4
% of net sales 3 3 4 4 35divestments 1.4 –95 31.0 5.7 2.8 9.6Non-current assets 693.0 1 688.0 682.6 674.5 700.9inventories 234.6 –32 346.0 299.2 290.4 301.6current receivables 475.4 –14 555.8 594.7 647.1 635.1cash and cash equivalents 121.6 69 72.1 68.0 45.5 48.7shareholders’ equity 735.3 45 508.1 509.7 556.1 536.2interest-bearing liabilities 404.1 –41 687.7 656.2 630.9 649.7interest-free liabilities 385.2 –17 466.1 478.6 470.5 500.4balance sheet total 1,524.6 –8 1,661.9 1,644.5 1,657.5 1,686.3return on investment (roi), % 3.8 7.3 4.5 11.0 10.5return on shareholders’ equity (roe), % 5.0 6.7 3.5 12.9 15.1equity ratio, % 48 31 31 34 32debt to equity ratio 0.6 1.4 1.3 1.1 1.2Gearing, % 38 121 115 105 112average personnel 6,362 1 6,285 6,582 6,786 4,968
calculation of key indicators, see page 120.
fiVe-year reVieW (ifrs)
EmpLoyEES AT yEAr END
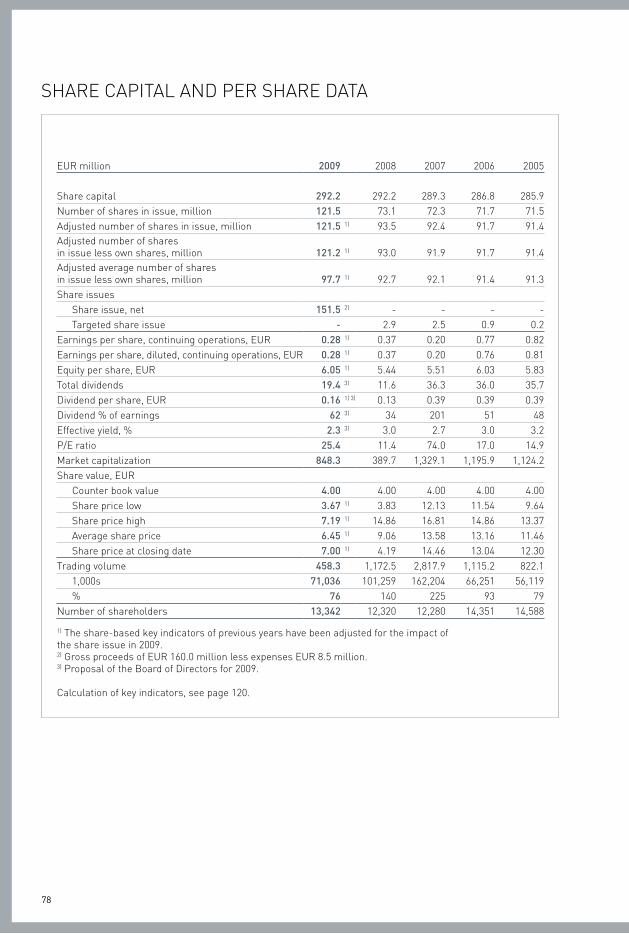
78
eUr million 2009 2008 2007 2006 2005
share capital 292.2 292.2 289.3 286.8 285.9Number of shares in issue, million 121.5 73.1 72.3 71.7 71.5adjusted number of shares in issue, million 121.5 1) 93.5 92.4 91.7 91.4adjusted number of shares in issue less own shares, million 121.2 1) 93.0 91.9 91.7 91.4adjusted average number of shares in issue less own shares, million 97.7 1) 92.7 92.1 91.4 91.3share issues
share issue, net 151.5 2) - - - -targeted share issue - 2.9 2.5 0.9 0.2
earnings per share, continuing operations, eUr 0.28 1) 0.37 0.20 0.77 0.82earnings per share, diluted, continuing operations, eUr 0.28 1) 0.37 0.20 0.76 0.81equity per share, eUr 6.05 1) 5.44 5.51 6.03 5.83total dividends 19.4 3) 11.6 36.3 36.0 35.7dividend per share, eUr 0.16 1) 3) 0.13 0.39 0.39 0.39dividend % of earnings 62 3) 34 201 51 48effective yield, % 2.3 3) 3.0 2.7 3.0 3.2p/e ratio 25.4 11.4 74.0 17.0 14.9Market capitalization 848.3 389.7 1,329.1 1,195.9 1,124.2share value, eUr
counter book value 4.00 4.00 4.00 4.00 4.00share price low 3.67 1) 3.83 12.13 11.54 9.64share price high 7.19 1) 14.86 16.81 14.86 13.37average share price 6.45 1) 9.06 13.58 13.16 11.46share price at closing date 7.00 1) 4.19 14.46 13.04 12.30
trading volume 458.3 1,172.5 2,817.9 1,115.2 822.11,000s 71,036 101,259 162,204 66,251 56,119% 76 140 225 93 79
Number of shareholders 13,342 12,320 12,280 14,351 14,588
1) the share-based key indicators of previous years have been adjusted for the impact of the share issue in 2009.2) Gross proceeds of eUr 160.0 million less expenses eUr 8.5 million.3) proposal of the board of directors for 2009.
calculation of key indicators, see page 120.
sHare capitaL aNd per sHare data
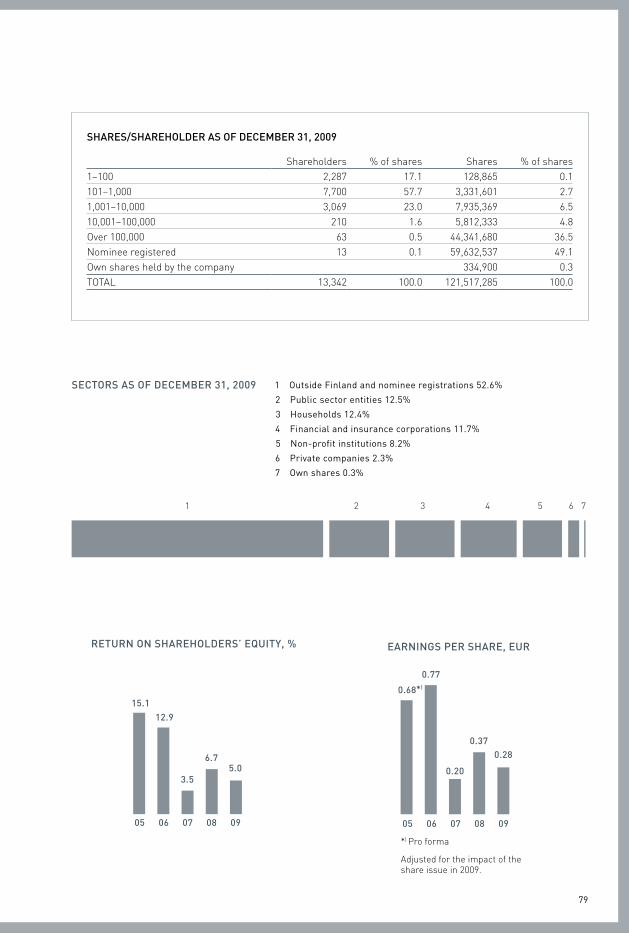
79
ShArES/ShArEhoLDEr AS of DEcEmBEr 31, 2009
shareholders % of shares shares % of shares1–100 2,287 17.1 128,865 0.1101–1,000 7,700 57.7 3,331,601 2.71,001–10,000 3,069 23.0 7,935,369 6.510,001–100,000 210 1.6 5,812,333 4.8over 100,000 63 0.5 44,341,680 36.5Nominee registered 13 0.1 59,632,537 49.1own shares held by the company 334,900 0.3totaL 13,342 100.0 121,517,285 100.0
SEcTorS AS of DEcEmBEr 31, 2009
1 2 3 4 5 6 7
1 Outside Finland and nominee registrations 52.6%
2 Public sector entities 12.5%
3 Households 12.4%
4 Financial and insurance corporations 11.7%
5 Non-profit institutions 8.2%
6 Private companies 2.3%
7 Own shares 0.3%
rETurN oN ShArEhoLDErS’ EquITy, %
05 06 07 08 09 05 06 07 08 09
6.75.0
15.1
12.9
3.5
EArNINgS pEr ShArE, Eur
0.370.28
0.68
0.77
0.20
*)
*) pro forma
adjusted for the impact of the share issue in 2009.
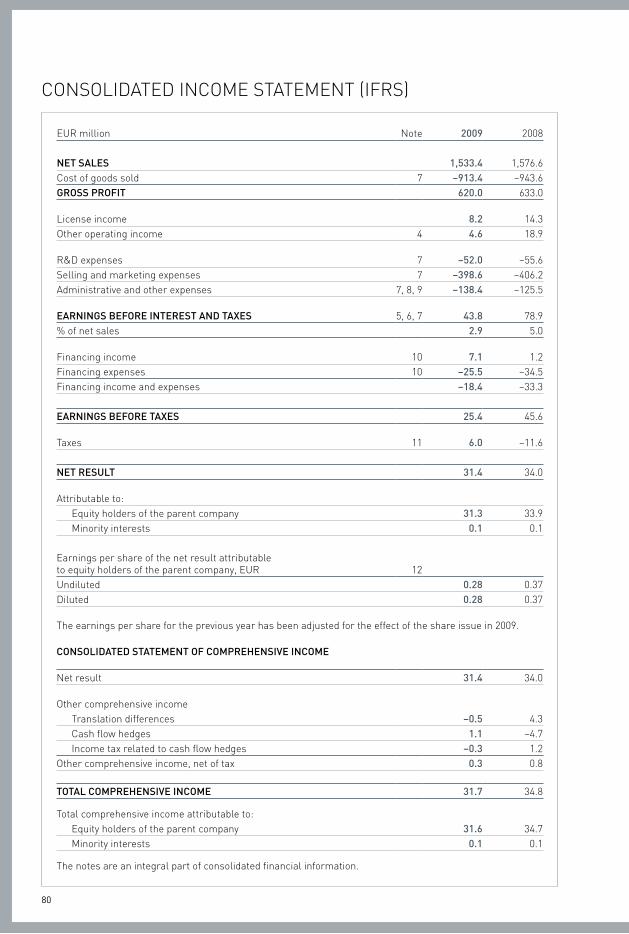
80
coNsoLidated iNcoMe stateMeNt (ifrs)
eUr million Note 2009 2008
NET SALES 1,533.4 1,576.6cost of goods sold 7 –913.4 –943.6groSS profIT 620.0 633.0
License income 8.2 14.3other operating income 4 4.6 18.9
r&d expenses 7 –52.0 –55.6selling and marketing expenses 7 –398.6 –406.2administrative and other expenses 7, 8, 9 –138.4 –125.5
EArNINgS BEforE INTErEST AND TAXES 5, 6, 7 43.8 78.9% of net sales 2.9 5.0
financing income 10 7.1 1.2financing expenses 10 –25.5 –34.5financing income and expenses –18.4 –33.3 EArNINgS BEforE TAXES 25.4 45.6
taxes 11 6.0 –11.6
NET rESuLT 31.4 34.0
attributable to:equity holders of the parent company 31.3 33.9Minority interests 0.1 0.1
earnings per share of the net result attributable to equity holders of the parent company, eUr 12Undiluted 0.28 0.37diluted 0.28 0.37
the earnings per share for the previous year has been adjusted for the effect of the share issue in 2009.
coNSoLIDATED STATEmENT of comprEhENSIVE INcomE
Net result 31.4 34.0
other comprehensive incometranslation differences –0.5 4.3cash flow hedges 1.1 –4.7income tax related to cash flow hedges –0.3 1.2
other comprehensive income, net of tax 0.3 0.8
ToTAL comprEhENSIVE INcomE 31.7 34.8
total comprehensive income attributable to:equity holders of the parent company 31.6 34.7Minority interests 0.1 0.1
the notes are an integral part of consolidated financial information.
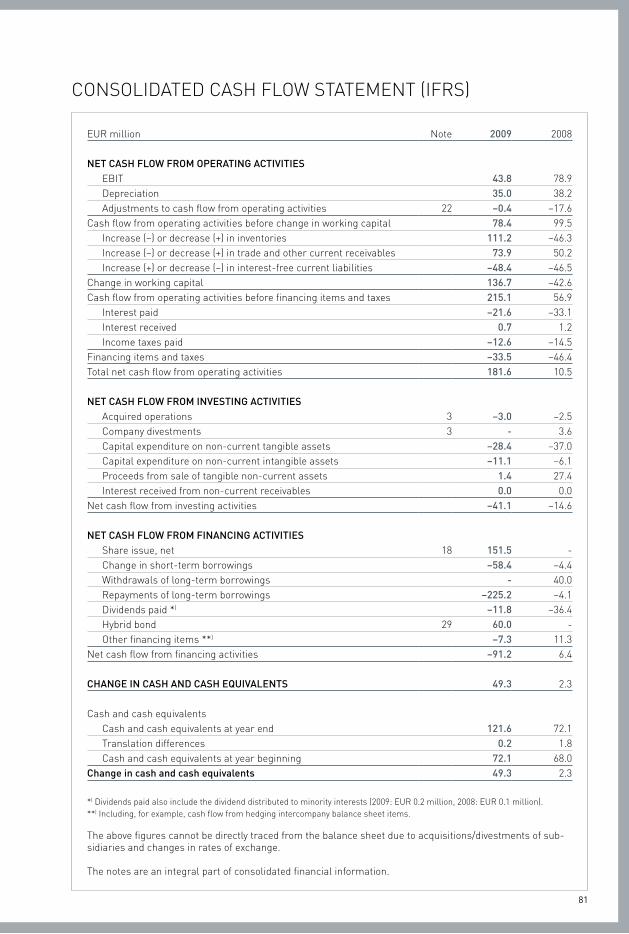
81
coNsoLidated casH fLoW stateMeNt (ifrs)
eUr million Note 2009 2008
NET cASh fLow from opErATINg AcTIVITIESebit 43.8 78.9depreciation 35.0 38.2adjustments to cash flow from operating activities 22 –0.4 –17.6
cash flow from operating activities before change in working capital 78.4 99.5increase (–) or decrease (+) in inventories 111.2 –46.3increase (–) or decrease (+) in trade and other current receivables 73.9 50.2increase (+) or decrease (–) in interest-free current liabilities –48.4 –46.5
change in working capital 136.7 –42.6cash flow from operating activities before financing items and taxes 215.1 56.9
interest paid –21.6 –33.1interest received 0.7 1.2income taxes paid –12.6 –14.5
financing items and taxes –33.5 –46.4total net cash flow from operating activities 181.6 10.5
NET cASh fLow from INVESTINg AcTIVITIESacquired operations 3 –3.0 –2.5company divestments 3 - 3.6capital expenditure on non-current tangible assets –28.4 –37.0capital expenditure on non-current intangible assets –11.1 –6.1proceeds from sale of tangible non-current assets 1.4 27.4interest received from non-current receivables 0.0 0.0
Net cash flow from investing activities –41.1 –14.6
NET cASh fLow from fINANcINg AcTIVITIESshare issue, net 18 151.5 -change in short-term borrowings –58.4 –4.4Withdrawals of long-term borrowings - 40.0repayments of long-term borrowings –225.2 –4.1dividends paid *) –11.8 –36.4Hybrid bond 29 60.0 -other financing items **) –7.3 11.3
Net cash flow from financing activities –91.2 6.4
chANgE IN cASh AND cASh EquIVALENTS 49.3 2.3
cash and cash equivalentscash and cash equivalents at year end 121.6 72.1translation differences 0.2 1.8cash and cash equivalents at year beginning 72.1 68.0
change in cash and cash equivalents 49.3 2.3
*) dividends paid also include the dividend distributed to minority interests (2009: eUr 0.2 million, 2008: eUr 0.1 million).**) including, for example, cash flow from hedging intercompany balance sheet items.
the above figures cannot be directly traced from the balance sheet due to acquisitions/divestments of sub-sidiaries and changes in rates of exchange.
the notes are an integral part of consolidated financial information.
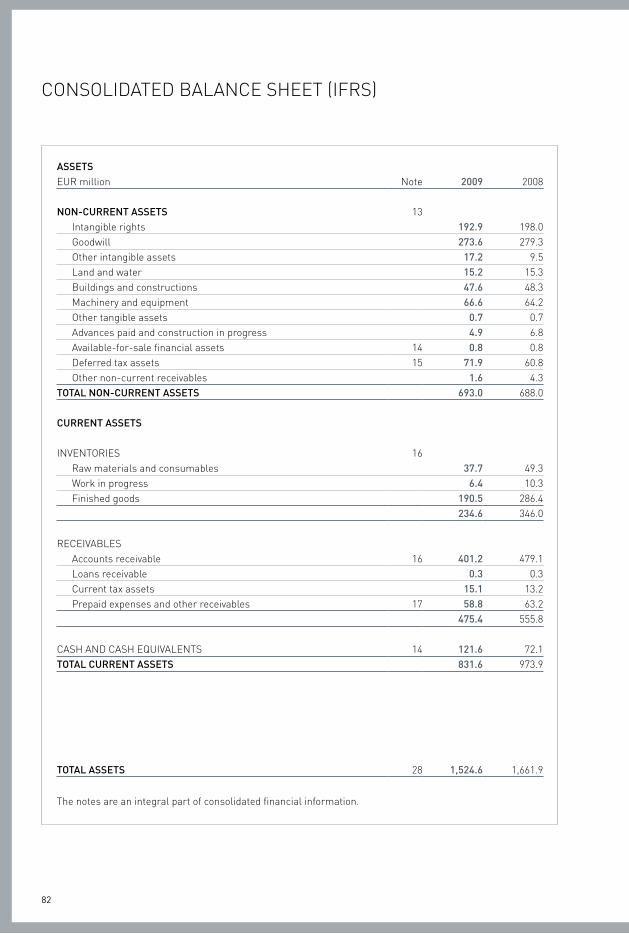
82
coNsoLidated baLaNce sHeet (ifrs)
ASSETSeUr million Note 2009 2008
NoN-currENT ASSETS 13intangible rights 192.9 198.0Goodwill 273.6 279.3other intangible assets 17.2 9.5Land and water 15.2 15.3buildings and constructions 47.6 48.3Machinery and equipment 66.6 64.2other tangible assets 0.7 0.7advances paid and construction in progress 4.9 6.8available-for-sale financial assets 14 0.8 0.8deferred tax assets 15 71.9 60.8other non-current receivables 1.6 4.3
ToTAL NoN-currENT ASSETS 693.0 688.0
currENT ASSETS
iNVeNtories 16 raw materials and consumables 37.7 49.3Work in progress 6.4 10.3finished goods 190.5 286.4
234.6 346.0
receiVabLesaccounts receivable 16 401.2 479.1Loans receivable 0.3 0.3current tax assets 15.1 13.2prepaid expenses and other receivables 17 58.8 63.2
475.4 555.8
casH aNd casH eQUiVaLeNts 14 121.6 72.1ToTAL currENT ASSETS 831.6 973.9
ToTAL ASSETS 28 1,524.6 1,661.9
the notes are an integral part of consolidated financial information.
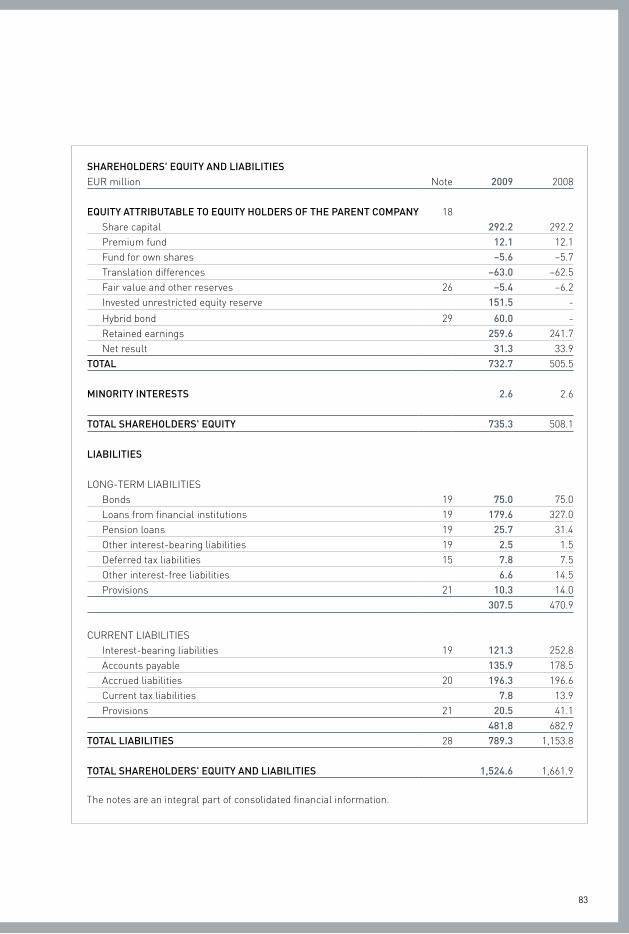
83
ShArEhoLDErS' EquITy AND LIABILITIESeUr million Note 2009 2008
EquITy ATTrIBuTABLE To EquITy hoLDErS of ThE pArENT compANy 18share capital 292.2 292.2premium fund 12.1 12.1fund for own shares –5.6 –5.7translation differences –63.0 –62.5fair value and other reserves 26 –5.4 –6.2invested unrestricted equity reserve 151.5 -
Hybrid bond 29 60.0 -retained earnings 259.6 241.7Net result 31.3 33.9
ToTAL 732.7 505.5
mINorITy INTErESTS 2.6 2.6
ToTAL ShArEhoLDErS' EquITy 735.3 508.1
LIABILITIES
LoNG-terM LiabiLities bonds 19 75.0 75.0Loans from financial institutions 19 179.6 327.0pension loans 19 25.7 31.4other interest-bearing liabilities 19 2.5 1.5deferred tax liabilities 15 7.8 7.5other interest-free liabilities 6.6 14.5provisions 21 10.3 14.0
307.5 470.9
cUrreNt LiabiLities interest-bearing liabilities 19 121.3 252.8accounts payable 135.9 178.5accrued liabilities 20 196.3 196.6current tax liabilities 7.8 13.9provisions 21 20.5 41.1
481.8 682.9ToTAL LIABILITIES 28 789.3 1,153.8
ToTAL ShArEhoLDErS' EquITy AND LIABILITIES 1,524.6 1,661.9
the notes are an integral part of consolidated financial information.
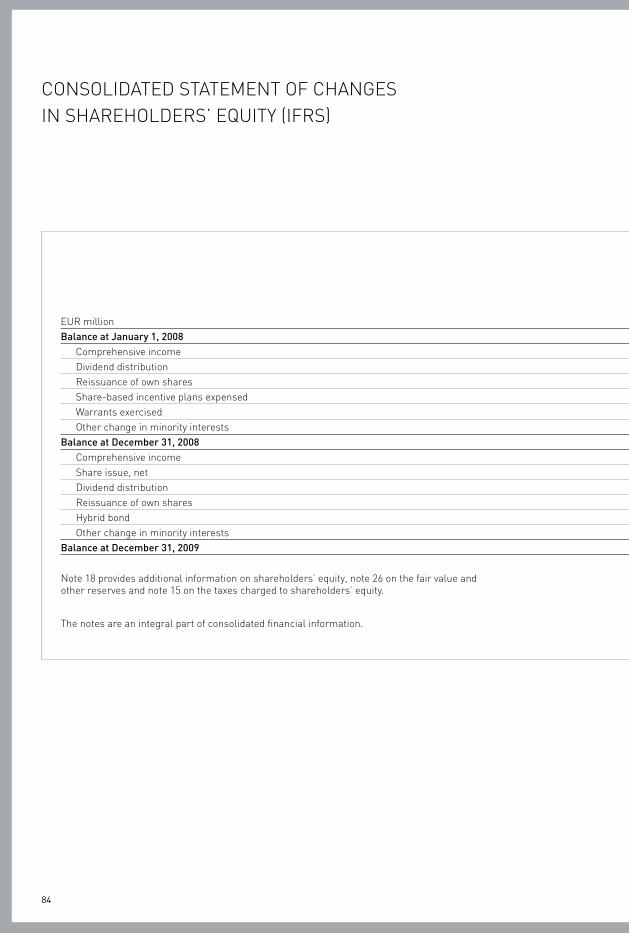
84
coNsoLidated stateMeNt of cHaNGesiN sHareHoLders’ eQUity (ifrs)
attributable to equity holders of the parent company
eUr millionshare
capitalpremium
fund
fund for own shares
transla-tion dif-
ferences
fair value and other reserves
invested unre-
stricted equity
reserveHybrid
bondretained earnings total
Minority interests
total share-
holders' equity
Balance at january 1, 2008 289.3 15.0 –7.5 –66.8 –2.7 - - 278.9 506.2 3.5 509.7comprehensive income 4.3 –3.5 33.9 34.7 0.1 34.8dividend distribution –36.3 –36.3 –0.1 –36.4reissuance of own shares 1.8 1.8 1.8share-based incentive plans expensed –0.9 –0.9 –0.9Warrants exercised 2.9 –2.9 0.0 0.0other change in minority interests –0.9 –0.9
Balance at December 31, 2008 292.2 12.1 –5.7 –62.5 –6.2 - - 275.6 505.5 2.6 508.1comprehensive income –0.5 0.8 31.3 31.6 0.1 31.7share issue, net 151.5 151.5 151.5dividend distribution –11.6 –11.6 –0.2 –11.8reissuance of own shares 0.1 0.1 0.1Hybrid bond 60.0 –4.4 55.6 55.6other change in minority interests 0.1 0.1
Balance at December 31, 2009 292.2 12.1 –5.6 –63.0 –5.4 151.5 60.0 290.9 732.7 2.6 735.3
Note 18 provides additional information on shareholders’ equity, note 26 on the fair value and other reserves and note 15 on the taxes charged to shareholders’ equity.
the notes are an integral part of consolidated financial information.

85
attributable to equity holders of the parent company
eUr millionshare
capitalpremium
fund
fund for own shares
transla-tion dif-
ferences
fair value and other reserves
invested unre-
stricted equity
reserveHybrid
bondretained earnings total
Minority interests
total share-
holders' equity
Balance at january 1, 2008 289.3 15.0 –7.5 –66.8 –2.7 - - 278.9 506.2 3.5 509.7comprehensive income 4.3 –3.5 33.9 34.7 0.1 34.8dividend distribution –36.3 –36.3 –0.1 –36.4reissuance of own shares 1.8 1.8 1.8share-based incentive plans expensed –0.9 –0.9 –0.9Warrants exercised 2.9 –2.9 0.0 0.0other change in minority interests –0.9 –0.9
Balance at December 31, 2008 292.2 12.1 –5.7 –62.5 –6.2 - - 275.6 505.5 2.6 508.1comprehensive income –0.5 0.8 31.3 31.6 0.1 31.7share issue, net 151.5 151.5 151.5dividend distribution –11.6 –11.6 –0.2 –11.8reissuance of own shares 0.1 0.1 0.1Hybrid bond 60.0 –4.4 55.6 55.6other change in minority interests 0.1 0.1
Balance at December 31, 2009 292.2 12.1 –5.6 –63.0 –5.4 151.5 60.0 290.9 732.7 2.6 735.3
Note 18 provides additional information on shareholders’ equity, note 26 on the fair value and other reserves and note 15 on the taxes charged to shareholders’ equity.
the notes are an integral part of consolidated financial information.
86
1. AccouNTINg poLIcIES
gENErAL
amer sports corporation is a finnish public listed com-pany that is domiciled in Helsinki.
amer sports corporation and its subsidiaries (“the Group”) manufacture, sell and market sports equip-ment, apparel and footwear to the sports equipment trade. the Group’s business is founded on its globally recognized brands – the major brands are Wilson, salomon, precor, atomic, Mavic, suunto and arc’teryx.
the Group has its own operations in 29 countries and its main market areas are the United states and europe.
these financial statements were authorized for issue by the board of directors on february 4, 2010.
BASIS of prEpArATIoN
the consolidated financial statements have been pre-pared in accordance with the international financial reporting standards (ifrs) approved for use in the eU, observing the ias and ifrs standards and sic and ifric interpretations in force as of december 31, 2009. in the finnish accounting act and the provisions issued under it, international financial reporting standards refer to standards approved for use in the eU in accor-dance with the procedure laid down in the eU regula-tion (ec) No 1606/2002, and their interpretations.
the Group has applied the following new and revised standards as of January 1, 2009: • IAS1 (revised): “Presentation of financial state-
ments”. the revised standard prohibits the presen-tation of income and expenses items (that is, “non-owner changes in equity”) in the statement of changes in equity, requiring “non-owner changes in equity” to be presented separately from owner changes in equity. all non-owner changes in equity are required to be shown in a performance state-ment, but entities can choose whether to present one performance statement (the statement of com-prehensive income) or two statements (the income statement and the statement of comprehensive income). Where entities restate or reclassify com-parative information, they are required to present a restated balance sheet as from the beginning of the comparative period in addition to the current requirement to present balance sheets for the end
of the current period and of the comparative period. both the income statement and the statement of comprehensive income are presented as perfor-mance statements.
• IFRS7(amended):“Enhancingdisclosuresonfinan-cial instruments”. the amendment requires enhanced disclosure about fair value measurement and liquidity risk. in particular, the amendment requires disclosure of fair value measurements by level of hierarchy. as the change in accounting pol-icy only results in additional disclosures, there is no impact on earnings per share.
• IFRS8: “Operating segments”. IFRS8 replacesias 14, “segment reporting.” the new standard requires a “management approach” under which segment information is presented on the same basis as that used for internal reporting purposes. ifrs 8 has not changed the company’s segmenta-tion which is consistent with the company’s internal reporting. furthermore, ifrs 8 requires disclosures, e.g., about company’s geographical areas of opera-tion and significant customers.
the following new and amended standards and interpretations that came into effect in 2009 did not have material impact on the Group’s financial state-ments:• IFRS2(amendment):“Share-basedpayment”deals
with vesting conditions and cancellations.• IAS23 (revised):”Borrowing costs” changes the
accounting policy in respect of borrowing costs relating to qualifying assets for which the com-mencement date for capitalization is on or after January 1, 2009. the borrowing costs directly attrib-utable to the acquisition, construction or production of a qualifying asset shall be capitalized as part of the cost of that asset.
• IAS1andIAS32(amendments):“Financial instru-ments puttable at fair value and obligations arising on liquidation”
• IAS39(amendment):“Financialinstruments:recog-nition and measurement – eligible hedged items”
• IFRIC11,IFRS2:“Groupandtreasurysharetrans-actions”
• IFRIC13:“Customerloyaltyprograms”• IFRIC14, IAS19: “The limit on a definedbenefit
asset, minimum funding requirements and their interaction”
Notes to tHe coNsoLidated fiNaNciaL stateMeNts
87
• Smallchangestovariousstandardsorinterpreta-tions as part of the annual improvements to ifrs project.
the Group will adopt the amendments in the stan-dard ifrs 3 (“business combinations”) in 2010. among other things the amendments include a requirement to expense all transaction costs and they affect the value of goodwill recognized in business combinations. in accordance with the transitional provisions of the standard, business combinations with an acquisition date prior to the effective date of the standard are not adjusted.
the following amendments and interpretations that will come into force in 2010 are expected not to have any material effect on the consolidated financial state-ments, as currently estimated by the Group (not yet approved for use in the eU):• IFRS1(amendment):“First-timeadoptionoffinan-
cial instruments” –additional exemptions for first-time adopters
• IFRS2 (amendment): “Share-based payment” –group cash-settled share-based payment transac-tions
• IFRIC9and IAS39 (amendment): “Reassessmentof embedded derivatives on reclassification”
• IFRIC18:“Transfersofassetsfromcustomers”
the following standards, interpretations and amendments will be adopted in 2011 or later (not yet approved for use in the eU):• IFRS9: “Financial instruments” represents the
first milestone in the iasb’s planned replacement of ias 39• IAS24(revised):“Relatedpartydisclosures”• IAS32(amendment):“Financialinstruments:pre-
sentation” – classification of rights issues• IFRIC19: “Extinguishingfinancial liabilitieswith
equity instruments”
the consolidated financial statements are pre-sented in millions of euros and are based on historical cost conventions with the exception of available-for-sale financial assets, financial assets and liabilities measured at fair value through profit and loss as well as derivative financial instruments at fair value.
prINcIpLES of coNSoLIDATIoN
the consolidated financial statements include all sub-sidiaries in which the parent company holds directly or indirectly more than half of the votes or otherwise con-trols the subsidiary as well as affiliated companies in which the Group holds 20–50% of the voting rights or in which it otherwise has considerable influence. com-panies acquired during the financial year have been included in the consolidated financial statements from the date when control was obtained. similarly, divested functions are included up to the date when control has been relinquished.
the consolidated financial statements are prepared according to the historical cost method. the acquisi-tion cost is allocated to assets, liabilities and contin-gent liabilities on the basis of their fair value at the time of acquisition. the proportion in excess of the fair value constitutes goodwill. Goodwill is not amortized, but its value is measured at least once a year by means of a cash flow-based impairment test (see impairment of assets below). impairment losses are booked in the income statement.
inter-company transactions as well as receivables and liabilities are eliminated. Minority interests are presented as a separate item in the income statement. Minority interests are also shown under shareholders’ equity in the balance sheet.
affiliated companies are consolidated using the equity method. the Group’s share of the results of affil-iated companies is included in the consolidated income statement. the Group’s share of the post-acquisition accumulated net assets of affiliated companies is added to the acquisition cost of affiliated companies and to retained earnings in the consolidated balance sheet.
forEIgN currENcIES
the assets and liabilities of foreign subsidiaries are translated into euros at the closing rates of exchange confirmed by the european central bank on the bal-ance sheet date. the income statement is translated into euros by consolidating each calendar month sep-arately using the actual daily average rate for the month, whereby the sum of the twelve calendar months rep-resents the whole year. translation differences arising from the elimination of the acquisition cost of foreign subsidiaries are booked to translation differences in consolidated shareholders’ equity. inter-company long-
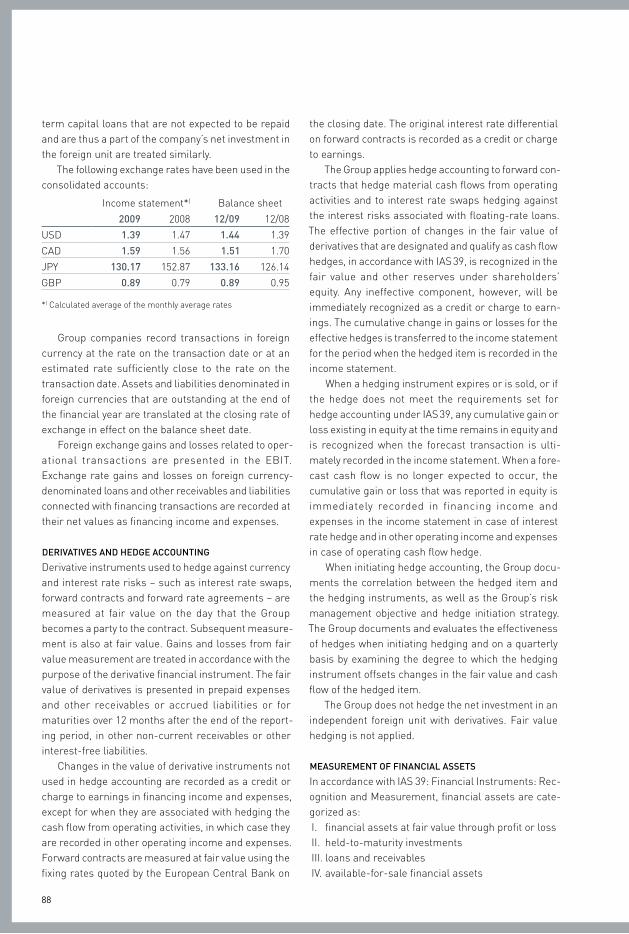
88
term capital loans that are not expected to be repaid and are thus a part of the company’s net investment in the foreign unit are treated similarly.
the following exchange rates have been used in the consolidated accounts:
income statement*) balance sheet
2009 2008 12/09 12/08
Usd 1.39 1.47 1.44 1.39
cad 1.59 1.56 1.51 1.70
Jpy 130.17 152.87 133.16 126.14
Gbp 0.89 0.79 0.89 0.95
*) calculated average of the monthly average rates
Group companies record transactions in foreign currency at the rate on the transaction date or at an estimated rate sufficiently close to the rate on the transaction date. assets and liabilities denominated in foreign currencies that are outstanding at the end of the financial year are translated at the closing rate of exchange in effect on the balance sheet date.
foreign exchange gains and losses related to oper-ational transactions are presented in the ebit. exchange rate gains and losses on foreign currency-denominated loans and other receivables and liabilities connected with financing transactions are recorded at their net values as financing income and expenses.
DErIVATIVES AND hEDgE AccouNTINg
derivative instruments used to hedge against currency and interest rate risks – such as interest rate swaps, forward contracts and forward rate agreements – are measured at fair value on the day that the Group becomes a party to the contract. subsequent measure-ment is also at fair value. Gains and losses from fair value measurement are treated in accordance with the purpose of the derivative financial instrument. the fair value of derivatives is presented in prepaid expenses and other receivables or accrued liabilities or for maturities over 12 months after the end of the report-ing period, in other non-current receivables or other interest-free liabilities.
changes in the value of derivative instruments not used in hedge accounting are recorded as a credit or charge to earnings in financing income and expenses, except for when they are associated with hedging the cash flow from operating activities, in which case they are recorded in other operating income and expenses. forward contracts are measured at fair value using the fixing rates quoted by the european central bank on
the closing date. the original interest rate differential on forward contracts is recorded as a credit or charge to earnings.
the Group applies hedge accounting to forward con-tracts that hedge material cash flows from operating activities and to interest rate swaps hedging against the interest risks associated with floating-rate loans. the effective portion of changes in the fair value of derivatives that are designated and qualify as cash flow hedges, in accordance with ias 39, is recognized in the fair value and other reserves under shareholders’ equity. any ineffective component, however, will be immediately recognized as a credit or charge to earn-ings. the cumulative change in gains or losses for the effective hedges is transferred to the income statement for the period when the hedged item is recorded in the income statement.
When a hedging instrument expires or is sold, or if the hedge does not meet the requirements set for hedge accounting under ias 39, any cumulative gain or loss existing in equity at the time remains in equity and is recognized when the forecast transaction is ulti-mately recorded in the income statement. When a fore-cast cash flow is no longer expected to occur, the cumulative gain or loss that was reported in equity is immediately recorded in financing income and expenses in the income statement in case of interest rate hedge and in other operating income and expenses in case of operating cash flow hedge.
When initiating hedge accounting, the Group docu-ments the correlation between the hedged item and the hedging instruments, as well as the Group’s risk management objective and hedge initiation strategy. the Group documents and evaluates the effectiveness of hedges when initiating hedging and on a quarterly basis by examining the degree to which the hedging instrument offsets changes in the fair value and cash flow of the hedged item.
the Group does not hedge the net investment in an independent foreign unit with derivatives. fair value hedging is not applied.
mEASurEmENT of fINANcIAL ASSETS
in accordance with ias 39: financial instruments: rec-ognition and Measurement, financial assets are cate-gorized as:i. financial assets at fair value through profit or lossii. held-to-maturity investmentsiii. loans and receivablesiV. available-for-sale financial assets
89
financial assets at fair value through profit or loss are financial assets held for trading. changes in fair value are booked as a credit or charge to earnings in financing income and expenses. derivatives are also categorized as held for trading unless they are desig-nated as hedges. assets in this category are classified as current assets, except for maturities over 12 months after the end of the reporting period.
Held-to-maturity investments and loans granted by the company are carried at amortized cost using the effective interest rate method. Held-to-maturity invest-ments are valued at cost and are included in current assets, except for maturities over 12 months after the end of the reporting period. at the end of the financial year, the Group did not possess any held-to-maturity investments.
Loans and receivables are non derivate financial assets with fixed or determinable payments that are not quoted in an active market.
available-for-sale financial assets are measured at their fair value by applying the market prices at the balance sheet date or some other determination of value used by the company. the change in fair value is presented in fair value and other reserves under share-holders’ equity. fair value changes are transferred from shareholders’ equity to the income statement when the asset is sold or its value has been impaired such that an impairment loss must be recognized. available-for-sale financial assets whose fair value cannot be deter-mined reliably are measured at cost or a lower value if they are impaired. available-for-sale financial assets are included in non-current assets unless the invest-ment matures or management intends to dispose of it within 12 months of the end of the reporting period.
financial assets are recognized on the settlement date. financial assets not carried at fair value through profit or loss are initially recognized at fair value plus transaction costs. financial assets carried at fair value through profit or loss are initially recognized at fair value and transaction costs are expensed in the income statement.
on each closing date, the Group assesses whether there is objective evidence for the impairment of a finan-cial asset item or class. the impairment loss is recorded as a credit or charge to earnings in financing items.
rEVENuE rEcogNITIoN
revenue from the sale of goods is booked when sig-nificant risks and rewards connected with ownership of the goods have been transferred to the purchaser.
Net sales represent the invoiced value of goods, less value added taxes as well as discounts and adding or subtracting foreign exchange differences.
revenue obtained from other companies is booked to license income when these companies manufacture or sell products bearing amer sports trademarks. in addition, license income includes royalty payments obtained from other companies when they utilize man-ufacturing technology patents owned by amer sports.
other operating income comprises rental income, gains on the sale of non-current assets as well as other non-recurring income, such as patent settlements.
coST of gooDS SoLD
the cost of goods sold includes all the salary and wage, material, procurement and other costs connected with the manufacture and purchase of products.
rESEArch AND DEVELopmENT EXpENSES
expenses connected with the technical development and testing of products as well as royalties for the uti-lization of non-proprietary manufacturing technology patents are booked to research and development expenses. research and development expenses are not capitalized unless there is certainty that material economic benefits are gained from them in the future. research and development expenses have not been capitalized during the year 2009.
SALES AND mArkETINg EXpENSES
expenses related to the sales, distribution, marketing and advertising of products are booked to sales and marketing expenses. these include sales inventory, customer service, marketing and sales, media adver-tising expenses and athlete endorsements.
ADmINISTrATIVE AND oThEr EXpENSES
administrative and other expenses encompass Group Headquarters’ expenses, general administration expenses, as well as minor one-off losses such as losses on disposals of non-current assets.
pENSIoN pLANS
the Group’s pension arrangements comply with the local rules and practices of the countries where amer sports operates. Under defined contribution based plans, such as principally within the finnish tyeL employment pension system, the Group’s contributions are recorded as an expense in the period to which they relate. in defined benefit plans, pension expenses are
90
recognized in the income statement, periodizing the regular costs for the employee’s years of employment according to annual pension actuarial computations, applying the projected unit credit method. the pension liability is obtained by calculating the present value of future pension contributions, applying the rate on long government treasury bills or similar instruments as the discount rate. actuarial gains and losses are rec-ognized in the income statement for the employees’ average remaining period of service to the extent that they exceed the greater of 10% of the defined benefit obligation or 10% of the fair value of plan assets.
ShArE-BASED pAymENT
the warrants or other share-based incentive schemes granted to key employees of the Group are measured at fair value at the time of granting using generally accepted valuation models. the fair values of are peri-odized as expenses in the income statement in even installments over the vesting period of the rights. cash-settled share-based payment transactions are also periodized as expenses over the vesting period.
the expense determined at the time of granting the warrants is based on an estimate of the number of warrants that it is believed will vest at the end of the vesting period. the contra item in the balance sheet is retained earnings. the Group updates its estimate of the final number of warrants on each closing date. changes in the estimates are recognized in the income statement.
the cash payments based on the exercise of the warrants granted before september 1, 2006 are entered in the company’s share capital and share premium fund n accordance with the terms and conditions of the arrangements. the cash payments based on the exer-cise of the warrants granted after september 1, 2006 are entered in the company’s share capital and invested unrestricted equity reserve.
NoN-currENT ASSETS hELD for SALE
AND DIScoNTINuED opErATIoNS
a non-current asset or a disposal group of assets and liabilities is categorized as held for sale when the eco-nomic benefits gained from it will be accrued primar-ily from its sale rather than continuous use. Non-cur-rent assets or disposal groups held for sale are mea-sured at the lower of carrying amount or fair value less selling costs and disclosed on a separate line in the balance sheet. these assets are not depreciated.
discontinued operations refer to a significant part of the company (such as a segment) that it has decided to discontinue. the net result of discontinued opera-tions is disclosed on its own line in the income state-ment, separately from continuing operations.
INcomE TAXES
taxes include the taxes for the financial year calculated on the basis of the result for the period or dividend paid out and in accordance with the tax legislation of each company’s local domicile as well as assessed or returned taxes for previous financial periods and the change in deferred taxes.
deferred tax assets and liabilities are calculated on all temporary differences between the book and tax base of assets in accordance with the tax rate at the balance sheet date or with the future tax rates prevail-ing when the tax is estimated to be paid. temporary differences arise from factors such as unused tax losses, depreciation differences, provisions, defined benefit pension plans, the fair valuation of derivative financial instruments, the internal inventory margin as well as measurements to fair value of assets in con-nection with business acquisitions. the tax effect of undistributed earnings of subsidiaries is recorded as a deferred tax liability if a dividend payout is probable and it will result in tax consequences. a deferred tax asset is recognized as a result of unused tax losses and other temporary differences to the extent that it is probable that they can be utilized in future financial periods. deferred tax assets and liabilities are offset when they relate to income taxes levied by the same tax authority.
EArNINgS pEr ShArE
the undiluted earnings per share are calculated by divid-ing the net result for the financial year by the weighted average number of shares outstanding during the finan-cial year. the dilutive effect of warrants is taken into account in calculating diluted earnings per share.
the effect of share issues on previous years’ earn-ings per share is taken into account by using a share issue ratio.
goVErNmENT grANTS
Government grants received are entered as adjust-ments to expenses in the result for the financial period except when they relate to investments, in which case they are deducted from the cost.
91
INTANgIBLE rIghTS AND oThEr
INTANgIBLE NoN-currENT ASSETS
intangible rights comprise trademarks and patents; software licenses, for instance, are included in other intangible assets. patents and software licenses are recognized in the balance sheet at cost and amortized on a straight-line basis during a useful life of from three to fifteen years. trademarks with indefinite useful lives are not amortized, but an annual cash flow-based impairment test is carried out on them (see impair-ment of assets below).
TANgIBLE NoN-currENT ASSETS
tangible non-current assets are stated as the differ-ence between the initial costs and accumulated depre-ciation less any impairment losses (see impairment of assets below).
depreciation is calculated on a straight-line basis in order to write off the cost of the tangible assets over their expected useful lives, adjusting for any impair-ment. the depreciation periods are:
buildings 25–40 yearsMachinery and equipment 3–10 yearsLand and water are not depreciated.
ImpAIrmENT of ASSETS
the carrying amounts of non-current tangible and intangible assets are assessed by means of impairment tests whenever there is an indication of impairment. any impairment of goodwill and other intangible rights having an indefinite useful life are nevertheless assessed at least once a year.
impairment tests involve measuring the recover-able amount of said asset. the recoverable amount is the higher of the asset’s net selling price or cash flow-based value in use. an impairment loss is recognized in the income statement when the carrying amount of an asset is greater than the recoverable amount. impairment recognized on assets other than goodwill is reversed if a change occurs in the estimates leading to the impairment charge. an impairment loss is reversed to a maximum amount that does not exceed the carrying amount of the asset if an impairment would not have been originally recognized.
the recoverable amount of goodwill and other intan-gible rights with indefinite useful lives is always deter-mined via their cash flow-based values in use (impair-ment tests of these items are more closely clarified in note 7).
in the cash flow-based impairment calculations for other intangible rights and property, plant and equip-ment, only the cash flows for the next five years are recognized, of which the first three are based on the budgets and strategic plans for the next three years as approved by the Group’s board of directors. in the cal-culations, the fourth and fifth years are estimated con-servatively according to the growth assumptions made in the three-year plans. the residual values used in the calculations are estimates of the probable net selling prices of the asset items.
the discount rate in the calculations is based on the long-term risk-free market interest rates and on gen-erally used standard risk premiums (the key assump-tions of the discount rate are presented more closely in note 7).
INVESTmENT propErTIES
investment properties are real estate that is held because of rental income or an appreciation in the property value. investment properties are measured at cost. the Group does not have major assets that are classified as investment properties.
LEASE AgrEEmENTS
Lease agreements relating to tangible assets, in which the Group bears an essential part of the ownership risks and rewards, are classified as finance lease agreements. a finance lease agreement is entered in the balance sheet at the lower of the asset’s fair value or the present value of minimum lease payments, and it is amortized. Lease obligations are included in inter-est-bearing liabilities. the Group does not have major finance lease agreements. other leasing payments are treated as rental expenses.
INVENTorIES
inventories are measured at the lower of cost calcu-lated according to the fifo principle or the net realiz-able value. for self-manufactured products, the cost includes direct wage and raw material costs for the manufacture of the products as well as a portion of the indirect costs of manufacture. Net realizable value is the estimated selling price in the ordinary course of business less the estimated costs of completion and the estimated costs necessary to make the sale.

92
AccouNTS rEcEIVABLE
accounts receivable are carried at the original invoiced amount less impairment losses and credits for returns. impairment losses are recognized case by case and on the basis of historical experience when there is evi-dence that the receivable cannot be recovered in full, such as due to the payment difficulties or impending bankruptcy of the debtor.
cASh AND cASh EquIVALENTS
cash and cash equivalents comprise cash in hand and deposits held at call with banks as well as readily real-izable marketable securities (maturity less than three months).
fINANcIAL LIABILITIES
financial liabilities are initially carried at fair value. transaction costs are included in the original carrying amount of financial liabilities. all financial liabilities are subsequently carried at amortized cost using the effective interest rate method. financial liabilities are classified as current liabilities unless they mature over 12 months after the balance sheet date, in which case they are included in long-term liabilities. the amounts drawn under the revolving credit facility are included in loans from financial institutions.
hyBrID BoND
in key figures, the hybrid bond has been included in shareholders’ equity. interest expenses for the hybrid bond have been accrued on the basis of its coupon rate and are debited directly to retained earnings net of tax. in the calculation of earnings per share, interest expenses of the hybrid bond have been included in the earnings for the period.
proVISIoNS
obligations arising as the consequence of a past event, which are legal or which the company has an actual obligation to settle and are considered certain or likely to occur, are booked in the income statement under an appropriate expense heading. they are presented in the balance sheet as provisions when it is probable that the resources will be transferred out of the Group but the precise amount or timing is not known. in other cases they are presented as accrued liabilities. the most important regular provisions are due to the repair or replacement of products during the warranty period. these provisions are determined on the basis of his-
torical experience. a provision for reorganization is made when the Group has drawn up a detailed reorga-nization plan and announced the reorganization.
uSE of ESTImATES IN ThE fINANcIAL STATEmENTS
When preparing the financial statements, the Group’s management has to make estimates and assumptions influencing the content of the financial statements and it must exercise its judgment regarding the application of accounting policies. the most important of these estimates and assumptions are related to any impair-ment of goodwill and other asset items, such as trade-marks, property, plant and equipment, inventories and accounts receivable; provisions for reorganization, war-ranty and legal proceedings; evaluation of pension lia-bilities and share-based payments schemes as well as the future utilization of deferred tax assets. actual results may differ from these estimates. any changes in the estimates and assumptions are recognized in the period in which the estimate or assumption is revised.
crITIcAL AccouNTINg ESTImATES AND ASSumpTIoNS
pension plans
the present value of the pension obligations depends on a number of factors that are determined on an actu-arial basis using a number of assumptions. the assumptions used in determining the net cost (or income) for pensions include the discount rate. any changes in these assumptions will impact the carrying amount of pension obligations.
amer sports determines the appropriate discount rate at the end of each year. this is the interest rate that should be used to determine the present value of estimated future cash outflows expected to be required to settle the pension obligations. other key assump-tions for pension obligations are based in part on cur-rent market conditions (see note 6).
Net liability recognized for defined benefit pension plans was eUr 5.6 million as of december 31, 2009.
Share-based payment
the warrants and other share-based incentive schemes granted to key employees of the Group are measured at fair value at the date at which they are granted, by using generally accepted valuation models. the fair val-ues are recognized as an expense in the income state-ment over the vesting period of the rights. the expense determined at the time of granting the warrants and
93
other share-based incentive instruments is based on an estimate of the number of instruments that it is believed will vest at the end of the vesting period. the Group updates its estimate of the final number of instru-ments on each reporting date. changes in the estimates are recognized in the income statement.
expenses recognized for the share-based incentive schemes for the year ended december 31, 2009 amounted to eUr 0.8 million.
Income taxes
Management judgment is required in determining pro-visions for income taxes, deferred tax assets and lia-bilities and the extent to which deferred tax assets can be recognized. the company has recognized eUr 64.1 million as of december 31, 2009 net deferred tax assets on tax loss carry forwards and other temporary differ-ences. the Group is also subject to income taxes in various jurisdictions. Judgment is required in deter-mining the Group’s provision for income taxes. there may be transactions and calculations for which the ultimate tax determination is uncertain during the ordi-nary course of business. the Group anticipates ques-tions arising in tax audits and recognizes liabilities for anticipated tax audit issues based on estimates of whether additional taxes will be due. Where the final tax outcome of these matters is different from the amounts that were initially recorded, such differences will impact the income tax and deferred tax provisions in the period in which such determination is made.
Impairment of assets
the carrying amounts of non-current tangible and intangible assets are assessed by means of impairment tests whenever there is an indication of impairment. any impairment of goodwill and other intangible assets having an indefinite useful life are nevertheless assessed at least once a year. the recoverable amounts of cash-generating units have been determined based on value-in-use calculations. these calculations require the use of estimates. as of december 31, 2009, the amount of goodwill and other non-current intan-gible assets with indefinite useful lives on balance sheet amounted to eUr 273.6 million and eUr 179.7 million, respectively. No impairment losses were recognised in 2009. Management estimates, used assumptions as well as sensitivity analyses are presented in note 7.
crITIcAL juDgmENTS IN AppLyINg
AccouNTINg poLIcIES
Inventories
the Group periodically reviews its inventories for excess amounts, obsolescence and declines in market value below cost and records an allowance against the inven-tory balance for any such declines. these reviews require management to estimate future demand for products. possible changes in these estimates could result in revisions to the valuation of inventories. as of december 31, 2009, the amount of inventories on bal-ance sheet amounted to eUr 234.6 million. Value of inventories has been decreased by eUr 23.8 million for the year ended december 31, 2009 to correspond to its net realizable value.
Accounts receivable
accounts receivable are carried at the original invoiced amount less impairment losses and credits for returns. impairment losses are recognized case by case and on the basis of historical experience when there is evi-dence that the receivable cannot be recovered in full, such as due to the payment difficulties or impending bankruptcy of the debtor. if the financial conditions of customers were to deteriorate, resulting in an impair-ment of their ability to make payments, additional impairment losses may be recognized in future periods. as of december 31, 2009, the amount of accounts receivable on balance sheet amounted to eUr 401.2 million and impairment losses of accounts receivable amounted to eUr 29.3 million.
provisions
provisions are recognized on the balance sheet when there is a legal or actual obligation for the company to settle an obligation arising as the consequence of a past event that is considered certain or likely to occur. the most important regular provisions are due to the repair or replacement of products during the warranty period. these provisions are determined on the basis of historical experience. the provisions recognized rep-resents management’s best estimate of the present value of the future costs assumed to be incurred. the actual costs may differ from the estimated. as of december 31, 2009, the amount of provisions on bal-ance sheet amounted to eUr 30.8 million.
94
BuSINESS SEgmENTS
winter and outdoor Ball Sports fitness
Business segments total
unallocated items Total
2009eUr million
Net sales 862.6 476.7 194.1 1,533.4 - 1,533.4ebit 46.5 23.5 –7.5 62.5 –18.7 43.8
% of net sales 5.4 4.9 4.1 - 2.9financing income and expenses –18.4 –18.4earnings before taxes 25.4
Goodwill and intangible assets with indefinite useful lives 218.3 93.4 141.6 453.3 - 453.3other assets 548.0 227.3 70.9 846.2 225.1 1,071.3Liabilities 184.5 122.3 39.8 346.6 442.7 789.3
capital expenditure 23.2 9.0 7.0 39.2 0.3 39.5depreciation 21.6 8.0 5.0 34.6 0.4 35.0cash flow from operating activities before financing items and taxes 118.4 86.0 24.2 228.6 –13.5 215.1
2008eUr million
Net sales 860.8 495.5 220.3 1,576.6 - 1,576.6ebit 41.1 37.0 3.8 81.9 –3.0 78.9
% of net sales 4.8 7.5 1.7 5.2 - 5.0financing income and expenses –33.3 –33.3earnings before taxes 45.6
Goodwill and intangible assets with indefinite useful lives 218.0 96.7 144.3 459.0 - 459.0other assets 657.4 284.4 101.0 1,042.8 160.1 1,202.9Liabilities 239.3 130.2 42.7 412.2 741.6 1,153.8capital expenditure 26.0 9.8 7.0 42.8 0.3 43.1depreciation 25.1 7.8 4.8 37.7 0.5 38.2cash flow from operating activities before financing items and taxes 50.4 11.4 20.7 82.5 –25.6 56.9
2. SEgmENT INformATIoN
the Group’s primary form of segment reporting is according to the business segments. the business seg-ments are based on the Group’s organizational struc-ture and management reporting. the chief operating decision maker of the Group is the executive board. the business segments are Winter and outdoor, ball sports, and fitness. there were no intersegment busi-ness operations in 2009 and 2008. in the income state-ment, line items after ebit have not been allocated to the segments.
the assets and liabilities of the business segments include only items directly connected to the business as well as the goodwill and non-current intangible assets with indefinite useful lives related to them. Unal-
located items relating to ebit include income and expenses of corporate headquarters.
the Group’s geographical segments are the americas (North, south and central america), eMea (europe, the Middle east and africa) and asia pacific (including Japan and australia). the definition of these areas is based on their geographical risks as well as the organization of the Group’s sales operations. Net sales of the geographical segments are presented according to customers’ location and assets according to where the assets are located. Goodwill and intangible assets with indefinite useful lives are not allocated to the geographical areas.
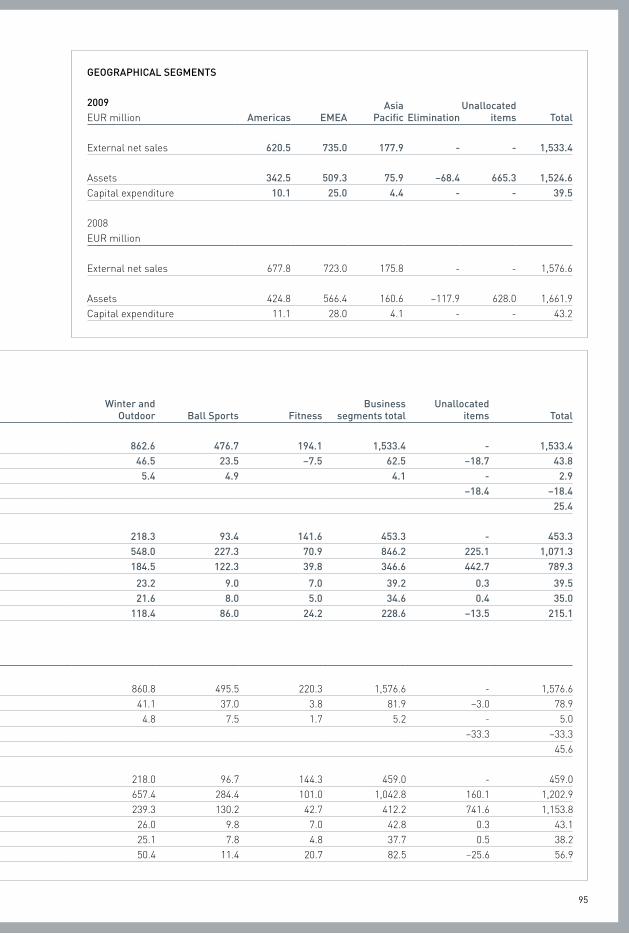
95
BuSINESS SEgmENTS
winter and outdoor Ball Sports fitness
Business segments total
unallocated items Total
2009eUr million
Net sales 862.6 476.7 194.1 1,533.4 - 1,533.4ebit 46.5 23.5 –7.5 62.5 –18.7 43.8
% of net sales 5.4 4.9 4.1 - 2.9financing income and expenses –18.4 –18.4earnings before taxes 25.4
Goodwill and intangible assets with indefinite useful lives 218.3 93.4 141.6 453.3 - 453.3other assets 548.0 227.3 70.9 846.2 225.1 1,071.3Liabilities 184.5 122.3 39.8 346.6 442.7 789.3
capital expenditure 23.2 9.0 7.0 39.2 0.3 39.5depreciation 21.6 8.0 5.0 34.6 0.4 35.0cash flow from operating activities before financing items and taxes 118.4 86.0 24.2 228.6 –13.5 215.1
2008eUr million
Net sales 860.8 495.5 220.3 1,576.6 - 1,576.6ebit 41.1 37.0 3.8 81.9 –3.0 78.9
% of net sales 4.8 7.5 1.7 5.2 - 5.0financing income and expenses –33.3 –33.3earnings before taxes 45.6
Goodwill and intangible assets with indefinite useful lives 218.0 96.7 144.3 459.0 - 459.0other assets 657.4 284.4 101.0 1,042.8 160.1 1,202.9Liabilities 239.3 130.2 42.7 412.2 741.6 1,153.8capital expenditure 26.0 9.8 7.0 42.8 0.3 43.1depreciation 25.1 7.8 4.8 37.7 0.5 38.2cash flow from operating activities before financing items and taxes 50.4 11.4 20.7 82.5 –25.6 56.9
gEogrAphIcAL SEgmENTS 2009
Americas EmEAAsia
pacific Eliminationunallocated
items TotaleUr million
external net sales 620.5 735.0 177.9 - - 1,533.4
assets 342.5 509.3 75.9 –68.4 665.3 1,524.6capital expenditure 10.1 25.0 4.4 - - 39.5
2008eUr million
external net sales 677.8 723.0 175.8 - - 1,576.6
assets 424.8 566.4 160.6 –117.9 628.0 1,661.9capital expenditure 11.1 28.0 4.1 - - 43.2
96
3. AcquIrED AND DIVESTED BuSINESSES
there were no significant business acquisitions or com-pany divestments in 2009 and 2008.
in february 2009, amer sports acquired tacktick Limited for eUr 1.1 million. tacktick specializes in wire-less marine sensors, instruments, and displays. of the purchase price eUr 0.9 million was allocated to tack-tick’s technological innovations and distribution chan-nels and eUr 0.2 million to goodwill.
suunto oy’s subsidiary Ursuk oy was sold in febru-ary 2008 for eUr 2.6 million, and clubcom inc., part of the fitness business segment, in september 2008 for eUr 1.0 million. these transactions did not result in significant gains or losses.
in a transaction published in september 2008, amer sports acquired the net assets of its long-term bulgar-ian subcontractor, pamporovo ski, mainly consisting of a factory site and inventories, for approximately eUr 5 million. of the purchase price, eUr 2.5 million was paid during the financial period 2008, eUr 1.9 million dur-ing 2009 and the remaining eUr 0.6 million will be paid in March 2010. the fair values of the acquired net assets did not substantially differ from their carrying amounts. the company’s 330 employees continued with the newly established amer sports bulgaria.
4. oThEr opErATINg INcomE
eUr million 2009 2008
rental return on real estate 1.0 1.0Gain on sale of non-current assets *) 0.4 15.8changes in the fair value of foreign exchange contracts not used in hedge accounting 0.1 0.1other 3.1 2.0total 4.6 18.9
*) amer sports corporation sold its corporate headquarters building in april 2008 for eUr 23.0 million. as a result of the transaction, the company booked a capital gain of eUr 13.1 million.
5. EmpLoyEE BENEfITS
eUr million 2009 2008
Wages and salaries 237.1 235.3social expenditure
pensions – defined contribution plans 7.0 6.9pensions – defined benefit plans 4.3 0.9other social security 53.0 51.6
total 301.4 294.7
in countries where social expenditure paid to society cannot be divided between pensions and other social security, the expenses are presented under the head-ing other social security.
6. pENSIoNS
pension security for Group companies is based on each country’s local regulations and practices. the Group’s most significant defined benefit pension plan is for Wilson sporting Goods co. (Usa) whose present value of funded obligations is 60% (67%) of the Group’s total value. in addition to Usa, the Group has defined ben-efit pension plans in france, switzerland, UK and fin-land. these are handled via pension funds or pension companies whose assets are not included in Group’s assets. contributions to the funds are made in accor-dance with local regulations. in Usa and UK pension funds are closed, and new members are no longer admitted to them. the Group’s other pension arrange-ments, such as the finnish tyeL statutory employment pension, are mainly defined contribution plans.
the net liability recognized in the balance sheet relating to defined benefit pension plans is defined as follows:eUr million 2009 2008
present value of funded obligations 87.5 83.3fair value of plan assets –70.3 –60.7deficit/(surplus) 17.2 22.6Unrecognized actuarial gains (+) and losses (–) –11.6 –17.5Net liability in the balance sheet at december 31 5.6 5.1
Net liability in the balance sheet:assets 3.7 5.6Liabilities 9.3 10.7Net liability at december 31 5.6 5.1
the amounts related to defined benefit pension plans are included in the balance sheet in prepaid expenses and accrued liabilities.
amounts recognized in the income statement:eUr million 2009 2008
current service cost 1.9 2.0interest cost 5.1 4.7expected return on plan assets –4.3 –5.8recognised actuarial gains (–) and losses (+) 1.6 0.0total, included in personnel expenses 4.3 0.9
amounts recognized in the income statement per function:eUr million 2009 2008
cost of goods sold 0.2 0.4selling and marketing 1.4 0.6administration 2.7 –0.1total 4.3 0.9
the actual return on plan assets 11.7 –16.1
salaries and other compensation of the management are presented in note 27.
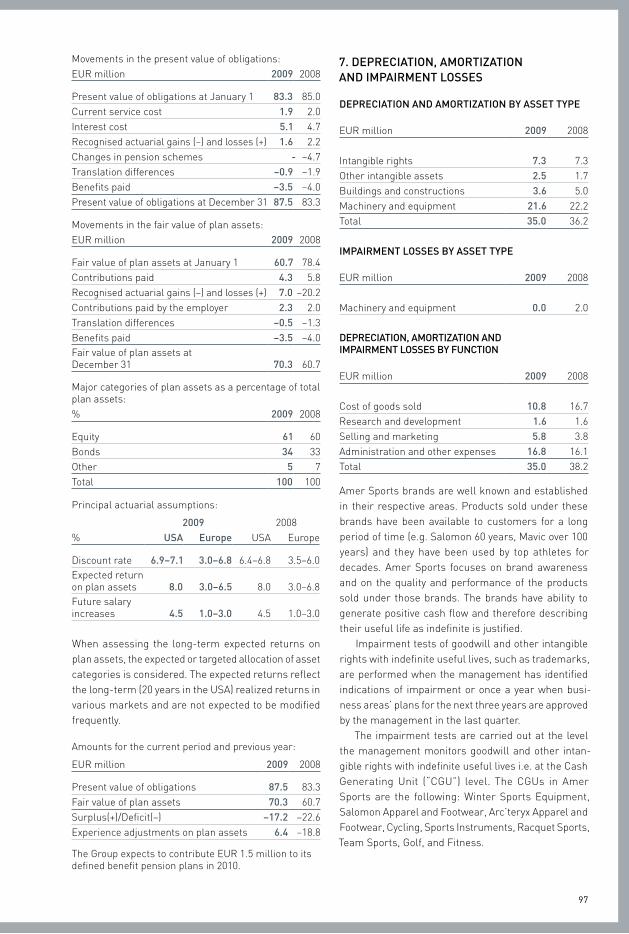
97
Movements in the present value of obligations:eUr million 2009 2008
present value of obligations at January 1 83.3 85.0current service cost 1.9 2.0interest cost 5.1 4.7recognised actuarial gains (–) and losses (+) 1.6 2.2changes in pension schemes - –4.7translation differences –0.9 –1.9benefits paid –3.5 –4.0present value of obligations at december 31 87.5 83.3
Movements in the fair value of plan assets:eUr million 2009 2008
fair value of plan assets at January 1 60.7 78.4contributions paid 4.3 5.8recognised actuarial gains (–) and losses (+) 7.0 –20.2contributions paid by the employer 2.3 2.0translation differences –0.5 –1.3benefits paid –3.5 –4.0fair value of plan assets at december 31 70.3 60.7
Major categories of plan assets as a percentage of total plan assets:% 2009 2008
equity 61 60bonds 34 33other 5 7total 100 100
principal actuarial assumptions:
2009 2008% uSA Europe Usa europe
discount rate 6.9–7.1 3.0–6.8 6.4–6.8 3.5–6.0expected return on plan assets 8.0 3.0–6.5 8.0 3.0–6.8future salary increases 4.5 1.0–3.0 4.5 1.0–3.0
When assessing the long-term expected returns on plan assets, the expected or targeted allocation of asset categories is considered. the expected returns reflect the long-term (20 years in the Usa) realized returns in various markets and are not expected to be modified frequently.
amounts for the current period and previous year:
eUr million 2009 2008
present value of obligations 87.5 83.3fair value of plan assets 70.3 60.7surplus(+)/deficit(–) –17.2 –22.6experience adjustments on plan assets 6.4 –18.8
the Group expects to contribute eUr 1.5 million to its defined benefit pension plans in 2010.
7. DEprEcIATIoN, AmorTIZATIoN AND ImpAIrmENT LoSSES
DEprEcIATIoN AND AmorTIZATIoN By ASSET TypE
eUr million 2009 2008
intangible rights 7.3 7.3other intangible assets 2.5 1.7buildings and constructions 3.6 5.0Machinery and equipment 21.6 22.2total 35.0 36.2
ImpAIrmENT LoSSES By ASSET TypE
eUr million 2009 2008
Machinery and equipment 0.0 2.0
DEprEcIATIoN, AmorTIZATIoN AND ImpAIrmENT LoSSES By fuNcTIoN
eUr million 2009 2008
cost of goods sold 10.8 16.7research and development 1.6 1.6selling and marketing 5.8 3.8administration and other expenses 16.8 16.1total 35.0 38.2
amer sports brands are well known and established in their respective areas. products sold under these brands have been available to customers for a long period of time (e.g. salomon 60 years, Mavic over 100 years) and they have been used by top athletes for decades. amer sports focuses on brand awareness and on the quality and performance of the products sold under those brands. the brands have ability to generate positive cash flow and therefore describing their useful life as indefinite is justified.
impairment tests of goodwill and other intangible rights with indefinite useful lives, such as trademarks, are performed when the management has identified indications of impairment or once a year when busi-ness areas’ plans for the next three years are approved by the management in the last quarter.
the impairment tests are carried out at the level the management monitors goodwill and other intan-gible rights with indefinite useful lives i.e. at the cash Generating Unit (“cGU”) level. the cGUs in amer sports are the following: Winter sports equipment, salomon apparel and footwear, arc’teryx apparel and footwear, cycling, sports instruments, racquet sports, team sports, Golf, and fitness.
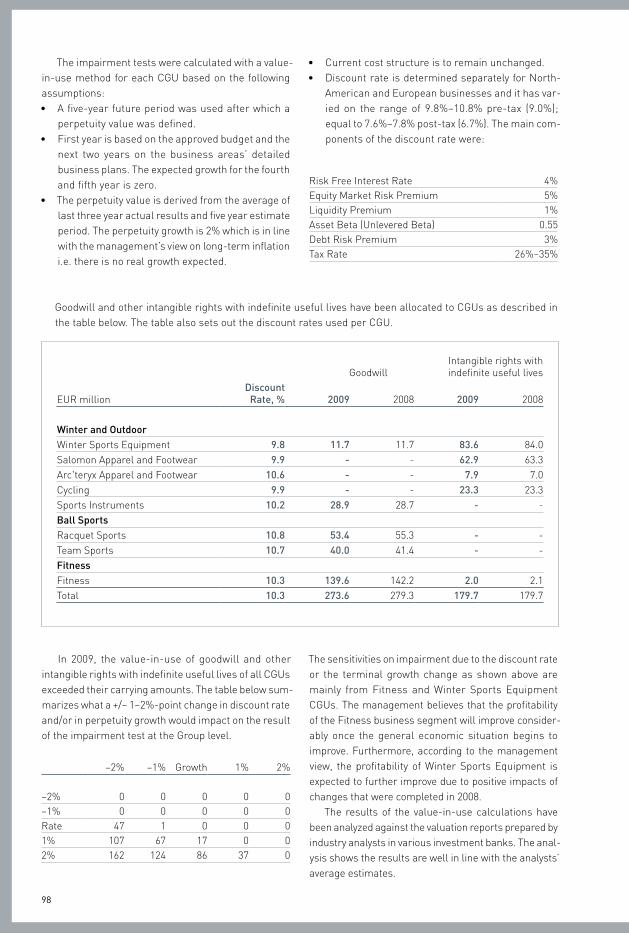
98
the impairment tests were calculated with a value-in-use method for each cGU based on the following assumptions:
a five-year future period was used after which a •perpetuity value was defined. first year is based on the approved budget and the •next two years on the business areas’ detailed business plans. the expected growth for the fourth and fifth year is zero.the perpetuity value is derived from the average of •last three year actual results and five year estimate period. the perpetuity growth is 2% which is in line with the management’s view on long-term inflation i.e. there is no real growth expected.
Goodwillintangible rights withindefinite useful lives
eUr millionDiscount
rate, % 2009 2008 2009 2008
winter and outdoorWinter sports equipment 9.8 11.7 11.7 83.6 84.0salomon apparel and footwear 9.9 - - 62.9 63.3arc'teryx apparel and footwear 10.6 - - 7.9 7.0cycling 9.9 - - 23.3 23.3sports instruments 10.2 28.9 28.7 - -Ball Sportsracquet sports 10.8 53.4 55.3 - -team sports 10.7 40.0 41.4 - -fitnessfitness 10.3 139.6 142.2 2.0 2.1total 10.3 273.6 279.3 179.7 179.7
current cost structure is to remain unchanged.•discount rate is determined separately for North-•american and european businesses and it has var-ied on the range of 9.8%–10.8% pre-tax (9.0%); equal to 7.6%–7.8% post-tax (6.7%). the main com-ponents of the discount rate were:
in 2009, the value-in-use of goodwill and other intangible rights with indefinite useful lives of all cGUs exceeded their carrying amounts. the table below sum-marizes what a +/– 1–2%-point change in discount rate and/or in perpetuity growth would impact on the result of the impairment test at the Group level.
–2% –1% Growth 1% 2%
–2% 0 0 0 0 0–1% 0 0 0 0 0rate 47 1 0 0 01% 107 67 17 0 02% 162 124 86 37 0
the sensitivities on impairment due to the discount rate or the terminal growth change as shown above are mainly from fitness and Winter sports equipment cGUs. the management believes that the profitability of the fitness business segment will improve consider-ably once the general economic situation begins to improve. furthermore, according to the management view, the profitability of Winter sports equipment is expected to further improve due to positive impacts of changes that were completed in 2008.
the results of the value-in-use calculations have been analyzed against the valuation reports prepared by industry analysts in various investment banks. the anal-ysis shows the results are well in line with the analysts’ average estimates.
risk free interest rate 4%equity Market risk premium 5%Liquidity premium 1%asset beta (Unlevered beta) 0.55debt risk premium 3%tax rate 26%–35%
Goodwill and other intangible rights with indefinite useful lives have been allocated to cGUs as described in the table below. the table also sets out the discount rates used per cGU.
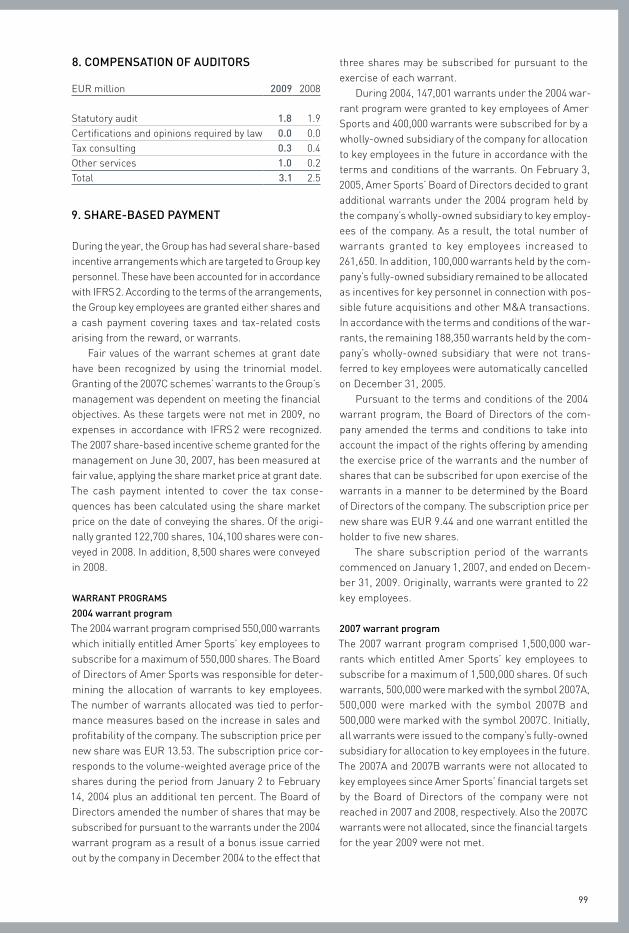
99
8. compENSATIoN of AuDITorS
eUr million 2009 2008
statutory audit 1.8 1.9certifications and opinions required by law 0.0 0.0tax consulting 0.3 0.4other services 1.0 0.2total 3.1 2.5
9. ShArE-BASED pAymENT
during the year, the Group has had several share-based incentive arrangements which are targeted to Group key personnel. these have been accounted for in accordance with ifrs 2. according to the terms of the arrangements, the Group key employees are granted either shares and a cash payment covering taxes and tax-related costs arising from the reward, or warrants.
fair values of the warrant schemes at grant date have been recognized by using the trinomial model. Granting of the 2007c schemes’ warrants to the Group’s management was dependent on meeting the financial objectives. as these targets were not met in 2009, no expenses in accordance with ifrs 2 were recognized. the 2007 share-based incentive scheme granted for the management on June 30, 2007, has been measured at fair value, applying the share market price at grant date. the cash payment intented to cover the tax conse-quences has been calculated using the share market price on the date of conveying the shares. of the origi-nally granted 122,700 shares, 104,100 shares were con-veyed in 2008. in addition, 8,500 shares were conveyed in 2008.
wArrANT progrAmS
2004 warrant program
the 2004 warrant program comprised 550,000 warrants which initially entitled amer sports’ key employees to subscribe for a maximum of 550,000 shares. the board of directors of amer sports was responsible for deter-mining the allocation of warrants to key employees. the number of warrants allocated was tied to perfor-mance measures based on the increase in sales and profitability of the company. the subscription price per new share was eUr 13.53. the subscription price cor-responds to the volume-weighted average price of the shares during the period from January 2 to february 14, 2004 plus an additional ten percent. the board of directors amended the number of shares that may be subscribed for pursuant to the warrants under the 2004 warrant program as a result of a bonus issue carried out by the company in december 2004 to the effect that
three shares may be subscribed for pursuant to the exercise of each warrant.
during 2004, 147,001 warrants under the 2004 war-rant program were granted to key employees of amer sports and 400,000 warrants were subscribed for by a wholly-owned subsidiary of the company for allocation to key employees in the future in accordance with the terms and conditions of the warrants. on february 3, 2005, amer sports’ board of directors decided to grant additional warrants under the 2004 program held by the company’s wholly-owned subsidiary to key employ-ees of the company. as a result, the total number of warrants granted to key employees increased to 261,650. in addition, 100,000 warrants held by the com-pany’s fully-owned subsidiary remained to be allocated as incentives for key personnel in connection with pos-sible future acquisitions and other M&a transactions. in accordance with the terms and conditions of the war-rants, the remaining 188,350 warrants held by the com-pany’s wholly-owned subsidiary that were not trans-ferred to key employees were automatically cancelled on december 31, 2005.
pursuant to the terms and conditions of the 2004 warrant program, the board of directors of the com-pany amended the terms and conditions to take into account the impact of the rights offering by amending the exercise price of the warrants and the number of shares that can be subscribed for upon exercise of the warrants in a manner to be determined by the board of directors of the company. the subscription price per new share was eUr 9.44 and one warrant entitled the holder to five new shares.
the share subscription period of the warrants commenced on January 1, 2007, and ended on decem-ber 31, 2009. originally, warrants were granted to 22 key employees.
2007 warrant program
the 2007 warrant program comprised 1,500,000 war-rants which entitled amer sports’ key employees to subscribe for a maximum of 1,500,000 shares. of such warrants, 500,000 were marked with the symbol 2007a, 500,000 were marked with the symbol 2007b and 500,000 were marked with the symbol 2007c. initially, all warrants were issued to the company’s fully-owned subsidiary for allocation to key employees in the future. the 2007a and 2007b warrants were not allocated to key employees since amer sports’ financial targets set by the board of directors of the company were not reached in 2007 and 2008, respectively. also the 2007c warrants were not allocated, since the financial targets for the year 2009 were not met.

100
ShArE-BASED INcENTIVE pLAN
on January 14, 2007, the board of directors resolved to establish a share-based incentive plan for amer sports’ key employees. in order to participate in the plan, each key employee was required to purchase shares up to the amount corresponding to one-half of the reward that was allocated to him/her. the plan’s rewards were paid in 2008 partially as shares and partially in cash. the cash payment covered taxes and tax-related costs arising from the reward. of the shares rewarded to employees under the plan, 25 percent will be transfer-able as of april 2010, 25 percent as of april 2011, and 50 percent as of april 2012. the rewards from the share-based incentive plan correspond to a maximum value of approximately 400,000 shares. at the end of 2009, 22 key employees were covered by the share-based incen-tive plan and they have received in total 102,800 shares (excluding the effect of the share issue in 2009).
on March 3, 2009, the board of directors decided to transfer the shares used for the Group’s key personnel’s share-based incentive plan to its fully-owned subsidiary, amer sports international oy for allocation to key employees in the future. as at financial year end, amer sports international oy owned 334,900 shares including the shares that have been returned to amer sports inter-
national oy during 2009, by persons who no longer par-ticipate in the plan. of the shares owned by amer sports international oy, 89,900 shares are available for alloca-tion to key employees.
in october 2009, amer sports organised a share issue, in conjunction with which the company decided to grant the persons included in the share-based incen-tive scheme the right to subscribe that number of shares that the key personnel in the scheme were enti-tled to subscribe on the basis of the terms and condi-tions of the rights issue, a total of 67,536 shares. the additional benefit accrued to the employees as the result of the shares issued was recognized at the fair value of the grant date, eUr 3.30 per new share, and that benefit will be amortized over the vesting period. the fair value of the additional benefit was determined by deducting from the fair value of the issued new shares the portion that the employees should have received in order to avoid a situation where the fair value of the shares already in their possession on the basis of the share-based incentive scheme would have been diluted as a result of the share issue.
the key conditions and assumptions used in the determination of the fair value of the arrangements are presented in the table below:
share-based incentive scheme Warrant schemes
2009 2008 2007 2007c 2004:1 2004:2
Grant dateSep. 17,
2009
apr. 29/aug. 6,
2008Jun. 30,
2007 -apr. 28,
2004feb. 3,
2005Number of instruments granted 67,536 8,500 104,100 - 147,001 114,649share price at grant date, eUr 5.62 11.35/9.56 18.31 - 13.57 13.80exercise price, eUr - - - - 9.44 9.44Vesting period, years 1–3 2–4 3–5 - 5.7 4.9expected volatility, % - - - - 32 30expected dividends, % - - - - 3.44 3.62risk-free interest rate, % - - - - 3.57 3.10departure rate, % - - - - 0 0returned shares 9,800 - -fair value per instrument at grant date, eUr 3.30 11.35/9.56 18.31 - 10.54 9.39
eUr million 2009 2008
expense of warrant and other share-based incentive schemes recognized in earnings 0.8 1.0
the expected volatility has been estimated by using the daily data on rates during the three years preceding the issue.
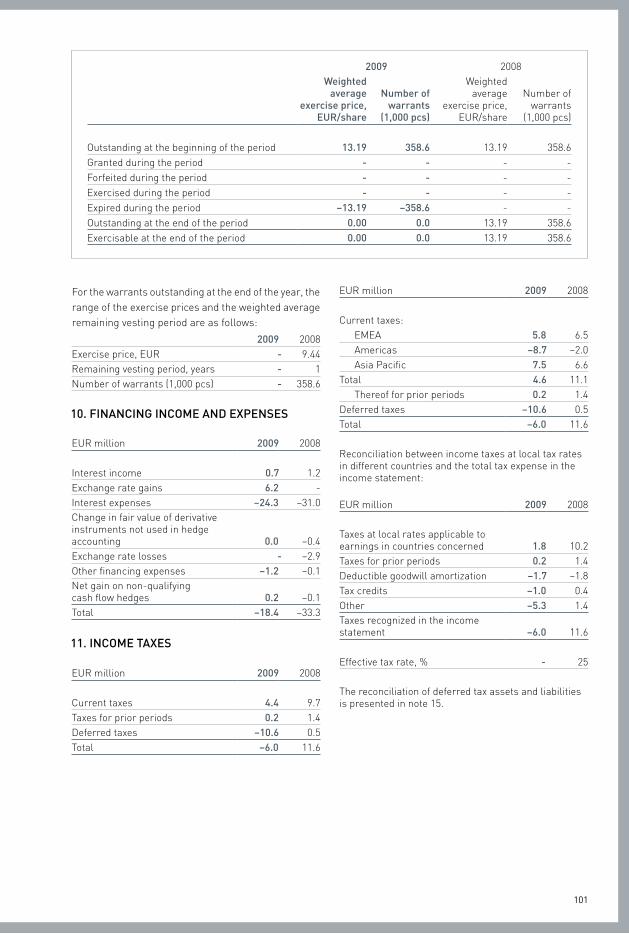
101
2009 2008weighted
average exercise price,
Eur/share
Number of warrants
(1,000 pcs)
Weighted average
exercise price, eUr/share
Number of warrants
(1,000 pcs)
outstanding at the beginning of the period 13.19 358.6 13.19 358.6Granted during the period - - - -forfeited during the period - - - -exercised during the period - - - -expired during the period –13.19 –358.6 - -outstanding at the end of the period 0.00 0.0 13.19 358.6exercisable at the end of the period 0.00 0.0 13.19 358.6
for the warrants outstanding at the end of the year, the range of the exercise prices and the weighted average remaining vesting period are as follows:
2009 2008exercise price, eUr - 9.44remaining vesting period, years - 1Number of warrants (1,000 pcs) - 358.6
10. fINANcINg INcomE AND EXpENSES
eUr million 2009 2008
interest income 0.7 1.2exchange rate gains 6.2 -interest expenses –24.3 –31.0change in fair value of derivativeinstruments not used in hedge accounting 0.0 –0.4exchange rate losses - –2.9other financing expenses –1.2 –0.1Net gain on non-qualifying cash flow hedges 0.2 –0.1total –18.4 –33.3
11. INcomE TAXES
eUr million 2009 2008
current taxes 4.4 9.7taxes for prior periods 0.2 1.4deferred taxes –10.6 0.5total –6.0 11.6
eUr million 2009 2008
current taxes:eMea 5.8 6.5americas –8.7 –2.0asia pacific 7.5 6.6
total 4.6 11.1thereof for prior periods 0.2 1.4
deferred taxes –10.6 0.5total –6.0 11.6
reconciliation between income taxes at local tax rates in different countries and the total tax expense in the income statement:
eUr million 2009 2008
taxes at local rates applicable to earnings in countries concerned 1.8 10.2taxes for prior periods 0.2 1.4deductible goodwill amortization –1.7 –1.8tax credits –1.0 0.4other –5.3 1.4taxes recognized in the income statement –6.0 11.6
effective tax rate, % - 25
the reconciliation of deferred tax assets and liabilities is presented in note 15.
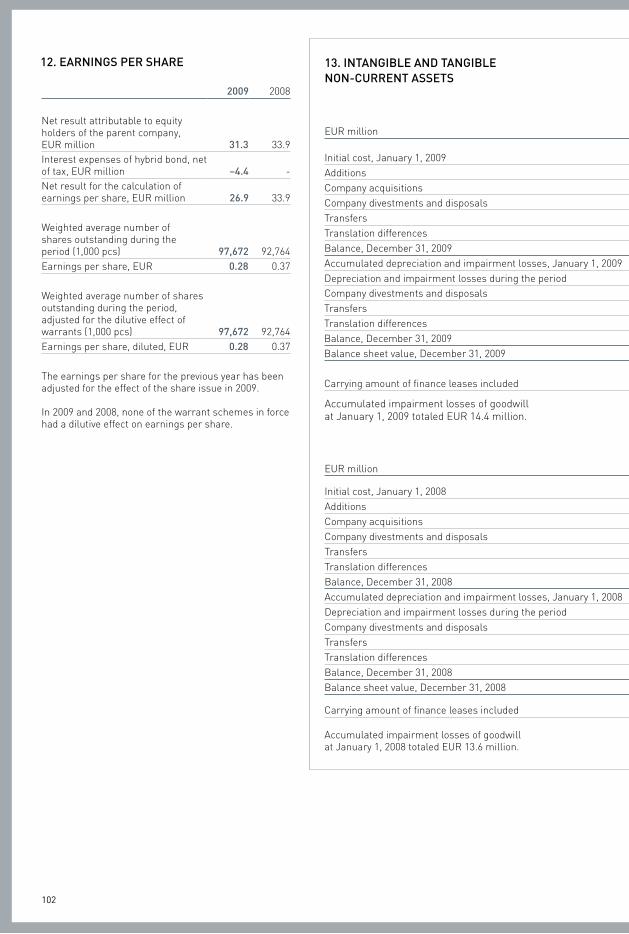
102
13. INTANgIBLE AND TANgIBLE NoN-currENT ASSETS
eUr millionIntangible
rights goodwill
other intangible
assetsLand and
water
Buildings and
construc- tions
machinery and
equipment
other tangible
assets
Advances paid and
construction in progress
initial cost, January 1, 2009 240.2 366.2 12.9 15.3 147.4 333.3 0.7 6.8additions 0.9 - 10.3 - 2.1 15.7 - 10.5company acquisitions 1.4 0.2 - - 0.0 0.2 - -company divestments and disposals 0.0 - 0.0 - –0.8 –4.5 - –0.3transfers –0.8 - 0.3 - –2.7 –58.4 0.0 –12.1translation differences 0.0 –7.8 –0.4 –0.1 –1.2 –1.4 0.0 0.0balance, december 31, 2009 241.7 358.6 23.1 15.2 144.8 284.9 0.7 4.9accumulated depreciation and impairment losses, January 1, 2009 42.2 86.9 3.4 0.0 99.1 269.1 - 0.0depreciation and impairment losses during the period 7.3 - 2.5 - 3.6 21.6 - -company divestments and disposals 0.0 - 0.0 - –0.6 –4.3 - -transfers –0.7 - 0.0 - –4.1 –66.7 - -translation differences 0.0 –1.9 0.0 - –0.8 –1.4 - -balance, december 31, 2009 48.8 85.0 5.9 0.0 97.2 218.3 - 0.0balance sheet value, december 31, 2009 192.9 273.6 17.2 15.2 47.6 66.6 0.7 4.9
carrying amount of finance leases included - - - - 0.0 0.7 - -
accumulated impairment losses of goodwill at January 1, 2009 totaled eUr 14.4 million.
eUr millionintangible
rights Goodwill
other intangible
assetsLand and
water
buildings and
construc- tions
Machinery and
equipment
other tangible
assets
advances paid and
construction in progress
initial cost, January 1, 2008 237.4 354.9 9.2 13.9 160.4 331.1 0.7 4.2additions 2.8 - 3.3 - 3.1 21.6 - 12.3company acquisitions - - - 0.6 2.6 0.4 - -company divestments and disposals –0.6 –1.3 0.0 –0.1 –23.1 –21.4 - –0.1transfers 0.4 - - 0.8 2.8 –1.3 0.0 –9.8translation differences 0.2 12.6 0.4 0.1 1.6 2.9 0.0 0.2balance, december 31, 2008 240.2 366.2 12.9 15.3 147.4 333.3 0.7 6.8accumulated depreciation and impairment losses, January 1, 2008 35.5 84.0 1.6 0.0 104.2 270.0 - 0.2depreciation and impairment losses during the period 7.3 - 1.7 - 5.0 24.3 - -company divestments and disposals –0.5 –0.1 0.0 - –12.8 –14.5 - -transfers –0.1 0.0 - - 1.8 –13.4 - –0.2translation differences 0.0 3.0 0.1 - 0.9 2.7 - 0.0balance, december 31, 2008 42.2 86.9 3.4 0.0 99.1 269.1 - 0.0balance sheet value, december 31, 2008 198.0 279.3 9.5 15.3 48.3 64.2 0.7 6.8
carrying amount of finance leases included - - - - 0.9 0.4 - -
accumulated impairment losses of goodwill at January 1, 2008 totaled eUr 13.6 million.
12. EArNINgS pEr ShArE
2009 2008
Net result attributable to equity holders of the parent company, eUr million 31.3 33.9interest expenses of hybrid bond, net of tax, eUr million –4.4 -Net result for the calculation of earnings per share, eUr million 26.9 33.9
Weighted average number of shares outstanding during the period (1,000 pcs) 97,672 92,764earnings per share, eUr 0.28 0.37
Weighted average number of shares outstanding during the period, adjusted for the dilutive effect of warrants (1,000 pcs) 97,672 92,764earnings per share, diluted, eUr 0.28 0.37
the earnings per share for the previous year has been adjusted for the effect of the share issue in 2009.
in 2009 and 2008, none of the warrant schemes in force had a dilutive effect on earnings per share.
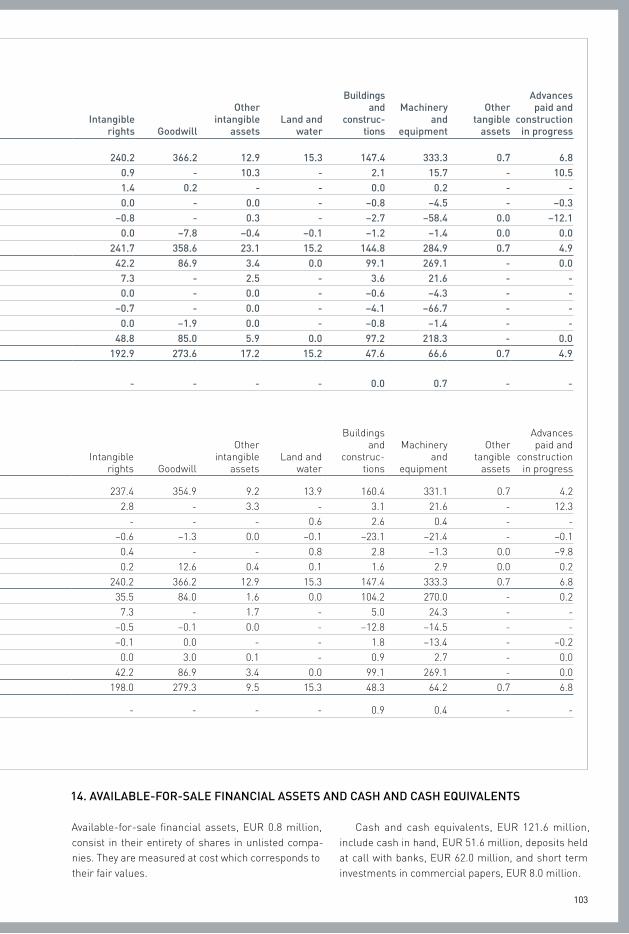
103
13. INTANgIBLE AND TANgIBLE NoN-currENT ASSETS
eUr millionIntangible
rights goodwill
other intangible
assetsLand and
water
Buildings and
construc- tions
machinery and
equipment
other tangible
assets
Advances paid and
construction in progress
initial cost, January 1, 2009 240.2 366.2 12.9 15.3 147.4 333.3 0.7 6.8additions 0.9 - 10.3 - 2.1 15.7 - 10.5company acquisitions 1.4 0.2 - - 0.0 0.2 - -company divestments and disposals 0.0 - 0.0 - –0.8 –4.5 - –0.3transfers –0.8 - 0.3 - –2.7 –58.4 0.0 –12.1translation differences 0.0 –7.8 –0.4 –0.1 –1.2 –1.4 0.0 0.0balance, december 31, 2009 241.7 358.6 23.1 15.2 144.8 284.9 0.7 4.9accumulated depreciation and impairment losses, January 1, 2009 42.2 86.9 3.4 0.0 99.1 269.1 - 0.0depreciation and impairment losses during the period 7.3 - 2.5 - 3.6 21.6 - -company divestments and disposals 0.0 - 0.0 - –0.6 –4.3 - -transfers –0.7 - 0.0 - –4.1 –66.7 - -translation differences 0.0 –1.9 0.0 - –0.8 –1.4 - -balance, december 31, 2009 48.8 85.0 5.9 0.0 97.2 218.3 - 0.0balance sheet value, december 31, 2009 192.9 273.6 17.2 15.2 47.6 66.6 0.7 4.9
carrying amount of finance leases included - - - - 0.0 0.7 - -
accumulated impairment losses of goodwill at January 1, 2009 totaled eUr 14.4 million.
eUr millionintangible
rights Goodwill
other intangible
assetsLand and
water
buildings and
construc- tions
Machinery and
equipment
other tangible
assets
advances paid and
construction in progress
initial cost, January 1, 2008 237.4 354.9 9.2 13.9 160.4 331.1 0.7 4.2additions 2.8 - 3.3 - 3.1 21.6 - 12.3company acquisitions - - - 0.6 2.6 0.4 - -company divestments and disposals –0.6 –1.3 0.0 –0.1 –23.1 –21.4 - –0.1transfers 0.4 - - 0.8 2.8 –1.3 0.0 –9.8translation differences 0.2 12.6 0.4 0.1 1.6 2.9 0.0 0.2balance, december 31, 2008 240.2 366.2 12.9 15.3 147.4 333.3 0.7 6.8accumulated depreciation and impairment losses, January 1, 2008 35.5 84.0 1.6 0.0 104.2 270.0 - 0.2depreciation and impairment losses during the period 7.3 - 1.7 - 5.0 24.3 - -company divestments and disposals –0.5 –0.1 0.0 - –12.8 –14.5 - -transfers –0.1 0.0 - - 1.8 –13.4 - –0.2translation differences 0.0 3.0 0.1 - 0.9 2.7 - 0.0balance, december 31, 2008 42.2 86.9 3.4 0.0 99.1 269.1 - 0.0balance sheet value, december 31, 2008 198.0 279.3 9.5 15.3 48.3 64.2 0.7 6.8
carrying amount of finance leases included - - - - 0.9 0.4 - -
accumulated impairment losses of goodwill at January 1, 2008 totaled eUr 13.6 million.
available-for-sale financial assets, eUr 0.8 million, consist in their entirety of shares in unlisted compa-nies. they are measured at cost which corresponds to their fair values.
cash and cash equivalents, eUr 121.6 million, include cash in hand, eUr 51.6 million, deposits held at call with banks, eUr 62.0 million, and short term investments in commercial papers, eUr 8.0 million.
14. AVAILABLE-for-SALE fINANcIAL ASSETS AND cASh AND cASh EquIVALENTS
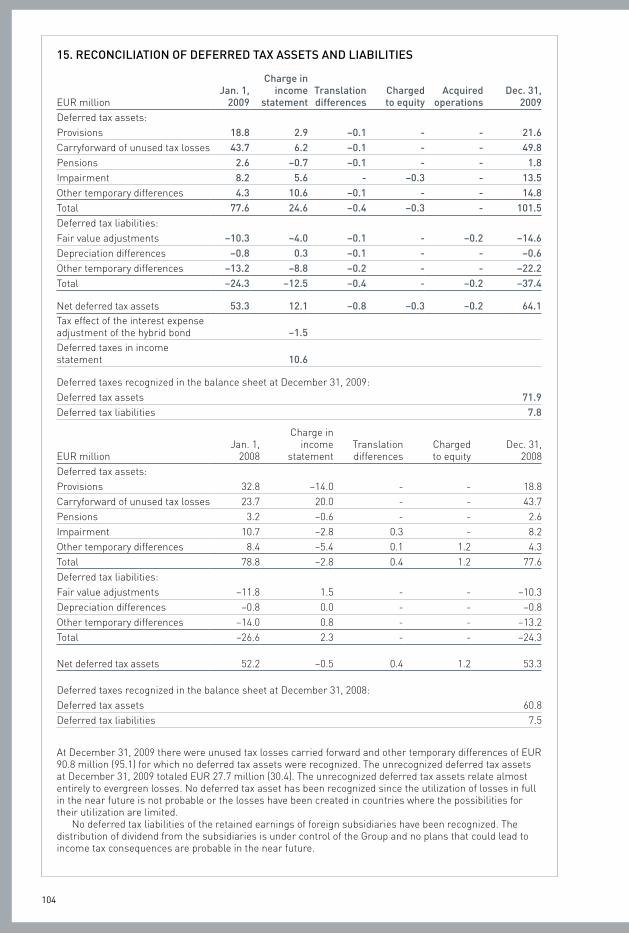
104
15. rEcoNcILIATIoN of DEfErrED TAX ASSETS AND LIABILITIES
jan. 1, 2009
charge in income
statementTranslation differences
charged to equity
Acquired operations
Dec. 31, 2009eUr million
deferred tax assets:provisions 18.8 2.9 –0.1 - - 21.6carryforward of unused tax losses 43.7 6.2 –0.1 - - 49.8pensions 2.6 –0.7 –0.1 - - 1.8impairment 8.2 5.6 - –0.3 - 13.5other temporary differences 4.3 10.6 –0.1 - - 14.8total 77.6 24.6 –0.4 –0.3 - 101.5deferred tax liabilities:fair value adjustments –10.3 –4.0 –0.1 - –0.2 –14.6depreciation differences –0.8 0.3 –0.1 - - –0.6other temporary differences –13.2 –8.8 –0.2 - - –22.2total –24.3 –12.5 –0.4 - –0.2 –37.4
Net deferred tax assets 53.3 12.1 –0.8 –0.3 –0.2 64.1tax effect of the interest expense adjustment of the hybrid bond –1.5deferred taxes in income statement 10.6
deferred taxes recognized in the balance sheet at december 31, 2009:deferred tax assets 71.9deferred tax liabilities 7.8
eUr millionJan. 1,
2008
charge in income
statementtranslation differences
charged to equity
dec. 31, 2008
deferred tax assets:provisions 32.8 –14.0 - - 18.8carryforward of unused tax losses 23.7 20.0 - - 43.7pensions 3.2 –0.6 - - 2.6impairment 10.7 –2.8 0.3 - 8.2other temporary differences 8.4 –5.4 0.1 1.2 4.3total 78.8 –2.8 0.4 1.2 77.6deferred tax liabilities:fair value adjustments –11.8 1.5 - - –10.3depreciation differences –0.8 0.0 - - –0.8other temporary differences –14.0 0.8 - - –13.2total –26.6 2.3 - - –24.3
Net deferred tax assets 52.2 –0.5 0.4 1.2 53.3
deferred taxes recognized in the balance sheet at december 31, 2008:deferred tax assets 60.8deferred tax liabilities 7.5
at december 31, 2009 there were unused tax losses carried forward and other temporary differences of eUr 90.8 million (95.1) for which no deferred tax assets were recognized. the unrecognized deferred tax assets at december 31, 2009 totaled eUr 27.7 million (30.4). the unrecognized deferred tax assets relate almost entirely to evergreen losses. No deferred tax asset has been recognized since the utilization of losses in full in the near future is not probable or the losses have been created in countries where the possibilities for their utilization are limited.
No deferred tax liabilities of the retained earnings of foreign subsidiaries have been recognized. the distribution of dividend from the subsidiaries is under control of the Group and no plans that could lead to income tax consequences are probable in the near future.
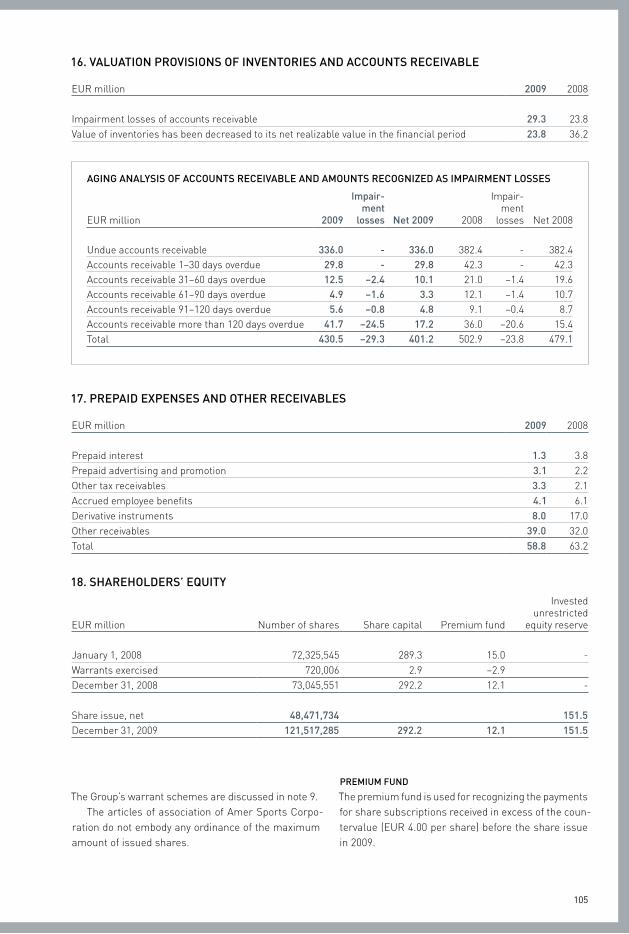
105
16. VALuATIoN proVISIoNS of INVENTorIES AND AccouNTS rEcEIVABLE
eUr million 2009 2008
impairment losses of accounts receivable 29.3 23.8Value of inventories has been decreased to its net realizable value in the financial period 23.8 36.2
17. prEpAID EXpENSES AND oThEr rEcEIVABLES
eUr million 2009 2008
prepaid interest 1.3 3.8prepaid advertising and promotion 3.1 2.2other tax receivables 3.3 2.1accrued employee benefits 4.1 6.1derivative instruments 8.0 17.0other receivables 39.0 32.0total 58.8 63.2
18. ShArEhoLDErS’ EquITy
eUr million Number of shares share capital premium fund
invested unrestricted
equity reserve
January 1, 2008 72,325,545 289.3 15.0 -Warrants exercised 720,006 2.9 –2.9december 31, 2008 73,045,551 292.2 12.1 -
share issue, net 48,471,734 151.5december 31, 2009 121,517,285 292.2 12.1 151.5
AgINg ANALySIS of AccouNTS rEcEIVABLE AND AmouNTS rEcogNIZED AS ImpAIrmENT LoSSES
eUr million 2009
Impair-ment
losses Net 2009 2008
impair-ment
losses Net 2008
Undue accounts receivable 336.0 - 336.0 382.4 - 382.4accounts receivable 1–30 days overdue 29.8 - 29.8 42.3 - 42.3accounts receivable 31–60 days overdue 12.5 –2.4 10.1 21.0 –1.4 19.6accounts receivable 61–90 days overdue 4.9 –1.6 3.3 12.1 –1.4 10.7accounts receivable 91–120 days overdue 5.6 –0.8 4.8 9.1 –0.4 8.7accounts receivable more than 120 days overdue 41.7 –24.5 17.2 36.0 –20.6 15.4total 430.5 –29.3 401.2 502.9 –23.8 479.1
the Group’s warrant schemes are discussed in note 9. the articles of association of amer sports corpo-
ration do not embody any ordinance of the maximum amount of issued shares.
prEmIum fuND
the premium fund is used for recognizing the payments for share subscriptions received in excess of the coun-tervalue (eUr 4.00 per share) before the share issue in 2009.
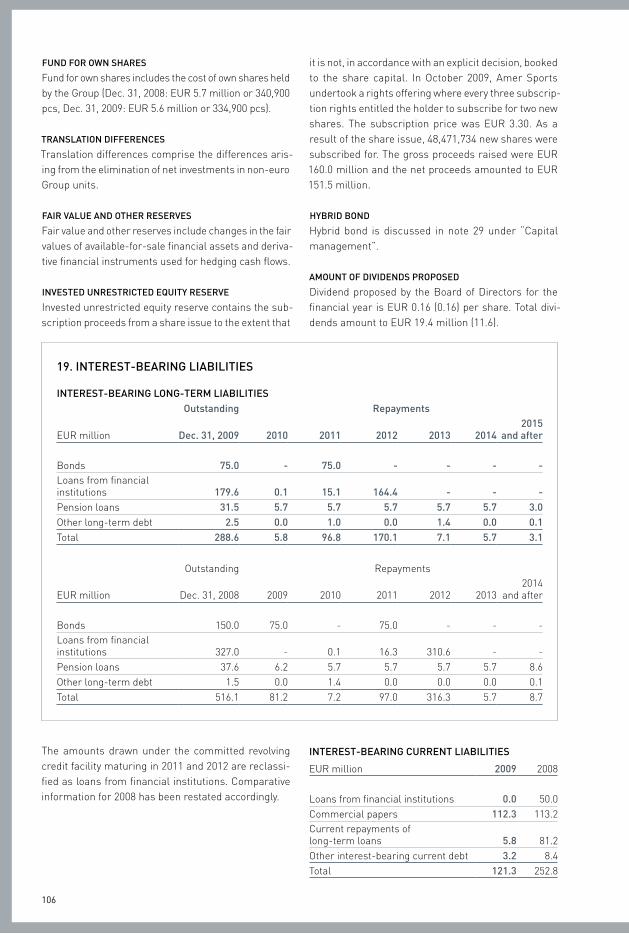
106
19. INTErEST-BEArINg LIABILITIES
INTErEST-BEArINg LoNg-TErm LIABILITIES outstanding repayments
eUr million Dec. 31, 2009 2010 2011 2012 2013 20142015
and after
bonds 75.0 - 75.0 - - - -Loans from financial institutions 179.6 0.1 15.1 164.4 - - -pension loans 31.5 5.7 5.7 5.7 5.7 5.7 3.0other long-term debt 2.5 0.0 1.0 0.0 1.4 0.0 0.1total 288.6 5.8 96.8 170.1 7.1 5.7 3.1
outstanding repayments
eUr million dec. 31, 2008 2009 2010 2011 2012 20132014
and after
bonds 150.0 75.0 - 75.0 - - -Loans from financial institutions 327.0 - 0.1 16.3 310.6 - -pension loans 37.6 6.2 5.7 5.7 5.7 5.7 8.6other long-term debt 1.5 0.0 1.4 0.0 0.0 0.0 0.1total 516.1 81.2 7.2 97.0 316.3 5.7 8.7
fuND for owN ShArES
fund for own shares includes the cost of own shares held by the Group (dec. 31, 2008: eUr 5.7 million or 340,900 pcs, dec. 31, 2009: eUr 5.6 million or 334,900 pcs).
TrANSLATIoN DIffErENcES
translation differences comprise the differences aris-ing from the elimination of net investments in non-euro Group units.
fAIr VALuE AND oThEr rESErVES
fair value and other reserves include changes in the fair values of available-for-sale financial assets and deriva-tive financial instruments used for hedging cash flows.
INVESTED uNrESTrIcTED EquITy rESErVE
invested unrestricted equity reserve contains the sub-scription proceeds from a share issue to the extent that
it is not, in accordance with an explicit decision, booked to the share capital. in october 2009, amer sports undertook a rights offering where every three subscrip-tion rights entitled the holder to subscribe for two new shares. the subscription price was eUr 3.30. as a result of the share issue, 48,471,734 new shares were subscribed for. the gross proceeds raised were eUr 160.0 million and the net proceeds amounted to eUr 151.5 million.
hyBrID BoND
Hybrid bond is discussed in note 29 under “capital management”.
AmouNT of DIVIDENDS propoSED
dividend proposed by the board of directors for the financial year is eUr 0.16 (0.16) per share. total divi-dends amount to eUr 19.4 million (11.6).
the amounts drawn under the committed revolving credit facility maturing in 2011 and 2012 are reclassi-fied as loans from financial institutions. comparative information for 2008 has been restated accordingly.
INTErEST-BEArINg currENT LIABILITIES
eUr million 2009 2008
Loans from financial institutions 0.0 50.0commercial papers 112.3 113.2current repayments of long-term loans 5.8 81.2other interest-bearing current debt 3.2 8.4total 121.3 252.8

107
21. proVISIoNS
eUr millionproduct
warrantyrestruc-
turingEnviron-
mental other Total
balance at January 1, 2009 25.8 23.9 1.0 4.4 55.1translation differences –1.7 –1.4 - –0.1 –3.2provisions made during the year 12.6 2.5 - 1.6 16.7provisions used during the year –18.0 –15.2 –0.3 –1.3 –34.8Unused provisions reversed during the year –0.8 –0.8 - –1.4 –3.0balance at december 31, 2009 17.9 9.0 0.7 3.2 30.8
current provisions 20.5Long-term provisions 10.3total 30.8
INTErEST-BEArINg LIABILITIES AT fAIr VALuE
2009 2008
eUr millioncarrying amount
fair value
carrying amount
fair value
bonds 75.0 75.0 150.0 150.0Loans from finan-cial institutions 179.6 179.6 377.0 377.0pension loans 31.5 33.0 37.6 36.4commercial papers 112.3 112.3 113.2 113.2other interest-bearing debt 5.7 5.7 9.9 9.9total 404.1 405.6 687.7 686.5
fair values have been calculated by discounting future cash flows at market-based interest rates at the end of the financial period.
20. AccruED LIABILITIES
eUr million 2009 2008
accrued personnel costs 81.1 78.0accrued interest 8.0 8.4accrued rent 5.9 6.8accrued advertising and promotion 12.1 11.5Value added tax 4.8 2.7forward contract payables 10.5 22.4other accrued liabilities 73.9 66.8total 196.3 196.6
fINANcE LEASE LIABILITIES
eUr million 2009 2008
finance lease liabilities are due as follows:Not later than one year 0.6 0.7Later than one year but not later than five years 0.6 0.7
total minimum lease payments 1.2 1.4
present value of minimum lease payments is not mate-rially different from their carrying amount.
the most important regular provisions are due to the repair or replacement of products during their war-ranty period. in material terms warranty provisions are realized in the following year. in fitness business some extended warranty periods are granted to customers. extended warranties are presented under long-term provisions. in 2008 unusually high warranty costs were recognised in the cycling business. these provisions were used during the period under review.
of the total restructuring provision of eUr 9.0 mil-lion at the period end, eUr 6.9 million is related to the restructuring of the Winter sports equipment business area. precise timing of these provisions is not known, but they are likely to occur by the end of 2012 and 2013.
therefore majority of these restructuring provisions are presented under long-term provisions.
other provisions include e.g. buyback provisions of fitness business and provisions for claims against group companies.
22. ADjuSTmENTS To cASh fLow from opErATINg AcTIVITIES
eUr million 2009 2008
share-based incentive schemes 0.0 –1.8Gains and losses on sale of non-current assets –0.4 –15.8total –0.4 –17.6
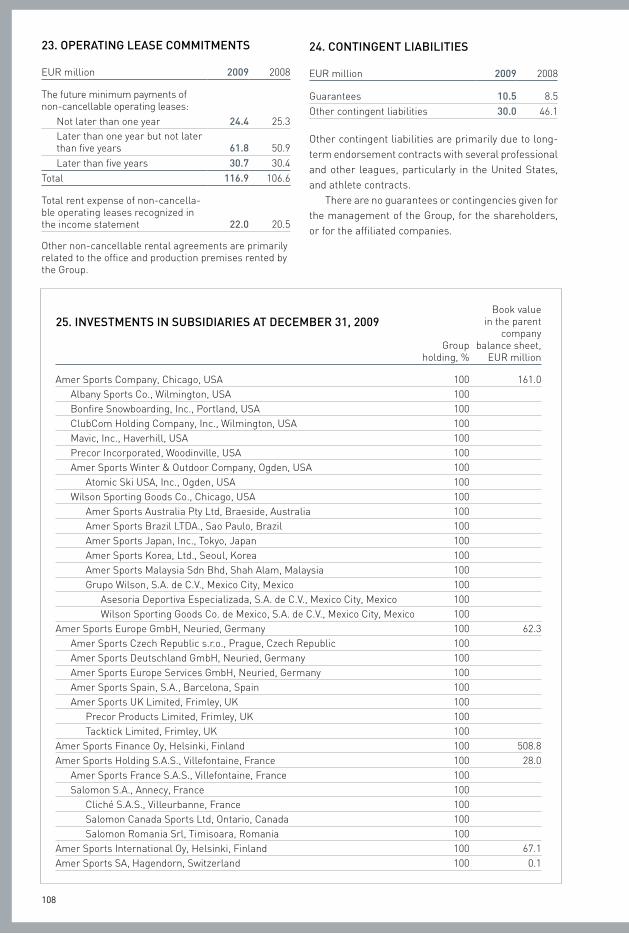
108
Group holding, %
book value in the parent
company balance sheet,
eUr million
amer sports company, chicago, Usa 100 161.0albany sports co., Wilmington, Usa 100bonfire snowboarding, inc., portland, Usa 100clubcom Holding company, inc., Wilmington, Usa 100Mavic, inc., Haverhill, Usa 100precor incorporated, Woodinville, Usa 100amer sports Winter & outdoor company, ogden, Usa 100
atomic ski Usa, inc., ogden, Usa 100Wilson sporting Goods co., chicago, Usa 100
amer sports australia pty Ltd, braeside, australia 100amer sports brazil Ltda., sao paulo, brazil 100amer sports Japan, inc., tokyo, Japan 100amer sports Korea, Ltd., seoul, Korea 100amer sports Malaysia sdn bhd, shah alam, Malaysia 100Grupo Wilson, s.a. de c.V., Mexico city, Mexico 100
asesoria deportiva especializada, s.a. de c.V., Mexico city, Mexico 100Wilson sporting Goods co. de Mexico, s.a. de c.V., Mexico city, Mexico 100
amer sports europe GmbH, Neuried, Germany 100 62.3amer sports czech republic s.r.o., prague, czech republic 100amer sports deutschland GmbH, Neuried, Germany 100amer sports europe services GmbH, Neuried, Germany 100amer sports spain, s.a., barcelona, spain 100amer sports UK Limited, frimley, UK 100
precor products Limited, frimley, UK 100tacktick Limited, frimley, UK 100
amer sports finance oy, Helsinki, finland 100 508.8amer sports Holding s.a.s., Villefontaine, france 100 28.0
amer sports france s.a.s., Villefontaine, france 100salomon s.a., annecy, france 100
cliché s.a.s., Villeurbanne, france 100salomon canada sports Ltd, ontario, canada 100salomon romania srl, timisoara, romania 100
amer sports international oy, Helsinki, finland 100 67.1amer sports sa, Hagendorn, switzerland 100 0.1
23. opErATINg LEASE commITmENTS
eUr million 2009 2008
the future minimum payments of non-cancellable operating leases:
Not later than one year 24.4 25.3Later than one year but not later than five years 61.8 50.9Later than five years 30.7 30.4
total 116.9 106.6
total rent expense of non-cancella-ble operating leases recognized in the income statement 22.0 20.5
other non-cancellable rental agreements are primarily related to the office and production premises rented by the Group.
24. coNTINgENT LIABILITIES
eUr million 2009 2008
Guarantees 10.5 8.5other contingent liabilities 30.0 46.1
other contingent liabilities are primarily due to long-term endorsement contracts with several professional and other leagues, particularly in the United states, and athlete contracts.
there are no guarantees or contingencies given for the management of the Group, for the shareholders, or for the affiliated companies.
25. INVESTmENTS IN SuBSIDIArIES AT DEcEmBEr 31, 2009
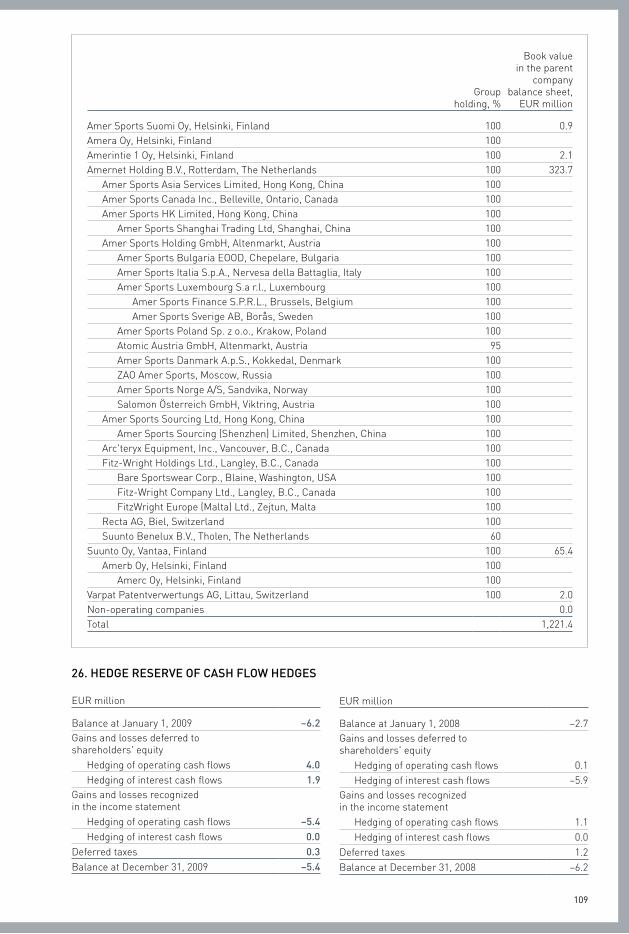
109
Group holding, %
book value in the parent
company balance sheet,
eUr million
amer sports suomi oy, Helsinki, finland 100 0.9amera oy, Helsinki, finland 100amerintie 1 oy, Helsinki, finland 100 2.1amernet Holding b.V., rotterdam, the Netherlands 100 323.7
amer sports asia services Limited, Hong Kong, china 100amer sports canada inc., belleville, ontario, canada 100amer sports HK Limited, Hong Kong, china 100
amer sports shanghai trading Ltd, shanghai, china 100amer sports Holding GmbH, altenmarkt, austria 100
amer sports bulgaria eood, chepelare, bulgaria 100amer sports italia s.p.a., Nervesa della battaglia, italy 100amer sports Luxembourg s.a r.l., Luxembourg 100
amer sports finance s.p.r.L., brussels, belgium 100amer sports sverige ab, borås, sweden 100
amer sports poland sp. z o.o., Krakow, poland 100atomic austria GmbH, altenmarkt, austria 95amer sports danmark a.p.s., Kokkedal, denmark 100Zao amer sports, Moscow, russia 100amer sports Norge a/s, sandvika, Norway 100salomon Österreich GmbH, Viktring, austria 100
amer sports sourcing Ltd, Hong Kong, china 100amer sports sourcing (shenzhen) Limited, shenzhen, china 100
arc'teryx equipment, inc., Vancouver, b.c., canada 100fitz-Wright Holdings Ltd., Langley, b.c., canada 100
bare sportswear corp., blaine, Washington, Usa 100fitz-Wright company Ltd., Langley, b.c., canada 100fitzWright europe (Malta) Ltd., Zejtun, Malta 100
recta aG, biel, switzerland 100suunto benelux b.V., tholen, the Netherlands 60
suunto oy, Vantaa, finland 100 65.4amerb oy, Helsinki, finland 100
amerc oy, Helsinki, finland 100Varpat patentverwertungs aG, Littau, switzerland 100 2.0Non-operating companies 0.0total 1,221.4
eUr million
balance at January 1, 2009 –6.2Gains and losses deferred to shareholders' equity
Hedging of operating cash flows 4.0Hedging of interest cash flows 1.9
Gains and losses recognized in the income statement
Hedging of operating cash flows –5.4Hedging of interest cash flows 0.0
deferred taxes 0.3balance at december 31, 2009 –5.4
eUr million
balance at January 1, 2008 –2.7Gains and losses deferred to shareholders' equity
Hedging of operating cash flows 0.1Hedging of interest cash flows –5.9
Gains and losses recognized in the income statement
Hedging of operating cash flows 1.1Hedging of interest cash flows 0.0
deferred taxes 1.2balance at december 31, 2008 –6.2
26. hEDgE rESErVE of cASh fLow hEDgES
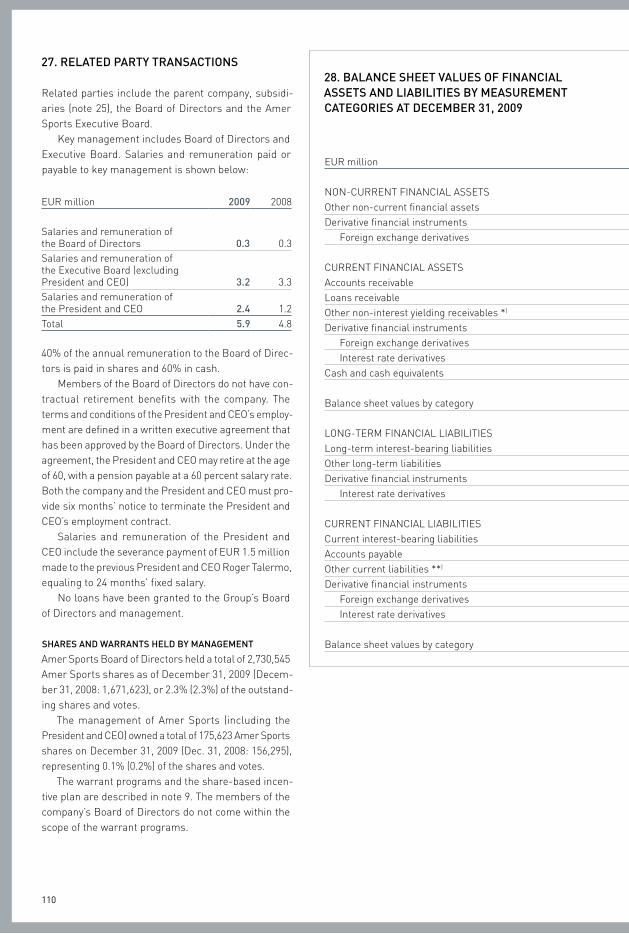
110
eUr million
financial assets/
liabilities at fair value
through income statement
Derivative financial
instruments used in hedge
accounting
Loans and other
receivables
Available- for-sale
financial assets
financial liabilities
measured at amortized
cost
carrying amount
by balance sheet item fair value
NoN-cUrreNt fiNaNciaL assetsother non-current financial assets 1.6 0.8 2.4 2.4derivative financial instruments
foreign exchange derivatives 0.0 0.0 0.0
cUrreNt fiNaNciaL assetsaccounts receivable 401.2 401.2 401.2Loans receivable 0.3 0.3 0.3other non-interest yielding receivables *) 43.9 43.9 43.9derivative financial instruments
foreign exchange derivatives 6.0 1.9 7.9 7.9interest rate derivatives 0.1 0.1 0.1
cash and cash equivalents 121.6 121.6 121.6
balance sheet values by category 6.0 2.0 568.6 0.8 577.4 577.4
LoNG-terM fiNaNciaL LiabiLitiesLong-term interest-bearing liabilities 282.8 282.8 284.4other long-term liabilities 3.4 3.4 3.4derivative financial instruments
interest rate derivatives 3.2 3.2 3.2
cUrreNt fiNaNciaL LiabiLitiescurrent interest-bearing liabilities 121.3 121.3 121.3accounts payable 135.9 135.9 135.9other current liabilities **) 170.9 170.9 170.9derivative financial instruments
foreign exchange derivatives 4.5 3.5 8.0 8.0interest rate derivatives 2.5 2.5 2.5
balance sheet values by category 4.5 9.2 714.3 728.0 729.6
27. rELATED pArTy TrANSAcTIoNS
related parties include the parent company, subsidi-aries (note 25), the board of directors and the amer sports executive board.
Key management includes board of directors and executive board. salaries and remuneration paid or payable to key management is shown below:
eUr million 2009 2008
salaries and remuneration of the board of directors 0.3 0.3salaries and remuneration of the executive board (excluding president and ceo) 3.2 3.3salaries and remuneration of the president and ceo 2.4 1.2total 5.9 4.8
40% of the annual remuneration to the board of direc-tors is paid in shares and 60% in cash.
Members of the board of directors do not have con-tractual retirement benefits with the company. the terms and conditions of the president and ceo’s employ-ment are defined in a written executive agreement that has been approved by the board of directors. Under the agreement, the president and ceo may retire at the age of 60, with a pension payable at a 60 percent salary rate. both the company and the president and ceo must pro-vide six months’ notice to terminate the president and ceo’s employment contract.
salaries and remuneration of the president and ceo include the severance payment of eUr 1.5 million made to the previous president and ceo roger talermo, equaling to 24 months’ fixed salary.
No loans have been granted to the Group’s board of directors and management.
ShArES AND wArrANTS hELD By mANAgEmENT
amer sports board of directors held a total of 2,730,545 amer sports shares as of december 31, 2009 (decem-ber 31, 2008: 1,671,623), or 2.3% (2.3%) of the outstand-ing shares and votes.
the management of amer sports (including the president and ceo) owned a total of 175,623 amer sports shares on december 31, 2009 (dec. 31, 2008: 156,295), representing 0.1% (0.2%) of the shares and votes.
the warrant programs and the share-based incen-tive plan are described in note 9. the members of the company’s board of directors do not come within the scope of the warrant programs.
28. BALANcE ShEET VALuES of fINANcIAL ASSETS AND LIABILITIES By mEASurEmENT cATEgorIES AT DEcEmBEr 31, 2009
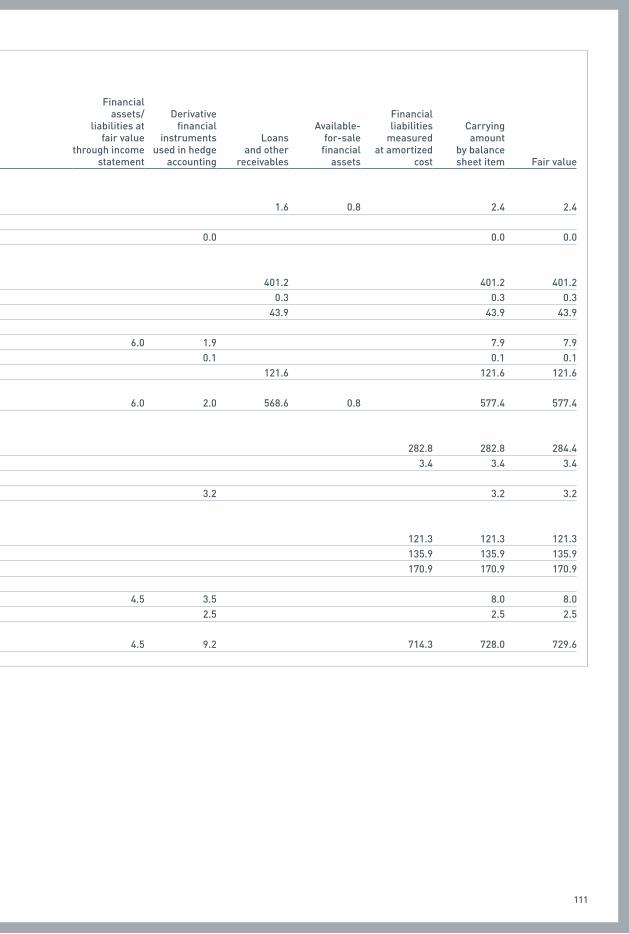
111
eUr million
financial assets/
liabilities at fair value
through income statement
Derivative financial
instruments used in hedge
accounting
Loans and other
receivables
Available- for-sale
financial assets
financial liabilities
measured at amortized
cost
carrying amount
by balance sheet item fair value
NoN-cUrreNt fiNaNciaL assetsother non-current financial assets 1.6 0.8 2.4 2.4derivative financial instruments
foreign exchange derivatives 0.0 0.0 0.0
cUrreNt fiNaNciaL assetsaccounts receivable 401.2 401.2 401.2Loans receivable 0.3 0.3 0.3other non-interest yielding receivables *) 43.9 43.9 43.9derivative financial instruments
foreign exchange derivatives 6.0 1.9 7.9 7.9interest rate derivatives 0.1 0.1 0.1
cash and cash equivalents 121.6 121.6 121.6
balance sheet values by category 6.0 2.0 568.6 0.8 577.4 577.4
LoNG-terM fiNaNciaL LiabiLitiesLong-term interest-bearing liabilities 282.8 282.8 284.4other long-term liabilities 3.4 3.4 3.4derivative financial instruments
interest rate derivatives 3.2 3.2 3.2
cUrreNt fiNaNciaL LiabiLitiescurrent interest-bearing liabilities 121.3 121.3 121.3accounts payable 135.9 135.9 135.9other current liabilities **) 170.9 170.9 170.9derivative financial instruments
foreign exchange derivatives 4.5 3.5 8.0 8.0interest rate derivatives 2.5 2.5 2.5
balance sheet values by category 4.5 9.2 714.3 728.0 729.6
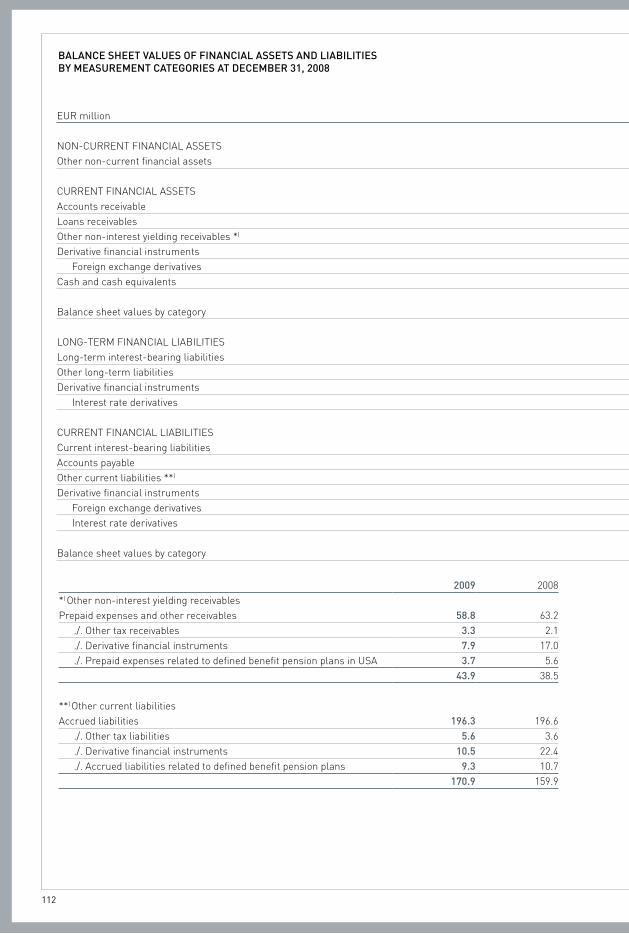
112
eUr million
financial assets/liabili-
ties at fair value through income
statement
derivative financial
instruments used in hedge
accounting
Loans and other
receivables
available- for-sale
financial assets
financial liabilities
measured at amortized
cost
carrying amount by
balance sheet item fair value
NoN-cUrreNt fiNaNciaL assetsother non-current financial assets 4.3 0.8 5.1 5.1
cUrreNt fiNaNciaL assetsaccounts receivable 479.1 479.1 479.1Loans receivables 0.3 0.3 0.3other non-interest yielding receivables *) 38.5 38.5 38.5derivative financial instruments
foreign exchange derivatives 9.1 7.9 17.0 17.0cash and cash equivalents 72.1 72.1 72.1
balance sheet values by category 9.1 7.9 594.3 0.8 612.1 612.1
LoNG-terM fiNaNciaL LiabiLitiesLong-term interest-bearing liabilities 434.9 434.9 433.7other long-term liabilities 7.3 7.3 7.3derivative financial instruments
interest rate derivatives 7.2 7.2 7.2
cUrreNt fiNaNciaL LiabiLitiescurrent interest-bearing liabilities 252.8 252.8 252.8accounts payable 178.5 178.5 178.5other current liabilities **) 159.9 159.9 159.9derivative financial instruments
foreign exchange derivatives 13.1 9.0 22.1 22.1interest rate derivatives 0.3 0.3 0.3
balance sheet values by category 13.1 16.5 1,033.4 1,063.0 1,061.8
2009 2008*) other non-interest yielding receivablesprepaid expenses and other receivables 58.8 63.2
./. other tax receivables 3.3 2.1
./. derivative financial instruments 7.9 17.0
./. prepaid expenses related to defined benefit pension plans in Usa 3.7 5.643.9 38.5
**) other current liabilitiesaccrued liabilities 196.3 196.6
./. other tax liabilities 5.6 3.6
./. derivative financial instruments 10.5 22.4
./. accrued liabilities related to defined benefit pension plans 9.3 10.7170.9 159.9
BALANcE ShEET VALuES of fINANcIAL ASSETS AND LIABILITIES By mEASurEmENT cATEgorIES AT DEcEmBEr 31, 2008
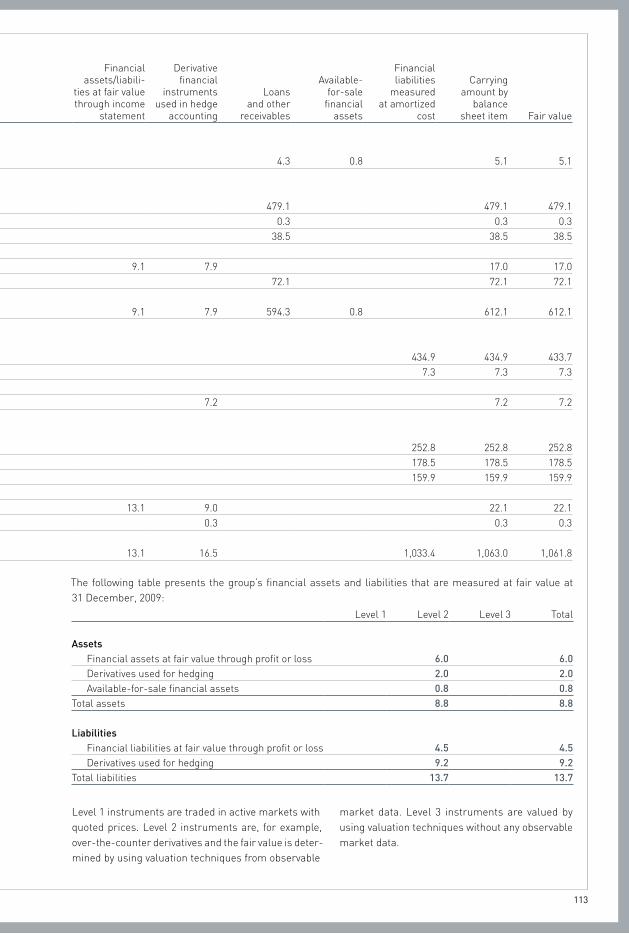
113
eUr million
financial assets/liabili-
ties at fair value through income
statement
derivative financial
instruments used in hedge
accounting
Loans and other
receivables
available- for-sale
financial assets
financial liabilities
measured at amortized
cost
carrying amount by
balance sheet item fair value
NoN-cUrreNt fiNaNciaL assetsother non-current financial assets 4.3 0.8 5.1 5.1
cUrreNt fiNaNciaL assetsaccounts receivable 479.1 479.1 479.1Loans receivables 0.3 0.3 0.3other non-interest yielding receivables *) 38.5 38.5 38.5derivative financial instruments
foreign exchange derivatives 9.1 7.9 17.0 17.0cash and cash equivalents 72.1 72.1 72.1
balance sheet values by category 9.1 7.9 594.3 0.8 612.1 612.1
LoNG-terM fiNaNciaL LiabiLitiesLong-term interest-bearing liabilities 434.9 434.9 433.7other long-term liabilities 7.3 7.3 7.3derivative financial instruments
interest rate derivatives 7.2 7.2 7.2
cUrreNt fiNaNciaL LiabiLitiescurrent interest-bearing liabilities 252.8 252.8 252.8accounts payable 178.5 178.5 178.5other current liabilities **) 159.9 159.9 159.9derivative financial instruments
foreign exchange derivatives 13.1 9.0 22.1 22.1interest rate derivatives 0.3 0.3 0.3
balance sheet values by category 13.1 16.5 1,033.4 1,063.0 1,061.8
the following table presents the group’s financial assets and liabilities that are measured at fair value at 31 december, 2009:
Level 1 Level 2 Level 3 total
Assetsfinancial assets at fair value through profit or loss 6.0 6.0derivatives used for hedging 2.0 2.0available-for-sale financial assets 0.8 0.8
total assets 8.8 8.8
Liabilitiesfinancial liabilities at fair value through profit or loss 4.5 4.5derivatives used for hedging 9.2 9.2
total liabilities 13.7 13.7
Level 1 instruments are traded in active markets with quoted prices. Level 2 instruments are, for example, over-the-counter derivatives and the fair value is deter-mined by using valuation techniques from observable
market data. Level 3 instruments are valued by using valuation techniques without any observable market data.
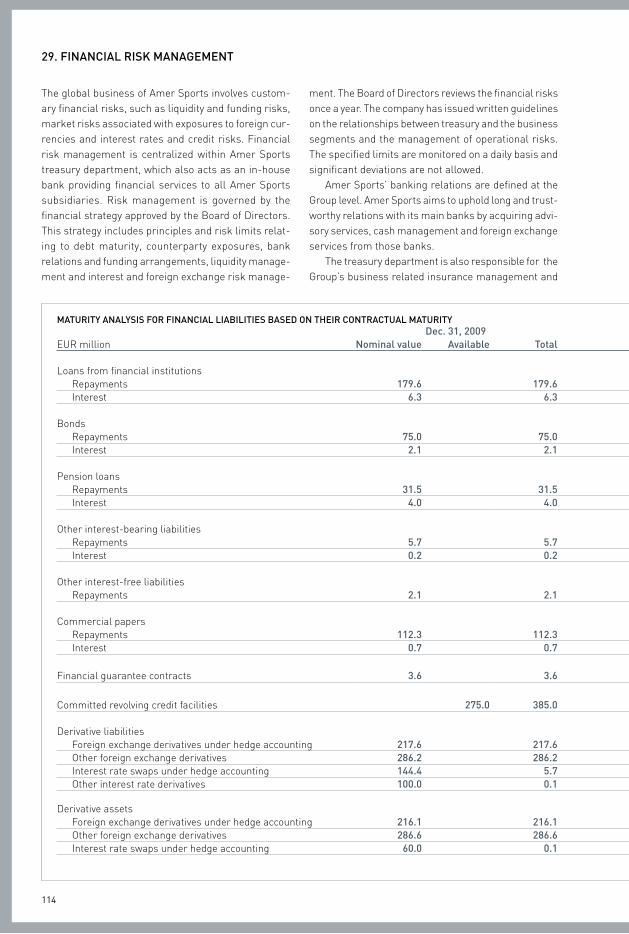
114
29. fINANcIAL rISk mANAgEmENT
the global business of amer sports involves custom-ary financial risks, such as liquidity and funding risks, market risks associated with exposures to foreign cur-rencies and interest rates and credit risks. financial risk management is centralized within amer sports treasury department, which also acts as an in-house bank providing financial services to all amer sports subsidiaries. risk management is governed by the financial strategy approved by the board of directors. this strategy includes principles and risk limits relat-ing to debt maturity, counterparty exposures, bank relations and funding arrangements, liquidity manage-ment and interest and foreign exchange risk manage-
ment. the board of directors reviews the financial risks once a year. the company has issued written guidelines on the relationships between treasury and the business segments and the management of operational risks. the specified limits are monitored on a daily basis and significant deviations are not allowed.
amer sports’ banking relations are defined at the Group level. amer sports aims to uphold long and trust-worthy relations with its main banks by acquiring advi-sory services, cash management and foreign exchange services from those banks.
the treasury department is also responsible for the Group’s business related insurance management and
mATurITy ANALySIS for fINANcIAL LIABILITIES BASED oN ThEIr coNTrAcTuAL mATurITyDec. 31, 2009 2014 dec. 31, 2008
eUr million Nominal value Available Total 2010 2011 2012 2013 and after Nominal value available total
Loans from financial institutionsrepayments 179.6 179.6 0.1 15.1 164.4 377.0 377.0interest 6.3 6.3 2.1 2.9 1.3 12.5 12.5
bondsrepayments 75.0 75.0 75.0 150.0 150.0interest 2.1 2.1 1.2 0.9 7.8 7.8
pension loansrepayments 31.5 31.5 5.7 5.7 5.7 5.7 8.7 37.6 37.6interest 4.0 4.0 1.3 1.0 0.8 0.5 0.4 5.5 5.5
other interest-bearing liabilitiesrepayments 5.7 5.7 3.3 1.0 1.4 9.9 9.9interest 0.2 0.2 0.1 0.0 0.0 0.0 0.1 0.5 0.5
other interest-free liabilitiesrepayments 2.1 2.1 2.1 7.3 7.3
commercial papersrepayments 112.3 112.3 112.3 113.2 113.2interest 0.7 0.7 0.7 2.8 2.8
financial guarantee contracts 3.6 3.6 3.6 4.3 4.3
committed revolving credit facilities 275.0 385.0 60.0 70.7 254.3 130.0 130.0
derivative liabilitiesforeign exchange derivatives under hedge accounting 217.6 217.6 217.6 215.7 215.7other foreign exchange derivatives 286.2 286.2 286.2 387.9 387.9interest rate swaps under hedge accounting 144.4 5.7 4.8 0.9 221.9 221.9other interest rate derivatives 100.0 0.1 0.1
derivative assetsforeign exchange derivatives under hedge accounting 216.1 216.1 214.5 1.6 215.1 215.1other foreign exchange derivatives 286.6 286.6 286.6 389.2 389.2interest rate swaps under hedge accounting 60.0 0.1 –0.2 0.3
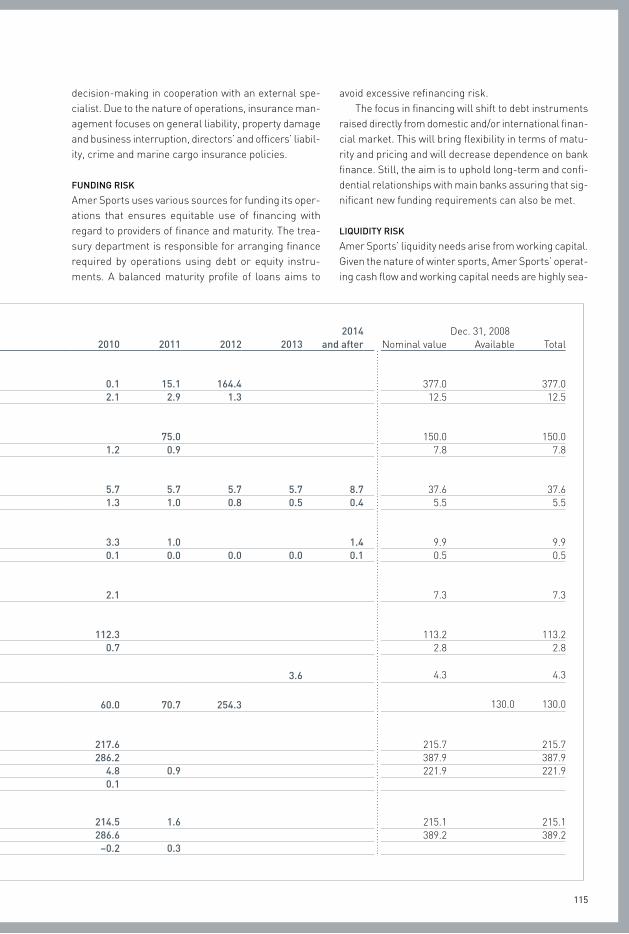
115
decision-making in cooperation with an external spe-cialist. due to the nature of operations, insurance man-agement focuses on general liability, property damage and business interruption, directors’ and officers’ liabil-ity, crime and marine cargo insurance policies.
fuNDINg rISk
amer sports uses various sources for funding its oper-ations that ensures equitable use of financing with regard to providers of finance and maturity. the trea-sury department is responsible for arranging finance required by operations using debt or equity instru-ments. a balanced maturity profile of loans aims to
avoid excessive refinancing risk.the focus in financing will shift to debt instruments
raised directly from domestic and/or international finan-cial market. this will bring flexibility in terms of matu-rity and pricing and will decrease dependence on bank finance. still, the aim is to uphold long-term and confi-dential relationships with main banks assuring that sig-nificant new funding requirements can also be met.
LIquIDITy rISk
amer sports’ liquidity needs arise from working capital. Given the nature of winter sports, amer sports’ operat-ing cash flow and working capital needs are highly sea-
mATurITy ANALySIS for fINANcIAL LIABILITIES BASED oN ThEIr coNTrAcTuAL mATurITyDec. 31, 2009 2014 dec. 31, 2008
eUr million Nominal value Available Total 2010 2011 2012 2013 and after Nominal value available total
Loans from financial institutionsrepayments 179.6 179.6 0.1 15.1 164.4 377.0 377.0interest 6.3 6.3 2.1 2.9 1.3 12.5 12.5
bondsrepayments 75.0 75.0 75.0 150.0 150.0interest 2.1 2.1 1.2 0.9 7.8 7.8
pension loansrepayments 31.5 31.5 5.7 5.7 5.7 5.7 8.7 37.6 37.6interest 4.0 4.0 1.3 1.0 0.8 0.5 0.4 5.5 5.5
other interest-bearing liabilitiesrepayments 5.7 5.7 3.3 1.0 1.4 9.9 9.9interest 0.2 0.2 0.1 0.0 0.0 0.0 0.1 0.5 0.5
other interest-free liabilitiesrepayments 2.1 2.1 2.1 7.3 7.3
commercial papersrepayments 112.3 112.3 112.3 113.2 113.2interest 0.7 0.7 0.7 2.8 2.8
financial guarantee contracts 3.6 3.6 3.6 4.3 4.3
committed revolving credit facilities 275.0 385.0 60.0 70.7 254.3 130.0 130.0
derivative liabilitiesforeign exchange derivatives under hedge accounting 217.6 217.6 217.6 215.7 215.7other foreign exchange derivatives 286.2 286.2 286.2 387.9 387.9interest rate swaps under hedge accounting 144.4 5.7 4.8 0.9 221.9 221.9other interest rate derivatives 100.0 0.1 0.1
derivative assetsforeign exchange derivatives under hedge accounting 216.1 216.1 214.5 1.6 215.1 215.1other foreign exchange derivatives 286.6 286.6 286.6 389.2 389.2interest rate swaps under hedge accounting 60.0 0.1 –0.2 0.3

116
sonal. amer sports’ need for cash is typically the great-est in the third quarter when operating cash and short-term debt are tied up in inventories and receivables. amer sports’ primary sources of liquidity have been operating cash flow and borrowings under its eUr 325 million committed credit facility. amer sports has also used its eUr 500 million finnish commercial paper program to finance its working capital needs. due to prevailing market conditions, amer sports has been using its committed credit facilities more than before.
cash flow forecasting is prepared by the subsidiar-ies on a daily basis and consolidated by the treasury department. this rolling 20-day forecast acts as a base tool for short term liquidity planning.
amer sports uses cash pooling to manage daily liquidity within the company. surplus cash generated by subsidiaries is sweeped daily to amer sports master accounts and placed in bank deposits or invested in commercial papers or certificates of deposits within agreed limits.
the table on the previous page sets out a breakdown of the Group’s non-derivative financial liabilities and net-settled derivative financial liabilities into relevant maturity groupings based on the remaining period at the balance sheet date to the contractual maturity date. However, amounts drawn under the committed revolv-ing credit facility maturing in 2011 and 2012 are pre-sented as maturing in 2012.
currENcy rISk
amer sports’ currency risk arises from transaction risks arising from foreign currency-denominated
receivables, liabilities, forecast cash flows in foreign currencies and derivatives and earnings’ translation risk. the company operates in all major currencies, and it has a sales office in 29 countries. risk manage-ment aims to eliminate the uncertainties associated with fluctuation in foreign exchange rates.
at the end of the year, amer sports’ currency posi-tion in accordance with ifrs 7 consisted of inter-com-pany and external interest-free and interest-bearing currency-denominated receivables and liabilities and foreign exchange derivatives. foreign exchange deriv-atives include both the forward contracts hedging the parent company’s foreign currency denominated bal-ance sheet and forecast cash flows.
owing to the geographical distribution of amer sports’ business operations, the most significant cur-rency risks arise from Us dollar, Japanese yen, cana-dian dollar, and swiss franc. the Us dollar risk is fur-ther emphasized by the fact that it is the most significant currency used in purchasing activities also outside the United states. in 2009, the importance of Us dollar even increased due to growth of apparel and footwear busi-ness that uses Us dollar as a purchase currency.
amer sports aims to minimize balance sheet risks by financing each subsidiary in its home currency. the balance sheet risks are concentrated to the businesses’ centralized distribution and purchasing units that invoice the subsidiaries in their respective home cur-rencies. the parent company’s foreign exchange bal-ance sheet risk arises from inter-company and exter-nal receivables and liabilities.
the following table sets out the ifrs 7-compliant foreign exchange position at the balance sheet date:
Dec. 31, 2009 dec. 31, 2008eUr million uSD jpy cAD chf Usd Jpy cad cHf
interest-bearing external receivables 8.3 - - - - - - -interest-bearing inter-company receivables 177.9 21.0 24.1 1.8 287.2 20.0 30.2 2.3external receivables 8.0 0.0 –7.2 5.0 14.3 0.0 –7.7 5.1inter-company receivables 1.6 2.3 1.2 2.2 –0.4 2.9 2.0 2.3
interest-bearing external liabilities –69.4 - - - –71.9 - - -external payables –25.4 –0.1 1.1 –0.8 –2.3 –0.1 1.9 –0.8inter-company payables –2.5 0.1 0.0 –1.9 –15.4 0.0 0.0 –2.2
foreign exchange derivatives –18.0 –50.2 –38.4 –46.4 –110.8 –56.1 –36.2 –39.9

117
the table below presents the sensitivity of share-holders’ equity and the income statement at the bal-ance sheet date to the strengthening of the euro by 10%, provided other factors were to remain unchanged. the weakening of the euro by 10% would cause a sim-ilar change in the opposite direction:
eUr millionShareholders'
equityIncome
statementUsd –8.9 0.9Jpy 2.0 0.7cad 1.2 0.7cHf 2.8 1.2
the following table presents the corresponding sensi-tivities at the balance sheet date in 2008:
eUr millionshareholders'
equityincome
statementUsd –8.7 0.8Jpy 2.3 1.0cad 0.8 0.2cHf 2.3 1.1
earnings sensitivity is influenced by changes in the fair value of derivative instruments not used in hedge accounting and on-balance sheet hedging derivative instruments as well as changes in the value of on-bal-ance sheet currency-denominated loans and receiv-ables. shareholders’ equity is affected by changes in the fair value of derivative instruments used in hedge accounting recognized under the hedge reserve.
the subsidiaries’ forecast currency-denominated cash flows comprise a transaction risk when a unit sells in its home currency goods whose costs are denominated in a foreign currency or sells or buys goods in a non-home currency.
the following table sets forth amer sports’ estimated main cash flow risks in the following currencies for 2010 (eUr million):
eUr Usd cHf Jpy Gbp cad rUb seK otHer
28 168 –42 –31 –27 –20 –17 –16 –42
the following table sets forth the hedging of amer sports’ cash flows as at december 31, 2009 (eUr million):
eUr Usd cHf Jpy Gbp cad rUb seK otHer
58 100 –45 –30 –21 –12 –8 –14 –28
the company’s exposure to russian ruble has risen because amer sports has increased direct sales to cus-tomers in russian markets instead of using intermedi-ate distributors.
the strengthening of the euro against the above cur-rencies typically weakens amer sports’ result of oper-ations. a significant share of the Us dollar denominated
purchase cost risk is eliminated against the Us dollar denominated operating result. due to changes in busi-ness operations the Us dollar purchases exceeded the Us dollar denominated operating result in 2009.
according to the company’s hedging policy, the transaction risk arising from subsidiaries’ business operations is hedged up to 12–18 months forward. the hedging is carried out so that the hedge ratio is higher for closer months than for the cash flows realized in later periods. the hedge ratio of the units is maintained between 30% and 70%, except for the Winter and out-door business, where the ratio is 80–120% due to the nature of the business. the hedged cash flow is expected to realize in the next 12 months. the company hedges only annual cash flows or other exposures with a value of over eUr 3.0 million.
the company utilizes hedge accounting for annual cash flows with a counter value of over eUr 10 million. the company monitors its hedge ratios daily and tests its effectiveness at three-month intervals. the effective-ness of forward contracts is tested using spot rates.
according to its financial strategy, the company may hedge 0 to 50% of subsidiaries’ equity. at the end of 2009, there were no equity hedges outstanding.
INTErEST rISk
amer sports’ interest risk arises out of reprising float-ing rate loans and raising new floating rate loans. amer sports is also subject to fair value risk arising from fixed rate loans. duration and fixed-to-floating ratio are used in monitoring the interest rate position. duration is calculated using the interest reprising date of financ-ing items. as of december 31, 2009, the duration of financing items was approximately ten months and fixed rate debt accounted for 79% of total net debt. the cash flow risk for debt is managed using interest rate derivatives.
the sensitivity of the income statement includes assessment of changes in interest expenses for the next 12 months due to an increase/decrease of one percentage point in interest rates, provided other fac-tors were to remain unchanged. shareholders’ equity is influenced by a change in the market value of the interest rate swaps included in hedge accounting. the change is booked to the hedge reserve.
the following table sets out the sensitivity of share-holders’ equity and income statement at the balance sheet date to an increase of 1% in interest rates, pro-vided other factors were to remain unchanged:
eUr million position 2009
shareholders' equity 204.4 3.9
income statement 63.0 –1.2
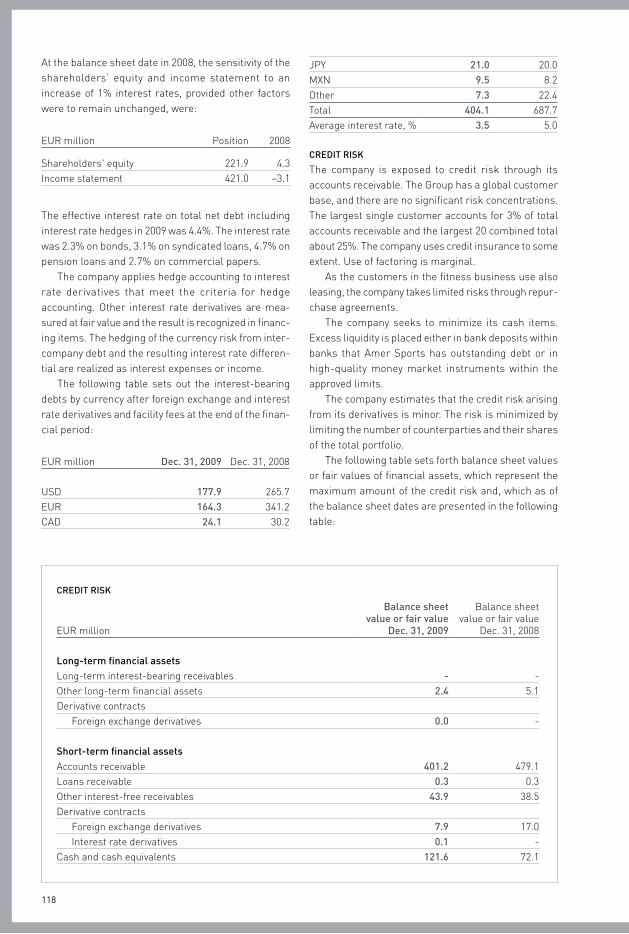
118
crEDIT rISk
eUr million
Balance sheet value or fair value
Dec. 31, 2009
balance sheet value or fair value
dec. 31, 2008
Long-term financial assetsLong-term interest-bearing receivables - -other long-term financial assets 2.4 5.1derivative contracts
foreign exchange derivatives 0.0 -
Short-term financial assetsaccounts receivable 401.2 479.1Loans receivable 0.3 0.3other interest-free receivables 43.9 38.5derivative contracts
foreign exchange derivatives 7.9 17.0interest rate derivatives 0.1 -
cash and cash equivalents 121.6 72.1
at the balance sheet date in 2008, the sensitivity of the shareholders’ equity and income statement to an increase of 1% interest rates, provided other factors were to remain unchanged, were:
eUr million position 2008
shareholders' equity 221.9 4.3income statement 421.0 –3.1
the effective interest rate on total net debt including interest rate hedges in 2009 was 4.4%. the interest rate was 2.3% on bonds, 3.1% on syndicated loans, 4.7% on pension loans and 2.7% on commercial papers.
the company applies hedge accounting to interest rate derivatives that meet the criteria for hedge accounting. other interest rate derivatives are mea-sured at fair value and the result is recognized in financ-ing items. the hedging of the currency risk from inter-company debt and the resulting interest rate differen-tial are realized as interest expenses or income.
the following table sets out the interest-bearing debts by currency after foreign exchange and interest rate derivatives and facility fees at the end of the finan-cial period:
eUr million Dec. 31, 2009 dec. 31, 2008
Usd 177.9 265.7eUr 164.3 341.2cad 24.1 30.2
Jpy 21.0 20.0MXN 9.5 8.2other 7.3 22.4total 404.1 687.7average interest rate, % 3.5 5.0
crEDIT rISk
the company is exposed to credit risk through its accounts receivable. the Group has a global customer base, and there are no significant risk concentrations. the largest single customer accounts for 3% of total accounts receivable and the largest 20 combined total about 25%. the company uses credit insurance to some extent. Use of factoring is marginal.
as the customers in the fitness business use also leasing, the company takes limited risks through repur-chase agreements.
the company seeks to minimize its cash items. excess liquidity is placed either in bank deposits within banks that amer sports has outstanding debt or in high-quality money market instruments within the approved limits.
the company estimates that the credit risk arising from its derivatives is minor. the risk is minimized by limiting the number of counterparties and their shares of the total portfolio.
the following table sets forth balance sheet values or fair values of financial assets, which represent the maximum amount of the credit risk and, which as of the balance sheet dates are presented in the following table:
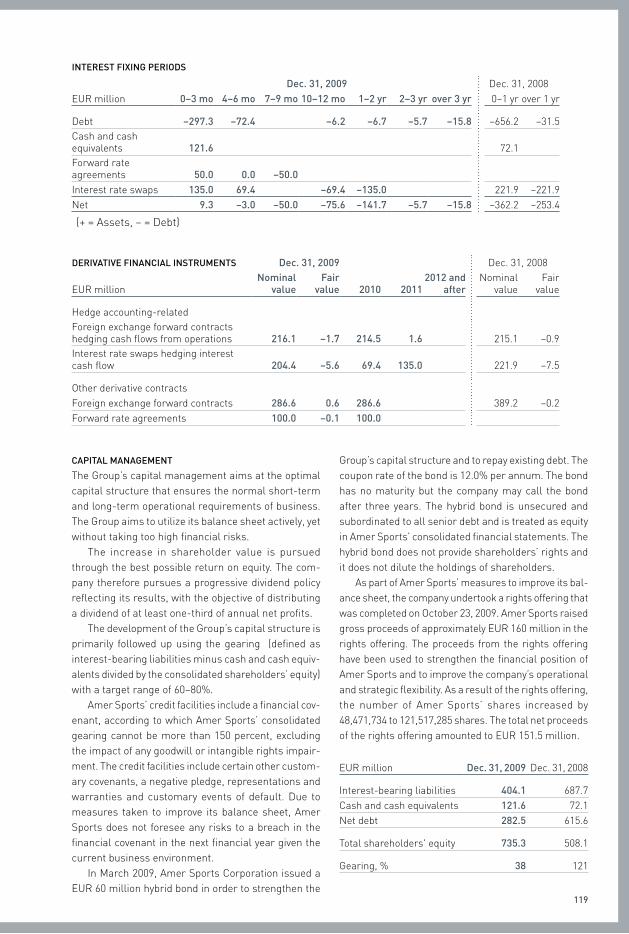
119
cApITAL mANAgEmENT
the Group’s capital management aims at the optimal capital structure that ensures the normal short-term and long-term operational requirements of business. the Group aims to utilize its balance sheet actively, yet without taking too high financial risks.
the increase in shareholder value is pursued through the best possible return on equity. the com-pany therefore pursues a progressive dividend policy reflecting its results, with the objective of distributing a dividend of at least one-third of annual net profits.
the development of the Group’s capital structure is primarily followed up using the gearing (defined as interest-bearing liabilities minus cash and cash equiv-alents divided by the consolidated shareholders’ equity) with a target range of 60–80%.
amer sports’ credit facilities include a financial cov-enant, according to which amer sports’ consolidated gearing cannot be more than 150 percent, excluding the impact of any goodwill or intangible rights impair-ment. the credit facilities include certain other custom-ary covenants, a negative pledge, representations and warranties and customary events of default. due to measures taken to improve its balance sheet, amer sports does not foresee any risks to a breach in the financial covenant in the next financial year given the current business environment.
in March 2009, amer sports corporation issued a eUr 60 million hybrid bond in order to strengthen the
INTErEST fIXINg pErIoDS
Dec. 31, 2009 dec. 31, 2008eUr million 0–3 mo 4–6 mo 7–9 mo 10–12 mo 1–2 yr 2–3 yr over 3 yr 0–1 yr over 1 yr
debt –297.3 –72.4 –6.2 –6.7 –5.7 –15.8 –656.2 –31.5cash and cash equivalents 121.6 72.1forward rate agreements 50.0 0.0 –50.0interest rate swaps 135.0 69.4 –69.4 –135.0 221.9 –221.9Net 9.3 –3.0 –50.0 –75.6 –141.7 –5.7 –15.8 –362.2 –253.4
(+ = assets, – = debt)
DErIVATIVE fINANcIAL INSTrumENTS Dec. 31, 2009 dec. 31, 2008
eUr millionNominal
valuefair
value 2010 20112012 and
afterNominal
valuefair
value
Hedge accounting-relatedforeign exchange forward contracts hedging cash flows from operations 216.1 –1.7 214.5 1.6 215.1 –0.9interest rate swaps hedging interest cash flow 204.4 –5.6 69.4 135.0 221.9 –7.5
other derivative contractsforeign exchange forward contracts 286.6 0.6 286.6 389.2 –0.2forward rate agreements 100.0 –0.1 100.0
Group’s capital structure and to repay existing debt. the coupon rate of the bond is 12.0% per annum. the bond has no maturity but the company may call the bond after three years. the hybrid bond is unsecured and subordinated to all senior debt and is treated as equity in amer sports’ consolidated financial statements. the hybrid bond does not provide shareholders’ rights and it does not dilute the holdings of shareholders.
as part of amer sports’ measures to improve its bal-ance sheet, the company undertook a rights offering that was completed on october 23, 2009. amer sports raised gross proceeds of approximately eUr 160 million in the rights offering. the proceeds from the rights offering have been used to strengthen the financial position of amer sports and to improve the company’s operational and strategic flexibility. as a result of the rights offering, the number of amer sports’ shares increased by 48,471,734 to 121,517,285 shares. the total net proceeds of the rights offering amounted to eUr 151.5 million.
eUr million Dec. 31, 2009 dec. 31, 2008
interest-bearing liabilities 404.1 687.7cash and cash equivalents 121.6 72.1Net debt 282.5 615.6
total shareholders' equity 735.3 508.1
Gearing, % 38 121
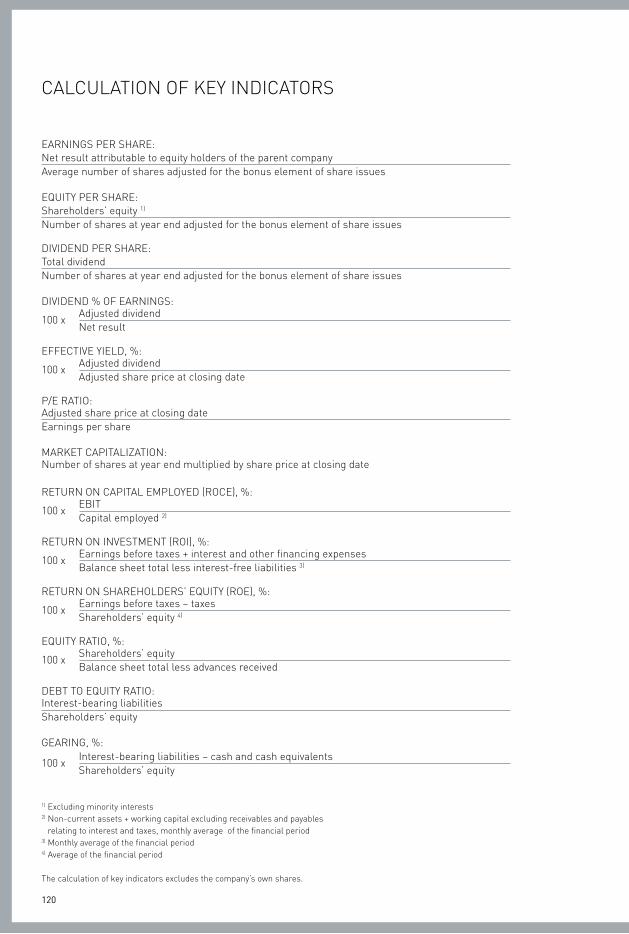
120
caLcULatioN of Key iNdicators
earNiNGs per sHare: Net result attributable to equity holders of the parent companyaverage number of shares adjusted for the bonus element of share issues eQUity per sHare:shareholders’ equity 1)
Number of shares at year end adjusted for the bonus element of share issues diVideNd per sHare: total dividend Number of shares at year end adjusted for the bonus element of share issues diVideNd % of earNiNGs:
100 x adjusted dividend
Net result effectiVe yieLd, %:
100 x adjusted dividend
adjusted share price at closing date p/e ratio: adjusted share price at closing dateearnings per share MarKet capitaLiZatioN: Number of shares at year end multiplied by share price at closing date
retUrN oN capitaL eMpLoyed (roce), %:
100 x ebit
capital employed 2)
retUrN oN iNVestMeNt (roi), %:
100 x earnings before taxes + interest and other financing expenses
balance sheet total less interest-free liabilities 3)
retUrN oN sHareHoLders’ eQUity (roe), %:
100 x earnings before taxes – taxes
shareholders’ equity 4)
eQUity ratio, %:
100 x shareholders’ equity
balance sheet total less advances received debt to eQUity ratio:interest-bearing liabilitiesshareholders’ equity
GeariNG, %:
100 x interest-bearing liabilities – cash and cash equivalents
shareholders’ equity
1) excluding minority interests 2) Non-current assets + working capital excluding receivables and payables
relating to interest and taxes, monthly average of the financial period 3) Monthly average of the financial period 4) average of the financial period
the calculation of key indicators excludes the company’s own shares.

121
eUr million 2009 2008
other operating income 10.0 24.1
EXpENSESpersonnel expenses 8.1 5.4depreciation 0.4 0.5other expenses 10.5 9.0total expenses 19.0 14.9
EArNINgS BEforE INTErEST AND TAXES –9.1 9.2
financing income 13.6 100.6financing expenses –53.5 –48.6financing income and expenses –39.9 52.0
EArNINgS BEforE EXTrAorDINAry ITEmS –49.0 61.2
extraordinary items 21.0 32.5
EArNINgS BEforE ApproprIATIoNS AND TAXES –28.0 93.7
appropriations 0.0 0.3taxes 0.0 –2.4
NET rESuLT –28.0 91.6
pareNt coMpaNy iNcoMe stateMeNt
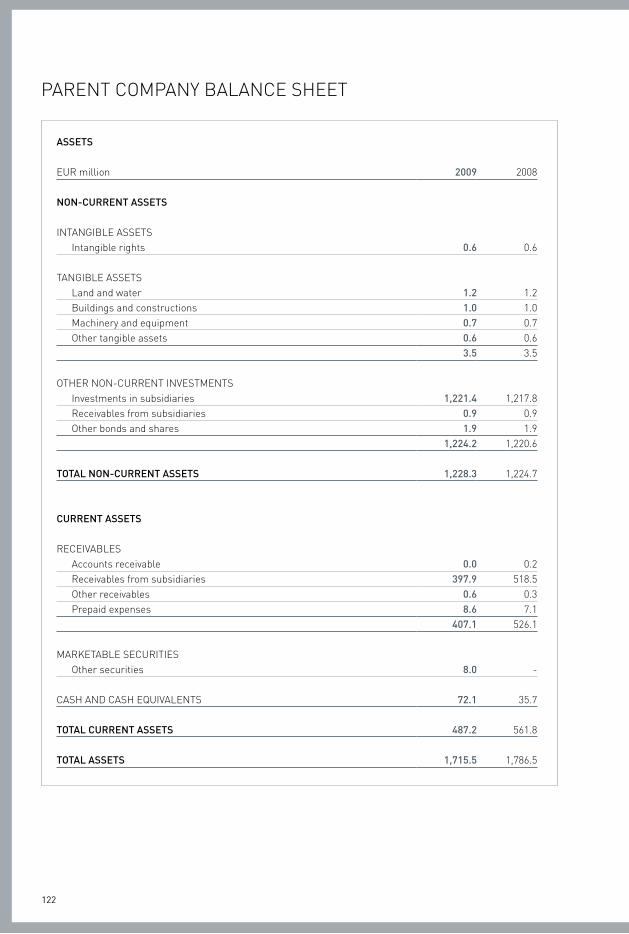
122
ASSETS
eUr million 2009 2008
NoN-currENT ASSETS
iNtaNGibLe assetsintangible rights 0.6 0.6
taNGibLe assetsLand and water 1.2 1.2buildings and constructions 1.0 1.0Machinery and equipment 0.7 0.7other tangible assets 0.6 0.6
3.5 3.5
otHer NoN-cUrreNt iNVestMeNtsinvestments in subsidiaries 1,221.4 1,217.8receivables from subsidiaries 0.9 0.9other bonds and shares 1.9 1.9
1,224.2 1,220.6
ToTAL NoN-currENT ASSETS 1,228.3 1,224.7
currENT ASSETS
receiVabLesaccounts receivable 0.0 0.2receivables from subsidiaries 397.9 518.5other receivables 0.6 0.3prepaid expenses 8.6 7.1
407.1 526.1
MarKetabLe secUritiesother securities 8.0 -
casH aNd casH eQUiVaLeNts 72.1 35.7
ToTAL currENT ASSETS 487.2 561.8
ToTAL ASSETS 1,715.5 1,786.5
pareNt coMpaNy baLaNce sHeet

123
ShArEhoLDErS’ EquITy AND LIABILITIES
eUr million 2009 2008
ShArEhoLDErS’ EquITyshare capital 292.2 292.1premium fund 12.1 12.1fund for own shares - –5.7invested unrestricted equity reserve 161.8 -retained earnings 274.0 199.9Net result –28.0 91.6
ToTAL ShArEhoLDErS’ EquITy 712.1 590.0
AccumuLATED ApproprIATIoNSaccumulated depreciation in excess of plan 0.3 0.3
proVISIoN for coNTINgENT LoSSESprovision for pension liability 0.1 0.1other provisions - 0.1
ToTAL proVISIoNS for coNTINgENT LoSSES 0.1 0.2
LIABILITIES
LoNG-terM LiabiLitiesbonds 75.0 75.0Loans from financial institutions 69.4 71.8pension loans 25.7 31.4other liabilities 60.0 -
230.1 178.2
cUrreNt LiabiLitiesbonds - 75.0other interest-bearing liabilities 228.5 431.0accounts payable 0.9 -payables to subsidiaries 531.7 488.7other current liabilities 0.3 0.2accrued liabilities 11.5 22.9
772.9 1,017.8ToTAL LIABILITIES 1,003.0 1,196.0
ToTAL ShArEhoLDErS’ EquITy AND LIABILITIES 1,715.5 1,786.5
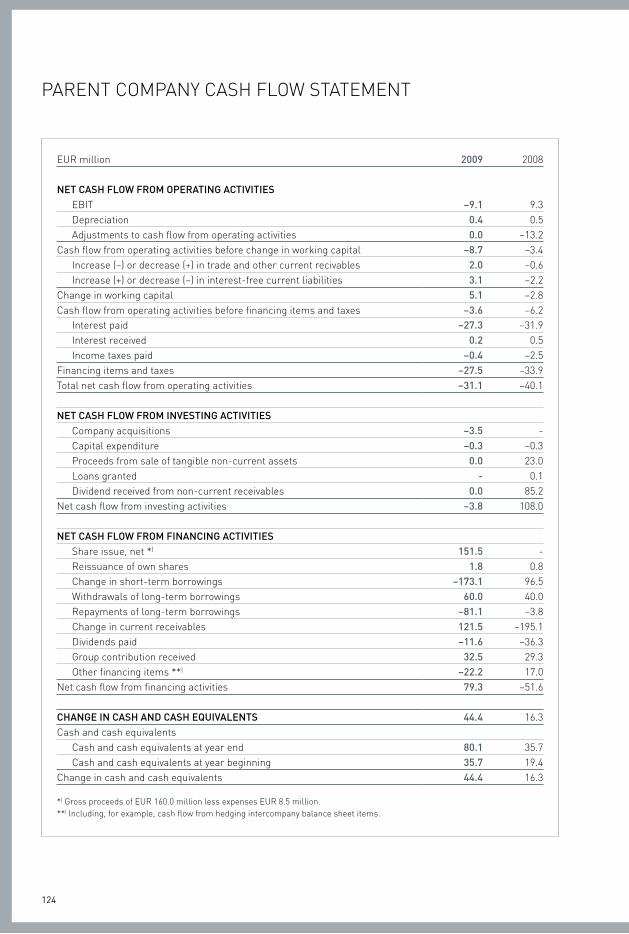
124
eUr million 2009 2008
NET cASh fLow from opErATINg AcTIVITIESebit –9.1 9.3depreciation 0.4 0.5adjustments to cash flow from operating activities 0.0 –13.2
cash flow from operating activities before change in working capital –8.7 –3.4increase (–) or decrease (+) in trade and other current recivables 2.0 –0.6increase (+) or decrease (–) in interest-free current liabilities 3.1 –2.2
change in working capital 5.1 –2.8cash flow from operating activities before financing items and taxes –3.6 –6.2
interest paid –27.3 –31.9interest received 0.2 0.5income taxes paid –0.4 –2.5
financing items and taxes –27.5 –33.9total net cash flow from operating activities –31.1 –40.1
NET cASh fLow from INVESTINg AcTIVITIEScompany acquisitions –3.5 -capital expenditure –0.3 –0.3proceeds from sale of tangible non-current assets 0.0 23.0Loans granted - 0.1dividend received from non-current receivables 0.0 85.2
Net cash flow from investing activities –3.8 108.0
NET cASh fLow from fINANcINg AcTIVITIESshare issue, net *) 151.5 -reissuance of own shares 1.8 0.8change in short-term borrowings –173.1 96.5Withdrawals of long-term borrowings 60.0 40.0repayments of long-term borrowings –81.1 –3.8change in current receivables 121.5 –195.1dividends paid –11.6 –36.3Group contribution received 32.5 29.3other financing items **) –22.2 17.0
Net cash flow from financing activities 79.3 –51.6
chANgE IN cASh AND cASh EquIVALENTS 44.4 16.3cash and cash equivalents
cash and cash equivalents at year end 80.1 35.7cash and cash equivalents at year beginning 35.7 19.4
change in cash and cash equivalents 44.4 16.3 *) Gross proceeds of eUr 160.0 million less expenses eUr 8.5 million.**) including, for example, cash flow from hedging intercompany balance sheet items.
pareNt coMpaNy casH fLoW stateMeNt

125
pareNt coMpaNy accoUNtiNG poLicies
the parent company’s financial statements are pre-pared in accordance with finnish law. the results are reported in euros using the historical cost convention. the financial statements are presented excluding the notes to the financial statements.
forEIgN currENcIES
the parent company records foreign currency transac-tions at the rates of exchange on the transaction date. assets and liabilities denominated in foreign curren-cies are translated at the closing rate of exchange con-firmed by the european central bank in effect at the balance sheet date.
exchange rate gains and losses related to financ-ing operations are reported at their net values as financing income and expenses.
DErIVATIVE INSTrumENTS
the company’s derivative instruments include foreign exchange forward contracts, forward rate agreements and interest rate swaps. foreign exchange forward con-tracts are used to hedge against changes in the value of receivables and liabilities denominated in a foreign currency and the forward rate agreements and interest rate swaps to hedge against the interest rate risk.
foreign exchange forward contracts are measured at fair value by recognizing the exchange rate differ-ence in the income statement. the original interest rate differential on foreign exchange forward contracts is amortized to profit and loss. forward rate agreements and interest rate swaps are not measured at fair value, but their fair values are presented in the notes. the fair value of forward rate agreements is based on the mar-ket prices quoted on the closing date. the fair values of interest rate swaps are calculated as the current value of future cash flows. the interest rate differential on interest rate swaps is periodized over the duration of the swaps on a net basis in interest expenses.
INTANgIBLE AND TANgIBLE NoN-currENT ASSETS
Non-current assets are stated at cost less accumulated depreciation.
depreciation is calculated on a straight-line basis in order to write off the cost or revalued amounts of assets over their expected useful lives which are as follows:
intangible rights and other capitalized expenditure 5–10 yearsbuildings 40 years Machinery and equipment 4–10 years Land and water are not depreciated.
proVISIoN for coNTINgENT LoSSES
future costs and losses which the company has an obligation to settle and which are certain or likely to occur are disclosed in the income statement under an appropriate expense heading. they are presented in the balance sheet as provisions for contingent losses when the precise amount or timing is not known. in other cases they are presented as accrued liabilities.
LEASINg
Leasing payments are treated as rental expenses.
pENSIoN pLANS
the pension and related fringe benefit arrangements of the parent company’s employees are administered by a pension insurance company and recorded as deter-mined by actuarial calculations and payments to the insurance company.
a minor part of the cost of supplementary pensions is borne directly by the parent company. annual pay-ments are expensed and pension liabilities are included in the provision for contingent losses.
TAXES
taxes include taxes for the period calculated on the basis of the net result for the period as well as assessed or returned taxes for prior periods.
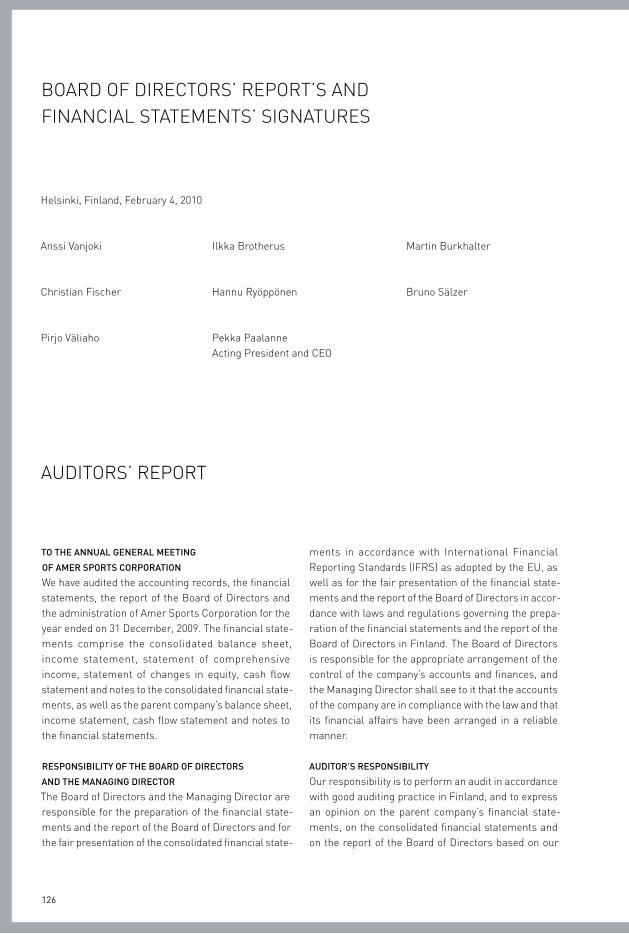
126
board of directors’ report’s aNd fiNaNciaL stateMeNts’ siGNatUres
Helsinki, finland, february 4, 2010
anssi Vanjoki ilkka brotherus Martin burkhalter
christian fischer Hannu ryöppönen bruno sälzer
pirjo Väliaho pekka paalanne acting president and ceo
To ThE ANNuAL gENErAL mEETINg
of AmEr SporTS corporATIoN
We have audited the accounting records, the financial statements, the report of the board of directors and the administration of amer sports corporation for the year ended on 31 december, 2009. the financial state-ments comprise the consolidated balance sheet, income statement, statement of comprehensive income, statement of changes in equity, cash flow statement and notes to the consolidated financial state-ments, as well as the parent company’s balance sheet, income statement, cash flow statement and notes to the financial statements.
rESpoNSIBILITy of ThE BoArD of DIrEcTorS
AND ThE mANAgINg DIrEcTor
the board of directors and the Managing director are responsible for the preparation of the financial state-ments and the report of the board of directors and for the fair presentation of the consolidated financial state-
aUditors’ report
ments in accordance with international financial reporting standards (ifrs) as adopted by the eU, as well as for the fair presentation of the financial state-ments and the report of the board of directors in accor-dance with laws and regulations governing the prepa-ration of the financial statements and the report of the board of directors in finland. the board of directors is responsible for the appropriate arrangement of the control of the company’s accounts and finances, and the Managing director shall see to it that the accounts of the company are in compliance with the law and that its financial affairs have been arranged in a reliable manner.
AuDITor’S rESpoNSIBILITy
our responsibility is to perform an audit in accordance with good auditing practice in finland, and to express an opinion on the parent company’s financial state-ments, on the consolidated financial statements and on the report of the board of directors based on our
127
audit. Good auditing practice requires that we comply with ethical requirements and plan and perform the audit to obtain reasonable assurance whether the financial statements and the report of the board of directors are free from material misstatement and whether the members of the board of directors of the parent company and the Managing director have com-plied with the Limited Liability companies act.
an audit involves performing procedures to obtain audit evidence about the amounts and disclosures in the financial statements and the report of the board of directors. the procedures selected depend on the audi-tor’s judgment, including the assessment of the risks of material misstatement of the financial statements and of the report of the board of directors, whether due to fraud or error. in making those risk assessments, the auditor considers internal control relevant to the entity’s preparation and fair presentation of the finan-cial statements and the report of the board of direc-tors in order to design audit procedures that are appro-priate in the circumstances. an audit also includes evaluating the appropriateness of accounting policies used and the reasonableness of accounting estimates made by management, as well as evaluating the over-all presentation of the financial statements and the report of the board of directors.
the audit was performed in accordance with good auditing practice in finland. We believe that the audit evi-dence we have obtained is sufficient and appropriate to provide a basis for our audit opinion.
opINIoN oN ThE coNSoLIDATED fINANcIAL STATEmENTS
in our opinion, the consolidated financial statements give a true and fair view of the financial position, finan-cial performance and cash flows of the group in accor-dance with international financial reporting standards (ifrs) as adopted by the eU.
opINIoN oN ThE compANy’S fINANcIAL STATEmENTS
AND ThE rEporT of ThE BoArD of DIrEcTorS
in our opinion, the financial statements and the report of the board of directors give a true and fair view of both the consolidated and the parent company’s finan-
cial performance and financial position in accordance with the laws and regulations governing the prepara-tion of the financial statements and the report of the board of directors in finland. the information in the report of the board of directors is consistent with the information in the financial statements.
oThEr opINIoNS
We support that the financial statements should be adopted. the proposal by the board of directors regard-ing the use of the profit shown in the balance sheet is in compliance with the Limited Liability companies act. We support that the Members of the board of directors and the presidents and ceo’s should be discharged from liability for the financial period audited by us.
Helsinki, finland, february 4, 2010
pricewaterhousecoopers oyauthorised public accountants
Jouko Malinenauthorised public accountant
128
Corporate Governance Statement
gENErALpursuant to the provisions of the finnish companies act and the articles of association of amer sports corporation (hereinafter referred to as “amer sports” or “the company”) responsibility for the control and management of amer sports is divided between the General Meeting of shareholders, the board of direc-tors and the president and ceo. shareholders par-ticipate in the control and management of amer sports through resolutions passed at General Meetings of shareholders, which are generally convened upon notice given by the board of directors. in addition, General Meetings of shareholders are held when requested in writing by an auditor of amer sports or by shareholders representing at least one-tenth of all the outstanding shares of the company.
amer sports’ shares are listed on the Nasdaq oMX Helsinki stock exchange. in addition, amer sports has a Level i adr program. the adrs are traded over-the-counter in the United states. two depositary receipts are equivalent to one amer sports share.
corporATE goVErNANcEin its decision making and administration, amer sports applies the finnish companies act, the finnish secu-rities Markets act and the rules issued by the Nasdaq oMX Helsinki stock exchange, amer sports’ articles
of association, and the finnish corporate Governance code 2008 for listed companies. amer sports complies with the code without exceptions. the code is publicly available on www.cgfinland.fi.
this corporate Governance statement has been prepared pursuant to recommendation 51 of the finn-ish corporate Governance code 2008 for listed com-panies and the securities Markets act (chapter 2, section 6). this corporate Governance statement is issued separately from amer sports’ operating and financial review.
BoArD of DIrEcTorScomposition and term of Board of Directorsthe board of directors is responsible for duly organiz-ing the administration and operations of amer sports. the annual General Meeting of shareholders (“the aGM”) elects a minimum of five and a maximum of seven directors for a term of one year. a person who has reached the age of 66 at the time of election may not become a member of the board of directors.
the board evaluates the independence of its members annually or more often, as may be necessary. each member of the board of directors is obligated to provide the board of directors with sufficient informa-tion that allows evaluation of their independence.
In its decision making and administration, Amer Sports applies the Finnish Companies Act, the Finnish Securities Markets Act and the
rules issued by the Nasdaq OMX Helsinki Stock Exchange, Amer Sports’ Articles of Association, and the Finnish Corporate
Governance Code 2008 for listed companies. Amer Sports´ Corporate Governance Statement has been prepared pursuant to
Recommendation 51 of the Finnish Corporate Governance Code 2008 for listed companies and the Securities Markets Act.
129
The Board of Directors’ rules of procedure and meeting practicesamer sports’ board of directors approves annually the rules of procedure to govern its work including a schedule for meetings. the rules of procedure include the specific themes discussed at each meeting in addition to the standard reporting and discussion items reviewed in each meeting. the rules of procedure also include a schedule of the dates when the board of directors will visit the operations of the company and its partners, as well as the annual evaluation of its own performance at the end of the period. committees established by the board of directors assist the board of directors for the matters assigned to them.
the board of directors convenes eight to ten (8–10) times a year according to a predetermined annual meeting schedule. in addition to these meetings, the board of directors convenes as necessary. at least once a year, the board of directors convenes when repre-sentatives of the company’s management are not in attendance. the president and ceo and the executive Vice president and cfo participate in the meetings of the board of directors and the Vice president of Legal affairs acts as the secretary of the board. other amer sports executives participate in the meetings as neces-sary.
Meeting materials are delivered to the members of the board of directors in advance and all meetings are documented.
The main duties of the Board of Directorsthe duties and responsibilities of the board of directors are defined according to the finnish companies act, other applicable legislation, and amer sports’ articles of association. the board of directors has general authority in all matters where neither law nor the company’s articles of association stipulate that a matter should be decided or performed by any other bodies. in addition, the board of directors must act in the interests of the company and all shareholders in
all circumstances, and direct amer sports’ operations with a view to generating maximum enduring added value to shareholders without neglecting other stake-holders.
the main duties of the board of directors are to:1. direct amer sports’ business operations and
strategies• Confirmthecompany’sstrategyandensurethatit
is up-to-date• Confirm the business plan on the basis of the
strategy and annual budget, and monitor its achievement
• Adopttheannualinvestmentplan• Decide on significant, strategically-important
investments or acquisitions and the sale of assets• Review the Corporate Social Responsibility
report
2. organize amer sports’ administration and func-tions
• AppointanddismissthePresidentandCEO• Appointanddismissthe immediatesubordinates
of the president and ceo• DecideonthetermsofserviceofthePresidentand
ceo and his or her immediate subordinates, includ-ing possible incentive programs
• SetthePresidentandCEO’spersonaltargetsforeach year and monitor their achievement
• Keep track of issues related to succession inmanagement and human resources strategy
• AdoptthedutiesandresponsibilitiesoftheBoardof directors and evaluate its performance once a year
3. supervise the management of financial administra-tion, internal control and risk management
• Reviewandapproveinterimreports,annualfinan-cial statements and the report by the board of directors as well as related stock exchange releases
130
• Holdameetingwiththecompany’sauditorsatleastonce a year
• Overseesignificantrisksconnectedwiththecom-pany’s operations and risk management
4. prepare matters to be decided on at the aGM• Draft the company’s dividendpayout policy and
submit a proposal on the dividend to the aGM• SubmitotherproposalstotheAGM
according to the rules of procedure, the chairman of the board of directors, in addition to leading the work of the board of directors, continuously monitors amer sports’ operations and development through contact with the president and ceo. furthermore, the chair-man of the board of directors represents the company in matters associated with shareholders and ensures that the work of the board of directors is evaluated annually, and that the board of directors continuously updates and deepens its knowledge of amer sports’ operations.
Year 2009the annual General Meeting of shareholders held on March 5, 2009, elected seven members to the amer sports board of directors. the board members re-elected were anssi Vanjoki, ilkka brotherus, Martin burkhalter, christian fischer, bruno sälzer, and pirjo Väliaho. Hannu ryöppönen was elected as a new member of the board of directors, anssi Vanjoki was re-elected as chairman and ilkka brotherus as vice chairman of the board of directors.
in 2009, the board of directors convened 20 times. the attendance rate of directors at meetings of the board of directors was 94% in 2009. on 5 March, 2009, the board of directors carried out a self-assessment of its performance.
BoArD commITTEESthe board of directors has established three permanent committees from amongst its members to support its
work and has defined the rules of procedure for them. the committee chairmen and members are elected annually. the committees report on their work to the entire board of directors on a regular basis. the com-mittees have no independent decision-making power.
Audit committeethe board of directors appoints an audit committee to assist it in its task of supervising the company’s finan-cial administration. the audit committee comprises a minimum of three members of the board of directors. the members must be independent and have the qualifications necessary to perform the duties of the audit committee. the audit committee meets at least four times per year and maintains regular contact with the company’s external auditor. the audit committee monitors the reporting of the company’s financial statements and the adequacy of internal control and risk management systems. in addition, the audit com-mittee monitors the statutory audit process, evaluates the independence of the statutory audit firm, and pre-pares the recommendation presented to the annual General Meeting on the election of the auditor.
Year 2009on March 5, 2009, the board of directors elected Hannu ryöppönen (chairman), ilkka brotherus and Martin burkhalter as members of the audit committee. the audit committee convened altogether 5 times in 2009. the meeting attendance rate was 93.3% in 2009.
compensation committeethe board of directors appoints a compensation com-mittee to ensure good governance in monitoring executive rewards, to recommend amer sports’ reward philosophy and executive reward programs, to assess pay and performance relationships and to recommend executive pay decisions concerning the president and ceo and his immediate direct reports for approval by amer sports’ board of directors. the compensation committee comprises a minimum of three members
131
of the board of directors. the chairman of the com-mittee convenes meetings as required, but at least twice a year.
Year 2009on March 5, 2009, the board of directors elected pirjo Väliaho (chairman), anssi Vanjoki, christian fischer, and bruno sälzer as members of the compensation committee. the compensation committee convened altogether 4 times in 2009. the meeting attendance rate was 93.8% in 2009.
Nomination committeethe board of directors appoints a Nomination com-mittee to assist it in its task of ensuring good gover-nance in preparing proposals concerning members of the board of directors and their compensation for decision by the General Meeting of shareholders. the Nomination committee communicates with major shareholders in matters concerning the appointment of the board of directors, when that is appropriate. the Nomination committee comprises a minimum of three members of the board of directors. the chairman of the committee convenes meetings as required, but at least once a year.
Year 2009on March 5, 2009, the board of directors elected ilkka brotherus (chairman), anssi Vanjoki, and Martin burkhalter as members of the Nomination committee. the Nomination committee convened altogether 8 times in 2009. the meeting attendance rate was 100% in 2009.
prESIDENT AND cEothe board of directors nominates the president and ceo, who is in responsible for managing amer sports in accordance with the finnish companies act and instructions provided by the board of directors. the executive Vice president and cfo acts as deputy to the president and ceo.
the president and ceo reports to the board of directors and keeps the board of directors informed about amer sports’ business, including its relevant markets and competitors, as well as its financial posi-tion and other significant matters. the president and ceo is also responsible for overseeing the company’s day-to-day administration and ensuring that the financial administration of the company has been arranged reliably. the president and ceo is assisted by the executive board. roger talermo served as president and ceo from 1996 until 22 december, 2009 and was also a member of the board of directors between 1996 and 2008. the executive Vice president and cfo, cur-rently pekka paalanne, acts as deputy to the president and ceo. Heikki takala was appointed as president and ceo of amer sports from april 1, 2010.
pekka paalanneacting president and ceo of amer sports from decem-ber 22, 2009 until March 31, 2010. executive Vice president and cfo since 1997. bachelor of science degree in economics. born 1950, finnish nationality. primary work experience: senior Vice president of corporate control and information systems of Kone corporation 1991–1997. several executive positions in Kone corporation 1979–1991.
heikki Takalapresident and ceo of amer sports from april 1, 2010. Master of science degree. born 1966, finnish nationality. primary working experience: commercial director of salon professional Global commercial operations of procter & Gamble. several line management positions in region and product line organizations in procter & Gamble 1992–2010.
roger Talermopresident and ceo from 1996 until 22 december 2009. born 1955, finnish nationality. Master of science degree in economics and an honorary doctor of phi-losophy degree in sports and Health sciences. primary
132
work experience: president and ceo of atomic companies (austria) 1995–1996, General Manager and chairman of salomon s.a. – North europe (sweden) 1993–1995, ceo of taylor Made Golf company, inc. (Usa) 1991–1993.
mAIN fEATurES of ThE INTErNAL coNTroL AND rISk mANAgEmENT SySTEmS pErTAININg To ThE fINANcIAL rEporTINg procESSInternal control and risk management Systemthe board of directors of amer sports approves and endorses the risk Management policy. the policy defines objectives, principles, processes and respon-sibilities concerning risk management within amer sports companies. identifying and evaluating risks makes it possible to manage them. this identification and evaluation of risks enables sufficient and effective internal controls to be put in place. the process of risk management and the internal controls relating to financial reporting in amer sports are designed to provide reasonable assurance regarding the reliability of financial reporting and the preparation of financial statements.
the risk management process is embedded in the business management and internal control framework in order to support the accomplishment of the com-pany’s strategic business targets and financial reporting objectives.
responsibility for risk management rests with amer sports’ business segments/areas, sales and supply chain organizations and support functions, which report regularly to the management of amer sports on the main risks connected with their operations.
the management of financial risks is centralized within amer sports’ treasury function. the guidelines for risk management are set out in the financial risk Management policy, which is approved by the board of directors and which encompasses the principles and risk limits connected with the balance sheet structure, relationships with financial institutions and other financing risks.
amer sports’ primary reporting segments are its business segments: Winter and outdoor, ball sports, and fitness. Winter and outdoor is divided into the fol-lowing business areas: Winter sports equipment, apparel and footwear, cycling and sports instruments. ball sports’ business areas are racquet sports, team sports and Golf. fitness’ business area is fitness equip-ment. the secondary reporting segments are the regions; the americas, eMea and asia pacific. in over-seeing the operations, the president and ceo and other executives make use of weekly sales reports, monthly financial reports, and regular meetings with the man-agement teams of business segments/areas and regions.
financial reporting is carried out in a harmonized way in all group companies. amer sports’ accounting policies in both external and internal financial reporting are based on the international financial reporting standards (ifrs). in addition to ifrs, more specific group policies and guidance are provided in amer sports’ accounting policies manual (corporate Manual). the amer sports finance and control function is respon-sible for maintaining the accounting policies and reporting systems. it also monitors that these reporting policies are followed.
the business segments are responsible for providing their financial statements. the amer sports finance and control function consolidates financial statements.
amer sports is in the process of implementing a group-wide, unified erp (enterprise resource planning) system (sap). this includes a harmonized chart of accounts and the control environment. the amer sports finance and control function is responsible for monitor-ing the implementation of sap rollouts.
the amer sports internal control and risk Man-agement framework includes elements from the framework introduced by the committee of sponsoring organizations (coso). there are five principle compo-nents: control environment, risk assessment, control activities, information and communication, and Monitoring.
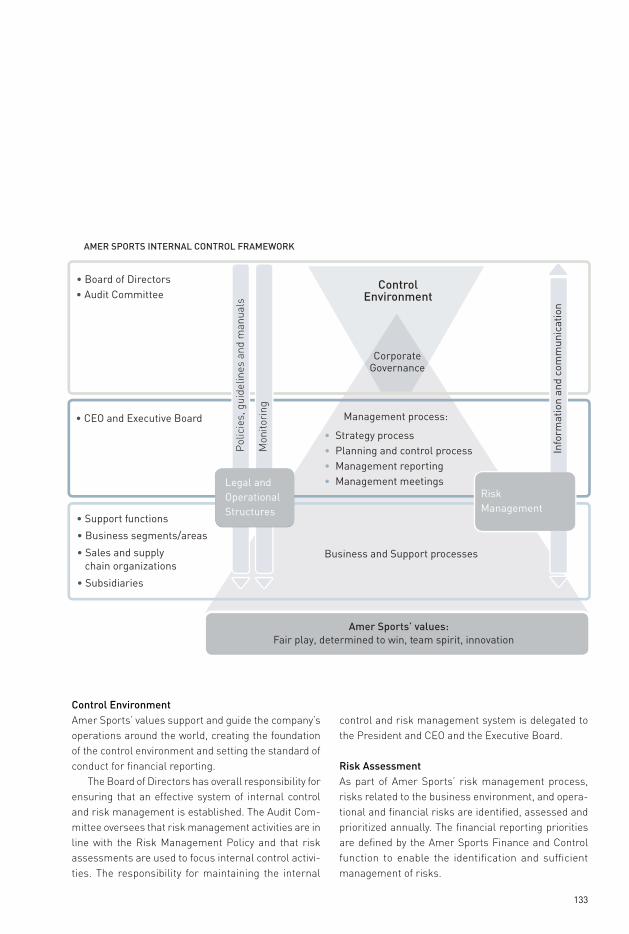
133
• Board of Directors• Audit Committee
• CEO and Executive Board
• Support functions
• Business segments/areas
• Sales and supply
chain organizations
• Subsidiaries
Corporate Governance
• Strategy process• Planning and control process• Management reporting• Management meetings
Business and Support processes
Management process:
Pol
icie
s, g
uide
lines
and
man
uals
Mon
itori
ng
Amer Sports’ values:Fair play, determined to win, team spirit, innovation
AMER SPORTS INTERNAL CONTROL FRAMEWORK
Control Environment
Legal and Operational Structures
Info
rmat
ion
and
com
mun
icat
ion
Risk Management
control Environmentamer sports’ values support and guide the company’s operations around the world, creating the foundation of the control environment and setting the standard of conduct for financial reporting.
the board of directors has overall responsibility for ensuring that an effective system of internal control and risk management is established. the audit com-mittee oversees that risk management activities are in line with the risk Management policy and that risk assessments are used to focus internal control activi-ties. the responsibility for maintaining the internal
control and risk management system is delegated to the president and ceo and the executive board.
risk Assessmentas part of amer sports’ risk management process, risks related to the business environment, and opera-tional and financial risks are identified, assessed and prioritized annually. the financial reporting priorities are defined by the amer sports finance and control function to enable the identification and sufficient management of risks.
134
control ActivitiesLegal and operational structures are the foundation of internal controls. because the organization is decen-tralized, it is the responsibility of the business seg-ments/areas, sales and supply chain organizations and support functions to align the company’s risk manage-ment priorities and strategies with their management processes. amer sports’ support functions issue poli-cies and guidelines for specific areas such as finance, accounting, purchasing, sales, it, Hr and legal compli-ance. it is at the responsibility of the business seg-ments/areas and sales and supply chain organizations and support functions to apply these policies and guidelines in order to achieve efficient and appropriate controls on the basis of their individual circumstances and context. risk management and control activities are planned to mitigate identified risks with consider-ation to the cost and potential effectiveness of the control activities.
amer sports’ treasury function monitors the implementation of the financial risk Management policy within the business segments/areas and sub-sidiaries.
the amer sports corporate Manual and the inter-nal control policy set standards for financial proce-dures. the financial control activities are designed to prevent, detect, and correct errors and irregularities. they include a range of activities such as reporting, authorizations, approvals, reconciliations, and the segregation of duties.
the internal control policy was developed by reviewing existing policies and procedures within a selection of amer sports businesses. the purpose of the policy is to act as a practical tool, to harmonize and clarify rules and procedures by setting and communi-cating the expected minimum requirements within the area of internal control.
the property, loss-of-profits and liability risks arising from the operations of the amer sports com-panies are covered by taking out appropriate insurance
policies. in addition to worldwide insurance programs, local policies are also used, for example, when there are special legislation-related needs.
Information and communicationthe components of the risk management and internal control system are described in various manuals, instructions and policies. these are communicated throughout the group of companies and are stored on amer sports’ intranet, which is accessible to the employees.
the amer sports corporate Manual defines, among other things, the planning and control process, report-ing and accounting policies, and the role of the amer sports treasury function. taxation matters are covered in different instructions and guidelines. the internal control policy provides further clarity and sets the expected minimum requirements regarding, for example, authorization matrix, capital expenditure, and credit control policy.
business segments/areas, sales and supply chain organizations and subsidiaries regularly provide financial and management reports to the management of amer sports, including analysis of financial perfor-mance as well as potential risks and opportunities. regular meetings are also held for sharing information and best practices regarding internal controls and risk management.
monitoringthe performance of the amer sports’ companies is reviewed regularly on various organizational levels. the reviews are formal and documented. the representa-tives of the amer sports’ finance and control function also regularly visit the businesses to perform opera-tional reviews. they also monitor the internal control procedures.
risk reporting is integrated into the operational planning and control cycle and into the strategic review cycle management processes. amer sports’
135
business segments/areas, sales and supply chain organizations and support functions report regularly on risk exposures and their mitigation efforts to the relevant management board.
the board of directors oversees significant risks connected with amer sports’ operations and evaluates the effectiveness of the risk management.
the risk Management steering team is responsible for overall risk management process development within amer sports, including facilitation of group-level risk mapping.
Internal Auditamer sports does not have a separate internal audit function to analyze the operations and processes relating to internal controls. However, the representa-tives of the amer sports’ finance and control function regularly visit group companies to perform operational and financial reviews. they also monitor the internal control procedures. the scope and content of the external audit reflects the fact that there is no separate internal audit organization. the audit committee and the amer sports’ finance and control function deter-mine one or more audit themes over and above the statutory auditing requirements. the themes change each year and separate reports on them are prepared for the audit committee and the management of amer sports.
External Auditaccording to the articles of association, amer sports has one auditor, which must be a public accounting firm certified by the central chamber of commerce.
the independent public accountant engaged by amer sports is in charge of directing and coordinating the audit work for the entire amer sports group of companies. the audit committee prepares the recom-mendation presented to the annual General Meeting on the election of the auditor. the annual General Meeting elects the auditor annually and for a period of one year.
amer sports’ auditor, the presidents of the business segments and areas and the finance directors as well as the general manager and the finance manager of selected subsidiaries meet at least once a year. the auditors of subsidiaries present their audit observa-tions annually to the company in question, to the amer sports’ auditor, and to the representatives of the amer sports’ finance and control function. in addition, they report in greater detail to the subsidiaries concerning observations made in the course of the audit.
the amer sports’ auditor submits a written report on their audit to the audit committee and the board of directors at least once a year. the principal auditor takes part in the board of directors meeting at which the financial statements for the fiscal year are dis-cussed and presents a summary of the year’s audit. the auditor is invited to each of the audit committee’s meetings and they give an update on how the group audit is progressing and present their findings.

136
ANSSI VANjokIindependent of the company and significant sharehold-ers. executive Vice president and General Manager of the Markets Unit of Nokia corporation. Master of sci-ence degree in economics. primary work experience: executive Vice president and General Manager of the Multimedia unit of Nokia corporation 2004–2007. executive Vice president of Nokia Mobile phones and senior Vice president of Nokia Mobile phones (europe and africa) 1994–1998, and Vice president of sales of Nokia Mobile phones 1991–1994. other positions of trust: Member of the executive board of Nokia corpo-ration and of the boards of directors of Koskitukki oy and sonova Holding aG.
ILkkA BroThEruSindependent of the company and significant sharehold-ers. owner, Managing director sinituote oy. Master of science degree in economics. primary work experi-ence: deputy Managing director of Hackman Group 1988–1989, Managing director of Hackman House-wares oy 1987–1988, and Managing director of Havi oy 1981–1986. other positions of trust: Member of the board of directors of sinituote oy and oy erkyte ab, a member of the board of directors of Veho Group oy ab, and a member of the supervisory board of tapiola Mutual pension insurance company.
Board of Directors
from LEfT: ANSSI VANjokI, pIrjo VäLIAho, BruNo SäLZEr, mArTIN BurkhALTEr, ILkkA BroThEruS, chrISTIAN fISchEr, hANNu ryöppöNEN
December 31, 2009

137
mArTIN BurkhALTErindependent of the company and significant sharehold-ers. chief operating officer of Vizrt Ltd. biotechnology and accounting degree. primary work experience: independent consultant in Geneva, switzerland, 2004–2005, senior Vice president and Managing direc-tor of eMea reebok international (france) 2001–2003, and chief executive officer of intersport international corporation (iic) (switzerland) 1997–2001.
chrISTIAN fISchErindependent of the company and significant sharehold-ers. founder and managing director of accelate, business Launch and expansion GmbH, founder of security Land sicherheitsfachmarkt GmbH. Mba degree. primary work experience: principal in a.t. Kearney Management consultants (Germany) 1994–1999, and international brand Management of Henkel aG & co. KGaa (Germany) in 1993.
hANNu ryöppöNENindependent of the company and significant sharehold-ers. business administration degree. primary work experience: deputy chief executive officer of stora enso oyj (finland, UK) 2007–2009, chief financial officer of stora enso oyj (finland, UK) 2005–2008, chief financial officer of Koninklijke ahold N.V. (the Netherlands) 2003–2005, chief financial officer of industri Kapital Group (UK) 1999–2003 and chief financial officer of the iKea Group 1985–1998. other positions of trust: chair-man of the board of directors of altor private equity
funds and tiimari oyj, and a member of the board of directors of Neste oil corporation, Novo Nordisk a/s and rautaruukki corporation.
BruNo SäLZErindependent of the company and significant sharehold-ers. business administration degree. primary work experience: chairman and chief executive officer of escada aG (Germany) 2008–2009, chairman and chief executive officer of Hugo boss aG (Germany) 2002–2008, executive Vice chairman of Hugo boss aG (Germany) 1998–2002, Managing director of Hairdress-ing international of Hans schwarzkopf GmbH (Germany) 1993–1995.
pIrjo VäLIAhoindependent of the company and significant sharehold-ers. Vice president and General Manager of procter & Gamble Germany, austria and switzerland. bachelor of science degree in economics. primary work experi-ence: several general management positions with the Gillette company (Vp and General Manager of Gillette Nordic, central europe West and Gillette eastern europe, and General Manager of braun Nordic), various Global strategic Marketing positions in the braun division of Gillette, and commercial Marketing posi-tions both in braun GmbH and in Gillette company in the United states, canada, and finland 1982–2005.
More information on amer sports’ board of directors can be found at www.amersports.com.
the members of the board of directors are as follows, december 31, 2009:
Name year born position year of election Nationality
anssi Vanjoki 1956 chairman since 2006 2004 finnish
ilkka brotherus 1951 Vice chairman since 2002 2000 finnish
Martin burkhalter 1952 Member 2008 swiss
christian fischer 1964 Member 2008 austrian
Hannu ryöppönen 1952 Member 2009 finnish
bruno sälzer 1957 Member 2008 German
pirjo Väliaho 1954 Member 2007 finnish
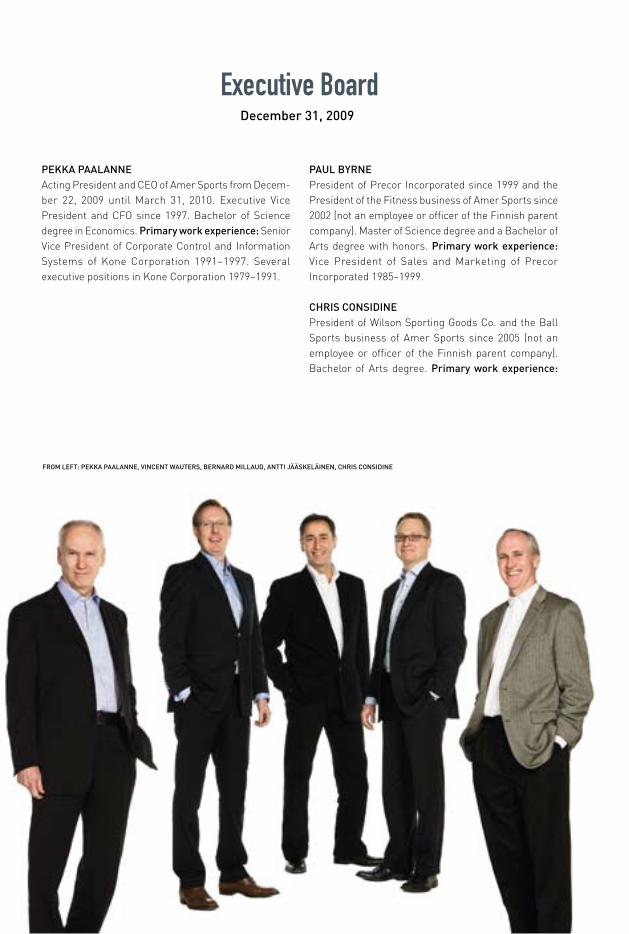
138
pEkkA pAALANNEacting president and ceo of amer sports from decem-ber 22, 2009 until March 31, 2010. executive Vice president and cfo since 1997. bachelor of science degree in economics. primary work experience: senior Vice president of corporate control and information systems of Kone corporation 1991–1997. several executive positions in Kone corporation 1979–1991.
Executive Board
pAuL ByrNEpresident of precor incorporated since 1999 and the president of the fitness business of amer sports since 2002 (not an employee or officer of the finnish parent company). Master of science degree and a bachelor of arts degree with honors. primary work experience: Vice president of sales and Marketing of precor incorporated 1985–1999.
chrIS coNSIDINEpresident of Wilson sporting Goods co. and the ball sports business of amer sports since 2005 (not an employee or officer of the finnish parent company). bachelor of arts degree. primary work experience:
from LEfT: pEkkA pAALANNE, VINcENT wAuTErS, BErNArD mILLAuD, ANTTI jääSkELäINEN, chrIS coNSIDINE
December 31, 2009
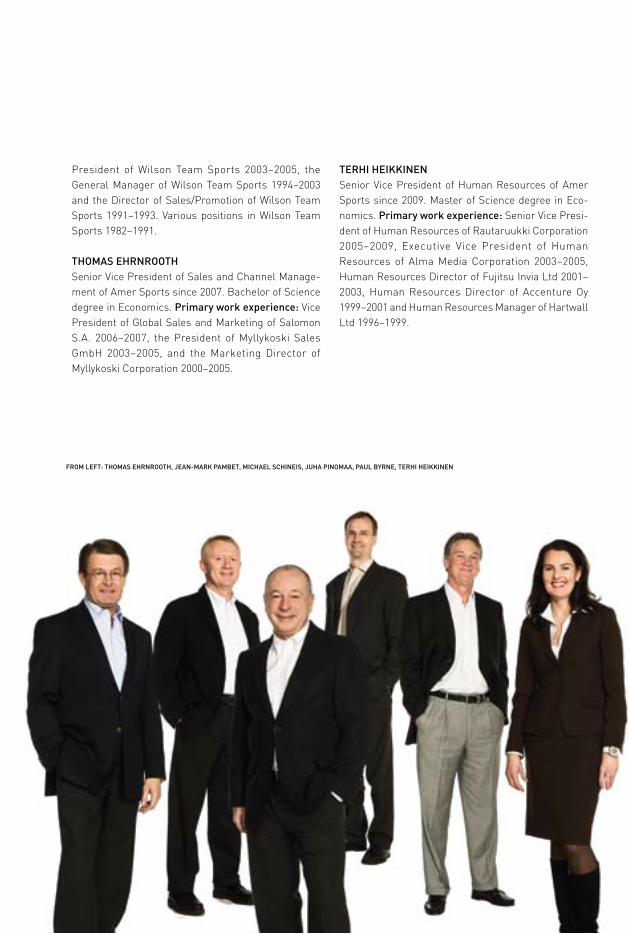
139
president of Wilson team sports 2003–2005, the General Manager of Wilson team sports 1994–2003 and the director of sales/promotion of Wilson team sports 1991–1993. Various positions in Wilson team sports 1982–1991.
ThomAS EhrNrooThsenior Vice president of sales and channel Manage-ment of amer sports since 2007. bachelor of science degree in economics. primary work experience: Vice president of Global sales and Marketing of salomon s.a. 2006–2007, the president of Myllykoski sales GmbH 2003–2005, and the Marketing director of Myllykoski corporation 2000–2005.
TErhI hEIkkINENsenior Vice president of Human resources of amer sports since 2009. Master of science degree in eco-nomics. primary work experience: senior Vice presi-dent of Human resources of rautaruukki corporation 2005–2009, executive Vice president of Human resources of alma Media corporation 2003–2005, Human resources director of fujitsu invia Ltd 2001–2003, Human resources director of accenture oy 1999–2001 and Human resources Manager of Hartwall Ltd 1996–1999.
from LEfT: ThomAS EhrNrooTh, jEAN-mArk pAmBET, mIchAEL SchINEIS, juhA pINomAA, pAuL ByrNE, TErhI hEIkkINEN
140
ANTTI jääSkELäINENchief development officer since 2009. Mba degree (iNsead, france), Msc (econ.) degree and Msc (eng.) degree. primary work experience: senior Vice presi-dent, biorefining & bioenergy, stora enso ab, sweden 2007–2009, senior Vice president, Head of Group strategy, stora enso international Ltd, UK 2006–2007, Vice president, corporate strategy & investments, stora enso oyj 2004–2006, engagement Manager, associate, McKinsey & company 2002–2004, business operations Manager, Nokia italia s.p.a 1999–2001.
BErNArD mILLAuDpresident of Mavic sas and president of the cycling business area of amer sports since 2010 (not an employee or officer of the finnish parent company). degree from the ecole polytechnique. primary work experience: president of salomon sas 2007–2009 General Manager of Mavic 2002–2009 and president salomon Winter sports of 1998–2009.
jEAN-mArc pAmBETpresident of salomon sas since 2010 and president of the apparel and footwear business area of amer sports since 2007 (not an employee or officer of the finnish parent company). degree from the ecole Hec paris. primary work experience: General Manager of salomon apparel and footwear business area 2002–2007. General Manager of salomon eMea 1996–2002. country Manager of salomon france 1990–1996. posi-tions of trust: board of directors of the european outdoor Group (eoG) since 2009.
juhA pINomAApresident of suunto oy and president of the sports instruments business area of amer sports since 2005 (not an employee or an officer of the finnish parent company). Mba and Master of science in technology. primary work experience: Vice president of entry business Line of Nokia’s Mobile phones business Group 2004–2005. prior to that various management positions at Nokia Mobile phones in category, business, sales and product management in finland, Us, and asia during 17 years.
mIchAEL SchINEISpresident of the Winter sports equipment business area of amer sports since 2007 and president of atomic austria GmbH since 1996 (not an employee or officer of the finnish parent company). Mba degree and a doctor of philosophy degree (dr.rer.pol.). primary work experience: General Manager of salomon Germany GmbH 1993–1996 and a member of the management team of contop (advertising agency) 1989–1993. posi-tions of trust: Member of the “beirat für Wissenschaft und forschung des Landes salzburg” and of the advisory board of bulthaup GmbH & co. KG.
VINcENT wAuTErSsenior Vice president of supply chain and it of amer sports since 2008. post-graduate degree in Geo-pol-itics and contemporary History. primary work experi-ence: several positions in Newell rubbermaid 2002–2008: Vice president of supply chain of Newell rub-bermaid eMea 2006–2008, director of supply chain and customer service of sanford europe 2004–2006 and officer of supply chain development of sanford europe 2002–2004. director of supply chain and cata-logue of amazon.fr 2000–2002. several positions in redcats (ppr Group) 1997–2000.
More information on amer sports’ executive board can be found at www.amersports.com
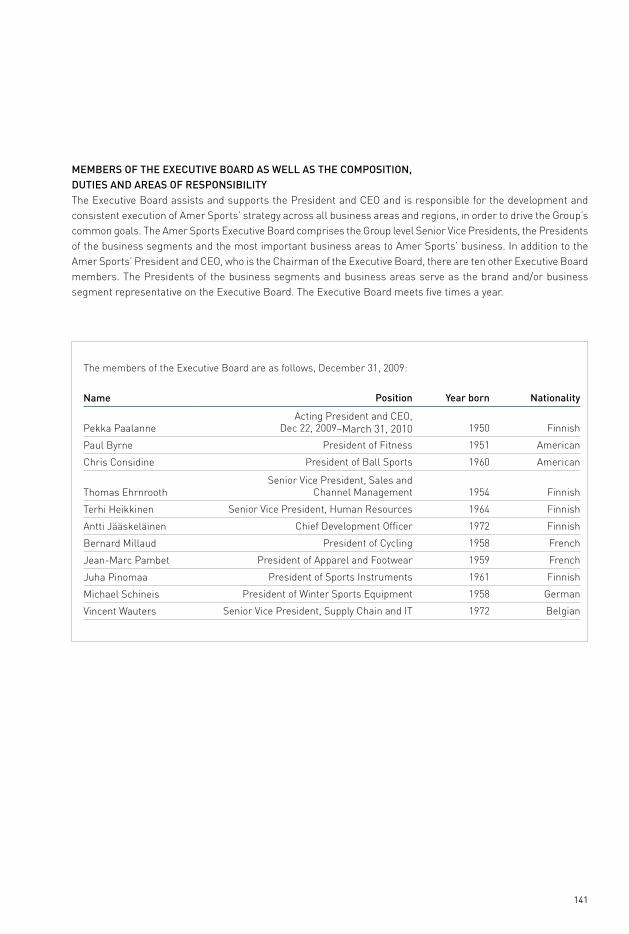
141
mEmBErS of ThE EXEcuTIVE BoArD AS wELL AS ThE compoSITIoN, DuTIES AND ArEAS of rESpoNSIBILITythe executive board assists and supports the president and ceo and is responsible for the development and consistent execution of amer sports’ strategy across all business areas and regions, in order to drive the Group’s common goals. the amer sports executive board comprises the Group level senior Vice presidents, the presidents of the business segments and the most important business areas to amer sports’ business. in addition to the amer sports’ president and ceo, who is the chairman of the executive board, there are ten other executive board members. the presidents of the business segments and business areas serve as the brand and/or business segment representative on the executive board. the executive board meets five times a year.
the members of the executive board are as follows, december 31, 2009:
Name position year born Nationality
pekka paalanneacting president and ceo,
dec 22, 2009–March 31, 2010 1950 finnish
paul byrne president of fitness 1951 american
chris considine president of ball sports 1960 american
thomas ehrnroothsenior Vice president, sales and
channel Management 1954 finnish
terhi Heikkinen senior Vice president, Human resources 1964 finnish
antti Jääskeläinen chief development officer 1972 finnish
bernard Millaud president of cycling 1958 french
Jean-Marc pambet president of apparel and footwear 1959 french
Juha pinomaa president of sports instruments 1961 finnish
Michael schineis president of Winter sports equipment 1958 German
Vincent Wauters senior Vice president, supply chain and it 1972 belgian
142
Remuneration
The Amer Sports total rewarding principles are closely linked to financial and personal performance. The total rewarding aim is to drive business success through total reward programs that attract, motivate,
reward and retain good and high performers.
rEmuNErATIoN AND oThEr fINANcIAL BENEfITS of ThE BoArD of DIrEcTorSremuneration and other financial benefits of the board directors pursuant to the finnish companies act, amer sports’ shareholders determine the amount of com-pensation to be paid to members of its board of directors at the annual General Meeting of sharehold-ers. the annual General Meeting of shareholders of amer sports, held on March 5, 2009, resolved that the chairman of the board of directors shall be paid an annual remuneration of eUr 80,000, the Vice chairman an annual remuneration of eUr 50,000 and other members of the board of directors an annual remu-neration of eUr 40,000.
according to the resolution of the annual General Meeting of shareholders of amer sports, 40 percent of the annual remuneration budgeted for the members of the board of directors, including with respect to the chairman of the board of directors and the Vice chair-man, will be used to acquire amer sports shares for the account of each member of the board of directors. a member of the board of directors is not permitted to sell or transfer any of these shares to any third party during the term of his or her board membership. However, this limitation is valid for a maximum of five years after the acquisition of the shares.
ThE NumBEr of ShArES AND ShArE-rELATED rIghTS grANTED To A BoArD of DIrEcTor AS rEmuNErATIoNon June 17, 2009, the members of the board of direc-tors together received annual remuneration totaling eUr 330,000, of which eUr 198,022.60 was paid in cash. simultaneously, the members of the board of directors received the following numbers of shares: Hannu ryöppönen, 2,025 shares; ilkka brotherus, 2,531 shares; Martin burkhalter, 2,025 shares; christian fischer, 2,025 shares; bruno sälzer, 2,025 shares; anssi Vanjoki, 4,050 shares; and pirjo Väliaho, 2,025 shares.
on June 17, 2008, the members of the board of directors together received annual remuneration totaling eUr 320,040, of which eUr 192,651.61 was paid in cash. simultaneously, the members of the board of directors received the following numbers of shares: felix björklund, 1,372 shares; ilkka brotherus, 1,715 shares; Martin burkhalter, 1,030 shares; christian fischer, 1,030 shares; bruno sälzer, 1,030 shares; anssi Vanjoki, 2,744 shares; and pirjo Väliaho, 1,372 shares. in addition, timo Maasilta and tuomo Lähdesmäki each received 342 shares. they were members of the board of directors until June 4, 2008.
143
rEmuNErATIoN of ThE prESIDENT AND cEo AND oThEr EXEcuTIVES AND ToTAL rEwArDINg prINcIpLESthe board of directors determines the salaries and compensation which is paid to the president and ceo and his immediate subordinates. the compensation committee is responsible for preparing the proposals for ceo and his immediate subordinates’ salaries and the executive’s incentive system. No separate compen-sation is paid to the members of the executive board for their participation in any management bodies.
the salaries, benefits and other compensation paid to the president and ceo and the members of the executive board amounted to eUr 4.1 million in 2009. in 2009, total compensation paid to the president and ceo amounted to eUr 0.9 million, of which incentives tied to profits and other objectives accounted for eUr 0.1 million. salaries, benefits and other compensation paid to the other members of the executive board totaled eUr 3.2 million, of which incentives amounted to eUr 0.5 million.
the amer sports total rewarding principles are closely linked to financial and personal performance. the total rewarding aim is to drive business success through total reward programs that attract, motivate, reward and retain good and high performers. empha-sis is also placed on team and individual accountability. the principles of total rewarding apply to all amer sports employees. the individual performance is evaluated in an annual performance discussion and is mutually agreed between the employee and the direct manager, and in case of the president and ceo, the performance is evaluated by the board of directors.
at amer sports the total rewarding components are base pay, benefits, annual incentives and long-term incentives. base pay forms the basic element of compensation and takes into account particularly the role content and demand of the role. benefits are part of amer sports total rewarding and the principles follow local practices. Local practices consist of taxable and non-taxable benefits.
the purpose of amer sports annual incentive pro-grams is to drive the company’s growth and profit-ability and to support the realization of company’s business strategy. annual incentives reward employees for achieving business success through company’s financial targets as well as personal accomplishment through individual targets. the weighting of the finan-cial targets of the overall target setting is higher in the executive roles. the participation in an annual incentive program is role dependant and is the most extensive incentive system in terms of personnel covered.
the long-term incentives at amer sports have strategic focus at Group level and concentrate on share-price development. the long-term incentives programs are governed by the board of directors. there are a limited number of executives participating in long-term incentive programs, and all participants are nominated by the president and ceo and approved by the board of directors. at the end of the year 2009, there were three long-term incentive programs in place:• Stockoptionprogram isdesigned tosupport the
achievement of long-term strategic objectives and to build shareholder value. the number of people in management within amer sports who came within the scope of stock options at the end of 2009 was 8 under the 2007 program.
• Ashare-basedincentiveplanforkeyexecutiveswasestablished in 2007. the amer sports’ share-based incentive plan is targeted for the company’s key personnel. the plan’s reward was paid in 2008 in part as amer sports’ shares and partially in cash. the cash payment covers taxes and tax-related costs arising from the reward. during 2009, there were two new participants in the plan who received the reward and the cash payment. of the shares, 25% will be transferable as of april 2010, 25% as of april 2011, and 50% as of april 2012. the rewards paid based on this plan corresponded to a maximum value of approximately 400,000 amer sports
144
corporation shares. at the end of the financial year the plan covered 22 people.
• Adeferredcashlong-termincentiveprogramthatseeks to elicit commitment from key executives. the program encourages the achievement of the annual plan. its result is tied to the three-year trend in shareholder value. at the end of 2009, 92 mem-bers in management tasks at subsidiaries came within the scope of the program.
LoNg-TErm rEmuNErATIoN progrAmS2007 warrant programthe 2007 warrant program comprises 1,500,000 war-rants which entitle amer sports’ key employees to sub-scribe for a maximum of 1,500,000 shares. of such warrants, 500,000 are marked with the symbol 2007a, 500,000 are marked with the symbol 2007b and 500,000 are marked with the symbol 2007c. initially, all war-rants were issued to the company’s fully-owned sub-sidiary for allocation to key employees in the future. the 2007a, 2007b and 2007c warrants were not allocated to key employees since amer sports’ financial targets set by the board of directors of the company were not reached in 2007, 2008 and 2009, respectively.
Share-Based Incentive planon January 14, 2007, the board of directors resolved to establish a share-based incentive plan for amer sports’ key employees. in order to participate in the plan, each key employee was required to purchase shares up to the amount corresponding to one-half of the reward that was allocated to him/her. the plan’s rewards were paid in 2008 partially as shares and par-tially in cash. the cash payment covered taxes and tax-related costs arising from the reward. of the shares rewarded to employees under the plan, 25 percent will be transferable as of april 2010, 25 percent as of april 2011, and 50 percent as of april 2012. the rewards from the share-based incentive plan correspond to a maxi-mum value of approximately 400,000 shares. at the end of 2009, 22 key employees were covered by the share-
based incentive plan and they have received in total 102,800 shares before the recent rights offering.
on March 3, 2009, the board of directors decided to transfer the shares used for the Group’s key person-nel’s share-based incentive plan to its fully-owned subsidiary, amer sports international oy for allocation to key employees in the future. as at financial year end, amer sports international oy owned 334,900 shares including the shares that have been returned to amer sports international oy during 2009, by persons who no longer participate in the plan, are taken into account. of the shares owned by amer sports international oy, 89,900 shares are available for allocation to key employees.
the terms and conditions of the share-based incen-tive plan do not contain any provisions regarding the impact of the offering on the plan. on september 17, 2009, the board of directors of the company resolved to supplement the terms and conditions of the share-based incentive plan to the effect that the subscription rights that will be allocated for the shares rewarded under the plan will be released from the transfer restriction. in addition, the board of directors of the company resolved that such released subscription rights shall be used to subscribe for offer shares by the participants of the plan and that the company will pay to the participants of the plan, as a salary, an amount corresponding to the subscription price for such offer shares together with any tax obligations arising as a result of the payment. the offer shares subscribed for in the offering are subject to the trans-fer restrictions on the same terms as shares that have already been re-awarded under the plan. to the extent the subscription of offer shares is not possible due to legal restrictions, subscription rights received on the basis of shares that have been re-awarded under the plan are released from the transfer restriction on sale by participants of the plan. those participants of the plan who were not able to subscribe for offer shares in connection with the offering due to legal restrictions, were re-awarded such additional amounts of shares
145
as is necessary to keep them in an equal position with the other participants of the plan. such amounts have been determined by the board of directors of the company and amer sports international oy has trans-ferred the shares to such participants of the plan. there were 60,236 additional shares subscribed to the plan participants in connection to the recent rights offering and 7,300 shares were transferred to those participants who were not able to subscribe to shares due to legal restrictions.
pENSIoNSexecutives in finland participate in the standard statu-tory finnish pension system called tyeL. according to the statutory pension system, base pay, taxable ben-efits and annual incentives form the pensionable earnings. acting president and ceo, executive Vice president and cfo, has an early retirement agreement of 60 years. executives in other countries participate in local pension systems applicable in each country. More in the financial statements on pages 96–97.
prESIDENT AND cEoin 2009, total compensation paid to the president and ceo amounted to eUr 0.9 million, of which incentives tied to profits and other objectives accounted for eUr 0.1 million.
the terms and conditions of the president and ceo’s employment are defined in a written executive agreement that has been approved by the board of directors. Under the agreement, the president and ceo may retire at the age of 60, with a pension payable at a 60 percent salary rate. both the company and the president and ceo must provide six months’ notice to terminate the president and ceo’s employment con-tract. should amer sports give the president and ceo notice of termination, he must be paid his salary for the duration of the notice period and severance pay.
roger talermo served as president and ceo from 1996 until 22 december, 2009 and was also a member of the board of directors between 1996 and 2008.
pekka paalanne is acting president and ceo of amer sports from december 22, 2009 until March 31, 2010. Heikki takala will be the president and ceo of amer sports from april 1, 2010.
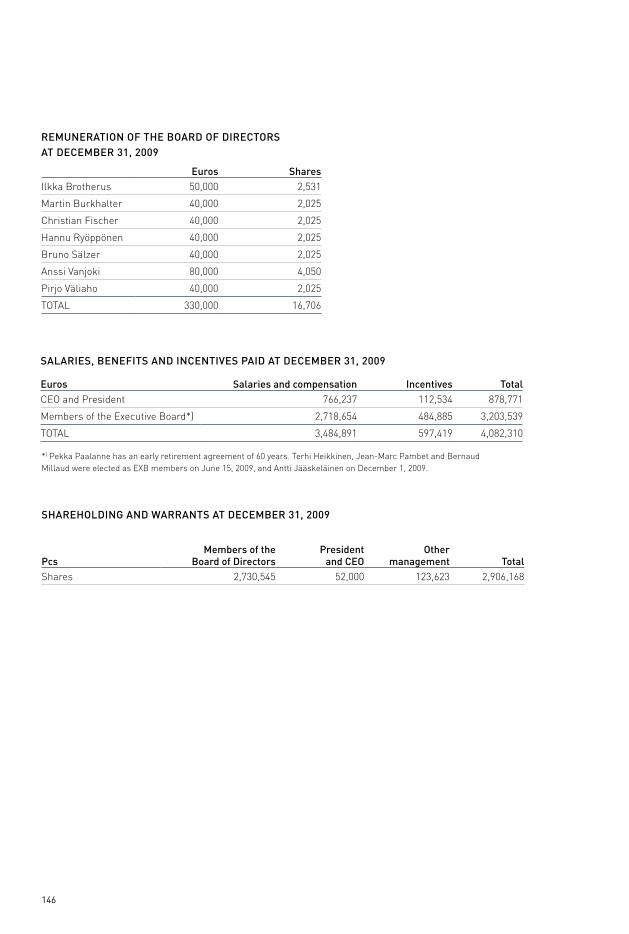
146
ShArEhoLDINg AND wArrANTS AT DEcEmBEr 31, 2009
pcsmembers of the
Board of Directorspresident
and cEoother
management Totalshares 2,730,545 52,000 123,623 2,906,168
rEmuNErATIoN of ThE BoArD of DIrEcTorS AT DEcEmBEr 31, 2009
Euros Sharesilkka brotherus 50,000 2,531
Martin burkhalter 40,000 2,025
christian fischer 40,000 2,025
Hannu ryöppönen 40,000 2,025
bruno sälzer 40,000 2,025
anssi Vanjoki 80,000 4,050
pirjo Väliaho 40,000 2,025
totaL 330,000 16,706
SALArIES, BENEfITS AND INcENTIVES pAID AT DEcEmBEr 31, 2009
Euros Salaries and compensation Incentives Totalceo and president 766,237 112,534 878,771
Members of the executive board*) 2,718,654 484,885 3,203,539
totaL 3,484,891 597,419 4,082,310
*) pekka paalanne has an early retirement agreement of 60 years. terhi Heikkinen, Jean-Marc pambet and bernaud Millaud were elected as eXb members on June 15, 2009, and antti Jääskeläinen on december 1, 2009.
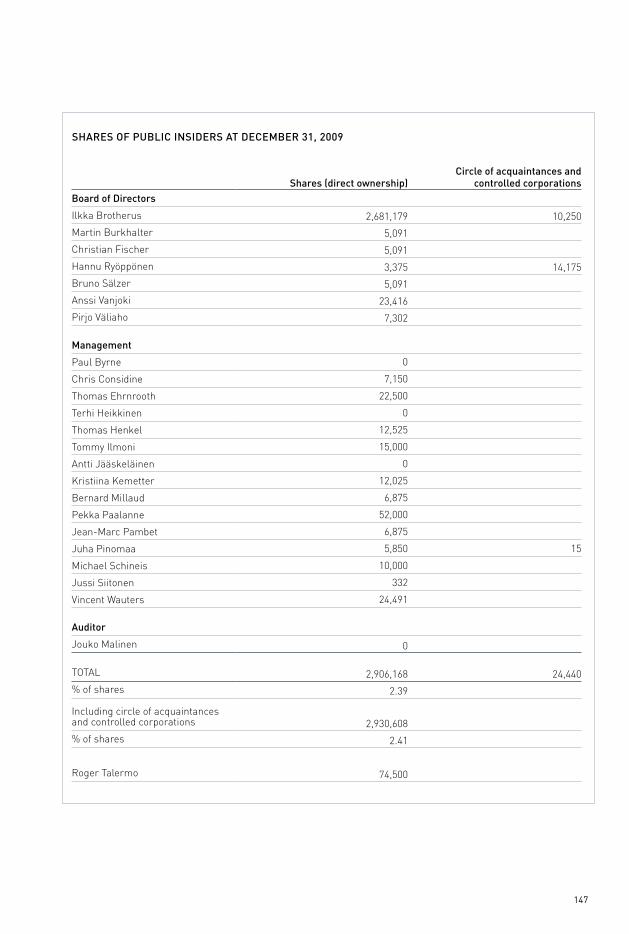
147
Shares (direct ownership)circle of acquaintances and
controlled corporationsBoard of Directors
ilkka brotherus 2,681,179 10,250
Martin burkhalter 5,091
christian fischer 5,091
Hannu ryöppönen 3,375 14,175
bruno sälzer 5,091
anssi Vanjoki 23,416
pirjo Väliaho 7,302
management
paul byrne 0
chris considine 7,150
thomas ehrnrooth 22,500
terhi Heikkinen 0
thomas Henkel 12,525
tommy ilmoni 15,000
antti Jääskeläinen 0
Kristiina Kemetter 12,025
bernard Millaud 6,875
pekka paalanne 52,000
Jean-Marc pambet 6,875
Juha pinomaa 5,850 15
Michael schineis 10,000
Jussi siitonen 332
Vincent Wauters 24,491
Auditor
Jouko Malinen 0
totaL 2,906,168 24,440% of shares 2.39
including circle of acquaintances and controlled corporations 2,930,608% of shares 2.41
roger talermo 74,500
ShArES of puBLIc INSIDErS AT DEcEmBEr 31, 2009
148
the company’s paid-up share capital recorded in the trade register as of december 31, 2009 was eUr 292,182,204. on december 31, 2009, the company had a market capitalization of eUr 848.3 million, excluding own shares.
AmEr SporTS’ rIghTS offErINg IN 2009a total of 48,471,734 new shares were subscribed for in amer sports’ rights offering. the subscription period for the offering ended on october 19, 2009. all the new shares were registered with the trade register on october 26, 2009. following the registration, the total number of amer sports’ shares increased by 48,471,743 shares into 121,517,285 shares. the new shares include the right to dividends and other distributions as well as other shareholder rights, effective from the registra-tion date of october 26, 2009.
the highest price of the subscription rights on the oMX Helsinki stock exchange was eUr 2.15, and the lowest eUr 1.23, and the last trading price was eUr 2.11. a total of 8.6 million shares were traded at a total price of eUr 13.1 million.
TrADINg IN ShArESover the course of the period, a total of 71.0 million amer sports shares were traded on the NasdaQ oMX Helsinki exchange, to a total value of eUr 458.3 million. the share turnover was 76.4% (of the average number of shares, excluding own shares).
at the close of the review period, the last trading in amer sports corporation shares was at eUr 7.00. the high for the period on the NasdaQ oMX Helsinki exchange was eUr 7.19, and the low eUr 3.67. the average share price was eUr 6.45.
Shares and shareholders
The Amer Sports Corporation’s shares have been publicly traded on the Helsinki Stock Exchange since year 1977.
at the end of december, amer sports had 13,342 registered shareholders. outside finland, ownership and nominee registrations represented 52.6% of the shares. public sector entities owned 12.5%, households 12.4%, financial and insurance corporations 11.7%, non-profit institutions 8.2%, and private companies 2.3%. amer sports had 334,900 own shares, which are owned by amer sports international oy. the number of own shares corresponded to 0.3% of all amer sports shares.
DIScLoSurE of coNTroLamer sports’ board of directors is not aware of any natural or legal persons who have control over the company or has information on these persons’ portion of the voting rights of the shares and of the total number of shares.
AgrEEmENTS AND ArrANgEmENTS rELATINg To ShArEhoLDINgS AND uSE of VoTINg rIghTSamer sports’ board of directors is not aware of any agreements or arrangements concerning the owner-ship of the company’s shares and the use of their voting rights.
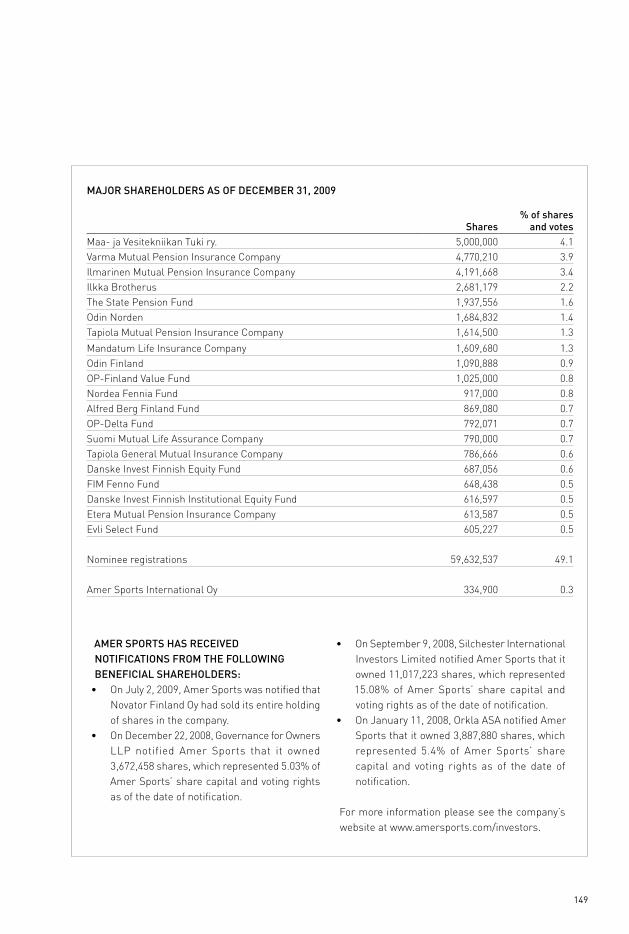
149
mAjor ShArEhoLDErS AS of DEcEmBEr 31, 2009
Shares% of shares
and votesMaa- ja Vesitekniikan tuki ry. 5,000,000 4.1Varma Mutual pension insurance company 4,770,210 3.9ilmarinen Mutual pension insurance company 4,191,668 3.4ilkka brotherus 2,681,179 2.2the state pension fund 1,937,556 1.6odin Norden 1,684,832 1.4tapiola Mutual pension insurance company 1,614,500 1.3
Mandatum Life insurance company 1,609,680 1.3odin finland 1,090,888 0.9op-finland Value fund 1,025,000 0.8Nordea fennia fund 917,000 0.8alfred berg finland fund 869,080 0.7op-delta fund 792,071 0.7suomi Mutual Life assurance company 790,000 0.7tapiola General Mutual insurance company 786,666 0.6danske invest finnish equity fund 687,056 0.6fiM fenno fund 648,438 0.5danske invest finnish institutional equity fund 616,597 0.5etera Mutual pension insurance company 613,587 0.5evli select fund 605,227 0.5
Nominee registrations 59,632,537 49.1
amer sports international oy 334,900 0.3
AmEr SporTS hAS rEcEIVED NoTIfIcATIoNS from ThE foLLowINg BENEfIcIAL ShArEhoLDErS:• OnJuly2,2009,AmerSportswasnotifiedthat
Novator finland oy had sold its entire holding of shares in the company.
• OnDecember22,2008,GovernanceforOwnersLLp notified amer sports that it owned 3,672,458 shares, which represented 5.03% of amer sports’ share capital and voting rights as of the date of notification.
• OnSeptember9,2008,SilchesterInternationalinvestors Limited notified amer sports that it owned 11,017,223 shares, which represented 15.08% of amer sports’ share capital and voting rights as of the date of notification.
• OnJanuary11,2008,OrklaASAnotifiedAmersports that it owned 3,887,880 shares, which represented 5.4% of amer sports’ share capital and voting rights as of the date of notification.
for more information please see the company’s website at www.amersports.com/investors.
150
EXErcISE of wArrANTSthe highest price of the 2004 warrants on the Nasdaq oMX Helsinki stock exchange was eUr 1.30, and the lowest eUr 0.11. in 2009, a total of 5,700 warrants were traded at a total price of eUr 4,609.
AmENDmENTS To ThE TErmS AND coNDITIoNS of ThE wArrANT progrAmSpursuant to the terms and conditions of amer sports’ warrant programs, amer sports’ board of directors must amend the terms and conditions of the warrant programs to take into account the impact of the rights offering by adjusting the exercise price of the warrants and/or the number of shares that can be subscribed for through exercise of the warrants in a manner to be determined by the board of directors. on october 29, 2009, amer sports’ board of directors decided on such amendments. the terms and conditions of its publicly traded 2004 warrants were amended to the effect that each 2004 warrant entitles its holder to subscribe for five shares at the subscription price of eUr 9.44 per share.
information on amer sports’ long-term remunera-tion programs on pages 142–147.
AuThorIZATIoNSamer sports’ annual General Meeting of shareholders, which was held on March 5, 2009, authorized the board of directors to decide on issuing new shares on the following terms and conditions: New shares may be issued and the company’s own shares held by the company may be conveyed against payment (“share issue against payment”) to the company’s sharehold-ers in proportion to their current shareholdings in the company. by virtue of the authorization, the board of directors is entitled to decide on issuing a maximum of 7,000,000 new shares. the subscription price of the new shares shall be booked to the invested un-restricted equity reserve. the authorization to issue shares is valid for two years from the date of the deci-sion of the annual General Meeting.
AuThorIZATIoN To rEpurchASE or coNVEy owN ShArESamer sports did not acquire any its own shares during 2009. amer sports’ board of directors have not had a valid authorization to acquire or dispose of amer sports’ own shares since March 5, 2009.
order Book codes•NASDAQOMX:AMEAS•Reuters:AMEAS.HE•Bloomberg:AMEAS.FH•ADR:AGPDY,023512205•ISINcode:FI0009000285
The most important indexes•NASDAQOMXHelsinki•OMXHelsinkiCAP•OMXHelsinki25•ConsumerDiscretionary
further information on amer sports’ shares is posted on amer sports website at www.amersports.com.
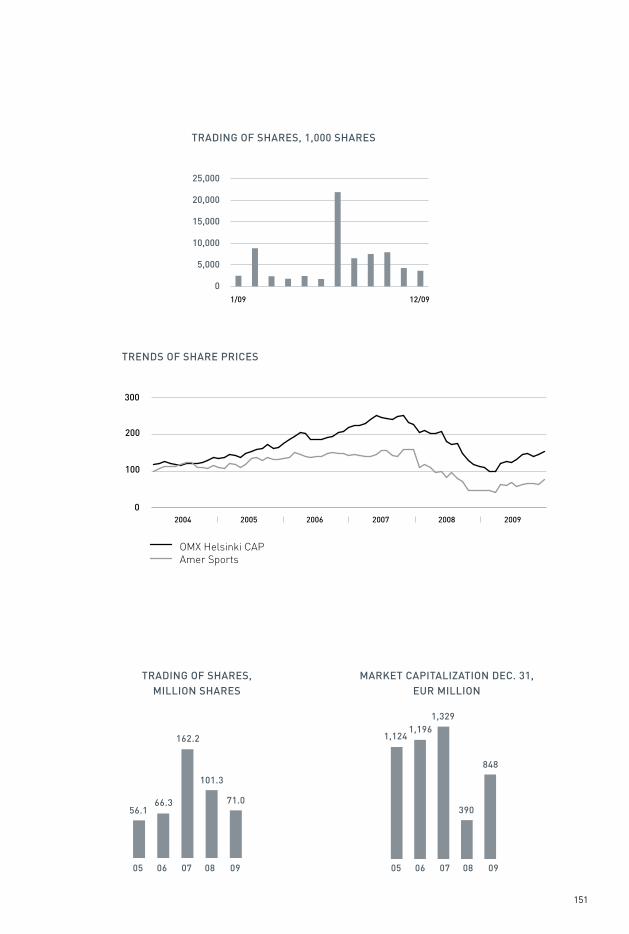
151
mArkET cApITALIZATIoN DEc. 31, Eur mILLIoN
TrADINg of ShArES, mILLIoN ShArES
05 06 07 08 09
1,1241,196
1,329
390
05 06 07 08 09
56.166.3
162.2
101.3
TrADINg of ShArES, 1,000 ShArES
1/09 12/09
TrENDS of ShArE prIcES
2004 200920082005 2006 20070
100
200
300
oMX Helsinki capamer sports
25,000
20,000
15,000
10,000
5,000
0
71.0
848
152
gENErAL mEETINg of ShArEhoLDErSUnder the finnish companies act, shareholders exercise their power to decide on corporate matters at General Meetings of shareholders (“General Meeting”). the annual General Meeting decides matters as defined for the General Meeting in the finnish compa-nies act and the articles of association of amer sports corporation. these matters include, amongst other things, adoption of annual accounts including con-solidated annual accounts, decisions regarding use of the profit shown on the balance sheet and the payment of dividend, discharging the members of the board of directors and ceo from liability for the financial year, appointing the members of the board of directors and auditor, and deciding their remuneration. pursuant to amer sports’ articles of association, the annual General Meeting must be held annually before the end of June.
an extraordinary General Meeting shall be held when considered necessary by the board of directors or when requested in writing by the auditor of amer sports or by shareholders representing at least one-tenth of all the issued shares of amer sports.
a shareholder has the right to bring up a matter falling within the competence of the General Meeting for consideration by the General Meeting, if a share-holder notifies the board of directors in writing well in advance of the General Meeting so that the matter can be added to the notice.
Under amer sports’ articles of association, a notice convening a General Meeting shall be delivered to the shareholders by publishing it in at least two daily papers published in Helsinki, finland, not earlier than two months and not later than 17 days before the date of
the meeting. pursuant to the amendments of the finnish companies act which entered into force in 2009, companies listed on the Helsinki stock exchange shall deliver a notice convening a General Meeting no later than three weeks before the meeting, however, at the minimum nine days before the record date of the General Meeting. amer sports complies with the minimum notice period regardless of the provisions of the articles of the association of the company. amer sports also publishes the invitations to the General Meetings as stock exchange releases and on its website www.amersports.com.
in order to attend and vote at the General Meeting, a shareholder must register at the place and by the date specified in the notice convening the meeting. a shareholder may participate in a General Meeting in person or through proxy representation. the registra-tion period and other practical instructions for the shareholders are specified in each notice convening a General Meeting.
at a General Meeting, every shareholder has the right to present questions with respect the matters to be considered at the meeting and table proposals for resolutions at the General Meeting in matters that fall within the competence of the General Meeting and that are on the agenda.
Under the finnish companies act, each share entitles its holder to one vote at the General Meeting, unless otherwise stipulated in the company’s articles of association. because there are no exceptions in amer sports’ articles of association, each shareholder of amer sports is entitled to at least one vote at a General Meeting. at a General Meeting, resolutions generally require the approval of a majority of the votes cast.
Information for investors

153
However, certain resolutions, such as a resolution to amend the articles of association, and a resolution to issue shares in deviation from the shareholders’ pre-emptive rights require a majority of two-thirds of the votes cast and of the shares represented at the General Meeting.
further, a decision on any merger or demerger (if amer sports would be the merging or demerging company), liquidation or directed purchase of its own shares requires a majority of two-thirds of the shares represented at the General Meeting of shareholders. in addition, certain resolutions, such as amendments to the articles of association which change the respec-tive rights of shareholders holding the same class of shares or increase the redemption rights of amer sports or its shareholders, require the consent of all shareholders, or, where only the rights of certain shareholders are affected, in addition to the applicable majority requirement, the consent of all those share-holders those shares are affected by the amendment.
INSIDErSamer sports’ insider policy is based on the Guidelines for insiders of the NasdaQ oMX Helsinki Ltd. and the securities Market act. the members of the board of directors, the president and ceo and the executive Vice president as well as the auditor are amer sports’ public insiders. furthermore, members of manage-ment are also public insiders.
persons who are in charge of amer sports finances, results reporting and communications, top manage-ment assistants as well as the principal users of the it system are included in the company-specific register of insider holdings. similarly, other persons who are
responsible for key company operations and regularly receive insider information in the course of their duties are included in the company-specific register of insider holdings. if a person has inside information, they may not issue commissions concerning the purchase, sale, etc. of amer sports securities, or directly or indirectly advise another person in such transactions.
an insider may not trade in amer sports securities during the 21-day period preceding the publication of an interim report or financial statement bulletin or preliminary information thereon. the closed window ends when the release in question has been made public.
persons who are party to the preparation of a project or are aware of a confidential project which, when implemented, is likely to have a substantial impact on the value of the amer sports securities, are project-specific insiders. similarly, any persons outside the company, who in the course of their duties or otherwise, acquire the aforementioned information, are included in the project-specific register of insider holdings. amer sports defines on a case-by-case basis the projects under preparation that are subject to insider rules.
the amer sports Vice president of Legal affairs acts as the insider compliance officer and is responsible for the due disclosure of information on insider matters. the Vice president of Legal affairs also sees to the maintenance of the insider register. amer sports keeps its insider register within the sire system operated by euroclear finland Ltd. (the register can be viewed at euroclear finland Ltd, Urho Kekkosen katu 5 c, 00100 Helsinki.)
154
the amer sports’ insider policy is made available to employees via the corporate intranet. the list of public insiders as well as their shareholdings in the company can be found on the amer sports website at www.amersports.com.
INformATIoN AND commuNIcATIoNamer sports complies in all its business operations with applicable laws and statutes, as well as generally accepted practices. additionally, the operations are guided by the amer sports’ values. amer sports requires that each one of its employees is familiar with the legislation and operating guidelines of their own areas of responsibility. in conjunction with internal audits, amer sports strives to ensure that everyone in the unit being audited is familiar with and complies with the laws, regulations and principles relating to their own work. in addition to amer sports manage-ment, the due course of operations is monitored by the board’s audit committee, which reports any miscon-duct to the board of directors.
the mission of amer sports corporate communica-tions is to provide strategic support for the company, positioning it as one of the world’s leading sports equipment companies. amer sports builds and exe-cutes its corporate strategy with a global business approach, and both facilitates and communicates joint issues internally.
amer sports provide the capital markets with a true and fair view of its business operations to ensure that the company’s market value can be assessed.
INVESTor rELATIoNSthe objective of amer sports investor relations is to provide open and reliable information to investors about the company’s financial position and its outlook for the future. to this end, amer sports arranges regular meetings with analysts and investors in all the main markets. the company furthermore arranges annual capital Market days offering the most active market participants a chance to hear and meet the company’s management.
Information and communication channelsamer sports has information and communication channels that ensure that instructions and manuals are available to those who need access to them and that information about news and updates is commu-nicated within amer sports corporation.
155
ANALySTS foLLowINg AmEr SporTSto amer sports’ knowledge, the following banks and brokerage firms evaluate amer sports corporation as an investment. this is not necessarily a complete list. those listed here follow amer sports on their own initiative, and amer sports is not responsible for any statements they make.
•ABGSundalCollier•BryanGarnier•Carnegie•DanskeBank•DeutscheBank•EvliBank•FIM•GoldmanSachs•Handelsbanken•J.P.Morgan•MerrillLynch•PohjolaBankplc•SEBEnskilda•Öhman
INVESTor rELATIoNS coNTAcT INformATIoNtommy ilmoni, Vice president, ir and corporate com-munications, tel. +358 9 7257 8233, [email protected], www.amersports.com/investors.
amer sports’ general e-mail address is [email protected].
156156
Publications and important dates
ANNuAL gENErAL mEETINgamer sports corporation’s annual General Meeting is to be held at 2 pm on Wednesday, March 10, 2010 in Mä ke länkatu 91, Helsinki, finland. the reception of persons who have registered for the meeting and the distribution of voting tickets will commence at 1:30 pm.
More information on the general meetings can be found at www.amersports.com.
pAymENT of DIVIDENDthe board of directors proposes that a dividend of eUr 0.16 per share be paid for 2009, representing a dividend ratio of 62%. a dividend of eUr 0.16 per share was paid for 2008.
ANNuAL rEporT for 2009the annual report will be published in finnish and english, and will be posted to all those requesting a copy. the annual report will also be available in pdf format at www.amersports.com.
STock EXchANgE rELEASESstock exchange releases are available in finnish and english immediately after publication at www.amersports.com. anyone wanting to be placed or removed from the email distribution list for releases can find a form for this purpose at www.amersports.com/investors. a request can also be send to [email protected].
INTErIm rEporTS 2010•fortheJanuarytoMarchperiod, on thursday, april 29•fortheJanuarytoJuneperiod, on thursday, august 5•fortheJanuarytoSeptemberperiod, on thursday, october 28
chANgE of ADDrESSif you are a shareholder and your address changes, we request that you send written notification of this to the bank where your book-entry account is held.
INVESTor SErVIcES oN ThE INTErNETthe investor section of amer sports’ website contains among the other investor information a share monitor with 15 minutes delayed data. there can also be found monthly updated information on amer sports’ largest shareholders, a list of company’s insiders and their holdings, presentation and report archives as well as services such as consensus estimates on amer sports’ performance provided by analysts, historical price lookup and investment calculator with which you can calculate the value of your amer sports investment.
read more about amer sports as an investment: www.amersports.com/investors.
SILENT pErIoDamer sports observes a silent period (‘closed window’) prior to the publication of its results lasting 21 days (three weeks). during this period, the company will not comment on non-disclosed developments or the prospects for its business in the quarter concerned, nor will company representatives meet analysts or investors, or take part in capital markets events.
Amer Sports corporationMäkelänkatu 91FI-00610 HelsinkiP.O. Box 130FI-00601 HelsinkiFINLANDTel. +358 9 725 7800Fax: +358 9 7257 8200www.amersports.comDomicile: HelsinkiBusiness ID: 0131505-5
SalomonSalomon SASLes CroiseletsFR-74996 AnnecyCedex FRANCETel. +33 4 5065 4141Fax: +33 4 5065 4395www.salomon.com
WilsonWilson Sporting Goods Co.8750 W. Bryn Mawr AvenueChicago, IL 60631USATel. +1 773 714 6400Fax: +1 773 714 4565www.wilson.com
Contact information
Information on career possibilities with Amer Sports, please visit: www.amersports.com/careers.
Contact information for the Group is available on the Amer Sports website, www.amersports.com. Contact information can also be requested by e-mail at [email protected].
PrecorPrecor Incorporated20031 142nd Avenue NEP.O. Box 7202Woodinville, WA 98072-4002USATel. +1 425 486 9292Fax: +1 425 486 3856www.precor.com
AtomicAtomic Austria GmbHLackengasse 301AT-5541 AltenmarktAUSTRIATel. +43 6452 3900 0Fax: +43 6452 3900 120www.atomicsnow.com
SuuntoSuunto OyValimotie 7FI-01510 VantaaFINLANDTel. +358 9 875 870Fax: +358 9 8758 7300www.suunto.com
MavicMavic SASLes CroiseletsFR-74996 AnnecyCedex FRANCETel. +33 4 5065 7171Fax: +33 4 5065 7172www.mavic.com
Arc’teryxArc’teryx Equipment Inc.100-2155 Dollarton HwyV7H 3B2 North Vancouver,British ColumbiaCANADATel. +1 604 960 3001Fax: +1 604 904 3692www.arcteryx.com
157