Annual Report 2019our portfolio of brands and successfully entered a new category with the launch of...
84
Annual Report 2019
Transcript of Annual Report 2019our portfolio of brands and successfully entered a new category with the launch of...

Annual Report 2019

Aritzia is a vertically integrated, innovative design house of exclusive fashion brands.We believe in high-quality, beautifully designed product. We believe in aspirational environments and experiences. And we believe that all of this should come at a price that is truly attainable.
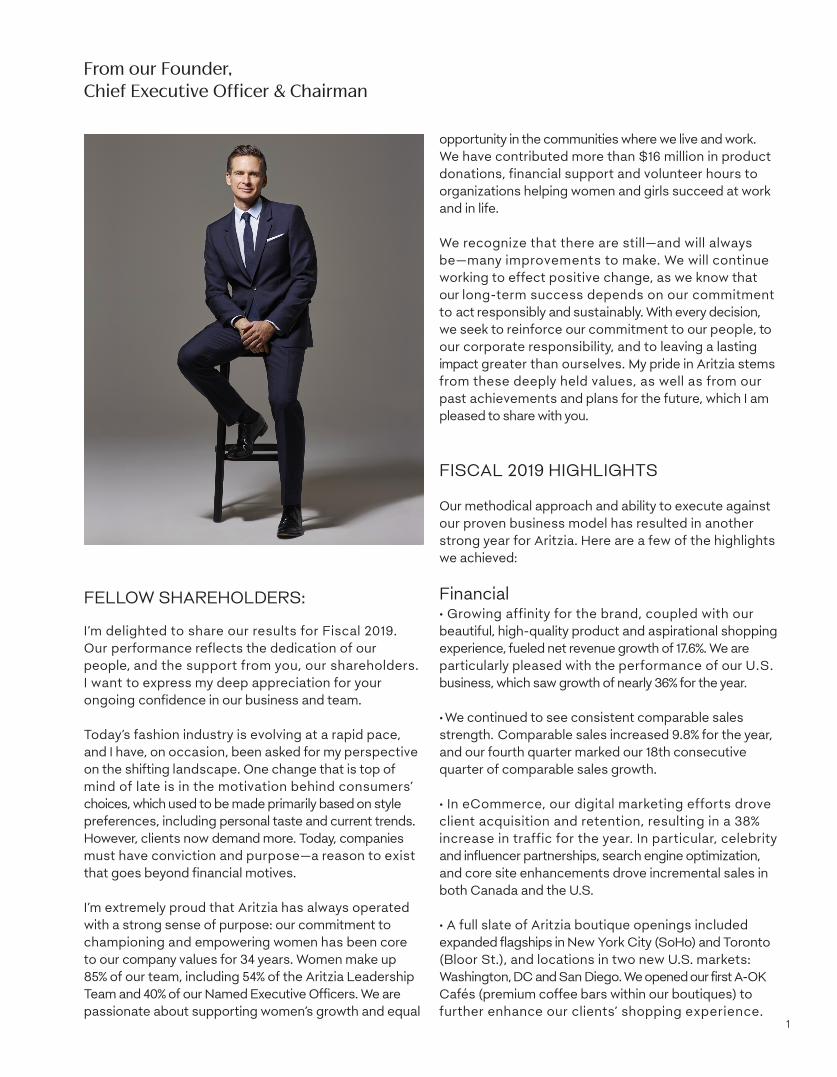
From our Founder, Chief Executive Officer & Chairman
FELLOW SHAREHOLDERS: I’m delighted to share our results for Fiscal 2019. Our performance reflects the dedication of our people, and the support from you, our shareholders. I want to express my deep appreciation for your ongoing confidence in our business and team. Today’s fashion industry is evolving at a rapid pace, and I have, on occasion, been asked for my perspective on the shifting landscape. One change that is top of mind of late is in the motivation behind consumers’ choices, which used to be made primarily based on style preferences, including personal taste and current trends. However, clients now demand more. Today, companies must have conviction and purpose—a reason to exist that goes beyond financial motives. I’m extremely proud that Aritzia has always operated with a strong sense of purpose: our commitment to championing and empowering women has been core to our company values for 34 years. Women make up 85% of our team, including 54% of the Aritzia Leadership Team and 40% of our Named Executive Officers. We are passionate about supporting women’s growth and equal
opportunity in the communities where we live and work. We have contributed more than $16 million in product donations, financial support and volunteer hours to organizations helping women and girls succeed at work and in life. We recognize that there are still—and will always be—many improvements to make. We will continue working to effect positive change, as we know that our long-term success depends on our commitment to act responsibly and sustainably. With every decision, we seek to reinforce our commitment to our people, to our corporate responsibility, and to leaving a lasting impact greater than ourselves. My pride in Aritzia stems from these deeply held values, as well as from our past achievements and plans for the future, which I am pleased to share with you.
FISCAL 2019 HIGHLIGHTS Our methodical approach and ability to execute against our proven business model has resulted in another strong year for Aritzia. Here are a few of the highlights we achieved:
Financial · Growing affinity for the brand, coupled with our beautiful, high-quality product and aspirational shopping experience, fueled net revenue growth of 17.6%. We are particularly pleased with the performance of our U.S. business, which saw growth of nearly 36% for the year. · We continued to see consistent comparable sales strength. Comparable sales increased 9.8% for the year, and our fourth quarter marked our 18th consecutive quarter of comparable sales growth. · In eCommerce, our digital marketing efforts drove client acquisition and retention, resulting in a 38% increase in traffic for the year. In particular, celebrity and influencer partnerships, search engine optimization, and core site enhancements drove incremental sales in both Canada and the U.S. · A full slate of Aritzia boutique openings included expanded flagships in New York City (SoHo) and Toronto (Bloor St.), and locations in two new U.S. markets: Washington, DC and San Diego. We opened our first A-OK Cafés (premium coffee bars within our boutiques) to further enhance our clients’ shopping experience.
1
Brand · Our collections’ consistently beautiful design and high- quality craftsmanship resulted in strong performance across all product categories. We elevated and expanded our portfolio of brands and successfully entered a new category with the launch of a denim brand, Denim Forum. · We increased our brand awareness by cultivating relat- ionships with our A-list celebrity following, which includes Meghan Markle, Duchess of Sussex as well as Kendall Jenner, Ariana Grande, and Hailey Bieber, among others. · We partnered with celebrated fine-art and fashion photographer Juergen Teller, a prestigious coup for our annual Artistic License series. His work was featured on our packaging and in our boutiques.
Culture · We expanded our talent pool across all workplaces with candidates sourced from our robust internal pipeline and complemented by seasoned professionals from outside our organization.
Operations · We completed the relocation of our Vancouver distri- bution centre—tripling its size—and upgraded our Warehouse Management System. With these upgrades, distribution and fulfillment are now not only a core competency, but also a competitive advantage for Aritzia.
OUR GROWTH STRATEGIES Looking towards the future, we continue to leverage new ways to meet our clients’ needs and surpass their expectations across all channels.
Grow eCommerce We have made great progress and remain focused on our multi-year eCommerce initiatives: driving client acquisition and retention through digital marketing, enhancing the aritzia.com experience, growing our clienteling program, building seamless omni-channel capabilities, and enhancing our site for top interna- tional countries. Over the last few years, we have put significant resources behind our eCommerce business and we look forward to seeing the benefits of these strategic investments and initiatives.
Expand Our Boutique Network
We will continue to grow our boutique network across North America, creating memorable interactions with
our brand for both existing and new clients. In the U.S., our growing brand awareness has resulted in numerous opportunities to negotiate premier locations with landlords. We plan to open six boutiques in the U.S. in fiscal 2020, four of which will be in new markets. Drive Exclusive Brand and Product Innovation
We will build on our portfolio of exclusive brands, with a continued focus on delivering beautiful and high-quality products that delight our clients. We will pursue further expansion into new categories, some of which may be exclusive to aritzia.com. Enhance Long-Term Profitability In addition to continually seeking to elevate the quality of our product, long-term profitability is at the core of our decision making, with a focus on driving sourcing efficiencies to contribute to the growth of our bottom line. Drive Brand Awareness Driving brand awareness remains the primary focus of our marketing initiatives. We will expand our successful organic and paid influencer programs and further enhance our social media capabilities to attract new clients. As I look back on this year and forward to our future, I am proud of what we’ve accomplished and confident that we will achieve our Fiscal 2021 targets. We remain well positioned to drive long-term revenue and earnings growth and I am tremendously excited about the opportunities ahead. In March, we marked a significant milestone, completing a secondary offering and concurrent repurchase of Berkshire Partners’ remaining shares in Aritzia. I would like to thank Berkshire for a very successful 14-year relationship, as well as for their collaboration over the years. I would also like to express my deep appreciation to our people. Our strong performance is due, above all else, to the talent, passion and dedication of our team. When Aritzia launched 34 years ago, I simply would not have imagined where we are today—nearly a billion-dollar company with our 100th boutique just around the corner. My heartfelt thanks for all that you do each and every day.
Sincerely,
2Brian Hill
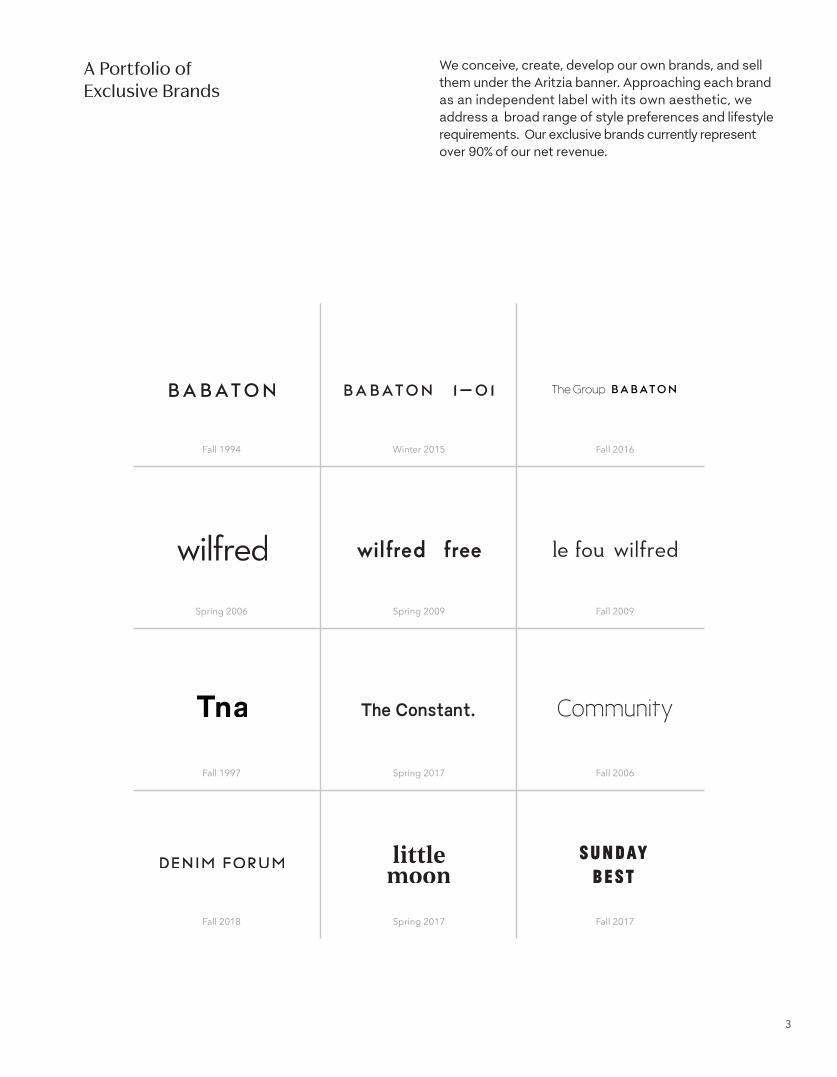
We conceive, create, develop our own brands, and sell them under the Aritzia banner. Approaching each brand as an independent label with its own aesthetic, we address a broad range of style preferences and lifestyle requirements. Our exclusive brands currently represent over 90% of our net revenue.
A Portfolio of Exclusive Brands
Tna
Winter 2015
Spring 2017
Spring 2009
Spring 2017
Fall 1994
Fall 1997
Spring 2006
Fall 2018
Fall 2016
Fall 2006
Fall 2009
Fall 2017
3
FY 2008
$153
FY 2009
$189
FY 2010
$207
FY 2011
$244
FY 2012
$322
FY 2013
$353
FY 2014
$377
FY 2015
$427
FY 2016
$542
FY 2017 FY 2018 FY 2019
$667$743
$874
FY 2008
28
26
FY 2009
36
31
FY 2010
427
35
FY 2011
478
39
Canada US
FY 2012
511041
FY 2013
5412
42
FY 2014
6214
48
FY 2015
6415
49
FY 2016
7417
57
FY 2017 FY 2018 FY 2019
7919
60
8591
22 24
63 67
17.2%CAGR
11.3%CAGR
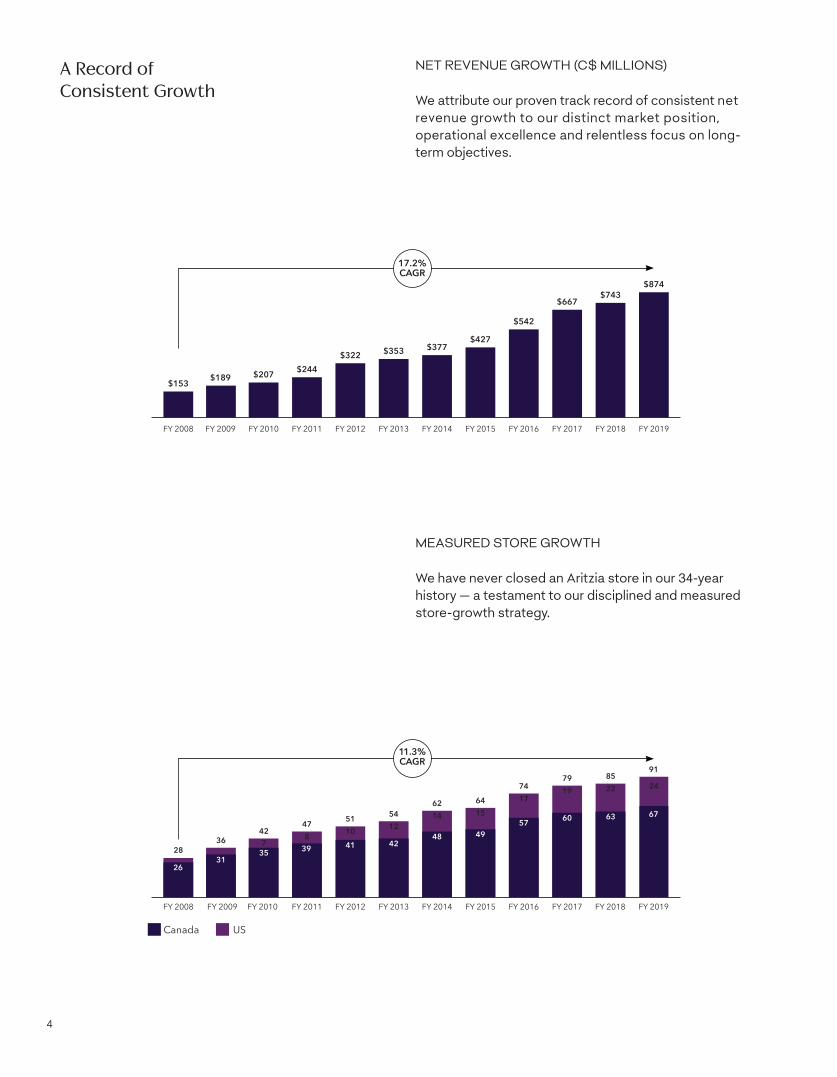
MEASURED STORE GROWTH
We have never closed an Aritzia store in our 34-year history — a testament to our disciplined and measured store-growth strategy.
A Record of Consistent Growth
4
NET REVENUE GROWTH (C$ MILLIONS)
We attribute our proven track record of consistent net revenue growth to our distinct market position, operational excellence and relentless focus on long-term objectives.

Differentiated Global Sourcing Strategy
5
We have a differentiated global-sourcing strategy that allows us to continually refine our supply chain, elevating our product, increasing the value to our customer and growing our gross margin. Our product teams plan, dev-elop and design our seasonal collections, then partner directly with our mills, our suppliers and our manufacturers to deliver exceptional value at attainable price points.

Innovative Creative Development
6
Our innovative creative development covers our product, our stores and website, and our marketing and communications. Our innovative design house offering a strategic mix of exclusive brands, combined with a refined and proven merchandise strategy, ensures that we provide the balanced assortment of high-quality, beautifully designed and constructed products that our customer desires. Our stores and website deliver on both form and function, creating an unrivaled customer experience. Our communications and marketing strategies are both brand propelling and sales driving through both traditional and digital channels.

Aspirational Omni-Channel Shopping Experience
7
We offer our products to our customers through a seamless omni-channel approach and delight our them with an aspirational shopping experience, both in our premier real estate locations and on aritzia.com. We focus on every detail of delivering exceptional service no matter where our customers choose to shop our brand.
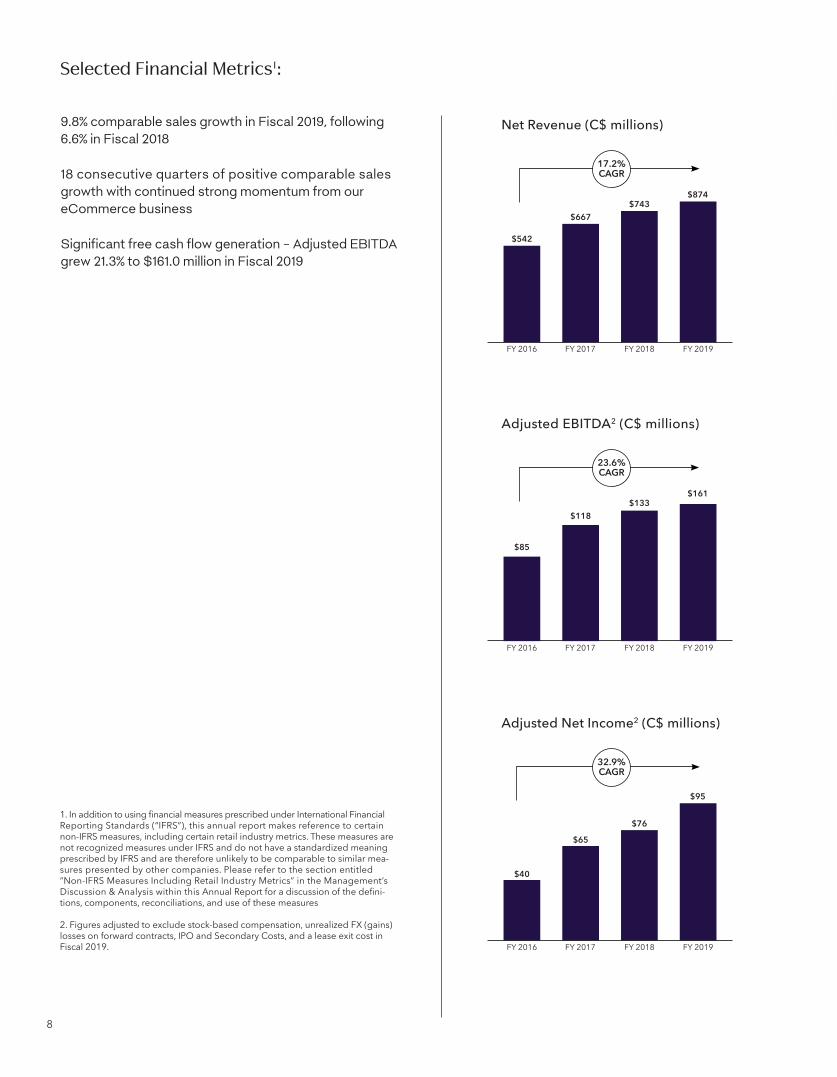
9.8% comparable sales growth in Fiscal 2019, following 6.6% in Fiscal 2018
18 consecutive quarters of positive comparable sales growth with continued strong momentum from our eCommerce business
Significant free cash flow generation – Adjusted EBITDA grew 21.3% to $161.0 million in Fiscal 2019
1. In addition to using financial measures prescribed under International Financial Reporting Standards (“IFRS”), this annual report makes reference to certain non-IFRS measures, including certain retail industry metrics. These measures are not recognized measures under IFRS and do not have a standardized meaning prescribed by IFRS and are therefore unlikely to be comparable to similar mea-sures presented by other companies. Please refer to the section entitled “Non-IFRS Measures Including Retail Industry Metrics” in the Management’s Discussion & Analysis within this Annual Report for a discussion of the defini-tions, components, reconciliations, and use of these measures
2. Figures adjusted to exclude stock-based compensation, unrealized FX (gains) losses on forward contracts, IPO and Secondary Costs, and a lease exit cost in Fiscal 2019.
Selected Financial Metrics1:
17.2%CAGR
Net Revenue (C$ millions)
FY 2016
$542
FY 2017 FY 2018 FY 2019
$667$743
$874
23.6%CAGR
Adjusted EBITDA2 (C$ millions)
FY 2016
$85
FY 2017 FY 2018 FY 2019
$118$133
$161
32.9%CAGR
Adjusted Net Income2 (C$ millions)
FY 2016
$40
FY 2017 FY 2018 FY 2019
$65
$76
$95
8

Management’s Discussion & Analysis
9
1
Aritzia Inc. MANAGEMENT’S DISCUSSION AND ANALYSIS Fiscal Year Ended March 3, 2019 May 9, 2019
The following Management’s Discussion and Analysis (“MD&A”) dated May 9, 2019 is intended to assist readers in understanding the business environment, strategies and performance and risk factors of Aritzia Inc. (together with its consolidated subsidiaries, referred to herein as “Aritzia”, the “Company”, “we”, “us” or “our”). This MD&A provides the reader with a view and analysis, from the perspective of management, of the Company’s financial results for the fourth quarter and the fiscal year ended March 3, 2019. This MD&A should be read in conjunction with the Company’s audited annual consolidated financial statements and accompanying notes for Fiscal 2019 (as hereinafter defined).
Basis of Presentation Our audited annual consolidated financial statements and accompanying notes have been prepared in
accordance with International Financial Reporting Standards (“IFRS”), as issued by the International Accounting Standards Board (“IASB”), using the accounting policies described therein. All amounts are presented in thousands of Canadian dollars unless otherwise indicated. We manage our business on the basis of one operating and reportable segment.
All references in this MD&A to “Q4 2019” are to our 14-week period ended March 3, 2019, and to “Q4 2018” are to our 13-week period ended February 25, 2018. All references in this MD&A to “Fiscal 2019” are to our 53-week period ended March 3, 2019, to “Fiscal 2018” are to our 52-week period ended February 25, 2018, to “Fiscal 2017” are to our 52-week period ended February 26, 2017, and to “Fiscal 2020” are to our 52-week period ended March 1, 2020. In addition, references to “Q1 2019” are to our 13-week period ended May 27, 2018, to “Q2 2019” are to our 13-week period ended August 26, 2018, to “Q3 2019” are to our 13-week period ended November 25, 2018, and to “Q1 2020” are to our 13-week period ended June 2, 2019.
The audited annual consolidated financial statements and accompanying notes for Fiscal 2019 and this MD&A were authorized by the Company’s Board of Directors.
Non-IFRS Measures Including Retail Industry Metrics This MD&A makes reference to certain non-IFRS measures including certain retail industry metrics. These
measures are not recognized measures under IFRS, do not have a standardized meaning prescribed by IFRS and are therefore unlikely to be comparable to similar measures presented by other companies. Rather, these measures are provided as additional information to complement those IFRS measures by providing further understanding of our results of operations from management’s perspective. Accordingly, these measures should not be considered in isolation or as a substitute for analysis of our financial information reported under IFRS. We use non-IFRS measures including “EBITDA”, “Adjusted EBITDA”, “Adjusted Net Income”, “Adjusted Net Income per diluted share” and “gross profit margin”. This MD&A also makes reference to “comparable sales growth”, which is a commonly used operating metric in the retail industry but may be calculated differently compared to other retailers. Our comparable sales growth calculation excludes the impact of foreign currency fluctuations. These non-IFRS measures, including retail industry metrics, are used to provide investors with supplemental measures of our operating performance and thus highlight trends in our core business that may not otherwise be apparent when relying solely on IFRS measures. We
10
2
believe that securities analysts, investors and other interested parties frequently use non-IFRS measures, including retail industry metrics, in the evaluation of issuers. Our management also uses non-IFRS measures, including retail industry metrics, in order to facilitate operating performance comparisons from period to period, to prepare annual operating budgets and forecasts and to determine components of management compensation. For definitions and reconciliations of these non-IFRS measures to the relevant reported measures, please see the “How We Assess the Performance of Our Business” and “Selected Consolidated Financial Information” sections of this MD&A.
Forward-Looking Information Certain statements made in this MD&A may constitute forward-looking information under applicable securities
laws. These statements may relate to our future financial outlook and anticipated events or results and include, but are not limited to, expectations regarding the quality of our products and our channel-agnostic client experience, expectations regarding our technology and infrastructure, outlook for revenue growth and gross profit margin in Fiscal 2020 as further described below, the expansion and repositioning of our boutique locations, expectations regarding the Company meeting or exceeding its stated fiscal 2021 performance targets, and other statements that are not historical facts. Particularly, information regarding our expectations of future results, targets, performance achievements, prospects or opportunities is forward-looking information. As the context requires, this may include certain targets as disclosed in the prospectus for our initial public offering, which are based on the factors and assumptions, and subject to the risks, as set out therein and herein. See also the “Outlook” section of this MD&A.
Often but not always, forward-looking statements can be identified by the use of forward-looking terminology such as “may” “will”, “expect”, “believe”, “estimate”, “plan”, “could”, “should”, “would”, “outlook”, “forecast”, “anticipate”, “foresee”, “continue” or the negative of these terms or variations of them or similar terminology. Forward-looking statements are current as of the date of this MD&A and are based on applicable estimates and assumptions made by us in light of our experience and perception of historical trends, current conditions and expected future developments, as well as other factors that we believe are appropriate and reasonable in the circumstances. However, we do not undertake to update any such forward-looking information whether as a result of new information, future events or otherwise, except as required under applicable securities laws in Canada. There can be no assurance that such estimates and assumptions will prove to be correct.
Implicit in forward-looking statements in respect of the Company’s expectations for Fiscal 2020 to deliver low double digit revenue growth and flat gross profit margin, as compared to fiscal 2019, are certain current assumptions, including, among others, the opening of six new boutiques in the U.S. including the Hudson Yards boutique in New York already opened in Q1 2020, three boutique expansions or repositions in Canada including the Mapleview boutique in Greater Toronto already opened in Q1 2020, gross profit margin is expected to be slightly higher in the first half of the year due to occupancy cost leverage being partially offset by the weakening of the Canadian dollar, and slightly lower in the second half of the year due to higher raw material costs for the fall/winter season, the continued ability to drive growth in our eCommerce business, SG&A to grow faster than revenue, as we will continue to make strategic investments in technology and infrastructure to support our long term growth, a portion of the investments related to our eCommerce platform improvements, omni-channel capabilities and other infrastructure including the product life-cycle management and data analytics platforms will be expensed within SG&A, incremental SG&A expenses related to these initiatives in Fiscal 2020 are expected to be approximately $7 million to $8 million, and occur primarily in the second and third quarters, net capital expenditures in the range of $45 million to $50 million, assumptions regarding the overall retail environment and currency exchange rates for Fiscal 2020. Specifically, we have assumed the following exchange rates for Fiscal 2020: USD:CAD = 1:1.33.
This forward-looking information and other forward-looking information are based on our opinions, estimates and assumptions in light of our experience and perception of historical trends, current conditions and expected future developments, as well as other factors that we currently believe are appropriate and reasonable in the circumstances. Despite a careful process to prepare and review the forward-looking information, there can be no assurance that the underlying opinions, estimates and assumptions will prove to be correct. Certain assumptions in respect of the expansion and enhancement of our boutique network; the growth of our eCommerce business; our ability to drive comparable sales growth; our ability to maintain, enhance, and grow our appeal within our addressable market; our ability to drive ongoing development and innovation of our exclusive brands and product categories; our ability to continue directly sourcing from third party mills, trim suppliers and manufacturers for our exclusive brands; our ability to build our international presence; our ability to retain key personnel; our ability to maintain and expand distribution capabilities; our ability to continue investing in infrastructure to support our growth; our ability to obtain and maintain
11
3
existing financing on acceptable terms; currency exchange and interest rates; the impact of competition; the changes and trends in our industry or the global economy; and the changes in laws, rules, regulations, and global standards are material factors made in preparing forward-looking information and management’s expectations.
Many factors could cause our actual results, level of activity, performance or achievements or future events or developments to differ materially from those expressed or implied by the forward-looking statements, including, without limitation, the factors discussed in the “Risk Factors” section of this MD&A and in the Company’s annual information form dated May 9, 2019 for the fiscal year ended March 3, 2019 (the “AIF”). A copy of the AIF and the Company’s other publicly filed documents can be accessed under the Company’s profile on the System for Electronic Document Analysis and Retrieval (“SEDAR”) at www.sedar.com. These factors are not intended to represent a complete list of the factors that could adversely affect the Company’s results. Readers are urged to consider the risks, uncertainties and assumptions carefully in evaluating the forward-looking information and are cautioned not to place undue reliance on such information. These factors should be considered carefully.
The purpose of the forward-looking statements is to provide the reader with a description of management’s current expectations regarding the Company’s financial performance and they may not be appropriate for other purposes; readers should not place undue reliance on forward-looking statements made herein. To the extent any forward-looking information in this MD&A constitutes future-oriented financial information or financial outlook, within the meaning of applicable securities laws, such information is being provided to demonstrate the potential of the Company and readers are cautioned that this information may not be appropriate for any other purpose. Future-oriented financial information and financial outlook, as with forward-looking information generally, are based on current assumptions and subject to risks, uncertainties and other factors. Furthermore, unless otherwise stated, the forward-looking statements contained in this MD&A are made as of the date of this MD&A, and we have no intention and undertake no obligation to update or revise any forward-looking statements, whether as a result of new information, future events or otherwise, except as required by applicable securities laws. The forward-looking statements contained in this MD&A are expressly qualified by this cautionary statement.
Overview Aritzia is a vertically integrated, innovative design house of exclusive fashion brands. We design apparel and
accessories for our collection of exclusive brands. We conceive, create, develop and sell a strategic mix of women’s fashion products directly to our clients with a depth of design and quality that provides compelling value. Our unique multi-brand portfolio and product mix affords us enhanced flexibility to address evolving fashion trends and enables us to appeal to our clients across multiple life stages, resulting in strong and enduring client loyalty.
We connect our clients to the energy of our culture through the products we sell, the environments we create and the ways in which we communicate. We currently operate 67 boutiques in Canada and 25 boutiques in the United States, averaging approximately 6,000 square feet, all of which are in prime locations within high performing retail malls and high streets. We sell our products exclusively through our boutiques and aritzia.com, giving us complete control of the presentation of our brand and the relationships with our clients. This strategy allows us to present our brand in a consistent manner, including pricing, marketing and product presentation. We strive to offer our clients an aspirational shopping experience and exceptional level of service at every interaction. Our culture is highly focused on the client, and our sales associates and eCommerce support teams are trained to provide shopping experiences that are personalized to exceed our clients’ wants and needs.
12
4
Secondary Offerings
On August 7, 2018, we completed a secondary offering (the “August 2018 Secondary Offering”) on a bought deal basis of our subordinate voting shares through a secondary sale of shares by certain shareholders. The August 2018 Secondary Offering of 6,050,000 subordinate voting shares raised gross proceeds of $100.1 million for the selling shareholders, at a price of $16.55 per subordinate voting share. We did not receive any proceeds from the August 2018 Secondary Offering. As part of the August 2018 Secondary Offering, certain selling shareholders exchanged 5,880,000 of their multiple voting shares for subordinate voting shares. Underwriting fees were paid by the selling shareholders, and other expenses related to the August 2018 Secondary Offering of $0.6 million are being paid by us.
Subsequent to the year ended March 3, 2019, on March 8, 2019, we completed a secondary offering (the “March 2019 Secondary Offering”) on a bought deal basis of our subordinate voting shares through a secondary sale of shares by certain shareholders. The March 2019 Secondary Offering of 19,505,000 subordinate voting shares raised gross proceeds of $329.6 million for the selling shareholders, at a price of $16.90 per subordinate voting share (the “March 2019 Offering Price”). We did not receive any proceeds from the March 2019 Secondary Offering. Underwriting fees were paid by the selling shareholders.
Concurrent with the completion of the March 2019 Secondary Offering, on March 8, 2019, we also completed a repurchase of 6,333,653 subordinate voting shares and multiple voting shares (the “Shares”) for cancellation from certain shareholders, including an investment vehicle (the “Berkshire Shareholder”) managed by Berkshire Partners LLC (“Berkshire”) (the “Share Repurchase”). The purchase price per Share paid by us under the Share Repurchase was the same as the March 2019 Offering Price and resulted in an aggregate purchase price of $107.0 million paid to the selling shareholders. Total expenses related to the March 2019 Secondary Offering and Share Repurchase of $2.5 million are being paid by us and are being reimbursed by the selling shareholders participating in the Share Repurchase, including the Berkshire Shareholder.
Upon completion of the March 2019 Secondary Offering and Share Repurchase on March 8, 2019, the Berkshire Shareholder has no remaining equity interest in us.
Financial Highlights We refer the reader to the section entitled “How We Assess the Performance of Our Business” of this MD&A for
the definition of the items discussed below and, when applicable, to the section entitled “Selected Consolidated Financial Information” for reconciliations of non-IFRS measures with the most directly comparable IFRS measure.
Q4 2019 Compared to Q4 2018
Select financial highlights include the following:
13
5
Comparable sales growth(1) was 5.5%, the 18th consecutive quarter of positive growth.
Net revenue increased by 17.9% to $259.1 million from $219.8 million in Q4 2018, with positive performance across all geographies and all channels.
Gross profit margin was 36.2%, compared to 37.9% in Q4 2018. The decline was primarily due to the weakening of the Canadian dollar.
Adjusted EBITDA(1) increased by 11.7% to $42.6 million from $38.1 million in Q4 2018.
Net income increased by 17.7% to $18.7 million from $15.9 million in Q4 2018.
Adjusted Net Income(1) increased by 11.5% to $25.1 million, or $0.21 per diluted share(1), from $22.5 million, or $0.19 per diluted share(1) in Q4 2018.
Fiscal 2019 Compared to Fiscal 2018
Select financial highlights include the following:
Comparable sales growth(1) was 9.8%, following 6.6% comparable sales growth in Fiscal 2018.
Net revenue increased by 17.6% to $874.3 million from $743.3 million in Fiscal 2018.
Gross profit margin was 39.2% compared to 39.8% in Fiscal 2018.
Adjusted EBITDA(1) increased by 21.3% to $161.0 million from $132.7 million in Fiscal 2018.
Net income increased by 37.9% to $78.7 million from $57.1 million in Fiscal 2018.
Adjusted Net Income(1) increased by 24.5% to $94.5 million, or $0.81 per diluted share(1), from $75.9 million, or $0.65 per diluted share(1) in Fiscal 2018.
Strategic accomplishments for Fiscal 2019
Grew boutique network with seven new boutiques: five in Canada, including one in a new market (Quebec City), and two in the United States, both in new markets (San Diego and Washington, D.C.). All boutiques opened in Fiscal 2019 are performing at or above expectations.
Expanded or repositioned four boutiques, including two expanded flagship locations (Bloor Street in Toronto and Soho in New York).
Achieved significant eCommerce growth, driven by a continued focus on search engine optimization and core site enhancements.
Drove product innovation with the successful launch of a leather program and denim brand, as well as an enhanced outerwear program.
Increased social media and influencer marketing efforts, which fueled brand awareness in the U.S. and contributed to 36% U.S. revenue growth.
Advanced omni-channel capabilities by opening a new 225,000-square-foot Greater Vancouver distribution centre and upgrading the warehouse management system.
Notes : (1) See the sections below entitled “How We Assess the Performance of our Business” and “Selected Consolidated Financial Information” for further details concerning comparable sales growth, Adjusted EBITDA, Adjusted Net Income and Adjusted Net Income per diluted share and for a reconciliation to the most comparable IFRS measure.
14
6
Summary of Factors Affecting Performance We believe that our performance and future success depend on a number of factors that present significant
opportunities for us. These factors are also subject to a number of inherent risks and challenges, some of which are discussed below. See also the “Risk Factors” section of this MD&A and in our AIF.
Our Brand Aritzia is a growing, vertically integrated, innovative design house of exclusive fashion brands that creates and
develops fashion apparel. We have become a well known and deeply loved brand by our clients in Canada with growing client awareness and affinity in the United States and outside of North America. Maintaining, enhancing and growing our brand appeal within our addressable market is critical to our continued success.
Product Innovation and Merchandise Planning Strategy We believe that our differentiated multi-brand strategy is a key driver of our continued year-over-year net
revenue growth and comparable sales growth. Each of our exclusive brands is treated as an independent label with its own vision and aesthetic point of view, and is supported by our own dedicated in-house design team focused on creating beautiful products. We believe our expansion into categories such as leather and denim will help drive increased wallet share among our existing clients as well as attract new clients. Our demand-driven merchandise planning, buying and inventory strategies have been developed and refined over many years, and are designed to ensure that we have the right product, at the right time, at the right price, in the right quantity and in the right place.
Boutique Network Expansion and Enhancement We have a meaningful opportunity to continue to grow our boutique network across North America, particularly
in the United States. Our growing brand awareness among both consumers and landlords continues to fuel new opportunities to secure premier locations in the best markets. In addition to opening new Aritzia and exclusive brand boutiques (e.g. Wilfred, Babaton and TNA), we have generated attractive returns on capital by enhancing elements of our existing boutiques (including footprint, layout and assortment) through carefully considered boutique expansions and repositions. As a result of our disciplined real estate selection process and compelling boutique economics, we have never closed an Aritzia boutique in our 34-year history.
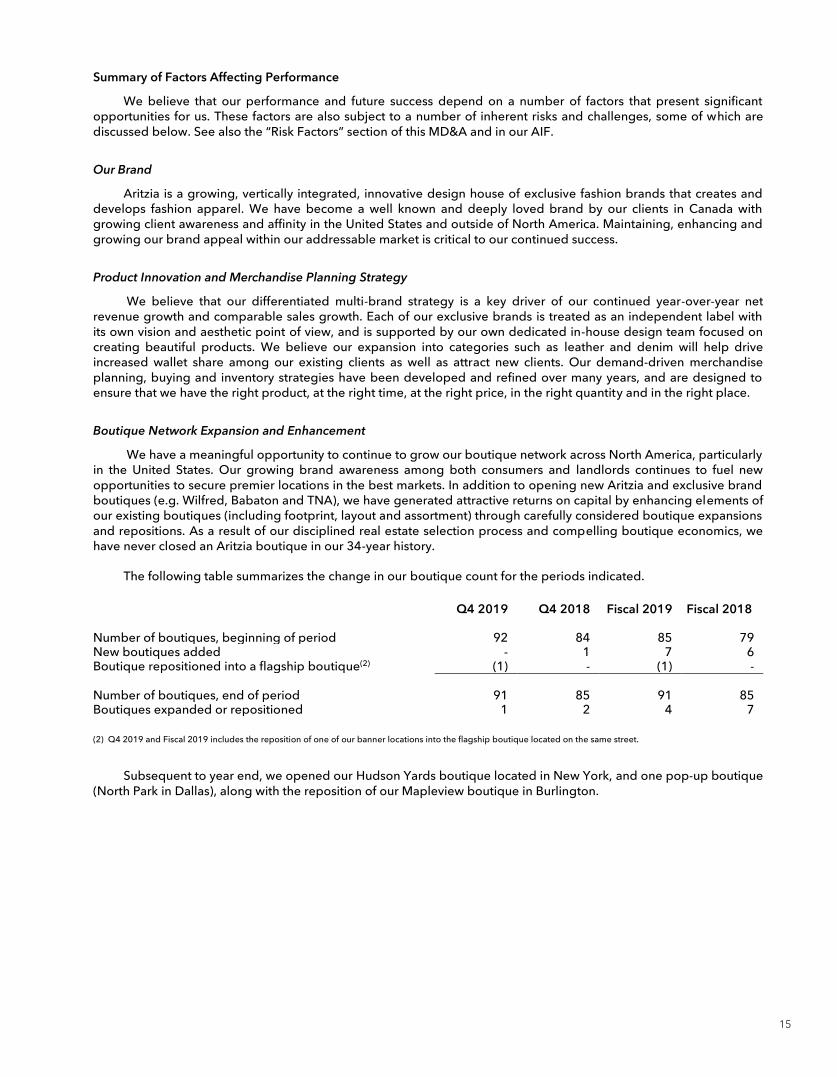
The following table summarizes the change in our boutique count for the periods indicated.
Q4 2019 Q4 2018 Fiscal 2019 Fiscal 2018
Number of boutiques, beginning of period 92 84 85 79 New boutiques added - 1 7 6 Boutique repositioned into a flagship boutique(2) (1) - (1) - Number of boutiques, end of period 91 85 91 85 Boutiques expanded or repositioned 1 2 4 7
(2) Q4 2019 and Fiscal 2019 includes the reposition of one of our banner locations into the flagship boutique located on the same street.
Subsequent to year end, we opened our Hudson Yards boutique located in New York, and one pop-up boutique (North Park in Dallas), along with the reposition of our Mapleview boutique in Burlington.
15
7
eCommerce Growth Our eCommerce business was launched in fiscal 2013 and quickly surpassed our growth expectations with
continued growth in online traffic.
We believe the following factors will support the net revenue growth of aritzia.com:
Capitalizing on digital marketing channels to drive client acquisition and retention - We are focusing on digital marketing to engage our existing clients, acquire new clients and drive further brand awareness. Digital marketing programs include search engine optimization enhancements, refinement of our email marketing and further leveraging our social media.
Improving the digital experience to enhance the shopping experience online – aritzia.com is an evolving digital representation of our brand, which is designed to inspire our clients’ digital shopping experience at every touch point of their journey.
Growing our clienteling program using personalization – We are in the early phases of leveraging advanced business intelligence and behaviour analytics to further enhance our understanding of our clients which will enable us to predict their needs and exceed their expectations. This includes optimizing our online operations to enhance personalization, which we believe will allow us to tailor an experience specific to a client and drive higher conversion and client loyalty.
Driving our omni-channel growth and capabilities – Our clients shop both online and in our boutiques, and we believe there are synergies between our boutique network and aritzia.com, with the success of each channel benefiting the other through increased brand awareness and affinity. The successful implementation of our new point-of-sale system is the foundation for a multi-year strategy that is intended to align our people, processes and systems so our clients can shop and receive our products through any of our channels they choose.
Enhancing our efforts in international eCommerce business – Our work to enhance our international website, together with our ability to ship to international markets via aritzia.com is setting the foundation for future expansion by gaining brand awareness, gathering intelligence, and identifying international markets to expand our boutique network.
Sourcing and Production We contract and maintain direct relationships with a diversified base of independent suppliers and
manufacturers for our exclusive brands, which provide us with the flexibility to source high quality materials and products at competitive costs. We source the majority of our raw materials directly from suppliers and manufacturers, which we believe to be best-in-class, located primarily in Asia and Europe that uphold our standards for quality, lead time and cost. By partnering closely with long-standing manufacturers as well as adding new innovative and scalable manufacturers, we have been able to drive lower product costs. We also maintain a formalized quality assurance program whereby we inspect our manufacturers’ factories to ensure quality control. We engage independent expert service providers to conduct factory audits for compliance with local laws and regulations and global standards.
Infrastructure Investments We continue to strategically invest in infrastructure to safeguard and maximize our existing business, as well as
enable growth. In Fiscal 2018, we successfully completed the implementation of our new point-of-sale (“POS”) system in all of our boutiques and our client care centre. This new POS system provides us with a robust platform on which to build and evolve the services and experience we offer to our clients. It has provided us with world class infrastructure, labour efficiencies, greater access to more reliable data and specifically, a foundation to evolve our omni-channel and clienteling capabilities. The new POS system provides near real-time visibility to inventory and sales data. This has already allowed us to respond more nimbly in managing our inventory to maximize sales, as well as begin providing true omni-channel capabilities to give our clients even more flexibility in how they shop and receive Aritzia products. In Fiscal 2019, we implemented verified eCommerce returns and integrated payments, which allows us to further enhance our clients’ experience.
16
8
In August 2018, we successfully completed the opening of our Greater Vancouver distribution centre, moving from an 83,000 square foot facility into a new 225,000 square foot flagship facility with an upgraded warehouse-management system. The new distribution centre primarily services the west coast and serves as a hub for the rest of our network.
The next business transforming foundational technology we are implementing is a Product Lifecycle Management (“PLM”) system. The PLM system will manage all of the data and support all of the processes to bring a product to market. This will enable us to focus on innovation, drive quality, reduce speed to market where appropriate, and ultimately, optimize costs in our manufacturing processes.
We are also working to drive our digital strategy, which is creating additional opportunities throughout the organization as we use digital tools to heighten our clients’ overall experience with the brand. Our focus on building our digital infrastructure impacts everything we do. In our view, digital is about more than just our technology and eCommerce business, it runs through the business all the way from design to the service we deliver in boutiques.
We also continue to expand our talent pool across the organization. We are continuing to find exceptional talent at all levels to facilitate our expected future growth.
These investments in systems, infrastructure and people are expected to drive increased efficiencies and enable our growth for the long term.
Consumer Trends The women’s apparel industry is subject to shifts in consumer trends, preferences and consumer spending and
our revenue and operating results depend, in part, on our ability to respond to such changes in a timely manner. Our differentiated multi-brand strategy gives us control over our products and provides us with the flexibility to optimize our brand mix as needed to address changes in consumer demand and fashion preferences, which has been a critical driver of the consistency of our growth. Our diversified mix of exclusive brands satisfies a broad range of fashion needs, which allows us to attract a wide client base and increases our addressable market. Our revenue is also impacted by discretionary spending by consumers, which is affected by many factors that are beyond our control, including, but not limited to, general economic conditions, consumer disposable income levels, consumer confidence levels, consumer debt, the cost of basic necessities and other goods and the effects of weather or natural disasters. We believe that our track record demonstrates the success of our exclusive brand strategy at responding to changes in fashion demands through all stages of economic cycles.
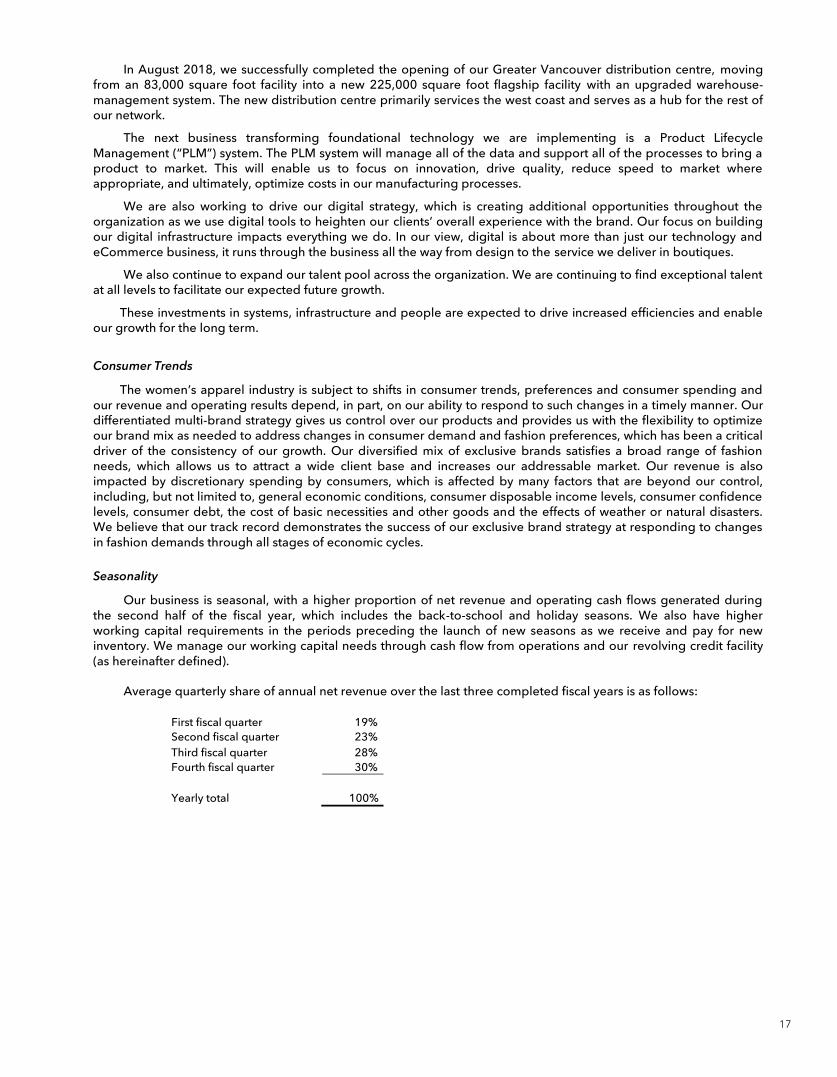
Seasonality Our business is seasonal, with a higher proportion of net revenue and operating cash flows generated during
the second half of the fiscal year, which includes the back-to-school and holiday seasons. We also have higher working capital requirements in the periods preceding the launch of new seasons as we receive and pay for new inventory. We manage our working capital needs through cash flow from operations and our revolving credit facility (as hereinafter defined).
Average quarterly share of annual net revenue over the last three completed fiscal years is as follows:
First fiscal quarter 19% Second fiscal quarter 23% Third fiscal quarter 28% Fourth fiscal quarter 30% Yearly total 100%
17
9
Weather Extreme weather conditions in the areas in which our boutiques are located could adversely affect our business
and financial results. For example, frequent or unusually heavy snowfall, ice storms, rainstorms or other extreme weather conditions over a prolonged period could make it difficult for our clients to travel to our boutiques and thereby reduce our revenue and profitability. This is potentially mitigated by our clients’ ability to buy our products through aritzia.com. Our business is also susceptible to unseasonable weather conditions. For example, extended periods of unseasonably warm temperatures during the winter season or cool weather during the summer season could render a portion of our inventory incompatible with those unseasonable conditions, which could adversely affect sales of these seasonal items.
Competition We operate in the women’s apparel industry, primarily within the North American market. We compete on the
basis of several factors that include our strategic mix of exclusive brands, offering high quality products at an attainable price point, our proven and sophisticated merchandise planning strategy, our focus on providing exceptional client service, our premier real estate portfolio and our market positioning. We believe the industry is evolving to benefit players like us that have the scale needed to leverage their infrastructure and capabilities in areas such as brand equity creation, real estate selection, boutique design, supply chain and eCommerce.
Foreign Exchange The majority of our net revenue is derived in Canadian dollars while the vast majority of our cost of goods sold
is denominated in U.S. dollars. Fluctuations in the exchange rate of the Canadian dollar versus the U.S. dollar could materially affect our gross profit margins and operating results. From time to time, we use foreign currency forward contracts to mitigate risks associated with forecasted U.S. dollar merchandise purchases sold in Canada, but there can be no assurances that such strategies will prove to be successful. See “Financial Instruments” and “Risk Factors” sections of this MD&A.
How We Assess the Performance of Our Business In assessing the performance of our business, we consider a variety of financial and operating measures that
affect our operating results.
Net Revenue Net revenue reflects our sale of merchandise, less returns and discounts. Retail revenue at point-of-sale is
measured at the fair value of the consideration received at the time the sale is made to the customer, net of discounts and an estimated allowance for returns. For merchandise that is ordered and paid in a boutique and subsequently picked up by or delivered to the customer, revenue is deferred until control of the merchandise has been transferred to the customer. eCommerce revenue is recognized at the date control has been transferred to the customer, and measured at the fair value of consideration received, net of discounts and an estimated allowance for returns. Revenues are reported net of sales taxes collected for various governmental agencies. See “Significant New Accounting Standards Recently Adopted – IFRS 15 – Revenue from Contracts with Customers.”
Comparable Sales Growth Comparable sales growth is a retail industry metric used to compare the percentage change in sales derived
from the established boutiques of a certain period as compared to the sales from the same boutiques in the same period in the prior year. Comparable sales growth helps to explain our revenue growth in established boutiques and eCommerce. Comparable sales is calculated based on revenue (net of sales tax, returns and discounts) from boutiques that have been opened for at least 56 weeks including eCommerce revenue (net of sales tax, returns and discounts), and excludes boutiques that were expanded or repositioned, boutiques in centres where we opened a new additional boutique, boutiques significantly impacted by nearby construction and other similar disruptions during this period and week 53 net revenue, if applicable. Our comparable sales growth calculation excludes the
18
10
impact of foreign currency fluctuations. We apply the prior year’s average quarterly exchange rate to both current year and prior year comparable sales to achieve a consistent basis for comparison (i.e. on a constant currency basis).
Gross Profit Gross profit reflects our net revenue less cost of goods sold. Cost of goods sold includes inventory and product-
related costs and occupancy costs, as well as depreciation and amortization expense for our boutiques and distribution centres. Our cost of goods sold may include different costs compared to other retailers. Gross profit margin is impacted by the components of cost of goods sold, product mix and markdowns. Currently our product costs have been pressured by rising materials costs, particularly wool, silk, down, cotton and polyester. We define gross profit margin as our gross profit divided by our net revenues.
Selling, General and Administrative (“SG&A”) Expenses Our SG&A expenses consist of selling expenses that are generally variable with net revenue and general and
administrative operating expenses that are primarily fixed. Our SG&A expenses also include depreciation and amortization expenses for all support office assets and intangible assets. We expect our SG&A expenses to increase as we continue to open new boutiques, grow our eCommerce business, increase brand awareness and invest in our infrastructure and people.
SG&A expenses as a percentage of net revenue are usually higher in the lower-volume first and second quarters, and lower in the higher-volume third and fourth quarters because a portion of these costs are relatively fixed. Our SG&A expenses may include different expenses compared to other retailers.
EBITDA We define EBITDA as consolidated net income before depreciation and amortization, finance expense and
income tax expense.
Adjusted EBITDA We believe Adjusted EBITDA is a useful measure of operating performance, as it provides a more relevant
picture of operating results in that it excludes the effects of financing and investing activities by removing the effects of interest, depreciation and amortization expenses that are not reflective of underlying business performance and other one-time or non-recurring expenses. We use Adjusted EBITDA to facilitate a comparison of our operating performance on a consistent basis from period-to-period and to provide for a more complete understanding of factors and trends affecting our business. We define Adjusted EBITDA as consolidated net income before depreciation and amortization, finance expense and income tax expense, adjusted for the impact of certain items, including non-cash items such as stock-based compensation expense, unrealized foreign exchange gains or losses on forward contracts and other items we consider non-recurring and not representative of our ongoing operating performance. Because Adjusted EBITDA excludes certain non-cash items, we believe that it is less susceptible to variances in actual performance resulting from depreciation and amortization and other non-cash charges.
Adjusted Net Income (per diluted share) We believe Adjusted Net Income (per diluted share) is a useful measure of performance, as it provides a more
relevant picture of results by excluding the effects of expenses that are not reflective of underlying business performance and other one-time or non-recurring expenses. We use Adjusted Net Income to facilitate a comparison of our performance on a consistent basis from period-to-period and to provide for a more complete understanding of factors and trends affecting our business. We define Adjusted Net Income as consolidated net income, adjusted for the impact of certain items, including non-cash items such as stock-based compensation expense, unrealized foreign exchange gains or losses on forward contracts and other items we consider non-recurring and not representative of our ongoing operating performance, net of related tax effects. We define Adjusted Net Income per diluted share by dividing Adjusted Net Income by the weighted average number of diluted shares outstanding. For purposes of reporting our Adjusted Net Income per diluted share, we have adopted the IFRS method for calculating weighted average number of diluted shares outstanding since Q1 2019. Please see “Summary of Consolidated Quarterly
19
11
Results and Certain Performance Measures” for a comparison of the impact of the current diluted share calculation versus our prior methodology.
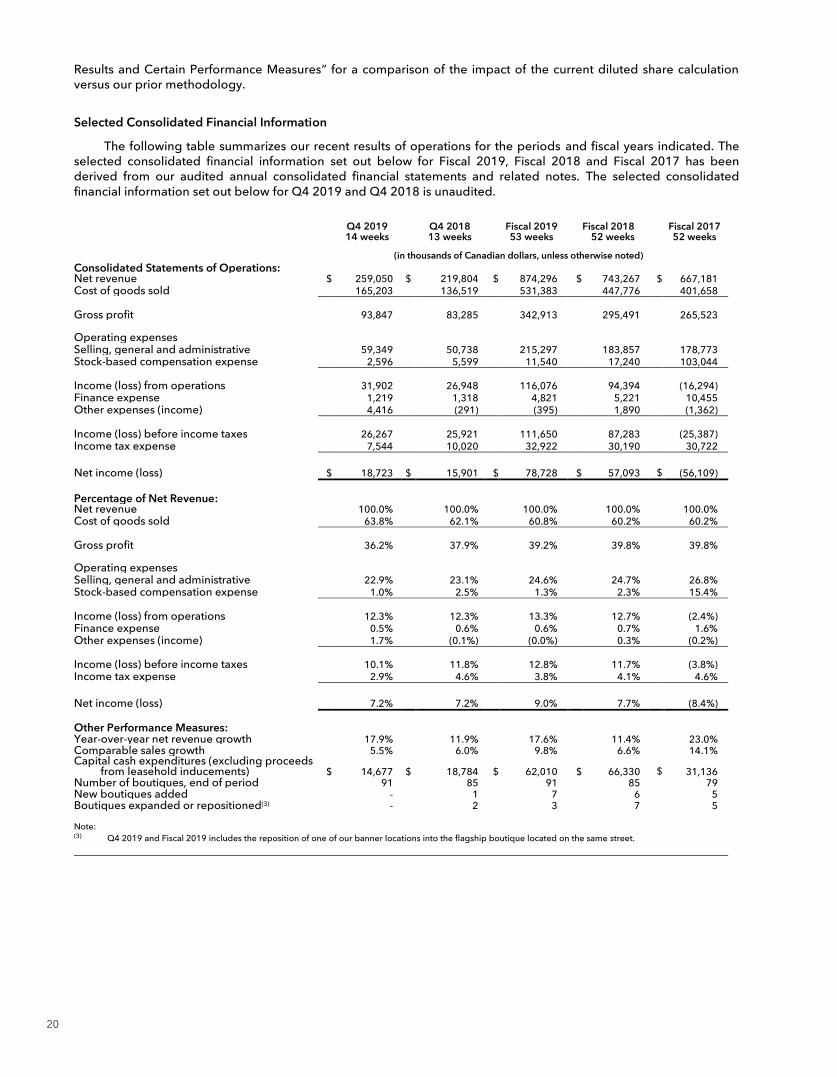
Selected Consolidated Financial Information The following table summarizes our recent results of operations for the periods and fiscal years indicated. The
selected consolidated financial information set out below for Fiscal 2019, Fiscal 2018 and Fiscal 2017 has been derived from our audited annual consolidated financial statements and related notes. The selected consolidated financial information set out below for Q4 2019 and Q4 2018 is unaudited.
Q4 2019 14 weeks Q4 2018
13 weeks Fiscal 2019 53 weeks Fiscal 2018
52 weeks Fiscal 2017 52 weeks
(in thousands of Canadian dollars, unless otherwise noted) Consolidated Statements of Operations: Net revenue $ 259,050 $ 219,804 $ 874,296 $ 743,267 $ 667,181 Cost of goods sold 165,203 136,519 531,383 447,776 401,658 Gross profit 93,847 83,285 342,913 295,491 265,523 Operating expenses Selling, general and administrative 59,349 50,738 215,297 183,857 178,773 Stock-based compensation expense 2,596 5,599 11,540 17,240 103,044 Income (loss) from operations 31,902 26,948 116,076 94,394 (16,294) Finance expense 1,219 1,318 4,821 5,221 10,455 Other expenses (income) 4,416 (291) (395) 1,890 (1,362) Income (loss) before income taxes 26,267 25,921 111,650 87,283 (25,387) Income tax expense 7,544 10,020 32,922 30,190 30,722 Net income (loss) $ 18,723 $ 15,901 $ 78,728 $ 57,093 $ (56,109)
Percentage of Net Revenue: Net revenue 100.0% 100.0% 100.0% 100.0% 100.0% Cost of goods sold 63.8% 62.1% 60.8% 60.2% 60.2% Gross profit 36.2% 37.9% 39.2% 39.8% 39.8% Operating expenses Selling, general and administrative 22.9% 23.1% 24.6% 24.7% 26.8% Stock-based compensation expense 1.0% 2.5% 1.3% 2.3% 15.4% Income (loss) from operations 12.3% 12.3% 13.3% 12.7% (2.4%) Finance expense 0.5% 0.6% 0.6% 0.7% 1.6% Other expenses (income) 1.7% (0.1%) (0.0%) 0.3% (0.2%) Income (loss) before income taxes 10.1% 11.8% 12.8% 11.7% (3.8%) Income tax expense 2.9% 4.6% 3.8% 4.1% 4.6% Net income (loss) 7.2% 7.2% 9.0% 7.7% (8.4%)
Other Performance Measures: Year-over-year net revenue growth 17.9% 11.9% 17.6% 11.4% 23.0% Comparable sales growth 5.5% 6.0% 9.8% 6.6% 14.1% Capital cash expenditures (excluding proceeds
from leasehold inducements) $ 14,677 $ 18,784 $ 62,010 $ 66,330 $ 31,136 Number of boutiques, end of period 91 85 91 85 79 New boutiques added - 1 7 6 5 Boutiques expanded or repositioned(3) - 2 3 7 5 Note: (3) Q4 2019 and Fiscal 2019 includes the reposition of one of our banner locations into the flagship boutique located on the same street.
20
12
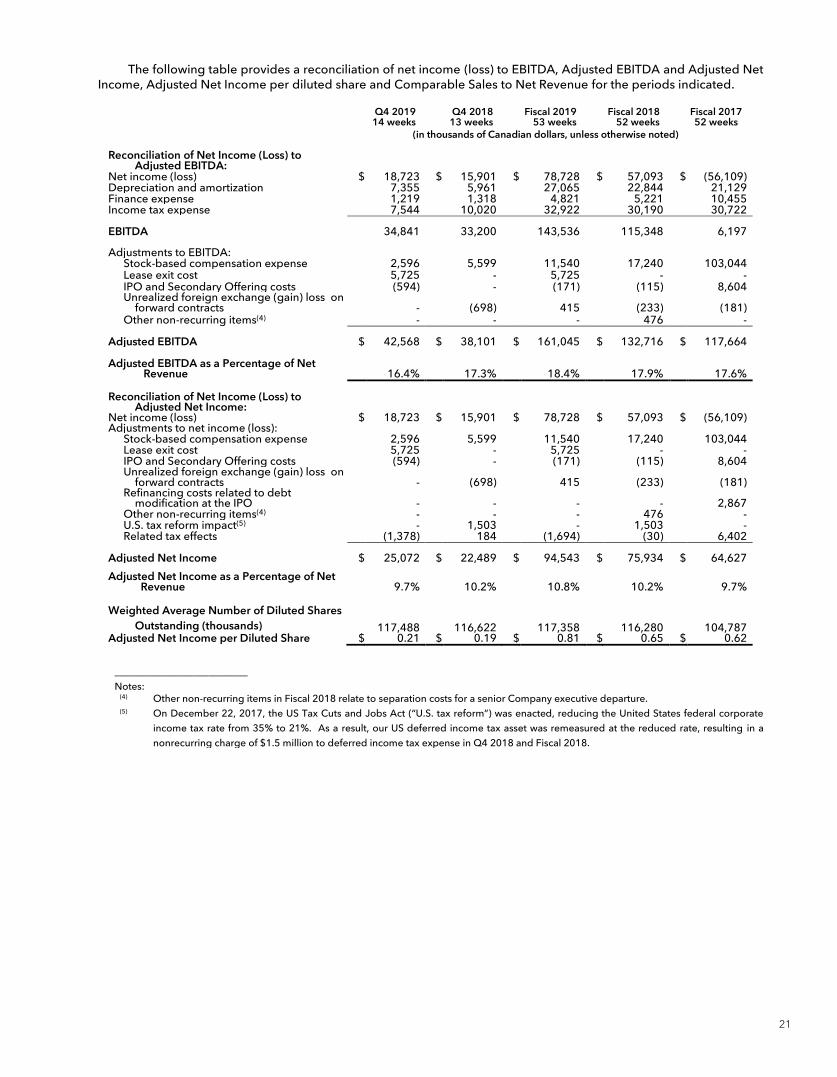
The following table provides a reconciliation of net income (loss) to EBITDA, Adjusted EBITDA and Adjusted Net Income, Adjusted Net Income per diluted share and Comparable Sales to Net Revenue for the periods indicated.
Q4 2019 14 weeks
Q4 2018 13 weeks
Fiscal 2019 53 weeks
Fiscal 2018 52 weeks
Fiscal 2017 52 weeks
(in thousands of Canadian dollars, unless otherwise noted)
Reconciliation of Net Income (Loss) to Adjusted EBITDA:
Net income (loss) $ 18,723 $ 15,901 $ 78,728 $ 57,093 $ (56,109) Depreciation and amortization 7,355 5,961 27,065 22,844 21,129 Finance expense 1,219 1,318 4,821 5,221 10,455 Income tax expense 7,544 10,020 32,922 30,190 30,722 EBITDA 34,841 33,200 143,536 115,348 6,197 Adjustments to EBITDA:
Stock-based compensation expense 2,596 5,599 11,540 17,240 103,044 Lease exit cost 5,725 - 5,725 - - IPO and Secondary Offering costs (594) - (171) (115) 8,604 Unrealized foreign exchange (gain) loss on
forward contracts - (698) 415 (233) (181) Other non-recurring items(4) - - - 476 -
Adjusted EBITDA $ 42,568 $ 38,101 $ 161,045 $ 132,716 $ 117,664
Adjusted EBITDA as a Percentage of Net Revenue 16.4% 17.3% 18.4% 17.9% 17.6%
Reconciliation of Net Income (Loss) to
Adjusted Net Income: Net income (loss) $ 18,723 $ 15,901 $ 78,728 $ 57,093 $ (56,109) Adjustments to net income (loss):
Stock-based compensation expense 2,596 5,599 11,540 17,240 103,044 Lease exit cost 5,725 - 5,725 - - IPO and Secondary Offering costs (594) - (171) (115) 8,604 Unrealized foreign exchange (gain) loss on
forward contracts - (698) 415 (233) (181) Refinancing costs related to debt
modification at the IPO - - - - 2,867 Other non-recurring items(4) - - - 476 - U.S. tax reform impact(5) - 1,503 - 1,503 - Related tax effects (1,378) 184 (1,694) (30) 6,402
Adjusted Net Income $ 25,072 $ 22,489 $ 94,543 $ 75,934 $ 64,627
Adjusted Net Income as a Percentage of Net Revenue 9.7% 10.2% 10.8% 10.2% 9.7%
Weighted Average Number of Diluted Shares
Outstanding (thousands) 117,488 116,622 117,358 116,280 104,787 Adjusted Net Income per Diluted Share $ 0.21 $ 0.19 $ 0.81 $ 0.65 $ 0.62
___________________________ Notes:
(4) Other non-recurring items in Fiscal 2018 relate to separation costs for a senior Company executive departure. (5) On December 22, 2017, the US Tax Cuts and Jobs Act (“U.S. tax reform”) was enacted, reducing the United States federal corporate
income tax rate from 35% to 21%. As a result, our US deferred income tax asset was remeasured at the reduced rate, resulting in a nonrecurring charge of $1.5 million to deferred income tax expense in Q4 2018 and Fiscal 2018.
21
13
Q4 2019
14 weeks Q4 2018
13 weeks Fiscal 2019
53 weeks Fiscal 2018
52 weeks
Fiscal 2017 52 weeks
(in thousands of Canadian dollars, unless otherwise noted)
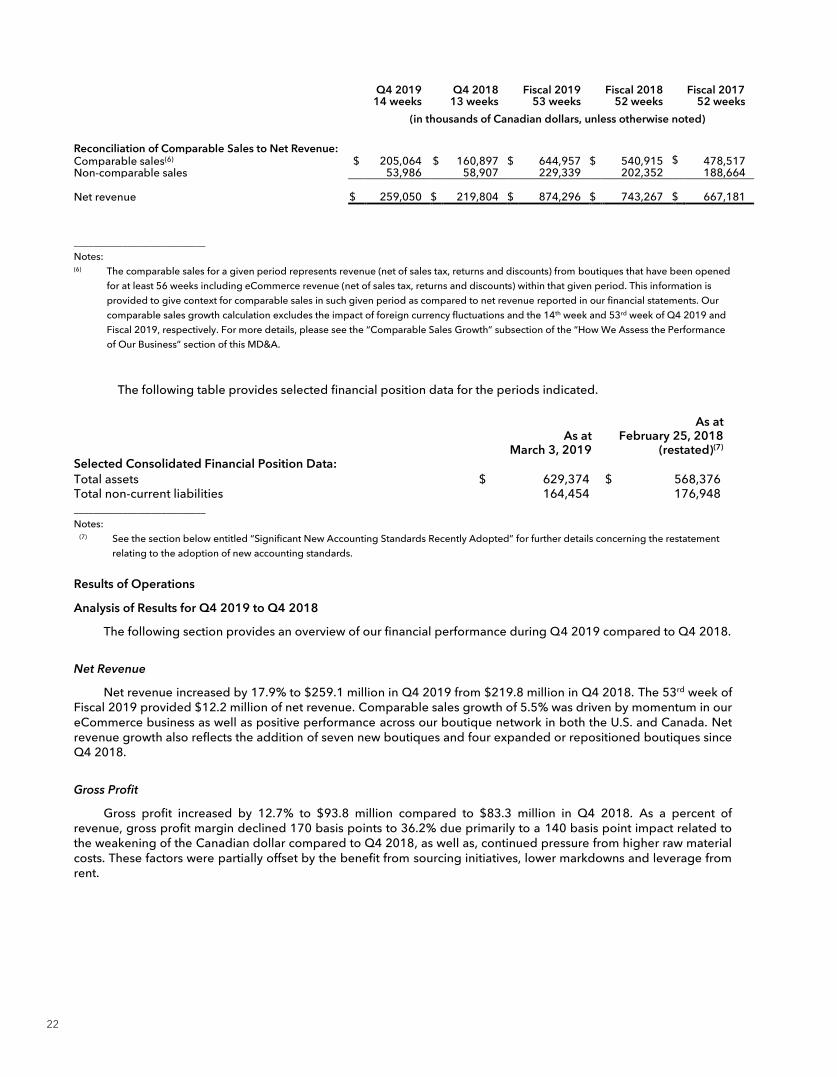
Reconciliation of Comparable Sales to Net Revenue: Comparable sales(6) $ 205,064 $ 160,897 $ 644,957 $ 540,915 $ 478,517 Non-comparable sales 53,986 58,907 229,339 202,352 188,664 Net revenue $ 259,050 $ 219,804 $ 874,296 $ 743,267 $ 667,181 ___________________________ Notes: (6) The comparable sales for a given period represents revenue (net of sales tax, returns and discounts) from boutiques that have been opened
for at least 56 weeks including eCommerce revenue (net of sales tax, returns and discounts) within that given period. This information is provided to give context for comparable sales in such given period as compared to net revenue reported in our financial statements. Our comparable sales growth calculation excludes the impact of foreign currency fluctuations and the 14th week and 53rd week of Q4 2019 and Fiscal 2019, respectively. For more details, please see the “Comparable Sales Growth” subsection of the “How We Assess the Performance of Our Business” section of this MD&A.
The following table provides selected financial position data for the periods indicated.
As at
March 3, 2019
As at February 25, 2018
(restated)(7) Selected Consolidated Financial Position Data: Total assets $ 629,374 $ 568,376 Total non-current liabilities 164,454 176,948 ___________________________ Notes:
(7) See the section below entitled “Significant New Accounting Standards Recently Adopted” for further details concerning the restatement relating to the adoption of new accounting standards.
Results of Operations Analysis of Results for Q4 2019 to Q4 2018
The following section provides an overview of our financial performance during Q4 2019 compared to Q4 2018.
Net Revenue Net revenue increased by 17.9% to $259.1 million in Q4 2019 from $219.8 million in Q4 2018. The 53rd week of
Fiscal 2019 provided $12.2 million of net revenue. Comparable sales growth of 5.5% was driven by momentum in our eCommerce business as well as positive performance across our boutique network in both the U.S. and Canada. Net revenue growth also reflects the addition of seven new boutiques and four expanded or repositioned boutiques since Q4 2018.
Gross Profit Gross profit increased by 12.7% to $93.8 million compared to $83.3 million in Q4 2018. As a percent of
revenue, gross profit margin declined 170 basis points to 36.2% due primarily to a 140 basis point impact related to the weakening of the Canadian dollar compared to Q4 2018, as well as, continued pressure from higher raw material costs. These factors were partially offset by the benefit from sourcing initiatives, lower markdowns and leverage from rent.
22
14
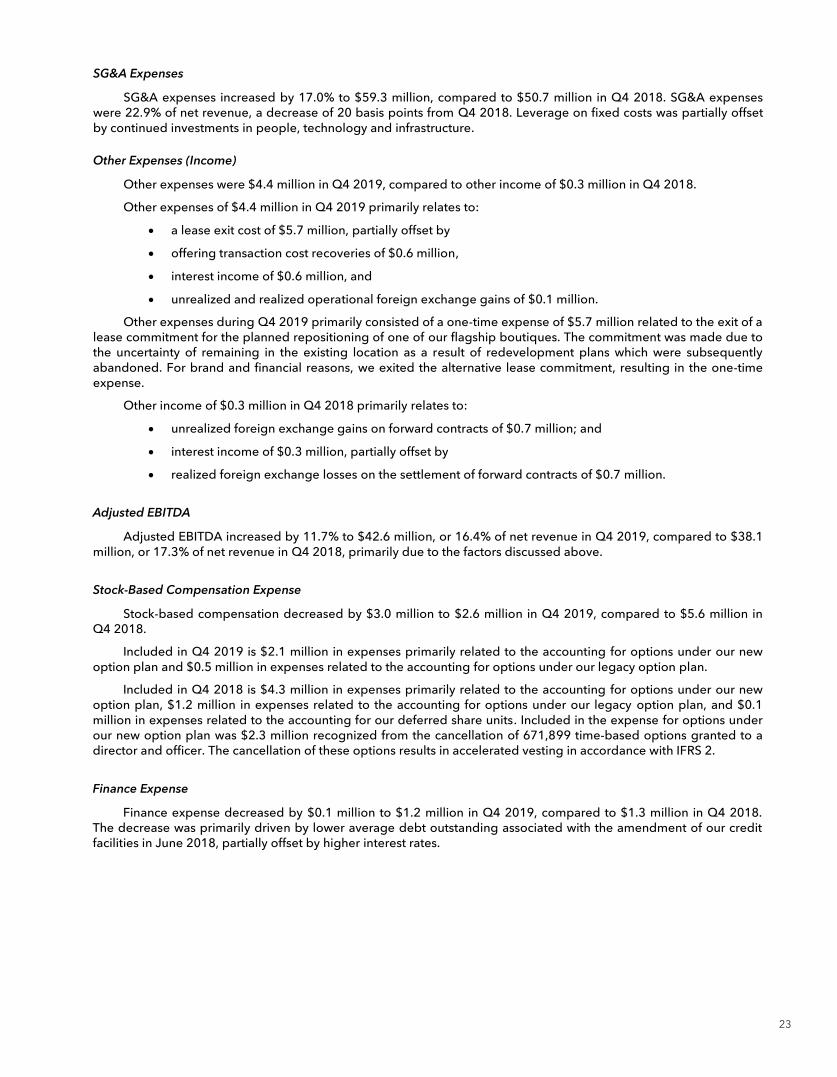
SG&A Expenses SG&A expenses increased by 17.0% to $59.3 million, compared to $50.7 million in Q4 2018. SG&A expenses
were 22.9% of net revenue, a decrease of 20 basis points from Q4 2018. Leverage on fixed costs was partially offset by continued investments in people, technology and infrastructure. Other Expenses (Income)
Other expenses were $4.4 million in Q4 2019, compared to other income of $0.3 million in Q4 2018.
Other expenses of $4.4 million in Q4 2019 primarily relates to:
a lease exit cost of $5.7 million, partially offset by
offering transaction cost recoveries of $0.6 million,
interest income of $0.6 million, and
unrealized and realized operational foreign exchange gains of $0.1 million.
Other expenses during Q4 2019 primarily consisted of a one-time expense of $5.7 million related to the exit of a lease commitment for the planned repositioning of one of our flagship boutiques. The commitment was made due to the uncertainty of remaining in the existing location as a result of redevelopment plans which were subsequently abandoned. For brand and financial reasons, we exited the alternative lease commitment, resulting in the one-time expense.
Other income of $0.3 million in Q4 2018 primarily relates to:
unrealized foreign exchange gains on forward contracts of $0.7 million; and
interest income of $0.3 million, partially offset by
realized foreign exchange losses on the settlement of forward contracts of $0.7 million.
Adjusted EBITDA Adjusted EBITDA increased by 11.7% to $42.6 million, or 16.4% of net revenue in Q4 2019, compared to $38.1
million, or 17.3% of net revenue in Q4 2018, primarily due to the factors discussed above.
Stock-Based Compensation Expense Stock-based compensation decreased by $3.0 million to $2.6 million in Q4 2019, compared to $5.6 million in
Q4 2018.
Included in Q4 2019 is $2.1 million in expenses primarily related to the accounting for options under our new option plan and $0.5 million in expenses related to the accounting for options under our legacy option plan.
Included in Q4 2018 is $4.3 million in expenses primarily related to the accounting for options under our new option plan, $1.2 million in expenses related to the accounting for options under our legacy option plan, and $0.1 million in expenses related to the accounting for our deferred share units. Included in the expense for options under our new option plan was $2.3 million recognized from the cancellation of 671,899 time-based options granted to a director and officer. The cancellation of these options results in accelerated vesting in accordance with IFRS 2.
Finance Expense Finance expense decreased by $0.1 million to $1.2 million in Q4 2019, compared to $1.3 million in Q4 2018.
The decrease was primarily driven by lower average debt outstanding associated with the amendment of our credit facilities in June 2018, partially offset by higher interest rates.
23
15
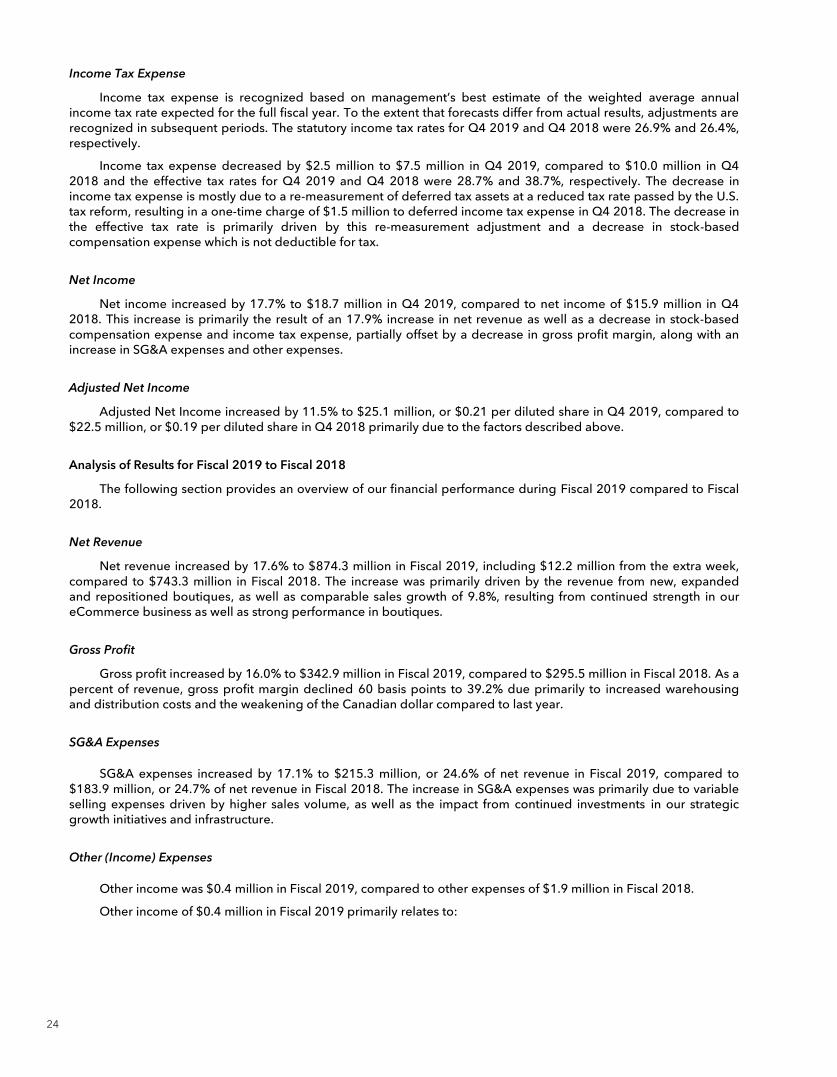
Income Tax Expense Income tax expense is recognized based on management’s best estimate of the weighted average annual
income tax rate expected for the full fiscal year. To the extent that forecasts differ from actual results, adjustments are recognized in subsequent periods. The statutory income tax rates for Q4 2019 and Q4 2018 were 26.9% and 26.4%, respectively.
Income tax expense decreased by $2.5 million to $7.5 million in Q4 2019, compared to $10.0 million in Q4 2018 and the effective tax rates for Q4 2019 and Q4 2018 were 28.7% and 38.7%, respectively. The decrease in income tax expense is mostly due to a re-measurement of deferred tax assets at a reduced tax rate passed by the U.S. tax reform, resulting in a one-time charge of $1.5 million to deferred income tax expense in Q4 2018. The decrease in the effective tax rate is primarily driven by this re-measurement adjustment and a decrease in stock-based compensation expense which is not deductible for tax.
Net Income Net income increased by 17.7% to $18.7 million in Q4 2019, compared to net income of $15.9 million in Q4
2018. This increase is primarily the result of an 17.9% increase in net revenue as well as a decrease in stock-based compensation expense and income tax expense, partially offset by a decrease in gross profit margin, along with an increase in SG&A expenses and other expenses.
Adjusted Net Income Adjusted Net Income increased by 11.5% to $25.1 million, or $0.21 per diluted share in Q4 2019, compared to
$22.5 million, or $0.19 per diluted share in Q4 2018 primarily due to the factors described above.
Analysis of Results for Fiscal 2019 to Fiscal 2018 The following section provides an overview of our financial performance during Fiscal 2019 compared to Fiscal
2018.
Net Revenue Net revenue increased by 17.6% to $874.3 million in Fiscal 2019, including $12.2 million from the extra week,
compared to $743.3 million in Fiscal 2018. The increase was primarily driven by the revenue from new, expanded and repositioned boutiques, as well as comparable sales growth of 9.8%, resulting from continued strength in our eCommerce business as well as strong performance in boutiques.
Gross Profit Gross profit increased by 16.0% to $342.9 million in Fiscal 2019, compared to $295.5 million in Fiscal 2018. As a
percent of revenue, gross profit margin declined 60 basis points to 39.2% due primarily to increased warehousing and distribution costs and the weakening of the Canadian dollar compared to last year.
SG&A Expenses
SG&A expenses increased by 17.1% to $215.3 million, or 24.6% of net revenue in Fiscal 2019, compared to $183.9 million, or 24.7% of net revenue in Fiscal 2018. The increase in SG&A expenses was primarily due to variable selling expenses driven by higher sales volume, as well as the impact from continued investments in our strategic growth initiatives and infrastructure.
Other (Income) Expenses
Other income was $0.4 million in Fiscal 2019, compared to other expenses of $1.9 million in Fiscal 2018.
Other income of $0.4 million in Fiscal 2019 primarily relates to:
24
16
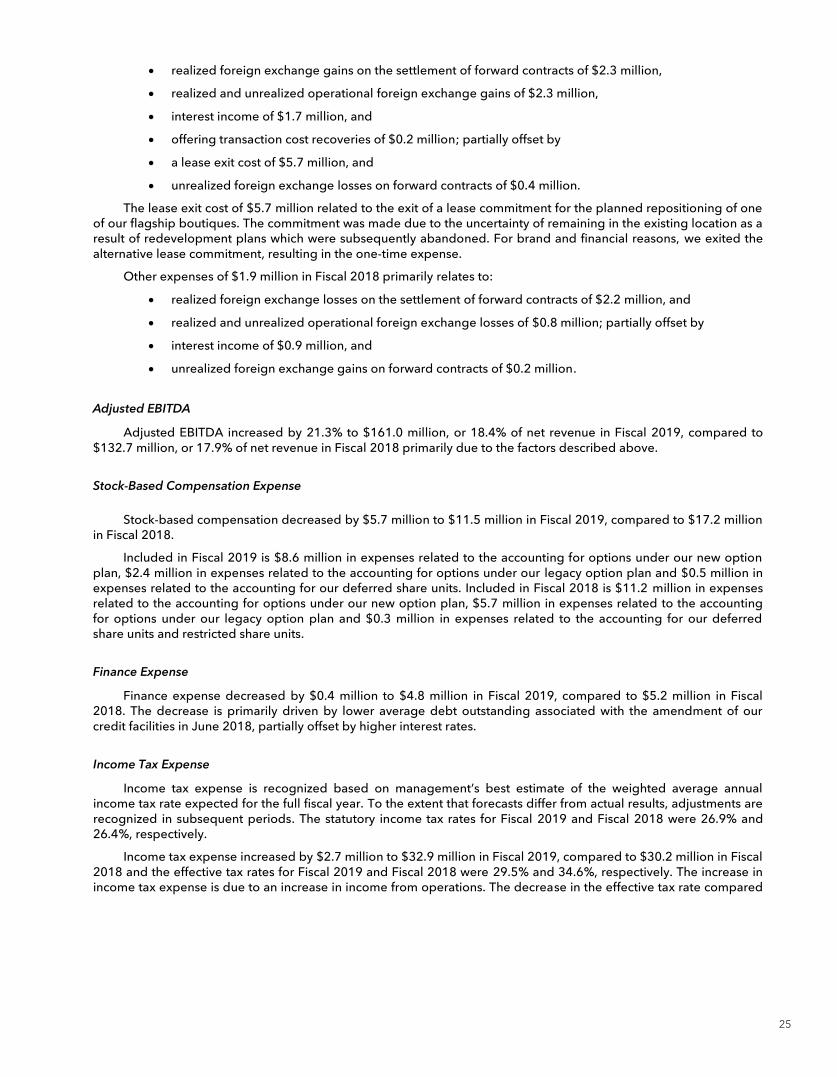
realized foreign exchange gains on the settlement of forward contracts of $2.3 million,
realized and unrealized operational foreign exchange gains of $2.3 million,
interest income of $1.7 million, and
offering transaction cost recoveries of $0.2 million; partially offset by
a lease exit cost of $5.7 million, and
unrealized foreign exchange losses on forward contracts of $0.4 million.
The lease exit cost of $5.7 million related to the exit of a lease commitment for the planned repositioning of one of our flagship boutiques. The commitment was made due to the uncertainty of remaining in the existing location as a result of redevelopment plans which were subsequently abandoned. For brand and financial reasons, we exited the alternative lease commitment, resulting in the one-time expense.
Other expenses of $1.9 million in Fiscal 2018 primarily relates to:
realized foreign exchange losses on the settlement of forward contracts of $2.2 million, and
realized and unrealized operational foreign exchange losses of $0.8 million; partially offset by
interest income of $0.9 million, and
unrealized foreign exchange gains on forward contracts of $0.2 million.
Adjusted EBITDA
Adjusted EBITDA increased by 21.3% to $161.0 million, or 18.4% of net revenue in Fiscal 2019, compared to $132.7 million, or 17.9% of net revenue in Fiscal 2018 primarily due to the factors described above.
Stock-Based Compensation Expense
Stock-based compensation decreased by $5.7 million to $11.5 million in Fiscal 2019, compared to $17.2 million in Fiscal 2018.
Included in Fiscal 2019 is $8.6 million in expenses related to the accounting for options under our new option plan, $2.4 million in expenses related to the accounting for options under our legacy option plan and $0.5 million in expenses related to the accounting for our deferred share units. Included in Fiscal 2018 is $11.2 million in expenses related to the accounting for options under our new option plan, $5.7 million in expenses related to the accounting for options under our legacy option plan and $0.3 million in expenses related to the accounting for our deferred share units and restricted share units.
Finance Expense Finance expense decreased by $0.4 million to $4.8 million in Fiscal 2019, compared to $5.2 million in Fiscal
2018. The decrease is primarily driven by lower average debt outstanding associated with the amendment of our credit facilities in June 2018, partially offset by higher interest rates.
Income Tax Expense Income tax expense is recognized based on management’s best estimate of the weighted average annual
income tax rate expected for the full fiscal year. To the extent that forecasts differ from actual results, adjustments are recognized in subsequent periods. The statutory income tax rates for Fiscal 2019 and Fiscal 2018 were 26.9% and 26.4%, respectively.
Income tax expense increased by $2.7 million to $32.9 million in Fiscal 2019, compared to $30.2 million in Fiscal 2018 and the effective tax rates for Fiscal 2019 and Fiscal 2018 were 29.5% and 34.6%, respectively. The increase in income tax expense is due to an increase in income from operations. The decrease in the effective tax rate compared
25
17
to Fiscal 2018 is due to a decrease in the amount of stock-based compensation expense and a one time re-measurement of deferred tax assets at a reduced rate passed by the U.S. tax reform in the prior year.
Net Income Net income increased by 37.9% to $78.7 million in Fiscal 2019, compared to net income of $57.1 million in
Fiscal 2018. This increase is primarily the result of a 17.6% increase in net revenue and an increase in other income, as well as a decrease in stock-based compensation expense and finance expense, partially offset by lower gross profit margin and higher SG&A expenses and income tax expense.
Adjusted Net Income Adjusted Net Income increased by 24.5% to $94.5 million, or $0.81 per diluted share in Fiscal 2019, compared
to $75.9 million, or $0.65 per diluted share in Fiscal 2018, primarily due to the factors described above.
26
18
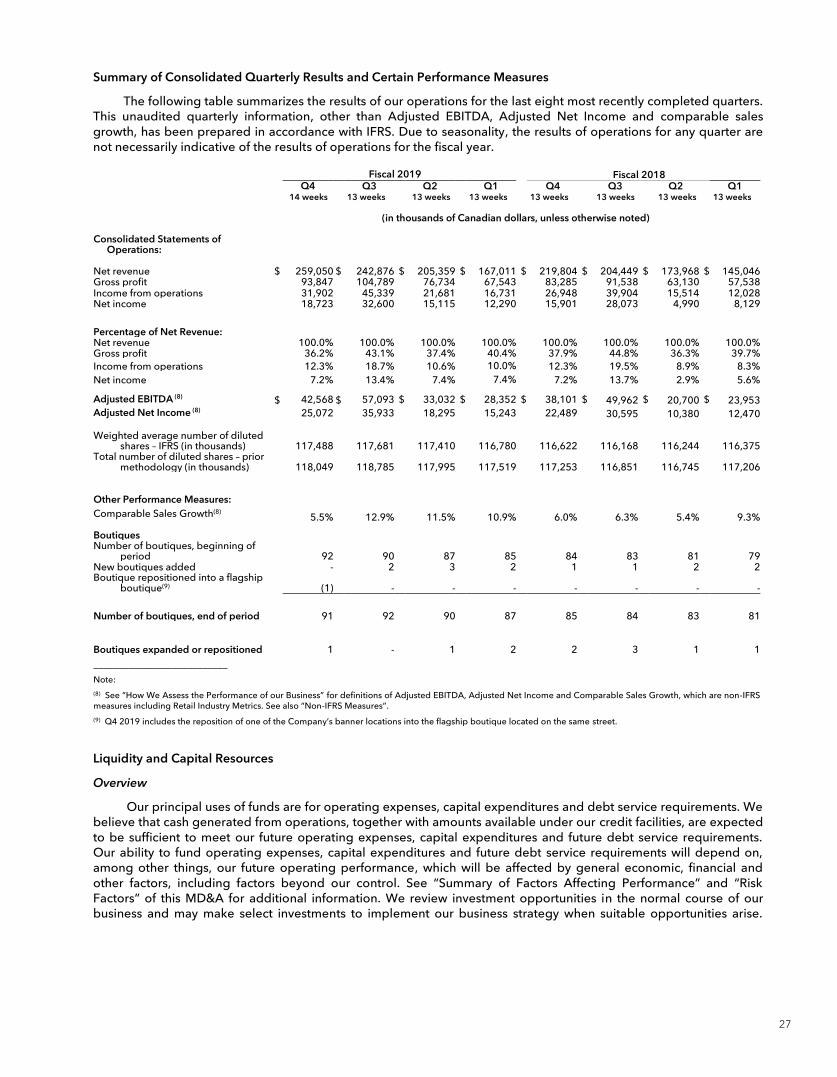
Summary of Consolidated Quarterly Results and Certain Performance Measures The following table summarizes the results of our operations for the last eight most recently completed quarters.
This unaudited quarterly information, other than Adjusted EBITDA, Adjusted Net Income and comparable sales growth, has been prepared in accordance with IFRS. Due to seasonality, the results of operations for any quarter are not necessarily indicative of the results of operations for the fiscal year.
Fiscal 2019 Fiscal 2018 Q4 Q3 Q2 Q1 Q4 Q3 Q2 Q1 14 weeks 13 weeks 13 weeks 13 weeks 13 weeks 13 weeks 13 weeks 13 weeks (in thousands of Canadian dollars, unless otherwise noted)
Consolidated Statements of Operations:
Net revenue $ 259,050 $ 242,876 $ 205,359 $ 167,011 $ 219,804 $ 204,449 $ 173,968 $ 145,046 Gross profit 93,847 104,789 76,734 67,543 83,285 91,538 63,130 57,538 Income from operations 31,902 45,339 21,681 16,731 26,948 39,904 15,514 12,028 Net income 18,723 32,600 15,115 12,290 15,901 28,073 4,990 8,129
Percentage of Net Revenue: Net revenue 100.0% 100.0% 100.0% 100.0% 100.0% 100.0% 100.0% 100.0% Gross profit 36.2% 43.1% 37.4% 40.4% 37.9% 44.8% 36.3% 39.7% Income from operations 12.3% 18.7% 10.6% 10.0% 12.3% 19.5% 8.9% 8.3% Net income 7.2% 13.4% 7.4% 7.4% 7.2% 13.7% 2.9% 5.6% Adjusted EBITDA (8) $ 42,568 $ 57,093 $ 33,032 $ 28,352 $ 38,101 $ 49,962 $ 20,700 $ 23,953 Adjusted Net Income (8) 25,072 35,933 18,295 15,243 22,489 30,595 10,380 12,470 Weighted average number of diluted
shares – IFRS (in thousands) 117,488 117,681 117,410 116,780 116,622 116,168 116,244 116,375 Total number of diluted shares – prior
methodology (in thousands) 118,049 118,785 117,995 117,519 117,253 116,851 116,745 117,206
Other Performance Measures: Comparable Sales Growth(8) 5.5% 12.9% 11.5% 10.9% 6.0% 6.3% 5.4% 9.3% Boutiques Number of boutiques, beginning of
period 92 90 87 85 84 83 81 79 New boutiques added - 2 3 2 1 1 2 2 Boutique repositioned into a flagship
boutique(9) (1) - - - - - - -
Number of boutiques, end of period 91 92 90 87 85 84 83 81
Boutiques expanded or repositioned 1 - 1 2 2 3 1 1 ___________________________
Note:
(8) See “How We Assess the Performance of our Business” for definitions of Adjusted EBITDA, Adjusted Net Income and Comparable Sales Growth, which are non-IFRS measures including Retail Industry Metrics. See also “Non-IFRS Measures”.
(9) Q4 2019 includes the reposition of one of the Company’s banner locations into the flagship boutique located on the same street.
Liquidity and Capital Resources Overview
Our principal uses of funds are for operating expenses, capital expenditures and debt service requirements. We believe that cash generated from operations, together with amounts available under our credit facilities, are expected to be sufficient to meet our future operating expenses, capital expenditures and future debt service requirements. Our ability to fund operating expenses, capital expenditures and future debt service requirements will depend on, among other things, our future operating performance, which will be affected by general economic, financial and other factors, including factors beyond our control. See “Summary of Factors Affecting Performance” and “Risk Factors” of this MD&A for additional information. We review investment opportunities in the normal course of our business and may make select investments to implement our business strategy when suitable opportunities arise.
27
19
Historically, the funding for any such investments has come from cash flows from operating activities and/or our credit facilities.
Credit Facilities On June 28, 2018, we amended our term loan and revolving credit facility (collectively the “Credit Facilities”)
with our syndicate of lenders. The amendment agreement included a reduction of the term loan from $118.7 million to $75.0 million and an increase of the revolving credit facility from $70.0 million to $100.0 million. The amended Credit Facilities mature on May 22, 2022 and have no scheduled principal payments prior to maturity. Interest is paid on a monthly basis. Under the amended Credit Facilities, we have the option to borrow using Banker’s Acceptance borrowings, LIBO rate borrowings, or Canadian prime rate borrowings plus a marginal interest rate between 0.50% and 2.50%. As part of the amendment, we made a $43.7 million term loan repayment on June 27, 2018.
In addition, we also have letters of credit facilities of $75.0 million, secured pari passu with the Credit Facilities. The interest rate for the letters of credit is between 1.00% and 2.50%.
As at March 3, 2019, the aggregate amount outstanding under our term loan credit facility was $75.0 million. No amounts were drawn on the revolving credit facility as at March 3, 2019. The term loan credit facility requires mandatory loan prepayments by us of principal and interest if certain events occur. See “Contractual Obligations – Off-Balance Sheet Arrangements and Commitments” for letters of credit issued.
The credit agreement contains restrictive covenants customary for credit facilities of this nature, including restrictions on us and each credit facility guarantor, subject to certain exceptions, to incur indebtedness, grant liens, merge, amalgamate or consolidate with other companies, transfer, lease or otherwise dispose of all or substantially all of its assets, liquidate or dissolve, engage in any material business other than the fashion retail business, make investments, acquisitions, loans, advances or guarantees, make any restricted payments, enter into transactions with affiliates, repay indebtedness, enter into restrictive agreements, enter into sale-leaseback transactions, ensure pension plan compliance, sell or discount receivables, enter into agreements with unconditional purchase obligations, issue shares, create or acquire a subsidiary or make any hostile acquisitions. Cash Flows
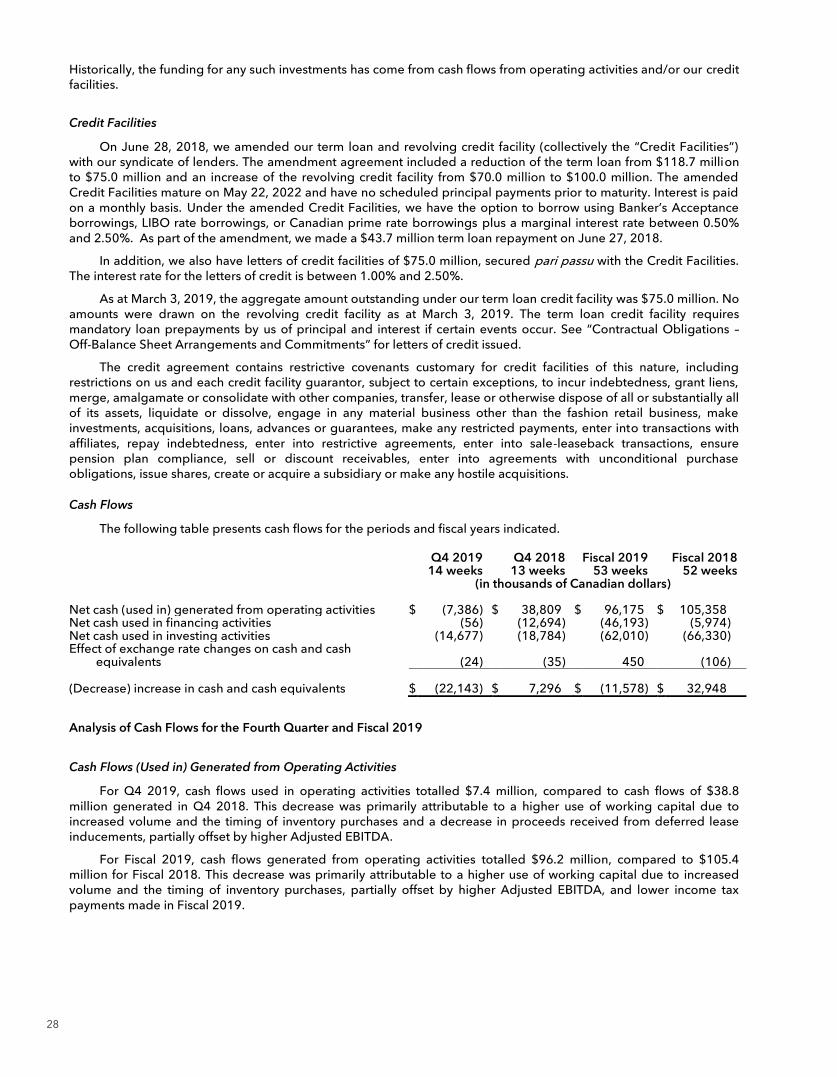
The following table presents cash flows for the periods and fiscal years indicated.
Q4 2019 Q4 2018 Fiscal 2019 Fiscal 2018 14 weeks 13 weeks 53 weeks 52 weeks (in thousands of Canadian dollars)
Net cash (used in) generated from operating activities $ (7,386) $ 38,809 $ 96,175 $ 105,358 Net cash used in financing activities (56) (12,694) (46,193) (5,974) Net cash used in investing activities (14,677) (18,784) (62,010) (66,330) Effect of exchange rate changes on cash and cash
equivalents (24) (35) 450 (106) (Decrease) increase in cash and cash equivalents $ (22,143) $ 7,296 $ (11,578) $ 32,948
Analysis of Cash Flows for the Fourth Quarter and Fiscal 2019
Cash Flows (Used in) Generated from Operating Activities For Q4 2019, cash flows used in operating activities totalled $7.4 million, compared to cash flows of $38.8
million generated in Q4 2018. This decrease was primarily attributable to a higher use of working capital due to increased volume and the timing of inventory purchases and a decrease in proceeds received from deferred lease inducements, partially offset by higher Adjusted EBITDA.
For Fiscal 2019, cash flows generated from operating activities totalled $96.2 million, compared to $105.4 million for Fiscal 2018. This decrease was primarily attributable to a higher use of working capital due to increased volume and the timing of inventory purchases, partially offset by higher Adjusted EBITDA, and lower income tax payments made in Fiscal 2019.
28
20
Cash Flows Used in Financing Activities For Q4 2019, cash flows used in financing activities totalled $0.1 million, compared to $12.7 million used in Q4
2018. This change was primarily due to a repayment on our Credit Facilities made in Q4 2018, partially offset by higher net proceeds received from options exercised in Q4 2018, and repurchase of subordinate voting shares for cancellation in Q4 2019 under our normal course issuer bid.
For Fiscal 2019, cash flows used in financing activities totalled $46.2 million, compared to $6.0 million used in Fiscal 2018. This change was primarily due to a $43.7 million term loan repayment made in Q2 2019 as a result of our debt refinancing and the repurchase of subordinate voting shares for cancellation in Fiscal 2019 under our normal course issuer bid. See “Current Share Information” below.
Cash Flows Used in Investing Activities For Q4 2019, cash flows used in investing activities totalled $14.7 million, compared to $18.8 million in Q4
2018. Investing activities in Q4 2019 relate to new boutiques and boutique expansions and repositions.
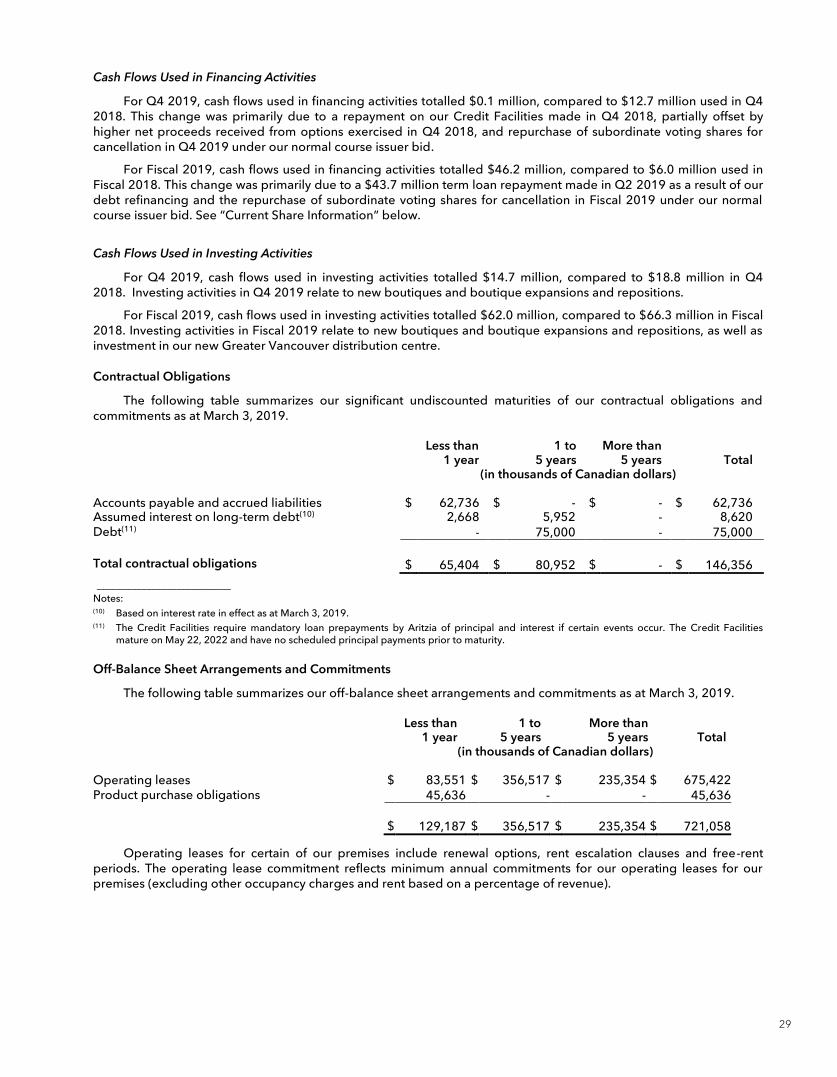
For Fiscal 2019, cash flows used in investing activities totalled $62.0 million, compared to $66.3 million in Fiscal 2018. Investing activities in Fiscal 2019 relate to new boutiques and boutique expansions and repositions, as well as investment in our new Greater Vancouver distribution centre. Contractual Obligations
The following table summarizes our significant undiscounted maturities of our contractual obligations and commitments as at March 3, 2019.
Less than
1 year 1 to
5 years More than
5 years Total (in thousands of Canadian dollars)
Accounts payable and accrued liabilities $ 62,736 $ - $ - $ 62,736 Assumed interest on long-term debt(10) 2,668 5,952 - 8,620 Debt(11) - 75,000 - 75,000 Total contractual obligations $ 65,404 $ 80,952 $ - $ 146,356
___________________________ Notes: (10) Based on interest rate in effect as at March 3, 2019. (11) The Credit Facilities require mandatory loan prepayments by Aritzia of principal and interest if certain events occur. The Credit Facilities
mature on May 22, 2022 and have no scheduled principal payments prior to maturity.
Off-Balance Sheet Arrangements and Commitments The following table summarizes our off-balance sheet arrangements and commitments as at March 3, 2019.
Less than
1 year 1 to
5 years More than
5 years Total (in thousands of Canadian dollars)
Operating leases $ 83,551 $ 356,517 $ 235,354 $ 675,422 Product purchase obligations 45,636 - - 45,636 $ 129,187 $ 356,517 $ 235,354 $ 721,058
Operating leases for certain of our premises include renewal options, rent escalation clauses and free-rent periods. The operating lease commitment reflects minimum annual commitments for our operating leases for our premises (excluding other occupancy charges and rent based on a percentage of revenue).
29
21
Our third party manufacturers purchase raw materials on our behalf to be used for future production. As at March 3, 2019, we had purchase obligations of $45.6 million, which represent commitments for fabric to be used during upcoming seasons, made in the normal course of business.
We enter into trade letters of credit to facilitate the international purchase of inventory. We also enter into standby letters of credit to secure certain of our obligations, including leases and duties related to import purchases. As at March 3, 2019, letters of credit totalling $43.1 million have been issued.
Other than those items disclosed here and elsewhere in this MD&A and our consolidated financial statements, we do not have any material off-balance sheet arrangements or commitments as at March 3, 2019.
Subsequent to year end, we entered into additional operating leases, increasing the total minimum lease commitments by $20.4 million (excluding other occupancy charges and rent based on percentage of revenue).
See also “Significant New Accounting Standards Issued But Not Yet Adopted – IFRS 16 – Leases” below.
Financial Instruments From time to time, we use foreign currency forward contracts to manage our exposure to fluctuations with
respect to the U.S. dollar for U.S. dollar merchandise purchases sold in Canada. The fair value of the forward contracts is included in prepaid expenses and other current assets or in accounts payable and accrued liabilities, depending on whether they represent assets or liabilities to us. Changes in the fair value of foreign currency forward contracts are recorded in net income. As at March 3, 2019, we did not have any outstanding foreign currency forward contracts.
Related Party Transactions (in thousands of Canadian dollars unless otherwise indicated)
Prior to the August 2018 Secondary Offering, we were ultimately controlled by Canada Retail Holdings, L.P., our ultimate parent and the Berkshire Shareholder. Effective August 7, 2018, upon completion of the August 2018 Secondary Offering, neither Canada Retail Holdings, L.P. nor any other entity maintained ultimate control of us. Subsequent to the year ended March 3, 2019, upon completion of the March 2019 Secondary Offering and Share Repurchase, the Berkshire Shareholder sold its entire investment in us. As a result, effective March 8, 2019, the Company is ultimately controlled by AHI Holdings Inc., an entity controlled by a director and officer of the Company (“Principal Shareholder”).
We entered into the following transactions with related parties:
Total reimbursements to Berkshire for travel, lodging and other costs for the year ended March 3, 2019 was $59 (February 25, 2018 - $66). As at March 3, 2019, $nil was included in accounts payable and accrued liabilities (February 25, 2018 - $nil).
In connection with the March 2019 Secondary Offering and Share Repurchase, we incurred an aggregate of $2.5 million in professional fees and other costs, $185 of which are costs incurred on behalf of the selling shareholders. At March 3, 2019, $2.5 million was included in accounts receivable, which represents the full amount being reimbursed by the selling shareholders participating in the Share Repurchase, including the Berkshire Shareholder. Also in connection with the March 2019 Secondary Offering and Share Repurchase, $0.7 million in costs relating to our IPO, previously included in accounts payable and accrued liabilities, was extinguished.
During the year ended March 3, 2019, we paid $4.1 million (February 25, 2018 - $3.6 million), for rent of premises and $0.9 million (February 25, 2018 - $0.4 million) for the use of a leased asset wholly or partially owned by companies that are owned by a director and officer of the Company. As at March 3, 2019, $71 was included in accounts payable and accrued liabilities (February 25, 2018 - $100) and $52 was included in prepaid expenses and other current assets (February 25, 2018 - $nil).
During the year ended February 25, 2018, we purchased $8.3 million of merchandise from a company partially owned by private equity funds managed by Berkshire. In August 2017, Berkshire exited its investment from the merchandise company; as such, purchases from the merchandise company subsequent to August 2017 are not considered related party transactions. Transactions with Key Management
30
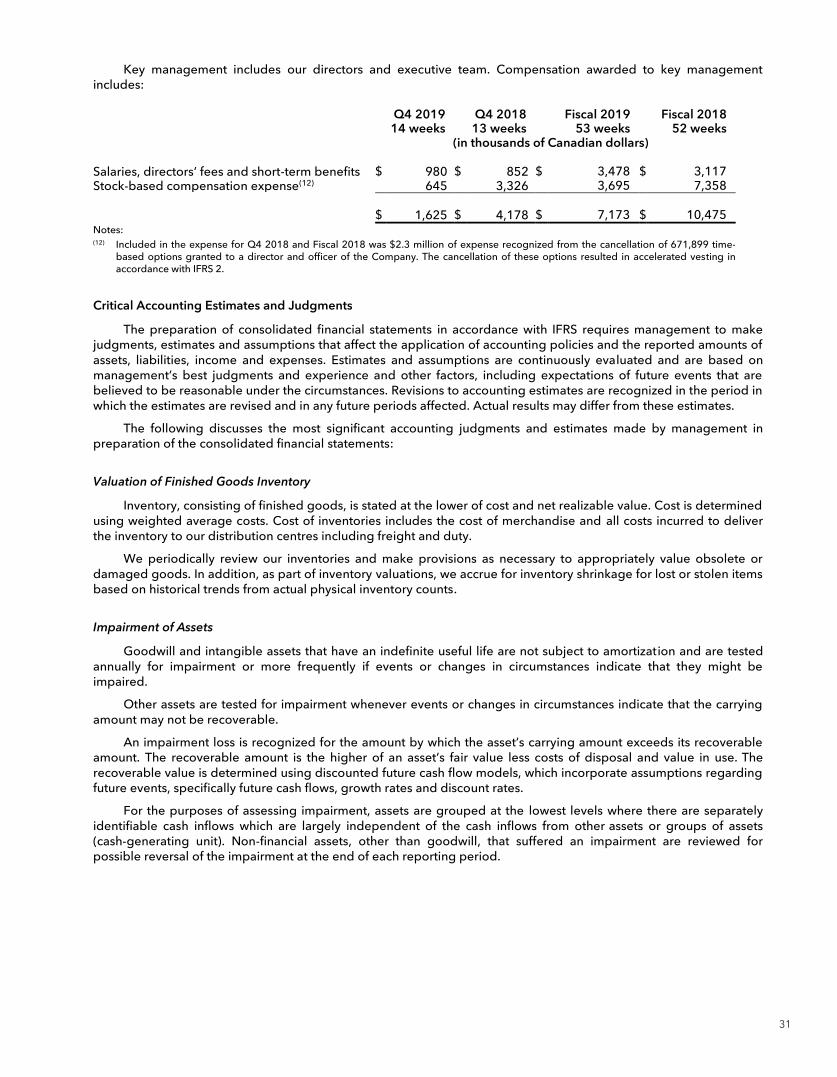
22
Key management includes our directors and executive team. Compensation awarded to key management includes:
Q4 2019 Q4 2018 Fiscal 2019 Fiscal 2018 14 weeks 13 weeks 53 weeks 52 weeks (in thousands of Canadian dollars)
Salaries, directors’ fees and short-term benefits $ 980 $ 852 $ 3,478 $ 3,117 Stock-based compensation expense(12) 645 3,326 3,695 7,358
$ 1,625 $ 4,178 $ 7,173 $ 10,475
Notes: (12) Included in the expense for Q4 2018 and Fiscal 2018 was $2.3 million of expense recognized from the cancellation of 671,899 time-
based options granted to a director and officer of the Company. The cancellation of these options resulted in accelerated vesting in accordance with IFRS 2.
Critical Accounting Estimates and Judgments The preparation of consolidated financial statements in accordance with IFRS requires management to make
judgments, estimates and assumptions that affect the application of accounting policies and the reported amounts of assets, liabilities, income and expenses. Estimates and assumptions are continuously evaluated and are based on management’s best judgments and experience and other factors, including expectations of future events that are believed to be reasonable under the circumstances. Revisions to accounting estimates are recognized in the period in which the estimates are revised and in any future periods affected. Actual results may differ from these estimates.
The following discusses the most significant accounting judgments and estimates made by management in preparation of the consolidated financial statements:
Valuation of Finished Goods Inventory Inventory, consisting of finished goods, is stated at the lower of cost and net realizable value. Cost is determined
using weighted average costs. Cost of inventories includes the cost of merchandise and all costs incurred to deliver the inventory to our distribution centres including freight and duty.
We periodically review our inventories and make provisions as necessary to appropriately value obsolete or damaged goods. In addition, as part of inventory valuations, we accrue for inventory shrinkage for lost or stolen items based on historical trends from actual physical inventory counts.
Impairment of Assets Goodwill and intangible assets that have an indefinite useful life are not subject to amortization and are tested
annually for impairment or more frequently if events or changes in circumstances indicate that they might be impaired.
Other assets are tested for impairment whenever events or changes in circumstances indicate that the carrying amount may not be recoverable.
An impairment loss is recognized for the amount by which the asset’s carrying amount exceeds its recoverable amount. The recoverable amount is the higher of an asset’s fair value less costs of disposal and value in use. The recoverable value is determined using discounted future cash flow models, which incorporate assumptions regarding future events, specifically future cash flows, growth rates and discount rates.
For the purposes of assessing impairment, assets are grouped at the lowest levels where there are separately identifiable cash inflows which are largely independent of the cash inflows from other assets or groups of assets (cash-generating unit). Non-financial assets, other than goodwill, that suffered an impairment are reviewed for possible reversal of the impairment at the end of each reporting period.
31
23
Stock-Based Compensation Expense Stock-based compensation expense requires the use of estimates in the Black-Scholes option pricing model,
including stock price volatility and the expected life of options.
Gift Card Breakage Recognition of gift card breakage requires the use of judgment in defining our average gift card breakage rate,
based on historical redemption rates. The resulting revenue from breakage is recognized in proportion to actual gift card redemptions.
Income Tax Expense Income tax expense requires judgment to determine when tax losses, credits and provisions are recognized
based on tax rules in various jurisdictions.
Significant New Accounting Standards Adopted IFRS 15 – Revenue from Contracts with Customers
Effective February 26, 2018, we adopted IFRS 15 issued in May 2014, and amended in September 2015 and April 2016. IFRS 15 outlines a single comprehensive five-step framework for the recognition, measurement and disclosure of revenue from contracts with customers, excluding contracts within the scope of the accounting standards on leases, insurance contracts and financial instruments. IFRS 15 is effective for annual periods beginning on or after January 1, 2018. We adopted the standard using the full retrospective approach. The adoption of IFRS 15 did not have a material impact on our consolidated financial statements other than on the recognition of our sales return allowance. Under IAS 18, “Revenue”, the sales return allowance on the consolidated Statement of Financial Position was recognized on a net basis, with no adjustment to other current assets. Upon adoption of IFRS 15, the sales return allowance is recognized on a gross basis, resulting in an adjustment of the Statement of Financial Position line items noted below. As the impact is limited to these two financial statement line items, a February 25, 2018 opening Statement of Financial Position has not been presented.
32
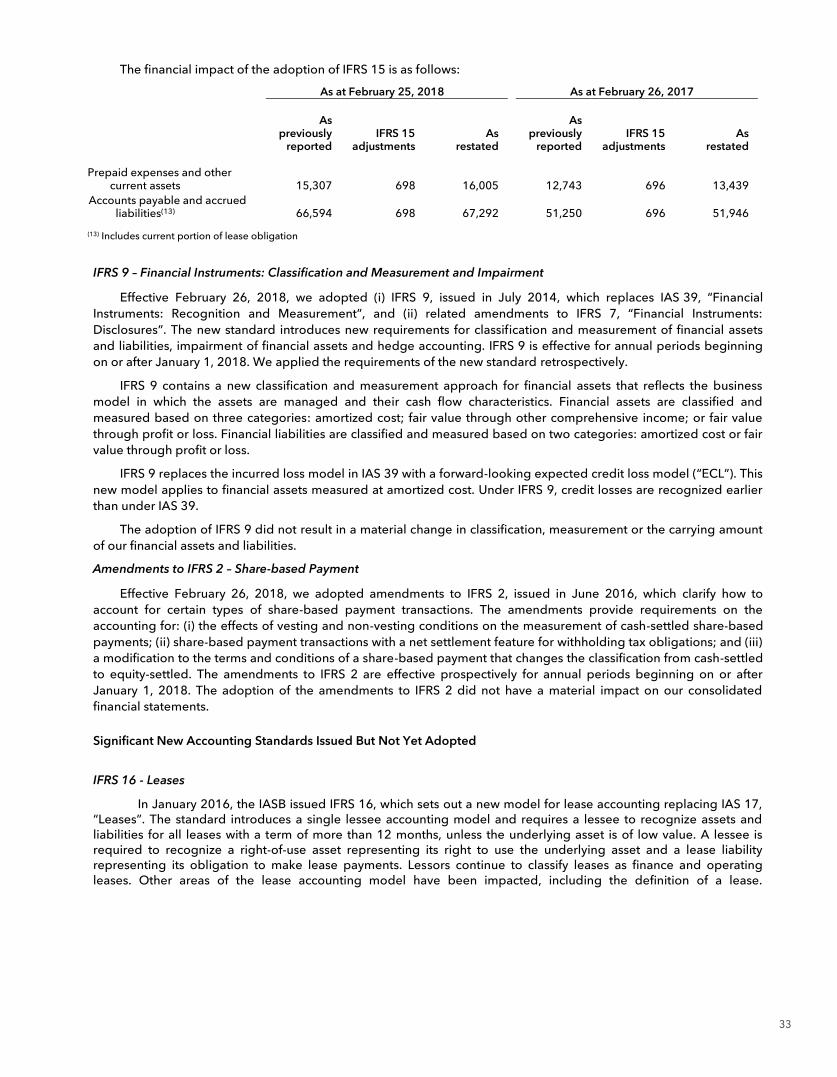
24
The financial impact of the adoption of IFRS 15 is as follows:
As at February 25, 2018 As at February 26, 2017
As previously
reported IFRS 15
adjustments As
restated
As previously reported
IFRS 15 adjustments
As restated
Prepaid expenses and other
current assets 15,307 698 16,005 12,743 696 13,439
Accounts payable and accrued liabilities(13) 66,594 698 67,292 51,250 696 51,946
(13) Includes current portion of lease obligation
IFRS 9 – Financial Instruments: Classification and Measurement and Impairment Effective February 26, 2018, we adopted (i) IFRS 9, issued in July 2014, which replaces IAS 39, “Financial
Instruments: Recognition and Measurement”, and (ii) related amendments to IFRS 7, “Financial Instruments: Disclosures”. The new standard introduces new requirements for classification and measurement of financial assets and liabilities, impairment of financial assets and hedge accounting. IFRS 9 is effective for annual periods beginning on or after January 1, 2018. We applied the requirements of the new standard retrospectively.
IFRS 9 contains a new classification and measurement approach for financial assets that reflects the business model in which the assets are managed and their cash flow characteristics. Financial assets are classified and measured based on three categories: amortized cost; fair value through other comprehensive income; or fair value through profit or loss. Financial liabilities are classified and measured based on two categories: amortized cost or fair value through profit or loss.
IFRS 9 replaces the incurred loss model in IAS 39 with a forward-looking expected credit loss model (“ECL”). This new model applies to financial assets measured at amortized cost. Under IFRS 9, credit losses are recognized earlier than under IAS 39.
The adoption of IFRS 9 did not result in a material change in classification, measurement or the carrying amount of our financial assets and liabilities.
Amendments to IFRS 2 – Share-based Payment Effective February 26, 2018, we adopted amendments to IFRS 2, issued in June 2016, which clarify how to
account for certain types of share-based payment transactions. The amendments provide requirements on the accounting for: (i) the effects of vesting and non-vesting conditions on the measurement of cash-settled share-based payments; (ii) share-based payment transactions with a net settlement feature for withholding tax obligations; and (iii) a modification to the terms and conditions of a share-based payment that changes the classification from cash-settled to equity-settled. The amendments to IFRS 2 are effective prospectively for annual periods beginning on or after January 1, 2018. The adoption of the amendments to IFRS 2 did not have a material impact on our consolidated financial statements.
Significant New Accounting Standards Issued But Not Yet Adopted
IFRS 16 - Leases In January 2016, the IASB issued IFRS 16, which sets out a new model for lease accounting replacing IAS 17,
“Leases”. The standard introduces a single lessee accounting model and requires a lessee to recognize assets and liabilities for all leases with a term of more than 12 months, unless the underlying asset is of low value. A lessee is required to recognize a right-of-use asset representing its right to use the underlying asset and a lease liability representing its obligation to make lease payments. Lessors continue to classify leases as finance and operating leases. Other areas of the lease accounting model have been impacted, including the definition of a lease.
33
25
Transitional provisions have been provided. IFRS 16 is effective for annual periods beginning on or after January 1, 2019. Early adoption is permitted if IFRS 15 has been adopted.
We will apply the new standard for Fiscal 2020 using the modified retrospective method. The modified retrospective method applies the requirements of IFRS 16 retrospectively with no restatement of the comparative period.
The new standard is expected to materially increase the assets and liabilities on the consolidated statement of financial position as the majority of our operating leases disclosed in the “Contractual Obligations” section of this MD&A are in scope for IFRS 16. Based on the information as at March 3, 2019, as a result of the initial application of the standard, we estimate to recognize approximately $460 million to $510 million of lease liabilities and $340 million to $390 milion of right-of-use assets on our consolidated statements of financial position. The difference, net of the deferred tax impact, will be recorded in opening retained earnings. The right-of-use assets will be depreciated on a straight-line basis over the remaining lease term. The lease liability will be carried at amortized cost with a finance charge recorded from the amortization of the lease liability discount. The depreciation expense of the right-of-use assets and the finance charge of the lease liability will partially replace the lease-related expenses recorded in costs of goods sold and selling, general and administrative expenses, previously recognized on a straight-line basis over the lease term under IAS 17. Variable lease payments will continue to be expensed as incurred.
The new standard will not change the amount of cash transferred between the lessor and lessee, but will change the presentation of the operating and financing cash flows presented in our consolidated statement of cash flows.
We have elected to apply the following practical expedients, as described under IFRS 16:
i) recognition exemption of short term leases;
ii) recognition exemption of low-value leases; and
iii) grandfather prior conclusions on contracts containing leases.
Annual Improvements In December 2017, the IASB issued amendments to IAS 12, “Income Taxes” and IAS 23, “Borrowing Costs” to
clarify existing requirements. These clarification amendments will be effective for annual periods beginning on or after January 1, 2019. The implementation of these clarification amendments is not expected to have a material impact on our consolidated financial statements.
Outlook
The first quarter of Fiscal 2020 is off to a strong start with the spring and summer collections being well-received by clients, with quarter to date comparable sales growth trending sequentially higher than Q4 2019.
For Fiscal 2020, we currently expect the following:
Net revenue growth in the low double-digits.
Six new boutiques in the U.S., including the Hudson Yards boutique in New York already opened in the first quarter.
Three boutique expansions or repositions in Canada, including the expansion of the Mapleview boutique in greater Toronto already opened in the first quarter.
Gross profit margin flat as compared to Fiscal 2019. Gross profit margin is expected to be slightly higher in the first half of the year due to occupancy cost leverage being partially offset by the weakening of the Canadian dollar, and slightly lower in the second half of the year due to higher raw material costs for the fall/winter season.
SG&A to grow faster than revenue, as we will continue to make strategic investments in technology and infrastructure to support our long term growth. A portion of the investments related to our eCommerce
34
26
platform improvements, omni-channel capabilities and other infrastructure including the product life-cycle management and data analytics platforms will be expensed within SG&A. Incremental SG&A expenses related to these initiatives in Fiscal 2020 are expected to be approximately $7 million to $8 million, and occur primarily in the second and third quarters.
Net capital expenditures in the range of $45 million to $50 million.
Overall, we remain on track to meet or exceed our stated fiscal 2021 performance targets.
See “Forward-Looking Information”.
Risk Factors For a detailed description of risk factors associated with the Company, refer to the “Risk Factors” section of our
AIF, which is available on SEDAR at www.sedar.com.
In addition, we are exposed to a variety of financial risks in the normal course of operations including foreign exchange, interest rate, credit and liquidity risk, as summarized below. Our overall risk management program and business practices seek to minimize any potential adverse effects on our consolidated financial performance.
Risk management is carried out under practices approved by our Audit Committee. This includes reviewing and making recommendations to the Board on the adequacy of our risk management policies and procedures with regard to identifying the Company’s principal risks and implementing appropriate systems and controls to manage these risks. Risk management covers many areas of risk including, but not limited to, foreign exchange risk, interest rate risk, credit risk and liquidity risk.
Foreign Exchange Risk We source the majority of our raw materials and merchandise from various suppliers in Asia and Europe with the
vast majority of purchases denominated in U.S. dollars. Our foreign exchange risk is primarily with respect to the U.S. dollar but we have limited exposure to other currencies as well. We may use foreign exchange forward contracts to mitigate risks associated with forecasted U.S. dollar merchandise purchases sold in Canada.
Interest Rate Risk We are exposed to changes in interest rates on our cash and cash equivalents, bank indebtedness and long-
term debt. Debt issued at variable rates exposes us to cash flow interest rate risk. Debt issued at fixed rates exposes us to fair value interest rate risk. During Fiscal 2019, we had only variable interest rate debt.
Credit Risk Credit risk refers to the possibility that we can suffer financial losses due to the failure of our counterparties to
meet their payment obligations. We are exposed to minimal credit risk. We do not extend credit to our clients, but do have some receivable exposure in relation to tenant improvement allowances. To reduce this risk, we enter into leases with landlords with established credit history, and for certain leases, we may offset rent payments until accounts receivable are fully satisfied. We deposit our cash and cash equivalents with major financial institutions that have been assigned high credit ratings by internationally recognized credit rating agencies. We only enter into derivative contracts with major financial institutions, as described above, for the purchase of foreign currency forward contracts.
Liquidity risk Liquidity risk is the risk that we cannot meet a demand for cash or fund our obligations as they come due. We
manage liquidity risk by continuously monitoring actual and projected cash flows, taking into account the seasonality of our revenue, income and working capital needs. The Credit Facility is used to maintain liquidity.
35
27
Controls and Procedures
Disclosure Controls and Procedures Management is responsible for establishing and maintaining a system of controls and procedures over the
public disclosure of financial and non-financial information regarding the Company. Such controls and procedures are designed to provide reasonable assurance that all relevant information is gathered and reported to senior management on a timely basis, including the CEO and the CFO, so that they can make appropriate and timely decisions regarding public disclosure, including information contained in annual and interim filings, including the consolidated financial statements, MD&A, Annual Information Form, and other documents and external communications.
As required by CSA National Instrument 52-109 - Certification of Disclosure in Issuers’ Annual and Interim Filings (“NI 52-109”), an evaluation of the adequacy of the design (quarterly) and effective operation (annually) of the Company’s disclosure controls and procedures was conducted under the supervision of management, including the CEO and CFO, as at March 3, 2019. Based on that evaluation, the CEO and the CFO have concluded that the design and operation of the system of disclosure controls and procedures were effective as at March 3, 2019.
Although the Company’s disclosure controls and procedures were operating effectively as of March 3, 2019, there can be no assurance that the Company’s disclosure controls and procedures will detect or uncover all failures of persons within the Company to disclose material information otherwise required to be set forth in the Company’s regulatory filings.
Internal Control over Financial Reporting Management is also responsible for establishing and maintaining adequate internal controls over financial
reporting to provide reasonable assurance regarding the reliability of financial reporting and the preparation of financial reports for external purposes in accordance with IFRS. The Company’s internal controls over financial reporting include, but are not limited to, detailed policies and procedures relating to financial accounting and reporting, and controls over systems that process and summarize transactions. The Company’s procedures for financial reporting also include the active involvement of qualified financial professionals, senior management and its Audit Committee.
As also required by NI 52-109, management, including the CEO and CFO, evaluated the adequacy of the design (quarterly) and the effective operation (annually) of the Company’s internal control over financial reporting as defined in NI 52-109, as at March 3, 2019. In making this assessment, management, including the CEO and CFO, used the framework set forth in the Internal Control – Integrated Framework (2013) issued by the Committee of Sponsoring Organizations of the Treadway Commission. Based on that evaluation, the CEO and the CFO have concluded that the design and operation of the Company’s internal controls over financial reporting, as defined by NI 52-109, were effective as at March 3, 2019.
In designing such controls, it should be recognized that due to inherent limitations, any control, no matter how well designed and operated, can provide only reasonable assurance of achieving the desired control objectives and may not prevent or detect misstatements. Additionally, management is required to use judgment in evaluating controls and procedures. Therefore, even when determined to be designed effectively, disclosure controls and internal control over financial reporting can provide only reasonable assurance with respect to disclosure, reporting and financial statement preparation.
Changes in Internal Control Over Financial Reporting There have been no changes in our internal controls over financial reporting during the quarter and year ended
March 3, 2019 that have materially affected, or are reasonably likely to materially affect, our internal controls over financial reporting.
Current Share Information On May 10, 2018, we announced the commencement of a normal course issuer bid (“NCIB”) to purchase and
cancel up to 5,429,658 subordinate voting shares commencing May 15, 2018 and ending May 14, 2019. During Fiscal 2019, we repurchased 549,880 subordinate voting shares for cancellation at an average price of $17.07 per
36
28
subordinate voting share, for total cash consideration of $9.4 million. Due to the Share Repurchase, we have suspended further purchases under our NCIB. We will evaluate renewing our NCIB in due course.
On May 31, 2018, we entered into an automated share purchase plan (“ASPP”) with a designated broker for the purpose of permitting us to purchase our subordinate voting shares under the NCIB during self-imposed blackout periods. The volume of purchases is determined by the broker in its sole discretion based on purchase price and maximum volume parameters established by us under the ASPP. We record a liability for purchases that are estimated to occur during blackout periods based on the parameters of the NCIB and ASPP. On March 3, 2019, we cancelled our ASPP.
Shareholders may receive a copy of the TSX notice in respect of the NCIB, without charge, by contacting the Company.
As of May 8, 2019, an aggregate of 83,238,108 subordinate voting shares, 24,537,349 multiple voting shares and no preferred shares are issued and outstanding. All of the issued and outstanding multiple voting shares are, directly or indirectly, held or controlled by the Principal Shareholder. As of May 8, 2019, an aggregate of 9,617,605 options to acquire subordinate voting shares are outstanding.
See “Secondary Offerings” section of this MD&A for further details on current share information. Additional Information
Additional information relating to the Company, including the Company’s AIF, is available on SEDAR at www.sedar.com. The Company’s Shares are listed for trading on the Toronto Stock Exchange (“TSX”) under the symbol “ATZ”.
37
Aritzia Inc.
Consolidated Financial Statements March 3, 2019 and February 25, 2018
(in thousands of Canadian dollars)
38
PricewaterhouseCoopers LLP PricewaterhouseCoopers Place, 250 Howe Street, Suite 1400, Vancouver, British Columbia, Canada V6C 3S7 T: +1 604 806 7000, F: +1 604 806 7806
“PwC” refers to PricewaterhouseCoopers LLP, an Ontario limited liability partnership.
Independent auditor’s report
To the Shareholders of Aritzia Inc.
Our opinion
In our opinion, the accompanying consolidated financial statements present fairly, in all material respects, the financial position of Aritzia Inc. and its subsidiaries (together, the Company) as at March 3, 2019 and February 25, 2018, and its financial performance and its cash flows for the years then ended in accordance with International Financial Reporting Standards (IFRS).
What we have audited The Company’s consolidated financial statements comprise:
the consolidated statements of financial position as at March 3, 2019 and February 25, 2018;
the consolidated statements of operations for the years then ended;
the consolidated statements of comprehensive income for the years then ended;
the consolidated statements of changes in shareholders’ equity for the years then ended;
the consolidated statements of cash flows for the years then ended; and
the notes to the consolidated financial statements, which include a summary of significant accounting policies.
Basis for opinion
We conducted our audit in accordance with Canadian generally accepted auditing standards. Our responsibilities under those standards are further described in the Auditor’s responsibilities for the audit of the consolidated financial statements section of our report.
We believe that the audit evidence we have obtained is sufficient and appropriate to provide a basis for our opinion.
Independence We are independent of the Company in accordance with the ethical requirements that are relevant to our audit of the consolidated financial statements in Canada. We have fulfilled our other ethical responsibilities in accordance with these requirements.
39
Other information
Management is responsible for the other information. The other information comprises the Management’s Discussion and Analysis, which we obtained prior to the date of this auditor’s report and the information, other than the consolidated financial statements and our auditor's report thereon, included in the Annual Report, which is expected to be made available to us after that date.
Our opinion on the consolidated financial statements does not cover the other information and we do not and will not express an opinion or any form of assurance conclusion thereon.
In connection with our audit of the consolidated financial statements, our responsibility is to read the other information identified above and, in doing so, consider whether the other information is materially inconsistent with the consolidated financial statements or our knowledge obtained in the audit, or otherwise appears to be materially misstated.
If, based on the work we have performed on the other information that we obtained prior to the date of this auditor’s report, we conclude that there is a material misstatement of this other information, we are required to report that fact. We have nothing to report in this regard. When we read the information, other than the consolidated financial statements and our auditor's report thereon, included in the Annual Report, if we conclude that there is a material misstatement therein, we are required to communicate the matter to those charged with governance.
Responsibilities of management and those charged with governance for the consolidated financial statements
Management is responsible for the preparation and fair presentation of the consolidated financial statements in accordance with IFRS, and for such internal control as management determines is necessary to enable the preparation of consolidated financial statements that are free from material misstatement, whether due to fraud or error.
In preparing the consolidated financial statements, management is responsible for assessing the Company’s ability to continue as a going concern, disclosing, as applicable, matters related to going concern and using the going concern basis of accounting unless management either intends to liquidate the Company or to cease operations, or has no realistic alternative but to do so.
Those charged with governance are responsible for overseeing the Company’s financial reporting process.
40
Auditor’s responsibilities for the audit of the consolidated financial statements
Our objectives are to obtain reasonable assurance about whether the consolidated financial statements as a whole are free from material misstatement, whether due to fraud or error, and to issue an auditor’s report that includes our opinion. Reasonable assurance is a high level of assurance, but is not a guarantee that an audit conducted in accordance with Canadian generally accepted auditing standards will always detect a material misstatement when it exists. Misstatements can arise from fraud or error and are considered material if, individually or in the aggregate, they could reasonably be expected to influence the economic decisions of users taken on the basis of these consolidated financial statements.
As part of an audit in accordance with Canadian generally accepted auditing standards, we exercise professional judgment and maintain professional skepticism throughout the audit. We also:
Identify and assess the risks of material misstatement of the consolidated financial statements, whether due to fraud or error, design and perform audit procedures responsive to those risks, and obtain audit evidence that is sufficient and appropriate to provide a basis for our opinion. The risk of not detecting a material misstatement resulting from fraud is higher than for one resulting from error, as fraud may involve collusion, forgery, intentional omissions, misrepresentations, or the override of internal control.
Obtain an understanding of internal control relevant to the audit in order to design audit procedures that are appropriate in the circumstances, but not for the purpose of expressing an opinion on the effectiveness of the Company’s internal control.
Evaluate the appropriateness of accounting policies used and the reasonableness of accounting estimates and related disclosures made by management.
Conclude on the appropriateness of management’s use of the going concern basis of accounting and, based on the audit evidence obtained, whether a material uncertainty exists related to events or conditions that may cast significant doubt on the Company’s ability to continue as a going concern. If we conclude that a material uncertainty exists, we are required to draw attention in our auditor’s report to the related disclosures in the consolidated financial statements or, if such disclosures are inadequate, to modify our opinion. Our conclusions are based on the audit evidence obtained up to the date of our auditor’s report. However, future events or conditions may cause the Company to cease to continue as a going concern.
Evaluate the overall presentation, structure and content of the consolidated financial statements, including the disclosures, and whether the consolidated financial statements represent the underlying transactions and events in a manner that achieves fair presentation.
Obtain sufficient appropriate audit evidence regarding the financial information of the entities or business activities within the Company to express an opinion on the consolidated financial statements. We are responsible for the direction, supervision and performance of the group audit. We remain solely responsible for our audit opinion.
41
We communicate with those charged with governance regarding, among other matters, the planned scope and timing of the audit and significant audit findings, including any significant deficiencies in internal control that we identify during our audit.
We also provide those charged with governance with a statement that we have complied with relevant ethical requirements regarding independence, and to communicate with them all relationships and other matters that may reasonably be thought to bear on our independence, and where applicable, related safeguards.
The engagement partner on the audit resulting in this independent auditor’s report is John DeLucchi.
(signed) PricewaterhouseCoopers LLP
Chartered Professional Accountants
Vancouver, British ColumbiaMay 9, 2019
42
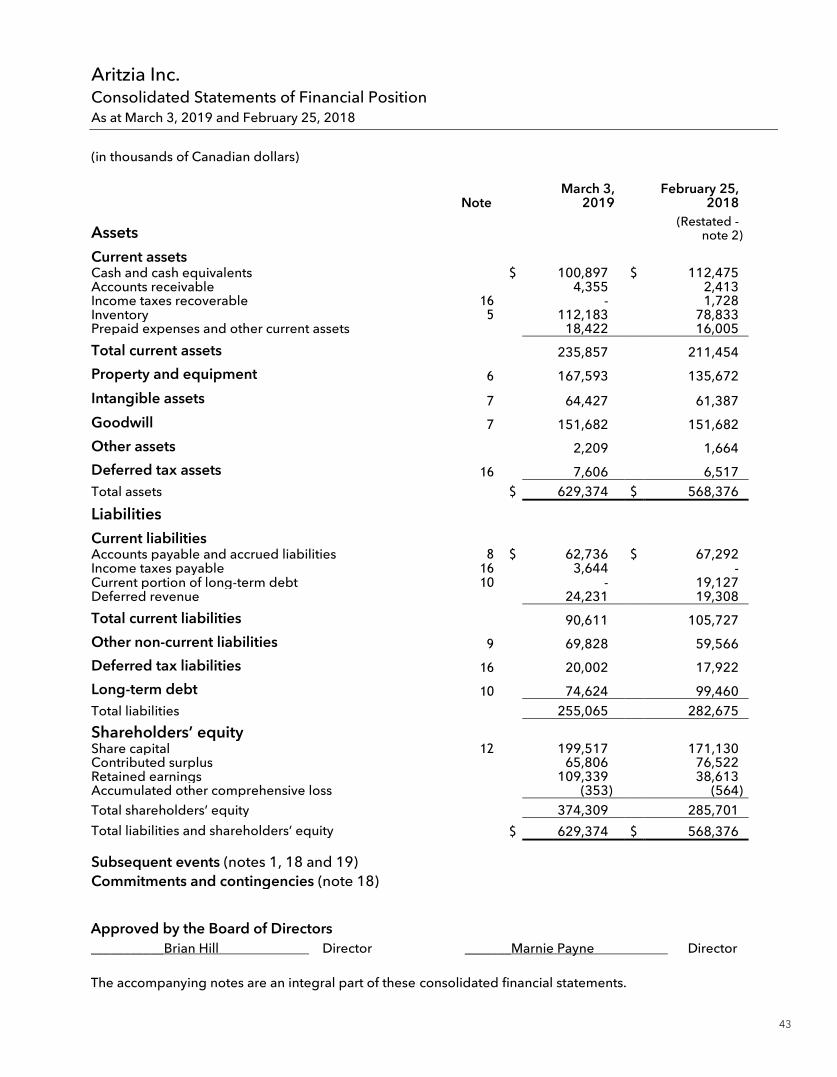
Aritzia Inc. Consolidated Statements of Financial Position As at March 3, 2019 and February 25, 2018
(in thousands of Canadian dollars)
Approved by the Board of Directors ___________Brian Hill Director _______Marnie Payne Director The accompanying notes are an integral part of these consolidated financial statements.
Note March 3,
2019 February 25,
2018
Assets (Restated -
note 2) Current assets Cash and cash equivalents $ 100,897 $ 112,475 Accounts receivable 4,355 2,413 Income taxes recoverable 16 - 1,728 Inventory 5 112,183 78,833 Prepaid expenses and other current assets 18,422 16,005 Total current assets 235,857 211,454 -- Property and equipment 6 167,593 135,672 Intangible assets 7 64,427 61,387 Goodwill 7 151,682 151,682 Other assets 2,209 1,664 Deferred tax assets 16 7,606 6,517 Total assets $ 629,374 $ 568,376 Liabilities Current liabilities Accounts payable and accrued liabilities 8 $ 62,736 $ 67,292 Income taxes payable 16 3,644 - Current portion of long-term debt 10 - 19,127 Deferred revenue 24,231 19,308 Total current liabilities 90,611 105,727 Other non-current liabilities 9 69,828 59,566 Deferred tax liabilities 16 20,002 17,922 Long-term debt 10 74,624 99,460 Total liabilities 255,065 282,675 Shareholders’ equity Share capital 12 199,517 171,130 Contributed surplus 65,806 76,522 Retained earnings 109,339 38,613 Accumulated other comprehensive loss (353) (564) Total shareholders’ equity 374,309 285,701 Total liabilities and shareholders’ equity $ 629,374 $ 568,376 Subsequent events (notes 1, 18 and 19) Commitments and contingencies (note 18)
43
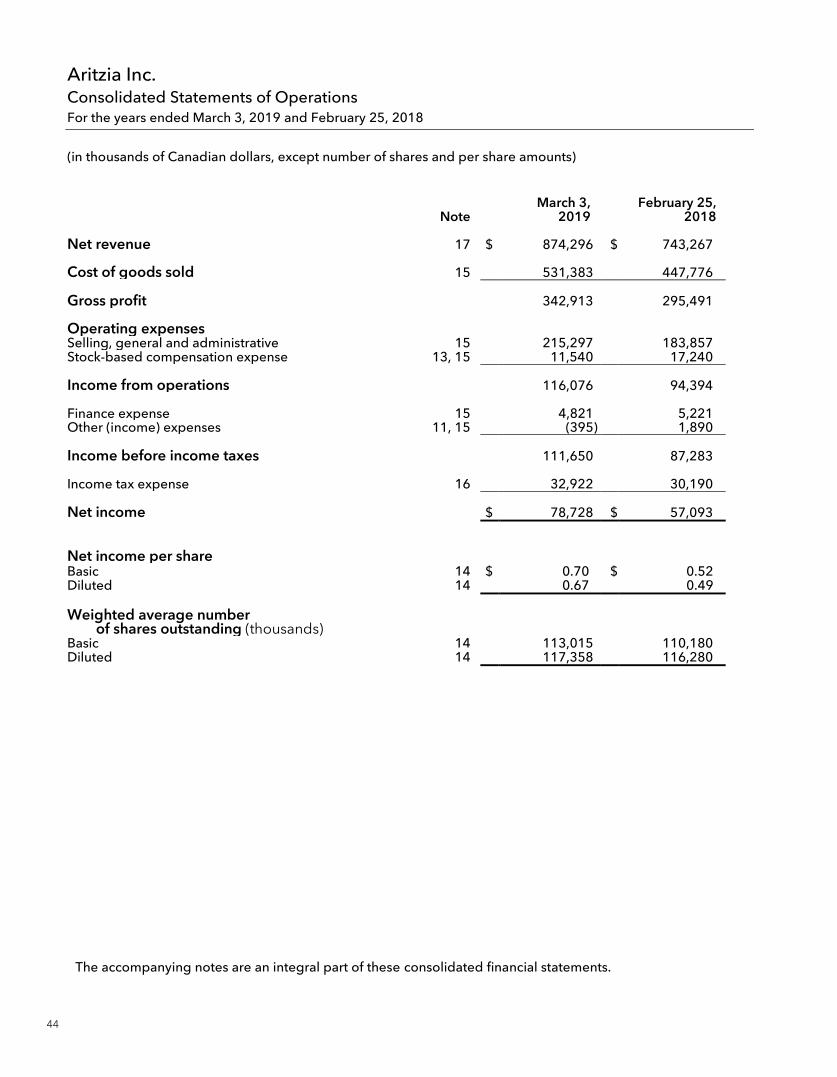
Aritzia Inc. Consolidated Statements of Operations For the years ended March 3, 2019 and February 25, 2018
(in thousands of Canadian dollars, except number of shares and per share amounts)
The accompanying notes are an integral part of these consolidated financial statements.
Note March 3,
2019 February 25,
2018
Net revenue 17 $ 874,296 $ 743,267 Cost of goods sold 15 531,383 447,776 Gross profit 342,913 295,491 Operating expenses Selling, general and administrative 15 215,297 183,857 Stock-based compensation expense 13, 15 11,540 17,240 Income from operations 116,076 94,394 Finance expense 15 4,821 5,221 Other (income) expenses 11, 15 (395) 1,890 Income before income taxes 111,650 87,283 Income tax expense 16 32,922 30,190 Net income $ 78,728 $ 57,093 Net income per share Basic 14 $ 0.70 $ 0.52 Diluted 14 0.67 0.49 Weighted average number
of shares outstanding (thousands) Basic 14 113,015 110,180 Diluted 14 117,358 116,280
44
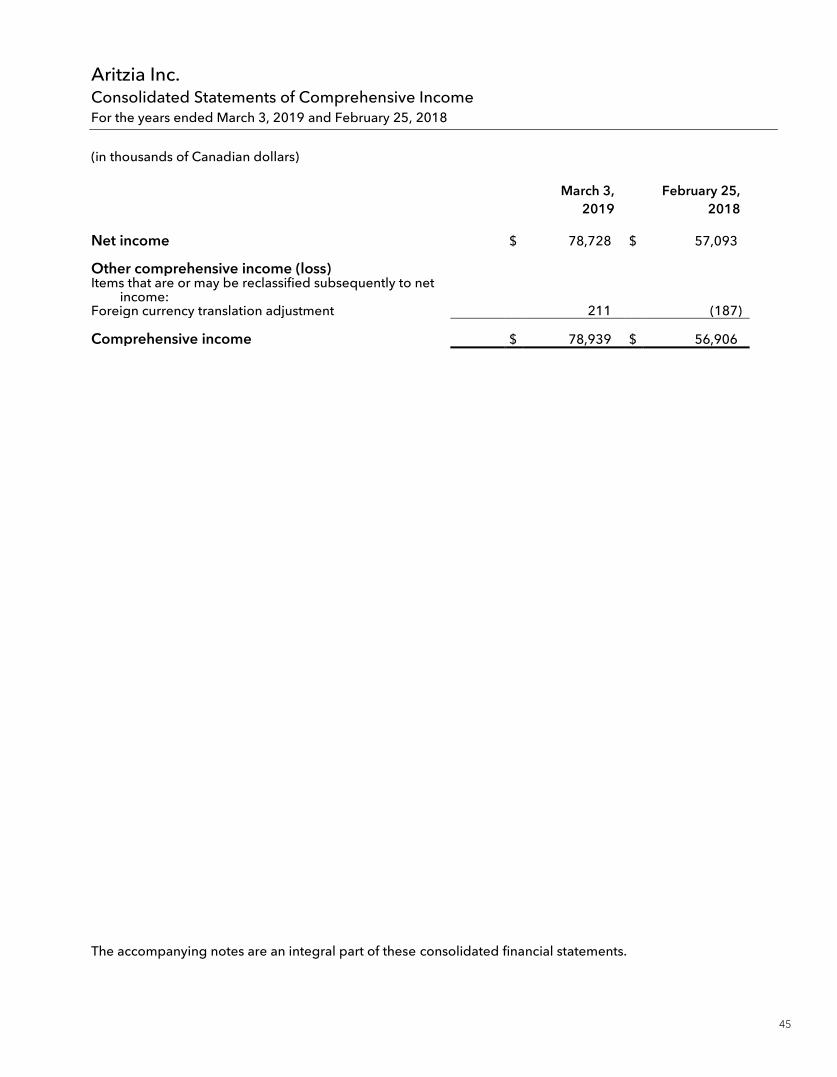
Aritzia Inc. Consolidated Statements of Comprehensive Income For the years ended March 3, 2019 and February 25, 2018
(in thousands of Canadian dollars)
The accompanying notes are an integral part of these consolidated financial statements.
March 3,
2019 February 25,
2018
Net income $ 78,728 $ 57,093 Other comprehensive income (loss) Items that are or may be reclassified subsequently to net
income: Foreign currency translation adjustment 211 (187) Comprehensive income $ 78,939 $ 56,906
45
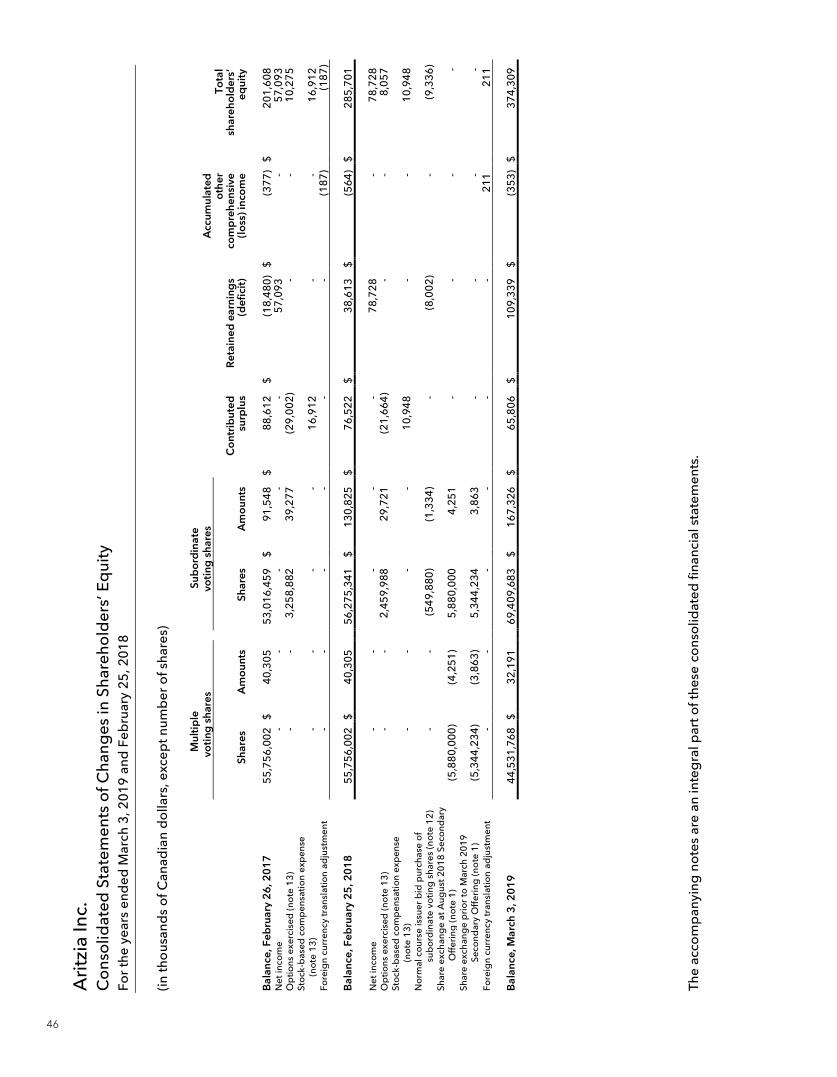
Ari
tzia
Inc.
C
ons
olid
ated
Sta
tem
ents
of C
hang
es in
Sha
reho
lder
s’ E
qui
ty
For
the
year
s en
ded
Mar
ch 3
, 201
9 a
nd F
ebru
ary
25, 2
018
(in th
ous
and
s o
f Can
adia
n d
olla
rs, e
xcep
t num
ber
of s
hare
s)
The
acco
mp
anyi
ng n
ote
s ar
e an
inte
gra
l par
t of t
hese
co
nso
lidat
ed fi
nanc
ial s
tate
men
ts.
M
ultip
le
Su
bord
inat
e
vo
ting
shar
es
vo
ting
shar
es
Ac
cum
ulat
ed
Shar
es
Am
ount
s
Shar
es
Am
ount
s
Cont
ribut
ed
surp
lus
Re
tain
ed ea
rnin
gs
(def
icit)
oth
er
com
preh
ensiv
e (lo
ss) i
ncom
e
Tota
l sh
areh
olde
rs’
equi
ty
Ba
lance
, Feb
ruar
y 26,
201
7
55,7
56,0
02
$ 40
,305
53,0
16,4
59
$ 91
,54
8 $
88,6
12
$ (1
8,4
80)
$ (3
77)
$ 20
1,60
8 N
et in
com
e
-
-
-
-
-
57,0
93
-
57
,093
O
ptio
ns e
xerc
ised
(no
te 1
3)
-
-
3,
258,
882
39
,277
(29,
002)
-
-
10,2
75
Sto
ck-b
ased
co
mp
ensa
tio
n ex
pen
se
(no
te 1
3)
-
-
-
-
16
,912
-
-
16,9
12
Fore
ign
curr
ency
tran
slat
ion
adju
stm
ent
-
-
-
-
-
-
(1
87)
(1
87)
Ba
lance
, Feb
ruar
y 25,
201
8
55,7
56,0
02
$ 40
,305
56,2
75,3
41
$ 13
0,82
5 $
76,5
22
$ 38
,613
$
(564
) $
285,
701
N
et in
com
e
-
-
-
-
-
78,7
28
-
78
,728
O
ptio
ns e
xerc
ised
(no
te 1
3)
-
-
2,
459,
988
29
,721
(21,
664
)
-
-
8,05
7 St
ock
-bas
ed c
om
pen
sati
on
exp
ense
(n
ote
13
)
-
-
-
-
10,9
48
-
-
10
,94
8 N
orm
al c
our
se is
suer
bid
pur
chas
e o
f su
bo
rdin
ate
votin
g s
hare
s (n
ote
12
)
-
-
(54
9,88
0)
(1
,334
)
-
(8,0
02)
-
(9
,336
) Sh
are
exch
ang
e at
Aug
ust
201
8 S
eco
ndar
y
Off
erin
g (n
ote
1)
(5
,880
,000
)
(4,2
51)
5,
880,
000
4
,251
-
-
-
- Sh
are
exch
ang
e p
rio
r to
Mar
ch 2
01
9
Seco
ndar
y O
ffer
ing
(no
te 1
)
(5,3
44,2
34)
(3
,863
)
5,34
4,2
34
3,
863
-
-
-
-
Fore
ign
curr
ency
tran
slat
ion
ad
just
men
t
-
-
-
-
-
-
211
21
1
Balan
ce, M
arch
3, 2
019
44
,531
,768
$
32,1
91
69
,409
,683
$
167,
326
$ 65
,806
$
109,
339
$ (3
53)
$ 37
4,3
09
46
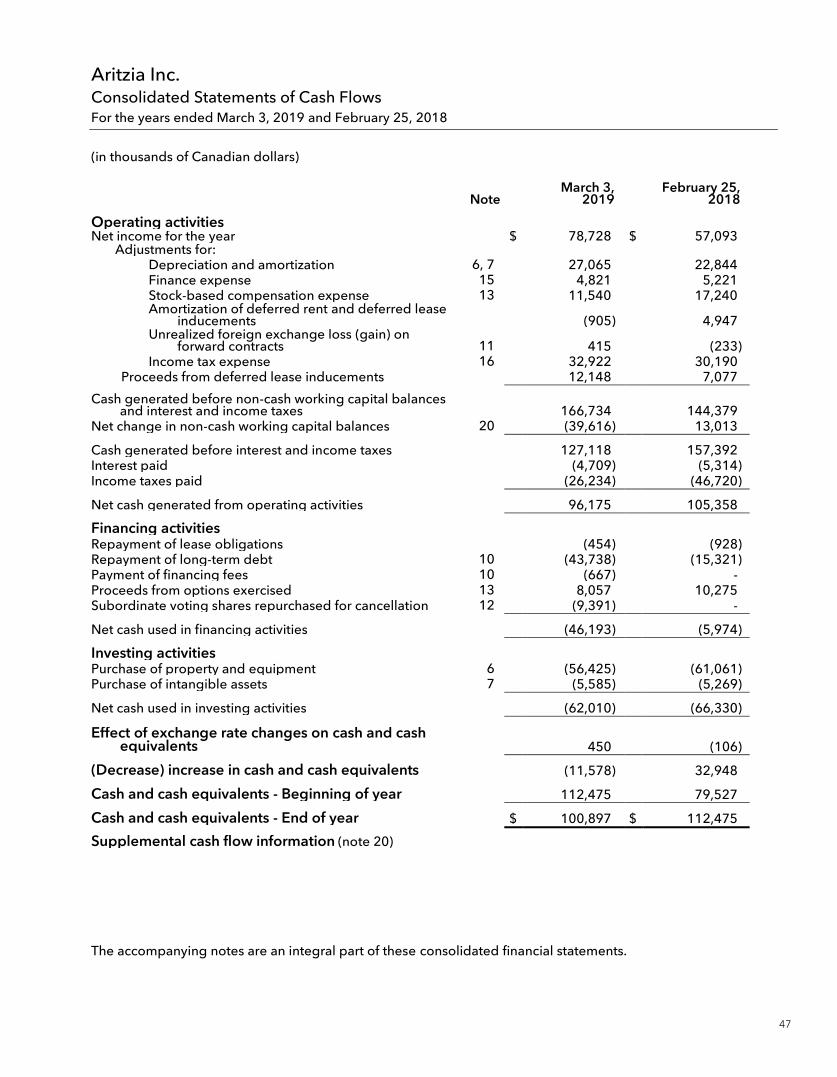
Aritzia Inc. Consolidated Statements of Cash Flows For the years ended March 3, 2019 and February 25, 2018
(in thousands of Canadian dollars)
The accompanying notes are an integral part of these consolidated financial statements.
Note March 3,
2019 February 25,
2018 Operating activities
Net income for the year $ 78,728 $ 57,093 Adjustments for:
Depreciation and amortization 6, 7 27,065 22,844 Finance expense 15 4,821 5,221 Stock-based compensation expense 13 11,540 17,240 Amortization of deferred rent and deferred lease
inducements (905) 4,947 Unrealized foreign exchange loss (gain) on
forward contracts 11 415 (233) Income tax expense 16 32,922 30,190
Proceeds from deferred lease inducements 12,148 7,077 Cash generated before non-cash working capital balances
and interest and income taxes 166,734 144,379 Net change in non-cash working capital balances 20 (39,616) 13,013 Cash generated before interest and income taxes 127,118 157,392 Interest paid (4,709) (5,314) Income taxes paid (26,234) (46,720) Net cash generated from operating activities 96,175 105,358 Financing activities Repayment of lease obligations (454) (928) Repayment of long-term debt 10 (43,738) (15,321) Payment of financing fees 10 (667) - Proceeds from options exercised 13 8,057 10,275 Subordinate voting shares repurchased for cancellation 12 (9,391) - Net cash used in financing activities (46,193) (5,974) Investing activities Purchase of property and equipment 6 (56,425) (61,061) Purchase of intangible assets 7 (5,585) (5,269) Net cash used in investing activities (62,010) (66,330) Effect of exchange rate changes on cash and cash
equivalents 450 (106) (Decrease) increase in cash and cash equivalents (11,578) 32,948 Cash and cash equivalents - Beginning of year 112,475 79,527 Cash and cash equivalents - End of year $ 100,897 $ 112,475 Supplemental cash flow information (note 20)
47
Aritzia Inc. Notes to Consolidated Financial Statements March 3, 2019 and February 25, 2018
(in thousands of Canadian dollars, unless otherwise noted)
(1)
1 Nature of operations and basis of presentation
Nature of operations
Aritzia Inc. and its subsidiaries (collectively referred to as the “Company”) is a vertically integrated design house of exclusive fashion brands. The Company designs apparel and accessories for its collection of exclusive brands. The Company’s assortment of women’s fashion apparel and accessories addresses a range of style preferences and lifestyle requirements. As at March 3, 2019, the Company had 91 boutiques (February 25, 2018 – 85 boutiques).
Aritzia Inc. is a corporation governed by the Business Corporations Act (British Columbia). The address of its registered office is 666 Burrard Street, Suite 1700, Vancouver, B.C., Canada, V6C 2X8.
On August 7, 2018, the Company completed a secondary offering (the “August 2018 Secondary Offering”) on a bought deal basis of its subordinate voting shares through a secondary sale of shares by certain shareholders. The August 2018 Secondary Offering of 6,050,000 subordinate voting shares raised gross proceeds of $100.1 million for the selling shareholders, at a price of $16.55 per subordinate voting share. The Company did not receive any proceeds from the August 2018 Secondary Offering. As part of the August 2018 Secondary Offering, certain selling shareholders exchanged 5,880,000 of their multiple voting shares for subordinate voting shares. Underwriting fees were paid by the selling shareholders, and other expenses related to the August 2018 Secondary Offering of $0.6 million are being paid by the Company.
Subsequent to the year ended March 3, 2019, on March 8, 2019, the Company completed a secondary offering (the “March 2019 Secondary Offering”) on a bought deal basis of its subordinate voting shares through a secondary sale of shares by certain shareholders. The March 2019 Secondary Offering of 19,505,000 subordinate voting shares raised gross proceeds of $329.6 million for the selling shareholders, at a price of $16.90 per subordinate voting share (the “March 2019 Offering Price”). The Company did not receive any proceeds from the March 2019 Secondary Offering. Underwriting fees were paid by the selling shareholders.
Concurrent with the completion of the March 2019 Secondary Offering, on March 8, 2019, the Company also completed its purchase of 6,333,653 subordinate voting shares and multiple voting shares (the “Shares”) for cancellation from certain shareholders, including an investment vehicle (the “Berkshire Shareholder”) managed by Berkshire Partners LLC (“Berkshire”) (the “Share Repurchase”). The purchase price per Share paid by the Company under the Share Repurchase was the same as the March 2019 Offering Price and resulted in an aggregate purchase price of $107.0 million paid to the selling shareholders. Total expenses related to the March 2019 Secondary Offering and Share Repurchase of $2.5 million are being paid by the Company and are being reimbursed by the selling shareholders participating in the Share Repurchase, including the Berkshire Shareholder.
Upon completion of the March 2019 Secondary Offering and Share Repurchase on March 8, 2019, the Berkshire Shareholder has no remaining equity interest in the Company.
48
Aritzia Inc. Notes to Consolidated Financial Statements March 3, 2019 and February 25, 2018
(in thousands of Canadian dollars, unless otherwise noted)
(2)
The Company’s subordinate voting shares are listed on the Toronto Stock Exchange under the stock symbol “ATZ”.
Basis of preparation
The Company’s fiscal year-end is the Sunday closest to the last day of February, typically resulting in a 52-week year, but occasionally giving rise to an additional week, resulting in a 53-week year. Fiscal 2019 was a 53-week year. Fiscal 2018 was a 52-week year. All references to 2019 and 2018 represent the fiscal years ended March 3, 2019 and February 25, 2018, respectively.
Seasonality of operations
The Company’s business is affected by the pattern of seasonality common to most retail apparel businesses. Historically, the Company has recognized a significant portion of its operating profit in the third and fourth quarters of each fiscal year as a result of increased net revenue during the back-to-school and holiday seasons.
Statement of compliance
The consolidated financial statements of the Company have been prepared in accordance with International Financial Reporting Standards (“IFRS”) as issued by the International Accounting Standards Board (“IASB”). The consolidated financial statements have been prepared on a historical cost basis, except for derivative instruments, deferred share units and restricted share units, as disclosed in the accounting policies set out in note 3.
These consolidated financial statements were authorized for issue by the Board of Directors on May 9, 2019.
2 Significant new accounting standards
Standards recently adopted
IFRS 15 – Revenue from Contracts with Customers
Effective February 26, 2018, the Company adopted IFRS 15 issued in May 2014, and amended in September 2015 and April 2016. IFRS 15 outlines a single comprehensive five-step framework for the recognition, measurement and disclosure of revenue from contracts with customers, excluding contracts within the scope of the accounting standards on leases, insurance contracts and financial instruments. IFRS 15 is effective for annual periods beginning on or after January 1, 2018. The Company adopted the standard using the full retrospective approach. The adoption of IFRS 15 did not have a material impact on the Company’s consolidated financial statements other than on the Company’s recognition of its sales return allowance. Under IAS 18, “Revenue”, the sales return allowance on the consolidated Statement of Financial Position was recognized on a net basis, with no adjustment to other current assets. Upon adoption of IFRS 15, the sales return allowance is recognized on a gross basis, resulting in an adjustment of the
49
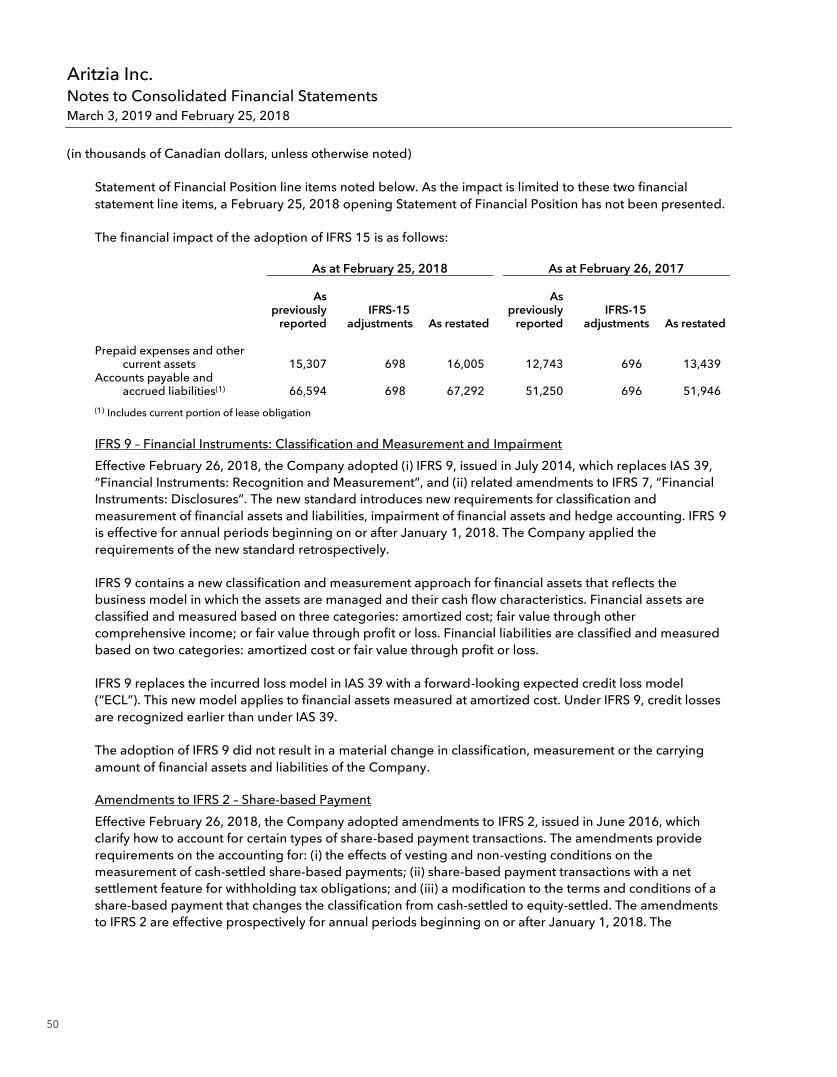
Aritzia Inc. Notes to Consolidated Financial Statements March 3, 2019 and February 25, 2018
(in thousands of Canadian dollars, unless otherwise noted)
(3)
Statement of Financial Position line items noted below. As the impact is limited to these two financial statement line items, a February 25, 2018 opening Statement of Financial Position has not been presented.
The financial impact of the adoption of IFRS 15 is as follows:
As at February 25, 2018 As at February 26, 2017
As previously
reported IFRS-15
adjustments As restated
As previously
reported IFRS-15
adjustments As restated
Prepaid expenses and other current assets 15,307 698 16,005 12,743 696 13,439
Accounts payable and accrued liabilities(1) 66,594 698 67,292 51,250 696 51,946
(1) Includes current portion of lease obligation
IFRS 9 – Financial Instruments: Classification and Measurement and Impairment
Effective February 26, 2018, the Company adopted (i) IFRS 9, issued in July 2014, which replaces IAS 39, “Financial Instruments: Recognition and Measurement”, and (ii) related amendments to IFRS 7, “Financial Instruments: Disclosures”. The new standard introduces new requirements for classification and measurement of financial assets and liabilities, impairment of financial assets and hedge accounting. IFRS 9 is effective for annual periods beginning on or after January 1, 2018. The Company applied the requirements of the new standard retrospectively.
IFRS 9 contains a new classification and measurement approach for financial assets that reflects the business model in which the assets are managed and their cash flow characteristics. Financial assets are classified and measured based on three categories: amortized cost; fair value through other comprehensive income; or fair value through profit or loss. Financial liabilities are classified and measured based on two categories: amortized cost or fair value through profit or loss.
IFRS 9 replaces the incurred loss model in IAS 39 with a forward-looking expected credit loss model (“ECL”). This new model applies to financial assets measured at amortized cost. Under IFRS 9, credit losses are recognized earlier than under IAS 39.
The adoption of IFRS 9 did not result in a material change in classification, measurement or the carrying amount of financial assets and liabilities of the Company.
Amendments to IFRS 2 – Share-based Payment
Effective February 26, 2018, the Company adopted amendments to IFRS 2, issued in June 2016, which clarify how to account for certain types of share-based payment transactions. The amendments provide requirements on the accounting for: (i) the effects of vesting and non-vesting conditions on the measurement of cash-settled share-based payments; (ii) share-based payment transactions with a net settlement feature for withholding tax obligations; and (iii) a modification to the terms and conditions of a share-based payment that changes the classification from cash-settled to equity-settled. The amendments to IFRS 2 are effective prospectively for annual periods beginning on or after January 1, 2018. The
50
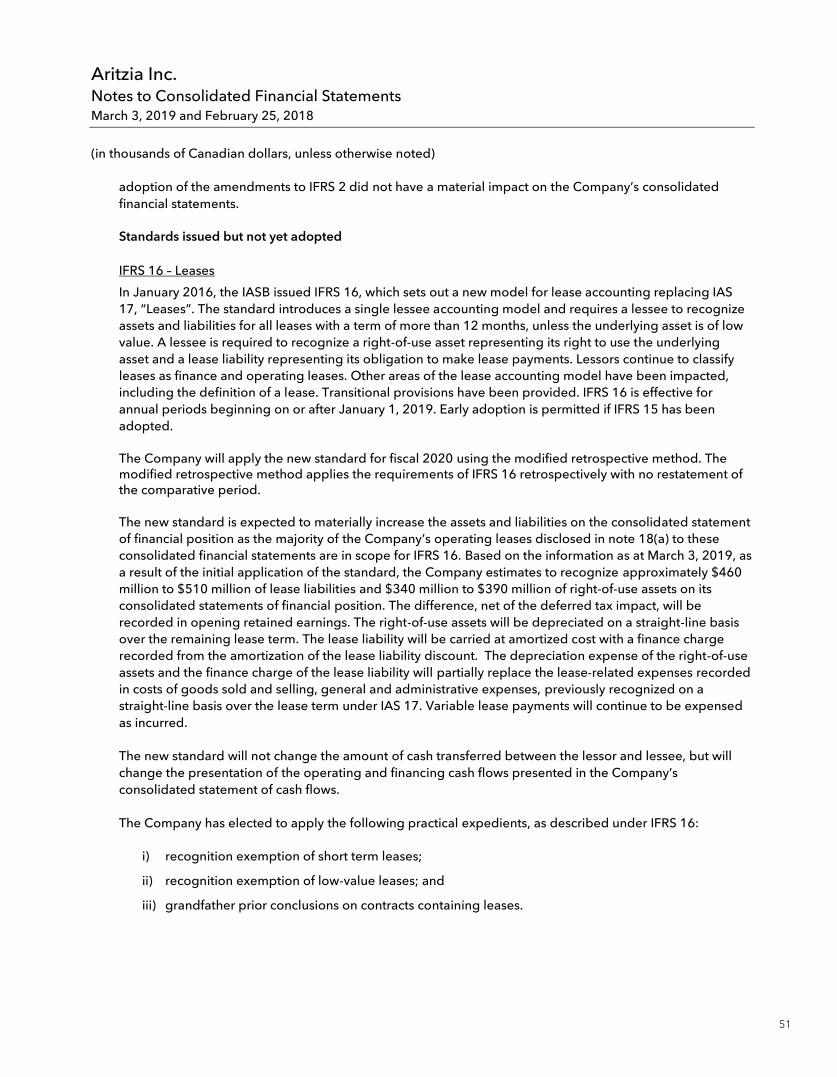
Aritzia Inc. Notes to Consolidated Financial Statements March 3, 2019 and February 25, 2018
(in thousands of Canadian dollars, unless otherwise noted)
(4)
adoption of the amendments to IFRS 2 did not have a material impact on the Company’s consolidated financial statements.
Standards issued but not yet adopted
IFRS 16 – Leases
In January 2016, the IASB issued IFRS 16, which sets out a new model for lease accounting replacing IAS 17, “Leases”. The standard introduces a single lessee accounting model and requires a lessee to recognize assets and liabilities for all leases with a term of more than 12 months, unless the underlying asset is of low value. A lessee is required to recognize a right-of-use asset representing its right to use the underlying asset and a lease liability representing its obligation to make lease payments. Lessors continue to classify leases as finance and operating leases. Other areas of the lease accounting model have been impacted, including the definition of a lease. Transitional provisions have been provided. IFRS 16 is effective for annual periods beginning on or after January 1, 2019. Early adoption is permitted if IFRS 15 has been adopted.
The Company will apply the new standard for fiscal 2020 using the modified retrospective method. The modified retrospective method applies the requirements of IFRS 16 retrospectively with no restatement of the comparative period.
The new standard is expected to materially increase the assets and liabilities on the consolidated statement of financial position as the majority of the Company’s operating leases disclosed in note 18(a) to these consolidated financial statements are in scope for IFRS 16. Based on the information as at March 3, 2019, as a result of the initial application of the standard, the Company estimates to recognize approximately $460 million to $510 million of lease liabilities and $340 million to $390 million of right-of-use assets on its consolidated statements of financial position. The difference, net of the deferred tax impact, will be recorded in opening retained earnings. The right-of-use assets will be depreciated on a straight-line basis over the remaining lease term. The lease liability will be carried at amortized cost with a finance charge recorded from the amortization of the lease liability discount. The depreciation expense of the right-of-use assets and the finance charge of the lease liability will partially replace the lease-related expenses recorded in costs of goods sold and selling, general and administrative expenses, previously recognized on a straight-line basis over the lease term under IAS 17. Variable lease payments will continue to be expensed as incurred.
The new standard will not change the amount of cash transferred between the lessor and lessee, but will change the presentation of the operating and financing cash flows presented in the Company’s consolidated statement of cash flows.
The Company has elected to apply the following practical expedients, as described under IFRS 16:
i) recognition exemption of short term leases;
ii) recognition exemption of low-value leases; and
iii) grandfather prior conclusions on contracts containing leases.
51
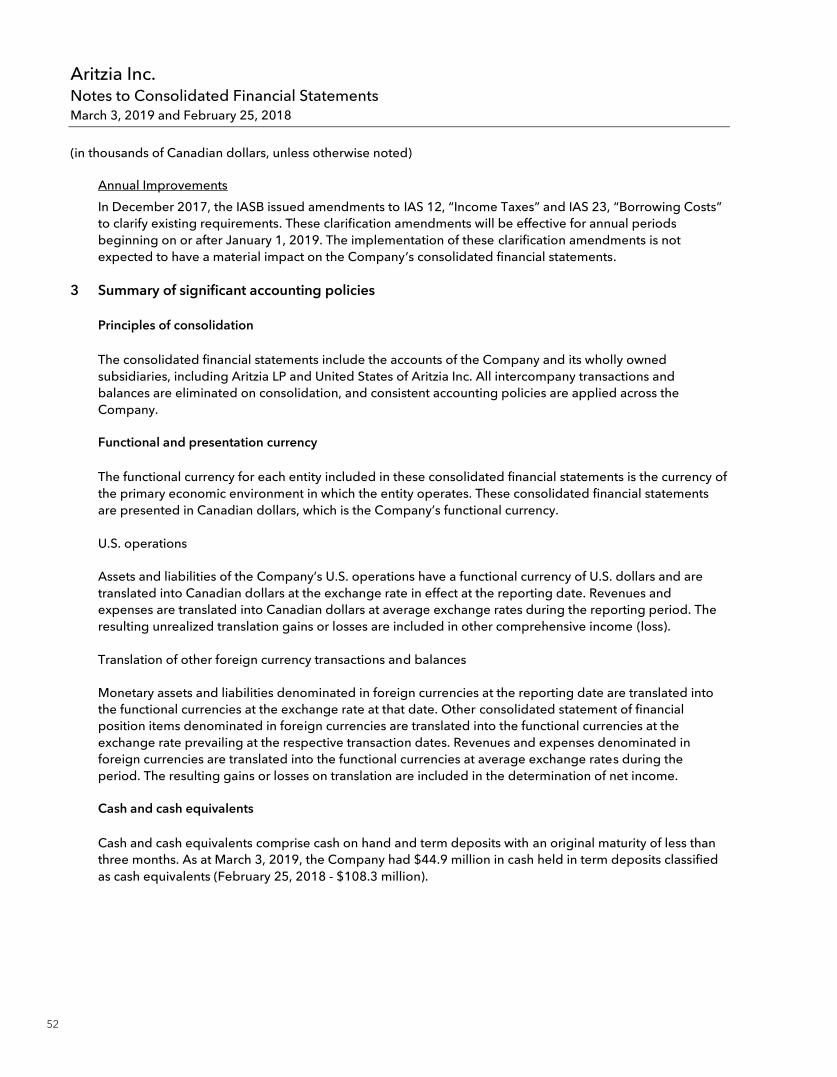
Aritzia Inc. Notes to Consolidated Financial Statements March 3, 2019 and February 25, 2018
(in thousands of Canadian dollars, unless otherwise noted)
(5)
Annual Improvements
In December 2017, the IASB issued amendments to IAS 12, “Income Taxes” and IAS 23, “Borrowing Costs” to clarify existing requirements. These clarification amendments will be effective for annual periods beginning on or after January 1, 2019. The implementation of these clarification amendments is not expected to have a material impact on the Company’s consolidated financial statements.
3 Summary of significant accounting policies
Principles of consolidation
The consolidated financial statements include the accounts of the Company and its wholly owned subsidiaries, including Aritzia LP and United States of Aritzia Inc. All intercompany transactions and balances are eliminated on consolidation, and consistent accounting policies are applied across the Company.
Functional and presentation currency
The functional currency for each entity included in these consolidated financial statements is the currency of the primary economic environment in which the entity operates. These consolidated financial statements are presented in Canadian dollars, which is the Company’s functional currency.
U.S. operations
Assets and liabilities of the Company’s U.S. operations have a functional currency of U.S. dollars and are translated into Canadian dollars at the exchange rate in effect at the reporting date. Revenues and expenses are translated into Canadian dollars at average exchange rates during the reporting period. The resulting unrealized translation gains or losses are included in other comprehensive income (loss).
Translation of other foreign currency transactions and balances
Monetary assets and liabilities denominated in foreign currencies at the reporting date are translated into the functional currencies at the exchange rate at that date. Other consolidated statement of financial position items denominated in foreign currencies are translated into the functional currencies at the exchange rate prevailing at the respective transaction dates. Revenues and expenses denominated in foreign currencies are translated into the functional currencies at average exchange rates during the period. The resulting gains or losses on translation are included in the determination of net income.
Cash and cash equivalents
Cash and cash equivalents comprise cash on hand and term deposits with an original maturity of less than three months. As at March 3, 2019, the Company had $44.9 million in cash held in term deposits classified as cash equivalents (February 25, 2018 - $108.3 million).
52
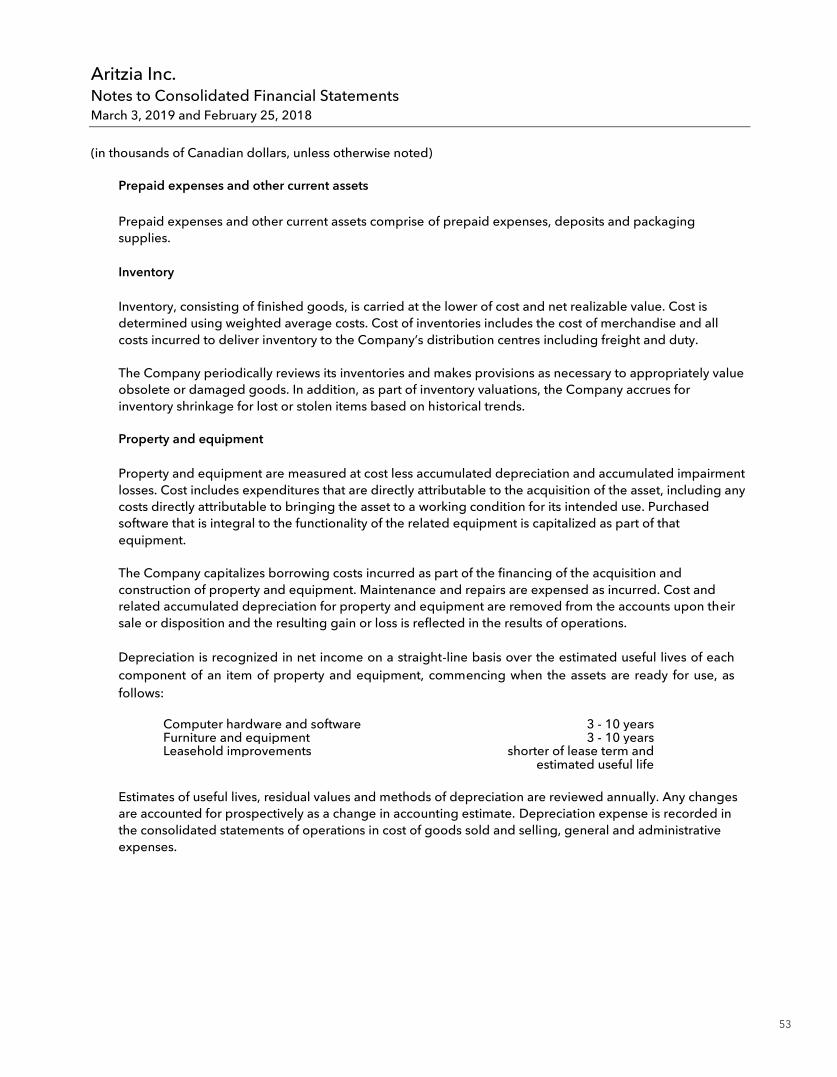
Aritzia Inc. Notes to Consolidated Financial Statements March 3, 2019 and February 25, 2018
(in thousands of Canadian dollars, unless otherwise noted)
(6)
Prepaid expenses and other current assets
Prepaid expenses and other current assets comprise of prepaid expenses, deposits and packaging supplies.
Inventory
Inventory, consisting of finished goods, is carried at the lower of cost and net realizable value. Cost is determined using weighted average costs. Cost of inventories includes the cost of merchandise and all costs incurred to deliver inventory to the Company’s distribution centres including freight and duty.
The Company periodically reviews its inventories and makes provisions as necessary to appropriately value obsolete or damaged goods. In addition, as part of inventory valuations, the Company accrues for inventory shrinkage for lost or stolen items based on historical trends.
Property and equipment
Property and equipment are measured at cost less accumulated depreciation and accumulated impairment losses. Cost includes expenditures that are directly attributable to the acquisition of the asset, including any costs directly attributable to bringing the asset to a working condition for its intended use. Purchased software that is integral to the functionality of the related equipment is capitalized as part of that equipment.
The Company capitalizes borrowing costs incurred as part of the financing of the acquisition and construction of property and equipment. Maintenance and repairs are expensed as incurred. Cost and related accumulated depreciation for property and equipment are removed from the accounts upon their sale or disposition and the resulting gain or loss is reflected in the results of operations.
Depreciation is recognized in net income on a straight-line basis over the estimated useful lives of each component of an item of property and equipment, commencing when the assets are ready for use, as follows:
Computer hardware and software 3 - 10 years Furniture and equipment 3 - 10 years Leasehold improvements shorter of lease term and
estimated useful life
Estimates of useful lives, residual values and methods of depreciation are reviewed annually. Any changes are accounted for prospectively as a change in accounting estimate. Depreciation expense is recorded in the consolidated statements of operations in cost of goods sold and selling, general and administrative expenses.
53
Aritzia Inc. Notes to Consolidated Financial Statements March 3, 2019 and February 25, 2018
(in thousands of Canadian dollars, unless otherwise noted)
(7)
Intangible assets
Intangible assets are recorded at cost and include trade names, trademarks, non-competition agreements, retail leases and internally developed computer software.
Significant costs to purchase any trademarks from third parties are capitalized and amortized over the useful lives of the assets. Cost includes all expenditures that are directly attributable to the acquisition or development of the asset.
The Company capitalizes, in intangible assets, direct costs incurred during the application and infrastructure development stages of developing computer software for internal use. All costs incurred during the preliminary project stage, including project scoping, identification and testing of alternatives, are expensed as incurred.
The Aritzia trade name has been determined to have an indefinite life and is not amortized. The remaining intangible assets are amortized on a straight-line basis over their estimated useful lives as follows:
Other trade names and trademarks term of registration or up to a maximum of 20 years Retail leases included in other intangible assets term of lease Computer software 3 - 7 years
Estimates of useful lives, residual values and methods of amortization are reviewed annually. Any changes are accounted for prospectively as a change in accounting estimate. Amortization expense is recorded in the consolidated statements of operations in cost of goods sold and selling, general and administrative expenses.
Goodwill
Goodwill represents non-identifiable intangible assets acquired on business combinations.
Impairment of assets
Goodwill and intangible assets that have an indefinite useful life are not subject to amortization and are tested annually for impairment, or more frequently if events or changes in circumstances indicate that they might be impaired. Other assets are tested for impairment whenever events or changes in circumstances indicate that the carrying amount may not be recoverable. An impairment loss is recognized for the amount by which the asset’s carrying amount exceeds its recoverable amount. The recoverable amount is the higher of an asset’s fair value less costs of disposal and value in use. For the purposes of assessing impairment, assets are grouped at the lowest levels for which there are separately identifiable cash inflows which are largely independent of the cash inflows from other assets or groups of assets (cash-generating unit or “CGU”). Non-financial assets, other than goodwill, that suffered an impairment are reviewed for possible reversal of the impairment at the end of each reporting period.
54
Aritzia Inc. Notes to Consolidated Financial Statements March 3, 2019 and February 25, 2018
(in thousands of Canadian dollars, unless otherwise noted)
(8)
Operating leases
The Company carries on its operations in premises under leases of varying terms, which are accounted for as operating leases. Operating leases are recorded on a straight-line basis over the term of the lease beginning on the possession date. Accordingly, reasonably assured rent escalations are amortized over the lease term, and free-rent periods are allocated a portion of rent expense. The difference between the recognized rental expense and the total rental payments is reflected in the consolidated statements of financial position as a deferred lease liability. Contingent rental payments based on sales volumes are recorded in the period in which the sales occur.
Tenant allowances are recorded as deferred lease credits on the consolidated statements of financial position and amortized as a reduction of rent expense over the term of the respective leases.
Provisions
Provisions are recognized when the Company has a present legal or constructive obligation as a result of a past event, it is probable that an outflow of economic benefits will be required to settle the obligation, and a reliable estimate can be made of the amount of the obligation. If the effect of the time value of money is material, provisions are discounted using a current pre-tax rate that reflects, where appropriate, the risks specific to the liability. Where discounting is used, the increase in the provision due to the passage of time is recognized as a finance cost.
An asset retirement obligation is a legal obligation associated with the retirement of tangible long-lived assets that the Company may be required to settle. The Company’s asset retirement obligations are primarily associated with leasehold improvements that the Company is contractually obligated to remove at the end of a lease. At inception of a lease with such conditions, the Company recognizes the best estimate of the fair value of the liability, with a corresponding increase in the carrying value of the related asset. The liability, recorded in other non-current liabilities, is estimated based on a number of assumptions requiring management’s judgment, including store closing costs, cost inflation rates and discount rates, and is accreted to its projected future value over time. The capitalized asset is depreciated over its useful life. Upon satisfaction of the asset retirement obligation conditions, differences between the recorded asset retirement obligation liability and the actual retirement costs incurred are recognized as a gain or loss in the consolidated statements of operations.
Financial instruments
Financial assets and financial liabilities are recognized when the Company becomes a party to the contractual provision of the financial instrument. Financial assets are derecognized when the contractual rights to receive cash flows from the financial asset expire and financial liabilities are derecognized when obligations under the contract expire, are discharged or cancelled. The Company’s financial assets, which includes cash and cash equivalents and accounts receivable, are classified as amortized cost. The Company’s financial liabilities, which includes accounts payable and accrued liabilities and long term debt, are classified as amortized cost. The Company’s foreign currency forward contracts, if any, are classified as fair value through profit or loss (“FVTPL”).
55
Aritzia Inc. Notes to Consolidated Financial Statements March 3, 2019 and February 25, 2018
(in thousands of Canadian dollars, unless otherwise noted)
(9)
Financial assets are initially measured at fair value and subsequently measured at amortized cost using the effective interest method if both of the following conditions are met and they are not designated as FVTPL:
(i) the financial asset is held within a business model whose objective is to hold financial assets to collect contractual cash flows; and
(ii) the contractual terms of the financial asset give rise, on specified dates, to cash flows that are solely payments of principal and interest on the principal amount outstanding. All financial assets not classified as amortized cost as described above are measured at FVTPL.
Financial liabilities are initially measured at fair value, less any directly attributable transaction costs, and subsequently measured at amortized cost using the effective interest method.
Financial assets and financial liabilities are measured at fair value using a valuation hierarchy for disclosure of fair value measurements. The determination of the applicable level within the hierarchy of a particular asset or liability depends on the inputs used in the valuation as of the measurement date, notably the extent to which the inputs are market-based (observable) or internally derived (unobservable). Observable inputs are inputs that market participants would use in pricing the asset or liability based on market data obtained from independent sources. Unobservable inputs are inputs based on a company’s own assumptions about market participant assumptions using the best information available. The hierarchy is broken down into three levels based on the reliability of inputs as follows:
Level 1 - Valuations based on quoted prices in active markets for identical assets or liabilities that a company has the ability to access at the measurement date.
Level 2 - Valuations based on quoted inputs other than quoted prices included within Level 1, that are observable for the asset or liability, either directly or indirectly through corroboration with observable market data.
Level 3 - Valuations based on inputs that are unobservable and significant to the overall fair value measurement.
Offsetting financial instruments
Financial assets and financial liabilities are offset and the net amount is reported in the consolidated statements of financial position when there is a legally enforceable right to offset the recognized amounts and there is an intention to settle on a net basis or to realize the asset and settle the liability simultaneously.
Share capital
Multiple voting shares and subordinate voting shares are classified as shareholders’ equity. Incremental costs directly attributable to the issuance of shares are shown in equity as a deduction, net of tax, from the proceeds of the issuance. When share capital recognized as equity is re-purchased for cancellation, the amount of consideration paid, which includes directly attributable costs, net of tax, is recognized as a
56
Aritzia Inc. Notes to Consolidated Financial Statements March 3, 2019 and February 25, 2018
(in thousands of Canadian dollars, unless otherwise noted)
(10)
deduction from equity. The excess of the purchase price over the carrying amount of the shares is charged to retained earnings.
Revenue recognition
The Company recognizes revenue when control of the goods or services has been transferred to the customer. Revenue is measured at the fair value of the amount of consideration to which the Company expects to be entitled to, including variable consideration, if any, to the extent that it is highly probable that a significant reversal will not occur.
Net revenue reflects the Company’s sale of merchandise, less returns and discounts. Retail revenue at point-of-sale is measured at the fair value of the consideration received at the time the sale is made to the customer, net of discounts and estimated allowance for returns. For merchandise that is ordered and paid for in a boutique and subsequently picked up by or delivered to the customer, revenue is deferred until control of the merchandise has been transferred to the customer. eCommerce revenue is recognized at the date control has been transferred to the customer, and measured at the fair value of the consideration received, net of discounts and an estimated allowance for returns.
Revenues are reported net of sales taxes collected for various governmental agencies.
Receipts from the sale of gift cards are treated as deferred revenue. When gift cards are redeemed for merchandise, the Company recognizes the related revenue. The Company estimates gift card breakage, to the extent there is no requirement for remitting card balances to government agencies under unclaimed property laws, and recognizes revenue in proportion to actual gift card redemptions as a component of net revenue.
The Company recognizes promotional gift cards as a reduction of revenue upon redemption.
Cost of goods sold
Cost of goods sold includes inventory and product-related costs and occupancy costs, as well as depreciation expense for the Company’s stores and distribution centres.
Selling, general and administrative
Selling, general and administrative expenses consist of selling expenses that are generally variable with revenues and general and administrative operating expenses that are primarily fixed. Selling, general and administrative expenses also include depreciation and amortization expense for all support office assets and intangible assets.
Store opening costs
Store opening costs are expensed as incurred.
57
Aritzia Inc. Notes to Consolidated Financial Statements March 3, 2019 and February 25, 2018
(in thousands of Canadian dollars, unless otherwise noted)
(11)
Employee benefits
Short-term employee benefit obligations, which include wages, salaries, compensated absences and bonuses, are expensed as the related service is provided.
Termination benefits are recognized as an expense when the Company has demonstrated commitment, without realistic possibility of withdrawal, to a formal detailed plan to terminate employment before the normal retirement date.
Income tax expense
Current and deferred income taxes are recognized in the Company’s net income, except to the extent that they relate to a business combination or items recognized directly in equity or other comprehensive income.
Current taxes are recognized for the estimated taxes payable or receivable on taxable income or loss for the current year and any adjustment to income taxes payable in respect of previous years. Current income taxes are determined using tax rates and tax laws that have been enacted or substantively enacted by the year-end date.
Deferred tax assets and liabilities are recognized where the carrying amount of an asset or liability differs from its tax base, except for taxable temporary differences arising on the initial recognition of goodwill and temporary differences arising on the initial recognition of an asset or liability in a transaction that is not a business combination, and at the time of the transaction affects neither accounting nor taxable income or loss. In addition, deferred tax liabilities are not recognized for taxable temporary differences arising on investments in subsidiaries, associates and joint ventures where the reversal of the temporary difference can be controlled and it is probable that the difference will not reverse in the foreseeable future. The amount of deferred tax provided is based on the expected manner of realization or settlement of the carrying amount of the asset and liability, using tax rates enacted or substantively enacted at the year-end date.
A deferred tax asset is recognized for unused tax losses, tax credits and deductible temporary differences, to the extent that it is probable that future taxable profits will be available against which they can be utilized. The carrying amount of deferred tax assets is reviewed at each statement of financial position date and reduced to the extent that it is no longer probable that sufficient taxable profits will be available to allow all or part of the asset to be recovered.
Deferred income tax assets and liabilities are offset when there is a legally enforceable right to offset current tax assets against current tax liabilities and when the deferred income tax assets and liabilities relate to income tax levied by the same taxation authority on either the taxable entity or different taxable entities where there is an intention to settle the balances on a net basis.
58
Aritzia Inc. Notes to Consolidated Financial Statements March 3, 2019 and February 25, 2018
(in thousands of Canadian dollars, unless otherwise noted)
(12)
Stock-based compensation expense
Stock Option Plans
Prior to the Company’s initial public offering (the “IPO”) the Company had a legacy equity incentive plan (the “Legacy Plan”) pursuant to which it has granted time-based and performance-based stock options to directors, employees, consultants and advisors.
Concurrent with the IPO, the Company implemented a new stock option plan (the “Option Plan”), pursuant to which it can grant time-based stock options to acquire subordinate voting shares to directors, executive officers, employees and consultants.
For awards with service conditions that are subject to graded vesting, compensation cost is recognized on a straight-line basis over the requisite service period for each separately vesting portion of the award as if the award was, in substance, multiple awards. In addition, the total amount of compensation expense to be recognized is based on the number of awards expected to vest and is adjusted to reflect those awards that do ultimately vest.
Deferred Share Units and Restricted Share Units
The Company has a Director Deferred Share Unit (“DSU”) Program for non employee board members. Effective October 3, 2018, the Company adopted a Restricted Share Unit (“RSU”) Program for employees and consultants. DSUs and RSUs are grants of notional subordinate voting shares that are redeemable for cash based on the market value of the Company’s shares and are non-dilutive to shareholders. The cost of the service received as consideration is initially measured based on the market value of the Company’s shares at the date of grant. The grant-date fair value is recognized as stock-based compensation expense with a corresponding increase recorded in other liabilities. DSUs and RSUs are remeasured at each reporting date based on the market value of the Company’s shares with changes in fair value recognized as stock-based compensation expense for the proportion of the service that has been rendered at that date.
Net income per share
Basic net income per share is calculated by dividing the net income for the fiscal year attributable to shareholders of the Company by the weighted average number of multiple voting shares and subordinate voting shares outstanding during the year.
Diluted net income per share is calculated by dividing the net income for the fiscal year attributable to shareholders of the Company by the weighted average number of multiple voting shares and subordinate voting shares outstanding during the year, plus the weighted average number of subordinate voting shares that would be issued on exercise of dilutive options granted, as calculated under the treasury stock method.
59
Aritzia Inc. Notes to Consolidated Financial Statements March 3, 2019 and February 25, 2018
(in thousands of Canadian dollars, unless otherwise noted)
(13)
4 Critical accounting estimates and judgments
The preparation of consolidated financial statements in accordance with IFRS requires management to make judgments, estimates and assumptions that affect the application of accounting policies and the reported amounts of assets, liabilities, income and expenses. Estimates and assumptions are continuously evaluated and are based on management’s best judgments and experience and other factors, including expectations of future events that are believed to be reasonable under the circumstances. Revisions to accounting estimates are recognized in the period in which the estimates are revised and in any future periods affected. Actual results may differ from these estimates.
Significant judgments and estimates made by management in the process of applying accounting policies and that have the most significant effect on the amounts recognized in the consolidated financial statements include the following:
The provision recorded to remeasure inventories based on the lower of cost and net realizable value (note 5), which is a critical estimate.
Property and equipment impairment testing, which is influenced by judgment in defining a CGU and
determining the indicators of impairment, and estimates used to measure impairment losses, if any (note 6). These estimates include future cash flow projections, growth rates and discount rates.
Goodwill and indefinite life intangible asset impairment testing, which requires management to make
critical estimates in the impairment testing model. On an annual basis, the Company tests whether goodwill and indefinite life intangible assets are impaired. The recoverable value is determined using discounted future cash flow models, which incorporate assumptions regarding future events, specifically future cash flows, growth rates and discount rates (note 7).
Stock-based compensation expense, which requires the use of judgment in determining the most
appropriate inputs, including estimates and assumptions with respect to expected life, risk-free interest rate, volatility and forfeiture rate (note 13).
Gift card breakage, which requires the use of judgment in defining the Company’s average gift card
breakage rate, based on historical redemption rates (note 3). The resulting revenue from breakage is recognized in proportion to actual gift card redemptions.
Income taxes, which requires judgment to determine when tax losses, credits and provisions are
recognized based on tax rules in various jurisdictions (note 16).
60
Aritzia Inc. Notes to Consolidated Financial Statements March 3, 2019 and February 25, 2018
(in thousands of Canadian dollars, unless otherwise noted)
(14)
5 Inventory
March 3,
2019 February 25,
2018
Finished goods $ 98,324 $ 60,385 Finished goods in transit 13,859 18,448 $ 112,183 $ 78,833
The Company records a reserve to value inventory to its estimated net realizable value. This resulted in an expense in cost of goods sold of $3.2 million for the year ended March 3, 2019 (February 25, 2018 - $2.0 million). No inventory write-downs recorded in previous periods were reversed.
All of the Company’s inventory is pledged as security for the Credit Facilities (note 10).
6 Property and equipment
Leasehold
improvements
Furniture and
equipment Computer hardware
Computer
software
Construction- in-
progress Total
Cost Balance, February 26, 2017 $ 131,305 $ 30,837 $ 10,122 $ 8,128 $ 14,482 $ 194,874 Additions 29,906 7,317 4,000 981 20,194 62,398 Transfers from construction-
in-progress 9,844 718 355 8 (10,925) - Dispositions - (337) (1,784) (2,847) - (4,968) Foreign exchange (1,450) (321) (68) (149) (402) (2,390)
Balance, February 25, 2018 169,605 38,214 12,625 6,121 23,349 249,914 Additions 26,596 9,085 3,348 356 14,566 53,951 Transfers from construction-
in-progress 24,099 6,216 290 864 (31,469) - Dispositions (15,011) (4,057) (1,011) (240) - (20,319) Foreign exchange 2,022 407 195 (87) 1,835 4,372 Balance, March 3, 2019 $ 207,311 $ 49,865 $ 15,447 $ 7,014 $ 8,281 $ 287,918
Accumulated depreciation Balance, February 26, 2017 $ 67,372 $ 18,716 $ 7,210 $ 5,881 $ - $ 99,179 Depreciation 13,846 3,465 2,300 1,321 - 20,932 Dispositions - (185) (1,679) (2,770) - (4,634) Foreign exchange (849) (180) (66) (140) - (1,235)
Balance, February 25, 2018 80,369 21,816 7,765 4,292 - 114,242 Depreciation 16,389 4,677 2,859 783 - 24,708 Dispositions (15,011) (4,057) (1,011) (240) - (20,319) Foreign exchange 1,169 442 57 26 - 1,694 Balance, March 3, 2019 $ 82,916 $ 22,878 $ 9,670 $ 4,861 $ - $ 120,325 Net carrying value Balance, March 3, 2019 $ 124,395 $ 26,987 $ 5,777 $ 2,153 $ 8,281 $ 167,593 Balance, February 25, 2018 89,236 16,398 4,860 1,829 23,349 135,672
Construction-in-progress includes store build costs for stores not yet opened and support office projects not put into use.
61
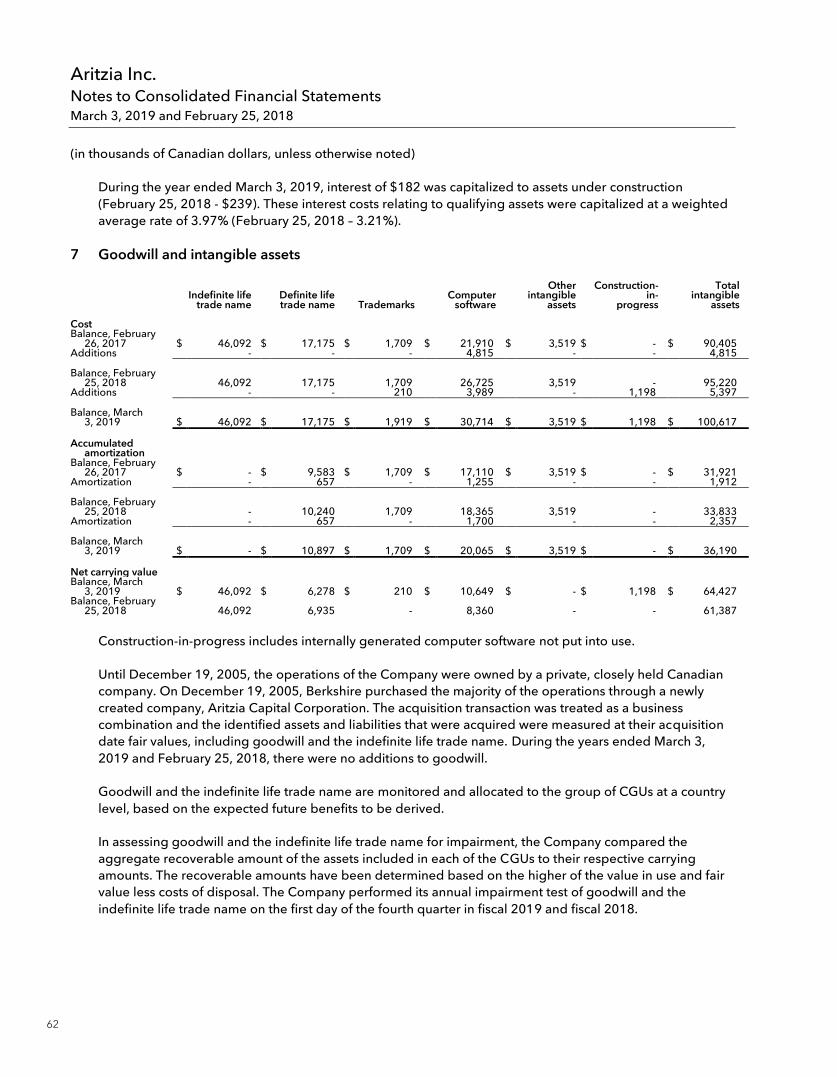
Aritzia Inc. Notes to Consolidated Financial Statements March 3, 2019 and February 25, 2018
(in thousands of Canadian dollars, unless otherwise noted)
(15)
During the year ended March 3, 2019, interest of $182 was capitalized to assets under construction (February 25, 2018 - $239). These interest costs relating to qualifying assets were capitalized at a weighted average rate of 3.97% (February 25, 2018 – 3.21%).
7 Goodwill and intangible assets
Indefinite life
trade name Definite life trade name Trademarks
Computer software
Other intangible
assets Construction-
in- progress
Total intangible
assets
Cost Balance, February
26, 2017 $ 46,092 $ 17,175 $ 1,709 $ 21,910 $ 3,519 $ - $ 90,405 Additions - - - 4,815 - - 4,815 Balance, February
25, 2018 46,092 17,175 1,709 26,725 3,519 - 95,220 Additions - - 210 3,989 - 1,198 5,397 Balance, March
3, 2019 $ 46,092 $ 17,175 $ 1,919 $ 30,714 $ 3,519 $ 1,198 $ 100,617 Accumulated
amortization Balance, February
26, 2017 $ - $ 9,583 $ 1,709 $ 17,110 $ 3,519 $ - $ 31,921 Amortization - 657 - 1,255 - - 1,912 Balance, February
25, 2018 - 10,240 1,709 18,365 3,519 - 33,833 Amortization - 657 - 1,700 - - 2,357 Balance, March
3, 2019 $ - $ 10,897 $ 1,709 $ 20,065 $ 3,519 $ - $ 36,190 Net carrying value Balance, March
3, 2019 $ 46,092 $ 6,278 $ 210 $ 10,649 $ - $ 1,198 $ 64,427 Balance, February
25, 2018 46,092 6,935 - 8,360 - - 61,387
Construction-in-progress includes internally generated computer software not put into use.
Until December 19, 2005, the operations of the Company were owned by a private, closely held Canadian company. On December 19, 2005, Berkshire purchased the majority of the operations through a newly created company, Aritzia Capital Corporation. The acquisition transaction was treated as a business combination and the identified assets and liabilities that were acquired were measured at their acquisition date fair values, including goodwill and the indefinite life trade name. During the years ended March 3, 2019 and February 25, 2018, there were no additions to goodwill.
Goodwill and the indefinite life trade name are monitored and allocated to the group of CGUs at a country level, based on the expected future benefits to be derived.
In assessing goodwill and the indefinite life trade name for impairment, the Company compared the aggregate recoverable amount of the assets included in each of the CGUs to their respective carrying amounts. The recoverable amounts have been determined based on the higher of the value in use and fair value less costs of disposal. The Company performed its annual impairment test of goodwill and the indefinite life trade name on the first day of the fourth quarter in fiscal 2019 and fiscal 2018.
62
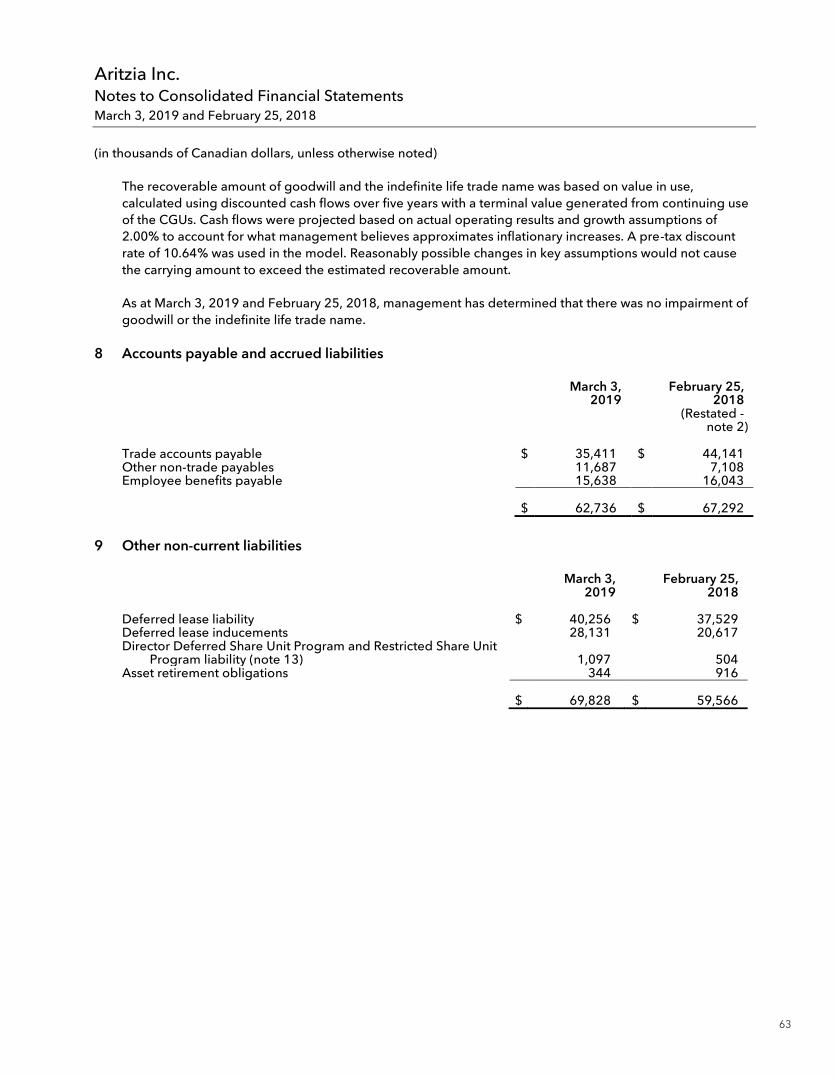
Aritzia Inc. Notes to Consolidated Financial Statements March 3, 2019 and February 25, 2018
(in thousands of Canadian dollars, unless otherwise noted)
(16)
The recoverable amount of goodwill and the indefinite life trade name was based on value in use, calculated using discounted cash flows over five years with a terminal value generated from continuing use of the CGUs. Cash flows were projected based on actual operating results and growth assumptions of 2.00% to account for what management believes approximates inflationary increases. A pre-tax discount rate of 10.64% was used in the model. Reasonably possible changes in key assumptions would not cause the carrying amount to exceed the estimated recoverable amount.
As at March 3, 2019 and February 25, 2018, management has determined that there was no impairment of goodwill or the indefinite life trade name.
8 Accounts payable and accrued liabilities
March 3,
2019 February 25,
2018
(Restated -
note 2)
Trade accounts payable $ 35,411 $ 44,141 Other non-trade payables 11,687 7,108 Employee benefits payable 15,638 16,043
$ 62,736 $ 67,292 9 Other non-current liabilities
March 3,
2019 February 25,
2018
Deferred lease liability $ 40,256 $ 37,529 Deferred lease inducements 28,131 20,617 Director Deferred Share Unit Program and Restricted Share Unit
Program liability (note 13) 1,097 504 Asset retirement obligations 344 916 $ 69,828 $ 59,566
63
Aritzia Inc. Notes to Consolidated Financial Statements March 3, 2019 and February 25, 2018
(in thousands of Canadian dollars, unless otherwise noted)
(17)
10 Bank indebtedness and long-term debt
The Company has a term loan and revolving credit facility with its syndicate of lenders.
a) Long-term debt
March 3,
2019 February 25,
2018
Term loan $ 75,000 $ 118,738 Less: Deferred financing fees (376) (151) Term loan, net of deferred financing fees 74,624 118,587 Less: Current portion - (19,127) Long-term debt $ 74,624 $ 99,460
On June 28, 2018, the Company amended its term loan and revolving credit facility (collectively the “Credit Facilities”) with its syndicate of lenders. The amendment agreement included a reduction of the term loan from $118.7 million to $75.0 million and an increase of the revolving credit facility from $70.0 million to $100.0 million. The amended Credit Facilities mature on May 22, 2022 and have no scheduled principal payments prior to maturity. Interest is paid on a monthly basis. Under the amended Credit Facilities, the Company has the option to borrow using Banker’s Acceptance borrowings (“BA”), LIBO rate borrowings (“LIBO”), or Canadian prime rate borrowings (“Prime”) plus a marginal interest rate between 0.50% and 2.50% (February 25, 2018 – 0.75% and 3.00%). As part of the amendment, the Company made a $43.7 million term loan repayment on June 27, 2018. As part of the amendment, the Company incurred $0.7 million of financing fees which have been deferred and are being amortized over the term of the Credit Facilities.
During the year ended March 3, 2019 the Company incurred $3.4 million of interest (February 25, 2018 - $4.1 million), at a weighted average rate of 3.97% (February 25, 2018 – 3.21%). As at March 3, 2019, the interest rate on the loan was 3.57% (February 25, 2018 – 3.58%), based on a one-month BA rate.
The term loan requires mandatory loan prepayments by the Company of principal and interest if certain events occur. As at March 3, 2019 and February 25, 2018, the Company was not required to make a mandatory loan prepayment.
The Company defers third party costs and creditor fees directly associated with acquiring long-term debt. These deferred costs are classified against long-term debt and bank indebtedness and are amortized as finance expense over the expected life of the related indebtedness using the effective interest rate method.
64
Aritzia Inc. Notes to Consolidated Financial Statements March 3, 2019 and February 25, 2018
(in thousands of Canadian dollars, unless otherwise noted)
(18)
b) Bank indebtedness
The Company has a revolving credit facility of $100.0 million (February 25, 2018 - $70.0 million). The revolving credit facility bears interest at BA, LIBO or Prime plus a marginal rate between 0.50% and 2.50% (February 25, 2018 – 0.75% and 3.00%). As at March 3, 2019, there were no open letters of credit against the revolving credit facility. As at February 25, 2018, the amount available under the revolving credit facility was reduced to $54.1 million by certain open letters of credit (note 18(c)). Up to $10.0 million of the facility can be drawn upon by way of a swingline loan.
As at March 3, 2019 and February 25, 2018, no advances were made under this revolving credit facility.
The Company also has letters of credit facilities of $75.0 million, secured pari passu with the Credit Facilities. The interest rate for the letters of credit is between 1.00% and 2.50%. The amount available under these facilities is reduced to $31.9 million (February 25, 2018 - $70.0 million) by certain open letters of credit (note 18(c)).
The Credit Facilities are collateralized by a first priority lien on all assets, leased real property interests and inventory. In addition, the Company is to maintain certain financial covenants. As at March 3, 2019 and February 25, 2018, the Company was in compliance with all financial covenants.
11 Derivative financial instruments
From time to time, the Company uses foreign currency forward contracts to manage its exposure to fluctuations with respect to the U.S. dollar for U.S. dollar merchandise purchases sold in Canada. The fair value of the forward contracts is included in prepaid expenses and other current assets or in accounts payable and accrued liabilities in the consolidated statements of financial position, depending on whether they represent assets or liabilities to the Company.
The amounts recorded in the consolidated statements of operations in other (income) expense include the unrealized change in fair value of foreign currency forward contracts during the year ended March 3, 2019, which was a loss of $0.4 million (February 25, 2018 – gain of $0.2 million). During the year ended March 3, 2019, the Company also realized a gain of $2.3 million (February 25, 2018 – a loss of $2.2 million), in other (income) expense, arising from the settlement of foreign currency forward contracts.
The foreign currency forward contracts generally have a term of no more than 12 months. The notional amount of these contracts outstanding as at March 3, 2019 was $nil (February 25, 2018 - $30.3 million U.S. dollars at an average forward rate of 1.2494). As at February 25, 2018, the forward contracts had a positive fair value of $0.4 million.
65
Aritzia Inc. Notes to Consolidated Financial Statements March 3, 2019 and February 25, 2018
(in thousands of Canadian dollars, unless otherwise noted)
(19)
12 Share capital
On May 10, 2018, the Company announced the commencement of a normal course issuer bid (“NCIB”) to purchase and cancel up to 5,429,658 subordinate voting shares over the 12-month period commencing May 15, 2018 and ending May 14, 2019. All repurchases are made through the facilities of the Toronto Stock Exchange and are done at market prices. As purchases are made, the Company reduces share capital for the average book value of the subordinate voting shares repurchased, and charges retained earnings for the difference between the price paid and the average book value. During the year ended March 3, 2019, the Company repurchased 549,880 subordinate voting shares for cancellation at an average price of $17.07 per subordinate voting share, for total cash consideration of $9.4 million.
On May 31, 2018, the Company entered into an automated share purchase plan (“ASPP”) with a designated broker for the purpose of permitting the Company to purchase its subordinate voting shares under the NCIB during self-imposed blackout periods. The volume of purchases is determined by the broker in its sole discretion based on purchase price and maximum volume parameters established by the Company under the ASPP. The Company records a liability for purchases that are estimated to occur during blackout periods based on the parameters of the NCIB and ASPP. On March 3, 2019, in connection with the Share Repurchase, the Company cancelled its ASPP.
On February 19, 2019, in connection with the March 2019 Secondary Offering and Share Repurchase, certain selling shareholders exchanged 5,344,234 of their multiple voting shares for subordinate voting shares.
As at March 3, 2019, there were 44,531,768 multiple voting shares and 69,409,683 subordinate voting shares issued and outstanding. There were no preferred shares issued and outstanding as at March 3, 2019. Neither the multiple voting shares nor the subordinate voting shares issued have a par value.
13 Stock options
The Company has granted stock options under the Legacy Plan and the Option Plan.
Legacy Plan
Following completion of the IPO, no additional options will be granted under the Legacy Plan, and the outstanding options under the Legacy Plan are exercisable for subordinate voting shares of the Company. The options vest annually pro rata on the anniversary of the grant date over a period of five years. All issued options expire after 10 to 15 years from the date granted.
Transactions for stock options granted under the Legacy Plan for the years ended March 3, 2019 and February 25, 2018 were as follows:
66
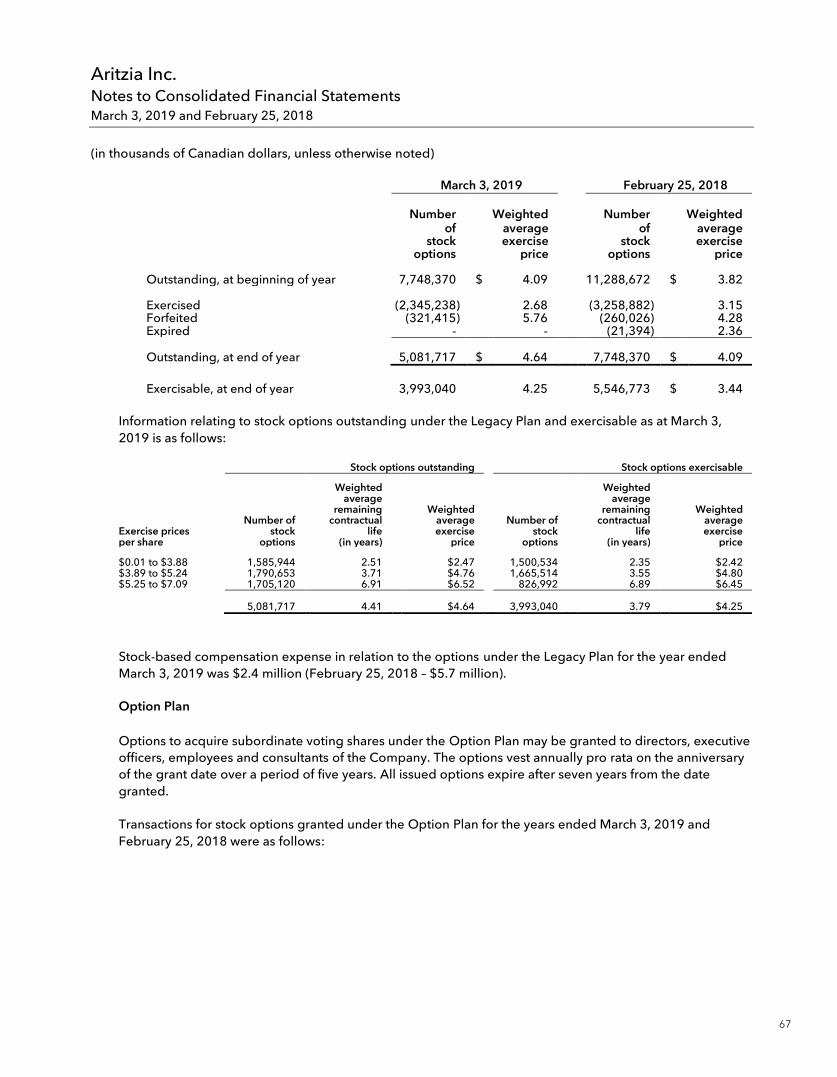
Aritzia Inc. Notes to Consolidated Financial Statements March 3, 2019 and February 25, 2018
(in thousands of Canadian dollars, unless otherwise noted)
(20)
March 3, 2019 February 25, 2018
Number of
stock options
Weighted average exercise
price
Number of
stock options
Weighted average exercise
price
Outstanding, at beginning of year 7,748,370 $ 4.09 11,288,672 $ 3.82
Exercised (2,345,238) 2.68 (3,258,882) 3.15 Forfeited (321,415) 5.76 (260,026) 4.28 Expired - - (21,394) 2.36
Outstanding, at end of year 5,081,717 $ 4.64 7,748,370 $ 4.09
Exercisable, at end of year 3,993,040 4.25 5,546,773 $ 3.44
Information relating to stock options outstanding under the Legacy Plan and exercisable as at March 3, 2019 is as follows:
Stock options outstanding Stock options exercisable
Exercise prices per share
Number of stock
options
Weighted average
remaining contractual
life (in years)
Weighted average exercise
price
Number of stock
options
Weighted average
remaining contractual
life (in years)
Weighted average exercise
price
$0.01 to $3.88 1,585,944 2.51 $2.47 1,500,534 2.35 $2.42 $3.89 to $5.24 1,790,653 3.71 $4.76 1,665,514 3.55 $4.80 $5.25 to $7.09 1,705,120 6.91 $6.52 826,992 6.89 $6.45 5,081,717 4.41 $4.64 3,993,040 3.79 $4.25
Stock-based compensation expense in relation to the options under the Legacy Plan for the year ended March 3, 2019 was $2.4 million (February 25, 2018 – $5.7 million).
Option Plan
Options to acquire subordinate voting shares under the Option Plan may be granted to directors, executive officers, employees and consultants of the Company. The options vest annually pro rata on the anniversary of the grant date over a period of five years. All issued options expire after seven years from the date granted.
Transactions for stock options granted under the Option Plan for the years ended March 3, 2019 and February 25, 2018 were as follows:
67
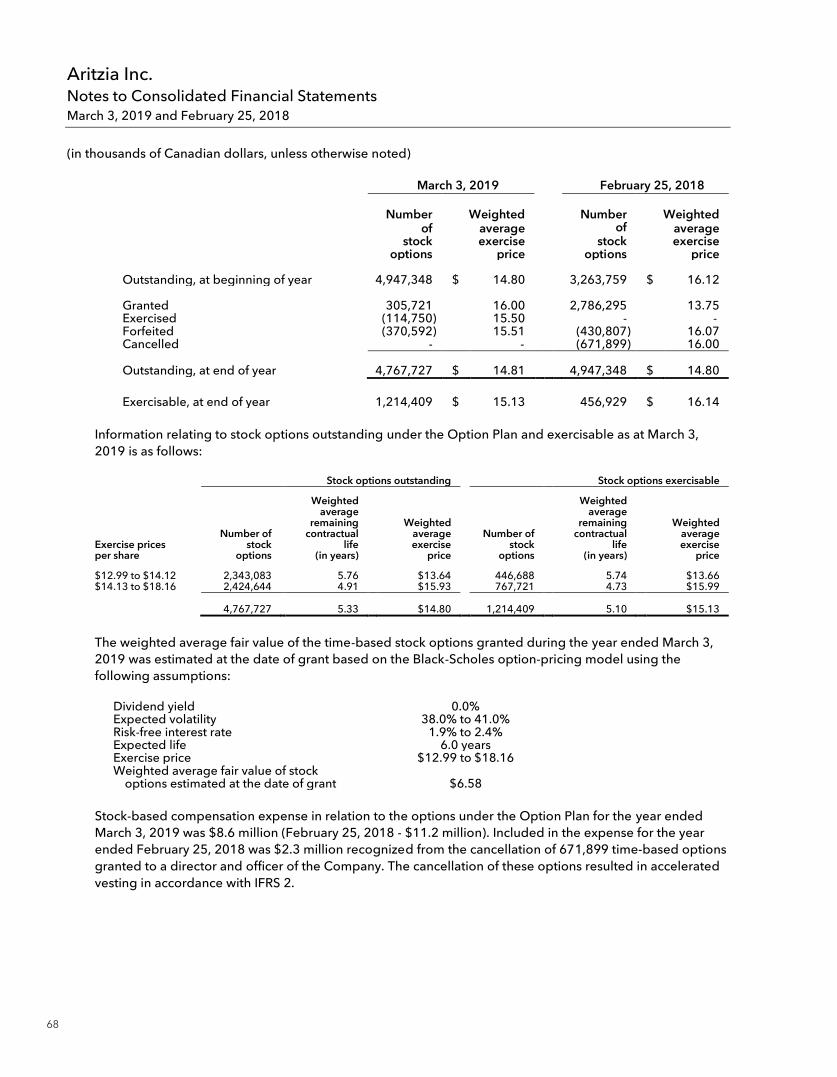
Aritzia Inc. Notes to Consolidated Financial Statements March 3, 2019 and February 25, 2018
(in thousands of Canadian dollars, unless otherwise noted)
(21)
March 3, 2019 February 25, 2018
Number of
stock options
Weighted average exercise
price
Number of
stock options
Weighted average exercise
price
Outstanding, at beginning of year 4,947,348 $ 14.80 3,263,759 $ 16.12
Granted 305,721 16.00 2,786,295 13.75 Exercised (114,750) 15.50 - - Forfeited (370,592) 15.51 (430,807) 16.07 Cancelled - - (671,899) 16.00
Outstanding, at end of year 4,767,727 $ 14.81 4,947,348 $ 14.80
Exercisable, at end of year 1,214,409 $ 15.13 456,929 $ 16.14
Information relating to stock options outstanding under the Option Plan and exercisable as at March 3, 2019 is as follows:
Stock options outstanding Stock options exercisable
Exercise prices per share
Number of stock
options
Weighted average
remaining contractual
life (in years)
Weighted average exercise
price
Number of stock
options
Weighted average
remaining contractual
life (in years)
Weighted average exercise
price
$12.99 to $14.12 2,343,083 5.76 $13.64 446,688 5.74 $13.66 $14.13 to $18.16 2,424,644 4.91 $15.93 767,721 4.73 $15.99 4,767,727 5.33 $14.80 1,214,409 5.10 $15.13
The weighted average fair value of the time-based stock options granted during the year ended March 3, 2019 was estimated at the date of grant based on the Black-Scholes option-pricing model using the following assumptions:
Dividend yield 0.0% Expected volatility 38.0% to 41.0% Risk-free interest rate 1.9% to 2.4% Expected life 6.0 years Exercise price $12.99 to $18.16 Weighted average fair value of stock
options estimated at the date of grant $6.58 Stock-based compensation expense in relation to the options under the Option Plan for the year ended March 3, 2019 was $8.6 million (February 25, 2018 - $11.2 million). Included in the expense for the year ended February 25, 2018 was $2.3 million recognized from the cancellation of 671,899 time-based options granted to a director and officer of the Company. The cancellation of these options resulted in accelerated vesting in accordance with IFRS 2.
68
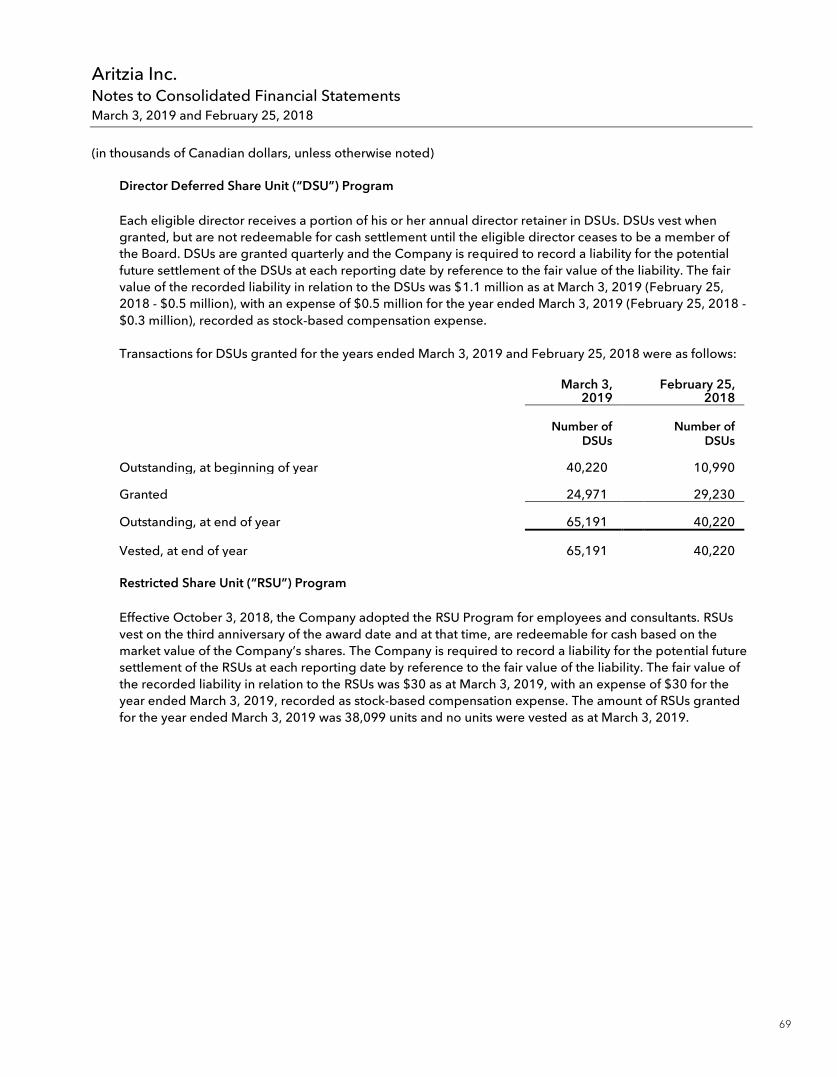
Aritzia Inc. Notes to Consolidated Financial Statements March 3, 2019 and February 25, 2018
(in thousands of Canadian dollars, unless otherwise noted)
(22)
Director Deferred Share Unit (“DSU”) Program
Each eligible director receives a portion of his or her annual director retainer in DSUs. DSUs vest when granted, but are not redeemable for cash settlement until the eligible director ceases to be a member of the Board. DSUs are granted quarterly and the Company is required to record a liability for the potential future settlement of the DSUs at each reporting date by reference to the fair value of the liability. The fair value of the recorded liability in relation to the DSUs was $1.1 million as at March 3, 2019 (February 25, 2018 - $0.5 million), with an expense of $0.5 million for the year ended March 3, 2019 (February 25, 2018 - $0.3 million), recorded as stock-based compensation expense.
Transactions for DSUs granted for the years ended March 3, 2019 and February 25, 2018 were as follows:
March 3,
2019 February 25,
2018
Number of
DSUs Number of
DSUs Outstanding, at beginning of year 40,220 10,990 Granted 24,971 29,230 Outstanding, at end of year 65,191 40,220 Vested, at end of year 65,191 40,220
Restricted Share Unit (“RSU”) Program
Effective October 3, 2018, the Company adopted the RSU Program for employees and consultants. RSUs vest on the third anniversary of the award date and at that time, are redeemable for cash based on the market value of the Company’s shares. The Company is required to record a liability for the potential future settlement of the RSUs at each reporting date by reference to the fair value of the liability. The fair value of the recorded liability in relation to the RSUs was $30 as at March 3, 2019, with an expense of $30 for the year ended March 3, 2019, recorded as stock-based compensation expense. The amount of RSUs granted for the year ended March 3, 2019 was 38,099 units and no units were vested as at March 3, 2019.
69
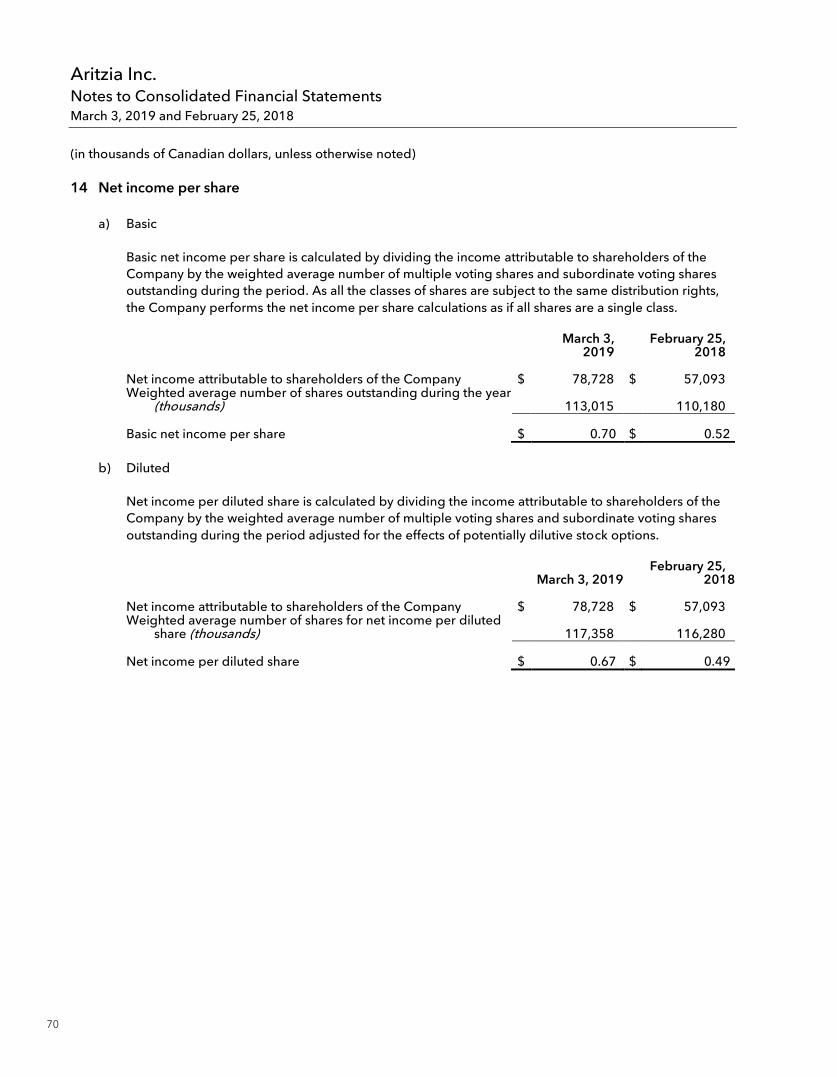
Aritzia Inc. Notes to Consolidated Financial Statements March 3, 2019 and February 25, 2018
(in thousands of Canadian dollars, unless otherwise noted)
(23)
14 Net income per share
a) Basic
Basic net income per share is calculated by dividing the income attributable to shareholders of the Company by the weighted average number of multiple voting shares and subordinate voting shares outstanding during the period. As all the classes of shares are subject to the same distribution rights, the Company performs the net income per share calculations as if all shares are a single class.
March 3,
2019 February 25,
2018
Net income attributable to shareholders of the Company $ 78,728 $ 57,093 Weighted average number of shares outstanding during the year
(thousands) 113,015 110,180
Basic net income per share $ 0.70 $ 0.52
b) Diluted
Net income per diluted share is calculated by dividing the income attributable to shareholders of the Company by the weighted average number of multiple voting shares and subordinate voting shares outstanding during the period adjusted for the effects of potentially dilutive stock options.
March 3, 2019 February 25,
2018
Net income attributable to shareholders of the Company $ 78,728 $ 57,093 Weighted average number of shares for net income per diluted
share (thousands) 117,358 116,280
Net income per diluted share $ 0.67 $ 0.49
70
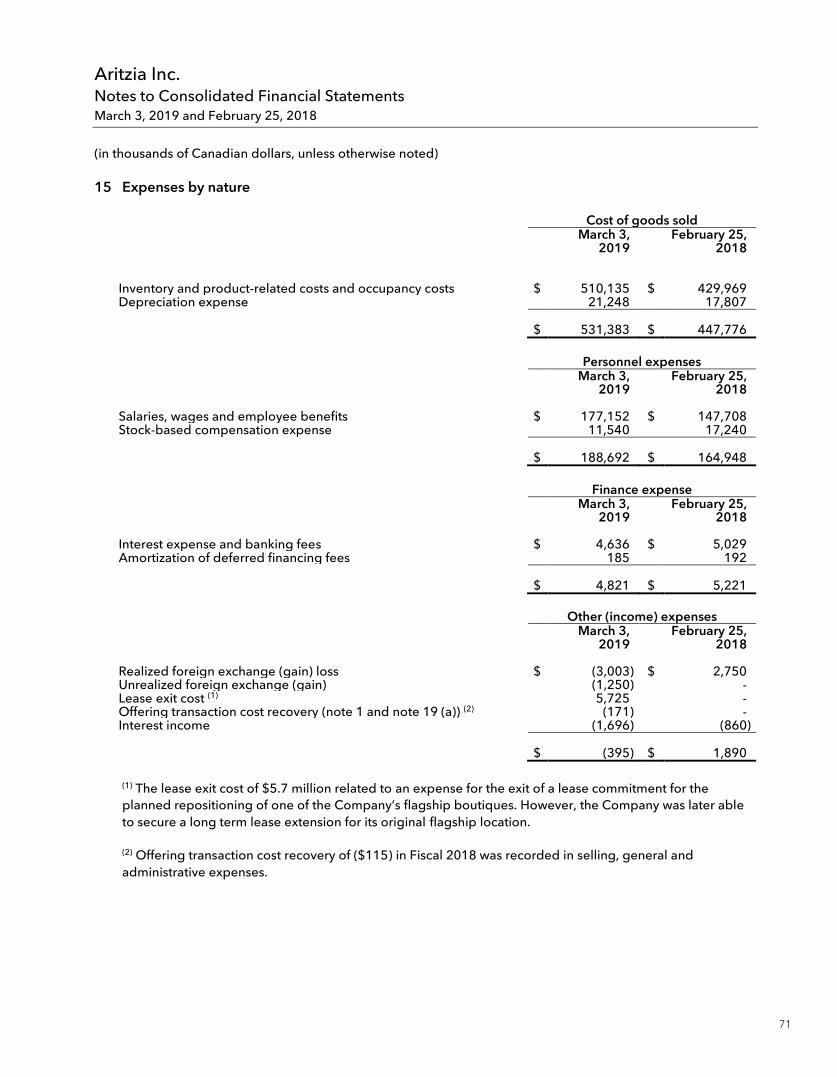
Aritzia Inc. Notes to Consolidated Financial Statements March 3, 2019 and February 25, 2018
(in thousands of Canadian dollars, unless otherwise noted)
(24)
15 Expenses by nature
Cost of goods sold
March 3,
2019 February 25,
2018 Inventory and product-related costs and occupancy costs $ 510,135 $ 429,969 Depreciation expense 21,248 17,807 $ 531,383 $ 447,776
Personnel expenses
March 3,
2019 February 25,
2018 Salaries, wages and employee benefits $ 177,152 $ 147,708 Stock-based compensation expense 11,540 17,240 $ 188,692 $ 164,948
Finance expense
March 3,
2019 February 25,
2018 Interest expense and banking fees $ 4,636 $ 5,029 Amortization of deferred financing fees 185 192 $ 4,821 $ 5,221
Other (income) expenses
March 3,
2019 February 25,
2018 Realized foreign exchange (gain) loss $ (3,003) $ 2,750 Unrealized foreign exchange (gain) (1,250) - Lease exit cost (1) 5,725 - Offering transaction cost recovery (note 1 and note 19 (a)) (2) (171) - Interest income (1,696) (860) $ (395) $ 1,890
(1) The lease exit cost of $5.7 million related to an expense for the exit of a lease commitment for the planned repositioning of one of the Company’s flagship boutiques. However, the Company was later able to secure a long term lease extension for its original flagship location.
(2) Offering transaction cost recovery of ($115) in Fiscal 2018 was recorded in selling, general and administrative expenses.
71
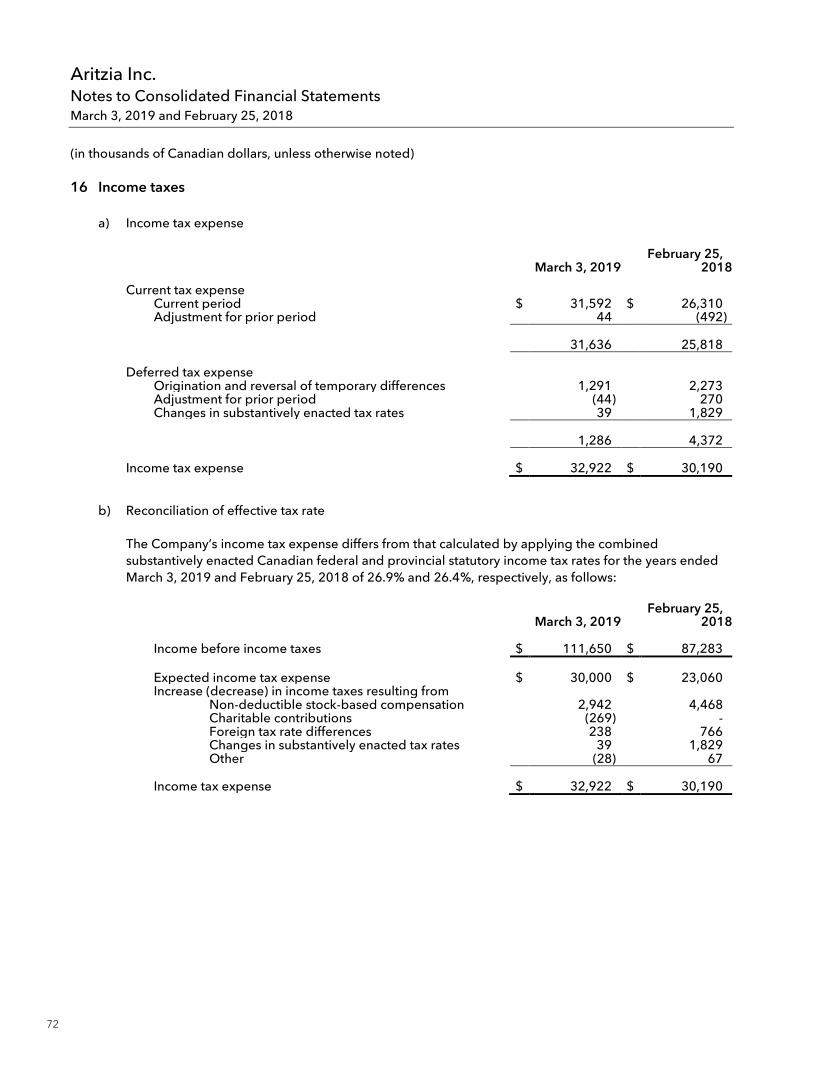
Aritzia Inc. Notes to Consolidated Financial Statements March 3, 2019 and February 25, 2018
(in thousands of Canadian dollars, unless otherwise noted)
(25)
16 Income taxes
a) Income tax expense
March 3, 2019 February 25,
2018
Current tax expense Current period $ 31,592 $ 26,310 Adjustment for prior period 44 (492)
31,636 25,818
Deferred tax expense
Origination and reversal of temporary differences 1,291 2,273 Adjustment for prior period (44) 270 Changes in substantively enacted tax rates 39 1,829
1,286 4,372 Income tax expense $ 32,922 $ 30,190
b) Reconciliation of effective tax rate
The Company’s income tax expense differs from that calculated by applying the combined substantively enacted Canadian federal and provincial statutory income tax rates for the years ended March 3, 2019 and February 25, 2018 of 26.9% and 26.4%, respectively, as follows:
March 3, 2019 February 25,
2018
Income before income taxes $ 111,650 $ 87,283
Expected income tax expense $ 30,000 $ 23,060 Increase (decrease) in income taxes resulting from
Non-deductible stock-based compensation 2,942 4,468 Charitable contributions (269) - Foreign tax rate differences 238 766 Changes in substantively enacted tax rates 39 1,829 Other (28) 67
Income tax expense $ 32,922 $ 30,190
72
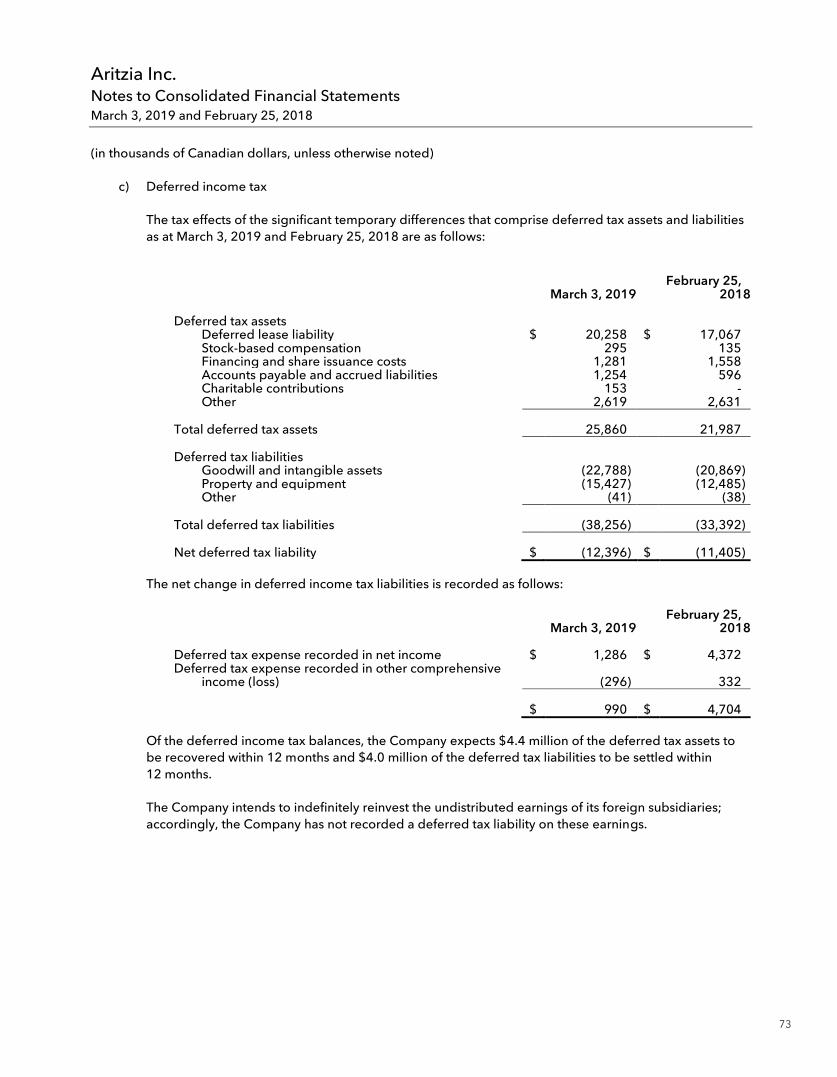
Aritzia Inc. Notes to Consolidated Financial Statements March 3, 2019 and February 25, 2018
(in thousands of Canadian dollars, unless otherwise noted)
(26)
c) Deferred income tax
The tax effects of the significant temporary differences that comprise deferred tax assets and liabilities as at March 3, 2019 and February 25, 2018 are as follows:
March 3, 2019
February 25, 2018
Deferred tax assets
Deferred lease liability $ 20,258 $ 17,067 Stock-based compensation 295 135 Financing and share issuance costs 1,281 1,558 Accounts payable and accrued liabilities 1,254 596 Charitable contributions 153 - Other 2,619 2,631
Total deferred tax assets 25,860 21,987
Deferred tax liabilities
Goodwill and intangible assets (22,788) (20,869) Property and equipment (15,427) (12,485) Other (41) (38)
Total deferred tax liabilities (38,256) (33,392)
Net deferred tax liability $ (12,396) $ (11,405)
The net change in deferred income tax liabilities is recorded as follows:
March 3, 2019 February 25,
2018
Deferred tax expense recorded in net income $ 1,286 $ 4,372 Deferred tax expense recorded in other comprehensive
income (loss) (296) 332 $ 990 $ 4,704
Of the deferred income tax balances, the Company expects $4.4 million of the deferred tax assets to be recovered within 12 months and $4.0 million of the deferred tax liabilities to be settled within 12 months.
The Company intends to indefinitely reinvest the undistributed earnings of its foreign subsidiaries; accordingly, the Company has not recorded a deferred tax liability on these earnings.
73
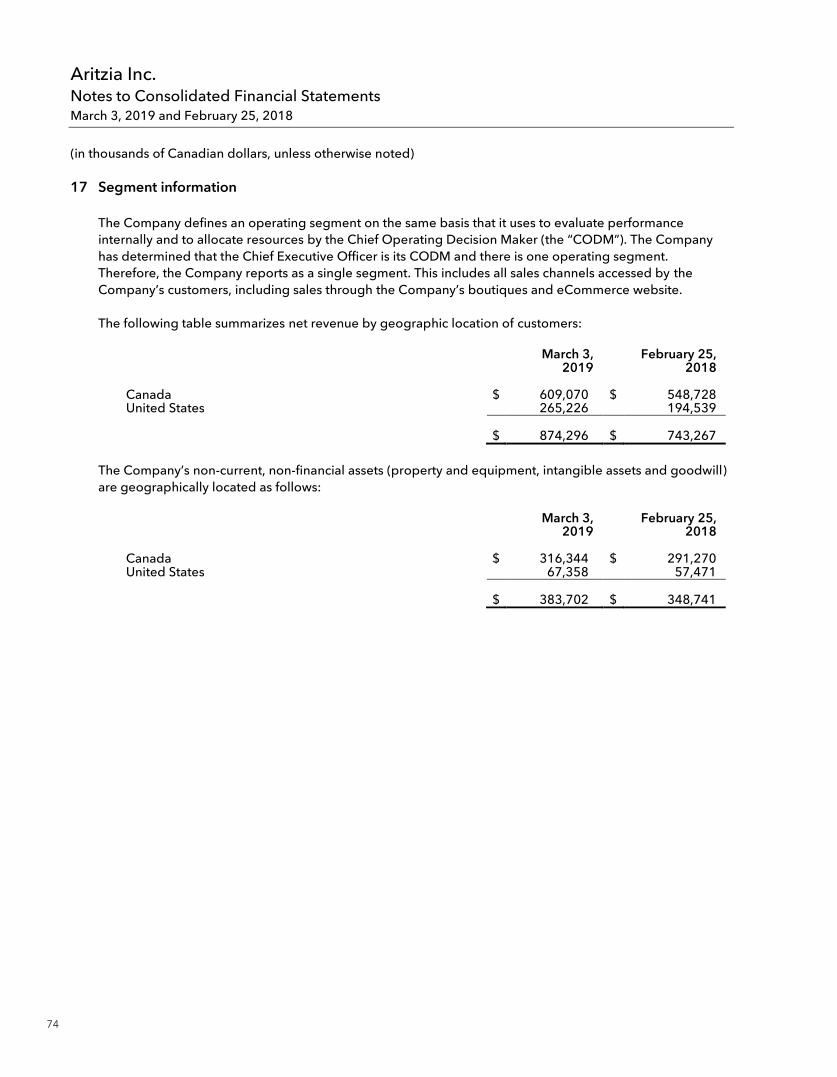
Aritzia Inc. Notes to Consolidated Financial Statements March 3, 2019 and February 25, 2018
(in thousands of Canadian dollars, unless otherwise noted)
(27)
17 Segment information
The Company defines an operating segment on the same basis that it uses to evaluate performance internally and to allocate resources by the Chief Operating Decision Maker (the “CODM”). The Company has determined that the Chief Executive Officer is its CODM and there is one operating segment. Therefore, the Company reports as a single segment. This includes all sales channels accessed by the Company’s customers, including sales through the Company’s boutiques and eCommerce website.
The following table summarizes net revenue by geographic location of customers:
March 3,
2019 February 25,
2018
Canada $ 609,070 $ 548,728 United States 265,226 194,539
$ 874,296 $ 743,267
The Company’s non-current, non-financial assets (property and equipment, intangible assets and goodwill) are geographically located as follows:
March 3,
2019 February 25,
2018
Canada $ 316,344 $ 291,270 United States 67,358 57,471
$ 383,702 $ 348,741
74
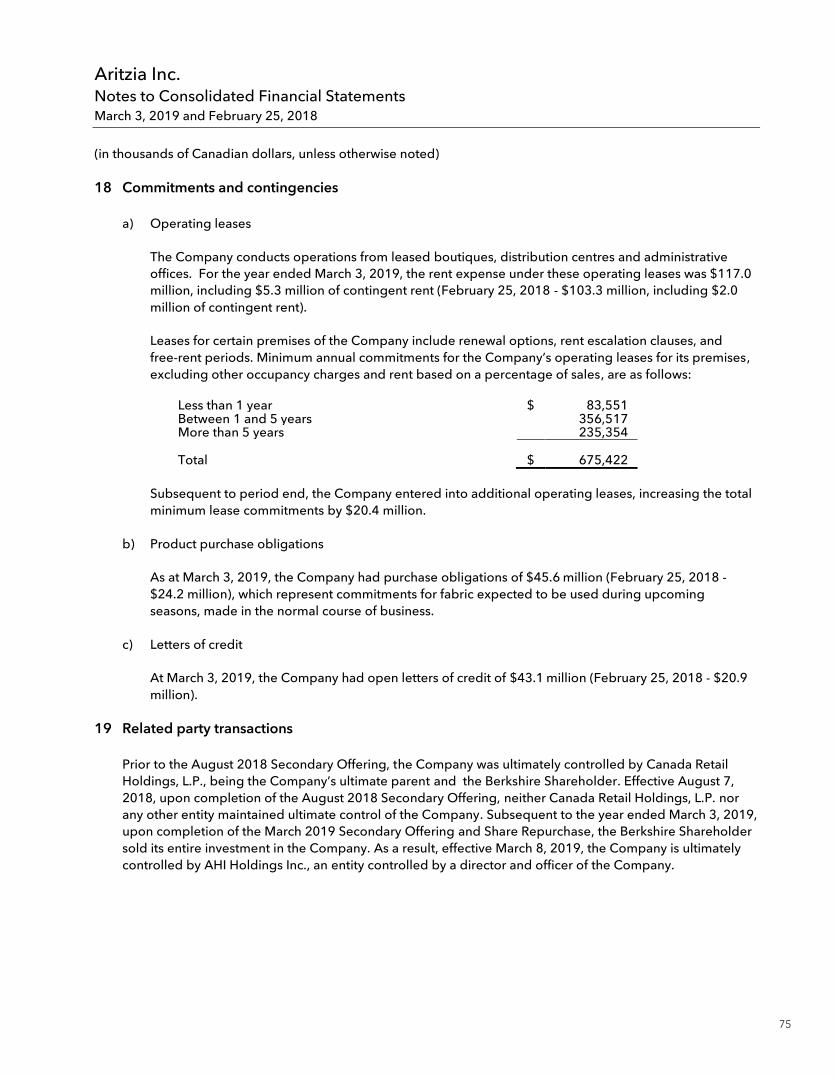
Aritzia Inc. Notes to Consolidated Financial Statements March 3, 2019 and February 25, 2018
(in thousands of Canadian dollars, unless otherwise noted)
(28)
18 Commitments and contingencies
a) Operating leases
The Company conducts operations from leased boutiques, distribution centres and administrative offices. For the year ended March 3, 2019, the rent expense under these operating leases was $117.0 million, including $5.3 million of contingent rent (February 25, 2018 - $103.3 million, including $2.0 million of contingent rent).
Leases for certain premises of the Company include renewal options, rent escalation clauses, and free-rent periods. Minimum annual commitments for the Company’s operating leases for its premises, excluding other occupancy charges and rent based on a percentage of sales, are as follows:
Less than 1 year $ 83,551 Between 1 and 5 years 356,517 More than 5 years 235,354
Total $ 675,422
Subsequent to period end, the Company entered into additional operating leases, increasing the total minimum lease commitments by $20.4 million.
b) Product purchase obligations
As at March 3, 2019, the Company had purchase obligations of $45.6 million (February 25, 2018 - $24.2 million), which represent commitments for fabric expected to be used during upcoming seasons, made in the normal course of business.
c) Letters of credit
At March 3, 2019, the Company had open letters of credit of $43.1 million (February 25, 2018 - $20.9 million).
19 Related party transactions
Prior to the August 2018 Secondary Offering, the Company was ultimately controlled by Canada Retail Holdings, L.P., being the Company’s ultimate parent and the Berkshire Shareholder. Effective August 7, 2018, upon completion of the August 2018 Secondary Offering, neither Canada Retail Holdings, L.P. nor any other entity maintained ultimate control of the Company. Subsequent to the year ended March 3, 2019, upon completion of the March 2019 Secondary Offering and Share Repurchase, the Berkshire Shareholder sold its entire investment in the Company. As a result, effective March 8, 2019, the Company is ultimately controlled by AHI Holdings Inc., an entity controlled by a director and officer of the Company.
75
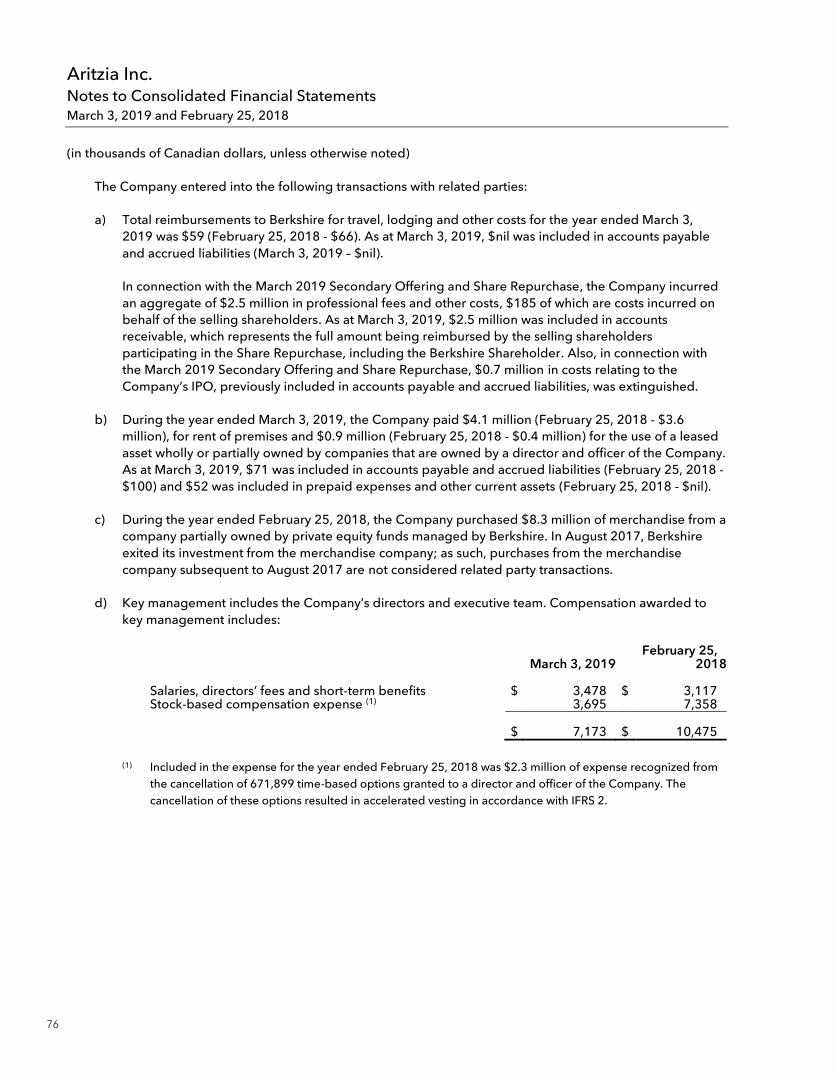
Aritzia Inc. Notes to Consolidated Financial Statements March 3, 2019 and February 25, 2018
(in thousands of Canadian dollars, unless otherwise noted)
(29)
The Company entered into the following transactions with related parties:
a) Total reimbursements to Berkshire for travel, lodging and other costs for the year ended March 3, 2019 was $59 (February 25, 2018 - $66). As at March 3, 2019, $nil was included in accounts payable and accrued liabilities (March 3, 2019 – $nil).
In connection with the March 2019 Secondary Offering and Share Repurchase, the Company incurred an aggregate of $2.5 million in professional fees and other costs, $185 of which are costs incurred on behalf of the selling shareholders. As at March 3, 2019, $2.5 million was included in accounts receivable, which represents the full amount being reimbursed by the selling shareholders participating in the Share Repurchase, including the Berkshire Shareholder. Also, in connection with the March 2019 Secondary Offering and Share Repurchase, $0.7 million in costs relating to the Company’s IPO, previously included in accounts payable and accrued liabilities, was extinguished.
b) During the year ended March 3, 2019, the Company paid $4.1 million (February 25, 2018 - $3.6 million), for rent of premises and $0.9 million (February 25, 2018 - $0.4 million) for the use of a leased asset wholly or partially owned by companies that are owned by a director and officer of the Company. As at March 3, 2019, $71 was included in accounts payable and accrued liabilities (February 25, 2018 - $100) and $52 was included in prepaid expenses and other current assets (February 25, 2018 - $nil).
c) During the year ended February 25, 2018, the Company purchased $8.3 million of merchandise from a company partially owned by private equity funds managed by Berkshire. In August 2017, Berkshire exited its investment from the merchandise company; as such, purchases from the merchandise company subsequent to August 2017 are not considered related party transactions.
d) Key management includes the Company’s directors and executive team. Compensation awarded to key management includes:
March 3, 2019 February 25,
2018
Salaries, directors’ fees and short-term benefits $ 3,478 $ 3,117 Stock-based compensation expense (1) 3,695 7,358
$ 7,173 $ 10,475
(1) Included in the expense for the year ended February 25, 2018 was $2.3 million of expense recognized from the cancellation of 671,899 time-based options granted to a director and officer of the Company. The cancellation of these options resulted in accelerated vesting in accordance with IFRS 2.
76
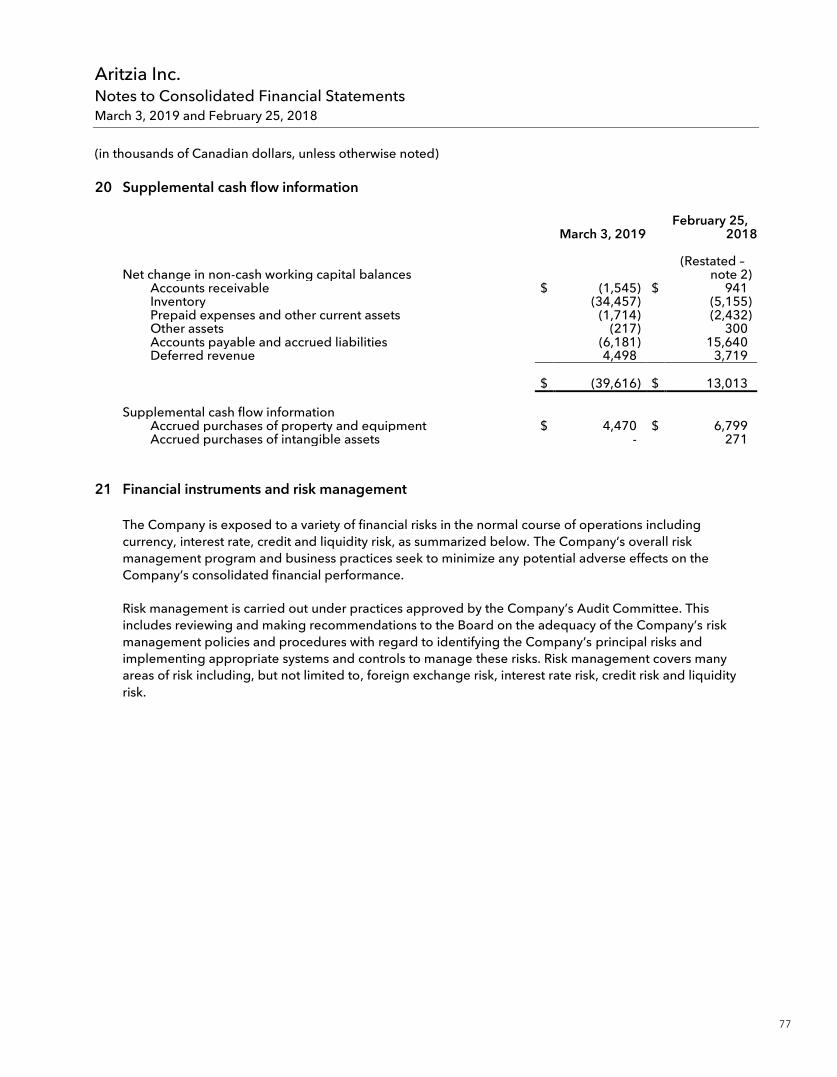
Aritzia Inc. Notes to Consolidated Financial Statements March 3, 2019 and February 25, 2018
(in thousands of Canadian dollars, unless otherwise noted)
(30)
20 Supplemental cash flow information
March 3, 2019 February 25,
2018
Net change in non-cash working capital balances (Restated –
note 2) Accounts receivable $ (1,545) $ 941 Inventory (34,457) (5,155) Prepaid expenses and other current assets (1,714) (2,432) Other assets (217) 300 Accounts payable and accrued liabilities (6,181) 15,640 Deferred revenue 4,498 3,719
$ (39,616) $ 13,013
Supplemental cash flow information Accrued purchases of property and equipment $ 4,470 $ 6,799 Accrued purchases of intangible assets - 271
21 Financial instruments and risk management
The Company is exposed to a variety of financial risks in the normal course of operations including currency, interest rate, credit and liquidity risk, as summarized below. The Company’s overall risk management program and business practices seek to minimize any potential adverse effects on the Company’s consolidated financial performance.
Risk management is carried out under practices approved by the Company’s Audit Committee. This includes reviewing and making recommendations to the Board on the adequacy of the Company’s risk management policies and procedures with regard to identifying the Company’s principal risks and implementing appropriate systems and controls to manage these risks. Risk management covers many areas of risk including, but not limited to, foreign exchange risk, interest rate risk, credit risk and liquidity risk.
77
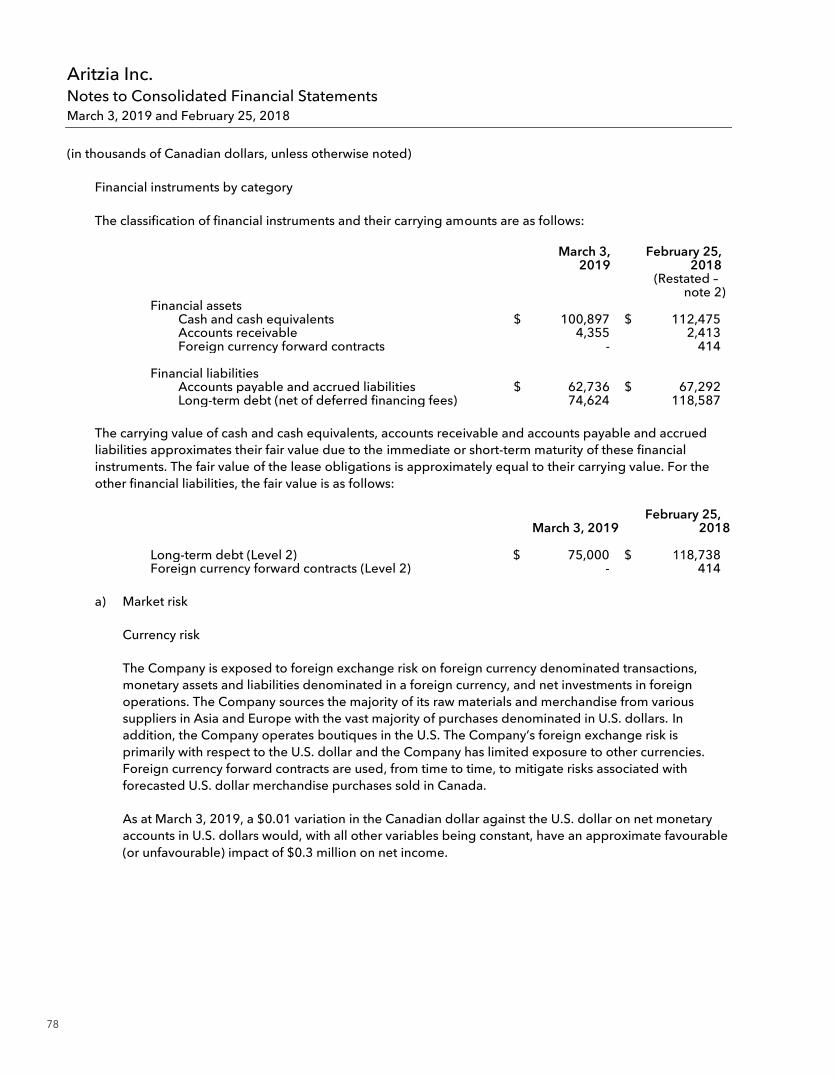
Aritzia Inc. Notes to Consolidated Financial Statements March 3, 2019 and February 25, 2018
(in thousands of Canadian dollars, unless otherwise noted)
(31)
Financial instruments by category
The classification of financial instruments and their carrying amounts are as follows:
March 3,
2019 February 25,
2018
(Restated –
note 2) Financial assets
Cash and cash equivalents $ 100,897 $ 112,475 Accounts receivable 4,355 2,413 Foreign currency forward contracts - 414
Financial liabilities
Accounts payable and accrued liabilities $ 62,736 $ 67,292 Long-term debt (net of deferred financing fees) 74,624 118,587
The carrying value of cash and cash equivalents, accounts receivable and accounts payable and accrued liabilities approximates their fair value due to the immediate or short-term maturity of these financial instruments. The fair value of the lease obligations is approximately equal to their carrying value. For the other financial liabilities, the fair value is as follows:
March 3, 2019 February 25,
2018
Long-term debt (Level 2) $ 75,000 $ 118,738 Foreign currency forward contracts (Level 2) - 414
a) Market risk
Currency risk
The Company is exposed to foreign exchange risk on foreign currency denominated transactions, monetary assets and liabilities denominated in a foreign currency, and net investments in foreign operations. The Company sources the majority of its raw materials and merchandise from various suppliers in Asia and Europe with the vast majority of purchases denominated in U.S. dollars. In addition, the Company operates boutiques in the U.S. The Company’s foreign exchange risk is primarily with respect to the U.S. dollar and the Company has limited exposure to other currencies. Foreign currency forward contracts are used, from time to time, to mitigate risks associated with forecasted U.S. dollar merchandise purchases sold in Canada.
As at March 3, 2019, a $0.01 variation in the Canadian dollar against the U.S. dollar on net monetary accounts in U.S. dollars would, with all other variables being constant, have an approximate favourable (or unfavourable) impact of $0.3 million on net income.
78
Aritzia Inc. Notes to Consolidated Financial Statements March 3, 2019 and February 25, 2018
(in thousands of Canadian dollars, unless otherwise noted)
(32)
Interest rate risk
The Company is exposed to changes in interest rates on its cash and cash equivalents, bank indebtedness and long-term debt. Debt issued at variable rates exposes the Company to cash flow interest rate risk. Debt issued at fixed rates exposes the Company to fair value interest rate risk. During the year, the Company had only variable rate debt. An increase (or decrease) in interest rate by 1% would result in an increase (or decrease) of $0.9 million in interest expense on the Credit Facilities.
b) Credit risk
Credit risk is the risk of an unexpected loss if a counterparty to a financial instrument fails to meet its contractual obligations. Financial instruments that potentially subject the Company to credit risk consist of cash and cash equivalents, accounts receivable, and derivative contracts used to hedge market risks. The Company offsets credit risks associated with cash and cash equivalents by depositing its cash and cash equivalents with major financial institutions that have been assigned high credit ratings by internationally recognized credit rating agencies. The Company is exposed to credit risk on accounts receivable from its landlords for tenant allowances. To reduce this risk, the Company enters into leases with landlords with established credit history and, for certain leases, the Company may offset rent payments until accounts receivable are fully satisfied. The Company only enters into derivative contracts with major financial institutions, as described above, for the purchase of its foreign currency forward contracts.
c) Liquidity risk
Liquidity risk is the risk that the Company cannot meet a demand for cash or fund its obligations as they come due. Liquidity risk also includes the risk of not being able to liquidate assets in a timely manner at a reasonable price. The Company manages liquidity risk through various means, including monitoring actual and projected cash flows, taking into account the seasonality of its revenue, income and working capital needs. The Company’s revolving credit facility is used to maintain liquidity. As at March 3, 2019, the Company had available credit of $100.0 million (February 25, 2018 - $70.0 million) under its revolving credit facility, of which $nil (February 25, 2018 - $nil) was drawn, and had no outstanding letters of credit (February 25, 2018 - $15.9 million of outstanding letters of credit, which reduced the availability under the revolving credit facility). Any amount drawn under this credit facility is presented as bank indebtedness in current liabilities based on the Company’s estimate of what it expects to settle in the next 12 months (note 10). As at March 3, 2019, the Company also had available credit of $75.0 million under trade finance agreements (February 25, 2018 – $75.0 million), of which $43.1 million of letters of credit were outstanding (February 25, 2018 – $5.0 million).
79
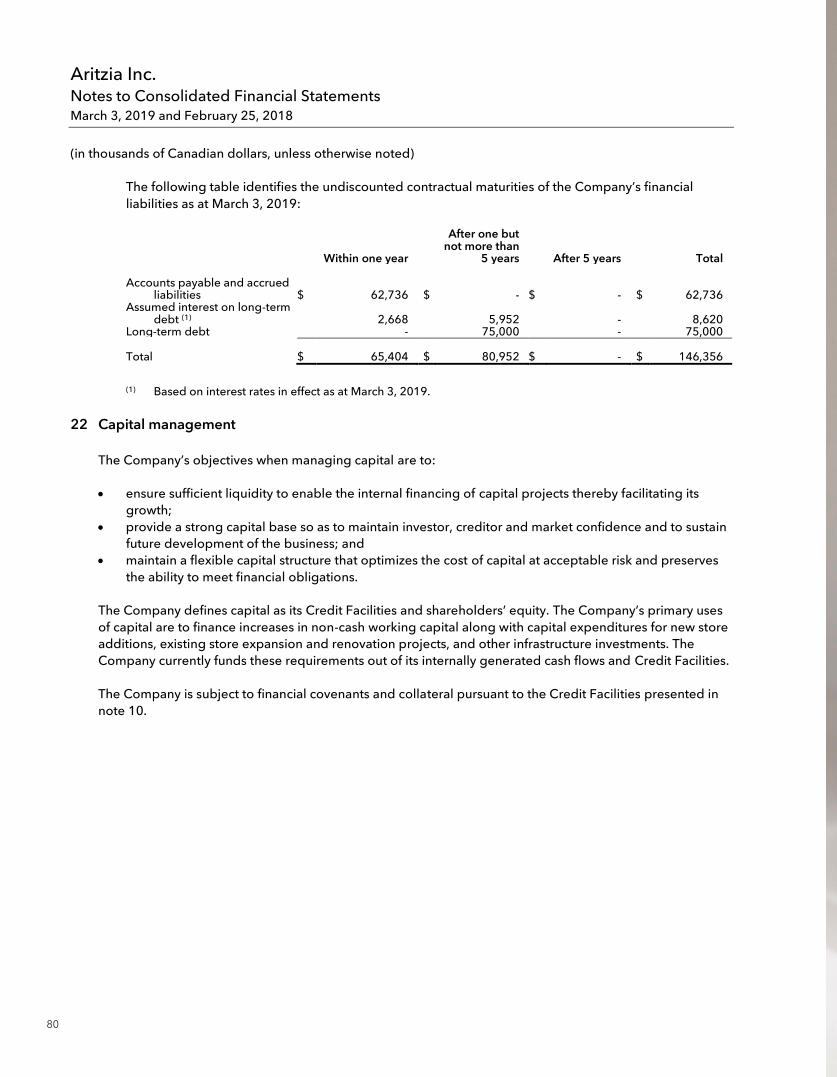
Aritzia Inc. Notes to Consolidated Financial Statements March 3, 2019 and February 25, 2018
(in thousands of Canadian dollars, unless otherwise noted)
(33)
The following table identifies the undiscounted contractual maturities of the Company’s financial liabilities as at March 3, 2019:
Within one year
After one but not more than
5 years After 5 years Total
Accounts payable and accrued liabilities $ 62,736 $ - $ - $ 62,736
Assumed interest on long-term debt (1) 2,668 5,952 - 8,620
Long-term debt - 75,000 - 75,000
Total $ 65,404 $ 80,952 $ - $ 146,356
(1) Based on interest rates in effect as at March 3, 2019.
22 Capital management
The Company’s objectives when managing capital are to:
ensure sufficient liquidity to enable the internal financing of capital projects thereby facilitating its growth;
provide a strong capital base so as to maintain investor, creditor and market confidence and to sustain future development of the business; and
maintain a flexible capital structure that optimizes the cost of capital at acceptable risk and preserves the ability to meet financial obligations.
The Company defines capital as its Credit Facilities and shareholders’ equity. The Company’s primary uses of capital are to finance increases in non-cash working capital along with capital expenditures for new store additions, existing store expansion and renovation projects, and other infrastructure investments. The Company currently funds these requirements out of its internally generated cash flows and Credit Facilities.
The Company is subject to financial covenants and collateral pursuant to the Credit Facilities presented in note 10.
80