View more Maersk drilling Rig Fleet Maersk Drilling supports global ...

Annual Report 2019

Table of contents
03 Directors’ report03 Overview
04 Letters from the Chairman and the CEO
07 Maersk Drilling 2019 at a glance
08 Five-year summary
10 Segment overview
12 Outlook for 2020
13 Business
14 Maersk Drilling and the oil and gas industry
15 Industry landscape
16 Business model
18 Market and strategy
23 Financial policy and capital allocation
24 Organisation and people
26 Sustainability
27 Climate and energy
29 Safe and responsible Drilling
30 Financial review
31 Financial performance in 2019
33 Segment performance
35 Revenue backlog
The Annual Report of The Drilling Company of 1972 A/S (referred to as “Maersk Drilling” or the “Group” when referring to the consolidated group of companies and the “Company” when referring to the parent company) comprises consolidated financial statements prepared in accordance with International Financial Reporting Standards (IFRS) as adopted by the EU and further requirements in the Danish Financial Statements Act, and Parent Company Financial Statements prepared in accordance with the Danish Financial Statements Act.
Forward-looking statementsThe Annual Report contains forward-looking statements and certain third-party data and information. Reference is made to the important notice in respect of forward-looking statements and third-party data and information included on page 102.
Comparative figuresUnless otherwise stated, all figures in parenthesis refer to the corresponding figures for the previous year. 1 Part of Directors’ report
2 Part of Financials
Business, page 13
36 Governance and risk
37 Corporate governance
41 Board of Directors
44 Executive Management
45 Remuneration
47 Risk management
50 Shareholder information
52 Financials53 Consolidated financial statements
84 Parent Company financial statements
93 Statement of the Board of Directors
and the Executive Management
94 Independent Auditor’s Report
97 Additional information98 Quarterly highlights 1
99 Fleet Status Report 1
100 Company overview2
101 Definition of terms
02Maersk Drilling Annual Report 2019

Directors’ report
Overview 04Business 13Sustainability 26Financial review 30Governance and risk 36
03Directors’ reportMaersk Drilling Annual Report 2019 Overview Business Sustainability Financial review Governance and risk
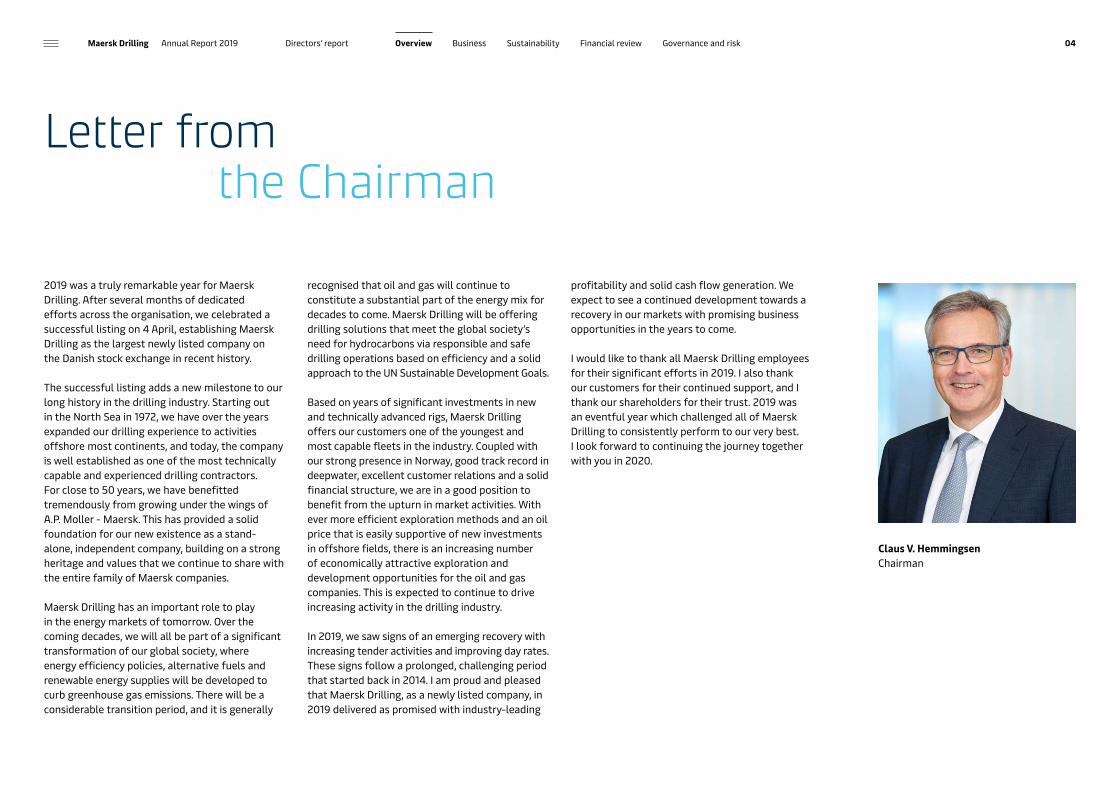
Letter from the Chairman
2019 was a truly remarkable year for Maersk Drilling. After several months of dedicated efforts across the organisation, we celebrated a successful listing on 4 April, establishing Maersk Drilling as the largest newly listed company on the Danish stock exchange in recent history.
The successful listing adds a new milestone to our long history in the drilling industry. Starting out in the North Sea in 1972, we have over the years expanded our drilling experience to activities offshore most continents, and today, the company is well established as one of the most technically capable and experienced drilling contractors. For close to 50 years, we have benefitted tremendously from growing under the wings of A.P. Moller - Maersk. This has provided a solid foundation for our new existence as a stand-alone, independent company, building on a strong heritage and values that we continue to share with the entire family of Maersk companies.
Maersk Drilling has an important role to play in the energy markets of tomorrow. Over the coming decades, we will all be part of a significant transformation of our global society, where energy efficiency policies, alternative fuels and renewable energy supplies will be developed to curb greenhouse gas emissions. There will be a considerable transition period, and it is generally
recognised that oil and gas will continue to constitute a substantial part of the energy mix for decades to come. Maersk Drilling will be offering drilling solutions that meet the global society’s need for hydrocarbons via responsible and safe drilling operations based on efficiency and a solid approach to the UN Sustainable Development Goals. Based on years of significant investments in new and technically advanced rigs, Maersk Drilling offers our customers one of the youngest and most capable fleets in the industry. Coupled with our strong presence in Norway, good track record in deepwater, excellent customer relations and a solid financial structure, we are in a good position to benefit from the upturn in market activities. With ever more efficient exploration methods and an oil price that is easily supportive of new investments in offshore fields, there is an increasing number of economically attractive exploration and development opportunities for the oil and gas companies. This is expected to continue to drive increasing activity in the drilling industry.
In 2019, we saw signs of an emerging recovery with increasing tender activities and improving day rates. These signs follow a prolonged, challenging period that started back in 2014. I am proud and pleased that Maersk Drilling, as a newly listed company, in 2019 delivered as promised with industry-leading
profitability and solid cash flow generation. We expect to see a continued development towards a recovery in our markets with promising business opportunities in the years to come.
I would like to thank all Maersk Drilling employees for their significant efforts in 2019. I also thank our customers for their continued support, and I thank our shareholders for their trust. 2019 was an eventful year which challenged all of Maersk Drilling to consistently perform to our very best. I look forward to continuing the journey together with you in 2020.
Claus V. HemmingsenChairman
Directors’ report Overview Business Sustainability Financial review Governance and risk 04Maersk Drilling Annual Report 2019

Letter from the CEO
2019 marked the end of an era and the beginning of a new exciting chapter in the history of Maersk Drilling. Building on our strong heritage and values, we established new functions and priorities as we began life as an independent company. I am proud that we maintained our profitability guidance throughout our first year as a separately listed company and delivered as promised to our shareholders. In the separation process from A.P. Moller - Maersk, it was critically important to maintain our focus on delivering the strong operational performance that Maersk Drilling is known for. In the end, this is what creates value for our customers and for our shareholders. With a financial uptime of 98.9% in 2019, we, once again, confirmed our ability to perform efficient drilling operations to the benefit of our customers’ campaign efficiency. Our North Sea jack-ups performed particularly well with a financial uptime of 99.6%. Safety remained a number one priority for Maersk Drilling in 2019. We saw an overall declining trend in the incident frequency, however with two serious injuries. This is not satisfactory. It is our ambition to bring the number of serious incidents to zero, and we firmly believe that this
is achievable. Already now, we see a decreasing average severity of incidents, which is a testament to the unwavering commitment to creating a safe working environment for our employees, day and night, all year round. The expected pick-up in the offshore drilling market started to materialise in 2019 with rising tender activity as well as increased utilisation and day rates. In 2019, Maersk Drilling’s fleet utilisation increased to 77% from 69% the year before. The total number of new contracts increased from 12 in 2018 to 14 in 2019, and the number of contract extensions grew from 13 in 2018 to 16 in 2019. In total, we added USD 828m to our revenue backlog, compared to USD 503m in 2018. At year-end, our backlog was USD 2.1bn, compared to USD 2.5bn at the end of 2018, impacted over the year by expiring legacy contracts entered into at higher day rates before the market downturn. I am pleased with Maersk Drilling’s ability to perform in a market still characterised by relatively short contracts. During 2019, we performed 12 successful rig mobilisations. This was one of many operational successes which contributed to the satisfaction of our customers who gave Maersk Drilling an average customer satisfaction score of 6.5 out of 7.
In the face of the changing market conditions, Maersk Drilling continues to reap the benefits of this strong customer focus. With our well-established long-term relationships with some of the world’s most prominent energy companies, we are able to further enhance our capacity to deliver end-to-end solutions to our customers. In 2019, we decided to re-organise our commercial, technical and operational functions. They are now part of a combined Operations function with the ambition to create a seamless integration of customer solutions. With this significant organisational change, we will be even better positioned to pursue our strategic ambition of Smarter Drilling for Better Value. Maersk Drilling wants to take on an expanded role in the well construction process and establish better planning, execution and orchestration of drilling campaigns. We aim to improve the overall project economics for our customers by combining our leading offshore drilling services with new business models and partnerships.
Jørn MadsenCEO
Directors’ report Overview Business Sustainability Financial review Governance and risk 05Maersk Drilling Annual Report 2019

In 2019, we saw the first tangible results of our new strategic approach. Under the alliance with Aker BP and Halliburton, we achieved average cost and time savings in the range of 5–10%, and in the most successful projects, we have achieved savings above 30%. As we build on these experiences and deepen the collaboration in the alliance, we expect to deliver even more value to our customers and to our shareholders. In 2019, we sold Mærsk Giant and Maersk Completer, continuing our focus and strengthening our offering of high-specification assets to our primary target markets – the harsh, ultra-harsh and deepwater segments. With one of the youngest and technically most advanced fleets in the industry, Maersk Drilling is strongly positioned to benefit further from the market upturn in the years to come and our solid financial position enables us to pursue attractive investment opportunities.
At present, our industry is undergoing a radical transformation and so is Maersk Drilling. I have been impressed by our people’s ability to face these challenges and continuously deliver a successful performance in a year where the separate listing of the company added many new tasks to our daily operations. The new tasks and challenges have been met with an abundance of courage, competence and curiosity. Thank you!
Directors’ report Overview Business Sustainability Financial review Governance and risk 06Maersk Drilling Annual Report 2019

Maersk Drilling 2019 at a glance
1.2 Revenue 2019 (USD billion)
22 Number of rigs
2.1 Revenue backlog 2019 (USD billion)
415 EBITDA before special items 2019 (USD million) (34% margin)
~2,850 Employees
6.5 out of 7Customer satisfaction, 2019
2Low-emission rigs commissioned for upgrade
98.9%Financial uptime 2019
0.75Lost-time incidents frequency (based on man hours)
109 Adjusted Free Cash Flow 2019 (USD million)
309 Capex 2019 (USD million)
Young and technically advanced fleet Median fleet age of 11 years
Separately listed Demerger and listing
Maersk Drilling supports the global oil and gas industry by providing high-efficiency drilling services to oil and gas companies around the world.
North Sea Africa Asia Rest of the world
Geographical presence by revenue 2019
66%
8%4%
22%
Directors’ report Overview Business Sustainability Financial review Governance and risk 07Maersk Drilling Annual Report 2019
Five-year summary
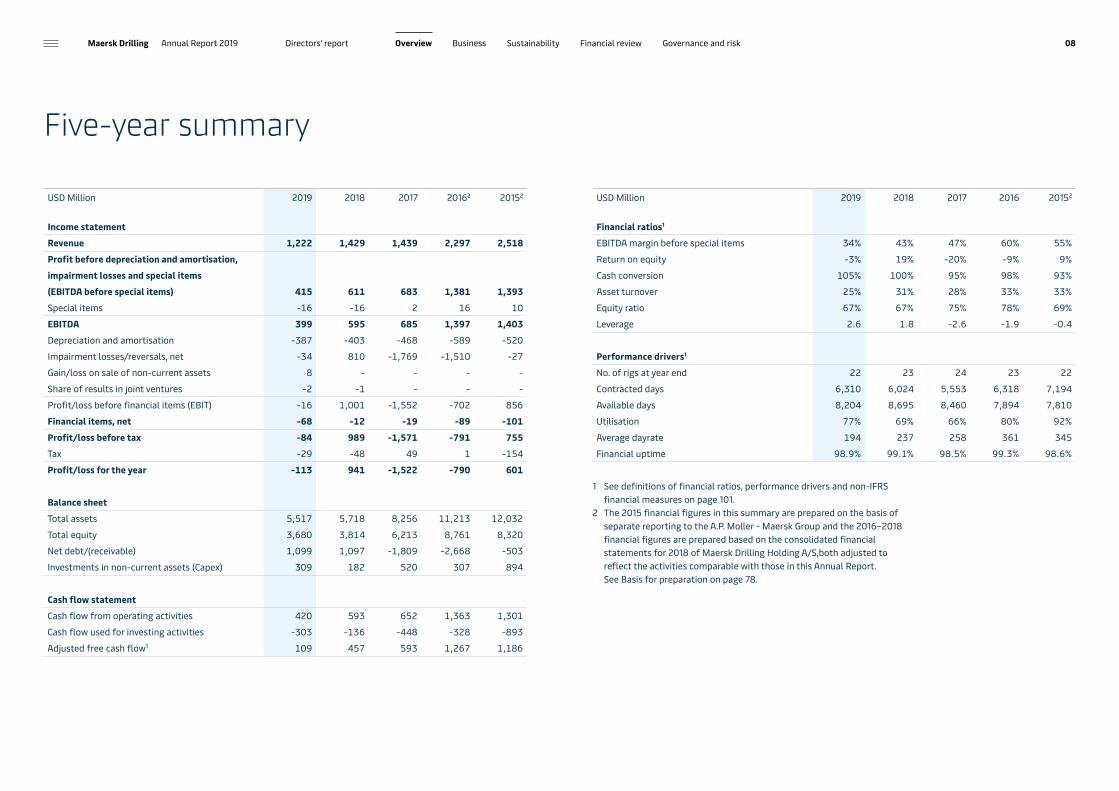
USD Million 2019 2018 2017 2016² 2015²
Income statementRevenue 1,222 1,429 1,439 2,297 2,518Profit before depreciation and amortisation,impairment losses and special items(EBITDA before special items) 415 611 683 1,381 1,393Special items -16 -16 2 16 10EBITDA 399 595 685 1,397 1,403Depreciation and amortisation -387 -403 -468 -589 -520Impairment losses/reversals, net -34 810 -1,769 -1,510 -27Gain/loss on sale of non-current assets 8 - - - - Share of results in joint ventures -2 -1 - - - Profit/loss before financial items (EBIT) -16 1,001 -1,552 -702 856Financial items, net -68 -12 -19 -89 -101Profit/loss before tax -84 989 -1,571 -791 755Tax -29 -48 49 1 -154Profit/loss for the year -113 941 -1,522 -790 601
Balance sheetTotal assets 5,517 5,718 8,256 11,213 12,032Total equity 3,680 3,814 6,213 8,761 8,320Net debt/(receivable) 1,099 1,097 -1,809 -2,668 -503Investments in non-current assets (Capex) 309 182 520 307 894
Cash flow statementCash flow from operating activities 420 593 652 1,363 1,301Cash flow used for investing activities -303 -136 -448 -328 -893Adjusted free cash flow¹ 109 457 593 1,267 1,186
USD Million 2019 2018 2017 2016 2015²
Financial ratios¹EBITDA margin before special items 34% 43% 47% 60% 55%Return on equity -3% 19% -20% -9% 9%Cash conversion 105% 100% 95% 98% 93%Asset turnover 25% 31% 28% 33% 33%Equity ratio 67% 67% 75% 78% 69%Leverage 2.6 1.8 -2.6 -1.9 -0.4
Performance drivers¹No. of rigs at year end 22 23 24 23 22Contracted days 6,310 6,024 5,553 6,318 7,194Available days 8,204 8,695 8,460 7,894 7,810Utilisation 77% 69% 66% 80% 92%Average dayrate 194 237 258 361 345Financial uptime 98.9% 99.1% 98.5% 99.3% 98.6%
1 See definitions of financial ratios, performance drivers and non-IFRS financial measures on page 101.
2 The 2015 financial figures in this summary are prepared on the basis of separate reporting to the A.P. Moller - Maersk Group and the 2016–2018 financial figures are prepared based on the consolidated financial statements for 2018 of Maersk Drilling Holding A/S,both adjusted to reflect the activities comparable with those in this Annual Report. See Basis for preparation on page 78.
Directors’ report Overview Business Sustainability Financial review Governance and risk 08Maersk Drilling Annual Report 2019

Five-year summary
0
300
600
900
1,200
1,500
109
1,267
593457
1,186
2015
USDm
2016 2017 2018 20190
400
800
1,200
1,600
2,000
415
1,381
683 611
1,393
2015
USDm
2016 2017 2018 2019
55% 60%47% 43%
34%
0
200
400
600
800
1,000
22816
2888
23
329115134
477
513
2020 2021
USDm
2022 2023+
1,013
625
249 244
Adjusted free cash flow ² EBITDA in USDm EBITDA in % of revenue
North Sea jack-ups International floaters Other
Free cash flowEBITDA¹
Revenue backlog
1 EBITDA before special items2 Adjusted Free Cash Flow defined as cash flow from operating activities less cash flow used for investing activities,
adjusted for newbuild cash flow and proceeds from the divestment of assets or activities.
0.0
0.5
1.0
1.5
2.0
2.5
3.0
2.49
0.75
2.75
0.92
2.662.44
0.530.49
2.07
0.31
2015 2016 2017 2018 2019
Lost Time Injury frequency Total recordable case frequency
Safety performance
Directors’ report Overview Business Sustainability Financial review Governance and risk 09Maersk Drilling Annual Report 2019
Segment overview
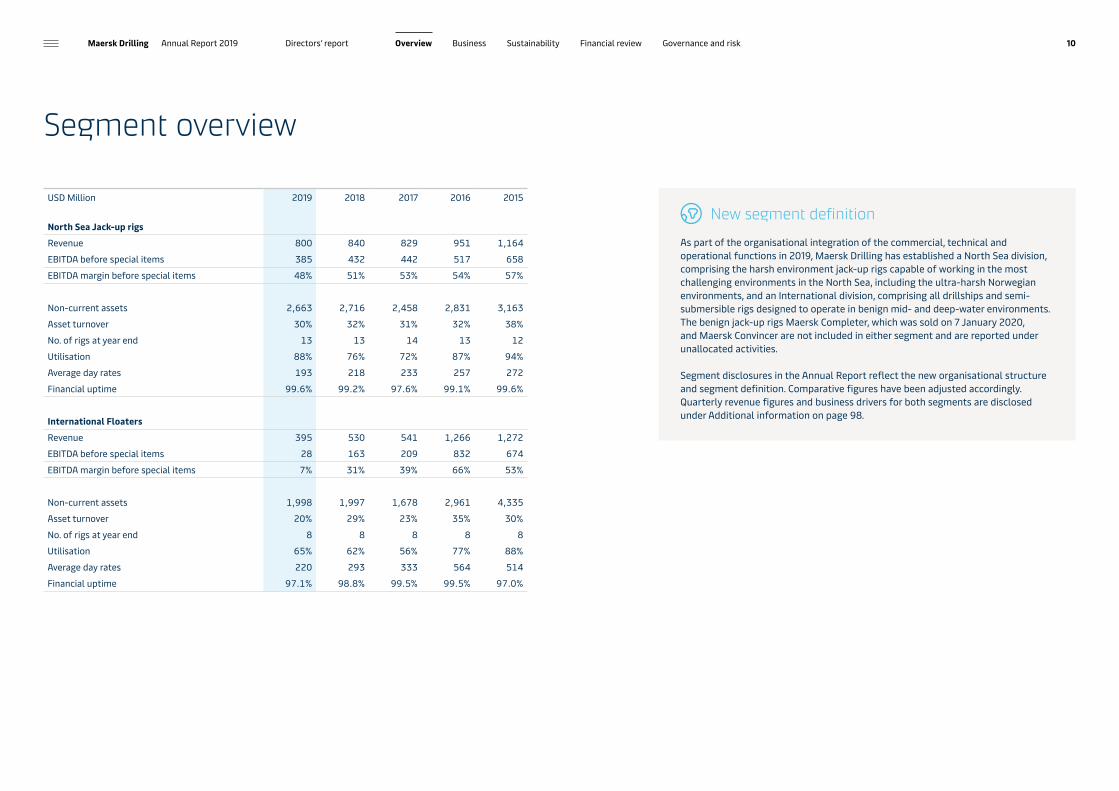
New segment definitionAs part of the organisational integration of the commercial, technical and operational functions in 2019, Maersk Drilling has established a North Sea division, comprising the harsh environment jack-up rigs capable of working in the most challenging environments in the North Sea, including the ultra-harsh Norwegian environments, and an International division, comprising all drillships and semi-submersible rigs designed to operate in benign mid- and deep-water environments. The benign jack-up rigs Maersk Completer, which was sold on 7 January 2020, and Maersk Convincer are not included in either segment and are reported under unallocated activities.
Segment disclosures in the Annual Report reflect the new organisational structure and segment definition. Comparative figures have been adjusted accordingly. Quarterly revenue figures and business drivers for both segments are disclosed under Additional information on page 98.
USD Million 2019 2018 2017 2016 2015
North Sea Jack-up rigsRevenue 800 840 829 951 1,164EBITDA before special items 385 432 442 517 658EBITDA margin before special items 48% 51% 53% 54% 57%
Non-current assets 2,663 2,716 2,458 2,831 3,163Asset turnover 30% 32% 31% 32% 38%No. of rigs at year end 13 13 14 13 12Utilisation 88% 76% 72% 87% 94%Average day rates 193 218 233 257 272Financial uptime 99.6% 99.2% 97.6% 99.1% 99.6%
International FloatersRevenue 395 530 541 1,266 1,272EBITDA before special items 28 163 209 832 674EBITDA margin before special items 7% 31% 39% 66% 53%
Non-current assets 1,998 1,997 1,678 2,961 4,335Asset turnover 20% 29% 23% 35% 30%No. of rigs at year end 8 8 8 8 8Utilisation 65% 62% 56% 77% 88%Average day rates 220 293 333 564 514Financial uptime 97.1% 98.8% 99.5% 99.5% 97.0%
Directors’ report Overview Business Sustainability Financial review Governance and risk 10Maersk Drilling Annual Report 2019

Segment overview
0
2,000
4,000
6,000
8,000
10,00094%
87%
72%76%
88%
4,6884,148
5,0494,9593,7064,051 3,564
4,2424,287 3,851
2015 2016 2017 2018 2019
0
2,000
4,000
6,000
8,000
10,00088%
56%
77%
65%62%
2,7861,797
2,9162,9202,9202,2462,474
1,6242,807
1,808
2015 2016 2017 2018 2019
Available days Contracted days Utilisation North Sea jack-ups International floaters Total
North Sea jack-ups International floaters Total Available days Contracted days Utilisation
North Sea jack-ups Average day rate
Financial uptimeInternational floaters
0
150
300
450
600
272
514
345
257
564
361
233
333258
218293
237193 220 194
20162015 20182017 2019
USDk
0
25
50
75
10099.6 97.0 98.6 99.1 99.5 99.3 97.6 99.5 98.5 99.2 98.8 99.1 99.6 97.1 98.9
20162015 20182017 2019
%
Directors’ report Overview Business Sustainability Financial review Governance and risk 11Maersk Drilling Annual Report 2019

Outlook for 2020
For 2020, we expect profit before depreciation and amortisation, impairment losses/reversals and special items (EBITDA before special items) in the range of USD 400–450m.
Capital expenditures are expected to be in the range of USD 150–200m.
The profitability guidance for 2020 is partly secured through the current contract backlog. Achieving the 2020 guidance requires that additional contracts are secured within both the North Sea and International divisions.
The secured contract revenue backlog for 2020 is overall on par with the revenue backlog when entering 2019. However, the secured backlog per segment is different with revenue backlog for 2020 in the North Sea segment of USD 513m and USD 477m in the International segment compared to USD 714m and USD 288m, respectively, for 2019. The different segment split reflects the rolling
off of legacy contracts in the North Sea and the strong contract backlog secured during 2019 for the International floaters.
Sensitivity guidanceOur guidance for 2020 is subject to risks and uncertainties as various factors, many of which are beyond Maersk Drilling’s control, may cause the actual development and results to differ materially from expectations. EBITDA before special items is primarily sensitive to the level of contracting of additional days to the current backlog, especially in the high margin North Sea segment, and the day rates thereon. Capital expenditures are sensitive to final scheduling and scoping of rig upgrades and yard stays, which are subject to commercial and operational planning.
The table below lists two additional sensitivities, all else being equal.
Factors Change Impact on EBITDA before special items
Financial uptime +/- 1.0 percentage point +/- USD 14mUSD/DKK exchange rate +/- 5.0% +/- USD 4m
Directors’ report Overview Business Sustainability Financial review Governance and risk 12Maersk Drilling Annual Report 2019

Business
13Maersk Drilling Annual Report 2019 Directors’ report Overview Business Sustainability Financial review Governance and risk

UPSTREAM
Exploration
Finding oil and gas Drilling wells for exploration, appraisal, and production
Extracting oil and gas
Development Production Transportation and storage, moving oil and gas to shore
Decommissioning the well
Refining, marketing and distribution to everyday products and transportation
MIDSTREAM DOWNSTREAM
Tanker
Production platform
Seismicexploration
vessel
RefineryStorage
PetrochemicalsPipeline
Powerheating
Fuellubricants
Maersk Drilling and the oil and gas industry
Maersk DrillingOffshore drilling rig services
Reliability – Safety – Efficiency
Directors’ report 14Maersk Drilling Annual Report 2019 Overview Business Sustainability Financial review Governance and risk

Industry landscape
The oil and gas value chain is categorised by three major segments: upstream, midstream and downstream. The upstream segment covers activities related to the full lifecycle of an oil and gas reservoir, spanning from early stage exploration and development activities to production and maintenance and finally to decommissioning, including the plugging and abandonment of wells. The midstream segment encompasses transportation and storage and the downstream segment includes refining as well as marketing and distribution of oil and gas products.
Oil and gas companies do not themselves perform all the various services needed to explore, develop and produce oil and gas and the ultimate plugging and abandonment of wells and fields. A large part of the activities, such as seismic and geological and geophysical surveys, well services, equipment manufacturing, drilling services, engineering services and transport and logistics services, are outsourced to third-party providers covering a wide array of services, technology, equipment, personnel and capital assets to support the oil and gas companies over the lifecycle of an oil and gas reservoir.
Within this oil and gas industry landscape, Maersk Drilling is positioned in the offshore drilling industry, providing drilling services to upstream oil and gas companies.
Drilling campaigns are technologically challenging and complex projects
Maersk DrillingSafe and efficient drilling services
Related drilling servicesRunning casing, cementing, drill bits, wireline, handling cuttings,
ROVs, etc.
EquipmentConductors, casing, liners,
X-mas trees, etc.
LogisticsVessels, helicopters, bulk handling, etc.
Well servicesMud logging, completion,
well testing, directional drilling, drilling fluids, etc.
Customercentricity
Operationalexcellence
Technology
Other services during a drilling campaign
Directors’ report 15Maersk Drilling Annual Report 2019 Overview Business Sustainability Financial review Governance and risk
Jack-uprig
Ultradeepwater drillship
Semi-submersible
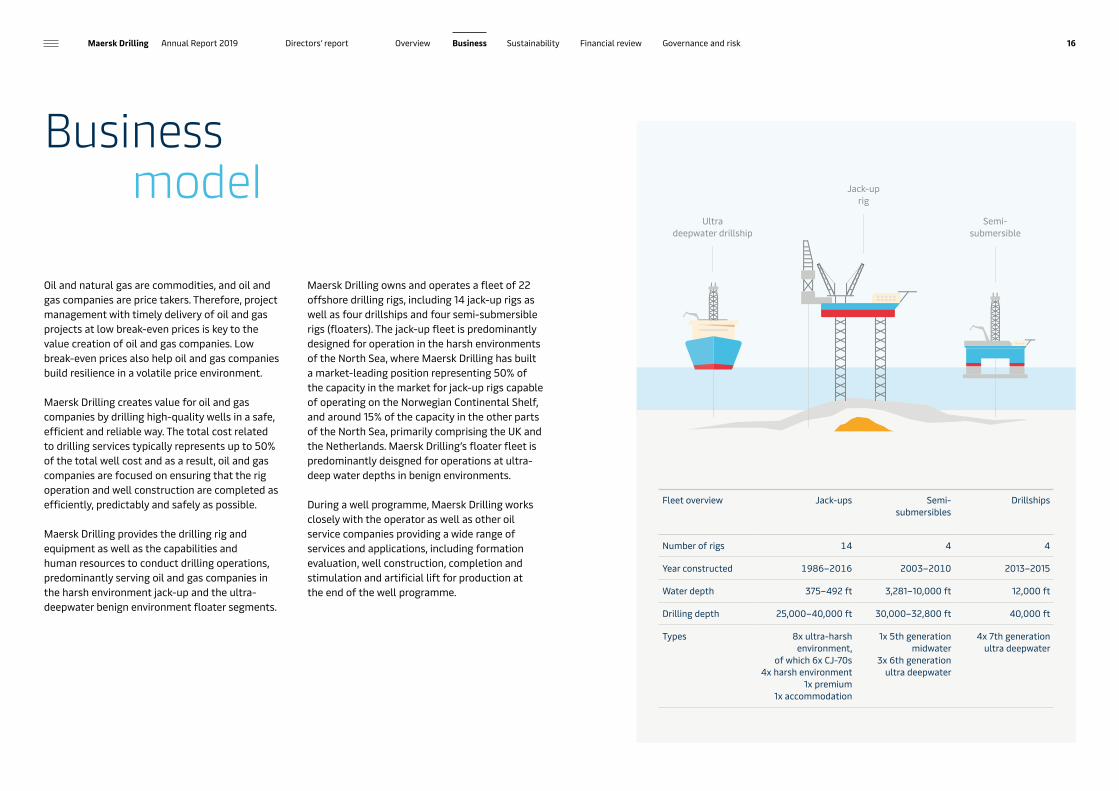
Fleet overview Jack-ups Semi- submersibles
Drillships
Number of rigs 14 4 4
Year constructed 1986–2016 2003–2010 2013–2015
Water depth 375–492 ft 3,281–10,000 ft 12,000 ft
Drilling depth 25,000–40,000 ft 30,000–32,800 ft 40,000 ft
Types 8x ultra-harshenvironment,
of which 6x CJ-70s4x harsh environment
1x premium1x accommodation
1x 5th generationmidwater
3x 6th generationultra deepwater
4x 7th generationultra deepwater
Business model
Oil and natural gas are commodities, and oil and gas companies are price takers. Therefore, project management with timely delivery of oil and gas projects at low break-even prices is key to the value creation of oil and gas companies. Low break-even prices also help oil and gas companies build resilience in a volatile price environment.
Maersk Drilling creates value for oil and gas companies by drilling high-quality wells in a safe, efficient and reliable way. The total cost related to drilling services typically represents up to 50% of the total well cost and as a result, oil and gas companies are focused on ensuring that the rig operation and well construction are completed as efficiently, predictably and safely as possible.
Maersk Drilling provides the drilling rig and equipment as well as the capabilities and human resources to conduct drilling operations, predominantly serving oil and gas companies in the harsh environment jack-up and the ultra-deepwater benign environment floater segments.
Maersk Drilling owns and operates a fleet of 22 offshore drilling rigs, including 14 jack-up rigs as well as four drillships and four semi-submersible rigs (floaters). The jack-up fleet is predominantly designed for operation in the harsh environments of the North Sea, where Maersk Drilling has built a market-leading position representing 50% of the capacity in the market for jack-up rigs capable of operating on the Norwegian Continental Shelf, and around 15% of the capacity in the other parts of the North Sea, primarily comprising the UK and the Netherlands. Maersk Drilling’s floater fleet is predominantly deisgned for operations at ultra-deep water depths in benign environments.
During a well programme, Maersk Drilling works closely with the operator as well as other oil service companies providing a wide range of services and applications, including formation evaluation, well construction, completion and stimulation and artificial lift for production at the end of the well programme.
Directors’ report 16Maersk Drilling Annual Report 2019 Overview Business Sustainability Financial review Governance and risk

Maersk Drilling enters into contracts with its customer either through a tender process or by direct negotiation. Maersk Drilling is typically remunerated based on a day rate, which is the amount that oil and gas companies pay to Maersk Drilling per day during the drilling campaign. Under the day rate model, the total well cost is more or less a direct function of the time required to drill to the geological target and complete the well. Beyond geological conditions, a variety of factors influence the time to drill a well. The main determinants include the capabilities of the rig itself, for example the ability to carry out multiple activities in parallel, the capabilities of the crew operating the equipment and the operational processes and systems applied by the drilling contractor, for example ensuring proper planning and coordination with various other suppliers.
The majority of Maersk Drilling’s revenue is generated through day-rate based contracts. Due to the focus on efficiency and predictability, Maersk Drilling is exploring new commercial and operational models with oil and gas companies and other oil service providers to align incentives towards driving down overall well costs. Examples of such models include bundling and integrating more services into the drilling contract and
establishing performance incentives aligning interests between the oil and gas company, Maersk Drilling and other service providers, whereby efficient operations are rewarded with additional financial compensation – in effect sharing the cost savings resulting from a shorter campaign. This comes on top of the day rate payments.
Maersk Drilling’s operating costs primarily consist of salaries to crew, shorebase costs, maintenance and supplies, catering, insurance and sales, general and administration costs. The cost structure is a combination of fixed and variable costs enabling Maersk Drilling to partly adjust the cost to activity levels. Maintaining a competitive cost structure is essential to effectively compete in the offshore drilling market. Other core day-to-day activities impacting Maersk Drilling’s profitability and cash flow generation include special periodic surveys, maintenance and upgrade of rigs. Maersk Drilling has no committed capital expenditures related to newbuildings or rig acquisitions.
Directors’ report 17Maersk Drilling Annual Report 2019 Overview Business Sustainability Financial review Governance and risk

Estimates
Market
A fundamental factor in driving demand for offshore drilling rigs is the level of spending by oil and gas companies on exploration, development, production and maintenance as well as decommissioning activities. This level is to a large extent a function of project sanctioning which is based on oil and gas companies’ long-term assessment of oil and gas prices impacting their cash flow generation as well as the economics of the offshore exploration and development projects in their portfolios.
simplification and service cost deflation. As a result of the lower cost levels, more than 90% of offshore oil and gas projects are today economically feasible at an oil price around USD 60 per barrel. Combined with the oil and gas companies’ increasing positive cash flows this provides them with the opportunity to invest in new offshore projects.
The price of Brent crude oil averaged USD 64 per barrel in 2019, representing a decrease of 11% compared to the average of USD 72 per barrel in 2018.
The robust cash flows and general feasibility of offshore projects are clearly visible in the levels of project sanctioning activity. Despite a slight decline in the number of Final Investment Decisions (“FIDs”) by oil and gas companies in 2019, the increasing overall trend since the low point in 2016 is expected to continue in the coming years. According to Rystad, the number of FIDs are
Following a couple of years of cost reductions and strict capital discipline, oil and gas companies started to generate positive free cash flows after dividends and share buy-backs in 2017. This allowed for an increase in capex spend in 2018 and 2019, which is expected to continue in 2020.
Over the past years, oil and gas companies have optimised their business models to structurally reduce offshore project costs through project optimisation, standardisation, digitisation,
expected to increase more than 50% year-on-year in 2020 and approximately 10% year-on-year in 2021.
Sanctioning activity spreads across almost all regions. Examples of large projects sanctioned in 2019 include the Area 1 LNG project offshore in Mozambique, Greater Liza in Latin America, Johan Sverdrup Phase 2 in Norway and Thunder Horse in the US Gulf of Mexico.
The rising sanctioning activity further translated into increased offshore investments in 2019, with additional capital expenditures in both deep-water and shallow-water activities. For 2020, offshore investments are expected to increase even further with additional deepwater spending to drive the majority of the increase.
Total cash-flows for top-25 listed upstream oil and gas companies
90% of offshore unsanctioned discoveries economic above 60 USD/bbl
Final Investment Decisions by water depth category
Offshore shelf Offshore deepwater Cash flow from operations Discovered to-be-sanctioned Cumulative % of total Shallow water Midwater Deepwater
2006 2008 2010 2012 2014 2016 2018 2020
USDbn
0
90
180
270
360
450
Below 25 30–35 40–45 50–55 60–65 70–75
97%95%94%
80%
41%
Billion boe
0
5
10
15
20
25
58%
32%22%
9%
89%
71%
’00 ’02 ’04 ’06 ’08 ’10 ’12 ’14 ’16 ’18 ’200
20
40
60
80
100
120
Directors’ report 18Maersk Drilling Annual Report 2019 Overview Business Sustainability Financial review Governance and risk

These overall market improvements cascaded down into the offshore drilling industry with global offshore rig utilisation continuing to increase as a result of rising demand as well as further rationalisations on the supply side. The increase in demand was most visible in the jack-up market, where marketed utilisation (excluding cold-stacked rigs) in the broader segment climbed above 85% during the fourth quarter of 2019 and averaged 81% through the year compared with 73% in 2018.
The majority of Maersk Drilling’s jack-up fleet is operating in the harsh- and ultra-harsh environments of the North Sea, defined as Denmark, the Netherlands, the United Kingdom and Norway. Given the high barriers to entry in Norway due to ultra-harsh environment conditions and strict regulatory requirements, the Norwegian niche market has not experienced the same supply/demand imbalance as other jack-up markets, and utilisation has remained relatively high through the downturn.
Marketed utilisation in Norway was 100% throughout 2019. Towards the end of 2019, Maersk Drilling signed three contracts with day rates ranging between USD 275k and USD 330k per day, reflecting the tight balance of the Norwegian jack-up market.
Further, a significant number of discoveries are currently under evaluation in Norway which are expected to drive demand for jack-up rigs over the coming years. Given the declining average size of the discoveries in Norway, many of these are expected to be developed via tie-in solutions to existing infrastructure, negatively impacting the duration of offshore drilling campaigns in the region. However, Maersk Drilling is currently engaged in several direct negotiations with customers for opportunities with long-term durations, albeit with the majority to commence in 2021.
In the broader North Sea, marketed utilisation climbed above 90% during the fourth quarter of 2019 and averaged 87% through the year compared with 74% in 2018. The continued tightening of the North Sea jack-up market has supported a recovery in day rates from rates close to operating break-even levels at the beginning of the year to day rates above USD 100k per day for the higher specification assets in recent fixtures.
Looking ahead, there are several opportunities in the North Sea commencing in 2020 and 2021 with both short- and long-term durations.
In the floater segment, marketed utilisation averaged 79% in 2019 compared with 75% in 2018. Contracting activity on the floater side has been soft since the start of the downturn, resulting in steep declines in forward coverage for the segment. This is constraining on a broader-based recovery of the floater market, with marketed
utilisation fluctuating around 80% during the past several months. More long-term projects are needed in order to build sufficient backlog and effectively remove supply from the segment for an extended period of time. In the second half of 2019, several tenders and pre-tenders were issued for multi-year drilling campaigns, boding well for future demand for floaters.
Day rates in the floater segment continued to gradually improve during 2019 and appear to have stabilised at levels above USD 200k per day compared with USD 150–180k per day in the beginning of the year.
Jack-ups: Supply/demand and utilisation rates Floaters: Supply/demand and utilisation rates
Total demand Marketed oversupply Total oversupply Total utilisation Marketed utilisation
Total demand Marketed oversupply Total oversupply Total utilisation Marketed utilisation
Jan 12 Jan 13 Jan 14 Jan 15 Jan 16 Jan 18 Jan 19Jan 170
100
200
300
400
500
600
0
20
40
60
80
100
%Utilisation
Jan 12 Jan 13 Jan 14 Jan 15 Jan 16 Jan 18 Jan 19Jan 170
50100150200250300350
0
20
%Utilisation
40
60
80
100
Directors’ report 19Maersk Drilling Annual Report 2019 Overview Business Sustainability Financial review Governance and risk

Strategy
Maersk Drilling’s principal goal is to create long-term value for shareholders by growing cash flow generation, maintaining a robust balance sheet and exercising disciplined capital allocation. To achieve this, Maersk Drilling’s strategy – Smarter Drilling for Better Value – focuses on optimising the Group’s service delivery and operational effectiveness, developing and implementing new service and business models and exploring attractive investment opportunities.
Improve service delivery and operational effectivenessDrilling services are a key component of the overall economics of oil and gas projects. The total cost of a drilling campaign is a direct result of its overall duration and the variable costs per day, therefore, critical factors determining the overall project economics are safety, quality, reliability and efficiency in the drilling operation.
Safe operations remain the foundation of Maersk Drilling’s business, both in terms of its licence to operate and its ability to generate backlog and convert that into earned day rates. Maersk Drilling continues to invest in the elimination of risk as well as capacity to reduce the likelihood that any incident will escalate into a serious accident.
Maersk Drilling aims to continuously enhance its value proposition of providing safe, high-quality, reliable and efficient offshore drilling rig services to address the total cost of a drilling campaign. The value of time efficiency and variable cost efficiency is at the center of Maersk Drilling’s value proposition to our customers. For oil and gas companies, efficiency and reliability of drilling operations improve the overall project economics and certainty, which can help unlock marginal oil and gas projects that would otherwise not be explored or developed.
Maersk Drilling is at the forefront of working with oil and gas companies in achieving their goal of improving offshore project economics. This agenda is a key element in staying ahead of the competition and driving future profitability and cash flow generation for Maersk Drilling.
Directors’ report 20Maersk Drilling Annual Report 2019 Overview Business Sustainability Financial review Governance and risk

Time and depth drilling curveThe total cost to drill and complete a well is a function of the time to construct the well and the costs per day. The well construction process can be illustrated by means of a time-depth curve, which is the graphical representation of the well depth as a function of time spent from initial well spudding to completion. The time-depth curve contains sliding parts, which reflect the drilling operations where progress is being made towards the well target depth, and flat parts reflecting other activities such as tripping, running casing, cementing and logging activities. Reducing the time to drill a well can be accomplished by drilling more efficiently and by orchestrating the broader supply chain involved in a drilling operation to eliminate the inefficiencies resulting from multiple third-party interfaces. Key levers to reduce daily variable costs include better supply chain integration and collaboration to drive drilling operation efficiency by aligning services from all service providers with the drilling schedule. This approach increases efficiency and reduces waste and costs by ensuring that all services involved in a drilling campaign are only made available when needed for the drilling operation The savings from an optimally planned and executed drilling programme is thus a function of the reduced time to drill the well and the lower daily variable cost.
Time savedTotal variable well costs
Depth versus time curve
Other services
Drilling servicesTime
Variablecost per
day (USD)
Customer satisfation score
Maersk Drilling regularly measures customer satisfaction in various dimensions, including safety and operational metrics, skills assessment and overall impact on well construction. On a scale from 1–7 with seven being highest level of satisfaction, Maersk Drilling’s average customer satisfaction score was 6.5 in 2019 (2018: 6.6), reflecting a high level of service delivery across the rig fleet and customer portfolio.
To maintain a competitive cost base, Maersk Drilling targets further innovative cost reduction measures without compromising safety. Examples of this include: (i) within overhead and administration, pursuing standardisation, simplification and automation; (ii) within operational expenditures, revisiting crew composition and digitalisation efforts; and (iii) within capital expenditures, investing in on-rig sensor networks and condition-based preventive maintenance to reduce maintenance expenditure on rigs.
Scale 1–7
2014 2015 2016 2017 2018 201920130
1
2
3
4
5
6
7
6.2 6.3 6.3 6.6 6.56.46.0
Time
Well depth
Target depthActual well
programme
Expected well programme
Saved cost
Directors’ report 21Maersk Drilling Annual Report 2019 Overview Business Sustainability Financial review Governance and risk

Smarter Drilling for Better Value
Develop and implement new services and business models A key challenge for Maersk Drilling’s customers is the significant inefficiencies and unreliability caused by multiple suppliers and misaligned incentives between the various third-party suppliers involved in a drilling campaign. To cater for the outlined major trends in the industry, Maersk Drilling aims to take on an expanded role in order to establish better planning, execution and orchestration across the value chain, while simultaneously creating better outcomes for its customers. Maersk Drilling seeks to obtain this by combining its existing leading offshore drilling services with new services and innovative business models together with customers and partners.
One example is the alliance with Aker BP, which aims to lower the cost per barrel and increase profitability for all alliance partners, including service
partner Halliburton, through the implementation of digital solutions, increased collaboration efficiency and standardisation and simplification of processes. The alliance is formalised in a five-year agreement entered into in November 2017, which includes an option to extend for an additional five years. Under this agreement, Maersk Drilling has a preferential but non-exclusive right to provide Aker BP’s jack-up rig requirements in Norway. In addition to setting up shared goals and incentives, the alliance also aims to integrate project organisations, align safety procedures and create a one-team mindset. Maersk Drilling is positioned to benefit from higher utilisation through preferential rights, and higher revenue and profits due to a commercial model where savings are shared. Looking ahead to the long-term, the expansion into new business models is, besides the near-term growth of new market entries, revenue streams and profits, a key component in ensuring the longevity of Maersk Drilling’s relationships with its customers and long-term growth.
Explore attractive investment opportunitiesMaersk Drilling will continue to explore investment opportunities that support long-term shareholder value creation. The screening of opportunities is based on an assessment of the attractiveness of the different market segments combined with Maersk Drilling’s relative competitive strengths. Given the market attractiveness and Maersk Drilling’s competitive strength within harsh environment operations, Maersk Drilling will continue to explore the potential within the harsh environment segments, including harsh environment floaters.
The investment criteria are that investments generally should be contract-backed with an attractive, immediate cash return and pay back profile.
Incentive mechanism in AkerBP alliance
Cost
Time
Service partners’ share Operator share
Expected cost
Cap
Actual cost
Drilling campaigns are technologically challenging and complex. Drilling one offshore well can take between 25 and 250 days involving over 60 suppliers, leading to multiple hand-over and coordination challenges. It is a central part of Maersk Drilling’s strategic ambition of Smarter Drilling for Better Value to eliminate these inefficiencies. Via orchestration, integrated services and incentive models based on shared benefits, Maersk Drilling has demonstrated an ability to reduce waste significantly in close collaboration with our partners. This has major positive effects on the project’s total time and cost.
In 2017, Maersk Drilling signed a five-year alliance agreement with Aker BP and service company Halliburton. This aims to remove waste from the value chain through a joint incentive structure by the use of digital solutions, increased collaboration, standardisation and simplification of processes. On average, we have seen a time reduction in the range of 5–10%. In 2019, Maersk Invincible carried out an installation campaign under the alliance that was the most successful to date. A job of installing 12 conductors (large pipes that are placed into the ground to provide the initial stable structural foundation for a well) originally estimated to take 38 days was completed in just 24 days, a 36% time reduction for the alliance resulting in bonus payments to Maersk Drilling and Halliburton as service partners.
Issue:
Many drilling campaigns suffer from inefficiencies caused by a complex supplier landscape and coordination challenges.
Alliance outcome:
36% reduction in time spent.
Directors’ report 22Maersk Drilling Annual Report 2019 Overview Business Sustainability Financial review Governance and risk

Financial policy and capital allocation
The overall objective of the financial policy is to enable Maersk Drilling to manage through the cyclicality that characterises the offshore drilling industry with an aim to create long-term shareholder value.
The financial policy ensures:• Financial flexibility, including adequate
liquidity reserves;• A long-term funding view to minimise
refinancing risk; and• A robust capital structure through
the business cycle.
In order to meet these objectives, free cash flow is to be allocated based on the following prioritisation: 1. Maintain a robust capital structure with
sufficient funding available to support the business through the cycle;
2. Pursue investment opportunities supporting long-term shareholder value creation; and
3. Return surplus capital to shareholders.
Maersk Drilling will generally work towards a leverage ratio (net debt divided by EBITDA before special items) of around 2.5x.
This means that if the leverage ratio is below 2.5x over time, and no attractive investment opportunities have been identified, Maersk Drilling
will seek to return capital to shareholders by means of dividends and/or share buy-backs.
If value adding investment opportunities that require additional funding arise, or if EBITDA is reduced in a business down cycle, the leverage may exceed the target level of around 2.5x for a period of time. The focus here will be to reduce net debt to reach the targeted leverage level of around 2.5x.
As of 31 December 2019, the leverage ratio was 2.6x. In line with the principles set out above, Maersk Drilling will not propose any dividends based on the 2019 Annual Report.
Until the annual general meeting in 2024, the Board of Directors is authorised to acquire treasury shares of up to 10% of the share capital provided that the purchase price does not deviate by more than 10% from the price quoted on Nasdaq Copenhagen at the time of the acquisition.
In order to fulfil obligations under the share-based long-term incentive programmes, Maersk Drilling expects to initiate share buy-backs during 2020.
Directors’ report 23Maersk Drilling Annual Report 2019 Overview Business Sustainability Financial review Governance and risk
44%
34%
8%
9%
5%
Organisation and people
Maersk Drilling has a global footprint with offices on four continents supporting our 22 drilling rigs.
Maersk Drilling’s offshore and onshore organisations comprise 2,852 employees of more than 65 nationalities with 2,069 working offshore and 783 working onshore.
In Maersk Drilling, we strive to uphold a supportive and productive working environment that stimulates the growth and development of our people. While our business involves operating the world’s largest offshore drilling rigs in technically complex scenarios, Maersk Drilling’s core asset is its people.
We believe that diversity and inclusion can contribute to increased performance and high-quality decision-making and are essential to innovation and organisational learning which are critical elements to maintaining our position as a leading service provider in the offshore drilling industry.
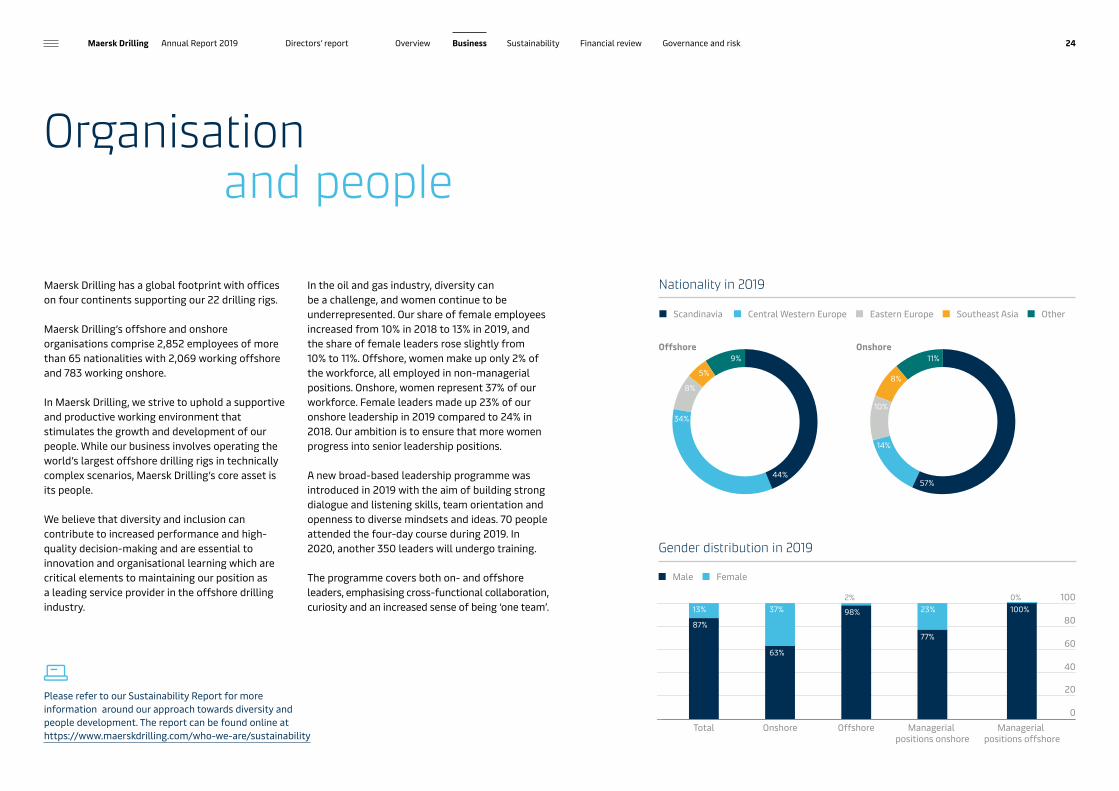
In the oil and gas industry, diversity can be a challenge, and women continue to be underrepresented. Our share of female employees increased from 10% in 2018 to 13% in 2019, and the share of female leaders rose slightly from 10% to 11%. Offshore, women make up only 2% of the workforce, all employed in non-managerial positions. Onshore, women represent 37% of our workforce. Female leaders made up 23% of our onshore leadership in 2019 compared to 24% in 2018. Our ambition is to ensure that more women progress into senior leadership positions.
A new broad-based leadership programme was introduced in 2019 with the aim of building strong dialogue and listening skills, team orientation and openness to diverse mindsets and ideas. 70 people attended the four-day course during 2019. In 2020, another 350 leaders will undergo training.
The programme covers both on- and offshore leaders, emphasising cross-functional collaboration, curiosity and an increased sense of being ‘one team’.
Gender distribution in 2019
Nationality in 2019
Scandinavia Central Western Europe Eastern Europe Southeast Asia Other
OnshoreOffshore
Total0
20
40
60
80
100
87%
63%
98%
2% 0%13% 37% 23%
77%
100%
Onshore Offshore Managerial positions onshore
Managerial positions offshore
Male Female
14%
10%
11%
8%
57%
Please refer to our Sustainability Report for more information around our approach towards diversity and people development. The report can be found online at https://www.maerskdrilling.com/who-we-are/sustainability
Directors’ report 24Maersk Drilling Annual Report 2019 Overview Business Sustainability Financial review Governance and risk

New People Performance Management systemDuring 2019, we have piloted a new People Performance Management system with an increased focus on team goals and collective contribution. The system aims to drive performance as a shared responsibility and establishes frequent conversations around engagement, personal growth and priorities between employees and leaders.
As part of the new People Performance Management system, we have also adapted our incentive plans for senior leaders who now all have shared objectives acknowledging that we can only win together.
Engagement through dialogueOur quarterly people survey, Compass, was launched in September 2018 and fully implemented in 2019. With Compass, we aim to improve the employee experience by using continuous conversations to drive development, a step-change compared to the annual employee satisfaction surveys that were used before. Compass has increased the frequency with which employees and leaders engage, and this has so far been well received by employees as well as leaders on- and offshore.
Organisational set-upDuring 2019, Maersk Drilling integrated its Operations, Commercial and Technical functions into one joint Operations function headed by Chief Operating Officer Morten Kelstrup. Following the changes, Maersk Drilling’s Executive Leadership Team consists of:
Jørn MadsenChief Executive Officer
Jesper Ridder OlsenChief Financial Officer
Morten KelstrupChief Operating Officer
Nikolaj SvaneChief Strategy & People Officer
The registered Executive Management continues to be the Chief Executive Officer and the Chief Financial Officer.
Maersk Drilling is further organised in a divisional structure with a North Sea division, comprising the harsh environment jack-up rigs capable of working in the most challenging environments in the North Sea, including the ultra-harsh Norwegian environments, and an International division, comprising all drillships and semi-submersible rigs designed to operate in benign mid- and deepwater environments. The head of each division reports to the Chief Operating Officer.
In 2019, the Global Business Solutions function, now reporting to the Chief Financial Officer, established a centralised service center in Gdansk, Poland, to provide services such as supply chain management, HR and finance operations to the global organisation.
Directors’ report 25Maersk Drilling Annual Report 2019 Overview Business Sustainability Financial review Governance and risk

Sustainability
Directors’ report 26Maersk Drilling Annual Report 2019 Overview Business Sustainability Financial review Governance and risk

Climate and energy
The transition towards a low-emission society represents one of the most fundamental challenges that we face today. With more than 100 years of societal development based on combustion engines and carbon based materials, this transition will take time.
With an expected rise in global population to almost 10 billion people by 2050, there will be an increasing demand for access to modern services that rely on stable and affordable energy
sources, especially in developing countries. Most experts expect a significant rise in global energy consumption towards 2040.
The most rapid transition scenarios show that oil and gas will make up a significant part of the energy mix for years to come. While renewable energy will grow significantly to meet the overall increase in demand and to replace carbon intensive coal, oil and gas are expected to account for a sizeable part of the energy mix towards 2040.
This entails a continued need for exploration and development of offshore oil and gas fields. Meeting this need in a responsible way is where Maersk Drilling can make an impact.
Norwegian fields are leading in energy efficiency improvementBased on our long-standing leading position in Norway, we are well-versed in some of the most demanding sustainability requirements in the world. The average carbon footprint from upstream activities on the Norwegian fields is around half the global average of 18 kg CO2 per barrel and it continues to drop. There are examples of fields in Norway where the carbon footprint has been brought down to below 1 kg CO2 per barrel, due to the use of e.g. hydro-based shorepower.
In Norway, drilling for exploration and development accounts for approximately 5% of total carbon footprint of the oil and gas companies’ upstream and midstream activities, a relatively small proportion compared to the around 80% coming from production platforms and around 15% from storage and transport to onshore processing. Maersk Drilling’s ambition is to offer solutions that allow our customers, the oil and gas companies, to significantly increase drilling efficiency, thereby reducing the total carbon footprint of each barrel of oil produced.
Change in global energy mix according to the main IEA scenarios
Oil Gas Coal Renewables
2017 2040Current policies
2040Stated policies
2040Sustainable
development
Million tonnes of oil equivalent
0
5,000
10,000
15,000
20,000
The Current Policies Scenario represents a world that continues along its present path, without any additional changes in policy. The Stated Policies Scenario includes today’s policy intentions and targets, and illustrates the potential results of policy-makers. The Sustainable Development Scenario charts a path aligned with the Paris Agreement, holding the rise in global temperatures to “well below 2°C”. Source: IEA World Energy Outlook 2019
Share of CO₂ emissions from up- and midstream activities
Includes the activities of exploration, development, production and transportation onshore. Does not include refining activities. Based on studies from the Norwegian Continental Shelf. Source: Based on Rystad data
~80% from production platforms
~15% from transport to onshore
~5% from drilling for exploration and development
Directors’ report 27Maersk Drilling Annual Report 2019 Overview Business Sustainability Financial review Governance and risk

With our strategic ambition of Smarter Drilling for Better Value, we aim to deliver operational excellence while exploring new business models and innovative technologies that reduce complexity for our customers. By rethinking the traditional ways of organising drilling campaigns through partnerships, we have, in our current best case example, been able to save up to 36% on time and an equivalent saving on energy and emissions in a drilling campaign.
Norway and the wider North Sea region has been an incubator for our most advanced solutions such as our shore-powered rig and hybrid rigs. Over time, these solutions can be leveraged and offered to our customers in other regions, as the energy transition accelerates and increases the incentives for adopting new technologies and new ways of working.
New hybrid solutions announced in 2019During 2019, a number of initiatives were introduced to reduce energy consumption and CO2 emissions during operations and during rig moves. In May, we announced a hybrid, low-emission upgrade of Maersk Intrepid which, under contract with Equinor, will be fitted with a unique combination of technologies that enable low-emission drilling for rigs that cannot be connected to shore power. In November, we announced the upgrade of a second hybrid rig, in connection with an agreement with Aker BP to install similar equipment on Maersk Integrator.
Norway is currently the only country where emissions regulation and public funding provide a sustainable business framework for these hybrid, low-emission upgrades.
The CO2 emissions linked to the production of one barrel of oil vary a great deal from oilfield to oilfield. Despite the harsh offshore environment, Norway has achieved one of the lowest CO2 footprints thanks to the adoption of energy and CO2 efficient technologies.
Kg CO2 per barrel
Source: Based on Rystad Energy study for the Norwegian Oil and Gas Association, September 2019
Producing oil in the right way makes a difference
Other offshoreshelves
Middle Eastonshore
Otheronshore
Offshoredeepwater
NorthAmerican
shale
NorwayMiddle Eastoffshore
shelf
0
10
20
30
231918
1311
68
Together with our customers, Maersk Drilling has developed a range of pilot technologies to jointly reduce the carbon foot print of drilling campaigns.
Shorepower Maersk Drilling was the first driller to introduce a rig powered by electricity through a sea cable. The rig is currently operating in Norway on the Valhall field.
Hybrid power based on energy storage In 2019, we announced together with our customers Equinor and Aker BP the intention to upgrade two rigs with hybrid power solutions based on batteries to reduce CO2 emissions.
Energy optimising software Our EEE solution – a fully digitalised fuel and energy monitoring system – uses advanced analytics to learn and optimise towards more efficient behaviour. The system is currently running on one of our Norwegian rigs and will be rolled out on two more rigs in the coming years.
Reducing our carbon footprint with novel technologies
Directors’ report 28Maersk Drilling Annual Report 2019 Overview Business Sustainability Financial review Governance and risk

Safe and responsible drilling
We have over many years built a strong sustainability foundation and operational culture based on the Maersk Core Values, which we still embrace in our new role as an independent company. With Maersk Drilling’s first Sustainability Report as a separately listed company, we present our approach to and efforts within sustainability, focusing on our specific role in the oil and gas value chain.
Through the lens of sustainability, Maersk Drilling’s role in the oil and gas value chain is to be a responsible drilling partner for our customers, shareholders, our employees, and for society as whole.
Sustainability is an integral part of how we do business. It is considered in our strategic decisions and integrated into our daily operations as part of the organisation’s key functions such as health and safety, procurement, human resources, legal, and commercial. Importantly, our people working offshore all have vital roles in ensuring that sustainability standards are upheld.
Governance and PoliciesThe Board of Directors oversees sustainability in Maersk Drilling. In April 2019, a Safety and Sustainability Board Committee was established to oversee safety and sustainability issues and progress across the company.
The Safety and Sustainability Committee is currently comprised of the Chairman of the Board and two other board members. The main purpose of the committee is to oversee the identification, management and mitigation of risks, including targets, objectives, policies, activities and management systems related to sustainability.
Maersk Drilling’s Executive Leadership Team holds the operational responsibility for our sustainability performance with specialist support from dedicated working groups. Our Sustainability Policy provides high-level guidance on how we conduct a sustainable business and, in addition, sustainability is integrated into our
overall Enterprise Risk Management system where sustainability risks are identified, evaluated and managed along with other business risks.
The Sustainability Policy is built on the ten principles of the UN Global Compact, the Universal Declaration of Human Rights, and the fundamental labour conventions of the International Labour Organisation (ILO). The overall policy is further supported by a number of subject-specific policies which guide us in our operations.
Maersk Drilling’s sustainability approach is described in further details on our website. Please refer to our full report on sustainability pursuant to section 99a of the Danish Financial Statements Act online at https://www.maerskdrilling.com/who-we-are/sustainability
Governance
• UN Global Compact membership• Universal Declaration of
Human Rights• Fundamental labour
conventions of the ILO• Support to the Paris Climate
Agreement
Sustainability policy with sub-policies and codes such as:• HSSE policy• Diversity and Inclusion policy• Code of Conduct• Third Party Code of Conduct• Modern Slavery policy
• Board of Directors including a sub-committee for Safety and Sustainability
• Executive Leadership Team
Commitments Policies and codes Governing bodies
Directors’ report 29Maersk Drilling Annual Report 2019 Overview Business Sustainability Financial review Governance and risk

Financial review
Directors’ report 30Maersk Drilling Annual Report 2019 Overview Business Sustainability Financial review Governance and risk

Financial performance in 2019
Maersk Drilling delivered in 2019 a financial performance in line with the expectations set out at the beginning of the year.
EBITDA before special items amounted to USD 415m (USD 611m), in line with the guidance of around USD 400m.
Capital expenditures amounted to USD 309m (USD 182m) in line with the most recent guidance of around USD 300m. Capital expenditures were impacted by Maersk Drilling conducting nine Special Periodic Surveys (SPS) in 2019. An SPS is a five- yearly inspection and service of the rig at a yard.
The higher activity in 2019 was reflected in the number of contracted days increasing to 6,310 (6,024) as well as the securing of 14 new contracts and 16 contract extensions adding USD 828m (USD 503m) to the contract backlog.
The secured contracts replenished 74% (38%) of the executed contract backlog in 2019.At the end of the year the contract backlog amounted to USD 2.1 billion (USD 2.5 billion). With a one-year forward contract coverage of 66% (63%), the degree of visibility into 2020 is relatively high, especially for the International Floater segment which has a one-year forward contract coverage of 75% (39%).
For the North Sea Jack-up segment, the one-year forward contract coverage is 58% (79%).
During the year, Maersk Drilling continued the high-grading and concentration of the rig fleet with the upgrade of two of its modern harsh environment jack-up rigs to perform hybrid, low-emission drilling in Norway. Concurrently, two non-strategic and stacked jack-up rigs were divested, one old harsh environment jack-up rig and a benign environment jack-up rig.
Based on information from its subcontractor Aker Solutions, Maersk Drilling has notified Repsol Norge AS, as the operator of the Yme field, that the onshore modifications to the Mærsk Inspirer are now scheduled to be completed late in the second quarter of 2020, whereafter the rig will move offshore for hook-up and commissioning. Maersk Drilling now expects limited EBITDA generation from Mærsk Inspirer in 2020.
ResultsRevenueRevenue for 2019 of USD 1,222m (USD 1,429m) was 14% lower compared with the previous year, mainly due to the effect on average day rates from the expiry of legacy contracts. The average day
rate of USD 194k (USD 237k) was 18% lower than in 2018, primarily impacted by Maersk Discoverer and Maersk Integrator having legacy contracts replaced with new contracts at significantly lower day rates.
Revenue consists primarily of day rate revenue which, in addition to the average day rates, are impacted by the higher number of contracted days.
The total number of contracted days increased by 5% to 6,310 (6,024) driving an increase in utilisation to 77% (69%). The increase in contracted days is considered satisfactory, especially in light of the nine SPSs conducted during the year.
Financial uptime remained high at 98.9% (99.1%) which demonstrates a strong operational performance, especially when taking into account the 12 rig mobilisations during 2019 related to entering into new contracts.
In addition to day-rate revenue, the contracts contributed other revenue comprising additional services and bonuses of USD 123m. In line with the strategy Smarter Drilling for Better Value, the share of other revenue increased to 11% of the day-rate revenue in 2019 from 10% in 2018.
CostsOperating costs comprising crew, maintenance, supplies, catering and insurance were reduced by 3% to USD 710m (734m) despite the higher activity levels reflected in the higher number of contracted days. As a result of the many cost saving initiatives implemented over the past years, the average operating cost per contracted day decreased by 8% in 2019 as compared to 2018.
Maersk Drilling continues to invest in its innovation capabilities now having a fully operating innovation function driving a substantial number of projects with the aim of delivering additional value to customers. The costs related to the innovation activities in 2019 amounted to USD 10m (USD 3m).
Sales, general and administration costs of USD 87m in 2019 (USD 81m) reflect the full-year effect of new functions added to the organisation during 2018 to support Maersk Drilling as a stand-alone listed company. With the new life as a stand-alone offshore drilling company, activities have been initiated to optimise the costs for supporting the business, among others through a Global Business Solution (GBS) set-up focusing on simplifying, standardising and automating the existing processes and ways of working.
Directors’ report 31Maersk Drilling Annual Report 2019 Overview Business Sustainability Financial review Governance and risk

EBITDA before special itemsEBITDA before special items amounted to USD 415m (USD 611m) resulting in an EBITDA margin of 34% (43%).
Special itemsSpecial items of USD 16m ( USD 16m) mainly comprised costs related to the demerger and listing of Maersk Drilling, including fees to investment banks, advisors, lawyers and auditors. Further, restructuring costs were incurred in connection with the reorganisation and integration of the commercial, technical and operational functions into one combined Operations function. The demerger/listing and restructuring costs were partly offset by warranty compensation received from yard.
Impairment losses/reversalsIn December 2019, an agreement to sell the jack-up rig Maersk Completer was entered into with completion in January 2020. Accordingly, the rig was classified as an asset held for sale end 2019. With an agreed sales price of USD 38m, a write-down of USD 34m was recognised in 2019.
No further impairment write-downs or impairment reversals were recognised in 2019. In 2018, parts of prior-year impairment losses were reversed with a net positive effect on the income statement of USD 810m.
Financial income and expensesFollowing the USD 1.5bn debt financing raised towards the end of 2018, the net financial expenses increased to USD 68m in 2019 (USD 12m). The average funding costs excluding fees were around 5% in 2019.
TaxThe tax expense for the year amounted to USD 29m (USD 48m), reflecting the lower result compared to 2018. Generally, Maersk Drilling is subject to corporate income or withholding taxes in the jurisdictions in which operations take place.
Profit/loss for the yearThe net loss for the year of 113m (profit of USD 941m) reflects the lower EBITDA and higher financial expenses compared to the previous year. In 2018, the profit was positively impacted by a non-cash reversal of previously recognised impairment losses of net USD 810m.
Cash flowsCash flow from operating activitiesCash flow from operating activities was USD 420m (USD 593m), equal to a cash conversion of 105% (100%). The high cash conversion was a result of reduced working capital.
Cash flow used for investing activitiesIn line with expectations, cash flow used for investing activities increased in 2019 to USD 303m (USD 136m), impacted by an increased number of rig upgrades and yard stays in connection with SPSs for nine rigs. Three SPSs are scheduled for completion in 2020.
Other capital expenditures in 2019 related to the upgrade of Mærsk Deliverer for the contract in Australia and other periodic maintenance on floating units.
Cash flow from financing activitiesCash flow from financing activities was an outflow of USD 180m (USD 134m), comprising amortisation of the debt financing with USD 103m and net interest payments of USD 77m.
Adjusted free cash flowAdjusted for the USD 8m proceeds from the sale of assets, the free cash flow amounted to USD 109m (USD 457m).
Capital structure and fundingEquityAt 31 December 2019, equity amounted to USD 3,680m (USD 3,814m), impacted by the loss for the year of USD 113m and negative value adjustment of hedges of USD 21m.
As part of the separation from A.P. Moller - Maersk, net assets of USD 4m were contributed and recognised as an increase in equity.
Net debt and capital structureAt 31 December 2019, the net debt amounted to USD 1,099m (USD 1,097m), comprising gross borrowings of USD 1,378m (USD 1,470m) and lease liabilities of USD 31m (USD 0m), offset by total cash and bank balances of USD 310m (USD 372m).
The lease liabilities were recognised in connection with the implementation of the new IFRS 16 ‘Leases’ standard with effect from 1 January 2019. Reference is made to note 5.1 in the consolidated financial statement.
Maersk Drilling’s policy is to partly hedge interest rate risk using a model under which a larger proportion of risk is hedged in the short to medium term and a smaller proportion is hedged in the longer term. As of 31 December 2019, the average fixed ratio of gross funding is 48% for the whole term with 63% and 50% for 2020 and 2021, respectively.
Maersk Drilling continues to have a solid capital structure with a high degree of financial flexibility. At 31 December 2019, the leverage ratio (net debt to EBITDA before special items) was 2.6 (1.8), while the equity ratio was unchanged at 67%.
The liquidity reserves amounted to USD 710 (USD 772m), comprising cash and bank balances of USD 310m and an undrawn revolving credit facility of USD 400m.
USD Million 2019 2018
Revenue 1,222 1,429
Costs 807 818
EBITDA before special items 415 611
Margin 34% 43%
EBITDA before special items
Directors’ report 32Maersk Drilling Annual Report 2019 Overview Business Sustainability Financial review Governance and risk

Segment performance
North Sea Jack-upsRevenueRevenue within the North Sea division amounted to USD 800m (USD 840m).
The 5% lower revenue compared to 2018 reflects a lower average day rate of USD 193k (USD 218k), partly offset by an increase in number of contracted days leading to a utilisation in 2019 of 88% (76%).
The lower average day rate was a result of the expiry of a four-year legacy contract for Maersk Integrator which was replaced by a new contract at lower rates in the current market, as well as of Maersk Innovator moving from a contract in Norway to the United Kingdom in the second half of 2018.
The financial uptime remained high at 99.6% (99.2%), demonstrating a continued strong operational performance.
EBITDA before special itemsEBITDA before special items amounted to USD 385m (USD 432m), reflecting the lower revenue and slightly higher operating costs due to more days in operation. The EBITDA margin for the North Sea jack-up segment remained relatively high at 48.1% (51.4%).
Depreciation and amortisationDepreciation and amortisation of USD 205m (USD 184m) was impacted by increasing asset values following the impairment reversals recognised in 2018 as well as the capitalisation of several SPSs and rig upgrades in 2019.
USD Million 2019 2018
Revenue 800 840
Costs 415 408
EBITDA before special items 385 432
Margin 48.1% 51.4%
EBITDA before special items
0
2,000
4,000
6,000
8,000
10,00094%
87%
72%76%
88%
4,688 4,1485,0494,959
3,7064,051 3,5644,2424,287 3,851
2015 2016 2017 2018 2019
Available days Contracted days Utilisation
North Sea jack-ups
Directors’ report 33Maersk Drilling Annual Report 2019 Overview Business Sustainability Financial review Governance and risk

International FloatersRevenueRevenue within the International division of USD 395m (USD 530m) was significantly impacted by a decrease in the average day rate from USD 293k in 2018 to USD 220k in 2019.
The lower average day rate was primarily the result of a legacy contract for Maersk Voyager in Ghana being replaced with a new contract at a significantly lower day rate. Further, Maersk Explorer was impacted by a prolonged yard stay.
The number of contracted days of 1,797 was overall at par with 2018, while utilisation increased slightly to 65% (62%).
The financial uptime was at 97.1% lower than in 2018 (98.8%), negatively impacted by unscheduled repair and maintenance downtime. EBITDA before special itemsEBITDA before special items of USD 28m (USD 163m) was mainly impacted by the lower revenue while costs remained unchanged. The costs incurred for contract start-ups were offset by general cost savings. The EBITDA margin for the International division was 7.1% (30.8%).
Depreciation and amortisationDepreciation and amortisation of USD 157m (USD 196m) reflects a lower cost base for newly capitalised SPSs, partly offset by increasing asset values following the impairment reversals recognised in 2018.
USD Million 2019 2018
Revenue 395 530
Costs 367 367
EBITDA before special items 28 163
Margin 7.1% 30.8%
EBITDA before special items
0
2,000
4,000
6,000
8,000
10,00088%
56%
77%
65%62%
2,7861,797
2,9162,9202,9202,2462,474
1,6242,807
1,808
2015 2016 2017 2018 2019
Available days Contracted days Utilisation
International floaters
Directors’ report 34Maersk Drilling Annual Report 2019 Overview Business Sustainability Financial review Governance and risk

Revenue backlog
During 2019, Maersk Drilling secured 14 new contracts and 16 contract extensions, adding USD 828m (USD 503m) to the contract backlog, thereby replacing 74% (38%) of the contract backlog realised during the year.
By the end of 2019, the revenue backlog amounted to USD 2.1 billion (USD 2.5 billion) with a one-year forward contract coverage of 66% (63%).
The forward contract coverage provides a relatively high degree of visibility into 2020. The International Floater segment carries a one-year
forward contract coverage of 75% (39%) compared to 58% (79%) in the North Sea Jack-up segment.
As of 5 February 2020, Maersk Drilling has three idle rigs and four rigs preparing for contracts. Maersk Drilling has no cold-stacked rigs.
Details on current and future contract status for the rig fleet is provided in the fleet status report dated 5 February 2020 and included on page 99.
Revenue backlog
North Sea jack-ups International floaters Other
Average backlog day rate
Development of revenue backlog in 2019
20200
80
160
240
320
186218
256 276 266 272218
266
2021 2022 2023
USDk
Revenuebacklog
2018
Revenuerecognised
in 2019
Other services not relatedto backlog
Additionto backlog
in 2019
Otherchanges
including FX
Revenuebacklog
2019
2,466 1,2222,131828 43
102
USDm
North Sea jack-ups International floaters
20200
200
400
600
800
1,000
513
477
1,013
USDm
329
288625
134115
24916
8
23
228
244
2021 2022 2023+
0
20
40
60
80
100
27%
31%36%
15%8%
2%5%
11%
12%
75%66%58%
2020 2021
%
2022 2023
North Sea jack-ups International floaters Total
Contract coverage
Directors’ report 35Maersk Drilling Annual Report 2019 Overview Business Sustainability Financial review Governance and risk

Governance and risk
Directors’ report 36Maersk Drilling Annual Report 2019 Overview Business Sustainability Financial review Governance and risk

Corporate governance
Our Values
Our five values were far ahead of their time when they were created by the founders of the Maersk Group. Today they remain our guiding principles, calling upon us to remain conscientious as we strive to do better.
Constant CareTake care of today, actively prepare for tomorrow.
Forward thinking, planning and execution. Being informed, innovative and seeking out new ideas. Looking for changes in the environment.
UprightnessOur word is our bond.
Honesty and accountability. Openness about the good and the bad. Speaking your mind in the debate, but backing the decision.
HumblenessListen, learn, share and give space to others.
Showing trust and giving empowerment. Having an attitude of continuous learning. Never underestimating our competitors or other stakeholders.
Our EmployeesThe right environment for the right people.
Attracting and retaining the right people, building the right team. Providing opportunities for continual development. Rewarding performance, promoting for potential.
Our NameThe sum of our values: passionately striving higher.
The embodiment of our values. Passion and pride for what we do and how we do it. Our image in the eyes of our customers and the external world.
Directors’ report 37Maersk Drilling Annual Report 2019 Overview Business Sustainability Financial review Governance and risk

Our five core values remain unchanged and have been ingrained in Maersk Drilling’s way of conducting business since its founding in 1972. They remain guiding principles for the work of the Board of Directors, the Executive Management and all activities in Maersk Drilling and translate into our approach to corporate governance.
Governance structure
Shareholders and general meeting
The governing body of Maersk Drilling is the general meeting, at which the shareholders exercise their rights in such matters as the election of board members and the external auditor, approval of the annual report and deciding on proposals submitted by the shareholders. Except for resolutions to amend the articles of association, resolutions can generally be passed by a simple majority.
Board of Directors
Maersk Drilling has a two-tier management structure consisting of the Board of Directors and the Executive Management. The Board of Directors supervises the work of the Executive Management and is responsible for the overall strategic management and proper organisation of the Group’s business and operations. The Executive Management handles the day-to-day management of the Group. No person may serve as a member of both corporate bodies.
In 2019, the Board of Directors consisted of six members elected by the general meeting and two members elected among the employees. Members elected by the general meeting are elected for a term of one year, whereas employee representatives are elected for a term of four years. Re-election of board members may take place.
The general meeting elects a chairman of the Board of Directors, and the Board of Directors elects a vice chairman among its members. The chairman and the vice chairman together constitute the Chairmanship.
The Board of Directors held six meetings in 2019. All members attended all meetings, except that Caroline Alting and Glenn Gormsen each attended five meetings.
Diversity, competencies and board evaluation
Maersk Drilling strives towards diversity in the composition of the Board of Directors, including gender as well as nationality, international experience, qualifications and competencies. Maersk Drilling’s overall ambition is to work towards having an equal gender distribution of the Board of Directors. Maersk Drilling’s target is two female board members elected by the general meeting no later than at the annual general meeting to be held in 2022. Additionally, Maersk Drilling’s current target is that at least 1/3 of the Board of Directors should be non-Danish citizens.
At 31 December 2019, one shareholder-elected board member was female and five were male, while four shareholder-elected board members were non-Danish citizens and two were Danish citizens.
Annually, the Board of Directors conducts a self-evaluation. The Chairmanship is in charge of the annual evaluation of the Board of Directors, and external assistance will be obtained at least every third year.
As part of the annual evaluation, the Board of Directors evaluates its composition considering the competencies needed to perform its tasks. The key competencies and areas of experience and expertise required by the Board of Directors are: capital markets, offshore oil & gas operations and industry, executive leadership and financial acumen, corporate transformations and ESG, including health and safety.
In 2019, the self-evaluation was carried out internally by way of a written questionnaire and a subsequent discussion of the conclusions.
Directors’ report 38Maersk Drilling Annual Report 2019 Overview Business Sustainability Financial review Governance and risk

Executive Leadership Team
Our corporate governance structure
Board of Directors
Executive Management CEO & CFO
Chief Operating
Officer
Chief Strategy
and People Officer
Shareholders
Remuneration Committee
Nomination Committee
Safety & Sustainability
Committee
Audit & Risk Committee
This first self-evaluation revealed sound performance by the Board of Directors and good cooperation between the Board of Directors and the Executive Management. Further, the self-evaluation confirmed the importance of continued focus on board composition to ensure diversity in a broad perspective, including qualifications and competencies as well as international experience, gender and nationality considering Maersk Drilling’s strategy and current and future possibilities and challenges.
Executive Management
The Executive Management consists of the Chief Executive Officer (CEO) and the Chief Financial Officer (CFO).
The Executive Management is responsible for the day-to-day management and compliance with the procedures, instructions, guidelines and recommendations issued by the Board of Directors.
The Chairmanship and the Executive Management regularly discuss the cooperation between the Board of Directors and the Executive Management. The Board of Directors also regularly and at least annually evaluates the work and performance of the Executive Management.
Board committees
In order to support the Board of Directors, Maersk Drilling has established an Audit & Risk Committee, a Remuneration Committee, a Nomination Committee and a Safety & Sustainability Committee.
The purpose of the board committees is to report and make recommendations to the Board of Directors on the matters assigned to each board committee. The committees are not authorised to make independent decisions but to examine all matters within the scope of their charters, which are available on Maersk Drilling’s website at https://investor.maerskdrilling.com/governance/corporate-governance.
All members of the committees are elected by the Board of Directors among its members, considering the optimal composition given the individual members’ key competencies.
Audit & Risk Committee
In 2019, the Audit & Risk Committee consisted of Kathleen McAllister as chair and Martin Larsen and Robert Routs as members.
The overall purpose and main activities of the Audit & Risk Committee is to monitor and review the Group’s financial reporting and related procedures, and to evaluate the accounting policies, estimates and judgements as well as transactions with related parties. Further, the Audit & Risk Committee is to monitor the Group’s external audit, including the provision of non-audit services.
Directors’ report 39Maersk Drilling Annual Report 2019 Overview Business Sustainability Financial review Governance and risk
Moreover, the Audit & Risk Committee oversees the Company’s risk management systems, including the ethics hotline.
The Audit & Risk Committee held four meetings in 2019. All members attended all meetings.
Remuneration Committee
In 2019, the Remuneration Committee consisted of Claus V. Hemmingsen as chair and Robert M. Uggla and Robert Routs as members.
The overall purpose and main activities of the Remuneration Committee is to maintain and oversee the Remuneration Policy and to evaluate the actual remuneration for the members of the Board of Directors and the Executive Management. Additionally, the Remuneration Committee annually reviews the compensation level for Maersk Drilling’s Executive Leadership Team and the general incentive framework for other employees.
The Remuneration Committee held three meetings in 2019. All members attended all meetings.
Nomination Committee
In 2019, the Nomination Committee consisted of Robert M. Uggla as chair and Claus V. Hemmingsen as member.
The overall purpose and main activities of the Nomination Committee is to ensure that appropriate plans and processes are in place for nomination of candidates to the Board of Directors, the Executive Management and the board committees. The Nomination Committee annually evaluates the composition of the Executive Management and, if requested, assists with the annual evaluation of the Board of Directors.
The Nomination Committee held one meeting in 2019. Both members attended the meeting.
Safety & Sustainability Committee
In 2019, the Safety and Sustainability Committee consisted of Claus V. Hemmingsen as chair and Alastair Maxwell and Robert Routs as members.
The overall purpose and main activities of the Safety & Sustainability Committee is to assist the Board of Directors with overseeing Maersk Drilling’s identification, management and mitigation of risks associated with matters of health, safety, security, environment and sustainability, including the annual Sustainability Report.
The Safety and Sustainability Committee held two meetings in 2019. All members attended both meetings.
Statutory report on corporate governance
Pursuant to section 107b of the Danish Financial Statements Act and the Rules for Issuers of Shares of Nasdaq Copenhagen A/S, listed companies must provide an annual statement on how they address the recommendations on corporate governance issued by the Danish Committee on Corporate Governance.
Our adoption of the recommendations, including descriptions of internal controls and risk management systems related to financial reporting, is set out in our Statement on Corporate Governance for 2019, which is available at https://investor.maerskdrilling.com/governance/corporate-governance.
Disclosure regarding change of control
As part of the demerger of A.P. Møller - Mærsk A/S, Maersk Drilling entered into a branding agreement with A.P. Møller - Mærsk A/S and A.P. Møller Holding A/S regarding Maersk Drilling’s future use of a number of trademarks, names, vessels and rig names and other designations including “Maersk Drilling”, the Maersk blue colour and the seven-pointed star. In addition to the parties’ right to terminate the branding agreement in case of breach and insolvency proceedings, the branding agreement is further subject to a number of termination provisions allowing A.P. Møller - Mærsk A/S and/or A.P. Møller Holding A/S to terminate (generally at 12 months’ notice) in case of certain events constituting a change of control under the branding agreement. Upon termination, Maersk Drilling must cease use of the Maersk trademarks and remove any references thereto.
Statutory report on gender and diversity
The Sustainability Report for 2019 serves as the statutory reporting according to sections 99a and 99b of the Danish Financial Statements Act. Read the full report at https://www.maerskdrilling.com/who-we-are/sustainability.
Directors’ report 40Maersk Drilling Annual Report 2019 Overview Business Sustainability Financial review Governance and risk

Board of Directors
From left: Martin Larsen, Glenn Gormsen, Kathleen McAllister, Robert Routs, Robert M. Uggla, Claus V. Hemmingsen, Caroline Alting and Alastair Maxwell.
Directors’ report 41Maersk Drilling Annual Report 2019 Overview Business Sustainability Financial review Governance and risk

Claus V. HemmingsenChairman
Chair of Remuneration Committee and Safety & Sustainability Committee; member of Nomination Committee
Born 1962
Gender Male
Nationality Danish
Joined the Board 2019
Term of office will end 2020
Professional board member
QualificationsExtensive international, commercial and managerial experience from offshore oil & gas and shipping industry, including HSSE & Sustainability, M&A, capital markets and non-executive directorships.
Other management duties, etc. DFDS A/S (Chairman; Chair of Nomination Committee and Remuneration Committee); Den A.P. Møllerske Støttefond (board member); Det Forenede Dampskibs-Selskabs Jubilæumsfond (board member).
Education• A.P. Moller Maersk Certified Shipping Education (1983)• Executive MBA (honours) from International Institute
for Management Development (IMD) (2007)• International Directors Programme (INSEAD) (2019)
Shareholding: 5,424 shares
Not considered independent
Robert M. UgglaVice Chairman
Chair of Nomination Committee; Member of Remuneration Committee
Born 1978
Gender Male
Nationality Swedish
Joined the Board 2019
Term of office will end 2020
CEO of A.P. Møller Holding A/S
QualificationsInternational, commercial and managerial experience within investments, incubation, shipping and marine services, including HSSE and other ESG aspects, M&A, capital markets and non-executive directorships.
Other management duties, etc. A.P. Møller - Mærsk A/S (board member; member of Nomination Committee, Transformation & Innovation Committee and Remuneration Committee); A.P. Møller Capital P/S (Chairman); APMH Invest A/S (Chairman); A.P. Møller Capital GP ApS (Chairman); Maersk Tankers A/S (Chairman); Maersk Product Tankers A/S (Chairman); IMD (Foundation Board member); Agata ApS (CEO); Estemco XII ApS (CEO).
Education• MSc in Finance and Economics from Stockholm
School of Economics, including studies at Università Commerciale Luigi Bocconi
• Executive education at the Wharton School of the University of Pennsylvania, Harvard Business School, Stanford Business School and IMD
Shareholding: 4,430 shares
Not considered independent
Alastair Maxwell
Member of Safety & Sustainability Committee
Born 1964
Gender Male
Nationality British
Joined the Board 2019
Term of office will end 2020
CFO of GasLog Ltd and GasLog Partners LP
QualificationsExtensive international and financial experience within energy markets, including M&A, privatisation, restructuring and equity and debt capital markets.
Other management duties, etc.: CFO of GasLog Ltd and GasLog Partners LP.
Education• MA (Hons) Modern Languages (Spanish and Portuguese)
from Oxford University• Successful completion of London Business School
Corporate Finance Evening Programme (1988/89)
Shareholding: 1,337 shares
Considered independent
Kathleen McAllister
Chair of Audit & Risk Committee
Born 1964
Gender Female
Nationality American
Joined the Board 2019
Term of office will end 2020
Professional board member
QualificationsExtensive international, financial and managerial experience within the offshore oil & gas industry, including M&A, capital markets, listed company CEO and CFO roles and non-executive directorships.
Other management duties, etc.Höegh LNG Partners LP (board member; member of Audit Committee and Conflicts Committee); Black Hills Corp. (board member).
Education• B.S. Accounting (honours), University of Houston
– Clear Lake• Certified Public Accountant• NACD Board Leadership Fellow
Shareholding: 0 shares
Considered independent
Directors’ report 42Maersk Drilling Annual Report 2019 Overview Business Sustainability Financial review Governance and risk

Robert Routs
Member of Audit & Risk Committee, Remuneration Committee, and Safety & Sustainability Committee
Born 1946
Gender Male
Nationality Dutch
Joined the Board 2019
Term of office will end 2020
Professional board member
QualificationsTechnical, commercial and managerial experience. More than 30 years of international working experience in research, general management and from CEO positions in the oil & gas, chemical, renewables and trading industries, including positions in listed companies.
Other management duties, etc.Koninklijke DSM NV (Chairman; Chair of Nomination Committee; member of Remuneration Committee); ATCO Ltd. (board member; member of Audit & Risk Committee and Corporate Governance: Nomination, Compensation and Succession Committee); AECOM (board member; Chair of Strategy, Risk and Safety Committee; member of Compensation and Organization Committee).
Education• MSc in Chemical Technology from the Technological
University of Eindhoven• Ph.D. in Technical Sciences from the Technological
University of Eindhoven• Executive MBA from Harvard Business School
Shareholding: 50 shares
Considered independent
Caroline Alting
Employee representative
Born 1975
Gender Female
Nationality Danish
Joined the Board 2019
Term of office will end 2023
Head of Engineering & Technical Authority with Maersk Drilling
QualificationsTechnical and operational experience within the offshore oil & gas industry, including HSSE, sustainability and the competitive landscape and customer relationships.
Other management duties, etc.Advisory board member for MCEDD Deepwater Development conference.
Education• MSc. Chemistry • PMD IESE Business School
Shareholding: 0 shares
Not considered independent due to employment within the Group
Glenn Gormsen
Employee representative
Born 1972
Gender Male
Nationality Danish
Joined the Board 2019
Term of office will end 2023
Offshore Installation Manager with Maersk Drilling
QualificationsIn-depth technical, operational and leadership experience within the offshore oil & gas operations and industry, including compliance, risk management and HSSE, as well as a deep cross-organisational understanding of Maersk Drilling.
Other management duties, etc.None
Education• Master Mariner• Officer of reserves, Royal Danish Navy• In Process: Bachelor in leadership, financial management
and asset management (Blue Diploma)
Shareholding: 105 shares
Not considered independent due to employment within the Group
Martin Larsen
Member of Audit & Risk Committee
Born 1979
Gender Male
Nationality Danish
Joined the Board 2019
Term of office will end 2020
CFO of A.P. Møller Holding A/S
QualificationsInternational, managerial and financial experience within offshore supply services, shipping, energy and insurance, including M&A and capital markets experience.
Other management duties, etc.APMH Invest A/S (CEO and board member); A.P. Møller Capital GP ApS (board member); APMH Invest IV A/S (board member); A.P. Møller Capital P/S (board member); Maersk Tankers A/S (board member and Chair of the Audit Committee); Maersk Product Tankers A/S (board member and Chair of the Audit Committee); Navigare Capital Partners A/S (board member); Stormgade I ApS (board member); Stormgade II ApS (board member); KKWSH ApS (board member); KK Wind Solutions Holding A/S (board member); APMH Invest VI A/S (board member); Assuranceforeningen Skuld (Gjensidig) (board member, Chair of the Audit Committee and member of the Risk Committee).
Education• Executive MBA from London School of Economics/
Columbia University• Master of Science, Economics and Finance from
Warwick University• Bachelor of Economics from University of Copenhagen
Shareholding: 182 shares
Not considered independent
Directors’ report 43Maersk Drilling Annual Report 2019 Overview Business Sustainability Financial review Governance and risk

Executive Management
Jørn MadsenChief Executive Officer (CEO)
Born 1964
Gender Male
Year of first employment 1997
In current position since 2016
Jørn has been CEO of Maersk Drilling since November 2016. Prior to his appointment as CEO, Jørn Madsen was CEO of Maersk Supply Service A/S from 2015–2016, and prior thereto, he held positions as COO and Rig Manager in Maersk Drilling from 1997–2015 and has been with A.P. Moller - Maersk since 1990. Jørn Madsen is currently Chairman of the Board of Directors of Maersk Decom A/S and a member of the Board of Directors of Maersk Training A/S. Jørn Madsen holds an Executive MBA from IMD/University of Geneva, and a Master of Science, Mechanical Engineering from the Technical University of Denmark.
Jesper Ridder OlsenChief Financial Officer (CFO)
Born 1970
Gender Male
Year of first employment 2018
In current position since 2018
Jesper has been CFO of Maersk Drilling since September 2018. Prior to his appointment as CFO, Jesper Ridder Olsen was Head of Accounting, Control & Tax of A.P. Møller - Mærsk A/S from November 2017 to September 2018. Prior thereto, he was a partner at Ernst & Young and KPMG where he was a member of the executive management. Jesper Ridder Olsen is currently a member of the Board of Directors of KK-Group A/S. Jesper Ridder Olsen holds a Master of Science, Business Administration and Auditing, Copenhagen Business School, and was authorised as State Authorised Public Accountant in 2001.
Directors’ report 44Maersk Drilling Annual Report 2019 Overview Business Sustainability Financial review Governance and risk

Remuneration
Remuneration PolicyAs part of the demerger of A.P. Møller - Mærsk A/S, the general meeting approved the Remuneration Policy applicable to the Board of Directors and the Executive Management of Maersk Drilling. At the 2020 annual general meeting of Maersk Drilling, the Board of Directors will propose the approval of a Remuneration Policy which fundamentally continues the existing policy principles, and any changes from the text of the previous version reflect developments in corporate governance rather than a change in underlying principles. The description below is a summary of the current Remuneration Policy.
The Remuneration Policy includes the overall guidelines on incentive pay for the Board of Directors and the Executive Management in accordance with sections 139 and 139a of the Danish Companies Act and based on the Corporate Governance Recommendations.
The Remuneration Policy promotes the objectives of:• ensuring alignment of interests between the
Board of Directors, the Executive Management and shareholders,
• attracting and retaining qualified members of the Board of Directors and the Executive Management,
• constantly maintaining the motivation of both the Board of Directors and the Executive Management for achieving the Group’s strategic long- and short-term targets, and
• promoting value creation for the benefit of the shareholders.
Board of DirectorsEach ordinary member of the Board of Directors will receive a fixed annual base fee, while the Chairman and the Vice Chairman receive fixed multiples of the fixed annual base fee. Participation in a board committee entitles a board member to an additional fixed annual fee based on a proportion of the fixed annual base fee. Members of the Board of Directors and the board committees do not receive any incentive or share-based pay. Fee levels are reviewed periodically taking into account independent advice (on comparisons with other large companies of similar size and complexity based in Denmark and Europe, supplemented by a perspective based on global drilling industry remuneration levels for industry specific expertise) and the time commitment required of the board members.
Executive Management Remuneration of the Executive Management will be decided by the Board of Directors based on recommendations from the Remuneration Committee. When determining the fixed pay of
the Executive Management, the Board of Directors takes into consideration: • our policy generally to provide a total reward
opportunity at around the median for similar positions with comparable status, responsibility and skills, in organisations of broadly similar size and complexity in Denmark and in Europe;
• a perspective based on global drilling industry remuneration levels for industry specific expertise.
The remuneration and benefits package for the Executive Management will consist of:• Fixed pay: A fixed annual cash salary.• Other benefits: Telephone, insurance coverage,
annual health check, newspaper subscriptions, training/education and similar benefits.
• Short-term incentive: A short-term cash incentive based on the achievement of the targets established.
• Long-term incentive: A share-based incentive scheme is offered to incentivise long-term performance, commitment and retention of the Executive Management, as well as to promote alignment of their interests with the shareholders. All long-term incentives must have a vesting or maturity period of at least three years from the relevant date of grant. The Executive Management will not be able to sell any shares vesting until the total period from grant is five years, i.e. an additional “holding
period” of two years in addition to the three-year “vesting period”. The Executive Management is also subject to a share ownership requirement of twice the annual long-term incentive grant level applicable.
• Transition of long-term incentives: To ensure the Executive Management had an equity interest in the Company from the date of the demerger, they were required to forfeit all unvested A.P. Møller - Mærsk A/S shares and share options as of 1 January 2019. The Executive Management instead received restricted share units in Maersk Drilling.
• Termination benefits: The period of notice applicable to the Executive Management is 12 months for the employer and 6 months for the executive. In addition to company notice, the Executive Management is entitled to a severance payment of up to 6 months’ fixed pay at the time of termination.
Directors’ report 45Maersk Drilling Annual Report 2019 Overview Business Sustainability Financial review Governance and risk
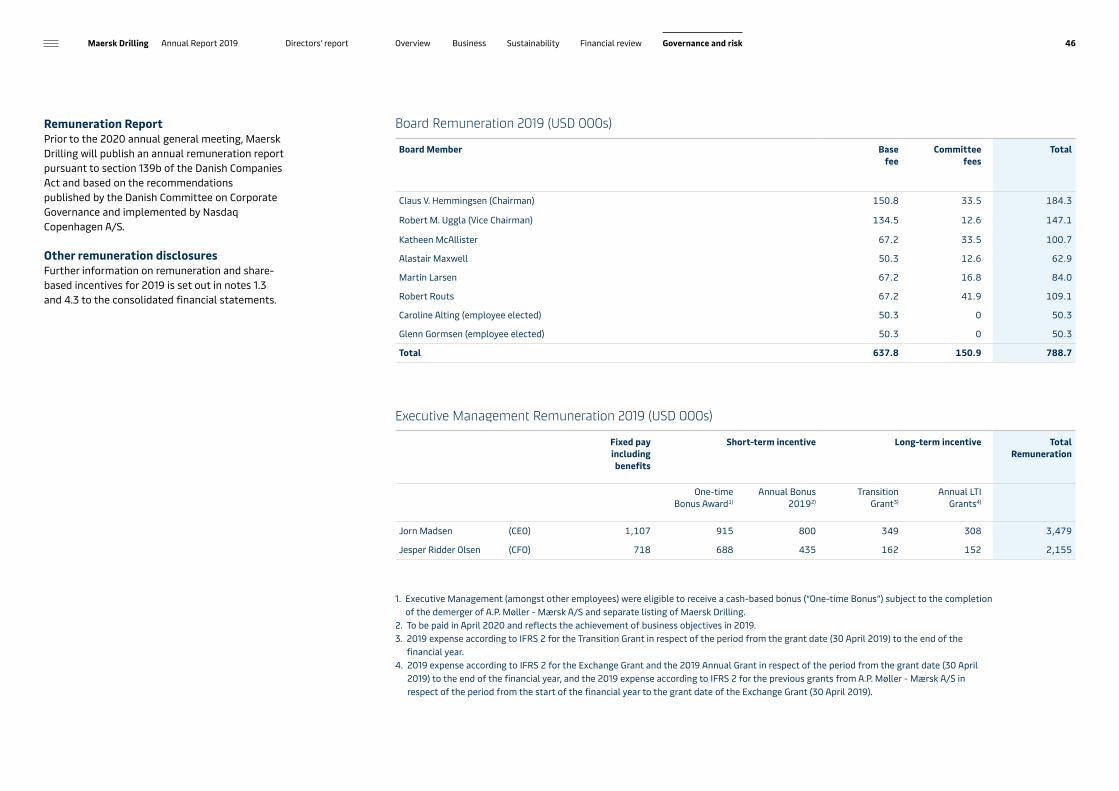
Board Member Base fee
Committeefees
Total
Claus V. Hemmingsen (Chairman) 150.8 33.5 184.3
Robert M. Uggla (Vice Chairman) 134.5 12.6 147.1
Katheen McAllister 67.2 33.5 100.7
Alastair Maxwell 50.3 12.6 62.9
Martin Larsen 67.2 16.8 84.0
Robert Routs 67.2 41.9 109.1
Caroline Alting (employee elected) 50.3 0 50.3
Glenn Gormsen (employee elected) 50.3 0 50.3
Total 637.8 150.9 788.7
Fixed pay including benefits
Short-term incentive Long-term incentive Total Remuneration
One-time Bonus Award1)
Annual Bonus 20192)
Transition Grant3)
Annual LTI Grants4)
Jorn Madsen (CEO) 1,107 915 800 349 308 3,479
Jesper Ridder Olsen (CFO) 718 688 435 162 152 2,155
Board Remuneration 2019 (USD 000s)
Executive Management Remuneration 2019 (USD 000s)
Remuneration ReportPrior to the 2020 annual general meeting, Maersk Drilling will publish an annual remuneration report pursuant to section 139b of the Danish Companies Act and based on the recommendations published by the Danish Committee on Corporate Governance and implemented by Nasdaq Copenhagen A/S. Other remuneration disclosuresFurther information on remuneration and share-based incentives for 2019 is set out in notes 1.3 and 4.3 to the consolidated financial statements.
1. Executive Management (amongst other employees) were eligible to receive a cash-based bonus (“One-time Bonus”) subject to the completion of the demerger of A.P. Møller - Mærsk A/S and separate listing of Maersk Drilling.
2. To be paid in April 2020 and reflects the achievement of business objectives in 2019.3. 2019 expense according to IFRS 2 for the Transition Grant in respect of the period from the grant date (30 April 2019) to the end of the
financial year.4. 2019 expense according to IFRS 2 for the Exchange Grant and the 2019 Annual Grant in respect of the period from the grant date (30 April
2019) to the end of the financial year, and the 2019 expense according to IFRS 2 for the previous grants from A.P. Møller - Mærsk A/S in respect of the period from the start of the financial year to the grant date of the Exchange Grant (30 April 2019).
Directors’ report 46Maersk Drilling Annual Report 2019 Overview Business Sustainability Financial review Governance and risk

Impact
Like
lihoo
d
Market dynamics
Rig moves
Contractual risks
Agent/partner risks
WeatherRig incidents
Tax non-compliance
Complex environmental laws
and regulations
Risk management
The objective of Maersk Drilling’s risk management is to contribute to the fulfilment of the company’s strategy by ensuring that risks are identified, assessed, reported, monitored and addressed in a way that is aligned with the business operations, objectives and risk appetite.
The processes are structured through an Enterprise Risk Management (ERM) framework, setting forth the necessary elements for having coordinated actions and alignment among the various stakeholders with regard to addressing the key risks.
The Executive Management assesses risks on an ongoing basis to address mitigation and
contingency planning activities. Risks are reported to and discussed with the Board of Directors on a regular basis and top risks are reported annually to external stakeholders through the Annual Report.
During 2019, a risk management maturity assessment conducted by an external party concluded that Maersk Drilling’s risk management process is at a “Mature” level on a scale ranging from Undeveloped, Basic, Intermediate, Mature and Advanced.
The most significant risks and their potential impact are listed below together with the appropriate mitigation activities.
Risk management structure
Maersk Drilling’s ERM framework is based on four elements;Risk Principles, Risk Governance, Risk Communication and Risk Processes
Riskprinciples
Accountability
TransparencyRele
vanc
e
Integration
Riskidentification
Riskmonitoring
Riskprioritisation
Riskmitigation
Contingencyplanning
Riskassessment
Risk governance
Risk communication
Directors’ report 47Maersk Drilling Annual Report 2019 Overview Business Sustainability Financial review Governance and risk

Rig incidents
Risk Description Risk Mitigation
Offshore drilling requires use of heavy equipment and exposure to hazardous conditions which carry inherent health and safety risks. Maersk Drilling’s operations are subject to hazards inherent in drilling for oil and gas, such as blow-outs, reservoir damage, loss of production, loss of well control, punch through, lost or stuck drill strings, equipment defects, craterings, fires, explosions and pollution.
Maersk Drilling’s operations are also subject to hazards inherent in marine operations, such as capsizing, grounding, navigation errors, collision, oil and hazardous substance spills, extensive uncontrolled fires and marine life infestations.
Such hazards present a potential risk to the safety of people, to the environment, assets, liquidity position and reputation.
The risks associated with operational accidents are mitigated through safety and maintenance standards, response preparedness, continuous training and rigorous monitoring. In addition to operational activity mitigations, our drilling contracts provide for varying levels of indemnity and allocation of liabilities between our customers and us. Also, people, assets and activities remain comprehensively insured against personal injuries, physical damage and liabilities.
Weather
Risk Description Risk Mitigation
Some of our drilling rigs are located in areas that frequently experience hurricanes and other forms of severe weather conditions which can cause damage or destruction to the drilling rigs. Further, high winds and turbulent seas could cause suspension of operations, and revenue, on drilling rigs for significant periods of time.
Maersk Drilling has put shut-down, moving and down-manning procedures in place in case of severe weather conditions. Additionally, in order for Maersk Drilling to ensure a high level of safety, tests of processes are conducted at regular intervals for rigs operating in risk areas.
Market dynamics
Risk Description Risk Mitigation
The offshore drilling industry is highly competitive, and profitability is strongly impacted by developments in rig supply and drilling demands. In addition, the industry is volatile and cyclical, which is largely the result of changes in oil and gas prices and their impact on exploration and production company expenditures.
Periods of low drilling demand and excess rig supply intensify competition in the industry and may result in rigs being idle or earning substantially lower day rates than the historical average for long periods of time. Additionally, general contractual terms and conditions are under pressure during periods of low industry activity, potentially further reducing the commercial value of available rig contracts.
Maersk Drilling mitigates the risks associated with low demand through a high focus on customers and their requirements, a continuous strong operational delivery and maintaining a fleet of modern and technologically advanced drilling rigs. Maersk Drilling is also focused on co-developing new compensation and business models with customers, focusing on reducing waste and costs related to drilling a well. Further, Maersk Drilling has adopted a warm stacking strategy for its fleet, enabling shorter time for reactivation and lower risks in reactivation to meet customer demands and keep utilisation high.
Rig moves
Risk Description Risk Mitigation
The offshore drilling market is a global market as rigs can relocate and operate in various environments. However, mobilisation of rigs is expensive and time-consuming and can be impacted by several factors, including weather and currents. When mobilising a rig, additional risks are introduced such as risk of collision, loss of tow, loss of stability/water tight integrity, mooring line failure and anchor dragging, which can cause human fatalities, damage to the rig or to other units.
Maersk Drilling mitigates the risks associated with rig moves through timely preparation of the mobilisation, which includes extensive planning and verification processes.
Directors’ report 48Maersk Drilling Annual Report 2019 Overview Business Sustainability Financial review Governance and risk

Contractual risks
Risk Description Risk Mitigation
Maersk Drilling may be subject to the risk of its customers seeking to terminate or renegotiate their contracts due to our non-compliance with the terms and conditions of the contract.
Contractual risks are addressed during the negotiation of new contracts or re-negotiation of existing contracts, where significant efforts are undertaken to ensure that contracts leave minimal opportunity for termination or that the impact from termination will not result in a significant financial loss.
Complex environmental laws and regulations
Risk Description Risk Mitigation
Maersk Drilling’s operations are subject to a variety of laws, regulations and requirements in multiple jurisdictions controlling the discharge of various materials into the environment, requiring removal and clean-up of materials that may harm the environment, controlling carbon dioxide emissions, or otherwise relating to the protection of the environment.
In general, the laws and regulations protecting the environment are becoming increasingly numerous, stringent and complex. Failure to comply with applicable environmental laws and regulations or to obtain or maintain necessary environmental permits or approvals, or even an accidental release of oil or other hazardous substances in connection with the operations, could subject Maersk Drilling to significant administrative and civil fines and penalties, criminal liability, remediation costs for natural resource damages, third-party damages and material adverse publicity, or may result in the suspension or termination of its operations.
We are committed to doing business in accordance with applicable regulatory standards and have adopted policies and procedures which are designed to promote legal and regulatory compliance.
In accordance with industry practice, Maersk Drilling’s customers typically take primary responsibility for any environmental pollution resulting from the customer’s use of the drilling rigs under the contracts, and Maersk Drilling typically assumes liability for pollution originating from its own equipment. Maersk Drilling has generally been able to obtain a certain degree of contractual indemnification pursuant to which our customers agree to hold harmless and indemnify Maersk Drilling against liability for pollution, well and environmental damage.
Agent / partner risks
Risk Description Risk Mitigation
Maersk Drilling relies on third-party suppliers to provide parts, crew and equipment. The reliance on third-party suppliers, manufacturers and service providers used in the drilling operations exposes us to the risk of these partners not adhering to company values and/or corporate policies and exposes us to volatility in the quality, price and availability of such items, especially where the number of suppliers is limited.
Maersk Drilling seeks to mitigate the risks associated with partners not adhering to company values and/or corporate policies through due diligence procedures, including termination clauses in contracts and assigning clear roles and responsibilities with partners. Additionally, continuous monitoring of partners and education in our values and corporate policies mitigate these risks. Maersk Drilling also seeks to ensure that we have good working relationships with multiple suppliers to reduce the risks of over-reliance on single suppliers.
Tax non-compliance
Risk Description Risk Mitigation
Maersk Drilling operates worldwide, which entails an inherent tax risk with respect to regulatory tax compliance, including corporate taxes, value added taxes and excise duties, as well as withholding taxes and taxes regarding specific rig taxation.
As tax laws are complex and subject to interpretation, there is a risk that these interpretations could affect the taxes Maersk Drilling pays in various jurisdictions. Maersk Drilling’s tax positions are also subject to audit by relevant tax authorities who may disagree with our interpretations or assessments of the effects of tax laws, treaties or regulations, or their applicability to our corporate structure or specific transactions we have undertaken.
As outlined in our Tax Policy, tax-related risks are mitigated through an upright approach, cooperation with the authorities in respect of investigations and enquiries, as well as ensuring that an efficient organisation of specialists with the necessary competencies is in place to best meet the requirements and tax regulations relevant to operations. Tax exposures are assessed before entering new commercial contracts and monitored systematically on an ongoing basis and presented to the Audit & Risk Committee.
Directors’ report 49Maersk Drilling Annual Report 2019 Overview Business Sustainability Financial review Governance and risk
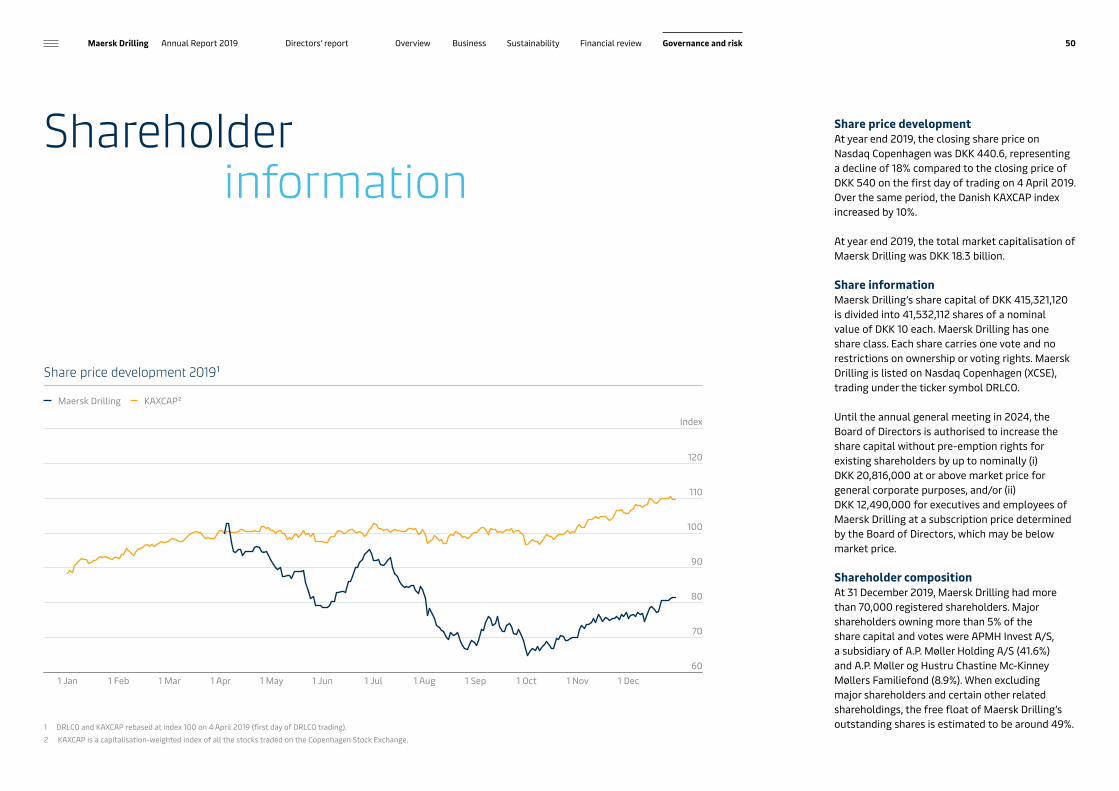
Shareholder information
Share price development 2019¹
Share price developmentAt year end 2019, the closing share price on Nasdaq Copenhagen was DKK 440.6, representing a decline of 18% compared to the closing price of DKK 540 on the first day of trading on 4 April 2019. Over the same period, the Danish KAXCAP index increased by 10%.
At year end 2019, the total market capitalisation of Maersk Drilling was DKK 18.3 billion.
Share informationMaersk Drilling’s share capital of DKK 415,321,120 is divided into 41,532,112 shares of a nominal value of DKK 10 each. Maersk Drilling has one share class. Each share carries one vote and no restrictions on ownership or voting rights. Maersk Drilling is listed on Nasdaq Copenhagen (XCSE), trading under the ticker symbol DRLCO.
Until the annual general meeting in 2024, the Board of Directors is authorised to increase the share capital without pre-emption rights for existing shareholders by up to nominally (i) DKK 20,816,000 at or above market price for general corporate purposes, and/or (ii) DKK 12,490,000 for executives and employees of Maersk Drilling at a subscription price determined by the Board of Directors, which may be below market price.
Shareholder compositionAt 31 December 2019, Maersk Drilling had more than 70,000 registered shareholders. Major shareholders owning more than 5% of the share capital and votes were APMH Invest A/S, a subsidiary of A.P. Møller Holding A/S (41.6%) and A.P. Møller og Hustru Chastine Mc-Kinney Møllers Familiefond (8.9%). When excluding major shareholders and certain other related shareholdings, the free float of Maersk Drilling’s outstanding shares is estimated to be around 49%.1 DRLCO and KAXCAP rebased at index 100 on 4 April 2019 (first day of DRLCO trading).
2 KAXCAP is a capitalisation-weighted index of all the stocks traded on the Copenhagen Stock Exchange.
Maersk Drilling KAXCAP²
60
70
80
90
100
110
120
1 Dec1 Jan 1 Feb 1 Mar 1 Apr 1 May 1 Jun 1 Jul 1 Aug 1 Sep 1 Oct 1 Nov
Index
Directors’ report 50Maersk Drilling Annual Report 2019 Overview Business Sustainability Financial review Governance and risk

It is estimated that global institutional investors own approximately 21% of the share capital, of which the United States and United Kingdom make up the largest groups.
Approximately 12% of Maersk Drilling’s shares are held by private investors, nearly all of them residing in Denmark.
Due to nominee shareholding structures and different ownership disclosure rules across jurisdictions, there is no complete record of all shareholders. This means that the beneficial owners of approximately 8% of the issued capital remain unidentified.
Until the annual general meeting in 2024, the Board of Directors is authorised to acquire treasury shares of up to 10% of the share capital provided that the purchase price does not deviate by more than 10% from the price quoted on Nasdaq Copenhagen at the time of the acquisition.
As of 31 December 2019, Maersk Drilling did not hold any treasury shares. As previously announced, Maersk Drilling intends to use treasury shares to meet its obligations to deliver shares under its long-term incentive programme, and such treasury shares will generally be bought back according to the EU Safe Harbour rules.
Communication with investorsTo ensure that capital market participants, including current and prospective shareholders, are able to make well-informed investment decisions, Maersk Drilling hosts conference calls with the Executive Management each quarter following the release of financial reports and trading statements. The Executive Management and Investor Relations also meet current and prospective investors on a regular basis at roadshows and equity conferences.
On 25 February 2019, Maersk Drilling hosted a Capital Markets Day, where members of the management team presented Maersk Drilling’s strategic and financial position to investors and analysts. The full Capital Market Day material is available at https://investor.maerskdrilling.com.
Analyst coverageMaersk Drilling is currently covered by 16 sell-side analysts, including analysts from large international banks, who regularly publish equity research reports about Maersk Drilling. A full list of analysts covering Maersk Drilling can be found at Maersk Drilling’s Investor Relations website https://investor.maerskdrilling.com.
No. of shares 41,532,112
Share classes 1
Listing Nasdaq Copenhagen
Trading symbol DRLCO
5 February Annual Report for 2019
2 April Annual General Meeting
27 May Q1 Trading Statement
14 August H1 Interim Financial Report
20 November Q3 Trading Statement
Maersk Drilling share data
Financial calendar for 2020
Investor type
Linked investors Institutional investors Retail investors Other investor types Unidentified
XX%
51%
21%
12%
8%8%
Directors’ report 51Maersk Drilling Annual Report 2019 Overview Business Sustainability Financial review Governance and risk
Financials
Consolidated financial statements 53Parent company financial statements 84Statement of the Board of Directors and the Executive Management 93Independent Auditor’s Report 94
52Maersk Drilling Annual Report 2019 Financials Consolidated financial statements 2019 Parent company financial statements 2019 Statements
Consolidated financial statements 2019
Maersk Drilling Annual Report 2019 Financials Consolidated financial statements 2019 Parent company financial statements 2019 Statements 53

Consolidated income statement
Consolidated statement of comprehensive income
USD Million Note 2019 2018
Revenue 1.1, 1.2 1,222 1,429Costs 1.3 -807 -818Profit before depreciation and amortisation, impairment losses/reversals and special items (EBITDA before special items) 415 611Special items 1.4 -16 -16Profit before depreciation and amortisation and impairment losses/reversals (EBITDA) 399 595Depreciation and amortisation 2.1, 2.2, 2.3 -387 -403Impairment losses/reversals 2.4 -34 810Gain/loss on sale of non-current assets 8 - Share of results in joint ventures -2 -1Profit/loss before financial items -16 1,001Financial expenses, net 1.5 -68 -12Profit/loss before tax -84 989Tax 1.6 -29 -48Profit/loss for the year -113 941
Earnings in USD per share of DKK 10 for the year¹ -2.7 22.7Diluted earnings in USD per share of DKK 10 for the year¹ -2.7 22.7
1 Refer to the consolidated statement of changes in equity.
USD Million Note 2019 2018
Profit/loss for the year -113 941Cash flow hedges:Value adjustment of hedges for the year 3.6 -29 -5Reclassified to income statement 8 2Total items that have or will be reclassified to the income statement -21 -3Actuarial gains/losses on defined benefit plans, etc. -2 - Total items that will not be reclassified to the income statement -2 - Other comprehensive income, net of tax -23 -3
Total comprehensive income for the year -136 938
Consolidated cash flow statementUSD Million Note 2019 2018
Profit/loss before financial items -16 1,001Depreciation, amortisation and impairment 2.1, 2.2, losses/reversals, net 2.3, 2.4 421 -407Gain on sale of non-current assets, etc., net -8 - Change in working capital 4.1 57 11Change in provisions, etc. -13 16Other non-cash items 3 - Taxes paid, net -24 -28Cash flow from operating activities 420 593
Purchase of intangible assets and property, plant and equipment 4.1 -307 -155Sale of intangible assets and property, plant and equipment 8 21Other financial investments, net -4 -2Cash flow used for investing activities -303 -136
Interest received 6 47Interest paid -83 -63Proceeds from borrowings 2.8 - 1,470Repayment of borrowings 2.8 -103 -262Dividends distributed - -1,326Cash flow from financing activities -180 -134
Net cash flow for the year -63 323
Cash and bank balances 1 January 372 49Currency translation effect on cash and bank balances 1 0Cash and bank balances 31 December 310 372
Adjusted free cash flowCash flow from operating activities 420 593Cash flow used for investing activities -303 -136Sale of assets or activities -8 - Adjusted free cash flow 109 457
The cash flow statement cannot be directly derived from the income statement and balance sheet.Cash and bank balances at 31 December 2019 include USD 14m (2018: USD 0m) that relates to cash and bank balances in countries with exchange control or other restrictions. These funds are not readily available for general use by Maersk Drilling.
Maersk Drilling Annual Report 2019 Financials Consolidated financial statements 2019 Parent company financial statements 2019 Statements 54
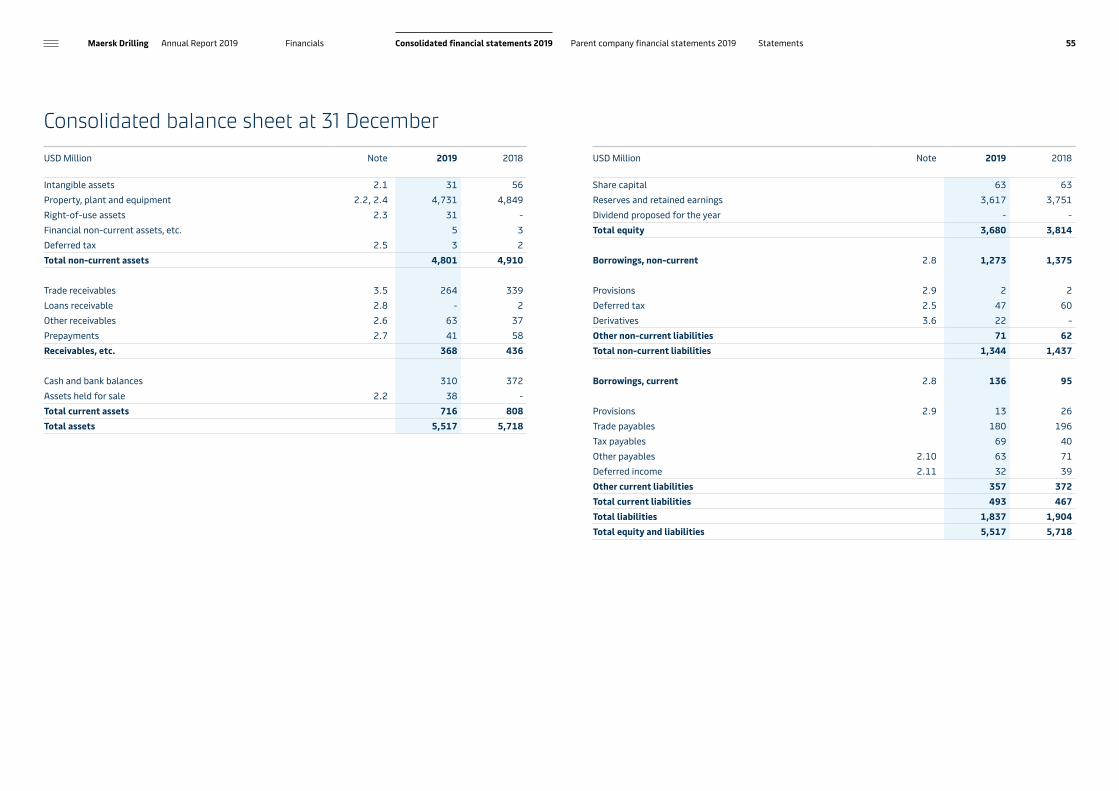
Consolidated balance sheet at 31 DecemberUSD Million Note 2019 2018
Intangible assets 2.1 31 56Property, plant and equipment 2.2, 2.4 4,731 4,849Right-of-use assets 2.3 31 - Financial non-current assets, etc. 5 3Deferred tax 2.5 3 2Total non-current assets 4,801 4,910
Trade receivables 3.5 264 339Loans receivable 2.8 - 2Other receivables 2.6 63 37Prepayments 2.7 41 58Receivables, etc. 368 436
Cash and bank balances 310 372Assets held for sale 2.2 38 - Total current assets 716 808Total assets 5,517 5,718
USD Million Note 2019 2018
Share capital 63 63Reserves and retained earnings 3,617 3,751Dividend proposed for the year - - Total equity 3,680 3,814
Borrowings, non-current 2.8 1,273 1,375
Provisions 2.9 2 2Deferred tax 2.5 47 60Derivatives 3.6 22 - Other non-current liabilities 71 62Total non-current liabilities 1,344 1,437
Borrowings, current 2.8 136 95
Provisions 2.9 13 26Trade payables 180 196Tax payables 69 40Other payables 2.10 63 71Deferred income 2.11 32 39Other current liabilities 357 372Total current liabilities 493 467Total liabilities 1,837 1,904Total equity and liabilities 5,517 5,718
Maersk Drilling Annual Report 2019 Financials Consolidated financial statements 2019 Parent company financial statements 2019 Statements 55

Consolidated statement of changes in equityUSD Million Share capital Reserve for
hedgesRetained earnings
Dividend proposed for the year
Total equity
Equity 1 January 2018 63 1 6,149 - 6,213
Other comprehensive income, net of tax - -3 - - -3Profit/loss for the year - - 941 - 941Total comprehensive income for the year - -3 941 - 938
Dividends to shareholders - - -3,337 - -3,337Total transactions with shareholders - - -3,337 - -3,337
Equity 31 December 2018 63 -2 3,753 - 3,814
2019Other comprehensive income, net of tax - -21 -2 - -23Profit/loss for the year - - -113 - -113Total comprehensive income for the year - -21 -115 - -136
Value of share based payments - - 3 - 3Other equity movements - - -1 - -1Total transactions with shareholders - - 2 - 2
Equity 31 December 2019 63 -23 3,640 - 3,680
Share capital and earnings per shareThe share capital comprises 41,532,112 shares of DKK 10. The Drilling Company of 1972 A/S was incorporated on 2 April 2019 in connection with the separation of the Maersk Drilling activities from the A.P. Moller - Maersk Group. The Consolidated Financial Statements have been prepared as if The Drilling Company of 1972 A/S had always been the parent company of the Maersk Drilling Group and therefore comprises the period 1 January – 31 December 2019 with comparative figures for the period 1 January – 31 December 2018.
Earnings per share is equal to profit/loss for the year divided by the number of shares or the diluted number of shares (2019: USD -113m/41,532,112 shares; 2018: USD 941m/41,532,112 shares). Earnings per share are determined based on the number of shares issued upon incorporation of the Company on 2 April 2019. At 31 December 2019, a potential dilution effect from the 130,313 shares outstanding under the long-term incentive programme (note 4.3) are excluded from the calculation of earnings per share as the inclusion would result in a reduction in the loss per share. There was no dilution effect at 31 December 2018.
Maersk Drilling Annual Report 2019 Financials Consolidated financial statements 2019 Parent company financial statements 2019 Statements 56

Notes
70 Section 3 – capital structure70 Note 3.1 Financial risk management
71 Note 3.2 Liquidity risk
72 Note 3.3 Interest rate risk
72 Note 3.4 Currency risk
73 Note 3.5 Credit risk
73 Note 3.6 Derivatives
74 Note 3.7 Financial instruments by category
75 Section 4 – other notes75 Note 4.1 Cash flow specifications
75 Note 4.2 Contingent liabilities and commitments
76 Note 4.3 Share-based payment
77 Note 4.4 Related parties
78 Note 4.5 Subsequent events
78 Section 5 – basis of preparation78 Note 5.1 Basis of preparation
79 Note 5.2 Significant accounting policies
82 Note 5.3 Significant accounting estimates and judgements
58 Section 1 – income statement58 Note 1.1 Segment information
60 Note 1.2 Revenue
60 Note 1.3 Costs
62 Note 1.4 Special items
63 Note 1.5 Financial income and expenses
63 Note 1.6 Tax
64 Section 2 – balance sheet64 Note 2.1 Intangible assets
64 Note 2.2 Property, plant and equipment
65 Note 2.3 Leases
66 Note 2.4 Impairment test
67 Note 2.5 Deferred tax
67 Note 2.6 Other receivables
67 Note 2.7 Prepayments
68 Note 2.8 Borrowings and net debt reconciliation
69 Note 2.9 Provisions
69 Note 2.10 Other payables
70 Note 2.11 Contract balances
Maersk Drilling Annual Report 2019 Financials Consolidated financial statements 2019 Parent company financial statements 2019 Statements 57

Note 1.1 Segment informationUSD Million 2019 2018
North Sea Jack-up rigs
International Floaters
Total North Sea Jack-up rigs
International Floaters
Total
RevenueSegments 800 395 1,195 840 530 1,370Unallocated activities 27 59Total revenue 1,222 1,429
EBITDA before special itemsSegments 385 28 413 432 163 595Unallocated activities 2 16
Total EBITDA before special items 415 611
Depreciation and amortisationSegments -205 -157 -362 -184 -196 -380Unallocated activities -25 -23Total depreciation and amortisation -387 -403
Total impairment losses/reversalsSegments - - - 375 445 820Unallocated activities -34 -10Total impairment losses/reversals -34 810
Investments in non-current assetsSegments 138 171 309 68 78 146Unallocated activities - 36Total investments in non-current assets 309 182
Non-current assetsSegments 2,663 1,998 4,661 2,716 1,997 4,713Unallocated activities 101 192Total non-current assets 4,762 4,905
Total revenue, total EBITDA before special items, total depreciation and amortisation and total impairment losses/reversals reconcile directly to the income statement and further reconciliations are therefore not included.
Total investment in non-current assets and total non-current assets comprise intangible assets and property, plant and equipment.
New segment definitionAs part of the organisational integration of the commercial, technical and operational functions in 2019, Maersk Drilling has established a North Sea division, comprising the harsh environment jack-up rigs capable of working in the most challenging environments in the North Sea including the ultra-harsh Norwegian environments, and an International division comprising all drillships and semi-submersible rigs designed to operate in benign mid- and deepwater environments. The benign jack-up rigs Maersk Completer, which was sold on 7 January 2020, and Maersk Convincer are not included in either segment and are reported under unallocated activities.
Segment disclosures in the consolidated financial statements reflect the new organisational structure and segment definition. Comparative numbers have been adjusted accordingly. Quarterly revenue figures and business drivers for both segments are disclosed under Additional information on page 98.
Maersk Drilling Annual Report 2019 Financials Consolidated financial statements 2019 Parent company financial statements 2019 Statements 58
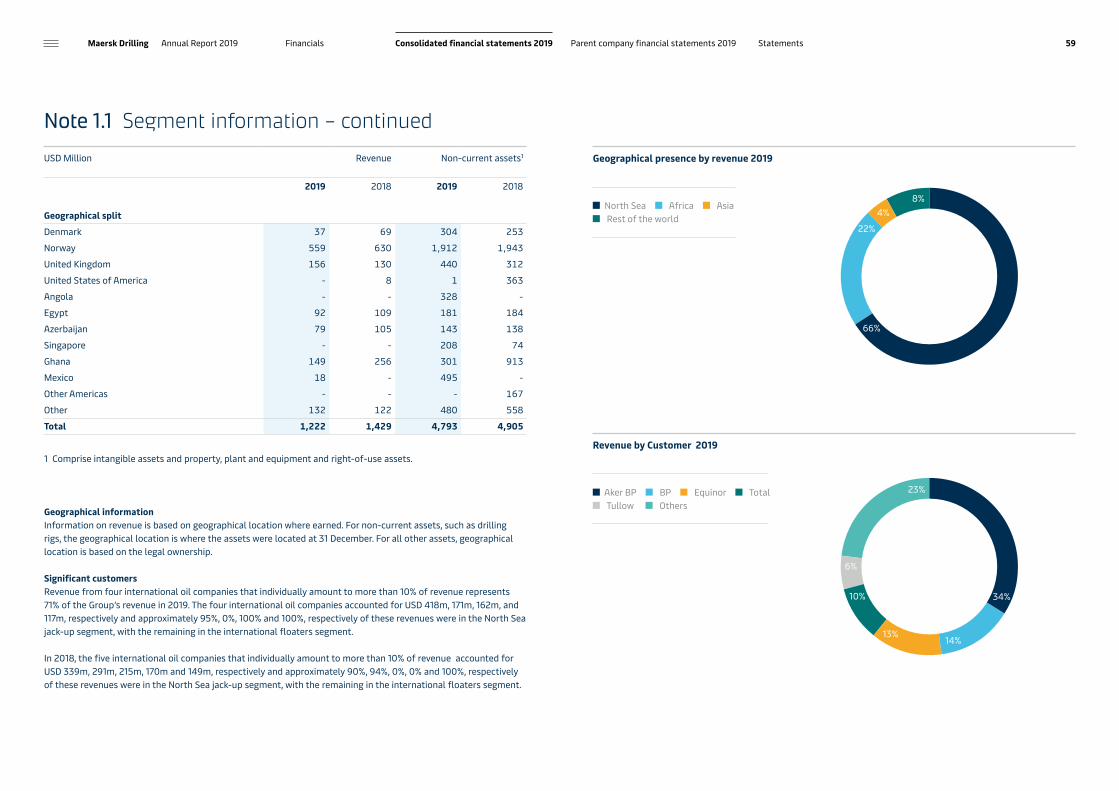
66%
8%4%
22%
Note 1.1 Segment information – continuedUSD Million Revenue Non-current assets¹
2019 2018 2019 2018
Geographical splitDenmark 37 69 304 253Norway 559 630 1,912 1,943United Kingdom 156 130 440 312United States of America - 8 1 363Angola - - 328 - Egypt 92 109 181 184Azerbaijan 79 105 143 138Singapore - - 208 74Ghana 149 256 301 913Mexico 18 - 495 - Other Americas - - - 167Other 132 122 480 558Total 1,222 1,429 4,793 4,905
1 Comprise intangible assets and property, plant and equipment and right-of-use assets.
Geographical informationInformation on revenue is based on geographical location where earned. For non-current assets, such as drilling rigs, the geographical location is where the assets were located at 31 December. For all other assets, geographical location is based on the legal ownership.
Significant customersRevenue from four international oil companies that individually amount to more than 10% of revenue represents 71% of the Group’s revenue in 2019. The four international oil companies accounted for USD 418m, 171m, 162m, and 117m, respectively and approximately 95%, 0%, 100% and 100%, respectively of these revenues were in the North Sea jack-up segment, with the remaining in the international floaters segment. In 2018, the five international oil companies that individually amount to more than 10% of revenue accounted for USD 339m, 291m, 215m, 170m and 149m, respectively and approximately 90%, 94%, 0%, 0% and 100%, respectively of these revenues were in the North Sea jack-up segment, with the remaining in the international floaters segment.
North Sea Africa Asia Rest of the world
Aker BP BP Equinor Total Tullow Others
Geographical presence by revenue 2019
Revenue by Customer 2019
13%
23%
34%
14%
10%
6%
Maersk Drilling Annual Report 2019 Financials Consolidated financial statements 2019 Parent company financial statements 2019 Statements 59

Note 1.2 RevenueUSD Million 2019 2018
Revenue splitDay rate revenue 1,099 1,302Other revenue 123 127Total 1,222 1,429
Revenue from drilling activities typically comprises fixed amounts for each day the rig is under contract differentiated by the activities undertaken (“day rate revenue”) and other revenue components such as lump sum payments for rig mobilisation and demobilisation and payments for investments in equipment or rig upgrades required to meet the operational needs of the drilling campaign, both of which are amortised over the contract period; bonuses linked to performance in terms of time, efficiency or drilling outcome measures such as reservoir targeting; or payments for third-party services to be delivered by Maersk Drilling.
Of day rate revenue, USD 730m (2018: USD 783m) was from the North Sea segment and USD 348m (2018: USD 468m) from the International segment. Of other revenue, USD 70m (2018: USD 57m) was from the North Sea segment and USD 47m (2018: USD 62m) from the International segment. The remainder of revenue was from the unallocated activities.
In line with the strategy, Smarter Drilling for Better Value, other revenue accounted for a larger part of total revenue in 2019 than in 2018, and in 2019, other revenue included bonuses received under the Aker BP alliance for two wells drilled since June 2019.
Revenue from drilling activities was recognised in accordance with the agreed rates for the work performed to date. The rates include both a lease component and a service component.
USD Million 2019 2018
Type of revenueService component 683 665Lease component 539 764Total 1,222 1,429
The service component comprised USD 385m (2018: USD 346m) in the North Sea segment and USD 274m (2018: USD 295m) in the International segment. The lease component comprised USD 415m (2018: USD 494m) in the North Sea segment and USD 121m (2018: USD 235m) in the International segment. The remainder of revenue was from the unallocated activities.
Note 1.3 CostsUSD Million 2019 2018
Operating costs 710 734Innovation 10 3Sales, general and administrative costs 87 81Total costs 807 818
Other external costs 440 444
Of which:Included in Operating costs 383 379Included in Innovation 7 2Included in Sales, general and administrative costs 40 45Included in Special items 10 18
Staff costsWages and salaries 362 365Severance payments 4 10Share based remuneration 2 - Pension costs 33 30Other social security costs 6 8Total Staff costs 407 413
Of which:Included in Operating costs 327 355Included in Innovation 3 1Included in Sales, general and administrative costs 47 36Included in Special items 8 8Recognised in the cost of assets 22 13
Average number of employees 2,852 2,854
Maersk Drilling Annual Report 2019 Financials Consolidated financial statements 2019 Parent company financial statements 2019 Statements 60

USD Million CEO CFO Total
Remuneration of Executive Management 2019Fixed pay 1.1 0.7 1.8Short-term incentive1) 1.7 1.1 2.8Long-term share based incentive 0.7 0.3 1.0Total remuneration 3.5 2.1 5.6
Remuneration of the Board of Directors, Executive Management and Key Employees
Board of DirectorsThe Board of Directors receives a fixed annual base fee, while the Chairman and Vice Chairman receive fixed multiples of the fixed annual base fee. Participation in a Board Committee entitles a member of the Board of Director to an additional fixed annual fee based on a proportion of the fixed annual base fee.
The Board of Directors did not receive any remuneration for 2018. Claus V. Hemmingsen has received prorated board fees since 2 April 2019, as his services to the Maersk Drilling Group prior to this point in time were considered part of his position as Vice-CEO in A.P. Møller - Mærsk A/S. Alastair Maxwell, Caroline Alting and Glenn Gormsen were appointed to the Board of Directors on 2 April 2019 and have received prorated board fees since this date.
Executive ManagementThe compensation of the Executive Management consists of a combination of fixed pay (a fixed annual cash salary, from which any contribution made by Maersk Drilling towards the cost of any pension or company car elections is deducted), other non-monetary benefits such as, phone, insurance coverage, annual health check, newspaper subscriptions, training/education and similar benefits, and short-term and long-term incentive pay. In addition, the Executive Management received in 2019 a one-time cash-based bonus related to the demerger and listing of the Company.
Note 1.3 Costs – continued
1) The cash bonus is composed of USD 0.9m (CEO) and USD 0.7m (CFO) for the completion of the demerger of A.P. Møller - Mærsk A/S and separate listing of Maersk Drilling and USD 0.8m (CEO) and USD 0.4m (CFO) for the short-term incentive plan for Executive Management.
Remuneration of Key Management PersonnelAt the end of 2019, the Group’s key management personnel included the Board of Directors, the Executive Management (CEO and CFO) and two other Key Employees who together with the Executive Management have the authority and responsibility for planning, directing and controlling the Group’s day-to-day activities. Other Key Employees have during 2019 and 2018 comprised up to six individuals simultaneously. The compensation of Other Key Employees is generally structured in a similar way as for the Executive Management.
USD Million 2019 2018
Fees to the statutory auditorsStatutory audit 1 1Other assurance services 1 1Tax and VAT advisory services - -Other services 1 1Total fees 3 3
Fees for other services than statutory audit of the financial statements provided by PricewaterhouseCoopers Statsautoriseret Revisionspartnerselskabs amount to USD 2m and mainly consist of services related to the separation and listing of Maersk Drilling, including advisory services related to implementation of a new treasury system.
Under the Short-term Incentive Plan, the target annual cash-based bonus payable can constitute an amount of up to 50% of the member of the Executive Management’s fixed pay at the end of the performance period of earning the cash incentive. The maximum bonus is 200% of the individual target. Under the Long-term Incentive Programme, the Executive Management was awarded an annual grant of restricted share units with a three year vesting period and a further two year holding period amounting to 100% (CEO) and 65% (CFO) of fixed pay. In addition, a transition award in lieu of unvested A.P. Møller - Mærsk A/S' shares and options of twice the annual grant level was awarded.
For additional information about share-based remuneration reference is made to note 4.3.
Maersk Drilling Annual Report 2019 Financials Consolidated financial statements 2019 Parent company financial statements 2019 Statements 61

USD Million Board of Directors
Executive Management2)
Other Key Employees
Total
2019Fixed pay 0.8 1.8 2.2 4.8Short-term cash incentive 3) - 2.8 2.7 5.5Termination benefits - - 1.1 1.1Long-term share based incentive - 1.0 0.8 1.8Total remuneration 0.8 5.6 6.8 13.2
2018Fixed pay - 1.2 2.4 3.6Short-term cash incentive - 0.8 1.1 1.9Termination benefits - - 1.0 1.0Long-term share based incentive - 0.2 0.3 0.5Total remuneration - 2.2 4.8 7.0
2) The amounts included for the CFO relate to amounts received on or after 1 September 2018 when he was first employed in the Maersk Drilling Group. The CFO was formally appointed to Executive Management in January 2019, but his remuneration is also reflected in the comparative figures for 2018 as he fulfilled a similar role prior to the formal appointment.
3) The cash bonus to Other Key Employees is composed of USD 1.6m for the completion of the demerger of A.P. Møller - Mærsk A/S and separate listing of Maersk Drilling and USD 1.1m for the short-term incentive plan for Senior Leaders.
The termination notice period applicable to the Executive Management is twelve months for the Company and six months for the members of the Executive Management. In addition to the Company's termination notice, Executive Management are entitled to a severance payment of up to six months’ fixed pay. The members of the Executive Management are subject to non-competition and non-solicitation clauses.
The termination notice period applicable to the Other Key Employees is twelve months for the Company and six months for the employee. In addition to the Company's termination notice, the Key Employees are entitled to statutory severance pay in accordance with the Danish Salaried Employees Act.
Note 1.3 Costs – continued Note 1.4 Special itemsUSD Million 2019 2018
Compensation from shipyard due to late delivery of rig, warranties etc. 2 10Special items, income 2 10
Separation and demerger/listing costs 13 6Transformation and restructuring costs 5 20Special items, costs 18 26Special items, net -16 -16
Special items comprise non-recurring income and expenses that are not considered to be part of Maersk Drilling’s ordinary operations such as warranty compensation from shipyards, major restructuring projects and separation and listing costs.
The separation and listing costs incurred in 2019 primarily comprise listing fees, investment bank fees, advisors, lawyers and auditors as well as one-off bonuses to Executive Management, key executives and certain other employees.
Maersk Drilling Annual Report 2019 Financials Consolidated financial statements 2019 Parent company financial statements 2019 Statements 62
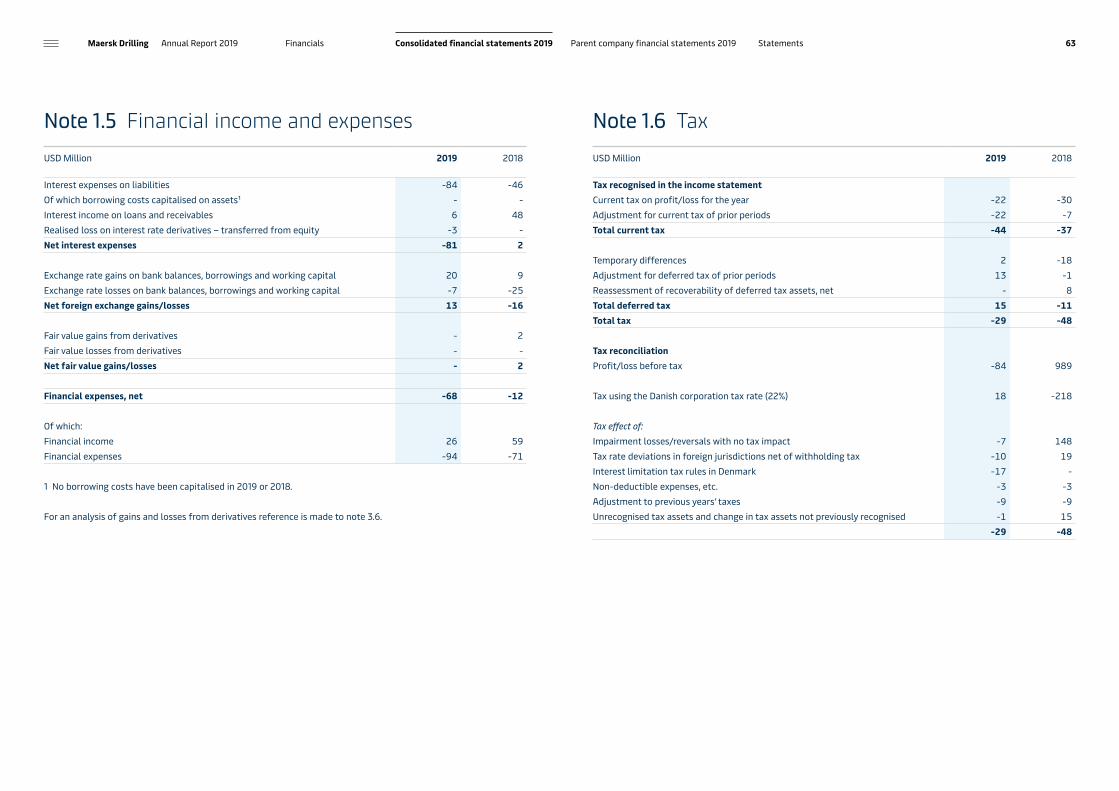
Note 1.5 Financial income and expenses Note 1.6 TaxUSD Million 2019 2018
Interest expenses on liabilities -84 -46Of which borrowing costs capitalised on assets¹ - - Interest income on loans and receivables 6 48Realised loss on interest rate derivatives – transferred from equity -3 - Net interest expenses -81 2
Exchange rate gains on bank balances, borrowings and working capital 20 9Exchange rate losses on bank balances, borrowings and working capital -7 -25Net foreign exchange gains/losses 13 -16
Fair value gains from derivatives - 2Fair value losses from derivatives - - Net fair value gains/losses - 2
Financial expenses, net -68 -12
Of which:Financial income 26 59Financial expenses -94 -71
1 No borrowing costs have been capitalised in 2019 or 2018.
For an analysis of gains and losses from derivatives reference is made to note 3.6.
USD Million 2019 2018
Tax recognised in the income statementCurrent tax on profit/loss for the year -22 -30Adjustment for current tax of prior periods -22 -7Total current tax -44 -37
Temporary differences 2 -18Adjustment for deferred tax of prior periods 13 -1Reassessment of recoverability of deferred tax assets, net - 8Total deferred tax 15 -11Total tax -29 -48
Tax reconciliationProfit/loss before tax -84 989
Tax using the Danish corporation tax rate (22%) 18 -218
Tax effect of:Impairment losses/reversals with no tax impact -7 148Tax rate deviations in foreign jurisdictions net of withholding tax -10 19Interest limitation tax rules in Denmark -17 -Non-deductible expenses, etc. -3 -3Adjustment to previous years’ taxes -9 -9Unrecognised tax assets and change in tax assets not previously recognised -1 15
-29 -48
Maersk Drilling Annual Report 2019 Financials Consolidated financial statements 2019 Parent company financial statements 2019 Statements 63

Note 2.1 Intangible assets Note 2.2 Property, plant and equipmentUSD Million customer
contracts and IT software
Cost1 January 2018 135Addition - 31 December 2018 135
Addition - 31 December 2019 135
Amortisation and impairment losses1 January 2018 50Amortisation 2931 December 2018 79
Amortisation 2531 December 2019 104
Carrying amount:31 December 2018 5631 December 2019 31
USD Million Jack-up rigs Floaters Equipment and other
Construction work in
progress
Total
Cost1 January 2018 5,515 5,103 130 97 10,845Addition - - 72 110 182Disposal 11 153 40 - 204Transfer 41 73 - -114 - Transfer to assets held for sale 168 - - - 16831 December 2018 5,377 5,023 162 93 10,655
Addition - - - 309 309Disposal 185 315 - - 500Transfer 47 119 34 -166 34Transfer, assets held for sale 233 - - - 23331 December 2019 5,006 4,827 196 236 10,265
Depreciation and impairment losses1 January 2018 2,983 3,547 41 - 6,571Depreciation 179 191 4 - 374Reversal of impairment losses 365 445 - - 810Disposal 4 142 15 - 161Transfer to assets held for sale 168 - - - 168Transfer -2 -23 25 - - 31 December 2018 2,623 3,128 55 - 5,806
Depreciation 199 155 1 - 355Impairment losses 34 - - - 34Disposal 185 315 - - 500Transfer - - 34 - 34Transfer, assets held for sale 195 - - - 19531 December 2019 2,476 2,968 90 - 5,534
Carrying amount:31 December 2018 2,754 1,895 107 93 4,84931 December 2019 2,530 1,859 106 236 4,731
Maersk Drilling Annual Report 2019 Financials Consolidated financial statements 2019 Parent company financial statements 2019 Statements 64

Operating leases as lessorProperty, plant and equipment include jack-up rigs and floaters which are leased out as part of the Group’s activities. The amounts below comprise the calculated future minimum lease payments for the assets and excludes the estimated service elements, which are presented in note 2.11. Jointly the two elements amount to Maersk Drilling’s revenue backlog.
PledgesProperty plant and equipment with carrying amount of USD 4,655m (2018: USD 4,686m) has been pledged as security for borrowings with a carrying amount of USD 1,378m (2018: USD 1,470m).
Asset held for saleAt the end of 2019, the jack-up rig Maersk Completer was classified as held for sale. The sale of the rig was finalised on 7 January 2020.
The carrying amount of Maersk Completer was USD 38m at the end of 2019 after the recognition of an impairment loss of USD 34m upon the reclassification to assets held for sale.
At 31 December 2018, the jack-up rig Maersk Giant was classified as held for sale at a carrying amount of USD 0m. Maersk Giant was sold during 2019.
Note 2.2 Property, plant and equipment – continued
USD Million 2019 2018
Operating lease receivablesWithin one year 454 541Between one and five years 599 701After five years 54 35Total 1,107 1,277
Note 2.3 LeasesUSD Million Land and
buildingsEquipment
and otherTotal
Right-of-use assetsRecognition of right-of-use asset on initial application of IFRS 16 as of 1 January 2019 35 1 36 Additions 2 - 2 Depreciation 6 1 7 31 December 2019 31 - 31
Net Carrying amount:1 January 2019 35 1 3631 December 2019 31 - 31
USD Million 2019
Lease liabilities1 January 2019 36 Additions 2 Interest expense 1 Lease payments -7Foreign exchange movements -131 December 2019 31
Lease liabilities are recognised in the balance sheet as follows:Non-current liabilities, presented in ‘Borrowings, non-current’ 25Current liabilities, presented in ‘Borrowings, current’ 6Total lease liabilities 31
Recognised in the profit and loss statement as follows:Interest expense related to lease liabilities -1Expense relating to short term leases, not capitalised -2Expense relating to leases of low-value assets, not capitalised -1Sublease income presented in ‘Other revenue’ 1
Recognised in the cash flow statement as follows:Interest elements of lease payments, presented in ‘Interest paid’ -1Principal elements of lease payments, presented in ‘Repayment of borrowings’ -6Total cash outflow in respect of leases in the year -7
There are no significant lease commitments for leases not commenced at year-end.
Maersk Drilling Annual Report 2019 Financials Consolidated financial statements 2019 Parent company financial statements 2019 Statements 65

Impairment tests of property, plant and equipment are carried out for cash generating units with indications of impairment losses or reversals. No indicators of a need for additional impairments or reversal of impairments have been identified as of 31 December 2019, as the development in the offshore drilling market with increased activity and improved long-term projections is considered to be in line with the expectations underlying the impairment test conducted in 2018. In 2018, part of the prior year impairment losses were reversed. The impairment reversals of USD 810m related to both the jack-up and floater segments.
An impairment loss of USD 34m was recognised upon the reclassification of Maersk Completer to assets held for sale. This loss is not considered to be an indicator of impairments for other rigs as the sales price was significantly impacted by the cost of bringing the rig out of cold-stacking mode and back into operations. Subsequent to the disposal of Maersk Completer, Maersk Drilling has no cold-stacked rigs.
Maersk Drilling considers rigs with similar functionality and operating environment as cash generating units due to largely interdependent cash flows. The cash generating units in the table below were further subcategorised in connection with the impairment test performed in 2018, however the methodology and assumptions are similar across the subgroups.
In 2018, the recoverable amount of each cash generating unit was determined based on the higher of its value-in-use or fair value less cost to sell. The value-in-use was calculated using certain key assumptions for the expected future cash flows and applied discount factor. The applied discount rate per annum after tax was 10% in 2018.
The cash flow projections were based on financial budgets and business plans approved by management. In nature, these projections are subject to judgement and estimates that are uncertain, though based on experience and external sources where available. The discount rates applied reflect the time value of money as well as the specific risks related to the underlying cash flows, i.e. project and/or country specific risk premium. Further, any uncertainties reflecting past performance and possible variations in the amount or timing of the projected cash flows are generally reflected in the discount rates.
The value in use calculations for the individual cash generating units are sensitive to the day rates expected to apply when contracts expire and to the risks of idle periods in the forecasts. In addition, the discount rate, growth rate and EBITDA margin after the budget period are critical variables.
The sensitivity analysis shows that the impairment reversals in 2018, for the cash generating units where impairment reversals were recognised, would have been respectively; • USD 1,194m and USD 468m with a -/+ 1 percentage point change in the discount rate,
keeping all other assumptions unchanged. • USD 951m and USD 678m with a +/- 1 percentage point change in growth rate after the budget period,
keeping all other assumptions unchanged.• USD 1,424m and USD 274m with a +/- 5 percentage point change in EBITDA margin,
keeping all other assumptions unchanged.
For additional information on accounting estimates and judgements in respect of impairment analysis, reference is made to note 5.3.
Note 2.4 Impairment testUSD Million 2018
Impairment losses/reversals Recoverable amount³
Cash generating unitJack-up rigs¹ 365 2,880 Floaters rigs² 445 1,929 Total 810
1 Covering four cash generating units, primarily operating in the North Sea.2 Covering one cash generating unit, operating globally.3 The recoverable amount is based on estimated value in use, as it is considered that there is no basis for making a
reliable estimate of the fair market value in an orderly transaction between market participants.
Maersk Drilling Annual Report 2019 Financials Consolidated financial statements 2019 Parent company financial statements 2019 Statements 66
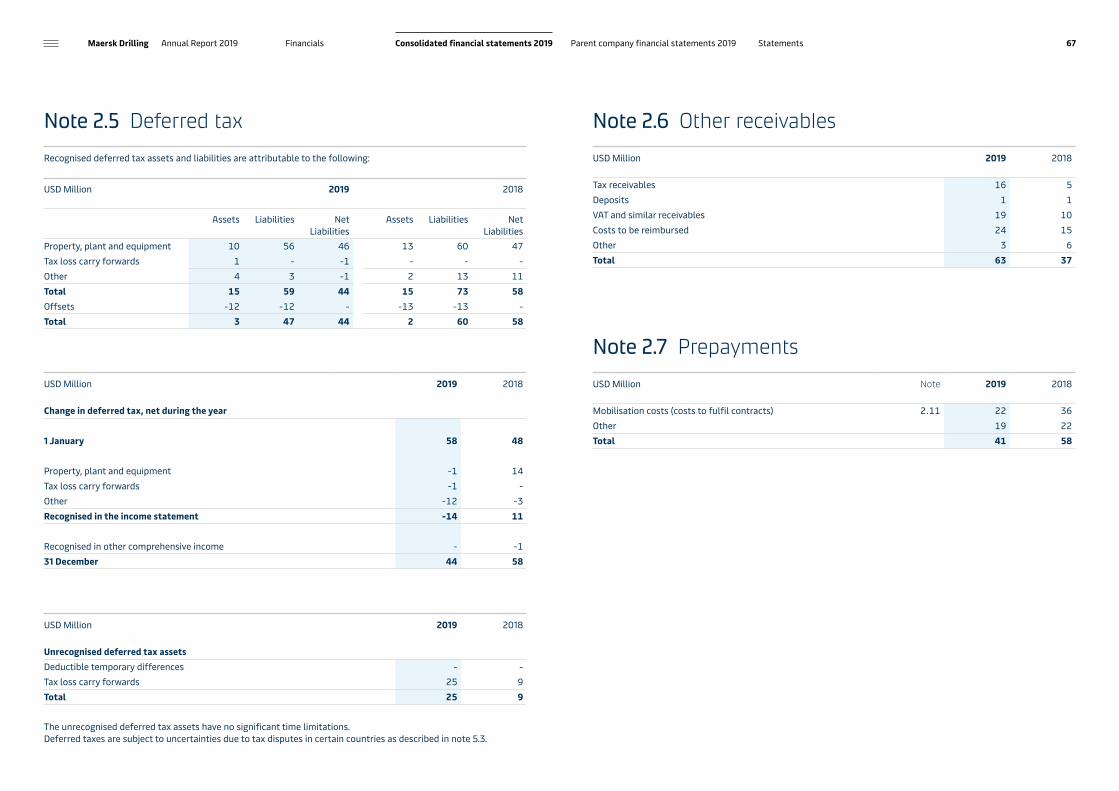
Recognised deferred tax assets and liabilities are attributable to the following:
Note 2.5 Deferred tax
USD Million 2019 2018
Assets Liabilities Net Liabilities
Assets Liabilities Net Liabilities
Property, plant and equipment 10 56 46 13 60 47Tax loss carry forwards 1 - -1 - - - Other 4 3 -1 2 13 11Total 15 59 44 15 73 58Offsets -12 -12 - -13 -13 - Total 3 47 44 2 60 58
USD Million 2019 2018
Change in deferred tax, net during the year
1 January 58 48
Property, plant and equipment -1 14Tax loss carry forwards -1 - Other -12 -3Recognised in the income statement -14 11
Recognised in other comprehensive income - -131 December 44 58
USD Million 2019 2018
Unrecognised deferred tax assetsDeductible temporary differences - - Tax loss carry forwards 25 9Total 25 9
The unrecognised deferred tax assets have no significant time limitations. Deferred taxes are subject to uncertainties due to tax disputes in certain countries as described in note 5.3.
Note 2.6 Other receivables
Note 2.7 Prepayments
USD Million 2019 2018
Tax receivables 16 5Deposits 1 1VAT and similar receivables 19 10Costs to be reimbursed 24 15Other 3 6Total 63 37
USD Million Note 2019 2018
Mobilisation costs (costs to fulfil contracts) 2.11 22 36Other 19 22Total 41 58
Maersk Drilling Annual Report 2019 Financials Consolidated financial statements 2019 Parent company financial statements 2019 Statements 67

Note 2.8 Borrowings and net debt reconciliationUSD Million 2019 2018
BorrowingsTerm loans 1,378 1,470Lease liabilities 31 - Total borrowings 1,409 1,470
Of which:Classified as non-current 1,273 1,375Classified as current 136 95
USD Million 2019 2018
Net debt reconciliationBorrowings 1,409 1,470Loans receivable, current - -2Total financial liabilities and assets from financing activities 1,409 1,468
Cash and bank balances -310 -372Other financial items¹ - 1Net debt 1,099 1,097
1 Comprise primarily other interest-bearing receivables
USD Million 2019 2018
Change in financial liabilities and assets from financing activities1 January 1,468 -1,758Impact from new accounting policy for leases 36Proceeds from borrowings - 1,470Repayment of borrowings -103 -262
Non-cash changes:Dividend distribution - 2,011Foreign exchange adjustments -1 4Discounting/amortisation 6 - Other 3 331 December 1,409 1,468
In addition to the collateral rigs set out in note 2.2, certain bank accounts and shares in the subsidiaries being owners of the collateral rigs and certain intra-group charterers in respect of the collateral rigs are pledged as security for term loans and credit facilities with a carrying amount at 31 December 2019 of USD 1,378m. In certain circumstances, earnings in respect of drilling contracts for the collateral rigs will be assigned in favour of the lenders under the loan agreements.
Maersk Drilling Annual Report 2019 Financials Consolidated financial statements 2019 Parent company financial statements 2019 Statements 68

Note 2.9 ProvisionsUSD Million Restructuring Legal
disputes, etc.Total
1 January 2018 1 9 10Provision made 20 1 21Amount used -1 - -1Amount reversed - -2 -231 December 2018 20 8 28
Of which:Classified as non-current - 2 2Classified as current 20 6 26
1 January 2019 20 8 28Provision made 5 - 5Amount used -13 -3 -16Amount reversed - -2 -231 December 2019 12 3 15
Of which:Classified as non-current - 2 2Classified as current 12 1 13
No provisions are expected to be realised after more than five years.
Restructuring includes provisions for decided and publicly announced restructurings. Legal disputes, etc. include among other things, indirect tax and duty disputes. The provisions are subject to uncertainty as described in note 5.3.
Reversals of provisions primarily relate to settlement of contractual disagreements, which are recognised in the income statement under operating costs.
Note 2.10 Other payablesUSD Million 2019 2018
Derivatives 1 1Interest payable 1 4VAT, duties and similar payables 22 27Payables to staff and management 30 29Other 9 10Total 63 71
Maersk Drilling Annual Report 2019 Financials Consolidated financial statements 2019 Parent company financial statements 2019 Statements 69

Note 2.11 Contract balancesUSD Million Note 2019 2018
Contract assetsMobilisation costs (costs to fulfil a contract) 2.7 22 36Total 22 36
Contract liabilitiesDeferred income 32 39Total 31 39
USD Million 2019 2018
Within one year 559 481Between one and five years 450 676After five years 15 32Total 1,024 1,189
Revenue recognised in 2019 that was included in the contract liability at the beginning of each year relates to mobilisation fees from customers that are deferred and recognised over the contract term. The amount recognised in 2019 was USD 18m (2018: USD 16m).
Costs to fulfil contracts relate to mobilisation costs paid that are capitalised and amortised over the contract term. The amortisation in 2019 amounted to USD 17m (2018: USD 35m).
The amounts allocated to the performance obligations that are to be completed under existing contracts relate to the service element which means that the amounts below exclude the estimated lease elements, which are presented in note 2.2. Jointly the two elements amount to Maersk Drilling's revenue backlog.
The overall objective of the financial policy is to enable Maersk Drilling to manage through the cyclicality that characterises the offshore drilling industry with an aim to create long-term shareholder value.
The financial policy ensures:• Financial flexibility including adequate liquidity reserves;• A long-term funding view to minimise refinancing risk; and• A robust capital structure through the business cycle.
In order to meet these objectives, free cash flow is to be allocated based on the following prioritisation:1. Maintain a robust capital structure with sufficient funding available to support the business through the cycle;2. Pursue investment opportunities supporting long-term shareholder value creation; and3. Return surplus capital to shareholders.
Maersk Drilling will generally work towards a leverage ratio (net debt divided by EBITDA before special items) of around 2.5x.
This means that if the leverage ratio is below 2.5x over time and no attractive investment opportunities have been identified, Maersk Drilling will seek to return capital to shareholders by means of dividends and/or share buy-backs.
If value adding investment opportunities that require additional funding arise, or if EBITDA is reduced in a business downcycle, the leverage may exceed the target level of around 2.5x for a period of time. The focus then will be to reduce net debt to reach the targeted leverage level of around 2.5x.
Financial risk managementThe Group's operating and financing activities expose it to a variety of financial risks, comprising:• Liquidity risk• Interest rate risk• Currency risk• Credit risk
Management of these financial risks is carried out by a central treasury department under policies approved by the Board of Directors. The treasury department identifies, evaluates and hedges each financial risk. The Group’s overall financial risk management programme focuses on the unpredictability of financial markets and seeks to minimise the potential adverse effects on the Group’s financial performance. The Group uses derivative financial instruments to hedge certain risks.
Exposure from each of the financial risks, together with the Group's policies and mitigation procedures are further described below.
Note 3.1 Financial risk management
Maersk Drilling Annual Report 2019 Financials Consolidated financial statements 2019 Parent company financial statements 2019 Statements 70

Liquidity risk is the risk that Maersk Drilling will encounter difficulty in meeting its obligations when they occur or ceasing to have access to adequate funding to pursue its strategic ambitions. The overall objective is to maintain adequate liquidity reserves to meet the Group's obligations and to withstand volatility in cash flow from operations.
The Group’s revenue backlog provides visibility into the Group’s future cash flow generation and is a key component in the Group’s mitigation of the liquidity risk inherent in the Group's financial liabilities. At 31 December 2019, the Group had a revenue backlog of USD 2,131m which provides clarity of the Group’s ability to meet its obligations as they fall due.
The Group has a centralized and structured approach to liquidity, capital funding and cash management, focusing on repatriating and concentrating cash. Short-term funding of subsidiaries is handled by the central treasury department, primarily through a group wide cash pool structure.
The liquidity reserve, which consists of cash and bank balances, loans receivable plus the aggregate amount of undrawn or unutilised committed credit facilities that remain committed for a period of not less than 365 days, amounts to USD 710m (2018: USD 772m).
The Group’s USD 400m revolving credit facility remains undrawn. The Group's loan facilities including its revolving credit facility contain customary representations, certain covenants and undertakings (including on minimum requirements of the aggregate fair market value and insurance of the pledged rigs, customary restrictions on the flag and classification society applicable to the pledged rigs and restrictions on creating liens on the pledged rigs) and customary events of default (in each case, subject to customary agreed exceptions, materiality tests, carve- outs and grace periods). In addition, the loan facilities contain minimum free liquidity, leverage ratio and equity ratio financial covenants, with which the Group must comply throughout the tenor of the facilities. The covenants have all been complied with in 2019.
The maturities of the Group's total loan facilities, comprising term loans drawn in full and the undrawn committed revolving facility, are illustrated in the chart below.
Note 3.2 Liquidity risk
Maturity of loan facilities
0
200
400
600
800
1,000
1,200
USDm
130 130 130
776
400
21224
1,176
2021
RCF
2022 2023 2024 20252020
USD Million Cash flows including interest
Carrying amount
0-1 year 1-5 years 5- years Total
Maturities of liabilities and commitments
2019Term loans 1,378 190 1,210 220 1,620Lease liabilities 31 7 22 5 34Trade and other payables 243 243 - - 243Derivatives 23 1 22 - 23Total recognised in balance sheet 1,675 441 1,254 225 1,920
Capital commitments 95 0 - 95Total 536 1,254 225 2,015
2018Term loans 1,470 173 1,396 257 1,826Trade and other payables 267 267 - - 267Total recognised in balance sheet 1,737 440 1,396 257 2,093
Capital commitments 46 - - 46Total 486 1,396 257 2,139
Drawn facility amounts Undrawn RFC
Maersk Drilling Annual Report 2019 Financials Consolidated financial statements 2019 Parent company financial statements 2019 Statements 71

Interest rate risk is the risk that future cash flows from financial instruments will fluctuate because of changes in market interest rates. The interest rate exposure arises from loans and other credit facilities carrying floating interest rates. The exposure towards interest rates is mitigated by entering into fixed rate loans or interest rate swaps.
It is the Group's policy that a minimum of 50% of the gross debt is at fixed interest rates.
At 31 December 2019, 63% (2018: 64%) of term loans carried fixed interest rates with a weighted average duration of 2.0 years (2018: 2.2 years).
Currency risk is the risk that future cash flows will fluctuate because of changes in foreign exchange rates. The currency exposure arises from Maersk Drilling operating in countries with different local currencies. Revenue is primarily denominated in USD, the functional currency of all material entities in the Group, while related operating expenses are incurred in both USD and local currencies. The Group’s net liability is also primarily denominated in USD and only a minimum of the Group’s other net liability is in other currencies such as DKK, EUR, and NOK.
The exposure to changes in foreign exchange rates is mitigiated by entering into customer contracts where an element of the contract value is in local currency to create a natural hedge between the contracted revenue and local operating costs. Subsequently, foreign exchange forwards are used to hedge any excess exposure.
Exposure to currency risk is generally low and does not significantly affect the Group’s profit or the value of financial instruments. It is the Group's policy to hedge significant net cash flows in currencies other than USD using a layered model with a 12-month horizon.
Cash kept in countries with limited access to repatriating surplus cash is subject to currency risks. As of 31 December 2019, the Group had the equivalent of USD 14m in Egyptian Pounds trapped in Egypt (2018: USD 0m).
Currency sensitivityDepreciation of the most material currencies in which Maersk Drilling trades (DKK, NOK, EUR, GBP, EGP, SGD) against USD by five percent is estimated to decrease profit for the year by USD 0m and decrease other comprehensive income (and thereby equity) by USD 4m (2018: decrease profit for the year by USD 2m and increase other comprehensive (and thereby equity) income by USD 5m). This analysis is based on financial instruments at 31 December, and assumes that all other variables remain constant. A five percentage point appreciation would have a corresponding inverse effect.
Interest rate sensitivityAn increase in interest rates by one percentage point is estimated to decrease profit for the year by USD 6m and increase other comprehensive income (and thereby equity) by USD 20m (2018: decrease profit for the year by USD 6m and increase other comprehensive income (and thereby equity) by USD 21m). This analysis is based on borrowings and loans receivable at 31 December, and assumes that all other variables remain constant. A one percentage point decrease would have a corresponding inverse effect.
Note 3.3 Interest rate risk Note 3.4 Currency risk
USD Million Next interest rate fixing
Carrying amount
0-1 year 1-5 years 5- years
Borrowings by interest rate levels inclusive of interest rate swaps
20193–6% 1,409 507 875 27Total 1,409 507 875 27
20183–6% 1,470 533 937 - Total 1,470 533 937 -
Maersk Drilling Annual Report 2019 Financials Consolidated financial statements 2019 Parent company financial statements 2019 Statements 72

The Group has exposure to commercial and financial counterparties.
For drilling contracts, credit risk is minimised by undertaking a credit assessment of the counterparty prior to entering into the contracts. Depending on the creditworthiness, the Group may seek protection, in form of parent company guarantees, pre-payments or other type of security.
In 2019, revenue from four major international oil companies, which individually account for more than 10% of revenue, represented 71% (2018: 81%) of the Group’s revenue. The credit risks associated with these significant customers are considered limited.
For financial counterparties, the credit risk is minimized by applying credit limits and transacting with financial institutions with a strong credit rating defined as a minimum credit rating of ‘A3’, ‘A-‘ and/or ‘A-‘ for Moody’s, S&P or Fitch, respectively. For derivatives, counterparties with an investment grade rating may be used. A limited number of geographies are not serviced by our relationship banks and have no operations by financial counterparties with a satisfactory credit rating.
Financial assets at amortised cost comprise loans receivable and other receivables. These are all considered to have low credit risk and thus the impairment provision calculated on the basis of 12 month expected losses is considered immaterial. The financial assets are considered to be low risk when they have low risk of default and the issuer has a strong capacity to meet its contractual cash flow obligations in the near term.
The Group applies the simplified approach to providing the expected credit losses prescribed by IFRS 9, which permits the use of the lifetime expected loss provision for all trade receivables. Customer contracts do not include unusual payment terms or material financing components. To measure the expected credit losses, trade receivables have been grouped based on shared credit risk characteristics and the days past due. In accordance with IFRS 9, non-due trade receivables have also been considered for expected credit losses.
The Group enters into derivative transactions in order to mitigate foreign exchange rate exposure related to costs incurred in local currencies and interest rate exposure on term loans. The derivative transactions comprise foreign exchange forward and swap contracts and interest rate swaps. Foreign exchange derivative contracts are used to hedge the currency risk related to recognised and unrecognised transactions, of which the majority are designated as cash flow hedges. Interest rate swaps are used to swap variable interest payments on term loans to fixed interest payments. All interest rate swaps are designated as cash flow hedges.
Currency derivatives designated as cash flow hedges are mainly realised within one year, whereas interest rate swaps designated as cash flow hedges generally mature over four years.
The notional value of currency derivative contracts at 31 December amounts to:
The majority of currency derivative contracts hedge future cash outflows, hence the respective foreign currencies are purchased and USD is sold.
The notional amount of interest rate swaps at 31 December 2019 amounts to USD 737m (2018: USD 781m), and are all denominated in USD. The average fixed rate of the interest rate swaps is 2.7%, which jointly with margins and fees paid results in an average 2019 interest cost of around 5.7%.
Fair value of derivative contracts are recognised as non-current derivatives at USD 22m (2018: USD 0m) and for the current part in other payables at USD 1m (2018: USD 1m). The hedge ratio is 1:1 for all hedging relationships.
Note 3.5 Credit risk Note 3.6 Derivatives
USD Million 2019 2018
Maturity analysis of trade receivablesReceivables not due 215 237Less than 90 days overdue 31 81More than 90 days overdue 18 24Receivables, gross 264 342Expected credit loss - 3Carrying amount 264 339
USD Million 2019 2018
Foreign currency
USD Foreign currency
USD
DKK/USD 551 84 725 113NOK/USD 50 6 - -
Maersk Drilling Annual Report 2019 Financials Consolidated financial statements 2019 Parent company financial statements 2019 Statements 73

The gains/losses, including realised transactions, are recognised as follows:
Movement in reserve for hedges can be specified as follows:
Note 3.6 Derivatives – continued
USD Million 2019 2018
Hedging foreign exchange risk on operating costs -5 -2Hedging interest rate risk -3 - Total reclassified from equity reserve for hedges -8 -2
Derivatives accounted for as held for tradingCurrency derivatives recognised directly in financial income/expenses - 2Net gains/losses recognised directly in the income statement - 2
Total -8 -
USD Million 2019
Foreign exchange risk
Interest rate risk
Total
Reserve for hedges 1 January -1 -1 -2Value adjustment of hedges for the year -5 -24 -29Reclassified to income statement 5 3 8Reserve for hedges 31 December -1 -22 -23
USD Million 2018
Foreign exchange risk
Interest rate risk
Total
Reserve for hedges 1 January 1 - 1Value adjustment of hedges for the year -4 -1 -5Reclassified to income statement 2 - 2Reserve for hedges 31 December -1 -1 -2
Note 3.7 Financial instruments by categoryUSD Million 2019 2018
Carrying amount
Fair value
Carrying amount
Fair value
Carried at amortised costLoans receivable - - 2 2Other interest-bearing receivables - - 2 2Total interest-bearing receivables - - 4 4Trade receivables 264 339Other receivables (non-interest-bearing) 49 32Cash and bank balances 310 372Financial assets at amortised cost 623 747
Carried at fair valueDerivatives - - - - Financial assets at fair value - - - -
Total financial assets 623 747
Carried at amortised costTerm loans 1,378 1,404 1,470 1,500Lease liabilities 31 31 - - Total borrowings 1,409 1,435 1,470 1,500Trade payables 180 196Other payables 62 70Financial liabilities at amortised cost 1,651 1,736
Carried at fair valueDerivatives 23 23 1 1Financial liabilities at fair value 23 23 1 1
Total financial liabilities 1,674 1,737
Maersk Drilling Annual Report 2019 Financials Consolidated financial statements 2019 Parent company financial statements 2019 Statements 74

Note 4.1 Cash flow specificationsUSD Million 2019 2018
Change in working capitalTrade and other receivables 79 -20Trade and other payables -22 31Total 57 11
Purchase of intangible assets and property, plant and equipmentAddition -309 -182Change in payables to suppliers regarding purchase of assets 2 27Total -307 -155
The term loans and credit facilities set out in note 2.8 may become prepayable in whole or in part on the occurrence of certain customary events including a change of control over the Company. Except for these and for customary agreements within the Group’s activities, no material agreements have been entered into that will take effect, change or expire upon changes of the control over the Company.
The Group is also involved in legal and tax disputes in certain countries. Some of these are subject to considerable uncertainty as described in note 5.3.
Through participation in a joint taxation scheme with A.P. Møller Holding A/S, the Danish companies are jointly and severally liable for taxes payable in Denmark.
Following the demerger from the A.P. Moller - Maersk group, Maersk Drilling is subject to a statutory demerger liability. In the event that A.P. Møller - Mærsk A/S defaults on its obligations, The Drilling Company of 1972 A/S will be liable for any obligations of A.P. Møller - Mærsk A/S existing at the date of publication of the demerger plan on 4 March 2019. Similarly, A.P. Møller - Mærsk A/S will be liable for any obligations assigned to The Drilling Company of 1972 A/S existing at that date. The potential liability for Maersk Drilling is capped at a maximum amount equal to the net value of the assets and liabilities contributed as part of the demerger. The risk of the statutory liability materialising will generally persist for three years from the demerger date and potentially up to thirty years for unknown claims.
Capital commitments and newbuilding programmeThe Group has capital commitments relating to acquisition of non-current assets totalling USD 95m (2018: USD 46m). No capital commitments are related to newbuildings.
Financial instruments measured at fair valueFinancial instruments carried at fair value can be divided into three levels:Level 1 – Quoted prices (unadjusted) in active markets for identical assets or liabilities;Level 2 – Inputs other than quoted prices included within level 1 that are observable for the asset or liability,
either directly (i.e. as prices) or indirectly (i.e. derived from prices);Level 3 – Inputs for the asset or liability that are not based on observable market data.
Fair value of derivatives fall within level 2 of the fair value hierarchy and is calculated on the basis of observable market data as of the end of the reporting period. The Group has no financial instruments within level 3.
Financial instruments carried at amortised costFair value of the short-term financial assets and other financial liabilities carried at amortised cost is not materially different from the carrying amount. In general, fair value is determined primarily based on the present value of expected future cash flows. Where a market price was available, however, this was deemed to be the fair value.
Fair value of the borrowing items falls within level 2 of the fair value hierarchy and is estimated on the basis of discounted future cash flows.
The fair value of loans receivable and borrowings against related parties have a floating interest rate and the fair value is assessed to be similar to the carrying amount.
Note 4.2 Contingent liabilities and commitments
Note 3.7 Financial instruments by category – continued
Maersk Drilling Annual Report 2019 Financials Consolidated financial statements 2019 Parent company financial statements 2019 Statements 75

Restricted share units in the Drilling Company of 1972 A/SFollowing the listing on 4 April 2019, Maersk Drilling implemented a long-term incentive programme (the “LTI”) and a one-time transition grant. Maersk Drilling believes that providing remuneration in the form of shares to appropriate levels of management promotes sustainable long-term value creation and ensures alignment of interests with its shareholders.
Under the LTI and transition grant the Executive Management, Key Employees and certain other employees will receive a number of restricted share units (“RSUs”). The vesting period for the RSUs is three years from the date of grant. Except for RSUs granted as part of the exchange grant, the Executive Management will not be able to sell any shares vesting until the total period from grant (inclusive of the vesting period) is five years, i.e. a holding period of two years in addition to the three-year vesting period. Executive Management and other Key Management Personnel are also subject to a share ownership requirement of twice the annual LTI grant level applicable.
The transfer of restricted shares is contingent on the participants still being employed and not being under notice of termination and generally takes place when three years have passed from the time of granting. The participants are not entitled to any dividend during the vesting period. Special conditions apply regarding illness, death and resignation as well as changes in capital structure, etc..
In 2019, 48,188 RSUs have been granted under the LTI and 94,515 RSUs have been granted under the one-time transition grant, inclusive of 20,803 RSUs that represent the exchange grant for forfeited unvested restricted shares and options in A.P. Møller - Mærsk A/S (see below "The A.P. Møller - Maersk Group's Restricted Shares Plan").
Note 4.3 Share-based payments
Shares in The Drilling Company of 1972 A/S
Restricted Shares Plan
Key Management Personnel¹
Restricted Shares Plan
Other employees¹
Total fair value¹
Outstanding awards under equity-settled incentive plans
No. No. USD Million
1 January 2019 - - Granted 116,599 26,104 11Vested - - Forfeited/cancelled 10,772 1,618Outstanding 31 December 2019 105,827 24,486
1 At the time of grant.
B-shares in A.P. Møller - Mærsk A/S
Restricted Shares Plan
Key Management Personnel¹
Restricted Shares Plan
Other employees¹
Total fair value¹
No. No. USD Million 1 January 2018 752 553Granted 354 156 1Vested 219 170Outstanding 31 December 2018 887 539
Adjustment 94 -255 -Vested - 50Converted to restricted shares in The Drilling Company of 1972 A/S
-981
-157
Outstanding 31 December 2019 - 77
1 At the time of grant.
The fair value of restricted shares granted to eight Key Management Personnel and to 33 Other employees was USD 11m at the time of the grant. Total expense recognised in the income statement in 2019 for granted restricted shares was a cost of USD 2m.
The average fair value per restricted share at the time of grant was DKK 510 (USD 77), which is equal to the average closing price for the first five trading days on Nasdaq Copenhagen or, for subsequent grants, the five trading days after the publication of the half year results.
The average remaining contractual life for the restricted shares as per 31 December 2019 was 2.3 years.
The A.P. Moller - Maersk Group’s Restricted Shares Plan In previous years, certain Executives and employees participated in the A.P. Moller - Maersk Group's incentive programs. The A.P. Moller - Maersk Group’s Restricted Shares Plan was introduced in 2013 and grants have since 2013 on a yearly basis been awarded to employees. The transfer of restricted shares was contingent on the employee still being employed and not being under notice of termination and took place when three years have passed from the time of granting.
Maersk Drilling Annual Report 2019 Financials Consolidated financial statements 2019 Parent company financial statements 2019 Statements 76

To ensure that the Executive Management, other key executives and certain other employees in Maersk Drilling had an equity interest in the Company from the date of the demerger, they were required to forfeit all unvested A.P. Møller - Mærsk A/S shares and share options as of 1 January 2019. The individuals instead received restricted share units in Maersk Drilling (the “exchange grant”). A total of 1,138 restricted share units (B-shares in A.P. Møller - Mærsk A/S) were converted to restricted share units in The Drilling Company of 1972 A/S of a corresponding value. 981 of these related to Key Management Personnel and 157 related to other employees.
The adjustment of the balance of restricted share units recognised for Maersk Drilling employees in A.P. Moller - Maersk as of 1 January 2019 relates to the treatment of unvested restricted share units in A.P. Møller - Mærsk A/S in anticipation of the demerger of A.P. Møller - Mærsk A/S and separate listing of Maersk Drilling. Maersk Drilling provided an Exchange Grant (of Maersk Drilling restricted share units) to those current employees of Maersk Drilling who participated in the one-time transition grant offer.
No restricted shares in A.P. Møller - Mærsk A/S were granted to Maersk Drilling employees in 2019. The fair value of restricted shares (A.P. Møller - Mærsk A/S B shares) granted in 2018 to seven members of Management and to five employees in Maersk Drilling was USD 1m at the time of the grant. Total expense recognised in the income statement in 2019 for restricted shares granted in previous years was a cost of USD 0.2m (2018: USD 1m).
The fair value per restricted share at the time of grant was DKK 9,273 (USD 1,532), which is equal to the volume weighted average share price on the date of grant, i.e. 1 April 2018. On 1 April 2018, the restricted shares originally granted in 2015 were settled by A.P. Møller - Mærsk A/S with the employees. The weighted average share price at that date was DKK 9,273 (USD 1,532).
The following related parties have a controlling interest in The Drilling Company of 1972 A/SThe A.P. Møller og Hustru Chastine Mc-Kinney Møllers Fond til Almene Formaal (Copenhagen, Denmark) and its subsidiary A.P. Møller Holding A/S (Copenhagen, Denmark) has control over APMH Invest A/S (Copenhagen, Denmark). APMH Invest A/S is considered to hold a controlling interest in The Drilling Company of 1972 A/S.
Key management personnel Related parties include the Group’s key management personnel. There have been no transactions with key management personnel other than remuneration, which is disclosed in note 1.3 and 4.3.
Other related partiesThe Board of Directors and the Executive Management of A.P. Møller og Hustru Chastine Mc-Kinney Møllers Fond til almene Formaal, A.P. Møller Holding A/S, APMH Invest A/S, and their close relatives including undertakings under their significant influence are also considered related parties. This includes subsidiaries and affiliates to A.P. Møller Holding A/S, including A.P. Møller - Mærsk A/S and its subsidiaries and affiliates and Danske Bank A/S.
Note 4.3 Share-based payments – continued Note 4.4 Related partiesUSD Million Controlling parties Other related parties
2019 2018 2019 2018
Income statementRevenue - - 3 34Costs - 13 21 14Financial income - 46 2 - Financial expenses - 43 12 0
AssetsLoans receivables - 2 - - Trade receivables - - 1 2Other receivables - 6 - - Cash and bank balances - - 93 258
LiabilitiesBorrowings - - 101 105Trade payables - - 7 5Derivatives - - 12 0Other payables - 4 1 3
Dividends declared - 3,337 - -
Maersk Drilling Annual Report 2019 Financials Consolidated financial statements 2019 Parent company financial statements 2019 Statements 77
No events have occurred after the balance sheet date which are expected to have a material impact on the consolidated financial statements.
As set out in note 2.2, the sale of the jack-up rig Maersk Completer was completed on 7 January 2020 at a price corresponding to the carrying amount at 31 December 2019.
Basis of preparationThis Annual Report reflects the consolidated figures for The Drilling Company of 1972 A/S (the “Company”) and its subsidiaries (the “Group” or “Maersk Drilling”). The comparative figures for 2018 have been prepared based on capital restructuring rules and reflect the consolidated financial statements for 2018 for Maersk Drilling Holding A/S with the addition of net USD 4m of other assets and liabilities contributed as set out below.
All amounts in the Annual Report are stated in United States Dollars (USD) and rounded to the nearest million. The accounting policies described have been applied consistently for the financial year and for the comparative figures except for the implementation of IFRS 16 ‘Leases’ as set out further below.
Founding of The Drilling Company of 1972 A/SThe Company was incorporated on 2 April 2019 in connection with the separation of the Maersk Drilling activities from the A.P. Moller - Maersk Group via a demerger of A.P. Møller - Mærsk A/S and a separate listing of the Company. A.P. Møller - Mærsk A/S injected 100% of the shares in Maersk Drilling Holding A/S, including this company’s subsidiaries, as well as certain other assets and liabilities to the Company. The net impact of the separation was a capital contribution of USD 4m reflecting the net value of the other assets and liabilities contributed. The consolidated financial statements have been prepared based on capital restructuring rules as if the Company had always been the parent company of the Maersk Drilling Group, and comparative figures have therefore been prepared as if the assets and liabilities contributed were always part of the Maersk Drilling Group.
The Company was officially listed on Nasdaq Copenhagen with the first trading day being 4 April 2019. Following the separation, A.P. Møller - Mærsk A/S ceased to have a controlling interest in the Group. A.P. Møller - Mærsk A/S is still considered a related party of Maersk Drilling as under the common control of A.P. Møller Holding A/S.
IFRS 16 ‘Leases’IFRS 16 ‘Leases’ was implemented as of 1 January 2019 applying the modified retrospective approach under which comparative figures are not to be adjusted in the financial statements. The adoption of IFRS 16 did not have a material impact on the financial results of the Group as most of the operating assets are owned.
Under IFRS 16, all leases are capitalised based on the present value of the remaining lease payments, discounted using the incremental borrowing rate as of 1 January 2019 and recognised as right-of-use assets and a corresponding lease liability. A right-of-use asset and a related lease liability of USD 36m was recognised on 1 January 2019 primarily related to property leases. There has been no material impact on other financial statement items.
Lease payments are allocated between a reduction of the liability and interest expense. The right-of-use asset is depreciated over the lease term on a straight-line basis.
The adoption of IFRS 16 has had an impact for 2019 of USD 7m on profit before depreciation, amortisation and impairment losses/reversals (EBITDA), as a portion of operating lease cost previously recognised as operating expense is now recognised as depreciation and interest expenses. Cash flow from operating activities has increased but is offset by an equl increase in cash outflow from financing activities, and, accordingly, there is no change to the underlying cash flow for the period.
Note 4.5 Subsequent events Note 5.1 Basis of preparation
Maersk Drilling Annual Report 2019 Financials Consolidated financial statements 2019 Parent company financial statements 2019 Statements 78

Certain lease costs are generally excluded from the lease liability recognised and, in implementing IFRS 16, certain practical expedients have been applied:• Leases with a lease term of less than 12 months and leases of assets of low value are excluded from the lease
liability recognised and are instead expensed on a straight-line basis over the lease term. In addition, leases with a remaining term of less than 12 months at 1 January 2019 were excluded upon adoption.
• Service components included in lease costs are not recognised as part of the lease liability. Such costs are recognised in the income statement as incurred.
• The definition of a lease under IAS 17 and IFRIC 4 has been retained and contracts not previously determined to contain a lease have not been reassessed.
• Initial direct costs are excluded from the measurement of the right-of-use assets at the date of the initial application.
• Distinct incremental borrowing rates are applied to major leases whereas a single discount rate have been applied for the remaining lease contracts.
The weighted average incremental borrowing rate applied was 4.4%.
Transition impactThe operating lease liability at 31 December 2018 can be reconciled to the lease liability recognised at 1 January 2019 in the following way:
ConsolidationConsolidation is performed by summarising the financial statements of the entities within the Group as described in note 5.1. Internal income and expenses, shareholdings, dividends, balances and gains on internal transactions within the Group are eliminated. Certain entities in which Maersk Drilling has an ownership share of less than 100% but holds the full right to govern and receive dividends through shareholder agreements etc. are considered subsidiaries and consolidated without any non-controlling interest.
Foreign currency translation The consolidated financial statements are presented in USD, which is also the functional currency of most material companies within the Group.
Transactions in currencies other than the functional currency are translated at the exchange rate prevailing at the date of the transaction. Monetary items in foreign currencies not settled at the balance sheet date are translated at the exchange rate as at the balance sheet date. Foreign exchange gains and losses are included in the income statement as financial income or expenses.
Segment informationThe allocation of business activities into segments is in line with the internal management reporting provided to the chief operating decision maker. The reportable segments are as follows:
North Sea segment Jack-up rigs operating in depths up to 500 ft and comprise the aggregated operating segments ultra-harsh environment jack-up rigs and harsh environment jack-up rigs, as they have similar economic characteristics, share the same customers and are largely interchangeable.
International segment Semi-submersible rigs and drillships designed to operate in benign mid- and deepwater
environments in depths up to 12,000 ft.
The benign jack-up rigs Maersk Completer, which was sold on 7 January 2020, and Maersk Convincer are not included in either segment and are reported under unallocated activities based on their different nature and limited materiality.
Segment profit/loss (defined as profit/loss before before depreciation and amortisation, impairment losses/ reversals and special items) comprise items directly related to or which can be allocated to segments. Costs in group functions are allocated to reportable segments if they can be allocated to segments. Financial assets, liabilities, income and expenses from these items, and tax are not attributed to reportable segments.
Income statementRevenue from drilling activities typically comprises fixed amounts for each day the rig is under contract differentiated by the activities undertaken (“day rate revenue”) and other revenue components such as lump sum payments for rig mobilisation and demobilisation and payments for investments in equipment or rig upgrades required to meet the operational needs of the drilling campaign, both of which are amortised over the contract period; bonuses linked to performance in terms of time, efficiency or drilling outcome measures such as reservoir targeting; or payments for third-party services to be delivered by Maersk Drilling.
Contracts under which Maersk Drilling is the lessorIFRS 16 does not introduce material changes from a lessor perspective, and no changes in the composition of the balance sheet from the adoption of IFRS 16 deriving from current contracts with costumers have been identified.
New reporting requirementsMaersk Drilling expects no material impact of endorsed but not yet implemented amendments or interpretations of IFRS standards.
Note 5.1 Basis of preparation – continued Note 5.2 Significant accounting policies
USD Million
Operating lease obligations at 31 December 2018 47Service components -4Low-value assets and short-term contracts -1Undiscounted lease liabilities 42Discounting effect -6Lease liability at 1 January 2019 36
Maersk Drilling did not have any material financial leases under IAS 17.
Maersk Drilling Annual Report 2019 Financials Consolidated financial statements 2019 Parent company financial statements 2019 Statements 79

Operating costs comprise costs incurred in generating revenue for the year, including costs for crew, repair and maintenance. Sales, general and administrative costs are presented separately.
Special items comprise non-recurring income and expenses that are not considered part of Maersk Drilling’s ordinary operations, such as gains and losses on divestments, compensation from shipyards and restructuring projects, including separation and demerger/listing costs.
Financial income and expenses comprise interest income and expenses including the interest element of lease payments related to leases capitalised under IFRS 16, foreign exchange gains/losses, realised and unrealised gains/losses on financial instruments and bank fees and transaction costs related to borrowings. Financial income and expenses are recognised in the income statement on an accrual basis.
Tax comprises an estimate of current and deferred income tax as well as adjustments to previous years for the individual entities covered by the consolidated financial statements. Income tax is tax on taxable profits and consists of corporation tax and withholding tax of dividends, etc. Tax is recognised in the income statement to the extent it arises from items recognised in the income statement.
Statement of comprehensive incomeOther comprehensive income consists of income and costs not recognised in the income statement, cash flow hedges as well as actuarial gains/losses on defined benefit plans, etc. Other comprehensive income includes current and deferred income tax to the extent that the items recognised in other comprehensive income are taxable or deductible.
Balance sheetIntangible assets are measured at cost less accumulated amortisation and impairment losses. Amortisation is calculated on a straight-line basis over the estimated useful lives of the assets. Customer contracts are amortised over the contract term. Estimated useful lives and residual values are reassessed on a regular basis.
Useful life (years) Residual value Customer contracts Contract term 0%IT Software 3–5 years 0%
Property, plant and equipment are valued at cost less accumulated depreciation and impairment losses. Depreciation is charged to the income statement on a straight-line basis over the useful lives to an estimated residual value. The cost of an asset is divided into separate components, which are depreciated separately if the useful lives of the individual components differ:
Useful life (years) Residual value Rigs, Hull 25 years 30%Rigs, Drilling Equipment/owner furnished equipment long 20 years 10%Rigs, Drilling Equipment/owner furnished equipment short 10 years 0%Rigs, Initial offshore inventory 10 years 0%Rigs, Other 5 years 0%Rigs, five-year special periodic survey 5 years 0%
Estimated useful lives and residual values are reassessed on a regular basis.
The five-year special periodic survey costs are recognised in the carrying amount of rigs when incurred and depreciated over the period until the next five year special periodic survey. Costs of on-going routine maintenance of the assets are expensed as incurred.
The cost of assets constructed by Maersk Drilling includes directly attributable expenses. For assets with a long construction period, borrowing costs during the construction period from specific as well as general borrowings are capitalised.
Impairment losses are recognised when the carrying amount of an asset or a cash-generating unit exceeds the higher of the estimated value in use and fair value less costs of disposal. The value in use is estimated as the present value of the future cash flows that Maersk Drilling expects to derive from the asset.
Intangible assets and property, plant and equipment are tested for impairment if there is an indication of impairment.
Previously recognised impairment losses are reversed if the higher of the estimated value in use and fair value less costs of disposal exceed the carrying amount of an asset or a cash-generating unit.
Lease contracts, under which the Group is the lessee, are capitalised using an incremental borrowing rate and recognised in the balance sheet as right-of-use assets and corresponding lease liabilities. The right-of-use assets are generally depreciated over the lease term. Lease payments made are split into an interest element presented under financial expenses and amortisation of the lease liability. Both elements are included under cash flow from financing activities in the cash flow statement.
Lease contracts with a term shorter than 12 months or for which the underlying asset are of low value are not capitalised but expensed straight-line over the lease term.
Note 5.2 Significant accounting policies – continued
Maersk Drilling Annual Report 2019 Financials Consolidated financial statements 2019 Parent company financial statements 2019 Statements 80
Receivables are initially recognised at fair value, plus any direct transaction costs and subsequently measured at amortised cost using the effective interest method.
The Group applies the simplified approach to providing the expected credit losses prescribed by IFRS 9, which permits the use of the lifetime expected loss provision for all trade receivables. To measure the expected credit losses, trade receivables have been grouped based on shared credit risk characteristics and the days past due. In accordance with IFRS 9, also non-due trade receivables have been impaired.
For loans receivable and other receivables than trade receivables, the initial impairment provision is calculated on the basis of 12 month expected credit losses. If a significant increase in credit risk occurs, lifetime expected credit losses are recognised.
Prepayments comprise consumables and prepaid cost including mobilisation and start-up costs that are considered costs to fulfil contracts under IFRS 15 (contract assets). For contract assets, any need for loss provisions are estimated using the simplified approach under IFRS 9.
Cash and bank balances comprise cash on hand and short-term deposits which are readily convertible to cash.
Assets held for sale, comprise assets for which the carrying amount will be recovered principally through a sale transaction rather than through continuing use. Assets are classified as held for sale when activities to carry out a sale have been initiated, when the assets are available for immediate sale in their present condition and when the assets are expected to be disposed of within 12 months. Liabilities directly associated with assets held for sale, if any, are presented separately from other liabilities.
Assets held for sale are measured at the lower of their carrying amount immediately before classification as held for sale and the fair value less costs to sell.
Non-current assets are not depreciated while classified as held for sale.
Equity includes total comprehensive income for the year comprising the profit/loss for the year and other comprehensive income. Reserve for hedges includes the accumulated fair value of derivatives qualifying for cash flow hedge accounting, net of tax.
Equity settled restricted shares allocated to employees as part of Maersk Drilling’s long-term incentive programme are recognised as staff costs over the vesting period at estimated fair value at the grant date and a corresponding adjustment in equity.
At the end of each reporting period, Maersk Drilling revises its estimates of the number of awards that are expected to vest based on the non-market vesting conditions and service conditions. Any impact of the revision is recognised in the income statement with a corresponding adjustment to equity.
Provisions are recognised when Maersk Drilling has a present legal or constructive obligation from past events. The item includes, among other, provisions for legal disputes, disputes over indirect taxes or duties and restructuring provisions. Provisions are recognised based on best estimates and are discounted where the time element is significant and where the time of settlement is reasonably determinable.
Deferred tax is calculated on temporary differences between the carrying amounts and tax bases of assets and liabilities. Deferred tax is not recognised for differences on the initial recognition of assets or liabilities where at the time of the transaction neither accounting nor taxable profit/loss is affected, unless the differences arise in a business combination. In addition, no deferred tax is recognised for undistributed earnings in subsidiaries, when Maersk Drilling controls the timing of dividends, and no taxable dividends are currently expected. A deferred tax asset is recognised to the extent that it is probable that it can be utilised within a foreseeable future.
Financial liabilities are initially recognised at fair value less transaction costs. Subsequently, the financial liabilities are measured at amortised cost using the effective interest method, whereby transaction costs and any premium or discount are recognised as financial expenses over the term of the liabilities.
Deferred income comprises of payments received from the customers, where recognition of revenue has been deferred as described in the accounting policy for revenue.
Derivative financial instrumentsDerivative financial instruments are recognised on the trading date and measured at fair value using generally acknowledged valuation techniques based on relevant observable swap curves and exchange rates.
The effective portion of changes in the value of derivative financial instruments designated to hedge highly probable future transactions is recognised in other comprehensive income until the hedged transactions are realised. At that time, the cumulated gains/losses are transferred to the items under which the hedged transactions are recognised. The ineffective portion of hedge transactions and changes in the fair values of derivative financial instruments, which do not qualify for hedge accounting, are recognised in the income statement as financial income or expenses.
Cash flow statement Cash flow from operating activities includes all cash transactions other than cash flows arisen from investments and divestments, principal payments of loans, instalments on finance lease liabilities, financial income received, financial expenses paid and equity transactions. Capitalisation of borrowing costs are considered as non-cash items, and the actual payments of those are included in cash flow from financing activities.
Note 5.2 Significant accounting policies – continued
Maersk Drilling Annual Report 2019 Financials Consolidated financial statements 2019 Parent company financial statements 2019 Statements 81

The preparation of consolidated financial statements requires management, on an ongoing basis, to make judgements and estimates and form assumptions that affect the reported amounts. Management forms its judgements and estimates based on historical experience, independent advisors and external data points as well as in-house specialists and on other factors believed to be reasonable under the circumstances.
In certain areas, the outcome of business plans, including ongoing negotiations with external parties to execute those plans or to settle claims that are raised against Maersk Drilling, is highly uncertain. Therefore, assumptions may change or the outcome may differ in the coming years, which could require a material upward or downward adjustment to the carrying amounts of assets and liabilities. This note includes the areas in which Maersk Drilling is particularly exposed to a material adjustment of the carrying amounts as at the end of 2019.
Aspects of uncertaintyIn its assumption setting, management is faced with uncertainty in different aspects. One aspect of uncertainty is whether an asset or liability exists where the assessment is basis for recognition or de-recognition decisions, including assessment of control. Another aspect is the measurement uncertainty, where management makes assumptions about the value of the assets and liabilities that are deemed to exist. These assumptions concern the timing and amount of future cash flows and the risks inherent in these.
Demand for drilling rigsMaersk Drilling is impacted by the demand for rigs as the oil and gas companies may cancel or defer projects and exert pressure for lower rates, more contract flexibility and low cost solutions when oil prices are low. Hence, the future long-term development in the oil price is (indirectly) impacting accounting estimates for Maersk Drilling through the demand for drilling rigs, which in turn impacts expectations towards future utilisation and day rates which could be impairment indicators and impact value-in-use estimates if impairment testing is done.
Property, plant and equipment Propert, plant and equipment are depreciated over their useful economic lives. Management assesses impairment indicators across this asset base. Judgement is applied in the definition of cash generating units and in the selection of methodologies and assumptions for impairment tests.
Maersk Drilling considers rigs with similar functionality and operating environment as cash generating units due to largely interdependent cash flows.
Projected cash flow models are used when fair value is not obtainable or when fair value is deemed lower than value in use. External data is used to the extent possible and centralised processes, involving corporate functions, ensure that indexes or data sources are selected consistently observing differences in risks and other circumstances. Current market values for rigs are estimated using acknowledged brokers, but may be impacted by distress in the market.
Impairment considerationsOil and gas operators continued to optimise their business models and structurally reduce offshore project costs through project optimisation, standardisation, digitisation, simplification, and service deflation. As a result of the structural approach to reducing offshore project costs, offshore project economics have improved significantly both in absolute terms as well as relative to other sources, including unconventional sources (shale oil). Consequently, offshore rig utilisation levels have been positively impacted by these demand- and supply-side factors.
In line with our expectations, operator demand for offshore drilling rigs continued to rise during 2019, with demand for jack-up rigs growing slightly higher than the demand for floaters. Drilling contractors also continued to reduce offshore drilling rig supply. Leading indicators continued to provide support for future drilling activity, as increased tendering activity translated into more awarded contracts throughout the year. Contracting activity also exhibited an element of direct awards, where operators, either through alliances or directly with selected drilling contractors, bypassed the tendering process.
In line with analysts who cover the market, Management continues to expect a gradual move towards more economically sustainable rates in the long-term.
No indicators of additional impairment or reversal of impairment have been identified as of 31 December 2019, as the development in the offshore drilling market with increased activity and improved long-term projections is considered to be in line with the expectations underlying the impairment test conducted in 2018.
The fair value estimates using the market approach are highly uncertain due to the character of the assets and few transactions. The value in use calculations for the individual cash generating units carried out in 2018 are sensitive to the day rates and to the risks of idle periods in the forecasts. In addition, the discount rate, growth rate and EBITDA margin after the budget period are critical variables.
Refer to note 2.4 for information about impairment losses, recoverable amounts, discount rates and sensitivity disclosures for the impairment testing done in 2018.
Note 5.3 Significant accounting estimates and judgements
Maersk Drilling Annual Report 2019 Financials Consolidated financial statements 2019 Parent company financial statements 2019 Statements 82
Depreciation and residual valuesUseful lives are estimated based on past experience. Management decides from time to time to revise the estimates for individual assets or groups of assets with similar characteristics due to factors such as quality of maintenance and repair, technical development and environmental requirements. Refer to note 5.2 for the useful lives typically used for new assets.
Residual values are difficult to estimate given the long lives of rigs, the uncertainty as to future economic conditions and the future price of steel, which are considered as the main determinant of the residual price. The long-term view is prioritised in order to disregard, to the extent possible, temporary market fluctuations which may be significant.
Legal disputes, uncertain tax positions, etc.Management’s estimate of the provisions in connection with legal disputes, including disputes on taxes and duties, is based on the knowledge available on the actual substance of the cases and a legal assessment of these. The resolution of legal disputes, through either negotiations or litigation, can take several years to complete and the outcome is subject to considerable uncertainty.
Maersk Drilling is engaged in a limited number of disputes with tax authorities of various scope. In evaluating the accounting impact of uncertain tax positions, Maersk Drilling applies a two stage test in accordance with IAS 12 and IFRIC 23. If it is probable (i.e. a probability of more than 50%) that a tax authority will accept a particular uncertain tax position, then the tax position reported in these consolidated financial statements is consistent with what is or will be used in the tax returns of the entity and no further liability is recognised. However, if it is not probable that a tax authority will accept a particular uncertain tax position then the income tax accounting is adjusted generally by recognising an additional liability. The adjustment could also be a decrease in tax receivables or an adjustment to deferred tax balances, depending on the tax position. The uncertain tax position is measured using either the most likely amount or the expected value, depending on which is thought to give a better prediction of the resolution of each uncertain tax position.
The classification as deferred or current tax is often encumbered with uncertainty due to the nature of these disputes and effects within joint taxation including calculated interest, and final assessments could impact the classifications and estimates of the disputes.
Deferred tax assetsEstimation has been applied in the measurement of deferred tax assets with respect to Maersk Drilling’s ability to utilise the assets. Management considers the likelihood of utilisation based on the latest business plans and recent financial performances of the individual entities.
Note 5.3 Significant accounting estimates and judgements – continued
Maersk Drilling Annual Report 2019 Financials Consolidated financial statements 2019 Parent company financial statements 2019 Statements 83
Parent company financial statements 2019
Maersk Drilling Annual Report 2019 Financials 84Consolidated financial statements 2019 Parent company financial statements 2019 Statements 84FinancialsMaersk Drilling Annual Report 2019

Income statementUSD Million Note 2019
Revenue - Costs 1 -2Gross result -2Depreciation and impairment losses 4 -0Profit/loss before financial items -2Financial income 2 28 Financial expenses 2 -42Profit/loss before tax -16Tax 3 -0 Profit/loss for the year -16
Appropration:Retained earnings -16
-16
The Drilling Company of 1972 A/S
Maersk Drilling Annual Report 2019 Financials 85Consolidated financial statements 2019 Parent company financial statements 2019 Statements

Balance sheet at 31 DecemberUSD Million Note 2019
Non-current assetsProperty, plant and equipment 4 4Financial non-current assets 5 4,446Total non-current assets 4,450
Current assetsReceivablesCurrent tax receivables 14Receivables from subsidiaries and group enterprises 790Prepayments, etc. 1Receivables, etc. 805
Cash and bank balances 81Total current assets 886Total assets 5,336
USD Million Note 2019
Share capital 63Retained earnings 3,856Total equity 3,919
Non-current liabilitiesBorrowings, non-current 6 1,248
Derivatives, non-current 6 22Other non-current liabilities 22Total non-current liabilities 1,270
Current liabilitiesBorrowings, current 6 130
Current tax payables, joint taxations 14Derivatives, current 6 1Other payables, etc., current 2Other current liabilities 17Total current liabilities 147Total liabilities 1,417Total equity and liabilities 5,336
The Drilling Company of 1972 A/S
Maersk Drilling Annual Report 2019 Financials 86Consolidated financial statements 2019 Parent company financial statements 2019 Statements

Statement of changes in equityUSD Million Share capital Retained
earningsTotal equity
Equity at incorporation 63 3,872 3,935
Profit/loss for the year -16 -16Equity 31 December 2019 63 3,856 3,919
The share capital comprises 41,532,112 shares of DKK 10. The Drilling Company of 1972 A/S was incorporated on 2 April 2019 in connection with the separation of the Maersk Drilling activities from the A.P. Moller - Maersk Group with financial effect from 1 January 2019.
The Drilling Company of 1972 A/S
Maersk Drilling Annual Report 2019 Financials 87Consolidated financial statements 2019 Parent company financial statements 2019 Statements

Notes
90 Note 7 – Contingent liabilities
90 Note 8 – Related parties
91 Note 9 – Significant accounting policies
92 Note 10 – Significant accounting estimates and judgements
92 Note 11 – Events after the balance sheet date
89 Note 1 – Costs
89 Note 2 – Financial income and expenses
89 Note 3 – Tax
89 Note 4 – Property, plant and equipment
89 Note 5 – Investments in subsidiaries
90 Note 6 – Borrowings
The Drilling Company of 1972 A/S
Maersk Drilling Annual Report 2019 Financials 88Consolidated financial statements 2019 Parent company financial statements 2019 Statements

The Drilling Company of 1972 A/S
The Drilling company of 1972 A/S did not have employees in 2019, as all personnel is employed in affiliated companies. For remuneration of the Board of Directors and Executive Management reference is made to notes 1.3 and 4.3 (share-based payment) in the consolidated financial statements.
Note 1 Costs
Note 2 Financial income and expenses
Note 3 Tax
USD Million 2019
Interest income 2Interest income from group enterprises 26Financial income 28
Interest expenses -40Interest expenses to group enterprises -1Loss on interest rate derivatives -1Financial expenses -42Financial expenses, net -14
Note 4 Property, plant and equipmentUSD Million Land &
BuildingsTotal
CostContribution at incorporation 4 431 December 2019 4 4
Depreciation and impairment lossesDepreciation -0 -031 December 2019 -0 -0
Carrying amount31 December 2019 4 4
Note 5 Investments in subsidiaries USD Million Investments in subsidiaries
CostContribution at incorporation 3,931Addition 51531 December 2019 4,446
Carrying amount31 December 2019 4,446
Valuation of Investment in subsidiariesAt 31 December 2019, the carrying amount of the investment in subsidiaries was considered for impairment. No impairment was recognised, as there was no triggering event.
List of subsidiariesReference is made to page 100 for a list of subsidiaries.Maersk Drilling Holding A/S is the only direct subsidiary of the Company.
USD Million 2019
Tax recognised in the income statementCurrent tax on profits for the year -0Total current tax -0
Total tax expense -0
Maersk Drilling Annual Report 2019 Financials 89Consolidated financial statements 2019 Parent company financial statements 2019 Statements
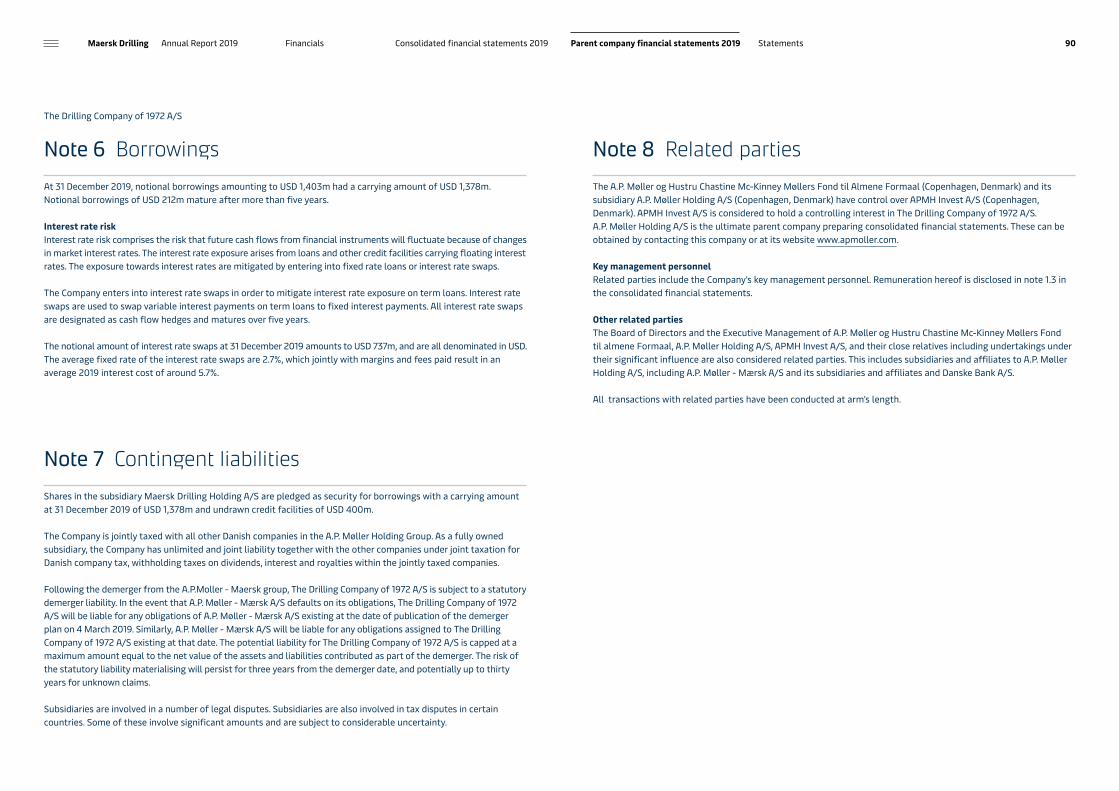
The Drilling Company of 1972 A/S
At 31 December 2019, notional borrowings amounting to USD 1,403m had a carrying amount of USD 1,378m. Notional borrowings of USD 212m mature after more than five years.
Interest rate riskInterest rate risk comprises the risk that future cash flows from financial instruments will fluctuate because of changes in market interest rates. The interest rate exposure arises from loans and other credit facilities carrying floating interest rates. The exposure towards interest rates are mitigated by entering into fixed rate loans or interest rate swaps. The Company enters into interest rate swaps in order to mitigate interest rate exposure on term loans. Interest rate swaps are used to swap variable interest payments on term loans to fixed interest payments. All interest rate swaps are designated as cash flow hedges and matures over five years. The notional amount of interest rate swaps at 31 December 2019 amounts to USD 737m, and are all denominated in USD. The average fixed rate of the interest rate swaps are 2.7%, which jointly with margins and fees paid result in an average 2019 interest cost of around 5.7%.
Note 6 BorrowingsThe A.P. Møller og Hustru Chastine Mc-Kinney Møllers Fond til Almene Formaal (Copenhagen, Denmark) and its subsidiary A.P. Møller Holding A/S (Copenhagen, Denmark) have control over APMH Invest A/S (Copenhagen, Denmark). APMH Invest A/S is considered to hold a controlling interest in The Drilling Company of 1972 A/S. A.P. Møller Holding A/S is the ultimate parent company preparing consolidated financial statements. These can be obtained by contacting this company or at its website www.apmoller.com.
Key management personnelRelated parties include the Company's key management personnel. Remuneration hereof is disclosed in note 1.3 in the consolidated financial statements.
Other related partiesThe Board of Directors and the Executive Management of A.P. Møller og Hustru Chastine Mc-Kinney Møllers Fond til almene Formaal, A.P. Møller Holding A/S, APMH Invest A/S, and their close relatives including undertakings under their significant influence are also considered related parties. This includes subsidiaries and affiliates to A.P. Møller Holding A/S, including A.P. Møller - Mærsk A/S and its subsidiaries and affiliates and Danske Bank A/S.
All transactions with related parties have been conducted at arm's length.
Note 8 Related parties
Shares in the subsidiary Maersk Drilling Holding A/S are pledged as security for borrowings with a carrying amount at 31 December 2019 of USD 1,378m and undrawn credit facilities of USD 400m.
The Company is jointly taxed with all other Danish companies in the A.P. Møller Holding Group. As a fully owned subsidiary, the Company has unlimited and joint liability together with the other companies under joint taxation for Danish company tax, withholding taxes on dividends, interest and royalties within the jointly taxed companies.
Following the demerger from the A.P.Moller - Maersk group, The Drilling Company of 1972 A/S is subject to a statutory demerger liability. In the event that A.P. Møller - Mærsk A/S defaults on its obligations, The Drilling Company of 1972 A/S will be liable for any obligations of A.P. Møller - Mærsk A/S existing at the date of publication of the demerger plan on 4 March 2019. Similarly, A.P. Møller - Mærsk A/S will be liable for any obligations assigned to The Drilling Company of 1972 A/S existing at that date. The potential liability for The Drilling Company of 1972 A/S is capped at a maximum amount equal to the net value of the assets and liabilities contributed as part of the demerger. The risk of the statutory liability materialising will persist for three years from the demerger date, and potentially up to thirty years for unknown claims.
Subsidiaries are involved in a number of legal disputes. Subsidiaries are also involved in tax disputes in certain countries. Some of these involve significant amounts and are subject to considerable uncertainty.
Note 7 Contingent liabilities
Maersk Drilling Annual Report 2019 Financials 90Consolidated financial statements 2019 Parent company financial statements 2019 Statements
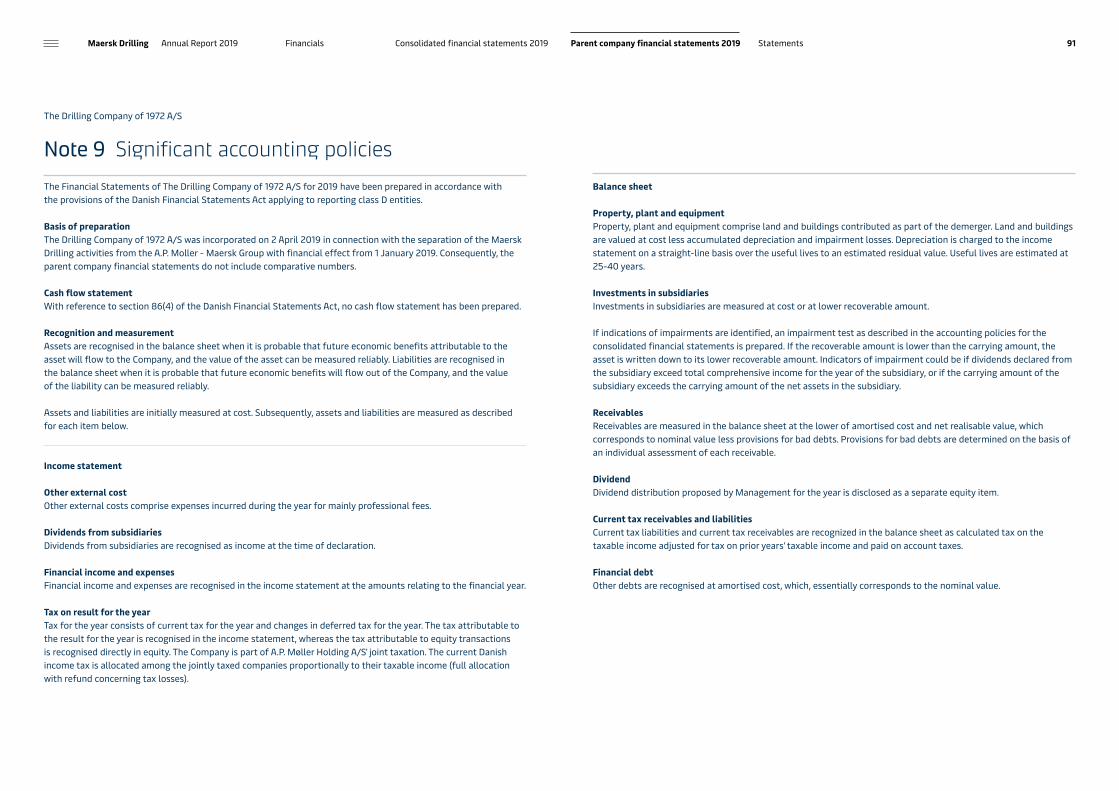
The Drilling Company of 1972 A/S
The Financial Statements of The Drilling Company of 1972 A/S for 2019 have been prepared in accordance with the provisions of the Danish Financial Statements Act applying to reporting class D entities.
Basis of preparationThe Drilling Company of 1972 A/S was incorporated on 2 April 2019 in connection with the separation of the Maersk Drilling activities from the A.P. Moller - Maersk Group with financial effect from 1 January 2019. Consequently, the parent company financial statements do not include comparative numbers.
Cash flow statementWith reference to section 86(4) of the Danish Financial Statements Act, no cash flow statement has been prepared.
Recognition and measurementAssets are recognised in the balance sheet when it is probable that future economic benefits attributable to the asset will flow to the Company, and the value of the asset can be measured reliably. Liabilities are recognised in the balance sheet when it is probable that future economic benefits will flow out of the Company, and the value of the liability can be measured reliably.
Assets and liabilities are initially measured at cost. Subsequently, assets and liabilities are measured as described for each item below.
Income statement
Other external costOther external costs comprise expenses incurred during the year for mainly professional fees.
Dividends from subsidiariesDividends from subsidiaries are recognised as income at the time of declaration.
Financial income and expensesFinancial income and expenses are recognised in the income statement at the amounts relating to the financial year.
Tax on result for the yearTax for the year consists of current tax for the year and changes in deferred tax for the year. The tax attributable to the result for the year is recognised in the income statement, whereas the tax attributable to equity transactions is recognised directly in equity. The Company is part of A.P. Møller Holding A/S' joint taxation. The current Danish income tax is allocated among the jointly taxed companies proportionally to their taxable income (full allocation with refund concerning tax losses).
Note 9 Significant accounting policiesBalance sheet
Property, plant and equipmentProperty, plant and equipment comprise land and buildings contributed as part of the demerger. Land and buildings are valued at cost less accumulated depreciation and impairment losses. Depreciation is charged to the income statement on a straight-line basis over the useful lives to an estimated residual value. Useful lives are estimated at 25-40 years.
Investments in subsidiariesInvestments in subsidiaries are measured at cost or at lower recoverable amount.
If indications of impairments are identified, an impairment test as described in the accounting policies for the consolidated financial statements is prepared. If the recoverable amount is lower than the carrying amount, the asset is written down to its lower recoverable amount. Indicators of impairment could be if dividends declared from the subsidiary exceed total comprehensive income for the year of the subsidiary, or if the carrying amount of the subsidiary exceeds the carrying amount of the net assets in the subsidiary. ReceivablesReceivables are measured in the balance sheet at the lower of amortised cost and net realisable value, which corresponds to nominal value less provisions for bad debts. Provisions for bad debts are determined on the basis of an individual assessment of each receivable.
DividendDividend distribution proposed by Management for the year is disclosed as a separate equity item.
Current tax receivables and liabilitiesCurrent tax liabilities and current tax receivables are recognized in the balance sheet as calculated tax on the taxable income adjusted for tax on prior years' taxable income and paid on account taxes.
Financial debtOther debts are recognised at amortised cost, which, essentially corresponds to the nominal value.
Maersk Drilling Annual Report 2019 Financials 91Consolidated financial statements 2019 Parent company financial statements 2019 Statements

The Drilling Company of 1972 A/S
When preparing the financial statements of the Company, management undertakes a number of accounting estimates and judgements to recognise, measure and classify the Company's assets and liabilities. The only significant accounting estimate and judgement relates to the assessment of impairment of investments in subsidiaries. Management assesses impairment indicators for investments in subsidiaries, and determines the recoverable amount generally consistent with the assumptions described in note 2.4 of the Consolidated financial statements to which reference is made.
Note 10 Significant accounting estimates and judgements
No events have occurred after the balance sheet date which are expected to have a material impact on the parent company financial statements.
Note 11 Subsequent events
Translation policiesTransactions in foreign currencies are translated at the exchange rates at the date of the transaction. Gains and losses arising due to differences between the transaction date rates and the rates at the dates of payment are recognised in financial income and expenses in the income statement.
Receivables, payables and other monetary items in foreign currencies that have not been settled at the balance sheet date are translated at the exchange rates at the balance sheet date. Any differences between the exchange rates at the balance sheet date and the transaction date rates are recognised in financial income and expenses in the income statement.
Fixed assets acquired in foreign currencies are measured at the transaction date rates.
USD is used as presentation currency because the majority of transactions are in United States Dollars. At 31 December 2019, the exchange rate DKK/USD was 667.59.
Note 9 Significant accounting policies – continued
Maersk Drilling Annual Report 2019 Financials 92Consolidated financial statements 2019 Parent company financial statements 2019 Statements

Statement of the Board of Directors and the Executive Management
The Board of Directors and the Executive Management have today discussed and approved the Annual Report of The Drilling Company of 1972 A/S for 2019.
The consolidated financial statements of The Drilling Company of 1972 A/S have been prepared in accordance with International Financial Reporting Standards (IFRS) as adopted by the EU and further requirements in the Danish Financial Statements Act, and the parent company financial statements has been prepared in accordance with the Danish Financial Statements Act. The Directors’ report has been prepared in accordance with the Danish Financial Statements Act.
Executive Management
Jørn Madsen CEO
Jesper Ridder OlsenCFO
Board of Directors
Claus V. Hemmingsen Chairman
Robert M. Uggla Vice Chairman
Kathleen McAllister
Alastair Maxwell
Martin Larsen
Robert Routs
Caroline Alting
Glenn Gormsen
In our opinion, the Annual Report gives a true and fair view of the Group’s and the Company’s assets and liabilities, financial position at 31 December 2019 and of the results of the Group’s and the Company’s operations and the Group’s cash flows for the financial year 2019.
In our opinion, the Directors’ report includes a fair review of the development in the Group’s and the Company’s operations and financial conditions, the results for the year, financial position and the Group’s cash flows as well as a description of the most significant risks and uncertainty factors that the Group and the Company face.
We recommend that the Annual Report will be approved at the Annual General Meeting.
Copenhagen, 5 February 2020
Maersk Drilling Annual Report 2019 Financials 93Consolidated financial statements 2019 Parent company financial statements 2019 Statements

Independent Auditor’s Report
To the shareholders of The Drilling Company of 1972 A/S
Our opinionIn our opinion, the Consolidated Financial Statements (pages 53–83, page 93 and pages 100–101) give a true and fair view of the Group’s financial position at 31 December 2019 and of the results of the Group’s operations and cash flows for the financial year 1 January to 31 December 2019 in accordance with International Financial Reporting Standards as adopted by the EU and further requirements in the Danish Financial Statements Act.
Moreover, in our opinion, the Parent Company Financial Statements (pages 84–92, page 93 and pages 100–101) give a true and fair view of the Parent Company’s financial position at 31 December 2019 and of the results of the Parent Company’s operations for the financial year 1 January to 31 December 2019 in accordance with the Danish Financial Statements Act.
Our opinion is consistent with our Auditor’s Long-form Report to the Audit & Risk Committee and the Board of Directors.
What we have auditedThe Consolidated Financial Statements of The Drilling Company of 1972 A/S for the financial year 1 January to 31 December 2019 comprise the consolidated income statement and consolidated statement of comprehensive income, the consolidated balance sheet, the consolidated statement of changes in equity, the consolidated cash flow statement and the notes, including summary of significant accounting policies.
The Parent Company Financial Statements of The Drilling Company of 1972 A/S for the financial year 1 January to 31 December 2019 comprise the income statement, the balance sheet, the statement of changes in equity and the notes, including summary of significant accounting policies.
Collectively referred to as the “Financial Statements”.
Basis for opinionWe conducted our audit in accordance with International Standards on Auditing (ISAs) and the additional requirements applicable in Denmark. Our responsibilities under those standards and requirements are further described in the Auditor’s responsibilities for the audit of the Financial Statements section of our report.
We believe that the audit evidence we have obtained is sufficient and appropriate to provide a basis for our opinion.
IndependenceWe are independent of the Group in accordance with the International Ethics Standards Board for Accountants’ Code of Ethics for Professional Accountants (IESBA Code) and the additional requirements applicable in Denmark. We have also fulfilled our other ethical responsibilities in accordance with the IESBA Code.
To the best of our knowledge and belief, prohibited non-audit services referred to in Article 5(1) of Regulation (EU) No 537/2014 were not provided.
AppointmentThe Drilling Company of 1972 A/S was founded on 2 April 2019 on which date we were appointed as auditors. The Drilling Company of 1972 A/S was listed on Nasdaq Nordic Copenhagen upon completion of the initial public offering on 4 April 2019 from which date The Drilling Company of 1972 A/S became a Public Interest Entity.
Key audit mattersKey audit matters are those matters that, in our professional judgement, were of most significance in our audit of the Financial Statements for 2019. These matters were addressed in the context of our audit of the Financial Statements as a whole, and in forming our opinion thereon, and we do not provide a separate opinion on these matters.
94Maersk Drilling Annual Report 2019 Financials Consolidated financial statements 2019 Parent company financial statements 2019 Statements

Statement on Directors' ReportManagement is responsible for Directors’ report (pages 3–51 and pages 98–99).
Our opinion on the Financial Statements does not cover the Directors' Report, and we do not express any form of assurance conclusion thereon.
In connection with our audit of the Financial Statements, our responsibility is to read the Directors' Report and, in doing so, consider whether the Directors' Report is materially inconsistent with the Financial Statements or our knowledge obtained in the audit, or otherwise appears to be materially misstated.
Moreover, we considered whether the Directors' Report includes the disclosures required by the Danish Financial Statements Act.
Based on the work we have performed, in our view, the Directors' Report is in accordance with the Consolidated Financial Statements and the Parent Company Financial Statements and has been prepared in accordance with the requirements of the Danish Financial Statements Act. We did not identify any material misstatement in the Directors' Report.
Management’s responsibilities for the Financial StatementsManagement is responsible for the preparation of consolidated financial statements that give a true and fair view in accordance with International Financial Reporting Standards as adopted by the EU and further requirements in the Danish Financial Statements Act and for the preparation of parent company financial statements that give a true and fair view in accordance with the Danish Financial Statements Act, and for such internal control as Management determines is necessary to enable the preparation of financial statements that are free from material misstatement, whether due to fraud or error.
In preparing the Financial Statements, Management is responsible for assessing the Group’s and the Parent Company’s ability to continue as a going concern, disclosing, as applicable, matters related to going concern and using the going concern basis of accounting unless Management either intends to liquidate the Group or the Parent Company or to cease operations, or has no realistic alternative but to do so.
Auditor’s responsibilities for the audit of the Financial StatementsOur objectives are to obtain reasonable assurance about whether the Financial Statements as a whole are free from material misstatement, whether due to fraud or error, and to issue an auditor’s report that includes our opinion. Reasonable assurance is a high level of assurance, but is not a guarantee that an audit conducted in accordance with ISAs and the additional requirements applicable in Denmark will always detect a material misstatement when it exists. Misstatements can arise from fraud or error and are considered material if, individually or in the aggregate, they could reasonably be expected to influence the economic decisions of users taken on the basis of these Financial Statements.
Key audit matter How our audit addressed the key audit matter
Valuation of non-current assetsThe carrying amount of the drilling rigs (non-current assets) is significant to the Consolidated Financial Statements.
Management continuously monitors the carrying value of the non-current assets based on identified cash-generating units (“CGUs”). If indications of impairment or reversal of previous impairment losses recognised exists, Management performs an impairment test. The indicators assessed by Management comprise, among others, current day rates, expected long term development in day rates, margins and discount rates.
If indications exist, the carrying value of the non-current assets mentioned, may be subject to material impairment or reversal of previously recognised impairment losses.
During 2019 and at year-end 2019 Management has assessed and concluded that no indicators of impairment or reversal of previously recognised impairment losses exist for the identified CGUs. Thus, no impairment test has been performed during or at year-end 2019.
We focused on this area as the amounts involved are material and because Managements assessment of whether impairment indicators exists is associated with a high degree of estimates and judgement.
Refer to note 2.4 in the Consolidated Financial Statements.
We discussed the processes for monitoring of the carrying value of non-current assets with Managements including the methodology aplied by Management for monitoring indicators of impairment.
Regarding Managements assessment of indictors of impairment of non-current assets, we:• Obtained and assessed the appropriateness
of Management’s assessment of whether any idicators of impairment or reversal of previous years impairments exist.
• Evaluated the sources of information used by Management in their assessment.
• Challenged Management’s assessment of the future day rates by comparing these to agreed contracts and assumptions for long term development, etc.
• Challenged the components of the assessed discount rates compared to previous periods including by involving our specialists.
Furthermore, we assessed the appropriateness of Management’s presentation of these matters in the Consolidated Financial Statements.
95Maersk Drilling Annual Report 2019 Financials Consolidated financial statements 2019 Parent company financial statements 2019 Statements

As part of an audit in accordance with ISAs and the additional requirements applicable in Denmark, we exercise professional judgement and maintain professional scepticism throughout the audit. We also: • Identify and assess the risks of material misstatement of the Financial Statements, whether
due to fraud or error, design and perform audit procedures responsive to those risks, and obtain audit evidence that is sufficient and appropriate to provide a basis for our opinion. The risk of not detecting a material misstatement resulting from fraud is higher than for one resulting from error, as fraud may involve collusion, forgery, intentional omissions, misrepresentations, or the override of internal control.
• Obtain an understanding of internal control relevant to the audit in order to design audit procedures that are appropriate in the circumstances, but not for the purpose of expressing an opinion on the effectiveness of the Group’s and the Parent Company’s internal control.
• Evaluate the appropriateness of accounting policies used and the reasonableness of accounting estimates and related disclosures made by Management.
• Conclude on the appropriateness of Management’s use of the going concern basis of accounting and based on the audit evidence obtained, whether a material uncertainty exists related to events or conditions that may cast significant doubt on the Group’s and the Parent Company’s ability to continue as a going concern. If we conclude that a material uncertainty exists, we are required to draw attention in our auditor’s report to the related disclosures in the Financial Statements or, if such disclosures are inadequate, to modify our opinion. Our conclusions are based on the audit evidence obtained up to the date of our auditor’s report. However, future events or conditions may cause the Group or the Parent Company to cease to continue as a going concern.
• Evaluate the overall presentation, structure and content of the Financial Statements, including the disclosures, and whether the Financial Statements represent the underlying transactions and events in a manner that achieves fair presentation.
• Obtain sufficient appropriate audit evidence regarding the financial information of the entities or business activities within the Group to express an opinion on the Consolidated Financial Statements. We are responsible for the direction, supervision and performance of the group audit. We remain solely responsible for our audit opinion.
We communicate with those charged with governance regarding, among other matters, the planned scope and timing of the audit and significant audit findings, including any significant deficiencies in internal control that we identify during our audit.
We also provide those charged with governance with a statement that we have complied with relevant ethical requirements regarding independence, and to communicate with them all relationships and other matters that may reasonably be thought to bear on our independence, and where applicable, related safeguards.
From the matters communicated with those charged with governance, we determine those matters that were of most significance in the audit of the Financial Statements of the current period and are therefore the key audit matters. We describe these matters in our auditor’s report unless law or regulation precludes public disclosure about the matter or when, in extremely rare circumstances, we determine that a matter should not be communicated in our report because the adverse consequences of doing so would reasonably be expected to outweigh the public interest benefits of such communication.
Copenhagen, 5 February 2020PricewaterhouseCoopersStatsautoriseret RevisionspartnerselskabCVR No. 3377 1231
Rasmus Friis Jørgensen Thomas Wraae HolmState Authorised Public Accountant State Authorised Public Accountantmne28705 mne30141
96Maersk Drilling Annual Report 2019 Financials Consolidated financial statements 2019 Parent company financial statements 2019 Statements

Additional information
Maersk Drilling Annual Report 2019 Additional information Quarterly highlights Fleet Status Report Company overview Definition of terms 97

Quarterly highlights – segments
USD Million Q1 2019 Q2 2019 Q3 2019 Q4 2019 FY 2019 FY 2018
ConsolidatedNo. of rigs at period end 23 23 23 22 22 23Revenue 308 315 294 305 1,222 1,429Average dayrate (USDk) 208 185 183 200 194 237Contracted days 1,475 1,704 1,608 1,523 6,310 6,024Available days 2,019 2,081 2,105 1,999 8,204 8,695Utilisation 73% 82% 76% 76% 77% 69%Financial uptime 99.9% 98.9% 98.2% 98.6% 98.9% 99.1%Revenue backlog at the end of the period (USDm) 2,233 2,340 2,151 2,131 2,131 2,466
Segment information – North Sea No. of rigs at period end 13 13 13 13 13 13Revenue 198 194 203 205 800 840Average dayrate (USDk) 205 181 184 204 193 218Contracted days 967 1,074 1,104 1,003 4,148 3,851Available days 1,170 1,171 1,196 1,151 4,688 5,049Utilisation 83% 92% 92% 87% 88% 76%Financial uptime 99.7% 99.6% 99.1% 100.0% 99.6% 99.2%Revenue backlog at the end of the period (USDm) 1,608 1,439 1,341 1,204 1,204 1,762
Segment information – International No. of rigs at period end 8 8 8 8 8 8Revenue 104 114 84 93 395 530Average dayrate (USDk) 247 213 204 217 220 293Contracted days 418 539 412 428 1,797 1,808Available days 669 728 725 664 2,786 2,916Utilisation 62% 74% 57% 64% 65% 62%Financial uptime 100.0% 97.2% 95.8% 95.7% 97.1% 98.8%Revenue backlog at the end of the period (USDm) 579 860 774 896 896 653
Maersk Drilling Annual Report 2019 Additional information 98Quarterly highlights Fleet Status Report Company overview Definition of terms

Fleet Status Report
2020 2021 2022 2023
Month Q1 Q2 Q3 Q4 Q1 Q2 Q3 Q4 Q1 Q2 Q3 Q4 Q1 Q2 Q3 Q4
Jack-ups
Maersk Innovator
Maersk Inspirer
Maersk Integrator
Maersk Interceptor
Maersk Intrepid
Maersk Invincible
Maersk Reacher
Maersk Resilient
Maersk Resolute
Maersk Resolve
Maersk Highlander
Maersk Gallant
Maersk Guardian
Maersk Convincer
Floaters
Maersk Deliverer
Maersk Developer
Maersk Discoverer
Maersk Explorer
Maersk Valiant
Maersk Venturer
Maersk Viking
Maersk Voyager
CNOOC – United Kingdom
Under upgrade/modification Repsol – Norway
Aker BP – Norway
MOL – Norway
Equinor – Norway
Aker BP – Norway
Aker BP – Norway
Petrogas – United Kingdom
Denmark
United Kingdom
Wintershall – Netherlands
Total – United Kingdom
Total – Denmark
BSP – Brunei
Inpex – Australia
Cairn - Mexico BG International Ltd. - Trinidad and Tobago
Edison – Egypt BP – Trinidad
BP – Azerbaijan
Repsol – Mexico Noble – Colombia
Tullow – Ghana
POSCO – Myanmar
Total – Angola and Namibia
Contract(s) Options Available Yard stay (SPS)
(until Q3 2025)
(until Q2 2027)
(until Q2 2024)
(until Q1 2025)
Serica – United Kingdom
Maersk Drilling Annual Report 2019 Additional information 99Quarterly highlights Fleet Status Report Company overview Definition of terms
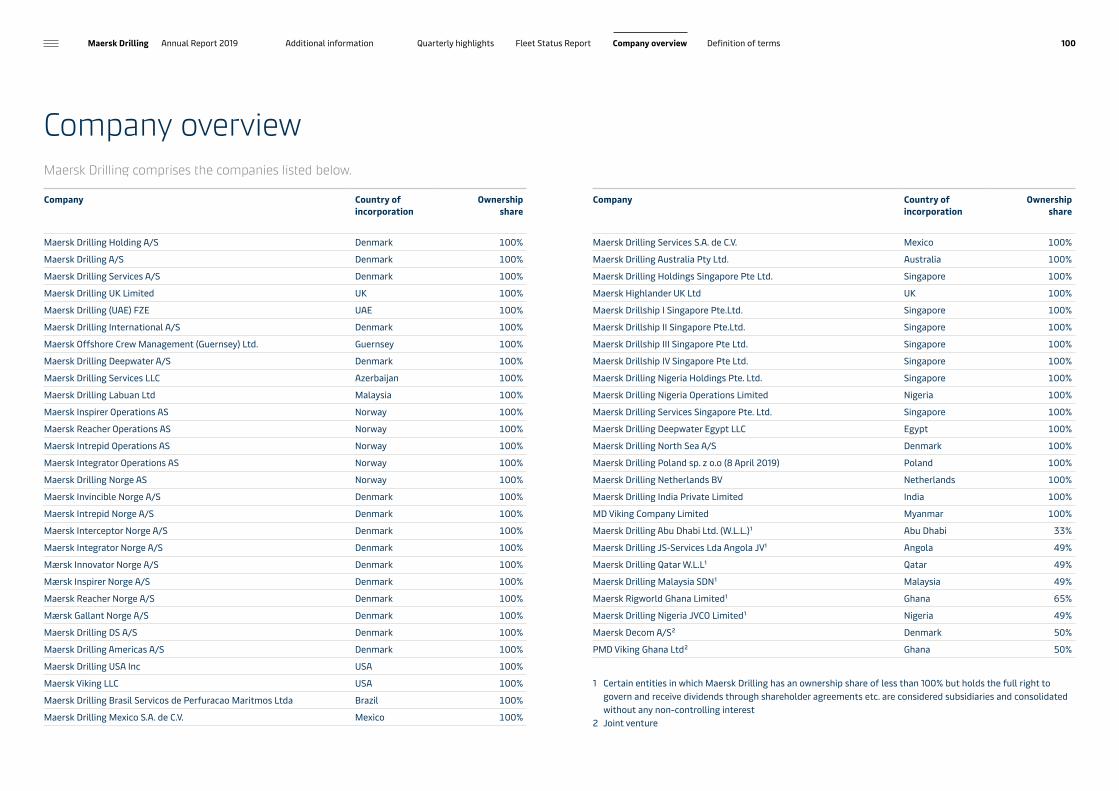
Company overviewMaersk Drilling comprises the companies listed below.
Company Country of incorporation
Ownership share
Maersk Drilling Holding A/S Denmark 100%
Maersk Drilling A/S Denmark 100%
Maersk Drilling Services A/S Denmark 100%
Maersk Drilling UK Limited UK 100%
Maersk Drilling (UAE) FZE UAE 100%
Maersk Drilling International A/S Denmark 100%
Maersk Offshore Crew Management (Guernsey) Ltd. Guernsey 100%
Maersk Drilling Deepwater A/S Denmark 100%
Maersk Drilling Services LLC Azerbaijan 100%
Maersk Drilling Labuan Ltd Malaysia 100%
Maersk Inspirer Operations AS Norway 100%
Maersk Reacher Operations AS Norway 100%
Maersk Intrepid Operations AS Norway 100%
Maersk Integrator Operations AS Norway 100%
Maersk Drilling Norge AS Norway 100%
Maersk Invincible Norge A/S Denmark 100%
Maersk Intrepid Norge A/S Denmark 100%
Maersk Interceptor Norge A/S Denmark 100%
Maersk Integrator Norge A/S Denmark 100%
Mærsk Innovator Norge A/S Denmark 100%
Mærsk Inspirer Norge A/S Denmark 100%
Maersk Reacher Norge A/S Denmark 100%
Mærsk Gallant Norge A/S Denmark 100%
Maersk Drilling DS A/S Denmark 100%
Maersk Drilling Americas A/S Denmark 100%
Maersk Drilling USA Inc USA 100%
Maersk Viking LLC USA 100%
Maersk Drilling Brasil Servicos de Perfuracao Maritmos Ltda Brazil 100%
Maersk Drilling Mexico S.A. de C.V. Mexico 100%
Company Country of incorporation
Ownership share
Maersk Drilling Services S.A. de C.V. Mexico 100%
Maersk Drilling Australia Pty Ltd. Australia 100%
Maersk Drilling Holdings Singapore Pte Ltd. Singapore 100%
Maersk Highlander UK Ltd UK 100%
Maersk Drillship I Singapore Pte.Ltd. Singapore 100%
Maersk Drillship II Singapore Pte.Ltd. Singapore 100%
Maersk Drillship III Singapore Pte Ltd. Singapore 100%
Maersk Drillship IV Singapore Pte Ltd. Singapore 100%
Maersk Drilling Nigeria Holdings Pte. Ltd. Singapore 100%
Maersk Drilling Nigeria Operations Limited Nigeria 100%
Maersk Drilling Services Singapore Pte. Ltd. Singapore 100%
Maersk Drilling Deepwater Egypt LLC Egypt 100%
Maersk Drilling North Sea A/S Denmark 100%
Maersk Drilling Poland sp. z o.o (8 April 2019) Poland 100%
Maersk Drilling Netherlands BV Netherlands 100%
Maersk Drilling India Private Limited India 100%
MD Viking Company Limited Myanmar 100%
Maersk Drilling Abu Dhabi Ltd. (W.L.L.) ¹ Abu Dhabi 33%
Maersk Drilling JS-Services Lda Angola JV¹ Angola 49%
Maersk Drilling Qatar W.L.L¹ Qatar 49%
Maersk Drilling Malaysia SDN ¹ Malaysia 49%
Maersk Rigworld Ghana Limited ¹ Ghana 65%
Maersk Drilling Nigeria JVCO Limited ¹ Nigeria 49%
Maersk Decom A/S ² Denmark 50%
PMD Viking Ghana Ltd ² Ghana 50%
1 Certain entities in which Maersk Drilling has an ownership share of less than 100% but holds the full right to govern and receive dividends through shareholder agreements etc. are considered subsidiaries and consolidated without any non-controlling interest
2 Joint venture
Maersk Drilling Annual Report 2019 Additional information 100Quarterly highlights Fleet Status Report Company overview Definition of terms

DefinitionsFinancial ratios and non-IFRS financial measures.
Maersk Drilling uses certain financial ratios and measures to provide management, investors and analysts with additional measures to evaluate and analyse the Group’s performance. These non-IFRS financial measures are defined and calculated by the Group, and may vary significantly from financial measures applied by other companies even if similar naming is applied.
Adjusted free cash flowCash flow from operating activities less cash flow used for investing activities, adjusted for newbuild cash flow and proceeds from the divestment of assets or activities.
Adjusted free cash flow is specified below the consolidated cash flow statement.
Asset turnoverRevenue as a percentage of average non-current assets.
Available daysAvailable days are the aggregate number of calendar days in the period less yard stays, if not paid by customer. For new rigs entering the fleet, available days is from when the rig is ready to operate.
Average day rateAverage day rates equals average daily revenue and are calculated by dividing revenue by the number of contracted days. Revenue includes the contractual rates for when the rig is in operation and other revenue components such as lump sum payments for rig mobilisation and demobilisation and payments for investments in equipment or rig upgrades required to meet the operational needs of the drilling campaign, both of which amortised over the contract period; bonuses
linked to performance in terms of time, efficiency or drilling outcome measures such as reservoir targeting; or payments for third-party services to be delivered by Maersk Drilling. Income and expenses attributable to reimbursable expenses are generally recognised net and therefore excluded in the calculation of average day rates.
Average backlog day rateRevenue backlog divided by the number of contracted days in the contract period.
CAPEXInvestments in intangible assets and property, plant and equipment, including additions from business combinations.
CAPEX can be derived as additions to intangible assets and property, plant and equipment as specified in notes 2.1 and 2.2 to the consolidated financial statements respectively.
Cash conversionCash flow from operating activities as a percentage of EBITDA.
Contracted daysContracted days are days covered by the contract with a customer, including mobilisation or yard stays if paid by customer.
DeepwaterWater depths greater than 5,000 ft.
DrillshipA vessel that has been fitted with drilling equipment, mainly used for deepwater drilling.
EBITProfit/loss before financial items and income taxes.
EBIT can be derived directly from the consolidated income statement.
EBITDAProfit/loss before depreciation, amortisation and impairment losses, financial items and income taxes.
EBITDA can be derived directly from the consolidated income statement.
EBITDA before special itemsProfit/loss before depreciation and amortisation, impairment losses and special items, financial items and income taxes.
EBITDA before special items can be derived directly from the consolidated income statement.
EBITDA margin before special itemsEBITDA before special items as a percentage of revenue.
Equity ratioEquity as a percentage of total assets.
Financial uptimeHours that can be invoiced for as a percentage of total hours in the period under contract with the customer.
Forward contract coveragePercentage indicating the part of rig days that are contracted for a specific period.
Jack-up rigA mobile drilling platform that stands on the seabed by means of three steel legs and a self-elevating system that adjusts the platform height to the water depth during the drilling operation, typically used for shallow water drilling.
LeverageNet debt divided by EBITDA before special items.
MidwaterWater depths 401–5,000 ft.
Net debtEquals interest-bearing debt less cash and bank balances and other interest-bearing assets.
Net debt is specified in note 2.8 to the consolidated financial statements.
Return on equityProfit/loss for the year divided by the average equity.
Revenue backlogFuture contract commitments for a rig, for a particular point in time at which revenues are expected to be realised. Calculated by multiplying contract rates by the contract period, excluding any optional extension periods.
Semi-submersibleA mobile vessel that is partially submerged in water during the drilling operation and positioned by means of a conventional mooring system and/or a computerised dynamic positioning system, typically used for midwater and deepwater drilling.
Shallow waterWater depths up to 400 ft.
Special itemsSpecial items comprise non-recurring income and expenses that are not considered to be part of Maersk Drilling’s ordinary operations such as compensation from shipyards, transformation and restructuring projects and separation, demerger and listing costs.
Special items are specified in note 1.4 to the consolidated financial statements.
Ultra deepwaterWater depths greater than 7,500 ft.
UtilisationUtilisation is the number of contracted days, divided by the number of available days.
Working capitalEquals trade receivables and other current assets less trade payables and other current payables.
Maersk Drilling Annual Report 2019 Additional information 101Quarterly highlights Fleet Status Report Company overview Definition of terms
Important notice
Forward looking statementsThis Annual Report contains certain forward-looking statements (being all statements that are not entirely based on historical facts including, but not limited to, statements as to the expectations, beliefs and future business, contract terms, including commencement dates, contract durations and day rates, rig availability, financial performance and prospects of The Drilling Company of 1972 A/S and its subsidiaries and affiliated companies. These forward-looking statements are based on our current expectations and are subject to certain risks, assumptions, trends and uncertainties that could cause actual results to differ materially from those indicated by the forward-looking statements due to external factors, including, but not limited to, oil and natural gas prices and the impact of the economic climate; changes in the offshore drilling market, including fluctuations in supply and demand; variable levels of drilling activity and expenditures in the energy industry; changes in day rates; ability to secure future contracts; cancellation, early termination or renegotiation by our customers of drilling contracts; customer credit and risk of customer bankruptcy; risks associated with fixed cost drilling operations; unplanned downtime; cost overruns or delays in transportation of drilling units; cost overruns or delays in maintenance, repairs, or other rig projects; operating hazards and equipment failure; risk of collision and
damage; casualty losses and limitations on insurance coverage; weather conditions in the Company’s operating areas; increasing costs of compliance with regulations; changes in tax laws and interpretations by taxing authorities, hostilities, terrorism, and piracy; impairments; cyber incidents; the outcomes of disputes, including tax disputes and legal proceeding; and other risks disclosed in Maersk Drilling’s Annual Reports and company announcements. Each forward-looking statement speaks only as of the date hereof, and the Company expressly disclaims any obligation to update or revise any forward-looking statements, except as required by law. Third-party data and informationThe IHS Markit reports, data and information referenced herein (the "IHS Markit Materials") are the copyrighted property of IHS Markit Ltd. and its subsidiaries (“IHS Markit”) and represent data, research, opinions or viewpoints published by IHS Markit, and are not representations of fact. The IHS Markit Materials speak as of the original publication date thereof and not as of the date of this document. The information and opinions expressed in the IHS Markit Materials are subject to change without notice and IHS Markit has no duty or responsibility to update the IHS Markit Materials. Moreover, while the IHS Markit Materials reproduced herein are from sources considered reliable, the accuracy and
completeness thereof are not warranted, nor are the opinions and analyses which are based upon it. IHS Markit is a trademark of IHS Markit. Other trademarks appearing in the IHS Markit Materials are the property of IHS Markit or their respective owners.
The data (“Rystad Data”) included in this document sourced to Rystad Energy AS (“Rystad Energy”) is included on an “as is” basis without any warranties of any kind, either express or implied. The Rystad Data speak as of the original publication date thereof and not as of the date of this document. The information and opinions expressed in the Rystad Data are subject to change without notice and Rystad has no duty or responsibility to update the Rystad Data. Rystad Energy expressly disclaims any and all legal liability or responsibility for the accuracy, completeness or fitness for a particular purpose (e.g. investment activities), or for the usefulness of any information used or disclosed in this document.
Maersk Drilling Annual Report 2019 102

5041 Printedmatter 0457
Rosendahls
The Drilling Company of 1972Lyngby Hovedgade 85 DK-2800 Kgs. Lyngby
Registration no. 40404716
Board of DirectorsClaus V. Hemmingsen, ChairmanRobert M. Uggla, Vice ChairmanKathleen McAllisterAlastair MaxwellMartin LarsenRobert RoutsCaroline AltingGlenn Gormsen
Executive ManagementJørn Madsen (CEO)Jesper Ridder Olsen (CFO)
AuditorPricewaterhouseCoopersStatsautoriseret Revisionspartnerselskab
EditorChristian Huss
Design and layoutExtrasmallagency
PrintPrinted in Denmark in 2020 by Rosendahls, an environmentally certified printing agency, on Arctic Matt

The Drilling Company of 1972 A/SLyngby Hovedgade 852800 Kgs. LyngbyDenmark
Registration no. 40404716
maerskdrilling.com