Annual Report 2019 (Final) - Pakistan Stock Exchange ...
194
mehransugar.com Annual Report 2019 STANDING STRONG
Transcript of Annual Report 2019 (Final) - Pakistan Stock Exchange ...

m e h r a n s u g a r . c o m
Annual Report 2019
STANDINGSTRONG
STANDINGSTRONGThe sugar industry is facing an extremely challenging scenario both domestically and internationally. High cane support prices have led to a glut of expensive sugar internally which has crashed domestic prices.
On the other hand, global sugar prices are at a 5 year low and hovering between USD 300 to USD 350 per ton. This situation makes exports uncompetitive thus adding to the local glut.
The economic situation in the country hasn’t helped either. Currency devaluation, followed by double digit inflation and interest rates have hit the industry badly. This scenario coupled with low consumer confidence and mounting fuel prices have created a challenging environment for both sugar and sugarcane producers.
04 Key Figures
05 Our Core Values
08 Vision & Mission
12 Geographical Location
16 Journey to Success
18 Company Information
20 SWOT Analysis
24 Code of Conduct and Ethical Values
26 Business Strategy & Goals
27 Management Committees
28 Board of Directors
30 Investing in Mehran Sugar
32 Investor Relations
34 Management Team
38 Horizontal & Vertical Analysis
44 Our Factory Profile
45 Statement of Value Addition
46 Six Years’ Review at a Glance
48 Six Years’ Sugarcane Trends Analysis
49 DuPont Analysis
50 Organogram
51 Chairman’s Review
52 Directors’ Report
60 Corporate Governance Framework
63 Corporate Social Responsibility
67 Pattern of Shareholding
76 Directors’ Report (Urdu)
77 Notice of the Annual General Meeting
85 Notice of the Annual General Meeting (Urdu)
86 Statement of Compliance with the CCG
88 Review Report to the Members on Statement of Compliance with the Code of Corporate Governance
89 Unconsolidated Financial Statements
137 Consolidated Financial Statements
Proxy Form
CONTENTS
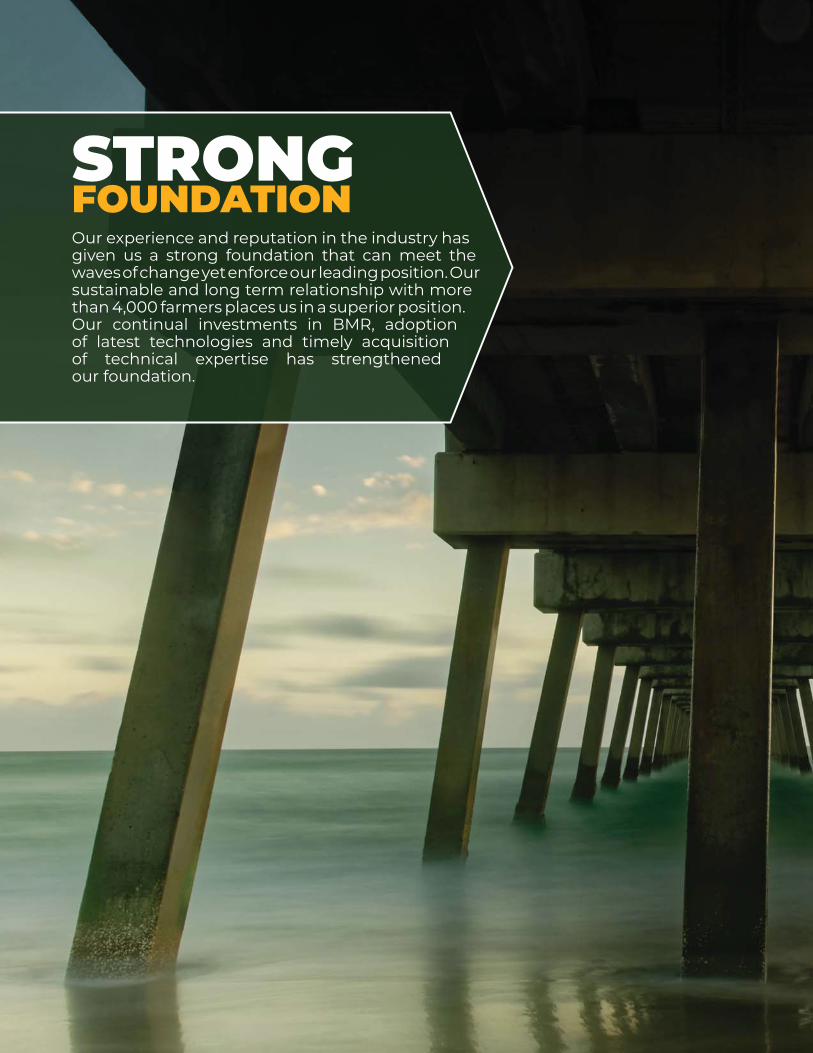
Our experience and reputation in the industry has given us a strong foundation that can meet the waves of change yet enforce our leading position. Our sustainable and long term relationship with more than 4,000 farmers places us in a superior position. Our continual investments in BMR, adoption of latest technologies and timely acquisition of technical expertise has strengthened our foundation.
FOUNDATIONSTRONG

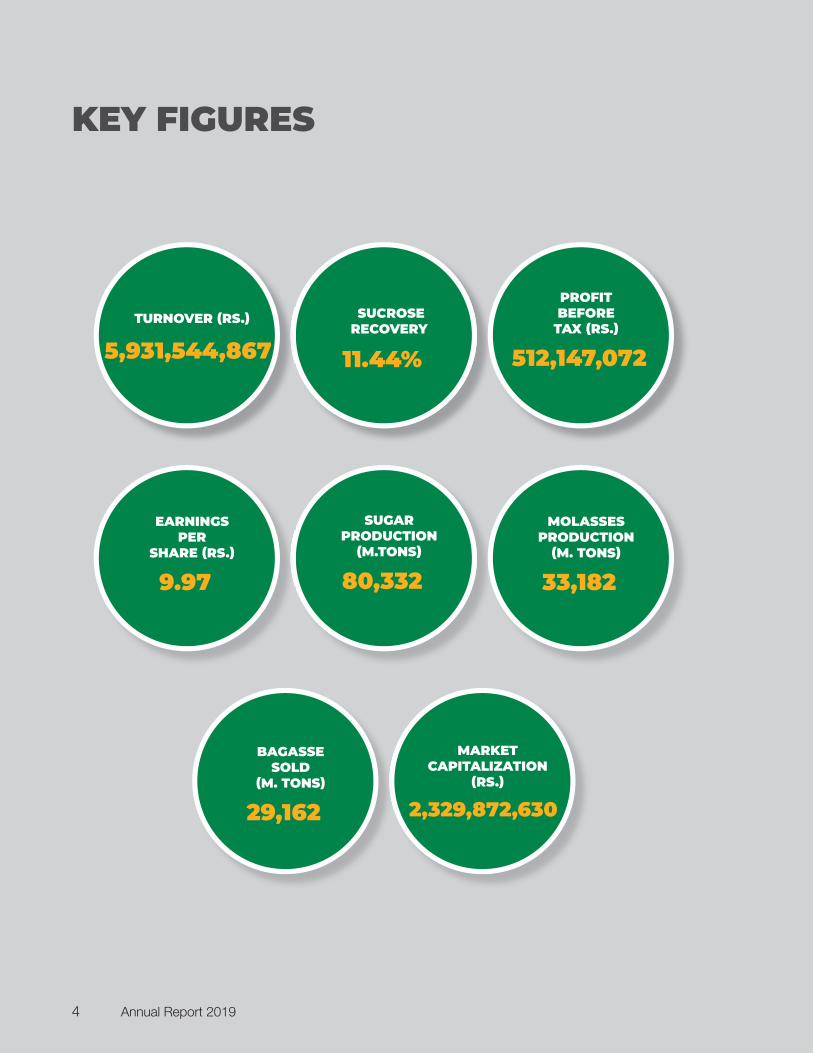
KEY FIGURES
SUCROSE RECOVERY
11.44%
TURNOVER (RS.)
5,931,544,867
PROFIT BEFORE
TAX (RS.)
512,147,072
SUGAR PRODUCTION
(M.TONS)
80,332
EARNINGS PER
SHARE (RS.)
9.97
MARKET CAPITALIZATION
(RS.)
2,329,872,630
BAGASSE SOLD
(M. TONS)
29,162
MOLASSES PRODUCTION
(M. TONS)
33,182
Annual Report 20194
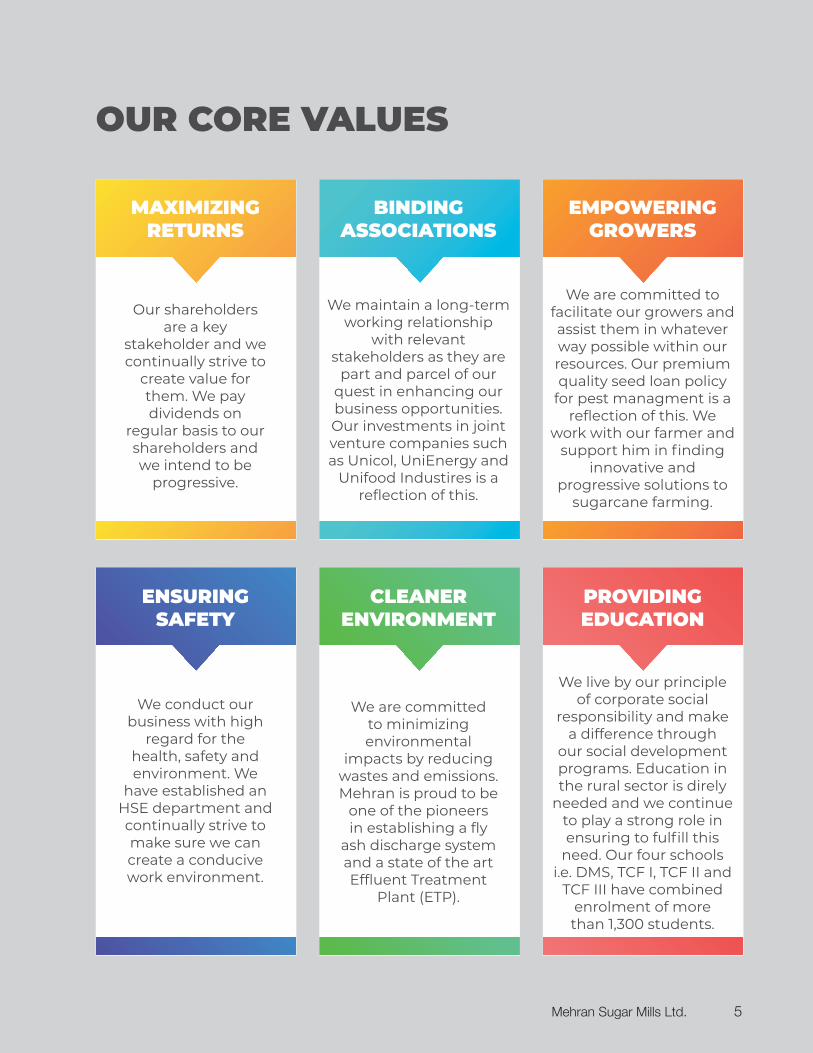
OUR CORE VALUES
MAXIMIZING RETURNS
ENSURING SAFETY
BINDING ASSOCIATIONS
CLEANER ENVIRONMENT
EMPOWERING GROWERS
PROVIDING EDUCATION
Our shareholders are a key
stakeholder and we continually strive to
create value forthem. We pay dividends on
regular basis to our shareholders and we intend to be
progressive.
We conduct our business with high
regard for the health, safety and environment. We
have established an HSE department and continually strive to make sure we can create a conducive work environment.
We maintain a long-term working relationship
with relevant stakeholders as they are
part and parcel of our quest in enhancing our business opportunities. Our investments in joint venture companies such as Unicol, UniEnergy and
Unifood Industires is areflection of this.
We are committed to minimizing environmental
impacts by reducing wastes and emissions. Mehran is proud to be
one of the pioneers in establishing a fly
ash discharge system and a state of the art Effluent Treatment
Plant (ETP).
We are committed to facilitate our growers and assist them in whatever way possible within our resources. Our premium quality seed loan policy
for pest managment is areflection of this. We
work with our farmer and support him in finding
innovative andprogressive solutions to
sugarcane farming.
We live by our principle of corporate social
responsibility and make a difference through
our social development programs. Education in the rural sector is direly
needed and we continue to play a strong role in ensuring to fulfill this
need. Our four schools i.e. DMS, TCF I, TCF II and
TCF III have combined enrolment of more than 1,300 students.
Mehran Sugar Mills Ltd. 5
OUTCOMESTRONGDespite the fact that sugar cane production in Sindh recorded a significant drop our robust sucrose recovery enabled us to attain positive margins and produce a volume of sugar which allowed decent overhead absorption.
Promising prices of by-products and sugar export under FTA with China are the other developments which affected the financial results positively.
Unicol limited contributed sizeably to our bottom line and its regular dividends improved our liquidity position.

Our Mission remains to ensure we can provide sustainable results and consistent growth to our shareholder. Our objective is to achieve this by utilising sugar and it’s by products to add value and grow our business.
Basic Purpose: The basic purpose of our Enterprise is to perpetuate as a Public Limited Company engaged in manufacturing and marketing white refined cane sugar and brown sugar while utilising its sugar byproducts such as molasses and Baggasse to produce ethanol and power respectively. To ensure sustainability we also look to make long term investments in industries which we feel add value to our shareholder and to the country.
VISION
MISSION
We remain focused on being one of Pakistan’s leading and largest sugar producers. A modern sugar mill must utilise its raw materials efficiently to produce sugar, ethanol and power at the most competitive pricing. Our vision remains to be the most economical producer of sugar by utilising these raw materials effectively.

PASSIONSTRONGWe are passionately moving towards our goal to become a “Modern Sugar Company” having our income streams diversified in sugar production, solar/Baggasse based power, ethanol and value add of sugar through investment in a FMCG business. Although, we are facing hindrances in our planned energy projects we continue to invest aggressively in energy efficiency with the objective to save as much Baggasse as possible.
Our newly incorporated FMCG project, UniFoods under the brand Good Goodies has started creating a mass market brand with a nationwide distribution network. Revenue & volumes are growing resultantly with sales expected to cross Rs. 1.0 Billion this year. As the company will add products to its portfolio it shall eventually be able to achieve a net profit.

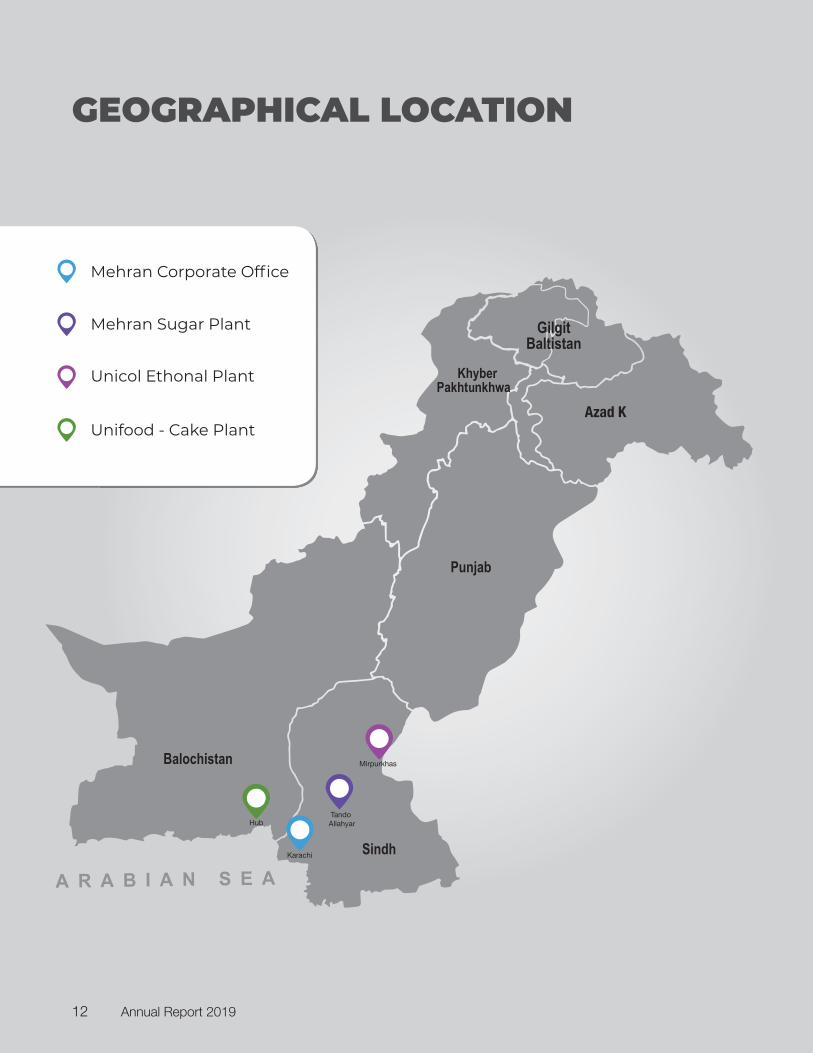
GEOGRAPHICAL LOCATION
Hub
Unifood - Cake Plant
Unicol Ethonal Plant
Mehran Sugar Plant
Mehran Corporate Office
Annual Report 201912
Mehran Sugar Mills Ltd. 13


With a steady and persistent improvement our Retail brand “Sugarie” has gained a strong
penetration in the niche segment of Brown sugar. Now “Sugarie” is available readily in 10 prominent
cities of Pakistan. The retail brand showed its resilience by achieving continual strong growth
in both volume and revenue figures in the reported financial period.
RESILIENCESTRONG
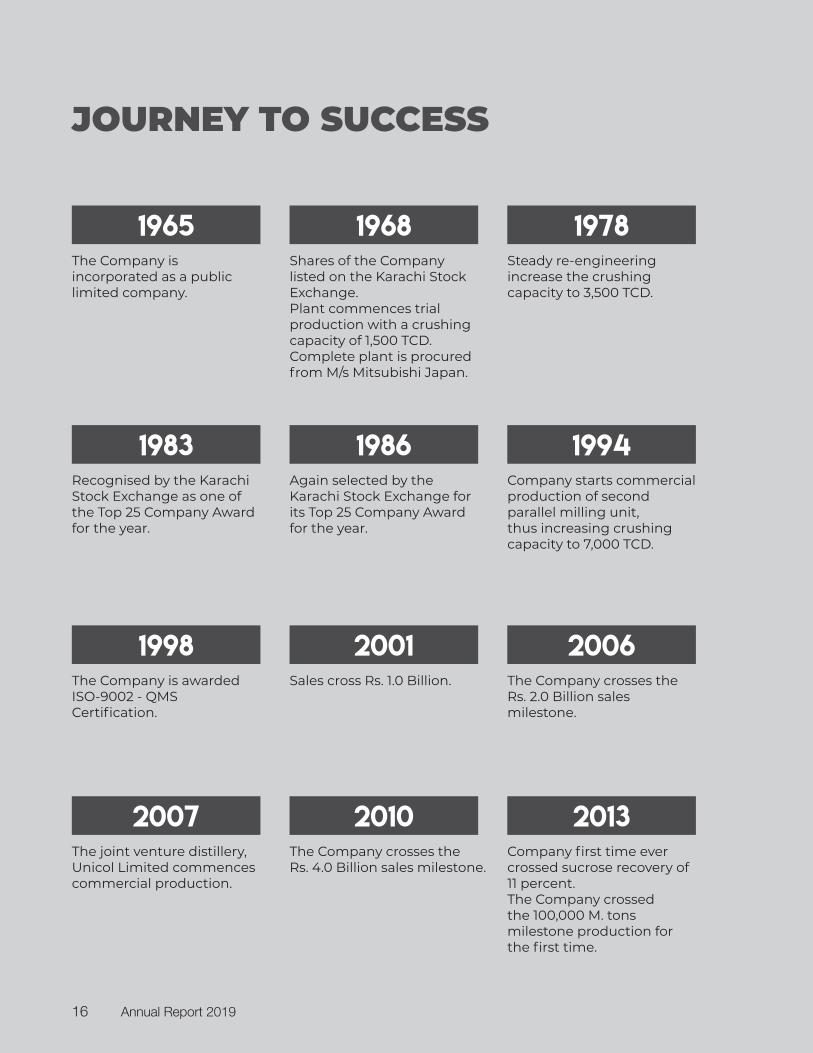
The Company is incorporated as a public limited company.
1965Shares of the Company listed on the Karachi Stock Exchange.Plant commences trial production with a crushing capacity of 1,500 TCD. Complete plant is procured from M/s Mitsubishi Japan.
1968Steady re-engineering increase the crushing capacity to 3,500 TCD.
1978
The joint venture distillery, Unicol Limited commences commercial production.
2007The Company crosses the Rs. 4.0 Billion sales milestone.
2010Company first time ever crossed sucrose recovery of 11 percent.The Company crossed the 100,000 M. tons milestone production for the first time.
2013
Recognised by the Karachi Stock Exchange as one of the Top 25 Company Award for the year.
1983Again selected by the Karachi Stock Exchange for its Top 25 Company Award for the year.
1986Company starts commercial production of second parallel milling unit, thus increasing crushing capacity to 7,000 TCD.
1994
The Company is awarded ISO-9002 - QMS Certification.
1998Sales cross Rs. 1.0 Billion.
2001The Company crosses the Rs. 2.0 Billion sales milestone.
2006
JOURNEY TO SUCCESS
Annual Report 201916
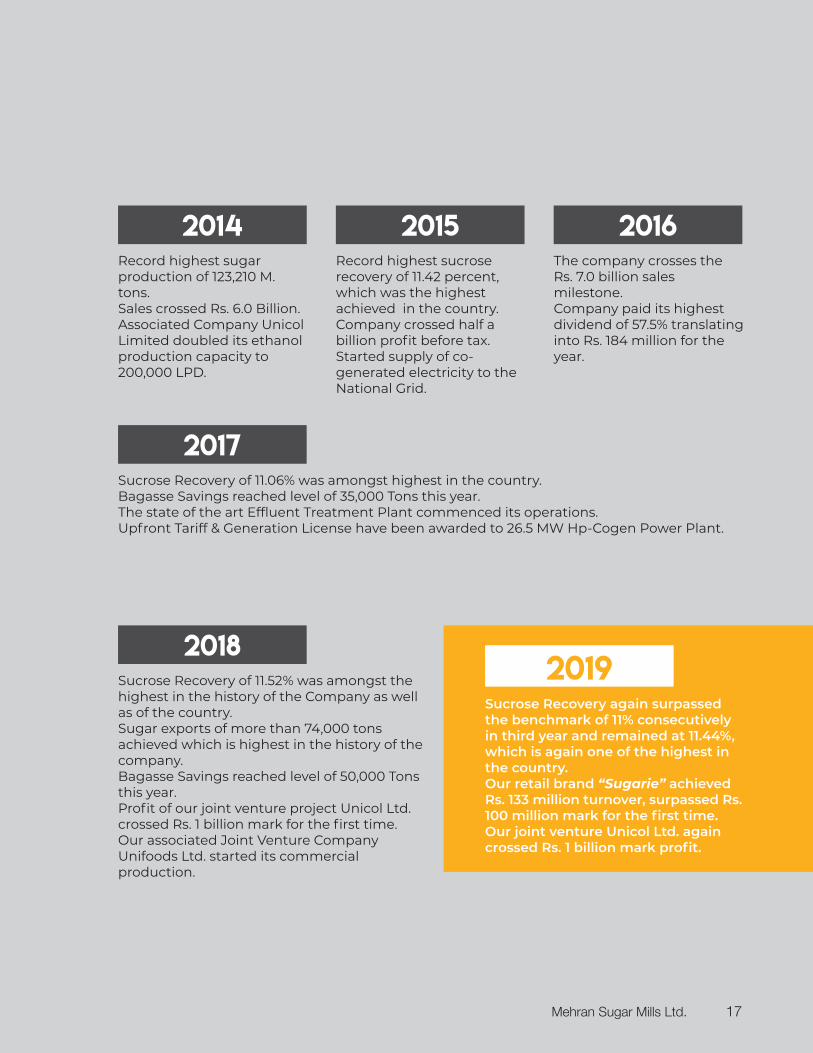
Sucrose Recovery of 11.52% was amongst the highest in the history of the Company as well as of the country. Sugar exports of more than 74,000 tons achieved which is highest in the history of the company.Bagasse Savings reached level of 50,000 Tons this year.Profit of our joint venture project Unicol Ltd. crossed Rs. 1 billion mark for the first time.Our associated Joint Venture Company Unifoods Ltd. started its commercial production.
2018
Sucrose Recovery again surpassed the benchmark of 11% consecutively in third year and remained at 11.44%, which is again one of the highest in the country.Our retail brand “Sugarie” achieved Rs. 133 million turnover, surpassed Rs. 100 million mark for the first time.Our joint venture Unicol Ltd. again crossed Rs. 1 billion mark profit.
2019
Sucrose Recovery of 11.06% was amongst highest in the country.Bagasse Savings reached level of 35,000 Tons this year.The state of the art Effluent Treatment Plant commenced its operations.Upfront Tariff & Generation License have been awarded to 26.5 MW Hp-Cogen Power Plant.
2017
Record highest sugar production of 123,210 M. tons.Sales crossed Rs. 6.0 Billion.Associated Company Unicol Limited doubled its ethanol production capacity to 200,000 LPD.
2014Record highest sucrose recovery of 11.42 percent, which was the highest achieved in the country.Company crossed half a billion profit before tax.Started supply of co-generated electricity to the National Grid.
2015The company crosses the Rs. 7.0 billion sales milestone.Company paid its highest dividend of 57.5% translating into Rs. 184 million for the year.
2016
Mehran Sugar Mills Ltd. 17
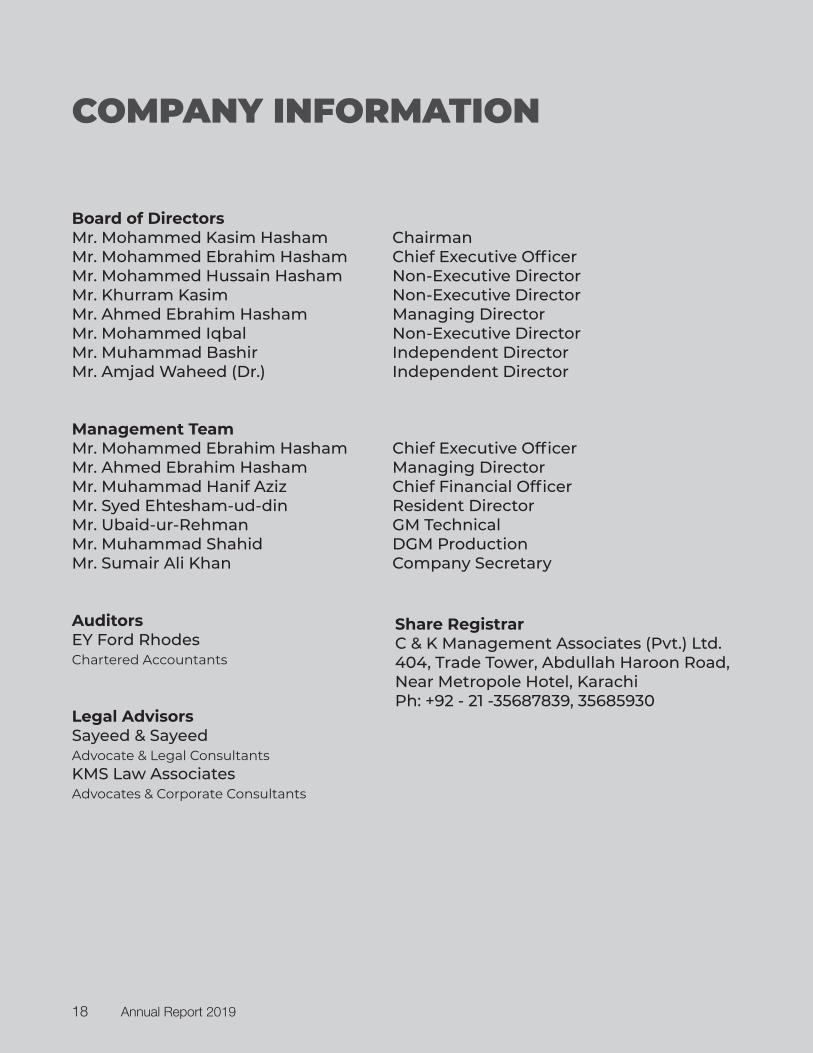
COMPANY INFORMATION
Board of DirectorsMr. Mohammed Kasim Hasham ChairmanMr. Mohammed Ebrahim Hasham Chief Executive OfficerMr. Mohammed Hussain Hasham Non-Executive Director Mr. Khurram Kasim Non-Executive DirectorMr. Ahmed Ebrahim Hasham Managing DirectorMr. Mohammed Iqbal Non-Executive DirectorMr. Muhammad Bashir Independent DirectorMr. Amjad Waheed (Dr.) Independent Director
Management TeamMr. Mohammed Ebrahim Hasham Chief Executive OfficerMr. Ahmed Ebrahim Hasham Managing DirectorMr. Muhammad Hanif Aziz Chief Financial OfficerMr. Syed Ehtesham-ud-din Resident DirectorMr. Ubaid-ur-Rehman GM TechnicalMr. Muhammad Shahid DGM ProductionMr. Sumair Ali Khan Company Secretary
AuditorsEY Ford RhodesChartered Accountants
Legal AdvisorsSayeed & SayeedAdvocate & Legal ConsultantsKMS Law AssociatesAdvocates & Corporate Consultants
Share RegistrarC & K Management Associates (Pvt.) Ltd.404, Trade Tower, Abdullah Haroon Road,Near Metropole Hotel, KarachiPh: +92 - 21 -35687839, 35685930
Annual Report 201918
Board Management Committees Audit CommitteeMr. Amjad Waheed ChairmanMr. Mohammed Hussain Hasham MemberMr. Khurram Kasim MemberMr. Muhammad Iqbal MemberMr. Muhammad Yasir Secretary
Executive CommitteeMr. Muhammad Ebrahim Hasham ChairmanMr. Ahmed Ebrahim Hasham MemberMr. Muhammad Hanif Aziz MemberMr. Ehtesham-ud-din Member
Human Resource & remuneration CommitteeMr. Mohammad Kasim Hasham ChairmanMr. Mohammed Ebrahim Hasham MemberMr. Khurram Kasim MemberMr. Muhammad Hanif Aziz Member
BankersAllied Bank LimitedAskari Bank LimitedBank Al Habib LimitedBank Alfalah LimitedBankIslami Pakistan LimitedHabib Metropolitan Bank LimitedMCB Bank LimitedMeezan Bank LimitedStandard Chartered Bank Limited
Registered OfficeExecutive Tower, Dolmen City,14th Floor, Block-4, Marine Drive, Clifton,Karachi-75600Tel: (92 21) 35297814-17Fax: (92 21) 35297818, [email protected]
MillsTando Adam Road, Distt. Tando Allahyar.Tel: (022) 3414501, 3414502, 3414503Fax: (022) 3414504
Mehran Sugar Mills Ltd. 19
SWOT ANALYSIS
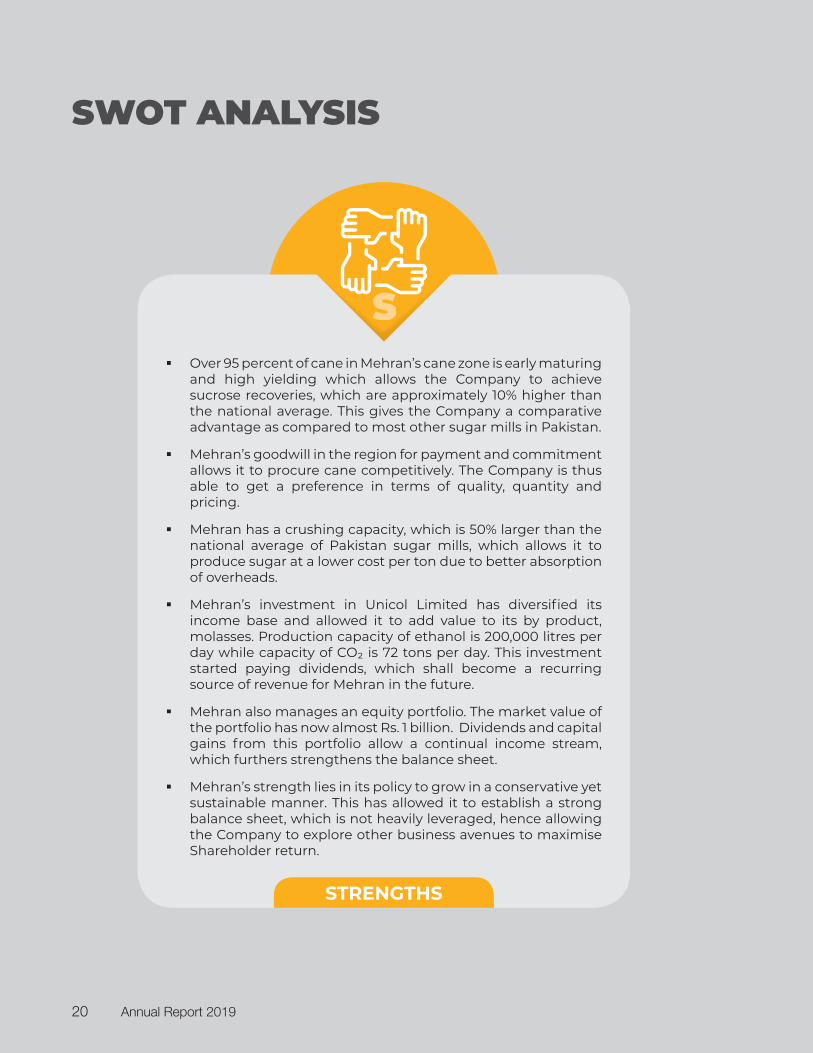
STRENGTHS
Over 95 percent of cane in Mehran’s cane zone is early maturing and high yielding which allows the Company to achieve sucrose recoveries, which are approximately 10% higher than the national average. This gives the Company a comparative advantage as compared to most other sugar mills in Pakistan.
Mehran’s goodwill in the region for payment and commitment allows it to procure cane competitively. The Company is thus able to get a preference in terms of quality, quantity and pricing.
Mehran has a crushing capacity, which is 50% larger than the national average of Pakistan sugar mills, which allows it to produce sugar at a lower cost per ton due to better absorption of overheads.
Mehran’s investment in Unicol Limited has diversified its income base and allowed it to add value to its by product, molasses. Production capacity of ethanol is 200,000 litres per day while capacity of CO₂ is 72 tons per day. This investment started paying dividends, which shall become a recurring source of revenue for Mehran in the future.
Mehran also manages an equity portfolio. The market value of the portfolio has now almost Rs. 1 billion. Dividends and capital gains from this portfolio allow a continual income stream, which furthers strengthens the balance sheet.
Mehran’s strength lies in its policy to grow in a conservative yet sustainable manner. This has allowed it to establish a strong balance sheet, which is not heavily leveraged, hence allowing the Company to explore other business avenues to maximise Shareholder return.
SS
Annual Report 201920
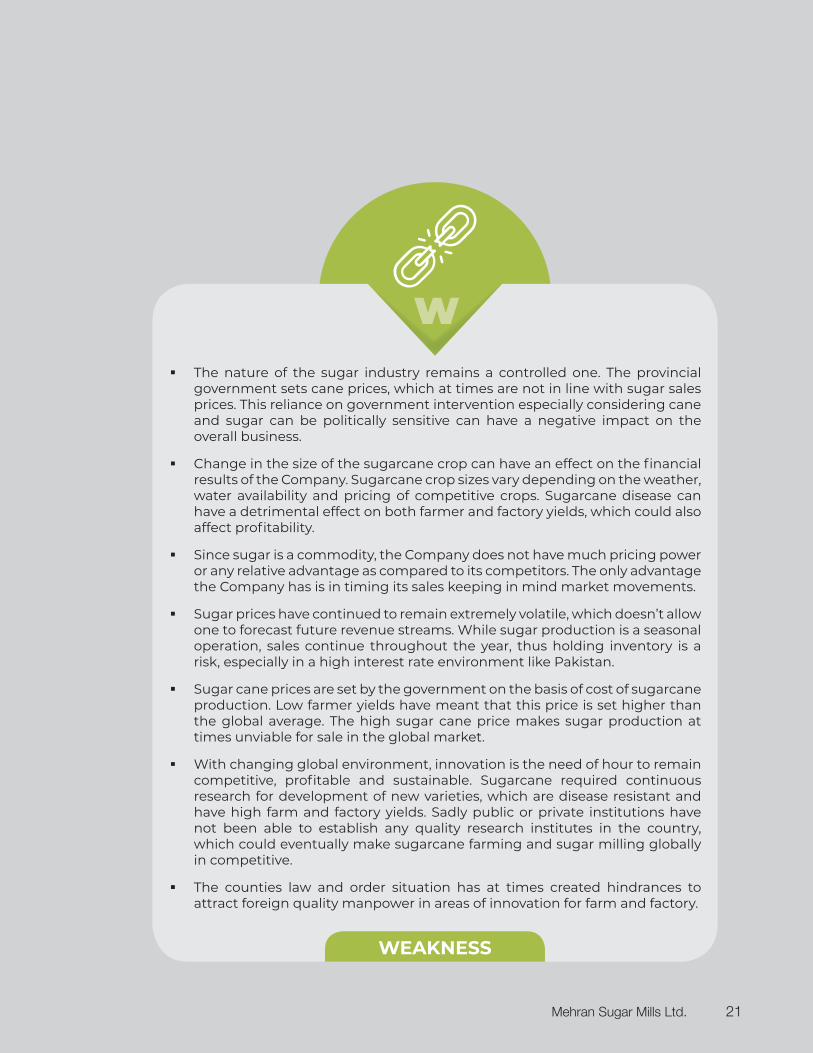
WEAKNESS
The nature of the sugar industry remains a controlled one. The provincial government sets cane prices, which at times are not in line with sugar sales prices. This reliance on government intervention especially considering cane and sugar can be politically sensitive can have a negative impact on the overall business.
Change in the size of the sugarcane crop can have an effect on the financial results of the Company. Sugarcane crop sizes vary depending on the weather, water availability and pricing of competitive crops. Sugarcane disease can have a detrimental effect on both farmer and factory yields, which could also affect profitability.
Since sugar is a commodity, the Company does not have much pricing power or any relative advantage as compared to its competitors. The only advantage the Company has is in timing its sales keeping in mind market movements.
Sugar prices have continued to remain extremely volatile, which doesn’t allow one to forecast future revenue streams. While sugar production is a seasonal operation, sales continue throughout the year, thus holding inventory is a risk, especially in a high interest rate environment like Pakistan.
Sugar cane prices are set by the government on the basis of cost of sugarcane production. Low farmer yields have meant that this price is set higher than the global average. The high sugar cane price makes sugar production at times unviable for sale in the global market.
With changing global environment, innovation is the need of hour to remain competitive, profitable and sustainable. Sugarcane required continuous research for development of new varieties, which are disease resistant and have high farm and factory yields. Sadly public or private institutions have not been able to establish any quality research institutes in the country, which could eventually make sugarcane farming and sugar milling globally in competitive.
The counties law and order situation has at times created hindrances to attract foreign quality manpower in areas of innovation for farm and factory.
W
Mehran Sugar Mills Ltd. 21
SWOT ANALYSIS
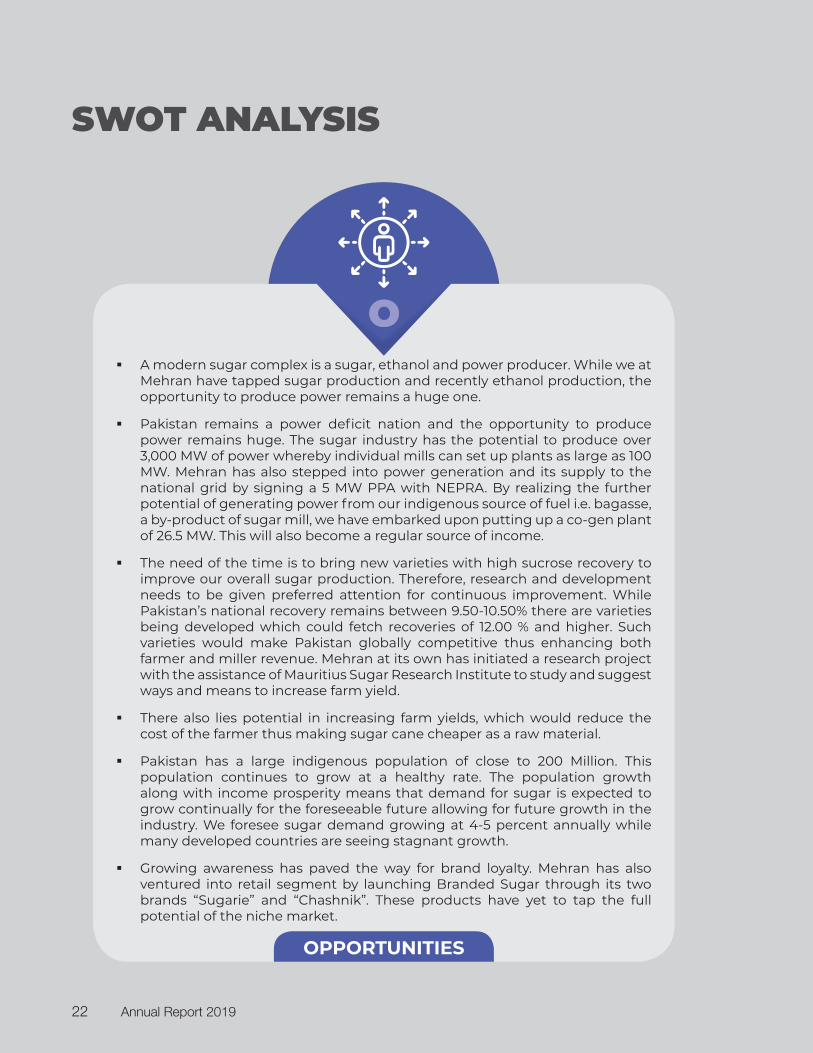
OPPORTUNITIES
A modern sugar complex is a sugar, ethanol and power producer. While we at Mehran have tapped sugar production and recently ethanol production, the opportunity to produce power remains a huge one.
Pakistan remains a power deficit nation and the opportunity to produce power remains huge. The sugar industry has the potential to produce over 3,000 MW of power whereby individual mills can set up plants as large as 100 MW. Mehran has also stepped into power generation and its supply to the national grid by signing a 5 MW PPA with NEPRA. By realizing the further potential of generating power from our indigenous source of fuel i.e. bagasse, a by-product of sugar mill, we have embarked upon putting up a co-gen plant of 26.5 MW. This will also become a regular source of income.
The need of the time is to bring new varieties with high sucrose recovery to improve our overall sugar production. Therefore, research and development needs to be given preferred attention for continuous improvement. While Pakistan’s national recovery remains between 9.50-10.50% there are varieties being developed which could fetch recoveries of 12.00 % and higher. Such varieties would make Pakistan globally competitive thus enhancing both farmer and miller revenue. Mehran at its own has initiated a research project with the assistance of Mauritius Sugar Research Institute to study and suggest ways and means to increase farm yield.
There also lies potential in increasing farm yields, which would reduce the cost of the farmer thus making sugar cane cheaper as a raw material.
Pakistan has a large indigenous population of close to 200 Million. This population continues to grow at a healthy rate. The population growth along with income prosperity means that demand for sugar is expected to grow continually for the foreseeable future allowing for future growth in the industry. We foresee sugar demand growing at 4-5 percent annually while many developed countries are seeing stagnant growth.
Growing awareness has paved the way for brand loyalty. Mehran has also ventured into retail segment by launching Branded Sugar through its two brands “Sugarie” and “Chashnik”. These products have yet to tap the full potential of the niche market.
O
Annual Report 201922
THREATS
Mehran has one of the most densely populated cane zones in Pakistan. The quantity of cane in the area allows the company to pay minimal transport costs for cane arrivals which gives it a comparative advantage, though frequent intervention by other sugar mills has somewhat dilated this advantage.
Sugar mills are typically located in rural areas, which are more susceptible to Law and Order situation. The movement of our cane team as well as farming team in specific areas can also be difficult and restricted.
Inflation affects the business due to cost increases. It also reduces the consumer buying power. Pakistan has been suffering from inflation since last few years. In order to curb inflation, State Bank of Pakistan regularly intervenes and revises interest rates, which affect the cost of doing business. A sudden surge in borrowing rates could adversely effect the Company’s financials, though at present the rate has been declining. With increasing inflation, Sugar Mills have to produce specific quantity, which allows them to get benefit of economies of scale. It requires huge investment for expanding the capacity as well as robust maintenance activity, which may not be possible for every mill due to variety of factors. Hence, their competitiveness is affected.
Proper maintenance during the off-season enables the plant to run smoothly during the season. Since the season is for a limited duration, a major breakdown could affect financial results for the entire year.
In the last two decades, the industry has consistently increased its sugarcane crushing capacities without objectively ensuring an increase in the size of crop. A major challenge going ahead is to ensure increased sugarcane cultivation to match crushing capacity. This requires not only availability of sufficient water but also motivation to growers towards sugarcane crop.
Sugar cane requires abundant quantity of water for cultivation. Pakistan with its growing population can in the future face such water constrains which could mitigate the growth of sugarcane and the industry.
T
Mehran Sugar Mills Ltd. 23
CODE OF CONDUCT & ETHICAL VALUESThe Company’s reputation and its actions as a legal entity depend on the conduct of its employees. Each employee must commit to act according to the highest ethical standards and to know and abide by applicable laws. We each must assure that our personal conduct is beyond doubt and complies with the highest standards of conduct and business ethics.
These principles highlight our responsibility to:
promote ethical business practices
respect the environment and communities in which we operate
assure equal employment opportunities
value dive rsity in the workplace
provide healthy and safe working environment
respect human rights and trade ethically
CONFIDENTIALITY
Confidential business information must not be shared with others outside the company or used for the personal gain of oneself or others. Employees, their family and close acquaintances should not buy or sell company shares if they have material information that has not been made public and could affect our share price.
We expect employees to keep all information confidential. This might include plans to buy or sell business, product formulation, manufacturing processes, advertising, marketing plans, concepts, research and development, suppliers, customers, financial information, personnel and employment matters, and other information which is not generally known to the public. We will make sure that they are aware of their obligations and also expect them to take steps to prevent unintentional disclosure. These obligations apply to all Employees, including those who leave the company.
Annual Report 201924
HEALTH AND SAFETY
We recognize the importance of health and safety within our business. We seek to provide a healthy, safe and clean working environment in line with local laws, regulations and industrial practice. We measure, appraise and report performance, as part of our commitment to the health and safety of our employees, contractors and everyone who works on or visits our sites.
THE ENVIRONMENT
We recognize our environmental responsibilities and our contribution to sustainable development. Our environment policy and its management processes deal not only with the environmental issues connected to our manufacturing processes and facilities, but also with Protecting the ecosystems from which we derive our raw materials, management of our supply chain, and distributing, selling and consumption of our products.
WORK ATMOSPHERE
MSML respects and highly values its diverse employee population. Accordingly, the company has an unwavering ethical commitment toward promoting a workplace that is respectful of personal differences and free of discrimination and harassment. This principle applies in our hiring and interviewing process as well as all aspects of our work environment.
Mehran Sugar Mills Ltd. 25
BUSINESS STRATEGY & GOALSMehran Sugar Mills Limited is a progressive and diversified sugarcane milling company with an objective to achieve growth through maximum capacity utilization, economies of scale and cost rationalization, without compromising the premium quality of products produced. We invest in our production facility and latest technologies on a systematic basis to achieve maximum productivity. Our ultimate goal is to ensure maximum returns to the shareholders within our resources.
Annual Report 201926
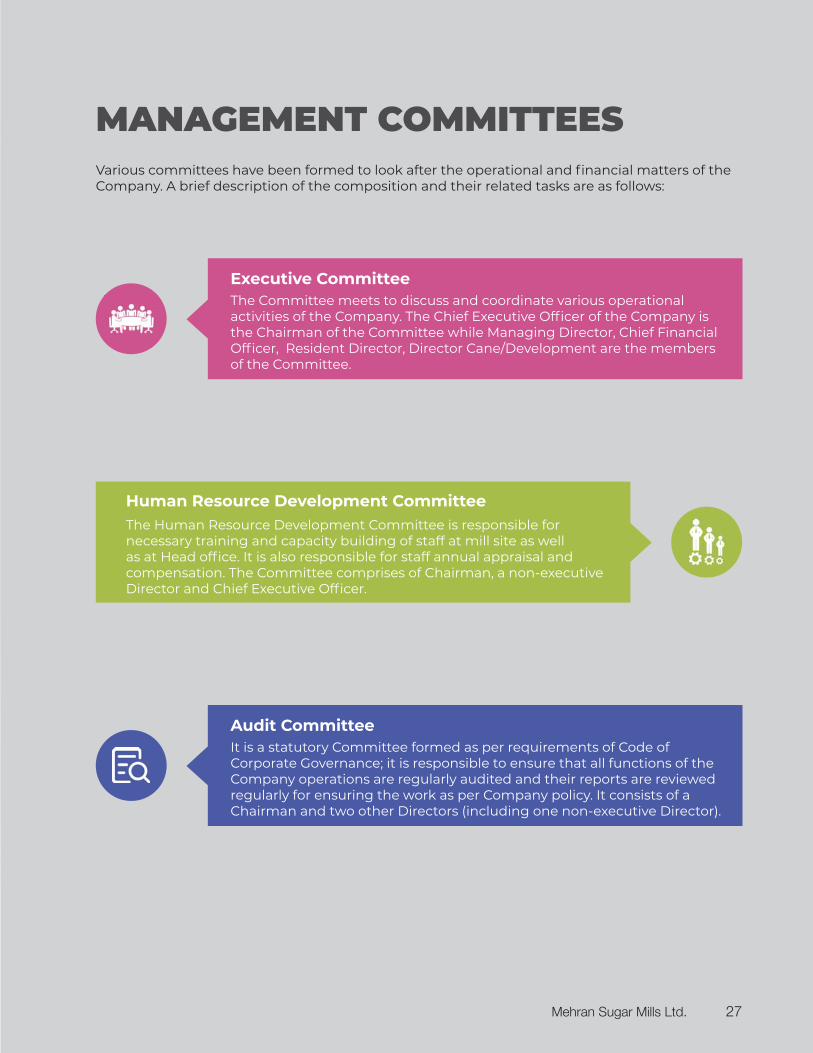
MANAGEMENT COMMITTEESVarious committees have been formed to look after the operational and financial matters of the Company. A brief description of the composition and their related tasks are as follows:
Executive CommitteeThe Committee meets to discuss and coordinate various operational activities of the Company. The Chief Executive Officer of the Company is the Chairman of the Committee while Managing Director, Chief Financial Officer, Resident Director, Director Cane/Development are the members of the Committee.
Audit CommitteeIt is a statutory Committee formed as per requirements of Code of Corporate Governance; it is responsible to ensure that all functions of the Company operations are regularly audited and their reports are reviewed regularly for ensuring the work as per Company policy. It consists of a Chairman and two other Directors (including one non-executive Director).
The Human Resource Development Committee is responsible for necessary training and capacity building of staff at mill site as well as at Head office. It is also responsible for staff annual appraisal and compensation. The Committee comprises of Chairman, a non-executive Director and Chief Executive Officer.
Human Resource Development Committee
Mehran Sugar Mills Ltd. 27

BOARD OF DIRECTORS
Muhammad Kasim Hasham Chairman
Bachelor’s Degree from Karachi University
Muhammad Hussain Hasham Director (Non-Executive)
B.A (Business)Chapman University, California, USA.
Muhammad Ebrahim Hasham Chief Executive Officer
M.A (Management) Chapman University, California, USA.
Ahmed Ebrahim Hasham Managing Director
Bachelor of Arts (Economics and IR)Tufts University, Medford MA, USA.
Annual Report 201928

Khurram Kasim Director (Non-Executive)
Bachelor of Science (Marketing) Babson College, Massachusetts, USA.
Muhammad Bashir Director (Independent)
B.Com, LLB, Chartered Accountant Institute of Chartered Accountants of Pakistan.
Dr. Amjad Waheed Director (Independent)
Ph. D (Business Administration)Southern Illinois University, USA.
Muhammad Iqbal Director (Non-Executive)
C.A – FinalistInstitute of Chartered Accountants of Pakistan.
Mehran Sugar Mills Ltd. 29
INVESTING IN MEHRAN SUGAR
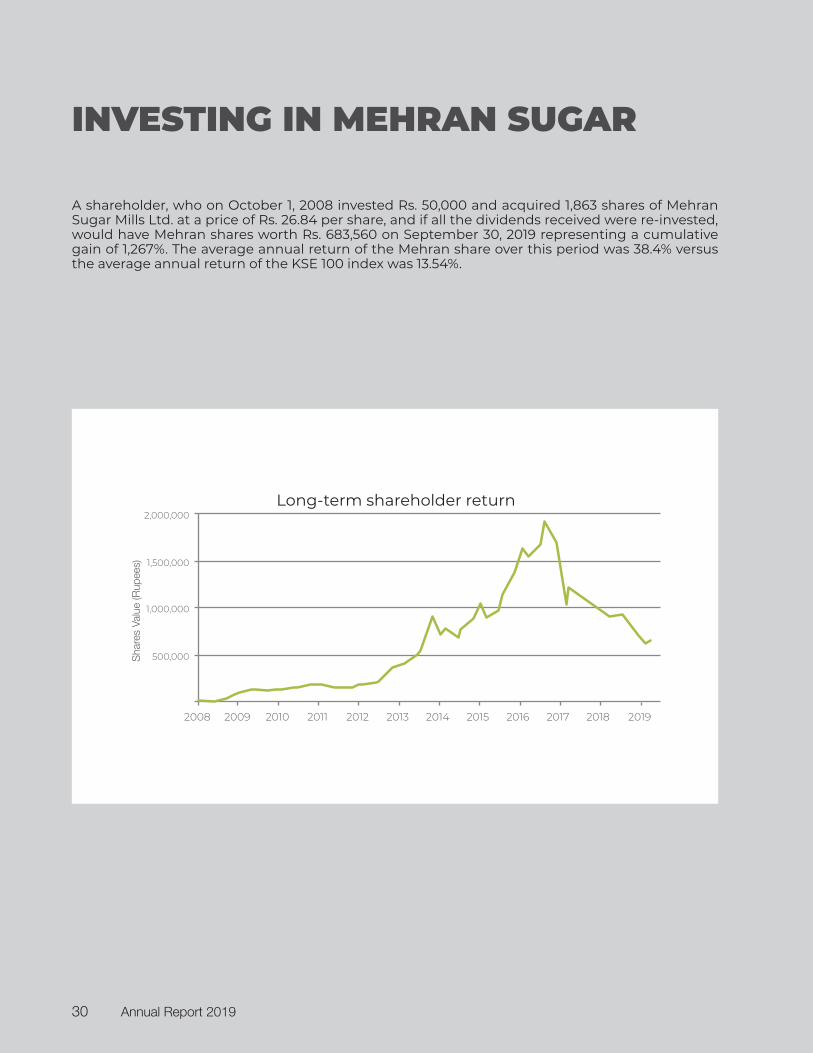
A shareholder, who on October 1, 2008 invested Rs. 50,000 and acquired 1,863 shares of Mehran Sugar Mills Ltd. at a price of Rs. 26.84 per share, and if all the dividends received were re-invested, would have Mehran shares worth Rs. 683,560 on September 30, 2019 representing a cumulative gain of 1,267%. The average annual return of the Mehran share over this period was 38.4% versus the average annual return of the KSE 100 index was 13.54%.
Long-term shareholder return
Sha
res
Valu
e (R
upee
s)
500,000
1,000,000
1,500,000
2,000,000
2008 2009 2010 2011 2012 2013 2014 2015 2016 2017 2018 2019
Annual Report 201930
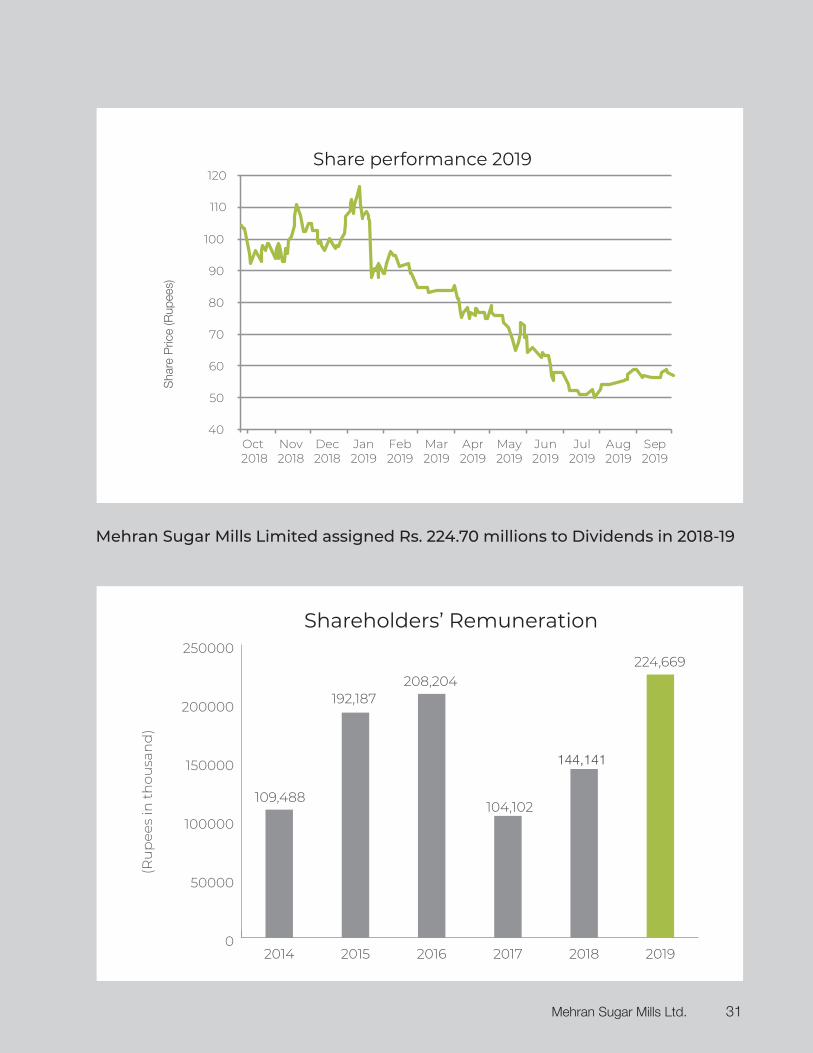
Mehran Sugar Mills Limited assigned Rs. 224.70 millions to Dividends in 2018-19
Shareholders’ Remuneration
(Ru
pee
s in
th
ousa
nd
)
109,488
192,187 208,204
104,102
144,141
224,669
0
50000
100000
150000
200000
250000
201920182017201620152014
Share performance 2019 S
hare
Pric
e (R
upee
s)
40
50
60
70
80
90
100
110
120
Oct 2018
Nov2018
Dec2018
Jan2019
Feb2019
Mar2019
Apr2019
May2019
Jun2019
Jul2019
Aug2019
Sep2019
Mehran Sugar Mills Ltd. 31
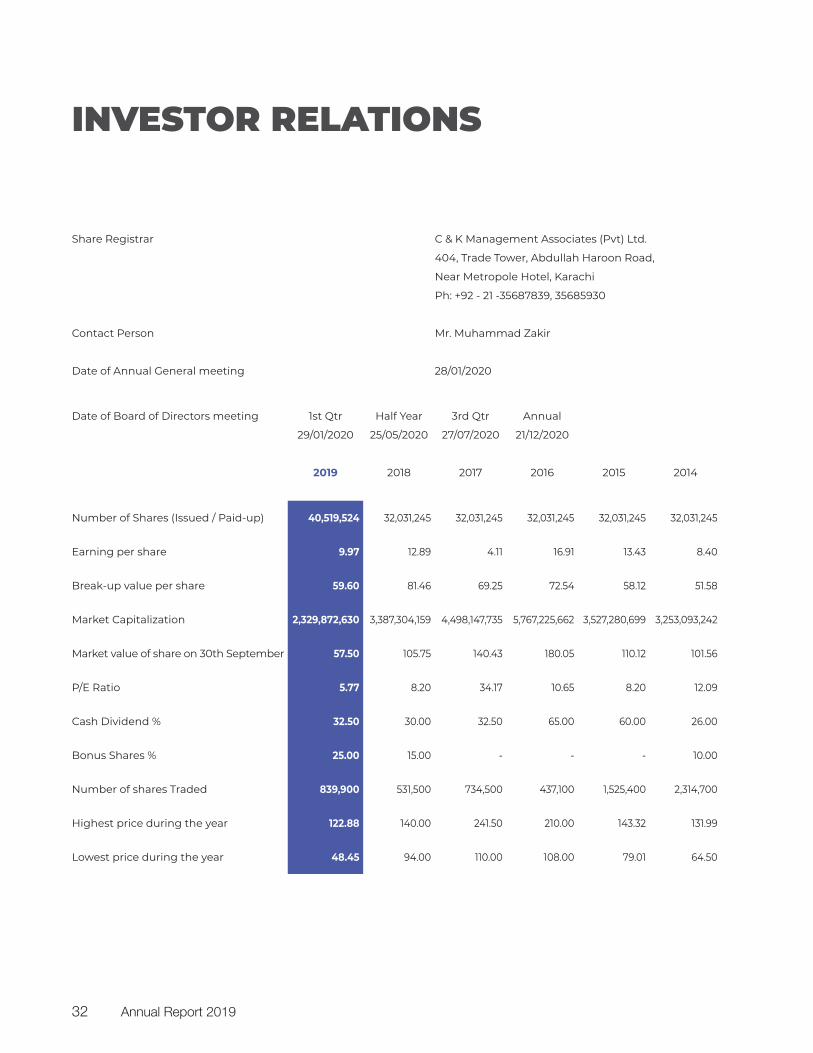
INVESTOR RELATIONS
Share Registrar C & K Management Associates (Pvt) Ltd.
404, Trade Tower, Abdullah Haroon Road,
Near Metropole Hotel, Karachi
Ph: +92 - 21 -35687839, 35685930
Contact Person Mr. Muhammad Zakir
Date of Annual General meeting 28/01/2020
Date of Board of Directors meeting 1st Qtr Half Year 3rd Qtr Annual
29/01/2020 25/05/2020 27/07/2020 21/12/2020
2019 2018 2017 2016 2015 2014
Number of Shares (Issued / Paid-up) 40,519,524 32,031,245 32,031,245 32,031,245 32,031,245 32,031,245
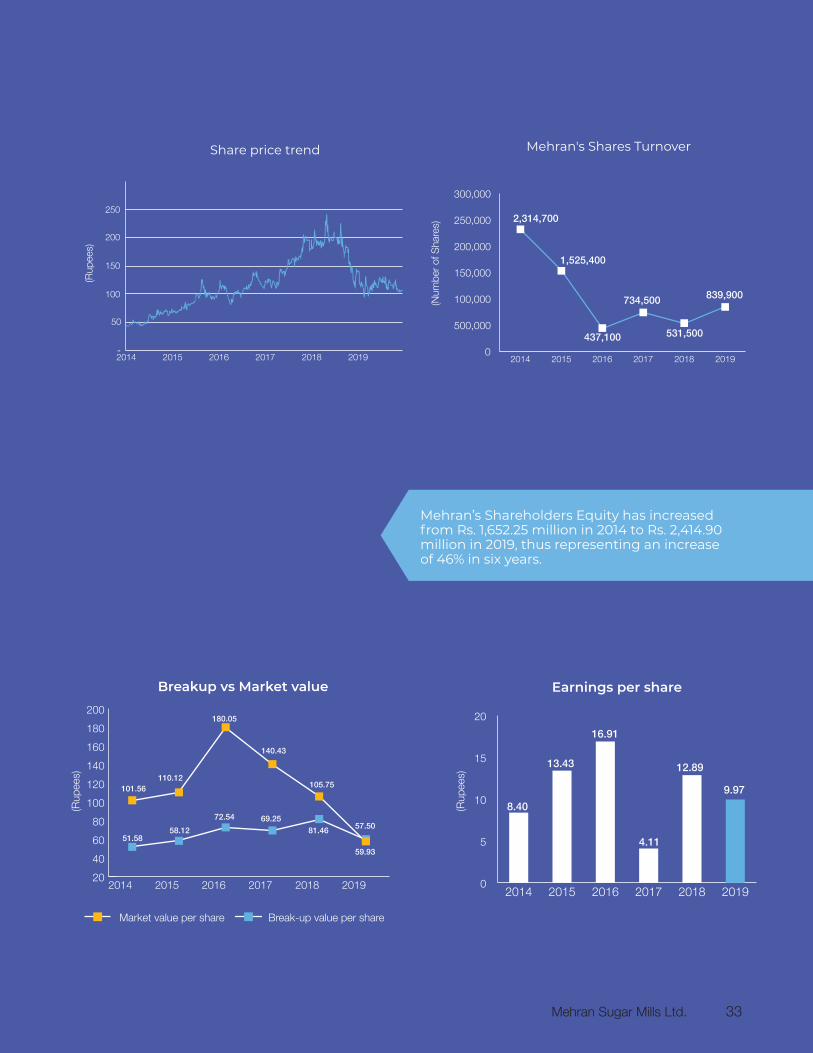
Earning per share 9.97 12.89 4.11 16.91 13.43 8.40
Break-up value per share 59.60 81.46 69.25 72.54 58.12 51.58
Market Capitalization 2,329,872,630 3,387,304,159 4,498,147,735 5,767,225,662 3,527,280,699 3,253,093,242
Market value of share on 30th September 57.50 105.75 140.43 180.05 110.12 101.56
P/E Ratio 5.77 8.20 34.17 10.65 8.20 12.09
Cash Dividend % 32.50 30.00 32.50 65.00 60.00 26.00
Bonus Shares % 25.00 15.00 - - - 10.00
Number of shares Traded 839,900 531,500 734,500 437,100 1,525,400 2,314,700
Highest price during the year 122.88 140.00 241.50 210.00 143.32 131.99
Lowest price during the year 48.45 94.00 110.00 108.00 79.01 64.50
Annual Report 201932
Share price trend
0
500,000
100,000
150,000
200,000
250,000
300,000
201920182017201620152014
Mehran's Shares Turnover
2,314,700
1,525,400
734,500 839,900
531,500437,100
(Rup
ees)
(Num
ber
of S
hare
s)
-
50
100
150
200
250
2014 2015 2016 2017 2018 2019
Breakup vs Market value
51.5858.12
72.54 69.25
81.46
101.56110.12
180.05
140.43
105.75
59.93
57.50
Market value per share Break-up value per share
Earnings per share
0
5
10
15
20
201920182017201620152014
(Rup
ees)
(Rup
ees)
9.97
8.40
13.43
16.91
4.11
12.89
20
40
60
80
100
120
140
160
180
200
201920182017201620152014
Mehran’s Shareholders Equity has increased from Rs. 1,652.25 million in 2014 to Rs. 2,414.90 million in 2019, thus representing an increase of 46% in six years.
Mehran Sugar Mills Ltd. 33
MANAGEMENT TEAM
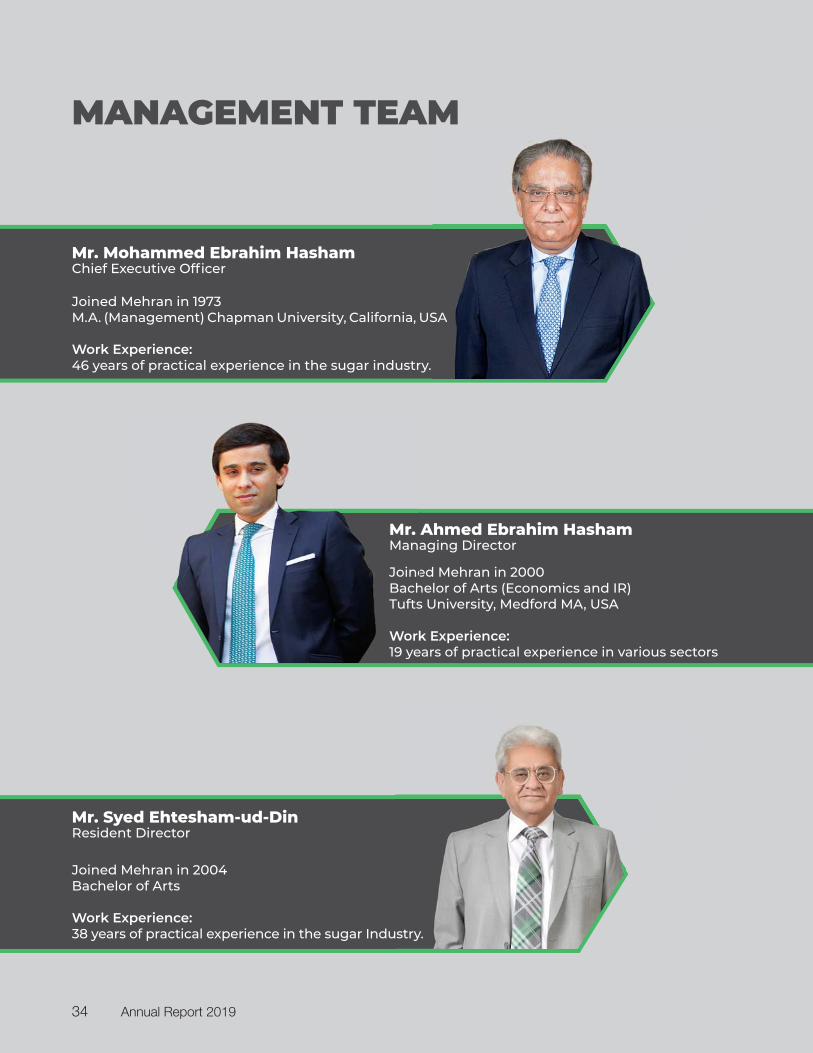
Joined Mehran in 1973M.A. (Management) Chapman University, California, USA
Work Experience:46 years of practical experience in the sugar industry.
Mr. Mohammed Ebrahim HashamChief Executive Officer
Joined Mehran in 2000Bachelor of Arts (Economics and IR) Tufts University, Medford MA, USA
Work Experience:19 years of practical experience in various sectors
Mr. Ahmed Ebrahim HashamManaging Director
Joined Mehran in 2004Bachelor of Arts
Work Experience:38 years of practical experience in the sugar Industry.
Mr. Syed Ehtesham-ud-Din Resident Director
JoineBachTufts
Work19 ye
Mr. Man
SA
Annual Report 201934

Joined Mehran in 2004FCMA - Institute of Cost & Management Accountants of PakistanFCIS - Institute of Corporate Secretaries of Pakistan
Work Experience:35 years of practical experience with multinational and national companies.
Mr. Muhammad Hanif AzizChief Financial Officer
Joined Mehran in 2012B-Tech (Hons) in Mechanical Engineering From Mehran University of Engineering - Jamshoro
Work Experience:37 years of practical experience in the sugar Industry.
Mr. Ubaid-Ur-RehmanGeneral Manager Technical
Joined Mehran in 2018Master of Science (Chemistry) From Punjab University
Work Experience:27 years of practical experience in the sugar Industry.
Mr. Muhammad ShahidDeputy General Manager Production
Joined Mehran in 2016 ACA - Institute of Chartered Accountants of PakistanAPFA - Institute of Public Finance Accountants of Pakistan
Work Experience:13 years of practical experience with national companies.
Mr. Sumair Ali KhanCompany Secretary
Mehran Sugar Mills Ltd. 35

Within the context of a broader corporate social responsibility strategy, our group started engaging in CSR activities since early 90s with a
focus in education and health sectors.
We have built and supported three schools with The Citizens Foundation (TCF - a renowned NGO) in rural vicinities of Sindh. The schools cater to nearby communities with an objective to empower rural Pakistan with eductaion. These campuses have generated employment for the local
men and women and hope to create leaders in the future.
Our continual support has helped build the state-of-the-art 100 bed “Usman Memorial Hospital”. This is a strong reflection of our CSR
commitment in the health sector. Mehran supported this flagship project and our efforts in this regard were also recognized by the
Pakistan Centre of Philanthropy which gave Mehran an award under the category of “Corporate Philanthropy and Sustainable
Development Goals in Pakistan”.
COMMITMENTSTRONG
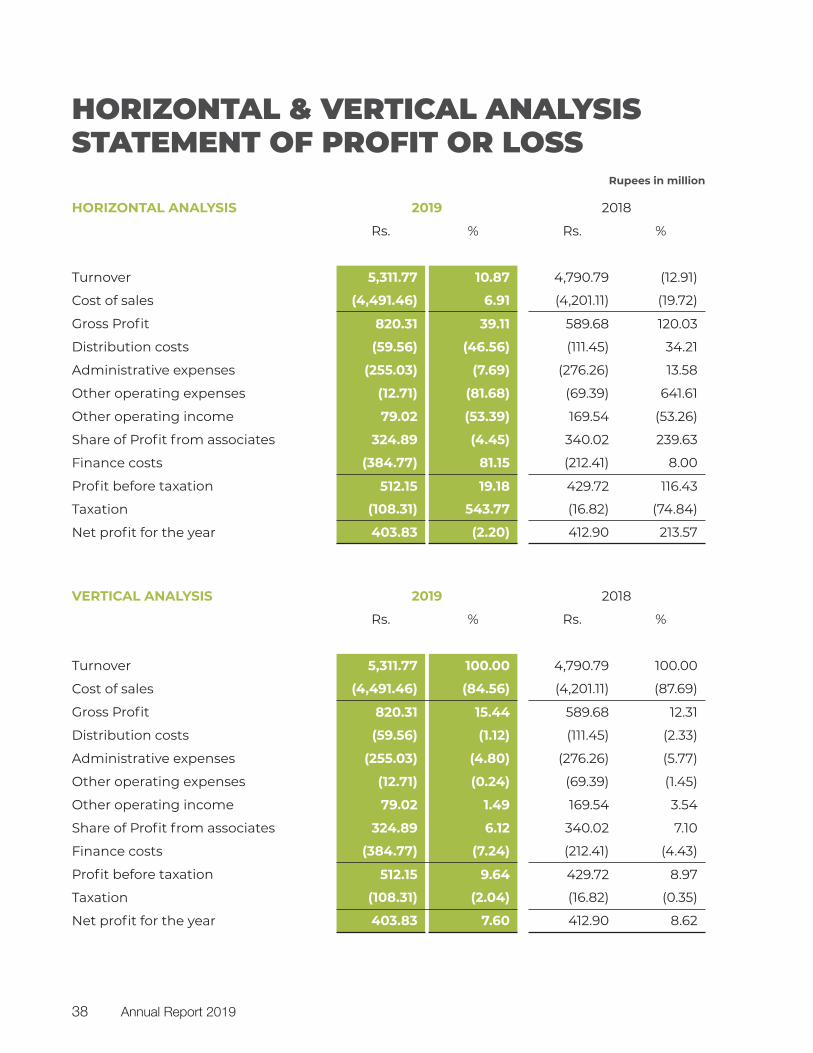
HORIZONTAL & VERTICAL ANALYSIS STATEMENT OF PROFIT OR LOSS
HORIZONTAL ANALYSIS 2019 2018
Rs. % Rs. %
Turnover 5,311.77 10.87 4,790.79 (12.91)
Cost of sales (4,491.46) 6.91 (4,201.11) (19.72)
Gross Profit 820.31 39.11 589.68 120.03
Distribution costs (59.56) (46.56) (111.45) 34.21
Administrative expenses (255.03) (7.69) (276.26) 13.58
Other operating expenses (12.71) (81.68) (69.39) 641.61
Other operating income 79.02 (53.39) 169.54 (53.26)
Share of Profit from associates 324.89 (4.45) 340.02 239.63
Finance costs (384.77) 81.15 (212.41) 8.00
Profit before taxation 512.15 19.18 429.72 116.43
Taxation (108.31) 543.77 (16.82) (74.84)
Net profit for the year 403.83 (2.20) 412.90 213.57
VERTICAL ANALYSIS 2019 2018
Rs. % Rs. %
Turnover 5,311.77 100.00 4,790.79 100.00
Cost of sales (4,491.46) (84.56) (4,201.11) (87.69)
Gross Profit 820.31 15.44 589.68 12.31
Distribution costs (59.56) (1.12) (111.45) (2.33)
Administrative expenses (255.03) (4.80) (276.26) (5.77)
Other operating expenses (12.71) (0.24) (69.39) (1.45)
Other operating income 79.02 1.49 169.54 3.54
Share of Profit from associates 324.89 6.12 340.02 7.10
Finance costs (384.77) (7.24) (212.41) (4.43)
Profit before taxation 512.15 9.64 429.72 8.97
Taxation (108.31) (2.04) (16.82) (0.35)
Net profit for the year 403.83 7.60 412.90 8.62
Rupees in million
Annual Report 201938
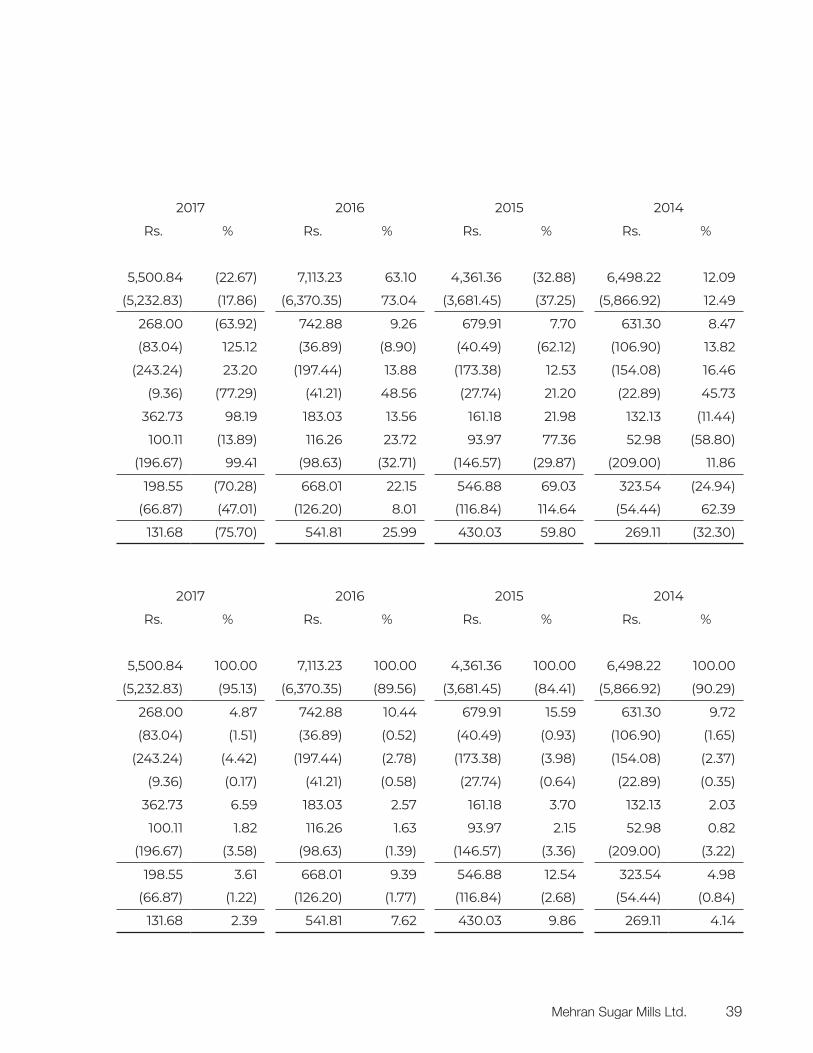
2017 2016 2015 2014
Rs. % Rs. % Rs. % Rs. %
5,500.84 (22.67) 7,113.23 63.10 4,361.36 (32.88) 6,498.22 12.09
(5,232.83) (17.86) (6,370.35) 73.04 (3,681.45) (37.25) (5,866.92) 12.49
268.00 (63.92) 742.88 9.26 679.91 7.70 631.30 8.47
(83.04) 125.12 (36.89) (8.90) (40.49) (62.12) (106.90) 13.82
(243.24) 23.20 (197.44) 13.88 (173.38) 12.53 (154.08) 16.46
(9.36) (77.29) (41.21) 48.56 (27.74) 21.20 (22.89) 45.73
362.73 98.19 183.03 13.56 161.18 21.98 132.13 (11.44)
100.11 (13.89) 116.26 23.72 93.97 77.36 52.98 (58.80)
(196.67) 99.41 (98.63) (32.71) (146.57) (29.87) (209.00) 11.86
198.55 (70.28) 668.01 22.15 546.88 69.03 323.54 (24.94)
(66.87) (47.01) (126.20) 8.01 (116.84) 114.64 (54.44) 62.39
131.68 (75.70) 541.81 25.99 430.03 59.80 269.11 (32.30)
2017 2016 2015 2014
Rs. % Rs. % Rs. % Rs. %
5,500.84 100.00 7,113.23 100.00 4,361.36 100.00 6,498.22 100.00
(5,232.83) (95.13) (6,370.35) (89.56) (3,681.45) (84.41) (5,866.92) (90.29)
268.00 4.87 742.88 10.44 679.91 15.59 631.30 9.72
(83.04) (1.51) (36.89) (0.52) (40.49) (0.93) (106.90) (1.65)
(243.24) (4.42) (197.44) (2.78) (173.38) (3.98) (154.08) (2.37)
(9.36) (0.17) (41.21) (0.58) (27.74) (0.64) (22.89) (0.35)
362.73 6.59 183.03 2.57 161.18 3.70 132.13 2.03
100.11 1.82 116.26 1.63 93.97 2.15 52.98 0.82
(196.67) (3.58) (98.63) (1.39) (146.57) (3.36) (209.00) (3.22)
198.55 3.61 668.01 9.39 546.88 12.54 323.54 4.98
(66.87) (1.22) (126.20) (1.77) (116.84) (2.68) (54.44) (0.84)
131.68 2.39 541.81 7.62 430.03 9.86 269.11 4.14
Mehran Sugar Mills Ltd. 39

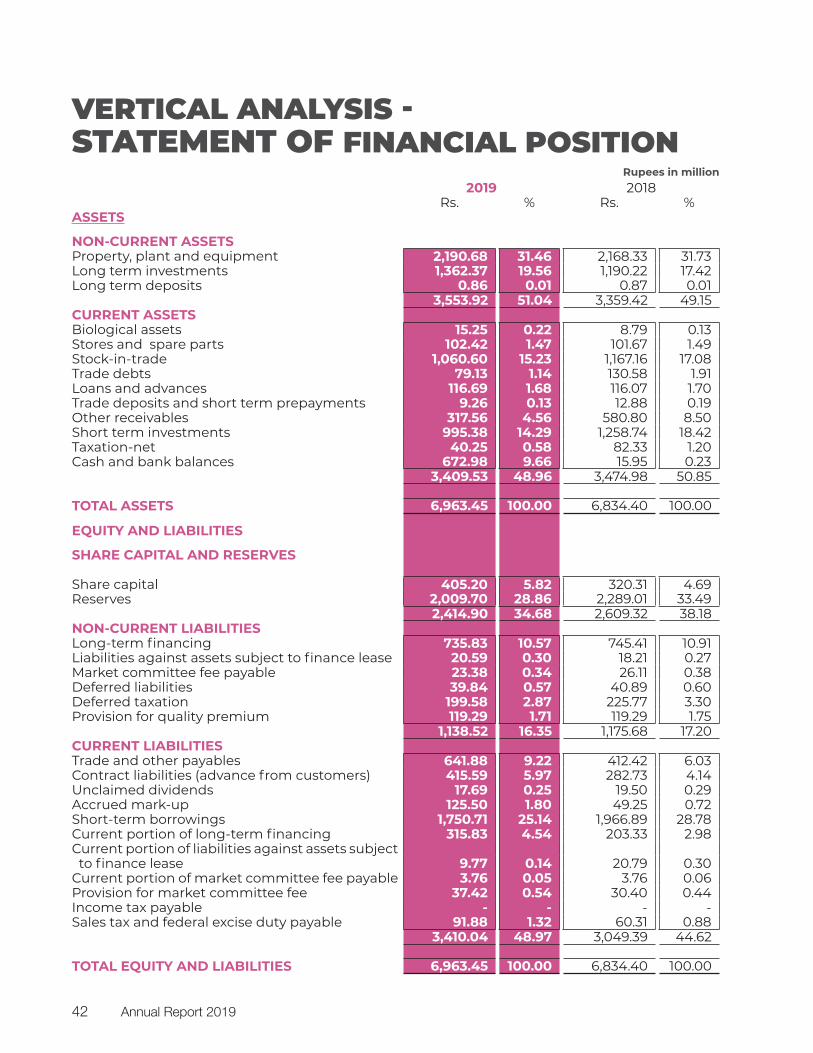
2019 2018Rs. % Rs. %
ASSETS
NON-CURRENT ASSETSProperty, plant and equipment 2,190.68 1.03 2,168.33 (0.91)Long term investments 1,362.37 14.46 1,190.22 21.74 Long term deposits 0.86 (1.15) 0.87 (21.63)
3,553.92 5.79 3,359.42 6.08 CURRENT ASSETSBiological assets 15.25 73.52 8.79 (50.26)Stores and spare parts 102.42 0.74 101.67 21.21 Stock-in-trade 1,060.60 (9.13) 1,167.16 (3.18)Trade debts 79.13 (39.40) 130.58 (25.17)Loans and advances 116.69 0.54 116.07 (21.76)Trade deposits and short term prepayments 9.26 (28.12) 12.88 66.13 Other receivables 317.56 (45.32) 580.80 12,824.15 Short term investments 995.38 (20.92) 1,258.74 51.60 Taxation-net 40.25 (51.11) 82.33 50.75 Cash and bank balances 672.98 4,118.22 15.95 (44.53)
3,409.53 (1.88) 3,474.98 35.96
TOTAL ASSETS 6,963.45 1.89 6,834.40 19.43
EQUITY AND LIABILITIES
SHARE CAPITAL AND RESERVES
Share capital 405.20 26.50 320.31 - Reserves 2,009.70 (12.20) 2,289.01 20.60
2,414.90 (7.45) 2,609.32 17.63 NON-CURRENT LIABILITIESLong-term financing 735.83 (1.29) 745.41 66.11 Liabilities against assets subject to finance lease 20.59 13.10 18.21 (42.54)Market committee fee payable 23.38 (10.45) 26.11 (60.42)Deferred liabilities 39.84 (2.57) 40.89 738.20Deferred taxation 199.58 (11.60) 225.77 (21.67)Provision for quality premium 119.29 - 119.29 -
1,138.52 (3.16) 1,175.68 22.62 CURRENT LIABILITIESTrade and other payables 641.88 55.64 412.42 (7.34)Contract liabilities (advance from customers) 415.59 46.99 282.73 (53.50)Unclaimed dividends 17.69 (9.28) 19.50 (45.48)Accrued mark-up 125.50 154.80 49.25 52.37 Short-term borrowings 1,750.71 (10.99) 1,966.89 76.08 Current portion of long-term financing 315.83 55.33 203.33 30.32 Current portion of liabilities against assets subject to finance lease 9.77 (52.99) 20.79 (14.91)Current portion of market committee fee payable 3.76 - 3.76 - Provision for market committee fee 37.42 23.10 30.40 52.25 Income tax payable - - - - Sales tax and federal excise duty payable 91.88 52.36 60.31 (41.57)
3,410.04 11.83 3,049.39 19.79
TOTAL EQUITY AND LIABILITIES 6,963.45 1.89 6,834.40 19.43
HORIZONTAL ANALYSIS - STATEMENT OF FINANCIAL POSITION
Rupees in million
Annual Report 201940
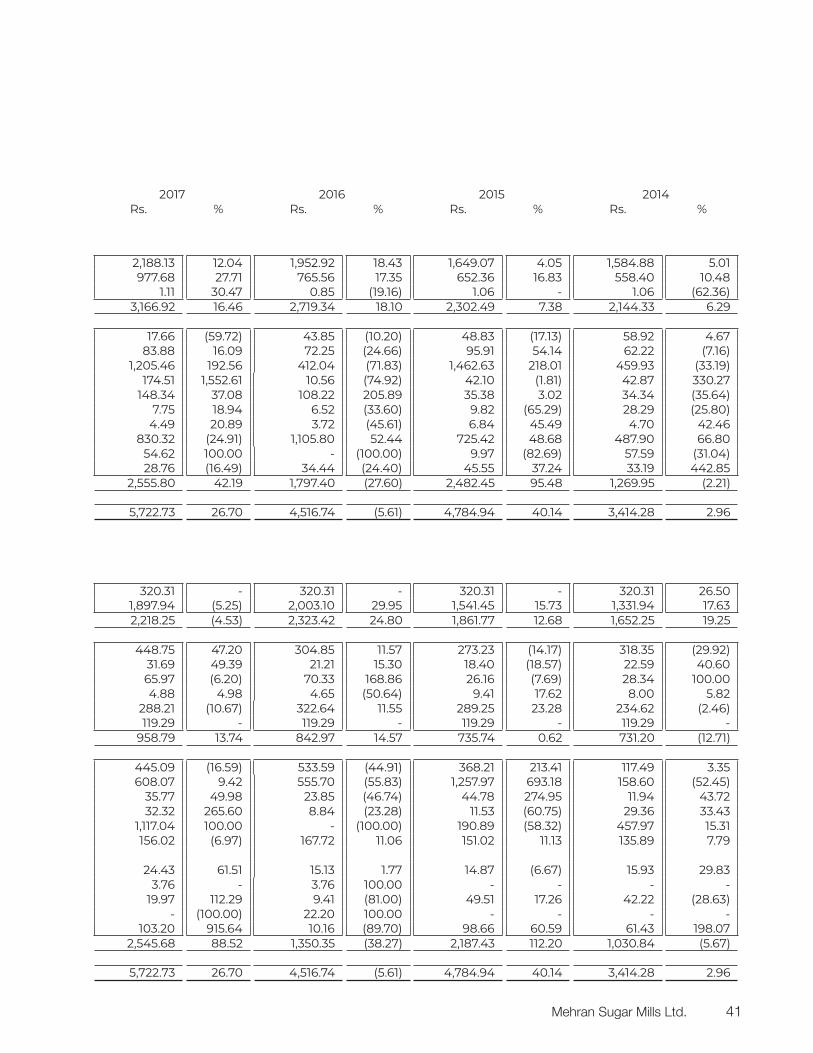
2017 2016 2015 2014Rs. % Rs. % Rs. % Rs. %
2,188.13 12.04 1,952.92 18.43 1,649.07 4.05 1,584.88 5.01 977.68 27.71 765.56 17.35 652.36 16.83 558.40 10.48
1.11 30.47 0.85 (19.16) 1.06 - 1.06 (62.36) 3,166.92 16.46 2,719.34 18.10 2,302.49 7.38 2,144.33 6.29
17.66 (59.72) 43.85 (10.20) 48.83 (17.13) 58.92 4.67 83.88 16.09 72.25 (24.66) 95.91 54.14 62.22 (7.16)
1,205.46 192.56 412.04 (71.83) 1,462.63 218.01 459.93 (33.19) 174.51 1,552.61 10.56 (74.92) 42.10 (1.81) 42.87 330.27
148.34 37.08 108.22 205.89 35.38 3.02 34.34 (35.64) 7.75 18.94 6.52 (33.60) 9.82 (65.29) 28.29 (25.80)
4.49 20.89 3.72 (45.61) 6.84 45.49 4.70 42.46 830.32 (24.91) 1,105.80 52.44 725.42 48.68 487.90 66.80
54.62 100.00 - (100.00) 9.97 (82.69) 57.59 (31.04) 28.76 (16.49) 34.44 (24.40) 45.55 37.24 33.19 442.85
2,555.80 42.19 1,797.40 (27.60) 2,482.45 95.48 1,269.95 (2.21)
5,722.73 26.70 4,516.74 (5.61) 4,784.94 40.14 3,414.28 2.96
320.31 - 320.31 - 320.31 - 320.31 26.50 1,897.94 (5.25) 2,003.10 29.95 1,541.45 15.73 1,331.94 17.63 2,218.25 (4.53) 2,323.42 24.80 1,861.77 12.68 1,652.25 19.25
448.75 47.20 304.85 11.57 273.23 (14.17) 318.35 (29.92) 31.69 49.39 21.21 15.30 18.40 (18.57) 22.59 40.60 65.97 (6.20) 70.33 168.86 26.16 (7.69) 28.34 100.00 4.88 4.98 4.65 (50.64) 9.41 17.62 8.00 5.82
288.21 (10.67) 322.64 11.55 289.25 23.28 234.62 (2.46) 119.29 - 119.29 - 119.29 - 119.29 -
958.79 13.74 842.97 14.57 735.74 0.62 731.20 (12.71)
445.09 (16.59) 533.59 (44.91) 368.21 213.41 117.49 3.35 608.07 9.42 555.70 (55.83) 1,257.97 693.18 158.60 (52.45)
35.77 49.98 23.85 (46.74) 44.78 274.95 11.94 43.72 32.32 265.60 8.84 (23.28) 11.53 (60.75) 29.36 33.43
1,117.04 100.00 - (100.00) 190.89 (58.32) 457.97 15.31 156.02 (6.97) 167.72 11.06 151.02 11.13 135.89 7.79
24.43 61.51 15.13 1.77 14.87 (6.67) 15.93 29.83 3.76 - 3.76 100.00 - - - -
19.97 112.29 9.41 (81.00) 49.51 17.26 42.22 (28.63) - (100.00) 22.20 100.00 - - - -
103.20 915.64 10.16 (89.70) 98.66 60.59 61.43 198.07 2,545.68 88.52 1,350.35 (38.27) 2,187.43 112.20 1,030.84 (5.67)
5,722.73 26.70 4,516.74 (5.61) 4,784.94 40.14 3,414.28 2.96
Mehran Sugar Mills Ltd. 41
2019 2018Rs. % Rs. %
ASSETS
NON-CURRENT ASSETSProperty, plant and equipment 2,190.68 31.46 2,168.33 31.73 Long term investments 1,362.37 19.56 1,190.22 17.42 Long term deposits 0.86 0.01 0.87 0.01
3,553.92 51.04 3,359.42 49.15 CURRENT ASSETSBiological assets 15.25 0.22 8.79 0.13 Stores and spare parts 102.42 1.47 101.67 1.49 Stock-in-trade 1,060.60 15.23 1,167.16 17.08 Trade debts 79.13 1.14 130.58 1.91 Loans and advances 116.69 1.68 116.07 1.70 Trade deposits and short term prepayments 9.26 0.13 12.88 0.19 Other receivables 317.56 4.56 580.80 8.50 Short term investments 995.38 14.29 1,258.74 18.42 Taxation-net 40.25 0.58 82.33 1.20 Cash and bank balances 672.98 9.66 15.95 0.23
3,409.53 48.96 3,474.98 50.85
TOTAL ASSETS 6,963.45 100.00 6,834.40 100.00
EQUITY AND LIABILITIES
SHARE CAPITAL AND RESERVES
Share capital 405.20 5.82 320.31 4.69 Reserves 2,009.70 28.86 2,289.01 33.49
2,414.90 34.68 2,609.32 38.18 NON-CURRENT LIABILITIESLong-term financing 735.83 10.57 745.41 10.91 Liabilities against assets subject to finance lease 20.59 0.30 18.21 0.27 Market committee fee payable 23.38 0.34 26.11 0.38 Deferred liabilities 39.84 0.57 40.89 0.60 Deferred taxation 199.58 2.87 225.77 3.30 Provision for quality premium 119.29 1.71 119.29 1.75
1,138.52 16.35 1,175.68 17.20 CURRENT LIABILITIESTrade and other payables 641.88 9.22 412.42 6.03 Contract liabilities (advance from customers) 415.59 5.97 282.73 4.14 Unclaimed dividends 17.69 0.25 19.50 0.29 Accrued mark-up 125.50 1.80 49.25 0.72 Short-term borrowings 1,750.71 25.14 1,966.89 28.78 Current portion of long-term financing 315.83 4.54 203.33 2.98 Current portion of liabilities against assets subject to finance lease 9.77 0.14 20.79 0.30 Current portion of market committee fee payable 3.76 0.05 3.76 0.06 Provision for market committee fee 37.42 0.54 30.40 0.44 Income tax payable - - - - Sales tax and federal excise duty payable 91.88 1.32 60.31 0.88
3,410.04 48.97 3,049.39 44.62
TOTAL EQUITY AND LIABILITIES 6,963.45 100.00 6,834.40 100.00
VERTICAL ANALYSIS - STATEMENT OF FINANCIAL POSITION
Rupees in million
Annual Report 201942
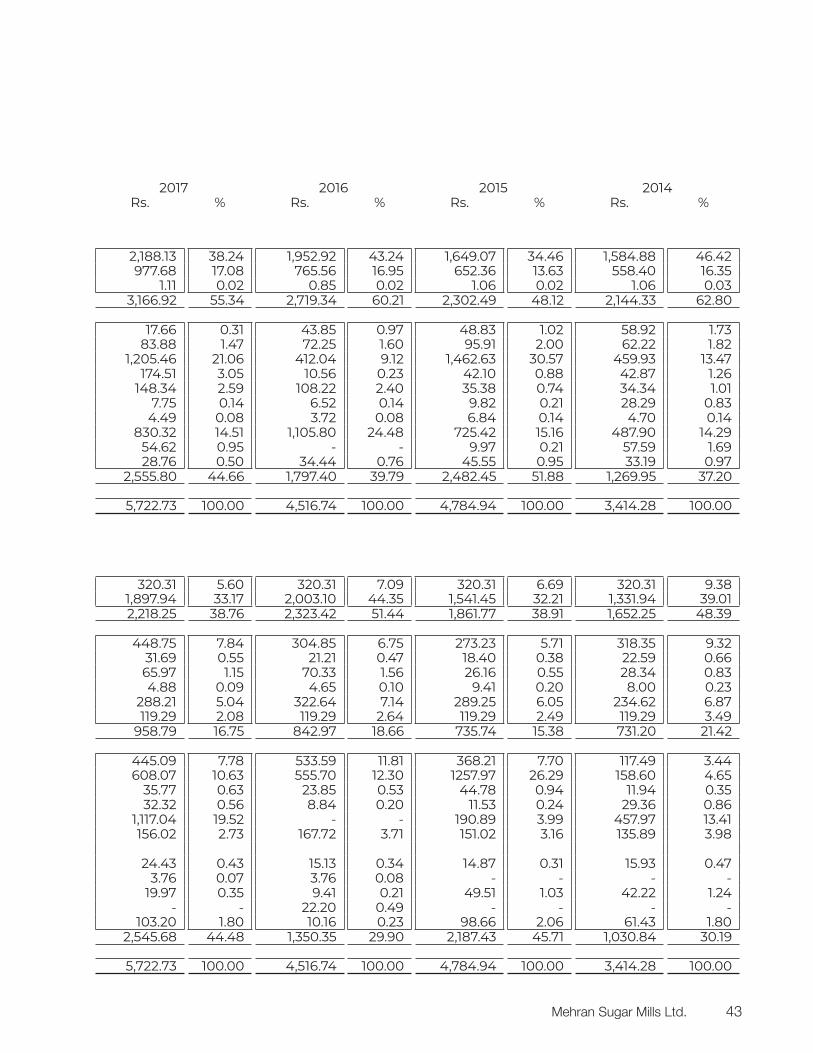
2017 2016 2015 2014Rs. % Rs. % Rs. % Rs. %
2,188.13 38.24 1,952.92 43.24 1,649.07 34.46 1,584.88 46.42 977.68 17.08 765.56 16.95 652.36 13.63 558.40 16.35
1.11 0.02 0.85 0.02 1.06 0.02 1.06 0.03 3,166.92 55.34 2,719.34 60.21 2,302.49 48.12 2,144.33 62.80
17.66 0.31 43.85 0.97 48.83 1.02 58.92 1.73 83.88 1.47 72.25 1.60 95.91 2.00 62.22 1.82
1,205.46 21.06 412.04 9.12 1,462.63 30.57 459.93 13.47 174.51 3.05 10.56 0.23 42.10 0.88 42.87 1.26
148.34 2.59 108.22 2.40 35.38 0.74 34.34 1.01 7.75 0.14 6.52 0.14 9.82 0.21 28.29 0.83
4.49 0.08 3.72 0.08 6.84 0.14 4.70 0.14 830.32 14.51 1,105.80 24.48 725.42 15.16 487.90 14.29
54.62 0.95 - - 9.97 0.21 57.59 1.69 28.76 0.50 34.44 0.76 45.55 0.95 33.19 0.97
2,555.80 44.66 1,797.40 39.79 2,482.45 51.88 1,269.95 37.20
5,722.73 100.00 4,516.74 100.00 4,784.94 100.00 3,414.28 100.00
320.31 5.60 320.31 7.09 320.31 6.69 320.31 9.38 1,897.94 33.17 2,003.10 44.35 1,541.45 32.21 1,331.94 39.01 2,218.25 38.76 2,323.42 51.44 1,861.77 38.91 1,652.25 48.39
448.75 7.84 304.85 6.75 273.23 5.71 318.35 9.32 31.69 0.55 21.21 0.47 18.40 0.38 22.59 0.66 65.97 1.15 70.33 1.56 26.16 0.55 28.34 0.83 4.88 0.09 4.65 0.10 9.41 0.20 8.00 0.23
288.21 5.04 322.64 7.14 289.25 6.05 234.62 6.87 119.29 2.08 119.29 2.64 119.29 2.49 119.29 3.49
958.79 16.75 842.97 18.66 735.74 15.38 731.20 21.42
445.09 7.78 533.59 11.81 368.21 7.70 117.49 3.44 608.07 10.63 555.70 12.30 1257.97 26.29 158.60 4.65
35.77 0.63 23.85 0.53 44.78 0.94 11.94 0.35 32.32 0.56 8.84 0.20 11.53 0.24 29.36 0.86
1,117.04 19.52 - - 190.89 3.99 457.97 13.41 156.02 2.73 167.72 3.71 151.02 3.16 135.89 3.98
24.43 0.43 15.13 0.34 14.87 0.31 15.93 0.47 3.76 0.07 3.76 0.08 - - - -
19.97 0.35 9.41 0.21 49.51 1.03 42.22 1.24 - - 22.20 0.49 - - - -
103.20 1.80 10.16 0.23 98.66 2.06 61.43 1.80 2,545.68 44.48 1,350.35 29.90 2,187.43 45.71 1,030.84 30.19
5,722.73 100.00 4,516.74 100.00 4,784.94 100.00 3,414.28 100.00
Mehran Sugar Mills Ltd. 43
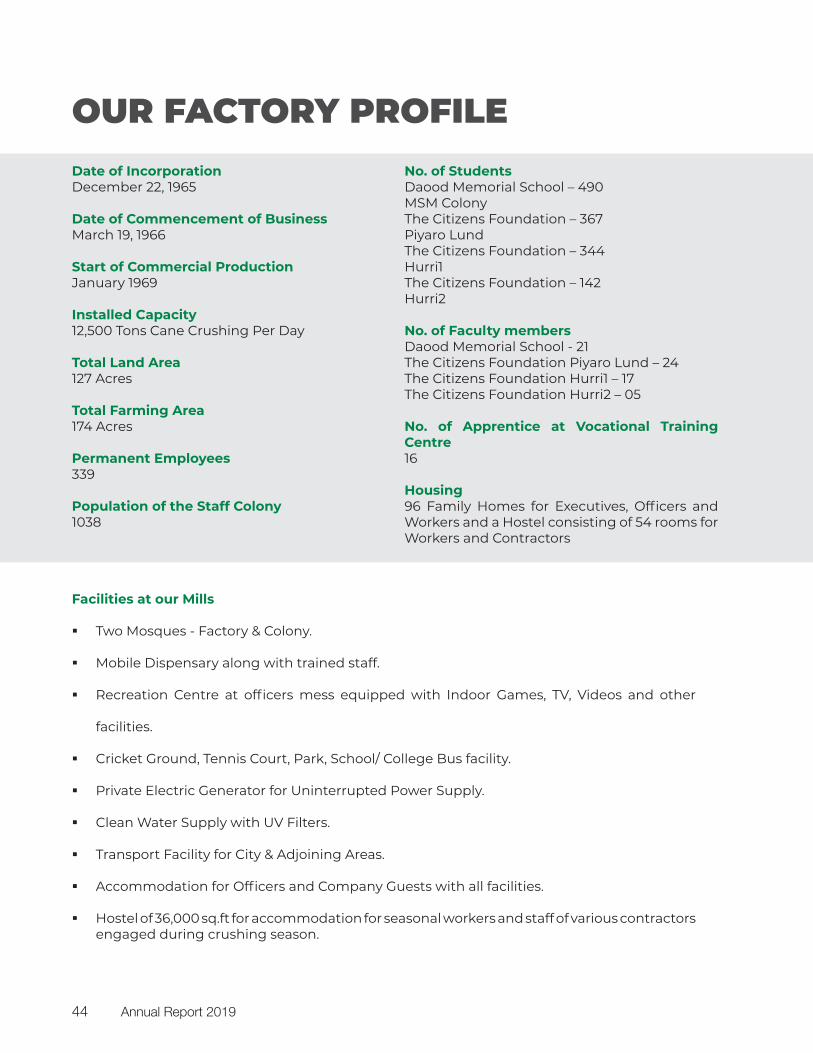
OUR FACTORY PROFILEDate of IncorporationDecember 22, 1965
Date of Commencement of BusinessMarch 19, 1966
Start of Commercial ProductionJanuary 1969
Installed Capacity12,500 Tons Cane Crushing Per Day
Total Land Area127 Acres
Total Farming Area174 Acres
Permanent Employees339
Population of the Staff Colony1038
No. of StudentsDaood Memorial School – 490MSM ColonyThe Citizens Foundation – 367Piyaro LundThe Citizens Foundation – 344Hurri1The Citizens Foundation – 142Hurri2
No. of Faculty membersDaood Memorial School - 21The Citizens Foundation Piyaro Lund – 24The Citizens Foundation Hurri1 – 17The Citizens Foundation Hurri2 – 05
No. of Apprentice at Vocational Training Centre16
Housing96 Family Homes for Executives, Officers and Workers and a Hostel consisting of 54 rooms for Workers and Contractors
Facilities at our Mills
Two Mosques - Factory & Colony.
Mobile Dispensary along with trained staff.
Recreation Centre at officers mess equipped with Indoor Games, TV, Videos and other
facilities.
Cricket Ground, Tennis Court, Park, School/ College Bus facility.
Private Electric Generator for Uninterrupted Power Supply.
Clean Water Supply with UV Filters.
Transport Facility for City & Adjoining Areas.
Acc ommodation for Officers and Company Guests with all facilities.
Hostel of 36,000 sq.ft for accommodation for seasonal workers and staff of various contractors engaged during crushing season.
Annual Report 201944
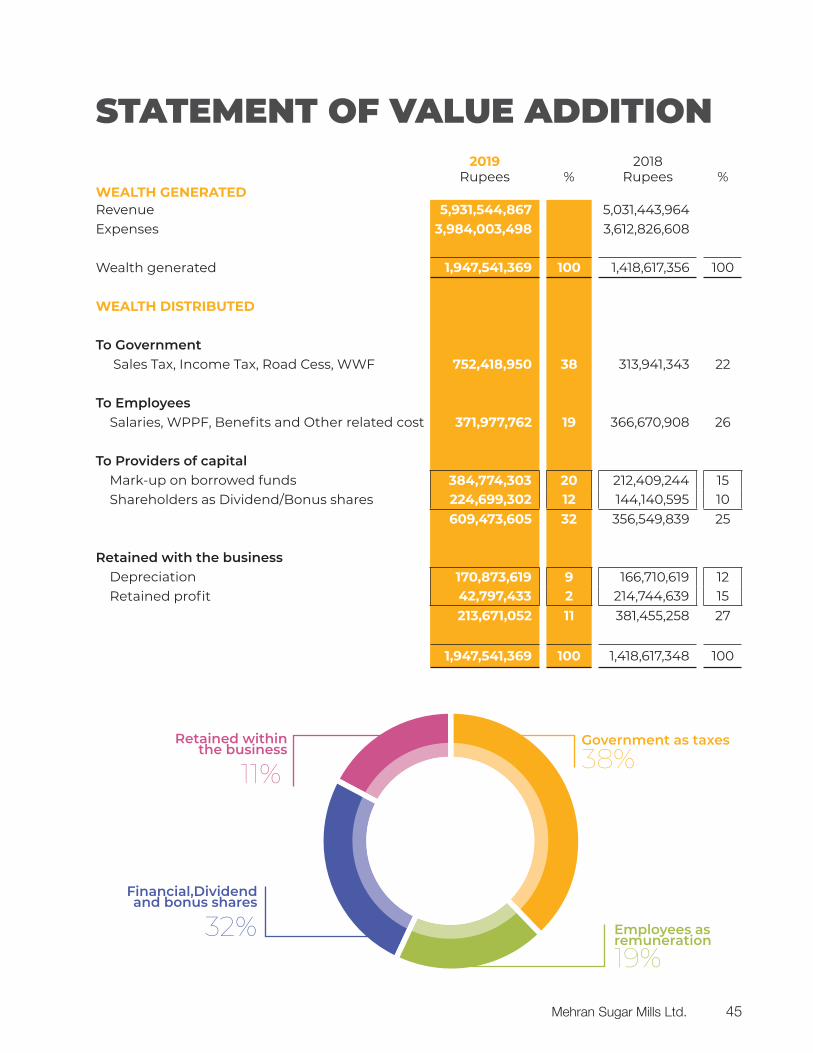
2019 2018Rupees % Rupees %
WEALTH GENERATEDRevenue 5,931,544,867 5,031,443,964 Expenses 3,984,003,498 3,612,826,608
Wealth generated 1,947,541,369 100 1,418,617,356 100
WEALTH DISTRIBUTED
To Government Sales Tax, Income Tax, Road Cess, WWF 752,418,950 38 313,941,343 22
To Employees Salaries, WPPF, Benefits and Other related cost 371,977,762 19 366,670,908 26
To Providers of capital Mark-up on borrowed funds 384,774,303 20 212,409,244 15 Shareholders as Dividend/Bonus shares 224,699,302 12 144,140,595 10
609,473,605 32 356,549,839 25
Retained with the business Depreciation 170,873,619 9 166,710,619 12 Retained profit 42,797,433 2 214,744,639 15
213,671,052 11 381,455,258 27
1,947,541,369 100 1,418,617,348 100
STATEMENT OF VALUE ADDITION
38%Government as taxes
19%Employees as remuneration
32%Financial,Dividendand bonus shares
11%Retained within
the business
Mehran Sugar Mills Ltd. 45
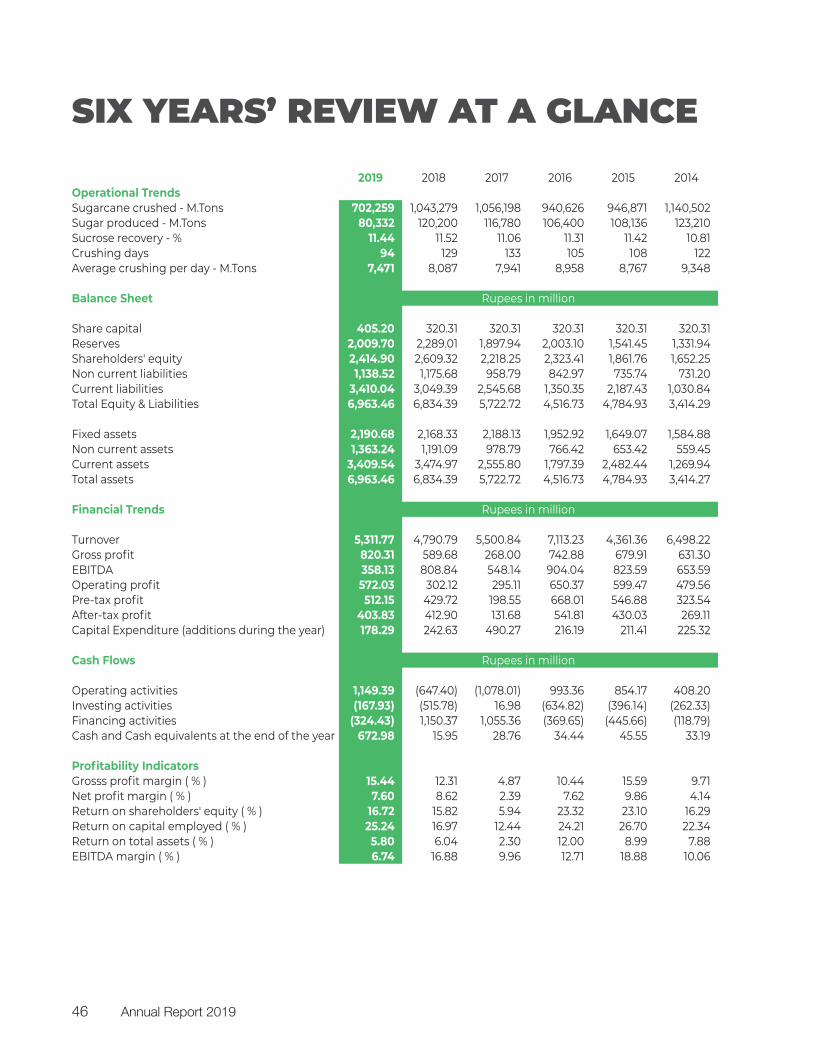
SIX YEARS’ REVIEW AT A GLANCE2019 2018 2017 2016 2015 2014
Operational TrendsSugarcane crushed - M.Tons 702,259 1,043,279 1,056,198 940,626 946,871 1,140,502 Sugar produced - M.Tons 80,332 120,200 116,780 106,400 108,136 123,210 Sucrose recovery - % 11.44 11.52 11.06 11.31 11.42 10.81 Crushing days 94 129 133 105 108 122 Average crushing per day - M.Tons 7,471 8,087 7,941 8,958 8,767 9,348
Balance Sheet Rupees in million
Share capital 405.20 320.31 320.31 320.31 320.31 320.31 Reserves 2,009.70 2,289.01 1,897.94 2,003.10 1,541.45 1,331.94 Shareholders' equity 2,414.90 2,609.32 2,218.25 2,323.41 1,861.76 1,652.25 Non current liabilities 1,138.52 1,175.68 958.79 842.97 735.74 731.20 Current liabilities 3,410.04 3,049.39 2,545.68 1,350.35 2,187.43 1,030.84 Total Equity & Liabilities 6,963.46 6,834.39 5,722.72 4,516.73 4,784.93 3,414.29
Fixed assets 2,190.68 2,168.33 2,188.13 1,952.92 1,649.07 1,584.88 Non current assets 1,363.24 1,191.09 978.79 766.42 653.42 559.45 Current assets 3,409.54 3,474.97 2,555.80 1,797.39 2,482.44 1,269.94 Total assets 6,963.46 6,834.39 5,722.72 4,516.73 4,784.93 3,414.27
Financial Trends Rupees in million
Turnover 5,311.77 4,790.79 5,500.84 7,113.23 4,361.36 6,498.22 Gross profit 820.31 589.68 268.00 742.88 679.91 631.30 EBITDA 358.13 808.84 548.14 904.04 823.59 653.59 Operating profit 572.03 302.12 295.11 650.37 599.47 479.56 Pre-tax profit 512.15 429.72 198.55 668.01 546.88 323.54 After-tax profit 403.83 412.90 131.68 541.81 430.03 269.11 Capital Expenditure (additions during the year) 178.29 242.63 490.27 216.19 211.41 225.32
Cash Flows Rupees in million
Operating activities 1,149.39 (647.40) (1,078.01) 993.36 854.17 408.20 Investing activities (167.93) (515.78) 16.98 (634.82) (396.14) (262.33)Financing activities (324.43) 1,150.37 1,055.36 (369.65) (445.66) (118.79)Cash and Cash equivalents at the end of the year 672.98 15.95 28.76 34.44 45.55 33.19
Profitability IndicatorsGrosss profit margin ( % ) 15.44 12.31 4.87 10.44 15.59 9.71 Net profit margin ( % ) 7.60 8.62 2.39 7.62 9.86 4.14 Return on shareholders' equity ( % ) 16.72 15.82 5.94 23.32 23.10 16.29 Return on capital employed ( % ) 25.24 16.97 12.44 24.21 26.70 22.34 Return on total assets ( % ) 5.80 6.04 2.30 12.00 8.99 7.88 EBITDA margin ( % ) 6.74 16.88 9.96 12.71 18.88 10.06
Annual Report 201946
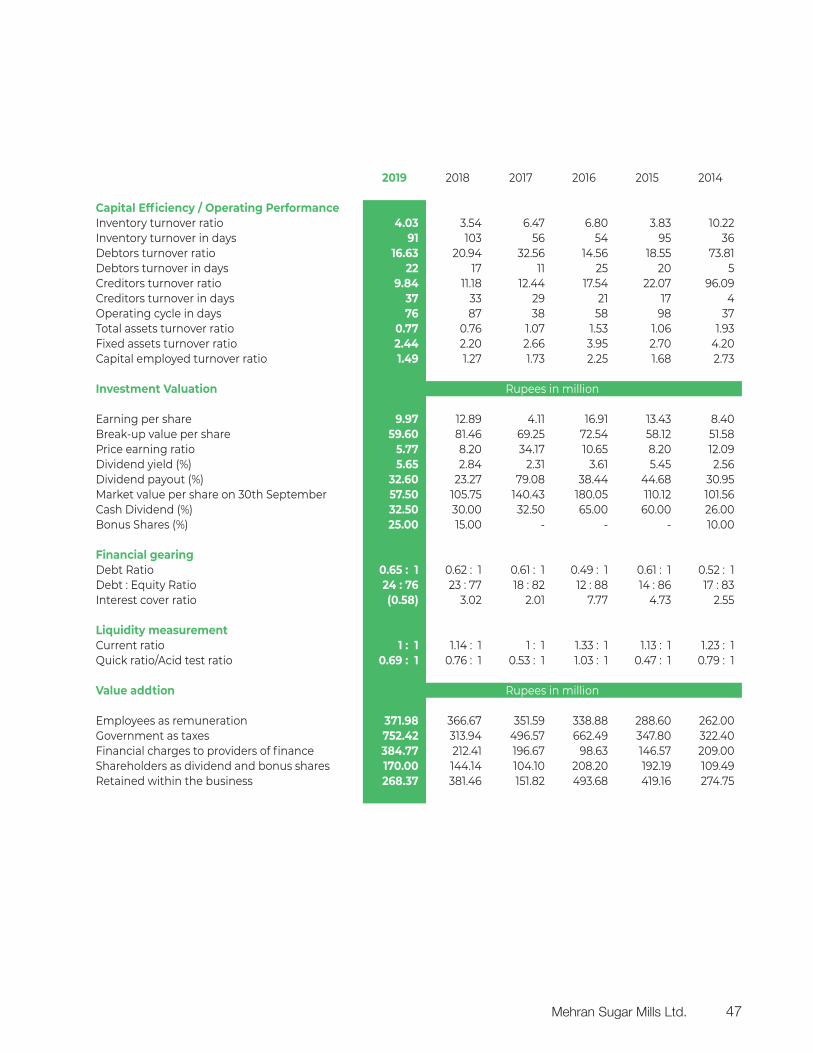
2019 2018 2017 2016 2015 2014
Capital Efficiency / Operating PerformanceInventory turnover ratio 4.03 3.54 6.47 6.80 3.83 10.22 Inventory turnover in days 91 103 56 54 95 36 Debtors turnover ratio 16.63 20.94 32.56 14.56 18.55 73.81 Debtors turnover in days 22 17 11 25 20 5 Creditors turnover ratio 9.84 11.18 12.44 17.54 22.07 96.09 Creditors turnover in days 37 33 29 21 17 4 Operating cycle in days 76 87 38 58 98 37 Total assets turnover ratio 0.77 0.76 1.07 1.53 1.06 1.93 Fixed assets turnover ratio 2.44 2.20 2.66 3.95 2.70 4.20 Capital employed turnover ratio 1.49 1.27 1.73 2.25 1.68 2.73
Investment Valuation Rupees in million
Earning per share 9.97 12.89 4.11 16.91 13.43 8.40 Break-up value per share 59.60 81.46 69.25 72.54 58.12 51.58 Price earning ratio 5.77 8.20 34.17 10.65 8.20 12.09 Dividend yield (%) 5.65 2.84 2.31 3.61 5.45 2.56 Dividend payout (%) 32.60 23.27 79.08 38.44 44.68 30.95 Market value per share on 30th September 57.50 105.75 140.43 180.05 110.12 101.56 Cash Dividend (%) 32.50 30.00 32.50 65.00 60.00 26.00 Bonus Shares (%) 25.00 15.00 - - - 10.00
Financial gearingDebt Ratio 0.65 : 1 0.62 : 1 0.61 : 1 0.49 : 1 0.61 : 1 0.52 : 1 Debt : Equity Ratio 24 : 76 23 : 77 18 : 82 12 : 88 14 : 86 17 : 83Interest cover ratio (0.58) 3.02 2.01 7.77 4.73 2.55
Liquidity measurementCurrent ratio 1 : 1 1.14 : 1 1 : 1 1.33 : 1 1.13 : 1 1.23 : 1 Quick ratio/Acid test ratio 0.69 : 1 0.76 : 1 0.53 : 1 1.03 : 1 0.47 : 1 0.79 : 1
Value addtion Rupees in million
Employees as remuneration 371.98 366.67 351.59 338.88 288.60 262.00 Government as taxes 752.42 313.94 496.57 662.49 347.80 322.40 Financial charges to providers of finance 384.77 212.41 196.67 98.63 146.57 209.00 Shareholders as dividend and bonus shares 170.00 144.14 104.10 208.20 192.19 109.49 Retained within the business 268.37 381.46 151.82 493.68 419.16 274.75
Mehran Sugar Mills Ltd. 47

SIX YEARS’ SUGARCANE TRENDS ANALYSIS
Support price vs Actual price
(Ru
pee
s)
0
50
100
150
200
250
201920182017201620152014
182
2
03
182
16
5 172
17
4
182 20
7
182
18
2
172
198
Cost of Cane as % of Turnover
0
20
40
60
80
100
201920182017201620152014
6977
93
7165
97
(%)
Avg.Recovery % of Mehran vs Avg. recovery % of Sindh
(%)
0
2
4
6
8
10
12
201920182017201620152014
10.8
1
11.4
2
11.5
210
.55 11.4
410
.77
11.0
6
10.2
1
10.5
3
10.4
311.3
1
9.85
Cane Purchases (Rupees in billion)
(Ru
pee
s in
bill
ion
)
0
1
2
3
4
5
6
201920182017201620152014
3.661
4.975
4.058 4.657
5.347
3.384
Annual Report 201948
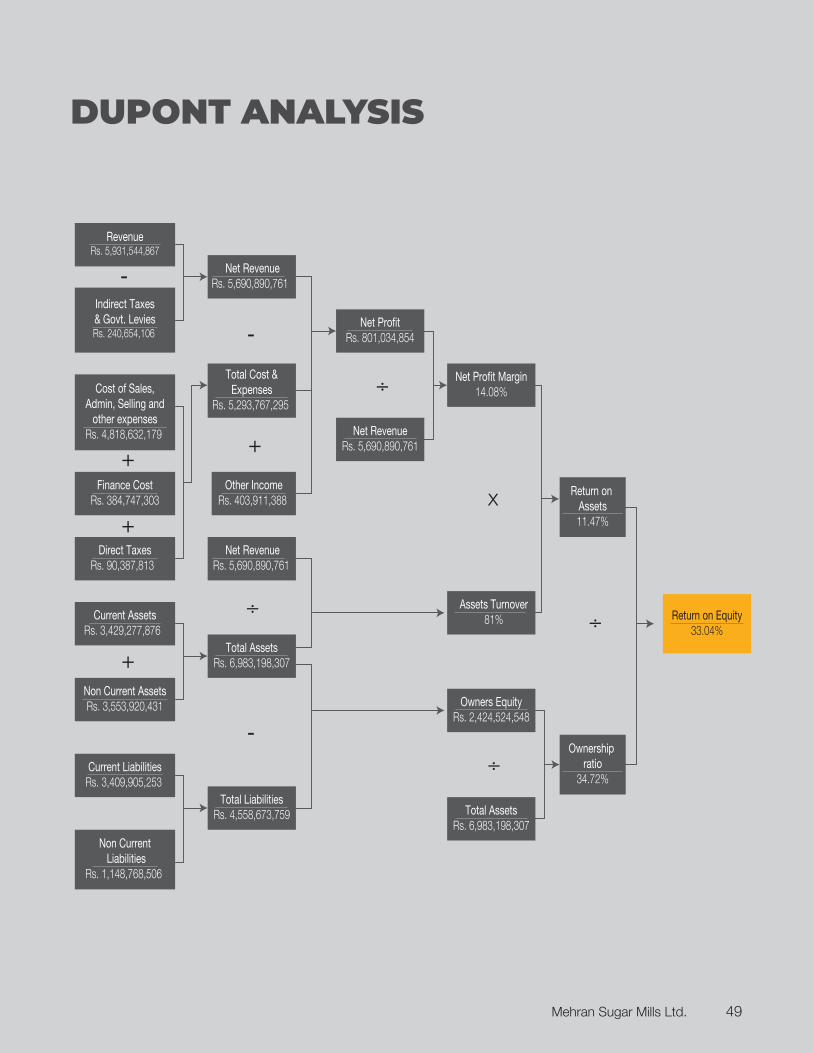
RevenueRs. 5,931,544,867
Finance CostRs. 384,747,303
Cost of Sales,Admin, Selling and
other expensesRs. 4,818,632,179
Non Current Liabilities
Rs. 1,148,768,506
Current LiabilitiesRs. 3,409,905,253
Non Current AssetsRs. 3,553,920,431
Current AssetsRs. 3,429,277,876
Direct TaxesRs. 90,387,813
Net RevenueRs. 5,690,890,761
Total Cost &Expenses
Rs. 5,293,767,295
Other IncomeRs. 403,911,388
Net RevenueRs. 5,690,890,761
Total AssetsRs. 6,983,198,307
Total LiabilitiesRs. 4,558,673,759
Rs. 801,034,854
Net RevenueRs. 5,690,890,761
Assets Turnover81%
Owners EquityRs. 2,424,524,548
Total AssetsRs. 6,983,198,307
++
+
+
-
-
x
Return on Equity33.04%
Indirect Taxes& Govt. LeviesRs. 240,654,106
Return on Assets11.47%
Ownership ratio
34.72%
14.08%
-
–
–
–
–
DUPONT ANALYSIS
Mehran Sugar Mills Ltd. 49
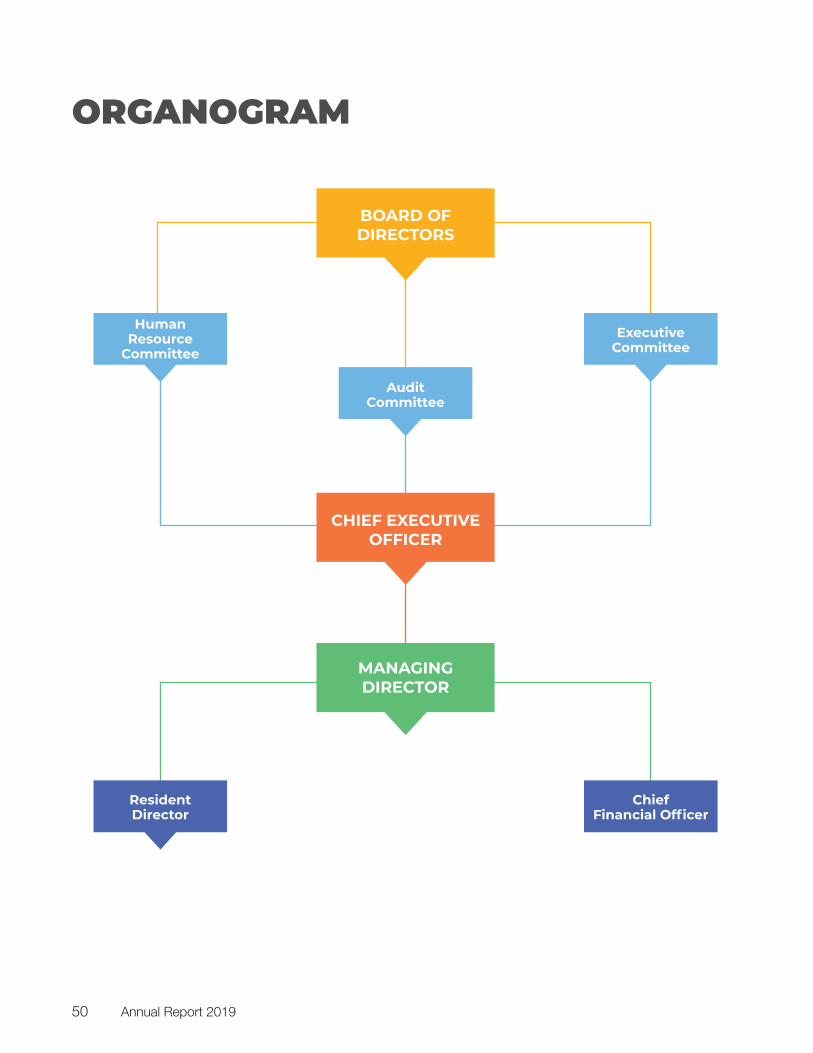
ORGANOGRAM
BOARD OF DIRECTORS
CHIEF EXECUTIVE OFFICER
MANAGING DIRECTOR
Audit Committee
Human Resource
CommitteeExecutive
Committee
Resident Director
Chief Financial Officer
Annual Report 201950
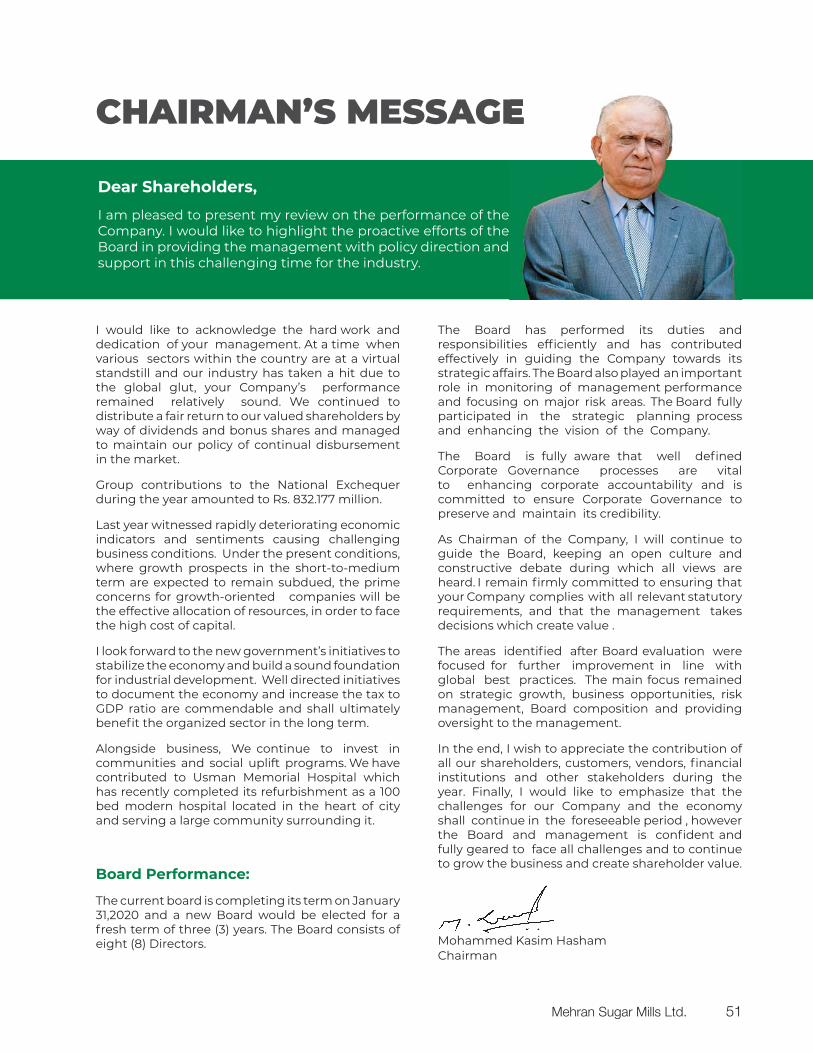
CHAIRMAN’S MESSAGE
I would like to acknowledge the hard work and dedication of your management. At a time when various sectors within the country are at a virtual standstill and our industry has taken a hit due to the global glut, your Company’s performance remained relatively sound. We continued to distribute a fair return to our valued shareholders by way of dividends and bonus shares and managed to maintain our policy of continual disbursement in the market.
Group contributions to the National Exchequer during the year amounted to Rs. 832.177 million.
Last year witnessed rapidly deteriorating economic indicators and sentiments causing challenging business conditions. Under the present conditions, where growth prospects in the short-to-medium term are expected to remain subdued, the prime concerns for growth-oriented companies will be the effective allocation of resources, in order to face the high cost of capital.
I look forward to the new government’s initiatives to stabilize the economy and build a sound foundation for industrial development. Well directed initiatives to document the economy and increase the tax to GDP ratio are commendable and shall ultimately benefit the organized sector in the long term.
Alongside business, We continue to invest in communities and social uplift programs. We have contributed to Usman Memorial Hospital which has recently completed its refurbishment as a 100 bed modern hospital located in the heart of city and serving a large community surrounding it.
Board Performance:
The current board is completing its term on January 31,2020 and a new Board would be elected for a fresh term of three (3) years. The Board consists of eight (8) Directors.
The Board has performed its duties and responsibilities efficiently and has contributed effectively in guiding the Company towards its strategic affairs. The Board also played an important role in monitoring of management performance and focusing on major risk areas. The Board fully participated in the strategic planning process and enhancing the vision of the Company.
The Board is fully aware that well defined Corporate Governance processes are vital to enhancing corporate accountability and is committed to ensure Corporate Governance to preserve and maintain its credibility.
As Chairman of the Company, I will continue to guide the Board, keeping an open culture and constructive debate during which all views are heard. I remain firmly committed to ensuring that your Company complies with all relevant statutory requirements, and that the management takes decisions which create value .
The areas identified after Board evaluation were focused for further improvement in line with global best practices. The main focus remained on strategic growth, business opportunities, risk management, Board composition and providing oversight to the management.
In the end, I wish to appreciate the contribution of all our shareholders, customers, vendors, financial institutions and other stakeholders during the year. Finally, I would like to emphasize that the challenges for our Company and the economy shall continue in the foreseeable period , however the Board and management is confident and fully geared to face all challenges and to continue to grow the business and create shareholder value.
Mohammed Kasim HashamChairman
Dear Shareholders,
I am pleased to present my review on the performance of the Company. I would like to highlight the proactive efforts of the Board in providing the management with policy direction and support in this challenging time for the industry.
Mehran Sugar Mills Ltd. 51
DIRECTORS’ REPORT
ECONOMY (MACRO PERSPECTIVE)
The Federal Government adopted stringent financial measures to preserve the depleting FX reserves by reducing the imports to stabilize the Current Account Deficit in FY19. However, the dampening GDP growth prospect (3.3% GDP growth rate forecasted by SBP for FY19 as compared to 5.5% in the corresponding period), worsening fiscal deficit, scrutiny from global money-laundering watchdog (FATF) over regulatory concerns, and delays in finalizing IMF bailout program kept the economy under pressure.
The Current Account Deficit for FY19 stood at $13.6 billion (4.8% of GDP) as compared to $19.8 billion (6.3% of GDP) in the same period last year, exhibiting a decline of 32% YoY. This improved performance was on the back of a decrease in imports of goods by 7% YoY to $52.38 billion from $56.59 billion, along with an increase in remittances of 10% YoY to $21.84 billion. However, exports of goods could not pick up as anticipated, because of uncertainty and remained flat at approximately the same at $24.4 billion from $24.77 billion, while the increase in debt servicing weighed on the foreign exchange reserves at $14.48 billion.
On the fiscal front, the Federal Board of Revenue managed to collect around PKR
3.829 trillion during the FY19 as compared to PKR 3.842 trillion in the same period last year. The tax collection remained below the revised target of PKR 4.398 trillion (11.5 percent of GDP), making it difficult for the Government to execute PSDP. Moreover, the Government has set a revenue collection target of PKR 5.55 trillion for FY20, which appears ambitious keeping in view the current economic slowdown. However, there are indications that this may be scaled down after discussions with IMF.
The increased international oil prices, PKR depreciation and increase in electricity and gas tariffs have fuelled CPI. Therefore, in order to address this issue along with burgeoning twin deficits led SBP to increase the policy rate up to 13%.
According to Economic Survey of FY19, the agriculture sector underperformed and missed its budgeted target of 3.94%, registering a meager increase of only 0.85%. This was mainly due to the prevalent water crisis and drop in fertilizer off take (higher prices) which hampered agricultural output. Similarly, shrinkage of LSM & in the services sector also caused the SBP to downward revise its real GDP growth target to approximately 3.5% for FY20.
Furthermore, Pakistan was able to attract only
ABOUT THE COMPANY
Mehran Sugar Mills Limited (the Company) was incorporated in Pakistan as a public limited company in December, 1965 under repealed Companies Act, 1913. The main business of the Company is manufacturing of refined sugar. Our manufacturing facilities are located in Tando Allahyar district and the factory has a capacity of 12,500 TCD. Our cane region has a majority of early maturing and high yielding varieties which allows the company to have one of the highest sucrose recoveries.
Since 2004 Mehran has also invested 33.33 percent in a public unquoted company, Unicol limited. Unicol Limited was set up as a greenfield ethanol project. We have been involved with the project since its inception. Today Unicol has an Ethanol production capacity of 200,000 litres per day and a CO2 production capacity of 72 Tons per day.
In 2017, Mehran has also invested in an FMCG business related to baking/food sector. Same year a 100 percent owned subsidiary was made, Mehran Energy to set up an IPP of 26.5 MW being Baggasse based. Status of these businesses are discussed in detail in the later part of this report.
Annual Report 201952
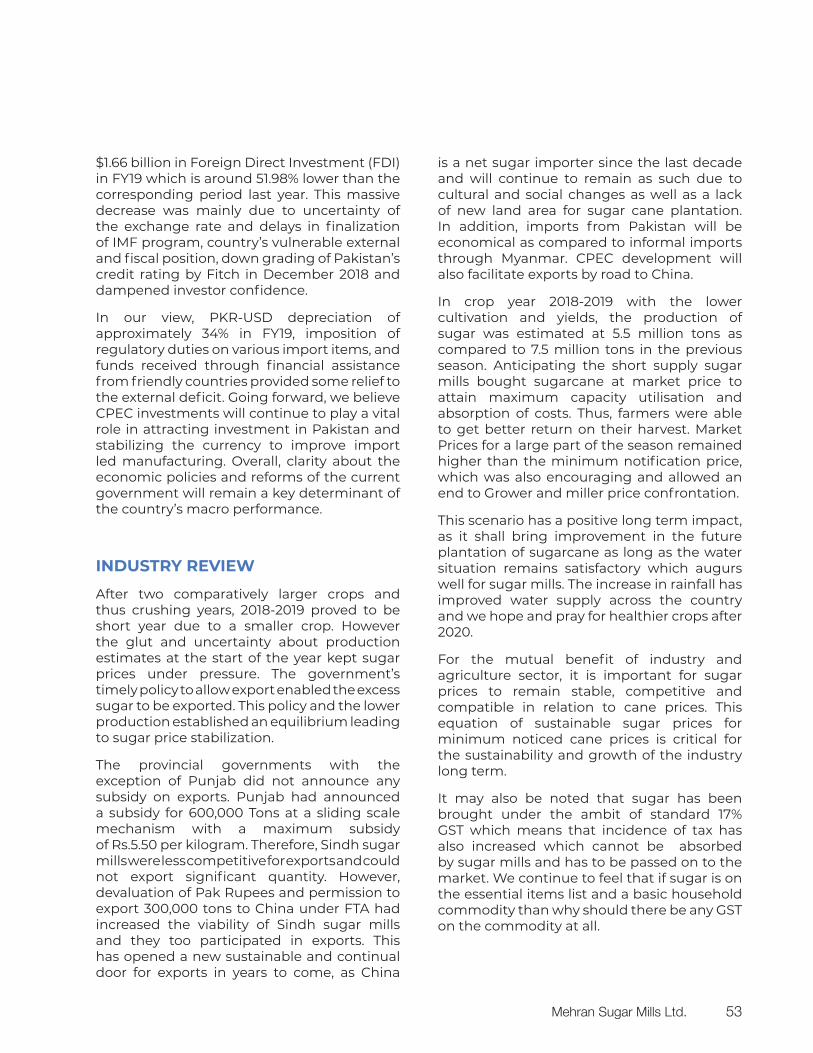
$1.66 billion in Foreign Direct Investment (FDI) in FY19 which is around 51.98% lower than the corresponding period last year. This massive decrease was mainly due to uncertainty of the exchange rate and delays in finalization of IMF program, country’s vulnerable external and fiscal position, down grading of Pakistan’s credit rating by Fitch in December 2018 and dampened investor confidence.
In our view, PKR-USD depreciation of approximately 34% in FY19, imposition of regulatory duties on various import items, and funds received through financial assistance from friendly countries provided some relief to the external deficit. Going forward, we believe CPEC investments will continue to play a vital role in attracting investment in Pakistan and stabilizing the currency to improve import led manufacturing. Overall, clarity about the economic policies and reforms of the current government will remain a key determinant of the country’s macro performance.
INDUSTRY REVIEW
After two comparatively larger crops and thus crushing years, 2018-2019 proved to be short year due to a smaller crop. However the glut and uncertainty about production estimates at the start of the year kept sugar prices under pressure. The government’s timely policy to allow export enabled the excess sugar to be exported. This policy and the lower production established an equilibrium leading to sugar price stabilization.
The provincial governments with the exception of Punjab did not announce any subsidy on exports. Punjab had announced a subsidy for 600,000 Tons at a sliding scale mechanism with a maximum subsidy of Rs.5.50 per kilogram. Therefore, Sindh sugar mills were less competitive for exports and could not export significant quantity. However, devaluation of Pak Rupees and permission to export 300,000 tons to China under FTA had increased the viability of Sindh sugar mills and they too participated in exports. This has opened a new sustainable and continual door for exports in years to come, as China
is a net sugar importer since the last decade and will continue to remain as such due to cultural and social changes as well as a lack of new land area for sugar cane plantation. In addition, imports from Pakistan will be economical as compared to informal imports through Myanmar. CPEC development will also facilitate exports by road to China.
In crop year 2018-2019 with the lower cultivation and yields, the production of sugar was estimated at 5.5 million tons as compared to 7.5 million tons in the previous season. Anticipating the short supply sugar mills bought sugarcane at market price to attain maximum capacity utilisation and absorption of costs. Thus, farmers were able to get better return on their harvest. Market Prices for a large part of the season remained higher than the minimum notification price, which was also encouraging and allowed an end to Grower and miller price confrontation.
This scenario has a positive long term impact, as it shall bring improvement in the future plantation of sugarcane as long as the water situation remains satisfactory which augurs well for sugar mills. The increase in rainfall has improved water supply across the country and we hope and pray for healthier crops after 2020.
For the mutual benefit of industry and agriculture sector, it is important for sugar prices to remain stable, competitive and compatible in relation to cane prices. This equation of sustainable sugar prices for minimum noticed cane prices is critical for the sustainability and growth of the industry long term.
It may also be noted that sugar has been brought under the ambit of standard 17% GST which means that incidence of tax has also increased which cannot be absorbed by sugar mills and has to be passed on to the market. We continue to feel that if sugar is on the essential items list and a basic household commodity than why should there be any GST on the commodity at all.
Mehran Sugar Mills Ltd. 53
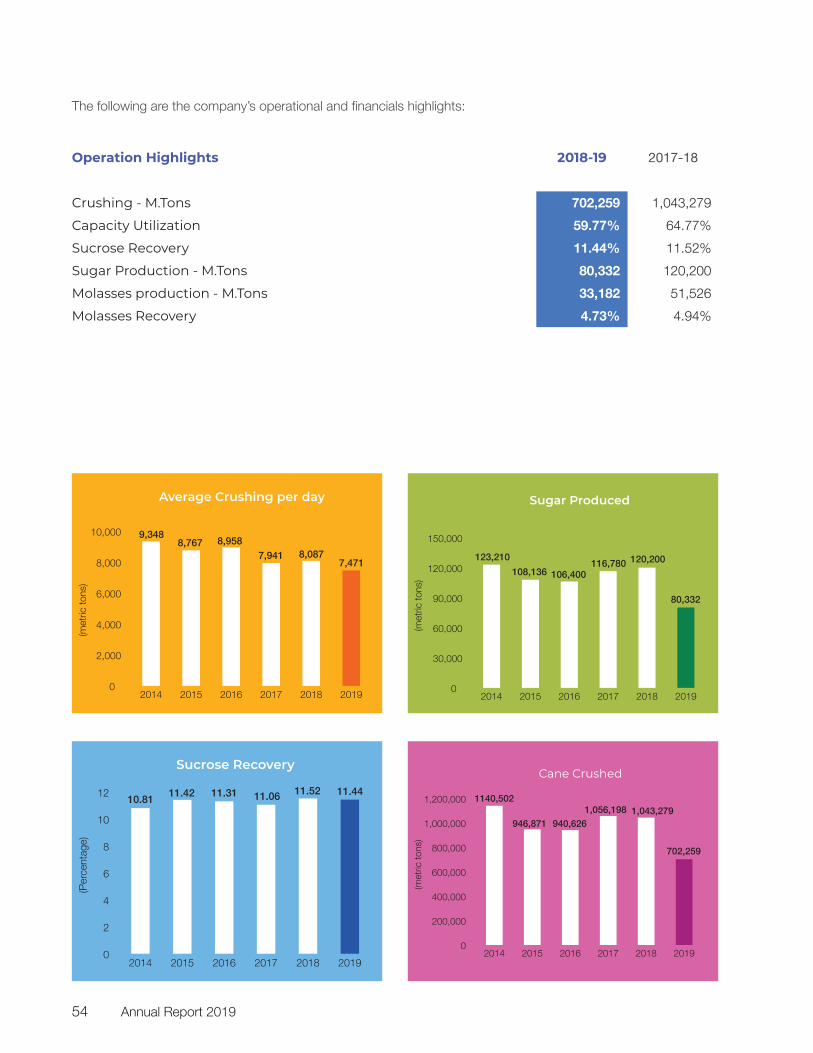
Operation Highlights 2018-19 2017-18
Crushing - M.Tons 702,259 1,043,279
Capacity Utilization 59.77% 64.77%
Sucrose Recovery 11.44% 11.52%
Sugar Production - M.Tons 80,332 120,200
Molasses production - M.Tons 33,182 51,526
Molasses Recovery 4.73% 4.94%
Average Crushing per day
0
2,000
4,000
6,000
8,000
10,000
201920182017201620152014
(met
ric to
ns)
9,3488,767 8,958
7,941 8,0877,471
Sucrose Recovery
0
2
4
6
8
10
12
201920182017201620152014
(Per
cent
age)
11.4410.81
11.42 11.31 11.06 11.52
Sugar Produced
0
30,000
60,000
90,000
120,000
150,000
201920182017201620152014
(met
ric to
ns)
80,332
123,210
108,136 106,400116,780 120,200
Cane Crushed
0
200,000
400,000
600,000
800,000
1,000,000
1,200,000
201920182017201620152014
(met
ric to
ns)
702,259
1140,502
946,871 940,626
1,056,198 1,043,279
Annual Report 201954
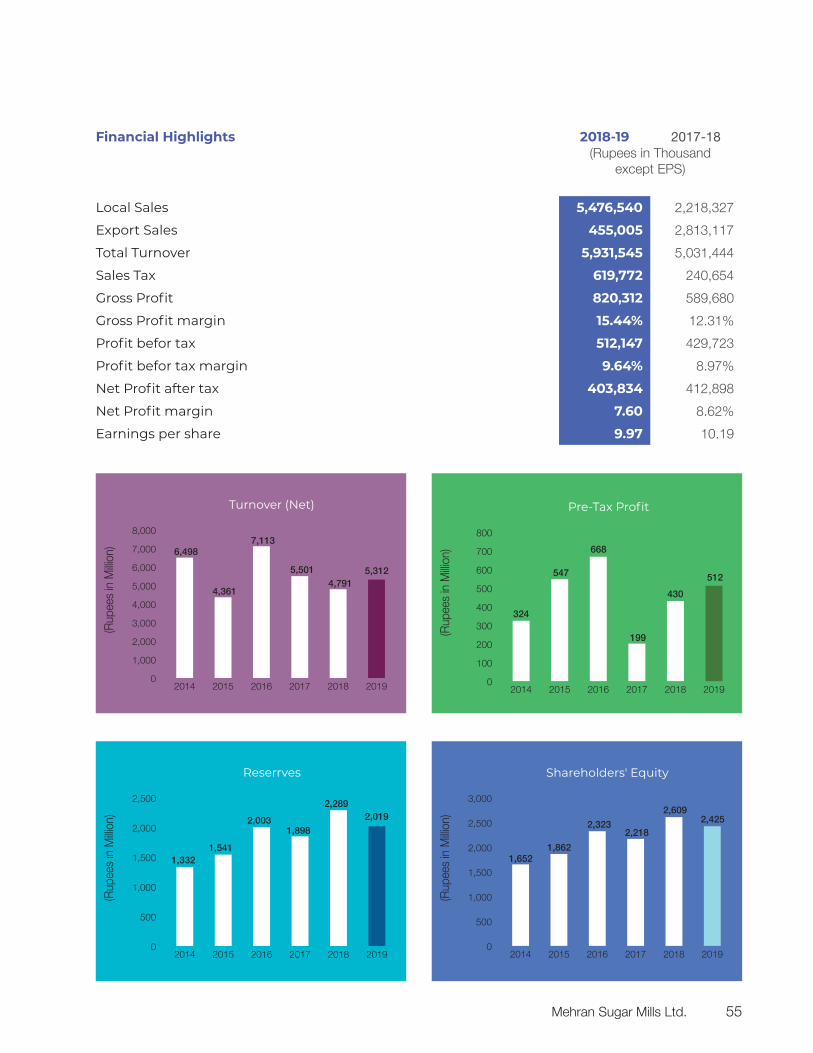
Financial Highlights 2018-19 2017-18(Rupees in Thousand
except EPS)
Local Sales 5,476,540 2,218,327
Export Sales 455,005 2,813,117
Total Turnover 5,931,545 5,031,444
Sales Tax 619,772 240,654
Gross Profit 820,312 589,680
Gross Profit margin 15.44% 12.31%
Profit befor tax 512,147 429,723
Profit befor tax margin 9.64% 8.97%
Net Profit after tax 403,834 412,898
Net Profit margin 7.60 8.62%
Earnings per share 9.97 10.19
Turnover (Net)
0
1,000
2,000
3,000
4,000
5,000
6,000
7,000
8,000
201920182017201620152014
(Rup
ees
in M
illion
)
5,312
6,498
4,361
7,113
5,501 4,791
Reserrves
0
500
1,000
1,500
2,000
2,500
201920182017201620152014
(Rup
ees
in M
illion
) 2,019
1,3321,541
2,0031,898
2,289
Pre-Tax Profit
0
100
200
300
400
500
600
700
800
201920182017201620152014
(Rup
ees
in M
illion
)
512
324
547
668
199
430
Shareholders' Equity
0
500
1,000
1,500
2,000
2,500
3,000
201920182017201620152014
(Rup
ees
in M
illion
) 2,425
1,6521,862
2,3232,218
2,609
Mehran Sugar Mills Ltd. 55
During the year under review, crushing campaign lasted for a relatively shorter duration due to reduction in overall crop size all across the country. Area under cultivation went down considerably over other crops having better returns. In addition, yields also declined considerably due to scarcity of water in the country and climate change. This situation gave rise to increase in cane prices by approximately 10 percentage over and above the minimum support price announced by the provincial government. The increase helped the farmer to regain a part of lower yields. However, this forced mills to pay cash for cane purchase. We must remember that sugar is a seasonal business and thus cane payments are made within 100 days of crushing while sugar is sold all year round. The higher cane prices, prompt payments and high rate of borrowing ballooned our financial expenses and were a major cost increase for the year.
Following factors were primarily responsible for our operational and financial results:
A significant part of total sugar sales consists of last years’ closing stock, where the realized price of sugar was higher than the cost of production. Thereby, gross margin showed comparatively better trend. Overall turnover showed improvement in the wake of increase in selling price of sugar.
Selling prices of both by-products (molasses & bagasse) improved substantially during the year as compared to last year due to decline in production and strong demand of the ethanol and biomass industry. Prices for molasses and Baggasse were 77 and 50 percentage higher respectively.
Cost of sugarcane rose significantly during the year due to the supply and demand scenario.
Reduction in crushing volume also reduced overhead absorption as factory ran for less number of days as compared to previous year and capacity utilization also went down.
Unicol was major contributor to the bottom line. It contributed Rs.379.76
Million during the period under review. However, its hefty contribution was partially reduced by Unifoods share of loss amounting to Rs. 54.88 Million.
Sales volume went down due to considerable reduction in exports, as compared to last year when we exported 74,423 Tons. However this steep decline was partially offset by increase in local sales volume and prices.
Sucrose recovery was 11.44% as compared to 11.52% the previous year but was still one of the highest in the country. This decline was attributed to reduction in crushing volume at the tail end of the season when recoveries are the highest.
The equity market remained under pressure on the back of depressed market participation emanating from high interest rates, poor investor confidence, weak economic conditions, regulatory tightening and continued foreign investor selling during the period. However, as the trend reverses, we expect our portfolio to revalue with handsome gains, as it comprises fundamentally strong scrips.
Dividend income from equity investments contributed Rs. 65 Million as compared to Rs. 38 Million earned during last year.
Finance cost increased due to unprecedented enhancement in policy rate from 6% to 13%. Our policy to make prompt cane payments and need of working capital has more than doubled the financial charges despite lower production. This has affected profitability substantially.
UNICOL LIMITED
Unicol was able to continue its successful operational and financial performance from the preceding year. The Ethanol and CO2 plants operated smoothly and ran at capacity.
The company was able to sell 50,806 Tons of ethanol and 9,933 Tons of CO2 for the year.
Annual Report 201956
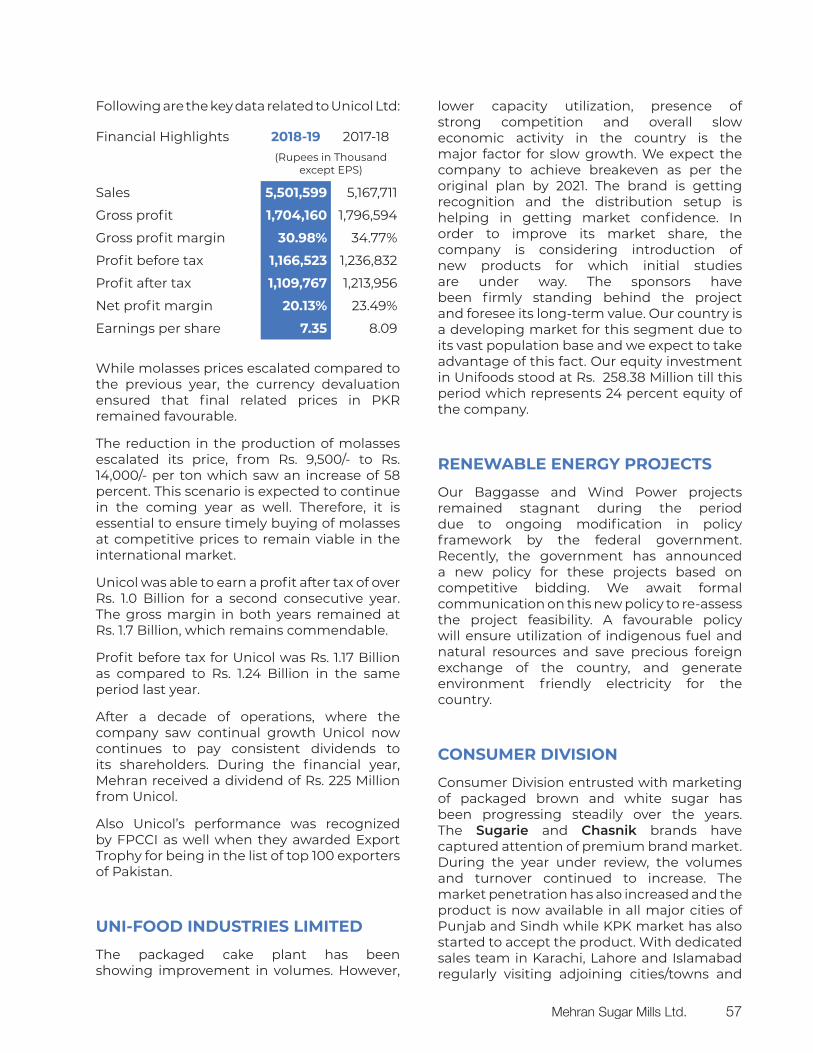
Following are the key data related to Unicol Ltd:
Financial Highlights 2018-19 2017-18(Rupees in Thousand
except EPS)
Sales 5,501,599 5,167,711
Gross profit 1,704,160 1,796,594
Gross profit margin 30.98% 34.77%
Profit before tax 1,166,523 1,236,832
Profit after tax 1,109,767 1,213,956
Net profit margin 20.13% 23.49%
Earnings per share 7.35 8.09
While molasses prices escalated compared to the previous year, the currency devaluation ensured that final related prices in PKR remained favourable.
The reduction in the production of molasses escalated its price, from Rs. 9,500/- to Rs. 14,000/- per ton which saw an increase of 58 percent. This scenario is expected to continue in the coming year as well. Therefore, it is essential to ensure timely buying of molasses at competitive prices to remain viable in the international market.
Unicol was able to earn a profit after tax of over Rs. 1.0 Billion for a second consecutive year. The gross margin in both years remained at Rs. 1.7 Billion, which remains commendable.
Profit before tax for Unicol was Rs. 1.17 Billion as compared to Rs. 1.24 Billion in the same period last year.
After a decade of operations, where the company saw continual growth Unicol now continues to pay consistent dividends to its shareholders. During the financial year, Mehran received a dividend of Rs. 225 Million from Unicol.
Also Unicol’s performance was recognized by FPCCI as well when they awarded Export Trophy for being in the list of top 100 exporters of Pakistan.
UNI-FOOD INDUSTRIES LIMITED
The packaged cake plant has been showing improvement in volumes. However,
lower capacity utilization, presence of strong competition and overall slow economic activity in the country is the major factor for slow growth. We expect the company to achieve breakeven as per the original plan by 2021. The brand is getting recognition and the distribution setup is helping in getting market confidence. In order to improve its market share, the company is considering introduction of new products for which initial studies are under way. The sponsors have been firmly standing behind the project and foresee its long-term value. Our country is a developing market for this segment due to its vast population base and we expect to take advantage of this fact. Our equity investment in Unifoods stood at Rs. 258.38 Million till this period which represents 24 percent equity of the company.
RENEWABLE ENERGY PROJECTS
Our Baggasse and Wind Power projects remained stagnant during the period due to ongoing modification in policy framework by the federal government. Recently, the government has announced a new policy for these projects based on competitive bidding. We await formal communication on this new policy to re-assess the project feasibility. A favourable policy will ensure utilization of indigenous fuel and natural resources and save precious foreign exchange of the country, and generate environment friendly electricity for the country.
CONSUMER DIVISION
Consumer Division entrusted with marketing of packaged brown and white sugar has been progressing steadily over the years. The Sugarie and Chasnik brands have captured attention of premium brand market. During the year under review, the volumes and turnover continued to increase. The market penetration has also increased and the product is now available in all major cities of Punjab and Sindh while KPK market has also started to accept the product. With dedicated sales team in Karachi, Lahore and Islamabad regularly visiting adjoining cities/towns and
Mehran Sugar Mills Ltd. 57
publicity campaign on social media awareness has enlarged. With more emphasis on its quality, packaging and health benefits, we are also spending on automation of production process to make it more safe and healthy.
FUTURE OUTLOOK
In view of better and timely returns to growers during the current season, February 2019 plantation of sugarcane has already seen some improvement and we expected the September 2019 sowing also to be progressive. This is sigh of relief for industry as it may allow mills to attain better capacity utilisation in season 2020-21. However, it is important that policy framework regarding sugarcane and sugar pricing may be rationalized once for all by taking all stakeholders into confidence to avoid continuous litigation and dispute. What the country needs is a formula determining the price of sugar according to the price of sugarcane. An early solution to this will prove beneficial to the government, growers, millers and consumer in the long run.
While 2019-2020 will be a shorter crop we feel beyond 2020 we could again see larger crops in the country. However sugar price improvement is essential to make it feasible for mills to pay enhanced support price. This would create a level playing field for all stakeholders whereby the farmer and the miller is assured of fair return on investment and long term sustainability of the crop is preserved.
The provincial government of Punjab has notified a minimum support price of Rs.190 per 40 kilograms and Sindh Government has notified Rs.192 as minimum support price however the Sind government continues to include QP in the price which gives an unfair advantage to one province having to pay a higher price than the other. The sugarcane harvesting has been very slow so far and mills are running at low capacities. Farmers are expecting higher cane prices and are thus waiting to harvest substantial quantities. We expect the harvest to normalise by the end of the year or latest by January.
The initial crop survey shows that sugarcane acreage is again lower by 20 percentage however better crop management has ensured that yields are much better than last year and might compensate the lower acreage. With the lower crop, we expect supply and demand equilibrium for the next year. This would provide level playing field for stakeholders. However, the industry is still uncertain about export subsidy payment pending from provincial government for more than a year now. As of today our pending subsidy amount is Rs. 298.90 Million which has increased our financial expenses.
Considering sugar remains a seasonal business, we average our sales across the year while we pay our farmer promptly thus the cost of holding sugar and the associated higher interest rates will have a large impact on our cost structure. In addition, Pak Rupee depreciation by 20% and rapidly rising
Annual Report 201958
inflation will also have their effect on overall profitability as it has increased our cost of goods sold as well as our cost of maintenance.
Thus, an effective sales strategy will be cruicial in ensuring healthy and sustainable financial results. The measures in the Federal Budget pertaining to documentation of sales have dampened market sentiment though its applicability has been deferred till January 2020. However, we hope this is a temporary phase and the market is expected to rebound soon after getting used to these measures.
In spite of all these challenges, we sincerely look forward to another good year in view of better operating margins. Higher realized value for sugar, molasses and bagasse should continue to keep the company competitive and profitable. Unicol will continue to pay healthy dividends throughout the year which shall contribute positively although its input cost is expected to increase. The stock market is also expected to rebound after persistent bearish spell and will bring better results to our profitability. While we have paid higher sugarcane purchase price due to lower harvest, we anticipate an improvement in sugar selling price. Future profitability largely depends on the overall crop for the year as well as of sugar price for the entire year however we are confident of positive outcome.
ACKNOWLEDGMENT
We are trying to build a stable and long-term future focused on stakeholder’s satisfaction. In achieving this objective, we would like to appreciate the devotion and efforts of the workers, staff and executives and anticipate that in the future as well; they will continue to contribute towards the enhancement of the productivity and well-being of the Company with greater zeal and spirit. The Board further extends its gratitude to the government functionaries, associations, banking and financial institutions, shareholders and vendors for their valued support and co-operation for the betterment and prosperity of the Company. Detailed report on Company’s effort towards CSR and compliance of corporate governance regulations and Pattern of Shareholding as at September 30, 2019 are annexed in the report.
For and on behalf of the Board of Directors
Mohammed Muhammad Ebrahim Hasham Iqbal Chief Executive Officer Director
Karachi: December 30, 2019
Mehran Sugar Mills Ltd. 59

CORPORATE GOVERNANCE FRAMEWORKCorporate Governance Framework
Board of Directors
The Board of Directors of the Company consists of eight members, comprising two independent, four nonexecutive (including the Chairman) and two executive Directors. The Board is responsible for independently and transparently monitoring the performance of the Company and taking strategic decisions to achieve sustainable growth in the Company operations. Written notices of the Board meetings were sent to the members seven days before the meetings.
During the year under review, four meetings of the Board convened and the attendance of the members was as follows:
S. No. Name of Directors Meetings attended
1 Mr. Mohammed Kasim Hasham 4
2 Mr. Mohammed Ebrahim Hasham 3
3 Mr. Mohammed Hussain Hasham 3
4 Mr. Khurram Kasim 3
5 Mr. Ahmed Ebrahim Hasham 4
6 Mr. Muhammad Iqbal 4
7 Dr. Amjad Waheed 1
8 Mr. Muhammad Bashir 2
The leave of absence was granted to the directors who could not attend some of the meetings due to being out of country or ill health.
Directors’ Remuneration
The Board of Directors has approved a “Remuneration Policy for Directors”; the salient features of which are:
The Company will not pay any remuneration to its non-executive directors except as
meeting fee for attending the Board and its Committee meetings.
The remuneration of a director for attending meetings of the Board of Directors or its Committees shall from time to time be determined and approved by the Board of Directors.
A director shall be provided or reimbursed for all travelling, boarding, lodging and other expenses incurred by them for attending meetings of the Board, its Committees and / or General Meetings of the Company.
Statement of Ethics & Business Practices
The Board has adopted the statement of Ethics & business practices. All employees are informed of this statement and are required to observe these rules of conduct in relation to customers, suppliers and regulations.
Audit Committee
The Audit Committee of the Company comprises of three non-executive and one independent (the Chairman) Directors. Four meetings of the audit committee were held during the year. Attendance of the members was as follows:
S. No. Name of Directors Meetings attended
1 Dr. Amjad Waheed (Chairman) 1
2 Mr. Mohammed Hussain Hasham 3
3 Mr. Khurram Kasim 3
4 Mr. Muhammad Iqbal 4
Annual Report 201960
The leave of absence was granted to the members who could not attend some of the meetings due to being out of country or ill health.
Human Resource and Remuneration Committee
The committee comprises of 4 non-executive members, the Chairman of the committee is an independent Director. During the year two meetings of the committee were held. Attendance of the members was as follows:
S. No. Name of Directors Meetings attended
1 Dr. Amjad Waheed (Chairman) -
2 Mr. Mohammed Kasim Hasham 1
3 Mr. Mohammed Ebrahim Hasham 2
4 Mr. Khurram Kasim 1
External Audit
The Company wishes to place on record its appreciation for the services rendered by the Company’s auditors M/s. EY Ford Rhodes, Chartered Accountants, who have completed the audit of financial statements of the Company for the year ended September 30, 2019. M/s EY Ford Rhodes, Chartered Accountants, being eligible, have offered themselves for re-appointment for the year ending September 30, 2020, Audit Committee has also recommended for re-appointment, however shareholders approval for the said appointment will be sought in AGM.
Corporate & Financial Reporting Framework
As required by the Code of Corporate Governance, your Directors are pleased to report that:
The financial statements, prepared by the management of the Company, fairly present its state of affairs, the result of its operations, cash flows and changes in equity;
The Company has maintained proper books of accounts as required under the law;
Appropriate accounting policies have been consistently applied in preparation of financial statements and accounting estimates are based on reasonable and prudent judgment;
International Financial Reporting Standards, as applicable in Pakistan, have been followed in preparation of financial statements and any departures there from has been adequately disclosed and explained;
There are no significant doubts upon the Company’s ability to continue as a going concern;
The summary of key operating and financial data for last six years is annexed;
The Company has made contribution towards the national exchequer in the form of Federal, Provincial and local taxes and levies; as disclosed in annexed Financial Statements.
The Company has proposed the final cash dividend of PKR 1.00 per share (i.e. 10%) and final bonus shares of 15 shares per 100 shares held (i.e. 15%) subject to the approval of shareholders in the upcoming Annual General Meeting scheduled to be held on January 28, 2020.
The Company is operating a Provident Fund Scheme for its permanent employees. The value of the fund as at September 30, 2019 was Rs. 180 million (un-audited);
There is also an un-funded gratuity scheme. On the basis of actuarial valuation conducted during 2019, a net liability of Rs. 4.762 million as at September 30, 2019 has been provided;
Mehran Sugar Mills Ltd. 61
The Pattern of Shareholding as at 30th September, 2019 is annexed;
Adequacy of Internal Financial Controls
The system of internal control is sound in design and has been effectively implemented and monitored, we confirm compliance of Corporate Governance with highest standard.
Certificate of Related Parties Transactions
It is confirmed that the transactions entered with related parties have been verified by the audit committee and the Board, and provides the information about the amount due from related parties at the balance sheet date, and the proportion of receivables from related parties provided as doubtful debts, if any.
Material Changes
There have been no material changes since September 30, 2019 and the Company has not entered into any commitment, which would affect its financial position at the date.
Mohammed Muhammad Ebrahim Hasham Iqbal Chief Executive Officer Director
Karachi: December 30, 2019
Annual Report 201962
CORPORATE SOCIAL RESPONSIBILITY
RESPONSIBILITY TO STAKEHOLDER
Investment in Human Capital
Focus on our human capital is one of the core areas of our corporate strategy. The Company regards its employee relations far more importantly than a mere legal and ethical obligation. We are committed to creating a culture for our most valued asset, comprising of satisfactory compensation and benefits, congenial and safe working environment, job satisfaction, professional growth, development and competitive career opportunities.
Our employee-training program is being continually upgraded to remain in line with the changing needs of our Company and industry. During this year, we continued to invest in our Human Resource through training programs at PIM, MAP and In-house Technical Trainings through UIT and NED University as well. A 16 members from the Mehran team spent 2 days in Karachi attending the PSST sugar conference. Our Electrical department Chief Engineer has delivered a paper on Synchronous Condenser Reactive Power Compensation and has got the best paper of PSST 2019-20.
We have engaged BMA a renowned technical consultant from Germany for evaluation of our plant heat mass balance, boilers steam efficiencies and to educate us for installation of FFEs in context of our 26.5 MW power project. During the exercise, our technical team along with our sugar technology partner IPRO has developed a great synergy with BMA and our technical team learnt a lot in context of defined areas. BMA also shared a comprehensive report covering their scope of engagement. Based on positive feedback of our Technical team we look forward to working with BMA in future by developing a long-standing relationship with them.
Investment in our Working Environment
We have in the last 5 years invested Rs. 67.0 million on uplifting our working environment for employees at both Head office and Mills. At the mill, our Management House and technical House have been modernized. Last year, we have invested 10.05 million on Construction of So-safe drinking water filter plant and Colony residence repair maintenance by considering our responsibility to provide improved facilities to our workers and staffs at our mills. This year, we have invested 35 million on Water conservation EMP plan in order to conserve Canal water and utilizing Sugarcane water for the processes. The entire boundary wall facing the main road has been re-built; in addition, pavers have been laid in most parts of the residential colony and the factory area walkways.
Investment in employee HSE
MSML employees are at the heart of the corporate strategy of the Company. The core objective of the Company is to create conducive working environment, in line with the best industrial practices and ensuring adherence to the requirements of the health and safety codes. The HSE department is entrusted with the responsibility of monitoring of HSE compliance and ensures mandatory usage of relevant safety equipment at work for workers. Continuing the standard practice this year the HSE department has conducted a three days’ workshop on safety training which seasonal contractors’ supervisory staff also attended. In addition to this Annual third party external environmental & safety audits, scheduled internal audit & inspection were performed. Through demonstrations safety observation culture was promoted to eliminate
Mehran Sugar Mills Ltd. 63
hazards which may lead to accidents, more than 3000 safety observations were made. For the awareness of employees and contractors, Global Health and Safety/ Environmental Days were also observed during the year.
Contribution towards Education in Rural Pakistan
We strongly believe that every sugar mill must play its role to assist in strengthening the educational environment around its vicinity. Since sugar mills are located in the rural areas of Pakistan they have an ideal opportunity to contribute where the need for education is most extreme.
One of the core initiatives of our social development programs is to provide education in the rural areas specifically near our mill premises. For this reason, three schools are running to provide quality education to our students.
Daood Memorial School (DMS)
The school is situated within the premises of the mills primarily for our employees and generally for the youth of the surrounding areas. Since its incorporation in 1998-99, the Company is providing full operational, financial and logistic support to the school. By the grace of God, and continuous efforts of the management and the teachers, the school is growing steadily, currently 490 students are enrolled, and 21 faculty members are entrusted to provide quality education. While the number of students increases, we have continued to ensure that there is no compromise on the education standards of the schools. This is benchmarked through teacher training programs as well as results of our students.
Collaboration with TCF
We have built and supported three schools with The Citizens Foundation (TCF - a renowned NGO) in rural vicinities of Sindh. These school all staff belonging to the nearby communities. These campuses have generated employment for the local women to earn a decent living. For establishment of such Schools MSM has contributed a Sum of Rupees 36.96 Million apart from the operational support. Presently more
than 800 students are enrolled with these campuses coupled with more than 50 faculty members. Our first supported School in Piyaro Lund area, 13 Kms from our factory is operational since 2011 the other two supported schools situated within the locality of 12 – 18 Kms from our factory premises were came in operation in 2016 & 2018.
Vocational training
In order to bring some improvement in life style of the women of surrounding areas, a Vocational training Centre has been established within the MSML Staff Colony, which provides basic training to the women of the colony and surrounding areas for sewing, embroidery, cooking and stitching to the women of the colony and surrounding areas. This year the entire center has been renovated to give a modern look. At present, the vocational center is providing training to 16 plus women in multiple faculties.
Health services
Our flagship project in hospitality ambit Usman Memorial Hospital (UMH) has recently gone through major renovation in terms of building, equipment and facilities, to meet the requirements of modern era; UMH is now a 100 bed air conditioned state-of-the-art hospital. It caters to the needs of our communities, providing quality care at affordable rates. UMH has a wide range of services to offer by a great team of doctors and surgeons on our panel. Mehran supported & contributed immensely in this project and in preceding two years, we have donated a sum of Rs. 69.7million to UMH. Our efforts in this regard were also recognized by Pakistan Centre of Philanthropy and gave Mehran an award under the category of “Corporate Philanthropy and Sustainable Development Goals in Pakistan”.
The Company recognizes its responsibility towards provision of health services in the surrounding areas of Tando Allahyar. The MSML mobile dispensary unit has been operational since 2004. The dispensary is fully equipped and provides basic health care services to the needy free of cost. A dedicated full time trained relevant medical staff have been assigned for this unit. Since its establishment,
Annual Report 201964
the dispensary has treated a quantum of more than 65,000 patients. In addition, before the start of crushing season every year, all seasonal workers and checked by the doctor for physical fitness for the relevant job.
Farmer support services
We believe that the farmers are the enablers of our sustainable growth. Throughout the year, the Company’s representatives interact with the farmers to share the latest research and developments in emerging new varieties of sugarcane and providing them seeds to grow high yielding sugarcane crop. Our supply of seed as loan to growers has been extremely beneficial in ensuring a better crop in our area.
We cultivate high yielding varieties at our farms and after cultivating them for three years, we give them on loan to farmers for commercial purposes. This program has been a major benefactor to create rural wealth in our region for both miller and farmer as it has helped improve both farm and factory yields.
Customer satisfaction
Mehran Sugar Mills limited is always keen to produce premium quality sugar, which qualifies international as well as “PSQCA” standards. Accordingly, the Company is in the process of establishing the Quality Management System based on the requirements of ISO 9001:2015 standards. For quality assurances management, a dedicated management representation is entrusted to implement and monitor the implementation of relevant policies.
RESPONSIBILITY TO SOCIETY
Power generation
Energy is considered to be the lifeline of any economy and the most vital instrument of socioeconomic development of a country. Pakistan’s sugar industry has the potential to contribute 1,500 MW of renewable energy through biomass fuel like bagasse. Power generation from bagasse will not only reduce import bill of furnace oil but also efficient use
of bagasse is environment-friendly and would help mitigate greenhouse gas emissions from the country’s power sector.
Seeking the opportunity to contribute its share to the national grid, Mehran Sugar Mills limited has obtained the power generation license from national power Regulatory Authority (NEPRA) and made necessary investments to connect to the national grid. Further, MSML successfully negotiated a Power purchase agreement with HESCO for supply of 5 MW. Power supply has started from January 2015. The success of this 5 MW power plant stimulate us to initiate Co-generation on larger scale, we are in the process of setting up a 26.5 MW Co-generation Power Plant.
Governance structure
The Company’s governance structure has helped to achieve best practice and drive performance from the boardroom to our employees, customers, society and the environment. The business integrity has led to long term success and we are committed to conduct our business responsibility and with integrity with an aim to strengthen our reputation. We pledge to observe all the governing laws of the jurisdiction in which we operate and to comply with the best practices of the code of corporate governance.
Contribution towards economy
The Company is a noteworthy contributor to the national economy and has contributed to the national exchequer Rs. 662 million in respects of payments towards Federal excise duty, income tax and other statutory levies. Our associated company UNICOL Limited was also able to export USD 38million of ethanol in the last financial year.
RESPONSIBILITY TO ENVIRONMENT
Mehran is highly conscious of ensuring that its production facility is environmentally compliant in all respects. We are conscious that it’s our responsibility to ensure compliance so as to be of no concern to the communities where we operate. We strive to make sure that the impact of our business is sustainable.
Mehran Sugar Mills Ltd. 65
Emission and discharges
Mehran is proud to state that we are one of the few mills in Pakistan, which has installed modern fly ash systems on 100% of its boilers thus ensuring zero fly ash discharge. The Company has invested approximately Rs. 80 million in the last five years on installing this system as well as maintaining it to ensure it runs at capacity and functions accordingly.
Waste Water Treatment
Over the last 3 years, we at Mehran have been striving to create an efficient waste water management system. We have recently completed stage three of our water discharge system whereby we have accomplished 90 percent reuse of waste water at the plant. The remaining water is used in our farms adjoining the factory. We have invested a total of Rs. 162 Million on the project and are proud to state that our waste water system was created in house by our capable engineering team. This plant is operational now and is only second of its kind in the entire sugar industry of the country.
Plantation Drive
We as a nation and responsible citizens need to understand the importance of plantation and must focus upon making our country green. Besides, community awareness and inculcation of civic sense is the need of time. We as a Company will ensure playing its role in this field accordingly this year, we have planted more than 5,000 Trees in the vicinity of our Mills, Colony, and adjacent areas.
For and on behalf of the Board of Directors
Mohammed Muhammad Ebrahim Hasham Iqbal Chief Executive Officer Director
Karachi: December 30, 2019
Annual Report 201966
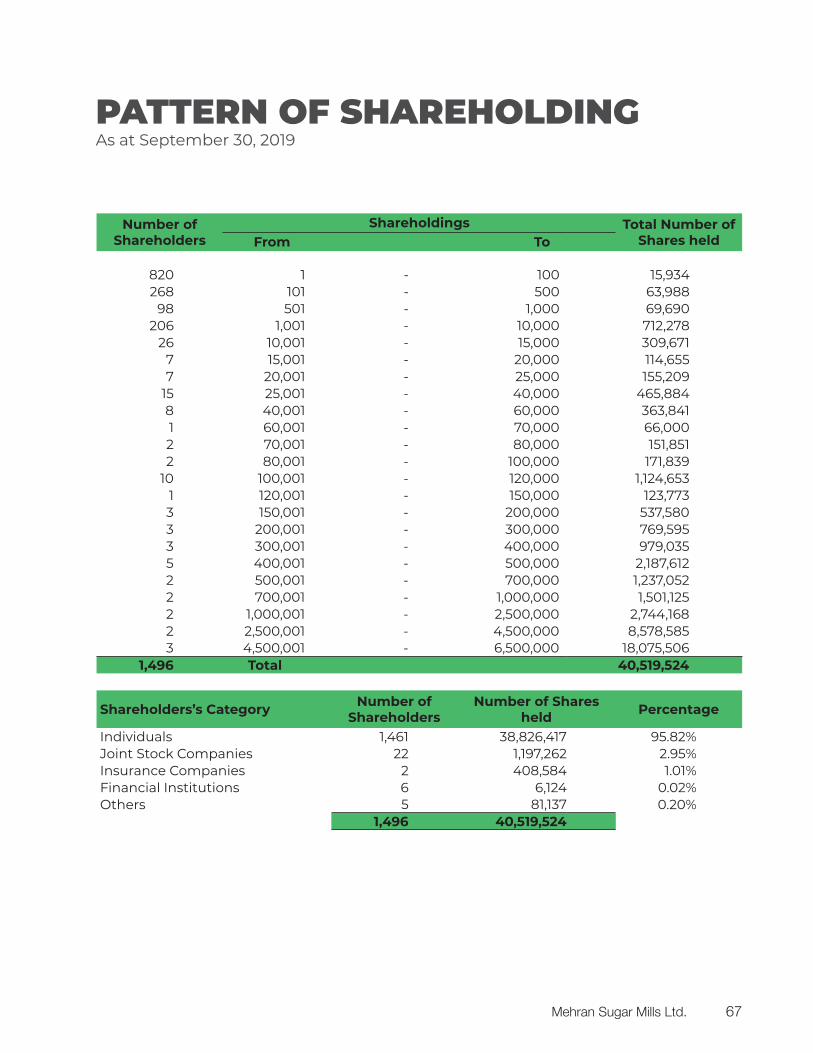
PATTERN OF SHAREHOLDINGAs at September 30, 2019
Number ofShareholders
Shareholdings Total Number ofShares heldFrom To
820 1 - 100 15,934 268 101 - 500 63,988
98 501 - 1,000 69,690 206 1,001 - 10,000 712,278
26 10,001 - 15,000 309,671 7 15,001 - 20,000 114,655 7 20,001 - 25,000 155,209
15 25,001 - 40,000 465,884 8 40,001 - 60,000 363,841 1 60,001 - 70,000 66,000 2 70,001 - 80,000 151,851 2 80,001 - 100,000 171,839
10 100,001 - 120,000 1,124,653 1 120,001 - 150,000 123,773 3 150,001 - 200,000 537,580 3 200,001 - 300,000 769,595 3 300,001 - 400,000 979,035 5 400,001 - 500,000 2,187,612 2 500,001 - 700,000 1,237,052 2 700,001 - 1,000,000 1,501,125 2 1,000,001 - 2,500,000 2,744,168 2 2,500,001 - 4,500,000 8,578,585 3 4,500,001 - 6,500,000 18,075,506
1,496 Total 40,519,524
Shareholders’s Category Number ofShareholders
Number of Sharesheld Percentage
Individuals 1,461 38,826,417 95.82%Joint Stock Companies 22 1,197,262 2.95%Insurance Companies 2 408,584 1.01%Financial Institutions 6 6,124 0.02%Others 5 81,137 0.20%
1,496 40,519,524
Mehran Sugar Mills Ltd. 67
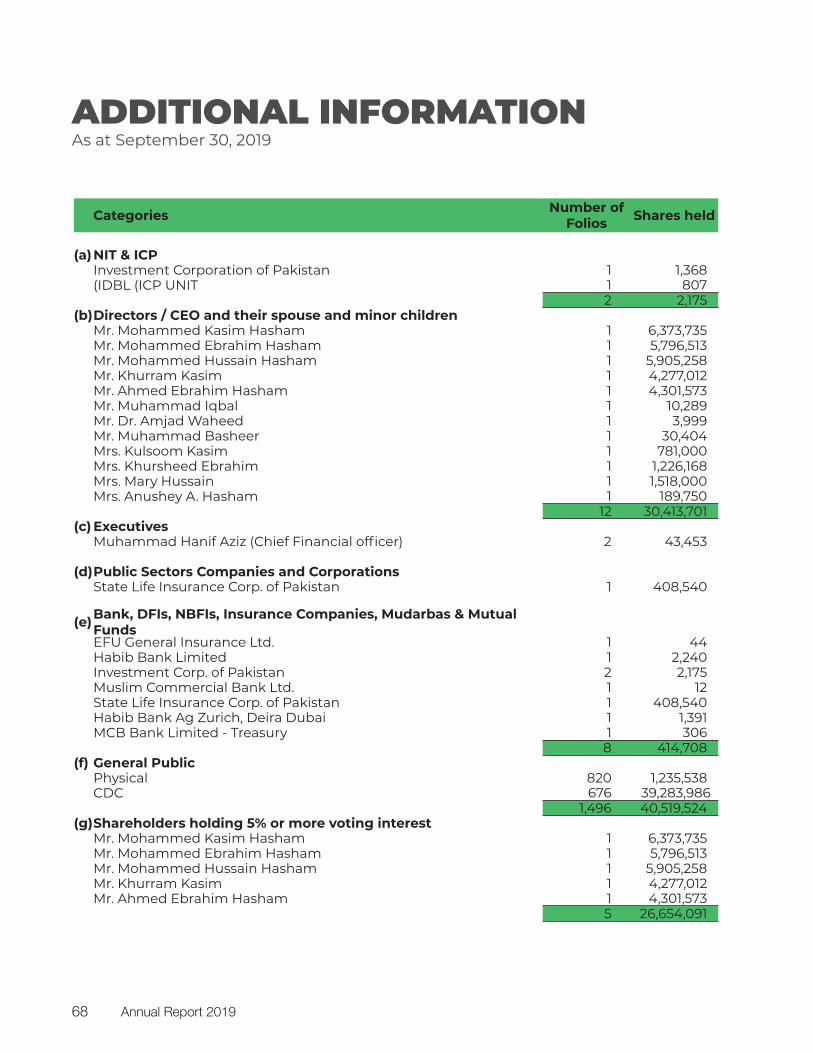
ADDITIONAL INFORMATIONAs at September 30, 2019
Categories Number ofFolios Shares held
(a)NIT & ICPInvestment Corporation of Pakistan 1 1,368 (IDBL (ICP UNIT 1 807
2 2,175 (b)Directors / CEO and their spouse and minor children
Mr. Mohammed Kasim Hasham 1 6,373,735 Mr. Mohammed Ebrahim Hasham 1 5,796,513 Mr. Mohammed Hussain Hasham 1 5,905,258 Mr. Khurram Kasim 1 4,277,012 Mr. Ahmed Ebrahim Hasham 1 4,301,573 Mr. Muhammad Iqbal 1 10,289 Mr. Dr. Amjad Waheed 1 3,999 Mr. Muhammad Basheer 1 30,404 Mrs. Kulsoom Kasim 1 781,000 Mrs. Khursheed Ebrahim 1 1,226,168 Mrs. Mary Hussain 1 1,518,000 Mrs. Anushey A. Hasham 1 189,750
12 30,413,701 (c) Executives
Muhammad Hanif Aziz (Chief Financial officer) 2 43,453
(d)Public Sectors Companies and CorporationsState Life Insurance Corp. of Pakistan 1 408,540
(e) Bank, DFIs, NBFIs, Insurance Companies, Mudarbas & MutualFundsEFU General Insurance Ltd. 1 44 Habib Bank Limited 1 2,240 Investment Corp. of Pakistan 2 2,175 Muslim Commercial Bank Ltd. 1 12 State Life Insurance Corp. of Pakistan 1 408,540 Habib Bank Ag Zurich, Deira Dubai 1 1,391 MCB Bank Limited - Treasury 1 306
8 414,708 (f) General Public
Physical 820 1,235,538 CDC 676 39,283,986
1,496 40,519,524 (g)Shareholders holding 5% or more voting interest
Mr. Mohammed Kasim Hasham 1 6,373,735 Mr. Mohammed Ebrahim Hasham 1 5,796,513 Mr. Mohammed Hussain Hasham 1 5,905,258 Mr. Khurram Kasim 1 4,277,012 Mr. Ahmed Ebrahim Hasham 1 4,301,573
5 26,654,091
Annual Report 201968
30
2019 30
Mehran Sugar Mills Ltd. 69
2019-20
40 190 2019-2040 192
2020 2019
20
298.90
20
2020
Annual Report 201970
2021
258.3824
PackagedChashnik Sugarie
20192019
2020-21
Mehran Sugar Mills Ltd. 71
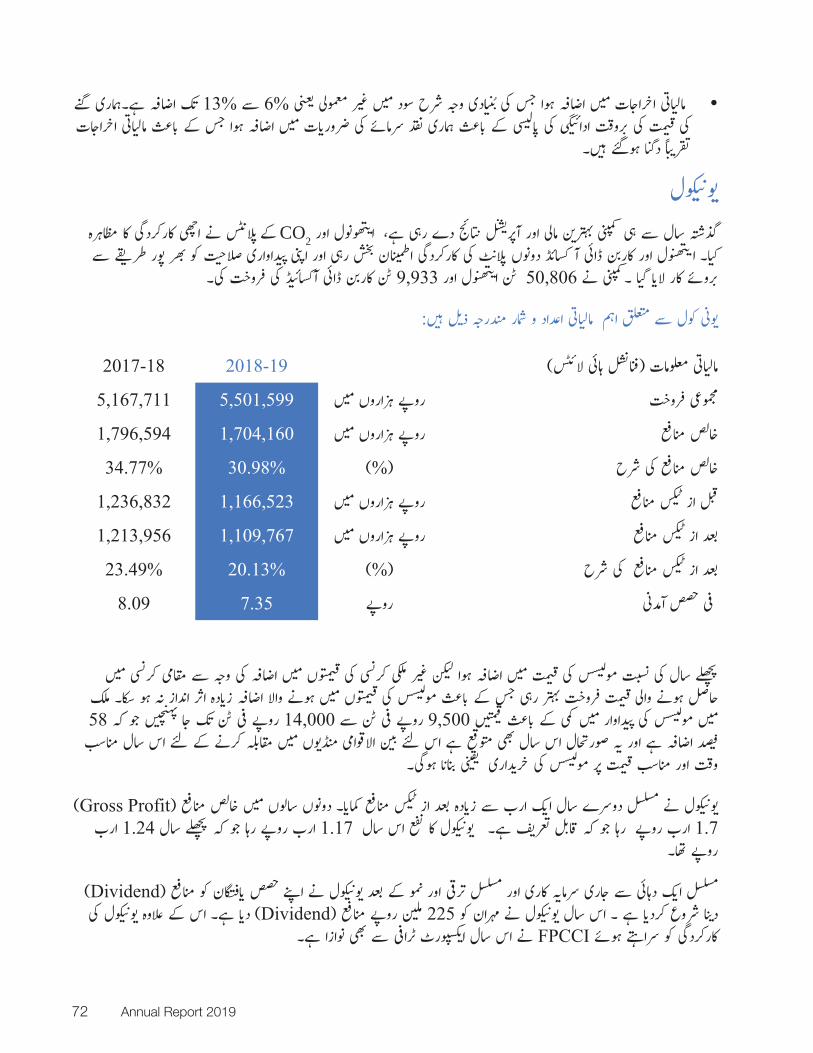
13% 6%
CO2
9,933 50,806
2017-18 2018-195,167,711 5,501,5991,796,594 1,704,16034.77% 30.98%
1,236,832 1,166,5231,213,956 1,109,76723.49% 20.13%
8.09 7.35
58 14,000 9,500
Gross Profit1.24 1.17 1.7
DividendDividend 225
FPCCI
Annual Report 201972
10
100 100
Gross Profit Margin
50 77
379.7654.87
74,423
11.44% 11.52%
38 65
Mehran Sugar Mills Ltd. 73
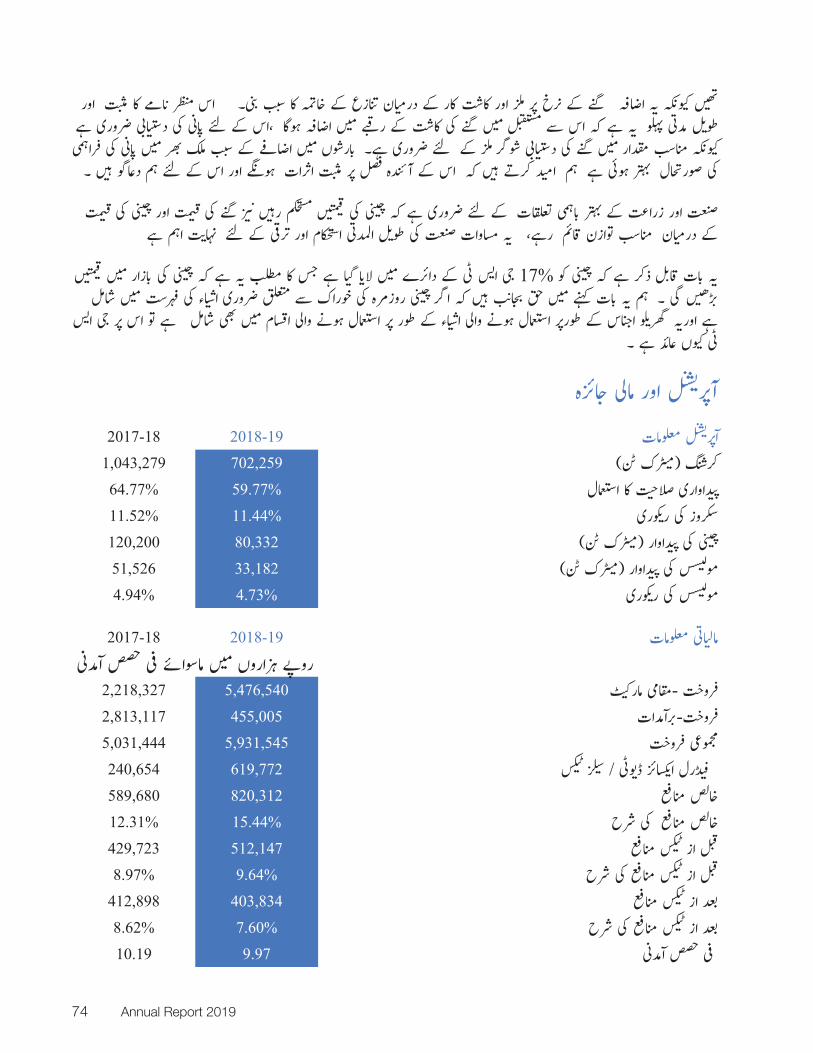
17%
2017-18 2018-191,043,279 702,25964.77% 59.77%11.52% 11.44%120,200 80,33251,526 33,1824.94% 4.73%
2018-192017-18
5,476,5402,218,327455,0052,813,117
5,931,5455,031,444619,772240,654820,312589,68015.44%12.31%512,147429,7239.64%8.97%
403,834412,8987.60%8.62%9.9710.19
Annual Report 201974
3.94 20190.85
20203.51.66 2019
51.98Fitch 2018
34 2019
2018-19
65.50
300,000
CPEC
2018-197.5 5.5
Mehran Sugar Mills Ltd. 75
1913 196512,500
33.33 2004200,000
722017
26.5
20195.5 3.3 2019
FATF13.6 IMF)
6.3 19.8 4.87 32
21.84 10 52.38 56.5924.77
14.48 24.43.829 2019
4.398 3.84211.5
5.55 2020
13
Annual Report 201976
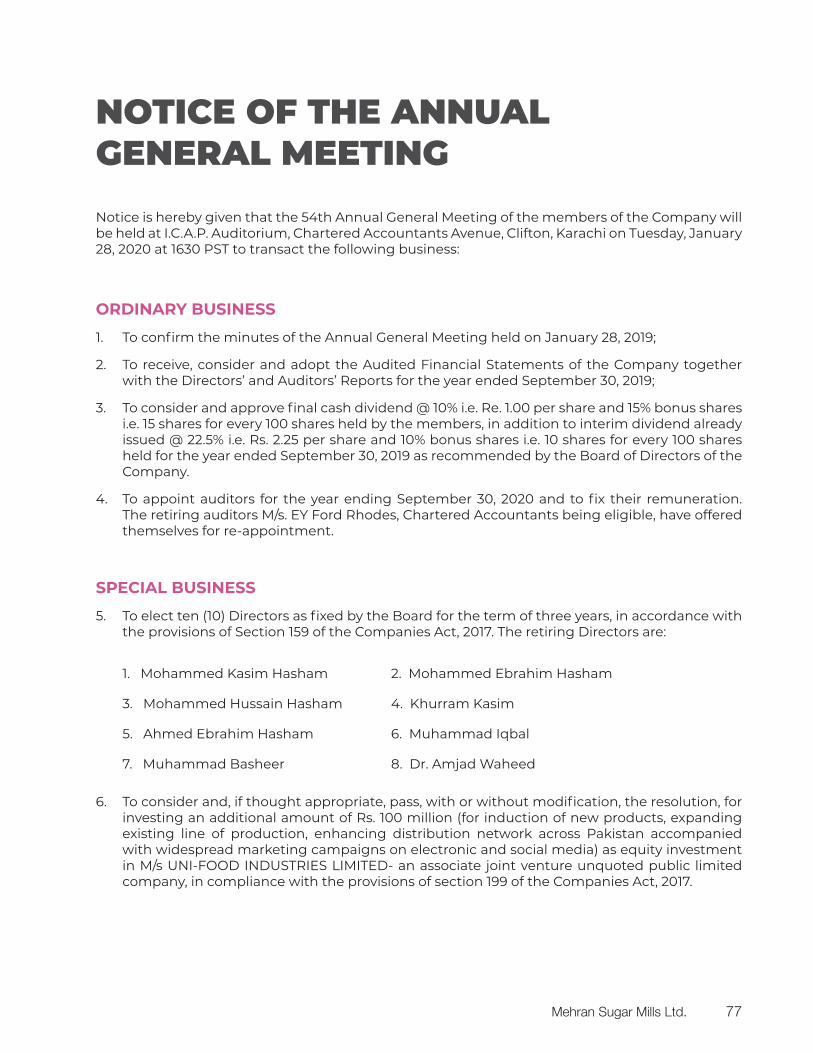
NOTICE OF THE ANNUALGENERAL MEETINGNotice is hereby given that the 54th Annual General Meeting of the members of the Company will be held at I.C.A.P. Auditorium, Chartered Accountants Avenue, Clifton, Karachi on Tuesday, January 28, 2020 at 1630 PST to transact the following business:
ORDINARY BUSINESS
1. To confirm the minutes of the Annual General Meeting held on January 28, 2019;
2. To receive, consider and adopt the Audited Financial Statements of the Company together with the Directors’ and Auditors’ Reports for the year ended September 30, 2019;
3. To consider and approve final cash dividend @ 10% i.e. Re. 1.00 per share and 15% bonus shares i.e. 15 shares for every 100 shares held by the members, in addition to interim dividend already issued @ 22.5% i.e. Rs. 2.25 per share and 10% bonus shares i.e. 10 shares for every 100 shares held for the year ended September 30, 2019 as recommended by the Board of Directors of the Company.
4. To appoint auditors for the year ending September 30, 2020 and to fix their remuneration. The retiring auditors M/s. EY Ford Rhodes, Chartered Accountants being eligible, have offered themselves for re-appointment.
SPECIAL BUSINESS
5. To elect ten (10) Directors as fixed by the Board for the term of three years, in accordance with the provisions of Section 159 of the Companies Act, 2017. The retiring Directors are:
1. Mohammed Kasim Hasham 2. Mohammed Ebrahim Hasham
3. Mohammed Hussain Hasham 4. Khurram Kasim
5. Ahmed Ebrahim Hasham 6. Muhammad Iqbal
7. Muhammad Basheer 8. Dr. Amjad Waheed
6. To consider and, if thought appropriate, pass, with or without modification, the resolution, for investing an additional amount of Rs. 100 million (for induction of new products, expanding existing line of production, enhancing distribution network across Pakistan accompanied with widespread marketing campaigns on electronic and social media) as equity investment in M/s UNI-FOOD INDUSTRIES LIMITED- an associate joint venture unquoted public limited company, in compliance with the provisions of section 199 of the Companies Act, 2017.
Mehran Sugar Mills Ltd. 77
A Statement under Section 134(3) of the Companies Act, 2017 containing material facts in respect of Investment in above company is attached herewith.
7. To apprise and review the status of investments in Associated Companies, for which statement as required by S.R.O 27(I)/2012 dated January 16, 2012 is being sent to the shareholders.
8. To transact any other business with the permission of the Chair.
By order of the of Board of Directors
Sumair Ali KhanCompany Secretary
Karachi: January 03, 2020
NOTES
1. The share transfer books of the Company will remain closed from January 22, 2020 to January 28, 2020 (both days inclusive).
2. A member entitled to attend and vote at the Annual General Meeting may appoint another member as his/her proxy to attend and vote in his/her behalf. Proxies in order to be effective must be received by the Company at its Registered Office not later than 48 hours before the time fixed for holding the Annual General Meeting.
3. The shareholders whose shares are registered in their account/sub-account with Central Depository System (CDS) are requested to bring their CNIC along with their account number in CDS and participant’s ID number for verification. In case of appointment of proxy by such account holders and sub-account holders the guidelines as contained in SECP’s circular 1 of 26th January, 2000 to be followed.
4. The shareholders are requested to notify the Company immediately the change in their address, if any.
5. The shareholders are also requested to intimate us their CNIC # to implement the requirements of Annual Returns (Form A) which the Company is required to file with the SECP under section 130 of the Companies Act 2017.
Annual Report 201978
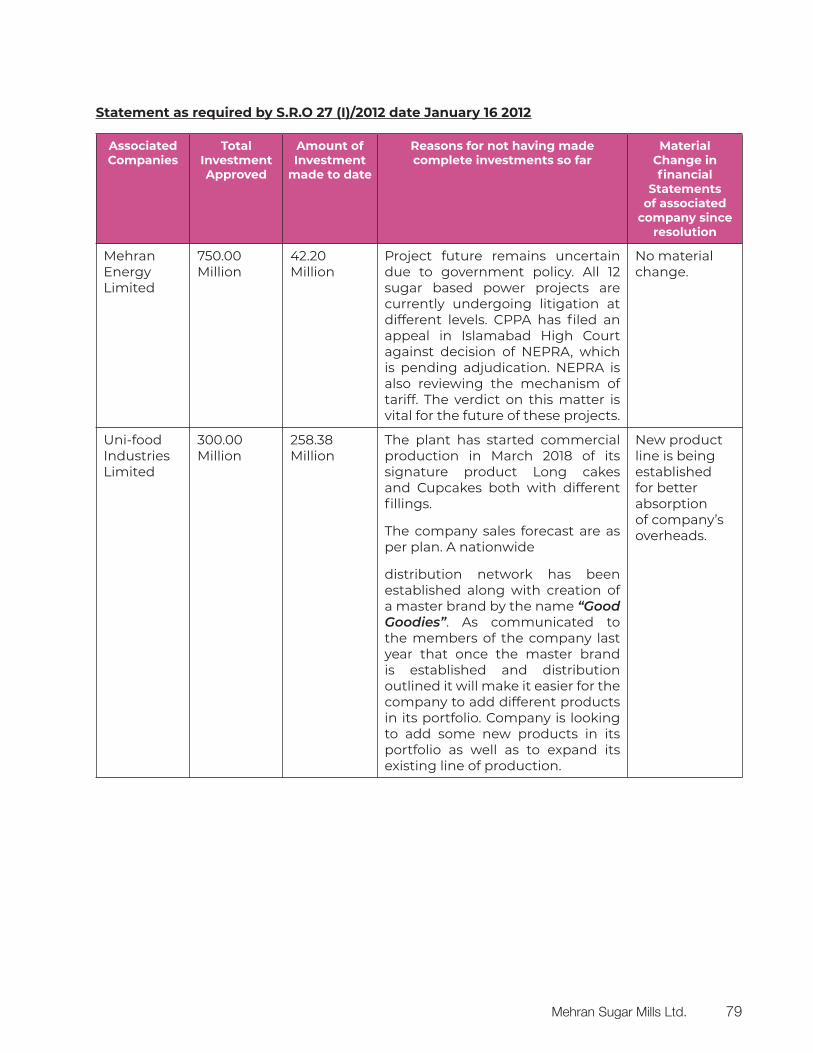
Statement as required by S.R.O 27 (I)/2012 date January 16 2012
Associated Companies
Total Investment Approved
Amount of Investment
made to date
Reasons for not having made complete investments so far
Material Change in financial
Statements of associated
company since resolution
Mehran Energy Limited
750.00 Million
42.20 Million
Project future remains uncertain due to government policy. All 12 sugar based power projects are currently undergoing litigation at different levels. CPPA has filed an appeal in Islamabad High Court against decision of NEPRA, which is pending adjudication. NEPRA is also reviewing the mechanism of tariff. The verdict on this matter is vital for the future of these projects.
No material change.
Uni-food Industries Limited
300.00 Million
258.38 Million
The plant has started commercial production in March 2018 of its signature product Long cakes and Cupcakes both with different fillings.
The company sales forecast are as per plan. A nationwide
distribution network has been established along with creation of a master brand by the name “Good Goodies”. As communicated to the members of the company last year that once the master brand is established and distribution outlined it will make it easier for the company to add different products in its portfolio. Company is looking to add some new products in its portfolio as well as to expand its existing line of production.
New product line is being established for better absorption of company’s overheads.
Mehran Sugar Mills Ltd. 79
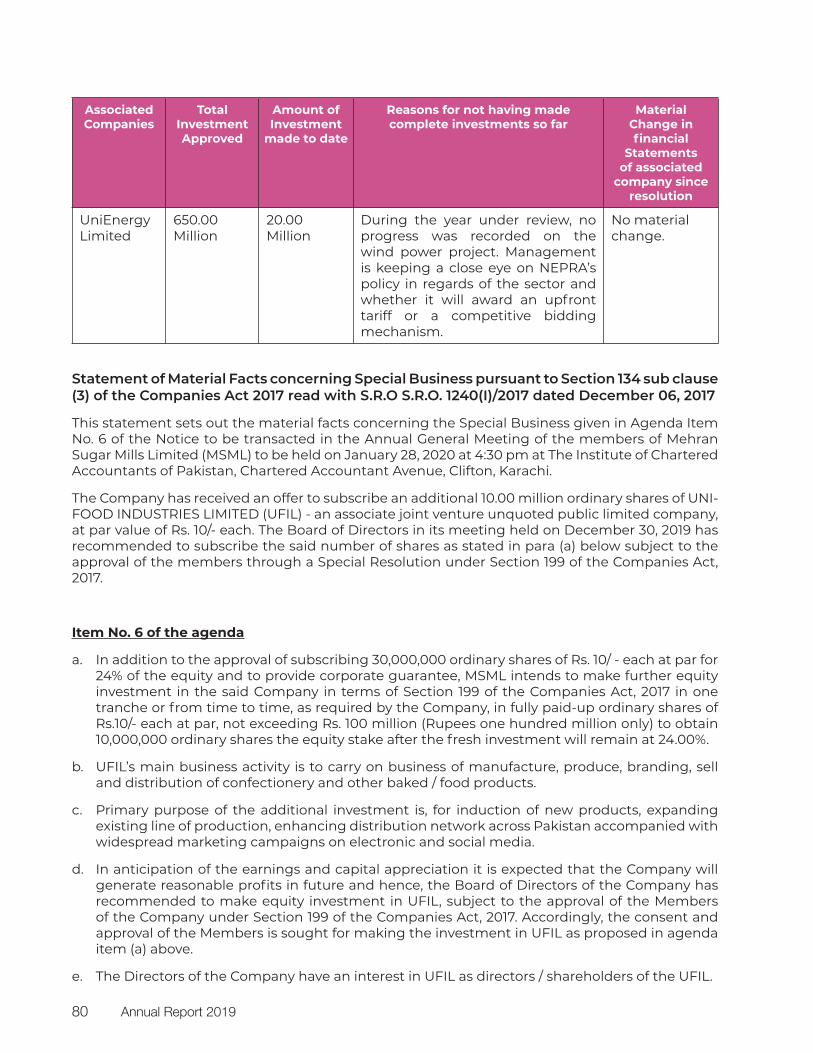
Associated Companies
Total Investment Approved
Amount of Investment
made to date
Reasons for not having made complete investments so far
Material Change in financial
Statements of associated
company since resolution
UniEnergy Limited
650.00 Million
20.00 Million
During the year under review, no progress was recorded on the wind power project. Management is keeping a close eye on NEPRA’s policy in regards of the sector and whether it will award an upfront tariff or a competitive bidding mechanism.
No material change.
Statement of Material Facts concerning Special Business pursuant to Section 134 sub clause (3) of the Companies Act 2017 read with S.R.O S.R.O. 1240(I)/2017 dated December 06, 2017
This statement sets out the material facts concerning the Special Business given in Agenda Item No. 6 of the Notice to be transacted in the Annual General Meeting of the members of Mehran Sugar Mills Limited (MSML) to be held on January 28, 2020 at 4:30 pm at The Institute of Chartered Accountants of Pakistan, Chartered Accountant Avenue, Clifton, Karachi.
The Company has received an offer to subscribe an additional 10.00 million ordinary shares of UNI-FOOD INDUSTRIES LIMITED (UFIL) - an associate joint venture unquoted public limited company, at par value of Rs. 10/- each. The Board of Directors in its meeting held on December 30, 2019 has recommended to subscribe the said number of shares as stated in para (a) below subject to the approval of the members through a Special Resolution under Section 199 of the Companies Act, 2017.
Item No. 6 of the agenda
a. In addition to the approval of subscribing 30,000,000 ordinary shares of Rs. 10/ - each at par for 24% of the equity and to provide corporate guarantee, MSML intends to make further equity investment in the said Company in terms of Section 199 of the Companies Act, 2017 in one tranche or from time to time, as required by the Company, in fully paid-up ordinary shares of Rs.10/- each at par, not exceeding Rs. 100 million (Rupees one hundred million only) to obtain 10,000,000 ordinary shares the equity stake after the fresh investment will remain at 24.00%.
b. UFIL’s main business activity is to carry on business of manufacture, produce, branding, sell and distribution of confectionery and other baked / food products.
c. Primary purpose of the additional investment is, for induction of new products, expanding existing line of production, enhancing distribution network across Pakistan accompanied with widespread marketing campaigns on electronic and social media.
d. In anticipation of the earnings and capital appreciation it is expected that the Company will generate reasonable profits in future and hence, the Board of Directors of the Company has recommended to make equity investment in UFIL, subject to the approval of the Members of the Company under Section 199 of the Companies Act, 2017. Accordingly, the consent and approval of the Members is sought for making the investment in UFIL as proposed in agenda item (a) above.
e. The Directors of the Company have an interest in UFIL as directors / shareholders of the UFIL.
Annual Report 201980
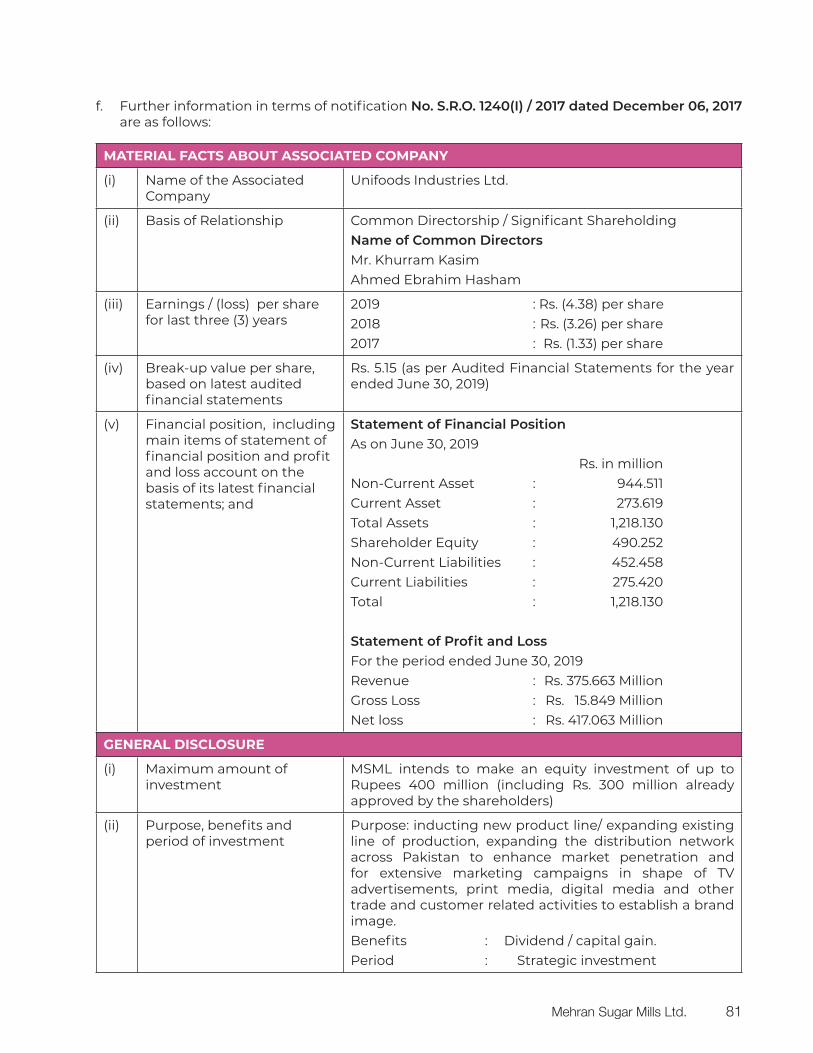
f. Further information in terms of notification No. S.R.O. 1240(I) / 2017 dated December 06, 2017 are as follows:
MATERIAL FACTS ABOUT ASSOCIATED COMPANY
(i) Name of the Associated Company
Unifoods Industries Ltd.
(ii) Basis of Relationship Common Directorship / Significant ShareholdingName of Common DirectorsMr. Khurram KasimAhmed Ebrahim Hasham
(iii) Earnings / (loss) per share for last three (3) years
2019 : Rs. (4.38) per share2018 : Rs. (3.26) per share2017 : Rs. (1.33) per share
(iv) Break-up value per share, based on latest audited financial statements
Rs. 5.15 (as per Audited Financial Statements for the year ended June 30, 2019)
(v) Financial position, including main items of statement of financial position and profit and loss account on the basis of its latest financial statements; and
Statement of Financial PositionAs on June 30, 2019 Rs. in millionNon-Current Asset : 944.511Current Asset : 273.619Total Assets : 1,218.130Shareholder Equity : 490.252Non-Current Liabilities : 452.458Current Liabilities : 275.420Total : 1,218.130
Statement of Profit and LossFor the period ended June 30, 2019Revenue : Rs. 375.663 MillionGross Loss : Rs. 15.849 MillionNet loss : Rs. 417.063 Million
GENERAL DISCLOSURE
(i) Maximum amount of investment
MSML intends to make an equity investment of up to Rupees 400 million (including Rs. 300 million already approved by the shareholders)
(ii) Purpose, benefits and period of investment
Purpose: inducting new product line/ expanding existing line of production, expanding the distribution network across Pakistan to enhance market penetration and for extensive marketing campaigns in shape of TV advertisements, print media, digital media and other trade and customer related activities to establish a brand image.Benefits : Dividend / capital gain. Period : Strategic investment
Mehran Sugar Mills Ltd. 81
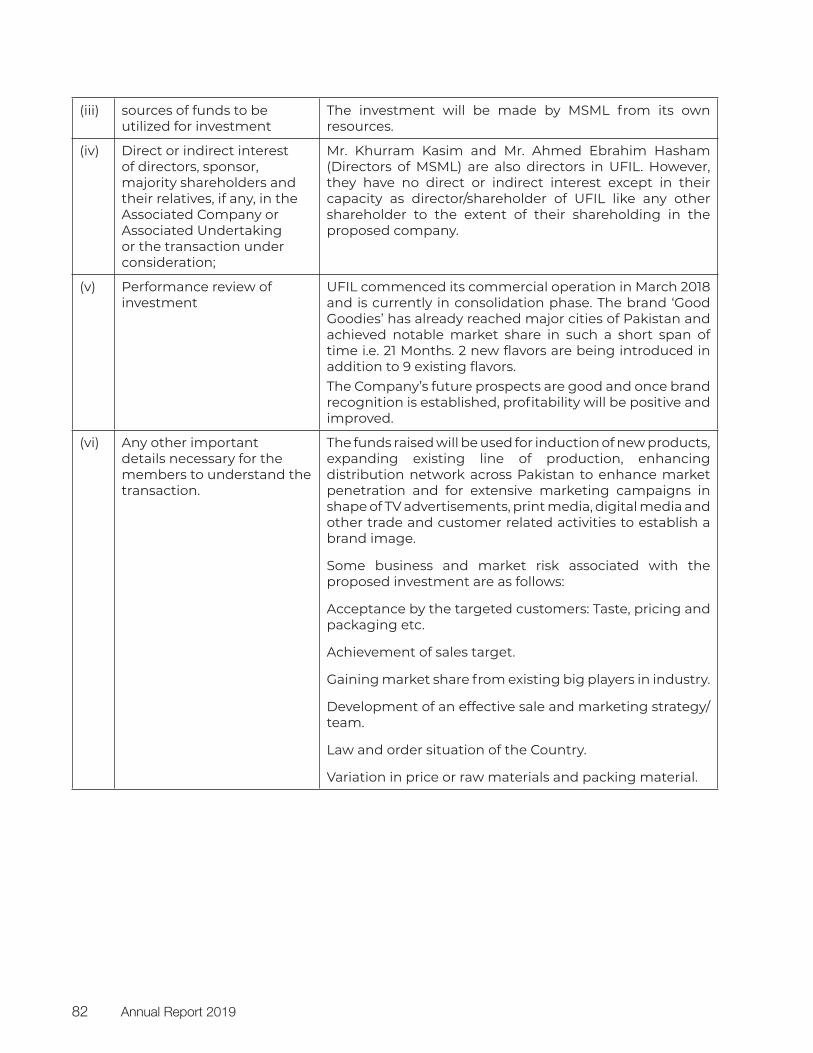
(iii) sources of funds to be utilized for investment
The investment will be made by MSML from its own resources.
(iv) Direct or indirect interest of directors, sponsor, majority shareholders and their relatives, if any, in the Associated Company or Associated Undertaking or the transaction under consideration;
Mr. Khurram Kasim and Mr. Ahmed Ebrahim Hasham (Directors of MSML) are also directors in UFIL. However, they have no direct or indirect interest except in their capacity as director/shareholder of UFIL like any other shareholder to the extent of their shareholding in the proposed company.
(v) Performance review of investment
UFIL commenced its commercial operation in March 2018 and is currently in consolidation phase. The brand ‘Good Goodies’ has already reached major cities of Pakistan and achieved notable market share in such a short span of time i.e. 21 Months. 2 new flavors are being introduced in addition to 9 existing flavors.The Company’s future prospects are good and once brand recognition is established, profitability will be positive and improved.
(vi) Any other important details necessary for the members to understand the transaction.
The funds raised will be used for induction of new products, expanding existing line of production, enhancing distribution network across Pakistan to enhance market penetration and for extensive marketing campaigns in shape of TV advertisements, print media, digital media and other trade and customer related activities to establish a brand image.
Some business and market risk associated with the proposed investment are as follows:
Acceptance by the targeted customers: Taste, pricing and packaging etc.
Achievement of sales target.
Gaining market share from existing big players in industry.
Development of an effective sale and marketing strategy/team.
Law and order situation of the Country.
Variation in price or raw materials and packing material.
Annual Report 201982
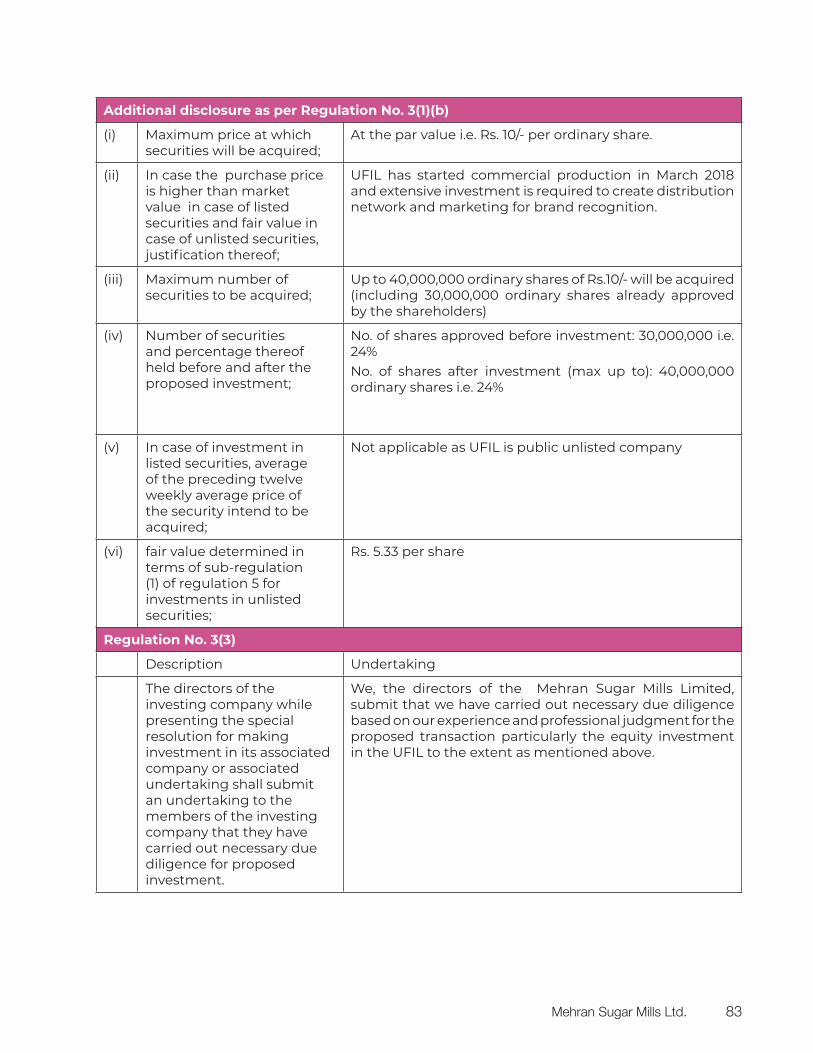
Additional disclosure as per Regulation No. 3(1)(b)
(i) Maximum price at which securities will be acquired;
At the par value i.e. Rs. 10/- per ordinary share.
(ii) In case the purchase price is higher than market value in case of listed securities and fair value in case of unlisted securities, justification thereof;
UFIL has started commercial production in March 2018 and extensive investment is required to create distribution network and marketing for brand recognition.
(iii) Maximum number of securities to be acquired;
Up to 40,000,000 ordinary shares of Rs.10/- will be acquired (including 30,000,000 ordinary shares already approved by the shareholders)
(iv) Number of securities and percentage thereof held before and after the proposed investment;
No. of shares approved before investment: 30,000,000 i.e. 24%No. of shares after investment (max up to): 40,000,000 ordinary shares i.e. 24%
(v) In case of investment in listed securities, average of the preceding twelve weekly average price of the security intend to be acquired;
Not applicable as UFIL is public unlisted company
(vi) fair value determined in terms of sub-regulation (1) of regulation 5 for investments in unlisted securities;
Rs. 5.33 per share
Regulation No. 3(3)
Description Undertaking
The directors of the investing company while presenting the special resolution for making investment in its associated company or associated undertaking shall submit an undertaking to the members of the investing company that they have carried out necessary due diligence for proposed investment.
We, the directors of the Mehran Sugar Mills Limited, submit that we have carried out necessary due diligence based on our experience and professional judgment for the proposed transaction particularly the equity investment in the UFIL to the extent as mentioned above.
Mehran Sugar Mills Ltd. 83
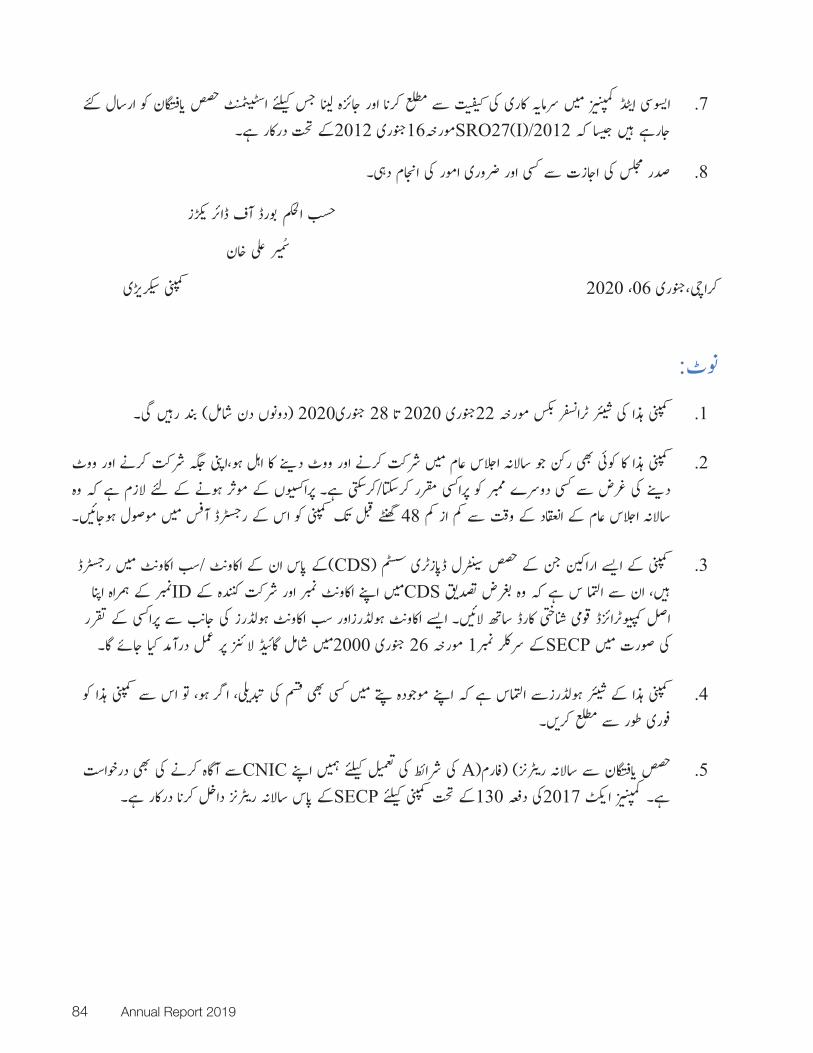
72012 16
8
2020 06
12020 28 2020 22
2
48
3CDSID CDS
2000 26 1 SECP
4
5CNIC ASECP 130 2017
Annual Report 201984
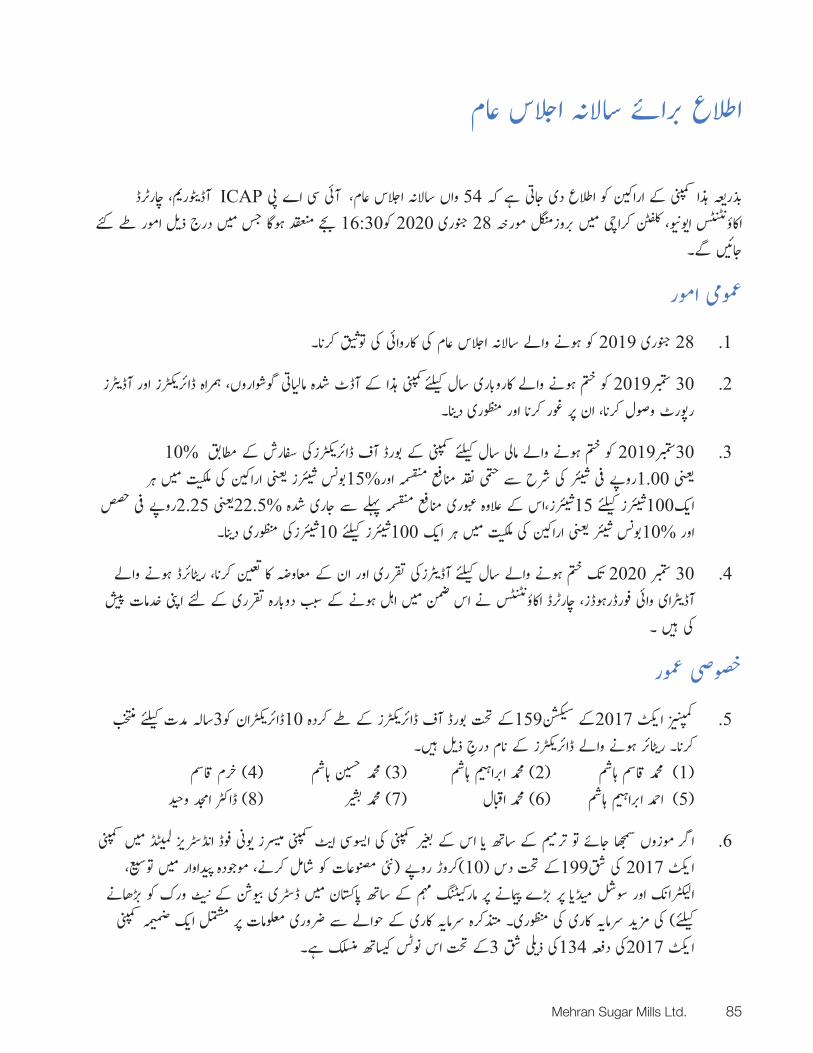
ICAP 542020 28
1 .2019 282 .2019 30
3 . 10% 2019 3015% 1.00
2.25 22.5% 15 10010 100 10%
4 .2020 30
53 10 159 2017
4 3 2 1) 8 7 6 5)
610 199 2017
3 134 2017
Mehran Sugar Mills Ltd. 85
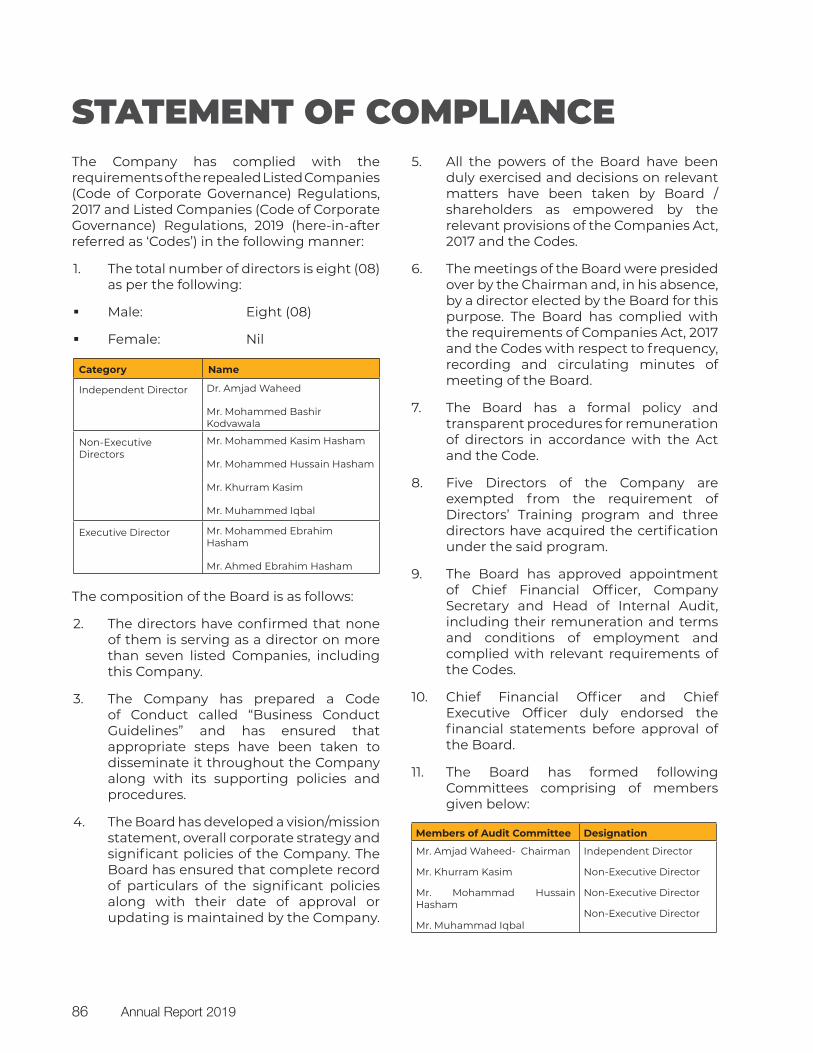
STATEMENT OF COMPLIANCEThe Company has complied with the requirements of the repealed Listed Companies (Code of Corporate Governance) Regulations, 2017 and Listed Companies (Code of Corporate Governance) Regulations, 2019 (here-in-after referred as ‘Codes’) in the following manner:
1. The total number of directors is eight (08) as per the following:
Male: Eight (08)
Female: Nil
Category Name
Independent Director Dr. Amjad Waheed
Mr. Mohammed Bashir Kodvawala
Non-Executive Directors
Mr. Mohammed Kasim Hasham
Mr. Mohammed Hussain Hasham
Mr. Khurram Kasim
Mr. Muhammed Iqbal
Executive Director Mr. Mohammed Ebrahim Hasham
Mr. Ahmed Ebrahim Hasham
The composition of the Board is as follows:
2. The directors have confirmed that none of them is serving as a director on more than seven listed Companies, including this Company.
3. The Company has prepared a Code of Conduct called “Business Conduct Guidelines” and has ensured that appropriate steps have been taken to disseminate it throughout the Company along with its supporting policies and procedures.
4. The Board has developed a vision/mission statement, overall corporate strategy and significant policies of the Company. The Board has ensured that complete record of particulars of the significant policies along with their date of approval or updating is maintained by the Company.
5. All the powers of the Board have been duly exercised and decisions on relevant matters have been taken by Board / shareholders as empowered by the relevant provisions of the Companies Act, 2017 and the Codes.
6. The meetings of the Board were presided over by the Chairman and, in his absence, by a director elected by the Board for this purpose. The Board has complied with the requirements of Companies Act, 2017 and the Codes with respect to frequency, recording and circulating minutes of meeting of the Board.
7. The Board has a formal policy and transparent procedures for remuneration of directors in accordance with the Act and the Code.
8. Five Directors of the Company are exempted from the requirement of Directors’ Training program and three directors have acquired the certification under the said program.
9. The Board has approved appointment of Chief Financial Officer, Company Secretary and Head of Internal Audit, including their remuneration and terms and conditions of employment and complied with relevant requirements of the Codes.
10. Chief Financial Officer and Chief Executive Officer duly endorsed the financial statements before approval of the Board.
11. The Board has formed following Committees comprising of members given below:
Members of Audit Committee Designation
Mr. Amjad Waheed- Chairman
Mr. Khurram Kasim
Mr. Mohammad Hussain Hasham
Mr. Muhammad Iqbal
Independent Director
Non-Executive Director
Non-Executive Director
Non-Executive Director
Annual Report 201986
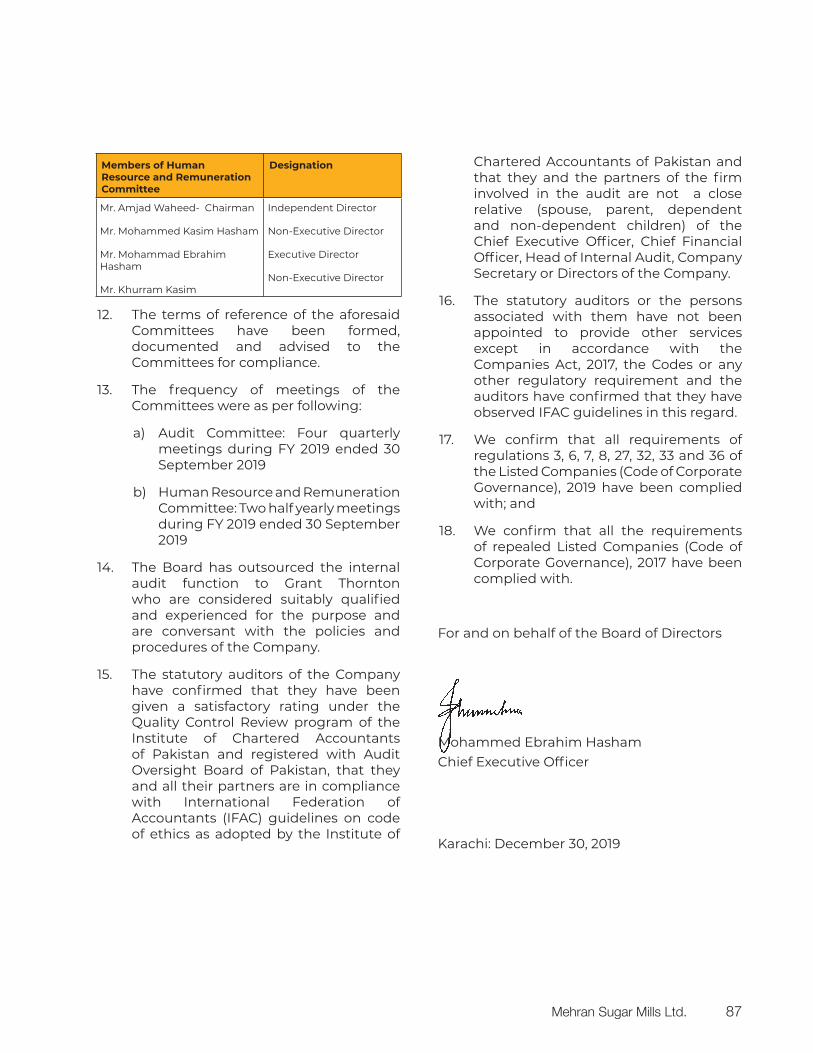
Members of Human Resource and Remuneration Committee
Designation
Mr. Amjad Waheed- Chairman
Mr. Mohammed Kasim Hasham
Mr. Mohammad Ebrahim Hasham
Mr. Khurram Kasim
Independent Director
Non-Executive Director
Executive Director
Non-Executive Director
12. The terms of reference of the aforesaid Committees have been formed, documented and advised to the Committees for compliance.
13. The frequency of meetings of the Committees were as per following:
a) Audit Committee: Four quarterly meetings during FY 2019 ended 30 September 2019
b) Human Resource and Remuneration Committee: Two half yearly meetings during FY 2019 ended 30 September 2019
14. The Board has outsourced the internal audit function to Grant Thornton who are considered suitably qualified and experienced for the purpose and are conversant with the policies and procedures of the Company.
15. The statutory auditors of the Company have confirmed that they have been given a satisfactory rating under the Quality Control Review program of the Institute of Chartered Accountants of Pakistan and registered with Audit Oversight Board of Pakistan, that they and all their partners are in compliance with International Federation of Accountants (IFAC) guidelines on code of ethics as adopted by the Institute of
Chartered Accountants of Pakistan and that they and the partners of the firm involved in the audit are not a close relative (spouse, parent, dependent and non-dependent children) of the Chief Executive Officer, Chief Financial Officer, Head of Internal Audit, Company Secretary or Directors of the Company.
16. The statutory auditors or the persons associated with them have not been appointed to provide other services except in accordance with the Companies Act, 2017, the Codes or any other regulatory requirement and the auditors have confirmed that they have observed IFAC guidelines in this regard.
17. We confirm that all requirements of regulations 3, 6, 7, 8, 27, 32, 33 and 36 of the Listed Companies (Code of Corporate Governance), 2019 have been complied with; and
18. We confirm that all the requirements of repealed Listed Companies (Code of Corporate Governance), 2017 have been complied with.
For and on behalf of the Board of Directors
Mohammed Ebrahim HashamChief Executive Officer
Karachi: December 30, 2019
Mehran Sugar Mills Ltd. 87
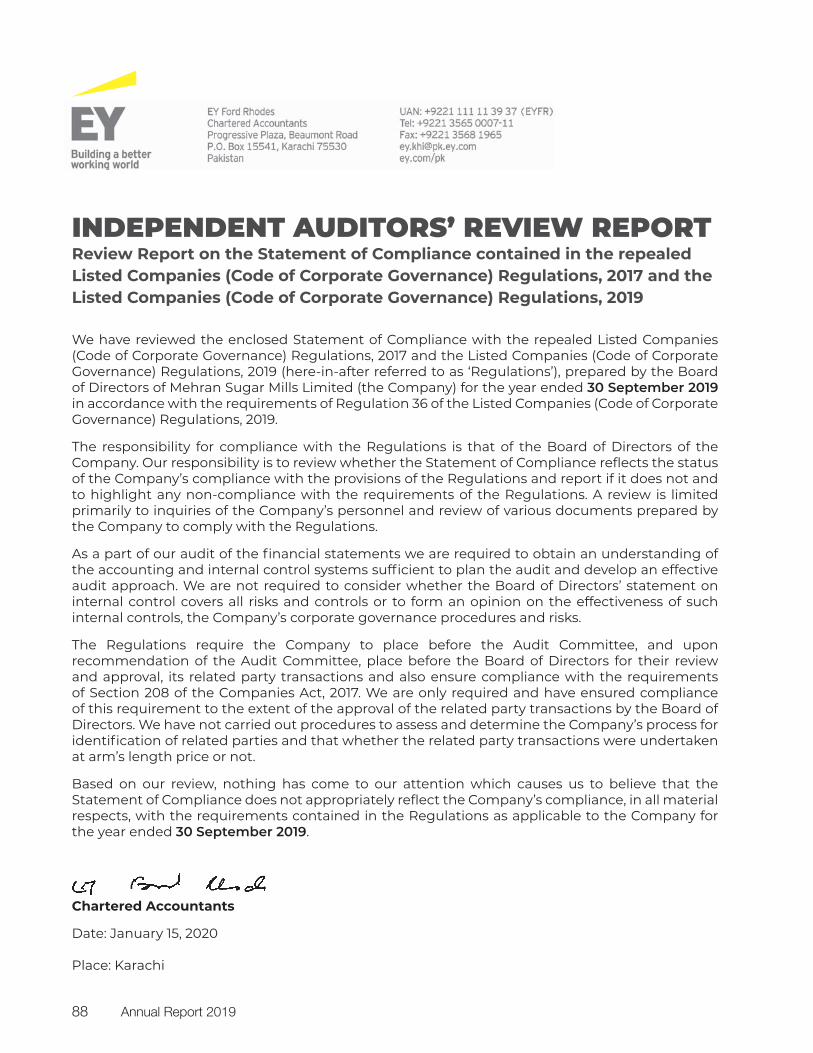
INDEPENDENT AUDITORS’ REVIEW REPORT
We have reviewed the enclosed Statement of Compliance with the repealed Listed Companies (Code of Corporate Governance) Regulations, 2017 and the Listed Companies (Code of Corporate Governance) Regulations, 2019 (here-in-after referred to as ‘Regulations’), prepared by the Board of Directors of Mehran Sugar Mills Limited (the Company) for the year ended 30 September 2019 in accordance with the requirements of Regulation 36 of the Listed Companies (Code of Corporate Governance) Regulations, 2019.
The responsibility for compliance with the Regulations is that of the Board of Directors of the Company. Our responsibility is to review whether the Statement of Compliance reflects the status of the Company’s compliance with the provisions of the Regulations and report if it does not and to highlight any non-compliance with the requirements of the Regulations. A review is limited primarily to inquiries of the Company’s personnel and review of various documents prepared by the Company to comply with the Regulations.
As a part of our audit of the financial statements we are required to obtain an understanding of the accounting and internal control systems sufficient to plan the audit and develop an effective audit approach. We are not required to consider whether the Board of Directors’ statement on internal control covers all risks and controls or to form an opinion on the effectiveness of such internal controls, the Company’s corporate governance procedures and risks.
The Regulations require the Company to place before the Audit Committee, and upon recommendation of the Audit Committee, place before the Board of Directors for their review and approval, its related party transactions and also ensure compliance with the requirements of Section 208 of the Companies Act, 2017. We are only required and have ensured compliance of this requirement to the extent of the approval of the related party transactions by the Board of Directors. We have not carried out procedures to assess and determine the Company’s process for identification of related parties and that whether the related party transactions were undertaken at arm’s length price or not.
Based on our review, nothing has come to our attention which causes us to believe that the Statement of Compliance does not appropriately reflect the Company’s compliance, in all material respects, with the requirements contained in the Regulations as applicable to the Company for the year ended 30 September 2019.
Chartered Accountants
Date: January 15, 2020
Place: Karachi
Review Report on the Statement of Compliance contained in the repealed Listed Companies (Code of Corporate Governance) Regulations, 2017 and the Listed Companies (Code of Corporate Governance) Regulations, 2019
Annual Report 201988

STATEMENTS
UNCONSOLIDATEDFINANCIAL
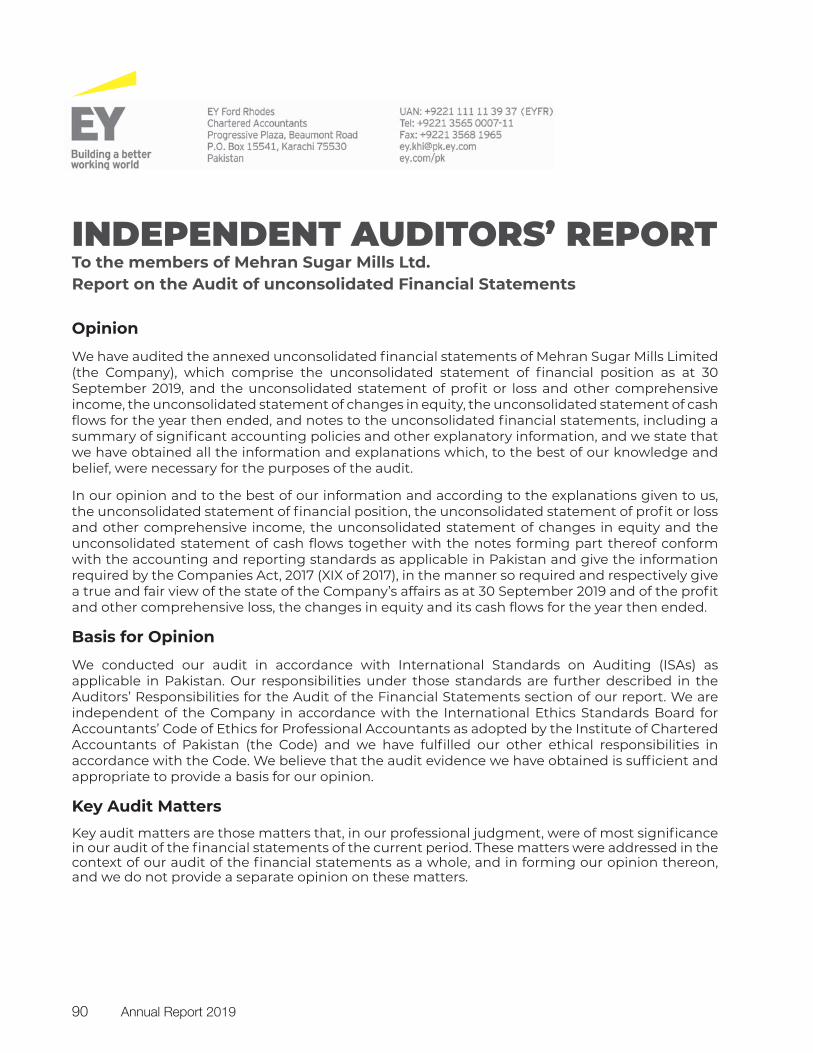
Opinion We have audited the annexed unconsolidated financial statements of Mehran Sugar Mills Limited (the Company), which comprise the unconsolidated statement of financial position as at 30 September 2019, and the unconsolidated statement of profit or loss and other comprehensive income, the unconsolidated statement of changes in equity, the unconsolidated statement of cash flows for the year then ended, and notes to the unconsolidated financial statements, including a summary of significant accounting policies and other explanatory information, and we state that we have obtained all the information and explanations which, to the best of our knowledge and belief, were necessary for the purposes of the audit.
In our opinion and to the best of our information and according to the explanations given to us, the unconsolidated statement of financial position, the unconsolidated statement of profit or loss and other comprehensive income, the unconsolidated statement of changes in equity and the unconsolidated statement of cash flows together with the notes forming part thereof conform with the accounting and reporting standards as applicable in Pakistan and give the information required by the Companies Act, 2017 (XIX of 2017), in the manner so required and respectively give a true and fair view of the state of the Company’s affairs as at 30 September 2019 and of the profit and other comprehensive loss, the changes in equity and its cash flows for the year then ended.
Basis for Opinion
We conducted our audit in accordance with International Standards on Auditing (ISAs) as applicable in Pakistan. Our responsibilities under those standards are further described in the Auditors’ Responsibilities for the Audit of the Financial Statements section of our report. We are independent of the Company in accordance with the International Ethics Standards Board for Accountants’ Code of Ethics for Professional Accountants as adopted by the Institute of Chartered Accountants of Pakistan (the Code) and we have fulfilled our other ethical responsibilities in accordance with the Code. We believe that the audit evidence we have obtained is sufficient and appropriate to provide a basis for our opinion.
Key Audit Matters Key audit matters are those matters that, in our professional judgment, were of most significance in our audit of the financial statements of the current period. These matters were addressed in the context of our audit of the financial statements as a whole, and in forming our opinion thereon, and we do not provide a separate opinion on these matters.
INDEPENDENT AUDITORS’ REPORT To the members of Mehran Sugar Mills Ltd. Report on the Audit of unconsolidated Financial Statements
Annual Report 201990
Following are the key audit matter:
Key audit matter How our audit addressed the key audit matter
1. First time adoption of IFRS 9 – Financial Instruments
As referred to in notes 3.1 and 5.14 to the accompanying unconsolidated financial statements, the Company has adopted IFRS 9 with effect from 1 October 2018. The new standard requires the Company to make provision for financial assets (including trade debts) using Expected Credit Loss (ECL) approach as against the Incurred Loss Model previously applied by the Company.
Our key procedures to review the application of IFRS 9 included, amongst others, review of the methodology developed and applied by the Company to estimate the ECL in relation to trade debts. We also considered and evaluated the assumptions used in applying the ECL methodology based on historical information and qualitative factors as relevant for such estimates.
Determination of ECL on trade debts requires significant judgements and assumptions including consideration of factors such as historical credit loss experience and forward-looking macro-economic information.
Further, we assessed the integrity and quality of the data used for ECL computation based on the accounting records of the Company as well as the related external sources as used for this purpose.
We have considered the first time adoption of IFRS 9 requirements as a key audit matter due to significance of the change in accounting methodology and involvement of estimates and judgements in this regard.
We checked the mathematical accuracy of the ECL model by performing recalculation on test basis.
In addition to above, we assessed the adequacy of disclosures in the unconsolidated financial statements of the Company regarding application of IFRS 9 as per the requirements of the above standard.
Information Other than the Financial Statements and Auditors’ Report Thereon
Management is responsible for the other information. The other information comprises the information included in the Annual Report, but does not include the financial statements and our auditors’ report thereon.
Our opinion on the financial statements does not cover the other information and we do not express any form of assurance conclusion thereon.
In connection with our audit of the financial statements, our responsibility is to read the other information and, in doing so, consider whether the other information is materially inconsistent with the financial statements or our knowledge obtained in the audit or otherwise appears to be materially misstated. If, based on the work we have performed, we conclude that there is a material misstatement of this other information, we are required to report that fact. We have nothing to report in this regard.
Mehran Sugar Mills Ltd. 91
Responsibilities of Management and Board of Directors for the Financial Statements
Management is responsible for the preparation and fair presentation of the financial statements in accordance with the accounting and reporting standards as applicable in Pakistan and the requirements of Companies Act, 2017 (XIX of 2017) and for such internal control as management determines is necessary to enable the preparation of financial statements that are free from material misstatement, whether due to fraud or error.
In preparing the financial statements, management is responsible for assessing the Company’s ability to continue as a going concern, disclosing, as applicable, matters related to going concern and using the going concern basis of accounting unless management either intends to liquidate the Company or to cease operations, or has no realistic alternative but to do so.
Board of directors are responsible for overseeing the Company’s financial reporting process.
Auditors’ Responsibilities for the Audit of the Financial Statements
Our objectives are to obtain reasonable assurance about whether the financial statements as a whole are free from material misstatement, whether due to fraud or error, and to issue an auditors’ report that includes our opinion. Reasonable assurance is a high level of assurance, but is not a guarantee that an audit conducted in accordance with ISAs as applicable in Pakistan will always detect a material misstatement when it exists. Misstatements can arise from fraud or error and are considered material if, individually or in the aggregate, they could reasonably be expected to influence the economic decisions of users taken on the basis of these financial statements.
As part of an audit in accordance with ISAs as applicable in Pakistan, we exercise professional judgment and maintain professional skepticism throughout the audit. We also:
Identify and assess the risks of material misstatement of the financial statements, whether due to fraud or error, design and perform audit procedures responsive to those risks, and obtain audit evidence that is sufficient and appropriate to provide a basis for our opinion. The risk of not detecting a material misstatement resulting from fraud is higher than for one resulting from error, as fraud may involve collusion, forgery, intentional omissions, misrepresentations, or the override of internal control.
Obtain an understanding of internal control relevant to the audit in order to design audit procedures that are appropriate in the circumstances, but not for the purpose of expressing an opinion on the effectiveness of the Company’s internal control.
Evaluate the appropriateness of accounting policies used and the reasonableness of accounting estimates and related disclosures made by management.
Conclude on the appropriateness of management’s use of the going concern basis of accounting and, based on the audit evidence obtained, whether a material uncertainty exists related to events or conditions that may cast significant doubt on the Company’s ability to continue as a going concern. If we conclude that a material uncertainty exists, we are required to draw attention in our auditors’ report to the related disclosures in the financial statements or, if such disclosures are inadequate, to modify our opinion. Our conclusions are based on the audit evidence obtained up to the date of our auditors’ report. However, future events or conditions may cause the Company to cease to continue as a going concern.
Annual Report 201992
Evaluate the overall presentation, structure and content of the financial statements, including the disclosures, and whether the financial statements represent the underlying transactions and events in a manner that achieves fair presentation.
We communicate with the board of directors regarding, among other matters, the planned scope and timing of the audit and significant audit findings, including any significant deficiencies in internal control that we identify during our audit.
We also provide the board of directors with a statement that we have complied with relevant ethical requirements regarding independence, and to communicate with them all relationships and other matters that may reasonably be thought to bear on our independence, and where applicable, related safeguards.
From the matters communicated with the board of directors, we determine those matters that were of most significance in the audit of the financial statements of the current period and are therefore the key audit matters. We describe these matters in our auditors’ report unless law or regulation precludes public disclosure about the matter or when, in extremely rare circumstances, we determine that a matter should not be communicated in our report because the adverse consequences of doing so would reasonably be expected to outweigh the public interest benefits of such communication.
Report on Other Legal and Regulatory Requirements
Based on our audit, we further report that in our opinion:
a. proper books of account have been kept by the Company as required by the Companies Act, 2017 (XIX of 2017);
b. the statement of financial position, the statement of profit or loss and other comprehensive income, the statement of changes in equity and the statement of cash flows together with the notes thereon have been drawn up in conformity with the Companies Act, 2017 (XIX of 2017) and are in agreement with the books of account and returns;
c. investments made, expenditure incurred and guarantees extended during the year were for the purpose of the Company’s business; and
d. zakat deductible at source under the Zakat and Ushr Ordinance, 1980 (XVIII of 1980), was deducted by the Company and deposited in the Central Zakat Fund established under Section 7 of that Ordinance.
The engagement partner on the audit resulting in this independent auditors’ report is Arif Nazeer.
Chartered Accountants
Date: January 15, 2020
Place: Karachi
Mehran Sugar Mills Ltd. 93
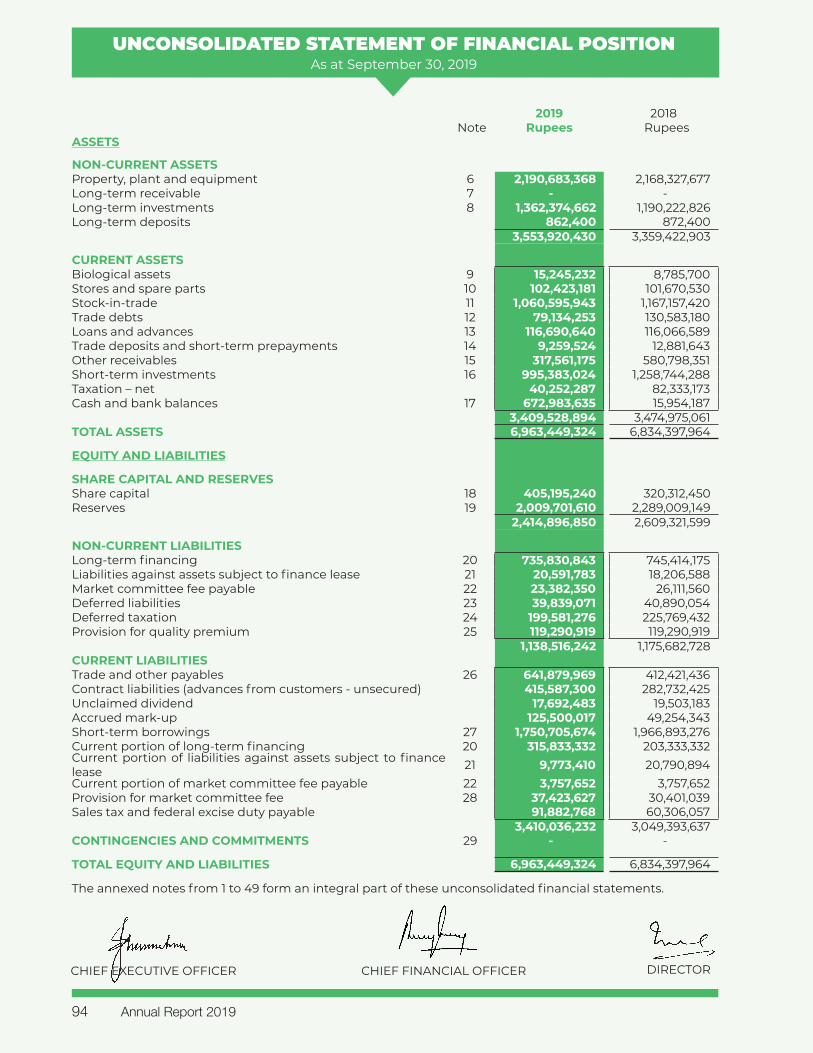
UNCONSOLIDATED STATEMENT OF FINANCIAL POSITIONAs at September 30, 2019
2019 2018 Note Rupees Rupees
ASSETS
NON-CURRENT ASSETS Property, plant and equipment 6 2,190,683,368 2,168,327,677 Long-term receivable 7 - - Long-term investments 8 1,362,374,662 1,190,222,826 Long-term deposits 862,400 872,400
3,553,920,430 3,359,422,903
CURRENT ASSETSBiological assets 9 15,245,232 8,785,700 Stores and spare parts 10 102,423,181 101,670,530 Stock-in-trade 11 1,060,595,943 1,167,157,420 Trade debts 12 79,134,253 130,583,180 Loans and advances 13 116,690,640 116,066,589 Trade deposits and short-term prepayments 14 9,259,524 12,881,643 Other receivables 15 317,561,175 580,798,351 Short-term investments 16 995,383,024 1,258,744,288 Taxation – net 40,252,287 82,333,173 Cash and bank balances 17 672,983,635 15,954,187
3,409,528,894 3,474,975,061 TOTAL ASSETS 6,963,449,324 6,834,397,964
EQUITY AND LIABILITIES
SHARE CAPITAL AND RESERVESShare capital 18 405,195,240 320,312,450 Reserves 19 2,009,701,610 2,289,009,149
2,414,896,850 2,609,321,599
NON-CURRENT LIABILITIESLong-term financing 20 735,830,843 745,414,175 Liabilities against assets subject to finance lease 21 20,591,783 18,206,588 Market committee fee payable 22 23,382,350 26,111,560 Deferred liabilities 23 39,839,071 40,890,054 Deferred taxation 24 199,581,276 225,769,432 Provision for quality premium 25 119,290,919 119,290,919
1,138,516,242 1,175,682,728 CURRENT LIABILITIESTrade and other payables 26 641,879,969 412,421,436 Contract liabilities (advances from customers - unsecured) 415,587,300 282,732,425 Unclaimed dividend 17,692,483 19,503,183 Accrued mark-up 125,500,017 49,254,343 Short-term borrowings 27 1,750,705,674 1,966,893,276 Current portion of long-term financing 20 315,833,332 203,333,332 Current portion of liabilities against assets subject to finance lease 21 9,773,410 20,790,894 Current portion of market committee fee payable 22 3,757,652 3,757,652 Provision for market committee fee 28 37,423,627 30,401,039 Sales tax and federal excise duty payable 91,882,768 60,306,057
3,410,036,232 3,049,393,637 CONTINGENCIES AND COMMITMENTS 29 - -
TOTAL EQUITY AND LIABILITIES 6,963,449,324 6,834,397,964
The annexed notes from 1 to 49 form an integral part of these unconsolidated financial statements.
CHIEF EXECUTIVE OFFICER CHIEF FINANCIAL OFFICER DIRECTOR
Annual Report 201994

UNCONSOLIDATED STATEMENT OF PROFIT OR LOSSFor the year ended September 30, 2019
2019 2018 Note Rupees Rupees
Turnover - net 30 5,311,773,145 4,790,789,858 Cost of sales 31 (4,491,460,810) (4,201,109,587)Gross profit 820,312,335 589,680,271
Distribution costs 32 (59,559,302) (111,448,318)Administrative expenses 33 (255,031,104) (276,264,701)Other expenses 34 (12,711,943) (69,392,379)Other income 35 79,021,066 169,541,014
(248,281,283) (287,564,384)
Operating profit 572,031,052 302,115,887
Share of profit from associates – net 324,890,323 340,016,123 Finance costs 36 (384,774,303) (212,409,244)
Profit before taxation 512,147,072 429,722,766
Taxation 37 (108,312,841) (16,824,716)
Net profit for the year 403,834,231 412,898,050
RestatedBasic and diluted earnings per share 38 9.97 10.19
The annexed notes from 1 to 49 form an integral part of these unconsolidated financial statements.
CHIEF EXECUTIVE OFFICER CHIEF FINANCIAL OFFICER DIRECTOR
Mehran Sugar Mills Ltd. 95
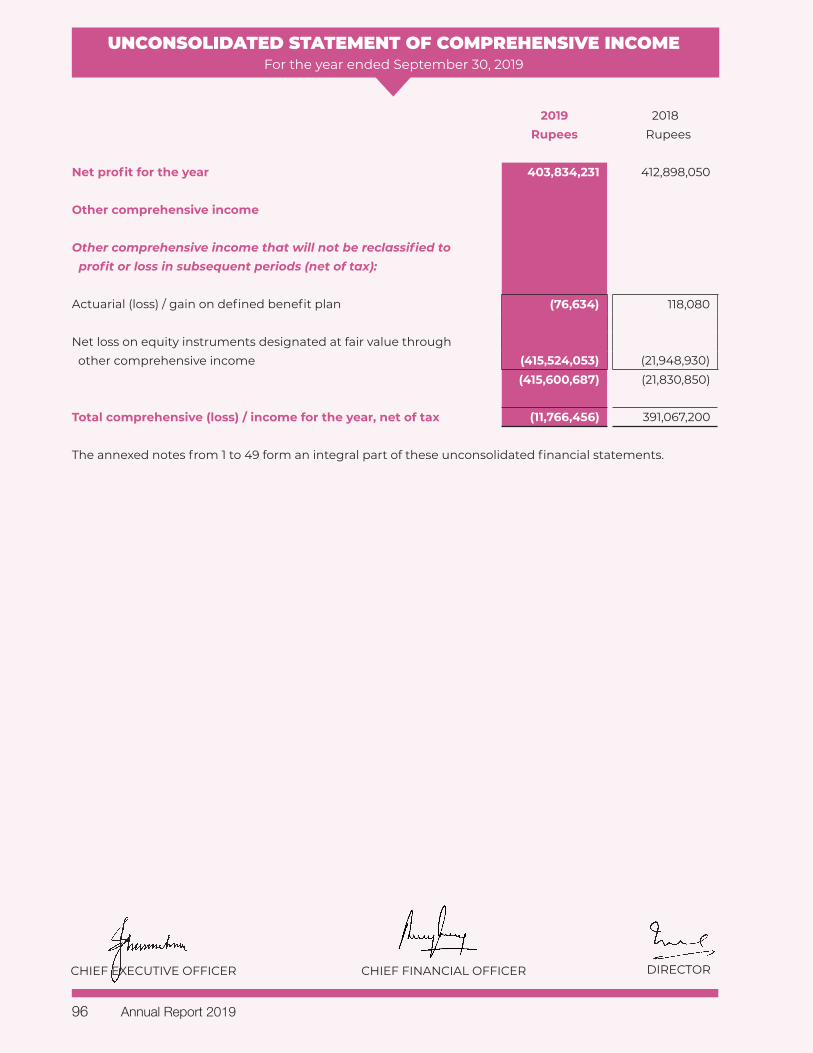
UNCONSOLIDATED STATEMENT OF COMPREHENSIVE INCOMEFor the year ended September 30, 2019
2019 2018Rupees Rupees
Net profit for the year 403,834,231 412,898,050
Other comprehensive income
Other comprehensive income that will not be reclassified to profit or loss in subsequent periods (net of tax):
Actuarial (loss) / gain on defined benefit plan (76,634) 118,080
Net loss on equity instruments designated at fair value through other comprehensive income (415,524,053) (21,948,930)
(415,600,687) (21,830,850)
Total comprehensive (loss) / income for the year, net of tax (11,766,456) 391,067,200
The annexed notes from 1 to 49 form an integral part of these unconsolidated financial statements.
CHIEF EXECUTIVE OFFICER CHIEF FINANCIAL OFFICER DIRECTOR
Annual Report 201996
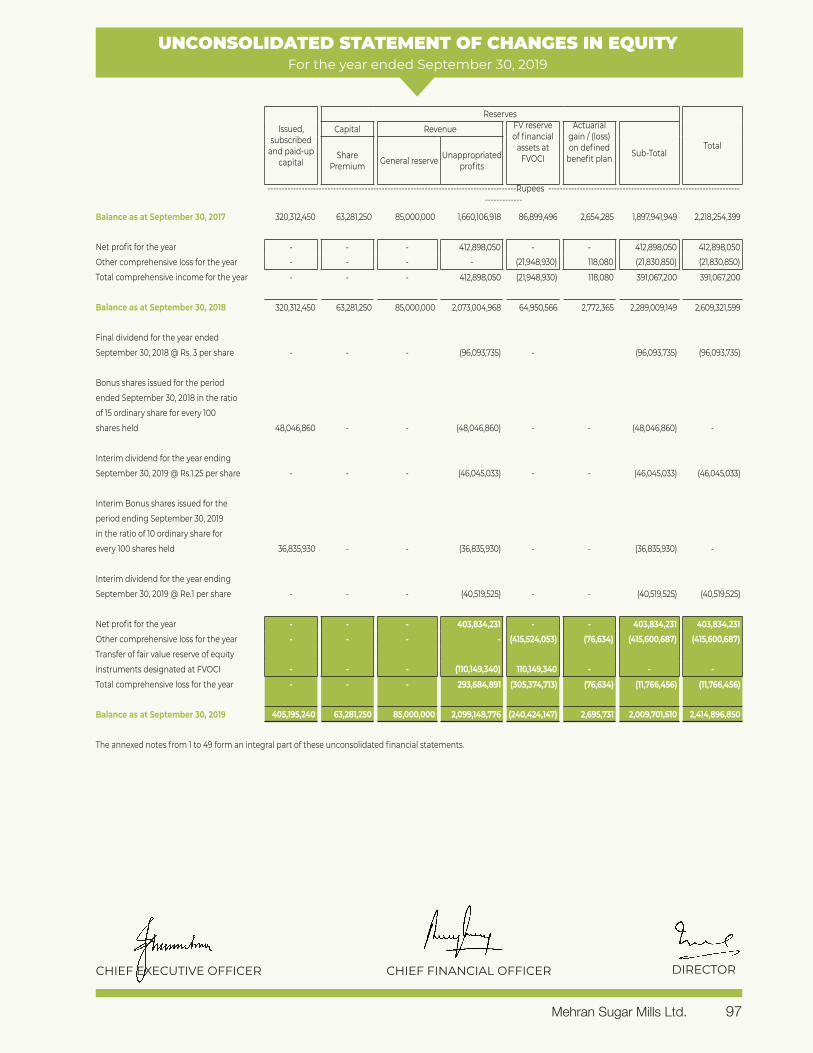
UNCONSOLIDATED STATEMENT OF CHANGES IN EQUITYFor the year ended September 30, 2019
Issued, subscribed
and paid-up capital
Reserves
Total
Capital Revenue FV reserve of financial
assets at FVOCI
Actuarial gain / (loss) on defined
benefit plan Sub-TotalShare Premium General reserve Unappropriated
profits
---------------------------------------------------------------------------------------Rupees --------------------------------------------------------------------------------
Balance as at September 30, 2017 320,312,450 63,281,250 85,000,000 1,660,106,918 86,899,496 2,654,285 1,897,941,949 2,218,254,399
Net profit for the year - - - 412,898,050 - - 412,898,050 412,898,050 Other comprehensive loss for the year - - - - (21,948,930) 118,080 (21,830,850) (21,830,850)
Total comprehensive income for the year - - - 412,898,050 (21,948,930) 118,080 391,067,200 391,067,200
Balance as at September 30, 2018 320,312,450 63,281,250 85,000,000 2,073,004,968 64,950,566 2,772,365 2,289,009,149 2,609,321,599
Final dividend for the year ended September 30, 2018 @ Rs. 3 per share - - - (96,093,735) - (96,093,735) (96,093,735)
Bonus shares issued for the period ended September 30, 2018 in the ratio of 15 ordinary share for every 100 shares held 48,046,860 - - (48,046,860) - - (48,046,860) -
Interim dividend for the year ending September 30, 2019 @ Rs.1.25 per share - - - (46,045,033) - - (46,045,033) (46,045,033)
Interim Bonus shares issued for the period ending September 30, 2019 in the ratio of 10 ordinary share for every 100 shares held 36,835,930 - - (36,835,930) - - (36,835,930) -
Interim dividend for the year ending September 30, 2019 @ Re.1 per share - - - (40,519,525) - - (40,519,525) (40,519,525)
Net profit for the year - - - 403,834,231 - - 403,834,231 403,834,231 Other comprehensive loss for the year - - - - (415,524,053) (76,634) (415,600,687) (415,600,687)Transfer of fair value reserve of equity instruments designated at FVOCI - - - (110,149,340) 110,149,340 - - - Total comprehensive loss for the year - - - 293,684,891 (305,374,713) (76,634) (11,766,456) (11,766,456)
Balance as at September 30, 2019 405,195,240 63,281,250 85,000,000 2,099,148,776 (240,424,147) 2,695,731 2,009,701,610 2,414,896,850
The annexed notes from 1 to 49 form an integral part of these unconsolidated financial statements.
CHIEF EXECUTIVE OFFICER CHIEF FINANCIAL OFFICER DIRECTOR
Mehran Sugar Mills Ltd. 97
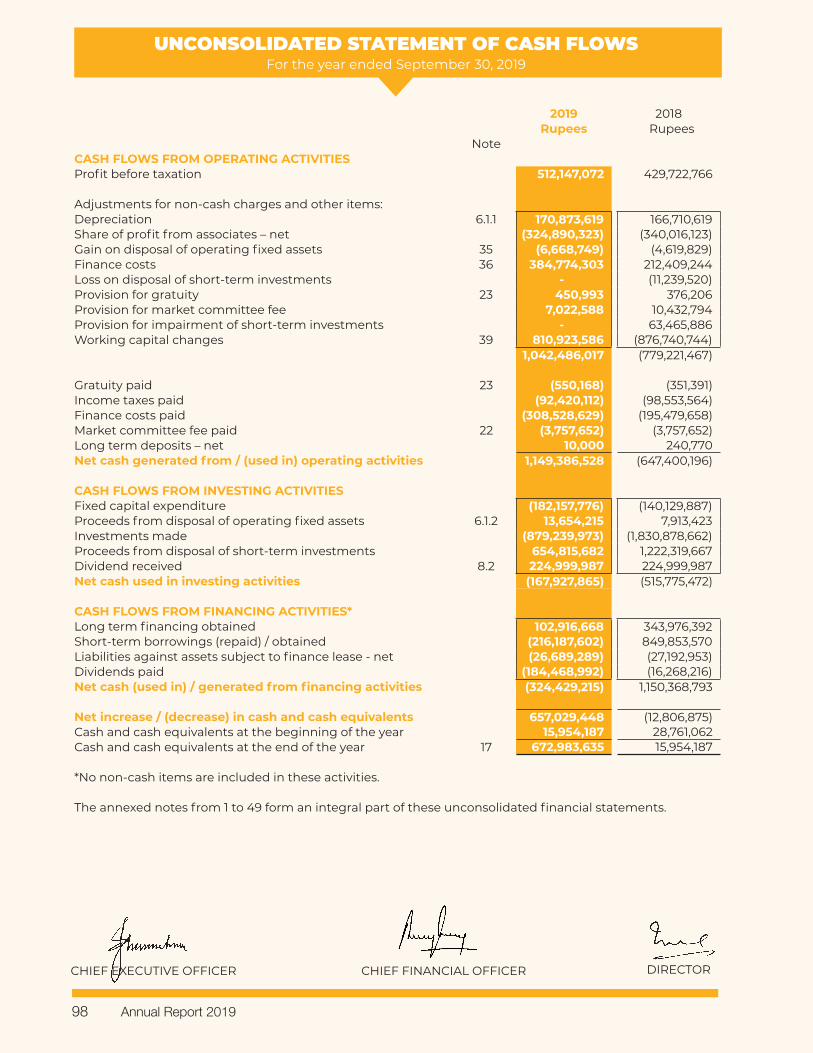
UNCONSOLIDATED STATEMENT OF CASH FLOWSFor the year ended September 30, 2019
2019 2018Rupees Rupees
NoteCASH FLOWS FROM OPERATING ACTIVITIESProfit before taxation 512,147,072 429,722,766
Adjustments for non-cash charges and other items:Depreciation 6.1.1 170,873,619 166,710,619 Share of profit from associates – net (324,890,323) (340,016,123)Gain on disposal of operating fixed assets 35 (6,668,749) (4,619,829)Finance costs 36 384,774,303 212,409,244 Loss on disposal of short-term investments - (11,239,520)Provision for gratuity 23 450,993 376,206 Provision for market committee fee 7,022,588 10,432,794 Provision for impairment of short-term investments - 63,465,886 Working capital changes 39 810,923,586 (876,740,744)
1,042,486,017 (779,221,467)
Gratuity paid 23 (550,168) (351,391)Income taxes paid (92,420,112) (98,553,564)Finance costs paid (308,528,629) (195,479,658)Market committee fee paid 22 (3,757,652) (3,757,652)Long term deposits – net 10,000 240,770 Net cash generated from / (used in) operating activities 1,149,386,528 (647,400,196)
CASH FLOWS FROM INVESTING ACTIVITIESFixed capital expenditure (182,157,776) (140,129,887)Proceeds from disposal of operating fixed assets 6.1.2 13,654,215 7,913,423 Investments made (879,239,973) (1,830,878,662)Proceeds from disposal of short-term investments 654,815,682 1,222,319,667 Dividend received 8.2 224,999,987 224,999,987 Net cash used in investing activities (167,927,865) (515,775,472)
CASH FLOWS FROM FINANCING ACTIVITIES*Long term financing obtained 102,916,668 343,976,392 Short-term borrowings (repaid) / obtained (216,187,602) 849,853,570 Liabilities against assets subject to finance lease - net (26,689,289) (27,192,953)Dividends paid (184,468,992) (16,268,216)Net cash (used in) / generated from financing activities (324,429,215) 1,150,368,793
Net increase / (decrease) in cash and cash equivalents 657,029,448 (12,806,875)Cash and cash equivalents at the beginning of the year 15,954,187 28,761,062 Cash and cash equivalents at the end of the year 17 672,983,635 15,954,187
*No non-cash items are included in these activities.
The annexed notes from 1 to 49 form an integral part of these unconsolidated financial statements.
CHIEF EXECUTIVE OFFICER CHIEF FINANCIAL OFFICER DIRECTOR
Annual Report 201998
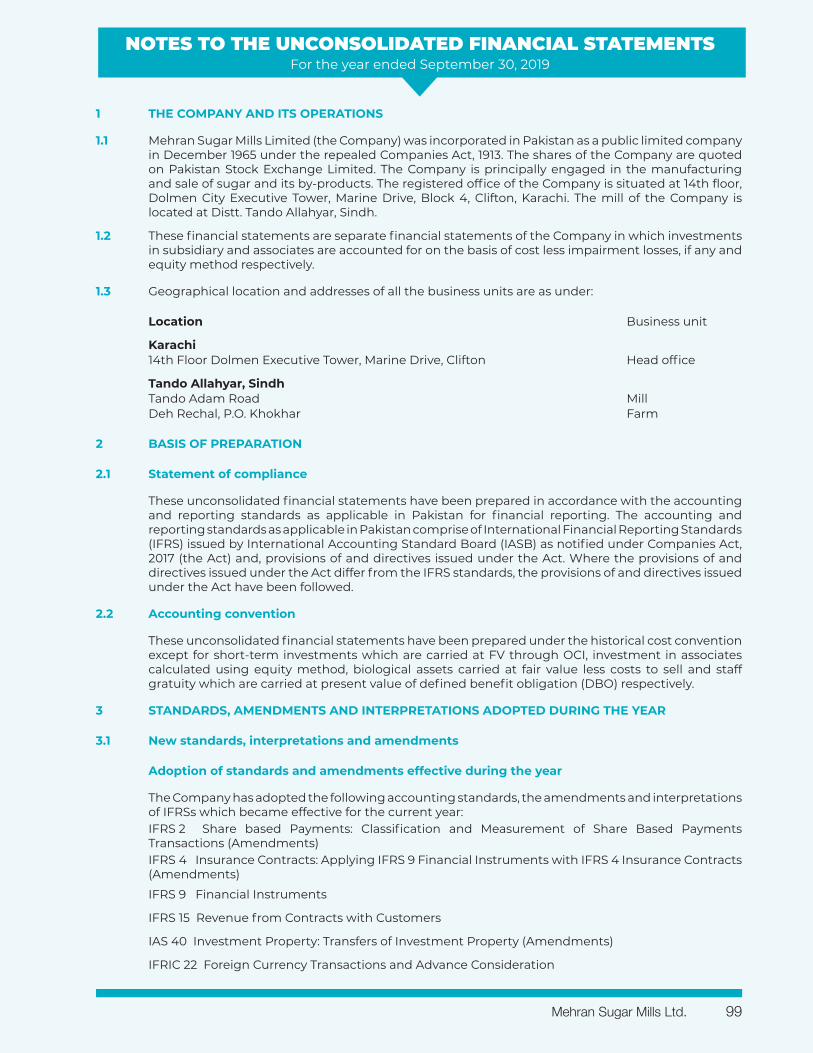
NOTES TO THE UNCONSOLIDATED FINANCIAL STATEMENTSFor the year ended September 30, 2019
1 THE COMPANY AND ITS OPERATIONS
1.1 Mehran Sugar Mills Limited (the Company) was incorporated in Pakistan as a public limited company in December 1965 under the repealed Companies Act, 1913. The shares of the Company are quoted on Pakistan Stock Exchange Limited. The Company is principally engaged in the manufacturing and sale of sugar and its by-products. The registered office of the Company is situated at 14th floor, Dolmen City Executive Tower, Marine Drive, Block 4, Clifton, Karachi. The mill of the Company is located at Distt. Tando Allahyar, Sindh.
1.2 These financial statements are separate financial statements of the Company in which investments in subsidiary and associates are accounted for on the basis of cost less impairment losses, if any and equity method respectively.
1.3 Geographical location and addresses of all the business units are as under:
Location Business unit
Karachi14th Floor Dolmen Executive Tower, Marine Drive, Clifton Head office
Tando Allahyar, SindhTando Adam Road MillDeh Rechal, P.O. Khokhar Farm
2 BASIS OF PREPARATION
2.1 Statement of compliance
These unconsolidated financial statements have been prepared in accordance with the accounting and reporting standards as applicable in Pakistan for financial reporting. The accounting and reporting standards as applicable in Pakistan comprise of International Financial Reporting Standards (IFRS) issued by International Accounting Standard Board (IASB) as notified under Companies Act, 2017 (the Act) and, provisions of and directives issued under the Act. Where the provisions of and directives issued under the Act differ from the IFRS standards, the provisions of and directives issued under the Act have been followed.
2.2 Accounting convention
These unconsolidated financial statements have been prepared under the historical cost convention except for short-term investments which are carried at FV through OCI, investment in associates calculated using equity method, biological assets carried at fair value less costs to sell and staff gratuity which are carried at present value of defined benefit obligation (DBO) respectively.
3 STANDARDS, AMENDMENTS AND INTERPRETATIONS ADOPTED DURING THE YEAR
3.1 New standards, interpretations and amendments
Adoption of standards and amendments effective during the year
The Company has adopted the following accounting standards, the amendments and interpretations of IFRSs which became effective for the current year:IFRS 2 Share based Payments: Classification and Measurement of Share Based Payments Transactions (Amendments) IFRS 4 Insurance Contracts: Applying IFRS 9 Financial Instruments with IFRS 4 Insurance Contracts (Amendments)
IFRS 9 Financial Instruments
IFRS 15 Revenue from Contracts with Customers
IAS 40 Investment Property: Transfers of Investment Property (Amendments)
IFRIC 22 Foreign Currency Transactions and Advance Consideration
Mehran Sugar Mills Ltd. 99
NOTES TO THE UNCONSOLIDATED FINANCIAL STATEMENTSFor the year ended September 30, 2019
Improvements to accounting standard issued by IASB in December 2016
IAS 28 Investments in Associates and Joint Ventures: Clarification that measuring investees at fair value through profit or loss is an investment-by-investment choice.
The adoption of the above standards, amendments and improvements to accounting standards did not have any material effect on the financial statements except for IFRS 9 and IFRS 15. The impact of adoption of IFRS 9 and IFRS 15 is given below:
IFRS 15 Revenue from Contracts with Customers
IFRS 15 supersedes IAS 11 Construction Contracts, IAS 18 Revenue and related Interpretations and it applies to all revenue arising from contracts with customers, unless those contracts are in the scope of other standards. The new standard establishes a five-step model to account for revenue arising from contracts with customers. Under IFRS 15, revenue is recognised at an amount that reflects the consideration to which an entity expects to be entitled in exchange for transferring goods or services to a customer.
The standard requires entities to exercise judgement, taking into consideration all of the relevant facts and circumstances when applying each step of the model to contracts with their customers. The standard also specifies the accounting for the incremental costs of obtaining a contract and the costs directly related to fulfilling a contract.
The Company elected the modified retrospective method and applied the standard retrospectively to only the most current period presented in the financial statements. Accordingly, the information presented for the previous corresponding period has not been restated.
The Company generates its revenue from sale of goods. The Company’s contracts with customers for the sale of goods generally include one performance obligation. The Company has concluded that revenue from sale of goods should be recognised at the point in time when control of the asset is transferred to the customer, generally on delivery of the goods. Therefore, the adoption of IFRS 15 did not have an impact on the timing of revenue recognition and the amount of revenue recognised.
In general the contracts for the sale of goods do not provide customers with a right of return and volume rebates. Accordingly, the application of the constraint on variable consideration did not have any impact on the revenue recognised by the Company.
IFRS 9 Financial Instruments
IFRS 9 Financial Instruments replaces IAS 39 Financial Instruments: Recognition and Measurement bringing together aspects of the accounting for financial instruments: classification and measurement and impairment.
Classification and measuremen
Except for certain trade receivables, under IFRS 9, the Company initially measures a financial asset at its fair value plus, in the case of a financial asset not at fair value through profit or loss, transaction costs.
Under IFRS 9, debt financial instruments are subsequently measured at fair value through profit or loss (FVPL), amortised cost, or fair value through other comprehensive income (FVOCI). The classification is based on two criteria: the Company’s business model for managing the assets; and whether the instruments’ contractual cash flows represent ‘solely payments of principal and interest’ on the principal amount outstanding (the ‘SPPI criterion’).
At transition date to IFRS 9, the Company has financial assets measured at amortised cost and equity instruments at FVOCI. The new classification and measurement of the Company’s financial assets are, as follows:
Debt instruments at amortised cost for financial assets that are held within a business model with the objective to hold the financial assets in order to collect contractual cash flows that meet the SPPI criterion.
Annual Report 2019100
NOTES TO THE UNCONSOLIDATED FINANCIAL STATEMENTSFor the year ended September 30, 2019
Equity instruments at FVOCI, with no recycling of gains or losses to profit or loss on derecognition. This category only includes equity instruments, which the Company intends to hold for the foreseeable future and which the Company has irrevocably elected to so classify upon initial recognition or transition. The Company classified its unquoted equity instruments as equity instruments at FVOCI. Equity instruments at FVOCI are not subject to an impairment assessment under IFRS 9. Under IAS 39, the Company’s unquoted equity instruments were classified as AFS financial assets.
There is no significant impact of IFRS 9 on the classification and measurement of financial assets for the year ended 30 September 2019 other than the changes in classification of loans and receivables and available for sale financial assets to the category of amortised cost and fair value through other comprehensive income respectively.
The accounting for the Company’s financial liabilities remains largely the same as it was under IAS 39. Accordingly, the adoption of IFRS 9 has not had a significant effect on the Company’s accounting policies related to financial liabilities.
Impairment
The adoption of IFRS 9 has fundamentally changed the Company’s accounting for impairment losses for financial assets by replacing IAS 39’s incurred loss approach with a forward-looking expected credit loss (ECL) approach. IFRS 9 requires the Company to record an allowance for ECLs for all loans and other debt financial assets not held at FVPL.
ECLs are based on the difference between the contractual cash flows due in accordance with the contract and all the cash flows that the Company expects to receive. The shortfall is then discounted at an approximation to the asset’s original effective interest rate.
For trade and other receivables, the Company has applied the standard’s simplified approach and has calculated ECLs based on lifetime expected credit losses. The Company has established a provision matrix that is based on the Company’s historical credit loss experience, adjusted for forward-looking factors specific to the debtors and the economic environment. However, in certain cases, the Company may also consider a financial asset to be in default when internal or external information indicates that the Company is unlikely to receive the outstanding contractual amounts in full before taking into account any credit enhancements held by the Company. The adoption of the ECL requirements of IFRS 9 did not result in any difference in the existing impairment allowances of the Company’s debt financial assets.
The accounting policy in respect of financial instrument is stated in note 5.14 to these financial statements.
3.2 Standards, interpretations and amendments to approved accounting standards that are not yet effective
The following standards, amendments and interpretations with respect to the approved accounting standards as applicable in Pakistan would be effective from the dates mentioned below against the respective standard or interpretation:
Standard or Interpretation
Effective date (annual periods beginning on
or after)
IFRS 3 Definition of a Business (Amendments) 01 January 2020IFRS 3 Business Combinations: Previously held interests in a joint operation 01 January 2019IFRS 9 Prepayment Features with Negative Compensation (Amendments) 01 January 2019IFRS 10 Consolidated Financial Statements and IAS 28 Investment in Associates
and Joint Ventures - Sale or Contribution of Assets between an Investor and its Associate or Joint Venture (Amendment) Not yet finalised
IFRS 11 Joint Arrangements: Previously held interests in a joint operation 01 January 2019IFRS 14 Regulatory Deferral Accounts 01 July 2019IFRS 16 Leases 01 January 2019IAS 1/ IAS 8 Definition of Material (Amendments) 01 January 2020IAS 12 Income Taxes: Income tax consequences of payments on financial
instruments classified as equity 01 January 2019IAS 19 Plan Amendment, Curtailment or Settlement (Amendments) 01 January 2019
Mehran Sugar Mills Ltd. 101
NOTES TO THE UNCONSOLIDATED FINANCIAL STATEMENTSFor the year ended September 30, 2019
IAS 23 Borrowing Costs - Borrowing costs eligible for capitalisation 01 January 2019IAS 28 Long-term Interests in Associates and Joint Ventures (Amendments) 01 January 2019IFRIC 23 Uncertainty over Income Tax Treatments 01 January 2019
The above standards and amendments are not expected to have any material impact on the Company’s unconsolidated financial statements in the period of initial application except for IFRS 16 - ‘Leases’. The Company is currently evaluating the impact of these standards.
In addition to the above standards and amendments, improvements to various accounting standards have also been issued by the IASB in December 2017. Such improvements are generally effective for annual reporting period beginning on or after January 01, 2019. The Company expects that such improvements to the standards will not have any material impact on the Company’s financial statements in the period of initial application.
The IASB has also issued the revised Conceptual Framework for Financial Reporting (the Conceptual Framework) in March 2018 which is effective for annual periods beginning on or after 01 January 2020 for preparers of financial statements who develop accounting policies based on the Conceptual Framework. The revised Conceptual Framework is not a standard, and none of the concepts override those in any standard or any requirements in a standard. The purpose of the Conceptual Framework is to assist IASB in developing standards, to help preparers develop consistent accounting policies if there is no applicable standard in place and to assist all parties to understand and interpret the standards.
Further, the following new standard have been issued by IASB which are yet to be notified by the SECP for the purpose of applicability in Pakistan.
Standard or Interpretation
IASB effective date (annual
periods beginning on
or after)
IFRS 17 Insurance Contracts January 01, 2021
The Company expects that above new standard will not have any material impact on the Company’s financial statements in the period of initial application.
4 SIGNIFICANT ACCOUNTING JUDGEMENTS AND ESTIMATES
The preparation of the Company’s unconsolidated financial statements requires management to make judgments and estimates that affect the reported amounts of revenues, expenses, assets and liabilities, and the disclosure of contingent liabilities, at the end of the reporting period. However, uncertainty about these judgments and estimates could result in outcomes that require a material adjustment to the carrying amount of the asset or liability affected in future periods. The management continually evaluates estimates and judgments which are based on historical experience and other factors, including expectations of future events that are believed to be reasonable under current circumstances. Revisions to accounting estimates are recognised prospectively.
In the process of applying the Company’s accounting policies, management has made the following estimates and judgments which are significant to the unconsolidated financial statements:
Property, plant and equipment
The Company reviews appropriateness of the rate of depreciation and useful life used in the calculation of depreciation. Further, where applicable, an estimate of the recoverable amount of assets is made for possible impairment on an annual basis. In making these estimates, the Company uses the technical resources available with the Company. Any change in the estimates in the future might affect the carrying amount of respective item of property, plant and equipment, with corresponding effects on the depreciation charge and impairment.
Annual Report 2019102
NOTES TO THE UNCONSOLIDATED FINANCIAL STATEMENTSFor the year ended September 30, 2019
Allowance for expected credit loss
The Company uses a provision matrix to calculate ECLs for trade receivables and other receivables. The provision rates are based on days past due for Grouping of various customer segments that have similar loss pattern. The provision matrix is initially based on the Company’s historical observed default rates. The Company will calibrate the matrix to adjust the historical credit loss experience with forward-looking information. For instance, if forecast economic conditions (i.e., gross domestic product) are expected to deteriorate over the next year which can lead to an increased number of defaults in the manufacturing sector, the historical default rates are adjusted. At every reporting date, the historical observed default rates are updated and changes in the forward-looking estimates are analysed. The assessment of the correlation between historical observed default rates, forecast economic conditions and ECLs is a significant estimate. The amount of ECLs is sensitive to changes in circumstances and of forecast economic condition. The Company’s historical credit loss experience and forecast of economic conditions may also not be representative of customer’s actual default in future. The information about the ECLs on the Company’s financial assets exposed to credit risk is disclosed in Note 43.
Inventories
The Company reviews the net realisable value (NRV) of stock-in-trade and stores and spare parts to assess any diminution in the respective carrying values. NRV is estimated with reference to the estimated selling price in the ordinary course of business less the estimated cost necessary to make the sale.
Taxation
In making the estimate for income tax payable by the Company, the Company takes into account the applicable tax laws and the decision by appellate authorities on certain issues in the past.
Deferred tax assets are recognised for all unused tax losses and credits to the extent that it is probable that taxable profit will be available against which such losses and credits can be utilised. Significant management judgment is required to determine the amount of deferred tax assets that can be recognised, based upon the likely timing and level of future taxable profits together with future tax planning strategies.
5 SIGNIFICANT ACCOUNTING POLICIES
5.1 Property, plant and equipment
Owned
These are stated at cost less accumulated depreciation and impairment except for freehold land, which is stated at cost.
Depreciation is charged to the unconsolidated statement of profit or loss using the reducing balance method, at the rates specified in note 6.1. Depreciation on additions is charged from the month in which the asset is available for use and on disposals up to the month the asset is in use.
The carrying values of the Company’s property plant and equipment are reviewed at each financial year end for impairment when events or changes in circumstances indicate that the carrying value may not be recoverable. If any such indication exists, and where the carrying values exceed the estimated recoverable amount, the assets are written down to their recoverable amount.
Repairs and maintenance cost is written off to the unconsolidated statement of profit or loss in the year in which it is incurred. Major renewals and improvements are capitalised when it is probable that respective future economic benefits will flow to the Company.
An item of property plant and equipment is derecognised upon disposal or when no future economic benefits are expected from its use or disposal. Gain or loss on disposal of property plant and equipment is recognised in the period of disposal.
Mehran Sugar Mills Ltd. 103
NOTES TO THE UNCONSOLIDATED FINANCIAL STATEMENTSFor the year ended September 30, 2019
Leased
Leases, recorded under the requirements of IAS 17 – “Leases”, which transfer to the Company substantially all the risks and benefits incidental to ownership of the leased item are capitalised at the inception of the lease, at the fair value of the leased property or, if lower at the present value of the minimum lease payments. Lease payments are apportioned between the finance charges and reduction of the lease liability so as to achieve a constant rate of interest on the remaining balance of the liability. Assets acquired under finance lease are depreciated using the same basis as for owned assets.
Capital work-in-progress
These are stated at cost less accumulated impairment, if any, and represent expenditure on fixed assets in the course of construction and installation. Transfers are made to relevant property, plant and equipment category as and when assets are available for their intended use.
5.2 Investments
Subsidiaries
These are stated at cost. Provision is made for permanent impairment in the value of investment, if any.
Associates
Investment in associates are accounted for using equity method of accounting. Investments over which the Company has “significant influence” are accounted for under this method i.e., investments to be carried in the reporting date at cost plus post-acquisition changes in the share of net assets of associates, less any impairment in value, if material. The unconsolidated statement of profit or loss reflects the Company’s share of the results of operations of associates after the date of acquisition. If an associate uses accounting policies other than those of the Company, adjustments are made to conform the associate’s policies to those of the Company, if the impact is considered material.
As the financial statements of all the associates may not necessarily be available at the year end, the Company uses the financial statements of the associates with a lag of three months for applying the equity method of accounting. Further, the Company considers the investment in associates as strategic investment.
5.3 Biological assets
These are measured at fair value less costs to sell on initial recognition and at each reporting date. Gain or loss arising on initial recognition of a biological asset at fair value less costs to sell and from a change in fair value less costs to sell of a biological asset at the reporting date is included in the unconsolidated statement of profit or loss for the period in which it arises.
To ascertain the fair value of the biological assets, the fair value less estimated point-of-sale costs of crops at the end of each reporting period is determined using prices and other relevant information generated by market transactions involving identical or comparable (i.e., similar) assets. Since, there exists an active market for the agricultural produce, the estimated selling price is obtained using the observable inputs and the estimated selling costs are the harvesting charges farmer takes for cutting the crop.
5.4 Stores and spare parts
Stores, spares and consumables are stated at the lower of weighted average cost and net realisable value. Cost comprises all costs of purchase, costs of conversion and other costs incurred in bringing the inventories to their present location and condition. Net realisable value is the estimated selling price in the ordinary course of business less net estimated costs to sell, which is generally equivalent to replacement cost.
Items in transit, if any, are valued at cost comprising invoice value plus other charges incurred thereon up to the reporting date.
Annual Report 2019104
NOTES TO THE UNCONSOLIDATED FINANCIAL STATEMENTSFor the year ended September 30, 2019
5.5 Stock-in-trade
Stock-in-trade is valued at the lower of cost and estimated net realisable value.
Cost comprises all costs of purchase, costs of conversion and other costs incurred in bringing the inventories to their present location and condition. Net realisable value signifies the estimated selling price in the ordinary course of business less net estimated costs of completion and sell.
Items in transit, if any, are valued at cost comprising invoice value plus other charges incurred thereon up to the reporting date.
5.6 Trade debts and other receivables
Trade debts and other receivables are stated at original invoice amount less provision for doubtful debts, if any. A provision for doubtful debts and other receivables is established when there is objective evidence that the Company will not be able to collect all amounts due according to the original terms of receivables (refer note 43.1.1). Bad debts are written-off when identified.
5.7 Cash and cash equivalents
Cash and cash equivalents comprise of cash in hand and current accounts held with banks, which are subject to insignificant risk of change. These are carried at cost.
5.8 Employees’ benefits
Gratuity
The Company operates an unfunded gratuity scheme for its permanent mill employees. An actuarial valuation of all defined benefit scheme is conducted every year. The valuation uses the Projected Unit Credit method. Actuarial gains and losses are recognised in full in the period in which they occur in the unconsolidated statement of comprehensive income.
All past service costs are recognised at the earlier of when the amendment or curtailment occurs and when the Company has recognised related restructuring or termination benefits.
Certain actuarial assumptions have been disclosed in note 23 to the financial statements for valuation of present value of defined benefit obligation and fair value of plan asset. Any changes in these assumptions in future years might affect gains and losses in those years.
Provident fund
The Company operates a recognised provident fund for those permanent employees who have opted for it. Equal monthly contributions are made to the fund by the Company and employees in accordance with the fund’s rules. Contributions are made by the employees at mill and the employees at head office at the rate of 11% and 10% respectively, of the aggregate of basic salary.
Investments made in provident fund have been made in accordance with the provisions of Section 218 of the Act and the conditions specified thereunder.
Compensated absences
The Company accrues its estimated liability towards leaves accumulated by employees on an accrual basis using current salary level.
5.9 Taxation
Current
Provision for current tax is based on the taxable income in accordance with the Income Tax Ordinance, 2001.
Mehran Sugar Mills Ltd. 105
NOTES TO THE UNCONSOLIDATED FINANCIAL STATEMENTSFor the year ended September 30, 2019
Deferred
Deferred tax is recognised using the liability method, on all temporary differences arising at the reporting date between the tax base of assets and liabilities and their carrying amounts for financial reporting purposes.
Deferred tax liabilities are recognised for all taxable temporary differences. Deferred tax assets are recognised for all deductible temporary differences to the extent that it is probable that the future taxable profits will be available against which the assets may be utilised. Deferred tax assets are reduced to the extent that it is no longer probable that the related tax benefit will be realised.
Deferred tax assets and liabilities are measured at the tax rates that are expected to apply to the period when the asset is realised or the liability is settled, based on the tax rates (and tax laws) that have been enacted or substantively enacted at the reporting date.
Deferred tax relating to items recognised outside unconsolidated statement of profit or loss is recognised outside unconsolidated statement of profit or loss. Deferred tax items are recognised in correlation to the underlying transaction either in unconsolidated statement of comprehensive income or directly in equity.
5.10 Trade and other payables
Liabilities for trade and other amounts payable are carried at cost which is the fair value of the consideration to be paid in the future for goods and services received, whether or not billed to the Company.
5.11 Provisions
Provisions are recognised when the Company has a present obligation (legal or constructive) as a result of a past event if it is probable that an outflow of resources embodying economic benefits will be required to settle the obligation and a reliable estimate can be made of the amount of obligation. Provisions are reviewed at each reporting date and adjusted to reflect the current best estimate.
5.12 Foreign currency transactions and translation
Foreign currency transactions are translated into Pak Rupees using the exchange rates prevailing at the dates of the transactions. Monetary assets and liabilities in foreign currencies are translated into Pak Rupees using the exchange rate at the reporting date. Foreign exchange gains and losses resulting from the settlement of such transactions and from the translations at the year end exchange rates of monetary assets and liabilities denominated in foreign currencies are recognised in the unconsolidated statement of profit or loss.
5.13 Borrowing and their costs
Borrowings are recognised initially at fair value, net of transaction costs incurred. Borrowing costs are recognised as an expense in the period in which these are incurred except to the extent of borrowing costs that are directly attributable to the acquisition, construction or production of a qualifying asset. Such borrowing costs, if any, are capitalised as part of the cost of that asset.
5.14 Financial instruments
A financial instrument is any contract that gives rise to a financial asset of one entity and a financial liability or equity instrument of another entity.
i) Financial assets
Initial recognition and measurement
Financial assets are classified, at initial recognition, as subsequently measured at amortised cost, fair value through other comprehensive income (OCI), and fair value through profit or loss.
Annual Report 2019106
NOTES TO THE UNCONSOLIDATED FINANCIAL STATEMENTSFor the year ended September 30, 2019
The classification of financial assets at initial recognition depends on the financial asset’s contractual cash flow characteristics and the Company’s business model for managing them. With the exception of trade receivables, the Company initially measures a financial asset at its fair value plus, in the case of a financial asset not at fair value through profit or loss, transaction costs. Trade receivables are measured at the transaction price determined under IFRS 15. Refer to the accounting policies in note 5.15 to these unconsolidated financial statements.
In order for a financial asset to be classified and measured at amortised cost or fair value through OCI, it needs to give rise to cash flows that are ‘solely payments of principal and interest (SPPI)’ on the principal amount outstanding. This assessment is referred to as the SPPI test and is performed at an instrument level. The Company’s business model for managing financial assets refers to how it manages its financial assets in order to generate cash flows. The business model determines whether cash flows will result from collecting contractual cash flows, selling the financial assets, or both.
Purchases or sales of financial assets that require delivery of assets within a time frame established by regulation or convention in the market place (regular way trades) are recognised on the trade date, i.e., the date that the Company commits to purchase or sell the asset.
Subsequent measurementFor purposes of subsequent measurement, financial assets are classified into following categories:
• Financial assets at amortised cost (debt instruments);
• Financial assets designated at fair value through OCI with no recycling of cumulative gains and losses upon derecognition (equity instruments); and
• Financial assets at fair value through profit or loss.
Financial assets at amortised cost (debt instruments)
This category is the most relevant to the Company. The Company measures financial assets at amortised cost if both of the following conditions are met:
• The financial asset is held within a business model with the objective to hold financial assets in order to collect contractual cash flows; and
• The contractual terms of the financial asset give rise on specified dates to cash flows that are solely payments of principal and interest on the principal amount outstanding.
Financial assets at amortised cost are subsequently measured using the effective interest (EIR) method and are subject to impairment. Gains and losses are recognised in profit or loss when the asset is derecognised, modified or impaired.
Financial assets designated at fair value through OCI (equity instruments)
Upon initial recognition, the Company can elect to classify irrevocably its equity investments as equity instruments designated at fair value through OCI when they meet the definition of equity under IAS 32 Financial Instruments: Presentation and are not held for trading. The classification is determined on an instrument-by-instrument basis.
Gains and losses on these financial assets are never recycled to profit or loss. Dividends are recognised as other income in the unconsolidated statement of profit or loss when the right of payment has been established, except when the Company benefits from such proceeds as a recovery of part of the cost of the financial asset, in which case, such gains are recorded in OCI. Equity instruments designated at fair value through OCI are not subject to impairment assessment.
The Company elected to classify irrevocably its non-listed equity investments under this category.
Mehran Sugar Mills Ltd. 107
NOTES TO THE UNCONSOLIDATED FINANCIAL STATEMENTSFor the year ended September 30, 2019
Financial assets at fair value through profit or loss
Financial assets at fair value through profit or loss include financial assets held for trading, financial assets designated upon initial recognition at fair value through profit or loss, or financial assets mandatorily required to be measured at fair value. Financial assets are classified as held for trading if they are acquired for the purpose of selling or repurchasing in the near term. Financial assets with cash flows that are not solely payments of principal and interest are classified and measured at fair value through profit or loss, irrespective of the business model. Notwithstanding the criteria for debt instruments to be classified at amortised cost or at fair value through OCI, as described above, debt instruments may be designated at fair value through profit or loss on initial recognition if doing so eliminates, or significantly reduces, an accounting mismatch.
Financial assets at fair value through profit or loss are carried in the statement of financial position at fair value with net changes in fair value recognised in the statement of profit or loss.
This category includes derivative instruments and listed equity investments which the Company had not irrevocably elected to classify at fair value through OCI. Dividends on listed equity investments are also recognised as other income in the statement of profit or loss when the right of payment has been established.
Derecognition
A financial asset (or, where applicable, a part of a financial asset or part of a group of similar financial assets) is primarily derecognised (i.e., removed from the Company’s unconsolidated statement of financial position) when:
• The rights to receive cash flows from the asset have expired; Or
• The Company has transferred its rights to receive cash flows from the asset or has assumed an obligation to pay the received cash flows in full without material delay to a third party under a ‘pass-through’ arrangement; and either (a) the Company has transferred substantially all the risks and rewards of the asset, or (b) the Company has neither transferred nor retained substantially all the risks and rewards of the asset, but has transferred control of the asset.
When the Company has transferred its rights to receive cash flows from an asset or has entered into a pass-through arrangement, it evaluates if, and to what extent, it has retained the risks and rewards of ownership.
When it has neither transferred nor retained substantially all of the risks and rewards of the asset, nor transferred control of the asset, the Company continues to recognise the transferred asset to the extent of its continuing involvement. In that case, the Company also recognises an associated liability. The transferred asset and the associated liability are measured on a basis that reflects the rights and obligations that the Company has retained.
Continuing involvement that takes the form of a guarantee over the transferred asset is measured at the lower of the original carrying amount of the asset and the maximum amount of consideration that the Company could be required to repay.
Impairment of financial assets
Further disclosures relating to impairment of financial assets are also provided in the following notes:
• Disclosures for significant assumptions - note 3• Trade receivables - note 12
The Company recognises an allowance for expected credit losses (ECLs) for all debt instruments not held at fair value through profit or loss. ECLs are based on the difference between the contractual cash flows due in accordance with the contract and all the cash flows that the Company expects to receive, discounted at an approximation of the original effective interest rate. The expected cash flows will include cash flows from the sale of collateral held or other credit enhancements that are integral to the contractual terms. For trade receivables, the Company applies a simplified
Annual Report 2019108
NOTES TO THE UNCONSOLIDATED FINANCIAL STATEMENTSFor the year ended September 30, 2019
approach in calculating ECLs. Therefore, the Company does not track changes in credit risk, but instead recognises a loss allowance based on lifetime ECLs at each reporting date. The Company has established a provision matrix that is based on its historical credit loss experience, adjusted for forward-looking factors specific to the debtors and the economic environment.
The Company considers a financial asset in default when contractual payments are 90 days past due. However, in certain cases, the Company may also consider a financial asset to be in default when internal or external information indicates that the Company is unlikely to receive the outstanding contractual amounts in full before taking into account any credit enhancements held by the Company. A financial asset is written off when there is no reasonable expectation of recovering the contractual cash flows.
ii) Financial liabilities
Initial recognition and measurement
Financial liabilities are classified, at initial recognition, as financial liabilities at fair value through profit or loss, loans and borrowings, payables, or as derivatives designated as hedging instruments in an effective hedge, as appropriate.
All financial liabilities are recognised initially at fair value and, in the case of loans and borrowings and payables, net of directly attributable transaction costs.
Financial liabilities at fair value through profit or loss
Financial liabilities at fair value through profit or loss include financial liabilities held for trading and financial liabilities designated upon initial recognition as at fair value through profit or loss. Gains or losses on liabilities held for trading are recognised in the unconsolidated statement of profit or loss. Financial liabilities designated upon initial recognition at fair value through profit or loss are designated at the initial date of recognition, and only if the criteria in IFRS 9 are satisfied. The Company has not designated any financial liability as at fair value through profit or loss.
Loans and borrowings
This is the category most relevant to the Company. After initial recognition, interest-bearing loans and borrowings are subsequently measured at amortised cost using the EIR method. Gains and losses are recognised in profit or loss when the liabilities are derecognised as well as through the EIR amortisation process.
Amortised cost is calculated by taking into account any discount or premium on acquisition and fees or costs that are an integral part of the EIR. The EIR amortisation is included as finance costs in the unconsolidated statement of profit or loss.
This category generally applies to interest-bearing loans and borrowings. For more information, refer to Note 20.
Derecognition
A financial liability is derecognised when the obligation under the liability is discharged or cancelled or expires. When an existing financial liability is replaced by another from the same lender on substantially different terms, or the terms of an existing liability are substantially modified, such an exchange or modification is treated as the derecognition of the original liability and the recognition of a new liability. The difference in the respective carrying amounts is recognised in the unconsolidated statement of profit or loss.
iii) Offsetting of financial instruments
Financial assets and financial liabilities are offset and the net amount is reported in the unconsolidated statement of financial position if there is a currently enforceable legal right to offset the recognised amounts and there is an intention to settle on a net basis, to realise the assets and settle the liabilities simultaneously.
Mehran Sugar Mills Ltd. 109
NOTES TO THE UNCONSOLIDATED FINANCIAL STATEMENTSFor the year ended September 30, 2019
5.15 Revenue from contracts with customers
The Company is in the business of sale of goods. Revenue from contracts with customers is recognised when control of the goods is transferred to the customer at an amount that reflects the consideration to which the Company expects to be entitled in exchange for those goods. The Company has generally concluded that it is the principal in its revenue arrangements because it typically controls the goods or services before transferring them to the customer.
The disclosures of significant accounting judgements, estimates and assumptions relating to revenue from contracts with customers are provided in note 4.
Revenue from sale of goods is recognised at the point in time when control of the asset is transferred to the customer, generally on delivery of the goods. The normal credit term is 30 to 90 days upon delivery.
The Company considers whether there are other promises in the contract that are separate performance obligations to which a portion of the transaction price needs to be allocated (e.g., right of returns, volume rebates). In determining the transaction price for the sale of goods, the Company considers the effects of variable consideration, the existence of significant financing components, noncash consideration.
Variable consideration
If the consideration in a contract includes a variable amount, the Company estimates the amount of consideration to which it will be entitled in exchange for transferring the goods to the customer. The variable consideration is estimated at contract inception and constrained until it is highly probable that a significant revenue reversal in the amount of cumulative revenue recognised will not occur when the associated uncertainty with the variable consideration is subsequently resolved. Some contracts for the sale of chemicals provide customers with a right of return and volume rebates. The rights of return and volume rebates give rise to variable consideration. Contracts with the Company’s customers provide them with a right of return, price adjustments and volume rebates and are considered as variable consideration.
Accounts receivables
A receivable represents the Company’s right to an amount of consideration that is unconditional (i.e. only the passage of time is required before payment of the consideration is due).
Dividend income is recognised when the right to receive dividend is established.
Profit on short-term deposits is accounted for using the effective interest rate method.
Income from sale of electricity is recognised upon the output delivered at rates specified under the agreement with the Hyderabad Electricity Supply Company (HESCO).
Farm and other income is recognised on accrual basis.
5.16 Dividend and appropriation to reserves
Dividend and appropriation to reserves are recognised in the unconsolidated financial statements in the period in which these are approved. However, if these are approved after the reporting period but before the unconsolidated financial statements are authorised for issue, disclosure is made in the unconsolidated financial statements.
5.17 Segment reporting
Operating segments are reported in a manner consistent with the internal reporting provided to the chief operating decision-maker. The chief operating decision-maker, who is responsible for allocating resources and assessing performance of the operating segments, has been identified as the Board of Directors that makes strategic decisions. The management has determined that the Company has a single reportable segment as the Board of Directors views the Company’s operations as one reportable segment.
Annual Report 2019110
NOTES TO THE UNCONSOLIDATED FINANCIAL STATEMENTSFor the year ended September 30, 2019
5.18 Functional and presentation currency
These unconsolidated financial statements are presented in Pakistani Rupees, which is the Company’s functional and presentation currency.
Following accounting Policies (from 5.19 to 5.21) were effective for the period ended on or before September 30, 2018.
5.19 Financial instruments
Available-for-sale
Investments which the management intends to hold for an indefinite period, but may be sold in response to the need for liquidity or changes in interest rates are classified as available-for-sale.
These investments are initially recognised at cost, being the fair value of the consideration given including transaction costs associated with the investment. After initial recognition, these investments are remeasured at fair value. For investments traded in active market, fair value is determined by reference to quoted market price and the investments for which a quoted market price is not available, or the fair value cannot be reasonably calculated, are measured at cost, subject to review for impairment at each reporting date.
Gains or losses on available-for-sale investments are recognised in other comprehensive income until the investment is disposed of or determined to be impaired, at which time the cumulative gain or loss previously reported in other comprehensive income is taken to unconsolidated statement of profit or loss.
Held-to-maturity
Investments with fixed or determinable payments and fixed maturity where management has both the positive intent and ability to hold to maturity are classified as held to maturity investments. These are initially measured at cost, being the fair value of the consideration given including transaction costs associated with the investment, and are subsequently measured at amortised cost using the effective interest method. Gains and losses are recognised in the unconsolidated statement of profit or loss when the investments are derecognised or impaired, as well as through the amortisation process.
Recognition
Financial assets and liabilities are recognised at the time when the Company becomes party to the contractual provisions of the instrument and are derecognised in the case of assets, when the contractual rights under the instruments are realised, expired or surrendered and in the case of liability, when the obligation is discharged, cancelled or expired.
Impairment
A financial asset (or, where applicable, a part of a financial asset or part of a group of similar financial assets) is primarily derecognised (i.e., removed from the Company’s unconsolidated statement of financial position) when the rights to receive cash flows from the asset have expired or the Company has transferred its rights to receive cash flows from the asset or has assumed an obligation to pay the received cash flows in full without material delay to a third party under a ‘pass-through’ arrangement; and either (a) the Company has transferred substantially all the risks and rewards of the asset, or (b) the Company has neither transferred nor retained substantially all the risks and rewards of the asset, but has transferred control of the asset. When the Company has transferred its rights to receive cash flows from an asset or has entered into a pass- through arrangement, it evaluates if, and to what extent, it has retained the risks and rewards of ownership. When it has neither transferred nor retained substantially all of the risks and rewards of the asset, nor transferred control of the asset, the Company continues to recognise the transferred asset to the extent of its continuing involvement. In that case, the Company also recognises an associated liability. The transferred asset and the associated liability are measured on a basis that reflects the rights and obligations that the Company has retained.
Mehran Sugar Mills Ltd. 111
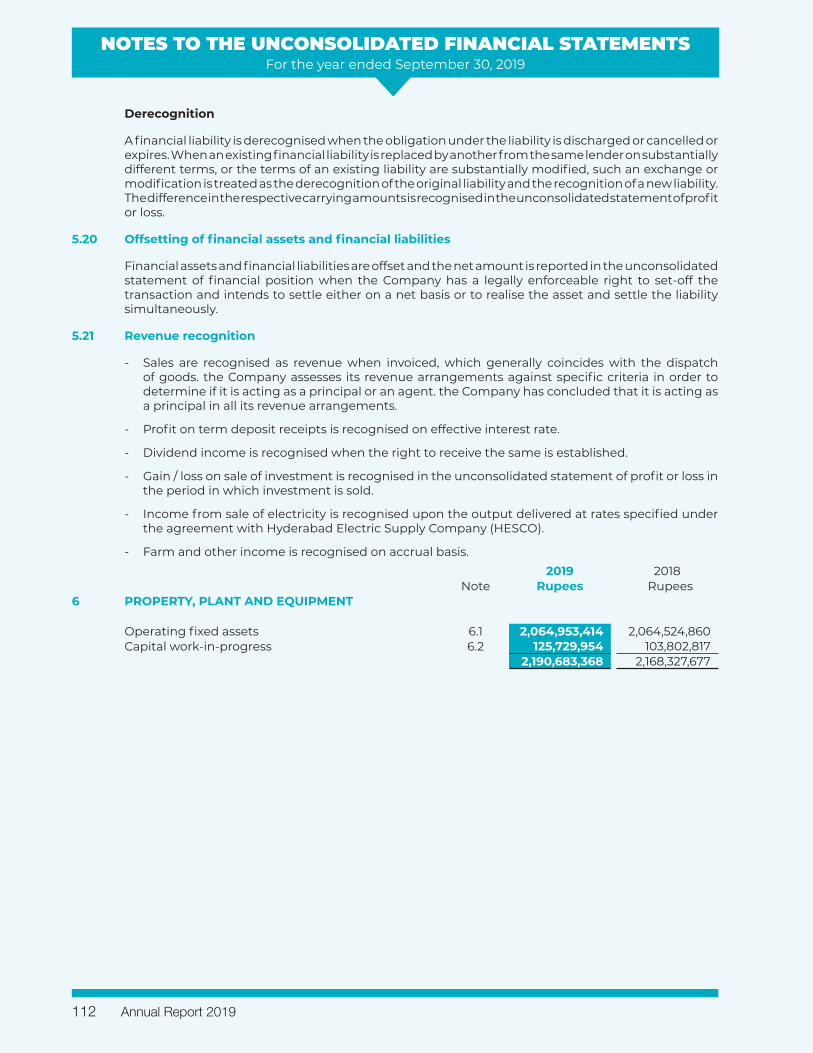
wz
NOTES TO THE UNCONSOLIDATED FINANCIAL STATEMENTSFor the year ended September 30, 2019
Derecognition
A financial liability is derecognised when the obligation under the liability is discharged or cancelled or expires. When an existing financial liability is replaced by another from the same lender on substantially different terms, or the terms of an existing liability are substantially modified, such an exchange or modification is treated as the derecognition of the original liability and the recognition of a new liability. The difference in the respective carrying amounts is recognised in the unconsolidated statement of profit or loss.
5.20 Offsetting of financial assets and financial liabilities
Financial assets and financial liabilities are offset and the net amount is reported in the unconsolidated statement of financial position when the Company has a legally enforceable right to set-off the transaction and intends to settle either on a net basis or to realise the asset and settle the liability simultaneously.
5.21 Revenue recognition
- Sales are recognised as revenue when invoiced, which generally coincides with the dispatch of goods. the Company assesses its revenue arrangements against specific criteria in order to determine if it is acting as a principal or an agent. the Company has concluded that it is acting as a principal in all its revenue arrangements.
- Profit on term deposit receipts is recognised on effective interest rate.
- Dividend income is recognised when the right to receive the same is established.
- Gain / loss on sale of investment is recognised in the unconsolidated statement of profit or loss in the period in which investment is sold.
- Income from sale of electricity is recognised upon the output delivered at rates specified under the agreement with Hyderabad Electric Supply Company (HESCO).
- Farm and other income is recognised on accrual basis.2019 2018
Note Rupees Rupees 6 PROPERTY, PLANT AND EQUIPMENT
Operating fixed assets 6.1 2,064,953,414 2,064,524,860 Capital work-in-progress 6.2 125,729,954 103,802,817
2,190,683,368 2,168,327,677
Annual Report 2019112
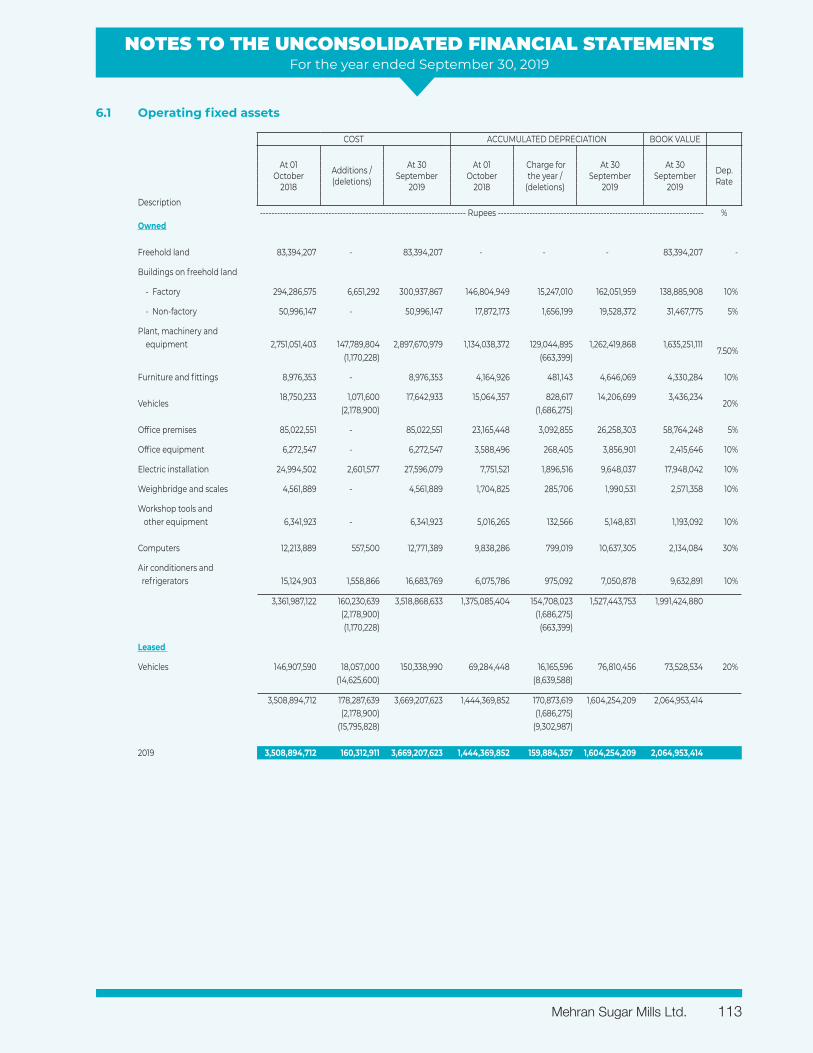
6.1 Operating fixed assets
COST ACCUMULATED DEPRECIATION BOOK VALUE
At 01 October
2018
Additions / (deletions)
At 30 September
2019
At 01 October
2018
Charge for the year /
(deletions)
At 30 September
2019
At 30 September
2019
Dep. Rate
Description------------------------------------------------------------------------ Rupees ------------------------------------------------------------------------ %
Owned
Freehold land 83,394,207 - 83,394,207 - - - 83,394,207 -
Buildings on freehold land
- Factory 294,286,575 6,651,292 300,937,867 146,804,949 15,247,010 162,051,959 138,885,908 10%
- Non-factory 50,996,147 - 50,996,147 17,872,173 1,656,199 19,528,372 31,467,775 5%
Plant, machinery and equipment 2,751,051,403 147,789,804 2,897,670,979 1,134,038,372 129,044,895 1,262,419,868 1,635,251,111
7.50% (1,170,228) (663,399)
Furniture and fittings 8,976,353 - 8,976,353 4,164,926 481,143 4,646,069 4,330,284 10%
Vehicles 18,750,233 1,071,600 17,642,933 15,064,357 828,617 14,206,699 3,436,234
20% (2,178,900) (1,686,275)
Office premises 85,022,551 - 85,022,551 23,165,448 3,092,855 26,258,303 58,764,248 5%
Office equipment 6,272,547 - 6,272,547 3,588,496 268,405 3,856,901 2,415,646 10%
Electric installation 24,994,502 2,601,577 27,596,079 7,751,521 1,896,516 9,648,037 17,948,042 10%
Weighbridge and scales 4,561,889 - 4,561,889 1,704,825 285,706 1,990,531 2,571,358 10%
Workshop tools and other equipment 6,341,923 - 6,341,923 5,016,265 132,566 5,148,831 1,193,092 10%
Computers 12,213,889 557,500 12,771,389 9,838,286 799,019 10,637,305 2,134,084 30%
Air conditioners and refrigerators 15,124,903 1,558,866 16,683,769 6,075,786 975,092 7,050,878 9,632,891 10%
3,361,987,122 160,230,639 3,518,868,633 1,375,085,404 154,708,023 1,527,443,753 1,991,424,880 (2,178,900) (1,686,275) (1,170,228) (663,399)
Leased
Vehicles 146,907,590 18,057,000 150,338,990 69,284,448 16,165,596 76,810,456 73,528,534 20% (14,625,600) (8,639,588)
3,508,894,712 178,287,639 3,669,207,623 1,444,369,852 170,873,619 1,604,254,209 2,064,953,414 (2,178,900) (1,686,275)
(15,795,828) (9,302,987)
2019 3,508,894,712 160,312,911 3,669,207,623 1,444,369,852 159,884,357 1,604,254,209 2,064,953,414
NOTES TO THE UNCONSOLIDATED FINANCIAL STATEMENTSFor the year ended September 30, 2019
Mehran Sugar Mills Ltd. 113
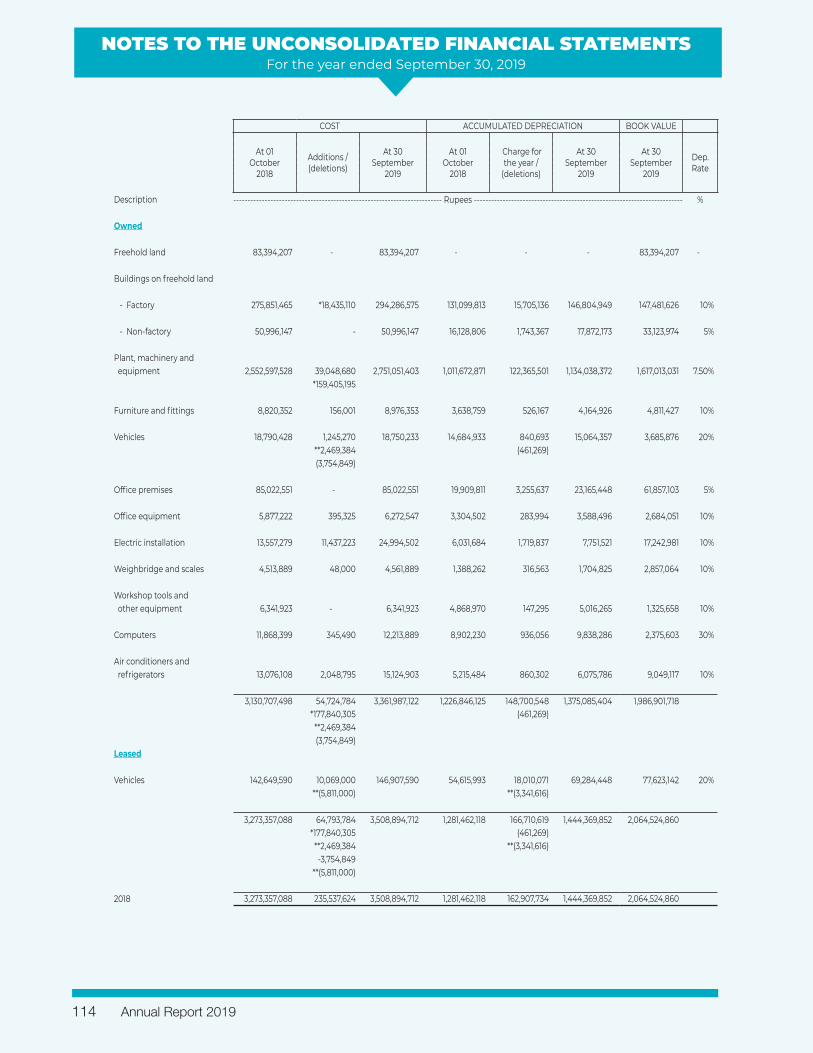
NOTES TO THE UNCONSOLIDATED FINANCIAL STATEMENTSFor the year ended September 30, 2019
COST ACCUMULATED DEPRECIATION BOOK VALUE
At 01 October
2018
Additions / (deletions)
At 30 September
2019
At 01 October
2018
Charge for the year /
(deletions)
At 30 September
2019
At 30 September
2019
Dep. Rate
Description ------------------------------------------------------------------------- Rupees ------------------------------------------------------------------------- %
Owned
Freehold land 83,394,207 - 83,394,207 - - - 83,394,207 -
Buildings on freehold land
- Factory 275,851,465 *18,435,110 294,286,575 131,099,813 15,705,136 146,804,949 147,481,626 10%
- Non-factory 50,996,147 - 50,996,147 16,128,806 1,743,367 17,872,173 33,123,974 5%
Plant, machinery and equipment 2,552,597,528 39,048,680 2,751,051,403 1,011,672,871 122,365,501 1,134,038,372 1,617,013,031 7.50%
*159,405,195
Furniture and fittings 8,820,352 156,001 8,976,353 3,638,759 526,167 4,164,926 4,811,427 10%
Vehicles 18,790,428 1,245,270 18,750,233 14,684,933 840,693 15,064,357 3,685,876 20%**2,469,384 (461,269) (3,754,849)
Office premises 85,022,551 - 85,022,551 19,909,811 3,255,637 23,165,448 61,857,103 5%
Office equipment 5,877,222 395,325 6,272,547 3,304,502 283,994 3,588,496 2,684,051 10%
Electric installation 13,557,279 11,437,223 24,994,502 6,031,684 1,719,837 7,751,521 17,242,981 10%
Weighbridge and scales 4,513,889 48,000 4,561,889 1,388,262 316,563 1,704,825 2,857,064 10%
Workshop tools and other equipment 6,341,923 - 6,341,923 4,868,970 147,295 5,016,265 1,325,658 10%
Computers 11,868,399 345,490 12,213,889 8,902,230 936,056 9,838,286 2,375,603 30%
Air conditioners and refrigerators 13,076,108 2,048,795 15,124,903 5,215,484 860,302 6,075,786 9,049,117 10%
3,130,707,498 54,724,784 3,361,987,122 1,226,846,125 148,700,548 1,375,085,404 1,986,901,718*177,840,305 (461,269)
**2,469,384 (3,754,849)
Leased
Vehicles 142,649,590 10,069,000 146,907,590 54,615,993 18,010,071 69,284,448 77,623,142 20%**(5,811,000) **(3,341,616)
3,273,357,088 64,793,784 3,508,894,712 1,281,462,118 166,710,619 1,444,369,852 2,064,524,860*177,840,305 (461,269)
**2,469,384 **(3,341,616) -3,754,849
**(5,811,000)
2018 3,273,357,088 235,537,624 3,508,894,712 1,281,462,118 162,907,734 1,444,369,852 2,064,524,860
Annual Report 2019114
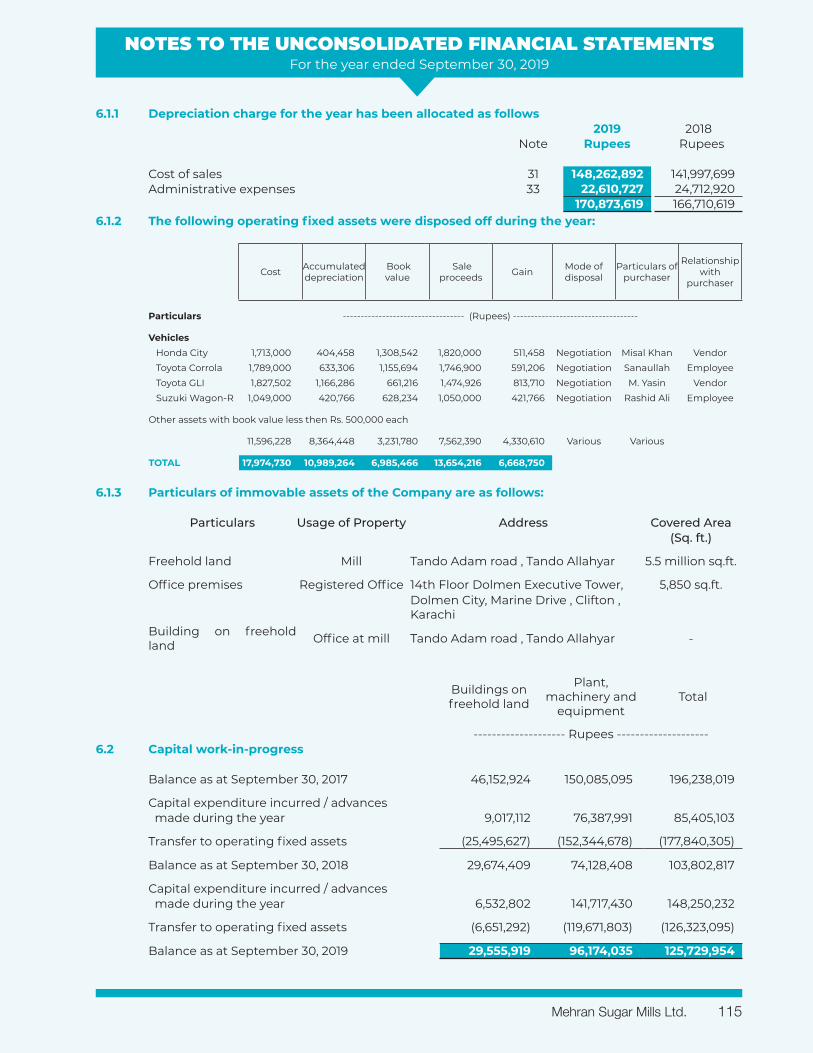
NOTES TO THE UNCONSOLIDATED FINANCIAL STATEMENTSFor the year ended September 30, 2019
Buildings on freehold land
Plant, machinery and
equipmentTotal
-------------------- Rupees --------------------6.2 Capital work-in-progress
Balance as at September 30, 2017 46,152,924 150,085,095 196,238,019
Capital expenditure incurred / advances made during the year 9,017,112 76,387,991 85,405,103
Transfer to operating fixed assets (25,495,627) (152,344,678) (177,840,305)
Balance as at September 30, 2018 29,674,409 74,128,408 103,802,817
Capital expenditure incurred / advances made during the year 6,532,802 141,717,430 148,250,232
Transfer to operating fixed assets (6,651,292) (119,671,803) (126,323,095)
Balance as at September 30, 2019 29,555,919 96,174,035 125,729,954
6.1.1 Depreciation charge for the year has been allocated as follows2019 2018
Note Rupees Rupees
Cost of sales 31 148,262,892 141,997,699 Administrative expenses 33 22,610,727 24,712,920
170,873,619 166,710,619 6.1.2 The following operating fixed assets were disposed off during the year:
Cost Accumulated depreciation
Book value
Sale proceeds Gain Mode of
disposalParticulars of
purchaser
Relationship with
purchaser
Particulars ---------------------------------- (Rupees) -----------------------------------
Vehicles Honda City 1,713,000 404,458 1,308,542 1,820,000 511,458 Negotiation Misal Khan VendorToyota Corrola 1,789,000 633,306 1,155,694 1,746,900 591,206 Negotiation Sanaullah EmployeeToyota GLI 1,827,502 1,166,286 661,216 1,474,926 813,710 Negotiation M. Yasin VendorSuzuki Wagon-R 1,049,000 420,766 628,234 1,050,000 421,766 Negotiation Rashid Ali Employee
Other assets with book value less then Rs. 500,000 each
11,596,228 8,364,448 3,231,780 7,562,390 4,330,610 Various Various
TOTAL 17,974,730 10,989,264 6,985,466 13,654,216 6,668,750
6.1.3 Particulars of immovable assets of the Company are as follows:
Particulars Usage of Property Address Covered Area(Sq. ft.)
Freehold land Mill Tando Adam road , Tando Allahyar 5.5 million sq.ft.
Office premises Registered Office 14th Floor Dolmen Executive Tower, 5,850 sq.ft.Dolmen City, Marine Drive , Clifton , Karachi
Building on freehold land Office at mill Tando Adam road , Tando Allahyar -
Mehran Sugar Mills Ltd. 115
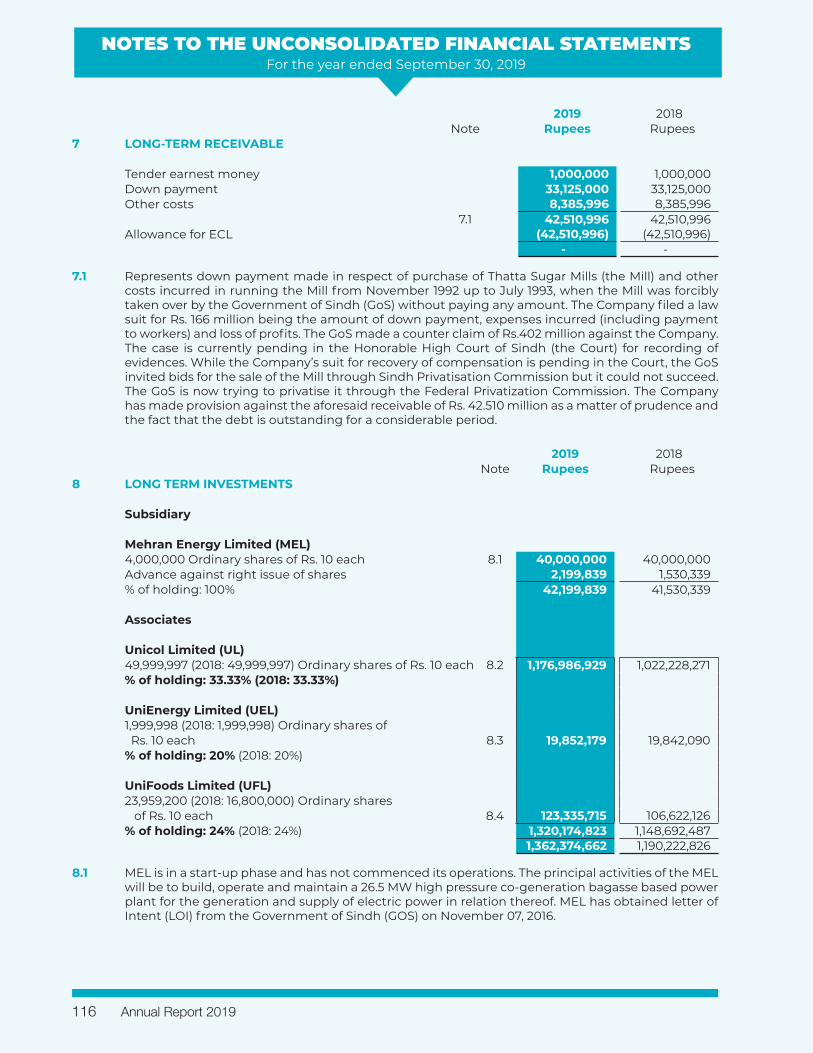
NOTES TO THE UNCONSOLIDATED FINANCIAL STATEMENTSFor the year ended September 30, 2019
2019 2018Note Rupees Rupees
7 LONG-TERM RECEIVABLE
Tender earnest money 1,000,000 1,000,000 Down payment 33,125,000 33,125,000 Other costs 8,385,996 8,385,996
7.1 42,510,996 42,510,996 Allowance for ECL (42,510,996) (42,510,996)
- -
7.1 Represents down payment made in respect of purchase of Thatta Sugar Mills (the Mill) and other costs incurred in running the Mill from November 1992 up to July 1993, when the Mill was forcibly taken over by the Government of Sindh (GoS) without paying any amount. The Company filed a law suit for Rs. 166 million being the amount of down payment, expenses incurred (including payment to workers) and loss of profits. The GoS made a counter claim of Rs.402 million against the Company. The case is currently pending in the Honorable High Court of Sindh (the Court) for recording of evidences. While the Company’s suit for recovery of compensation is pending in the Court, the GoS invited bids for the sale of the Mill through Sindh Privatisation Commission but it could not succeed. The GoS is now trying to privatise it through the Federal Privatization Commission. The Company has made provision against the aforesaid receivable of Rs. 42.510 million as a matter of prudence and the fact that the debt is outstanding for a considerable period.
2019 2018Note Rupees Rupees
8 LONG TERM INVESTMENTS
Subsidiary
Mehran Energy Limited (MEL)4,000,000 Ordinary shares of Rs. 10 each 8.1 40,000,000 40,000,000 Advance against right issue of shares 2,199,839 1,530,339 % of holding: 100% 42,199,839 41,530,339
Associates
Unicol Limited (UL)49,999,997 (2018: 49,999,997) Ordinary shares of Rs. 10 each 8.2 1,176,986,929 1,022,228,271 % of holding: 33.33% (2018: 33.33%)
UniEnergy Limited (UEL)1,999,998 (2018: 1,999,998) Ordinary shares of Rs. 10 each 8.3 19,852,179 19,842,090 % of holding: 20% (2018: 20%)
UniFoods Limited (UFL)23,959,200 (2018: 16,800,000) Ordinary shares of Rs. 10 each 8.4 123,335,715 106,622,126 % of holding: 24% (2018: 24%) 1,320,174,823 1,148,692,487
1,362,374,662 1,190,222,826
8.1 MEL is in a start-up phase and has not commenced its operations. The principal activities of the MEL will be to build, operate and maintain a 26.5 MW high pressure co-generation bagasse based power plant for the generation and supply of electric power in relation thereof. MEL has obtained letter of Intent (LOI) from the Government of Sindh (GOS) on November 07, 2016.
Annual Report 2019116
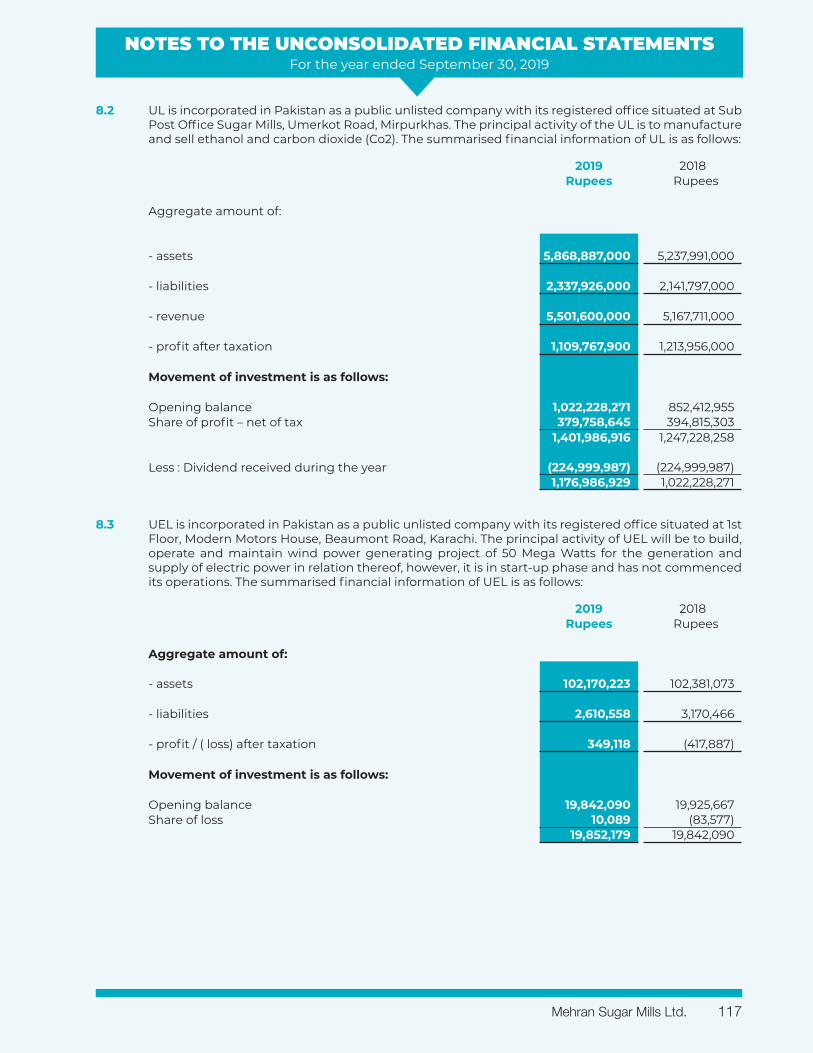
NOTES TO THE UNCONSOLIDATED FINANCIAL STATEMENTSFor the year ended September 30, 2019
8.2 UL is incorporated in Pakistan as a public unlisted company with its registered office situated at Sub Post Office Sugar Mills, Umerkot Road, Mirpurkhas. The principal activity of the UL is to manufacture and sell ethanol and carbon dioxide (Co2). The summarised financial information of UL is as follows:
2019 2018Rupees Rupees
Aggregate amount of:
- assets 5,868,887,000 5,237,991,000
- liabilities 2,337,926,000 2,141,797,000
- revenue 5,501,600,000 5,167,711,000
- profit after taxation 1,109,767,900 1,213,956,000
Movement of investment is as follows:
Opening balance 1,022,228,271 852,412,955 Share of profit – net of tax 379,758,645 394,815,303
1,401,986,916 1,247,228,258
Less : Dividend received during the year (224,999,987) (224,999,987) 1,176,986,929 1,022,228,271
8.3 UEL is incorporated in Pakistan as a public unlisted company with its registered office situated at 1st Floor, Modern Motors House, Beaumont Road, Karachi. The principal activity of UEL will be to build, operate and maintain wind power generating project of 50 Mega Watts for the generation and supply of electric power in relation thereof, however, it is in start-up phase and has not commenced its operations. The summarised financial information of UEL is as follows:
2019 2018Rupees Rupees
Aggregate amount of:
- assets 102,170,223 102,381,073
- liabilities 2,610,558 3,170,466
- profit / ( loss) after taxation 349,118 (417,887)
Movement of investment is as follows:
Opening balance 19,842,090 19,925,667 Share of loss 10,089 (83,577)
19,852,179 19,842,090
Mehran Sugar Mills Ltd. 117
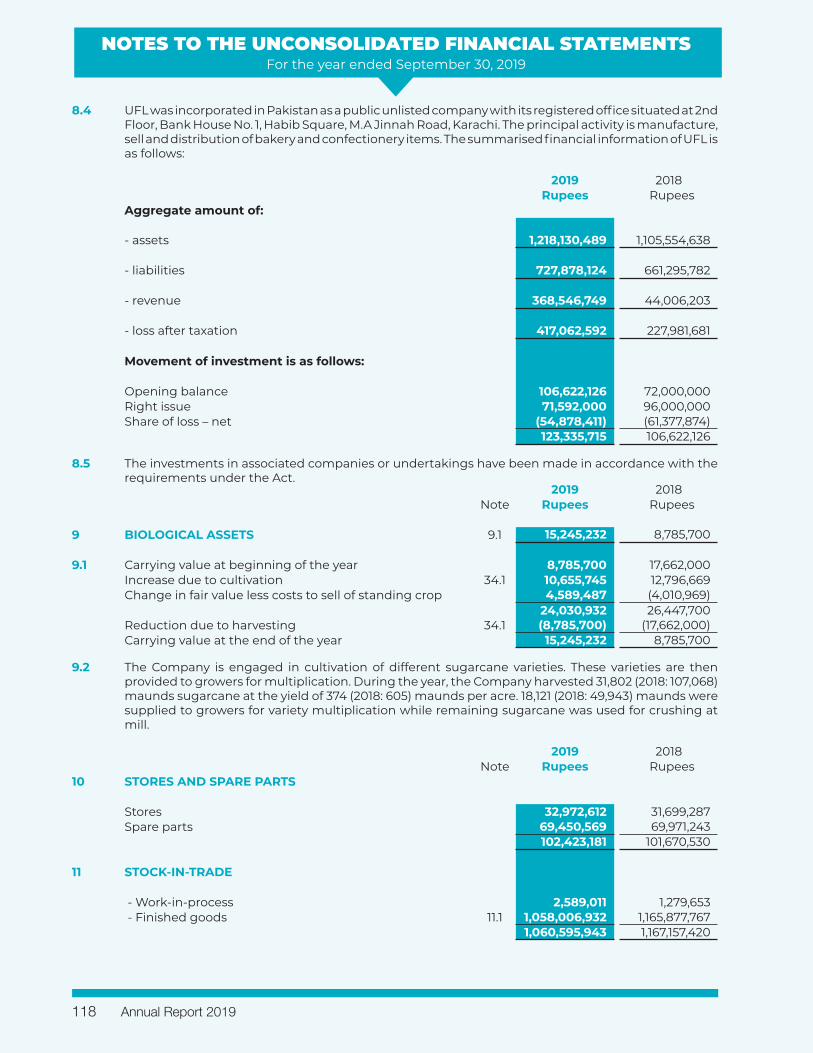
NOTES TO THE UNCONSOLIDATED FINANCIAL STATEMENTSFor the year ended September 30, 2019
8.4 UFL was incorporated in Pakistan as a public unlisted company with its registered office situated at 2nd Floor, Bank House No. 1, Habib Square, M.A Jinnah Road, Karachi. The principal activity is manufacture, sell and distribution of bakery and confectionery items. The summarised financial information of UFL is as follows:
2019 2018Rupees Rupees
Aggregate amount of:
- assets 1,218,130,489 1,105,554,638
- liabilities 727,878,124 661,295,782
- revenue 368,546,749 44,006,203
- loss after taxation 417,062,592 227,981,681
Movement of investment is as follows:
Opening balance 106,622,126 72,000,000 Right issue 71,592,000 96,000,000 Share of loss – net (54,878,411) (61,377,874)
123,335,715 106,622,126
8.5 The investments in associated companies or undertakings have been made in accordance with the requirements under the Act.
2019 2018Note Rupees Rupees
9 BIOLOGICAL ASSETS 9.1 15,245,232 8,785,700
9.1 Carrying value at beginning of the year 8,785,700 17,662,000 Increase due to cultivation 34.1 10,655,745 12,796,669 Change in fair value less costs to sell of standing crop 4,589,487 (4,010,969)
24,030,932 26,447,700 Reduction due to harvesting 34.1 (8,785,700) (17,662,000)Carrying value at the end of the year 15,245,232 8,785,700
9.2 The Company is engaged in cultivation of different sugarcane varieties. These varieties are then provided to growers for multiplication. During the year, the Company harvested 31,802 (2018: 107,068) maunds sugarcane at the yield of 374 (2018: 605) maunds per acre. 18,121 (2018: 49,943) maunds were supplied to growers for variety multiplication while remaining sugarcane was used for crushing at mill.
2019 2018Note Rupees Rupees
10 STORES AND SPARE PARTS
Stores 32,972,612 31,699,287 Spare parts 69,450,569 69,971,243
102,423,181 101,670,530
11 STOCK-IN-TRADE
- Work-in-process 2,589,011 1,279,653 - Finished goods 11.1 1,058,006,932 1,165,877,767
1,060,595,943 1,167,157,420
Annual Report 2019118
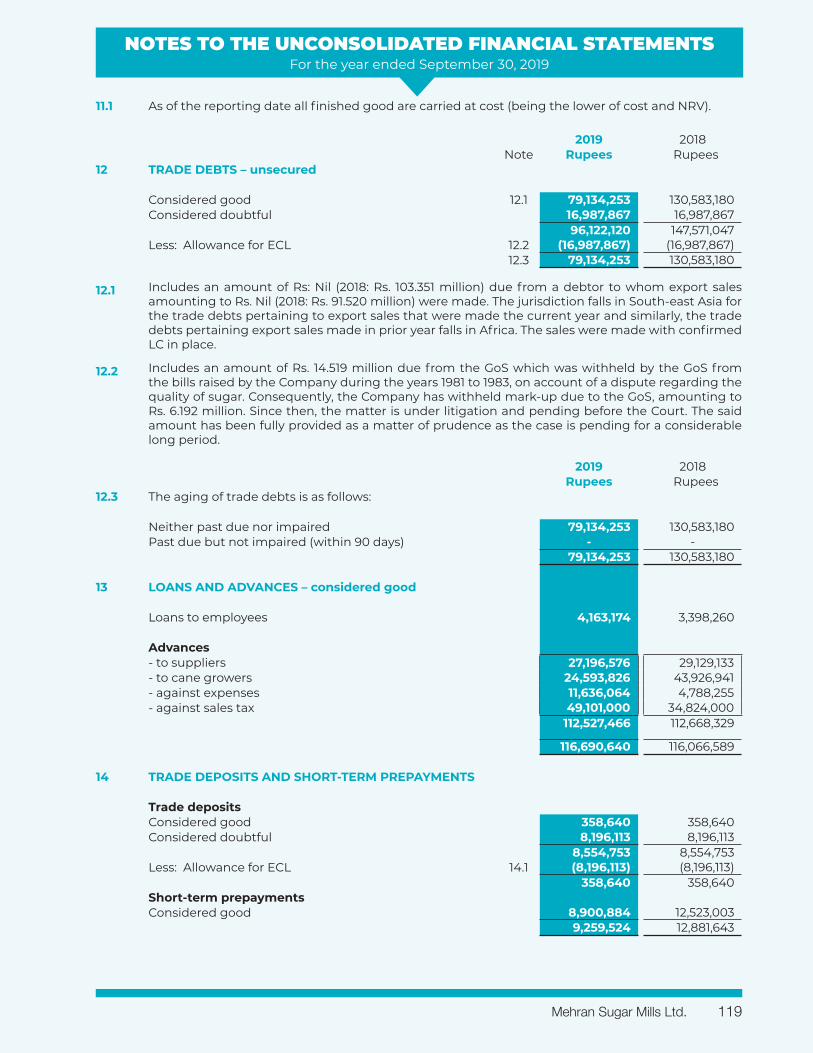
NOTES TO THE UNCONSOLIDATED FINANCIAL STATEMENTSFor the year ended September 30, 2019
11.1 As of the reporting date all finished good are carried at cost (being the lower of cost and NRV).
2019 2018Note Rupees Rupees
12 TRADE DEBTS – unsecured
Considered good 12.1 79,134,253 130,583,180 Considered doubtful 16,987,867 16,987,867
96,122,120 147,571,047 Less: Allowance for ECL 12.2 (16,987,867) (16,987,867)
12.3 79,134,253 130,583,180
12.1 Includes an amount of Rs: Nil (2018: Rs. 103.351 million) due from a debtor to whom export sales amounting to Rs. Nil (2018: Rs. 91.520 million) were made. The jurisdiction falls in South-east Asia for the trade debts pertaining to export sales that were made the current year and similarly, the trade debts pertaining export sales made in prior year falls in Africa. The sales were made with confirmed LC in place.
12.2 Includes an amount of Rs. 14.519 million due from the GoS which was withheld by the GoS from the bills raised by the Company during the years 1981 to 1983, on account of a dispute regarding the quality of sugar. Consequently, the Company has withheld mark-up due to the GoS, amounting to Rs. 6.192 million. Since then, the matter is under litigation and pending before the Court. The said amount has been fully provided as a matter of prudence as the case is pending for a considerable long period.
2019 2018Rupees Rupees
12.3 The aging of trade debts is as follows:
Neither past due nor impaired 79,134,253 130,583,180 Past due but not impaired (within 90 days) - -
79,134,253 130,583,180
13 LOANS AND ADVANCES – considered good
Loans to employees 4,163,174 3,398,260
Advances - to suppliers 27,196,576 29,129,133 - to cane growers 24,593,826 43,926,941 - against expenses 11,636,064 4,788,255 - against sales tax 49,101,000 34,824,000
112,527,466 112,668,329
116,690,640 116,066,589
14 TRADE DEPOSITS AND SHORT-TERM PREPAYMENTS
Trade depositsConsidered good 358,640 358,640 Considered doubtful 8,196,113 8,196,113
8,554,753 8,554,753 Less: Allowance for ECL 14.1 (8,196,113) (8,196,113)
358,640 358,640 Short-term prepaymentsConsidered good 8,900,884 12,523,003
9,259,524 12,881,643
Mehran Sugar Mills Ltd. 119
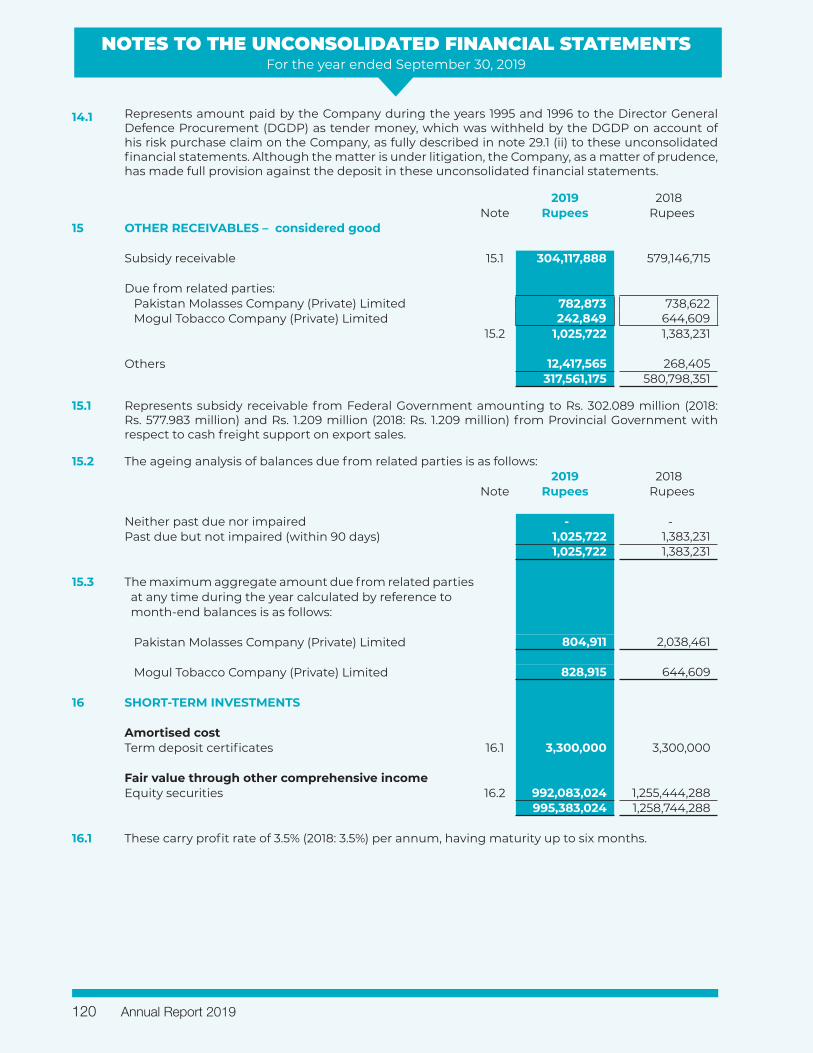
NOTES TO THE UNCONSOLIDATED FINANCIAL STATEMENTSFor the year ended September 30, 2019
14.1 Represents amount paid by the Company during the years 1995 and 1996 to the Director General Defence Procurement (DGDP) as tender money, which was withheld by the DGDP on account of his risk purchase claim on the Company, as fully described in note 29.1 (ii) to these unconsolidated financial statements. Although the matter is under litigation, the Company, as a matter of prudence, has made full provision against the deposit in these unconsolidated financial statements.
2019 2018Note Rupees Rupees
15 OTHER RECEIVABLES – considered good
Subsidy receivable 15.1 304,117,888 579,146,715
Due from related parties: Pakistan Molasses Company (Private) Limited 782,873 738,622 Mogul Tobacco Company (Private) Limited 242,849 644,609 15.2 1,025,722 1,383,231
Others 12,417,565 268,405 317,561,175 580,798,351
15.1 Represents subsidy receivable from Federal Government amounting to Rs. 302.089 million (2018: Rs. 577.983 million) and Rs. 1.209 million (2018: Rs. 1.209 million) from Provincial Government with respect to cash freight support on export sales.
15.2 The ageing analysis of balances due from related parties is as follows:2019 2018
Note Rupees Rupees
Neither past due nor impaired - - Past due but not impaired (within 90 days) 1,025,722 1,383,231
1,025,722 1,383,231
15.3 The maximum aggregate amount due from related parties at any time during the year calculated by reference to month-end balances is as follows:
Pakistan Molasses Company (Private) Limited 804,911 2,038,461
Mogul Tobacco Company (Private) Limited 828,915 644,609
16 SHORT-TERM INVESTMENTS
Amortised costTerm deposit certificates 16.1 3,300,000 3,300,000
Fair value through other comprehensive incomeEquity securities 16.2 992,083,024 1,255,444,288
995,383,024 1,258,744,288
16.1 These carry profit rate of 3.5% (2018: 3.5%) per annum, having maturity up to six months.
Annual Report 2019120
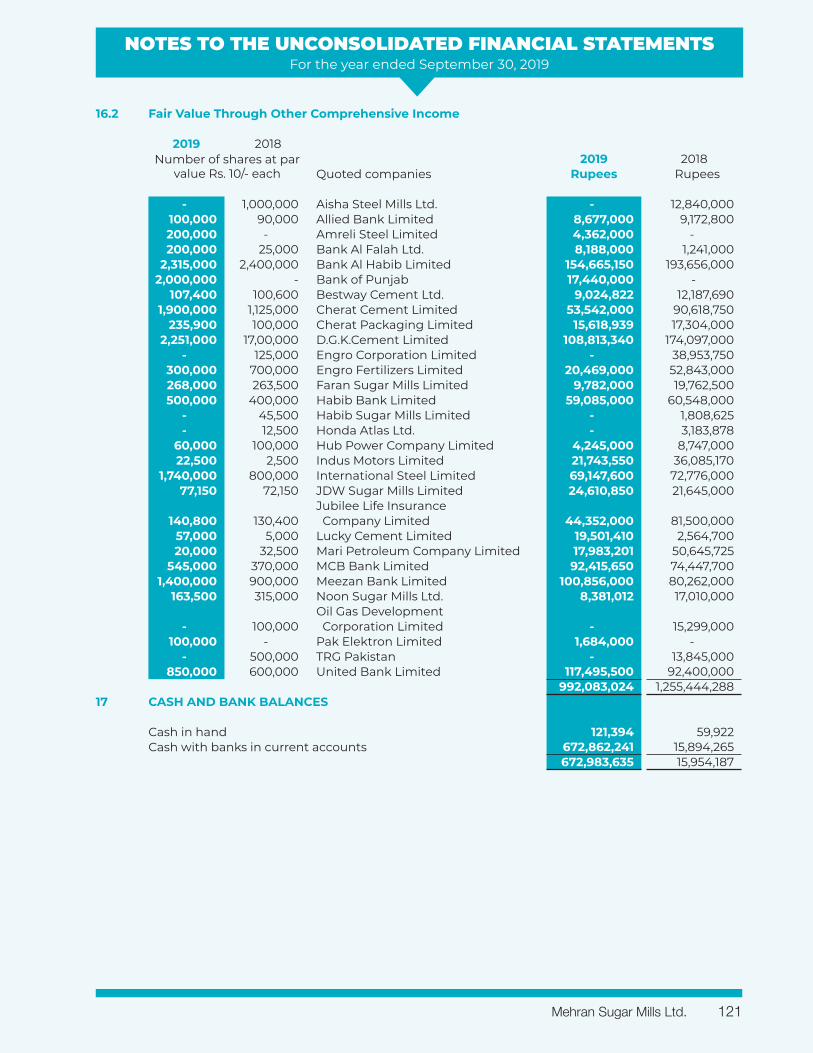
NOTES TO THE UNCONSOLIDATED FINANCIAL STATEMENTSFor the year ended September 30, 2019
16.2 Fair Value Through Other Comprehensive Income
2019 2018Number of shares at par
value Rs. 10/- each2019 2018
Quoted companies Rupees Rupees
- 1,000,000 Aisha Steel Mills Ltd. - 12,840,000 100,000 90,000 Allied Bank Limited 8,677,000 9,172,800 200,000 - Amreli Steel Limited 4,362,000 - 200,000 25,000 Bank Al Falah Ltd. 8,188,000 1,241,000
2,315,000 2,400,000 Bank Al Habib Limited 154,665,150 193,656,000 2,000,000 - Bank of Punjab 17,440,000 -
107,400 100,600 Bestway Cement Ltd. 9,024,822 12,187,690 1,900,000 1,125,000 Cherat Cement Limited 53,542,000 90,618,750
235,900 100,000 Cherat Packaging Limited 15,618,939 17,304,000 2,251,000 17,00,000 D.G.K.Cement Limited 108,813,340 174,097,000
- 125,000 Engro Corporation Limited - 38,953,750 300,000 700,000 Engro Fertilizers Limited 20,469,000 52,843,000 268,000 263,500 Faran Sugar Mills Limited 9,782,000 19,762,500 500,000 400,000 Habib Bank Limited 59,085,000 60,548,000
- 45,500 Habib Sugar Mills Limited - 1,808,625 - 12,500 Honda Atlas Ltd. - 3,183,878
60,000 100,000 Hub Power Company Limited 4,245,000 8,747,000 22,500 2,500 Indus Motors Limited 21,743,550 36,085,170
1,740,000 800,000 International Steel Limited 69,147,600 72,776,000 77,150 72,150 JDW Sugar Mills Limited 24,610,850 21,645,000
Jubilee Life Insurance 140,800 130,400 Company Limited 44,352,000 81,500,000
57,000 5,000 Lucky Cement Limited 19,501,410 2,564,700 20,000 32,500 Mari Petroleum Company Limited 17,983,201 50,645,725
545,000 370,000 MCB Bank Limited 92,415,650 74,447,700 1,400,000 900,000 Meezan Bank Limited 100,856,000 80,262,000
163,500 315,000 Noon Sugar Mills Ltd. 8,381,012 17,010,000 Oil Gas Development
- 100,000 Corporation Limited - 15,299,000 100,000 - Pak Elektron Limited 1,684,000 -
- 500,000 TRG Pakistan - 13,845,000 850,000 600,000 United Bank Limited 117,495,500 92,400,000
992,083,024 1,255,444,288 17 CASH AND BANK BALANCES
Cash in hand 121,394 59,922 Cash with banks in current accounts 672,862,241 15,894,265
672,983,635 15,954,187
Mehran Sugar Mills Ltd. 121
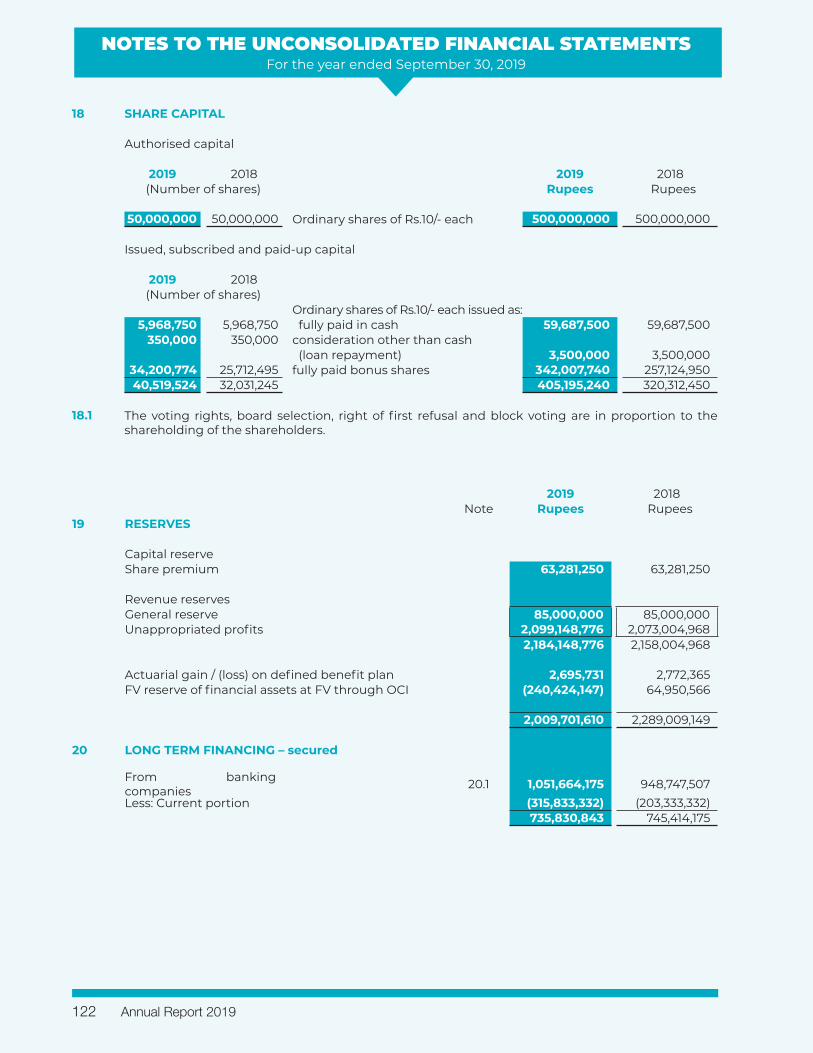
NOTES TO THE UNCONSOLIDATED FINANCIAL STATEMENTSFor the year ended September 30, 2019
18 SHARE CAPITAL
Authorised capital
2019 2018 2019 2018(Number of shares) Rupees Rupees
50,000,000 50,000,000 Ordinary shares of Rs.10/- each 500,000,000 500,000,000
Issued, subscribed and paid-up capital
2019 2018(Number of shares)
Ordinary shares of Rs.10/- each issued as: 5,968,750 5,968,750 fully paid in cash 59,687,500 59,687,500
350,000 350,000 consideration other than cash (loan repayment) 3,500,000 3,500,000
34,200,774 25,712,495 fully paid bonus shares 342,007,740 257,124,950 40,519,524 32,031,245 405,195,240 320,312,450
18.1 The voting rights, board selection, right of first refusal and block voting are in proportion to the shareholding of the shareholders.
2019 2018Note Rupees Rupees
19 RESERVES
Capital reserveShare premium 63,281,250 63,281,250
Revenue reservesGeneral reserve 85,000,000 85,000,000 Unappropriated profits 2,099,148,776 2,073,004,968
2,184,148,776 2,158,004,968
Actuarial gain / (loss) on defined benefit plan 2,695,731 2,772,365 FV reserve of financial assets at FV through OCI (240,424,147) 64,950,566
2,009,701,610 2,289,009,149
20 LONG TERM FINANCING – secured
From banking companies 20.1 1,051,664,175 948,747,507 Less: Current portion (315,833,332) (203,333,332)
735,830,843 745,414,175
Annual Report 2019122
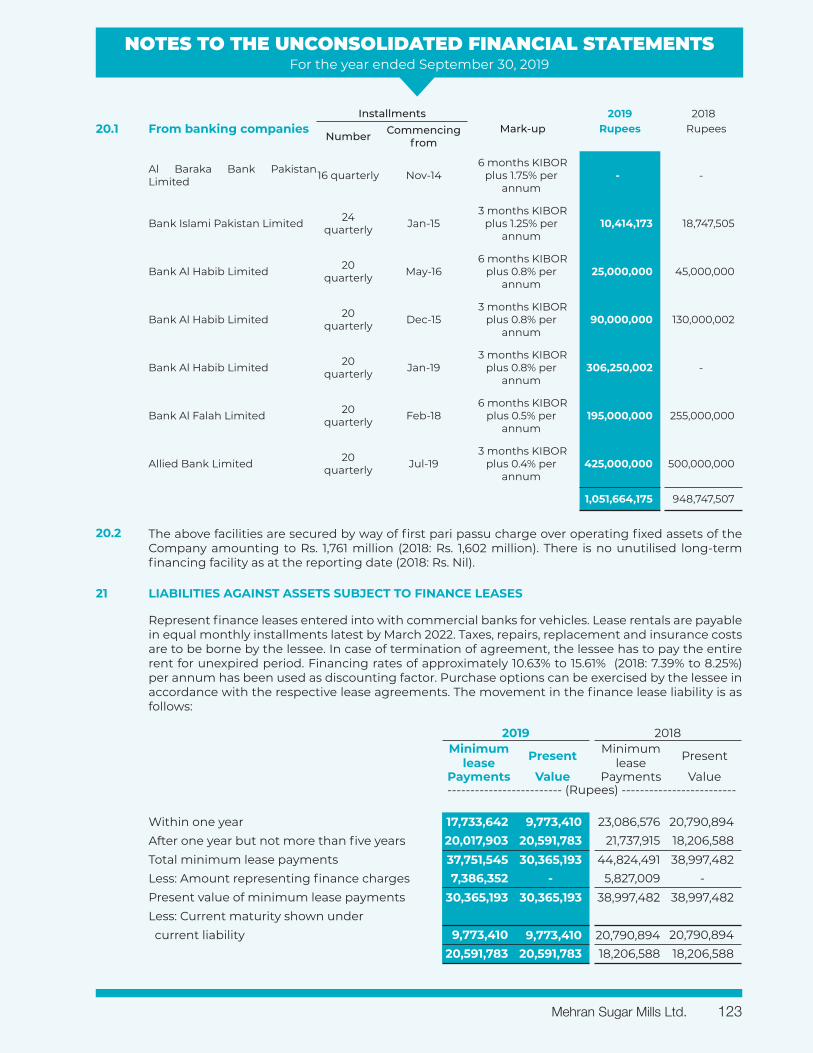
NOTES TO THE UNCONSOLIDATED FINANCIAL STATEMENTSFor the year ended September 30, 2019
Installments Mark-up
2019 201820.1 From banking companies
Number Commencing from
Rupees Rupees
Al Baraka Bank Pakistan Limited 16 quarterly Nov-14
6 months KIBOR plus 1.75% per
annum - -
Bank Islami Pakistan Limited 24 quarterly Jan-15
3 months KIBOR plus 1.25% per
annum 10,414,173 18,747,505
Bank Al Habib Limited 20 quarterly May-16
6 months KIBOR plus 0.8% per
annum 25,000,000 45,000,000
Bank Al Habib Limited 20 quarterly Dec-15
3 months KIBOR plus 0.8% per
annum 90,000,000 130,000,002
Bank Al Habib Limited 20 quarterly Jan-19
3 months KIBOR plus 0.8% per
annum 306,250,002 -
Bank Al Falah Limited 20 quarterly Feb-18
6 months KIBOR plus 0.5% per
annum 195,000,000 255,000,000
Allied Bank Limited 20 quarterly Jul-19
3 months KIBOR plus 0.4% per
annum 425,000,000 500,000,000
1,051,664,175 948,747,507
20.2 The above facilities are secured by way of first pari passu charge over operating fixed assets of the Company amounting to Rs. 1,761 million (2018: Rs. 1,602 million). There is no unutilised long-term financing facility as at the reporting date (2018: Rs. Nil).
21 LIABILITIES AGAINST ASSETS SUBJECT TO FINANCE LEASES
Represent finance leases entered into with commercial banks for vehicles. Lease rentals are payable in equal monthly installments latest by March 2022. Taxes, repairs, replacement and insurance costs are to be borne by the lessee. In case of termination of agreement, the lessee has to pay the entire rent for unexpired period. Financing rates of approximately 10.63% to 15.61% (2018: 7.39% to 8.25%) per annum has been used as discounting factor. Purchase options can be exercised by the lessee in accordance with the respective lease agreements. The movement in the finance lease liability is as follows:
2019 2018Minimum
lease Present Minimum lease Present
Payments Value Payments Value------------------------- (Rupees) -------------------------
Within one year 17,733,642 9,773,410 23,086,576 20,790,894After one year but not more than five years 20,017,903 20,591,783 21,737,915 18,206,588Total minimum lease payments 37,751,545 30,365,193 44,824,491 38,997,482Less: Amount representing finance charges 7,386,352 - 5,827,009 - Present value of minimum lease payments 30,365,193 30,365,193 38,997,482 38,997,482Less: Current maturity shown under current liability 9,773,410 9,773,410 20,790,894 20,790,894
20,591,783 20,591,783 18,206,588 18,206,588
Mehran Sugar Mills Ltd. 123
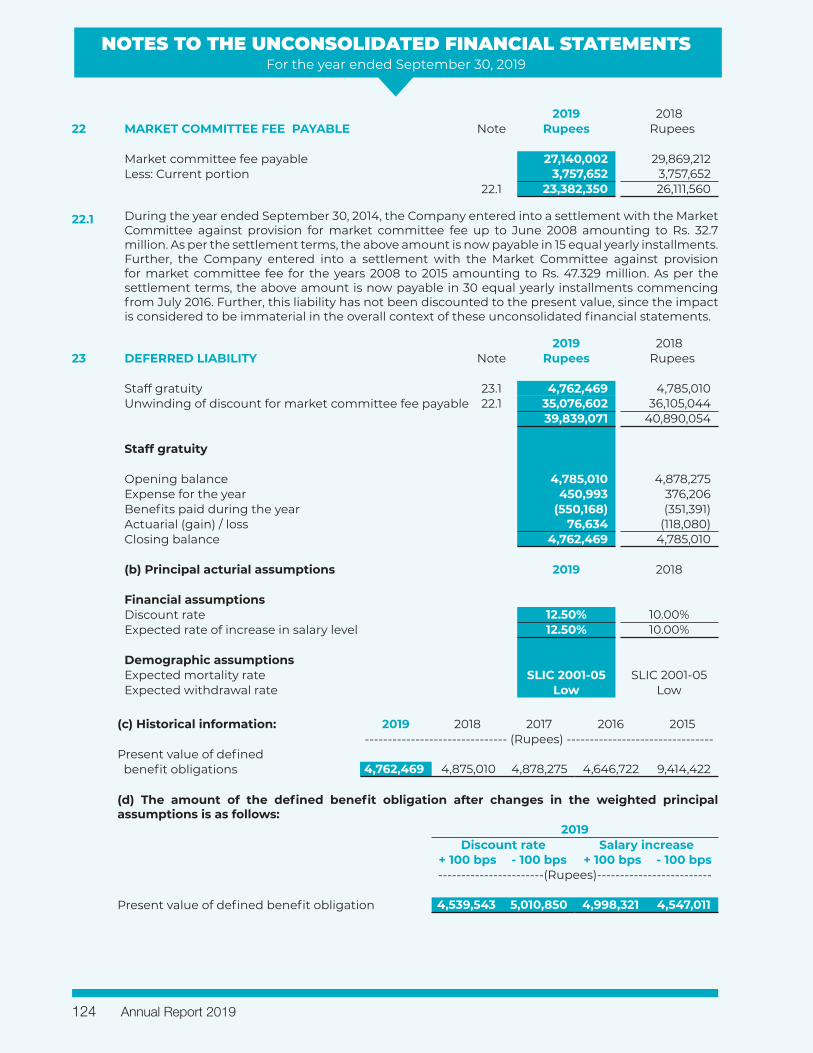
NOTES TO THE UNCONSOLIDATED FINANCIAL STATEMENTSFor the year ended September 30, 2019
2019 201822 MARKET COMMITTEE FEE PAYABLE Note Rupees Rupees
Market committee fee payable 27,140,002 29,869,212Less: Current portion 3,757,652 3,757,652
22.1 23,382,350 26,111,560
22.1 During the year ended September 30, 2014, the Company entered into a settlement with the Market Committee against provision for market committee fee up to June 2008 amounting to Rs. 32.7 million. As per the settlement terms, the above amount is now payable in 15 equal yearly installments. Further, the Company entered into a settlement with the Market Committee against provision for market committee fee for the years 2008 to 2015 amounting to Rs. 47.329 million. As per the settlement terms, the above amount is now payable in 30 equal yearly installments commencing from July 2016. Further, this liability has not been discounted to the present value, since the impact is considered to be immaterial in the overall context of these unconsolidated financial statements.
2019 201823 DEFERRED LIABILITY Note Rupees Rupees
Staff gratuity 23.1 4,762,469 4,785,010 Unwinding of discount for market committee fee payable 22.1 35,076,602 36,105,044
39,839,071 40,890,054
Staff gratuity
Opening balance 4,785,010 4,878,275 Expense for the year 450,993 376,206 Benefits paid during the year (550,168) (351,391)Actuarial (gain) / loss 76,634 (118,080)Closing balance 4,762,469 4,785,010
(b) Principal acturial assumptions 2019 2018
Financial assumptionsDiscount rate 12.50% 10.00%Expected rate of increase in salary level 12.50% 10.00%
Demographic assumptionsExpected mortality rate SLIC 2001-05 SLIC 2001-05Expected withdrawal rate Low Low
(c) Historical information: 2019 2018 2017 2016 2015------------------------------- (Rupees) --------------------------------
Present value of defined benefit obligations 4,762,469 4,875,010 4,878,275 4,646,722 9,414,422
(d) The amount of the defined benefit obligation after changes in the weighted principal assumptions is as follows:
2019Discount rate Salary increase
+ 100 bps - 100 bps + 100 bps - 100 bps -----------------------(Rupees)-------------------------
Present value of defined benefit obligation 4,539,543 5,010,850 4,998,321 4,547,011
Annual Report 2019124
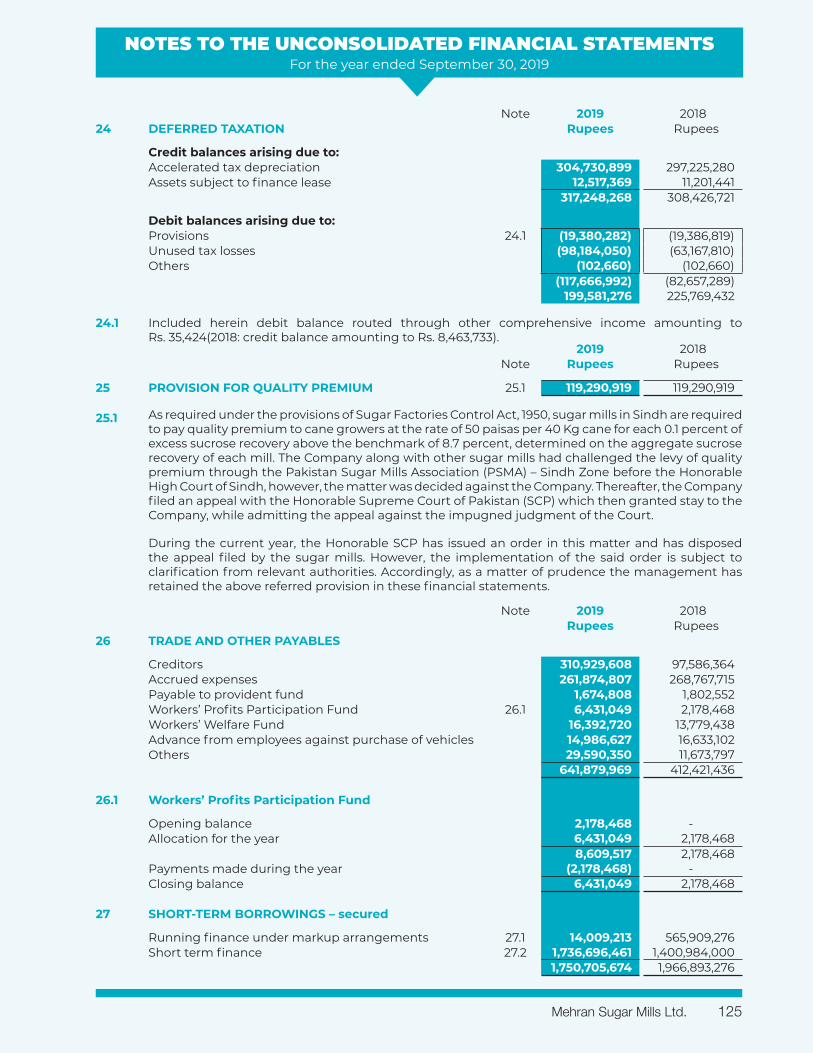
NOTES TO THE UNCONSOLIDATED FINANCIAL STATEMENTSFor the year ended September 30, 2019
Note 2019 201824 DEFERRED TAXATION Rupees Rupees
Credit balances arising due to:Accelerated tax depreciation 304,730,899 297,225,280 Assets subject to finance lease 12,517,369 11,201,441
317,248,268 308,426,721
Debit balances arising due to:Provisions 24.1 (19,380,282) (19,386,819)Unused tax losses (98,184,050) (63,167,810)Others (102,660) (102,660)
(117,666,992) (82,657,289) 199,581,276 225,769,432
24.1 Included herein debit balance routed through other comprehensive income amounting to Rs. 35,424(2018: credit balance amounting to Rs. 8,463,733).
2019 2018Note Rupees Rupees
25 PROVISION FOR QUALITY PREMIUM 25.1 119,290,919 119,290,919
25.1 As required under the provisions of Sugar Factories Control Act, 1950, sugar mills in Sindh are required to pay quality premium to cane growers at the rate of 50 paisas per 40 Kg cane for each 0.1 percent of excess sucrose recovery above the benchmark of 8.7 percent, determined on the aggregate sucrose recovery of each mill. The Company along with other sugar mills had challenged the levy of quality premium through the Pakistan Sugar Mills Association (PSMA) – Sindh Zone before the Honorable High Court of Sindh, however, the matter was decided against the Company. Thereafter, the Company filed an appeal with the Honorable Supreme Court of Pakistan (SCP) which then granted stay to the Company, while admitting the appeal against the impugned judgment of the Court.
During the current year, the Honorable SCP has issued an order in this matter and has disposed the appeal filed by the sugar mills. However, the implementation of the said order is subject to clarification from relevant authorities. Accordingly, as a matter of prudence the management has retained the above referred provision in these financial statements.
Note 2019 2018Rupees Rupees
26 TRADE AND OTHER PAYABLES
Creditors 310,929,608 97,586,364 Accrued expenses 261,874,807 268,767,715 Payable to provident fund 1,674,808 1,802,552 Workers’ Profits Participation Fund 26.1 6,431,049 2,178,468 Workers’ Welfare Fund 16,392,720 13,779,438 Advance from employees against purchase of vehicles 14,986,627 16,633,102 Others 29,590,350 11,673,797
641,879,969 412,421,436
26.1 Workers’ Profits Participation Fund Opening balance 2,178,468 - Allocation for the year 6,431,049 2,178,468
8,609,517 2,178,468 Payments made during the year (2,178,468) - Closing balance 6,431,049 2,178,468
27 SHORT-TERM BORROWINGS – secured
Running finance under markup arrangements 27.1 14,009,213 565,909,276 Short term finance 27.2 1,736,696,461 1,400,984,000
1,750,705,674 1,966,893,276
Mehran Sugar Mills Ltd. 125
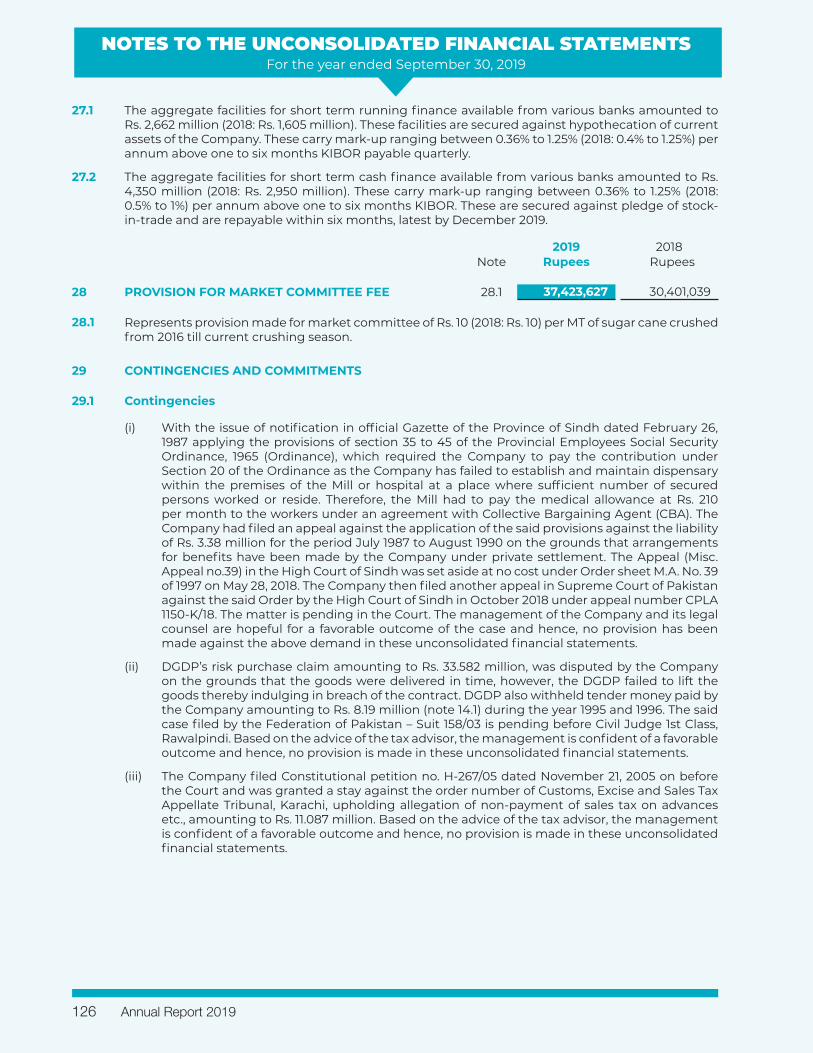
NOTES TO THE UNCONSOLIDATED FINANCIAL STATEMENTSFor the year ended September 30, 2019
27.1 The aggregate facilities for short term running finance available from various banks amounted to Rs. 2,662 million (2018: Rs. 1,605 million). These facilities are secured against hypothecation of current assets of the Company. These carry mark-up ranging between 0.36% to 1.25% (2018: 0.4% to 1.25%) per annum above one to six months KIBOR payable quarterly.
27.2 The aggregate facilities for short term cash finance available from various banks amounted to Rs. 4,350 million (2018: Rs. 2,950 million). These carry mark-up ranging between 0.36% to 1.25% (2018: 0.5% to 1%) per annum above one to six months KIBOR. These are secured against pledge of stock-in-trade and are repayable within six months, latest by December 2019.
2019 2018Note Rupees Rupees
28 PROVISION FOR MARKET COMMITTEE FEE 28.1 37,423,627 30,401,039
28.1 Represents provision made for market committee of Rs. 10 (2018: Rs. 10) per MT of sugar cane crushed from 2016 till current crushing season.
29 CONTINGENCIES AND COMMITMENTS
29.1 Contingencies
(i) With the issue of notification in official Gazette of the Province of Sindh dated February 26, 1987 applying the provisions of section 35 to 45 of the Provincial Employees Social Security Ordinance, 1965 (Ordinance), which required the Company to pay the contribution under Section 20 of the Ordinance as the Company has failed to establish and maintain dispensary within the premises of the Mill or hospital at a place where sufficient number of secured persons worked or reside. Therefore, the Mill had to pay the medical allowance at Rs. 210 per month to the workers under an agreement with Collective Bargaining Agent (CBA). The Company had filed an appeal against the application of the said provisions against the liability of Rs. 3.38 million for the period July 1987 to August 1990 on the grounds that arrangements for benefits have been made by the Company under private settlement. The Appeal (Misc. Appeal no.39) in the High Court of Sindh was set aside at no cost under Order sheet M.A. No. 39 of 1997 on May 28, 2018. The Company then filed another appeal in Supreme Court of Pakistan against the said Order by the High Court of Sindh in October 2018 under appeal number CPLA 1150-K/18. The matter is pending in the Court. The management of the Company and its legal counsel are hopeful for a favorable outcome of the case and hence, no provision has been made against the above demand in these unconsolidated financial statements.
(ii) DGDP’s risk purchase claim amounting to Rs. 33.582 million, was disputed by the Company on the grounds that the goods were delivered in time, however, the DGDP failed to lift the goods thereby indulging in breach of the contract. DGDP also withheld tender money paid by the Company amounting to Rs. 8.19 million (note 14.1) during the year 1995 and 1996. The said case filed by the Federation of Pakistan – Suit 158/03 is pending before Civil Judge 1st Class, Rawalpindi. Based on the advice of the tax advisor, the management is confident of a favorable outcome and hence, no provision is made in these unconsolidated financial statements.
(iii) The Company filed Constitutional petition no. H-267/05 dated November 21, 2005 on before the Court and was granted a stay against the order number of Customs, Excise and Sales Tax Appellate Tribunal, Karachi, upholding allegation of non-payment of sales tax on advances etc., amounting to Rs. 11.087 million. Based on the advice of the tax advisor, the management is confident of a favorable outcome and hence, no provision is made in these unconsolidated financial statements.
Annual Report 2019126
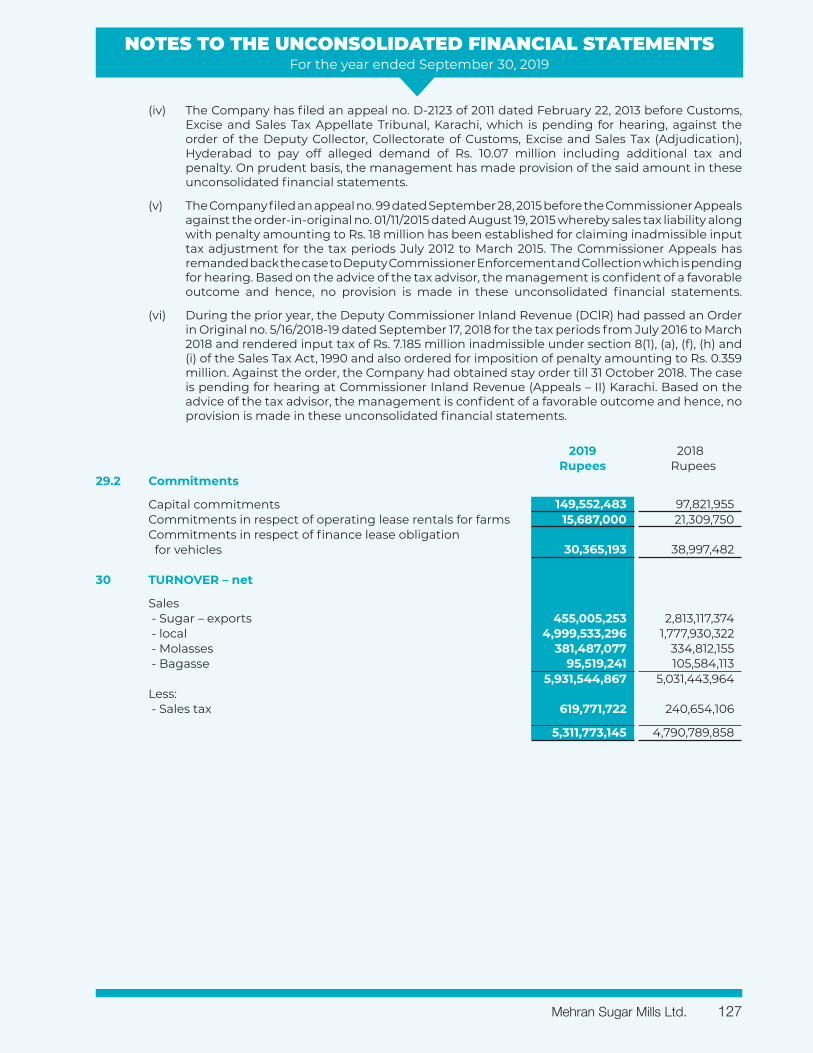
NOTES TO THE UNCONSOLIDATED FINANCIAL STATEMENTSFor the year ended September 30, 2019
(iv) The Company has filed an appeal no. D-2123 of 2011 dated February 22, 2013 before Customs, Excise and Sales Tax Appellate Tribunal, Karachi, which is pending for hearing, against the order of the Deputy Collector, Collectorate of Customs, Excise and Sales Tax (Adjudication), Hyderabad to pay off alleged demand of Rs. 10.07 million including additional tax and penalty. On prudent basis, the management has made provision of the said amount in these unconsolidated financial statements.
(v) The Company filed an appeal no. 99 dated September 28, 2015 before the Commissioner Appeals against the order-in-original no. 01/11/2015 dated August 19, 2015 whereby sales tax liability along with penalty amounting to Rs. 18 million has been established for claiming inadmissible input tax adjustment for the tax periods July 2012 to March 2015. The Commissioner Appeals has remanded back the case to Deputy Commissioner Enforcement and Collection which is pending for hearing. Based on the advice of the tax advisor, the management is confident of a favorable outcome and hence, no provision is made in these unconsolidated financial statements.
(vi) During the prior year, the Deputy Commissioner Inland Revenue (DClR) had passed an Order in Original no. 5/16/2018-19 dated September 17, 2018 for the tax periods from July 2016 to March 2018 and rendered input tax of Rs. 7.185 million inadmissible under section 8(1), (a), (f), (h) and (i) of the Sales Tax Act, 1990 and also ordered for imposition of penalty amounting to Rs. 0.359 million. Against the order, the Company had obtained stay order till 31 October 2018. The case is pending for hearing at Commissioner Inland Revenue (Appeals – II) Karachi. Based on the advice of the tax advisor, the management is confident of a favorable outcome and hence, no provision is made in these unconsolidated financial statements.
2019 2018Rupees Rupees
29.2 Commitments
Capital commitments 149,552,483 97,821,955 Commitments in respect of operating lease rentals for farms 15,687,000 21,309,750 Commitments in respect of finance lease obligation for vehicles 30,365,193 38,997,482
30 TURNOVER – net
Sales - Sugar – exports 455,005,253 2,813,117,374 - local 4,999,533,296 1,777,930,322 - Molasses 381,487,077 334,812,155 - Bagasse 95,519,241 105,584,113
5,931,544,867 5,031,443,964 Less: - Sales tax 619,771,722 240,654,106
5,311,773,145 4,790,789,858
Mehran Sugar Mills Ltd. 127
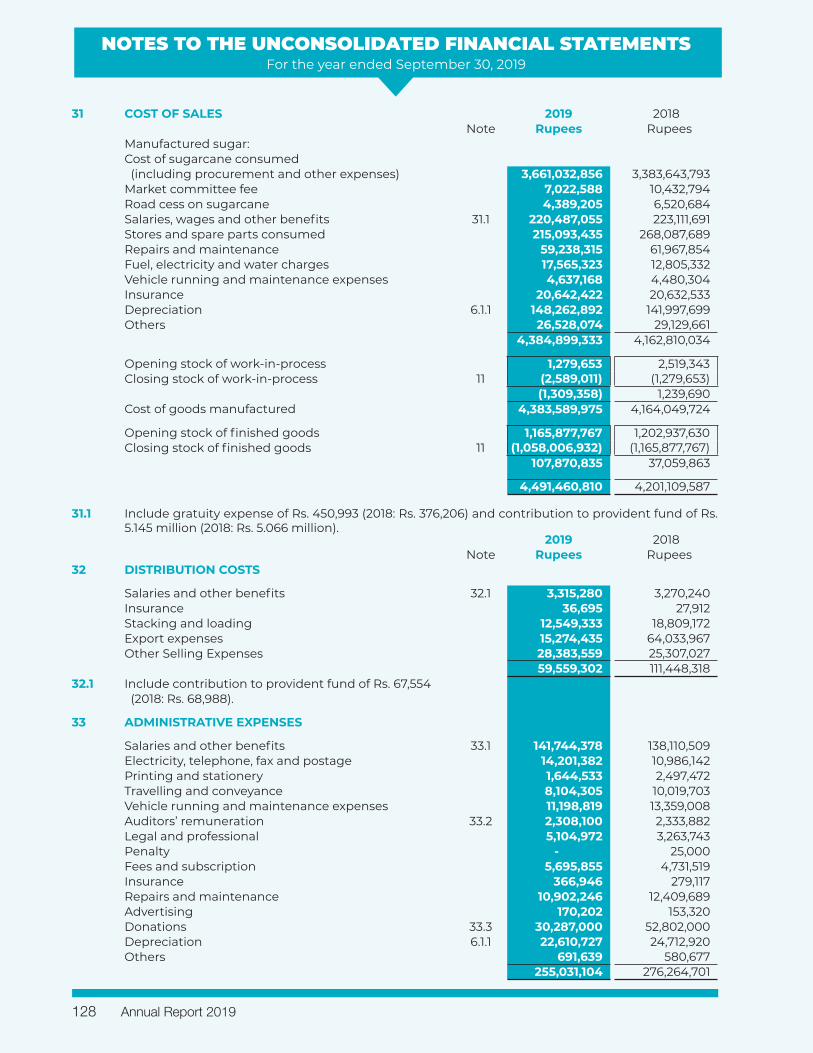
NOTES TO THE UNCONSOLIDATED FINANCIAL STATEMENTSFor the year ended September 30, 2019
31 COST OF SALES 2019 2018Note Rupees Rupees
Manufactured sugar:Cost of sugarcane consumed (including procurement and other expenses) 3,661,032,856 3,383,643,793 Market committee fee 7,022,588 10,432,794 Road cess on sugarcane 4,389,205 6,520,684 Salaries, wages and other benefits 31.1 220,487,055 223,111,691 Stores and spare parts consumed 215,093,435 268,087,689 Repairs and maintenance 59,238,315 61,967,854 Fuel, electricity and water charges 17,565,323 12,805,332 Vehicle running and maintenance expenses 4,637,168 4,480,304 Insurance 20,642,422 20,632,533 Depreciation 6.1.1 148,262,892 141,997,699 Others 26,528,074 29,129,661
4,384,899,333 4,162,810,034
Opening stock of work-in-process 1,279,653 2,519,343 Closing stock of work-in-process 11 (2,589,011) (1,279,653)
(1,309,358) 1,239,690 Cost of goods manufactured 4,383,589,975 4,164,049,724
Opening stock of finished goods 1,165,877,767 1,202,937,630 Closing stock of finished goods 11 (1,058,006,932) (1,165,877,767)
107,870,835 37,059,863
4,491,460,810 4,201,109,587
31.1 Include gratuity expense of Rs. 450,993 (2018: Rs. 376,206) and contribution to provident fund of Rs. 5.145 million (2018: Rs. 5.066 million).
2019 2018Note Rupees Rupees
32 DISTRIBUTION COSTS
Salaries and other benefits 32.1 3,315,280 3,270,240 Insurance 36,695 27,912 Stacking and loading 12,549,333 18,809,172 Export expenses 15,274,435 64,033,967 Other Selling Expenses 28,383,559 25,307,027
59,559,302 111,448,318 32.1 Include contribution to provident fund of Rs. 67,554
(2018: Rs. 68,988).
33 ADMINISTRATIVE EXPENSES
Salaries and other benefits 33.1 141,744,378 138,110,509 Electricity, telephone, fax and postage 14,201,382 10,986,142 Printing and stationery 1,644,533 2,497,472 Travelling and conveyance 8,104,305 10,019,703 Vehicle running and maintenance expenses 11,198,819 13,359,008 Auditors’ remuneration 33.2 2,308,100 2,333,882 Legal and professional 5,104,972 3,263,743 Penalty - 25,000 Fees and subscription 5,695,855 4,731,519 Insurance 366,946 279,117 Repairs and maintenance 10,902,246 12,409,689 Advertising 170,202 153,320 Donations 33.3 30,287,000 52,802,000 Depreciation 6.1.1 22,610,727 24,712,920 Others 691,639 580,677
255,031,104 276,264,701
Annual Report 2019128
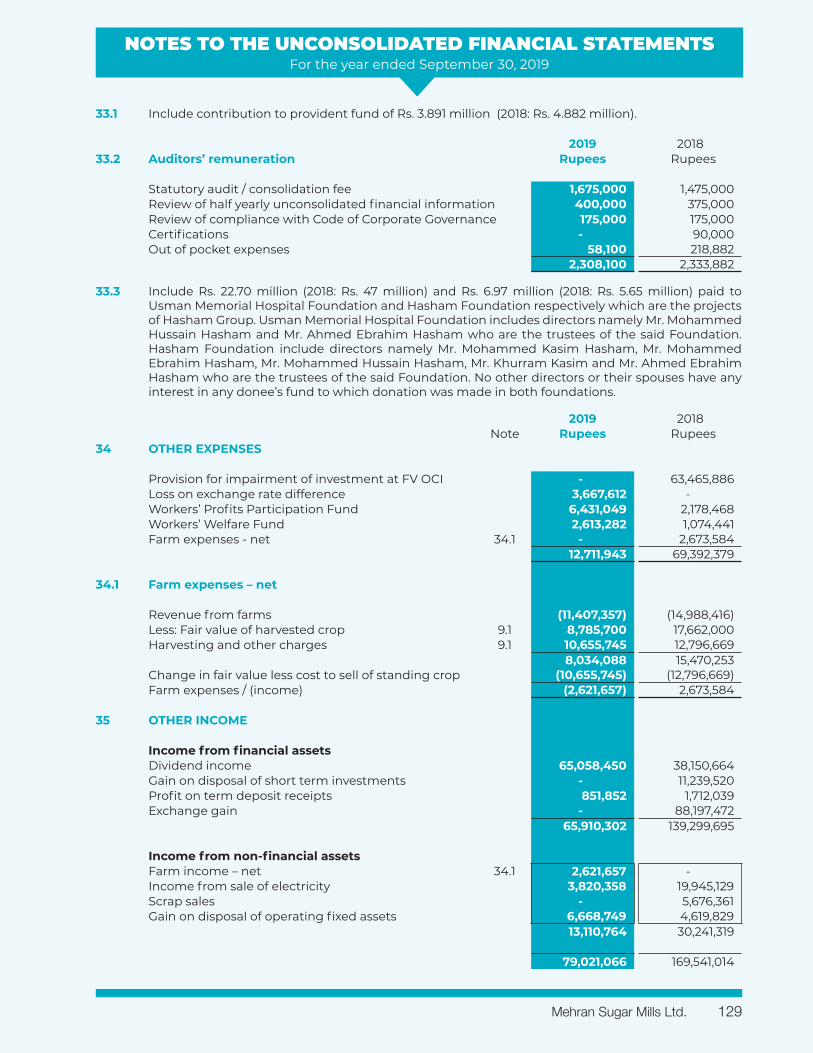
NOTES TO THE UNCONSOLIDATED FINANCIAL STATEMENTSFor the year ended September 30, 2019
33.1 Include contribution to provident fund of Rs. 3.891 million (2018: Rs. 4.882 million).
2019 201833.2 Auditors’ remuneration Rupees Rupees
Statutory audit / consolidation fee 1,675,000 1,475,000 Review of half yearly unconsolidated financial information 400,000 375,000 Review of compliance with Code of Corporate Governance 175,000 175,000 Certifications - 90,000 Out of pocket expenses 58,100 218,882
2,308,100 2,333,882
33.3 Include Rs. 22.70 million (2018: Rs. 47 million) and Rs. 6.97 million (2018: Rs. 5.65 million) paid to Usman Memorial Hospital Foundation and Hasham Foundation respectively which are the projects of Hasham Group. Usman Memorial Hospital Foundation includes directors namely Mr. Mohammed Hussain Hasham and Mr. Ahmed Ebrahim Hasham who are the trustees of the said Foundation. Hasham Foundation include directors namely Mr. Mohammed Kasim Hasham, Mr. Mohammed Ebrahim Hasham, Mr. Mohammed Hussain Hasham, Mr. Khurram Kasim and Mr. Ahmed Ebrahim Hasham who are the trustees of the said Foundation. No other directors or their spouses have any interest in any donee’s fund to which donation was made in both foundations.
2019 2018Note Rupees Rupees
34 OTHER EXPENSES
Provision for impairment of investment at FV OCI - 63,465,886 Loss on exchange rate difference 3,667,612 - Workers’ Profits Participation Fund 6,431,049 2,178,468 Workers’ Welfare Fund 2,613,282 1,074,441 Farm expenses - net 34.1 - 2,673,584
12,711,943 69,392,379
34.1 Farm expenses – net
Revenue from farms (11,407,357) (14,988,416)Less: Fair value of harvested crop 9.1 8,785,700 17,662,000 Harvesting and other charges 9.1 10,655,745 12,796,669
8,034,088 15,470,253 Change in fair value less cost to sell of standing crop (10,655,745) (12,796,669)Farm expenses / (income) (2,621,657) 2,673,584
35 OTHER INCOME
Income from financial assetsDividend income 65,058,450 38,150,664 Gain on disposal of short term investments - 11,239,520 Profit on term deposit receipts 851,852 1,712,039 Exchange gain - 88,197,472
65,910,302 139,299,695
Income from non-financial assetsFarm income – net 34.1 2,621,657 - Income from sale of electricity 3,820,358 19,945,129 Scrap sales - 5,676,361 Gain on disposal of operating fixed assets 6,668,749 4,619,829
13,110,764 30,241,319
79,021,066 169,541,014
Mehran Sugar Mills Ltd. 129
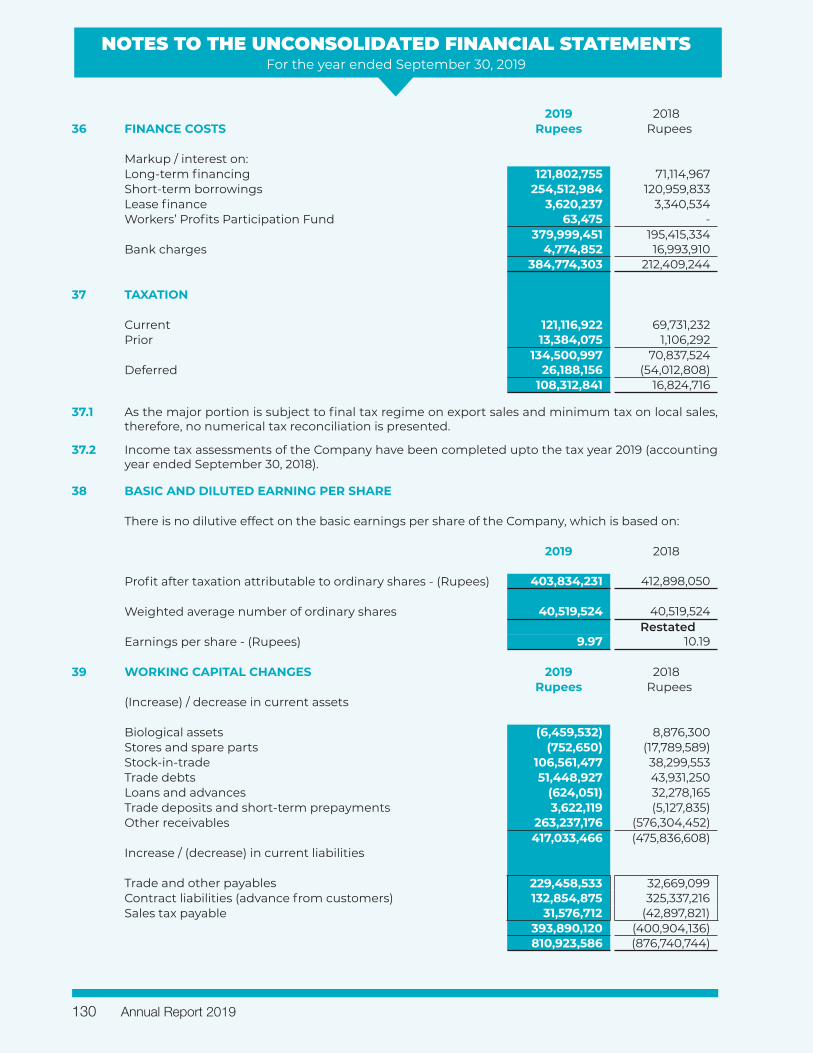
NOTES TO THE UNCONSOLIDATED FINANCIAL STATEMENTSFor the year ended September 30, 2019
2019 201836 FINANCE COSTS Rupees Rupees
Markup / interest on:Long-term financing 121,802,755 71,114,967 Short-term borrowings 254,512,984 120,959,833 Lease finance 3,620,237 3,340,534 Workers’ Profits Participation Fund 63,475 -
379,999,451 195,415,334 Bank charges 4,774,852 16,993,910
384,774,303 212,409,244
37 TAXATION
Current 121,116,922 69,731,232 Prior 13,384,075 1,106,292
134,500,997 70,837,524 Deferred 26,188,156 (54,012,808)
108,312,841 16,824,716
37.1 As the major portion is subject to final tax regime on export sales and minimum tax on local sales, therefore, no numerical tax reconciliation is presented.
37.2 Income tax assessments of the Company have been completed upto the tax year 2019 (accounting year ended September 30, 2018).
38 BASIC AND DILUTED EARNING PER SHARE
There is no dilutive effect on the basic earnings per share of the Company, which is based on:
2019 2018
Profit after taxation attributable to ordinary shares - (Rupees) 403,834,231 412,898,050
Weighted average number of ordinary shares 40,519,524 40,519,524 Restated
Earnings per share - (Rupees) 9.97 10.19
39 WORKING CAPITAL CHANGES 2019 2018Rupees Rupees
(Increase) / decrease in current assets
Biological assets (6,459,532) 8,876,300 Stores and spare parts (752,650) (17,789,589)Stock-in-trade 106,561,477 38,299,553 Trade debts 51,448,927 43,931,250 Loans and advances (624,051) 32,278,165 Trade deposits and short-term prepayments 3,622,119 (5,127,835)Other receivables 263,237,176 (576,304,452)
417,033,466 (475,836,608)Increase / (decrease) in current liabilities
Trade and other payables 229,458,533 32,669,099Contract liabilities (advance from customers) 132,854,875 325,337,216Sales tax payable 31,576,712 (42,897,821)
393,890,120 (400,904,136) 810,923,586 (876,740,744)
Annual Report 2019130
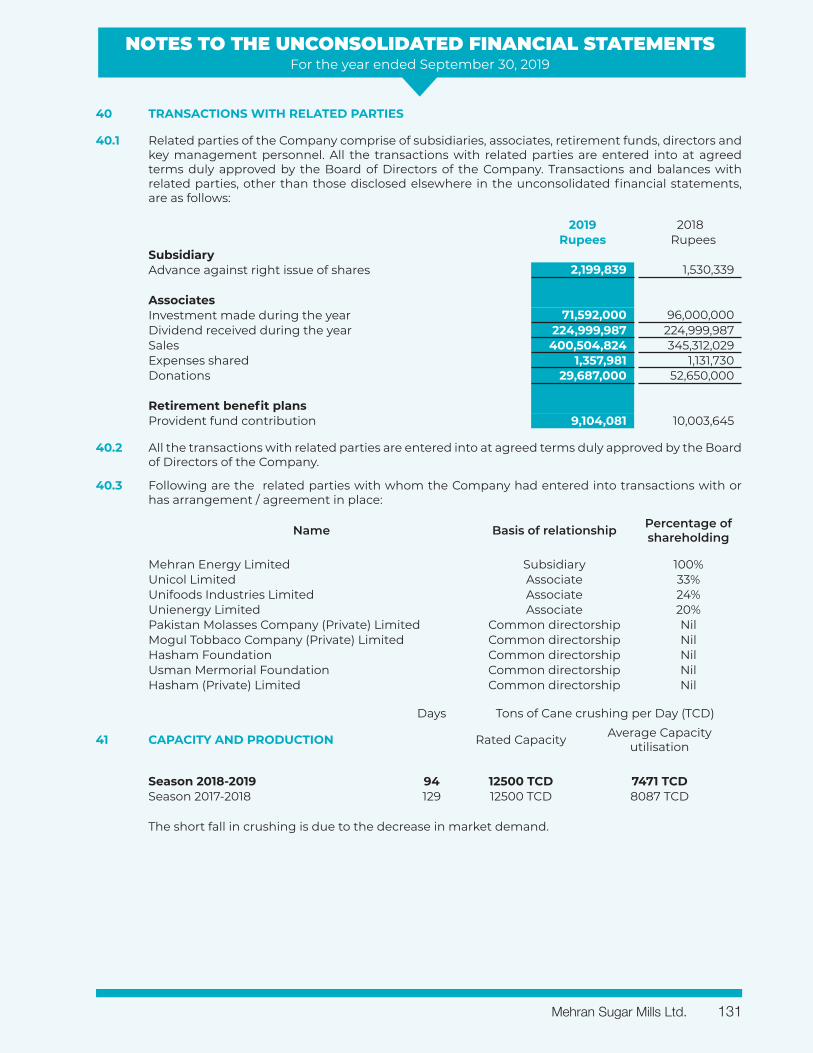
NOTES TO THE UNCONSOLIDATED FINANCIAL STATEMENTSFor the year ended September 30, 2019
40 TRANSACTIONS WITH RELATED PARTIES
40.1 Related parties of the Company comprise of subsidiaries, associates, retirement funds, directors and key management personnel. All the transactions with related parties are entered into at agreed terms duly approved by the Board of Directors of the Company. Transactions and balances with related parties, other than those disclosed elsewhere in the unconsolidated financial statements, are as follows:
2019 2018Rupees Rupees
SubsidiaryAdvance against right issue of shares 2,199,839 1,530,339
AssociatesInvestment made during the year 71,592,000 96,000,000 Dividend received during the year 224,999,987 224,999,987 Sales 400,504,824 345,312,029 Expenses shared 1,357,981 1,131,730 Donations 29,687,000 52,650,000
Retirement benefit plansProvident fund contribution 9,104,081 10,003,645
40.2 All the transactions with related parties are entered into at agreed terms duly approved by the Board of Directors of the Company.
40.3 Following are the related parties with whom the Company had entered into transactions with or has arrangement / agreement in place:
Name Basis of relationship Percentage of shareholding
Mehran Energy Limited Subsidiary 100%Unicol Limited Associate 33%Unifoods Industries Limited Associate 24%Unienergy Limited Associate 20%Pakistan Molasses Company (Private) Limited Common directorship NilMogul Tobbaco Company (Private) Limited Common directorship NilHasham Foundation Common directorship NilUsman Mermorial Foundation Common directorship NilHasham (Private) Limited Common directorship Nil
Days Tons of Cane crushing per Day (TCD)
41 CAPACITY AND PRODUCTION Rated Capacity Average Capacity utilisation
Season 2018-2019 94 12500 TCD 7471 TCDSeason 2017-2018 129 12500 TCD 8087 TCD
The short fall in crushing is due to the decrease in market demand.
Mehran Sugar Mills Ltd. 131
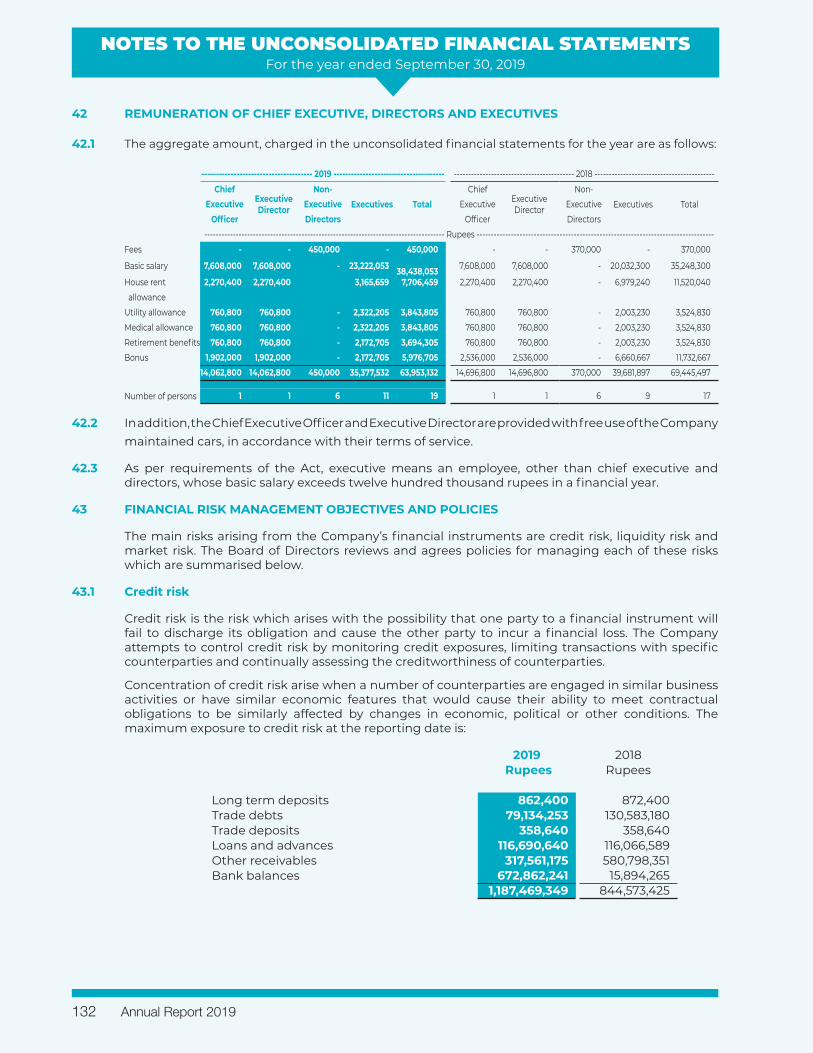
NOTES TO THE UNCONSOLIDATED FINANCIAL STATEMENTSFor the year ended September 30, 2019
42 REMUNERATION OF CHIEF EXECUTIVE, DIRECTORS AND EXECUTIVES
42.1 The aggregate amount, charged in the unconsolidated financial statements for the year are as follows:
-------------------------------------- 2019 -------------------------------------- ------------------------------------------ 2018 ------------------------------------------
Chief Executive Director
Non-Executives Total
Chief Executive Director
Non-Executives TotalExecutive Executive Executive Executive
Officer Directors Officer Directors------------------------------------------------------------------------------------ Rupees -----------------------------------------------------------------------------------
Fees - - 450,000 - 450,000 - - 370,000 - 370,000
Basic salary 7,608,000 7,608,000 - 23,222,053 38,438,053 7,608,000 7,608,000 - 20,032,300 35,248,300
House rent 2,270,400 2,270,400 3,165,659 7,706,459 2,270,400 2,270,400 - 6,979,240 11,520,040 allowanceUtility allowance 760,800 760,800 - 2,322,205 3,843,805 760,800 760,800 - 2,003,230 3,524,830 Medical allowance 760,800 760,800 - 2,322,205 3,843,805 760,800 760,800 - 2,003,230 3,524,830 Retirement benefits 760,800 760,800 - 2,172,705 3,694,305 760,800 760,800 - 2,003,230 3,524,830 Bonus 1,902,000 1,902,000 - 2,172,705 5,976,705 2,536,000 2,536,000 - 6,660,667 11,732,667
14,062,800 14,062,800 450,000 35,377,532 63,953,132 14,696,800 14,696,800 370,000 39,681,897 69,445,497
Number of persons 1 1 6 11 19 1 1 6 9 17
42.2 In addition, the Chief Executive Officer and Executive Director are provided with free use of the Companymaintained cars, in accordance with their terms of service.
42.3 As per requirements of the Act, executive means an employee, other than chief executive and directors, whose basic salary exceeds twelve hundred thousand rupees in a financial year.
43 FINANCIAL RISK MANAGEMENT OBJECTIVES AND POLICIES
The main risks arising from the Company’s financial instruments are credit risk, liquidity risk and market risk. The Board of Directors reviews and agrees policies for managing each of these risks which are summarised below.
43.1 Credit risk
Credit risk is the risk which arises with the possibility that one party to a financial instrument will fail to discharge its obligation and cause the other party to incur a financial loss. The Company attempts to control credit risk by monitoring credit exposures, limiting transactions with specific counterparties and continually assessing the creditworthiness of counterparties.
Concentration of credit risk arise when a number of counterparties are engaged in similar business activities or have similar economic features that would cause their ability to meet contractual obligations to be similarly affected by changes in economic, political or other conditions. The maximum exposure to credit risk at the reporting date is:
2019 2018 Rupees Rupees
Long term deposits 862,400 872,400 Trade debts 79,134,253 130,583,180 Trade deposits 358,640 358,640 Loans and advances 116,690,640 116,066,589 Other receivables 317,561,175 580,798,351 Bank balances 672,862,241 15,894,265
1,187,469,349 844,573,425
Annual Report 2019132
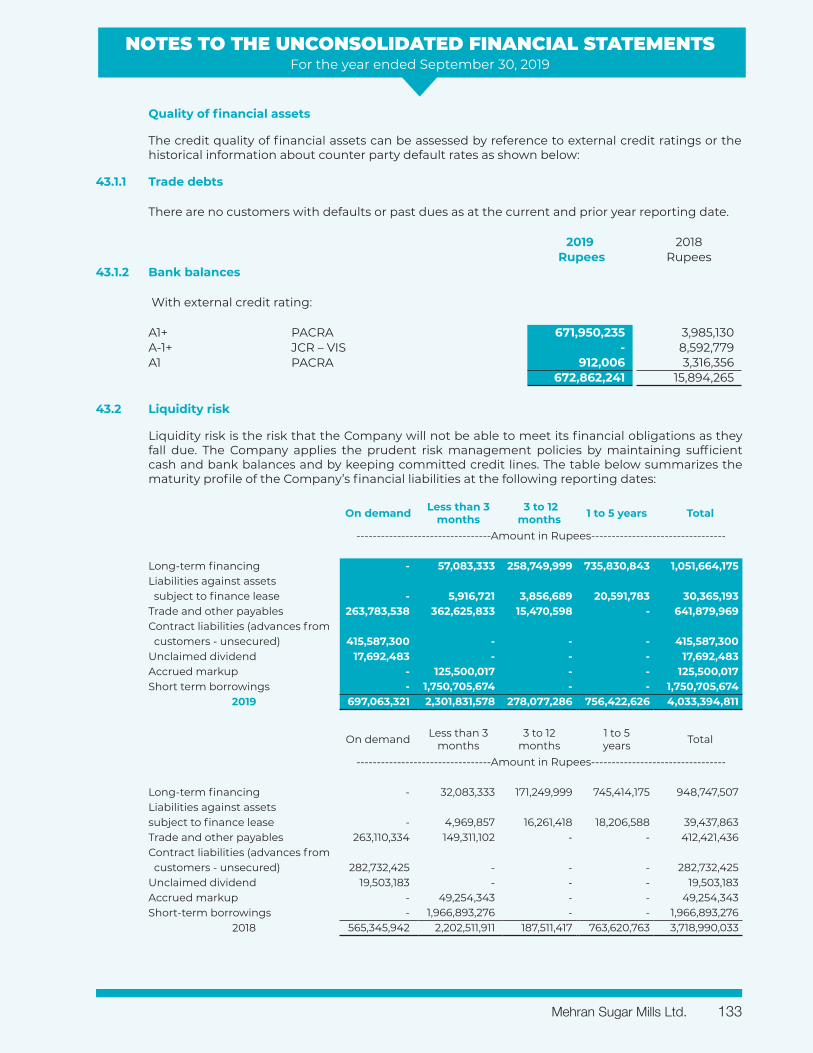
NOTES TO THE UNCONSOLIDATED FINANCIAL STATEMENTSFor the year ended September 30, 2019
Quality of financial assets
The credit quality of financial assets can be assessed by reference to external credit ratings or the historical information about counter party default rates as shown below:
43.1.1 Trade debts
There are no customers with defaults or past dues as at the current and prior year reporting date.
2019 2018 Rupees Rupees
43.1.2 Bank balances
With external credit rating: A1+ PACRA 671,950,235 3,985,130 A-1+ JCR – VIS - 8,592,779 A1 PACRA 912,006 3,316,356
672,862,241 15,894,265
43.2 Liquidity risk
Liquidity risk is the risk that the Company will not be able to meet its financial obligations as they fall due. The Company applies the prudent risk management policies by maintaining sufficient cash and bank balances and by keeping committed credit lines. The table below summarizes the maturity profile of the Company’s financial liabilities at the following reporting dates:
On demand Less than 3 months
3 to 12 months 1 to 5 years Total
---------------------------------Amount in Rupees---------------------------------
Long-term financing - 57,083,333 258,749,999 735,830,843 1,051,664,175 Liabilities against assets subject to finance lease - 5,916,721 3,856,689 20,591,783 30,365,193 Trade and other payables 263,783,538 362,625,833 15,470,598 - 641,879,969 Contract liabilities (advances from customers - unsecured) 415,587,300 - - - 415,587,300 Unclaimed dividend 17,692,483 - - - 17,692,483 Accrued markup - 125,500,017 - - 125,500,017 Short term borrowings - 1,750,705,674 - - 1,750,705,674
2019 697,063,321 2,301,831,578 278,077,286 756,422,626 4,033,394,811
On demand Less than 3 months
3 to 12 months
1 to 5 years Total
---------------------------------Amount in Rupees---------------------------------
Long-term financing - 32,083,333 171,249,999 745,414,175 948,747,507 Liabilities against assets subject to finance lease - 4,969,857 16,261,418 18,206,588 39,437,863 Trade and other payables 263,110,334 149,311,102 - - 412,421,436 Contract liabilities (advances from customers - unsecured) 282,732,425 - - - 282,732,425 Unclaimed dividend 19,503,183 - - - 19,503,183 Accrued markup - 49,254,343 - - 49,254,343 Short-term borrowings - 1,966,893,276 - - 1,966,893,276
2018 565,345,942 2,202,511,911 187,511,417 763,620,763 3,718,990,033
Mehran Sugar Mills Ltd. 133
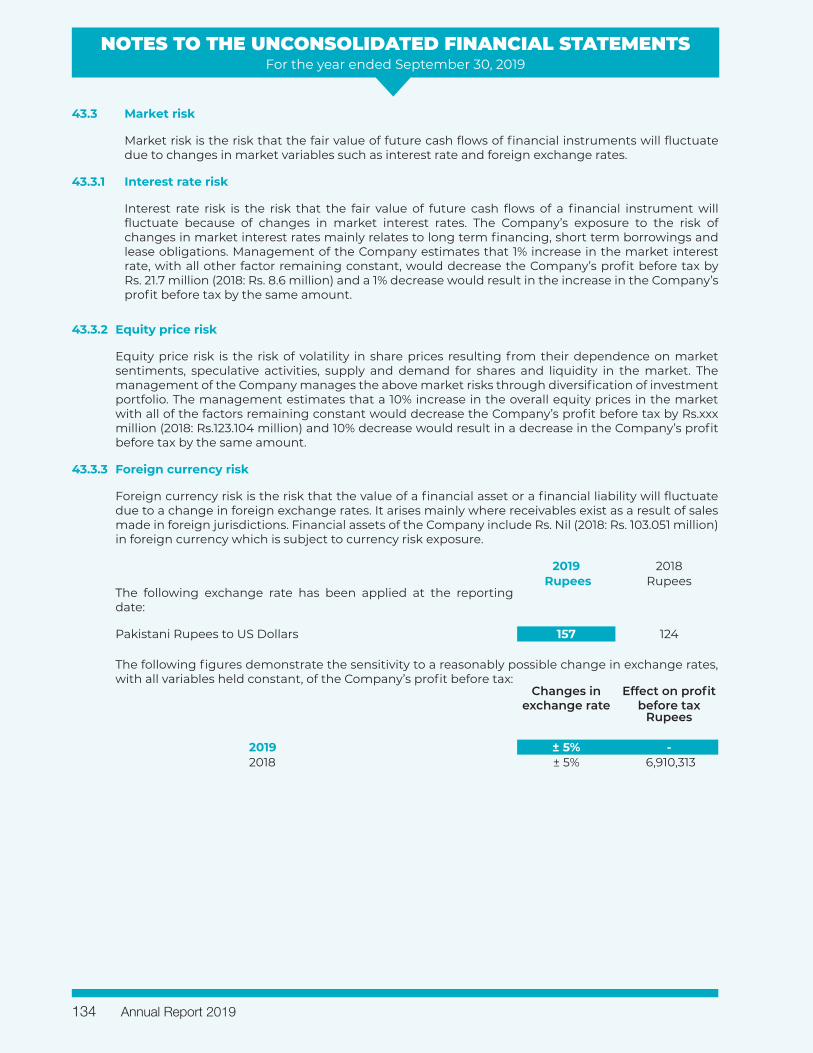
NOTES TO THE UNCONSOLIDATED FINANCIAL STATEMENTSFor the year ended September 30, 2019
43.3.2 Equity price risk
Equity price risk is the risk of volatility in share prices resulting from their dependence on market sentiments, speculative activities, supply and demand for shares and liquidity in the market. The management of the Company manages the above market risks through diversification of investment portfolio. The management estimates that a 10% increase in the overall equity prices in the market with all of the factors remaining constant would decrease the Company’s profit before tax by Rs.xxx million (2018: Rs.123.104 million) and 10% decrease would result in a decrease in the Company’s profit before tax by the same amount.
43.3.3 Foreign currency risk
Foreign currency risk is the risk that the value of a financial asset or a financial liability will fluctuate due to a change in foreign exchange rates. It arises mainly where receivables exist as a result of sales made in foreign jurisdictions. Financial assets of the Company include Rs. Nil (2018: Rs. 103.051 million) in foreign currency which is subject to currency risk exposure.
2019 2018 Rupees Rupees
The following exchange rate has been applied at the reporting date:
Pakistani Rupees to US Dollars 157 124
The following figures demonstrate the sensitivity to a reasonably possible change in exchange rates, with all variables held constant, of the Company’s profit before tax:
Changes in exchange rate
Effect on profit before tax
Rupees
2019 ± 5% -2018 ± 5% 6,910,313
43.3 Market risk
Market risk is the risk that the fair value of future cash flows of financial instruments will fluctuate due to changes in market variables such as interest rate and foreign exchange rates.
43.3.1 Interest rate risk
Interest rate risk is the risk that the fair value of future cash flows of a financial instrument will fluctuate because of changes in market interest rates. The Company’s exposure to the risk of changes in market interest rates mainly relates to long term financing, short term borrowings and lease obligations. Management of the Company estimates that 1% increase in the market interest rate, with all other factor remaining constant, would decrease the Company’s profit before tax by Rs. 21.7 million (2018: Rs. 8.6 million) and a 1% decrease would result in the increase in the Company’s profit before tax by the same amount.
Annual Report 2019134
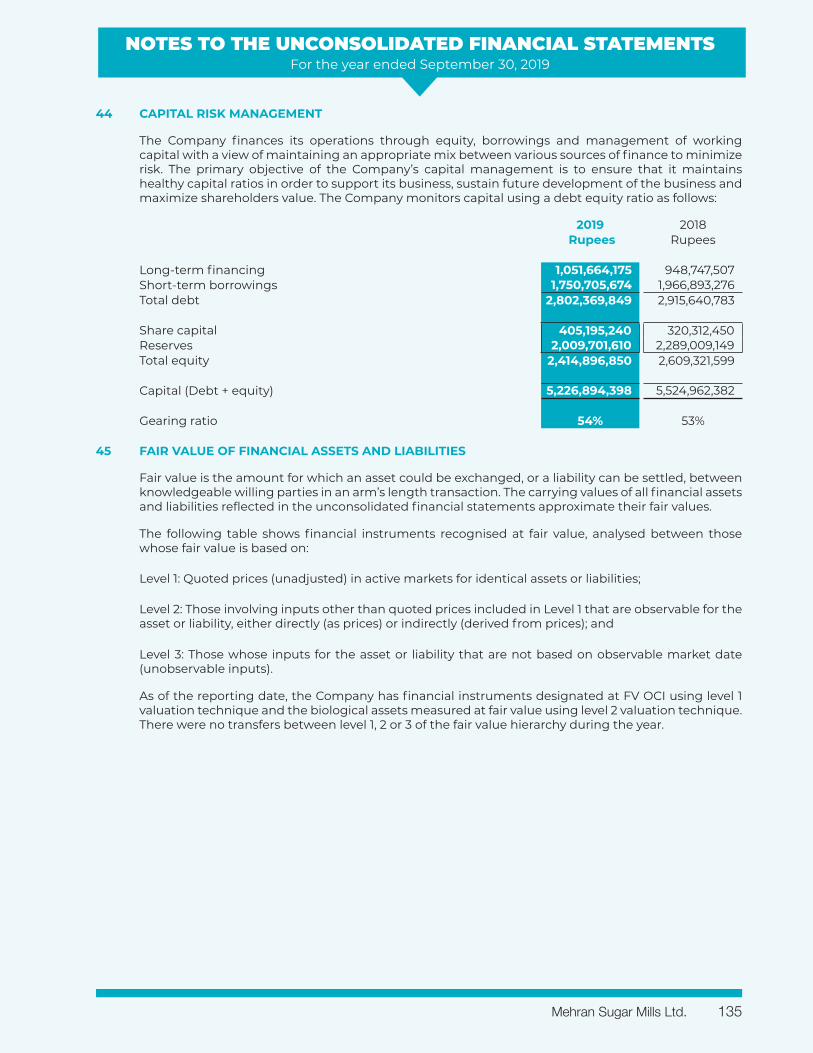
NOTES TO THE UNCONSOLIDATED FINANCIAL STATEMENTSFor the year ended September 30, 2019
44 CAPITAL RISK MANAGEMENT
The Company finances its operations through equity, borrowings and management of working capital with a view of maintaining an appropriate mix between various sources of finance to minimize risk. The primary objective of the Company’s capital management is to ensure that it maintains healthy capital ratios in order to support its business, sustain future development of the business and maximize shareholders value. The Company monitors capital using a debt equity ratio as follows:
2019 2018 Rupees Rupees
Long-term financing 1,051,664,175 948,747,507 Short-term borrowings 1,750,705,674 1,966,893,276 Total debt 2,802,369,849 2,915,640,783
Share capital 405,195,240 320,312,450 Reserves 2,009,701,610 2,289,009,149 Total equity 2,414,896,850 2,609,321,599
Capital (Debt + equity) 5,226,894,398 5,524,962,382
Gearing ratio 54% 53%
45 FAIR VALUE OF FINANCIAL ASSETS AND LIABILITIES
Fair value is the amount for which an asset could be exchanged, or a liability can be settled, between knowledgeable willing parties in an arm’s length transaction. The carrying values of all financial assets and liabilities reflected in the unconsolidated financial statements approximate their fair values.
The following table shows financial instruments recognised at fair value, analysed between those whose fair value is based on:
Level 1: Quoted prices (unadjusted) in active markets for identical assets or liabilities;
Level 2: Those involving inputs other than quoted prices included in Level 1 that are observable for the asset or liability, either directly (as prices) or indirectly (derived from prices); and
Level 3: Those whose inputs for the asset or liability that are not based on observable market date (unobservable inputs).
As of the reporting date, the Company has financial instruments designated at FV OCI using level 1 valuation technique and the biological assets measured at fair value using level 2 valuation technique. There were no transfers between level 1, 2 or 3 of the fair value hierarchy during the year.
Mehran Sugar Mills Ltd. 135
NOTES TO THE UNCONSOLIDATED FINANCIAL STATEMENTSFor the year ended September 30, 2019
2019 2018 Rupees Rupees
46 NUMBER OF EMPLOYEES
Total number of employees as at reporting date 582 580
Average number of employees during the year 581 583
47 DATE OF AUTHORISATION FOR ISSUE
These unconsolidated financial statements were authorised for issue on December 30, 2019 by the Board of Directors of the Company.
48 NON-ADJUSTING EVENTS AFTER THE REPORTING DATE
48.1 Subsequent to the year end, the Board of Directors of the Group in their meeting held on December 30, 2019 have proposed a final cash dividend of Rs. 1.00 (2018: Rs. 3) per share and issue of bonus shares in the proportion of 15 (2018:15) ordinary shares for every hundred (100) ordinary shares held for the year ended September 30, 2019.
48.2 Under section 5A of the Income Tax Ordinance, 2001 (the Ordinance), every public company is obliged to pay tax at the rate 5% on its accounting profit before tax if it derives profit for a tax year but, does not distribute atleast 20% of its after tax profits within six months of the end of the tax year, through cash.
Based on the above fact, the Board of Directors of the Company has recommended a final cash dividend amounting to Rs. 1.00 per share 10% (2018: Rs. 3/- per share i.e. 30%) and issue of bonus shares in the proportion of 15 (2018: 15) ordinary shares for every hundred (100) ordinary shares held for the year ended September 30, 2019. This exceeds the prescribed minimum dividend requirement as referred above. Accordingly, no further tax provision has been recorded under section 5A of the Ordinance.
The approval of the members for the proposed final cash dividend and the proposed bonus issue will be obtained at the Annual General Meeting of the Company to be held on Januray 28, 2020. The financial statements for the year ended September 30, 2019 do not include the effect of the final cash dividend and proposed bonus issue which will be accounted for in the financial statements for the year ending September 30, 2020.
48 GENERAL
48.1 Amounts have been rounded off to the nearest rupee unless otherwise stated.
48.2 Certain prior year figures were reclassified for comparison purposes. However, there are no material reclassifications to report.
48.3 The Company constitutes a single reportable segment, the principal class of product provided is Sugar.
CHIEF EXECUTIVE OFFICER CHIEF FINANCIAL OFFICER DIRECTOR
Annual Report 2019136

STATEMENTS
CONSOLIDATEDFINANCIAL
INDEPENDENT AUDITORS’ REPORTTo the members of Mehran Sugar Mills Limited
Opinion
We have audited the annexed consolidated financial statements of Mehran Sugar Mills Limited (the Holding Company) and its subsidiary company – Mehran Energy Limited (the Subsidiary Company) [collectively here-in-after referred to as the Group], which comprise the consolidated statement of financial position as at 30 September 2019, and the consolidated statement of profit or loss and other comprehensive income, the consolidated statement of changes in equity, the consolidated statement of cash flows for the year then ended, and notes to the consolidated financial statements, including a summary of significant accounting policies and other explanatory information, and we state that we have obtained all the information and explanations which, to the best of our knowledge and belief, were necessary for the purposes of the audit.
In our opinion and to the best of our information and according to the explanations given to us, the consolidated statement of financial position, the consolidated statement of profit or loss and other comprehensive income, the consolidated statement of changes in equity and the consolidated statement of cash flows together with the notes forming part thereof conform with the accounting and reporting standards as applicable in Pakistan and give the information required by the Companies Act, 2017 (XIX of 2017), in the manner so required and respectively give a true and fair view of the state of the Group’s affairs as at 30 September 2019 and of the profit and other comprehensive loss, the changes in equity and its cash flows for the year then ended.
Basis for Opinion
We conducted our audit in accordance with International Standards on Auditing (ISAs) as applicable in Pakistan. Our responsibilities under those standards are further described in the Auditors’ Responsibilities for the Audit of the Financial Statements section of our report. We are independent of the Group in accordance with the International Ethics Standards Board for Accountants’ Code of Ethics for Professional Accountants as adopted by the Institute of Chartered Accountants of Pakistan (the Code) and we have fulfilled our other ethical responsibilities in accordance with the Code. We believe that the audit evidence we have obtained is sufficient and appropriate to provide a basis for our opinion.
Key Audit Matters
Key audit matters are those matters that, in our professional judgment, were of most significance in our audit of the financial statements of the current period. These matters were addressed in the context of our audit of the financial statements as a whole, and in forming our opinion thereon, and we do not provide a separate opinion on these matters.
Annual Report 2019138
Following are the key audit matter:
Key audit matter How our audit addressed the key audit matter
First time adoption of IFRS 9 – Financial Instruments
As referred to in notes 3.1 and 5.14 to the accompanying consolidated financial statements, the Group has adopted IFRS 9 with effect from 1 October 2018. The new standard requires the Group to make provision for financial assets (including trade debts) using Expected Credit Loss (ECL) approach as against the Incurred Loss Model previously applied by the Group.
Determination of ECL on trade debts requires significant judgements and assumptions including consideration of factors such as historical credit loss experience and forward-looking macro-economic information.
We have considered the first time adoption of IFRS 9 requirements as a key audit matter due to significance of the change in accounting methodology and involvement of estimates and judgements in this regard.
Our key procedures to review the application of IFRS 9 included, amongst others, review of the methodology developed and applied by the Group to estimate the ECL in relation to trade debts. We also considered and evaluated the assumptions used in applying the ECL methodology based on historical information and qualitative factors as relevant for such estimates.
Further, we assessed the integrity and quality of the data used for ECL computation based on the accounting records of the Group as well as the related external sources as used for this purpose.
We checked the mathematical accuracy of the ECL model by performing recalculation on test basis.
In addition to above, we assessed the adequacy of disclosures in the consolidated financial statements of the Group regarding application of IFRS 9 as per the requirements of the above standard.
Information Other than the Financial Statements and Auditors’ Report Thereon
Management is responsible for the other information. The other information comprises the information included in the Annual Report, but does not include the financial statements and our auditors’ report thereon.
Our opinion on the financial statements does not cover the other information and we do not express any form of assurance conclusion thereon.
In connection with our audit of the financial statements, our responsibility is to read the other information and, in doing so, consider whether the other information is materially inconsistent with the financial statements or our knowledge obtained in the audit or otherwise appears to be materially misstated. If, based on the work we have performed, we conclude that there is a material misstatement of this other information, we are required to report that fact. We have nothing to report in this regard.
Responsibilities of Management and Board of Directors for the Financial Statements
Management is responsible for the preparation and fair presentation of the financial statements in accordance with the accounting and reporting standards as applicable in Pakistan and the requirements of Companies Act, 2017 (XIX of 2017) and for such internal control as management determines is necessary to enable the preparation of financial statements that are free from material misstatement, whether due to fraud or error.
Mehran Sugar Mills Ltd. 139
In preparing the financial statements, management is responsible for assessing the Group’s ability to continue as a going concern, disclosing, as applicable, matters related to going concern and using the going concern basis of accounting unless management either intends to liquidate the Group or to cease operations, or has no realistic alternative but to do so.
Board of directors are responsible for overseeing the Group’s financial reporting process.
Auditors’ Responsibilities for the Audit of the Financial Statements
Our objectives are to obtain reasonable assurance about whether the financial statements as a whole are free from material misstatement, whether due to fraud or error, and to issue an auditors’ report that includes our opinion. Reasonable assurance is a high level of assurance, but is not a guarantee that an audit conducted in accordance with ISAs as applicable in Pakistan will always detect a material misstatement when it exists. Misstatements can arise from fraud or error and are considered material if, individually or in the aggregate, they could reasonably be expected to influence the economic decisions of users taken on the basis of these financial statements.
As part of an audit in accordance with ISAs as applicable in Pakistan, we exercise professional judgment and maintain professional skepticism throughout the audit. We also:
Identify and assess the risks of material misstatement of the financial statements, whether due to fraud or error, design and perform audit procedures responsive to those risks, and obtain audit evidence that is sufficient and appropriate to provide a basis for our opinion. The risk of not detecting a material misstatement resulting from fraud is higher than for one resulting from error, as fraud may involve collusion, forgery, intentional omissions, misrepresentations, or the override of internal control.
Obtain an understanding of internal control relevant to the audit in order to design audit procedures that are appropriate in the circumstances, but not for the purpose of expressing an opinion on the effectiveness of the Group’s internal control.
Evaluate the appropriateness of accounting policies used and the reasonableness of accounting estimates and related disclosures made by management.
Conclude on the appropriateness of management’s use of the going concern basis of accounting and, based on the audit evidence obtained, whether a material uncertainty exists related to events or conditions that may cast significant doubt on the Group’s ability to continue as a going concern. If we conclude that a material uncertainty exists, we are required to draw attention in our auditors’ report to the related disclosures in the financial statements or, if such disclosures are inadequate, to modify our opinion. Our conclusions are based on the audit evidence obtained up to the date of our auditors’ report. However, future events or conditions may cause the Group to cease to continue as a going concern.
Evaluate the overall presentation, structure and content of the financial statements, including the disclosures, and whether the financial statements represent the underlying transactions and events in a manner that achieves fair presentation.
Annual Report 2019140
We communicate with the board of directors regarding, among other matters, the planned scope and timing of the audit and significant audit findings, including any significant deficiencies in internal control that we identify during our audit.
We also provide the board of directors with a statement that we have complied with relevant ethical requirements regarding independence, and to communicate with them all relationships and other matters that may reasonably be thought to bear on our independence, and where applicable, related safeguards.
From the matters communicated with the board of directors, we determine those matters that were of most significance in the audit of the financial statements of the current period and are therefore the key audit matters. We describe these matters in our auditors’ report unless law or regulation precludes public disclosure about the matter or when, in extremely rare circumstances, we determine that a matter should not be communicated in our report because the adverse consequences of doing so would reasonably be expected to outweigh the public interest benefits of such communication.
Report on Other Legal and Regulatory Requirements
Based on our audit, we further report that in our opinion:
a. proper books of account have been kept by the Group as required by the Companies Act, 2017 (XIX of 2017);
b. the statement of financial position, the statement of profit or loss and other comprehensive income, the statement of changes in equity and the statement of cash flows together with the notes thereon have been drawn up in conformity with the Companies Act, 2017 (XIX of 2017) and are in agreement with the books of account and returns;
c. investments made, expenditure incurred and guarantees extended during the year were for the purpose of the Group’s business; and
d. zakat deductible at source under the Zakat and Ushr Ordinance, 1980 (XVIII of 1980), was deducted by the Group and deposited in the Central Zakat Fund established under Section 7 of that Ordinance.
The engagement partner on the audit resulting in this independent auditors’ report is Arif Nazeer.
Chartered Accountants
Date: January 15, 2020
Place: Karachi
Mehran Sugar Mills Ltd. 141
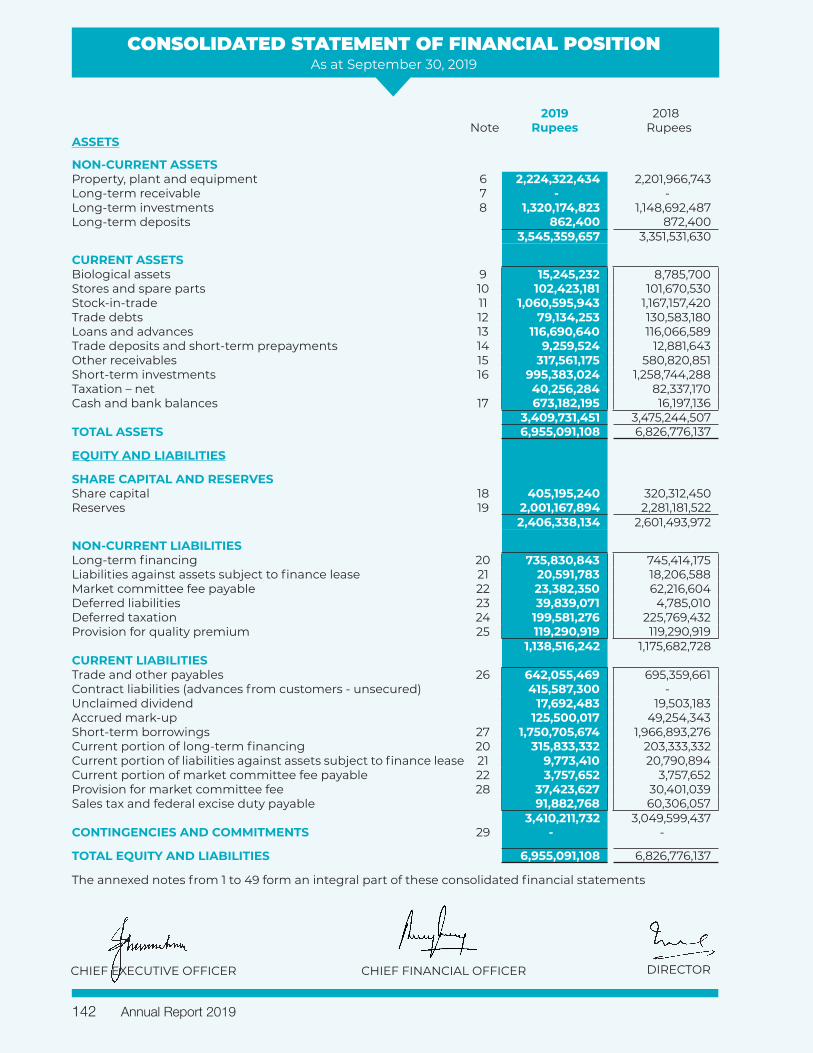
CONSOLIDATED STATEMENT OF FINANCIAL POSITIONAs at September 30, 2019
2019 2018 Note Rupees Rupees
ASSETS
NON-CURRENT ASSETS Property, plant and equipment 6 2,224,322,434 2,201,966,743 Long-term receivable 7 - - Long-term investments 8 1,320,174,823 1,148,692,487 Long-term deposits 862,400 872,400
3,545,359,657 3,351,531,630
CURRENT ASSETSBiological assets 9 15,245,232 8,785,700 Stores and spare parts 10 102,423,181 101,670,530 Stock-in-trade 11 1,060,595,943 1,167,157,420 Trade debts 12 79,134,253 130,583,180 Loans and advances 13 116,690,640 116,066,589 Trade deposits and short-term prepayments 14 9,259,524 12,881,643 Other receivables 15 317,561,175 580,820,851 Short-term investments 16 995,383,024 1,258,744,288 Taxation – net 40,256,284 82,337,170 Cash and bank balances 17 673,182,195 16,197,136
3,409,731,451 3,475,244,507 TOTAL ASSETS 6,955,091,108 6,826,776,137
EQUITY AND LIABILITIES
SHARE CAPITAL AND RESERVESShare capital 18 405,195,240 320,312,450 Reserves 19 2,001,167,894 2,281,181,522
2,406,338,134 2,601,493,972
NON-CURRENT LIABILITIESLong-term financing 20 735,830,843 745,414,175 Liabilities against assets subject to finance lease 21 20,591,783 18,206,588 Market committee fee payable 22 23,382,350 62,216,604 Deferred liabilities 23 39,839,071 4,785,010 Deferred taxation 24 199,581,276 225,769,432 Provision for quality premium 25 119,290,919 119,290,919
1,138,516,242 1,175,682,728 CURRENT LIABILITIESTrade and other payables 26 642,055,469 695,359,661 Contract liabilities (advances from customers - unsecured) 415,587,300 - Unclaimed dividend 17,692,483 19,503,183 Accrued mark-up 125,500,017 49,254,343 Short-term borrowings 27 1,750,705,674 1,966,893,276 Current portion of long-term financing 20 315,833,332 203,333,332 Current portion of liabilities against assets subject to finance lease 21 9,773,410 20,790,894 Current portion of market committee fee payable 22 3,757,652 3,757,652 Provision for market committee fee 28 37,423,627 30,401,039 Sales tax and federal excise duty payable 91,882,768 60,306,057
3,410,211,732 3,049,599,437 CONTINGENCIES AND COMMITMENTS 29 - -
TOTAL EQUITY AND LIABILITIES 6,955,091,108 6,826,776,137
The annexed notes from 1 to 49 form an integral part of these consolidated financial statements
CHIEF EXECUTIVE OFFICER CHIEF FINANCIAL OFFICER DIRECTOR
Annual Report 2019142
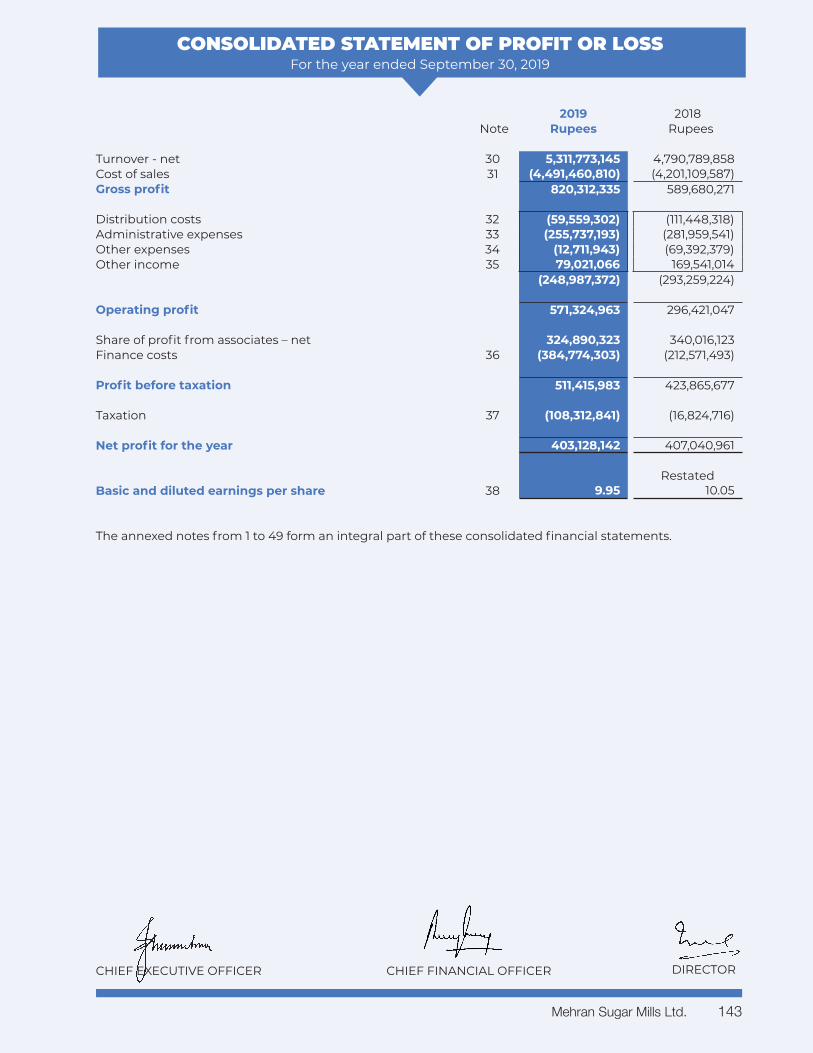
CONSOLIDATED STATEMENT OF PROFIT OR LOSSFor the year ended September 30, 2019
2019 2018 Note Rupees Rupees
Turnover - net 30 5,311,773,145 4,790,789,858 Cost of sales 31 (4,491,460,810) (4,201,109,587)Gross profit 820,312,335 589,680,271
Distribution costs 32 (59,559,302) (111,448,318)Administrative expenses 33 (255,737,193) (281,959,541)Other expenses 34 (12,711,943) (69,392,379)Other income 35 79,021,066 169,541,014
(248,987,372) (293,259,224)
Operating profit 571,324,963 296,421,047
Share of profit from associates – net 324,890,323 340,016,123 Finance costs 36 (384,774,303) (212,571,493)
Profit before taxation 511,415,983 423,865,677
Taxation 37 (108,312,841) (16,824,716)
Net profit for the year 403,128,142 407,040,961
RestatedBasic and diluted earnings per share 38 9.95 10.05
The annexed notes from 1 to 49 form an integral part of these consolidated financial statements.
CHIEF EXECUTIVE OFFICER CHIEF FINANCIAL OFFICER DIRECTOR
Mehran Sugar Mills Ltd. 143

CONSOLIDATED STATEMENT OF COMPREHENSIVE INCOMEFor the year ended September 30, 2019
2019 2018Rupees Rupees
Net profit for the year 403,128,142 407,040,961
Other comprehensive income
Other comprehensive income that will not be reclassified to profit or loss in subsequent periods (net of tax):
Actuarial (loss) / gain on defined benefit plan (76,634) 118,080
Net loss on equity instruments designated at fair value through other comprehensive income (415,524,053) (21,948,930)
(415,600,687) (21,830,850)
Total comprehensive (loss) / income for the year, net of tax (12,472,545) 385,210,111
The annexed notes from 1 to 49 form an integral part of these consolidated financial statements.
CHIEF EXECUTIVE OFFICER CHIEF FINANCIAL OFFICER DIRECTOR
Annual Report 2019144
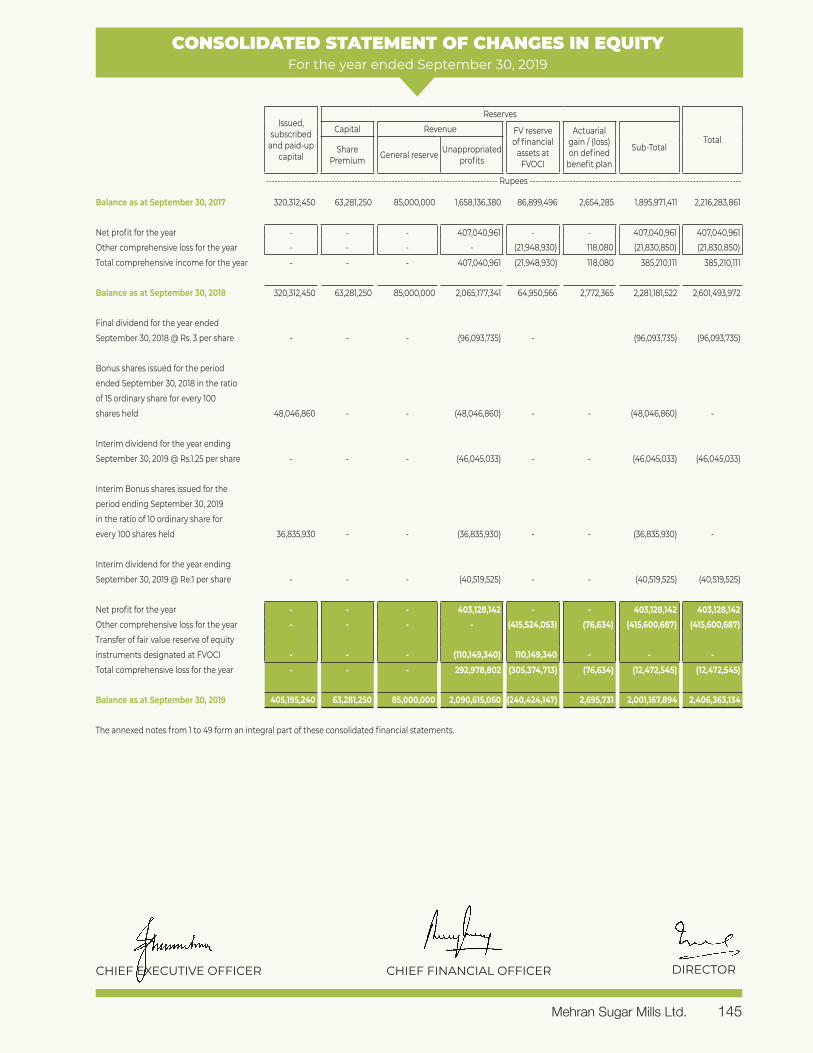
CONSOLIDATED STATEMENT OF CHANGES IN EQUITYFor the year ended September 30, 2019
Issued, subscribed
and paid-up capital
Reserves
TotalCapital Revenue FV reserve
of financial assets at
FVOCI
Actuarial gain / (loss) on defined
benefit plan
Sub-TotalShare Premium General reserve Unappropriated
profits
--------------------------------------------------------------------------------- Rupees --------------------------------------------------------------------------
Balance as at September 30, 2017 320,312,450 63,281,250 85,000,000 1,658,136,380 86,899,496 2,654,285 1,895,971,411 2,216,283,861
Net profit for the year - - - 407,040,961 - - 407,040,961 407,040,961 Other comprehensive loss for the year - - - - (21,948,930) 118,080 (21,830,850) (21,830,850)
Total comprehensive income for the year - - - 407,040,961 (21,948,930) 118,080 385,210,111 385,210,111
Balance as at September 30, 2018 320,312,450 63,281,250 85,000,000 2,065,177,341 64,950,566 2,772,365 2,281,181,522 2,601,493,972
Final dividend for the year ended September 30, 2018 @ Rs. 3 per share - - - (96,093,735) - (96,093,735) (96,093,735)
Bonus shares issued for the period ended September 30, 2018 in the ratio of 15 ordinary share for every 100 shares held 48,046,860 - - (48,046,860) - - (48,046,860) -
Interim dividend for the year ending September 30, 2019 @ Rs.1.25 per share - - - (46,045,033) - - (46,045,033) (46,045,033)
Interim Bonus shares issued for the period ending September 30, 2019 in the ratio of 10 ordinary share for every 100 shares held 36,835,930 - - (36,835,930) - - (36,835,930) -
Interim dividend for the year ending September 30, 2019 @ Re.1 per share - - - (40,519,525) - - (40,519,525) (40,519,525)
Net profit for the year - - - 403,128,142 - - 403,128,142 403,128,142 Other comprehensive loss for the year - - - - (415,524,053) (76,634) (415,600,687) (415,600,687)Transfer of fair value reserve of equity instruments designated at FVOCI - - - (110,149,340) 110,149,340 - - - Total comprehensive loss for the year - - - 292,978,802 (305,374,713) (76,634) (12,472,545) (12,472,545)
Balance as at September 30, 2019 405,195,240 63,281,250 85,000,000 2,090,615,060 (240,424,147) 2,695,731 2,001,167,894 2,406,363,134
The annexed notes from 1 to 49 form an integral part of these consolidated financial statements.
CHIEF EXECUTIVE OFFICER CHIEF FINANCIAL OFFICER DIRECTOR
Mehran Sugar Mills Ltd. 145
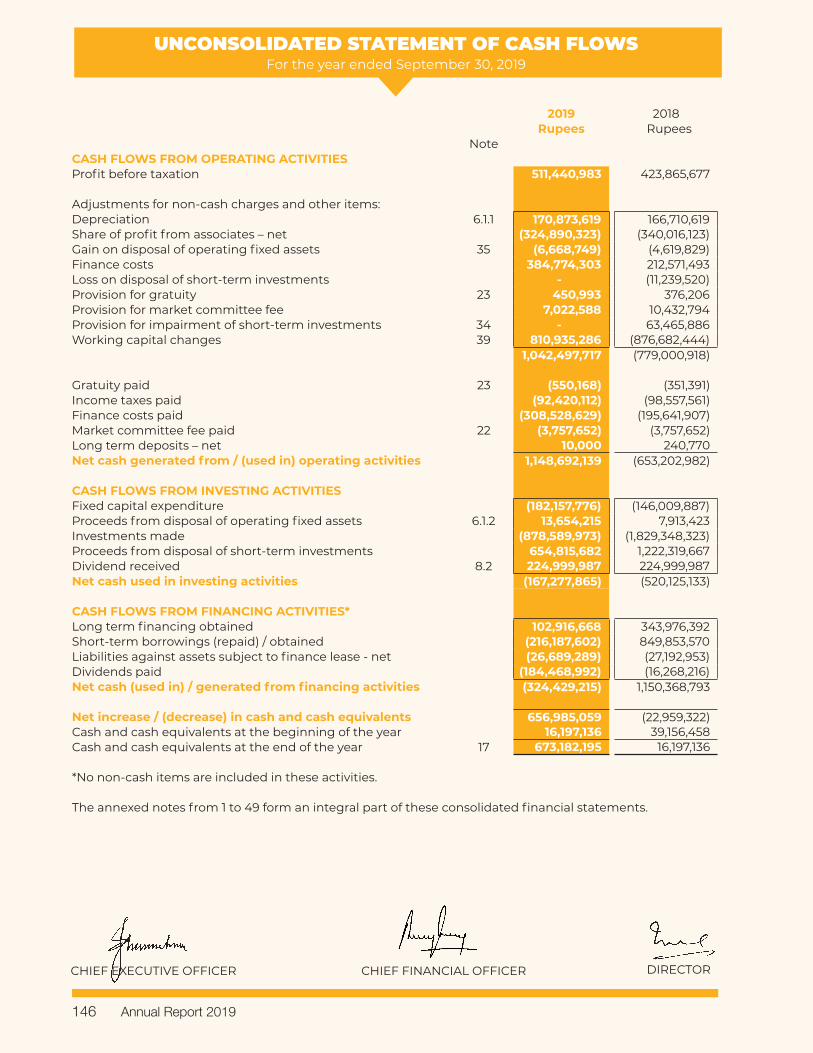
UNCONSOLIDATED STATEMENT OF CASH FLOWSFor the year ended September 30, 2019
2019 2018Rupees Rupees
NoteCASH FLOWS FROM OPERATING ACTIVITIESProfit before taxation 511,440,983 423,865,677
Adjustments for non-cash charges and other items:Depreciation 6.1.1 170,873,619 166,710,619 Share of profit from associates – net (324,890,323) (340,016,123)Gain on disposal of operating fixed assets 35 (6,668,749) (4,619,829)Finance costs 384,774,303 212,571,493 Loss on disposal of short-term investments - (11,239,520)Provision for gratuity 23 450,993 376,206 Provision for market committee fee 7,022,588 10,432,794 Provision for impairment of short-term investments 34 - 63,465,886 Working capital changes 39 810,935,286 (876,682,444)
1,042,497,717 (779,000,918)
Gratuity paid 23 (550,168) (351,391)Income taxes paid (92,420,112) (98,557,561)Finance costs paid (308,528,629) (195,641,907)Market committee fee paid 22 (3,757,652) (3,757,652)Long term deposits – net 10,000 240,770 Net cash generated from / (used in) operating activities 1,148,692,139 (653,202,982)
CASH FLOWS FROM INVESTING ACTIVITIESFixed capital expenditure (182,157,776) (146,009,887)Proceeds from disposal of operating fixed assets 6.1.2 13,654,215 7,913,423 Investments made (878,589,973) (1,829,348,323)Proceeds from disposal of short-term investments 654,815,682 1,222,319,667 Dividend received 8.2 224,999,987 224,999,987 Net cash used in investing activities (167,277,865) (520,125,133)
CASH FLOWS FROM FINANCING ACTIVITIES*Long term financing obtained 102,916,668 343,976,392 Short-term borrowings (repaid) / obtained (216,187,602) 849,853,570 Liabilities against assets subject to finance lease - net (26,689,289) (27,192,953)Dividends paid (184,468,992) (16,268,216)Net cash (used in) / generated from financing activities (324,429,215) 1,150,368,793
Net increase / (decrease) in cash and cash equivalents 656,985,059 (22,959,322)Cash and cash equivalents at the beginning of the year 16,197,136 39,156,458 Cash and cash equivalents at the end of the year 17 673,182,195 16,197,136
*No non-cash items are included in these activities.
The annexed notes from 1 to 49 form an integral part of these consolidated financial statements.
CHIEF EXECUTIVE OFFICER CHIEF FINANCIAL OFFICER DIRECTOR
Annual Report 2019146
NOTES TO THE CONSOLIDATED FINANCIAL STATEMENTSFor the year ended September 30, 2019
1 LEGAL STATUS AND OPERATIONS OF THE GROUP
1.1 The Holding Company
Mehran Sugar Mills Limited (the Holding Company) was incorporated in Pakistan as a public limited Company in December, 1965 under the repealed Companies Act, 1913. The shares of the Holding Company are quoted on Pakistan Stock Exchange Limited. The Holding Company is principally engaged in the manufacturing and sale of sugar and its by-products. The registered office of the Holding Comapny is situated at 14th floor, Dolmen City Executive Tower, Marine Drive, Block 4, Clifton, Karachi. The mill of the Holding Company is located at Distt. Tando Allahyar, Sindh.
1.2 The Subsidiary Company
Mehran Energy Limited (the Subsidiary), a wholly owned subsidiary of Mehran Sugar Mills Limited (the Holding Company) was incorporated in Pakistan as a public unlisted company in October 2016. The Subsidiary is in start-up phase and has not commenced its operations. The principal activities of the Subsidiary will be to build, operate and maintain a 26.5 MW high pressure co-generation bagasse based power plant for the generation and supply of electric power in relation thereof. The Subsidiary obtained letter of intent (LOI) from the Government of Sindh (GoS) on November 07, 2016. However, the Subsidiary will commence its operations upon signing of Energy Purchase Agreement with Central Power Purchasing Agency (CPPA). The EPA has been delayed to a mutual disagreement of terms and conditions between the Subsidiary and CPPA. As the offered terms and conditions of the EPA are not in general acceptable to the electricity producing companies, the matter in dispute is pending before the Islamabad High Court in form of a petition. The Holding Company Company is committed to provide financial support to the Subsidiary as and when required.
1.3 Geographical location and addresses of all the business units are as under:
Location Business unit
Karachi14th Floor Dolmen Executive Tower, Marine Drive, Clifton Block 4 Head office of Group
Tando Allahyar, SindhTando Adam Road MillDeh Rechal, P.O. Khokhar Farm
2 BASIS OF PREPARATION
2.1 Statement of compliance
These consolidated financial statements have been prepared in accordance with the accounting and reporting standards as applicable in Pakistan for financial reporting. The accounting and reporting standards as applicable in Pakistan comprise of International Financial Reporting Standards (IFRS) issued by International Accounting Standard Board (IASB) as notified under Companies Act, 2017 (the Act) and, provisions of and directives issued under the Act. Where the provisions of and directives issued under the Act differ from the IFRS standards, the provisions of and directives issued under the Act have been followed.
2.2 Accounting convention
These consolidated financial statements have been prepared under the historical cost convention except for short-term investments which are carried at FV through OCI, investment in associates calculated using equity method, biological assets carried at fair value less costs to sell and staff gratuity which are carried at present value of defined benefit obligation (DBO) respectively.
2.3 Basis of consolidation
These consolidated financial statements comprise the financial statements of the Holding Company and the Subsidiary as at the reporting date, here-in-after referred to as ‘the Group’.
Mehran Sugar Mills Ltd. 147
NOTES TO THE CONSOLIDATED FINANCIAL STATEMENTSFor the year ended September 30, 2019
2.3.1 Subsidiaries
Subsidiaries are those entities over which the Group has control. Control is achieved when the Group is exposed, or has rights, to variable returns from its involvement with the investee and has the ability to affect those returns through its power over the investee. Specifically, the Group controls an investee if, and only if, the Group has:
power over the investee (i.e. existing rights that give it the current ability to direct the relevant activities of the investee);
exposure, or rights, to variable returns from its involvement with the investee; and
the ability to use its power over the investee to affect its returns.
The Holding Company meets all the above conditions and hence has power over the subsidiary.
Subsidiaries are consolidated from the date on which the Group obtains control, and continue to be consolidated until the date when such control ceases. Assets, liabilities, income and expenses of a subsidiary acquired or disposed off during the year are included in the profit and loss account from the date the Group gains control until the date the Group ceases to control the subsidiary.
Identifiable assets acquired and liabilities and contingent liabilities assumed in a business combination are measured initially at their fair values at the acquisition date, irrespective of the extent of any non-controlling interest. The excess of the cost of acquisition is recorded as goodwill. If the cost of acquisition is less than fair value of the net assets of the subsidiary acquired, the difference is recognised directly in the consolidated statement of profit or loss.
After initial recognition, goodwill is measured at cost less accumulated impairment losses, if any. For the purposes of impairment testing, goodwill acquired in a business combination is, on the acquisition date, allocated to each of the Group’s cash generating units that are expected to benefit from the combination. Goodwill is tested annually or whenever there is an indication of impairment exists. Impairment loss in respect of goodwill is recognised in consolidated statement of profit or loss and is not reversed in future periods.
The assets, liabilities, income and expenses of subsidiary companies are consolidated on a line by line basis and the carrying value of investments held by the Holding Company is eliminated against the subsidiaries’ shareholders’ equity in the consolidated financial statements.
All intra-group transactions, balances, income, expenses and unrealised gains and losses on transactions between Group companies are eliminated in full.
The Subsidiary has same reporting period as that of the Holding Company. The accounting policies of the Subsidiary are consistent with the accounting policies of the Group.
3 STANDARDS, AMENDMENTS AND INTERPRETATIONS ADOPTED DURING THE YEAR
3.1 New standards, interpretations and amendments
Adoption of standards and amendments effective during the year
The Group has adopted the following accounting standards, the amendments and interpretations of IFRSs which became effective for the current year:
IFRS 2 Share based Payments: Classification and Measurement of Share Based Payments Transactions (Amendments)IFRS 4 Insurance Contracts: Applying IFRS 9 Financial Instruments with IFRS 4 Insurance Contracts (Amendments)
IFRS 9 Financial Instruments
IFRS 15 Revenue from Contracts with Customers
IAS 40 Investment Property: Transfers of Investment Property (Amendments)
IFRIC 22 Foreign Currency Transactions and Advance Consideration
Annual Report 2019148
NOTES TO THE CONSOLIDATED FINANCIAL STATEMENTSFor the year ended September 30, 2019
Improvements to accounting standard issued by IASB in December 2016
IAS 28 Investments in Associates and Joint Ventures: Clarification that measuring investees at fair value through profit or loss is an investment-by-investment choice
The adoption of the above standards, amendments and improvements to accounting standards did not have any material effect on the financial statements except for IFRS 9 and IFRS 15. The impact of adoption of IFRS 9 and IFRS 15 is given below:
IFRS 15 Revenue from Contracts with Customers
IFRS 15 supersedes IAS 11 Construction Contracts, IAS 18 Revenue and related Interpretations and it applies to all revenue arising from contracts with customers, unless those contracts are in the scope of other standards. The new standard establishes a five-step model to account for revenue arising from contracts with customers. Under IFRS 15, revenue is recognised at an amount that reflects the consideration to which an entity expects to be entitled in exchange for transferring goods or services to a customer.
The standard requires entities to exercise judgement, taking into consideration all of the relevant facts and circumstances when applying each step of the model to contracts with their customers. The standard also specifies the accounting for the incremental costs of obtaining a contract and the costs directly related to fulfilling a contract.
The Group elected the modified retrospective method and applied the standard retrospectively to only the most current period presented in the financial statements. Accordingly, the information presented for the previous corresponding period has not been restated.
The Group generates its revenue from sale of goods. The Group’s contracts with customers for the sale of goods generally include one performance obligation. The Group has concluded that revenue from sale of goods should be recognised at the point in time when control of the asset is transferred to the customer, generally on delivery of the goods. Therefore, the adoption of IFRS 15 did not have an impact on the timing of revenue recognition and the amount of revenue recognised.
In general the contracts for the sale of goods do not provide customers with a right of return and volume rebates. Accordingly, the application of the constraint on variable consideration did not have any impact on the revenue recognised by the Group.
IFRS 9 Financial Instruments
IFRS 9 Financial Instruments replaces IAS 39 Financial Instruments: Recognition and Measurement bringing together aspects of the accounting for financial instruments: classification and measurement and impairment.
Classification and measurement
Except for certain trade receivables, under IFRS 9, the Group initially measures a financial asset at its fair value plus, in the case of a financial asset not at fair value through profit or loss, transaction costs.
Under IFRS 9, debt financial instruments are subsequently measured at fair value through profit or loss (FVPL), amortised cost, or fair value through other comprehensive income (FVOCI). The classification is based on two criteria: the Group’s business model for managing the assets; and whether the instruments’ contractual cash flows represent ‘solely payments of principal and interest’ on the principal amount outstanding (the ‘SPPI criterion’).
At transition date to IFRS 9, the Group has financial assets measured at amortised cost and equity instruments at FVOCI. The new classification and measurement of the Group’s financial assets are, as follows:
Debt instruments at amortised cost for financial assets that are held within a business model with the objective to hold the financial assets in order to collect contractual cash flows that meet the SPPI criterion.
Mehran Sugar Mills Ltd. 149
NOTES TO THE CONSOLIDATED FINANCIAL STATEMENTSFor the year ended September 30, 2019
Equity instruments at FVOCI, with no recycling of gains or losses to profit or loss on derecognition. This category only includes equity instruments, which the Group intends to hold for the foreseeable future and which the Group has irrevocably elected to so classify upon initial recognition or transition. The Group classified its unquoted equity instruments as equity instruments at FVOCI. Equity instruments at FVOCI are not subject to an impairment assessment under IFRS 9. Under IAS 39, the Group’s unquoted equity instruments were classified as AFS financial assets.
There is no significant impact of IFRS 9 on the classification and measurement of financial assets for the year ended 30 September 2019 other than the changes in classification of loans and receivables and available for sale financial assets to the category of amortised cost and fair value through other comprehensive income respectively.
The accounting for the Group’s financial liabilities remains largely the same as it was under IAS 39. Accordingly, the adoption of IFRS 9 has not had a significant effect on the Group’s accounting policies related to financial liabilities.
Impairment
The adoption of IFRS 9 has fundamentally changed the Group’s accounting for impairment losses for financial assets by replacing IAS 39’s incurred loss approach with a forward-looking expected credit loss (ECL) approach. IFRS 9 requires the Group to record an allowance for ECLs for all loans and other debt financial assets not held at FVPL.
ECLs are based on the difference between the contractual cash flows due in accordance with the contract and all the cash flows that the Group expects to receive. The shortfall is then discounted at an approximation to the asset’s original effective interest rate.
For trade and other receivables, the Group has applied the standard’s simplified approach and has calculated ECLs based on lifetime expected credit losses. The Group has established a provision matrix that is based on the Group’s historical credit loss experience, adjusted for forward-looking factors specific to the debtors and the economic environment. However, in certain cases, the Group may also consider a financial asset to be in default when internal or external information indicates that the Group is unlikely to receive the outstanding contractual amounts in full before taking into account any credit enhancements held by the Group. The adoption of the ECL requirements of IFRS 9 did not result in any difference in the existing impairment allowances of the Group’s debt financial assets.
The accounting policy in respect of financial instrument is stated in note 5.14 to these financial statements.
3.2 Standards, interpretations and amendments to approved accounting standards that are not yet effective
The following standards, amendments and interpretations with respect to the approved accounting standards as applicable in Pakistan would be effective from the dates mentioned below against the respective standard or interpretation:
Standard or Interpretation
Effective date (annual periods beginning on
or after)
IFRS 3 Definition of a Business (Amendments) 01 January 2020IFRS 3 Business Combinations: Previously held interests in a joint operation 01 January 2019IFRS 9 Prepayment Features with Negative Compensation (Amendments) 01 January 2019IFRS 10 Consolidated Financial Statements and IAS 28 Investment in Associates
and Joint Ventures - Sale or Contribution of Assets between an Investor and its Associate or Joint Venture (Amendment) Not yet finalised
IFRS 11 Joint Arrangements: Previously held interests in a joint operation 01 January 2019IFRS 14 Regulatory Deferral Accounts 01 July 2019
Annual Report 2019150
NOTES TO THE CONSOLIDATED FINANCIAL STATEMENTSFor the year ended September 30, 2019
IFRS 16 Leases 01 July 2019IAS 1/ IAS 8 Definition of Material (Amendments) 01 January 2020IAS 12 Income Taxes: Income tax consequences of payments on
financial instruments classified as equity 01 January 2019IAS 19 Plan Amendment, Curtailment or Settlement (Amendments) 01 January 2019IAS 23 Borrowing Costs - Borrowing costs eligible for capitalisation 01 January 2019IAS 28 Long-term Interests in Associates and Joint Ventures (Amendments) 01 January 2019IFRIC 23 Uncertainty over Income Tax Treatments 01 January 2019
The above standards and amendments are not expected to have any material impact on the Group’s consolidated financial statements in the period of initial application except for IFRS 16 - ‘Leases’. The Group is currently evaluating the impact of these standards.
In addition to the above standards and amendments, improvements to various accounting standards have also been issued by the IASB in December 2017. Such improvements are generally effective for annual reporting period beginning on or after January 01, 2019. The Group expects that such improvements to the standards will not have any material impact on the Group’s financial statements in the period of initial application.
The IASB has also issued the revised Conceptual Framework for Financial Reporting (the Conceptual Framework) in March 2018 which is effective for annual periods beginning on or after 01 January 2020 for preparers of financial statements who develop accounting policies based on the Conceptual Framework. The revised Conceptual Framework is not a standard, and none of the concepts override those in any standard or any requirements in a standard. The purpose of the Conceptual Framework is to assist IASB in developing standards, to help preparers develop consistent accounting policies if there is no applicable standard in place and to assist all parties to understand and interpret the standards.
Further, the following new standard have been issued by IASB which are yet to be notified by the SECP for the purpose of applicability in Pakistan.
Standard or Interpretation
IASB effective date (annual
periods beginning on
or after)
IFRS 17 Insurance Contracts January 01, 2021
The Group expects that above new standard will not have any material impact on the Group’s financial statements in the period of initial application.
4 SIGNIFICANT ACCOUNTING JUDGEMENTS AND ESTIMATES
The preparation of the Group’s consolidated financial statements requires management to make judgments and estimates that affect the reported amounts of revenues, expenses, assets and liabilities, and the disclosure of contingent liabilities, at the end of the reporting period. However, uncertainty about these judgments and estimates could result in outcomes that require a material adjustment to the carrying amount of the asset or liability affected in future periods. The management continually evaluates estimates and judgments which are based on historical experience and other factors, including expectations of future events that are believed to be reasonable under current circumstances. Revisions to accounting estimates are recognised prospectively.
In the process of applying the Group’s accounting policies, management has made the following estimates and judgments which are significant to the consolidated financial statements:
Mehran Sugar Mills Ltd. 151
NOTES TO THE CONSOLIDATED FINANCIAL STATEMENTSFor the year ended September 30, 2019
Property, plant and equipment
The Group reviews appropriateness of the rate of depreciation and useful life used in the calculation of depreciation. Further, where applicable, an estimate of the recoverable amount of assets is made for possible impairment on an annual basis. In making these estimates, the Group uses the technical resources available with the Group. Any change in the estimates in the future might affect the carrying amount of respective item of property, plant and equipment, with corresponding effects on the depreciation charge and impairment.
Allowance for expected credit loss
The Group uses a provision matrix to calculate ECLs for trade receivables and other receivables. The provision rates are based on days past due for Grouping of various customer segments that have similar loss pattern. The provision matrix is initially based on the Group’s historical observed default rates. The Group will calibrate the matrix to adjust the historical credit loss experience with forward-looking information. For instance, if forecast economic conditions (i.e., gross domestic product) are expected to deteriorate over the next yearwhich can lead to an increased number of defaults in the manufacturing sector, the historical default rates are adjusted. At every reporting date, the historical observed default rates are updated and changes in the forward-looking estimates are analysed. The assessment of the correlation between historical observed default rates, forecast economic conditions and ECLs is a significant estimate. The amount of ECLs is sensitive to changes in circumstances and of forecast economic condition. The Group’s historical credit loss experience and forecast of economic conditions may also not be representative of customer’s actual default in future. The information about the ECLs on the Group’s financial assets exposed to credit risk is disclosed in Note 43.
Inventories
The Group reviews the net realisable value (NRV) of stock-in-trade and stores and spare parts to assess any diminution in the respective carrying values. NRV is estimated with reference to the estimated selling price in the ordinary course of business less the estimated cost necessary to make the sale.
Taxation
In making the estimate for income tax payable by the Group, the Group takes into account the applicable tax laws and the decision by appellate authorities on certain issues in the past.
Deferred tax assets are recognised for all unused tax losses and credits to the extent that it is probable that taxable profit will be available against which such losses and credits can be utilised. Significant management judgment is required to determine the amount of deferred tax assets that can be recognised, based upon the likely timing and level of future taxable profits together with future tax planning strategies.
5 SIGNIFICANT ACCOUNTING POLICIES
5.1 Property, plant and equipment
Owned
These are stated at cost less accumulated depreciation and impairment except for freehold land, which is stated at cost.
Depreciation is charged to the consolidated statement of profit or loss using the reducing balance method, at the rates specified in note 6.1. Depreciation on additions is charged from the month in which the asset is available for use and on disposals up to the month the asset is in use.
The carrying values of the Group’s property plant and equipment are reviewed at each financial year end for impairment when events or changes in circumstances indicate that the carrying value may not be recoverable. If any such indication exists, and where the carrying values exceed the estimated recoverable amount, the assets are written down to their recoverable amount.
Annual Report 2019152
NOTES TO THE CONSOLIDATED FINANCIAL STATEMENTSFor the year ended September 30, 2019
Repairs and maintenance cost is written off to the consolidated statement of profit or loss in the year in which it is incurred. Major renewals and improvements are capitalised when it is probable that respective future economic benefits will flow to the Group.
An item of property plant and equipment is derecognised upon disposal or when no future economic benefits are expected from its use or disposal. Gain or loss on disposal of property plant and equipment is recognised in the period of disposal.
Leased
Leases, recorded under the requirements of IAS 17 – “Leases”, which transfer to the Group substantially all the risks and benefits incidental to ownership of the leased item are capitalised at the inception of the lease, at the fair value of the leased property or, if lower at the present value of the minimum lease payments. Lease payments are apportioned between the finance charges and reduction of the lease liability so as to achieve a constant rate of interest on the remaining balance of the liability. Assets acquired under finance lease are depreciated using the same basis as for owned assets.
Capital work-in-progress
These are stated at cost less accumulated impairment, if any, and represent expenditure on fixed assets in the course of construction and installation. Transfers are made to relevant property, plant and equipment category as and when assets are available for their intended use.
5.2 Investments
Associates
Investment in associates are accounted for using equity method of accounting. Investments over which the Group has “significant influence” are accounted for under this method i.e., investments to be carried in the reporting date at cost plus post-acquisition changes in the share of net assets of associates, less any impairment in value, if material. The consolidated statement of profit or loss reflects the Group’s share of the results of operations of associates after the date of acquisition. If an associate uses accounting policies other than those of the Group, adjustments are made to conform the associate’s policies to those of the Group, if the impact is considered material.
As the financial statements of all the associates may not necessarily be available at the year end, the Group uses the financial statements of the associates with a lag of three months for applying the equity method of accounting. Further, the Group considers the investment in associates as strategic investment.
5.3 Biological assets
These are measured at fair value less costs to sell on initial recognition and at each reporting date. Gain or loss arising on initial recognition of a biological asset at fair value less costs to sell and from a change in fair value less costs to sell of a biological asset at the reporting date is included in the consolidated statement of profit or loss for the period in which it arises.
To ascertain the fair value of the biological assets, the fair value less estimated point-of-sale costs of crops at the end of each reporting period is determined using prices and other relevant information generated by market transactions involving identical or comparable (i.e., similar) assets. Since, there exists an active market for the agricultural produce, the estimated selling price is obtained using the observable inputs and the estimated selling costs are the harvesting charges farmer takes for cutting the crop.
5.4 Stores and spare parts
Stores, spares and consumables are stated at the lower of weighted average cost and net realisable value. Cost comprises all costs of purchase, costs of conversion and other costs incurred in bringing the inventories to their present location and condition. Net realisable value is the estimated selling price in the ordinary course of business less net estimated costs to sell, which is generally equivalent to replacement cost.
Mehran Sugar Mills Ltd. 153
NOTES TO THE CONSOLIDATED FINANCIAL STATEMENTSFor the year ended September 30, 2019
Items in transit, if any, are valued at cost comprising invoice value plus other charges incurred thereon up to the reporting date.
5.5 Stock-in-trade
Stock-in-trade is valued at the lower of cost and estimated net realisable value.
Cost comprises all costs of purchase, costs of conversion and other costs incurred in bringing the inventories to their present location and condition. Net realisable value signifies the estimated selling price in the ordinary course of business less net estimated costs of completion and sell.
Items in transit, if any, are valued at cost comprising invoice value plus other charges incurred thereon up to the reporting date.
5.6 Trade debts and other receivables
Trade debts and other receivables are stated at original invoice amount less provision for doubtful debts, if any. A provision for doubtful debts and other receivables is established when there is objective evidence that the Group will not be able to collect all amounts due according to the original terms of receivables (refer note 43.1.1). Bad debts are written-off when identified.
5.7 Cash and cash equivalents
Cash and cash equivalents comprise of cash in hand and current accounts held with banks, which are subject to insignificant risk of change. These are carried at cost.
5.8 Employees’ benefits
Gratuity
The Group operates an unfunded gratuity scheme for its permanent mill employees. An actuarial valuation of all defined benefit scheme is conducted every year. The valuation uses the Projected Unit Credit method. Actuarial gains and losses are recognised in full in the period in which they occur in the consolidated statement of comprehensive income.
All past service costs are recognised at the earlier of when the amendment or curtailment occurs and when the Group has recognised related restructuring or termination benefits.
Certain actuarial assumptions have been disclosed in note 23 to the financial statements for valuation of present value of defined benefit obligation and fair value of plan asset. Any changes in these assumptions in future years might affect gains and losses in those years.
Provident fund
The Group operates a recognised provident fund for those permanent employees who have opted for it. Equal monthly contributions are made to the fund by the Group and employees in accordance with the fund’s rules. Contributions are made by the employees at mill and the employees at head office at the rate of 11% and 10% respectively, of the aggregate of basic salary.
Investments made in provident fund have been made in accordance with the provisions of Section 218 of the Act and the conditions specified thereunder.
Compensated absences
The Group accrues its estimated liability towards leaves accumulated by employees on an accrual basis using current salary level.
Annual Report 2019154
NOTES TO THE CONSOLIDATED FINANCIAL STATEMENTSFor the year ended September 30, 2019
5.9 Taxation
Current
Provision for current tax is based on the taxable income in accordance with the Income Tax Ordinance, 2001.
Deferred
Deferred tax is recognised using the liability method, on all temporary differences arising at the reporting date between the tax base of assets and liabilities and their carrying amounts for financial reporting purposes.
Deferred tax liabilities are recognised for all taxable temporary differences. Deferred tax assets are recognised for all deductible temporary differences to the extent that it is probable that the future taxable profits will be available against which the assets may be utilised. Deferred tax assets are reduced to the extent that it is no longer probable that the related tax benefit will be realised.
Deferred tax assets and liabilities are measured at the tax rates that are expected to apply to the period when the asset is realised or the liability is settled, based on the tax rates (and tax laws) that have been enacted or substantively enacted at the reporting date.
Deferred tax relating to items recognised outside consolidated statement of profit or loss is recognised outside consolidated statement of profit or loss. Deferred tax items are recognised in correlation to the underlying transaction either in consolidated statement of comprehensive income or directly in equity.
5.10 Trade and other payables
Liabilities for trade and other amounts payable are carried at cost which is the fair value of the consideration to be paid in the future for goods and services received, whether or not billed to the Group.
5.11 Provisions
Provisions are recognised when the Group has a present obligation (legal or constructive) as a result of a past event if it is probable that an outflow of resources embodying economic benefits will be required to settle the obligation and a reliable estimate can be made of the amount of obligation. Provisions are reviewed at each reporting date and adjusted to reflect the current best estimate.
5.12 Foreign currency transactions and translation
Foreign currency transactions are translated into Pak Rupees using the exchange rates prevailing at the dates of the transactions. Monetary assets and liabilities in foreign currencies are translated into Pak Rupees using the exchange rate at the reporting date. Foreign exchange gains and losses resulting from the settlement of such transactions and from the translations at the year end exchange rates of monetary assets and liabilities denominated in foreign currencies are recognised in the consolidated statement of profit or loss.
5.13 Borrowing and their costs
Borrowings are recognised initially at fair value, net of transaction costs incurred. Borrowing costs are recognised as an expense in the period in which these are incurred except to the extent of borrowing costs that are directly attributable to the acquisition, construction or production of a qualifying asset. Such borrowing costs, if any, are capitalised as part of the cost of that asset.
5.14 Financial instruments
A financial instrument is any contract that gives rise to a financial asset of one entity and a financial liability or equity instrument of another entity.
Mehran Sugar Mills Ltd. 155
NOTES TO THE CONSOLIDATED FINANCIAL STATEMENTSFor the year ended September 30, 2019
i) Financial assets
Initial recognition and measurement
Financial assets are classified, at initial recognition, as subsequently measured at amortised cost, fair value through other comprehensive income (OCI), and fair value through profit or loss.
The classification of financial assets at initial recognition depends on the financial asset’s contractual cash flow characteristics and the Group’s business model for managing them. With the exception of trade receivables, the Group initially measures a financial asset at its fair value plus, in the case of a financial asset not at fair value through profit or loss, transaction costs. Trade receivables are measured at the transaction price determined under IFRS 15. Refer to the accounting policies in note 5.15 to these consolidated financial statements.
In order for a financial asset to be classified and measured at amortised cost or fair value through OCI, it needs to give rise to cash flows that are ‘solely payments of principal and interest (SPPI)’ on the principal amount outstanding. This assessment is referred to as the SPPI test and is performed at an instrument level. The Group’s business model for managing financial assets refers to how it manages its financial assets in order to generate cash flows. The business model determines whether cash flows will result from collecting contractual cash flows, selling the financial assets, or both.
Purchases or sales of financial assets that require delivery of assets within a time frame established by regulation or convention in the market place (regular way trades) are recognised on the trade date, i.e., the date that the Group commits to purchase or sell the asset.
Subsequent measurement
For purposes of subsequent measurement, financial assets are classified into following categories:
Financial assets at amortised cost (debt instruments);
Financial assets designated at fair value through OCI with no recycling of cumulative gains and losses upon derecognition (equity instruments); and
Financial assets at fair value through profit or loss.
Financial assets at amortised cost (debt instruments)
This category is the most relevant to the Group. The Group measures financial assets at amortised cost if both of the following conditions are met:
The financial asset is held within a business model with the objective to hold financial assets in order to collect contractual cash flows; and
The contractual terms of the financial asset give rise on specified dates to cash flows that are solely payments of principal and interest on the principal amount outstanding.
Financial assets at amortised cost are subsequently measured using the effective interest (EIR) method and are subject to impairment. Gains and losses are recognised in profit or loss when the asset is derecognised, modified or impaired.
Financial assets designated at fair value through OCI (equity instruments)
Upon initial recognition, the Group can elect to classify irrevocably its equity investments as equity instruments designated at fair value through OCI when they meet the definition of equity under IAS 32 Financial Instruments: Presentation and are not held for trading. The classification is determined on an instrument-by-instrument basis.
Gains and losses on these financial assets are never recycled to profit or loss. Dividends are recognised as other income in the consolidated statement of profit or loss when the right of payment has been established, except when the Group benefits from such proceeds as a recovery of part of the cost of the financial asset, in which case, such gains are recorded in OCI. Equity instruments designated at fair value through OCI are not subject to impairment assessment.
Annual Report 2019156
NOTES TO THE CONSOLIDATED FINANCIAL STATEMENTSFor the year ended September 30, 2019
The Group elected to classify irrevocably its non-listed equity investments under this category.
Financial assets at fair value through profit or loss
Financial assets at fair value through profit or loss include financial assets held for trading, financial assets designated upon initial recognition at fair value through profit or loss, or financial assets mandatorily required to be measured at fair value. Financial assets are classified as held for trading if they are acquired for the purpose of selling or repurchasing in the near term. Financial assets with cash flows that are not solely payments of principal and interest are classified and measured at fair value through profit or loss, irrespective of the business model. Notwithstanding the criteria for debt instruments to be classified at amortised cost or at fair value through OCI, as described above, debt instruments may be designated at fair value through profit or loss on initial recognition if doing so eliminates, or significantly reduces, an accounting mismatch.
Financial assets at fair value through profit or loss are carried in the statement of financial position at fair value with net changes in fair value recognised in the statement of profit or loss.
This category includes derivative instruments and listed equity investments which the Group had not irrevocably elected to classify at fair value through OCI. Dividends on listed equity investments are also recognised as other income in the statement of profit or loss when the right of payment has been established.
Derecognition
A financial asset (or, where applicable, a part of a financial asset or part of a group of similar financial assets) is primarily derecognised (i.e., removed from the Group’s consolidated statement of financial position) when:
The rights to receive cash flows from the asset have expired; Or
The Group has transferred its rights to receive cash flows from the asset or has assumed an obligation to pay the received cash flows in full without material delay to a third party under a ‘pass-through’ arrangement; and either (a) the Group has transferred substantially all the risks and rewards of the asset, or (b) the Group has neither transferred nor retained substantially all the risks and rewards of the asset, but has transferred control of the asset.
When the Group has transferred its rights to receive cash flows from an asset or has entered into a pass-through arrangement, it evaluates if, and to what extent, it has retained the risks and rewards of ownership.
When it has neither transferred nor retained substantially all of the risks and rewards of the asset, nor transferred control of the asset, the Group continues to recognise the transferred asset to the extent of its continuing involvement. In that case, the Group also recognises an associated liability. The transferred asset and the associated liability are measured on a basis that reflects the rights and obligations that the Group has retained.
Continuing involvement that takes the form of a guarantee over the transferred asset is measured at the lower of the original carrying amount of the asset and the maximum amount of consideration that the Group could be required to repay.
Impairment of financial assets
Further disclosures relating to impairment of financial assets are also provided in the following notes:
Disclosures for significant assumptions - note 3
Trade receivables - note 12
Mehran Sugar Mills Ltd. 157

NOTES TO THE CONSOLIDATED FINANCIAL STATEMENTSFor the year ended September 30, 2019
The Group recognises an allowance for expected credit losses (ECLs) for all debt instruments not held at fair value through profit or loss. ECLs are based on the difference between the contractual cash flows due in accordance with the contract and all the cash flows that the Group expects to receive, discounted at an approximation of the original effective interest rate. The expected cash flows will include cash flows from the sale of collateral held or other credit enhancements that are integral to the contractual terms. For trade receivables, the Group applies a simplified approach in calculating ECLs. Therefore, the Group does not track changes in credit risk, but instead recognises a loss allowance based on lifetime ECLs at each reporting date. The Group has established a provision matrix that is based on its historical credit loss experience, adjusted for forward-looking factors specific to the debtors and the economic environment.
The Group considers a financial asset in default when contractual payments are 90 days past due. However, in certain cases, the Group may also consider a financial asset to be in default when internal or external information indicates that the Group is unlikely to receive the outstanding contractual amounts in full before taking into account any credit enhancements held by the Group. A financial asset is written off when there is no reasonable expectation of recovering the contractual cash flows.
ii) Financial liabilities
Initial recognition and measurement
Financial liabilities are classified, at initial recognition, as financial liabilities at fair value through profit or loss, loans and borrowings, payables, or as derivatives designated as hedging instruments in an effective hedge, as appropriate.
All financial liabilities are recognised initially at fair value and, in the case of loans and borrowings and payables, net of directly attributable transaction costs.
Financial liabilities at fair value through profit or loss
Financial liabilities at fair value through profit or loss include financial liabilities held for trading and financial liabilities designated upon initial recognition as at fair value through profit or loss. Gains or losses on liabilities held for trading are recognised in the consolidated statement of profit or loss. Financial liabilities designated upon initial recognition at fair value through profit or loss are designated at the initial date of recognition, and only if the criteria in IFRS 9 are satisfied. The Group has not designated any financial liability as at fair value through profit or loss.
Loans and borrowings
This is the category most relevant to the Group. After initial recognition, interest-bearing loans and borrowings are subsequently measured at amortised cost using the EIR method. Gains and losses are recognised in profit or loss when the liabilities are derecognised as well as through the EIR amortisation process.
Amortised cost is calculated by taking into account any discount or premium on acquisition and fees or costs that are an integral part of the EIR. The EIR amortisation is included as finance costs in the consolidated statement of profit or loss.
This category generally applies to interest-bearing loans and borrowings. For more information, refer to Note 20.
Derecognition
A financial liability is derecognised when the obligation under the liability is discharged or cancelled or expires. When an existing financial liability is replaced by another from the same lender on substantially different terms, or the terms of an existing liability are substantially modified, such an exchange or modification is treated as the derecognition of the original liability and the recognition of a new liability. The difference in the respective carrying amounts is recognised in the consolidated statement of profit or loss.
Annual Report 2019158
NOTES TO THE CONSOLIDATED FINANCIAL STATEMENTSFor the year ended September 30, 2019
iii) Offsetting of financial instruments
Financial assets and financial liabilities are offset and the net amount is reported in the consolidated statement of financial position if there is a currently enforceable legal right to offset the recognised amounts and there is an intention to settle on a net basis, to realise the assets and settle the liabilities simultaneously.
5.15 Revenue from contracts with customers
The Group is in the business of sale of goods. Revenue from contracts with customers is recognised when control of the goods is transferred to the customer at an amount that reflects the consideration to which the Group expects to be entitled in exchange for those goods. The Group has generally concluded that it is the principal in its revenue arrangements because it typically controls the goods or services before transferring them to the customer.
The disclosures of significant accounting judgements, estimates and assumptions relating to revenue from contracts with customers are provided in note 4.
Revenue from sale of goods is recognised at the point in time when control of the asset is transferred to the customer, generally on delivery of the goods. The normal credit term is 30 to 90 days upon delivery.
The Group considers whether there are other promises in the contract that are separate performance obligations to which a portion of the transaction price needs to be allocated (e.g., right of returns, volume rebates). In determining the transaction price for the sale of goods, the Group considers the effects of variable consideration, the existence of significant financing components, noncash consideration.
Variable consideration
If the consideration in a contract includes a variable amount, the Group estimates the amount of consideration to which it will be entitled in exchange for transferring the goods to the customer. The variable consideration is estimated at contract inception and constrained until it is highly probable that a significant revenue reversal in the amount of cumulative revenue recognised will not occur when the associated uncertainty with the variable consideration is subsequently resolved. Some contracts for the sale of chemicals provide customers with a right of return and volume rebates. The rights of return and volume rebates give rise to variable consideration. Contracts with the Group’s customers provide them with a right of return, price adjustments and volume rebates and are considered as variable consideration.
Accounts receivables
A receivable represents the Group’s right to an amount of consideration that is unconditional (i.e. only the passage of time is required before payment of the consideration is due).
Dividend income is recognised when the right to receive dividend is established.
Profit on short-term deposits is accounted for using the effective interest rate method.
Income from sale of electricity is recognised upon the output delivered at rates specified under the agreement with the Hyderabad Electricity Supply Group (HESCO).
Farm and other income is recognised on accrual basis.
5.16 Dividend and appropriation to reserves
Dividend and appropriation to reserves are recognised in the consolidated financial statements in the period in which these are approved. However, if these are approved after the reporting period but before the consolidated financial statements are authorised for issue, disclosure is made in the consolidated financial statements.
Mehran Sugar Mills Ltd. 159
NOTES TO THE CONSOLIDATED FINANCIAL STATEMENTSFor the year ended September 30, 2019
5.17 Segment reporting
Operating segments are reported in a manner consistent with the internal reporting provided to the chief operating decision-maker. The chief operating decision-maker, who is responsible for allocating resources and assessing performance of the operating segments, has been identified as the Board of Directors that makes strategic decisions. The management has determined that the Group has a single reportable segment as the Board of Directors views the Group’s operations as one reportable segment.
5.18 Functional and presentation currency
These consolidated financial statements are presented in Pakistani Rupees, which is the Group’s functional and presentation currency.
Following accounting Policies (from 5.19 to 5.21) were effective for the period ended on or before September 30, 2018.
5.19 Financial instruments
Available-for-sale
Investments which the management intends to hold for an indefinite period, but may be sold in response to the need for liquidity or changes in interest rates are classified as available-for-sale.
These investments are initially recognised at cost, being the fair value of the consideration given including transaction costs associated with the investment. After initial recognition, these investments are remeasured at fair value. For investments traded in active market, fair value is determined by reference to quoted market price and the investments for which a quoted market price is not available, or the fair value cannot be reasonably calculated, are measured at cost, subject to review for impairment at each reporting date.
Gains or losses on available-for-sale investments are recognised in other comprehensive income until the investment is disposed of or determined to be impaired, at which time the cumulative gain or loss previously reported in other comprehensive income is taken to consolidated statement of profit or loss.
Held-to-maturity
Investments with fixed or determinable payments and fixed maturity where management has both the positive intent and ability to hold to maturity are classified as held to maturity investments. These are initially measured at cost, being the fair value of the consideration given including transaction costs associated with the investment, and are subsequently measured at amortised cost using the effective interest method. Gains and losses are recognised in the consolidated statement of profit or loss when the investments are derecognised or impaired, as well as through the amortisation process.
Recognition
Financial assets and liabilities are recognised at the time when the Group becomes party to the contractual provisions of the instrument and are derecognised in the case of assets, when the contractual rights under the instruments are realised, expired or surrendered and in the case of liability, when the obligation is discharged, cancelled or expired.
Annual Report 2019160
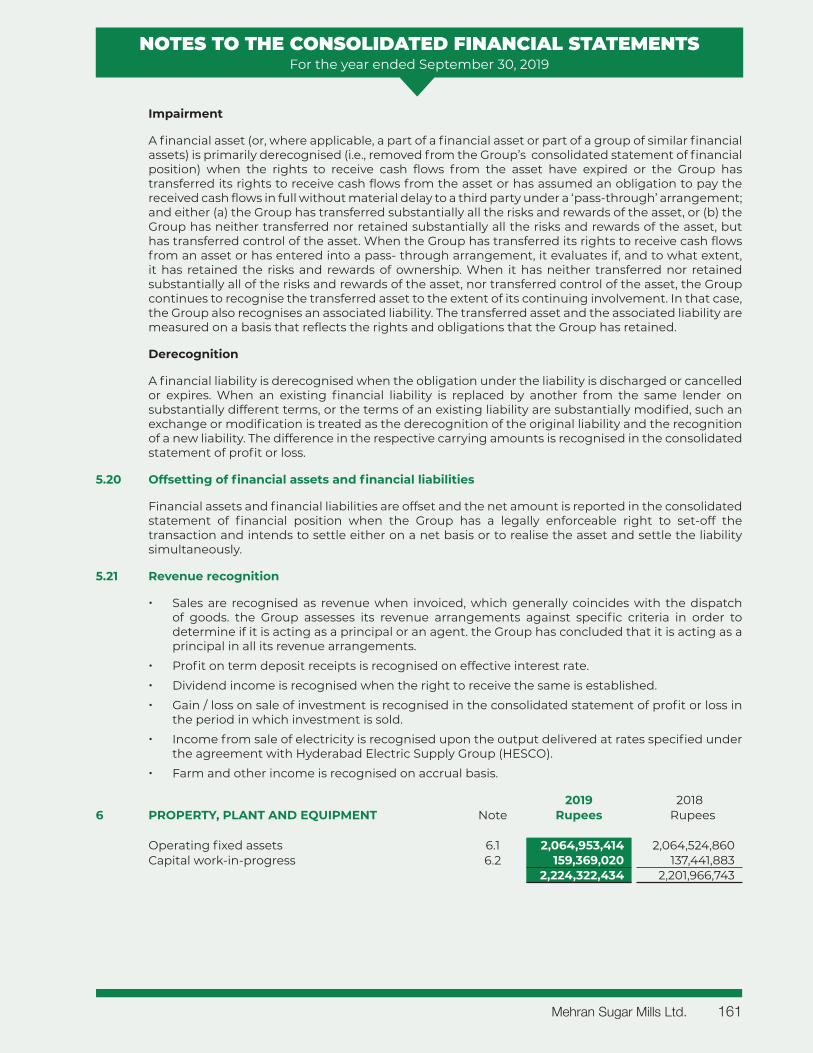
Impairment
A financial asset (or, where applicable, a part of a financial asset or part of a group of similar financial assets) is primarily derecognised (i.e., removed from the Group’s consolidated statement of financial position) when the rights to receive cash flows from the asset have expired or the Group has transferred its rights to receive cash flows from the asset or has assumed an obligation to pay the received cash flows in full without material delay to a third party under a ‘pass-through’ arrangement; and either (a) the Group has transferred substantially all the risks and rewards of the asset, or (b) the Group has neither transferred nor retained substantially all the risks and rewards of the asset, but has transferred control of the asset. When the Group has transferred its rights to receive cash flows from an asset or has entered into a pass- through arrangement, it evaluates if, and to what extent, it has retained the risks and rewards of ownership. When it has neither transferred nor retained substantially all of the risks and rewards of the asset, nor transferred control of the asset, the Group continues to recognise the transferred asset to the extent of its continuing involvement. In that case, the Group also recognises an associated liability. The transferred asset and the associated liability are measured on a basis that reflects the rights and obligations that the Group has retained.
Derecognition
A financial liability is derecognised when the obligation under the liability is discharged or cancelled or expires. When an existing financial liability is replaced by another from the same lender on substantially different terms, or the terms of an existing liability are substantially modified, such an exchange or modification is treated as the derecognition of the original liability and the recognition of a new liability. The difference in the respective carrying amounts is recognised in the consolidated statement of profit or loss.
5.20 Offsetting of financial assets and financial liabilities
Financial assets and financial liabilities are offset and the net amount is reported in the consolidated statement of financial position when the Group has a legally enforceable right to set-off the transaction and intends to settle either on a net basis or to realise the asset and settle the liability simultaneously.
5.21 Revenue recognition
Sales are recognised as revenue when invoiced, which generally coincides with the dispatch of goods. the Group assesses its revenue arrangements against specific criteria in order to determine if it is acting as a principal or an agent. the Group has concluded that it is acting as a principal in all its revenue arrangements.
Profit on term deposit receipts is recognised on effective interest rate.
Dividend income is recognised when the right to receive the same is established.
Gain / loss on sale of investment is recognised in the consolidated statement of profit or loss in the period in which investment is sold.
Income from sale of electricity is recognised upon the output delivered at rates specified under the agreement with Hyderabad Electric Supply Group (HESCO).
Farm and other income is recognised on accrual basis.
2019 20186 PROPERTY, PLANT AND EQUIPMENT Note Rupees Rupees
Operating fixed assets 6.1 2,064,953,414 2,064,524,860 Capital work-in-progress 6.2 159,369,020 137,441,883
2,224,322,434 2,201,966,743
NOTES TO THE CONSOLIDATED FINANCIAL STATEMENTSFor the year ended September 30, 2019
Mehran Sugar Mills Ltd. 161
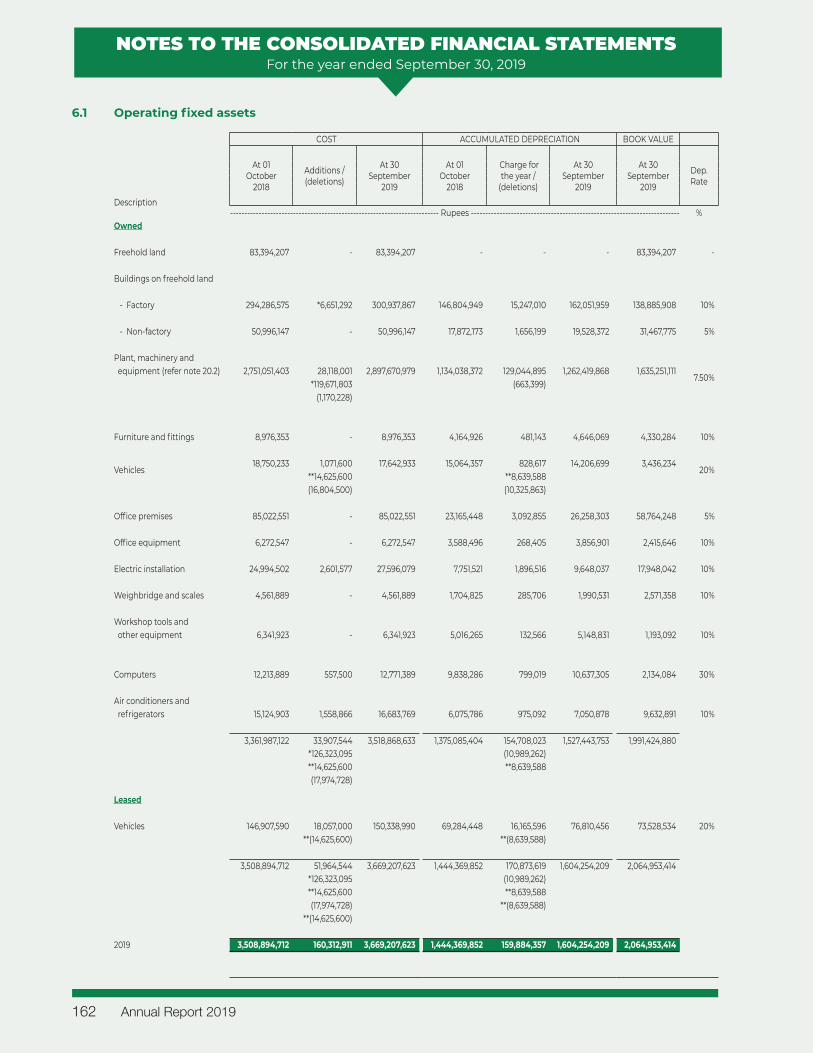
NOTES TO THE CONSOLIDATED FINANCIAL STATEMENTSFor the year ended September 30, 2019
6.1 Operating fixed assets
COST ACCUMULATED DEPRECIATION BOOK VALUE
At 01 October
2018
Additions / (deletions)
At 30 September
2019
At 01 October
2018
Charge for the year /
(deletions)
At 30 September
2019
At 30 September
2019
Dep. Rate
Description------------------------------------------------------------------------- Rupees ------------------------------------------------------------------------- %
Owned
Freehold land 83,394,207 - 83,394,207 - - - 83,394,207 -
Buildings on freehold land
- Factory 294,286,575 *6,651,292 300,937,867 146,804,949 15,247,010 162,051,959 138,885,908 10%
- Non-factory 50,996,147 - 50,996,147 17,872,173 1,656,199 19,528,372 31,467,775 5%
Plant, machinery and equipment (refer note 20.2) 2,751,051,403 28,118,001 2,897,670,979 1,134,038,372 129,044,895 1,262,419,868 1,635,251,111
7.50%*119,671,803 (663,399) (1,170,228)
Furniture and fittings 8,976,353 - 8,976,353 4,164,926 481,143 4,646,069 4,330,284 10%
Vehicles 18,750,233 1,071,600 17,642,933 15,064,357 828,617 14,206,699 3,436,234
20% **14,625,600 **8,639,588 (16,804,500) (10,325,863)
Office premises 85,022,551 - 85,022,551 23,165,448 3,092,855 26,258,303 58,764,248 5%
Office equipment 6,272,547 - 6,272,547 3,588,496 268,405 3,856,901 2,415,646 10%
Electric installation 24,994,502 2,601,577 27,596,079 7,751,521 1,896,516 9,648,037 17,948,042 10%
Weighbridge and scales 4,561,889 - 4,561,889 1,704,825 285,706 1,990,531 2,571,358 10%
Workshop tools and other equipment 6,341,923 - 6,341,923 5,016,265 132,566 5,148,831 1,193,092 10%
Computers 12,213,889 557,500 12,771,389 9,838,286 799,019 10,637,305 2,134,084 30%
Air conditioners and refrigerators 15,124,903 1,558,866 16,683,769 6,075,786 975,092 7,050,878 9,632,891 10%
3,361,987,122 33,907,544 3,518,868,633 1,375,085,404 154,708,023 1,527,443,753 1,991,424,880 *126,323,095 (10,989,262) **14,625,600 **8,639,588 (17,974,728)
Leased
Vehicles 146,907,590 18,057,000 150,338,990 69,284,448 16,165,596 76,810,456 73,528,534 20% **(14,625,600) **(8,639,588)
3,508,894,712 51,964,544 3,669,207,623 1,444,369,852 170,873,619 1,604,254,209 2,064,953,414 *126,323,095 (10,989,262) **14,625,600 **8,639,588 (17,974,728) **(8,639,588)
**(14,625,600)
2019 3,508,894,712 160,312,911 3,669,207,623 1,444,369,852 159,884,357 1,604,254,209 2,064,953,414
Annual Report 2019162
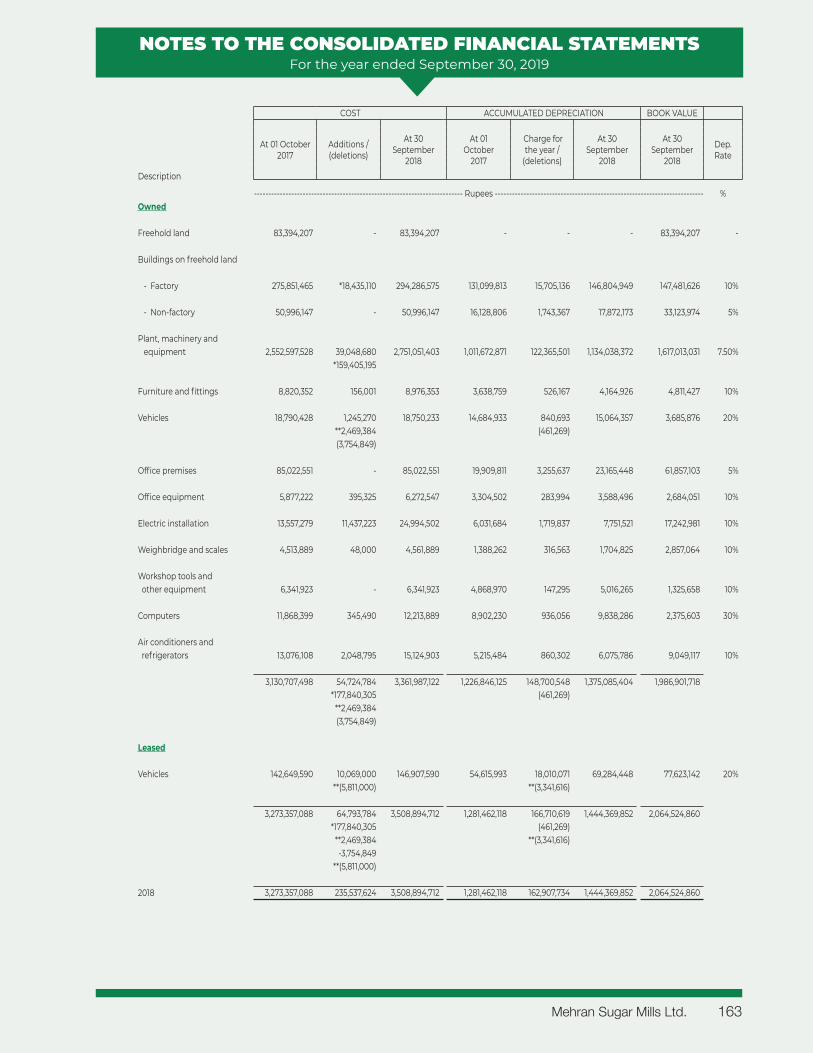
NOTES TO THE CONSOLIDATED FINANCIAL STATEMENTSFor the year ended September 30, 2019
COST ACCUMULATED DEPRECIATION BOOK VALUE
At 01 October 2017
Additions / (deletions)
At 30 September
2018
At 01 October
2017
Charge for the year /
(deletions)
At 30 September
2018
At 30 September
2018
Dep. Rate
Description
------------------------------------------------------------------------- Rupees ------------------------------------------------------------------------- %Owned
Freehold land 83,394,207 - 83,394,207 - - - 83,394,207 -
Buildings on freehold land
- Factory 275,851,465 *18,435,110 294,286,575 131,099,813 15,705,136 146,804,949 147,481,626 10%
- Non-factory 50,996,147 - 50,996,147 16,128,806 1,743,367 17,872,173 33,123,974 5%
Plant, machinery and equipment 2,552,597,528 39,048,680 2,751,051,403 1,011,672,871 122,365,501 1,134,038,372 1,617,013,031 7.50%
*159,405,195
Furniture and fittings 8,820,352 156,001 8,976,353 3,638,759 526,167 4,164,926 4,811,427 10%
Vehicles 18,790,428 1,245,270 18,750,233 14,684,933 840,693 15,064,357 3,685,876 20%**2,469,384 (461,269) (3,754,849)
Office premises 85,022,551 - 85,022,551 19,909,811 3,255,637 23,165,448 61,857,103 5%
Office equipment 5,877,222 395,325 6,272,547 3,304,502 283,994 3,588,496 2,684,051 10%
Electric installation 13,557,279 11,437,223 24,994,502 6,031,684 1,719,837 7,751,521 17,242,981 10%
Weighbridge and scales 4,513,889 48,000 4,561,889 1,388,262 316,563 1,704,825 2,857,064 10%
Workshop tools and other equipment 6,341,923 - 6,341,923 4,868,970 147,295 5,016,265 1,325,658 10%
Computers 11,868,399 345,490 12,213,889 8,902,230 936,056 9,838,286 2,375,603 30%
Air conditioners and refrigerators 13,076,108 2,048,795 15,124,903 5,215,484 860,302 6,075,786 9,049,117 10%
3,130,707,498 54,724,784 3,361,987,122 1,226,846,125 148,700,548 1,375,085,404 1,986,901,718*177,840,305 (461,269)
**2,469,384 (3,754,849)
Leased
Vehicles 142,649,590 10,069,000 146,907,590 54,615,993 18,010,071 69,284,448 77,623,142 20%**(5,811,000) **(3,341,616)
3,273,357,088 64,793,784 3,508,894,712 1,281,462,118 166,710,619 1,444,369,852 2,064,524,860*177,840,305 (461,269)
**2,469,384 **(3,341,616) -3,754,849
**(5,811,000)
2018 3,273,357,088 235,537,624 3,508,894,712 1,281,462,118 162,907,734 1,444,369,852 2,064,524,860
Mehran Sugar Mills Ltd. 163
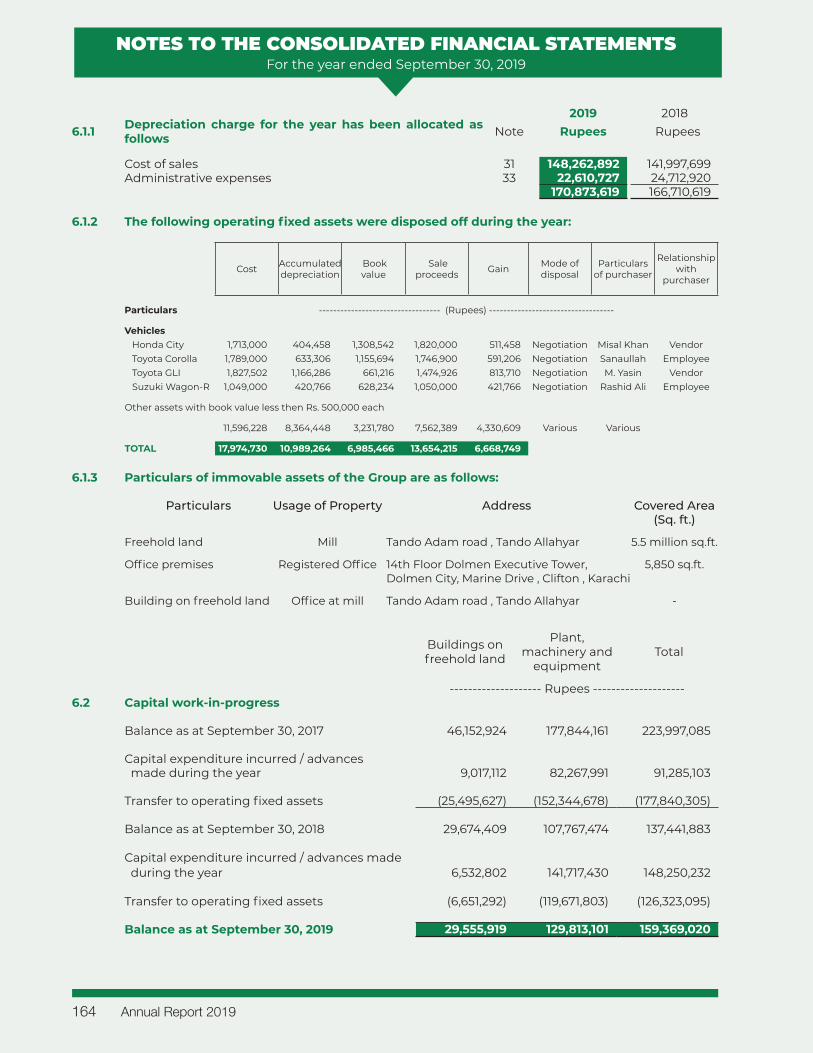
NOTES TO THE CONSOLIDATED FINANCIAL STATEMENTSFor the year ended September 30, 2019
2019 20186.1.1 Depreciation charge for the year has been allocated as
follows Note Rupees Rupees
Cost of sales 31 148,262,892 141,997,699 Administrative expenses 33 22,610,727 24,712,920
170,873,619 166,710,619
Buildings on freehold land
Plant, machinery and
equipmentTotal
-------------------- Rupees --------------------6.2 Capital work-in-progress
Balance as at September 30, 2017 46,152,924 177,844,161 223,997,085
Capital expenditure incurred / advances made during the year 9,017,112 82,267,991 91,285,103
Transfer to operating fixed assets (25,495,627) (152,344,678) (177,840,305)
Balance as at September 30, 2018 29,674,409 107,767,474 137,441,883
Capital expenditure incurred / advances made during the year 6,532,802 141,717,430 148,250,232
Transfer to operating fixed assets (6,651,292) (119,671,803) (126,323,095)
Balance as at September 30, 2019 29,555,919 129,813,101 159,369,020
6.1.2 The following operating fixed assets were disposed off during the year:
Cost Accumulated depreciation
Book value
Sale proceeds Gain Mode of
disposalParticulars
of purchaser
Relationship with
purchaser
Particulars ---------------------------------- (Rupees) -----------------------------------
Vehicles Honda City 1,713,000 404,458 1,308,542 1,820,000 511,458 Negotiation Misal Khan VendorToyota Corolla 1,789,000 633,306 1,155,694 1,746,900 591,206 Negotiation Sanaullah EmployeeToyota GLI 1,827,502 1,166,286 661,216 1,474,926 813,710 Negotiation M. Yasin VendorSuzuki Wagon-R 1,049,000 420,766 628,234 1,050,000 421,766 Negotiation Rashid Ali Employee
Other assets with book value less then Rs. 500,000 each
11,596,228 8,364,448 3,231,780 7,562,389 4,330,609 Various Various
TOTAL 17,974,730 10,989,264 6,985,466 13,654,215 6,668,749
6.1.3 Particulars of immovable assets of the Group are as follows:
Particulars Usage of Property Address Covered Area(Sq. ft.)
Freehold land Mill Tando Adam road , Tando Allahyar 5.5 million sq.ft.
Office premises Registered Office 14th Floor Dolmen Executive Tower, 5,850 sq.ft.Dolmen City, Marine Drive , Clifton , Karachi
Building on freehold land Office at mill Tando Adam road , Tando Allahyar -
Annual Report 2019164
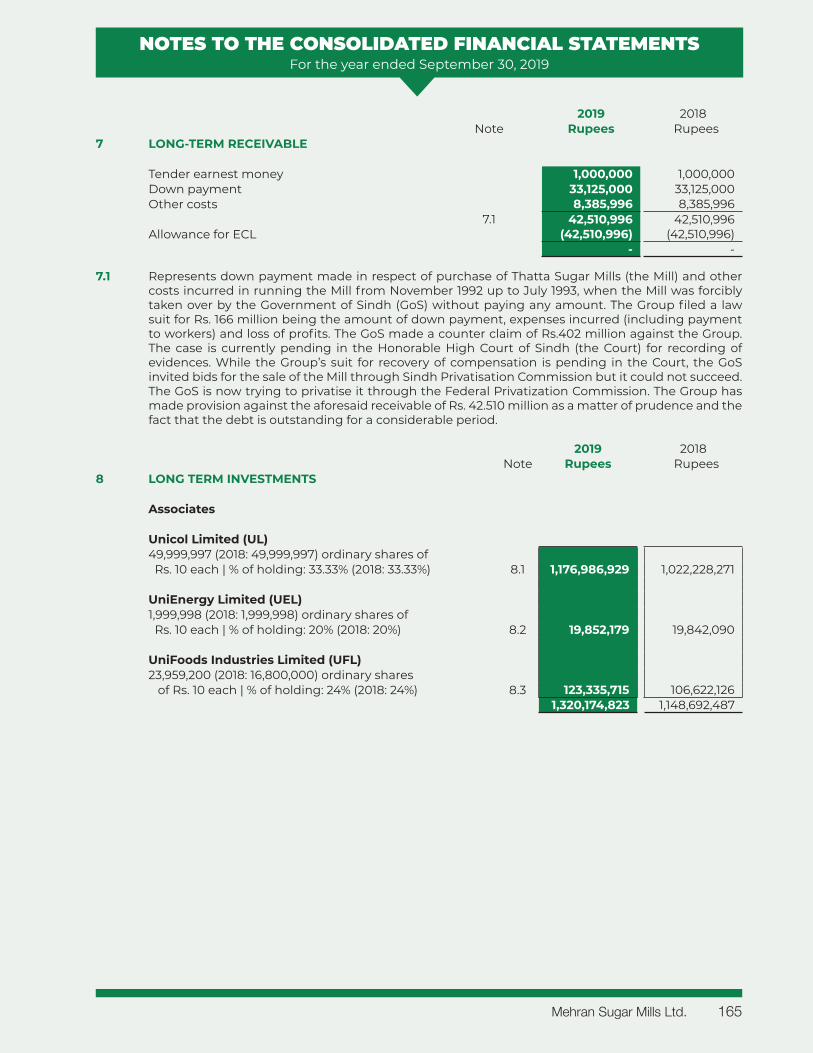
NOTES TO THE CONSOLIDATED FINANCIAL STATEMENTSFor the year ended September 30, 2019
2019 2018Note Rupees Rupees
7 LONG-TERM RECEIVABLE
Tender earnest money 1,000,000 1,000,000 Down payment 33,125,000 33,125,000 Other costs 8,385,996 8,385,996
7.1 42,510,996 42,510,996 Allowance for ECL (42,510,996) (42,510,996)
- -
7.1 Represents down payment made in respect of purchase of Thatta Sugar Mills (the Mill) and other costs incurred in running the Mill from November 1992 up to July 1993, when the Mill was forcibly taken over by the Government of Sindh (GoS) without paying any amount. The Group filed a law suit for Rs. 166 million being the amount of down payment, expenses incurred (including payment to workers) and loss of profits. The GoS made a counter claim of Rs.402 million against the Group. The case is currently pending in the Honorable High Court of Sindh (the Court) for recording of evidences. While the Group’s suit for recovery of compensation is pending in the Court, the GoS invited bids for the sale of the Mill through Sindh Privatisation Commission but it could not succeed. The GoS is now trying to privatise it through the Federal Privatization Commission. The Group has made provision against the aforesaid receivable of Rs. 42.510 million as a matter of prudence and the fact that the debt is outstanding for a considerable period.
2019 2018Note Rupees Rupees
8 LONG TERM INVESTMENTS
Associates
Unicol Limited (UL)49,999,997 (2018: 49,999,997) ordinary shares of Rs. 10 each | % of holding: 33.33% (2018: 33.33%) 8.1 1,176,986,929 1,022,228,271
UniEnergy Limited (UEL)1,999,998 (2018: 1,999,998) ordinary shares of Rs. 10 each | % of holding: 20% (2018: 20%) 8.2 19,852,179 19,842,090
UniFoods Industries Limited (UFL)23,959,200 (2018: 16,800,000) ordinary shares of Rs. 10 each | % of holding: 24% (2018: 24%) 8.3 123,335,715 106,622,126
1,320,174,823 1,148,692,487
Mehran Sugar Mills Ltd. 165
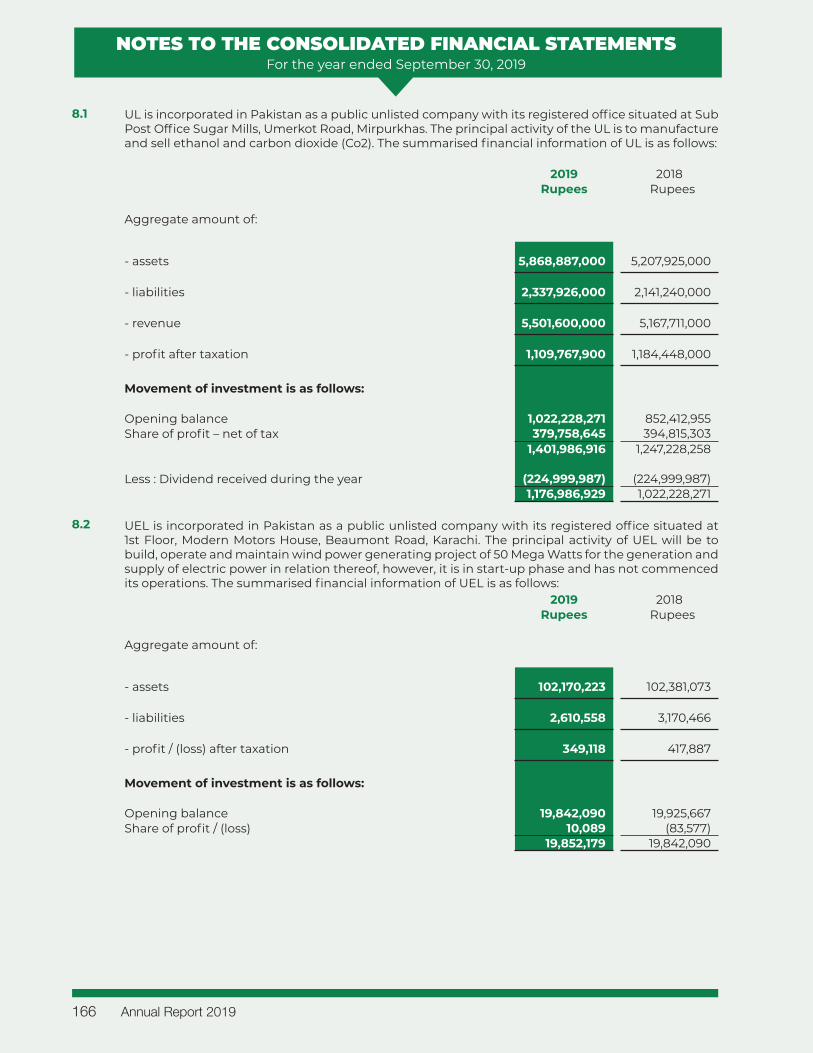
NOTES TO THE CONSOLIDATED FINANCIAL STATEMENTSFor the year ended September 30, 2019
8.1 UL is incorporated in Pakistan as a public unlisted company with its registered office situated at Sub Post Office Sugar Mills, Umerkot Road, Mirpurkhas. The principal activity of the UL is to manufacture and sell ethanol and carbon dioxide (Co2). The summarised financial information of UL is as follows:
2019 2018Rupees Rupees
Aggregate amount of:
- assets 5,868,887,000 5,207,925,000
- liabilities 2,337,926,000 2,141,240,000
- revenue 5,501,600,000 5,167,711,000
- profit after taxation 1,109,767,900 1,184,448,000
Movement of investment is as follows:
Opening balance 1,022,228,271 852,412,955 Share of profit – net of tax 379,758,645 394,815,303
1,401,986,916 1,247,228,258
Less : Dividend received during the year (224,999,987) (224,999,987) 1,176,986,929 1,022,228,271
8.2 UEL is incorporated in Pakistan as a public unlisted company with its registered office situated at 1st Floor, Modern Motors House, Beaumont Road, Karachi. The principal activity of UEL will be to build, operate and maintain wind power generating project of 50 Mega Watts for the generation and supply of electric power in relation thereof, however, it is in start-up phase and has not commenced its operations. The summarised financial information of UEL is as follows:
2019 2018Rupees Rupees
Aggregate amount of:
- assets 102,170,223 102,381,073
- liabilities 2,610,558 3,170,466
- profit / (loss) after taxation 349,118 417,887
Movement of investment is as follows:
Opening balance 19,842,090 19,925,667 Share of profit / (loss) 10,089 (83,577)
19,852,179 19,842,090
Annual Report 2019166
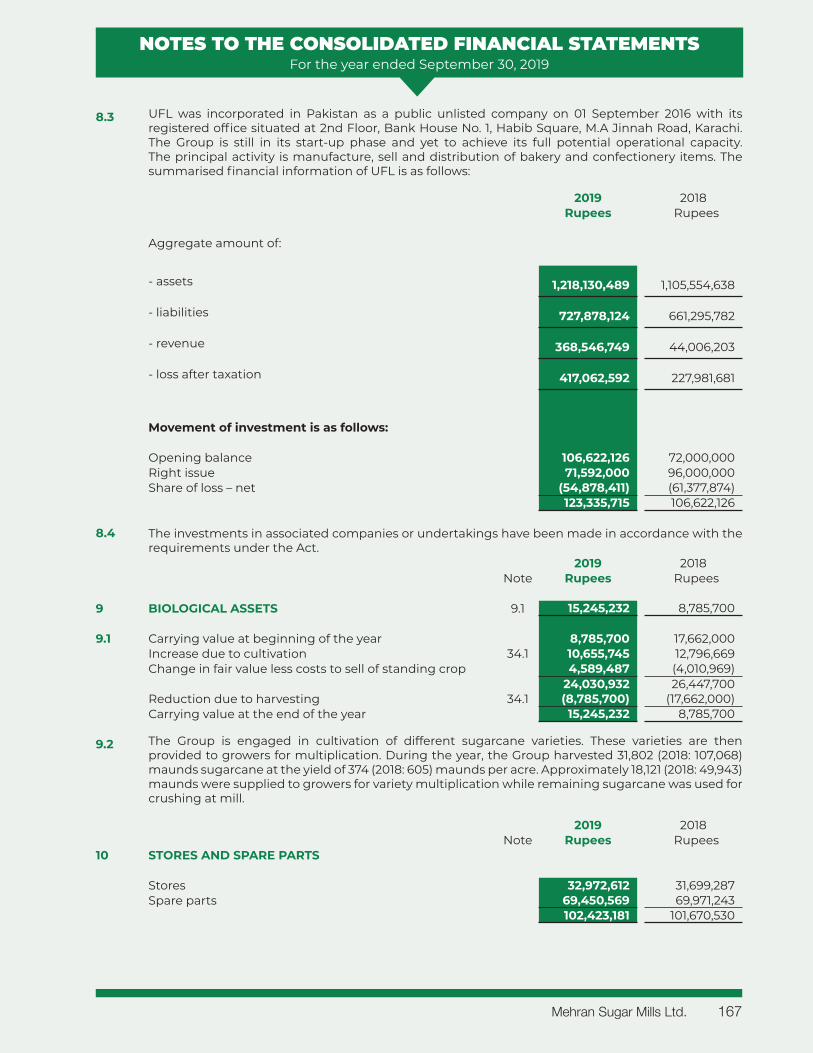
NOTES TO THE CONSOLIDATED FINANCIAL STATEMENTSFor the year ended September 30, 2019
8.3 UFL was incorporated in Pakistan as a public unlisted company on 01 September 2016 with its registered office situated at 2nd Floor, Bank House No. 1, Habib Square, M.A Jinnah Road, Karachi. The Group is still in its start-up phase and yet to achieve its full potential operational capacity. The principal activity is manufacture, sell and distribution of bakery and confectionery items. The summarised financial information of UFL is as follows:
2019 2018Rupees Rupees
Aggregate amount of:
- assets 1,218,130,489 1,105,554,638
- liabilities 727,878,124 661,295,782
- revenue 368,546,749 44,006,203
- loss after taxation 417,062,592 227,981,681
Movement of investment is as follows:
Opening balance 106,622,126 72,000,000 Right issue 71,592,000 96,000,000 Share of loss – net (54,878,411) (61,377,874)
123,335,715 106,622,126
8.4 The investments in associated companies or undertakings have been made in accordance with the requirements under the Act.
2019 2018Note Rupees Rupees
9 BIOLOGICAL ASSETS 9.1 15,245,232 8,785,700
9.1 Carrying value at beginning of the year 8,785,700 17,662,000 Increase due to cultivation 34.1 10,655,745 12,796,669 Change in fair value less costs to sell of standing crop 4,589,487 (4,010,969)
24,030,932 26,447,700 Reduction due to harvesting 34.1 (8,785,700) (17,662,000)Carrying value at the end of the year 15,245,232 8,785,700
9.2 The Group is engaged in cultivation of different sugarcane varieties. These varieties are then provided to growers for multiplication. During the year, the Group harvested 31,802 (2018: 107,068) maunds sugarcane at the yield of 374 (2018: 605) maunds per acre. Approximately 18,121 (2018: 49,943) maunds were supplied to growers for variety multiplication while remaining sugarcane was used for crushing at mill.
2019 2018Note Rupees Rupees
10 STORES AND SPARE PARTS
Stores 32,972,612 31,699,287 Spare parts 69,450,569 69,971,243
102,423,181 101,670,530
Mehran Sugar Mills Ltd. 167
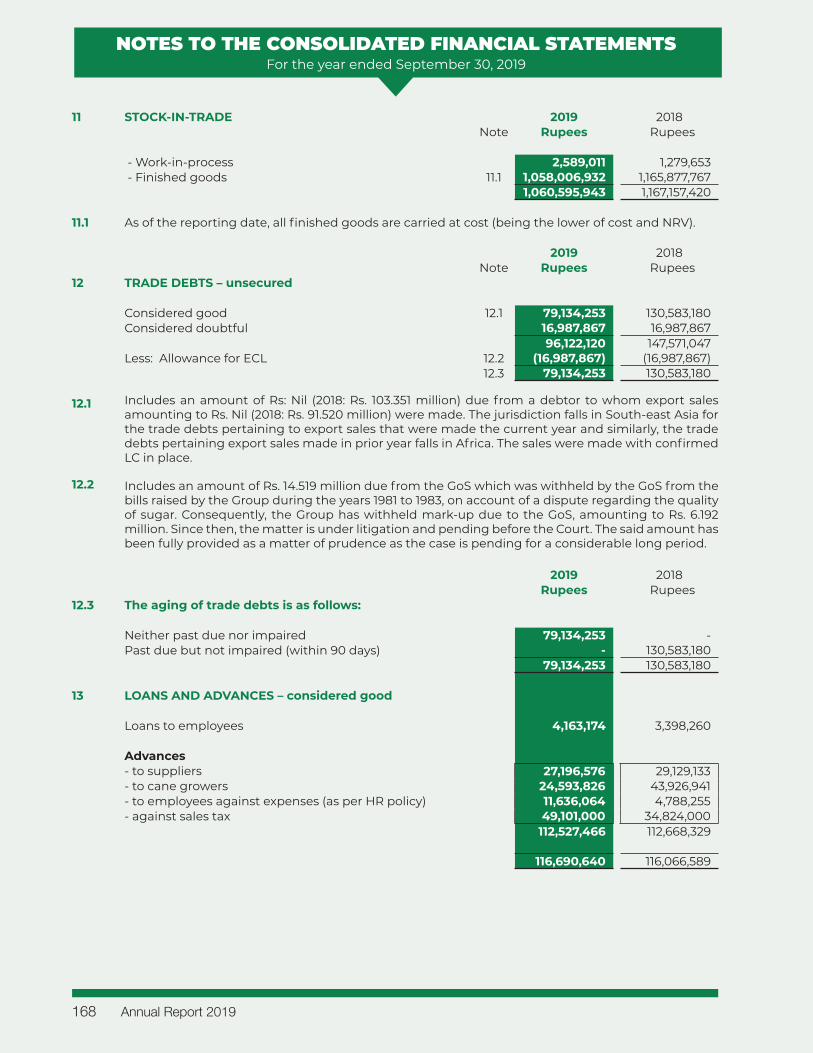
NOTES TO THE CONSOLIDATED FINANCIAL STATEMENTSFor the year ended September 30, 2019
11 STOCK-IN-TRADE 2019 2018Note Rupees Rupees
- Work-in-process 2,589,011 1,279,653 - Finished goods 11.1 1,058,006,932 1,165,877,767
1,060,595,943 1,167,157,420
11.1 As of the reporting date, all finished goods are carried at cost (being the lower of cost and NRV).
2019 2018Note Rupees Rupees
12 TRADE DEBTS – unsecured
Considered good 12.1 79,134,253 130,583,180 Considered doubtful 16,987,867 16,987,867
96,122,120 147,571,047 Less: Allowance for ECL 12.2 (16,987,867) (16,987,867)
12.3 79,134,253 130,583,180
12.1 Includes an amount of Rs: Nil (2018: Rs. 103.351 million) due from a debtor to whom export sales amounting to Rs. Nil (2018: Rs. 91.520 million) were made. The jurisdiction falls in South-east Asia for the trade debts pertaining to export sales that were made the current year and similarly, the trade debts pertaining export sales made in prior year falls in Africa. The sales were made with confirmed LC in place.
12.2 Includes an amount of Rs. 14.519 million due from the GoS which was withheld by the GoS from the bills raised by the Group during the years 1981 to 1983, on account of a dispute regarding the quality of sugar. Consequently, the Group has withheld mark-up due to the GoS, amounting to Rs. 6.192 million. Since then, the matter is under litigation and pending before the Court. The said amount has been fully provided as a matter of prudence as the case is pending for a considerable long period.
2019 2018Rupees Rupees
12.3 The aging of trade debts is as follows:
Neither past due nor impaired 79,134,253 - Past due but not impaired (within 90 days) - 130,583,180
79,134,253 130,583,180
13 LOANS AND ADVANCES – considered good
Loans to employees 4,163,174 3,398,260
Advances - to suppliers 27,196,576 29,129,133 - to cane growers 24,593,826 43,926,941 - to employees against expenses (as per HR policy) 11,636,064 4,788,255 - against sales tax 49,101,000 34,824,000
112,527,466 112,668,329
116,690,640 116,066,589
Annual Report 2019168
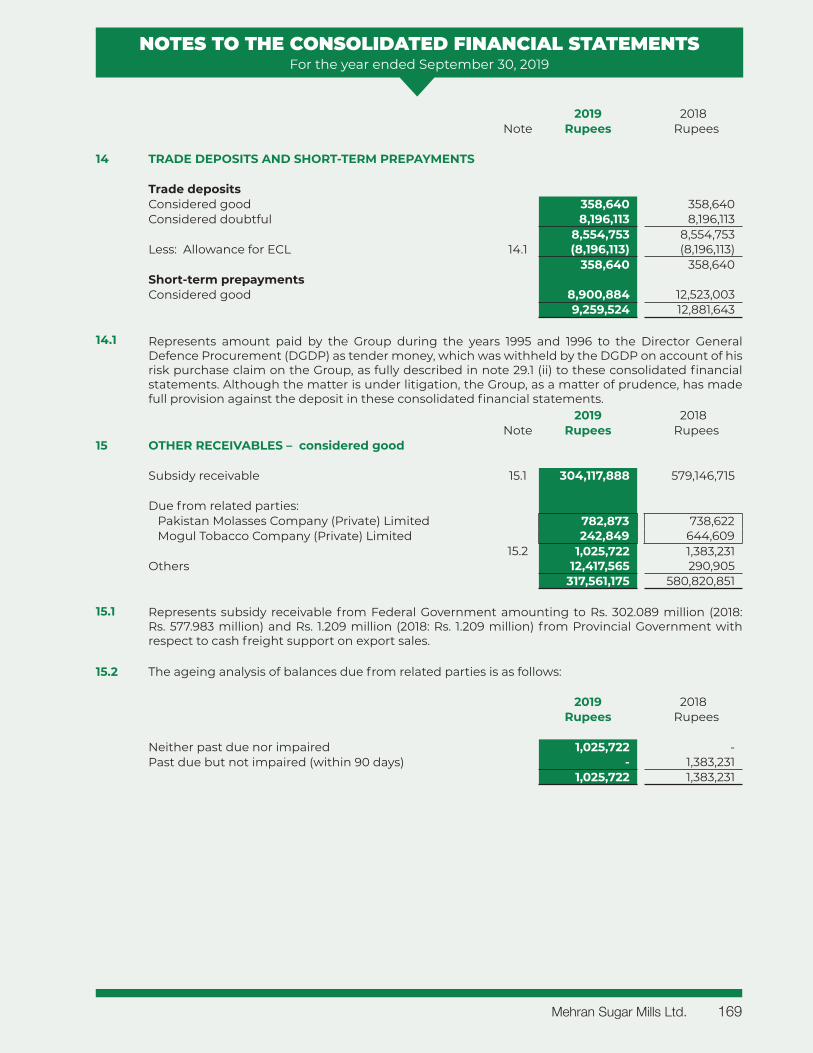
NOTES TO THE CONSOLIDATED FINANCIAL STATEMENTSFor the year ended September 30, 2019
2019 2018Note Rupees Rupees
14 TRADE DEPOSITS AND SHORT-TERM PREPAYMENTS
Trade depositsConsidered good 358,640 358,640 Considered doubtful 8,196,113 8,196,113
8,554,753 8,554,753 Less: Allowance for ECL 14.1 (8,196,113) (8,196,113)
358,640 358,640 Short-term prepaymentsConsidered good 8,900,884 12,523,003
9,259,524 12,881,643
14.1 Represents amount paid by the Group during the years 1995 and 1996 to the Director General Defence Procurement (DGDP) as tender money, which was withheld by the DGDP on account of his risk purchase claim on the Group, as fully described in note 29.1 (ii) to these consolidated financial statements. Although the matter is under litigation, the Group, as a matter of prudence, has made full provision against the deposit in these consolidated financial statements.
2019 2018Note Rupees Rupees
15 OTHER RECEIVABLES – considered good
Subsidy receivable 15.1 304,117,888 579,146,715
Due from related parties: Pakistan Molasses Company (Private) Limited 782,873 738,622 Mogul Tobacco Company (Private) Limited 242,849 644,609 15.2 1,025,722 1,383,231 Others 12,417,565 290,905
317,561,175 580,820,851
15.1 Represents subsidy receivable from Federal Government amounting to Rs. 302.089 million (2018: Rs. 577.983 million) and Rs. 1.209 million (2018: Rs. 1.209 million) from Provincial Government with respect to cash freight support on export sales.
15.2 The ageing analysis of balances due from related parties is as follows:
2019 2018Rupees Rupees
Neither past due nor impaired 1,025,722 - Past due but not impaired (within 90 days) - 1,383,231
1,025,722 1,383,231
Mehran Sugar Mills Ltd. 169
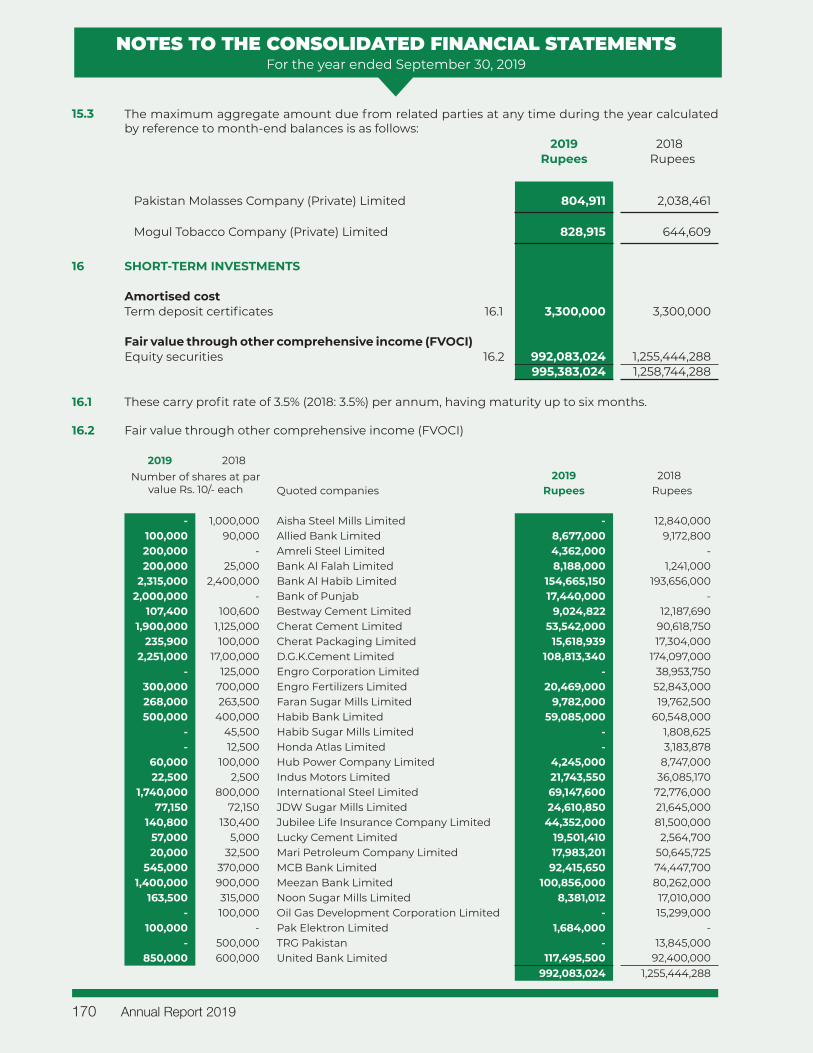
NOTES TO THE CONSOLIDATED FINANCIAL STATEMENTSFor the year ended September 30, 2019
15.3 The maximum aggregate amount due from related parties at any time during the year calculated by reference to month-end balances is as follows:
2019 2018Rupees Rupees
Pakistan Molasses Company (Private) Limited 804,911 2,038,461
Mogul Tobacco Company (Private) Limited 828,915 644,609
16 SHORT-TERM INVESTMENTS
Amortised costTerm deposit certificates 16.1 3,300,000 3,300,000
Fair value through other comprehensive income (FVOCI)Equity securities 16.2 992,083,024 1,255,444,288
995,383,024 1,258,744,288
16.1 These carry profit rate of 3.5% (2018: 3.5%) per annum, having maturity up to six months.
16.2 Fair value through other comprehensive income (FVOCI)
2019 2018Number of shares at par
value Rs. 10/- each2019 2018
Quoted companies Rupees Rupees
- 1,000,000 Aisha Steel Mills Limited - 12,840,000 100,000 90,000 Allied Bank Limited 8,677,000 9,172,800 200,000 - Amreli Steel Limited 4,362,000 - 200,000 25,000 Bank Al Falah Limited 8,188,000 1,241,000
2,315,000 2,400,000 Bank Al Habib Limited 154,665,150 193,656,000 2,000,000 - Bank of Punjab 17,440,000 -
107,400 100,600 Bestway Cement Limited 9,024,822 12,187,690 1,900,000 1,125,000 Cherat Cement Limited 53,542,000 90,618,750
235,900 100,000 Cherat Packaging Limited 15,618,939 17,304,000 2,251,000 17,00,000 D.G.K.Cement Limited 108,813,340 174,097,000
- 125,000 Engro Corporation Limited - 38,953,750 300,000 700,000 Engro Fertilizers Limited 20,469,000 52,843,000 268,000 263,500 Faran Sugar Mills Limited 9,782,000 19,762,500 500,000 400,000 Habib Bank Limited 59,085,000 60,548,000
- 45,500 Habib Sugar Mills Limited - 1,808,625 - 12,500 Honda Atlas Limited - 3,183,878
60,000 100,000 Hub Power Company Limited 4,245,000 8,747,000 22,500 2,500 Indus Motors Limited 21,743,550 36,085,170
1,740,000 800,000 International Steel Limited 69,147,600 72,776,000 77,150 72,150 JDW Sugar Mills Limited 24,610,850 21,645,000
140,800 130,400 Jubilee Life Insurance Company Limited 44,352,000 81,500,000 57,000 5,000 Lucky Cement Limited 19,501,410 2,564,700 20,000 32,500 Mari Petroleum Company Limited 17,983,201 50,645,725
545,000 370,000 MCB Bank Limited 92,415,650 74,447,700 1,400,000 900,000 Meezan Bank Limited 100,856,000 80,262,000
163,500 315,000 Noon Sugar Mills Limited 8,381,012 17,010,000 - 100,000 Oil Gas Development Corporation Limited - 15,299,000
100,000 - Pak Elektron Limited 1,684,000 - - 500,000 TRG Pakistan - 13,845,000
850,000 600,000 United Bank Limited 117,495,500 92,400,000 992,083,024 1,255,444,288
Annual Report 2019170
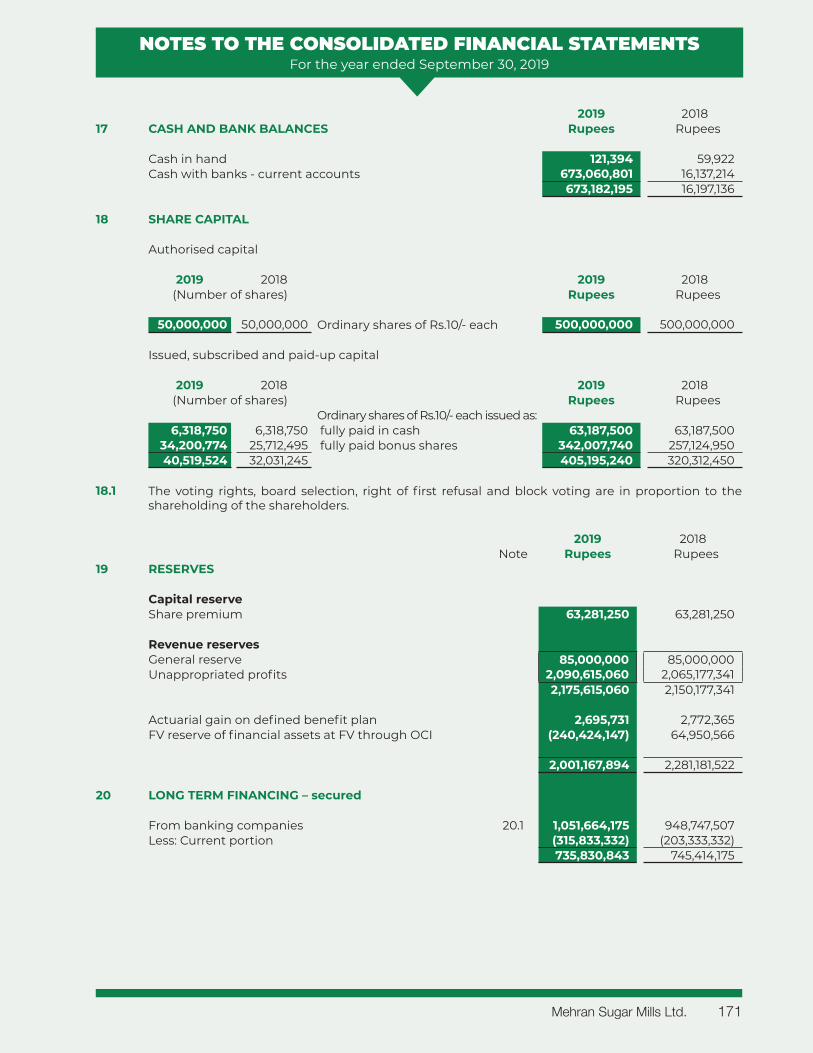
NOTES TO THE CONSOLIDATED FINANCIAL STATEMENTSFor the year ended September 30, 2019
2019 201817 CASH AND BANK BALANCES Rupees Rupees
Cash in hand 121,394 59,922 Cash with banks - current accounts 673,060,801 16,137,214
673,182,195 16,197,136
18 SHARE CAPITAL
Authorised capital
2019 2018 2019 2018(Number of shares) Rupees Rupees
50,000,000 50,000,000 Ordinary shares of Rs.10/- each 500,000,000 500,000,000
Issued, subscribed and paid-up capital
2019 2018 2019 2018(Number of shares) Rupees Rupees
Ordinary shares of Rs.10/- each issued as: 6,318,750 6,318,750 fully paid in cash 63,187,500 63,187,500
34,200,774 25,712,495 fully paid bonus shares 342,007,740 257,124,950 40,519,524 32,031,245 405,195,240 320,312,450
18.1 The voting rights, board selection, right of first refusal and block voting are in proportion to the shareholding of the shareholders.
2019 2018Note Rupees Rupees
19 RESERVES
Capital reserveShare premium 63,281,250 63,281,250
Revenue reservesGeneral reserve 85,000,000 85,000,000 Unappropriated profits 2,090,615,060 2,065,177,341
2,175,615,060 2,150,177,341
Actuarial gain on defined benefit plan 2,695,731 2,772,365 FV reserve of financial assets at FV through OCI (240,424,147) 64,950,566
2,001,167,894 2,281,181,522
20 LONG TERM FINANCING – secured
From banking companies 20.1 1,051,664,175 948,747,507 Less: Current portion (315,833,332) (203,333,332)
735,830,843 745,414,175
Mehran Sugar Mills Ltd. 171
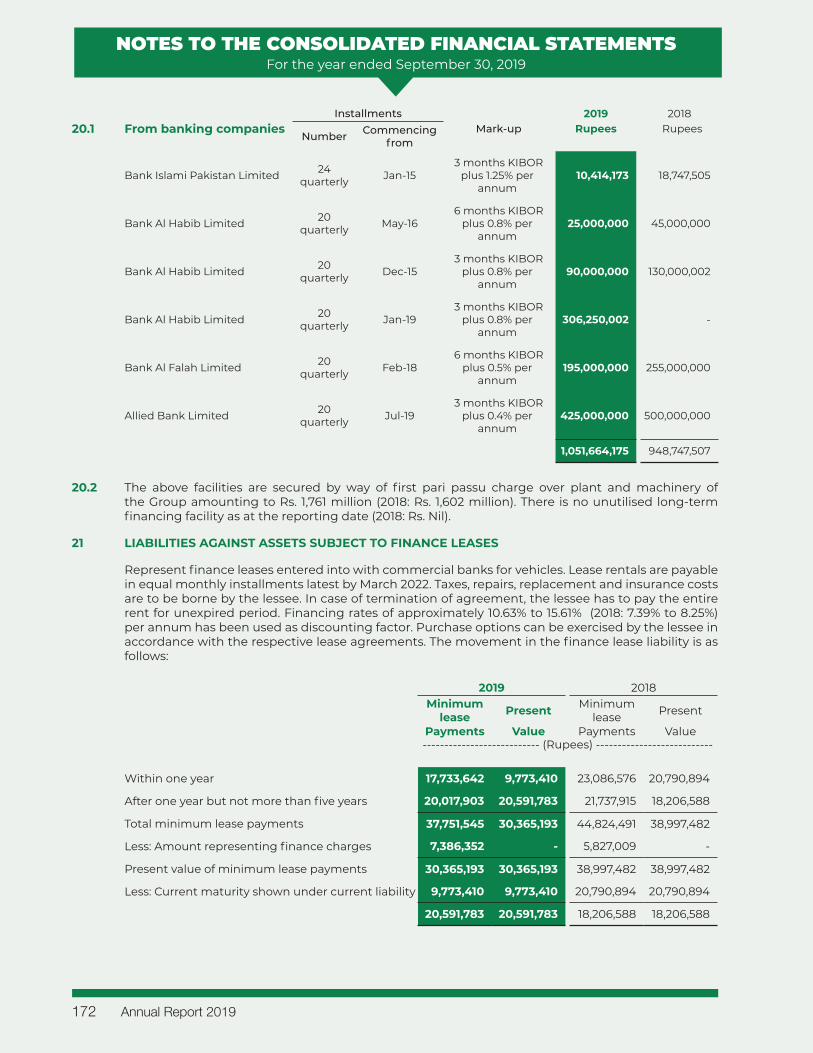
NOTES TO THE CONSOLIDATED FINANCIAL STATEMENTSFor the year ended September 30, 2019
2019 2018Minimum
lease Present Minimum lease Present
Payments Value Payments Value--------------------------- (Rupees) ---------------------------
Within one year 17,733,642 9,773,410 23,086,576 20,790,894
After one year but not more than five years 20,017,903 20,591,783 21,737,915 18,206,588
Total minimum lease payments 37,751,545 30,365,193 44,824,491 38,997,482
Less: Amount representing finance charges 7,386,352 - 5,827,009 -
Present value of minimum lease payments 30,365,193 30,365,193 38,997,482 38,997,482
Less: Current maturity shown under current liability 9,773,410 9,773,410 20,790,894 20,790,894
20,591,783 20,591,783 18,206,588 18,206,588
20.2 The above facilities are secured by way of first pari passu charge over plant and machinery of the Group amounting to Rs. 1,761 million (2018: Rs. 1,602 million). There is no unutilised long-term financing facility as at the reporting date (2018: Rs. Nil).
21 LIABILITIES AGAINST ASSETS SUBJECT TO FINANCE LEASES
Represent finance leases entered into with commercial banks for vehicles. Lease rentals are payable in equal monthly installments latest by March 2022. Taxes, repairs, replacement and insurance costs are to be borne by the lessee. In case of termination of agreement, the lessee has to pay the entire rent for unexpired period. Financing rates of approximately 10.63% to 15.61% (2018: 7.39% to 8.25%) per annum has been used as discounting factor. Purchase options can be exercised by the lessee in accordance with the respective lease agreements. The movement in the finance lease liability is as follows:
Installments Mark-up
2019 201820.1 From banking companies
Number Commencing from
Rupees Rupees
Bank Islami Pakistan Limited 24 quarterly Jan-15
3 months KIBOR plus 1.25% per
annum 10,414,173 18,747,505
Bank Al Habib Limited 20 quarterly May-16
6 months KIBOR plus 0.8% per
annum 25,000,000 45,000,000
Bank Al Habib Limited 20 quarterly Dec-15
3 months KIBOR plus 0.8% per
annum 90,000,000 130,000,002
Bank Al Habib Limited 20 quarterly Jan-19
3 months KIBOR plus 0.8% per
annum 306,250,002 -
Bank Al Falah Limited 20 quarterly Feb-18
6 months KIBOR plus 0.5% per
annum 195,000,000 255,000,000
Allied Bank Limited 20 quarterly Jul-19
3 months KIBOR plus 0.4% per
annum 425,000,000 500,000,000
1,051,664,175 948,747,507
Annual Report 2019172
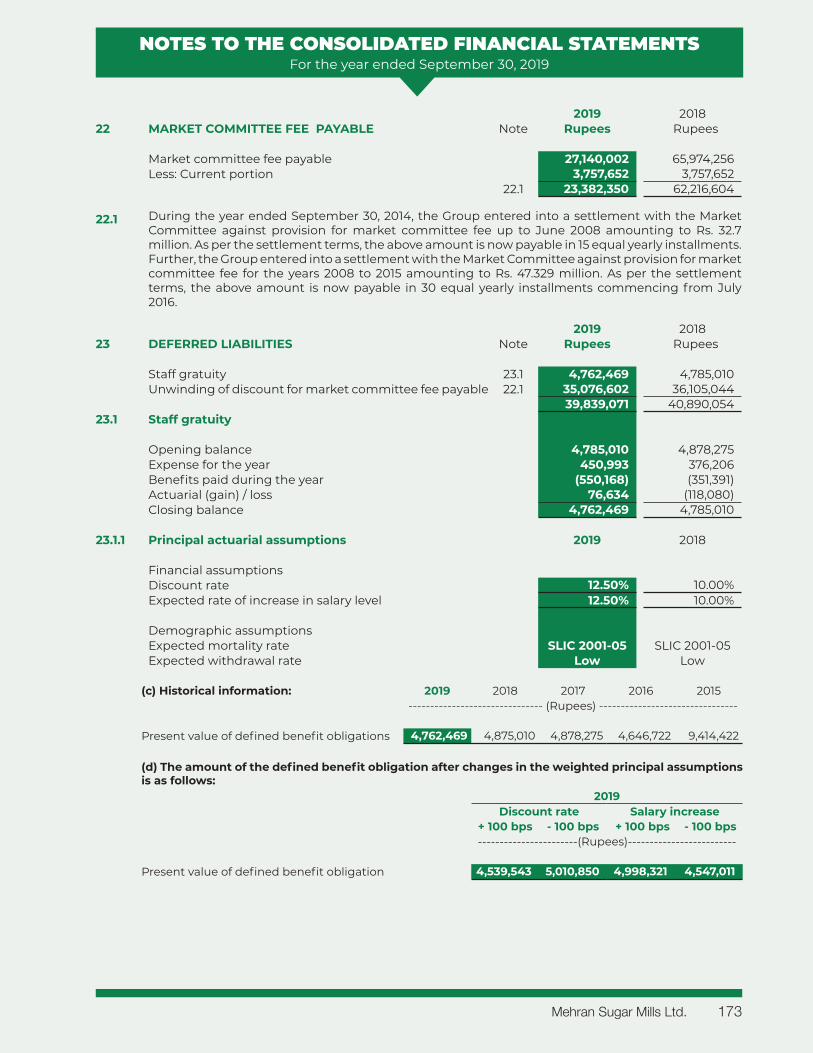
NOTES TO THE CONSOLIDATED FINANCIAL STATEMENTSFor the year ended September 30, 2019
2019 201822 MARKET COMMITTEE FEE PAYABLE Note Rupees Rupees
Market committee fee payable 27,140,002 65,974,256 Less: Current portion 3,757,652 3,757,652
22.1 23,382,350 62,216,604
22.1 During the year ended September 30, 2014, the Group entered into a settlement with the Market Committee against provision for market committee fee up to June 2008 amounting to Rs. 32.7 million. As per the settlement terms, the above amount is now payable in 15 equal yearly installments. Further, the Group entered into a settlement with the Market Committee against provision for market committee fee for the years 2008 to 2015 amounting to Rs. 47.329 million. As per the settlement terms, the above amount is now payable in 30 equal yearly installments commencing from July 2016.
2019 201823 DEFERRED LIABILITIES Note Rupees Rupees
Staff gratuity 23.1 4,762,469 4,785,010 Unwinding of discount for market committee fee payable 22.1 35,076,602 36,105,044
39,839,071 40,890,054 23.1 Staff gratuity
Opening balance 4,785,010 4,878,275 Expense for the year 450,993 376,206 Benefits paid during the year (550,168) (351,391)Actuarial (gain) / loss 76,634 (118,080)Closing balance 4,762,469 4,785,010
23.1.1 Principal actuarial assumptions 2019 2018
Financial assumptionsDiscount rate 12.50% 10.00%Expected rate of increase in salary level 12.50% 10.00%
Demographic assumptionsExpected mortality rate SLIC 2001-05 SLIC 2001-05Expected withdrawal rate Low Low
(c) Historical information: 2019 2018 2017 2016 2015------------------------------- (Rupees) --------------------------------
Present value of defined benefit obligations 4,762,469 4,875,010 4,878,275 4,646,722 9,414,422
(d) The amount of the defined benefit obligation after changes in the weighted principal assumptions is as follows:
2019Discount rate Salary increase
+ 100 bps - 100 bps + 100 bps - 100 bps -----------------------(Rupees)-------------------------
Present value of defined benefit obligation 4,539,543 5,010,850 4,998,321 4,547,011
Mehran Sugar Mills Ltd. 173
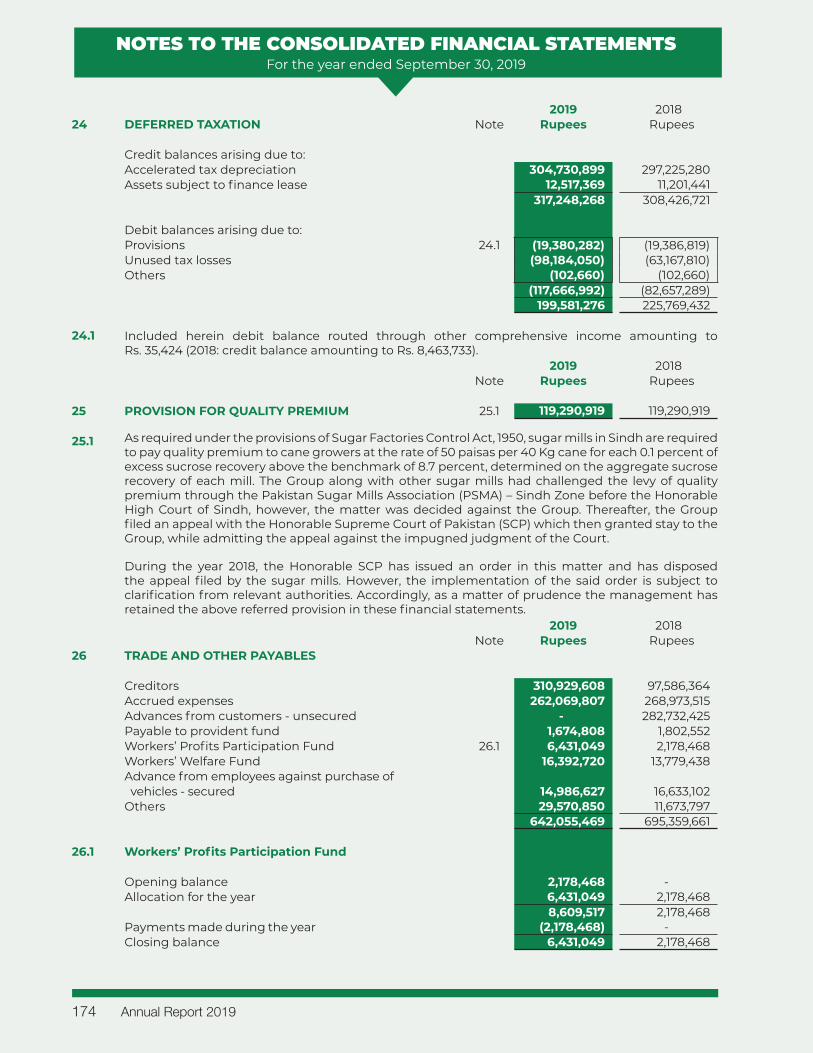
NOTES TO THE CONSOLIDATED FINANCIAL STATEMENTSFor the year ended September 30, 2019
2019 201824 DEFERRED TAXATION Note Rupees Rupees
Credit balances arising due to:Accelerated tax depreciation 304,730,899 297,225,280 Assets subject to finance lease 12,517,369 11,201,441
317,248,268 308,426,721
Debit balances arising due to:Provisions 24.1 (19,380,282) (19,386,819)Unused tax losses (98,184,050) (63,167,810)Others (102,660) (102,660)
(117,666,992) (82,657,289) 199,581,276 225,769,432
24.1 Included herein debit balance routed through other comprehensive income amounting to Rs. 35,424 (2018: credit balance amounting to Rs. 8,463,733).
2019 2018Note Rupees Rupees
25 PROVISION FOR QUALITY PREMIUM 25.1 119,290,919 119,290,919
25.1 As required under the provisions of Sugar Factories Control Act, 1950, sugar mills in Sindh are required to pay quality premium to cane growers at the rate of 50 paisas per 40 Kg cane for each 0.1 percent of excess sucrose recovery above the benchmark of 8.7 percent, determined on the aggregate sucrose recovery of each mill. The Group along with other sugar mills had challenged the levy of quality premium through the Pakistan Sugar Mills Association (PSMA) – Sindh Zone before the Honorable High Court of Sindh, however, the matter was decided against the Group. Thereafter, the Group filed an appeal with the Honorable Supreme Court of Pakistan (SCP) which then granted stay to the Group, while admitting the appeal against the impugned judgment of the Court.
During the year 2018, the Honorable SCP has issued an order in this matter and has disposed the appeal filed by the sugar mills. However, the implementation of the said order is subject to clarification from relevant authorities. Accordingly, as a matter of prudence the management has retained the above referred provision in these financial statements.
2019 2018Note Rupees Rupees
26 TRADE AND OTHER PAYABLES
Creditors 310,929,608 97,586,364 Accrued expenses 262,069,807 268,973,515 Advances from customers - unsecured - 282,732,425 Payable to provident fund 1,674,808 1,802,552 Workers’ Profits Participation Fund 26.1 6,431,049 2,178,468 Workers’ Welfare Fund 16,392,720 13,779,438 Advance from employees against purchase of vehicles - secured 14,986,627 16,633,102 Others 29,570,850 11,673,797
642,055,469 695,359,661
26.1 Workers’ Profits Participation Fund Opening balance 2,178,468 - Allocation for the year 6,431,049 2,178,468
8,609,517 2,178,468 Payments made during the year (2,178,468) - Closing balance 6,431,049 2,178,468
Annual Report 2019174
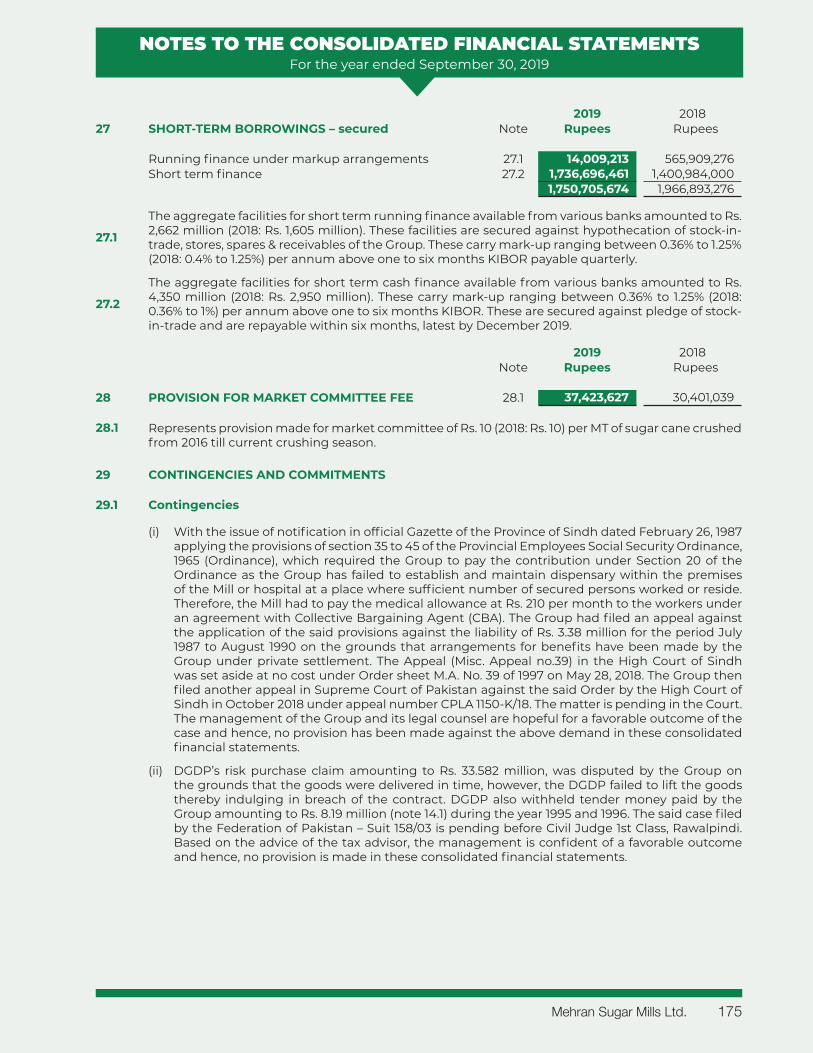
NOTES TO THE CONSOLIDATED FINANCIAL STATEMENTSFor the year ended September 30, 2019
2019 201827 SHORT-TERM BORROWINGS – secured Note Rupees Rupees
Running finance under markup arrangements 27.1 14,009,213 565,909,276 Short term finance 27.2 1,736,696,461 1,400,984,000
1,750,705,674 1,966,893,276
27.1
The aggregate facilities for short term running finance available from various banks amounted to Rs. 2,662 million (2018: Rs. 1,605 million). These facilities are secured against hypothecation of stock-in-trade, stores, spares & receivables of the Group. These carry mark-up ranging between 0.36% to 1.25% (2018: 0.4% to 1.25%) per annum above one to six months KIBOR payable quarterly.
27.2
The aggregate facilities for short term cash finance available from various banks amounted to Rs. 4,350 million (2018: Rs. 2,950 million). These carry mark-up ranging between 0.36% to 1.25% (2018: 0.36% to 1%) per annum above one to six months KIBOR. These are secured against pledge of stock-in-trade and are repayable within six months, latest by December 2019.
2019 2018Note Rupees Rupees
28 PROVISION FOR MARKET COMMITTEE FEE 28.1 37,423,627 30,401,039
28.1 Represents provision made for market committee of Rs. 10 (2018: Rs. 10) per MT of sugar cane crushed from 2016 till current crushing season.
29 CONTINGENCIES AND COMMITMENTS
29.1 Contingencies
(i) With the issue of notification in official Gazette of the Province of Sindh dated February 26, 1987 applying the provisions of section 35 to 45 of the Provincial Employees Social Security Ordinance, 1965 (Ordinance), which required the Group to pay the contribution under Section 20 of the Ordinance as the Group has failed to establish and maintain dispensary within the premises of the Mill or hospital at a place where sufficient number of secured persons worked or reside. Therefore, the Mill had to pay the medical allowance at Rs. 210 per month to the workers under an agreement with Collective Bargaining Agent (CBA). The Group had filed an appeal against the application of the said provisions against the liability of Rs. 3.38 million for the period July 1987 to August 1990 on the grounds that arrangements for benefits have been made by the Group under private settlement. The Appeal (Misc. Appeal no.39) in the High Court of Sindh was set aside at no cost under Order sheet M.A. No. 39 of 1997 on May 28, 2018. The Group then filed another appeal in Supreme Court of Pakistan against the said Order by the High Court of Sindh in October 2018 under appeal number CPLA 1150-K/18. The matter is pending in the Court. The management of the Group and its legal counsel are hopeful for a favorable outcome of the case and hence, no provision has been made against the above demand in these consolidated financial statements.
(ii) DGDP’s risk purchase claim amounting to Rs. 33.582 million, was disputed by the Group on the grounds that the goods were delivered in time, however, the DGDP failed to lift the goods thereby indulging in breach of the contract. DGDP also withheld tender money paid by the Group amounting to Rs. 8.19 million (note 14.1) during the year 1995 and 1996. The said case filed by the Federation of Pakistan – Suit 158/03 is pending before Civil Judge 1st Class, Rawalpindi. Based on the advice of the tax advisor, the management is confident of a favorable outcome and hence, no provision is made in these consolidated financial statements.
Mehran Sugar Mills Ltd. 175
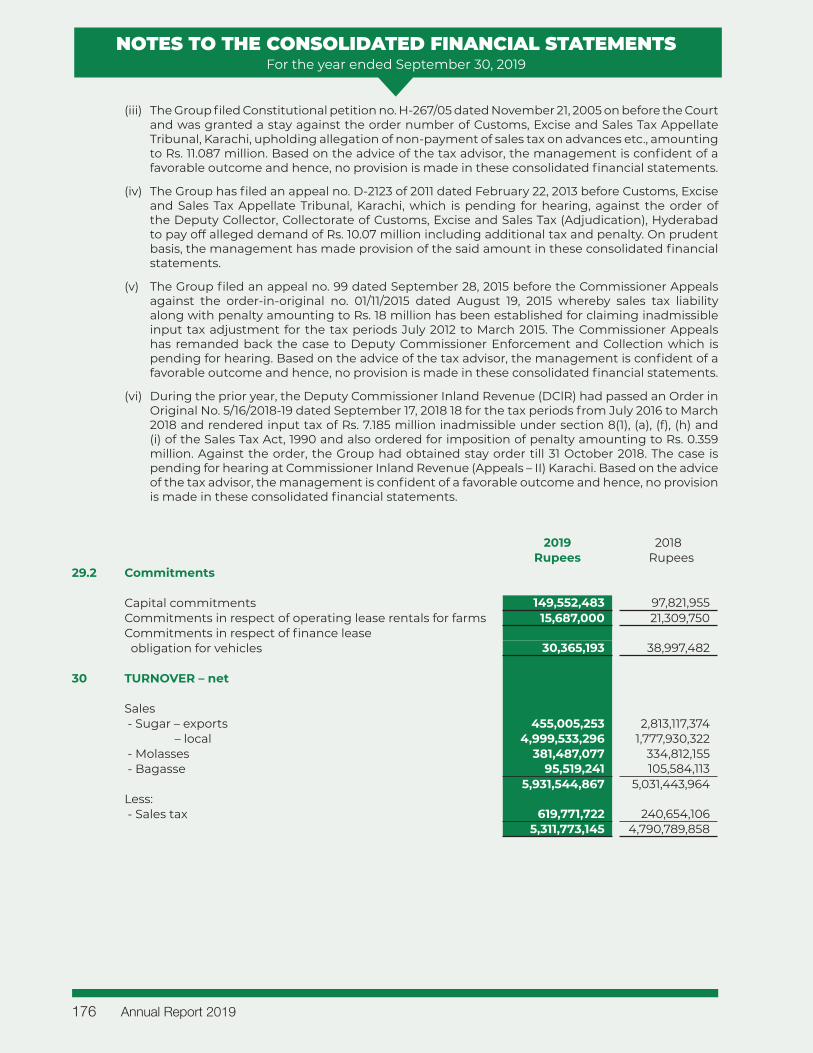
NOTES TO THE CONSOLIDATED FINANCIAL STATEMENTSFor the year ended September 30, 2019
(iii) The Group filed Constitutional petition no. H-267/05 dated November 21, 2005 on before the Court and was granted a stay against the order number of Customs, Excise and Sales Tax Appellate Tribunal, Karachi, upholding allegation of non-payment of sales tax on advances etc., amounting to Rs. 11.087 million. Based on the advice of the tax advisor, the management is confident of a favorable outcome and hence, no provision is made in these consolidated financial statements.
(iv) The Group has filed an appeal no. D-2123 of 2011 dated February 22, 2013 before Customs, Excise and Sales Tax Appellate Tribunal, Karachi, which is pending for hearing, against the order of the Deputy Collector, Collectorate of Customs, Excise and Sales Tax (Adjudication), Hyderabad to pay off alleged demand of Rs. 10.07 million including additional tax and penalty. On prudent basis, the management has made provision of the said amount in these consolidated financial statements.
(v) The Group filed an appeal no. 99 dated September 28, 2015 before the Commissioner Appeals against the order-in-original no. 01/11/2015 dated August 19, 2015 whereby sales tax liability along with penalty amounting to Rs. 18 million has been established for claiming inadmissible input tax adjustment for the tax periods July 2012 to March 2015. The Commissioner Appeals has remanded back the case to Deputy Commissioner Enforcement and Collection which is pending for hearing. Based on the advice of the tax advisor, the management is confident of a favorable outcome and hence, no provision is made in these consolidated financial statements.
(vi) During the prior year, the Deputy Commissioner Inland Revenue (DClR) had passed an Order in Original No. 5/16/2018-19 dated September 17, 2018 18 for the tax periods from July 2016 to March 2018 and rendered input tax of Rs. 7.185 million inadmissible under section 8(1), (a), (f), (h) and (i) of the Sales Tax Act, 1990 and also ordered for imposition of penalty amounting to Rs. 0.359 million. Against the order, the Group had obtained stay order till 31 October 2018. The case is pending for hearing at Commissioner Inland Revenue (Appeals – II) Karachi. Based on the advice of the tax advisor, the management is confident of a favorable outcome and hence, no provision is made in these consolidated financial statements.
2019 2018Rupees Rupees
29.2 Commitments
Capital commitments 149,552,483 97,821,955 Commitments in respect of operating lease rentals for farms 15,687,000 21,309,750 Commitments in respect of finance lease obligation for vehicles 30,365,193 38,997,482
30 TURNOVER – net
Sales - Sugar – exports 455,005,253 2,813,117,374 – local 4,999,533,296 1,777,930,322 - Molasses 381,487,077 334,812,155 - Bagasse 95,519,241 105,584,113
5,931,544,867 5,031,443,964 Less: - Sales tax 619,771,722 240,654,106
5,311,773,145 4,790,789,858
Annual Report 2019176
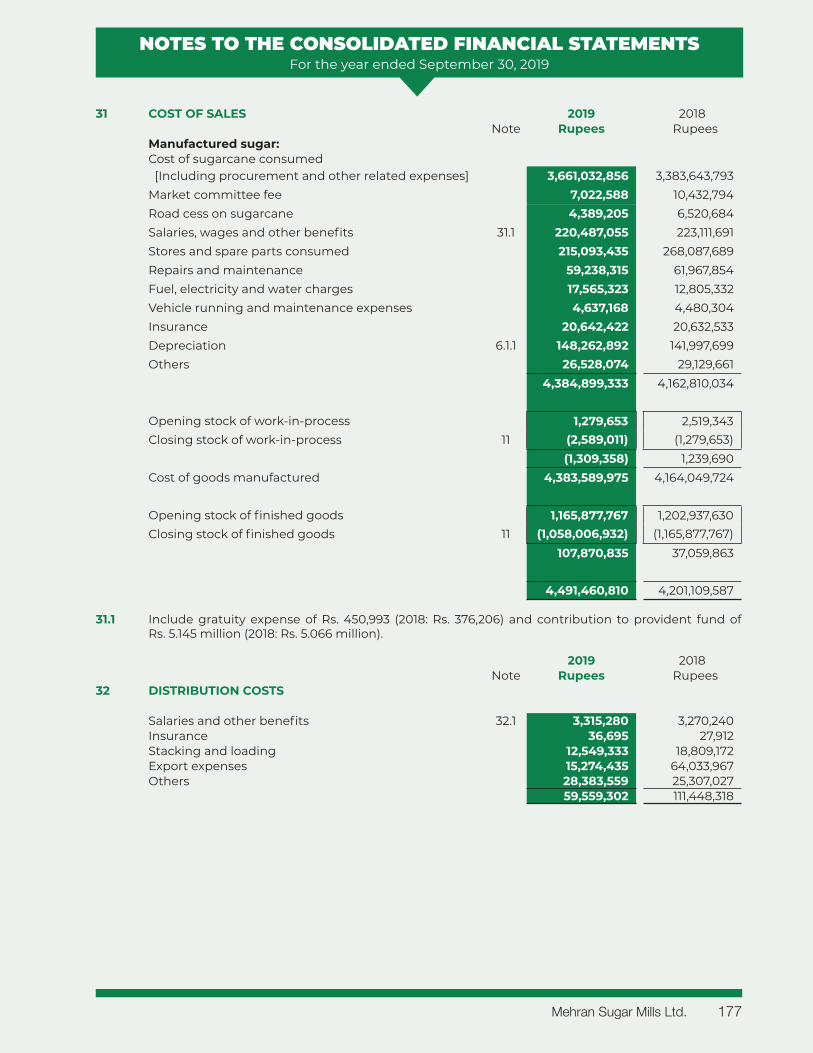
NOTES TO THE CONSOLIDATED FINANCIAL STATEMENTSFor the year ended September 30, 2019
31 COST OF SALES 2019 2018Note Rupees Rupees
Manufactured sugar:Cost of sugarcane consumed [Including procurement and other related expenses] 3,661,032,856 3,383,643,793 Market committee fee 7,022,588 10,432,794 Road cess on sugarcane 4,389,205 6,520,684 Salaries, wages and other benefits 31.1 220,487,055 223,111,691 Stores and spare parts consumed 215,093,435 268,087,689 Repairs and maintenance 59,238,315 61,967,854 Fuel, electricity and water charges 17,565,323 12,805,332 Vehicle running and maintenance expenses 4,637,168 4,480,304 Insurance 20,642,422 20,632,533 Depreciation 6.1.1 148,262,892 141,997,699 Others 26,528,074 29,129,661
4,384,899,333 4,162,810,034
Opening stock of work-in-process 1,279,653 2,519,343 Closing stock of work-in-process 11 (2,589,011) (1,279,653)
(1,309,358) 1,239,690 Cost of goods manufactured 4,383,589,975 4,164,049,724
Opening stock of finished goods 1,165,877,767 1,202,937,630 Closing stock of finished goods 11 (1,058,006,932) (1,165,877,767)
107,870,835 37,059,863
4,491,460,810 4,201,109,587
31.1 Include gratuity expense of Rs. 450,993 (2018: Rs. 376,206) and contribution to provident fund of Rs. 5.145 million (2018: Rs. 5.066 million).
2019 2018Note Rupees Rupees
32 DISTRIBUTION COSTS
Salaries and other benefits 32.1 3,315,280 3,270,240 Insurance 36,695 27,912 Stacking and loading 12,549,333 18,809,172 Export expenses 15,274,435 64,033,967 Others 28,383,559 25,307,027
59,559,302 111,448,318
Mehran Sugar Mills Ltd. 177
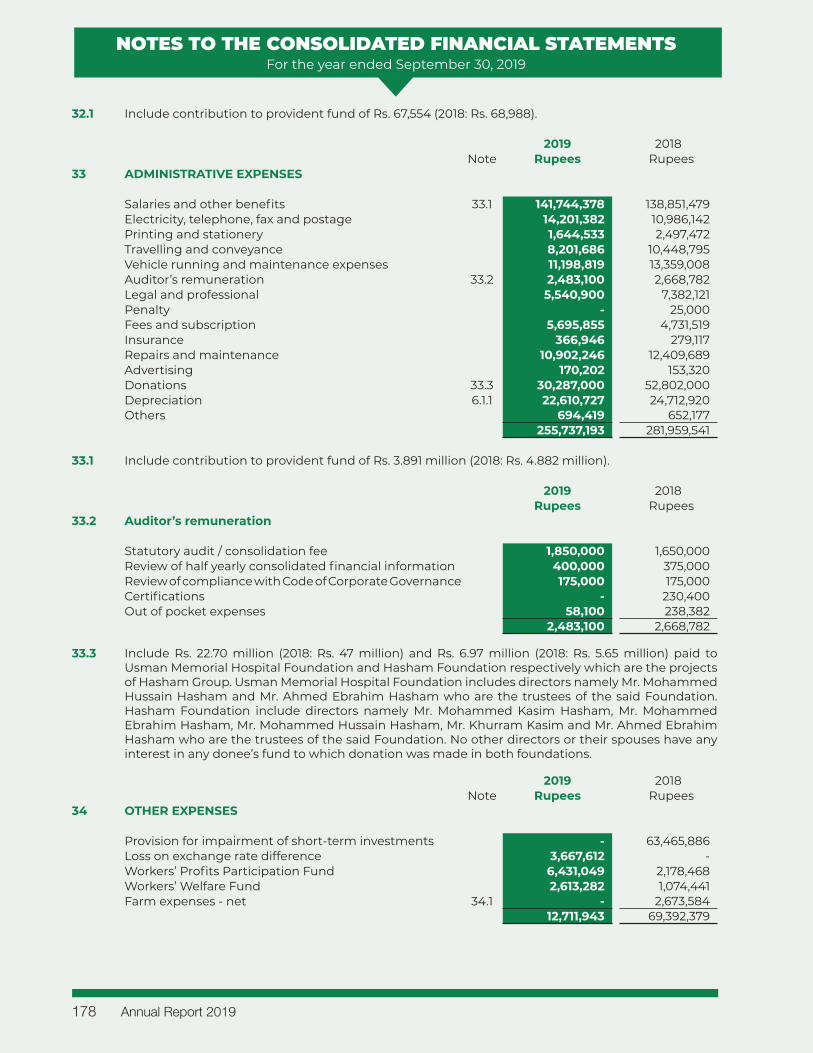
NOTES TO THE CONSOLIDATED FINANCIAL STATEMENTSFor the year ended September 30, 2019
32.1 Include contribution to provident fund of Rs. 67,554 (2018: Rs. 68,988).
2019 2018Note Rupees Rupees
33 ADMINISTRATIVE EXPENSES
Salaries and other benefits 33.1 141,744,378 138,851,479 Electricity, telephone, fax and postage 14,201,382 10,986,142 Printing and stationery 1,644,533 2,497,472 Travelling and conveyance 8,201,686 10,448,795 Vehicle running and maintenance expenses 11,198,819 13,359,008 Auditor’s remuneration 33.2 2,483,100 2,668,782 Legal and professional 5,540,900 7,382,121 Penalty - 25,000 Fees and subscription 5,695,855 4,731,519 Insurance 366,946 279,117 Repairs and maintenance 10,902,246 12,409,689 Advertising 170,202 153,320 Donations 33.3 30,287,000 52,802,000 Depreciation 6.1.1 22,610,727 24,712,920 Others 694,419 652,177
255,737,193 281,959,541
33.1 Include contribution to provident fund of Rs. 3.891 million (2018: Rs. 4.882 million).
2019 2018Rupees Rupees
33.2 Auditor’s remuneration
Statutory audit / consolidation fee 1,850,000 1,650,000 Review of half yearly consolidated financial information 400,000 375,000 Review of compliance with Code of Corporate Governance 175,000 175,000 Certifications - 230,400 Out of pocket expenses 58,100 238,382
2,483,100 2,668,782
33.3 Include Rs. 22.70 million (2018: Rs. 47 million) and Rs. 6.97 million (2018: Rs. 5.65 million) paid to Usman Memorial Hospital Foundation and Hasham Foundation respectively which are the projects of Hasham Group. Usman Memorial Hospital Foundation includes directors namely Mr. Mohammed Hussain Hasham and Mr. Ahmed Ebrahim Hasham who are the trustees of the said Foundation. Hasham Foundation include directors namely Mr. Mohammed Kasim Hasham, Mr. Mohammed Ebrahim Hasham, Mr. Mohammed Hussain Hasham, Mr. Khurram Kasim and Mr. Ahmed Ebrahim Hasham who are the trustees of the said Foundation. No other directors or their spouses have any interest in any donee’s fund to which donation was made in both foundations.
2019 2018Note Rupees Rupees
34 OTHER EXPENSES
Provision for impairment of short-term investments - 63,465,886 Loss on exchange rate difference 3,667,612 - Workers’ Profits Participation Fund 6,431,049 2,178,468 Workers’ Welfare Fund 2,613,282 1,074,441 Farm expenses - net 34.1 - 2,673,584
12,711,943 69,392,379
Annual Report 2019178
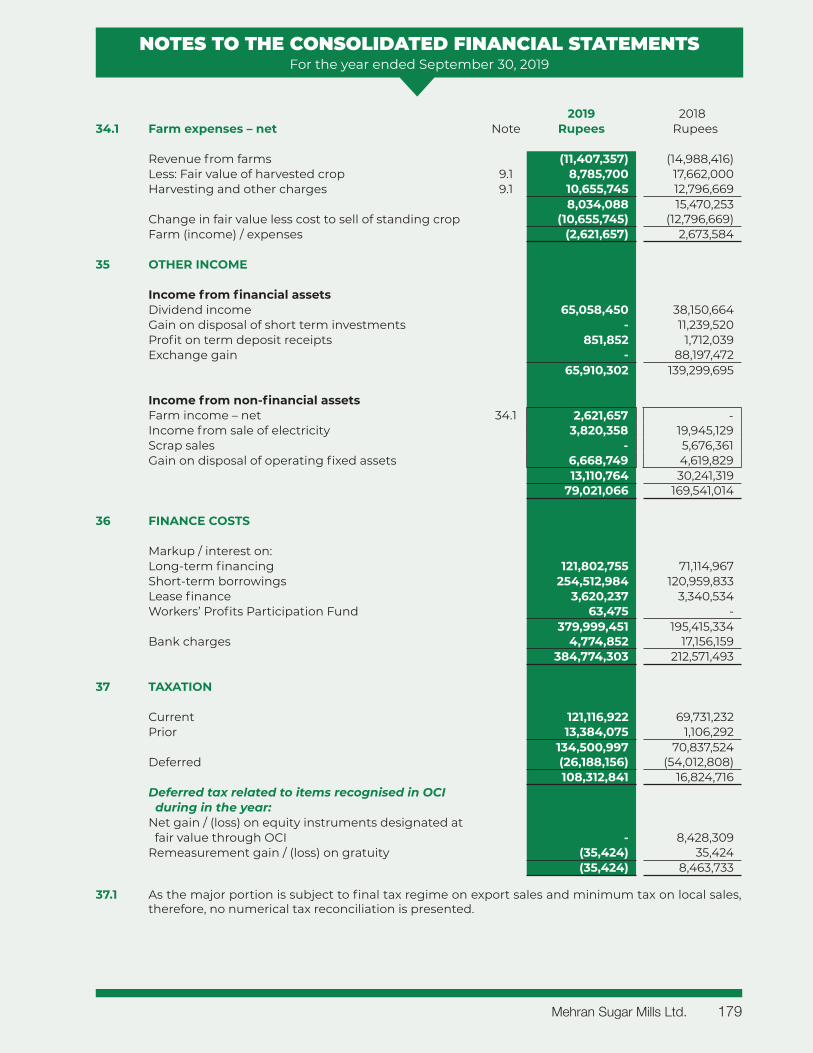
NOTES TO THE CONSOLIDATED FINANCIAL STATEMENTSFor the year ended September 30, 2019
2019 201834.1 Farm expenses – net Note Rupees Rupees
Revenue from farms (11,407,357) (14,988,416)Less: Fair value of harvested crop 9.1 8,785,700 17,662,000 Harvesting and other charges 9.1 10,655,745 12,796,669
8,034,088 15,470,253 Change in fair value less cost to sell of standing crop (10,655,745) (12,796,669)Farm (income) / expenses (2,621,657) 2,673,584
35 OTHER INCOME
Income from financial assetsDividend income 65,058,450 38,150,664 Gain on disposal of short term investments - 11,239,520 Profit on term deposit receipts 851,852 1,712,039 Exchange gain - 88,197,472
65,910,302 139,299,695
Income from non-financial assetsFarm income – net 34.1 2,621,657 - Income from sale of electricity 3,820,358 19,945,129 Scrap sales - 5,676,361 Gain on disposal of operating fixed assets 6,668,749 4,619,829
13,110,764 30,241,319 79,021,066 169,541,014
36 FINANCE COSTS
Markup / interest on:Long-term financing 121,802,755 71,114,967 Short-term borrowings 254,512,984 120,959,833 Lease finance 3,620,237 3,340,534 Workers’ Profits Participation Fund 63,475 -
379,999,451 195,415,334 Bank charges 4,774,852 17,156,159
384,774,303 212,571,493
37 TAXATION
Current 121,116,922 69,731,232 Prior 13,384,075 1,106,292
134,500,997 70,837,524 Deferred (26,188,156) (54,012,808)
108,312,841 16,824,716 Deferred tax related to items recognised in OCI during in the year: Net gain / (loss) on equity instruments designated at fair value through OCI - 8,428,309 Remeasurement gain / (loss) on gratuity (35,424) 35,424
(35,424) 8,463,733
37.1 As the major portion is subject to final tax regime on export sales and minimum tax on local sales, therefore, no numerical tax reconciliation is presented.
Mehran Sugar Mills Ltd. 179
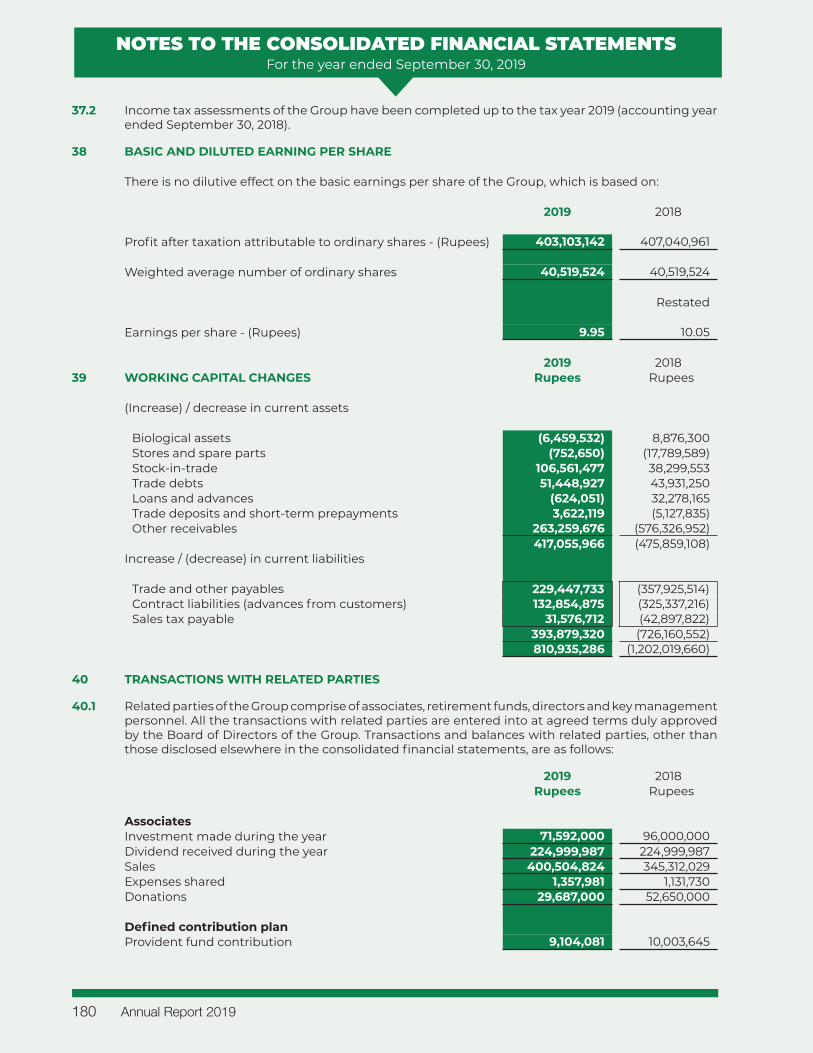
NOTES TO THE CONSOLIDATED FINANCIAL STATEMENTSFor the year ended September 30, 2019
37.2 Income tax assessments of the Group have been completed up to the tax year 2019 (accounting year ended September 30, 2018).
38 BASIC AND DILUTED EARNING PER SHARE
There is no dilutive effect on the basic earnings per share of the Group, which is based on:
2019 2018
Profit after taxation attributable to ordinary shares - (Rupees) 403,103,142 407,040,961
Weighted average number of ordinary shares 40,519,524 40,519,524
Restated
Earnings per share - (Rupees) 9.95 10.05
2019 201839 WORKING CAPITAL CHANGES Rupees Rupees
(Increase) / decrease in current assets
Biological assets (6,459,532) 8,876,300 Stores and spare parts (752,650) (17,789,589)Stock-in-trade 106,561,477 38,299,553 Trade debts 51,448,927 43,931,250 Loans and advances (624,051) 32,278,165 Trade deposits and short-term prepayments 3,622,119 (5,127,835)Other receivables 263,259,676 (576,326,952)
417,055,966 (475,859,108)Increase / (decrease) in current liabilities
Trade and other payables 229,447,733 (357,925,514)Contract liabilities (advances from customers) 132,854,875 (325,337,216)Sales tax payable 31,576,712 (42,897,822)
393,879,320 (726,160,552) 810,935,286 (1,202,019,660)
40 TRANSACTIONS WITH RELATED PARTIES
40.1 Related parties of the Group comprise of associates, retirement funds, directors and key management personnel. All the transactions with related parties are entered into at agreed terms duly approved by the Board of Directors of the Group. Transactions and balances with related parties, other than those disclosed elsewhere in the consolidated financial statements, are as follows:
2019 2018Rupees Rupees
AssociatesInvestment made during the year 71,592,000 96,000,000 Dividend received during the year 224,999,987 224,999,987 Sales 400,504,824 345,312,029 Expenses shared 1,357,981 1,131,730 Donations 29,687,000 52,650,000
Defined contribution planProvident fund contribution 9,104,081 10,003,645
Annual Report 2019180
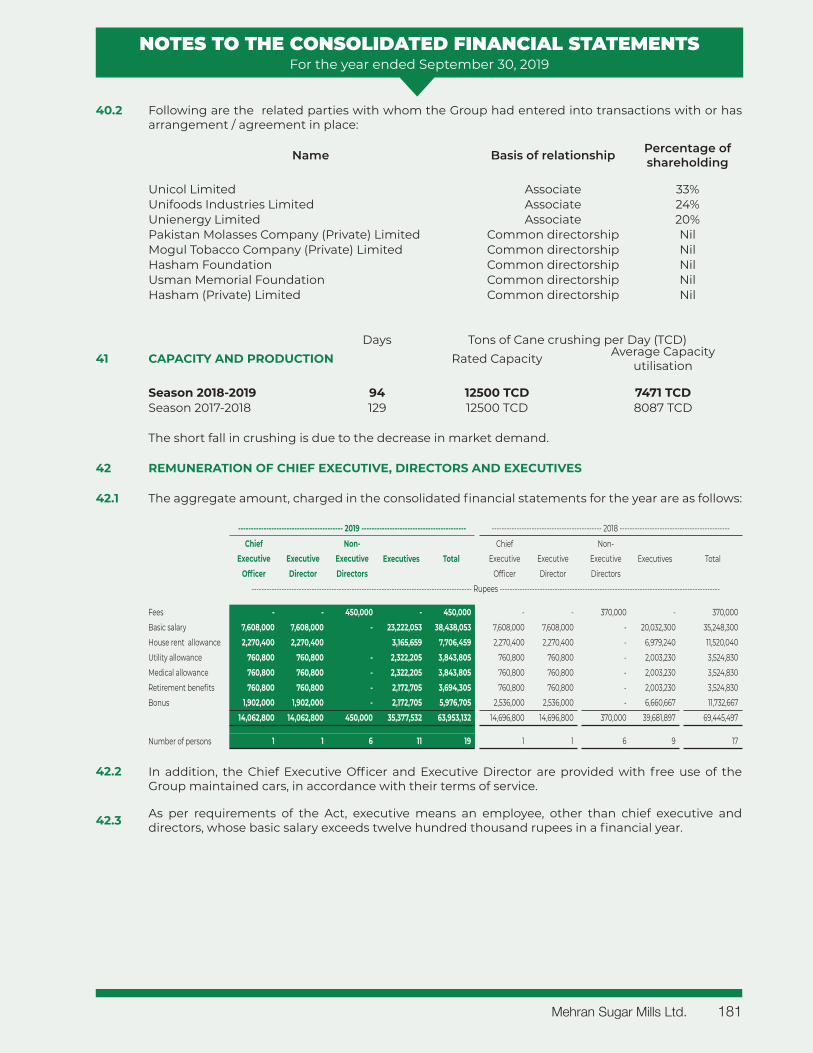
NOTES TO THE CONSOLIDATED FINANCIAL STATEMENTSFor the year ended September 30, 2019
40.2 Following are the related parties with whom the Group had entered into transactions with or has arrangement / agreement in place:
Name Basis of relationship Percentage of shareholding
Unicol Limited Associate 33%Unifoods Industries Limited Associate 24%Unienergy Limited Associate 20%Pakistan Molasses Company (Private) Limited Common directorship NilMogul Tobacco Company (Private) Limited Common directorship NilHasham Foundation Common directorship NilUsman Memorial Foundation Common directorship NilHasham (Private) Limited Common directorship Nil
The short fall in crushing is due to the decrease in market demand.
42 REMUNERATION OF CHIEF EXECUTIVE, DIRECTORS AND EXECUTIVES
42.1 The aggregate amount, charged in the consolidated financial statements for the year are as follows:
----------------------------------------- 2019 ----------------------------------------- -------------------------------------------- 2018 --------------------------------------------
Chief Non-Executives Total
Chief Non-Executives TotalExecutive Executive Executive Executive Executive Executive
Officer Director Directors Officer Director Directors---------------------------------------------------------------------------------------- Rupees ----------------------------------------------------------------------------------------
Fees - - 450,000 - 450,000 - - 370,000 - 370,000 Basic salary 7,608,000 7,608,000 - 23,222,053 38,438,053 7,608,000 7,608,000 - 20,032,300 35,248,300 House rent allowance 2,270,400 2,270,400 3,165,659 7,706,459 2,270,400 2,270,400 - 6,979,240 11,520,040 Utility allowance 760,800 760,800 - 2,322,205 3,843,805 760,800 760,800 - 2,003,230 3,524,830 Medical allowance 760,800 760,800 - 2,322,205 3,843,805 760,800 760,800 - 2,003,230 3,524,830 Retirement benefits 760,800 760,800 - 2,172,705 3,694,305 760,800 760,800 - 2,003,230 3,524,830 Bonus 1,902,000 1,902,000 - 2,172,705 5,976,705 2,536,000 2,536,000 - 6,660,667 11,732,667
14,062,800 14,062,800 450,000 35,377,532 63,953,132 14,696,800 14,696,800 370,000 39,681,897 69,445,497
Number of persons 1 1 6 11 19 1 1 6 9 17
42.2 In addition, the Chief Executive Officer and Executive Director are provided with free use of the Group maintained cars, in accordance with their terms of service.
42.3 As per requirements of the Act, executive means an employee, other than chief executive and directors, whose basic salary exceeds twelve hundred thousand rupees in a financial year.
Days Tons of Cane crushing per Day (TCD)41 CAPACITY AND PRODUCTION Rated Capacity Average Capacity
utilisation
Season 2018-2019 94 12500 TCD 7471 TCDSeason 2017-2018 129 12500 TCD 8087 TCD
Mehran Sugar Mills Ltd. 181
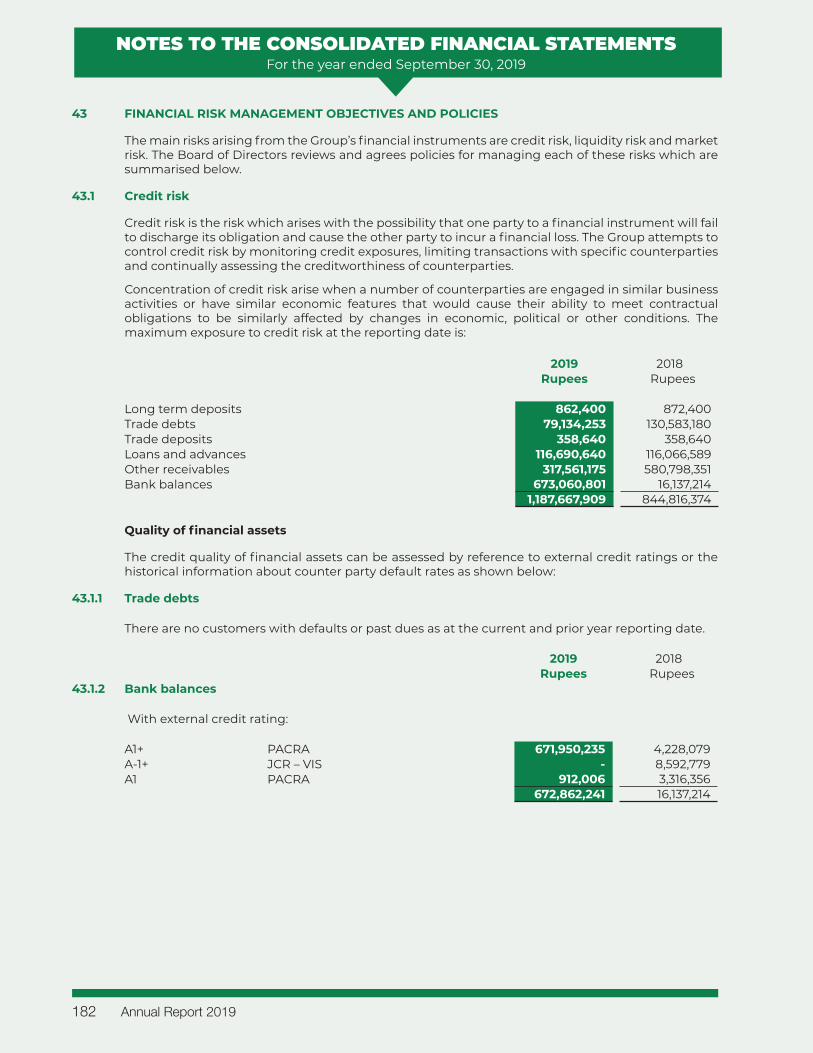
NOTES TO THE CONSOLIDATED FINANCIAL STATEMENTSFor the year ended September 30, 2019
43 FINANCIAL RISK MANAGEMENT OBJECTIVES AND POLICIES
The main risks arising from the Group’s financial instruments are credit risk, liquidity risk and market risk. The Board of Directors reviews and agrees policies for managing each of these risks which are summarised below.
43.1 Credit risk
Credit risk is the risk which arises with the possibility that one party to a financial instrument will fail to discharge its obligation and cause the other party to incur a financial loss. The Group attempts to control credit risk by monitoring credit exposures, limiting transactions with specific counterparties and continually assessing the creditworthiness of counterparties.
Concentration of credit risk arise when a number of counterparties are engaged in similar business activities or have similar economic features that would cause their ability to meet contractual obligations to be similarly affected by changes in economic, political or other conditions. The maximum exposure to credit risk at the reporting date is:
2019 2018Rupees Rupees
Long term deposits 862,400 872,400 Trade debts 79,134,253 130,583,180 Trade deposits 358,640 358,640 Loans and advances 116,690,640 116,066,589 Other receivables 317,561,175 580,798,351 Bank balances 673,060,801 16,137,214
1,187,667,909 844,816,374
Quality of financial assets
The credit quality of financial assets can be assessed by reference to external credit ratings or the historical information about counter party default rates as shown below:
43.1.1 Trade debts
There are no customers with defaults or past dues as at the current and prior year reporting date.
2019 2018Rupees Rupees
43.1.2 Bank balances
With external credit rating: A1+ PACRA 671,950,235 4,228,079 A-1+ JCR – VIS - 8,592,779 A1 PACRA 912,006 3,316,356
672,862,241 16,137,214
Annual Report 2019182
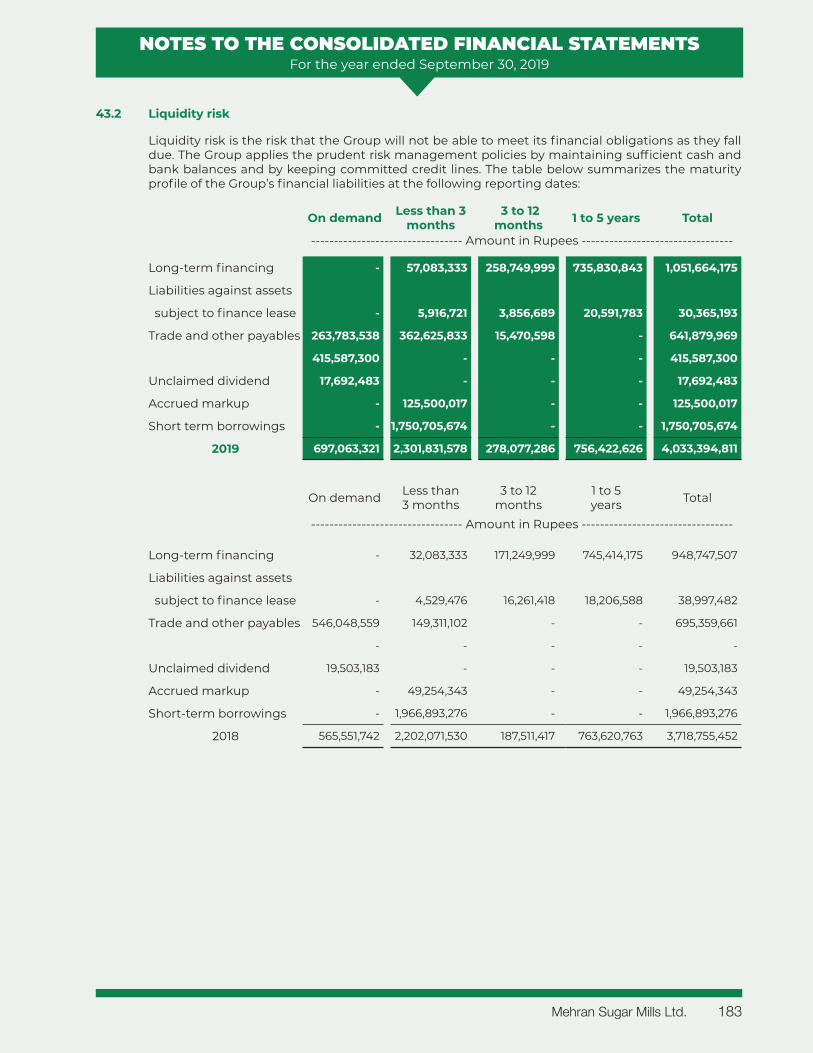
NOTES TO THE CONSOLIDATED FINANCIAL STATEMENTSFor the year ended September 30, 2019
43.2 Liquidity risk
Liquidity risk is the risk that the Group will not be able to meet its financial obligations as they fall due. The Group applies the prudent risk management policies by maintaining sufficient cash and bank balances and by keeping committed credit lines. The table below summarizes the maturity profile of the Group’s financial liabilities at the following reporting dates:
On demand Less than 3 months
3 to 12 months 1 to 5 years Total
--------------------------------- Amount in Rupees ---------------------------------
Long-term financing - 57,083,333 258,749,999 735,830,843 1,051,664,175
Liabilities against assets
subject to finance lease - 5,916,721 3,856,689 20,591,783 30,365,193
Trade and other payables 263,783,538 362,625,833 15,470,598 - 641,879,969
415,587,300 - - - 415,587,300
Unclaimed dividend 17,692,483 - - - 17,692,483
Accrued markup - 125,500,017 - - 125,500,017
Short term borrowings - 1,750,705,674 - - 1,750,705,674
2019 697,063,321 2,301,831,578 278,077,286 756,422,626 4,033,394,811
On demand Less than 3 months
3 to 12 months
1 to 5 years Total
--------------------------------- Amount in Rupees ---------------------------------
Long-term financing - 32,083,333 171,249,999 745,414,175 948,747,507
Liabilities against assets
subject to finance lease - 4,529,476 16,261,418 18,206,588 38,997,482
Trade and other payables 546,048,559 149,311,102 - - 695,359,661
- - - - -
Unclaimed dividend 19,503,183 - - - 19,503,183
Accrued markup - 49,254,343 - - 49,254,343
Short-term borrowings - 1,966,893,276 - - 1,966,893,276
2018 565,551,742 2,202,071,530 187,511,417 763,620,763 3,718,755,452
Mehran Sugar Mills Ltd. 183
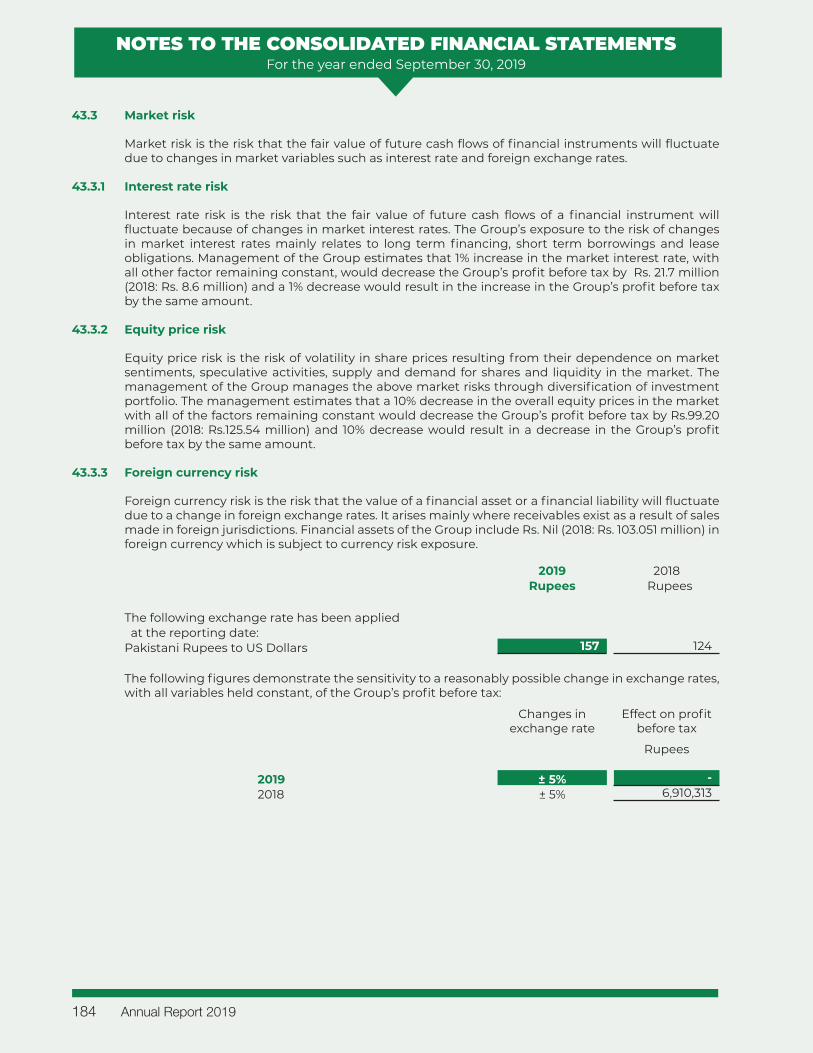
NOTES TO THE CONSOLIDATED FINANCIAL STATEMENTSFor the year ended September 30, 2019
43.3 Market risk
Market risk is the risk that the fair value of future cash flows of financial instruments will fluctuate due to changes in market variables such as interest rate and foreign exchange rates.
43.3.1 Interest rate risk
Interest rate risk is the risk that the fair value of future cash flows of a financial instrument will fluctuate because of changes in market interest rates. The Group’s exposure to the risk of changes in market interest rates mainly relates to long term financing, short term borrowings and lease obligations. Management of the Group estimates that 1% increase in the market interest rate, with all other factor remaining constant, would decrease the Group’s profit before tax by Rs. 21.7 million (2018: Rs. 8.6 million) and a 1% decrease would result in the increase in the Group’s profit before tax by the same amount.
43.3.2 Equity price risk
Equity price risk is the risk of volatility in share prices resulting from their dependence on market sentiments, speculative activities, supply and demand for shares and liquidity in the market. The management of the Group manages the above market risks through diversification of investment portfolio. The management estimates that a 10% decrease in the overall equity prices in the market with all of the factors remaining constant would decrease the Group’s profit before tax by Rs.99.20 million (2018: Rs.125.54 million) and 10% decrease would result in a decrease in the Group’s profit before tax by the same amount.
43.3.3 Foreign currency risk
Foreign currency risk is the risk that the value of a financial asset or a financial liability will fluctuate due to a change in foreign exchange rates. It arises mainly where receivables exist as a result of sales made in foreign jurisdictions. Financial assets of the Group include Rs. Nil (2018: Rs. 103.051 million) in foreign currency which is subject to currency risk exposure.
2019 2018Rupees Rupees
The following exchange rate has been applied at the reporting date:Pakistani Rupees to US Dollars 157 124
The following figures demonstrate the sensitivity to a reasonably possible change in exchange rates, with all variables held constant, of the Group’s profit before tax:
Changes in exchange rate
Effect on profit before tax
Rupees
2019 ± 5% - 2018 ± 5% 6,910,313
Annual Report 2019184
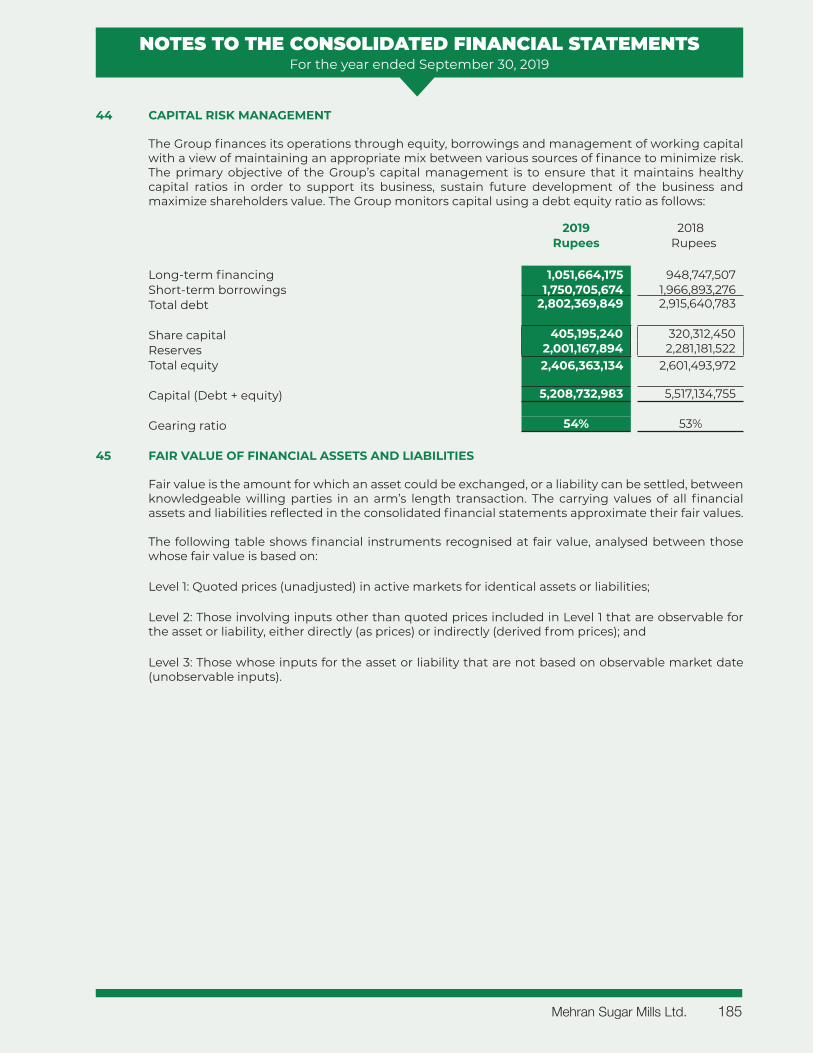
NOTES TO THE CONSOLIDATED FINANCIAL STATEMENTSFor the year ended September 30, 2019
44 CAPITAL RISK MANAGEMENT
The Group finances its operations through equity, borrowings and management of working capital with a view of maintaining an appropriate mix between various sources of finance to minimize risk. The primary objective of the Group’s capital management is to ensure that it maintains healthy capital ratios in order to support its business, sustain future development of the business and maximize shareholders value. The Group monitors capital using a debt equity ratio as follows:
2019 2018Rupees Rupees
Long-term financing 1,051,664,175 948,747,507 Short-term borrowings 1,750,705,674 1,966,893,276 Total debt 2,802,369,849 2,915,640,783
Share capital 405,195,240 320,312,450 Reserves 2,001,167,894 2,281,181,522 Total equity 2,406,363,134 2,601,493,972
Capital (Debt + equity) 5,208,732,983 5,517,134,755
Gearing ratio 54% 53%
45 FAIR VALUE OF FINANCIAL ASSETS AND LIABILITIES
Fair value is the amount for which an asset could be exchanged, or a liability can be settled, between knowledgeable willing parties in an arm’s length transaction. The carrying values of all financial assets and liabilities reflected in the consolidated financial statements approximate their fair values.
The following table shows financial instruments recognised at fair value, analysed between those whose fair value is based on:
Level 1: Quoted prices (unadjusted) in active markets for identical assets or liabilities;
Level 2: Those involving inputs other than quoted prices included in Level 1 that are observable for the asset or liability, either directly (as prices) or indirectly (derived from prices); and
Level 3: Those whose inputs for the asset or liability that are not based on observable market date (unobservable inputs).
Mehran Sugar Mills Ltd. 185
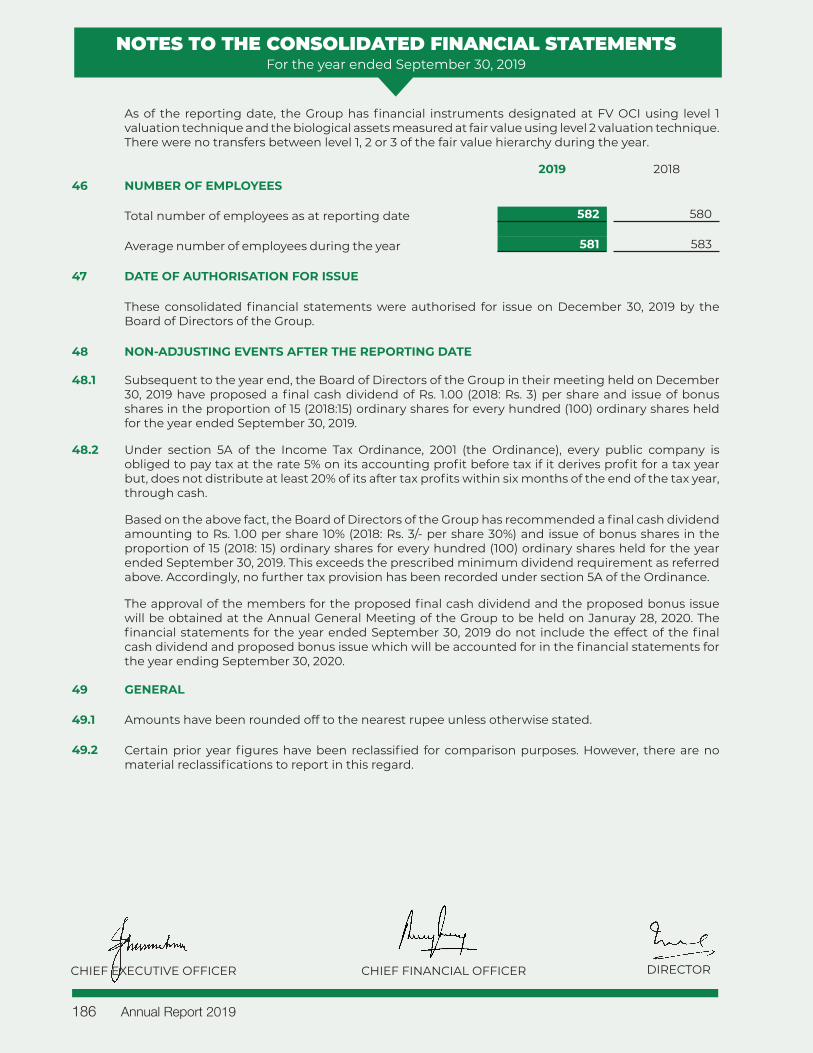
NOTES TO THE CONSOLIDATED FINANCIAL STATEMENTSFor the year ended September 30, 2019
As of the reporting date, the Group has financial instruments designated at FV OCI using level 1 valuation technique and the biological assets measured at fair value using level 2 valuation technique. There were no transfers between level 1, 2 or 3 of the fair value hierarchy during the year.
2019 201846 NUMBER OF EMPLOYEES
Total number of employees as at reporting date 582 580
Average number of employees during the year 581 583
47 DATE OF AUTHORISATION FOR ISSUE
These consolidated financial statements were authorised for issue on December 30, 2019 by the Board of Directors of the Group.
48 NON-ADJUSTING EVENTS AFTER THE REPORTING DATE
48.1 Subsequent to the year end, the Board of Directors of the Group in their meeting held on December 30, 2019 have proposed a final cash dividend of Rs. 1.00 (2018: Rs. 3) per share and issue of bonus shares in the proportion of 15 (2018:15) ordinary shares for every hundred (100) ordinary shares held for the year ended September 30, 2019.
48.2 Under section 5A of the Income Tax Ordinance, 2001 (the Ordinance), every public company is obliged to pay tax at the rate 5% on its accounting profit before tax if it derives profit for a tax year but, does not distribute at least 20% of its after tax profits within six months of the end of the tax year, through cash.
Based on the above fact, the Board of Directors of the Group has recommended a final cash dividend amounting to Rs. 1.00 per share 10% (2018: Rs. 3/- per share 30%) and issue of bonus shares in the proportion of 15 (2018: 15) ordinary shares for every hundred (100) ordinary shares held for the year ended September 30, 2019. This exceeds the prescribed minimum dividend requirement as referred above. Accordingly, no further tax provision has been recorded under section 5A of the Ordinance.
The approval of the members for the proposed final cash dividend and the proposed bonus issue will be obtained at the Annual General Meeting of the Group to be held on Januray 28, 2020. The financial statements for the year ended September 30, 2019 do not include the effect of the final cash dividend and proposed bonus issue which will be accounted for in the financial statements for the year ending September 30, 2020.
49 GENERAL
49.1 Amounts have been rounded off to the nearest rupee unless otherwise stated.
49.2 Certain prior year figures have been reclassified for comparison purposes. However, there are no material reclassifications to report in this regard.
CHIEF EXECUTIVE OFFICER CHIEF FINANCIAL OFFICER DIRECTOR
Annual Report 2019186

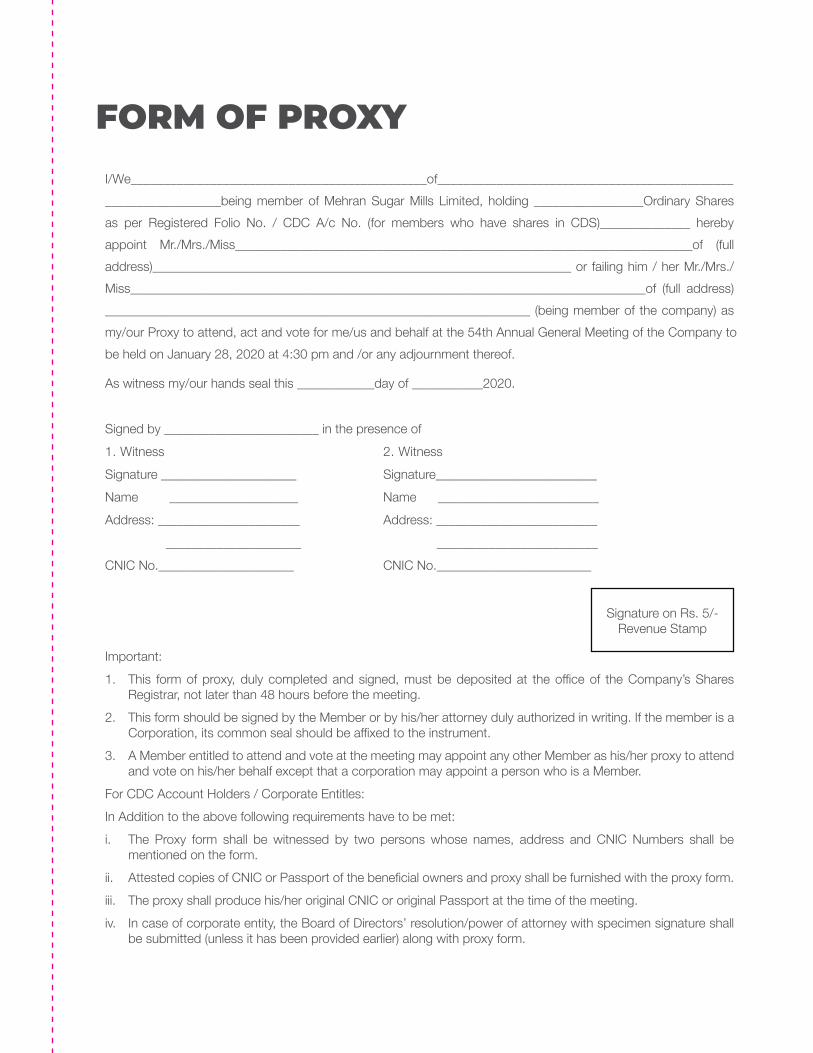
FORM OF PROXYI/We_____________________________________________of_____________________________________________
__________________being member of Mehran Sugar Mills Limited, holding _________________Ordinary Shares
as per Registered Folio No. / CDC A/c No. (for members who have shares in CDS)______________ hereby
appoint Mr./Mrs./Miss_______________________________________________________________________of (full
address)_________________________________________________________________ or failing him / her Mr./Mrs./
Miss________________________________________________________________________________of (full address)
__________________________________________________________________ (being member of the company) as
my/our Proxy to attend, act and vote for me/us and behalf at the 54th Annual General Meeting of the Company to
be held on January 28, 2020 at 4:30 pm and /or any adjournment thereof.
As witness my/our hands seal this ____________day of ___________2020.
Signed by ________________________ in the presence of
1. Witness 2. Witness
Signature _____________________ Signature_________________________
Name ____________________ Name _________________________
Address: ______________________ Address: _________________________
_____________________ _________________________
CNIC No._____________________ CNIC No.________________________
Important:
1. Registrar, not later than 48 hours before the meeting.
2. This form should be signed by the Member or by his/her attorney duly authorized in writing. If the member is a
3. A Member entitled to attend and vote at the meeting may appoint any other Member as his/her proxy to attend and vote on his/her behalf except that a corporation may appoint a person who is a Member.
For CDC Account Holders / Corporate Entitles:
In Addition to the above following requirements have to be met:
i. The Proxy form shall be witnessed by two persons whose names, address and CNIC Numbers shall be mentioned on the form.
ii.
iii. The proxy shall produce his/her original CNIC or original Passport at the time of the meeting.
iv. In case of corporate entity, the Board of Directors’ resolution/power of attorney with specimen signature shall be submitted (unless it has been provided earlier) along with proxy form.
Signature on Rs. 5/- Revenue Stamp
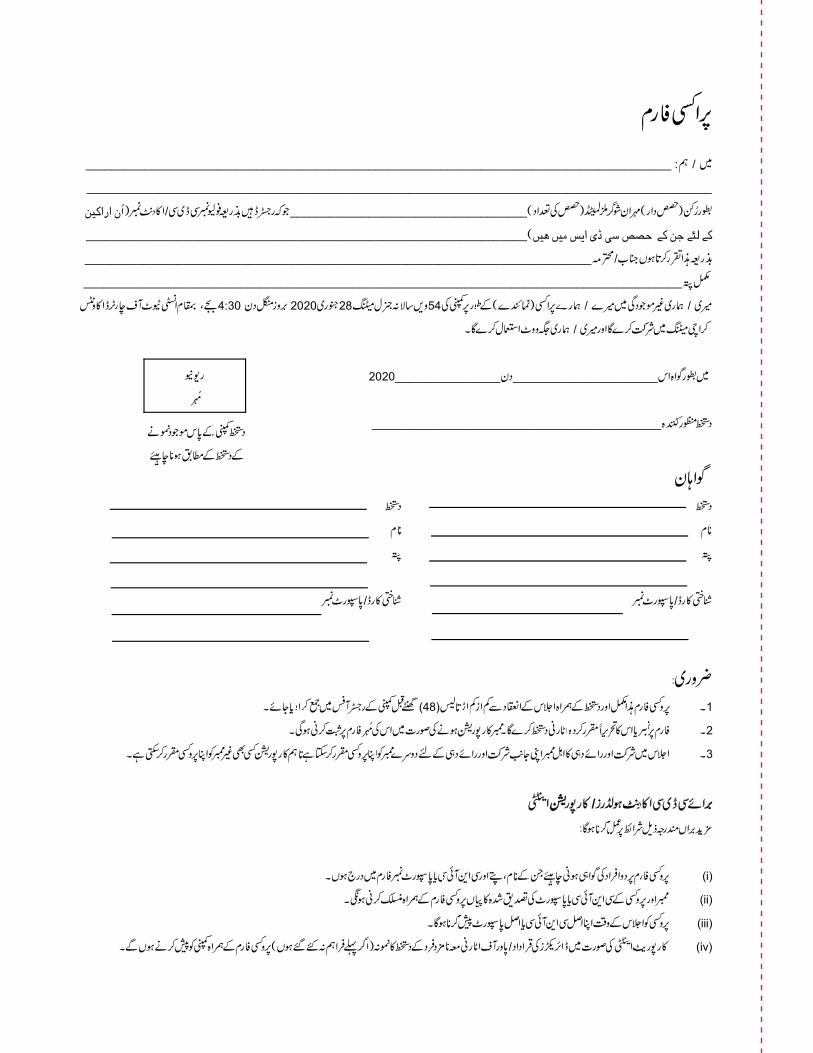


Executive Tower, Dolmen City,14th Floor, Block-4, Marine Drive, Clifton, Karachi-75600
Tel : (92 21) 35297814-17Fax : (92 21) 35297818, 35297827
m e h r a n s u g a r . c o m