Annual Report 2019 - European Commission · 2.12. Slovenia’s structural budget balance:...
116
Annual Report 2019 European Fiscal Board
Transcript of Annual Report 2019 - European Commission · 2.12. Slovenia’s structural budget balance:...
Annual Report
2019
European Fiscal Board
Composition of the European Fiscal Board Niels THYGESEN Chair Professor Emeritus of International Economics at the University of Copenhagen and former adviser to governments and international institutions, Denmark Roel BEETSMA Member Professor at the University of Amsterdam and Vice-Dean of the Faculty of Economics and Business, the Netherlands Massimo BORDIGNON Member Professor and former Director of the Department of Economics and Finance at the Catholic University of Milan, Italy Sandrine DUCHÊNE Member General Secretary of AXA France, France Mateusz SZCZUREK Member Former Finance Minister, teacher at Warsaw University, and EBRD Associate Director, Poland For more information about the European Fiscal Board, please visit the following website: https://ec.europa.eu/european-fiscal-board This report has been written under the responsibility of the European Fiscal Board with the support of its secretariat. Comments on the report should be sent to: Secretariat of the European Fiscal Board European Commission Rue de la Loi 200 Office BERL 06/265 B-1049 Brussels Email: [email protected] Cut-off date: 28 September 2019
The opinions expressed in this document are the sole responsibility of the European Fiscal Board and do not necessarily reflect
the views and positions of the institutions the Members of the Board are affiliated or work with.

ABBREVIATIONS
European Fiscal Board
Member States
BE Belgium
BG Bulgaria
CZ Czechia
DK Denmark
DE Germany
EE Estonia
EI Ireland
EL Greece
ES Spain
FR France
IT Italy
HR Croatia
CY Cyprus
LV Latvia
LT Lithuania
LU Luxembourg
HU Hungary
MT Malta
NL The Netherlands
AT Austria
PL Poland
PT Portugal
RO Romania
SI Slovenia
SK Slovakia

European Fiscal Board
iv
FI Finland
SE Sweden
UK United Kingdom
EA Euro area
EU European Union
EU-28 European Union, 28 Member States
EA-19 Euro area, 19 Member States
EA-12 Euro area, 12 Member States
Other
AIReF Independent authority of fiscal responsibility
AWG Ageing Working Group
CAB Cyclically-adjusted budget balance
CAPB Cyclically-adjusted primary balance
CNFP Conseil National des Finances Publiques
CP Convergence programme
CPB Dutch Bureau for Economic Policy Analysis
CSR Country-specific recommendation
DBP Draft budgetary plan
DG ECFIN Directorate-General for Economic and Financial Affairs
DSA Debt sustainability analysis
ECA European Court of Auditors
ECB European Central Bank
ECOFIN Economic and Financial Affairs Council
EDP Excessive deficit procedure
EERP European economic recovery plan
EFB European Fiscal Board
EFC Economic and Financial Committee
EFC-A Alternates of the Economic and Financial Committee

European Fiscal Board
v
EIP Excessive imbalance procedure
EMU Economic and Monetary Union
EPC Economic Policy Committee
EPP Economic partnership programme
ESM European Stability Mechanism
FDC Fiscal Discipline Council
FPB Federal Planning Bureau
FPC Fiscal Policy Council
FRIB Fiscal Responsibility Institute Budapest
GDP Gross domestic product
GFCF Gross fixed capital formation
HCF High Council of Finance
HCPF High Council of Public Finance
HICP Harmonised index of consumer prices
IFIs Independent financial institutions
IMF International Monetary Fund
JRC Joint Research Centre
MIP Macroeconomic imbalance procedure
MLSA Minimum linear structural adjustment
MTBF Medium-term budgetary framework
MTO Medium-term budgetary objective
NAWRU Non-accelerating wage rate of unemployment
NCEF National Commission for Economic Forecasting
NIER National Institute of Economic Research
NPLs Non-performing loans
NRP National reform programme
OECD Organisation of Economic Co-operation and Development
OGWG Output Gap Working Group

European Fiscal Board
vi
PBO Parliamentary Budget Office
PISA Programme for international student assessment
PPS Purchasing power standard
QPF Quality of public finances
RQMV Reverse qualified majority voting
SB Structural balance
SDP Significant deviation procedure
SEC Signal enhancement capacity
SGP Stability and Growth Pact
SIFI Scope index of fiscal institutions
SP Stability programme
SCPs Stability and convergence programmes
SPB Structural primary balance
SRSS Structural Reform Support Service
TFEU Treaty on the Functioning of the European Union
TSCG Treaty on Stability, Coordination and Governance
UMTS Universal mobile telecommunications systems

CONTENTS
European Fiscal Board
Foreword 1
1. Executive summary 3
2. Ex-post evaluation of the implementation of the EU's fiscal framework 9
2.1. Main macroeconomic and fiscal developments 10
2.2. The 2018 EU fiscal surveillance cycle 14
3. Independent fiscal institutions 38
3.1. Two illustrative cases: Spain and Sweden 39
3.2. Minimum standards for EU IFIs 46
3.3. The role of IFIs in the 2018 EU fiscal surveillance cycle 47
3.4. The role of IFIs in the 2018 electoral cycle 54
4. Assessment of the fiscal stance in 2018 57
4.1. Budgetary projections and outturn 58
4.2. Assessing the fiscal stance in 2018 59
5. Future evolution of the EU's fiscal framework 70
5.1. Overview 71
5.2. Four sources of unnecessary complexity in the current implementation of the rules 74
5.3. A ceiling on net government expenditures 75
5.4. Protecting public investment 77
5.5. Going beyond uniform rules 77
Glossary 80
Annex A: Overview tables 85
Annex B: Statistical annex 94
References 101
LIST OF TABLES
2.1. Revision in potential and actual GDP levels in 2018: spring 2017 vs spring 2019 forecast 11
2.2. Positive revenue surprise and spending revisions (net of one-offs, % of GDP) 14

European Fiscal Board
2.3. Forecasts, targets and outturns in the euro area and the EU: 2018 15
2.4. Minimum and actual medium-term-objectives (MTOs): the 2018 update 18
2.5. Country-specific changes to commonly agreed output gap methodology 20
2.6. Output gap estimates flagged by the plausibility tool in the 2018 surveillance cycle 23
2.7. Assessment of compliance of the draft budgetary plans with the preventive arm of the SGP 26
2.8. Italy’s mid-year budget correction for 2019. Impact on required adjustment towards MTO 31
4.1. Main budgetary variables in the euro area and its largest Member States, projections and outturn 58
A1. Application of EU fiscal rules in the 2018 surveillance cycle: The preventive arm of the SGP 85
A2. Application of EU fiscal rules in the 2018 surveillance cycle: The corrective arm of the SGP: Countries not in EDP 89
A3. Application of the EU fiscal rules in the 2018 surveillance cycle: The corrective arm of the SGP: Countries in EDP 91
B1. Gross domestic product at 2010 reference levels (annual percentage change, 2001-2020) 94
B2. Harmonised index of consumer prices (percentage change on preceding year, 2001-2020) 95
B3. Net lending (+) or net borrowing (-), general government (as a percentage of GDP, 2001-2020) 96
B4. Interest expenditure, general government (as a percentage of GDP, 2001-2020) 97
B5. Structural budget balance, general government (as a percentage of GDP, 2011-2020) 98
B6. Gross debt, general government (as a percentage of GDP, 2001-2020) 99
B7. Debt dynamic components (as a percentage of GDP) 100
LIST OF GRAPHS
2.1. Real GDP and its components, euro area 10
2.2. Nominal GDP growth surprises in 2018: Commission forecasts vs stability and convergence programmes (SCPs) 10
2.3. Nominal GDP growth projections: positive vs negative growth surprises (2012-2018) 11
2.4. Percentage of countries at MTO and change in structural balance (1998-2018) 12
2.5. Revision in the estimated distance to MTO and change in the structural balance in 2018 12
2.6. General government budget balance in 2018; outturn vs target in the 2017 SCPs 13
2.7. The annual cycle of EU fiscal surveillance 16
2.8. Continuous (non)observance of the minimum benchmark: the case of Finland 17
2.9. Fiscal adjustment requirements for 2018 (EU Member States not yet at MTO) 23
2.10. Planned fiscal adjustments. Vintages of stability and convergence programmes 24
2.11. 2018 final assessment of compliance with the preventive arm of the Stability and Growth Pact 27
2.12. Slovenia’s structural budget balance: alternative output gap estimations 29
2.13. Belgium: advance payments from corporations 32
4.1. Change in the general government budget balance in 2018, projections and outturn 58
4.2. Commission classification of the fiscal stance in the euro area in 2018 59
4.3. Real GDP growth projections and guidance on the fiscal stance for the euro area in 2018 60
4.4. Sustainability indicators in autumn 2017 64
4.5. Analysis of the fiscal stance in 2018 65
4.6. The fiscal stance in the euro area 67
4.7. Change in the structural balance and real net expenditure growth in 2018 by group of countries 67
4.9. Real net expenditure growth, projections and outturn 68
4.8. Change in the structural balance and fiscal requirements, projections vs. outturn 69

European Fiscal Board
LIST OF BOXES
2.1. The preventive arm of the Stability and Growth Pact (SGP) in a nutshell 19
2.2. The margin of discretion: a new element in assessing compliance 21
2.3. How the final assessment of compliance has evolved under the preventive arm of the SGP 29
2.4. The corrective arm of the Stability and Growth Pact (SGP) in a nutshell 34
2.5. Implementation of the Stability and Growth Pact for Italy in 2018 36
4.1. Guidance issued by the Commission, the Council and the EFB 60
5.1. Other proposals to reform the EU fiscal framework 72
A1. Reading the overview tables A1, A2 and A3 92

FOREWORD
European Fiscal Board
Prof. Niels Thygesen
Chair of the European Fiscal Board
In this third Annual Report from the European Fiscal Board (EFB), we provide an overview of how the fiscal rules have been implemented over the latest year for which information about the course of the European Semester is fully available, i.e. 2018. We also provide, as in earlier years, an analysis of the contributions made by the national independent fiscal institutions (IFI) to surveillance, with in-depth comments on two of them – Spain and Sweden. We further look back at the advice provided by the Commission and the Council, as well as by the EFB, on what seemed an appropriate fiscal stance for the euro area in the aggregate in 2018, both when seen from the 2017 perspective and with the benefit of hindsight. The final chapter contains a summary of the conclusions of a report in which the EFB was asked by the Commission President to assess the impact of the six and two-pack legislation of 2011 and 2013.
The year 2018 was in several respects a transition year from the slowly accelerating recovery which had been under way since 2013-14 to a very gradual slowdown since the middle of the year. Due to the strong momentum from 2017, the outturn for the whole of 2018 was broadly in line with what was anticipated, and economic growth remained a bit in excess of the trend, while unemployment continued to decline moderately. Public finances turned out stronger than expected, mainly due to windfall gains in revenues, i.e. beyond the effects of rising incomes; the underestimation of revenues was particularly pronounced in Germany. The overall change in the structural budget balance was very close to being neutral. However, when the focus is on the rate of growth in net public expenditures – an indicator preferred by the EFB – a signal of fiscal expansion is flashed. This was hardly appropriate in a year when resource utilisation, whether measured by the
output gap or by employment, was at a high and growing level.
Concerns about the appropriateness of the fiscal stance grow when one looks at the country composition. Most of the expansionary fiscal changes were observable in seven Member States with very high debt. While all countries had by 2018 exited the deficit-based EDP – and Greece its conditional program –, the headline deficit ratio had gradually become a relatively soft target as the recovery proceeded. But a high degree of vulnerability continued to pose risks to the very-highly indebted countries which should have put more emphasis on building buffers against a future slowdown.
The implementation of the fiscal rules, though marked by new elements of flexibility, did not help to check this evolution and did not lead to better compliance. The Commission introduced a ‘margin of discretion’, a more explicit attempt to address the trade-off between ensuring sustainability and leaving room for counter-cyclical stabilisation, in itself appropriate, but the initiative came on top of other dimensions of flexibility and rather late in the recovery. The approach would have required a clearer demarcation of economic analysis from political decisions than is currently observable.
The efforts to take specific national circumstances into account and to use several opportunities to delay adjustment did give cumulative strength to the trend the EFB had observed in previous reports, viz. to make the fiscal framework ever more complex and opaque – and to lead to an increasingly bilateral practice in surveillance. On the whole, the experience of 2018 provided a growing number of illustrations of the weaknesses of implementation, discussed in the EFB Assessment Report of August 2019.
For the first time ever, the Commission asked for a revised draft budgetary plan (DBP). Italy presented in October 2018 a DBP not in compliance with the debt reduction benchmark. While the procedure under Article 126(3) of the Treaty was halted on the basis of a commitment by the government to consolidate in 2019-20, the process led to criticism, well justified in the view of the EFB, of a lack of transparency and deviation from past practice.

European Fiscal Board
2
A number of IFIs, e.g. in France and Italy, intervened in the surveillance process to flag downside risks to the forecasts on which budgets were based; others criticised an insufficient medium-term orientation of policies. While the involvement of the IFIs has added significant elements of decentralisation and transparency to the surveillance process, the effectiveness of IFIs should be strengthened by defining a set of minimum standards with respects to mandate, resources and access to information, as the network of EU IFIs has already proposed.
The perspective of the EFB on the EU fiscal framework has been enriched this year by combining the more granular approach of annual
experience in our Annual Reports with the longer-term lessons since the legislative reforms of nearly a decade ago. In our Assessment Report of August 2019, summarised in Chapter 5 of this Annual Report, we offer a number a specific criticisms of the fiscal framework, arguing that the rules leave much room for simplification and reforms. The framework may have made a contribution to underpinning sustainability in the less indebted EU countries, but it has neither improved the record of often pro-cyclical policies of the earlier regime, nor protected the quality of public expenditures – in the sense of growth-enhancing investments – from major cutbacks. The present Annual Report brings additional examples of this record, making the case for an update of the framework more urgent.

1. EXECUTIVE SUMMARY
European Fiscal Board
This annual report documents the work of the European Fiscal Board for the 2018 cycle of EU fiscal surveillance. In accordance with the mandate assigned by the Commission to the Board, this report offers a comprehensive and independent assessment of the implementation of the Stability and Growth Pact. The assessment covers the 2018 fiscal surveillance cycle, which is the most recent complete annual cycle of economic surveillance in the EU. It starts from the fiscal guidance provided by the Council in the 2017 country-specific recommendations (CSRs) and ends with the final assessment of compliance performed in spring 2019. The report also assesses the appropriateness of the aggregate fiscal stance of the euro area in 2018 and how this aggregate stance results from the individual fiscal policies of euro area Member States.
Economic activity in the euro area and in the EU continued to expand in 2018, but at a slower pace. While 2017 was a year of robust economic expansion in the EU, underpinned by a strong cyclical upswing in external demand, economic growth slowed down in 2018 on the back of weakening global activity and trade tensions. External demand deteriorated substantially, but real GDP growth in the euro area and the EU remained nonetheless robust, at 1.9% and 2.0% respectively. These rates are in line with the average growth performance registered after the crisis and are also above current estimates of potential growth. The economic expansion in 2018 was particularly job-rich, with robust growth in employment and wages. This, however, had only a limited pass-through to underlying price pressures: core inflation in 2018 remained subdued, in line with previous years, and a headline inflation rate of 1.8% was mostly driven by rising energy prices.
Economic growth was broadly in line with the projections underpinning the medium-term fiscal plans of Member States. Forecast errors tend to have a cyclical pattern: economic projections turn out to be pessimistic during upturns and optimistic during downturns. This feature is confirmed across the various forecast vintages for 2018. Earlier forecasts for 2018 were progressively raised to account for the successive
growth surprises observed in the course of 2017 and were subsequently lowered in light of a string of negative news in the second half of 2018. At the end of 2018, economic growth turned out to be broadly in line with the medium-term projections originally embedded in the Member States’ stability and convergence programmes of spring 2017. As a result, the macroeconomic outlook did not turn out to be a source of budgetary slippages.
While the macro outlook was in line with initial expectations, fiscal positions turned out to be better than anticipated. Fiscal projections suffer from two major sources of risk: the macroeconomic outlook and budgetary developments. The latter played a prominent role in 2018. Medium-term fiscal plans in spring 2017 envisaged an aggregate budget deficit of around 1% of GDP for 2018, in both the euro area and the EU as a whole. The actual budget deficit turned out to be around 0.5% of GDP, as the economic expansion turned out to be more job-rich than predicted, leading to unexpected windfalls in the collection of income and wealth taxes. In the euro area, revenues came in 0.8% of GDP higher than planned the stability programmes, of which only 0.1% is explained by new discretionary fiscal measures. At the same time, the continuation of an exceptionally accommodative monetary policy by the European Central Bank throughout the year led to lower-than-expected debt servicing costs for Member States, generating further fiscal leeway.
Better-than-expected revenues largely explain the measured improvement in the structural budget balance of the euro area. The structural primary balance of the euro area improved by 0.1% of GDP in 2018. This was in line with the overall fiscal adjustment required under the Stability and Growth Pact (SGP), as set out in the country-specific recommendations of spring 2017. However, since the structural budget balance is calculated using a constant budgetary elasticity, this marginal improvement includes the higher-than-normal revenue content of GDP growth mentioned above. Furthermore, around half of those windfalls occurred in Germany, which was already at its medium-term budgetary objective (MTO). Similarly, lower interest expenditure

European Fiscal Board
4
generated additional fiscal leeway for euro area governments, but this cannot be considered a fiscal effort since financing conditions are not directly under the control of the government. As a result, the underlying budgetary positions of many euro area Member States did not improve.
Net expenditure growth in 2018 exceeded potential growth, indicating a fiscal loosening in the euro area. The medium-term potential growth rate for the euro area, calculated as a 10-year forward- and backward-looking average, is currently estimated at a disappointing 1.0%. Under the Stability and Growth Pact, this estimate represents the main anchor of the expenditure benchmark. It is meant to measure the rate of increase in net primary expenditure ensuring a neutral fiscal stance, i.e. consistent with no improvement or deterioration of the underlying budgetary position over the cycle. In 2018, primary expenditure net of discretionary revenue measures grew by almost 2%, signalling a measurable fiscal expansion. Furthermore, many Member States experienced expenditure slippages compared to medium-term fiscal plans. Hence, like in past years, favourable economic conditions have not been used to build fiscal buffers in many Member States.
The conflicting signals from the two indicators, the structural balance and the expenditure benchmark, complicated the assessment of the fiscal stance. In its 2017 June report, the EFB advised a neutral fiscal stance for the euro area as a whole as compared to the broadly neutral recommendations of the Commission and the Council. While the change in the structural primary balance suggests that the aggregate fiscal outcome was in line with the EFB’s advice, net expenditure growth – an indicator which the EFB generally considers as more reliable – signals that fiscal policy was overly expansionary.
Economic conditions and sustainability risks warranted fiscal adjustment in high-debt Member States. Economic conditions in the euro area have greatly improved compared with the years of the crisis. The year 2018 was the fifth consecutive year of positive real GDP growth. The latest Commission forecast suggests that the euro area output returned to its potential already in 2017. While output gap estimates are surrounded by considerable uncertainty, the improved macroeconomic outlook is confirmed by the overall robust pace of growth for the euro area in 2018, and by the continued reduction in the
unemployment rate, which declined to 8.2% in 2018, below its average pre-crisis level. At the same time, risks to medium-term fiscal sustainability remained significant in high-debt Member States. Overall, based on the economic conditions in 2018, high-debt Member States should have taken advantage of the improved situation to build up fiscal buffers, which would have resulted in a modest fiscal retrenchment in the euro area as a whole.
In several cases, the estimated progress towards the MTO was partly the result of statistical revisions. Only eight euro area countries were required to consolidate their public finances in 2018 (1), since all other Member States were estimated to be already at their MTOs. The only exception was Finland. In exchange for further structural reforms under the existing flexibility provisions, Finland was granted the possibility to pursue a moderate fiscal expansion although it was not above its MTO. While the overall picture of formal compliance with the requirements of the preventive arm looks positive, estimates of the underlying fiscal position of several Member States have benefited from statistical revisions in potential output, which tend to be pro-cyclical. Some of these revisions were the consequence of country-specific modifications to the commonly agreed methodology used to estimate potential output. Together with revenue windfalls, statistical revisions portray a rosier picture of Member States’ fiscal positions vis-à-vis their MTOs.
New forms of flexibility and discretion were applied in the 2018 annual cycle of surveillance. At the start of the cycle, fiscal guidance departed from the established practice with the application of what is referred to as the margin of discretion. At the end, the overall assessment of compliance went also beyond the conventional indicators – the structural balance and the expenditure benchmark – to either include ad hoc modifications or additional information not provided for in the rules. Greater discretion was also applied in the economic measurement of slack, and in the related assessment of the structural fiscal position. Finally, a debt-based based excessive deficit procedure (EDP) was not opened for Italy despite its clear departure from the required adjustment path (1) In line with past years, the analysis excludes Member States who
under a macroeconomic adjustment programme, because they are subject to a separate regime of fiscal surveillance. Therefore, Greece is excluded from the analysis throughout this report.

European Fiscal Board
5
towards the MTO. Except in a few instances, the Council did not disagree with the Commission on how discretion was applied.
While provided for in the legislation, the continued use of two separate indicators for assessing compliance in the preventive arm remains problematic. Under the preventive arm of the SGP, Regulation (EC) No 1466/97 establishes that compliance with fiscal requirements is assessed in an ‘overall assessment’ on the basis of two separate indicators: the structural balance and the expenditure benchmark. The expenditure benchmark has, however, been identified as the best indicator because, unlike the structural balance, it is not affected by revenue windfalls and is less prone to pro-cyclicality. Accordingly, at the end of 2016 the Council adopted an opinion to strengthen the role of the expenditure benchmark in the preventive arm (2). Nonetheless, the structural balance remains in use in assessing compliance. Relying on two separate indicators, which often provide conflicting signals on the size and direction of the fiscal stance, remains an obstacle for a predictable and transparent implementation of the SGP.
The Commission applied new elements of discretion when issuing fiscal guidance to Member States. Under the European Semester, fiscal requirements for a given year are laid down in the CSRs published in the spring of the preceding year. For the first time, the CSRs adopted in 2017 applied what is referred to as the ‘margin of discretion’ in defining fiscal requirements for Italy and Slovenia in 2018; the Commission proposed the margin, but Member States did not explicitly agree on its implementation. By taking into account indicators to assess the fragility of an economic recovery, on top of the elements provided for by the agreed matrix of adjustment, the ‘margin of discretion’ implied a departure from the established methodology to set fiscal requirements. By reducing the predictability of initial fiscal guidance, the ‘margin of discretion’ further weakens the medium-term orientation of fiscal policies in the EU.
Spain exited its excessive deficit procedure but continued to pursue a nominal strategy. Spain, the only Member State still under an excessive deficit procedure (EDP) in 2018, continued to (2) Council of the European Union (2016), ‘Improving the
predictability and transparency of the SGP: a stronger focus on the expenditure benchmark in the preventive arm’. 29 November.
pursue a ‘nominal strategy’, aiming to reach the 3% of GDP deficit ceiling on account of tailwinds in the economic cycle, rather than by delivering the required fiscal effort. Although Spain fell short of both the required structural adjustment and the nominal deficit target included in the last Council recommendation, the EDP was abrogated in the end. The possibility of pursuing a nominal strategy remains a source of discontinuity between the corrective arm and the preventive arm of the SGP.
In many Member States, there were substantial gaps in compliance with the SGP requirements. In its final assessment, the Commission evidenced that 12 Member States were in significant deviation on the basis of at least one of the two established indicators: the structural balance and the expenditure benchmark. In seven of these cases, both indicators pointed to a significant deviation: Belgium, Ireland, Italy, Hungary, Romania, Slovenia and Slovakia. However, only in three cases (Italy, Hungary and Romania) did the Commission conclude that there was evidence of a significant deviation from the requirements of the preventive arm. In the end a significant deviation procedure was launched only for Hungary and Romania, to whom sanctions do not apply.
In October 2018, Italy presented a draft budget for 2019 that openly rejected its commitments under the SGP. The draft budget Italy presented had a sizeable fiscal expansion planned for 2019, which was a major violation of the rules. In its exchanges with the Commission, the Italian authorities acknowledged that the draft budget was not compliant with the SGP but argued that a fiscal expansion was nonetheless needed to support the ongoing economic recovery. For the first time since the entry into force of the two-pack legislation, the Commission asked the government to submit a revised draft budget. But the Italian authorities initially failed to substantially modify the budget. The Commission also took the first steps envisaged by the Treaty towards opening an EDP. However, it decided not to open an EDP after the government adopted an amended budget law with a lower projected deficit.
The Commission did not recommend corrective measures for Italy, despite a significant deviation in 2018. In spring 2019, based on budgetary outturns in 2018 and its latest forecast, the Commission assessed the existence of a significant deviation across 2018, 2019 and 2020,
European Fiscal Board
6
and non-compliance with the debt reduction benchmark throughout all three years. Given that compliance with the preventive arm of the SGP was established as a key relevant factor for assessing compliance with the debt criterion, the Commission initiated a report under Article 126(3) of the Treaty on the Functioning of the European Union outlining the case for opening a debt-based EDP. The procedure was later halted following a commitment by the government to implement additional consolidation measures in 2019 and 2020. This is a break with past practices, when an established breach of rules typically led to a Council recommendation to correct ‘gross errors’.
In the case of Belgium, the Commission considered there was insufficient ground to formally conclude on a significant deviation for 2018. As already discussed in the 2018 annual report, Belgium benefited from a sharp increase in corporate income tax payments in 2017 and 2018, which resulted from a shift in the timing of tax collection. The Commission and the national authorities have been in disagreement over the statistical treatment of this revenue measure, the Commission considering it a one-off event and Belgium considering it a structural measure. Already in the 2017 assessment cycle, the Commission refrained from reaching a final verdict, although both established indicators suggested a significant deviation, and this approach has been maintained for the 2018 cycle. The inability to reach a final verdict on the statistical treatment of fiscal measures injects further uncertainty in the economic governance framework. Furthermore, since the enforcement of fiscal rules hinges on an assessment of compliance, the integrity of the SGP is undermined by a situation where conclusions on compliance cannot be drawn because of the presence of uncertainties.
In the cases of Latvia, Portugal and Slovakia, the overall assessment considered elements beyond the two established indicators of compliance. When assessing compliance for 2018 the Commission, on the one hand, stated that the assessment of the two established indicators – the structural balance and the expenditure benchmark – pointed to a significant deviation, on the other hand, it reasoned that there was no sufficient ground to conclude that a significant deviation existed. This conclusion was based on the consideration of additional information, such as the distance from the MTO, the level of the headline deficit and debt dynamics. The assessment
for Portugal also considered a modified version of the expenditure benchmark, which is not explicitly provided for in the rules. A similar approach was used in the cases of Estonia and Ireland.
In the case of Slovenia, an alternative estimate of the output gap was used in the final assessment, which made a material difference for the conclusions. In 2017, the Commission introduced a ‘plausibility tool’ to assess the reliability of output gap estimates. Based on its spring 2019 forecast, the Commission reached the conclusion that, in light of the uncertainty surrounding real-time output gap estimates, considering an alternative level for the output gap was appropriate: 1.5% of GDP rather than 3.3%. This led to a recalculated estimate for the structural budget balance of Slovenia, which became a slight surplus. On this basis, the Commission concluded that Slovenia was close to its MTO, and therefore an assessment of compliance was no longer needed, despite an observed significant deviation from the required fiscal effort using standard estimates. However, although it was considered at its MTO under the recalculated output gap, Slovenia received in its CSRs a recommendation to pursue a further adjustment. While the plausibility tool has been used several times in the past, its application for Slovenia in 2018 constitutes the first instance when this tool made a significant difference in implementing the SGP.
In several euro area Member States, the gaps in compliance were already reflected at the planning stage. In autumn 2017, the Commission assessed that six Member States had presented draft budgets for 2018 that were ‘at risk of non- compliance’. This indicated that – according to the Commission forecast at the time – implementation of these budgets would have resulted in a breach of the rules. These Member States were Belgium, France, Italy, Austria, Portugal and Slovenia (3). In a number of Member States, there is a recurring tendency to present draft budgets that are at risk of significant deviation: in particular, Belgium, Italy, Portugal and Slovenia presented budgets at risk of significant deviation in all of the last three years. Incidentally, all these Member States turned out to deviate from the required adjustment path in the final assessment for 2018 based on the conventional indicators, namely the expenditure benchmark and the structural balance.
(3) In March 2018, Austria presented an update of the draft
budgetary plan, which was found broadly compliant with the requirements of the SGP.

European Fiscal Board
7
The 2018 surveillance cycle confirms once again the inherent difficulty in imposing sanctions on Member States. Corrective procedures were launched only for Hungary and Romania, which were put under the significant deviation procedure. Non-euro area Member States are exempt from financial penalties in case of non-compliance with the SGP. Euro area Member States, on the other hand, may be subject to sanctions under both the preventive and corrective arm of the pact but, so far, this has proven difficult to implement. This calls for a reform of the EU economic governance framework, which goes beyond a simple revision of the rules, and crucially incorporates revisions in the existing governance architecture. One of the main objectives of such a reform, as outlined in the 2018 annual report, should be to separate the economic analysis, which underpins the assessment of compliance, from the decision to launch corrective procedures and sanctions, which is inherently political.
In some Member States, independent fiscal institutions (IFIs) played an important role in strengthening transparency and accountability. Like in previous years, several IFIs intervened in the 2018 assessment cycle to flag downside risks to medium-term economic forecasts (e.g. in France and Italy). In some cases, IFIs took a proactive role in flagging compliance risks in fiscal plans (e.g. in Austria and Belgium). Several IFIs (e.g. in Spain and Slovenia) also criticised an insufficient medium-term orientation in government fiscal policies. Finally, in a number of Member States, IFIs enhanced the transparency of the electoral process by assessing the fiscal impact of political programmes (e.g. in the Netherlands, Latvia and Slovenia).
Defining a set of minimum standards would help to make EU IFIs more effective. EU IFIs have been designed in a number of different ways, which means their mandate, resources, and access to information may vary substantially. While EU and intergovernmental legislation have established a set of guiding principles for designing independent institutions, these were broadly defined to avoid the need for uniform solutions and allow Member States to set up institutions that reflect country-specific characteristics. As a consequence, however, some IFIs remain in a weak position, with limited safeguards to their independence. Establishing and monitoring at the EU level a set of minimum standards could make IFIs more effective while safeguarding their local
ownership. The Network of EU IFIs has already advanced a similar proposal.
In its assessment of the EU fiscal framework, the European Fiscal Board (EFB) identified a number of shortcomings in the rules. In 2019, the EFB carried out an assessment of EU fiscal rules, following a request by the President of the Commission. The EFB was mandated to assess the effectiveness of EU fiscal rules, especially in light of the six and two-pack legislation. The criteria by which the EFB was asked to assess the performance of the rules were their ability to underpin fiscal sustainability, dampen the pro-cyclicality of fiscal policy and improve the quality of public finances. The assessment identified a number of weaknesses. The most prominent ones relate to an excessive reliance on unobservable indicators in assessing compliance with fiscal requirements, a pro-cyclical use of flexibility, a tendency to backload fiscal consolidation and a diminished role for peer review in fiscal surveillance. Furthermore, a review of Member States’ budgetary policies over the last few years indicates that progress in reducing fiscal imbalances has been highly uneven. In particular, high debt Member States have been unable to significantly reverse the increase in public debt ratios that occurred in the aftermath of the Great Recession. The Board is of the view that a reform of the SGP is warranted to address these shortcomings.
The EFB proposes a four-pronged reform of the EU fiscal governance framework. Following an assessment of the existing EU fiscal architecture, the EFB is of the view that the rules should be reformed along four separate dimensions: (i) a radical simplification, which could be achieved by moving towards a single indicator – an expenditure rule linked to a debt target – and a general escape clause based on independent analysis. This implies that the numerous flexibility provisions, which currently exist, be abolished. Such a proposal for simplification was already advanced by the EFB in its 2018 annual report and is in the same spirit as proposals developed by some international institutions, think-tanks and individual academic economists. It is confirmed by the findings of the assessment; (ii) safeguarding the quality of public finances by introducing a targeted Golden Rule to protect productive public expenditures during episodes of fiscal consolidation; (iii) moving beyond uniform rules, by introducing country-specific debt targets that could be modulated on sustainability-related issues,

European Fiscal Board
8
such as long-term ageing costs; (iv) strengthening the governance of the rules, with a stronger separation between policy decisions and the underlying economic assessment. This could be achieved by granting more independence to the Directorate-General for Economic and Financial
Affairs in secondary legislation, by strengthening the political role of the Eurogroup with a full-time president, and by eliminating reverse qualified majority voting to redraw the balance between the Commission and the Council.

2. EX-POST EVALUATION OF THE IMPLEMENTATION OF THE
EU'S FISCAL FRAMEWORK
European Fiscal Board
Key Findings
Economic growth continued in 2018 both in the euro area and in the EU, albeit at a slower pace than in 2017 amid increasing uncertainty over the external environment.
Real and nominal GDP growth in the euro area and in the EU were roughly as projected in Member States’ spring 2017 medium-term fiscal plans.
Budgetary outcomes were better than planned, thanks to higher-than-expected revenues and larger-than-expected savings on interest expenditure. As in the past years, windfalls were only partially used to build up buffers, especially in high-debt countries.
Only a small part of higher-than-expected government expenditure was directed towards investment.
In the 2018 surveillance cycle, the Commission applied both established and new elements of flexibility and discretion.
The Commission lowered the fiscal adjustment requirements for Italy and Slovenia by applying the margin of discretion with the stated aim of balancing public finance sustainability against macroeconomic stabilisation needs. Both countries fell short of the reduced requirement.
In assessing compliance with the SGP, a number of cases stand out:
a) Although established indicators showed a significant deviation from the required adjustment, the Commission did not propose action for Latvia, Portugal and Slovakia. Departing from established practice, the decision was motivated by taking into account new elements in the overall assessment, such as the headline deficit and debt developments.
b) The assessment for Portugal also included an ad hoc correction of the expenditure benchmark, which nevertheless pointed to a significant deviation from the required adjustment.
c) In the case of Belgium, the Commission was of the view that, due to measurement uncertainty surrounding revenue increases, there was not sufficiently robust evidence to conclude that a significant deviation existed.
d) In the case of Slovenia, where recourse to an alternative estimate of the output gap supported the conclusion that the MTO had already been achieved, standard indicators signalled a significant deviation from SGP requirements.
e) For Italy, the Commission did not propose corrective measures despite the country’s significant deviation and non-compliance with the debt benchmark in 2018. In contrast to established practice, a commitment by the government was used as an argument for not launching an EDP.
f) The EDP for Spain was abrogated thanks to revenue windfalls. Neither the deficit target nor the required structural effort, set in the Council recommendation, were met in 2018.
Commission increased the number of country-specific changes to the commonly agreed methodology for the calculation of the output gap. The EFB would caution against a proliferation of the country-specific changes, which should remain exceptional and of a meaningful technical nature.

European Fiscal Board
10
2.1. MAIN MACROECONOMIC AND FISCAL
DEVELOPMENTS
In 2018, GDP growth in the euro area and the EU continued, albeit at a slower pace compared to the previous year. In the first half of 2018 economic growth was still dynamic, while in the second half it deteriorated on the back of weakening global activity and trade tensions. The increased uncertainties in the external environment has slowed trade with countries outside the EU and manufacturing in the euro area. Consequently, the contribution of net exports to GDP growth declined compared to 2017. However, thanks to continued growth in investment and consumption, the real GDP growth remained steady and in line with the post-crisis average at 1.9% in the euro area and 2.0% in the EU.
In the wake of continued economic growth, labour and financial markets continued to improve and remained supportive of domestic demand. The job-rich nature of current economic growth was reflected in a notable increase in employment and wages. However, wage increases did not pass through to core inflation, which remained subdued. Moreover, increased stability in the EU banking system ensured robust credit growth at relatively favourable lending conditions to the non-financial sector. Investment was further supported by deleveraging in the public and private sectors and corporate financing from internal funds.
Graph 2.1: Real GDP and its components, euro area
Source: European Commission
Real and nominal GDP growth on aggregate turned out broadly as assumed in spring 2017 when the 2018 EU fiscal surveillance cycle started. Nevertheless, macroeconomic projections for 2018 changed across successive vintages of forecast. Until spring 2018, we observed increasingly higher real GDP growth projections followed by a decrease starting in summer 2018, mainly due greater external uncertainty.
Compared to projections underpinning the 2017 stability and convergence programmes, the aggregate nominal GDP growth in 2018 turned out slightly higher (by 0.1 percentage points) for both the euro area and the EU as a whole (Table 2.3). In a few cases (i.e. Denmark, Belgium, Spain, Italy and Luxembourg), governments overestimated nominal GDP growth (see Graph 2.2). In the case of Denmark, Italy and Spain, nominal GDP growth came in below projections mainly due to a lower-than-expected GDP deflator. The lower-than-expected GDP growth in Denmark was also due to the country’s exceptionally large export activity that temporarily lifted real GDP in 2017; this came to be known only after the release of the convergence programme. As a result, the actual nominal GDP growth in 2018 was negatively affected by this temporary level change in the base year.
Unsurprisingly, nominal GDP forecast errors present a cyclical pattern. At the trough of economic cycle, in 2011-2012, most of the budgetary plans were based on overly optimistic growth assumptions. When the economic recovery strengthened, nominal GDP growth surprised on the upside for an increased number of countries. For most of the EU Member States, nominal GDP growth in 2017-2018 came in higher than projected in their stability and convergence programmes (see Graph 2.3).
Potential output estimates — a key ingredient to calculate the structural budget balance — were revised upward during the 2018 surveillance cycle. In spring 2019, the estimated level of potential GDP for 2018 was up by around 1.0% compared to the level estimated for the same year in spring 2017, for both the euro area and the EU as a whole, broadly in line with the revisions observed in the most recent years. The largest revision occurred between the spring and autumn 2017 rounds of Commission forecasting. The size of the upward revision was slightly below the revision for actual GDP (around 1 ½%).
-1
0
1
2
3
4
2014 2015 2016 2017 2018
Net export Inventories
Investment Government consumption
Private consumtion GDP growth

European Fiscal Board
11
Graph 2.3: Nominal GDP growth projections: positive vs negative growth surprises (2012-2018)
Notes: The chart shows the number of stability and convergence programmes for which actual nominal GDP growth turned out to be higher (positive growth surprise) or lower (negative growth surprise) than the one-year ahead projections underpinning the programme. The chart uses data from the stability and convergence programmes for the years 2011-2017.
Source: European Commission
The situation varies significantly across Member States (see Table 2.1). For three countries (i.e. Spain, Croatia and Italy), the upward revision in the level of potential output exceeds that of actual GDP. In other words, the revision of GDP was considered to be fully structural, rather than cyclical. In the case of Ireland, Italy, Luxembourg and Slovenia, the country-specific changes to the commonly agreed method agreed by the Economic Policy Committee (EPC) in the course of 2018
contributed, other things being equal, to the upward revision in potential GDP.
Upward revisions of potential output have important implications for fiscal surveillance. Most importantly, they improve the estimate of the structural budget balance, which in turn affects the assessment of compliance.
Table 2.1: Revision in potential and actual GDP levels in 2018: spring 2017 vs spring 2019 forecast
Source: European Commission
Turning to public finances, the fiscal positions continued to improve in 2018. The budget deficit declined from 1.0% of GDP in 2017 to 0.5% and 0.6% of GDP in the euro area and the EU as a whole respectively, the lowest levels since 2000.
0%
10%
20%
30%
40%
50%
60%
70%
80%
90%
100%
2012 2013 2014 2015 2016 2017 2018
perc
enta
ge o
f sta
bility
and c
onverg
ence p
lans
positive growth surprise negative growth surprise
potential GDP
level
% change
real GDP
level
% change
output gap
% pot. GDP
pps change
(A) (B) (C)
ES 1.5 0.8 -0.7
HR 3.9 2.5 -1.3
IT 1.0 0.9 -0.2
RO 4.4 4.6 0.1
PT 2.0 2.3 0.2
CY 5.8 6.6 0.8
CZ 2.3 2.7 0.4
MT 7.1 8.2 1.1
BG 1.4 1.6 0.3
NL 2.2 2.8 0.6
SI 2.5 3.2 0.7
HU 2.4 3.2 0.8
IE 8.4 11.3 2.7
UK 1.1 1.6 0.5
Graph 2.2: Nominal GDP growth surprises in 2018: Commission forecasts vs stability and convergence programmes
(SCPs)
Notes: (1) The chart shows the difference between actual nominal GDP growth in 2018 and the forecast of nominal GDP growth in spring 2017. (2) EU27 and EA18 refer to the EU and the euro area excluding Greece. Greece did not submit a stability programme in 2017 because Member States undergoing a macroeconomic adjustment programme are exempt from the reporting requirements of the European Semester. Source: European Commission, 2017 stability and convergence programmes, own calculations
-3
-2
-1
0
1
2
3
4
diffe
rence b
etw
een p
roje
cte
d a
nd a
ctu
al n
om
inal
GD
P g
row
th in
2018 (in
%)
Outturn versusCommission2017 springforecast
Outturn versusSCP 2017projection
positive nominal GDP grow th surprise
negative nominal GDP grow th surprise
EA countries non-EA countries

European Fiscal Board
12
Favourable cyclical conditions (i.e. real GDP grew above its potential), healthy revenue developments and declining interest expenditure were the main drivers behind the reduction in the deficit. At the aggregate level, while the structural primary balance improved marginally in 2018, by 0.1% of GDP, net government expenditure (4), which is not affected by revenue windfalls, grew faster than medium-term potential GDP; this pointed to a fiscal loosening.
At the end of 2018, 12 countries were estimated to be at or above their MTO; this is the highest share since the SGP came into force in 1998. However, Graph 2.4 shows that in recent years, the increase in the number of countries at or above the MTO has gone hand in hand with a decline in the annual improvement of the underlying fiscal position. The same trend applies for all groups of countries, regardless of their initial position in relation to the MTO. These two conflicting patterns are explained by the important upward revisions of potential output mentioned above, which tend to be pro-cyclical.
Graph 2.4: Percentage of countries at MTO and change in structural balance (1998-2018)
Notes: (1) Before 2006, the MTO was equal to a balanced budget in structural terms for all Member States. (2) Position vis-à-vis the MTO based on actual estimation of the structural balance as from the Commission spring 2019 forecast. (3) Until 2003, the structural improvement is measured by the change in the cyclically adjusted balance. It is corrected for the proceeds of the sales from mobile phone licences in 2000-2001 but not for other possible one-offs. (4) The year-on-year (y-o-y) change in the structural balance is the simple average across all EU countries.
Source: European Commission, own calculations
Also in 2018, statistical revisions in GDP and, in turn, potential GDP had an important impact. As (4) The primary government expenditure net of certain items outside
the control of government and net of revenue measures.
shown in Graph 2.5, some countries were estimated to have advanced towards MTO (or have increased their distance if already above MTO) by more than the estimated structural effort.
Graph 2.5: Revision in the estimated distance to MTO and change in the structural balance in 2018
Notes: (1) Revisions in the estimated distance to MTO is calculated by comparing spring 2019 with spring 2018 round of Commission forecast estimates. (2) The year-on-year change in the structural balance is based on the Commission spring 2019 forecast. (3) The structural balance’s change as reflected by the blue dots includes the effect of the revised distance to the MTO. Source: European Commission
Gross government debt declined for the fourth year in a row by 2 pps to 87.1% in the euro area and by 1.7 pps to 81.5% of GDP in the EU as a whole. With the exception of Italy and Cyprus, debt-to-GDP was down on the previous year for all countries (5).
For most of the EU Member States, the headline budget balances in 2018 were higher than the targets set out in the 2017 stability and convergence programmes (see Graph 2.6). Notable exceptions were Spain, France, Italy and Cyprus, where budget balances came in lower than expected (6). Although nominal GDP growth in 2018 was broadly in line with the assumptions underpinning the 2017 stability and convergence programmes, revenues came in considerably higher than originally expected. These positive revenue surprises were mainly driven by the upward revision in 2017 revenue levels, producing a base (5) The debt-to-GDP ratio also increased in Greece in 2018 (by 5
pps). However, Greece is not part of this assessment, given that in 2018 Greece was still under the economic adjustment programme.
(6) In the case of Cyprus, the headline budget balance dropped to -4.8% of GDP due to one-out support measures related to the sale of Cyprus Cooperative Bank. Netting off these temporary measures, the headline budget balance would show a surplus of 3.4% of GDP in 2018.
-1.5
-1.0
-0.5
0.0
0.5
1.0
1.5
0
5
10
15
20
25
30
35
40
45
1998
1999
2000
2001
2002
2003
2004
2005
2006
2007
2008
2009
2010
2011
2012
2013
2014
2015
2016
2017
2018
% EU Member States at or above MTO
Structural balance (y-o-y change, rhs)
%
% of potential
GDP
-2
-1.5
-1
-0.5
0
0.5
1
1.5
2
BG
LU
CY
NL
RO
PL
MT
PT
DK
DE
AT SI
UK
BE
HR
SE
SK
HU
LT FI
LV
FR IT CZ IE EE
Revision in the estimated distance to MTO in 2018
Structural balance (y-o-y change)
% of pot.GDP

European Fiscal Board
13
effect, which was not yet fully anticipated in the budgetary plans of spring 2017 (7). The nominal GDP growth surprise that occurred in 2017 (8) had a permanent impact on tax bases. Therefore, the upward revision in 2017 revenue levels carried over to 2018. As for the source of the revenue surprise in 2018, three quarters came from better-than-planned income and wealth tax intakes, in line with a job-rich recovery.
Better-than-expected revenues were only partially used to build up fiscal buffers. In the euro area, almost half of the revenue surprise compared to the budgetary plans of spring 2017 was used to increase spending (see Table 2.2). Discretionary revenue measures (DRM), in addition to those already included in the budgetary plans of spring 2017, contributed only marginally to the upsurge in revenue. The pattern was similar for the EU as a whole (9). If all euro area countries had stuck to the planned expenditure levels for 2018, the headline (7) In spring 2017, when the stability and convergence programmes
were being prepared, total revenues for 2017 were still projected on the basis of a lower-than-actual nominal GDP growth.
(8) See European Fiscal Board (2018b). (9) Also compared to the draft budgetary plans, better-than-expected
revenues (around €64.1 billion) in the euro area were largely spent (nearly €23.2 billion) but less significantly (around €7 billion) after one-offs in spending are excluded.
budget deficit in the euro area would have narrowed to 0.1% of GDP instead of 0.5% of GDP. Similarly, for the EU as a whole, the budget deficit would have fallen to 0.2% of GDP instead of finishing at 0.6% of GDP.
However, the situation varied remarkably among countries. Germany alone accounted for more than half of the positive revenue surprise in the euro area. At the same time, compared to its original plan, expenditure turned out to be lower than initially planned. Conversely, many other countries showed less fiscal prudence. Spain, France and Belgium, three of the most highly indebted countries, allocated all the better-than-expected revenues, and more, to additional spending. Similarly, spending overruns occurred in Romania, which was — and remains — subject to a significant deviation procedure, and Slovakia, which the Commission assessed at risk of non-compliance with the SGP in autumn 2017.
Graph 2.6: General government budget balance in 2018; outturn vs target in the 2017 stability and convergence
programmes (SCPs)
Notes: (1) EU27 and EA18 refer to the EU and the euro area excluding Greece. Greece did not submit a stability programme in 2017 because Member States undergoing a macroeconomic adjustment programme are exempt from the reporting requirements of the European Semester. (2) Countries are ordered by increasing difference between the outturn and the 2017 SCP target. (3) Yellow triangle=budgetary target assuming actual nominal GDP growth. It aims to show what the 2018 budgetary targets could have been, if national authorities had known the actual rate of nominal GDP growth for 2018 when preparing the 2017 SCPs. It is calculated as the sum of: (i) the budgetary target for 2018 and (ii) the product of the semi-elasticity of the budget balance and the difference between actual nominal GDP growth and the forecast of nominal GDP growth for 2018. A yellow triangle above the light blue square indicates a growth surprise. A yellow triangle above a dark blue dot indicates that spending has also increased compared to the plans (i.e. the growth surprise has been only partially used to build up fiscal buffers).
Source: European Commission, 2017 stability and convergence programmes, own calculations
-6.0
-5.0
-4.0
-3.0
-2.0
-1.0
0.0
1.0
2.0
3.0
CY IT ES FR SK RO BE IE HU EE LT SE UK EA18 EU27 PT LV CZ NL AT SI FI HR DK MT DE PL LU BG
Bu
dg
et
ba
lan
ce
(%
of
GD
P)
Budgetary target of the 2017 SCP Budgetary balance outturn Budgetary target assuming actual nominal GDP growth
Budget balance below target
Budget balance above target
Budget balance broadly on target

European Fiscal Board
14
Table 2.2: Positive revenue surprise and spending revisions (net of one-offs, % of GDP)
Notes: (1) The table shows countries for which revenues came in higher than expected in their SCPs. (2) Positive revenue surprise (column A) is defined as the difference between actual revenues and those projected in the 2017 SCP. (3) The change in discretionary revenue measures (∆ in DRM, column B) shows the difference between the actual Commission’s assessment of DRM and the one underlying the Commission spring 2017 forecast. A positive sign (+) indicates a revenue-increasing change in policy measure. (4) Spending revision (column C) is the difference between the actual and projected expenditure in the 2017 SCP. (5) All the amounts in the table exclude one-off measures.
Source: European Commission, 2017 SCPs, own calculations
Compared to the plans set out in the 2017 stability and convergence programmes, five sixths of spending increases in the euro area focused on current expenditure, notably on compensation of public employees and on government current consumption. Conversely, only a small fraction (around €8 billion) of the extra spending was allocated to investment, despite sizeable savings from debt-servicing costs (around €16 billion). A similar pattern occurred in the EU as a whole.
On the other side, revenue came in lower than originally planned in Italy and Sweden. In the case of Italy, the difference between actual and projected revenues was primarily due to the non-implementation of the planned increase of the VAT rate, which had been legislated as a safeguard clause, in order to reach annual fiscal budgetary targets (10). In addition, it should be noted that Italy’s medium-term budgetary plan was based on an overly optimistic GDP growth projection. This appears as a recurrent feature of Italy’s budgetary plans, which was also pointed out by the national independent fiscal institution and outlined in our previous reports. In the case of Sweden, revenues were lower than expected due to the change in tax legislation (i.e. tax cuts).
(10) The VAT hike (estimated at around €15 billion or 0.9% of GDP
for 2018) was included in the government’s projections underpinning the 2017 stability programme, but subsequently the clause did not take effect.
2.2. THE 2018 EU FISCAL SURVEILLANCE
CYCLE
This section assesses how the SGP was implemented in 2018. Like in the two previous annual reports, it provides a full overview of the individual annual fiscal surveillance cycle, as outlined in Graph 2.7. It focuses on significant cases and developments that characterised the implementation of the SGP. The analysis is based on a careful study and review of all relevant documents produced by the Commission and the Council.
This section has two parts. The first examines recent innovations to the EU fiscal framework introduced by the Commission and the Council. The second assesses the implementation of the SGP in 2018 under the preventive and corrective arm of the Pact. Annex A includes tables showing a complete chronological overview of the 2018 annual fiscal surveillance cycle for all EU countries.
2.2.1. Innovations in the surveillance method and practice
This section will analyse the methodological and interpretative innovations to the EU fiscal framework that have been developed or refined since the 2018 annual report and that have an impact on the current and future implementation of the SGP. This includes (i) the change to the methodology for calculating the minimum benchmark, (ii) the update of the minimum MTOs, (iii) further refinements to the use of the plausibility tool for assessing the output gap, and (iv) horizontal or country-specific modifications of the commonly agreed output gap methodology by the Output Gap Working Group. We will also analyse whether changes to practice and interpretation have been reflected in the updated versions of the Vade mecum and the Code of conduct of the SGP.
Minimum benchmark
In the SGP framework, the minimum benchmark (i.e. the lowest value of the structural balance that provides a safety margin against the risk of breaching the Treaty reference value of 3% of GDP for the deficit during normal cyclical fluctuations) serves two main purposes (11). First, (11) The minimum benchmark is calculated by adjusting the reference
value of 3% of GDP to take into account the effect of normal cyclical fluctuation. Under the old methodology, the standard
countrypositive
revenue
surprise
of which:
∆ in DRM
spending
revisioncountry
positive
revenue
surprise
of which:
∆ in DRM
spending
revision
(A) (B) (C) (A) (B) (C)
MT 4.7 -0.7 2.9 PT 1.4 0.2 0.2
CZ 4.6 -0.1 3.9 IE 1.3 0.2 1.2
CY 4.3 0.4 1.1 DE 1.3 0.0 -0.5
LV 3.4 0.8 2.8 NL 1.2 -0.2 0.4
BG 2.8 0.6 0.2 RO 1.2 0.4 1.0
LU 2.8 0.0 0.8 AT 0.9 0.0 -0.1
DK 2.2 0.0 0.8 LT 0.8 0.6 0.3
FI 1.8 -0.3 0.9 BE 0.7 0.7 1.2
UK 1.8 -0.1 1.3 FR 0.6 0.1 0.7
SK 1.7 -0.1 1.9 ES 0.4 -0.1 0.4
SI 1.6 0.0 0.6 HR 0.2 0.1 -0.9
PL 1.6 0.5 -0.7 EA-18 0.8 0.1 0.3
EE 1.5 -0.2 1.3 EU-27 0.9 0.1 0.4

European Fiscal Board
15
in the preventive arm of the SGP, the minimum benchmark is one of the elements for setting the minimum MTO, the lower bound for the country-specific MTO. Second, it is used as an eligibility criterion for the flexibility clauses, as specified in the 2016 ‘Commonly agreed position on flexibility within the SGP’ (12). For this reason, in 2016 the Commission and the Member States decided to update the minimum benchmark annually instead of every three years, while leaving the minimum MTO unchanged for three years (13). The stated intention was greater transparency and better adherence to the prevailing economic situation.
formula was MB = -3 -ε*ROG, where ε is the semi-elasticity of the budget to the output gap and ROG is the representative output gap (for a more detailed explanation on how the minimum benchmark is calculated, refer to Annex 2 of the 2017 edition of the Vade mecum on the SGP).
(12) http://data.consilium.europa.eu/doc/document/st-14345-2015-init/en/pdf.
(13) See the May 2017 Revised Code of Conduct of the SGP. http://data.consilium.europa.eu/doc/document/ST-9344-2017-INIT/en/pdf
Since 2017, annual updates of the minimum benchmark have appeared increasingly more binding (i.e. higher) for most EU Member States. This was mainly due to the 25-year rolling time window of past output gap series used in the existing methodology to calculate the effect of a normal cyclical fluctuation, since it was gradually incorporating the large negative output gaps recorded during the economic crisis. In particular, the shift of the 25-year window from 1988-2012 to 1989-2013, with the inclusion of 2013, a particular negative year following the sovereign debt crisis, implied a larger safety margin and, in turn, a more demanding minimum benchmark.
As a result, on the practical implementation of flexibility provisions, the Commission decided to examine compliance with the minimum benchmark only at the time the country applied for the use of the flexibility clauses. In other words, Member States will continue to benefit from the flexibility
Table 2.3: Forecasts, targets and outturns in the euro area and the EU: 2018
Notes: (1) EU-27 and EA-18 refer to the EU and the euro area aggregates excluding Greece. Source: European Commission, stability and convergence programmes, draft budgetary plans.
Spring 2019
Commission
forecasts
(SF17)
Stability and
convergence
programmes (SCPs)
Commission
forecasts (AF17)
Draft budgetary
plans (DBPs)Outturn
Outturn vs
SF17
Outturn vs
AF17
Outturn vs
SCPs
Outturn vs
DBPs
Real GDP 1.8 1.7 2.1 2.0 1.8 0.0 -0.2 0.1 -0.2
Nominal GDP 3.2 3.2 3.6 3.6 3.3 0.0 -0.4 0.1 -0.3
Potential GDP 1.2 1.4 1.5 1.5 1.4 0.2 -0.1 0.0 -0.1
Total revenue 2.8 3.1 3.1 3.1 3.7 1.0 0.6 0.6 0.6
Total expenditure 2.7 2.3 2.8 2.6 2.7 0.0 -0.1 0.5 0.2
Primary expenditure 2.9 2.4 3.0 2.8 3.0 0.1 -0.1 0.6 0.2
Real GDP 10235 10267 10350 10396 10379 1.4 0.3 1.1 -0.2
Nominal GDP 11223 11242 11381 11365 11393 1.5 0.1 1.3 0.2
Potential GDP 10218 - 10313 - 10315 0.9 0.0 - -
Total revenue 5167 5182 5216 5207 5271 2.0 1.0 1.7 1.2
Total expenditure 5319 5288 5324 5310 5333 0.3 0.2 0.9 0.4
Primary expenditure 5100 5065 5109 5098 5126 0.5 0.3 1.2 0.5
Effect of discretionary revenue measures -15.0 5.5 -11.7 -10.9 -11.5 - - - -
one-off on the revenue side 1.2 3.8 2.4 2.6 5.2 - - - -
one-off on the expenditure side -1.9 -3.9 -2.7 -2.7 -18.9 - - - -
Output gap, % of potential GDP 0.1 -0.1 0.3 -0.1 0.6 0.5 0.3 0.7 0.7
Budget balance -1.3 -0.9 -0.9 -0.9 -0.5 0.8 0.4 0.4 0.4
Primary balance 0.6 1.0 0.9 1.0 1.2 0.7 0.3 0.2 0.3
Structural primary balance 0.5 1.1 0.7 1.0 1.0 0.5 0.3 -0.1 0.0One-off and other temporary measures -0.01 -0.02 0.00 -0.03 -0.12 - - - -
Real GDP 1.8 1.9 2.1 - 1.9 0.1 -0.1 0.1 -
Nominal GDP 3.4 3.4 3.8 - 3.5 0.2 -0.3 0.1 -
Potential GDP 1.4 1.6 1.6 - 1.6 0.2 0.0 0.0 -
Total revenue 3.1 3.4 3.0 - 3.7 0.6 0.7 0.3 -
Total expenditure 2.9 2.3 2.7 - 2.9 0.0 0.1 0.6 -
Primary expenditure 3.0 2.5 3.0 - 3.1 0.1 0.2 0.6 -
Real GDP 14089 14334 14242 - 14302 1.5 0.4 -0.2 -
Nominal GDP 15599 15579 15841 - 15883 1.8 0.3 1.9 -
Potential GDP 14057 - 14182 - 14200 1.0 0.1 - -
Total revenue 6948 6915 6963 - 7062 1.6 1.4 2.1 -
Total expenditure 7180 7089 7135 - 7163 -0.2 0.4 1.0 -
Primary expenditure 6877 6780 6839 - 6875 0.0 0.5 1.4 -
Effect of discretionary revenue measures -11.0 9.6 -8.5 - -6.0 - - - -
one-off on the revenue side 1.3 1.1 2.4 - 5.2 - - - -
one-off on the expenditure side -1.9 -3.0 -2.7 - -19.6 - - - -
Output gap, % of potential GDP 0.2 0.0 0.4 - 0.7 0.5 0.3 0.5 -
Budget balance -1.5 -1.1 -1.1 - -0.6 0.8 0.4 0.5 -
Primary balance 0.4 0.9 0.8 - 1.2 0.7 0.4 0.3 -
Structural primary balance 0.4 0.9 0.6 - 0.9 0.5 0.3 0.0 -One-off and other temporary measures 0.00 -0.03 0.00 - -0.09 - - - -
billion euro
% of GDP
year-on-year % change
billion euro percent change
Spring 2017 Revisions Autumn 2017
year-on-year % change percentage points
percent change
% of GDP
percentage points
Euro
are
a -
18
(1)
EU-2
7 (1
)
% of GDP% of GDP

European Fiscal Board
16
even if the minimum benchmark is no longer observed (14). This interpretation — which is not included in the Code of conduct of the SGP — is at odds with the commonly agreed position on flexibility which specifies that ‘an appropriate safety margin is continuously preserved so that the deviation from the MTO or the agreed fiscal adjustment path does not lead to an excess over the 3% of GDP reference value for the deficit’.
As a concrete example, in the case of Finland, the fiscal adjustment requirement for 2018 was set taking into account the flexibilities granted in 2017, which apply for three years. As a result, the required fiscal adjustment was reduced to 0.1% of GDP compared to the matrix-based requirement of 0.6% of GDP. Starting from an estimated structural deficit of 1.34% of GDP, the required adjustment would not be enough to comply with the minimum benchmark; that is, the structural balance would have remained below the minimum benchmark (see Graph 2.8). This is true not only (14) For the sake of completeness, the 2017 Vade mecum, and
subsequent editions, already included an interpretative provision according to which for the sake of predictability, [flexibility] clauses are not retracted once granted, if compliance with the minimum benchmark is altered due to future minimum benchmark revisions. See the 2017 edition of the Vade mecum on the SGP, footnote 60, page 41.
for the more stringent minimum benchmark for 2018 (-0.6% of GDP), but also to the one prevailing in 2017 at the time the eligibility for the flexibility clauses was assessed (-1.1% of GDP). The observance of a safety margin against the risk of breaching was also disregarded in autumn 2017, when requirements were ‘unfrozen’. A similar imperfection was signalled in the case of Italy in our previous report last year (15).
In January 2018, the update of the minimum benchmark for 2019 turned out again more binding than the previous update. In September 2018, following a request from the Economic and Financial Committee, the Commission presented a note with several possible alternatives for calculating the minimum benchmark.
(15) European Fiscal Board (2018).
Graph 2.7: The annual cycle of EU fiscal surveillance
Source: European Commission

European Fiscal Board
17
Graph 2.8: Continuous (non)observance of the minimum
benchmark: the case of Finland
Source: European Commission
The Commission’s preferred option, which uses the standard deviation of the cyclical component of past budget balances to measure volatility, garnered the most support. However, the decision of the December 2018 Euro Summit to include compliance with the minimum benchmark among the eligibility conditions for the ESM’s precautionary conditioned credit line (PCCL) (16) likely increased preferences for a methodology that could avert the risk of producing excessively relaxed minimum benchmarks.
Early 2019, after lengthy discussions, a compromise was reached with a few technical adjustments to the proposal, which uses a combination of the country-specific volatility and the EU-wide volatility of the cyclical component of the budget balance (17). Compared to the existing (16) https://www.consilium.europa.eu/media/37563/20181214-euro-
summit-statement.pdf (17) The volatility is measured as the simple average between the
country-specific standard deviation of the cyclical component of the budget balance and the one based on all available observations for all Member States since 1985. Thus, the minimum benchmark for a country i in time t is calculated as follows:
𝑀𝐵𝑖,𝑡 = −3 + 1.2
∗ [0.5 ∗ 𝜀𝑖 ∗ √∑ (𝑂𝐺𝑖,𝑘 − 𝑂𝐺𝑖,𝑡)
2𝑡𝑘=1985
𝑁𝑖,𝑡 − 1
+ 0.5
∗ √∑ 𝜀𝑗
2 ∗ ∑ (𝑂𝐺𝑗,𝑘 − 𝑂𝐺𝑗,𝑡)2
𝑡𝑘=1985𝑗
∑ 𝑁𝑗,𝑡 − 1𝑗
]
𝑠𝑢𝑏𝑗𝑒𝑐𝑡 𝑡𝑜 − 0.7 ≥ 𝑀𝐵𝑖,𝑡 ≥ −1.5
where εi is the semi-elasticity of the budget to the output gap for country i (constant over time), OGi,t the output gap in year t and
𝑂𝐺𝑖,𝑡 the sample mean average of the output gap of country i up to year t. The index j runs over all countries, while the index k
methodology, the Commission considers that this option has several advantages. First, the minimum benchmark remains country-specific; second, it ensures that the higher the past volatility of the economy, the higher the minimum benchmark (18); and third, using all available data since 1985 it is less sensitive to the addition (or the possible removal) of specific data points compared with the representative output gap used in the current methodology.
Changes to the current methodology were reflected in the 2019 edition of the Vade mecum, a Commission document, but not in the Code of conduct of the SGP, an agreement between the Commission and the Council. It reflects the fact that the change to the methodology was not fully consensual.
The update of the minimum MTOs
In February 2019, following the agreement on the new methodology to calculate the minimum benchmark, the Commission presented the updated minimum MTOs — for calculating which minimum benchmark constitutes a crucial element — for 2020-2022 (19). The minimum MTOs, which ensure that debt ratios converge towards a prudent level, including by taking into account the budgetary impact of ageing populations while allowing for the free operation of the automatic fiscal stabilisers (20), provide the lower bound at which Member States can set their MTO (21).
runs from the starting year (i.e. 1985) to year t. N is the number of observations in the country-specific sample (Ni,t) and in the EU countries sample (Nj,t). The volatility is increased by a factor of 1.2, to avoid excessively relaxed minimum benchmarks. The agreement also provides that minimum benchmarks will lie within a defined corridor of values of -1.5 and 0.7% of GDP, to avoid
excessively lenient or stringent MBs. (18) In the existing methodology, there was no correlation between
minimum benchmarks and the country-specific volatility of the economic cycle mainly because output gap outliers were trimmed for the aggregate distribution (i.e. including all countries). This was operated by trimming the bottom and the top 2.5% percentile of the distribution. However, outliers in the country specific distribution were not deleted from the series (unless they were in the top or bottom 2.5% of the aggregate distribution), which continued to be affected by the most negative episodes rather than the overall volatility.
(19) The new minimum MTOs were published in the 2019 edition of the Vade mecum on the SGP (April 2019): https://ec.europa.eu/info/sites/info/files/economy-finance/ip101_en.pdf
(20) For example, higher welfare spending and lower tax revenues during downturns.
(21) They were calculated using the most up-to-date projections (Commission autumn 2018 forecast) and indicators, including the cost of ageing presented in the Commission 2018 Ageing Report: Economic and Budgetary Projections for the EU Member States (2016-2070).
-1.6
-1.4
-1.2
-1.0
-0.8
-0.6
-0.4
-0.2
0.0
spring2017
autumn2017
spring2019
Structural balance in 2017 (starting point)
Structural balance in 2018 following requirement (with flexibility)
Finland's MTO in 2017-19
Minimum benchmark at the time of assessing eligibility
for f lexible clauses (2017)
Minimum benchmark in 2018

European Fiscal Board
18
For several Member States, the new minimum MTOs were more stringent (i.e. higher) than the previous ones. This was either due to the higher estimated costs of ageing (Belgium, Bulgaria, Czechia, Italy, Luxembourg, Hungary and the United Kingdom) or to the increase in the minimum benchmark (Estonia, Croatia and Romania). In the case of Italy, the more stringent minimum MTO also reflected debt sustainability challenges due to lower long term output growth projections. As a result, in spring 2019, six of these Member States were required to set higher MTOs for 2020-2022 compared to the current MTOs (Czechia, Croatia, Italy, Luxembourg, Hungary and the United Kingdom), which were triggered by a more stringent minimum MTO. At the same time, three Member States (i.e. Portugal, Slovenia and Slovakia) opted for less stringent targets compared to their previous ones. For the first two countries, the change followed a downward revision in their minimum MTOs (see Table 2.4).
Table 2.4: Minimum and actual medium-term-objectives
(MTOs): the 2018 update
Source: European Commission, 2019 stability and convergence programmes
The plausibility of output gap estimates and the use of constrained judgement
In autumn 2016, the Economic and Financial Committee (EFC) approved the use of a ‘plausibility tool’ (22) with a two-year testing period which ended in October 2018. This tool allows the Commission, when conducting its fiscal assessments, to use constrained judgement in cases where the output gap estimates of the commonly agreed methodology might be subjected to a high degree of uncertainty (23) (24). In autumn 2018, the Output Gap Working Group (OGWG) evaluated the experience with the plausibility tool and presented its findings to the EFC. As the results were positive but not robust enough to make the constrained judgement a permanent tool, the EFC extended the trial period for another year to continue developing the tool.
While it will be interesting to see if the methodology can be improved and make calculating the output gap more transparent, it also has its limits. First, it would represent an extra layer of judgement in an already complex procedure. Second, according to a simulation made by the Commission using past data, the plausibility tool does not provide robust results. In a number of cases, potential revisions were not confirmed ex-post or they even point in the wrong direction.
Country-specific changes to the commonly agreed methodology for potential output and output gap estimates
In 2018, the Commission and Member States continued to work on country-specific changes to the commonly agreed methodology. The underlying motivation of these amendments is to capture better the change in the macroeconomic developments relevant for the required structural adjustment under the SGP. In September 2017, the EFC approved the principles and governance rules for a new procedure enabling more country-specific changes to be made, if necessary, to the EU’s commonly agreed methodology for (22) For a technical description see Hristov, A., Raciborski, R.,
Vandermeulen, V., (2017) ‘Assessment of the plausibility of the output gap estimates’, Economic Brief 23.
(23) Under the EU fiscal surveillance framework, the European Commission estimates potential output and the output gap with a commonly agreed methodology endorsed by the ECOFIN Council back in 2002. The agreed methodology belongs to the category of structural models, and it estimates potential GDP using a production function approach, which brings together the potential levels of labour, capital and total factor productivity. For more details, see Box 4.2 of the EFB annual report 2017.
(24) See Havik, K. et al. (2014).
min MTO
2017-2019
MTO
2019
BE -0.50 0.00 0.00 0.00
BG -2.25 -1.25 -1.00 -1.00
CZ -1.50 -0.75 -1.00 -0.75
DK -1.00 -1.00 -0.50 -0.50
DE -0.50 -1.00 -0.50 -0.50
EE -1.00 -0.75 -0.50 -0.50
IE -0.50 -1.00 -0.50 -0.50
EL - 0.25 - 0.25
ES -1.00 -1.00 0.00 0.00
FR -1.00 -1.00 -0.40 -0.40
HR -1.75 -1.25 -1.75 -1.00
IT -0.50 0.50 0.00 0.50
CY -1.00 -1.00 0.00 0.00
LV -1.00 -1.00 -1.00 -1.00
LT -1.00 -1.00 -1.00 -1.00
LU -1.00 0.50 -0.50 0.50
HU -1.50 -1.00 -1.50 -1.00
MT -0.50 -1.00 0.00 0.00
NL -1.00 -1.00 -0.50 -0.50
AT -0.75 -0.75 -0.50 -0.50
PL -1.25 -1.50 -1.00 -1.00
PT 0.25 0.00 0.25 0.00
RO -1.75 -1.25 -1.00 -1.00
SI 0.25 -0.25 0.25 -0.25
SK -1.00 -1.00 -0.50 -1.00
FI -1.00 -1.00 -0.50 -0.50
SE -1.25 -1.50 -1.00 -1.00
UK -0.75 -0.50 -0.75 -0.50
min MTO
2020-2022
MTO
2020

European Fiscal Board
19
calculating the potential output growth (25). The OGWG holds a mandate to evaluate the possibility of including a selection of changes in the common methodology. In the first half of 2018, the OGWG finalised the first batch of 10 country-specific cases and in the second half of 2018 a second batch of eight cases.
The Economic Policy Committee (EPC) adopted six changes to the commonly agreed methodology relative to five countries (Lithuania, Luxembourg, (25) See Chapter 2.2.1 EFB (2018) for a detailed presentation of the a
more reliable output gap estimation.
Italy - two cases, Slovenia, and Ireland). The detailed descriptions of the cases are presented in Table 2.5. This process presents a new step in the direction of a more structured and transparent way of estimating the impact of the country specific changes on the estimation of the output gap.
However, the impact of those changes on the estimation of the structural balance remains uncertain. Most of the changes appear to go in the direction of lifting the potential GDP and therefore of widening the output gap and reducing fiscal efforts, other things being equal. While the process
Box 2.1: The preventive arm of the Stability and Growth Pact (SGP) in a nutshell
Legal basis: Article 121 of the Treaty on the Functioning of the European Union (TFEU) and Council Regulation
(EC) 1466/97 ‘on the strengthening of the surveillance of budgetary positions and the surveillance and coordination
of economic policies’, amended in 2005 and 2011. Elements of the two-pack legislation (2013) complement the legal
basis of the preventive arm of the SGP.
Objective: To promote sound management of Member States’ public finances by requiring national governments to
achieve and maintain their medium-term budgetary objective (MTO).
MTO: A country-specific budgetary target, expressed in structural terms, i.e. corrected for the budgetary impact of
the economic cycle and temporary and one-off factors. It is built by considering a country’s debt level and the
sustainability challenges posed by the costs of an ageing population. It is defined to allow automatic stabilisers to
operate freely, while preventing the deficit from breaching the Treaty reference value of 3% of GDP under normal
cyclical fluctuations.
Adjustment path: Member States that are not at their MTO are required to implement a fiscal adjustment. The
required annual adjustment amounts to 0.5% of GDP as a benchmark and can be modulated according to prevailing
cyclical conditions and the level of government debt. The matrix of adjustment requirements introduced in 2015 details
the degree of modulation around the benchmark.
Compliance indicators: Compliance with the requirements of the preventive arm is assessed using a two-pillar
approach. The assessment of the estimated annual change of the structural balance (the first pillar) is complemented
by an expenditure benchmark (the second pillar), which limits the increase of government spending relative to
potential GDP growth in the medium term, unless funded by new revenue measures.
Temporary deviations: Under certain conditions, the SGP allows for temporary deviations from the MTO or the
adjustment path towards it. Member States may request flexibility to support investment or major structural reforms.
Specific unusual events outside the control of government and severe economic downturns can also be taken into
account.
Significant deviation: A deviation from the MTO — or the adjustment towards it — is significant if larger than 0.5%
of GDP in one year or 0.25% of GDP on average over 2 consecutive years.
Significant deviation procedure: If, on the basis of outturn data, the final assessment concludes that there was a
significant deviation from the MTO or the adjustment towards it, the Commission launches a significant deviation
procedure (SDP) so as to give the Member State concerned the opportunity to return to the appropriate adjustment
path. To that end, the Commission issues a warning under Article 121(4) TFEU. The warning is followed by a Council
recommendation, based on a Commission proposal, for the policy measures needed to address the significant
deviation.
Sanctions: If a Member State under an SDP fails to take appropriate action by the given deadline, a decision on no
effective action and the imposition of sanctions for euro area countries, in the form of an interest-bearing deposit, are
possible. The interest-bearing deposit is transformed into a non-interest bearing deposit if an excessive deficit
procedure is launched (see Box 2.4).
More detailed information on the preventive arm can be found in the Vade Mecum on the SGP and the Code of Conduct
of the SGP.

European Fiscal Board
20
has its merit, the EFB would caution against a proliferation of the country-specific changes, which should remain exceptional and of a meaningful technical nature.
Table 2.5: Country-specific changes to commonly agreed output gap methodology
Source: European Commission
2.2.2. Applying the Stability and Growth Pact in 2018
In 2018, 26 EU Member States were subject to the preventive arm of the SGP, one more than in 2017, as France corrected its excessive deficit in the course of the year (see Table 2 in Annex A). Spain was still subject to the corrective arm of the SGP, while Greece successfully concluded its three-year ESM financial assistance programme on 22 August 2018. Therefore, Greece was fully integrated into the European Semester as from 2019. At the beginning of the 2018 surveillance cycle, 15 of the 26 EU Member States subject to the preventive arm of the SGP had not achieved the MTO, yet.
Policy guidance: defining fiscal requirements
In spring 2017, the Council’s fiscal recommendations for 2018 entailed three important changes compared to those issued in the past. First, the recommended fiscal effort was only quantified in the recitals — the descriptive and introductory part to the legal text. In the previous years, this was quantified in the enacting part of the recommendation, the part of the fiscal CSR that is legally binding and is meant to provide clear guidance to government on how to conduct fiscal policy over the next 12-18 months. Second, in line with the EFC Opinion on putting a stronger focus on the expenditure benchmark in the preventive arm of 29 November 2016, the recommendations quantified the required fiscal effort both in terms
of the change of the structural balance and in terms of the maximum nominal growth rate of net primary government expenditure.
The third and most important change in the country-specific recommendation for 2018 was the introduction of a new layer of discretion. As indicated in last year’s annual report, in May 2017 the Commission officially signalled its intention to apply a margin of discretion in assessing the Member States’ compliance with the SGP. Specifically, for all countries with a structural adjustment requirement in 2018 of 0.5% of GDP or above, the fiscal recital of the country-specific recommendations stated that ‘the assessment of the 2018 Draft Budgetary Plan and subsequent assessment of 2018 budget outcomes will need to take due account of the goal to achieve a fiscal stance that contributes to both strengthening the ongoing recovery and ensuring the sustainability of [the Member State]’s public finances’. This statement provided the basis for applying the margin of discretion in the Commission’s final assessment of compliance (26). In the absence of a quantified adjustment requirement in the enacting part of the recommendation and given that other qualitative elements of the country’s economic conditions can be considered, the margin of discretion allows for the possibility of finding a country compliant even if the established indicators point to a shortfall with the requirement.
In sum, adjustment requirements for 2018 were based on the matrix of requirements, with some exceptions (see Graph 2.9). The application of the margin of discretion for Italy and Slovenia were the most notable examples. In autumn 2017, the Commission carried out a preliminary qualitative analysis of the strength of the recovery in several Member States (see Box 2.2). On that basis, the Commission recommended a reduction in the adjustment requirements applicable to Italy from 0.6% to 0.3% of GDP, and a reduction in those applicable to Slovenia from 1.0% to 0.6% of GDP.
(26) On 10 March 2017, the Council, in its recommendation on the
economic policy of the euro area, had already called on Member States to achieve an appropriate balance in 2017 and 2018 between the double objective of ensuring long-term sustainability of national public finances and short-term macroeconomic stabilisation, amid uncertainty surrounding the still fragile recovery.
http://data.consilium.europa.eu/doc/document/ST-5757-2017-INIT/en/pdf
Country Description
LatviaThe EPC aknowledged the uncertainty regarding the calculation of the output gap
and agreed to adjust the depreciation rate.
LuxembourgThe EPC aknowledged a high share of cross-border workers. They agreed to
adjust the participation rate.
Italy
The EPC agreed with the proposed changes in the statistical methods used for
calculation of certain parameters that enter the labour component (NAIWRU
estimations) to obtain more robust results of the output gaps.
Italy
The EPC confirmed negative growth rates of the total factor productivity (TFP)
which contributed to the reduction of the potential output. They agreed to replace
the sentiment indicator with capacity utilisation in the service sector.
Slovenia
The EPC aknowledged the uncertainty stemming from the calculation of the
potential growth rate. They agreed on using only short-term unemployment in the
labour component (NAWRU estimation).
Ireland
The EPC aknowledged that the relocation of global companies headquarters
distorted output gaps estimates. They agreed to refine adjustment of the capital
stock.

European Fiscal Board
21
(Continued on the next page)
Box 2.2: The margin of discretion: a new element in assessing compliance
In 2018, the Commission applied for the first time the so-called margin of discretion, a new interpretation of the
overall assessment of compliance under the preventive arm of the Stability and Growth (SGP) (Article 6(3),
Regulation No. 1466/97) (1). According to the new interpretation, the overall assessment goes beyond checking
whether a country has delivered the required budgetary adjustment in terms of the expenditure benchmark and/or the
structural budget balance. It also takes into account the balance between the stabilisation and sustainability needs of a
country. Hence, the Commission’s overall assessment may conclude that a country is compliant with the SGP even if
the fiscal effort falls short of the improvement recommended under the expenditure benchmark or the structural budget
balance. In practice, the margin of discretion is meant for countries where the required fiscal effort is 0.5% of GDP or
above and where the economic recovery is assessed as ‘fragile’ or ‘further fiscal tightening might endanger the
ongoing recovery’. As a reminder: the Council did not agree to the new interpretation of the overall assessment under
the preventive arm of the SGP; see EFB (2018) Section 2.2.1.
The subsequent steps in the 2018 surveillance cycle
Spring 2017: The Commission’s intention to apply the margin of discretion in 2018 was officially signalled to the
Member States in May 2017 when the country specific recommendations (CSRs) were published. In order to prepare
for the new and extended interpretation of the overall assessment, the Commission moved the quantification of the
fiscal adjustment from the legally binding part of the CSRs and to the non-legally binding recitals. The legally binding
part simply asked Member States to comply with the SGP.
Autumn 2017: When assessing the draft budgetary plans (DBPs) for 2018, the Commission carried out an additional
analysis of the economic recovery of eight potential beneficiaries of the margin of discretion: Belgium, France,
Hungary, Italy, Poland, Portugal, Romania and Slovenia. Stabilisation needs were assessed on the basis of a series of
macroeconomic indicators such as economic growth, the rate of unemployment rate, inflation (2). Sustainability needs,
by contrast, were assessed based on short and medium term risk indicators and the level of government debt. Table 1
summarises the most relevant indicators used in the Commission analysis.
In addition to assessing the relative importance of stabilisation and sustainability, the Commission outlined the
following conditions in sequence: (i) Countries with short-term sustainability risks would not qualify for the margin
of discretion. None of the eight countries mentioned above was considered to face short-term sustainability risks. (ii)
Countries with a sufficiently robust recovery would not qualify. Belgium, France and Portugal were found to be in
this category. (iii) Countries with a fragile recovery or where a too large fiscal tightening risked jeopardising the
recovery were considered to qualify. Italy and Slovenia were assessed to be in this category (3). As a result of its
additional analysis the Commission concluded that the fiscal adjustment for 2018 could depart from the quantitative
requirements of the Pact in Italy and Slovenia. For Italy the Commission recommended a reduction of the structural
(1) See Chapter 2.2.1 EFB (2018) for a detailed presentation of the margin of discretion.
(2) The economic indicators used in the analysis carried out by the Commission to establish the stabilisation needs of a country are
(i) real GDP growth, output gap, potential output; (ii) investment: gross fixed capital formation (GFGF) growth, investment-to-GDP, capacity utilisation; (iii) labour market: employment rate, unemployment rate, labour market slack and (iii) price
developments: overall HICP, Core HICP, wages. The forecast estimates were based on the Commission autumn forecast for
2017.
(3) See Annex 13 of the Vade Mecum on the SGP – 2018 edition.
Table 1: Sustainability and cyclical indicators at the time of Autumn 2017 qualitative assessment
Short-
term
Medium-
termRecovery
Plausibility of
output gap
estimation
S0 S1 2017 2018 2017 2018 2017 2018 2017 2018 2017 2018 2017 2018 2017 2018
IT low high 132.1 130.8 1.5 1.3 fragile -0.6 0.3 high uncertainty 2.5 3.8 1.0 0.9 11.3 10.9 1.4 1.2
SI low high 76.4 74.1 4.7 4.0 not fragile 1.8 3.3 uncertainty 9.1 9.8 2.3 1.6 6.8 5.9 1.6 1.5
BE low high 103.8 102.5 1.7 1.8 not fragile -0.3 0.1 - 4.1 3.2 1.1 0.9 7.3 7.0 2.2 1.4
FR low high 96.9 96.9 1.6 1.7 not fragile -0.8 -0.2 - 3.2 3.6 1.1 0.9 9.5 9.3 1.1 1.2
HU low medium 72.6 71.5 3.7 3.6 not fragile 1.5 2.1 - 15.2 10.9 1.1 0.6 4.2 4.0 2.3 2.6
PL low medium 53.2 53.0 4.2 3.8 not fragile 0.6 1.1 - 4.2 7.9 1.6 0.8 5.0 4.2 1.6 2.1
PT low high 126.4 124.1 2.6 2.1 not fragile 0.4 1.1 - 8.1 5.3 2.9 1.2 9.2 8.3 1.5 1.4
RO low high 37.9 39.1 5.7 4.4 not fragile 0.7 1.1 - 1.6 6.5 0.7 0.4 5.3 5.1 1.0 2.9
Source: Indicators are based on the Commission reports: Draft budgetary plans 2018, Fiscal sustainability report 2015 and Autumn 2017 forecast.
Note: Reliability of output gap estimates refers to results of the plausibility tool. 'High uncertainty' means that the output gap of the commonly agreed methodology falls
outside the 90% probability bounds of the estimate derived from the plausibility tool, while 'uncertainty' refers to the 68% bounds.
Output gap
Sustainability indicators Main cyclical indicators
Debt in %
of GDP
Real GDP
growth
(y-o-y )
Investment
growth
(y-o-y)
Employment
growth
(y-o-y)
Unemployment
rate
Inflation
(y-o-y)

European Fiscal Board
22
The use of flexibility and unusual event clauses reduced Member States’ fiscal requirements, but to a lesser degree compared to previous years. No new structural reform or investment clauses have been requested or granted for 2018. Fiscal adjustment requirements for Latvia, Lithuania, Finland and Austria took into account previously granted allowances under flexibility or unusual event clauses, which are, depending on the country’s position in relation to the MTO, carried forward for three years. Requirements were also reduced for Poland and Portugal to take into account the budgetary impact of expenditure related to natural calamities (i.e. 0.07% and 0.04% of GDP, respectively).
In principle, the fiscal requirements set in spring t-1 remain unchanged over the entire surveillance cycle, unless: (i) a country experiences a worsening of its economic conditions (i.e. the output gap falls below -3% of GDP); or (ii) a country is assessed to have achieved, or have come close to, the MTO (27). In autumn 2017, fiscal requirements were lowered for Austria (28) and Finland because their starting structural balances were estimated to be closer to their respective MTOs compared to spring 2017 estimates. In spring 2019, setting the final adjustment requirements for 2018, the (27) Unlike previous practice, where such ‘unfreezing’ could occur at
each round of Commission forecasting, since the 2018 surveillance cycle, fiscal requirements can only be reviewed twice: ex ante, in autumn t-1; or ex post, in spring t+1 at the time of the final assessment.
(28) As an exception, in the case of Austria, the unfreezing also occurred in spring 2018 on the basis of the ad hoc forecast underpinning the assessment of the updated draft budgetary plans. In autumn 2017, Austria submitted its draft budgetary plan on a no-policy-change basis, in the absence of a sworn-in government.
Commission also lowered the requirements for Ireland, Latvia, Slovakia, and further lowered them for Finland due to a closer initial distance to the MTO. No cases of unfreezing for very bad or exceptionally bad cyclical conditions occurred.
In light of the frequent and sizeable revisions of output gap and structural balance estimates, finding the right balance between stability/predictability and adaptability to changing economic conditions is a challenge. As already pointed out in our previous report, the built-in asymmetry of the unfreezing principle (i.e. revisions can only lower requirements) contributes to the downward bias of fiscal adjustments (29). As an example, in the case of Estonia, the initial distance to the MTO turned out to be larger than the one estimated at the beginning of the surveillance cycle. Due to the asymmetric nature of the unfreezing rule, the fiscal requirement remained unchanged (i.e. Estonia was allowed to deteriorate its fiscal position by 0.2% of GDP) although the Commission 2017 autumn forecast was already signalling that a consolidation would have been more appropriate.
With the notable exception of Slovenia, the use of the plausibility tool and the constrained judgement (30) to test the reliability of the output gap estimates of the commonly agreed methodology did not entail changes to requirements. Based on the Commission 2019 spring forecast, the screening tool suggested that in the case of Cyprus, Lithuania, Luxemburg, Slovenia and Spain the real-time output gap estimates of the commonly agreed methodology for 2018 were (29) European Fiscal Board (2018). (30) See Section 2.2.1 of the 2018 EFB annual report.
Box (continued)
fiscal adjustment in 2018 from 0.6% to 0.3% of GDP; for Slovenia the Commission recommended a reduction from
1.0% to 0.6% of GDP.
Spring 2019. The Commission published an overall assessment for Italy and Slovenia on the 5 June 2019, without the
expected re-examination of whether, based on outturn data, the conditions for the application of the ‘margin of
discretion’ to the required fiscal adjustments were still valid. In the case of Slovenia, the margin of discretion was no
longer necessary given that the Commission applied an alternative estimation of the output gap which improved the
structural balance and found Slovenia to be close to the MTO. In the case of Italy, the Commission assessed compliance
with the preventive arm of the SGP, considering the margin of discretion as assessed in autumn 2017, despite no full
consensus on its use among Member States. The margin of discretion was also part of the 5 June Commission
assessment on the existence of an excessive deficit (Article 126(3) TFEU report). In addition, in its assessment, the
Commission referred to Italy’s economic conditions as a mitigating factor without referring to the margin of
discretion (4).
(4) Commissioner Pierre Moscovici: remarks on the spring 2019 round of fiscal surveillance for Italy following the College meeting:
http://europa.eu/rapid/press-release_SPEECH-19-3649_en.htm.

European Fiscal Board
23
subject to a high degree of uncertainty (31). However, only for the last two countries was a careful examination deemed relevant (32). The Commission’s analysis confirmed that considering an alternative, more plausible level for the output gap was appropriate for both Spain and Slovenia.
Graph 2.9: Fiscal adjustment requirements for 2018 (EU Member States not yet at MTO)
Notes: (1) Fiscal adjustment requirements are expressed in terms of year-on-year change of the structural budget balance, as a percentage of potential GDP. (2) The initial adjustment requirements are based on the matrix of requirements using the Commission spring 2017 forecast. (3) In spring 2019, the Commission, based on a constrained judgement, considered that Slovenia was close to its MTO in 2018. Therefore, no adjustment was required.
Source: European Commission
In the case of Slovenia, the structural balance, recalculated on the basis of the output gap which was considered more plausible (i.e. 1.5% instead of the 3.3% of GDP of the commonly agreed methodology), suggested that Slovenia was close to its MTO in 2018, therefore making any assessment of compliance with the preventive arm of the SGP redundant. For Spain, the Commission recommended to lower the adjustment requirement for 2020 from 1% to 0.65% of GDP given that, according to the alternative estimation of its cyclical position, Spain could be in normal times rather than good times (33).
Fiscal requirements were also revised to take into account earlier Council recommendations for the correction of significant deviations. In spring 2018, (31) However, only Cyprus was a ‘clear-cut’ case, which means that the
output gap of the commonly agreed methodology fell outside the 90% probability bounds of the estimate derived from the plausibility tool.
(32) Cyprus, Lithuania and Luxemburg were estimated to have already achieved their MTOs and were expected to remain above them. Therefore, the uncertainty surrounding the output gap estimates was considered irrelevant for assessing their compliance with the preventive arm of the Pact.
(33) The fiscal requirement for Spain was also lowered in 2019 on the basis of a similar analysis.
following the opening of a significant deviation procedure (SDP) for Hungary and Romania, the Council issued recommendations requesting that the two countries correct the significant deviation from the adjustment path towards the MTO. In the case of Romania, given the need to correct for the cumulated deviation in 2016 and 2017 and the risk of breaching the reference value of 3% of GDP, the Council recommended an additional effort of 0.3% of GDP in 2018, raising the required adjustment to 0.8% of GDP.
Table 2.6: Output gap estimates flagged by the plausibility tool in the 2018 surveillance cycle
Notes: An asterisk indicates a large degree of uncertainty, which means that the output gap of the commonly agreed methodology falls outside the 90% probability bounds of the estimate derived from the plausibility tool. The plausibility range, within which the Commission can exert its ‘constrained judgment’, is in square brackets. Boundaries are given by the estimate of the commonly agreed method (value on the left) and the central estimate of the plausibility tool (value on the right). Source: European Commission
As for past practice, the Council did not issue specific fiscal recommendations to countries at or above their MTO. However, to ensure an appropriate differentiation of fiscal efforts across the Member States, the Council, on account of the available fiscal space and the spillovers across euro area countries, invited Germany and the Netherlands to use fiscal and structural polices to support domestic demand and to boost investment, in particular in education, research and innovation (34).
(34) The Council amended those specific paragraphs of the
Commission's proposed recommendations by adding the sentence ‘while respecting the medium-term objective’ and by making a reference to the need to also support potential growth.
http://data.consilium.europa.eu/doc/document/ST-9564-2017-INIT/en/pdf
-1.5 -1.0 -0.5 0.0 0.5 1.0
BE
FR
UK
IE
SK
AT
LV
FI
PL
PT
LT
IT
SI
HU
RO
adjustment requirement (matrix-based, spring 2017)final adjustment requirement (spring 2019)
revised initial distance from MTO + use of flexibility
use of flexibility
margin of discretion
revised Council reccomendations
revised initial distance from MTO
autumn 2017
(year 2017)
[plausibility range]
spring 2018
(year 2017)
[plausibility range]
autumn 2018
(year 2018)
[plausibility range]
spring 2019
(year 2018)
[plausibility range]
Cyprus
[1.3 , 0.3]
Cyprus
[0.7 , -0.4]
Cyprus*
[2.3 , 0.7]
Cyprus*
[2.8 , 0.8]
- -Spain
[0.9 , -0.6]
Spain
[0.9 , -0.5]
Croatia
[0.6 , 0.0]
Croatia*
[0.9 , -0.8]
Croatia
[1.6 , 0.5]-
Italy*
[-0.6 , -1.7]- - -
- - -Lithuania
[3.6 , 1.8]
-Latvia
[2.0 , 0.3]- -
- -Luxemburg
[0.0 , -1.8]
Luxemburg
[0.6 , -1.8]
-Netherlands
[0.2 , -0.5]- -
Slovenia
[1.8 , 0.2]
Slovenia
[1.4 , 0.1]
Slovenia
[2.7 , 1.1]
Slovenia
[3.3 , 1.5]
Finland
[-0.7 , -1.5]- - -

European Fiscal Board
24
Medium-term budgetary plans in the stability and convergence programmes
In spring 2017, countries’ medium-term budgetary plans were broadly consistent with their consolidation needs. According to the 2017 stability and convergence plans (SCPs), Member States that had not yet attained their MTO intended to move towards it over the SCP horizon, with the exception of Hungary and Romania. Fiscal adjustments, as measured by the change in the recalculated structural balance (35), appeared evenly distributed over the planning horizon, especially among the euro area countries. On the other hand, Hungary and Romania deliberately planned a deterioration of their structural fiscal positions.
Graph 2.10: Planned fiscal adjustments. Vintages of stability and convergence programmes
Notes: (1) Structural fiscal adjustments (i.e. change in structural budget balance) are recalculated by the Commission based on the information contained in the stability and convergence programmes, following the commonly agreed methodology. (2) Euro area countries not at MTO at the beginning of the 2018 surveillance cycle: AT, BE, FI, FR, IE, IT, LV, PT, SI, SK, HU, PL, RO, UK. The analysis included also ES. Source: European Commission
However, one year later, medium-term plans underpinning the 2018 stability and convergence programmes were watered down, despite calls to rebuild fiscal buffers (Graph 2.10). Most of the countries reduced and back-loaded fiscal efforts. On aggregate, for countries with consolidation needs, the planned adjustment for 2018 declined from close to 0.5% to 0.1% of GDP among euro area members and from 0.9% to 0.2% of GDP for non-euro area countries. In particular, some of them were planning a structural deterioration in 2018 (i.e. Ireland, Austria, Slovenia, Latvia, Poland, Hungary and Romania) or a broadly neutral fiscal stance (i.e. Italy, France), despite repeated calls to (35) Structural balances are recalculated by the Commission based on
the information contained in the stability and convergence programmes, following the commonly agreed methodology for estimating the potential GDP and output gaps.
build fiscal buffers in light of the broad-based economic recovery (36).
Experience has shown that stability and convergence plans have a weak impact on the national budgetary process (37). Slippages are a recurring feature, rather than an exceptional circumstance. Subsequent reforms to the EU fiscal framework, in particular the 2011 six-pack reform, aimed to strengthen the link between the medium-term fiscal plans and the national budgetary process. They aimed to do this in particular by integrating the stability and convergence programmes into the European Semester for economic policy coordination and by increasing the quality and monitoring of the budgetary planning documents. However, evidence suggests that there is room for improvement.
Assessing the draft budgetary plans for 2018
In autumn 2017, all euro-area members, with the exception of Greece, presented draft budgetary plans for 2018 (38). On the back of a favourable economic outlook, draft budgetary plans implied a continued decline of the aggregate headline deficit to 0.9% of GDP in 2018. In structural terms, however, the draft budgetary plans corresponded to a slight increase in the euro area’s aggregate structural deficit by 0.1% of GDP in 2018, a figure confirmed by the Commission forecast. However, the aggregate situation masked considerable differences across countries. While several countries with healthier public finances intended to use the room for manoeuvre permitted by the EU’s fiscal rules, other countries, in particular those with major consolidation needs, were planning to deviate from the adjustment requirements. This pattern can be observed over the past several years.
Article 7(2) of Regulation (EU) 473/2013 empowers the Commission to issue a negative opinion if it identifies a case of ‘particularly serious non-compliance’. In line with the procedure outlined in the Code of Conduct of the two-pack (39), the (36) On 23 January 2018, the Council recommendation on the
economic policy of the euro area stressed that the improving economic conditions called for the need to rebuild fiscal buffers, in particular where debt ratios were high. See also International Monetary Fund (2018) and European Central Bank (2018).
(37) See Public Finance in EMU (2007). (38) Since Greece was under a macroeconomic adjustment
programme, it was not obliged to submit a plan, as the programme already provided for close fiscal monitoring (Article 13 of Regulation 473/2013).
(39) ‘Specifications on the implementation of the Two Pack and Guidelines on the format and content of draft budgetary plans, economic partnership programmes and debt issuance reports’:

European Fiscal Board
25
Commission first assesses whether, based on the content of the budgetary plans, a country is intentionally planning either a significant deviation from the MTO — or from the adjustment path towards it — or an obvious breach of the deficit or debt Treaty criteria. In autumn 2017, although the Commission assessed that none of the draft budgetary plans were in this particular situation, it addressed letters to four countries (i.e. Belgium, France, Italy and Portugal) requesting additional information about their budget plans and highlighting preliminary observations on compliance risks. All four Member States replied to the Commission without making additional commitments or amendments to the draft budgetary plans (40). France, Italy and Portugal questioned the results from the commonly agreed methodology for estimating the output gap, despite the fact that the plausibility tool did not flag any of these estimates as implausible.
On 22 November 2017, the Commission issued its opinions on the draft budgetary plans of euro-area countries (except Greece). Based on its 2017 autumn forecast, the Commission found Belgium, France, Italy, Austria, Portugal and Slovenia at risk of non-compliance with the requirements of the SGP for 2018 (41). For Belgium, France and Italy, non-compliance with the debt reduction benchmark was also projected (42). For the countries found at risk of non-compliance, the Commission invited the authorities to take the necessary measures within the national budgetary process to ensure that the 2018 budget would be compliant with the SGP. The Commission accompanied the opinion on the draft budgetary plan for Italy by issuing a (second) letter, highlighting the risk of non-compliance with EU fiscal rules, especially in light of its still very high public debt.
http://ec.europa.eu/economy_finance/economic_governance/sgp/pdf/coc/2014-11-07_two_pack_coc_amended_en.pdf
(40) In its reply, the French government announced an amendment to the budget law to introduce a one-off revenue measure on corporate income tax for 2017, with the aim of meeting the reference value of 3% of GDP and correct its excessive deficit in due time.
(41) Based on its 2017 autumn forecast, the Commission also concluded that Germany, Lithuania, Latvia, Luxemburg, Finland and the Netherlands were fully compliant with the requirements of the SGP, while Estonia, Ireland, Cyprus, Malta, Slovakia and Spain were found to be broadly compliant with the SGP in 2018.
(42) In the case of France, which was still subject to the three-year transition debt rule, non-compliance was established against a lower requirement, i.e. the ‘minimum linear structural adjustment’, which ensures compliance with the debt benchmark after 3 years.
On 4 December 2017, when discussing the Commission opinions, the Eurogroup issued a detailed statement underlining the importance of a timely and meaningful multilateral examination of the draft budgetary plans. The Eurogroup also invited all the Member States found at risk of non-compliance to consider in a timely manner the necessary additional measures to address the risks identified by the Commission and to put their budget in compliance with SGP provisions. No concrete actions were taken in response to these calls.
Germany, Austria and Spain submitted updated budgetary plans in 2018 (43). In the case of Austria, the Commission found that the updated draft budgetary plan submitted in March 2018 was broadly compliant with the SGP. For Germany, the updated draft budgetary plan submitted in June 2018 was found compliant with the SGP. In the case of Spain, the Commission was of the opinion that the updated draft budgetary plan of April 2018, was broadly compliant with the SGP. However, in its 2018 spring forecast, the Commission projected that in 2018 neither the headline deficit target nor the required fiscal effort set by the Council would be met.
The systematic recourse to the margin of broad compliance — a tolerated deviation from the adjustment requirement — in the planning phase continued in 2018. As was argued in last year’s annual report, while this margin is motivated in the final assessment by the fact that gauging discretionary fiscal policy is inherently difficult and compliance indicators are subject to some measurement error, its purpose in the planning phase is questionable. As Table 2.7 shows, some countries are inclined to include systematically this margin of broad compliance in their budgetary plans.
(43) Austria and Germany submitted their draft budgetary plans on a
no-policy-change basis, in the absence of a sworn-in government. Spain submitted a no-policy-change plan due to a delay in the budgetary process.
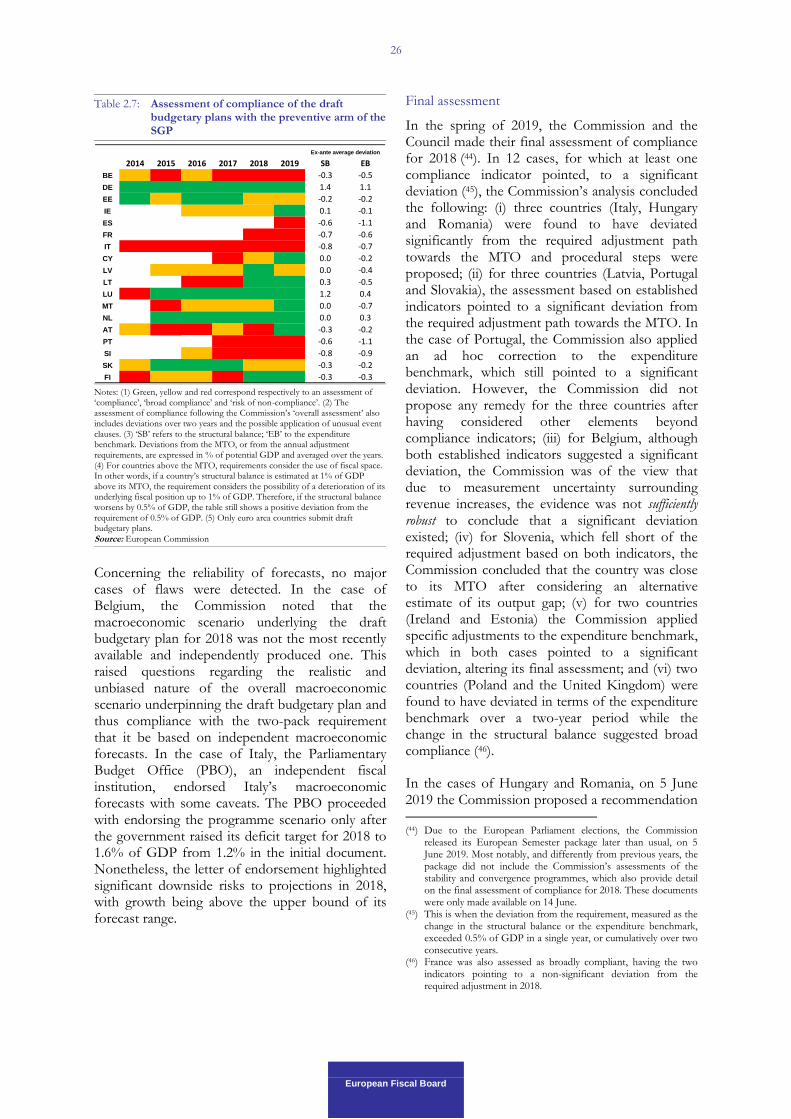
European Fiscal Board
26
Table 2.7: Assessment of compliance of the draft budgetary plans with the preventive arm of the SGP
Notes: (1) Green, yellow and red correspond respectively to an assessment of ‘compliance’, ‘broad compliance’ and ‘risk of non-compliance’. (2) The assessment of compliance following the Commission’s ‘overall assessment’ also includes deviations over two years and the possible application of unusual event clauses. (3) ‘SB’ refers to the structural balance; ‘EB’ to the expenditure benchmark. Deviations from the MTO, or from the annual adjustment requirements, are expressed in % of potential GDP and averaged over the years. (4) For countries above the MTO, requirements consider the use of fiscal space. In other words, if a country’s structural balance is estimated at 1% of GDP above its MTO, the requirement considers the possibility of a deterioration of its underlying fiscal position up to 1% of GDP. Therefore, if the structural balance worsens by 0.5% of GDP, the table still shows a positive deviation from the requirement of 0.5% of GDP. (5) Only euro area countries submit draft budgetary plans.
Source: European Commission
Concerning the reliability of forecasts, no major cases of flaws were detected. In the case of Belgium, the Commission noted that the macroeconomic scenario underlying the draft budgetary plan for 2018 was not the most recently available and independently produced one. This raised questions regarding the realistic and unbiased nature of the overall macroeconomic scenario underpinning the draft budgetary plan and thus compliance with the two-pack requirement that it be based on independent macroeconomic forecasts. In the case of Italy, the Parliamentary Budget Office (PBO), an independent fiscal institution, endorsed Italy’s macroeconomic forecasts with some caveats. The PBO proceeded with endorsing the programme scenario only after the government raised its deficit target for 2018 to 1.6% of GDP from 1.2% in the initial document. Nonetheless, the letter of endorsement highlighted significant downside risks to projections in 2018, with growth being above the upper bound of its forecast range.
Final assessment
In the spring of 2019, the Commission and the Council made their final assessment of compliance for 2018 (44). In 12 cases, for which at least one compliance indicator pointed, to a significant deviation (45), the Commission’s analysis concluded the following: (i) three countries (Italy, Hungary and Romania) were found to have deviated significantly from the required adjustment path towards the MTO and procedural steps were proposed; (ii) for three countries (Latvia, Portugal and Slovakia), the assessment based on established indicators pointed to a significant deviation from the required adjustment path towards the MTO. In the case of Portugal, the Commission also applied an ad hoc correction to the expenditure benchmark, which still pointed to a significant deviation. However, the Commission did not propose any remedy for the three countries after having considered other elements beyond compliance indicators; (iii) for Belgium, although both established indicators suggested a significant deviation, the Commission was of the view that due to measurement uncertainty surrounding revenue increases, the evidence was not sufficiently robust to conclude that a significant deviation existed; (iv) for Slovenia, which fell short of the required adjustment based on both indicators, the Commission concluded that the country was close to its MTO after considering an alternative estimate of its output gap; (v) for two countries (Ireland and Estonia) the Commission applied specific adjustments to the expenditure benchmark, which in both cases pointed to a significant deviation, altering its final assessment; and (vi) two countries (Poland and the United Kingdom) were found to have deviated in terms of the expenditure benchmark over a two-year period while the change in the structural balance suggested broad compliance (46).
In the cases of Hungary and Romania, on 5 June 2019 the Commission proposed a recommendation (44) Due to the European Parliament elections, the Commission
released its European Semester package later than usual, on 5 June 2019. Most notably, and differently from previous years, the package did not include the Commission’s assessments of the stability and convergence programmes, which also provide detail on the final assessment of compliance for 2018. These documents were only made available on 14 June.
(45) This is when the deviation from the requirement, measured as the change in the structural balance or the expenditure benchmark, exceeded 0.5% of GDP in a single year, or cumulatively over two consecutive years.
(46) France was also assessed as broadly compliant, having the two indicators pointing to a non-significant deviation from the required adjustment in 2018.
2014 2015 2016 2017 2018 2019 SB EB
BE -0.3 -0.5
DE 1.4 1.1
EE -0.2 -0.2
IE 0.1 -0.1
ES -0.6 -1.1
FR -0.7 -0.6
IT -0.8 -0.7
CY 0.0 -0.2
LV 0.0 -0.4
LT 0.3 -0.5
LU 1.2 0.4
MT 0.0 -0.7
NL 0.0 0.3
AT -0.3 -0.2
PT -0.6 -1.1
SI -0.8 -0.9
SK -0.3 -0.2
FI -0.3 -0.3
Ex-ante average deviation

European Fiscal Board
27
for a Council decision establishing that no effective action had been taken by the two countries in response to the Council recommendations of 4 December 2018, de facto closing the significant deviation procedures (SDP) opened on the basis of 2017 data. On the same day, the Commission launched a new SDP, based on 2018 data. In the case of Romania, this was the third SDP in a row and the second for Hungary. Looking at the Commission 2019 spring forecast both countries are expected to continue exhibiting significant deviation from the recommended adjustment path. In contrast to Hungary, Romania’s deficit is expected to increase above the Treaty reference value of 3% of GDP in 2019 and 2020. Without any sign of complying with the recommendation over the medium term, it shows how the non-euro area countries enter into a loop with no sanctions, which makes the procedure largely ineffective (47).
(47) The system of sanctions introduced by the six-pack reform of the
SGP of 2011 does not apply to countries outside the euro area. The only tool available, which is to request a re-programming of the EU funds under the European Structural and Investment Fund (ESIF), appears legally and procedurally difficult to apply. For more details, see the 2018 EFB annual report.
In the case of Italy, final data for 2018 showed a significant deviation from the required adjustment path towards the MTO, even after taking into account the margin of discretion. In addition, Italy did not comply with the debt reduction benchmark in 2018 according to the SGP rules. Therefore, on 5 June 2019, the Commission prepared a report under Article 126(3) of the Treaty on the Functioning of the European Union, concluding that the opening of a debt-based excessive deficit procedure (EDP) was warranted (see the next part assessing the existence of an excessive deficit).
There were several cases where the assessment of compliance involved a certain degree of discretion and interpretative add-ons to the EU fiscal framework, which may set a precedent for the future implementation of the SGP.
In the case of Latvia, Portugal and Slovakia, although the overall assessment based on the structural balance and expenditure benchmark pointed to a significant deviation in 2018, the
Graph 2.11: 2018 final assessment of compliance with the preventive arm of the Stability and Growth Pact
Notes: (1) A negative number represents a deviation from the required fiscal adjustment. A deviation is considered ‘significant’ if greater than 0.5% of GDP (the red area). A positive number indicates an overachievement (the green area). (2) Circle colours: green, yellow and red correspond respectively to an assessment of ‘compliance’, ‘broad compliance’ and ‘non-compliance’, based on the Commission’s spring 2018 assessment. A grey circle is used for the case of Belgium, Latvia, Portugal and Slovakia where the Commission’s assessment was not conclusive.
Source: European Commission
BE
BG
CZ
DK
DE
EEIE
FR
HR
IT
CY
LV
LT
LU
HU
MTNL
AT
PL
PT
RO
SISK
FI
SE
UK
-3.0
-2.0
-1.0
0.0
1.0
2.0
3.0
-3.0 -2.0 -1.0 0.0 1.0 2.0 3.0
Ex
pe
nd
itu
re b
en
ch
ma
rk i
nd
ica
tor:
de
via
tio
n fro
m r
eq
uir
em
en
t, %
of
GD
P
Structural balance indicator: deviation from requirement, % of GDP
non-compliantbroadly compliantcompliantno conclusion
OVERALLASSESSMENT
OVERALLASSESSMENT
OVERALLASSESSMENT
overachievementdeviation
ove
rachie
vem
ent
devi
ation
significant deviation threshold
sig
nific
ant
devi
ation t
hre
shold

European Fiscal Board
28
Commission concluded that there was no sufficient ground to conclude on the existence of an observed significant deviation (48). The Commission motivated this conclusion by referring to a number of factors beyond the reading of the two numerical indicators: (i) the current distance from the MTO and the planned adjustment by the government to move towards it; (ii) the headline deficit and its distance from the Treaty reference value of 3% of GDP; (iii) the actual debt level and, where it applies, compliance with the debt reduction rule.
The choice to enlarge the scope of the overall assessment is new. The introduction of the ‘margin of discretion’ in autumn 2017, which was limited to an analysis of the fragility of the recovery, had already opened the door to broader and more flexible assessment (see Box 2.3). The new cases described above have further extended the margin of discretion in the final assessment. Unlike in the past, the new elements of discretion and flexibility were applied without a prior discussion within the relevant Council committees. These extra elements in the final assessment of compliance appear (48) See Section 4.1 of the Commission assessment of the 2019
stability and convergence programmes for these countries.
somewhat to mirror those used to analyse the ‘other relevant factors’ when assessing whether an excessive deficit situation exists (49). When assessing if there is an excessive deficit, the Commission considers, among other factors, whether the country is moving towards its MTO. When assessing if there has been compliance with the preventive arm (i.e. if the Member State has observed the MTO or made an adjustment towards it), the Commission looks at nominal deficit and debt developments.
In the case of Belgium, although both the expenditure benchmark and the structural balance pointed to a significant deviation from the required adjustment path towards the MTO, the Commission did not conclude that a significant deviation existed, because of the stated uncertainty over the treatment of corporate income tax revenues, in particular whether the strong increase in advanced tax payments collected in 2017 and 2018 was to be considered temporary or permanent (50). The non-conclusive decision was a (49) Article 2(3) of Regulation (EC) 1467/97 (50) These revenue increases originated from the introduction, in two
steps, 2017 and 2018, of higher surcharges of non-payment of advanced tax payments. Following an established practice, the
Box 2.3: How the final assessment of compliance has evolved under the preventive arm of the
SGP
Since its inception, the final assessment of compliance with the preventive arm has been a key element of the Stability
and Growth Pact’s implementation. The assessment has evolved over time. The 2018 surveillance cycle included some
noteworthy innovations, setting a precedent for the Pact’s future implementation.
It started with a focus on fiscal outcomes and moved towards an evaluation of actual fiscal measures in 2005. In 2018,
the assessment moved for the first time beyond the actual fiscal effort to include other elements.
Table 1: The evolution of the final assessment of compliance
objective instrument year legal status
Assessment of fiscal
outcomes
main focus on nominal balance
(close to balance or in surplus )< 2005
legislative
change
main focus on fiscal effort measured as change in the structural balance
taking into account revenue windfalls + change in potential output.2005-2011
legislative
change
An expenditure benchmark added alongside the structural balance to measure the fiscal effort.
Conclusion follows an overall assessment based on the two indicators.2011 +
legislative
change
The final assessment also takes into account elements of flexibility:
structural reform, investment and unusual event clauses.2015 +
interpretation of
legislation
Balance stabilisation
vs. sustainability
Margin of discretion:
on top of change in the structural balance and expenditure benchmark (see Box 2.2).2017 +
interpretation of
legislation
Other elements
Additional discretion:
Irrespective of the two indicators (the structural balance and the expenditure benchmark) other elements
are considered in the assessment (e.g. distance from MTO, nominal deficit, debt )
2018 +interpretation of
legislation
Assessment of fiscal
effort compared to
requirements

European Fiscal Board
29
repetition of last year’s assessment of compliance, which was equally indecisive. The 2018 EFB annual report already raised concerns about that choice, notably by highlighting the risk of: (i) creating a new category of compliance beyond those already provided by the Code of Conduct of the SGP; and (ii) further delaying the required fiscal adjustment. This year, the alleged difficulty of reaching a conclusion on the significance of the deviation in 2018 appears even more debatable. Firstly, the discrepancy between the views of Commission and the Belgian government on the temporary nature of the tax measure has narrowed. Secondly, the uncertainty vanished as the Commission indicated that even after […] considering the entire increase as structural both in 2017 and 2018, there appears to be a significant deviation over 2017 and 2018 (51). Therefore, other considerations might have guided the conclusion (see the assessment of excessive deficit for more details).
In the case of Slovenia, both the expenditure benchmark and the structural balance indicators pointed to a significant deviation from the adjustment path towards the MTO in 2018 (by 1.1% and 0.8% of GDP respectively). These gaps already considered the reduced requirement after the margin of discretion was applied (52). However, the Commission decided to reassess the structural balance of Slovenia, by replacing the output gap of the commonly agreed methodology (3.3% of GDP) with the one estimated using the plausibility tool (i.e. 1.5% of GDP). As a result, the structural balance improved from a deficit of 0.7% of GDP to a surplus of 0.1% of GDP in 2018, suggesting that Slovenia had reached its MTO, which is. a surplus of 0.25% of GDP, given the margin of uncertainty of 0.25% of GDP (see Graph 2.12).
This was the first time the plausibility tool’s outcomes and the constrained judgement was used in the final assessment to reconsider the position of the structural balance compared to the country’s MTO (53). Nonetheless, the use of the constrained
Commission considered the measure a permanent change in the timing of collection of recurrent revenue, thus shifting – at least in part – tax collection from ex post tax settlement to advance tax payments. In turn, according to the Commission’s analysis, a large part of the increase in tax revenue was considered exceptional and temporary.
(51) Commission report on Belgium of 5 June 2019, prepared in accordance with Article 126(3) TFEU (see page 7).
(52) Without considering this reduction, the deviation would amount to – 1.3% and – 1.1% of GDP respectively.
(53) In 2017, the Commission used the constrained judgement for granting the requested flexibility under the structural reform and investment clause to Finland. The structural balance recalculated on the basis of the output gap considered more plausible, was
judgement, as agreed with the Economic and Financial Committee (EFC) (54), has some limits.
Graph 2.12: Slovenia’s structural budget balance: alternative output gap estimations
Notes: (1) The chart uses central estimations of the plausibility tool carried out in the context of the 2017, 2018 and 2019 Commission spring forecasts. (2) The chart reports the alternative estimation for the structural balance in 2016 even if the plausibility tool did not flag Slovenia’s estimates as subject to a high degree of uncertainty. (3) The dotted blue line is only indicative, given that the plausibility tool can only provide estimates for output gap level and not for any changes. Therefore, it is not suitable for assessing the change in the structural balance (i.e. the fiscal effort). Source: European Commission, own calculations
Firstly, the alternative estimates of output gaps remain subject to uncertainty, an unavoidable feature of all unobservable indicators, in particular because the plausibility tool did not flag Slovenia as a ‘clear-cut’ case (55). Secondly, the output gap estimate (and the derived alternative structural balance) emerging from the constrained judgement does not replace the value of the output gap (and the structural balance) in the Commission’s official forecast or in the formal adjustment requirement in the country-specific recommendations. In addition, the plausibility tool is not designed to produce a consistent series of output gap estimates over time. Therefore, this makes it unsuitable for assessing
expected to observe the safety margin against the risk of breaching the Treaty reference value of 3% of GDP. This was the only case where the plausibility tool had a direct impact on fiscal surveillance.
(54) The EFC meeting of 25 October approved the use of the constrained judgement approach for the fiscal surveillance exercise in autumn 2016. A detailed description of the agreed approach is included in Section II.3 of European Commission (2018).
(55) It means that the output gap of the commonly agreed methodology fell outside the 68% probability bounds of the estimate derived from the plausibility tool but not outside the stricter criterion of the 90% confidence bands, which defines the ‘clear-cut’ cases in the Commission’s methodology.
-3.5
-3.0
-2.5
-2.0
-1.5
-1.0
-0.5
0.0
0.5
1.0
-1.4
-1.2
-1.0
-0.8
-0.6
-0.4
-0.2
0.0
0.2
0.4
2015 2016 2017 2018headline budget balance (rhs)
using output gaps of the commonly agreed methodology
using output gaps of the plausibility tool (central estimate)
MTO

European Fiscal Board
30
the change in the structural balance, the core measure for fiscal effort (56).
These limitations are particularly evident in the case of Slovenia. In spring 2019, while the Commission concluded that in 2018 the country had achieved its MTO, it nevertheless required Slovenia to make a fiscal adjustment towards its MTO of more than 0.5% of GDP in both 2019 and 2020. This creates inconsistency within the surveillance framework and therefore inevitably raises questions on the meaningfulness of the EU fiscal rules, beyond the well-known criticism about transparency and complexity.
In some cases, the Commission applied ad hoc corrections to compliance indicators, a practice we also reviewed in last year’s report. In assessing Portugal’s compliance with the required adjustment – and before considering the other elements mentioned above –, the Commission argued that the expenditure benchmark was adversely affected by the medium-term reference rate of potential GDP growth (57) due to the exceptionally low potential GDP growth during the crisis. Therefore, the Commission found it more appropriate to apply an ad hoc correction to the reference rate; first, by excluding the years most affected by the crisis (2012-2014), which represented an absolute novelty, and second, by using the updated estimates of potential growth rate from the 2019 spring forecast. As pointed out in last year’s annual report, these ad hoc corrections set a problematic precedent, especially because they apply asymmetrically: they are only used to make the assessment of compliance more lenient.
In the case of Ireland, both the expenditure benchmark and the structural balance pointed to a significant deviation in 2018, by 0.5% and 0.9% of GDP, respectively. While concluding that the expenditure benchmark provided a more appropriate guidance for fiscal policy, given the very open nature of Ireland’s economy, the Commission argued that it did not fully capture the additional revenue due to the continued non- (56) The plausibility tool is based on an econometric regression built
on data for a single year. It can produce estimates only for the output gap level, not for its changes. Therefore, the measurement of the fiscal effort used in the surveillance process continues to be calculated on the basis of the estimates from the commonly agreed methodology and is unaffected by the 'constrained judgement' approach.
(57) Estimated as the 10-year average of potential GDP, which comprises five years of outturn data, the year underway and four years of forward-looking data.
indexation of income tax bands (58). However, the Commission did not explain why the change in the structural balance, which should fully capture the budgetary impact of the non-indexation of tax bands, pointed to an even larger negative deviation from the required adjustment path towards the MTO.
Similarly, in the case of Estonia, the diverging signal presented by the two indicators (a significant deviation of 0.7% of GDP for the expenditure benchmark versus a deviation of 0.3% of GDP for the structural balance) was explained by the lower GDP deflator used in calculating expenditure benchmark compared to the one underlying the structural balance (59). The Commission considered the higher-than-expected price and wage pressures in 2018 as a mitigating factor in gauging the extent of the deviation. As a result, the Commission concluded that the deviation from the expenditure benchmark was not significant. That the requirement set in spring 2017 (60) has proved incorrect (see section on policy guidance) and Estonia moved far away from its MTO are facts that have not been considered.
In sum, the Commission continued to use ample discretion and qualitative judgement in assessing compliance with the EU fiscal rules under the preventive arm of the Pact. In some cases, the Commission went beyond the established and agreed practices. While the use of discretion and judgement might have been sensible given the prevailing circumstances, including allowing a stronger focus on cases where fiscal correction was considered most needed by the Commission, it inevitably set a precedent for future assessment of compliance, adding a further layer to an already complex framework.
(58) Indexation arrangements are a widespread feature of Member
States’ public finances. For example, adjusting the tax system to inflation avoids inflation driving taxpayers into higher tax brackets. In Ireland, changing tax bands was common practice up to 2008 but it was then halted to support consolidation. For that reason, the Commission has so far not recognised non-indexation as a discretionary revenue measure. In line with the commonly agreed forecast principles, the Commission included the impact of non-indexation of income tax-bands in the baseline scenario, considered as a consolidated past policy orientation.
(59) The GDP deflator used to calculating the expenditure benchmark is based on the projection of the Commission forecast at the beginning of the surveillance cycle (i.e. spring 2017) and is kept frozen. At that time, the forecast expected much lower price and wage pressures than materialised in 2018.
(60) Estonia was allowed to deteriorate by 0.2% of GDP.

European Fiscal Board
31
Assessing the existence of an excessive deficit
On 5 June 2019, the Commission issued an Article 126(3) TFEU report for Italy. This was the sixth since Italy corrected its excessive deficit in 2013 (61). According to the data notified in April 2019, Italy’s debt-to-GDP ratio increased in 2018, reaching 132.2%. It showed a clear breach of the debt reduction benchmark. After examining other relevant factors, including Italy’s non-compliance with the recommended adjustment path towards the MTO (i.e. already discounted by the margin of discretion), the report concluded that the opening of a debt-based EDP was warranted. The EFC reached the same conclusion (62), inviting Italy to take the necessary measures to restore compliance with the SGP. In its opinion, the EFC also agreed on the continuation of the dialogue between the Commission and the Italian authorities, stating that further elements that Italy may put forward could be taken into account by the Commission and the Committee.
Table 2.8: Italy’s mid-year budget correction for 2019. Impact on required adjustment towards MTO
Notes: (1) Budgetary outcomes for 2018 are based on outturn data. Deviations for 2018 already consider the reduced requirement following the application of the margin of discretion (from 0.6% to 0.3% of GDP). (2) A deviation is significant (red) if it exceeds 0.5% of GDP in a single year, or 0.25% of GDP on average over two consecutive years. (3) Flexibility in 2019 refers to the preliminary allowance of 0.18% of GDP granted to Italy for the ‘unusual event’ related to the collapse of Genoa’s bridge, which needs to be confirmed based on outturn data. Source: European Commission, EFB own calculation
On 1 July 2019, after a bilateral dialogue with the Commission, Italy adopted a fiscal correction for 2019 of around €7.6 billion. According to the Commission analysis, the budget adjustment would imply a structural improvement of around 0.2% of GDP in 2019, as opposed to a deterioration of 0.2% of GDP in the Commission 2019 spring forecast (see Table 2.8). The Commission considered the planned budget adjustment for 2019 sufficient to avert the risk of a significant deviation in 2019 and to compensate for the slippages in the adjustment path observed in 2018. As for 2020, the (61) https://ec.europa.eu/info/sites/info/files/economy-
finance/com2019_532_it_en.pdf (62) https://images.agi.it/pdf/agi/agi/2019/06/12/132729478-
6be286b8-c049-4bd7-bc7b-52ec6927160c.pdf.
Commission acknowledged the Italian government’s political commitment to achieve a structural improvement in line with the Council recommendation, including by ensuring ‘the full replacement’ of the VAT-hike safeguard clause with comparable fiscal measures (63).
The Commission informed the Council of its decision not to propose the opening of an EDP via a written Communication (64), accompanied by a slightly more analytical document explaining its assessment (65). As far as we know, no Member States opposed the Commission’s decision.
For completeness, a report under Article 126(3) TFEU for Italy was also prepared in November 2018 following the submission of its draft budgetary plan for 2019. The report concluded that the opening of a debt-based EDP was warranted (66). As for the July 2019 events, after tense discussions between the Commission and the Italian authorities, a correction to the budget prevented the opening of an EDP (for a detailed description of the December 2018 events see Box 2.5). However, it is important to distinguish the two cases. The procedural step launched in November 2018 had a forward-looking dimension, meaning that it was entirely based on the government’s intentions underpinning its draft budgetary plans for 2019 (67). Conversely, the report prepared in June 2019 was triggered by outturn data for 2018.
The implementation of the SGP for Italy in spring 2019 raises several considerations. Firstly, the decision by the Commission, agreed by the Council, to replace the opening of a formal EDP, if non-compliance is observed, with an informal future commitment is a major novelty. The Treaty, and relevant SGP regulations, assign to the Commission the role of assessing whether an excessive deficit — or a breach of the debt reduction rule — exists, and not whether a country can commit to correct it in the future. In the past, (63) https://ec.europa.eu/info/sites/info/files/economy-
finance/0.letter_pres_conte_min_tria_002.pdf (64) COM(2019) 351 final https://ec.europa.eu/info/sites/info/files/economy-
finance/communication_to_the_council_aftercollege_-_final.pdf (65) SWD(2019) 430 final https://ec.europa.eu/info/sites/info/files/economy-
finance/swd_italys_fiscal_surveillance_aftercollege_-_final.pdf (66) COM(2018) 809 final https://ec.europa.eu/info/sites/info/files/economy-
finance/1263_commission_report_211118_-_italy_en_1.pdf (67) According to the Commission, Italy’s budgetary plans entailed a
‘particularly serious non-compliance’ with the recommended adjustment for 2019.
% of GDP 2018(1) 2019 2019
2019
with flex(3)
Headline budget balance -2.13 -2.46 -2.04 -
Govenrment debt 132.16 133.74 133.32 -
Structual budget balance (SBB) -2.17 -2.40 -1.95 -
Annual change in SBB -0.09 -0.24 0.21 -
1 year deviation from the required
adjustment (2) -0.4 -0.8 -0.4 -0.2
2 years average deviation from the
required adjustment (2) -0.4 -0.6 -0.4 -0.3
Spring 2019
(Commission forecast)
July 2019
(mid-year budget correction)
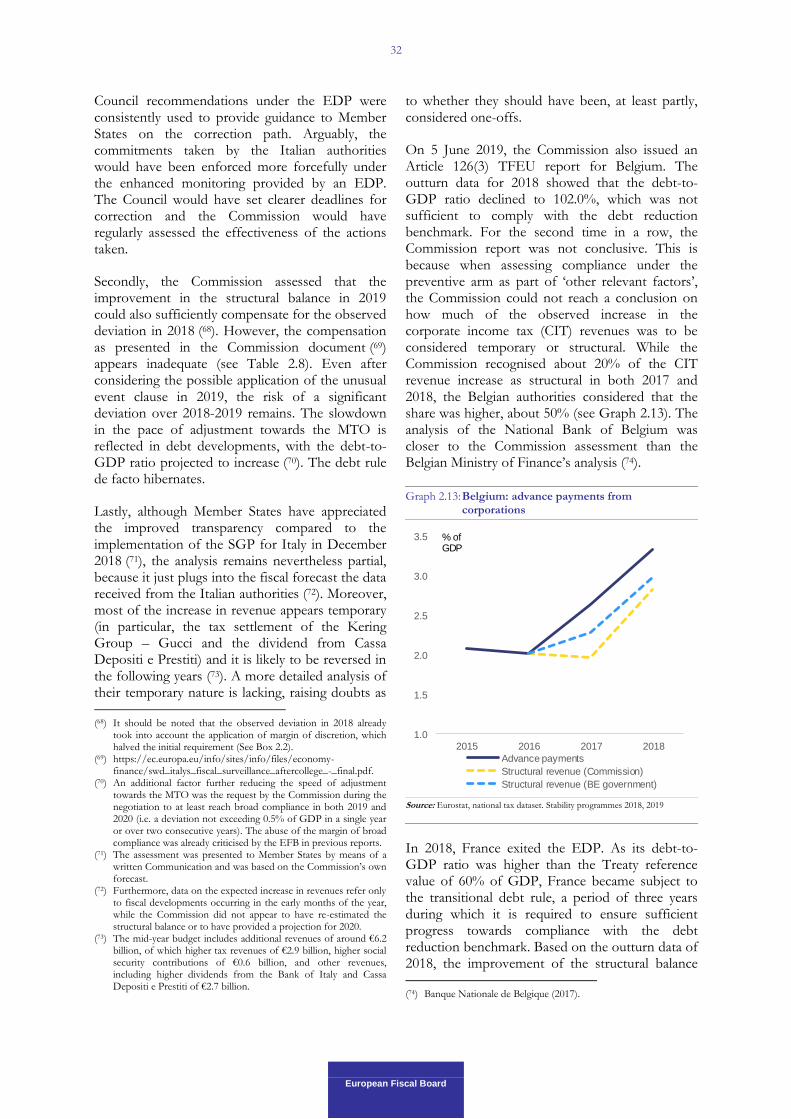
European Fiscal Board
32
Council recommendations under the EDP were consistently used to provide guidance to Member States on the correction path. Arguably, the commitments taken by the Italian authorities would have been enforced more forcefully under the enhanced monitoring provided by an EDP. The Council would have set clearer deadlines for correction and the Commission would have regularly assessed the effectiveness of the actions taken.
Secondly, the Commission assessed that the improvement in the structural balance in 2019 could also sufficiently compensate for the observed deviation in 2018 (68). However, the compensation as presented in the Commission document (69) appears inadequate (see Table 2.8). Even after considering the possible application of the unusual event clause in 2019, the risk of a significant deviation over 2018-2019 remains. The slowdown in the pace of adjustment towards the MTO is reflected in debt developments, with the debt-to-GDP ratio projected to increase (70). The debt rule de facto hibernates.
Lastly, although Member States have appreciated the improved transparency compared to the implementation of the SGP for Italy in December 2018 (71), the analysis remains nevertheless partial, because it just plugs into the fiscal forecast the data received from the Italian authorities (72). Moreover, most of the increase in revenue appears temporary (in particular, the tax settlement of the Kering Group – Gucci and the dividend from Cassa Depositi e Prestiti) and it is likely to be reversed in the following years (73). A more detailed analysis of their temporary nature is lacking, raising doubts as (68) It should be noted that the observed deviation in 2018 already
took into account the application of margin of discretion, which halved the initial requirement (See Box 2.2).
(69) https://ec.europa.eu/info/sites/info/files/economy-finance/swd_italys_fiscal_surveillance_aftercollege_-_final.pdf.
(70) An additional factor further reducing the speed of adjustment towards the MTO was the request by the Commission during the negotiation to at least reach broad compliance in both 2019 and 2020 (i.e. a deviation not exceeding 0.5% of GDP in a single year or over two consecutive years). The abuse of the margin of broad compliance was already criticised by the EFB in previous reports.
(71) The assessment was presented to Member States by means of a written Communication and was based on the Commission’s own forecast.
(72) Furthermore, data on the expected increase in revenues refer only to fiscal developments occurring in the early months of the year, while the Commission did not appear to have re-estimated the structural balance or to have provided a projection for 2020.
(73) The mid-year budget includes additional revenues of around €6.2 billion, of which higher tax revenues of €2.9 billion, higher social security contributions of €0.6 billion, and other revenues, including higher dividends from the Bank of Italy and Cassa Depositi e Prestiti of €2.7 billion.
to whether they should have been, at least partly, considered one-offs.
On 5 June 2019, the Commission also issued an Article 126(3) TFEU report for Belgium. The outturn data for 2018 showed that the debt-to-GDP ratio declined to 102.0%, which was not sufficient to comply with the debt reduction benchmark. For the second time in a row, the Commission report was not conclusive. This is because when assessing compliance under the preventive arm as part of ‘other relevant factors’, the Commission could not reach a conclusion on how much of the observed increase in the corporate income tax (CIT) revenues was to be considered temporary or structural. While the Commission recognised about 20% of the CIT revenue increase as structural in both 2017 and 2018, the Belgian authorities considered that the share was higher, about 50% (see Graph 2.13). The analysis of the National Bank of Belgium was closer to the Commission assessment than the Belgian Ministry of Finance’s analysis (74).
Graph 2.13: Belgium: advance payments from corporations
Source: Eurostat, national tax dataset. Stability programmes 2018, 2019
In 2018, France exited the EDP. As its debt-to-GDP ratio was higher than the Treaty reference value of 60% of GDP, France became subject to the transitional debt rule, a period of three years during which it is required to ensure sufficient progress towards compliance with the debt reduction benchmark. Based on the outturn data of 2018, the improvement of the structural balance (74) Banque Nationale de Belgique (2017).
1.0
1.5
2.0
2.5
3.0
3.5
2015 2016 2017 2018
Advance payments
Structural revenue (Commission)
Structural revenue (BE government)
% of GDP

European Fiscal Board
33
fell short of the required adjustment, leading the Commission to issue an Article 126(3) TFEU report. The overall assessment took into account, as part of the other relevant factors, the fact that the structural adjustment towards the MTO was assessed as broadly compliant – although with a large deviation of 0.4% of GDP. Therefore, the report concluded that France complied with the transitional debt rule in 2018. However, the assessment pointed to a risk of significant deviation in both 2019 and 2020 (75).
Of relevance, neither the 2019 stability programme nor the Commission 2019 spring forecast included the measures announced on 25 April 2019 by the French authorities as a result of its national debate (76). According to preliminary estimates by the French Ministry of Finance, the package will increase the deficit by 0.2% of GDP in 2020. The details of the new measures will be presented in the autumn in the draft budgetary plan.
Assessing compliance under the EDP
Following France’s correction of the excessive deficit in 2018 and the Council decision to abrogate the procedure for France in the course of 2018, only one country remained in EDP: Spain. The deadline for correcting the excessive deficit set by the Council was 2018 (77), and on 9 July 2019 the Council decided to abrogate the EDP procedure (78).
In spring 2019, the Commission assessed Spain to have corrected its excessive deficit in a timely and durable manner. The headline deficit for 2018 reached 2.5% of GDP, 0.3 percentage points of GDP above the target recommended by the Council in August 2018, but it was projected to decline further in 2019 and 2020. However, the structural balance remained unchanged in 2018, (75) In addition, while the report stressed the low debt sustainability
risk in the short term, it did not mention that France faces high medium terms sustainability risks. Accordingly, focusing on the short term only conveys a somewhat misleading picture about its sustainability challenges.
(76) Following the yellow vest protests at the end of 2018, President Macron launched a national debate (Grand Débat) on 15 January 2019 covering four major issues: taxation and public spending, public services, climate change, democracy and citizenship. On 25 April, President Macron gave a press conference to conclude the debate.
(77) Council Decision 11552/16 of 2 August 2018, giving notice to Spain to take deficit reduction measures deemed necessary to remedy the excessive deficit situation: http://data.consilium.europa.eu/doc/document/ST-11552-2016-INIT/en/pdf
(78) https://data.consilium.europa.eu/doc/document/ST-10001-2019-INIT/en/pdf.
suggesting that the estimated fiscal effort after correcting for the revision of potential growth and revenue windfalls fell short of the required effort of 1.4% of GDP (79). Nevertheless, the Commission projected the deficit to be below the Treaty reference value over the forecast horizon. This once again reflects the fact that Spain continued to follow a ‘nominal strategy’ using windfalls from better-than-expected economic growth, an issue that was already highlighted in previous EFB annual reports.
(79) Corresponding to a gap of 1.8% of GDP cumulated over 2016-
2018.

European Fiscal Board
34
Box 2.4: The corrective arm of the Stability and Growth Pact (SGP) in a nutshell
Legal basis: Article 126 of the Treaty on the Functioning of the European Union (TFEU) and Protocol No 12 on the
excessive deficit procedure (EDP) annexed to the Treaty. The EDP is detailed in Regulation (EC) 1467/97 on Speeding
up and clarifying the implementation of the excessive deficit procedure, amended in 2005 and 2011. Regulation (EU)
473/2013 introduced additional provisions for euro area countries, especially for the excessive deficit procedure.
Objective: To dissuade excessive government deficits and debt and, if they occur, to ensure that the Member States
concerned take effective action towards their timely correction.
Main reference values: 3% of GDP for the general government deficit and 60% of GDP for gross general government
debt. If gross general government debt exceeds 60% of GDP, the differential with the reference value is expected to
diminish at a satisfactory pace, i.e. it has to decrease over the previous 3 years at an average rate of 1/20th per year as
a benchmark.
Excessive deficit procedure: A procedure of successive steps for countries found to have excessive deficit or debt
levels. Whenever the Commission observes a breach of the reference value of either the deficit or the debt criterion,
it prepares a report under Article 126(3) TFEU to establish whether an excessive deficit has occurred. The assessment
also takes into account ‘other relevant factors’. For countries where the Council decides that an excessive deficit exists,
it adopts, upon a recommendation from the Commission, a recommendation setting out a (i) deadline for the correction
of the excessive deficit, and (ii) an adjustment path for both nominal and structural budget balances. Following an
opinion of the Economic and Financial Committee (November 2016), the adjustment path towards the correction of
an excessive deficit will also be defined in terms of an expenditure benchmark. That is to say, the new recommendation
will define an upper bound for the nominal growth rate of government expenditure (net of discretionary revenue
measures), consistent with the targets of the nominal and structural budget balance.
Assessment of effective action: While an excessive deficit procedure is ongoing, the Commission regularly assesses
whether a Member State has taken the appropriate measures to achieve the budgetary targets recommended by the
Council and aimed at the timely correction of the excessive deficit. The assessment begins by considering whether the
Member State has met the recommended targets for the headline deficit and delivered the recommended improvement
in the structural budget balance. If the Member State has achieved both, the excessive deficit procedure is held in
abeyance. Otherwise, a careful analysis is carried out to determine whether the country concerned has delivered the
required policy commitments and the deviation from the targets is due to events outside its control.
Sanctions: Euro area Member States can face sanctions in the form of a non-interest bearing deposit once an excessive
deficit is launched. They can also face sanctions in the form of fines if they fail to take effective action in response to
Council recommendations. Fines amount to 0.2% of GDP as a rule and can go up to a maximum of 0.5% of GDP if
the failure to take effective action persists. Beneficiaries of the European Structural and Investment Funds, except the
United Kingdom, can also see part of or all of their commitments suspended.
Monitoring cycle: The Commission continuously monitors compliance with the Council recommendations and
provides detailed updates on the back of its regular macroeconomic forecast exercises, in the context of the European
Semester cycle.
More detailed information on the corrective arm of the SGP can be found in the Code of Conduct of the SGP and the
Commission’s Vade Mecum on the SGP.
-

European Fiscal Board
35
(Continued on the next page)
Box 2.5: Implementation of the Stability and Growth Pact for Italy in 2018
Autumn 2018. Italy’s draft budgetary plan (DBP) for 2019 was the first to be rejected by the Commission under
Article 7(2) of Regulation (EU) 473/2013, on grounds of particularly serious non-compliance. The Commission’s
conclusion was motivated by the very large planned deviation from the recommended adjustment path towards the
medium-term budgetary objective (MTO). The DBP envisaged a deterioration of the structural budget balance by
0.8% of GDP against a required consolidation of 0.6% of GDP. Moreover, the DBP was predicated on an unrealistic
macroeconomic scenario which was not endorsed by the national independent fiscal council. The revised DBP the
Italian government presented on 13 November 2018 did not include any substantial change compared to the first
submission. The Commission also considered that the particularly serious non-compliance warranted a re-assessment
of Italy’s compliance with the debt criterion of the Stability and Growth Pact (SGP). In May 2018, a Commission
report under Article 126(3) of TFEU concluded that the expected adjustment path towards the MTO was a relevant
factor for not opening a debt-based excessive deficit procedure. Therefore, the Commission reassessed Italy’s
compliance with the debt rule at the end of November and concluded that opening an excessive deficit procedure
(EDP) was warranted, given the significant planned deviation. The Economic and Financial Committee (EFC) of the
Council reached the same conclusion. In the following weeks, a dialogue between the Commission and the Italian
authorities took place, at the end of which the Italian government announced some amendments to the budget law. As
a result, the Commission upgraded its assessment of Italy’s DBP from a case of particularly serious non-compliance
to a risk of significant deviation and concluded that a debt-based EDP was no longer warranted at that stage.
Graph 1: Autumn 2018 developments in the assessment of the Italian DBP
In December 2018, the Italian authorities updated the draft budgetary plan for 2019. It included several elements:
Macroeconomic scenario. Real GDP growth and nominal GDP growth in 2019 were revised down by 0.5 and 0.8
percentage points to 1.0% and 2.3%, respectively. The revision implied a slower closing of the output gap, which
contributed to reducing the structural deterioration by 0.1 pps. The revised outlook was based on the Bank of
Italy’s December 2018 forecast and endorsed by the Italian national fiscal council.
Budgetary measures. The Italian government announced some changes to the planned budgetary measures by around
0.5% of GDP. The bulk consisted in delaying the introduction of two flagship policy measures (the citizen’s
income and a pension reform) and back-loading investment expenditure. Therefore, most of the improvement,
€7.9 billion, came by delaying planned expenditure, which improved the structural budget balance. The revised
budget plan also included some new revenue increasing measures that contribute 0.1 pps to the structural effort in
2019 (see Table 1).
Ex-ante request for flexibility. The Italian government applied for, and was granted in advance, flexibility under the
unusual event clause for two events: (i) the collapse of the Morandi bridge in Genoa (August 2018) and (ii) floods
related to extreme weather conditions (October 2018). This ex ante flexibility reduced the required structural
adjustment for 2019 by 0.2% of GDP.
Spending freezing mechanism. The Italian government also announced a safeguard mechanism in the form of a
freezing mechanism on expenditure in case budgetary slippages were to occur in the course of 2019.
Italy submits its DBP
Commission Opinion: rejection of the plan
and request to submit a revised DBP
Eurogroup: agreement with Commission
assessment.
Economic and Financial Committee: agrees
with Commission and supports the dialogue
16/10
18/10
23/10
5/11
13/11
21/11
29/11
3/12
18/12
19/12
Italy submits a revised DBP
Italy letter to Commission: changes
to DBP
Commission Letter to Italy: an obvious
significant deviation
Commission Opinion: EDP warranted
Commission conclusion not to
recommend opening an EDP
Eurogroup: recommendation to
Italy to take necessary measures
30/12
2019 budget passed in Italian parliament

European Fiscal Board
36
Box (continued)
(Continued on the next page)
Some EU Member States criticised the decision not to proceed with an EDP pressing the Commission to provide a
written note clarifying and quantifying the assessment underpinning its decision. The Commission reacted by
providing a note only available to the governments of the Member States. However, this note did not dispel all
concerns. Dissensions reached the highest point in March this year with the letter that the Dutch Finance Minister
addressed to the national parliament as reported by the press (1). The Commission was criticised on several grounds:
(i) the absence of a fully-fledged assessment of the revised DBP, including the use of Italy's own macroeconomic
projections, rather than the Commission’s more pessimistic forecasts, (ii) the lack of progress in reducing Italy's debt;
(iii) the reversal by the Italian authorities of some structural reforms; and (iv) the lack of transparency.
The implementation/interpretation of the SGP around the assessment of Italy’s DBP of 2019 includes some
noteworthy novelties. The rejection of the Italian draft budgetary plan, the first since the two-pack reform seems to
clarify the Commission interpretation of the two-pack ‘particular serious non-compliance’, in the sense that deliberate
and considerably large deviations from the required adjustment are considered as relevant cases. Second, the planned
fiscal adjustment in the revised DBP of Italy is a deterioration of 0.2% of GDP, against a recommendation of 0.6% of
GDP. Even considering the unusual event clause this still amounts to a significant deviation from the required
adjustment path towards the MTO. Third, the Commission’s conclusion not to proceed with an EDP for Italy was
entirely based on the projections/assessment provided by the Italian government. Normally, the Commission bases its
decision on its own assessment and forecast. Fourth, in contrast to the Code of conduct on the two-pack regulations,
the Eurogroup did not hold a proper discussion on the amendments to the budgetary law before it was adopted by the
national parliament. Moreover, the final decision accentuates a bilateral dimension to the EU fiscal surveillance,
involving interaction between the Commission and Italy, as opposed to the multilateral dimension defined in the
Treaty.
From an economic perspective, we acknowledge the value of negotiations as part of the process of fiscal surveillance.
However, in this case the policy measures that helped the most to reduce of the structural deterioration consisted in
postponing already planned spending, thus shifting potential fiscal sustainability risks to the future. Additionally, it
appears unorthodox that the revision of the macroeconomic scenario by the Italian authorities has been accounted as
one of the factors reducing the planned structural deterioration. Finally, in contrast to standard practice, even though
not against the SGP legislation, the Commission granted flexibility under the unusual event clause on an ex ante basis,
that is before the budgetary impact of the associated extraordinary expenditure (a part of which was not directly linked
to the unusual event, but also includes the prevention plan and maintenance of road infrastructure) had materialised.
Spring 2019. On 19 April 2019, Italy submitted its 2019 stability programme for 2019-2022 (hereafter called Stability
Programme). On 5 June 2019, based on outturn data for 2018 and projections underpinning the country's stability
programme, the Commission assessed that Italy was not compliant with the debt rule and concluded that the opening
of an excessive deficit procedure (EDP) was warranted. In the following weeks, a dialogue between the Commission
and the Italian authorities took place, at the end of which the Italian government adopted a package of measures
addressing Commission conditions (2): (i) compensate the 2018 observed deviation as much as possible at a
(1) See the letter from the Dutch Ministry of Finance: ‘Written explanation of the European Commission on the SGP decision Italy
December 2018’ of 7 March 2019 and the article 'Dutch question Brussels’ explanation on Italian budget' in the Financial Times
of 7 March 2019. https://www.rijksoverheid.nl/binaries/rijksoverheid/documenten/kamerstukken/2019/03/07/schriftelijke-toelichting-europese-
commissie-op-sgp-besluit-italie-december-2018/schriftelijke-toelichting-europese-commissie-op-sgp-besluit-italie-december-2018.pdf
(2) http://europa.eu/rapid/press-release_SPEECH-19-3649_en.htm.
Table 1:
Real GDP growth (in %) 1.5 1.0 -0.5 Revenue increase (in EUR bn) 2.1
Nominal GDP growth (in %) 3.1 2.3 -0.8 Pension contributions 0.1
Potential GDP growth (in %) 0.9 0.7 -0.2 Real estate sales (one-off measure) 1.0
General government budget balance (in % of GDP) -2.4 -2.0 0.4 Taxes 1.0
Gross debt (in % of GDP) 129.2 130.7 1.5 Expenditure reduction (in EUR bn) 8.2
Structural budget balance (in % of GDP) -1.7 -1.3 0.4 Citizenship fund 1.9
Structural effort (in % of GDP) (A) -0.8 -0.2 0.6 Pension fund 2.7
Required fiscal adjustment (in % of GDP) (B) 0.6 0.4 -0.2 Pension indexation 0.3
Expected deviation (B-A) 1.4 0.6 -0.8 Reprogramming of investment 3.0
Others (in EUR bn) 0.3
-0.1 Total (in EUR bn) 10.3
-0.2 in % of GDP 0.6
-0.5 in % of GDP (excluding one-offs) 0.5Changes in fiscal measures (excluding one-offs)
Source: Italian government
of which:
Changes in government measures 2019Macroeconomic and fiscal outlook for 201913 November
201818 December
2018Difference
Impact of revisited macroeconomic scenario
Preliminary allowance for unusual events

European Fiscal Board
37
Box (continued)
later stage, (ii) correct the gap of 0.3 % for 2019 and (iii) give assurance that the next budget for 2020 will be broadly
compliant with the SGP. The fiscal correction of around €7.6 billion adopted by the Italian government included: (i) a
budget adjustment for 2019 of €6.1 billion which mainly consisted of higher revenues; and (ii) a new spending-freezing
clause of €1.5 billion that ensures achieving the 2019 fiscal target also in case when projected savings on the early
retirement and citizenship income schemes would not materialise. The freeze on spending came on top of the freezing
mechanism of €2 billion legislated in December 2018, which was fully activated.
Italy submits its stability programme for 2019-2021
Commission publishes its 2019 spring forecast
Commission issues Art. 126(3) TFEU report:
EDP warranted
Economic and Financial Committee: agrees with
Commission and supports the dialogue
19/04
23/04
07/05
05/06
11/06 01/07
2/07Eurostat publishes
validated data for deficit and debt of 2018
Commission Communication to the
Council: not to recommend opening an EDP
Italian government adopts a fiscal correction via a mid-
term budget
14/06
Commission assessment of the stability programme:
significant deviation in 2018
3/07
Italy letter to Commission: fiscal correction for 2019
and commitment for 2020

3. INDEPENDENT FISCAL INSTITUTIONS
European Fiscal Board
Key Findings
This chapter takes a close look at the national independent fiscal institutions (IFIs) in Spain and Sweden.
It briefly discusses the need for a system to monitor minimum standards for EU IFIs and reviews the role of the EU IFIs in the 2018 EU fiscal surveillance cycle.
The Spanish IFI was established in 2013 as a result of the crisis and external peer pressure.
Its mandate has been carefully drafted to ensure surveillance of public finances at the regional level.
It is one of the IFIs in the EU with the broadest mandate.
Within a short period of time, the Spanish IFI has cultivated strong ties with the Spanish Parliament and is frequently invited to hearings.
The Swedish IFI was created in 2007, but it was not until 2011, after its mandate was revised, that it enjoyed cross-party support.
Its main task is to assess the long-term sustainability of public finances and the consistency of fiscal policy with national budgetary targets.
The experience of the Swedish IFI is noteworthy because it underscores the importance of having a credible fiscal framework that can bolster IFI effectiveness.
Its presence in the public debate keeps alive the collective memory of the Swedish fiscal crisis of the early 1990s.
The EFB notes that the mandates, tasks, arrangements for accessing information and the resources of IFIs vary widely.
An agreement on and a monitoring of minimum standards is necessary to ensure effectiveness. The EFB welcomes the proposal by the Network of EU IFIs along these lines.
Data collected by the EFB point to the key role that IFIs have played in the 2018 EU fiscal surveillance cycle but also highlight some existing shortcomings.
Some recently established IFIs have turned into rigorous assessors of compliance with fiscal rules.
Many IFIs highlighted the lack of a medium-term orientation of budgetary plans.
In 2018, most IFIs endorsed the macroeconomic scenarios of the governments for the following year but not without pointing out risks in the medium term.
A few IFIs made real-time interventions in the fiscal policy debate by criticising some aspects of potential fiscal plans.
General elections offer a particular window of opportunity for IFIs to disseminate impartial information on fiscal policy.
Inspired by the Dutch experience with costing election manifestos, the Latvian IFI has taken the first steps towards assessing the impact of electoral promises on public finances.
The Slovenian IFI has produced its first assessment of a coalition agreement after the government was formed.

European Fiscal Board
39
3.1. TWO ILLUSTRATIVE CASES: SPAIN AND
SWEDEN
The objective of this section is to take an in-depth look at the experience of two national Independent Fiscal Institutions (IFIs): the one in Spain and in Sweden. Given that different legislative requirements apply to euro area and non-euro area Member States, it is insightful to scrutinise national IFIs from both areas. Another rationale for juxtaposing the Swedish and the Spanish case is the timing of their establishment. The Swedish Fiscal Policy Council (FPC) was set up before the last crisis; AIReF by contrast was created in direct response to the same crisis.
3.1.1. The Independent Authority for Fiscal Responsibility (AIReF)
The Independent Authority for Fiscal Responsibility (AIReF) was established at the height of the European sovereign debt crisis in 2013. Spain’s economy had suffered from a severe downturn and its budget deficit had exceeded the 3 percent threshold by a multiple in the preceding years. The decision to create an IFI was part of a broader overhaul of the Spanish fiscal framework, which entailed introducing new fiscal rules binding all levels of government. It reflected the new legal obligations stemming from the Fiscal Compact, the ‘six-pack’ and the ‘two-pack’, but it also reflected Spain’s strong commitment to sustainable public finances (80). The crisis laid bare the failure of fiscal surveillance at the national and subnational level where non-compliance with the fiscal targets was rampant. Consequently, AIReF has one of the broadest mandates among its European peers, in particular when it comes to performing at the subnational level. It has been designed to take into account the nature of Spanish fiscal federalism with its numerous autonomous regions and local governments. AIReF is attached to the Ministry of Finance but acts independently as a public law institution. Within its short period of existence, it has overcome initial scepticism in Parliament and managed to gain a reputation for its impartiality. As a result, its analyses have started to increasingly penetrate congressional debates.
In Spain, the domestic structural balance and the debt thresholds follow the SGP rules. However, there is neither a full replication of the significant deviation procedure nor of the public debt rule. (80) Horvath (2018).
While a domestic expenditure benchmark exists, it does not include a convergence margin. AIReF carries out an ex ante and in-year assessment of the national fiscal rules. According to its mandate, AIReF has to help to ensure that all public administrations comply with the constitutionally enshrined principle of budgetary stability (81). For this purpose, AIReF produces reports that cover the entire budgetary cycle of each level of the public administration. For instance, it must produce an assessment of the individual fiscal targets of each autonomous region before the fiscal targets are assessed by a body responsible for policy coordination between the central government and the regions and then approved by the government (82). In addition, AIReF plays an important role in assessing the macroeconomic forecasts underlying the central government’s budget, the stability programme and the regional draft budgets and points out if there is a discrepancy with national government’s forecast. Upon publication of the relevant data, AIReF is supposed to issue a detailed report that could entail early warnings of non-compliance. Before July 15, AIReF has to report on the risks of non-compliance by each public administration, the central government and the subnational public administrations with the fiscal targets of the ongoing year (83). AIReF also undertakes an ex ante, in-year and ex post assessment of the compliance with EU fiscal rules. Finally, AIReF has the capacity to act as a ‘rule enforcer’ by recommending that the competent authority (i.e. the Finance Ministry for the autonomous regions and the regions or the Finance Ministry for the municipalities depending on who has the competence) activate certain preventive and corrective legal measures (84). Even though AIReF has proposed that preventive measures be activated in some cases, the Ministry of Finance has not acted upon them (85). As a consequence, AIReF has sought clarifications on the application of the fiscal framework at the regional level and advocated carrying out a review of the institutional setting for subnational administrations (86).
Various indices have been used to measure the independence and effectiveness of fiscal councils. According to the OECD index on IFI independence, AIReF scores in line with the (81) Escrivá et al. (2018), p.91. (82) Escrivá et al. (2018), p.91. (83) Escrivá et al. (2018), p.91. (84) Escrivá et al. (2018), p.92. (85) Escrivá et al. (2018), p.93. (86) Escrivá et al. (2018), p.93.

European Fiscal Board
40
average OECD fiscal council (87). The signal-enhancement capacity (SEC) index measures the breath of the mandate, the ability to communicate, influence on the budget process, and the level of political independence of fiscal councils. Interestingly, in the case of AIReF there is a significant discrepancy between its unweighted SEC score (approx. 0.7 out of 1.0) and its independence-contingent SEC score (0.3 out of 1.0) (88). For the independence-contingent score, AIReF performs below average, but for its unweighted score it performs above average. According to the European Commission’s Scope Index of Fiscal Institutions (SIFI), AIReF’s remit ranks high above the EU average and is on par with Portugal’s Public Finance Council. AIReF has been modelled in line with the state-of-the-art design precepts, as enshrined in the relevant EU legislation. It performs many tasks upon an explicit legal mandate, which increases its SIFI score. Moreover, AIReF employs its own economic model when it assesses the government’s macroeconomic and budgetary forecast. In sum, given the breath of its mandate when compared to its EU peers, we can conclude that AIReF ranks high.
AIReF’s legal independence is guaranteed in Organic Law 6/2013 on the establishment of an independent authority for fiscal responsibility. Accordingly, AIReF’s objective is to contribute to the principle of budgetary stability as stipulated in Art. 135 of the Spanish Constitution. Its internal organisation and operation have been further detailed by Royal Decree 215/2014 which approved its organic statute. Its creation broadly coincided with a general overhaul of the Spanish fiscal framework as set out in Organic Law 2/2012 on fiscal stability and financial sustainability, which introduces a balanced budget rule, a public debt rule and an expenditure rule.
Financial independence is another key prerequisite for the effective functioning of IFIs. Ideally, multiannual budget appropriations should provide protection from political pressures. However, AIReF’s budget requires annual ministerial approval before it is incorporated in the general state budget. This practice is not uncommon but has often led to a budget lower than initially demanded by AIReF. While AIReF’s annual (87) von Trapp and Nicol (2018), p.56; slightly above 80 percent. (88) Beetsma and Debrun (2016, 2017).
budget of €7.04 million (2018)(89) ranks among the highest compared to other EU IFIs, it should not be overstated given the many resource-intensive tasks that it has chosen to assume. Without its own budgetary reserves (unspent resources from its first operational year in 2014) the amount would have been lowered to €4.675 million (i.e. the amount officially approved in the General State Budget Law) (90). AIReF has cautioned that it will need to raise additional funds in 2019 if it wants to keep performing all of its current tasks (91). Nevertheless, AIReF possesses a unique funding structure. In order to safeguard its financial independence and to give the public administrations a stake in its maintenance, AIReF’s founding document stipulates that its budget is to be financed by ‘supervision fees’ levied on the various public administrations (for example, central government, social security, autonomous communities, and municipalities) (92). In practice, this means that the government imposes a levy on each public administration’s budget to fund AIReF’s services. The rate of the levy is set by the General State Budget Law which is an annual legislative initiative. In 2016, AIReF covered 84% of its expenditures through levies on these stakeholders (93). Although, AIReF’s funding model could make it overly dependent on its stakeholders, it could also generate uncertain funding conditions (94). If AIReF wants to keep its budget per task ratio stable, it will ultimately have to ask for more resources either from direct transfers by the central government or from increased ‘supervision fees’ levied on the public administrations (95). To further strengthen AIReF’s financial independence proposals have been made to provide budgetary safeguards comparable to those enjoyed by the Bank of Spain (96).
A key part of the operational independence of an IFI is the secure and timely access to information. In the past, AIReF encountered repeated difficulties in this area despite a strong legal basis in its organic law (Article 4) that should, in theory, have sufficed to guarantee the level of access to deliver on its mandate. However, subsequent (89) Of this budget €1.56 million was allocated to the spending review.
The spending review is to be carried out by the end of 2019. (90) von Trapp et al. (2017), p.22. (91) von Trapp et al. (2017), p.24. (92) von Trapp et al. (2017), p.23-24. Autonomous communities and
municipalities with budgets below €200 million are exempted from the levy.
(93) von Trapp et al. (2017), p.23. (94) Horvath (2018), p.127. (95) von Trapp et al. (2017), p.24. (96) von Trapp et al. (2017), p.22.

European Fiscal Board
41
legislation has introduced new hurdles that have narrowed the degree of access again (97). A successful legal challenge against the central government lifted some access restrictions through the partial repeal of Ministerial Order HEP/1287/2015 (98). In addition, AIReF diligently tracked its information requests made to its interlocutor in the Ministry of Finance, the Economic-Financial Information Center, to ratchet up the pressure. On 9 March 2018, Royal Decree 105/2018 amended AIReF’s organic statute to further improve access to the required information and make it easier to prepare its own budget and monitor its recommendations (99). Importantly, it eliminated existing obstacles to requesting auxiliary information, which had been a frequent reason for requests being denied in the past. In contrast to the central level, at the subnational level the challenge is not one of gaining access to information. Rather the administrations at that level lack the capacity to generate the appropriate data (100). In particular, the municipal level faced difficulties coping with the amount of data demanded by AIReF. To fulfil its mandate in spite of the scarcity of information, AIReF developed new screening instruments to identify municipalities in which the sustainability of public finances was at risk (101). Finally, AIReF’s leadership independence could be further increased. The ministerial control over certain aspects of the hiring process (i.e. number and type of positions/ staff costs) should be reduced (102). Furthermore, AIReF is one of the few EU IFIs where the Board consists of the President alone (103). A Management Committee and an Advisory Board exist to facilitate decision-making.
AIReF is fully committed to enhancing transparency, an objective that features prominently in its strategic plan for 2015-2020. It publishes all its reports, including the underlying methodology of its analyses. It is also a member of the Transparency Council’s Committee for Transparency and Good Governance (104). This is (97) European Fiscal Board (2018), p.47. (98) Some weaknesses in AIReF’s access to information regime were
first identified in the 2017 Fiscal Compact transposition report of the European Commission.
(99) AIReF (2018), p.58-59. (100) Escrivá et al. (2018), p.93. (101) Escrivá et al. (2018), p.93. (102) Horvath (2018), p.129. (103) Other examples include economic forecasting institutions in
Austria, the Netherlands and Slovenia and IFIs embedded in the National Audit Office in Lithuania and Finland.
(104) von Trapp et al. (2017), p.75; the Transparency Council is an independent public body created by the Transparency and Good Governance Act approved in 2013. It includes, among others,
part of a broader shift towards the general promotion of transparency within the public sector that dates back to Law 19/2013 on Transparency, Access to Public Information and Good Governance (105). Moreover, AIReF helps to promote fiscal transparency via interactive web-based tools (106). Its commitment to transparency is further underpinned by the publication of technical explanations of its macroeconomic forecasting models, an accessible website, a calendar of its scheduled publications and extensive media outreach (107). AIReF has also been tasked by the government to conduct a spending review which the government had committed to in its budgetary plan update submitted to the European Commission on 9 December 2016 (108). The spending review is carried out over a three-year period. A comprehensive action plan that took into account the Eurogroup’s common principles for spending reviews was issued for the first stage of the review. The European Commission’s new Structural Reform Support Service (SRSS) provided substantial financial resources for the first stage of implementation of the spending review. While from the government’s perspective it is understandable to entrust an independent entity with such a politically sensitive task, there is a risk that the AIReF will be perceived as an agent of the central level. Due to AIReF’s lack of expertise in spending reviews, it had to partially outsource certain tasks to external consultancies. While this allows AIReF to leverage its scarce resources and build up a temporary analytical capacity with potential learning effects, it could undermine the consistency and transparency of its work (109). In sum and in line with the OECD recommendations (110), AIReF should only take on additional tasks if these are matched by a prior increase in its resources.
Another way to increase the effectiveness of IFIs is to introduce a ‘comply-or-explain’ principle. This creates an obligation for the government to publicly explain its reasons in case it disregards the IFI’s recommendations (111). This, in turn, might trigger a public debate, increase the salience of the IFI’s recommendations and raise the political costs
members from the Upper and Lower House of Parliament, the Ombudsman, and the Court of Auditors.
(105) von Trapp et al. (2017), p.13. (106) Jancovics and Sherwood (2017), p.14. (107) von Trapp et al. (2017), p.50. (108) AIReF (2017a). (109) von Trapp et al. (2017), p.37. (110) von Trapp et al. (2017), p.37. (111) European Fiscal Board (2017), p.37.

European Fiscal Board
42
of non-compliance. Organic Law 6/2013 subjects the recommendations in AIReF’s mandatory reports to the ‘comply-or-explain’ principle. AIReF monitors the implementation of its recommendations. Its data reveals that in 47 percent of the cases AIReF has either obtained a commitment to comply or the government has already complied (112). Empirical examples show that due to the ‘comply-or-explain’ principle, AIReF was able to: trigger a debate on the financial sustainability of the social security system; foster the consistent calculation of the expenditure rule across levels of government; empower the general comptroller in his reporting duties to the regional government to improve his preventive role; and render the government’s macroeconomic forecasts more transparent (113). A practical obstacle remains: in many cases governments either reply too late or their reply to the IFI’s recommendations is lacking in detail (114).
Generally, the impact of IFIs is difficult to measure because it is usually indirect, and there are strong interactive effects with the fiscal framework (115). To influence the public debate on fiscal policy and improve the fiscal literacy of voters, IFIs can rely on parliamentary debates, newspaper coverage and social media. AIReF has made extensive use of all these channels to improve fiscal sustainability. It is one of the few IFIs that employs a communication team of four dedicated staff (as external contractors) to maximise the impact of its reports. This effort has generated regular press coverage but has put an additional strain on its budget. The attention of the press peaks around April and July when AIReF publishes its assessment of whether public administrations have complied with the fiscal rules (116). It also coincides with an uptick in the number of visitors on its website where the reports can be downloaded. Moreover, AIReF has managed to establish a strong rapport with the Spanish Parliament and its analyses have penetrated the parliamentary debate on fiscal issues. The parliamentary mentions of AIReF’s work have gradually increased each year since its creation (117). The clearest expression of the well-developed working relationship between AIReF (112) von Trapp et al. (2017), p.71-72. In 2017, AIReF issued 95
recommendations that were subject to the ‘comply-or-explain’ principle. The compliance rate might appear higher than it actually is given that a mere commitment to comply suffices.
(113) von Trapp et al. (2017), p.72-73. (114) European Fiscal Board (2017), p.37. (115) Jancovics and Sherwood (2017). (116) von Trapp et al. (2017), p.66. (117) von Trapp et al. (2017), p.70-71.
and the Parliament is the increased number of parliamentary hearings in front of various committees in which AIReF’s president participates (118).
The case of AIReF bears important policy lessons that with the necessary caution can be applied generally to other IFIs in the EU. First, the Spanish example shows that severe crisis and external pressures can function as important catalysts for setting up strong fiscal councils that take into account best practice (119). In 2011, an IMF staff report for the Chapter IV consultations with Spain recommended creating an IFI to bolster fiscal credibility (120). However, at the time, that was no part of the government’s plans. Only when the crisis exacerbated and the need to regain fiscal credibility became more urgent did the government consent to creating an IFI.
Second, IFIs in countries with strong regional governments need to take the public finances of the subnational level into account in order to have a comprehensive view of the sustainability of fiscal policy. Here, AIReF has been a catalyst for change that has improved the fiscal framework at all levels of government. This was only possible because it was perceived as a truly independent and impartial watchdog. In particular, AIReF has not shied away from repeatedly reverting to legal challenges in order to clarify its role and the role of the government. In view of the constraints on resources, IFIs should harness the full potential of the existing toolbox before developing new instruments to deliver on their mandate. For instance, AIReF has addressed existing shortcomings of the ‘comply-or-explain’ principle to put pressure on the government to implement its recommendations.
Third, AIReF has put a strong emphasis on communicating its reports properly. This has multiplied their impact. Moreover, it has helped in spreading non-biased information on the true state of the Spanish public finances. As a result, AIReF is frequently invited to parliamentary hearings and their reports are increasingly mentioned in parliamentary debates on fiscal issues.
(118) von Trapp et al. (2017), p.70. (119) Tesche (forthcoming). (120) IMF (2011), p.24.

European Fiscal Board
43
3.1.2. The Swedish Fiscal Policy Council
Created in 2007 by ordinance, the Swedish Fiscal Policy Council (FPC) is a governmental agency accountable to the Ministry of Finance. In Sweden, the idea of establishing an advisory fiscal council to avoid a pro-cyclical fiscal policy stance dates back to discussions on potentially adopting the euro (121). A report commissioned by the Swedish government highlighted the importance of fiscal policy as a stabilising tool in a currency union (122). A moot point in the discussions was whether tasks related to fiscal policy making should be delegated to an independent body or whether a purely advisory council should be established (123). When the FPC was set up by Finance Minister Anders Borg in 2007, the liberal-conservative government followed the latter model.
The early adoption of a fiscal council in Sweden (before the 2008 financial crisis and the relevant EU legislation) rendered its experience highly relevant for the following upsurge in fiscal councils. Initially, the opposition had collectively rejected the government’s plan to establish the FPC mostly on the grounds that it lacked democratic legitimacy (124). As the FPC grew increasingly critical of certain governmental policies, the government’s attitude towards the fiscal council also changed. Heightened tensions followed after the FPC sent a letter to the Finance Ministry in which it criticised its working conditions (125). However, in early 2011, the Minister of Finance started to explore options on how to strengthen the FPC’s mandate. He then forged a cross-party consensus to revise the FPC’s mandate and reduce its size to a maximum of six members.
Since these changes, the government formally appoints the head of the agency in charge of the budget who is also the head of the secretariat. The head of the secretariat supports the work of the FPC together with three economists and one administrator. Given that most IFIs employ less than 10 staff, the FPC with five staff ranks in line with the median in the EU spectrum of IFIs (126). In 2012, the FPC received an annual budget appropriation of SEK 8,931,000 (approximately (121) Calmfors and Wren-Lewis (2011), p.678. (122) Commission on Stabilisation Policy in the EMU (2002), p.15-16. (123) von Trapp, Lienert and Wehner (2016), p.232. (124) Calmfors (2013), p.206-207. (125) Calmfors (2013), p.206-207. (126) Jancovics and Sherwood (2017), p.16-17.
€1 million) (127). According to the OECD IFI database, the FPC’s budget is relatively high compared to other EU peers (128). The FPC releases its annual report no later than 15 May of each year and presents it at a hearing at the Riksdag Committee on Finance (129). This calendar sequence allows the Parliament to take into account the FPC’s conclusions when adopting the spring fiscal policy bill in the following month (130). The autumn budget bill also contains a dedicated section covering the FPC’s recommendations even though no formal ‘comply-or-explain’ provision exists.
According to the mandate, stipulated in the 2011 ordinance, ‘the Council is to review and assess the extent to which the fiscal and economic policy objectives proposed by the Government and decided by the Riksdag are being achieved and thus contribute to more transparency and clarity about the aims and effectiveness of economic policy’ (131). The FPC’s main task is to assess the consistency of fiscal policy — as outlined in the spring fiscal policy bill and the autumn budget bill — with the long-term sustainability of public finances and the budgetary targets. On this basis, the FPC is to assess whether the fiscal policy stance is justified considering the cyclical position of the economy. Furthermore, the FPC assesses whether fiscal policy is in line with long-term sustainable growth and high employment. In addition, it is to examine the clarity of the budget bills and analyse the effects of fiscal policy on welfare distribution. The FPC has to carry out an evaluation of the government’s economic forecasts and reports to Parliament on public finances and the costs of reform proposals (132). Finally, the FPC is expected to actively stimulate public debates on economic policy. In this way, the FPC also keeps alive the collective memory of the fiscal crisis in the early 1990s (133). As the number of Swedish politicians with first-hand experience of the crisis declines, the task to remind the public of the severe consequences of fiscal imbalances will become that more important.
(127) von Trapp, Lienert and Wehner (2016), p.236. (128) It is difficult to compare this budget to other EU IFI budgets
given differing mandates, price levels and labour costs. (129) In European Parliament election years, the annual report is to be
published no later than May 10. (130) von Trapp, Lienert and Wehner (2016), p.236. (131) Ordinance (2011: 466), paragraph 5-9, details the FPC’s duties. (132) Fiscal Policy Council (2018), p.1. (133) Andersson and Jonung (2019).

European Fiscal Board
44
A key rationale for creating IFIs is their capacity to reduce the ‘forecasting bias’ as a driver of excessive deficits (134). The FPC does not produce its own forecasts but instead relies on the macro-fiscal forecasts prepared by the independent National Institute of Economic Research (NIER) for its assessment. Following the FPC’s creation, overly pessimistic fiscal balance forecasts turned into a negligible optimistic bias (135). However, the real-time impact of the relevant opinion is limited because it is only published once a year (136). NIER also assesses the macroeconomic effects of a wide range of policy proposals. On occasion, the FPC has leveraged its scarce resources by outsourcing some more technical work to NIER (137). In addition, the National Financial Management Authority (SNFMA) produces frequently updated budget forecasts and is in charge of the government’s annual financial statements (138).
Even though the IFI literature characterises the FPC as a ‘watchdog with a broad remit’ (139), when compared to the breadth of the mandate of other IFIs, the FPC’s remit appears to be below the EU average according to the European Commission’s scope index of fiscal institutions (SIFI) (140). Several factors explain the discrepancy between the perception of the FPC’s remit and its actual SIFI score. First, the SIFI score does not capture certain tasks that the FPC performs, such as assessing the impact of fiscal policy on long-term growth and employment or on welfare distribution. Second, the SIFI index attaches a higher weight to tasks performed according to an explicit legal mandate. However, the FPC’s remit has been informally expanded through soft law, i.e. governmental communications on the fiscal framework. Third, the FPC does not engage in costing policies nor does it produce its own macroeconomic and budgetary forecasts due to its limited resources, which also lowers its SIFI score. In sum, we can conclude that there are certain dimensions of the FPC’s remit that are not captured by the SIFI score.
(134) Jonung and Larch (2006). (135) IMF (2013a), p.39. (136) Jancovics and Sherwood (2017), p.24. (137) Calmfors (2013), p.202, reports that this has included ‘calculations
of the employment effects and net costs of the earned income tax credit, analyses of government investment and the government capital stock, and estimates of government net worth’.
(138) Calmfors (2013), p.202, other institutions that complement the work of the FPC are the National Debt Office (NDO) and the National Audit Office (NAO).
(139) Calmfors (2013). (140) European Commission (2018).
Fiscal councils require a sufficient degree of independence to establish themselves as credible, non-partisan voices in fiscal policy-making. The OECD index on IFI independence distinguishes between leadership independence, legal and financial independence, operational independence, and access to information and transparency (141). An alternative index measures the signal-enhancement capacity (SEC) of fiscal councils contingent on their independence (142). The FPC has been described as a ‘self-perpetuating body’ because its current members publicly propose new candidates to the government without prior consultation (143). This practice has contributed to the FPC’s independence because it has ensured that its members are recruited predominantly from outside the political system (144). However, in December 2017, the government decided to amend this procedure in ways that will give the Parliament’s Finance Committee greater influence on leadership appointments. A body of five consisting of the chair and deputy chair of the Finance Committee and three heads of different government agencies will make proposals for future FPC appointments (145). The government retains its prerogative to decide on the final appointments. An earlier proposal by the so-called ‘Surplus Target Committee’ that would have given the Finance Committee even more influence on the appointment procedure was met with harsh criticism and ultimately withdrawn (146). Apart from this change in the appointment procedure, which poses a serious risk to the independence of the FPC’s leadership, the selection criteria for appointments follow best practice, striking a balance between merit and technical expertise with clearly defined term limits. A dismissal procedure is currently not in place.
As a government agency, the head of the FPC secretariat has the annual obligation to meet with the state secretary of the Finance Ministry, formally responsible for the FPC, to discuss its performance (147). At the same time, the government proposes the FPC’s budget but it is ultimately the Parliament that decides upon it as a separate line item in the annual budget (148). When the FPC raised the issue of inadequate resources in (141) von Trapp and Nicol (2018). (142) Beetsma and Debrun (2016, 2017). The FPC score is 0.2 out 1.0. (143) Jonung (2018), p.138. (144) Jonung (2015), p.209. (145) Jonung (2018), p.141. (146) Jonung (2018), p.141. (147) Calmfors (2013), p.205. (148) Andersson and Jonung (2019).

European Fiscal Board
45
an open letter to the government in 2010, it was threatened with budget cuts before its mandate was ultimately revised in 2011 (149). Its proposal to make the Parliament its principal in order to bolster its independence was not followed (150). The empirical evidence, however, suggests that on average parliamentary budget offices (PBOs) do not necessarily enjoy a higher degree of independence than fiscal councils (151). Furthermore, the FPC’s legal basis could be put on a stronger footing by anchoring its mandate in primary legislation or constitutional law. Amendments of the fiscal framework resulting in changed duties for the FPC should be reflected in a revised ordinance.
The FPC possesses a sufficient degree of operational independence as it can freely determine its work programme. It maintains no informal contacts with the government and is not involved in governmental consultancy. Potential risks to its non-partisan reputation emanate from providing normative recommendations that could turn the IFI into a stakeholder in the fiscal policymaking process (152), whereas ex post analysis generally faces a low risk of politicisation. Finally, the EFB, the OECD, the IMF, the European Commission and the Network of EU IFIs have all been adamant that good and timely access to information is a ‘sine qua non condition’ for the functional independence and effectiveness of IFIs (153). Upon request, the FPC can access non-public information used for the autumn budget bill by the Ministry of Finance (154). In practice, the current exchange of information works even though access to information is neither secured by legislation nor via a memorandum of understanding. Finally, the FPC is one of the few IFIs that has the explicit mandate to promote fiscal transparency.
The FPC carries out its tasks within a well-defined rules-based fiscal policy framework. In line with a ‘top-down approach’, the Riksdag decides on the total volume of expenditures and its distribution across 27 areas of expenditure. Four budgetary targets constitute the core pillars of the fiscal policy framework: (i) a central government nominal (149) von Trapp, Lienert and Wehner (2016), p.236.; Calmfors (2013),
p.207. (150) Calmfors (2013), p.207. (151) von Trapp and Nicol (2018), p.55-56. (152) Jancovics and Sherwood (2017), p.14; von Trapp and Nicol
(2018), p. 53. (153) EFB (2018), p.46-47; von Trapp, Lienert and Wehner (2016); IMF
(2013a); Jancovics and Sherwood (2017); Network of EU IFIs (2016).
(154) von Trapp, Lienert and Wehner (2016), p.238.
expenditure ceiling for the third year ahead in the autumn budget bill; (ii) a surplus target for general government net lending; (iii) a balanced budget requirement for local governments; and (iv) a medium term debt anchor of 35 per cent of GDP of the public sector’s consolidated gross debt (155). Trade-offs between the different budgetary targets might occur when the scope under the nominal expenditure ceiling is fully used but incompatible with the surplus target. In such a scenario, the expenditure ceiling loses its steering function unless adequate revenue-raising measures are implemented (156). Based upon a proposal by the ‘Surplus Target Committee’, the Riksdag has decreased the surplus target level from 1 per cent of GDP to 1/3 per cent of GDP on average over the business cycle from 2019 onwards (157).
The FPC’s past focus was predominantly on assessing the consistency with the first two pillars of the fiscal framework. A 2018 government communication tasked the FPC with including the latter two pillars in its assessment and further intensifying its scrutiny of the surplus target (158). The FPC has to assess whether a deviation from the surplus target is significant (i.e. more than 0.5 per cent of GDP) and whether the reasons given by the government warrant a deviation. In case of a significant deviation, the government has to outline a prudent adjustment path towards the target level. In fact, the surplus target is a frequent point of contention in the FPC’s annual reports, either because the underlying reasons given by the government concerning the fundamental objectives remain opaque or because there is a lack of guidance on how the government itself intends to monitor compliance with the target (159). In its 2018 annual report the FPC pointed out that not even the reduced surplus target had been achieved in the last 8 years (160). Andersson and Jonung (2019) have proposed to phase out the surplus target once the debt level has reached a sufficiently low level. They propose to focus predominantly on a debt anchor of 25 per cent (+/-5%) of GDP. According to the authors, a major economic crisis could add 30 to 50 percentage points to the Swedish debt to GDP ratio. They find that the borrowing costs of the Swedish government would sharply increase if the debt were to exceed a level (155) Jonung (2015); Calmfors and Wren-Lewis (2011); Fiscal Policy
Council (2018), p.3.; Andersson and Jonung (2019). (156) Fiscal Policy Council (2018), p.6. (157) Fiscal Policy Council (2018), p.3. (158) Swedish Ministry of Finance (2018), p.24-25. (159) Jonung (2015), p.208. (160) Fiscal Policy Council (2018), p.3.

European Fiscal Board
46
of 70-75 per cent of GDP. Thus, maintaining the level of public spending during such a major crisis would require the debt level to range between 20 to 30 per cent of GDP in normal times.
The FPC’s annual reports and externally commissioned background papers have covered a wide array of topics. They have highlighted the need for structural reforms in areas such as the tax system, the reform of unemployment insurance and economic reporting practices (161). A quantitative content analysis of the annual reports published before the revision of the mandate in 2011 has shown that fiscal sustainability and compliance monitoring with the budgetary targets featured prominently, whereas issues related to macroeconomic stabilisation played only a minor part (162). A review of the six annual reports published between 2007-2013 showed that the FPC played an important role in sounding the alarm when expenditures were coming close to reaching the cap or when attempts were made to circumvent the expenditure ceiling (163). As a result, the expenditure ceiling has acted as a binding constraint even though it did not prevent nominal expenditure growth (164).
One important transmission channel through which IFIs can stimulate a public debate and make their voice heard is via the media. An established media presence can contribute to a strong fiscal performance (165). FPC members frequently act as commentators on economic and budgetary issues during the year and have succeeded in starting debates on selected economic issues (166). The dissemination of unbiased information will improve the fiscal literacy of voters and help them to cast their ballot in line with their fiscal preferences (167). IFIs with a higher level of independence tend to have a higher media impact due to their credibility as impartial watchdogs. In addition, IFIs operating in fiscal frameworks with more binding rules seem to receive more press attention (168). This is corroborated by the fact that the FPC’s annual reports have received extensive media coverage (169).
(161) IMF (2013b), p.41. (162) Calmfors and Wren-Lewis (2011). (163) Jonung (2015), p.208. (164) Jonung (2015), p.204. (165) IMF (2013a), p.28. (166) von Trapp, Lienert and Wehner (2016), p.238; Hemming and
Joyce (2013), p.219. (167) Beetsma and Debrun (2016). (168) IMF (2013a), p.29. (169) Jonung (2015), p.208-209.
The case of the FPC holds three valuable policy lessons that are potentially applicable to other IFIs in the EU. First, an IFI should complement the existing fiscal framework rather than substitute it. A dynamic interplay between the IFI and the fiscal framework will be mutually reinforcing. On the one hand, it will make the current fiscal rules more credible, because an impartial watchdog will increase the reputational costs of non-compliance. On the other hand, a rules-based fiscal framework provides a democratically legitimated benchmark for the IFI’s assessments.
Second, a domestic cross-party consensus about the need for establishing an IFI is a desirable point of departure for fostering local ownership of the fiscal rules. While securing the support of the opposition might result in a less focused mandate, it can create an effective safeguard against political pressures. This in turn will put the IFI in a stronger position to bargain good and timely access to information and adequate resources.
Third, the Swedish fiscal framework is continuously evolving, the most recent addition being the debt anchor. A frequently levelled criticism against fiscal councils is that their strong preference for sustainable public finances will lead to unwarranted fiscal restraint. The track record of the FPC does not vindicate this concern. During the economic downturn in Sweden in 2009-2010, the FPC advocated a more expansionary fiscal stance than the government (170). Concretely, the FPC proposed a temporary increase in employment benefits and additional support for local governments (171). The example shows that fiscal councils not only have an important role to play in pushing for counter-cyclical fiscal policy but also in encouraging governments to make use of the available fiscal space under certain cyclical conditions.
3.2. MINIMUM STANDARDS FOR EU IFIS
The portraits of AIReF and the FPC demonstrate that IFIs have become an integral part of the EU fiscal framework. They have actively helped to increase the reputational costs to fiscally profligate governments (172). Both IFIs, the AIReF and the FPC, show best practices that are directly linked to their specific national designs. However, many IFIs (170) Calmfors (2013), p.195-96. (171) IMF (2013b), p.41. (172) Jancovics and Sherwood (2017).
European Fiscal Board
47
still face obstacles that prevent them from harnessing their full potential.
EU legislation and principles agreed at an international level have defined certain minimum standards that are supposed to ensure the functional autonomy of IFIs. While the number of EU IFIs increased rapidly in 2010-2018, very different models were allowed to emerge in order to take into account country-specific factors, such as federal versus non-federal political systems (173). As a result, and most importantly, some IFIs are still in a weak position due to budget constraints and legal underpinnings. This leaves them without any protection from their government. An agreement on minimum standards for IFIs is needed to bolster the position of IFIs in the EU. However, any such agreement should not undermine the local ownership of the IFIs.
To be effective, an agreement on minimum standards would have to be complemented with a process of regular monitoring (174). Legislation can offer protection for an IFI up to a certain level beyond which political and societal factors can come into play. To ensure continuous compliance with minimum standards, a process of periodically reviewing IFIs at the European level should be established. Such a process should ideally be able to detect any changes hampering the effectiveness of EU IFIs. Opening an infringement procedure as a legal instrument to enforce certain minimum standards will not necessarily be successful because current EU legislation does not prevent the creation of relatively heterogeneous IFIs. An alternative option would be to include measures to strengthen IFIs in the country-specific recommendations (CSRs). However, in the past the follow-up on IFI-related CSRs has not always been effective.
At the invitation of the Irish, Spanish and Portuguese IFIs, the OECD has conducted comprehensive reviews based on the OECD Principles for Independent Fiscal Institutions (175). Some EU IFIs have an explicit requirement in their mandate to be externally reviewed, whereas others lack such an obligation. Hence, it would be advisable to create a Code of Conduct for EU IFIs that sets minimum standards against which periodic reviews could be carried out. This would foster the exchange of best practice and offer a degree of (173) European Commission (2019), p.135. (174) von Trapp and Nicol (2018), p.50. (175) von Trapp, Lienert and Wehner (2016)
protection via peer pressure or moral suasion, in particular, to IFIs that have struggled to assert themselves.
Recently, the Network of EU IFIs reiterated a call for ‘a specific and recurrent monitoring process at the EU level’ that would monitor compliance on the basis of certain minimum standards (176). The cornerstones of the proposal by the Network of EU IFIs are: (1) functional autonomy (i.e. sufficient resources), (2) adequate and timely access to information, (3) safeguards against political pressures, and (4) an effective implementation of the ‘comply-or-explain’ principle (177). The proposal broadly overlaps with the OECD principles for IFIs but is more ambitious for the ‘comply-or-explain’ provision. The European Fiscal Board welcomes the proposal by the Network of EU IFIs and stands ready to support this initiative in close cooperation with the Network of EU IFIs.
3.3. THE ROLE OF IFIS IN THE 2018 EU
FISCAL SURVEILLANCE CYCLE
This section is based on information gathered from a dedicated questionnaire. The Member States covered in the questionnaire were selected according to the following criteria: Member States (i) which in the autumn of 2017 were assessed to be at risk of non-compliance with EU fiscal rules in 2018 or subject to a significant deviation procedure under the preventive arm of the SGP or an excessive deficit procedure under its corrective arm; or (ii) where a general/parliamentary election took place in 2018. Our sample encompasses: Austria (Austrian Fiscal Advisory Council), Belgium (High Council of Finance, Federal Planning Bureau), France (Haut Conseil des Finances Publiques), Italy (Parliamentary Budget Office), Latvia (Fiscal Discipline Council), Luxembourg (Conseil National des Finances Publiques), Portugal (Public Finance Council), Slovenia (Slovenian Fiscal Council/Institute of Macroeconomic Analysis and Development), Spain (Independent Authority for Fiscal Responsibility), Hungary (Fiscal Council of Hungary), Romania (Romanian Fiscal Council) and Sweden (Fiscal Policy Council).
This section will assess whether the competent IFI identified any risks of non-compliance with (176) Network of EU IFIs (2019a, p.5; 2016). (177) Network of EU IFIs (2019a, p.3-5).

European Fiscal Board
48
national and/or EU fiscal rules and whether its recommendations had any impact on the behaviour of governments.
In Austria, the Fiscal Advisory Council (FAC) foresaw several significant violations of EU fiscal rules for 2018 unless effective measures were taken to address them (178). First, in May 2017 the FAC projected that Austria’s Maastricht deficit — while still below the threshold of 3% of GDP — would be higher in 2018 than forecasted in the government’s spring 2017 stability programme (179). Second, it cautioned that non-compliance with the MTO in 2018 could prompt the European Commission to issue an early warning of a significant deviation based on the EU expenditure rule (180). As in the government’s spring 2017 stability programme, the FAC expected Austria to deviate from the required structural adjustment in 2018 (181). Third, the FAC argued that the intended budgetary path would deviate from the EU requirements under the preventive arm of the SGP for 2018 unless the government took effective action to correct the expenditure growth in 2018. Finally, the FAC expected full compliance with the debt rule for 2018. In December 2017, it highlighted that the fiscal stance would be procyclical for 2018. Furthermore, it pointed out that Austria would deviate from its medium-term budgetary objective (MTO) and that government expenditure growth would exceed the 2.6% threshold set by the EU. Finally, the FAC underscored that Austria would fail to meet its structural adjustment requirement for 2018 but that the decline in the debt ratio of 3.4 p.p. for 2018 was mainly due to stock-flow adjustments and an increase in nominal GDP (182). While the FAC now estimated a Maastricht deficit of -0.6% for 2018, the Finance Ministry forecasted -0.8% (183). The assessment changed somewhat in May 2018, when the FAC expected Austria to remain broadly compliant with the deficit rule, the structural fiscal rules, and the debt rule over the entire forecasting horizon (2018-2022) but that it would still fail to comply with the expenditure rule (184). The assessment further improved in December 2018, when the FAC expected Austria would reach its MTO in 2018 (with a margin of tolerance of 0.25% (178) Austrian Fiscal Advisory Council (2017a), (2017b), p.6. (179) Austrian Fiscal Advisory Council (2017a), p.2. (180) Austrian Fiscal Advisory Council (2017a), p.3. (181) Austrian Fiscal Advisory Council (2017a), p.3. (182) Austrian Fiscal Advisory Council (2017b), p.7. (183) Austrian Fiscal Advisory Council (2017b), p.7. (184) Austrian Fiscal Advisory Council (2018a), p.1.
of GDP) (185). It assessed Austria’s largely neutral fiscal stance for 2017-2019 to be appropriate.
In Belgium, what is referred to as the ‘Concertation Committee’, a political body comprising representatives from the federal and the regional level, sets the budgetary targets for any given year. The High Council of Finance (HCF) is supposed to undertake an in-year assessment of compliance against these targets. If no consensus is reached in the ‘Concertation Committee’, the HCF cannot assess compliance (as happened in 2017) (186). The Federal Planning Bureau (FPB) produces the macroeconomic forecasts that underpin the government’s budget preparation. The FPB also provides budgetary medium-term projections in a no-policy-change framework that are used by the HCF. In its March 2017 report the HCF proposed two potential budgetary trajectories as input for the discussions of the Concertation Committee. It argued that a more ambitious budgetary trajectory was necessary compared to the one envisaged by the preventive arm of the SGP to comply faster with the EU debt rule (187). It stressed that if the MTO was supposed to be reached already by 2018, a structural improvement of 1.0% of GDP would be required in both 2017 and 2018 (188). In July 2018, the HCF pointed to a discrepancy between the FPB’s and the government’s forecasts. According to the FPB, the structural balance would deteriorate by 0.4% of GDP in 2018 (189). In contrast, the April 2018 stability programme forecasted an improvement in the structural balance by 0.1 p.p. in 2018. The HCF urged the government to take the necessary structural measures to implement the budgetary trajectory as outlined in the 2018-2021 stability programme (published in April 2018) and to ensure debt sustainability. An ex post assessment of compliance with national and EU fiscal rules for 2018 will be published in July 2019.
In France, the High Council of Public Finance (HCPF) highlighted that the macroeconomic scenario underpinning the April 2017 stability programme entailed a downward revision of GDP growth and inflation forecasts for 2018 (190). It considered this to be a more prudent scenario for 2018 and the trajectory of public finances. Nevertheless, the HCPF stressed that the potential (185) Austrian Fiscal Advisory Council (2018b), p.1 and 7. (186) European Fiscal Board (2018), p.49. (187) High Council of Finance (2017a), p.6. (188) High Council of Finance (2017a), p.7. (189) High Council of Finance (2018), p.15. (190) High Council of Public Finance (2017a).

European Fiscal Board
49
growth forecast for 2018 was still significantly higher than estimates by the European Commission. On 24 September 2017, the HCPF issued its opinion on the budget bill for 2018. It considered the government’s macroeconomic scenario for 2018 reasonable but cautioned that the planned structural adjustment of 0.1% of GDP for 2018 was below the minimum structural adjustment required according to EU fiscal rules (191). Furthermore, the HCPF pointed out that the structural deficit for 2018 was high and stressed the need to observe the expenditure targets set by the national budget bill even in case of positive revenue surprises. In April 2018, the HCPF assessed the macroeconomic scenario underpinning the 2018-2022 stability programme to be plausible. It considered the government’s growth forecast of 2% to be realistic and the output gap estimate for 2018 acceptable. However, the HCPF cautioned that the scenario for growth to remain above potential for 2020-2022 was optimistic (192). The HCPF reiterated that strict compliance with the government’s commitment to control public expenditure was essential. Its May 2018 opinion pointed out that the structural effort had been slightly negative. Nevertheless, given that France reduced the general government deficit below 3% of GDP, it was still expected to emerge from the excessive deficit procedure (EDP). In its October 2018 opinion on the amending budget bill for the year 2018, the HCPF considered the budget balance forecast for 2018 plausible. It further noted that the estimated structural deficit for 2018 was in line with the path set out in the programming law and that the structural effort would be close to zero in 2018 (193).
In Italy on 31 March 2017, the country’s Parliamentary Budget Office (PBO) endorsed the government’s macroeconomic trend forecast as being ‘within a range deemed acceptable’ but also listed various risks (194). It noted that the trend forecasts for GDP growth for 2018 were close to the upper bound of the interval. It cautioned that if nominal GDP growth turned out to be lower than expected, it could adversely affect public finances via the change in the debt-to-GDP ratio. In its validation letter sent to the Finance Ministry on 19 April 2017, the PBO also endorsed the 2017-2020 policy macroeconomic forecasts as published in the (191) High Council of Public Finance (2017b). (192) High Council of Public Finance (2018a). (193) High Council of Public Finance (2018b). (194) Parliamentary Budget Office (2017a).
EFD (195). In its May 2017 Budgetary Planning Report, the PBO argued that the policy scenario for 2018-2020 appeared to be fully compliant with both European and national fiscal rules with the exception of the debt-to-GDP ratio (196). The planned structural adjustment of 0.8 p.p. for 2018 (in annual terms) would be in line with the EU structural balance rule. However, some risk of deviation emerged for the two-year average period 2017-2018 (197). The PBO stated that the data provided by the Ministry of Finance indicated compliance with the EU expenditure benchmark for 2018 but cautioned that the government’s Economic and Financial Document (EFD) did not encompass information about budget measures for 2018 (198). Furthermore, the policy scenario for the debt-to-GDP ratio as outlined in the EFD was non-compliant with the numerical debt rule over the entire period 2017-2020 (199). In 2018, the publication of the Budgetary Planning Report was postponed because the outgoing government presented a stability programme based on a no-policy-change scenario. Instead, the PBO published a comprehensive account of its parliamentary hearing in May 2018, which also included an assessment of compliance with the national and EU fiscal rules (200). The Budgetary Planning Report was published in April 2019 and included an ex post assessment of compliance with the EU fiscal rules for 2018 (201). In the Budgetary Policy Report published in December 2017, the PBO warned that the assessment of compliance with the fiscal rules for both 2017 and 2018 had revealed considerable problems (202). In particular, the debt rule was not complied with in 2017-2018. Furthermore, the PBO highlighted that the planned structural improvement for 2018 was entirely the result of lowered interest expenditure (as a share of GDP) (203). According to the PBO, the policy scenario underlying the draft budgetary plan for 2018 expected the debt-to-GDP ratio to decline at a faster pace in 2018 compared to the debt trajectory of the April 2017 EFD (204). In addition, it noted that the EU debt reduction rule was not complied with in 2018. According to the PBO, the draft budgetary plan for 2018 also lacked sufficient information to determine whether the (195) Parliamentary Budget Office (2017b). (196) Parliamentary Budget Office (2017c), p.7. (197) Parliamentary Budget Office (2017c), p.100-3. (198) Parliamentary Budget Office (2017c), p.105-6. (199) Parliamentary Budget Office (2017c), p.106. (200) Parliamentary Budget Office (2018). (201) Parliamentary Budget Office (2019a). (202) Parliamentary Budget Office (2017d), p.7. (203) Parliamentary Budget Office (2017d), p.28. (204) Parliamentary Budget Office (2017d), p.31.

European Fiscal Board
50
envisaged privatisation receipts were achievable. Moreover, the PBO argued that the public finance scenario of the draft budgetary plan for 2018 pointed towards a neutral fiscal stance in 2018 even though the output gap was still negative (205). Finally, from a two-year perspective there was a risk that a significant deviation from the expenditure benchmark for 2018 would occur (206). In its Budgetary Policy Report whose publication was postponed to January 2019 due to the dialogue between the government and the European Commission, the PBO warned that the estimated structural adjustment for 2018 appeared to be inadequate to meet the EU structural balance requirement (207) and that the EU debt reduction rule was not complied with either (208).
The Latvian Fiscal Discipline Council (FDC), in its surveillance interim report on Latvia’s stability programme for 2017-2020, endorsed the macroeconomic forecast by the Ministry of Finance (209). However, the FDC questioned that the claimed health reform justified a deviation from the MTO of -0.4% of GDP for 2018. In addition, it did not support the classification of the tax reform as a one-off measure justifying a deterioration of the fiscal balance of -0.7% of GDP in 2018 (210). As a result of the differing classification of one-off measures, the maximum permissible expenditure for 2018 calculated by the Ministry of Finance was €249.2 million higher than the expenditure ceiling calculated by the FDC. Moreover, the FDC found that the projected debt-to-GDP ratio of 38% for 2018 was in line with the national debt rule but cautioned against rising debt levels leading to increasing debt servicing costs. According to an MoU between the Ministry of Finance and the FDC, the FDC has to endorse the macroeconomic forecasts underpinning Latvia’s stability programme and the annual state budget and medium-term budgetary framework (MTBF). In July 2017, the FDC endorsed the macroeconomic projections of the MoF underpinning the draft state budget for 2018 and the draft MTBF for 2018-2020 with the exception of the potential GDP and output gap indicators (211). After an exchange of views and a revision of the figures by the MoF, the FDC endorsed the updated potential GDP growth rate (205) Parliamentary Budget Office (2017d), p.46. (206) Parliamentary Budget Office (2017d), p.58. (207) Parliamentary Budget Office (2019b), p.55. (208) Parliamentary Budget Office (2019b), p.56. (209) Fiscal Discipline Council (2017a), p.3. (210) Fiscal Discipline Council (2017a), p.14-15. (211) Fiscal Discipline Council (2017b).
forecast of 2.8% and a zero output gap for 2017. In the FDC’s October 2017 assessment, the national expenditure ceilings still differed from that of the Ministry of Finance for 2018-2020 (212). However, it projected that in 2018 the expenditure growth would be below the potential GDP growth (213). While the debt-to-GDP ratio below 60% would be in compliance with the national debt rule, the FDC urged the government to reduce the debt level at an appropriate pace during good times (214).Whenever it observed violations of the Fiscal Discipline Law, the FDC intervened in real-time by issuing so-called ‘non-conformity reports’. In addition, the FDC assesses the evolution of budget revenues and expenditures as well as the budget programme ‘funds for unforeseen events’ on a monthly basis. In March 2019, in its ex post assessment, the FDC concluded that the structural balance objective set in the state budget for 2018 had not been achieved and criticised the practice of continued debt-financed deficit spending (215).
In Luxembourg, in June 2017 the Conseil National des Finances Publiques (CNFP) assessed that while the short-term macroeconomic forecasts, in particular for 2018, were optimistic, the medium-term macroeconomic forecasts underpinning the 2017-2021 stability programme published in April 2017 were relatively pessimistic (216). According to the CNFP, the expected general government surplus for 2017 and 2018 would remain below the level recorded in 2015-2016 (217). Moreover, the CNFP stated that stability programme lacked sufficient information to assess the expected public expenditure annual growth of 4.8% in 2018 (218). In November 2017, the CNFP noted that Luxembourg was expected to comply with the budgetary rule over the entire period (219). In addition, it stated that the level of gross debt is expected to remain under 25% of GDP up to 2021. Interestingly, in its assessment of the accuracy of its forecast of macroeconomic and budgetary data issued in June 2018, the CNFP concluded that the nominal budget balances of the general government had been significantly underestimated over the period 2006-2016. Furthermore, in its assessment of the 2018-2022 stability programme published in June 2018, the (212) Fiscal Discipline Council (2017c), p.19. (213) Fiscal Discipline Council (2017c), p.19. (214) Fiscal Discipline Council (2017c), p.22. (215) Fiscal Discipline Council (2019), p.6. (216) Conseil National des Finances Publiques (2017a), p.15. (217) Conseil National des Finances Publiques (2017a), p.7. (218) Conseil National des Finances Publiques (2017a), p.28. (219) Conseil National des Finances Publiques (2017b).

European Fiscal Board
51
CNFP stressed that future age-related spending could create risks to the long-term sustainability of Luxembourg’s public finances. As a result, the CNFP argued that an MTO of 0.25% of GDP would be necessary to stabilise the long term debt ratio at 60% of GDP (220). In addition, the CNFP found in June 2018 that the government’s short-term growth projections were relatively optimistic. However, meeting the MTO (a structural deficit of 0.5% of GDP) in 2018 was assessed to be realistic (221).
In Portugal, the Public Finance Council (CFP) assessed that the forecast for 2018 in the 2017-2021 stability programme suggested a risk for the growth composition (222). In particular, the CFP highlighted the risk stemming from a positive contribution of net exports throughout the forecasting horizon. In its May 2017 assessment of the government’s stability programme for 2017-2021, the CFP found for 2018 a continued fiscal consolidation and a substantial improvement in the fiscal balance mostly dependent on policy measures (223). The CFP pointed to an accelerated structural adjustment from 2018 onwards mostly as a result of a decline in structural expenditure (224). It projected a counter-cyclical fiscal policy stance for 2018. According to the CFP, the outlined public debt path in the stability programme would meet the minimum requirements of the EU fiscal rules in 2018. The CFP criticised that ‘the lack of proper description has been a feature of Portuguese stability programmes, thereby missing the opportunity to act as a framework for the taking of the decisions on which the credibility of the objectives and the ability to achieve them depend’ (225). In its assessment of the draft state budget for 2018 published in October 2017, the CFP endorsed the macroeconomic forecasts that underpinned the draft state budget for 2018 (226). At the same time, it highlighted the government’s commitment to reduce the deficit and debt level. However, the CFP stressed that the Ministry of Finance’s forecast of a decrease in expenditure’s relative weight in GDP (down 0.3 p.p.) in 2018 depended entirely on decreasing interest charges (227). Furthermore, the CFP pointed to inconsistencies between the forecast change in (220) Conseil National des Finances Publiques (2018), p.48. (221) Conseil National des Finances Publiques (2018). (222) Portuguese Public Finance Council (2017a), p.12. (223) Portuguese Public Finance Council (2017b), p.2/16. (224) Portuguese Public Finance Council (2017b), p.5. (225) Portuguese Public Finance Council (2017b), p.iv. (226) Portuguese Public Finance Council (2017c), p.11. (227) Portuguese Public Finance Council (2017d), p.17.
compensation of general government employees in 2018 and the planned gradual unfreezing of civil service promotions (228). In addition, the CFP underlined that the draft state budget for 2018 projected a rise of 21% in capital expenditure due to the strong growth in gross fixed capital formation in 2018. Furthermore, the CFP argued that the draft state budget used ‘the ambiguity of the [national] rules, and the frailties that are still a feature of public accounts reporting in Portugal, in order to formally comply with the SGP’s preventive arm, without truly reflecting its underlying structural nature’ (229). In addition, the CFP identified risks of non-compliance with the trajectory of convergence towards the MTO and the expenditure benchmark. It argued that the structural effort of 0.3 percentage point of GDP in 2018 stood in marked contrast to the recommended 0.6 percentage point of GDP each year (230). Finally, the CFP found that ‘the deviation of planned growth in primary expenditure, net of discretionary revenue measures, exceeds on average the applicable benchmark by 1% of GDP’ for 2017 and 2018 (231). The CFP’s analysis of the 2018-2022 Portuguese stability programme issued in spring 2018 pointed out that the projected budget balance was partially dependent on ‘spending review’ measures that lacked sufficient detail to assess their budgetary impact (232). Generally, the CFP found that the counter-cyclical approach of deficit and debt reduction was warranted given the position in the cycle. It also endorsed the underlying macroeconomic forecasts for 2018 (233).
In Slovenia, the Fiscal Council confirmed in April 2017 that the government’s stability programme for 2017-2021 was in compliance with the EU 3% deficit rule and the EU debt rule (234). However, the Fiscal Council noted that compliance with the EU expenditure rule could not be assessed due to a lack of data in the draft amendment to the stability programme. Furthermore, the Fiscal Council pointed out that the envisaged structural effort for 2018 was too low for the EU rules. In October 2017, the Fiscal Council assessed that the government’s budgetary plan was only in partial compliance with national fiscal rules (235). It called on the government to achieve an annual average (228) Portuguese Public Finance Council (2017d), p.20. (229) Portuguese Public Finance Council (2017d), p.4. (230) Portuguese Public Finance Council (2017d), p.5. (231) Portuguese Public Finance Council (2017d), p.6. (232) Portuguese Public Finance Council (2018b). (233) Portuguese Public Finance Council (2018a), p.15. (234) Slovenian Fiscal Council (2017a), p.1. (235) Slovenian Fiscal Council (2017b), p.1.

European Fiscal Board
52
structural effort of at least 0.6 percentage point of GDP for 2017-2019 in order to achieve a structural surplus of 0.25% of GDP in 2019 and cautioned against the risk of an EDP (236). It argued that Slovenia would comply with the expenditure rule in 2018. It also stated that compliance with the debt reduction rule in 2018 was largely the result of favourable cyclical trends. More generally, the Fiscal Council was of the view that the lack of a sufficient medium-term orientation of fiscal policy posed risks. In its assessment of Slovenia’s draft stability programme in April 2018, the Fiscal Council revised its earlier opinion and projected that Slovenia would not comply with the expenditure rule in 2018-2019. It concluded that based on the underlying no-policy-change scenario, the expenditure ceilings stipulated by the national fiscal rule in November 2017 would be violated (237). In addition, the estimated deterioration of the structural balance for 2018 would significantly deviate from the required adjustment path towards the MTO. The Fiscal Council further stressed the importance of counter-cyclical fiscal policy to create the necessary fiscal buffers to adequately address the next cyclical downturn. An ex post assessment of the compliance of the general government budgets with the fiscal rules in 2018 was published in June 2019 (238). The Fiscal Council found that ‘the medium-term budgetary objective under EU rules was attained in 2018’ (239). High revenues due to favourable economic conditions and an increase in non-tax categories drove up the compliance rate with the fiscal rules.
On 10 May 2017, AIReF endorsed the macroeconomic forecasts that underpinned Spain’s 2017-2020 stability programme published in April 2017, stating that it deemed the outlook to be likely (240). AIReF estimated the fiscal policy stance to be moderately neutral in 2018. However, it pointed out that the 2017-2020 stability programme contained hardly any new measures that would allow an assessment of compliance with the budgetary stability targets for 2018 (241). Nevertheless, it deemed the envisaged deficit target for 2018-2020 feasible yet demanding in the outer years. Official expenditure projections were considered feasible but revenues were deemed to be optimistic. Overall, the debt-to-GDP ratio in (236) Slovenian Fiscal Council (2017b), p.1. (237) Slovenian Fiscal Council (2018c), p.6. (238) Slovenian Fiscal Council (2019). (239) Slovenian Fiscal Council (2019), p.5. (240) AIReF (2017b), p.36. (241) AIReF (2017b), p.40.
the stability programme showed a downward path for the entire period of 2017-2020 exceeding AIReF’s central forecast (242). On 16 October 2017, AIReF endorsed the macroeconomic forecast for the 2018 draft budgetary plan (243). It considered the growth path for 2018 and its composition plausible (244). In March 2018, AIReF endorsed the macroeconomic scenario that underpinned the 2018 draft general state budget (245). It considered the 2018 growth forecast ‘prudent’ and its composition plausible. In April 2018 AIReF endorsed the macroeconomic scenario of the 2018-2021 stability programme update but highlighted that compliance with the planned deficit path for 2018-2021 was unlikely (246). In addition, AIReF considered the path of the debt-to-GDP ratio for 2018-2021 to be ‘borderline feasible’ (247). Finally, AIReF stressed the need for consistent medium-term budgetary planning and warned that the stability programme should not turn into a ‘formal exercise for setting a deficit reduction path, not based on sufficiently detailed measures’ (248). In its July report on compliance with the fiscal rules of the public administrations AIReF noted that it was unlikely that the general government sector would achieve its deficit target of 2.2% of GDP in 2018 even though it was expected to exit the EDP and enter into the preventive arm (249).
Non-euro area Member States are not under the obligation to submit draft budgetary plans (DBPs). As a consequence, IFIs in these Member States assess risks to non-compliance on the basis of the draft budget laws only. In its April 2017 opinion on the government’s draft budget bill the Fiscal Council of Hungary argued that the economic growth projections underpinning the draft budget were slightly overoptimistic (250). According to the opinion of the Hungarian Fiscal Council, this could, in turn, lead to an overestimation of the revenue stream. Furthermore, the Fiscal Council criticised that the planned policy measures in the draft budget did not sufficiently quantify their potential budgetary impact (251). At the same time, the Fiscal Council assessed that the national public debt rule would be met even if projected economic growth turned out lower than expected. It also (242) AIReF (2017b), p.55. (243) AIReF (2017c), p.14. (244) AIReF (2017c), p.17. (245) AIReF (2018b). (246) AIReF (2018d), p.2. (247) AIReF (2018d), p.5. (248) AIReF (2018d), p.7. (249) AIReF (2018e), p.4. (250) Hungarian Fiscal Council (2017), p.3. (251) Hungarian Fiscal Council (2017), p.4.

European Fiscal Board
53
found the expected decrease in the public debt level to be compliant with the EU’s debt reduction rule. In addition, the Fiscal Council asked the government to provide details about its intended adjustment path towards achieving its MTO (a structural deficit of 1.5% of GDP) (252). While the Maastricht Treaty’s deficit threshold of 3% of GDP was likely to be met in 2018, the structural deficit would exceed the target set in Hungary’s convergence programme for 2016-2020 (253). Despite these severe objections, the Fiscal Council nevertheless endorsed the draft budget bill instead of confronting the government head on. In September 2018, the Fiscal Council issued its opinion on the state of the budget implementation. It assessed that the updated growth projection of the government for 2018 was ‘viable’ (254). It argued that a steeper decline in the debt level would be warranted given the favourable economic conditions (255). The Fiscal Council also explained that due to the unprecedented cash deficit of recent years, the central budget debt had increased already in the first half of 2018 above the level that was projected for the whole year (256). Thus, the Fiscal Council stated that the risks endangering the implementation of the cash-based deficit target at the regional level were more serious than in the past (257). Nevertheless, the Fiscal Council assessed that the debt level would be compliant with national and European rules. In its response to the EFB questionnaire, the Fiscal Council pointed out that fiscal buffers had been increased by 50% and that the MTO would be reached in 2019. The Fiscal Council will publish its ex post assessment for the whole fiscal year of 2018 when the relevant data becomes available (i.e. after June 2019).
In Romania, the government and the parliament are required to consider the opinion of the Fiscal Council before adopting the fiscal strategy and annual budget (according to the Fiscal Responsibility Law (FRL) Art.53, para.4). However, the Fiscal Council had effectively less than a week in December 2017 to carry out a complete assessment of the fiscal strategy for 2018-2020, the annual draft budget law for 2018 and other measures with budgetary implications. Due to the significant time pressure, it decided to issue a preliminary opinion on the State Budget Law and (252) Hungarian Fiscal Council (2017), p.4. (253) Hungarian Fiscal Council (2017), p.12. (254) Hungarian Fiscal Council (2018), p.4. (255) Hungarian Fiscal Council (2018), p.5. (256) Hungarian Fiscal Council (2018), p.5. (257) Hungarian Fiscal Council (2018), p.15.
Social Insurance Law for 2018 (258). The Fiscal Council cautioned against a pro-cyclical fiscal policy stance that could widen the deviation from the MTO. It pointed out that the potential and effective growth forecast by the National Commission for Economic Forecasting (NCEF) remained ‘significantly more optimistic’ compared to the European Commission’s forecast. The Fiscal Council stated that the underlying ‘scenario was rather inappropriate from the point of view of a prudent budget construction’ (259). In addition, the Fiscal Council criticised the projected VAT revenues, which it said were overestimated, whereas expenditures for social assistance were underestimated. Finally, the projection that the deficit would not breach the threshold of 3% of GDP depended largely on highly uncertain one-off revenues. The addendum issued by the Fiscal Council on 21st December 2017 further substantiated these concerns, calling the situation ‘in flagrant contradiction with the fiscal rules’ as stipulated in the national Fiscal Responsibility Law (260). In sum, the Fiscal Council concluded that the budgetary deficits outlined in the fiscal strategy would very likely not be met. In its ex post assessment of compliance with national fiscal rules for the fiscal year 2017 (published in June 2018 in its annual report), the Fiscal Council continued to criticise the systematic violation of the majority of fiscal rules (261). It further pointed out that the structural deficit rule had been disregarded since 2016, and no effort had been made to remedy this state of affairs. An ex post assessment of compliance with national fiscal rules for the fiscal year 2018 will be published in the annual report in June 2019.
In Sweden, the Fiscal Policy Council (FPC) found in its 2018 annual report (published in May 2018 and covering past and future periods) that the country’s public finances were sustainable in the long term (262). However, the FPC cautioned against past systematic deviations from the national surplus target and stressed the need for active counter-cyclical fiscal policy (263). According to the FPC, the deviation from the one percent surplus target for 2018 was pronounced, taking into account the calculations by the National Institute of Economic Research (264). In the FPC’s opinion, (258) Romanian Fiscal Council (2017a). (259) Romanian Fiscal Council (2017a), p.2. (260) Romanian Fiscal Council (2017b), p.2. (261) Romanian Fiscal Council (2018), p.11. (262) Fiscal Policy Council (2018), p.7. (263) Fiscal Policy Council (2018), p.50. (264) Fiscal Policy Council (2018), p.66.
European Fiscal Board
54
the government had not made sufficient use of the favourable economic situation in recent years to balance the deficit that resulted from the financial crisis. It estimated that the measures announced by the government in the budget bill for 2018 would weaken public finances by SEK 40 billion in 2018 (265). At the time, the FPC considered the permissible space under the expenditure ceiling for 2018sufficiently high to allow for expenditure increases (266). However, the FPC argued that using the available space would require higher public revenues. The FPC also warned against the risk of pro-cyclical fiscal policy stance because the government would have to tighten fiscal policy in a future recession to reach the surplus target. It urged the government to reflect on the desirable expenditure and income trajectory over the medium term. The FPC also comments on macroeconomic and budgetary forecasts, but no formal endorsement procedure is currently in place. The FPC’s annual report for 2019 was published on 7 May and entailed an ex post assessment of compliance with national and EU fiscal rules for the year 2018.
Overall, the data gathered by the EFB questionnaire confirm that the formulations used by IFIs to endorse the macroeconomic forecasts vary widely. For instance, while AIReF uses the formulation ‘endorsed as likely’, the PBO finds that the macroeconomic forecasts are ‘within a range deemed acceptable’. This confirms earlier findings by Jankovics and Sherwood (2017: 23) that have highlighted the broad range of formulations used in the endorsement procedures. The Network of EU IFIs recently remarked that ‘IFIs are almost equally split between those that provide an explicit statement and those that eschew a clear formulation’ (267). Furthermore, several IFIs have criticised the lack of sufficiently detailed policy measures in the stability and convergence programmes submitted by the governments. This finding was particularly striking in the case of the Portuguese CFP. Finally, several IFIs (for example, in Spain and Slovenia) underscored that fiscal policy planning was not sufficiently geared towards the medium term. This finding is in line with broadly similar results presented in the European Fiscal Monitor by the Network of EU IFIs (268).
(265) Fiscal Policy Council (2018), p.37. (266) Fiscal Policy Council (2018), p.66. (267) Network of EU IFIs (2019b). (268) Network of EU IFIs (2019c).
3.4. THE ROLE OF IFIS IN THE 2018
ELECTORAL CYCLE
This section assesses whether the general parliamentary elections that took place in 2018 had any notable impact — positive or negative — on the IFIs in question. Moreover, the dedicated questionnaire asked IFIs whether their government had submitted an updated draft budgetary plan (DBP) after the general election. Finally, stakeholders were asked whether the IFIs output featured prominently during the national election campaigns (i.e. whether it generated newspaper coverage or was referred to in party manifestos). Countries in which general parliamentary elections took place in 2018 included (269): Slovenia, Sweden, Latvia, Luxembourg, Italy and Hungary.
There are several reasons why general elections can have a bearing on EU IFIs and the EU fiscal surveillance cycle. First, general elections can either be a blessing or a curse for the independence of national IFIs, depending on the attitude of the newly elected government towards its IFI. This explains why the term of the IFI leadership should be independent of the electoral cycle and why it should not be appointed by the government (270). Second, elections offer an opportunity for IFIs to heighten their non-partisan profile and to disseminate their output through media appearances. In doing so, they set the tone for an unbiased public debate on fiscal policy during the electoral campaign. The Dutch Bureau for Economic Policy Analysis (CPB) regularly scores party manifestos in the run-up to the elections and analyses the coalition agreement after the formation of the government (271). This levels the playing field among the competing political parties because it gives smaller opposition parties the chance to build up fiscal credibility (272). Tighter scrutiny by the IFI provides an incentive for political parties to write more detailed electoral manifestos (i.e. to pay more attention to the revenue-raising side of their proposals). A potential pitfall of costing is that certain beneficial effects of a policy might not be captured by the economic model that is used. Thus, the public needs to be aware of the limitations of the models underpinning the costing exercise. This requires a high degree of transparency. Ideally, the public (269) Countries in which there was a change of government without
general elections were not included in the sample. (270) von Trapp, Lienert and Wehner (2016), p.28; Network of EU
IFIs (2019), p.4. (271) European Fiscal Board (2017), p.36. (272) von Trapp, Lienert and Wehner (2016), p.18.

European Fiscal Board
55
should have free access to the economic models that are deployed for the analysis. Greater public scrutiny will promote competition and act as an incentive for the IFI to use state-of-the-art economic models. Otherwise, there is the risk that costing could stifle policy innovation rather than encourage it. For the first time, the Latvian Fiscal Discipline Council (FDC) has started costing parties’ fiscal plans in the run-up to the 2018 election, while the Slovenian Fiscal Council did an assessment of the coalition agreement (273). Third, during an election year some governments submit a DBP based on a ‘no-policy change scenario’. This can increase the risk of non-compliance with the fiscal rules if the newly elected government does not provide a timely update of its DBP after taking office. Fourth, IFIs are supposed to improve fiscal transparency by sending a credible signal about the state of public finances. This information should enable voters to distinguish between sustainable and unsustainable fiscal policies. Greater fiscal literacy will help voters to cast their ballot in line with their fiscal preferences (274).
In general, risks to the functional autonomy of IFIs did not materialise in the wake of general elections in 2018 nor were any plans envisaged to strengthen the IFIs. The surveyed IFIs reported that the elections have left the status quo unaltered. In this regard, it is important to recall that the functional autonomy of the Hungarian Fiscal Council had been significantly curtailed by the government already in 2010. The non-profit Fiscal Responsibility Institute Budapest (FRIB), a civil society initiative, was created in 2011 to provide independent analysis on budgetary issues (275). However, FRIB’s funding sources have dried up, and it is no longer operational.
In 2018, elections affected the work programme of the IFIs in some countries. However, this was not the result of political interference. Rather, it was due to autonomous adjustments to the work programme or the timing of the election. In Luxembourg, the work programme has been affected, because the elections took place in late 2018 and delayed the publication of the DBP for 2019 to March 2019. As a consequence, the assessment of the DPB also had to be rescheduled to spring 2019 (without affecting its significance). In addition, the elections have caused a delay in the (273) Platais and Kalsone (2018); Slovenian Fiscal Council (2018a). (274) Beetsma et al. (2017). (275) For more information, see the FRIB website
http://kfib.hu/en/home
appointment of new members of the CNFP’s council, as the expiration of the mandate coincided with the elections. In Italy, the Parliamentary Budget Office (PBO) published a focus paper in February 2018 — one month before the election took place (276). The paper was aimed at spurring public debate on topics such as the outlook of Italian public finances but also fiscal risks related to taxation and the pension system. In Latvia, the FDC invited all political parties in spring 2018 to participate on a voluntary basis in a survey aimed at costing their fiscal plans before the election on 6 October 2018. Given the limited resources of the FDC, it was decided to shift the burden of conducting the actual costing to the political parties themselves (277). Under the guidance of the FDC, 6 out of 16 political parties participating in the 2018 election ultimately returned the questionnaire (278). In its evaluation of the costing initiative, the FDC concluded that it raised the electorate’s awareness of the likely implications of different fiscal plans (279). Moreover, it gave the parties the opportunity to signal fiscal responsibility. New challenger parties that were not represented in the previous Parliament were especially eager to participate in order to gain fiscal credibility (280). This shows that IFIs can improve the quality of democracy by lowering the barriers to entry for challenger parties. However, a politicisation of the IFI should be avoided because it could undermine its reputation for impartiality. In Slovenia, the Fiscal Council provided an assessment of the coalition agreement for the first time. It was published only after the new government was confirmed by the Parliament to avoid the perception that it was interfering with the electoral process (281). In sum, the experience of the IFIs surveyed shows that elections can offer IFIs an opportunity to provide unbiased information on fiscal issues to the electorate before and/or after the elections.
The EFB questionnaires confirmed the loose commitment of governments to provide timely updates of their DBPs after an election. Elections have caused governments to update their DBPs with a delay (the case of Latvia, Luxembourg and Slovenia). A prolonged period of political uncertainty before or after a general parliamentary (276) Italian Parliamentary Budget Office (2018). (277) Kalsone and van Veldhuizen (2019). (278) Kalsone and van Veldhuizen (2019). (279) Platais and Kalsone (2018), p.17; Kalsone and van Veldhuizen
(2019). (280) Platais and Kalsone (2018); Kalsone and van Veldhuizen (2019). (281) Slovenian Fiscal Council (2018a).

European Fiscal Board
56
election can increase budgetary risks. In Slovenia, a period of heightened political uncertainty ensued after the government resigned in March and lasted until the June 2018 elections. The Slovenian Fiscal Council publicly cautioned against increased risks to fiscal sustainability and even called on Parliament to moderate their expenditure proposals (282). It also called on the National Council to exercise its veto right if the Parliament failed to comply with its call for moderation. The intervention was not required by legislation but came at an important point in time when the political parties were outbidding each other with expenditure proposals just before the upcoming election. In Sweden, after the general elections of 9 September 2018 a new government was not formed until 14 January 2019. In the meantime, an opposition budget was adopted after the budget proposed by the transitional government failed in December. As a result, the new government had to present a supplementary budget by 15 April 2019. Similarly, in Latvia an interim budget was adopted for 2019 due to the difficulties in the government formation. In conclusion, these episodes demonstrate that IFIs have an important role to play during periods of heightened political uncertainty. Even though the provision of unbiased recommendations to parliament might go beyond their narrow legal mandates in some cases, the proactive promotion of fiscal transparency by IFIs can caution against risks to the overall fiscal sustainability.
The responses to the EFB questionnaire demonstrate that IFIs engaging in the costing of election manifestos or in the assessment of coalition agreements tend to attract significant media attention. This type of output is particularly salient and fits the news cycle. In Slovenia, the assessment of the coalition agreement was the first of its kind and thus sparked a lot of media coverage. The Fiscal Council found that implementing the coalition’s planned measures could distance the country from its medium-term fiscal objective and lead to a procyclical fiscal policy stance (283). It even triggered an extraordinary session of the Parliament’s Committee on the supervision of public finances. Even prior to these positive reactions, the Fiscal Council had committed itself to continue this practice in the future. The Latvian FDC reported that after a press conference presenting the costing results, 87 media items referred to the initiative the (282) Slovenian Fiscal Council (2018b). (283) Slovenian Fiscal Council (2018a).
next day. These examples show that initiatives specifically tailored towards the elections have the potential to feature prominently in the public debate. Nevertheless, to avoid the potential pitfalls of electoral costing, it is essential that IFIs are completely transparent about the procedural steps of the exercise, which includes public access to the economic models used and their underlying assumptions.

4. ASSESSMENT OF THE FISCAL STANCE IN 2018
European Fiscal Board
Key findings
In 2017, there was general agreement among the EFB, the Commission and the Council that a neutral fiscal stance would be appropriate for the euro area as a whole in 2018, although with the latter two institutions adding the somewhat ambiguous qualification ‘broadly’.
Policy guidance also unanimously called for a differentiated fiscal stance in individual Member States: consolidation where needed and higher public investment where possible.
The year 2018 was a year of relatively strong economic growth but with remaining challenges to fiscal sustainability. As in 2017, it would have provided a useful window of opportunity to reduce high debts and build fiscal buffers.
In the Commission 2017 autumn forecast, however, the projected fiscal stance in nearly all euro area countries was on the mildly expansionary side. Many countries that were not at their MTO were thus set to depart from their fiscal requirements in 2018.
The prospect of a slightly expansionary stance, in countries where this was in conflict with both economic needs and SGP requirements, involved two risks: missing a chance to reduce fiscal imbalances and, venturing into pro-cyclical territory.
The aggregate fiscal stance, as measured in spring 2019 by the estimated change in the structural primary balance, points to a marginal fiscal retrenchment that appears to be roughly in line with guidance, the observed economic situation and the aggregation of country-specific fiscal recommendations.
Composition across countries is lopsided compared to recommendations, however.
Much of the aggregate outcome reflects the fact that of seven countries that had available fiscal space, four consolidated further beyond their MTOs.
By contrast, 7 out of the 10 countries that were in the preventive arm and not yet at their MTO did not deliver the required structural effort, and Spain, the last country subject to an excessive deficit procedure, did not make any structural effort at all.
Moreover, much of the estimated marginal increase in the structural primary balance is due to revenue windfalls. By contrast, dynamic developments in net expenditure, which grew nearly twice as fast as potential output, suggest a sizeable fiscal expansion. This points to the problem of using two different indicators.

European Fiscal Board
58
4.1. BUDGETARY PROJECTIONS AND
OUTTURN
The outlook for aggregate deficit and debt levels for 2018 improved in the course of 2017, as positive macroeconomic and budgetary news for 2017 came in. For the euro area as a whole, the Commission expected in the autumn of 2017 that both the general government deficit and debt would start from a lower outturn in 2017 and decline somewhat faster in 2018 than expected in its 2017 spring forecast (Table 4.1). This was consistent with a favourable revision to the macroeconomic outlook. The figure for the expected decline in the aggregate structural primary surplus was also revised slightly downwards. In the spring of 2017, the Commission expected, based on a no-policy-change scenario, that the fiscal stance in 2018 would be slightly expansionary in the euro area as a whole and in most euro area countries. A few months later, based on its 2017 autumn forecast which included policy measures for 2018 following the submission of draft budgetary plans (DBPs), the Commission still expected that the fiscal stance would be slightly expansionary. It noted, however, that the fiscal stance fell in the ‘broadly neutral’ range when it was measured using the change in the structural balance rather than the change in the structural primary balance or the Discretionary Fiscal Effort, which both exclude interest expenditure.
While short-term risks were assessed to be low, the Commission’s and the IMF’s assessments found that, in the medium to long run, there were risks to public debt sustainability for some countries. They
also noted that some countries were vulnerable to financial market swings. In May 2017, therefore, the Commission Communication on the CSRs mentioned ‘those countries with high debt and where vulnerability to financial market swings may be more accentuated’. This echoed the conclusions of IMF Article IV reviews for some countries.
Graph 4.1: Change in the general government budget balance in 2018, projections and outturn
Note: A decrease in interest payments is shown as an improvement in the headline balance.
Source: European Commission, own calculations
As in previous years, on aggregate the expected improvement in nominal budget balances in 2018 relied entirely on improving cyclical conditions and reduced interest payments (Graph 4.1). Discretionary fiscal policy measures, by contrast, were expected to weaken the underlying budgetary
-0.5
0.0
0.5
Commission 2017
spring forecast
Commission 2017
autumn forecast
Outturn
Change in the structural primary balance
Change in the impact of one-offs
Change in interest payments (reversed sign)
Change in the cyclical component
Change in the headline balance
(% o
f G
DP
)
Table 4.1: Main budgetary variables in the euro area and its largest Member States, projections and outturn
Source: European Commission.
2017 2018 2017 2018 2017 2018 2017 2018 2017 2018 2017 2018
EA-19 -1.4 -1.3 -1.1 -0.9 -1.0 -0.5 90.3 89.0 89.3 87.2 89.1 87.1
DE 0.5 0.3 0.9 1.0 1.0 1.7 65.8 63.3 64.8 61.2 64.5 60.9
FR -3.0 -3.2 -2.9 -2.9 -2.8 -2.5 96.4 96.7 96.9 96.9 98.4 98.4
IT -2.2 -2.3 -2.1 -1.8 -2.4 -2.1 133.1 132.5 132.1 130.8 131.4 132.2
ES -3.2 -2.6 -3.1 -2.4 -3.1 -2.5 99.2 98.5 98.4 96.9 98.1 97.1
2017 2018 2017 2018 2017 2018 2017 2018 2017 2018 2017 2018
EA-19 -1.1 -1.3 -1.0 -1.1 -0.9 -0.7 0.9 0.6 1.0 0.8 1.0 1.2
DE 0.6 0.3 0.9 0.9 0.8 1.6 1.8 1.3 2.1 2.1 1.8 2.5
FR -2.3 -2.8 -2.4 -2.7 -2.7 -2.6 -0.5 -1.0 -0.6 -1.0 -1.0 -0.9
IT -2.0 -2.2 -2.1 -2.0 -2.1 -2.2 1.9 1.5 1.7 1.6 1.7 1.5
ES -3.4 -3.4 -3.1 -3.1 -2.7 -2.7 -0.8 -1.0 -0.6 -0.8 -0.1 -0.2
Outturn
Headline balance (% of GDP) General government debt (% of GDP)
Structural balance (% of potential GDP) Structural primary balance (% of potential GDP)
Spring 2017 Spring 2017
Spring 2017 Autumn 2017 Outturn Autumn 2017Spring 2017
Autumn 2017 OutturnAutumn 2017 Outturn

European Fiscal Board
59
positions on aggregate.
Moving ahead, the latest data indicate that the headline deficit in the euro area as a whole fell by 0.5 percentage point of GDP in 2018. The deficit reduction was twice that expected in the autumn of 2017, although real GDP growth eventually turned out to be as expected in the spring of 2017, i.e. lower than in the 2017 autumn forecast. The explanation for the larger decline in the deficit is that the fiscal stance turned out on aggregate to be marginally restrictive rather than marginally expansionary. This outcome was largely driven by a sizeable increase in the German structural surplus (Table 4.1).
4.2. ASSESSING THE FISCAL STANCE IN 2018
4.2.1. Policy guidance issued in 2017 and early 2018
2017 was the first year in which the EFB intervened in the European semester, giving guidance on the fiscal stance ahead of the Commission’s and Council’s recommendations. In June 2017, the newly established EFB for the first time issued its assessment of the fiscal stance appropriate for the euro area in 2018 (Box 4.1). The Commission published guidance on two occasions. The first was in July 2017 (284), and the second in November 2017, when it assessed the DBPs submitted by the euro area countries and issued its recommendation for a Council recommendation for the euro area as a whole. Finally, the Council issued statements based on the Commission and EFB analyses and, in early 2018, adopted a recommendation for the euro area as a whole.
The general reading of the situation and the guidance issued were roughly the same across all three institutions. Combining stabilisation and sustainability considerations, the EFB, the Commission and the Council agreed that the situation called for a (broadly) neutral fiscal stance, which was supposed to be achieved with country-differentiated contributions. In particular, high-debt countries and countries lacking sufficient fiscal buffers were advised to consolidate as (284) In May and June 2017, the Commission presented its analysis of
the fiscal stance to Council committees, along with its horizontal assessment of stability and convergence programmes (SCPs) and country-specific recommendations; the Commission note discussing both the SCPs and the fiscal stance was published in July 2017.
required by the SGP, all the more so when their output gap was expected to turn or remain positive. This alone would have led to a slightly restrictive stance, but a neutral stance could be achieved if the countries with available fiscal space made use of it.
Graph 4.2: Commission classification of the fiscal stance in the euro area in 2018
(1) Stability programmes, Draft budgetary plans: aggregate fiscal stance based respectively on the stability programmes and the draft budgetary plans of euro area Member States.
Source: European Commission
The main difference in guidance is that the EFB called for a neutral fiscal stance while the Commission and the Council called for a broadly neutral one. In Commission language, ‘broadly neutral’ covers a fairly wide range, from slightly expansionary to slightly restrictive (Graph 4.2), as already discussed by the EFB (285), and the phrase can be understood to mean quite different things, depending on the context. In July 2017, the Commission argued that a broadly neutral fiscal stance would be more appropriate for 2018 than the slightly expansionary stance envisaged in its spring 2017 forecast, and noted that the aggregation of stability programmes led to such a stance. This gave the impression that the fiscal stance emerging from the stability programmes, which was on the ‘slightly restrictive’ end of the ‘broadly neutral’ spectrum, was appropriate. In November 2017, however, the Commission found that both its autumn 2017 forecast and the aggregation of the draft budgetary plans pointed to a broadly neutral fiscal stance, and that this was appropriate. This time, however, this implicitly referred to a fiscal stance on the ‘slightly (285) EFB (2018a).
-0.4
-0.3
-0.2
-0.1
0
0.1
0.2
0.3
Changein SPB
Changein SB
Changein SPB
Changein SB
Changein SPB
Changein SB
Commission forecast Stability programmes Draft budgetary plans
% of potential GDP
Spring 2017 Autumn 2017 Outturn
broadly neutral fiscal stance
slightly restrictive fiscal stance
slightly expansionary fiscal stance

European Fiscal Board
60
expansionary’ end of the spectrum of ‘broadly neutral’.
Although growth prospects for 2018 improved markedly in the second half of 2017, this was not fully reflected in the guidance issued in late 2017. When the Commission, the Council and the EFB issued their guidance in the spring and summer of 2017, the prevailing view was that the euro area economy would gradually move from moderate recovery in 2017 to steadier expansion in 2018. By contrast, when the Commission and the Council issued policy recommendations for the euro area as a whole in autumn 2017 and winter 2018, the outlook for 2018 was getting brighter, in the wake of good economic news for 2017 (Graph 4.3). Nevertheless, the Commission described the ‘current economic recovery’ as ‘strengthening but remain[ing] atypical and incomplete’ and maintained its recommendation for a broadly neutral fiscal stance, which was also adopted by the Council. However, neither the Commission nor the Council clarified whether the appropriate fiscal
stance should be closer to the restrictive bound of the ‘broadly neutral’ range (like the fiscal stance emerging from the stability programmes) or the expansionary bound (as suggested by the draft budgetary plans and the Commission forecasts).
Another difference in guidance is that the Board explicitly indicated that, if growth turned out to be higher than expected, revenue windfalls should be used to reduce debt.
The Commission’s guidance on the fiscal stance also had a sizeable impact on country-specific guidance for two Member States. In its May 2017 communication on country-specific recommendations, the Commission announced that it would take the trade-off between stabilisation and sustainability into account when assessing compliance with the fiscal rules, making use of a ‘margin of discretion’ (see Chapter 2). This eventually led the Commission to conclude that Italy and Slovenia could depart from the requirements that would normally apply on the basis of the matrix of adjustment requirements.
Graph 4.3: Real GDP growth projections and guidance on the fiscal stance for the euro area in 2018
Note: The ECB/Eurosystem staff and the OECD both report working-day-adjusted growth rates, while the Commission and the IMF report unadjusted numbers. The other sources do not tell whether they adjust growth rates for working days.
Source: European Commission, ECB, IMF, OECD, Consensus Economics, MJEconomics.
1
1.25
1.5
1.75
2
2.25
2.5
Mar
-17
Ap
r-1
7
May
-17
Jun
-17
Jul-
17
Au
g-1
7
Sep
-17
Oct
-17
Nov
-17
Dec
-17
Jan-
18
Feb
-18
Mar
-18
Ap
r-1
8
May
-18
Jun
-18
Jul-
18
Au
g-1
8
Sep
-18
Oct
-18
Nov
-18
Dec
-18
Jan-
19
Feb
-19
Mar
-19
Ap
r-1
9
May
-19
European Commission ECB/Eurosystem IMFOECD Consensus Economics Forecasts Euro Zone BarometerSurvey of Professional Forecasters
Commission 2017 spring forecast
Commission 2019 spring forecast
EFB
June report
CSRs - Commission
recommendations
Publication of Commission'sassessment of SCPs and fiscal stance
Commission: DBP assessment + recommendation for Council euro
area recommendation
Eurogroup conclusions
Council: euro area recommendation
CSRs - Adoption of Council
recommendations
Commission 2017 autumn forecast
European Fiscal Board
61
(Continued on the next page)
Box 4.1: Guidance issued by the Commission, the Council and the EFB
Commission Communication on country-specific recommendations, 22 May 2017:
‘After several years of budgetary consolidation, the fiscal policy stance in the euro area and the EU (...) is set to remain [broadly neutral] in 2017. With the proposed country-specific recommendations, the fiscal adjustment required for Member States under the preventive arm not yet at their medium-term budgetary objective is consistent with the Stability and Growth Pact. For Member States under the corrective arm, the proposed recommendations reiterate the need to comply with the requirements of the Excessive Deficit Procedure. Setting public debt ratios firmly on a downward path is especially important in those countries with high debt and where vulnerability to financial market swings may be more accentuated. Overall, these adjustments to comply fully with the Pact would imply a slightly restrictive aggregate fiscal stance for the euro area as a whole in 2018.
Within the existing rules of the Stability and Growth Pact, euro area Member States that have fiscal scope are therefore recommended to use it to support domestic demand, notably investment in infrastructure, research and innovation. This would strengthen their growth potential and lead to a better distribution of the fiscal adjustment across the euro area. It would also contribute to achieving a broadly more appropriate fiscal stance for the area as a whole in 2018. This would be important to strike the right balance between attaining public finance sustainability and safeguarding the ongoing recovery in economic activity and in employment. Moreover, when taking policy measures to achieve the recommended budgetary adjustments under the preventive arm of the Pact, Member States should consider the need to support the recovery and the potential impact on employment. In carrying out its future assessments, the Commission stands ready to use its margin of appreciation in cases where the impact of large fiscal adjustment on growth and employment is particularly significant. In that context, it will make use of any updated information regarding the projected position in the economic cycle of each Member State and work closely with the Council to that effect. This is consistent with the approach already set out by the Commission in its Communication of January 2015 on making the best use of the flexibility within the rules of the Stability and Growth Pact and in its Communication of November 2016 on a positive fiscal stance for the euro area.’
EFB June 2017 report, 20 June 2017:
‘In 2018, a neutral fiscal stance for the euro area as a whole seems appropriate. Current projections of a closing output gap do not support a case for discretionary fiscal expansion, i.e. on top of the effect of automatic stabilisers, at the aggregate level, keeping in mind the continuation of a very accommodative monetary policy. At the same time, we have observed increasing and large external imbalances of the euro area. Moreover, there is a danger of long-lasting effects of low levels of economic activity on the labour market and the capital stock. Therefore, a significant euro-area wide fiscal contraction to accelerate debt reduction over and above the projected decline could weigh on the steady but fairly measured pace of the economic recovery. If economic conditions improve substantially, windfalls should be allocated to debt reduction, especially in the countries with high government debt-to-GDP ratios. (...)
A broadly neutral fiscal stance for the euro area in 2018 could be implemented through differentiated national policies within the parameters of the SGP. Some Member States, whose structural budget balance exceeds the medium-term budgetary objective (MTO), are not making full use of the available fiscal space. If these Member States were to fully use their fiscal space in 2018, while others consolidated as required under the SGP — consolidation is particularly warranted in countries with a high debt ratio — a neutral fiscal stance for the euro area as a whole could be achieved. Making or not making use of available fiscal space — both options are compatible with the SGP. This freedom of choice follows from the asymmetry of the fiscal rules, which do not include provisions for countries over-achieving the MTO. Therefore, achieving the appropriate fiscal stance in 2018, while at the same time respecting the SGP at national level, presupposes coordinated agreement between participating Member States. Implementing the SGP without the use of available fiscal space would lead to a slightly contractionary fiscal stance.’

European Fiscal Board
62
Box (continued)
(Continued on the next page)
Commission overview of the 2017 SCPs and assessment of the euro area fiscal stance for 2018, July 2017:
‘The euro area fiscal stance is expected to be slightly expansionary in 2017 and 2018 according to the discretionary fiscal effort derived from the Commission 2017 spring forecast (under the no-policy-change assumption for 2018). On the one hand, the economic recovery is steady with continuously closing output gap. On the other hand, the policy-supported economic recovery still remains moderate, with risks to the outlook tilted to the downside. Despite recent improvements in unemployment, significant slack remains in the labour market. Over the next two years, wage growth is expected to remain constrained and the investment gap is expected to persist, while core inflation is forecast to stay subdued. Together with a large expected current account surplus in the euro area, this suggests that there is still scope for higher growth without triggering inflationary pressures. Therefore, the analysis points to a remaining trade-off between sustainability and stabilisation needs for the euro area as a whole for 2018. A convincing strategy for addressing the remaining uncertainties would therefore be to pursue a broadly neutral fiscal stance in 2018 for the euro area as a whole, with proper differentiation across Member States, catering for sustainability needs. The aggregation of the Member States plans presented in the stability programmes actually points to a broadly neutral fiscal stance. In addition, an analysis shows that cross-country spillover effects are non-negligible. This finding strengthens the case for an appropriately differentiated fiscal stance, i.e., one in which Member States with fiscal space make use of it and Member States who need to consolidate do so at a lesser cost.’
Eurogroup conclusions, 10 July 2017:
‘The Commission and the EFB, whose role it is to advise the Commission, presented their analyses of the euro area fiscal stance and assessed the projected broadly neutral fiscal stance for 2018 to be appropriate. The Commission and the EFB further called for a growth-friendly reorientation of government expenditure towards prioritising investment. The institutions concurred that Member States at risk of not meeting their obligations under the SGP should take additional measures to ensure compliance and that Member States that have outperformed their medium term objectives have been invited to prioritise investments to boost potential growth while preserving the long-term sustainability of public finances. The EFB also discussed the policy-relevance of the fiscal stance concept pointing to the tensions between the aggregate and national perspectives inherent in the current governance framework. I concluded that there was agreement that a broadly neutral overall stance is appropriate for 2018 and that Member States would take this analysis into account in the preparation of our national budgets in the coming months and in the discussions on the Draft budgetary plans later this year.’
Commission overall assessment of the 2018 DBPs, 22 November 2017:
‘The euro area fiscal stance, as measured by the change in the aggregate structural balance, is broadly neutral in 2018. Compared to the structural balance, the structural primary balance points to a slightly more expansionary stance in 2018, as it does not include the ongoing decline in interest expenditure. Also the Discretionary Fiscal Effort, an indicator that is close to the expenditure benchmark of the Stability and Growth Pact, points to a somewhat more expansionary stance in 2017 and 2018, both according to the DBPs and on the basis of the Commission forecast.
A broadly neutral fiscal stance at aggregate level for the euro area appears appropriate in the light of the current economic recovery in the euro area, which is characterised by some atypical features, the debt legacy from the crisis and the expected recalibration of asset purchases by the ECB.
The aggregate situation hides considerable differences between Member States, with some facing the need to consolidate, while others have some fiscal space. A differentiated approach to national fiscal policies is thus needed in order to balance the objectives of stabilising the economy and ensuring the longer-term sustainability of public finances. Overall, large differences remain in Member States' positions vis-à-vis their medium-term budgetary objectives (MTO). According to the Commission forecast, six euro area Member States are at (Lithuania) or above their MTO (Cyprus, Germany, Luxembourg, Malta and the Netherlands) in 2017. They are all projected to remain so in 2018, while some of them are projected to use part of their fiscal space. According to its no-policy-change DBP, also Germany is expected to use some of

European Fiscal Board
63
Box (continued)
its fiscal space. Ireland is projected to reach its MTO in 2018 while Slovakia is set to make substantial progress towards it. At the same time, for some Member States that are still far away from their MTO, the Commission forecast does not project any major improvement (Spain, Italy, Portugal and Slovenia) or even expects a deterioration of the structural balance (Belgium and France). Apart from Slovenia, these are also the Member States with the highest debt ratios.
With the objective of balancing stabilisation needs with possible sustainability challenges, the Commission can exercise its degree of discretion when assessing a departure from the required fiscal adjustment. In particular, the Commission concluded that a fiscal adjustment that departs from the requirement can be deemed adequate for Italy and Slovenia, provided that they effectively ensure such a fiscal adjustment in 2018. However, such an adjustment does not appear to be delivered according to the Commission forecast.’
Commission recommendation for a Council Recommendation on the economic policy of the euro area, 22 November 2017:
‘Aim at a broadly neutral fiscal stance at the aggregate level for the Euro Area and a balanced policy mix. Fiscal policies should strike the appropriate balance between ensuring the sustainability of public finances, in particular reducing debt ratios where they are high, and supporting the economic recovery. While ensuring the effective functioning of national fiscal frameworks, Member States should pursue fiscal policies in respect of the SGP and which support investment and improve the quality and composition of public finances, also by making use of spending reviews and adopting growth-friendly and fair tax structures.’
Accompanying Commission staff working document, 22 November 2017:
‘A broadly neutral fiscal stance at aggregate level for the euro area appears appropriate in the light of the current economic recovery characterised by some atypical features, the debt legacy from the crisis and the expected recalibration of asset purchases by the ECB. Striking the right balance between ensuring the long-term sustainability of public finances, depending on country-specific conditions, and supporting the economic recovery is essential.
The overall fiscal stance of the euro area is (...) expected to remain [broadly neutral] in 2018 (...). A broadly neutral fiscal stance for the euro area appears still appropriate in the light of the current economic recovery, which is strengthening but remains atypical and incomplete. This is even more relevant in the context of persistent debt legacy from the crisis.
There are nonetheless considerable differences at national level, with some countries facing the need to consolidate, while others have some fiscal space. A differentiated approach to national fiscal policies is thus needed in order to balance the objectives of stabilising the economy and ensuring the long-term sustainability of public finances. It is also important to reduce excessive debt levels and re-build fiscal buffers, in order to be able to absorb potentially upcoming shocks. According to the latest Commission economic forecast, the aggregate debt level for the euro area is expected to reach around 89% of GDP at the end of 2017 and decline to around 87% and 85% in 2018 and 2019 respectively. Public debt levels have decreased on average at a slow pace and remain close to their historic peaks in several euro area countries. The strengthening recovery in the euro area and the associated steepening of the yield curve observed since the fourth quarter of 2016 suggest that the opportunity presented by the current low financing cost environment might be slowly fading. Where debt ratios are high, curbing less growth-friendly spending and cutting tax loopholes is important for strengthening the sustainability of public finances.’
Council Recommendation on the economic policy of the euro area, 23 January 2018:
‘Deliver the planned, broadly neutral overall fiscal stance for the Euro Area, contributing to a balanced policy mix. Strike an appropriate balance between ensuring the sustainability of public finances, in particular where debt ratios are high, and supporting the economy, in full respect of the Stability and Growth Pact and taking into account fiscal space and spillovers across Member States. Use the improving economic conditions to rebuild fiscal buffers, while continuing to strengthen economic growth potential.’

European Fiscal Board
64
4.2.2. Ex-post assessment
The remainder of this chapter discusses whether, in hindsight, the guidance and the observed fiscal stance were appropriate.
The EFB’s assessment of the fiscal stance follows an economic reasoning: it considers the need for discretionary fiscal stabilisation subject to the sustainability constraints of public finances (286). Alternative fiscal stances, along with the fiscal requirements under the SGP, are reported in Graph 4.5, based on both the expectations of autumn 2017 (upper panel) and the outturn observed in spring 2019 (lower panel).
There is no single optimal target for how fast economic activity should return to its potential level or for debt dynamics that would be relevant for all countries. To account for differences across countries and over time, Graph 4.5 shows possible ranges for the fiscal stance. Starting with the stabilisation objective, a range of stylised policies is considered when the output gap has not closed yet, namely a moderate to fast stabilisation — i.e. closing the output gap by 25 % to 50 % within the reference year (287) (288). Countries are sorted by the level of their output gap in 2017, as an indication of how advanced their recovery already was. When the output gap is negative, fiscal policy stabilises the economy more when it is more expansionary; conversely, when the output gap is positive, more stabilisation means more fiscal contraction.
For sustainability constraints, fiscal adjustment can be implemented at a constant pace over several years or frontloaded; when sustainability is already ensured, no consolidation is assumed to be needed (289). To provide more background on (286) For further details on the EFB’s approach, see Boxes 4.1, 4.2 and
4.3 on ‘Assessing the appropriate fiscal stance’, ‘Assessing the cyclical position of the economy’ and ‘Assessing the sustainability of public finances’ in our 2017 annual report (European Fiscal Board, 2017b).
(287) In this chapter, the fiscal stance needed to achieve a certain change in the output gap is calculated using a fiscal multiplier of 0.8. This is an average value that seems reasonable given the constraints on monetary policy and assuming a balanced composition between revenue and expenditure measures.
(288) Outside these indicative standardised ranges, the relevant target can also be a neutral fiscal stance — i.e. no discretionary fiscal stabilisation — e.g. when the output gap has just closed or changed signs, or when the stabilisation provided by automatic fiscal stabilisers is sufficient. For the sake of readability, this is not reported in the graph.
(289) For instance, a negative value of the S1 indicator in a given country does not imply that its structural primary position should deteriorate so that its debt ratio increases to 60 % of GDP; it only means that some leeway is available for fiscal stabilisation if needed.
whether sustainability is ensured or at risk in the various Member States, Graph 4.4 shows the assessment of risks according to four different indicators used by the Commission as measured in autumn 2017. These are (i) the S1 indicator, (ii) a debt sustainability analysis, (iii) the distance to MTO and (iv) the primary gap, which is used as input for the debt rule (290). For high-debt countries, these standard indicators conveyed consistent signals of high risks to sustainability. The graph also reports the values for the euro area as a whole, although in the absence of a central fiscal capacity issuing common debt, the analysis of sustainability for the euro area as a whole remains a theoretical aggregation of national situations.
Graph 4.4: Sustainability indicators in autumn 2017
Notes: (1) This graph shows three quantitative indicators (S1, the distance to MTO and the primary gap) plus the risk classification resulting from the Commission's debt sustainability analysis (DSA), except for the euro area as a whole for which the Commission does not publish a DSA. (2) The graph shows the euro area on the left, followed by Member States grouped by risk category according to the DSA and ranked by increasing levels of S1. (3) S1 measures the total cumulative adjustment, in terms of structural primary balance, needed in 2018-2022 to bring the debt to GDP ratio to 60 % by 2032. (4) A negative distance to MTO means that the Member State is above its MTO. (5) The primary gap measures the distance between the current primary balance and the primary balance consistent with a reduction of the excess of debt over 60 % of GDP at an annual pace of 5%.
Source: European Commission, own calculations.
To give a comprehensive overview of the fiscal situation, Graph 4.5 also shows the fiscal requirements under the Pact. The requirements incorporate the impact of granted flexibility. For some countries, the graph includes an additional point, corresponding to less demanding requirements. For the countries that had overachieved their MTO in 2017, this additional point shows their available fiscal space in 2018, i.e.
(290) The primary gap measures the distance between the current
primary balance and the primary balance consistent with a reduction of the excess of debt over 60 % of GDP at an annual rate of 5%.
-4
-3
-2
-1
0
1
2
3
4
5
EA LU MT EE NL LV DE SK LT IE CY AT SI FI BE ES FR PT IT
S1 Distance to MTO Primary gap
HighMedium% of GDP
Risk category according to the Commission's debt sustainability analysis
Low % of GDP

European Fiscal Board
65
Graph 4.5: Analysis of the fiscal stance in 2018
Notes: (1) The ranges for stabilisation are computed using a uniform fiscal multiplier of 0.8. (2) S1 measures the total cumulative adjustment needed in 2018-2022 to bring the debt-to-GDP ratio to 60% by 2032. Uniform implementation over five years means that one fifth of S1 is implemented in 2018. (3) For consistency, the fiscal requirements (diamonds) are recalculated in terms of change in the structural primary balance, while in official documents they are formulated in terms of change in the structural balance. (4) The countries benefitting from clauses are Latvia, Lithuania, Austria, Portugal (ex post only) and Finland.
Source: European Commission, own calculations.
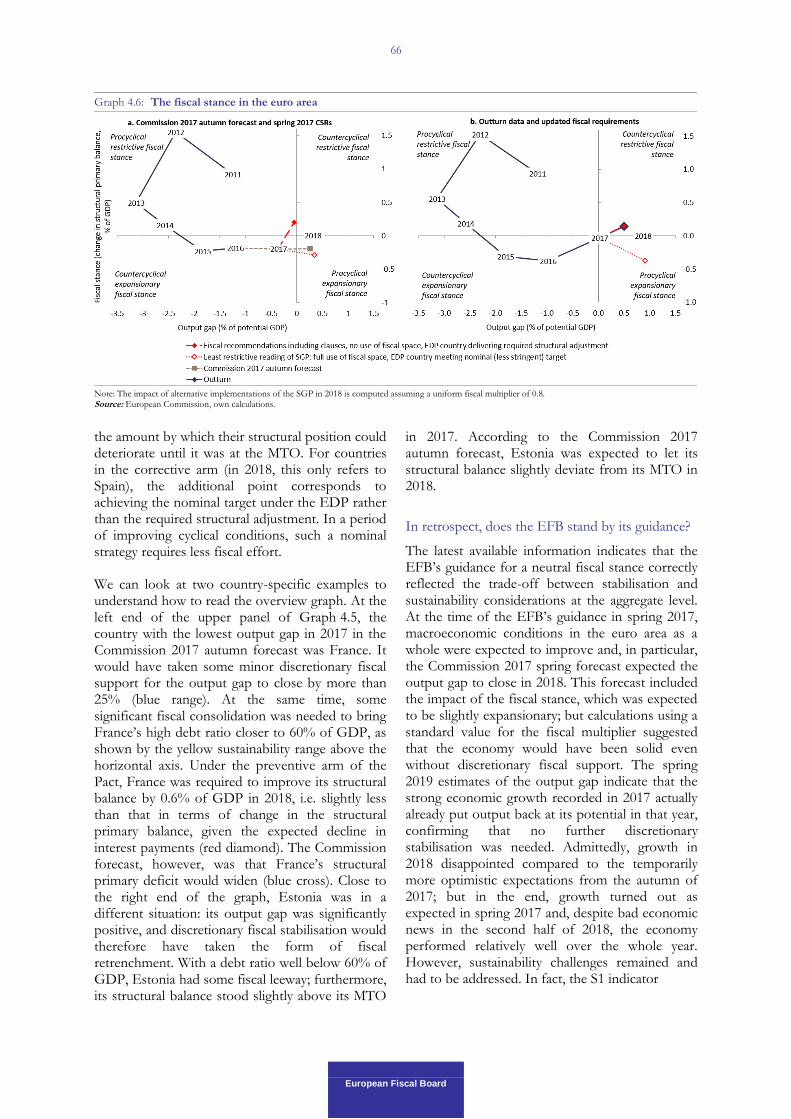
European Fiscal Board
66
the amount by which their structural position could deteriorate until it was at the MTO. For countries in the corrective arm (in 2018, this only refers to Spain), the additional point corresponds to achieving the nominal target under the EDP rather than the required structural adjustment. In a period of improving cyclical conditions, such a nominal strategy requires less fiscal effort.
We can look at two country-specific examples to understand how to read the overview graph. At the left end of the upper panel of Graph 4.5, the country with the lowest output gap in 2017 in the Commission 2017 autumn forecast was France. It would have taken some minor discretionary fiscal support for the output gap to close by more than 25% (blue range). At the same time, some significant fiscal consolidation was needed to bring France’s high debt ratio closer to 60% of GDP, as shown by the yellow sustainability range above the horizontal axis. Under the preventive arm of the Pact, France was required to improve its structural balance by 0.6% of GDP in 2018, i.e. slightly less than that in terms of change in the structural primary balance, given the expected decline in interest payments (red diamond). The Commission forecast, however, was that France’s structural primary deficit would widen (blue cross). Close to the right end of the graph, Estonia was in a different situation: its output gap was significantly positive, and discretionary fiscal stabilisation would therefore have taken the form of fiscal retrenchment. With a debt ratio well below 60% of GDP, Estonia had some fiscal leeway; furthermore, its structural balance stood slightly above its MTO
in 2017. According to the Commission 2017 autumn forecast, Estonia was expected to let its structural balance slightly deviate from its MTO in 2018.
In retrospect, does the EFB stand by its guidance?
The latest available information indicates that the EFB’s guidance for a neutral fiscal stance correctly reflected the trade-off between stabilisation and sustainability considerations at the aggregate level. At the time of the EFB’s guidance in spring 2017, macroeconomic conditions in the euro area as a whole were expected to improve and, in particular, the Commission 2017 spring forecast expected the output gap to close in 2018. This forecast included the impact of the fiscal stance, which was expected to be slightly expansionary; but calculations using a standard value for the fiscal multiplier suggested that the economy would have been solid even without discretionary fiscal support. The spring 2019 estimates of the output gap indicate that the strong economic growth recorded in 2017 actually already put output back at its potential in that year, confirming that no further discretionary stabilisation was needed. Admittedly, growth in 2018 disappointed compared to the temporarily more optimistic expectations from the autumn of 2017; but in the end, growth turned out as expected in spring 2017 and, despite bad economic news in the second half of 2018, the economy performed relatively well over the whole year. However, sustainability challenges remained and had to be addressed. In fact, the S1 indicator
Graph 4.6: The fiscal stance in the euro area
Note: The impact of alternative implementations of the SGP in 2018 is computed assuming a uniform fiscal multiplier of 0.8. Source: European Commission, own calculations.

European Fiscal Board
67
envisaging fiscal consolidation in 2018-2022 points to higher consolidation needs in most high-debt countries when it is recalculated using outturn data than when it is based on the Commission 2017 autumn forecast (Graph 4.5).
The aggregated fiscal requirements under the Pact covered the whole spectrum of the ‘broadly neutral’ range, depending on whether fiscal space was used or not. Based on the Commission 2017 autumn forecast, using all the available fiscal space could have led the fiscal stance into pro-cyclical territory, while full compliance with the fiscal CSRs without any use of fiscal space implied only a limited risk of pro-cyclical fiscal consolidation (Graph 4.6a). Similarly, based on the Commission 2019 spring forecast, compliance with the structural requirements at country level and no use of fiscal space amounted, at aggregate level, to a marginally restrictive fiscal stance, in counter-cyclical territory (Graph 4.6b). On the other hand, negative economic news in Germany in the second semester of 2018 could have justified some use of fiscal space, which would have drawn the aggregate to a more neutral stance.
Was the aggregate fiscal stance appropriate?
At first sight, the fiscal stance is estimated to have been marginally restrictive in 2018, based on the Commission’s spring 2019 estimates. This falls into the broadly neutral range, and the fact that it is on the restrictive side by 0.1% of GDP should not be
overstressed given that later revisions are still possible, as shown by the recent revisions for 2015-2017 (Graph 4.6). The precise classification of the fiscal stance in 2018 is all the more uncertain as government expenditure net of revenue measures grew twice as fast as potential GDP, pointing to some fiscal expansion (Graph 4.7).
With this caveat in mind, the fiscal stance appears to have been broadly appropriate at aggregate level. It was in line with guidance and it closely matched the aggregation of fiscal requirements.
Was the country composition appropriate?
The apparent match between the aggregate fiscal stance and aggregate fiscal requirements masks a different reality at the country level. Back in the autumn of 2017, the projected change in the structural (primary) balance for the euro area as a whole was close to the aggregation of fiscal requirements assuming that Spain would meet its nominal target and with a full use of fiscal space where available (Graphs 4.6a and 4.7a). But zooming in to country level, of the 11 countries that were in the corrective arm or in the preventive arm and not yet at their MTO, only two were expected to comply with their fiscal requirements (Graph 4.8). The other seven were expected to deviate more or less markedly. This was especially the case for the large, high-debt countries: the Commission forecast pointed to little or no consolidation, and for some countries even to a
Graph 4.7: Change in the structural balance and real net expenditure growth in 2018 by group of countries
Notes: (1) Countries are grouped according to their situation at the beginning of 2018. ES was the only country in EDP. Countries in the preventive arm not at MTO: BE, IE, FR, IT, LV, AT, PT, SI, SK and FI. At or above MTO: DE, EE, CY, LT, LU, MT and NL. (2) In line with practice for the expenditure benchmark, medium-term potential growth is frozen at its spring 2017 value and real net expenditure growth is corrected for one-offs. Source: European Commission, own calculations.
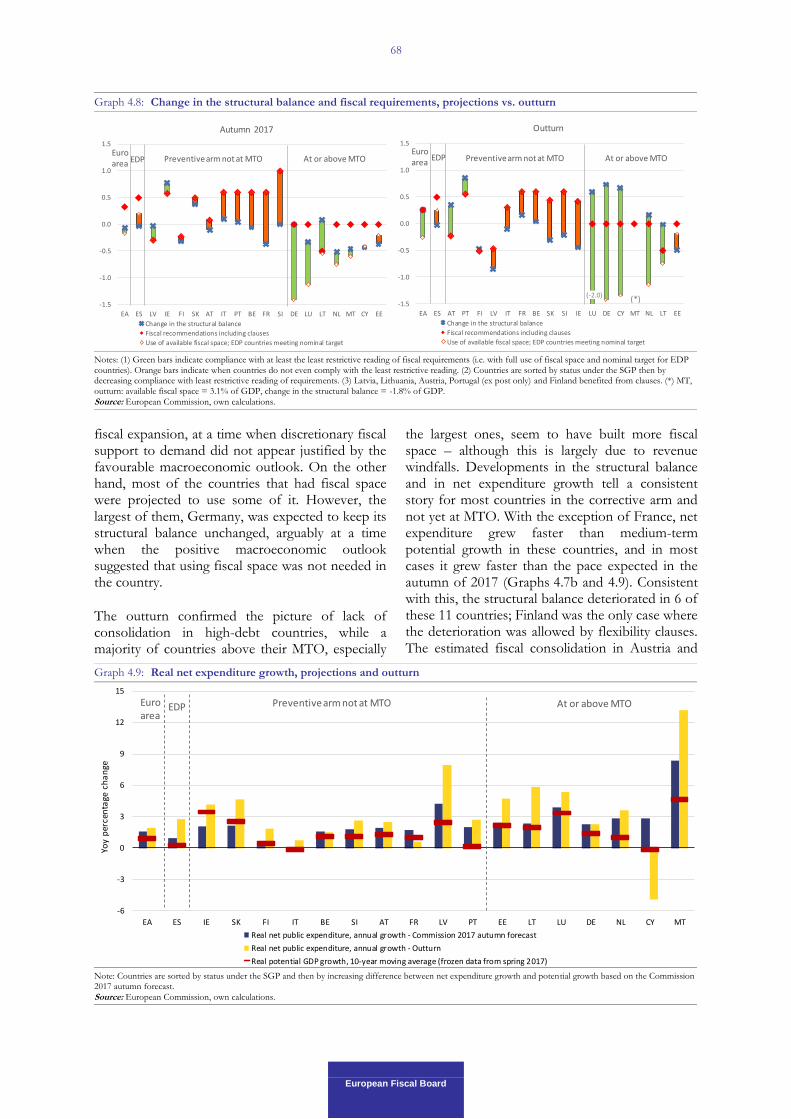
European Fiscal Board
68
fiscal expansion, at a time when discretionary fiscal support to demand did not appear justified by the favourable macroeconomic outlook. On the other hand, most of the countries that had fiscal space were projected to use some of it. However, the largest of them, Germany, was expected to keep its structural balance unchanged, arguably at a time when the positive macroeconomic outlook suggested that using fiscal space was not needed in the country.
The outturn confirmed the picture of lack of consolidation in high-debt countries, while a majority of countries above their MTO, especially
the largest ones, seem to have built more fiscal space – although this is largely due to revenue windfalls. Developments in the structural balance and in net expenditure growth tell a consistent story for most countries in the corrective arm and not yet at MTO. With the exception of France, net expenditure grew faster than medium-term potential growth in these countries, and in most cases it grew faster than the pace expected in the autumn of 2017 (Graphs 4.7b and 4.9). Consistent with this, the structural balance deteriorated in 6 of these 11 countries; Finland was the only case where the deterioration was allowed by flexibility clauses. The estimated fiscal consolidation in Austria and
Graph 4.8: Change in the structural balance and fiscal requirements, projections vs. outturn
Notes: (1) Green bars indicate compliance with at least the least restrictive reading of fiscal requirements (i.e. with full use of fiscal space and nominal target for EDP countries). Orange bars indicate when countries do not even comply with the least restrictive reading. (2) Countries are sorted by status under the SGP then by decreasing compliance with least restrictive reading of requirements. (3) Latvia, Lithuania, Austria, Portugal (ex post only) and Finland benefited from clauses. (*) MT, outturn: available fiscal space = 3.1% of GDP, change in the structural balance = -1.8% of GDP.
Source: European Commission, own calculations.
Graph 4.9: Real net expenditure growth, projections and outturn
Note: Countries are sorted by status under the SGP and then by increasing difference between net expenditure growth and potential growth based on the Commission 2017 autumn forecast.
Source: European Commission, own calculations.
-1.5
-1.0
-0.5
0.0
0.5
1.0
1.5
EA ES LV IE FI SK AT IT PT BE FR SI DE LU LT NL MT CY EE
Autumn 2017
Change in the structural balance
Fiscal recommendations including clauses
Use of available fiscal space; EDP countries meeting nominal target
At or above MTOPreventive arm not at MTOEDPEuro area
-1.5
-1.0
-0.5
0.0
0.5
1.0
1.5
EA ES AT PT FI LV IT FR BE SK SI IE LU DE CY MT NL LT EE
Outturn
Change in the structural balance
Fiscal recommendations including clauses
Use of available fiscal space; EDP countries meeting nominal target
At or above MTOPreventive arm not at MTOEDPEuro area
(*)(-2.0)
-6
-3
0
3
6
9
12
15
EA ES IE SK FI IT BE SI AT FR LV PT EE LT LU DE NL CY MT
Yoy
per
cen
tage
ch
an
ge
Real net public expenditure, annual growth - Commission 2017 autumn forecast
Real net public expenditure, annual growth - Outturn
Real potential GDP growth, 10-year moving average (frozen data from spring 2017)
EDP Preventive arm not at MTO At or above MTOEuro area

European Fiscal Board
69
Portugal partly reflects revenue windfalls, while net expenditure developments in these two countries suggest a more expansionary stance. For the countries above their MTO, revenue windfalls also appear to distort the picture. In particular, Germany’s fiscal space is estimated to have increased markedly, by 0.8% of GDP, while net expenditure developments suggest a modest fiscal expansion: net expenditure growth came out slightly above potential growth, in line with the expectations of autumn 2017. The
difference between the two perspectives is mainly explained by large revenue windfalls.
Overall, the country composition was not appropriate. For most of the high-debt countries, the cyclical conditions would have provided a useful window of opportunity to consolidate as required by the Pact without damaging growth. Still, with rare exceptions, the only countries that complied with fiscal requirements were those that had already achieved their MTO.

5. FUTURE EVOLUTION OF THE EU'S FISCAL FRAMEWORK
European Fiscal Board
KEY FINDINGS
The President of the European Commission, Jean-Claude Juncker, asked the European Fiscal Board (EFB) to conduct an assessment of the EU fiscal rules with a focus on the six and two-pack reforms. The request entailed three broad objectives for the assessment: (i) the long-term sustainability of public finances, (ii) the stabilisation of economic activity in a counter-cyclical fashion, and (iii) the improvement of the quality of public finances. In addition, the EFB interviewed a broad range of stakeholders and ‘architects’ of the six and two-pack reforms.
Headline government deficits have been reduced sharply since the crisis peaked in 2010 and on the back of a protracted economic recovery. It is difficult to establish clear causality with the six and two-pack reforms. Structural improvements in budgetary positions have declined in recent years. In an important group of countries, debt-to-GDP ratios did not decline. In sum, while the EU fiscal rules seem to work for some Member States, they clearly do not work for others.
The EFB identified multiple sources of complexity, which make rules and their implementation opaque and ultimately call for a simplification of the existing EU fiscal framework.
The sources of complexity include: (i) an excessive reliance on unobservable indicators and data subject to major ex post revisions, (ii) too much emphasis on annual, rather than longer-term performance indicators, (iii) badly timed use of flexibility encouraging pro-cyclical fiscal policy, and (iv) an increasingly bilateral process of fiscal surveillance, which discourages multilateral peer review.
Complexity has encouraged, and been reinforced by, increasing bilateralisation and a diminishing role for peer review in surveillance. Reverse qualified majority voting (RQMV) also contributed to this trend, as it has taken responsibility out of the hands of the ECOFIN and endowed the Commission with additional powers it was reluctant to exert.
The reform proposal explores ways in which the EU fiscal rules could be simplified and revised to better protect public investment through a targeted Golden Rule. On governance, it proposes to give a more important role to independent analysis and advice to change the voting procedure in the Council and to nominate a full-time President of the Eurogroup.
In line with the EFB’s 2018 annual report, the EFB proposes relying simply on a debt anchor and one operational target: a ceiling on the growth rate of primary expenditure net of discretionary revenue measures.
The rationale for introducing flexibility into the Stability and Growth Pact (SGP) was to reconcile stabilisation and sustainability while improving the quality of public finances. This objective remains appropriate. However, it could be better achieved by replacing all the existing flexibility provisions with a general escape clause. The general escape clause should be parsimoniously applied and triggered, based on independent economic analysis and advice based on this analysis.
Going beyond uniform rules, medium-term debt targets could be made country-specific based on a mutual agreement between Member States covering a seven-year cycle, staggered against the multiannual financial framework of the EU.
High-debt countries would commit to reducing their debt and, symmetrically, low-debt countries would commit to increasing growth-enhancing government expenditure, in particular those that have positive cross-border spillovers. The proposed agreement would effectively implement a euro area aggregate fiscal stance.
Macroeconomic imbalances could be taken into account in setting the debt target.

European Fiscal Board
71
5.1. OVERVIEW
This chapter presents the findings of an assessment of EU fiscal rules with a focus on the six and two-pack legislation. At the beginning of 2019, the President of the European Commission, Jean-Claude Juncker, asked the European Fiscal Board (EFB) to carry out such a review taking into account three broad objectives of fiscal rules: (i) the long-term sustainability of public finances, (ii) the stabilisation of economic activity in a counter-cyclical fashion, and (iii) the improvement of the quality of public finances. The stated objective of the requested assessment is to generate ideas on how to simplify the current set of EU fiscal rules. The complete assessment report was published on 11 September 2019 (291). This chapter summarises the EFB’s proposal for reforming the EU fiscal rules derived from the assessment.
Any one of the following conclusions about the impact of the EU fiscal rules is necessarily tentative in the absence of a counterfactual. Important trade-offs exist between sustainability, stabilisation and the quality of public finances. Their resolution requires normative judgement or assumptions about policy preferences. Heterogeneous policy preferences in the EU make this task even more difficult. Finally, the gradual modifications in the implementation of the rules over the past decade present another challenge. Establishing causal claims about the extent to which the rules have contributed to sustainability, stabilisation and the quality of public finances is very difficult. The EFB took the original rationale for the EU fiscal rules — to strengthen sustainability — as its point of departure for the assessment.
The underlying premise of the EFB’s assessment is that well-designed fiscal rules can have a positive effect on national budgetary outcomes. In the Economic and Monetary Union (EMU), budgetary imbalances can no longer trigger the currency tensions that characterised the pre-EMU era. Yet the loss of monetary autonomy makes the stabilisation of the economy more difficult. Spillovers from national fiscal policy intensify through demand effects and, most importantly, through financial market linkages. The potential tension between national political incentives and the Union-wide interest in monitoring the coherence of national fiscal policies provides a constant challenge to the EU fiscal framework. (291) https://ec.europa.eu/info/publications/assessment-eu-fiscal-
rules-focus-six-and-two-pack-legislation_en
Deeper integration could take the form of extended coordination of national policies and the creation of a central fiscal capacity. During the Maastricht negotiations, such steps were neither politically feasible nor regarded as economically essential for the viability of EMU.
There are clear limits to what the fiscal rules can achieve in practice. Various demands lead to an overburdening of the fiscal rules. Their implementation has become a bone of contention among Member States and the Commission. It is therefore high time to consider how they could be simplified and made more effective. Simplification is not necessarily a panacea, however. The broader context of EU fiscal governance and recent economic developments characterised by slow growth and low interest rates deserve equal consideration.
On average, the sustainability of public finances has improved since the six and two-pack legislation entered into force. Against the backdrop of a protracted period of economic growth, three achievements are noteworthy: (i) no Member State remains subject to an excessive deficit procedure (EDP); (ii) headline deficits have been reduced sharply from over 6% of GDP to below 1% of GDP on average since their peak in 2010; and (iii) government debt ratios have on average edged downwards since 2014. ‘Gross errors’ in the evolution of public finances since the six and two-pack reform have largely been corrected. The EFB also observed that the pace of debt reduction in a group of very high-debt countries has been slower than desirable, or has stalled, and that in recent years the annual improvement in structural budget balances has declined.
The six-pack reform was agreed in 2010 at a moment when the EU economies were just beginning to recover from the global economic and financial crisis. During the pre-crisis years, most Member States failed to build up sufficient fiscal buffers, while government debt ratios had stabilised around 60% of GDP as an average for the euro area. The European Economic Recovery Plan of 2008-2009 had the appropriate counter-cyclical effect during the downturn, but did not sufficiently differentiate between weaker and stronger economies. At the same time, the average government debt ratio was approaching 90% of GDP for the euro area. By 2010, the revealed vulnerabilities of public finances led governments to re-emphasise sustainability.
European Fiscal Board
72
(Continued on the next page)
Box 5.1: Other proposals to reform the EU fiscal framework
On May 2017 the Commission published a ‘Reflection paper on the deepening of the Economic and Monetary Union’
(see COM(2017) 291), which envisaged a simplification of the rules of the stability and growth pact as a possible step
to be taken between 2020 and 2025, as part of an overall roadmap to review the EMU architecture. Since then, a debate
has started among institutions, thinks tanks and academic researchers on what are the desirable features of a reformed
fiscal framework. As part of this debate, European Fiscal Board (2018) detailed a concrete proposal for simplifying
the SGP without changing the treaties in three major ways: (i) Moving towards a system centred on a single fiscal
anchor, the 60% reference value for the debt-to-GDP ratio. (ii) Using a single operational indicator in the form of an
expenditure rule. (iii) Introducing a general escape clause, monitored by an independent institution, to provide
additional flexibility during exceptional economic circumstances.
While in this box we cannot make justice to all existing proposals for reforming the EU economic governance
framework, we point to some related contributions. One of the earliest proposals to reform the SGP by adopting an
expenditure rule was advanced by Coricelli and Ercolani (2002). Debrun et al. (2008) propose a rule based on a debt
anchor with an error correction mechanism, to ensure that past deviations do not have a permanent effect on debt. This
correction mechanism could be based either on cumulative deviations from a cyclically-adjusted deficit target or on
an expenditure growth ceiling with a debt-feedback component. Over the last two years, numerous reform proposals
have been presented to achieve simpler, more transparent and more enforceable rules. In one of the earliest
contributions to this debate, Bénassy-Quéré et al. (2018, 2019) present a list of proposals to strengthen the monetary
union by increasing risk-sharing and market discipline. Among these proposals, they suggest replacing the existing
set of fiscal rules with a simple expenditure rule guided by a long-term debt reduction target, suggesting that such a
rule would be less error-prone and more effective in stabilising economic cycles. They also suggest that independent
national fiscal watchdogs should be in charge of monitoring compliance under the supervision of an independent euro
area-level institution. Finally, they suggest that governments who violate the rule should be required to finance excess
spending using junior bonds, because market pressure would be more effective than fines.
IMF (2018) also proposes a simplification of the SGP, in line with the reform proposal outlined by the EFB. Similarly,
Eyraud et al. (2018) suggest that fiscal frameworks should be based on a debt anchor combined with a small number
of operational rules, while flexibility can be allowed by combining expenditure rules with escape clauses. OECD
(2018) also proposes to simplify the SGP by adopting an expenditure objective ensuring that debt-to-GDP ratio
converges towards sustainable levels over the medium-term, while the preventive and corrective arms of the SGP
could be merged, so that there is a single set of targets, procedures and indicators. To strengthen enforcement, they
also suggest an increasing scope for positive incentives in the SGP. Cuerpo and Rodriguez (2019) also propose to
reform domestic fiscal rules in Spain by moving towards an expenditure rule linked to a debt-reduction target.
However, they envisage a stronger role for Spain’s independent fiscal institution, in order to limit the areas where
discretion could undermine the whole effectiveness of the framework.
Also Darvas et al. (2018) propose replacing the existing set of rules with a simpler expenditure rule. Such a rule, they
argue, would help reconcile fiscal prudence and macroeconomic stabilisation of the economy. Well-equipped national
fiscal councils should conduct surveillance, coordinated and overseen by a European Fiscal Council. Enforcement
could be assured via positive incentives (such as access to a central fiscal capacity), via market discipline, and by
raising political costs for non-compliance with a comply-or-explain principle. While Heinemann (2018) also proposes
to rely on an expenditure rule, unifying the preventive and corrective arm of the SGP, he also suggests that shifting
discretionary power to an independent fiscal institution could help achieve a substantial simplification of the rules,
because independence is a substitute for complexity. Feld et al. (2018) proposes a system where a modified
expenditure benchmark as an annual operational target would coexist with the structural budget balance as a medium-
term target. Furthermore, a debt-correction factor would help achieve a long-run debt anchor at 60% of GDP. In their
proposal, enforcement could be achieved via more automatic sanctions and, while the European Commission would
still be in charge of assessing compliance with the rules, it could bind its assessment to the verdict of an independent
fiscal council. Kopits (2018) proposes three avenues of reform: under the first, the structural balance and the debt
convergence targets are replaced with a primary surplus target, while retaining the expenditure benchmark. Under the
second, a single operational debt rule would set a limit on the discretionary budget deficit. The third option consists
of a market-based approach, whereby Member States may either adopt home-grown fiscal rules or engage in
discretionary fiscal policymaking.
Deutsche Bundesbank (2019) argues that if an expenditure and Golden Rule were to be introduced, it has to be ensured
that high debt ratios continue to decline. They also propose transferring fiscal surveillance to an

European Fiscal Board
73
Financial market pressures fostered a degree of consensus among Member States to tighten the fiscal rules. The rapid deterioration of Greek government finances and the prospect of bailing-in private creditors provided additional impulses for fiscal prudence. In addition, the creation of the European Stability Mechanism (ESM) expanded the crisis-management toolbox. At the same time, the six-pack reform introduced new elements of flexibility, such as the unusual events clause, an escape clause for severe economic downturns, and additional elements to be included under other relevant factors when deciding whether to open an EDP or not.
The focus on sustainability in the years following the reforms came at the expense of pro-cyclical fiscal policies in most Member States in 2011-2013. This, in turn, is likely to have contributed to a double dip recession in the euro area. Other causes included overly cautious monetary policy until mid-2012 and an underestimation of the impact of simultaneous fiscal consolidation in most Member States. Since 2014, the aggregate fiscal stance has been broadly neutral. There was legally a lack of counter-cyclical fiscal policies would have been advisable after business cycles entered more robust recovery by 2017-2018.
Based on the EFB’s review of EU fiscal rules, it is clear that there has at times been conflict between improving sustainability and conducting counter-cyclical fiscal policies have. During certain periods, sustainability was prioritised over stabilisation, as was the case in 2011-2013, for example. More recently, pro-cyclical policies in countries with high debt have weakened both stabilisation and sustainability objectives.
The question whether the EU fiscal rules have improved the quality of public finances is difficult
to answer because there is no precise measure of the quality. By design, EU fiscal rules have focused almost exclusively on budgetary aggregates — government deficits and debt-to-GDP ratios — leaving the allocative and distributional aspects of fiscal policies to the Member States. As part of the broader policy coordination mechanism set out in Article 121 of the Treaty on the Functioning of the European Union, the country-specific recommendations (CSRs) do address issues related to the quality of public finances. However, CSRs do not function as credible commitment devices, not least because there is no enforcement mechanism in place. Compliance has been disappointing despite the relevance of the CSRs for long-term economic performance.
Since 2015, EU fiscal rules have incentivised Member States to engage in structural reforms and public investment. In its 2018 annual report the EFB carried out a dedicated review of the flexibility clauses. Both elements have proven to be difficult to apply ex ante and to monitor ex post, and both have been subject to a cap. For instance, the investment clause has been applicable only to countries with a sizeable negative output gap (292). Neither the investment nor the structural reform clause have been much invoked. Instead, national governments have slowed down structural reform initiatives and postponed public investment. In general, fiscal rules have not offered sufficient protection for government investment over the past decade.
EU fiscal rules should ideally retain their original focus on sustainability but become simpler. Reform and simplification of the fiscal rules is controversial, however, for two reasons. First, a (292) Currently, this is not observed in any Member State on the basis
of the commonly agreed methodology agreed by the Council and the Commission.
Box (continued)
independent institution, establishing a control account for failures to achieve targets and introducing national rainy
day funds into fiscal rules.
Finally, Kamps and Leiner-Killinger (2019) identify four main reform needs that should be addressed by a possible
reform of EU fiscal rules: (i) strengthening the coherence of the SGP by reviewing the three main fiscal indicators:
the 3% and 60% reference values for the deficit and debt ratios and the structural MTO; (ii) reducing complexity by
lessening the reliance on unobservable indicators such as the structural balance and the output gap; (iii) strengthening
fiscal discipline with positive incentives, such as financial rewards; (iv) clarifying the role of national fiscal policies
and the aggregate euro area fiscal stance during exceptionally bad economic times.
CEPR (2019) provides a selected overview of the numerous reform proposals for reforming the euro area, as part of
the debate that was triggered by Bénassy-Quéré et al. (2018).

European Fiscal Board
74
simplification of the EU fiscal rules might have unintended consequences that are difficult to predict. In addition, the costs of non-reform are still perceived to be low for both Member States advocating more flexibility and those wanting to apply the rules more strictly. Second, changes in the (perceived) economic environment — low economic growth and policy rates at the lower zero bound — should be taken into account before embarking on the difficult path towards simplifying the EU fiscal rules.
5.2. FOUR SOURCES OF UNNECESSARY
COMPLEXITY IN THE CURRENT
IMPLEMENTATION OF THE RULES
The current EU fiscal framework is characterised by four main sources of complexity that are the result of its gradual evolution.
The first source of complexity is the heavy reliance on unobservable indicators of fiscal performance in all stages of fiscal surveillance — issuing guidance, monitoring implementation and the final assessment of compliance. The 2005 SGP reform recognised that there are sound economic arguments for preferring the cyclically-adjusted (structural) government deficit rather than the more observable headline deficit as the latter does not measure policy efforts. From the start, some Member States regarded the 3% of GDP reference value in the Treaty not as a ceiling, but as a target. As a result, fiscal policy has become more pro-cyclical. The inability to deal with adverse shocks in a regime focusing on the headline deficit became more and more apparent. However, estimation of the analytically superior structural deficit requires an assessment of both the degree of resource utilisation in any given year (summarised in the output gap) and assumptions about how the budget reacts to changes in the economic environment (summarised by budgetary elasticities). Meticulous work on estimating the output gap and the budgetary elasticities has been ongoing for almost two decades in the Commission and among national experts, refining the ‘commonly agreed methodology’ adopted in 2002. Significant revisions continue to be made periodically. In particular, small open economies for which the level of output and employment consistent with stable inflation can be subject to large fluctuations and estimates of the output gap tend to vary considerably over time. Member States have seized upon the ambiguities of the output gap
and the budgetary elasticities and put the technical subject of individual adjustments onto the agenda of Ministers and other high-level officials.
The architects of the six and two-pack reforms recognised the pathologies of the structural deficit when they designed the rules. Thus, the six-pack reform proposed the expenditure benchmark as an alternative. It was supposed to better capture the stance of fiscal policy with more stable inputs. However, with the expenditure benchmark being in use alongside the structural deficit, Member States were in the position to ‘cherry-pick’ the measure requiring the lesser fiscal effort. Although the expenditure benchmark also suffers from some measurement problems, a move towards a single and better-defined indicator would reduce the risk of policy mistakes. It would also be easier to communicate the fiscal policy stance to the public. Outside expert circles, the structural deficit remains an obscure notion that does not feature prominently in public debate (with the possible exception of Germany), and not even financial market participants have paid much attention to the measure to adjust market expectations.
Inflation in the euro area has remained very low despite the output gap turning positive in 2017-2018. Central banks have drawn the conclusion that the size and even the sign of the output gap has become less relevant for the monetary policy stance. While the role of the output gap in monetary and fiscal policy may not be the same, it further undermines the role of the output gap and other indicators linked to it.
Along with downgrading the role of the structural deficit for the implementation of the fiscal rules, the matrix of requirements introduced by the Commission in 2015 as an element of flexibility should also be discarded. The matrix approach varies the required speed of adjustment of Member States to their respective MTOs depending on the size of the output gap and the debt level. It has however failed to generate differentiated recommendations that reconcile sustainability and stabilisation objectives. Hence, the consequences of eliminating the matrix of requirements would be modest.
The second source of weakness is the reliance on annual, rather than longer-term indicators. The attachment to the annual headline budget deficit is understandable. It is easily observable even if the headline deficit is subject to cyclical fluctuations

European Fiscal Board
75
beyond a government’s control. If longer-term indicators were used, medium-term budget plans would be revised less often. However, national budgetary planning is focused on the annual budget bill. Medium-term plans are likely to be outdated quickly. The stability and convergence programmes (SCP) of Member States, for example, do contain the fiscal outlook for a 3-year horizon, but often a major part of the fiscal adjustments is postponed to the outer years of the horizon.
The 3% of GDP reference value has the high status of a Treaty objective, which is a reform obstacle. It played an important role in fiscal policy adjustments after the crisis. National policy makers emphasise that it enables easy communication with the general public. Even if the 3% of GDP reference value may have lost part of its relevance, there is no point in eliminating it.
A third weakness is that the Commission and the Council have had difficulties in getting the timing of flexibility right. The original intention to introduce more flexibility was appropriate, but flexibility was applied too late during the recovery and promoted pro-cyclicality.
In 2017, the Commission proposed an additional element of flexibility, called the margin of discretion. The eligibility criterion was whether the recovery of a Member State could be considered ‘fragile’. The margin of discretion was supposed to address consolidation needs in high-debt countries and support a speedy recovery (293). The margin of discretion was controversial because it came on top of the already substantial scope for a flexible implementation of the rules. In 2018, the Commission applied additional discretion that went beyond the margins discussed with Member States.
A fourth weakness is that fiscal surveillance and the compliance assessment have become subject to bilateral negotiations between the Commission and the Member State concerned. Discussions of the Commission's recommendations in the Eurogroup have become increasingly perfunctory. The Commission has pointed out that so far, the Eurogroup has always endorsed its recommendations on the implementation of the EU fiscal rules. Nevertheless, statements made by national officials after Eurogroup meetings implied that decision-making had been controversial.
(293) See Chapter 2.2.2.
The EFB conjectures that the decision-making process has become stacked in favour of adopting the Commission’s proposals without major discussion. National finance ministers serve for shorter periods and have less time to form strong collegial relationships. This makes it difficult for them to challenge the outcome of the Commission’s bilateral negotiations with a government. Second, the six-pack reform introduced the principle of reverse qualified majority voting (RQMV). Most observers expected this change in the voting rules to lead to a quasi-automatic approach towards sanctions in the event of non-compliance, something which has not happened.
The rise of the ‘political’ Commission raises two important concerns. First, there is insufficient separation between the independent economic analysis by expert staff in the Commission and the political deliberations. Second, the only body that debates political considerations is now the College of Commissioners.
Two adjustments could establish a balance between the Commission and the Eurogroup. These are: (i) abandoning RQMV and (ii) nominating a full-time President of the Eurogroup who is neither a national finance minister nor a member of the Commission. It is of great importance to have a clear demarcation between independent economic analysis, policy advice based on it, and potential broader political considerations. More autonomy would have to be delegated to the Commission’s expert staff via secondary legislation. More specifically, the competent European Commission Directorate-General would conduct a fully independent analysis accompanied by policy conclusions that would be made public. The College of Commissioners would use this as input to its recommendations to the Council.
5.3. A CEILING ON NET GOVERNMENT
EXPENDITURES
An earlier version of our main proposal was first presented in the EFB 2018 annual report. The proposal encompasses the following elements:
a single fiscal anchor: a debt ratio objective and a declining path towards it;
a single indicator of fiscal performance: a ceiling on the growth rate of net primary expenditures

European Fiscal Board
76
for countries with debt in excess of 60% of GDP and;
a general escape clause: parsimoniously applied and triggered on the basis of independent economic analysis, provided both by the IFI of the country concerned and a more autonomous Commission staff.
These general ideas are close to proposals made by a number of independent economists and by international institutions such as the IMF, OECD and ECB (294), indicating some agreement as to how the fiscal rules could be reformed. Specifically, the growth rate of the expenditure ceiling would be capped by the trend rate of potential output growth, with correction calibrated to bring the debt ratio within the range of its long-run objective in a given maximum number of years. Member States with a debt ratio below 60% of GDP would not be subject to a net expenditure ceiling, but would still have to observe the 3% deficit.
The proposed reform would significantly reduce the sources of complexity. Both debt and net primary expenditure growth are largely observable. The latter is under the control of the government. It is important to recall that debt servicing costs and unemployment benefit payments (at unchanged rates) are excluded. Expenditure growth is adjusted for the impact of discretionary changes in government revenues (i.e. direct and indirect tax rates). A correction that does involve estimates rather than firm data. The trend growth rate of potential output moves slowly and is subject to less important revisions than estimates of annual potential output growth and levels (295). Hence, the path of net primary expenditure growth is linked to a variable that is subject to relatively little change. To address the problem of short-termism resulting from the reliance on annual data, we propose to set the ceiling of net expenditure growth for a period of three years and recalculate it thereafter. Even though monitoring would continue to be annual, the medium-term horizon would provide incentives for governments to look beyond the coming year.
(294) Other contributions have also proposed a net expenditure growth
rule, usually in combination with a long-run debt target. Examples are Bénassy-Quéré et al. (2018, 2019), Darvas et al. (2018), Eyraud et al. (2018), EFB (2018), Feld et al. (2018), Heinemann (2018), and Kopits (2018).
(295) See Darvas, Martin, and Ragot (2018), p.6 and footnote 15; also see Darvas and Simon (2015).
The EFB proposal should also reduce the need for flexibility in the implementation of the rules. The net primary expenditure ceiling has a built-in automatic stabilising property. When nominal output grows more slowly than the trend rate of potential output, net primary expenditure growth will exceed the latter, resulting into a rising expenditure-to-GDP ratio that will help to stabilise the economy. Vice versa, when nominal GDP grows faster than the trend, net expenditures will shrink as a share of GDP. We also envisage a compensation account in which deviations from planned net primary expenditure growth are accumulated. Such a compensation account would be subject to some maximum and a requirement to de-cumulate in the case of windfall gain. Increases in the compensation account can only occur as a result of unexpectedly adverse developments and should not be planned in advance.
The proposed reform should reduce the lack of transparency that has characterised recent implementation. The simplicity of the reform proposal would help in this regard. It would become more difficult for policy-makers to postpone the required adjustments by referring to uncertainties and technical measurement issues.
One objection to our proposal pertains to the speed of adjustment. A reduction of the expenditure ceiling to bring about a convergence to the 60% of GDP debt level over a relatively short time span of, say, 15 or 20 years (as envisaged in the current rule) during a period of modest growth would represent an unprecedented adjustment effort (compared to what has been observed empirically in the past (296)). The simulations in the EFB 2018 annual report suggest that Italy and Portugal would have to run primary budget surpluses in the order of 4-5% of GDP over a decade or more to follow the outlined debt reduction path. This estimate may be regarded as too pessimistic because it assumes that the average debt servicing costs of highly-indebted countries are independent of the path of their respective debt ratios. Once a country embarks on a credible debt reduction path, a gradual decline of debt servicing costs is likely. However, the question remains of whether the proposed debt reduction path is economically and politically feasible. Independent economic analysis from the national IFI and the Commission should tackle this question carefully (296) In fact, Eichengreen and Panizza (2014) show that historical
episodes of extended periods of such high primary surpluses are rare.
European Fiscal Board
77
weighting the expected benefits in terms of output gains against the risks of slower improvements in sustainability.
Finally yet importantly, sanctions have been very difficult to enforce. One proposal that the EFB made in the 2017 annual report is to replace financial sanctions with an incentive for countries to access joint facilities. This is already the case for the ESM’s precautionary facility. Conditionality could also be attached to access to a future common fiscal capacity.
5.4. PROTECTING PUBLIC INVESTMENT
The EFB’s review of the six and two-pack reforms also assessed whether the fiscal rules have improved the quality of public finance. The review concluded that since the start of the global economic and financial crisis (gross) public investment had been cut disproportionally relative to other expenditure categories. Measures of the value of the stock of public assets are highly imprecise. New investment has been postponed and the maintenance of parts of the public capital stock has also lagged behind. This is a major concern at a time when trend growth of GDP in the euro area and rising productivity remain modest. In addition to its role in raising the longer-term growth prospects, most public investment can have a larger impact on demand than other categories of government expenditures via the multiplier effect. Incentives to encourage investment through the SGP’s flexibility provisions have not worked.
The low cost of debt servicing since the crisis has provided direct support to the strengthening of public finances. If a country with a government debt roughly the size of its GDP experiences a gradual lowering of its average debt serving costs of, say, 2 percentage points, that translates into a cut of 2% of GDP in the deficit and debt ratio. At the margin, where the interest rate on newly issued sovereign debt is currently slightly negative for maturities up to 10 years for some euro area countries, a reallocation of expenditures in favour of growth-enhancing investment is desirable.
The introduction of a variant of the Golden Rule to encourage government investment might now be more justified. Two important caveats apply to the Golden Rule. First, involvement in the allocation of government expenditures in individual
Member States needs to respect national sovereignty. Second, a Golden Rule would provide incentives for national governments to reclassify expenditures as investment. It is possible, however, to address these potential problems. For example, the EU budget contains well-defined areas for encouraging investment and other growth-enhancing spending. These include investments in physical and digital infrastructure and the mitigation of climate change. National co-financing for these projects is already excluded under the investment clause. Countries could voluntarily top up expenditures beyond their co-financing commitments. Additional spending in the identified areas should be excluded from the calculation of the net primary expenditures. These areas could delineate the expenditure categories which would qualify under a Golden Rule, and could be open to monitoring. The concern that national governments would re-label expenditure as government investment could be mitigated by giving national IFIs a mandate to monitor national accounting practices in this area.
From the start, EMU was presented as the road to an investment-friendly regime. Prudent fiscal policies were required to underpin this regime. Contrary to these expectations, public investment has not been sufficient to sustain a trend rate of growth of more than about 1.5% per annum for the euro area as an average. This calls for more far-reaching reforms that go beyond incentivising government investment through modifications of the fiscal rules.
5.5. GOING BEYOND UNIFORM RULES
This section engages with new ideas on the reform of the Stability and Growth Pact going forward. There are clear interaction effects between fiscal rules, monetary policy and other informally coordinated policy areas. These other policy areas are subject to informal coordination efforts, while the ECB conducts monetary policy. As a result, there is a risk of overburdening the fiscal rules. This can cause a situation in which the fiscal rules are put at the service of objectives that conflict with national preferences. In principle, effective attainment of multiple objectives is limited to the available set of policy instruments. If these instruments are also constrained by rules, their effectiveness may be limited.
European Fiscal Board
78
Broader reform of the EU fiscal rules needs to take account of a number of challenges. First, the fiscal rules started out with the ambition of being simple, uniform and enforceable. During two decades of implementation, major departures from all three ambitions have occurred.
Second, the operationalisation of aggregate concepts for a heterogeneous euro area will remain a continuous challenge. The macroeconomic imbalance procedure (MIP) and the euro area fiscal stance were vital elements of the six-pack reform, but neither has shaped policy to the expected extent. The MIP appears to have revealed structural deficiencies in the economies of Member States. However, when discussing fiscal issues it did not sufficiently consider the (im)balance between private savings and investment. Potential sanctions for excessive imbalances have never been imposed. Furthermore, the implementation of the fiscal rules remains analytically and organisationally separate from the MIP.
Third, when the Maastricht Treaty was signed, a primary concern was that the Commission and the Council should focus entirely on national economic performance and policy recommendations and that the ECB would look exclusively at the euro area aggregates. Such a division of labour would minimise the risk of fiscal dominance and ensure that policy coordination between the monetary and political authorities could take place. These perceptions have changed. Since 2014, the ECB has demanded increasing support from fiscal policy to correct internal divergences and to stabilise the euro area as a whole.
Could a revision of the EU fiscal rules and the fiscal governance framework address these challenges? A sizeable central fiscal capacity for stabilisation subject to appropriate conditionality would be desirable for risk reduction and risk sharing (297). It would alleviate the problem of sustainability in vulnerable Member States and spare others from considering crisis management measures in the event of a significant downturn. National automatic stabilisers provide the first line of defence against a temporary slowdown of economic activity. However, these might not provide sufficient stabilisation in the absence of a centralised fiscal capacity. More specific meaning (297) We are aware that central fiscal capacity remains a contentious
issue, for example see the German Council of Economic Experts (2019).
should be given to the idea of coordination beyond the current fiscal rules.
The EFB regards the 3% of GDP deficit value as a ceiling and not as a target. Its role as a debt stabilising indicator has gradually declined in importance, because the rule mirrors the economic circumstances that prevailed at the time of its creation. Against the backdrop of a changed economic environment, the 3% of GDP reference value for the deficit is effectively no longer a constraint on debt developments. Despite its diminished relevance, the 3% of GDP deficit rule has turned into a focal point for policy-makers and the public at large. This should be taken into account when discussing potential reform proposals.
The 60% of GDP debt reference value requires more discussion. This norm is to some degree arbitrary but justifiable in light of both economic analysis and documented experience. However, it risks lapsing into irrelevance. For those Member States that are well below the 60% of GDP debt reference value, compliance with the rule provides no guidance. For the very high-debt Member States, the rule looks unattainable even over a longer time span. The latter group should not exclusively focus on the distance between the current debt level and the 60% of GDP reference value, but on the ‘satisfactory’ pace of debt reduction, to be discussed at the European level, that will enable compliance. The six-pack reform aimed to operationalise the debt target. Today, the debt rule is the main constraint on national policies in several countries. The EFB’s main proposal is to improve the implementation of such a debt-reduction strategy.
First, the adjustment of government debt could be made country-specific, either by changing the reference values in the Treaty protocol, or by differentiating the speed of adjustment towards the current debt reference value (298). Such differentiation would take into account demographic factors and their effects on savings rates, pension systems, et cetera. These are already central components in the Commission's assessment of sustainability and of the reports of (298) The modification of the reference values for the debt and the
deficit can be done without going through the involved procedure foreseen for Treaty changes. The deficit and debt reference value of the SGP are defined in Protocol 12 of the Treaty on the Functioning of the European Union, which can be amended with a unanimous decision of the Council, still demanding but less than a full Treaty change.

European Fiscal Board
79
the Economic Policy Committee. Crucially, the countries currently not subject to any debt reduction rule would also go through this procedure to make its application fully symmetrical. The fiscally soundest Member States benefiting from particularly low borrowing costs would commit to undertaking additional net public investment according to the priorities determined at EU level. The legal status of the new commonly agreed national debt targets should be raised above that of the MTO, to make them more enforceable. The combined challenge is to make the differentiated national targets credible, raise public ownership and facilitate communication with national parliaments and the public. The targets should be truly multilateral agreements adopted after careful review by the Council. They should be prepared by the Commission and the government and should take into account the views of the national IFI. The process would resemble the negotiations of the multiannual financial framework (MFF). It could be carried out in a similar seven-year cycle, but should not overlap with the EU budget negotiations.
Symmetry in the process would be achieved by
commitments from both high-debt and low debt Member States. High-debt countries would commit to a net government expenditure path for the coming seven years staggered against the MFF. Member States with strong fiscal positions would commit to a binding net expenditure path, which would include growth-enhancing public investments with cross border effects. A period of seven years for fixing net expenditure growth paths may seem rather long, as the economic outlook may fundamentally change over such a long horizon. However, flexibility in response to unforeseen economic developments is provided by the escape clause. In addition, debt targets could be revised by mutual agreement after a midterm review. The MIP and the assessment of the appropriateness of the euro area fiscal stance would match this pattern of negotiations and commitment. Countries with high current account deficits would limit their expenditure targets more, while countries with an excessive external surplus would have to increase the rate of expenditure growth. Closer integration of fiscal and macroeconomic considerations would constitute a significant step towards a truly coordinated policy approach in the euro area.

GLOSSARY
European Fiscal Board
Automatic fiscal stabilisers: Features of the tax and spending regime of a government budget which react automatically to the economic cycle and reduce its fluctuations. As a result, the government budget balance in per cent of GDP tends to improve in years of high economic growth and deteriorate during economic slowdowns.
Budget semi-elasticity: The change in the budget balance-to-GDP ratio to a cyclical change in GDP. The estimates of budget semi-elasticity used for EU fiscal surveillance purposes are derived from an agreed methodology developed by the OECD. The average semi-elasticity for the EU as a whole is 0.5.
Constrained judgement: A two-step approach that allows the Commission, under specific circumstances, to depart from the output gap estimates of the commonly agreed method in its assessment of the cyclical position of a Member State. The plausibility of the commonly agreed method is first checked against the indications of an alternative tool. If the difference between the two exceeds a given threshold, the Commission may apply a constrained degree of discretion in choosing the appropriate output gap estimate for surveillance purposes.
Corrective arm of the Stability and Growth Pact: The part of the Stability and Growth Pact that deals with preventing the risk of and/or correcting an excessive budgetary imbalance. Under the SGP an excessive budgetary imbalance is (i) a government deficit exceeding 3% of GDP and (ii) government debt in excess of 60% of GDP that is not approaching 60% at a satisfactory pace (see also debt reduction benchmark).
Country-specific recommendations (CSRs): Policy guidance tailored to each EU Member State based on the provisions of the SGP and the MIP. The recommendations are put forward by the European Commission in May of each year, then discussed among Member States in the Council, endorsed by EU leaders at a summit in June, and formally adopted by the finance ministers in July.
Debt reduction benchmark: The reduction of a country’s government debt above 60% of GDP by 1/20th per year on average. This is the criterion used to assess whether excessive government debt
is sufficiently diminishing and approaching 60% of GDP at a satisfactory pace. The pace of reduction is assessed over both the past three years and the next three years, and after correcting for the cycle. Compliance in at least one of the three cases is sufficient to ensure compliance with the debt criterion (see corrective arm of the SGP).
Discretionary fiscal policy: A government decision that leads to a change in government spending or revenue above and beyond the effect of existing fiscal policies. Its effect is usually measured as the change in the budget balance net of the effect of automatic fiscal stabilisers, one-off measures and interest payments (see also structural balance and structural primary balance).
Draft budgetary plans (DBPs): Governments submit DBPs to the Commission and the Council to ensure the coordination of fiscal policies among Member States who have the euro as their currency and because the EU Treaty recognises economic policy as ‘a matter of common concern’. They submit their DBPs for the following year between 1 and 15 October. The requirement was introduced in 2013 with the two-pack reform of the Stability and Growth Pact.
Economic partnership programme: since the two-pack reform of 2013, euro-area Member States entering an excessive deficit procedure (or receiving a new deadline for correction) must present such programmes, which contain detailed fiscal and structural reforms (for example, on pension systems, taxation or public healthcare) that will correct Member States’ deficits in a lasting way.
Enhanced surveillance: tighter surveillance introduced by the two-pack reform for countries experiencing financial difficulties or under precautionary assistance programmes from the European Stability Mechanism. Under the enhanced surveillance, they are subject to regular review missions by the Commission and must provide additional data, for example on their financial sectors.
European economic recovery plan: a large coordinated stimulus package initiated by the European Commission and the euro-area Member States to tackle the negative effects of the 2008

European Fiscal Board
81
global financial crisis. It aimed to boost demand and stimulate confidence. The plan called for a fiscal stimulus of €200 billion, equivalent to 1.5% of EU GDP. €170 billion would come from Member States’ budgets, while the rest would take the form of EU funding.
European Semester: A framework for the coordination of economic policies across the European Union. It is organised around an annual timeline that allows EU countries to discuss their economic and budgetary plans and monitor progress at specific dates throughout the year.
Excessive deficit procedure (EDP): A procedure under the corrective arm of the SGP to correct an excessive deficit, i.e. a deficit that lastingly exceeds the 3% of GDP Treaty threshold by a margin, or a debt ratio that is not diminishing sufficiently.
Expenditure benchmark: One of the two pillars used to assess compliance with the preventive arm of the Stability and Growth Pact, along with the change in the structural balance. It specifies a maximum growth rate for public expenditure that (i) is corrected for certain non-discretionary items, such as interest expenditure, (ii) includes a smoothed measure of public investment, and (iii) is adjusted for discretionary revenue measures. The growth rate may not exceed potential GDP growth over the medium term and is further constrained for Member States that have not yet achieved their medium-term budgetary objective.
Fiscal Compact: The fiscal chapter of the Treaty on Stability, Coordination and Governance in the Economic and Monetary Union (TSCG), which is an intergovernmental treaty aiming to reinforce fiscal discipline in the euro area. The TSCG was signed on 2 March 2012 by all Member States of the European Union except the Czechia, the United Kingdom and Croatia (which did not join the EU until 2013). Of the 25 contracting parties to the TSCG, 22 (the 19 euro area Member States plus Bulgaria, Denmark and Romania) are formally bound by the Fiscal Compact. They are required to have enacted laws requiring their national budgets to be in balance or in surplus. These laws must also provide for a self-correcting mechanism to prevent their breach.
Fiscal stance: A measure of the direction and extent of discretionary fiscal policy. In this report, it is defined as the annual change in the structural primary
balance. When the change is positive, the fiscal stance is said to be restrictive. When it is negative, the fiscal stance is said to be expansionary.
Five Presidents’ Report: A report on ‘Completing Europe’s Economic and Monetary Union’, prepared by the President of the European Commission in close cooperation with the President of the Euro Summit, the President of the Eurogroup, the President of the European Central Bank, and the President of the European Parliament. Published on 22 June 2015, the report defines a roadmap towards the completion of the Economic and Monetary Union.
Flexibility clauses: Provisions under the preventive arm of the SGP allowing for a temporary and limited deviation from the MTO, or the adjustment path towards it. Flexibility clauses can be granted, subject to pre-defined eligibility conditions, to accommodate the budgetary impact of major structural reforms or government investment.
Maastricht Treaty: The Treaty on European Union was signed in Maastricht in the Netherlands on 7 February 1992. The Treaty founded the European Union and also laid the foundations of economic and monetary union.
Macroeconomic imbalance procedure (MIP): The macroeconomic imbalance procedure aims to identify, prevent and address the emergence of potentially harmful macroeconomic imbalances that could adversely affect economic stability in a particular EU Member States, the euro area, or the EU as a whole. It was introduced in 2011 after the financial crisis showed that macroeconomic imbalances in one country, such as a large current account deficit or a real estate bubble, can affect others.
Margin of broad compliance: The margin of error the Commission applies in the assessment of compliance with the preventive arm of the SGP. A Member State is considered to be broadly compliant if the observed deviation from its MTO, or from the recommended adjustment towards it, does not exceed 0.5% of GDP in a single year, or cumulatively over two consecutive years. The margin of broad compliance is motivated by the measurement uncertainty surrounding real time estimates of the structural budget balance.
European Fiscal Board
82
Margin of discretion: A new element of discretion the Commission intends to use in the 2018 surveillance cycle when assessing compliance with the preventive arm of the SGP. Allowing for a margin of discretion means that a Member State may be found compliant even if the established indicators — the change in the structural budget balance and the expenditure benchmark — point to a significant deviation from the MTO or the adjustment path towards it.
Matrix of adjustment requirements: A double-entry table detailing the structural adjustment required under the preventive arm of the Stability and Growth Pact since 2015. It modulates the benchmark annual adjustment of 0.5% of GDP depending on (i) cyclical conditions, as indicated by the level of the output gap and whether GDP growth is above or below potential, and (ii) the level of government debt and sustainability risks as measured by the S1 indicator.
Medium-term budgetary objective (MTO): the Stability and Growth Pact requires EU Member States to specify a medium-term objective for their budgetary position in the stability and convergence programmes. The MTO is country-specific, in order to take account of the diversity of economic and budgetary developments and the diversity of fiscal risks to the sustainability of public finances. It is defined in structural terms (see structural balance).
Minimum benchmark: The lowest value of the structural balance that provides a sufficient margin against the risk of breaching the Treaty deficit threshold of 3% of GDP during normal cyclical fluctuations. For each Member State, the Commission provides an annual update of the minimum benchmark, by taking into account past output volatility and the budgetary responses to output fluctuations. A Member State with a greater output volatility and a larger budgetary semi-elasticity will need a more demanding structural balance in order to ensure compliance with the threshold of 3% of GDP.
Output gap: The difference between actual output and estimated potential output at any particular point in time. A business cycle typically includes a period of positive output gaps and a period of negative output gaps. When the output gap is closed, the economy is in line with its potential level (see potential GDP). A standard business cycle usually lasts up to eight years, suggesting that the
output gap is normally expected to close roughly every four years.
Overall assessment: The analysis of the information conveyed by the two indicators used to assess compliance with the preventive arm of the SGP, namely the change in the structural balance and the expenditure benchmark. An overall assessment is conducted whenever at least one of the two indicators does not point to compliance with the requirements. It is meant to clarify (i) whether and how specific factors may affect one or both indicators, and (ii) in case where the two indicators do not support the same conclusions, which indicator would provide a more accurate assessment in the given context.
Potential GDP (or potential output): The level of real GDP in a given year that is consistent with a stable rate of inflation. If actual output rises above its potential level, constraints on capacity begin to show and inflationary pressures build. If output falls below potential, resources are lying idle and inflationary pressures abate (see also production function approach and output gap).
Preventive arm of the Stability and Growth Pact: The part of the Stability and Growth Pact that aims to prevent gross policy errors and excessive deficits. Under the preventive arm, Member States are required to progress towards their medium-term budgetary objective at a sufficient pace and maintain it after it is reached.
Production function approach: A method of estimating an economy’s sustainable level of output, compatible with stable inflation based on available labour inputs, the capital stock and their level of efficiency. Potential output is used to estimate the output gap, a key input in estimating the structural balance.
Reverse qualified majority voting: an EU decision system according to which a Commission proposal is deemed to be approved by the EU Council of Ministers unless a qualified majority of Member States overturns it. Since the six-pack reform of 2011, decisions on most sanctions under the excessive deficit procedure are taken by reverse qualified majority voting (RQMV).
S0 indicator: A composite indicator published by the European Commission to evaluate the extent to which there might be a risk of fiscal stress in the short term, stemming from the fiscal, macro-

European Fiscal Board
83
financial or competitiveness sides of the economy. A set of 25 fiscal and financial-competitiveness variables proven to perform well in detecting fiscal stress in the past is used to construct the indicator.
S1 indicator: A medium-term sustainability indicator published by the European Commission. It indicates the additional adjustment, in terms of change in the structural primary balance, required over five years to bring the general government debt-to-GDP ratio to 60% in 15 years’ time, including financing for any future additional expenditure arising from an ageing population.
S2 indicator: The European Commission’s long-term sustainability indicator. It shows the upfront adjustment to the current structural primary balance required to stabilise the debt-to-GDP ratio over an infinite horizon, including financing for any additional expenditure arising from an ageing population.
Safety margin: The difference between the 3%-of-GDP deficit threshold and the minimum benchmark.
Significant deviation procedure (SDP): A procedure under the preventive arm of the SGP to correct a significant deviation from the MTO or the adjustment path towards it.
Six-pack: A set of European legislative measures — five regulations and one directive — to reform the Stability and Growth Pact. The six-pack entered into force on 13 December 2011. It aims to strengthen the procedures for reducing public deficits and debts and to address macroeconomic imbalances.
Stabilisation: Economic policy intervention to bring actual output closer to potential output. In the Economic and Monetary Union, in normal economic times, this is expected to be achieved through the ECB’s monetary policy (for common shocks) and national automatic fiscal stabilisers (for country-specific shocks). When this is not sufficient, discretionary fiscal policy can also play a role.
Stability and convergence programmes (SCPs): Every year in April, EU Member States are required to set out their fiscal plans for the next three years and to submit them for assessment to the European Commission and the Council. This exercise is based on the economic governance rules under the Stability and Growth Pact. Euro area
countries submit stability programmes; non-euro area countries convergence programmes.
Stability and Growth Pact (SGP): A set of rules designed to ensure that countries in the European Union pursue sound public finances and coordinate their fiscal policies. The SGP is based on an agreement reached by the EU Member States in 1997 to enforce the deficit and debt limits established by the Maastricht Treaty.
Structural (budget) balance: The actual budget balance corrected for the impact of the economic cycle and net of one-off and other temporary measures. The structural balance gives a measure of the underlying trend in the budget balance and of the overall orientation of fiscal policy (see also fiscal stance).
Structural primary (budget) balance: The structural (budget) balance net of interest payments (see also fiscal stance).
Sustainability of public finances: The ability of a government to service its debt. From a purely theoretical point of view, this basically assumes that the government debt level does not grow faster than the interest rate. While conceptually intuitive, an agreed operational definition of sustainability has proven difficult to achieve. The European Commission uses three indicators of sustainability with different time horizons (S0, S1 and S2). They are complemented by a debt sustainability analysis including sensitivity tests on government debt projections and alternative scenarios.
Two-pack: Two European regulations adopted in 2013 to introduce stronger fiscal surveillance including under the Stability and Growth Pact. The new mechanisms aim to increase the transparency of Member States’ budgetary decisions, strengthen coordination in the euro area starting with the 2014 budgetary cycle, and recognise the special needs of euro area Member States under severe financial pressure.
Unusual event clause: A provision under the preventive arm of the SGP allowing for a temporary deviation from the MTO or the adjustment towards it, in the case of an unusual event outside government control with a major impact on the financial position of the general government. To be granted, the deviation must not endanger fiscal sustainability in the medium term.

European Fiscal Board
84
Zero lower bound (ZLB): When the short-term nominal interest rate is at or near zero, the central bank is limited in its capacity to stimulate economic growth by further lowering policy rates. To overcome the constraint imposed by the ZLB, alternative methods of stimulating demand, such as asset purchase programmes, are generally considered. The root cause of the ZLB is the issuance of paper currency, which effectively guarantees a zero nominal interest rate and acts as an interest rate floor. Central banks cannot encourage spending by lowering interest rates, because people would choose to hold cash instead.

ANNEX A: OVERVIEW TABLES
European Fiscal Board
Table A1: Application of EU fiscal rules in the 2018 surveillance cycle — The preventive arm of the SGP (see Box A1 on how to read the table)
(Continued on the next page)
Autumn 2017 2018
∆SB EB ∆SB EB
-0.6 -0.7 -0.1 -0.6
2.9 2.4 2.4 1.2
1.4 0.3 1.8 0.8
1.3 2.2 1.8 1.8
2.2 1.0 2.1 1.2
-0.3 -0.7 0.0 -0.1
-0.9 -0.5 -0.2 -0.5
Spring 2019
Compliant -
Deviation not considered significant after taking
into account extra revenue not counted in the
expenditure benchmark.
IE -0.6 (2.4 ; 0.6) - Broadly compliant
Broadly compliant Compliant -
Deviation not considered significant after taking
into account the impact of higher-than-expected
inflation on government expenditure.
0.2
BE
BG
CZ
DK
DE
EE
-1.6
0.6
1.0
0.1
1.1
The Commission was of the view that there were
not sufficiently robust evidence to conclude on
the existence of a significant deviation in 2018 and
over 2017 and 2018 together.
- -
- -
-
Spring 2017
Distance to
MTO in 2017
% of GDP
Country-specific recommendation
(CSRs) for 2018
Commission assessment of
draft budgetary plan (DBP) In-year assessment
-
- -
- Compliant
(1.6 ; 0.6) - Risk of non-compliance Risk of non-compliance
Compliant
- Compliant Compliant
-
-- - -
Conclusion of the overall assessment and
procedural steps after the reference period
Required adjustment:
spending growth limit
(exp. benchmark, EB) ;
change in the structural
balance (∆SB)
(y-o-y % ch. ; % of GDP)
Final Commission assessment
Observed deviation from the
required structural
adjustment (or MTO)
% of GDPred = significant deviation if
< -0.5% (1-y) or < -0.25% (2-y)
2018 2017-18
Compliant
Compliant
Flexibility clauses
(granted ex ante )
% of GDP
Flexibility and unusual
event clauses
(granted ex post )
% of GDP
No conclusion
Compliant
Compliant
- - - Compliant
- -
Broadly compliant
Broadly compliant
Remain at the MTO -

European Fiscal Board
86
Table (continued)
(Continued on the next page)
Autumn 2017 2018
∆SB EB ∆SB EB
-0.4 -0.3
1.4 0.7 2.0 1.0
-0.4 -0.7 -0.4 -0.5
2.0 2.8 1.7 1.0
-0.4 -1.4 0.0 -0.8
0.7 -0.46 0.9 0.2
2.6 1.2 2.7 1.0
Spring 2017 Spring 2019
Distance to
MTO in 2017
% of GDP
Country-specific recommendation
(CSRs) for 2018
Commission assessment of
draft budgetary plan (DBP) In-year assessment
Final Commission assessment
Conclusion of the overall assessment and
procedural steps after the reference period
Required adjustment:
spending growth limit
(exp. benchmark, EB) ;
change in the structural
balance (∆SB)
(y-o-y % ch. ; % of GDP)
Flexibility clauses
(granted ex ante )
% of GDP
Flexibility and unusual
event clauses
(granted ex post )
% of GDP
Observed deviation from the
required structural
adjustment (or MTO)
% of GDPred = significant deviation if
< -0.5% (1-y) or < -0.25% (2-y)
2018 2017-18
(*) Without the margin of discretion the Commission unilaterally decided in autumn 2017, Italy would have deviated from the SB and the EB by -0.7% and -0.9% of GDP, respectively.
LV -0.4 (6.0 ; -0.3)(-0.7)
Compliant
-Lithania was assessed to have achieved its MTO
in 2018.0.1
LU 0.9 - - Compliant Compliant - -
LT (6.4 ; -0.6)(-0.5)
Compliant Compliant
Broadly compliant -
The Commission was of the view that there were
not sufficient ground to conclude on the
existence of an observed significant deviation in
2018, after having considered other elements
beyond compliance indicators.
-0.2 (0.3 ; 0.2) - Broadly compliant Compliant - -
IT -2.0 (0.2 ; 0.6) - Risk of non-compliance
CY
Risk of non-compliance
The Commission applied
a margin of discretion
reducing the requirement
from 0.6 to 0.3% of
GDP (*)
Significant deviation.
On 5 June 2019, the Commission issued a report
under Article 121(4) TFEU (see Table x.x).
HR 0.1 Remain at the MTO - - Compliant - -
FR -1.9 (1.2 ; 0.6) - Risk of non-compliance Broadly compliant -
Deviation not significant because within the
margin of broad compliance
of -0.5 % of GDP.
Compliant
Compliant
No conclusion
Compliant
Non-compliant
Compliant
Broadly compliant
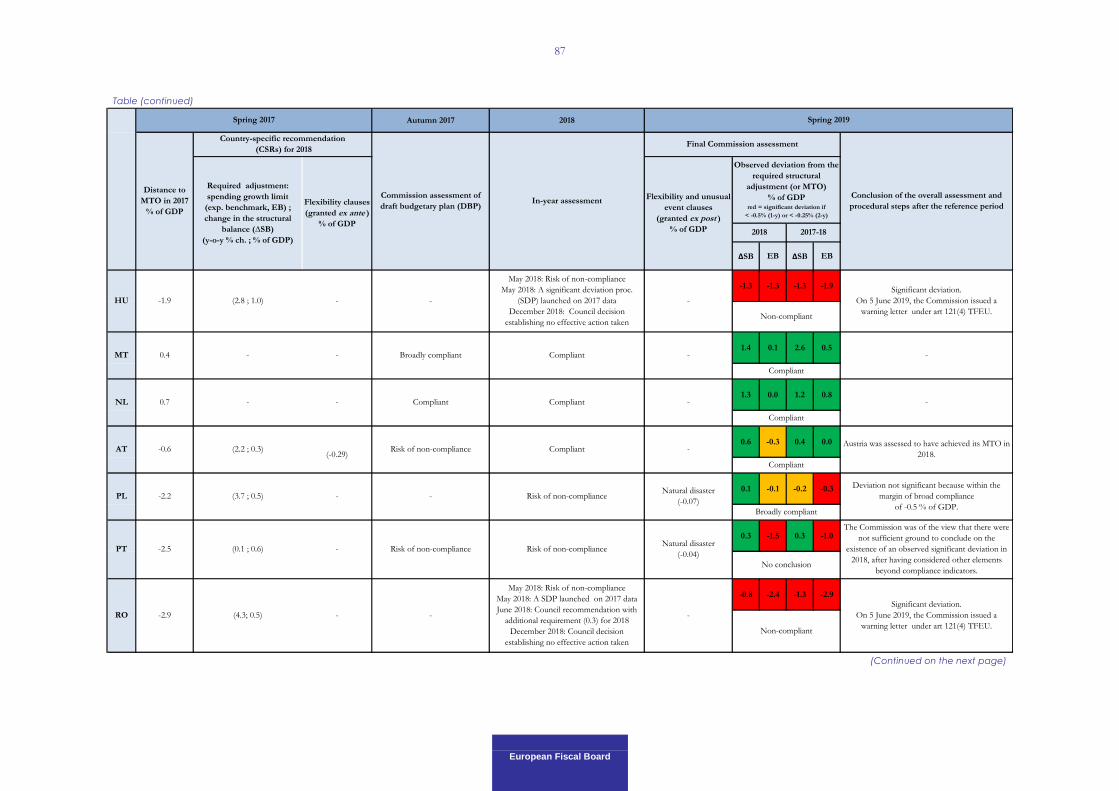
European Fiscal Board
87
Table (continued)
(Continued on the next page)
Autumn 2017 2018
∆SB EB ∆SB EB
-1.3 -1.3 -1.3 -1.9
1.4 0.1 2.6 0.5
1.3 0.0 1.2 0.8
0.6 -0.3 0.4 0.0
0.1 -0.1 -0.2 -0.3
0.3 -1.5 0.3 -1.0
-0.8 -2.4 -1.3 -2.9May 2018: Risk of non-compliance
May 2018: A SDP launched on 2017 data
June 2018: Council recommendation with
additional requirement (0.3) for 2018
December 2018: Council decision
establishing no effective action taken
-
Significant deviation.
On 5 June 2019, the Commission issued a
warning letter under art 121(4) TFEU.
RO -2.9 (4.3; 0.5) - -
Non-compliant
Deviation not significant because within the
margin of broad compliance
of -0.5 % of GDP.
PT -2.5 (0.1 ; 0.6) - Risk of non-compliance Risk of non-complianceNatural disaster
(-0.04)
The Commission was of the view that there were
not sufficient ground to conclude on the
existence of an observed significant deviation in
2018, after having considered other elements
beyond compliance indicators.
PL -2.2 (3.7 ; 0.5) - - Risk of non-complianceNatural disaster
(-0.07)
AT -0.6 (2.2 ; 0.3)(-0.29)
Risk of non-compliance Compliant -Austria was assessed to have achieved its MTO in
2018.
NL 0.7 - - Compliant Compliant
Spring 2017 Spring 2019
Distance to
MTO in 2017
% of GDP
Country-specific recommendation
(CSRs) for 2018
Commission assessment of
draft budgetary plan (DBP) In-year assessment
- -
Conclusion of the overall assessment and
procedural steps after the reference period
Required adjustment:
spending growth limit
(exp. benchmark, EB) ;
change in the structural
balance (∆SB)
(y-o-y % ch. ; % of GDP)
Flexibility clauses
(granted ex ante )
% of GDP
Flexibility and unusual
event clauses
(granted ex post )
% of GDP
Observed deviation from the
required structural
adjustment (or MTO)
% of GDPred = significant deviation if
< -0.5% (1-y) or < -0.25% (2-y)
2018 2017-18
MT 0.4 - - Broadly compliant Compliant - -
HU -1.9 (2.8 ; 1.0) - -
May 2018: Risk of non-compliance
May 2018: A significant deviation proc.
(SDP) launched on 2017 data
December 2018: Council decision
establishing no effective action taken
-
Significant deviation.
On 5 June 2019, the Commission issued a
warning letter under art 121(4) TFEU.
No conclusion
Broadly compliant
Compliant
Compliant
Compliant
Non-compliant
Final Commission assessment
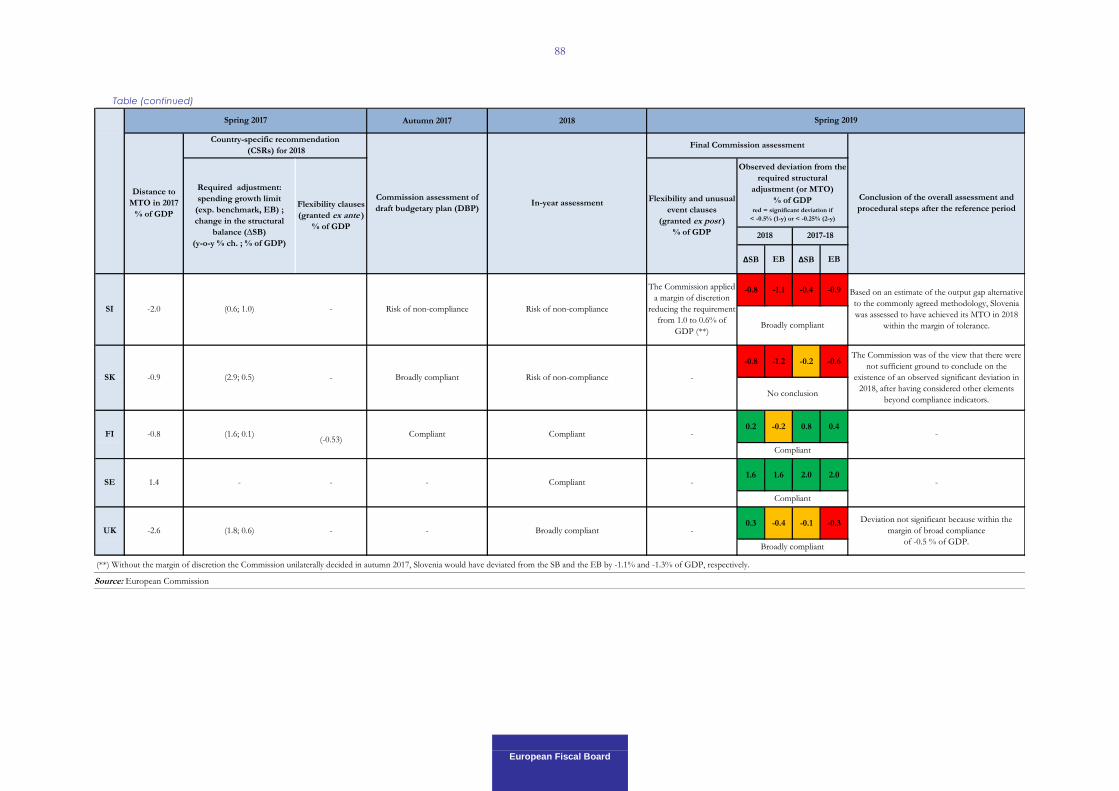
European Fiscal Board
88
Table (continued)
Source: European Commission
Autumn 2017 2018
∆SB EB ∆SB EB
-0.8 -1.1 -0.4 -0.9
-0.8 -1.2 -0.2 -0.6
0.2 -0.2 0.8 0.4
1.6 1.6 2.0 2.0
0.3 -0.4 -0.1 -0.3
Conclusion of the overall assessment and
procedural steps after the reference period
Required adjustment:
spending growth limit
(exp. benchmark, EB) ;
change in the structural
balance (∆SB)
(y-o-y % ch. ; % of GDP)
Flexibility clauses
(granted ex ante )
% of GDP
Flexibility and unusual
event clauses
(granted ex post )
% of GDP
Observed deviation from the
required structural
adjustment (or MTO)
% of GDPred = significant deviation if
< -0.5% (1-y) or < -0.25% (2-y)
2018 2017-18
Compliant - -
UK -2.6 (1.8; 0.6) - - Broadly compliant -
Deviation not significant because within the
margin of broad compliance
of -0.5 % of GDP.
SE 1.4 - - -
-0.8 (1.6; 0.1)(-0.53)
Compliant Compliant - -
SK -0.9 (2.9; 0.5) - Broadly compliant Risk of non-compliance -
The Commission was of the view that there were
not sufficient ground to conclude on the
existence of an observed significant deviation in
2018, after having considered other elements
beyond compliance indicators.
FI
SI -2.0 (0.6; 1.0) - Risk of non-compliance Risk of non-compliance
The Commission applied
a margin of discretion
reducing the requirement
from 1.0 to 0.6% of
GDP (**)
Based on an estimate of the output gap alternative
to the commonly agreed methodology, Slovenia
was assessed to have achieved its MTO in 2018
within the margin of tolerance.
Spring 2017 Spring 2019
Distance to
MTO in 2017
% of GDP
Country-specific recommendation
(CSRs) for 2018
Commission assessment of
draft budgetary plan (DBP) In-year assessment
Final Commission assessment
(**) Without the margin of discretion the Commission unilaterally decided in autumn 2017, Slovenia would have deviated from the SB and the EB by -1.1% and -1.3% of GDP, respectively.
Broadly compliant
Compliant
Compliant
No conclusion
Broadly compliant

European Fiscal Board
89
Table A2: Application of EU fiscal rules in the 2018 surveillance cycle — The corrective arm of the SGP: Countries not in EDP (see Box A1 on how to read the table)
(Continued on the next page)
Autumn 2017 2018 Spring 2019
Commission assessment of draft budgetary plan (DBP)
Procedural steps during the reference period
Final assessment
Procedural steps after the reference period
Deficit Rule
Debt Rule (DR) /
Transitional Arrangement
(MLSA)
Deficit Rule
Debt Rule (DR) / Transitional Arrangement
(MLSA)
BE Compliant
At risk of non-compliance with
the debt rule
23/05/2018 – The Commission prepared a report under Article 126(3) TFEU after the 2018 spring forecast, since Belgium had not made sufficient progress towards compliance with the debt reduction benchmark in 2017 and was not expected to comply with it in 2018 and 2019 either. The Commission’s assessment of relevant factors stressed that (i) the previously unfavourable but improving macroeconomic conditions made them less of a factor in explaining lack of compliance with the debt reduction benchmark; (ii) there was insufficiently robust evidence for a conclusion on the existence of a significant deviation from the adjustment towards the MTO in Belgium in 2017, and in 2016 and 2017 combined; and (iii) the implementation of growth-enhancing structural reforms in recent years, several of which were considered substantial and projected to help improve debt sustainability. The report concluded that there was insufficiently robust evidence to determine whether the debt criterion was complied with or not. However, the report underscored that the expected fiscal adjustment in 2018 did not appear adequate to ensure compliance with the adjustment path towards the MTO.
19/10/2018 – The Commission sent a letter to the Belgian authorities following the submission of the DBP for 2019, seeking clarifications on the compliance of Belgium’s planned fiscal effort and expenditure developments in 2018 and 2019 with the requirements of the preventive arm of the SGP and highlighting a risk of significant deviation. The letter also recalled that Belgium’s broad compliance with the preventive arm of the SGP in 2018 was a relevant factor in the report under article 126(3) TFEU issued on 23 May 2018.
22/10/2018 – The Belgian authorities replied with a letter.
21/11/2018 - The Commission published its Opinion on the DBP of Belgium. The Commission concluded that Belgium is at risk of non-compliance with the provisions of the SGP in 2018: the expenditure benchmark and the structural balance pointed to a risk of a significant deviation from the required adjustment path towards the MTO and it was not projected to comply with the debt reduction benchmark in 2018.
Compliant Non-compliant
05/06/2019 – The Commission prepared a report under Article 126(3) TFEU, after official data and the Commission 2019 spring forecast suggested that Belgium had not made sufficient progress towards compliance with the debt reduction benchmark in 2018. The Commission’s assessment of relevant factors stressed (i) the macroeconomic conditions were no longer considered a factor in explaining Belgium’s gap to the debt reduction benchmark; (ii) the implementation of growth-enhancing structural reforms in recent years, several of which were considered substantial and projected to help improve debt sustainability; and (iii) the fact that there was insufficiently robust evidence for a conclusion on the existence of a significant deviation from Belgium’s adjustment path towards the MTO in 2018 and over 2017 and 2018 taken together. The report concluded that the current analysis is not fully conclusive as to whether the debt criterion was or was not complied with as defined in the Treaty and in Regulation (EC) No 1467/1997.
FR
Compliant Non-compliant
05/06/2019 – The Commission prepared a report under Article 126(3) TFEU, after official data and the Commission 2019 spring forecast suggested that France had prima facie not made sufficient progress towards compliance with the debt reduction benchmark in 2018. Moreover, the Commission forecast did not expect France to comply with the debt reduction benchmark in 2019 and 2020 either. At the same time, the planned deficit for 2019 provided evidence of the prima facie existence of an excessive deficit. The Commission’s assessment of relevant factors stressed (i) the fact that France is broadly compliant with the recommended adjustment path towards the MTO in 2018; (ii) short-term sustainability risks are low; (iii) the breach of the 3% of GDP value in 2019 is marginal, temporary and solely due to a one-off effect; and (iv) the implementation of growth-enhancing structural reforms in recent years, several of which were considered substantial and projected to help improve debt sustainability. The report concluded that deficit and debt criteria should be considered as being complied with at present.
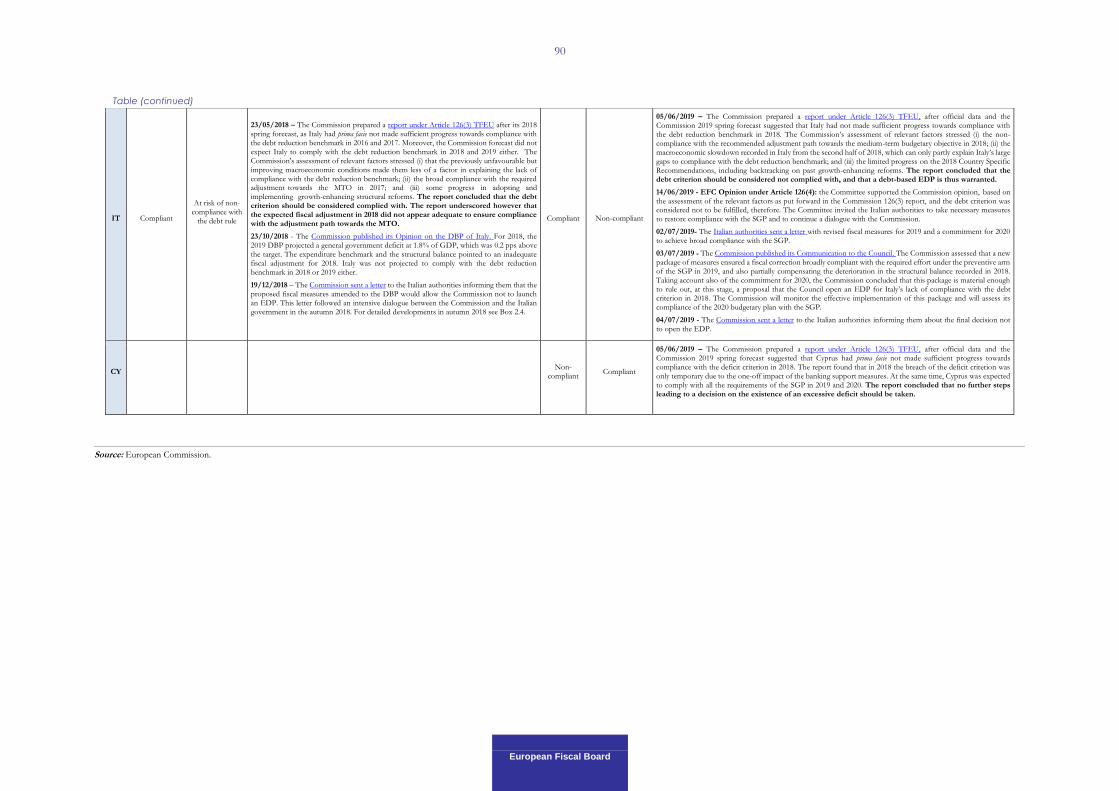
European Fiscal Board
90
Table (continued)
Source: European Commission.
IT Compliant
At risk of non-compliance with
the debt rule
23/05/2018 – The Commission prepared a report under Article 126(3) TFEU after its 2018 spring forecast, as Italy had prima facie not made sufficient progress towards compliance with the debt reduction benchmark in 2016 and 2017. Moreover, the Commission forecast did not expect Italy to comply with the debt reduction benchmark in 2018 and 2019 either. The Commission's assessment of relevant factors stressed (i) that the previously unfavourable but improving macroeconomic conditions made them less of a factor in explaining the lack of compliance with the debt reduction benchmark; (ii) the broad compliance with the required adjustment towards the MTO in 2017; and (iii) some progress in adopting and implementing growth-enhancing structural reforms. The report concluded that the debt criterion should be considered complied with. The report underscored however that the expected fiscal adjustment in 2018 did not appear adequate to ensure compliance with the adjustment path towards the MTO.
23/10/2018 - The Commission published its Opinion on the DBP of Italy. For 2018, the 2019 DBP projected a general government deficit at 1.8% of GDP, which was 0.2 pps above the target. The expenditure benchmark and the structural balance pointed to an inadequate fiscal adjustment for 2018. Italy was not projected to comply with the debt reduction benchmark in 2018 or 2019 either.
19/12/2018 – The Commission sent a letter to the Italian authorities informing them that the proposed fiscal measures amended to the DBP would allow the Commission not to launch an EDP. This letter followed an intensive dialogue between the Commission and the Italian government in the autumn 2018. For detailed developments in autumn 2018 see Box 2.4.
Compliant Non-compliant
05/06/2019 – The Commission prepared a report under Article 126(3) TFEU, after official data and the Commission 2019 spring forecast suggested that Italy had not made sufficient progress towards compliance with the debt reduction benchmark in 2018. The Commission’s assessment of relevant factors stressed (i) the non-compliance with the recommended adjustment path towards the medium-term budgetary objective in 2018; (ii) the macroeconomic slowdown recorded in Italy from the second half of 2018, which can only partly explain Italy’s large gaps to compliance with the debt reduction benchmark; and (iii) the limited progress on the 2018 Country Specific Recommendations, including backtracking on past growth-enhancing reforms. The report concluded that the debt criterion should be considered not complied with, and that a debt-based EDP is thus warranted.
14/06/2019 - EFC Opinion under Article 126(4): the Committee supported the Commission opinion, based on the assessment of the relevant factors as put forward in the Commission 126(3) report, and the debt criterion was considered not to be fulfilled, therefore. The Committee invited the Italian authorities to take necessary measures to restore compliance with the SGP and to continue a dialogue with the Commission.
02/07/2019- The Italian authorities sent a letter with revised fiscal measures for 2019 and a commitment for 2020 to achieve broad compliance with the SGP.
03/07/2019 - The Commission published its Communication to the Council. The Commission assessed that a new package of measures ensured a fiscal correction broadly compliant with the required effort under the preventive arm of the SGP in 2019, and also partially compensating the deterioration in the structural balance recorded in 2018. Taking account also of the commitment for 2020, the Commission concluded that this package is material enough to rule out, at this stage, a proposal that the Council open an EDP for Italy’s lack of compliance with the debt criterion in 2018. The Commission will monitor the effective implementation of this package and will assess its compliance of the 2020 budgetary plan with the SGP.
04/07/2019 - The Commission sent a letter to the Italian authorities informing them about the final decision not to open the EDP.
CY
Non-compliant
Compliant
05/06/2019 – The Commission prepared a report under Article 126(3) TFEU, after official data and the Commission 2019 spring forecast suggested that Cyprus had prima facie not made sufficient progress towards compliance with the deficit criterion in 2018. The report found that in 2018 the breach of the deficit criterion was only temporary due to the one-off impact of the banking support measures. At the same time, Cyprus was expected to comply with all the requirements of the SGP in 2019 and 2020. The report concluded that no further steps leading to a decision on the existence of an excessive deficit should be taken.

European Fiscal Board
91
Table A3: Application of the EU fiscal rules in the 2018 surveillance cycle — The corrective arm of the SGP: Countries in EDP (see Box A1 on how to read the table)
Source: European Commission.
Spring 2017 Autumn 2017
2018 Spring 2019
EDP status
(deadline)
Requirements
% of GDP
Commission Assessment of draft budgetary
plan (DBP) Procedural steps during the reference period
Final assessment
% of GDP
Procedural steps after the
reference period Headline
budget
balance
Structural
adjustment
Headline
budget
balance
Change
in the
structural
budget
balance
ES
in abeyance
(2018)
-2.2 0.5
Broadly compliant
12/11/2017 – The Commission published its
Opinion on the DBP of Spain. While
acknowledging the no-policy-change nature of
the budgetary plan, the Commission's assessment
indicated that neither the intermediate headline
deficit target nor the recommended fiscal effort
would be achieved. The Commission invited
Spain to submit an updated Draft Budgetary Plan
for 2018.
30/04/2018 – The Spanish authorities submitted
an updated DBP.
23/05/2018 – The Commission published its
Opinion on the updated DBP of Spain. The
Commission concluded that the updated DBP
was broadly compliant with the provisions of the
SGP, based on an expected timely correction of
the excessive deficit. However, the Commission
highlighted that neither the headline deficit target
nor the fiscal effort required by the Council
Decision of 8 August 2016 would be met in 2018.
The Commission therefore invited the authorities
to stand ready to take further measures to ensure
that the 2018 budget was compliant with the
SGP.
23/05/2018 – The Commission issued a Recommendation for a Council Recommendation on the 2018 National
Reform Programme and a Council opinion on the 2018 Stability Programme of Spain. The fiscal effort in 2018, and
cumulated over 2016-2018, is not expected to be ensured. While the economic expansion is supports the deficit
reduction, it is not being used to structurally strengthen public finances.
13/07/2018 – The Council adopted a Recommendation on the 2018 National Reform Programme of Spain and its
Opinion on the 2018 Stability Programme of Spain. The conclusions of the Recommendation coincided with those
of the Commission’s Recommendation.
-2.5 0.0
05/06/2019 – The Commission
issued a Recommendation under
Article 126(12) TFEU for a
Council Decision abrogating the
Decision on the existence of an
excessive deficit.
09/07/2019 – The Council
adopted the Decision abrogating
the Decision on the existence of an
excessive deficit in Spain.

European Fiscal Board
92
(Continued on the next page)
Box A1: Reading the overview tables A1, A2 and A3
The overview tables in Annex A of this annual report aim to provide a comprehensive view of the status of the EU Member States and the various steps under the Stability and Growth Pact for the reference period 2018. All overview
tables are organised by columns that follow the annual cycle of fiscal surveillance.
Table A.1. Application of EU fiscal rules in euro area in 2018: The preventive arm
Column 1 – Distance to MTO: the difference between the country-specific medium-term budgetary objective (MTO) and the structural balance in 2017 on the basis of the spring 2017 Commission forecasts underpinning the July 2017
country-specific recommendations by the Council.
Column 2 – Required adjustment: the annual adjustment requirement is expressed in terms of the two quantitative indicators under the preventive arm of the SGP. These are the expenditure benchmark (EB) and the change in the structural budget balance (∆SB). The EB limits the year-on-year increase of government spending unless funded by new revenue measures. It is expressed by the annual growth rate of an expenditure aggregate, net of interest payments, spending on EU programmes paid for by EU funds and the cyclical component of unemployment benefits, while nationally financed government investment is smoothed over four years. The ∆SB is defined on the basis of the country’s cyclical conditions, while taking into account the sustainability needs of its public finances (1). The required structural adjustment is net of any flexibility clauses granted ex ante – see column 3.
Column 3 – Flexibility clauses granted ex ante: an allowance for a reduction in the structural adjustment the country is required to deliver, granted for 2018 in the context of the assessment of the Stability and Convergence Programmes in spring 2017, or granted in previous years and carried over for three years. Allowed deviations apply to either the change or level of the structural balance, whichever leads to the least stringent requirement. A deviation in terms of change affects the adjustment path towards the MTO and applies to countries that are still relatively far from their MTO. By contrast, when the structural balance stands in the vicinity of the MTO, the deviation is in level and refers directly to the distance from the MTO. In 2018, all the flexibility granted ex ante pertains to this last case. A Member State can be granted flexibility for structural reforms, including the specific case of pension reform, for investments, or for the impact of adverse economic events outside its control, such as natural disasters or the refugee crisis. For a comprehensive presentation of how flexibility is taken into account, see the Vade Mecum (2018 edition) sections 1.3.2.3, 1.3.2.4, 1.3.2.5.
Column 4 – Commission overall assessment of the 2018 draft budgetary plan (DBP): In line with Regulation (EU) 473/2013, every year, all euro area countries submit their DBPs by 15 October except when under a macroeconomic adjustment programme (in our reference period, Greece). They are assessed for (ex ante) compliance with the provisions of the SGP. The overall conclusion of the Commission can be compliant, risk of (some) deviation (2) or risk of significant deviation. In case of risk of some deviation, the DBP is considered to be ‘broadly compliant’, while in case of risk of significant deviation, the DBP is considered as non-compliant. For a comprehensive presentation of the assessment of compliance with the preventive arm of the SGP, see the Vade Mecum section 1.3.2.7.
Column 5 – In-year assessment: Commission’s assessment of compliance with the preventive arm of the SGP between autumn 2017 and spring 2019. For non-euro area countries, the column reports the assessment of the spring 2018 Convergence Programmes.
Column 6 – Flexibility and unusual event clauses granted ex post: includes any flexibility clauses that are granted for 2018 in the context of the final assessment. In 2018, the Commission also applied a margin of discretion.
Column 7 - Observed deviation from the required structural adjustment (or MTO): presents the observed deviation from the fiscal requirement according to both compliance indicators: (i) the ∆SB and (ii) the EB. It includes the deviation in one year and on average over two consecutive years (i.e. 2017 and 2018). Colours: green, yellow and red, corresponding respectively to the indicator pointing to compliance, some deviation or a significant deviation to the MTO or the required path towards it. The deviation is considered significant if it exceeds 0.5% of GDP in a single year, or 0.25% of GDP on average over two consecutive years. The assessment is done by comparing the actual change in the structural balance to the required adjustment path as a reference, including an assessment of compliance with the expenditure benchmark. If both indicators confirm the required adjustment, the overall conclusion is of compliance with the preventive arm. In all other cases, the conclusion will depend on an ‘overall assessment’, which includes an in-depth analysis of both indicators;
see the Vade Mecum section 2.
Column 8 – Conclusion of the overall assessment and procedural steps after the reference period: records procedural or other steps taken following the spring 2019 assessment. For those cases where the country seems not to have delivered the requirements but no procedural steps to have been taken, an explanation is provided.
(1) The ‘Required Structural Adjustment based on matrix’ is based on the matrix for specifying the annual adjustment towards the
MTO under the preventive arm of the Pact, as presented in the Commonly Agreed Position on Flexibility in the SGP endorsed
by the ECOFIN Council of 12 February 2016. http://data.consilium.europa.eu/doc/document/ST-14345-2015-INIT/en/pdf (2) ‘Some deviation’ refers to any deviation which is not significant, namely below 0.5 – as expressed by articles 6(3) and 10(3) of
Regulation 1466/97.

European Fiscal Board
93
Box (continued)
Table A.2. Application of EU fiscal rules in euro area in 2018 - The corrective arm: Countries not in EDP
Column 1 – Deficit Rule: the Commission’s assessment of the Member State’s 2018 Draft Budgetary Plans’ (3) compliance with the 3% of GDP deficit criterion in autumn 2017.
Column 2 – Debt Rule (DR) / Transitional Arrangement (MLSA): Commission’s assessment of the country’s compliance with the debt criterion. A Member State is considered compliant with the debt criterion if its general government consolidated gross debt is below 60 % of GDP or is sufficiently diminishing and approaching 60 % of GDP at a satisfactory pace. For Member States that were in EDP on the date the Six Pack was adopted (8 November 2011), special provisions are applied under a transitional arrangement for the three years following the correction of their excessive deficit. For a comprehensive presentation of both cases, see Vade Mecum sections 2.2.1.2 and 2.2.1.3.
Column 3 – Procedural steps taken during the reference period: records procedural or other steps under the corrective arm of the SGP taken between autumn 2017 and spring 2019. For 2017, this column presents Reports on the basis of Article 126 (3) TFEU, which is the first step in the EDP, analysing compliance with the deficit and debt criterion
in the Treaty.
Column 4 – Deficit Rule: see column 1 of this table.
Column 5 – Debt Rule (DR) / Transitional Arrangement (MLSA): see column 2 of this table.
Column 6 – Procedural steps after the reference period: see Table A.1 column 8.
Table A.3. Application of EU fiscal rules in euro area in 2018 - The corrective arm: Countries in EDP
Column 1 – EDP status (deadline): presents the country’s status in the EDP procedure in July 2017; in brackets, the deadline set by the Council for the correction of the excessive deficit.
Column 2 – Headline Budget Balance: the Council recommends to Member States in EDP to deliver annual headline deficit targets in order to ensure the correction of the excessive deficit within a set deadline. This column presents the
required headline budget balance for 2018.
Column 3 – Structural adjustment: the required annual improvement in the structural balance consistent with the nominal target recommended by the Council and presented in column 1.
Column 4 – Commission assessment of 2018 Draft Budgetary Plans: see Table A.2 – column 4.
Column 5 – Procedural steps taken during the reference period: covers all steps taken under the corrective arm of the SGP in the period between autumn 2017 and spring 2019. All Articles referred to in this column are of the Treaty on the Functioning of the European Union.
Column 6 – Headline budget balance: presents the headline budget balance outturn in 2018 or the information that the excessive deficit has been corrected.
Column 7 – Observed structural adjustment: the estimated structural adjustment delivered in 2018 alongside the corrected figure for unanticipated revenue windfalls/shortfalls and changes in potential growth compared to the scenario
underpinning the EDP recommendations. For the latter, see the Vade Mecum (2016 edition), Annex 5.
Column 8 – Procedural steps after the reference period: see Table A.2 column 8.
(3) https://ec.europa.eu/info/business-economy-euro/economic-and-fiscal-policy-coordination/eu-economic-governance-
monitoring-prevention-correction/stability-and-growth-pact/annual-draft-budgetary-plans-dbps-euro-area-countries/draft-
budgetary-plans-2017_en

ANNEX B: STATISTICAL ANNEX
European Fiscal Board
Table B1: Gross domestic product at 2010 reference levels (annual percentage change, 2001-2020)
Note: EA and EU aggregated figures are weighted in common currency.
Source: Commission spring 2019 forecast.
2001 2002 2003 2004 2005 2006 2007 2008 2009 2010 2011 2012 2013 2014 2015 2016 2017 2018 2019 2020
BE 0.8 1.8 0.8 3.6 2.1 2.5 3.4 0.8 -2.3 2.7 1.8 0.2 0.2 1.3 1.7 1.5 1.7 1.4 1.2 1.2
BG 3.8 5.9 5.2 6.4 7.1 6.9 7.3 6.0 -3.6 1.3 1.9 0.0 0.5 1.8 3.5 3.9 3.8 3.1 3.3 3.4
CZ 2.9 1.7 3.6 4.9 6.5 6.9 5.6 2.7 -4.8 2.3 1.8 -0.8 -0.5 2.7 5.3 2.5 4.4 2.9 2.6 2.4
DK 0.8 0.5 0.4 2.7 2.3 3.9 0.9 -0.5 -4.9 1.9 1.3 0.2 0.9 1.6 2.3 2.4 2.3 1.4 1.7 1.6
DE 1.7 0.0 -0.7 1.2 0.7 3.7 3.3 1.1 -5.6 4.1 3.7 0.5 0.5 2.2 1.7 2.2 2.2 1.4 0.5 1.5
EE 6.3 6.1 7.4 6.3 9.4 10.3 7.7 -5.4 -14.7 2.3 7.6 4.3 1.9 2.9 1.9 3.5 4.9 3.9 2.8 2.4
IE 5.3 5.9 3.0 6.6 5.7 5.0 5.3 -4.4 -5.0 1.9 3.7 0.2 1.3 8.8 25.1 5.0 7.2 6.7 3.8 3.4
EL 4.1 3.9 5.8 5.1 0.6 5.7 3.3 -0.3 -4.3 -5.5 -9.1 -7.3 -3.2 0.7 -0.4 -0.2 1.5 1.9 2.2 2.2
ES 4.0 2.9 3.2 3.2 3.7 4.2 3.8 1.1 -3.6 0.0 -1.0 -2.9 -1.7 1.4 3.6 3.2 3.0 2.6 2.1 1.9
FR 2.0 1.1 0.8 2.8 1.7 2.4 2.4 0.3 -2.9 1.9 2.2 0.3 0.6 1.0 1.1 1.2 2.2 1.6 1.3 1.5
HR 3.5 5.3 5.6 3.9 4.1 4.9 5.3 2.0 -7.3 -1.5 -0.3 -2.3 -0.5 -0.1 2.4 3.5 2.9 2.6 2.6 2.5
IT 1.8 0.2 0.2 1.6 0.9 2.0 1.5 -1.1 -5.5 1.7 0.6 -2.8 -1.7 0.1 0.9 1.1 1.7 0.9 0.1 0.7
CY 4.0 3.7 2.6 5.0 4.9 4.7 5.1 3.6 -2.0 1.3 0.4 -2.9 -5.8 -1.3 2.0 4.8 4.5 3.9 3.1 2.7
LV 6.5 7.1 8.4 8.3 10.7 11.9 10.0 -3.5 -14.4 -3.9 6.4 4.0 2.4 1.9 3.0 2.1 4.6 4.8 3.1 2.8
LT 6.5 6.8 10.5 6.6 7.7 7.4 11.1 2.6 -14.8 1.6 6.0 3.8 3.5 3.5 2.0 2.4 4.1 3.4 2.7 2.4
LU 2.5 3.8 1.6 3.6 3.2 5.2 8.4 -1.3 -4.4 4.9 2.5 -0.4 3.7 4.3 3.9 2.4 1.5 2.6 2.5 2.6
HU 3.8 4.5 3.8 5.0 4.4 3.9 0.4 0.9 -6.6 0.7 1.7 -1.6 2.1 4.2 3.5 2.3 4.1 4.9 3.7 2.8
MT 0.6 3.0 2.5 0.4 3.8 1.8 4.0 3.3 -2.5 3.5 1.3 2.7 4.5 8.5 10.7 5.7 6.7 6.6 5.5 4.8
NL 2.3 0.2 0.2 2.0 2.1 3.5 3.8 2.2 -3.7 1.3 1.6 -1.0 -0.1 1.4 2.0 2.2 2.9 2.7 1.6 1.6
AT 1.3 1.7 0.9 2.7 2.2 3.5 3.7 1.5 -3.8 1.8 2.9 0.7 0.0 0.7 1.1 2.0 2.6 2.7 1.5 1.6
PL 1.2 2.0 3.6 5.1 3.5 6.2 7.0 4.2 2.8 3.6 5.0 1.6 1.4 3.3 3.8 3.1 4.8 5.1 4.2 3.6
PT 1.9 0.8 -0.9 1.8 0.8 1.6 2.5 0.2 -3.0 1.9 -1.8 -4.0 -1.1 0.9 1.8 1.9 2.8 2.1 1.7 1.7
RO 5.2 5.7 2.3 10.4 4.7 8.0 7.2 9.3 -5.5 -3.9 2.0 2.1 3.5 3.4 3.9 4.8 7.0 4.1 3.3 3.1
SI 2.9 3.8 2.8 4.4 4.0 5.7 6.9 3.3 -7.8 1.2 0.6 -2.7 -1.1 3.0 2.3 3.1 4.9 4.5 3.1 2.8
SK 3.3 4.5 5.4 5.3 6.8 8.5 10.8 5.6 -5.4 5.0 2.8 1.7 1.5 2.8 4.2 3.1 3.2 4.1 3.8 3.4
FI 2.6 1.7 2.0 3.9 2.8 4.1 5.2 0.7 -8.3 3.0 2.6 -1.4 -0.8 -0.6 0.5 2.8 2.7 2.3 1.6 1.2
SE 1.6 2.1 2.4 4.3 2.8 4.7 3.4 -0.6 -5.2 6.0 2.7 -0.3 1.2 2.6 4.5 2.7 2.1 2.3 1.4 1.6
UK 2.8 2.5 3.3 2.3 3.1 2.5 2.5 -0.3 -4.2 1.7 1.6 1.4 2.0 2.9 2.3 1.8 1.8 1.4 1.3 1.3
EA-19 2.1 1.0 0.7 2.3 1.7 3.2 3.1 0.5 -4.5 2.1 1.6 -0.9 -0.2 1.4 2.1 2.0 2.4 1.9 1.2 1.5
EU-28 2.2 1.4 1.3 2.5 2.1 3.3 3.1 0.5 -4.3 2.1 1.8 -0.4 0.3 1.8 2.3 2.0 2.5 2.0 1.4 1.6

European Fiscal Board
95
Table B2: Harmonised index of consumer prices (percentage change on preceding year, 2001-2020)
Note: National index if not available. Source: Commission 2019 spring forecast.
2001 2002 2003 2004 2005 2006 2007 2008 2009 2010 2011 2012 2013 2014 2015 2016 2017 2018 2019 2020
BE 2.4 1.5 1.5 1.9 2.5 2.3 1.8 4.5 0.0 2.3 3.4 2.6 1.2 0.5 0.6 1.8 2.2 2.3 1.8 1.6
BG 7.4 5.8 2.3 6.1 6.0 7.4 7.6 12.0 2.5 3.0 3.4 2.4 0.4 -1.6 -1.1 -1.3 1.2 2.6 2.0 1.8
CZ 4.5 1.4 -0.1 2.6 1.6 2.1 2.9 6.3 0.6 1.2 2.2 3.5 1.4 0.4 0.3 0.6 2.4 2.0 2.4 2.0
DK 2.3 2.4 2.0 0.9 1.7 1.8 1.7 3.6 1.0 2.2 2.7 2.4 0.5 0.4 0.2 0.0 1.1 0.7 1.3 1.5
DE 1.9 1.3 1.1 1.8 1.9 1.8 2.3 2.8 0.2 1.1 2.5 2.2 1.6 0.8 0.7 0.4 1.7 1.9 1.5 1.5
EE 5.6 3.6 1.4 3.0 4.1 4.4 6.7 10.6 0.2 2.7 5.1 4.2 3.2 0.5 0.1 0.8 3.7 3.4 2.4 2.2
IE 4.0 4.7 4.0 2.3 2.2 2.7 2.9 3.1 -1.7 -1.6 1.2 1.9 0.5 0.3 0.0 -0.2 0.3 0.7 1.0 1.3
EL 3.6 3.9 3.4 3.0 3.5 3.3 3.0 4.2 1.3 4.7 3.1 1.0 -0.9 -1.4 -1.1 0.0 1.1 0.8 0.8 0.8
ES 2.8 3.6 3.1 3.1 3.4 3.6 2.8 4.1 -0.2 2.0 3.0 2.4 1.5 -0.2 -0.6 -0.3 2.0 1.7 1.1 1.4
FR 1.8 1.9 2.2 2.3 1.9 1.9 1.6 3.2 0.1 1.7 2.3 2.2 1.0 0.6 0.1 0.3 1.2 2.1 1.3 1.4
HR 4.3 2.5 2.4 2.1 3.0 3.3 2.7 5.8 2.2 1.1 2.2 3.4 2.3 0.2 -0.3 -0.6 1.3 1.6 1.0 1.2
IT 2.3 2.6 2.8 2.3 2.2 2.2 2.0 3.5 0.8 1.6 2.9 3.3 1.2 0.2 0.1 -0.1 1.3 1.2 0.9 1.1
CY 2.0 2.8 4.0 1.9 2.0 2.2 2.2 4.4 0.2 2.6 3.5 3.1 0.4 -0.3 -1.5 -1.2 0.7 0.8 0.9 1.1
LV 2.5 2.0 2.9 6.2 6.9 6.6 10.1 15.3 3.3 -1.2 4.2 2.3 0.0 0.7 0.2 0.1 2.9 2.6 2.8 2.4
LT 1.5 0.3 -1.1 1.2 2.7 3.8 5.8 11.1 4.2 1.2 4.1 3.2 1.2 0.2 -0.7 0.7 3.7 2.5 2.1 2.1
LU 2.4 2.1 2.5 3.2 3.8 3.0 2.7 4.1 0.0 2.8 3.7 2.9 1.7 0.7 0.1 0.0 2.1 2.0 1.8 1.7
HU 9.1 5.2 4.7 6.8 3.5 4.0 7.9 6.0 4.0 4.7 3.9 5.7 1.7 0.0 0.1 0.4 2.4 2.9 3.2 3.2
MT 2.5 2.6 1.9 2.7 2.5 2.6 0.7 4.7 1.8 2.0 2.5 3.2 1.0 0.8 1.2 0.9 1.3 1.7 1.8 1.9
NL 5.1 3.9 2.2 1.4 1.5 1.6 1.6 2.2 1.0 0.9 2.5 2.8 2.6 0.3 0.2 0.1 1.3 1.6 2.5 1.5
AT 2.3 1.7 1.3 2.0 2.1 1.7 2.2 3.2 0.4 1.7 3.6 2.6 2.1 1.5 0.8 1.0 2.2 2.1 1.8 1.9
PL 5.3 1.9 0.7 3.6 2.2 1.3 2.6 4.2 4.0 2.6 3.9 3.7 0.8 0.1 -0.7 -0.2 1.6 1.2 1.8 2.5
PT 4.4 3.7 3.2 2.5 2.1 3.0 2.4 2.7 -0.9 1.4 3.6 2.8 0.4 -0.2 0.5 0.6 1.6 1.2 1.1 1.6
RO 34.5 22.5 15.3 11.9 9.1 6.6 4.9 7.9 5.6 6.1 5.8 3.4 3.2 1.4 -0.4 -1.1 1.1 4.1 3.6 3.0
SI 8.6 7.5 5.6 3.7 2.4 2.5 3.8 5.5 0.8 2.1 2.1 2.8 1.9 0.4 -0.8 -0.2 1.6 1.9 1.8 2.1
SK 7.2 3.5 8.4 7.5 2.8 4.3 1.9 3.9 0.9 0.7 4.1 3.7 1.5 -0.1 -0.3 -0.5 1.4 2.5 2.4 2.3
FI 2.7 2.0 1.3 0.1 0.8 1.3 1.6 3.9 1.6 1.7 3.3 3.2 2.2 1.2 -0.2 0.4 0.8 1.2 1.4 1.6
SE 2.7 1.9 2.3 1.0 0.8 1.5 1.7 3.3 1.9 1.9 1.4 0.9 0.4 0.2 0.7 1.1 1.9 2.0 1.5 1.6
UK 1.2 1.3 1.4 1.3 2.1 2.3 2.3 3.6 2.2 3.3 4.5 2.8 2.6 1.5 0.0 0.7 2.7 2.5 2.0 2.1
EA-19 2.4 2.3 2.1 2.2 2.2 2.2 2.2 3.3 0.3 1.6 2.7 2.5 1.3 0.4 0.2 0.2 1.5 1.8 1.4 1.4
EU-28 3.2 2.5 2.1 2.3 2.3 2.3 2.4 3.7 1.0 2.1 3.1 2.6 1.5 0.6 0.1 0.2 1.7 1.9 1.6 1.7

European Fiscal Board
96
Table B3: Net lending (+) or net borrowing (-), general government (as a percentage of GDP, 2001-2020)
Source: Commission 2019 spring forecast.
2001 2002 2003 2004 2005 2006 2007 2008 2009 2010 2011 2012 2013 2014 2015 2016 2017 2018 2019 2020
BE 0.2 0.0 -1.8 -0.2 -2.8 0.2 0.1 -1.1 -5.4 -4.0 -4.2 -4.2 -3.1 -3.1 -2.4 -2.4 -0.8 -0.7 -1.3 -1.5
BG 1.1 -1.2 -0.4 1.8 1.0 1.8 1.1 1.6 -4.1 -3.1 -2.0 -0.3 -0.4 -5.5 -1.7 0.1 1.2 2.0 0.8 1.0
CZ -5.5 -6.4 -6.9 -2.4 -3.0 -2.2 -0.7 -2.0 -5.5 -4.2 -2.7 -3.9 -1.2 -2.1 -0.6 0.7 1.6 0.9 0.2 -0.2
DK 1.1 0.0 -0.1 2.1 5.0 5.0 5.0 3.2 -2.8 -2.7 -2.1 -3.5 -1.2 1.1 -1.3 -0.1 1.4 0.5 0.6 -0.1
DE -3.1 -3.9 -4.2 -3.7 -3.4 -1.7 0.2 -0.2 -3.2 -4.2 -1.0 0.0 -0.1 0.6 0.8 0.9 1.0 1.7 1.0 0.8
EE 0.2 0.4 1.8 2.4 1.1 2.9 2.7 -2.7 -2.2 0.2 1.2 -0.3 -0.2 0.7 0.1 -0.3 -0.4 -0.6 -0.3 -0.5
IE 1.0 -0.5 0.3 1.3 1.6 2.8 0.3 -7.0 -13.8 -32.1 -12.8 -8.1 -6.2 -3.6 -1.9 -0.7 -0.3 0.0 0.0 0.3
EL -5.5 -6.0 -7.8 -8.8 -6.2 -5.9 -6.7 -10.2 -15.1 -11.2 -10.3 -8.9 -13.2 -3.6 -5.6 0.5 0.7 1.1 0.5 -0.1
ES -0.5 -0.4 -0.4 0.0 1.2 2.2 1.9 -4.4 -11.0 -9.4 -9.6 -10.5 -7.0 -6.0 -5.3 -4.5 -3.1 -2.5 -2.3 -2.0
FR -1.4 -3.2 -4.0 -3.6 -3.4 -2.4 -2.6 -3.3 -7.2 -6.9 -5.2 -5.0 -4.1 -3.9 -3.6 -3.5 -2.8 -2.5 -3.1 -2.2
HR -2.2 -3.5 -4.7 -5.2 -3.9 -3.4 -2.4 -2.8 -6.0 -6.3 -7.9 -5.3 -5.3 -5.1 -3.2 -1.0 0.8 0.2 0.1 0.5
IT -3.4 -3.0 -3.3 -3.5 -4.1 -3.5 -1.5 -2.6 -5.2 -4.2 -3.7 -2.9 -2.9 -3.0 -2.6 -2.5 -2.4 -2.1 -2.5 -3.5
CY -2.1 -4.1 -5.9 -3.7 -2.2 -1.0 3.2 0.9 -5.4 -4.7 -5.7 -5.6 -5.1 -9.0 -1.3 0.3 1.8 -4.8 3.0 2.8
LV -1.9 -2.3 -1.5 -0.9 -0.4 -0.5 -0.5 -4.2 -9.5 -8.6 -4.3 -1.2 -1.2 -1.4 -1.4 0.1 -0.6 -1.0 -0.6 -0.6
LT -3.5 -1.9 -1.3 -1.4 -0.3 -0.3 -0.8 -3.1 -9.1 -6.9 -8.9 -3.1 -2.6 -0.6 -0.3 0.2 0.5 0.7 0.3 0.0
LU 5.9 2.4 0.2 -1.3 0.1 1.9 4.2 3.3 -0.7 -0.7 0.5 0.3 1.0 1.3 1.4 1.9 1.4 2.4 1.4 1.1
HU -4.1 -8.8 -7.1 -6.5 -7.8 -9.3 -5.0 -3.7 -4.5 -4.5 -5.4 -2.4 -2.6 -2.6 -1.9 -1.6 -2.2 -2.2 -1.8 -1.6
MT -6.1 -5.4 -9.0 -4.3 -2.6 -2.5 -2.1 -4.2 -3.2 -2.4 -2.4 -3.5 -2.4 -1.7 -1.0 0.9 3.4 2.0 1.1 0.9
NL -0.5 -2.1 -3.1 -1.8 -0.4 0.1 -0.1 0.2 -5.1 -5.2 -4.4 -3.9 -2.9 -2.2 -2.0 0.0 1.2 1.5 1.4 0.8
AT -0.7 -1.4 -1.8 -4.8 -2.5 -2.5 -1.4 -1.5 -5.3 -4.4 -2.6 -2.2 -2.0 -2.7 -1.0 -1.6 -0.8 0.1 0.3 0.2
PL -4.8 -4.8 -6.1 -5.0 -4.0 -3.6 -1.9 -3.6 -7.3 -7.3 -4.8 -3.7 -4.1 -3.7 -2.7 -2.2 -1.5 -0.4 -1.6 -1.4
PT -4.8 -3.3 -4.4 -6.2 -6.2 -4.3 -3.0 -3.8 -9.8 -11.2 -7.4 -5.7 -4.8 -7.2 -4.4 -2.0 -3.0 -0.5 -0.4 -0.1
RO -3.5 -1.9 -1.4 -1.1 -0.8 -2.1 -2.7 -5.4 -9.1 -6.9 -5.4 -3.7 -2.2 -1.3 -0.7 -2.7 -2.7 -3.0 -3.5 -4.7
SI -3.9 -2.4 -2.6 -2.0 -1.3 -1.2 -0.1 -1.4 -5.8 -5.6 -6.7 -4.0 -14.7 -5.5 -2.8 -1.9 0.0 0.7 0.7 0.9
SK -6.4 -8.1 -2.7 -2.3 -2.9 -3.6 -1.9 -2.4 -7.8 -7.5 -4.3 -4.3 -2.7 -2.7 -2.6 -2.2 -0.8 -0.7 -0.5 -0.6
FI 5.0 4.1 2.4 2.2 2.6 3.9 5.1 4.2 -2.5 -2.6 -1.0 -2.2 -2.6 -3.2 -2.8 -1.7 -0.8 -0.7 -0.4 -0.2
SE 1.4 -1.5 -1.3 0.4 1.8 2.2 3.4 1.9 -0.7 0.0 -0.2 -1.0 -1.4 -1.6 0.0 1.0 1.4 0.9 0.4 0.4
UK 0.2 -1.9 -3.1 -3.1 -3.1 -2.8 -2.6 -5.2 -10.1 -9.3 -7.5 -8.1 -5.3 -5.3 -4.2 -2.9 -1.9 -1.5 -1.5 -1.2
EA-19 -2.0 -2.7 -3.2 -3.0 -2.6 -1.5 -0.7 -2.2 -6.2 -6.2 -4.2 -3.7 -3.1 -2.5 -2.0 -1.6 -1.0 -0.5 -0.9 -0.9
EU-28 -1.6 -2.6 -3.2 -2.9 -2.5 -1.6 -0.9 -2.5 -6.6 -6.4 -4.6 -4.3 -3.3 -2.9 -2.3 -1.7 -1.0 -0.6 -1.0 -1.0

European Fiscal Board
97
Table B4: Interest expenditure, general government (as a percentage of GDP, 2001-2020)
Source: Commission 2019 spring forecast.
2001 2002 2003 2004 2005 2006 2007 2008 2009 2010 2011 2012 2013 2014 2015 2016 2017 2018 2019 2020
BE 6.5 5.8 5.4 4.8 4.4 4.1 4.0 4.0 3.8 3.6 3.6 3.6 3.3 3.3 3.0 2.8 2.5 2.3 2.1 2.0
BG 4.2 2.2 2.2 1.9 1.6 1.3 1.1 0.8 0.7 0.7 0.7 0.8 0.7 0.9 0.9 0.9 0.8 0.7 0.6 0.5
CZ 0.9 1.1 1.0 1.1 1.1 1.0 1.1 1.0 1.2 1.3 1.3 1.4 1.3 1.3 1.1 0.9 0.7 0.8 0.8 0.8
DK 3.4 3.1 2.8 2.5 2.1 1.8 1.6 1.4 1.9 1.9 2.0 1.8 1.7 1.5 1.6 1.3 1.1 1.1 1.1 1.1
DE 3.0 2.9 2.9 2.8 2.7 2.7 2.7 2.7 2.6 2.5 2.5 2.3 2.0 1.6 1.4 1.2 1.0 0.9 0.9 0.8
EE 0.2 0.3 0.2 0.2 0.2 0.2 0.2 0.2 0.2 0.1 0.1 0.1 0.1 0.1 0.1 0.1 0.0 0.0 0.0 0.0
IE 1.4 1.3 1.2 1.1 1.0 1.0 1.0 1.3 2.0 2.8 3.4 4.2 4.3 3.9 2.6 2.3 2.0 1.6 1.5 1.2
EL 6.3 5.6 4.9 4.8 4.7 4.4 4.5 4.8 5.0 5.9 7.3 5.1 4.0 3.9 3.5 3.2 3.1 3.3 3.5 3.7
ES 3.0 2.6 2.3 2.0 1.7 1.6 1.6 1.5 1.7 1.9 2.5 3.0 3.5 3.5 3.1 2.8 2.6 2.5 2.3 2.1
FR 3.0 3.0 2.8 2.8 2.7 2.6 2.7 2.9 2.5 2.5 2.7 2.6 2.3 2.2 2.0 1.8 1.7 1.7 1.6 1.6
HR 1.8 1.8 1.8 1.9 1.9 1.9 1.9 2.0 2.3 2.4 2.7 3.1 3.2 3.4 3.5 3.1 2.7 2.3 2.1 1.8
IT 6.1 5.5 5.0 4.6 4.5 4.4 4.8 4.9 4.4 4.3 4.7 5.2 4.8 4.6 4.1 3.9 3.8 3.7 3.6 3.7
CY 3.2 3.0 3.2 3.0 3.2 3.0 2.8 2.6 2.3 2.0 2.1 3.1 3.4 3.2 3.2 2.8 2.6 2.5 2.4 2.1
LV 0.9 0.7 0.7 0.7 0.5 0.4 0.4 0.6 1.5 1.8 1.8 1.7 1.5 1.4 1.3 1.0 0.9 0.7 0.7 0.6
LT 1.5 1.3 1.2 0.9 0.8 0.7 0.7 0.7 1.2 1.8 1.8 2.0 1.8 1.6 1.5 1.3 1.1 0.9 0.8 0.7
LU 0.4 0.3 0.3 0.2 0.2 0.2 0.3 0.4 0.4 0.4 0.5 0.5 0.5 0.4 0.4 0.3 0.3 0.3 0.2 0.2
HU 4.7 4.0 4.0 4.3 4.1 3.9 4.0 4.0 4.5 4.1 4.1 4.6 4.5 4.0 3.5 3.2 2.8 2.5 2.4 2.4
MT 3.7 3.9 3.5 3.7 3.8 3.7 3.5 3.3 3.3 3.1 3.2 3.0 2.9 2.7 2.3 2.1 1.8 1.5 1.4 1.3
NL 2.9 2.6 2.4 2.3 2.2 2.0 2.0 2.0 2.0 1.8 1.8 1.7 1.6 1.5 1.3 1.2 1.0 0.9 0.8 0.7
AT 3.6 3.4 3.2 3.0 3.2 3.1 3.1 2.9 3.1 2.9 2.8 2.7 2.6 2.4 2.3 2.1 1.8 1.7 1.5 1.4
PL 3.1 2.9 3.0 2.7 2.5 2.4 2.2 2.1 2.5 2.5 2.5 2.7 2.5 2.0 1.8 1.7 1.6 1.4 1.4 1.3
PT 3.0 2.8 2.7 2.6 2.6 2.8 2.9 3.1 3.0 2.9 4.3 4.9 4.9 4.9 4.6 4.2 3.8 3.5 3.3 3.1
RO 3.4 2.5 1.6 1.5 1.2 0.8 0.7 0.7 1.4 1.5 1.6 1.8 1.8 1.7 1.6 1.5 1.3 1.2 1.2 1.3
SI 2.3 2.1 1.9 1.7 1.5 1.4 1.2 1.1 1.3 1.6 1.9 2.0 2.6 3.2 3.2 3.0 2.5 2.0 1.6 1.5
SK 3.9 3.5 2.5 2.1 1.7 1.4 1.4 1.3 1.4 1.3 1.5 1.8 1.9 1.9 1.7 1.6 1.4 1.3 1.3 1.2
FI 2.6 2.0 1.8 1.7 1.6 1.5 1.4 1.4 1.3 1.3 1.4 1.4 1.3 1.2 1.2 1.1 1.0 0.9 0.9 0.9
SE 2.6 2.9 2.1 1.7 1.7 1.6 1.7 1.6 1.2 1.0 1.1 0.9 0.8 0.7 0.6 0.5 0.5 0.5 0.5 0.5
UK 2.1 1.8 1.8 1.8 2.0 2.0 2.2 2.2 1.8 2.9 3.1 2.9 2.8 2.7 2.3 2.4 2.7 2.5 2.4 2.3
EA-19 3.7 3.4 3.2 3.0 2.9 2.8 2.9 2.9 2.8 2.8 3.0 3.0 2.8 2.6 2.3 2.1 2.0 1.8 1.8 1.7
EU-28 3.1 2.9 2.8 2.7 2.6 2.6 2.7 2.6 2.7 2.9 2.9 2.7 2.5 2.2 2.1 2.0 1.9 1.8 1.7

European Fiscal Board
98
Table B5: Structural budget balance, general government (as a percentage of GDP, 2011-2020)
Source: Commission 2019 spring forecast.
2011 2012 2013 2014 2015 2016 2017 2018 2019 2020
BE -4.1 -3.5 -3.1 -2.9 -2.3 -2.3 -1.4 -1.4 -1.4 -1.8
BG -2.1 -0.2 0.0 -1.7 -1.1 0.3 1.1 1.9 0.7 0.6
CZ -2.5 -1.5 0.1 -0.8 -0.6 0.8 1.0 0.4 -0.1 -0.4
DK -0.6 -0.2 -1.0 -0.6 -1.8 0.3 1.5 0.8 0.9 1.0
DE -1.2 -0.1 0.2 1.0 0.9 0.7 0.8 1.6 1.1 0.8
EE 0.2 0.1 -0.5 0.2 0.2 -0.8 -1.7 -2.2 -1.7 -1.5
IE -8.6 -7.2 -5.2 -4.5 -2.9 -2.1 -0.9 -1.4 -1.2 -0.5
EL -4.9 1.6 3.7 3.5 3.3 5.6 5.1 5.0 1.9 0.8
ES -6.0 -2.7 -1.2 -1.0 -2.2 -3.1 -2.7 -2.7 -2.9 -3.2
FR -5.1 -4.4 -3.4 -3.0 -2.8 -2.8 -2.7 -2.6 -2.6 -2.5
HR -7.0 -3.5 -3.0 -3.1 -1.7 -0.6 0.6 -0.3 -0.8 -0.5
IT -3.4 -1.3 -0.7 -0.9 -0.7 -1.7 -2.1 -2.2 -2.4 -3.6
CY -4.7 -3.7 -0.5 3.5 2.1 1.1 1.3 2.0 1.1 0.7
LV -2.0 -0.3 -0.9 -1.0 -1.5 -0.2 -1.2 -2.1 -1.6 -1.1
LT -3.3 -2.2 -1.8 -1.2 -0.6 -0.4 -0.8 -0.8 -1.0 -0.9
LU 1.6 2.7 2.7 2.3 1.3 1.7 1.5 2.1 0.9 0.5
HU -4.0 -1.2 -1.3 -2.1 -2.0 -1.8 -3.4 -3.7 -3.3 -2.7
MT -1.8 -2.5 -1.4 -2.2 -2.6 0.3 3.1 1.4 0.6 0.7
NL -3.7 -2.3 -1.6 -0.6 -0.9 0.4 0.6 0.8 0.7 0.2
AT -2.5 -1.8 -1.1 -0.6 0.0 -1.1 -0.8 -0.5 -0.1 0.0
PL -5.7 -3.8 -3.4 -2.8 -2.3 -1.9 -1.9 -1.4 -2.8 -3.0
PT -6.6 -3.5 -2.9 -1.6 -2.2 -2.0 -1.3 -0.4 -0.5 -0.5
RO -2.7 -2.6 -0.9 -0.3 -0.1 -1.7 -2.9 -3.0 -3.6 -4.8
SI -4.4 -1.5 -1.1 -2.0 -1.3 -1.1 -0.5 -0.7 -0.8 -0.3
SK -3.9 -3.4 -1.5 -2.0 -2.1 -2.0 -0.9 -1.3 -1.3 -1.4
FI -0.8 -1.0 -1.0 -1.3 -0.7 -0.7 -0.7 -1.0 -1.0 -0.6
SE 0.0 0.2 0.0 -0.5 -0.1 0.7 1.2 0.6 0.5 0.6
UK -5.6 -6.5 -4.3 -5.0 -4.4 -3.2 -2.4 -2.0 -1.8 -1.4
EA-19 -3.5 -2.0 -1.3 -0.9 -0.9 -1.1 -0.9 -0.7 -0.9 -1.2
EU-28 -3.7 -2.7 -1.7 -1.6 -1.6 -1.4 -1.1 -0.9 -1.1 -1.3

European Fiscal Board
99
Table B6: Gross debt, general government (as a percentage of GDP, 2001-2020)
Notes: For EA-19, non-consolidated for intergovernmental loans (bn EUR): 0.9 in 2009, 21.2 in 2010, 69.3 in 2011, 193.4 in 2012, 231.0 in 2013, 240.5 in 2014, 231.0 in 2015, 231.0 in 2016. For EU-28, non-consolidated for intergovernmental loans (bn EUR): 0.9 in 2009, 21.2 in 2010, 69.8 in 2011, 196.4 in 2012, 235.9 in 2013, 245.7 in 2014, 236.4 in 2015, 235.7 in 2016. Source: Commission 2019 spring forecast.
2001 2002 2003 2004 2005 2006 2007 2008 2009 2010 2011 2012 2013 2014 2015 2016 2017 2018 2019 2020
BE 107.6 104.7 101.1 96.5 94.7 91.0 87.0 92.5 99.5 99.7 102.6 104.3 105.5 107.5 106.4 106.1 103.4 102.0 101.3 100.7
BG 65.0 51.4 43.7 36.0 26.8 21.0 16.3 13.0 13.7 15.3 15.2 16.7 17.1 27.1 26.2 29.6 25.6 22.6 20.5 18.4
CZ 22.8 25.9 28.3 28.5 27.9 27.7 27.5 28.3 33.6 37.4 39.8 44.5 44.9 42.2 40.0 36.8 34.7 32.7 31.7 31.1
DK 48.5 49.1 46.2 44.2 37.4 31.5 27.3 33.3 40.2 42.6 46.1 44.9 44.0 44.3 39.8 37.2 35.5 34.1 33.0 32.5
DE 57.7 59.4 63.1 64.8 67.0 66.5 63.7 65.2 72.6 81.8 79.4 80.7 78.2 75.3 71.6 68.5 64.5 60.9 58.4 55.6
EE 4.8 5.7 5.6 5.1 4.5 4.4 3.7 4.5 7.0 6.6 6.1 9.7 10.2 10.5 9.9 9.2 9.2 8.4 8.5 8.5
IE 33.2 30.6 29.9 28.2 26.1 23.6 23.9 42.4 61.5 86.0 110.9 119.9 119.7 104.1 76.8 73.5 68.5 64.8 61.3 55.9
EL 107.1 104.9 101.5 102.9 107.4 103.6 103.1 109.4 126.7 146.2 172.1 159.6 177.4 178.9 175.9 178.5 176.2 181.1 174.9 168.9
ES 54.2 51.3 47.6 45.3 42.3 38.9 35.6 39.5 52.8 60.1 69.5 85.7 95.5 100.4 99.3 99.0 98.1 97.1 96.3 95.7
FR 58.3 60.3 64.4 65.9 67.4 64.6 64.5 68.8 83.0 85.3 87.8 90.6 93.4 94.9 95.6 98.0 98.4 98.4 99.0 98.9
HR 36.5 36.6 38.1 40.3 41.2 38.7 37.3 39.0 48.3 57.3 63.9 69.5 80.4 84.0 83.7 80.5 77.8 74.6 70.9 67.6
IT 104.7 101.9 100.5 100.1 101.9 102.6 99.8 102.4 112.5 115.4 116.5 123.4 129.0 131.8 131.6 131.4 131.4 132.2 133.7 135.2
CY 57.3 60.5 63.8 64.8 63.4 59.3 54.0 45.6 54.3 56.8 66.2 80.1 103.1 108.0 108.0 105.5 95.8 102.5 96.4 89.9
LV 13.8 13.0 13.7 14.0 11.4 9.6 8.0 18.2 36.3 47.3 43.1 41.6 39.4 40.9 36.8 40.3 40.0 35.9 34.5 33.5
LT 22.9 22.1 20.4 18.7 17.6 17.2 15.9 14.6 28.0 36.2 37.2 39.8 38.8 40.5 42.6 40.0 39.4 34.2 37.0 36.4
LU 7.3 7.0 6.9 7.3 7.4 7.8 7.7 14.9 15.7 19.8 18.7 22.0 23.7 22.7 22.2 20.7 23.0 21.4 20.7 20.3
HU 51.9 55.3 57.9 58.7 60.5 64.5 65.5 71.6 77.8 80.2 80.5 78.4 77.2 76.7 76.7 76.0 73.4 70.8 69.2 67.7
MT 65.2 63.2 69.0 71.9 70.0 64.5 62.3 62.6 67.6 67.5 70.2 67.7 68.4 63.4 57.9 55.5 50.2 46.0 42.8 40.2
NL 49.5 48.8 50.0 50.3 49.8 45.2 43.0 54.7 56.8 59.3 61.7 66.2 67.7 67.9 64.6 61.9 57.0 52.4 49.1 46.7
AT 66.7 66.7 65.9 65.2 68.6 67.3 65.0 68.7 79.9 82.7 82.4 81.9 81.3 84.0 84.7 83.0 78.2 73.8 69.7 66.8
PL 37.3 41.8 46.6 45.0 46.4 46.9 44.2 46.3 49.4 53.1 54.1 53.7 55.7 50.4 51.3 54.2 50.6 48.9 48.2 47.4
PT 53.4 56.2 58.7 62.0 67.4 69.2 68.4 71.7 83.6 96.2 111.4 126.2 129.0 130.6 128.8 129.2 124.8 121.5 119.5 116.6
RO 25.9 24.8 22.1 18.9 15.9 12.4 12.0 12.4 21.9 29.8 34.2 37.0 37.6 39.2 37.8 37.3 35.2 35.0 36.0 38.4
SI 26.1 27.3 26.7 26.8 26.3 26.0 22.8 21.8 34.6 38.4 46.6 53.8 70.4 80.4 82.6 78.7 74.1 70.1 65.9 61.7
SK 48.3 42.9 41.6 40.6 34.1 31.0 30.1 28.5 36.3 41.2 43.7 52.2 54.7 53.5 52.2 51.8 50.9 48.9 47.3 46.0
FI 41.0 40.2 42.8 42.7 40.0 38.2 34.0 32.7 41.7 47.1 48.5 53.9 56.5 60.2 63.4 63.0 61.3 58.9 58.3 57.7
SE 52.2 50.2 49.7 48.9 49.1 43.9 39.2 37.7 41.3 38.6 37.8 38.1 40.7 45.5 44.2 42.4 40.8 38.8 34.4 32.4
UK 34.3 34.4 35.6 38.6 39.8 40.7 41.7 49.7 63.7 75.2 80.8 84.1 85.2 87.0 87.9 87.9 87.1 86.8 85.1 84.2
EA-19 67.1 67.0 68.2 68.5 69.3 67.4 65.0 68.7 79.2 85.0 87.6 91.8 94.1 94.4 92.3 91.4 89.1 87.1 85.8 84.3
EU-28 59.3 58.8 60.4 60.9 61.5 60.1 57.5 60.7 73.3 79.1 82.1 85.4 87.6 88.3 86.2 85.0 83.3 81.5 80.2 78.8
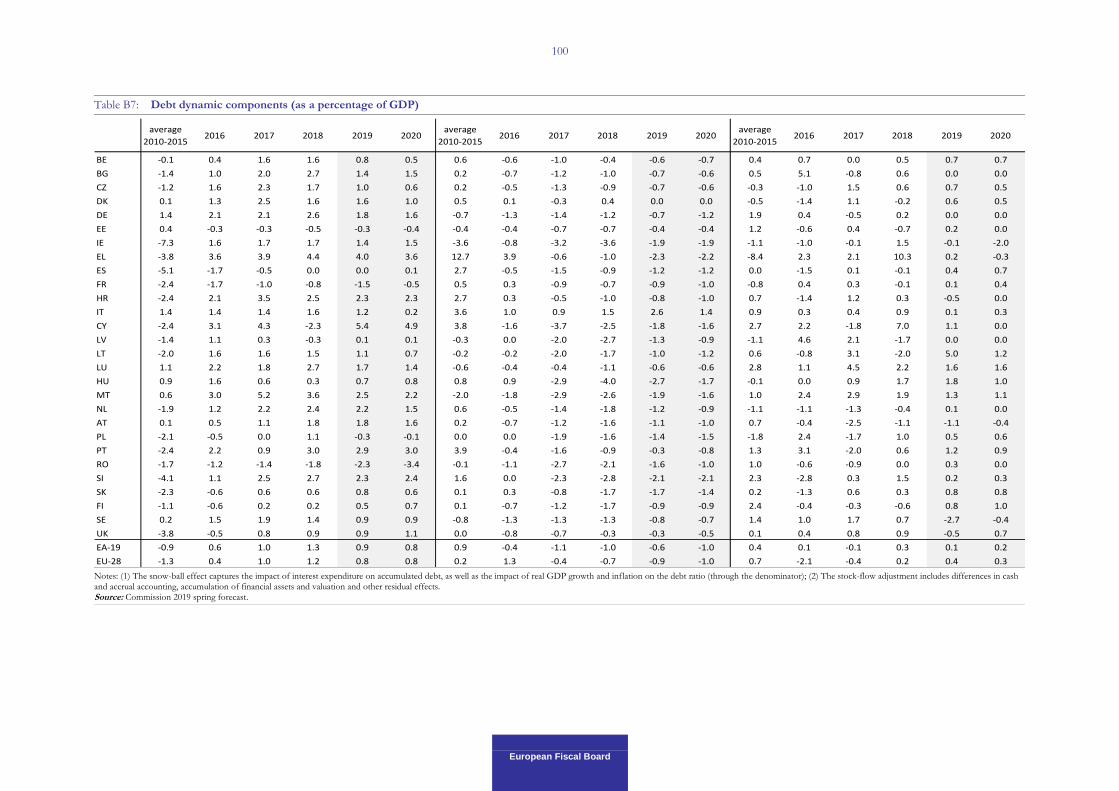
European Fiscal Board
100
Table B7: Debt dynamic components (as a percentage of GDP)
Notes: (1) The snow-ball effect captures the impact of interest expenditure on accumulated debt, as well as the impact of real GDP growth and inflation on the debt ratio (through the denominator); (2) The stock-flow adjustment includes differences in cash and accrual accounting, accumulation of financial assets and valuation and other residual effects. Source: Commission 2019 spring forecast.
average
2010-20152016 2017 2018 2019 2020
average
2010-20152016 2017 2018 2019 2020
average
2010-20152016 2017 2018 2019 2020
BE -0.1 0.4 1.6 1.6 0.8 0.5 0.6 -0.6 -1.0 -0.4 -0.6 -0.7 0.4 0.7 0.0 0.5 0.7 0.7
BG -1.4 1.0 2.0 2.7 1.4 1.5 0.2 -0.7 -1.2 -1.0 -0.7 -0.6 0.5 5.1 -0.8 0.6 0.0 0.0
CZ -1.2 1.6 2.3 1.7 1.0 0.6 0.2 -0.5 -1.3 -0.9 -0.7 -0.6 -0.3 -1.0 1.5 0.6 0.7 0.5
DK 0.1 1.3 2.5 1.6 1.6 1.0 0.5 0.1 -0.3 0.4 0.0 0.0 -0.5 -1.4 1.1 -0.2 0.6 0.5
DE 1.4 2.1 2.1 2.6 1.8 1.6 -0.7 -1.3 -1.4 -1.2 -0.7 -1.2 1.9 0.4 -0.5 0.2 0.0 0.0
EE 0.4 -0.3 -0.3 -0.5 -0.3 -0.4 -0.4 -0.4 -0.7 -0.7 -0.4 -0.4 1.2 -0.6 0.4 -0.7 0.2 0.0
IE -7.3 1.6 1.7 1.7 1.4 1.5 -3.6 -0.8 -3.2 -3.6 -1.9 -1.9 -1.1 -1.0 -0.1 1.5 -0.1 -2.0
EL -3.8 3.6 3.9 4.4 4.0 3.6 12.7 3.9 -0.6 -1.0 -2.3 -2.2 -8.4 2.3 2.1 10.3 0.2 -0.3
ES -5.1 -1.7 -0.5 0.0 0.0 0.1 2.7 -0.5 -1.5 -0.9 -1.2 -1.2 0.0 -1.5 0.1 -0.1 0.4 0.7
FR -2.4 -1.7 -1.0 -0.8 -1.5 -0.5 0.5 0.3 -0.9 -0.7 -0.9 -1.0 -0.8 0.4 0.3 -0.1 0.1 0.4
HR -2.4 2.1 3.5 2.5 2.3 2.3 2.7 0.3 -0.5 -1.0 -0.8 -1.0 0.7 -1.4 1.2 0.3 -0.5 0.0
IT 1.4 1.4 1.4 1.6 1.2 0.2 3.6 1.0 0.9 1.5 2.6 1.4 0.9 0.3 0.4 0.9 0.1 0.3
CY -2.4 3.1 4.3 -2.3 5.4 4.9 3.8 -1.6 -3.7 -2.5 -1.8 -1.6 2.7 2.2 -1.8 7.0 1.1 0.0
LV -1.4 1.1 0.3 -0.3 0.1 0.1 -0.3 0.0 -2.0 -2.7 -1.3 -0.9 -1.1 4.6 2.1 -1.7 0.0 0.0
LT -2.0 1.6 1.6 1.5 1.1 0.7 -0.2 -0.2 -2.0 -1.7 -1.0 -1.2 0.6 -0.8 3.1 -2.0 5.0 1.2
LU 1.1 2.2 1.8 2.7 1.7 1.4 -0.6 -0.4 -0.4 -1.1 -0.6 -0.6 2.8 1.1 4.5 2.2 1.6 1.6
HU 0.9 1.6 0.6 0.3 0.7 0.8 0.8 0.9 -2.9 -4.0 -2.7 -1.7 -0.1 0.0 0.9 1.7 1.8 1.0
MT 0.6 3.0 5.2 3.6 2.5 2.2 -2.0 -1.8 -2.9 -2.6 -1.9 -1.6 1.0 2.4 2.9 1.9 1.3 1.1
NL -1.9 1.2 2.2 2.4 2.2 1.5 0.6 -0.5 -1.4 -1.8 -1.2 -0.9 -1.1 -1.1 -1.3 -0.4 0.1 0.0
AT 0.1 0.5 1.1 1.8 1.8 1.6 0.2 -0.7 -1.2 -1.6 -1.1 -1.0 0.7 -0.4 -2.5 -1.1 -1.1 -0.4
PL -2.1 -0.5 0.0 1.1 -0.3 -0.1 0.0 0.0 -1.9 -1.6 -1.4 -1.5 -1.8 2.4 -1.7 1.0 0.5 0.6
PT -2.4 2.2 0.9 3.0 2.9 3.0 3.9 -0.4 -1.6 -0.9 -0.3 -0.8 1.3 3.1 -2.0 0.6 1.2 0.9
RO -1.7 -1.2 -1.4 -1.8 -2.3 -3.4 -0.1 -1.1 -2.7 -2.1 -1.6 -1.0 1.0 -0.6 -0.9 0.0 0.3 0.0
SI -4.1 1.1 2.5 2.7 2.3 2.4 1.6 0.0 -2.3 -2.8 -2.1 -2.1 2.3 -2.8 0.3 1.5 0.2 0.3
SK -2.3 -0.6 0.6 0.6 0.8 0.6 0.1 0.3 -0.8 -1.7 -1.7 -1.4 0.2 -1.3 0.6 0.3 0.8 0.8
FI -1.1 -0.6 0.2 0.2 0.5 0.7 0.1 -0.7 -1.2 -1.7 -0.9 -0.9 2.4 -0.4 -0.3 -0.6 0.8 1.0
SE 0.2 1.5 1.9 1.4 0.9 0.9 -0.8 -1.3 -1.3 -1.3 -0.8 -0.7 1.4 1.0 1.7 0.7 -2.7 -0.4
UK -3.8 -0.5 0.8 0.9 0.9 1.1 0.0 -0.8 -0.7 -0.3 -0.3 -0.5 0.1 0.4 0.8 0.9 -0.5 0.7
EA-19 -0.9 0.6 1.0 1.3 0.9 0.8 0.9 -0.4 -1.1 -1.0 -0.6 -1.0 0.4 0.1 -0.1 0.3 0.1 0.2
EU-28 -1.3 0.4 1.0 1.2 0.8 0.8 0.2 1.3 -0.4 -0.7 -0.9 -1.0 0.7 -2.1 -0.4 0.2 0.4 0.3

REFERENCES
European Fiscal Board
AIReF (2017a), ‘Action Plan for Public Administration Subsidy Spending Review’, Independent Authority for Fiscal Responsibility: Madrid.
AIReF (2017b), ‘Report on the 2017-2020 Stability Programme Update of the Kingdom of Spain’, 10 May, Independent Authority for Fiscal Responsibility: Madrid.
AIReF (2017c), ‘Report on the Macroeconomic Forecasts in the 2018 Draft Budgetary Plan’, 16 October, Independent Authority for Fiscal Responsibility: Madrid.
AIReF (2018a), ‘Annual Report 2017’, Independent Authority for Fiscal Responsibility: Madrid.
AIReF (2018b), ‘Report on the Macroeconomic Forecasts in the 2018 Draft General State Budgets’, Report 2/2018, 27 March, Independent Authority for Fiscal Responsibility: Madrid.
AIReF (2018c), ‘Report on the initial budgets of the Local Governments: 2018’, Report 23/2018, 10 May, Independent Authority for Fiscal Responsibility: Madrid.
AIReF (2018d), ‘Report on the 2018-2021 Stability Programme Update of the Kingdom of Spain’, Report 24/2018, 18 May, Independent Authority for Fiscal Responsibility: Madrid.
AIReF (2018e), ‘Report on expected public administration compliance with the budgetary stability target, government debt target and expenditure rule: 2018’, Report 37/2018, 20 July, Independent Authority for Fiscal Responsibility: Madrid.
Andersson, F.N.G., and Jonung, L. (2019), ‘The Swedish fiscal framework – the most successful one in the EU? The first twenty years and beyond’, presented at the EFB workshop ‘Independent Fiscal Institutions in the EU Fiscal Framework’, 28 February, Brussels.
Austrian Fiscal Advisory Council (2017a), ‘Fiscal Rule Compliance Report 2016-2021 (May 2017) - Summary’, Vienna: Fiscal Advisory Council.
Austrian Fiscal Advisory Council (2017b), ‘Key Results of the Austrian Fiscal Advisory Council’s Report on Public Finances 2016-2018’, Vienna: Fiscal Advisory Council.
Austrian Fiscal Advisory Council (2018a), ‘Fiscal Rule Compliance Report 2017-2022 (May 2018) - Summary’, Vienna: Fiscal Advisory Council.
Austrian Fiscal Advisory Council (2018b), ‘Austria’s 2017 to 2019 Fiscal Stance And Key Results of the Austrian Fiscal Advisory Council’s 2018 Report on Public Finances’, Vienna: Fiscal Advisory Council.
Banke Nationale de Belgique (2018), ‘Aspects budgétaires et macroéconomiques de la réforme de l’impôt des sociétés en Belgique’, Brussels, Belgium. https://www.nbb.be/doc/ts/publications/other/ds1711552fr.pdf
Beetsma, R.M.W.J., and Debrun, X. (2016), ‘Debunking ‘fiscal alchemy’: The role of councils’, VoxEU.org. retrieved from: https://voxeu.org/article/debunking-fiscal-alchemy-role-fiscal-councils
Beetsma, R.M.W.J., and Debrun, X. (2017), ‘Fiscal Councils: Rationale and Effectiveness’, in: Rethinking Fiscal Policy after the Crisis, edited by Ľudovít Ódor, 103-37. Cambridge: Cambridge University Press.

European Fiscal Board
102
Beetsma, R.M.W.J., Debrun, X., and Sloof, R. (2017), ‘The Political Economy of Fiscal Transparency and Independent Fiscal Councils’, IMF Working Paper No. 17/195, Washington, D.C.: International Monetary Fund.
Bénassy-Quéré, A., Brunnermeier, M., Enderlein, H., Farhi, E., Fratzscher, M., Fuest, C., Gourinchas, P.-O., Martin, P., Pisani- Ferry, J., Rey, H., Schnabel, I., Véron, N., Weder di Mauro, B., and Zettelmeyer, J. (2018), Reconciling risk sharing with market discipline: A constructive approach to euro area reform, CEPR Policy Insight, No 91, Centre for Economic Policy research, London.
Bénassy-Quéré, A., Brunnermeier, M., Enderlein, H., Farhi, E., Fratzscher, M., Fuest, C., Gourinchas, P.-O., Martin, P., Pisani- Ferry, J., Rey, H, Schnabel, I., Véron, N., Weder di Mauro, B., and Zettelmeyer, J. (2019), ‘Euro area architecture: What reforms are still needed, and why’, VOX, CEPR Policy Portal.
Bos, F. and Teulings, C. (2012), ‘Evaluating election platforms: a task for fiscal councils? Scope and rules of the game in view of 25 years of Dutch practice’, in: Rules and Institutions for Sound Fiscal Policy after the Crisis, edited by Banca d’Italia, 417-442. https://www.bancaditalia.it/pubblicazioni/collana-seminari-convegni/2012-0011/Intero_Volume.pdf
Calmfors, L. and Wren-Lewis, S. (2011), ‘What should fiscal councils do?’, Economic Policy, 26, 649-695.
Calmfors, L. (2013), ‘The Swedish Fiscal Policy Council: Watchdog with a Broad Remit’, in: Restoring Public Debt Sustainability: The Role of Independent Fiscal Institutions, edited by George Kopits, 189-211. Oxford: Oxford University Press.
CEPR (2019), ‘Risk Sharing Plus Market Discipline: A New Paradigm for Euro Area Reform? A Debate’, June 18.
Commission on Stabilisation Policy in the EMU (2002), ‘Stabiliseringspolitik i valutaunionen’, SOU 2002:16, Ministry of Finance, Stockholm. retrieved from: https://www.regeringen.se/rattsliga-dokument/statens-offentliga-utredningar/2002/03/sou-200216/
Conseil National des Finances Publiques (2017a), ‘Evaluation des finances publiques à l’occasion du Programme de stabilité et de croissance pour la période 2017 à 2021’, June, Luxembourg.
Conseil National des Finances Publiques (2017b), ‘Evaluation des finances publiques à l’occasion du projet de budget pour 2018 et du projet de loi de programmation financière pluriannuelle pour la période 2017 à 2021’, November, Luxembourg.
Conseil National des Finances Publiques (2018), ‘Evaluation des finances publiques à l’occasion du Programme de stabilité et de croissance pour la période 2018 à 2022’, June, Luxembourg.
Coricelli, F. and Ercolani, V. (2002), ‘Cyclical and Structural Deficits on the Road to Accession: Fiscal Rules for an Enlarged European Union,’ CEPR Discussion Papers 3672, C.E.P.R. Discussion Papers.
Cuerpo, C. and Rodriguez, L. (2019), ‘Some Elements for a revamped Fiscal Framework for Spain’, in Independent fiscal institutions in the EU fiscal framework, proceedings from the 2019 EFB Workshop, 28 February, Brussels. https://publications.europa.eu/en/publication-detail/-/publication/5cdfe914-7d04-11e9-9f05-01aa75ed71a1
Darvas, Z. and Simon, A. (2015), ‘Filling the Gap: Open Economy Considerations for More Reliable Potential Output Estimates’, Bruegel Working Paper No 11, Bruegel, Brussels.
Darvas, Z., Martin, P. and Ragot, X. (2018), ‘European Fiscal Rules Require a Major Overhaul’, Les notes du conseil d’analyse économique No 47, Bruegel, Brussels.

European Fiscal Board
103
Deutsche Bundesbank (2019), ‘European Stability and Growth Pact: individual reform options’, Monthly Report April 2019, Frankfurt am Main, Germany.
Debrun, X., Epstein, N. and Symansky, S. (2008), ‘A New Fiscal Rule; Should Israel “Go Swiss?”,’ IMF Working Papers 08/87, International Monetary Fund.
Debrun, X., Kinda, T., Curristine, T., Eyraud, L., Harris, J. and Seiwald, J. (2013), ‘The Functions and Impact of Fiscal Councils’, IMF Policy Paper, July 16, Washington, D.C.: IMF.
Debrun, X. (2019), ‘Independent Fiscal Institutions in the European Union: Is Coordination Required?’, in Independent fiscal institutions in the EU fiscal framework, proceedings from the 2019 EFB Workshop, 28 February 2019, Brussels. https://publications.europa.eu/en/publication-detail/-/publication/5cdfe914-7d04-11e9-9f05-01aa75ed71a1
Eichengreen, B. and Panizza, U. (2014), ‘A Surplus of Ambition: Can Europe Rely on Large Primary Surpluses to Solve its Debt Problem?’, NBER Working Paper No 20316, National Bureau of Economic Research, Cambridge, US.
Escrivá, J.L., Janeba, E., and Langenus, G. (2018), ‘Fiscal councils in federal or decentralised countries: Belgium, Germany and Spain’, in: Independent Fiscal Councils: Watchdogs or lapdogs?, edited by Roel M.W.J. Beetsma and Xavier Debrun, 85-102. London: VoxEU/CEPR Press.
European Central Bank (2018), ‘Economic Bulletin’ No. 4, Frankfurt am Main, Germany.
European Commission (2018), ‘Scope Index of Independent Fiscal Institutions (SIFI)’, retrieved from: https://ec.europa.eu/info/business-economy-euro/indicators-statistics/economic-databases/fiscal-governance-eu-member-states/independent-fiscal-institutions_en
European Fiscal Board (2017), ‘Annual Report 2017’, EFB: Brussels.
European Fiscal Board (2018), ‘Annual Report 2018’, EFB: Brussels.
Eyraud, L., Gaspar V., and Poghosyan T. (2017), ‘Fiscal Politics in the Euro Area’, In Fiscal Politics, edited by V. Gaspar, S. Gupta, and C. Mulas-Granados, pp. 439–76, International Monetary Fund, Washington, DC.
Eyraud, L., Debrun, X., Hodge, A., Lledo, V., Pattillo, C. (2018), ‘Second-Generation Fiscal Rules; Balancing Simplicity, Flexibility, and Enforceability’, IMF Staff Discussion Notes 18/04, International Monetary Fund.
Feld, L. Ch. Schmidt, I. Schnabel, V. Wieland (2018), ‘Refocusing the European Fiscal Framework’, German Council of Economic Experts, VOX, CEPR Policy Portal.
Fiscal Discipline Council (2017a), ‘Fiscal Discipline Interim Surveillance Report on Latvia’s Stability Programme for 2017-2020’, Riga: Fiscal Discipline Council.
Fiscal Discipline Council (2017b), ‘On the endorsement of the macroeconomic indicator forecast’, Riga: Fiscal Discipline Council.
Fiscal Discipline Council (2017c), ‘Fiscal Discipline Surveillance Report on Latvia’s Medium Term Budget Framework 2018-2020’, Riga: Fiscal Discipline Council.
Fiscal Discipline Council (2018), ‘Fiscal Discipline Interim Surveillance Report on Latvia’s Stability Programme for 2018-2021’, Riga: Fiscal Discipline Council.

European Fiscal Board
104
Fiscal Discipline Council (2019), ‘Fiscal Discipline Surveillance Report on Latvia’s State Budget for 2019’, Riga: Fiscal Discipline Council.
Fiscal Policy Council (2018), ‘Fiscal Policy Council Report 2018’, Fiscal Policy Council: Stockholm.
German Council of Economic Experts (2018), ‘Annual report 2018/19: Setting the right course for economic policy’, GCEE: Wiesbaden, Germany.
Heinemann, F. (2018), ‘How could the Stability and Growth Pact be simplified?’ Economic Governance Support Unit, European Parliament, Brussels.
Hemming, R., and Joyce, P. (2013), ‘The Role of Fiscal Councils in Promoting Fiscal Responsibility’, in: Public Financial Management and Its Emerging Architecture, edited by Marco Cangiano, Teresa Curristine and Michel Lazare, 205-24. Washington, D.C.: IMF.
High Council of Finance (2017a), ‘Trajectoire budgetaire en preparation du programme de stabilite 2017-2020’, April, Brussels: HCP.
High Council of Finance (2017b), ‘Analyse des realisations budgetaires recentes’, July, Brussels: HCP.
High Council of Finance (2018a), ‘Trajectoire budgetaire en preparation du programme de stabilite 2018-2021’, March, Brussels: HCP.
High Council of Finance (2018b), ‘Analyse des realisations budgetaires recentes’, July, Brussels: HCP.
High Council of Public Finance (2017a), ‘Opinion of the HCFP on the macroeconomic assumptions of the Stability Programme 2018-2022’, Paris: HCPF.
High Council of Public Finance (2017b), ‘Opinion n° HCFP-2017-4 on the budget bill and the social security financing bill for the year 2018’, Paris: HCPF.
High Council of Public Finance (2018a), ‘Opinion of the HCFP on the macroeconomic assumptions of the Stability Programme 2018-2022’, Paris: HCPF.
High Council of Public Finance (2018b), ‘Opinion n° HCFP-2018-4 on the amending budget bill for the year 2018’, Paris: HCPF.
Horvath, M. (2018), ‘Children of the crisis: Fiscal councils in Portugal, Spain and Ireland’, in: Independent Fiscal Councils: Watchdogs or lapdogs?, edited by Roel M.W.J. Beetsma and Xavier Debrun, 125-133. London: VoxEU/CEPR Press.
Hungarian Fiscal Council (2017), ‘Opinion of the Fiscal Council on the draft bill of Hungary’s 2018 Central Budget’, Resolution 3/2017.04.27., KVT/28-2/2017, April: Budapest.
Hungarian Fiscal Council (2018), ‘Opinion of the Fiscal Council about the state of implementation of the 2018 central budget act of Hungary and the expected trend of sovereign debt’, Resolution 6/2018.09.18., KVT/56-1/2018, September: Budapest.
International Monetary Fund (2018), ‘Euro Area Policies: 2018 Article IV Consultation-Press Release; Staff Report; and Statement by the Executive Director for Member Countries’, Country Report No. 18/223, Washington DC, USA. https://www.imf.org/en/Publications/CR/Issues/2018/07/18/Euro-Area-Policies-2018-Article-IV-Consultation-Press-Release-Staff-Report-and-Statement-by-46096
IMF (2011), ‘Spain – Staff Report for the 2011 Article IV Consultation’, IMF Country Report No. 11/215, Washington, D.C.: IMF.

European Fiscal Board
105
IMF (2013a), ‘The Functions and Impact of Fiscal Councils’, International Monetary Fund: Washington, D.C.
IMF (2013b), ‘Case studies on fiscal councils – Functions and Impact’, pp. 38-42, International Monetary Fund: Washington D.C.
IMF (2018), ‘Euro Area Policies – 2018 Article IV Consultation – Press Release; Staff Report; and Statement by the Executive Director for Member Countries’, IMF Country Report No.18/223, International Monetary Fund: Washington D.C.
Italian Parliamentary Budget Office (2018), ‘State and outlook of the Italian public finances’, Focus Paper no. 3, 13 February, PBO: Rome.
Jankovics, L., and Sherwood, M. (2017), ‘Independent Fiscal Institutions in the EU Member States: The Early Years’, European Economy Discussion Papers, 67, 1-34.
Jonung, L. and Larch, M. (2006), ‘Improving fiscal policy in the EU: the case for independent forecasts’, Economic Policy, 21(47), 491-534.
Jonung, L. (2015), ‘Reforming the Fiscal Framework: The Case of Sweden 1973-2013’, in: Reform Capacity and Macroeconomic Performance in the Nordic Countries, edited by Torben M. Andersen, Michael Bergman, and Svend E. Hougaard Jensen, 190-215, Oxford: Oxford University Press.
Jonung, L. (2018), ‘Homegrown: The Swedish fiscal policy framework’, in: Independent Fiscal Councils: Watchdogs or lapdogs?, edited by Roel M.W.J. Beetsma and Xavier Debrun, 135-43. London: VoxEU/CEPR Press.
Kalsone, D. and van Veldhuizen, S. (2019), ‘Costing Election Manifestos: Experience from EU IFIs’, presented at the EFB workshop ‘Independent Fiscal Institutions in the EU Fiscal Framework’, 28 February, Brussels.
Kamps, C. and Leiner-Killinger, N. (2019), ‘Taking stock of the functioning of the EU fiscal rules and options for reform’, Occasional Paper Series 231, European Central Bank.
Kopits, G. (2018), ‘How could the Stability and Growth Pact be simplified?’, Economic Governance Support Unit, European Parliament, Brussels.
Network of EU IFIs (2016), ‘Defining and Enforcing Minimum Standards for Independent Fiscal Institutions’, February.
Network of EU IFIs (2019a), ‘Network Statement on the Need to Reinforce and Protect EU IFIs’, 22 January.
Network of EU IFIs (2019b), ‘Endorsement of Macroeconomic Forecasts by EU IFIs’, January.
Network of EU IFIs (2019c), ‘European Fiscal Monitor: January 2019’, January. https://www.euifis.eu/download2/overview_2019_winter.pdf
OECD (2018), ‘Euro area’, OECD Economic Surveys, June.
Ordinance (2011), ‘Instructions for the Fiscal Policy Council (Förordning (2011:446) med instruktion för Finanspolitiska rådet), 28 April.
Parliamentary Budget Office (2017a), ‘Validation Letter for the 2017-2020 macroeconomic trend scenario’, 31 March, Rome.

European Fiscal Board
106
Parliamentary Budget Office (2017b), ‘Validation Letter for the 2017-2020 macroeconomic policy scenario’, 19 April, Rome.
Parliamentary Budget Office (2017c), ‘2017 Parliamentary Planning Report’, May, Rome.
Parliamentary Budget Office (2017d), ‘2018 Budgetary Policy Report’, December, Rome.
Parliamentary Budget Office (2018), ‘Audizione del Presidente dell’Ufficio parlamentare di bilancio nell’ambito dell’attività conoscitiva preliminare all’esame del Documento di economia e finanza 2018’, May, Rome. http://www.upbilancio.it/wp-content/uploads/2018/05/Audizione-DEF-2018.pdf
Parliamentary Budget Office (2019a), ‘2019 Budgetary Planning Report’, April, Rome. http://en.upbilancio.it/wp-content/uploads/2019/05/2019-Budgetary-Planning-Report_web.pdf
Parliamentary Budget Office (2019b), ‘2019 Budgetary Policy Report’, January, Rome.
Platais, J. and Kalsone, D. (2018), ‘Political Parties Fiscal Responsibility – Report on political parties survey on fiscal discipline issues in 2018’, Research Paper 03/2018, Riga: Latvian Fiscal Discipline Council.
Portuguese Public Finance Council (2017a), ‘Macroeconomic forecasts underlying the 2017-2021 Stability Program, Opinion of the Portuguese Public Finance Council, 18 April, Portuguese Public Finance Council: Lisbon.
Portuguese Public Finance Council (2017b), ‘Analysis of 2017-2021 Stability Programme’, No.4/2017, May, Portuguese Public Finance Council: Lisbon.
Portuguese Public Finance Council (2017c), ‘Macroeconomic forecasts underlying the Draft State Budget for 2018’, Opinion of the Portuguese Public Finance Council, October, Portuguese Public Finance Council: Lisbon.
Portuguese Public Finance Council (2017d), ‘Analysis of the Draft State Budget for 2018’, No.9/2017, November, Portuguese Public Finance Council: Lisbon.
Portuguese Public Finance Council (2018a), ‘Macroeconomic forecasts underlying the 2018-2022 Stability Program, Opinion of the Portuguese Public Finance Council, 12 April, Portuguese Public Finance Council: Lisbon.
Portuguese Public Finance Council (2018b), ‘Analysis of 2018-2022 Stability Programme’, No.5/2018, May, Portuguese Public Finance Council: Lisbon.
Romanian Fiscal Council (2017a), ‘Fiscal Council’s preliminary opinion on the State Budget Law and Social Insurance Budget Law for 2018’, Fiscal Council: Bucharest.
Romanian Fiscal Council (2017b), ‘Addendum to Fiscal Council’s preliminary opinion on the State Budget Law, Social Insurance Budget Law for 2018 and Fiscal Strategy for 2018-2020’, Fiscal Council: Bucharest.
Romanian Fiscal Council (2018), ‘Annual Report 2017’, Fiscal Council: Bucharest.
Slovenian Fiscal Council (2017a), ‘Assessment of the compliance of the fiscal policy with the fiscal rules based on the draft amendment to the Stability Programme 2017 and the proposed framework for the preparation of the general government budgets for the 2018–2020 period’, April.
Slovenian Fiscal Council (2017b), ‘Assessment by the Fiscal Council: Compliance of the budgetary documents for the 2018-2020 period with the fiscal rules’, 19 October.
Slovenian Fiscal Council (2018a), ‘Assessment of fiscal and macroeconomic consequences of the Coalition Agreement on Cooperation within the Government of the Republic of Slovenia in the 2018–2022 term-of-office’, Document No.: 30-2/2018/11, September.

European Fiscal Board
107
Slovenian Fiscal Council (2018b), ‘Recommendation of the Fiscal Council: The National Assembly should stop all legislative procedures whose effects on public expenditure are not included in the existing budget frameworks’, Ref. No.: 30-2/2017/9, April.
Slovenian Fiscal Council (2018c), ‘Assessment of the compliance of the fiscal policy with the fiscal rules based on the draft Stability Programme – 2018 amendment’, April.
Slovenian Fiscal Council (2019), ‘Assessment of the compliance of the general government budgets with the fiscal rules in 2018’, April.
Swedish Ministry of Finance (2018), ‘The Swedish Fiscal Policy Framework’, Skr. 2017/18: 207, Government Offices of Sweden: Stockholm.
Tesche, T. (2019), ‘‘The troika is dead, long live the domestic troikas?’: The diffusion of national fiscal councils in the European Union’, JCMS: Journal of Common Market Studies, early view.
von Trapp, L., Lienert, I. and Wehner, J. (2016), ‘Principles for independent fiscal institutions and case studies’, OECD Journal on Budgeting, Vol. 15/2.
von Trapp, L., Nicol, S., Fontaine, P., Lago-Peñas, S. and Suyker, W. (2017), ‘OECD Review of the Independent Authority for Fiscal Responsibility’, OECD: Paris.
von Trapp, L., and Nicol, S. (2018), ‘Measuring IFI independence: A first pass using the OECD IFI database’, in: Independent Fiscal Councils: Watchdogs or lapdogs?, edited by Roel M.W.J. Beetsma and Xavier Debrun, 47-64. London: VoxEU/CEPR Press.


![Presentation 2.13 tvp mini[1]](https://static.fdocuments.in/doc/165x107/55c56b29bb61eb30738b46fd/presentation-213-tvp-mini1.jpg)