ANNUAL REPORT 2019 · companies having the right remuneration structure to attract and retain...
53
ANNUAL REPORT 2019
Transcript of ANNUAL REPORT 2019 · companies having the right remuneration structure to attract and retain...

ANNUAL REPORT 2019

2 3
Contents
Financial Highlights 4
Chairman’s Report 6
Managing Director’s Report 9
Transforming Business Travel for 25 Years 12
Sustainability, CSR and Our People 14
Board of Directors 16
Executive Team 18
Annual Financial Report 20
Corporate Travel Management Limited
ABN 17 131 207 611

4 5
Financial Highlights
UN
DE
RLYING EBITDA CONTRIBUTIO
N BY
RE
GIO
N
30%TOTAL TRANSACTION VALUE
$6,457.5m
21%REVENUE & OTHER INCOME
$449.5m
20%UNDERLYING EBITDA
$150.1m
12%STATUTORY NPATATTRIBUTABLE TO OWNERS
$86.2m
10%UNDERLYING EPS
89.5c/share
11%DIVIDEND PAYMENT
40c/share
15%ASIA
32%AU/NZ27%
NORTHAMERICA
26%EUROPE
UN
DE
RLYING EBITDA CONTRIBUTIO
N BY
RE
GIO
N
30%TOTAL TRANSACTION VALUE
$6,457.5m
21%REVENUE & OTHER INCOME
$449.5m
20%UNDERLYING EBITDA
$150.1m
12%STATUTORY NPATATTRIBUTABLE TO OWNERS
$86.2m
10%UNDERLYING EPS
89.5c/share
11%DIVIDEND PAYMENT
40c/share
15%ASIA
32%AU/NZ27%
NORTHAMERICA
26%EUROPE
UN
DE
RLYING EBITDA CONTRIBUTIO
N BY
RE
GIO
N
30%TOTAL TRANSACTION VALUE
$6,457.5m
21%REVENUE & OTHER INCOME
$449.5m
20%UNDERLYING EBITDA
$150.1m
12%STATUTORY NPATATTRIBUTABLE TO OWNERS
$86.2m
10%UNDERLYING EPS
89.5c/share
11%DIVIDEND PAYMENT
40c/share
15%ASIA
32%AU/NZ27%
NORTHAMERICA
26%EUROPE
UN
DE
RLYING EBITDA CONTRIBUTIO
N BY
RE
GIO
N
30%TOTAL TRANSACTION VALUE
$6,457.5m
21%REVENUE & OTHER INCOME
$449.5m
20%UNDERLYING EBITDA
$150.1m
12%STATUTORY NPATATTRIBUTABLE TO OWNERS
$86.2m
10%UNDERLYING EPS
89.5c/share
11%DIVIDEND PAYMENT
40c/share
15%ASIA
32%AU/NZ27%
NORTHAMERICA
26%EUROPE
UN
DE
RLYING EBITDA CONTRIBUTIO
N BY
RE
GIO
N
30%TOTAL TRANSACTION VALUE
$6,457.5m
21%REVENUE & OTHER INCOME
$449.5m
20%UNDERLYING EBITDA
$150.1m
12%STATUTORY NPATATTRIBUTABLE TO OWNERS
$86.2m
10%UNDERLYING EPS
89.5c/share
11%DIVIDEND PAYMENT
40c/share
15%ASIA
32%AU/NZ27%
NORTHAMERICA
26%EUROPE
UN
DE
RLYING EBITDA CONTRIBUTIO
N BY
RE
GIO
N
30%TOTAL TRANSACTION VALUE
$6,457.5m
21%REVENUE & OTHER INCOME
$449.5m
20%UNDERLYING EBITDA
$150.1m
12%STATUTORY NPATATTRIBUTABLE TO OWNERS
$86.2m
10%UNDERLYING EPS
89.5c/share
11%DIVIDEND PAYMENT
40c/share
15%ASIA
32%AU/NZ27%
NORTHAMERICA
26%EUROPE
UN
DE
RLYING EBITDA CONTRIBUTIO
N BY
RE
GIO
N
30%TOTAL TRANSACTION VALUE
$6,457.5m
21%REVENUE & OTHER INCOME
$449.5m
20%UNDERLYING EBITDA
$150.1m
12%STATUTORY NPATATTRIBUTABLE TO OWNERS
$86.2m
10%UNDERLYING EPS
89.5c/share
11%DIVIDEND PAYMENT
40c/share
15%ASIA
32%AU/NZ27%
NORTHAMERICA
26%EUROPE

6 7
Chairman’s Report
Dear Shareholders,I am pleased to provide shareholders with my first report as a Director and Chairman of the Corporate Travel Management Limited (“CTM” or “the Group”) Board. I look forward to meeting in person shareholders who attend the Annual General Meeting (AGM) in Brisbane on 6 November 2019, and I welcome shareholder questions or comments regarding the company at any time.
CTM is an Australian success story which has leveraged technology innovation to carve for itself a leading position in the global corporate travel market. It is an admirable achievement and a key reason I chose to join the CTM Board. The Group operates from four regions, and there remains scope to grow both organically as well as through further acquisitions. A key focus as Chairman will be to ensure our company has appropriate governance processes, a robust strategy and management structures to support sustainable growth.
Financial results and operating conditionsI am pleased to report net profit after tax (“NPAT”) of $86.2 million for the full year ending 30 June 2019. Excluding the one-off or non-recurring items (tax effected) of $5.1 million and non-cash amortisation of client intangibles (tax effected) of $5.6 million, underlying NPAT was $96.9 million, an increase of 13% over the previous year.
This was a solid result given corporate travel activity was impacted by major headwinds in our key markets of Europe, US and Asia. Specifically, travel activity was affected by continuing Brexit uncertainty in the UK, continuing tension from US/China trade talks and ongoing civil unrest in Hong Kong.
Despite these external factors, our global strategy delivered good results and provides a strong platform for the future. In Asia we have now integrated the Lotus acquisition and expect this will underpin increasing contributions from this region. In the US we see positive signs following a sustained period of acquisitions where increased capacity will support new business wins in a highly competitive but deep
and attractive market. The Australia/New Zealand business continues to perform strongly and has again increased market share by leveraging our proprietary technology solutions.
As company founder and Managing Director, Jamie Pherous, outlines in his report which follows CTM remains confident that its customer value proposition remains compelling and that there is enormous untapped potential in each of the markets in which we operate.
DividendsThe board declared a final dividend of 22 cents per share, franked to 50%. This represents a total dividend payment for the year of 40 cents per share which equates to a payout ratio of 50%. The dividend payment date will be 3 October 2019. The payout ratio is in line with our stated dividend policy. We are pleased that shareholders have received good dividend growth per share since listing.
Board and senior management changesI would like to acknowledge my predecessor Tony Bellas and thank him for his substantial contribution as CTM Chairman since listing in 2010.
One of my first priorities as Chairman is to work with the Board on a process of orderly renewal and a broadening of our Director skill base given CTM’s substantial growth and expansion of operations in recent years. We recognise it is very important the Board’s collective skills match the demands of diligent oversight of an expanded and growing global business.
Stephen Lonie, who has served as a Director since CTM listed, has decided he will step down as a Director at the AGM in November. I will speak to Stephen’s extensive contribution to CTM as well as provide more detail on our Board renewal plan at the AGM. We also expect to announce the appointment of a new Director to the Board over the coming weeks.
Ewen Crouch AM Chairman

8 9
This process of Board renewal is accompanied by a close review of the company’s governance processes and protocols. The Board has conducted a review and tightened the procedures and reporting of changes in Directors’ interests. Shareholders can be assured of the Board’s commitment to good governance practice.
The Board also welcomes Neale O’Connell as our Global CFO, replacing Steve Fleming who will focus on his role as CFO Europe. Neale brings a strong background in ASX 100 and UK listed multi-national companies.
RemunerationThe investment community is rightly focused on companies having the right remuneration structure to attract and retain talent as well as align management and shareholders’ expectations.
While the enclosed Remuneration Report provides important insight and detail, by way of an overview comment, the Board has endeavoured to strike the right balance between growth and accountability. CTM’s long term appreciation incentives are a very important element of the remuneration structure which ensures management remains focussed on making long term strategic decisions while managing for nearer term performance. We value shareholder feedback to ensure we maintain the right balance.
PeopleI would like to thank our more than 2,600 employees (full time equivalents) around the world for their dedication. Their commitment to delivering customer outcomes is what allows us to achieve a strong financial result and continue the growth story for CTM despite some tough trading conditions in the past six months. In particular, I acknowledge Jamie Pherous and the Senior Executive Team, who have worked tirelessly and with great passion to drive results for shareholders and service for our clients around the world.
I look forward to meeting all shareholders who can attend our Annual General Meeting.
Yours sincerely
Ewen Crouch AM
Chairman Corporate Travel Management Limited 21 August 2019
25 years of CTMI am pleased to present the 2019 Annual Financial Report of CTM.
2019 represents our 25th year of operations. Before commenting on yet another record performance, it is important to reflect on how far CTM has come in 25 years.
In 1994, the company was established with one common goal, to deliver an enhanced value proposition to the corporate market. Corporate customers around the world demanded intuitive technology, supported by highly personalised service and underpinned by a return on investment methodology to reduce the overall cost of corporate travel. Most importantly, that same customer service proposition that anchored the company’s growth from 1994 is just as relevant today and relevant globally.
Growth opportunityFrom a Brisbane start-up in 1994, CTM has grown to become a global travel company, employing over 2,600 employees (full time equivalents) worldwide. In FY19, over 70% of Group’s revenue was generated outside of Australia and New Zealand, supporting the success of the client proposition on a global scale.
The company has seen sequential TTV growth in every year of its 25 years, and since listing in 2010, TTV, EBITDA and dividend has sequentially grown in every year.
There is an untapped opportunity that lies ahead now that the company is well established in every region it operates. Despite TTV of approximately $6.5 billion, CTM represents under 1% of the global corporate market and corporate travel is expected to grow continuously over the long term.
We feel confident in our value proposition, business model, and our ability to execute, to take advantage of the growth opportunities ahead.
Outstanding performanceIn the year to 30 June 2019, CTM’s revenue of $446.7 million was 20% higher than the previous year.
CTM’s statutory net profit after tax (“NPAT”) of $86.2 million for the year to 30 June 2019 compares with $76.7 million in the previous year, representing a 12% increase. Underlying NPAT was $96.9 million, when adding back one-off acquisition costs and other non-recurring costs (tax effected) of $5.1 million and non-cash amortisation of client intangibles (tax effected) of $5.6 million, representing a 13% increase on prior year.
Financial positionThe continued generation of strong cash flows contributed to the Group’s sound financial position, with net cash flows from operating activities of $133.5 million over the year to 30 June 2019. The operating cash conversion rate, which is net operating cash flows excluding interest, finance costs and income tax paid divided by EBITDA is approximately 113%.
Total equity of $592.5 million at 30 June 2019 compares with $471.5 million at 30 June 2018, an increase of $121.0 million or 26% over the year.
Strategic initiativesThe Group focused on the following key strategic initiatives during the year:
1. Continued Organic Growth and Acquisitions:
• Enhancing our value proposition to meet client needs across the CTM global network.
• Leveraging clients across all lines of business (CTM, ETM, B2B, B2C).
• Executing upon merger and acquisition opportunities that add scale, niche, and/or geography, including Lotus Travel in Asia and Platinum Travel in ANZ.
2. Client Facing Innovation:
• Expanding SMART technology globally by developing new tools for and with our clients.
Managing Director’s Report
10 11
• Through regional technology hubs, building tools that address local or regional market requirements.
3. Productivity and Internal Innovation:
• Internal innovation feedback loops, to improve and automate existing client and non-client facing processes.
• Staff empowerment to make service decisions to drive high staff engagement and client satisfaction outcomes.
4. Leveraging our Scale and Geography:
• Capitalising on scale and our global network, to develop and optimise supplier performance for our clients.
• Continuing to demonstrate that CTM is a valuable partner in the global travel supply chain.
5. Our People:
• Continuing to attract, retain and develop the industry’s brightest talent.
• Empowering our team to support our clients’ needs.
• Embracing a culture that represents our values and business drivers.
EmployeesA competent and motivated workforce is integral to CTM’s success. CTM employs over 2,600 employees (full time equivalents).
CTM’s culture is founded upon the principle of empowering its people, through good processes and excellent training, to grow, evolve, and deliver the superior service that CTM’s clients demand. CTM continues to invest in its people, through its in-house training programs, selective recruitment and a commitment to provide the resourcing to support its people in delivering service excellence to clients.
The Board and the senior management team appreciate and recognise the contribution that CTM’s
staff have made to the Group’s strong performance. Their professionalism and commitment have been fundamental to the development of CTM’s reputation as a highly valued business partner for its clients.
Positioning for the FutureAs we look forward to 2020, CTM remains confident that its customer value proposition remains compelling and that there is enormous untapped potential in each of the markets in which we operate.
CTM now has in place regional technology hubs to ensure that we build client facing technologies that address local and regional market requirements. This approach will assist our organic growth through client wins and retentions, which coupled with pursuing further merger and acquisition opportunities that add scale, niche and geography will ensure that CTM is well positioned for further growth.
CTM’s focus remains its clients and staff, to ensure its service offering is both innovative and cost effective, and enabling staff to offer the personalised service and expertise demanded by clients.
ConclusionI would like to take this opportunity to thank the Board, management team and staff for their efforts, and congratulate them on the continued success of CTM as a leading-edge and profitable corporate travel solutions company.
I would also like to thank CTM’s shareholders and, most importantly, CTM’s clients for their continuing support.
Yours sincerely
Jamie Pherous
Managing Director Corporate Travel Management Limited 21 August 2019
Jamie Pherous Managing Director

12 13
1994CTM founded
in Brisbane, Australia
2010Lists on ASX
Share price $1Market cap $70.3m
TTV $352m350 employees
2012Enters US market
2010Enters New Zealandmarket
2014Enters Asia market
2015Enters UK market
2017Established CTM techhubs across all regions
2019Share price $22.50 22.5xMarket cap $2,441m 34x
TTV $6,457m 18x2,600+ employees
*
Transforming Business Travel for 25 Years
From a humble start-up in 1994, Corporate Travel Management (CTM) has grown its customer base and expanded its reach and offering to become a well-recognised international travel management business.
This year CTM marks the exciting milestone of 25 years in business.
Founded in 1994 in Brisbane, Australia by Managing Director Jamie Pherous, CTM has always prided itself on building a highly responsive operating model that can tailor and adapt its service and technology solutions quickly to meet customer needs. The desire to be the best travel management company in every region of operation is matched with a vision to transform the business travel experience, while also ensuring a return on investment for customers.
Our customers, which include some of the world’s largest corporates, rely on us to take on complex briefs, deliver under pressure and demonstrate that we can achieve savings on their travel spend. This focus has allowed CTM to grow from a two-man operation to a global workforce of more than 2,600 (full time equivalents) employees with annual TTV in excess of $6.457 billion for the year ended 30 June 2019.
Today, more than 70% of CTM’s revenue is generated outside of Australia and New Zealand and our reach extends to the UK/Europe, Asia and North America. Our strategy of expanding the portfolio has been carefully managed to ensure we drive strong organic growth in new markets entered. In 2018 we achieved our target of generating total transaction value (TTV) of AU$1bn in every region, with the main proceeds derived from organic growth.
Since listing in 2010, we’ve paid out $159.1 million in dividends, sharing the rewards of our performance with shareholders who have watched us build a long term, sustainable business.
While many milestones have been crossed in our first 25 years, we are excited about what is still to come.
This year CTM marks the exciting milestone of 25 years in business.
*At 30 June 2019

14 15
Sustainability, CSR and Our People
At CTM, we understand our responsibility to deliver business services, partnerships and working environments which positively support our people, customers, communities and the environment. CTM has developed and maintains a strong commitment to Corporate Governance and Corporate Social Responsibility (CSR).
We are committed to the ongoing development and delivery of initiatives and programs that provide practical benefits to the environment and local communities, while also prioritising investment in our people.
In support of our CSR plan and long-term vision, CTM delivered a number of initiatives which contribute to furthering these objectives during FY19. Our efforts are focused into four core areas; Environment, Community, Diversity and People.
EnvironmentCTM is committed to a range of initiatives that support building sustainability in our business practices. In every region we operate in, we implement initiatives with the aim to reduce our environmental footprint across every aspect of our
business.
CTM partners with South Pole, a company which provides businesses with
sustainability solutions which contribute to meeting the
Sustainable Development Goals set out by the UN. This
partnership enables CTM to offset its own employees’
travel against a range of global initiatives.
In the past 12 months, CTM has compensated more than 500 tonnes of greenhouse gas emissions and protected more than 700m2 of
biodiversity by investing in climate protection projects in Australia, Thailand, Indonesia and China.
CTM is also committed to deploying a broad range of environmental initiatives across its global offices. These include environmentally sound eWaste disposal processes, paperless processes to reduce printing and the provision of recycling facilities to name a few. Additionally, in Australia the office buildings CTM occupies have achieved NABERS Energy and Water Rating of 4 stars and above.
In FY19, CTM deployed new employee onboarding initiatives globally, including electronic onboarding communications, the provision of reusable coffee cups, water bottles and shopping bags for employees to reduce their plastic consumption.
Community CTM is focused on developing partnerships that deliver prolonged and meaningful benefits for the wider community. We empower our teams in all global regions to develop local partnerships which give back to local communities.
In FY19, just some of these initiatives included;
• Fundraising events for a range of beneficiaries including the Paddington Fire Station’s A21RUNforGrenfell and Angelman Syndrome in the UK, the Cancer Council’s Biggest Morning Tea in Australia, and a variety of initiatives supported by the Community Chest of Hong Kong including support services for the homeless, dental care and child protection initiatives.
• Volunteer days at North Texas food bank and the food bank of the Rockies, and cleaning Ronald McDonald House in North America.
• Salvation Army Christmas Gift Appeal donations in the UK and Australia.
• Packing emergency provisions for women in need in Australia.
• Recycling and distribution of books to remote communities in need in Taiwan.
• Provision of bottled water for the MINDS (Movement for the Intellectually Disabled of Singapore) water project.
CTM also provides employees with Volunteer Days to help support local charity events and initiatives.
In 2019, CTM launched a new Indigenous Awareness Plan in Australia, designed to take CTM employees on an awareness-raising journey to gain a greater understanding of traditional cultures and learn about our shared history. Further extending CTM’s commitment to cultural awareness, support and integration, CTM is proud of its continued partnership with NRL Cowboys House, a program that provides supported accommodation for Aboriginal and Torres Strait Islander students from remote communities in Queensland, enabling them to access quality secondary education options.
CTM also provides support for sponsored TAFE educational programs in Australia.
DiversityAt CTM, we work in an industry that embraces diversity and we strive to ensure that our workplaces, employee initiatives, partnerships and solutions support the principles of equality.
CTM provides Equal Opportunity Training to employees globally through a robust compliance training program completed by employees upon induction and again annually.
Globally, CTM is extremely proud of its high female employee base. As at 30 June 2019:
• 73% of all CTM employees globally were female.• 50% of all CTM senior leaders globally were
female.
CTM actively participates in International Women’s Day events, further supporting the importance of gender equality and equality of opportunity more broadly.
In Australia, CTM is compliant with the Workplace Gender Equality Act (WGEA) 2012.
PeopleAt CTM, we understand that people are at the core of our success and we implement a wide range of initiatives that support equality of opportunity, professional development and wellness.
In FY19, CTM’s global leadership development program, the HiPo Program, was made up of more than 50% females, demonstrating CTM’s ongoing investment in developing its future female leaders.
We also understand that modern workplaces must embrace flexibility to drive a positive work/life balance and employee wellness. CTM applies industry-wide best practices through a range of flexible work solutions globally, including flexible hours, job-share and work-from-home options. This year, CTM launched a new ‘Holidays Contract’ in Australia, designed to give employees (male and female) the opportunity to take up to 12 weeks’ leave during school holiday periods.
Around the world, CTM supports year-round wellness initiatives across its offices, designed to support employees and raise awareness of important health and wellbeing programs. These include R U OK? Day, White Ribbon Day, mental health initiatives and flu vaccinations to name a few.
CTM’s long-term success is directly linked to the safety and wellbeing of our people and supporting the communities where we work and live. To meet the needs of the present while contributing to a sustainable future, we will continue to develop environmentally, socially and economically responsible programs into all our operations.

16 17
Board of Directors
Ewen Crouch AMChairman
Independent
Non-Executive Director
Jamie PherousManaging Director
Stephen LonieIndependent
Non-Executive Director
Ewen Crouch was a Partner at Allens from 1988-2013. He served as a member of the firm’s board for 11 years, including four years as Chairman of Partners and was co-head mergers & acquisitions and equity capital markets from 2004-2010. He was a director of Mission Australia from 1995, including as Chairman from 2009, until retiring in November 2016. He is a member of the Commonwealth Remuneration Tribunal and a director of Jawun and Sydney Symphony Orchestra. He served as a member of the Takeovers Panel from 2010-2015.
Ewen Crouch was appointed as Chairman on 25 March 2019.
Jamie Pherous founded Corporate Travel Management Limited (CTM) in Brisbane in 1994. He has built the Group from its headquarters in Brisbane to become one of the world’s largest travel management companies.
Prior to establishing CTM, Jamie Pherous was employed by Arthur Andersen, now Ernst & Young, as a qualified Chartered Accountant, specialising in business services and financial consulting, notably in Australia, Papua New Guinea and the United Arab Emirates.
Stephen Lonie is a Chartered Accountant and is a former Managing Partner Queensland of the international accounting and consulting firm, KPMG. He now practices as an independent management consultant and business adviser.
Greg MoynihanIndependent
Non-Executive Director
Admiral Robert J. Natter, US Navy (Ret.)Independent
Non-Executive Director
Laura RufflesExecutive Director
Greg Moynihan is a former Chief Executive Officer of Metway Bank Limited. He has also held senior executive positions with Citibank Australia and Suncorp Metway. Since leaving Suncorp Metway in 2003, Greg Moynihan has focused on his commitments as a Non-Executive Company Director, as well as pursuing business interests in the investment management and private equity sectors.
Robert Natter retired from active military service in 2003 and now has over 15 years of experience in both the government and private sectors in the North American market.
In his Navy career, Robert Natter served as the Commander of the U.S. Seventh Fleet operating throughout Asia and the Indian Ocean; Commander in Chief of the U.S Atlantic Fleet; and the first Commander of U.S. Fleet Forces, overseeing all Continental U.S. Navy bases, facilities and training operations.
Laura Ruffles is CTM’s Global Chief Operating Officer and, in late 2015, was appointed an Executive Director in recognition of her leadership contribution. She has significant local, regional and global industry experience and, in a career of more than 20 years, has led teams across sales, account management, operations and technology. Laura Ruffles is responsible for all aspects of CTM’s business performance. She joined CTM in 2010 and has been a key contributor to its successful growth. She is also a Director of the Australian Federation of Travel Agents.

18 19
Executive Team
Jamie Pherous founded Corporate Travel Management Limited (CTM) in Brisbane in 1994. He has built the Group from its headquarters in Brisbane to become one of the world’s largest travel management companies.
Prior to establishing CTM, Jamie Pherous was employed by Arthur Andersen, now Ernst & Young, as a qualified Chartered Accountant, specialising in business services and financial consulting, notably in Australia, Papua New Guinea and the United Arab Emirates.
Jamie PherousManaging Director
Neale O’Connell joined CTM as Global CFO in July 2019, bringing a wealth of experience in listed company financial management built over a 25-year career. Neale spent 14 years at Tatts Group before departing in 2018 as Group CFO following the merger with Tabcorp. Neale has deep public company experience; he managed the major financial elements for the floats of Smorgon Steel and Tattersall’s and managed multinational projects as Finance Director for contracting and logistics supplier Delta Group. Neale is a member of the Institute of Chartered Accountants, a member of the Australian Institute of Company Directors and a member of the Finance and Treasury Association.
Neale O’ConnellGlobal Chief Financial Officer
Laura Ruffles is CTM’s Global Chief Operating Officer and, in late 2015, was appointed an Executive Director in recognition of her leadership contribution. She has significant local, regional and global industry experience and, in a career of more than 20 years, has led teams across sales, account management, operations and technology. Laura Ruffles is responsible for all aspects of CTM’s business performance. She joined CTM in 2010 and has been a key contributor to its successful growth. She is also a Director of the Australian Federation of Travel Agents.
Laura RufflesGlobal Chief Operating Officer
Debbie has worked in the travel industry for more than 30 years’ in several key strategic and senior roles, including Commercial Director at Britannic Travel. During this time Debbie led the setup of global brand FCM Travel Solutions and became the Executive General Manager of Europe. In 2011 Debbie joined Chambers Travel and became COO soon after. Debbie successfully instilled new company processes, productivity and developments in supplier relations. In December 2014 Chambers was acquired by Corporate Travel Management, during which time Debbie played a key role in the successful transition. Debbie was appointed as CEO Europe for CTM in July 2016.
Debbie CarlingCEO Europe
Joining Westminster Travel in 2008, Larry Lo is responsible for the company’s overall management, sales operations and continued development of strategic alliance partnerships across the Asia region. He started his career in 1988 as a Travel Consultant and worked in several travel companies in Hong Kong and Canada gaining an in-depth insight into the international travel industry. Today, he manages the CTM business in Hong Kong, Mainland China, Macau, Taiwan and Singapore. He currently serves as a Chairman on the Society of IATA Passenger Agents (SIPA) and a director of the Travel Industry Council of Hong Kong (TIC).
Larry LoCEO Asia
Chris Thelen joined Chambers Travel (UK, Europe) in 1999 and led a management buy-out of the company five years later. Under his leadership, Chambers Travel more than quadrupled its turnover and its staff, and became an award-winning business with offices across eight European countries. Chambers Travel was acquired by CTM in December 2014, where Chris remained at the helm of CTM’s European operations until his transfer to CEO North America in July 2016.
Chris ThelenCEO North America
Greg McCarthy has more than 35 years’ experience in the travel industry holding several leadership positions. He founded two travel management companies in Australia, building them up from small operations to highly successful medium-sized businesses. Greg has worked for international airlines and held an executive directorship in a global TMC, achieving a strong track record delivering for customers. He was co-founder of Platinum Travel Corporation. CTM acquired Platinum’s Brisbane and Sydney offices in 2018, with Greg commencing as CTM CEO Australia and New Zealand on 1 July 2018.
Greg McCarthyCEO Australia & New Zealand

20 21
Annual Financial Report
Annual Financial Report 20
Directors’ Report 22
Corporate Governance Statement 42
Consolidated Statement of Comprehensive Income 43
Consolidated Statement of Financial Position 44
Consolidated Statement of Changes in Equity 45
Consolidated Statement of Cash Flows 46
Notes to the Consolidated Financial Statements 47
Directors’ Declaration 93
Independent Auditor’s Report 94
Shareholder Information 101
Corporate Directory 103

22 23
Directors’ ReportThe Directors present their report, together with the financial report of Corporate Travel Management Limited and its controlled subsidiaries (“CTM” or “the Group”), for the financial year ended 30 June 2019.
DirectorsThe following persons were Directors of Corporate Travel Management Limited during the financial year and until the date of this report for the entire period unless otherwise stated:
• Ewen Crouch AM (Chairman) (appointed on 25 March 2019).• Tony Bellas (Chairman) (resigned 25 March 2019).• Jamie Pherous (Managing Director).• Stephen Lonie (Independent Non-Executive Director).• Greg Moynihan (Independent Non-Executive Director).• Admiral Robert J. Natter, U.S. Navy (Ret.) (Independent Non-Executive Director).• Laura Ruffles (Executive Director).
Principal activitiesThe principal activities of the Group during the year consisted of managing the purchase and delivery of travel services for its clients. There were no significant changes in the nature of the activities of the Group during the year.
DividendsDividends paid to members during the financial year were as follows:
2019$’000
Final ordinary dividend for the year ended 30 June 2018 of 21.0 cents per fully paid share paid on 4 October 2018 22,734
Interim ordinary dividend for the year ended 30 June 2019 of 18.0 cents per fully paid share paid on 12 April 2019 19,529
Total dividends paid 42,263
Since the end of the financial year, the Directors have recommended the payment of a final ordinary dividend of $23,868,229 (22.0 cents per fully paid share, 50% franked), to be paid on 3 October 2019 out of retained earnings at 30 June 2019.
Review of operationsGroup overviewThe Group continued to engage in its principal activity, being the provision of travel services, the results of which are disclosed in the following financial statements.
Group financial performanceCTM’s key financial metrics are summarised in the following table:
2019 2018 Change
$’000 $’000 %
Total Transaction Value (TTV) (unaudited) 6,457,480 4,958,331 30%
Revenue and other income 449,483 372,236 21%
Earnings before interest, tax, depreciation and amortisation (EBITDA) 143,760 124,598 15%
Acquisition/one-off/non-recurring costs 6,330 852
Underlying EBITDA (adjusted for acquisition/one-off/non-recurring costs)1 150,090 125,450 20%
Statutory net profit after tax (NPAT): 89,473 80,582 11%
NPAT - attributable to owners of CTM 86,235 76,712 12%
Acquisition/one-off/non-recurring costs (tax effected) 5,053 708
Underlying NPAT - attributable to owners of CTM 91,288 77,420 18%
Amortisation of client intangibles (tax effected) 5,576 8,561
Underlying NPAT - Attributable to owners (excluding acquisition amortisation) 96,864 85,981 13%
Directors’ Report (continued)Review of operations (continued)1 Management assess the performance of the business based on a measure of underlying EBITDA. This measurement basis excludes the effects of the costs of acquisitions, acquisition related adjustments, and other non-recurring items during the year. Refer note 1 – segment reporting.
The net profit after tax of the Group for the financial period amounted to $86,235,000 (2018: $76,712,000). The result was underpinned by a 20% increase in revenue.
Strong organic growth and cost management has underpinned the performance, with a record value of new client wins in the period.
In addition, underlying EBITDA grew by 20% to $150.1 million, with the reconciliation to profit before income tax from continuing operations as set out in note 1 in the financial statements. On a constant currency basis, underlying EBITDA grew by 14% to $142.8 million. Strong organic growth has underpinned the performance, with client wins and retentions of historically high levels. There has been strong translation of revenue to EBITDA due to benefits of CTM’s growing scale, technology and integrated automation, despite the increase move to on-line (lower yielding) transactions.
2019 2018 2017 2016 2015
$’000 $’000 $’000 $’000 $’000
Statutory net profit after tax:
Attributable to members 86,235 76,712 54,556 42,134 26,367
Attributable to minority interest 3,238 3,870 3,282 3,609 2,727
Shareholder funds 364,368 301,747 281,847 175,231 161,675
Basic EPS (cents per share) 79.6 72.4 53.5 43.2 28.1
Basic EPS growth 10% 35% 24% 54% 48%
Return on equity 24% 25% 19% 24% 16%
Dividend per share - year end 22.00 21.00 18.00 15.00 10.00
Dividend per share - interim 18.00 15.00 12.00 9.00 6.00
Dividend per share - full financial year 40.00 36.00 30.00 24.00 16.00
Total Transaction Value (TTV) (unaudited)TTV represents the amount at which travel products and services have been transacted across the Group’s operations whilst acting as agents for airlines and other service providers, along with revenue streams. TTV does not represent revenue in accordance with Australian Accounting Standards and is not subject to audit. TTV is stated net of GST. TTV is utilised by management as a key travel industry metric.
2019 2018
$’000 $’000
TTV net of GST (unaudited) 6,457,480 4,958,331
The Group maintained strong growth in TTV (unaudited). The Group continues to grow market share particularly in regions where the CTM SMART Technology suite has been fully implemented.
CTM also continues to maintain a strong financial position, with net current assets of $110.3 million and total equity of $592.5 million. At 30 June 2019, the Group had $39.3 million (2018: $44.0 million) in borrowings.
The Company continues to pay dividends at its stated dividend policy level (refer note 14), with a final dividend declared at 22.0 cents per share (full year: 40.0 cents). This dividend represents an increase of 11% on the preceding period.
Financing and working capitalThe timing of fixed supplier payment cycle relative to reporting dates results in short term fluctuations in reporting cash flow. The operating cash flow conversion for the year ended 30 June 2019 was 113%. Cash conversion since the time of IPO is demonstrated in the following graph:

24 25
Directors’ Report (continued)Review of operations (continued)Financing and working capital (continued)
The operating cash conversion rate, which is net operating cashflows excluding interest, finance costs and income tax paid divided by EBITDA is approximately 113%.
As at 30 June 2019, borrowings totalled $39.3 million, representing a debt to equity ratio of approximately 7%.
Bank GuaranteesThe Group has drawn on its financing facilities to put in place bank guarantees totalling $123.0 million. These guarantees are used primarily for trade support for transactions with airlines in Greater China and European rail, which are strongly growing businesses.
The requirement for these bank guarantees is mandatory by these suppliers and represents a significant barrier to entry for competitors and new entrants in these markets, which are constrained by growth or financial capacity, and provides an important competitive advantage for CTM.
Following the Lotus acquisition in October 2018, guarantees increased by $54.6 million to $138.2 million in December 2018.
Since 31 December 2018, the guarantees balance has reduced by $15.2 million. Subsequent to 30 June 2019, guarantees have decreased by a further $27.1 million and at the date of this report total guarantees are $95.9 million. This represents a $42.3 million or 30% decrease on the guarantees balance at 31 December 2018. The business continues to rationalise guarantees with suppliers, particularly in Asia.
Subsequent to 30 June 2019, the Group refinanced the senior debt facilities. Details of the new facility are shown at note 18. The new facility offers CTM improved rates, lower annual costs, bank diversity and allows for future growth and flexibility.
Constant currencyDue to a significant portion of the Group’s operations being outside Australia, the Group is exposed to currency exchange rate translation risk, being the risk that the Group’s offshore earnings fluctuate when reported in Australian dollars.
The Group’s regional results for the 2019 financial year have also been provided on a constant currency basis in the following commentary, with the revenue and EBITDA for the regions converted at the average rate for the 2018 financial year, to remove the impact of foreign exchange movements in assessing the Group’s performance against the prior year. The constant currency comparatives are not compliant with Australian Accounting Standards.
Directors’ Report (continued)Review of operations (continued)Review of underlying operations
The key financial results by region are summarised in the following table:
* Constant currency reflects June 2018 as previously reported. June 2019 represents local currency converted at FY2018 average foreign currency rates.
Australia and New Zealand (“ANZ”)Revenue rose by 12% to $121.7 million for the year ended 30 June 2019. The increased revenue has flowed through to the underlying EBITDA, which rose by 17% to $51.5 million, with an improved margin of 42.3%. The region continued to grow its market share through new client wins and continues its historic outperformance to market since listing. In the lead up to the federal election, the region experienced a softening in activity which is attributed to uncertainty in the market. Post election, the region experienced a return to normal trading. ANZ has again been a significant contributor to the Group’s profit.
North AmericaRevenue grew by 18% to $149.3 million for the year ended 30 June 2019. The underlying EBITDA rose by 15% to $43.5 million. As previously indicated to shareholders, this revenue growth was partially offset by $2.9 million technology hub development costs expensed in this financial year that did not exist last year. The underlying EBITDA margin declined from 29.8% to 29.1% largely as a result of the technology hub development costs. The technology solution (SMART and Lightning) is now in place in the region which will assist in driving further market share growth opportunities.
AsiaRevenue grew by 49% to $80.4 million for the year ended 30 June 2019 and underlying EBITDA grew by 27% to $24.7 million. Lotus Travel was acquired on 2 October 2018. The underlying EBITDA margin decreased from 36.2% to 30.7% due to the impact of the Lotus nine-month contribution, as Lotus was acquired on a lower revenue and profit margin than the existing CTM business. Lotus Travel is now fully integrated. The underlying EBITDA results excludes $4.2 million of non-recurring integration costs. The second half was impacted by the US/China trade discussions and the Hong Kong demonstrations.
EuropeThe operation in Europe contributed $95.3 million in revenue for the year ended 30 June 2019, an increase of 17% on prior year. The underlying EBITDA for the Europe business rose by 20% to $40.9 million and the underlying EBITDA margin increased from 41.9% to 42.9% as a result of improved supplier negotiations. The business continues to win market share despite Brexit and the resulting effect of Brexit uncertainty.
Strategy and future performanceThe Group continues to focus on its key strategic drivers, being:• Implementing and integrating its acquisitions;• Retaining current clients;• Winning new clients; • Innovative technology such as client tools and internal processes, to enhance service to clients and improve
internal productivity; and• Staff engagement.
In the 2019 financial year, the Group executed well on these business drivers, with maintenance of the historically strong client retention numbers, a record year of new client wins and improved productivity and high staff engagement outcomes in all regions.
A vast proportion of CTM’s cost base is employee costs, which highlights the importance of productivity initiatives. During the year, there has been an increase in productivity, but not through a reduction of service. In fact, service
CTM Consolidated Australia New Zealand North America Asia Europe Group
2019 $’m
2018 $’m
2019 $’m
2018 $’m
2019 $’m
2018 $’m
2019 $’m
2018 $’m
2019 $’m
2018 $’m
2019 $’m
2018 $’m
Reported AUD
TTV 6,457.5 4,958.3 30% 1,335.5 1,155.9 16% 1,459.1 1,306.1 12% 2,519.0 1,483.0 70% 1,143.9 1,013.3 13% - -
Revenue 446.7 371.0 20% 121.7 108.5 12% 149.3 127.0 18% 80.4 53.8 49% 95.3 81.7 17% - -
Underlying EBITDA 150.1 125.4 20% 51.5 44.0 17% 43.5 37.9 15% 24.7 19.5 27% 40.9 34.2 20% (10.5) (10.2) 3%
Underlying EBITDA as % of Revenue
33.6% 33.8% 42.3% 40.6% 29.1% 29.8% 30.7% 36.2% 42.9% 41.9%
Constant Currency*
TTV 6,093.9 4,958.3 23% 1,334.6 1,155.9 15% 1,344.5 1,306.1 3% 2,320.5 1,483.0 56% 1,0494.3 1,013.3 8% - -
Revenue 424.3 371.0 14% 121.6 108.5 12% 137.4 127.0 8% 74.1 53.8 38% 91.2 81.7 12% - -
Underlying EBITDA 142.8 125.4 14% 51.5 44.0 17% 39.9 37.9 5% 22.9 19.5 17% 39.0 34.2 14% (10.5) (10.2) 3%Underlying EBITDA as % of Revenue 33.7% 33.8% 42.4% 40.6% 29.0% 29.8% 30.9% 36.2% 42.8% 41.9%

26 27
Directors’ Report (continued)Review of operations (continued)Strategy and future performance (continued)
levels have risen as automation has replaced manual processes, providing CTM’s consultants with the time to operate more effectively and for the benefit of clients.
The Group intends to continue to pursue the opportunity for its growth globally through organic growth as well as exploring acquisition opportunities in each regional market, underpinned by a focus on client service, supported by the continued investment in new technology for its clients.
The Group is subject to both specific risks to its business activities and risks of a general nature.
Material business risksThese strategic risks include:
• The Group operates in multiple jurisdictions subject to trade negotiations such as those occurring in Europe and between the US and China, which may impact the Group’s operations, and are also subject to differing regulatory environments and may be impacted by changes in government policy.
• Global conflicts, terrorism and pandemics: International travel remains susceptible to the impact of regional conflicts, terrorism and health pandemics.
• Economic conditions: Economic downturns, both globally and regionally, may have an adverse impact on the Group’s operating performance.
• Foreign exchange: The volatility of foreign exchange markets impacts on the Australian dollar results for the Group, which is mitigated by matching funding sources to operating cash flows.
• Financial structure: The Group has acquired a number of businesses, all of which has resulted in the creation of significant intangible assets, the recoverability of which is totally dependent upon future performance, including depending on major contracts. For further commentary refer note 15 – impairment. New acquisitions also require additional resources and integration into the existing businesses. These can result in additional risk whilst the Group completes these processes.
• Information technology: The Group relies on both its outsourced technology platforms and develops its own IP. Whilst all systems are licensed, any disruption to supply or performance of systems may have an immediate and a longer term impact on client and supplier satisfaction and company performance. The Group’s internal and outsourced systems are also subject to potential cyber-attacks. For example, cyber-attacks on airline operators could cause significant disruption to travel schedules.
• Competition: The Group operates in a competitive market, and current competitors or new competitors may become more effective.
• Key personnel: The Group is reliant on talent and experience to run its business. The Group’s ability to retain and attract key people is important to its continued success. The company regularly reviews its succession planning to ensure that key personnel risk is identified.
• Financial risk management: refer note 16, for discussion on interest rate risk, credit risk, liquidity risk and foreign exchange risk.
Significant changes in the state of affairsIn the opinion of the Directors, there were no significant changes in the state of affairs of the Group during the financial year not otherwise disclosed in this report or the consolidated financial statements.
Events since the end of the financial yearOther than the following items, there have been no matters, or circumstances, not otherwise dealt with in this report, that will significantly affect the operation of the Group, the results of those operations or the state or affairs of the Group or subsequent financial years.
On 7 August 2019 the Group entered into a $225 million (GBP 125 million) multi-currency syndicated facility. The new Syndicated Facility Agreement is with HSBC UK Bank plc, Commonwealth Bank of Australia and Barclays Bank plc.
This facility replaces the existing facility in place at 30 June 2019 – refer note 12. The new facility offers CTM improved rates, lower annual costs, bank diversity and allows for future growth and flexibility.
As part of the new agreement is a permitted indebtedness basket of $406 million (GBP 225 million) in support of transactional banking facilities including bank guarantees, merchant facilities and overdrafts.
Likely developments and expected results of operationsFurther information on likely developments in the Group’s operations and the expected results of operations has not been included in this report because the Directors consider that would be likely to result in unreasonable prejudice to the Group.
Directors’ Report (continued)Environmental regulationThe Group has determined that no particular or significant environment regulations apply to its operations.
The Directors have considered climate-related risks and do not currently deem there to be an associated material risk to the Group’s operations and the amounts recognised in the financial statements. The Group continues to monitor climate-related and other emerging risks and the potential impact on the financial statements.
Information on DirectorsThe following information is current as of the date of report.
Mr Ewen Crouch AM, BEc (Hons.), LLB, FAICD – Independent Non-Executive Director – Chairman
Experience and expertise Ewen Crouch was a Partner at Allens from 1988-2013. He served as a member of the firm’s board for 11 years, including four years as Chairman of Partners and was co-head mergers & acquisitions and equity capital markets from 2004-2010. He was a director of Mission Australia from 1995, including as Chairman from 2009, until retiring in November 2016. He is a member of the Commonwealth Remuneration Tribunal and a director of Jawun and Sydney Symphony Orchestra. He served as a member of the Takeovers Panel from 2010-2015.
Ewen Crouch was appointed as Chairman on 25 March 2019.
Listed Company Directorships (including key dates)
BlueScope Steel Limited (since March 2013) and Westpac Banking Corporation (since February 2013).
Special responsibilities Chair of the BoardChair of Nomination CommitteeAudit Committee memberRisk Management Committee memberRemuneration Committee member
Interests in shares and options Ordinary shares in Corporate Travel Management Limited 5,000
Mr Jamie Pherous, BCom – Executive Director, Managing Director
Experience and expertise Jamie Pherous founded Corporate Travel Management Limited (CTM) in Brisbane in 1994. He has built the Group from its headquarters in Brisbane to become one of the world’s largest travel management companies.
Prior to establishing CTM, Jamie Pherous was employed by Arthur Andersen, now Ernst & Young, as a qualified Chartered Accountant, specialising in business services and financial consulting, notably in Australia, Papua New Guinea and the United Arab Emirates.
Listed Company Directorships (including key dates)
None.
Special responsibilities Managing Director
Interests in shares and options Ordinary shares in Corporate Travel Management Limited 21,266,893
Mr Stephen Lonie, BCom, MBA, FCA, SFFin, FAICD, FIMCA, Senior MACS – Independent Non-Executive Director
Experience and expertise Stephen Lonie is a Chartered Accountant and is a former Managing Partner Queensland of the international accounting and consulting firm, KPMG. He now practices as an independent management consultant and business adviser.
Listed Company Directorships (including key dates)
MyState Limited (since 2012), Apollo Tourism and Leisure Ltd (since 2016) and Retail Food Group Limited (2013-2018).
Special responsibilities Chair of Audit CommitteeChair of Risk Management CommitteeRemuneration Committee memberNomination Committee member
Interests in shares and options Ordinary shares in Corporate Travel Management Limited 254,312

28 29
Directors’ Report (continued)Information on Directors (continued)
Mr Greg Moynihan, BCom, Grad Dip SIA, CPA, SFFIN, MAICD – Independent Non-Executive Director
Experience and expertise Greg Moynihan is a former Chief Executive Officer of Metway Bank Limited. He has also held senior executive positions with Citibank Australia and Suncorp Metway. Since leaving Suncorp Metway in 2003, Greg Moynihan has focused on his commitments as a Non-Executive Company Director, as well as pursuing business interests in the investment management and private equity sectors.
Listed Company Directorships (including key dates)
Shine Corporate Limited (since 2013).
Special responsibilities Chair of Remuneration CommitteeNomination Committee memberAudit Committee memberRisk Management Committee member
Interests in shares and options Ordinary shares in Corporate Travel Management Limited 254,312
Admiral Robert J. Natter, US Navy (Ret.) – Independent Non-Executive Director
Experience and expertise Robert Natter retired from active military service in 2003 and now has over 15 years of experience in both the government and private sectors in the North American market.
In his Navy career, Robert Natter served as the Commander of the U.S. Seventh Fleet operating throughout Asia and the Indian Ocean; Commander in Chief of the U.S Atlantic Fleet; and the first Commander of U.S. Fleet Forces, overseeing all Continental U.S. Navy bases, facilities and training operations.
Until this year, Robert Natter served as Chairman of the U.S. Naval Academy Alumni Association representing about 60,000 graduates. He now serves on the Naval Academy Foundation Board. He served for 10 years on the Board of BAE systems, Inc. (the U.S. based subsidiary of BAE Systems Plc). He currently serves on the Board of Allied Universal (a privately held US based security company with over 210,000 employees) and is Chairman of the Governance and Compensation Committees. He also served on the Board of the U.S. National Navy Seal Museum and was Chairman of G4S Government Solutions Inc.
Listed Company Directorships (including key dates)
NOVONIX Limited (since 2017).
Special responsibilities Remuneration Committee memberNomination Committee member
Interests in shares and options Ordinary shares in Corporate Travel Management Limited 119,200
Laura Ruffles – MBA, GAICD – Executive Director, COO
Experience and expertise Laura Ruffles is CTM’s Chief Operating Officer and, in late 2015, was appointed an Executive Director in recognition of her leadership contribution. She has significant local, regional and global industry experience and, in a career of more than 20 years, has led teams across sales, account management, operations and technology. Laura Ruffles is responsible for all aspects of CTM’s business performance. She joined CTM in 2010 and has been a key contributor to its successful growth. She is also a Director of the Australian Federation of Travel Agents.
Listed Company Directorships (including key dates)
None.
Special responsibilities Executive Director
Interests in shares and options Ordinary shares in Corporate Travel Management LimitedShare appreciation rights over ordinary shares in Corporate Travel Management Limited
177,915
500,000
Directors’ Report (continued)Company secretaries• Mrs Suzanne Yeates (Joint Company Secretary).• Mr Steve Fleming (Joint Company Secretary).
Suzanne Yeates, BBus (Accounting), CASuzanne Yeates is a Chartered Accountant, Founder and Principal of Outsourced Accounting Solutions Pty Ltd. She holds similar positions with other public and private companies.
Steve Fleming, BBus (Accounting), CASteve Fleming was CTM’s Global Chief Financial Officer until 9 July 2019 and is now CFO for the Europe region.
Steve Fleming has more than 20 years’ experience in commercial finance roles gained with high growth companies across a number of industries and countries, including Abbey National, TrizecHahn, Deutsche Bank and Arthur Andersen. Prior to joining CTM in 2009, Steve Fleming was Group Finance Manager of Super Retail Group Ltd.
Steve Fleming is a member of the Institute of Chartered Accountants in Australia.
Meetings of DirectorThe numbers of meetings of the Group’s Board of Directors and of each Board Committee held during the year ended 30 June 2019, and the numbers of meetings attended by each Director were:
Director Full meetings of directors
Committee meetings
Audit Risk Management Renumeration Nomination
A B A B A B A B A B
Mr Ewen Crouch AM 4 4 1 1 - - 1 1 1 1
Mr Tony Bellas 8 8 4 4 3 3 4 4 1 1
Mr Stephen Lonie 10 12 5 5 3 3 5 5 2 2
Mr Greg Moynihan 12 12 5 5 3 3 5 5 2 2
Mr Jamie Pherous 11 12 * * * * * * * *
Admiral Robert J. Natter 10 12 * * * * 5 5 2 2
Ms Laura Ruffles 11 12 * * * * * * * *
A = Number of meetings attended.B = Number of meetings held during the time the Director held office or was a member of the Committee
during the year.* Not a member of the relevant Committee.
Remuneration reportThe Directors are pleased to present Corporate Travel Management Limited’s 2019 remuneration report, outlining key aspects of the Group’s remuneration policy and framework, as well as remuneration awarded in the year.
The report is structured as follows:
1. CTM’s remuneration framework.2. Key elements of remuneration.3. Who is covered by this report.4. Details of Executive KMP remuneration.5. Contractual arrangements for Executive KMP.6. Non-executive director arrangements.7. Additional required disclosures.

30 31
Directors’ Report (continued)Remuneration report (continued)1. CTM’s remuneration framework
The following section outlines CTM’s remuneration framework and the policies that underpin it. Information is presented in a question and answer format.
Key questions CTM’s approach Further info
Remuneration framework
1. What is the objective of the Group’s senior executive reward framework?
The objective of the Group’s executive reward framework is to ensure reward for performance is competitive and appropriate for the results delivered. The framework aligns senior executive reward with achievement of strategic objectives and the creation of value for shareholders, and conforms with market practice for the delivery of senior executive rewards.
The Board ensures that the approach to senior executive reward satisfies the following key criteria for good reward governance practices:
• Competitiveness and reasonableness;• Alignment to the interests of shareholders and other
stakeholders;• Performance linkage and alignment of executive
compensation;• Transparency; and• Capital management.
2. What are the key elements of the remuneration framework?
The framework is based on the following key elements:
• Alignment to shareholders’ interests, which: • Has economic profit as a core component of plan design; • Focuses on sustained growth in shareholder wealth,
consisting of dividends and growth in share price, and delivering an appropriate return on assets, as well as focusing the executive on key non-financial drivers of value; and
• Attracts and retains high calibre senior executives.
• Alignment to program participants’ interests, which: • Rewards capability and expertise; • Reflects competitive reward for contribution to growth in
shareholder wealth; • Provides a clear structure for earning rewards; and • Provides recognition for individual and team contributions.
3. What is the role of the Remuneration Committee?
The Remuneration Committee is a Committee of the Board and its role is to advise the Board on remuneration and issues relevant to remuneration policies and practices, including for senior executives and Non-Executive Directors. CTM’s Corporate Governance Statement provides further information on the role of this Committee.
Section 2
4. What proportion of remuneration is at risk?
The framework provides for a mix of fixed and variable remuneration, and a blend of short and long-term incentives. As executives gain seniority with the Group, the balance of this mix shifts to a higher proportion of ‘at risk’ rewards. The proportion of short-term incentives (STI) and long-term incentives (LTI) (relative to fixed pay) is set at the start of the financial year, along with all relevant KPI’s.
Section 4
Directors’ Report (continued)Remuneration report (continued)1. CTM’s remuneration framework (continued)
Key questions CTM’s approach Further info
5. How is CTM’s performance reflected in this year’s remuneration outcomes?
CTM’s remuneration outcomes are strongly linked to delivery of return on investment to shareholders over the short and long term.
Short term: CTM’s performance in 2019 in terms of EBITDA and other financial targets, as well as non-financial strategic targets is reflected in STI payments in the range of 40%-90% for Executive KMP.
Long term: The three-year performance period for the FY17 LTI completed on 30 June 2019. Based on strong growth in earnings per share (EPS), the performance conditions pertaining to the FY17 share appreciation rights have been achieved.
CTM’s Board is committed to ensuring senior executives’ remuneration links to return on investment for shareholders and, therefore, will continue to use EPS growth as the primary performance metric for the FY20 LTI award.
Section 4
6. What are the performance measures for LTI?
Target earnings per share growth of 10% per annum average over a three-year vesting period.
Section 4
7. What changes have been made to the remuneration structure in FY19?
There have been no significant changes to the approach to remuneration in FY19.
8. Are any changes planned for FY20?
There are no significant changes planned for FY20. However, in line with previous years, the Board will review and adjust (if necessary) the threshold and performance levels for the performance objectives applicable to the STI and LTI awards.
2. Key elements of remunerationThe executive remuneration framework has three components:
• Fixed pay;• Short-term performance incentives (STI); and• Long-term incentives through participation in the Share Appreciation Rights Plan (LTI).

32 33
Directors’ Report (continued)Remuneration report (continued)
2. Key elements of remuneration (continued)Additional detail on each of these components is included in the following table.
Key elements of remuneration
Fixed PayFixed pay includes base remuneration and benefits and is structured as a total employment cost package, which may be delivered as a combination of cash and prescribed non-financial benefits at the executives’ reasonable discretion.
Senior executives are offered a competitive base remuneration package that comprises the fixed component of remuneration and rewards. Base remuneration for executives is reviewed annually, to ensure the executive’s remuneration is competitive with the market. An executive’s remuneration is also reviewed on promotion.
There is no guaranteed base remuneration increase included in any executives’ contracts.
In Australia, superannuation contributions are paid in accordance with relevant Government legislation, to employee nominated defined contribution superannuation funds.
STIBased on a pre-determined profit targets set annually by the Remuneration Committee, a short-term incentive (“STI”) pool is available to senior executives and other eligible participants. Cash incentives/bonuses are payable around 30 September each year. A profit target ensures variable reward is only available when value has been created for shareholders and when profit is consistent with CTM’s approved business plan. The incentive pool is increased for performance above the profit target, in order to provide an incentive for superior performance.
Senior executives have a target STI opportunity depending on the accountabilities of the role and impact on the organisation or business unit performance.
STI (continued)Each year, the Remuneration Committee considers the appropriate targets and key performance indicators (“KPI”s), to link the STI plan and the level of payout if targets are met, including setting any maximum payout under the STI plan, and minimum levels of performance to trigger payment of STI.
The Remuneration Committee is responsible for assessing whether the KPIs are met. The Remuneration Committee also has absolute discretion to adjust short-term incentives, in light of unexpected or unintended circumstances.
Additional detail on the STI scheme is included in Section 4: Details of Executive KMP remuneration.
LTIThe Group has a long term incentive scheme using a Share Appreciation Rights Plan. The Plan is designed to focus executives on delivering long-term shareholder returns.
Under the Plan, participants are granted rights if performance conditions pertaining to the earnings per share growth are met and the employee is still employed at the end of the three year vesting period.
Participation in the Plan is at the Board’s absolute discretion and no individual has a contractual right to participate in the Plan.
Additional detail on the LTI scheme is included in Section 4: Details of Executive KMP remuneration.
The combination of these components comprises a senior executive’s total remuneration. The Group intends to continue to review incentive plans during the year ending 30 June 2020 to ensure continued alignment with the Group’s financial and strategic objectives.
Directors’ Report (continued)Remuneration report (continued)
3. Who is covered by this reportThis Remuneration Report sets out remuneration information for CTM’s Non-Executive Directors, Executive Directors and other key management personnel (KMP) of the Group, which includes the following persons:
Board of Directors Other Group KMP
Non-Executive DirectorsMr Ewen Crouch AM (appointed 25 March 2019).Mr Tony Bellas (resigned 25 March 2019).Mr Stephen Lonie.Mr Greg Moynihan.Admiral Robert J. Natter.
Executive DirectorsMr Jamie Pherous.Ms Laura Ruffles.
Mr Steve Fleming – Global CFO* (appointed CFO of Europe on 9 July 2019).Mr Larry Lo – CEO – Asia.Mr Chris Thelen – CEO - North America.Ms Debbie Carling – CEO - Europe.Mr Greg McCarthy – CEO Australia and New Zealand (appointed 1 July 2018).
* Neale O’Connell was appointed Global CFO on 9 July 2019 and will be a KMP for the 2020 financial year.
4. Details of Executive KMP remunerationRemuneration outcomes are disclosed in accordance with Australian accounting standards.
Name Year
Fixed remuneration Variable remuneration
Total$
Perfor-mance
Related%
Cashsalary
and fees$
Non-cash
benefits1
$Leave2
$
Super-annuation
$
Short-term
Incentive$
Long-term incentive3
$
Executive Directors
Jamie Pherous4
2019 470,808 8,908 23,857 39,531 100,000 - 643,104 16%
2018 460,319 8,904 3,203 62,730 200,000 - 735,156 27%
Laura Ruffles
2019 700,000 10,280 66,058 76,229 630,000 473,109 1,955,676 56%
2018 588,219 10,954 29,919 106,516 533,000 274,855 1,543,463 52%
Other key management personnel of the Group
Steve Fleming5
2019 497,521 - (9,046) 47,265 135,688 223,024 894,452 40%
2018 486,417 - - 45,299 173,392 134,391 839,499 37%
Larry Lo52019 562,457 - 8,533 3,206 149,608 223,024 946,828 39%
2018 501,051 - (9,447) 2,963 184,361 134,391 813,319 39%
Chris Thelen5
2019 642,198 - (1,371) - 83,790 223,024 947,641 32%
2018 579,524 - (8,916) - 128,783 102,909 802,300 29%
Debbie Carling5
2019 345,220 - 4,384 7,519 144,734 223,024 724,881 51%
2018 292,391 - (1,500) 3,641 138,714 119,699 552,945 47%
Greg McCarthy
2019 379,951 - 12,252 20,531 40,000 160,153 612,887 33%
2018 - - - - - - - -
Total Executive KMP
2019 3,598,155 19,188 104,667 194,281 1,283,820 1,525,358 6,725,469
2018 2,907,921 19,858 13,259 221,149 1,358,250 766,245 5,286,682
1 Non-cash benefits represents the cost to the Group of providing parking.2 Leave represents the movement in the annual leave and long service leave provision balances. The accounting value may be negative, for example, when an Executive’s leave balance decreases as a result of taking more than the entitlement accrued during the year.
3 Long-term incentive represents amounts expensed during the year relating to share appreciation rights granted to date and not yet vested.
4 Jamie Pherous does not participate in the Long-Term Incentive Scheme. The preliminary estimate of his STI was $200,000, however, Jamie Pherous offered, and the Board agreed, to forego 50% of his STI.
5 Payments made to Steve Fleming, Larry Lo, Chris Thelen and Debbie Carling are in local currency and converted at average exchange rates.

34 35
Directors’ Report (continued)Remuneration report (continued)
4. Details of Executive KMP remuneration (continued)Short-term incentive (STI)The key components of the Group’s STI structure as follows:
Purpose The STI scheme is designed to reward and recognise outstanding employee performance, provided the Group can also demonstrate it has created value for its shareholders.
Participants All Executive KMP participate in the STI scheme.
Performance conditions
For the year ended 30 June 2019, the key performance indicators (KPIs) linked to STI plans were based on the Group objectives, with the key financial metric being consolidated Earnings before Interest, Tax, Depreciation and Amortisation (EBITDA). Other KPIs’ include the achievement of business plans, client retention and satisfaction, and staff satisfaction. All KPIs are measurable and have performance benchmarks.
Structure If the Group achieves a pre-determined adjusted EBITDA target set by the Remuneration Committee, a short-term incentive (“STI”) pool is available to executives and other eligible participants. The adjusted EBITDA target set by the Remuneration Committee represents EBITDA adjusted for non-recurring items, currency movements, and items such as merger and acquisition activity.
Executives have a target STI opportunity depending on the accountabilities of the role and impact on the organisation or business unit performance. The average maximum target bonus opportunity for Executive KMP in the 2019 year was approximately 44% (2018: 47%) of base fixed remuneration and benefits.
Payments made under the STI plan are highly correlated with the Group’s financial results. The relationship between STI and Corporate Travel Management Ltd’s performance over the last 5 years is set out in the following table.
Item 2019 2018 2017 2016 2015
Profit for the year attributable to owners of Corporate Travel Management Ltd ($’000) 86,235 76,712 54,556 42,134 26,367
Basic earnings per share (cents) 79.6 72.4 53.5 43.2 28.1
Dividend payments ($’000) 42,263 34,964 27,554 18,539 12,609
Dividend payout ratio (%)* 49.0% 45.6% 50.5% 44.0% 47.8%
Increase/(decrease) in share price % -17.6% 19.0% 63.9% 35.8% 60.6%
Total KMP STI as a percentage of profit/(loss) for the year (%) 1.6% 1.9% 2.2% 2.1% 2.7%
* Dividend payout ratio based on dividends paid in respect of the financial year.
For each short term incentive included in the table on page 33, the percentage split of the available bonus awarded and forfeited is disclosed in the following table.
Name2019 2018
Awarded%
Forfeited%
Awarded%
Forfeited%
Jamie Pherous 40% 60% 80% 20%
Laura Ruffles 90% 10% 89% 11%
Steve Fleming 60% 40% 80% 20%
Larry Lo 60% 40% 80% 20%
Chris Thelen 30% 70% 50% 50%
Debbie Carling 80% 20% 80% 20%
Greg McCarthy 80% 20% - -
Directors’ Report (continued)Remuneration report (continued)
4. Details of Executive KMP remuneration (continued)Long-term incentive (LTI)The Group introduced a long-term incentive scheme using a Share Appreciation Rights Plan during the 2013 financial year. The key components of the Plan as follows.
Purpose The purpose of the LTI scheme at CTM is to provide long-term incentives to senior executives to deliver long-term shareholder returns.
Eligibility Participation in the plan is at the Board’s absolute discretion and no individual has a contractual right to participate in the plan.
Instrument Awards under this plan are made in the form of Share Appreciation Rights (SARs).
Performance period
Performance is measured over a three-year period. The FY19 grant has a performance period commencing 1 July 2018 and ending 30 June 2021.
Performance hurdles
The SARs are subject to average Earnings per Share (EPS) growth over the performance period, with target performance being set at 10% average EPS growth.
Vesting The SARs will only vest if the performance hurdles are met and the employee remains in service. Once vested, a participant will be deemed to have automatically exercised all vested SARs and CTM will settle in line with the SARs Plan.
Upon vesting, the conversion of a SAR to an equity or cash based settlement, is determined using a formula referencing the relevant share prices of CTM, the number of SARs exercised, and is at the Board’s sole discretion.
Grants made during FY19 will vest on a scaled basis as follows:
Minimum EPS growth from 1 July 2018 to 30 June 2021
Portion of SARs that become performance qualified
80% achievement of target growth rate (i.e. 8% EPS growth) 50% of SARs
90% achievement of target growth rate (i.e. 9% EPS growth) 75% of SARs
100% achievement of target growth rate (i.e. 10% EPS growth) 100% of SARs
SARs will become performance qualified on a straight-line basis where average EPS growth falls between 8-10% EPS growth.
Termination/ forfeiture
Upon termination of employment, all unvested SARs will automatically be forfeited by the participant, unless the Board otherwise determines, in its absolute discretion, to permit some or all of the SARs to vest.
Dilution Dilution that may result from securities being issued under CTM’s LTI plan is capped at the limit set out in ASIC Class Order 14/1000, which provides that the number of unissued securities under those plans must not exceed five per cent of the total number of the securities of that class at the time of the relevant offer.
Hedging Consistent with the Corporations Act 2001, participants are prohibited from hedging their unvested performance rights.

36 37
Directors’ Report (continued)Remuneration report (continued)
4. Details of Executive KMP remuneration (continued)The following table sets out details of the SARs granted to key management personnel during the financial year under the 2019 allocation and vested under the 2016 allocation, as well as details of SARs granted under prior year awards that have not yet vested as at 30 June 2019.
Year ofgrant
Year inwhichrights
may vest
Numberof rightsgranted
Value perright at
grant date
Number ofrights
vestedduring the
yearVested
%Forfeited
%
Max valueyet to
vest$
Laura Ruffles
2019 2022 150,000 $4.80 - - - 720,690
2018 2021 150,000 $2.49 - - - 374,244
2017 2020 200,000 $1.62 - - - 324,734
2016 2019 100,000 $1.26 100,000 100% - -
Steve Fleming
2019 2022 75,000 $4.80 - - - 360,345
2018 2021 75,000 $2.49 187,122
2017 2020 75,000 $1.62 - - - 121,775
2016 2019 75,000 $1.26 75,000 100% - -
Larry Lo
2019 2022 75,000 $4.80 - - - 360,345
2018 2021 75,000 $2.49 187,122
2017 2020 75,000 $1.62 - - - 121,775
2016 2019 75,000 $1.26 75,000 100% - -
Chris Thelen
2019 2022 75,000 $4.80 - - - 360,345
2018 2021 75,000 $2.49 187,122
2017 2020 75,000 $1.62 - - - 121,775
2016 2019 - - - - - -
Debbie Carling
2019 2022 75,000 $4.80 - - - 360,345
2018 2021 75,000 $2.49 187,122
2017 2020 75,000 $1.62 - - - 121,775
2016 2019 40,000 $1.26 40,000 100% - -
Greg McCarthy 2019 2022 100,000 $4.80 - - - 480,460
Directors’ Report (continued)Remuneration report (continued)
5. Contractual arrangements for Executive KMPEach Executive KMP member, including the Managing Director, has a formal contract, known as a service agreement. There were no changes to the service agreements for Executive KMP in FY19. Summary of the notice period required for Executive KMP and the Group are included in the table below.
Executive KMP Contract duration
Notice period by KMP
Notice period by Group Termination payment
Jamie Pherous No fixed duration 6 months 6 months Combination of notice and payment in lieu totalling no less than 6 months.
Laura Ruffles No fixed duration 24 weeks 24 weeks Combination of notice and payment in lieu totalling no less than 24 weeks.
Steve Fleming1 No fixed duration 6 months 6 months Combination of notice and payment in lieu totalling no less than 6 months.
Neale O’Connell1 No fixed duration 12 weeks 12 weeks Combination of notice and payment in lieu totalling no less than 12 weeks.
Larry Lo No fixed duration 6 months 6 months Combination of notice and payment in lieu totalling no less than 6 months.
Chris Thelen No fixed duration 6 months 6 months Combination of notice and payment in lieu totalling no less than 6 months.
Debbie Carling No fixed duration 3 months 3 months Combination of notice and payment in lieu totalling no less than 3 months.
Greg McCarthy No fixed duration 12 weeks 12 weeks Combination of notice and payment in lieu totalling no less than 12 weeks.
1 Steve Fleming ceased as an executive KMP on 9 July 2019. Neale O’Connell commenced as an executive KMP on 9 July 2019.
Termination payments are assessed on a case-by-case basis and are capped by law. As is the case for all employees, KMP employment may be terminated immediately by serious misconduct.
6. Non-Executive Director ArrangementsIn contrast to Executive KMP remuneration, the remuneration of CTM’s Non-Executive Directors is not linked to performance, which is consistent with Non-Executive Directors being responsible for objective and independent oversight of the Group.
Non-executive Directors’ fees and payments are reviewed annually by the Board. The Chairman’s fees are determined independently to the fees of Non-Executive Directors. The Chairman is not present at any discussions relating to determination of his own remuneration.
Non-Executive Directors have not received any fees other than those described in this section, and do not receive bonuses or any other incentive payments or retirement benefits. Non-Executive Directors are reimbursed for expenses properly incurred in performing their duties as a Director of CTM.
Directors’ feesThe current base fees were last increased with effect from 25 September 2017.
Non-Executive Directors’ fees are determined within an aggregate Directors’ fee pool limit, which is periodically recommended for approval by shareholders. The maximum approved amount currently stands at $700,000 (2018: $700,000).

38 39
Directors’ Report (continued)Remuneration report (continued)
6. Non-Executive Director Arrangements (continued)Details of the remuneration of the Non-Executive Directors of the Group are set out in the following table.
Name Year Director fees Superannuation* Total
Ewen Crouch AM^ 2019 59,010 5,133 64,143
Tony Bellas^2019 102,846 9,770 112,616
2018 134,904 12,816 147,720
Stephen Lonie2019 110,000 10,450 120,450
2018 107,342 10,198 117,540
Greg Moynihan2019 110,000 10,450 120,450
2018 107,342 10,198 117,540
Admiral Robert J. Natter**2019 144,618 - 144,618
2018 131,797 - 131,797
Total Non-Executive Director Remuneration
2019 526,474 35,803 562,277
2018 481,385 33,212 514,597
^ Tony Bellas resigned as Chairman on 25 March 2019. Ewen Crouch AM was appointed as Chairman on 25 March 2019. The amounts represent remuneration paid to/from the respective dates.* Superannuation contributions required under the Australian superannuation guarantee legislation are made and are deducted from the Directors’ overall fee entitlements.** Payments made to Admiral Natter are in US Dollars and converted at average exchange rates.
7. Additional required disclosuresEquity instruments held by key management personnel
The number of ordinary shares held during the financial year by CTM’s directors and KMP is set out in the following table:
Restated
Ordinary sharesBalance
at30 June 2018
Purchased DisposedReceived on
vesting of rights
Otherchanges
during theyear
Balanceat
30 June 2019
Non-Executive Directors
Ewen Crouch AM - 5,000 - - - 5,000
Tony Bellas 220,836 - (180,836) - - N/A2
Stephen Lonie 254,312 - - - - 254,312
Greg Moynihan 254,312 - - - - 254,312
Admiral Robert J. Natter 107,200 12,000 - - - 119,200
Executive Directors
Jamie Pherous 21,011,8931 255,000 - - - 21,266,893
Laura Ruffles 118,124 - - 59,791 - 177,915
Other key management personnel of the Group
Steve Fleming 25,131 15,000 - 44,843 - 84,974
Larry Lo 94,433 - - 44,843 - 139,276
Debbie Carling 22,844 (20,000) 23,917 - 26,761
Chris Thelen 197,099 - 233,9083 431,007
Greg McCarthy - 85,6274 85,627
Directors’ Report (continued)Remuneration report (continued)
7. Additional required disclosures (continued) 1 As advised to the ASX on 1 April 2019, Mr Jamie Pherous is a director and 25% shareholder of Shamiz Pty Ltd which held 526,893 CTM shares at 30 June 2019. The balance at 30 June 2018 has been restated to reflect this. 2 Tony Bellas ceased being a director on 25 March 2019.3 Equity portion of deferred consideration payment in relation to the Chambers Travel acquisition.4 Equity portion of consideration paid for acquisition of SCT Travel Limited on 1 July 2018.
All equity transactions with key management personnel have been entered into under terms and conditions no more favourable than those the Group would have adopted if dealing at arm’s length.
Shares under optionThere are currently no unissued ordinary shares of CTM under option. No share options were granted as equity compensation benefits during the financial year (2018: nil).
Other transactions and balances with key management personnelDeferred consideration balance of $13.5 million was paid to Chris Thelen in relation to the Chambers Travel acquisition. No remaining deferred consideration is payable to Chris Thelen. Rental expense of $50,805 was also paid to Chris Thelen.
A balance payable to Greg McCarthy is included as consideration payable at 30 June 2019. This payable relates to the acquisition of Platinum Travel has been split between acquisition payable and contingent consideration payable. A working capital adjustment of $44,000 was paid to Greg McCarthy in relation to the Platinum Travel acquisition.
Directors of the Group hold other directorships in public corporations, as detailed in the Directors’ Report. Where any of these related entities are clients of the Group, the arrangements are on similar terms to other clients.
Directors and executives can receive travel and event management services. All transactions are made on normal terms and conditions and at market rates. There are no amounts outstanding in relation to these transactions at 30 June 2019.
Insurance of officers and indemnitiesAn Officers’ Deed of Indemnity, Access and Insurance is in place for Directors, the Company Secretaries and some other key executives. The liabilities covered by the insurance include legal costs that may be incurred in defending civil or criminal proceedings that may be brought against the Officers in their capacity as Officers of the Company or its controlled entities. Disclosure of premiums paid is prohibited under the insurance contract.
Proceedings on behalf of the companyNo person has applied to the Court, under section 237 of the Corporations Act 2001, for leave to bring proceedings on behalf of the Group, or to intervene in any proceedings to which the Group is a party, for the purpose of taking responsibility on behalf of the Group for all or part of those proceedings.
No proceedings have been brought or intervened in on behalf of the Group with leave of the Court under section 237 of the Corporations Act 2001.
Non-audit servicesThe Group may decide to employ the auditor on assignments in addition to its statutory audit duties, where the auditor’s expertise and experience with the Group are important.
Details of the amounts paid or payable to PricewaterhouseCoopers, the auditor of the consolidated entity, for audit and non-audit services provided during the year are set out in note 27.
The Board has considered the position and, in accordance with the advice received from the Audit Committee, is satisfied that the provision of non-audit services is compatible with the general standard of independence for auditors imposed by the Corporations Act 2001. The Directors are satisfied that the provision of non-audit services by the auditor did not compromise the auditor independence requirements of the Corporations Act 2001 as none of the services undermine the general principles relating to auditor independence as set out in APES110 Code of Ethics for Professional Accountants.
Auditor’s independence declarationA copy of the auditors’ independence declaration, as required under section 307C of the Corporations Act 2001, is appended to this Directors’ Report.

40 41
Directors’ Report (continued)Rounding of amounts
The Group is of a kind referred to in Class Order 2016/191, issued by the Australian Securities and Investments Commission, relating to the ‘’rounding off’’ of amounts in the Directors’ Report. Amounts in the Directors’ Report have been rounded off in accordance with that Class Order to the nearest thousand dollars or in certain cases, to the nearest dollar.
Signed in accordance with a resolution of the Directors.
Mr Ewen Crouch AMChairman
Brisbane, 21 August, 2019
Mr Jamie PherousManaging Director
PricewaterhouseCoopers, ABN 52 780 433 757 480 Queen Street, BRISBANE QLD 4000, GPO Box 150, BRISBANE QLD 4001 T: +61 7 3257 5000, F: +61 7 3257 5999, www.pwc.com.au
Liability limited by a scheme approved under Professional Standards Legislation. 26
Auditor’s Independence Declaration As lead auditor for the audit of Corporate Travel Management Limited for the year ended 30 June 2019, I declare that to the best of my knowledge and belief, there have been:
(a) no contraventions of the auditor independence requirements of the Corporations Act 2001 in relation to the audit; and
(b) no contraventions of any applicable code of professional conduct in relation to the audit.
This declaration is in respect of Corporate Travel Management Limited and the entities it controlled during the period.
Michael Crowe Brisbane Partner PricewaterhouseCoopers
21 August 2019

42 43
Corporate Governance StatementThe Board and management of Corporate Travel Management Limited are committed to achieving and demonstrating the highest standards of corporate governance. Corporate Travel Management Limited has reviewed its corporate governance practices against the Corporate Governance Principles and Recommendations (3rd edition) published by the ASX Corporate Governance Council.
The 2019 corporate governance statement is dated as at 30 June 2019 and reflects the corporate governance practices in place throughout the 2019 financial year. The 2019 corporate governance statement was approved by the Board on 21 August 2019. A description of the Group’s current corporate governance practices is set out in the Group’s corporate governance statement which can be viewed at investor.travelctm.com.au/corporate-governance/.
Consolidated Statement of Comprehensive IncomeFor the year ended 30 June 2019
2019 2018
Note $’000 $’000
Revenue 2 446,739 371,030
Other income 2,744 1,206
Total revenue and other income 449,483 372,236
Operating expenses
Employee benefits (225,394) (186,214)
Occupancy (18,557) (12,429)
Depreciation and amortisation 6 (20,348) (17,833)
Information technology and telecommunications (38,790) (31,281)
Travel and entertainment (5,542) (4,554)
Administrative and general (17,148) (13,029)
Total operating expenses (325,779) (265,340)
Finance costs 6 (2,765) (3,226)
Profit before income tax 120,939 103,670
Income tax expense 5 (31,466) (23,088)
Profit for the year 89,473 80,582
Profit attributable to:
Owners of Corporate Travel Management Limited 86,235 76,712
Non-controlling interests 23(b) 3,238 3,870
89,473 80,582
Other comprehensive income
Items that may be reclassified to profit or loss:
Exchange differences on translation of foreign operations 19,339 16,266
Changes in the fair value of cash flow hedges (447) 87
Other comprehensive income for the period, net of tax 18,892 16,353
Total comprehensive income for the year 108,365 96,935
Total comprehensive income for the year attributable to:
Owners of Corporate Travel Management Limited 104,424 92,359
Non-controlling interests 3,941 4,576
108,365 96,935
Earnings per share for profit from continuing operations attributable to the ordinary equity holders of the company
- Basic (cents per share) 3 79.6 72.4
- Diluted (cents per share) 3 79.3 71.4
The above Consolidated Statement of Comprehensive Income should be read in conjunction with the accompanying notes.

44 45
Consolidated Statement of Financial PositionAs at 30 June 2019
2019 2018
Note $’000 $’000
ASSETS
Current assets
Cash and cash equivalents 9 138,791 84,297
Trade and other receivables 10 328,771 252,237
Other assets 19 10,576 4,203
Total current assets 478,138 340,737
Non-current assets
Plant and equipment 20 13,328 6,118
Intangible assets 8 506,690 451,597
Deferred tax assets 5 5,693 6,389
Total non-current assets 525,711 464,104
TOTAL ASSETS 1,003,849 804,841
LIABILITIES
Current liabilities
Trade and other payables 11 316,753 253,621
Borrowings 12 19,205 14,677
Income tax payable 5,971 7,310
Provisions 13 25,905 15,786
Total current liabilities 367,834 291,394
Non-current liabilities
Trade and other payables 11 4,158 2,872
Borrowings 12 20,085 29,301
Provisions 13 4,488 1,833
Deferred tax liabilities 5 14,802 7,949
Total non-current liabilities 43,533 41,955
TOTAL LIABILITIES 411,367 333,349
NET ASSETS 592,482 471,492
EQUITY
Contributed equity 14(a) 364,368 301,747
Reserves 14(b) 27,001 19,369
Retained earnings 14(c) 177,190 133,218
Capital and reserves attributed to owners of the company 568,559 454,334
Non-controlling interests – equity 23(b) 23,923 17,158
TOTAL EQUITY 592,482 471,492
The above Consolidated Statement of Financial Position should be read in conjunction with the accompanying notes.
Consolidated Statement of Changes in EquityFor the year ended 30 June 2019
Note Contributed Equity
Retained Earnings
Other Reserves Total
Non- Controlling
InterestsTotal Equity
$’000 $’000 $’000 $’000 $’000 $’000
Balance at 30 June 2017 281,847 91,470 12,999 386,316 15,088 401,404
Profit for the year - 76,712 - 76,712 3,870 80,582
Other comprehensive income (net of tax)
- - 15,647 15,647 707 16,354
Total comprehensive income for the year
- 76,712 15,647 92,359 4,577 96,936
Transactions with owners in their capacity as owners:
Shares issued (net of transaction costs) 14(a) 19,900 - - 19,900 - 19,900
Dividends paid 4 - (34,964) - (34,964) (2,507) (37,471)
Share-based payments - - (9,277) (9,277) - (9,277)
19,900 (34,964) (9,277) (24,341) (2,507) (26,848)
Balance at 30 June 2018 301,747 133,218 19,369 454,334 17,158 471,492
Profit for the year - 86,235 - 86,235 3,238 89,473
Other comprehensive income (net of tax)
- - 18,189 18,189 703 18,892
Total comprehensive income for the year
- 86,235 18,189 104,424 3,941 108,365
Transactions with owners in their capacity as owners:
Shares issued (net of transaction costs) 14(a) 62,621 - - 62,621 - 62,621
Dividends paid 4 - (42,263) - (42,263) (3,008) (45,271)
Share-based payments - - (10,557) (10,557) - (10,557)
Non-controlling interests acquisition of subsidiary
- - - - 5,560 5,560
Non-controlling interests disposal of subsidiary
- - - - 272 272
62,621 (42,263) (10,557) 9,801 2,824 12,625
Balance at 30 June 2019 364,368 177,190 27,001 568,559 23,923 592,482
The above Consolidated Statement of Changes in Equity should be read in conjunction with the accompanying notes.

46 47
Consolidated Statement of Cash FlowsFor the year ended 30 June 2019
2019 2018
Note $’000 $’000
Cash flows from operating activities
Receipts from customers (inclusive of consumption tax) 455,131 337,468
Payments to suppliers and employees (inclusive of consumption tax) (292,252) (217,621)
Transaction costs relating to acquisition (634) (151)
Interest received 292 131
Finance costs (2,582) (2,584)
Income tax paid (26,478) (22,851)
Net cash flows from operating activities 9 133,477 94,392
Cash flows from investing activities
Payment for plant and equipment 20 (8,138) (2,676)
Payment for intangibles 8 (18,770) (11,057)
Proceeds from sale of plant and equipment 13 16
Purchase of controlled entities, deferred consideration 7 (15,835) (33,476)
Payments relating to purchase of controlled entities, net of cash acquired 7 (30,777) (3,683)
Proceeds from sale of controlled entities 1,546 -
Net cash flows from investing activities (71,961) (50,876)
Cash flows from financing activities
Proceeds from issue of new shares 14 40,016 -
Share issue transaction costs 14 (796) (38)
Proceeds from borrowings 198,537 114,917
Repayments of borrowings (206,963) (117,995)
Release of secured deposits 4,991 -
Dividends paid to company’s shareholders 4 (42,263) (34,964)
Dividends paid to non-controlling interests in subsidiaries (3,008) (2,507)
Net cash flows from financing activities (9,486) (40,587)
Net increase/(decrease) in cash and cash equivalents 52,030 2,929
Effects of exchange rate changes on cash and cash equivalents 2,464 2,151
Cash and cash equivalents at beginning of year 84,297 79,217
Cash and cash equivalents at end of year 138,791 84,297
The above Consolidated Statement of Cash Flows should be read in conjunction with the accompanying notes.
Notes to the Consolidated Financial StatementsBasis of preparation . . . . . . . . . . . . . . . . . . . . . . . . . . . . . . . . . . . . . . . . . . . . . . . . . . . . . . . . . . . . . . . . . . . . . . . . . . . . . . . . . . . . .48
Critical estimates, assumptions and judgements . . . . . . . . . . . . . . . . . . . . . . . . . . . . . . . . . . . . . . . . . . . . . . . . . . . . . . . . . .49
Performance . . . . . . . . . . . . . . . . . . . . . . . . . . . . . . . . . . . . . . . . . . . . . . . . . . . . . . . . . . . . . . . . . . . . . . . . . . . . . . . . . . . . . . . . . . . .50This section explains the results and performance of the Group for the year ended 30 June 2019. It provides a breakdown of those individual line items in the financial statements, that the Directors consider most relevant in the context of the operations of the Group, or where there have been significant changes that required specific explanations. It also provides detail on how the performance of the Group has translated into returns to shareholders.
1. Segment reporting . . . . . . . . . . . . . . . . . . . . . . . . . . . . . . . . . . . . . . . . . . . . . . . . . . . . . . . . . . . . . . . . . . . . . . . . . . . . . . . . . . . . . . . . . . . 502. Revenue . . . . . . . . . . . . . . . . . . . . . . . . . . . . . . . . . . . . . . . . . . . . . . . . . . . . . . . . . . . . . . . . . . . . . . . . . . . . . . . . . . . . . . . . . . . . . . . . . . . . . . 523. Earnings per share . . . . . . . . . . . . . . . . . . . . . . . . . . . . . . . . . . . . . . . . . . . . . . . . . . . . . . . . . . . . . . . . . . . . . . . . . . . . . . . . . . . . . . . . . . . . 534. Dividends paid and proposed . . . . . . . . . . . . . . . . . . . . . . . . . . . . . . . . . . . . . . . . . . . . . . . . . . . . . . . . . . . . . . . . . . . . . . . . . . . . . . . . . 545. Income tax expense . . . . . . . . . . . . . . . . . . . . . . . . . . . . . . . . . . . . . . . . . . . . . . . . . . . . . . . . . . . . . . . . . . . . . . . . . . . . . . . . . . . . . . . . . . 556. Expenses . . . . . . . . . . . . . . . . . . . . . . . . . . . . . . . . . . . . . . . . . . . . . . . . . . . . . . . . . . . . . . . . . . . . . . . . . . . . . . . . . . . . . . . . . . . . . . . . . . . . . 58
Group Structure . . . . . . . . . . . . . . . . . . . . . . . . . . . . . . . . . . . . . . . . . . . . . . . . . . . . . . . . . . . . . . . . . . . . . . . . . . . . . . . . . . . . . . . . 59This section explains significant aspects of the Group structure and how changes have affected the financial position and performance of the Group.
7. Business combinations . . . . . . . . . . . . . . . . . . . . . . . . . . . . . . . . . . . . . . . . . . . . . . . . . . . . . . . . . . . . . . . . . . . . . . . . . . . . . . . . . . . . . . . 598. Intangible assets . . . . . . . . . . . . . . . . . . . . . . . . . . . . . . . . . . . . . . . . . . . . . . . . . . . . . . . . . . . . . . . . . . . . . . . . . . . . . . . . . . . . . . . . . . . . . . 61
Capital . . . . . . . . . . . . . . . . . . . . . . . . . . . . . . . . . . . . . . . . . . . . . . . . . . . . . . . . . . . . . . . . . . . . . . . . . . . . . . . . . . . . . . . . . . . . . . . . . 63A core part of the Group’s operations is to maintain a strong financial position and low levels of external debt. This section explains how the Group has performed in areas relating to capital management.
9. Cash and cash equivalents . . . . . . . . . . . . . . . . . . . . . . . . . . . . . . . . . . . . . . . . . . . . . . . . . . . . . . . . . . . . . . . . . . . . . . . . . . . . . . . . . . . . 6310. Trade and other receivables . . . . . . . . . . . . . . . . . . . . . . . . . . . . . . . . . . . . . . . . . . . . . . . . . . . . . . . . . . . . . . . . . . . . . . . . . . . . . . . . . . . 6411. Trade and other payables . . . . . . . . . . . . . . . . . . . . . . . . . . . . . . . . . . . . . . . . . . . . . . . . . . . . . . . . . . . . . . . . . . . . . . . . . . . . . . . . . . . . . 6612. Borrowings and contingent liabilities . . . . . . . . . . . . . . . . . . . . . . . . . . . . . . . . . . . . . . . . . . . . . . . . . . . . . . . . . . . . . . . . . . . . . . . . . . 6713. Provisions . . . . . . . . . . . . . . . . . . . . . . . . . . . . . . . . . . . . . . . . . . . . . . . . . . . . . . . . . . . . . . . . . . . . . . . . . . . . . . . . . . . . . . . . . . . . . . . . . . . . 6914. Contributed equity, reserves and retained earnings . . . . . . . . . . . . . . . . . . . . . . . . . . . . . . . . . . . . . . . . . . . . . . . . . . . . . . . . . . . . 71
Risk . . . . . . . . . . . . . . . . . . . . . . . . . . . . . . . . . . . . . . . . . . . . . . . . . . . . . . . . . . . . . . . . . . . . . . . . . . . . . . . . . . . . . . . . . . . . . . . . . . . 73This section discusses the Group’s exposure to various financial risks, explains how these affect the Group’s financial position and performance, and what the Group does to manage these risks.
15. Impairment testing of goodwill . . . . . . . . . . . . . . . . . . . . . . . . . . . . . . . . . . . . . . . . . . . . . . . . . . . . . . . . . . . . . . . . . . . . . . . . . . . . . . . 7316. Financial risk management . . . . . . . . . . . . . . . . . . . . . . . . . . . . . . . . . . . . . . . . . . . . . . . . . . . . . . . . . . . . . . . . . . . . . . . . . . . . . . . . . . . 75
Unrecognised Items . . . . . . . . . . . . . . . . . . . . . . . . . . . . . . . . . . . . . . . . . . . . . . . . . . . . . . . . . . . . . . . . . . . . . . . . . . . . . . . . . . . . 78This section provides information about items that are not recognised in the financial statements, but could potentially have a significant impact on the Group’s financial position and performance.
17. Commitments . . . . . . . . . . . . . . . . . . . . . . . . . . . . . . . . . . . . . . . . . . . . . . . . . . . . . . . . . . . . . . . . . . . . . . . . . . . . . . . . . . . . . . . . . . . . . . . . 7818. Events occurring after the reporting period . . . . . . . . . . . . . . . . . . . . . . . . . . . . . . . . . . . . . . . . . . . . . . . . . . . . . . . . . . . . . . . . . . . . 78
Other Items . . . . . . . . . . . . . . . . . . . . . . . . . . . . . . . . . . . . . . . . . . . . . . . . . . . . . . . . . . . . . . . . . . . . . . . . . . . . . . . . . . . . . . . . . . . . 79This section provides information on items which require disclosure to comply with Australian Accounting Standards and other regulatory pronouncements, however are not considered critical in understanding the financial performance of the Group.
19. Other assets . . . . . . . . . . . . . . . . . . . . . . . . . . . . . . . . . . . . . . . . . . . . . . . . . . . . . . . . . . . . . . . . . . . . . . . . . . . . . . . . . . . . . . . . . . . . . . . . . . 7920. Plant and equipment . . . . . . . . . . . . . . . . . . . . . . . . . . . . . . . . . . . . . . . . . . . . . . . . . . . . . . . . . . . . . . . . . . . . . . . . . . . . . . . . . . . . . . . . . 7921. Fair value measurement . . . . . . . . . . . . . . . . . . . . . . . . . . . . . . . . . . . . . . . . . . . . . . . . . . . . . . . . . . . . . . . . . . . . . . . . . . . . . . . . . . . . . . 8022. Share-based payments . . . . . . . . . . . . . . . . . . . . . . . . . . . . . . . . . . . . . . . . . . . . . . . . . . . . . . . . . . . . . . . . . . . . . . . . . . . . . . . . . . . . . . . 8023. Interest in other entities . . . . . . . . . . . . . . . . . . . . . . . . . . . . . . . . . . . . . . . . . . . . . . . . . . . . . . . . . . . . . . . . . . . . . . . . . . . . . . . . . . . . . . . 8224. Related party transactions . . . . . . . . . . . . . . . . . . . . . . . . . . . . . . . . . . . . . . . . . . . . . . . . . . . . . . . . . . . . . . . . . . . . . . . . . . . . . . . . . . . . 8425. Parent entity financial information . . . . . . . . . . . . . . . . . . . . . . . . . . . . . . . . . . . . . . . . . . . . . . . . . . . . . . . . . . . . . . . . . . . . . . . . . . . . 85 26. Deed of cross guarantee . . . . . . . . . . . . . . . . . . . . . . . . . . . . . . . . . . . . . . . . . . . . . . . . . . . . . . . . . . . . . . . . . . . . . . . . . . . . . . . . . . . . . . 8727. Auditors’ remuneration . . . . . . . . . . . . . . . . . . . . . . . . . . . . . . . . . . . . . . . . . . . . . . . . . . . . . . . . . . . . . . . . . . . . . . . . . . . . . . . . . . . . . . . 8928. Summary of significant account policies . . . . . . . . . . . . . . . . . . . . . . . . . . . . . . . . . . . . . . . . . . . . . . . . . . . . . . . . . . . . . . . . . . . . . . . 8929. Changes in accounting policies . . . . . . . . . . . . . . . . . . . . . . . . . . . . . . . . . . . . . . . . . . . . . . . . . . . . . . . . . . . . . . . . . . . . . . . . . . . . . . . 91

48 49
NOTES TO THE CONSOLIDATED FINANCIAL STATEMENTS
Basis of preparation
(a) Basis of consolidationThe consolidated financial statements comprise the financial statements of Corporate Travel Management Limited and its controlled entities (“CTM” or “the Group”).
Subsidiaries are all entities over which the Group has control. The Group controls an entity when the Group is exposed to, or has right to, variable returns from its involvement with the entity and has ability to affect those returns through its power to direct the activities of the entity.
The financial statements of subsidiaries are prepared for the same reporting period as the parent company, using consistent accounting policies. Adjustments are made to bring into line any dissimilar accounting policies that may exist.
In preparing the consolidated financial statements, all intercompany balances and transactions, income and expenses and profit and losses resulting from intra-Group transactions have been eliminated in full.
Subsidiaries are fully consolidated from the date on which control is transferred to the Group and deconsolidated from the date that control ceases.
(b) Foreign currency translation(i) Functional and presentation currencyItems included in each of the Group entities’ financial statements are measured using the currency of the primary economic environment in which the entity operates (‘the functional currency’). The consolidated financial statements are presented in Australian dollars, which is the Group’s functional and presentation currency.
(ii) Transactions and balancesForeign currency transactions are translated into the functional currency using the exchange rates prevailing at the transaction dates. Foreign exchange gains and losses resulting from the settlement of such transactions and from the translation at year-end exchange rates of monetary assets and liabilities denominated in foreign currencies are recognised in the profit and loss in the Consolidated Statement of Comprehensive Income, except when deferred in equity as qualifying cash flow hedges and qualifying net investment hedges.
Translation differences on non-monetary financial assets and liabilities, such as equities held at fair value through profit or loss, are recognised in profit or loss in the Consolidated Statement of Comprehensive Income as part of the fair value gain or loss. Translation differences on non-monetary financial assets, such as equities classified as available-for-sale financial assets, are included in the fair value reserve in other comprehensive income.
(iii) Foreign operationsThe results and financial position of all the foreign operations that have functional currencies different to the presentation currencies are translated into the presentation currency as follows:
• Assets and liabilities for each Consolidated Statement of Financial Position item presented are translated at the closing rate at the date of that statement;
• Income and expenses for each profit and loss item in the Consolidated Statement of Comprehensive Income are translated at average exchange rates; and
• All resulting exchange differences are recognised as a separate component of equity.
Exchange differences arising from the translation of any net investment in foreign operations and of borrowings and other financial instruments designated as hedges of such investments are recognised in other comprehensive income. When a foreign operation is sold or any borrowings forming part of the net investment are repaid, a proportionate share of such exchange differences is recognised in the profit and loss in the Consolidated Statement of Comprehensive Income as part of the gain or loss on sale.
Goodwill and fair value adjustments arising on the acquisition of foreign operations are treated as the foreign operations’ assets and liabilities and translated at the closing rate.
NOTES TO THE CONSOLIDATED FINANCIAL STATEMENTS
Critical estimates, assumptions and judgements
Estimates and judgements are continually evaluated and are based on historical experience and other factors, including expectations of future events that may have a financial impact on the entity and that are considered to be reasonable under the circumstances.
In the process of applying the Group’s accounting policies, management is required to exercise judgement. Those judgements involving estimations that may have an effect on the amounts recognised in the financial statements.
The Group makes estimates, assumptions and judgements concerning the future. The resulting accounting estimates will, by definition, seldom equal the related actual results. The judgements, estimates and assumptions that have a significant risk of causing a material adjustment to the carrying amounts of assets and liabilities within the next financial year are discussed in this report, as follows:
• Value of intangible assets relating to acquisitions: • Refer note 7 – Business combinations.
• Software developed or acquired not as part of a business combination: • Refer note 8 – Intangible assets.
• Impairment of goodwill: • Refer note 15 – Impairment testing of goodwill.

50 51
NOTES TO THE CONSOLIDATED FINANCIAL STATEMENTS: PERFORMANCE
This section explains the results and performance of the Group for the year ended 30 June 2019. It provides a breakdown of those individual line items in the financial statements, that the Directors consider most relevant in the context of the operations of the Group, or where there have been significant changes that required specific explanations. It also provides detail on how the performance of the Group has translated into returns to shareholders.
1. Segment reporting
(a) Description of segmentsThe operating segments are based on the reports reviewed by the group of key senior managers who assess performance and determine resource allocation.
The Chief Operating Decision Makers (“CODM”) are the Managing Director Jamie Pherous (MD), Global Chief Financial Officer Steve Fleming (CFO) and Global Chief Operating Officer Laura Ruffles (COO).
The CODM considers, organises and manages the business from a geographic perspective. The CODM has identified four operating segments being Travel Services Australia and New Zealand, Travel Services North America, Travel Services Asia, and Travel Services Europe. There are currently no non-reportable segments.
(b) Segment information provided to the Chief Operating Decision MakersThe CODM assess the performance of the operating segments based on a measure of underlying EBITDA. This measurement basis excludes the effects of the costs of acquisitions, acquisition related adjustments, and other non-recurring items during the year.
The segment information provided to the CODM for the reportable segments for the year ended 30 June 2019 is as follows:
Travel services
Travel services
Travel services
Travel services
June 2019
Australia and New Zealand
North America Asia Europe Other* Total
$’000 $’000 $’000 $’000 $’000 $’000
Total revenue from external parties 121,761 149,284 80,372 95,322 - 446,739
Underlying EBITDA 51,530 43,424 24,748 40,845 (10,457) 150,090
Total segment assets 142,367 285,996 295,202 267,386 12,898 1,003,849
Total assets include:
Non-current assets
Plant and equipment 2,803 2,016 7,096 1,413 - 13,328
Intangibles 66,958 218,204 67,898 150,154 3,476 506,690
Total segment liabilities 59,859 42,300 167,485 96,983 44,740 411,367
* The other segment represents the cost of the Group’s support service, created to support the operating segments and growth of the global business.
NOTES TO THE CONSOLIDATED FINANCIAL STATEMENTS: PERFORMANCE
1. Segment reporting (continued)
(b) Segment information provided to the Chief Operating Decision Makers (continued)
Travel services
Travel services
Travel services
Travel services
June 2018
Australia and New Zealand
North America Asia Europe Other* Total
$’000 $’000 $’000 $’000 $’000 $’000
Total revenue from external parties 108,519 127,003 53,816 81,692 - 371,030
Underlying EBITDA 44,038 37,888 19,541 34,232 (10,249) 125,450
Total segment assets 117,863 262,535 160,757 250,755 12,931 804,841
Total assets include:
Non-current assets
Plant and equipment 2,581 1,522 646 1,369 - 6,118
Intangibles 57,799 201,760 38,450 149,851 3,737 451,597
Total segment liabilities 49,292 34,334 88,371 84,708 76,644 333,349
* The other segment represents the cost of the Group’s support service, created to support the operating segments and growth of the global business.
Other segment information(i) Underlying EBITDA
The reconciliation of underlying EBITDA to operating profit before income tax is provided as follows:
2019 2018
$’000 $’000
Underlying EBITDA 150,090 125,450
Interest revenue 292 131
Finance costs (2,765) (3,226)
Depreciation (3,342) (2,045)
Amortisation (17,006) (15,788)
One off items:
Activist response costs (1,242) -
Hong Kong office restructure costs (4,152) -
Acquisition and other non-recurring items (936) (852)
Net profit before income tax from continuing operations 120,939 103,670
Accounting policyAASB 8 Operating Segments requires a ‘management approach’, under which segment information is presented on the same basis as that used for internal reporting purposes.
Operating segments are reported in a manner that is consistent with the internal reporting provided to the Chief Operating Decision Makers. The CODM has been identified as a group of executives, which is the committee that makes strategic decisions.
Goodwill is allocated by management to groups of cash-generating units on a segment level.

52 53
NOTES TO THE CONSOLIDATED FINANCIAL STATEMENTS: PERFORMANCE
2. Revenue(a) Disaggregation of revenue from contracts with customers
Travel services
Travel services
Travel services
Travel services
June 2019
Australia and New Zealand
North America Asia Europe Total
$’000 $’000 $’000 $’000 $’000
Transactional revenue 98,426 130,745 50,088 85,264 364,523
Volume based incentive revenue 23,042 16,207 30,197 8,421 77,867
Other revenue 293 2,332 87 1,637 4,349
Total revenue from external parties 121,761 149,284 80,372 95,322 446,739
Travel services
Travel services
Travel services
Travel services
June 2018
Australia and New Zealand
North America Asia Europe Total
$’000 $’000 $’000 $’000 $’000
Transactional revenue 88,055 113,447 36,565 73,425 311,492
Volume based incentive revenue 20,093 12,816 17,184 6,784 56,877
Other revenue 371 740 67 1,483 2,661
Total revenue from external parties 108,519 127,003 53,816 81,692 371,030
(b) Assets related to contracts with customersThe Group has contract assets related to contracts with customers:
2019 2018
$’000 $’000
Contract assets 31,035 23,810
Contract assets represent only current balances for amounts outstanding from suppliers for volume based incentive revenue.
(i) Significant changes in contract assets
The acquisition of Lotus Travel Limited on 2 October 2018 has contributed an additional $2.3 million to the closing contract asset balance. Other significant changes which have contributed to the movement in the contract asset balance relates to the overall growth of the business, which has impacted on the volume based incentive revenue. The period end contract asset balance reflect the payment cycle for each individual supplier.
Accounting policyTransactional revenueTransactional revenue is revenue derived from clients and suppliers generated from the provision of travel services to clients. The performance obligation is the facilitation of travel related services on behalf of clients. Transactional revenue is the fixed amount per client transaction and is recognised at either the ticketed date of the travel booking or on the date of travel, depending on the terms of the contract.
Transactional revenue also includes Pay Direct Commission, which is recognised when the performance obligation has been satisfied and the amount of the commission is highly probable, which is either upon receipt from the supplier or when it is confirmed commissionable by the supplier.
NOTES TO THE CONSOLIDATED FINANCIAL STATEMENTS: PERFORMANCE
2. Revenue (continued)
Accounting policy (continued)Volume based incentive revenueVolume based incentive revenue is revenue derived from contracts with suppliers. The revenue is variable and is dependent upon the achievement of contractual performance criteria specific to each supplier. Revenue is recognised over time and is measured as the amount that is deemed highly probable to be received, which has been determined using the most likely amount method and the Group’s experience with the contracts.
Other revenueOther revenue is recognised when the transfer of the promised goods or service to the customer has been completed. Other revenue includes third party licensing and development fees, interest revenue, rental income, and other minor operating revenue.
3. Earnings per share
The following information reflects the income and share data used in the basic and diluted earnings per share computations:
2019 2018
$’000 $’000
Net profit attributable to ordinary equity holders of Corporate Travel Management Limited 86,235 76,712
2019 2018
Shares Shares
Weighted average number of ordinary shares used as a denominator in calculating basic earnings per share 108,278,527 105,941,226
Adjustments for calculation of diluted earnings per share:
Share appreciation rights (i) 416,657 1,247,408
Deferred shares on acquisitions (ii) - 249,644
Weighted average number of ordinary shares and potential ordinary shares used as the denominator in calculating diluted earnings per share 108,695,184 107,438,278
(i) Share appreciation rightsShare Appreciation Rights (SARs) are considered to be potential ordinary shares. They have been included in the determination of diluted earnings per share as if the required hurdles would have been met based on the Group’s performance up to the reporting date, and to the extent to which they are dilutive. The options have not been included in the determination of basic earnings per share. Details relating to the options are set out in note 22.
(ii) Deferred sharesDeferred shares on acquisitions relates to shares offered as part of the contingent consideration component of a business combination. They have been included in the determination of diluted earnings per share as if the required hurdles would have been met based on the Group’s performance up to the reporting date, and to the extent to which they are dilutive. The deferred shares have not been included in the determination of basic earnings per share.
Accounting policyBasic earnings per share is calculated as net profit attributable to owners of the Group, adjusted to exclude any costs of servicing equity (other than dividends) divided by the weighted average number or ordinary shares, adjusted for any bonus element.
Diluted earnings per share is calculated as net profit attributable to members of the parent, divided by the weighted average number of ordinary shares and dilutive potential ordinary shares, adjusted for any bonus element, and adjusted for:• Costs of servicing equity (other than dividends);• The after tax effect of dividends and interest associated with dilutive potential ordinary shares that have been
recognised as expenses; and• Other non-discretionary changes in revenues or expenses during the period that would result from the
conversion into potential ordinary shares.

54 55
NOTES TO THE CONSOLIDATED FINANCIAL STATEMENTS: PERFORMANCE
4. Dividends paid and proposed
Ordinary shares2019 2018
$’000 $’000
Final ordinary dividend for the year ended 30 June 2018 of 21.0 cents per fully paid share paid on 4 October 2018 22,734 19,048
Interim ordinary dividend for the year ended 30 June 2019 of 18.0 cents per fully paid share paid on 12 April 2019 19,529 15,916
Total dividends paid 42,263 34,964
Approved by the Board of Directors on 21 August 2019 (not recognised as a liability as at 30 June 2019)
Final ordinary dividend for the year ended 30 June 2019 of 22.0 cents (2018: 21.0 cents) per fully paid share 23,868^ 22,698^
^ This dividend does not include shares issued post balance sheet date as part of the vesting of share appreciation rights.
The final dividend recommended after 30 June 2019 will be 50% franked out of existing franking credits, or out of franking credits arising from the payment of income tax in the year ending 30 June 2020.
Franking credit balance2019 2018
$’000 $’000
Franking credits available for subsequent reporting periods based on a tax rate of 30% (2018: 30%) 3,848 4,993
These amounts are calculated from the balance of the franking account as at the end of the reporting period, adjusted for franking credits and debits that will arise from the settlement of liabilities of or receivables for income tax and dividends after the end of the year.
Accounting policy Provision is made for the amount of any dividend declared, being appropriately authorised and no longer at the discretion of the entity, on or before the end of the financial year but not distributed at balance dates. Provisions are measured at the present value of management’s best estimate of the expenditure required to settle the present obligation at the end of the reporting period.
NOTES TO THE CONSOLIDATED FINANCIAL STATEMENTS: PERFORMANCE
5. Income tax expense
Income tax expense2019 2018
$’000 $’000
Current income tax
Current tax on profits for the year 29,693 25,420
Adjustments for current tax of prior periods (398) (1,012)
Deferred income tax
(Increase) decrease in deferred tax assets (2,514) 601
Increase (decrease) in deferred tax liabilities 4,685 (1,921)
Income tax expense 31,466 23,088
Numerical reconciliation of income tax expense to prima facie tax payable
Accounting profit before income tax 120,939 103,670
Tax at the Australian tax rate of 30% (2018: 30%) 36,282 31,101
Tax effect of amounts which are not deductible/(assessable) in calculating taxable income:
Non-deductible amounts 776 823
Other amounts (813) (36)
(37) 787
Recognition of temporary differences previously not brought to account 1,676 (58)
Difference in overseas tax rates (6,006) (5,150)
Changes in tax rates - (2,520)
Adjustments for current tax of prior periods (398) (1,012)
Research and development tax credit (36) (55)
Unrecognised tax losses (15) (5)
(4,779) (8,800)
Income tax expense 31,466 23,088
Deferred income tax2019 2018
$’000 $’000
Deferred tax assets
The balance comprises temporary differences attributable to:
Provisions 5,774 4,815
Employee benefits 3,641 6,638
Other 1,210 30
10,625 11,483
Set off against deferred tax liabilities (4,932) (5,094)
Net deferred tax assets 5,693 6,389
Deferred tax liabilities
The balance comprises temporary differences attributable to:
Depreciation/amortisation 15,000 8,708
Accrued income 2,493 2,383
Other 2,241 1,952
19,734 13,043
Set off against deferred tax assets (4,932) (5,094)
Net deferred tax liabilities 14,802 7,949

56 57
NOTES TO THE CONSOLIDATED FINANCIAL STATEMENTS: PERFORMANCE
5. Income tax expense (continued)
Deferred tax assets
At 1 July
Transfer from
income tax
receivable
(Charged)/ credited
in year via P&L
(Charged)/ credited
in year via equity
Acquisition of
subsidiaries
Change in FX rates At 30 June
$’000 $’000 $’000 $’000 $’000 $’000 $’000
2019
Provisions 4,815 - 703 (60) 179 137 5,774
Employee benefits 6,638 - 636 (3,633) - - 3,641
Other 30 - 1,175 - - 5 1,210
11,483 - 2,514 (3,693) 179 142 10,625
2018
Provisions 6,087 - (925) (398) - 51 4,815
Employee benefits 6,779 - 324 (465) - - 6,638
Other 30 - - - - - 30
12,896 - (601) (863) - 51 11,483
Deferred tax liabilities
At 1 July
Transfer from
income tax
receivable
(Charged)/ credited
in year via P&L
(Charged)/ credited
in year via equity
Acquisition of
subsidiaries
Change in FX rates At 30 June
$’000 $’000 $’000 $’000 $’000 $’000 $’000
2019
Depreciation/ amortisation 8,708 - 4,907 - 970 415 15,000
Accrued income 2,383 - 19 - - 91 2,493
Other 1,952 - (241) 530 - - 2,241
13,043 - 4,685 530 970 506 19,734
2018
Depreciation/ amortisation 10,409 - (2,020) - - 319 8,708
Accrued income 2,581 - (206) - - 8 2,383
Other 932 154 305 561 - - 1,952
13,922 154 (1,921) 561 - 327 13,043
Accounting policy
Tax consolidationCorporate Travel Management Limited and its 100% owned Australian resident subsidiaries have formed a tax consolidated group with effect from 1 July 2008. Corporate Travel Management Limited is the head entity of the tax consolidated group. Members of the Group have entered into a tax sharing agreement in order to enable Corporate Travel Management Limited to allocate income tax expense to the wholly owned subsidiaries on a pro-rata basis. In addition, the agreement provides for the allocation of income tax liabilities amongst the entities should the head entity default on its tax payment obligations.
NOTES TO THE CONSOLIDATED FINANCIAL STATEMENTS: PERFORMANCE
5. Income tax expense (continued)Accounting policy (continued)
Tax effect accounting by members of the tax consolidated groupMembers of the tax consolidated group have entered into a tax funding agreement. The tax funding agreement provides for the allocation of current taxes to members of the tax consolidated group in accordance with their accounting profit for the period, while deferred taxes are allocated to members of the tax consolidated group in accordance with the principles of AASB 112 Income Taxes. Allocations under the tax funding agreement are made at the end of each quarter.
The allocation of taxes under the tax funding agreement is recognised as an increase/decrease in the subsidiaries’ inter-company accounts with the tax consolidated group head company, Corporate Travel Management Limited.
The income tax expense (or revenue) for the period is the tax payable on the current period’s taxable income based on the applicable income tax rate for each jurisdiction, adjusted by changes in deferred tax assets and liabilities attributable to temporary differences and to unused tax losses. The current income tax charge is calculated on the basis of the tax laws enacted or substantively enacted at the end of the reporting period in the countries where the Group’s subsidiaries and associates operate and generate taxable income. Management periodically evaluates positions taken in tax returns with respect to situations in which applicable tax regulation is subject to interpretation. It establishes provisions, where appropriate, on the basis of amounts expected to be paid to the tax authorities.
Deferred income tax is provided in full, using the liability method, on temporary differences arising between the tax bases of assets and liabilities and their carrying amounts in the consolidated financial statements. However, the deferred income tax is not accounted for if it arises from initial recognition of an asset or liability in a transaction other than a business combination that, at the time of the transaction, affects neither accounting nor taxable profit nor loss. Deferred income tax is determined using tax rates and laws that have been enacted, or substantially enacted, by the end of the reporting period and are expected to apply when the related deferred income tax asset is realised or the deferred income tax liability is settled.
Deferred tax assets are recognised for deductible temporary differences and unused tax losses only if it is probable that future taxable amounts will be available to utilise those temporary differences and losses.
Deferred tax liabilities and assets are not recognised for temporary differences between the carrying amount and tax bases of investments in controlled entities where the parent entity is able to control the timing of the reversal of the temporary differences and it is probable that the differences will not reverse in the foreseeable future.
Deferred tax assets and liabilities are offset when there is a legally enforceable right to offset current tax assets and liabilities and when the deferred tax balances relate to the same taxation authority. Current tax assets and tax liabilities are offset where the entity has a legally enforceable right to offset and intends either to settle on a net basis, or to realise the asset and settle the liability simultaneously.
Current and deferred tax is recognised in profit or loss, except to the extent that it relates to items recognised in other comprehensive income or directly in equity. In this case, the tax is also recognised in other comprehensive income or directly in equity, respectively.
Other taxesRevenues, expenses and assets are recognised net of the amount of GST except:
• When the GST incurred on a purchase of goods and services is not recoverable from the taxation authority, in which case, the GST is recognised as part of the cost of acquisition of the asset or as part of the expense item as applicable; and
• Receivables and payables, which are stated with the amount of GST included.
The net amount of GST recoverable from, or payable to, the taxation authority is included as part of receivables or payables in the Consolidated Statement of Financial Position. Cash flows are included in the Consolidated Statement of Cash Flows on a gross basis and the GST component of cash flows arising from investing and financing activities, which is recoverable from, or payable to, the taxation authority are classified as operating cash flows. Commitments and contingencies are disclosed net of the amount of GST recoverable from, or payable to, the taxation authority.

58 59
NOTES TO THE CONSOLIDATED FINANCIAL STATEMENTS: PERFORMANCE
6. Expenses
Profit before income tax includes the following specific expenses:2019 2018
$’000 $’000
Depreciation and amortisation
Depreciation of non-current assets – plant and equipment note 20 3,342 2,045
Amortisation of client contracts and relationships – intangibles note 8 7,165 10,186
Amortisation of software – intangibles note 8 9,378 5,174
Amortisation of other intangible assets – intangibles note 8 463 428
Total depreciation and amortisation expense 20,348 17,833
Finance costs
Bank loans 2,538 2,425
Other interest 227 801
Total finance costs 2,765 3,226
Other expense disclosures
Defined contribution superannuation expense 7,242 6,303
Rental expense relating to operating leases 13,648 8,828
Accounting policy
Depreciation expenseDepreciation is calculated over plant and equipment using the following estimated useful lives and methods:
Item Years Method
Plant and equipment:
Leasehold improvements 3 – 8 Straight line
Computer hardware 2.5 – 3 Straight line
Furniture, fixture and equipment 4 – 10 Diminishing value or straight line
The assets’ residual values, useful lives and amortisation methods are reviewed, and adjusted, if appropriate, at each financial year end.
Amortisation expenseThe useful lives of these intangible assets are assessed to be finite.
A summary of the amortisation policies applied to the Group’s intangible assets is as follows:
Item Years Method Internally generated/acquired
Intangible assets:
Client contracts and relationships 3 – 5 Straight line Acquired
Software 3 – 5 Straight line Acquired/Internally generated
Other intangible assets 10 Straight line Acquired
Where amortisation is charged on assets with finite lives, this expense is taken to the profit and loss in the Consolidated Statement of Comprehensive Income in the expense category ‘depreciation and amortisation’.
Finance costsThis expense is recognised as interest accrues, using the effective interest method. This method calculates the amortised cost of a financial liability and allocates the interest expense over the relevant period using the effective interest rate, which is the rate that exactly discounts estimated future cash payments through the expected life of the financial liability to the net carrying amount of the financial liability.
NOTES TO THE CONSOLIDATED FINANCIAL STATEMENTS: GROUP STRUCTURE
This section explains significant aspects of the Group structure and how changes have affected the financial position and performance of the Group.
7. Business combinations
Fair value acquisition consideration and reconciliation to cash flow Lotus $’000
Platinum $’000
Total $’000
Initial consideration - cash paid 39,928 3,000 42,928
Initial consideration - equity issued - 2,298 2,298
Working capital adjustment - 44 44
Acquisition date fair value contingent consideration - earn-out - 3,232 3,232
Total acquisition date fair value consideration 39,928 8,574 48,502
Cash paid 39,928 3,044 42,972
less: cash balances acquired (10,602) (1,593) (12,195)
Total outflow of cash - investing activities 29,326 1,451 30,777
The provisional fair values of the assets and liabilities of Lotus and the final fair values of the assets and liabilities of Platinum, at date of acquisition were as follows:
Lotus $’000
Platinum $’000
Total $’000
Cash and cash equivalents 10,602 1,593 12,195
Trade and other receivables 61,493 255 61,748
Other assets 10,937 - 10,937
Plant and equipment 1,255 36 1,291
Intangible assets: client contracts and relationships 4,767 614 5,381
Deferred tax asset 155 24 179
Trade and other payables (56,521) (1,524) (58,045)
Borrowings (2,963) - (2,963)
Income tax payable 187 (21) 166
Provisions (6,798) (82) (6,880)
Deferred tax liability (786) (184) (970)
Net identifiable assets acquired* 22,328 711 23,039
Less: non-controlling interest (5,560) - (5,560)
Goodwill on acquisition 23,160 7,863 31,023
Net assets acquired 39,928 8,574 48,502
* There have been some reclassifications and measurement period adjustments within the opening balance sheet to align with Group policy, this had an impact of approximately $508,000 on the net identifiable assets acquired.
Lotus Travel Group LimitedOn 2 October 2018, the Group acquired 75.1% of the shares of Lotus Travel Group Limited (“Lotus”), an Asian based travel management company. The initial cost of the acquisition was $39,928,000 (HK$225,300,000), paid in cash. Additional earn-out consideration, contingent on achieving an FY2019 net profit after tax threshold, was not expected to be met at the date of acquisition, and has not been included within the acquisition date fair value consideration.
The full value of the goodwill and client intangibles is not expected to be tax deductible for tax purposes.
Acquisition-related costs of $425,300 are included in administrative and general expenses in the Statement of Comprehensive Income.
The trade and other receivables approximate the gross contractual amount receivable, of which no balances are expected to be uncollectable.
The acquired business contributed revenues of $23,263,000 and net profit after tax of $2,057,000 to the Group for the period 2 October 2018 to 30 June 2019. If the acquisition had occurred on 1 July 2018, consolidated revenue and net profit after tax for the Group for the year ended 30 June 2019 would have been $455,237,000 and $90,564,000 respectively.

60 61
NOTES TO THE CONSOLIDATED FINANCIAL STATEMENTS: GROUP STRUCTURE
7. Business combinations (continued)
SCT Travel Group Pty Ltd trading as Platinum Travel CorporationOn 1 July 2018, the Group acquired 100% of the shares of SCT Travel Group Pty Ltd, trading as Platinum Travel Corporation (“Platinum”), a travel management company headquartered in New South Wales, Australia. The initial cost of the acquisition was $5,298,000, paid in both cash $3,000,000 and shares $2,298,000, with further contingent consideration payable of $3,232,000.
The full value of the goodwill and client intangibles is not expected to be tax deductible for tax purposes.
The acquired business contributed revenues of $2,042,000 and net profit after tax of $883,000 to the Group for the period 1 July 2018 to 30 June 2019.
The trade and other receivables approximate the gross contractual amount receivable of which no balances are expected to be uncollectable.
Prior period business combinations During the year ended 30 June 2019, the final deferred consideration of $8.8 million was paid for the Redfern business combination. The final deferred consideration of $13.5 million in relation to the Chambers business combination was also settled. Refer note 24 – related party transactions.
Summary of consideration paid for acquisitions made in prior periods Redfern $’000
Chambers $’000
Total $’000
Cash paid 8,792 7,043 15,835
Equity issued - 6,456 6,456
Total consideration paid for acquisitions made in prior periods 8,792 13,499 22,291
Accounting policyThe purchase method of accounting is used to account for all business combinations regardless of whether equity instruments or other assets are acquired. The consideration transferred is measured as the fair value of the assets acquired, shares issued or liabilities incurred or assumed at the date of exchange, and, for acquisitions prior to 1 July 2009, included costs directly attributable to the combination. For acquisitions after 1 July 2009, acquisition-related costs are expensed in the period in which the costs are incurred, rather than being added to the cost of the business combination, as required by revised AASB 3 Business Combinations.
Where equity instruments are issued in a business combination, the fair value of the instruments is their published market price as at the date of exchange. Transaction costs arising on the issue of equity instruments are recognised directly in equity. The consideration transferred also includes the fair value of any asset or liability resulting from a contingent consideration arrangement.
With limited exceptions, all identifiable assets acquired and liabilities and contingent liabilities assumed in a business combination are measured initially at their fair values at the acquisition date. The excess of the consideration transferred, amount of any non-controlling interest in the acquired entity, over the net fair value of the Group’s share of the identifiable net assets acquired is recognised as goodwill. If the consideration transferred of the acquisition is less than the Group’s share of the net fair value of the identifiable net assets of the subsidiary, the difference is recognised as a gain in the profit and loss in the Consolidated Statement of Comprehensive Income, but only after a reassessment of the identification and measurement of the net assets acquired.
Where settlement of any part of the cash consideration is deferred, the amounts payable in the future are discounted to their present value, as at the date of exchange. The discount rate used is the entity’s incremental borrowing rate, being the rate at which a similar borrowing could be obtained from an independent financier under comparable terms and conditions.
Contingent consideration is classified as a financial liability. Amounts classified as a financial liability are subsequently remeasured to fair value, with changes in fair value recognised in other income or other expenses, and interest expense resulting from discounting is recognised within finance costs in the Statement of Comprehensive Income. Any subsequent adjustment to the final contingent consideration, based on actual results as at 30 June 2019, will be reflected in the Statement of Comprehensive Income.
NOTES TO THE CONSOLIDATED FINANCIAL STATEMENTS: GROUP STRUCTURE
7. Business combinations (continued)
Accounting policy (continued)The Group recognises any non-controlling interest, in the acquired entity on an acquisition-by-acquisition basis either at fair value or at the non-controlling interests’ proportionate share of the acquired entity’s net identifiable assets.
Non-controlling interests in the results and equity of subsidiaries are shown separately in the Consolidated Statement of Comprehensive Income, Consolidated Statement of Financial Position and Consolidated Statement of Changes in Equity.
Critical estimates, assumptions and judgements• Value of intangible assets relating to acquisitions
The Group has allocated portions of the cost of acquisitions to client contracts and relationships intangibles, valued using the multi-period excess earnings method. These calculations require the use of assumptions including future customer retention rates and cash flows.
8. Intangible assets
Client contracts
and relationships
Software GoodwillOther
Intangible assets
Total
$’000 $’000 $’000 $’000 $’000
Year ended 30 June 2019
Cost 62,924 52,684 453,522 4,924 574,054
Accumulated depreciation (43,668) (22,370) - (1,326) (67,364)
19,256 30,314 453,522 3,598 506,690
Opening net book amount at 1 July 2018 20,140 20,399 407,187 3,871 451,597
Additions - 18,770 - - 18,770
Additions through the acquisition of entities/businesses (note 7) 5,381 - 31,023 - 36,404
Amortisation charge (7,165) (9,378) - (463) (17,006)
Exchange differences 900 523 15,312 190 16,925
Closing net book amount 19,256 30,314 453,522 3,598 506,690
Year ended 30 June 2018
Cost 55,167 33,151 407,187 4,687 500,192
Accumulated depreciation (35,027) (12,752) - (816) (48,595)
20,140 20,399 407,187 3,871 451,597
Opening net book amount 29,411 14,217 392,013 4,156 439,797
Additions - 11,057 - - 11,057
Amortisation charge (10,186) (5,174) - (428) (15,788)
Exchange differences 915 299 15,174 143 16,531
Closing net book amount 20,140 20,399 407,187 3,871 451,597
Customer contractsThe customer contracts were acquired as part of a business combination (refer note 7 for details). They are recognised at their fair value at the date of acquisition and are subsequently amortised based on the timing of projected cash flows of the contracts over their estimated useful lives.
Acquired from a business combinationIntangible assets from a business combination are capitalised at fair value as at the date of acquisition. Following initial recognition, the cost model is applied to the class of intangible assets.

62 63
NOTES TO THE CONSOLIDATED FINANCIAL STATEMENTS: GROUP STRUCTURE
8. Intangible assets (continued)
Accounting policy
Software developed or acquired not as part of a business combinationCosts incurred in developing products or systems and costs incurred in acquiring software and licenses that will contribute to future period financial benefits through revenue generation and/or cost reduction are capitalised as software and systems assets.
Gains or losses arising from the derecognition of an intangible asset are measured as the difference between the net disposal proceeds and the carrying amount of the asset and are recognised in the profit and loss in the Consolidated Statement of Comprehensive Income when the asset is derecognised.
GoodwillGoodwill acquired on a business combination is initially measured at cost, being the excess of the consideration transferred for the business combination over the Group’s interest in the net fair value of the acquiree’s identifiable assets, liabilities and contingent liabilities.
Following initial recognition, goodwill is measured at cost less any accumulated impairment losses.
Goodwill is reviewed for impairment, annually, or more frequently, if events or changes in circumstances indicate that the carrying value may be impaired (refer note 15).
As at the acquisition date, any goodwill acquired is allocated to each of the cash-generating units that are expected to benefit from the combination’s synergies.
Impairment is determined by assessing the recoverable amount of the cash-generating unit to which the goodwill relates.
Where the recoverable amount of the cash-generating unit is less than the carrying amount, an impairment loss is recognised in the Statement of Comprehensive Income.
Where goodwill forms part of a cash-generating unit and part of the operation within that unit is disposed, the goodwill associated with the disposed operation is included in the carrying amount of the operation when determining the gain or loss on disposal of the operation.
Disposed goodwill in this circumstance is measured on the basis of the relative values of the disposed operation and the portion of the cash-generating unit retained.
Critical estimates, assumptions and judgements• Software developed or acquired not as part of a business combination
The Group recognises internally generated software assets arising from development once they meet the criteria set out in the Australian Accounting Standards. Estimates are used in determining the useful life for amortisation. There is also judgement involved in assessing how the asset will deliver probable future economic benefit to the Group.
NOTES TO THE CONSOLIDATED FINANCIAL STATEMENTS: CAPITAL
A core part of the Group’s operations is to maintain a strong financial position and low levels of external debt. This section explains how the Group has performed in areas relating to capital management.
9. Cash and cash equivalents
2019 2018
$’000 $’000
Cash at bank and on hand 96,571 57,019
Client cash 42,220 27,278
Total cash and cash equivalents 138,791 84,297
Cash at bank earns interest at floating rates based on daily bank deposit rates: 2019: 0.00%-2.37% (2018: 0.00%-1.95%). The client accounts earn interest at floating rates based on daily bank deposit rates: 2019: 0.00%-1.60% (2018: 0.00%-1.30%). The weighted average interest rate for the year was 0.13% (2018: 0.12%).
Accounting policyCash and cash equivalents in the Consolidated Statement of Financial Position comprise cash at bank and on hand and short-term deposits, with an original maturity of three months or less, that are readily convertible to known amounts of cash and which are subject to an insignificant risk of changes in value.
Client cash represents amounts from clients held before release to service and product suppliers, with a maturity of three months or less.
For the purpose of the Consolidated Cash Flow Statement, cash and cash equivalents consist of cash and cash equivalents as defined, net of outstanding bank overdrafts.
Reconciliation of profit after income tax to net cash inflow from operating activities
2019 2018
$’000 $’000
Profit for the year 89,473 80,582
Adjustments for:
Depreciation and amortisation 20,348 17,833
Net exchange differences 406 (92)
Non-cash interest 122 678
Non-cash employee benefits expense - share-based payments 3,690 2,168
Non-cash release of acquisition payable - (330)
Net (gain) on sale of subsidiary (423) -
Fair value adjustment of acquisition payable (602) (420)
Net gain/(loss) on disposal of non-current assets 169 (5)
Changes in operating assets and liabilities
(Increase) in trade and other receivables (7,464) (41,341)
(Increase)/decrease in prepayments (546) 669
Increase/(decrease) in deferred tax balances 2,190 (999)
Increase in income tax payable 2,797 1,730
Increase in payables and provisions 23,317 33,919
Net cash flow from operating activities 133,477 94,392

64 65
NOTES TO THE CONSOLIDATED FINANCIAL STATEMENTS: CAPITAL
9. Cash and cash equivalents (continued)
Net debt reconciliationThis section sets out an analysis of net debt and the movements in net debt for each of the periods presented.
2019 2018
$’000 $’000
Cash and cash equivalents 138,791 84,297
Borrowings (repayable within 1 year) (19,205) (14,677)
Borrowings (repayable after 1 year) (20,085) (29,301)
Net debt 99,501 40,319
Cash and cash equivalents 138,791 84,297
Gross debt - variable interest rates (39,290) (43,978)
Net debt 99,501 40,319
Cash Borrowings due within 1 year
Borrowings due after 1 year Total
$’000 $’000 $’000 $’000
Net debt at 1 July 2018 84,297 (14,677) (29,301) 40,319
Cash flows 52,030 (1,270) 9,570 60,330
Acquisition - (2,963) - (2,963)
Foreign exchange adjustments 2,464 (295) (354) 1,815
Net debt at 30 June 2019 138,791 (19,205) (20,085) 99,501
Net debt at 1 July 2017 79,217 (18,122) (27,301) 33,794
Cash flows 2,929 4,186 (1,518) 5,597
Foreign exchange adjustments 2,151 (741) (482) 928
Net debt at 30 June 2018 84,297 (14,677) (29,301) 40,319
10. Trade and other receivablesRestated
2019 2018
$’000 $’000
Current
Trade receivables (i) 25,882 19,339
Client receivables (i) 253,942 199,715
Contract assets (ii) 31,035 23,810
310,859 242,864
Deposits (iii) 16,574 7,587
Other receivables 1,338 1,786
Total trade and other receivables 328,771 252,237
The increase in trade and other receivables is predominantly due to the acquisition of Lotus Travel.
(i) Trade and client receivables are non-interest bearing and are generally on terms ranging from 7 to 30 days. This balance includes amounts receivable from a related party – refer note disclosure 24(e).(ii) Balances were reclassified to contract assets as a result of the adoption of AASB 15. An amount of $31.0 million (2018: $23.8 million) was reclassified from trade receivables to contract assets.(iii) Deposits balance relates to advance deposits to suppliers and deposits made on behalf of clients for travel which will occur at a future date. Advance deposits to suppliers relate to securing access during high sales periods, which is the normal business practise in Hong Kong.
NOTES TO THE CONSOLIDATED FINANCIAL STATEMENTS: CAPITAL
10. Trade and other receivables (continued)
Accounting policy from 1 July 2018Trade and client receivables are recognised initially at fair value and, subsequently, measured at amortised cost using the effective interest method, less a provision for impairment in accordance with the simplified approach permitted by AASB 9.
The Group applies the simplified approach to providing for expected credit losses prescribed by AASB 9, which permits the use of the lifetime expected loss provision for all trade and client receivables and contract assets.
To measure the expected credit losses, trade and client receivables, contract assets and deposits have been grouped based on their shared characteristics and the days past due.
Contract assets represent balances earned, but which are not yet unconditional and have the substantially the same characteristics as trade receivables. The Group has therefore concluded that the expected loss rates for trade receivables are a reasonable approximation for the contract asset balances.
The expected credit loss rates are based on the historical payment profile of receivables prior to 30 June 2019 and 1 July 2018 and the corresponding historical credit losses experienced during this period. The historical loss rates are adjusted to reflect current and forward-looking information affecting the ability of the clients to settle the receivables.
Accounting policy applied until 30 June 2018Trade and client receivables, which generally have 7 to 30 day terms, are recognised initially at fair value and, subsequently, measured at amortised cost using the effective interest method, less an allowance for impairment.
Client receivables result from the provision of travel services to clients. Trade receivables result from other activities relating to the provision of travel services, such as commissions payable by suppliers.
Collectability of trade and client receivables is reviewed on an ongoing basis at an operating unit level. Individual debts that are known to be uncollectible are written off when identified. An impairment provision is recognised when there is objective evidence that the Group will not be able to collect the receivable. The amount of the impairment loss is the receivable carrying amount compared to the present value of estimated future cash flows, discounted at the original effective interest rate.
The amount of the impairment loss is recognised in the profit and loss in the Consolidated Statement of Comprehensive Income within administration expenses. When a trade receivable, for which an impairment allowance had been recognised, becomes uncollectible in a subsequent period, it is written off against the allowance account. Subsequent recoveries of amounts previously written off are credited against administration expenses in the profit and loss in the Consolidated Statement of Comprehensive Income.

66 67
NOTES TO THE CONSOLIDATED FINANCIAL STATEMENTS: CAPITAL
11. Trade and other payables
2019 2018
$’000 $’000
Current
Trade payables (i) 13,373 12,536
Client payables (i) 267,424 185,122
Other payables and accruals 35,256 33,458
Acquisition payable (ii) 700 22,505
Total current trade and other payables 316,753 253,621
Non-current
Other payables and accruals 1,573 2,872
Contingent consideration payable (iii) 2,585 -
Total non-current trade and other payables 4,158 2,872
(i) Trade payables and client payables are non-interest bearing and are normally settled on terms ranging from 7 to 30 days. The increase in trade and client payables is predominantly due to the acquisition of Lotus Travel and timing of supplier payments.(ii) The reduction in acquisition payable reflects the payments made during the year relating to the Redfern Travel and Chambers Travel business combinations. Current balance represents the payable upon meeting the performance hurdle for Platinum Travel acquisition for the year ended 30 June 2019.(iii) The contingent consideration payable relates to the Platinum Travel business combination which remains contingent on the achievement of specific performance hurdles.
Fair valueThe carrying value of these payables approximates their fair value.
Interest rate risk and liquidity riskInformation regarding interest rate risk and liquidity risk exposure is set out in note 16.
Accounting policyTrade and other payables and client payables are carried at original invoice amount and represent liabilities for goods and services provided to the Group to the end of the financial year that are unpaid and arise when the Group becomes obliged to make future payments in respect of the purchase of these goods and services. These amounts are unsecured and are paid within terms ranging from 7 to 30 days from recognition. They are recognised initially at their fair value and subsequently measured at amortised cost using the effective interest method.
Client payables result from provision of travel services and products to clients. Trade payables result from other activities required to provide those travel services, such as corporate services.
Acquisition and contingent consideration payable are recognised where settlement of any part of the business combination is deferred or contingent on meeting additional earnout thresholds. The amounts payable in the future are discounted to their present value, as at the date of exchange. The discount rate used is the entity’s effective interest rate.
Contingent consideration subsequently remeasured to fair value, with changes in fair value recognised in other income or other expenses, and interest expense resulting from discounting is recognised within finance costs in the Statement of Comprehensive Income. Any subsequent adjustment to the final contingent consideration, based on actual results as at 30 June 2019, will be reflected in the Statement of Comprehensive Income.
NOTES TO THE CONSOLIDATED FINANCIAL STATEMENTS: CAPITAL
12. Borrowings and contingent liabilities
BorrowingsA breakdown of the existing borrowings balance is set out in the following table:
2019 2018
$’000 $’000
Current borrowings 19,205 14,677
Non-current borrowings 20,085 29,301
Total borrowings 39,290 43,978
Guarantees/Letter of credit facilitiesThe Group has provided bank guarantees and letters of credit in relation to various facilities with vendors and in accordance with local travel agency licensing and International Air Transport Association (IATA) regulations. Guarantees provided by the parent are held on behalf of other Group entities.
Guarantees provided for:2019 2018
$’000 $’000
Various vendors 123,021 83,586
Total guarantees 123,021 83,586
There were no other contingencies as at reporting date (2018: $nil).
Increase in guarantees following the Lotus acquisition in October 2018. Since 31 December 2018, the balance has reduced by $15.2 million. Subsequent to 30 June 2019, guarantees have decreased by a further $27.1 million and at the date of this report total guarantees are $95.9 million.
Financial facilitiesThe unused portion of the Group’s total facilities at 30 June 2019 is set out in the following table:
Senior facilities $’000
Unused 82,776
Used (i) 100,724
Total senior facilities 183,500
Permitted indebtedness $’000
Unused 53,322
Used (ii) 96,678
Total permitted indebtedness 150,000
Total facilities $’000
Unused 136,098
Used (i) 197,402
Total facilities 333,500
(i) Included within the used portion of the total senior facilities are bank guarantees of $61.4 million. (ii) Included within the used portion of the permitted indebtedness are bank guarantees of $51.2 million.

68 69
NOTES TO THE CONSOLIDATED FINANCIAL STATEMENTS: CAPITAL
12. Borrowings and contingent liabilities (continued)
Financial facilities (continued)
The Group’s facilities at 30 June 2019 include overdraft, merchant facilities and bank guarantees. The senior debt facility is with HSBC Bank and Commonwealth Bank of Australia. This multi-currency facility includes senior debt facilities of $183.5 million.
Including the permitted indebtedness, the Group had $333.5 million of facility which is drawn to $197.4 million at 30 June 2019 (being bank borrowings of $39.3 million, bank guarantees of $112.7 million and credit card facilities of $45.4 million). Lotus guarantees of $10.3 million are excluded from the permitted indebtedness basket.
Security had been provided to the guarantor over the Groups assets and subsidiary shareholding through a security trustee on behalf of the senior lenders.
At 30 June 2019, Lotus Travel have secured deposits totalling $5.8 million in support of guarantees and merchant banking facilities – refer note 19. The Group continues to integrate the banking requirements with the long-term objective to reduce and eventually remove the need for this security. There has been a release of $5.0 million during the period as a result of this integration.
On 7 August 2019, the Group refinanced the senior debt facilities (refer note 18). The new facilities provide further headroom and broader banking relationships. The syndicated facility has three participants (HSBC Bank, Commonwealth Bank of Australia and Barclays Bank).
Accounting policyAll loans and borrowings are initially recognised at the fair value of consideration received less directly attributable transaction costs. After initial recognition, interest-bearing loans and borrowings are subsequently measured at cost.
Borrowings are classified as current liabilities unless the Group has an unconditional right to defer settlement of the liability for at least 12 months after the reporting date.
Borrowing costsBorrowing costs are recognised as an expense using the effective interest method. The Group does not currently hold qualifying assets but, if it did, the borrowing costs directly associated with this asset would be capitalised, including any other associated costs directly attributable to the borrowing and temporary investment income earned on the borrowing.
Borrowings are removed from the Consolidated Statement of Financial Position when the obligation specified in the contract is discharged, cancelled or expired. The difference between the carrying amount of a financial liability that has been extinguished or transferred to another party and the consideration paid, including any non-cash assets transferred or liabilities assumed, is recognised in profit or loss as other income or finance costs.
NOTES TO THE CONSOLIDATED FINANCIAL STATEMENTS: CAPITAL
13. Provisions
Movements in provisionsEmployee
entitlementsMake-good
provision
Provisions for other
liabilities and charges
Total
$’000 $’000 $’000 $’000
At 1 July 2018 5,935 655 11,029 17,619
Acquisition of subsidiary (note 7) 1,749 927 4,204 6,880
Arising during the year 8,935 1,138 90,412 100,485
Utilised (7,454) (320) (84,788) (92,562)
Write back of provision (592) - (2,599) (3,191)
Changes due to change in foreign currency 309 50 803 1,162
At 30 June 2019 8,882 2,450 19,061 30,393
At 1 July 2017 5,635 638 10,892 17,165
Arising during the year 6,882 93 38,534 45,509
Utilised (6,541) (87) (36,020) (42,648)
Write back of provision (106) (5) (2,779) (2,890)
Changes due to change in foreign currency 65 16 402 483
At 30 June 2018 5,935 655 11,029 17,619
2019
Current 6,813 31 19,061 25,905
Non-current 2,069 2,419 - 4,488
8,882 2,450 19,061 30,393
2018
Current 4,720 37 11,029 15,786
Non-current 1,215 618 - 1,833
5,935 655 11,029 17,619
Accounting policyProvisions are recognised when the Group has a present legal or constructive obligation as a result of a past event, it is probable that an outflow of resources embodying economic benefits will be required to settle the obligation and a reliable estimate can be made of the amount of the obligation. Provisions are measured at the present value of management’s best estimate of the expenditure required to settle the present obligation at the end of the reporting period. The discount rate used to determine the present value is a pre-tax rate that reflects current market assessments of the time value of money and the risks specific to the liability. The increase in the provision due to the passage of time is recognised as interest expense.
Where the Group expects some or all of a provision to be reimbursed, for example, under an insurance contract, the reimbursement is recognised as a separate asset, but only when the reimbursement is virtually certain. The expense relating to any provision is presented in the profit and loss in the Consolidated Statement of Comprehensive Income, net of any reimbursement.
If the effect of the time value of money is material, provisions are determined by discounting the expected future cash flows at a pre-tax rate that reflects current market assessments of the time value of money and, where appropriate, the risks specific to the liability.
Where discounting is used, the increase in the provision due to the passage of time is recognised as a finance cost.
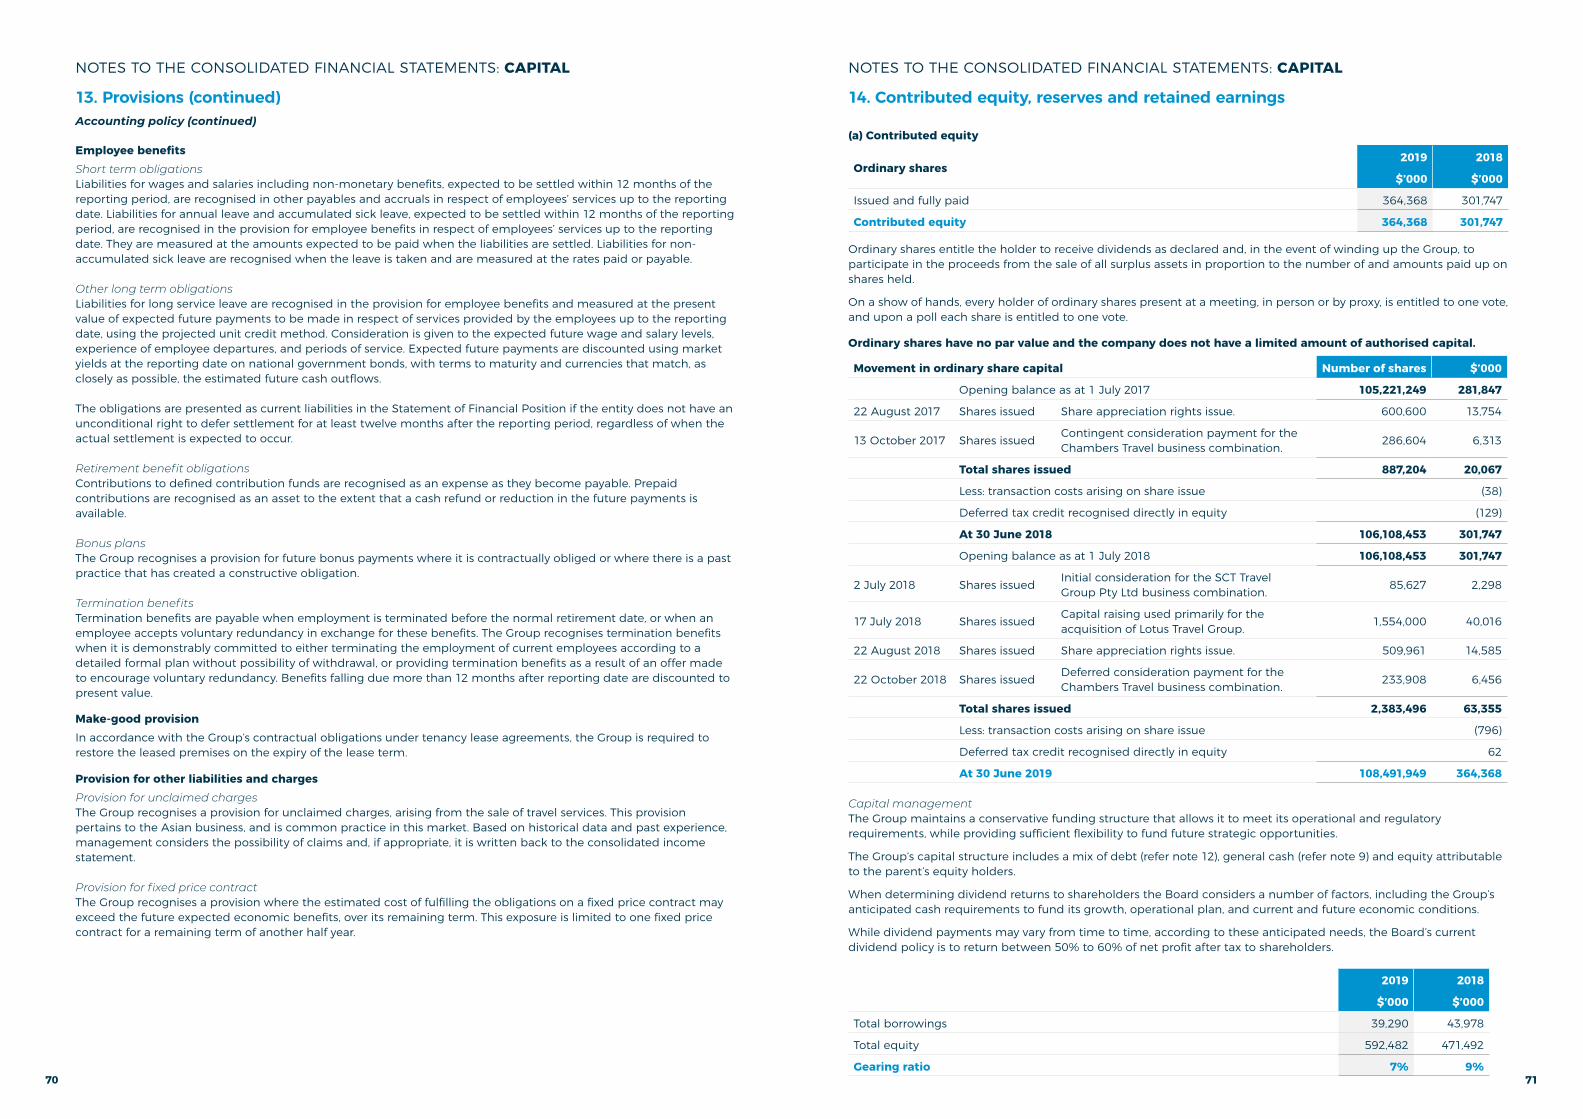
70 71
NOTES TO THE CONSOLIDATED FINANCIAL STATEMENTS: CAPITAL
13. Provisions (continued) Accounting policy (continued)
Employee benefitsShort term obligationsLiabilities for wages and salaries including non-monetary benefits, expected to be settled within 12 months of the reporting period, are recognised in other payables and accruals in respect of employees’ services up to the reporting date. Liabilities for annual leave and accumulated sick leave, expected to be settled within 12 months of the reporting period, are recognised in the provision for employee benefits in respect of employees’ services up to the reporting date. They are measured at the amounts expected to be paid when the liabilities are settled. Liabilities for non-accumulated sick leave are recognised when the leave is taken and are measured at the rates paid or payable.
Other long term obligationsLiabilities for long service leave are recognised in the provision for employee benefits and measured at the present value of expected future payments to be made in respect of services provided by the employees up to the reporting date, using the projected unit credit method. Consideration is given to the expected future wage and salary levels, experience of employee departures, and periods of service. Expected future payments are discounted using market yields at the reporting date on national government bonds, with terms to maturity and currencies that match, as closely as possible, the estimated future cash outflows.
The obligations are presented as current liabilities in the Statement of Financial Position if the entity does not have an unconditional right to defer settlement for at least twelve months after the reporting period, regardless of when the actual settlement is expected to occur.
Retirement benefit obligationsContributions to defined contribution funds are recognised as an expense as they become payable. Prepaid contributions are recognised as an asset to the extent that a cash refund or reduction in the future payments is available.
Bonus plansThe Group recognises a provision for future bonus payments where it is contractually obliged or where there is a past practice that has created a constructive obligation.
Termination benefitsTermination benefits are payable when employment is terminated before the normal retirement date, or when an employee accepts voluntary redundancy in exchange for these benefits. The Group recognises termination benefits when it is demonstrably committed to either terminating the employment of current employees according to a detailed formal plan without possibility of withdrawal, or providing termination benefits as a result of an offer made to encourage voluntary redundancy. Benefits falling due more than 12 months after reporting date are discounted to present value.
Make-good provisionIn accordance with the Group’s contractual obligations under tenancy lease agreements, the Group is required to restore the leased premises on the expiry of the lease term.
Provision for other liabilities and chargesProvision for unclaimed chargesThe Group recognises a provision for unclaimed charges, arising from the sale of travel services. This provision pertains to the Asian business, and is common practice in this market. Based on historical data and past experience, management considers the possibility of claims and, if appropriate, it is written back to the consolidated income statement.
Provision for fixed price contractThe Group recognises a provision where the estimated cost of fulfilling the obligations on a fixed price contract may exceed the future expected economic benefits, over its remaining term. This exposure is limited to one fixed price contract for a remaining term of another half year.
NOTES TO THE CONSOLIDATED FINANCIAL STATEMENTS: CAPITAL
14. Contributed equity, reserves and retained earnings
(a) Contributed equity
Ordinary shares2019 2018
$’000 $’000
Issued and fully paid 364,368 301,747
Contributed equity 364,368 301,747
Ordinary shares entitle the holder to receive dividends as declared and, in the event of winding up the Group, to participate in the proceeds from the sale of all surplus assets in proportion to the number of and amounts paid up on shares held.
On a show of hands, every holder of ordinary shares present at a meeting, in person or by proxy, is entitled to one vote, and upon a poll each share is entitled to one vote.
Ordinary shares have no par value and the company does not have a limited amount of authorised capital.
Movement in ordinary share capital Number of shares $’000
Opening balance as at 1 July 2017 105,221,249 281,847
22 August 2017 Shares issued Share appreciation rights issue. 600,600 13,754
13 October 2017 Shares issued Contingent consideration payment for the Chambers Travel business combination. 286,604 6,313
Total shares issued 887,204 20,067
Less: transaction costs arising on share issue (38)
Deferred tax credit recognised directly in equity (129)
At 30 June 2018 106,108,453 301,747
Opening balance as at 1 July 2018 106,108,453 301,747
2 July 2018 Shares issued Initial consideration for the SCT Travel Group Pty Ltd business combination. 85,627 2,298
17 July 2018 Shares issued Capital raising used primarily for the acquisition of Lotus Travel Group. 1,554,000 40,016
22 August 2018 Shares issued Share appreciation rights issue. 509,961 14,585
22 October 2018 Shares issued Deferred consideration payment for the Chambers Travel business combination. 233,908 6,456
Total shares issued 2,383,496 63,355
Less: transaction costs arising on share issue (796)
Deferred tax credit recognised directly in equity 62
At 30 June 2019 108,491,949 364,368
Capital managementThe Group maintains a conservative funding structure that allows it to meet its operational and regulatory requirements, while providing sufficient flexibility to fund future strategic opportunities.
The Group’s capital structure includes a mix of debt (refer note 12), general cash (refer note 9) and equity attributable to the parent’s equity holders.
When determining dividend returns to shareholders the Board considers a number of factors, including the Group’s anticipated cash requirements to fund its growth, operational plan, and current and future economic conditions.
While dividend payments may vary from time to time, according to these anticipated needs, the Board’s current dividend policy is to return between 50% to 60% of net profit after tax to shareholders.
2019 2018
$’000 $’000
Total borrowings 39,290 43,978
Total equity 592,482 471,492
Gearing ratio 7% 9%
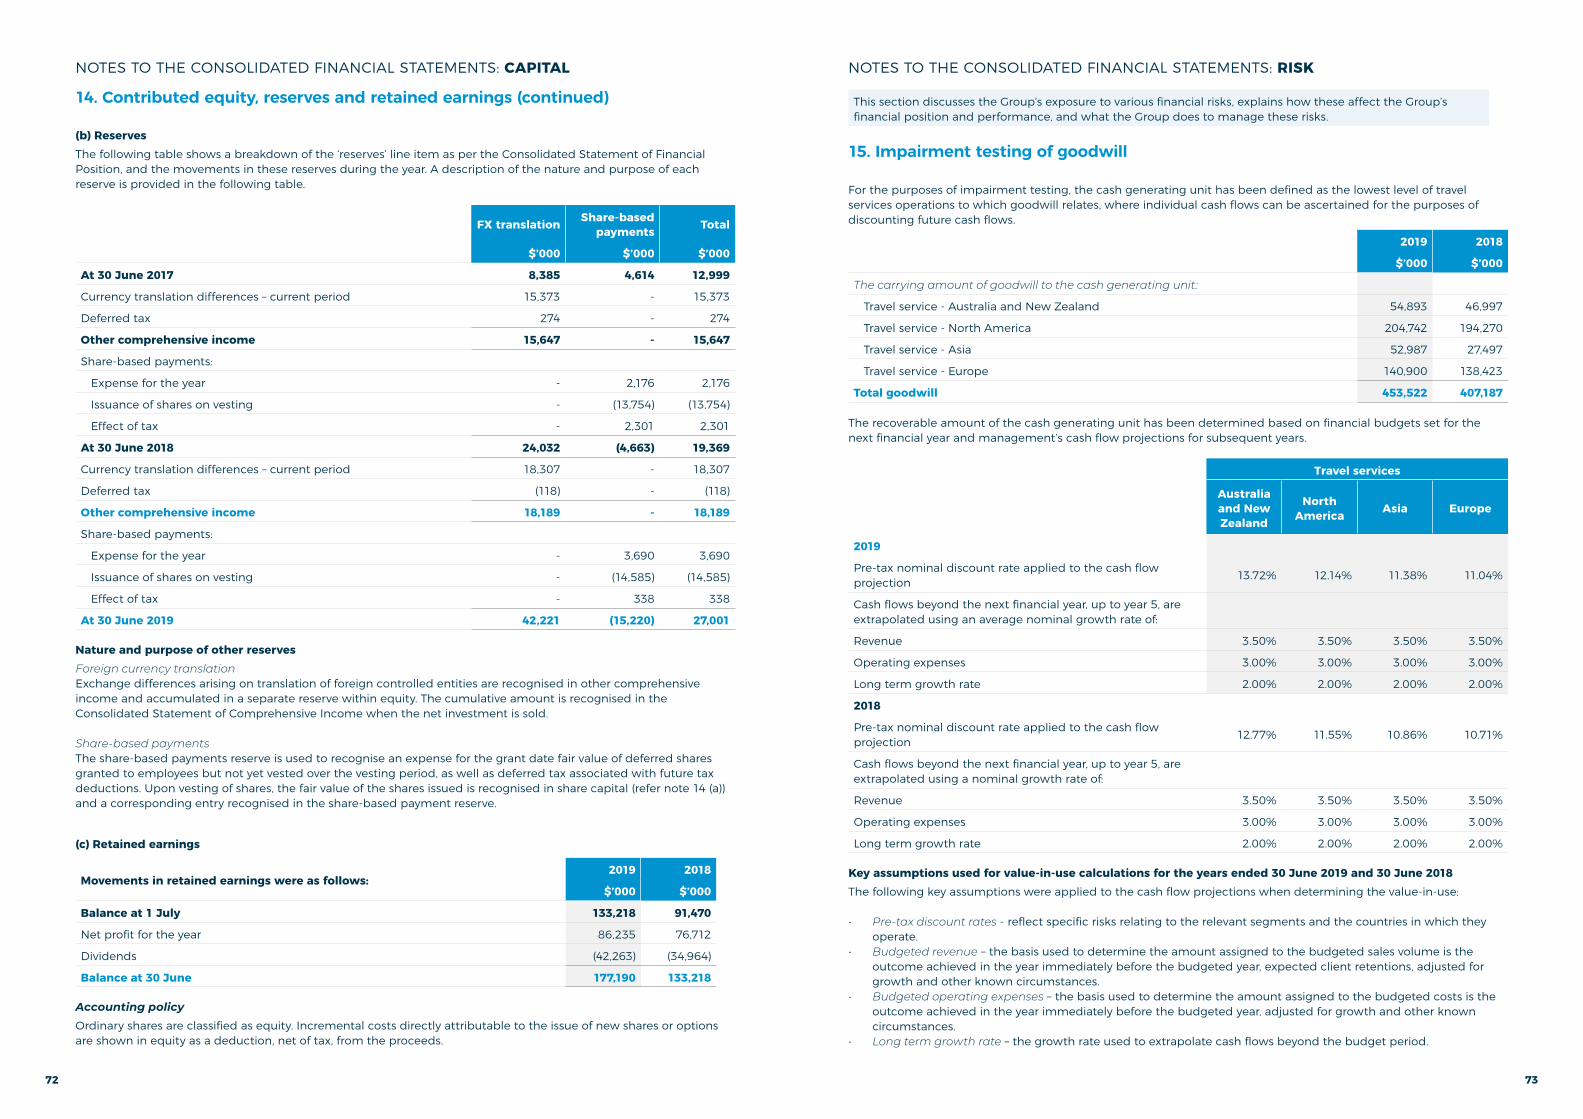
72 73
NOTES TO THE CONSOLIDATED FINANCIAL STATEMENTS: CAPITAL
14. Contributed equity, reserves and retained earnings (continued)
(b) ReservesThe following table shows a breakdown of the ‘reserves’ line item as per the Consolidated Statement of Financial Position, and the movements in these reserves during the year. A description of the nature and purpose of each reserve is provided in the following table.
FX translation Share-based payments Total
$’000 $’000 $’000
At 30 June 2017 8,385 4,614 12,999
Currency translation differences – current period 15,373 - 15,373
Deferred tax 274 - 274
Other comprehensive income 15,647 - 15,647
Share-based payments:
Expense for the year - 2,176 2,176
Issuance of shares on vesting - (13,754) (13,754)
Effect of tax - 2,301 2,301
At 30 June 2018 24,032 (4,663) 19,369
Currency translation differences – current period 18,307 - 18,307
Deferred tax (118) - (118)
Other comprehensive income 18,189 - 18,189
Share-based payments:
Expense for the year - 3,690 3,690
Issuance of shares on vesting - (14,585) (14,585)
Effect of tax - 338 338
At 30 June 2019 42,221 (15,220) 27,001
Nature and purpose of other reservesForeign currency translationExchange differences arising on translation of foreign controlled entities are recognised in other comprehensive income and accumulated in a separate reserve within equity. The cumulative amount is recognised in the Consolidated Statement of Comprehensive Income when the net investment is sold.
Share-based paymentsThe share-based payments reserve is used to recognise an expense for the grant date fair value of deferred shares granted to employees but not yet vested over the vesting period, as well as deferred tax associated with future tax deductions. Upon vesting of shares, the fair value of the shares issued is recognised in share capital (refer note 14 (a)) and a corresponding entry recognised in the share-based payment reserve.
(c) Retained earnings
Movements in retained earnings were as follows:2019 2018
$’000 $’000
Balance at 1 July 133,218 91,470
Net profit for the year 86,235 76,712
Dividends (42,263) (34,964)
Balance at 30 June 177,190 133,218
Accounting policyOrdinary shares are classified as equity. Incremental costs directly attributable to the issue of new shares or options are shown in equity as a deduction, net of tax, from the proceeds.
NOTES TO THE CONSOLIDATED FINANCIAL STATEMENTS: RISK
This section discusses the Group’s exposure to various financial risks, explains how these affect the Group’s financial position and performance, and what the Group does to manage these risks.
15. Impairment testing of goodwill
For the purposes of impairment testing, the cash generating unit has been defined as the lowest level of travel services operations to which goodwill relates, where individual cash flows can be ascertained for the purposes of discounting future cash flows.
2019 2018
$’000 $’000
The carrying amount of goodwill to the cash generating unit:
Travel service - Australia and New Zealand 54,893 46,997
Travel service - North America 204,742 194,270
Travel service - Asia 52,987 27,497
Travel service - Europe 140,900 138,423
Total goodwill 453,522 407,187
The recoverable amount of the cash generating unit has been determined based on financial budgets set for the next financial year and management’s cash flow projections for subsequent years.
Travel services
Australia and New Zealand
North America Asia Europe
2019
Pre-tax nominal discount rate applied to the cash flow projection 13.72% 12.14% 11.38% 11.04%
Cash flows beyond the next financial year, up to year 5, are extrapolated using an average nominal growth rate of:
Revenue 3.50% 3.50% 3.50% 3.50%
Operating expenses 3.00% 3.00% 3.00% 3.00%
Long term growth rate 2.00% 2.00% 2.00% 2.00%
2018
Pre-tax nominal discount rate applied to the cash flow projection 12.77% 11.55% 10.86% 10.71%
Cash flows beyond the next financial year, up to year 5, are extrapolated using a nominal growth rate of:
Revenue 3.50% 3.50% 3.50% 3.50%
Operating expenses 3.00% 3.00% 3.00% 3.00%
Long term growth rate 2.00% 2.00% 2.00% 2.00%
Key assumptions used for value-in-use calculations for the years ended 30 June 2019 and 30 June 2018The following key assumptions were applied to the cash flow projections when determining the value-in-use:
• Pre-tax discount rates - reflect specific risks relating to the relevant segments and the countries in which they operate.
• Budgeted revenue – the basis used to determine the amount assigned to the budgeted sales volume is the outcome achieved in the year immediately before the budgeted year, expected client retentions, adjusted for growth and other known circumstances.
• Budgeted operating expenses – the basis used to determine the amount assigned to the budgeted costs is the outcome achieved in the year immediately before the budgeted year, adjusted for growth and other known circumstances.
• Long term growth rate – the growth rate used to extrapolate cash flows beyond the budget period.
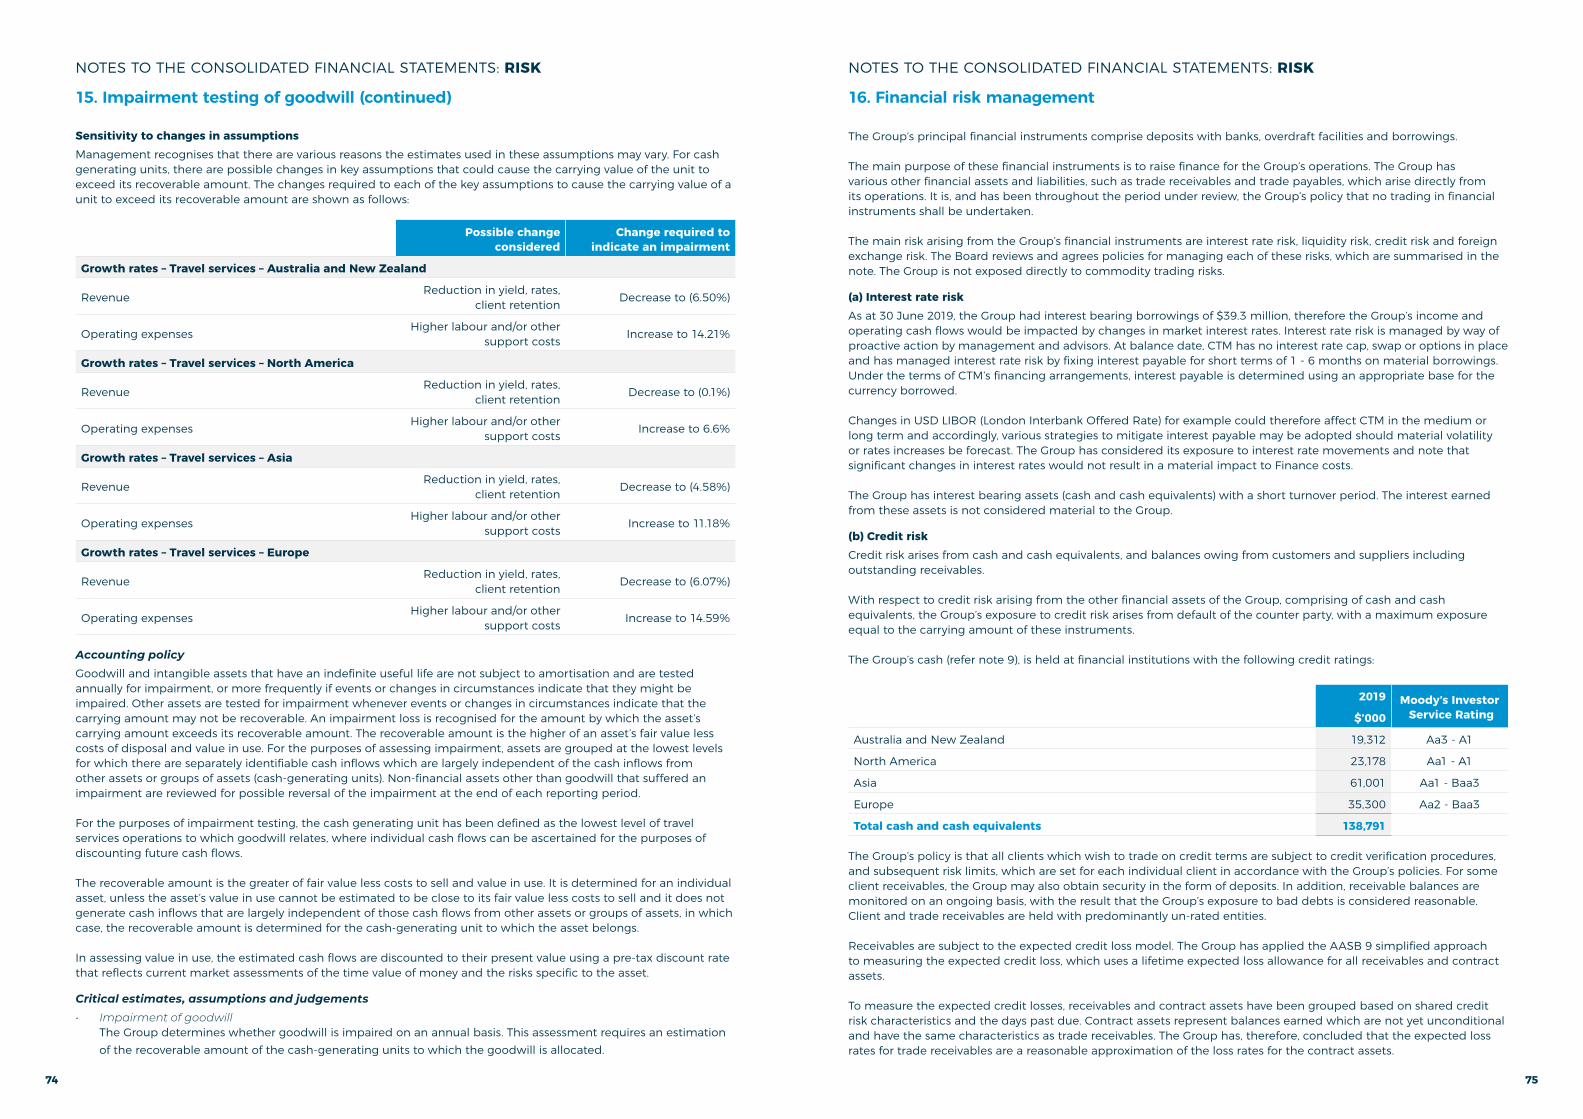
74 75
NOTES TO THE CONSOLIDATED FINANCIAL STATEMENTS: RISK
15. Impairment testing of goodwill (continued)
Sensitivity to changes in assumptionsManagement recognises that there are various reasons the estimates used in these assumptions may vary. For cash generating units, there are possible changes in key assumptions that could cause the carrying value of the unit to exceed its recoverable amount. The changes required to each of the key assumptions to cause the carrying value of a unit to exceed its recoverable amount are shown as follows:
Possible change considered
Change required to indicate an impairment
Growth rates – Travel services – Australia and New Zealand
Revenue Reduction in yield, rates,client retention Decrease to (6.50%)
Operating expenses Higher labour and/or othersupport costs Increase to 14.21%
Growth rates – Travel services – North America
Revenue Reduction in yield, rates,client retention Decrease to (0.1%)
Operating expenses Higher labour and/or othersupport costs Increase to 6.6%
Growth rates – Travel services – Asia
Revenue Reduction in yield, rates,client retention Decrease to (4.58%)
Operating expenses Higher labour and/or othersupport costs Increase to 11.18%
Growth rates – Travel services – Europe
Revenue Reduction in yield, rates,client retention Decrease to (6.07%)
Operating expenses Higher labour and/or othersupport costs Increase to 14.59%
Accounting policyGoodwill and intangible assets that have an indefinite useful life are not subject to amortisation and are tested annually for impairment, or more frequently if events or changes in circumstances indicate that they might be impaired. Other assets are tested for impairment whenever events or changes in circumstances indicate that the carrying amount may not be recoverable. An impairment loss is recognised for the amount by which the asset’s carrying amount exceeds its recoverable amount. The recoverable amount is the higher of an asset’s fair value less costs of disposal and value in use. For the purposes of assessing impairment, assets are grouped at the lowest levels for which there are separately identifiable cash inflows which are largely independent of the cash inflows from other assets or groups of assets (cash-generating units). Non-financial assets other than goodwill that suffered an impairment are reviewed for possible reversal of the impairment at the end of each reporting period.
For the purposes of impairment testing, the cash generating unit has been defined as the lowest level of travel services operations to which goodwill relates, where individual cash flows can be ascertained for the purposes of discounting future cash flows.
The recoverable amount is the greater of fair value less costs to sell and value in use. It is determined for an individual asset, unless the asset’s value in use cannot be estimated to be close to its fair value less costs to sell and it does not generate cash inflows that are largely independent of those cash flows from other assets or groups of assets, in which case, the recoverable amount is determined for the cash-generating unit to which the asset belongs.
In assessing value in use, the estimated cash flows are discounted to their present value using a pre-tax discount rate that reflects current market assessments of the time value of money and the risks specific to the asset.
Critical estimates, assumptions and judgements• Impairment of goodwill
The Group determines whether goodwill is impaired on an annual basis. This assessment requires an estimation of the recoverable amount of the cash-generating units to which the goodwill is allocated.
NOTES TO THE CONSOLIDATED FINANCIAL STATEMENTS: RISK
16. Financial risk management
The Group’s principal financial instruments comprise deposits with banks, overdraft facilities and borrowings.
The main purpose of these financial instruments is to raise finance for the Group’s operations. The Group has various other financial assets and liabilities, such as trade receivables and trade payables, which arise directly from its operations. It is, and has been throughout the period under review, the Group’s policy that no trading in financial instruments shall be undertaken.
The main risk arising from the Group’s financial instruments are interest rate risk, liquidity risk, credit risk and foreign exchange risk. The Board reviews and agrees policies for managing each of these risks, which are summarised in the note. The Group is not exposed directly to commodity trading risks.
(a) Interest rate riskAs at 30 June 2019, the Group had interest bearing borrowings of $39.3 million, therefore the Group’s income and operating cash flows would be impacted by changes in market interest rates. Interest rate risk is managed by way of proactive action by management and advisors. At balance date, CTM has no interest rate cap, swap or options in place and has managed interest rate risk by fixing interest payable for short terms of 1 - 6 months on material borrowings. Under the terms of CTM’s financing arrangements, interest payable is determined using an appropriate base for the currency borrowed.
Changes in USD LIBOR (London Interbank Offered Rate) for example could therefore affect CTM in the medium or long term and accordingly, various strategies to mitigate interest payable may be adopted should material volatility or rates increases be forecast. The Group has considered its exposure to interest rate movements and note that significant changes in interest rates would not result in a material impact to Finance costs.
The Group has interest bearing assets (cash and cash equivalents) with a short turnover period. The interest earned from these assets is not considered material to the Group.
(b) Credit risk Credit risk arises from cash and cash equivalents, and balances owing from customers and suppliers including outstanding receivables.
With respect to credit risk arising from the other financial assets of the Group, comprising of cash and cash equivalents, the Group’s exposure to credit risk arises from default of the counter party, with a maximum exposure equal to the carrying amount of these instruments.
The Group’s cash (refer note 9), is held at financial institutions with the following credit ratings:
2019 Moody’s Investor Service Rating$’000
Australia and New Zealand 19,312 Aa3 - A1
North America 23,178 Aa1 - A1
Asia 61,001 Aa1 - Baa3
Europe 35,300 Aa2 - Baa3
Total cash and cash equivalents 138,791
The Group’s policy is that all clients which wish to trade on credit terms are subject to credit verification procedures, and subsequent risk limits, which are set for each individual client in accordance with the Group’s policies. For some client receivables, the Group may also obtain security in the form of deposits. In addition, receivable balances are monitored on an ongoing basis, with the result that the Group’s exposure to bad debts is considered reasonable. Client and trade receivables are held with predominantly un-rated entities.
Receivables are subject to the expected credit loss model. The Group has applied the AASB 9 simplified approach to measuring the expected credit loss, which uses a lifetime expected loss allowance for all receivables and contract assets.
To measure the expected credit losses, receivables and contract assets have been grouped based on shared credit risk characteristics and the days past due. Contract assets represent balances earned which are not yet unconditional and have the same characteristics as trade receivables. The Group has, therefore, concluded that the expected loss rates for trade receivables are a reasonable approximation of the loss rates for the contract assets.

76 77
NOTES TO THE CONSOLIDATED FINANCIAL STATEMENTS: RISK
16. Financial risk management (continued)
(b) Credit risk (continued)Receivables and contract assets are written off when there is no reasonable expectation of recovery. Impairment losses on receivables and contract assets are presented as net impairment losses within operating profit. Subsequent recoveries of amounts previously written off are credited against the same line item.
Previous accounting policy for impairment of trade receivablesIn the prior year, the impairment of receivables was assessed based on the incurred loss model. Individual receivables which were known to be uncollectible were written off by reducing the carrying amount directly. Receivables for which an impairment provision was recognised were written off against the provision when there was no expectation of recovering additional cash.
(c) Liquidity riskThe Group’s objective is to maintain a balance between continuity of funding and flexibility through the use of bank overdrafts, bank loans and hire purchase contracts. Refer note 12 – borrowings and contingent liabilities for discussion on the use of banking facilities in managing the Group’s liquidity needs.
The Group manages liquidity risk by monitoring cash flows and estimating future operational draws on cash reserves. The following table reflects all contractually fixed repayments and interest resulting from recognised financial liabilities as at 30 June 2019.
The Group’s financial liabilities comprise of trade and other payables, borrowings, and no derivative financial instruments are held. The respective undiscounted cash flows for the respective upcoming fiscal years are included in the following table. Cash flows for financial liabilities without fixed amount or timing are based on the conditions existing at 30 June 2019.
The remaining non-derivative contractual maturities of the Group’s financial liabilities are:
Contractual cash flows Carrying amount
2019 2018 2019 2018
$’000 $’000 $’000 $’000
1 year or less 316,661 253,556 316,753 253,621
1 – 5 years 2,942 1,691 4,158 2,872
Over 5 years - - - -
Total trade and other payables 319,603 255,247 320,911 256,493
1 year or less 19,205 14,677 19,205 14,677
1 – 5 years 20,085 29,301 20,085 29,301
Over 5 years - - - -
Total borrowings 39,290 43,978 39,290 43,978
(d) Foreign exchange riskThe Group operates internationally and is subject to foreign exchange risk arising from exposure to foreign currencies.
The Group adopts various procedures and policies to manage foreign currency risk where practicable. These procedures include the use of natural hedges arising from trading operations and subsidiaries’ results, forecasting of future cash flows by currency, and can include the use of forward exchange contracts where abnormal transactions outside of operating activities could give rise to a material exposure – e.g. initial and contingent consideration payments made in relation to acquisitions. Additionally, the Group has a multi-currency debt facility which allows for borrowings in the relevant entity’s functional currency.
NOTES TO THE CONSOLIDATED FINANCIAL STATEMENTS: RISK
16. Financial risk management (continued)
(d) Foreign exchange risk (continued)The following table includes the financial assets and liabilities denominated in currencies other than the functional currency of the respective entities and presents the Group’s exposure to foreign exchange risk at the end of the reporting period, expressed in Australian dollars.
2019
Cash and cash
equivalents
Trade and other
receivables
Related party loans
Trade and other payables
Borrowings Total
$’000 $’000 $’000 $’000 $’000 $’000
USD 2,071 3,145 23,438 (3,179) - 25,475
HKD 264 133 (22,302) (117) - (22,022)
GBP 324 - 857 (260) - 921
NZD 2 34 2,894 - - 2,930
JPY 295 25 - (1,348) - (1,028)
EUR 487 514 4,788 (313) - 5,476
CHF 267 - 1,388 (13) - 1,642
Others 1,684 838 3,209 (1,736) - 3,995
Total foreign exchange risk 5,394 4,689 14,272 (6,966) - 17,389
Based on the 2019 balances, a 10% stronger/(weaker) Australian dollar against the currencies held, would result in a Profit & Loss impact of $1,102,970/($902,430).
2018
Cash and cash
equivalents
Trade and Other
receivables
Related party loans
Trade and Other
payablesBorrowings Total
$’000 $’000 $’000 $’000 $’000 $’000
USD 1,186 6,661 23,067 (3,505) - 27,409
HKD 439 232 (23,698) (57) - (23,084)
GBP 257 - (6,009) (80) - (5,832)
NZD 2 - 1,036 (1) - 1,037
JPY 109 86 - (1,257) - (1,062)
Others 697 448 82 (1,441) - (214)
Total foreign exchange risk 2,690 7,427 (5,522) (6,341) - (1,746)

78 79
NOTES TO THE CONSOLIDATED FINANCIAL STATEMENTS: UNRECOGNISED ITEMS
This section provides information about items that are not recognised in the financial statements, but could potentially have a significant impact on the Group’s financial position and performance.
17. Commitments
(a) Operating lease commitments – Group as lesseeThe Group has entered into commercial leases for the rental of premises. These leases have an average life of between one and eight years. There are no restrictions placed upon the lessee by entering into these leases.
Future minimum rentals payable under non-cancellable operating leases as at 30 June are as follows:
2019 2018
$’000 $’000
Within one year 10,371 8,837
After one year but not more than five years 25,843 13,244
More than five years 3,733 1,070
Total commitments 39,947 23,151
(b) Capital commitmentsThere is no significant capital expenditure contracted as at the end of the reporting period but not recognised as liabilities.
Accounting policyThe determination of whether an arrangement is or contains a lease is based on the substance of the arrangement and requires an assessment of whether the fulfilment of the arrangement is dependent on the use of a specific asset or assets and the arrangement conveys a rights to use the asset.
Operating lease payments, which do not transfer to the Group substantially all the risks and benefits incidental to ownership of the leased item, are recognised as an expense in the Consolidated Statement of Comprehensive Income on a straight-line basis over the lease term. Incentives for entering into operating leases are recognised on a straight-line basis over the term of the lease. Lease income from operating leases, where the Group is a lessor, is recognised in income on a straight-line basis over the lease term.
18. Events occurring after the reporting period
Other than the following items, there have been no matters, or circumstances, not otherwise dealt with in this report, that will significantly affect the operation of the Group, the results of those operations or the state or affairs of the Group or subsequent financial years.
On 7 August 2019 the Group entered into a $225 million (GBP 125 million) multi-currency syndicated facility. The new Syndicated Facility Agreement is with HSBC UK Bank plc, Commonwealth Bank of Australia and Barclays Bank plc.
This facility replaces the existing facility in place at 30 June 2019 – refer note 12. The new facility offers CTM improved rates, lower annual costs, bank diversity and allows for future growth and flexibility.
As part of the new agreement is a permitted indebtedness basket of $406 million (GBP 225 million) in support of transactional banking facilities including bank guarantees, merchant facilities and overdrafts.
NOTES TO THE CONSOLIDATED FINANCIAL STATEMENTS: OTHER ITEMS
This section provides information on items which require disclosure to comply with Australian Accounting Standards and other regulatory pronouncements, however are not considered critical in understanding the financial performance of the Group.
19. Other assets
2019 2018
$’000 $’000
Prepayments 4,824 3,701
Secured deposits (i) 5,752 -
Financial assets at fair value - 502 Total other current assets 10,576 4,203
(i) This relates to secured deposits within the Lotus business – refer note 12 for further details.
20. Plant equipmentNo additions during the year (2018: $nil) were financed under lease agreements.
Furniture, fixtures and equipment
Computer equipment
Leasehold improvements Other Total
$’000 $’000 $’000 $’000 $’000
Year ended 30 June 2019
Cost 7,052 14,668 9,090 1,405 32,215
Accumulated depreciation (4,219) (11,797) (2,649) (222) (18,887)
2,833 2,871 6,441 1,183 13,328
Opening net book amount 1,176 2,208 2,599 135 6,118
Additions 1,912 1,583 4,644 1,133 9,272
Additions through the acquisition of entities/businesses (note 7) 267 666 35 323 1,291
Depreciation charge (533) (1,656) (850) (303) (3,342)
Exchange differences 11 70 13 (105) (11)
Closing net book amount 2,833 2,871 6,441 1,183 13,328
Year ended 30 June 2018
Cost 5,582 9,009 5,203 449 20,243
Accumulated depreciation (4,406) (6,801) (2,604) (314) (14,125)
1,176 2,208 2,599 135 6,118
Opening net book amount 870 1,755 2,544 93 5,262
Additions 647 1,351 678 89 2,765
Depreciation charge (353) (967) (672) (53) (2,045)
Exchange differences 12 69 49 6 136
Closing net book amount 1,176 2,208 2,599 135 6,118
Accounting policyPlant and equipment is stated at historical cost less accumulated depreciation and any accumulated impairment losses. Historical cost includes expenditure that is directly attributable to the acquisition of the item. All other repairs and maintenance costs are charged to the profit and loss in the Consolidated Statement of Comprehensive Income during the reporting period in which they are incurred.
Impairment of non-financial assets, other than goodwill and intangible assetsAt each reporting date, the Group assesses whether there is an indication that an asset may be impaired. Where an indicator of impairment exists, the Group makes a formal estimate of recoverable amount. Where the carrying amount of an asset exceeds its recoverable amount, the asset is considered impaired and is written down to its recoverable amount.

80 81
NOTES TO THE CONSOLIDATED FINANCIAL STATEMENTS: OTHER ITEMS
20. Plant and equipment (continued)Accounting policy (continued)
The carrying values of plant and equipment are reviewed for impairment when events or changes in circumstances indicate that the carrying value may not be recoverable.
The recoverable amount of plant and equipment is the higher of fair value less costs to sell and value in use. In assessing value in use, the estimated future cash flows are discounted to their present value using a pre-tax discount rate that reflects current market assessments of the time value of money and the risks specific to the asset.
DerecognitionAn item of plant and equipment is derecognised upon disposal or when no future economic benefits are expected to arise from the continued use of the asset.
Any gain or loss arising on derecognition of the asset, calculated as the difference between the net disposal proceeds and the carrying amount of the asset, is included in the Statement of Comprehensive Income in the year the asset is derecognised.
21. Fair value measurement
Fair value hierarchyThe balance for the Group’s asset and liabilities measured and recognised at fair value is $2.6 million. The following table represents the changes for the year ended 30 June 2019.
Contingent Consideration
$’000
Opening balance 1 July 2018 -
Additions 3,232
Transfer to Acquisition payable (i) (700)
Discount unwind 53
Closing balance at 30 June 2019 2,585
(i) The balance transferred to Acquisition payable during the period relates to the Platinum Travel contingent consideration ($0.7 million), based on the financial criteria relating to the earn out period being met.
Fair values of other financial instruments At 30 June 2019 there are no forward exchange contracts in place.
The Group also has a number of financial instruments which are not measured at fair value in the Statement of Financial Position. For these instruments, their carrying value was considered to be a reasonable approximation of their fair value.
Valuation processesThe finance department of the Group performs the valuations of assets required for financial reporting purposes, including level 3 fair values. This team reports directly to the Global Chief Financial Officer (CFO) and the Audit Committee (AC). Discussions of valuation processes and results are held between the CFO, AC, and the finance team at least once every six months, in line with the Group’s reporting dates.
22. Share-based payments
Share appreciation rightsThe establishment of the CTM Share Appreciation Rights (SARs) Plan was approved by the Board on 19 October 2012. The SARs Plan is designed to provide long-term incentives for senior executives to deliver long-term shareholder returns. Under the plan, participants are granted SARs which only vest if certain performance standards are met, and the employee remains in service. Participation in the plan is at the Board’s absolute discretion and no individual has a contractual right to participate in the plan or to receive any guaranteed benefits.
NOTES TO THE CONSOLIDATED FINANCIAL STATEMENTS: OTHER ITEMS
22. Share-based payments (continued)Share appreciation rights (continued)Once vested, a participant will be deemed to have automatically exercised all vested SARs and CTM will settle its obligation in line with the SARs Plan. There is no consideration payable by the participant upon exercising of vested SARs. When exercised, the conversion of a SAR to an equity or cash based settlement, is determined using a formula referencing the relevant share prices of CTM, the number of SARs exercised, and is at the Board’s sole absolute discretion.
Grants made during 2019 will vest on a scaled basis as follows:• 50% vest at 80% target achievement; • 75% vest at 90% target achievement; and• 100% at 100% target achievement.
For equity based settlements, the calculation is as follows:• Equity Settlement Amount = ((SMV – BP) / SMV) x PQSR
For cash based settlements, the calculation is as follows:• Cash Settlement Amount = (SMV – BP) x PQSAR
Where: Equity Settlement Amount – is the number of shares to be issued or transferred to the relevant participant in
equity settlement of the performance qualified SAR at exercise;
Cash Settlement Amount – is the amount paid to a participant in cash settlement of a performance qualified SAR at exercise;
SMV – the Subsequent Market Value is the market value of a CTM Ltd share as at the performance qualification date in connection with that SAR;
BP – the Base Price of the SAR as determined by the Board; and
PQSAR – is the total number of performance qualified SARs with the same Base Price held by the relevant participant.
SARs granted under the plan carry no dividend or voting rights.
The following table summarises the SARs granted under the plan, no SARS expired during the periods below:
2019 2018
Number of SARS Number of SARS
As at 1 July 3,575,500 3,117,500
Granted during the year 1,613,000 1,610,000
Exercised during the year (845,000) (865,000)
Forfeited during the year (475,000) (287,000)
As at 30 June 3,868,500 3,575,500
Vested and exercisable at 30 June - -
SARs outstanding at the end of the year have the following expiry date and share base prices:
Grant date Performance period Base price SARS 30 June 2019
SARS 30 June 2018
1 July 2015 1 July 2015 – 30 June 2018 $ 8.80 - 50,000
1 July 2015 1 July 2015 – 30 June 2018 $ 11.50 - 795,000
1 July 2016 1 July 2016 – 30 June 2019 $ 15.33 1,307,500 1,332,500
22 August 2017 1 July 2017 – 30 June 2020 $ 23.90 1,158,000 1,398,000
22 August 2018 1 July 2018 – 30 June 2021 $ 29.00 1,403,000 -
3,868,500 3,575,500
On 21 August 2019, 386,762 shares will be issued upon vesting of 1,297,500 SARs. In addition to the share issue, on 21 August 2019, 1,753,000 SARs were granted, pursuant to the CTM SARs plan.

82 83
NOTES TO THE CONSOLIDATED FINANCIAL STATEMENTS: OTHER ITEMS
22. Share-based payments (continued)
Fair value of SARs grantedThe assessed fair value at grant date of the SARs granted during the year ended 30 June 2019 was $4.80 per SAR (2018 - $2.49). The fair value at grant date has been determined using a Black-Scholes pricing model that takes into account the share price at the time of the grant, the exercise price, the term of the SAR, the expected dividend yield, the expected price volatility of the underlying share and the risk free interest rate for the term of the SAR.
The fair value model inputs for SARs granted during the year ended 30 June 2019 included:
• SARs are granted for no consideration and vest based on Corporate Travel Management Limited’s Earnings per Share growth over a 3 year vesting period.
• Base price: $29.00 (2018 - $23.90).• Grant Date: 22 August 2018 (2018 – 22 August 2017).• Expiry Date: 1 July 2021 (2018 - 1 July 2020).• Share Price at Grant Date: $30.87 (2018 - $21.85).• Expected price volatility of the Group’s shares: 22.5% (2018 - 25%).• Expected dividend yield: 3.0% (2018 - 3.0%).• Risk-free interest rate: 2.13% (2018 – 1.94%).
The expected price volatility is based on the historic volatility, based on the remaining life of the SARS, adjusted for any expected changes to future volatility due to publicly available information.
Expenses arising from SARSTotal expenses arising from share-based payment transactions recognised during the period as part of employee benefit expense relating to share appreciation rights is $3,690,000 (2018: $2,176,000).
Accounting policyShare-based compensation benefits are provided to employees by way of a SARs. The fair value of SARs granted is recognised as an employee benefits expense, with a corresponding increase in equity. The total amount to be expensed is determined by reference to the fair value of the rights granted, which includes any market performance conditions and the impact of any non-vesting conditions but excludes the impact of any service and non-market performance vesting conditions.
Non-market vesting conditions are included in assumptions about the number of SARs that are expected to vest. The total expense is recognised over the vesting period, which is the period over which all of the specified vesting conditions are to be satisfied. At the end of each period, CTM revises its estimates of the number of SARs that are expected to vest based on the non-market vesting conditions. CTM recognises the impact of the revision to original estimates, if any, in profit or loss, with a corresponding adjustment to equity.
23. Interests in other entities
(a) Material subsidiariesThe Group’s principal subsidiaries at 30 June 2019 are set out in the following table. Unless otherwise stated, each entity has share capital consisting solely of ordinary shares that are held by the Group, and the proportion of ownership interests held equals the voting rights held by the Group. The country of incorporation or registration is also their principal place of business.
NOTES TO THE CONSOLIDATED FINANCIAL STATEMENTS: OTHER ITEMS
23. Interests in other entities (continued)
(a) Material subsidiaries (continued)Subsidiaries that provide travel services and contribute more than 5% of the Group’s net profit before tax or 5% of the Group’s net assets are considered material to the Group.
Name of entity
Place of business/ country of incorporation
Ownership interest held by The Group
Ownership interest held by noncontrolling interest
Principal activities
2019 2018 2019 2018
% % % %
Corporate Travel Management Group Pty Ltd*
Australia 100.0 100.0 - - Travel services
Corporate Travel Management North America Inc
United States of America 100.0 100.0 - - Travel services
Westminster Travel Limited Hong Kong 75.1 75.1 24.9 24.9 Travel services
Lotus Travel Limited Hong Kong 75.1 - 24.9 - Travel services
Corporate Travel Management Limited (HK) Hong Kong 75.1 75.1 24.9 24.9 Travel services
Corporate Travel Management (United Kingdom) Limited
United Kingdom 100.0 100.0 - - Travel services
Corporate Travel Management (North) Limited
United Kingdom 100.0 100.0 - - Travel services
* This subsidiary has been granted relief from the necessity to prepare financial reports in accordance with Class Order 2016/785 issued by the Australian Securities and Investments Commission. For further information refer note 26.
(b) Non-controlling interests (NCI)The following table summarises the financial information for Wealthy Aim Investments Limited (“Westminster Travel”), which has a non-controlling interest which is material to the Group.
The Westminster Travel Group includes non-controlling interests which are not material to the Group.

84 85
NOTES TO THE CONSOLIDATED FINANCIAL STATEMENTS: OTHER ITEMS
23. Interests in other entities (continued)
(b) Non-controlling interests (NCI) (continued)The amounts disclosed are before inter-company eliminations.
Summarised Statement of Financial Position2019 2018
$’000 $’000
Current assets 243,801 145,404
Current liabilities (164,246) (85,983)
Current net assets 79,555 59,421
Non-current assets 60,587 17,482
Non-current liabilities (4,064) (936)
Non-current net assets 56,523 16,546
Net assets 136,078 75,967
Accumulated NCI 23,923 17,158
Summarised Statement of Comprehensive Income2019 2018
$’000 $’000
Revenue 80,704 53,807
Profit for the period 13,079 15,649
Other comprehensive income 5,453 2,699
Total comprehensive income 18,532 18,348
Profit/(loss) allocated to NCI 3,238 3,870
Dividends paid to NCI 3,008 2,507
Summarised Statement of Cash Flows2019 2018
$’000 $’000
Cash flows from operating activities 29,982 18,311
Cash flows from investing activities (47,965) (832)
Cash flows from financing activities 45,350 (13,085)
Net increase/(decrease) in cash and cash equivalents 27,367 4,394
24. Related party transactions(a) Parent entitiesThe ultimate parent entity within the Group is Corporate Travel Management Limited.
(b) SubsidiariesInterest in subsidiaries are set out in note 23
(c) Key management personnel compensation
2019 2018
$ $
Short-term 5,427,637 4,767,414
Post-employment 230,084 254,361
Long-term benefits 104,667 13,259
Share-based payments 1,525,358 766,245
Total KMP compensation 7,287,746 5,801,279
Detailed remuneration disclosures are provided in the Remuneration Report on pages 29-39.
NOTES TO THE CONSOLIDATED FINANCIAL STATEMENTS: OTHER ITEMS
24. Related party transactions (continued)
(d) Transactions with other related partiesDeferred consideration balance of $13.5 million was paid to Chris Thelen in relation to the Chambers Travel acquisition. No remaining deferred consideration is payable to Chris Thelen. Rental expense of $50,805 was also paid to Chris Thelen.
Working capital adjustment of $44,000 was paid to Greg McCarthy in relation to the Platinum Travel acquisition.
(e) Outstanding balances with related partiesThe following balances are outstanding at the end of the reporting period in relation to transactions with related parties:
2019 2018
$’000 $’000
Trade and other receivables- 378
Key management personnel
Other payables3,285 13,631
Key management personnel (i)
Other related parties - 82
(i) The balance represents the present value of the consideration payable to Greg McCarthy, as a part of the acquisition of SCT Travel Group Pty Ltd, trading as Platinum Travel Corporation – refer to note 11.
(f) Terms and conditionsDirectors for the Group hold other directorships as detailed in the Directors’ Report. Where any of these related entities are clients of the Group, the arrangements are on similar terms to other clients. All transactions are made on normal commercial terms and conditions and at market rates.
Directors and executives can receive travel and event management services. All transactions are made on normal terms and conditions and at market rates. There are no amounts outstanding in relation to these transactions at 30 June 2019.
25. Parent entity financial information
(a) Summary financial informationThe individual financial statements of the parent entity show the following aggregate amounts:
Statement of Financial Position2019 2018
$’000 $’000
Current assets 8,186 1,279
Total assets 444,327 397,056
Current liabilities 14,878 26,988
Total liabilities 27,627 47,938
Net assets 416,700 349,118
Shareholders’ equity
Issued capital 384,771 322,150
Reserves 582 6,409
Retained earnings 31,347 20,559
Shareholders’ equity 416,700 349,118
Profit for the year 53,051 34,113
Total comprehensive income 53,051 34,113

86 87
NOTES TO THE CONSOLIDATED FINANCIAL STATEMENTS: OTHER ITEMS
25. Parent entity financial information (continued)
(b) Guarantees entered into by the parent entityThe parent entity is party to the overall financing arrangements and related security as detailed in note 12.
(c) Contingent liabilities of the parent entityThe parent entity did not have any contingent liabilities as at 30 June 2019 or 30 June 2018.
(d) Contractual commitmentsThe parent did not have any contractual commitments at 30 June 2019 or 30 June 2018.
Accounting policyThe financial information for the parent entity, Corporate Travel Management Limited, has been prepared on the same basis as the consolidated financial statements, except as follows:
(i) Investments in subsidiaries Investments in subsidiaries are accounted for at cost in the financial statements of Corporate Travel Management Limited.
(ii) Tax consolidation legislationCorporate Travel Management Limited and its wholly-owned Australian controlled entities have implemented tax consolidation legislation. The head entity, Corporate Travel Management Limited and the controlled entities in the tax consolidated group account for their own current and deferred tax amounts. These tax amounts are measured as if each entity in the tax consolidated group continues to be a stand-alone taxpayer in its own right.
In addition to its own current and deferred tax amounts, Corporate Travel Management Limited also recognises the current tax liabilities or assets and the deferred tax assets arising from unused tax losses and unused tax credits assumed from controlled entities in the tax consolidated group.
These entities have also entered into a tax funding agreement under which the wholly-owned entities fully compensate Corporate Travel Management Limited for any current tax payable assumed and are compensated by Corporate Travel Management Limited for any current tax receivable and deferred tax assets relating to unused tax losses or unused tax credits that are transferred to Corporate Travel Management Limited under the tax consolidation legislation. The funding amounts are determined by reference to the amounts recognised in the wholly-owned entities’ financial statements.
The amounts receivable/payable under the tax funding agreement are due upon receipt of the funding advice from the head entity, which is issued as soon as practicable after the end of each financial year. The head entity may also require payment of interim funding amounts, to assist with its obligations to pay tax instalments.
Assets or liabilities arising under tax funding agreements with the tax consolidated entities are recognised as current amounts receivable from or payable to other entities in the Group. Any difference between the amounts assumed and amounts receivable or payable under the tax funding agreement are recognised as a contribution to or distribution from wholly-owned tax consolidated entities.
(iii) Financial guarantees Where the parent entity has provided financial guarantees in relation to loans and payables of subsidiaries for no compensation, the fair values of these guarantees are accounted for in the parent company and consolidated financial statements.
NOTES TO THE CONSOLIDATED FINANCIAL STATEMENTS: OTHER ITEMS
26. Deed of cross guarantee
Corporate Travel Management Limited, Corporate Travel Management Group Pty Ltd, Floron Nominees Pty Ltd, Sainten Pty Limited, Travelogic Pty Limited, WA Travel Management Pty Ltd, Travelcorp Holdings Pty Ltd, Travelcorp (Aust) Pty Ltd, ETM Travel Pty Ltd and Corporate Travel Management (New Zealand), Corporate Travel Management North America Limited, Corporate Travel Management North America, Inc, are parties to a Deed of Cross Guarantee, under which each company guarantees the debts of the other companies.
By entering into the Deed, the wholly owned Australian entities have been relieved from the requirement to prepare a Financial report and Directors’ Report under Class Order 2016/785 (as amended) issued by the Australian Securities and Investments Commission.
These companies represent a ‘closed group’ for the purposes of the Class Order and, as there are no other parties to the deed of cross guarantee that are controlled by Corporate Travel Management Limited, they also represent the ‘extended closed Group’.
The following table presents a consolidated income statement, a Consolidated Statement of Comprehensive Income and a summary of movements in consolidated retained earnings for the year ended 30 June 2019 of the closed Group.
(a) Consolidated Statement of Comprehensive Income
2019 2018
$’000 $’000
Revenue 271,265 235,600
Other income 39,308 21,276
Total revenue and other income 310,573 256,876
Operating expenses
Employee benefits (145,724) (127,478)
Occupancy (7,217) (6,244)
Depreciation and amortisation (10,413) (8,221)
Information technology and telecommunications (24,838) (20,790)
Travel and entertainment (3,494) (3,048)
Administrative and general (9,111) (8,007)
Total operating expenses (200,797) (173,788)
Finance costs (5,545) (4,519)
Profit before income tax 104,231 78,569
Income tax expense (23,682) (16,065)
Profit for the year 80,549 62,504
Other comprehensive income
Items that may be reclassified to profit or loss:
Exchange differences on translation of foreign operations 8,662 7,119
Changes in the fair value of cash flow hedge (447) 87
Other comprehensive income for the period, net of tax 8,215 7,206
Total comprehensive income for the year 88,764 69,710
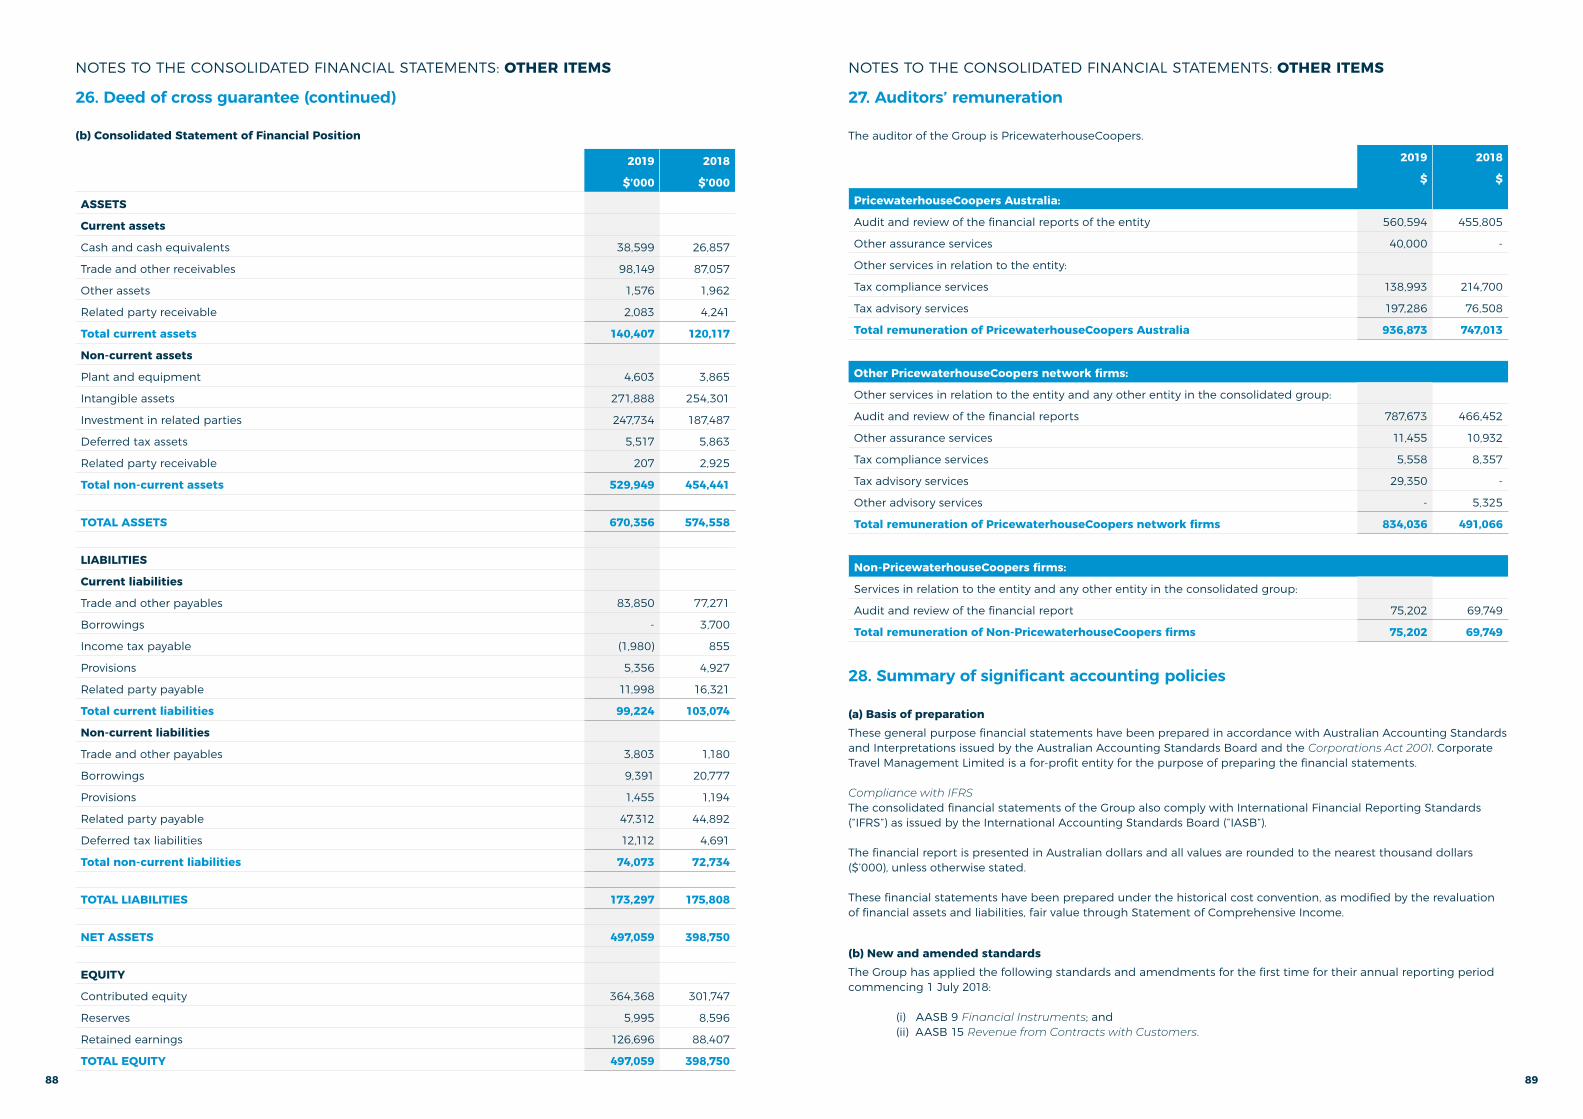
88 89
NOTES TO THE CONSOLIDATED FINANCIAL STATEMENTS: OTHER ITEMS
26. Deed of cross guarantee (continued)
(b) Consolidated Statement of Financial Position
2019 2018
$’000 $’000
ASSETS
Current assets
Cash and cash equivalents 38,599 26,857
Trade and other receivables 98,149 87,057
Other assets 1,576 1,962
Related party receivable 2,083 4,241
Total current assets 140,407 120,117
Non-current assets
Plant and equipment 4,603 3,865
Intangible assets 271,888 254,301
Investment in related parties 247,734 187,487
Deferred tax assets 5,517 5,863
Related party receivable 207 2,925
Total non-current assets 529,949 454,441
TOTAL ASSETS 670,356 574,558
LIABILITIES
Current liabilities
Trade and other payables 83,850 77,271
Borrowings - 3,700
Income tax payable (1,980) 855
Provisions 5,356 4,927
Related party payable 11,998 16,321
Total current liabilities 99,224 103,074
Non-current liabilities
Trade and other payables 3,803 1,180
Borrowings 9,391 20,777
Provisions 1,455 1,194
Related party payable 47,312 44,892
Deferred tax liabilities 12,112 4,691
Total non-current liabilities 74,073 72,734
TOTAL LIABILITIES 173,297 175,808
NET ASSETS 497,059 398,750
EQUITY
Contributed equity 364,368 301,747
Reserves 5,995 8,596
Retained earnings 126,696 88,407
TOTAL EQUITY 497,059 398,750
NOTES TO THE CONSOLIDATED FINANCIAL STATEMENTS: OTHER ITEMS
27. Auditors’ remuneration
The auditor of the Group is PricewaterhouseCoopers.
2019 2018
$ $
PricewaterhouseCoopers Australia:
Audit and review of the financial reports of the entity 560,594 455,805
Other assurance services 40,000 -
Other services in relation to the entity:
Tax compliance services 138,993 214,700
Tax advisory services 197,286 76,508
Total remuneration of PricewaterhouseCoopers Australia 936,873 747,013
Other PricewaterhouseCoopers network firms:
Other services in relation to the entity and any other entity in the consolidated group:
Audit and review of the financial reports 787,673 466,452
Other assurance services 11,455 10,932
Tax compliance services 5,558 8,357
Tax advisory services 29,350 -
Other advisory services - 5,325
Total remuneration of PricewaterhouseCoopers network firms 834,036 491,066
Non-PricewaterhouseCoopers firms:
Services in relation to the entity and any other entity in the consolidated group:
Audit and review of the financial report 75,202 69,749
Total remuneration of Non-PricewaterhouseCoopers firms 75,202 69,749
28. Summary of significant accounting policies
(a) Basis of preparationThese general purpose financial statements have been prepared in accordance with Australian Accounting Standards and Interpretations issued by the Australian Accounting Standards Board and the Corporations Act 2001. Corporate Travel Management Limited is a for-profit entity for the purpose of preparing the financial statements.
Compliance with IFRSThe consolidated financial statements of the Group also comply with International Financial Reporting Standards (“IFRS”) as issued by the International Accounting Standards Board (“IASB”).
The financial report is presented in Australian dollars and all values are rounded to the nearest thousand dollars ($’000), unless otherwise stated.
These financial statements have been prepared under the historical cost convention, as modified by the revaluation of financial assets and liabilities, fair value through Statement of Comprehensive Income.
(b) New and amended standardsThe Group has applied the following standards and amendments for the first time for their annual reporting period commencing 1 July 2018:
(i) AASB 9 Financial Instruments; and (ii) AASB 15 Revenue from Contracts with Customers.

90 91
NOTES TO THE CONSOLIDATED FINANCIAL STATEMENTS: OTHER ITEMS
28. Summary of significant accounting policies (continued)
(b) New and amended standards (continued)The Group had to change its accounting policies and make certain presentation adjustments following the adoption of AASB 9 and AASB 15, which is disclosed in note 29.
(c) New and amended standards not yet appliedThe Group has not early adopted any amendments, standards or interpretations that have been issued but are not yet effective in the current year.
Certain new accounting standards and interpretations have been published that are not mandatory for the year ended 30 June 2019 and have not been adopted early by the Group. The Group’s assessment of the impact of these new standards and interpretations is set out in the following table.
Title of standard Summary and impact on the Group’s financial statements
Mandatory application date/ date of adoption by the Group
AASB 16 Leases AASB 16 was issued in February 2016. It will result in almost all leases being recognised on the balance sheet by lessees, as the distinction between operating and finance leases is removed. Under the new standard, an asset (the right to use the leased item) and a financial liability to pay rentals are recognised. The only exceptions are short-term and low-value leases. The Group has set up a project team which has reviewed all of the Group’s leasing arrangements over the last year in light of the new lease accounting rules in AASB 16. The standard will affect the accounting for the Group’s operating leases. As at the reporting date, the Group has non-cancellable operating lease commitments of $39,947,000, refer note 17. Of these commitments, approximately $1,085,000 relate to short-term leases and $1,088,000 to low value leases which will both be recognised on a straight-line basis as expense in profit or loss. The Group expects to recognise right-of-use assets of approximately $54,200,000 on 1 July 2019, lease liabilities of $57,400,000 (after adjustments for prepayments and accrued lease payments recognised as at 30 June 2019) and deferred tax assets of $894,000. Overall, net assets will be approximately $2,300,000 lower, and net current assets will be $7,600,000 lower due to the presentation of a portion of the liability as a current liability. Underlying EBITDA used to measure segment results is expected to increase within the range of $9,500,000 to $10,500,000 as the operating lease payments were previously included in EBITDA, but the amortisation of the right-of-use assets and interest on the lease liability will be excluded from this measure. The Group expects that net profit after tax will decrease within the range of $50,000 to $950,000 for financial year 2020 as a result of adopting the new standard.
Operating cash flows will increase, and financing cash flows will decrease within the range of $9,000,000 to $9,500,000 as repayment of the principal portion of the lease liabilities will now be classified as cash flows from financing activities.
The Group’s activities as a lessor are not material and hence the Group does not expect any significant impact on the financial statements.
The Group will apply the standard from its mandatory adoption date of 1 July 2019. The Group intends to apply the simplified transition approach and will not restate comparative amounts for the year prior to first adoption.
Right-of-use assets will be measured on transition as if the new rules had always been applied but using the incremental borrowing rate at the date of transition.
NOTES TO THE CONSOLIDATED FINANCIAL STATEMENTS: OTHER ITEMS
28. Summary of significant accounting policies (continued)
(c) New and amended standards not yet applied (continued)
Title of standard Summary and impact on the Group’s financial statements
Mandatory application date/ date of adoption by the Group
AASB Interpretation 23 Uncertainty over Income Tax Treatments
AASB Interpretation 23 clarifies how to apply the recognition and measurement requirements in AASB 112 when there is uncertainty over income tax treatments. Where such uncertainty exists, an entity will be required to recognised and measure its current or deferred tax asset or liability, applying the requirements in AASB 112 based on taxable profit (tax loss), tax bases, unused tax losses, unused tax credits and tax rates determined by applying this Interpretation. When there is uncertainty over income tax treatments, the Interpretation addresses the following:
• Whether an entity considers uncertain tax treatments separately;• The assumptions an entity makes about the examination of tax
treatments by taxation authorities;• How an entity determines taxable profit (tax loss), tax bases, unused
tax losses, unused tax credits and tax rates; and• How an entity considers changes in facts and circumstances.
An entity is required to determine whether to consider each uncertain tax treatment separately, or together, with one or more other uncertain tax treatments, and shall follow the approach that better predicts the resolution of the uncertainty.
The application of the interpretation is not anticipated to have a material impact on the Group’s consolidated financial statements.
Mandatory for financial year ending 30 June 2020.
At this stage, the Group does not intend to adopt the standard before its effective date.
Accounting policies of subsidiaries have been changed, where necessary, to ensure consistency with policies adopted by the Group.
(d) Rounding of amountsThe Company is of a kind referred to in Class Order 2016/191, issued by the Australian Securities and Investments Commission, relating to the “rounding off” of amounts in the financial statements. Amounts in the financial statements have been rounded off in accordance with that Class Order to the nearest thousand dollars, or in certain cases, the nearest dollar.
29. Changes in accounting policies
This note explains the impact of the adoption of AASB 15 Revenue from Contracts with Customers and AASB 9 Financial Instruments on the Group’s financial statements and discloses the new accounting policies that have been applied from 1 July 2018, where they are different to those applied in prior periods.
AASB 15 Revenue from Contracts with Customers – Impact of adoption
The Group has adopted AASB 15 Revenue from Contracts with Customers from 1 July 2018, which resulted in changes in accounting policies and adjustments to the note disclosure. There has been no material impact on the Group’s results for the year ended 30 June 2019. In accordance with transition provisions, the Group has restated comparatives for the year ended 30 June 2018 for note disclosures (note 10). A new accounting policy for revenue has been disclosed within note - 2 Revenue. In line with AASB 15 disclosure requirements, revenue has been presented at a disaggregated level within note 2 - Revenue and the total contract asset balance has also been disclosed separately within note 10 – Trade and other receivables.

92 93
NOTES TO THE CONSOLIDATED FINANCIAL STATEMENTS: OTHER ITEMS
29. Changes in accounting policies (continued)
AASB 9 Financial Instruments – Impact of adoptionAASB 9 replaces the provisions of AASB 139 that relate to the recognition, classification and measurement of financial assets and financial liabilities, derecognition of financial instruments, impairment of financial assets and hedge accounting.
The adoption of AASB 9 Financial Instruments from 1 July 2018 resulted in changes in accounting policies adopted by the Group, which has been detailed note – 10 Trade and other receivables. The change in the Group’s accounting policies, applied from 1 July 2018, did not impact prior year financial statement balances. Opening balances have not been restated. There has been no material impact on the Group’s results for the year ended 30 June 2019.
(a) Classification and measurementOn 1 July 2018 (the date of initial application of AASB 9), the Group’s management has assessed which business models apply to the financial assets held by the Group and has classified its financial instruments into the appropriate AASB 9 categories. There was no material impact on the balances in the financial statements resulting from this reclassification.
(b) Derivative and hedging activitiesThere is no material impact on derivative and hedge activities from the adoption of AASB 9. The Group does not have any open hedges as at balance sheet date. The prior year balance relating to hedge activities is not impacted by the adoption of AASB 9.
(c) Impairment of financial assetsThe Group’s financial assets are subject to AASB 9’s new expected credit loss model. The Group has revised its impairment methodology for financial assets and applied the simplified approach to measuring expected credit losses. The simplified approach uses a lifetime expected loss allowance.
Financial assets have been grouped based on their shared credit risk characteristics. Contract assets represent balances earned, but which are not yet unconditional and have the same characteristics as trade receivables. Loss rates for trade receivables are a reasonable approximation for contract asset balances. The loss allowances for financial assets on 1 July 2018 were not materially different to the loss allowances as at 30 June 2018. There was no material impact on the financial statement balances resulting from the application of AASB 9 methodology.
Individual debts that are known to be uncollectible are written off when identified.
Directors’ DeclarationIn the Directors’ opinion:
(a) The financial statements and notes set out on pages 43 to 92 are in accordance with the Corporations Act 2001, including:
(i) Complying with Accounting Standards, the Corporations Regulations 2001 and other mandatory professional reporting requirements; and
(ii) Giving a true and fair view of the consolidated entity’s financial position as at 30 June 2019 and of its performance for the financial year ended on that date; and
(b) There are reasonable grounds to believe that the Company will be able to pay its debts as and when they become due and payable; and
(c) At the date of this declaration, there are reasonable grounds to believe that the members of the extended closed group identified in note 26 will be able to meet any obligations or liabilities to which they are, or may become, subject by virtue of the deed of cross guarantee described in note 26.
Note 28 confirms that the financial statements also comply with International Financial Reporting Standards as issued by the International Accounting Standards Board.
The Directors have been given the declarations by the Managing Director and Global Chief Financial Officer required by section 295A of the Corporations Act 2001.
This declaration is made in accordance with a resolution of the Directors.
Mr Ewen Crouch AMChairman
Brisbane, 21 August, 2019
Mr Jamie PherousManaging Director

94 95
79
Our audit approach An audit is designed to provide reasonable assurance about whether the financial report is free from material misstatement. Misstatements may arise due to fraud or error. They are considered material if individually or in aggregate, they could reasonably be expected to influence the economic decisions of users taken on the basis of the financial report.
We tailored the scope of our audit to ensure that we performed enough work to be able to give an opinion on the financial report as a whole, taking into account the geographic and management structure of the Group, its accounting processes and controls and the industry in which it operates.
The Group provides travel management solutions to the corporate market and operates in four broad geographic regions, being Australia & New Zealand (“ANZ”), North America, Asia and Europe. The regional finance functions report to the Group finance function in Brisbane, Australia where the consolidation is performed.
Materiality
● For the purpose of our audit we used overall Group materiality of $6.0 million, which representsapproximately 5% of the Group’s profit before tax.
● We applied this threshold, together with qualitative considerations, to determine the scope of ouraudit and the nature, timing and extent of our audit procedures and to evaluate the effect ofmisstatements on the financial report as a whole.
● We chose Group profit before tax because the Group is profit oriented and because, in our view, itis one of the metrics against which the performance of the Group is most commonly measured andit is a generally accepted benchmark.
● We utilised a 5% threshold based on our professional judgement, noting it is within the range ofcommonly acceptable profit related thresholds.
Audit Scope
● Our audit focused on where the Group made subjective judgements; for example, significantaccounting estimates involving assumptions and inherently uncertain future events.
● In establishing the overall approach to the Group audit, we determined the type of audit work thatneeded to be performed by us, as the Group engagement team, and by component auditors inHong Kong and the UK operating under our instruction. We structured our audit as follows:- We engaged component auditors in Hong Kong and the UK to perform audit procedures over
the Asia and Europe regions respectively.- We performed audit procedures over the North America region, which included us visiting the
Houston and Los Angeles based finance functions.PricewaterhouseCoopers, ABN 52 780 433 757 480 Queen Street, BRISBANE QLD 4000, GPO Box 150, BRISBANE QLD 4001 T: +61 7 3257 5000, F: +61 7 3257 5999, www.pwc.com.au
Liability limited by a scheme approved under Professional Standards Legislation. 78
Independent auditor’s report To the members of Corporate Travel Management Limited
Report on the audit of the financial report
Our opinion In our opinion:
The accompanying financial report of Corporate Travel Management Limited (the Company) and its controlled entities (together the Group) is in accordance with the Corporations Act 2001, including:
(a) giving a true and fair view of the Group's financial position as at 30 June 2019 and of its financialperformance for the year then ended
(b) complying with Australian Accounting Standards and the Corporations Regulations 2001.
What we have audited The Group financial report comprises:
● the consolidated statement of financial position as at 30 June 2019● the consolidated statement of comprehensive income for the year then ended● the consolidated statement of changes in equity for the year then ended● the consolidated statement of cash flows for the year then ended● the notes to the consolidated financial statements, which include a summary of significant
accounting policies● the directors’ declaration.
Basis for opinion We conducted our audit in accordance with Australian Auditing Standards. Our responsibilities under those standards are further described in the Auditor’s responsibilities for the audit of the financial report section of our report.
We believe that the audit evidence we have obtained is sufficient and appropriate to provide a basis for our opinion.
Independence We are independent of the Group in accordance with the auditor independence requirements of the Corporations Act 2001 and the ethical requirements of the Accounting Professional and Ethical Standards Board’s APES 110 Code of Ethics for Professional Accountants (the Code) that are relevant to our audit of the financial report in Australia. We have also fulfilled our other ethical responsibilities in accordance with the Code.

96 97
81
Key audit matter How our audit addressed the key audit matter
Impairment assessment on the Group’s goodwill balances (Refer to note 15 Impairment testing of goodwill)
At 30 June 2019, the Group recorded $506.7m of intangible assets, of which $453.5m related to goodwill. These assets are allocated between four cash generating units (“CGUs”), being Australia & New Zealand, North America, Europe and Asia.
As required by Australian Accounting Standards, at 30 June 2019 the Group performed an impairment assessment over the goodwill balance by calculating the recoverable amount for each CGU, using a ‘value in use’ discounted cash flow model.
Given the level of judgement involved in estimating the key assumptions in the valuation models, including forecast performance, growth rates and discount rates, and the materiality of the goodwill recognised on the Group’s balance sheet, we determined that this was a key audit matter.
No impairment charge was recorded by the Group in the current financial year.
Our procedures in relation to the impairment assessment of goodwill included, amongst others:
● Assessing the appropriateness of the Group’s determination of its CGUs
● Testing the mathematical accuracy of the underlying calculations in the Group’s discounted cash flow valuation models
● Comparing the cash flow forecasts for FY20 used in the models to the Board approved budget for FY20
● Comparing the FY19 actual results with prior year forecasts to assess the accuracy of the Group’s forecasting processes
● Evaluating the key assumptions in the cash flow models, including growth rates and discount rates
● Performing sensitivity analysis to assess the impact of reasonably possible changes in the assumptions used in the valuation models, including the discount rates, growth rates, and FY20 forecast.
We also compared the Group’s net assets as at 30 June 2019 of $592.5m to its market capitalisation of $2,441.1m at 30 June 2019, and noted the $1,848.6m of implied headroom in the comparison.
Capitalisation of internally generated software development costs (Refer to note 8 Intangible assets)
The Group has software development teams in each of its regions, and during the year ended 30 June 2019, material expenditure has been incurred in developing technology solutions.
This expenditure is capitalised when the development projects meet the criteria of AASB 138 Intangible assets.
In the year ended 30 June 2019, there were software additions of $18.8m, which primarily relates to salary costs associated with internally developed software.
We focused on this area due to the level of judgement involved in assessing whether the costs meet the recognition criteria for capitalisation per AASB 138, as well as the quantum of expenditure capitalised during the year.
Our procedures in relation to the capitalisation of internally generated software development costs included, amongst others:
● Developing an understanding of the Group’s policy for capitalising software development costs and the process for capturing costs
● Testing a sample of capitalised costs by obtaining payslip data and timesheet records
● Testing, on a sampling basis, whether transfers from ‘work in progress’ to ‘software’ have occurred at the appropriate time upon completion of the development project
● Assessing, on a sampling basis, the Group’s assessment of likely future economic benefit for developed assets
● Assessing, on a sampling basis, the reasonableness of the useful lives of developed software assets.
80
- We also performed audit procedures over the Australia & New Zealand region, in addition toauditing the consolidation of the Group’s regional reporting units into the Group’s financialreport.
● For the work performed by component auditors in Hong Kong and the UK, we determined the level of involvement we needed to have in the audit work at these locations to be satisfied that sufficient audit evidence had been obtained as a basis for our opinion on the Group financial report as a whole. This included active dialogue throughout the year through discussions, issuing written instructions, receiving formal interoffice reporting, as well as attending meetings with local management. Members of our Group audit team undertook site visits to each of the four regions during the year ended 30 June 2019.
Key audit matters Key audit matters are those matters that, in our professional judgement, were of most significance in our audit of the financial report for the current period. The key audit matters were addressed in the context of our audit of the financial report as a whole, and in forming our opinion thereon, and we do not provide a separate opinion on these matters. Further, any commentary on the outcomes of a particular audit procedure is made in that context. We communicated the key audit matters to the Audit Committee.
Key audit matter How our audit addressed the key audit matter
Recognition and presentation of revenue (Refer to note 2 Revenue)
The Group’s provision of travel services to clients drives a number of revenue streams. The recognition of revenue from these sources is dependent on the terms of the underlying contracts with customers and suppliers.
Judgement is involved in the recognition of volume based incentive revenue, as revenue is accrued over the contract period based on the expected achievement of contractual performance criteria specific to each supplier.
We focused on the recognition and presentation of revenue due to the materiality of the revenue balance as a whole, the judgemental nature of volume based incentive revenue, and the additional disclosure considerations per the requirements of AASB 15 Revenue from contracts with customers.
Our procedures in relation to the recognition of revenue from selected significant revenue streams included, amongst others:
● Obtaining an understanding of the Group’srevenue recognition processes
● Agreeing a sample of recorded fees andcommission transactions to supportingdocuments, including customer agreements,invoices, remittances and bank statements
● Utilising data analytic techniques to identifyrevenue transactions for our testing of journalentries
● Comparing on a sampling basis, volume basedincentive revenue balances to supportingdocuments, including third partyconfirmations, remittances and bankstatements
● Comparing the percentages, rates and TotalTransaction Value (“TTV”) inputs used in theunderlying calculations of volume basedincentive revenue, for a sample of suppliers, topercentages and rates stipulated in thesupplier agreements, and known TTV datasupplied by third parties
● Assessing the completeness and accuracy ofthe Group’s revenue disclosures per therequirements of AASB 15.
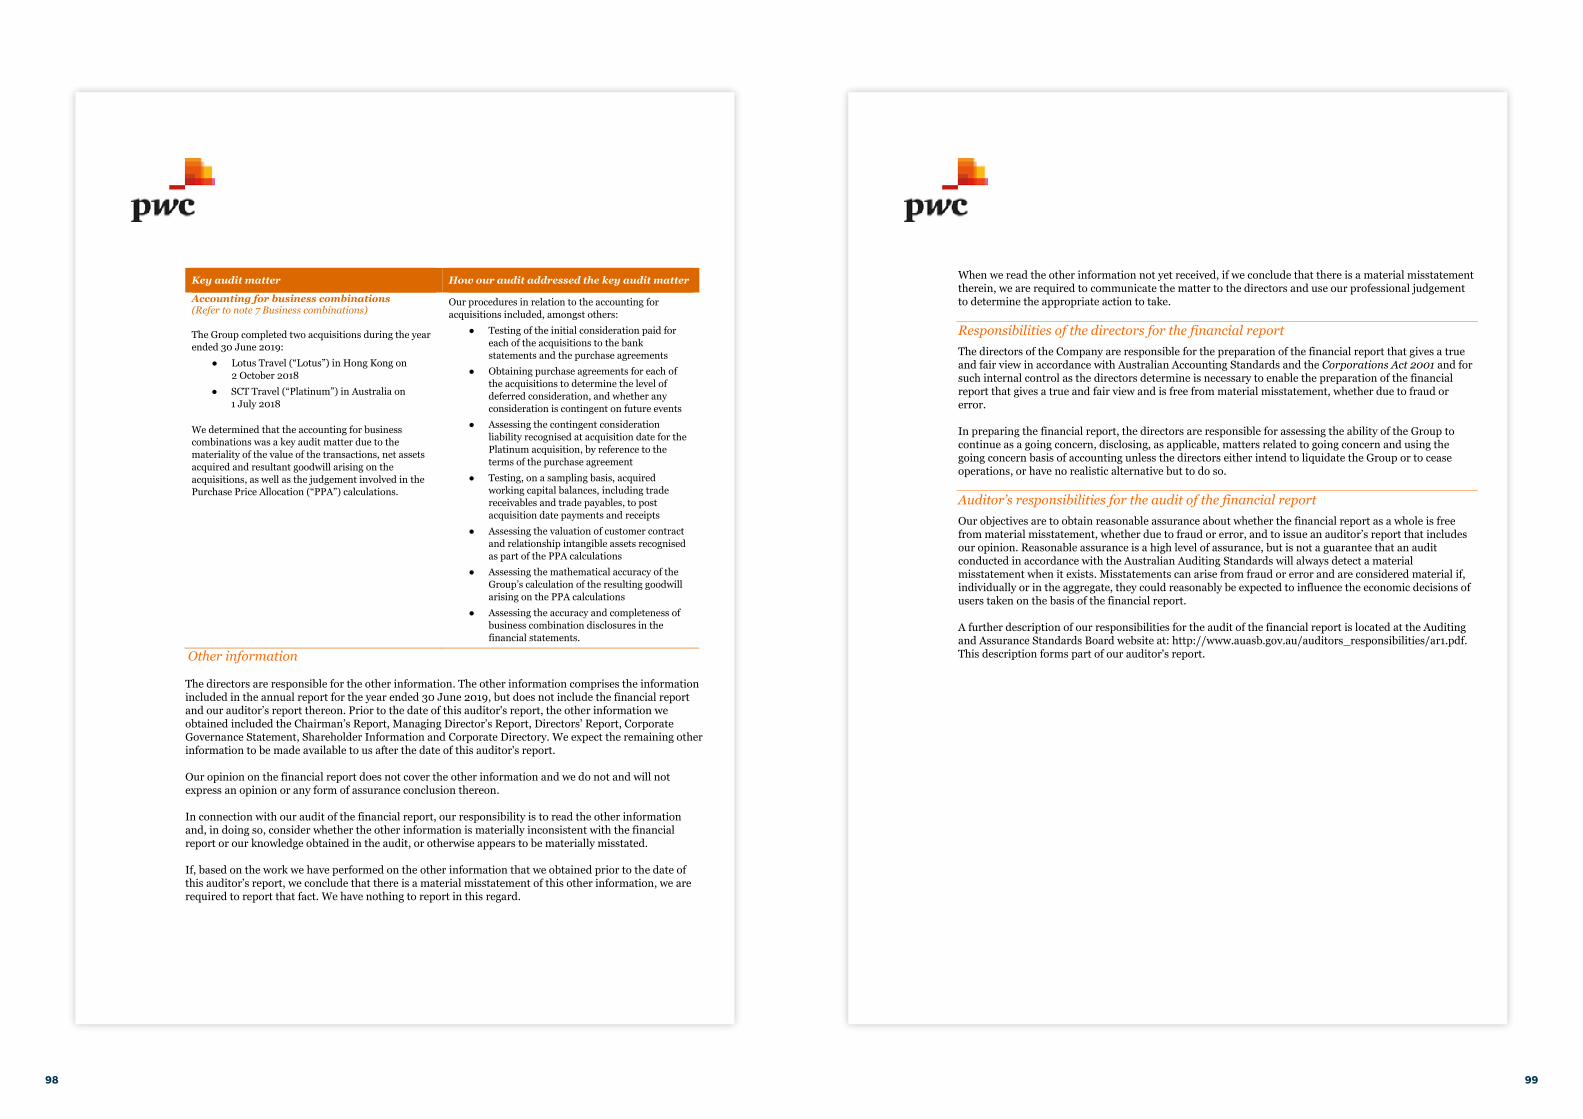
98 99
83
When we read the other information not yet received, if we conclude that there is a material misstatement therein, we are required to communicate the matter to the directors and use our professional judgement to determine the appropriate action to take.
Responsibilities of the directors for the financial report The directors of the Company are responsible for the preparation of the financial report that gives a true and fair view in accordance with Australian Accounting Standards and the Corporations Act 2001 and for such internal control as the directors determine is necessary to enable the preparation of the financial report that gives a true and fair view and is free from material misstatement, whether due to fraud or error.
In preparing the financial report, the directors are responsible for assessing the ability of the Group to continue as a going concern, disclosing, as applicable, matters related to going concern and using the going concern basis of accounting unless the directors either intend to liquidate the Group or to cease operations, or have no realistic alternative but to do so.
Auditor’s responsibilities for the audit of the financial report Our objectives are to obtain reasonable assurance about whether the financial report as a whole is free from material misstatement, whether due to fraud or error, and to issue an auditor’s report that includes our opinion. Reasonable assurance is a high level of assurance, but is not a guarantee that an audit conducted in accordance with the Australian Auditing Standards will always detect a material misstatement when it exists. Misstatements can arise from fraud or error and are considered material if, individually or in the aggregate, they could reasonably be expected to influence the economic decisions of users taken on the basis of the financial report.
A further description of our responsibilities for the audit of the financial report is located at the Auditing and Assurance Standards Board website at: http://www.auasb.gov.au/auditors_responsibilities/ar1.pdf. This description forms part of our auditor's report.
82
Key audit matter How our audit addressed the key audit matter
Accounting for business combinations (Refer to note 7 Business combinations)
The Group completed two acquisitions during the year ended 30 June 2019:
● Lotus Travel (“Lotus”) in Hong Kong on 2 October 2018
● SCT Travel (“Platinum”) in Australia on 1 July 2018
We determined that the accounting for business combinations was a key audit matter due to the materiality of the value of the transactions, net assets acquired and resultant goodwill arising on the acquisitions, as well as the judgement involved in the Purchase Price Allocation (“PPA”) calculations.
Our procedures in relation to the accounting for acquisitions included, amongst others:
● Testing of the initial consideration paid for each of the acquisitions to the bank statements and the purchase agreements
● Obtaining purchase agreements for each of the acquisitions to determine the level of deferred consideration, and whether any consideration is contingent on future events
● Assessing the contingent consideration liability recognised at acquisition date for the Platinum acquisition, by reference to the terms of the purchase agreement
● Testing, on a sampling basis, acquired working capital balances, including trade receivables and trade payables, to post acquisition date payments and receipts
● Assessing the valuation of customer contract and relationship intangible assets recognised as part of the PPA calculations
● Assessing the mathematical accuracy of the Group’s calculation of the resulting goodwill arising on the PPA calculations
● Assessing the accuracy and completeness of business combination disclosures in the financial statements.
Other information
The directors are responsible for the other information. The other information comprises the information included in the annual report for the year ended 30 June 2019, but does not include the financial report and our auditor’s report thereon. Prior to the date of this auditor's report, the other information we obtained included the Chairman’s Report, Managing Director’s Report, Directors’ Report, Corporate Governance Statement, Shareholder Information and Corporate Directory. We expect the remaining other information to be made available to us after the date of this auditor's report.
Our opinion on the financial report does not cover the other information and we do not and will not express an opinion or any form of assurance conclusion thereon.
In connection with our audit of the financial report, our responsibility is to read the other information and, in doing so, consider whether the other information is materially inconsistent with the financial report or our knowledge obtained in the audit, or otherwise appears to be materially misstated.
If, based on the work we have performed on the other information that we obtained prior to the date of this auditor’s report, we conclude that there is a material misstatement of this other information, we are required to report that fact. We have nothing to report in this regard.

100 101
Shareholder InformationThe shareholder information set out below was applicable at 21 August 2019.
a) Distribution of equity securitiesAnalysis of numbers of equity security holders by size of holding:
Number ofshareholders
1 - 1,000 8,830
1,001 - 5,000 3,654
5,001 - 10,000 413
10,001 - 100,000 262
100,001 Over 42
13,201
There were 395 holders of less than a marketable parcel of ordinary shares.
b) Equity security holdersTwenty largest quoted equity security holders
The names of the twenty largest holders of quoted equity securities are listed as follows:
2019Number
held
Percentage of issued shares
HSBC Custody Nominees (Australia) Limited 27,432,968 25.20%
Pherous Holdings Group Pty Ltd 20,740,000 19.05%
J P Morgan Nominees Australia Pty Limited 11,488,471 10.55%
Citicorp Nominees Pty Limited 7,919,806 7.27%
BNP Paribas Nominees Pty Ltd 3,123,760 2.87%
National Nominees Limited 2,091,849 1.92%
BNP Paribas Noms Pty Ltd 2,057,810 1.89%
Matimo Pty Ltd 1,279,350 1.18%
National Nominees Limited 1,264,961 1.16%
Steven Craig Smith 1,090,838 1.00%
Ms Helen Logas 978,554 0.90%
Citicorp Nominees Pty Limited 844,884 0.78%
Argo Investments Limited 736,682 0.68%
Mr Matthew Dalling 729,171 0.67%
HSBC Custody Nominees (Australia) Limited 569,477 0.52%
HSBC Custody Nominees (Australia) Limited - A/C 2 553,118 0.51%
Shamiz Pty Ltd 526,893 0.48%
Christopher Alexander Thelen 446,864 0.41%
Doobie Investments Pty Ltd 414,936 0.38%
BNP Paribas Nominees Pty Ltd Hub24Custodial Serv Ltd Drp 380,770 0.35%
84,671,162 77.77%
84
Report on the remuneration report
Our opinion on the remuneration report We have audited the remuneration report included in pages 29 to 39 of the directors’ report for the year ended 30 June 2019.
In our opinion, the remuneration report of Corporate Travel Management Limited for the year ended 30 June 2019 complies with section 300A of the Corporations Act 2001.
Responsibilities The directors of the Company are responsible for the preparation and presentation of the remuneration report in accordance with section 300A of the Corporations Act 2001. Our responsibility is to express an opinion on the remuneration report, based on our audit conducted in accordance with Australian Auditing Standards.
PricewaterhouseCoopers
Michael Crowe Brisbane Partner 21 August 2019

102 103
Shareholder Information (continued)b) Equity security holders (continued)Unquoted equity securities
Number on issue
Number of holders
Share Appreciation Rights 3,998,500 47
c) Substantial holdersSubstantial holders (including associate holdings) in the company are set out as follows:
Numberheld
PercentageIssued shares
HSBC Custody Nominees (Australia) Ltd 24,660,822 22.73%
Pherous Holdings Group Pty Ltd and Shamiz Pty Ltd 21,266,893 19.60%
Mitsubishi UFJ Financial Group Inc. 13,213,375 12.18%
J P Morgan Nominees Australia Limited 12,228,565 11.27%
Bennelong Australian Equity Partners Ltd 8,209,124 7.57%
Citicorp Nominees Pty Limited 7,997,890 7.37%
Morgan Stanley 7,457,961 6.87%
Commonwealth Bank of Australia 6,548,987 6.04%
Pinnacle Investment Management Group Limited and Pinnacle Investment Management Limited 5,651,178 5.65%
Hyperion Asset Management Limited 5,019,113 5.04%
d) Voting rightsThe voting rights attaching to each class of equity securities are set out below:
Ordinary shares voting rightsOn a show of hands, every member present at a meeting in person or by proxy shall have one vote. Upon a poll, each share shall have one vote. There are currently no options held.
Share Appreciation RightsShare appreciation rights have no voting rights.
Corporate Directory
Directors Ewen Crouch AMJamie PherousStephen LonieGreg MoynihanAdmiral Robert J. Natter, U.S. Navy (Ret.)Laura RufflesSophie Mitchell (appointed 02 September 2019)
Secretary S. YeatesA. Tucker (appointed 02 September 2019)
Notice of Annual General Meeting The Annual General Meeting of Corporate Travel Management will be held in Brisbane on Wednesday 6 November 2019 at 11am at the Marriott, Brisbane (515 Queen Street, Brisbane QLD 4000).
Registered office in Australia Level 24, 307 Queen StreetBrisbane QLD 4000Telephone: +61 7 3211 2400
Share register Computershare Investor Services Pty LimitedYarra Falls, 452 Johnston Street,Abbotsford, VIC 3067Telephone: 1300 787 272
Auditor PricewaterhouseCoopers Australia480 Queen StreetBrisbane QLD 4000
Stock exchange listing Corporate Travel Management shares are listed on the Australian Securities Exchange (ASX).
Website address www.travelctm.com
ABN 17 131 207 611

Registered Office:Level 24,
307 Queen Street, Brisbane QLD 4000www.travelctm.com