Annual Report 2018s1.q4cdn.com/101769452/files/doc_financials/doc_annual/...forms, producers,...
260
Transcript of Annual Report 2018s1.q4cdn.com/101769452/files/doc_financials/doc_annual/...forms, producers,...

BG
C P
AR
TN
ER
S, IN
C. A
nnual Repo
rt 2018

BGC EXPECTS TO CONTINUE TO DELIVER STRONG RETURNS TO OUR INVESTORS OVER TIME AS WE GROW OUR FULLY ELECTRONIC FENICS BUSINESS, BUILD OUR INSURANCE BROKERAGE VERTICAL, AND CONTINUE TO PROFITABLY HIRE AND ACQUIRE ACCRETIVELY ACROSS THE COMPANY’S BUSINESSES. GLOBAL ECONOMIC GROWTH, THE CONTINUED ADOPTION OF ELECTRONIC TRADING BY MARKET PARTICIPANTS, AND MORE NORMALIZED INDUSTRY VOLUMES WERE POSITIVES FOR THE COMPANY IN 2018.
HOWARD W. LUTNICKChairman & Chief Executive Officer
SHAUN D. LYNNPresident
BGC PARTNERS, INC.

Headquartered in London and New York, we have offices in dozens of major markets across the globe. From these locations we serve many of the world’s largest banks, broker-dealers, investment banks, trading firms, hedge funds, governments, corporations, and investment firms. We had 4,700 global employees including 2,600 brokers and 600 technology professionals at year end.
4,700 GLOBAL EMPLOYEES
including 2,600 brokers and 600 technology professionals

BGC expects to continue to deliver strong returns to our investors as we grow our fully elec-tronic Fenics2 business, build our insurance brokerage vertical, and continue to profitably hire and acquire accretively across the Company’s businesses. The continued adoption of electronic trading by market participants and more normalized industry volumes were positives for the Company in 2018. You can find more detail on our financial results in the tables and charts in the color section of this document and in our Annual Report on Form 10-K that follows. In this year’s letter, we will focus on the following key areas:
our improved brokerage revenues by asset class;
recent acquisitions;
the growth of Fenics;
the increased revenues and earnings generated by our continuing operations; and
our outlook for the future.
DOUBLE-DIGIT GROWTH IN BROKERAGE REVENUESThe Company’s brokerage revenues increased by 10% to $1,823 million in 2018. Our rates busi-ness led this improvement. BGC’s fully electronic rates business increased by 17% year-on-year, while our overall rates revenues were up by 12% to $570 million. We also generated strong growth from our foreign exchange and energy and commodities businesses, where our top-line grew by 16% and 12%, respectively, compared with 2017.
RECENT ACQUISITIONSWhile the vast majority of BGC’s growth in 2018 was organic, we have continued to make acquisitions to fuel future growth. For example, in November 2018, BGC acquired Poten & Partners, a ship brokerage, consulting and business intelligence firm specializing in liquefied natu-ral gas, tanker and liquefied petroleum gas markets. Poten will add new sources of revenue to our energy and commodities business going forward.
P.02BGC PARTNERS
DEAR FELLOW
STOCKHOLDERS: 2018 was another successful and important year for BGC Partners, Inc.
(NASDAQ: BGCP) (“BGC Partners”, “BGC”, or the “Company”). We
delivered strong performance from our continuing operations and provided
our stockholders with the opportunity to continue to benefit from our real
estate business via the Spin-Off of all the shares of our former subsidiary
Newmark Group, Inc. (NASDAQ: NMRK) (“Newmark”) on November 30,
2018.1 We are proud of the value we created in building our real estate busi-
ness and its Spin-Off. Barry Gosin, Newmark’s Chief Executive Officer, will
have more to say about Newmark in their separate Annual Report.

We also completed the acquisition of Ed Broking Group, an independent Lloyd’s of London insur-ance broker, in January 2019. Ed is now part of BGC’s growing insurance brokerage business, which we launched in 2017 with the acquisition of Besso Insurance.
We have a proven record of accomplishment with respect to acquiring and growing industry-leading brokerage and services companies. For example, we increased the annualized revenues of Newmark by a compounded annual growth rate (“CAGR”) of 37% between 2011, when we acquired the business, until 2018, the year of the Spin-Off .3 In our various acquisitions over the years across both Newmark and our continuing operations, we have consistently worked to identify the right combination of plat-forms, producers, services, and management teams. Over time, we expect these additions to fur-ther increase the Company’s revenues and profits. We are excited about the opportunity to use Besso and Ed as the foundation upon which to build another world-class brokerage business.
We expect to continue to grow our revenues across all our asset classes over time both organically and through accretive acquisitions. As we execute on this strategy, we anticipate both adding to our existing $1.6 billion of voice and hybrid brokerage revenue4 and converting a significant portion of this business to more profitable fully electronic trading via our Fenics platform.
STRONG GROWTH FROM FENICSFenics once again generated strong year-on-year revenue growth in 2018 from the fully electronic trading of rates, credit, and foreign exchange. Fenics brokerage revenues across all asset classes increased by 16% for the year. Fenics also generated 20% top-line growth from its high margin data, software, and post-trade businesses. Total Fenics revenues improved by 17% in 2018 to $261 million. Fenics generated more net revenues in 2018 than the annualized revenues of eSpeed and Trayport combined. As a reminder, BGC sold eSpeed in the second quarter of 2013 for a total consideration of $1.2 billion and sold Trayport for an additional $650 million in the fourth quarter of 2015.5
P.03
HOWARD W. LUTNICK Chairman & Chief Executive Off icer
SHAUN D. LYNN President

BGC PARTNERS
Total net revenues generated by Fenics have grown by a CAGR of 23% between 2010 and 2018, and increased from approximately 4% of BGC’s overall revenues to nearly 14% over the same timeframe. Our investment of over $150 million a year in technology6 drives this strong growth. Over time, we expect Fenics to continue to increase as a percentage of BGC’s overall revenues as we further invest in technology, convert our voice and hybrid business to more profitable fully electronic trading, and continue to roll out new initiatives across data, software, and post-trade.
OVERALL RESULTS FROM CONTINUING OPERATIONSA key benefit of our ongoing investment in technology has been a continual improvement in average productivity per broker or salesperson. Average revenue per broker/salesperson7 increased by 12 percent year-over-year in 2018 and by 5 percent in the fourth quarter of 2018. This was the eighth consecutive quarter in which we generated such an increase in front-office productivity. These increases in productivity are one of the main drivers of our growth in reve-nues and profits.
BGC’s top-line increased by 11% year-on-year in 2018 to $1,938 million. Our GAAP 8 income from operations before income taxes improved significantly to $180 million in 2018 versus $4 million in 2017. Our Adjusted EBITDA grew by 25% to $501 million, while the Company’s Adjusted Earnings before non-controlling interest in subsidiaries and taxes grew by 31% to $393 million.
OUR OUTLOOK We expect BGC to continue to benefit from the long-term trend towards more electronic trading, increased demand for market data, and need for increased automation and post-trade services by and among our traditional client base as well as our newer customers.
P.04
55% EMEA
14% APAC
31% AMERICAS
FY2018 GLOBAL REVENUES
FY2018 REVENUE BREAKDOWN BY ASSET CLASS
29% RATES
19% F/X
15% CREDIT
12% ENERGY & COMMODITIES
18% EQUITIES, INSURANCE AND OTHER ASSET CLASSES
6% DATA, SOFTWARE, POST-TRADE AND OTHER
Note: Percentages may not sum to 100% due to rounding.

$1.9B
P.05
Our higher margin Fenics business has increased from 4% of revenue in 2010 to 14% in 2018.
GROWN FROM LESS THAN
$500 MILLION IN ANNUAL REVENUES
IN 2004 TO OVER $1.9 BILLION IN
REVENUES FROM CONTINUING
OPERATIONS IN 2018
FY2018 REVENUE BREAKDOWN
86% VOICE/HYBRID & OTHER
14% FENICS

BGC PARTNERS
P.06
HOWARD W. LUTNICK Chairman & Chief Executive Officer
SHAUN D. LYNN President
Because we expect to further invest in Fenics, roll out new services, hire profitably, make accre-tive acquisitions, and continue to increase the productivity of our brokers and salespeople, we anticipate having strong performance and increasing our market share in the years to come. As we execute on our strategy, we expect to increase our revenues, profits, and dividends over time, as well as to maintain our investment grade rating.
CONCLUSION
Since we announced the formation of BGC in 2004, we have progressively increased the size and scale of the Company through organic growth, accretive acquisitions, profitably adding to our revenue-generating headcount, and investing in technology. We have grown from less than $500 million in annual revenues in 2004 to over $1.9 billion in revenues from continuing oper-ations in 2018. This $1.9 billion is in addition to the more than $2 billion in revenues generated by Newmark in 2018.
None of our success would be possible without the continued backing of our clients, partners, employees, and investors. For this reason, we once again would like to thank our customers for their steadfast support, and our partners and employees around the world for their ongoing dedication and hard work. Lastly, we would like to thank you, our stockholders, for your enduring investment through the years.
Sincerely,

P.07
1 On November 30, 2018, we completed our previously announced pro-rata distribution (the “Spin-Off ”) to our stockholders of all of the shares of common stock of our publicly traded subsidiary, Newmark, which operated our Real Estate Services businesses, owned by us as of immediately prior to the effective time of the Spin-Off. Following the Spin-Off, we ceased to be Newmark’s controlling stockholder, and we and our subsidiaries no longer hold any shares of Newmark’s common stock or other equity interests in Newmark or its subsidiaries. Following the Spin-Off, we have been operating our business solely in one segment. Newmark is a full-service commercial real estate services business that completed its initial public offering (“IPO”) on December 19, 2017. Because BGC did not own any shares of Newmark as of December 31, 2018, Newmark’s results are presented as discontinued operations within BGC’s consolidated results for all periods through the November 30, 2018 Spin-Off date. Newmark’s results are not included in BGC’s consolidated results presented after the Spin-Off. Unless otherwise stated, all the tables and results shown or discussed throughout the color portion of this document reflect only BGC’s results from continuing operations.
2 For the purposes of this document, all of the Company’s fully electronic businesses may be collectively referred to as “Fenics”. Fenics includes revenues from fully elec-tronic brokerage, as well as data, software, and post-trade services. All Fenics results discussed in this document exclude inter-company revenues, revenues related to eSpeed, which BGC sold in June 2013, and revenues related to Trayport, which BGC sold in December 2015.
3 This CAGR is based on the unaudited full year 2011 revenues for Newmark & Company Real Estate, Inc., and the 2018 audited results for Newmark Group, Inc. 4 This f igure is based on BGC’s voice/hybrid brokerage revenues from continuing operations in 2018.5 On December 11, 2015, we completed the sale of all of the equity interests in the entities that make up the Trayport business to Intercontinental Exchange, Inc. (“ICE”). At the closing, we received 2,527,658 shares of ICE common stock issued with respect to the $650 million purchase price, which was adjusted at closing. Trayport, prior to its sale, had generated gross revenues of approximately $80 million over the twelve months ended September 30, 2015. On June 28, 2013, we sold our eSpeed business to Nasdaq, Inc. (“Nasdaq”) for cash consideration of $750 million paid at closing, plus an earn-out of up to 14,883,705 shares of Nasdaq com-mon stock to be paid ratably in each of the fifteen years following the closing in which the consolidated gross revenue of Nasdaq is equal to or greater than $25 mil-lion. eSpeed generated approximately $99 million in revenues in 2012 and $48.6 million in revenues in the f irst six months of 2013. During the third quarter of 2017, the Company transferred the right to receive earn-out payments from Nasdaq to Newmark. Following the Spin-Off, the right to receive earn-out payments from Nasdaq remains with Newmark. The contingent future issuances of Nasdaq common stock are also subject to acceleration upon the occurrence of certain events.
6 The technology investment figure is based on BGC’s average annual total technology-related expenses and fixed asset purchases over the two years ended December 31, 2018, excluding Newmark.
7 The productivity f igures include revenues from total brokerage revenues, data, software, and post-trade. The average revenues for all brokers/salespeople (which is used interchangeably with “front office” or “producers”) are approximate and based on the total revenues divided by the weighted-average number of producers for the period. Any total headcount numbers are based on period-end figures.
8 U.S. Generally Accepted Accounting Principles is referred to as “GAAP”. In the color portions of this document, including the letter, BGC uses non-GAAP financial measures. See the section at the end of this document and/or the Company’s most recent f inancial results press release titled “Non-GAAP Financial Measures”, in which the Company’s non-GAAP results are reconciled to those under GAAP; the complete and revised definitions of these non-GAAP terms; how, when and why management uses non-GAAP terms; and the differences between results under GAAP and these non-GAAP items for the periods discussed herein. Figures for non-GAAP items in this document reflect the presentation under the old methodology. For historical non-GAAP financial presentation for 2018 and 2017 consistent with the new definition, please see the Excel tables on the Company’s investor relations website at ir.bgcpartners.com.
WE EXPECT TO CONTINUE TO GROW OUR
REVENUES ACROSS ALL OUR ASSET CLASSES
OVER TIME BOTH ORGANICALLY AND THROUGH
ACCRETIVE ACQUISITIONS. AS WE EXECUTE ON
THIS STRATEGY, WE ANTICIPATE BOTH ADDING
TO OUR EXISTING $1.6 BILLION OF VOICE AND
HYBRID BROKERAGE REVENUE AND CONVERT-
ING A SIGNIFICANT PORTION OF THIS BUSINESS
TO MORE PROFITABLE FULLY ELECTRONIC TRAD-
ING VIA OUR FENICS PLATFORM.
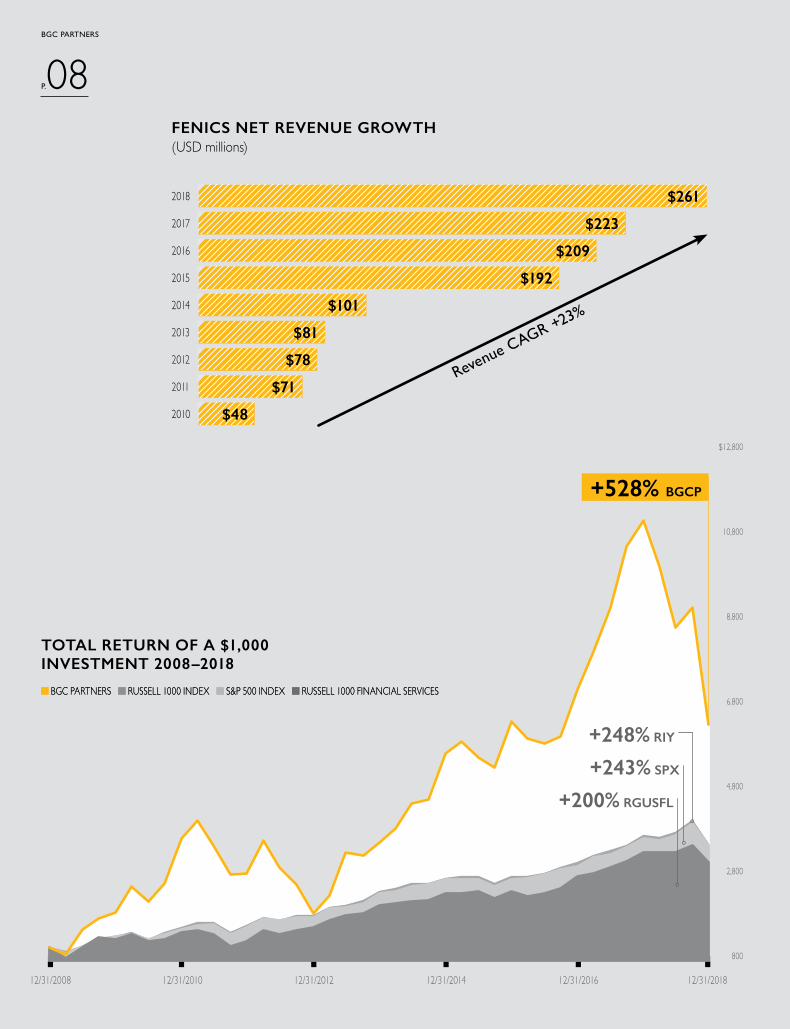
FENICS NET REVENUE GROWTH(USD millions)
2010
$2612018
2010
$2232017
2010
$2092016
2010
$1922015
2010
$1012014
2010
$812013
2010
$782012
2010
$712011
2010
$482010
Revenue CAGR +23%
800
2,800
4,800
6,800
8,800
10,800
$12,800
12/31/2008 12/31/2010 12/31/2012 12/31/2014 12/31/2016 12/31/2018
+243% SPX
+200% RGUSFL
+248% RIY
+528% BGCP
TOTAL RETURN OF A $1,000 INVESTMENT 2008–2018
BGC PARTNERS RUSSELL 1000 INDEX S&P 500 INDEX RUSSELL 1000 FINANCIAL SERVICES
BGC PARTNERS
P.08
BGC PARTNERS RUSSELL 1000 INDEX S&P 500 INDEX RUSSELL 1000 FINANCIAL SERVICES

BGC PARTNERS, INC.
SELECTED CONSOLIDATED FINANCIAL DATA FROM CONTINUING OPERATIONS
Revenues (USD 000s) 18 vs. 17 Change 2018 2017
Rates 12% $ 570,178 $ 510,880 Foreign exchange 16% 375,903 324,386 Equities, insurance, and other asset classes 9% 356,988 327,390 Credit 3% 292,171 284,551 Energy and commodities 12% 228,199 204,016 Data, software, post-trade and other1 15% 114,371 99,728
Total Revenues 11% $1,937,810 $1,750,951
GAAP Earnings (USD 000s)
Total income (loss) from operations before income taxes NMF 179,817 4,136 Net income (loss) from continuing operations for fully diluted shares NMF 73,704 (124,803)
Adjusted Earnings (USD 000s)
Total pre-tax Adjusted Earnings from continuing operations 31% 393,469 299,594 Post-tax Adjusted Earnings from continuing operations 16% 335,848 288,498
Per Share Data
Post-tax Adjusted Earnings per fully diluted share from continuing operations 8% $ 0.69 $ 0.64 GAAP fully diluted earnings (loss) per share from continuing operations NMF 0.23 (0.43)Dividends declared per share 3% 0.72 0.70
Adjusted EBITDA (USD 000s)
Adjusted EBITDA from continuing operations2 25% $ 500,647 $ 401,385
Balance Sheet (USD 000s)
Liquidity3 –26% $ 410,881 $ 552,146 Notes payable and other borrowings 33% 763,548 575,029 Total capital4 –25% 887,880 1,186,156
1. Other includes fees from related parties, interest income, and other revenues of $49.2 million and $45.2 million, respectively, in 2018 and 2017.2. Beginning in the first quarter of 2019, while calculating Adjusted EBITDA, BGC will add back all charges relating to equity-based compensation and no
longer exclude GAAP charges with respect to employee loan amortization and reserves on employee loans. Figures for non-GAAP items in this document reflect the presentation under the old methodology. For historical non-GAAP financial presentation for 2018 and 2017 consistent with the new definition, please see the Excel tables on the Company’s investor relations website at ir.bgcpartners.com.
3. As of December 31, 2018 and December 31, 2017, $15.1 million and $144.7 million, respectively, of Marketable securities on our balance sheet were lent out in Securities loaned transactions and therefore are not included as part of our Liquidity Analysis.
4. Defined as Redeemable Partnership Interest, Stockholders' Equity, and Noncontrolling Interest in Subsidiaries.
P.09

P.10BGC PARTNERS
$12M+Charity Day raised over $12 million in 2018 in honor of the 658 Cantor Fitzgerald and 61 Eurobrokers friends and colleagues we lost.
100% $159M
Charity Day has raised approximately $159 million globally since inception.
of global revenues donated.
BGC CHARITY DAY To make a donation to the
Cantor Fitzgerald Relief Fund, please call (212) 829-4770 or visit cantorrelief.org/donate-now

P.11Henrik Lundqvist
Gracie Carvalho
Our clients and employees, together
with our special celebrity guests, have
helped us turn this incredibly sad day
into an uplifting one by helping so
many outstanding organizations. Being
able to raise millions of dollars in a
single day, and knowing the impact it
will have on so many lives, is a truly
meaningful way to remember those
who lost their lives and hold them
forever in our hearts.

BGC PARTNERS
P.12
Sarah, Duchess of York
Charity Day is a time for honoring
our cherished colleagues and loved
ones who lost their lives on this day
by helping others in need locally and
globally. BGC, Cantor Fitzgerald
Newmark, and GFI donate 100 percent
of the global revenues generated
on Charity Day, which has raised
approximately $159 million globally
since its inception in 2005.
Damian Lewis and
Helen McCrory

P.13
Tom Hardy
BGC Charity Day was held in BGC
offices across the globe including
London, New York, Paris, Hong
Kong, São Paulo, Singapore, Sydney,
and other locations. Distinguished
guests representing participating char-
ities joined licensed brokers on the
trading floors to conduct transactions
with clients.
Victor Cruz
Dascha Polanco

P.14
We are truly grateful to the dozens of celebrities and esteemed guests who attend
each year, working alongside our dedicated employees to raise money for charities
around the world and make a difference in the lives of those in need. Some of these
guests are pictured here.
Charity Day 2018, held on Tuesday, September 11, was our most successful event
to date, raising over $12 million in one day.
17 YEARS OF CELEBRITIES AND NOTABLE FIGURES PARTICIPATING IN CHARITY DAY
Sophie, Countess of Wessex
BGC PARTNERS

P.15
Nicole ScherzingerLiev Schreiber
Common
Calvin Johnson Jr.


Throughout this document, BGC Partners, Inc. is referred to as “BGC” and, together with its subsidiaries, as the “Company,” “BGC Partners,” “we,” “us,” or “our.”


Financial Brokerage


Market Data
Software Solutions and Post-Trade Services
Aqua Business
Insurance Brokerage

Shipping Brokerage

Pre-Trade Technology.
Inter-Dealer and Wholesale Trading Technology.
Post-Trade Technology.
Systems Architecture.


Inter-Dealer or Wholesale Financial Brokers
Market Data and Financial Software Vendors
Exchanges and Other Trading Platforms

Banks and Broker-Dealers

U.S. Regulation

U.K. and European Regulation

Recent European Regulatory Developments

Insurance Regulation
Other Financial Services Regulation

U.S.

Non-U.S.

Stock Ownership

BGC Partners, Inc. Partnership Structure

•
•


Knight Frank Partnership

Domestic and Latin American Real Estate Services Alliances
Real Estate Customers and Clients
Real Estate Services Sales and Marketing
Real Estate Services Competition
Real Estate Services Seasonality

BP Transaction Agreement and Real Estate LP Limited Partnership Agreement
Berkeley Point Acquisition
Investment in Real Estate LP
Additional Terms of the BP Transaction Agreement

Real Estate Services Regulation


.


•
•

•
•
•
•

•
•
•
•
•
•

••••••••
•
•

•
••
•


BP Transaction Agreement and Real Estate LP Limited Partnership Agreement
Newmark IPO, Separation Transaction and Spin-Off
Separation and Distribution Agreement
Related Agreements

Underwriting Agreement
March 2018 Investment in Newmark
Amended and Restated Separation and Distribution Agreement

divided by
plus plus
Spin–Off of Newmark

Lucera Acquisition
Acquisition of GFI Group, Inc.

Trayport Transaction
Nasdaq Transaction

Fully Electronic Trading (Fenics) and Hybrid Trading
Impact of ASC 606 on Results


Growth Drivers
Overall Market Volumes and Volatility

Rates Volumes and Volatility

Foreign Exchange Volumes and Volatility
Equities, Insurance, and Other Asset Classes
Credit Volumes
Energy and Commodities
Summary of Results from Continuing Operations


Revenues
Brokerage

Rates
Credit
Foreign Exchange
Energy and Commodities
Equities, Insurance, and Other Asset Classes
Fees from Related Parties

Data, software and post-trade
Interest Income
Other Revenues
Expenses
Compensation and Employee Benefits

Other Operating Expenses
Other Income (Losses), Net
Gain on Divestiture and Sale of Investments
Gains (Losses) on Equity Method Investments
Other Income

Provision for Income Taxes


Year Ended December 31, 2018 Compared to Year Ended December 31, 2017
Revenues
Brokerage Revenues
Fees from Related Parties
Data, Software and Post-Trade
Interest Income
Other Revenues
Expenses
Compensation and Employee Benefits

Allocations of Net Income and Grant of Exchangeability to Limited Partnership Units and FPUs and Issuance of Common Stock
Occupancy and Equipment
Fees to Related Parties
Professional and Consulting Fees
Communications
Selling and Promotion
Commissions and Floor Brokerage
Interest Expense
Other Expenses

Other Income (Losses), net
Gain (Loss) on Divestiture and Sale of Investments
Gains (Losses) on Equity Method Investments
Other Income (Loss)
Provision (Benefit) for Income Taxes
Net Income (Loss) From Continuing Operations Attributable to Noncontrolling Interest in Subsidiaries
Net Income (Loss) From Discontinued Operations Attributable to Noncontrolling Interest in Subsidiaries
Year Ended December 31, 2017 Compared to Year Ended December 31, 2016
Revenues
Brokerage Revenues

Fees from Related Parties
Data, Software and Post-Trade
Interest Income
Other Revenues
Expenses
Compensation and Employee Benefits
Allocations of Net Income and Grant of Exchangeability to Limited Partnership Units and FPUs and Issuance of Common Stock
Occupancy and Equipment

Fees to Related Parties
Professional and Consulting Fees
Communications
Selling and Promotion
Commissions and Floor Brokerage
Interest Expense
Other Expenses
Other Income (Losses), Net
Gain (Loss) on Divestiture and Sale of Investments
Gains (Losses) on Equity Method Investments

Other Income (Loss)
Provision (Benefit) for Income Taxes
Net Income (Loss) From Continuing Operations Attributable to Noncontrolling Interest in Subsidiaries
Net Income (Loss) From Discontinued Operations Attributable to Noncontrolling Interest in Subsidiaries


Balance Sheet

Funding

Notes Payable, Other and Short-term Borrowings
Unsecured Senior Revolving Credit Agreement
Unsecured Senior Term Loan Credit Agreement

8.125% Senior Notes
5.375% Senior Notes
8.375% Senior Notes
5.125% Senior Notes

5.375% Senior Notes due 2023
Collateralized Borrowings
Short-term Borrowings


Discussion of the year ended December 31, 2018
(in millions)
Discussion of the year ended December 31, 2017
(in millions)


Class A Common Stock

Class B Common Stock
Unit Redemptions and Share Repurchase Program


•

•
•
Stock Option Exercises
Registration Statements


Revenue Recognition
Equity-Based and Other Compensation

Goodwill
Intangibles – Goodwill and Other
Income Taxes
Income Taxes

Credit Risk
Principal Transaction Risk

Market Risk
Operational Risk

Foreign Currency Risk
Interest Rate Risk
Disaster Recovery

Consolidated Financial Statements for the years ended December 31, 2018, 2017 and 2016
Reports of Independent Registered Public Accounting Firm and Independent Auditor
Consolidated Financial Statements—


The accompanying Notes to the Consolidated Financial Statements are an integral part of these financial statements.

Basic earnings (loss) per share from continuing operations
Fully diluted earnings (loss) per share from continuing operations
The accompanying Notes to the Consolidated Financial Statements are an integral part of these financial statements.

The accompanying Notes to the Consolidated Financial Statements are an integral part of these financial statements.

The accompanying Notes to the Consolidated Financial Statements are an integral part of these financial statements.

The accompanying Notes to the Consolidated Financial Statements are an integral part of these financial statements.

The
acco
mpa
nyin
g No
tes t
o th
e Co
nsol
idat
ed F
inan
cial
Sta
tem
ents
are
an
inte
gral
par
t of t
hese
fina
ncia
l sta
tem
ents
.

The
acco
mpa
nyin
g No
tes t
o th
e Co
nsol
idat
ed F
inan
cial
Sta
tem
ents
are
an
inte
gral
par
t of t
hese
fina
ncia
l sta
tem
ents
.

The
acco
mpa
nyin
g No
tes t
o th
e Co
nsol
idat
ed F
inan
cial
Sta
tem
ents
are
an
inte
gral
par
t of t
hese
fina
ncia
l sta
tem
ents
.

Business Overview
Acquisition of Berkeley Point and Investment in Real Estate LP

Separation and Distribution Agreement and Newmark IPO

Assumption and repayment of Indebtedness by BGC Group and Newmark Group

Spin-Off of Newmark
Basis of Presentation

Discontinued Operations
Recently Adopted Accounting Pronouncements
Compensation—Stock Compensation (Topic 718): Improvements to Employee Share-Based Payment Accounting
Revenue from Contracts with Customers
Revenue from Contracts with Customers (Topic 606): Principal versus Agent Considerations (Reporting Revenue Gross versus Net)

Financial Instruments—Overall (Subtopic 825-10): Recognition and Measurement of Financial Assets and Financial Liabilities
Technical Corrections and Improvements to Financial Instruments—Overall (Subtopic 825-10): Recognition and Measurement of Financial Assets and Financial Liabilities
Statement of Cash Flows (Topic 230)—Classification of Certain Cash Receipts and Cash Payments
Statement of Cash Flows (Topic 230)—Restricted Cash
Business Combinations (Topic 805): Clarifying the Definition of a Business
Other Income—Gains and Losses from the Derecognition of Nonfinancial Assets (Subtopic 610-20): Clarifying the Scope of Asset Derecognition Guidance and Accounting for Partial Sales of Nonfinancial Assets Other Income—Gains and Losses from Derecognition of Nonfinancial Assets
Compensation—Stock Compensation (Topic 718): Scope of Modification Accounting,

New Accounting Pronouncements
Leases (Topic 842)
Codification Improvements to Topic 842, Leases
Leases (Topic 842), Targeted Improvements
Leases
Leases (Topic 842), Narrow-Scope Improvements for Lessors
Financial Instruments—Credit Losses (Topic 326)—Measurement of Credit Losses on Financial Instruments
Codification Improvements to Topic 326, Financial Instruments—Credit Losses
LeasesLeases

Intangibles—Goodwill and Other (Topic 350): Simplifying the Test for Goodwill Impairment
Derivatives and Hedging (Topic 815): Targeted Improvements to Accounting for Hedging Activities
Derivatives and Hedging (Topic 815): Inclusion of the Secured Overnight Financing Rate (SOFR) Overnight Index Swap (OIS) Rate as a Benchmark Interest Rate for Hedge Accounting Purposes
Income Statement—Reporting Comprehensive Income (Topic 220): Reclassification of Certain Tax Effects from Accumulated Other Comprehensive Income.
Compensation—Stock Compensation (Topic 718): Improvements to Nonemployee Share-Based Payment Accounting
Fair Value Measurement (Topic 820): Disclosure Framework—Changes to the Disclosure Requirements for Fair Value Measurement
—

Intangibles—Goodwill and Other—Internal-Use Software (Subtopic 350-40): Customer’s Accounting for Implementation Costs Incurred in a Cloud Computing Arrangement That Is a Service Contract (a consensus of the FASB Emerging Issues Task Force)
Consolidation (Topic 810): Targeted Improvements to Related Party Guidance for Variable Interest Entities Consolidation
Founding/Working Partner Units

Limited Partnership Units

Cantor Units
General

Revenue from Contracts with Customers
Commissions:
Principal Transactions:
Fees from Related Parties:

Data, Software and Post-trade:
Other Revenues:
Gain (Loss) on Divestiture and Sale of Investments:
Gains (Losses) on Equity Method Investments:
Other Income (Loss):


Investments Debt and Equity Securities
Asset Retirement Obligations

Investments—Other
Consolidation of Variable Interest Entities
Impairment or Disposal of Long-Lived Assets
Intangibles—Goodwill and Other
Income Taxes

Restricted Stock Units:
Restricted Stock:
Limited Partnership Units:


Poten & Partners Group
Ed Broking Group Limited
Berkeley Point
Besso
Other Acquisitions
Total Consideration


Continuing Operations
Fully diluted (loss) earnings per share:

Discontinued Operations
Fully diluted (loss) earnings per share:

Class A Common Stock
Class B Common Stock
Exchange of BGC Partners Class A Common Stock for BGC Partners Class B Common Stock
Controlled Equity Offering

Unit Redemptions and Share Repurchase Program

Redeemable Partnership Interest
Repurchase Agreements
Securities Loaned


Quantitative Information About Level 3 Fair Value Measurements on a Recurring Basis

Information About Uncertainty of Level 3 Fair Value Measurements
Service Agreements

Newmark IPO and Spin-Off

Investment in Newmark
CF Real Estate Finance Holdings, L.P.
Lucera

Clearing Agreement with Cantor
Other Agreements with Cantor


Receivables from and Payables to Related Broker-Dealers
Loans, Forgivable Loans and Other Receivables from Employees and Partners, Net
Controlled Equity Offerings and Other Transactions with CF&Co

Transactions with Cantor Commercial Real Estate Company, L.P.
Cantor Rights to Purchase Limited Partnership Interests from BGC Holdings

Transactions with Executive Officers and Directors
Transactions with Relief Fund

Other Transactions
Equity Method Investments and Investments Carried Under the Measurement Alternative
(in thousands)

Investments Carried Under Measurement Alternative
Investments—Other
Investments—Other
Investments in Variable Interest Entities

Consolidated VIE


Unsecured Senior Revolving Credit Agreement

Unsecured Senior Term Loan Credit Agreement
Senior Notes
8.125% Senior Notes
5.375% Senior Notes

8.375% Senior Notes
5.125% Senior Notes
5.375% Senior Notes due 2023

Convertible Notes
Collateralized Borrowings
Short-term Borrowings

Limited Partnership Units

Restricted Stock Units

Restricted Stock
Deferred Compensation

Stock Options
Contractual Obligations and Commitments

Contingent Payments Related to Acquisitions

Contingencies
Employment, Competitor-Related and Other Litigation
Letter of Credit Agreements
Risk and Uncertainties

Insurance
Guarantees
Indemnifications


Segment Information
Geographic Information

Product Information

Disaggregation of Revenue

Contract Balances
Contract Costs


Fourth Quarter 2018 Dividend
Acquisitions
Divestitures
Controlled Equity Offering


See accompanying Notes to Financial Statements.

Net income (loss) available to common stockholders:
Basic earnings (loss) per share
Fully diluted earnings (loss) per share
See accompanying Notes to Financial Statements.

See accompanying Notes to Financial Statements.

See accompanying Notes to Financial Statements.

Unsecured Senior Revolving Credit and Converted Term Loan Agreement
Unsecured Senior Term Loan Credit Agreement

8.125% Senior Notes
5.375% Senior Notes
5.125% Senior Notes

5.375% Senior Notes due 2023
Convertible Notes
Short-term Borrowings


∗∗∗∗
∗
∗

∗
∗

∗
∗
∗
∗
∗∗∗∗

∗∗∗∗
∗
∗
∗

∗
∗
∗


Per Share Data
Dividends declared per share of common stock 0.72$ 0.70$ Dividends declared and paid per share of common stock 0.72$ 0.70$


This page intentionally left blank

This page intentionally left blank

BGC PARTNERS, INC. BOARD OF DIRECTORS Howard W. LutnickChairman of the Board of Directors and Chief Executive Off icer
Linda A. BellDirector
Stephen T. CurwoodDirector
William J. MoranDirector
David P. RichardsDirector
BGC EUROPEAN GP LIMITED, BOARD OF DIRECTORS Stephen J. Harper
James R. Lightbourne
Shaun D. Lynn
Paul M. Pion
Simon Smith
Sean A. Windeatt
BGC PARTNERS, INC. MANAGEMENTHoward W. LutnickChairman of the Board of Directors and Chief Executive Off icer
Shaun D. LynnPresident
Sean A. WindeattChief Operating Off icer and Interim Chief Financial Off icer
Stephen M. MerkelExecutive Vice President and General Counsel
Sean GalvinChief Accounting Off icer
Caroline A. KosterCorporate Secretary
CORPORATE HEADQUARTERS499 Park AvenueNew York, NY 10022T: +1 212 610 2200
INTERNATIONAL HEADQUARTERSOne Churchill PlaceCanary WharfLondon E14 5RDUnited KingdomT: +44 20 7894 7700
INVESTOR RELATIONS & REQUESTS FOR ANNUAL REPORT ON FORM 10-KJason A. McGruderHead of Investor Relations
Copies of the Company’s Annual Report on Form 10-K, along with news releases, other recent SEC f ilings, and general stock information are available without charge by going to ir.bgcpartners.com, or by calling Investor Relations at +1 212 610 2426, or by writing to Investor Relations at BGC Partners’ corporate headquarters.
LEGAL COUNSELMorgan, Lewis & Bockius LLP101 Park AvenueNew York, NY 10178-0060
INDEPENDENT REGISTERED PUBLIC ACCOUNTING FIRMErnst & Young LLP5 Times SquareNew York, NY 10036
STOCK LISTINGNASDAQ, BGCP
TRANSFER AGENTAmerican Stock Transfer & Trust Company6201 15th AvenueBrooklyn, NY 11219T: +1 718 921 8124www.amstock.com
ABOUT BGC PARTNERS, INC.BGC Partners is a leading global brokerage and f inancial technology company. BGC’s Financial Services offerings include f ixed income securities, interest rate swaps, for-eign exchange, equities, equity derivatives, credit derivatives, commodities, futures, and structured products. BGC provides a wide range of services, including trade execution, broker-dealer services, clearing, trade com-pression, post-trade, information, and other services to a broad range of f inancial and non-f inancial institutions. Through brands including Fenics, BGC Trader, Capitalab, Lucera, and Fenics Market Data, BGC offers financial technology solutions, market data, and analytics related to numerous f inancial instruments and markets. BGC, BGC Trader, GFI, Fenics, Fenics Market Data, Capitalab, and Lucera are trade-marks/service marks and/or registered trademarks/service marks of BGC Partners, Inc. and/or its aff iliates.
BGC’s customers include many of the world’s largest banks, broker-dealers, invest-ment banks, trading f irms, hedge funds, governments, corporations, and investment f irms. BGC’s Class A common stock trades on the NASDAQ Global Select Market under the ticker symbol “BGCP”. BGC Partners is led by Chairman and Chief Executive Off icer Howard W. Lutnick. For more information, please visit http://www.bgcpartners.com. You can also follow BGC at https://twitter.com/bgcpartners, https://www.linkedin.com/company/bgc-partners and/or http://ir.bgcpartners.com/Investors/default.aspx.
CORPORATE INFORMATION
THE MANAGEMENT AND DIRECTORS OF BGC PARTNERS, INC. AT THE 2018 ANNUAL MEETING OF STOCKHOLDERSLEFT TO RIGHT (TOP ROW): Steven R. McMurray (Chief Financial Officer until December 14, 2018), Shaun D. Lynn (President), Howard W. Lutnick (Chairman of the Board of Directors and Chief Executive Officer), Stephen M. Merkel (Executive Vice President and General Counsel), Sean A. Windeatt (Chief Operating Officer and Interim Chief Financial Officer from December 14, 2018) LEFT TO RIGHT (BOTTOM ROW): Stephen T. Curwood (Director), Linda A. Bell (Director), David P. Richards (Director), William J. Moran (Director)Not present in the picture above are Sean Galvin (current Chief Accounting Officer) and Caroline A. Koster (current Corporate Secretary)

© 2019 BGC Partners, Inc. All rights reserved.
BGCPARTNERS.COM
Neve Campbell
Josh Lucas
BG
C P
AR
TN
ER
S, IN
C. A
nnual Repo
rt 2018