ANNUAL REPORT 2018 REPORT 2018
168
ANNUAL REPORT 2018 ANNUAL REPORT 2018
Transcript of ANNUAL REPORT 2018 REPORT 2018

ANNUAL REPORT 2018A
NN
UA
L R
EPO
RT
201
8
AN
NU
AL R
EPO
RT 2
018 —
BO
SKA
LIS
EY F
IGU
RES
JAA
RV
ERSL
AG
20
17
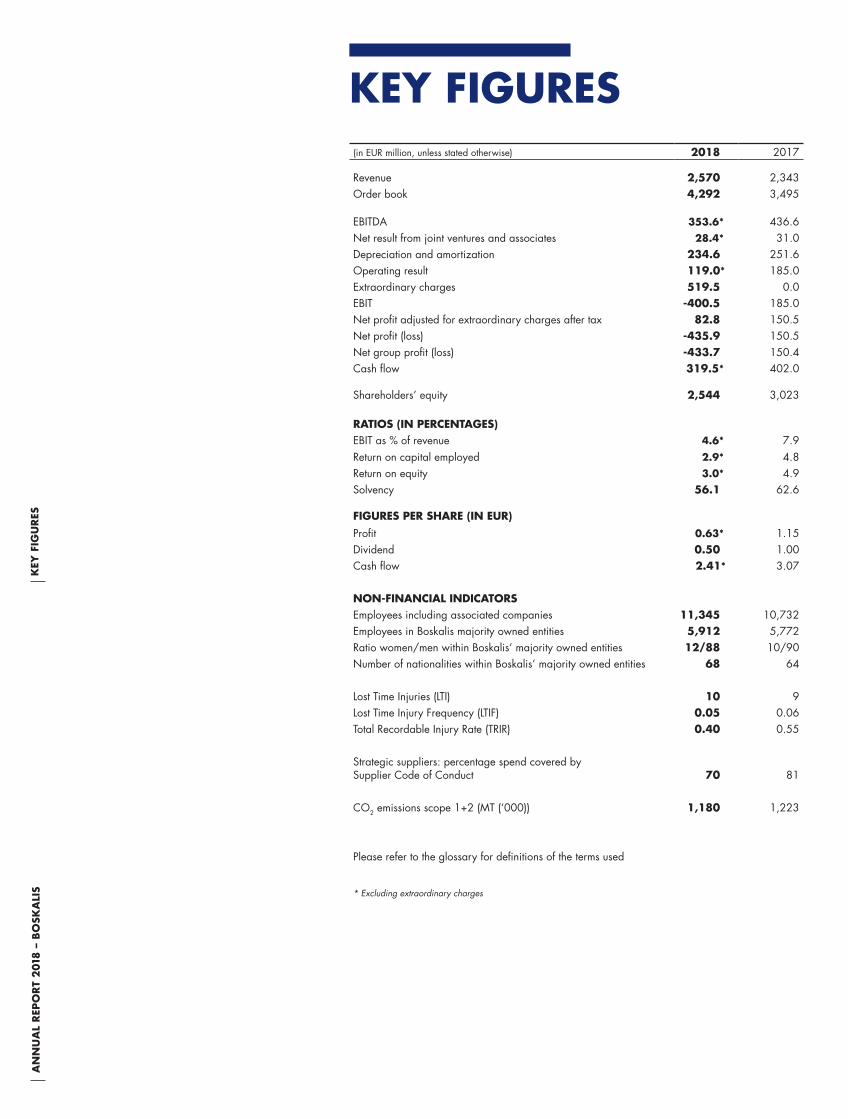
KEY FIGURES(in EUR million, unless stated otherwise) 2018 2017
Revenue 2,570 2,343Order book 4,292 3,495
EBITDA 353.6* 436.6Net result from joint ventures and associates 28.4* 31.0Depreciation and amortization 234.6 251.6Operating result 119.0* 185.0Extraordinary charges 519.5 0.0EBIT -400.5 185.0Net profit adjusted for extraordinary charges after tax 82.8 150.5Net profit (loss) -435.9 150.5Net group profit (loss) -433.7 150.4Cash flow 319.5* 402.0
Shareholders’ equity 2,544 3,023
RATIOS (IN PERCENTAGES)EBIT as % of revenue 4.6* 7.9Return on capital employed 2.9* 4.8Return on equity 3.0* 4.9Solvency 56.1 62.6
FIGURES PER SHARE (IN EUR)Profit 0.63* 1.15Dividend 0.50 1.00Cash flow 2.41* 3.07
NON-FINANCIAL INDICATORSEmployees including associated companies 11,345 10,732Employees in Boskalis majority owned entities 5,912 5,772Ratio women/men within Boskalis’ majority owned entities 12/88 10/90Number of nationalities within Boskalis’ majority owned entities 68 64
Lost Time Injuries (LTI) 10 9Lost Time Injury Frequency (LTIF) 0.05 0.06Total Recordable Injury Rate (TRIR) 0.40 0.55
Strategic suppliers: percentage spend covered by Supplier Code of Conduct 70 81
CO2 emissions scope 1+2 (MT (‘000)) 1,180 1,223
Please refer to the glossary for definitions of the terms used
* Excluding extraordinary charges
KEY
FIG
UR
ESA
NN
UA
L R
EPO
RT
201
8 –
BO
SKA
LIS

REVENUE By SEgMENT (in EUR million) REVENUE By gEOgRAPHICAL AREA (in EUR million)
2017 2018
2,5702,343
2018*2017
82.8
150.5
2017 2018
178
17
335
20
2017 2018
4,292
3,495
2017 2018
16
3735
14
36 36
2017 2018
3,367
2,909
REVENUE (in EUR million) NET PROfIT (in EUR million) CAPITAL EXPENDITURE (in EUR million)
DisposalsNet capital expenditure
ORDER BOOK (in EUR million) ACQUIRED ORDERS (in EUR million) fLEET UTILIZATION (in weeks per year)
Cutters HTVsHoppers
606
952
336
355
106215
North and South America
AfricaMiddle East
Australia / AsiaRest of Europe
The NetherlandsDredging & Inland Infra
Offshore Energy
Towage & Salvage
Eliminations (-32)
1,4291,041
132

ANNUAL REPORT 2018
This annual report contains forward-looking statements. These statements are based on current expectations, estimates and projections of Boskalis’ management and information currently available to the company. These forecasts are not certain and contain elements of risk that are difficult to predict and therefore Boskalis does not guarantee that its expectations will be realized. Boskalis is under no obligation to update the statements contained in this annual report. Some of the projects referred to in this report were carried out in cooperation with other companies.
1

TABLE OFCONTENTS
2
The Marker Wadden in the Netherlands

3
4 CHAIRMAN’S STATEMENT
6 BOSKALIS AT A GLANCE
20 REPORT OF THE SUPERVISORY BOARD
32 REPORT OF THE BOARD OF MANAGEMENT
69 FINANCIAL STATEMENTS 2018
144 OTHER INFORMATION

A
NN
UA
L R
EPO
RT
201
8 –
BO
SKA
LIS
4
CHAIRMAN’S STATEMENT
Reflecting on 2018, it was a year with some appealing highlights in a market that continues to be challenging. With our offshore transport activities we set a new record with the transport of the heaviest cargo ever whilst in dredging we concluded a very large dry-excavated harbor basin in Duqm, Oman. In the market environment in which we operate we see cautious signs of recovery in due course, although we are still a long way away from the exuberant market climate of three to five years ago.
We closed 2018 with an order book of EUR 4,292 million, almost 23% higher than twelve months earlier. Revenue amounted to EUR 2,570 million and there was a sharp decline in the net profit adjusted for impairments and extraordinary charges to EUR 83 million. The decline in profitability was mainly due to a steep drop in the result of the Offshore Energy division where the transport activities suffered, in particular at the low end of the market. Following a review of our position, in a market which offers no prospects for improvement, it was decided to fully exit this loss-making segment. Due in part to this decision, as well as impairment charges in the towage division, an extraordinary charge of EUR 519 million was recognized, consisting mainly of goodwill impairments and a write-off of vessels. Based on our solid balance sheet and the strong cash flow we expect to continue to generate, we have for the purpose of the dividend adjusted the net loss for the extraordinary charges. We propose to pay-out 79% of the adjusted net profit equivalent to a dividend of EUR 0.50 per share, which will be paid out in cash.
During the year further progress was made in the execution of our strategy. In February the 3,000-ton crane vessel Bokalift 1 entered into service. It is a truly unique transport and installation vessel with its revolving crane and large deck area and it had a busy first year installing turbine foundations for a sizable wind farm. Following the strong performance by the mid-2017 acquired survey activities of Gardline, we further expanded our position in survey by investing in a new vessel and acquiring a majority stake in the Middle East survey operator Horizon. In 2018 we also strengthened our offshore cable installation position through the intended acquisition of the cable-laying assets of Bohlen & Doyen in Germany. A welcome addition following a string of large contract wins in this market. And in the closing weeks of the year we signed a multi-year charter for a construction support vessel, a necessary addition to strengthen our proposition in the higher end of the installation market.
4CH
AIR
MA
N’S
STA
TEM
ENT
DREDGING & INLAND INFRA
Early 2018 we secured two prestigious projects which are critical for the further development of Singapore with a combined value of EUR 700 million. The first project relates to the expansion of Tuas Port. For Finger Pier 3 we will design and construct 387 hectares of land reclamation works bounded by 9.1 kilometers of caisson walls in consortium with Penta Ocean and Hyundai. The second project marks the construction of Singapore’s first polder, Pulau Tekong. The project comprises dike closures, dike reinforcements, drainage of the reclamation area and extensive dry earthmoving activities in joint venture with Penta Ocean. Early October the green light was given for the LNG Canada export facility contract in Kitimat. The dredging scope for Boskalis includes the removal and cleaning of contaminated and non-contaminated soil from the site of the future facility.
In the Netherlands we acquired the contract for the expansion of the IJburg district of Amsterdam, involving the construction of an artificial island in the IJmeer lake, adjacent to the existing IJburg islands. In addition, in the course of the year, we acquired numerous Inland Infra projects in the Netherlands, including the N69 project, involving the construction of the new road connection linking the N69 provincial road with the A67 motorway in the south of the Netherlands.

AN
NU
AL
REP
OR
T 2
018
– B
OSK
ALI
S
5
Along with a raft of smaller contracts the order book at Dredging & Inland Infra increased in 2018 with a mixture of long-term multi-year projects and near-term work. All in all with the projects in hand, we have good visibility for the fleet for the first half of 2019.
OFFSHORE ENERGY
Our Offshore Energy division on the one hand continues to be affected by the lackluster investment climate in Oil & Gas, which in particular led to the decision to exit the low-end transport market. On the other hand, the early cyclical survey activities and offshore wind prospered in 2018. The Ostwind 2 project is an excellent example and with a value of EUR 250 million it is also the largest cable-laying contract ever acquired by Boskalis. This renewables project will combine multiple in-house disciplines including UXO survey, geotechnical and geophysical surveys, seabed preparation works, the transport and installation of 270 kilometer export cable and seabed reinstatement. Furthermore, we won the Triton Knoll and Moray East cable installation contracts with a combined value of EUR 200 million. A good example of early contractor involvement is the contract that we signed for the Inch Cape offshore wind farm. A project with a potential value of over EUR 200 million with a transport and installation (T&I) scope comprising turbine foundations, inter-array and export cables and an offshore substation.
In the fourth quarter Boskalis in partnership with Lamprell joined the Long-Term Agreement for Offshore Facilities (LTA) program of Saudi Aramco. The LTA covers engineering, procurement, construction, transportation and installation (EPCI) contracts in support of Aramco’s offshore investment program under which it expects to invest billions of euros each year. All in all, a prestigious framework agreement that provides us with plenty of scope for T&I and subsea work in the next 10 years. Moreover, it supports our strategy aimed at expanding our T&I activities towards the higher end of the S curve.
In 2018 the BOKA Vanguard broke numerous records with the transport of the 90,000-ton P67 FPSO from China to Brazil. With this project we demonstrated the huge benefits of the dry transportation of box-shaped FPSOs in terms of time and reliability.
Our relatively young Survey (Gardline) and Subsea businesses were busy sowing the seeds for 2019 and the years to come. The redevelopment of the Tyra offshore gas field holds potential for subsea, including engineering, procurement, production and installation work. Most of the offshore work will be carried out using the DSV BOKA Atlantis that we acquired in late 2017. Early 2019 Gardline acquired a new vessel which will be equipped to become a high-end geophysical vessel to accommodate the Northwest European market. Early 2019 we also announced the acquisition of a majority share in Horizon survey which will offer us access to the attractive survey market in the Middle East.
TOWAGE & SALVAGE
The volumes at Towage continue to be relatively stable, albeit that increased competition and client concentration in container shipping resulted in further pricing pressure. The rapidly changing market conditions initiated a fundamental discussion about the future and our position within the harbor towage joint ventures
resulting in the announcements early 2019 that Boskalis intends to sell its stake in Saam Smit Towage and Kotug Smit Towage.
Salvage had a busy and good year. Early in 2018 we were awarded the contract for salvaging the ultra-large container ship Maersk Honam. The vessel caught fire in the Arabian Sea and was rescued by the Salvage colleagues along with most of the cargo. The ship was then towed to Dubai, where the remaining cargo was offloaded and fire-damaged waste was discharged and cleaned. In addition to this sizable project we also succeeded in acquiring the contracts for salvage in two of the three geographic zones in the world as defined by the U.S. Navy. The third zone was acquired by our U.S. partner Donjon, meaning that we are now able to provide salvage services to the U.S. Navy around the globe.
QUALITY MANAGEMENT
In the past year we also made great strides in terms of further harmonizing our activities. In 2018 we continued with the roll-out of our Way of Working program, the new common standard for the quality assurance of our processes. From tendering to delivery, all steps in a single system, on a single platform, making it easier to provide our clients with a one-stop shop for multidisciplinary projects. It is by combining activities and services that we can provide a unique proposition to the market. Which is exactly why in 2018 we transitioned to a single brand name for all our activities: Boskalis.
SUSTAINABLE HORIZONS
Sustainability is very much on the agenda at Boskalis and in 2018 many interesting new developments took place. As part of our Boskalis on Bio program launched in 2015, Boskalis Nederland joined forces with GoodFuels in a partnership aimed at reducing the CO2 emissions of our equipment in the Netherlands. We also launched a large-scale experiment on board of our hopper dredger Shoalway aimed at reducing emissions by applying fuel water emulsion on the main engines. 2018 also saw the first LNG-powered harbor tugs in southeast Asia enter into service at Keppel Smit Towage. As a company we often find ourselves in a position in which we are able to make a difference in many places in the world, as can be seen from the many social initiatives on our projects and that you can read about in our CSR report. In addition to supporting these local initiatives we also share a lot of our expert knowledge and capabilities with NGOs of which The Ocean Cleanup founded by Boyan Slat is a great example. Like Boyan and his team we believe we can move boundaries and create new sustainable horizons together.
On behalf of the Board of Management I want to thank all colleagues for their hard work and great achievements during the past year, and thank our clients, partners and shareholders for the trust and confidence they place in us.
Peter Berdowski

BOSKALIS AT A GLANCE
Trailing suction hopper dredger Strandway carrying out beach replenishment work along the Dutch coast
6

7
8 COMPANY PROFILE
9 ACTIVITIES
10 STRATEGY
16 SHAREHOLDER INFORMATION

BO
SKA
LIS
IN V
OG
ELV
LUCH
TA
NN
UA
L R
EPO
RT
201
8 –
BO
SKA
LIS
8
COMPANY PROFILE
In addition to our traditional dredging activities we offer a broad range of maritime services for the offshore energy sector. Furthermore, we provide towage services as well as emergency response and salvage-related services.
As a partner we are able to realize complex infrastructural works for our clients within the chain of design, project management and execution on time, safely and within budget, even at vulnerable or remote locations around the world. We strive for sustainable design and realization of our solutions.
Demand for our services is driven by growth in global trade, growing energy consumption, growth in world population and climate change. Boskalis operates worldwide but concentrates on those regions that have the highest growth expectations. This spread gives us both a solid foundation and the flexibility to be able to secure a wide range of projects, as well as providing
good prospects for balanced and sustained growth. Our main clients are governments, port and terminal operators, oil, gas and wind energy companies, mining companies and related EPC contractors and subcontractors, shipping companies, insurance companies and international project developers.
Royal Boskalis Westminster N.V. (Boskalis) has 11,345 employees, including associated companies. The safety of our employees and those of our subcontractors is paramount. Boskalis operates its progressive global safety program No Injuries No Accidents (NINA), which is held in high regard in the industry and by our clients. Our versatile fleet consists of more than 900 vessels and floating equipment, including associated companies. Our head office is based in the Dutch city of Papendrecht. Royal Boskalis Westminster N.V. shares have been listed on Euronext Amsterdam since 1971.
Boskalis is a leading dredging and marine expert creating new horizons for all its stakeholders.
8

AN
NU
AL
REP
OR
T 2
018
– B
OSK
ALI
S
9
DREDGING & INLAND INFRA
Traditionally the core activity of Boskalis is dredging. This involves all activities required to remove silt, sand, clay and other layers from the sea- or riverbed and reusing it elsewhere where possible, for example for coastal protection or land reclamation. The services we provide also include the construction and maintenance of ports and waterways, and coastal defense and riverbank protection. In addition, Boskalis is active in the extraction of raw materials using dredging techniques and dry earthmoving. In the Netherlands, Boskalis also operates as a contractor of dry infrastructure projects. This involves the design, preparation and execution of large-scale civil infra works, such as the construction of roads and railroads, bridges, aqueducts, viaducts and tunnels in addition to dike and riverbank related projects. In doing so, we also perform specialist works such as soil improvement and remediation.
OFFSHORE ENERGY
With its offshore contracting capabilities and services Boskalis supports the activities of the international energy sector, including oil and gas companies and providers of renewable energy such as wind power. We are involved in the engineering, construction, maintenance and decommissioning of oil and LNG import/export facilities, offshore platforms, pipelines and cables and offshore wind farms. In performing these activities Boskalis applies its expertise in the areas of heavy transport, lift and installation work, as well as diving and ROV services complemented with marine surveying, dredging, offshore pipeline, cable and rock installation.
TOWAGE
We provide assistance to incoming and outgoing oceangoing vessels in ports around the world through joint ventures with regional partners: Keppel Smit Towage in Asia, Saam Smit Towage in the Americas and Kotug Smit Towage in Northwest Europe. In addition we offer a full range of services for the operation and management of onshore and offshore terminals through Smit Lamnalco. These services include assistance with the berthing and unberthing of tankers at oil and LNG terminals as well as additional support services such as pilotage, subsea inspection and maintenance, firefighting, and the coupling and uncoupling of
ACTIVITIESterminal connections. With a versatile fleet of over 400 vessels we assist vessels in around 100 ports and terminal locations in 35 countries, including oil and chemical tankers, container ships, reefers, ro-ro vessels and mixed cargo ships.
SALVAGE
Boskalis provides services relating to marine salvage and wreck removal. We assist vessels in distress and are able to spring into action at any time and anywhere in the world. We are able to do so by operating out of four locations which are strategically situated along the main international shipping routes: Houston, Cape Town, Rotterdam and Singapore. The removal of shipwrecks or damaged offshore platforms almost always takes place at locations where the wreck forms an obstruction to traffic or presents an environmental hazard. We have the advanced technology and expertise needed to remove hazardous substances such as heavy fuel oil from wrecks and boast a successful track record in salvaging vessels and platforms under challenging circumstances.
Boskalis is renowned for its innovative approach and specialist knowledge of environmentally friendly techniques. With our great expertise, multidisciplinary approach, versatile state-of-the-art fleet and extensive experience in engineering and project management we have proven time and again that we are able to realize complex projects on time, safely and within budget, anywhere in the world.

BO
SKA
LIS
AT
A G
LAN
CE
AN
NU
AL
REP
OR
T 2
018
– B
OSK
ALI
S10
STRATEGYBoskalis operates around the world and is a leading player in the fields of dredging, offshore energy and maritime services. The company is a leader in its market segments thanks to its ability to deliver innovative all-round solutions combined with a broad portfolio of specialist activities. Its versatile maritime assets with value-adding potential are the cornerstone of the Boskalis business model. Systematic execution of the strategy, which is reviewed regularly in light of relevant market developments, is a key factor in Boskalis’ success.
In the development of our strategy, which is driven by long-term trends, we focus on the creation of long-term value for our stakeholders.
Our strategy is elaborated on in our three-year business plan. The current 2017-2019 Corporate Business Plan was formulated early 2017 and is based on three strategic pillars: Focus, Optimize and Expand. We have just embarked on the last year of the business plan period and looking back at 2018 we made good progress in the realization of our strategic objectives.
MARKET DEVELOPMENTS
BUSINESS DRIVERS
The Corporate Business Plan is formulated with a clear eye on the long-term megatrends that underpin the Boskalis business model. These business drivers are structural growth and rising prosperity of the global population, which in turn drives growth in global trade and demand for raw materials and energy.
Global warming also continues to create business opportunities for Boskalis, with a growing need for flood protection measures and land reclamation and our contribution to the energy transition through LNG projects and facilitating the development of renewable energy.
Growing energyconsumption
Dredging &Inland Infra
Offshore Energy
Towage & Salvage
Climate change
Population growth
Figure 1: Boskalis business drivers and related activities
Growing world trade
Figure 2: Boskalis business drivers and related activities
EXPAND
FOCUS
OPTIMIZE
Market & Activity Focus Value-Adding Assets
Effectiveness Efficiency
Dredging & Inland Infra Towage & Salvage Offshore Energy
BOSKALIS2017 - 2019
Figure 7: Strategic framework for 2017-2019
AN
NU
AL
REP
OR
T 2
018
– B
OSK
ALI
S
11
These macro trends are the key drivers of long-term growth for our activities, irrespective of unpredictable and potentially less favorable developments in the shorter term in some of the regions and markets where Boskalis is active.
Through our strategy and responsible business practices, we contribute to the United Nations Sustainable Development Goals (SDGs), which form the blueprint to achieve a better and more sustainable future for all. More information on the relevance of our work in relation to the SDGs is available in our CSR report.
A closer look at our business driversThe WTO anticipates the trade volume growth of 4.4% over 2018 to moderate to 4.0% in 2019. Whilst this is below the average rate of 4.8% since 1990, it is firmly above the post-crisis average of 3.0%. The consequences of potentially escalating trade tensions may impact this outlook. Current projections suggest that seaborne trade will continue to roughly keep pace with trade volume growth. Boskalis is also benefiting from the trend towards larger vessels with deeper drafts. In ports these vessels require deeper access channels and larger and deeper berths and turning basins, creating primarily opportunities in the area of dredging.
Energy demand continues to increase and although part of this demand can be served from existing sources, new investments are required to meet future demand. While renewables are expected to see further growth as a result of the energy transition, the dependence on fossil fuels will remain significant with absolute volumes in this segment projected to grow. Against this backdrop, the share of offshore oil and gas in the energy mix is expected to remain stable and an associated increase in investments in exploration and production is being forecast. A large part of these investments will take place in regions with shallow water where development and production costs per barrel are more favorable.
Underpinning the aforementioned drivers is the growth in the global population, projected to rise to 8.5 billion by 2030. With half of the global population living within 60 kilometers of the coast and 75% of major cities worldwide located on the coast, the pressure on available land is huge. Furthermore, many of these coastal regions are at risk from our fourth business driver, climate change.
Climate change issues have risen up the agenda, partly as a result of the United Nations Paris Agreement (COP21) that came into force in November 2016 and the subsequent COP Climate Change Conferences held in Marrakesh, Morocco, Bonn, Germany and Katowice, Poland. The consequences of climate change can be observed frequently nowadays. Extreme periods of drought are followed by excessive rainfall and the frequency and intensity of tropical storms has increased. Climate change is prompting governments on several continents to take steps to protect their populations against flooding and rising sea levels. The World Bank and the Intergovernmental Panel on Climate Change (IPCC) have warned that huge investments are needed to mitigate the impact of climate change. Opportunities for Boskalis in this area include potentially greater demand for coastal defense and riverbank protection projects.
STRATEGIC FRAMEWORK
The Boskalis strategy is a logical progression from our mission and vision.
We are a leading dredging and marine contracting and services expert that creates new horizons for all our stakeholders. We do so by offering a unique combination of people, vessels and activities. We provide innovative and competitive solutions for our clients in the offshore industry, ports and coastal areas, always maintaining the highest standards of safety and sustainability.
The execution of our strategy is guided by our deeply rooted company culture, which is characterized by the core values of professionalism, entrepreneurship and teamwork.
Our current strategic framework is based on three pillars: Focus, Optimize and Expand.
FOCUS
The Focus pillar of our strategy is aimed at: � Value-Adding Assets � Specific market segments
Value-Adding AssetsBoskalis’ strength lies in deploying its own assets combined with additional capabilities to add value for our clients. Boskalis will sustain its success as long as we use our broad range of equipment, staff and competencies to provide a balanced service to the various client groups both at the top and the lower end of the market. However, their requirements vary widely, both within and between the market segments. We seek to achieve the optimum balance between margin maximization and fleet utilization by operating our assets at various points on the S curve (see figure 4). We have clients who need us to deliver integrated, innovative services or turnkey solutions. In order to meet these client requirements we need competencies that complement and reinforce one another, such as risk management and engineering.
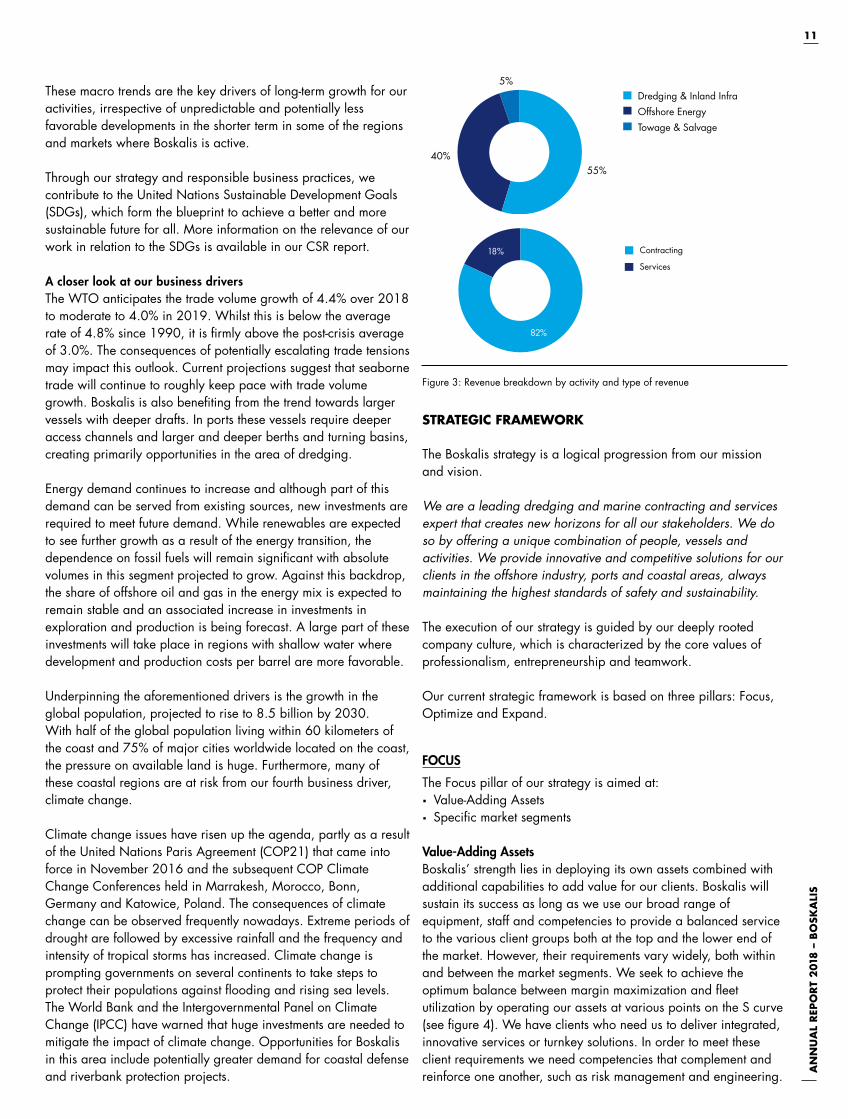
Figure 3: Revenue breakdown by activity and type of revenue
Services
Contracting
82%
18%
Dredging & Inland Infra
Offshore Energy
Towage & Salvage
55%40%
5%
BO
SKA
LIS
AT
A G
LAN
CE
AN
NU
AL
REP
OR
T 2
018
– B
OSK
ALI
S12
In addition, we need to be able to act as lead contractor, and project management experience is essential. In the contracting segment with its higher margin potential we expressly position ourselves towards the top of the S curve.
The more straightforward services assets are positioned at the lower end of the S curve. Some of these services support contracting projects but the bulk of the business is third-party services revenue. Here the emphasis lies on sustaining fleet utilization levels whilst maintaining a responsible risk profile, with cost leadership being an important prerequisite.
The S curve concept is dynamic in time and we therefore need to be critical with regard to the scope for adding sufficient value to assets at the bottom of the S curve. A structural shift in supply and demand can for example cause a former value-adding asset to be structurally repositioned lower on the curve. If this results in an asset becoming a commodity that cannot be moved up the S curve, we will consider divesting it. Conversely, modifying an existing asset or deploying it in a new market segment – for
example in conjunction with our high-value contracting activities – can result in it being repositioned higher on the curve. Boskalis manages its portfolio of assets actively to be able to respond to such market dynamics. The essence of our value-adding asset concept is that we aim to move up the S curve.
Results: Our decision in 2018 to discontinue the low-end transport activities is a good illustration of our focus on value adding assets. At the time of the Dockwise acquisition, part of the fleet served the high-end oil and gas clients, whilst the lower half clearly served a more commoditized market segment. When market demand was strong these low-end vessels made a healthy contribution, but as the balance between supply and demand shifted, this part of the business became a price takers market with ultimately negative cashflows. Without there being a prospect to add value with these assets, the decision was made to discontinue these transport activities.
The announcements early 2019 to sell the stakes in the Saam Smit Towage (SST) and Kotug Smit Towage (KoST) joint ventures are also a reflection of our value adding focus. Whilst harbor towage is a relatively stable and low-risk activity within the group, the ability to generate incremental value versus competitors is extremely limited. The competitive situation in the regions where SST and KoST operate made this situation all the more visible. The intended sale of both stakes therefore allows Boskalis to allocate the cash from these transactions to growth opportunities higher on the S-curve and to return part of it to shareholders.
Activity and Market focusOur core activities are focused on geographic regions and market segments that offer us the greatest opportunities whereby we provide our services on both a combined and a standalone basis. Our mix of activities gives us a broad geographical scope. Some of our activities, such as Dredging, Transport, Towage and Salvage, have a truly global reach, while others have a regional focus. For example, our Inland Infra activities are concentrated on
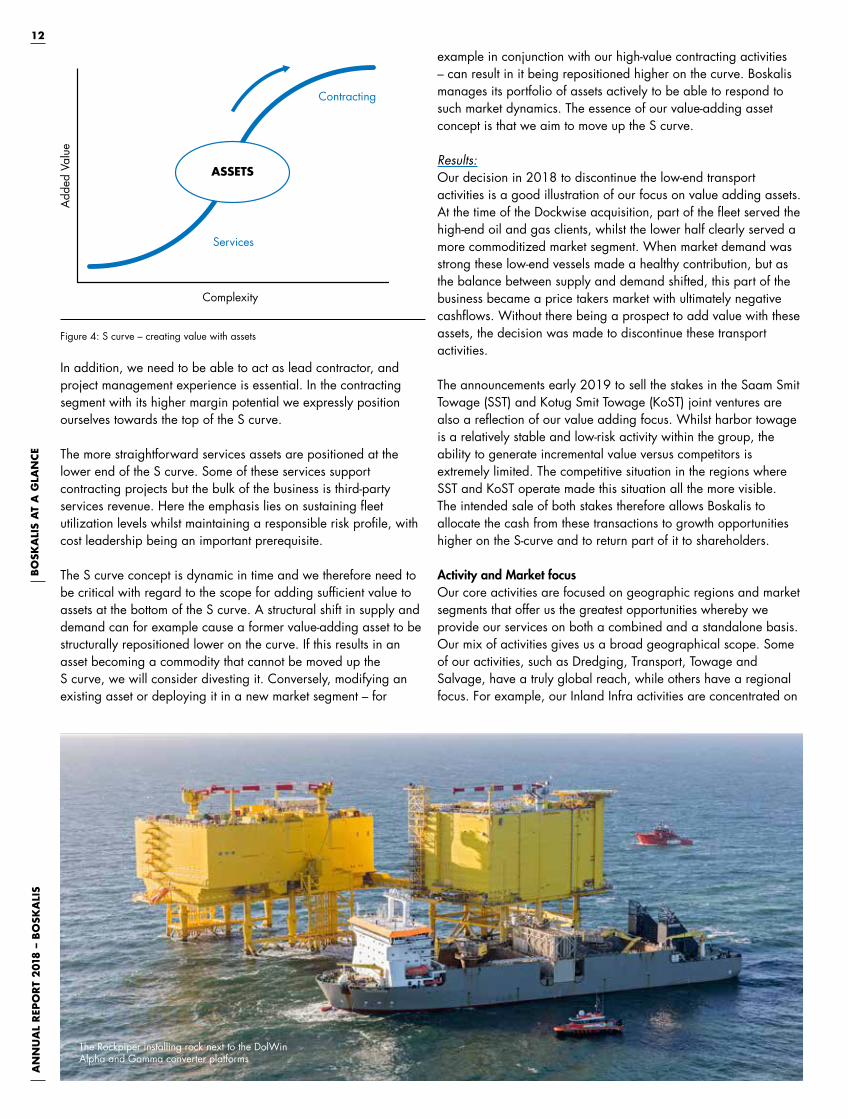
The Rockpiper installing rock next to the DolWin Alpha and Gamma converter platforms
ASSETS
Add
ed V
alue
Complexity
Contracting
Services
Figure 5: S curve - creating value with assests
Figure 4: S curve – creating value with assets
AN
NU
AL
REP
OR
T 2
018
– B
OSK
ALI
S
13
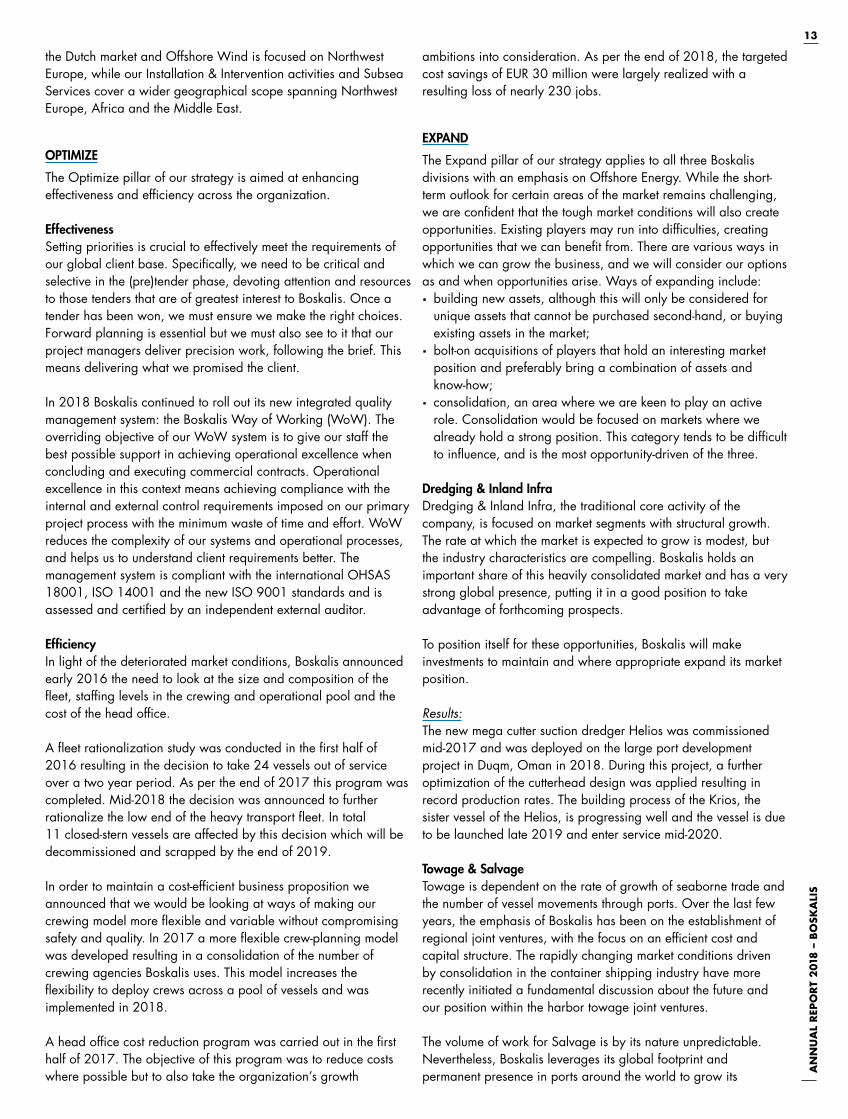
the Dutch market and Offshore Wind is focused on Northwest Europe, while our Installation & Intervention activities and Subsea Services cover a wider geographical scope spanning Northwest Europe, Africa and the Middle East.
OPTIMIZE
The Optimize pillar of our strategy is aimed at enhancing effectiveness and efficiency across the organization.
EffectivenessSetting priorities is crucial to effectively meet the requirements of our global client base. Specifically, we need to be critical and selective in the (pre)tender phase, devoting attention and resources to those tenders that are of greatest interest to Boskalis. Once a tender has been won, we must ensure we make the right choices. Forward planning is essential but we must also see to it that our project managers deliver precision work, following the brief. This means delivering what we promised the client.
In 2018 Boskalis continued to roll out its new integrated quality management system: the Boskalis Way of Working (WoW). The overriding objective of our WoW system is to give our staff the best possible support in achieving operational excellence when concluding and executing commercial contracts. Operational excellence in this context means achieving compliance with the internal and external control requirements imposed on our primary project process with the minimum waste of time and effort. WoW reduces the complexity of our systems and operational processes, and helps us to understand client requirements better. The management system is compliant with the international OHSAS 18001, ISO 14001 and the new ISO 9001 standards and is assessed and certified by an independent external auditor.
EfficiencyIn light of the deteriorated market conditions, Boskalis announced early 2016 the need to look at the size and composition of the fleet, staffing levels in the crewing and operational pool and the cost of the head office.
A fleet rationalization study was conducted in the first half of 2016 resulting in the decision to take 24 vessels out of service over a two year period. As per the end of 2017 this program was completed. Mid-2018 the decision was announced to further rationalize the low end of the heavy transport fleet. In total 11 closed-stern vessels are affected by this decision which will be decommissioned and scrapped by the end of 2019.
In order to maintain a cost-efficient business proposition we announced that we would be looking at ways of making our crewing model more flexible and variable without compromising safety and quality. In 2017 a more flexible crew-planning model was developed resulting in a consolidation of the number of crewing agencies Boskalis uses. This model increases the flexibility to deploy crews across a pool of vessels and was implemented in 2018.
A head office cost reduction program was carried out in the first half of 2017. The objective of this program was to reduce costs where possible but to also take the organization’s growth
ambitions into consideration. As per the end of 2018, the targeted cost savings of EUR 30 million were largely realized with a resulting loss of nearly 230 jobs.
EXPAND
The Expand pillar of our strategy applies to all three Boskalis divisions with an emphasis on Offshore Energy. While the short-term outlook for certain areas of the market remains challenging, we are confident that the tough market conditions will also create opportunities. Existing players may run into difficulties, creating opportunities that we can benefit from. There are various ways in which we can grow the business, and we will consider our options as and when opportunities arise. Ways of expanding include: � building new assets, although this will only be considered for unique assets that cannot be purchased second-hand, or buying existing assets in the market;
� bolt-on acquisitions of players that hold an interesting market position and preferably bring a combination of assets and know-how;
� consolidation, an area where we are keen to play an active role. Consolidation would be focused on markets where we already hold a strong position. This category tends to be difficult to influence, and is the most opportunity-driven of the three.
Dredging & Inland InfraDredging & Inland Infra, the traditional core activity of the company, is focused on market segments with structural growth. The rate at which the market is expected to grow is modest, but the industry characteristics are compelling. Boskalis holds an important share of this heavily consolidated market and has a very strong global presence, putting it in a good position to take advantage of forthcoming prospects.
To position itself for these opportunities, Boskalis will make investments to maintain and where appropriate expand its market position.
Results: The new mega cutter suction dredger Helios was commissioned mid-2017 and was deployed on the large port development project in Duqm, Oman in 2018. During this project, a further optimization of the cutterhead design was applied resulting in record production rates. The building process of the Krios, the sister vessel of the Helios, is progressing well and the vessel is due to be launched late 2019 and enter service mid-2020.
Towage & SalvageTowage is dependent on the rate of growth of seaborne trade and the number of vessel movements through ports. Over the last few years, the emphasis of Boskalis has been on the establishment of regional joint ventures, with the focus on an efficient cost and capital structure. The rapidly changing market conditions driven by consolidation in the container shipping industry have more recently initiated a fundamental discussion about the future and our position within the harbor towage joint ventures.
The volume of work for Salvage is by its nature unpredictable. Nevertheless, Boskalis leverages its global footprint and permanent presence in ports around the world to grow its

BO
SKA
LIS
AT
A G
LAN
CE
AN
NU
AL
REP
OR
T 2
018
– B
OSK
ALI
S14
Subsea SolutionsOver the years Boskalis has developed a modest but successful position in the subsea services market, focusing on survey and UXO clearance, diving and Inspection, Repair and Maintenance (IRM) work in shallow water regions in Northwest Europe, Africa and the Middle East. This is another highly fragmented market, with the vast majority of players operating just one or two survey and diving support vessels in a region. With numerous players also being financially stretched, we see opportunities for expanding our position in Northwest Europe, Africa and the Middle East by acquiring assets or by acquiring a player with assets.The global shallow water SURF (Subsea, Umbilicals, Risers and Flowlines) market is also substantial in size. Based on the market outlook and Boskalis’ existing subsea contracting capabilities, we want to look into a gradual expansion into the shallow water SURF market and will explore acquisition opportunities to achieve this.
Results: 2018 was the first full year for Gardline as part of the group. The survey market and performance of Gardline was strong and Boskalis took further steps to expand its survey activities. Late 2018 a new vessel was acquired which will be converted into a high-end geophysical survey vessel for the European market and in February Boskalis announced a further geographic expansion of its footprint into the Middle East after acquiring a 62.5% majority stake in the Horizon Group from the United Arab Emirates.
Boskalis also expanded its Subsea Services business in 2018 with the opening of a new office in Aberdeen. In line with the ambitions set out in the business plan, Boskalis successfully acquired a SURF contract for phase II of the redevelopment of the subsea installation of the Tyra gas field for which our diving support vessel Boka Atlantis will be deployed.
Offshore WindThe position of Boskalis in the Offshore Wind market lies primarily around foundations and cables. With our wealth of seabed know-how and broad asset base we are capable of transporting and installing all types of wind turbine foundations offshore. Over the years Boskalis has also developed its subsea cables and flexibles activities. Boskalis is currently the leading European player in the field of subsea export and array cables.
The offshore wind market has taken off in earnest in recent years but despite an impressive drop in cost per kWh the economics of offshore wind remains dependent on government subsidies. The offshore wind-related market in Northwest Europe is expected to be relatively stable with an average addressable market of EUR 1.5-1.7 billion annually for the coming years. Boskalis’ share in this ranges from around 10% (foundations) to around 35% (cables) and the company is committed to maintaining a strong presence in the European market.
Results:The Bokalift 1, a 3,000 ton DP2 crane vessel, was commissioned early 2018 and was virtually fully booked in its first year on an offshore wind foundation installation project. Demonstrating its versatility, the vessel’s next assignment involves the decommissioning of a number of offshore platforms starting in mid-2019. During the
Emergency Response business. Furthermore we use our own assets and apply our expertise in both engineering and contract and risk management to secure wreck removal contracts.
Offshore EnergyThe Expand pillar of our strategy remains strongly geared to Offshore Energy. In terms of prospects, this relates both to traditional fossil fuels such as oil and gas as well as renewables, more specifically offshore wind. Despite the sharp decline in the oil price and the cutback in capital expenditure by the offshore oil and gas industry over the last couple of years, specific segments in this market remain attractive for Boskalis.
Boskalis offers a broad range of capabilities, which can be subdivided into contracting-focused Installation & Intervention (I&I) activities, Subsea activities including IRM, Offshore Wind activities and Survey, and the more short-term-focused Heavy Marine Transport and Marine Services business. Given the nature of the contracting business, where we are expected to take on a broader responsibility with a higher reward potential, the I&I, Subsea and Offshore Wind activities are positioned higher on the S curve and are therefore an area where we want to pursue further development.
Installation & InterventionThe I&I market comprises the installation and decommissioning of floating and fixed structures and landfall-related activities. The competitive landscape for the installation and decommissioning of floating and fixed structures is highly fragmented, with the combined market share of traditional global Engineering, Procurement, Construction and Installation (EPCI) players estimated to be less than 40%. Many of the other players are active with just one or two key assets and due to the market downturn an increasing number of them are suffering from weak financial performance and overleveraged balance sheets. This presents us with an opportunity to step into this market and to position ourselves as an attractive independent player just below the EPCI contractors with a geographic focus on Northwest Europe, Africa and the Middle East.
Results: In 2018 we were selected as a contractor under Saudi Aramco’s Long Term Agreement for Offshore Facilities (LTA) program. The LTA is part of an ambitious offshore investment program and covers EPCI contracts to support a large part of Saudi Aramco’s investment program. It gives Boskalis with its partner Lamprell the right to bid for tenders put out by Saudi Aramco, together with a select number of other contractors. It marks an important milestone for Boskalis supporting our ambition to grow towards becoming a full-scope transport & installation contractor at the high-end of the offshore energy market.
To position ourselves higher on the S curve in the floating installation market, we added a construction support vessel (CSV) to the fleet late 2018. The Boka Falcon is a modern DP2 vessel with a bollard pull in excess of 400 ton, two ROVs, a 150-ton crane, ample crew capacity and large deck space. The vessel is on a multi-year charter and will enter into service in March 2019. If the right opportunity were to present itself, Boskalis will consider adding a second CSV to the fleet.

AN
NU
AL
REP
OR
T 2
018
– B
OSK
ALI
S
15
year further design and engineering work was carried out for a conversion of a possible second crane vessel. A firm decision on the conversion of another vessel into a crane vessel and its exact specifications will be addressed in the business plan for the period 2020-2022.
The position held by Boskalis in the offshore wind park cabling market through its Cables & Flexibles business unit was further expanded through a string of project wins and the announcement on the intended acquisition of Bohlen & Doyen’s offshore cable- laying business. This acquisition will further strengthen our position in the German market and add assets which are well-suited for the growing cable repair and replacement market.
TransportBoskalis has a global leading position in heavy marine transport and is also active in long-distance ocean towage. Boskalis is committed to serving the high end of the market where contracts are frequently long-term by nature, requiring extensive engineering know-how, generally related to oil and gas production. In this market we offer a unique proposition with our open-stern Type 0 and I vessels. Our scale is also unparalleled in terms of number of transport assets and the combination of heavy marine transport with long-distance towage. Following the successful transport of a box-shaped FPSO in 2018 we also see new opportunities for increased volume in the market.
The market served by the smaller, frequently closed-stern heavy marine transport vessels has been under pressure for some time and late 2017, Boskalis announced that it was going to review its position in this market. This segment has rapidly become a commodity transport market, often not oil and gas-related and structurally confronted with (Asian) overcapacity. These developments prompted Boskalis to exit this market segment and to take the eleven closed-stern heavy transport vessels out of service.
IN CONCLUSION
Boskalis entered the 2017-2019 business plan period on a very solid basis, with a net debt-free balance sheet. Despite the challenging market outlook our operating model, based on our own assets, means that we will continue to generate a healthy cash flow. In addition we have a strong global client base, highly committed and passionate employees and a state-of-the-art, versatile fleet.
While we expect the operating environment to remain challenging during the remainder of the current business plan period, we want to use this period to strengthen the company and invest counter-cyclically – sowing the seeds so we can reap the benefits in the future. In the course of 2018, we took a number of these steps and looking ahead we will continue to invest prudently in the business. Total capital expenditure over the business plan period is projected at around EUR 250 million per annum, roughly in line with depreciation. This amount excludes any asset acquisitions, bolt-on acquisitions or consolidation opportunities that may arise.
A healthy balance sheet is essential in our line of business. We believe a net debt/EBITDA ratio in a range of 1 to 1.5 through the cycle to be appropriate for our mix of activities. We expect to remain below this range during this business plan period, both as a matter of prudence and in order to have the flexibility to expand if opportunities present themselves.
We remain committed to our shareholders and recognize the importance of a healthy dividend. Our policy is to distribute 40% to 50% of the net profit from ordinary operations as dividend but we also strive to achieve a stable development of the dividend in the longer term, taking into account both the company’s desired balance sheet structure and the interests of shareholders. These considerations have led to the proposal to the Annual General Meeting of Shareholders to pay a cash dividend of EUR 0.50 per ordinary share, resulting in a pay-out ratio of 79%.

BO
SKA
LIS
AT
A G
LAN
CE
AN
NU
AL
REP
OR
T 2
018
– B
OSK
ALI
S16
SHAREHOLDER INFORMATION
We strive to inform our stakeholders as completely as possible and to provide insight into the strategic direction and performance of the company. These efforts should allow for an accurate valuation of the Boskalis share over time.
INVESTOR RELATIONS POLICY
Providing clear, transparent, accurate and timely information to our stakeholders is something we value highly. We consider our financial stakeholders to include existing and potential shareholders, other investors, banks and brokers as well as the media. Relevant information is equally and simultaneously provided to all interested parties and is made available through annual, semi-annual and quarterly updates, press releases, presentations to investors and the Boskalis website. To build and maintain long-term relationships with our stakeholders we organize roadshows, attend
16

AN
NU
AL
REP
OR
T 2
018
– B
OSK
ALI
S
17
conferences and accommodate meeting requests and conference calls where feasible, while adhering to all legal disclosure regulations and obligations.
Bilateral meetings and conference calls with analysts and existing or potential shareholders are not held during ‘closed periods’. Our policy of holding bilateral meetings with shareholders is set out in the Investor Relations section of our corporate website.
OPEN DIALOGUE
Following the publication of the annual and half-year results, we host comprehensive plenary analyst meetings which can also be followed through a webcast. Following important announcements, we also contact shareholders proactively and we maintain regular contact with major investors and analysts, for example by providing the opportunity, where feasible, to visit a project or a vessel.
In 2018 we again hosted a broad roadshow and investor conference program. We participated in conferences in the Netherlands, France and the UK. Roadshows for institutional investors were organized in Belgium, Canada, Finland, France, Germany, Ireland, the Netherlands, Spain, Switzerland, the UK and the US. In addition, a large number of investor meetings took place at our head office in the Netherlands. In 2018 more than 300 meetings were held with investors.
Boskalis is covered by all the major Benelux brokers. We are in frequent contact with their analysts, who play a key role in distributing information to their clients about the markets in which Boskalis operates.
On 9 May 2018 we held our Annual General Meeting (AGM) of Shareholders. On 15 August 2018 we held an Extraordinary General Meeting (EGM). More information on the AGM and the EGM can be found on our corporate website.
DIVIDEND
The main principle underlying the Boskalis dividend policy is to distribute 40% to 50% of the net profit from ordinary operations as dividend. At the same time Boskalis aims to achieve a stable development of the dividend in the longer term. The choice of dividend takes into account both the company’s desired balance sheet structure and the interests of shareholders.
On 9 May 2018 the AGM approved a proposal to pay out 87% of the 2017 net profit equivalent to EUR 1.00 per ordinary share. The dividend was paid in ordinary shares, unless shareholders opted to receive the dividend in cash.
ISSUE AND REPURCHASE OF SHARES
Seventy-two per cent (72%) of the 2017 dividend was distributed in the form of stock. As a consequence, the issued share capital as at 5 June 2018 increased by 2,026,444 shares to 135,378,338. As per year end, 134,067,826 ordinary shares hold voting rights, the remaining 1,310,512 being treasury stock.
On 26 March 2018 Boskalis completed its share buyback program which was launched on 3 July 2017. Under the program, Boskalis repurchased a total of 3,275,042 shares for a total amount of EUR 93,498,816.10. Of this total number, 600,441 were repurchased in 2018.
SHARES AND LISTINGS
Ordinary shares in Royal Boskalis Westminster N.V are listed on the Euronext stock exchange in Amsterdam, the Netherlands (ticker BOKA.AS, ISIN code NL0000852580). Options on ordinary Boskalis shares are traded on the European Option Exchange in Amsterdam (Euronext.liffe). Due to a decline in the free float corrected market capitalization, the Boskalis share was removed from the AEX-index in March 2018 and moved to the AMX-index. The share was also removed from the MSCI Europe Index in May. Boskalis shares are included in numerous indices such as the Euronext Next 150 index and the STOXX Europe 600 Index.
The authorized capital amounts to EUR 4.8 million with 240 million ordinary shares and 80 million cumulative protective shares, with a respective nominal value per share of EUR 0.01 and EUR 0.03.
MAJOR SHAREHOLDERS
Under the Dutch Financial Markets Supervision Act, shareholdings of 3% or more in any Dutch company must be disclosed to the Netherlands Authority for the Financial Markets (AFM). According to the register kept by the AFM the following shareholders disclosed that they have a direct or indirect (potential) interest in Boskalis as at 31 December 2018:
HAL Investments B.V.: 40.30%Sprucegrove Investment Management Limited: 5.16%Oppenheimer Funds, Inc.: 5.06%International Value Advisers, LLC: 5.06%Marathon Asset Management: 3.57%Dimensional Fund Advisors LP : 3.11%Black Creek Investments: 3.03%
Besides these large shareholders, an estimated 11% of the shares are held by shareholders in the US, 5% in the UK and the remainder in mainly Spain, the Netherlands, Ireland, France and Germany.
BO
SKA
LIS
AT
A G
LAN
CE
AN
NU
AL
REP
OR
T 2
018
– B
OSK
ALI
S18
2018 2017 2016 2015 2014Note
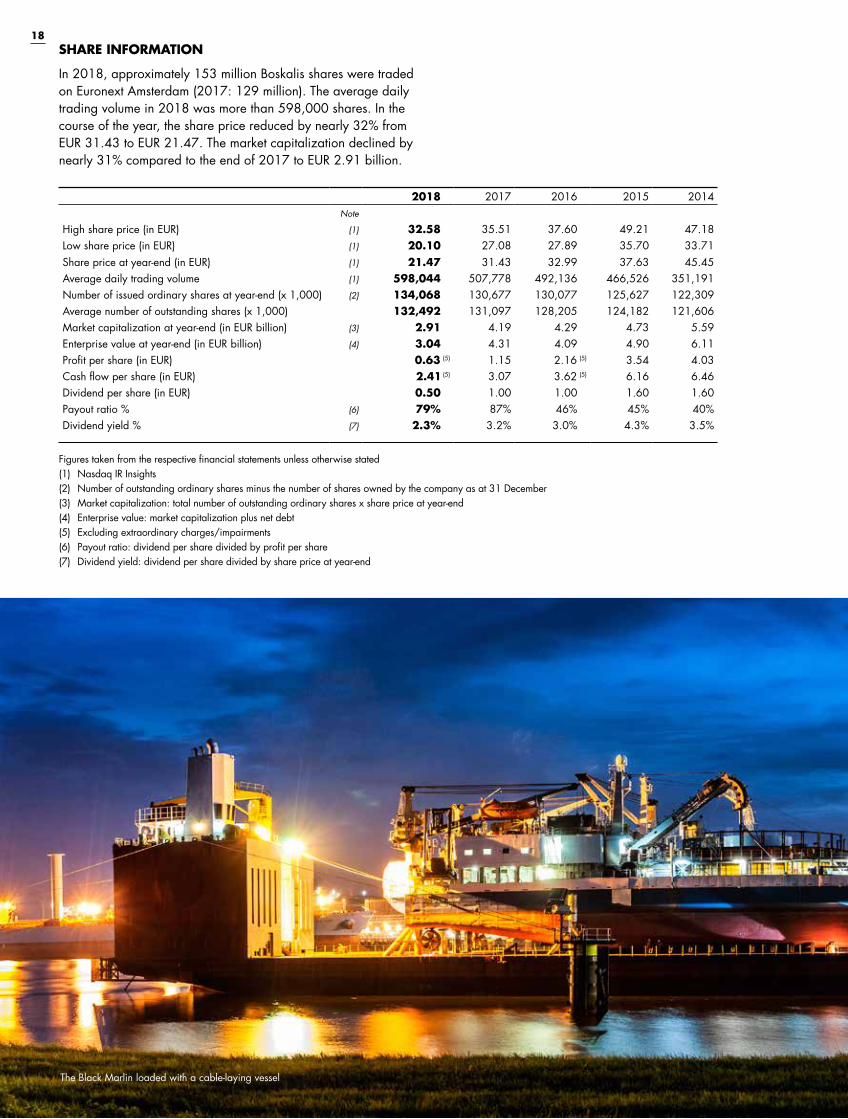
High share price (in EUR) (1) 32.58 35.51 37.60 49.21 47.18 Low share price (in EUR) (1) 20.10 27.08 27.89 35.70 33.71 Share price at year-end (in EUR) (1) 21.47 31.43 32.99 37.63 45.45 Average daily trading volume (1) 598,044 507,778 492,136 466,526 351,191 Number of issued ordinary shares at year-end (x 1,000) (2) 134,068 130,677 130,077 125,627 122,309 Average number of outstanding shares (x 1,000) 132,492 131,097 128,205 124,182 121,606 Market capitalization at year-end (in EUR billion) (3) 2.91 4.19 4.29 4.73 5.59 Enterprise value at year-end (in EUR billion) (4) 3.04 4.31 4.09 4.90 6.11 Profit per share (in EUR) 0.63 (5) 1.15 2.16 (5) 3.54 4.03Cash flow per share (in EUR) 2.41 (5) 3.07 3.62 (5) 6.16 6.46Dividend per share (in EUR) 0.50 1.00 1.00 1.60 1.60Payout ratio % (6) 79% 87% 46% 45% 40%Dividend yield % (7) 2.3% 3.2% 3.0% 4.3% 3.5%
Figures taken from the respective financial statements unless otherwise stated(1) Nasdaq IR Insights(2) Number of outstanding ordinary shares minus the number of shares owned by the company as at 31 December(3) Market capitalization: total number of outstanding ordinary shares x share price at year-end(4) Enterprise value: market capitalization plus net debt(5) Excluding extraordinary charges/impairments (6) Payout ratio: dividend per share divided by profit per share(7) Dividend yield: dividend per share divided by share price at year-end
SHARE INFORMATION
In 2018, approximately 153 million Boskalis shares were traded on Euronext Amsterdam (2017: 129 million). The average daily trading volume in 2018 was more than 598,000 shares. In the course of the year, the share price reduced by nearly 32% from EUR 31.43 to EUR 21.47. The market capitalization declined by nearly 31% compared to the end of 2017 to EUR 2.91 billion.
The Black Marlin loaded with a cable-laying vessel
AN
NU
AL
REP
OR
T 2
018
– B
OSK
ALI
S
19FINANCIAL AGENDA 2019
7 March Publication of 2018 annual results8 May Trading update on first quarter of 20198 May Annual General Meeting of Shareholders10 May Ex-dividend date13 May Record date for dividend entitlement (after market close)20 May Date of dividend payment 22 August Publication of 2019 half-year results8 November Trading update on third quarter of 2019

REPORT OF THE SUPERVISORY BOARD
20
Beach replenishment activities along the coast of the Dutch Wadden Island Texel

21
REP
OR
T O
F TH
E SU
PER
VIS
ORY
BO
AR
DA
NN
UA
L R
EPO
RT
201
8 –
BO
SKA
LIS
22
The Supervisory Board wishes to thank the employees and the Board of Management of Boskalis for the great efforts they have shown in 2018, especially considering the current market conditions.
In accordance with Article 26 of the Articles of Association of Royal Boskalis Westminster N.V., the Supervisory Board presents the 2018 annual report to the Annual General Meeting of Shareholders. The annual report, including the report of the Board of Management, the statement of directors’ responsibilities and the financial statements, was drawn up by the Board of Management. The financial statements are accompanied by the report of the company’s external auditor Ernst & Young Accountants LLP, which is included on pages 138 to 142 of this report.
We recommend the following to the Annual General Meeting of Shareholders: � The adoption of the financial statements, including the appropriation of profit or loss.
� The discharge of the members of the Board of Management in respect of their management activities during 2018.
� The discharge of the members of the Supervisory Board for their supervision of management during 2018.
� The distribution to shareholders of a cash dividend of EUR 0.50 per ordinary share.
COMPOSITION OF THE BOARD OF MANAGEMENT
The Board of Management consisted of three members at the start of the 2018 reporting year. On 9 May 2018, Mr. Kamps, the Chief Financial Officer, was reappointed for a period until the Annual General Meeting in 2019. On 15 August 2018, Mr. Heijermans was appointed as member of the Board of Management for a period commencing 1 September 2018 until and including the Annual General Meeting of Shareholders in 2022. No further changes to the composition of the Board of Management occurred during the year under review. As a result as from 1 September 2018 the Board of Management consists of four members.
COMPOSITION OF THE SUPERVISORY BOARD
At the start of 2018 the Supervisory Board consisted of six members. At the Annual General Meeting of Shareholders on 9 May 2018 Mr. Hessels stepped down as Chairman and member of the Supervisory Board. Mr. Van der Veer succeeded Mr. Hessels as Chairman of the Supervisory Board as per the same date. Mr. De Kreij was appointed by the Annual General Meeting of Shareholders as member of the Supervisory Board commencing on 9 May 2018 until and including the Annual General Meeting of Shareholders in 2022. Mr. Hazewinkel was reappointed as member of the Supervisory Board on 9 May 2018 for a period until the Annual General Meeting in 2020. No further changes to the composition of the Supervisory Board occurred during the year under review. As a result as from 9 May 2018 the Supervisory Board consists of six members.
REPORT OF THE SUPERVISORY BOARD
AN
NU
AL
REP
OR
T 2
018
– B
OSK
ALI
S
23
ACTIVITIES OF THE SUPERVISORY BOARD
The Supervisory Board held five regular meetings with the Board of Management and Group Management of the company. The attendance rate at the meetings of the Supervisory Board is for all Supervisory Board members 100%, apart from Mr. Van der Veer, who missed one meeting in January 2018. The Supervisory Board also met several times without the Board of Management being present and there was regular telephone and one-on-one contact between the Chairman of the Supervisory Board and the Chairman of the Board of Management. Neither transactions with a (potential) conflict of interest, nor transactions with a majority shareholder, have occurred in the year under review. The Supervisory Board has discussed the acceptance of supervisory board positions by members of the Board of Management and members of the Supervisory Board at other companies or institutions.
The Supervisory Board held its meetings to discuss the annual and half-year results in the presence of the external auditor, Ernst & Young Accountants LLP.
Permanent items on the agenda of the Supervisory Board are the strategy, the development of the results, the financials, the safety performance, and the industry and market developments.
In 2018 the Supervisory Board received an update from the Board of Management on the implementation, execution, risks and opportunities of the Corporate Business Plan 2017-2019.
Within the context of the market developments the order book and potential large projects as well as the status of important contracted projects were discussed. During the year under review subjects addressed included among others the impact of the low oil price and the continuing uncertain market conditions on the company, which affected especially the Offshore Energy division with a sharp drop in the results relating to the transport activities at the low end of the market. The Supervisory Board considered in this context the proposal of the Board of Management to terminate these activities, which no longer formed a fit with the strategy for Offshore Energy as set out in the Corporate Business Plan 2017-2019. Furthermore the proposed divestment of the equity stakes in Saam Smit Towage and Kotug Smit Towage were discussed. The Supervisory Board assessed the total extraordinary charge of EUR 519.5 million which was mainly due to the termination of the transport activities, the impairment on Boskalis’ interests in the harbor towage joint ventures, as well as the effects for the organization.
The Supervisory Board discussed the contracting of large dredging projects such as the award of the building of a polder and the Tuas Terminal Finger Pier 3 in Singapore as well the contract for the performance of dredging activities for LNG Canada. For Offshore Energy the conclusion of a Long Term Agreement with
Saudi Aramco in Saudi Arabia and contract for the Export Cable Installation for the wind farm Ostwind 2 were considered. For Towage & Salvage the two multi-year marine salvage contracts with the American Navy and the emergency response contract for the partly burned out container vessel Maersk Honam were paid attention to.
The Supervisory Board also informed themselves on the execution of projects such as among others the Duqm Liquid Berths Project in Oman and Wikinger, the offshore wind farm project in Germany. In discussing these projects the Supervisory Board devoted attention to the various operational, geopolitical, societal, environmental and financial risks, and, where applicable, judged provisions made by the Board of Management.
Other topics under scrutiny in 2018 included the corporate budget, the working capital, the liquidity, the share price development and relations with shareholders, acquisition and investment/divestment proposals, the organizational structure, personnel and the staffing policies. Specific attention was paid to the company’s policy on safety, health and the environment and the societal aspects of doing business.
The Supervisory Board received presentations by senior managers within the company to inform themselves on the developments regarding the streamlining of Gardline and the update of the global safety program No Injuries No Accidents (NINA).
Attention was also paid to corporate social responsibility, with a comprehensive discussion by the Supervisory Board of the Boskalis Corporate Social Responsibility report. The Supervisory Board paid among others attention to the initiative of Boskalis to reduce CO2 emissions of its fleet by using sustainable biofuel, where feasible, and the acquisition of two LNG powered tugs. In 2018 the General Code of Business Conduct, the Supplier Code of Conduct and the Whistleblower Policy with the therein embodied values, and their execution and compliance were discussed. The Supervisory Board also addressed the policy and relevant developments in relation to anti-corruption and integrity.
The Audit Committee assessed the structure and operation of the internal risk management and control systems associated with the strategy and discussed these with the Supervisory Board.No significant changes to the internal risk management and control systems were made during the year under review. Further information about the company’s risk management can be found on pages 54 to 60 of this annual report.
In 2018 the Supervisory Board gave consideration to the acquisition of the offshore companies Bohlen & Doyen GmbH in Germany and Horizon Survey Company (FZA) in the United Arab Emirates.

REP
OR
T O
F TH
E SU
PER
VIS
ORY
BO
AR
DA
NN
UA
L R
EPO
RT
201
8 –
BO
SKA
LIS
24
During the year under review the share buyback program, proposed by the Board of Management to acquire its shares in the company, was also discussed by the Supervisory Board.
The Supervisory Board paid a working visit to the regional office in the Middle East during the year under review. During this visit the Supervisory Board familiarized itself with the activities of Boskalis in the field of Dredging & Inland Infra, Offshore Energy and Towage in that area. In the course of doing so extensive attention was paid to the market trends, geopolitical aspects, tender procedures and possible new projects in the region. In addition, the Supervisory Board visited the Liquid Berths Project in Oman, a sizable dredging work to develop a new part of the Port of Duqm.
A number of Supervisory Board members met with the Works Council to discuss the results, the corporate strategy, the conduct and culture of the company, the market developments and personnel matters.
The Supervisory Board has three core committees – the Audit Committee, the Remuneration Committee and the Selection and Appointment Committee. The committees performed their tasks as follows:
AUDIT COMMITTEE
Members of the Audit CommitteeAt the beginning of 2018 the Audit Committee consisted of three members: Mr. Hazewinkel (Chairman), Mr. Van Wiechen and Ms. Haaijer. After the meeting of the Audit Committee on 15 August 2018 Ms. Haaijer stepped down as member of the Audit Committee and
was succeeded by Mr. De Kreij. Mr. Hazewinkel fulfills the role of financial expert in the Audit Committee. More than half of the members of the Audit Committee are independent in accordance with the Code.
Duties and responsibilities of the Audit CommitteeThe duties of the Audit Committee include: � Informing the Supervisory Board of the company of the outcome of the statutory audit and explaining how the statutory audit contributed to the integrity of the financial reporting and what the role of the Audit Committee has been in that process.
� Monitoring the financial reporting process and submitting proposals to ensure its integrity.
� Monitoring the effectiveness of the internal control system, the internal audit function and the risk management system regarding the financial reporting of the company.
� Monitoring the statutory audit of the financial statements and the consolidated annual accounts, in particular the execution thereof taking into account the assessment of the AFM in accordance with article 26, sub clause 6 of EU Directive 537/2014.
� Assessing and monitoring the independence of the external auditor, specifically taking into account the provision of ancillary services to the company.
� Determining the procedure for the selection of the external auditor and the nomination for the engagement to carry out the statutory audit in accordance with article 16 of EU Directive 537/2014.
� Advising the Supervisory Board on the approval of the appointment and the dismissal of the internal auditor.
� Providing its opinion on the performance of the internal audit function.
� Advising on the annual internal audit plan.
The cutter suction dredger Helios at work in Duqm, Oman

AN
NU
AL
REP
OR
T 2
018
– B
OSK
ALI
S
25
Activities during 2018The Audit Committee met on three occasions during 2018. The attendance rate for the meetings of the Audit Committee was 100%.
Regular topics discussed during these meetings included: the financial statements, the (interim) financial reporting for the financial year, the results relating to large projects and operating activities, developments in IFRS regulations, developments in the order book, cost control, share price developments, and the financing and liquidity of the company.
The Audit Committee discussed with the Board of Management the internal risk management and control systems and assessed the effectiveness of the design and the operation thereof by evaluating the systems with the Board of Management, the internal and external auditor and senior management. The Audit Committee reported hereon to the Supervisory Board.
Other topics of discussion included the impact of the situation on the financial markets, insurance matters, the company’s tax policies, tax position and relevant tax developments, the administrative organization, the provision of adequate information within the company, the relevant legislation and legal proceedings.
In addition, the Audit Committee focused more specifically on the framework of the financial reporting on the recognition in the accounts of the impairments regarding goodwill and assets as related to the 2017 and 2018 financial statements with regard to the harbor towage activities and the termination of the low-end transport activities, the development of the working capital, cybersecurity, the anti-corruption policies and the purchase price allocation of Gardline.
Within the context of the market developments the order book and potential large projects as well as the status of important contracted projects were discussed. During the year under review subjects addressed included among others the impact of the low oil price and the continuing uncertain market conditions on the company, which affected especially the Offshore Energy division with a sharp drop in the results relating to the transport activities at the low end of the market. The Supervisory Board considered in this context the proposal of the Board of Management to terminate these activities, which no longer formed a fit with the strategy for Offshore Energy as set out in the Corporate Business Plan 2017-2019. Furthermore the proposed divestment of the equity stakes in Saam Smit Towage and Kotug Smit Towage were discussed.
The Audit Committee assessed the total extraordinary charge of EUR 519.5 million which was mainly due to the termination of the transport activities, the impairment on Boskalis’ interests in the Harbour Towage joint ventures, as well as the effects for the organization.
In the Audit Committee the activities performed by the internal auditor during 2018 as well as the internal Audit Plan for 2019 have been discussed with the internal auditor. Other topics of discussion included a review of the scope of the internal audit function.
In addition to the Chairman of the Board of Management and the Chief Financial Officer, the Group Controller and the external auditor were also present at the meetings of the Audit Committee. The internal auditor and other officers joined the meetings of the Audit Committee for the topics relevant to their function.
The Audit Committee discussed with the external auditor the audit plan as well as the audit fees. The scope and materiality of the audit plan and the principal risks of the annual reporting, as well as the findings and outcome of control process of the financial statements and management letter, was given consideration by the Audit Committee, whereby the Audit Committee received information on the most important topics of discussion with the external auditor related to the drafts of the Management Letter and the audit report.
The workings of the external and internal audit functions were assessed by means of discussions with the Board of Management, the internal and external auditor as well as senior management.
The Audit Committee informed the external auditor of the main elements regarding its performance. The Audit Committee also established the independence of the external auditor. The Audit Committee reported its findings on the performance of and the relationship with the external auditor to the Supervisory Board. During the year under review meetings were also held with the external auditor without the company’s Board of Management being present.
Reports and findings of the meetings of the Audit Committee were presented to and discussed with the entire Supervisory Board.
REMUNERATION COMMITTEE
Members of the Remuneration CommitteeAt the beginning of 2018 the Remuneration Committee consisted of two members, with Mr. Van Woudenberg as Chairman and Mr. Van der Veer as member. After the meeting of the Remuneration Committee on 15 August 2018, Ms. Haaijer joined the Remuneration Committee as third member.
Duties and responsibilities of the Remuneration CommitteeIt is the role of the Remuneration Committee to advise the Supervisory Board on: � The submission of a clear and understandable proposal concerning the remuneration policy to be pursued for members of the Board of Management with focus on long-term value creation for the company and the business connected with it and shall take into account the internal pay ratios within the business. The Remuneration Committee shall consider and include all matters required by law and the Corporate Governance Code 2016 (the “Code”). The Supervisory Board shall present the policy to the General Meeting of Shareholders for adoption.
� The submission of a proposal concerning the remuneration of individual members of the Board of Management. The proposal shall be drawn up in accordance with the remuneration policy that has been established and will, in any event, cover the remuneration structure, the amount of the fixed and variable remuneration components, the performance criteria used, the scenario analyses that are carried out and the pay ratios with

REP
OR
T O
F TH
E SU
PER
VIS
ORY
BO
AR
DA
NN
UA
L R
EPO
RT
201
8 –
BO
SKA
LIS
26
the company and its affiliated enterprise. When formulating the proposal for remuneration of the Board of Management, the Remuneration Committee shall take note of the views of the individual members of the Board of Management with regard to the amount and structure of their remuneration.
� The preparation of the report on the remuneration policy implemented in the past financial year. The Remuneration Committee shall consider and include all matters required by law and the Code. The Supervisory Board’s remuneration report is available on the company’s website.
Activities during 2018The Remuneration Committee met three times during 2018. The attendance rate for the meetings of the Remuneration Committee was 100%. The Committee also held regular consultations outside these meetings. More than half of the members of the Remuneration Committee is independent in accordance with the Code.
During the year under review the activities of the Remuneration Committee included: � informing itself of developments surrounding remuneration policy for senior management in the Dutch and international market;
� staying abreast of the latest corporate governance developments in the Netherlands and internationally;
� performing scenario analyses; � submitting a proposal concerning the remuneration of individual members of the Board of Management in accordance with the law and the Code, wherein among others note has been taken of views of the individual members of the Board of Management with regard to the amount and structure of their own remuneration in the framework of the Remuneration Policy;
� discussing with the Board of Management the remuneration of the members of the Group Management, who are not members of the Board of Management;
� preparing a proposal for a new share-based long-term incentive scheme based on the outcome of a remuneration survey that was executed in 2017.
In the year under review, the Remuneration Committee commissioned an external remuneration advisor to assist in the execution of its activities.
The Remuneration Committee applies for the execution of its remuneration activities a labor market reference group, that is composed of a mix of fourteen Dutch (AEX and AMX-listed) companies that are comparable in terms of size and business activities. The labor market reference group consists of BAM, DSM, Fugro, SBM Offshore, Sligro, RELX Group, PostNL, Wolters Kluwer, Arcadis, Vopak, Aalberts Industries, OCI, KPN and TKH Group. In 2018 the labor market reference group remained unaltered.
In 2017 the Remuneration Committee re-evaluated the prevailing remuneration policy for the members of the Board of Management in light of the current market developments and circumstances.The outcome of this remuneration survey showed that the members of the Board of Management receive an appropriate basic salary, but that the overall direct compensation package for all members of the Board of Management are in comparison with the labor
market reference group below or around the lowest quartile (P25). This as a result of a relatively low long-term variable element. In addition, more and more (AEX and AMX-listed) companies have a share-based long-term incentive scheme. Based on this, it was announced in the Remuneration Report 2017, that the Supervisory Board had decided to propose an adjustment in the remuneration policy for the Board of Management to the Annual General Meeting of Shareholders to be held on 9 May 2018, wherein the level of remuneration for the Board of Management would be brought more in line with the market and a share-based long-term incentive scheme would be introduced to be applicable from 1 January 2018. In 2017 also a remuneration survey has been performed to calibrate the level of remuneration of members of the Supervisory Board. The results of this survey showed that the remuneration of the Supervisory Board is relatively lower than the median of the labor market reference group. In the Remuneration Report 2017 it was therefore also announced that the Supervisory Board would propose an adjustment in the remuneration policy for the Supervisory Board to the Annual General Meeting of Shareholders to bring the level of remuneration in line with market level. However, in view of the prevailing business environment and the general interest of the company, the Supervisory Board has decided, in close consultation with the Board of Management, not to schedule the proposals to adjust the remuneration policy for the Board of Management and the Supervisory Board for the agenda of the Annual General Meeting of Shareholders in 2018. The Chairman of the Remuneration Committee explained the background of this decision at the Annual General Meeting of Shareholders on 9 May 2018.
The Supervisory Board will schedule a new proposal for an adjustment in the remuneration policy for the Board of Management to the Annual General Meeting in 2020, wherein the level of remuneration for the Board of Management will be brought more in line with the market and a share-based long-term incentive scheme will be introduced.
The overview of the activities of the Remuneration Committee is also published in the Remuneration report 2018 on the website of the company (www.boskalis.com).
Remuneration policy for the Board of ManagementThe current remuneration policy for the Board of Management was adopted by the Extraordinary General Meeting of Shareholders on 21 January 2011. The remuneration policy is consistent with the strategy and core values of Boskalis, which are centered on long-term orientation and continuity and take into account the interests of Boskalis’ shareholders, clients, employees as well as the ‘wider environment’. In 2018 the remuneration policy was applied in accordance with the remuneration policy as last adopted by the Extraordinary General Meeting of Shareholders on 21 January 2011. The full text of the remuneration policy can be found on the Boskalis website.
Remuneration policy for the Supervisory BoardThe remuneration policy for the Supervisory Board was adopted by the General Meeting of Shareholders on 10 May 2012. In 2018 the remuneration was applied in accordance with the remuneration policy as adopted.
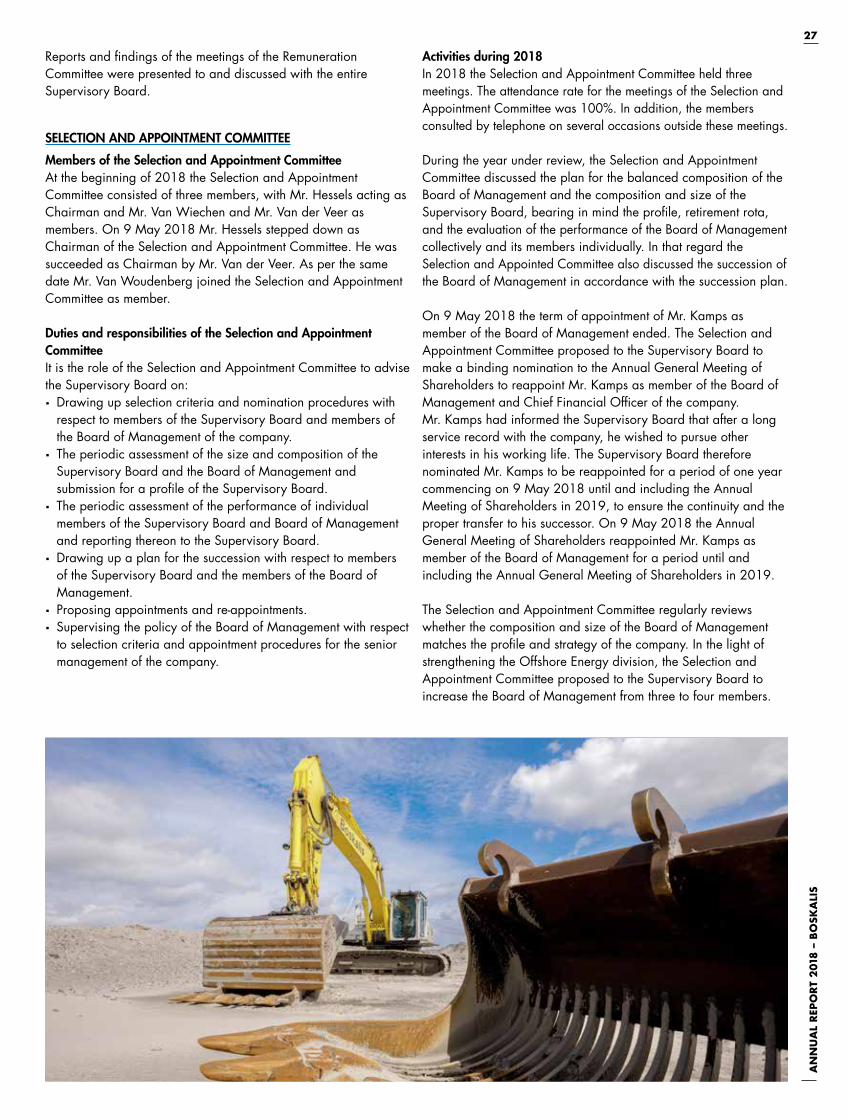
AN
NU
AL
REP
OR
T 2
018
– B
OSK
ALI
S
27
Reports and findings of the meetings of the Remuneration Committee were presented to and discussed with the entire Supervisory Board.
SELECTION AND APPOINTMENT COMMITTEE
Members of the Selection and Appointment Committee At the beginning of 2018 the Selection and Appointment Committee consisted of three members, with Mr. Hessels acting as Chairman and Mr. Van Wiechen and Mr. Van der Veer as members. On 9 May 2018 Mr. Hessels stepped down as Chairman of the Selection and Appointment Committee. He was succeeded as Chairman by Mr. Van der Veer. As per the same date Mr. Van Woudenberg joined the Selection and Appointment Committee as member.
Duties and responsibilities of the Selection and Appointment CommitteeIt is the role of the Selection and Appointment Committee to advise the Supervisory Board on: � Drawing up selection criteria and nomination procedures with respect to members of the Supervisory Board and members of the Board of Management of the company.
� The periodic assessment of the size and composition of the Supervisory Board and the Board of Management and submission for a profile of the Supervisory Board.
� The periodic assessment of the performance of individual members of the Supervisory Board and Board of Management and reporting thereon to the Supervisory Board.
� Drawing up a plan for the succession with respect to members of the Supervisory Board and the members of the Board of Management.
� Proposing appointments and re-appointments. � Supervising the policy of the Board of Management with respect to selection criteria and appointment procedures for the senior management of the company.
Activities during 2018In 2018 the Selection and Appointment Committee held three meetings. The attendance rate for the meetings of the Selection and Appointment Committee was 100%. In addition, the members consulted by telephone on several occasions outside these meetings.
During the year under review, the Selection and Appointment Committee discussed the plan for the balanced composition of the Board of Management and the composition and size of the Supervisory Board, bearing in mind the profile, retirement rota, and the evaluation of the performance of the Board of Management collectively and its members individually. In that regard the Selection and Appointed Committee also discussed the succession of the Board of Management in accordance with the succession plan.
On 9 May 2018 the term of appointment of Mr. Kamps as member of the Board of Management ended. The Selection and Appointment Committee proposed to the Supervisory Board to make a binding nomination to the Annual General Meeting of Shareholders to reappoint Mr. Kamps as member of the Board of Management and Chief Financial Officer of the company. Mr. Kamps had informed the Supervisory Board that after a long service record with the company, he wished to pursue other interests in his working life. The Supervisory Board therefore nominated Mr. Kamps to be reappointed for a period of one year commencing on 9 May 2018 until and including the Annual Meeting of Shareholders in 2019, to ensure the continuity and the proper transfer to his successor. On 9 May 2018 the Annual General Meeting of Shareholders reappointed Mr. Kamps as member of the Board of Management for a period until and including the Annual General Meeting of Shareholders in 2019.
The Selection and Appointment Committee regularly reviews whether the composition and size of the Board of Management matches the profile and strategy of the company. In the light of strengthening the Offshore Energy division, the Selection and Appointment Committee proposed to the Supervisory Board to increase the Board of Management from three to four members.

REP
OR
T O
F TH
E SU
PER
VIS
ORY
BO
AR
DA
NN
UA
L R
EPO
RT
201
8 –
BO
SKA
LIS
28
The Supervisory Board adopted this proposal and decided that a vacancy had to be filled. The Selection and Appointment Committee, after a careful selection process, found Mr. Heijermans willing to fill this vacancy. Mr. Heijermans was selected due to his extensive experience in developing, executing and operating offshore oil and gas projects as well as wind farms within international listed companies. The Supervisory Board adopted this recommendation of the Selection and Appointment Committee and made a binding nomination to the Extraordinary General Meeting of Shareholders to appoint Mr Heijermans as member of the Board of Management for the period commencing on 1 September 2018 until and including the Annual General Meeting of Shareholders in 2022. On 15 August 2018 the Extraordinary General Meeting of Shareholders appointed Mr. Heijermans as member of the Board of Management for a period until and including the Annual General Meeting of Shareholders in 2022.
The Selection and Appointment Committee discussed in 2018 the succession of Mr. Kamps. The Selection and Appointment Committee, after a careful selection process, found Mr. Van Noort willing to fill this vacancy. Mr. Van Noort is currently financial director of Boskalis Nederland. Mr. Van Noort was selected due his excellent track record within Boskalis with a broad background and in-depth knowledge of the organization and the business. As announced on 11 October 2018, the Supervisory Board adopted this recommendation of the Selection and Appointment Committee and shall make a binding nomination to the Annual General Meeting of Shareholders to appoint Mr. Van Noort as member of the Board of Management and Chief Financial Officer of the company for the period commencing on 8 May 2019 until and including the Annual General Meeting of Shareholders in 2023.
On 8 May 2019 the term of appointment of Mr. Baartmans as member of the Board of Management will end. The Selection and Appointment Committee proposed to the Supervisory Board to make a binding nomination to the Annual General Meeting of Shareholders to reappoint Mr. Baartmans as member of the Board of Management. Mr. Baartmans informed the Selection and Appointment Committee to be available for reappointment. The Supervisory Board adopted the recommendation by the Selection and Appointment Committee due to the fact that Mr. Baartmans has delivered as member of the Board of Management a significant contribution to the company and has fulfilled his position in an excellent manner. As announced on 9 November 2018, the Supervisory Board shall make a binding nomination to the Annual General Meeting of Shareholders to reappoint Mr. Baartmans as member of the Board of Management for a period of four years commencing on 8 May 2019 until and including the Annual Meeting of Shareholders in 2023.
On 13 December 2019 the term of appointment of Mr. Berdowski as member of the Board of Management and Chief Executive Officer will end. The Selection and Appointment Committee proposed to the Supervisory Board to make a binding nomination to the Annual General Meeting of Shareholders to reappoint Mr. Berdowski as member of the Board of Management and Chief Executive Officer. Mr. Berdowski informed the Selection and Appointment Committee to be available for reappointment. The Supervisory Board adopted the recommendation by the Selection
and Appointment Committee due to the continuity of management of the company and the fact that Mr. Berdowski has delivered as member of the Board of Management and Chief Executive Officer a significant contribution to the company and has fulfilled his position in an excellent manner. As announced on 9 November 2018, the Supervisory Board therefore shall make a binding nomination to the Annual General Meeting of Shareholders to reappoint Mr. Berdowski as member of the Board of Management for a period of four years commencing on 8 May 2019 until and including the Annual Meeting of Shareholders in 2023.
Furthermore, the Selection and Appointment Committee also paid attention to the succession of the Supervisory Board in accordance with the succession plan.
Mr. Hessels indicated his wish to resign as Chairman and member of the Supervisory Board after the Annual General Meeting of Shareholders on 9 May 2018. The Selection and Appointment Committee discussed in 2018 the succession of Mr. Hessels and found Mr. Van der Veer willing to fill the position of Chairman of the Supervisory Board. The Supervisory Board adopted this recommendation and appointed Mr. Van der Veer as such per 9 May 2018.
Due to the resignation of Mr. Hessels a vacancy in the Supervisory Board needed to be filled. The Selection and Appointment Committee, after a careful selection process, found Mr. De Kreij willing to fill this vacancy. Mr. De Kreij is the former vice-chairman of the Executive Board and Chief Financial Officer of Royal Vopak N.V. and has previously held different positions at PWC, lastly as Managing Partner Transaction Services. Mr. De Kreij was selected in accordance with the Profile of the Supervisory Board given his extensive management experience gained in an international listed company active in the oil, chemical and gas markets as well as his accrued knowledge and experience as senior partner at PWC.The Supervisory Board adopted this recommendation of the Selection and Appointment Committee and made a binding nomination to the Annual General Meeting of Shareholders to appoint Mr. De Kreij as member of the Supervisory Board for the period commencing on 9 May 2018 until and including the Annual General Meeting of Shareholders in 2022. On 9 May 2018 the Annual General Meeting of Shareholders appointed Mr. De Kreij as member of the Supervisory Board for a period until and including the Annual General Meeting of Shareholders in 2022.
On 9 May 2018 the term of appointment of Mr. Hazewinkel as member of the Supervisory Board ended. The Selection and Appointment Committee proposed to the Supervisory Board in accordance with the Profile of the Supervisory Board to make a binding nomination to the Annual General Meeting of Shareholders to reappoint Mr. Hazewinkel as member of the Supervisory Board. The Supervisory Board adopted this recommendation and made a binding nomination to reappoint Mr. Hazewinkel for a period commencing on 9 May 2018 until and including the Annual Meeting of Shareholders in 2020. On 9 May 2018 the Annual General Meeting of Shareholders reappointed Mr. Hazewinkel as member of the Supervisory Board for a period until and including the Annual General Meeting of Shareholders in 2020.
AN
NU
AL
REP
OR
T 2
018
– B
OSK
ALI
S
29
On 8 May 2019 the term of appointment of Mr. Van der Veer as member of the Supervisory Board ends. The Selection and Appointment Committee proposed to the Supervisory Board in accordance with the Profile to make a binding nomination to the Annual General Meeting of Shareholders to reappoint Mr. Van der Veer as member of the Supervisory Board, due to his extensive experience as Chairman and member of the Supervisory Board and the professional manner in which he fulfills that Chairman- and membership The Supervisory Board adopted this recommendation and shall make a binding nomination to the coming Annual General Meeting of Shareholders to reappoint Mr. Van der Veer for a period commencing on 8 May 2019 until and including the Annual Meeting of Shareholders in 2023.
On 8 May 2019 the term of appointment of Mr. Van Wiechen as member of the Supervisory Board ends.The Selection and Appointment Committee proposed to the Supervisory Board in accordance with the Profile to make a binding nomination to the Annual General Meeting of Shareholders to reappoint Mr. Van Wiechen as member of the Supervisory Board. This nomination deviates of best practice 2.2.2 of the Code, but is due to Mr. Van Wiechen’s position of director at HAL Investments B.V., his extensive experience as member of the Supervisory Board and the professional manner in which he fulfills that membership. The Supervisory Board adopted this recommendation and shall make a binding nominationto the coming Annual General Meeting of Shareholders to reappoint Mr. Van Wiechen for a period commencing on 8 May 2019 until and including the Annual Meeting of Shareholders in 2023.
On 8 May 2019 the third term of appointment of Mr. Van Woudenberg as member of the Supervisory Board ends. Mr. Van Woudenberg is no longer available for reappointment. Therefore a vacancy in the Supervisory Board needs to be filled. The Selection and Appointment Committee, after a careful selection process, found Ms. Tammenoms-Bakker willing to fill this vacancy. Ms. Tammenoms-Bakker fulfilled in the past the function of advisor and chairman of the Dutch Council for the Environment and Infrastructure and the position of Director-General of the Dutch Ministry of Infrastructure and Water Management. Furthermore she has been working for Quest International Limited, McKinsey & Co and several parts of Royal Dutch Shell plc. Currently Ms. Tammenoms-Bakker is chairman of the Van Leer Group Foundation and member of the supervisory boards of Groupe Wendel, Unibail-Rodamco SE and TomTom N.V. as well as non-executive director of CNH Industrial N.V. Ms. Tammenoms-Bakker was selected in accordance with the Profile of the Supervisory Board given her broad management experience at international (stock-listed) companies and her knowledge and experience in the field of transport and infrastructure. The Supervisory Board adopted this recommendation of the Selection and Appointment Committee and shall make a binding nomination to the coming Annual General Meeting of Shareholders to appoint Ms. Tammenoms-Bakker as member of the Supervisory Board for the period commencing on 8 May 2019 until and including the Annual General Meeting of Shareholders in 2023.
The company arranged an induction program for Mr. De Kreij in July 2018 to familiarize him with the general affairs of the company regarding financial, social and legal matters, the workings of the Supervisory Board, the markets Boskalis is operating in, its culture and the works council. No further training needs have been identified for the Supervisory Board or the Board of Management in the year under review.
Reports and findings of the meetings of the Selection and Appointment Committee were presented to and discussed with the entire Supervisory Board.
DUTCH CORPORATE GOVERNANCE CODE
Since the introduction of the Dutch Corporate Governance Code (the “Code”) in 2004 and the revision in 2016, the principles of proper corporate governance and best practice provisions set out in the Code have regularly been discussed at Supervisory Board meetings. The principal points of the Boskalis Corporate Governance policy can be found on pages 64 and 65 of this annual report.
In the opinion of the Supervisory Board, the provisions of the Code regarding the independence of the members of the Supervisory Board have been complied with. The Supervisory Board considers Mr. Van Wiechen the only Supervisory Board member not to be independent in light of the Code, due to the fact that he fulfills the position of director at HAL Investments B.V., which company holds as at 31 December 2018 a major interest of 40.30% in the share capital of Boskalis.
Outside the presence of the Board of Management the Supervisory Board discussed the performance of the Board of Management. It also discussed the performance of the Supervisory Board, the Chairman of the Supervisory Board, the three committees and the individual members of the Supervisory Board. This evaluation was conducted by means of a questionnaire as well as through collective and bilateral discussions between the members of the Supervisory Board, the Chairman of the Supervisory Board and the Chairman of the Board of Management. In its opinion the Supervisory Board is functioning well. The Supervisory Board has implemented actions to address the conclusions of the evaluation, among others with regard to diversity.
The Supervisory Board wishes to thank the employees and the Board of Management of Boskalis for the great efforts they have shown in 2018, especially considering the current market conditions.
Papendrecht / Sliedrecht, 6 March 2019
Supervisory Board
Mr. J. van der Veer, ChairmanMr. H.J. Hazewinkel, deputy ChairmanMs. I. HaaijerMr. J.P. de KreijMr. J.N. van WiechenMr. C. van Woudenberg

BOSKALIS BREAKS RECORDS ON DUQM PROJECT
The project involves the creation of an enormous port area that will house, among other things, a bulk terminal and a refinery. Boskalis is executing this engineering, procurement & construct contract for the Special Economic Zone Authority Duqm. “What makes this project unique is that we first drained a large part of the future port by constructing a temporary ring dike, pump and keep out all water and then building all the structures in this so-called polder,” project director Bart Pröpper said. Operations began in 2017 with an intensive design and preparation phase, and extensive soil surveys. The work included the construction of a large port basin and an entrance channel with a depth of 18 meters, and the construction of a kilometer-long quay wall and two 400-meter-long jetties. Boskalis will start the second phase of the major land reclamation for the port area in the first half of 2019. The perimeter of the area will be protected with geotextile and a total of 1 million tons of rock.
In 2018 Boskalis was still at work in the south of Oman. The challenge there can compare in terms of size and complexity with major projects such as Maasvlakte 2 and Gorgon. This Duqm Liquid Bulk Berth Project is breaking records in terms of both productivity and safety.
30

LANDMARK ACHIEVEMENT
“Many hundreds of people work here every day,” Pröpper explained. “In addition to colleagues from numerous disciplines at Boskalis, there are a lot of local employees: more than 10% of our workforce is from Oman. We also make 10% of our purchases with local small and medium companies and adapt our work to the needs of local fishermen and protect marine life, including a whale colony.” Despite the enormous size of the project, the complexity and tight schedule, the project is proceeding to the full satisfaction of the client. “We are working ahead of schedule, have met our first four of seven milestones and we are also doing well in terms of safety,” Pröpper said. “In late 2018 we booked a landmark achievement: four million man-hours without a lost-time incident. Thanks in part to our innovative approach, the option in our contract was recently awarded resulting in the dredging of an extra ten million cubic meters by the Helios and another reclamation job for approximately 7 million cubic meters.”
NINA
NINA, the Boskalis safety-awareness program, plays a crucial role here. “We have been organizing NINA training courses and toolbox meetings since the beginning of the project,” Pröpper said. “We are working here with temporary staff from 25 different countries, including drivers and operators from places including Pakistan, India and Oman. Not everyone has a complete command of English and so we regularly call in local supervisors and foremen during safety meetings to translate and ensure that our safety message gets across properly. We are also very serious about using Safety Hazard Observation Cards. We have already received more than ten thousand, and we are addressing the proposed improvements.”
SAND SUPPLIES AND COMPACTION
During the first phase of the project, the trailing suction hopper dredgers Queen of the Netherlands and Prins der Nederlanden pumped in millions of cubic meters of sand for the land reclamation and the construction of the temporary ring dike. For phase two the hopper Fairway will pump in a similar quantity of sand as in phase one. The excavation and large-scale earthmoving work for the construction and deepening of the polder, with a total volume of 9 million cubic meters, was carried out under the supervision of colleagues from Boskalis Nederland involving over 80 units of dry earthmoving equipment. Our subsidiary Cofra is compacting the reclaimed area. Some of that work has now been completed and the areas in question have been tested and handed over to the client.
QUAY WALL AND JETTIES
Working with our partner Six Construct, Boskalis built a gigantic quay wall on the edge of the extensive polder.
31
More than 5,000 large concrete blocks were required for this operation and they were produced elsewhere on site. At the same time, the impressive steel structures were built in the middle of the polder for the two jetties. That involved installing 330 large steel piles that were then connected to each other with steel beams and in situ poured concrete platforms.
NEW TYPE OF CUTTER HEAD
In late 2017 the cutter suction dredger Helios started the first phase of dredging for the entrance channel to the new port area. It also started excavating the outer section of the port basin. “We came across a lot of tough rock in this first stage. It was a challenge for the dredger,” Pröpper said. “To get the job done, a team of Boskalis specialists developed and produced new cutter heads within an extremely tight schedule. Since October 2018 the Helios has been using them to remove the remaining 15 million cubic meters of various types of rock.”
FLOODING THE POLDER
After the completion of the civil engineering work, the polder was flooded in mid-January 2019 using large siphons and so the impressive engineered structures are now largely hidden from view. “From a technical and logistical point of view, we have achieved something very special here,” Pröpper concluded. The final completion date for the project is April 2020.
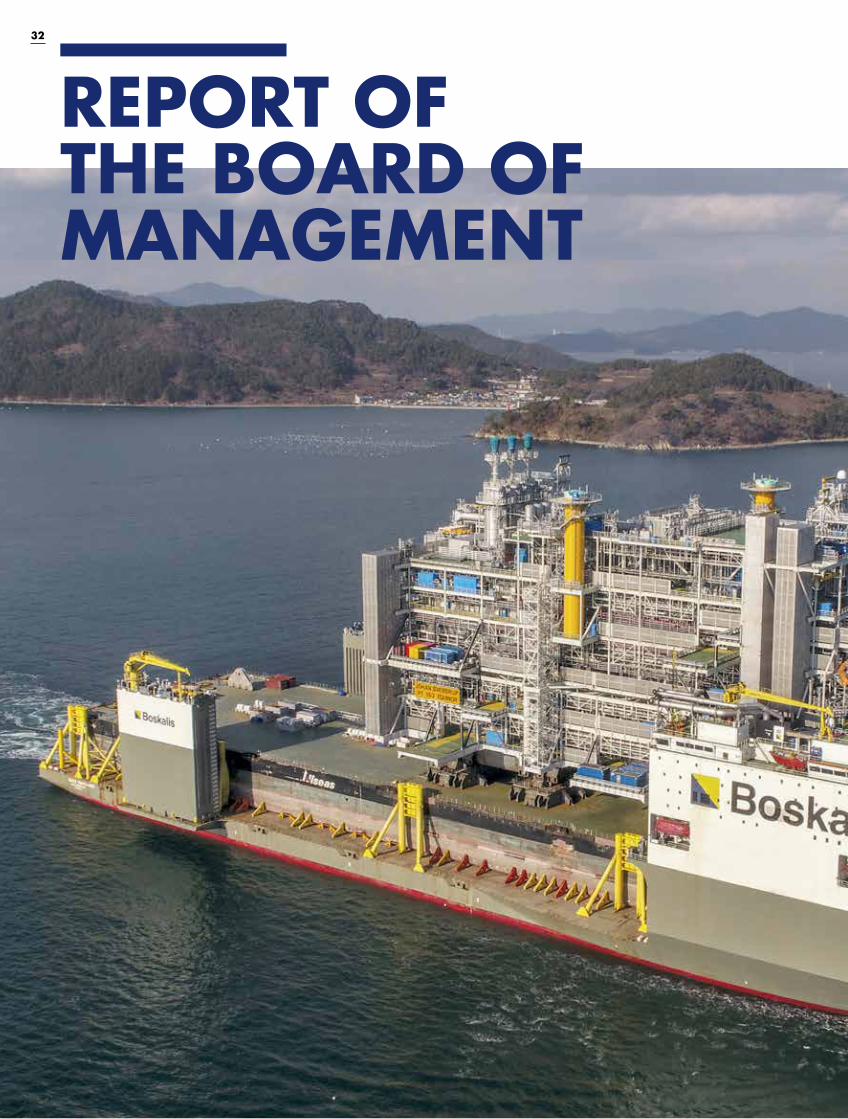
32
REPORT OF THE BOARD OF MANAGEMENT

33
34 FINANCIALPERFORMANCE
46 ORGANIZATIONAL DEVELOPMENTS
50 CORPORATE SOCIAL RESPONSIBILITY
52 BUSINESS PRINCIPLES
54 RISK MANAGEMENT
64 CORPORATE GOVERNANCE
66 OUTLOOK
67 STATEMENT OF DIRECTORS’ RESPONSIBILITIES

34R
EPO
RT
OF
THE
BO
AR
D O
F M
AN
AG
EMEN
T
FINANCIAL PERFORMANCERoyal Boskalis Westminster N.V. (Boskalis) closed 2018 with a lower result, in line with expectations. Net operating profit was EUR 83 million (2017: EUR 150 million). Including an almost entirely non-cash extraordinary charge of EUR 519 million there was a net loss of EUR 436 million.
Revenue rose 10% compared to the previous year to EUR 2.57 billion (2017: EUR 2.34 billion).
EBITDA equaled EUR 354 million and the operating result was EUR 119 million, both adjusted for extraordinary charges (2017: EBITDA EUR 437 million and EBIT EUR 185 million).
The lower result is mainly attributable to a sharp decline in the result at the Offshore Energy division, which posted an operating loss for the first half of 2018. In light of the poor prospects the decision was taken in the first half of the year to terminate the low-end transport activities within this division. Market conditions have also deteriorated for the harbor towage activities, mainly as a result of the consolidation among the large container shipping companies. Together these developments resulted in an extraordinary charge of EUR 519 million, almost entirely non-cash and consisting primarily of impairments of goodwill and vessels.
Dredging & Inland Infra had a relatively stable year. With a number of large works in progress in countries including India and Oman, supplemented by a large number of medium-sized projects, both revenue and the result rose by over 10%. Utilization of both the hopper fleet and the cutter fleet was slightly higher than in the previous year. The margin was stable compared to 2017 with the
AN
NU
AL
REP
OR
T 2
018
– B
OSK
ALI
S
usual combination of results from ongoing works and from the financial settlement of projects completed earlier.
At Offshore Energy revenue rose 7% due to a strong contribution from the contracting activities and the addition of survey (Gardline). The strong decline in the division’s results was largely due to the deterioration at services. The winding-up of the loss-making transport activities at the low end of the market is proceeding according to plan. The transport and subsea activities had a difficult year and were loss-making on balance.
At Towage & Salvage the combined result, adjusted for extraordinary charges, was virtually stable. The contribution from Towage declined, mainly due to lower margins as a result of the consolidation among the large container shipping companies. The changed market situation prompted a strategic reorientation of the harbor towage joint ventures, which resulted in the proposed sale of the stakes in the Saam Smit Towage and Kotug Smit Towage joint ventures. Salvage had a busy year with two large contracts, including the successful salvage of the ultra-large container vessel Maersk Honam. Together with numerous smaller contracts this resulted in higher revenue and an increased result.
Boskalis’ financial position continues to be strong, with a solvency ratio of 56% and a modest net debt position of EUR 131 million.
The order book, excluding our share in the order book of joint ventures and associated companies, increased by 23% to EUR 4.29 billion (end-2017: EUR 3.50 billion).

35
606
952
336
355
106215
North and South America
AfricaMiddle East
Australia / AsiaRest of Europe
The Netherlands
Dredging & Inland Infra
Offshore Energy
Towage & Salvage
Eliminations (-32)
1,4291,041
132
REVENUE BY SEGMENT 2018 2017
(in EUR million)
Dredging & Inland Infra 1,428.7 1,298.3 Offshore Energy 1,041.3 972.1 Towage & Salvage 131.7 100.5 Eliminations -32.2 -28.3
Total 2,569.5 2,342.6
REVENUE BY GEOGRAPHICAL AREA 2018 2017
(in EUR million)
The Netherlands 605.6 497.8 Rest of Europe 952.0 856.5 Australia / Asia 336.1 364.4 Middle East 355.2 256.4 Africa 106.1 84.8 North and South America 214.5 282.7
Total 2,569.5 2,342.6
OPERATIONAL AND FINANCIAL DEVELOPMENTS
The Boskalis 2018 financial result was substantially impacted by extraordinary charges of in total EUR 519.5 million pre-tax (EUR 518.7 million post-tax). Of these charges, EUR 502.2 million were non-cash impairments, with EUR 344.8 million relating primarily to goodwill (including goodwill embedded in the book value of joint ventures), EUR 136.9 million to equipment within the Offshore Energy division and the remaining EUR 20.6 million to equipment and associates within two towage joint ventures.
For comparison purposes the EBITDA and operating result are adjusted for these extraordinary charges; operating result is defined as EBIT before extraordinary charges. Excluding the extraordinary charges, the 2018 net profit amounted to EUR 82.8 million.
As of 2018 Boskalis is required to apply IFRS 15 Revenue from Contracts with Customers and IFRS 9 Financial Instruments. The application of these standards did not have material consequences. For comparison purposes certain 2017 financials have been adjusted, including a minimal adjustment of the revenue within the Offshore Energy division (increase of EUR 5.4 million).
REVENUE
Over the past year revenue increased by 10% to EUR 2.570 billion (2017: EUR 2.343 billion). Adjusted for consolidation, deconsolidation and currency effects, revenue increased by 9%. The underlying revenue growth was generated across all three divisions.
Within the Dredging & Inland Infra division a 10% revenue increase was accompanied by a higher utilization of both the hopper and cutter fleet. The biggest revenue growth was realized outside of Europe, with in particular large projects under execution in Oman and India.
The revenue of the Offshore Energy division increased by 8% with in particular a busier year for contracting and survey (Gardline). Furthermore, the full year consolidation of Gardline, which was acquired mid-August 2017, also has a positive effect. The largest contribution to the contracting revenue growth came from various offshore wind and seabed intervention projects. Within services, subsea services and the survey activities also improved year-on-year. Revenues from the Marine Transport & Services cluster declined as a result of prevailing market conditions and the decision earlier in the year to exit the low-end heavy marine transport market.
Within the Towage & Salvage division, Salvage had a busy year. In addition to numerous smaller emergency response contracts, two large contracts contributed to this growth.
RESULT
The 2018 operating result before interest, taxes, depreciation, amortization and impairment and other extraordinary charges (EBITDA) totaled EUR 353.6 million (2017: EUR 436.6 million). EBITDA includes the contribution from our share in the net result of joint ventures and associates.
AN
NU
AL
REP
OR
T 2
018
– B
OSK
ALI
S
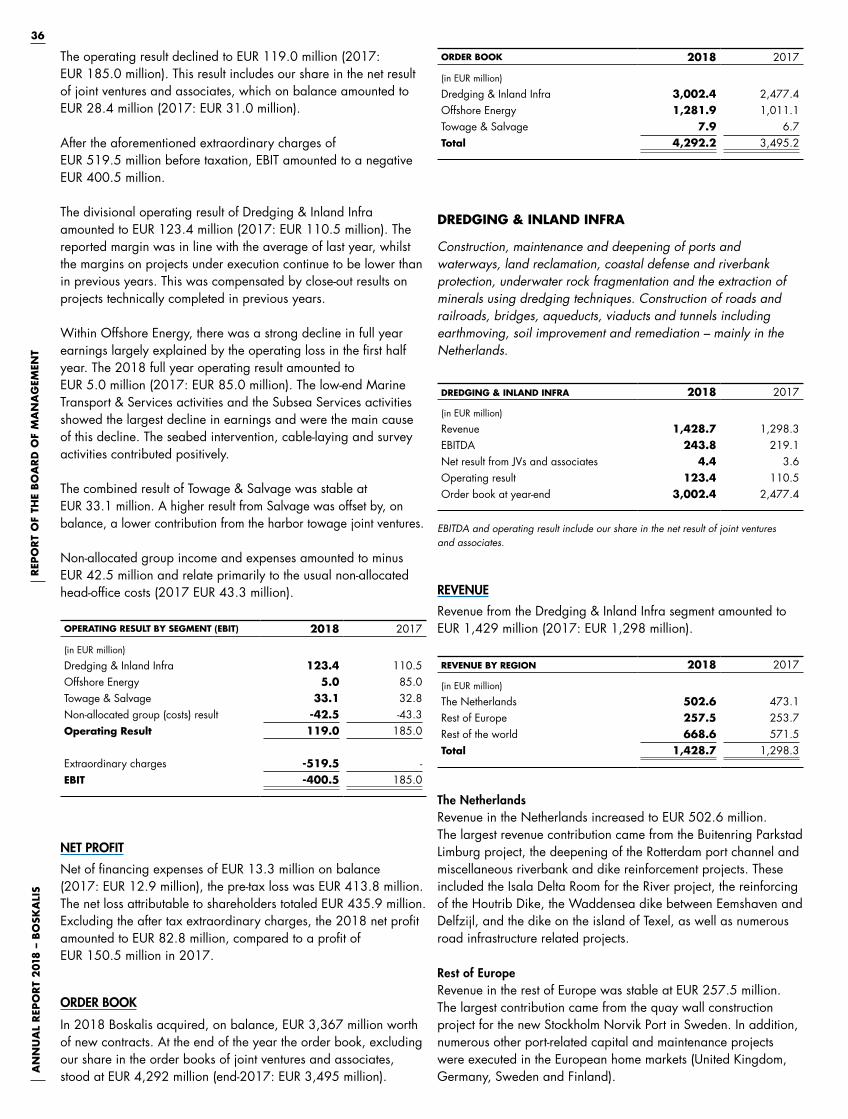
REP
OR
T O
F TH
E B
OA
RD
OF
MA
NA
GEM
ENT
AN
NU
AL
REP
OR
T 2
018
– B
OSK
ALI
S36
The operating result declined to EUR 119.0 million (2017: EUR 185.0 million). This result includes our share in the net result of joint ventures and associates, which on balance amounted to EUR 28.4 million (2017: EUR 31.0 million).
After the aforementioned extraordinary charges of EUR 519.5 million before taxation, EBIT amounted to a negative EUR 400.5 million.
The divisional operating result of Dredging & Inland Infra amounted to EUR 123.4 million (2017: EUR 110.5 million). The reported margin was in line with the average of last year, whilst the margins on projects under execution continue to be lower than in previous years. This was compensated by close-out results on projects technically completed in previous years.
Within Offshore Energy, there was a strong decline in full year earnings largely explained by the operating loss in the first half year. The 2018 full year operating result amounted toEUR 5.0 million (2017: EUR 85.0 million). The low-end Marine Transport & Services activities and the Subsea Services activities showed the largest decline in earnings and were the main cause of this decline. The seabed intervention, cable-laying and survey activities contributed positively.
The combined result of Towage & Salvage was stable at EUR 33.1 million. A higher result from Salvage was offset by, on balance, a lower contribution from the harbor towage joint ventures.
Non-allocated group income and expenses amounted to minus EUR 42.5 million and relate primarily to the usual non-allocated head-office costs (2017 EUR 43.3 million). OPERATING RESULT BY SEGMENT (EBIT) 2018 2017
(in EUR million)
Dredging & Inland Infra 123.4 110.5 Offshore Energy 5.0 85.0 Towage & Salvage 33.1 32.8 Non-allocated group (costs) result -42.5 -43.3Operating Result 119.0 185.0
Extraordinary charges -519.5 -EBIT -400.5 185.0
NET PROFIT
Net of financing expenses of EUR 13.3 million on balance (2017: EUR 12.9 million), the pre-tax loss was EUR 413.8 million. The net loss attributable to shareholders totaled EUR 435.9 million. Excluding the after tax extraordinary charges, the 2018 net profit amounted to EUR 82.8 million, compared to a profit of EUR 150.5 million in 2017.
ORDER BOOK
In 2018 Boskalis acquired, on balance, EUR 3,367 million worth of new contracts. At the end of the year the order book, excluding our share in the order books of joint ventures and associates, stood at EUR 4,292 million (end-2017: EUR 3,495 million).
ORDER BOOK 2018 2017
(in EUR million)
Dredging & Inland Infra 3,002.4 2,477.4 Offshore Energy 1,281.9 1,011.1 Towage & Salvage 7.9 6.7 Total 4,292.2 3,495.2
DREDGING & INLAND INFRA
Construction, maintenance and deepening of ports and waterways, land reclamation, coastal defense and riverbank protection, underwater rock fragmentation and the extraction of minerals using dredging techniques. Construction of roads and railroads, bridges, aqueducts, viaducts and tunnels including earthmoving, soil improvement and remediation – mainly in the Netherlands.
DREDGING & INLAND INFRA 2018 2017
(in EUR million)
Revenue 1,428.7 1,298.3 EBITDA 243.8 219.1 Net result from JVs and associates 4.4 3.6 Operating result 123.4 110.5 Order book at year-end 3,002.4 2,477.4
EBITDA and operating result include our share in the net result of joint ventures and associates.
REVENUE
Revenue from the Dredging & Inland Infra segment amounted to EUR 1,429 million (2017: EUR 1,298 million).
REVENUE BY REGION 2018 2017
(in EUR million)
The Netherlands 502.6 473.1 Rest of Europe 257.5 253.7 Rest of the world 668.6 571.5 Total 1,428.7 1,298.3
The NetherlandsRevenue in the Netherlands increased to EUR 502.6 million. The largest revenue contribution came from the Buitenring Parkstad Limburg project, the deepening of the Rotterdam port channel and miscellaneous riverbank and dike reinforcement projects. These included the Isala Delta Room for the River project, the reinforcing of the Houtrib Dike, the Waddensea dike between Eemshaven and Delfzijl, and the dike on the island of Texel, as well as numerous road infrastructure related projects.
Rest of EuropeRevenue in the rest of Europe was stable at EUR 257.5 million. The largest contribution came from the quay wall construction project for the new Stockholm Norvik Port in Sweden. In addition, numerous other port-related capital and maintenance projects were executed in the European home markets (United Kingdom, Germany, Sweden and Finland).

AN
NU
AL
REP
OR
T 2
018
– B
OSK
ALI
S
37
Rest of the worldThe strongest revenue growth was achieved outside of Europe, with an increase to EUR 668.6 million. The project for the development of the port of Duqm (Oman) and the deepening of the access channel to the Jawaharlal Nehru Port in Mumbai (India) had the greatest revenue contribution in 2018. Other important projects included LNG Canada, the deepening of Lyttelton Port (New Zeeland), the expansion of the port of Lekki (Nigeria) and various other port and channel related projects in South America, Southeast Asia and the Indian subcontinent.
FLEET DEVELOPMENTS
Utilization of the hopper and cutter fleet was relatively stable compared to both the first half year and the full year 2017. The hopper fleet had an effective annual utilization rate of 36 weeks (2017: 35 weeks), with the cutter fleet utilization rate at 16 weeks (2017: 14 weeks).
The construction of the Krios, the sister vessel to the mega cutter Helios, is progressing according to plan. The vessel is due to be launched later this year and is expected to be taken into service mid-2020.
SEGMENT RESULT
Dredging & Inland Infra achieved an EBITDA of EUR 243.8 million, with an operating result of EUR 123.4 million (2017: EUR 219.1 million and EUR 110.5 million, respectively).
The dredging result is a reflection of the continued challenging market conditions. The reported margin was stable versus 2017 and is considered to be good under the current market circumstances. The Dutch Inland Infra activities had a solid year and contributed positively to the result. Similar to previous years, financial settlements from projects that were technically completed at an earlier stage had a positive impact on the result.
The segment result includes our share in the net result of joint ventures and associates. The contribution from these activities was EUR 4.4 million (2017: EUR 3.6 million).
ORDER BOOK
The end of year order book amounted to EUR 3,002.4 million and was therefore stable compared to six months earlier but higher than the end-2017 position.
Crew member supporting diving activities on board the DSV Boka Atlantis

REP
OR
T O
F TH
E B
OA
RD
OF
MA
NA
GEM
ENT
AN
NU
AL
REP
OR
T 2
018
– B
OSK
ALI
S38
Notable project wins in the Netherlands included the road connection between the N69-A67, the deepening of the Nieuwe Waterweg shipping lane in the Port of Rotterdam, the construction of an artificial island in the IJmeer lake for the city of Amsterdam, an additional scope on the Markermeerdijken and the construction of the N3/A16 motorway interchange. The order book for the Rest of Europe was lower than at the end of 2017. The order book for the Rest of the World increased significantly, with the most noteworthy contract wins being the expansion of the Singapore Tuas Mega Port, the development of a polder in the northeastern part of Singapore, a variation order for the development of the port of Duqm (Oman) and the deepening of the access channel to the port of Lyttelton (New Zeeland). On balance projects with a total value of EUR 1,953.7 million were acquired in the course of 2018.
ORDER BOOK BY MARKET 2018 2017
(in EUR million)
The Netherlands 670.2 604.4 Rest of Europe 513.0 557.6 Rest of the world 1,819.2 1,315.4 Total 3,002.4 2,477.4
OFFSHORE ENERGY
Offshore dredging and rock installation projects, heavy transport, lift and installation work, surveying, diving and ROV services in support of the development, construction, maintenance and dismantling of oil and LNG import/export facilities, offshore platforms, pipelines and cables and offshore wind farms.
OFFSHORE ENERGY 2018 2017
(in EUR million)
Revenue 1,041.3 972.1EBITDA 111.3 221.1 Net result from JVs and associates 3.8 0.3Operating result 5.0 85.0 Order book at year-end 1,281.9 1,011.1
EBITDA and operating result include our share in the net result of joint ventures and associates.2018 EBITDA is presented excluding extraordinary charges.
REVENUE
Revenue from the Offshore Energy segment amounted to EUR 1,041.3 million (2017: EUR 972.1 million). The year-on-year revenue increase came from the contracting activities, which account for approximately 57% of divisional revenue, and from Gardline, due to the full year effects of the consolidation of Gardline, as well as due to a substantial increase of its revenues since the acquisition (mid-August 2017).
Offshore Services includes Marine Transport & Services, Subsea Services and Marine Survey. As a consequence of the prevailing weak market conditions, in the first half of the year the decision was taken to rationalize and largely exit the loss-making low-end of the heavy marine transport market.
At Marine Transport & Services, there was a decline in revenue in part due to the decision exit the low-end market. The remaining vessels were active on projects such as the transport of the P67 and Johan Sverdrup FPSOs involving the type 0 and type 1 vessels. Based on the current tender activity and market, the mid to long term prospects for the high-end market look encouraging. For the near term, the high-end is however expected to be increasingly dependent on the spot market, with prices under pressure. At Subsea Services, the main focus area continues to be Europe, the Middle East and Western Africa. Subsea markets, in particular the North Sea, continue to be under pressure, which is reflected in virtually stable revenue levels. The two large diving support vessels that were acquired late 2017 were still being positioned in the market, resulting in a low utilization. Marine Survey, comprising the Gardline activities, had a strong year. Revenue levels and pricing for this early-cyclical activity improved in the course of the year, providing further assurance that there is a beginning of a recovery of this market. The order book for 2019 is looking promising for a continued strong performance.
Offshore Contracting includes the installation of floating and fixed structures, seabed intervention, offshore wind and cable-laying related activities, all of which saw revenue levels increase in 2018. The largest Installation & Intervention projects under execution in 2018 were the gas pipeline projects TurkStream and Nord Stream 2, as well as work for the Borssele offshore wind export cable and the transportation and installation of jackets and topsides for the NASR field offshore Abu Dhabi. Offshore wind farm developments contributing to revenue included Aberdeen, Hornsea, Borssele, Arkona, Hohe See and Horns Rev 3. These projects included a mixture of export cables, array cables and a balance of plant project (Aberdeen OWF). The Bokalift 1 crane vessel, which entered service at the end of the first quarter, was fully utilized on an offshore wind farm foundation installation project.
FLEET DEVELOPMENTS
For the year the (weighted) utilization rate of active part of the heavy marine transport fleet was stable at 70% (2017: 69%). The captive assets (cable-laying vessels, fallpipe vessels and crane vessel) had a good year, with a utilization rate of 78% (2017: 69%).
At the end of the fourth quarter, Boskalis signed a three year time charter for a large modern construction support vessel. The Boka Falcon is a modern DP2 vessel with a bollard pull in excess of 400 ton, two ROVs, a 150 ton crane, ample crew capacity and large deck space. With this vessel Boskalis intends to position itself higher on the S curve in the floating installation market. The vessel will enter into service in March 2019.
Late 2018 Boskalis purchased a new offshore supply vessel that will be converted into a high-end geophysical survey vessel for the Northwest European market. The vessel will have full site investigation capabilities as well as a streamer arrangement that will expand our leading position in the 3D high definition survey market. The vessel is expected to enter service early 2020.
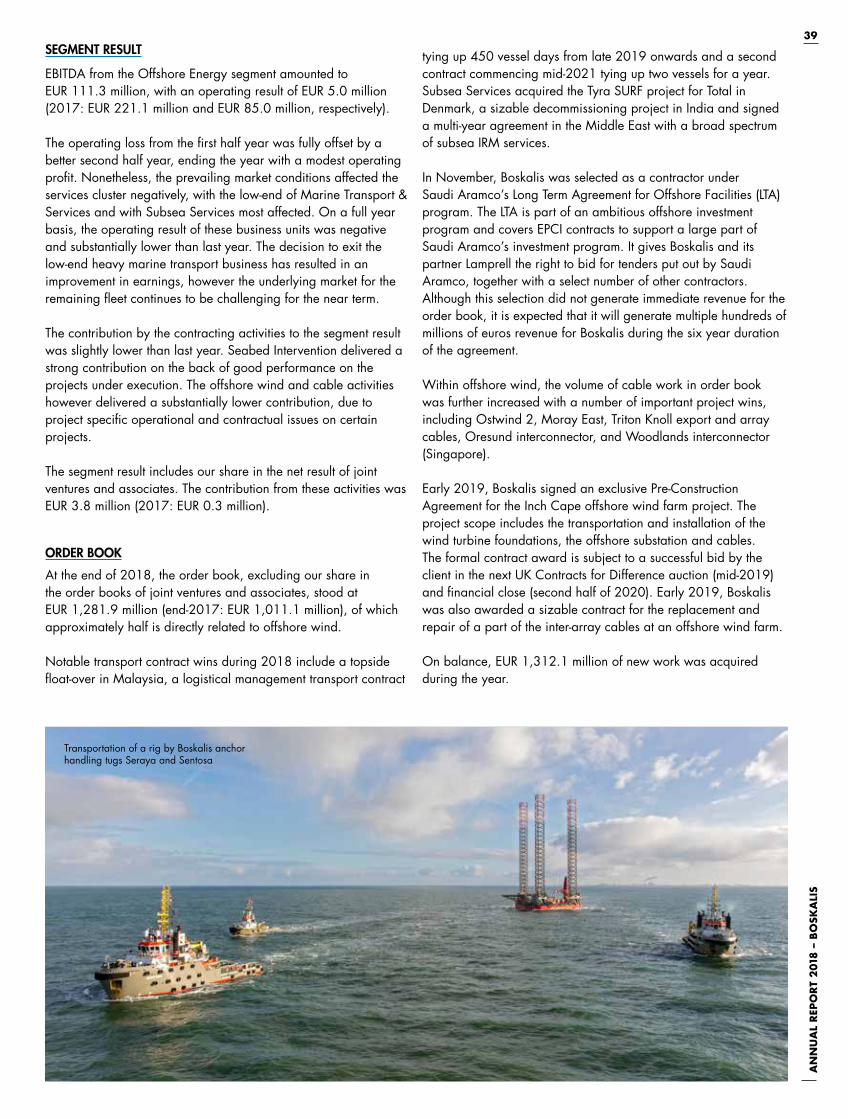
AN
NU
AL
REP
OR
T 2
018
– B
OSK
ALI
S
39SEGMENT RESULT
EBITDA from the Offshore Energy segment amounted to EUR 111.3 million, with an operating result of EUR 5.0 million (2017: EUR 221.1 million and EUR 85.0 million, respectively).
The operating loss from the first half year was fully offset by a better second half year, ending the year with a modest operating profit. Nonetheless, the prevailing market conditions affected the services cluster negatively, with the low-end of Marine Transport & Services and with Subsea Services most affected. On a full year basis, the operating result of these business units was negative and substantially lower than last year. The decision to exit the low-end heavy marine transport business has resulted in an improvement in earnings, however the underlying market for the remaining fleet continues to be challenging for the near term.
The contribution by the contracting activities to the segment result was slightly lower than last year. Seabed Intervention delivered a strong contribution on the back of good performance on the projects under execution. The offshore wind and cable activities however delivered a substantially lower contribution, due to project specific operational and contractual issues on certain projects.
The segment result includes our share in the net result of joint ventures and associates. The contribution from these activities was EUR 3.8 million (2017: EUR 0.3 million).
ORDER BOOK
At the end of 2018, the order book, excluding our share in the order books of joint ventures and associates, stood at EUR 1,281.9 million (end-2017: EUR 1,011.1 million), of which approximately half is directly related to offshore wind.
Notable transport contract wins during 2018 include a topside float-over in Malaysia, a logistical management transport contract
tying up 450 vessel days from late 2019 onwards and a second contract commencing mid-2021 tying up two vessels for a year. Subsea Services acquired the Tyra SURF project for Total in Denmark, a sizable decommissioning project in India and signed a multi-year agreement in the Middle East with a broad spectrum of subsea IRM services.
In November, Boskalis was selected as a contractor under Saudi Aramco’s Long Term Agreement for Offshore Facilities (LTA) program. The LTA is part of an ambitious offshore investment program and covers EPCI contracts to support a large part of Saudi Aramco’s investment program. It gives Boskalis and its partner Lamprell the right to bid for tenders put out by Saudi Aramco, together with a select number of other contractors. Although this selection did not generate immediate revenue for the order book, it is expected that it will generate multiple hundreds of millions of euros revenue for Boskalis during the six year duration of the agreement.
Within offshore wind, the volume of cable work in order book was further increased with a number of important project wins, including Ostwind 2, Moray East, Triton Knoll export and array cables, Oresund interconnector, and Woodlands interconnector (Singapore).
Early 2019, Boskalis signed an exclusive Pre-Construction Agreement for the Inch Cape offshore wind farm project. The project scope includes the transportation and installation of the wind turbine foundations, the offshore substation and cables. The formal contract award is subject to a successful bid by the client in the next UK Contracts for Difference auction (mid-2019) and financial close (second half of 2020). Early 2019, Boskalis was also awarded a sizable contract for the replacement and repair of a part of the inter-array cables at an offshore wind farm.
On balance, EUR 1,312.1 million of new work was acquired during the year.
Transportation of a rig by Boskalis anchor handling tugs Seraya and Sentosa
REP
OR
T O
F TH
E B
OA
RD
OF
MA
NA
GEM
ENT
AN
NU
AL
REP
OR
T 2
018
– B
OSK
ALI
S40
TOWAGE & SALVAGE
Towage: towage services and berthing and unberthing of oceangoing vessels in ports and at offshore terminals, management and maintenance both above and below the surface of onshore and offshore oil and gas terminals and associated maritime and management services.Salvage: providing assistance to vessels in distress, wreck removal, environmental care services and consultancy.
TOWAGE & SALVAGE 2018 2017
(in EUR million)
Revenue 131.7 100.5 EBITDA 36.4 35.1 Net result from JVs and associates 20.0 26.1 Operating result 33.1 32.8 Order book at year-end 7.9 6.7
EBITDA and operating result include our share in the net result of the joint ventures and associates.The net result from the joint ventures and associates are presented excluding impairment charges
REVENUE
Revenue from the Towage & Salvage segment increased to EUR 131.7 million (2017: EUR 100.5 million). The two largest projects contributing to this revenue increase were the salvage of the ultra-large containership Maersk Honam, the subsequent removal of the damaged containers and cleaning of the hull of this
vessel, and the oil removal from the SSL Kolkata in India. Numerous smaller emergency response contracts were also executed in 2018.
All harbor towage activities are conducted through joint ventures. Our share in the net results of these joint ventures is recognized as net result from joint ventures and associated companies.
SEGMENT RESULT
EBITDA generated by the Towage & Salvage segment totaled EUR 36.4 million, with an operating result of EUR 33.1 million (2017: EUR 35.1 million and EUR 32.8 million, respectively).
The Salvage result included financial settlements from projects that were executed in previous years. Such settlements are a common source of income for the salvage business. The actual size and timing of this income is, however, unpredictable.
The segment result includes our share in the net result of joint ventures and associated companies, the main ones being terminal services (Smit Lamnalco) and harbor towage (Keppel Smit Towage, Saam Smit Towage and Kotug Smit Towage). The contribution from these joint ventures was EUR 20.0 million (2017: EUR 26.1 million). In 2018, the three harbor towage joint ventures were adversely affected by increased competition and pricing pressure, in particular as a result of the consolidation trend in the container shipping industry. These developments led to a critical evaluation of the book value of the joint ventures,
Unloading operation of a grounded container vessel by SMIT Salvage

AN
NU
AL
REP
OR
T 2
018
– B
OSK
ALI
S
41
resulting in an impairment charge, mainly related to goodwill embedded in these joint ventures. These developments have furthermore triggered a re-evaluation of the position Boskalis holds in harbor towage. This resulted in the announcements early 2019 that Boskalis intends to sell its share in Saam Smit Towage and Kotug Smit Towage.
ORDER BOOK
At end-2018 the order book, excluding our share in the order books of joint ventures and associates, stood at EUR 7.9 million (end-2017: EUR 6.7 million). The order book relates solely to the Salvage business unit.
The value of the order book of the joint ventures is not includedin the consolidated financials. As per end-2017 the 100% value of the order book of the joint ventures amounted to EUR 1,267 million, which is fully attributable to terminal services contracts (Smit Lamnalco).
HOLDING AND ELIMINATIONS
Non-allocated head office activities.
HOLDING AND ELIMINATIONS 2018 2017
(in EUR million)
Revenue -32.2 -28.3EBITDA -38.0 -38.7Net result from JVs and associates 0.2 1.1Operating result -42.5 -43.3
SEGMENT RESULT
The operating result for the reporting period mainly includes the usual non-allocated head-office costs, as well as various non-allocated (in many cases non-recurring) income and expenses. The operating result in 2017 included a reorganization provision as well as a number of non-recurring non-allocated income items, including a positive result on the sale of real estate. In comparison to previous years, the non-recurring non-allocated income was substantially lower in 2018.
OTHER FINANCIAL INFORMATION
DEPRECIATION, AMORTIZATION AND IMPAIRMENT CHARGES
Depreciation and amortization expenses, excluding impairment charges, amounted to EUR 234.6 million (2017: EUR 251.6 million).
Prevailing weak market conditions in the offshore energy services sector as well as a challenging environment in harbor towage led to substantial non-cash impairment charges in 2018. The total impairment charges amounted EUR 481.7 million before taxation (EUR 480.9 million after taxation). A large part of the charges relate to the Offshore Energy division, of which EUR 136.9 million relates to an impairment charge for vessels and EUR 154.9 million to an impairment of the remaining goodwill of this division. The remaining amount of EUR 189.9 million is nearly all related to
goodwill embedded in the book value of the towage joint ventures, mostly goodwill created at the time of the forming of the joint ventures and subsequent currency translation differences.
INCOME FROM JOINT VENTURES AND ASSOCIATES
Our share in the net result from joint ventures and associates, adjusted for impairment charges reported within two of these joint ventures and associates, was EUR 28.4 million (2017: EUR 31.0 million). This result relates mainly to our share in the net results of Smit Lamnalco, the Singapore partnerships with Keppel (Keppel Smit Towage, Maju Maritime and Asian Lift), Saam Smit Towage and Kotug Smit Towage.
TAX
The tax charge decreased to EUR 19.9 million (2017: EUR 21.7 million) with an effective tax rate of -4.8% (2017: 12.6%). Excluding our share in the net results of joint ventures and associates and excluding the (tax effect on) extraordinary charges, the effective tax rate was 26.8%. The effective rate in 2017, adjusted for the net result from joint ventures and associates and a net badwill gain related to Gardline, was 18.4%.
CAPITAL EXPENDITURE AND BALANCE SHEET
In 2018, a total amount of EUR 194.8 million was invested in property, plant and equipment (2017: EUR 354.7 million), of which EUR 42.7 million was related to dry dockings. Disposals were made totaling EUR 17.0 million.
The largest investment under construction is within Dredging and relates to the construction of the mega cutter Krios (sister vessel to the Helios), which is progressing according to plan. The vessel is due to be completed mid-2020.
Capital expenditure commitments at the end of the year were EUR 162 million (end-2017: EUR 120 million). The largest part of these commitments relate to the Krios. EUR 25 million is related to the recent (conditional) acquisition of the offshore activities of Bohlen & Doyen, expected to be closed in the first quarter of 2019.
In 2018, Boskalis used EUR 36.3 million cash for payments of the dividend related to the 2017 financial year (2017: EUR 29.5 million), for those shareholders who opted to receive a cash dividend. This represented around 28% of the dividend, with the remaining 72% being distributed in stock. As a consequence, the issued number of shares increased by 2,026,444. As at 31 December 2018, the issued share capital consisted of 135,378,338 ordinary shares, of which 1,310,512 are treasury stock held by Boskalis.
The cash flow amounted to EUR 319.5 million (2017: EUR 402.0 million).
The working capital position at year-end was EUR 349 million negative (year-end 2017: EUR 386 million negative). The seasonal outflow of working capital in the first half of the year was largely reversed in the second half.
REP
OR
T O
F TH
E B
OA
RD
OF
MA
NA
GEM
ENT
AN
NU
AL
REP
OR
T 2
018
– B
OSK
ALI
S42
The cash position at the end of the year was EUR 336.2 million (year-end 2017: EUR 192.0 million). The solvency ratio decreased to 56.1%, primarily as a result of the impairment charges (year-end 2017: 62.6%).
The interest-bearing debt totaled EUR 467.1 million at year-end. The resulting net debt position amounted to EUR 130.9. At the end of 2017 the debt position was EUR 311.7 million, with a net debt position of EUR 119.7 million.
The interest-bearing debt relates largely to a long-term US Private Placement (USPP) of USD 325 million (EUR 283.6 million as at 31 December 2018). This USPP matures in 2023. Furthermore, Boskalis has a EUR 600 million syndicated bank facility at its disposal (matures in 2021) of which EUR 150 million was drawn as at 31 December 2018.
Boskalis must comply with a number of covenants as agreed with the syndicate of banks and the USPP investors. These covenants were comfortably met as at end-2018. The main covenants relate to the net debt : EBITDA ratio, with a limit of 3, and the EBITDA : net interest ratio, with a minimum of 4. At 31 December 2018 the net debt : EBITDA ratio stood at 0.7 and the EBITDA : net interest ratio at 23.8.
OTHER DEVELOPMENTS
BOHLEN & DOYEN
Late 2018 Boskalis reached an agreement for the acquisition of the offshore cable installation activities and assets of Bohlen & Doyen GmbH. The scope of the transaction includes the acquisition of the equipment, burial tools, personnel plus several smaller commercial and maintenance contracts. The acquisition will further strengthen Boskalis’ position in the German market and add assets which are well suited for the growing cable repair and replacement market. The transaction is expected to close at the end of the first quarter 2019.
SAAM SMIT TOWAGE
Early February 2019 Boskalis signed an agreement with SAAM S.A. (SAAM) relating to the sale and purchase of the equity share held by Boskalis in Saam Smit Towage. Under the terms of the agreement Boskalis expects to receive USD 201 million in cash. In recent years the structure and dynamics of the towage market have drastically changed. In joint discussions, Boskalis and SAAM agreed that the most effective way to respond to these developments would be for SAAM to become the outright owner of Saam Smit Towage. Subject to the satisfaction of customary conditions, the transaction is expected to close in the first half of 2019.
HORIZON
In February 2019 Boskalis acquired a 62.5% majority stake in the United Arab Emirates based company Horizon Geoscience. The consideration paid was EUR 66 million. Horizon’s main activities include marine geophysical surveys and geotechnical services with a strong regional focus on the Middle East. Through this transaction, Boskalis adds an important strategic position to its existing marine survey and subsea geotechnical business. Horizon operates a fleet of seven large survey/geotechnical vessels, five smaller survey vessels, two jack-up platforms, three motion-compensated drill towers for geotechnical services and eight ROVs. The remaining 37.5% of the shares are held by the incumbent management.
INTENDED SHARE BUYBACK PROGRAM
In February 2019 Boskalis announced an intended program to buy back the equivalent of EUR 100 million of its own shares. The actual start and details of the share buyback program will at that time be announced through a press release.
KOTUG SMIT TOWAGE
Early March 2019 Boskalis together with its co-shareholder Kotug International B.V. (Kotug) signed a letter of intent (LOI) relating to the sale of Kotug Smit Towage to Boluda. Under the terms of the LOI, Boskalis expects to receive approximately EUR 90 million in cash for its 50% equity stake in the joint venture. In recent years, the structure and dynamics of the towage market have drastically changed. Boskalis and Kotug are of the opinion that a further consolidation of the European harbor towage market would be beneficial, a vision which is shared by Boluda. This agreement is subject to customary conditions including a due diligence and approval from regulatory agencies in the respective countries involved. The transaction is expected to close in the second half of 2019.

AN
NU
AL
REP
OR
T 2
018
– B
OSK
ALI
S
43
Cable-laying vessel Ndurance installing inter-array cables for the Hohe See Offshore Wind Farm
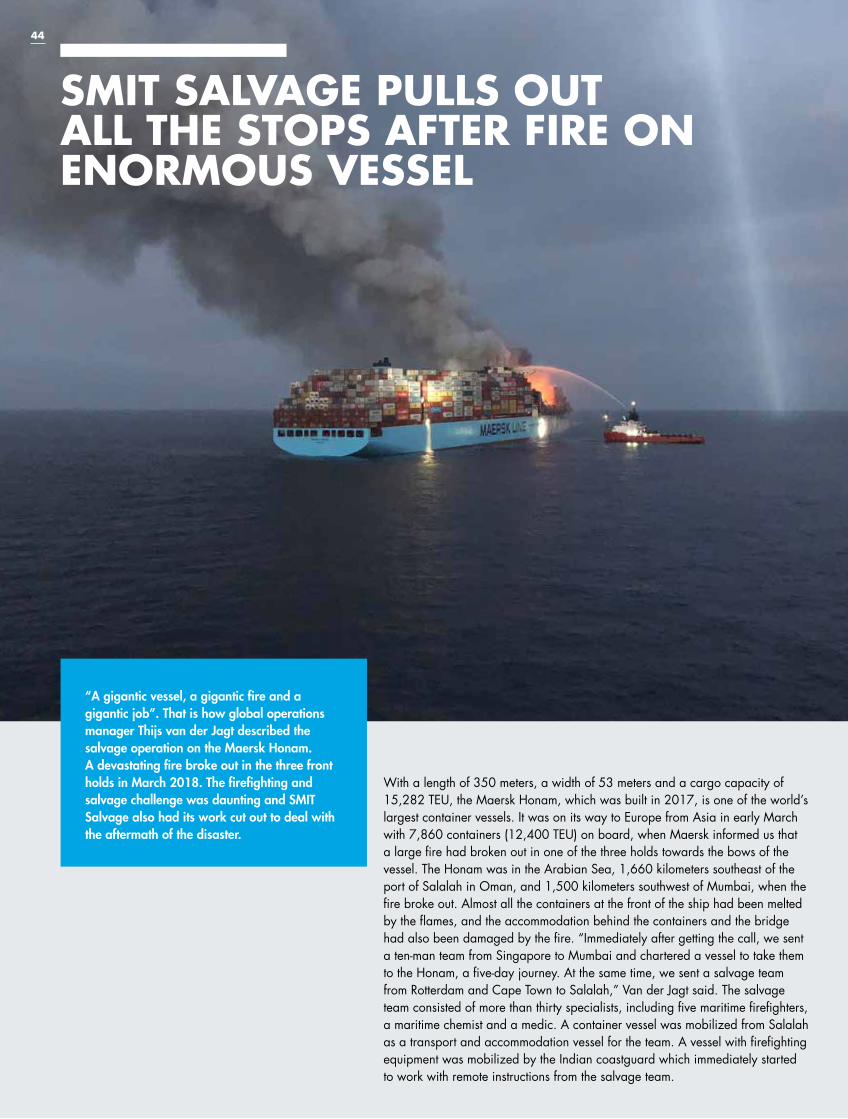
SMIT SALVAGE PULLS OUT ALL THE STOPS AFTER FIRE ON ENORMOUS VESSEL
44
With a length of 350 meters, a width of 53 meters and a cargo capacity of 15,282 TEU, the Maersk Honam, which was built in 2017, is one of the world’s largest container vessels. It was on its way to Europe from Asia in early March with 7,860 containers (12,400 TEU) on board, when Maersk informed us that a large fire had broken out in one of the three holds towards the bows of the vessel. The Honam was in the Arabian Sea, 1,660 kilometers southeast of the port of Salalah in Oman, and 1,500 kilometers southwest of Mumbai, when the fire broke out. Almost all the containers at the front of the ship had been melted by the flames, and the accommodation behind the containers and the bridge had also been damaged by the fire. “Immediately after getting the call, we sent a ten-man team from Singapore to Mumbai and chartered a vessel to take them to the Honam, a five-day journey. At the same time, we sent a salvage team from Rotterdam and Cape Town to Salalah,” Van der Jagt said. The salvage team consisted of more than thirty specialists, including five maritime firefighters, a maritime chemist and a medic. A container vessel was mobilized from Salalah as a transport and accommodation vessel for the team. A vessel with firefighting equipment was mobilized by the Indian coastguard which immediately started to work with remote instructions from the salvage team.
“A gigantic vessel, a gigantic fire and a gigantic job”. That is how global operations manager Thijs van der Jagt described the salvage operation on the Maersk Honam. A devastating fire broke out in the three front holds in March 2018. The firefighting and salvage challenge was daunting and SMIT Salvage also had its work cut out to deal with the aftermath of the disaster.

45
FIREFIGHTING OPERATION
The team chartered a large number of auxiliary vessels and coordinated the firefighting from an offshore supply vessel. Two anchor handling tugs with firefighting equipment were deployed, as well as several other tugs and a working vessel. “The main focus was on getting the fire under control and making sure it didn’t spread to the holds behind the bridge,” Van der Jagt explained. “So the tugs were constantly moving the Maersk Honam to the right position with respect to the wind, and that also stopped the rudderless ship from drifting further.” In addition to fighting the fire, the fireboats were constantly at work cooling the remaining cargo. “It was important to monitor the draft of the ship constantly,” Van der Jagt said. “Due to the enormous amount of firefighting water in the holds, there was a risk of too much pressure being placed on the structure of the vessel and of the vessel cracking or even breaking as a result.”
CRATERS
“Even our most experienced salvage specialists told us that they had never seen a fire this big. There had been explosions and the temperature on board was so high that the holds at the front of the vessel had been transformed into craters and many containers had completely melted,” Van der Jagt said. It took two months before the fire was sufficiently under control to tow the Honam to Jebel Ali in Dubai. “Because an enormous amount of firefighting water had ended up in the vessel, it was too deep in the water to enter the port,” Van der Jagt explained. “The water that we pumped out of the holds to raise the vessel was so polluted that it had to be collected in a large tanker for cleaning later.”
NO STANDARD SOLUTIONS
A caretaking contract was signed for the salvage follow-up. “In Jebel Ali, we provided trim and ballast assistance during the unloading of the containers from the stern section, and removed the contents of the three burnt-out holds,” Van der Jagt said. “We were then instructed to remove and dispose of the burnt and heavily contaminated remnants, which amounted to more than 28,000 tons. That was an extremely difficult job: the 20-meter-deep holds were a complete chaos full of burnt materials and a sort of toxic chemical soup consisting of heavily polluted liquids. There are no standard solutions for this kind of extreme operation,” he continued. “We mobilized two jack-up barges and positioned them alongside the wreck. Operating from the barges, we removed the burnt and carbonized debris from the holds, using cranes with spider grabs and excavators with pressurized cabins. Our people wore special clothing and pressure suits as protection from toxic fumes,” he added.
UNIQUE JOB
The Honam was transferred to a dry dock in Dubai in November, where it was cut in half. The rear section was then taken elsewhere for fitting out with a new bow. “We carried on emptying the three holds there,” Van der Jagt said. “Separating the enormous amount of burnt material is extremely labor-intensive. At a yard elsewhere in Dubai that was specially fitted out for the purpose, we are investigating all the different parts separately, categorizing them and, if necessary, cleaning them or packaging them safely, and sending them to processing companies. This part of the project is also unique in terms of logistics and environmental technology.”
Salvage operation of the Maersk Honam

REP
OR
T O
F T
HE
BO
AR
D O
F M
AN
AG
EMEN
TA
NN
UA
L R
EPO
RT
201
8 –
BO
SKA
LIS
46
HEALTH AND SAFETY
Safety continues to be a top priority in everything we do. We want our people and the people we work with to return safely from work every day. Our No Injuries No Accidents (NINA) safety behavior program helps us achieve this goal by embedding a safety culture throughout our organization.
NINA makes people more aware of their own responsibility towards safety and stimulates a working environment in which safety, responsibilities and potentially hazardous situations are openly discussed and reported. We help keep safety top of mind through regular staff engagement activities and training at all levels.
This year, a new NINA Workbox Lifting & Hoisting was added to the range of practical Workbox training tools that make people aware of their subconscious, routine behavior. We also launched a new 3-day NINA Facilitating Training for SHE-Q employees, with the aim to improve skills and enable our SHE-Q specialists to embed the NINA behavioral aspects further into our organization.
ORGANIZATIONAL DEVELOPMENTS
46

AN
NU
AL
REP
OR
T 2
018
– B
OSK
ALI
S
47
Identifying and reporting potentially dangerous situations help us to take measures to create a safer workplace. Such safety awareness is stimulated by encouraging people to report dangerous situations using Safety Hazard Cards (SHOCs). This year, based on an analysis of our safety data, we identified the top-4 safety risks faced by our employees. In doing so, we have identified in which areas we need to increase awareness, ownership and improve processes to further improve safety performance. The YES Scan launched in 2018, is a practical tool that helps people reflect on possible safety issues for ‘Yourself, Equipment and Surroundings’ each time they start work.
Since the launch of NINA in 2010 our safety performance has improved significantly. This year, the frequency of incidents resulting in absence from work (Lost Time Injury Frequency) further decreased from 0.06 in 2017 to 0.05 in 2018. The Total Recordable Injury Rate (TRIR) dropped from 0.55 in 2017 to 0.40 this year. The increase in the number of submitted SHOCs (11,445 in 2017 and 27,710 this year) is an encouraging sign that awareness and the willingness to report risks is increasing.
For detailed reporting on our safety policy and safety performance, please refer to pages 36 to 47 of our CSR report.
QUALITY MANAGEMENT
The Boskalis integrated quality management system Way of Working (WoW) was launched in August 2017. The system aims to achieve operational excellence based on a consistent client approach, with a clear focus on providing safe and sustainable solutions. WoW is crucial for optimizing our tender and project processes. It integrates health and safety, environment and social responsibility aspects, such as the inclusion of stakeholder interests, in our work.
This year we focused on the implementation of the program throughout the company. In order to embed WoW in our processes, WoW training was given to over 1,200 colleagues. In addition, intensive StartUp workshops for tender and project teams were organized and the ‘Navigator’ software tool – part and parcel of WoW – was made available to all business units. This means that we have in place an effective and transparent support system to record and share information throughout our organization.
In order to assess the implementation of WoW, as well as our environmental management system, nearly all business units were audited this year. They received ISO 9001:2015, ISO14001:2015 and OHSAS18001 certification. Ongoing introductory training sessions, Project and Tender StartUp workshops and Train-the-Trainer sessions will ensure the further embedding of WoW within all our processes.
HUMAN CAPITAL
After a reduction of our overall headcount in 2016 and 2017 in response to the challenging business environment, over the past year we have focused efforts on our Talent Strategy: reviewing which competencies we have in house and what expertise is
required to fulfill our ambitions and keep our workforce prepared for the future. Based on the outcomes of the review, we updated our strategic workforce plan across four key areas:
ATTRACTING THE RIGHT TALENT
In order to continue to attract the right people, for the right position, at the right time, we have to be able to offer interesting work, a culture of trust and recognition and opportunities to develop and grow. We also need to be visible and accessible in the market. Therefore, this year we expanded our recruitment processes with an employee referral program and an #experienceboskalis recruitment event.
ENGAGING OUR EMPLOYEES
At the end of the day, it is our people who assess how successful we have been at providing them an inspiring working environment, with career prospects and a work-life balance in line with their aspirations. As we look to raise the bar and monitor our progress, a survey is being prepared and will be held amongst our employees at the beginning of 2019. In addition to gaining insight on what drives our employees to work for us, the survey will also explore how our employees view important themes, such as social responsibility or environmental management.
CREATING EQUITABLE REWARDS AND RECOGNITION
Having an equitable and competitive compensation and benefits package in place helps us attract and retain talent. As next-step within the strategic workforce plan, in 2019 we will be revising our policies on rewards and recognition. This will include benchmarking our terms of employment.
ENABLING CAREER ASPIRATIONS
To maximize the full potential of our people and to satisfy employee needs, we stimulate internal career moves. We believe such mobility boosts knowledge-sharing and our power to innovate. In order to make it easier for employees to grow in line with their ambitions and capabilities, we focus on training and development opportunities and talent identification, as well as specific career mobility initiatives. In 2018 we implemented the following initiatives:
Internal MobilityA Career Center platform for Boskalis employees was launched in September 2018 and is intended to create more transparency and awareness regarding vacancies and available training and courses. A new Pool Management 2.0 approach was implemented. It is designed to stimulate the mobility between projects and staff departments and will identify and actively boost team diversification in relation to roles and nationalities. The establishment of an international talent pool for vital project positions within the Dredging division was initiated in 2017 and formalized this year. As well as providing our international specialists the opportunity to further their career, the pool helps us find and recruit highly qualified hands-on specialists for projects worldwide.

REP
OR
T O
F TH
E B
OA
RD
OF
MA
NA
GEM
ENT
AN
NU
AL
REP
OR
T 2
018
– B
OSK
ALI
S48
Training and DevelopmentTraineeship – Our trainee program is geared towards attracting graduates and professionals with a technical or finance background and up to two years’ work experience. A group of 46 trainees embarked on the program this year. Over a period of 18 months, trainees rotate between three different assignments. They gain first-hand experience of our projects and the vibrant environment in which we operate. Knowledge-sharing and skills development are key to everything they undertake.
Personal skills development – This year, we further strengthened our learning culture, investing more in learning and development tools which are available to employees through our online portal. This includes the successful blended learning programs on Effective Communication and Influencing launched in 2017, repeated in 2018 and planned already for 2019.
Young professional programs – We encourage our young professionals to develop the skills and knowledge in line with their career needs. These programs combine learning with working and provide young professionals with invaluable insights into the diversity of our projects, as well as preparing them for their next career step. Programs include our Cost Engineering Program and Finance Development Program.
Boskalis Leadership Development Program (BLDP) – We invest in developing leaders and helping equip them with the skills needed to be successful in their role. Developing personal leadership, building an internal network and encouraging innovation and
entrepreneurship are important core values of the BLDP that kicked off in 2018.
Boskalis Operational Development Program (BODP) – The one-year BODP that was launched in 2017, gives present and future project managers the opportunity to develop and grow in line with the changing market and complexity of our projects. The first participants completed the program this year, focusing on improving hard and soft leadership skills, safety, professional development and stimulating company-wide knowledge sharing.
For further information on social and human resource matter and our policies, outcomes, risks, how these risks are managed and other non-performance indicators, we refer you to pages 36 to 54 of our CSR report.
FLEET DEVELOPMENTS
Boskalis makes targeted investments in new build and existing vessels to retain or expand our market position. At the same time, old or non-strategic vessels are taken out of service. In 2018, the following major developments took place:
DredgingIn 2017 the decision was taken to build a sister vessel of the mega cutter suction dredger Helios. Named Krios, the vessel has a total installed power of almost 24,000 kW, a total pumping capacity of 15,600 kW and a maximum cutter power of 7,000 kW. This dredger is expected to be taken into service in the course of 2020.
Excited candidates during the Boskalis trainee selection day

AN
NU
AL
REP
OR
T 2
018
– B
OSK
ALI
S
49
In 2018 the decision was taken for the environmentally responsible dismantling of the trailing suction hopper dredgers Seaway and Shahaf, the cutter suction dredger Cyrus, the multi-purpose pontoon Scradeway and the backhoe dredger Rocky 1. The hopper barges Frigg and Rind were sold.
Offshore EnergyIn February 2018 the transport and installation crane vessel Bokalift 1 was taken into service. This converted heavy transport vessel is equipped with a 3,000-ton capacity pedestal crane, dynamic positioning (DP2) and accommodation for up to 150 people.
At the end of 2018 the Boka Falcon was added to the Boskalis fleet under a long term charter. Built in 2011 the vessel is a multi-functional DP2 deepwater construction support vessel and 403 ton bollard pull anchor handling tug. Designed and equipped to meet the harshest global conditions the Boka Falcon is among the largest in its class.
In 2018, the low-end closed-stern semi-submersible heavy transport vessels Swan, Swift, Teal, Transporter, Talisman and Treasure were taken out of service for dismantling.
RESEARCH AND DEVELOPMENT
Our research and development activities are helping us deliver added value to our clients and stakeholders and support our business growth. We use our know-how, experience and resources to address and find answers to sustainability related challenges.
2018 HIGHLIGHTS
WaveJump Innovation ChallengeThe Boskalis WaveJump innovation program continued in 2018, focused on stimulating a mindset of continuous innovation within our company. We launched an Innovation Challenge, including an acceleration program to provide support and professional coaching for the winners. In this way, we aim to improve the chance of the success of the winning idea.
ReefVivalAfter the successful installation of six 3D-printed artificial reef modules in the Larvotto Reserve in 2017, this year, in collaboration with the University of Nice, we monitored their ecological performance. We have also been exploring the possibilities of upscaling our 3D printing technology to other locations. In this context, we printed reefs for a global environmental NGO to ecologically enhance the seabed in the North Sea.
The most sustainable road in the NetherlandsIn 2018 we commenced construction of the most sustainable road in the Netherlands. We will be using innovations, including the generation of renewable energy that will compensate for the carbon emissions from the construction and maintenance work.
Using nature for coastal protectionIn a collaboration with value chain partners and as a direct result of our work with EcoShape on the restoration of mangrove forests in Indonesia, a major study was conducted in the unique Deltares
Delta Flume test facility. The project is looking to acquire knowledge for the use of vegetation on a larger scale in flood risk management projects.
Minimizing underwater noiseMarine mammals can be sensitive to underwater noise. In order to meet strict noise requirements on our wind-firm related activities, we partnered with Van Oord and TU Delft – amongst others – in the GROW innovation program to reduce piling noise.
Boosting innovation in the global maritime industryBoskalis extended its partnership with Port XL that is aimed at accelerating start-ups in the maritime sector. Other partners are the Port of Rotterdam, EY, Shell and various other internationally operating companies. Our participation is focused on bringing our know-how and network to start-ups and support them in bringing their ideas to market. This year, in collaboration with Van Oord, we carried out a pilot with semi-dry scrubbers on our vessels to reduce fuel costs and cut SOx emissions to levels in keeping with IMO Global and IMO ECA compliance. The patented technology that requires no structural renovations has been developed by a Port XL start-up.
We also took steps to include another Port XL innovation in our tenders: ECOncrete. This high-performance precast concrete is a perfect match for our Building with Nature approach, as well as our artificial reef initiative: it enhances marine and coastal infrastructure by providing marine habitats and encouraging marine growth, while providing excellent functional and structural properties.
ICT
In line with the decision taken in 2017 to outsource specific non-strategic IT-related activities, these activities were taken over by third parties at the beginning of 2018. This enabled us to focus our efforts on providing value-adding IT solutions to support core Boskalis activities.
Also in 2018 work was ongoing as planned for the implementation of the new Enterprise Resource Planning system (ERP) in our offices and on projects in Germany, Finland, Sweden, the Middle East and Singapore. Implementation of the system within the Dredging division will be completed in 2019. The new ERP system has significantly improved the efficiency of numerous processes and enhanced the transparency of our business operations, as well as governance on authorizations.It was decided in 2018 to introduce a company-wide software tool to optimize Fleet Management processes, such as: plant maintenance, crewing and SHE-Q-processes. Implementation of this tool is planned for 2019.
Increasingly, clients are requiring us to operate in line with Building Information Modeling (BIM) standards. This model looks to integrate all project design and planning into one standard. Since a couple of years already, we have been busy adapting our working methods to comply with BIM. This year our focus was on developing supporting IT solutions.

REP
OR
T O
F TH
E B
OA
RD
OF
MA
NA
GEM
ENT
AN
NU
AL
REP
OR
T 2
018
– B
OSK
ALI
S50
CORPORATE SUSTAINABILITY AND RESPONSIBILITY
The principal strategic objective of Boskalis is the creation of long-term sustainable profitability. The systematic execution of the corporate strategy, that is reviewed regularly in light of relevant market developments, is key to our success. Our CSR strategy is derived from the corporate business strategy, and ongoing interaction and dialogue with our stakeholders. We aim to create new horizons for our clients and stakeholders based on sustainable profitability.
STRATEGY Focus
OptimizeExpand
BOSKALIS BUSINESS
MISSIONLeading dredging, offshore
and marine experts
IMPACT ON LOCAL COMMUNITIES
� Stakeholder engagement � Community investments � Social Impact Program � Operating around the world
IMPACT ON THE ENVIRONMENT
� Natural resources � Energy � Environmental expertise
CARE FOR OUR PEOPLE
� NINA � Talent management � 5,912 employees � Engineering expertise
BUSINESS CONDUCT
� Codes of Conduct � Business principles � Boskalis Way of Working
FINANCIAL CAPITAL
� 900 vessels � Strong balance sheet � Funding (shareholder equity & debt)
IMPACT ON LOCAL COMMUNITIES
� Local development � Long-term relationships � Partnerships
IMPACT ON THE ENVIRONMENT
� Biodiversity and ecosystems � Emissions � Climate change adaptation
CARE FOR OUR PEOPLE
� Health & Safety � Sustainable employability � Fair labor practices
BUSINESS CONDUCT
� Responsible business conduct � Responsible sourcing
FINANCIAL CAPITAL
� Dividend � Taxes � Market capitalization
INPUT OUTCOME
PROFESSIONALISM
D
REDGING & INLAND INFRA
TOW
AG
E & SALVAGE
OFFSHO
RE E
NER
GY
ENTR
EPRENEURSHIP
TE
AM
WO
RK
CREATING NEW
HORIZONS

AN
NU
AL
REP
OR
T 2
018
– B
OSK
ALI
S
51
Sustainability at Boskalis goes beyond managing our business and projects in a responsible manner. We seek to leverage our ability to influence and innovate, to create added social, environmental and economic value where we can. Our approach is framed in our General Code of Business Conduct, which is based on international guidelines and the Universal Declaration of Human Rights. We endorse the principles of the International Labor Organization and the OECD Guidelines for Multinational Enterprises.
In our separate CSR report we account in detail for material and relevant non-financial aspects of our performance arising from our strategy and core activities. The report is based on the guidance of the Global Reporting Initiative (GRI) and focuses on communicating the key sustainability challenges and opportunities we at Boskalis face and the many ways we are responding to
these. We report on topics based on the 2017 materiality analysis, which defines the sustainability topics that are most relevant to Boskalis and our stakeholders. Our most material issues are related to health and safety, impact on biodiversity and ecosystems emissions, local development, economic performance, and responsible business conduct. Whilst we have a wide range of stakeholders, we see our key stakeholder groups as being: employees; clients and their respective project communities; suppliers and subcontractors; NGOs and civil society organizations; and investors and shareholders.
We refer to pages 14 to 25 of our CSR report for further information on environmental matters and our policies, outcomes of these policies, risks and how these risks are managed and related non-performance indicators.
Services that contribute to a safer, healthier and more prosperous local community
A positive contribution to economic growth and job creation
Projects that reduce negative and enhance positive biodiversity impacts
Contributing to clean energy through our renewable energy projects
Limiting the consequences of climate change through our coastal defense and riverbank protection projects
A safe and inspiring work environment with skilled and engaged employees
Satisfied clients
Long-term sustainable profit
IMPACT THE BOSKALIS VALUE CREATION MODEL
This model is a schematic overview of the value we create over time.
Input We use the inputs in the execution of our strategy. The four material themes are the backbone of our CSR report. The fifth (financial capital) is presented in our Annual Report.
Boskalis business Our market-facing divisions – Dredging & Inland Infra, Offshore Energy and Towage & Salvage – execute our business strategy based on our company culture and its core values: professionalism, entrepreneurship and teamwork.
Outcome & impactThe outcome and impact of our business model in terms of CSR correspond to the topics most relevant to our business as identified in our materiality process.

REP
OR
T O
F TH
E B
OA
RD
OF
MA
NA
GEM
ENT
AN
NU
AL
REP
OR
T 2
018
– B
OSK
ALI
S52
BUSINESS PRINCIPLES
GENERAL CODE OF BUSINESS CONDUCT
Integrity, reliability and responsibility are key elements for building trust between Boskalis and its stakeholders. These intrinsic values are reinforced by establishing guidelines and principles for responsible business conduct, and ensuring these are maintained.
Boskalis has a General Code of Business Conduct, which is based on international guidelines, including the Universal Declaration of Human Rights. We endorse the principles of the International Labour Organization (including safety on the work floor through our safety program, No Injuries, No Accidents, and the conventions of the International Labour Organization, among others related to child labour) and the OECD Guidelines for Multinational Enterprises. Boskalis accepts responsibility for matters which lie within its sphere of influence.In the countries where Boskalis operates, we are subject to national legislation and regulations. Boskalis refrains from cultural judgments and conducts itself as a good citizen or guest. We adhere to relevant international and national sanctions. Boskalis reviews its General Code of Business Conduct at least once every two years, most recently in 2018.
The full text of our General Code of Business Conduct is available on our corporate website.

AN
NU
AL
REP
OR
T 2
018
– B
OSK
ALI
S
53
WHISTLEBLOWER POLICY
Boskalis has a Whistleblower Policy in place that offers employees the possibility to report suspected misconduct within the company. This includes any subject of a general, financial or operational nature which is not in line with the General Code of Business Conduct. A confidential independent counselor has been appointed for the purposes of the Whistleblower Policy. The counselor shall take the reported suspected misconduct immediately into consideration and gain information in relation thereto. Based on this information the counselor shall decide which actions are appropriate and necessary, including a possible investigation on the reported misconduct. The employee who has in good faith reported the suspected misconduct to the counselor, in accordance with the Whistleblower Policy, shall not suffer any detriment as a consequence of this notification. The Whistleblower Policy also provides for the possibility to consult a female counselor. The Whistleblower Policy was revised in early 2019 and can be found on the corporate website.
SUPPLIER CODE OF CONDUCT
Boskalis has a Supplier Code of Conduct, which mirrors our own internal General Code of Business Conduct. Besides considering quality, delivery reliability and price, we also select our suppliers based on sustainability criteria. The Supplier Code of Conduct is an integral part of all procurement contracts. By entering into a contract, suppliers commit themselves to the Boskalis Supplier Code of Conduct. This commitment is also applicable to their own suppliers. In 2018 70% of our strategic suppliers endorsed the Supplier Code of Conduct, compared to 81% in 2017.
Each year, we conduct an implementation scan at a cross section at approximately 10% of our strategic suppliers. Suppliers that do not meet our standards are given the chance to improve under our supervision. In the absence of sufficient progress, we will eventually terminate our relationship with these suppliers. More details of this risk matrix assessment and the results over the past years is described in detail on pages 48 to 54 in our CSR report, which also includes the related non-performance indicators on amongst others human rights.
ANTI-BRIBERY AND ANTI-CORRUPTION POLICY
The Boskalis anti-bribery and anti-corruption policy is enshrined in the General Code of Business Conduct. The General Code of Business Conduct states that Boskalis shall not offer, pay, request or accept bribes or other favors for the purpose of acquiring or bestowing any improper business, financial or personal advantage. The General Code of Business Conduct forms part of the employment contracts of Boskalis staff, having been
incorporated in the accompanying employee manual, as well as contracts with directors. Boskalis employees are provided with targeted training on the anti-bribery and anti-corruption policy and are monitored with regard to regulations and legislation concerning bribery and corruption.
Furthermore the principles that no bribes or other favors shall be offered, paid, requested or accepted for the purpose of acquiring or bestowing any improper business, financial or personal advantage has also been incorporated in the Supplier Code of Conduct, which is part of the contractual relationship between Boskalis and its suppliers. Suppliers are obliged to select their own suppliers in accordance with the Boskalis Supplier Code of Conduct. In many countries where Boskalis operates it is impossible to conduct activities without a local partner or sponsor. The guidelines for collaborating with such a partner are set out in a contract, which also specifically includes the principles from the General Code of Business Conduct as described above. Local contacts may be maintained by an agent, who also assists in the efficient setting up and execution of projects. Control of integrity risks and compliance with the procedures for concluding agent contracts are part of the internal audits.
TAX PRINCIPLES
Boskalis has adopted the following tax principles. We believe these principles illustrate good corporate practice in the area of tax management and tax transparency, balancing the interests of our various stakeholders, including clients, investors and the governments and communities in the countries in which we operate.
COMPLIANCE
We act at all times in accordance with applicable laws and are guided by relevant international standards, for example OECD Guidelines. Disclosures are made in accordance with the relevant domestic regulations, as well as applicable reporting requirements and standards such as IFRS.
BUSINESS RATIONALE
Tax follows the business, meaning that transactions must have a business rationale. Boskalis does not seek to avoid taxes through ‘artificial’ structures in tax haven jurisdictions.
RELATIONSHIP WITH TAX AUTHORITIES
Boskalis seeks to develop strong, mutually respectful relationships with tax authorities.

REP
OR
T O
F TH
E B
OA
RD
OF
MA
NA
GEM
ENT
AN
NU
AL
REP
OR
T 2
018
– B
OSK
ALI
S54
RISKMANAGEMENT
The proper identification, assessment and management of risks and opportunities – notably with respect to tendering, preparation and execution of projects – is an integral part of our management approach.
Our tolerance or appetite for risks is documented in the Group’s guidelines, policies, procedures and instructions. Examples include the General Code of Business Conduct and the Supplier Code of Conduct, safety and quality policies and procedures, vendor selection criteria, project risk classification system, contracting guidelines, authorization limits, treasury policies, management planning and control systems, financial control framework, crisis management plans, information security and access management policies.
During the year under review we have further embedded our group-wide quality management system which we refer to as the Boskalis Way of Working (WoW). In designing this system we observed the principles and guidelines of the ISO 31000 standard for risk management. The overriding objective of our WoW-system is to give our staff the best possible support in achieving operational excellence when contracting and executing projects. Operational excellence in this context means achieving compliance with the internal and external control requirements imposed on our primary project process whilst minimizing failure costs. For all business units, external certification bodies have asserted that the implementation of WoW complies with the most recent applicable international (ISO) standards.
Below sets out an overview of what we currently consider to be the most important strategic, operational, compliance, financial (reporting) and other risks we face in pursuing our business objectives. This overview is not exhaustive and risks have not been ranked in order of importance. There may be other risks which we currently do not consider to be significant but which at a later stage may manifest themselves as such. Where possible, we have indicated the specific measures in place to help mitigate these risks.
STRATEGIC AND MARKET RISKS
The Boskalis markets are heterogeneous and often develop disparately. Our main (end) customer groups are national, regional and local governments, or associated institutions such as port authorities, private port operators and major international oil and gas companies and wind energy companies (operators as well as contractors). Other customer types are (container) shipping companies, ship and offshore construction yards, insurance companies, mining companies and (infrastructure and real estate) project developers.
Notwithstanding the positive long-term growth prospects for our markets they can be – certainly in the short and medium term – negatively impacted by factors outside our control. Such factors include for example general or regional geopolitical developments, such as energy policies, political unrest, piracy, government-imposed trade barriers and volatility in the energy and commodities markets.
Boskalis aims to respond as effectively as possible to both positive and negative developments in individual markets, through a global spread of its activities, an extensive and versatile fleet operating out of various international locations, and strong positions in its core markets. Moreover, our activities are largely focused on the development, construction, installation and maintenance of infrastructure, which means that longer-term developments will generally outweigh short-term economic fluctuations.
Contracts are not included in our order book until agreement has been reached with the client. Although experience shows that once agreement has been reached, cancellations,

AN
NU
AL
REP
OR
T 2
018
– B
OSK
ALI
S
55
postponements or substantial reductions in the scope or size of contracts are quite rare, they do occur, certainly in markets that are under severe pressure. Consequently, if such a cancellation or substantial reduction occurs, losses may arise from the unwinding or settlement of financial derivatives which were taken out to hedge related currency risks and/or fuel price risks, but for which the underlying transaction or cash flows will no longer be realized.
Boskalis deals with a variety of competitors in the various markets and submarkets in which it operates. Such competitors vary from large, internationally operating companies to more regional and local companies. A considerable part of our revenue is derived from contracts awarded through public or private tender procedures, with competition often being predominately price-based. However, other factors – such as the assurance of adequate safety, social and environmental practices as well as the financial resilience of the contractor – are also regularly taken into consideration when awarding contracts. Proper decision-making processes have been put in place for the submission of tenders to ensure that the risks associated with the execution of a specific project are systematically identified and assessed.
A substantial part of Boskalis’ activities are capital-intensive which means that prices in these markets are largely influenced by the utilization rate of the relevant equipment at a given time. This implies that a broad international presence along with a leadership position in terms of type and quality of equipment and cost competitiveness are key success factors. Boskalis places a great deal of emphasis on
these, both as a critical point of attention in operational management and in its capital allocation decisions. Consequently, individual investment proposals are subjected to a thorough evaluation and approval process.
In the course of executing its strategy, Boskalis also regularly acquires companies. To achieve the anticipated results, Boskalis attaches great importance to integrating such acquisitions with care. Creating value for our stakeholders and retaining key personnel are important elements in this process.
OPERATIONAL RISKS
CONTRACTING AND EXECUTION RISKS
The main operational risks for Boskalis are related to the contracting and execution of projects. For most of our contracting activities the common type of contract is fixed price/lump sum. Under this type of contract, the contractor’s price must reflect virtually all the operational risks as well as the (cost) risks associated with the procurement of materials and subcontractor services. Typically, it is not possible to charge clients for any unforeseen costs. Furthermore, many contracts include milestones and associated penalty clauses for if the milestones are not achieved on time. That is why great emphasis is placed on identifying, analyzing and quantifying such delay risks and the associated operating costs during the tendering process and the preparation and execution phase of a project.
The record-breaking transport of the 90,000-ton FPSO P-67 by the BOKA Vanguard
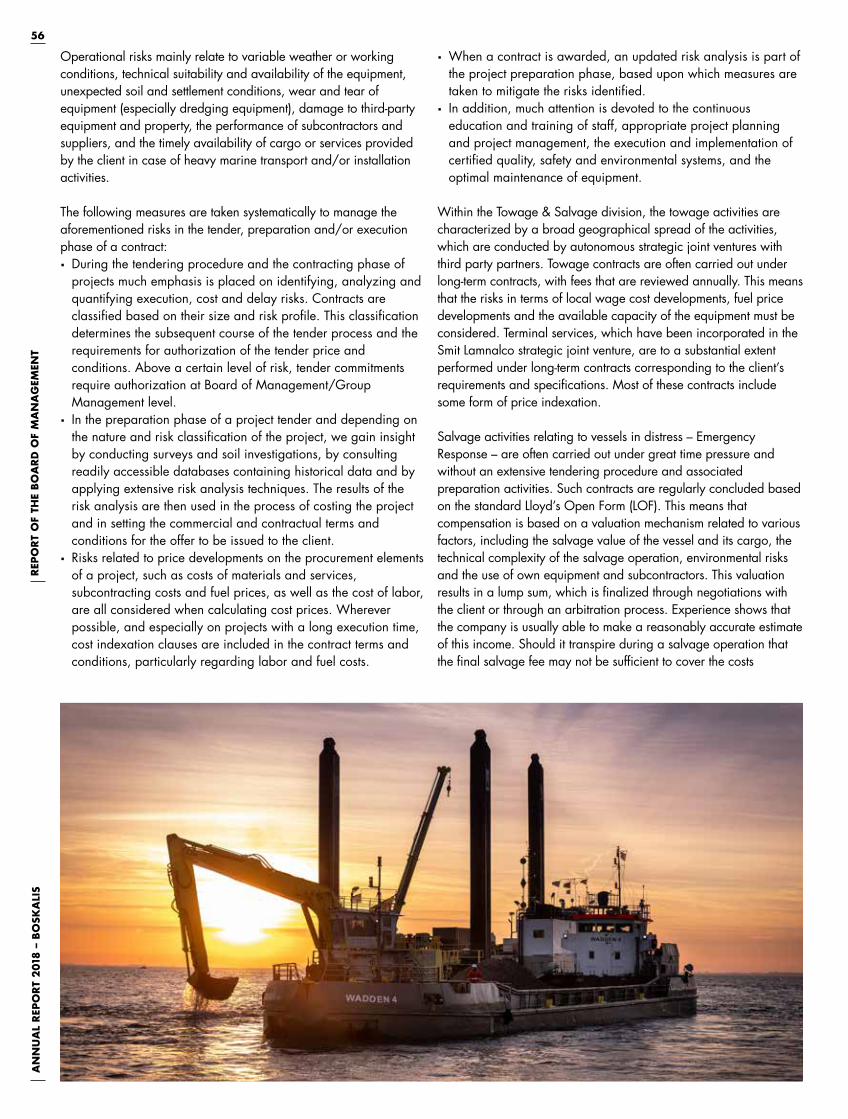
REP
OR
T O
F TH
E B
OA
RD
OF
MA
NA
GEM
ENT
AN
NU
AL
REP
OR
T 2
018
– B
OSK
ALI
S56
Operational risks mainly relate to variable weather or working conditions, technical suitability and availability of the equipment, unexpected soil and settlement conditions, wear and tear of equipment (especially dredging equipment), damage to third-party equipment and property, the performance of subcontractors and suppliers, and the timely availability of cargo or services provided by the client in case of heavy marine transport and/or installation activities.
The following measures are taken systematically to manage the aforementioned risks in the tender, preparation and/or execution phase of a contract: � During the tendering procedure and the contracting phase of projects much emphasis is placed on identifying, analyzing and quantifying execution, cost and delay risks. Contracts are classified based on their size and risk profile. This classification determines the subsequent course of the tender process and the requirements for authorization of the tender price and conditions. Above a certain level of risk, tender commitments require authorization at Board of Management/Group Management level.
� In the preparation phase of a project tender and depending on the nature and risk classification of the project, we gain insight by conducting surveys and soil investigations, by consulting readily accessible databases containing historical data and by applying extensive risk analysis techniques. The results of the risk analysis are then used in the process of costing the project and in setting the commercial and contractual terms and conditions for the offer to be issued to the client.
� Risks related to price developments on the procurement elements of a project, such as costs of materials and services, subcontracting costs and fuel prices, as well as the cost of labor, are all considered when calculating cost prices. Wherever possible, and especially on projects with a long execution time, cost indexation clauses are included in the contract terms and conditions, particularly regarding labor and fuel costs.
� When a contract is awarded, an updated risk analysis is part of the project preparation phase, based upon which measures are taken to mitigate the risks identified.
� In addition, much attention is devoted to the continuous education and training of staff, appropriate project planning and project management, the execution and implementation of certified quality, safety and environmental systems, and the optimal maintenance of equipment.
Within the Towage & Salvage division, the towage activities are characterized by a broad geographical spread of the activities, which are conducted by autonomous strategic joint ventures with third party partners. Towage contracts are often carried out under long-term contracts, with fees that are reviewed annually. This means that the risks in terms of local wage cost developments, fuel price developments and the available capacity of the equipment must be considered. Terminal services, which have been incorporated in the Smit Lamnalco strategic joint venture, are to a substantial extent performed under long-term contracts corresponding to the client’s requirements and specifications. Most of these contracts include some form of price indexation.
Salvage activities relating to vessels in distress – Emergency Response – are often carried out under great time pressure and without an extensive tendering procedure and associated preparation activities. Such contracts are regularly concluded based on the standard Lloyd’s Open Form (LOF). This means that compensation is based on a valuation mechanism related to various factors, including the salvage value of the vessel and its cargo, the technical complexity of the salvage operation, environmental risks and the use of own equipment and subcontractors. This valuation results in a lump sum, which is finalized through negotiations with the client or through an arbitration process. Experience shows that the company is usually able to make a reasonably accurate estimate of this income. Should it transpire during a salvage operation that the final salvage fee may not be sufficient to cover the costs
AN
NU
AL
REP
OR
T 2
018
– B
OSK
ALI
S
57
incurred, then the choice can be made to convert the LOF into a contract based on a daily hire fee, thus limiting the financial risks. Contracts for salvaging sunken vessels (wrecks) are usually carried out on a lump sum basis. The contracting and execution of such projects, which in many cases do involve a tendering procedure, are subject to the customary procedures for contracting and execution activities applicable within Boskalis.
Some of the equipment within the Offshore Energy division, as well as in some of the strategic joint ventures, is chartered out for relatively short periods (spot markets), mainly subject to standard conditions. The challenging conditions in the oil and gas sectors have reduced the volume of work under long-term contracts and resulted in an increased share of the spot market activities. Although the operational risks involved in such activities are generally relatively limited, they do result in increased utilization and pricing risk, which we aim to mitigate through adequate capacity and strict cost control management.
ENVIRONMENTAL AND SOCIAL RISKS
To gain insight into the relevance and importance of environmental and social topics, Boskalis engages with its stakeholders and regularly conducts a materiality analysis. The outcome of this engagement is reflected in our CSR report in a materiality matrix. The nature of most of our activities implies that we have an impact on society and the environment. In most cases this impact will be positive, for example when we are involved in creating infrastructure, making land safer or facilitating the transition to renewable energy sources such as offshore wind. However, a potential negative impact during the execution of projects cannot be ruled out. Environmental risks include the impact on biodiversity in vulnerable ecosystems and the emissions produced by our vessels. Boskalis has developed the innovative Building with Nature program and has an in-house engineering department to address ecological aspects from the early tender stage through to monitoring during execution. CO2 emissions are measured and reported and Boskalis is seeking means by which it can reduce its emissions footprint.
Social risks include the impact of projects on local communities. The extent to which our activities have a social impact is highly dependent on the type and/or location of a project. Where relevant, we implement a social impact program and work with our clients to mitigate the impact and where possible make a positive contribution to communities affected by our activities.
ICT RISKS
Like most companies, Boskalis is faced with an increase in ICT security risks and increasingly sophisticated levels of computer crime. Successful cyberattacks can result in significant costs as well as other negative consequences including reputational damage, remediation costs and other liabilities to stakeholders. Furthermore, enhanced protection measures place additional financial and operational burdens on the business. To help mitigate these risks Boskalis has developed information security policies and practices based on the international Code of Practice for Information Security Management. During the year under review we continued the monitoring of suspicious activity on our ICT infrastructure as
well as our efforts to increase the awareness of cybercrime risks amongst our staff. Additionally, we developed initiatives to comply with the guidelines on maritime cyber risk management as issued by the International Maritime Organization which will take effect in 2021.
LOCAL WORKING CONDITIONS RISKS
Local management on projects and operations must have a proper understanding of the local (working) conditions. The scale of local operations is often too small to warrant a full-fledged organization, including extensive support services and staff departments. This is addressed through regular visits by responsible managers and employees from the relevant business units and support from central staff departments at head office as well as by involving (local) external advisors.
FINANCIAL RISKS
POLITICAL AND CREDIT RISKS
These include risks related to unrest or disruption due to political developments and violence, and the risk of non-payment by clients. Boskalis operates strict acceptance, credit and hedging policies with respect to political and payment risks. Other than in the case of very strong, creditworthy clients with an undisputed credit history, all substantial credit risks are normally covered by means of credit insurance, standby letters of credit, bank guarantees and/or advance payments. Revenues and earnings are only recognized in the accounts where there is sufficient certainty that they will be realized.
LIQUIDITY AND FUNDING RISKS
As is customary for a contractor, Boskalis also has significant obligations outstanding in the form of guarantees from banks and insurance companies, mainly in favor of clients. Given that the availability of sufficient credit and bank guarantee facilities is essential to the continuity of the business, Boskalis’ funding policy is aimed at maintaining a strong financial position. Solid balance sheet ratios and the use of diversified sources of funding provide for ample capacity to absorb liquidity risks and the constant creation of adequate borrowing capacity and guarantee facilities. The company has ample credit and bank guarantee facilities at its disposal and operates well within the agreed covenants under its financing agreements.
CURRENCY RISKS
The functional currency of Boskalis is the euro. Several business units, especially in Heavy Marine Transport as well as several strategic joint ventures, use other functional currencies. The most important of these is the US dollar, followed by the Singapore dollar. The revenues and expenses of these entities are largely or entirely based on these non-euro currencies. Our holdings in these entities are viewed from a long-term perspective. Exchange rate risks related to these entities are not hedged as it is assumed that currency fluctuations and developments in interest rates and inflation will offset each other in the long term.

REP
OR
T O
F TH
E B
OA
RD
OF
MA
NA
GEM
ENT
AN
NU
AL
REP
OR
T 2
018
– B
OSK
ALI
S58
A large proportion of the activities of the group companies that have the euro as their functional currency are not contracted in euros. This particularly applies to the group companies that are involved in dredging and related projects. The costs of these entities, however, are largely incurred in euros. Generally, the net cash flows in non-euro currencies within these entities are fully hedged, usually by means of forward exchange contracts. The US dollar exchange rate in relation to the euro is particularly relevant in this context. A large proportion of the projects is contracted in US dollars or in currencies that are to a greater or lesser extent linked to the US dollar.
Most of our major international competitors in the dredging industry also have cost structures largely based on the euro. This implies that exchange rate fluctuations do not have a material impact on our relative competitive position. In several market segments, particularly in Offshore Energy, there is competition from parties whose cost structures are not based on the euro, meaning that the competitive impact of currency fluctuations in these market segments is greater. However, on balance, exchange rate fluctuations only have limited impact on the company’s competitive position in these activities.
TAX RISKS
Because of the (constantly changing) mix of projects and operational results in a large number of countries and entities, various kinds of taxes, such as income tax, wage tax, VAT and import duties, are assessed and then paid in various countries. Profits are attributed to countries where value is created in accordance with national and international rules and standards,
which can be extremely complex. Knowledge in this domain, along with related compliance and application, are embedded in procedures within the Tax Management function. In cases where insufficient knowledge is available in-house, external advisors are used.
INTEREST RATE RISKS
Our long-term financial liabilities are predominantly based on fixed long-term interest rates, meaning that our exposure to interest rate fluctuations on these is limited.
FUEL PRICE RISKS
In a substantial part of its activities, Boskalis is exposed to risks arising from changes in fuel prices. Fuel costs are hedged in a number of different ways. Where possible, contracts include fuel price variation clauses. Also, contracts are sometimes based on fuel being supplied by the client. In other cases, where the fuel price presents a substantial risk, exposure can be hedged by means of financial instruments, such as forward contracts or fixed fuel supply contracts.
DERIVATIVES
Financial derivatives are only used to hedge underlying currency risks, fuel cost risks or other risks where there is a physical underlying transaction. There is, however, a risk of losses arising from the unwinding or settlement of such financial derivatives due to cancellation of a contract or a substantial reduction in the scope of a contract.
AN
NU
AL
REP
OR
T 2
018
– B
OSK
ALI
S
59
OTHER RISKS
COMPLIANCE WITH LEGISLATION AND REGULATIONS
As an international dredging and marine contracting and services expert, Boskalis is active in numerous countries, and therefore must deal with a wide range of diverse legislation and regulations. Some of the activities are managed by Boskalis local management, but in many countries intermediaries and/or local representatives are used in securing and executing projects. This combination of factors results in a heightened risk that relevant (local) legislation and regulations may not be fully complied with. Events of non-compliance can result in regulatory investigations, litigations and/or sanctions. These risks are as much as possible mitigated by the company’s internal risk management and control systems that include a General Code of Business Conduct as well as a Supplier Code of Conduct, which are reviewed and evaluated regularly. Intermediaries and/or local representatives are also contractually bound to comply with our codes of conduct. Entering into contracts with local intermediaries and/or representatives is subject to clearly defined procedures, including background checks. Furthermore, Boskalis has a Whistleblower Policy in place and a confidential independent counselor to whom employees can report any suspected misconduct.
PROPERTY DAMAGE AND THIRD-PARTY LIABILITIES
Boskalis has taken out a broad package of insurances to cover against risks with respect to damage to its properties as well as third-party properties and potential other third-party liabilities.
INTERNAL RISK MANAGEMENT AND CONTROL SYSTEMS
The internal risk management and control systems of Boskalis are based on the principles of effective management control at various levels in the organization and are tailored to the day-to-day working environment in which the company operates worldwide. One of the main foundations for risk management is the internal culture of the company, which is characterized by a high degree of transparency regarding the timely identification, evaluation and reporting of risks and a remuneration system that is geared to avoiding potentially perverse incentives. In addition to the specific risk mitigation measures mentioned above, our internal risk management and control systems include the following main components: � In the daily operations, the operational risk management and control is largely supported by a comprehensive system of quality assurance rules, procedures and systems, particularly regarding the acquisition and execution of projects.
� In addition to audits by external certification bodies, Boskalis also performs regular internal audits under the auspices of the SHE-Q department to review the design and operational effectiveness of this system. SHE-Q is discussed at the quarterly meetings between the Board of Management and the management of the business units, with the management of the SHE-Q department also being present.
� The daily management of the organization is based on short lines of communication and command. Speed, know-how and decisiveness are of the essence, both in the tendering phase and in project execution. Daily management is hands-on.
� The progress and development of the operating results and the financial position of individual projects and business units and the Company as a whole, as well as the operational and financial risks, are monitored by means of structured periodical reporting, analysis of the financial results and performance reviews at Board of Management and senior management levels.
RISKS REGARDING FINANCIAL REPORTING
FINANCIAL REPORTING STRUCTURE
Financial reporting at Boskalis is structured within a tight framework of budgeting, reporting and forecasting. A distinction is made between reports for internal and external use. External reporting at group level consists of an annual report, including financial statements audited by the external auditor, as well as a half-year report, containing summarized financial information, both consolidated and segmented. The external reports are based on the internal financial reporting, in accordance with EU-IFRS.
Internal financial reporting consists of extensive consolidated quarterly reports in which current developments are compared to the quarterly (cumulative) budgets and previous forecasts. In addition, each quarter we reiterate or update our forecast for the annual results, including the cash flow and balance sheet positions at the end of the financial year. The quarterly budgets are part of the annual group budget, which is prepared every year by the Board of Management and approved by the Supervisory Board. Internal financial reporting has a layered structure – in accordance with the internal allocation of management responsibilities – with consolidation taking place at successive levels, starting with the projects, through the business units and divisions, and resulting in consolidated group reports. The financial and operating results are analyzed and clarified at each of these levels. Project and contract managers are responsible for budgets, income statements and balance sheets for their projects or contracts, and these are drawn up in accordance with the applicable guidelines and instructions. In turn, business unit managers are responsible for the financial reporting of their respective business units.
Boskalis holds substantial investments in joint ventures and associated companies and these holdings are intensively monitored. Shareholder and/or board meetings are held regularly, with Boskalis being represented in line with the size of its interest. Clear shareholder agreements have been concluded with the co-shareholders in such joint ventures regarding topics such as board and management representation, filling of management positions, strategy and policy, budget, financial reporting, the appointment of auditors, investments and financing. The policy is that such joint ventures are in principle financed without guarantees from the shareholders.
The Board of Management discusses the quarterly reports with the relevant business unit managers in formal quarterly meetings. These meetings are minuted. The consolidated group reports are discussed with the Supervisory Board on a quarterly basis.
The most important aspects of our financial reporting systems are set out in manuals, guidelines and procedures, all of which are available electronically. Staff are trained in how to apply

REP
OR
T O
F TH
E B
OA
RD
OF
MA
NA
GEM
ENT
AN
NU
AL
REP
OR
T 2
018
– B
OSK
ALI
S60
accounting standards, guidelines and procedures. Internal audits to monitor and improve quality and discipline are conducted based on an annual audit plan and ad hoc examinations. Moreover, the quality of the financial control systems is evaluated regularly in the context of the activities of the external auditor. Findings concerning the quality of the financial control systems identified during the audit of the financial statements are reported by the external auditor in the Management Letter.
Further to a review of our controls over financial (reporting) risks, we have designed and implemented a new Financial Control Framework (FCF) that stipulates and documents the control requirements to help mitigate these risks. In doing so, the updated COSO internal control framework has been used as a standard of reference. A gap-analysis was performed to compare actual controls with these minimum control requirements. The new electronic platform containing the FCF-documentation has been made to match that of our WoW-system with the aim of optimizing its user-friendliness for our staff.
INTERNAL AUDIT FUNCTION
In addition to the internal audits performed under the auspices of the SHE-Q department, Boskalis has an internal audit function that mainly focusses on the company’s management and financial reporting processes. It is guided by the International Standards for the Professional Practice of Internal Auditing and the Code of Ethics as published by The Institute of Internal Auditors.
The internal audit manager is accountable to the Board of Management, represented by the Chief Executive Officer for day to day operations and to the Audit Committee as part of its oversight role. Appointment and dismissal of the internal audit manager will be submitted to the Supervisory Board for approval, along with a recommendation by the Audit Committee.
On an annual basis the internal audit manager submits to the Board of Management and the Audit Committee a report on the activities performed in the year past, including the main findings, as well as a risk based internal audit plan for the next year for their review and approval.
Based on the internal audit plan, the internal audit manager agrees with the Board of Management the specific audit subjects, the detailed scope of work and the allocation of resources. The internal audit function’s performance relative to its plan are regularly communicated and discussed between the Internal Audit Manager and the Board of Management, represented by the Chief Financial Officer.
The internal audit function also periodically interacts with the company’s external financial auditor to share information on audit planning and progress as well as key findings and observations. The internal audit function’s final reports are made available to the external auditor and management letters of the external auditor will be shared with the internal audit manager.
EVALUATION OF INTERNAL RISK MANAGEMENT AND CONTROL SYSTEMS
Similar to last year, the Board of Management has initiated a so-called Corporate Risk Assessment to systematically evaluate the risks inherent to the Group’s strategic business objectives as well as the related risk management and control activities. For this purpose, a comprehensive risk classification system was used that contains pertinent information for each of the risk categories identified. This includes examples of – and contributing factors to – possible risk manifestations as well as current risk management and control activities to help mitigate these risks.
The risk categories identified were evaluated for their significance, defined as the degree to which risks within the respective risk category could adversely impact our ability to achieve our strategic objectives, as well as for the potential for improving their related risk management and control activities. Compared to the previous year, this evaluation did not identify significant shifts in the Company’s overall risk profile and its main results have been included in the preceding overview of the main risks we face in pursuing our business objectives.
The structure and functioning of our risk management and internal control systems are discussed annually with the Supervisory Board.
No matter how much care is taken in setting up risk management and internal control systems, they are unable to provide absolute certainty with regard to realizing the company’s objectives, nor can they preclude material mistakes, losses, fraud, or infringements of legislation and regulations.
STATEMENTS REGARDING INTERNAL RISK MANAGEMENT AND CONTROL SYSTEMS
With due consideration of the aforementioned inherent limitations and scope for improvement, the Board of Management is of the opinion that: � the report provides sufficient insights into any failings in the effectiveness of the internal risk management and control systems;
� the aforementioned systems provide reasonable assurance that the financial reporting does not contain any material inaccuracies;
� based on the current state of affairs, it is justified that the financial reporting is prepared on a going concern basis;
� the report states those material risks and uncertainties that are relevant to the expectation of the company’s continuity for the period of twelve months after the preparation of the report.

AN
NU
AL
REP
OR
T 2
018
– B
OSK
ALI
S
61
The large twin-bell diving support vessel Boka Atlantis

62
By converting the heavy transport vessel Finesse into the impressive crane vessel Bokalift 1, Boskalis is responding to a number of promising market developments. “The reaction from our clients has been very positive,” said Eugène van Dodeweerd, director Fleet Management of the Offshore Energy division. “A unique combination of lifting capacity and deck space means the transport and installation vessel can be used on numerous wind, decommissioning and other offshore projects.”
The Bokalift 1 has been fitted out with a large, rotating mast crane with a lifting capacity of 3,000 tons, dynamic positioning (DP2) and additional accommodation for 150 people. “The DP2 system eliminates the use of anchors and anchor handling tugs during installation work. That saves a lot of time and money,” Captain Gerben Swan said. “A vital component is the advanced anti-heeling system. This is a sophisticated array of pumps and ballast systems that keeps the ship perfectly balanced during loading and unloading operations.”The vessel’s crew were given simulator training courses developed in-house. They mastered the advanced technologies used on this new type of vessel in the specific conditions they will face on future projects.
LOGISTICAL BENEFITS
“The combination of substantial crane capacity with the enormous deck – more than seven thousand square meters – is unique in the market,” Van Dodeweerd said. “With the Bokalift 1 we can load and transport a large number of jackets or
62
BOKALIFT 1 MAKES A STRONG START
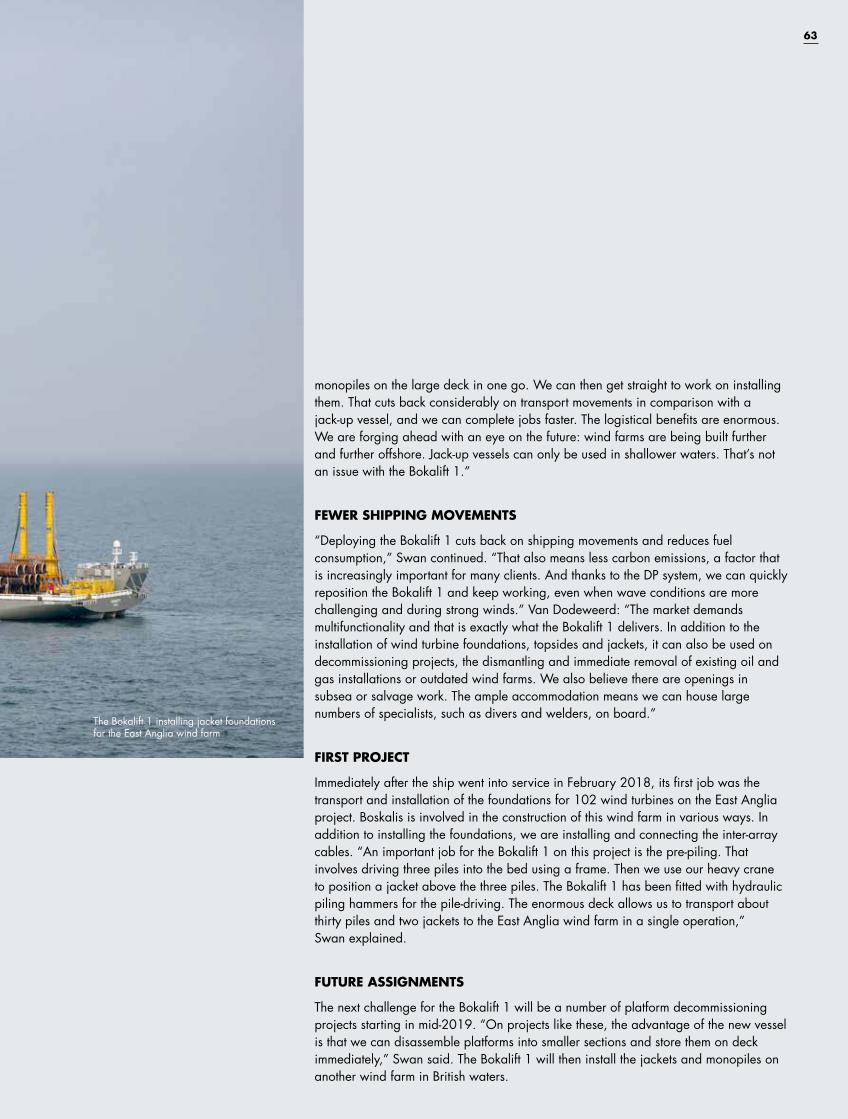
monopiles on the large deck in one go. We can then get straight to work on installing them. That cuts back considerably on transport movements in comparison with a jack-up vessel, and we can complete jobs faster. The logistical benefits are enormous. We are forging ahead with an eye on the future: wind farms are being built further and further offshore. Jack-up vessels can only be used in shallower waters. That’s not an issue with the Bokalift 1.”
FEWER SHIPPING MOVEMENTS
“Deploying the Bokalift 1 cuts back on shipping movements and reduces fuel consumption,” Swan continued. “That also means less carbon emissions, a factor that is increasingly important for many clients. And thanks to the DP system, we can quickly reposition the Bokalift 1 and keep working, even when wave conditions are more challenging and during strong winds.” Van Dodeweerd: “The market demands multifunctionality and that is exactly what the Bokalift 1 delivers. In addition to the installation of wind turbine foundations, topsides and jackets, it can also be used on decommissioning projects, the dismantling and immediate removal of existing oil and gas installations or outdated wind farms. We also believe there are openings in subsea or salvage work. The ample accommodation means we can house large numbers of specialists, such as divers and welders, on board.”
FIRST PROJECT
Immediately after the ship went into service in February 2018, its first job was the transport and installation of the foundations for 102 wind turbines on the East Anglia project. Boskalis is involved in the construction of this wind farm in various ways. In addition to installing the foundations, we are installing and connecting the inter-array cables. “An important job for the Bokalift 1 on this project is the pre-piling. That involves driving three piles into the bed using a frame. Then we use our heavy crane to position a jacket above the three piles. The Bokalift 1 has been fitted with hydraulic piling hammers for the pile-driving. The enormous deck allows us to transport about thirty piles and two jackets to the East Anglia wind farm in a single operation,” Swan explained.
FUTURE ASSIGNMENTS
The next challenge for the Bokalift 1 will be a number of platform decommissioning projects starting in mid-2019. “On projects like these, the advantage of the new vessel is that we can disassemble platforms into smaller sections and store them on deck immediately,” Swan said. The Bokalift 1 will then install the jackets and monopiles on another wind farm in British waters.
63
The Bokalift 1 installing jacket foundations for the East Anglia wind farm

REP
OR
T O
F TH
E B
OA
RD
OF
MA
NA
GEM
ENT
AN
NU
AL
REP
OR
T 2
018
– B
OSK
ALI
S64
CORPORATE GOVERNANCE
APPLICATION AT BOSKALIS
Boskalis operates a two-tier board model, which means that management and supervision are segregated.
The Board of Management is responsible for the day-to-day management of the business, the continuity of the company and for setting out and realizing the company’s strategy for the long-term value creation as well as for the culture, opportunities and risks and the results of the company. The Board of Management is responsible for establishing the company’s objectives, implementing its business policies and for the resulting performance. The Board of Management is accountable to the Supervisory Board and the General Meeting of Shareholders. In performing its tasks, the Board of Management is guided by the interests of the company and its activities, the markets the company is operating in, and takes into account any relevant interests of parties involved with the company.
The Supervisory Board is responsible for supervising the Board of Management on the formulation and implementation of the strategy for the realization of the long-term value creation. Furthermore, the Supervisory Board is responsible for supervising management performance regarding the general affairs of the company and advising the Board of Management. In doing so the Supervisory Board also focuses on the effectiveness of the company’s internal risk management and control systems and the integrity and quality of the financial reporting. The Supervisory Board is supported in its work by three so-called core committees: the Audit Committee, the Remuneration Committee and the Selection and Appointment Committee. For a summary of the activities of the Supervisory Board and its committees in 2018, please refer to pages 22 to 29 of this annual report.
At Boskalis there is close collaboration between the Supervisory Board and its committees, the Board of Management and the stakeholders. The Board of Management and the Supervisory Board are jointly responsible for looking after the interests of our stakeholders, which includes creating long-term value.
The company has a Group Management, consisting of the members of the Board of Management and the Group Directors. The Group Management meets on a regular basis in order for the Board of Management to obtain a full overview of the activities in the divisions of the company, to align the day-to-day management across the company and to ensure optimal exchange of information between the divisions.
Our stakeholders are those groups and individuals that directly or indirectly influence the company’s activities, or are influenced by them. They include the employees, shareholders and other financiers, suppliers, clients, government bodies, educational and knowledge institutes, industry and society associations (including NGOs) and the communities in which Boskalis operates.
At least one General Meeting of Shareholders takes place every year. Its tasks include the adoption of financial statements and it holds authority with regard to the appointment and dismissal of Supervisory Board members and the members of the Board of Management.
The interests of employees are promoted by the Works Council, which provides ongoing employee representation as required under the Dutch Works Councils Act. It is the task of the Works Council to ensure that management objectives correspond to those of the employees.
The general standards and values relating to our business activities are set out in the General Code of Business Conduct and the Supplier Code of Conduct. In these codes the main principles are laid down on how employees and suppliers of Boskalis should conduct themselves with regard to, for example, legislation and regulations, human rights, anti-corruption, competition, the environment, health and safety, staff and quality. Both codes can be found on the company’s website. The General Code of Business Conduct and the Supplier Code of Conduct were revised in 2018. In addition, the core values and rules for safety at work are set out in our safety program NINA. The Board of Management regularly stresses the importance of complying with the General Code of Business Conduct and the NINA principles. The Board of Management also provides employees with the opportunity to report any suspected misconduct within Boskalis of a general, financial, operational and employment nature which is not in line with the General Code of Business Conduct to a confidential independent counselor, without jeopardizing their legal position. This Whistleblower Policy can also be found on the company’s website.
ARTICLES OF ASSOCIATION
The Articles of Association of Boskalis set forth aspects of the governing principles regarding the company related to among others, the seat, the objects, the capital and shares of the company as well as its governing bodies, the financial year, the annual accounts and loss and profit. The text of the Articles of Association is available at www.boskalis.com
COMPLIANCE
The 2016 Dutch Corporate Governance Code (the “Code”) applies to all Dutch companies listed on the stock exchange and comprises a code of conduct for governance best practice. This Code includes both specific principles and best practice provisions, as well as guidelines for their proper supervision.
Boskalis subscribes to the notion that a sound and transparent system of checks and balances is key to maintaining confidence in
AN
NU
AL
REP
OR
T 2
018
– B
OSK
ALI
S
65
companies operating on the capital market. Boskalis believes clarity and openness in accountability and supervision are the cornerstones of good management and entrepreneurship.The regulations of the Supervisory Board and its committees as well as the profile of the Supervisory Board are aligned with the principles and best practices of the Code. These regulations and the profile of the Supervisory Board are published on the company’s website (www.boskalis.com).
Boskalis has also formulated a Diversity Policy explaining the company’s broad view on diversity. Boskalis operates a strict equal opportunities policy for all employees, the Board of Management and the Supervisory Board, regardless of race, nationality, ethnic background, age, religion, gender, sexual orientation or disability, whereby the principle of the best person for the job is leading. The Diversity Policy is also available on www.boskalis.com.
As described in the Diversity Policy, the composition and size of the Board of Management are based on the profile and strategy of the company. The expertise, experience and various competencies of the members of the Board of Management should contribute to this profile and strategy. The goal for the composition of the Board of Management is to aim as much as possible for a diverse composition, where possible, in age and gender, taking into account the statutory requirements and the requirements related to education and experience as contained in the Diversity Policy and the Code. In the year under review the combination of these elements resulted in the four members of the current Board of Management being male, meaning that the Board of Management, partly due to the nature of the company, is a reflection of the majority of the company’s employee population.
At the Extraordinary General Meeting of Shareholders held on 15 August 2018, Mr. B.H. Heijermans was appointed to the Board of Management with effect from 1 September 2018 and for a term until the Annual General Meeting of Shareholders in 2022. Based on the specific requirements to lead the Offshore Energy division, Mr. Heijermans was found the most suitable candidate, considering his expertise, knowledge and experience in the field of Offshore Energy. No equivalent female candidate was found.
The composition and size of the Supervisory Board are also based on the company’s profile and strategy. As stated in the profile of the Supervisory Board and the Diversity Policy, the expertise, experience and various competencies of members of the Supervisory Board should contribute to proper supervision of the company’s management and general performance. The goal for the composition of the Supervisory Board is to aim as much as possible for a diverse composition, where possible, in age and gender, taking into account the statutory requirements
and the requirements related to education and experience contained in the Diversity Policy and the Code. Per ultimo 2018 this resulted in five members of the Supervisory Board being male and one member being female. When drafting the profile for new members of the Supervisory Board emphasis is placed on diversity in view of the objective of achieving a balanced representation on the Supervisory Board. At the Annual General Meeting of Shareholders held on 9 May 2018, Mr. J.M. Hessels resigned as a member of the Supervisory Board and Mr. J.P. de Kreij was appointed as a new member of the Supervisory Board for a term until the Annual General Meeting of Shareholders in 2022. Based on Profile of the Supervisory Board, Mr. De Kreij was found the most suitable candidate, considering his extensive management experience, which he has gained in an internationally listed company, active in the oil, chemical and gas markets as well as his knowledge and experience as senior partner at PWC. No equivalent female candidate was found.
In accordance with the Code, Boskalis publishes an ‘Apply or Explain’ report that sets out how the principles and best practice provisions are applied at Boskalis. This report is available on the website and copies can also be requested from the company.
Boskalis subscribes to and applies all the principles and best practice provisions contained in the Corporate Governance Code, with the exception of best practice 4.3.3. In deviation of this best practice, according to the Articles of Association, the General Meeting of Shareholders may pass a resolution to deprive the binding nature of a nomination for the appointment or a resolution for dismissal of a member of the Board of Management or a member of the Supervisory Board by a majority of at least two/third of the votes cast representing more than one-half of the company’s issued share capital. The deviation of this best practice provision is justified in view of the long-term value creation. Maintaining continuity at both the Board of Management and the Supervisory Board is essential for delivering such long-term value. The company is protecting its stakeholders against a sudden change in management and supervision by maintaining the qualified majority and voting quorum requirement, which is in accordance with Dutch law.
The Corporate Governance Declaration can be found on the website www.boskalis.com/corporategovernance.

REP
OR
T O
F TH
E B
OA
RD
OF
MA
NA
GEM
ENT
AN
NU
AL
REP
OR
T 2
018
– B
OSK
ALI
S66
The market picture for 2019 is not fundamentally different from 2018. With a limited recovery in the prospective volume of work, prices and margins will remain under pressure.
At Dredging & Inland Infra we see a reasonable volume of work in the market in the short term. The emphasis for Boskalis is on maintaining utilization at a responsible level of project risk. The current size of the order book means that a good part of the fleet will be utilized in 2019.
The picture for the Offshore Energy market has not changed. In the short term transport and Subsea Services will be largely dependent on the competitive spot market. Survey is expected to have another good year with further growth, partly thanks to the addition of Horizon. For the contracting activities we expect the projects in the order book to result in a reasonable year.
The planned sale of our stakes in the Towage activities of Saam Smit Towage and Kotug Smit Towage will lead to a lower contribution to the result. Market volumes at the other towage joint ventures are stable.
The project-based nature of a significant part of our activities, in addition to the uncertain market conditions, makes it difficult to provide a specific quantitative forecast with regard to the 2019 full-year result early on in the year. However, expectations are that while EBITDA levels will be stable, exceeding the 2018 net operating profit will be a challenge.
Capital expenditure in 2019 is expected to be around EUR 265 million, including the intended Bohlen & Doyen offshore asset transaction, however excluding acquisitions, and will be financed from the company’s own cash flow. Boskalis has a very sound financial position and comfortably meets its financial covenants.
OUTLOOK
The Ndeavor installing power cables for the Aberdeen Offshore Wind Farm
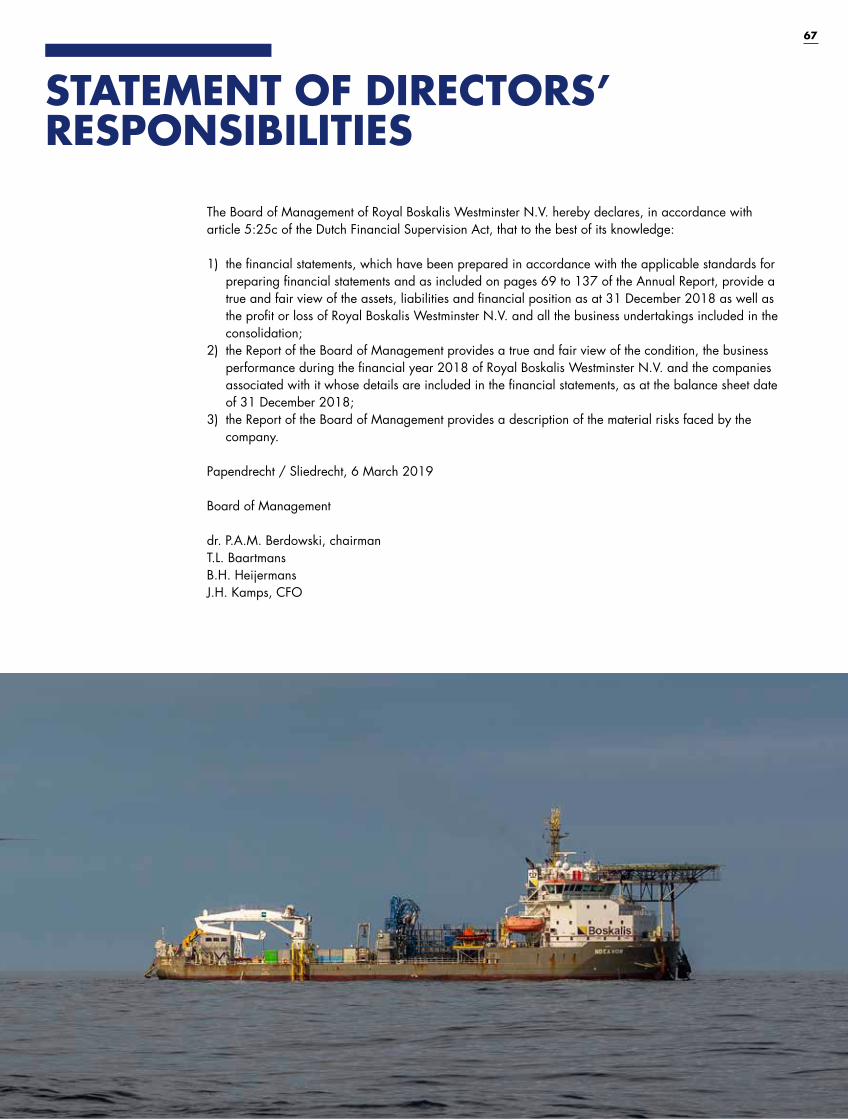
AN
NU
AL
REP
OR
T 2
018
– B
OSK
ALI
S
67
The Board of Management of Royal Boskalis Westminster N.V. hereby declares, in accordance with article 5:25c of the Dutch Financial Supervision Act, that to the best of its knowledge:
1) the financial statements, which have been prepared in accordance with the applicable standards for preparing financial statements and as included on pages 69 to 137 of the Annual Report, provide a true and fair view of the assets, liabilities and financial position as at 31 December 2018 as well as the profit or loss of Royal Boskalis Westminster N.V. and all the business undertakings included in the consolidation;
2) the Report of the Board of Management provides a true and fair view of the condition, the business performance during the financial year 2018 of Royal Boskalis Westminster N.V. and the companies associated with it whose details are included in the financial statements, as at the balance sheet date of 31 December 2018;
3) the Report of the Board of Management provides a description of the material risks faced by the company.
Papendrecht / Sliedrecht, 6 March 2019
Board of Management
dr. P.A.M. Berdowski, chairmanT.L. BaartmansB.H. HeijermansJ.H. Kamps, CFO
STATEMENT OF DIRECTORS’ RESPONSIBILITIES

68A
NN
UA
L R
EPO
RT
201
8 –
BO
SKA
LIS
FIN
AN
CIA
L ST
ATE
MEN
TS 2
018
Birds flying around the Marker Wadden islands

69
AN
NU
AL
REP
OR
T 2
018
– B
OSK
ALI
S
BOSKALIS FINANCIAL STATEMENTS 2018
AN
NU
AL
REP
OR
T 2
01
8 ---
BO
SKA
LIS
FI
NA
NCIA
L ST
ATE
MEN
TS 2
01
8
TABLE OF CONTENTS Consolidated Statement of Profit or Loss 72
Consolidated Statement of Other Comprehensive Income 73
Consolidated Statement of Financial Position 74
Consolidated Statement of Cash Flows 75
Consolidated Statement of Changes in Equity 76
Explanatory notes to the Consolidated Financial Statements 78 1. General 78 2. Compliance with International Financial Reporting Standards 78 2.1 Compliance statement 78 2.2 Adopted new standards 78 2.3 Changes in Principles of Financial Reporting 78 2.4 New standards and interpretations not yet adopted 78 3. Principles of Financial Reporting 79 3.1 Format and valuation 79 3.2 Consolidation 79 3.3 Foreign currencies 80 3.4 Financial Instruments 81 3.5 Impairment 81 3.6 Intangible assets 82 3.7 Property, plant and equipment 82 3.8 Joint ventures and associates 82 3.9 Non-current financial assets 83 3.10 Financial instruments available for sale 83 3.11 Inventories 83 3.12 Unbilled and deferred revenue 83 3.13 Trade and other receivables 83 3.14 Cash and cash equivalents 83 3.15 Share capital 83 3.16 Interest-bearing borrowings 83 3.17 Employee benefits 83 3.18 Provisions 84 3.19 Trade and other payables 84 3.20 Assets held for sale 84 3.21 Revenue 84 3.22 Other income and other expenses 85 3.23 Raw materials, consumables, services and contracted work 85 3.24 Personnel expenses 85 3.25 Lease payments 85 3.26 Finance income and expenses 85 3.27 Share in result of joint ventures and associates 85 3.28 Taxation / deferred income tax assets and liabilities 85 3.29 Earnings per share 86 3.30 Dividend 86 3.31 Determination of fair value 86 3.32 Consolidated statement of cash flows 86 3.33 First-time application of IFRS 9 ‘Financial Instruments’ and IFRS 15 ‘Revenue From Contracts With Customers’ 87 4. Segment reporting 90 4.1 Operational segments 91 5. Business combinations and other significant transactions 92 5.1 Business combinations and other significant transactions in prior year 92 5.2 Sale of interest in partnership Saam Smit Towage 92 6. Revenue 92 7. Other income and other expenses 93 8. Raw materials, consumables, services and subcontracted work 93 9. Personnel expenses 93 10. Impairment charges 94 11. Finance income and expenses 95 12. Income tax expenses 95 13. Income tax receivable and payable 96

AN
NU
AL
REP
OR
T 2
01
8 ---
B
OSK
ALI
S
14. Deferred income tax assets and liabilities 97 15. Intangible assets 99 15.1 Goodwill 99 15.2 Other intangible assets 100 16. Property, plant and equipment 101 17. Joint ventures and associates 102 18. Non-current financial assets 105 18.1 Other non-current receivables 105 18.2 Financial instruments available-for-sale 105 19. Inventories 105 20. Unbilled and deferred Revenue 105 21. Trade and other receivables 106 22. Cash and cash equivalents 106 23. Group equity 106 23.1 Share capital and dividend 106 23.2 Share premium reserve 107 23.3 Retained earnings 107 23.4 Dividend 107 23.5 Earnings per share 107 23.6 Other reserves 108 24. Interest-bearing borrowings 110 25. Employee benefits 111 25.1 Defined benefit pension plans 111 25.2 Defined contribution pension plans 115 26. Provisions 115 27. Trade and other payables 116 28. Financial instruments 116 28.1 Financial risk management 116 28.2 On-balance financial instruments and fair value 122 28.3 Capital management 124 28.4 Other financial instruments 124 29. Commitments and contingent liabilities 125 30. Related parties 126 30.1 Identity of related parties 126 30.2 Related party transactions 129 30.3 Joint operations 130 31. Subsequent events 131
Company Statement of Profit or Loss 132
Company Statement of Financial Position 132
Statement of Changes in Shareholders’ Equity 133
Explanatory notes to the Company Financial Statements 134 1. General 134 2. Principles of financial reporting 134 2.1 Accounting policies 134 2.2 Format 134 2.3 Investments in group companies 134 2.4 Amounts due from group companies 134 2.5 Amounts due to group companies 134 2.6 Result of group company 134 3. Investments in group companies 134 4. Issued capital and optional dividend 135 5. Other reserves 135 6. Profit or loss for the year 135 7. Financial instruments 135 8. Operating income and expenses 136 9. Remuneration of the members of the Board of Management and Members of the Supervisory Board 136 10. Auditor remuneration 136 11. Commitments and contingent liabilities 136
Provisions in the articles of association relating to profit appropriation 137
Independent auditor’s report 138
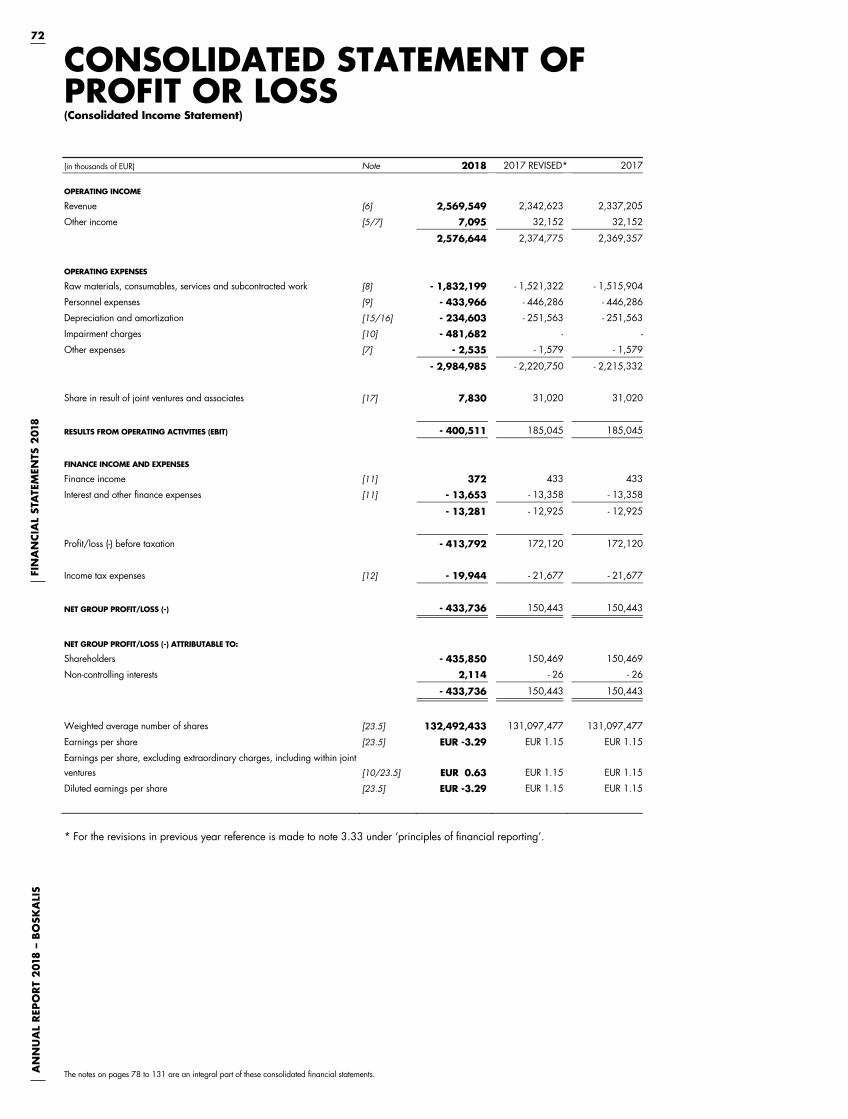
72A
NN
UA
L R
EPO
RT
201
8 –
BO
SKA
LIS
FIN
AN
CIA
L ST
ATE
MEN
TS 2
018
The notes on pages 78 to 131 are an integral part of these consolidated financial statements.
72 A
NN
UA
L R
EPO
RT
20
18
--- B
OSK
ALI
S F
INA
NCIA
L ST
ATE
MEN
TS 2
01
8
CONSOLIDATED STATEMENT OF PROFIT OR LOSS (Consolidated Income Statement)
(in thousands of EUR) Note 2018 2017 REVISED* 2017
OPERATING INCOME
Revenue [6] 2,569,549 2,342,623 2,337,205
Other income [5/7] 7,095 32,152 32,152
2,576,644 2,374,775 2,369,357
OPERATING EXPENSES
Raw materials, consumables, services and subcontracted work [8] - 1,832,199 - 1,521,322 - 1,515,904
Personnel expenses [9] - 433,966 - 446,286 - 446,286
Depreciation and amortization [15/16] - 234,603 - 251,563 - 251,563
Impairment charges [10] - 481,682 - -
Other expenses [7] - 2,535 - 1,579 - 1,579
- 2,984,985 - 2,220,750 - 2,215,332
Share in result of joint ventures and associates [17] 7,830 31,020 31,020
RESULTS FROM OPERATING ACTIVITIES (EBIT) - 400,511 185,045 185,045
FINANCE INCOME AND EXPENSES
Finance income [11] 372 433 433
Interest and other finance expenses [11] - 13,653 - 13,358 - 13,358
- 13,281 - 12,925 - 12,925
Profit/loss (-) before taxation - 413,792 172,120 172,120
Income tax expenses [12] - 19,944 - 21,677 - 21,677
NET GROUP PROFIT/LOSS (-) - 433,736 150,443 150,443
NET GROUP PROFIT/LOSS (-) ATTRIBUTABLE TO:
Shareholders - 435,850 150,469 150,469
Non-controlling interests 2,114 - 26 - 26
- 433,736 150,443 150,443
Weighted average number of shares [23.5] 132,492,433 131,097,477 131,097,477
Earnings per share [23.5] EUR -3.29 EUR 1.15 EUR 1.15
Earnings per share, excluding extraordinary charges, including within joint ventures [10/23.5] EUR 0.63 EUR 1.15 EUR 1.15
Diluted earnings per share [23.5] EUR -3.29 EUR 1.15 EUR 1.15
* For the revisions in previous year reference is made to note 3.33 under ‘principles of financial reporting’.
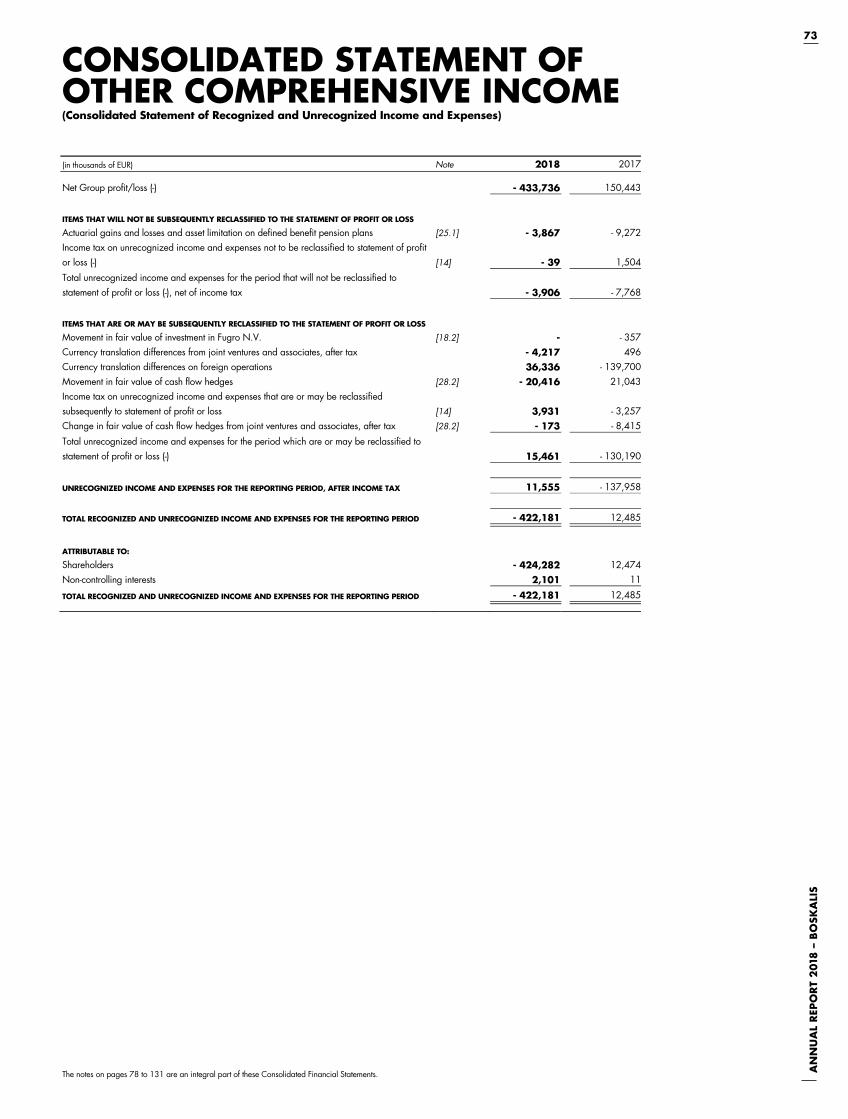
73
AN
NU
AL
REP
OR
T 2
018
– B
OSK
ALI
S
The notes on pages 78 to 131 are an integral part of these Consolidated Financial Statements.
73
AN
NU
AL
REP
OR
T 2
01
8 ---
BO
SKA
LIS
CONSOLIDATED STATEMENT OF OTHER COMPREHENSIVE INCOME (Consolidated Statement of Recognized and Unrecognized Income and Expenses)
(in thousands of EUR) Note 2018 2017
Net Group profit/loss (-) - 433,736 150,443
ITEMS THAT WILL NOT BE SUBSEQUENTLY RECLASSIFIED TO THE STATEMENT OF PROFIT OR LOSS
Actuarial gains and losses and asset limitation on defined benefit pension plans [25.1] - 3,867 - 9,272Income tax on unrecognized income and expenses not to be reclassified to statement of profit or loss (-) [14] - 39 1,504
Total unrecognized income and expenses for the period that will not be reclassified to statement of profit or loss (-), net of income tax - 3,906 - 7,768
ITEMS THAT ARE OR MAY BE SUBSEQUENTLY RECLASSIFIED TO THE STATEMENT OF PROFIT OR LOSS
Movement in fair value of investment in Fugro N.V. [18.2] - - 357Currency translation differences from joint ventures and associates, after tax - 4,217 496Currency translation differences on foreign operations 36,336 - 139,700Movement in fair value of cash flow hedges [28.2] - 20,416 21,043Income tax on unrecognized income and expenses that are or may be reclassified subsequently to statement of profit or loss [14] 3,931 - 3,257Change in fair value of cash flow hedges from joint ventures and associates, after tax [28.2] - 173 - 8,415
Total unrecognized income and expenses for the period which are or may be reclassified to statement of profit or loss (-) 15,461 - 130,190
UNRECOGNIZED INCOME AND EXPENSES FOR THE REPORTING PERIOD, AFTER INCOME TAX 11,555 - 137,958
TOTAL RECOGNIZED AND UNRECOGNIZED INCOME AND EXPENSES FOR THE REPORTING PERIOD - 422,181 12,485
ATTRIBUTABLE TO:
Shareholders - 424,282 12,474Non-controlling interests 2,101 11
TOTAL RECOGNIZED AND UNRECOGNIZED INCOME AND EXPENSES FOR THE REPORTING PERIOD - 422,181 12,485
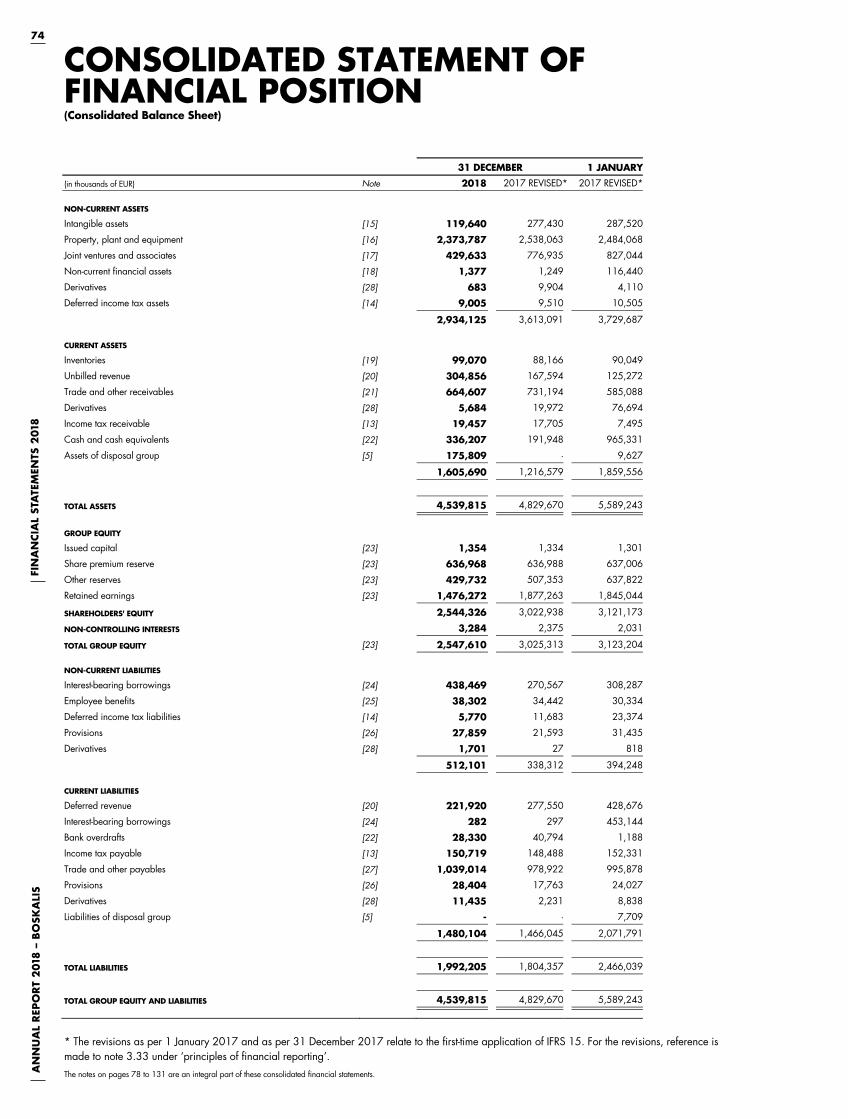
74A
NN
UA
L R
EPO
RT
201
8 –
BO
SKA
LIS
FIN
AN
CIA
L ST
ATE
MEN
TS 2
018
The notes on pages 78 to 131 are an integral part of these consolidated financial statements.
74 A
NN
UA
L R
EPO
RT
20
18
--- B
OSK
ALI
S F
INA
NCIA
L ST
ATE
MEN
TS 2
01
8
CONSOLIDATED STATEMENT OF FINANCIAL POSITION (Consolidated Balance Sheet)
31 DECEMBER 1 JANUARY
(in thousands of EUR) Note 2018 2017 REVISED* 2017 REVISED*
NON-CURRENT ASSETS
Intangible assets [15] 119,640 277,430 287,520
Property, plant and equipment [16] 2,373,787 2,538,063 2,484,068
Joint ventures and associates [17] 429,633 776,935 827,044
Non-current financial assets [18] 1,377 1,249 116,440
Derivatives [28] 683 9,904 4,110
Deferred income tax assets [14] 9,005 9,510 10,505
2,934,125 3,613,091 3,729,687
CURRENT ASSETS
Inventories [19] 99,070 88,166 90,049
Unbilled revenue [20] 304,856 167,594 125,272
Trade and other receivables [21] 664,607 731,194 585,088
Derivatives [28] 5,684 19,972 76,694
Income tax receivable [13] 19,457 17,705 7,495
Cash and cash equivalents [22] 336,207 191,948 965,331
Assets of disposal group [5] 175,809 - 9,627
1,605,690 1,216,579 1,859,556
TOTAL ASSETS 4,539,815 4,829,670 5,589,243
GROUP EQUITY
Issued capital [23] 1,354 1,334 1,301
Share premium reserve [23] 636,968 636,988 637,006
Other reserves [23] 429,732 507,353 637,822
Retained earnings [23] 1,476,272 1,877,263 1,845,044
SHAREHOLDERS' EQUITY 2,544,326 3,022,938 3,121,173
NON-CONTROLLING INTERESTS 3,284 2,375 2,031
TOTAL GROUP EQUITY [23] 2,547,610 3,025,313 3,123,204
NON-CURRENT LIABILITIES
Interest-bearing borrowings [24] 438,469 270,567 308,287
Employee benefits [25] 38,302 34,442 30,334
Deferred income tax liabilities [14] 5,770 11,683 23,374
Provisions [26] 27,859 21,593 31,435
Derivatives [28] 1,701 27 818
512,101 338,312 394,248
CURRENT LIABILITIES
Deferred revenue [20] 221,920 277,550 428,676
Interest-bearing borrowings [24] 282 297 453,144
Bank overdrafts [22] 28,330 40,794 1,188
Income tax payable [13] 150,719 148,488 152,331
Trade and other payables [27] 1,039,014 978,922 995,878
Provisions [26] 28,404 17,763 24,027
Derivatives [28] 11,435 2,231 8,838
Liabilities of disposal group [5] - - 7,709
1,480,104 1,466,045 2,071,791
TOTAL LIABILITIES 1,992,205 1,804,357 2,466,039
TOTAL GROUP EQUITY AND LIABILITIES 4,539,815 4,829,670 5,589,243
* The revisions as per 1 January 2017 and as per 31 December 2017 relate to the first-time application of IFRS 15. For the revisions, reference is made to note 3.33 under ‘principles of financial reporting’.
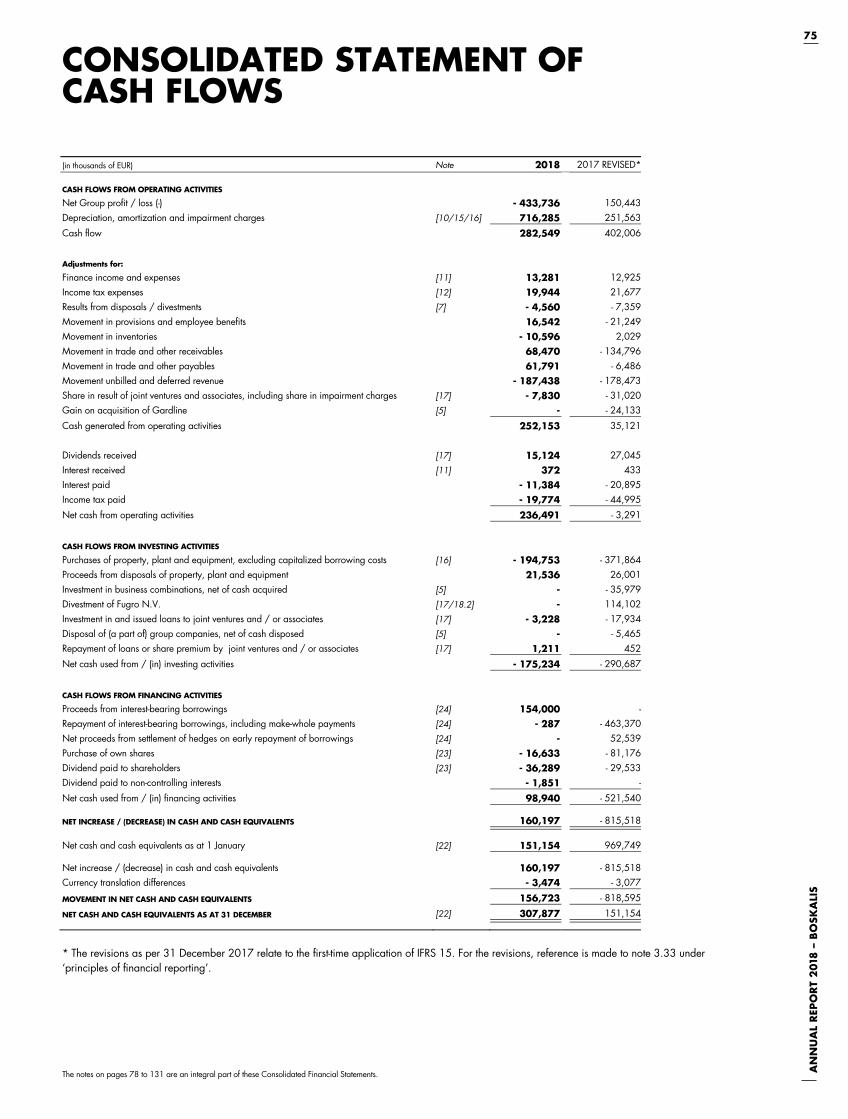
75
AN
NU
AL
REP
OR
T 2
018
– B
OSK
ALI
S
The notes on pages 78 to 131 are an integral part of these Consolidated Financial Statements.
75
AN
NU
AL
REP
OR
T 2
01
8 ---
BO
SKA
LIS
CONSOLIDATED STATEMENT OF CASH FLOWS
(in thousands of EUR) Note 2018 2017 REVISED*
CASH FLOWS FROM OPERATING ACTIVITIES
Net Group profit / loss (-) - 433,736 150,443Depreciation, amortization and impairment charges [10/15/16] 716,285 251,563
Cash flow 282,549 402,006
Adjustments for:
Finance income and expenses [11] 13,281 12,925Income tax expenses [12] 19,944 21,677Results from disposals / divestments [7] - 4,560 - 7,359Movement in provisions and employee benefits 16,542 - 21,249Movement in inventories - 10,596 2,029Movement in trade and other receivables 68,470 - 134,796Movement in trade and other payables 61,791 - 6,486Movement unbilled and deferred revenue - 187,438 - 178,473Share in result of joint ventures and associates, including share in impairment charges [17] - 7,830 - 31,020Gain on acquisition of Gardline [5] - - 24,133
Cash generated from operating activities 252,153 35,121
Dividends received [17] 15,124 27,045Interest received [11] 372 433Interest paid - 11,384 - 20,895Income tax paid - 19,774 - 44,995
Net cash from operating activities 236,491 - 3,291
CASH FLOWS FROM INVESTING ACTIVITIES
Purchases of property, plant and equipment, excluding capitalized borrowing costs [16] - 194,753 - 371,864Proceeds from disposals of property, plant and equipment 21,536 26,001Investment in business combinations, net of cash acquired [5] - - 35,979Divestment of Fugro N.V. [17/18.2] - 114,102Investment in and issued loans to joint ventures and / or associates [17] - 3,228 - 17,934Disposal of (a part of) group companies, net of cash disposed [5] - - 5,465Repayment of loans or share premium by joint ventures and / or associates [17] 1,211 452
Net cash used from / (in) investing activities - 175,234 - 290,687
CASH FLOWS FROM FINANCING ACTIVITIES
Proceeds from interest-bearing borrowings [24] 154,000 -Repayment of interest-bearing borrowings, including make-whole payments [24] - 287 - 463,370Net proceeds from settlement of hedges on early repayment of borrowings [24] - 52,539Purchase of own shares [23] - 16,633 - 81,176Dividend paid to shareholders [23] - 36,289 - 29,533Dividend paid to non-controlling interests - 1,851 -
Net cash used from / (in) financing activities 98,940 - 521,540
NET INCREASE / (DECREASE) IN CASH AND CASH EQUIVALENTS 160,197 - 815,518
Net cash and cash equivalents as at 1 January [22] 151,154 969,749
Net increase / (decrease) in cash and cash equivalents 160,197 - 815,518Currency translation differences - 3,474 - 3,077
MOVEMENT IN NET CASH AND CASH EQUIVALENTS 156,723 - 818,595
NET CASH AND CASH EQUIVALENTS AS AT 31 DECEMBER [22] 307,877 151,154
* The revisions as per 31 December 2017 relate to the first-time application of IFRS 15. For the revisions, reference is made to note 3.33 under ‘principles of financial reporting’.
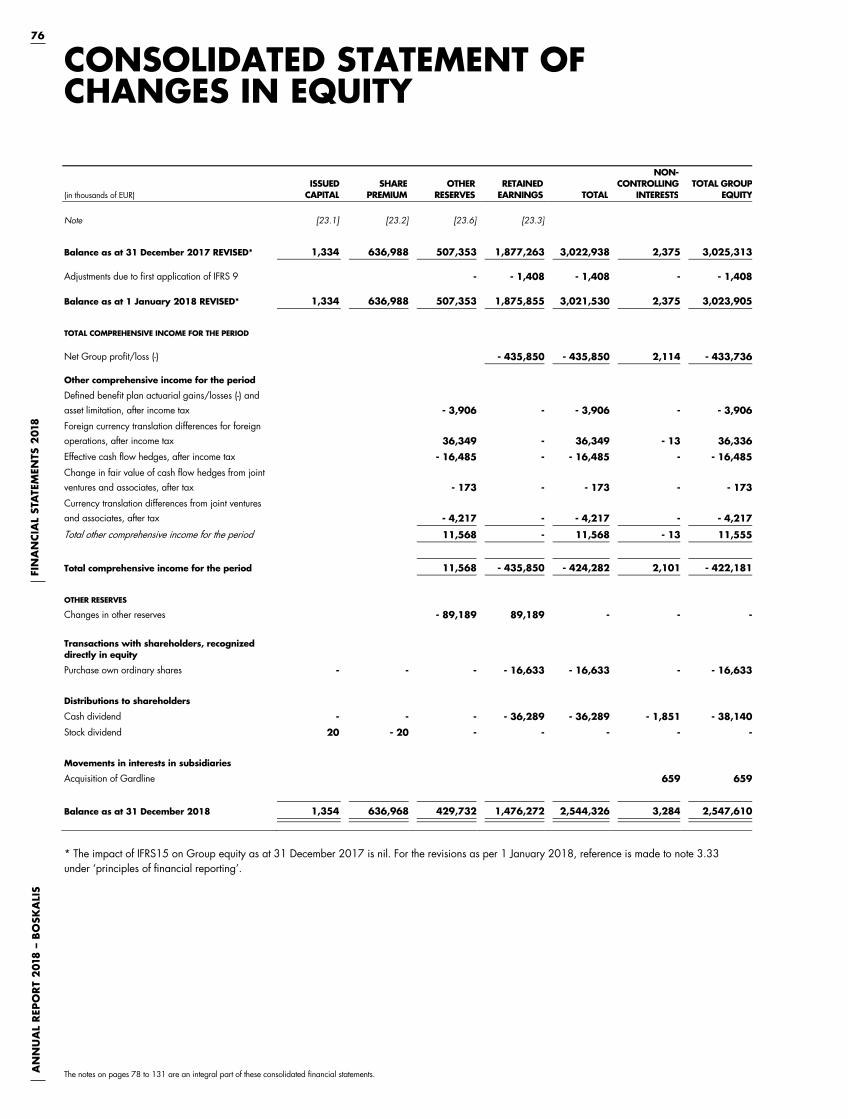
76A
NN
UA
L R
EPO
RT
201
8 –
BO
SKA
LIS
FIN
AN
CIA
L ST
ATE
MEN
TS 2
018
The notes on pages 78 to 131 are an integral part of these consolidated financial statements.
76 A
NN
UA
L R
EPO
RT
20
18
--- B
OSK
ALI
S F
INA
NCIA
L ST
ATE
MEN
TS 2
01
8
CONSOLIDATED STATEMENT OF CHANGES IN EQUITY
(in thousands of EUR) ISSUED
CAPITALSHARE
PREMIUMOTHER
RESERVESRETAINED
EARNINGS TOTAL
NON-CONTROLLING
INTERESTSTOTAL GROUP
EQUITY
Note [23.1] [23.2] [23.6] [23.3]
Balance as at 31 December 2017 REVISED* 1,334 636,988 507,353 1,877,263 3,022,938 2,375 3,025,313
Adjustments due to first application of IFRS 9 - - 1,408 - 1,408 - - 1,408
Balance as at 1 January 2018 REVISED* 1,334 636,988 507,353 1,875,855 3,021,530 2,375 3,023,905
TOTAL COMPREHENSIVE INCOME FOR THE PERIOD
Net Group profit/loss (-) - 435,850 - 435,850 2,114 - 433,736
Other comprehensive income for the period
Defined benefit plan actuarial gains/losses (-) and asset limitation, after income tax - 3,906 - - 3,906 - - 3,906
Foreign currency translation differences for foreign operations, after income tax 36,349 - 36,349 - 13 36,336
Effective cash flow hedges, after income tax - 16,485 - - 16,485 - - 16,485
Change in fair value of cash flow hedges from joint ventures and associates, after tax - 173 - - 173 - - 173
Currency translation differences from joint ventures and associates, after tax - 4,217 - - 4,217 - - 4,217
Total other comprehensive income for the period 11,568 - 11,568 - 13 11,555
Total comprehensive income for the period 11,568 - 435,850 - 424,282 2,101 - 422,181
OTHER RESERVES
Changes in other reserves - 89,189 89,189 - - -
Transactions with shareholders, recognized directly in equity
Purchase own ordinary shares - - - - 16,633 - 16,633 - - 16,633
Distributions to shareholders
Cash dividend - - - - 36,289 - 36,289 - 1,851 - 38,140
Stock dividend 20 - 20 - - - - -
Movements in interests in subsidiaries
Acquisition of Gardline 659 659
Balance as at 31 December 2018 1,354 636,968 429,732 1,476,272 2,544,326 3,284 2,547,610
* The impact of IFRS15 on Group equity as at 31 December 2017 is nil. For the revisions as per 1 January 2018, reference is made to note 3.33 under ‘principles of financial reporting’.
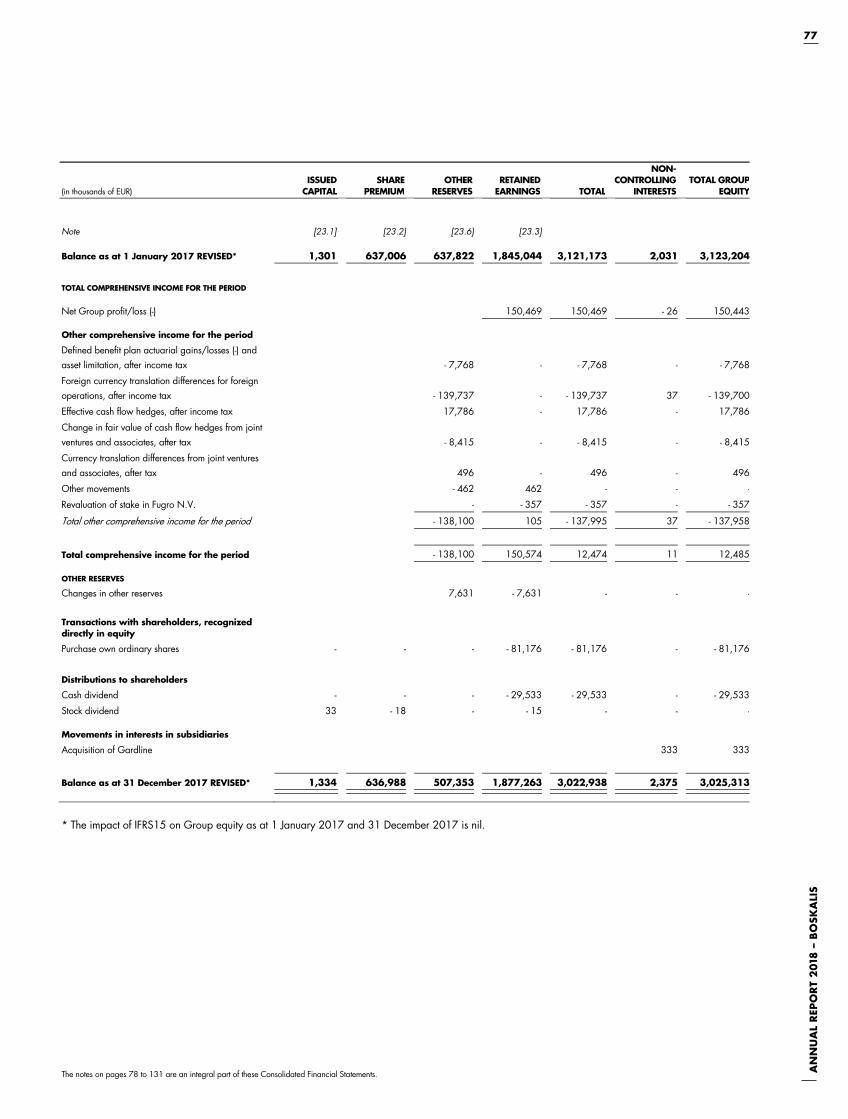
77
AN
NU
AL
REP
OR
T 2
018
– B
OSK
ALI
S
The notes on pages 78 to 131 are an integral part of these Consolidated Financial Statements.
77
AN
NU
AL
REP
OR
T 2
01
8 ---
BO
SKA
LIS
(in thousands of EUR) ISSUED
CAPITALSHARE
PREMIUMOTHER
RESERVESRETAINED
EARNINGS TOTAL
NON-CONTROLLING
INTERESTSTOTAL GROUP
EQUITY
Note [23.1] [23.2] [23.6] [23.3]
Balance as at 1 January 2017 REVISED* 1,301 637,006 637,822 1,845,044 3,121,173 2,031 3,123,204
TOTAL COMPREHENSIVE INCOME FOR THE PERIOD
Net Group profit/loss (-) 150,469 150,469 - 26 150,443
Other comprehensive income for the period
Defined benefit plan actuarial gains/losses (-) and asset limitation, after income tax - 7,768 - - 7,768 - - 7,768
Foreign currency translation differences for foreign operations, after income tax - 139,737 - - 139,737 37 - 139,700
Effective cash flow hedges, after income tax 17,786 - 17,786 - 17,786
Change in fair value of cash flow hedges from joint ventures and associates, after tax - 8,415 - - 8,415 - - 8,415
Currency translation differences from joint ventures and associates, after tax 496 - 496 - 496
Other movements - 462 462 - - -
Revaluation of stake in Fugro N.V. - - 357 - 357 - - 357
Total other comprehensive income for the period - 138,100 105 - 137,995 37 - 137,958
Total comprehensive income for the period - 138,100 150,574 12,474 11 12,485
OTHER RESERVES
Changes in other reserves 7,631 - 7,631 - - -
Transactions with shareholders, recognized directly in equity
Purchase own ordinary shares - - - - 81,176 - 81,176 - - 81,176
Distributions to shareholders
Cash dividend - - - - 29,533 - 29,533 - - 29,533
Stock dividend 33 - 18 - - 15 - - -
Movements in interests in subsidiaries
Acquisition of Gardline 333 333
Balance as at 31 December 2017 REVISED* 1,334 636,988 507,353 1,877,263 3,022,938 2,375 3,025,313 - - - - - - -
* The impact of IFRS15 on Group equity as at 1 January 2017 and 31 December 2017 is nil.
78A
NN
UA
L R
EPO
RT
201
8 –
BO
SKA
LIS
FIN
AN
CIA
L ST
ATE
MEN
TS 2
018
78 A
NN
UA
L R
EPO
RT
20
18
--- B
OSK
ALI
S F
INA
NCIA
L ST
ATE
MEN
TS 2
01
8
EXPLANATORY NOTES TO THE CONSOLIDATED FINANCIAL STATEMENTS
1. GENERAL
Royal Boskalis Westminster N.V. is a leading global services provider operating in the dredging, dry and maritime infrastructure and maritime services sectors. Royal Boskalis Westminster N.V. (the ‘Company’) has its registered office in Sliedrecht, the Netherlands, and its head office is located at Rosmolenweg 20, 3356 LK in Papendrecht, the Netherlands. The Company is registered at the Chamber of Commerce under number 23008599 and is a publicly listed company on the Euronext Amsterdam.
The consolidated financial statements of Royal Boskalis Westminster N.V. for 2018 include the Company and group companies (hereinafter referred to jointly as the ‘Group’ and individually as the ‘group companies’) and the interests of the Group in associates and entities over which it has joint control. The consolidated financial statements were prepared by the Board of Management and were signed on 6 March 2019. The financial statements for 2018 will be submitted for approval to the Annual General Meeting of Shareholders on 8 May 2019.
2. COMPLIANCE WITH INTERNATIONAL FINANCIAL REPORTING STANDARDS
2.1 COMPLIANCE STATEMENT The consolidated financial statements and the accompanying explanatory notes have been prepared in accordance with International Financial Reporting Standards, as adopted by the European Union (EU-IFRS), and with Part 9 of Book 2 of the Dutch Civil Code.
2.2 ADOPTED NEW STANDARDS The accounting principles applied to the valuation of assets and liabilities and the determination of results are the same as the valuation principles applied to consolidated financial statements in prior years, except for the relevant changes mentioned in section 2.3: Changes in Principles of Financial Reporting.
2.3 CHANGES IN PRINCIPLES OF FINANCIAL REPORTING The Group applied IFRS 9 and IFRS 15 for the first time. Both standards came into effect on 1 January 2018 and require to a certain extent a revision of the comparative figures, as explained below:
IFRS 9 Financial Instruments IFRS 9 ‘Financial Instruments’ addresses the classification, measurement and recognition of financial assets and financial liabilities. This new standard replaces IAS 39. The introduction of IFRS 9 had no material impact on the results of the Group in the year under review and is not expected to materially impact results in future periods.
IFRS 15 Revenue from Contracts with Customers IFRS 15 ‘Revenue from Contracts with Customers’ provides a framework for the recognition of revenues and replaces IAS 18 ‘Revenue’ and IAS 11 ‘Construction Contracts’. The introduction of IFRS 15 had no material impact on the revenue and results of the Group and is not expected to do so in future periods.
The impact of the adoption of these two standards is further explained and quantified in the Consolidated Statement of Profit or Loss, the Consolidated Statement of Financial Position and the disclosure in note 3.33.
2.4 NEW STANDARDS AND INTERPRETATIONS NOT YET ADOPTED The following standards, amendments to standards and interpretations were not effective in 2018 and / or not yet adopted by the European Union. As a consequence, these new standards, amendments and interpretations have not been applied in these consolidated financial statements. The Group does not adopt these standards and interpretations early and the exact extent of the possible impact has not been determined. The most important consequences for the Group can be summarized as follows:
IFRS 16 ‘Leases’ replaces the current standard for leases (IAS 17) and provides a new framework for the recognition of lease contracts. The standard was issued in January 2016 and will be effective as of 1 January 2019. This new standard relates to changes in accounting for operational lease commitments of the Group (see note 29). IFRS 16 requires lessees to recognize a liability in their Statement of Financial Position and to capitalize the right-of-use of a leased asset if it is leased for a period exceeding one year. The Group will apply this standard, as allowed by IFRS 16, retrospectively with the cumulative effect of initially applying IFRS 16 recognized as per 1 January 2019. Comparative figures 2018 will not be restated. During 2018 leases have been identified and preliminary calculations have been made. Based on our first assessment of these figures, we expect the total effect on the Consolidated Statement of Financial Position to be an increase of total assets and total liabilities between EUR 75 million and EUR 100 million, an increase of EBITDA to be between EUR 15 million and EUR 20 million and a decrease of the net Group result of less than EUR 1 million in 2019. As per the effective date there will be no impact on Group equity.
IFRIC 23 ‘Uncertainty over Income Tax Treatments’ was
issued in June 2017 and will be effective as of 1 January 2019. The interpretation as included in IFRIC 23 is to be applied to the determination of taxable profit (taxable loss), tax bases, unused tax losses, unused tax credits and tax

79
AN
NU
AL
REP
OR
T 2
018
– B
OSK
ALI
S
79
AN
NU
AL
REP
OR
T 2
01
8 ---
BO
SKA
LIS
rates, where there is uncertainty over income tax treatments under IAS 12. Under IFRIC 23 the key requirement is to question whether it is probable that the tax authorities will accept the tax treatment the Group has chosen under the assumption that tax authorities will have full knowledge of all relevant information in assessing a proposed tax treatment. When it is probable that the tax authorities will accept the tax treatment, the whole amount of the tax position determined should be recognized. When it is not probable that the tax treatment will be accepted by the tax authorities, the financial consequences of this uncertainty should be accounted for in the tax position. The Group can only reassess and change the recognized uncertain tax positions in case facts and circumstances on which the judgement or estimate was based change. Based on the analysis made, it is expected that there will be no impact on Group equity. The introduction of IFRIC23 is expected not to have a material impact on the results of the Group.
3. PRINCIPLES OF FINANCIAL REPORTING
The principles of financial reporting subsequently disclosed are applied consistently for all periods included in these consolidated financial statements and have been applied consistently by the group companies.
3.1 FORMAT AND VALUATION The consolidated financial statements are presented in euros, the Group’s presentation currency. The consolidated financial statements are based upon historical cost to the extent that IFRS does not prescribe another accounting method for specific items. Preparing financial statements means that estimates and assumptions made by management partially determine the amounts recognized under assets, liabilities, revenue and costs. The estimates and assumptions are mainly related to the measurement of intangible assets (including goodwill), property, plant and equipment, joint ventures and associates, expected results on the completion of projects, pension liabilities, taxation, provisions and financial instruments. Judgements made by management within the application of IFRS which have a material effect on the financial statements are the qualifications of investments as group companies, joint operations, joint ventures or associates. Details are incorporated in the explanatory notes to these items. Other than the elements already explained in the explanatory notes to the financial statements, no critical valuation judgements relating to the application of the principles need further explanation. The estimates made and the related assumptions are based on management’s experience and understanding and the development of external factors that can be considered reasonable under the given circumstances. Estimates and assumptions are subject to alterations as a result of changes in facts and insights and may have different outcomes in different reporting periods. Any differences are recognized in the Statement of Financial Position, or the Statement of Profit or Loss, or the Statement of Other Comprehensive Income, depending on the nature of the item. Actual results may deviate from results reported previously on the basis of estimates and assumptions. Unless stated otherwise, all amounts in the notes to these financial statements are stated in thousands of euros.
3.2 CONSOLIDATION The Group consolidates companies over which control is exercised when the Group is exposed or has the right to variable returns from its involvement with the investee and has the ability to affect such returns. Subsidiaries are included in the consolidation for 100%, taking into account any minority interests. For joint operations the Group accounts for its specific rights and obligations. Joint ventures and associates are accounted for using the equity method.
3.2.1 SUBSIDIARIES Subsidiaries are included in the consolidation for 100% on the basis of existing control, taking into account any minority interests. The figures of subsidiaries are included in the consolidated financial statements from the date that control commences until the date that control ceases.
Control exists if the Group has: the ability to direct relevant activities through its voting
power; the right to variable returns from its involvement with the
investee; and the ability to use its power to affect such returns. In assessing whether the Group has acquired control, and whether such control exists in the sense that it has power over the investee, the Group takes into consideration voting rights, or similar rights in an entity, potential voting rights that are currently exercisable, and all other relevant facts and circumstances.
If and when the Group loses control over a subsidiary, it derecognizes the assets and liabilities of the subsidiary, any non-controlling interests and any components of equity related to the subsidiary. Any resulting gain or loss is recognized in the statement of profit or loss. If the Group retains any stake in the former subsidiary, then such interest is measured at fair value at the date that control is lost.
3.2.2 JOINT OPERATIONS If the Group has joint control over and is entitled to the rights to the assets and is liable for the liabilities of the partnership, the partnership is classified as a joint operation. Such a joint control has been laid down in a contract and strategic decisions on financial and operational policy are taken by unanimous agreement. Joint operations mainly relate to project driven construction consortiums.
Joint operations are included in the consolidated financial statements on a pro rata basis in accordance with the participation interest of the Group in the joint operation, also referred to as proportionate consolidation.
3.2.3 JOINT VENTURES AND ASSOCIATES The Group divides strategic investments into joint ventures and associates based on the type and degree of influence.
Joint ventures are those entities over which the Group has joint control. Such joint control is laid down in a contract and strategic decisions on financial and operational policy are taken by unanimous agreement. The Group is only entitled to the net assets of the joint ventures.
80A
NN
UA
L R
EPO
RT
201
8 –
BO
SKA
LIS
FIN
AN
CIA
L ST
ATE
MEN
TS 2
018
80 A
NN
UA
L R
EPO
RT
20
18
--- B
OSK
ALI
S F
INA
NCIA
L ST
ATE
MEN
TS 2
01
8
Shareholdings other than subsidiaries and joint ventures, where there is significant influence on the financial and operating policy, are recognized under associates. Significant influence is presumed to exist when the Group holds 20 percent or more of the voting power of another entity.
The consolidated financial statements include the Group’s share in the result of associates, after adjustments to align the accounting policies with those of the Group, from the date that significant influence commences until the date it ceases to exist (see note 3.8).
If the ownership in a joint venture or associates is reduced, but joint control or significant influence is retained, dilution gains and losses arising from joint ventures and associates are recognized in the statement of profit or loss and only a proportionate share of the amount previously recognized in the statement of other comprehensive income is recycled to the consolidated statement of profit or loss, where appropriate.
If the Group loses significant influence over or joint control of an investment, it derecognizes the carrying amount of that investment (including any goodwill included in the carrying amount) and recognizes any resulting gain or loss, including the recycling of amounts previously recognized in the statement of other comprehensive income, from this event in the consolidated statement of profit or loss. Any investment retained is recognized at fair value.
3.2.4 ELIMINATION OF TRANSACTION UPON CONSOLIDATION Intragroup receivables and payables, as well as intragroup transactions, finance income and expenses and unrealized results within the Group are eliminated in the preparation of the consolidated financial statements. The Group recognizes its share in the results on transactions that transfer assets and liabilities between the Company and its investments or between its investments, to the extent these are considered realized as transactions with third parties and its joint venture partners, using proportionate elimination.
3.2.5 BUSINESS COMBINATION AND ACQUISITIONS OF NON-CONTROLLING INTERESTS Business combinations are accounted for using the acquisition method as at the acquisition date, which is the date on which control is transferred to the Group.
The Group measures goodwill at the acquisition date as: the fair value of the consideration transferred; plus the recognized amount of any non-controlling interests in the
acquiree; plus if the business combination is achieved in stages, the fair
value of the existing equity interest in the acquiree (refer also note to 3.8); less
the net recognized amount (generally fair value) of the identifiable assets acquired and liabilities assumed.
If the excess is negative (bargain purchase), the Group reassesses the correctness and completeness of the identified assets acquired and liabilities assumed, and the appropriateness of underlying assumptions and measurement approaches applied for valuation purposes. After such
reassessment, the determined gain on a bargain purchase is immediately recognized in the statement of profit or loss.
The consideration transferred does not include amounts related to the settlement of pre-existing relationships. Such amounts are recognized in the statement of profit or loss. Costs related to the acquisition, other than those associated with the issue of debt or equity securities, that the Group incurs in connection with a business combination are expensed as incurred.
A newly acquired non-controlling interest is valued at either the fair value or the proportionate share of the fair value of the acquired asset and liabilities, determined per transaction.
Accounting for acquisitions of non-controlling interests Acquisitions of non-controlling interests are accounted for as transactions with owners in their capacity as owners and therefore no goodwill is recognized as a result of such transactions.
3.3 FOREIGN CURRENCIES The assets and liabilities of foreign group companies and joint ventures that are denominated in functional currencies other than the euro are translated at the exchange rates as at the end of the reporting period. The statement of profit or loss items of the foreign group companies and joint operations concerned have been translated at average exchange rates. Resulting currency translation differences are added or charged directly to the currency translation reserve in Group equity. Exchange rate differences as a result of operational transactions are included in the Consolidated Statement of Profit or Loss for the reporting period.
At the end of each reporting period monetary items denominated in foreign currencies are translated at the rates prevailing at that date. The foreign currency gain or loss on monetary items is the difference between amortized cost in the functional currency at the beginning of the year, adjusted for effective interest and payments during the year, and the amortized cost in foreign currency translated at the exchange rate at the end of the year. Non-monetary items that are measured in terms of historical cost in a foreign currency are translated using the exchange rate at the date of the transaction. Foreign currency differences on non-current receivables, loans and other borrowings are recognized as finance income and expenses with the exception of differences resulting from financial instruments assigned to a hedged position (see section 3.4.3).
Joint ventures and associates with a functional currency other than the presentation currency of the Group are translated according to the aforementioned method, taking into account that assets and liabilities of these interests are not consolidated.
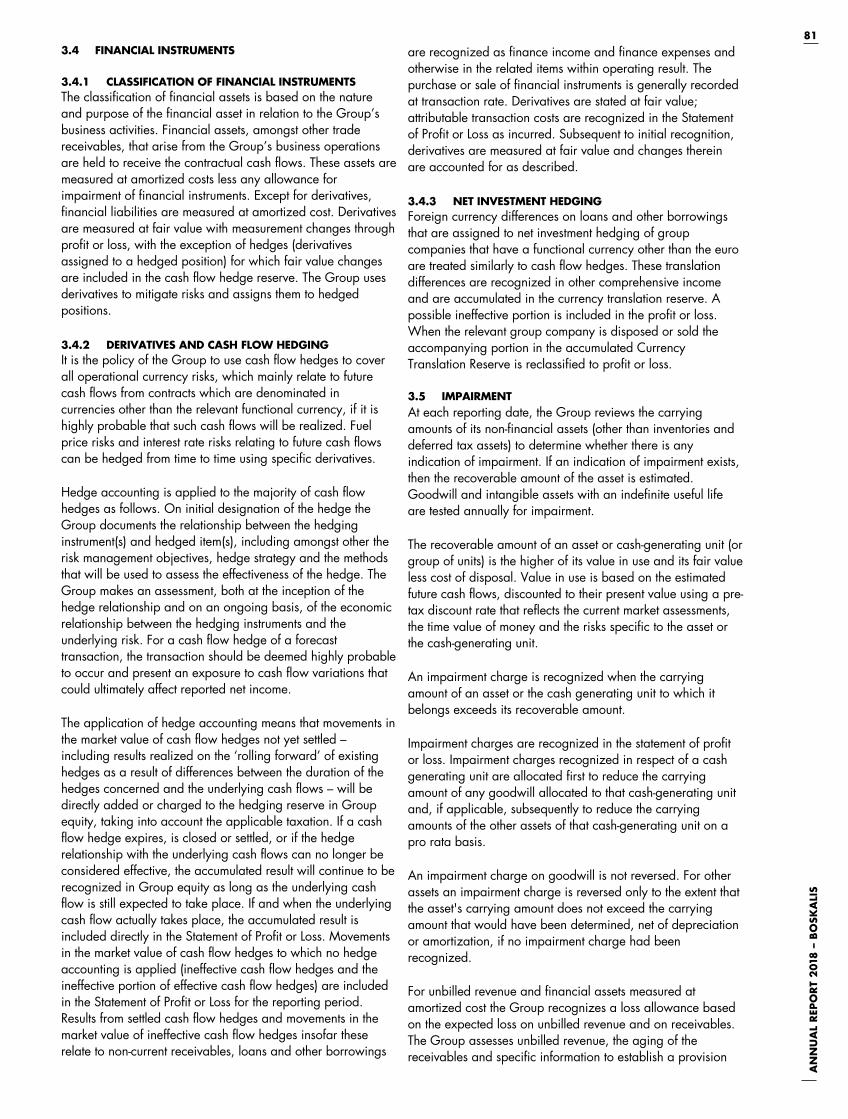
81
AN
NU
AL
REP
OR
T 2
018
– B
OSK
ALI
S
81
AN
NU
AL
REP
OR
T 2
01
8 ---
BO
SKA
LIS
3.4 FINANCIAL INSTRUMENTS
3.4.1 CLASSIFICATION OF FINANCIAL INSTRUMENTS The classification of financial assets is based on the nature and purpose of the financial asset in relation to the Group’s business activities. Financial assets, amongst other trade receivables, that arise from the Group’s business operations are held to receive the contractual cash flows. These assets are measured at amortized costs less any allowance for impairment of financial instruments. Except for derivatives, financial liabilities are measured at amortized cost. Derivatives are measured at fair value with measurement changes through profit or loss, with the exception of hedges (derivatives assigned to a hedged position) for which fair value changes are included in the cash flow hedge reserve. The Group uses derivatives to mitigate risks and assigns them to hedged positions.
3.4.2 DERIVATIVES AND CASH FLOW HEDGING It is the policy of the Group to use cash flow hedges to cover all operational currency risks, which mainly relate to future cash flows from contracts which are denominated in currencies other than the relevant functional currency, if it is highly probable that such cash flows will be realized. Fuel price risks and interest rate risks relating to future cash flows can be hedged from time to time using specific derivatives.
Hedge accounting is applied to the majority of cash flow hedges as follows. On initial designation of the hedge the Group documents the relationship between the hedging instrument(s) and hedged item(s), including amongst other the risk management objectives, hedge strategy and the methods that will be used to assess the effectiveness of the hedge. The Group makes an assessment, both at the inception of the hedge relationship and on an ongoing basis, of the economic relationship between the hedging instruments and the underlying risk. For a cash flow hedge of a forecast transaction, the transaction should be deemed highly probable to occur and present an exposure to cash flow variations that could ultimately affect reported net income.
The application of hedge accounting means that movements in the market value of cash flow hedges not yet settled – including results realized on the ‘rolling forward’ of existing hedges as a result of differences between the duration of the hedges concerned and the underlying cash flows – will be directly added or charged to the hedging reserve in Group equity, taking into account the applicable taxation. If a cash flow hedge expires, is closed or settled, or if the hedge relationship with the underlying cash flows can no longer be considered effective, the accumulated result will continue to be recognized in Group equity as long as the underlying cash flow is still expected to take place. If and when the underlying cash flow actually takes place, the accumulated result is included directly in the Statement of Profit or Loss. Movements in the market value of cash flow hedges to which no hedge accounting is applied (ineffective cash flow hedges and the ineffective portion of effective cash flow hedges) are included in the Statement of Profit or Loss for the reporting period. Results from settled cash flow hedges and movements in the market value of ineffective cash flow hedges insofar these relate to non-current receivables, loans and other borrowings
are recognized as finance income and finance expenses and otherwise in the related items within operating result. The purchase or sale of financial instruments is generally recorded at transaction rate. Derivatives are stated at fair value; attributable transaction costs are recognized in the Statement of Profit or Loss as incurred. Subsequent to initial recognition, derivatives are measured at fair value and changes therein are accounted for as described.
3.4.3 NET INVESTMENT HEDGING Foreign currency differences on loans and other borrowings that are assigned to net investment hedging of group companies that have a functional currency other than the euro are treated similarly to cash flow hedges. These translation differences are recognized in other comprehensive income and are accumulated in the currency translation reserve. A possible ineffective portion is included in the profit or loss. When the relevant group company is disposed or sold the accompanying portion in the accumulated Currency Translation Reserve is reclassified to profit or loss.
3.5 IMPAIRMENT At each reporting date, the Group reviews the carrying amounts of its non-financial assets (other than inventories and deferred tax assets) to determine whether there is any indication of impairment. If an indication of impairment exists, then the recoverable amount of the asset is estimated. Goodwill and intangible assets with an indefinite useful life are tested annually for impairment.
The recoverable amount of an asset or cash-generating unit (or group of units) is the higher of its value in use and its fair value less cost of disposal. Value in use is based on the estimated future cash flows, discounted to their present value using a pre-tax discount rate that reflects the current market assessments, the time value of money and the risks specific to the asset or the cash-generating unit.
An impairment charge is recognized when the carrying amount of an asset or the cash generating unit to which it belongs exceeds its recoverable amount.
Impairment charges are recognized in the statement of profit or loss. Impairment charges recognized in respect of a cash generating unit are allocated first to reduce the carrying amount of any goodwill allocated to that cash-generating unit and, if applicable, subsequently to reduce the carrying amounts of the other assets of that cash-generating unit on a pro rata basis.
An impairment charge on goodwill is not reversed. For other assets an impairment charge is reversed only to the extent that the asset's carrying amount does not exceed the carrying amount that would have been determined, net of depreciation or amortization, if no impairment charge had been recognized.
For unbilled revenue and financial assets measured at amortized cost the Group recognizes a loss allowance based on the expected loss on unbilled revenue and on receivables. The Group assesses unbilled revenue, the aging of the receivables and specific information to establish a provision
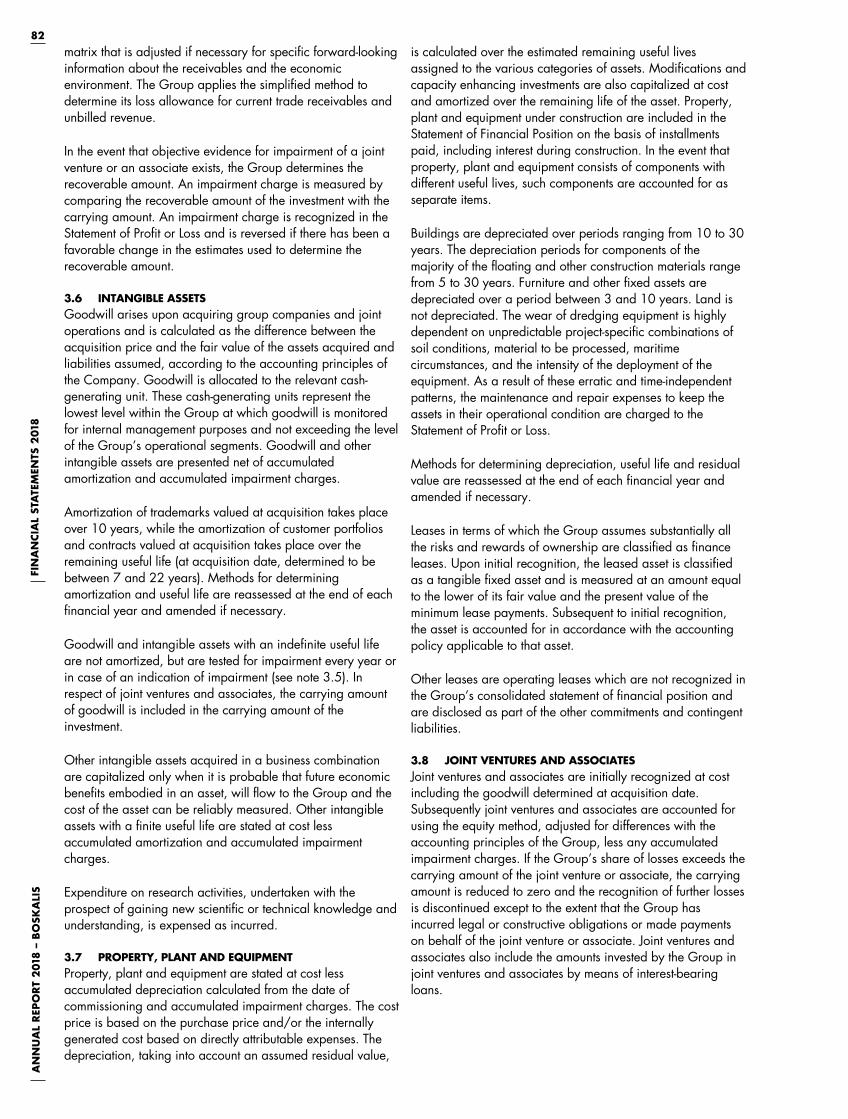
82A
NN
UA
L R
EPO
RT
201
8 –
BO
SKA
LIS
FIN
AN
CIA
L ST
ATE
MEN
TS 2
018
82 A
NN
UA
L R
EPO
RT
20
18
--- B
OSK
ALI
S F
INA
NCIA
L ST
ATE
MEN
TS 2
01
8
matrix that is adjusted if necessary for specific forward-looking information about the receivables and the economic environment. The Group applies the simplified method to determine its loss allowance for current trade receivables and unbilled revenue.
In the event that objective evidence for impairment of a joint venture or an associate exists, the Group determines the recoverable amount. An impairment charge is measured by comparing the recoverable amount of the investment with the carrying amount. An impairment charge is recognized in the Statement of Profit or Loss and is reversed if there has been a favorable change in the estimates used to determine the recoverable amount.
3.6 INTANGIBLE ASSETS Goodwill arises upon acquiring group companies and joint operations and is calculated as the difference between the acquisition price and the fair value of the assets acquired and liabilities assumed, according to the accounting principles of the Company. Goodwill is allocated to the relevant cash-generating unit. These cash-generating units represent the lowest level within the Group at which goodwill is monitored for internal management purposes and not exceeding the level of the Group’s operational segments. Goodwill and other intangible assets are presented net of accumulated amortization and accumulated impairment charges.
Amortization of trademarks valued at acquisition takes place over 10 years, while the amortization of customer portfolios and contracts valued at acquisition takes place over the remaining useful life (at acquisition date, determined to be between 7 and 22 years). Methods for determining amortization and useful life are reassessed at the end of each financial year and amended if necessary.
Goodwill and intangible assets with an indefinite useful life are not amortized, but are tested for impairment every year or in case of an indication of impairment (see note 3.5). In respect of joint ventures and associates, the carrying amount of goodwill is included in the carrying amount of the investment.
Other intangible assets acquired in a business combination are capitalized only when it is probable that future economic benefits embodied in an asset, will flow to the Group and the cost of the asset can be reliably measured. Other intangible assets with a finite useful life are stated at cost less accumulated amortization and accumulated impairment charges.
Expenditure on research activities, undertaken with the prospect of gaining new scientific or technical knowledge and understanding, is expensed as incurred.
3.7 PROPERTY, PLANT AND EQUIPMENT Property, plant and equipment are stated at cost less accumulated depreciation calculated from the date of commissioning and accumulated impairment charges. The cost price is based on the purchase price and/or the internally generated cost based on directly attributable expenses. The depreciation, taking into account an assumed residual value,
is calculated over the estimated remaining useful lives assigned to the various categories of assets. Modifications and capacity enhancing investments are also capitalized at cost and amortized over the remaining life of the asset. Property, plant and equipment under construction are included in the Statement of Financial Position on the basis of installments paid, including interest during construction. In the event that property, plant and equipment consists of components with different useful lives, such components are accounted for as separate items.
Buildings are depreciated over periods ranging from 10 to 30 years. The depreciation periods for components of the majority of the floating and other construction materials range from 5 to 30 years. Furniture and other fixed assets are depreciated over a period between 3 and 10 years. Land is not depreciated. The wear of dredging equipment is highly dependent on unpredictable project-specific combinations of soil conditions, material to be processed, maritime circumstances, and the intensity of the deployment of the equipment. As a result of these erratic and time-independent patterns, the maintenance and repair expenses to keep the assets in their operational condition are charged to the Statement of Profit or Loss.
Methods for determining depreciation, useful life and residual value are reassessed at the end of each financial year and amended if necessary.
Leases in terms of which the Group assumes substantially all the risks and rewards of ownership are classified as finance leases. Upon initial recognition, the leased asset is classified as a tangible fixed asset and is measured at an amount equal to the lower of its fair value and the present value of the minimum lease payments. Subsequent to initial recognition, the asset is accounted for in accordance with the accounting policy applicable to that asset.
Other leases are operating leases which are not recognized in the Group’s consolidated statement of financial position and are disclosed as part of the other commitments and contingent liabilities.
3.8 JOINT VENTURES AND ASSOCIATES Joint ventures and associates are initially recognized at cost including the goodwill determined at acquisition date. Subsequently joint ventures and associates are accounted for using the equity method, adjusted for differences with the accounting principles of the Group, less any accumulated impairment charges. If the Group’s share of losses exceeds the carrying amount of the joint venture or associate, the carrying amount is reduced to zero and the recognition of further losses is discontinued except to the extent that the Group has incurred legal or constructive obligations or made payments on behalf of the joint venture or associate. Joint ventures and associates also include the amounts invested by the Group in joint ventures and associates by means of interest-bearing loans.

83
AN
NU
AL
REP
OR
T 2
018
– B
OSK
ALI
S
83
AN
NU
AL
REP
OR
T 2
01
8 ---
BO
SKA
LIS
3.9 NON-CURRENT FINANCIAL ASSETS Non-current financial assets mainly comprise (other) non-current receivables which are carried at amortized cost. Accumulated impairment charges are deducted from the carrying amount.
3.10 FINANCIAL INSTRUMENTS AVAILABLE FOR SALE Financial instruments available for sale, as regulated by IAS39 Financial Instruments, include equity investments (certificates on shares) and are recognized initially at fair value increased with transaction costs. After first recognition, financial instruments available for sale are subsequently measured at fair value with unrealized gains or losses recognized in other comprehensive income. At derecognition or reclassification to associates, any cumulative unrealized result is recycled to and recognized in the statement of profit or loss. In case of impairment, the cumulative loss is reclassified from the other comprehensive income to the statement of profit or loss.
3.11 INVENTORIES Inventories, which mainly consist of fuel, auxiliary materials and spare parts, are stated at the lower of cost and net realizable value. Net realizable value is the estimated selling price in the ordinary course of business, less the estimated costs of disposal.
3.12 UNBILLED AND DEFERRED REVENUE Unbilled revenue (an asset) or Deferred revenue (a liability) concerns the balance of revenue recognized on contracts (see note 3.21) less progress billings and advance payments. Whether this balance results in an asset or a liability is assessed at the individual contract level.
3.13 TRADE AND OTHER RECEIVABLES Trade and other receivables are stated initially at fair value and subsequently at amortized cost less credit losses. Amortized cost is determined using the original effective interest rate. Trade and other receivables include prepayments (at historical cost), amongst other cost that are made to fulfill a contract for a customer. Such costs are capitalized and amortized over the lifetime of the contract.
3.14 CASH AND CASH EQUIVALENTS Cash and cash equivalents consist of cash and bank balances, deposits with terms of no more than three months or that qualify as highly liquid investments that are readily convertible and which are subject to insignificant risks of change in value. The explanatory notes disclose the extent to which cash and cash equivalents are not freely available as a result of transfer restrictions, joint control or other legal restrictions. Bank overdrafts are included as a component of cash and cash equivalents for the purpose of the consolidated statement of cash flows.
3.15 SHARE CAPITAL Ordinary shares are classified as equity. Incremental costs directly attributable to the issue of ordinary shares are recognized as a deduction from equity, net of any tax effects. Transaction costs directly attributable to share buy backs are recognized as a deduction from equity, net of any tax effects.
3.16 INTEREST-BEARING BORROWINGS Interest-bearing borrowings are liabilities mainly to financial institutions. At initial recognition, interest-bearing borrowings are stated at fair value less transaction costs. Subsequently, interest-bearing borrowings are stated at amortized cost with any difference between cost and redemption value being recognized in the statement of profit or loss over the period of the borrowings using the original effective interest rate.
3.17 EMPLOYEE BENEFITS Defined contribution pension plans A defined contribution pension plan is a post-employment benefit scheme under which the Group pays fixed contributions into a separate pension fund or an insurance company. The Group has no legal or constructive obligation to pay further amounts if the pension fund or insurance company has insufficient funds to pay employee benefits in connection with services rendered by the employee in the current period or prior periods. Obligations for contributions to defined contribution pension plans are recognized as an employee benefit expense as part of the personnel expenses in the statement of profit or loss when they are owed. Prepaid contributions are recognized as an asset. Contributions to a defined contribution pension plan payable more than 12 months after the period during which the employee rendered the services, are discounted.
Defined benefit pension plans A defined benefit pension plan is every post-employment benefit plan other than a defined contribution plan. For each separate defined benefit pension plan, the net asset or liability is determined as the balance of the discounted value of the future payments to employees and former employees, less the fair value of plan assets. The calculations are done by qualified actuaries using the projected unit credit method. The discount rate equals the yield on high-quality corporate bonds as at the date of the statement of financial position, with the period to maturity of the bonds approximating the duration of the liability. If the calculation results in a positive balance for the Group, the asset is included up to an amount equal to any unrecognized past service pension costs and the discounted value of economic benefits in the form of possible future refunds or lower future pension premiums from the fund. In calculating the discounted value of economic benefits, the lowest possible financing obligations are taken into account as applicable to the individual plans in force within the Group. An economic benefit is receivable by the Group if it can be realized within the period to maturity of the plan or upon settlement of the scheme’s obligations. Actuarial gains and losses, including any movements in limitations on net pension assets, are recognized in the unrecognized results within the statement of other comprehensive income. If plan benefits are changed or if a plan is amended, past service costs or a resulting curtailment profit or loss is recognized directly in the statement of profit or loss. The Group recognizes profit or losses on the settlement of defined benefit plans at the time of settlement.
Short-term employee benefits Short-term employee benefit obligations are measured on an undiscounted basis and are expensed when the related service is provided.

84A
NN
UA
L R
EPO
RT
201
8 –
BO
SKA
LIS
FIN
AN
CIA
L ST
ATE
MEN
TS 2
018
84 A
NN
UA
L R
EPO
RT
20
18
--- B
OSK
ALI
S F
INA
NCIA
L ST
ATE
MEN
TS 2
01
8
A liability is recognized for the amount expected to be paid under short-term cash bonus or profit-sharing plans if the Group has a present legal or constructive obligation to pay this amount as a result of past services provided by the employee, and the obligation can be estimated reliably.
Other long-term employee benefits Other long-term employee benefits mainly consist of jubilee benefits. The calculation of these liabilities is executed according to the ‘projected unit credit’ method, using the actuarial assumptions for the predominant defined benefit plan.
Remuneration plans Members of the Board of Management and some senior employees participate in a bonus plan that is based on the development of the share price, whereby the bonus is distributed in cash. The fair value of the amount payable over the year is recognized as personnel expenses in the statement of profit or loss, with a corresponding increase in liabilities. The liability is remeasured each reporting date and at settlement date. Any changes in the fair value of the liability are recognized as personnel expenses in the statement of profit or loss.
EU-IFRS expenses regarding the remuneration of the Board of Management include the amounts paid, payable and accrued for annual salaries and remuneration, pension plans, short-term and long-term variable remunerations and other reimbursements. The short-term and long-term variable remuneration expenses of the Board of Management, based on EU-IFRS, include the charge that relates to the short-term variable part for targets for the reporting year and the charge for the long-term variable part for targets that, until the actual payment is determined by the Remuneration Committee, are based on the assumption that the performance of the Board of Management is on target. This charge also includes any changes to the amounts accrued in previous years.
3.18 PROVISIONS Provisions are determined on the basis of estimates of future outflows of economic benefits relating to operational activities for legal or constructive obligations of an uncertain size or with an uncertain settlement date that arise from past events and for which a reliable estimate can be made. Provisions are discounted insofar as the difference between the discounted value and nominal value is material. If applicable, provisions relate, amongst other things, to reorganizations, warranties, onerous contracts, soil contamination, legal proceedings and received claims.
Provisions for reorganization costs are recognized when the Group has a detailed formal plan for the restructuring and has announced its main features to those affected by it at the date of the Statement of Financial Position or when the execution of the plan has commenced.
Provisions for warranties are recognized based on the best estimate of the expected cash outflows or cost of repair to settle contractually agreed warranties during the defect notification period for completed projects. The carrying amount of these provisions is estimated based on common
industry practice and the Group’s experience with warranty claims for relevant projects.
A provision for onerous contracts, including contracts with customers, is recognized when the expected benefits to be derived by the Group from a contract are lower than the remaining unavoidable cost of meeting its obligations under the contract.
In accordance with the Group’s policy and applicable legal requirements, a provision for site restoration in respect of contaminated land, and the related expenses, is recognized if the land is contaminated.
3.19 TRADE AND OTHER PAYABLES Trade and other payables are recognized initially at fair value and subsequently at (amortized) cost. If the difference between the discounted and nominal value is not material, trade and other payables are stated at cost.
3.20 ASSETS HELD FOR SALE Assets are classified as held for sale (disposal group) when it is highly probable that they will be recovered primarily through sale rather than through continuing use. Such assets are generally measured at the lower of their carrying amount and fair value less costs to sell. Liabilities related to the assets held for sale are separately recognized as liabilities held for sale. Once classified as held for sale, intangible assets and property, plant and equipment are no longer amortized or depreciated. For a joint venture or associate held for sale, the use of the equity method is discontinued.
3.21 REVENUE The Group has contracting activities in all three of its operational segments. Almost all activities are based on contracts with customers. These activities include construction projects and the execution of service-related contracts. The duration of the construction projects varies from approximately one month to several years. Service-related contracts also vary in duration, mostly from several days to more than a year, in the latter case due to a combination of multiple transports in a single contract. Contracts are agreements under which the Group and the customer have mutually enforceable rights and obligations. A combination of contracts rarely occurs but contract modifications, such as those related to additional work, are common. Additional work included in the recognition of revenue is based on mutually agreed contract modifications. In most cases such modifications or extended services are not distinct and therefore form part of a single performance obligation that is partially completed at the time of the contract modification. Most often the contracts contain only one performance obligation. Performance obligations are the asset to be constructed for the customer or the service that is to be rendered. Revenue recognized is based on contract considerations, including fixed prices and variable prices as well as indexation of raw materials and other costs, possible claims, incentives or liquidated damages. If there is a right to variable remuneration, such as incentive agreements, this is taken into account to the extent that it is highly unlikely that it will be reversed at a later date. Revenue is recognized over time when the customer simultaneously receives and consumes the benefits provided through the Group’s performance or
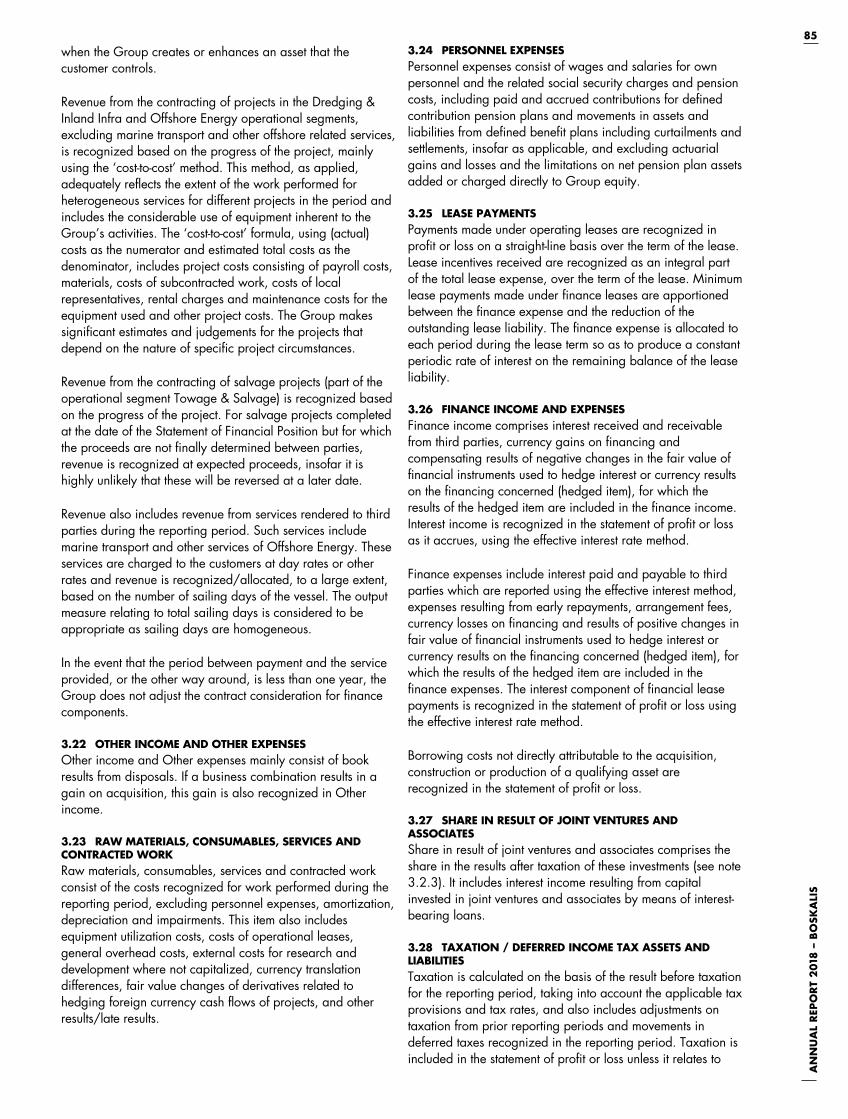
85
AN
NU
AL
REP
OR
T 2
018
– B
OSK
ALI
S
85
AN
NU
AL
REP
OR
T 2
01
8 ---
BO
SKA
LIS
when the Group creates or enhances an asset that the customer controls.
Revenue from the contracting of projects in the Dredging & Inland Infra and Offshore Energy operational segments, excluding marine transport and other offshore related services, is recognized based on the progress of the project, mainly using the ‘cost-to-cost’ method. This method, as applied, adequately reflects the extent of the work performed for heterogeneous services for different projects in the period and includes the considerable use of equipment inherent to the Group’s activities. The ‘cost-to-cost’ formula, using (actual) costs as the numerator and estimated total costs as the denominator, includes project costs consisting of payroll costs, materials, costs of subcontracted work, costs of local representatives, rental charges and maintenance costs for the equipment used and other project costs. The Group makes significant estimates and judgements for the projects that depend on the nature of specific project circumstances.
Revenue from the contracting of salvage projects (part of the operational segment Towage & Salvage) is recognized based on the progress of the project. For salvage projects completed at the date of the Statement of Financial Position but for which the proceeds are not finally determined between parties, revenue is recognized at expected proceeds, insofar it is highly unlikely that these will be reversed at a later date.
Revenue also includes revenue from services rendered to third parties during the reporting period. Such services include marine transport and other services of Offshore Energy. These services are charged to the customers at day rates or other rates and revenue is recognized/allocated, to a large extent, based on the number of sailing days of the vessel. The output measure relating to total sailing days is considered to be appropriate as sailing days are homogeneous.
In the event that the period between payment and the service provided, or the other way around, is less than one year, the Group does not adjust the contract consideration for finance components.
3.22 OTHER INCOME AND OTHER EXPENSES Other income and Other expenses mainly consist of book results from disposals. If a business combination results in a gain on acquisition, this gain is also recognized in Other income.
3.23 RAW MATERIALS, CONSUMABLES, SERVICES AND CONTRACTED WORK Raw materials, consumables, services and contracted work consist of the costs recognized for work performed during the reporting period, excluding personnel expenses, amortization, depreciation and impairments. This item also includes equipment utilization costs, costs of operational leases, general overhead costs, external costs for research and development where not capitalized, currency translation differences, fair value changes of derivatives related to hedging foreign currency cash flows of projects, and other results/late results.
3.24 PERSONNEL EXPENSES Personnel expenses consist of wages and salaries for own personnel and the related social security charges and pension costs, including paid and accrued contributions for defined contribution pension plans and movements in assets and liabilities from defined benefit plans including curtailments and settlements, insofar as applicable, and excluding actuarial gains and losses and the limitations on net pension plan assets added or charged directly to Group equity.
3.25 LEASE PAYMENTS Payments made under operating leases are recognized in profit or loss on a straight-line basis over the term of the lease. Lease incentives received are recognized as an integral part of the total lease expense, over the term of the lease. Minimum lease payments made under finance leases are apportioned between the finance expense and the reduction of the outstanding lease liability. The finance expense is allocated to each period during the lease term so as to produce a constant periodic rate of interest on the remaining balance of the lease liability.
3.26 FINANCE INCOME AND EXPENSES Finance income comprises interest received and receivable from third parties, currency gains on financing and compensating results of negative changes in the fair value of financial instruments used to hedge interest or currency results on the financing concerned (hedged item), for which the results of the hedged item are included in the finance income. Interest income is recognized in the statement of profit or loss as it accrues, using the effective interest rate method.
Finance expenses include interest paid and payable to third parties which are reported using the effective interest method, expenses resulting from early repayments, arrangement fees, currency losses on financing and results of positive changes in fair value of financial instruments used to hedge interest or currency results on the financing concerned (hedged item), for which the results of the hedged item are included in the finance expenses. The interest component of financial lease payments is recognized in the statement of profit or loss using the effective interest rate method.
Borrowing costs not directly attributable to the acquisition, construction or production of a qualifying asset are recognized in the statement of profit or loss.
3.27 SHARE IN RESULT OF JOINT VENTURES AND ASSOCIATES Share in result of joint ventures and associates comprises the share in the results after taxation of these investments (see note 3.2.3). It includes interest income resulting from capital invested in joint ventures and associates by means of interest-bearing loans.
3.28 TAXATION / DEFERRED INCOME TAX ASSETS AND LIABILITIES Taxation is calculated on the basis of the result before taxation for the reporting period, taking into account the applicable tax provisions and tax rates, and also includes adjustments on taxation from prior reporting periods and movements in deferred taxes recognized in the reporting period. Taxation is included in the statement of profit or loss unless it relates to

86A
NN
UA
L R
EPO
RT
201
8 –
BO
SKA
LIS
FIN
AN
CIA
L ST
ATE
MEN
TS 2
018
86 A
NN
UA
L R
EPO
RT
20
18
--- B
OSK
ALI
S F
INA
NCIA
L ST
ATE
MEN
TS 2
01
8
items recognized directly in equity, in which case taxation is included in equity. Income tax expenses also include the corporate income tax levied on deemed profit determined by revenue (withholding tax). Temporary differences are accounted for in deferred tax assets and/or deferred tax liabilities. Deferred tax assets are only recognized to the extent that it is probable that taxable profit will be available for realization in the foreseeable future. Deferred tax assets are reviewed at each reporting date and are reduced to the extent that it is no longer probable that the related tax benefit will be realized. Deferred tax assets and liabilities are offset if there is a legally enforceable right to do so, and if they relate to income taxes levied by the same tax authority on the same taxable entity or on different tax entities, but provided there is an intention to settle the tax liabilities and assets on a net basis or the tax assets and liabilities will be realized simultaneously. Deferred income tax assets and liabilities are recognized at nominal value. Additional (income) taxes that arise from the distribution of dividend are recognized at the same time that the liability to pay the related dividend is recognized.
3.29 EARNINGS PER SHARE The Group discloses earnings per ordinary share as well as diluted earnings per ordinary share. Earnings per ordinary share are calculated based on the result attributable to the Group’s shareholders divided by the calculated weighted average number of issued ordinary shares during the reporting period, taking into account any shares that have been issued or repurchased during the reporting period. In calculating the diluted earnings per share the result attributable to the Group’s shareholders and the weighted average number of issued ordinary shares are adjusted for all potentially diluting effects on ordinary shares.
3.30 DIVIDEND Dividends are recognized as a liability in the period in which they are declared.
3.31 DETERMINATION OF FAIR VALUE A number of the Group’s accounting policies and disclosures require the determination of fair value, for both financial and non-financial assets and liabilities. Fair value is determined for measurement and/or disclosure purposes based on the following methods:
Intangible assets The fair value of other intangible assets recorded as a result of a business combination is based on the discounted cash flows expected to be derived from the use and eventual sale of the assets.
Joint ventures and associates Where relevant, the fair value of joint ventures and associates is determined or disclosed based on quoted prices or business valuations.
Property, plant and equipment The fair value of property, plant and equipment recognized as a result of a business combination is based on market values. The market value of property is the estimated amount for which a property could be exchanged on the date of valuation between a willing buyer and a willing seller in an arm’s length transaction, after proper marketing wherein each party acted knowledgeably, prudently and without compulsion.
Trade and other receivables The fair value of trade and other receivables, other than due from customers, is estimated as the present value of future cash flows, discounted at the market rate of interest at the reporting date.
Share-based payment transactions The fair value is determined based on quoted prices.
Derivatives The fair value of derivatives is based on the estimated amount to be paid or received for a settlement of the contract as at the reporting date taking into account the actual interest rate and the credit rating of the counterparty. The fair value is based on broker quotes tested for reasonableness by discounting estimated future cash flows based on the terms and maturity of each contract and using market interest rates for a similar instrument at the measurement date.
Non-derivative financial liabilities Fair value, which is determined for disclosure purposes, is calculated based on the present value of future principal and interest cash flows, discounted at the market rate of interest at the reporting date.
Fair value hierarchy Assets and liabilities for which fair value is measured or disclosed in the financial statements are categorized within the fair value hierarchy as follows:
Level 1: quoted prices (unadjusted) in active markets for identical assets or liabilities;
Level 2: inputs other than quoted prices included within Level 1 that are observable for the asset or liability, either directly (i.e. as prices) or indirectly (i.e. derived from prices).
Level 3: inputs for the asset or liability that are not based on observable market data (unobservable inputs).
3.32 CONSOLIDATED STATEMENT OF CASH FLOWS The consolidated statement of cash flows is drawn up using the indirect method. Cash is defined as cash and cash equivalents including bank overdrafts as presented in the explanatory notes to the cash and cash equivalents. Cash flows are presented separately in the statement of cash flows as cash flows from operating activities, investing activities and financing activities. The cash flows in the statement of cash flows also included the cash flows, if any, related to disposal group.

87
AN
NU
AL
REP
OR
T 2
018
– B
OSK
ALI
S
87
AN
NU
AL
REP
OR
T 2
01
8 ---
BO
SKA
LIS
3.33 FIRST-TIME APPLICATION OF IFRS 9 ‘FINANCIAL INSTRUMENTS’ AND IFRS 15 ‘REVENUE FROM CONTRACTS WITH CUSTOMERS’ Impact of IFRS 9 IFRS 9 introduces the required expected credit loss model for receivables and unbilled revenue. The impact of IFRS 9 on the Consolidated Statement of Financial Position is limited to Joint ventures and associates (EUR 1,289 thousand lower), deferred tax assets (EUR 38 thousand higher), Trade receivables (EUR 153 thousand lower) and the cumulative effect within Group equity (EUR 1,404 thousand lower). In line with IFRS 9 the Group has included the total impact in equity as at 1 January 2018 without restating the comparative information for the 2017 financial year. The hedge accounting model under IFRS 9 is more flexible and allows more hedges to qualify for hedge accounting. The Group applies the prospective approach for the transition of hedge accounting, in accordance with IFRS 9.
Classification of financial instruments As required by IFRS, the classification of the financial instruments of the Group, according to IFRS 9 and compared to IAS 39, can be summarized as follows:
Item in Statement of Financial Position Classification according to IFRS 9 ‘Financial Instruments’ Classification according to IAS 39: ‘Financial
Instruments: Recognition and Measurement’ 1 JANUARY 2018
Financial assets Derivatives assets Fair value through profit or loss Fair value through profit or loss 29,876Trade and other receivables Amortized costs Loans and receivables (amortized costs) 759,139Cash and cash equivalents Amortized costs Loans and receivables (amortized costs) 191,948 Financial liabilities Derivatives liabilities Fair value through profit or loss Fair value through profit or loss 2,258Interest-bearing borrowings Amortized costs Financial liabilities at amortized costs 270,864Bank overdrafts Amortized costs Financial liabilities at amortized costs 40,794Trade and other payables Amortized costs Financial liabilities at amortized costs 1,011,629

88A
NN
UA
L R
EPO
RT
201
8 –
BO
SKA
LIS
FIN
AN
CIA
L ST
ATE
MEN
TS 2
018
88 A
NN
UA
L R
EPO
RT
20
18
--- B
OSK
ALI
S F
INA
NCIA
L ST
ATE
MEN
TS 2
01
8
IFRS 15 Revenue from Contracts with Customers With respect to IFRS 15 the Group applied the full retrospective approach and has used the transition options that contracts completed before 1 January 2017 or contracts that begin and end within the same annual reporting period do not need to be restated (see note 3.12 Contract Assets and Liabilities and note 3.21 Revenue). IFRS 15 has introduced contract assets and liabilities. Within the Group contract assets are defined as unbilled revenue and contract liabilities as deferred revenue. This largely comprises unbilled revenue resulting from contracting activities, previously reported as ‘due from customers’ or deferred revenue, previously reported as ‘due to customers’. Unbilled and deferred revenue also includes amounts to be invoiced and accrued income for service activities that were previously reported as part of ‘Other receivables’ and ‘Other liabilities’, respectively. The changes incorporated in IFRS 15 have no impact on the Consolidated Statement of Other Comprehensive Income.
Impact on Consolidated Statement of Profit or Loss The effect of IFRS 15 on the Consolidated Statement of Profit or Loss 2017 was:
(in thousands of EUR)
2017 (IAS 11, IAS18)
EFFECT FIRST-TIME APPLICATION OF
IFRS 15 2017
(IFRS 15)
Operating income Revenue 2,337,205 5,418 2,342,623Other income 32,152 - 32,152
2,369,357 5,418 2,374,775
Operating expenses Raw materials, consumables, services and subcontracted work - 1,515,904 - 5,418 - 1,521,322Other operating expenses - 699,428 - - 699,428
- 2,215,332 - 5,418 - 2,220,750 Share in result of joint ventures and associates 31,020 - 31,020
Results from operating activities (EBIT) 185,045 - 185,045 Finance income and expenses - 12,925 - - 12,925
Profit/loss (-) before taxation 172,120 - 172,120
Income tax expenses - 21,677 - - 21,677
Net Group profit/loss (-) 150,443 - 150,443
Net Group profit/loss (-) attributable to: Shareholders 150,469 - 150,469Non-controlling interests - 26 - - 26
150,443 - 150,443
The effect concerns costs which classify as costs to fulfill a contract under IFRS 15. Impact on Consolidated Statement of Financial Position as per 31 December 2017 The effect of IFRS 15 on the Consolidated Statement of Financial Position was:
(in thousands of EUR)
31 DECEMBER 2017 (IAS 11, IAS18)
EFFECT FIRST-TIME APPLICATION OF
IFRS 15 31 DECEMBER 2017
(IFRS 15)
Current assets Due from customers 123,457 - 123,457 -Unbilled revenue - 167,594 167,594Trade and other receivables 759,139 - 27,945 731,194
Current liabilities Due to customers 230,651 - 230,651 -Deferred revenue - 277,550 277,550Trade and other payables 1,011,629 - 32,707 978,922Other current liabilities 207,573 2,000 209,573

89
AN
NU
AL
REP
OR
T 2
018
– B
OSK
ALI
S
89
AN
NU
AL
REP
OR
T 2
01
8 ---
BO
SKA
LIS
Impact on Consolidated Statement of Financial Position as per 1 January 2017 The impact on Current assets and Current liabilities as per 1 January 2017 can be summarized as follows:
(In thousands of EUR, only relevant items in Consolidated Statements of Financial
Position as at 1 January 2017)
1 JANUARY 2017 (IAS 11, IAS18)
EFFECT FIRST-TIME APPLICATION OF
IFRS 15 1 JANUARY 2017
(IFRS 15)
Current assets Due from customers 87,194 - 87,194 -Unbilled revenue - 125,272 125,272Trade and other receivables 597,928 - 12,840 585,088
Current liabilities Due to customers 315,632 - 315,632 -Deferred revenue - 428,676 428,676Trade and other payables 1,085,684 - 89,806 995,878Provisions 22,027 2,000 24,027
First-time application of IFRS 15 did not impact Non-current assets, Non-current liabilities and Group equity in the Consolidated Statement of Financial Position as per 1 January 2017.

90A
NN
UA
L R
EPO
RT
201
8 –
BO
SKA
LIS
FIN
AN
CIA
L ST
ATE
MEN
TS 2
018
AN
NU
AL
REP
OR
T 2
01
8 ---
BO
SKA
LIS
FI
NA
NCIA
L ST
ATE
MEN
TS 2
01
8
90
4. SEGMENT REPORTING
The Group recognizes three operational segments which comprise the divisions of the Group as described below. These divisions offer different products and services and are managed separately because they require different strategies. Each of the divisions reports on a quarterly basis, by means of internal management reporting to the Board of Management.
The following is a brief summary of the activities of the operational segments:
Dredging & Inland Infra Traditionally, dredging is the core activity of the Group. It involves all activities required to remove silt, sand and other layers from the seabed and river bed and in some cases using it elsewhere where possible, for example for coastal protection or land reclamation. The services provided also include the construction and maintenance of ports and waterways, and coastal defense and riverbank protection, as well as associated specialist services such as underwater rock fragmentation. In addition, the Group is active in the extraction of raw materials using dredging techniques and dry earthmoving. In the Netherlands, the Group also operates as a contractor of dry infrastructure projects. This involves the design, preparation (by means of dry earthmoving) and execution of large-scale civil infra works, such as the construction of roads and railroads, bridges, dams, viaducts and tunnels. These activities include performing specialist works such as soil improvement and land remediation.
Offshore Energy With the offshore contracting capabilities and services the Group supports activities of the international energy sector, including oil and gas companies and providers of renewable energy such as wind power. The Group is involved in the engineering, construction, maintenance and decommissioning of oil and LNG-import/export facilities, offshore platforms, pipelines and cables and offshore wind farms. In performing these activities the Group applies its expertise in the areas of heavy transport, lift and installation work, as well as diving and ROV services complemented with marine surveying dredging, offshore pipeline installation, rock installation, offshore cable installation and marine activities. The acquired surveying activities of Gardline have been part of this segment since 15 August 2017.
Towage & Salvage In ports around the world assistance is provided to incoming and outgoing ocean-going vessels through the Group’s joint ventures Keppel Smit Towage, Saam Smit Towage and Kotug Smit Towage. In addition, a full range of services for the operation and management of onshore and offshore terminals is offered through its strategic joint venture Smit Lamnalco. These services include assistance with the berthing and unberthing of tankers at oil and LNG terminals as well as additional support services. The versatile fleet of over 400 vessels provides assistance to, amongst others, oil and chemical tankers, container ships, reefers, RoRo ships and mixed cargo ships in around 100 ports and terminal locations in 35 countries. Smit Salvage provides marine salvage-related services and assistance to vessels in distress and is able to act at anytime and anywhere in the world. It is able to do so by operating out of four locations which are strategically situated in relation to the main international shipping routes: Houston, Cape Town, Rotterdam and Singapore. Wreck removal of sunken ships and offshore platforms almost always takes place at locations where the wreck forms an obstruction to traffic or presents an environmental hazard.
Segments The operational segments are monitored based on the segment result (operating result) and EBITDA. The segment result and EBITDA are used to measure the performance of operational segments, both between segments and compared to other companies in the same industry. Inter-operational segment services, if any, take place on an arm’s length basis. In the reporting period there were no material inter-operational segment services. For contracts executed in a joint operation of two segments, the segments only report their own share in revenue and the results recognized, resulting in no material related party transactions between segments that need to be eliminated. EBITDA is defined as being the segment result before depreciation, amortization and impairments.

91
AN
NU
AL
REP
OR
T 2
018
– B
OSK
ALI
S
AN
NU
AL
REP
OR
T 2
01
8 ---
B
OSK
ALI
S
91
4.1 OPERATIONAL SEGMENTS
2018 DREDGING &
INLAND INFRAOFFSHORE
ENERGYTOWAGE &
SALVAGEHOLDING &
ELIMINATIONS GROUP
Revenue 1,428,731 1,041,358 131,658 - 32,198 2,569,549
EBITDA 243,830 111,346 36,362 - 37,972 353,566
Share in result of joint ventures and associates, before extraordinary charges 4,354 3,834 19,990 208 28,386
Operating result (before extraordinary charges) 123,357 5,002 33,131 - 42,527 118,963
Extraordinary charges, including within joint ventures - 519,474
EBIT - 400,511
Non-allocated finance income and expenses - 13,281
Non-allocated income tax expenses - 19,944
Net Group profit / loss (-) - 433,736
Carrying amount of joint ventures and associates 19,387 63,753 347,620 - 1,127 429,633
Investments in property, plant and equipment 112,079 73,090 1,261 8,323 194,753
Depreciation on property, plant and equipment 120,449 103,847 2,281 4,555 231,132
Amortization of intangible assets 24 2,497 950 - 3,471
Impairment charges on property, plant and equipment - 136,864 - - 136,864
Impairment charges on goodwill - 154,939 - - 154,939
Impairment charges on joint ventures and associates - - 189,879 - 189,879
Impairment charges within joint ventures - - 20,556 - 20,556
2017 REVISED* DREDGING &
INLAND INFRAOFFSHORE
ENERGYTOWAGE &
SALVAGEHOLDING &
ELIMINATIONS GROUP
Revenue 1,298,317 972,136 100,463 - 28,293 2,342,623
EBITDA 219,055 221,121 35,086 - 38,654 436,608
Share in result of joint ventures and associates, before extraordinary charges 3,606 256 26,060 1,098 31,020
Operating result (EBIT) 110,488 85,020 32,803 - 43,266 185,045
Non-allocated finance income and expenses - 12,925
Non-allocated income tax expenses - 21,677
Net Group profit / loss (-) 150,443
Carrying amount of joint ventures and associates 15,495 59,244 702,094 102 776,935
Investments in property, plant and equipment 143,044 207,898 444 3,293 354,679
Depreciation on property, plant and equipment 108,567 126,619 2,283 4,612 242,081
Amortization of intangible assets - 9,482 - - 9,482
* The introduction of IFRS 15 results in an increase of revenue within the operational segment Offshore Energy with EUR 5.4 million.
As required by IFRS, the information as presented above reconciles to the internal management information of the Board of Management. In measuring the financial performance of operational segments certain line items relating to extraordinary charges were presented differently in the internal management information compared to in the EU-IFRS consolidated financial statements.
In the EU-IFRS Consolidated Statement of Profit or Loss the Result from operating activities (EBIT) shows a loss of EUR 400.5 million and includes impairment charges of EUR 481.7 million, related additions to provisions of EUR 17.2 million and impairment charges accounted for within joint ventures of EUR 20.6 million, totaling the extraordinary charges to EUR 519.5 million. The Operating result (before impairment charges) presented in the table above shows a profit of EUR 119.0 million profit and does not include these extraordinary charges. The impairment charges are specified for each operational segment in the table above. EBITDA in the table above equals the operating result before depreciation and amortization.

92A
NN
UA
L R
EPO
RT
201
8 –
BO
SKA
LIS
FIN
AN
CIA
L ST
ATE
MEN
TS 2
018
AN
NU
AL
REP
OR
T 2
01
8 ---
BO
SKA
LIS
FI
NA
NCIA
L ST
ATE
MEN
TS 2
01
8
92
5. BUSINESS COMBINATIONS AND OTHER SIGNIFICANT TRANSACTIONS
5.1 BUSINESS COMBINATIONS AND OTHER SIGNIFICANT TRANSACTIONS IN PRIOR YEAR On 15 August 2017 the Group acquired control over Gardline Holdings Ltd, United Kingdom, through the acquisition of all its outstanding shares, for a cash consideration of GBP 34.0 million (EUR 37.4 million).
The acquisition has resulted in a positive impact on the net result for the year 2017 of approximately EUR 14.6 million, comprising a net-profit of EUR 0.8 million (excluding restructuring expenses), a gain from the bargain purchase of EUR 24.1 million, restructuring expenses of EUR 9.2 million and transaction costs relating to the acquisition of EUR 1.2 million. The contribution to the Group in 2017 was EUR 24.9 million to revenue and EUR 14.6 million to net profit, respectively.
On 12 January 2017 the Group sold its subsidiary Aannemingsmaatschappij Markus B.V. The transaction did not result in a book result.
On 28 February 2017 the Group sold its remaining investment in Fugro N.V. at EUR 14.50 per share. The net proceeds amounted to EUR 114.1 million; the impact on the net result in 2017 was a loss of EUR 0.9 million.
5.2 SALE OF INTEREST IN PARTNERSHIP SAAM SMIT TOWAGE Early February 2019 the Group signed an agreement with Sudamericana Agencias Aereas y Maritimas S.A. (SAAM) relating to the sale and purchase of the Group’s interest in the partnership Saam Smit Towage. Boskalis expects to receive USD 201 million in cash for its interest. In the fourth quarter of 2018 the interest in the partnership, previously reported under Joint ventures and associates, is classified as a disposal group. The disposal group, within the operational segment Towage & Salvage, is valued, after recognizing an impairment charge of EUR 93.6 million, at its fair value of EUR 175.8 million. As from the classifying as a disposal group, no further share in the results of the partnership will be recognized by the Group. As at 31 December 2018 the cumulative unrecognized income and expenses relating to the disposal group amounts to a net income of EUR 42.1 million and consist of positive currency translation differences. The disposal of our interest in the partnership, which is expected to be realized in the first half 2019, is expected to result in a positive book result of approximately EUR 43 million, before, if any, corporate income tax due on this transaction.
6. REVENUE
Revenue by region can be specified as follows:
REVENUE
2018 2017 REVISED*
The Netherlands 605,582 497,771Rest of Europe 951,989 856,522Australia / Asia 336,070 364,442Middle East 355,238 256,392Africa 106,148 84,840North and South America 214,522 282,656
2,569,549 2,342,623
* The comparative figures of region Australia / Asia are revised with EUR 5.4 million due to the first-time application of IFRS 15.
A region is determined as the location at which projects are realized and services are provided. For sea transport the region refers to the port of arrival (or nearest point of arrival) of the transport or the project location for offshore installation. A large part of the Group’s revenue is generated on projects for a variety of clients in various countries and geographical areas. Because of the often-incidental nature and spread of the contracts none of these clients qualifies structurally as a material client in relation to the total revenue of the Group.

93
AN
NU
AL
REP
OR
T 2
018
– B
OSK
ALI
S
AN
NU
AL
REP
OR
T 2
01
8 ---
B
OSK
ALI
S
93
Revenue by activity can be specified as follows:
REVENUE
2018 2017 REVISED
Contracting activities 2,119,808 1,907,986Service activities 449,741 434,637
2,569,549 2,342,623
Revenue from contracting activities mainly comprises net revenue from the operational segments of Dredging & Inland Infra and Offshore Energy (excluding marine transport and other offshore services), and salvage projects. For most of the contracting activities the most common type of contract is based on a fixed/lump sum price. In these cases the contractor’s price must take into account virtually all the operational risks as well as the costs and other risks associated with the procurement of materials and subcontractor services. In most cases it is not possible to charge clients for any unforeseen costs and the Group acts as contractor and principal of the engagement.
Revenue from services rendered to third parties is primarily realized in the Offshore Energy (marine transport and other services) operational segment and in the joint ventures within the Towage & Salvage operational segment. The services are usually charged at day rates.
The value of the order book equals the contract revenue of projects yet to be completed and services yet to be rendered at balance sheet date and amounts to EUR 4.3 billion (2017: EUR 3.5 billion).
Contracts are not included in the order book until agreement has been reached with the client. The Group estimates that approximately 40% of the order book will be executed next year (31 December 2017: 50%). Actual execution depends on several factors, such as weather, soil, technical conditions, cooperation with subcontractors, the availability of cargo, and other factors.
7. OTHER INCOME AND OTHER EXPENSES
Other income mainly relates to book profits on the disposal of property, plant and equipment of EUR 7.1 million (2017: EUR 8.0 million). Other income in the prior year also included the gross result of EUR 24.1 million on the bargain purchase of the Gardline Group (see note 5.1).
Other expenses relates to book losses on the disposal of equipment, amounting to EUR 2.5 million (2017: EUR 0.7 million). Other expenses in the prior year also included EUR 0.9 million relating to the divestment of the remaining stake in Fugro N.V. (see note 5.1).
8. RAW MATERIALS, CONSUMABLES, SERVICES AND SUBCONTRACTED WORK
As part of this line item operating lease costs relating to leased equipment are reported for an amount of EUR 29 million (2017: EUR 31 million).
9. PERSONNEL EXPENSES
2018 2017
Wages and salaries - 352,013 - 370,803Social security expenses - 39,278 - 35,376Pension expenses for defined benefit pension plans - 1,542 - 1,046Pension expenses for defined contribution pension plans - 41,133 - 39,061
- 433,966 - 446,286
A number of senior managers participates in a long-term incentive plan based upon the development of the share price, which is settled on a cash basis. The fair value of the related liability for the year is included as part of the personnel expenses in the statement of profit or loss. The related charge for 2018 amounts to EUR 1.6 million (2017: EUR 2.0 million) and the corresponding liability is EUR 4.6 million (2017: EUR 4.8 million). For the remuneration of the Board of Management and the Supervisory Board refer to note 30.2.
In 2018 expenses for reorganization were incurred for an amount of EUR 6.8 million, mainly in connection with the decision to exit the low end of the transport market, which are fully reported under Raw materials,
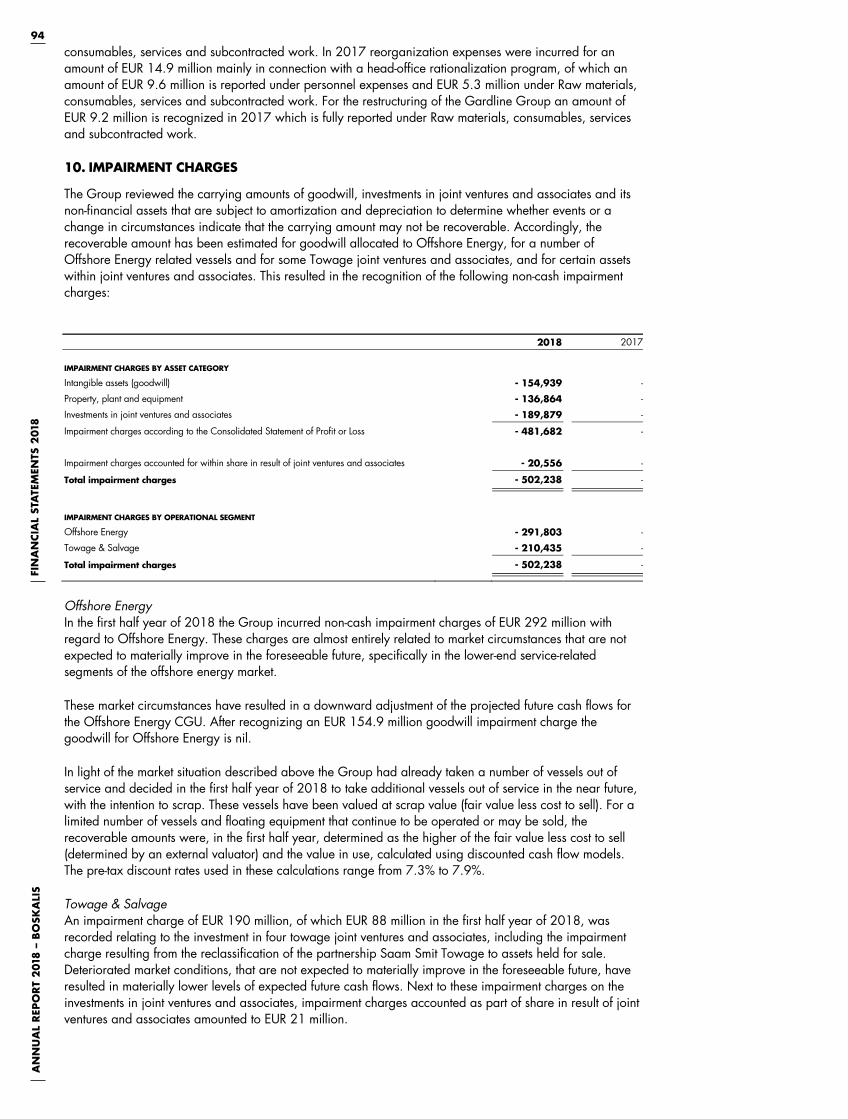
94A
NN
UA
L R
EPO
RT
201
8 –
BO
SKA
LIS
FIN
AN
CIA
L ST
ATE
MEN
TS 2
018
AN
NU
AL
REP
OR
T 2
01
8 ---
BO
SKA
LIS
FI
NA
NCIA
L ST
ATE
MEN
TS 2
01
8
94
consumables, services and subcontracted work. In 2017 reorganization expenses were incurred for an amount of EUR 14.9 million mainly in connection with a head-office rationalization program, of which an amount of EUR 9.6 million is reported under personnel expenses and EUR 5.3 million under Raw materials, consumables, services and subcontracted work. For the restructuring of the Gardline Group an amount of EUR 9.2 million is recognized in 2017 which is fully reported under Raw materials, consumables, services and subcontracted work.
10. IMPAIRMENT CHARGES
The Group reviewed the carrying amounts of goodwill, investments in joint ventures and associates and its non-financial assets that are subject to amortization and depreciation to determine whether events or a change in circumstances indicate that the carrying amount may not be recoverable. Accordingly, the recoverable amount has been estimated for goodwill allocated to Offshore Energy, for a number of Offshore Energy related vessels and for some Towage joint ventures and associates, and for certain assets within joint ventures and associates. This resulted in the recognition of the following non-cash impairment charges:
2018 2017
IMPAIRMENT CHARGES BY ASSET CATEGORY
Intangible assets (goodwill) - 154,939 -
Property, plant and equipment - 136,864 -
Investments in joint ventures and associates - 189,879 -
Impairment charges according to the Consolidated Statement of Profit or Loss - 481,682 -
Impairment charges accounted for within share in result of joint ventures and associates - 20,556 -
Total impairment charges - 502,238 -
IMPAIRMENT CHARGES BY OPERATIONAL SEGMENT
Offshore Energy - 291,803 -
Towage & Salvage - 210,435 -
Total impairment charges - 502,238 -
Offshore Energy In the first half year of 2018 the Group incurred non-cash impairment charges of EUR 292 million with regard to Offshore Energy. These charges are almost entirely related to market circumstances that are not expected to materially improve in the foreseeable future, specifically in the lower-end service-related segments of the offshore energy market.
These market circumstances have resulted in a downward adjustment of the projected future cash flows for the Offshore Energy CGU. After recognizing an EUR 154.9 million goodwill impairment charge the goodwill for Offshore Energy is nil.
In light of the market situation described above the Group had already taken a number of vessels out of service and decided in the first half year of 2018 to take additional vessels out of service in the near future, with the intention to scrap. These vessels have been valued at scrap value (fair value less cost to sell). For a limited number of vessels and floating equipment that continue to be operated or may be sold, the recoverable amounts were, in the first half year, determined as the higher of the fair value less cost to sell (determined by an external valuator) and the value in use, calculated using discounted cash flow models. The pre-tax discount rates used in these calculations range from 7.3% to 7.9%.
Towage & Salvage An impairment charge of EUR 190 million, of which EUR 88 million in the first half year of 2018, was recorded relating to the investment in four towage joint ventures and associates, including the impairment charge resulting from the reclassification of the partnership Saam Smit Towage to assets held for sale. Deteriorated market conditions, that are not expected to materially improve in the foreseeable future, have resulted in materially lower levels of expected future cash flows. Next to these impairment charges on the investments in joint ventures and associates, impairment charges accounted as part of share in result of joint ventures and associates amounted to EUR 21 million.
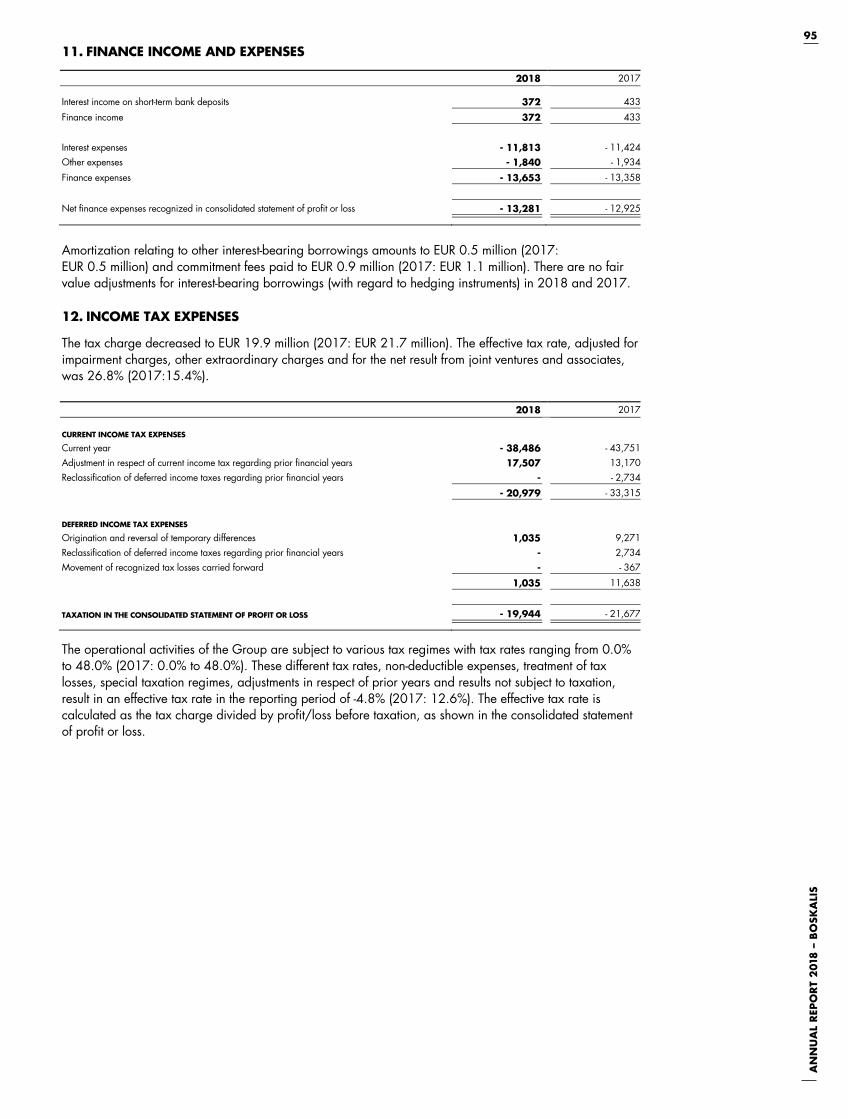
95
AN
NU
AL
REP
OR
T 2
018
– B
OSK
ALI
S
AN
NU
AL
REP
OR
T 2
01
8 ---
B
OSK
ALI
S
95
11. FINANCE INCOME AND EXPENSES
2018 2017
Interest income on short-term bank deposits 372 433
Finance income 372 433
Interest expenses - 11,813 - 11,424Other expenses - 1,840 - 1,934
Finance expenses - 13,653 - 13,358
Net finance expenses recognized in consolidated statement of profit or loss - 13,281 - 12,925
Amortization relating to other interest-bearing borrowings amounts to EUR 0.5 million (2017: EUR 0.5 million) and commitment fees paid to EUR 0.9 million (2017: EUR 1.1 million). There are no fair value adjustments for interest-bearing borrowings (with regard to hedging instruments) in 2018 and 2017.
12. INCOME TAX EXPENSES
The tax charge decreased to EUR 19.9 million (2017: EUR 21.7 million). The effective tax rate, adjusted for impairment charges, other extraordinary charges and for the net result from joint ventures and associates, was 26.8% (2017:15.4%).
2018 2017
CURRENT INCOME TAX EXPENSES
Current year - 38,486 - 43,751Adjustment in respect of current income tax regarding prior financial years 17,507 13,170Reclassification of deferred income taxes regarding prior financial years - - 2,734
- 20,979 - 33,315
DEFERRED INCOME TAX EXPENSES
Origination and reversal of temporary differences 1,035 9,271Reclassification of deferred income taxes regarding prior financial years - 2,734Movement of recognized tax losses carried forward - - 367
1,035 11,638
TAXATION IN THE CONSOLIDATED STATEMENT OF PROFIT OR LOSS - 19,944 - 21,677
The operational activities of the Group are subject to various tax regimes with tax rates ranging from 0.0% to 48.0% (2017: 0.0% to 48.0%). These different tax rates, non-deductible expenses, treatment of tax losses, special taxation regimes, adjustments in respect of prior years and results not subject to taxation, result in an effective tax rate in the reporting period of -4.8% (2017: 12.6%). The effective tax rate is calculated as the tax charge divided by profit/loss before taxation, as shown in the consolidated statement of profit or loss.

96A
NN
UA
L R
EPO
RT
201
8 –
BO
SKA
LIS
FIN
AN
CIA
L ST
ATE
MEN
TS 2
018
AN
NU
AL
REP
OR
T 2
01
8 ---
BO
SKA
LIS
FI
NA
NCIA
L ST
ATE
MEN
TS 2
01
8
96
The reconciliation between the Dutch nominal income tax rate and the effective income tax rate is as follows:
2018 2017
Profit/loss (-) before taxation - 413,792 172,120Tax exempted share in result of joint ventures and associates (excluding impairments) - 28,386 - 31,020Impairment charges and other extraordinary charges 519,474 -
Profit/loss (-) before taxation, adjusted 77,296 141,100
Effects on tax (rate):
Nominal tax rate in the Netherlands - 19,324 25.0% - 35,275 25.0%Tonnage tax, withholding tax, other special tax regimes - 18,725 24.2% 7,696 - 5.5%Different statutory tax rates for other jurisdictions 16,214 - 21.0% 7,209 - 5.1%
Weighted average tax (rate) - 21,835 28.2% - 20,370 14.4%
Increase (decrease) in tax (rate) resulting from:
Unrecognized income tax losses and temporary differences - 5,047 6.5% - 6,896 4.9%Recognition of previously unrecognized tax losses 8,424 - 10.9% 2,577 - 1.8%
Tax exempted revaluation results and book results - - 5,803 - 4.1%Non-deductible expenses - 19,808 25.6% - 15,961 11.3%Prior year adjustments 17,507 - 22.6% 13,170 - 9.3%
Adjusted effective tax (rate) - 20,759 26.8% - 21,677 15.4%
Tax exempted share in result of joint ventures and associates (excluding impairments) - - 7.2% - - 2.8%Tax benefit on impairment charges and other extraordinary charges 815 - 24.4% - -Income tax (rate) as disclosed in Consolidated Income statement - 19,944 - 4.8% - 21,677 12.6%
In 2017 tax exempted revaluation results and book results relate to the Gardline transaction (see note 5.1).
13. INCOME TAX RECEIVABLE AND PAYABLE
The current income tax receivables and income tax payables relate to the tax positions of the respective group companies and consist of financial years yet to be settled less withholding taxes and tax refunds.

97
AN
NU
AL
REP
OR
T 2
018
– B
OSK
ALI
S
AN
NU
AL
REP
OR
T 2
01
8 ---
B
OSK
ALI
S
97
14. DEFERRED INCOME TAX ASSETS AND LIABILITIES
BALANCE AS AT
1 JANUARY 2018 MOVEMENT IN TEMPORARY DIFFERENCES DURING THE YEAR BALANCE AS AT
31 DECEMBER 2018
Asset Liability
Charged (-)/ added
to netprofit
Charged toequity
Reclassified to disposal
group
In / (out)consolida-
tion and business
combina-tions
Currency translation differences Asset Liability
Intangible assets - - 2,387 583 - - - - 195 - 1,999
Property, plant and equipment 390 - 3,120 - 103 - - - - 44 128 - 3,005
Unbilled revenue and deferred revenue - - 34 34 - - - - - -
Trade and other receivables 38 - 18 - - - 1 57 -
Hedging reserve - - 3,252 321 3,931 - - - 1,000 -
Actuarial gains / losses (-) and asset limitation on defined benefit pension plans 7,069 - 252 - 39 - - 42 7,324 -
Employee benefits 4,026 - 3,388 - 484 - - - - 36 3,518 - 3,400
Provisions 897 - - 670 - - - 504 731 -
Interest-bearing borrowings 249 - - - - - - 249 -
Trade and other payables 252 - 370 403 - - - - 26 354 - 95
Other assets and liabilities 308 - 1,163 381 - - - 41 276 - 709
Foreign branch results 600 - 2,336 300 - - - - - - 1,436
Income tax losses carried forward 86 - - - - - - 39 47 -
13,915 - 16,050 1,035 3,892 - - 443 13,879 - 10,644
Offsetting of deferred income tax assets and liabilities - 4,367 4,367 - 4,874 4,874
Net in the consolidated statement of financial position 9,548 - 11,683 9,005 - 5,770
BALANCE AS AT
1 JANUARY 2017 MOVEMENT IN TEMPORARY DIFFERENCES DURING THE YEAR BALANCE AS AT
31 DECEMBER 2017
Asset Liability
Charged (-)/ added
to netprofit
Charged toequity
Reclassified to disposal
group
In / (out)consolida-
tion and business
combina-tions
Currency translation differences Asset Liability
Intangible assets - - 2,165 2 - - - 211 - 13 - - 2,387
Property, plant and equipment 583 - 12,397 8,887 - - - 197 390 - 3,120
Unbilled revenue and deferred revenue - - 6,857 6,308 - - - 515 - - 34
Trade and other receivables - - 2 2 - - - - - -
Hedging reserve 330 - - 330 - 3,257 - - 5 - - 3,252
Actuarial gains / losses (-) and asset limitation on defined benefit pension plans 5,790 - - 1,504 - - - 225 7,069 -
Employee benefits 4,083 - 3,292 - 350 - - - 197 4,026 - 3,388
Provisions 1,287 - - 1,053 - - 585 78 897 -
Interest-bearing borrowings 345 - - 96 - - - - 249 -
Trade and other payables 1,291 - - 1,024 - - - - 385 252 - 370
Other assets and liabilities 445 - 1,158 - 171 - - - 29 308 - 1,163
Foreign branch results - - 1,566 - 170 - - - - 600 - 2,336
Income tax losses carried forward 414 - - 367 - - 37 2 86 -
14,568 - 27,437 11,638 - 1,753 - 411 400 13,877 - 16,050
Offsetting of deferred income tax assets and liabilities - 4,063 4,063 - 4,367 4,367
Net in the consolidated statement of financial position 10,505 - 23,374 9,510 - 11,683
The difference between the balance as at 31 December 2017 compared to 1 January 2018 is related to the first-time application of IFRS 9 (see note 3.33).
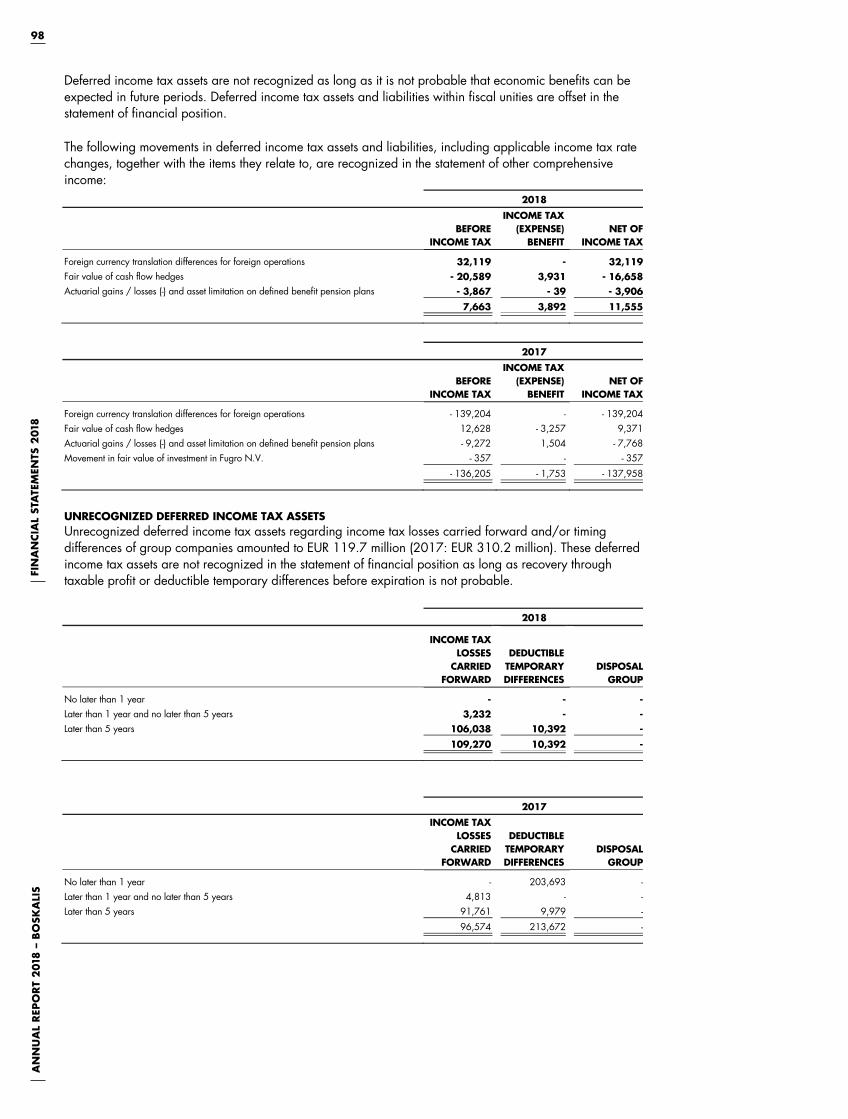
98A
NN
UA
L R
EPO
RT
201
8 –
BO
SKA
LIS
FIN
AN
CIA
L ST
ATE
MEN
TS 2
018
AN
NU
AL
REP
OR
T 2
01
8 ---
BO
SKA
LIS
FI
NA
NCIA
L ST
ATE
MEN
TS 2
01
8
98
Deferred income tax assets are not recognized as long as it is not probable that economic benefits can be expected in future periods. Deferred income tax assets and liabilities within fiscal unities are offset in the statement of financial position.
The following movements in deferred income tax assets and liabilities, including applicable income tax rate changes, together with the items they relate to, are recognized in the statement of other comprehensive income:
2018
BEFORE INCOME TAX
INCOME TAX (EXPENSE)
BENEFITNET OF
INCOME TAX
Foreign currency translation differences for foreign operations 32,119 - 32,119Fair value of cash flow hedges - 20,589 3,931 - 16,658Actuarial gains / losses (-) and asset limitation on defined benefit pension plans - 3,867 - 39 - 3,906
7,663 3,892 11,555
2017
BEFORE INCOME TAX
INCOME TAX (EXPENSE)
BENEFITNET OF
INCOME TAX
Foreign currency translation differences for foreign operations - 139,204 - - 139,204Fair value of cash flow hedges 12,628 - 3,257 9,371Actuarial gains / losses (-) and asset limitation on defined benefit pension plans - 9,272 1,504 - 7,768Movement in fair value of investment in Fugro N.V. - 357 - - 357
- 136,205 - 1,753 - 137,958
UNRECOGNIZED DEFERRED INCOME TAX ASSETS Unrecognized deferred income tax assets regarding income tax losses carried forward and/or timing differences of group companies amounted to EUR 119.7 million (2017: EUR 310.2 million). These deferred income tax assets are not recognized in the statement of financial position as long as recovery through taxable profit or deductible temporary differences before expiration is not probable.
2018
INCOME TAX LOSSES
CARRIEDFORWARD
DEDUCTIBLETEMPORARYDIFFERENCES
DISPOSAL GROUP
No later than 1 year - - -Later than 1 year and no later than 5 years 3,232 - -Later than 5 years 106,038 10,392 -
109,270 10,392 -
2017
INCOME TAX LOSSES
CARRIEDFORWARD
DEDUCTIBLETEMPORARYDIFFERENCES
DISPOSAL GROUP
No later than 1 year - 203,693 -Later than 1 year and no later than 5 years 4,813 - -Later than 5 years 91,761 9,979 -
96,574 213,672 -
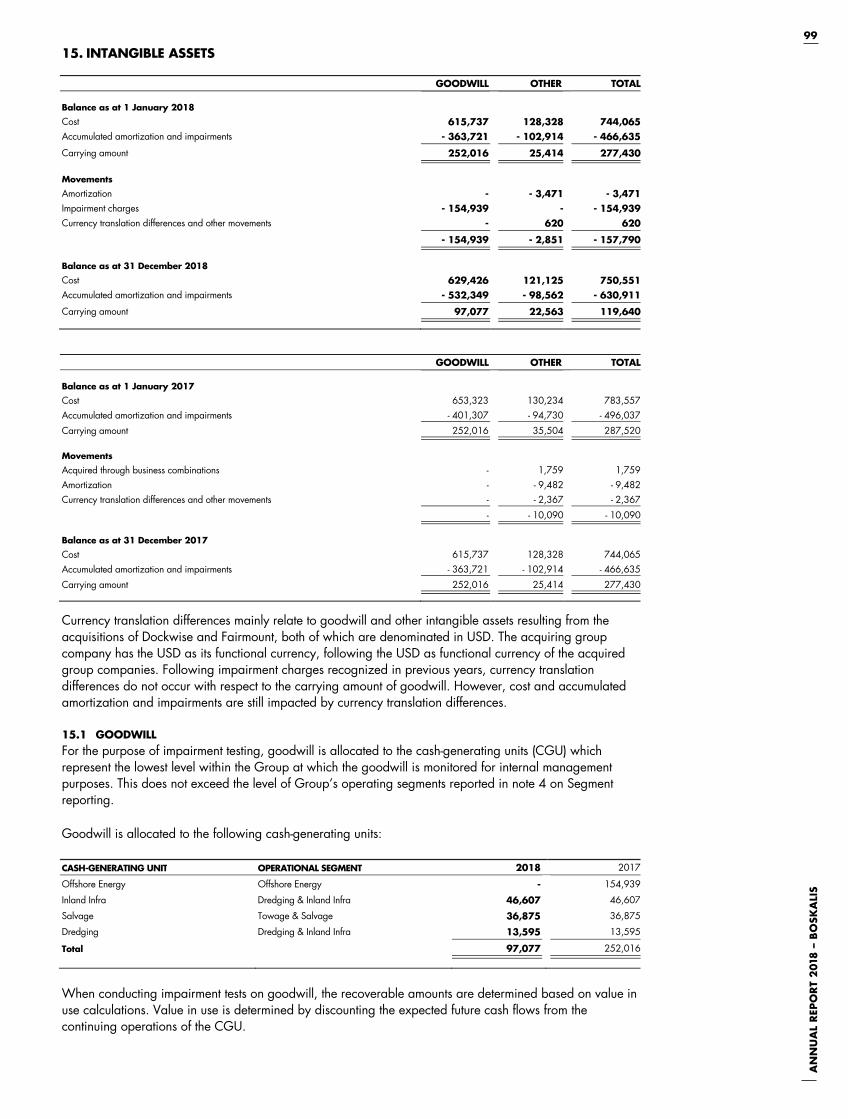
99
AN
NU
AL
REP
OR
T 2
018
– B
OSK
ALI
S
AN
NU
AL
REP
OR
T 2
01
8 ---
B
OSK
ALI
S
99
15. INTANGIBLE ASSETS
GOODWILL OTHER TOTAL
Balance as at 1 January 2018
Cost 615,737 128,328 744,065Accumulated amortization and impairments - 363,721 - 102,914 - 466,635
Carrying amount 252,016 25,414 277,430
Movements
Amortization - - 3,471 - 3,471Impairment charges - 154,939 - - 154,939Currency translation differences and other movements - 620 620
- 154,939 - 2,851 - 157,790
Balance as at 31 December 2018
Cost 629,426 121,125 750,551Accumulated amortization and impairments - 532,349 - 98,562 - 630,911
Carrying amount 97,077 22,563 119,640
GOODWILL OTHER TOTAL
Balance as at 1 January 2017
Cost 653,323 130,234 783,557Accumulated amortization and impairments - 401,307 - 94,730 - 496,037
Carrying amount 252,016 35,504 287,520
Movements
Acquired through business combinations - 1,759 1,759Amortization - - 9,482 - 9,482Currency translation differences and other movements - - 2,367 - 2,367
- - 10,090 - 10,090
Balance as at 31 December 2017
Cost 615,737 128,328 744,065Accumulated amortization and impairments - 363,721 - 102,914 - 466,635
Carrying amount 252,016 25,414 277,430
Currency translation differences mainly relate to goodwill and other intangible assets resulting from the acquisitions of Dockwise and Fairmount, both of which are denominated in USD. The acquiring group company has the USD as its functional currency, following the USD as functional currency of the acquired group companies. Following impairment charges recognized in previous years, currency translation differences do not occur with respect to the carrying amount of goodwill. However, cost and accumulated amortization and impairments are still impacted by currency translation differences.
15.1 GOODWILL For the purpose of impairment testing, goodwill is allocated to the cash-generating units (CGU) which represent the lowest level within the Group at which the goodwill is monitored for internal management purposes. This does not exceed the level of Group’s operating segments reported in note 4 on Segment reporting.
Goodwill is allocated to the following cash-generating units:
CASH-GENERATING UNIT OPERATIONAL SEGMENT 2018 2017
Offshore Energy Offshore Energy - 154,939
Inland Infra Dredging & Inland Infra 46,607 46,607
Salvage Towage & Salvage 36,875 36,875
Dredging Dredging & Inland Infra 13,595 13,595
Total 97,077 252,016
When conducting impairment tests on goodwill, the recoverable amounts are determined based on value in use calculations. Value in use is determined by discounting the expected future cash flows from the continuing operations of the CGU.
100A
NN
UA
L R
EPO
RT
201
8 –
BO
SKA
LIS
FIN
AN
CIA
L ST
ATE
MEN
TS 2
018
AN
NU
AL
REP
OR
T 2
01
8 ---
BO
SKA
LIS
FI
NA
NCIA
L ST
ATE
MEN
TS 2
01
8
100
Management projects cash flows based on past trends and estimates of future market developments, cost developments and investment plans. These projections also factor in market conditions, order book in hand, expected win rates of contracts and expected vessel utilization. Key assumptions in the calculation of value in use are the growth rate applied in the calculation of the terminal value and the discount rate used. Cash flows for the CGUs beyond five years are extrapolated using an estimated long-term growth rate of 1% (2017: 1%). The applicable growth rate does not exceed the long-term average growth rate which may be expected for the activities. The pre-tax discount rate used in the calculations per CGU are: Offshore Energy 8.9% (2017: 9.1%), Inland Infra 8.4% (2017: 9.0%), Salvage 6.7% (2017: 6.7%) and Dredging 8.2% (2017: 8.3%) and is determined by means of an iterative calculation using the projected post-tax cash flows, expected tax rate and a post-tax discount rate for each CGU.
The Group has analyzed sensitivity to a reasonable possible change in the discounted expected future cash flows of the carrying amount, including goodwill, of the CGU (‘headroom’). The recoverable amounts for Inland Infra, Salvage and Dredging exceed the carrying amounts of the CGUs with significant headroom.
In 2018 the Group incurred a non-cash goodwill impairment charge of EUR 154.9 million with regard to Offshore Energy. This charge is almost entirely related to current market circumstances that are not expected to materially improve in the foreseeable future, specifically with respect to the lower-end service segments of the offshore energy market.
These market circumstances have resulted in a downward adjustment of the projected future cash flows for the Offshore Energy CGU. After recognizing the goodwill impairment charge the recoverable amount for Offshore Energy equals EUR 1.2 billion, based on a value in use calculation.
15.2 OTHER INTANGIBLE ASSETS Other intangible assets, which are identified and recognized at fair value in business combinations, consist of trade names, technology (including software) and favorable contracts. In December 2017 the Group decided to use Boskalis as the main trade name. Under IFRS this decision required an evaluation of the lifetimes and an impairment test of the value in use, which was performed by an external valuator. The test did not result in the recognition of an impairment charge and resulted in the harmonization of the remaining useful lives of trade names to 10 years. This change in accounting estimates had no material impact on the net result for 2017 and 2018.
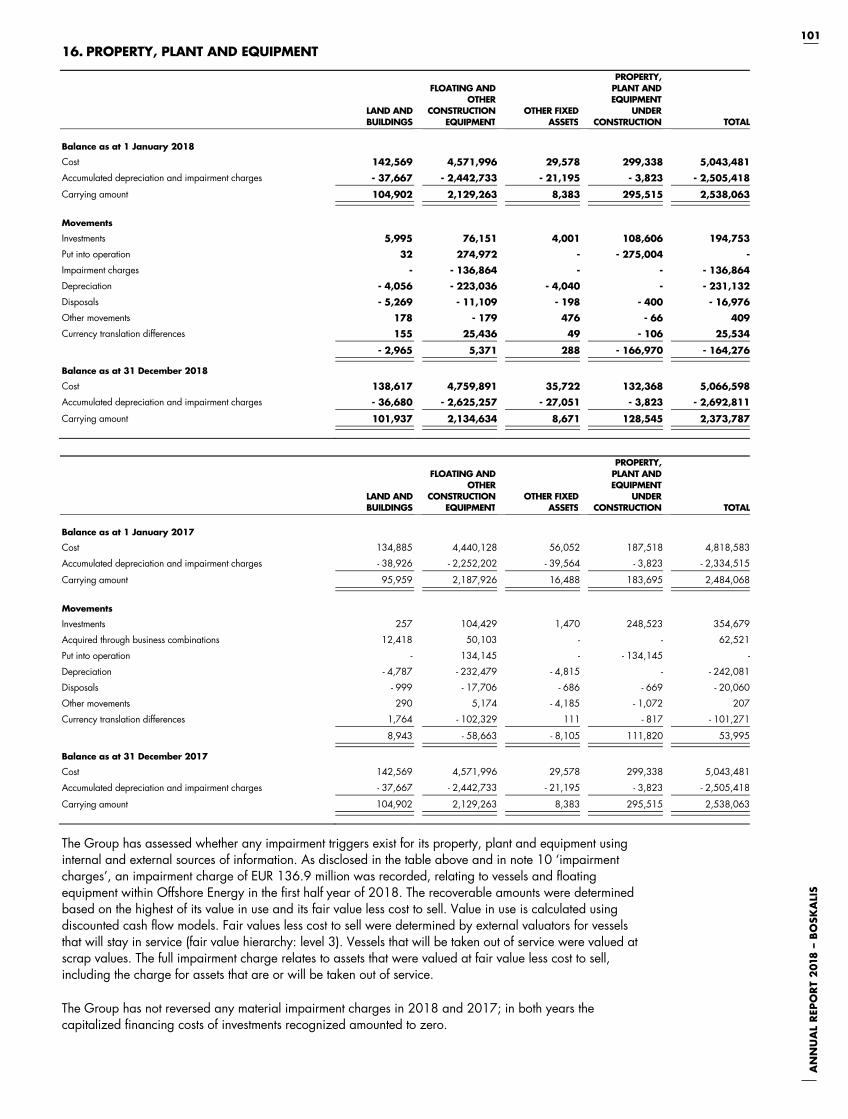
101
AN
NU
AL
REP
OR
T 2
018
– B
OSK
ALI
S
AN
NU
AL
REP
OR
T 2
01
8 ---
B
OSK
ALI
S
101
16. PROPERTY, PLANT AND EQUIPMENT
LAND AND BUILDINGS
FLOATING AND OTHER
CONSTRUCTION EQUIPMENT
OTHER FIXED ASSETS
PROPERTY, PLANT AND EQUIPMENT
UNDER CONSTRUCTION TOTAL
Balance as at 1 January 2018
Cost 142,569 4,571,996 29,578 299,338 5,043,481
Accumulated depreciation and impairment charges - 37,667 - 2,442,733 - 21,195 - 3,823 - 2,505,418
Carrying amount 104,902 2,129,263 8,383 295,515 2,538,063
Movements
Investments 5,995 76,151 4,001 108,606 194,753
Put into operation 32 274,972 - - 275,004 -
Impairment charges - - 136,864 - - - 136,864
Depreciation - 4,056 - 223,036 - 4,040 - - 231,132
Disposals - 5,269 - 11,109 - 198 - 400 - 16,976
Other movements 178 - 179 476 - 66 409
Currency translation differences 155 25,436 49 - 106 25,534
- 2,965 5,371 288 - 166,970 - 164,276
Balance as at 31 December 2018
Cost 138,617 4,759,891 35,722 132,368 5,066,598
Accumulated depreciation and impairment charges - 36,680 - 2,625,257 - 27,051 - 3,823 - 2,692,811
Carrying amount 101,937 2,134,634 8,671 128,545 2,373,787
LAND AND BUILDINGS
FLOATING AND OTHER
CONSTRUCTION EQUIPMENT
OTHER FIXED ASSETS
PROPERTY, PLANT AND EQUIPMENT
UNDER CONSTRUCTION TOTAL
Balance as at 1 January 2017
Cost 134,885 4,440,128 56,052 187,518 4,818,583
Accumulated depreciation and impairment charges - 38,926 - 2,252,202 - 39,564 - 3,823 - 2,334,515
Carrying amount 95,959 2,187,926 16,488 183,695 2,484,068
Movements
Investments 257 104,429 1,470 248,523 354,679
Acquired through business combinations 12,418 50,103 - - 62,521
Put into operation - 134,145 - - 134,145 -
Depreciation - 4,787 - 232,479 - 4,815 - - 242,081
Disposals - 999 - 17,706 - 686 - 669 - 20,060
Other movements 290 5,174 - 4,185 - 1,072 207
Currency translation differences 1,764 - 102,329 111 - 817 - 101,271
8,943 - 58,663 - 8,105 111,820 53,995
Balance as at 31 December 2017
Cost 142,569 4,571,996 29,578 299,338 5,043,481
Accumulated depreciation and impairment charges - 37,667 - 2,442,733 - 21,195 - 3,823 - 2,505,418
Carrying amount 104,902 2,129,263 8,383 295,515 2,538,063
The Group has assessed whether any impairment triggers exist for its property, plant and equipment using internal and external sources of information. As disclosed in the table above and in note 10 ‘impairment charges’, an impairment charge of EUR 136.9 million was recorded, relating to vessels and floating equipment within Offshore Energy in the first half year of 2018. The recoverable amounts were determined based on the highest of its value in use and its fair value less cost to sell. Value in use is calculated using discounted cash flow models. Fair values less cost to sell were determined by external valuators for vessels that will stay in service (fair value hierarchy: level 3). Vessels that will be taken out of service were valued at scrap values. The full impairment charge relates to assets that were valued at fair value less cost to sell, including the charge for assets that are or will be taken out of service.
The Group has not reversed any material impairment charges in 2018 and 2017; in both years the capitalized financing costs of investments recognized amounted to zero.
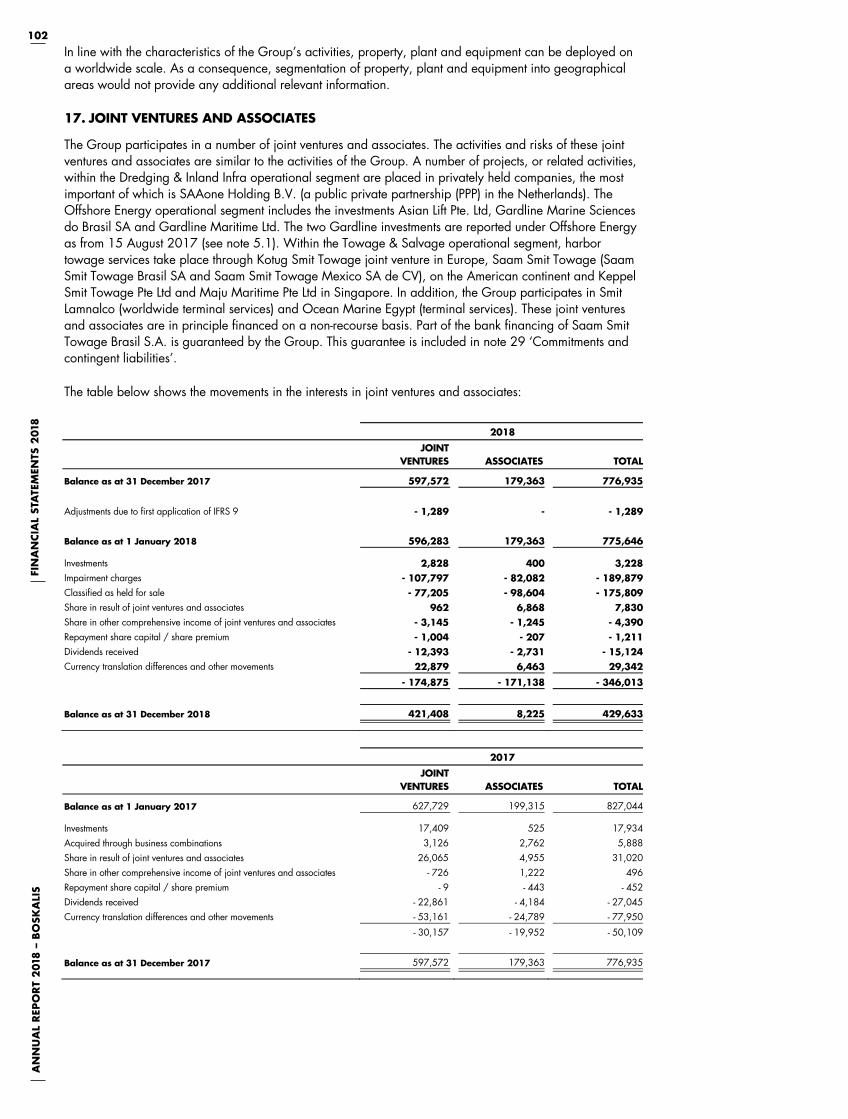
102A
NN
UA
L R
EPO
RT
201
8 –
BO
SKA
LIS
FIN
AN
CIA
L ST
ATE
MEN
TS 2
018
AN
NU
AL
REP
OR
T 2
01
8 ---
BO
SKA
LIS
FI
NA
NCIA
L ST
ATE
MEN
TS 2
01
8
102
In line with the characteristics of the Group’s activities, property, plant and equipment can be deployed on a worldwide scale. As a consequence, segmentation of property, plant and equipment into geographical areas would not provide any additional relevant information.
17. JOINT VENTURES AND ASSOCIATES
The Group participates in a number of joint ventures and associates. The activities and risks of these joint ventures and associates are similar to the activities of the Group. A number of projects, or related activities, within the Dredging & Inland Infra operational segment are placed in privately held companies, the most important of which is SAAone Holding B.V. (a public private partnership (PPP) in the Netherlands). The Offshore Energy operational segment includes the investments Asian Lift Pte. Ltd, Gardline Marine Sciences do Brasil SA and Gardline Maritime Ltd. The two Gardline investments are reported under Offshore Energy as from 15 August 2017 (see note 5.1). Within the Towage & Salvage operational segment, harbor towage services take place through Kotug Smit Towage joint venture in Europe, Saam Smit Towage (Saam Smit Towage Brasil SA and Saam Smit Towage Mexico SA de CV), on the American continent and Keppel Smit Towage Pte Ltd and Maju Maritime Pte Ltd in Singapore. In addition, the Group participates in Smit Lamnalco (worldwide terminal services) and Ocean Marine Egypt (terminal services). These joint ventures and associates are in principle financed on a non-recourse basis. Part of the bank financing of Saam Smit Towage Brasil S.A. is guaranteed by the Group. This guarantee is included in note 29 ‘Commitments and contingent liabilities’.
The table below shows the movements in the interests in joint ventures and associates:
2018
JOINTVENTURES ASSOCIATES TOTAL
Balance as at 31 December 2017 597,572 179,363 776,935
Adjustments due to first application of IFRS 9 - 1,289 - - 1,289
Balance as at 1 January 2018 596,283 179,363 775,646
Investments 2,828 400 3,228Impairment charges - 107,797 - 82,082 - 189,879Classified as held for sale - 77,205 - 98,604 - 175,809Share in result of joint ventures and associates 962 6,868 7,830Share in other comprehensive income of joint ventures and associates - 3,145 - 1,245 - 4,390Repayment share capital / share premium - 1,004 - 207 - 1,211Dividends received - 12,393 - 2,731 - 15,124Currency translation differences and other movements 22,879 6,463 29,342
- 174,875 - 171,138 - 346,013
Balance as at 31 December 2018 421,408 8,225 429,633
2017
JOINTVENTURES ASSOCIATES TOTAL
Balance as at 1 January 2017 627,729 199,315 827,044
Investments 17,409 525 17,934Acquired through business combinations 3,126 2,762 5,888Share in result of joint ventures and associates 26,065 4,955 31,020Share in other comprehensive income of joint ventures and associates - 726 1,222 496Repayment share capital / share premium - 9 - 443 - 452Dividends received - 22,861 - 4,184 - 27,045Currency translation differences and other movements - 53,161 - 24,789 - 77,950
- 30,157 - 19,952 - 50,109
Balance as at 31 December 2017 597,572 179,363 776,935

103
AN
NU
AL
REP
OR
T 2
018
– B
OSK
ALI
S
AN
NU
AL
REP
OR
T 2
01
8 ---
B
OSK
ALI
S
103
The Group had earlier committed to a limited capital funding for SAAone Holding B.V., which was effected in October 2017. The loans, amounting to EUR 13.6 million in total, being part of the Group’s investment in SAAone Holding B.V, are included in interest in joint ventures in the table above. The interest income of EUR 1.2 million (2017: EUR 0.3 million) related to these loans is reported under share in result of joint ventures and associates.
The 2018 share in result of joint ventures and associates amounts to EUR 7.8 million as disclosed in the table above. This includes EUR 20.6 million as the Group’s share in impairment charges accounted for by joint ventures and associates.
In 2018 the Group incurred a non-cash impairment charge of EUR 190 million relating to towage joint ventures and associates due to deteriorated market conditions that are not expected to materially improve in the foreseeable future. The carrying value, as part of the required application of the equity method, includes goodwill resulting from the initial recognition of the investments. The recoverable amounts were determined, for each investment, based on the higher of the fair value less cost to sell and value in use calculations using discounted cash flow models. The values were determined based on 100% figures, taking into account net debt, and adjusted for our share. Fair values less cost to sell were based on EBITDA-multiplier models, determined with the assistance of an external valuator. Values in use were determined by discounting the expected future cash flows from the continued use of the investment. Management projects cash flows based on past trends and estimates of future market developments, cost developments and investment plans. These projections also factor in market conditions. Cash flows for the first period of these projections were based on management’s most recent forecasts. Key assumptions in the calculation of value in use of the investments are the growth rate applied in the calculation of the terminal value and the discount rate used. Cash flows beyond ten years are extrapolated using an estimated long-term growth rate of 1.0%-1.5%. The applicable growth rate does not exceed the long-term average growth rate which may be expected for the activities. The pre-tax discount rates used in the calculation range from 7.4%-10.4% and were determined through an iterative calculation using the projected post-tax cash flows, expected tax rate and a post-tax discount rate. If, for the joint ventures of which the recoverable amounts were determined based on value in use, the cash flow projections used in the value in use calculations would have been 3% lower, the Group would have recognized an additional impairment charge of EUR 7 million. If the estimated discount rates for these joint ventures would have been 1% higher than disclosed above, the Group would have recognized an additional impairment charge of approximately EUR 27 million.
The main joint ventures of the Group are:
Interest in joint ventures ENTITY COUNTRY OF INCORPORATION 2018 2017
Saam Smit Towage Brasil S.A.* Brazil 50% 50%Gardline Marine Sciences do Brasil SA Brazil 50% 50%Lamnalco Marine Cyprus 50% 50%Ocean Marine Egypt S.A.E Egypt 50% 50%Asian Lift Pte. Ltd Singapore 50% 50%Keppel Smit Towage Pte Ltd Singapore 49% 49%Maju Maritime Pte Ltd Singapore 49% 49%Penta-Ocean / Hyundai / Boskalis JV PTE. Ltd Singapore 30% -ACCN B.V. The Netherlands 50% 50%Kotug Smit Partnership B.V. The Netherlands 50% 50%SAAone Holding B.V. The Netherlands 17% 17%Gardline Maritime Ltd. United Kingdom 50% 50%
*classified as held for sale as per year-end 2018 (see note 5.2)
The main associates of the Group are:
Interest in associates COMPANY COUNTRY OF INCORPORATION 2018 2017
Damietta for Maritime Services Company S.A.E. Egypt 31% 31%Saam Smit Towage Mexico S.A. de C.V.* Mexico 49% 49%
*classified as held for sale as per year-end 2018 (see note 5.2)
The voting rights in associates are equal to the ownership interests.
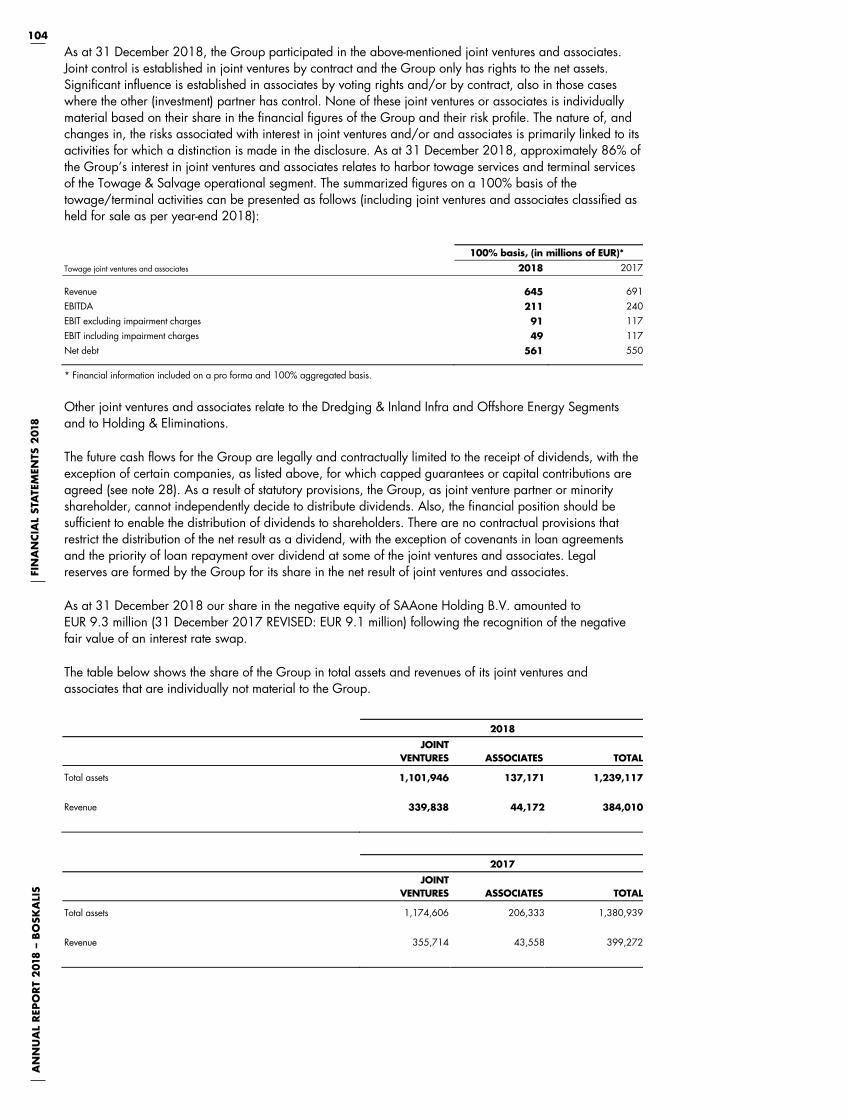
104A
NN
UA
L R
EPO
RT
201
8 –
BO
SKA
LIS
FIN
AN
CIA
L ST
ATE
MEN
TS 2
018
AN
NU
AL
REP
OR
T 2
01
8 ---
BO
SKA
LIS
FI
NA
NCIA
L ST
ATE
MEN
TS 2
01
8
104
As at 31 December 2018, the Group participated in the above-mentioned joint ventures and associates. Joint control is established in joint ventures by contract and the Group only has rights to the net assets. Significant influence is established in associates by voting rights and/or by contract, also in those cases where the other (investment) partner has control. None of these joint ventures or associates is individually material based on their share in the financial figures of the Group and their risk profile. The nature of, and changes in, the risks associated with interest in joint ventures and/or and associates is primarily linked to its activities for which a distinction is made in the disclosure. As at 31 December 2018, approximately 86% of the Group’s interest in joint ventures and associates relates to harbor towage services and terminal services of the Towage & Salvage operational segment. The summarized figures on a 100% basis of the towage/terminal activities can be presented as follows (including joint ventures and associates classified as held for sale as per year-end 2018):
100% basis, (in millions of EUR)*
Towage joint ventures and associates 2018 2017
Revenue 645 691EBITDA 211 240EBIT excluding impairment charges 91 117EBIT including impairment charges 49 117Net debt 561 550
* Financial information included on a pro forma and 100% aggregated basis.
Other joint ventures and associates relate to the Dredging & Inland Infra and Offshore Energy Segments and to Holding & Eliminations.
The future cash flows for the Group are legally and contractually limited to the receipt of dividends, with the exception of certain companies, as listed above, for which capped guarantees or capital contributions are agreed (see note 28). As a result of statutory provisions, the Group, as joint venture partner or minority shareholder, cannot independently decide to distribute dividends. Also, the financial position should be sufficient to enable the distribution of dividends to shareholders. There are no contractual provisions that restrict the distribution of the net result as a dividend, with the exception of covenants in loan agreements and the priority of loan repayment over dividend at some of the joint ventures and associates. Legal reserves are formed by the Group for its share in the net result of joint ventures and associates.
As at 31 December 2018 our share in the negative equity of SAAone Holding B.V. amounted to EUR 9.3 million (31 December 2017 REVISED: EUR 9.1 million) following the recognition of the negative fair value of an interest rate swap.
The table below shows the share of the Group in total assets and revenues of its joint ventures and associates that are individually not material to the Group.
2018
JOINTVENTURES ASSOCIATES TOTAL
Total assets 1,101,946 137,171 1,239,117 Revenue 339,838 44,172 384,010
2017
JOINTVENTURES ASSOCIATES TOTAL
Total assets 1,174,606 206,333 1,380,939 Revenue 355,714 43,558 399,272
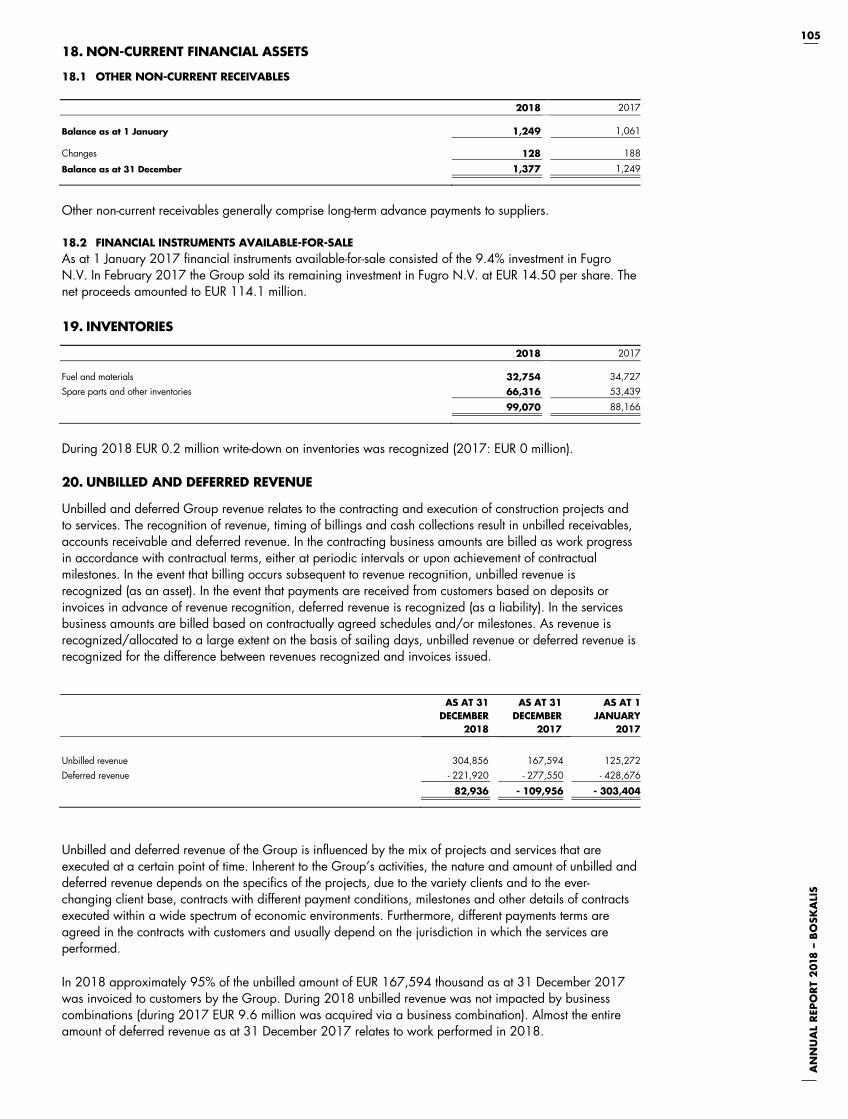
105
AN
NU
AL
REP
OR
T 2
018
– B
OSK
ALI
S
AN
NU
AL
REP
OR
T 2
01
8 ---
B
OSK
ALI
S
105
18. NON-CURRENT FINANCIAL ASSETS
18.1 OTHER NON-CURRENT RECEIVABLES 2018 2017
Balance as at 1 January 1,249 1,061
Changes 128 188
Balance as at 31 December 1,377 1,249
Other non-current receivables generally comprise long-term advance payments to suppliers.
18.2 FINANCIAL INSTRUMENTS AVAILABLE-FOR-SALE As at 1 January 2017 financial instruments available-for-sale consisted of the 9.4% investment in Fugro N.V. In February 2017 the Group sold its remaining investment in Fugro N.V. at EUR 14.50 per share. The net proceeds amounted to EUR 114.1 million.
19. INVENTORIES
2018 2017
Fuel and materials 32,754 34,727Spare parts and other inventories 66,316 53,439
99,070 88,166
During 2018 EUR 0.2 million write-down on inventories was recognized (2017: EUR 0 million).
20. UNBILLED AND DEFERRED REVENUE
Unbilled and deferred Group revenue relates to the contracting and execution of construction projects and to services. The recognition of revenue, timing of billings and cash collections result in unbilled receivables, accounts receivable and deferred revenue. In the contracting business amounts are billed as work progress in accordance with contractual terms, either at periodic intervals or upon achievement of contractual milestones. In the event that billing occurs subsequent to revenue recognition, unbilled revenue is recognized (as an asset). In the event that payments are received from customers based on deposits or invoices in advance of revenue recognition, deferred revenue is recognized (as a liability). In the services business amounts are billed based on contractually agreed schedules and/or milestones. As revenue is recognized/allocated to a large extent on the basis of sailing days, unbilled revenue or deferred revenue is recognized for the difference between revenues recognized and invoices issued.
AS AT 31 DECEMBER
2018
AS AT 31 DECEMBER
2017
AS AT 1 JANUARY
2017
Unbilled revenue 304,856 167,594 125,272Deferred revenue - 221,920 - 277,550 - 428,676
82,936 - 109,956 - 303,404
Unbilled and deferred revenue of the Group is influenced by the mix of projects and services that are executed at a certain point of time. Inherent to the Group’s activities, the nature and amount of unbilled and deferred revenue depends on the specifics of the projects, due to the variety clients and to the ever-changing client base, contracts with different payment conditions, milestones and other details of contracts executed within a wide spectrum of economic environments. Furthermore, different payments terms are agreed in the contracts with customers and usually depend on the jurisdiction in which the services are performed.
In 2018 approximately 95% of the unbilled amount of EUR 167,594 thousand as at 31 December 2017 was invoiced to customers by the Group. During 2018 unbilled revenue was not impacted by business combinations (during 2017 EUR 9.6 million was acquired via a business combination). Almost the entire amount of deferred revenue as at 31 December 2017 relates to work performed in 2018.
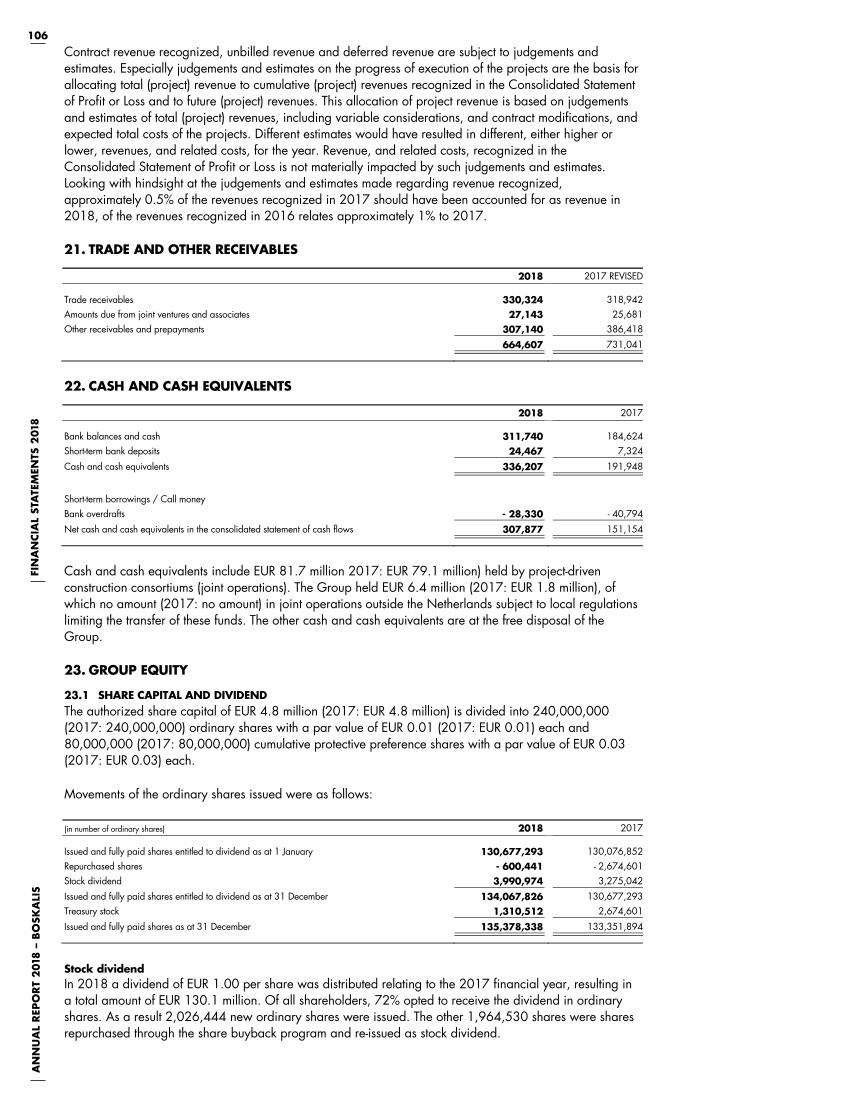
106A
NN
UA
L R
EPO
RT
201
8 –
BO
SKA
LIS
FIN
AN
CIA
L ST
ATE
MEN
TS 2
018
AN
NU
AL
REP
OR
T 2
01
8 ---
BO
SKA
LIS
FI
NA
NCIA
L ST
ATE
MEN
TS 2
01
8
106
Contract revenue recognized, unbilled revenue and deferred revenue are subject to judgements and estimates. Especially judgements and estimates on the progress of execution of the projects are the basis for allocating total (project) revenue to cumulative (project) revenues recognized in the Consolidated Statement of Profit or Loss and to future (project) revenues. This allocation of project revenue is based on judgements and estimates of total (project) revenues, including variable considerations, and contract modifications, and expected total costs of the projects. Different estimates would have resulted in different, either higher or lower, revenues, and related costs, for the year. Revenue, and related costs, recognized in the Consolidated Statement of Profit or Loss is not materially impacted by such judgements and estimates. Looking with hindsight at the judgements and estimates made regarding revenue recognized, approximately 0.5% of the revenues recognized in 2017 should have been accounted for as revenue in 2018, of the revenues recognized in 2016 relates approximately 1% to 2017.
21. TRADE AND OTHER RECEIVABLES
2018 2017 REVISED
Trade receivables 330,324 318,942Amounts due from joint ventures and associates 27,143 25,681Other receivables and prepayments 307,140 386,418
664,607 731,041
22. CASH AND CASH EQUIVALENTS
2018 2017
Bank balances and cash 311,740 184,624Short-term bank deposits 24,467 7,324
Cash and cash equivalents 336,207 191,948
Short-term borrowings / Call money Bank overdrafts - 28,330 - 40,794
Net cash and cash equivalents in the consolidated statement of cash flows 307,877 151,154
Cash and cash equivalents include EUR 81.7 million 2017: EUR 79.1 million) held by project-driven construction consortiums (joint operations). The Group held EUR 6.4 million (2017: EUR 1.8 million), of which no amount (2017: no amount) in joint operations outside the Netherlands subject to local regulations limiting the transfer of these funds. The other cash and cash equivalents are at the free disposal of the Group.
23. GROUP EQUITY
23.1 SHARE CAPITAL AND DIVIDEND The authorized share capital of EUR 4.8 million (2017: EUR 4.8 million) is divided into 240,000,000 (2017: 240,000,000) ordinary shares with a par value of EUR 0.01 (2017: EUR 0.01) each and 80,000,000 (2017: 80,000,000) cumulative protective preference shares with a par value of EUR 0.03 (2017: EUR 0.03) each.
Movements of the ordinary shares issued were as follows:
(in number of ordinary shares) 2018 2017
Issued and fully paid shares entitled to dividend as at 1 January 130,677,293 130,076,852Repurchased shares - 600,441 - 2,674,601Stock dividend 3,990,974 3,275,042
Issued and fully paid shares entitled to dividend as at 31 December 134,067,826 130,677,293Treasury stock 1,310,512 2,674,601
Issued and fully paid shares as at 31 December 135,378,338 133,351,894
Stock dividend In 2018 a dividend of EUR 1.00 per share was distributed relating to the 2017 financial year, resulting in a total amount of EUR 130.1 million. Of all shareholders, 72% opted to receive the dividend in ordinary shares. As a result 2,026,444 new ordinary shares were issued. The other 1,964,530 shares were shares repurchased through the share buyback program and re-issued as stock dividend.
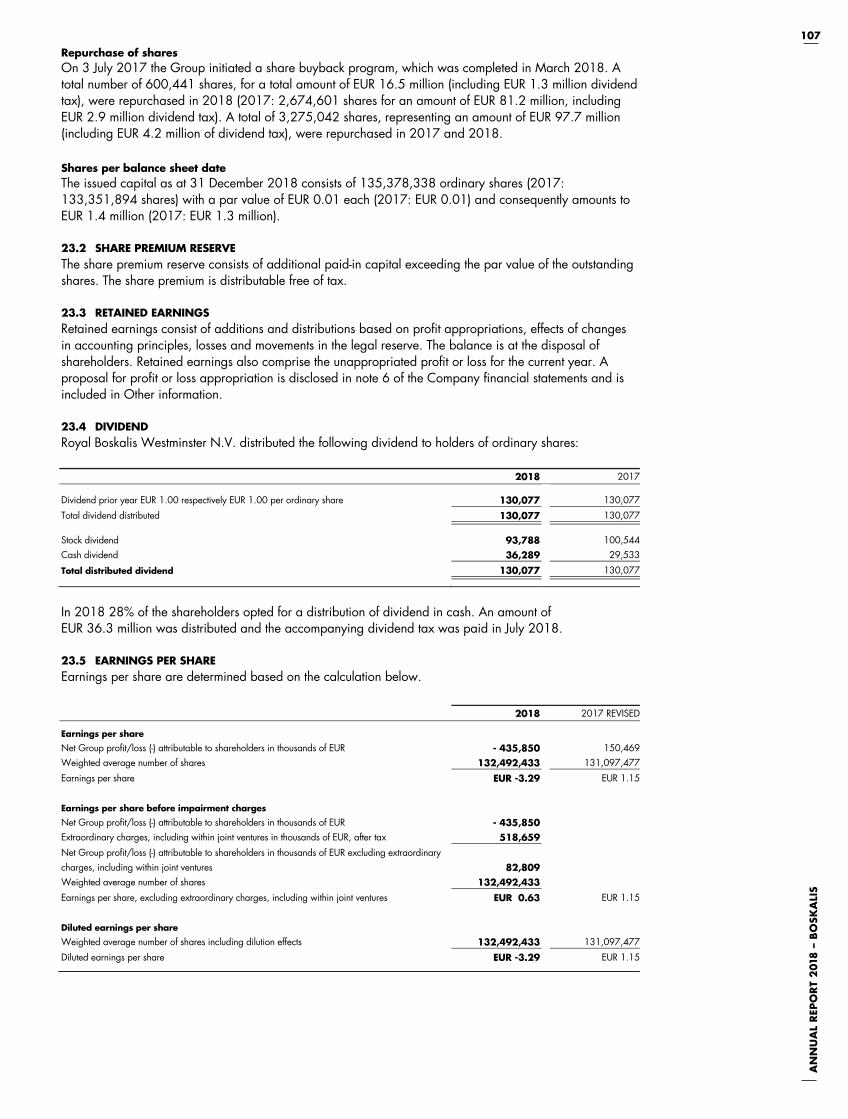
107
AN
NU
AL
REP
OR
T 2
018
– B
OSK
ALI
S
AN
NU
AL
REP
OR
T 2
01
8 ---
B
OSK
ALI
S
107
Repurchase of shares On 3 July 2017 the Group initiated a share buyback program, which was completed in March 2018. A total number of 600,441 shares, for a total amount of EUR 16.5 million (including EUR 1.3 million dividend tax), were repurchased in 2018 (2017: 2,674,601 shares for an amount of EUR 81.2 million, including EUR 2.9 million dividend tax). A total of 3,275,042 shares, representing an amount of EUR 97.7 million (including EUR 4.2 million of dividend tax), were repurchased in 2017 and 2018.
Shares per balance sheet date The issued capital as at 31 December 2018 consists of 135,378,338 ordinary shares (2017: 133,351,894 shares) with a par value of EUR 0.01 each (2017: EUR 0.01) and consequently amounts to EUR 1.4 million (2017: EUR 1.3 million).
23.2 SHARE PREMIUM RESERVE The share premium reserve consists of additional paid-in capital exceeding the par value of the outstanding shares. The share premium is distributable free of tax.
23.3 RETAINED EARNINGS Retained earnings consist of additions and distributions based on profit appropriations, effects of changes in accounting principles, losses and movements in the legal reserve. The balance is at the disposal of shareholders. Retained earnings also comprise the unappropriated profit or loss for the current year. A proposal for profit or loss appropriation is disclosed in note 6 of the Company financial statements and is included in Other information.
23.4 DIVIDEND Royal Boskalis Westminster N.V. distributed the following dividend to holders of ordinary shares:
2018 2017
Dividend prior year EUR 1.00 respectively EUR 1.00 per ordinary share 130,077 130,077
Total dividend distributed 130,077 130,077
Stock dividend 93,788 100,544Cash dividend 36,289 29,533
Total distributed dividend 130,077 130,077
In 2018 28% of the shareholders opted for a distribution of dividend in cash. An amount of EUR 36.3 million was distributed and the accompanying dividend tax was paid in July 2018.
23.5 EARNINGS PER SHARE Earnings per share are determined based on the calculation below.
2018 2017 REVISED
Earnings per share
Net Group profit/loss (-) attributable to shareholders in thousands of EUR - 435,850 150,469Weighted average number of shares 132,492,433 131,097,477
Earnings per share EUR -3.29 EUR 1.15
Earnings per share before impairment charges
Net Group profit/loss (-) attributable to shareholders in thousands of EUR - 435,850Extraordinary charges, including within joint ventures in thousands of EUR, after tax 518,659Net Group profit/loss (-) attributable to shareholders in thousands of EUR excluding extraordinary charges, including within joint ventures 82,809Weighted average number of shares 132,492,433Earnings per share, excluding extraordinary charges, including within joint ventures EUR 0.63 EUR 1.15
Diluted earnings per share
Weighted average number of shares including dilution effects 132,492,433 131,097,477
Diluted earnings per share EUR -3.29 EUR 1.15
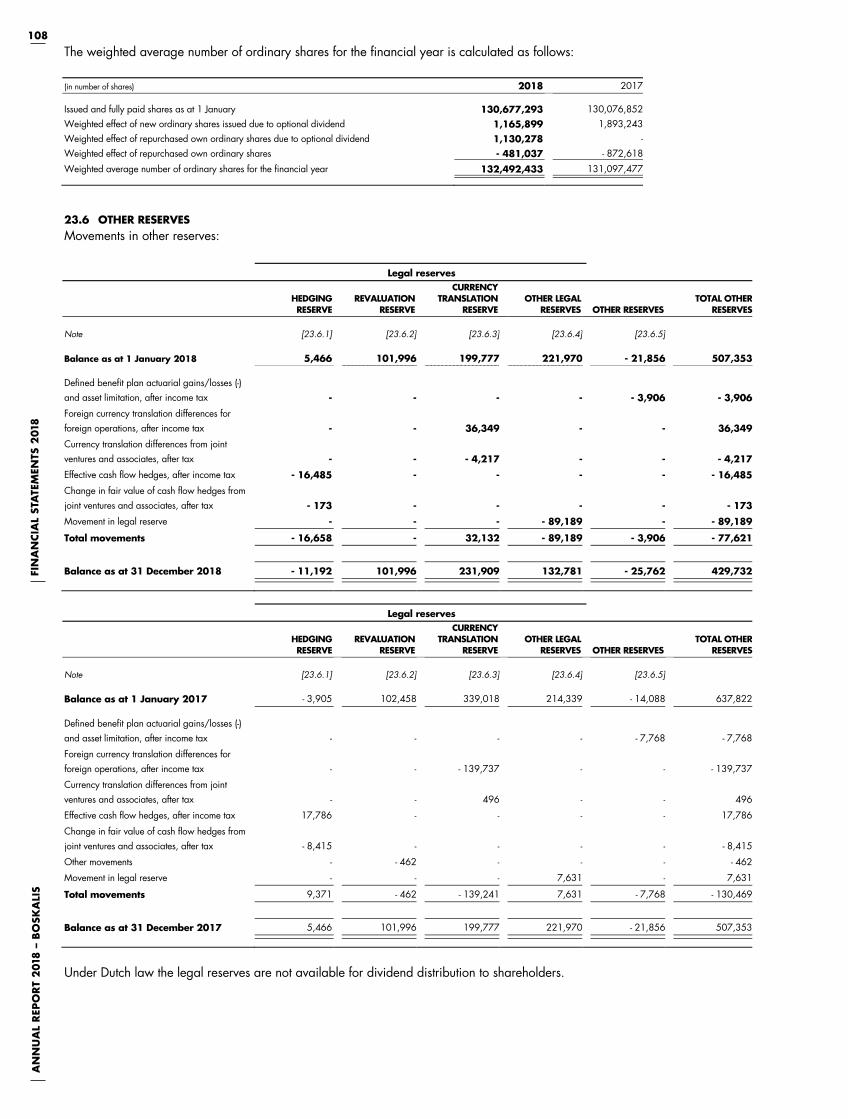
108A
NN
UA
L R
EPO
RT
201
8 –
BO
SKA
LIS
FIN
AN
CIA
L ST
ATE
MEN
TS 2
018
AN
NU
AL
REP
OR
T 2
01
8 ---
BO
SKA
LIS
FI
NA
NCIA
L ST
ATE
MEN
TS 2
01
8
108
The weighted average number of ordinary shares for the financial year is calculated as follows:
(in number of shares) 2018 2017
Issued and fully paid shares as at 1 January 130,677,293 130,076,852Weighted effect of new ordinary shares issued due to optional dividend 1,165,899 1,893,243Weighted effect of repurchased own ordinary shares due to optional dividend 1,130,278 -Weighted effect of repurchased own ordinary shares - 481,037 - 872,618
Weighted average number of ordinary shares for the financial year 132,492,433 131,097,477
23.6 OTHER RESERVES Movements in other reserves:
Legal reserves
HEDGING RESERVE
REVALUATION RESERVE
CURRENCY TRANSLATION
RESERVEOTHER LEGAL
RESERVES OTHER RESERVESTOTAL OTHER
RESERVES
Note [23.6.1] [23.6.2] [23.6.3] [23.6.4] [23.6.5]
Balance as at 1 January 2018 5,466 101,996 199,777 221,970 - 21,856 507,353
Defined benefit plan actuarial gains/losses (-) and asset limitation, after income tax - - - - - 3,906 - 3,906
Foreign currency translation differences for foreign operations, after income tax - - 36,349 - - 36,349
Currency translation differences from joint ventures and associates, after tax - - - 4,217 - - - 4,217
Effective cash flow hedges, after income tax - 16,485 - - - - - 16,485
Change in fair value of cash flow hedges from joint ventures and associates, after tax - 173 - - - - - 173
Movement in legal reserve - - - - 89,189 - - 89,189
Total movements - 16,658 - 32,132 - 89,189 - 3,906 - 77,621
Balance as at 31 December 2018 - 11,192 101,996 231,909 132,781 - 25,762 429,732
Legal reserves
HEDGING RESERVE
REVALUATION RESERVE
CURRENCY TRANSLATION
RESERVEOTHER LEGAL
RESERVES OTHER RESERVESTOTAL OTHER
RESERVES
Note [23.6.1] [23.6.2] [23.6.3] [23.6.4] [23.6.5]
Balance as at 1 January 2017 - 3,905 102,458 339,018 214,339 - 14,088 637,822
Defined benefit plan actuarial gains/losses (-) and asset limitation, after income tax - - - - - 7,768 - 7,768
Foreign currency translation differences for foreign operations, after income tax - - - 139,737 - - - 139,737
Currency translation differences from joint ventures and associates, after tax - - 496 - - 496
Effective cash flow hedges, after income tax 17,786 - - - - 17,786
Change in fair value of cash flow hedges from joint ventures and associates, after tax - 8,415 - - - - - 8,415
Other movements - - 462 - - - - 462
Movement in legal reserve - - - 7,631 - 7,631
Total movements 9,371 - 462 - 139,241 7,631 - 7,768 - 130,469
Balance as at 31 December 2017 5,466 101,996 199,777 221,970 - 21,856 507,353
Under Dutch law the legal reserves are not available for dividend distribution to shareholders.

109
AN
NU
AL
REP
OR
T 2
018
– B
OSK
ALI
S
AN
NU
AL
REP
OR
T 2
01
8 ---
B
OSK
ALI
S
109
23.6.1 HEDGING RESERVE (LEGAL RESERVE) The hedging reserve comprises the fair value of effective cash flow hedges, not yet realized at the balance sheet date, net of taxation, including results realized on the ‘rolling forward’ of existing hedges as a result of differences between the duration of the hedges concerned and the underlying cash flows. An amount of EUR 1 million is included in the hedging reserve relating to discontinued hedges. This will be recognized in the income statement when the future cash flows, that were designated as hedged items, occur. Details about the movements in the hedging reserve are disclosed in note 28.2.
23.6.2 REVALUATION RESERVE (LEGAL RESERVE) This reserve mainly relates to profit with respect to the revaluation of existing non-controlling interests prior to the recognition of business combinations and book results on contributions in newly formed strategic partnerships.
23.6.3 CURRENCY TRANSLATION RESERVE (LEGAL RESERVE) The currency translation reserve comprises all accumulated currency translation differences arising from net investments in foreign operations which are denominated in functional currencies other than the presentation currency used by the Group, including related intragroup financing. These currency translation differences are accumulated as from the IFRS transition date (1 January 2004) and are taken to the Statement of Profit or Loss at disposal or termination of these foreign operations (see also note 5.2). At the acquisition date of activities (business combinations) with a functional currency other than the euro, the translation reserve of these activities is started at zero.
The cumulative changes of foreign currency instruments used to hedge net investments in foreign operations are included under currency translation reserve for a negative amount of EUR 38.1 million as per 31 December 2018 (31 December 2017: negative amount of EUR 24.4 million); a change of EUR 13.7 million in 2018.
23.6.4 OTHER LEGAL RESERVES A legal reserve is formed to account for differences between the cost price and the equity value of joint ventures and associates where the Group cannot independently decide on the distribution of dividends, unless such differences are already included in the legal reserve for accumulated currency translation differences on foreign operations.
23.6.5 OTHER RESERVES Other reserves mainly comprise actuarial movements related to the limitation on net plan assets of defined benefit pension plans and the actuarial gains and losses originating from the difference between the realized and the expected movement in defined benefit obligations and the return on plan assets.
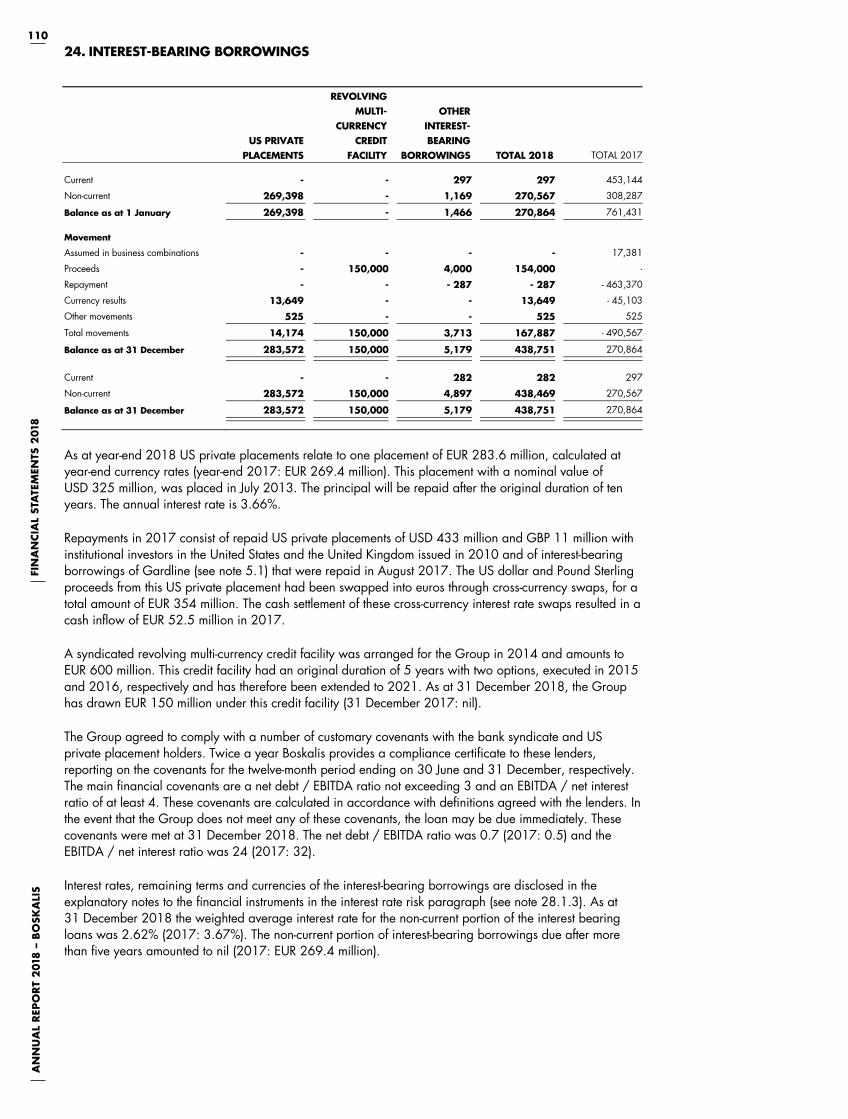
110A
NN
UA
L R
EPO
RT
201
8 –
BO
SKA
LIS
FIN
AN
CIA
L ST
ATE
MEN
TS 2
018
AN
NU
AL
REP
OR
T 2
01
8 ---
BO
SKA
LIS
FI
NA
NCIA
L ST
ATE
MEN
TS 2
01
8
110
24. INTEREST-BEARING BORROWINGS
US PRIVATE PLACEMENTS
REVOLVING MULTI-
CURRENCY CREDIT
FACILITY
OTHER INTEREST-BEARING
BORROWINGS TOTAL 2018 TOTAL 2017
Current - - 297 297 453,144
Non-current 269,398 - 1,169 270,567 308,287
Balance as at 1 January 269,398 - 1,466 270,864 761,431
Movement
Assumed in business combinations - - - - 17,381
Proceeds - 150,000 4,000 154,000 -
Repayment - - - 287 - 287 - 463,370
Currency results 13,649 - - 13,649 - 45,103
Other movements 525 - - 525 525
Total movements 14,174 150,000 3,713 167,887 - 490,567
Balance as at 31 December 283,572 150,000 5,179 438,751 270,864
Current - - 282 282 297
Non-current 283,572 150,000 4,897 438,469 270,567
Balance as at 31 December 283,572 150,000 5,179 438,751 270,864
As at year-end 2018 US private placements relate to one placement of EUR 283.6 million, calculated at year-end currency rates (year-end 2017: EUR 269.4 million). This placement with a nominal value of USD 325 million, was placed in July 2013. The principal will be repaid after the original duration of ten years. The annual interest rate is 3.66%.
Repayments in 2017 consist of repaid US private placements of USD 433 million and GBP 11 million with institutional investors in the United States and the United Kingdom issued in 2010 and of interest-bearing borrowings of Gardline (see note 5.1) that were repaid in August 2017. The US dollar and Pound Sterling proceeds from this US private placement had been swapped into euros through cross-currency swaps, for a total amount of EUR 354 million. The cash settlement of these cross-currency interest rate swaps resulted in a cash inflow of EUR 52.5 million in 2017.
A syndicated revolving multi-currency credit facility was arranged for the Group in 2014 and amounts to EUR 600 million. This credit facility had an original duration of 5 years with two options, executed in 2015 and 2016, respectively and has therefore been extended to 2021. As at 31 December 2018, the Group has drawn EUR 150 million under this credit facility (31 December 2017: nil).
The Group agreed to comply with a number of customary covenants with the bank syndicate and US private placement holders. Twice a year Boskalis provides a compliance certificate to these lenders, reporting on the covenants for the twelve-month period ending on 30 June and 31 December, respectively. The main financial covenants are a net debt / EBITDA ratio not exceeding 3 and an EBITDA / net interest ratio of at least 4. These covenants are calculated in accordance with definitions agreed with the lenders. In the event that the Group does not meet any of these covenants, the loan may be due immediately. These covenants were met at 31 December 2018. The net debt / EBITDA ratio was 0.7 (2017: 0.5) and the EBITDA / net interest ratio was 24 (2017: 32).
Interest rates, remaining terms and currencies of the interest-bearing borrowings are disclosed in the explanatory notes to the financial instruments in the interest rate risk paragraph (see note 28.1.3). As at 31 December 2018 the weighted average interest rate for the non-current portion of the interest bearing loans was 2.62% (2017: 3.67%). The non-current portion of interest-bearing borrowings due after more than five years amounted to nil (2017: EUR 269.4 million).
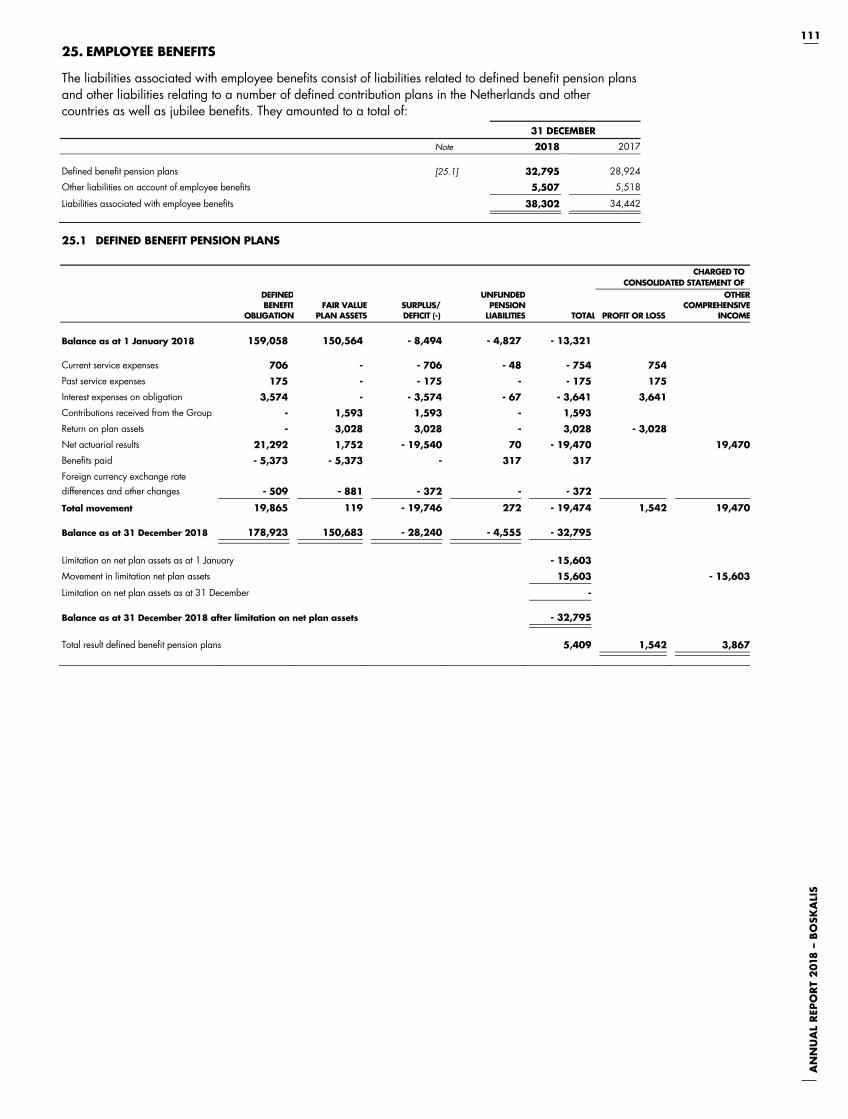
111
AN
NU
AL
REP
OR
T 2
018
– B
OSK
ALI
S
AN
NU
AL
REP
OR
T 2
01
8 ---
B
OSK
ALI
S
111
25. EMPLOYEE BENEFITS
The liabilities associated with employee benefits consist of liabilities related to defined benefit pension plans and other liabilities relating to a number of defined contribution plans in the Netherlands and other countries as well as jubilee benefits. They amounted to a total of:
31 DECEMBER
Note 2018 2017
Defined benefit pension plans [25.1] 32,795 28,924
Other liabilities on account of employee benefits 5,507 5,518
Liabilities associated with employee benefits 38,302 34,442
25.1 DEFINED BENEFIT PENSION PLANS
CHARGED TO
CONSOLIDATED STATEMENT OF
DEFINEDBENEFIT
OBLIGATIONFAIR VALUE
PLAN ASSETSSURPLUS/ DEFICIT (-)
UNFUNDEDPENSION
LIABILITIES TOTAL PROFIT OR LOSS
OTHER COMPREHENSIVE
INCOME
Balance as at 1 January 2018 159,058 150,564 - 8,494 - 4,827 - 13,321
Current service expenses 706 - - 706 - 48 - 754 754
Past service expenses 175 - - 175 - - 175 175
Interest expenses on obligation 3,574 - - 3,574 - 67 - 3,641 3,641
Contributions received from the Group - 1,593 1,593 - 1,593
Return on plan assets - 3,028 3,028 - 3,028 - 3,028
Net actuarial results 21,292 1,752 - 19,540 70 - 19,470 19,470
Benefits paid - 5,373 - 5,373 - 317 317
Foreign currency exchange rate differences and other changes - 509 - 881 - 372 - - 372
Total movement 19,865 119 - 19,746 272 - 19,474 1,542 19,470
Balance as at 31 December 2018 178,923 150,683 - 28,240 - 4,555 - 32,795
Limitation on net plan assets as at 1 January - 15,603
Movement in limitation net plan assets 15,603 - 15,603
Limitation on net plan assets as at 31 December -
Balance as at 31 December 2018 after limitation on net plan assets - 32,795
Total result defined benefit pension plans 5,409 1,542 3,867

112A
NN
UA
L R
EPO
RT
201
8 –
BO
SKA
LIS
FIN
AN
CIA
L ST
ATE
MEN
TS 2
018
AN
NU
AL
REP
OR
T 2
01
8 ---
BO
SKA
LIS
FI
NA
NCIA
L ST
ATE
MEN
TS 2
01
8
112
CHARGED TO
CONSOLIDATED STATEMENT OF
DEFINEDBENEFIT
OBLIGATIONFAIR VALUE
PLAN ASSETSSURPLUS/ DEFICIT (-)
UNFUNDEDPENSION
LIABILITIES TOTAL PROFIT OR LOSS
OTHER COMPREHENSIVE
INCOME
Balance as at 1 January 2017 160,380 153,196 - 7,184 - 5,142 - 12,326
Current service expenses 637 - - 637 - 32 - 669 669
Interest expenses on obligation 3,554 - - 3,554 - 71 - 3,625 3,625
Contributions received from the Group - 4,137 4,137 - 4,137
Return on plan assets - 3,248 3,248 - 3,248 - 3,248
Net actuarial results 5,165 203 - 4,962 148 - 4,814 4,814
Benefits paid - 6,144 - 6,144 - 270 270
Foreign currency exchange rate differences and other changes - 4,534 - 4,076 458 - 458
Total movement - 1,322 - 2,632 - 1,310 315 - 995 1,046 4,814
Balance as at 31 December 2017 159,058 150,564 - 8,494 - 4,827 - 13,321
Limitation on net plan assets as at 1 January - 11,145
Movement in limitation net plan assets - 4,458 4,458
Limitation on net plan assets as at 31 December - 15,603
Balance as at 31 December 2017 after limitation on net plan assets - 28,924
Total result defined benefit pension plans 10,318 1,046 9,272
In the Netherlands Boskalis has arranged a pension plan for a large part of its Dutch staff with the Pensioenfonds Grafische Bedrijven (PGB), while other employees in the Netherlands participate in the pension plans of five Dutch multi-employer pension funds or in one of the Dutch insured pension plans. In the Netherlands the tasks and responsibilities of employer, employee and pension provider in relation to pensions are set out in the Dutch Pension Act. The Pension Act stipulates the requirements and conditions that pension plans must comply with, including the requirement of integrating the plan into either a recognized pension fund or with a recognized pension insurance company and also that rights granted must be immediately funded by the employer. The law also sets requirements for the amounts of equity that pension providers should maintain. Compliance with the law is supervised by the Dutch Central Bank (DNB) and the Dutch Financial Markets Authority (AFM). In addition, the Group has a number of foreign pension plans, of which the largest is in the United Kingdom.
Pension plan at Pensioenfonds Grafische Bedrijven The Group has arranged its pension plan, which is qualified as a defined contribution plan, for the majority of its Dutch staff with Pensioenfonds Grafische Bedrijven, a multi-employer fund. The annual premium contribution by the Group is determined by PGB, based on the actuarial cost of purchasing pension rights on an annual basis. The Group has no obligation to cover any plan deficits, nor are there any specific separate plan assets dedicated to the Group in this pension plan that are managed by PGB. After payment of the annual premium, the Group has no obligation to pay for additional contributions or higher future premiums in the event of a shortfall at PGB, nor if the plan or the fund is terminated. Furthermore, the Group has no entitlement to any surplus in the PGB pension fund. Future cash flows are limited to the payment of future premiums for purchasing (new) rights for the years to come. The premium is influenced by the usual, underlying actuarial assumptions, expected returns and agreed contribution ceiling.
Besides Boskalis, multiple other companies have also arranged their pension plans with PGB. The Group has no direct involvement in the governance of PGB. PGB does not hold specific, segregated pension assets dedicated to the Group. The share of the Boskalis pension plans in total liabilities and assets at PGB is limited.
Dutch multi-employer pension funds Some of the Dutch staff participate in one of five industry-wide multi-employer pension funds, all within the framework of the Dutch Pension Act as referred to above, of which Bedrijfstak Pensioenfonds Waterbouw is the only one with a proportionately significant premium contribution by Boskalis of 20% (2017: 20%). As at 31 December 2018 the Bedrijfstak Pensioenfonds Waterbouw had a coverage ratio greater than 113 % (2017: greater than 105%).
113
AN
NU
AL
REP
OR
T 2
018
– B
OSK
ALI
S
AN
NU
AL
REP
OR
T 2
01
8 ---
B
OSK
ALI
S
113
The Group has no direct involvement in the governance of the multi-employer pension funds. Employers’ Associations, of which the Group is a member, designate some of the board members and/or supervisors of the multi-employer pension funds. In addition, the boards also include representatives of employees and retirees, possibly supplemented by one or more independent persons. The pension includes retirement and survivor's pension. These pension funds have indicated they are not able to provide sufficient information for a calculation in accordance with IFRS because there is no reliable and consistent basis to which to attribute the pension obligations, plan assets, and the absolute and relative share of the Group in the fund and to which to allocate income and expenses to the individual member companies of these pension funds. As a result, these defined benefit plans are recognized in these financial statements as a defined contribution plan in accordance with IFRS. In all cases relating to industry-wide multi-employer pension funds, the Group has no obligation whatsoever to pay additional contributions in the case of a deficit in the respective fund, other than paying the annual premium. Nor does the Group have a right to any surpluses in the funds. The premium covers the actuarially determined cost of purchasing the yearly rights for participants. The premium on the basis of the actuarial cost of purchasing rights in years is influenced by customary underlying actuarial assumptions, expected returns and often agreed ceilings. The expected contribution for the coming year is explained below.
Other pension plans Other pension plans relate to, individually not material, multi-employer pension plans arranged with pension funds in the United Kingdom and insurance companies in the Netherlands, Belgium, the United Kingdom and the United States, as well as to minor unfunded defined benefit plans for two group companies in Germany. These pension plans are in compliance with local laws and/or regulations applicable in the aforementioned countries. With the exception of the plan in the United Kingdom, where the Group may appoint one or more Directors or Trustees, the Group has no direct and/or significant involvement in the governance of these pension plans. The pension plans are characterized by defined benefit rights over the participant’s years of service, which are mainly based on average wages and include retirement and survivor’s pension. These pensions are indexed, for the main part with a limit being set to the available contributions and the return on plan assets, respectively. The pension liabilities and pension assets are placed with and managed by the pension funds or insurance companies. The risk for the Group relating to these pensions is therefore limited. With the exception of a closed pension plan in the United Kingdom, the future cash flows for the other arrangements are limited to the actuarially calculated annual premiums based on the cost of purchasing future pension rights. In other funded defined benefit plans there is no enforceable statutory or regulatory direct obligation to cover any deficits to fulfill future actuarial obligations. The contributions are subject to the customary, actuarial assumptions, expected returns and agreed contribution ceiling.
The Group’s company pension fund in the United Kingdom is managed by BKW Trustee Company Limited. The management of the Trust company is partly appointed by Boskalis and partly elected by plan participants. The investment policy is geared to the fact that it is a closed arrangement and investments at the end of the year were only fixed income. Pension law in the United Kingdom includes the requirement to annually index pension plans. There is no requirement to immediately and fully cover an existing deficit in this pension plan. However, the intention is to transfer the pension obligation in the near future to an insurance company.
Defined benefit pension plans As per 2018, the remaining balance of the net defined benefit obligation mainly relates to closed pension plans. The net defined benefit obligation of the aforementioned pension plan in the United Kingdom is in line with the expected pricings of the transfer to an insurance company in the near future. The expected contribution to this fund for the coming year, other than payment of the net defined benefit obligation in case of a buy in/buy out transaction being realized, is expected to be close to nil. (2017: GBP 0.6 million).
The other defined pension plan is a closed insured pension for which future cash inflows consist of the Group’s entitlement to excess returns achieved by the insurance company and future cash outflows for premiums for price indexation of insured pensions. The net defined benefit obligation for this pension plan is based on an estimate of this future cash outflow for premiums. The Group’s entitlement to excess returns is not accounted for as an asset. Both the annual income from excess returns and expense for premiums for price indexation continue to be recognized through the statement of other comprehensive income.
Therefore the expected impact of these remaining defined benefit pension plans on future statements of profit or loss is not significant.
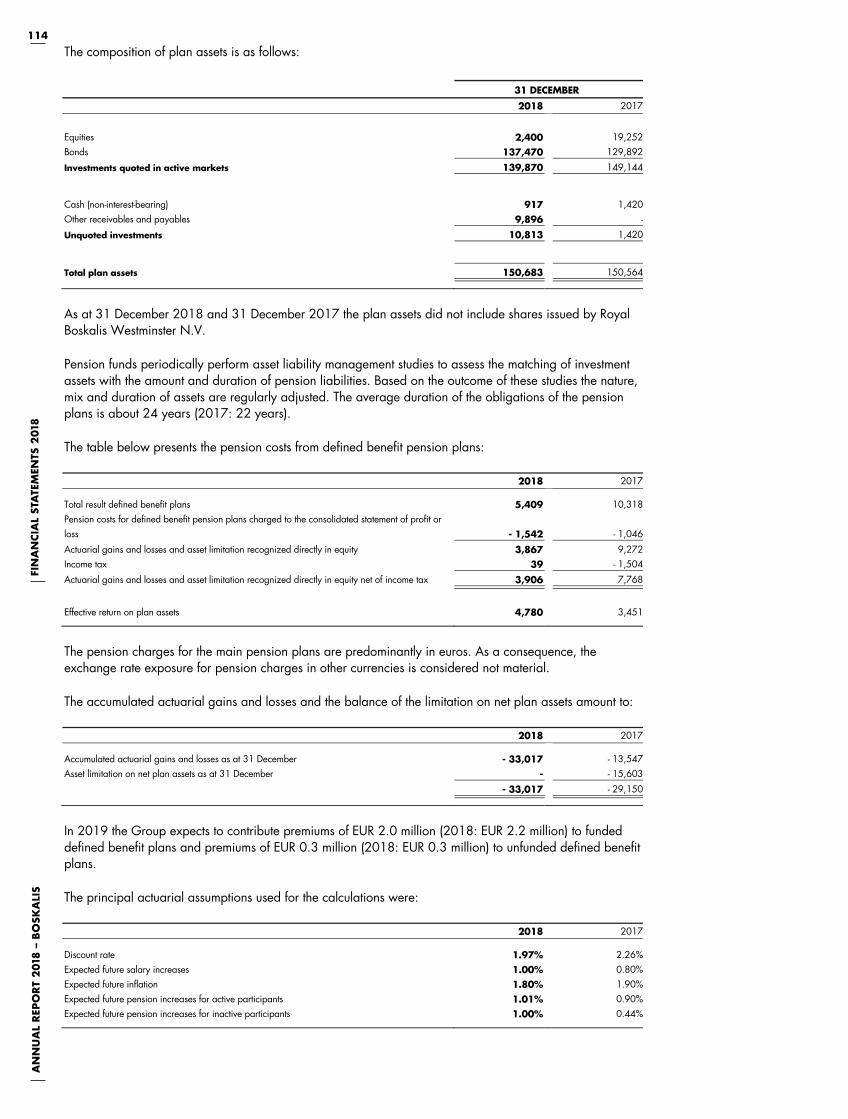
114A
NN
UA
L R
EPO
RT
201
8 –
BO
SKA
LIS
FIN
AN
CIA
L ST
ATE
MEN
TS 2
018
AN
NU
AL
REP
OR
T 2
01
8 ---
BO
SKA
LIS
FI
NA
NCIA
L ST
ATE
MEN
TS 2
01
8
114
The composition of plan assets is as follows:
31 DECEMBER
2018 2017
Equities 2,400 19,252Bonds 137,470 129,892
Investments quoted in active markets 139,870 149,144
Cash (non-interest-bearing) 917 1,420Other receivables and payables 9,896 -
Unquoted investments 10,813 1,420
Total plan assets 150,683 150,564
As at 31 December 2018 and 31 December 2017 the plan assets did not include shares issued by Royal Boskalis Westminster N.V.
Pension funds periodically perform asset liability management studies to assess the matching of investment assets with the amount and duration of pension liabilities. Based on the outcome of these studies the nature, mix and duration of assets are regularly adjusted. The average duration of the obligations of the pension plans is about 24 years (2017: 22 years).
The table below presents the pension costs from defined benefit pension plans:
2018 2017
Total result defined benefit plans 5,409 10,318Pension costs for defined benefit pension plans charged to the consolidated statement of profit or loss - 1,542 - 1,046
Actuarial gains and losses and asset limitation recognized directly in equity 3,867 9,272Income tax 39 - 1,504
Actuarial gains and losses and asset limitation recognized directly in equity net of income tax 3,906 7,768
Effective return on plan assets 4,780 3,451
The pension charges for the main pension plans are predominantly in euros. As a consequence, the exchange rate exposure for pension charges in other currencies is considered not material.
The accumulated actuarial gains and losses and the balance of the limitation on net plan assets amount to:
2018 2017
Accumulated actuarial gains and losses as at 31 December - 33,017 - 13,547Asset limitation on net plan assets as at 31 December - - 15,603
- 33,017 - 29,150
In 2019 the Group expects to contribute premiums of EUR 2.0 million (2018: EUR 2.2 million) to funded defined benefit plans and premiums of EUR 0.3 million (2018: EUR 0.3 million) to unfunded defined benefit plans.
The principal actuarial assumptions used for the calculations were:
2018 2017
Discount rate 1.97% 2.26%Expected future salary increases 1.00% 0.80%Expected future inflation 1.80% 1.90%Expected future pension increases for active participants 1.01% 0.90%Expected future pension increases for inactive participants 1.00% 0.44%

115
AN
NU
AL
REP
OR
T 2
018
– B
OSK
ALI
S
AN
NU
AL
REP
OR
T 2
01
8 ---
B
OSK
ALI
S
115
Sensitivity to changes in the applied assumptions can be summarized as follows:
Assumptions as at 31 December 2018 Increase of 0.25% Decrease of 0.25%
Effect on defined benefit obligation
Change in discount rate - 9,196 10,259Change in expected future salary increases 2,581 - 2,470Change in pension increase for active participants 1,758 - 1,663Change in pension increase for inactive participants 3,843 - 3,580
Assumptions as at 31 December 2017 Increase of 0.25% Decrease of 0.25%
Effect on defined benefit obligation
Change in discount rate - 7,534 8,344Change in expected future salary increases 1,939 - 1,870Change in pension increase for active participants 1,914 - 1,815Change in pension increase for inactive participants 3,083 - 2,887
Historical information:
2018 2017 2016 2015 2014
Defined benefit obligation - 178,923 - 159,058 - 160,380 - 753,035 - 747,808
Fair value of plan assets 150,683 150,564 153,196 734,794 691,932
Surplus / deficit (-) - 28,240 - 8,494 - 7,184 - 18,241 - 55,876
Unfunded pension liabilities - 4,555 - 4,827 - 5,142 - 5,175 - 5,316
Total surplus / deficit (-) - 32,795 - 13,321 - 12,326 - 23,416 - 61,192
The reduction of defined benefit obligations and the fair value of plan assets in 2016 mainly related to the settlement of two defined benefit plans in 2016.
25.2 DEFINED CONTRIBUTION PENSION PLANS In 2019 the Group expects to contribute an amount of EUR 41.0 million (2018: EUR 40.0 million) to premiums for defined contributions plans. This concerns contributions to defined contribution pension plans and pension plans arranged with multi-employer pension funds, which are accounted for as defined contribution pension plans in these financial statements, in accordance with IFRS.
26. PROVISIONS
ONEROUS
CONTRACTS WARRANTIES RESTRUCTURING OTHER TOTAL 2018 TOTAL 2017
Balance as at 1 January REVISED 5,619 14,548 9,879 9,310 39,356 55,462
Assumed in business combinations - - - - - 2,790
Provisions made during the year 13,129 6,016 6,407 721 26,273 21,883
Provisions used during the year - 119 - - 6,982 - - 7,101 - 20,968
Provisions reversed during the year - 120 - 1,208 - 785 - 149 - 2,262 - 18,803
Exchange rate differences and other movements - 38 - 5 30 - 3 - 1,008
Balance as at 31 December 18,471 19,356 8,524 9,912 56,263 39,356
Current 18,471 2,369 6,652 912 28,404 17,763
Non-current - 16,987 1,872 9,000 27,859 21,593
Balance as at 31 December 18,471 19,356 8,524 9,912 56,263 39,356
The provision for onerous contracts includes a provision for unfavorable contracts, both as part of contracts with customers and as part of the liabilities assumed in business combinations.
Restructuring provisions relate mainly to the restructuring of Group head office and Gardline.
Other provisions mainly relate to various claims made against the Group or threatening to be made including potential sanctions, from legal, regulatory and governmental proceedings. The Group disputes these claims and proceedings and has made an assessment of the amount of cash outflows that can be reasonably estimated. As litigation is inherently unpredictable, the possible outcome is uncertain and the amount may differ from the provisions listed above.
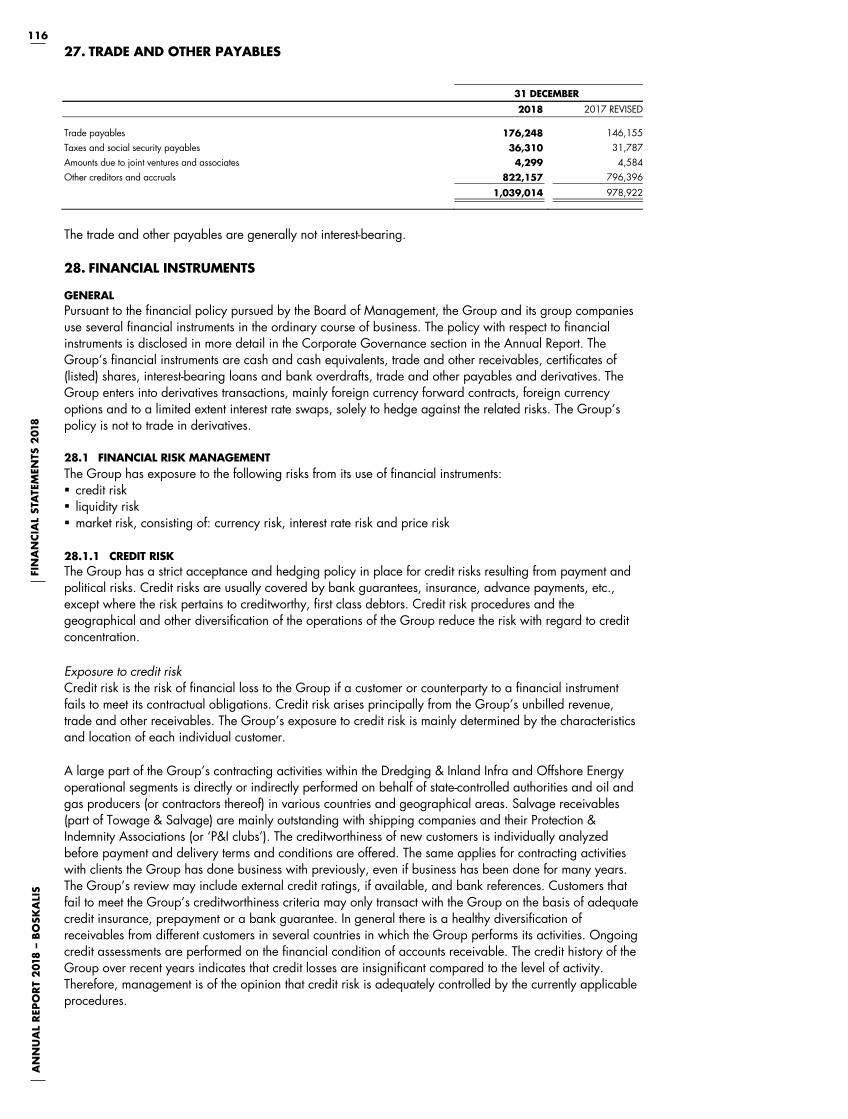
116A
NN
UA
L R
EPO
RT
201
8 –
BO
SKA
LIS
FIN
AN
CIA
L ST
ATE
MEN
TS 2
018
116 A
NN
UA
L R
EPO
RT
20
18
--- B
OSK
ALI
S F
INA
NCIA
L ST
ATE
MEN
TS 2
01
8
27. TRADE AND OTHER PAYABLES
31 DECEMBER
2018 2017 REVISED
Trade payables 176,248 146,155Taxes and social security payables 36,310 31,787Amounts due to joint ventures and associates 4,299 4,584Other creditors and accruals 822,157 796,396
1,039,014 978,922
The trade and other payables are generally not interest-bearing.
28. FINANCIAL INSTRUMENTS
GENERAL Pursuant to the financial policy pursued by the Board of Management, the Group and its group companies use several financial instruments in the ordinary course of business. The policy with respect to financial instruments is disclosed in more detail in the Corporate Governance section in the Annual Report. The Group’s financial instruments are cash and cash equivalents, trade and other receivables, certificates of (listed) shares, interest-bearing loans and bank overdrafts, trade and other payables and derivatives. The Group enters into derivatives transactions, mainly foreign currency forward contracts, foreign currency options and to a limited extent interest rate swaps, solely to hedge against the related risks. The Group’s policy is not to trade in derivatives.
28.1 FINANCIAL RISK MANAGEMENT The Group has exposure to the following risks from its use of financial instruments: credit risk liquidity risk market risk, consisting of: currency risk, interest rate risk and price risk
28.1.1 CREDIT RISK The Group has a strict acceptance and hedging policy in place for credit risks resulting from payment and political risks. Credit risks are usually covered by bank guarantees, insurance, advance payments, etc., except where the risk pertains to creditworthy, first class debtors. Credit risk procedures and the geographical and other diversification of the operations of the Group reduce the risk with regard to credit concentration.
Exposure to credit risk Credit risk is the risk of financial loss to the Group if a customer or counterparty to a financial instrument fails to meet its contractual obligations. Credit risk arises principally from the Group’s unbilled revenue, trade and other receivables. The Group’s exposure to credit risk is mainly determined by the characteristics and location of each individual customer.
A large part of the Group’s contracting activities within the Dredging & Inland Infra and Offshore Energy operational segments is directly or indirectly performed on behalf of state-controlled authorities and oil and gas producers (or contractors thereof) in various countries and geographical areas. Salvage receivables (part of Towage & Salvage) are mainly outstanding with shipping companies and their Protection & Indemnity Associations (or ‘P&I clubs’). The creditworthiness of new customers is individually analyzed before payment and delivery terms and conditions are offered. The same applies for contracting activities with clients the Group has done business with previously, even if business has been done for many years. The Group’s review may include external credit ratings, if available, and bank references. Customers that fail to meet the Group’s creditworthiness criteria may only transact with the Group on the basis of adequate credit insurance, prepayment or a bank guarantee. In general there is a healthy diversification of receivables from different customers in several countries in which the Group performs its activities. Ongoing credit assessments are performed on the financial condition of accounts receivable. The credit history of the Group over recent years indicates that credit losses are insignificant compared to the level of activity. Therefore, management is of the opinion that credit risk is adequately controlled by the currently applicable procedures.

117
AN
NU
AL
REP
OR
T 2
018
– B
OSK
ALI
S
AN
NU
AL
REP
OR
T 2
01
8 ---
B
OSK
ALI
S
117
The maximum credit risk as at the balance sheet date, without taking into account the aforementioned financial risk coverage policy and instruments, consists of the carrying amounts of the financial assets as stated below.
31 DECEMBER
2018 2017 REVISED
Other non-current receivables 1,377 1,249Trade receivables 330,324 318,942Amounts due from joint ventures and associates 27,143 25,681Other receivables and prepayments 307,140 386,418Derivatives 6,367 29,876Income tax receivable 19,457 17,705Cash and cash equivalents 336,207 191,948
1,028,015 971,819
The maximum credit risk on trade receivables by operational segment was as follows as at the reporting date:
31 DECEMBER
2018 2017
Dredging & Inland Infra 198,924 200,385Offshore Energy 97,465 114,182Towage & Salvage 29,119 3,606Holding & Eliminations 4,816 769
330,324 318,942
Loss allowances relate to the expected credit loss (ECL) on unbilled revenue (0.4%) and trade receivables. For unbilled revenue, the ECL is incorporated in the valuation of (unbilled) revenue. The aging of trade receivables as at 31 December was as follows:
2018 2017
Gross Credit loss Credit loss in % Gross Impairment
Not past due 186,101 - 748 0.4% 196,935 - 77
Past due 0 - 90 days 110,461 - 927 0.8% 61,314 - 212
Past due 90 - 180 days 25,318 - 717 2.8% 12,825 - 92
Past due 180 - 360 days 2,465 - 376 15.3% 10,421 - 4,741
More than 360 days 18,596 - 9,849 53.0% 51,767 - 9,198
342,941 - 12,617 333,262 - 14,320
Credit loss / Impairment - 12,617 - 14,320
Trade receivables at book value 330,324 318,942
Loss allowances relate to the expected credit loss (ECL) based on the characteristics of the customers, the aging of the receivables, the performance of the Group credit risk management policy and any convincing forward-looking information. Aging and local payment practices and the legal terms applicable for payments in the respective jurisdiction are relevant to the Group’s policy on writing off receivables.

118A
NN
UA
L R
EPO
RT
201
8 –
BO
SKA
LIS
FIN
AN
CIA
L ST
ATE
MEN
TS 2
018
AN
NU
AL
REP
OR
T 2
01
8 ---
BO
SKA
LIS
FI
NA
NCIA
L ST
ATE
MEN
TS 2
01
8
118
The movement in the loss allowances in respect of trade receivables during the year was as follows:
2018 2017
Balance as at 1 January based on incurred losses 14,320 20,729
Change in accounting principles (see note 3.33) 153
Balance as at 1 January based on expected losses method 14,473 Acquired through business combinations - 42Provisions made during the year 3,515 3,898Provisions used during the year - 3,372 - 4,396Provisions reversed during the year - 2,689 - 5,109Currency exchange rate differences 690 - 844
- 1,856 - 6,409
Balance as at 31 December 12,617 14,320
At 1 January 2018 the Group reassessed its loss allowances for trade receivables based on the expected loss method according to IFRS 9. In 2017 loss allowances were calculated based on the incurred loss method in IAS 39.
Concentration of credit risk of customers As at the reporting date there was no concentration of credit risk with any customers.
Credit risk cash and cash equivalents The Group had cash and cash equivalents of EUR 336 million as at 31 December 2018 (2017: EUR 192 million), representing its maximum credit risk exposure on these assets. The cash and cash equivalents are held with bank and financial institution counterparties with investment grade credit ratings.
28.1.2 LIQUIDITY RISK Liquidity risk is the risk that the Group will not be able to meet its financial obligations as they fall due.
The Group’s approach to managing liquidity is aimed at ensuring that it will have sufficient liquidity to meet its liabilities when due, under both normal and stressed conditions. Liquidity projections including available credit facilities are incorporated in the regular management information reviewed by the Board of Management. The focus of the liquidity review is on the net financing capacity, being free cash (see note 22) plus available credit facilities in relation to financial liabilities (see note 24). The total of free cash and available credit facilities at year-end amounted to EUR 0.6 billion. Furthermore, based on the Group’s financial ratios it can be concluded that the Group has significant debt capacity available under an (implied) investment grade credit profile.
The following are the contractual maturities of financial liabilities, including estimated interest payments and excluding the impact of netting agreements:
As at 31 December 2018 Book value
Contractual
cash flows One year or less 1 - 5 years
More than
5 years
US private placements 283,572 331,124 10,405 320,719 -
Revolving multi-currency credit facility 150,000 151,125 750 150,375 -
Other interest-bearing borrowings 5,179 6,979 642 6,337 -
Bank overdrafts 28,330 28,986 28,986 - -
Trade and other payables 1,039,014 1,039,014 1,039,014 - -
Income tax payable 150,719 150,719 150,719 - -
Derivatives 13,136 13,136 11,435 1,701 -
1,669,950 1,721,083 1,241,951 479,132 -

119
AN
NU
AL
REP
OR
T 2
018
– B
OSK
ALI
S
AN
NU
AL
REP
OR
T 2
01
8 ---
B
OSK
ALI
S
119
As at 31 December 2017 REVISED Book value
Contractual
cash flows One year or less 1 - 5 years
More than
5 years
US private placements 269,398 325,136 9,906 39,624 275,606
Other interest-bearing borrowings 1,466 1,715 347 1,368 -
Bank overdrafts 40,794 40,931 40,931 - -
Trade and other payables 978,922 978,922 978,922 - -
Income tax payable 148,488 148,488 148,488 - -
Derivatives 2,258 2,258 2,231 27 -
1,441,326 1,497,450 1,180,825 41,019 275,606
28.1.3 MARKET RISK Market risk concerns the risk that Group income or the value of investments in financial instruments is adversely affected by changes in market prices, such as currency exchange rates, interest rates and fuel prices. The objective of managing market risks is to keep the market risk position within acceptable boundaries while achieving the best possible return.
Currency risk The presentation currency of the Group is the euro. A number of group companies (the most important of which being Dockwise) and substantial joint ventures and associates (Smit Lamnalco, Keppel Smit Towage, Asian Lift and Saam Smit Towage) have other functional currencies than the euro. The main other currency is the US dollar (the functional currency of the Dockwise, Smit Lamnalco and Saam Smit Towage entities) and to a lesser extent the Pound Sterling and Singapore dollar. The revenue and expenses of these companies are largely or entirely based on their functional currency, other than the euro. In 2018 group companies, joint ventures and associates with a functional currency other than the euro contributed approximately 20% (2017: 25%) to Group revenue, 35% (2017: 40%) to the operating result excluding impairment charges and 30% (2017: 35%) to EBITDA.
The Board of Management has defined a policy to control foreign currency risk based on the hedging by group companies of material transactions in foreign currencies other than the functional currency. The policy is that these group companies hedge any material currency risks resulting from operational transactions in currencies other than their functional currency. This is mainly relevant for group companies involved in dredging or offshore energy projects. The functional currency of a large part of the activities of group companies is the euro. The expenses of these companies are mainly presented in euros and to a lesser extent in the local currency of the country in which the activities are undertaken. The Group contracts projects mainly in euro, US dollar, Pound Sterling and other currencies pegged to the US dollar.
The Group only uses derivative financial instruments to hedge underlying business transactions, mainly future cash flows from contracted projects. In most cases forward currency contracts are used to hedge foreign currency cash flows. Also, cash / bank overdraft balances are sometimes used to hedge currency exposures from future cash flows. The same currency and quantity are designated to the hedge, resulting in a one-to-one relationship and in principle in a hedge ratio of one. The Group tests the economic relationship of the hedges periodically.
Exposure to currency risk The Group’s currency risk management policy was maintained in 2018 and resulted in a non-material sensitivity of the Group to currency transaction risk.
The following significant exchange rates applied during the year under review:
Average rate Spot rate as at 31 December
Euro 2018 2017 2018 2017
US dollar 1.180 1.133 1.143 1.201Pound Sterling 0.886 0.874 0.898 0.888Singapore dollar 1.590 1.561 1.558 1.605
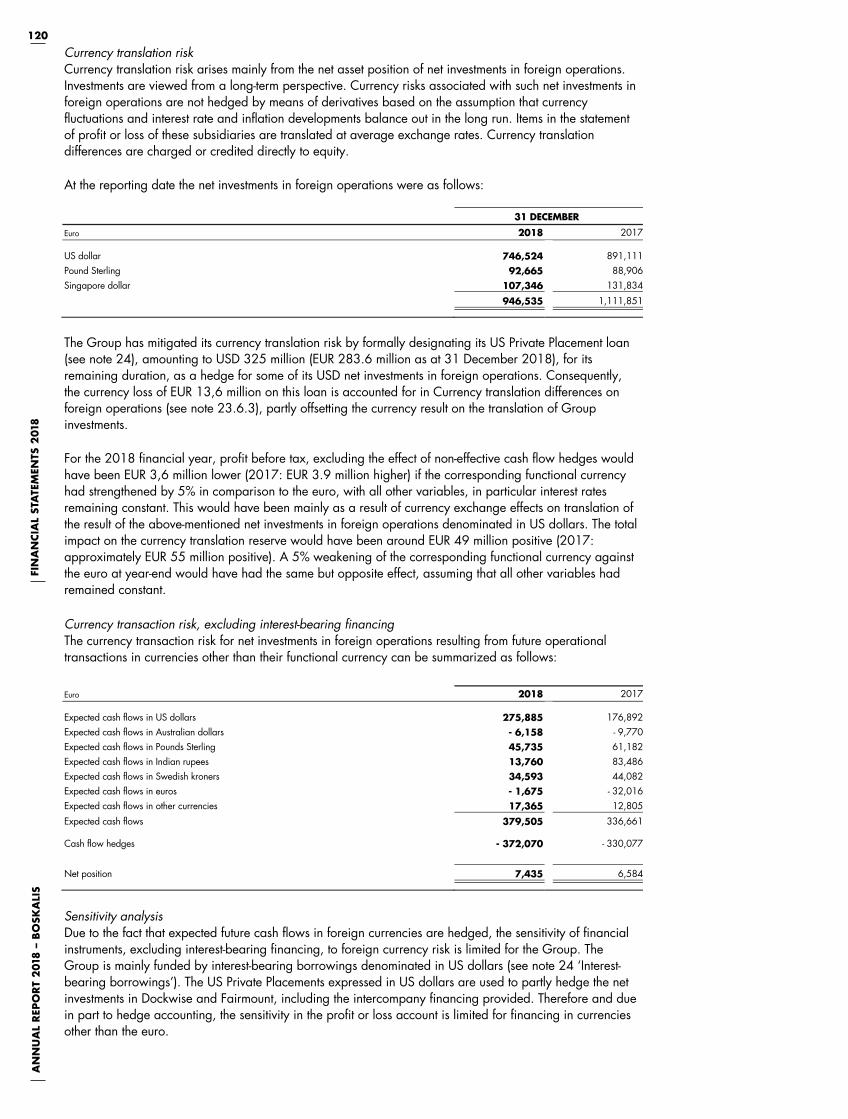
120A
NN
UA
L R
EPO
RT
201
8 –
BO
SKA
LIS
FIN
AN
CIA
L ST
ATE
MEN
TS 2
018
AN
NU
AL
REP
OR
T 2
01
8 ---
BO
SKA
LIS
FI
NA
NCIA
L ST
ATE
MEN
TS 2
01
8
120
Currency translation risk Currency translation risk arises mainly from the net asset position of net investments in foreign operations. Investments are viewed from a long-term perspective. Currency risks associated with such net investments in foreign operations are not hedged by means of derivatives based on the assumption that currency fluctuations and interest rate and inflation developments balance out in the long run. Items in the statement of profit or loss of these subsidiaries are translated at average exchange rates. Currency translation differences are charged or credited directly to equity.
At the reporting date the net investments in foreign operations were as follows:
31 DECEMBER
Euro 2018 2017
US dollar 746,524 891,111Pound Sterling 92,665 88,906Singapore dollar 107,346 131,834
946,535 1,111,851
The Group has mitigated its currency translation risk by formally designating its US Private Placement loan (see note 24), amounting to USD 325 million (EUR 283.6 million as at 31 December 2018), for its remaining duration, as a hedge for some of its USD net investments in foreign operations. Consequently, the currency loss of EUR 13,6 million on this loan is accounted for in Currency translation differences on foreign operations (see note 23.6.3), partly offsetting the currency result on the translation of Group investments.
For the 2018 financial year, profit before tax, excluding the effect of non-effective cash flow hedges would have been EUR 3,6 million lower (2017: EUR 3.9 million higher) if the corresponding functional currency had strengthened by 5% in comparison to the euro, with all other variables, in particular interest rates remaining constant. This would have been mainly as a result of currency exchange effects on translation of the result of the above-mentioned net investments in foreign operations denominated in US dollars. The total impact on the currency translation reserve would have been around EUR 49 million positive (2017: approximately EUR 55 million positive). A 5% weakening of the corresponding functional currency against the euro at year-end would have had the same but opposite effect, assuming that all other variables had remained constant.
Currency transaction risk, excluding interest-bearing financing The currency transaction risk for net investments in foreign operations resulting from future operational transactions in currencies other than their functional currency can be summarized as follows:
Euro 2018 2017
Expected cash flows in US dollars 275,885 176,892Expected cash flows in Australian dollars - 6,158 - 9,770Expected cash flows in Pounds Sterling 45,735 61,182Expected cash flows in Indian rupees 13,760 83,486Expected cash flows in Swedish kroners 34,593 44,082Expected cash flows in euros - 1,675 - 32,016Expected cash flows in other currencies 17,365 12,805
Expected cash flows 379,505 336,661
Cash flow hedges - 372,070 - 330,077
Net position 7,435 6,584
Sensitivity analysis Due to the fact that expected future cash flows in foreign currencies are hedged, the sensitivity of financial instruments, excluding interest-bearing financing, to foreign currency risk is limited for the Group. The Group is mainly funded by interest-bearing borrowings denominated in US dollars (see note 24 ‘Interest-bearing borrowings’). The US Private Placements expressed in US dollars are used to partly hedge the net investments in Dockwise and Fairmount, including the intercompany financing provided. Therefore and due in part to hedge accounting, the sensitivity in the profit or loss account is limited for financing in currencies other than the euro.

121
AN
NU
AL
REP
OR
T 2
018
– B
OSK
ALI
S
AN
NU
AL
REP
OR
T 2
01
8 ---
B
OSK
ALI
S
121
Interest rate risk The Group has mainly fixed interest rate liabilities and a revolving multi-currency facility with a variable interest rate. With a view to managing interest rate risks, the policy is that interest rates for loans payable are in principle primarily fixed for the entire maturity period. This is achieved by contracting loans that carry a fixed interest rate and/or by using derivatives such as interest rate swaps.
The interest rates and maturity profiles of interest-bearing loans, deposits and cash and cash equivalents are stated below.
As at 31 December 2018 Interest rate One year or less 1 - 5 years Over 5 years Total
Cash and cash equivalents 0.00% 311,740 - - 311,740
Short-term deposits 2.68% 24,467 - - 24,467
US Private Placements (USD) 3.66% - - 283,572 - - 283,572
Revolving multi-currency credit facility (EUR) 0.50% - - 150,000 - - 150,000
Other interest-bearing borrowings (EUR) 6.95% - 282 - 4,897 - - 5,179
Bank overdrafts 2.32% - 28,330 - - - 28,330
307,595 - 438,469 - - 130,874
As at 31 December 2017 Interest rate One year or less 1 - 5 years Over 5 years Total
Cash and cash equivalents 0.00% 184,624 - - 184,624
Short-term deposits 2.36% 7,324 - - 7,324
US Private Placements (USD) 3.66% - - - 269,398 - 269,398
Other interest-bearing borrowings (EUR) 3.40% - 297 - 1,169 - - 1,466
Bank overdrafts 0.34% - 40,794 - - - 40,794
150,857 - 1,169 - 269,398 - 119,710
The US Private Placements and some of the cash and cash equivalents, short-term deposits and other interest-bearing borrowings have fixed interest rates.
Sensitivity analysis In managing interest rate risks the Group aims to reduce the impact of short-term fluctuations on Group earnings. In the long term, however, permanent changes in interest rates have an impact on profit.
At the reporting date the interest rate profile of the Group’s interest-bearing financial instruments was:
2018 2017
FIXED RATE INSTRUMENTS
Financial assets - -Financial liabilities - 288,751 - 270,864
- 288,751 - 270,864
VARIABLE RATE INSTRUMENTS
Financial assets 336,207 191,948Financial liabilities - 178,330 - 40,794
157,877 151,154
A drop of 100 basis points, insofar as possible, in interest rates as at 31 December 2018 would have had no material impact on the Group’s profit before income tax (2017: no material impact), with all other variables, in particular currency exchange rates, remaining constant. A rise of 100 basis points in interest rates as at 31 December 2018 would also have had no material impact on the Group’s profit before income tax (2017: no material impact), with all other variables, in particular currency exchange rates, remaining constant.
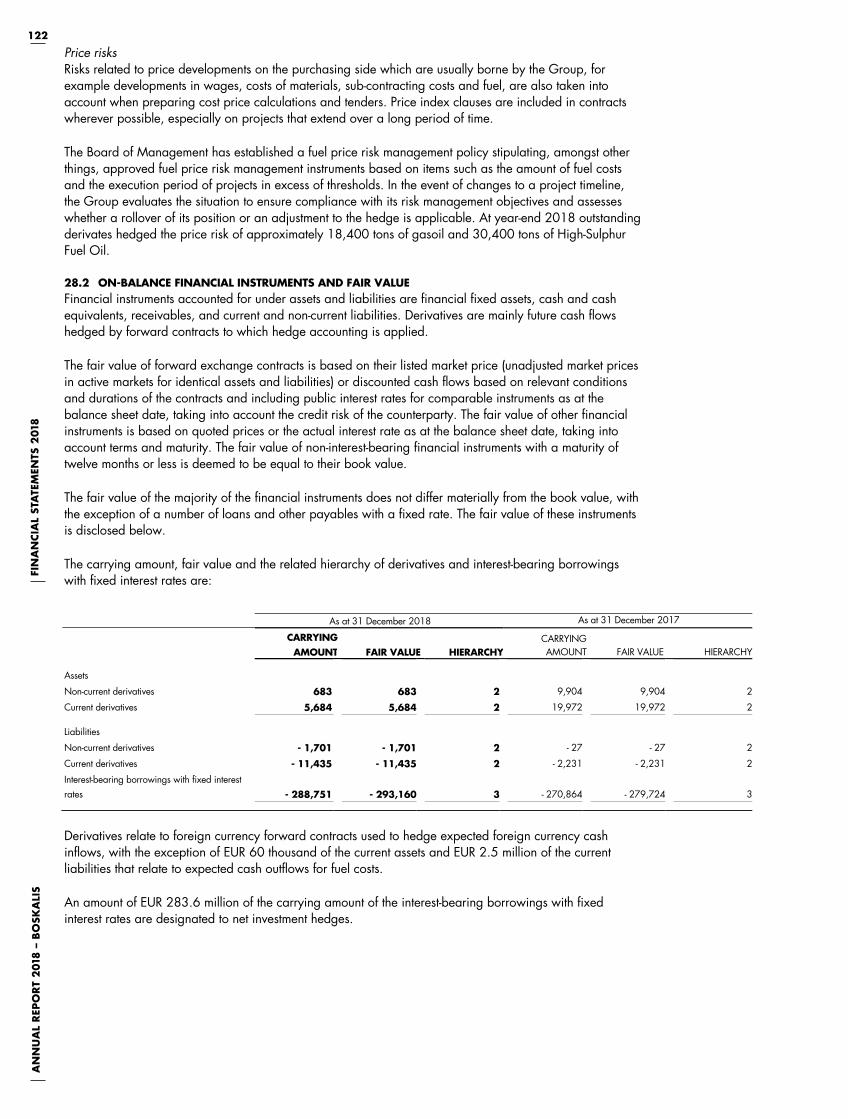
122A
NN
UA
L R
EPO
RT
201
8 –
BO
SKA
LIS
FIN
AN
CIA
L ST
ATE
MEN
TS 2
018
AN
NU
AL
REP
OR
T 2
01
8 ---
BO
SKA
LIS
FI
NA
NCIA
L ST
ATE
MEN
TS 2
01
8
122
Price risks Risks related to price developments on the purchasing side which are usually borne by the Group, for example developments in wages, costs of materials, sub-contracting costs and fuel, are also taken into account when preparing cost price calculations and tenders. Price index clauses are included in contracts wherever possible, especially on projects that extend over a long period of time.
The Board of Management has established a fuel price risk management policy stipulating, amongst other things, approved fuel price risk management instruments based on items such as the amount of fuel costs and the execution period of projects in excess of thresholds. In the event of changes to a project timeline, the Group evaluates the situation to ensure compliance with its risk management objectives and assesses whether a rollover of its position or an adjustment to the hedge is applicable. At year-end 2018 outstanding derivates hedged the price risk of approximately 18,400 tons of gasoil and 30,400 tons of High-Sulphur Fuel Oil.
28.2 ON-BALANCE FINANCIAL INSTRUMENTS AND FAIR VALUE Financial instruments accounted for under assets and liabilities are financial fixed assets, cash and cash equivalents, receivables, and current and non-current liabilities. Derivatives are mainly future cash flows hedged by forward contracts to which hedge accounting is applied.
The fair value of forward exchange contracts is based on their listed market price (unadjusted market prices in active markets for identical assets and liabilities) or discounted cash flows based on relevant conditions and durations of the contracts and including public interest rates for comparable instruments as at the balance sheet date, taking into account the credit risk of the counterparty. The fair value of other financial instruments is based on quoted prices or the actual interest rate as at the balance sheet date, taking into account terms and maturity. The fair value of non-interest-bearing financial instruments with a maturity of twelve months or less is deemed to be equal to their book value.
The fair value of the majority of the financial instruments does not differ materially from the book value, with the exception of a number of loans and other payables with a fixed rate. The fair value of these instruments is disclosed below.
The carrying amount, fair value and the related hierarchy of derivatives and interest-bearing borrowings with fixed interest rates are:
As at 31 December 2018 As at 31 December 2017
CARRYINGAMOUNT FAIR VALUE HIERARCHY
CARRYING AMOUNT FAIR VALUE HIERARCHY
Assets
Non-current derivatives 683 683 2 9,904 9,904 2
Current derivatives 5,684 5,684 2 19,972 19,972 2
Liabilities
Non-current derivatives - 1,701 - 1,701 2 - 27 - 27 2
Current derivatives - 11,435 - 11,435 2 - 2,231 - 2,231 2
Interest-bearing borrowings with fixed interest rates - 288,751 - 293,160 3 - 270,864 - 279,724 3
Derivatives relate to foreign currency forward contracts used to hedge expected foreign currency cash inflows, with the exception of EUR 60 thousand of the current assets and EUR 2.5 million of the current liabilities that relate to expected cash outflows for fuel costs.
An amount of EUR 283.6 million of the carrying amount of the interest-bearing borrowings with fixed interest rates are designated to net investment hedges.
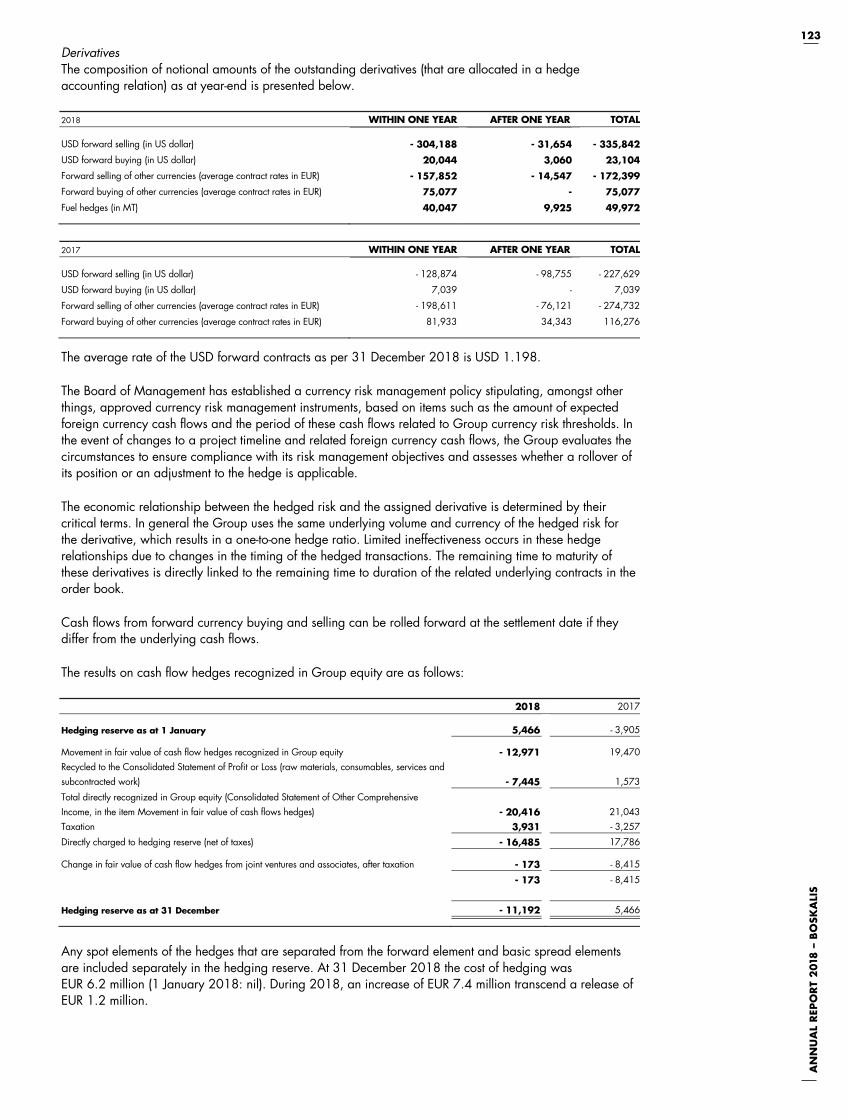
123
AN
NU
AL
REP
OR
T 2
018
– B
OSK
ALI
S
AN
NU
AL
REP
OR
T 2
01
8 ---
B
OSK
ALI
S
123
Derivatives The composition of notional amounts of the outstanding derivatives (that are allocated in a hedge accounting relation) as at year-end is presented below.
2018 WITHIN ONE YEAR AFTER ONE YEAR TOTAL
USD forward selling (in US dollar) - 304,188 - 31,654 - 335,842
USD forward buying (in US dollar) 20,044 3,060 23,104
Forward selling of other currencies (average contract rates in EUR) - 157,852 - 14,547 - 172,399
Forward buying of other currencies (average contract rates in EUR) 75,077 - 75,077
Fuel hedges (in MT) 40,047 9,925 49,972
2017 WITHIN ONE YEAR AFTER ONE YEAR TOTAL
USD forward selling (in US dollar) - 128,874 - 98,755 - 227,629
USD forward buying (in US dollar) 7,039 - 7,039
Forward selling of other currencies (average contract rates in EUR) - 198,611 - 76,121 - 274,732
Forward buying of other currencies (average contract rates in EUR) 81,933 34,343 116,276
The average rate of the USD forward contracts as per 31 December 2018 is USD 1.198.
The Board of Management has established a currency risk management policy stipulating, amongst other things, approved currency risk management instruments, based on items such as the amount of expected foreign currency cash flows and the period of these cash flows related to Group currency risk thresholds. In the event of changes to a project timeline and related foreign currency cash flows, the Group evaluates the circumstances to ensure compliance with its risk management objectives and assesses whether a rollover of its position or an adjustment to the hedge is applicable.
The economic relationship between the hedged risk and the assigned derivative is determined by their critical terms. In general the Group uses the same underlying volume and currency of the hedged risk for the derivative, which results in a one-to-one hedge ratio. Limited ineffectiveness occurs in these hedge relationships due to changes in the timing of the hedged transactions. The remaining time to maturity of these derivatives is directly linked to the remaining time to duration of the related underlying contracts in the order book.
Cash flows from forward currency buying and selling can be rolled forward at the settlement date if they differ from the underlying cash flows.
The results on cash flow hedges recognized in Group equity are as follows:
2018 2017
Hedging reserve as at 1 January 5,466 - 3,905
Movement in fair value of cash flow hedges recognized in Group equity - 12,971 19,470Recycled to the Consolidated Statement of Profit or Loss (raw materials, consumables, services and subcontracted work) - 7,445 1,573
Total directly recognized in Group equity (Consolidated Statement of Other Comprehensive Income, in the item Movement in fair value of cash flows hedges) - 20,416 21,043Taxation 3,931 - 3,257
Directly charged to hedging reserve (net of taxes) - 16,485 17,786
Change in fair value of cash flow hedges from joint ventures and associates, after taxation - 173 - 8,415
- 173 - 8,415
Hedging reserve as at 31 December - 11,192 5,466
Any spot elements of the hedges that are separated from the forward element and basic spread elements are included separately in the hedging reserve. At 31 December 2018 the cost of hedging was EUR 6.2 million (1 January 2018: nil). During 2018, an increase of EUR 7.4 million transcend a release of EUR 1.2 million.
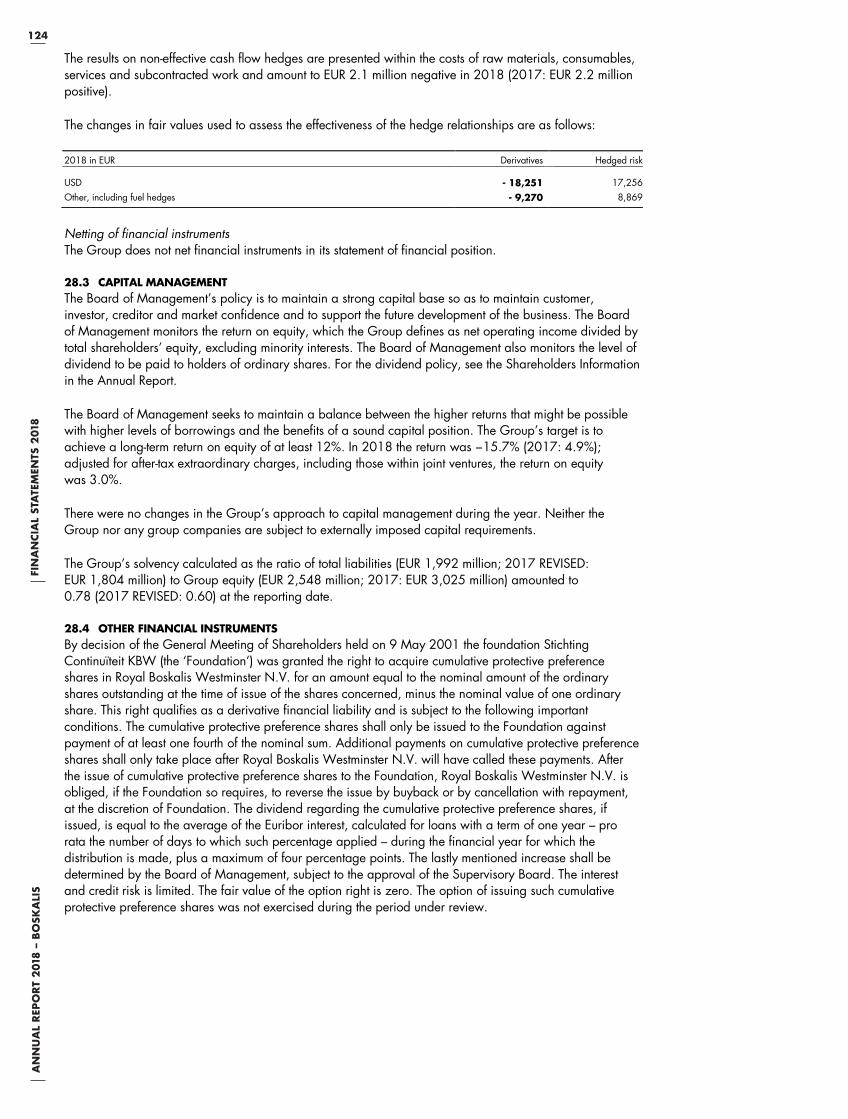
124A
NN
UA
L R
EPO
RT
201
8 –
BO
SKA
LIS
FIN
AN
CIA
L ST
ATE
MEN
TS 2
018
AN
NU
AL
REP
ORT
20
18
--- B
OSK
ALI
S
FIN
AN
CIA
L ST
ATE
MEN
TS 2
01
8
124
The results on non-effective cash flow hedges are presented within the costs of raw materials, consumables, services and subcontracted work and amount to EUR 2.1 million negative in 2018 (2017: EUR 2.2 million positive).
The changes in fair values used to assess the effectiveness of the hedge relationships are as follows:
2018 in EUR Derivatives Hedged risk
USD - 18,251 17,256 Other, including fuel hedges - 9,270 8,869 Netting of financial instruments The Group does not net financial instruments in its statement of financial position.
28.3 CAPITAL MANAGEMENT The Board of Management’s policy is to maintain a strong capital base so as to maintain customer, investor, creditor and market confidence and to support the future development of the business. The Board of Management monitors the return on equity, which the Group defines as net operating income divided by total shareholders’ equity, excluding minority interests. The Board of Management also monitors the level of dividend to be paid to holders of ordinary shares. For the dividend policy, see the Shareholders Information in the Annual Report.
The Board of Management seeks to maintain a balance between the higher returns that might be possible with higher levels of borrowings and the benefits of a sound capital position. The Group’s target is to achieve a long-term return on equity of at least 12%. In 2018 the return was −15.7% (2017: 4.9%); adjusted for after-tax extraordinary charges, including those within joint ventures, the return on equity was 3.0%.
There were no changes in the Group’s approach to capital management during the year. Neither the Group nor any group companies are subject to externally imposed capital requirements.
The Group’s solvency calculated as the ratio of total liabilities (EUR 1,992 million; 2017 REVISED: EUR 1,804 million) to Group equity (EUR 2,548 million; 2017: EUR 3,025 million) amounted to 0.78 (2017 REVISED: 0.60) at the reporting date.
28.4 OTHER FINANCIAL INSTRUMENTS By decision of the General Meeting of Shareholders held on 9 May 2001 the foundation Stichting Continuïteit KBW (the ‘Foundation’) was granted the right to acquire cumulative protective preference shares in Royal Boskalis Westminster N.V. for an amount equal to the nominal amount of the ordinary shares outstanding at the time of issue of the shares concerned, minus the nominal value of one ordinary share. This right qualifies as a derivative financial liability and is subject to the following important conditions. The cumulative protective preference shares shall only be issued to the Foundation against payment of at least one fourth of the nominal sum. Additional payments on cumulative protective preference shares shall only take place after Royal Boskalis Westminster N.V. will have called these payments. After the issue of cumulative protective preference shares to the Foundation, Royal Boskalis Westminster N.V. is obliged, if the Foundation so requires, to reverse the issue by buyback or by cancellation with repayment, at the discretion of Foundation. The dividend regarding the cumulative protective preference shares, if issued, is equal to the average of the Euribor interest, calculated for loans with a term of one year – pro rata the number of days to which such percentage applied – during the financial year for which the distribution is made, plus a maximum of four percentage points. The lastly mentioned increase shall be determined by the Board of Management, subject to the approval of the Supervisory Board. The interest and credit risk is limited. The fair value of the option right is zero. The option of issuing such cumulative protective preference shares was not exercised during the period under review.

125
AN
NU
AL
REP
OR
T 2
018
– B
OSK
ALI
S
AN
NU
AL
REP
OR
T 2
01
8 ---
B
OSK
ALI
S
125
29. COMMITMENTS AND CONTINGENT LIABILITIES
Operational lease obligations The operational lease obligations relate primarily to the operational lease of some floating and other construction equipment, cars and offices. Additional clauses are not taken into account presuming that these are not unconditional. Non-redeemable operating lease contracts are recognized at nominal amounts and are due as follows:
2018 2017
Within one year 23,065 24,247Between one and five years 43,250 33,836After more than five years 20,211 11,663
86,526 69,746
Guarantees The guarantee commitments as at 31 December 2018 amounted to EUR 691 million (2017: EUR 565 million) and can be specified as follows:
2018 2017
Guarantees provided with respect to: Joint ventures 61,300 58,300Contracts and joint operations 628,300 505,300Lease obligations and other financial obligations 1,400 1,400
691,000 565,000
The above-mentioned guarantees outstanding as at 31 December 2018 refer to guarantees and counter guarantees provided to financial institutions for approximately EUR 690 million (2017: approximately EUR 564 million). At year-end 2018, 35 key group companies were jointly and severally liable in respect of credit facilities and guarantees provided to several group companies. In respect of these facilities, it has been agreed to limit the provision of further securities on existing property, plant and equipment.
Group companies are jointly and severally liable for the non-consolidated part of the liabilities of their joint operations amounting to EUR 151 million (2017: EUR 152 million). group companies are also jointly and severally liable for performance obligations for contracts with third parties in project-driven construction consortiums. In addition, certain recourse obligations exist in respect of project financiers and guarantees of deployment relating to equipment. Where deemed necessary, provisions have been made.
In principle the Group does not provide parent company guarantees to its subsidiaries, other than for commercial reasons. group companies have filed declarations of joint and several liability for a number of subsidiaries with the Chamber of Commerce.
Capital commitments As at 31 December 2018 capital expenditure and acquisition commitments amounted to EUR 162 million (year-end 2017: EUR 120 million).
Capital contribution obligations On behalf of the Group, financial institutions have provided bank guarantees for the amount of the capital contribution obligations as disclosed as part of the aforementioned guarantees and counter guarantees.
Other Several legal proceedings and investigations, including regulatory and other governmental, are regularly instituted against (entities of) Royal Boskalis Westminster N.V. Provisions were made where deemed necessary and if a reliable estimate of the future cash outflows could be made. Dutch companies form part of a fiscal unity. The companies are therefore liable for the tax obligations of the fiscal unity as a whole.
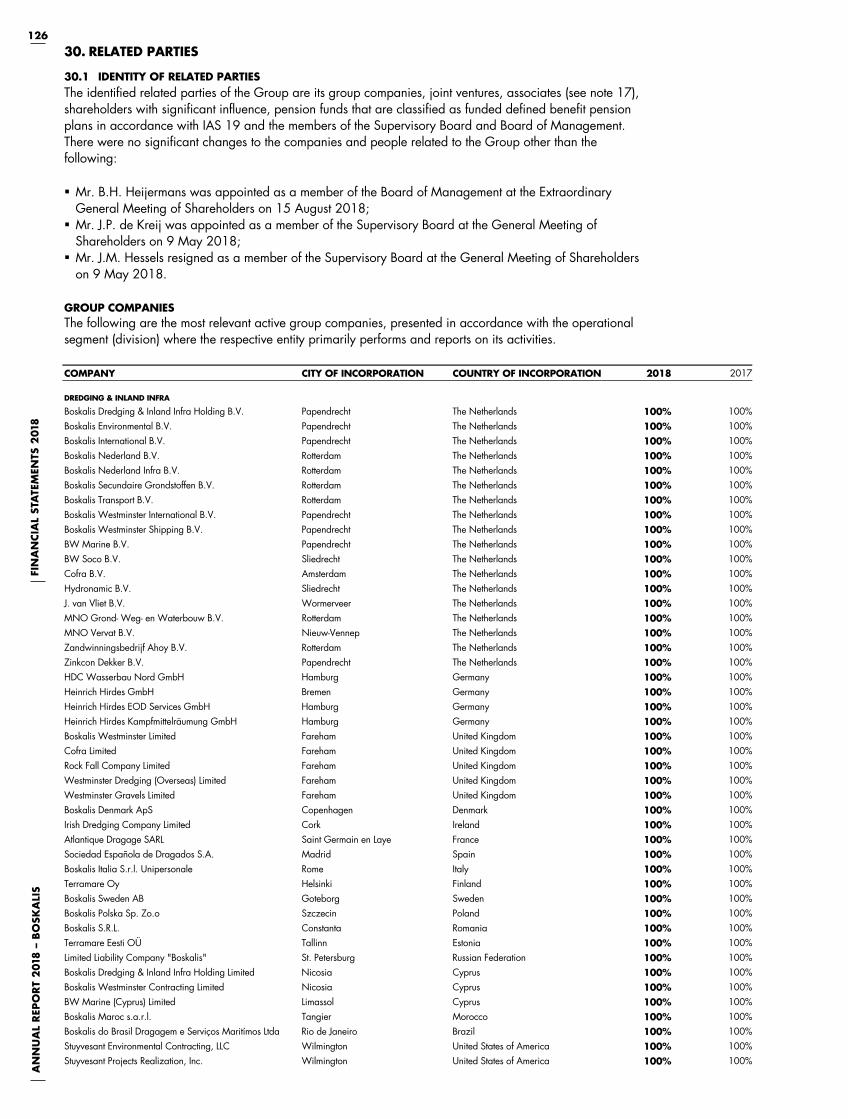
126A
NN
UA
L R
EPO
RT
201
8 –
BO
SKA
LIS
FIN
AN
CIA
L ST
ATE
MEN
TS 2
018
AN
NU
AL
REP
OR
T 2
01
8 ---
BO
SKA
LIS
FI
NA
NCIA
L ST
ATE
MEN
TS 2
01
8
126
30. RELATED PARTIES
30.1 IDENTITY OF RELATED PARTIES The identified related parties of the Group are its group companies, joint ventures, associates (see note 17), shareholders with significant influence, pension funds that are classified as funded defined benefit pension plans in accordance with IAS 19 and the members of the Supervisory Board and Board of Management. There were no significant changes to the companies and people related to the Group other than the following:
Mr. B.H. Heijermans was appointed as a member of the Board of Management at the Extraordinary General Meeting of Shareholders on 15 August 2018;
Mr. J.P. de Kreij was appointed as a member of the Supervisory Board at the General Meeting of Shareholders on 9 May 2018;
Mr. J.M. Hessels resigned as a member of the Supervisory Board at the General Meeting of Shareholders on 9 May 2018.
GROUP COMPANIES The following are the most relevant active group companies, presented in accordance with the operational segment (division) where the respective entity primarily performs and reports on its activities.
COMPANY CITY OF INCORPORATION COUNTRY OF INCORPORATION 2018 2017
DREDGING & INLAND INFRA Boskalis Dredging & Inland Infra Holding B.V. Papendrecht The Netherlands 100% 100%Boskalis Environmental B.V. Papendrecht The Netherlands 100% 100%Boskalis International B.V. Papendrecht The Netherlands 100% 100%Boskalis Nederland B.V. Rotterdam The Netherlands 100% 100%Boskalis Nederland Infra B.V. Rotterdam The Netherlands 100% 100%Boskalis Secundaire Grondstoffen B.V. Rotterdam The Netherlands 100% 100%Boskalis Transport B.V. Rotterdam The Netherlands 100% 100%Boskalis Westminster International B.V. Papendrecht The Netherlands 100% 100%Boskalis Westminster Shipping B.V. Papendrecht The Netherlands 100% 100%BW Marine B.V. Papendrecht The Netherlands 100% 100%BW Soco B.V. Sliedrecht The Netherlands 100% 100%Cofra B.V. Amsterdam The Netherlands 100% 100%Hydronamic B.V. Sliedrecht The Netherlands 100% 100%J. van Vliet B.V. Wormerveer The Netherlands 100% 100%MNO Grond- Weg- en Waterbouw B.V. Rotterdam The Netherlands 100% 100%MNO Vervat B.V. Nieuw-Vennep The Netherlands 100% 100%Zandwinningsbedrijf Ahoy B.V. Rotterdam The Netherlands 100% 100%Zinkcon Dekker B.V. Papendrecht The Netherlands 100% 100%HDC Wasserbau Nord GmbH Hamburg Germany 100% 100%Heinrich Hirdes GmbH Bremen Germany 100% 100%Heinrich Hirdes EOD Services GmbH Hamburg Germany 100% 100%Heinrich Hirdes Kampfmittelräumung GmbH Hamburg Germany 100% 100%Boskalis Westminster Limited Fareham United Kingdom 100% 100%Cofra Limited Fareham United Kingdom 100% 100%Rock Fall Company Limited Fareham United Kingdom 100% 100%Westminster Dredging (Overseas) Limited Fareham United Kingdom 100% 100%Westminster Gravels Limited Fareham United Kingdom 100% 100%Boskalis Denmark ApS Copenhagen Denmark 100% 100%Irish Dredging Company Limited Cork Ireland 100% 100%Atlantique Dragage SARL Saint Germain en Laye France 100% 100%Sociedad Española de Dragados S.A. Madrid Spain 100% 100%Boskalis Italia S.r.l. Unipersonale Rome Italy 100% 100%Terramare Oy Helsinki Finland 100% 100%Boskalis Sweden AB Goteborg Sweden 100% 100%Boskalis Polska Sp. Zo.o Szczecin Poland 100% 100%Boskalis S.R.L. Constanta Romania 100% 100%Terramare Eesti OÜ Tallinn Estonia 100% 100%Limited Liability Company "Boskalis" St. Petersburg Russian Federation 100% 100%Boskalis Dredging & Inland Infra Holding Limited Nicosia Cyprus 100% 100%Boskalis Westminster Contracting Limited Nicosia Cyprus 100% 100%BW Marine (Cyprus) Limited Limassol Cyprus 100% 100%Boskalis Maroc s.a.r.l. Tangier Morocco 100% 100%Boskalis do Brasil Dragagem e Serviços Maritímos Ltda Rio de Janeiro Brazil 100% 100%Stuyvesant Environmental Contracting, LLC Wilmington United States of America 100% 100%Stuyvesant Projects Realization, Inc. Wilmington United States of America 100% 100%

127
AN
NU
AL
REP
OR
T 2
018
– B
OSK
ALI
S
AN
NU
AL
REP
OR
T 2
01
8 ---
B
OSK
ALI
S
127
COMPANY CITY OF INCORPORATION COUNTRY OF INCORPORATION 2018 2017
Boskalis Canada Dredging & Marine Service Ltd Vancouver Canada 100% 100%Dragamex S.A. de CV Mexico City Mexico 100% 100%Boskalis Panama S.A. Panama City Panama 100% 100%Boskalis Guyana Inc. Georgetown Guyana 100% 100%Boskalis International Uruguay S.A. Montevideo Uruguay 100% 100%Dravensa C.A. Caracas Venezuela 100% 100%Nigerian Westminster Dredging and Marine Limited Lagos Nigeria 60% 60%Boskalis Westminster Contracting FZE Lekki Nigeria 100% 100%BKI Gabon S.A. Libreville Gabon 100% 100%Boskalis International Maldives Private Limited Male Maldives 100% 100%Boskalis Mozambique Limitada Maputo Mozambique 100% 100%Boskalis Westminster Oman LLC * Muscat Oman 49% 49%Boskalis Westminster Al Rushaid Co Ltd * Al Khobar Saudi Arabia 49% 49%Boskalis Australia Pty Ltd Perth Australia 100% 100%Boskalis International (S) Pte Ltd Singapore Singapore 100% 100%Koon Zinkcon Pte Ltd * Singapore Singapore 50% 50%Zinkcon Marine Singapore Pte. Ltd Singapore Singapore 100% 100%P.T. Boskalis International Indonesia Jakarta Indonesia 100% 100%Boskalis Smit India LLP Mumbai India 100% 100%Beijing Boskalis Dredging Technology Co Ltd Beijing China 100% 100%Boskalis Taiwan Limited Taipei Taiwan 100% 100%
OFFSHORE ENERGY Black Marlin B.V. Breda The Netherlands 100% 100%Blue Marlin B.V. Breda The Netherlands 100% 100%Boskalis CTD - Offshore B.V. Papendrecht The Netherlands 100% 100%Boskalis Holding I (dollar) B.V. Papendrecht The Netherlands 100% 100%Boskalis Holding II (dollar) B.V. Papendrecht The Netherlands 100% 100%Boskalis Offshore Contracting B.V. Papendrecht The Netherlands 100% 100%Boskalis Offshore Fleet Management B.V. Papendrecht The Netherlands 100% 100%Boskalis Offshore Holding B.V. Papendrecht The Netherlands 100% 100%Boskalis Offshore International B.V. Rotterdam The Netherlands 100% 100%Boskalis Offshore International Holding B.V. Papendrecht The Netherlands 100% 100%Boskalis Offshore Marine Contracting B.V. Rotterdam The Netherlands 100% 100%Boskalis Offshore Marine Services B.V. Papendrecht The Netherlands 100% 100%Boskalis Offshore Subsea Contracting B.V. Papendrecht The Netherlands 100% 100%Boskalis Offshore Subsea Services (Europe) B.V. Papendrecht The Netherlands 100% 100%BW Marine (NL) B.V. (formerly Stemat B.V.) Papendrecht The Netherlands 100% 100%Dockwise B.V. Breda The Netherlands 100% 100%Dockwise Shipping B.V. Breda The Netherlands 100% 100%Dockwise Transporter B.V. Breda The Netherlands 100% 100%Dockwise Vanguard B.V. Breda The Netherlands 100% 100%Fairmount Alpine B.V. Rotterdam The Netherlands 100% 100%Fairmount Expedition B.V. Rotterdam The Netherlands 100% 100%Fairmount Glacier B.V. Rotterdam The Netherlands 100% 100%Fairmount Marine B.V. Rotterdam The Netherlands 100% 100%Fairmount Sherpa B.V. Rotterdam The Netherlands 100% 100%Fairmount Summit B.V. Rotterdam The Netherlands 100% 100%Fairstar Finesse B.V. Rotterdam The Netherlands 100% 100%Fairstar Fjell B.V. Rotterdam The Netherlands 100% 100%Fairstar Fjord B.V. Rotterdam The Netherlands 100% 100%Fairstar Forte B.V. Rotterdam The Netherlands 100% 100%Fairstar Heavy Transport N.V. Rotterdam The Netherlands 100% 100%Offshore Equipment B.V. Papendrecht The Netherlands 100% 100%Stemat Beheer B.V. Rotterdam The Netherlands 100% 100%Stemat Holding B.V. Rotterdam The Netherlands 100% 100%Stemat Support Services B.V. Rotterdam The Netherlands 100% 100%Talisman B.V. Breda The Netherlands 100% 100%Target B.V. Breda The Netherlands 100% 100%Tranship B.V. Den Helder The Netherlands 100% 100%Treasure B.V. Breda The Netherlands 100% 100%Triumph B.V. Breda The Netherlands 100% 100%Trustee B.V. Breda The Netherlands 100% 100%VBMS B.V. Papendrecht The Netherlands 100% 100%VBMS Holding B.V. Papendrecht The Netherlands 100% 100%White Marlin B.V. Papendrecht The Netherlands 100% 100%Dockwise Transport N.V. Curacao Curacao 100% 100%Boskalis Offshore Marine Services N.V. Antwerp Belgium 100% 100%
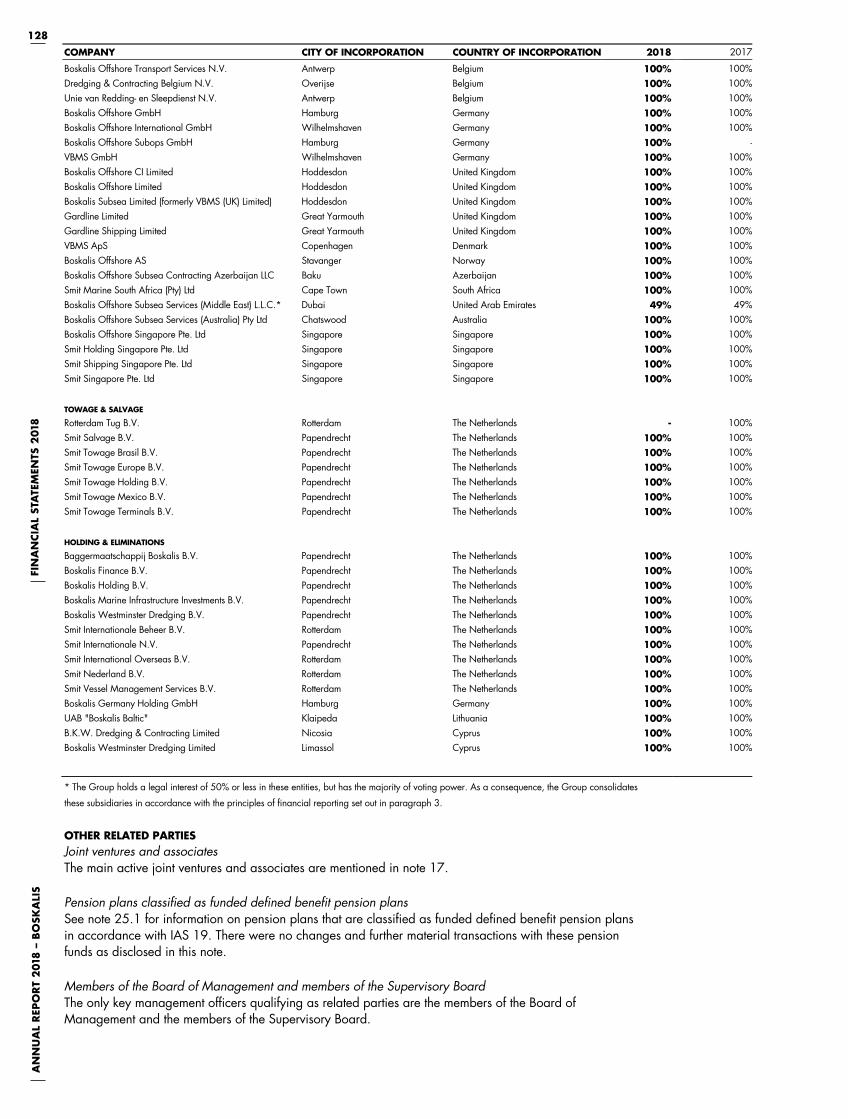
128A
NN
UA
L R
EPO
RT
201
8 –
BO
SKA
LIS
FIN
AN
CIA
L ST
ATE
MEN
TS 2
018
AN
NU
AL
REP
OR
T 2
01
8 ---
BO
SKA
LIS
FI
NA
NCIA
L ST
ATE
MEN
TS 2
01
8
128
COMPANY CITY OF INCORPORATION COUNTRY OF INCORPORATION 2018 2017
Boskalis Offshore Transport Services N.V. Antwerp Belgium 100% 100%Dredging & Contracting Belgium N.V. Overijse Belgium 100% 100%Unie van Redding- en Sleepdienst N.V. Antwerp Belgium 100% 100%Boskalis Offshore GmbH Hamburg Germany 100% 100%Boskalis Offshore International GmbH Wilhelmshaven Germany 100% 100%Boskalis Offshore Subops GmbH Hamburg Germany 100% -VBMS GmbH Wilhelmshaven Germany 100% 100%Boskalis Offshore CI Limited Hoddesdon United Kingdom 100% 100%Boskalis Offshore Limited Hoddesdon United Kingdom 100% 100%Boskalis Subsea Limited (formerly VBMS (UK) Limited) Hoddesdon United Kingdom 100% 100%Gardline Limited Great Yarmouth United Kingdom 100% 100%Gardline Shipping Limited Great Yarmouth United Kingdom 100% 100%VBMS ApS Copenhagen Denmark 100% 100%Boskalis Offshore AS Stavanger Norway 100% 100%Boskalis Offshore Subsea Contracting Azerbaijan LLC Baku Azerbaijan 100% 100%Smit Marine South Africa (Pty) Ltd Cape Town South Africa 100% 100%Boskalis Offshore Subsea Services (Middle East) L.L.C.* Dubai United Arab Emirates 49% 49%Boskalis Offshore Subsea Services (Australia) Pty Ltd Chatswood Australia 100% 100%Boskalis Offshore Singapore Pte. Ltd Singapore Singapore 100% 100%Smit Holding Singapore Pte. Ltd Singapore Singapore 100% 100%Smit Shipping Singapore Pte. Ltd Singapore Singapore 100% 100%Smit Singapore Pte. Ltd Singapore Singapore 100% 100%
TOWAGE & SALVAGE Rotterdam Tug B.V. Rotterdam The Netherlands - 100%Smit Salvage B.V. Papendrecht The Netherlands 100% 100%Smit Towage Brasil B.V. Papendrecht The Netherlands 100% 100%Smit Towage Europe B.V. Papendrecht The Netherlands 100% 100%Smit Towage Holding B.V. Papendrecht The Netherlands 100% 100%Smit Towage Mexico B.V. Papendrecht The Netherlands 100% 100%Smit Towage Terminals B.V. Papendrecht The Netherlands 100% 100%
HOLDING & ELIMINATIONS Baggermaatschappij Boskalis B.V. Papendrecht The Netherlands 100% 100%Boskalis Finance B.V. Papendrecht The Netherlands 100% 100%Boskalis Holding B.V. Papendrecht The Netherlands 100% 100%Boskalis Marine Infrastructure Investments B.V. Papendrecht The Netherlands 100% 100%Boskalis Westminster Dredging B.V. Papendrecht The Netherlands 100% 100%Smit Internationale Beheer B.V. Rotterdam The Netherlands 100% 100%Smit Internationale N.V. Papendrecht The Netherlands 100% 100%Smit International Overseas B.V. Rotterdam The Netherlands 100% 100%Smit Nederland B.V. Rotterdam The Netherlands 100% 100%Smit Vessel Management Services B.V. Rotterdam The Netherlands 100% 100%Boskalis Germany Holding GmbH Hamburg Germany 100% 100%UAB "Boskalis Baltic" Klaipeda Lithuania 100% 100%B.K.W. Dredging & Contracting Limited Nicosia Cyprus 100% 100%Boskalis Westminster Dredging Limited Limassol Cyprus 100% 100%
* The Group holds a legal interest of 50% or less in these entities, but has the majority of voting power. As a consequence, the Group consolidates
these subsidiaries in accordance with the principles of financial reporting set out in paragraph 3.
OTHER RELATED PARTIES
Joint ventures and associates The main active joint ventures and associates are mentioned in note 17.
Pension plans classified as funded defined benefit pension plans See note 25.1 for information on pension plans that are classified as funded defined benefit pension plans in accordance with IAS 19. There were no changes and further material transactions with these pension funds as disclosed in this note.
Members of the Board of Management and members of the Supervisory Board The only key management officers qualifying as related parties are the members of the Board of Management and the members of the Supervisory Board.
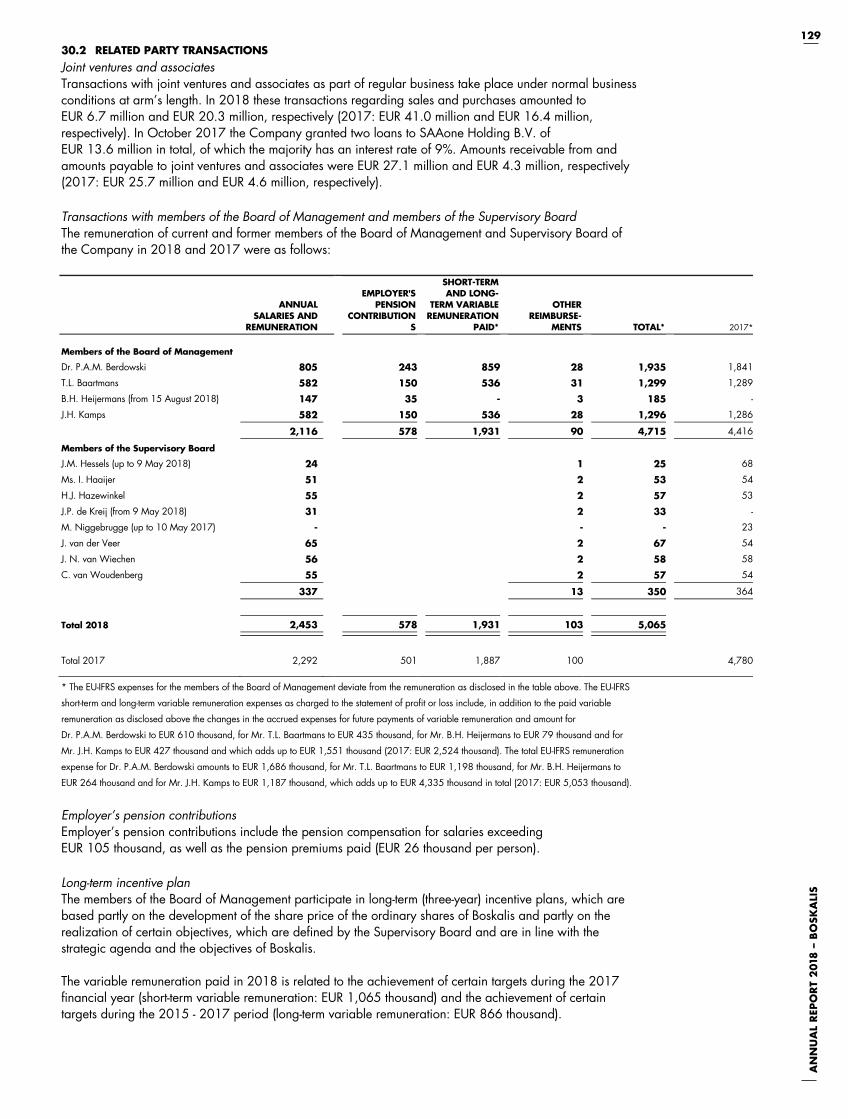
129
AN
NU
AL
REP
OR
T 2
018
– B
OSK
ALI
S
AN
NU
AL
REP
OR
T 2
01
8 ---
B
OSK
ALI
S
129
30.2 RELATED PARTY TRANSACTIONS
Joint ventures and associates Transactions with joint ventures and associates as part of regular business take place under normal business conditions at arm’s length. In 2018 these transactions regarding sales and purchases amounted to EUR 6.7 million and EUR 20.3 million, respectively (2017: EUR 41.0 million and EUR 16.4 million, respectively). In October 2017 the Company granted two loans to SAAone Holding B.V. of EUR 13.6 million in total, of which the majority has an interest rate of 9%. Amounts receivable from and amounts payable to joint ventures and associates were EUR 27.1 million and EUR 4.3 million, respectively (2017: EUR 25.7 million and EUR 4.6 million, respectively).
Transactions with members of the Board of Management and members of the Supervisory Board The remuneration of current and former members of the Board of Management and Supervisory Board of the Company in 2018 and 2017 were as follows:
ANNUAL SALARIES AND
REMUNERATION
EMPLOYER'S PENSION
CONTRIBUTIONS
SHORT-TERM AND LONG-
TERM VARIABLE REMUNERATION
PAID*
OTHER REIMBURSE-
MENTS TOTAL* 2017*
Members of the Board of Management
Dr. P.A.M. Berdowski 805 243 859 28 1,935 1,841
T.L. Baartmans 582 150 536 31 1,299 1,289
B.H. Heijermans (from 15 August 2018) 147 35 - 3 185 -
J.H. Kamps 582 150 536 28 1,296 1,286
2,116 578 1,931 90 4,715 4,416
Members of the Supervisory Board
J.M. Hessels (up to 9 May 2018) 24 1 25 68
Ms. I. Haaijer 51 2 53 54
H.J. Hazewinkel 55 2 57 53
J.P. de Kreij (from 9 May 2018) 31 2 33 -
M. Niggebrugge (up to 10 May 2017) - - - 23
J. van der Veer 65 2 67 54
J. N. van Wiechen 56 2 58 58
C. van Woudenberg 55 2 57 54
337 13 350 364
Total 2018 2,453 578 1,931 103 5,065
Total 2017 2,292 501 1,887 100 4,780
* The EU-IFRS expenses for the members of the Board of Management deviate from the remuneration as disclosed in the table above. The EU-IFRS
short-term and long-term variable remuneration expenses as charged to the statement of profit or loss include, in addition to the paid variable
remuneration as disclosed above the changes in the accrued expenses for future payments of variable remuneration and amount for
Dr. P.A.M. Berdowski to EUR 610 thousand, for Mr. T.L. Baartmans to EUR 435 thousand, for Mr. B.H. Heijermans to EUR 79 thousand and for
Mr. J.H. Kamps to EUR 427 thousand and which adds up to EUR 1,551 thousand (2017: EUR 2,524 thousand). The total EU-IFRS remuneration
expense for Dr. P.A.M. Berdowski amounts to EUR 1,686 thousand, for Mr. T.L. Baartmans to EUR 1,198 thousand, for Mr. B.H. Heijermans to
EUR 264 thousand and for Mr. J.H. Kamps to EUR 1,187 thousand, which adds up to EUR 4,335 thousand in total (2017: EUR 5,053 thousand).
Employer’s pension contributions Employer’s pension contributions include the pension compensation for salaries exceeding EUR 105 thousand, as well as the pension premiums paid (EUR 26 thousand per person).
Long-term incentive plan The members of the Board of Management participate in long-term (three-year) incentive plans, which are based partly on the development of the share price of the ordinary shares of Boskalis and partly on the realization of certain objectives, which are defined by the Supervisory Board and are in line with the strategic agenda and the objectives of Boskalis. The variable remuneration paid in 2018 is related to the achievement of certain targets during the 2017 financial year (short-term variable remuneration: EUR 1,065 thousand) and the achievement of certain targets during the 2015 - 2017 period (long-term variable remuneration: EUR 866 thousand).

130A
NN
UA
L R
EPO
RT
201
8 –
BO
SKA
LIS
FIN
AN
CIA
L ST
ATE
MEN
TS 2
018
AN
NU
AL
REP
OR
T 2
01
8 ---
BO
SKA
LIS
FI
NA
NCIA
L ST
ATE
MEN
TS 2
01
8
130
Multi-year overview of variable remuneration The following variable remuneration was granted to the members of the Board of Management with regard to the years 2016, 2017 and 2018:
Year of payment
2019 2018 2017
Dr. P.A.M. Berdowski 694 859 815T.L. Baartmans 449 536 536B.H. Heijermans (from 15 August 2018) 57 - -J.H. Kamps 441 536 536Total 1,641 1,931 1,887
Balance sheet position On 31 December 2018 the Group recognized a liability in the balance sheet item Trade and other payables of EUR 2.1 million (2017: EUR 2.3 million) relating to the long-term incentive plans for the periods 2016 – 2018, 2017 – 2019 and 2018 – 2020.
30.3 JOINT OPERATIONS The Group has activities in the Dredging & Inland Infra and Offshore Energy operational segments through joint operations which are not related parties as defined in IFRS. Legally these joint operations comprise project-driven construction consortiums. In joint operations joint control is established by contract and the Group has rights to the assets and is liable for the debts of the operations. An amount of EUR 547 million of Group revenue was realized through joint operations (2017: EUR 219 million). The balance sheet of the Group holds current assets of EUR 261 million (2017: EUR 157 million), including cash and cash equivalents (refer to note 22) and an amount of EUR 250 million (2017: EUR 263 million) of current liabilities that was included on a pro-rata basis in accordance with the Group’s interest in these joint operations. Temporary and other surpluses and shortages in the financing of a joint operation are withdrawn or financed by the partners in the joint operation. At year-end 2018, group companies owed joint operations an amount of EUR 152.9 million (2017: EUR 197.3 million) and held EUR 131.6 million (2017: EUR 81.1 million) in receivables from joint operations. Similar to contracts of group companies, guarantees are also provided for contracts of joint operations by the Group or one of its group companies. The guarantee commitments regarding joint operations are disclosed in note 29 as part of the guarantee commitments relating to contracts and joint ventures. group companies are jointly and severally liable for the non-consolidated part of the liabilities of their joint operations which are disclosed in note 28. The guarantees provided are predominantly backed up by comparable receivables from the clients of the joint operations, reducing the Group’s exposure.
The table below shows the legal share in the major joint operations (project driven construction consortiums) in which the Group is involved:
ENTITY COUNTRY OF INCORPORATION 2018 2017
DREDGING & INLAND INFRA Boskalis Van Oord Pluit City JV V.O.F. The Netherlands 50% 50%BPL Beton The Netherlands 50% 50%BPL Wegen The Netherlands 50% 50%Combinatie BadhoeverBogen V.O.F. The Netherlands 20% 20%Combinatie BaggerIJ The Netherlands 50% 50%Combinatie Houtribdijk V.O.F. The Netherlands 50% 50%Combinatie IJburg The Netherlands 80% -Combinatie IJsselweide The Netherlands 50% 50%Combinatie Isala Delta The Netherlands 50% 50%Combinatie Ommelanderdiek The Netherlands 70% 70%Combinatie Regenboog V.O.F. The Netherlands 38% 38%Combinatie Tessel The Netherlands 70% 70%MSB Grind & Zand V.O.F The Netherlands 33% 33%Projectorganisatie Uitbreiding Maasvlakte (PUMA) The Netherlands 50% 50%SAAone EPCM Bouwcombinatie V.O.F. The Netherlands 30% 30%SAAone GWW V.O.F. The Netherlands 50% 50%Unie van Marken V.O.F. The Netherlands 70% 70%ZSNH Combinatie Van Oord/Boskalis V.O.F. The Netherlands 50% 50%Boskalis Jan de Nul - Dragagens E Afins LDA Angola 50% 50%Bahia Blanca Argentina 50% 50%

131
AN
NU
AL
REP
OR
T 2
018
– B
OSK
ALI
S
AN
NU
AL
REP
OR
T 2
01
8 ---
B
OSK
ALI
S
131
ENTITY COUNTRY OF INCORPORATION 2018 2017
Fehmarn Belt Contractors I/S Denmark 50% 50%NMDC-Boskalis-Van Oord-Jan de Nul Consortium for Suez Canal Project Egypt 25% 25%BSI ----- JDN Joint - Venture India 51% 51%Ras Laffan Port Extension Qatar 50% 50%Penta-Ocean Koon DI Boskalis Ham JV (Jurong 4) Singapore 17% 17%Boskalis / Penta-Ocean Joint Venture Singapore 51% -Penta-Ocean / Hyundai / Boskalis JV Singapore 30% -Consorcio Boskalis-Dredging International Uruguay 50% -
OFFSHORE ENERGY Boskalis Offshore AS - Tideway V.O.F. The Netherlands 50% 50%JV North Sea Link The Netherlands 50% 50%Nord Stream 2 Rock Joint Venture The Netherlands 50% 50%Thames JV The Netherlands 50% 50%Tideway-Boskalis JV The Netherlands 50% 50%V.O.F. Tideway B.V. - Boskalis Offshore Subsea Contracting B.V The Netherlands 50% 50%VBNK Borssele V.O.F. The Netherlands 50% 50%Vulcan & Viking JV The Netherlands 50% 50%
31. SUBSEQUENT EVENTS
Acquisition of 62.5% interest in the Horizon Group On 21 February 2019 the Group announced the acquisition of a 62.5% interest in The Horizon Group from the United Arab Emirates. Horizon’s main activities include marine geophysical surveys and geotechnical services in the Middle East. Horizon operates seven large survey/geotechnical vessels (of which three are on a long term charter), five smaller survey vessels, two jack-up platforms, three motion-compensated drill towers for geotechnical services and eight ROVs. The remaining 37.5% of the shares are held by the incumbent management. The consideration paid amounted to EUR 66 million.
Due to the short time lag between the acquisition date and the reporting date not all information as required by IFRS can be disclosed at this moment. This information will be disclosed in the Half Year report 2019.
Intended sale of interest in Kotug Smit Towage joint venture Early March 2019 the Group, together with its co-shareholder Kotug International B.V. (Kotug), signed a letter of intent relating to the sale of Kotug Smit Towage to Boluda Group. The Group expects to receive approximately EUR 90 million in cash for its 50% interest in the joint venture. The transaction is expected to close in the second half of 2019, subject to, amongst others, customary conditions including a due diligence and approval from regulatory agencies. In the first quarter 2019, the interest in the joint venture, previously reported under Joint ventures and associates, will be classified as a disposal group. Sale of interest in partnership Saam Smit Towage Early February 2019 the Group signed an agreement with Sudamerica Agencias Aereas y Maritimas S.A. (SAAM) related to the intended sale and purchase of the Group’s interest in the partnership Saam Smit Towage (see note 5.2). Intended share buyback program In February 2019, Boskalis announced an intended share buyback program. Subject to the successful completion of the Saam Smit Towage transaction, Boskalis intends to repurchase the equivalent of EUR 100 million of its own shares. The actual start and details of the share buyback program will at that time be announced through a press release.
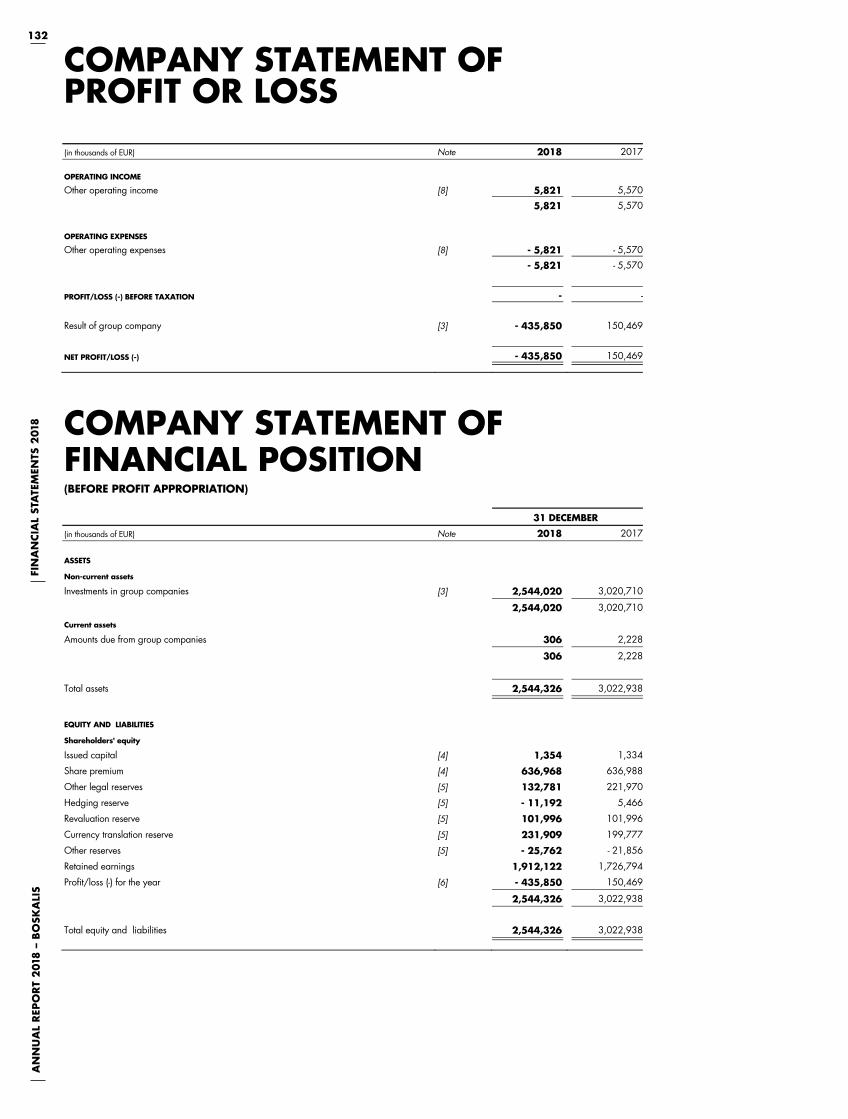
132A
NN
UA
L R
EPO
RT
201
8 –
BO
SKA
LIS
FIN
AN
CIA
L ST
ATE
MEN
TS 2
018
132 A
NN
UA
L R
EPO
RT
20
18
--- B
OSK
ALI
S F
INA
NCIA
L ST
ATE
MEN
TS 2
01
8
COMPANY STATEMENT OF PROFIT OR LOSS
(in thousands of EUR) Note 2018 2017
OPERATING INCOME
Other operating income [8] 5,821 5,570
5,821 5,570
OPERATING EXPENSES
Other operating expenses [8] - 5,821 - 5,570
- 5,821 - 5,570
PROFIT/LOSS (-) BEFORE TAXATION - -
Result of group company [3] - 435,850 150,469
NET PROFIT/LOSS (-) - 435,850 150,469
COMPANY STATEMENT OF FINANCIAL POSITION
(BEFORE PROFIT APPROPRIATION)
31 DECEMBER
(in thousands of EUR) Note 2018 2017
ASSETS
Non-current assets
Investments in group companies [3] 2,544,020 3,020,710
2,544,020 3,020,710
Current assets
Amounts due from group companies 306 2,228
306 2,228
Total assets 2,544,326 3,022,938
EQUITY AND LIABILITIES
Shareholders' equity
Issued capital [4] 1,354 1,334
Share premium [4] 636,968 636,988
Other legal reserves [5] 132,781 221,970
Hedging reserve [5] - 11,192 5,466
Revaluation reserve [5] 101,996 101,996
Currency translation reserve [5] 231,909 199,777
Other reserves [5] - 25,762 - 21,856
Retained earnings 1,912,122 1,726,794
Profit/loss (-) for the year [6] - 435,850 150,469
2,544,326 3,022,938
Total equity and liabilities 2,544,326 3,022,938

133
AN
NU
AL
REP
OR
T 2
018
– B
OSK
ALI
S
133
AN
NU
AL
REP
OR
T 2
01
8 ---
BO
SKA
LIS
STATEMENT OF CHANGES IN SHAREHOLDERS’ EQUITY
(in thousands of EUR) Note
Balance as at
1 January 2018*
Repurchase own
ordinary shares
Cash dividend
Stock dividend
Movement retained earnings
Other movements
Total recognized
income and expenses
Balance as at 31 December
2018
Issued capital [4] 1,334 20 1,354
Share premium [4] 636,988 - 20 636,968
638,322 - 638,322
Other legal reserves [5] 221,970 - 89,189 - 132,781
Hedging reserve [5] 5,466 - - 16,658 - 11,192
Revaluation reserve [5] 101,996 - - 101,996
Currency translation reserve [5] 199,777 - 32,132 231,909
Other reserves [5] - 21,856 - - 3,906 - 25,762
Retained earnings 1,725,386 - 16,633 114,180 89,189 - 1,912,122
2,232,739 - 16,633 114,180 - 11,568 2,341,854
Profit/loss (-) appropriation 2017 150,469 - 36,289 - - 114,180 - -
Net profit/loss (-) 2018 - - - - - 435,850 - 435,850
Profit/loss (-) for the year [6] 150,469 - 36,289 - - 114,180 - 435,850 - 435,850
Shareholders' equity 3,021,530 - 16,633 - 36,289 - - - - 424,282 2,544,326
* Due to the first-time application of IFRS 9, there is a difference in retained earnings between 31 December 2017 and 1 January 2018. Reference is made to note 3.33 in the consolidated principles of financial reporting.
(in thousands of EUR) Note
Balance as at
1 January 2017
Repurchase own
ordinary shares
Cash dividend
Stock dividend
Movement retained earnings
Other movements
Total recognized
income and expenses
Balance as at 31 December
2017
Issued capital [4] 1,301 33 1,334
Share premium [4] 637,006 - 18 636,988
638,307 15 638,322
Other legal reserves [5] 214,339 7,631 - 221,970
Hedging reserve [5] - 3,905 - 9,371 5,466
Revaluation reserve [5] 102,458 - 462 - 101,996
Currency translation reserve [5] 339,018 - - 139,241 199,777
Other reserves [5] - 14,088 - - 7,768 - 21,856
Retained earnings 2,408,774 - 81,176 - 593,278 - 7,169 - 357 1,726,794
3,046,596 - 81,176 - 593,278 - - 137,995 2,234,147
Profit/loss (-) appropriation 2016 - 563,730 - 29,533 - 15 593,278 - -
Net profit/loss (-) 2017 - - - - 150,469 150,469
Profit/loss (-) for the year [6] - 563,730 - 29,533 - 15 593,278 150,469 150,469
Shareholders' equity 3,121,173 - 81,176 - 29,533 - - - 12,474 3,022,938
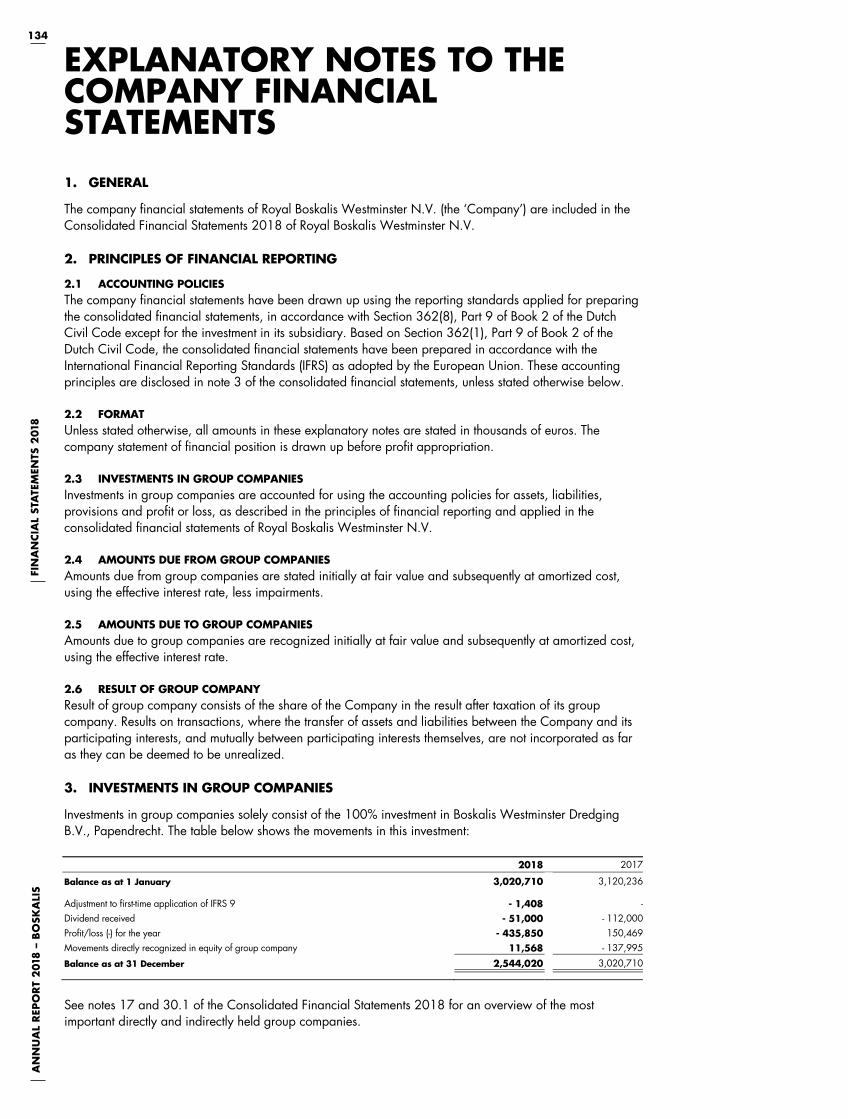
134A
NN
UA
L R
EPO
RT
201
8 –
BO
SKA
LIS
FIN
AN
CIA
L ST
ATE
MEN
TS 2
018
AN
NU
AL
REP
OR
T 2
01
8 ---
BO
SKA
LIS
FI
NA
NCIA
L ST
ATE
MEN
TS 2
01
8
134
EXPLANATORY NOTES TO THE COMPANY FINANCIAL STATEMENTS
1. GENERAL
The company financial statements of Royal Boskalis Westminster N.V. (the ‘Company’) are included in the Consolidated Financial Statements 2018 of Royal Boskalis Westminster N.V.
2. PRINCIPLES OF FINANCIAL REPORTING
2.1 ACCOUNTING POLICIES The company financial statements have been drawn up using the reporting standards applied for preparing the consolidated financial statements, in accordance with Section 362(8), Part 9 of Book 2 of the Dutch Civil Code except for the investment in its subsidiary. Based on Section 362(1), Part 9 of Book 2 of the Dutch Civil Code, the consolidated financial statements have been prepared in accordance with the International Financial Reporting Standards (IFRS) as adopted by the European Union. These accounting principles are disclosed in note 3 of the consolidated financial statements, unless stated otherwise below.
2.2 FORMAT Unless stated otherwise, all amounts in these explanatory notes are stated in thousands of euros. The company statement of financial position is drawn up before profit appropriation.
2.3 INVESTMENTS IN GROUP COMPANIES Investments in group companies are accounted for using the accounting policies for assets, liabilities, provisions and profit or loss, as described in the principles of financial reporting and applied in the consolidated financial statements of Royal Boskalis Westminster N.V.
2.4 AMOUNTS DUE FROM GROUP COMPANIES Amounts due from group companies are stated initially at fair value and subsequently at amortized cost, using the effective interest rate, less impairments.
2.5 AMOUNTS DUE TO GROUP COMPANIES Amounts due to group companies are recognized initially at fair value and subsequently at amortized cost, using the effective interest rate.
2.6 RESULT OF GROUP COMPANY Result of group company consists of the share of the Company in the result after taxation of its group company. Results on transactions, where the transfer of assets and liabilities between the Company and its participating interests, and mutually between participating interests themselves, are not incorporated as far as they can be deemed to be unrealized.
3. INVESTMENTS IN GROUP COMPANIES
Investments in group companies solely consist of the 100% investment in Boskalis Westminster Dredging B.V., Papendrecht. The table below shows the movements in this investment:
2018 2017
Balance as at 1 January 3,020,710 3,120,236
Adjustment to first-time application of IFRS 9 - 1,408 -Dividend received - 51,000 - 112,000Profit/loss (-) for the year - 435,850 150,469Movements directly recognized in equity of group company 11,568 - 137,995
Balance as at 31 December 2,544,020 3,020,710
See notes 17 and 30.1 of the Consolidated Financial Statements 2018 for an overview of the most important directly and indirectly held group companies.
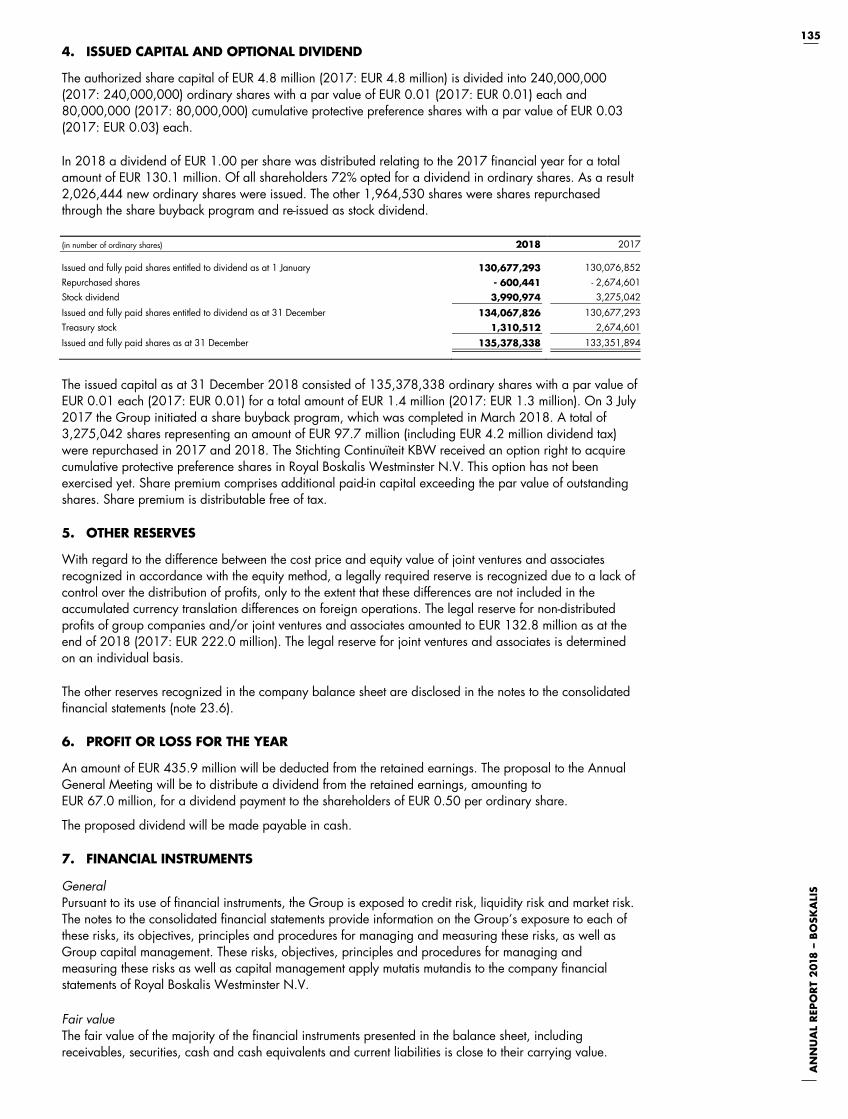
135
AN
NU
AL
REP
OR
T 2
018
– B
OSK
ALI
S
AN
NU
AL
REP
OR
T 2
01
8 ---
B
OSK
ALI
S
135
4. ISSUED CAPITAL AND OPTIONAL DIVIDEND
The authorized share capital of EUR 4.8 million (2017: EUR 4.8 million) is divided into 240,000,000 (2017: 240,000,000) ordinary shares with a par value of EUR 0.01 (2017: EUR 0.01) each and 80,000,000 (2017: 80,000,000) cumulative protective preference shares with a par value of EUR 0.03 (2017: EUR 0.03) each.
In 2018 a dividend of EUR 1.00 per share was distributed relating to the 2017 financial year for a total amount of EUR 130.1 million. Of all shareholders 72% opted for a dividend in ordinary shares. As a result 2,026,444 new ordinary shares were issued. The other 1,964,530 shares were shares repurchased through the share buyback program and re-issued as stock dividend.
(in number of ordinary shares) 2018 2017
Issued and fully paid shares entitled to dividend as at 1 January 130,677,293 130,076,852Repurchased shares - 600,441 - 2,674,601Stock dividend 3,990,974 3,275,042
Issued and fully paid shares entitled to dividend as at 31 December 134,067,826 130,677,293Treasury stock 1,310,512 2,674,601
Issued and fully paid shares as at 31 December 135,378,338 133,351,894
The issued capital as at 31 December 2018 consisted of 135,378,338 ordinary shares with a par value of EUR 0.01 each (2017: EUR 0.01) for a total amount of EUR 1.4 million (2017: EUR 1.3 million). On 3 July 2017 the Group initiated a share buyback program, which was completed in March 2018. A total of 3,275,042 shares representing an amount of EUR 97.7 million (including EUR 4.2 million dividend tax) were repurchased in 2017 and 2018. The Stichting Continuïteit KBW received an option right to acquire cumulative protective preference shares in Royal Boskalis Westminster N.V. This option has not been exercised yet. Share premium comprises additional paid-in capital exceeding the par value of outstanding shares. Share premium is distributable free of tax.
5. OTHER RESERVES
With regard to the difference between the cost price and equity value of joint ventures and associates recognized in accordance with the equity method, a legally required reserve is recognized due to a lack of control over the distribution of profits, only to the extent that these differences are not included in the accumulated currency translation differences on foreign operations. The legal reserve for non-distributed profits of group companies and/or joint ventures and associates amounted to EUR 132.8 million as at the end of 2018 (2017: EUR 222.0 million). The legal reserve for joint ventures and associates is determined on an individual basis.
The other reserves recognized in the company balance sheet are disclosed in the notes to the consolidated financial statements (note 23.6).
6. PROFIT OR LOSS FOR THE YEAR
An amount of EUR 435.9 million will be deducted from the retained earnings. The proposal to the Annual General Meeting will be to distribute a dividend from the retained earnings, amounting to EUR 67.0 million, for a dividend payment to the shareholders of EUR 0.50 per ordinary share.
The proposed dividend will be made payable in cash.
7. FINANCIAL INSTRUMENTS
General Pursuant to its use of financial instruments, the Group is exposed to credit risk, liquidity risk and market risk. The notes to the consolidated financial statements provide information on the Group’s exposure to each of these risks, its objectives, principles and procedures for managing and measuring these risks, as well as Group capital management. These risks, objectives, principles and procedures for managing and measuring these risks as well as capital management apply mutatis mutandis to the company financial statements of Royal Boskalis Westminster N.V.
Fair value The fair value of the majority of the financial instruments presented in the balance sheet, including receivables, securities, cash and cash equivalents and current liabilities is close to their carrying value.

136A
NN
UA
L R
EPO
RT
201
8 –
BO
SKA
LIS
FIN
AN
CIA
L ST
ATE
MEN
TS 2
018
AN
NU
AL
REP
OR
T 2
01
8 ---
BO
SKA
LIS
FI
NA
NCIA
L ST
ATE
MEN
TS 2
01
8
136
8. OPERATING INCOME AND EXPENSES
Other operation expenses comprise the remuneration of the members of the Board of Management and members of the Supervisory Board for a total amount of EUR 5.1 million (2017: EUR 4.8 million) (see note 30.2) as well as other third party expenses of EUR 0.7 million (2017: EUR 0.8 million). Other operating expenses are borne by group companies and these are reported as Other operating income.
9. REMUNERATION OF THE MEMBERS OF THE BOARD OF MANAGEMENT AND MEMBERS OF THE SUPERVISORY BOARD
The remuneration of members of the Board of Management and members of the Supervisory Board is disclosed in the consolidated financial statements under Related party transactions (note 30.2).
10. AUDITOR REMUNERATION
Ernst & Young Accountants LLP and its entire network charged the following fees to the Company and its subsidiaries:
2018 2017
Ernst & Young
Accountants LLP Other EY network Total
Ernst & Young Accountants LLP
Other EY network Total
Audit of the financial statements 2,338 458 2,796 1,778 483 2,261
Other audit engagements 51 8 59 118 8 126
Tax advisory services - 259 259 - 358 358
Other non-audit services - - - - - -
2,389 725 3,114 1,896 849 2,745
In addition to the statutory audit of the financial statements, Ernst & Young Accountants LLP provided the following services: Audits of financial statements of group entities; Services in accordance with ISA 800 ‘Audits of financial statements prepared in accordance with special
purpose framework’; Services in accordance with ISA 2400 ‘’Engagements to review historical financial statements’; Services in accordance with ISA 3000 ‘Assurance engagements other than audits or reviews of historical
financial information’; Services in accordance with ISA 4400 ‘Engagements to perform agreed upon procedures’. 11. COMMITMENTS AND CONTINGENT LIABILITIES
Royal Boskalis Westminster N.V. heads a fiscal unity. The Company is therefore liable for the tax obligations of the fiscal unity as a whole.
The Company has arrangements with third parties, amongst which banks and pension funds. These arrangements are on behalf of group companies. Because the risks and rewards are with these group companies, the costs are charged to these companies and the liabilities are recognized by these companies. The Company is jointly and severally liable for the fulfillment of obligations.
Certain recourse obligations exist in respect of project financing. Where necessary, provisions are deemed to have been made.
Some legal proceedings and investigations are ongoing with respect to entities of Royal Boskalis Westminster N.V. Where necessary, provisions are deemed to have been made.
Papendrecht / Sliedrecht, 6 March 2019
Supervisory Board J. van der Veer, chairman H.J. Hazewinkel, deputy chairman Ms. I. Haaijer J.P. de Kreij J.N. van Wiechen C. van Woudenberg
Board of Management dr. P.A.M. Berdowski, chairman T.L. Baartmans B.H. Heijermans J.H. Kamps, CFO
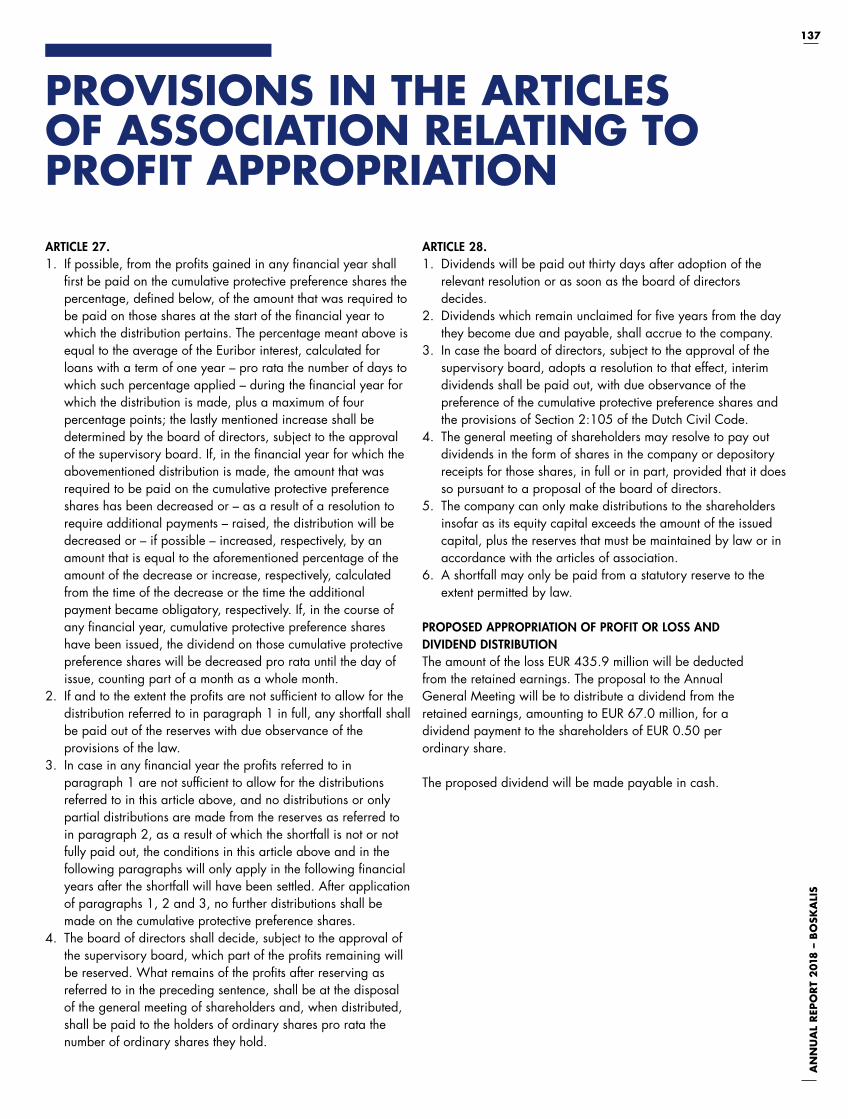
AN
NU
AL
REP
OR
T 2
018
– B
OSK
ALI
S
137
ARTICLE 27. 1. If possible, from the profits gained in any financial year shall
first be paid on the cumulative protective preference shares the percentage, defined below, of the amount that was required to be paid on those shares at the start of the financial year to which the distribution pertains. The percentage meant above is equal to the average of the Euribor interest, calculated for loans with a term of one year – pro rata the number of days to which such percentage applied – during the financial year for which the distribution is made, plus a maximum of four percentage points; the lastly mentioned increase shall be determined by the board of directors, subject to the approval of the supervisory board. If, in the financial year for which the abovementioned distribution is made, the amount that was required to be paid on the cumulative protective preference shares has been decreased or – as a result of a resolution to require additional payments – raised, the distribution will be decreased or – if possible – increased, respectively, by an amount that is equal to the aforementioned percentage of the amount of the decrease or increase, respectively, calculated from the time of the decrease or the time the additional payment became obligatory, respectively. If, in the course of any financial year, cumulative protective preference shares have been issued, the dividend on those cumulative protective preference shares will be decreased pro rata until the day of issue, counting part of a month as a whole month.
2. If and to the extent the profits are not sufficient to allow for the distribution referred to in paragraph 1 in full, any shortfall shall be paid out of the reserves with due observance of the provisions of the law.
3. In case in any financial year the profits referred to in paragraph 1 are not sufficient to allow for the distributions referred to in this article above, and no distributions or only partial distributions are made from the reserves as referred to in paragraph 2, as a result of which the shortfall is not or not fully paid out, the conditions in this article above and in the following paragraphs will only apply in the following financial years after the shortfall will have been settled. After application of paragraphs 1, 2 and 3, no further distributions shall be made on the cumulative protective preference shares.
4. The board of directors shall decide, subject to the approval of the supervisory board, which part of the profits remaining will be reserved. What remains of the profits after reserving as referred to in the preceding sentence, shall be at the disposal of the general meeting of shareholders and, when distributed, shall be paid to the holders of ordinary shares pro rata the number of ordinary shares they hold.
ARTICLE 28. 1. Dividends will be paid out thirty days after adoption of the
relevant resolution or as soon as the board of directors decides.
2. Dividends which remain unclaimed for five years from the day they become due and payable, shall accrue to the company.
3. In case the board of directors, subject to the approval of the supervisory board, adopts a resolution to that effect, interim dividends shall be paid out, with due observance of the preference of the cumulative protective preference shares and the provisions of Section 2:105 of the Dutch Civil Code.
4. The general meeting of shareholders may resolve to pay out dividends in the form of shares in the company or depository receipts for those shares, in full or in part, provided that it does so pursuant to a proposal of the board of directors.
5. The company can only make distributions to the shareholders insofar as its equity capital exceeds the amount of the issued capital, plus the reserves that must be maintained by law or in accordance with the articles of association.
6. A shortfall may only be paid from a statutory reserve to the extent permitted by law.
PROPOSED APPROPRIATION OF PROFIT OR LOSS AND DIVIDEND DISTRIBUTIONThe amount of the loss EUR 435.9 million will be deductedfrom the retained earnings. The proposal to the AnnualGeneral Meeting will be to distribute a dividend from theretained earnings, amounting to EUR 67.0 million, for adividend payment to the shareholders of EUR 0.50 perordinary share.
The proposed dividend will be made payable in cash.
PROVISIONS IN THE ARTICLES OF ASSOCIATION RELATING TO PROFIT APPROPRIATION

AN
NU
AL
REP
OR
T 2
018
– B
OSK
ALI
S138
To: the Shareholders and the Supervisory Board of Royal Boskalis Westminster N.V.
REPORT ON THE AUDIT OF THE FINANCIAL STATEMENTS 2018 INCLUDED IN THE ANNUAL REPORT
OUR OPINION
We have audited the financial statements 2018 of Royal Boskalis Westminster N.V., based in Sliedrecht, the Netherlands. The financial statements include the consolidated financial statements and the company financial statements.
In our opinion: � The accompanying consolidated financial statements give a true and fair view of the financial position of Royal Boskalis Westminster N.V. as at 31 December 2018, and of its result and its cash flows for 2018 in accordance with International Financial Reporting Standards as adopted by the European Union (EU-IFRS) and with Part 9 of Book 2 of the Dutch Civil Code.
� The accompanying company financial statements give a true and fair view of the financial position of Royal Boskalis Westminster N.V. as at 31 December 2018, and of its result for 2018 in accordance with Part 9 of Book 2 of the Dutch Civil Code.
The consolidated financial statements comprise: � The consolidated statement of financial position as at 31 December 2018
� The following statements for 2018: the consolidated statement of profit or loss, the consolidated statement of other comprehensive income, the consolidated statement of cash flows and the consolidated statement of changes in equity
� The notes comprising a summary of the significant accounting policies and other explanatory information
The company financial statements comprise: � The company statement of financial position as at 31 December 2018
� The company statement of profit or loss and the statement of changes in shareholders’ equity for 2018
� The notes comprising a summary of the accounting policies and other explanatory information
BASIS OF OUR OPINION
We conducted our audit in accordance with Dutch law, including the Dutch Standards on Auditing. Our responsibilities under those standards are further described in the “Our responsibilities for the audit of the financial statements” section of our report.
We are independent of Royal Boskalis Westminster N.V. in accordance with the EU Regulation on specific requirements regarding statutory audit of public-interest entities, the Wet toezicht accountantsorganisaties (Wta, Audit firms supervision act), the
Verordening inzake de onafhankelijkheid van accountants bij assurance-opdrachten (ViO, Code of Ethics for Professional Accountants, a regulation with respect to independence) and other relevant independence regulations in the Netherlands. Furthermore we have complied with the Verordening gedrags- en beroepsregels accountants (VGBA, Dutch Code of Ethics).
We believe the audit evidence we have obtained is sufficient and appropriate to provide a basis for our opinion.
MATERIALITY
We have also taken into account misstatements and/or possible misstatements that in our opinion are material for the users of the financial statements for qualitative reasons.
We agreed with the Supervisory Board that misstatements in excess of EUR 0.9 million, which are identified during the audit, would be reported to them, as well as smaller misstatements that in our view must be reported on qualitative grounds.
SCOPE OF THE GROUP AUDIT
Royal Boskalis Westminster N.V. is at the head of a group of entities. The financial information of this group is included in the consolidated financial statements of Royal Boskalis Westminster N.V.
Our group audit mainly focused on significant group entities and joint ventures in terms of size and/or risk, within the operating segments Dredging & Inland Infra, Offshore Energy and Towage & Salvage. We performed most of the audit procedures at those segments ourselves. For the audit work in amongst others Australia, Mexico, Singapore, Germany, Finland and the UK, we used other EY network firms. We have used the work of other non-EY firms when auditing a number of group entities, especially in the Middle East and UK, which represented approximately 6% of the net turnover. Also certain joint ventures were audited by non-EY firms.
MATERIALITY EUR 18.0 million (2017: EUR 18.0 million)
BENCHMARK APPLIED
0.75% of revenue
EXPLANATION Based on our professional judgment we consider an activity based measure as the most appropriate basis to determine materiality. Given the current market conditions we consider revenue a stable and appropriate measure to determine materiality. We applied a percentage of 0.75%, which is the mid-end of an acceptable range.
INDEPENDENT AUDITOR’S REPORT
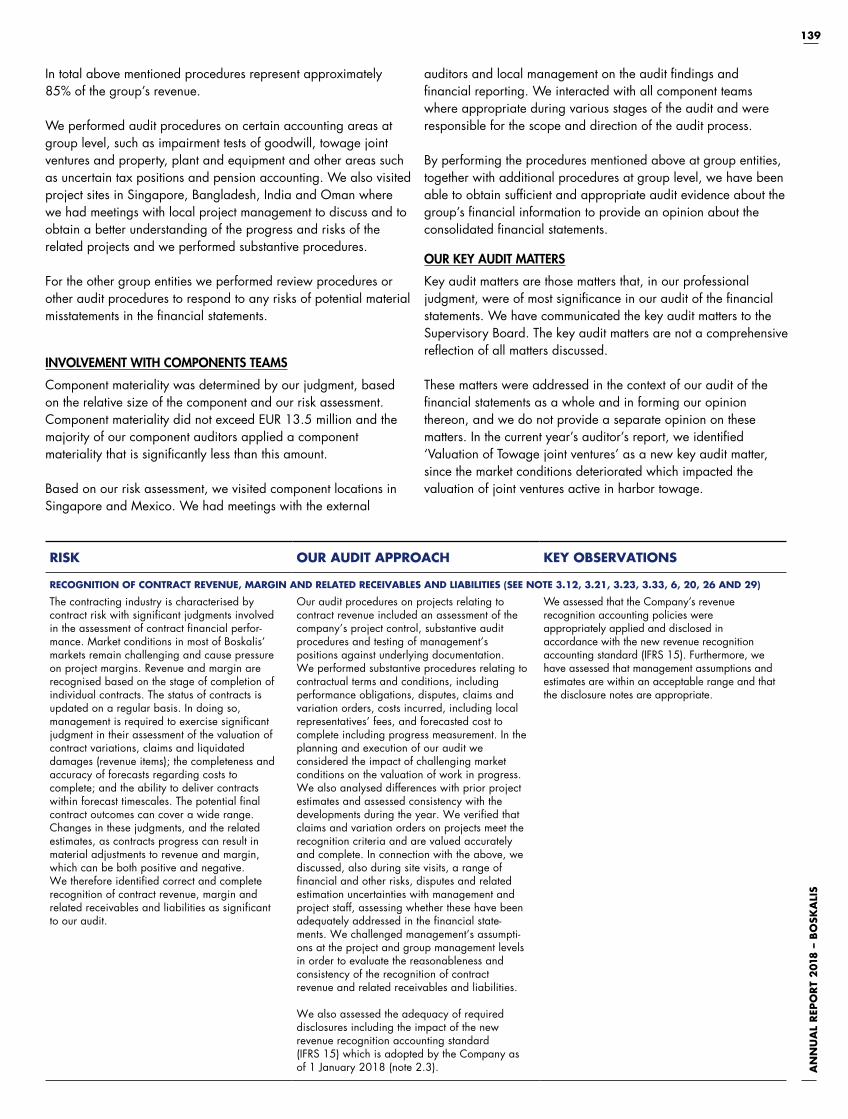
AN
NU
AL
REP
OR
T 2
018
– B
OSK
ALI
S
139
In total above mentioned procedures represent approximately 85% of the group’s revenue.
We performed audit procedures on certain accounting areas at group level, such as impairment tests of goodwill, towage joint ventures and property, plant and equipment and other areas such as uncertain tax positions and pension accounting. We also visited project sites in Singapore, Bangladesh, India and Oman where we had meetings with local project management to discuss and to obtain a better understanding of the progress and risks of the related projects and we performed substantive procedures.
For the other group entities we performed review procedures or other audit procedures to respond to any risks of potential material misstatements in the financial statements.
INVOLVEMENT WITH COMPONENTS TEAMS
Component materiality was determined by our judgment, based on the relative size of the component and our risk assessment. Component materiality did not exceed EUR 13.5 million and the majority of our component auditors applied a component materiality that is significantly less than this amount.
Based on our risk assessment, we visited component locations in Singapore and Mexico. We had meetings with the external
RISK OUR AUDIT APPROACH KEY OBSERVATIONS
RECOGNITION OF CONTRACT REVENUE, MARGIN AND RELATED RECEIVABLES AND LIABILITIES (SEE NOTE 3.12, 3.21, 3.23, 3.33, 6, 20, 26 AND 29)
The contracting industry is characterised by contract risk with significant judgments involved in the assessment of contract financial perfor-mance. Market conditions in most of Boskalis’ markets remain challenging and cause pressure on project margins. Revenue and margin are recognised based on the stage of completion of individual contracts. The status of contracts is updated on a regular basis. In doing so, management is required to exercise significant judgment in their assessment of the valuation of contract variations, claims and liquidated damages (revenue items); the completeness and accuracy of forecasts regarding costs to complete; and the ability to deliver contracts within forecast timescales. The potential final contract outcomes can cover a wide range. Changes in these judgments, and the related estimates, as contracts progress can result in material adjustments to revenue and margin, which can be both positive and negative. We therefore identified correct and complete recognition of contract revenue, margin and related receivables and liabilities as significant to our audit.
Our audit procedures on projects relating to contract revenue included an assessment of the company’s project control, substantive audit procedures and testing of management’s positions against underlying documentation. We performed substantive procedures relating to contractual terms and conditions, including performance obligations, disputes, claims and variation orders, costs incurred, including local representatives’ fees, and forecasted cost to complete including progress measurement. In the planning and execution of our audit we considered the impact of challenging market conditions on the valuation of work in progress. We also analysed differences with prior project estimates and assessed consistency with the developments during the year. We verified that claims and variation orders on projects meet the recognition criteria and are valued accurately and complete. In connection with the above, we discussed, also during site visits, a range of financial and other risks, disputes and related estimation uncertainties with management and project staff, assessing whether these have been adequately addressed in the financial state-ments. We challenged management’s assumpti-ons at the project and group management levels in order to evaluate the reasonableness and consistency of the recognition of contract revenue and related receivables and liabilities.
We also assessed the adequacy of required disclosures including the impact of the new revenue recognition accounting standard (IFRS 15) which is adopted by the Company as of 1 January 2018 (note 2.3).
We assessed that the Company’s revenue recognition accounting policies were appropriately applied and disclosed in accordance with the new revenue recognition accounting standard (IFRS 15). Furthermore, we have assessed that management assumptions and estimates are within an acceptable range and that the disclosure notes are appropriate.
auditors and local management on the audit findings and financial reporting. We interacted with all component teams where appropriate during various stages of the audit and were responsible for the scope and direction of the audit process.
By performing the procedures mentioned above at group entities, together with additional procedures at group level, we have been able to obtain sufficient and appropriate audit evidence about the group’s financial information to provide an opinion about the consolidated financial statements.
OUR KEY AUDIT MATTERS
Key audit matters are those matters that, in our professional judgment, were of most significance in our audit of the financial statements. We have communicated the key audit matters to the Supervisory Board. The key audit matters are not a comprehensive reflection of all matters discussed.
These matters were addressed in the context of our audit of the financial statements as a whole and in forming our opinion thereon, and we do not provide a separate opinion on these matters. In the current year’s auditor’s report, we identified ‘Valuation of Towage joint ventures’ as a new key audit matter, since the market conditions deteriorated which impacted the valuation of joint ventures active in harbor towage.
AN
NU
AL
REP
OR
T 2
018
– B
OSK
ALI
S140
RISK OUR AUDIT APPROACH KEY OBSERVATIONS
VALUATION OF HARBOR TOWAGE JOINT VENTURES (SEE NOTE 3.5, 3.8, 3.20, 5.2, 10, 17 AND 31)
Deteriorating market conditions in a number of port areas where harbor towage joint ventures are active indicate a risk of impairment. In February 2019 Boskalis announced the contemplated sale of its stake held in the partnership Saam Smit Towage for a sales price approximating the book value, after recognizing an impairment charge. In March 2019 the contemplated sale of the stake held in Kotug Smit Towage was announced.
Management performed impairment tests on the valuation of its harbor towage joint ventures for which management identified external and internal indications of impairment. The assess-ment of the valuation of the joint ventures is considered complex and requires significant management judgment with respect to future market and economic conditions, developments in revenue, margins, working capital levels and investments, which individually may have a material effect on the result of the calculation. Therefore it is significant to our audit. Impairment charges relating to the harbor towage joint ventures of EUR 189.9 million were recognized in the profit and loss account of 2018 (2017: nil).
In our audit approach we evaluated the impairment testing models including the main assumptions used. This includes assessing the forecasted margins, working capital and investment levels, discount rates and contemplated sales prices, where applicable. The procedures performed include comparing assumptions to external data. Furthermore, we analysed sensitivities, compared the projected cash flows to budgets and management’s forecasts and assessed the historical accuracy of management’s estimates. We included valuation experts in our team to assess the valuation models and parameters used and to assist us with above mentioned procedures. Furthermore, we evaluated the adequacy of the company’s disclosures regarding the impairment of the harbor towage joint ventures.
We consider management’s key assumptions and estimates, used in the impairment tests, to be within an acceptable range. We agree with the management’s conclusion from its impairment tests and further analyses that the book value of the joint ventures should be impaired. We further assessed that the required disclosures were appropriate.
VALUATION FLOATING AND OTHER CONSTRUCTION EQUIPMENT RELATED TO THE OFFSHORE ENERGY DIVISION (SEE NOTE 3.5, 3.7, 10 AND 16)
Property, plant and equipment includes floating and other construction equipment amounting to EUR 2.4 billion as at 31 December 2018, which represents 52% of the balance sheet total. Due to a deteriorated market outlook for some categories of equipment, management decided to take a number of specific vessels out of service in the near future, mainly for future scrapping. Management performed impairment tests of the respective floating equipment related to the transport activities in the low end of the Offshore Energy market.The assessment of the valuation of floating and other construction equipment is significant to our audit because this process is complex and requires significant management judgments, such as of future market and economic conditions. Impairment charges of EUR 136.9 million were recognized in the profit and loss account of 2018.
In our audit approach we evaluated management’s assessment of impairment indications, tested management’s assumptions used in the value in use calculations and we assessed the historical accuracy of management’s estimates. We evaluated supporting external broker reports obtained by management and observable market data on scrap values to evaluate the fair value less cost of disposal, where applicable. We involved our valuation experts to assess the valuation model and to evaluate the discount rate used, performed sensitivity analyses where considered necessary, and assessed the consistency of valuation methodologies applied. Furthermore, we evaluated the adequacy of the company’s disclosures regarding the impairments of this equipment.
We consider management’s assessment of impairment indicators as appropriate and the key assumptions and estimates used in the impairment tests to be within an acceptable range. We agree with management’s conclusion on the recorded impairment amount. We further assessed that the required disclosures were appropriate.
VALUATION OF GOODWILL OF THE OFFSHORE ENERGY DIVISION (SEE NOTE 3.5, 3.6, 10 AND 15)
Goodwill of the Offshore Energy division amounts to nil as at 31 December 2018 (2017: EUR 154.9 million) and is fully impaired in 2018. A sharp decrease in the results in certain parts of the Offshore Energy division, in particular in the transport activities in the low end of the market, and the decision to take a specific number of vessels out of service, required management to conduct an impairment analysis. Goodwill impairment test is considered complex and requires significant management judgment with respect to future market and economic conditions, developments in revenue, margins, working capital levels and investments, which individually may have a material effect on the result of the calculation. Therefore it is significant to our audit.
In our audit approach we evaluated the goodwill impairment testing model including the main assumptions used with regard to the future market and economic conditions and the decision taken to exit the lower-end of transport activities. This includes assessing the forecasted margins, working capital and investment levels and discount rate. The procedures performed include comparing assumptions to external data. Furthermore, we analyzed sensitivities, compared the projected cash flows to budgets and management’s forecast and assessed the historical accuracy of management’s estimates. We included valuation experts in our team to assess the valuation models and parameters used and to assist us with above mentioned procedures. Furthermore, we evaluated the adequacy of the company’s disclosures regarding the impairment of goodwill.
We consider management’s key assumptions and estimates, used in the impairment test, to be within an acceptable range. We agree with management’s conclusion that the full goodwill amount for the CGU Offshore Energy is impaired. We further assessed that the required disclosures were appropriate.
AN
NU
AL
REP
OR
T 2
018
– B
OSK
ALI
S
141
REPORT ON OTHER INFORMATION INCLUDED IN THE ANNUAL REPORT
In addition to the financial statements and our auditor’s report thereon, the annual report contains other information that consists of: � The Report of the Board of Management and the Report of the Supervisory Board
� The Chairman’s Statement, Boskalis at a Glance and Other Information
� Other information pursuant to Part 9 of Book 2 of the Dutch Civil Code (included in the Financial Statements 2018 section)
Based on the following procedures performed, we conclude that the other information: � Is consistent with the financial statements and does not contain material misstatements
� Contains the information as required by Part 9 of Book 2 of the Dutch Civil Code
We have read the other information. Based on our knowledge and understanding obtained through our audit of the financial statements or otherwise, we have considered whether the other information contains material misstatements. By performing these procedures, we comply with the requirements of Part 9 of Book 2 of the Dutch Civil Code and the Dutch Standard 720. The scope of the procedures performed is substantially less than the scope of those performed in our audit of the financial statements.
Management is responsible for the preparation of the other information, including the Report of the Board of Management in accordance with Part 9 of Book 2 of the Dutch Civil Code and other information as required by Part 9 of Book 2 of the Dutch Civil Code.
REPORT ON OTHER LEGAL AND REGULATORY REQUIREMENTS
ENGAGEMENT
We were engaged by the Annual General Meeting as auditor of Royal Boskalis Westminster N.V. on 13 May 2014, as of the audit for the year 2014 and have operated as statutory auditor ever since that date.
NO PROHIBITED NON-AUDIT SERVICES
We have not provided prohibited non-audit services as referred to in Article 5(1) of the EU Regulation on specific requirements regarding statutory audit of public-interest entities.
DESCRIPTION OF RESPONSIBILITIES FOR THE FINANCIAL STATEMENTS
RESPONSIBILITIES OF THE BOARD OF MANAGEMENT AND THE SUPERVISORY BOARD FOR THE FINANCIAL STATEMENTS
Management is responsible for the preparation and fair presentation of the financial statements in accordance with EU-IFRS and Part 9 of Book 2 of the Dutch Civil Code. Furthermore, management is responsible for such internal control as management determines is necessary to enable the preparation of the financial statements that are free from material misstatement, whether due to fraud or error.
As part of the preparation of the financial statements, management is responsible for assessing the company’s ability to continue as a going concern. Based on the financial reporting frameworks mentioned, management should prepare the financial statements using the going concern basis of accounting unless management either intends to liquidate the company or to cease operations, or has no realistic alternative but to do so. Management should disclose events and circumstances that may cast significant doubt on the company’s ability to continue as a going concern in the financial statements.
The Supervisory Board is responsible for overseeing the company’s financial reporting process.
OUR RESPONSIBILITIES FOR THE AUDIT OF THE FINANCIAL STATEMENTS
Our objective is to plan and perform the audit engagement in a manner that allows us to obtain sufficient and appropriate audit evidence for our opinion.
Our audit has been performed with a high, but not absolute, level of assurance, which means we may not have detected all material errors and fraud during our audit.
RISK OUR AUDIT APPROACH KEY OBSERVATIONS
UNCERTAIN TAX POSITIONS (SEE NOTE 3.28 AND 12)
Boskalis operates in a range of jurisdictions subject to different tax regimes. The cross-border operations may result in estimation differences or disputes with national tax authorities. If management considers it probable that such disputes will lead to an outflow of resources, accruals have been formed accordingly. We therefore identified correct and complete recognition of accruals for uncertain tax positions as significant to our audit.
In our audit approach, we tested the acceptability of the accruals formed in this estimation process. In doing so, we used tax specialists in reviewing the assumptions underlying the estimates and discussing them with management in the light of local tax rules and regulations. In connection with this, we also devoted attention to the substantiation of the estimated probability of the positions taken and details provided thereon by management and we assessed the historical accuracy of management’s assumptions.
We assessed that the Company’s accounting policies were appropriately applied. Furthermore, we have assessed that management assumptions and estimates are within an acceptable range. We further assessed that the disclosure notes are appropriate.

AN
NU
AL
REP
OR
T 2
018
– B
OSK
ALI
S142
Misstatements can arise from fraud or error and are considered material if, individually or in the aggregate, they could reasonably be expected to influence the economic decisions of users taken on the basis of these financial statements. The materiality affects the nature, timing and extent of our audit procedures and the evaluation of the effect of identified misstatements on our opinion.
We have exercised professional judgment and have maintained professional skepticism throughout the audit, in accordance with Dutch Standards on Auditing, ethical requirements and independence requirements. Our audit included among others: � Identifying and assessing the risks of material misstatement of the financial statements, whether due to fraud or error, designing and performing audit procedures responsive to those risks, and obtaining audit evidence that is sufficient and appropriate to provide a basis for our opinion. The risk of not detecting a material misstatement resulting from fraud is higher than for one resulting from error, as fraud may involve collusion, forgery, intentional omissions, misrepresentations, or the override of internal control.
� Obtaining an understanding of internal control relevant to the audit in order to design audit procedures that are appropriate in the circumstances, but not for the purpose of expressing an opinion on the effectiveness of the company’s internal control.
� Evaluating the appropriateness of accounting policies used and the reasonableness of accounting estimates and related disclosures made by management.
� Concluding on the appropriateness of management’s use of the going concern basis of accounting, and based on the audit evidence obtained, whether a material uncertainty exists related to events or conditions that may cast significant doubt on the company’s ability to continue as a going concern. If we conclude that a material uncertainty exists, we are required to draw attention in our auditor’s report to the related disclosures in the financial statements or, if such disclosures are inadequate, to modify our opinion. Our conclusions are based on the audit evidence obtained up to the date of our auditor’s report. However, future events or conditions may cause a company to cease to continue as a going concern.
� Evaluating the overall presentation, structure and content of the financial statements, including the disclosures.
� Evaluating whether the financial statements represent the underlying transactions and events in a manner that achieves fair presentation.
Because we are ultimately responsible for the opinion, we are also responsible for directing, supervising and performing the group audit. In this respect we have determined the nature and extent of the audit procedures to be carried out for group entities. Decisive were the size and/or the risk profile of the group entities or operations. On this basis, we selected group entities for which an audit or review had to be carried out on the complete set of financial information or specific items.
We communicate with the Supervisory Board regarding, among other matters, the planned scope and timing of the audit and significant audit findings, including any significant findings in internal control that we identify during our audit. In this respect we have reported to the Audit Committee in accordance with Article 11 of the EU Regulation on specific requirements regarding statutory audit of public-interest entities. The information included in this additional report is consistent with our audit opinion in this auditor’s report.
We provide the Supervisory Board with a statement that we have complied with relevant ethical requirements regarding independence, and communicate with them all relationships and other matters that may reasonably be thought to bear on our independence, and where applicable, related safeguards.
From the matters communicated with the Supervisory Board, we determine the key audit matters: those matters that were of most significance in the audit of the financial statements. We describe these matters in our auditor’s report unless law or regulation precludes public disclosure about the matter or when, in extremely rare circumstances, not communicating the matter is in the public interest.
Rotterdam, 6 March 2019
Ernst & Young Accountants LLP
Signed by J. Hetebrij

AN
NU
AL
REP
OR
T 2
018
– B
OSK
ALI
S
143
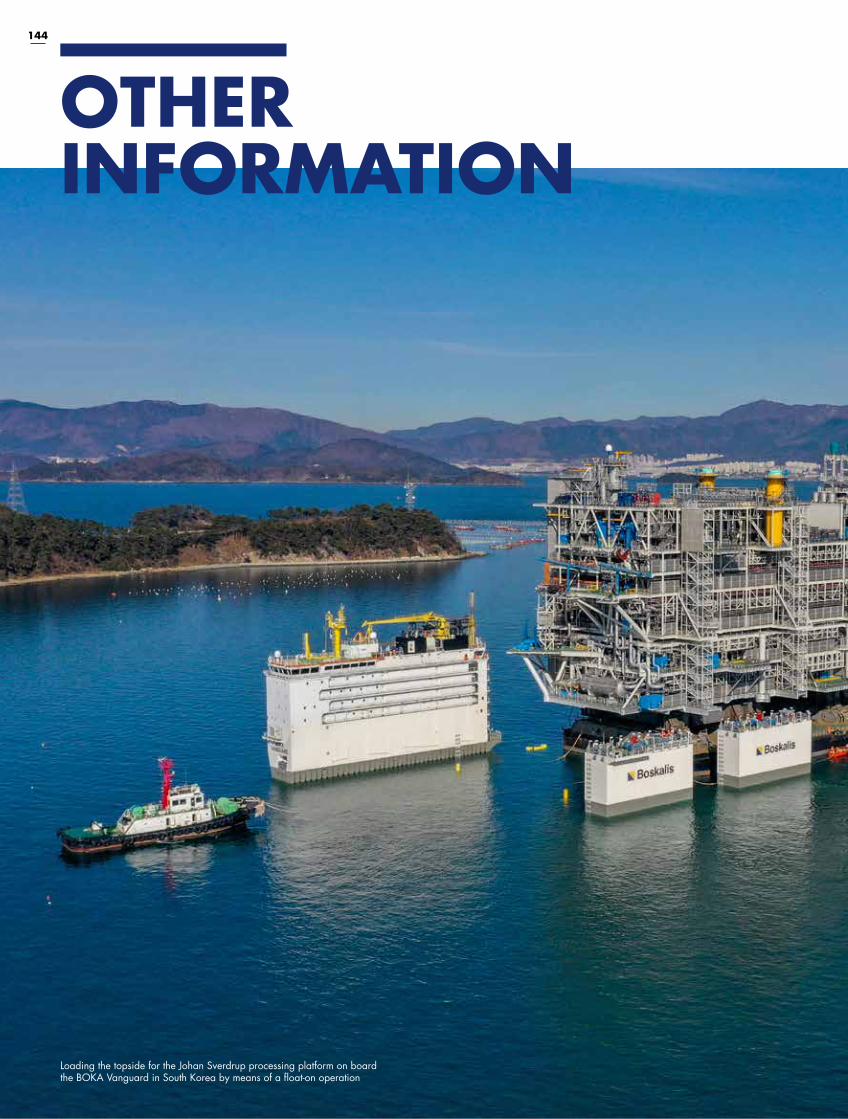
A
NN
UA
L R
EPO
RT
201
8 –
BO
SKA
LIS
144
OTHER INFORMATION
Loading the topside for the Johan Sverdrup processing platform on board the BOKA Vanguard in South Korea by means of a float-on operation
AN
NU
AL
REP
OR
T 2
018
– B
OSK
ALI
S
145
146 HISTORIC OVERVIEW
149 STICHTING CONTINUÏTEIT KBW
150 SUPERVISION, BOARD & MANAGEMENT
154 DISCLOSURES REQUIRED BY THE DECREE ARTICLE 10 OF THE EU DIRECTIVE ON TAKEOVER BIDS
156 GLOSSARY
159 EQUIPMENT

OTH
ER I
NFO
RM
ATI
ON
AN
NU
AL
REP
OR
T 2
018
– B
OSK
ALI
S146
HISTORIC OVERVIEW (1) (15)
(in EUR million, unless stated otherwise)
Revenue 2,570 2,343 2,596 3,240 3,167 3,144 3,081
Order book 4,292 3,495 2,924 2,490 3,286 3,323 4,106
EBITDA (3) 353.6* 436.6 660.5* 884.7 945.9 757.2 567.1
Depreciation and amortization 234.6 251.6 277.2 278.6 261.9 254.4 227.2
Operating result (12) 119.0 185.0 384.6 577.3 684.0 502.8 339.9
Extraordinary charges/impairments 519.5 0.0 842.6 14.5 31.6 39.4 4.1
EBIT (2) -400.5 185.0 -458.1 562.8 652.3 463.4 335.8
Net profit (14) 82.8* 150.5 276.4* 440.2 490.3 365.7 249.0
Net group profit/loss -433.7 150.4 -561.8 443.5 492.2 365.3 252.0
Cash flow 319.5* 402.0 464.0 765.4 785.7 659.1 483.3
Shareholders’ equity 2,544 3,023 3,121 3,714 3,152 2,525 1,898
Average number of outstanding shares (x 1,000)
(4) 132,492 131,097 128,205 124,182 121,606 118,445 105,644
Number of outstanding shares (x 1,000)
(5) 134,068 130,677 130,077 125,627 122,309 120,265 107,284
Personnel (headcount) (13) 7,078 6,410 6,960 8,268 8,446 8,459 15,653
Ratios (in percentages)
EBIT as % of the revenue 4.6* 7.9 14.8* 17.4 20.6 14.7 10.9
Return on capital employed (6) 2.9* 4.8 9.1* 10.8 13.8 13.0 11.1
Return on equity (7) 3.0* 4.9 8.1* 12.8 17.3 16.5 13.8
Solvency (8) 56.1 62.6 56.1 56.3 53.4 47.6 39.2
Figures per share (in EUR)
Profit (5) (9) 0.63* 1.15 2.16* 3.54 4.03 3.09 2.36
Cash flow (5) 2.41* 3.07 3.62* 6.16 6.46 5.56 4.58
Dividend 0.50 1.00 1.00 1.60 1.60 1.24 1.24
Share price range (in EUR)
Low 20.10 27.08 27.89 35.70 33.71 26.92 23.26
High 32.58 35.51 37.60 49.21 47.18 38.58 34.50
* Excluding extraordinary charges/impairments
(1) Figures taken from the respective financial statements. (2) EBIT as reported in the consolidated statement of profit or loss.(3) EBIT before depreciation, amortization and impairment losses.(4) Weighted average number of outstanding shares less the number of shares owned by the company.(5) Number of outstanding ordinary shares less the number of shares owned by the company as at 31 December.(6) Net profit + interest expenses regarding long term loans (non-current interest bearing borrowings) as % of the average capital employed (2016 average capital includes adjustment for debt to be repaid early).(7) Net profit as % of the average shareholders’ equity.(8) Group equity as % of balance sheet total (non-current assets + current assets).(9) The dilution effect was practically nil up to and including the financial year 2018.(10) Adjusted for changes in the IFRS regulations (IAS19R).(11) As of 1 January 2014 Boskalis applies IFRS11 which impacts the way joint ventures and associated companies are recognized.
The full year 2013 comparative figures have been adjusted accordingly.(12) EBIT - extraordinary charges/impairments.(13) Employees employed by majority owned entities including employees Anglo Eastern, crew of the heavy transport vessels.(14) The net loss in 2018 and 2016 have been adjusted for post tax extraordinary charges/impairments.(15) On 21 May 2007 a share split on a three-for-one basis was effected. For comparative purposes the data regarding the number of shares and figures per share of all the periods preceding the share split have been recalculated. (16) As of 1 January 2018 Boskalis applies IFRS15. The full year 2017 comparative figures have been adjusted accordingly.
2017 (16) 2016 2015 2014 (11) 2013 (11) 2012 (10)2018 (16)
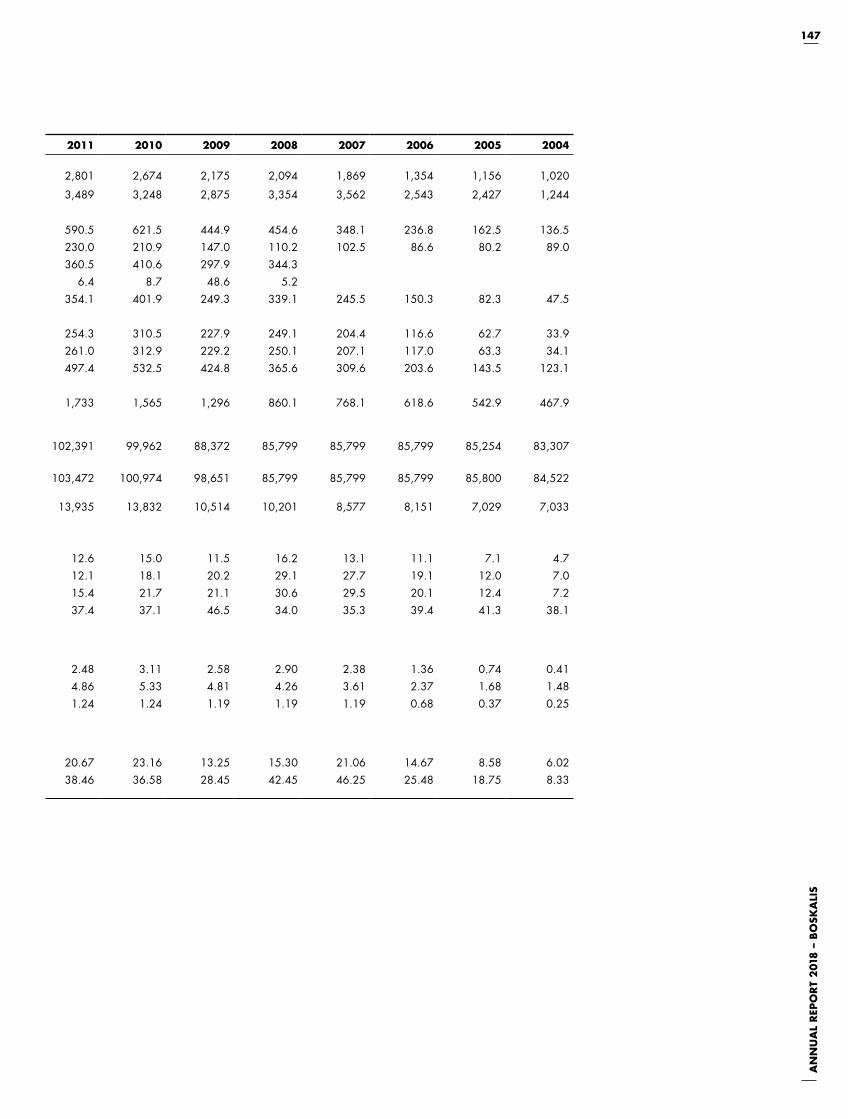
AN
NU
AL
REP
OR
T 2
018
– B
OSK
ALI
S
147
2011 2010 2009 2008 2007 2006 2005 2004
2,801 2,674 2,175 2,094 1,869 1,354 1,156 1,020
3,489 3,248 2,875 3,354 3,562 2,543 2,427 1,244
590.5 621.5 444.9 454.6 348.1 236.8 162.5 136.5
230.0 210.9 147.0 110.2 102.5 86.6 80.2 89.0
360.5 410.6 297.9 344.3
6.4 8.7 48.6 5.2
354.1 401.9 249.3 339.1 245.5 150.3 82.3 47.5
254.3 310.5 227.9 249.1 204.4 116.6 62.7 33.9
261.0 312.9 229.2 250.1 207.1 117.0 63.3 34.1
497.4 532.5 424.8 365.6 309.6 203.6 143.5 123.1
1,733 1,565 1,296 860.1 768.1 618.6 542.9 467.9
102,391 99,962 88,372 85,799 85,799 85,799 85,254 83,307
103,472 100,974 98,651 85,799 85,799 85,799 85,800 84,522
13,935 13,832 10,514 10,201 8,577 8,151 7,029 7,033
12.6 15.0 11.5 16.2 13.1 11.1 7.1 4.7
12.1 18.1 20.2 29.1 27.7 19.1 12.0 7.0
15.4 21.7 21.1 30.6 29.5 20.1 12.4 7.2
37.4 37.1 46.5 34.0 35.3 39.4 41.3 38.1
2.48 3.11 2.58 2.90 2.38 1.36 0.74 0.41
4.86 5.33 4.81 4.26 3.61 2.37 1.68 1.48
1.24 1.24 1.19 1.19 1.19 0.68 0.37 0.25
20.67 23.16 13.25 15.30 21.06 14.67 8.58 6.02
38.46 36.58 28.45 42.45 46.25 25.48 18.75 8.33
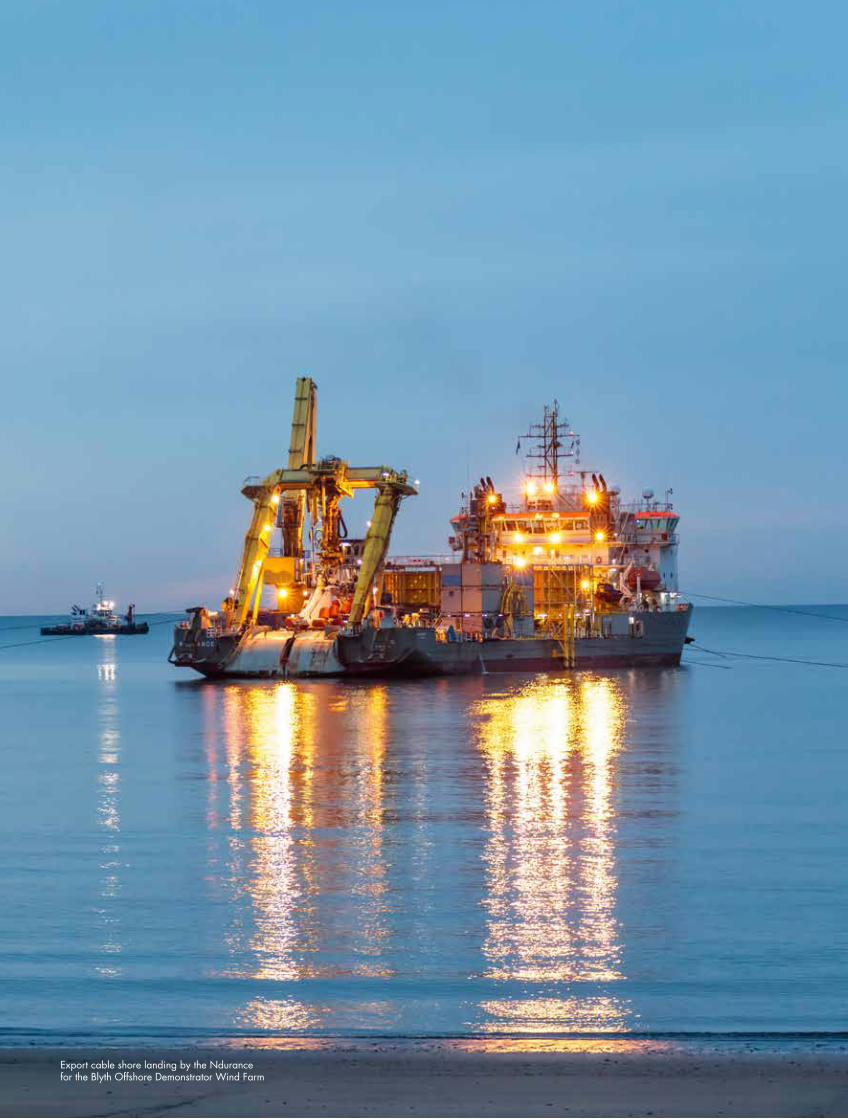
OTH
ER I
NFO
RM
ATI
ON
AN
NU
AL
REP
OR
T 2
018
– B
OSK
ALI
S148
Export cable shore landing by the Ndurance for the Blyth Offshore Demonstrator Wind Farm

AN
NU
AL
REP
OR
T 2
018
– B
OSK
ALI
S
149
STICHTING CONTINUÏTEIT KBW
REPORT
By decision of the General Meeting of Shareholders held on 9 May 2001 the foundation Stichting Continuïteit KBW was granted the right to acquire cumulative protective preference shares in Royal Boskalis Westminster N.V. for a nominal amount equal to the nominal amount of ordinary shares outstanding at the time of issue of the shares concerned, minus the nominal value of one ordinary share. The option of issuing such cumulative protective preference shares was not exercised during the period under review.
The Board of Stichting Continuïteit KBW consists of three members:
C.J.A. van Lede, chairmanJ.S.T. TiemstraP.N. Wakkie
As per 1 July 2018, Mr. C.J.A. van Lede became a member and chairman of the Board of Stichting Continuïteit KBW, replacing Mr. J.A. Dekker.
The articles of association of the Stichting Continuïteit KBW are to be found at www.boskalis.com/corporategovernance.
DECLARATION OF INDEPENDENCE
The Board of Stichting Continuïteit KBW and the Board of Management of Royal Boskalis Westminster N.V. hereby declare that, in their opinion, Stichting Continuïteit KBW is an independent legal entity, separate from Royal Boskalis Westminster N.V., as defined in Section 5:71, first paragraph, under c, of the Dutch Financial Supervision Act.
Papendrecht / Sliedrecht, 6 March 2019Royal Boskalis Westminster N.V.Board of Management
Hilversum, 6 March 2019Stichting Continuïteit KBWThe Board

OTH
ER I
NFO
RM
ATI
ON
AN
NU
AL
REP
OR
T 2
018
– B
OSK
ALI
S150
MEMBERS OF THE SUPERVISORY BOARD
MR. J. VAN DER VEER (1947)
� date of first appointment 12 May 2015, current terms ends AGM 2019
� former CEO of Royal Dutch Shell plc � chairman of the Supervisory Board of Royal Philips N.V. � member of the Board of Directors of Equinor ASA � chairman of Het Concertgebouw Fonds � chairman of the Supervisory Committee of the Delft University of Technology
MR. H.J. HAZEWINKEL (1949), DEPUTY CHAIRMAN
� date of first appointment 27 March 2010, current term ends AGM 2020
� former chairman of the Board of Directors of Royal Volker Wessels Stevin N.V.
� chairman of the Supervisory Board of SOWECO N.V. � member of the Supervisory Board VanWonen Holding B.V. � non-executive partner of Quadrum Capital B.V. � chairman of the Board of Stichting Continuïteit ASR Nederland � member of the Board of Stichting Administratiekantoor Slagheek � member of the Board of Stichting Continuïteit ForFarmers
MS. I. HAAIJER (1969)
� date of first appointment 10 November 2016, current term ends AGM 2020
� CEO of Bugaboo International B.V. � former president & CEO of DSM Food Specialties and member of the Leadership Team of Royal DSM N.V.
MR. J.P. DE KREIJ (1959)
� date of first appointment 9 May 2018, current term ends AGM 2022
� former deputy chairman of the Executive Board and former Chief Financial Officer of Royal Vopak N.V.
� member of the Supervisory Board of TomTom N.V. � member of the Supervisory Board of Corbion N.V. � member of the Advisory Council of YGroup Companies
MR. J.N. VAN WIECHEN (1972)
� date of first appointment 12 May 2011, current term ends AGM 2019
� member of the Executive Board of HAL Holding N.V./director HAL Investments B.V.
� chairman of the Supervisory Board of Mondhoekje B.V. (Coolblue)
� member of the Supervisory Board of Atlas Services Group Holding B.V.
MR. C. VAN WOUDENBERG (1948)
� date of first appointment 9 May 2007, current term ends AGM 2019
� former member of the Executive Committee of Air France-KLM � chairman of the Supervisory Board of Blauwe Oceaan B.V. � member of the Supervisory Committee of Stichting Het Gelders Orkest (The Arnhem Philharmonic Orchestra)
All the members of the Supervisory Board have the Dutch nationality.
Company secretary: Ms. F.E. Buijs (1969)
SUPERVISION, BOARD AND MANAGEMENT

AN
NU
AL
REP
OR
T 2
018
– B
OSK
ALI
S
151
DR. P.A.M. BERDOWSKI (1957), CHAIRMAN
� chairman of the Board of Management since 2006 � member of the Board of Management since 1997 � member of the Supervisory Board of Amega Groep B.V.
MR T.L. BAARTMANS (1960)
� member of the Board of Management since 2007 � chairman of the Executive Board of the Netherlands Association of International Contractors (NABU)
� member of the board of the International Association of Dredging Companies (IADC)
� member of the Supervisory Committee of the Stichting Prosea marine education
MR B.H. HEIJERMANS (1966)
� member of the Board of Management since 2018 � member of the Advisory Board of Bold Capital Management B.V.
MR J.H. KAMPS (1959), CHIEF FINANCIAL OFFICER
� member of the Board of Management since 2006 � member of the Supervisory Board of Sligro Food Group N.V.
All the members of the Board of Management have the Dutch nationality.
Company secretary: Ms. F.E. Buijs (1969)
From left to right: J.H. Kamps, B.H. Heijermans, P.A.M. Berdowski, T.L. Baartmans
MEMBERS OF THE BOARD OF MANAGEMENT

OTH
ER I
NFO
RM
ATI
ON
AN
NU
AL
REP
OR
T 2
018
– B
OSK
ALI
S152
GROUP MANAGEMENTdr. P.A.M. Berdowski chairman Board of ManagementT.L. Baartmans member Board of ManagementB.H. Heijermans member Board of ManagementJ.H. Kamps member Board of Management, Chief Financial OfficerR.J.A. van Acker group director Towage & SalvageP. van der Knaap group director Dredging & Inland InfraP. van der Linde group director
CENTRAL BUSINESS SUPPORT
Personnel & Organization J. den Hartog ICT M.J. KrijgerSHE-Q J.M. van VugtResearch & Development dr. A.C. SteenbrinkCentral Fleet Support P.E. van EertenProcurement & Logistics J.E. Rijnsdorp
CORPORATE SUPPORT
Company secretary & Corporate Legal F.E. BuijsTreasury F.A.J. RousseauIR & Corporate Communications M.L.D. SchuttevâerGroup Controlling E.C.P. Verstraete Fiscal Affairs J. JagerInsurance A.J. HuiskesCorporate Development C.A. Visser
WORKS COUNCILD.A. van Uitert (chairman), M.A. Koerts (vice-chairman), L. Wubben (secretary), P. Boer, K. de Bruijn, K. van Dam, R. Gooijer, S. Henrion, L. Keuning, J. van Reijendam, R. Roos, T. Swalen, S.C. Tervoort, R. Wisse, A. Zwart.
TOWAGE & SALVAGE OFFSHORE ENERGYDREDGING & INLAND INFRA
Area Northwest Europe W.B. VogelaarArea Middle M. SiebingaArea Middle East P.G.R. DevinckArea East S.G.M. van Bemmelen Area West P. KlipThe Netherlands P. van der LindeBoskalis Environmental H.H.A.G. Wevers
Finance W.T. BienBusiness Development J.F.A. de BlaeijDesign, Tendering & Engineering A.J. FokkemaFleet Management J.T. van LeeuwenPersonnel & Organization L. Wijngaard
Marine Installation C.J. d’CortSeabed Intervention J.M.L.D. Dieteren Offshore WindM.R.J. van BergenHeavy Marine Transport W.Q. NelemansMarine ServicesS.R.L. van HulleSubsea Services S.I. CameronSubsea Cables & Flexibles R.P. RijperSurvey (Gardline) C.A. Vermeijden
Finance R.F.P. van ’t HofBusiness Development J.G.M. MeijFleet Management E.B. van DodeweerdPersonnel & Organization T. Lageman, M.C. Verhage
Towage T.R. BennemaSalvageR.L.C. Janssen

AN
NU
AL
REP
OR
T 2
018
– B
OSK
ALI
S
153

OTH
ER I
NFO
RM
ATI
ON
AN
NU
AL
REP
OR
T 2
018
– B
OSK
ALI
S154
DISCLOSURES REQUIRED BY THE DECREE ARTICLE 10 OF THE EU DIRECTIVE ON TAKEOVER BIDS
Under the Decree article 10 of the EU Directive on takeover bids, companies whose securities are admitted to trading on a regulated market must disclose information in their annual reports on matters including their capital structure and the existence of any shareholders with special rights. Furthermore, the Code requires Boskalis to give an overview of all existing and potential anti-takeover measures indicating the circumstances whereunder and by whom these measures may likely be used. In accordance with these requirements, Boskalis hereby makes the following disclosures:
a. For information on the capital structure of the company, the capital and the existence of various types of shares, please refer to page 106 of the notes to the consolidated financial statements in this annual report. For information on the rights attached to these shares, please refer to the company’s Articles of Association which can be found on the company website. To summarize, the rights attached to ordinary shares comprise pre-emptive subscription rights upon the issue of ordinary shares, the entitlement to attend the General Meeting of Shareholders, and to speak and vote at that meeting, and the right to distribution of such amount of the company’s profit as remains after allocation to reserves. As at December 31, 2018, the issued capital consisted exclusively of ordinary shares (partly registered and partly bearer shares (aandelen aan toonder)). These are only issued against payment in full.
b. The company has imposed no limitations on the transfer of ordinary shares. The Articles of Association have stipulated a blocking procedure for protective preference shares. The company is not aware of any shares having been exchanged for depositary receipts.
c. For information on equity stakes in the company to which a notification requirement applies (pursuant to Sections 5:34, 5:35 and 5:43 of the Financial Supervision Act), please refer to the section ‘Shareholder information’ on page 17 of this annual report. Under the heading ‘Major shareholders’ you can find a list of shareholders who are known to the company to have holdings of 3% or more at the stated date.
d. There are no special control rights or other rights associated with shares in the company.
e. The company does not operate a scheme granting employees rights to acquire or obtain shares in the capital of the company or any of its subsidiaries.
f. No restrictions apply to voting rights associated with the company’s shares, nor are there any deadlines for exercising voting rights.
g. No agreements with shareholders exist which may result in restrictions on the transfer of shares or limitation of voting rights.
h. The thresholds for shareholders to exercise the right of inquiry (het enquêterecht) are based on article 346 sub clause 1 under c of the Dutch Civil Code, regardless of the current nominal share capital of the company.
i. The rules governing the appointment and dismissal of members of the Board of Management and the Supervisory Board and amendment of the Articles of Association are stated in the company’s Articles of Association. Members of the Board of Management and Supervisory Board are appointed and dismissed by the General Meeting of Shareholders on binding nomination of the Supervisory Board. The General Meeting of Shareholders may pass a resolution to deprive the binding nature of the nomination for the appointment or dismissal of any member of the Board of Management or the Supervisory Board by at least a majority of two/thirds of the votes cast, representing more than one-half of the company’s issued share capital. An amendment of the company’s Articles of Association requires a decision by the General Meeting of Shareholders in response to a proposal made by the Board of Management with the approval of the Supervisory Board.
j. The general powers of the Board of Management are set out in the Articles of Association of the company. The powers of the Board of Management in respect of the issuance of shares in the company are set out in article 4 of the company’s Articles of Association. To summarize, the General Meeting of Shareholders – or the Board of Management authorized by the General Meeting of Shareholders – takes the decision, subject to prior approval by the Supervisory Board, to issue shares, whereby the issue price and other conditions relating to the issue are determined by the General Meeting – or the Board of Management authorized by the General Meeting of Shareholders. In the event the Board of Management is authorized to take decisions with respect to the issue of shares, the number of shares that may be issued as well as the term of the authorization must also be determined. Procedures governing the acquisition and disposal by the company of shares in its own capital are set out in article 7 of the Articles of Association. To summarize, the Board of Management may

AN
NU
AL
REP
OR
T 2
018
– B
OSK
ALI
S
155
decide, subject to authorization by the General Meeting of Shareholders and to prior approval by the Supervisory Board, for the company to buy back fully paid-up shares up to a statutory maximum of 50% of issued capital. Decisions regarding the disposal of shares acquired by the company are taken by the Board of Management, subject to prior approval by the Supervisory Board.
k. With the exception of the option agreement with Stichting Continuïteit KBW concerning the placement of cumulative protective preference shares as set out in section 28.4 of the financial statements, the company is not a party to any significant agreements which take effect or are altered or terminated upon a change of control of the company as a result of a public offer within the meaning of Section 5:70 of the Financial Supervision Act. The General Meeting of Shareholders of May 9, 2001 decided to grant Stichting Continuïteit KBW the right to acquire cumulative protective preference shares as a preventive measure against an unsolicited offer for the shares of the company. These shares may be issued in the event that (significant) influence is obtained or is threatened to be obtained by (legal) persons, who, without the involvement of the Board of Management, intend to acquire control over the company, without safeguards being in place for the independence and continuity of the company and its enterprise and without ensuring the interests of employees, other shareholders and other stakeholders of the company and its enterprise.
l. The company has not entered into any agreements with either members of the Board of Management or employees, which provide for a pay-out on termination of their employment as a result of a public offer within the meaning of Section 5:70 of the Financial Supervision Act.
Installation of a suction bucket foundation for the Aberdeen Offshore Wind Farm by the floating sheerleg crane Asian Hercules III

OTH
ER I
NFO
RM
ATI
ON
AN
NU
AL
REP
OR
T 2
018
– B
OSK
ALI
S156
GLOSSARY
Acquired orders Contract value of acquired assignments.
Average capital employed Shareholders’ equity + long term loans (non-current interest bearing borrowings).
Backhoe dredger A large hydraulic excavating machine positioned on the end of a pontoon. The pontoon is held firmly in place using spuds. Backhoes can dredge in a range of soil types with extreme precision.
Bunker fuel Type of fuel used by oceangoing and other vessels. Bunkering refers to the act or process of supplying a ship with this type of fuel.
Cash flow Group net profit + depreciation + amortization + impairment losses.
Cost leadership Achieving lowest cost price.
Cutter suction dredger (CSD) A vessel that dredges while being held into place using spuds and anchors. This technique combines powerful cutting with suction dredging. Cutter suction dredgers are mainly used where the sea- and riverbed is hard and compact. The dredged material is sometimes loaded into hoppers but is generally pumped to land through a pressure pipeline.
Decommission To dismantle and/or remove an object.
EBIT Earnings before interest and tax.
EBITDA EBIT before depreciation, amortization and impairment losses.
CO2 Emissions Carbon dioxide released into the environment.
EPC contract EPC stands for Engineering, Procurement, Construction and is a type of contracting agreement in the construction industry. The contractor is responsible for carrying out the detailed engineering design of the project, procure all the equipment and materials required, and then construct to deliver a functioning facility or asset to the client.
EU-IFRS IFRS stands for International Financial Reporting Standards. EU-IFRS are financial reporting rules drawn up and issued by the IASB (International Accounting Standards Board) and adopted within the European Union. Since 2005 all publicly listed companies within the European Union have been obliged to comply with these standards in their external financial accounting/reporting.
Fallpipe vessel Vessel that moves over the area to be covered, while dumping rock through a fallpipe. The vessel is kept in place by a dynamic positioning system in which the propellers and rudders are controlled by an automatic system. The end of the pipe is located just a few meters above the level of the surface to be covered. The fallpipe is controlled using a precise positioning system. The fallpipe vessel Seahorse can also be equipped with an A-frame on the aftship and a grab controlled by an ROV (Remotely Operated Vehicle). This makes it possible to dredge down to depths of 1,000 meters.
Float-over installation Installation of a topside (for an offshore oil or gas platform production unit) on a subsea structure such as a jacket. A semi-submersible heavy transport vessel is used to convey the topside to the site and position it precisely in relation to the subsea structure piles. The ship is then partially submerged, allowing the support points of the topside to be lowered precisely onto the jacket connectors.
Floating sheerleg crane Floating cranes for heavy lifting.
FPSO Floating Production Storage and Offloading unit. Floating production, storage and transshipment systems that often operate a long way offshore. The systems separate the incoming liquids into oil, gas and water and temporarily store the crude oil. Tankers are used to transport the oil.
Futures A future (derivative) is a so-called forward contract; an agreement between traders to purchase or sell certain financial products on a specified future date at a previously agreed fixed price.
Global Reporting Initiative International organization that develops global standards for sustainability reporting.
Hazardous substances Liquid or solid substances which present a health hazard and/or are damaging to the environment.
Heavy lift vessel See HTV.
Home market Boskalis distinguishes itself from its competitors in the Dredging segment by the use of a home market strategy. The home market organizations have local marketing profiles, as well as their own fleets and infrastructures. They can rely on the support of the financial and technical resources of the global Boskalis organization. Home markets provide a stable flow of assignments and opportunities to generate additional margins through associated activities.
Hopper/hopper dredger See trailing suction hopper dredger.
HTV A (semi-submersible) heavy transport vessel. At 275 meters long and 70 meters wide the BOKA Vanguard is the biggest semi-submersible heavy transport vessel in the world and is capable of conveying objects weighing up to 110,000 tons.
International projects market Market that focuses primarily on larger capital expenditure projects for new buildings and/or extensions. In addition, there are projects that regularly involve cooperation with third parties. This makes it possible to provide clients with optimal services and to share risks.
Jack-up platform An offshore platform that can either float or have its legs lowered to stand on the seabed. Jack-up rigs are generally used by oil and gas companies for exploration and production purposes. Platforms of this type can be transported either by semi-submersible heavy transport vessel or by oceangoing tug.
LNG Liquefied Natural Gas.
LTI Lost Time Injury. Expresses the number of workplace accidents serious enough to result in absence from work.
LTIF Lost Time Injury Frequency. Expresses the number of workplace accidents serious enough to result in absence from work, per 200,000 hours worked.
Net Group profit Net profit + net profit attributable to non-controlling interests.
NINA No Injuries No Accidents. To achieve an incident and accident-free working environment Boskalis applies the NINA safety program. NINA sets out Boskalis’ vision on safety and describes the safety conduct the company expects from its staff and subcontractors. The program makes people aware of their own responsibility and encourages them to take action in situations which are unsafe.
Operating result EBIT - impairments including joint ventures.
Order book Contract revenue as yet uncompleted.
Return on capital employed Net profit + interest expenses regarding long term loans (non-current interest bearing borrowings) as % of the average capital employed.
Return on equity Net profit as % of the average shareholders’ equity.
Roll-on/roll-off vessel (ro-ro) Vessels designed to carry wheeled cargo such as automobiles, trucks, semi-trailer trucks, trailers or railroad cars that are driven on and off the ship on their own wheels.
Rock fragmentation under water Drilling and blasting hard materials such as rock and granite, often to deepen ports and clear navigational channels.
ROV Remotely Operated Vehicle. An unmanned robotic subsea vehicle that is remotely controlled (often from a ship or platform).
SHE-Q Safety, Health, Environment & Quality.
Solvency Group equity as % of balance sheet total (non-current assets + current assets).
Topside The upper section of an offshore oil production platform.
Trailing suction hopper dredger (TSHD) A self-propelled unit that loads its well or hopper using centrifugal pumps and pipes that trail over the bed as the ship sails. Trailing suction hopper dredgers can operate independently of other equipment and can transport material over long distances. The dredged material is dumped through flaps or bottom doors, by rainbowing, or pumped onto land using a pipeline.
TRIR Total Recordable Injury Rate. Number of LTIs, restricted work cases and medical treatment cases per 200,000 hours worked.

AN
NU
AL
REP
OR
T 2
018
– B
OSK
ALI
S
157
Diving support vessel Constructor

OTH
ER I
NFO
RM
ATI
ON
AN
NU
AL
REP
OR
T 2
018
– B
OSK
ALI
S158
The Bokalift 1 installing jacket foundations for an offshore wind farm in the North Sea

AN
NU
AL
REP
OR
T 2
018
– B
OSK
ALI
S
159
EQUIPMENT
The numbers listed above include the vessels under construction and vessels and floating equipment of the (non-controlled) associated companies. In addition to the equipment shown here, the group also owns a range of auxiliary equipment such as floating pipelines, winches, pumps, draglines, hydraulic excavators, wheel loaders, dumpers, bulldozers, mobile cranes, crawler drill rigs, sand pillers, filling installations for shore protection, mattresses, fixed land pipelines and a wide variety of salvage equipment, such as fire-fighting, diving and anti-pollution equipment.
DREDGERS
Trailing suction hopper dredgers
Capacity > 6,000 m3
Capacity ≤ 6,000 m3
21
9
12
Cutter suction dredgers
Capacity > 12,000 kW
Capacity ≤ 12,000 kW
11
4
7
Backhoes
Bucket capacity from 1.4 to 33 m3
18
Floating grab cranes
Grab capacity from 1.2 to 9.2 m3
12
Other dredging equipment
bucket dredger, environmental disc cutter,
barge unloading dredgers, suction dredgers, stone
placing vessels
26
OFFSHORE VESSELS
Heavy transport vessels (semi-submersible)
Capacity up to 110,000 tons
11
Heavy lift vessels
Capacity from 500 to 3,000 tons
3
Fallpipe vessels
Capacity from 17,000 to 24,000 tons
2
Diving support vessels
Air and saturation diving support, ROV services
6
Cable-laying vessels 3
Floating sheerlegs cranes
Capacity from 400 to 5,000 tons
6
Survey vessels 18
OCEANGOING TUGS AND ANCHOR HANDLING TUGS
Oceangoing tugs 6
Anchor Handling Tugs
From 70 to 205 ton bollard pull
16
BARGES AND PONTOONS
Hopper barges
Capacity from 50 to 3,800 m3
72
Oceangoing flat top barges
(semi-submersible)
Capacity 21,000 tons
2
Oceangoing flat top barges/pontoons
Capacity from 1,000 to 14,000 tons
44
Inland barges
Capacity from 100 to 2,000 tons
39
VESSELS TOWAGE JOINT VENTURES 421
LAUNCHES, WORK/SUPPLY VESSELS 96
VARIOUS/OTHER FLOATING EQUIPMENT 86
The Bokalift 1 installing jacket foundations for an offshore wind farm in the North Sea
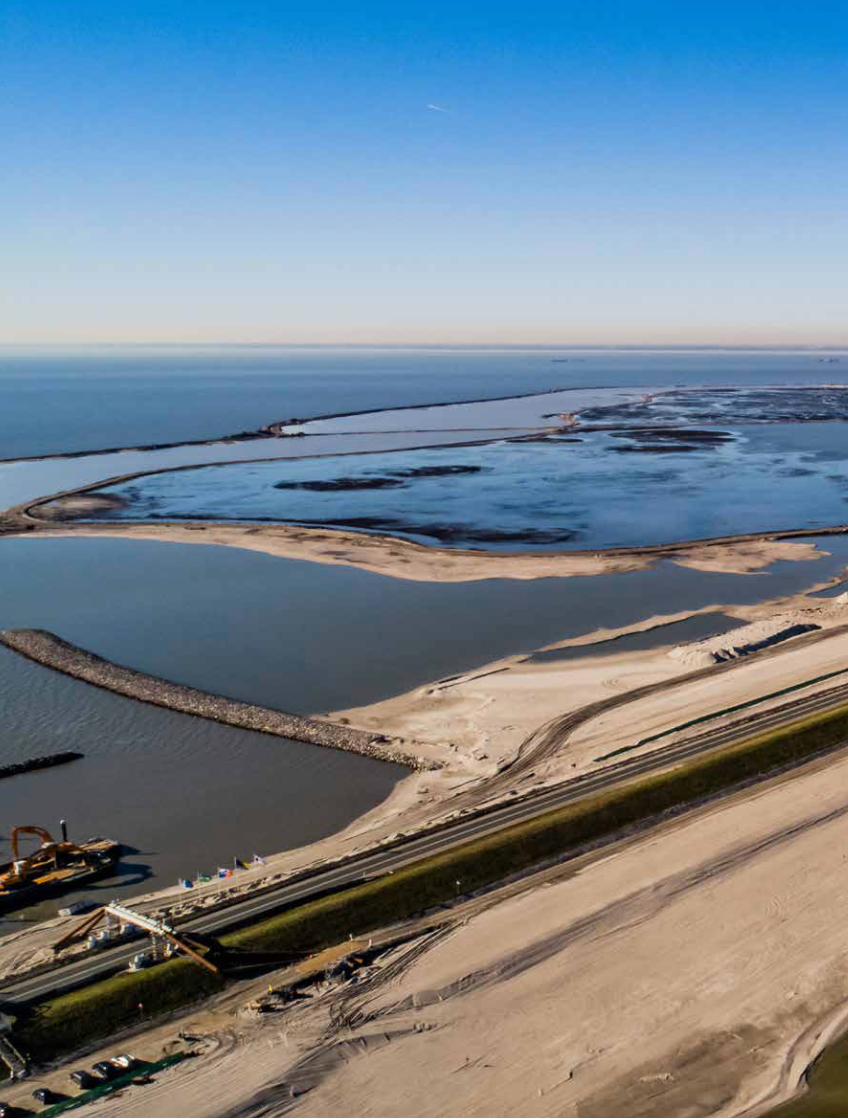
OTH
ER I
NFO
RM
ATI
ON
AN
NU
AL
REP
OR
T 2
018
– B
OSK
ALI
S160

AN
NU
AL
REP
OR
T 2
018
– B
OSK
ALI
S
161
Reinforcement of the Houtrib Dike and construction of the Trintelzand nature area

OTH
ER I
NFO
RM
ATI
ON
AN
NU
AL
REP
OR
T 2
018
– B
OSK
ALI
S162
Beach replenishment activities near the Oosterscheldekering, the largest storm surge barrier of the Dutch Delta Works

COLOPHONCompiled and coordinated by Royal Boskalis Westminster N.V.Corporate Communications DepartmentGroup Controlling Department
www.boskalis.com
carbon neutralnatureOffice.com | NL-001-683706
print production

Royal Boskalis Westminster N.V.Rosmolenweg 20PO Box 433350 AA PapendrechtThe Netherlands
[email protected] +31 78 6969000
www.boskalis.com
AN
NU
AL R
EPO
RT 2
018 —
BO
SKA
LIS