Annual Report 2018 - Central Bank of Nigeria Report 2018...8 2018 Annual Report National Financial...
93
image sources: https://www.ippmedia.com https://www.smeventure.com ANNUAL REPORT 2018
Transcript of Annual Report 2018 - Central Bank of Nigeria Report 2018...8 2018 Annual Report National Financial...

image sources: https://www.ippmedia.com https://www.smeventure.com
ANNUAL REPORT2018

STAKEHOLDER INSTITUTIONSPROVIDERS:
ENABLERS:
SUPPORTING INSTITUTIONS:

The Financial Inclusion Secretariat acknowledges and expresses in-depth gratitude to the
Management of the Bank and all stakeholders, whose meticulous and pious inputs and
contributions made the publication of this Report a reality.
Editorial Board:
v Mr. Joseph A. Attah
v Dr. Paul I. Oluikpe
v Mr. Stephen M. Ambore
Mrs. Temitope Akin-Fadeyi
Mr. Peter Olayinka
v Mr. George N. Ogudu
v Dr. Muhammed A. Garzali
v Mr. Uzosike U. Jonathan
v Mr. Emeka M. Okoye (infographics)
v Dr. Nurudeen A. Zauro
v Ms. Sophia O. Abu
v Mr. Kabiru A. Gambo
v Mr. Maximillian C. Belonwu
v Mr. Patrick O. Hinmikalu
v Mrs. Umar Zainab
v Mr. Hilary D. Ewubor
v Mrs. Usman Nasa
ACKNOWLEDGMENTS
32018 Annual Report National Financial Inclusion Strategy Implementation

The Nigerian National Financial Inclusion Strategy (NFIS) was launched on October 23, 2012. The aim was
to reduce the percentage of adult Nigerians who do not have access to nancial services from 46.3 per cent
in 2010 to 20 per cent in 2020. In addition, the strategy stipulates that 70 per cent of those to be included in
the nancial system by 2020 should be in the formal sector.
The Strategy is implemented through a wide range of stakeholders and the implementation monitored
through Governing Committees, as shown below:
Figure A: Governing Structure of NFIS
The National Financial Inclusion
Steering Committee, chaired by the
Central Bank of Nigeria (CBN) Governor,
comprises the Heads of relevant Ministries,
Departments and Agencies (MDAs),
Industry Associations, Regulators and
Technical Advisory companies. It provides
high-level policy and strategic direction for
the implementation process. The National
F i n a n c i a l I n c l u s i o n Te c h n i c a l
Committee, chaired by the CBN Deputy
Governor, Financial System Stability,
comprises CBN Directors as well as
equivalents within relevant Ministries,
Departments and Agencies, Industry
Associations, Regulators and Technical
Advisory companies. It provides technical
support and validates data supplied on nancial inclusion. The Technical Committee carries out its
operational activities through Working Groups – Products, Channels, Financial Literacy and
Special Interventions Working Groups: The Working Groups develop and implement annual work plans
in order to achieve the dened nancial inclusion targets by 2020 and monitor implementation of the
strategy.
T h e F i n a n c i a l I n c l u s i o n
Secretariat
The Financial Inclusion Secretariat is a
Unit within the CBN, which was
established to run the day-to-day
coordination, data management and
reporting on the National Financial
Inclusion Strategy implementation
process. It comprises three key
ofces, the Strategy Coordination
Ofce, the Data Management Ofce
and the Digital Financial Services
Programme Management Unit.
ABOUT THE NATIONAL FINANCIAL INCLUSION STRATEGY
Figure B: FIS organogram
2018 Annual Report National Financial Inclusion Strategy Implementation4
National Financial Inclusion Secretariat Central Bank of Nigeria
Strategy Coordination Office
Data Management Office
Digital Financial Services Office
Gender Desk
National Financial Inclusion Steering Committee
National Financial Inclusion Technical Committee and Four National Financial Inclusion Working Groups
National Financial Inclusion Secretariat
Federal Ministries & Agencies
Industry Associations
Regulators Technical Advisors
National Working
Group
Financial Inclusion State Steering
Committee

FOREWORD
EXECUTIVE SUMMARY
1.0 INTRODUCTION
1.1 The National Financial Inclusion Strategy
2.0 IMPLEMENTATION ENVIRONMENT
2.1 Macroeconomic Environment
2.2 Banking Sector
2.3 Micronance Bank Sector
2.4 E-Payments Sector
2.5 Insurance Sector
2.6 Pension Sector
2.7
Capital Market Sector
3.0 STAKEHOLDER ACTIVITIES
3.1 National Financial Inclusion Steering Committee (NFISC)
3.2 National Financial Inclusion Technical Committee (NFITC)
3.3 National Financial Inclusion Working Groups
3.3.1 Channels Working Group (FICWG):
3.3.2 Financial Literacy Working Group (FLWG):
3.3.3 Financial Inclusion Products Working Group (FIPWG):
3.3.4 Special Interventions Working Group (FISIWG):
3.5 Providers
3.5.1 Bankers’ Committee
3.5.2 The National Association of Micronance Banks (NAMB)
3.5.3 The National Co-operative Financing Agency of Nigeria (CFAN)
3.5.4 Fund Managers Association of Nigeria (FMAN)
3.6 Activities of Enablers
3.6.1 Central Bank of Nigeria
8
11
18
19
24
25
26
29
31
35
36
37
42
43
43
44
44
44
44
44
45
45
47
47
47
47
47
TABLE OF CONTENTS
2.8 Informal Financial Sector 39

3.6.2 National Pension Commission
3.7 Supporting Institutions
3.7.1 The Alliance for Financial Institution (AFI)
3.7.2 Enhancing Financial Invoation & Access (EFInA)
3.7.3 Deutsche Gesellschaft Fuer Internationale Zusammenarbeit (GIZ)
4.4.1 Electronic Payments
4.1.2 Savings
4.1.3 Credit
4.1.4 Insurance
4.1.5 Pension
4.2 Channel Indicators
4.2.1 Bank Branches
48
50
50
50
50
62
63
65
66
66
66
66
3.6.1.4 Recapitalization of Micronance Banks
3.6.1.5 The Geospatial Mapping of Financial Access Points
3.6.1.1 Release of the Guidelines for Licensing and Regulation of Payment Service Banks
3.6.1.2 Establishment of the NIRSAL Micronance Bank
3.6.1.3 The Launch of Agri-Business Small & Medium Enterprise Investment Scheme
47
48
47
47
47
4.2.2 Micronance Bank Branches
4.2.3 ATM and POS
66
67
3.6.3 National Insurance Commission 48
3.6.4 Securities and Exchange Commission 49
3.6.5 The Nigerian Communications Commission 49
3.6.6 Nigeria Deposit Insurance Corporation 49
3.6.7 National Identity Management Commission 49
3.6.8 Federal Ministry of Youth and Sports Development 50
3.6.9 Nigeria Postal Service 50
3.8 Financial Inclusion State Steering Committee (FISSCO) 51
4.0 STRATEGY IMPLEMENTATION PROCESS 61
4.1 Product Indicators 62
4.2.5 Agents 69
4.3.1 Know Your Customer (KYC)/ID 70
4.3 Enablers 70
4.3.2 Financial Literacy
5.1 Recap of 2018
5.2 Projections for 2019
5.2.1 More Focus on Stakeholder Innovation
70
84
84
84
4.3.3 Women Initiatives 71
5.0 Future Outlook
5.2.2 Increased deployment of Fintech for Financial inclusion 84
5.2.3 Increased Stakeholder Collaboration 85
5.2.4 Deeping Financial Inclusion Channels 85
5.2.5
5.2.6
5.2.7
Licensing of PSBs
Roll Out of NIRSAL Micronance Bank (NMFB) Branches
Increased Focus on Financial Literacy and Consumer Protection
85
85
85
REFERENCES 89
LIST OF ACRONYMS 90
83
APPENDIX 87

FOREWORD
2018 Annual Report National Financial Inclusion Strategy Implementation8
Financial inclusion is the provision of a broad range of nancial services which are relevant, appropriate and
affordable for the entire adult population especially the low income and rural segment of our population.
Such services include, but not limited to: savings, credit, insurance, payments, remittances and pensions.
People from different segments of the society should have access to the nancial institutions and be able to
avail themselves of various nancial programs being offered by different policy initiatives of the government.
The overall objective of nancial inclusion is to bring the underserved segment of our population (unbanked
population) into the formal nancial system by providing them with access to nancial services. Improved
access to nance is an important factor in accelerating sustainable economic growth, reducing poverty and
unemployment, and enhancing the stability of the nancial sector.
The importance of an inclusive nancial system is widely recognized in the policy circle and has become a
priority in many countries including Nigeria. As a central bank, we believe that nancial inclusion will help
CBN to achieve its core mandate of ensuring price and monetary stability in the economy by increasing the
scope of savings, investment and consumption decisions that are made within the formal nancial sector. A
more inclusive nancial system brings nancial decision makers within the purview of the central bank and
thus enables the monetary authority, monitor, regulate and supervise nancial transaction with a view to
maintaining nancial system stability. It also improves the efcacy of monetary 'policy interventions .It is
indeed encouraging to note that the National Financial Inclusion Strategy (NFIS) being driven by the Bank is
yielding positive results. The nancial exclusion rate of adults has progressively improved from 46.3 per cent
in 2010 to 41.6 per cent in 2016 and 36.8 per cent in 2018 as against the NFIS target of 20.0 per cent by 2020.
The improved macroeconomic environment such as stable exchange rate, monetary and nancial stability
in the recent times has fostered a conducive environment for nancial inclusion to thrive, particularly in the
underserved segments of the country.
In order to meet the NFIS target of 20.0 per cent nancial exclusion for adults by 2020, the strategy has been
refocused to explore ve priority themes of Youth, Women, Rural areas, Micro Small and Medium Enterprises
(MSMEs) and the Northern region. These priority areas are expected to close identied gaps and
tremendously advance nancial inclusion. Emphasis will also be placed on the use of technological tools in
improving access to nance among the underserved. Consequently, a stakeholder-driven implementation
approach would give impetus to the achievement of the targeted
outcomes. I am optimistic that the fundamental building blocks for
incremental growth have already been laid.
I therefore charge all stakeholders to heed this clarion call: work
assiduously to attain the nancial inclusion target set for 2019 and
2020. I hereby present the 2018 Annual Report of the National
Financial Inclusion Strategy for public use.
Thank you.
Godwin I. Emeele, CON
Governor, Central Bank of Nigeria
Chairman, National Financial Inclusion Steering Committee.
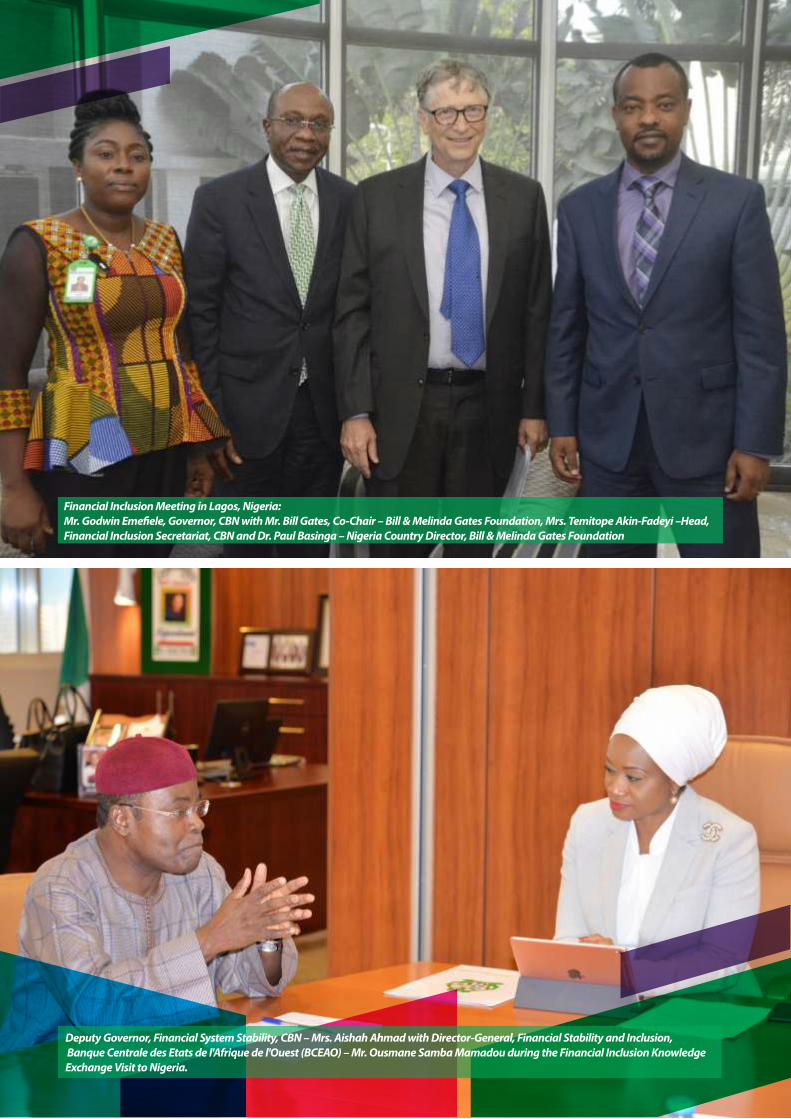
Financial Inclusion Meeting in Lagos, Nigeria: Mr. Godwin Eme�ele, Governor, CBN with Mr. Bill Gates, Co-Chair – Bill & Melinda Gates Foundation, Mrs. Temitope Akin-Fadeyi –Head, Financial Inclusion Secretariat, CBN and Dr. Paul Basinga – Nigeria Country Director, Bill & Melinda Gates Foundation
Deputy Governor, Financial System Stability, CBN – Mrs. Aishah Ahmad with Director-General, Financial Stability and Inclusion, Banque Centrale des Etats de l'Afrique de l'Ouest (BCEAO) – Mr. Ousmane Samba Mamadou during the Financial Inclusion Knowledge Exchange Visit to Nigeria.

NIGERIA AT A GLANCE

Financial Inclusion rate in Nigeria now 63.2%
After a dip in the nancial inclusion headline number in 2016, the biannual nancial inclusion
survey number shows a marginal increase from 58.4 per cent in year 2016 to 63.2 per cent in
2018. The measurement also disaggregated nancial inclusion data on state-by-state level for
the rst time. While the data showed signicant improvement in the in the North West and North
East zones, the two zones remained more disproportionally excluded than any other zone at 62
per cent and 55 per cent exclusion rates respectively. The Southwest remained the only region
to have surpassed the targeted 20 per cent exclusion rate by 2020, with 19 per cent exclusion
rate recorded in 2018.
2018 is a Year of Landmark Financial Inclusion Policies and Initiatives
In addition to being a measurement year, 2018 can be described as a very important year that
brought a massive shift in nancial inclusion policy approach. First, the National Financial
Inclusion Strategy was revised to address changes in the regulatory and technology landscape
with a view to accelerate the achievement of the strategic objective of 80 per cent Financial
Inclusion by year 2020. The core of the Revised National Financial Inclusion Strategy (NFIS 2.0)
focused on a rst principle approach with two overarching principles; creating a level playing
ground and adopting a risk-based approach and encouraging stakeholders to play in the area
of their core strength or comparative advantage. The strategy also seeks to leverage Digital
Financial Services (DFS) to drive nancial inclusion by enabling Digital ID, expanding agent
network, focusing on business cases that would drive Government to People (G2P) and People
to Government (P2G) payment amongst other priority area.
As a direct offshoot of the revised strategy, the Central Bank of Nigeria (CBN) Issued a Payment
Service Bank (PSB) Licensing and Regulatory framework. In line with the NFIS 2.0 principle of
providing a level non-traditional player like the Telco's, Fast Moving Consumer Good
companies (FMCGs) and all entities with large distribution network to leverage on their existing
structure and provide nancial services for the unbanked. According to the policy trust
promoters of PSB would have 25% of their presence in the excluded areas.
One issue that has bedeviled the penetration of Financial Services to underserved area is
insufcient xed location agents. To achieve the nancial inclusion target of 80% by 2020,
Nigeria requires 62 Agents per 100,000 adults of which as at December 2017only 28.2 agents
per 100,000 adults had been recorded. To address this issue; the Body of Bank Chief Executive
Ofcers (CEOs) and the CBN setup the Shared Agent Network Expansion Facility (SANEF),
which has amongst other objectives, the mandate to increase agent network by half a million by
2020. Most of these agents would be located in areas with high unbanked population like the
North West and North East regions.
In order to ensure the presence of at least one nancial services access point in all 774 local
government areas in Nigeria, the Central Bank of Nigeria has licensed a National Micronance
Bank (NIRSAL) that would leverage the locations of NIPOST in all 774 Local Government Areas
(LGAs) in Nigeria deepen nancial inclusion has been proposed. This is intended to fast track
access to credits to MSMEs and facilitates inclusive economic growth.
EXECUTIVE SUMMARY
Financial
Inclusion survey
numbers shows a
marginal increase
from 58.4% in 2016
to 63.2% in 2018.
Signicant
improvements
recorded in the
North West and
North East zones,
although they still
lagged as states
with the highest
exclusion rates.
“
“
As a direct
offshoot of the
revised strategy, the
CBN issued a
Payment Service
Bank (PSB)
Licensing and
Regulatory
framework,
providing a level
playing ground for
non-traditional
players to provide
nancial
services.
“
“
A National
Micronance
(NIRSAL) Bank with
a mandate to
leverage the
locations of NIPOST
in all 774 local
government areas
to deepen nancial
inclusion has been
licensed. This is
intended to fast
track access to
credits to MSMEs
and facilitates
inclusive economic
growth.
“
“
112018 Annual Report National Financial Inclusion Strategy Implementation

In the same vein, the Alliance for Financial Inclusion (AFI), at its annual Global Policy forum
which was held in Sochi Russia in September 2018 issued the Fintech Accord for Financial
Inclusion. The Accords seeks to leverage Fintech for Financial Inclusion. Nigeria is a signatory
to the Accord. Similarly, Nigeria was recognized on the global stage for its sustained country
commitment to nancial inclusion. In this regard, the CBN was awarded an AFI Medallion for its
lead role in the AFI network as a provider of in-country knowledge exchange on the
implementation process of the NFIS.
To improve pension penetration to the informal sector, the National Pension Commission
(PENCOM) published the guidelines for the Micro Pension Plan in September 2018.
The major change in the nancial services sector occurred in 2018 occurred in the
Micronance sector where a recapitalization exercised occurred. The exercise is focused on
strengthening Micronance Banks and making them more efcient.
The Macroeconomic Environment in 2018 was Favorable to Financial Inclusion
These policies and initiatives were rolled out against the backdrop of a relatively stable
macroeconomic environment, steady increase in foreign reserve balance, and the impact of
sustained implementation of the Economic Recovery and Growth Plan (ERGP) and social and
developmental initiative like the Conditional Cash Transfer Programme, the TraderMoni
initiatives, and the Anchor Borrower Programme of the Central Bank of Nigeria. The stable
macroeconomic environment together with these activities provided a conducive environment
for nancial inclusion in year 2018.
Addressing MSME Credit Gap through Development Finance Interventions
Based on the objective of Financial Inclusion in Nigeria, to achieve 80 per cent Financial
Inclusion, it is expected that credit penetration should be at 40 per cent by the year 2020.
Unfortunately, credit penetration is still at 3 per cent as at 2018. Lack of collateral and high
interest rates among under challenges has hindered availability of credits especially to
MSMEs. To address this gap, the Bankers Committee in April 2018 launched the Agri-Business
Small and Medium Enterprise Investment Scheme (AGSMEIS). The scheme seeks to provide
access to credit to MSMEs at a concessionary rate, with no collateral.
Electronic transactions volumes across all digital channels with the exception of NEFT
continue to increase. In total electronic transaction volume went up by 38.41 per cent in 2018
compared to 2017. Transaction volume in 2018 also went up by 34 per cent when compared to
2017.
Various Initiatives were embarked on in 2018 to improve Financial Inclusion
One key bottle neck for the implementation of the NFIS strategy is the lack of sufcient funds to
carry out major activities. To tackle this challenge, the National Financial Inclusion Steering
committee approved the implementation of a Financial Inclusion trust fund. 60 per cent
contribution to the funds would come from Regulatory institutions who are members of the
Steering committee while 40 per cent would come from other members.
Another major highlight of year 2018 is the approval obtained by the National Identity card
Management Commission (NIMC) to commence the ID card ecosystems project. The initiative
seeks to decentralize and simplify National ID card capture while consolidating the disparate
implementation of various government ID ecosystems in Nigeria. This is a major initiative as
digital identication is one of the key priority area of the revised National Financial Inclusion
strategy.
Nigeria was
recognized on the
global stage as the
CBN was awarded
an AFI Medallion
for its lead role in
the AFI network as
a provider of in-
country knowledge
exchange on the
implementation
process of the
NFIS.
“
“The stable
macroeconomic
environment
together with these
activities provided
a conducive
environment for
nancial inclusion
in year 2018.
“ “
2018 Annual Report National Financial Inclusion Strategy Implementation12

The Nigerian Postal Services (NIPOST) has taken major strides to improve the penetration of
Financial services during the year under review. In addition to providing physical location in all
774 LGAs in Nigeria to house the NIRSAL Micronance Bank, the agency also acquired a
Super-Agent License to enable them to provide nancial services agents around the country.
Based on the Governing arrangement of Financial Inclusion, the tenure of the leadership of the
Working Groups came to an end during the period under review. Elections were conducted at
the Working Group level and new executives elected to see to the affairs of the working groups
for another two years (2019 – 2020).
2018 Witnessed Increase in overall Financial Inclusion headline number but slow
progress along Product and Channel Indicators
The effort of stakeholders in 2018 yielded positive outcomes that was obvious in the overall
increase in the nancial inclusion headline number of 2018, which puts the current inclusion
rate at 63.2% 4.4% up from 56.8% in 2016. This progress notwithstanding, indicators shows
that the actual performances across all indicators were below the target for 2018. For instance,
the planned target for payments penetration for 2018 was 63.2%, but the actual target is 36.2%.
Actual targets were also less than planned target across all products categories. The statics is
similar for the channel indicators. Actual achievement of Commercial Bank branches per 100,
000 customers was 4.8, which is 2.7 less than the target of 7.5. Actual achieved for ATMs, POS
and Agents are all less than planned.
While total number of registered Bank Verication Number (BVN) increased by 15% when
compared to 2017, savings in formal institutions declined by 13.3%.
Overall, a good year for Financial Inclusion
2018 was indeed a good year for Financial Inclusion in Nigeria, not only because of an increase
in the nancial inclusion rate, but also due to deliberate policies and initiatives that would
facilitate better rails, encourage participation of a broader range of stakeholders and better
address the need of the nancially excluded.
Nigeria remained a priority country for overall nancial inclusion rates in Sub-Saharan Africa.
The strategy implementation process in the country continued to command appreciable
attention and support from both the domestic and international stakeholders.
thThis report is the 4 edition of the Annual Financial Inclusion report. It presents insights into the
implementation of the National Financial Inclusion Strategy in Nigeria in year 2018.
New Working
Group Executives
were elected to
lead the various
strategy
implementation
areas for the next
two years.
“ “
The effort of
stakeholders in
2018 yielded
positive outcomes
that were obvious
in the overall
increase in the
nancial inclusion
headline number of
2018, which puts
the current
inclusion rate at
63.2%
“
“
Nigeria
remained a priority
country for overall
nancial inclusion
rates in Sub-
Saharan
Africa.
“ “
132018 Annual Report National Financial Inclusion Strategy Implementation

Innovation in Financial Inclusion Initiatives Award at the New Age Banking Summit
Alliance for Financial Inclusion (AFI) nomination for the Maya Declaration Award and Special Recognition Award/ Medallion for Nigeria’s contributions to the global network.
Africa Fintech Summit Award for Excellence in Financial Inclusion Governance and Policy
FINANCIAL INCLUSION AWARDS FOR NIGERIA

152018 Annual Report National Financial Inclusion Strategy Implementation
FINANCIAL INCLUSION DASHBOARD
Status Implementation
Area Status of Financial Inclusion in Nigeria
Completed
Governance
Refresh of the National Financial inclusion Strategy: The NFIS document was revised as a follow-up to the review report approved in 2017. The Governing Committee approved the establishment of the Financial Inclusion Trust Fund with a contribution formula of 60% (shared by CBN, PENCOM, SEC, NIMC and NDIC) and 40% (shared amongst other Steering Committee members). Financial Inclusion State Steering Committee (FISSCO) was inauguration in all 36 states of the Federation and FCT. Regional capacity building for FISSCO members to facilitate state level implementation of NFIS. The Financial Inclusion Trust Fund was approved by the governing committee. Approval of the Gender Desk under the Financial Inclusion Secretariat.
Payment
NCC and CBN signed an MoU to enhance payment systems and drafted a regulatory framework on the use of Unstructured Supplementary Service Data (USSD). The NCC concluded a comprehensive study on USSD pricing with an aim to addressing the high and variable USSD cost that affects the nancial inclusion drive.
Pension The Micro Pension Guideline for the informal sector and self-employed was released.
Monitoring
and
evaluation
EFInA released the report of the 2018 Access to Financial Services Survey. The results showed a moderate improvement in the level of nancial inclusion from 58.4 per cent in 2016 to 63.2 per cent in 2018.
On Track
Payment
The CBN and the Body of Bank Chief Executive Ofcers (CEOs) unveiled the Shared Agent Network Expansion Facility (SANEF) as a medium term intervention facility to leading CBN-licensed Super Agents and Mobile Money Operators to fund the expansion of a Shared Agent Network and deploy agent banking facilities in underserved and nancially excluded locations across the country. Release of the Guidelines for Licensing and Regulation of Payment Service Banks by the CBN. The Guidelines enabled selected companies, licensed as PSBs, to provide payment and remittance services, issue debit and prepaid cards.
Credit
(1) The CBN, in collaboration with Bankers’ Committee and the Nigerian Postal Service (NIPOST) established the NIRSAL Micronance Bank, as a nationally licensed micronance institution in December, 2018. The MFB will leverage the extensive network of the NIPOST to provide services in the 774 local government areas in the country.

(2) The Agri-Business Small and Medium Enterprise Investment Scheme (AGSMEIS) was launched by the Bankers’ Committee in April 2018. It is a voluntary initiative aimed at supporting the federal government’s efforts and policy measures to facilitate easy access to credit for small and medium scale enterprises.
Financial
Literacy
Approval of the Financial Education Strategy for implementation
Micronance The CBN, on October 22, 2018, announced an upward review of the capital requirements of micronance banks with effect from April 01, 2020.
Identity Approval of the National Economic Council (NEC) to commence the implementation of the proposed National ID card Ecosystem programme in Nigeria
At Risk Insurance Implementation of the Bancassurance model did not record much traction in 2018.
2018 Annual Report National Financial Inclusion Strategy Implementation16
Dr. M. A. Olaitan - Director, Development Finance Department chairing a Financial Inclusion Stakeholder Engagement

1. The adult nancial inclusion rate includes any adult who falls under one of the three nancial access strands (i)
Banked (ii) Formal Other (iii) Informal Only, measured by EFInA in its biennial Access to Financial Services in Nigeria
Survey. The formal adult nancial inclusion rate includes any adult who falls under one of the two nancial access
strands (i) Banked and (ii) Formal Other.
2. The denitions of the nancial access strands are as follows: Banked: Adults who have access to or use a deposit
money bank in addition to having/using a traditional banking product, including ATM (debit) card, credit card, savings
account, current account, xed deposit account, mortgage, overdraft, loan from a bank, or no-interest banking product,
including indirect access. Formal Other: Adults who have access to or use other formal institutions and nancial
products not supplied by deposit money banks, including insurance companies, micronance banks, pension
schemes, mobile money operators or shares. It also includes remittances (through formal channels); including indirect
access. Informal Only: Adults who do not have any bank or formal other products but have access to or use only
informal services and products. This includes savings clubs/pools, esusu, ajo, or money lenders; as well as remittances
(through informal channels such as via a transport service or recharge card); Financially Excluded: Adults not in the (i)
banked (ii) Formal Other or (iii) Informal only categories, even though the person may be using or have access to any of
the following: loan/gift from friends or family and loan from employers, as well as remittances via a friend/family member.
3. BVN data sourced from the Nigerian Interbank Settlement System Plc. The Bank Verication Number (BVN) was
introduced by the CBN in collaboration with commercial banks in February 2014 to ensure unique biometric
identication across commercial banks in Nigeria. The BVN was made a mandatory requirement for any customer who
would like to open and use a commercial bank account in October 2015. Therefore, the indicator is used as a proxy for
the % of the adult population having a commercial bank account, which serves as a payments and savings product, as it
can be used to make payments and save.
4. Note that the 2018 gure of insurance penetration was adopted from the EFInA A2F 2018. Industry data form
insurance companies fell short of the survey gures. Moreover, Special schemes such as the NHIS and NSITF gures
though higher but are not included. Premiums for these later schemes are paid directly by employers and the
employees may not use the cover even when the event occurs because he/she may not be aware or have little
knowledge of the insurance cover.
NOTES
172018 Annual Report National Financial Inclusion Strategy Implementation
Volunteer Corps Member educating her host community on �nancial inclusion and literacy during her Community Development Service (CDS)

INTRODUCTION
This year's report of the implementation of the
National Financial Inclusion Strategy contains
deve lopmen ts i n t he domes t i c and
International Financial Inclusion landscape
and an analysis of its impact on the subsector.
It also documents the review and refresh
exercise of the National Financial Inclusion
Strategy 2.0 (2018 - 2020), as well as a
synthesis of periodic reports from relevant
stakeholders in the sector.
1.0

1.1 THE NATIONAL FINANCIAL INCLUSION STRATEGY
The National Financial Inclusion Strategy (NFIS) is an integrated roadmap that provides clarity
around set objectives, involves multiple stakeholders and actors, highlights key challenges and
gaps in achieving nancial inclusion, articulates the priority areas requiring key intervention, and
focuses collective action on achieving desired outcomes.
Nigeria made signicant progress in 2018 in her quest to take formal nancial services to the
unbanked and under-banked population. Between 2016 and 2018, banked population
increased slightly from 38.3 per cent to 39.6 per cent (which translates to an increase of 1.3
percentage points). Excluded population also dropped slightly from 41.6 per cent in 2016 to
36.8 per cent in 2018
( r e p r e s e n t i n g 4 . 8 1percentage point growth) .
On the gender gap, female
exclusion rate dropped by
5.7 percentage points (46.6
per cent in 2016 versus 40.9
per cent in 2018), while male
exclusion rate dropped by
4.3 percentage points (36.8
per cent in 2016 versus 32.5
per cent in 2018). The
foregoing statistics are moderate progress the country has made in 2 years.
As at 2012 when Nigeria launched her National Financial Inclusion Strategy, indicators of
payments, savings, credit, insurance and pension products showed that Nigeria lags behind
her peers in Africa and globally. It was, therefore, imperative, that the NFIS 1.0 would seek ways
to scale up access to nance across the various product segments highlighted above. To
achieve this, the various actors in the nancial inclusion (FI) space were mandated to seek ways
to reduce the following barriers to access nancial services:
i. High Cost of obtaining nancial services
ii. Distance of Financial access points
iii. Low level of nancial literacy and education
iv. Stringent documentation and identication requirements
v. Lack of trust
vi. Religious and cultural impediments
To be able to remove the aforementioned barriers, a lot of regulatory changes in the nancial
services industry were required. Consequently, between 2012 and 2018, a plethora of policy
and regulatory reforms, reviews and enactments occurred, thus transforming the landscape of
access to nance and helping to deepen access. These policy and regulatory changes are
outlined in Fig.1 below:
Between
2012 and 2018,
a plethora of policy
and regulatory
changes, reviews
and enactments
occurred, thus
transforming the
landscape of
access to nance
and helping to
scale up nancial
inclusion rate in
the country.
“
”
The current
nancial
inclusion rate
is 63.2 per cent,
increasing from
58.4 per cent in
2016.
“”
192018 Annual Report National Financial Inclusion Strategy Implementation
1 EFInA Access to Financial Services Survey report, 2018.
PROGRESS MADE 2016 2018 CHANGE
Banked population 38.3% 39.6% +1.3%
Financially excluded
population
41.6%
36.8%
-4.8%
Female exclusion rate
46.6%
40.9%
-5.7%
Male exclusion rate
36.8%
32.5%
-4.3%

The
revised strategy
is anchored on
two over-arching
principles: an
appropriately
regulated level
playing eld that
focuses on
activities and
actors while
adopting a risk-
based approach;
and, stakeholders'
concentration on
areas of core
strengths or
comparative
advantage to
engender high
impact.
“
”
Figure 1: Regulatory Improvements to Deepen Financial Inclusion in Nigeria
Source: CBN, FIS
Moderate progress occurred towards achieving nancial inclusion objectives between 2012
and 2015. However, the progress achieved during the period was counteracted by various
challenges such as the 2016 economic recession, heightened security challenges occasioned
by the Boko Haram insurgency in the North East as well as low adoption of Digital Financial
Services which constrained the expansion of access to nance. Consequently by 2018, credit,
insurance and pension uptake had grown moderately by 2, 2 and 8 per cent, respectively, while
payment and savings rates stood at 40 and 24 per cent, respectively. These developments,
among others, necessitated the review of the National Financial Inclusion Strategy in 2017.
Unlike the NFIS 1.0 which adopted a broad-based target setting for the various nancial service
providers (FSPs), the revised strategy is anchored on two over-arching principles: an
appropriately regulated level playing eld that focuses on activities and actors while adopting a
risk-based approach; and stakeholders' concentration on areas of core strengths or
comparative advantage to engender high impact.
The reviewed Strategy culminated in the identication of ve most nancially excluded groups:
women, youths between ages 18-25 years, rural dwellers, the informal sector and people living
in the Northern region (North East and North West). Consequently, ve priority actions
emerged as high impact drivers to close the nancial exclusion gap across the demographics
identied above. These are:
i. Creating an enabling environment for the expansion of Digital Financial Services
(DFS);
ii. Enabling the rapid growth of agent networks with nationwide reach;
iii. Harmonizing KYC requirements for opening and operating accounts/mobile wallets
on all nancial services platforms;
iv. Creating a conducive environment to serve the most excluded; and
v. Improving the adoption of cashless payment channels, particularly in Government to
People (G2P) and People to Government (P2G).
2018 Annual Report National Financial Inclusion Strategy Implementation20

Similarly, the reviewed Strategy identied the following broad industry-wide initiatives as focal
areas for deepening nancial inclusion in the current strategy cycle (2019-2020):
i. Improving regulatory and policy environment;
ii. Securing private sector understanding and interest in nancial inclusion;
iii. Expanding agent networks to reach underserved areas;
iv. Scaling up issuance of National Identity and the review of KYC conditionalities to cater
for the most excluded;
v. Expanding Digital Financial Services (DFS);
vi. Facilitating community lending using the MFI and MFB model;
vii. Encouraging FSP investment in tailored savings and credit products; and
viii. Advocating for increased P2G, G2P.
ix. Increase nancial and digital literacy
The revised Strategy formulated is destination-based and focuses on a number of targets for
Payments (70%), Savings (60%), Credit (40%), Insurance (40%), Pension (40%,) Bank
branches (7.6 units per 100,000 adults), Micronance branches (5.0), ATMs (203.6), POS
(850.0), Mobile Money/Bank Agents (476) and KYC ID (100%).
Following this introductory chapter, Chapter Two of the Report describes the implementation
environment for the period under review, while Chapter Three discusses the key activities of the
various stakeholders in Nigeria's nancial inclusion ecosystem. Chapter Four presents the data
on strategy implementation progress, while Chapter Five concludes the report with
recommendations and the outlook for 2019.
212018 Annual Report National Financial Inclusion Strategy Implementation
DG, FSS - Mrs. Aishah Ahmad and a cross-section of Directors at the Technical Committee meeting

2018 Annual Report National Financial Inclusion Strategy Implementation22
§ Creating an enabling environment for the expansion of DFS
§ Enabling the rapid growth of agent networks with nationwide reach
§ Harmonizing KYC requirements for opening and operating accounts/mobile
wallets on all nancial services platforms
§ Creating a conducive environment to serve the most excluded
§
Improving the adoption of cashless payment channels, particularly in G2P and P2G
§
Improving regulatory and policy environment
§ Securing private sector understanding and interest in FI
§ Expanding agent networks to reach underserved areas
§ Scaling up issuance of National Identity and the review of KYC conditionalities to cater for the most excluded
§
Expanding Digital Financial Services (DFS)
§
Facilitating community lending using the MFI and MFB model
§ Encouraging FSP investment in tailored savings & credit products
§ Advocating for increased P2G, G2P
§ Increase nancial and digital literacy

GLOBAL AND NIGERIAN FINANCIAL INCLUSION DEVELOPMENTS
SINCE 2010MAYA DECLARATION TIMELINE
Maya Declaration launchedat the 2011 AFI GlobalPolicy Forum in RivieraMaya, Mexico.
At the G20 Leaders’ Summit in Los Cabos, Mexico, G20 Leaders recognize the role of the Maya Declaration in the Implementation of concrete and innovative nancial inclusion initiatives.
Sasana Accord launched atthe 2013 Global Policy Forumin Kuala Lumpur, Malaysia.
Launch of the OnlineProgress Dashboard.
Maputo Accord launchedat the 2015 GlobalPolicy Forum in Maputo,Mozambique.
AFI Online Data Portal(ADP) launched toreplace the OnlineProgress Dashboard.
AFI MemberInstitutions withcommitments to theMaya Declaration
AFI MemberInstitutions withcommitments to theMaya Declaration
AFI MemberInstitutions withcommitments to theMaya Declaration
AFI MemberInstitutions withcommitments to theMaya Declaration
AFI MemberInstitutions withcommitments to theMaya Declaration
AFI MemberInstitutions withcommitments to theMaya Declaration
17
2012
40
46
54
58
26
2011
2012
2013
2014
2015
2010
NIGERIAN TIMELINE
2016
Nigeria launches the National FinancialInclusion Strategy with specic targets
Financial Inclusion Secretariat set up tocoordinate NFIS implementation
Financial Inclusion Secretariat fully staffed
National FI Governing Committees and Working Groups inaugurated
Consumer Protection Framework
EFInA’s A2F Baseline Survey revealsthat 46% of adult Nigerians nancially excluded
Nigeria signs MAYA declaration andcommits to an 80% nancial inclusion rate by 2020.
CBN launches the Cashless Policy
Financial inclusion pilot launched in Borno State
Bankers’ Committee launches BankVerication Number (BVN),
FI desks set up at implementing agencies
Financial Education Curriculum
Source: Alliance for Financial Inclusion (2016a)
Guidelines for the Regulation of Agent Banking
Three-tiered KYC requirements
NDIC extends deposit insurance to mobile money customers
National Collateral Registry goes live
Bankers’ Committee approves nancialinclusion targets for commercial banks
NIMC launches National Identication Number
Regulatory Framework for Licensing Super-Agents
2017
2011
2013
2014
2015
2016
2017th· At the 9 AFI-GPF held in Egypt,
the Sharm El Sheikh
Climate Change Accord was approved.
· AFI also introduced its new Regional
Ofce in Africa during the Forum.
Hosted by the Ministry of the Economy
and Finance of Cote d'Ivoire and the
Central Bank of West African States
(BCEAO) in Abidjan, Cote d'Ivoire
70
AFI MemberInstitutions withcommitments to theMaya Declaration
Financial Inclusion State Steering Committee in all 36
States and the FCT.
Revised guidelines for Microinsurance operations
Takaful Guidelines was also released
Establishment of a Programme Management Unit for
Digital Financial Services, FIS.
NIMC released 5 (ve) gazzetted regulations in support
of the FG’s policy on National Identity.
SEC Capital Market Strategy
232018 Annual Report National Financial Inclusion Strategy Implementation
AFI Sochi Accord on FinTech for Financial Inclusion
IMF/World Bank Bali FinTech Agenda
National Financial Inclusion Strategy Refresh (NFIS 2.0)
Payment Service Bank Licensing and Regulatory Framework
2018 20182
Global FinTechPronouncements

IMPLEMENTATION
ENVIRONMENT
This chapter describes the implementation
environment of the National Financial Inclusion
S t r a t e g y i n 2 0 1 8 . I t e x a m i n e s t h e
macroeconomic environment as well as
analyses relevant sub-sectors of the Nigerian
nancial industry
2.0

2.1 Macroeconomic Environment
The economy sustained its positive growth rebound in 2018. Growth was spurred by a relatively
stable macroeconomic environment, boost in infrastructural spending supported by increased
foreign exchange receipts due to higher crude oil production and prices. In addition, the impact
of sustained implementation of the Economic Recovery and Growth Plan (ERGP) and the
developmental nance interventions of the Central Bank of Nigeria (CBN), especially, the
Anchor Borrowers' Programme (ABP), helped drive growth in 2018. The stable
macroeconomic environment witnessed within the year provided a conducive environment for
nancial inclusion activities which led to improvement across most economic indicators
compared to the previous year.
Provisional data from the National Bureau of Statistics (NBS) showed that the economy
recorded a modest growth of 1.9 per cent, compared with 0.8 per cent in 2017. The growth was
driven by the services, agriculture, industry and construction sectors which contributed 1.1,
0.5, 0.3 and 0.1 per cent to the growth rate, respectively, while the trade sector contributed
negative growth of 0.11 per cent (see Figure 2.1.1.).
Source: National Bureau of Statistics (NBS)
The impact
of sustained
implementation of
the Economic
Recovery and
Growth Plan
(ERGP) and the
developmental and
policy
interventions of the
Central Bank of
Nigeria, especially,
the Anchor
Borrowers
Programme,
spurred growth in
2018.
“
”
252018 Annual Report National Financial Inclusion Strategy Implementation
Figure 2.1.1.: Growth Rates of GDP at 2010 Constant Basic Prices, 2014 to 2018 (%)
The
Services sector
recorded the
fastest growth rate
of 3.05 per cent
compared to a
contraction of 0.67
per cent recorded
in 2017.
“
”
In terms of growth rates of individual sectors, the Services sector recorded the highest growth
rate of 3.05 per cent, compared with 0.67 per cent contraction recorded in 2017. Furthermore,
Construction, Agriculture and Industry sectors grew by 2.33, 2.12, and 1.69 per cent,
respectively, while the Trade sector contracted by 0.63 per cent during the year.
The mutually reinforcing nexus between nancial inclusion and economic progress was
evident during the year, as increase in economic activities supported an increase in the number
of people that accessed and used nancial services during the year, thus driving growth,
especially within the services sector.
Throughout the year, ination remained above single digit. The rates maintained a seven-
month consistent decline ending in July 2018, after which sustained uptick in ination
dominated the remaining months of the year. The persistent decline in inationary trend during
the rst seven months of the year was attributed to declining prices in the food and core
components of the Consumer Price Index (CPI). However, the rebound in aggregate prices
noticed in the remaining months of 2018 has been ascribed to upward inationary pressures
witnessed in the food component of the basket, pass-through effect of exchange rate to
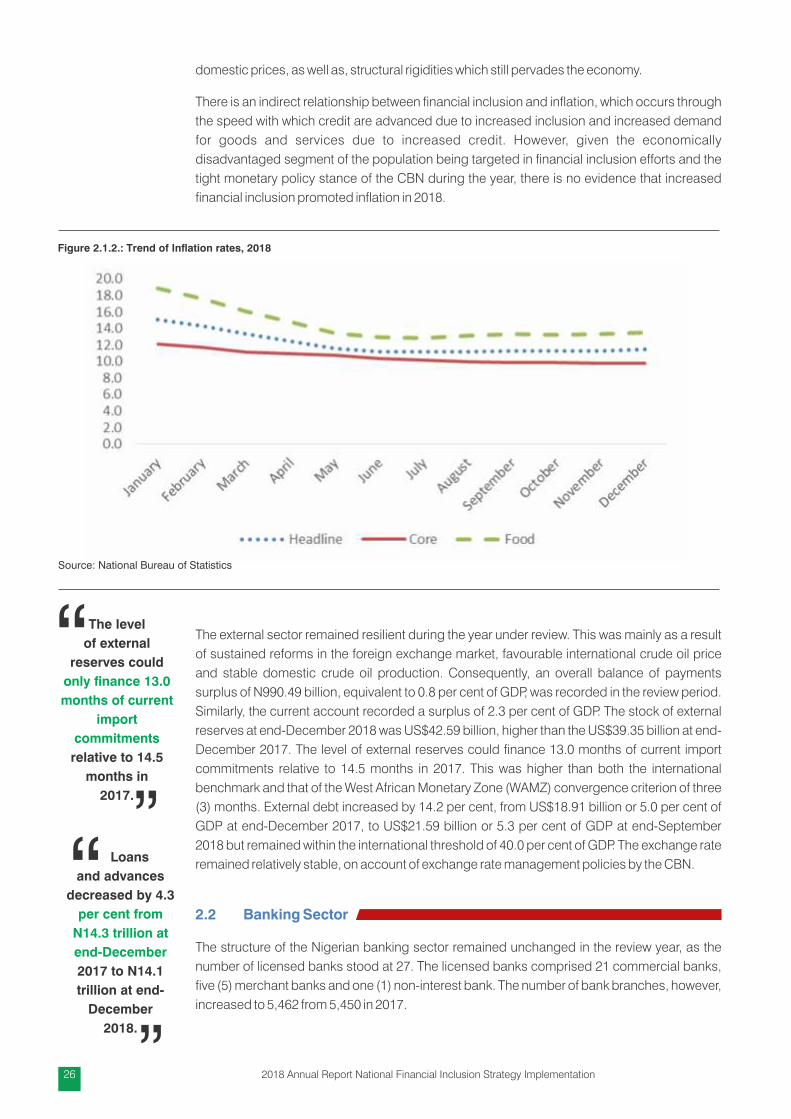
Figure 2.1.2.: Trend of Ination rates, 2018
Source: National Bureau of Statistics
2018 Annual Report National Financial Inclusion Strategy Implementation26
The level
of external
reserves could
only nance 13.0
months of current
import
commitments
relative to 14.5
months in
2017.
“
”Ÿ Loans
and advances
decreased by 4.3
per cent from
N14.3 trillion at
end-December
2017 to N14.1
trillion at end-
December
2018.
“
”
domestic prices, as well as, structural rigidities which still pervades the economy.
There is an indirect relationship between nancial inclusion and ination, which occurs through
the speed with which credit are advanced due to increased inclusion and increased demand
for goods and services due to increased credit. However, given the economically
disadvantaged segment of the population being targeted in nancial inclusion efforts and the
tight monetary policy stance of the CBN during the year, there is no evidence that increased
nancial inclusion promoted ination in 2018.
The external sector remained resilient during the year under review. This was mainly as a result
of sustained reforms in the foreign exchange market, favourable international crude oil price
and stable domestic crude oil production. Consequently, an overall balance of payments
surplus of N990.49 billion, equivalent to 0.8 per cent of GDP, was recorded in the review period.
Similarly, the current account recorded a surplus of 2.3 per cent of GDP. The stock of external
reserves at end-December 2018 was US$42.59 billion, higher than the US$39.35 billion at end-
December 2017. The level of external reserves could nance 13.0 months of current import
commitments relative to 14.5 months in 2017. This was higher than both the international
benchmark and that of the West African Monetary Zone (WAMZ) convergence criterion of three
(3) months. External debt increased by 14.2 per cent, from US$18.91 billion or 5.0 per cent of
GDP at end-December 2017, to US$21.59 billion or 5.3 per cent of GDP at end-September
2018 but remained within the international threshold of 40.0 per cent of GDP. The exchange rate
remained relatively stable, on account of exchange rate management policies by the CBN.
2.2 Banking Sector
The structure of the Nigerian banking sector remained unchanged in the review year, as the
number of licensed banks stood at 27. The licensed banks comprised 21 commercial banks,
ve (5) merchant banks and one (1) non-interest bank. The number of bank branches, however,
increased to 5,462 from 5,450 in 2017.

In the other nancial institutions (OFIs) sub-
sector, there were 5,488 l icensed
institutions as at end-December 2018,
compared with 4,870 institutions in 2017.
The total number of OFIs comprised seven
(7) DFIs, 35 PMBs, 885 MFBs, 69 FCs and
4,492 BDCs. The increase was as a result of
newly licensed OFIs (752 BDCs, 31 MFBs
and 18 FCs).
LICENSED BANKS 27
Commercial Banks 21
Merchant Banks 5
Non-Interest Banks 1
Bank Branches 5,462
OTHER FINANCIAL INSTITUTIONS
5,488
DFIs 7
PMBs 35
MFBs 885
FCs 69
BDCs 4,492
272018 Annual Report National Financial Inclusion Strategy Implementation
Financial Inclusion Performance Review with Financial Service Providers (FSPs)

Table 2.2.1. Statistics of the Banking Sector (DMBs) (Naira)

Net loans
and advances
also increased by
13.4 per cent to
N216.00 billion at
end-December
2018, compared
with N190.49 billion
at end-December
2017.
“
”Credit from
the Central Bank
of Nigeria
increased by 9.4
per cent from
N1.004 trillion by
end-December
2017 to N1.099
trillion at end-
December
2018
“
”
Available data indicates that total assets of the banking sector increased by 10.1 per cent to
reach N38.7 trillion as at end-December 2018 from N35.2 trillion in 2017. Total deposit liabilities
also grew by 13.7 per cent from N19.4 trillion as at end-December 2017 to N22.0 trillion by end-
December 2018. On the other hand, loans and advances decreased by 4.3 per cent from
N14.3 trillion as at end-December 2017 to N14.1 trillion as at end-December 2018. Credit from
the Central Bank increased by 9.4 per cent from N1.004 trillion by end-December 2017 to
N1.099 trillion as at end-December 2018, while net foreign assets decreased marginally from
N386.1 billion to N216.4 billion over same period (see Table 2.2.1.).
2.3 Micronance Bank Sector
The number of micronance banks (MFBs) stood at 898 as at end-December 2018, compared
with 1,008 MFBs operating as at end-December 2017. This comprised nine (9) National, 107
State and 782 Unit MFBs. Provisional data revealed that the total assets of MFBs stood at
N420.42 billion as at end-December 2018, compared with N393.55 billion reported as at end-
December 2017. The paid-up capital and reserves of MFBs increased by 10.4 per cent to
N99.60 billion compared with the level as at end-December 2017. The development was
attributed to modest capital injection, licensing of 31 new MFBs and increase in operating
prots during the review period. Net loans and advances also increased by 13.4 per cent to
N216.00 billion at end-December 2018, compared with N190.49 billion at end-December
2017. Deposit liabilities rose by 12.6 per cent to N205.03 billion. Investments also increased by
11.3 per cent, to N28.33 billion at end-December 2018, compared with N25.44 billion at end-
December 2017.
292018 Annual Report National Financial Inclusion Strategy Implementation

Table 2.3.1. Selected Statistics of Micronance Sector

Figure 2.4.2: Volume of Electronic Payments (Naira), 2016-2018
Figure 2.4.1: Volume of Electronic Payments, 2016 – 2018
Source: Central Bank of Nigeria, Nigeria Inter-Bank Settlement System
The rise in
e-payment
transactions was
attributed to
increased
consumer
condence and
awareness in the
use of the
e-payment
channels.
“
”2
01
6
715.1M
20
17
1,023.6 M
20
18
1,282.1M
20
16
6,636.4B
20
17
9,134.0B
20
18
10,503.8B
2.4 E-Payments Sector
The volume and value of payment on different channels (comprising ATM, PoS, Mobile and
Internet) rose by 25.3 and 15.0 per cent to 1,282.1 million and N10,503.8 billion, respectively,
compared with 1,023.6
million and N9,134.0 billion
in the preceding year. The
r i s e i n e - p a y m e n t
transactions was attributed
to increased consumer
condence and awareness
in the use of the e-payment
channels.
Tables 2.4.1 and 2.4.2 provides further insight into the trend of the volume and value of the
specic electronic transaction channels from 2013 to 2017.
E-PAYMENTS 2016
2017
2018
CHANGE
(2017-
2018)
Volume of Electronic
Payments (N mln)
715
1,023
1,282
+25%
Value of Electronic Payments
(N bln)6,636 9,134 10,503 +15%
A breakdown of e-payment transactions for 2018, indicated that the ATM channel remained the most
patronised, accounting for 68.3 per cent, followed by PoS terminals and mobile payments with 23.1 and
4.6 per cent, respectively. The web (internet) was the least patronised and accounted for 4.0 per cent of
the total. In terms of value, the ATM accounted for 61.7 per cent, PoS, 22.7 per cent; mobile channels, 11.8
per cent; and web (internet), 3.8 per cent.
312018 Annual Report National Financial Inclusion Strategy Implementation

Figure 2.4.3: Classication of e-Money Products by Volume, 2018
Source: Central Bank of Nigeria, Nigeria Inter-Bank Settlement System
In terms of
volume of
electronic
transactions, ATMs
remained the most
frequently used
electronic channel
in 2018 with 875.5
million
transactions
“
”
Mobile
Internet
PoS
ATM
23.1%
4.0%
68.3%
4.6%
More comprehensively, in terms of volume of electronic transactions, ATMs remained the most
frequently used electronic channel in 2018 with 875.5 million transactions being the most
dominant channel with a share of 42.8 per cent of total electronic transactions. This was
closely followed by NIP which recorded 663.1 million transactions with a share of 32.4 per cent
compared to 370.9 million transactions recorded the preceding year (see Table 2.4.1.). Others
were POS, mobile money, Internet Banking, Remita, NAPS, NEFT and Central Pay which had
respective shares of 14.5, 2.9, 2.5, 2.2, 1.3, 1.3 and 0.06 per cent. Similarly, other less dominant
channels such as e-Bills Pay and m-Cash had respective shares of 0.1 and 0.01 per cent,
respectively.
In terms of growth in the use of these channels, the ve fastest growing channels in 2018 were
Central Pay, m-Cash, NAPS, POS and NIP transaction channels which grew by 235.8, 194.6,
130.1, 102.3 and 78.8 per cent respectively compared to their growth rates in the previous year.
Others were Internet Banking, Mobile Money, e-Bills Pay, Remita and ATM channels which grew
by 75.3, 25.2, 16.3, 12.0 and 9.3 per cent, respectively. NEFT, on the other hand, recorded a
13.8 per cent decline in usage in 2018 compared to 2017.
In terms of nominal value of electronic transactions, NIP remained the channel through which
transactions with the highest value in Naira were made in 2018. The value of NIP transactions
increased by 43.0 per cent from N56.2 trillion in 2017 to N80.4 trillion in 2018, accounting for
60.5 per cent of the total value of electronic transactions in 2018 (see Table 2.4.2). Remita was
the channel with the second highest value in 2018 at N18.5 trillion, as its share in total value of
transactions stood at 37 per cent in 2018. The sum of N12.1 trillion was also transacted on
NAPS platform in 2018, representing a share of 9 per cent in 2018 compared a share of 5 per
cent achieved in the preceding year.
2018 Annual Report National Financial Inclusion Strategy Implementation32

74.0
67.6
62.9
54.1
42.8
7.6
11.1
16.5
25.1
32.4
3.9
5.3
6.8
9.9
14.5
5.1
6.9
5.0
3.2
2.9
2.8
3.0
4.1
2.7
2.2
5.5
4.5
2.7
2.1
1.3
1.0
1.2
1.5
2.0
2.5
0.0
0.1
0.4
0.8
1.3
0.1
0.2
0.1
0.1
0.1
0.0
0.0
0.0
0.0
0.1
0.0
0.0
0.0
0.0
0.0
2014
2015
2016
2017
2018
ATM NIP PoS Mobile Money Remita NEFT Internet Banking NAPS e-Bills Pay Central Pay m-Cash
0.1M
0.2M
0.0M
0.1M
0.1M
0.4M
1.3M
0.6M
1.2M
1.0M
0.9M
1.1M
.9M
4.0M
11.9M
27.4M
29.7M
28.9M
25.3M
31.0M
26.8M
15.0M
19.4M
38.2M
39.7M
44.5M
27.7M
43.9M
47.1M
47.8M
59.9M
20.8M
33.7M
63.7M
146.3M
295.9M
40.8M
71.2M
154.5M
370.9M
663.1M
400.3M
433.7M
590.2M
800.5M
875.5M
2014
2015
2016
2017
2018
ATM NIP PoS Mobile Money Remita NEFT NAPS e-Bills Pay Central Pay m-Cash
Source: Central Bank of Nigeria, Nigeria Inter-Bank Settlement System
Table 2.4.1.: Volume (Percent) of Electronic Transactions, 2014 to 2018, by Electronic Transaction Channel.
Table 2.4.1.: Volume of Electronic Transactions by Electronic Transaction Channel (Number)
332018 Annual Report National Financial Inclusion Strategy Implementation

45.4
51.0
55.3
56.6
60.4
33.2
26.1
18.0
15.1
4.9
11.2
12.4
15.4
13.6
13.9
8.4
7.9
7.2
6.5
4.9
0.7
0.9
1.1
1.4
1.8
0.8
0.9
1.1
1.1
0.9
0.0
0.2
1.1
5.0
9.1
0.1
0.4
0.5
0.6
0.4
0.2
0.2
0.2
0.2
0.3
2014
2015
2016
2017
2018
NIP NEFT Remita ATM PoS Mobile Money NAPS E-Bills Pay Internet Banking Central Pay m-Cash
0.0Tn
0.0Tn
0.0Tn
0.0Tn
0.0Tn
0.1Tn
0.1Tn
0.1Tn
0.2Tn
0.4Tn
0.0Tn
0.2Tn
0.3Tn
0.6Tn
0.5Tn
0.0Tn
0.1Tn
0.8Tn
5.0Tn
12.1Tn
0.3Tn
0.4Tn
0.8Tn
1.1Tn
1.2Tn
0.3Tn
0.4Tn
0.8Tn
1.4Tn
2.4Tn
3.7Tn
4.0Tn
5.0Tn
6.4Tn
6.5Tn
4.9Tn
6.2Tn
10.7Tn
13.5Tn
18.5Tn
14.6Tn
13.1Tn
12.5Tn
14.9Tn
6.5Tn
19.9Tn
25.5Tn
38.2Tn
56.2Tn
80.4Tn
2014
2015
2016
2017
2018
NIP NEFT Remita ATM PoS Mobile Money NAPS E-Bills Pay Internet Banking Central Pay
Source: Central Bank of Nigeria, Nigeria Inter-Bank Settlement System
Table 2.4.2.: Nominal Value of Electronic Transactions by Electronic Transaction Channel (%)
Table 2.4.2.: Nominal Value of Electronic Transactions by Electronic Transaction Channel (Naira)
2018 Annual Report National Financial Inclusion Strategy Implementation34

2Table 2.5.1.: Industry Gross Premium by Insurance Type and Growth Rate, 2009 to 2018
Source: Returns from the National Insurance Commission
Insurance
companies paid
out claims worth
N194.3 billion in
2018 compared to
N186.5 billion
paid out in
2017.
“
”
2 Please note that 2018 data is provisional; 2016 and 2017 data has been updated from the 2017 Annual Report.
153.1Bn
157.3Bn
175.8Bn
193.5Bn
196.0Bn
195.9Bn
198.4Bn
201.5Bn
210.8Bn
245.5Bn
36.8Bn
43.0Bn
58.0Bn
64.9Bn
80.5Bn
86.0Bn
91.0Bn
124.6Bn
161.1Bn
175.7Bn
190.0Bn
200.4Bn
233.8Bn
258.4Bn
276.5Bn
281.8Bn
289.3Bn
326.1Bn
371.8Bn
421.2Bn
2009
2010
2011
2012
2013
2014
2015
2016
2017
2018
Non-Life Gross Premium Life Gross Premium Industry Gross Premium
sub-sector grew by 9.1 per cent during the review year. The respective shares of the non-life
and life gross premium of the total industry's gross premium amounted to at 58.3 and 41.7 per
cent, respectively, in 2018 (see Table 2.5.1.).
In terms of claims settled by Insurance companies during the year, the companies paid out
claims worth N194.3 billion in 2018, compared to N186.5 billion paid out in 2017. This
represented a growth of 4.2 per cent, compared to the rate recorded in 2017. The marginal
growth recorded during the period was attributed to the lag effects of the economic downturn
that accompanied the recession, which ended the preceding year, as well as, increased
penetration of the insurance industry driven by increased insurance products and nancial
inclusion (see Table 2.5.2.).
352018 Annual Report National Financial Inclusion Strategy Implementation
2.5 Insurance Sector
The insurance sector's gross premium grew by 13.3 per cent to N421.2 billion as at end-
December 2018, compared with N371.8 billion in 2017. Within the sector, growth in gross
premium was witnessed in both sub-sectors, which comprise Non-life (General) and Life
Insurance. The gross premium in the non-life sub-sector grew by 16.5 per cent, while the life

Source: Returns from the National Insurance Commission
The
cumulative
volume and value
of traded securities
were 101.15 billion
shares and N1.19
trillion,
respectively, in
1,048,776
deals.
“
”
3Table 2.5.2.: Industry Gross Claims Paid, by Insurance Type, and Growth Rate, 2009 to 2018
3 Please note that 2017 data is provisional. 4 The claims ratio is dened as the share of gross claims paid of gross premium income.
49.5Bn
37.6Bn
26.8Bn
55.7Bn
71.6Bn
65.6Bn
66.0Bn
78.6Bn
113.9Bn
107.6Bn
12.5Bn
16.2Bn
20.8Bn
23.4Bn
35.7Bn
33.6Bn
45.2Bn
67.3Bn
72.5Bn
86.7Bn
62.0Bn
53.8Bn
47.6Bn
79.1Bn
107.3Bn
99.2Bn
111.2Bn
145.8Bn
186.4Bn
194.3Bn
2009
2010
2011
2012
2013
2014
2015
2016
2017
2018
Non-Life Gross Claims Life Gross Claims Industry Gross Claim
2.6 Pension Sector
The total annual contributions made into the Contributory Pension Scheme (CPS) by
employees and employers from both, the public and private sectors, amounted to N607.56
billion in 2018. This represented a decrease of 11.92 per cent compared to the contributions
made in 2017. The decrease was due to a reduction in the volume of contributions made by the
private sector which declined by 3.68 per cent in 2018 compared to the previous year. The
decline in total contributions occurred despite an increase of 3.78 per cent recorded in public
sector contributions during the year. Consequently, the share of public sector contributions to
total contributions in 2018 stood at 43.9 per cent compared to 56.1 per cent for the private
sector. (see Table 2.6.1.).
2018 Annual Report National Financial Inclusion Strategy Implementation36

Table 2.6.1.: Annual Pension Contributions from 2004 to 2018, by Sector, in Billion Naira
Source: National Pension Commission
The
aggregate market
capitalisation of
the 286 listed
securities fell by
3.6 per cent to
N21.90 trillion,
compared with the
level in
2017.
“
”
2.7 Capital Market Sector
Major capital market indicators in 2018 were bearish, as these indicators, with the exception of
the market turnover volume, trended downward. This was on the account of perceived political
risks, volatility in oil prices and rising global yields, which resulted in negative sentiments in the
market.
As at end-December 2018, the cumulative volume and value of traded securities were 101.15
billion shares and N1.19 trillion, respectively, in 1,048,776 deals. The total volume of traded
securities rose by 0.8 per cent, over the level of 100.31 billion shares in the preceding year, while
the total value fell by 6.2 per cent, from N1.27 trillion in 837,421 deals. The bulk of the
transactions was in equities, which accounted for 99.9 per cent, apiece, of both volume and
value of traded securities, compared with 99.9 per cent and 99.8 per cent, respectively, in 2017.
The aggregate market capitalisation of the 286 listed securities fell by 3.6 per cent to N21.90
trillion, compared with the level in 2017. This reected a decline in the value of securities across
different asset classes (equities and ETF). Similarly, market capitalisation of the 169 listed
equities fell by 13.9 per cent, compared with the level in 2017, to N11.73 trillion at end-
December 2018.
372018 Annual Report National Financial Inclusion Strategy Implementation
15.6Bn
34.7Bn
37.4Bn
80.6Bn
99.3Bn
137.1Bn
162.5Bn
228.9Bn
331.1Bn
278.5Bn
237.8Bn
200.1Bn
225.9Bn
257.1Bn
266.8Bn
23.0Bn
68.3Bn
80.8Bn
91.2Bn
103.0Bn
119.5Bn
174.4Bn
225.4Bn
344.0Bn
358.9Bn
262.3Bn
353.7Bn
340.7Bn
15.6Bn
34.7Bn
60.4Bn
149.0Bn
180.1Bn
228.3Bn
265.5Bn
348.5Bn
505.6Bn
503.9Bn
581.7Bn
559.0Bn
488.2Bn
610.8Bn
607.6Bn
2004
2005
2006
2007
2008
2009
2010
2011
2012
2013
2014
2015
2016
2017
2018
Public Sector Contributions Private Sector Contributions Total Contributions

2,350.9
1,338.6
950.4
575.7
1,273.2
1,194.3
19,077.4
16,875.1
17,003.4
16,185.7
22,917.9
2,405.8
2,939.9
2,367.0
1,447.6
1,905.4
3,292.2
0.0
267.3
108.5
92.9
95.8
100.3
101.2
0
50
100
150
200
250
300
0
5,000
10,000
15,000
20,000
25,000
2013 2014 2015 2016 2017 2018
Biil
lion
Naira B
illio
n
Value of Stocks Traded (Turnover Value) Total Market Capitalisation
Banking Sector Market Capitalization Volume of Stocks Traded (Turnover Volume)
Number of Listed Securities
254
253
257
247
261
286
2013 2014 2015 2016 2017 2018
NSE Value Index (1984=100)
41.3K
34.7K
28.6K
26.9K
38.2K
31.4K
2013 2014 2015 2016 2017 2018
23.5
19
18
16
20.1
3.6
2.7
1.5
1.9
2.9
2.9
1.5
1
0.6
5
15.4
14
8.5
11.8
14.4
11
11.4
8.1
9.8
16.6
7.9
8.5
12.3
7.9
5.6
3.5
5.6
5.5
2013
2014
2015
2016
2017
2018
Annual Turnover Value/Total Market Capitalisation (%)
Annual Turnover Volume/Value of Stock (%)
Banking Sector Capitalisation/ Market Capitalisation (%)
Value of Stocks Traded/GDP (%)
Of which: Banking Sector/GDP (%)
Total Market Capitalisation/GDP (%)
21.9K
Table 2.7.1.: Indicators of Capital Market Developments in the Nigerian Stock Exchange, 2013 to 2018
Source: Securities & Exchange Commission
2018 Annual Report National Financial Inclusion Strategy Implementation38

2.8. Informal Financial Sector
Nigeria's informal sector is huge, accounting for over 65% of the country's GDP. People who are
employed in this sector operate in an environment relatively free of regulation. In some cases,
self-regulation by Apex associations of the operators remains the norm.
By and large, the informal sector employs the largest proportion of the labour force in Nigeria.
Micro and Small businesses such as dress makers, hair dressers, shoe cobblers, small scale
traders, car wash services and a host of other services are provided by the informal sector. In
2018, employment opportunity was boosted in the informal sector as the Federal Government
implemented the “Tradermoni” empowerment programme, which is a loan given to micro and
small traders to boost their economic activities. The Tradermoni scheme plans to extend
business nance facility of NGN10,000 to at least 30,000 petty traders in each of the 36 States
and the Federal Capital City. Beneciaries would have access to higher loan values as they
repay the initial facility.
5 IMF (2017) The Potential for growth and Africa's Informal Economy. Available on https://blogs.imf.org/
Cross section of participants at the Plenary session of the Financial Inclusion Working Group meetings
392018 Annual Report National Financial Inclusion Strategy Implementation

NIGERIA AT A GLANCE
Source: LBS State of the Market Report 2018
2018 Annual Report National Financial Inclusion Strategy Implementation40

CBN Branch Controller, Jigawa with the Secretary to the State Government during the Jigawa FISSCO inauguration
Dr. Abdul Zubair (Ag. Director-General, SEC) with Mr. Suleyman M. Dabai (Director, FSS2020) and Mr Alaka Kazeem (CBN Branch Controller, Portharcourt) at the South-South Regional Capacity Building for FISSCO members.
CBN Branch Controller, Delta with some members during the Delta FISSCO inauguration
FINANCIAL INCLUSION STATE STEERING COMMITTEE(FISSCO) INAUGURATION NATIONWIDE

Financial Inclusion activities are executed through a broad range
of stakeholders as articulated in the National Financial Inclusion
Strategy. These group of stakeholders include: regulators, apex
associations of FSPs, representatives of various nancial
consumer groups, the civil society and development partners.
The activities of these stakeholders are coordinated under the
Financial Inclusion Governing Structure. This structure consists
of relevant Working Groups that report to a technical committee,
and a steering committee (which is the apex Committee of the
Governing arrangement).
This chapter highlights the activities of stakeholders and
Committees for the reporting period
3.0
STAKEHOLDERS'
ACTIVITIES

The NFISC
approved the
publication of the
Revised National
Financial Inclusion
Strategy
document for
implementation
“
”
Reviewed
and updated Terms
of Reference of the
Committee and its
Working Groups
and on-boarded
new members to
enhance Strategy
implementation.
“
”
3.1 National Financial Inclusion Steering Committee (NFISC)
The Committee held its statutory meetings in July and December 2018 for the year under review
and the following outcomes were achieved:
At the July 2018 meeting, the Committee considered and approved the following;
Ÿ The 2017 Annual Report of the NFIS Implementation
Ÿ The Exposure Draft of the NFIS Refresh document was released for public
comments
Ÿ Stakeholders charged with developing sector specic implementation plans in other
to operationalize the refreshed National Financial Inclusion Strategy (NFIS).
Ÿ The Financial Inclusion Secretariat was charged with developing a guidance
document to support agencies in the preparation of their NFIS implementation
plans.
Ÿ The proposed Financial Inclusion Trust Fund should be reviewed for better
alignment with the NFIS Refresh and the budget realities of members.
At the December 2018 meeting, the Committee considered and approved the following
initiatives;
Ÿ The publication of the Revised National Financial Inclusion Strategy document for
implementation
Ÿ The establishment of the Financial Inclusion Trust Fund with a contribution formula of
60% (shared by CBN, PENCOM, SEC, NIMC and NDIC) and 40% (shared amongst
other Steering Committee members).
Ÿ The approval to organize the National Financial Literacy Stakeholders Forum in
January, 2019.
3.2 National Financial Inclusion Technical Committee (NFITC)
The Committee held its quarterly meetings in March, June, September and November 2018 for
the year under review with the following key outcomes:Ÿ Reviewed and updated Terms of Reference of the Committee and its Working Groups
and on-boarded new members to enhance Strategy implementation.
Ÿ Reviewed the outcome of the Exposure Draft of the revised NFIS and convened a
Stakeholder Consultative Forum to consider input into the nal version of the document.
Ÿ Inauguration of Financial Inclusion State Steering Committee (FISSCO) across the 36
states and the Federal Capital Territory to give effect to the approved nancial inclusion
state level implementation framework.
Ÿ The conduct of Regional Capacity Building workshops for the FISSCO members in six
geo-political zones to support stakeholder implementation efforts
Ÿ Sensitization campaign on the National Collateral Registry in all geopolitical zones.
Ÿ Industry collaboration on a comprehensive study on USSD pricing with an aim to
addressing the high and variable USSD cost that affects the nancial inclusion drive.
Ÿ Industry collaboration with the Shared Agent Network Expansion Facility (SANEF)
towards massive Agents and Bank Verication Number (BVN) rollout across the country.
Ÿ Considered the outcome of the 2018 Alliance for Financial Inclusion (AFI) Global Policy
Forum and the Sochi Accord on Fintech for Financial Inclusion. The Committee also
approved the convening of a Stakeholder Roundtable on emerging opportunities and
risk on Digital Financial Services.
432018 Annual Report National Financial Inclusion Strategy Implementation

The FICWG
continued in its
effort to facilitate
engagement to
harmonize USSD
pricing.
“”
There was
a change in the
leadership of the
Working Groups,
and the election of
new Executives to
lead strategy
implementation for
2019 – 2020.
“
”
Ÿ Facilitated comprehensive roundtable discussion amongst relevant regulators and
actors to address hindrances to the deployment of innovative insurance products.
3.3 National Financial Inclusion Working Groups
The four Working Groups dened and implemented their respective annual work plans. Their
meetings held in April, June, September and November 2018. The major achievements of the
Working Groups are as follows:
3.3.1 Financial Inclusion Channels Working Group (FICWG): Notable achievements
by member institutions of the Working Group included proposal to CBN management
to re-introduce the cashless policy to drive the adoption of digital nancial services in
Nigeria. Also, the group is sustaining in its efforts to facilitate engagement to
harmonize USSD pricing and the use of airtime for payment of insurance premiums
and has also presented a guideline for the monitoring and evaluation of SANEF to the
CBN Management's approval.
3.3.2 Financial Inclusion Literacy Working Group (FILWG): Prominent milestones of
the Group's activities during the review year included the approval of the Financial
Education Strategy for implementation and the proposal for the Financial Literacy
Conference scheduled to hold in January 2019. In addition, about 194,434 students
were directly impacted by school reach out and mentoring activities, while 124,646
people directly beneted from mass sensitization efforts of member institutions.
3.3.3 Financial Inclusion Products Working Group (FIPWG): Remarkable
achievements of the Working Group included securing approval of the National
Economic Council (NEC) to commence the implementation of the proposed National
ID card Ecosystem programme in Nigeria by the Nigerian Identity Management
Commission and issuance of Super-Agent License to NIPOST.
3.3.4 Financial Inclusion Special Interventions Working Group (FISIWG): Under the
NYSC Peer Educator Programme, 96,000 new accounts were opened with additional
694 Volunteer Corps Members (VCMs) trained in 2018 Batch C stream 1 totaling 3,894
trained VCMs. Also, a sub-committee on gender was set up to develop a framework to
guide members in improving access to nance for women, while the Non-Interest
Finance Association of Nigeria (NIFAN) was co-opted to help with regional challenges,
especially with apathy for conventional nancial products and services in the North.
There was a change in the leadership of the Working Groups, and the election of new
Executives to lead strategy implementation for 2019 – 2020. The new executives are as follows:
Working Group Outgoing Member Institution Elect Member Institution
Channels Chairperson: Fund Managers’
Association of Nigeria (FMAN)
Vice Chairperson: Banking & Payments System Department,
CBN
Chairperson: Fund Managers’ Association of
Nigeria (FMAN)
Vice Chairperson: Payment System
Management Department, CBN
Table 3.3.4.1: Schedule of Leadership for the Working Groups
2018 Annual Report National Financial Inclusion Strategy Implementation44

3.5 Providers
3.5.1 The Bankers' Committee
Some of the activities of the Bankers' Committee towards the implementation of the Strategy include:
i. Shared Agent Network Expansion Facility (SANEF):
In March 2018, the CBN, in collaboration with the Body of Bank Chief Executive Ofcers (CEOs), unveiled the Shared Agent Network Expansion Facility (SANEF) as a medium-term
Product Chairperson: Nigeria Deposit
Insurance Corporation (NDIC)
Vice Chairperson: Association of
Licensed Mobile Payment
Operators (ALMPO)
Chairperson: Cooperatives Financing
Association of Nigeria (CFAN)
Vice Chairperson: Financial Policy and
Regulations Department (FPRD), CBN
Special
Interventions
Chairperson: Enhancing Financial
Innovation & Access (EFInA)
Vice Chairperson: Bank of Industry
(BOI)
Chairperson: Enhancing Financial
Innovation & Access (EFInA)
Vice Chairperson: Federal Ministry of Youth
and Sports Development (FMYSD)
Financial
Literacy
Chairperson: Consumer Protection
Department, CBN
Vice Chairperson: Federal Ministry
of Finance (FMF)
Chairperson: Consumer Protection
Department, CBN Vice Chairperson: Securities and Exchange
Commission (SEC)
Presentation of the SANEF Plan to His Excellency, The Vice President Prof. Yemi Osinbajo
452018 Annual Report National Financial Inclusion Strategy Implementation

CFAN
implemented its
Cooperative Family
Feeding
Programme (CFFP)
in 2018 which
allows access to
Food through a
credit facility aimed
at ghting extreme
hunger and
realizing SDG
goals on zero
hunger.
“
”
The CBN
released the
Payment Service
Banks (PSBs)
guidelines during
the year under
review
“”
intervention facility to leading CBN-licensed Super Agents and Mobile Money Operators (MMO) to nance the expansion of a Shared Agent Network and deploy agent banking facilities in underserved and nancially excluded locations across the country.
The initiative entails the provision of a seed capital of N25,000,000,000 (twenty-ve billion naira) by the CBN to facilitate the aggressive roll out of 500,000 shared agents across the 774 Local Governments in Nigeria to offer basic nancial services.
SANEF was designed to facilitate access to basic nancial services, such as Cash-in-Cash-out (CICO), funds transfer, bills payment, airtime purchase, government disbursements, as well as, remote BVN enrolment to an estimated 40 million Nigerians who are currently under-banked in Nigeria. As at December 2018, SANEF was reported to have on-boarded over 90,000 agents.
ii. Financial Literacy Programmes:
Ÿ 2018 Global Money Week: On the 15th March 2018, the Annual Global Money Week was celebrated by nancial sector stakeholders across the country. Each bank chose ve (5) schools in each of the six (6) geopolitical areas to educate the students on the benets of a savings culture. The total number of students enrolled in the programme was 74,168 in the 523 schools visited.
Ÿ 2018 World Savings Day: The Deposit Money Banks (DMBs) along with all other nancial sector stakeholders celebrated the 2018 Global World Savings Day on October 31, 2018. The aim of the celebrations was to reduce nancial illiteracy and enable students develop skills necessary to make smart nancial decisions throughout life. Approximately 53,000 students participated in the programme.
iii. Innovative Outreach Centers:
Deposit Money Banks established cluster markets across campuses and rural neighborhoods to help drive nancial inclusion through campaigns in densely populated areas and in major markets nationwide. Target groups included traders, students, farmers, artisans, amongst others. In addition, nancial inclusion centers were established to provide account opening services, credit access information and other nancial services to women and unbanked communities.
“
”
In March
2018,
the CBN and the
Bankers'
Committee
unveiled the
Shared Agent
Network
Expansion Facility
(SANEF) and as at
December 2018,
SANEF reported
that they had on-
boarded over
90,000
agents.
Cross-section of Nigerian Bank Chief Executive Officers at the formal launch of the Shared Agent Network Expansion Facility (SANEF)
2018 Annual Report National Financial Inclusion Strategy Implementation46

The CBN,
in collaboration
with Bankers'
Committee and the
Nigerian Postal
Service (NIPOST)
established the
NIRSAL
Micronance
Bank
“
”
The
Agri-Business
Small and Medium
Enterprise
Investment
Scheme
(AGSMEIS) was
launched by the
Bankers'
Committee in April
2018.
“
”
3.5.2 The National Association of Micronance Banks (NAMB):
In line with the KYC policy of the Bank, MFBs across the country were scaled up to facilitate their participation in the ongoing BVN capturing exercise. During the year under review, over 400 BVN capturing devices were acquired by MFBs with support from CBN.
3.5.3 The National Co-operative Financing Agency of Nigeria (CFAN):
The Agency implemented its Cooperative Family Feeding Programme (CFFP) in 2018, which allowed access to food through a credit facility targeted at tackling extreme hunger and realization of the SDG goal on zero hunger. The programme was designed to enhance the agricultural value chain starting with cultivation, processing, packaging, marketing, distribution and consumption. The Agency also provided education nance, in form of school fees loans, to parents, school working capital to owners of schools and loans to workers of schools.
3.5.4 Fund Managers Association of Nigeria (FMAN):
In 2018, the Association received approval to improve distribution channels for capital market products and services in the country. It also conducted awareness sessions with stakeholders within the sector to present details of the retail initiative and operational guidelines.
3.6 Enablers
3.6.1 Central Bank of Nigeria
During the year under review, the Central Bank of Nigeria embarked on various initiatives and policies geared towards accelerating nancial inclusion in the country. Some of the major initiatives included:
3.6.1.1 Release of the Guidelines for Licensing and Regulation of Payment Service Banks:
In a bid to leverage mobile and digital platforms to deepen nancial inclusion in the country, the CBN released the Payment Service Banks (PSBs) guidelines during the year under review. The Guidelines enabled selected companies, licensed as PSBs, to provide payment and remittance services, issue debit and prepaid cards, invest in Federal Government and CBN's securities and provide deposit products to micro, small businesses and low income households, as well as, perform any other eligible activities as may be stipulated in the Guidelines for the licensed PSBs.
3.6.1.2 Establishment of the NIRSAL Micronance Bank
In order to ensure the presence of at least one nancial service access point in all local governments across the country, so as to deepen access to nance for smallholder farmers and MSMEs, the CBN, in collaboration with Bankers' Committee and the Nigerian Postal Service (NIPOST), established the NIRSAL Micronance Bank, as a nationally licensed micronance bank in December, 2018. The MFB will leverage the extensive network of NIPOST to provide nancial services in the 774 local government areas of the country.
3.6.1.3 The Launch of Agri-Business Small & Medium Enterprise Investment Scheme
The Agri-Business Small and Medium Enterprise Investment Scheme (AGSMEIS) was launched as a voluntary nancing initiative of the Bankers' Committee in April 2018. It is aimed at supporting the federal government's efforts and policy measures to facilitate access to low-cost credit by micro, small and medium enterprises (MSMEs).
It requires all banks to set aside 5 per cent of their prot after tax (PAT) annually. The amount investible in any enterprise shall be limited to a maximum of N2 billion.
3.6.1.4 Recapitalization of Micronance Banks
To further strengthen the micronance sub-sector and reposition micronance banks (MFBs)
472018 Annual Report National Financial Inclusion Strategy Implementation

towards improved performance and ultimately promote a sound nancial system, the CBN, on October 22, 2018, announced an upward review of the capital requirements of micronance banks with effect from April 01, 2020.
Details of the review are provided in table… below
Source: CBN
MINIMUM CAPITAL REQUIREMENTS (N MLN)
PREVIOUSLY
FROM 04/2020
Announced in 10/18
FROM 04/ 2020
Announced in 03/19
FROM 04/2021
Announced in 03/19
Unit
20
100
Tier 2: 35
Tier 2: 50
Tier 1: 100
Ter 1: 200
State
100
1,000
500
1,000
National 2,000 5,000 3,500 5,000
Table 3.6.1: Capital base Requirement for MFBs
In September,
2018, the National
Pension
Commission
(PENCOM)
released the
guidelines for the
Micro Pension
Plan.
“
”
3.6.1.5 The Geospatial Mapping of Financial Access Points
The Geospatial Mapping Survey of nancial access points was undertaken in Nigeria to
provide a visual representation of the nancial services landscape, by identifying where active
and inactive nancial access points are located across the country, so that nancial institutions
can make more evidence-based decisions on where to situate or locate their services. The
interactive map helped identify gaps in access to nancial services, assist in designing
nancial inclusion policy and to inform decision making.
3.6.2 National Pension Commission
In September 2018, the National Pension Commission (PENCOM) released the guidelines for
the Micro Pension Plan. The Plan provides a framework for the participation of the self-
employed and persons operating in the informal sector in the pension scheme which was
previously not allowed.
Accordingly, a micro pension contributor is expected to open a Retirement Savings Account
(RSA) with any pension fund administrator (PFA), make contributions into their RSA (in
accordance with the guidelines) and make contingent withdrawals, amongst others.
Additionally, the PENCOM engaged various tertiary institutions to introduce Pension
Administration courses in order to educate students on pension management. In furtherance
of this, the Commission signed Memorandum of Understanding (MoU) with Ahmadu Bello
University, Zaria and the University of Lagos on the introduction of a Pension Administration
course in their respective academic curriculum to be implemented in 2019.
3.6.3 National Insurance Commission
In its bid to improve insurance service delivery in the country, the National Insurance
Commission (NAICOM) conducted interactive sessions with major consumers of insurance
products during the year under review. The sessions aimed to improve the level of nancial
literacy especially on the benets of insurance.
2018 Annual Report National Financial Inclusion Strategy Implementation48

492018 Annual Report National Financial Inclusion Strategy Implementation
NCC signed
an MoU with CBN
to boost mobile
money service
penetration in the
country
“”
Similarly, in September 2018, NAICOM facilitated a capacity building workshop in FCT, Abuja,
on the Implementation of the Islamic Finance Services Board (IFSB) Standards and effective
supervision and regulation of Takaful Insurance Industry.
Furthermore, the Commission, in conjunction with Almond Productions Limited, convened the
2018 edition of Insurance Consumers Forum (ICF) in November 2018. The ICF provided a
platform for interaction between Insurers and consumers on issues bothering on customer
service delivery.
3.6.4 Securities and Exchange Commission
The Securities and Exchange Commission (SEC), during the year under review, conducted
investors' sensitization programmes as part of its commitment towards achieving 80 per cent
nancial inclusion by year 2020. The sensitization programmes were aimed at commemorating
the 'World Investor Week' (WIW) - a global event initiated by the International Organization of
Securities Commission (IOSCO) to educate and enlighten investors, particularly, the low-
income population.
Furthermore, to inculcate the culture of nancial literacy and deepen awareness of the capital
market, the SEC engaged the Nigerian Educational Research and Development Council
(NERDC) to develop a stand-alone Capital Market Studies (CMS) curriculum for infusion into
basic and senior secondary schools as part of its 10-year Capital Market Master Plan. In
furtherance to this, the SEC conducted a workshop on Content Selection in 2018.
3.6.5 The Nigerian Communications Commission
Some of the nancial inclusion activities of the Nigerian Communications Commission (NCC)
in 2018 included:
Ÿ The signing of MoU with CBN to boost mobile money service penetration in the
country.Ÿ Conclusion of a study on Mobile Termination Rate to determine the cost of
Unstructured Supplementary Service Data (USSD) in Nigeria.
3.6.6 Nigeria Deposit Insurance Corporation
The Nigeria Deposit Insurance Corporation (NDIC), in December 2018, was granted full
membership of the Islamic Financial Services Board (IFSB) by its Council. The membership will
improve the Corporation's capacity to supervise and regulate the operators of non-interest
banking and nance in Nigeria.
The Corporation also conducted a workshop themed 'Financial Inclusion, Consumer
Protection and Evolution of Virtual Currencies in Nigeria' for nancial journalists and business
editors to deliberate on ways to protect consumers and ensure condence in the nancial
system.
3.6.7 National Identity Management Commission
A major milestone for the NIMC during the year under review was the approval of the
implementation of its Strategic Roadmap for Digital Identity Ecosystem in Nigeria by the
Federal Executive Council (FEC). As identied in the National Financial Inclusion Strategy, low
penetration of national identity remains a key barrier to nancial inclusion. The Roadmap was
set to harmonize existing capabilities and infrastructure of government agencies and private
sector to enroll citizens and legal residents nationwide into the national ID database. With the
approval of the Roadmap, NIMC will have the powers to enforce the use of National Identity
Number (NIN).
A major
milestone for the
NIMC during the
year under review
was the approval
for the
implementation of
its Strategic
Roadmap for
Digital Identity
Ecosystem in
Nigeria by the
Federal Executive
Council
(FEC).
“
”

From
inception till date,
a total of 3,894
Volunteer Corp
Members (VCM)
have been trained
under the National
Peer Group
Educator
Programme
(NAPGEP)
on Financial
Inclusion.
“
”
2018 Annual Report National Financial Inclusion Strategy Implementation50
NIPOST has
been granted
approval-in-
principle to operate
as a super-agent
by the CBN.
“”
3.6.8 Federal Ministry of Youth and Sports Development
In collaboration with the National Youth Service Corps (NYSC), the Ministry's National Peer
Group Educator Programme (NAPGEP) on Financial Inclusion for Volunteer Corp Members
(VCM) opened 96,000 new accounts with additional 694 VCMs trained in 2018. From inception
till date, a total of 3,894 VCMs have been trained under the programme.
The NAPGEP on Financial Inclusion for VCMs was designed to enable the Corp Members
reach out to their peers, MSMEs and farmers, through education, sensitization and advocacy
programmes during their Community Development Service days.
3.6.9 Nigeria Postal Service
During the year under review, NIPOST conducted the following activities towards the
achievement of the National Financial Inclusion Target:
Ÿ Deployment of ATMs and POS: NIPOST has commenced mounting of ATMs in major post
ofce locations to enable people in underserved areas have access to nancial services
and also encourage cashless transactions.
Ÿ Approval- in -principle to operate as a Super-Agent: NIPOST has been granted approval-in-
principle to operate as a super-agent by the CBN. With the approval, NIPOST can offer
cash-in-cash-out (CICO) services at their agent locations.
Ÿ Partnership on Establishment of NIRSAL Micronance Bank: NIPOST signed an MoU
with the Bankers' Committee and CBN to leverage their presence in 774 local
governments to host the NIRSAL Micronance Bank.
3.7 Supporting Institutions
3.7.1 The Alliance for Financial Inclusion (AFI)
AFI and the Bank of Russia co-hosted the 2018 Global Policy Forum (GPF) in Sochi, Russia
from the 5th - 7th September 2018. The event, which marked the 10th Anniversary of AFI as an
organization as well as the 10th GPF edition was themed “Innovation, Inclusion, Impact”.
During the Forum, the AFI's Membership Council endorsed the Sochi Accord on FinTech for
Financial Inclusion. The CBN was nominated for the Maya Declaration Award and also received
a Special Recognition Award, an AFI Medallion for its contributions to the global network as
host of Financial Inclusion Knowledge Exchange programmes.
3.7.2 Enhancing Financial Innovation & Access (EFInA)
EFInA, a nancial sector deepening agency in Nigeria that conducts biennial surveys to
determine, measure, benchmark, and prole levels of access to nancial services by all
Nigerian adults.
The organization released the results of its 2018 Access to Financial Services (A2F) survey in
Nigeria, which showed a moderate improvement in the level of nancial inclusion from 58.4 per
cent in 2016 to 63.2 per cent in 2018.
3.7.3 Deutsche Gesellschaft Fuer Internationale Zusammenarbeit (GIZ)
During the year, GIZ collaborated with the CBN and other stakeholders to review the content of
various nancial education materials being used to drive nancial literacy, and initiated the
development of an eLearning platform on nancial literacy for trainers and multipliers. GIZ has
The CBN
was nominated for
the Maya
Declaration Award
and also received a
Special
Recognition Award,
an AFI Medallion
for its contributions
to the global
network as host of
Financial Inclusion
Knowledge
Exchange
programmes.
“
”

EFInA
released
the results of the
2018 Access to
Financial Services
(A2F) survey. The
result showed a
moderate
improvement in the
level of nancial
inclusion from 58.4
per cent in 2016 to
63.2 per cent in
2018.
“
”
512018 Annual Report National Financial Inclusion Strategy Implementation
been supporting the Federal Ministry of Youth and Sports Development, CBN and other
stakeholders to develop an implementation strategy for the NAPGEP. The capacity of 28 public,
private and civil-society agencies was built to provide nancial literacy trainings to 52,790
beneciaries. The eLearning course SMEsabi was developed and piloted to strengthen the
entrepreneurial capacity of (micro-)businesses. GIZ also supported the Bank of Industry in a
review of their agriculture mechanization loan.
3.8 Financial Inclusion State Steering Committee (FISSCO)
The FISSCOs, which are the nancial inclusion governing committee at the state level, were
inaugurated in January 2018 to coordinate activities of nancial inclusion stakeholders. Since
inauguration, the FISSCOs have carried out some activities towards deepening nancial
inclusion considering the peculiarities of their states. A summary of their key activities is
presented in the appendices.
Cross section of participants at the Plenary session of the Financial Inclusion Working Group meetings

Field visit to LAPO Micro�nance Bank
Decoration of the AFI Capacity Building Manager as a Financial Inclusion Champion
AFI INCOUNTRY PEER ADVISORY VISIT ON FINANCIAL INCLUSION TO NIGERIA.
Field Visit to Teasy Mobile

STAKEHOLDER WORKSHOPS
Stakeholder Workshop

STAKEHOLDER WORKSHOPS
Financial Inclusion Outreach programme by Securities & Exchange Commission (SEC)

STAKEHOLDER WORKSHOPS

STAKEHOLDER ENGAGEMENTS
Financial Inclusion Outreach programme

Launch of the AGSMEIS to enhance access to Credit
CBN Governor and Management staff at the official launch of the Agric-Business Small and Medium Enterprise Investment Scheme (AGSMEIS)

Mr. Godwin Eme�ele - CBN Governor, Mrs. Aishah Ahmad - Deputy Governor, Financial System Stability (CBN), and Prince thAghatise Erediauwa - Executive Director, Operations (NDIC) at the 6 Steering Committee meeting in Abuja.
Director General, NIMC –Engr. Aliyu Aziz, Permanent Secretary Federal Ministry of Youth and Sport Development - Mr Olusade thAdesola, Deputy Director, NDIC – K. O. Nwaigwe and other members at the 7 Steering Committee meeting.
GOVERNING COMMITTEE MEETINGS
DG, FSS - Mrs. Aishah Ahmad and a cross-section of Directors at the 15th Technical Committee meeting

Volunteer Corps Members educating their host communities on �nancial inclusion and literacy during their Community Development Service (CDS)
NYSC Peer Educator Programme on Financial Inclusion

NYSC Peer Educator Programme on Financial Inclusion
Volunteer Corps Members educating their host communities on �nancial inclusion and literacy during their Community Development Service (CDS)

4.0
STRATEGY
IMPLEMENTATION
PROCESS
This chapter presents the statistical measure
of progress made during the year under
review. The measurement is presented under
three sub-headings, namely: Products,
Channels and Enablers. Two major data
sources were used. The rst is the demand-
side data source which draws heavily from
the Access to nancial services survey
conducted by EFInA every 2 years

The 2018 A2F
reports reveal that
about 16% of the
adult Nigerian
population made at
least one digital
payment for goods
and services,
up by 3.3% from
2016.
“
”
6 EFInA Access to Financial Services Survey, 2018.7 EFInA survey holds every 2 years. There was no survey in 2017.
The 2018 edition of the EFInA Access to nancial services in Nigeria survey was published in
December 2018 although data collection exercise held from June to September of the same
year. The second data source was the supply-side data derived from the statutory returns
submitted by service providers to their respective regulatory agencies.
4.1 PRODUCT INDICATORS
Five nancial products were tracked for the purpose of measuring nancial inclusion
penetration. The products are payments, savings, credit insurance and pension. This sub-
section of the report presents quantitative measure of progress on these products.
4.1.1 Electronic Payments
Key activities in 2018
In 2018, the Central Bank of Nigeria released the guidelines for licensing and regulation of
Payments Service Banks in Nigeria. The PSBs are expected to leverage on mobile and digital
services to enhance nancial inclusion and stimulate economic activities at the grassroots
through the provision of nancial services. Status and Trends in 2018
The demand-side data shows a marginal improvement in the proportion of adult Nigerians who
used electronic payment products from 38% in 2016 to 40% in 2018. The 2018 A2F reports
reveal that about 16% of the adult Nigerian population made at least one digital payment for
goods and services, up by 3.3% from 2016. Similarly, a growth in the registered users of Mobile
Money between 2016 and 2018 from 0.8% to 1.7% reects a deepening rather than an
expansion as the uptake of Mobile Money services remains amongst already banked
populations.
On the other hand, the supply-side shows the proportion of adults who owned a regulated
nancial product that can be used for electronic payment rose to 36.2% (36.1 million) from 31.3% (31.0 million) in 2017. The actual volume and value of electronic transactions was 217
million and NGN13.7 trillion respectively which is an increase of 10% and 15% over the 2017
gures.
Further analysis reveals the highest volumes of transactions were done mostly through Point of
Sale (POS), Automated Teller Machines (ATMs), NIBSS Instant Payment (NIP), Electronic Bills
Payment (E-Bills), Mobile Money and Web Payment.
From both sources of data, Nigeria lags behind the 2018 targets of 63.2% for electronic
payments despite signicant progress made in policy changes.
2018 Annual Report National Financial Inclusion Strategy Implementation62

There was
however a rise in
informal savings –
In 2018, 42.7% of
respondents saved
with informal
savings groups,
higher than 31.4%
in 2016.
“
”
Total number
of BVN registered
as at December
2018 was 36.2
million out of which
14.9 million were
owned by female
(18 years and
above).
“
”8 Any other form of payment other than cash was considered as electronic. For example, use of Cheques, NEFT, ATM,
POS, Internet, mobile NIP, m-cash, EBillspay, Remita, NAPS and Central-pay channels were all considered.9 (NIBSS E-Payment channels in the Nigerian Banking Sector 2018)10 This was estimated by the number unique adults who own a deposit account in a regulated nancial institution such
as commercial and micronance banks. People who own mobile wallet only are excluded from this gure.
Way forward and Future outlook
The National Financial Inclusion Strategy prescribed a target for 70% payments by 2020 and
while there still existed a 30% gap in the achievement of the target, the reafrmation of the
strategic importance of adoption of Digital Financial Services in NFIS 2.0 continues to provide
the impetus for initiatives targeted at driving increased e-payments. 4.1.2 Savings
The 2018 demand-side survey data showed an overall decline of 13.3% in savings with formal
institutions (Banks) from 40.7% in 2016 to 38.3% in 2018. Other formal (non-bank) savings also
declined from 12.3% to 9.7% in the period under review. There was, however, a rise in informal
savings – In 2018, 42.7% of respondents saved with informal savings groups, higher than
31.4% in 2016. Overall, savings declined to 24% in 2018 from 36% in 2016 (EFInA A2F 2018).
Figure 4.1: Status of the Channel Key performance indicators as at December 2018
PRODUCT INDICATORS
2016
2017 2018
CHANGE
(2017-
18)
Current accounts –
total no. held by
DMBs/MFBs (‘000)
12,670
16,157 15,856 -2%
Savings accounts -
total no. held by
DMBs/MFBs (‘000)
75,329
87,146 97,710 +12%
BVN registered in Nigeria -
men
2,781
18,733 21,218 +13%
BVN registered in Nigeria – women 1,940 12,679 14,951 +18%
Credit Accounts – total no. held by
DMBs/MFBs (‘000)5,808 5,333 5,437 +2%
632018 Annual Report National Financial Inclusion Strategy Implementation
(23.0m Adults) (22.6m Adults) (27.2m Adults) (31.0m Adults) (36.1m Adults) (64m Adults) (74.1m Adults)
(14.0m Adults) (22.6m Adults) (27.2m Adults) (31.0m Adults) (36.1m Adults) (53.5m Adults) (63.5m Adults)
(1.0m Adults) (1.7m Adults) (5.4m Adults) (5.5m Adults) (34.8m Adults) (42.3m Adults)
(6.6m Adults) (1.7m Adults) (1.2m Adults) (2.15m Adults) (32.8m Adults) (42.3m Adults)
(6.4m Adults) (7.2m Adults) (7.6m Adults) (8.4m Adults) (8.5m Adults) (33.2m Adults) (42.3m Adults)
Actual
2014
Payment
Savings
Credit
Insurance
% of adult population having a
payment product with a formal
financial institution
% of adult population having a
savings product with a formal
financial institution
% of adult population having
borrowed or paid back a loan
through a regulated financial
institution over the last 12
months
% of adult population covered
by a regulated insurance policy
% of adult population
registered with a regulated
pension scheme
Definition of Indicator
Defi
nitio
n of
Pro
xy In
dica
tor
% o
f adu
lt po
pula
tion
havi
ng B
ank
Ver
ifica
tion
Num
bers Baseline
2010
Pensions
Trend
2017 - 18Status
Target
2020
Actual
2015
Actual
2016
Actual
2017
Actual
2018
Target
2018
1.8% 1.1% 2.0% 32.4%
34.4% 40.0%
40.0%
70.0%
70.0%
40.0%
22.0% 24.0% 23.6% 28.0%
23.6%
1.0% 1%*
63.2%31.3% 36.2%
24.0%
2.0%
1.0%
5.0%
15.0%
1.1% 3%* 1.8% 5.4% 5.5%
28.0% 31.3% 36.2% 52.8%
6.8% 7.5% 7.9% 8.4% 8.5% 32.4%
Based on the 2018 Biennial Access to Financial Services in Nigeria Survey by EFInA

The number
of Nigerians
contribution to the
Pension scheme,
supervised by the
National Pension
Commission stood
at 8.47 million.
“
”
The proportion of adults who owned savings products also increased to 36.2% in 2018 (36.1
million) from 31.3% (31.0 million) in 2017. As at December 2018, the banking industry reported
a total of 123 million accounts in commercial and micronance banks (15.1 million of these
accounts are held by micronance banks). Total number of BVN registered as at December
2018 was 36.2 million out of which 14.9 million were owned by female (18 years and above).
Way forward and Future outlook
Access to formal savings represents the rst point of contact for the unbanked to enter the
formal nancial system. Looking to the 2020 targets, at least 16.5 previously unbanked
Nigerians need to be formally included in the nancial system to achieve 80% nancial
inclusion. Of this number, 8.3 million adults are expected to open accounts and start saving in
2019.
Figure 4.1: Total number of savings and current accounts in Nigeria. Source: CBN
Figure 4.2: Total number of BVN registered in Nigeria. Source: NIBSS, Lagos.
2018 Annual Report National Financial Inclusion Strategy Implementation64
Total number of accounts held by DMBs and MFBs
2016 2017 2018
75,329,255
Current account Savings account
12,669,674 16,157,282
87,145,929
15,855,961
97,710,300
Total number of BVN registered in Nigeria
2016 2017 2018
Female Male
21,218,152
14,951,452
18,732,862
12,678,806
1,939,953 2,780,844

Figure 4.3: Total number of Credit accounts held in DMBs and MFBs
11 (Selected Banking Sector Data, NBS 2018)12 It is assumed that there is a one-on-one correspondence between number of credit accounts and number of
individuals who own the accounts.
In 2018,
69% of the adult
population
reported not
borrowing within
the year.
“”
Non-
performing
loans in the
banking sector
as a percentage of
total loans granted thin the fourth (4 )
quarter, 2018 was
11.6% down from
14.81% in the
corresponding
period of the
previous year
“
”
4.1.3 Credit
Key activities in 2018
Several interventions/schemes by the Central Bank of Nigeria in 2018 supported increased
access to affordable loans to MSMEs at affordable rates. The Agri-Business Small and Medium
Enterprises Investment Scheme (AGSMEIS) launched in 2017 granted credit to 509
enterprises in 2018 with a total of N414,926,386 disbursed.
Status and Trends in 2018
The lack of access to credit remains a huge barrier for many entrepreneurs looking to grow their
businesses sustainably. In 2018, 69% of the adult population reported not borrowing within the
year. Of those who did borrow, 4.3% took loans from the bank, 4% from other formal nancial
institutions, 23.2% from informal nancial services providers and 77.7% from family and
friends. (EFInA A2F 2018).
Supply-side data on access to loans shows that banking sector credit to private sector
declined year-on-year by 3.85% between Q4 2017 and Q4 2018. Data also showed that non-thperforming loans in the banking sector as a percentage of total loans granted in the fourth (4 )
quarter, 2018 was 11.6% down from 14.81% in the corresponding period of the previous year.
From the industry data, the total number of credit accounts recorded in 2018 was 5.43 million
accounts made up of 1.7 million accounts in DMBs and 3.72 million accounts in MFBs. This is
estimated to be about 5.5% of total adult population. The Strategy planned to achieve a 34.4%
Credit target in 2018. This progress made in the review period shows that the country lags
behind the year's target.
Way Forward and Future Outlook
In order to facilitate improved access to credit to the unbanked, interventions must focus
specically on the vulnerable segments identied in the revised NFIS. Women, youth, rural
dwellers, indigenes of the North East and North West and MSMEs must be given priority and
specically mentioned in guidelines of schemes and interventions to support improved uptake
of credit by these groups.
652018 Annual Report National Financial Inclusion Strategy Implementation
Total number of Credit accounts held in DMBs and MFBs
2016 2017 2018
5,808,309
5,332,699
5,436,564
Credit Accounts

Actual
2018
4.8(4,752
Branches)
0.9(898
Branches)
19.0(18,910 ATMs)
218.0(217,283 PoS)
Actual
2017
Target
2018
Trend
2017 - 18Status
Target
2020
%Achieved
2018Definition of Indicator
Defi
nitio
n of
Pro
xy In
dica
tor
% o
f adu
lt po
pula
tion
havi
ng B
ank
Ver
ifica
tion
Num
bers Baseline
2010
Actual
2014
Actual
2015
Actual
2016
Commercial
Bank Branches
per 100,000
Adults
6.8 5.9(5,508
Branches)
(5,462
Branches)
(5,446
Branches)
(5,470
Branches)
4.7
ATMs per
100,000 Adults11.8 17.0
7.6
Microfinance
Bank Branches
per 100,000
Adults
2.9 2.2 2.3 2.3 2.3
5.7 5.6 5.5 7.5 73%
Agents per
100,000 Adults0.0 N/A N/A
(63,000 ATMs)
62.018.8
59.6
PoS Devices
per 100,000
Adults
13.3 87.9 122.4 116.3 153.0 605.6
17.2 18.0 18.2 49.5 37%
25%
65%
(8,000
Branches)
(2,107
Branches)
(2,227
Branches)
(2,197
Branches)
(2,231
Branches)
(5,300
Branches)
49% 5.0
(18,228
Agents)
(27,978
Agents)
(15,935 ATMs) (16,452 ATMs) (17,440 ATMs) (18,060 ATMs)
28.2 43.438.6(38,416
Agents)
(65,600
Agents)
850.0(899,000 PoS)(82,540 PoS) (116,868 PoS) (112,847 PoS) (151,786 PoS)
Based on Industry Data as at December 2018
The total
number of adults
issued with a
National Identity
Number (NIN) as at
December, 2018
stood at
33.7million.
“
”
Insurance
penetration
remains
signicantly
subpar as only 2%
of the Nigerian
adult population
had access to
Insurance in
2018.
“
”
According to
the EFInA access
to Financial
Services Survey, in
December 2018,
there were 5.3
Bank branches per
100,000 adults in
2018.
“
”
4.1.4 Insurance
Insurance penetration remains signicantly subpar, as only 2% of the Nigerian adult population
had access to Insurance in 2018. In absolute terms, as at June 2018, the number of insurance
policies stood at 794,960 up by only 15.7% from December of the preceding year with 686,957
corporate insurance policies. Non-corporate insurance policies declined from 1,153,502 in
December 2017 to 119,121 as at June 2018. The variance of 38% between the 2018 insurance
penetration of 2% and the 2020 target of 40% presents an opportunity for intensied efforts by
insurance operators to innovate and develop appropriate products and services.
4.1.5 Pension
In the period under review, the number of Nigerians contributing to the Pension scheme,
supervised by the National Pension Commission, stood at 8.47 million. Further analysis of the
contributors showed 2.47 million female contributors and 5.93 million male contributors.
Breakdown of the contributions by product reveals that the Retirement Savings Account (RSA)
had the highest contribution at 8.41 million while the closed Pension Fund Administrators
(CPFA) had 23,332 and Approved Existing Scheme (AES) stood at 40,951.
4.2 Channels
4.2.1 Bank Branches
As at December 2018, the total number of Commercial Banks stood at 24, one less than the
corresponding period of the preceding year. The total number of active branches was 4,752 in
2018 up from 4,763 in 2017, while the number of cash centers remained 712 in 2018 from 686 in
the previous year. According to the EFInA access to Financial Services Survey, in December
2018, there were 5.3 bank branches per 100,000 adults in 2018. This number increased
marginally from 5.1 in 2016.
4.2.2 Micronance Bank Branches
The advent of Digital Financial Services (DFS) provides the impetus for deemphasizing the
increase in the number of branches. As at December 2018, the number of Micronance Banks
decreased to 898 from 1,002 in December 2017. Similarly, the total number of MFB branches
also decreased from 2,271 in December 2017 to 2,044 in December 2018. The number of MFB
branches per 100,000 adults in 2018 stood at 2.0 as opposed to 2.3 per 100,000 adults in 2017.
The recapitalization exercise embarked upon will support the banks in meeting the critical
targets set out in the Micronance Policy and as well, support the achievement of the targets in
the NFIS 2.0.
Figure 4.6: Key performance indicators for Channels of distribution
2018 Annual Report National Financial Inclusion Strategy Implementation66

Figure 4.7: Number of Point of Sale machines deployed in 2018
As at
December, 2018
the number of
Micronance
Banks decreased
to 898 from 1,002
in December
2017.
“
”
Deployed Active
60% 40%
217,283 144,461
4.2.3 ATM and POS
ATMs: As at December 2018, the number of ATMs deployed across the country in absolute
terms stood at 18,615, down by 1.56% from the preceding month of November with 18,910
deployed. However, the number deployed in absolute terms increased year-on-year from
18,060 in 2017. Despite this positive trend, however, only 34.7% per cent of the 2018 target of
52.9 ATMs per 100,000 adults was achieved.
POS: As at December 2018, 217,283 POS devices were connected but only 144,461 of the
terminals were active. The number of deployed devices increased from 151,786 in 2017,
representing a 43.1% increase between 2017 and 2018. This trend aligns with the increase
in the number of POS' per 100,000 adults, as 214.4 POS per 100,000 adults were deployed
in 2018 as against 184.5 per 100,000 adults in 2017.
672018 Annual Report National Financial Inclusion Strategy Implementation
The number
of MFB branches
per 100,000 adults
in 2018 stood at 2.0
as opposed to 2.3
per 100,000 adults
in 2017.
“”
As at
December 2018,
217,283 POS
devices were
connected but only
144,461 of the
terminals were
active.
“
”
Head, Business Development and Commercial Services, NIMC—Ms. Carolyn Folami and a cross-section of participants at the interactive session on the National Identity Card Ecosystem

2018 AQUIRING DEVICES
2017 AQUIRING DEVICES
% Increase in 2018 over 2017 gures
Total As at
Month
ATMs
POS Terminals
ATMs
POS
Terminals
ATMs
POS Terminals
Deployed
Connected
Active
Deployed
Connected
Active
Deployed
Connected Active
January
17,512
159,579
104,744
17,468
113,510
72,569
0.25%
41% 44%
February
17,656
164,607
110,748
17,504
115,044
76,135
0.87%
43% 45%
March
17,808
170,306
116,933
17,594
109,916
78,615
1.22%
55% 49%
April
17,947
177,045
118,677
17,647
115,097
82,202
1.70%
54% 44%
May
18,035
183,003
120,618
17,632
121,807
88,515
2.29%
50% 36%
June
18,052
185,026
118,707
17,712
125,608
89,516
1.92%
47% 33%
July
18,143
187,621
124,249
17,792
128,603
92,912
1.97%
46% 34%
August
18,296
193,306
128,955
16,967
141,531
96,392
7.83%
37% 34%
September
18,321
198,802
132,751
17,051
140,448
99,550
7.45%
42% 33%
October
18,791
200,239
138,697
17,234
145,350
101,038
9.03%
38% 37%
November 18,910 208,611 142,148 17,356 150,650 103,618 8.95% 38% 37%
December 18,615 217,283 144,461 17,449 155,462 105,118 6.68% 40% 37%
ANNUAL AVERAGE 18,174 187,119 125,141 17,451 130,252 90,515 4.15% 44% 38%
Table 4.2: Number of ATM and POS devices
Figure 4.8: Active POS terminals across Nigeria
72.6K
76.1K
78.6K
82.2K
88.5K
89.5K
92.9K
96.4K
99.6K
101.0K
103.6K
105.1K
104.7K
110.7K
116.9K
118.7K
120.6K
118.7K
124.2K
129.0K
132.8K
138.7K
142.1K
144.5K
Jan
Feb
Mar
Apr
May
Jun
Jul
Aug
Sep
Oct
Nov
Dec
2018 2017
Number of ATMs and POS devices deployed in the period under review is shown in the gure
below:
2018 Annual Report National Financial Inclusion Strategy Implementation68
Figure 4.9: Deployed ATM terminals across Nigeria
17.5K
17.5K
17.6K
17.6K
17.6K
17.7K
17.8K
17.0K
17.1K
17.2K
17.4K
17.4K
17.5K
17.7K
17.8K
17.9K
18.0K
18.1K
18.1K
18.3K
18.3K
18.8K
18.9K
18.6K
Jan
Feb
Mar
Apr
May
Jun
Jul
Aug
Sep
Oct
Nov
Dec
2018 2017

The number
of Mobile Money
agents surged from
11,104 in 2017 to
38,416 in 2018
representing.
“”
4.2.5 Agents
In absolute terms, the number of Mobile Money agents surged from 11,104 in 2017 to 38,416 in
2018, representing 246 per cent increase. About 18 per cent of these agents are located in 2
States and the FCT, namely Lagos (5,100 agents), Kano (479 agents) and FCT (1,322 agents).
692018 Annual Report National Financial Inclusion Strategy Implementation
Figure 4.5: Geographical spread of mobile money Agents in Nigeria. Source: Nigeria Financial Services Maps 2018

NIN registration
was skewed by
gender with
20,087,367 male
Nigerians
registered and
13,581,827 female
Nigerians
registered.
One key
outlook for
nancial literacy is
the digitization of
procedures to
enable nancial
educators and
trainers' access e-
content to be used
to train end
beneciaries.
“
“
”
”
The total number
of adults issued
with a National
Identity Number
(NIN) as at
December, 2018
stood at
33.7million.
“
”
4.3. ENABLERS
4.3.1 Know Your Customer (KYC)/ ID
Key activities in 2018
In 2018, the Digital Identity Ecosystem Strategic Roadmap was approved by the Federal
Executive Council. The major objective of the framework was to leverage existing capabilities
and infrastructure of disparate or distinct government agencies and private sector
organizations or operators to carry out enrolment of Nigerians and foreign legal residents to
them by providing digitally enabled identity known as the National Identication Number (NIN).
Status and Trends in 2018
The total number of adults issued with a National Identity Number (NIN) as at December 2018
stood at 33.7million. This number increased from 27.7million in 2017, representing a 21.7%
increase year-on-year. Of the total NIN registered in 2018, only 1,609,443 were issued e-IDs by
the National Identity Management Commission (NIMC), representing 4.78% of registered NIN
holders.
Further analysis showed NIN registration was skewed by gender with 20,087,367 male
Nigerians registered compared with 13,581,827 female Nigerians registered. In addition, the
highest registration for NIN was found within adults aged 34 – 45, followed by ages 26 – 33.
Nigerians aged 18 and below had the lowest number of NIN issued with only 260,688.The Issuance of e-IDs as at December 2018 revealed similar trends with NIN issuance. In 2018,
973,427 e-IDs were issued to males and 636,016 issued to females.
Way Forward and Future Outlook
The Federal Government's directive on the mandatory use of the NIN is set to commence in
2019. This has the potential of ensuring that all Nigerians register and acquire their NIN, which
will in turn be used as a valid form of identication for the provision of nancial services. To this
end, the NIMC has been mandated to register all Nigerians and legal residents or at least 95 per
cent by the year 2022.
4.3.2 Financial Literacy
Key Activities in 2018
The nation-wide sensitization programme of the Central Bank of Nigeria provides the avenue
for the Bank to provide nancial literacy and awareness to rural and urban communities across
the nation. In 2018, eight (8) states were visited, namely Ondo, Oyo, Imo, Delta, Dutse, Gombe,
Kaduna and Katsina. In addition, the Financial Inclusion National Peer Group Educator
Programme (NAPGEP) was held across 16 states in the year under review.
Status and Trends in 2018
As at end 2018, 3,894 Volunteer NYSC Corps members were trained across 16 states to
provide end-beneciary nancial education to rural communities in their respective States.
98,800 new bank accounts opened within the year were attributed to the NAPGEP programme.
In addition, the nation-wide sensitization provided the opportunity for participants to become
more nancially literate with 1418 beneciaries in Delta State, 1678 in Imo State, 1909 in Oyo
State, 2240 in Ondo state with similar numbers in Bauchi, Gombe, Kaduna and Katsina States.
2018 Annual Report National Financial Inclusion Strategy Implementation70

The Financial
Exclusion rate for
women stood at
40.9% (20.5m) as
against 32.5%
(16.2m) for
men
“”
Way Forward and Future Outlook
The delivery of nancial education remains critical to improving nancial literacy of unbanked
populations in order to empower them with the capabilities to make informed decisions. One
key outlook for nancial literacy is the digitization of procedures to enable nancial educators
and trainers' access e-content to be used to train end beneciaries. In line with this, an e-
Learning portal is being conceptualized to be developed and piloted in 2019 to ensure
standardization of nancial literacy content, as well as, reduce cost of in-person training of
trainers.
4.3.3 Women Initiatives
Key Activities in 2018
In 2018, the Gender Gap persisted with nancial access skewed towards male adults as 40.9
per cent of women remained nancially excluded compared to 32.5 per cent of men (EFInA,
2018). The Financial Inclusion Special Interventions Working Group (FISIWG) intensied efforts
to identify peculiar challenges faced by women in accessing nancial products and services in
Nigeria. A series of engagements occurred through the course of the year to map out
strategies to advance nancial inclusion amongst women and 13 recommendations were
proposed.
712018 Annual Report National Financial Inclusion Strategy Implementation
S/N RECOMMENDATION
1 That focus be placed on innovative micro loan products that can drive Financial Inclusion
for people at the bottom of the pyramid. Examples include: the product developed by
Jaiz Bank.
2 That FIS increase sensitization of Financial Service Providers (FSPs) on the need to
improve access to nance for women. It is recommended that the FIS considers holding
a multi Stakeholder forum to discuss issues on access to nance for women.
3 That ongoing nancial education/literacy programmes be conducted Strictly for women
in partnership with the FMoWA&SD.
4 That in disbursing loans to women particularly in the hinterlands, workshops be held for
the “men behind the women” to ensure that the funds are not cornered by husbands.
5 To drive uptake of Digital Financial Services (DFS), Banks should be encouraged to
develop a product that enables women to purchase phones as a tool for nancial
inclusion.
6 That Banks/Financial Service Providers be incentivized for improving access to nance
for women and going to the hinterland to provide nancial services. Such incentives
could free capacity building and knowledge exchanges for banks that do well on women
nance, reduced corporate tax for women owned enterprises, amongst others.
7 That FIS consider organizing awards for nancial institutions that excel in providing
access to nancial services (savings, credit, insurance etc) for women.
8 That a comprehensiv e list of female owned cooperatives be updated on the Federal
Ministry of Women Affairs website, so that possible suppliers of access to nance have a
veriable list to employ for the disbursement of loans.
9 That the FIS facilitate the linkages betwe en trained women entrepreneurs (MSMEs) and
nancial services providers. For instance, link up organizations such as NCWD,
FMoWA&SD with suppliers like DBN, Bank of Industry (BOI).
10 That CBN encourages banks to develop more women friendly nancial pro ducts under
the auspices of Bankers’ Committee and monitor implementation.
11 That Federal and State Governments explore the possibility of initiating programmes that
will assist women to participate in relevant entrepreneurship development activities to
build their business management capacities and better their welfare
12 That Banks reporting templates to CBN be modied such that it is gender specic. This
way, submissions from Banks can be sifted such that analysis can be done based on
gender to inform women nance policies and decisions.
13 That a comprehensive framework that provides a guide and blue print for women nance
is developed to sustainably address women access to nance issues in Nigeria.

Financial Inclusion Secretariat at the Federal Ministry of Women Affairs and Social Development
ENGAGEMENTS ON CLOSING THE FINANCIALINCLUSION GENDER GAP
Financial Inclusion Secretariat at the Development Bank of NigeriaFinancial Inclusion Secretariat at the National Centre for Women Development

Status and Trends in 2018
According to the Enhancing Financial Innovation and Access (EFInA) access to nance survey
report 2018, the nancial exclusion rate for women stood at 40.9 per cent (20.5 million) as
against 32.5 per cent (16.2 million) for men, meaning that the nancial inclusion gender gap in
Nigeria stood at 8.4 per cent as at 2018, a slight improvement from 9.8 per cent in 2016.
Way Forward and future Outlook
The Denarau action plan developed in 2016 recommends amongst others that member
countries incorporate gender considerations in their activities, with the working groups to
promote peer learning and develop appropriate knowledge products relating to gender and
women's nancial inclusion. Considerations for the establishment of a gender desk focused on
driving increased access to nance for women have commenced and would take effect in
2019. This desk, within the Financial Inclusion Secretariat, will be primarily responsible for
working with relevant stakeholders to deliberately drive the development and adoption of
gender-specic products.
Financial Inclusion Strategy Review Session with Stakeholders
732018 Annual Report National Financial Inclusion Strategy Implementation

NIGERIA AT A GLANCE
North-West
North-East
GENDER GAP REGIONAL GAP
FORMALITY GAP
40.9%Exclusion
HigherExclusion
RURAL GAP
45.6%Exclusion
47.0%Exclusion
AGE GAP
The 18-25 group is the least included age group Total DMBs credit to MSMES as a percentage credit to private sector in 2016 was 0.07%
FI rates are much lower in rural areas than in urban areas. However informal inclusion is higher in rural than urban areas
Financial Inclusion rates are lower among women than men. However,
informal inclusion is higher for women than men
62%Exclusion 55%
ExclusionOnly ~33% of adults in the NE and NW (combined) are financially included
FIVE PRIORITY DEMOGRAPHICS
TRENDS IN FINANCIAL ACCESS STRAND (2008 – 2018)
Source: 2018 Biennial Access to Financial Services in Nigeria Survey by EFInA

56%70%
62%
20142016
2018
68%62%
55%
20142016 2018
33%39%
31%
20142016
2018
25%
18% 19%
20142016
2018
33%31%
23%
20142016
2018
25%
28%29%
20142016
2018
FINANCIAL EXCLUSION RATES ACROSS GEOPOLITICAL ZONES
Most Excluded States in NE
ªGombe (76%)
ªBauchi (61%)
ªYobe (60%)
Most excluded states are above regional zone average
Most Excluded States in NW
ªKano (75%)
ªJigawa (65%)
ªKatsina (64%)
Most Excluded States in NC
ªNasarawa (40%)
ªNiger (38%)
ªPlateau (38%)
ªFCT (32%)
Most Excluded States in SS
ªBayelsa (35%)
ªA/Ibom (29%)
ªEdo (25%)
Most Excluded States in SE
ªEbonyi (44%)
Most Excluded States in SW
ªOndo (29%)
ªOyo (23%)
ªOgun (22%)
Source: 2018 Biennial Access to Financial Services in Nigeria Survey by EFInA
NIGERIA AT A GLANCE
Volunteer Corps Member educating their host community on �nancial inclusion and literacy during their Community Development Service (CDS)
752018 Annual Report National Financial Inclusion Strategy Implementation

CREDIT
6%
Actu
al
2018
Targ
et
2018
Targ
et
2020
34%40%
36.1madults
% of adult population having borrowed or paid back a loan through a regulated financial institution over the last 12 months
INSURANCE
2%
Actu
al
2018
Targ
et
2018
Targ
et
2020
32%
40%
2.2madults
% of adult population covered by a regulated insurance policy
SAVINGS
36%
53%70%
5.5madults
% of adult population having a savings product with a formal financial institution
Actu
al
2018
Targ
et
2018
Targ
et
2020
PAYMENT
36%
63%70%
36.1madults
% of adult population having a payment product with a formal financial institution
Actu
al
2018
Targ
et
2018
Targ
et
2020
PENSIONS
9%
32%40%
8.5madults
% of adult population registered with a regulated pension scheme
Actu
al
2018
Targ
et
2018
Targ
et
2020
PRODUCT INDICATORS
Based on the 2018 Biennial Access to Financial Services in Nigeria Survey by EFInA

18,910Automatic Teller Machines in 2018
217,283PoS Devices in 2018
898Microfinance Bank branches in 2018
4,752Commercial Bank branches in 2018
38,416Agents in 2018
CHANNELS INDICATORS
Branches per 100,000 Adults
Branches per 100,000 Adults
ATMs per 100,000 Adults
Devices per
100,000 Adults
5.0
0.9
4.7
Actual ‘18 Target ‘18 Target ‘20
7.5
4.8
7.6
Actual ‘18 Target ‘18 Target ‘20
49.5
19.0
59.6
Actual ‘18 Target ‘18 Target ‘20
606
218
850
Actual ‘18 Target ‘18 Target ‘20
38.6 43.4
62.0
Actual ‘18 Target ‘18 Target ‘20
Agents per 100,000 Adults
Based on Industry Data as at December 2018


DG, FSS (CBN) and DG (BCEAO) with the CBN staff and Delegates to Nigeria
BCEAO Financial Inclusion Knowledge Exchange visit to Nigeria
DG, NIMC welcoming the BCEAO delegation to NIMC

DG, NIMC and DG (BCEAO) with a cross section of participants during the �eld visit to NIMC
DG, BCEAO and CEO, NIBSS with a cross-section of participants during the �eld visit to NIBSS
BCEAO Financial Inclusion Knowledge Exchange visit to Nigeria
Director, Development Finance Department, CBN team and the BCEAO Delegates
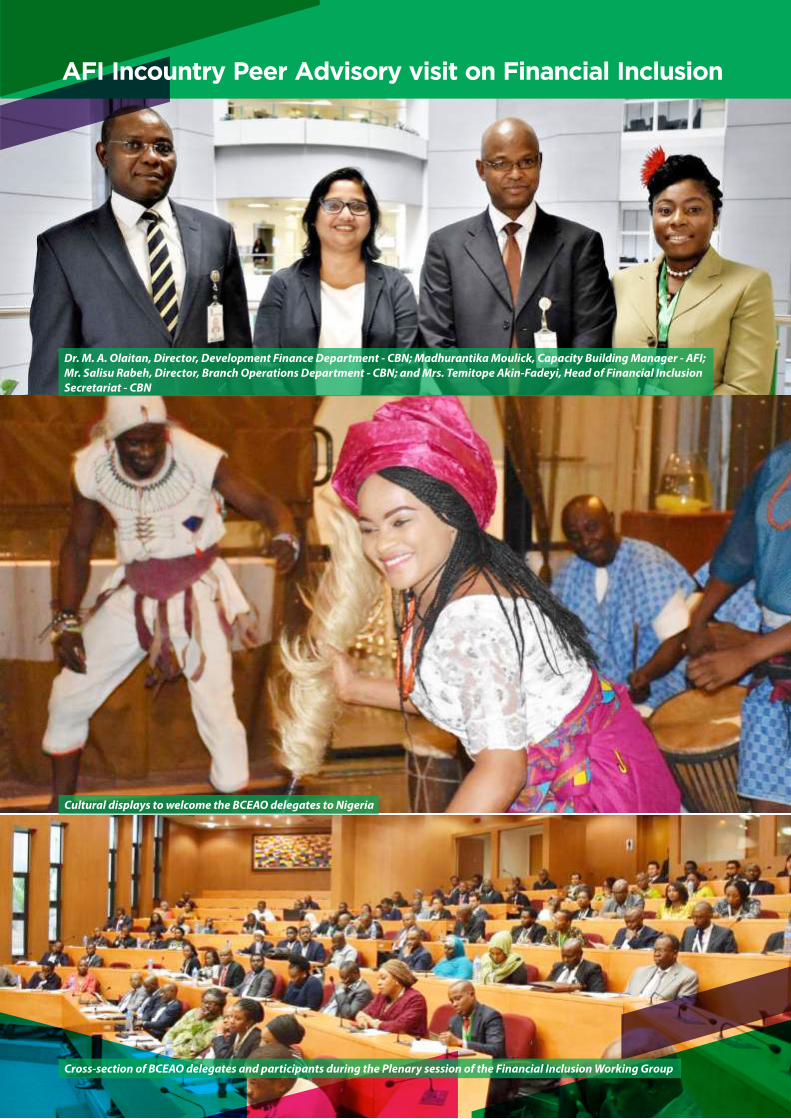
AFI Incountry Peer Advisory visit on Financial Inclusion
Dr. M. A. Olaitan, Director, Development Finance Department - CBN; Madhurantika Moulick, Capacity Building Manager - AFI;Mr. Salisu Rabeh, Director, Branch Operations Department - CBN; and Mrs. Temitope Akin-Fadeyi, Head of Financial Inclusion Secretariat - CBN
Cultural displays to welcome the BCEAO delegates to Nigeria
Cross-section of BCEAO delegates and participants during the Plenary session of the Financial Inclusion Working Group

5.0
FUTURE
OUTLOOK
This Chapter presents a highlight of
the direction of nancial inclusion in
Nigeria for the year 2019, based on
the progress and plan of the
reporting year.

5.1 Recap of 2018
The year 2018 witnessed major policy milestones aimed at enabling nancial inclusion.
Specically, the National Financial Inclusion Strategy was revised to reect changes in the
nancial and technology landscape, and the need to leverage innovation for developing
service offerings that will better serve the needs of the unbanked. The principle-based strategy
provides a roadmap to improve agent network and digital identication to extend nancial
services to the hitherto underserved.
The Strategy also sought to unlock high potential models through leveraging Digital Financial
Services (DFS) and broadening and deepening nancial inclusion through nancial and digital
literacy and facilitating Government to People (G2P) payment to drive transaction volumes and
DFS adoption in the economy.
Another key milestone recorded in 2018 was the approval of the Licensing and Regulation
Guidelines for Payment Service Banks (PSBs), which seeks to provide a level playing ground
and expanding the nancial services space for non-traditional players with extensive
distribution networks. Telecommunication rms (Telcos) and Fast-Moving Consumer Goods
(FMCGs) can now set up subsidiaries to be licensed as PSBs and take advantage of the
expanded ecosystem to drive nancial inclusion and grow new clientele base, particularly in
the underserved areas of the country, scaling up the drive for 80% inclusion by 2020.
Other key initiatives approved in the year 2018 included the Shared Agent Network Expansion
Facility (SANEF) and the Agri-Business Small and Medium Enterprise Investment Scheme
(AGSMEIS). The details of these initiative have been provided under the relevant stakeholder
section in chapter 3.
The year 2018 was incidentally a measurement year for nancial inclusion which saw the
nancial exclusion rate reduce from 40.1 million adults in 2016 to 36.6 million adults in 2018.
This means that 63.2 per cent Nigerians are now included compared to 58.4 per cent in 2016.
5.2 Projections for 2019
5.2.1 More Focus on Stakeholder Innovation
Though nancial inclusion numbers improved in 2018, effective implementation of the strategy
was constrained as it did not give room for innovation and changes in the nancial services
landscape. Given the review of the NFIS in 2018 which provides for a principle-based approach
to implementation, thereby allowing FSPs to create innovative products and services to
deepen nancial inclusion, it is expected that regulators and FSPs will be more innovative in
designing and implementing programmes that will accelerate the pace of nancial inclusion in
2019.
5.2.2 Increased deployment of Fintech for Financial inclusion
One key feature of the revised National Financial Inclusion Strategy is the recommendation to
leverage DFS and technological innovation to drive nancial inclusion in underserved areas. In
the same vein, the Alliance for Financial Inclusion (AFI), highlighted the value that technology-
based nancial innovations can bring to addressing nancial inclusion, issued the Sochi
Accord for Fintech. In this sense, implementation in 2019 will focus on domesticating the Sochi
Accord in Nigeria, thereby unlocking the potential for Fintechs to drive nancial inclusion in
Nigeria. It is also expected that there would be increased stakeholder engagements with the
Fintech communities in 2019 and beyond.
2018 Annual Report National Financial Inclusion Strategy Implementation84

5.2.3 Increased Stakeholder Collaboration
Several stakeholders are involved in providing policy direction, services and funding for
nancial inclusion activities. While these efforts have been helpful over the years, there is a
need to streamline and focus the various resources towards achieving optimal results. The
NFIS implementation in 2019 will therefore focus on intensifying and enriching collaboration
across various levels of nancial inclusion stakeholders in such a way that it would improve the
progress towards achieving nancial inclusion objectives in a cost-effective manner. This effort
commenced in 2018 by expanding Financial Inclusion Working Group membership to include
important players and developing a proposal for a Financial Inclusion Trust Fund. These efforts
will be sustained in 2019 with special focus on encouraging shared-services so as to reduce
the cost of providing nancial services to the underserved areas by FSPs.
5.2.4 Deeping Financial Inclusion Channels
Given the launch and implementation of SANEF in 2018, with its target of deploying 500,000
agents by 2020, it is projected that an additional 200,000 agents would be deployed
nationwide to deliver nancial services to the underserved segments of the society.
5.2.5 Licensing of PSBs
Following the release of the Guidelines for Licensing and Regulation of Payment Service Banks
in November 2018, prospective promoters have expressed interest in participation and
commenced the process of obtaining operational license from the Bank. It is expected that
operational licenses will be obtained by FSPs in 2019, thereby facilitating their commencement
of operation as payment service banks.
5.2.6 Roll Out of NIRSAL Micronance Bank (NMFB) Branches
Following the approval of the NIRSAL MFB to start operation in 2019 as a nationally licensed
MFB, it is expected that an aggressive roll out of branches will be undertaken by the bank in
2019. This is expected to expand nancial access points in under-served areas.
5.2.7 Increased Focus on Financial literacy and Consumer Protection
The year, 2018, witnessed the introduction of several policies that would lead to changes in how
nancial services are delivered to the nancially excluded segments of the society. Innovative
delivery channels that rely on the increased use of technology would help deliver DFS to these
segments of the population. There is the need, therefore, for consumer protection awareness
and digital literacy which would complement the development of new redress mechanisms
necessary to facilitate the adoption of these initiatives. Consequently, it is expected that in
2019, nancial literacy and education programmes will be intensied, so as to sensitize
consumers on the benets of the programmes especially DFS. Also, increased awareness on
customer redress mechanisms would be carried out during the year.
In conclusion, we believe that the achievements of 2018 and the policies and initiatives
implemented within the year will yield further results as we kick-off the implementation of the
revised National Financial inclusion Strategy in 2019. This is anticipated to move us much
closer to achieving the nancial inclusion target for 2020, setting Nigeria on a pedestal to
achieve sustained economic development and inclusive growth.
NIRSAL
MFB to start
operation in 2019
as a nationally
licensed MFB
“”
Financial
Literacy and
Education
programmes will
be intensied so as
to sensitize
consumers on the
benets of the
programmes
especially
DFS.
“
”852018 Annual Report National Financial Inclusion Strategy Implementation

FINANCIAL INCLUSION STATE STEERING COMMITTEE(FISSCO) REGIONAL CAPACITY BUILDING PROGRAMME
Training Faculty members for the North-West Region (Kano), led by Mrs. Ameena Pindar Abubakar (CBN Branch Controller, Kano)
Representative of the Executive Vice-Chairman, NCC - Mrs. Josephine Amuwa, (Director, Policy, Competition & Economic Analysis) delivering the Opening Remarks at the South-East Region (Enugu)

APPENDIX
Table 1: Activities of FISSCOs in 2018
South West Zone Lagos, Ogun, Oyo, Osun, Ondo and Ekiti State
Grassroot Outreach
§ Compilation of the database of cooperatives in Osun State. Sensitization and Awareness
§ Campaigns to markets in urban and rural areas in Osun State. Markets visited include: O lu market, Obada market and urban day market in IleIfe.
Advocacy
§ Strategic engagement with the Federation of Informal Workers Organization of Nigeria (FIWON) during their monthly meetings.
§ Courtesy visits to Permanent Secretaries, Secretary to the Sta te Governments’ and Commissioners in the states to get their buy -in and support for Financial Inclusion.
§ Meetings with the state executives of the National Association of Micronance Banks on the importance of providing accurate statistics on new accounts opened in their institutions.
Digital Financial
Services
§ Collaborated with Wema Bank in conjunction with NIPOST and launched Agency Banking in Oyo town.
South East Zone Anambra, Enugu, Ebonyi, Imo and Abia State
Sensitization and
Awareness
§ Sensitized the National Orientation Agency (NOA) in Abia State on FISSCO objectives and programmes by the Outreach Working Group
§ Sensitized private business owners, Non -Governmental Organizations (NGOs), trade unions and informal groups to encourage them to key -in to Pension Scheme.
§ Sensitized small business owners and entrepreneurs to encourage them to procure Point of Sale (POS) machines for nancial transactions.
Digital Financial
Services
§ Facilitated the installation of 2 ATM Points by Micronance Banks in Enugu and the deepening of Financial Inclusion by the NIPOST through the provision of POS machines during trade fairs and other exhibitions.
South-South Zone Edo, Delta, Rivers, Bayelsa, Cross-River and Akwa-Ibom State
Sensitization and
Awareness/Account
opening
§ Successfully conducted a “FISSCO week” in Cross River and Akwa Ibom states in the third quarter of 2018 which involved massive sensitization on nancial inclusion across the states.
§ In collaboration with Wetland MFB, a nancial inclusion awareness programme was conducted in a pilot Local Government Agency (LGA) which led to the opening of 4,994 accounts in Delta state.
Digital Financial
Services
§ Inaugurated the Bayelsa State chapter of Agent Bankers Network Executives which led to the state’s achievement of 92% of their planned target for Agent Banking
§ Collaborated with the Nigerian Police Force and other security agencies in Bayelsa state which led to improved security conditions for mobile money agents in doing business.
872018 Annual Report National Financial Inclusion Strategy Implementation

North East Zone Borno, Adamawa, Yobe, Bauchi, Gombe and Taraba
Sensitization and
Awareness
§ Commenced monthly Working Group meetings in Adamawa state. § Introduced nancial inclusion jingles in Hausa language in some
states in the zone.
BVN Registration
§ Facilitated the opening of tier-1 KYC accounts for Internally Displaced Persons (IDPs) by FSPs.
§ Association of non-Bank Micronance Institutions in Nigeria (ANMFIN) in collaboration with Tink Tank Nigeria Limited in Gombe state recorded over 1,000 successful BVN registrations in 11 LGA’s in the state.
North West Zone Kano, Kaduna, Katsina, Kebbi, Jigawa, Sokoto and Zamfara
Sensitization and
Awareness/Account
Opening
§ Enlightened District Heads in Igabi, Kaduna South and Kaduna North on Financial Inclusion.
§ Sensitization of 992 Village/Ward Heads at the Emir’s Palace, Kano and the successful conduct of the rst Agency Banking fair organized in collaboration with Bizi mobile cashless consultants in Kano. Over 45,000 adults were nancially Included as a result of the fair.
§ Mobilization of Micronance Banks in the LGAs in Sokoto state to drive nancial inclusion which led to the opening of over 25,000 accounts.
§ Sensitization of Village/Ward Heads and the conduct of the second Agency Banking fair organized in collaboration with Bizi Mobile Cashless Consultants in Birnin Kebbi. Over 30,000 adults were nancially included as a result of the fair.
Credit § Disbursed N200 million Kaduna State Women Empowerment Fund
(KADSWEF) to 5,000 unbanked women and People with Disabilities (PWD) which led to opening of about 5,000 new accounts.
North Central Zone Nasarawa, Plateau, Benue, Kogi, Kwara, Niger and FCT
Sensitization and
Awareness
§ Participation at a radio talk show on Plateau Radio and Television (PRTV) tagged: ‘Business Foundation’ sponsored by the Blue Wales MFB. Three members of the Committee enlightened members of the public on nancial inclusion.
§ A FISSCO data form was designed to gather information from all the LGAs to identify the unbanked within Nassarawa state.
§ Supported sen sitization campaigns carried out by Teasy Pay in conjunction with Future Growth MFB, Abuja. The focus was on female entrepreneurs trained to serve as agents.
BVN Registration
§ Sensitized and BVN capturing of farmers – a minimum of 500 accounts were opened for the rural farmers/populace. 178 staff of Federal Ministries of Defense and Justice were enrolled for Anchor Borrowers Program.
2018 Annual Report National Financial Inclusion Strategy Implementation88

REFERENCES
Central Bank of Nigeria (2018) Industry Statutory Returns
EFInA (2018). Access to nancial services survey-2018, conducted by Enhancing Financial
Innovation and Access, available online at www.ena.org.ng
CBN-GIS data (2015) Geospatial mapping of nancial access points in Nigeria, available online at
https://i2ifacility.org/data-portal/NGA/fsp-maps.
National Bureau of Statistics (2018) https://www.nigerianstat.gov.ng/
NIBSS (2018) Bank Verication Number statistics, accessed from https://nibss-plc.com.ng/bvn/
Lagos Business School, Customer Segmentation Framework (2018)
Financial Inclusion Secretariat, 2018 Stakeholder Report
892018 Annual Report National Financial Inclusion Strategy Implementation

LIST OF ACRONYMS
Acronyms Full Meaning
Alliance For Financial Inclusion
Agribusiness Small And Medium Enterprise Investment Scheme
Approval In Principle
Association Of Non-Bank Micronance Institutions
Automated Teller Machines
Business to government payments
Bill and Melinda Gates Foundation
Bank Of Industry
Base of pyramid
Banking And Payment System Department
Bank Verication Number
Central Bank of Nigeria
Committee of e-banking industry heads
Cooperative Financing Agency Of Nigeria
Contributory Pension Scheme
Digital Financial Services
Deposit Money Banks
Employee Contribution Scheme
Entrepreneurship Development Centers
Enhancing Financial Innovation and Access
Financial Education Curriculum
Financial Inclusion
Financial Technology Companies
Financial Inclusion Product Working Group
Financial Inclusion Secretariat
Financial Inclusion Steering Committee
Financial Inclusion State Steering Committee
Financial Inclusion Technical Committee
AFI
AGSMEIS
AIP
ANMFIN
ATM
B2G
BMGF
BOI
BoP
BPSD
BVN
CBN
CeBIH
CFAN
CPS
DFS
DMBs
ECS
EDCs
EFinA
FEC
FI
FINTECH
FIPWG
FIS
FISC
FISSCO
FITC
FLWG
FMBN
FSP
G2B
G2P
GDP
GEEP
Financial Literacy Working Group
Federal Mortgage Bank Of Nigeria
Financial Services Provider
Government to Business Payments
Government to Public Payments
Gross Domestic Product
Government Enterprise and Empowerment Program
2018 Annual Report National Financial Inclusion Strategy Implementation90
Biometric Management SystemBMS
Financial Inclusion Trust FundFITF
FMAN Fund Managers Association of Nigeria
FMCG Fast Moving Consumer Goods
FME Federal Ministry of Education
Federal Ministry of Communication TechnologyFMoCT
Federal Ministry of FinanceFMoF
Federal Ministry of Information and CultureFMoIC
Federal Ministry of Women Affairs & Social DevelopmentFMWASD
Federal Ministry of Youth & Sports DevelopmentFMYSD
Anchor Borrowers’ Programme ABP

LBS
M&E
MDAs
MFBs
MFI
MMOs
MNOs
MSME
MSMEDF
NAICOM
NAPGEP
NBS
NCC
NCR
NDIC
NFBI
NFIS
NGOs
NHIS
NIA
NIBSS
NICMP
NIN
NIPOST
NSE
NSITF
NYSC
PAT
PENCOM
PenOp
PoS
PWD
RSA
SEC
SMEDAN
SPV
UNSGSA
USSD
YEDP
Lagos Business School
Monitoring and Evaluation
Ministries Departments And Agencies
Micronance Banks
Micronance Institutions
Mobile Money Operators
Mobile Network Operators
Micro, Small and Medium Enterprises
Micro Small Medium Enterprise Development Fund
National Insurance Commission
National Peer Group Educator
National Bureau of Statistics
Nigerian Communications Commission National Collateral Registry
Nigeria Deposit Insurance Corporation
Non-bank Financial Institution
National Financial Inclusion Stra0tegy
Non-Governmental Organization
National Health Insurance Scheme
Nigerian Insurance Association
Nigerian Inter-Bank Settlement System
Non-Interest Capital Market Products
National Identity Numbers
Nigerian Postal Services
Nigerian Stock Exchange
Nigerian Social Insurance Trust Fund
National Youth Service Corp
Prot After Tax
National Pension Commission
Pension Fund Operators Association of Nigeria
Point of Sale
People With Disabilities
Retirement Saving Account
Securities And Exchange Commission
Small And Medium Enterprise Development Agency
Special Purpose Vehicle
United Nation Secretary General Special Advocate
Unstructured Supplementary Service Data
Youth Entrepreneurship Development Program
912018 Annual Report National Financial Inclusion Strategy Implementation
GoN
GPF
GPZ
GWP
IATF
IFC
IFIS
IFSB
IMTO
KPI
KYC
Government of Nigeria
Global Policy Forum
Geopolitical Zone
Gross Written Premium
Interagency Taskforce
International Finance Cooperation
Inters witch Financial Inclusion Services
Islamic Finance Service Board
International Money Transfer Operation
Key Performance Indicator
Know Your Customer
MC Mercy Corps
NAMB National Association of Micronance Banks
NBC Nigerian Bankers Committee
NIMC National Identity Management Commission
GIZ Deutsche Gesellschaft für Internationale Zusammenarbeit

WAY FORWARD
out of 10 Nigeriansfinancially included by 20208
North West
62%
40.9%
47.0%Exclusion
Exclusion
Exclusion
MSMEs
LOWER
Inclusion
Gen
der G
ap
Reg
iona
l Gap
Age
Gap
Regional G
apF
orm
ality
Gap
Step I: Building Foundation
Step II: Unlocking High Potential Models
Step III: Broadening and Deepening Inclusion
55%
Exclusion
� Regulatory and policy environment
� Private Sector understanding and interest
� Agent networks
� National Identity
� Digital financial services
� Community lending (MFI and MFB models)
� FSP investment in tailored savings and credit products
� P2G, G2P and digital payments ecosystems
� Financial and digital literacyH
igh
pri
ori
ty t
he
me
s
High
prio
rity the
me
s
Fiv
e M
ost
Exc
lud
ed
Gro
up
s

For further enquiries, please contact:Head, Financial Inclusion SecretariatCentral Bank of NigeriaPlot 33, Abubakar Tafawa Balewa WayCentral Business District,Cadastral Zone, Abuja,Federal Capital TerritoryTelephone: 0946237625Email: [email protected]