ANNUAL REPORT 2018 - carlsberggroup.com · CARLSBERG GROUP ANNUAL REPORT 2018 LETTER FROM THE...
140
ANNUAL REPORT 2018
Transcript of ANNUAL REPORT 2018 - carlsberggroup.com · CARLSBERG GROUP ANNUAL REPORT 2018 LETTER FROM THE...

ANNUALREPORT2018
CARLSBERG GROUP ANNUAL REPORT 2018 LETTER FROM THE CHAIRMAN & THE CEO 2
Letter from the Chairman
& the CEO ..................................................... 3 2019 earnings expectations ................... 5
2018 HIGHLIGHTS Strategic priorities ...................................... 6 Our brands .................................................... 8 Regional priorities ...................................... 9 Golden triangle ......................................... 10 Financial highlights ................................. 11 Key figures ................................................. 13
REGIONAL REVIEW Western Europe ....................................... 14 Asia ............................................................... 17 Eastern Europe ......................................... 20
OUR STRATEGY Beer trends ................................................ 23 Business model ........................................ 24 SAIL’22 ......................................................... 25
GOVERNANCE Risk management ................................... 35 Corporate governance ........................... 37 Remuneration ........................................... 43 Supervisory Board................................... 49 Executive Committee ............................. 52 Share information ................................... 54
Forward-looking statements ............. 55
CONSOLIDATED FINANCIAL STATEMENTS Statements ...........................................57 Notes ......................................................61
PARENT COMPANY FINANCIAL
STATEMENTS Statements ........................................ 125 Notes ................................................... 128
REPORTS Management statement ................ 135 Auditor’s report ................................ 136
MANAGEMENT REVIEW
FINANCIAL STATEMENTS
carlsberggroup.com
@carlsberggroup
@carlsberggroup
Carlsberg Group
GROW IN ASIA
Front page: A strategic growth priority is to
continue to grow in Asia, where a key growth
driver is continued premiumisation in China
through growing sales of our international
brands Tuborg, Carlsberg and 1664 Blanc.
Supported by our targeted expansion into big
cities outside our core western China
provinces, our international brand portfolio in
China grew by 13% in 2018.

CARLSBERG GROUP ANNUAL REPORT 2018 LETTER FROM THE CHAIRMAN & THE CEO 3
2018 was a good year for the Carlsberg Group, with strong net revenue, operating profit and cash flow. The benefits from Funding the Journey were partly reinvested to support our strategic priorities.
As a result, we are pleased to report improved
financial, strategic and organisational health of
our business.
FINANCIAL HEALTH: A YEAR OF STRONG
DELIVERY
With respect to our financial health, the first
results of the SAIL’22 growth priorities
manifested themselves in organic net revenue
growth of 6.5%, driven by solid price/mix of
+2% and volume growth of 4.8%, although the
latter was helped by the warm summer in
several European markets and the timing of
the festive season in Asia.
Funding the Journey, which was a three-year
profit improvement programme initiated in
November 2015, came to an end in 2018. It
has been very successful, delivering significantly
more benefits than initially anticipated, and
allowing us to invest more than DKK 1bn in our
SAIL’22 priorities. Going forward, the mindset
of the programme will prevail. Now embedded
in operations across the Group, the focus on
efficiency, costs and cash will remain an
important driver of future value creation.
During the year, we adjusted our earnings
expectations twice. In August, we increased the
full-year guidance from mid- to high-single-
digit percentage organic growth, and in
October we further increased expectations to
10-11% organic growth in operating profit.
Thanks to the higher benefits from Funding the
Journey, good growth of our SAIL’22 priorities
and higher volumes due to the aforementioned
warm weather, operating profit grew
organically by 11% and the operating margin
improved by 30bp to 14.9%.
Net profit was DKK 5,309m and adjusted EPS
was DKK 35.2, up 9% on 2017.
The earnings delivery was an important driver
of the ROIC improvement of 120bp and the
free cash flow of DKK 6.2bn. The free cash
flow was also supported by a solid contribution
from trade working capital of DKK 1.9bn.
During the year, we engaged in several M&A
transactions, increasing our stakes in the
Cambodian and Greek businesses to 75% and
100% respectively, and acquiring a stake in the
controlling shareholder of the Portuguese
business, bringing our total direct and indirect
holding in Super Bock Group to 60%. Despite
these investments, the net interest-bearing
debt/EBITDA ratio at year-end was 1.29x, still
well below our target of below 2.0x.
On the back of the strong results, the
Supervisory Board will propose to the Annual
General Meeting that the payout ratio of
around 50% be maintained, resulting in a 13%
increase in the ordinary dividend to DKK 18.0
per share. In addition, the Board has initiated a
DKK 4.5bn share buy-back programme,
leading to cash returns to shareholders of DKK
7.2bn for the year. You can read more about
this on page 34.
STRATEGIC HEALTH: PROGRESS ON
SAIL’22
Our strategic health also improved during
2018. Our strategy, SAIL’22, which was
launched in March 2016, is now well
established and understood across the Group.
Among a number of positive achievements, we
would like to highlight the growth rates of our
craft & speciality portfolio (+26%) and alcohol-
free brews in Western Europe (+33%).
Our international brands and local power
brands had a very good year, and in Asia we
grew further in India and China, the latter
supported by our “big city” approach.
You can read about our SAIL’22 initiatives in
2018 on pages 25-34.
Part of our strategy is our ambitious
sustainability programme Together Towards
ZERO, based on our purpose of brewing for a
better today and tomorrow. We are working
hard to meet the programme’s targets within
carbon, water, responsible drinking and health
& safety, and our actions and achievements in
2018 are outlined on pages 31-33 and
LETTER FROM THE CHAIRMAN & THE CEO
SHIFTING GEARS TO GROWTH
Letter from the Chairman & the CEO
“Our strong performance in 2018 will result in a considerable cash return to shareholders, with the aggregated value of dividends and share buy-back for the year totalling DKK 7.2bn.”
Flemming Besenbacher
Chairman of the Supervisory Board

CARLSBERG GROUP ANNUAL REPORT 2018 LETTER FROM THE CHAIRMAN & THE CEO 4
discussed in more detail in our Sustainability
Report.
In September, we were excited to launch a
series of ground-breaking sustainability
innovations for the Carlsberg brand, including
the new Snap Pack, which, when fully rolled
out, will reduce plastic usage by up to 76%,
equivalent to 1,200 tonnes of plastic – or 60
million plastic bags – per year. Less plastic
means less reliance on fossil fuel-based
packaging, thereby reducing carbon emissions.
ORGANISATIONAL HEALTH: A WINNING
ORGANISATION
During the past three years, there have been
several changes in the top-200 management
team. Today, we have a strong group of
leaders across the Group’s functions and
markets. In 2018, we also welcomed our head
of Group Commercial, Jessica Spence, to the
Executive Committee.
In many areas, such as commercial, finance,
supply chain, digital and data we further
professionalised our ways of working. In digital,
we accelerated our digital agenda with the
establishment of a digital transformation team.
We also changed the incentive structure to
achieve better alignment with our objectives,
Overall, our winning culture has become much
deeper embedded across the Group, and our
people are characterised by a winning spirit.
CHANGES TO THE SUPERVISORY BOARD
Lars Rebien Sørensen, Donna Cordner and
Nina Smith have notified the Supervisory Board
that they are not standing for re-election at
the Annual General Meeting in 2019. In
addition, Nancy Cruickshank stepped down
from the Board in May to join the Group as
Senior Vice President Digital Business
Transformation. The Supervisory Board will
propose the election of Lars Fruergaard
Jørgensen, Domitille Doat-Le Bigot, Lilian
Fossum Biner and Majken Schultz as new
members.
THANK YOU
We would like to thank our shareholders for
their support. We would also like to express our
appreciation to everyone in the Carlsberg
Group for their cooperation, dedication and
enthusiasm in bringing SAIL’22 to life and
securing the successful delivery of Funding the
Journey. Finally, we would like to acknowledge
the excellent relationships that we have with
our customers and suppliers, and to state our
gratitude to our consumers around the world.
Flemming Besenbacher Cees ’t Hart
Chairman CEO
EXCEL IN EXECUTION
Chairman Flemming Besenbacher (left) and
CEO Cees ’t Hart in front of a showcase of our
DraughtMaster™ system. This patented one-
way 20-litre PET keg system with no added CO2
and a 31-day shelf life enhances the freshness
and beer experience for consumers and allows
outlets to have greater on-tap variety and a
more user-friendly draught beer installation.

CARLSBERG GROUP ANNUAL REPORT 2018 2019 EARNINGS EXPECTATIONS 5
In 2019, we will continue to execute on our SAIL’22 strategic priorities in support of top- and bottom-line growth.
Driving growth of craft & speciality and
alcohol-free brews and continuing volume
and value growth in Asia will remain our key
growth accelerators. Additionally, we will
support and further develop our core beer
portfolio, which includes our local power
brands and our international brands Tuborg
and Carlsberg. For the Carlsberg brand in
particular, an important priority for 2019 is
the roll-out of the new brand design and
packaging innovations.
During the course of the three-year profit
improvement programme – Funding the
Journey – its focus on efficiencies, costs and
cash has become an integral part of our day-
to-day operations, and this will remain an
important driver of future value creation.
Consequently, we will continue to enforce strict
cash and cost discipline to optimise processes
and drive efficiencies throughout the supply
chain, and to streamline SG&A costs through
operating cost management (OCM).
Our regional priorities will be to increase net
revenue and the operating margin in Western
Europe, drive growth in Asia through
premiumisation, and strengthen market
leadership in Eastern Europe.
Based on these priorities, the Group expects to
deliver:
• Mid-single-digit percentage organic growth
in operating profit.
Based on the spot rates as at 5 February, we
assume a DKK translation impact of around
zero for 2019.
Other relevant assumptions are as follows:
Financial expenses, excluding currency losses
or gains, are expected to be DKK 700-750m.
The effective tax rate is expected to be below
28%.
Capital expenditure at constant currencies is
expected to be around DKK 4.5bn.
FORWARD-LOOKING STATEMENTS
This Annual Report contains forward-looking
statements. Any such statements are subject to
risks and uncertainties that could cause the
Group’s actual results to differ materially from
the results discussed in such forward-looking
statements. Accordingly, forward-looking
statements should not be relied on as prediction
of the actual results. Please see page 55 for
the full forward-looking statement disclaimer.
EXPECTATIONS
2019 Earnings expectations
2019 EARNINGS EXPECTATIONS
CARLSBERG In 2018, we unveiled a new Carlsberg brand
design alongside packaging innovations that will
reduce plastic waste and increase recyclability.
The innovations included the pioneering Snap
Pack solution, a new coating on refillable glass
bottles to extend their lifespan, new caps that
remove oxygen to make the beer taste fresher
for longer, and a new Cradle to Cradle Certified™
green ink to improve recyclability.
REVITALISE CORE BEER

SAIL'22 DELIVERINGTOP-LINE GROWTH...
STRATEGIC PRIORITIES
Our 2018 results served as proof points for our strategic choices. Funding the Journey delivered above initial expectations and our investments in SAIL’22 supported organic top-line growth of 6.5%.
Our craft & speciality portfolio had another year of strong growth, supported by 1664 Blanc, which grew by 49%, and Grimbergen, which grew by 14%.
STRONG DELIVERY OF FUNDING THE JOURNEY
Funding the Journey as a specific programme came to an end in 2018, delivering around DKK 3bn, well above initial expectations. More than DKK 1bn has been reinvested in support of our SAIL’22 priorities. The focus on efficiencies, costs and cash will continue.
READ MORE ABOUT OUR STRATEGY AND KPIs ON PAGES 25-34
Our premiumisation efforts in Asia contributed to a strong price/mix of 4%. Our international brands continued their strong performance, growing volumes by 14%. India and China delivered particularly strong results. An important initiative in 2018 was the successful expansion of our international portfolio into big cities in China.
Our alcohol-free brews delivered strong results in Western Europe, growing by 33%. Throughout the region, we successfully supported alcohol- free line extensions of our local power brands. In Russia, Baltika 0 grew by 35%. We launched Birell, a global stand-alone alcohol-free beer.
PREMIUMISING IN ASIA
CONTINUED GROWTH OF CRAFT & SPECIALITY
STRONG PROGRESS OF ALCOHOL-FREE BREWS
ACTIVELY SHAPE ALCOHOL-FREE BREWS
FUNDING THE JOURNEY
GROW CRAFT & SPECIALITY
GROW IN ASIA
6CARLSBERG GROUP ANNUAL REPORT 2018 2018 HIGHLIGHTS
VOLUME GROWTH OF 26%
VOLUME GROWTH OF 33%

ZEROACCIDENTSCULTURE
ZEROIRRESPONSIBLEDRINKING
ZEROWATERWASTE
ZEROCARBONFOOTPRINT
... AND PROGRESS TOWARDS ZERO
In 2018, we continued to work hard to deliver on our ambitious sustainability programme, Together Towards ZERO, with its clear priorities within the areas of carbon, water, responsible drinking and health & safety.
35%96%9%20%reduction in lost-time accident rate since 2015. In 2018, we rolled out our Life Saving Rules programme, focusing on the specific areas where we have learned that people’s lives can be endangered if rules are not followed.
of our products now carry responsible drinking messages advising consumers not to drink-drive and not to drink when underage or pregnant. In Western Europe, we included information on ingredients and nutritional values per 100 ml on 86% of products.
improvement in water efficiency since our 2015 baseline. We aim to halve water usage at our breweries by 2030. With steady performance in 2018, we still have a long way to go to achieve this target.
reduction in relative carbon emissions since 2015, using 46% renewable electricity in 2018. Since 2015, our coal usage has been reduced by 78%.
READ MORE ON PAGES 31-33 AND IN OUR SUSTAINABILITY REPORT
7
STRATEGIC PRIORITIESCARLSBERG GROUP ANNUAL REPORT 2018 2018 HIGHLIGHTS

8
OUR BRANDS
A COMPLETE AND ATTRACTIVE PORTFOLIO
Our core beer portfolio spans the international beer brands Tuborg and Carlsberg and local power brands. Alongside our core beer, we have great craft & speciality beers and alcohol-free brews.
CORE BEER GROWING CATEGORIES
SOLID PROGRESS OF CORE BEERMainstream lager beer enjoys high penetration and frequency in most markets. Core beer is the backbone of our business, representing our largest volume and profit pool. Our core beer portfolio consists of strong local power brands in combination with our international brands Tuborg and Carlsberg. Improving the brand fundamentals within core beer is an important priority of SAIL’22, and in 2018 we revealed a series of betterments and a new look & feel for the Carlsberg brand.
STRONG RESULTS FOR OUR GROWING CATEGORIESImportant priorities of SAIL’22 are to strengthen our position within craft & speciality and alcohol-free brews. The popularity of these categories is on the rise in many markets, driven by consumers’ desire for premium brands with varied tastes and styles as well as the interest in healthier lifestyles. Both categories offer superior margin opportunities. In 2018, we launched Birell – our first stand-alone alcohol-free brew – in Poland and Bulgaria.
REVITALISE CORE BEER WIN IN GROWING CATEGORIES
INTERNATIONAL BRANDS LOCAL POWER BRANDS CRAFT & SPECIALITY ALCOHOL-FREE BREWS
of own beer net revenue
13%of own beer net revenue
87%
of own beer volumes
7%of own beer
volumes
93%
10% volume growthin 2018 14%
volume growthin 2018
5% volume growthin 2018 49%
volume growthin 2018
CARLSBERG GROUP ANNUAL REPORT 2018 2018 HIGHLIGHTS

000CARLSBERG GROUP ANNUAL REPORT 2018 CHAPTER
STRONG RESULTS ACROSS OUR REGIONSThe Carlsberg Group has a well-diversified geographic footprint with strong no. 1 or 2 positions in 25 markets across Western Europe, Asia and Eastern Europe. Around 75% of volumes are sold in these markets and no market accounts for more than 16% of Group volumes.
REGIONAL PRIORITIES
In 2018, Eastern Europe rebalanced the Golden Triangle towards volume and top-line. Organic net revenue growth was driven by volume growth of 3.1% and price/mix of +6%. In Russia, price/mix was positive, driven by price increases. The other markets in the region achieved solid revenue and earnings growth.
Growing in Asia is a key SAIL’22 priority on which we delivered strongly in 2018. Organic net revenue growth was driven by strong volume growth of 8.6% and price/mix of +4%. Our international brands – Tuborg, Carlsberg and 1664 Blanc – were significant contributors, but we also saw good results for our local power brands. Operating profit grew organically by 15.8%.
Western Europe delivered organic growth in net revenue of 3.0% and in operating profit of 7.0%. Reported operating margin was 15.0% (+60bp). These results were driven by good progress on our SAIL’22 priorities, including craft & speciality and alcohol-free brews, value management and Funding the Journey, and by the warm summer in some markets.
WESTERN EUROPE
IMPROVE MARGINS AND GROW OPERATING PROFIT ORGANICALLY
ASIA
ACCELERATE ORGANIC GROWTH THROUGH PREMIUMISATION
EASTERN EUROPE
REBALANCE THE GOLDEN TRIANGLE TOWARDS TOP-LINE GROWTH
Organic growth in net revenue
Organic growth in net revenue
Operating margin expansion
Share of Groupvolume
47%Share of Group
operating profit
21%Share of Group
operating profit
50%Share of Group
volume
24%Share of Group
volume
29%Share of Group
operating profit
29%
+11.3%
+7.0%Organic operating
profit growth
+60bp +13.3% +9.3%
+15.8%Organic operating
profit growth
Organic operating profit growth

CARLSBERG GROUP ANNUAL REPORT 2018 2018 HIGHLIGHTS 10
VOLUMES
Total volumes grew organically by 4.8%.
Volumes in Asia were up organically by 8.6%,
with strong results achieved in most markets
in the region. In Western Europe, the organic
volume growth of 3.6% was impressive,
supported by warm weather during the
summer. In Eastern Europe, all markets
contributed to the organic growth of 3.1%.
GROSS PROFIT AFTER LOGISTICS
MARGIN
The gross profit after logistics (GPaL) margin
developed favourably in 2018, growing
organically by 100bp. The improvement was
the result of the positive price/mix and supply
chain efficiencies. All three regions saw positive
development of their GPaL margins.
OPERATING PROFIT
Operating profit grew organically by 11% as a
result of volume growth, positive price/mix and
the benefits from Funding the Journey. 2018
was the last year of Funding the Journey,
which has delivered benefits of around DKK
3bn. The sharp focus on efficiencies, costs and
cash has been embedded in our daily business
processes and systems, and will continue in the
years to come.
FREE CASH FLOW
Free cash flow amounted to DKK 6.2bn,
positively impacted by strict financial discipline
and the change in trade working capital of DKK
+1.9bn. During the year, we increased our
ownership share in a number of subsidiaries
and associates, with net investments
amounting to a total of around DKK 2.8bn.
GOLDEN TRIANGLE
WELL-BALANCED GOLDEN TRIANGLE
The Golden Triangle is an important KPI in our performance management at Group, regional and market level. By focusing on our SAIL’22 priorities, we aim to optimise the balance between market share/volumes, gross profit after logistics (GPaL) margin, operating profit and cash generation, thereby creating sustainable value growth.

CARLSBERG GROUP ANNUAL REPORT 2018 2018 HIGHLIGHTS 11
FINANCIAL HIGHLIGHTS
DELIVERING ON OUR PRIORITIES
Net revenue¹ (DKKbn)
Operating profit (DKKbn)
Net profit (DKKbn)
ROIC (%)
NIBD/EBITDA (x)
Dividend/share (DKK)
62.5bn
Net revenue grew organically
by 6.5% as a result of volume
growth of 4.8% and price/mix
of 2%. Asia and Eastern
Europe contributed positively
to both volume and price/mix,
while in Western Europe
price/mix was negatively
impacted by country mix.
In reported terms, net revenue
grew by 3.0%, impacted by
adverse currencies.
9.3bn
Operating profit grew
organically by 11.0%, with
all three regions delivering
very solid results. Operating
expenses were up 4%
organically due to marketing
investments. Excluding
marketing, they declined by
1% due to Funding the
Journey benefits.
Reported operating profit of
DKK 9.3bn was up 5.1% due
to currencies. The operating
margin was 14.9% (+30bp).
5.3bn
Net profit attributable to
shareholders in Carlsberg A/S
was up significantly on 2017.
In 2017, net profit was
impacted by a DKK 4.8bn
impairment.
Adjusted for special items
after tax, net profit increased
by 9% to DKK 5.4bn. The
positive development was the
result of higher operating
profit, lower financial expenses
and a lower effective tax rate
compared with 2017.
8.1%
Return on invested capital
(ROIC) increased by 120bp
to 8.1%, impacted by lower
invested capital, improved
profitability and a lower
effective tax rate.
ROIC excluding goodwill
increased by 520bp to
20.9%, with improvements
achieved in all three regions.
More details on ROIC are
provided in section 2.1 of the
consolidated financial
statements.
1.29x
Despite a higher dividend
payout in the year and
increased ownership of
subsidiaries and associates,
net interest-bearing debt
(NIBD) was reduced further
in 2018. NIBD/EBITDA was
1.29x, comfortably meeting
our target of below 2.0x.
We have thus delivered on
all our capital allocation
priorities, as explained on
page 34.
18.0
The Supervisory Board will
propose to the AGM a
dividend of DKK 18.0. This
equals a payout ratio of 51%,
in line with our dividend policy
of an adjusted payout ratio of
around 50%. The proposed
dividend represents an
increase of 13% on 2017.
In addition, the Supervisory
Board has announced a DKK
4.5bn share buy-back
programme (see page 34).
More details on operating profit are provided in section 1 of the
consolidated financial statements.
Find more details on NIBD, capital structure, dividends and share
buy-back in section 4 of the consolidated financial statements.
40
45
50
55
60
65
2017 2018
5
6
7
8
9
10
2016 2017 20180.0
1.5
3.0
4.5
6.0
7.5
2016 2017 2018
0
5
10
15
20
25
Incl. goodwill Excl. goodwill
0.0
0.5
1.0
1.5
2.0
2.5
2016 2017 2018
0
4
8
12
16
20
2016 2017 2018
¹ Net revenue restated for 2017.
2016 2017 2018

CARLSBERG GROUP ANNUAL REPORT 2018 2018 HIGHLIGHTS 12
OTHER KEY FINANCIALS Net special items (DKKbn)
Net financial items (DKKbn)
Effective tax rate (%)
TWC/net revenue (%)
Cash flow (DKKbn)
NIBD (DKKbn)
-88m
Net special items of DKK
-88m were primarily impacted
by measures related to
Funding the Journey in
Western Europe.
The significantly negative
special items in 2017 were
the result of an impairment of
the Baltika brand in Russia.
More details on special items
are provided in section 3.1 of
the consolidated financial
statements.
-722m
Net financial items continued
to decline and amounted to
DKK -722m (2017: DKK
-788m), positively impacted
by the lower NIBD. Excluding
foreign exchange gains, net,
they amounted to DKK
-758m, in line with our
assumption at the beginning
of the year of around DKK
-800m.
More details on net financial
items are provided in section
4.1 of the consolidated financial
statements.
28%
The effective tax rate (ETR)
of 28% was significantly
down on 2017, when it was
impacted by the impairment
of the Baltika brand in Russia.
Adjusted for this impairment,
the effective tax rate (adj.
ETR) in 2017 was 29%. At the
beginning of the year, we
expected an effective tax rate
for 2018 of below 29%.
More details on tax are
provided in section 6 of
the consolidated financial
statements and in the section
on economic value and total tax
contribution in the 2018
Sustainability Report.
-16.0%
The change in trade working
capital was DKK +1,908m
and average trade working
capital to net revenue
declined further to -16.0%
compared to -14.0% for
2017. The change was
positively impacted by the
change in trade payables,
which was the result of higher
volumes, our disciplined cash
focus, country mix and the
acquisition of Cambrew.
More details on working capital
are provided in section 1.4 of
the consolidated financial
statements.
6.2bn
Operating cash flow was
12.0bn, up DKK 213m. The
free cash flow of DKK 6.2bn
was positively impacted by
the strong trade working
capital. The decline versus
2017 was primarily due to the
increased ownership in
Cambrew and Super Bock.
CapEx was DKK 4.0bn,
initially expected to be around
DKK 4.5bn, and in October
adjusted to DKK 4.0-4.5bn.
More details on the free cash
flow are provided in sections
1.4 and 5.2 of the consolidated
financial statements.
17.3bn
Net interest-bearing debt
(NIBD) declined by DKK
2.3bn. Since 2015, NIBD has
declined by DKK 13.6bn.
70% of the gross financial
debt was long term. 96% of
the net financial debt was
denominated in EUR and DKK
(after swaps). The duration
was 4.2 years, within our
target of 2-5 years.
More details on financing and
capital structure are provided in
section 4 of the consolidated
financial statements.
-6.0
-4.5
-3.0
-1.5
0.0
1.5
2016 2017 2018
-2.0
-1.6
-1.2
-0.8
-0.4
0.0
2016 2017 2018
20
25
30
35
40
45
2016 2017 2018
-20.0
-18.0
-16.0
-14.0
-12.0
-10.0
2016 2017 2018
0
3
6
9
12
15
2016 2017 2018
0
6
12
18
24
30
2016 2017 2018

CARLSBERG GROUP ANNUAL REPORT 2018 2018 HIGHLIGHTS 13
KEY FIGURES
FIVE-YEAR SUMMARY 2018 2017 2016 2015 2014
Volumes (million hl)¹
Beer 112.3 107.1 116.9 120.3 122.8
Other beverages 20.8 19.2 21.9 21.5 21.0
DKK million
Income statement
Net revenue¹ 62,503 60,655 62,614 65,354 64,506
Gross profit¹ 31,220 30,208 31,419 31,925 31,781
Operating profit before amortisation, depreciation
and impairment losses 13,420 13,583 13,006 13,213 13,338
Operating profit before special items 9,329 8,876 8,245 8,457 9,230
Special items, net -88 -4,565 251 -8,659 -1,353
Financial items, net -722 -788 -1,247 -1,531 -1,191
Profit before tax 8,519 3,523 7,249 -1,733 6,686
Income tax -2,386 -1,458 -2,392 -849 -1,748
Consolidated profit 6,133 2,065 4,857 -2,582 4,938
Attributable to
Non-controlling interests 824 806 371 344 524
Shareholders in Carlsberg A/S (net profit) 5,309 1,259 4,486 -2,926 4,414
Shareholders in Carlsberg A/S, adjusted² 5,359 4,925 3,881 4,292 5,496
Statement of financial position
Total assets 117,700 114,251 126,906 124,901 137,458
Invested capital 82,721 84,488 96,089 94,950 108,866
Invested capital excl. goodwill 31,792 33,991 43,225 44,680 56,319
Interest-bearing debt, net 17,313 19,638 25,503 30,945 36,567
Equity, shareholders in Carlsberg A/S 45,302 46,930 50,811 43,489 52,437
Statement of cash flows
Cash flow from operating activities 12,047 11,834 9,329 10,140 7,405
Cash flow from investing activities -5,891 -3,154 -713 -2,618 -6,735
Free cash flow 6,156 8,680 8,616 7,522 670
¹ Comparative figures for 2017 have been restated because of the change in accounting policies arising from the
implementation of IFRS 15, the change in classification of certain central costs and the change in definition of volumes,
all as of 1 January 2018.
2018 2017 2016 2015 2014
Investments
Acquisition and disposal of property,
plant and equipment and intangible
assets, net -3,773 -3,868 -3,596 -2,922 -5,647
Acquisition and disposal of subsidiaries -974 268 1,969 -33 -1,681
Financial ratios
Gross margin¹ % 50.0 49.8 50.2 48.8 49.3
Operating margin¹ % 14.9 14.6 13.2 12.9 14.3
Return on invested capital (ROIC) % 8.1 6.9 5.9 5.6 5.8
ROIC excl. goodwill % 20.9 15.7 12.7 11.0 10.7
Effective tax rate for the year % 28.0 41.4 33.0 49.0 26.1
Equity ratio % 38.5 41.1 40.0 34.8 38.3
Debt/equity ratio (financial gearing) x 0.36 0.40 0.48 0.66 0.65
NIBD/operating profit before
depreciation, amortisation and
impairment losses x 1.29 1.45 1.96 2.34 2.74
Interest cover x 12.92 11.26 6.61 5.53 7.75
Stock market ratios
Earnings per share (EPS) DKK 34.8 8.3 29.4 -19.2 28.9
Earnings per share, adjusted (EPS-A)² DKK 35.2 32.3 25.4 28.1 36.0
Cash flow from operating activities per
share (CFPS) DKK 78.7 77.6 61.2 66.3 48.4
Free cash flow per share (FCFPS) DKK 40.2 56.9 56.5 49.2 4.4
Dividend per share (proposed) DKK 18.0 16.0 10.0 9.0 9.0
Payout ratio % 52 194 34 nm 31
Payout ratio, adjusted² % 51 50 39 32 25
Share price (B shares) DKK 692.6 745.0 609.5 612.5 478.8
Market capitalisation DKKm 104,830 112,116 92,896 93,977 74,525
Number of shares (year-end, excl.
treasury shares) 1,000 152,457 152,390 152,552 152,552 152,538
Number of shares (average, excl.
treasury shares) 1,000 152,428 152,496 152,552 152,542 152,535
² Adjusted for special items after tax.
CARLSBERG GROUP ANNUAL REPORT 2018 REGIONAL REVIEW 14
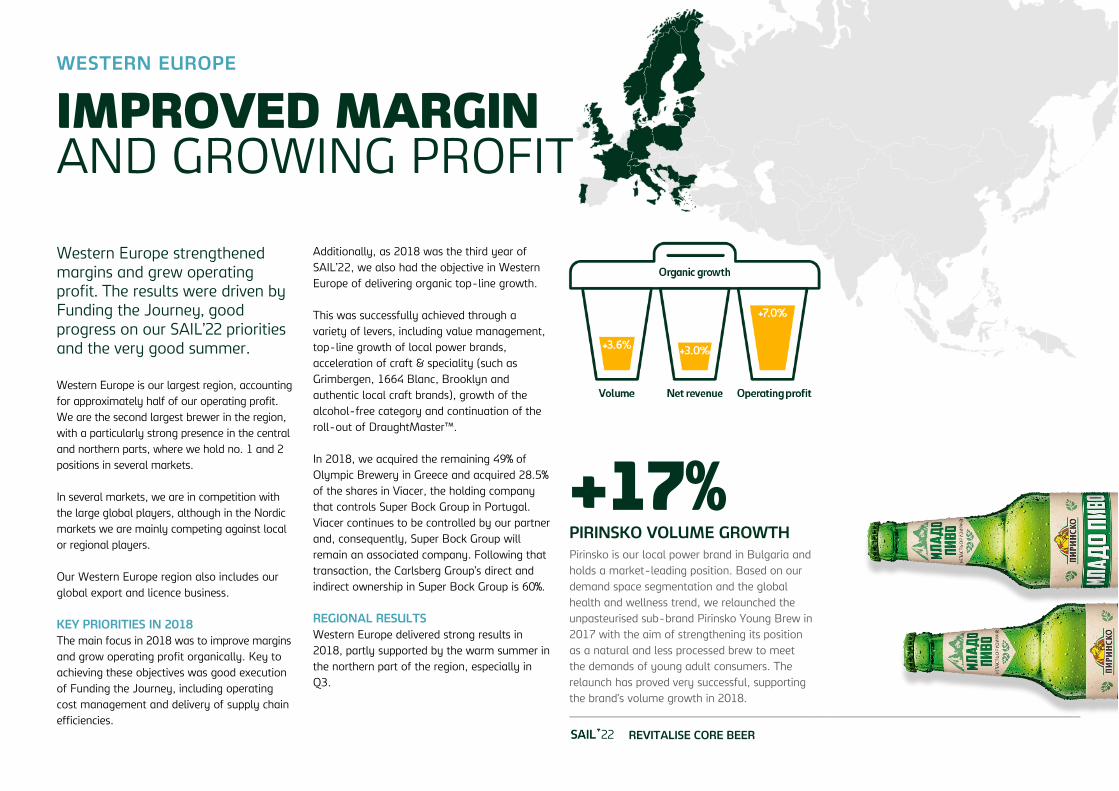
Western Europe strengthened margins and grew operating profit. The results were driven by Funding the Journey, good progress on our SAIL’22 priorities and the very good summer.
Western Europe is our largest region, accounting
for approximately half of our operating profit.
We are the second largest brewer in the region,
with a particularly strong presence in the central
and northern parts, where we hold no. 1 and 2
positions in several markets.
In several markets, we are in competition with
the large global players, although in the Nordic
markets we are mainly competing against local
or regional players.
Our Western Europe region also includes our
global export and licence business.
KEY PRIORITIES IN 2018
The main focus in 2018 was to improve margins
and grow operating profit organically. Key to
achieving these objectives was good execution
of Funding the Journey, including operating
cost management and delivery of supply chain
efficiencies.
Additionally, as 2018 was the third year of
SAIL’22, we also had the objective in Western
Europe of delivering organic top-line growth.
This was successfully achieved through a
variety of levers, including value management,
top-line growth of local power brands,
acceleration of craft & speciality (such as
Grimbergen, 1664 Blanc, Brooklyn and
authentic local craft brands), growth of the
alcohol-free category and continuation of the
roll-out of DraughtMaster™.
In 2018, we acquired the remaining 49% of
Olympic Brewery in Greece and acquired 28.5%
of the shares in Viacer, the holding company
that controls Super Bock Group in Portugal.
Viacer continues to be controlled by our partner
and, consequently, Super Bock Group will
remain an associated company. Following that
transaction, the Carlsberg Group’s direct and
indirect ownership in Super Bock Group is 60%.
REGIONAL RESULTS
Western Europe delivered strong results in
2018, partly supported by the warm summer in
the northern part of the region, especially in
Q3.
WESTERN EUROPE
Regional review
IMPROVED MARGIN AND GROWING PROFIT
+17% PIRINSKO VOLUME GROWTH
Pirinsko is our local power brand in Bulgaria and
holds a market-leading position. Based on our
demand space segmentation and the global
health and wellness trend, we relaunched the
unpasteurised sub-brand Pirinsko Young Brew in
2017 with the aim of strengthening its position
as a natural and less processed brew to meet
the demands of young adult consumers. The
relaunch has proved very successful, supporting
the brand’s volume growth in 2018.
REVITALISE CORE BEER

CARLSBERG GROUP ANNUAL REPORT 2018 REGIONAL REVIEW 15
Net revenue grew organically by 3.0% as a
result of 3.6% organic total volume growth and
-1% price/mix. Reported net revenue grew by
1.2% due to the divestment of the German
wholesaler Nordic Getränke in April 2017 and
a negative currency impact.
Price/mix was positive in the majority of our
Western European markets, supported by
successful premiumisation efforts and some
price increases, partly countered by the higher
growth of non-beer products. At regional level,
the positive price/mix was more than offset by
country mix due to growth in licence markets,
such as Turkey, and loss of volumes in high-
revenue export markets in the Middle East.
Organic operating profit grew by 7.0%, and the
operating margin improved by 60bp to 15.0%.
The earnings progress was driven by volume
growth, value management, premiumisation,
Funding the Journey benefits and lower
depreciation.
The organic operating profit growth in H2 was
6.3%, and the operating margin declined by
10bp year-on-year for the half-year due to
higher investments in SAIL’22 priorities such as
craft & speciality, alcohol-free brews and the
DraughtMaster™ roll-out.
Total volumes increased organically by 3.6%
and beer volumes by 2.9%, with a significant
improvement in H2 thanks to the warm
weather in Q3 after a difficult start to the year.
Non-beer volumes grew by 5.9% due to good
performance in the Nordics. Reported volumes
grew by 3.0%, with a small net acquisition
impact from the divestment of Nordic Getränke
in 2017. We estimate that our regional market
share grew slightly.
PERFORMANCE BY MARKET
THE NORDICS
The Nordic businesses all benefited from the
extraordinarily warm weather in Q3, which
positively impacted volumes, net revenue and
earnings. Total volumes grew organically by 6%.
Our total volumes in Denmark grew in line with
a slightly growing beer market. We saw good
performance of the Carlsberg brand as well as
Tuborg Classic, Grimbergen, 1664 Blanc and
alcohol-free brews such as Carlsberg Nordic,
whereas Tuborg Green declined due to price
increases on large-pack formats. As a result,
price/mix improved by 5%. The non-beer
business delivered strong growth, supported by
the warm summer.
Total volume¹ (m hl)
Net revenue¹ (DKKbn)
Operating profit (DKKbn)
Operating margin¹ (%)
48
52
56
60
64
68
2017 2018
20
24
28
32
36
40
2017 2018
1
2
3
4
5
6
2016 2017 2018
12
13
14
15
16
17
2017 2018
Change Change
Volume (million hl) 2017 Organic Acq., net FX 2018 Reported
Beer 46.1 2.9% -0.2% - 47.3 2.7%
Other beverages 14.5 5.9% -2.0% - 15.1 3.9%
Total volume 60.6 3.6% -0.6% - 62.4 3.0%
DKK million
Net revenue 35,716 3.0% -0.7% -1.1% 36,151 1.2%
Operating profit before special items 5,144 7.0% 0.2% -1.7% 5,425 5.5%
Operating margin (%) 14.4 15.0 60bp
¹ Volume and net revenue restated for 2017.

CARLSBERG GROUP ANNUAL REPORT 2018 REGIONAL REVIEW 16
In Norway, we saw continued good business
performance. Our volumes grew slightly, and
price/mix strengthened, supported by growth
of premium brands such as Frydenlund and
1664 Blanc. Within alcohol-free brews, we
saw good traction for Munkholm and the
alcohol-free variants of 1664 Blanc and
Somersby. The new Snap Pack packaging was
introduced for the Carlsberg brand in Q4.
In Sweden, total volumes grew, driven by
strong non-beer volume growth, while beer
volumes declined slightly due to the loss of
distribution rights for third-party brands. Our
own beer brands, such as Eriksberg, Carlsberg
and 1664 Blanc, achieved good volume growth
and grew market share. Within alcohol-free
brews, the Carlsberg brand continued to drive
category growth and expanded its market-
leading position.
In Finland, the beer market declined following
a regulatory change that increased the ABV
level permitted in beverages sold in the regular
off-trade, thereby allowing the sale of spirit-
based drinks. Our total volume growth was
strong, driven by relisting at a major retailer in
Q1 for the winter campaign and growth of
non-beer products. Sinebrychoff, our Finnish
subsidiary, will celebrate its 200th anniversary
in 2019.
FRANCE
In a growing French market, our volumes grew
by 5%. Price/mix improved as a result of
continued growth of our premium brands. Our
craft & speciality and alcohol-free brews
performed well, while the Kronenbourg brand
in the mainstream segment declined. The good
overall performance was achieved despite
some supply issues due to the French national
rail strike in Q2.
SWITZERLAND
The positive trend in our Swiss business
continued. Volumes grew slightly, and
price/mix improved, driven by solid
performance of our beer portfolio. Our key beer
brand, Feldschlösschen, our regional brands
and our alcohol-free brews all delivered good
growth.
POLAND
The Polish market grew, and our volumes
increased slightly. After a slow start to the
year, the business accelerated throughout the
summer and towards the end of the year. We
achieved price/mix of high-single-digit
percentages, helped by good performance for
our upper-mainstream and premium brands
such as Okocim, Carlsberg, Zatec and
Somersby, as well as strong performance of
alcohol-free brews.
THE UK
Our volumes declined by 3% in a slightly
growing beer market. Our volumes in the
premium category increased, driven by growth
of brands such as Poretti and licence brands,
whereas the mainstream Carlsberg brand lost
market share. During the year, we completed
our exit from porterage activities, which
reduced net revenue.
OTHER MARKETS
In the other Western European markets, we
achieved particularly strong top-line and
margin improvement in markets such as
Bulgaria, Croatia, Serbia and the Baltics, where
good growth of Carlsberg, Tuborg, craft &
speciality and alcohol-free brews supported a
positive price/mix development.
Our German business delivered solid top-line
performance, driven by our local power brands
Lübzer and Astra.
In our Export & Licence business, licence sales
of Tuborg in Turkey increased significantly,
while sales in some Middle Eastern countries
declined due to significant market contraction
caused by higher duties and VAT.
Our markets in Western Europe
Consumption characteristics Our position
Our
operations
Country
Per capita
beer
consumption
(litres)
On-trade
share of
market,
approx. (%)
Market
position (no.)
Market
share (%) Breweries¹
Denmark 59 26 1 54 1
Sweden 46 19 1 31 1
Norway 50 20 1 53 1
Finland 78 14 1 38 1
France 33 27 2 28 1
Switzerland 56 38 1 40 1
UK 66 47 4 10 1
Poland 98 9 3 18 3
Germany² 84 16 1 17 2
Italy 25 38 4 7 1
The Baltics 66-78 4-9 1-2 29-39 2
South East Europe 35-81 23-58 1-3 13-35 6
Portugal 52 58 1 47 1
¹ Breweries with capacity above 100,000 hl. ² Northern Germany.
Source: GlobalData, Carlsberg estimates.

CARLSBERG GROUP ANNUAL REPORT 2018 REGIONAL REVIEW 17
Asia had another year of strong top- and bottom-line growth, with an important driver being the continued growth of our international brands.
The importance of Asia for the Group has
increased significantly over the past decade,
during which we have expanded our presence in
the region organically and through acquisitions.
Today, we have an attractive position, with
no. 1 and 2 positions in seven markets. The
competitive landscape varies significantly
between markets, with both global players
and local brewers present.
SAIL’22 singles out Asia as a significant
contributor to the Group’s top- and bottom-
line growth. Consequently, a significant
proportion of our SAIL’22 investments has
been allocated to the region.
KEY PRIORITIES IN 2018
In 2018, our overall regional priority was to
accelerate profitable top-line growth by growing
our international core brands – Tuborg and
Carlsberg – and our international speciality
brand 1664 Blanc. In China specifically, we
aimed at growing the footprint of these brands
by expanding into new channels and big cities
outside our core western China provinces.
In addition to the international brands, we
continued to strengthen our local power
brands, which still contribute over 50% of
our Asian volume.
In 2018, we further expanded our Asian
footprint through the acquisition of a
controlling stake in our former joint venture
in Cambodia, Cambrew. Following the
acquisition, our ownership share is 75%.
REGIONAL RESULTS
The Asia region continued its good progress
and delivered a strong set of results for the
year. Net revenue grew organically by 13.3%,
driven by 8.6% organic volume growth and
+4% price/mix. Reported net revenue grew by
11.4% due to a negative currency impact in
most countries in the region, which more than
offset the acquisition impact of Cambrew.
The solid 4% price/mix improvement was the
result of our ongoing premiumisation efforts,
especially in China, where the premium
portfolio performed strongly.
ASIA
CONTINUED GROWTH AND PREMIUMISATION
+13% TUBORG GROWTH IN ASIA
2018 was another strong year for Tuborg in Asia.
Important drivers of the continued success of Tuborg
during the year included the introduction of a new visual
identity, and a variety of activities on our global music
platform Tuborg Open. In 2018, Tuborg Open brought
together popular musicians from local markets to create
a song with a single global story told in different ways,
as each collaborating artist used their own unique lyrics
to reflect diversity and local culture.
GROW IN ASIA

CARLSBERG GROUP ANNUAL REPORT 2018 REGIONAL REVIEW 18
Organic operating profit grew by 15.8%, mainly
due to the revenue growth. The operating
margin declined by 40bp to 20.4%. While the
gross margin improved considerably, this was
offset by a significant increase in marketing
investments, with a sizeable proportion of our
SAIL’22 investments being allocated to further
strengthening our Asian business, and as a
result of the consolidation of Cambrew.
The organic volume growth was broadly based,
with all major markets delivering solid growth.
PERFORMANCE BY MARKET
CHINA
Our Chinese business achieved very strong
results in 2018. Net revenue grew organically
by 15%, driven by 8% organic volume growth
and +7% price/mix.
We outperformed the Chinese market, which
declined by an estimated 1% due to the
continued decline of the mainstream segment
as the premium segments continued to expand.
As a result, our premium portfolio grew by
13%. Our price/mix improvement was the result
of list price increases and the pronounced
premiumisation trend.
INDIA AND NEPAL
Our Indian business had an excellent year,
following a challenging 2017. Our volumes
grew by 19% and price/mix was +7%. The
price/mix improvement was driven by strong
growth of the Carlsberg brand and improved
pricing. Profitability improved considerably
due to volume growth, positive price/mix and
supply chain efficiencies following the opening
of the Karnataka brewery.
Our Nepalese business showed strong progress.
Following a 30% excise tax increase in the
middle of the year, retail beer prices rose
by approximately 15%, leading to a slightly
declining price/mix. In H2, we revitalised the
communication platform for the Tuborg brand.
LAOS, VIETNAM AND CAMBODIA
In Laos, our volumes grew by high-single-digit
percentages, driven by growth of all three
categories: beer, soft drinks and water. Price/
mix was slightly negative due to product mix.
Our Beerlao brand strengthened its position as
a result of improved communication. In line
with our focus on craft & speciality, we launched
crafty line extensions of the Beerlao brand.
In Cambodia, we gained control of Cambrew
in August after increasing our ownership from
50% to 75%. We are currently in the process of
rebuilding the business and are optimistic about
the prospects for the market and our business.
Although the business had a challenging year
with double-digit volume decline and operating
loss, the first signs of the rebuild are
encouraging.
Total volume¹ (m hl)
Net revenue¹ (DKKbn)
Operating profit (DKKbn)
Operating margin¹ (%)
20
24
28
32
36
40
2017 2018
0
4
8
12
16
20
2017 2018
1.0
1.5
2.0
2.5
3.0
3.5
2016 2017 2018
18
19
20
21
22
23
2017 2018
Change Change
Volume (million hl) 2017 Organic Acq., net FX 2018 Reported
Beer 31.2 8.3% 2.0% - 34.4 10.3%
Other beverages 2.8 11.6% 15.7% - 3.6 27.3%
Total volume 34.0 8.6% 3.1% - 38.0 11.7%
DKK million
Net revenue 13,944 13.3% 2.7% -4.6% 15,530 11.4%
Operating profit before special items 2,905 15.8% -1.3% -5.6% 3,164 8.9%
Operating margin (%) 20.8 20.4 -40bp
¹ Volume and net revenue restated for 2017.
CARLSBERG GROUP ANNUAL REPORT 2018 REGIONAL REVIEW 19
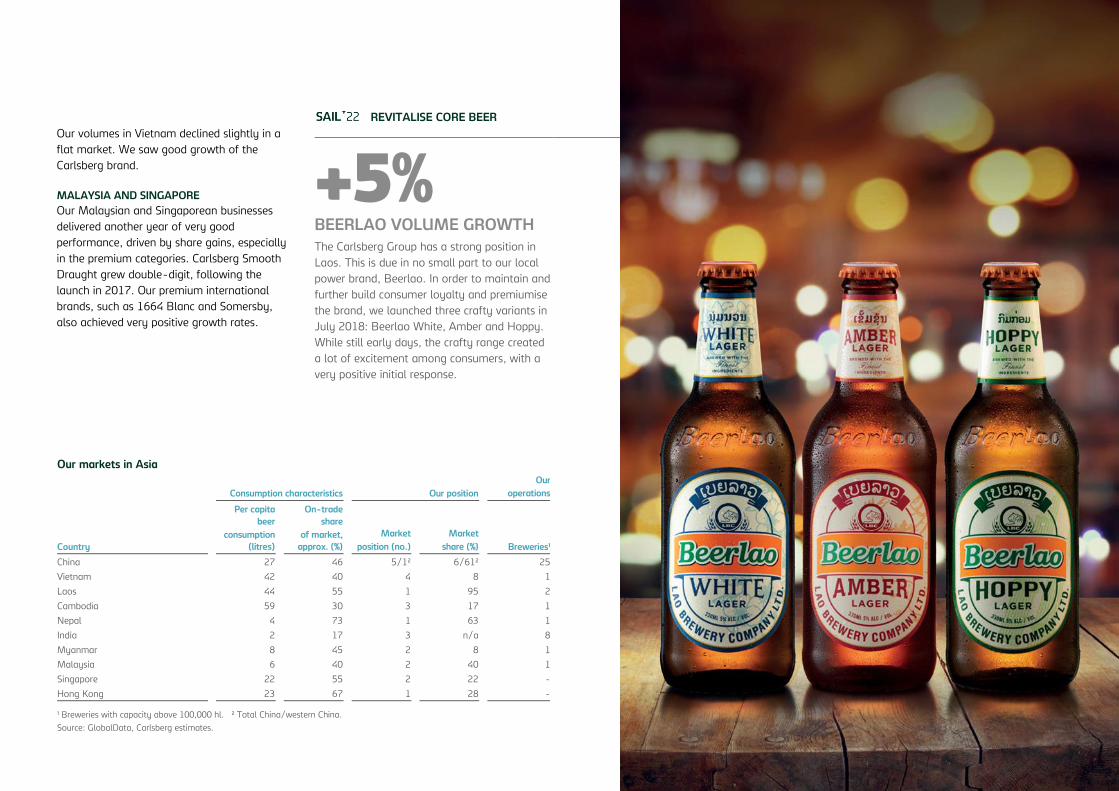
Our volumes in Vietnam declined slightly in a
flat market. We saw good growth of the
Carlsberg brand.
MALAYSIA AND SINGAPORE
Our Malaysian and Singaporean businesses
delivered another year of very good
performance, driven by share gains, especially
in the premium categories. Carlsberg Smooth
Draught grew double-digit, following the
launch in 2017. Our premium international
brands, such as 1664 Blanc and Somersby,
also achieved very positive growth rates.
REVITALISE CORE BEER
+5% BEERLAO VOLUME GROWTH
The Carlsberg Group has a strong position in
Laos. This is due in no small part to our local
power brand, Beerlao. In order to maintain and
further build consumer loyalty and premiumise
the brand, we launched three crafty variants in
July 2018: Beerlao White, Amber and Hoppy.
While still early days, the crafty range created
a lot of excitement among consumers, with a
very positive initial response.
Our markets in Asia
Consumption characteristics Our position
Our
operations
Country
Per capita
beer
consumption
(litres)
On-trade
share
of market,
approx. (%)
Market
position (no.)
Market
share (%) Breweries¹
China 27 46 5/1² 6/61² 25
Vietnam 42 40 4 8 1
Laos 44 55 1 95 2
Cambodia 59 30 3 17 1
Nepal 4 73 1 63 1
India 2 17 3 n/a 8
Myanmar 8 45 2 8 1
Malaysia 6 40 2 40 1
Singapore 22 55 2 22 -
Hong Kong 23 67 1 28 -
¹ Breweries with capacity above 100,000 hl. ² Total China/western China.
Source: GlobalData, Carlsberg estimates.

CARLSBERG GROUP ANNUAL REPORT 2018 REGIONAL REVIEW 20
Eastern Europe achieved solid organic top-line growth in 2018, driven by a combination of volume growth and price/mix.
Eastern Europe is our smallest region,
accounting for 21% of operating profit. Our two
main markets in the region are Russia and
Ukraine, accounting for approximately 65% and
20% respectively of regional volumes.
We have leading positions in all markets in
Eastern Europe. In Russia and Ukraine, the
competitive environment is split between a
strong presence of global players and a
large number of small local brewers.
KEY PRIORITIES IN 2018
The overriding priority for Eastern Europe in
2018 was to rebalance the Golden Triangle in
Russia following the significant volume decline
in 2017 caused by PET downsizing.
Regaining momentum in the Russian PET
segment was therefore a focus, as was further
strengthening our regional and local core brand
portfolios and alcohol-free brews, where
Baltika 0 holds a market-leading position.
The ongoing channel shift towards modern
trade and the growth of DIOT (draught in off-
trade) in Russia reinforced our focus on
growing in these channels.
Finally, we continued our sharp focus on costs
to counter the pressure on operating margin
due to the volume growth in the low-priced
PET segment.
In the other Eastern European markets, the
focus was on continuing the good momentum
of recent years and maintaining the well-
balanced Golden Triangle in these markets.
EASTERN EUROPE
REBALANCING VOLUME AND VALUE
+5% VOLUME GROWTH IN UKRAINE
Carlsberg Ukraine enjoyed another year of
excellent results, supported by growth of our strong
local power brand, Lvivske, and our international
brands. Originally brewed by monks, Lvivske is the
oldest Ukrainian beer brand, dating back to 1715.
It is part of Ukrainian history, culture and cuisine
and holds a market share of around 16%. To
support the continued relevance of the brand for
consumers, we expanded the range with two line
extensions: Lwiwske Eksportowe and Knaypa.
REVITALISE CORE BEER
CARLSBERG GROUP ANNUAL REPORT 2018 REGIONAL REVIEW 21
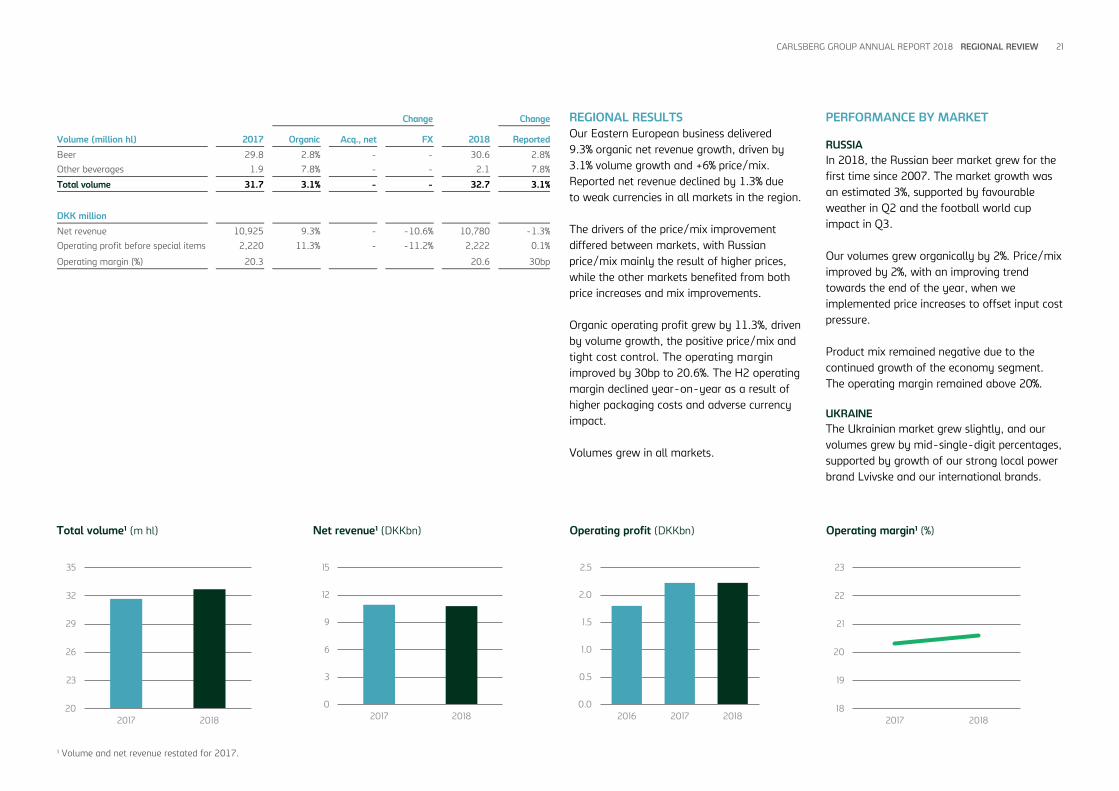
REGIONAL RESULTS
Our Eastern European business delivered
9.3% organic net revenue growth, driven by
3.1% volume growth and +6% price/mix.
Reported net revenue declined by 1.3% due
to weak currencies in all markets in the region.
The drivers of the price/mix improvement
differed between markets, with Russian
price/mix mainly the result of higher prices,
while the other markets benefited from both
price increases and mix improvements.
Organic operating profit grew by 11.3%, driven
by volume growth, the positive price/mix and
tight cost control. The operating margin
improved by 30bp to 20.6%. The H2 operating
margin declined year-on-year as a result of
higher packaging costs and adverse currency
impact.
Volumes grew in all markets.
PERFORMANCE BY MARKET
RUSSIA
In 2018, the Russian beer market grew for the
first time since 2007. The market growth was
an estimated 3%, supported by favourable
weather in Q2 and the football world cup
impact in Q3.
Our volumes grew organically by 2%. Price/mix
improved by 2%, with an improving trend
towards the end of the year, when we
implemented price increases to offset input cost
pressure.
Product mix remained negative due to the
continued growth of the economy segment.
The operating margin remained above 20%.
UKRAINE
The Ukrainian market grew slightly, and our
volumes grew by mid-single-digit percentages,
supported by growth of our strong local power
brand Lvivske and our international brands.
Total volume¹ (m hl)
Net revenue¹ (DKKbn)
Operating profit (DKKbn)
Operating margin¹ (%)
20
23
26
29
32
35
2017 2018
0
3
6
9
12
15
2017 2018
0.0
0.5
1.0
1.5
2.0
2.5
2016 2017 201818
19
20
21
22
23
2017 2018
Change Change
Volume (million hl) 2017 Organic Acq., net FX 2018 Reported
Beer 29.8 2.8% - - 30.6 2.8%
Other beverages 1.9 7.8% - - 2.1 7.8%
Total volume 31.7 3.1% - - 32.7 3.1%
DKK million
Net revenue 10,925 9.3% - -10.6% 10,780 -1.3%
Operating profit before special items 2,220 11.3% - -11.2% 2,222 0.1%
Operating margin (%) 20.3 20.6 30bp
¹ Volume and net revenue restated for 2017.

CARLSBERG GROUP ANNUAL REPORT 2018 REGIONAL REVIEW 22
The growth of Lvivske was supported by the
line extension Lvivske Eksportowe and an
alcohol-free variant.
Price/mix developed very favourably due to
price increases and growth in premium
products, with particularly strong growth for
1664 Blanc, Grimbergen, Somersby and
Garage.
OTHER MARKETS
Our businesses in Belarus, Kazakhstan and
Azerbaijan all delivered solid revenue and
earnings growth.
Our markets in Eastern Europe
Consumption characteristics Our position
Our
operations
Country
Per capita
beer
consumption
(litres)
On-trade
share
of market,
approx. (%)
Market
position (no.)
Market
share (%) Breweries¹
Russia 52 19 1 30 8
Ukraine 42 12 1 33 3
Belarus 50 5 1 29 1
Kazakhstan 32 7 2 36 1
Azerbaijan 5 41 1 75 1
¹ Breweries with capacity above 100,000 hl.
Source: GlobalData, Carlsberg estimates.
16% BALTIKA 7 VOLUME GROWTH
Baltika 7 is a premium line extension of
Baltika, the leading national brand in Russia.
In 2018, Russia hosted the football world cup,
and Baltika was the proud sponsor of the
Russian team. To support the team, Baltika 7
carried out a successful campaign called
“FootCheering”, featuring some of Russia’s
top celebrities. The campaign included TV
advertising and a wide range of digital media.
Baltika 7 was also activated in more than
2,000 outlets in 66 cities.
LEVERAGE OUR STRONGHOLDS

CARLSBERG GROUP ANNUAL REPORT 2018 OUR STRATEGY 23
Beer market trends and characteristics vary between and within our regions, although common features can be detected.
An ongoing trend in many markets is the
ongoing premiumisation, supported by the
growth of craft & speciality beer and, in Asia,
particularly China, the increasing demand for
international beer brands. The growing interest
in craft & speciality has several advantages for
the beer category: it sparks consumer interest
in the beer category, generates a positive
perception of beer.
In many Western European markets and in
Russia, the alcohol-free beer segment is
showing solid growth rates as a consequence
of consumers’ desire to consume less alcohol
and pursue a more healthy lifestyle. The
growth of the segment is also supported by
greater choice and the significantly improved
quality of alcohol-free beer.
Several Asian markets, including India, Laos,
Cambodia and Vietnam, are seeing market
volume growth. This is being driven by factors
such as expanding populations, growing
economies, urbanisation and rising disposable
income levels. It is important to note, though,
that growth trends in these emerging markets
are subject to volatility.
BEER TRENDS
Our strategy
BEER TRENDS IN OUR REGIONS
“RE-INVENT THE BAR” BY DEVELOPING DIGITAL TOOLS
“Re-invent the bar” is an excellent example of our
digital approach and adoption of agile ways of
working. “Re-invent the bar” aims to strengthen the
relationship with our on-trade customers by offering
digital products that can help them grow their
business. Based on a radical customer-centric way of
working, including continuous testing and validation
with customers in Hong Kong, Switzerland and
Denmark, we work in cross-functional teams to
rapidly develop, introduce and continuously improve a
digital product for educating bar staff and another
digital product that enables customers to make better
business decisions based on insights from available
data.
STEP CHANGE WITH DIGITAL

24CARLSBERG GROUP ANNUAL REPORT 2018 OUR STRATEGY
We strive to be a successful, professional and attractive brewer in our markets. This ambition is crucial for our business model with its clear priorities on markets, portfolio, customers, supply chain and sustainability.
BUSINESS MODEL
A BUSINESS MODEL DRIVING VALUE
Core beer is a volume business. Consequently, strong market positions are key drivers of profitability. We have particular focus on the 25 markets in Western Europe, Eastern Europe and Asia where we are no. 1 or 2.
BREWING FOR A BETTER TODAY AND TOMORROW In all our markets, we aim to lead in sustain- ability because it is central to our purpose and because we sincerely believe it is the right thing to do – delivering tangible benefits for our business and for society as a whole.
Beer is our core business and the strength of our portfolio lies in the strong local roots of our local brands combined with our excellent craft & speciality brands, alcohol-free brews and international core beer brands.
BREWING FOR A BETTER TODAY AND TOMORROW Our brands offer us powerful opportunities for communicating with consumers. We use these opportunities to encourage moderate, responsible consumption of our products. We also increase the availability of alcohol-free brews.
Our customers range from on-trade to off-trade, from big to small. We aim to become their preferred beer supplier, providing products and services that will deliver value growth for them and us.
BREWING FOR A BETTER TODAY AND TOMORROW Such products and services include sustainable packaging solutions, such as Snap Pack, and our innovative draught system, DraughtMaster™. In addition, digital solutions and services are becoming increasingly important enablers.
Funding the Journey as a programme came to a successful end in 2018. It has delivered efficiencies and reduced costs across supply chain and back office. Going forward, Funding the Journey ways of working will prevail.
BREWING FOR A BETTER TODAY AND TOMORROW Recognising the need for strong actions in the face of complex sustainability challenges, our sustainability programme Together Towards ZERO sets clear and ambitious targets for carbon emissions and water usage.
… AND STRIVE TO EXCEL IN OUR SERVICE TO ON- AND OFF-TRADE CUSTOMERS...
… WHERE WE DELIVER AN ATTRACTIVE BEER PORTFOLIO FOR ALL CONSUMER SITUATIONS...
WE FOCUS ON THE MARKETS WHERE WE HAVE A NO. 1 OR 2 POSITION...
... BY OPTIMISING OUR SUPPLY CHAIN AND IMPROVING PROCESSES AND SYSTEMS.

CARLSBERG GROUP ANNUAL REPORT 2018 OUR STRATEGY 25
SAIL’22 made good progress in 2018, delivering the remaining benefits from Funding the Journey as well as top-line growth.
When launching SAIL’22 in March 2016, we
defined clear strategic priorities for how we
intended to strengthen our core beer business
while at the same time positioning the
Company for future growth.
Our strategic priorities were defined based on
analyses of the trends impacting the beer
industry (see page 23).
2018 was the third year of SAIL’22. It was also
the final year of Funding the Journey as a
specific programme. By reinvesting part of the
benefits from this programme, we have been
able to invest in top-line growth.
Our results in 2018 reassure us that our
strategic priorities are right. Our focus in the
future will be on both delivering top-line
growth and improving the operating margin by
premiumisation and continued focus on
efficiencies and costs.
In the following pages, we present snapshots
of initiatives carried out during the year and
follow up on our performance against our
strategic KPIs. Our strategic priorities are
presented in the 2016 Annual Report,
available on www.carlsberggroup.com.
SAIL’22
SHIFTING GEARS TO TOP-LINE GROWTH
“We’re pleased with the progress of our strategic priorities, which have been supported by Funding the Journey investments.“
Cees ’t Hart
CEO
+9% NYA CARNEGIE VOLUME GROWTH
Teaming up with Brooklyn Brewery, we established
the Nya Carnegie brewery in Stockholm, Sweden, in
2012. The craft brewery’s product line-up features
seven year-round beers, seasonal releases and special
limited experiments. Since its inauguration, the
brewery and its restaurant have become increasingly
popular with both Stockholmers and tourists from
around the world. Leveraging Carlsberg’s distribution
set-up, Nya Carnegie’s beers are sold across Sweden.
In 2018, Nya Carnegie grew volumes by 9%.
GROW CRAFT & SPECIALITY

CARLSBERG GROUP ANNUAL REPORT 2018 OUR STRATEGY 26
STRENGTHEN THE CORE
There were many initiatives and actions during
the year to grow and further develop our core
beer portfolio in our core markets, strengthen
execution and deliver on Funding the Journey.
These included the betterment of the Carlsberg
brand, continued support of our local power
brands, further roll-out of DraughtMaster™,
stepping up on digital and executing strong
discipline on Funding the Journey.
CARLSBERG
The Carlsberg brand has a unique history
spanning 171 years. In September, we launched
a new, distinctly Danish redesign of the brand.
This redesign was based on extensive research
into the brand’s heritage, which led to careful
recrafting of famous brand elements, including
bringing the Carlsberg logo closer to its original
design from 1904.
We also launched a series of sustainable
packaging innovations, including the Snap
Pack, which is set to reduce plastic waste
globally by more than 1,200 tonnes a year.
Other sustainability improvements include a
new coating on refillable glass bottles to extend
their lifespan and new caps that remove oxygen
to make the beer taste fresher for longer.
The Carlsberg brand’s green ink is also being
replaced with a Cradle to Cradle Certified™ ink
to improve recyclability. Read more about these
sustainability initiatives on page 32.
The new design and betterments have been
launched in Norway, Finland, Sweden, Denmark
and the UK, and many more markets, such as
China, India and Malaysia, will follow in the
coming months.
LOCAL POWER BRANDS
Our local power brands each occupy a distinct
position in their respective markets. Although
they differ by market, they share many
common characteristics, opportunities and
challenges. In order to support the continued
relevance of these brands with consumers, we
have developed a common brand framework,
enabling markets to apply a well-tested, all-
round methodology to strengthen their local
brands and positions in the market.
All our markets have embraced the group-
wide concepts and methodologies to further
strengthen their local power brands. Examples
include Okocim in Poland and Pirinsko in
Bulgaria (see page 14).
DRAUGHTMASTER™
The roll-out of our proprietary one-way keg
system continued in 2018. DraughtMaster™
is an important enabler for our premiumisation
efforts in the on-trade, as it allows outlets to
serve a greater variety of beer on tap, including
craft & speciality brands.
The system is now available in all Western
European markets, and the process of
converting all steel-keg installations in the
Nordic markets is well under way and expected
to be finalised within the next two to three
years. In 2018, the number of DraughtMaster™
installations grew by around 35%.
DIGITAL
Digital is one of the cornerstones of SAIL’22.
In 2018, our digital journey took a big step
forward with the establishment of a digital
business transformation team responsible for
assessing digital technologies and business
models, and accelerating the development of
digital products and services to drive future
growth.
To support our digital transformation, we are
applying agile ways of working in small, cross-
functional teams, giving them the opportunity
to develop and test new products and services
in an agile and minimal way to determine what
and how to upscale into meaningful solutions.
+5% OKOCIM VOLUME GROWTH
In 2017, we successfully relaunched our
local upper-mainstream Okocim brand in
Poland with a focus on authenticity, quality
and beer expertise. Following up on the
relaunch, in 2018 Carlsberg Polska launched
its biggest ever digital campaign for the
Okocim brand, further strengthening the
brand image in relation to competitors,
expanded distribution and launched popular
radler variants.
REVITALISE CORE BEER

CARLSBERG GROUP ANNUAL REPORT 2018 OUR STRATEGY 27
During the year, we focused on a series of
“lighthouse projects” aimed at taking
a digital-first view of different areas of the
business with a view to growing top and
bottom line. The initial projects focused on
route-to-market and the on-trade channel,
identifying promising new products and services
to step-change our customer offer. The scope
also included areas within supply chain,
including demand planning and artificial
intelligence.
We have established a digital council, chaired
by our CEO and comprising the heads of
digital, commercial, global business services,
logistics and HR along with young “digital
natives”. The council meets once a month to
sponsor, accelerate and provide optimal
conditions for the digital reinvention of the
Group.
FUNDING THE JOURNEY
Funding the Journey came to a successful end
in 2018. The four elements of the programme
– value management, supply chain efficiency,
operating cost management and right-sizing of
businesses – all delivered better than initially
expected. The programme achieved benefits of
around DKK 3bn compared with the 2015
baseline. The benefits included the incentive
payment to the top-200 management team,
who were enrolled in the two-year Funding the
Journey cash programme.
The strong delivery has enabled us to reinvest
more than DKK 1bn in the growth priorities of
SAIL’22, including roll-out of DraughtMaster™,
expansion of our international premium brands
in China, growth of craft & speciality across our
markets, further development of our alcohol-
free brews, and stepping up on digital.
The programme has led to the implementation
of new ways of working, and systems and
processes are now in place to ensure continued
momentum within value management, and
operating cost and supply chain management.
Going forward, we will therefore continue our
strict focus on efficiencies, costs and cash, and
further improvement in these areas will
contribute to continuous margin improvement.
STEP CHANGE WITH DIGITAL
CARL’S SHOP In 2018, we launched Carl’s Shop – an integrated
online ordering platform for on-trade customers –
in Western Europe. Carl’s Shop will provide superior
customer service and reduce costs by digitising
processes, globalising platforms and scaling online
solutions. It works on all devices, enabling customers
to place orders at any time of the day and avoid
waiting in line for telesales. The platform gives access
to training and educational material and targeted
promotions, and aims to provide advice on best-
selling products based on similar outlets. The initial
results have been promising, showing visible growth
in net revenue per customer.
CARLSBERG GROUP ANNUAL REPORT 2018 OUR STRATEGY 28
POSITION FOR GROWTH
Recognising our geographic footprint, a pivotal
ambition of SAIL’22 was to identify the Group’s
organic growth drivers. We aim to achieve
sustainable organic top-line growth through a
combination of volume growth, premiumisation
and price. Asia is expected to be the main driver
of volume growth, while premiumisation will
be achieved through the growth of craft &
speciality and alcohol-free brews in all three
regions.
CRAFT & SPECIALITY
In 2018, our craft & speciality portfolio delivered
growth of 26%, achieved through strong
growth of the international speciality brands
Grimbergen and 1664 Blanc, and of authentic
craft brands such as Brooklyn, Nya Carnegie in
Sweden and Valaisanne in Switzerland. By the
end of 2018, we had ten craft breweries in
Western Europe.
1664 BLANC
1664 Blanc is our sophisticated French wheat
beer. In 2018, the brand achieved a significant
milestone, breaking through and going well
beyond the 1m hl mark. The brand is sold
globally and delivered volume growth of 49%
over the year.
Growth came from every corner of the world,
and the brand has been successful in every
market where it has been launched. In 2018,
1664 Blanc was launched in markets such as
Denmark, Mexico and Chile.
GRIMBERGEN
Grimbergen is our abbey beer from Belgium
dating back to 1128. It is an important brand in
our international speciality portfolio, and in
2018 it continued its growth trajectory with
brand volume up 14%.
NYA CARNEGIE
The Nya Carnegie brewery in Stockholm is
an excellent example of our authentic craft
strategy. The brewery, a cooperation with
Brooklyn, was established in 2012, with the
first brew coming out in 2014.
The combination of Brooklyn’s superior craft
brewing skills and Carlsberg’s brand-building
and quality expertise and distribution power has
generated strong growth rates since 2014. In
2018, Nya Carnegie volumes grew by 9%.
ALCOHOL-FREE BREWS
Our alcohol-free brew portfolio encompasses
alcohol-free line extensions of core beer
brands, the alcohol-free line extension of our
international speciality brand 1664 Blanc and
stand-alone alcohol-free brands. Combined,
these showed strong momentum in 2018 and
our alcohol-free brews grew by 33% in Western
Europe.
LOCAL ALCOHOL-FREE BREWS
Our extensive portfolio of local alcohol-free
brews includes brands such as Carlsberg Nordic
in Denmark, Munkholm in Norway, Feld-
schlösschen Alkoholfrei in Switzerland and
Baltika 0 in Russia.
In 2018, Baltika 0 grew by 35%, supported by
a massive communication and sampling
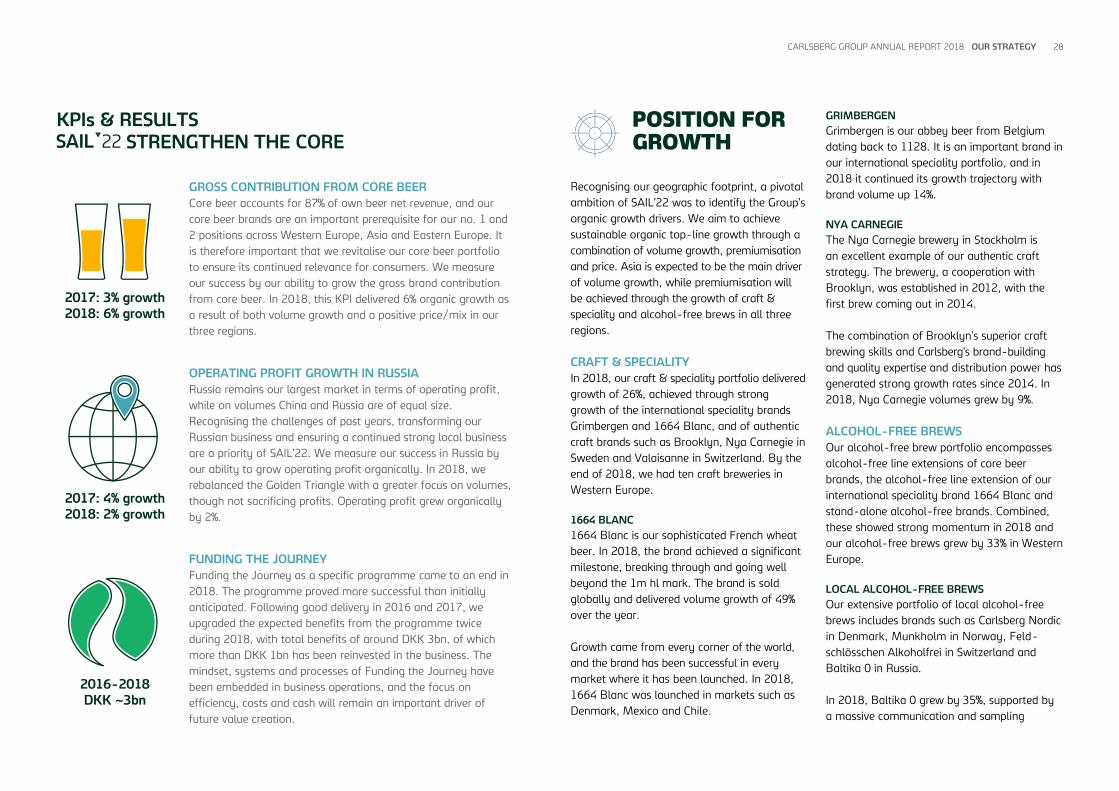
KPIs & RESULTS STRENGTHEN THE CORE
2017: 3% growth
2018: 6% growth
GROSS CONTRIBUTION FROM CORE BEER
Core beer accounts for 87% of own beer net revenue, and our
core beer brands are an important prerequisite for our no. 1 and
2 positions across Western Europe, Asia and Eastern Europe. It
is therefore important that we revitalise our core beer portfolio
to ensure its continued relevance for consumers. We measure
our success by our ability to grow the gross brand contribution
from core beer. In 2018, this KPI delivered 6% organic growth as
a result of both volume growth and a positive price/mix in our
three regions.
2017: 4% growth
2018: 2% growth
OPERATING PROFIT GROWTH IN RUSSIA
Russia remains our largest market in terms of operating profit,
while on volumes China and Russia are of equal size.
Recognising the challenges of past years, transforming our
Russian business and ensuring a continued strong local business
are a priority of SAIL’22. We measure our success in Russia by
our ability to grow operating profit organically. In 2018, we
rebalanced the Golden Triangle with a greater focus on volumes,
though not sacrificing profits. Operating profit grew organically
by 2%.
2016-2018
DKK ~3bn
FUNDING THE JOURNEY
Funding the Journey as a specific programme came to an end in
2018. The programme proved more successful than initially
anticipated. Following good delivery in 2016 and 2017, we
upgraded the expected benefits from the programme twice
during 2018, with total benefits of around DKK 3bn, of which
more than DKK 1bn has been reinvested in the business. The
mindset, systems and processes of Funding the Journey have
been embedded in business operations, and the focus on
efficiency, costs and cash will remain an important driver of
future value creation.

CARLSBERG GROUP ANNUAL REPORT 2018 OUR STRATEGY 29
campaign, strong commercial focus and the
successful launch of Baltika 0 Wheat in 2017.
In Sweden, we promoted our growing range
of alcohol-free brews by delivering alcohol-
free brews to pleasure yachtsmen in
Stockholm’s archipelago. Our "alcohol-free
brews boat" subsequently received a five-star
rating from consumers on its Facebook page.
Our alcohol-free brew portfolio in Sweden
grew by 34%.
In France, our alcohol-free brews grew by 21%,
driven by 1664 Blonde Sans Alcool, 1664
Blanc Sans Alcool and Tourtel.
BIRELL
During the year, we launched Birell as the
Group’s first global alcohol-free brew. The brand
was launched in Bulgaria and Poland in May.
The comprehensive launch campaign included
TV commercials, cutting-edge digital marketing,
outdoor advertising and extensive sampling
applying various techniques.
The initial consumer response has been positive,
and in Bulgaria the brand has already achieved
a market share of 15% of the alcohol-free beer
segment.
GROW IN ASIA
Our investments in premiumisation and
expansion in Asia are delivering strong results.
In 2018, total volumes grew organically by
8.6%. Our international portfolio in the region –
Tuborg, Carlsberg and 1664 Blanc – delivered
even better results, growing volumes by 14%.
SAIL’22 is focused in particular on China and
India, as these markets have good potential for
top-line growth. In China, premiumisation will
be an important driver of top-line growth,
while in India market volume growth is also
expected to be a contributor. Our 2018 results
in Asia are presented on pages 17-19.
+49% 1664 BLANC VOLUME GROWTH
1664 Blanc is a good example of SAIL’22.
In 2015, it was a local French line extension
of the 1664 lager. As part of SAIL’22, it was
decided to turn the brand into a leading global
speciality brand. Since then, 1664 Blanc has
undergone a rapid transformation and is now
the fastest-growing global brand in the Group.
Its popularity with consumers is indisputable,
not least in China, where the brand’s
sophisticated look and great taste led to
volume growth of 51% in 2018, making China
the brand’s largest single market.
GROW CRAFT & SPECIALITY

CARLSBERG GROUP ANNUAL REPORT 2018 OUR STRATEGY 30
CHINA
During 2018, we further expanded our footprint
in China by applying a “big city” approach
outside our core western China provinces. By
the end of the year, we were present in more
than 20 large cities, where the consumer
response to our international portfolio has been
very positive. Our geographic expansion was a
positive contributor to the price/mix of 7%.
INDIA
Although the Indian beer market is volatile,
we continued to support and develop our
Indian business. Tuborg and Carlsberg, our
main brands in the country, delivered growth of
17% and 31% respectively.
KPIs & RESULTS POSITION FOR GROWTH
2017: 29% growth
2018: 26% growth
WIN IN GROWING CATEGORIES: CRAFT & SPECIALITY
Craft & speciality is an attractive category in most markets.
The contribution margin of our craft & speciality portfolio
significantly exceeds the core beer average, and consequently
growing the portfolio’s share of total beer volume contributes
positively to margin progression. 2018 was another year of
strong growth for our craft & speciality brands with volume
growth of 26%. Our international speciality brands 1664 Blanc
and Grimbergen achieved volume growth of 14% and 49%
respectively.
2017: 15% growth
2018: 33% growth
WIN IN GROWING CATEGORIES: ALCOHOL-FREE BREWS
The alcohol-free brews category offers excellent margin
opportunities and is growing across Western Europe and also in
Eastern Europe. We believe it will remain an attractive beverage
category in the years to come, as it benefits from the growing
global health & wellness trend among consumers. Our portfolio
of alcohol-free brews had very good momentum in 2018,
achieving volume growth of 33% in the Western European
markets. In Russia, growth was 33%, with significant volume
growth for brands such as Baltika 0 and Baltika 7 Non-
Alcoholic.
2017: 8.1% growth
2018: 15.8% growth
GROW IN ASIA
In 2018, Asia accounted for 29% of Group volumes and Group
operating profit. Continuing the growth trajectory of this region
remains a priority of SAIL’22, and in 2018 volume growth was
8.6% and organic operating profit growth 15.8%. Good growth of
our international brands as well as our local power brands
contributed to both top- and bottom-line growth. Particularly
strong results were achieved in China and India, with organic
operating profit growth of 18% and 131% respectively.
4x1 PREMIUMISING LOCAL CHINESE POWER BRANDS
In December 2017, we simultaneously
launched a white (wheat) beer line extension
of our four local Chinese power brands:
ChongQing, Xixia, Wusu and Dali. All the
brands have market-leading positions in
their local geographies, but, following the
general decline of mainstream beer in China,
all were in need of a premium offering.
Generally, Chinese consumers enjoy wheat
beer, and core beer consumers proved willing
to trade up and pay more for a local wheat
beer, delivering strong results for 2018.
REVITALISE CORE BEER & GROW IN ASIA

CARLSBERG GROUP ANNUAL REPORT 2018 OUR STRATEGY 31
WINNING CULTURE
An important element of SAIL’22 is our winning
culture, which is team-based, performance-
driven, characterised by a high level of integrity
and sets high standards within sustainability.
TEAM-BASED PERFORMANCE
Our team-based performance culture is
based on our triple A concept (alignment,
accountability and action). During the year, we
maintained strict discipline on performance
management and ensured a team-based, one-
company approach in our monthly business
performance reviews and by aligning targets
across markets and regions.
TOGETHER TOWARDS ZERO
Our ambitious sustainability programme,
Together Towards ZERO (TTZ), defines our
sustainability priorities and sets measurable
targets for 2022 and 2030 respectively within
the areas of carbon, water, responsible drinking
and health & safety.
Recognising that we cannot achieve our
ambitions by working in isolation, TTZ was
devised with the support of experts using a
science-based approach, and we are
collaborating with experts to deliver on it.
We also launched the Carlsberg Young Scientist
Community, where a group of postdocs will
build on our scientific strength to identify and
develop solutions within water and energy
consumption at our breweries.
In 2018, we entered into a partnership with
WWF Denmark. With its help, we will devise
solutions to reduce the total – “beer-in-hand”
– carbon footprint of our products and protect
local water resources. We will make further
announcements about this during 2019.
ZERO CARBON FOOTPRINT
We are committed to bold climate action and
the TTZ carbon targets are designed to reduce
our emissions in line with the 1.5°C level of the
Paris Agreement. We believe this is possible
while still continuing to drive business growth.
At our breweries
We are acting fast to eliminate coal because it
is a carbon-intensive, polluting source of
energy. In 2018, we reduced our coal usage by
28% compared with 2017, representing a 78%
reduction since 2015. We will continue the
focus on converting our remaining coal-fuelled
sites in China, India and Poland on our journey
towards zero coal by 2022.
We use solar installations at our breweries
in China, India and Switzerland, and in 2018
we added a new 1 MW rooftop installation
at our brewery in Lithuania. Other sources of
renewables include biomass and biogas. A new
biomass boiler at our Čelarevo brewery in
Serbia, fuelled by wood pellets, helped reduce
relative carbon emissions at the site by 22% in
2018.
Moreover, in 2018 we introduced the Carlsberg
Operational Manual at our breweries in order
to continuously improve within our existing
processes through best practice learnings from
across the Group.
Packaging
At 40%, packaging is the biggest source of
carbon emissions in our value chain. As many
stakeholders are involved in the development
and use of packaging, we must work together
to improve it. One outcome of our work in this
area was the launch of several packaging
innovations for the Carlsberg brand during
2018 (see next page).
ZERO WATER WASTE
Water is an essential ingredient both in our
products and for cleaning during the brewing
process. Treating wastewater so that it can be
reused is an essential method for cutting water
usage within the brewing process. With the
right equipment, it can be reused for cleaning
bottles or safely discharged into the
environment.
In the UK, a new project involves recovering
used rinsewater from the cleaning of bottles
prior to filling. After treatment, the water is
used for pasteurisation, saving around 4.5
million litres of water during the year.
ZERO IRRESPONSIBLE DRINKING
While consumers make their own decisions
about how they consume our beers, we can
support them in making smart choices. Our
campaigns target the biggest issues in each
market. In some, drink-driving is the greatest
challenge, while in others it is underage or
binge drinking. By working with local partners,
we pinpoint the key behaviour to change at
point of sale, during consumption moments
and across our marketing communications.
20,000 SHOPS VISITED IN UKRAINE
On Global Beer Responsibility Day, Carlsberg
Ukraine employees wearing T-shirts featuring
retro audio-cassettes with the headline, “Don’t
know how it works? Sorry, no beer for you!”
visited 20,000 shops to talk about the dangers
of selling alcohol to young people. Shop-
workers were given fun gifts to prompt ID
requests, and two leading psychologists
mentored parents on how to talk to their
teenage children about the importance of
not drinking alcohol while underage.
TOGETHER TOWARDS ZERO –
RESPONSIBLE DRINKING

32CARLSBERG GROUP ANNUAL REPORT 2018 OUR STRATEGY
OUR NEW SNAP PACK
A GREENER GREEN
FRESHER BEER
Our revolutionary new Snap Pack is designed to reduce waste, eliminating more than 1,200 tonnes of plastic per year.
The use of Cradle to Cradle Certified™ ink on our Pilsner bottle labels allows better recycling.
Our new ZerO² cap is cleverly designed to remove oxygen from the bottle for fresher tasting beer every time.
TONNES OF PLASTIC SAVED
In September, we launched the pioneering Snap Pack solution to reduce plastic waste. Snap Pack glues together multi-packs, thereby making it possible for the Carlsberg Group to reduce plastic waste by more than 1,200 tonnes per year – equivalent to 60 million plastic bags. In addition, a number of other betterments for the Carlsberg brand were achieved, including caps that remove oxygen to make the beer taste fresher for longer and changing the brand’s green ink to a Cradle to Cradle Certified™ ink to improve recyclability.
1,200
TOGETHER TOWARDS ZERO

CARLSBERG GROUP ANNUAL REPORT 2018 OUR STRATEGY 33
By the end of 2018, 96% of our products
carried responsible drinking messages advising
consumers not to drink-drive and not to drink
when underage or pregnant. In addition, we
included information on ingredients and
nutritional values per 100 ml on 86% of
packaging in Western Europe.
ZERO ACCIDENTS CULTURE
Protecting the lives and health of our people
is a fundamental priority for us. In 2017, we
achieved a significant reduction in accident
rates, and in 2018 we sustained this.
During the year, we rolled out our new Life
Saving Rules programme across the business.
Built on industry experience, this programme
focuses on the specific areas where we have
learned that people’s lives can be endangered
if rules are not followed correctly. We are
providing training for our leaders, preparing
them to better model desired behaviours,
communicate consistently and engage their
teams with health & safety. By the end of
2018, we had reached 1,500 leaders, and we
are targeting 1,200 more in 2019.
Despite the positive progress within health &
safety, our performance in 2018 was not good
enough, as we very sadly recorded three
fatalities. These tragedies underline the need
for day-to-day vigilance to create a zero
accidents culture.
LIVE BY OUR COMPASS
In order to ensure the high degree of integrity,
honesty and ethical business conduct that is
part of our winning culture, as well as reduce
the risk of non-compliance with applicable
rules and regulations, in 2016 we launched the
Live by our Compass programme.
The programme continues to provide detailed
guidance on ethical behaviour, emphasising the
importance of integrity at all levels of our
organisation. We reinforce this with risk
assessments, third-party screening,
compliance training and market audits.
In December 2018, we launched a single
global online platform covering all codes,
policies and manuals, accompanied by a
comprehensive communications package.
REPORTING
Our 2018 Sustainability Report contains
much more information on TTZ, including a
detailed description of our KPIs and progress
towards our 2022 and 2030 targets.
The report carries an assurance statement
by PwC on selected indicators, serves as our
annual Communication on Progress to the
United Nations Global Compact and enables
us to live up to our legal responsibility for CSR
disclosure under section 99a of the Danish
Financial Statements Act.
Download our
Sustainability Report
www.carlsberggroup.com/reports-downloads/
carlsberg-group-2018-sustainability-report/
KPIs & RESULTS WINNING CULTURE
ZERO CARBON FOOTPRINT
We want to achieve zero carbon emissions at our breweries by
2030, with a 50% reduction by 2022. Our full value chain target
is a 30% reduction in emissions by 2030, with a 15% reduction by
2022. In 2018, we had reduced relative carbon emissions by 20%
since 2015.
ZERO WATER WASTE
We aim to halve water usage at our breweries by 2030, with a
25% reduction by 2022. At 3.1 hl/hl in 2018, we have made a
9% improvement in water efficiency from our 2015 baseline.
Performance in 2018 was on a par with 2017, meaning that
faster change will be required to reach our 2022 target.
ZERO IRRESPONSIBLE DRINKING
Our targets include 100% distribution of alcohol-free brews to
expand consumer choice and 100% of our markets to improve on
responsible drinking year on year. In 2018, we made steady
progress on key performance indicators, including responsible
drinking messages and consumer information on our packaging,
and growing alcohol-free beer availability and volume.
ZERO ACCIDENTS CULTURE
We are determined to provide a safe working environment for
our employees, and our aim is to achieve zero lost-time
accidents by 2030. In 2017, we achieved a significant reduction
in accident rates, a performance we sustained in 2018. However,
our performance was not good enough, as we very sadly
recorded three fatalities.

CARLSBERG GROUP ANNUAL REPORT 2018 OUR STRATEGY 34
DELIVERING VALUE
SAIL’22 is an organic strategy focused on
improving and growing our current business in
order to deliver value to shareholders.
When launching SAIL’22 in March 2016, we
identified three priorities for creating value for
shareholders: growing operating profit
organically, improving return on invested
capital, and ensuring an optimal capital
allocation.
Our capital allocation principles are well-
defined: 1. We invest in our business to drive
long-term value creation; 2. We target a net
interest-bearing debt/EBITDA ratio of below
2.0x; 3. We target a dividend payout ratio of
around 50%; 4. We distribute any excess cash
back to shareholders through share buy-back;
and 5. We deviate from the latter principle only
if value-enhancing acquisition opportunities
arise.
By 2017, the second year of our seven-year
strategy, we successfully delivered on the first
three capital allocation principles. 2018 was
another year of successful delivery on our
priorities for creating shareholder value,
including the first three capital allocation
principles.
SHARE BUY-BACK
As a result of recent years’ healthy development
of the business and the strong earnings and
cash flow, the Supervisory Board has decided
to use share buy-back programmes to return
excess cash to shareholders. The size of
potential future share buy-back programmes
will depend on the expected organic and
inorganic investments needed to grow the
business and the Group’s intention to maintain
net interest-bearing debt/EBITDA below 2.0x.
Consequently, the Group intends to buy back
shares worth DKK 4.5bn during the 12-month
period starting 6 February 2019. The share
buy-back programme will be split into two
tranches of approximately six months each.
The first tranche started on 6 February at an
amount of DKK 2.5bn, with a maximum of 15
million shares.
The purpose of the programme is to reduce the
Company’s share capital and meet obligations
related to the Group’s share-based incentive
programmes. At the Annual General Meeting
in 2020, the Supervisory Board intends to
propose that shares not used for hedging of
incentive programmes be cancelled.
The programme will be executed in accordance
with the Safe Harbour Regulation (see section
4.3 of the consolidated financial statements).
The Group is entitled to suspend or stop the
programme at any time. Any such decision will
be disclosed to the public by a Company
announcement.
The Carlsberg Foundation will participate pro
rata in the 2019 share buy-back programme
at its current notional holding of 30.33% of the
total shares in the Carlsberg Group.
KPIs & RESULTS DELIVER VALUE FOR SHAREHOLDERS
2017: 8.4% growth
2018: 11.0% growth
ORGANIC GROWTH IN OPERATING PROFIT
Sustainable organic growth in operating profit is testament to
our ability to deliver top-line growth and margin improvement.
In 2018, we delivered strongly against this KPI, achieving 11.0%
organic growth in operating profit. The benefits from Funding
the Journey were larger than initially expected and were the
driver of the organic growth achieved in 2016, 2017 and 2018.
2017: +100bp
2018: +120bp
ROIC IMPROVEMENT
In order to drive a positive development in shareholder returns,
we aim to continuously improve return on invested capital
(ROIC). We will do this by improving earnings and reducing
invested capital. In 2018, ROIC improved by 120bp to 8.1%.
The main driver of the improvement was the growth in
operating profit, the lower tax rate and lower invested capital.
2017: 1.45x
2018: 1.29x
OPTIMAL CAPITAL ALLOCATION
Our capital allocation targets include NIBD/EBITDA of below
2.0x and a dividend payout ratio of around 50%. We already
achieved both these targets for 2017. Investing in profitable
growth to secure the long-term value creation of the Group is,
and will remain, our first priority, followed by maintaining a
leverage of below 2.0x and a payout ratio of around 50%. As all
these priorities were delivered on in 2018, the Supervisory
Board announced a 12- month DKK 4.5bn share buy-back
programme, starting 6 February 2019.

CARLSBERG GROUP ANNUAL REPORT 2018 GOVERNANCE 35
We seek to manage risks in such a way that we minimise their threats while making the best use of their opportunities.
GOVERNANCE STRUCTURE
The Supervisory Board is ultimately responsible
for risk management, and it has appointed
the Audit Committee to act on its behalf in
monitoring the effectiveness of the Group’s risk
management. Monitoring is mainly performed
in connection with the half-year reviews,
although recurring financial risks are evaluated
on a quarterly basis. The Audit Committee
adopts guidelines for key areas of risk,
monitors developments and ensures that plans
are in place for the management of individual
risks, including commercial and financial risks.
The Executive Committee (ExCom) is
responsible for reviewing the overall risk
exposure associated with the Group’s activities.
Risks are assessed according to a two-
dimensional heat map rating system that
estimates the impact of the risk on operating
profit or brand/image and the likelihood of the
risk materialising. Based on this assessment,
ExCom identifies the high-risk issues for the
coming year. ExCom assigns risk owners, who
are then responsible for mitigating the risks
through a programme of risk management
activities.
Local entities and Group functions are
responsible for the identification, evaluation,
qualification, recording and reporting to
management of business risks at local level.
Local and functional risk assessment follows
the same principles and methodology as
Group-level risk assessment. The responsibility
for the local review lies with the risk officer,
typically the local head of Finance, to ensure
that risk management is incorporated into
management meetings, business reviews and
key decision-making. Following the risk
identification, local risk owners are assigned
and given responsibility for mitigating the risks
through a programme of risk management
activities.
Risk reporting is incorporated in regular
business reviews and Group Risk Management
is responsible for facilitating and following up
on risk action plans for the most significant
risks in the Carlsberg Group.
RISKS IDENTIFIED FOR 2019
The identified risks for 2019 are shown in the
box to the right. We rank risk according to
impact and likelihood, and the five highest
ranked risks are described in the following.
COMMODITY AND FOREIGN EXCHANGE
IMPACT Description
This remains a high-impact risk for 2019.
Increasing commodity prices, including barley
and malt due to the poor harvest after the very
warm summer in 2018, and adverse foreign
exchange movements negatively affect the
prices of raw materials and other inputs,
thereby affecting the competitiveness of the
business and the delivery of results.
Competition in most markets is generally fierce
and trade term pressure from our customers
remains strong, leading to a challenging pricing
environment.
Foreign exchange and commodity risks,
including our hedging approach, are described
in more detail in the notes to the consolidated
financial statements, see sections 1.2, 1.3 and
4.6.
Mitigation
We will continue to embed a value-based
approach across all markets to achieve a
positive price/mix while applying the Golden
Triangle to ensure a balanced approach to
RISK MANAGEMENT
Governance
MANAGING RISKS TO REDUCE UNCERTAINTIES
IDENTIFIED RISKS FOR 2019
RISKS WITH HIGHEST POTENTIAL
IMPACT AND PROBABILITY
• Commodity and foreign exchange
impact
• Legal and regulatory compliance
• Partnerships
• Industry consolidation
• Political and economic instability
OTHER IDENTIFIED RISKS
• Cyber and IT security
• Income tax
• Regulatory changes, incl. duties
• Strategy execution
• Talent management
• Pensions
• Business/brewery interruption
• Quality design and execution

CARLSBERG GROUP ANNUAL REPORT 2018 GOVERNANCE 36
market share, GPaL (gross profit after logistics)
margin and operating profit.
LEGAL AND REGULATORY COMPLIANCE Description
Legal and regulatory compliance risks
include competition law and data protection
compliance as well as non-compliance with
anti-bribery & corruption regulations. Failure
to comply with regulations and Group policies
may lead to fines, claims and brand damage.
In 2018, the Group experienced competition
law dawn raids in more than one jurisdiction.
Competition law is a real and growing risk. The
significance of this risk is also reflected in the
consolidated financial statements (see section
3.3).
Mitigation
We are strengthening the Group-wide control
framework covering all legal compliance areas,
including, but not limited to, competition law,
anti-bribery & corruption and data protection.
We have policies in place, and conduct regular
training of relevant employees and emphasise
continued awareness building for the top-60
leadership team. Employees are required to
pass e-learning modules within relevant legal
areas on a continuous basis to drive awareness
and knowledge building.
PARTNERSHIPS Description
Partnerships remain a high risk for 2019.
We cooperate with partners in a number of
markets, particularly the global soft drinks
manufacturers in the Nordic countries and
some Asian markets as well as local partners
in some Asian and European markets.
The strength of the relationships with our
different partners, and in some cases the risk of
partnership disagreement, may affect our
ability to manage the growth of our business.
Mitigation
We seek to have an ongoing dialogue with
our partners to identify any issues at an early
stage. The relevant members of ExCom are
actively involved in partner relationships,
participating in the ongoing dialogues to
ensure constructive negotiations and effective
and fast resolution of potential issues.
INDUSTRY CONSOLIDATION Description
Industry consolidation has been viewed as a
high risk since 2016. Consolidation within the
beer industry has created bigger players with
increased scale.
Although strong local market positions remain
key to creating value, consolidation creates
stronger competitors with increased financial
strength and bargaining power, potentially
impacting on the Carlsberg Group’s ability to
compete.
Consolidation is also taking place among our
customers and suppliers, This leads to increased
dependency, pricing pressure and the risk of
margin pressure.
Mitigation
The priorities and initiatives of SAIL’22 seek to
position the Group in such a way that we are
able to act upon and mitigate the impact of
industry consolidation. This includes improving
our core beer business and driving craft &
speciality and alcohol-free brews, becoming
a valued partner of our customers and offering
the preferred beer of our consumers.
In addition, we will seek to further develop our
partnerships with suppliers and create
alternative sourcing solutions.
POLITICAL AND ECONOMIC INSTABILITY Description
Political and economic instability has been
considered a high-impact risk since 2017.
Adverse economic conditions may result in
reduced consumer demand and a higher
degree of price sensitivity on the part of
consumers, while major social or political
changes may disrupt sales and operations.
Political and economic instability may lead to
adverse exchange rate fluctuations, increased
credit risk, insolvency of suppliers, impairment
of goodwill or brands, operational restrictions,
increases in duties and taxes imposed on beer,
and possibly nationalisation of assets.
Mitigation
We closely monitor our markets in order to
be able to respond in a timely manner to any
adverse developments.
Mitigating activities also include hedging and
maintaining variability in the cost base. SAIL’22
also provides mitigation by further
strengthening our core business in mature,
stable markets, premiumising our portfolio and
expanding our geographic footprint.
Download our policies
www.carlsberggroup.com/sustainability/download/
download-our-policies

CARLSBERG GROUP ANNUAL REPORT 2018 GOVERNANCE 37
Our governance framework aims to ensure active business management across the Group and reduce risk.
The Carlsberg Group seeks to develop and
maintain a positive and constructive
relationship with all its stakeholders. For
this reason, and in order to reduce risk and
promote good governance in the Carlsberg
Group, the Group has policies for a number of
key areas, such as communications, human
resources, environment, business ethics,
competition law, marketing communication,
finance and responsibility to customers and
society in general. The Supervisory Board is
responsible for overseeing that the Executive
Committee (ExCom) has an adequate system
and resources in place to ensure compliance
with these policies.
The basis of our corporate governance includes
in particular the Danish Companies Act, the
Danish Financial Statements Act, IFRS, the EU
Market Abuse Regulation, Nasdaq Copenhagen
A/S’ rules for issuers of shares, local legislation
and the Company’s Articles of Association.
RECOMMENDATIONS ON CORPORATE
GOVERNANCE
The recommendations of the Danish Committee
on Corporate Governance form part of Nasdaq
Copenhagen A/S’ rules for issuers of shares.
The Company complies with all but three of the
recommendations, as explained below.
With respect to the recommendation to publish
quarterly reports, the Supervisory Board finds
that half-year reporting is more appropriate
due to the seasonality of the Group’s business
and the fact that the Group historically has
seen high volatility in quarterly earnings and
margins as a result of phasing of costs. The
Supervisory Board considers the high volatility
to be potentially misleading for understanding
underlying Group performance. The Company
issues Q1 and Q3 trading statements, which
include volume and net revenue data, along
with comments on sales performance in the
quarter.
With respect to diversity, the Company
complies with the recommendation that the
Board should discuss the Group’s activities on
an annual basis to ensure relevant diversity at
management levels, including the adoption of a
policy on diversity. However, the policy is not
published on the Group’s website as
recommended by the Committee.
Moreover, from May to December 2018,
the Company did not comply with the
recommendation that at least half of the
members of the Supervisory Board elected by
the general meeting should be independent. In
May 2018 Nancy Cruickshank, a former tenth
Supervisory Board member elected by the
General Meeting, stepped down from the
Supervisory Board to join the Group as Senior
Vice President Digital Business Transformation.
The process of identifying a new candidate for
election at the next Annual General Meeting in
March 2019 was immediately initiated and has
been completed.
The Company’s statutory report on corporate
governance includes a full list of the
recommendations, with comments on the
Group’s position on each recommendation.
Download our statutory report
on corporate governance
www.carlsberggroup.com/who-we-are/corporate-
governance/#StatutoryReports
THE ANNUAL GENERAL MEETING
The 2018 Annual General Meeting (AGM) took
place on 14 March. The minutes of the meeting
are available on www.carlsberggroup.com.
Rules and deadlines applying to the AGM and
other General Meetings are stipulated in the
Company’s Articles of Association, which are
available on www.carlsberggroup.com along
with other AGM-related information.
GOVERNANCE STRUCTURE
The Supervisory Board has established three
board committees: an Audit Committee, a
Nomination Committee and a Remuneration
Committee. For the time being, the Supervisory
Board considers these committees to be
sufficient; however, each year the Supervisory
Board considers whether the number and scope
of the committees are appropriate. The board
committees prepare and facilitate Supervisory
Board decisions.
The Supervisory Board hires and supervises the
Executive Board, which consists of the CEO and
CFO, who are not members of the Supervisory
Board. The Group also has a wider Executive
Committee, which, in addition to the CEO and
CFO, consists of a wider group of Executive
Vice Presidents, portrayed on pages 52-53.
While the Executive Board members are
CORPORATE GOVERNANCE
CONTINUED FOCUS ON CORPORATE GOVERNANCE

CARLSBERG GROUP ANNUAL REPORT 2018 GOVERNANCE 38
formally registered as executive directors of
the Company, ExCom collectively prepares
and implements the Company’s strategic plans.
COMPOSITION OF THE SUPERVISORY
BOARD
The Supervisory Board currently has nine
members elected by the General Meeting and,
in accordance with the Danish Companies Act,
five members elected by the employees.
The members elected by the General Meeting
are elected individually and for a term of one
year. Re-election is possible.
Four of the nine members elected by the
General Meeting are independent and have an
international business background in addition
to competences related to FMCG, finance,
emerging markets and Russia. The other five
members are affiliated to the Carlsberg
Foundation, the Company’s principal
shareholder, and have an academic
background. These members are bearers
of the Carlsberg Group culture, and the
heritage and values stemming from founder
J.C. Jacobsen, and the Supervisory Board
sees these members as patrons of the same.
The employee representatives are elected for
a term of four years. They hold the same rights
and obligations as the members elected by
the General Meeting. The current employee
representatives were elected in 2018 and
the next election will take place in 2022.
The Supervisory Board believes that the
composition of the Board ensures an
appropriate level of diversity and breadth
in the members’ approach to their duties,
thereby helping to ensure that decisions are
well considered and that the long-term
perspective is duly taken into account.
Each year, the Supervisory Board considers
the skills that should be represented on
the Supervisory Board on the basis of a
recommendation from the Nomination
Committee.
These skills are described in the Specification
of Competences, available on
www.carlsberggroup.com. The Nomination
Committee and the Supervisory Board take
the description of the required skills into
consideration when recommending new
candidates for the Supervisory Board. None
of the members of the Supervisory Board
are or have been involved in the executive
management of the Group.
Information on the Supervisory Board members
is available on pages 49-51. Detailed CVs can
be found on www.carlsberggroup.com.
DIVERSITY
The Supervisory Board believes that its
members should be chosen for their
competences, but recognises the benefits of
diversity in respect of experience, culture,
international experience and gender, and has
laid down the following specific objectives in
relation to international experience and gender:
• With regard to international experience, the
objective is that 50% or more of the
Supervisory Board members elected by the
General Meeting should have substantial
international experience from managing large
corporations or institutions. The Supervisory
Board expects to fulfil this objective with the
candidates nominated for election at the
2019 AGM. Furthermore, with a representation
of more than 20 nationalities, the international
experience of the Carlsberg Group top-60
leadership team is significant.
• The proportion of the underrepresented
gender (currently women) on the Supervisory
Board should reach at least 40% of the
members elected by the General Meeting
no later than 2021. In May 2018, Nancy
Cruickshank stepped down from the
Supervisory Board to join the Group as SVP
Digital Business Transformation. Up to that
point, three Supervisory Board members
elected by the General Meeting were women.
At the AGM in 2019, a new female candidate,
Domitille Doat-Le Bigot, will be nominated to
replace Nancy Cruickshank. Diversity remains
a high priority for the Supervisory Board.
The gender target applies to the boards of all
Supervisory Board meetings
Board member
Chairmanship
meetings attended
Board
meetings attended
Flemming Besenbacher (Chairman)1
Lars Rebien Sørensen (Deputy Chairman)1,2
Hans Andersen3
Carl Bache1
Richard Burrows1,2
Magdi Batato1,2
Donna Cordner1,2
Nancy Cruickshank 1,2
Eva Vilstrup Decker3
Kees van der Graaf1,2
Finn Lok3
Erik Lund3
Søren-Peter Fuchs Olesen1
Peter Petersen3
Nina Smith1
Lars Stemmerik1
1 Elected by the General Meeting. 2 Independent. 3 Employee-elected.
Attended meeting. Did not attend meeting. Not a Board member at the time.

CARLSBERG GROUP ANNUAL REPORT 2018 GOVERNANCE 39
Danish Carlsberg Group companies that are
required to set such objectives. This is
currently Carlsberg A/S, Carlsberg Breweries
A/S, Carlsberg Global Business Services A/S,
Carlsberg Danmark A/S and Carlsberg Supply
Company Denmark A/S. In 2018, two
Supervisory Board members of Carlsberg A/S
elected by the General Meeting were women,
i.e. 22%, although up to May 2018, when
Nancy Cruickshank stepped down, the figure
was 30%. Accordingly, the objective with
regard to gender diversity on the Supervisory
Board has not yet been met. At Carlsberg
Breweries A/S, all four Supervisory Board
members elected by the General Meeting are
men. The Board consists of the members of
the Chairmanship and of the Executive Board
of Carlsberg A/S, and it was not considered
appropriate to change this approach in 2018.
At Carlsberg Global Business Services A/S
and Carlsberg Supply Company Denmark
A/S, the three members of the respective
boards are all men, which means that the
target has not yet been met in either
company. At Carlsberg Danmark A/S, one of
the three Supervisory Board members is a
woman, which means that the objective with
regard to gender diversity is considered
fulfilled.
Whilst the Supervisory Board is of the opinion
that competences must always come first, it
will consider candidates with a view to
increasing the underrepresented gender on
the Supervisory Board.
Currently, women are also underrepresented
in senior management positions. To increase
the proportion of women, the Supervisory
Board has drawn up a policy and set out
specific action points for the Executive Board
to implement.
In 2018, these actions included:
• As part of the Group Recruitment Policy,
recruitment companies and executive search
companies were asked to prepare a shortlist
with at least one qualified female candidate
when the Group recruits for senior
management positions.
• At least one third of the participants in the
Group's leadership programme should be
women. This target was met in 2018, as
30% of the leadership programme nominees
were women.
• Our leadership development centres support
individual development towards senior
leadership positions. In 2018, one third of
the participants in our Development Centres
Level 2 were women.
THE WORK OF THE SUPERVISORY
BOARD
The Supervisory Board monitors that the
Executive Board observes the goals, strategies
and business procedures established by the
Board.
The Chairman and Deputy Chairman of the
Supervisory Board constitute the Chairmanship.
The specific duties of the Chairman – and, in
his absence, the Deputy Chairman – are set
out in the Rules of Procedure. In 2018, the
Chairmanship and the Executive Board held six
meetings. The Supervisory Board of Carlsberg
A/S held eight meetings as well as a 1.5-day
strategy seminar.
• Discussion and approval of the bonus
structures in the Group’s incentive
programme, ensuring support of and
alignment with SAIL’22.
Compliance and core values
• Compliance and enhancing compliance
efforts.
• Review of reputation survey and
discussion of how to sustain and
enhance the Group’s strong
reputation.
• Review of the progress of the Group’s
sustainability programme Together
Towards ZERO.
• Review and discussion of how to
improve the development and quality
programmes.
Governance and risk management
• Review of the outcome of the 2017
Supervisory Board evaluation process,
including follow-up on all
suggestions.
• Review and discussion of the Group
Internal Audit reports, working
processes and continued improvement.
• Discussion of relevant issues and
ways of working with the external
auditor.
• Approval of the external auditor for
election at the 2018 AGM.
SUPERVISORY BOARD 2018 MAIN TOPICS OF DISCUSSION
Strategy
• Ongoing review and implementation of
SAIL’22.
• Review of and debate on R&D, innovation,
branding, quality and other strategic
initiatives.
• Review and discussion of organic and
potential inorganic opportunities.
• Monitoring of the Funding the Journey
programme and the continued embedding
of its principles in the Group’s ways of
working.
• Review and approval of the Group’s
capital structure and funding.
Organisation, people, succession planning and talent management
• Recommendation of Magdi Batato as
Supervisory Board candidate for election
at the 2018 AGM.
• Succession planning for the Supervisory
Board and its committees, including the
recommendation of Lars Fruergaard
Jørgensen, Domitille Doat-Le Bigot and
Lilian Fossum Biner as candidates for the
Supervisory Board at the 2019 AGM.
• Succession planning for the executive
management.
• Review of the Group’s people agenda,
including diversity.
• Organisational restructuring, management
and development of the internal talent
pool, and general succession planning.
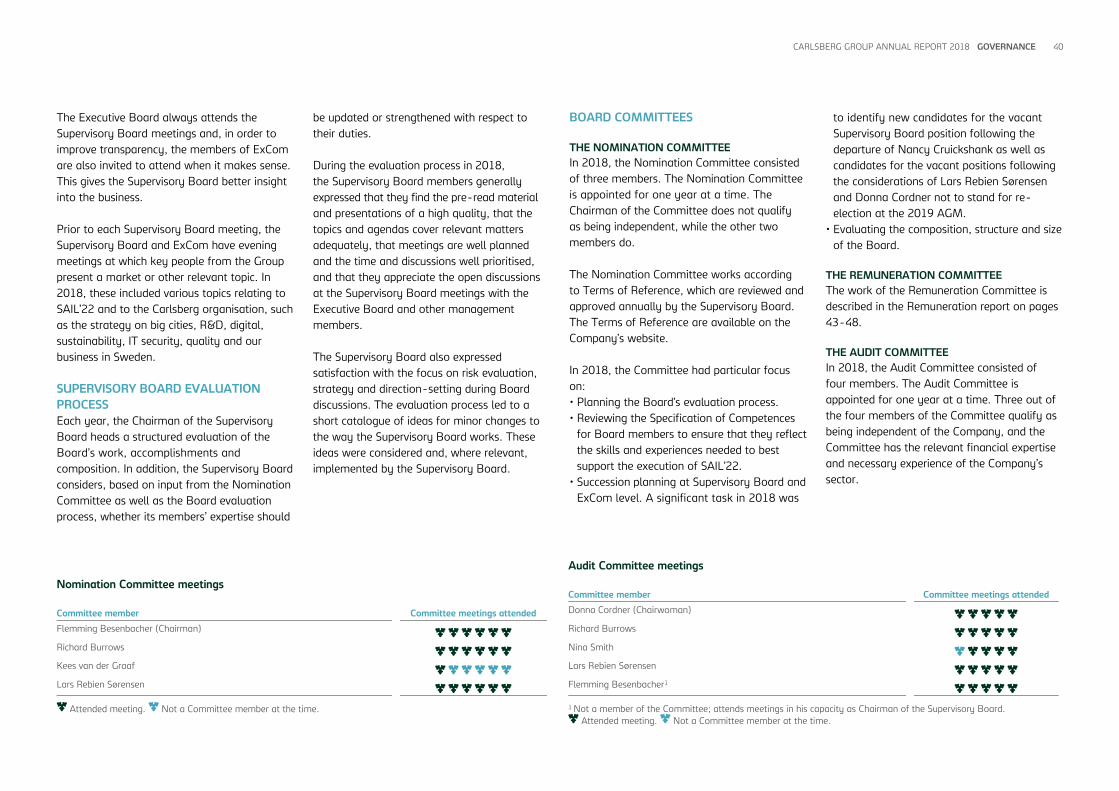
CARLSBERG GROUP ANNUAL REPORT 2018 GOVERNANCE 40
The Executive Board always attends the
Supervisory Board meetings and, in order to
improve transparency, the members of ExCom
are also invited to attend when it makes sense.
This gives the Supervisory Board better insight
into the business.
Prior to each Supervisory Board meeting, the
Supervisory Board and ExCom have evening
meetings at which key people from the Group
present a market or other relevant topic. In
2018, these included various topics relating to
SAIL’22 and to the Carlsberg organisation, such
as the strategy on big cities, R&D, digital,
sustainability, IT security, quality and our
business in Sweden.
SUPERVISORY BOARD EVALUATION
PROCESS
Each year, the Chairman of the Supervisory
Board heads a structured evaluation of the
Board’s work, accomplishments and
composition. In addition, the Supervisory Board
considers, based on input from the Nomination
Committee as well as the Board evaluation
process, whether its members’ expertise should
be updated or strengthened with respect to
their duties.
During the evaluation process in 2018,
the Supervisory Board members generally
expressed that they find the pre-read material
and presentations of a high quality, that the
topics and agendas cover relevant matters
adequately, that meetings are well planned
and the time and discussions well prioritised,
and that they appreciate the open discussions
at the Supervisory Board meetings with the
Executive Board and other management
members.
The Supervisory Board also expressed
satisfaction with the focus on risk evaluation,
strategy and direction-setting during Board
discussions. The evaluation process led to a
short catalogue of ideas for minor changes to
the way the Supervisory Board works. These
ideas were considered and, where relevant,
implemented by the Supervisory Board.
BOARD COMMITTEES
THE NOMINATION COMMITTEE
In 2018, the Nomination Committee consisted
of three members. The Nomination Committee
is appointed for one year at a time. The
Chairman of the Committee does not qualify
as being independent, while the other two
members do.
The Nomination Committee works according
to Terms of Reference, which are reviewed and
approved annually by the Supervisory Board.
The Terms of Reference are available on the
Company’s website.
In 2018, the Committee had particular focus
on:
• Planning the Board’s evaluation process.
• Reviewing the Specification of Competences
for Board members to ensure that they reflect
the skills and experiences needed to best
support the execution of SAIL’22.
• Succession planning at Supervisory Board and
ExCom level. A significant task in 2018 was
to identify new candidates for the vacant
Supervisory Board position following the
departure of Nancy Cruickshank as well as
candidates for the vacant positions following
the considerations of Lars Rebien Sørensen
and Donna Cordner not to stand for re-
election at the 2019 AGM.
• Evaluating the composition, structure and size
of the Board.
THE REMUNERATION COMMITTEE
The work of the Remuneration Committee is
described in the Remuneration report on pages
43-48.
THE AUDIT COMMITTEE
In 2018, the Audit Committee consisted of
four members. The Audit Committee is
appointed for one year at a time. Three out of
the four members of the Committee qualify as
being independent of the Company, and the
Committee has the relevant financial expertise
and necessary experience of the Company’s
sector.
Nomination Committee meetings
Committee member Committee meetings attended
Flemming Besenbacher (Chairman)
Richard Burrows
Kees van der Graaf
Lars Rebien Sørensen
Attended meeting. Not a Committee member at the time.
Audit Committee meetings
Committee member Committee meetings attended
Donna Cordner (Chairwoman)
Richard Burrows
Nina Smith
Lars Rebien Sørensen
Flemming Besenbacher1
1 Not a member of the Committee; attends meetings in his capacity as Chairman of the Supervisory Board.
Attended meeting. Not a Committee member at the time.

CARLSBERG GROUP ANNUAL REPORT 2018 GOVERNANCE 41
The Audit Committee works according to
Terms of Reference and a detailed annual
meeting plan, which are reviewed and approved
by the Supervisory Board prior to the beginning
of each financial year. The Supervisory Board
approved the Audit Committee meeting plan
for 2019 and the current Terms of Reference at
the Supervisory Board meeting in December
2018. The Terms of Reference are available on
the Company’s website.
In 2018, the Audit Committee had particular
focus on a number of other areas, including:
• Monitoring the effectiveness of the control
environment and overseeing the progress on
developing a new reporting system on the
effectiveness of the controls over financial
reporting.
• Reviewing the progress of the work of the
Group Internal Audit function.
• Reviewing the Integrity Committee’s work.
• Managing financial risk.
• Reviewing the risk management process.
AUDITING
To safeguard the interests of shareholders and
the general public, an independent auditor is
appointed at the Annual General Meeting
following a proposal from the Supervisory
Board, which is based on a recommendation
from the Audit Committee.
INTERNAL CONTROL AND RISK
MANAGEMENT RELATED TO THE
FINANCIAL REPORTING PROCESS
OVERALL CONTROL ENVIRONMENT
The Supervisory Board and ExCom have overall
responsibility for the Carlsberg Group’s control
environment. The Audit Committee is
responsible for monitoring the effectiveness of
the internal control and risk management
systems related to the financial reporting
process on an ongoing basis.
The Group has a number of policies and
procedures in key areas of financial reporting,
including the Finance Policy, the Accounting
Manual, the Controller Manual, the Use of
Auditors Policy, the Chart of Authority, the
Risk Management Policy, the Financial Risk
Management Policy, the Corporate Governance
Policy, the Information Security and Acceptable
Use Policy, the Records Management &
Personal Data Protection Policy, the Stock
Exchange Compliance Policy, the Tax Policy,
and the Code of Ethics and Conduct.
The policies and procedures apply to all
subsidiaries, and similar requirements are set
out in collaboration with the partners in joint
ventures.
In 2018, the Group implemented a new risk
and internal control framework for financial
reporting. The framework defines who is
responsible and where the controls are
performed, and is designed to reduce and
mitigate financial risks identified and ensure
reliable internal and external financial
reporting.
The framework has been strengthened by
implementing several controls, providing
assurance that key risks are covered by
mitigating internal control assertions.
During the implementation and strengthening
of the framework across functions and entities,
there has been continual focus on the
standardisation of processes and controls. In
addition, the governance has been
strengthened, including through extensive
education and training in risk and controls.
As a consequence of the Group’s growth as a
result of acquisitions, processes are not
standardised across entities. The current state
of the control environment is not yet, therefore,
where the Group wants to be.
The Group will continue to strengthen the
financial control environment through further
standardisation, increased automation, strong
analytics and transparent governance.
The framework is monitored through entities’
self-assessment of the effectiveness of the
implemented controls and continuous testing of
performance by an established second-line-
of-defence team. The monitoring of the
performance of the controls focuses on the
quality of the controls, the effectiveness with
which they are performed and the efficiency of
the overall controlling processes.
RISK ASSESSMENT
With the implementation of the control
framework for financial reporting, the Group
has identified the risks that could have a direct
or indirect material impact on the financial
statements. Group entities are required to
document transaction processes and the controls
in place to cover the key risks identified. The
minimum requirements for documenting the
risks must be set out in the framework and
visualised in the processes.
Group entities are required to reassess their
controls biannually and must update changes
to the control framework for financial reporting,
including new risks and controls.
CONTROL ACTIVITIES
The Group has implemented a formalised
financial reporting process for the strategy
process, budget process, estimates and monthly
reporting on actual performance. The accounting
information reported by all Group companies is
reviewed both by controllers with regional or
functional in-depth knowledge of the individual
companies/functions and by technical
accounting specialists.
In addition, significant Group companies have
controllers with extensive commercial and/or
supply chain knowledge and insight. Controllers
are continuously updated on best practice
relating to internal financial controls, and
trained in new accounting and reporting
requirements.
The entities in the Group are dependent on
IT systems. Any weaknesses in the system
controls or IT environment are compensated
for by manual controls in order to mitigate
any significant risk relating to the financial
reporting.
In 2018, the Group continued the outsourcing
of certain key processes and implemented
various tools for standardising key processes.
Furthermore, the Group has established a
quality assurance team in order to ensure the
quality of the controls that are part of the
outsourced processes, including their
performance.

CARLSBERG GROUP ANNUAL REPORT 2018 GOVERNANCE 42
INFORMATION AND COMMUNICATION
The Group has established information and
communication systems to ensure accounting
and internal control compliance. During the risk
assessment periods, Group entities are required
to report on missing or inadequate controls.
Each entity assesses any need for compensating
controls, or for design and implementation of
new controls.
During implementation of the new control
framework in 2018, Group entities mapped
controls on segregation of duties to implement
necessary compensating controls, and are now
implementing stronger remediated controls for
segregation of duties in the ERP systems.
MONITORING
The Audit Committee’s monitoring covers
both the internal control environment and
business risk. Monitoring of the internal control
environment is covered by the Group’s control
framework for financial reporting.
The financial risks are assessed and reviewed at
multiple levels in the Group, including monthly
performance review meetings at ExCom level,
periodic review of control documentation, and
audits performed by Group Internal Audit.
GROUP INTERNAL AUDIT
Group Internal Audit provides objective and
independent assessment of the adequacy,
effectiveness and quality of the Group’s internal
controls. Group Internal Audit works in
accordance with a charter, which is reviewed on
an annual basis and approved by the Audit
Committee.
Taking into account the annual review of
business risks (cf. pages 35-36), an internal
audit plan is drawn up for the year. The plan is
reviewed and approved by the Audit Committee.
In 2018, Group Internal Audit conducted audits
mainly in the areas of financial reporting
controls, compliance (internal and external
regulation) and information technology.
SPEAK UP
The Carlsberg Group has a Speak Up system
that enables employees to report misconduct.
Reports typically relate to suspected violations
of the Carlsberg Code of Ethics and Conduct.
The Speak Up system is facilitated by an
external provider and allows concerns to be
brought to the attention of Group Legal and
Compliance anonymously and via multiple
channels. The Chief Compliance Officer is
responsible for reviewing all reported Speak Up
matters. Furthermore, an Integrity Committee,
chaired by the CFO, oversees the follow-up of
major Speak Up investigations and provides a
report on this to the Audit Committee at least
quarterly.
The Speak Up Manual and Misconduct
Investigation Manual were updated in 2018 to
reflect the roles and responsibilities of the parties
involved in Speak Up investigations. The launch
of these revised manuals was accompanied by
a campaign to raise awareness of the various
Speak Up channels available in the Group.
Since the establishment of the Speak Up
system in April 2010, some reports and their
subsequent investigation have led to various
disciplinary sanctions, including dismissal on
the basis of violation of Group policies and, in
some cases, relevant criminal laws. Most of
these matters related to isolated incidents of
fraud carried out by individual employees in the
Group. The incidents have not had any material
impact on the financial results of the Group or
the Group company in question.
+12% SOMERSBY GROWTH
First launched in Denmark in 2008, Somersby
has grown to become the world’s leading
international cider brand outside the UK.
Today, Somersby is available in 50 markets
around the globe and has a no. 1 or 2
position in more than 30 markets, including
Poland, Denmark, Switzerland, Ukraine,
Malaysia and Australia. In 2018, Somersby
experienced 12% volume growth, driven by a
new, refreshingly optimistic advertising
campaign and successful innovation with the
multi-market launch of Somersby Sparkling
Rose and Watermelon.
GROW CRAFT & SPECIALITY

CARLSBERG GROUP ANNUAL REPORT 2018 GOVERNANCE 43
We want our executives to share our shareholders’ interests, and the remuneration of executive directors should support this alignment.
The Remuneration Committee has not
proposed any changes to the pay structure,
and the Remuneration Policy will remain
unchanged in 2019.
REMUNERATION OF THE EXECUTIVE
BOARD
REMUNERATION POLICY
The main elements of the executive directors’
remuneration arrangements are summarised in
the table on page 45 and explained in more
detail in the following paragraphs.
Fixed salary
The Committee reviews fixed salaries for
the executive directors annually, taking into
account a number of relevant factors, including
the individual’s performance, role and
responsibilities. Executives make their own
provision for retirement, meaning no additional
pension contributions are made on their behalf.
The Committee also takes into account levels
of remuneration for similar roles at comparable
companies in both the beverage and FMCG
sectors, as well as companies based in the
Nordic region across all industry sectors.
The Committee and the Supervisory Board
have decided to increase the executive
directors’ fixed salaries in 2019 by 2.3%.
Annual bonus
The annual bonus is structured to incentivise
the executive directors to deliver on the Group’s
short-term strategic objectives.
For 2019, the potential maximum bonus
will remain at 100% of fixed salary, with
60% of fixed salary payable for on-target
performance.
Determination of the final bonus is subject
to the discretion of the Committee and the
Supervisory Board, taking into account the
overall performance of the business.
For 2019, the annual bonus comprises two
elements. The first element, accounting for
80% of the bonus, is based on three measures:
organic net revenue growth, organic operating
profit and addressable cash flow.
REMUNERATION
EXECUTIVES’ REMUNERATION
MAIN ACTIVITIES IN 2018
During 2018, the main activities of
the Remuneration Committee were:
• Determining levels of long-term
incentive awards.
• Considering stakeholders’ feedback
from the 2018 Annual General
Meeting and from media.
• Reviewing the Remuneration Policy
for the Executive Board and agreeing
to make no changes to the policy.
• Considering the achievement of
performance criteria for the annual
bonus plan for 2017.
• Considering the achievement of
performance criteria for the Funding
the Journey cash incentive award.
• Reviewing fixed salary levels, bonus
targets and levels of long-term
incentive awards for 2019.
2019 OBJECTIVES
• Monitoring the implementation of the
EU Shareholder Rights Directive and
ensuring that we continue to report
transparently and in line with all
relevant guidelines and regulations.
• Reviewing the overall remuneration
structures for 2020 and beyond as the
Company enters a period of growth.
OUR APPROACH TO REMUNERATION The Carlsberg Group’s remuneration is
designed to enable us to recruit and retain
individuals with the expertise and ability
required to run a growing international
company, and to do so in a way that
drives our business success and rewards
executives when shareholders are rewarded.
Levels of fixed remuneration are set based
on individuals’ experience and contribution,
and in the context of the external market.
While we do not seek to adhere rigidly to
market benchmarks, we monitor and take
into account pay levels and incentive
opportunities in the principal markets from
which we recruit: our European brewing and
spirits peers and the global consumer goods
sector, as well as companies across industry
sectors in the Nordic region.
Many of our investors – including our
main shareholder – are long-term holders
of our shares. We want our executives to
share our shareholders’ perspective and
believe that remuneration should align their
interests accordingly. The balance between
the short-term remuneration package and
long-term share-based pay and
shareholding requirements strengthens this
alignment.
The Company’s full Remuneration Policy for
the Supervisory Board and Executive Board,
and guidelines for incentive programmes as
approved at the Annual General Meeting on
30 March 2017, are available on the
Company’s website.
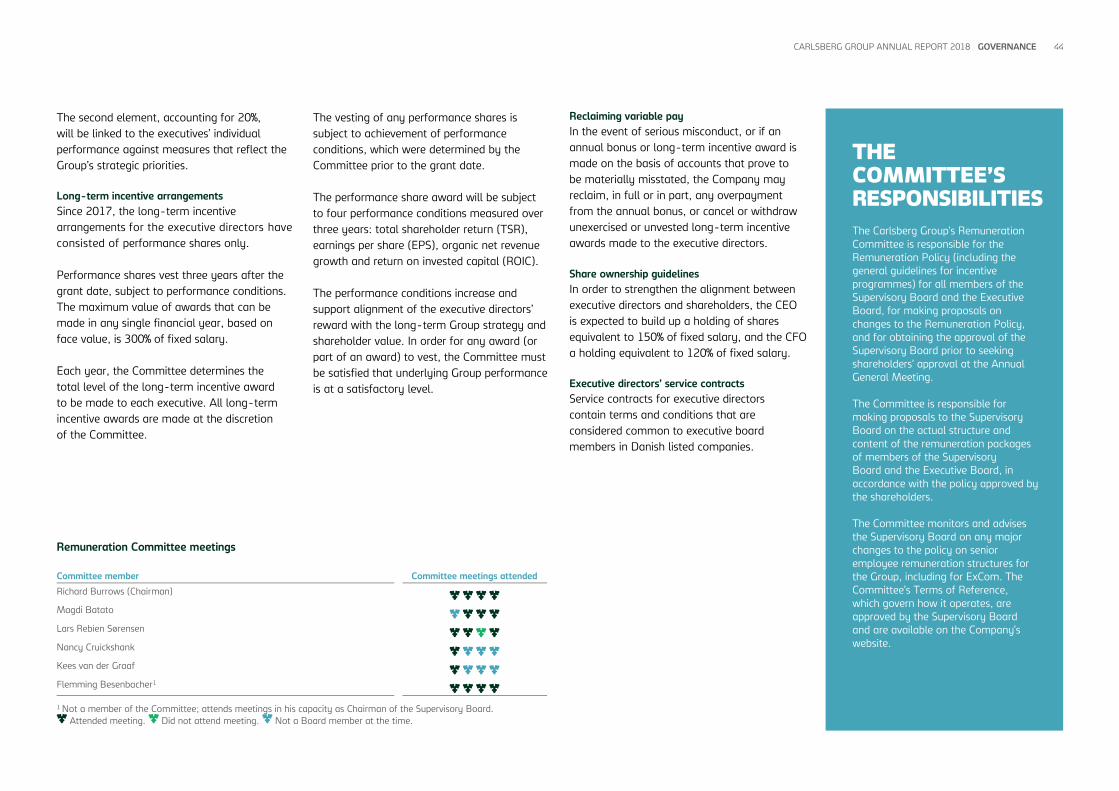
CARLSBERG GROUP ANNUAL REPORT 2018 GOVERNANCE 44
The second element, accounting for 20%,
will be linked to the executives’ individual
performance against measures that reflect the
Group’s strategic priorities.
Long-term incentive arrangements
Since 2017, the long-term incentive
arrangements for the executive directors have
consisted of performance shares only.
Performance shares vest three years after the
grant date, subject to performance conditions.
The maximum value of awards that can be
made in any single financial year, based on
face value, is 300% of fixed salary.
Each year, the Committee determines the
total level of the long-term incentive award
to be made to each executive. All long-term
incentive awards are made at the discretion
of the Committee.
The vesting of any performance shares is
subject to achievement of performance
conditions, which were determined by the
Committee prior to the grant date.
The performance share award will be subject
to four performance conditions measured over
three years: total shareholder return (TSR),
earnings per share (EPS), organic net revenue
growth and return on invested capital (ROIC).
The performance conditions increase and
support alignment of the executive directors’
reward with the long-term Group strategy and
shareholder value. In order for any award (or
part of an award) to vest, the Committee must
be satisfied that underlying Group performance
is at a satisfactory level.
Reclaiming variable pay
In the event of serious misconduct, or if an
annual bonus or long-term incentive award is
made on the basis of accounts that prove to
be materially misstated, the Company may
reclaim, in full or in part, any overpayment
from the annual bonus, or cancel or withdraw
unexercised or unvested long-term incentive
awards made to the executive directors.
Share ownership guidelines
In order to strengthen the alignment between
executive directors and shareholders, the CEO
is expected to build up a holding of shares
equivalent to 150% of fixed salary, and the CFO
a holding equivalent to 120% of fixed salary.
Executive directors’ service contracts
Service contracts for executive directors
contain terms and conditions that are
considered common to executive board
members in Danish listed companies.
Remuneration Committee meetings
Committee member Committee meetings attended
Richard Burrows (Chairman)
Magdi Batato
Lars Rebien Sørensen
Nancy Cruickshank
Kees van der Graaf
Flemming Besenbacher1
1 Not a member of the Committee; attends meetings in his capacity as Chairman of the Supervisory Board.
Attended meeting. Did not attend meeting. Not a Board member at the time.
THE COMMITTEE’S RESPONSIBILITIES
The Carlsberg Group’s Remuneration
Committee is responsible for the
Remuneration Policy (including the
general guidelines for incentive
programmes) for all members of the
Supervisory Board and the Executive
Board, for making proposals on
changes to the Remuneration Policy,
and for obtaining the approval of the
Supervisory Board prior to seeking
shareholders’ approval at the Annual
General Meeting.
The Committee is responsible for
making proposals to the Supervisory
Board on the actual structure and
content of the remuneration packages
of members of the Supervisory
Board and the Executive Board, in
accordance with the policy approved by
the shareholders.
The Committee monitors and advises
the Supervisory Board on any major
changes to the policy on senior
employee remuneration structures for
the Group, including for ExCom. The
Committee’s Terms of Reference,
which govern how it operates, are
approved by the Supervisory Board
and are available on the Company’s
website.

CARLSBERG GROUP ANNUAL REPORT 2018 GOVERNANCE 45
Remuneration Policy
Element of pay Objective Award level Performance criteria Performance period
Fixed salary Attract and retain high-performing individuals by reflecting
market value of role and executive’s skills and experience.
Reward day-to-day performance. Set at a level to prevent
over-reliance on variable pay.
Takes into account the market rate for similar roles in
comparable international companies as well as executive’s
skills and experience.
No performance criteria per se, but the performance of the
individual is taken into account when fixed salary levels are
reviewed.
Financial year.
Benefits Operate a competitive benefits suite to aid recruitment and
retention.
Perquisites and other benefits corresponding to market
practices.
N/A N/A
Pension Executives make their own provision for retirement. N/A N/A N/A
Annual bonus plan Drive and reward delivery of short-term business objectives. Maximum bonus opportunity is 100% of fixed salary.
Bonus opportunity at target is 60% of fixed salary.
• Organic net revenue growth.
• Organic operating profit.
• Addressable cash flow.
• Strategic measures.
Financial year.
Long-term incentive plan Drive and reward delivery of longer-term business objectives.
Maximise alignment with shareholder value.
The maximum level of long-term incentive awards is 300% of
fixed salary based on the face value of the award at the
grant date.
• Relative total shareholder return (TSR).
• Growth in adjusted EPS at constant currencies.
• Organic net revenue growth.
• ROIC at constant currencies.
3 years with 3-year
vesting.
Performance share awards – performance criteria for 2019
Measure Description Performance condition measured over the three financial years 2019-2021 Weighting
Relative total shareholder
return (TSR)
TSR measures the total return to investors. The Group’s TSR
performance will be measured relative to a comparator
group of 16 companies¹.
• 25% of TSR element vests if the Group’s TSR performance is at median of peer group’s¹.
• 100% vests for upper-quartile performance.
• Straight-line vesting between median and upper quartile.
25%
Adjusted EPS growth Adjusted EPS growth targets measure the Group’s underlying
financial success.
• 25% of the adjusted EPS at constant currencies element vests for 4% p.a. growth.
• 100% vests for 9% p.a. growth.
• Straight-line vesting between 4% p.a. and 9% p.a.
25%
Organic net revenue growth Organic net revenue growth is a measure of the Group’s ability
to deliver on our SAIL’22 priorities.
• 25% of the organic net revenue element vests for 1.5% p.a. growth.
• 100% vests for 4.5% p.a. growth.
• Straight-line vesting between 1.5% p.a. and 4.5% p.a.
25%
Growth in ROIC Growing ROIC is a key financial metric reflecting our ability to
drive a positive development in shareholder returns.
• 25% of the ROIC in constant currencies element vests at 9.0% in 2021.
• 100% vests for 10.0% in 2021.
• Straight-line vesting between 9.0% and 10.0% in 2021.
25%
¹ TSR comparator group: Kirin Holdings, Britvic, Davide Campari-Milano, Rémy Cointreau, Asahi Group Holdings, Compañía Cervecerías Unidas, Diageo, Heineken, Ambev, Brown-Forman, Pernod-Ricard, Sapporo
Holdings, Dr Pepper Snapple Group, Tsingtao Brewery, Anheuser-Busch Inbev and Molson Coors Brewing.
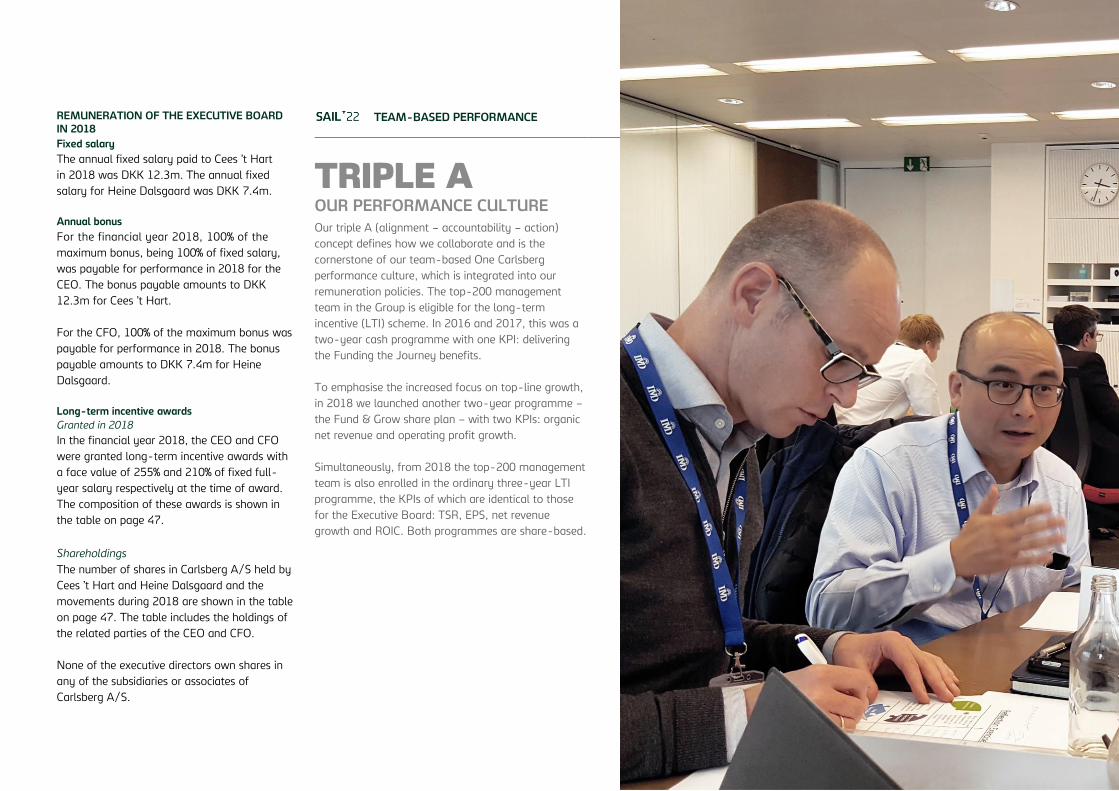
CARLSBERG GROUP ANNUAL REPORT 2018 GOVERNANCE 46
REMUNERATION OF THE EXECUTIVE BOARD
IN 2018 Fixed salary
The annual fixed salary paid to Cees ’t Hart
in 2018 was DKK 12.3m. The annual fixed
salary for Heine Dalsgaard was DKK 7.4m.
Annual bonus
For the financial year 2018, 100% of the
maximum bonus, being 100% of fixed salary,
was payable for performance in 2018 for the
CEO. The bonus payable amounts to DKK
12.3m for Cees ’t Hart.
For the CFO, 100% of the maximum bonus was
payable for performance in 2018. The bonus
payable amounts to DKK 7.4m for Heine
Dalsgaard.
Long-term incentive awards
Granted in 2018
In the financial year 2018, the CEO and CFO
were granted long-term incentive awards with
a face value of 255% and 210% of fixed full-
year salary respectively at the time of award.
The composition of these awards is shown in
the table on page 47.
Shareholdings
The number of shares in Carlsberg A/S held by
Cees ’t Hart and Heine Dalsgaard and the
movements during 2018 are shown in the table
on page 47. The table includes the holdings of
the related parties of the CEO and CFO.
None of the executive directors own shares in
any of the subsidiaries or associates of
Carlsberg A/S.
TEAM-BASED PERFORMANCE
TRIPLE A OUR PERFORMANCE CULTURE
Our triple A (alignment – accountability – action)
concept defines how we collaborate and is the
cornerstone of our team-based One Carlsberg
performance culture, which is integrated into our
remuneration policies. The top-200 management
team in the Group is eligible for the long-term
incentive (LTI) scheme. In 2016 and 2017, this was a
two-year cash programme with one KPI: delivering
the Funding the Journey benefits.
To emphasise the increased focus on top-line growth,
in 2018 we launched another two-year programme –
the Fund & Grow share plan – with two KPIs: organic
net revenue and operating profit growth.
Simultaneously, from 2018 the top-200 management
team is also enrolled in the ordinary three-year LTI
programme, the KPIs of which are identical to those
for the Executive Board: TSR, EPS, net revenue
growth and ROIC. Both programmes are share-based.
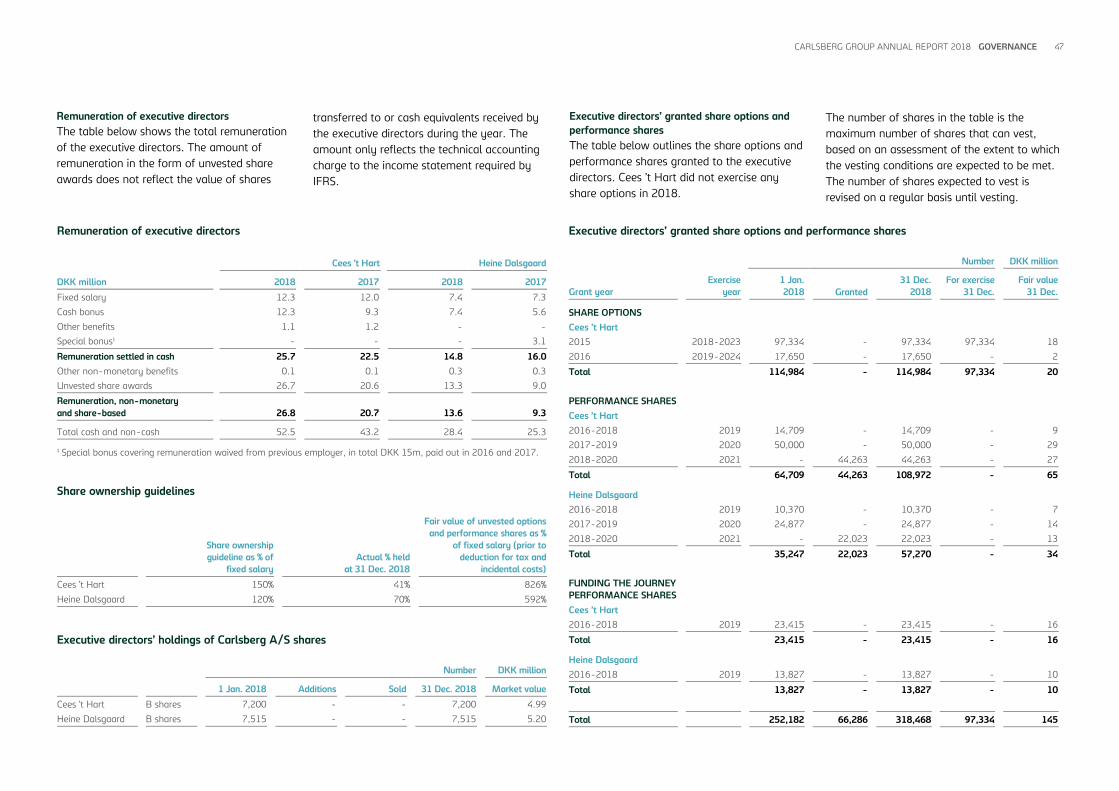
CARLSBERG GROUP ANNUAL REPORT 2018 GOVERNANCE 47
Remuneration of executive directors
The table below shows the total remuneration
of the executive directors. The amount of
remuneration in the form of unvested share
awards does not reflect the value of shares
transferred to or cash equivalents received by
the executive directors during the year. The
amount only reflects the technical accounting
charge to the income statement required by
IFRS.
Executive directors’ granted share options and
performance shares
The table below outlines the share options and
performance shares granted to the executive
directors. Cees ’t Hart did not exercise any
share options in 2018.
The number of shares in the table is the
maximum number of shares that can vest,
based on an assessment of the extent to which
the vesting conditions are expected to be met.
The number of shares expected to vest is
revised on a regular basis until vesting.
Executive directors’ holdings of Carlsberg A/S shares
Number DKK million
1 Jan. 2018 Additions Sold 31 Dec. 2018 Market value
Cees ’t Hart B shares 7,200 - - 7,200 4.99
Heine Dalsgaard B shares 7,515 - - 7,515 5.20
Share ownership guidelines
Share ownership
guideline as % of
fixed salary
Actual % held
at 31 Dec. 2018
Fair value of unvested options
and performance shares as %
of fixed salary (prior to
deduction for tax and
incidental costs)
Cees ’t Hart 150% 41% 826%
Heine Dalsgaard 120% 70% 592%
Executive directors’ granted share options and performance shares
Number DKK million
Grant year
Exercise
year
1 Jan.
2018 Granted
31 Dec.
2018
For exercise
31 Dec.
Fair value
31 Dec.
SHARE OPTIONS
Cees ’t Hart
2015 2018-2023 97,334 - 97,334 97,334 18
2016 2019-2024 17,650 - 17,650 - 2
Total 114,984 - 114,984 97,334 20
PERFORMANCE SHARES
Cees ’t Hart
2016-2018 2019 14,709 - 14,709 - 9
2017-2019 2020 50,000 - 50,000 - 29
2018-2020 2021 - 44,263 44,263 - 27
Total 64,709 44,263 108,972 - 65
Heine Dalsgaard
2016-2018 2019 10,370 - 10,370 - 7
2017-2019 2020 24,877 - 24,877 - 14
2018-2020 2021 - 22,023 22,023 - 13
Total 35,247 22,023 57,270 - 34
FUNDING THE JOURNEY
PERFORMANCE SHARES
Cees ’t Hart
2016-2018 2019 23,415 - 23,415 - 16
Total 23,415 - 23,415 - 16
Heine Dalsgaard
2016-2018 2019 13,827 - 13,827 - 10
Total 13,827 - 13,827 - 10
Total 252,182 66,286 318,468 97,334 145
Remuneration of executive directors
Cees ’t Hart Heine Dalsgaard
DKK million 2018 2017 2018 2017
Fixed salary 12.3 12.0 7.4 7.3
Cash bonus 12.3 9.3 7.4 5.6
Other benefits 1.1 1.2 - -
Special bonus¹ - - - 3.1
Remuneration settled in cash 25.7 22.5 14.8 16.0
Other non-monetary benefits 0.1 0.1 0.3 0.3
Unvested share awards 26.7 20.6 13.3 9.0
Remuneration, non-monetary
and share-based 26.8 20.7 13.6 9.3
Total cash and non-cash 52.5 43.2 28.4 25.3
¹ Special bonus covering remuneration waived from previous employer, in total DKK 15m, paid out in 2016 and 2017.
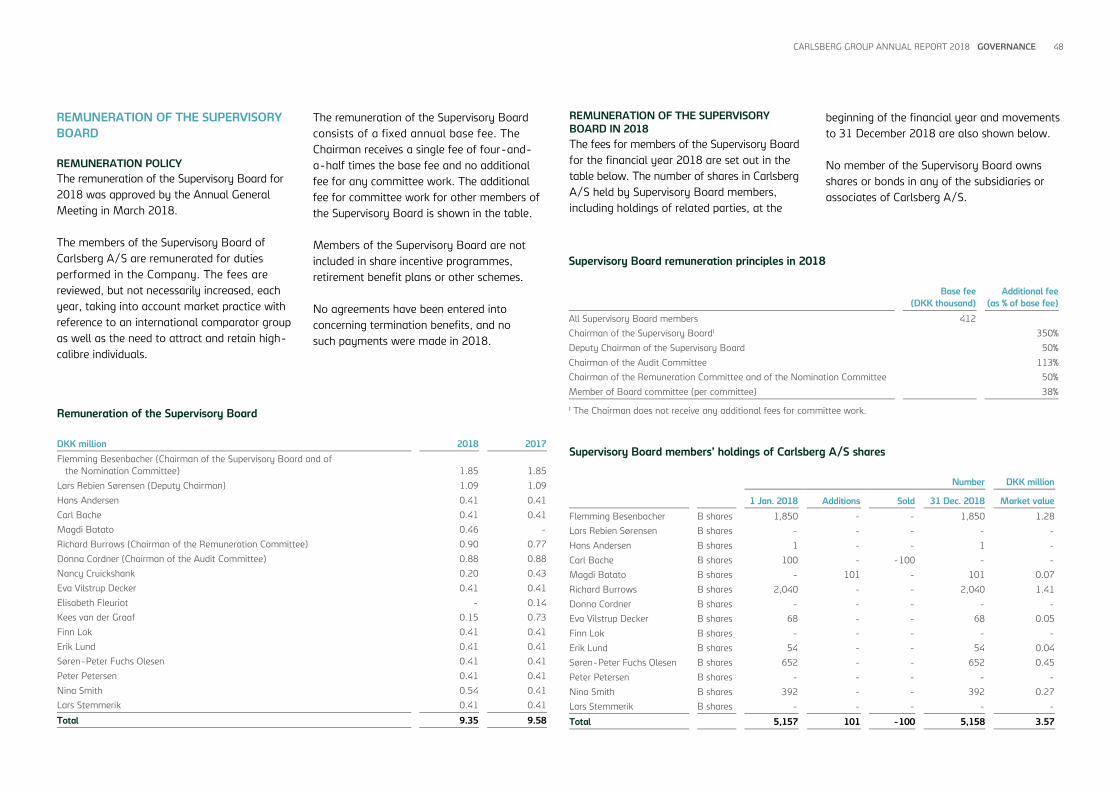
CARLSBERG GROUP ANNUAL REPORT 2018 GOVERNANCE 48
REMUNERATION OF THE SUPERVISORY
BOARD
REMUNERATION POLICY
The remuneration of the Supervisory Board for
2018 was approved by the Annual General
Meeting in March 2018.
The members of the Supervisory Board of
Carlsberg A/S are remunerated for duties
performed in the Company. The fees are
reviewed, but not necessarily increased, each
year, taking into account market practice with
reference to an international comparator group
as well as the need to attract and retain high-
calibre individuals.
The remuneration of the Supervisory Board
consists of a fixed annual base fee. The
Chairman receives a single fee of four-and-
a-half times the base fee and no additional
fee for any committee work. The additional
fee for committee work for other members of
the Supervisory Board is shown in the table.
Members of the Supervisory Board are not
included in share incentive programmes,
retirement benefit plans or other schemes.
No agreements have been entered into
concerning termination benefits, and no
such payments were made in 2018.
REMUNERATION OF THE SUPERVISORY
BOARD IN 2018
The fees for members of the Supervisory Board
for the financial year 2018 are set out in the
table below. The number of shares in Carlsberg
A/S held by Supervisory Board members,
including holdings of related parties, at the
beginning of the financial year and movements
to 31 December 2018 are also shown below.
No member of the Supervisory Board owns
shares or bonds in any of the subsidiaries or
associates of Carlsberg A/S.
Supervisory Board members’ holdings of Carlsberg A/S shares
Number DKK million
1 Jan. 2018 Additions Sold 31 Dec. 2018 Market value
Flemming Besenbacher B shares 1,850 - - 1,850 1.28
Lars Rebien Sørensen B shares - - - - -
Hans Andersen B shares 1 - - 1 -
Carl Bache B shares 100 - -100 - -
Magdi Batato B shares - 101 - 101 0.07
Richard Burrows B shares 2,040 - - 2,040 1.41
Donna Cordner B shares - - - - -
Eva Vilstrup Decker B shares 68 - - 68 0.05
Finn Lok B shares - - - - -
Erik Lund B shares 54 - - 54 0.04
Søren-Peter Fuchs Olesen B shares 652 - - 652 0.45
Peter Petersen B shares - - - - -
Nina Smith B shares 392 - - 392 0.27
Lars Stemmerik B shares - - - - -
Total 5,157 101 -100 5,158 3.57
Remuneration of the Supervisory Board
DKK million 2018 2017
Flemming Besenbacher (Chairman of the Supervisory Board and of
the Nomination Committee)
1.85
1.85
Lars Rebien Sørensen (Deputy Chairman) 1.09 1.09
Hans Andersen 0.41 0.41
Carl Bache 0.41 0.41
Magdi Batato 0.46 -
Richard Burrows (Chairman of the Remuneration Committee) 0.90 0.77
Donna Cordner (Chairman of the Audit Committee) 0.88 0.88
Nancy Cruickshank 0.20 0.43
Eva Vilstrup Decker 0.41 0.41
Elisabeth Fleuriot - 0.14
Kees van der Graaf 0.15 0.73
Finn Lok 0.41 0.41
Erik Lund 0.41 0.41
Søren-Peter Fuchs Olesen 0.41 0.41
Peter Petersen 0.41 0.41
Nina Smith 0.54 0.41
Lars Stemmerik 0.41 0.41
Total 9.35 9.58
Supervisory Board remuneration principles in 2018
Base fee
(DKK thousand)
Additional fee
(as % of base fee)
All Supervisory Board members 412
Chairman of the Supervisory Board¹ 350%
Deputy Chairman of the Supervisory Board 50%
Chairman of the Audit Committee 113%
Chairman of the Remuneration Committee and of the Nomination Committee 50%
Member of Board committee (per committee) 38%
¹ The Chairman does not receive any additional fees for committee work.
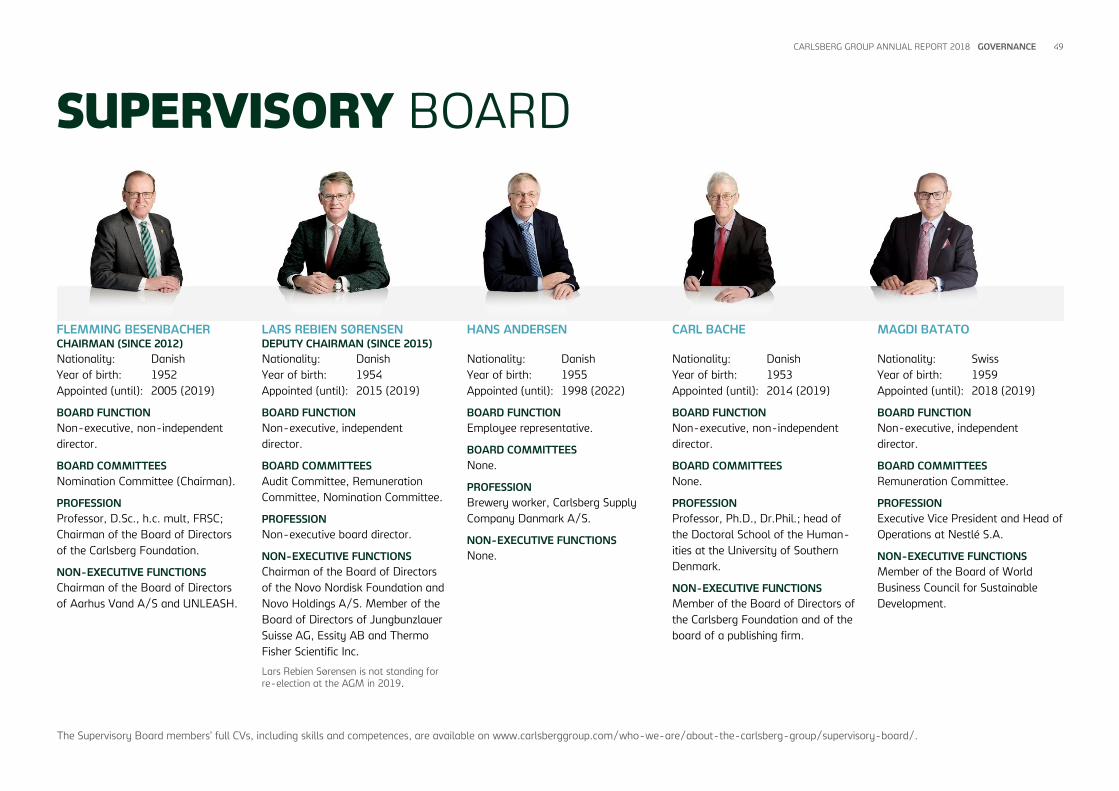
CARLSBERG GROUP ANNUAL REPORT 2018 GOVERNANCE 49
SUPERVISORY BOARD
FLEMMING BESENBACHER CHAIRMAN (SINCE 2012)
LARS REBIEN SØRENSEN DEPUTY CHAIRMAN (SINCE 2015)
HANS ANDERSEN
CARL BACHE
MAGDI BATATO
Nationality: Danish
Year of birth: 1952
Appointed (until): 2005 (2019)
BOARD FUNCTION
Non-executive, non-independent
director.
BOARD COMMITTEES
Nomination Committee (Chairman).
PROFESSION
Professor, D.Sc., h.c. mult, FRSC;
Chairman of the Board of Directors
of the Carlsberg Foundation.
NON-EXECUTIVE FUNCTIONS
Chairman of the Board of Directors
of Aarhus Vand A/S and UNLEASH.
Nationality: Danish
Year of birth: 1954
Appointed (until): 2015 (2019)
BOARD FUNCTION
Non-executive, independent
director.
BOARD COMMITTEES
Audit Committee, Remuneration
Committee, Nomination Committee.
PROFESSION
Non-executive board director.
NON-EXECUTIVE FUNCTIONS
Chairman of the Board of Directors
of the Novo Nordisk Foundation and
Novo Holdings A/S. Member of the
Board of Directors of Jungbunzlauer
Suisse AG, Essity AB and Thermo
Fisher Scientific Inc.
Lars Rebien Sørensen is not standing for re-election at the AGM in 2019.
Nationality: Danish
Year of birth: 1955
Appointed (until): 1998 (2022)
BOARD FUNCTION
Employee representative.
BOARD COMMITTEES
None.
PROFESSION
Brewery worker, Carlsberg Supply
Company Danmark A/S.
NON-EXECUTIVE FUNCTIONS
None.
Nationality: Danish
Year of birth: 1953
Appointed (until): 2014 (2019)
BOARD FUNCTION
Non-executive, non-independent
director.
BOARD COMMITTEES
None.
PROFESSION
Professor, Ph.D., Dr.Phil.; head of
the Doctoral School of the Human-
ities at the University of Southern
Denmark.
NON-EXECUTIVE FUNCTIONS
Member of the Board of Directors of
the Carlsberg Foundation and of the
board of a publishing firm.
Nationality: Swiss
Year of birth: 1959
Appointed (until): 2018 (2019)
BOARD FUNCTION
Non-executive, independent
director.
BOARD COMMITTEES
Remuneration Committee.
PROFESSION
Executive Vice President and Head of
Operations at Nestlé S.A.
NON-EXECUTIVE FUNCTIONS
Member of the Board of World
Business Council for Sustainable
Development.
The Supervisory Board members’ full CVs, including skills and competences, are available on www.carlsberggroup.com/who-we-are/about-the-carlsberg-group/supervisory-board/.

CARLSBERG GROUP ANNUAL REPORT 2018 GOVERNANCE 50
SUPERVISORY BOARD
RICHARD BURROWS
DONNA CORDNER
EVA VILSTRUP DECKER
FINN LOK
ERIK LUND
Nationality: Irish
Year of birth: 1946
Appointed (until): 2009 (2019)
BOARD FUNCTION
Non-executive, independent
director.
BOARD COMMITTEES
Audit Committee, Remuneration
Committee (Chairman).
PROFESSION
Non-executive board director.
NON-EXECUTIVE FUNCTIONS
Chairman of the Board of Directors
of British American Tobacco and
Craven House Capital. Member of
the Board of Directors and Chairman
of the Remuneration Committee of
Rentokil Initial plc.
Nationality: American
Year of birth: 1956
Appointed (until): 2012 (2019)
BOARD FUNCTION
Non-executive, independent
director.
BOARD COMMITTEES
Audit Committee (Chairman).
PROFESSION
Managing partner of OKM Capital.
NON-EXECUTIVE FUNCTIONS
Member of the Board of Directors of
Lia Diagnostics.
Donna Cordner is not standing for re-election at the AGM in 2019.
Nationality: Danish
Year of birth: 1964
Appointed (until): 2014 (2022)
BOARD FUNCTION
Employee representative.
BOARD COMMITTEES
None.
PROFESSION
Director, Carlsberg Breweries A/S.
NON-EXECUTIVE FUNCTIONS
None.
Nationality: Danish
Year of birth: 1958
Appointed (until): 2014 (2022)
BOARD FUNCTION
Employee representative.
BOARD COMMITTEES
None.
PROFESSION
Ph.D., Senior Scientist, Carlsberg A/S.
NON-EXECUTIVE FUNCTIONS
None.
Nationality: Danish
Year of birth: 1964
Appointed (until): 2015 (2022)
BOARD FUNCTION
Employee representative.
BOARD COMMITTEES
None.
PROFESSION
Head Brewer, Carlsberg A/S.
NON-EXECUTIVE FUNCTIONS
None.
The Supervisory Board members’ full CVs, including skills and competences, are available on www.carlsberggroup.com/who-we-are/about-the-carlsberg-group/supervisory-board/.

CARLSBERG GROUP ANNUAL REPORT 2018 GOVERNANCE 51
SUPERVISORY BOARD
SØREN-PETER FUCHS OLESEN
PETER PETERSEN
NINA SMITH
LARS STEMMERIK
Nationality: Danish
Year of birth: 1955
Appointed (until): 2012 (2019)
BOARD FUNCTION
Non-executive, non-independent
director.
BOARD COMMITTEES
None.
PROFESSION
Professor, D.M.Sc; CEO of the
Danish National Research
Foundation.
NON-EXECUTIVE FUNCTIONS
Member of the Board of Directors
of the Carlsberg Foundation.
Nationality: Danish
Year of birth: 1969
Appointed (until): 2010 (2022)
BOARD FUNCTION
Employee representative.
BOARD COMMITTEES
None.
PROFESSION
President of the Staff Association;
Process Lead, Carlsberg Supply
Company Danmark A/S.
NON-EXECUTIVE FUNCTIONS
None.
Nationality: Danish
Year of birth: 1955
Appointed (until): 2013 (2019)
BOARD FUNCTION
Non-executive, non-independent
director.
BOARD COMMITTEES
Audit Committee.
PROFESSION
Professor, M.Sc. (Econ); non-
executive director.
NON-EXECUTIVE FUNCTIONS
Member of the Board of Directors
of the Carlsberg Foundation. Chairman
of the Board of Directors of Forenet
Kredit. Deputy Chairman of the Board
of Directors of Nykredit Realkredit A/S
and Nykredit Holding A/S.
Nina Smith is not standing for re-election at
the AGM in 2019.
Nationality: Danish
Year of birth: 1956
Appointed (until): 2010 (2019)
BOARD FUNCTION
Non-executive, non-independent
director.
BOARD COMMITTEES
None.
PROFESSION
Professor, D.Sc; non-executive
director.
NON-EXECUTIVE FUNCTIONS
Member of the Board of Directors
of the Carlsberg Foundation.
The Supervisory Board members’ full CVs, including skills and competences, are available on www.carlsberggroup.com/who-we-are/about-the-carlsberg-group/supervisory-board/.

CARLSBERG GROUP ANNUAL REPORT 2018 GOVERNANCE 52
OUR MANAGEMENT TEAM
EXECUTIVE COMMITTEE
CEES ’T HART CEO
Nationality: Dutch
Year of birth: 1958
Appointed: 2015
PRIOR EXPERIENCE
Prior to joining the Carlsberg Group, Cees was
CEO of the Dutch dairy company Royal
FrieslandCampina, a position he had held since
2008. Prior to FrieslandCampina, Cees spent
25 years with Unilever, holding management
positions across Eastern Europe, Western
Europe and Asia. His last position at Unilever
was as a member of the Europe Executive
Board. Cees is a member of the Supervisory
Board of KLM.
HEINE DALSGAARD CFO
Nationality: Danish
Year of birth: 1971
Appointed: 2016
PRIOR EXPERIENCE
Heine joined the Carlsberg Group in 2016
from ISS, one of the world’s largest facility
services companies. He went to ISS in 2013,
prior to the company’s IPO in 2014. Before
ISS, he was Group CFO at Grundfos, a leading
global pump manufacturer. Heine’s previous
experience includes various senior management
and financial positions at companies such as
Carpetland, Hewlett Packard and Arthur
Andersen.
JESSICA SPENCE EXECUTIVE VICE PRESIDENT,
GROUP COMMERCIAL
Nationality: British/Luxembourgish
Year of birth: 1975
Appointed: 2018
PRIOR EXPERIENCE
Jessica joined the Carlsberg Group in 2012
as Marketing Director, Asia region, and in
2014 was promoted to Vice President
Commercial, Asia region. Since 2015, she
has been globally responsible for the Group’s
commercial function, including marketing,
sales, innovation and R&D. Jessica joined
the Group from SABMiller, where she held
several senior commercial positions in the
UK, Russia, Slovakia and Poland.
PHILIP HODGES EXECUTIVE VICE PRESIDENT,
GROUP SUPPLY CHAIN
Nationality: Swiss/British
Year of birth: 1966
Appointed: 2017
PRIOR EXPERIENCE
Philip joined the Carlsberg Group in
February 2017. His most recent position
was at Mondelēz, where he was Senior Vice
President, heading up the integrated supply
chain in Europe for Mondelēz International.
His previous experience includes managerial
positions with Kraft Foods in Europe, Asia and
the USA within supply chain and finance.

CARLSBERG GROUP ANNUAL REPORT 2018 GOVERNANCE 53
EXECUTIVE COMMITTEE
CHRIS WARMOTH EXECUTIVE VICE PRESIDENT,
WESTERN EUROPE
Nationality: British
Year of birth: 1959
Appointed: 2014
PRIOR EXPERIENCE
Chris first joined the Carlsberg Group as Senior
Vice President, Asia in 2014. During his tenure,
he has headed up Funding the Journey and,
most recently, Group Strategy. Previously,
Chris worked for H.J. Heinz, where he held
various senior management positions in
Continental and Eastern Europe and the Far
East, with his last position being Executive VP
for Asia Pacific, Middle East and Africa. Prior to
joining Heinz, Chris worked for The Coca-Cola
Company and P&G.
GRAHAM FEWKES EXECUTIVE VICE PRESIDENT,
ASIA
Nationality: British
Year of birth: 1968
Appointed: 2014
PRIOR EXPERIENCE
Graham joined the Carlsberg Group as Vice
President Commercial, Asia in 2008, before
becoming Senior Vice President of Group
Sales, Marketing & Innovation in 2014.
Graham has strong experience in the
global drinks business, having served in
a wide range of international sales and
marketing roles for Grand Metropolitan
plc, Foster’s Brewing Group and S&N plc.
JACEK PASTUSZKA EXECUTIVE VICE PRESIDENT,
EASTERN EUROPE
Nationality: Polish
Year of birth: 1963
Appointed: 2015
PRIOR EXPERIENCE
Jacek joined Carlsberg in 2009 and has
been Managing Director of our businesses
in Poland, Norway and, since 2015, Russia.
Prior to joining the Group, Jacek was with
P&G, where he held various sales positions
in multiple markets, including customer team
assignments with Wal-Mart in the USA and
Tesco in Central Europe and Asia. Jacek has
also been Commercial VP for Danone in Poland
and the Baltics, and General Manager for AIG
operations in Poland.

CARLSBERG GROUP ANNUAL REPORT 2018 GOVERNANCE 54
Carlsberg A/S is listed on Nasdaq Copenhagen. The Company has around 40,000 registered shareholders.
The Company has two share classes: Carlsberg
A and Carlsberg B. Each A share carries 20
votes, while each B share carries two votes and
is entitled to a preferential dividend. The B
share is included in the Nasdaq OMX Nordic
Large Cap and OMXC20 blue-chip indices.
The Carlsberg B share price was DKK 692.6
at 31 December 2018. This was a decline of
7% during the year, while the OMXC20 share
index declined by 13%.
As a supplement to its Copenhagen listing,
the Company has established a sponsored
level 1 ADR (American Depository Receipt)
programme with J.P. Morgan. The ADRs
trade over-the-counter in the USA under
the symbol CABGY. More information on
the ADR programme is available on our
investor website.
MAJOR SHAREHOLDERS
At 31 December 2018, the Company’s largest
shareholder was the Carlsberg Foundation with
30% of the capital and 75% of the votes. In
accordance with section 29 of the Danish
Securities Trading Act, Massachusetts Financial
Services Company (Boston, USA) has notified
Carlsberg that it too owns more than 5% of the
share capital.
DIVIDEND POLICY
The Carlsberg Group’s dividend policy stipulates
an adjusted payout ratio of around 50%. In
addition, the Company has launched a share
buy-back programme. For more information,
see page 34.
INVESTOR RELATIONS
The Carlsberg Group aims to give shareholders
and the market the best possible insight into
factors considered relevant for ensuring
market-efficient and fair pricing of the
Company’s shares. This is achieved through
the quality, consistency and continuity of the
information provided to the market, which is
handled by the Group’s Investor Relations
department.
We observe a four-week silent period prior
to the publication of the annual and half-
year reports, and a two-week silent period
prior to the Q1 and Q3 trading statements.
GROUP WEBSITE
www.carlsberggroup.com provides
comprehensive information about the Group
and its shares and bonds, including company
announcements, annual and quarterly reports,
share prices and financial data, investor
presentations, webcasts and transcripts, and
a financial and events calendar.
At the end of 2018, a total of 31 analysts
had coverage of the Company. Their names
and consensus estimates can be found on the
website.
SHARE INFORMATION
INFORMATION FOR SHAREHOLDERS
Shareholder geographic split
(% of free float)
Carlsberg B share and OMXC20 share index
development 2018
Share information
Share class A B Total Number of shares 33,699,252 118,857,554 152,556,806
Carlsberg Foundation 33,061,264 13,202,708 46,263,972
Votes per share 20 2
Par value DKK 20 DKK 20
Share price, year-end DKK 670.0 DKK 692.6
Proposed dividend per share DKK 18.0 DKK 18.0
USA 38%
UK 16%
DK 16%
Other 30%
70
80
90
100
110
120
Jan
Feb
Mar
Apr
May
Jun
Jul
Aug
Sep
Oct
Nov
Dec
Carl B OMXC20
The Annual General Meeting of Carlsberg A/S will be held on 13 March 2019 at Ny Carlsberg Glyptotek, Dantes Plads 7, Copenhagen.

CARLSBERG GROUP ANNUAL REPORT 2018 FORWARD-LOOKING STATEMENTS 55
FORWARD-LOOKING STATEMENTS
This Annual Report contains forward-looking
statements, including statements about the
Group’s sales, revenues, earnings, spending,
margins, cash flow, inventory, products, actions,
plans, strategies, objectives and guidance with
respect to the Group's future operating results.
Forward-looking statements include, without
limitation, any statement that may predict,
forecast, indicate or imply future results,
performance or achievements, and may contain
the words “believe, anticipate, expect, estimate,
intend, plan, project, will be, will continue, will
result, could, may, might”, or any variations
of such words or other words with similar
meanings. Any such statements are subject
to risks and uncertainties that could cause the
Group’s actual results to differ materially from
the results discussed in such forward-looking
statements. Prospective information is based
on management’s then current expectations or
forecasts. Such information is subject to the
risk that such expectations or forecasts, or the
assumptions underlying such expectations or
forecasts, may change. The Group assumes no
obligation to update any such forward-looking
statements to reflect actual results, changes in
assumptions or changes in other factors
affecting such forward-looking statements.
Some important risk factors that could cause
the Group’s actual results to differ materially
from those expressed in its forward-looking
statements include, but are not limited to:
economic and political uncertainty (including
interest rates and exchange rates), financial
and regulatory developments, demand for
the Group’s products, increasing industry
consolidation, competition from other
breweries, the availability and pricing of
raw materials and packaging materials, cost
of energy, production- and distribution-related
issues, information technology failures, breach
or unexpected termination of contracts, market-
driven price reductions, market acceptance of
new products, changes in consumer preferences,
launches of rival products, stipulation of fair
value in the opening balance sheet of acquired
entities, litigation, environmental issues and
other unforeseen factors. New risk factors
can arise, and it may not be possible for
management to predict all such risk factors,
nor to assess the impact of all such risk factors
on the Group’s business or the extent to which
any individual risk factor, or combination of
factors, may cause results to differ materially
from those contained in any forward-looking
statement. Accordingly, forward-looking
statements should not be relied on as a
prediction of actual results.
Forward-looking statements

CARLSBERG GROUP ANNUAL REPORT 2018 CONSOLIDATED FINANCIAL STATEMENTS 56
CONSOLIDATED FINANCIAL
STATEMENTS
Income statement ................................... 57
Statement of comprehensive
income ......................................................... 57
Statement of financial position ......... 58
Statement of changes in equity ........ 59
Statement of cash flows ...................... 60
Notes ............................................................ 61
PARENT COMPANY FINANCIAL
STATEMENTS
Statements .............................................. 125
Notes ......................................................... 128
REPORTS
Management statement ................... 135
Auditor’s report ..................................... 136
SECTION 1
OPERATING ACTIVITIES
1.1 Segmentation of operations ..................63
1.2 Operating expenses, inventories
and deposit liabilities ................................66
1.3 Foreign exchange risk related to
earnings ........................................................68
1.4 Cash flow from operating
activities ........................................................69
1.5 Trade receivables and on-trade
loans ..............................................................70
SECTION 2
ASSET BASE AND RETURNS
2.1 Segmentation of assets and
returns ...........................................................73
2.2 Impairment ..................................................74
2.3 Intangible assets and property,
plant and equipment ................................80
SECTION 3
SPECIAL ITEMS AND PROVISIONS
3.1 Special items ...............................................84
3.2 Provisions .....................................................85
3.3 Contingent liabilities .................................86
SECTION 4
FINANCING COSTS, CAPITAL
STRUCTURE AND EQUITY
4.1 Financial income and expenses ............88
4.2 Net interest-bearing debt .......................88
4.3 Capital structure ........................................89
4.4 Borrowings and cash................................91
4.5 Interest rate risk .........................................92
4.6 Foreign exchange risk related to
net investments and financing
activities ........................................................93
4.7 Liquidity risk ................................................95
4.8 Derivative financial instruments............97
SECTION 5
ACQUISITIONS, DISPOSALS,
ASSOCIATES AND JOINT VENTURES
5.1 Investment model and risks ...................99
5.2 Acquisitions and disposals ................... 100
5.3 Contingent considerations ................... 102
5.4 Associates and joint ventures ............. 103
SECTION 6
TAX
6.1 Income tax ................................................ 104
6.2 Deferred tax ............................................. 105
SECTION 7
STAFF COSTS AND REMUNERATION
7.1 Staff costs ................................................. 107
7.2 Remuneration .......................................... 108
7.3 Share-based payments ........................ 109
7.4 Retirement benefit obligations
and similar obligations ......................... 111
SECTION 8
OTHER DISCLOSURE REQUIREMENTS
8.1 Earnings per share ................................. 114
8.2 Related parties ........................................ 115
8.3 Fees to auditors ...................................... 115
8.4 Events after the reporting period ...... 115
SECTION 9
BASIS FOR PREPARATION
9.1 Significant accounting estimates
and judgements ...................................... 116
9.2 General accounting policies ................ 116
9.3 Changes in accounting policies .......... 119
9.4 New legislation ....................................... 120
SECTION 10
GROUP COMPANIES
10 Group companies.................................... 121
CONSOLIDATED FINANCIAL STATEMENTS
Consolidated financial statements

CARLSBERG GROUP ANNUAL REPORT 2018 CONSOLIDATED FINANCIAL STATEMENTS 57
INCOME STATEMENT STATEMENT OF COMPREHENSIVE INCOME
DKK million Section 2018 2017
Revenue 88,970 85,789
Excise duties on beer and soft drinks -26,467 -25,134
Net revenue 1.1 62,503 60,655
Cost of sales 1.2.1 -31,283 -30,447
Gross profit 31,220 30,208
Sales and distribution expenses 1.2.3 -17,474 -17,144
Administrative expenses -4,615 -4,563
Other operating activities, net 1.2.4 68 113
Share of profit after tax of associates and joint ventures 5.4 130 262
Operating profit before special items 9,329 8,876
Special items, net 3.1 -88 -4,565
Financial income 4.1 358 511
Financial expenses 4.1 -1,080 -1,299
Profit before tax 8,519 3,523
Income tax 6.1 -2,386 -1,458
Consolidated profit 6,133 2,065
Attributable to
Non-controlling interests 1.1 824 806
Shareholders in Carlsberg A/S (net profit) 5,309 1,259
DKK
Earnings per share 8.1
Earnings per share of DKK 20 34.8 8.3
Diluted earnings per share of DKK 20 34.7 8.2
DKK million Section 2018 2017
Consolidated profit 6,133 2,065
Other comprehensive income
Retirement benefit obligations 7.4 392 1,266
Share of other comprehensive income in associates and joint ventures 5.4 4 -12
Income tax 6.1 -33 -141
Items that will not be reclassified to the income statement 363 1,113
Foreign exchange adjustments of foreign entities 4.1 -2,754 -3,842
Fair value adjustments of hedging instruments 4.1 -640 -305
Income tax 6.1 85 25
Items that may be reclassified to the income statement -3,309 -4,122
Other comprehensive income -2,946 -3,009
Total comprehensive income 3,187 -944
Attributable to
Non-controlling interests 855 499
Shareholders in Carlsberg A/S 2,332 -1,443

CARLSBERG GROUP ANNUAL REPORT 2018 CONSOLIDATED FINANCIAL STATEMENTS 58
DKK million Section 31 Dec. 2018 31 Dec. 2017
ASSETS
Non-current assets
Intangible assets 2.2, 2.3 66,868 67,793 Property, plant and equipment 2.2, 2.3 25,394 24,325
Investments in associates and joint ventures 5.4 4,562 4,266
Receivables 1.5 1,097 952 Deferred tax assets 6.2 1,693 1,663
Total non-current assets 99,614 98,999
Current assets Inventories 1.2.1 4,435 3,834
Trade receivables 1.5 5,084 4,611
Tax receivables 213 181 Other receivables 1.5 1,925 2,138
Prepayments 840 1,026
Cash and cash equivalents 4.4.2 5,589 3,462
Total current assets 18,086 15,252
Total assets 117,700 114,251
DKK million Section 31 Dec. 2018 31 Dec. 2017
EQUITY AND LIABILITIES
Equity
Share capital 4.3.2 3,051 3,051 Reserves -36,837 -33,483
Retained earnings 79,088 77,362
Equity, shareholders in Carlsberg A/S 45,302 46,930 Non-controlling interests 2,587 2,595
Total equity 47,889 49,525
Non-current liabilities Borrowings 4.2, 4.4.1 16,750 23,340
Retirement benefit obligations and similar obligations 7.4 2,908 3,351
Deferred tax liabilities 6.2 5,659 5,601 Provisions 3.2 3,827 3,611
Other liabilities 5.3 6,186 3,757
Total non-current liabilities 35,330 39,660
Current liabilities
Borrowings 4.2, 4.4.1 7,233 849
Trade payables 16,199 13,474 Deposits on returnable packaging materials 1.2.2 1,583 1,576
Provisions 3.2 1,100 591
Tax payables 878 931 Other liabilities 7,488 7,645
Total current liabilities 34,481 25,066
Total liabilities 69,811 64,726
Total equity and liabilities 117,700 114,251
STATEMENT OF FINANCIAL POSITION

CARLSBERG GROUP ANNUAL REPORT 2018 CONSOLIDATED FINANCIAL STATEMENTS 59
STATEMENT OF CHANGES IN EQUITY
DKK million Section Shareholders in Carlsberg A/S
2018
Share
capital
Currency
translation
Hedging
reserves
Total
reserves
Retained
earnings Total
Non-
controlling
interests
Total
equity
Equity at 1 January 3,051 -32,902 -581 -33,483 77,362 46,930 2,595 49,525
Consolidated profit - - - - 5,309 5,309 824 6,133
Other comprehensive income - -3,214 -140 -3,354 377 -2,977 31 -2,946
Total comprehensive income for the year - -3,214 -140 -3,354 5,686 2,332 855 3,187
Acquisition/disposal of treasury shares 4.3.2 - - - - 44 44 - 44
Settlement of share-based payments 4.3.2 - - - - -94 -94 - -94
Share-based payments 7.3 - - - - 171 171 3 174
Dividends paid to shareholders 4.3.1 - - - - -2,439 -2,439 -869 -3,308
Non-controlling interests - - - - -1,642 -1,642 - -1,642
Acquisition of entities 5.2 - - - - - - 3 3
Total changes in equity - -3,214 -140 -3,354 1,726 -1,628 -8 -1,636
Equity at 31 December 3,051 -36,116 -721 -36,837 79,088 45,302 2,587 47,889
2017
Equity at 1 January 3,051 -29,080 -611 -29,691 77,451 50,811 2,839 53,650
Consolidated profit - - - - 1,259 1,259 806 2,065
Other comprehensive income - -3,822 30 -3,792 1,090 -2,702 -307 -3,009
Total comprehensive income for the year - -3,822 30 -3,792 2,349 -1,443 499 -944
Acquisition/disposal of treasury shares 4.3.2 - - - - -118 -118 - -118
Settlement of share-based payments 4.3.2 - - - - -38 -38 - -38
Share-based payments 7.3 - - - - 33 33 - 33
Dividends paid to shareholders 4.3.1 - - - - -1,525 -1,525 -738 -2,263
Non-controlling interests - - - - -790 -790 -2 -792
Disposal of entities 5.2 - - - - - - -3 -3
Total changes in equity - -3,822 30 -3,792 -89 -3,881 -244 -4,125
Equity at 31 December 3,051 -32,902 -581 -33,483 77,362 46,930 2,595 49,525

CARLSBERG GROUP ANNUAL REPORT 2018 CONSOLIDATED FINANCIAL STATEMENTS 60
DKK million Section 2018 2017
Operating profit before special items 9,329 8,876
Depreciation and amortisation 4,064 4,581
Impairment losses¹ 27 126
Operating profit before depreciation, amortisation and impairment losses¹ 13,420 13,583
Other non-cash items 143 -279
Change in trade working capital 1,908 848
Change in other working capital² 52 388
Restructuring costs paid -238 -364
Interest etc. received 153 156
Interest etc. paid -1,016 -564
Income tax paid -2,375 -1,934
Cash flow from operating activities 1.4 12,047 11,834
Acquisition of property, plant and equipment and intangible assets -4,017 -4,053
Disposal of property, plant and equipment and intangible assets 254 160
Change in on-trade loans² 1.4 -192 40
Total operational investments -3,955 -3,853
Free operating cash flow 8,092 7,981
Acquisition and disposal of subsidiaries, net 5.2 -974 268
Acquisition and disposal of associates and joint ventures, net 5.2 -1,491 242
Acquisition and disposal of financial investments, net 3 10
Change in financial receivables -36 -54
Dividends received 572 208
Total financial investments -1,926 674
Other investments in property, plant and equipment -10 -
Disposal of other property, plant and equipment - 25
Total other activities³ -10 25
Cash flow from investing activities -5,891 -3,154
Free cash flow 6,156 8,680
Shareholders in Carlsberg A/S 4.3.2 -2,489 -1,681
Non-controlling interests 4.3.2 -1,186 -740
External financing 4.4.1 -123 -5,239
Cash flow from financing activities -3,798 -7,660
Net cash flow 2,358 1,020
Cash and cash equivalents at 1 January⁴ 3,120 2,348
Foreign exchange adjustment of cash and cash equivalents -44 -248
Cash and cash equivalents at 31 December⁴ 4.4.2 5,434 3,120
STATEMENT OF CASH FLOWS
1 Impairment losses excluding those reported in special items, cf. section 3.1. 2 Impacted by a reclassification of on-trade loans from other receivables of DKK 238m. 3 Other activities cover real estate, separate from beverage activities. 4 Cash and cash equivalents less bank overdrafts.

CARLSBERG GROUP ANNUAL REPORT 2018 CONSOLIDATED FINANCIAL STATEMENTS 61
62.5bn NET REVENUE (DKK)
Net revenue grew by 3.0%, amounting to
DKK 62,503m (2017: DKK 60,655m). The
net revenue growth was positively impacted
by an increase in volumes, a positive price/mix
development and acquisitions, with adverse
currency movements partly offsetting this
impact.
Net revenue growth (%)
50.0% GROSS MARGIN
Cost of goods sold per hl declined by
approximately 3%, negatively impacted by
higher input costs and mix, while positively
impacted by currencies. The solid price/mix
and ongoing efficiency improvements led to a
gross margin improvement of 20bp to 50.0%.
9.3bn OPERATING PROFIT (DKK)
Operating expenses were impacted by
investments in the SAIL’22 priorities and grew
by 2%. As a percentage of net revenue,
operating expenses declined by 45bp.
Excluding marketing expenses, operating
expenses declined by 1%.
Operating profit before special items was DKK
9,329m (2017: DKK 8,876m). The 5.1%
growth was driven by organic growth of 11.0%,
which was partly offset by a negative currency
impact of 5.6% and a negative net acquisition
impact of 0.3%. Western Europe and Asia
delivered positive operating profit growth, while
growth was flat in Eastern Europe, where
11.3% organic growth was offset by adverse
currencies. Reported operating margin
improved by 30bp to 14.9% (2017: 14.6%).
Operating profit growth (%)
6.1bn NET PROFIT (DKK)
Special items, net, amounted to DKK -88m
(2017: DKK -4,565m, impacted by impairment
of the Baltika brand in Russia). Special items
were particularly impacted by measures related
to SAIL’22 initiatives in Western Europe.
Tax totalled DKK -2,386m (2017: DKK
-1,458m). The effective tax rate was 28.0%
(2017: 41.4% but 29.0% adjusted for the
aforementioned brand impairment).
Consolidated profit was DKK 6,133m
compared to DKK 2,065m in 2017.
Consolidated profit was driven by operating
profit growth, reduced special items, lower
financial expenses and a lower effective tax
rate compared with 2017.
Non-controlling interests’ share of consolidated
profit totalled DKK 824m (2017: DKK 806m).
The Carlsberg Group’s share of consolidated
profit was DKK 5,309m (2017: DKK 1,259m).
6.5% 0.1% -3.6%
54
56
58
60
62
64
66
11.0% -0.3% -5.6%
6
7
8
9
10
11
SECTION 1
OPERATING ACTIVITIES
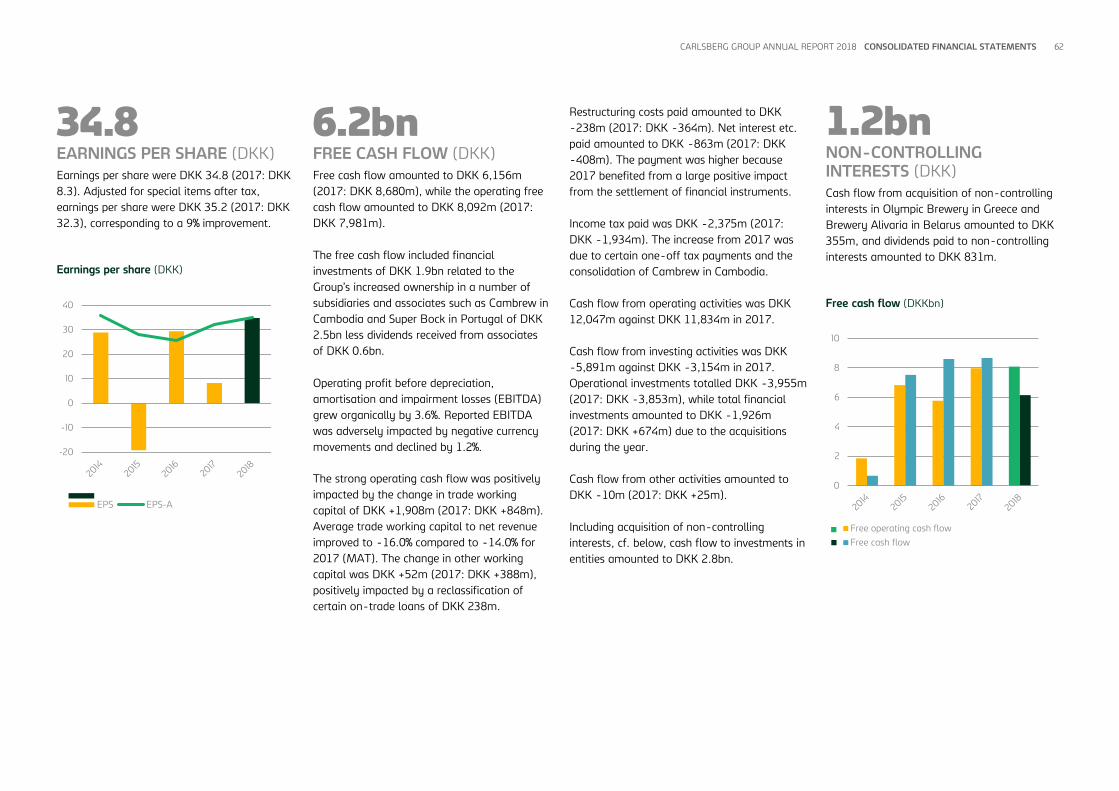
CARLSBERG GROUP ANNUAL REPORT 2018 CONSOLIDATED FINANCIAL STATEMENTS 62
34.8 EARNINGS PER SHARE (DKK)
Earnings per share were DKK 34.8 (2017: DKK
8.3). Adjusted for special items after tax,
earnings per share were DKK 35.2 (2017: DKK
32.3), corresponding to a 9% improvement.
Earnings per share (DKK)
6.2bn FREE CASH FLOW (DKK)
Free cash flow amounted to DKK 6,156m
(2017: DKK 8,680m), while the operating free
cash flow amounted to DKK 8,092m (2017:
DKK 7,981m).
The free cash flow included financial
investments of DKK 1.9bn related to the
Group’s increased ownership in a number of
subsidiaries and associates such as Cambrew in
Cambodia and Super Bock in Portugal of DKK
2.5bn less dividends received from associates
of DKK 0.6bn.
Operating profit before depreciation,
amortisation and impairment losses (EBITDA)
grew organically by 3.6%. Reported EBITDA
was adversely impacted by negative currency
movements and declined by 1.2%.
The strong operating cash flow was positively
impacted by the change in trade working
capital of DKK +1,908m (2017: DKK +848m).
Average trade working capital to net revenue
improved to -16.0% compared to -14.0% for
2017 (MAT). The change in other working
capital was DKK +52m (2017: DKK +388m),
positively impacted by a reclassification of
certain on-trade loans of DKK 238m.
Restructuring costs paid amounted to DKK
-238m (2017: DKK -364m). Net interest etc.
paid amounted to DKK -863m (2017: DKK
-408m). The payment was higher because
2017 benefited from a large positive impact
from the settlement of financial instruments.
Income tax paid was DKK -2,375m (2017:
DKK -1,934m). The increase from 2017 was
due to certain one-off tax payments and the
consolidation of Cambrew in Cambodia.
Cash flow from operating activities was DKK
12,047m against DKK 11,834m in 2017.
Cash flow from investing activities was DKK
-5,891m against DKK -3,154m in 2017.
Operational investments totalled DKK -3,955m
(2017: DKK -3,853m), while total financial
investments amounted to DKK -1,926m
(2017: DKK +674m) due to the acquisitions
during the year.
Cash flow from other activities amounted to
DKK -10m (2017: DKK +25m).
Including acquisition of non-controlling
interests, cf. below, cash flow to investments in
entities amounted to DKK 2.8bn.
1.2bn NON-CONTROLLING INTERESTS (DKK)
Cash flow from acquisition of non-controlling
interests in Olympic Brewery in Greece and
Brewery Alivaria in Belarus amounted to DKK
355m, and dividends paid to non-controlling
interests amounted to DKK 831m.
Free cash flow (DKKbn)
-20
-10
0
10
20
30
40
EPS EPS-A
0
2
4
6
8
10
Free operating cash flow
Free cash flow

CARLSBERG GROUP ANNUAL REPORT 2018 CONSOLIDATED FINANCIAL STATEMENTS 63
SECTION 1.1
SEGMENTATION OF OPERATIONS
REVENUE
As of 1 January 2018, the Group implemented
IFRS 15 “Revenue from Contracts with
Customers”. Comparative figures for 2017 have
been restated accordingly.
The Group’s net revenue arises primarily from
the sale of beverages to our customers.
Revenue from brand licensing, sale of by-
products and other revenue in aggregate
accounts for around 1% of the Group’s gross
revenue and is not seen as a material source of
revenue. Net revenue grew by DKK 1,848m in
2018 and was positively impacted by the
increase in volumes, improved price/mix across
the regions and the acquisition of Cambrew.
Not allocated net revenue, DKK 42m (2017:
DKK 70m), consisted of DKK 1,362m (2017:
DKK 1,438m) net revenue and DKK -1,320m
(2017: DKK -1,368m) from eliminations of
sales between the geographical segments.
Geographical allocation of net revenue
DKK million 2018 2017
Denmark (Carlsberg
A/S’ domicile) 4,614 4,366
China 7,509 6,654
Russia 7,507 8,113
Other countries 42,873 41,522
Total 62,503 60,655
The DKK value of net revenue in Russia was impacted by
the decrease in the average RUB/DKK rate of 11.2% in
2018.
Segmentation of income statement
DKK million
2018
Western
Europe Asia
Eastern
Europe
Not
allocated
Beverages,
total
Non-
beverage
Carlsberg
Group, total
Net revenue 36,151 15,530 10,780 42 62,503 - 62,503
Total cost -30,847 -12,293 -8,558 -1,489 -53,187 -117 -53,304
Share of profit after tax of associates and joint ventures 121 -73 - 4 52 78 130
Operating profit before special items 5,425 3,164 2,222 -1,443 9,368 -39 9,329
Special items, net -88 - -88
Financial items, net -718 -4 -722
Profit before tax 8,562 -43 8,519
Income tax -2,395 9 -2,386
Consolidated profit 6,167 -34 6,133
Operating margin 15.0% 20.4% 20.6% 15.0% 14.9%
2017
Western
Europe Asia
Eastern
Europe
Not
allocated
Beverages,
total
Non-
beverage
Carlsberg
Group, total
Net revenue 35,716 13,944 10,925 70 60,655 - 60,655
Total cost -30,754 -11,088 -8,705 -1,377 -51,924 -117 -52,041
Share of profit after tax of associates and joint ventures 182 49 - - 231 31 262
Operating profit before special items 5,144 2,905 2,220 -1,307 8,962 -86 8,876
Special items, net -4,615 50 -4,565
Financial items, net -774 -14 -788
Profit before tax 3,573 -50 3,523
Income tax -1,485 27 -1,458
Consolidated profit 2,088 -23 2,065
Operating margin 14.4% 20.8% 20.3% 14.8% 14.6%

CARLSBERG GROUP ANNUAL REPORT 2018 CONSOLIDATED FINANCIAL STATEMENTS 64
SECTION 1.1 (CONTINUED)
SEGMENTATION OF OPERATIONS
OPERATING PROFIT BEFORE
SPECIAL ITEMS
Not allocated operating profit before special
items, DKK -1,443m (2017: DKK -1,307m),
consisted of DKK -1,381m (2017: DKK
-1,242m) relating to central costs not
managed by the regions, including costs of
developing branding activities to support the
SAIL’22 initiatives, general costs of headquarter
functions and DKK -62m (2017: DKK -65m)
from various eliminations.
Compared with 2017, central costs increased
due to investments in growth initiatives as part
of SAIL’22.
VOLUMES
As of 1 January 2018, the Group decided to
change the definition of volumes to include
only the Group’s sales of beverages in
consolidated entities. Compared with 2017, the
new definition thus excludes volumes in
associates and joint ventures. Comparative
figures for 2017 have been restated
accordingly.
Total volumes grew organically by 4.8%, driven
by growth in all three regions. Reported
volume growth was 5.3%, positively impacted
by the increased ownership in Cambrew and
negatively impacted by the fact that the
German wholesaler Nordic Getränke, which
was disposed of in April 2017, did not
contribute to the reported volume in 2018.
NON-CONTROLLING INTERESTS
Non-controlling interests' share of profit for
the year
DKK million 2018 2017
Lao Brewery 292 304
Chongqing Brewery Group 236 230
Carlsberg Malaysia Group 229 182
Asia, other 52 79
Other regions 15 11
Total 824 806
ACCOUNTING ESTIMATES AND JUDGEMENTS
The Group considers all terms and activities in
contracts with customers in order to determine the
performance obligation, the transaction price and the
allocation of the transaction price and, as a result,
how revenue is recognised.
If the consideration in a contract includes a variable
amount, the Group estimates the amount of
consideration to which it will be entitled in exchange
for transferring goods to the customer. The variable
consideration is estimated at contract inception based
on expected sales volumes using historical and year-
to-date sales figures and other current information
about trading with the individual customer or with a
group of customers.
The Group estimates discounts using either the
expected value method or the most likely amount
method depending on which method better predicts
the amount of consideration to which it will be
entitled.
The most likely amount method is used for contracts
with a single contract sum, while the expected value
method is used for contracts with more than one
threshold due to the complexity and the activities
agreed with the individual customer during the year.
Certain contracts related to specific major events
which are held within such a short time period that it
is not possible to sell all the goods during the event
(e.g. football matches) provide the customer with a
right to return the goods within a specified period.
The Group uses the expected value method to
estimate the goods that will not be returned, as this
method best predicts the amount of variable
consideration to which the Group will be entitled. For
goods that are expected to be returned, the Group
recognises a refund liability instead of revenue.
Management makes judgements when deciding
whether supporting activities with a customer should
be classified as a discount or a marketing expense.
Generally, marketing activities with the individual
customer should be seen as a discount, whereas costs
related to broader marketing activities are classified
as marketing expenses.
The classification of duties, taxes and fees paid to
local authorities or brewery organisations etc.
requires accounting estimates and judgements to be
made by management.
Locally imposed duties, taxes and fees are typically
based on product type, alcohol content, consumption
of certain raw materials, such as glue, plastic or
metal in caps, and energy consumption. These are
classified as either sales-related duties, and deducted
from revenue, or as related to the input/use of goods
in production, distribution etc., and recognised in the
relevant line item. The type of authority or
organisation imposing the duty, tax or fee and the
objective of these are key factors when determining
the classification.
Whether the Group is acting as a principal or an agent
is evaluated by management on a country-by-
country basis. The Group has concluded that it is the
principal in its revenue arrangements because it
controls the goods before transferring them to the
customer.
Group financial performance
Change Change
Volumes (million hl) 2017 Organic Acq., net FX 2018 Reported
Beer 107.1 4.4% 0.5% - 112.3 4.9%
Other beverages 19.2 6.9% 0.8% - 20.8 7.7%
Total volume 126.3 4.8% 0.5% - 133.1 5.3%
DKK million
Net revenue 60,655 6.5% 0.1% -3.6% 62,503 3.0%
Operating profit before special items 8,876 11.0% -0.3% -5.6% 9,329 5.1%
Operating margin (%) 14.6 14.9 30bp

CARLSBERG GROUP ANNUAL REPORT 2018 CONSOLIDATED FINANCIAL STATEMENTS 65
SECTION 1.1 (CONTINUED)
SEGMENTATION OF OPERATIONS
ACCOUNTING POLICIES
Revenue
Revenue from contracts with customers comprises
sales of goods, royalty income, rental income from
non-stationary equipment, service fees and sales of
by-products.
Revenue from the sale of own-produced finished
goods, goods for resale (third-party products) and
by-products is recognised at the point in time when
the control of goods and products is transferred to
the customer, which is generally upon delivery. For
contracts providing the customer with a right of return
within a specified period, the Group considers the
timing of recognition.
Royalty and licence fees are recognised when earned
according to the terms of the licence agreements.
Revenue from contracts with customers is measured
at an amount that reflects the consideration to which
the Group expects to be entitled in exchange for
those goods. Amounts disclosed as net revenue
exclude discounts, VAT and other duties. Excise duties
on beer and soft drinks are disclosed separately from
revenue.
The Group considers whether contracts include other
promises that constitute separate performance
obligations and to which a portion of the transaction
price needs to be allocated. In determining the
transaction price, the Group considers the effects of
variable consideration. No element of financing is
deemed present, as payment is generally made on
the basis of cash on delivery or up to 30 days of
credit.
Variable consideration
The Group pays various discounts and fees depending
on the nature of the customer and business.
Customer discounts comprise off-invoice discounts,
volume- and activity-related discounts, including
specific promotion prices offered, and other discounts.
Furthermore, customer discounts include the difference
between the present value and the nominal amount of
on-trade loans to customers, cf. section 1.5.
Off-invoice discounts arise from sales transactions
where the customer immediately receives a reduction
in the sales price. This also includes cash discounts
and incentives for early payments.
Volume- and activity-related discounts is a broad
term covering incentives for customers to sustain
business with the Group over a longer time and may
be related to a current campaign or a sales target
measured in volumes or total value. Examples include
discounts paid as a lump sum, discounts for meeting
all or certain sales targets or for exceeding targets, or
progressive discounts offered in step with increasing
sales to a customer.
Other discounts include listing fees, i.e. fees for
certain listings on shelves, in coolers or in favourable
store locations, as such specific promotions are
closely related to the volumes sold.
Segment information
The Group’s beverage activities are segmented
according to the three geographical regions where
sales take place. These regions make up the Group’s
reportable segments. The non-beverage activities are
managed separately and therefore not segmented
geographically but shown separately.
The segmentation reflects the geographical and
strategic management, decision and reporting
structure applied by the Executive Committee for
monitoring the Group’s strategic and financial targets.
Segments are managed based on business
performance measured as operating profit before
special items.
Not allocated comprises income and expenses
incurred for ongoing support of the Group’s overall
operations, strategic development and driving
efficiency programmes. The expenses include costs of
running central functions and marketing, including
global sponsorships.
The geographical allocation of net revenue is based
on the selling entities’ domicile and comprises
countries individually accounting for more than 10%
of the Group’s consolidated net revenue as well as the
domicile country.
Decisions on restructurings, acquisition and
divestment of entities included in special items as well
as on financing (financial income and expenses) and
tax planning (income tax) are made based on
information for the Group as a whole and therefore
not segmented.
Reported figures
Reported figures are analysed by looking at the
impact of organic growth, net acquisitions and foreign
exchange effects. The net acquisition effect is
calculated as the effect of acquisitions and
divestments, including any share obtained from an
increase/decrease in ownership of associates and
joint ventures, for a 12-month period from the
acquisition/divestment date. The foreign exchange
effect is the difference between the figures from the
current reporting period translated at the exchange
rates applying to the previous reporting period and
the figures for the current reporting period translated
at the current exchange rates. Organic growth is the
remaining growth that is not related to acquisitions,
divestments or foreign exchange effects.

CARLSBERG GROUP ANNUAL REPORT 2018 CONSOLIDATED FINANCIAL STATEMENTS 66
SECTION 1.2
OPERATING EXPENSES, INVENTORIES AND DEPOSIT LIABILITIES
1.2.1 COST OF SALES AND INVENTORIES
Cost of sales increased by 3% and was affected
by the organic increase in volumes across all
three regions and by the acquisition of
Cambrew. Organically, cost of sales per hl
increased by approximately 1%, mainly due to
higher input costs.
Cost of sales
DKK million 2018 2017
Cost of materials 17,252 16,147
Direct staff costs 1,365 1,357
Amortisation and
depreciation 2,849 3,263
Indirect production
overheads 4,191 4,163
Purchased finished goods
and other costs 5,626 5,517
Total 31,283 30,447
Inventories increased by 16% compared with
2017, impacted by inventory build-up prior to
the festive season in Asia, which is earlier in
2019 than in 2018, and the consolidation of
Cambrew. Cost of raw materials was
furthermore impacted by the higher purchase
price of grain in 2018.
Inventories
DKK million 2018 2017
Raw materials 1,891 1,625
Work in progress 308 269
Finished goods 2,236 1,940
Total 4,435 3,834
Commodity risks are associated in particular
with purchasing of cans (aluminium), malt
(barley) and energy. The management of
commodity risks is coordinated centrally, and
aimed at achieving stable and predictable
prices in the medium term and avoiding capital
and liquidity being tied up unnecessarily.
As the underlying markets for the specified
categories vary, so does the way in which they
are hedged against price increases.
The most common form of hedging is fixed-
price purchase agreements in local currencies
with suppliers.
It is Group policy to fix the prices of 70% of
malt (barley) purchases for a given year no
later than at the end of the third quarter of the
previous year and to hedge up to around 90%
early in the following year. The main part of
the exposure for the Group for 2018 was
therefore hedged through fixed-price purchase
agreements entered into during 2017. Likewise,
the majority of the exposure for 2019 was
hedged during 2018. The percentage that is
hedged or at fixed prices is higher for Western
Europe and Eastern Europe than for Asia,
which is partly due to the timing of the harvest
season in the southern hemisphere.
In the majority of purchase agreements for
cans, the Group’s purchase price is variable and
based on the global market price of aluminium
(London Metal Exchange, LME). The Group is
thereby able to hedge the underlying
aluminium price risk applying a hedge ratio of
1:1.
In 2018, the majority of the aluminium price
risk was hedged with financial instruments or
with fixed prices via the suppliers to the Group.
The same has been done for 2019. The fair
values of the financial instruments are specified
in section 4.8.
ACCOUNTING ESTIMATES AND JUDGEMENTS
At least once a year, management assesses whether
the standard cost of inventories approximates the
actual cost. During the year, the standard cost is
revised if it deviates by more than 5% from the actual
cost.
Management also assesses the impact on the
standard cost of government and other grants
received to fund operating activities. This includes
assessing the terms and conditions of grants received
and the risk of any repayment.
Funding and grants are recognised in the income
statement in the same period as the activities to
which they relate.
Indirect production overheads are calculated on the
basis of relevant assumptions as to capacity
utilisation, production time and other factors.
The calculation of the net realisable value of
inventories is relevant to packaging materials, point-
of-sale materials and spare parts. The net realisable
value is normally not calculated for beer and soft
drinks due to their limited shelf-life, which means
that slow-moving goods must be scrapped instead.
ACCOUNTING POLICIES
Cost of sales comprises cost of materials, including
malt (barley), hops, glass, cans, other packaging
materials, and indirect production costs. Purchased
finished goods include cost of point-of-sale
materials and third-party products sold to
customers.
Own-produced finished goods and work in progress
are measured at standard cost comprising the cost of
raw materials, consumables, direct labour and
indirect production overheads. Indirect production
overheads comprise indirect supplies, wages and
salaries, amortisation of brands and software, as well
as maintenance and depreciation of machinery, plant
and equipment used for production.
Hedging of raw material price risk
DKK million
Sensitivity assuming
100% efficiency Time of maturity
2018 % change
Effect
on OCI
Tonnes
purchased
Average
price (DKK) 2019 2020
Aluminium 10% 112 93,296 13,095 71,531 21,765
2017 2018 2019
Aluminium 10% 93 66,424 13,066 66,424 -

CARLSBERG GROUP ANNUAL REPORT 2018 CONSOLIDATED FINANCIAL STATEMENTS 67
SECTION 1.2 (CONTINUED)
OPERATING EXPENSES, INVENTORIES AND DEPOSIT LIABILITIES
The cost of purchased finished goods, raw and
packaging materials and point-of-sale materials
includes any costs that are directly related to bringing
inventories to the relevant place of sale and getting
them ready for sale, for example purchase cost,
insurance, freight, duties and similar costs.
Inventories are measured at the lower of standard
cost (own-produced finished goods) and weighted
average cost (other inventories), or net realisable
value. The net realisable value is the estimated selling
price less costs of completion and costs necessary to
make the sale, also taking into account marketability,
obsolescence and developments in expected selling
price.
The cost of scrapped/impaired goods is expensed in
the function (line item) responsible for the loss, i.e.
losses during distribution are included in distribution
expenses, while scrapping of products due to sales
not meeting forecasts is included in sales expenses.
1.2.2 DEPOSITS ON
RETURNABLE PACKAGING MATERIALS
Deposits on returnable packaging materials
amounted to DKK 1,583m (2017: DKK
1,576m). The capitalised value of returnable
packaging materials was DKK 1,898m (2017:
DKK 1,855m).
The capitalised value of returnable packaging
materials exceeds the deposits because each of
the returnable packaging items circulates a
number of times in the market and some
markets have regulations that require the
deposit value to be set lower than the cost of
the returnable packaging materials.
ACCOUNTING ESTIMATES AND JUDGEMENTS
Management assesses the local business model to
determine whether the Group has a legal or
constructive obligation to accept returns of returnable
packaging materials from the market and,
accordingly, the level of control over returnable
packaging materials. Returnable packaging materials
controlled by the Group are capitalised as property,
plant and equipment and depreciated over the
expected useful life. This entails the Group
considering, among others, the return rate and the
annual circulation in the individual markets. These
factors are assessed annually.
The deposit on returnable packaging materials is
estimated based on movements during the year in
recognised liabilities, loss of returnable packaging
materials in the market, planned changes in
packaging types and historical information about
return rates.
ACCOUNTING POLICIES
Returnable packaging materials that the Group
controls through a legal or constructive obligation are
capitalised as property, plant and equipment.
Returnable packaging materials are depreciated over
3-10 years. The accounting policies for property,
plant and equipment are further described in section
2.3.
The obligation to refund deposits on returnable
packaging materials is measured on the basis of
deposit price, an estimate of the number of bottles,
kegs, cans and crates in circulation, and expected
return rates.
1.2.3 SALES AND DISTRIBUTION
EXPENSES
Sales and distribution expenses increased by 2%
in reported terms and by 5% organically. The
reported figure was impacted by higher
marketing expenses related to investments in
the SAIL’22 priorities. However, the impact was
partly offset by a decrease in distribution
expenses of approximately 5%, which was
mainly driven by a change in the UK logistics
set-up during 2018.
Sales and distribution expenses
DKK million 2018 2017
Marketing expenses 5,345 4,730
Sales expenses 5,849 5,815
Distribution expenses 6,280 6,599
Total 17,474 17,144
ACCOUNTING POLICIES
Marketing expenses consist of expenses for brand
marketing and trade marketing.
Brand marketing is an investment in the Group’s
brands and consists of brand-specific investments in
the development of communication vehicles, the use
of these to drive the sale of branded products, sales
campaigns and sponsorships.
Trade marketing is promotional activities directed
towards customers, such as the supply of point-of-
sale materials, promotional materials and trade
offers.
Sales expenses comprise costs relating to general
sales activities, write-downs for bad debt losses,
wages and salaries as well as depreciation and
impairment of sales equipment. Distribution expenses
comprise costs incurred in distributing goods, wages
and salaries, and depreciation and impairment of
distribution equipment.
1.2.4 OTHER OPERATING
ACTIVITIES, NET
Other operating activities are secondary to the
principal activities of the Group and include
income and expenses relating to rental
properties, restaurants, on-trade loans,
research activities, and gains and losses on the
disposal of intangible assets and property,
plant and equipment.
Other operating activities, net
DKK million 2018 2017
Gains and losses on disposal
of property, plant and
equipment and intangible
assets, net 13 26
On-trade loans, net 21 31
Real estate, net -15 -18
Research centres, net -127 -120
Other, net 176 194
Total 68 113
ACCOUNTING POLICIES
Gains and losses on disposal of intangible assets and
property, plant and equipment are determined as the
sales price less selling costs and the carrying amount
at the disposal date.
On-trade loans, net, comprise the effective interest
on the loans measured at amortised cost less
impairment.
Expenses relating to research activities comprise
research in Denmark and France less funding received
from the Carlsberg Foundation for the operation of
the Carlsberg Research Laboratory and grants
received to fund research. The funding and grants are
recognised in the income statement in the same
period as the activities to which they relate. Product
development costs are included in cost of sales.

CARLSBERG GROUP ANNUAL REPORT 2018 CONSOLIDATED FINANCIAL STATEMENTS 68
SECTION 1.3
FOREIGN EXCHANGE RISK RELATED TO EARNINGS
A significant part of the Group’s activities takes
place outside Denmark and in currencies other
than DKK. Foreign exchange risk is therefore a
principal financial risk for the Group, and
exchange rate fluctuations can have a
significant impact on the income statement.
TRANSACTION RISKS ON PURCHASES
AND SALES
The Group is exposed to transaction risks on
purchases and sales in currencies other than
the local functional currencies. It is the Group’s
intention to hedge 70-90% of future cash flows
in currencies other than the local functional
currency on a four-quarter rolling basis.
Western Europe
For the entities in Western Europe, a major
part of the purchases in foreign currencies is in
EUR. Hedging of EUR against the local
currencies will effectively eliminate a significant
part of the currency risk in the entities’
operating profit in local currency. At Group
level, these hedges are effectively an economic
hedge of (parts of) the net revenue in the
relevant currency, and they are accounted for
as cash flow hedges, cf. section 4.8. The
EUR/DKK exposure is considered to be limited
and is not hedged.
Asia
The transaction risk is considered to be less
significant compared with the risk in the other
regions because of the lower sales and
purchases in currencies other than the local
functional currencies as well as the high
correlation between USD and most of the
Asian currencies. As a consequence, the risk is
not hedged.
Eastern Europe
Baltika Breweries and the other entities in
Eastern Europe have expenses in both USD and
EUR, and appreciation of the RUB and other
currencies vis-à-vis EUR and USD has a
positive impact on operating profit, while
depreciation has a negative effect. The Group
has chosen not to systematically hedge the
transaction risk in Eastern Europe to the same
degree as in Western Europe due to the
significant cost of hedging these currencies over
a longer period of time. For 2018 and 2019,
the Group has chosen to hedge a portion of
Baltika Breweries’ expenses in USD. The
volatility of the Eastern European currencies
will continue to affect operating profit
measured in both DKK and local currencies.
TRANSLATION RISK
The Group is exposed to risk from translation
of foreign entities into the Group’s presentation
currency, DKK.
The Group’s single largest exposure in respect
of operating profit continued to be the
exposure to RUB. The exposure to fluctuations
in EUR/DKK is considered to be limited due to
Denmark’s fixed exchange rate policy towards
EUR and is consequently not hedged.
The Group has chosen not to hedge the
exposure arising from translation of revenue or
earnings in foreign currencies, but some of the
Group’s debt is denominated in currencies in
which the Group generates significant earnings
and cash flow.
Net revenue by functional currency (%)
Impact on operating profit
Developments in exchange rates between DKK
and the functional currencies of foreign entities
had a negative impact on operating profits
from all regions measured in DKK. At Group
level, the negative net impact was 5.6%, of
which the contribution from RUB was around
2%.
Entities in
Functional
currency
Change in average FX
rate 2017 to 2018
Countries in the
eurozone EUR 0.19%
Russia RUB -11.20%
China CNY -2.10%
United Kingdom GBP -0.80%
Switzerland CHF -3.80%
Norway NOK -2.30%
Sweden SEK -5.90%
Laos LAK -7.20%
EUR 20% (20%) RUB 12% (13%)
CNY 12% (12%) DKK 10% (10%)
GBP 6% (6%) CHF 6% (6%)
NOK 6% (6%) Other 28% (27%)
2018 (2017)

CARLSBERG GROUP ANNUAL REPORT 2018 CONSOLIDATED FINANCIAL STATEMENTS 69
SECTION 1.4
CASH FLOW FROM OPERATING ACTIVITIES
Change in trade working capital amounted to
DKK 1,908m (2017: DKK 848m) and was
driven by higher trade payables in all regions,
partly from increased volumes and focused
cash discipline combined with the acquisition of
Cambrew.
The decrease in other working capital
amounted to DKK 52m (2017: DKK 388m).
Other working capital was positively affected
by a reclassification from prepaid costs to on-
trade loans of DKK 238m.
Average trade working capital (% of net
revenue)
The change in on-trade loans amounted to
DKK -192m (2017: DKK 40m), affected by the
same reclassification.
Restructuring costs paid amounted to DKK
-238m (2017: DKK -364m), a large part of
which relates to termination benefits to
employees made redundant due to
optimisation in a number of markets, including
France and the UK.
Net interest etc. paid amounted to DKK -863m
(2017: DKK -408m). The increase in interest
paid was driven by the liquidity effect from
settlements of financial instruments, with
EUR/USD and EUR/RUB foreign exchange
swaps as the largest items. In 2018, the effect
amounted to DKK -207m, while it was positive
at DKK 491m in 2017.
Income tax paid amounted to DKK -2,375m
(2017: DKK -1,934m). The increase in tax paid
was mainly the result of a property sale in
Germany and reduced taxes paid in France in
2017 due to refund of on-account tax paid in
2016.
Average trade working capital improved from
-14.0% to -16.0% of net revenue primarily due
to higher trade payables.
The calculation of average trade working
capital, as a percentage of net revenue, has
been impacted by the implementation of IFRS
15, which lead to a reduction of net revenue.
Comparative figure for 2017 has been restated.
-40
-30
-20
-10
0
10
20
Trade payables incl. deposits and dutiesTrade working capital incl. deposits and dutiesInventoriesTrade receivables
Other specifications of cash flow from operating activities
DKK million Section 2018 2017
Other non-cash items
Share of profit after tax of associates and joint ventures 5.4 -130 -262
Gain on disposal of property, plant and equipment and intangible assets, net 2.3 -13 -26
Share-based payments 174 33
Other items 112 -24
Total 143 -279
Trade working capital
Inventories 1.2.1 -586 -75
Trade receivables 1.5 -423 467
Trade payables, duties payable and deposits on returnable packaging
materials 2,917 456
Total 1,908 848
Other working capital
Other receivables 125 375
Other payables -364 -70
Retirement benefit obligations and other liabilities related to
operating profit before special items 7.4 338 108
Unrealised foreign exchange gains/losses -47 -25
Total 52 388
On-trade loans
Loans provided -960 -710
Repayments 449 460
Amortisation of on-trade loans 319 290
Total 1.5 -192 40

CARLSBERG GROUP ANNUAL REPORT 2018 CONSOLIDATED FINANCIAL STATEMENTS 70
SECTION 1.5
TRADE RECEIVABLES AND ON-TRADE LOANS
Receivables included in the
statement of financial position
DKK million 2018 2017
Trade receivables 5,084 4,611
Other receivables 1,925 2,138
Total current
receivables 7,009 6,749
Non-current
receivables 1,097 952
Total 8,106 7,701
The Group’s non-current receivables consist
mainly of on-trade loans that fall due more
than one year from the reporting date. Of the
total non-current receivables, DKK 171m
(2017: DKK 188m) falls due more than five
years from the reporting date.
Receivables by origin
DKK million 2018 2017
Sale of goods
and services 4,605 4,203
On-trade loans 1,451 1,251
Other receivables 2,050 2,247
Total 8,106 7,701
In 2018, on-trade loans increased due to a
reclassification of certain prepaid discounts of
DKK 238m from other receivables, which in
turn declined.
The carrying amount of receivables
approximates their fair value. For on-trade
loans, the fair value is calculated as discounted
cash flows using the interest rate at the
reporting date.
ON-TRADE LOANS
Under certain circumstances, the Group grants
loans to on-trade customers in France, the UK,
Switzerland, Germany and Sweden. On-trade
loans are spread across a large number of
customers/debtors and consist of several types
of loan, including loans repaid in cash or
through reduced discounts, prepaid discounts
and guarantees for loans provided by third
parties, cf. section 3.3. The operating entities
monitor and control these loans in accordance
with Group guidelines.
On-trade loans recognised in other operating
activities, net
DKK million 2018 2017
Interest and amortisation of
on-trade loans 61 64
Losses and write-downs on
on-trade loans -40 -33
On-trade loans, net 21 31
The average effective interest rate on loans to
the on-trade was 3.6% (2017: 4.1%).
Ageing of receivables
2018
Net carrying
amount
at 31 Dec.
Neither
impaired
nor past due
Past due
less than
30 days
Past due
between 30
and 90 days
Past due
more than
90 days
Weighted average loss rate,
trade receivables 0.2% 2.7% 9.2% 100.0%
DKK million
Sale of goods and services 4,605 3,924 368 126 187
On-trade loans 1,451 1,316 8 22 105
Other receivables 2,050 1,802 12 160 76
Total 8,106 7,042 388 308 368
Total 2017 7,701 6,721 238 285 457

CARLSBERG GROUP ANNUAL REPORT 2018 CONSOLIDATED FINANCIAL STATEMENTS 71
SECTION 1.5 (CONTINUED)
TRADE RECEIVABLES AND ON-TRADE LOANS
1.5.1 CREDIT RISK
In 2018, 87% (2017: 87%) of the total
receivables were neither impaired nor past due.
Receivables in Poland decreased due to trade
receivable improvements, while receivables in
France increased due to the reclassification of
on-trade loans and a worsening of the trade
receivables balance. Furthermore, translated
into DKK, the proportionate shares of the
receivables have changed due to differences in
the currencies’ development against DKK.
The impairment losses are related to several
minor customers that have – in different ways
– indicated that they do not expect to be able
to pay their outstanding balances, mainly due
to adverse economic developments.
Trade receivables and on-trade loans
(Broken down by country)
ACCOUNTING ESTIMATES AND JUDGEMENTS
On-trade loan agreements are complex, cover several
aspects of the customer relationship and may vary
from agreement to agreement. Management
assesses the recognition and classification of income
and expenses for each agreement, including the
allocation of payments from the customer between
revenue, discounts, interest (other operating activities)
and repayment of the loan.
Management also assesses whether developments in
local conditions for on-trade customers should
impact the expected credit losses both individually
and on a portfolio basis.
Exposure to credit risk on receivables is managed
locally, and credit limits are set as deemed
appropriate for the customer, taking into account the
current local market conditions.
The local entities assess the credit risk and adhere to
Group guidelines, which include setting credit limits,
encouraging cash payment, purchasing credit
insurance and taking collateral.
In assessing credit risk, management analyses the
need for impairment of trade receivables and on-
trade loans due to customers’ inability to pay.
Management assesses the expected credit losses
(ECL) for portfolios of receivables based on customer
segments, historical information on payment
patterns, terms of payment, concentration maturity,
and information about the general economic situation
in the countries. The portfolios are based on on-trade
and off-trade customers, and on-trade receivables
and loans.
On-trade loans carry a higher risk than trade
receivables and are concentrated in a few markets.
The local entities manage and control these loans in
accordance with Group guidelines.
The credit risk on on-trade loans can be reduced
through collateral and pledges of on-trade movables
(equipment in bars, cafés etc.). The fair value of the
pledged on-trade movables cannot be estimated
reliably but is assessed to be insignificant, as the
movables cannot readily be used again.
ACCOUNTING POLICIES
Receivables are recognised initially at fair value and
subsequently measured at amortised cost less loss
allowance or impairment losses. Trade receivables
comprise sale of goods and services as well as short-
term on-trade loans to customers. Other receivables
comprise VAT receivables, loans to partners,
associates and joint ventures, interest receivables and
other financial receivables.
Regarding the on-trade loans, any difference
between the present value and the nominal amount
at inception is treated as a prepaid discount to the
customer, and is recognised in the income statement
in accordance with the terms of the agreement.
The market interest rate is used as the discount rate,
corresponding to the money market rate based on
the maturity of the loan with the addition of a risk
premium. The effective interest on these loans is
recognised in other operating activities, net. The
amortisation of the difference between the discount
rate and the effective interest rate is included as a
discount in revenue.
The Group applies the simplified approach to measure
expected credit losses. This entails recognising a
lifetime expected loss allowance for all trade
receivables. Loss rates are determined based on
grouping of trade receivables sharing the same credit
risk characteristics and past due days.
Regarding on-trade loans and loans to associates, a
loss allowance is recognised based on 12-month or
lifetime expected credit losses, depending on whether
a significant increase in credit risk has arisen since
initial recognition.
France 14% (7%) Russia 11% (12%)
Finland 8% (2%) UK 9% (11%)
Switzerland 7% (9%) Germany 8% (8%)
Poland 5% (8%) Other 38% (43%)
2018 (2017)
Development in impairment losses on receivables
DKK million 2017
2018
Trade
receivables¹
On-trade
loans²
Other
receivables² Total Total
Impairment at 1 January -795 -237 -11 -1,043 -1,012
Impairment losses recognised -166 -49 - -215 -345
Realised impairment losses 90 48 2 140 160
Reversed impairment losses 151 9 1 161 80
Disposal of entities - - - - 54
Foreign exchange adjustments 20 8 1 29 20
Impairment at 31 December -700 -221 -7 -928 -1,043
1 Lifetime expected credit loss. 2 12-month expected credit loss, except for an insignificant share that is a lifetime expected credit loss.

CARLSBERG GROUP ANNUAL REPORT 2018 CONSOLIDATED FINANCIAL STATEMENTS 72
117.7bn TOTAL ASSETS (DKK)
Total assets increased by DKK 3.4bn, due to an
increase in property, plant and equipment,
inventories, trade receivables and an improved
cash position.
Intangible assets amounted to DKK 66.9bn at
31 December 2018 (2017: DKK 67.8bn),
impacted among other things by the
depreciation of the Russian rouble and Asian
currencies.
Property, plant and equipment increased by
DKK 1.1bn to DKK 25.4bn (2017: DKK
24.3bn), impacted by new investments and the
consolidation of Cambrew.
Current assets increased by DKK 2.8bn to DKK
18.1bn, driven by increases in inventories of
raw materials and finished goods, and trade
receivables, in total amounting to DKK 1.1bn,
and an increase in cash and cash equivalents of
DKK 2.1bn. The DKK 0.6bn increase in
inventories was caused by the inventory build-
up prior to the festive season in Asia, which is
earlier in 2019 than in 2018, and the
consolidation of Cambrew. The increase in cash
and cash equivalents to DKK 5.6bn was due to
the strong free cash flow.
4.0bn CAPEX (DKK) CapEx included construction of the new
greenfield brewery in Germany, completion of
a new brewery in India and various sales
equipment. The greenfield brewery in Germany
is expected to be completed by the end of
2019. The positive effect on ROIC from the
relatively low CapEx is partly offset by the
increase in the ratio of CapEx to amortisation
and depreciation to 98% (2017: 86%).
8.1% ROIC
Return on invested capital (ROIC) increased by
120bp to 8.1%, impacted by lower invested
capital, improved profitability and a lower
effective tax rate. ROIC excluding goodwill
increased by 520bp to 20.9%, with
improvements achieved in all regions.
The impairment loss on the Baltika brand
recognised at year-end 2017 had a full-year
impact on the average invested capital for
2018. For 2017, ROIC would have been 7.2%,
compared to the reported 6.9%, if the loss had
been recognised at 1 January 2017.
SECTION 2
ASSET BASE AND RETURNS
Asset base1 (DKKm)
1 The asset base represents the total investment in intangible assets and property, plant and equipment.
CapEx and amortisation/
depreciation (DKKbn)
Return on invested capital (ROIC) (%)
92,118
7,229 -3,030-4,064
9 92,262
0
1
2
3
4
5
6
CapExAmortisation and depreciation
4
8
12
16
20
24
ROIC ROIC excl. goodwill

CARLSBERG GROUP ANNUAL REPORT 2018 CONSOLIDATED FINANCIAL STATEMENTS 73
SECTION 2.1
SEGMENTATION OF ASSETS AND RETURNS
Invested capital was down by DKK 1.8bn,
affected by an increase in assets included of
DKK 1.6bn, which was primarily driven by
investments in associates and higher trade
receivables and inventories. The increase was
more than offset by the increase in trade
payables. In 2017, invested capital was also
impacted by the DKK 4.8bn impairment of the
Baltika brand.
The negative impact on total assets from
foreign exchange rates attributed to Russia is
DKK 4.2bn, compared with the DKK value they
would have had if they had been translated at
the exchange rates applied at year-end 2017.
Non-current assets comprise intangible assets
and property, plant and equipment owned by
the segment/country, even if the income is
earned outside the segment/country that owns
the asset. Furthermore, they include non-
current financial assets other than financial
instruments and deferred tax assets.
Geographical allocation of non-current assets
DKK million 2018 2017
Denmark
(Carlsberg A/S'
domicile) 3,104 3,905
Russia 21,578 24,949
China 14,152 14,466
Other countries 57,990 53,064
Total 96,824 96,384
Not allocated comprises supporting companies
without brewing activities and eliminations of
investments in subsidiaries, receivables and
loans.
ACCOUNTING ESTIMATES AND JUDGEMENTS
The calculation of return on invested capital (ROIC)
uses operating profit before special items adjusted for
tax using the effective tax rate, and invested capital
including assets held for sale and trade receivables
sold, and excludes contingent considerations and
income tax.
ACCOUNTING POLICIES
The Group’s assets and returns are segmented on the
basis of geographical regions in accordance with the
management reporting for the current year, cf.
section 1.1.
Invested capital
DKK million 2018 2017
Total assets 117,700 114,251
Less
Deferred tax assets -1,693 -1,663
Financial receivables,
hedging instruments and
receivables sold 1,660 1,386
Cash and cash equivalents -5,589 -3,462
Assets included 112,078 110,512
Trade payables -16,199 -13,474
Deposit on returnable
packaging materials -1,583 -1,576
Provisions, excl.
restructurings -4,546 -3,709
Other liabilities, excl. hedging
instruments -7,029 -7,265
Liabilities offset -29,357 -26,024
Invested capital 82,721 84,488
Goodwill -50,929 -50,497
Invested capital excl.
goodwill 31,792 33,991
Invested capital, average 82,590 91,668
Segmentation of assets and returns
DKK million
2018
Western
Europe Asia
Eastern
Europe
Not
allocated
Beverages,
total
Non-
beverage
Carlsberg
Group,
total
Invested capital 38,254 21,090 23,976 -1,696 81,624 1,097 82,721
Invested capital excl. goodwill 17,440 5,040 9,911 -1,696 30,695 1,097 31,792
Acquisition of property, plant and equipment and
intangible assets 1,948 1,164 547 347 4,006 21 4,027
Amortisation and depreciation 1,725 1,227 667 435 4,054 10 4,064
Impairment losses 56 56 -45 - 67 - 67
Return on invested capital (ROIC) 10.8% 11.8% 7.0% - 8.2% - 8.1%
ROIC excl. goodwill 24.4% 44.0% 17.1% - 21.4% - 20.9%
2017
Invested capital 37,218 20,131 27,376 -1,055 83,670 818 84,488
Invested capital excl. goodwill 16,489 6,197 11,542 -1,055 33,173 818 33,991
Acquisition of property, plant and equipment and
intangible assets 1,837 1,212 716 83 3,848 205 4,053
Amortisation and depreciation 1,872 1,311 761 625 4,569 12 4,581
Impairment losses 107 -113 4,820 - 4,814 - 4,814
Return on invested capital (ROIC) 9.9% 9.9% 5.1% - 7.0% - 6.9%
ROIC excl. goodwill 21.9% 31.2% 10.2% - 16.0% - 15.7%
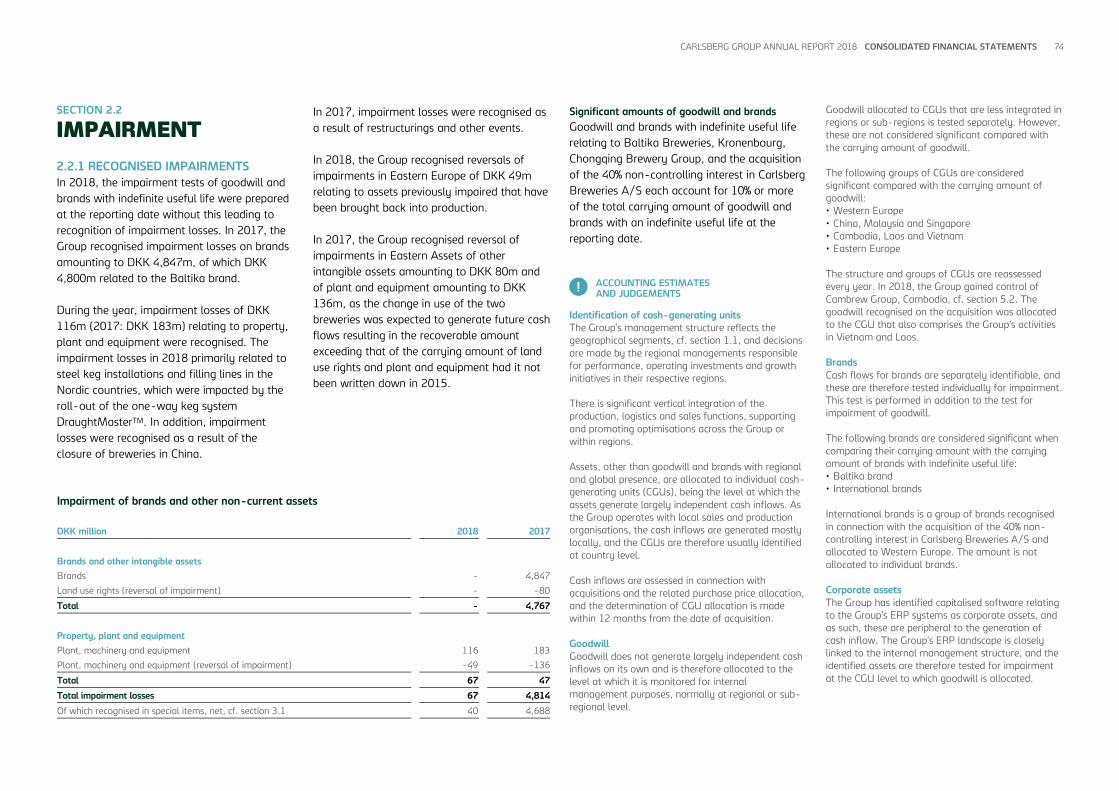
CARLSBERG GROUP ANNUAL REPORT 2018 CONSOLIDATED FINANCIAL STATEMENTS 74
SECTION 2.2
IMPAIRMENT
2.2.1 RECOGNISED IMPAIRMENTS
In 2018, the impairment tests of goodwill and
brands with indefinite useful life were prepared
at the reporting date without this leading to
recognition of impairment losses. In 2017, the
Group recognised impairment losses on brands
amounting to DKK 4,847m, of which DKK
4,800m related to the Baltika brand.
During the year, impairment losses of DKK
116m (2017: DKK 183m) relating to property,
plant and equipment were recognised. The
impairment losses in 2018 primarily related to
steel keg installations and filling lines in the
Nordic countries, which were impacted by the
roll-out of the one-way keg system
DraughtMasterTM. In addition, impairment
losses were recognised as a result of the
closure of breweries in China.
In 2017, impairment losses were recognised as
a result of restructurings and other events.
In 2018, the Group recognised reversals of
impairments in Eastern Europe of DKK 49m
relating to assets previously impaired that have
been brought back into production.
In 2017, the Group recognised reversal of
impairments in Eastern Assets of other
intangible assets amounting to DKK 80m and
of plant and equipment amounting to DKK
136m, as the change in use of the two
breweries was expected to generate future cash
flows resulting in the recoverable amount
exceeding that of the carrying amount of land
use rights and plant and equipment had it not
been written down in 2015.
Significant amounts of goodwill and brands
Goodwill and brands with indefinite useful life
relating to Baltika Breweries, Kronenbourg,
Chongqing Brewery Group, and the acquisition
of the 40% non-controlling interest in Carlsberg
Breweries A/S each account for 10% or more
of the total carrying amount of goodwill and
brands with an indefinite useful life at the
reporting date.
ACCOUNTING ESTIMATES AND JUDGEMENTS
Identification of cash-generating units
The Group’s management structure reflects the
geographical segments, cf. section 1.1, and decisions
are made by the regional managements responsible
for performance, operating investments and growth
initiatives in their respective regions.
There is significant vertical integration of the
production, logistics and sales functions, supporting
and promoting optimisations across the Group or
within regions.
Assets, other than goodwill and brands with regional
and global presence, are allocated to individual cash-
generating units (CGUs), being the level at which the
assets generate largely independent cash inflows. As
the Group operates with local sales and production
organisations, the cash inflows are generated mostly
locally, and the CGUs are therefore usually identified
at country level.
Cash inflows are assessed in connection with
acquisitions and the related purchase price allocation,
and the determination of CGU allocation is made
within 12 months from the date of acquisition.
Goodwill
Goodwill does not generate largely independent cash
inflows on its own and is therefore allocated to the
level at which it is monitored for internal
management purposes, normally at regional or sub-
regional level.
Goodwill allocated to CGUs that are less integrated in
regions or sub-regions is tested separately. However,
these are not considered significant compared with
the carrying amount of goodwill.
The following groups of CGUs are considered
significant compared with the carrying amount of
goodwill:
• Western Europe
• China, Malaysia and Singapore
• Cambodia, Laos and Vietnam
• Eastern Europe
The structure and groups of CGUs are reassessed
every year. In 2018, the Group gained control of
Cambrew Group, Cambodia, cf. section 5.2. The
goodwill recognised on the acquisition was allocated
to the CGU that also comprises the Group’s activities
in Vietnam and Laos.
Brands
Cash flows for brands are separately identifiable, and
these are therefore tested individually for impairment.
This test is performed in addition to the test for
impairment of goodwill.
The following brands are considered significant when
comparing their carrying amount with the carrying
amount of brands with indefinite useful life:
• Baltika brand
• International brands
International brands is a group of brands recognised
in connection with the acquisition of the 40% non-
controlling interest in Carlsberg Breweries A/S and
allocated to Western Europe. The amount is not
allocated to individual brands.
Corporate assets
The Group has identified capitalised software relating
to the Group’s ERP systems as corporate assets, and
as such, these are peripheral to the generation of
cash inflow. The Group’s ERP landscape is closely
linked to the internal management structure, and the
identified assets are therefore tested for impairment
at the CGU level to which goodwill is allocated.
Impairment of brands and other non-current assets
DKK million 2018 2017
Brands and other intangible assets
Brands - 4,847
Land use rights (reversal of impairment) - -80
Total - 4,767
Property, plant and equipment
Plant, machinery and equipment 116 183
Plant, machinery and equipment (reversal of impairment) -49 -136
Total 67 47
Total impairment losses 67 4,814
Of which recognised in special items, net, cf. section 3.1 40 4,688

CARLSBERG GROUP ANNUAL REPORT 2018 CONSOLIDATED FINANCIAL STATEMENTS 75
SECTION 2.2 (CONTINUED)
IMPAIRMENT
Other non-current assets
Other non-current assets are tested for impairment
when indications of impairment exist.
For property, plant and equipment, management
performs an annual assessment of the assets’ future
application, for example in relation to changes in
production structure, restructurings or closing of
breweries.
For investments in associates and joint ventures,
examples of indications of impairment are loss-
making activities or major changes in the business
environment.
ACCOUNTING POLICIES
Goodwill and brands with indefinite useful life are
subject to an annual impairment test, performed
initially before the end of the year of acquisition.
The test is performed at the level where cash flows
are considered to be generated; either at CGU level or
at the level of a group of CGUs. All assets are tested
if an event or circumstance indicates that the carrying
amount may not be recoverable. If an asset’s carrying
amount exceeds its recoverable amount, an
impairment loss is recognised. The recoverable
amount is the higher of the asset’s fair value less
costs of disposal and its value in use.
For all assets, the value in use is assessed based on
budget and target plan with reference to the expected
future net cash flows. The assessment is based on the
lowest CGU affected by the changes that indicate
impairment. The cash flow is discounted by a
discount rate adjusted for any risk specific to the
asset, if relevant to the applied calculation method.
Impairment losses on goodwill and brands, significant
losses on property, plant and equipment, associates
and joint ventures, and losses arising on significant
restructurings of processes and structural adjustments
are recognised as special items. Minor losses are
recognised in the income statement in the relevant
line item.
Impairment of goodwill is not reversed. Impairment of
other assets is reversed only to the extent of changes
in the assumptions and estimates underlying the
impairment calculation. Impairment is only reversed
to the extent that the asset’s new carrying amount
does not exceed the carrying amount of the asset
after amortisation/depreciation had the asset not
been impaired.
2.2.2 IMPAIRMENT TEST OF GOODWILL
The carrying amount of goodwill
allocated to groups of CGUs
DKK million 2018 2017
Western Europe 20,814 20,729
China, Malaysia
and Singapore 9,391 9,424
Cambodia, Laos
and Vietnam 6,110 3,941
Eastern Europe 14,065 15,834
Significant groups of CGUs 50,380 49,928
Other, Asia 549 569
Total 50,929 50,497
In 2018 and 2017, the significant groups of
CGUs represented 99% of the total carrying
amount.
The estimation of the expected cash flow
involves developing multiple probability-
weighted scenarios to reflect different
outcomes in terms of timing and amount. The
measurement of the forecast period growth
rates reflects risk adjustments made to
calculate the expected cash flows.
Key assumptions
2018
Forecast
cash flow
growth
Terminal
period
growth
Pre-tax
discount
rate
Western
Europe -8% 0.3% 1.3%
China,
Malaysia and
Singapore -8% 1.0% 4.4%
Cambodia,
Laos and
Vietnam -6% 0.5% 2.7%
Eastern
Europe -14% 4.0% 7.5%
The average cash flow growth in the forecast
period reflects the significant risk adjustments
included in the forecast specifically for the
impairment test. The risk adjustment considers
only negative alternative scenarios to account
for the uncertainty related to the benefits
expected from the strategic initiatives in
SAIL’22 in Western Europe, the development in
beer consumption in Asia and particularly in
China, and the volatile macroeconomic
situation in Eastern Europe. Potential upsides
are not identified and adjusted in the cash
flows used for impairment testing. The growth
is projected in nominal terms and therefore
does not translate into cash flow at the same
growth rate in the Group’s presentation
currency, DKK.
WESTERN EUROPE
The region primarily comprises mature beer
markets. While market volumes tend to be flat,
the overall value of the region has seen a
positive, albeit small, development in recent
years. This has been driven by improving beer
category dynamics through innovations,
increased interest in craft & speciality beers and
alcohol-free brews, and an overall improved
category perception.
The region is generally characterised by well-
established retail structures and a strong
tradition of beer consumption. The
consumption is generally resilient but the on-
trade tends to suffer in a weak macroeconomic
environment.
The focus is on improving margins by driving a
positive price/mix development and reducing
the cost base across the value chain. This
process has been started by the initiatives in
SAIL’22.
ASIA
The importance of Asia for the Group has
increased significantly over the past decade,
during which the Group has expanded its
presence in the region, both organically and
through acquisitions.
The Asian markets are very diverse but offer
considerable prospects for value growth,
underpinned by young populations,
urbanisation, rising disposable income levels,
growing economies and, in some markets,
relatively low per capita beer consumption.
However, as many Asian markets are emerging
markets, development is subject to volatility.
Both the on-trade and off-trade channels are
characterised by a strong traditional outlet
segment but with the modern outlet segment
growing in most markets.
The focus is to continue the revenue growth
trajectory in the region. Activities include the
CARLSBERG GROUP ANNUAL REPORT 2018 CONSOLIDATED FINANCIAL STATEMENTS 76
SECTION 2.2 (CONTINUED)
IMPAIRMENT
continued expansion of our international
premium brands, in particular Tuborg, and the
strengthening and premiumisation of our local
power brands in combination with a continued
focus on costs and efficiencies.
EASTERN EUROPE
The two main markets in the region are Russia
and Ukraine, which account for around 65%
and 20% respectively of regional beer volumes.
The Russian beer market has been under
significant pressure in the past decade, more
recently due to challenging macroeconomic
conditions and a ban on individual PET bottles
larger than 1.5 litres. In 2018, however, the
market was positively impacted by the football
world cup and warmer weather.
In recent years, the modern off-trade,
consisting of hypermarkets and supermarkets,
has grown significantly and now accounts for
approximately 50% of the market in Russia.
Another growing channel is the so-called DIOT
– draught in off-trade – which is estimated to
account for around 10-15% of the market.
The Ukrainian beer market has shown small
positive growth rates in 2017 and 2018
following the previous years’ decline due to the
severe macroeconomic slowdown.
The focus for Eastern Europe is to continue to
strengthen our business in local currencies and
mitigate the negative earnings impact from the
weakening currencies. Actions include a
commercial agenda with clear priorities as well
as a continued focus on costs and efficiencies.
Management expects the current
macroeconomic situation and developments to
continue in the short term, with inflation
stabilising at the current level and, in the
medium to long term, with interest rates
expected to decline and stabilise at a level
lower than currently observed in the market.
This will ease the pressure on profitability from
input costs denominated in foreign currencies.
ACCOUNTING ESTIMATES AND JUDGEMENTS
Goodwill
The value in use is the discounted value of the
expected future risk-adjusted cash flows. This
involves developing multiple probability-weighted
scenarios to reflect different outcomes in terms of
timing and amount.
Key assumptions
The cash flow is based on the budget and target
plans for the next three years. Cash flows beyond the
three-year period are extrapolated using the terminal
period growth rate.
The probability weighting applied is based on past
experience and the uncertainty of the prepared
budget and target plans.
Potential upsides and downsides identified during the
budget process and in the daily business are reflected
in the future cash flow scenarios for each CGU.
The risk-adjusted cash flows are discounted using a
discount rate reflecting the risk-free interest rate for
each CGU with the addition of a spread. The interest
rates used in the impairment tests are based on
observable market data. Please refer to the
description of discount rates in section 2.2.3.
The key assumptions on which management bases its
cash flow projections are:
• Volumes
• Sales prices
• Input costs
• Operating investments
• Terminal period growth
The assumptions are determined at CGU level and are
based on past experience, external sources of
information and industry-relevant observations for
each CGU. Local conditions, such as expected
development in macroeconomic and market
conditions specific to the individual CGUs, are
considered. The assumptions are challenged and
verified by management at CGU and Group level.
The budget and target plan process takes into
account events or circumstances that are relevant in
order to reliably project the short-term performance
of each CGU. Examples include significant campaign
activities, changes in excise duties etc., which may
have a short-term impact but are non-recurring.
Given their short-term nature, they are not taken into
consideration when estimating the terminal period
growth rate.
Volumes
Projections are based in part on past experience and
external market data, and include planned
commercial initiatives, such as marketing campaigns
and sponsorships, and the expected impact on
consumer demand and the level of premiumisation.
The projections are, if relevant, adjusted for the
expected changes in the level of premiumisation. No
changes in market shares are assumed in the medium
or long term.
Demographic expectations general to the industry,
such as the development in population, consumption
levels, generation-shift patterns, rate of urbanisation
as well as macroeconomics etc., are also considered
for medium- and long-term projections.
Events and circumstances can impact the timing of
volumes entering the market. This can be affected by
excessive stocking related to an increase in excise
duties, campaign activities and the timing of national
holidays and festivals. Such short-term effects are
not material to volume projections and do not impact
the long-term projections.
Sales prices
The level of market premiumisation and the locally
available portfolio are key drivers in identifying price
points. When planning pricing structures, factors
including price elasticity, local competition and
inflation expectations can also impact the projection.
Increases in excise duties are typically passed on to
the customers with a delay of a few months. Since
the increase is a pass-through cost and thereby
compensated for by price increases at the time of
implementation, it does not impact the long-term
sales price growth and is therefore not taken into
consideration in the projections unless circumstances
specifically indicate otherwise. No changes to duties
in the short or medium term are taken into
consideration unless there is a firm plan to introduce
changes.
Input costs
Input costs in the budget and target plans are based
on past experience and on:
• Contracted raw and packaging materials
• Contracted services within sales, marketing,
production and logistics
• Planned commercial investments
• Cost optimisations not related to restructurings
• Expected inflation
In the long term, projections follow the level of
inflation unless long-term contracts are in place.
Operating investments
Projections are based on past experience of the level
of necessary maintenance of existing production
capacity, including replacement of parts. This also
includes planned production line overhauls and
improvements to existing equipment. Non-contracted
capacity increases and new equipment are not
included.
Terminal period growth
Growth rates are projected to be equal to or below
the expected rate of general inflation and assume no
nominal growth. The projected growth rates and the
applied discount rates are compared to ensure a
sensible correlation between the two.

CARLSBERG GROUP ANNUAL REPORT 2018 CONSOLIDATED FINANCIAL STATEMENTS 77
SECTION 2.2 (CONTINUED)
IMPAIRMENT
2.2.3 IMPAIRMENT TEST OF BRANDS
Significant brands with indefinite useful life
DKK million 2018 2017
Baltika brand 5,585 6,425
International brands 3,000 3,000
Significant brands 8,585 9,425
In 2018, significant brands represented 60%
(2017: 62%) of the total carrying amount of
brands with indefinite useful life.
Other brands comprise a total of 17 brands
that are not considered individually material
compared with the total carrying amount.
BALTIKA BREWERIES
In 2018, the Russian beer market grew slightly
after having experienced a continuous decline
in recent years due to very challenging
macroeconomic conditions.
The Baltika brand performed in line with the
growth projections made when the expected
future growth for the brand was reassessed in
2017. Compared with previous years, the
brand’s decline has stopped, and moderate
growth is projected.
ACCOUNTING ESTIMATES AND JUDGEMENTS
Brands
The test for impairment of brands is performed using
the relief from royalty method and is based on the
expected future cash flows generated from the
royalty payments avoided for the individual brand for
the next 20 years and projections for subsequent
years.
The risk-free cash flows are discounted using a
discount rate reflecting the risk-free interest rate with
the addition of the risk premium associated with the
individual brand.
Key assumptions
The key assumptions on which management bases its
cash flow projection include the expected useful life,
revenue growth, a theoretical tax amortisation
benefit, the royalty rate and the discount rate.
Expected useful life
Management has assessed that the value of brands
with indefinite useful life can be maintained for an
indefinite period, as these are well-established brands
in their markets, some of which have existed for
centuries. The beer industry is characterised as being
very stable with consistent consumer demand and a
predictable competitive environment, and is expected
to be profitable for the foreseeable future. Control of
the brands is legally established and is enforceable
indefinitely.
In management’s opinion, the risk of the useful life of
these brands becoming finite is minimal because of
their individual market positions and because current
and planned marketing initiatives are expected to
sustain their useful life.
Revenue growth
At the time of acquisition of any individual brand, a
revenue growth curve is forecast based on a long-
term strategic view of the risk and opportunities
relevant to the brand. The curve is forecast for a 20-
year horizon. This horizon reliably reflects the lengthy
process of implementing brand strategies to support a
brand occupying its intended place in the Group’s
portfolio. The forecast period applied is comparable
with the common term of the majority of licence
agreements to which the Group is party.
In the local markets, the product portfolio usually
consists of local power brands and international
premium brands. When projecting revenue growth for
local brands, in addition to its commercial strength –
such as market share and segment position – the
forecast takes into consideration the demographics of
the primary markets, including expected development
in population, consumption levels, generation-shift
patterns, rate of urbanisation, beer market maturity,
level of premiumisation, circumstances generally
limiting the growth opportunities for alcoholic
beverages etc.
For brands with global or regional presence,
enhanced investments in product development and
marketing are expected. The expected growth rate for
these brands is generally higher than for more
localised brands, and is usually highest early in the
20-year period.
Depending on the nominal growth expectations for
the individual brand, the revenue growth in individual
years may be above, equal to or below the forecast
inflation level in the markets where the brand is
present.
When preparing budgets, consideration is given to
events or circumstances that are relevant in order to
reliably project the short-term performance of each
brand. Examples include significant campaign
activities, changes in excise duties etc., which may
have a short-term impact but are non-recurring and
quickly absorbed by the business. Since the impact is
not material to the long-term projections, it is not
taken into consideration when estimating the long-
term and terminal period growth rates. Please refer
to the description of the impact of increases in excise
duties in section 2.2.2, Sales prices.
Tax benefit
The theoretical tax benefit applied in the test makes
use of tax rates and amortisation periods based on
current legislation. The impairment test applies tax
rates in the range of 15-34% and amortisation
periods of 5-10 years.
Royalty rate
Royalties generated by a brand are based on the
Group’s total income from the brand and are earned
globally, i.e. the income is also earned outside the
CGU that owns the brand. If external licence
agreements for the brand already exist, the market
terms of such agreements are taken into
consideration when assessing the royalty rate that
the brand is expected to generate in a transaction
with independent parties. The royalty rate is based on
the actual market position of the individual brand in
the global, regional and local markets and assumes a
20-year horizon. This term is common to the
beverage industry when licensing brands.
For some brands, the share of the total beer market
profit exceeds the volume share to an extent that
creates significant market entry barriers for
competing brands and justifies a higher royalty rate.
Royalty rates
International, premium and
speciality beers 3.5-15.0%
Strong regional and national brands 3.0-5.0%
Local and mainstream brands 2.0-3.5%
Key assumptions
2018
Average
revenue
growth
Terminal
period growth
Pre-tax
discount rate
Post-tax
discount rate
Baltika brand 4% 4% 11.1% 9.7%
International brands 1% 1% 5.6% 4.4%

CARLSBERG GROUP ANNUAL REPORT 2018 CONSOLIDATED FINANCIAL STATEMENTS 78
SECTION 2.2 (CONTINUED)
IMPAIRMENT
Discount rates
The discount rate is a weighted average cost of
capital (WACC) that reflects the risk-free interest rate
with the addition of a risk premium relevant to each
brand.
The risk-free interest rates used in the impairment
tests are based on observed market data. For
countries where long-term risk-free interest rates are
not observable or valid due to specific national or
macroeconomic conditions, the interest rate is
estimated based on observations from other markets
and/or long-term expectations expressed by
international financial institutions considered reliable
by the Group.
The added credit risk premium (spread) for the risk-
free interest rate is fixed at market price or slightly
higher, reflecting the expected long-term market
price. The aggregate interest rate, including spread,
thereby reflects the long-term interest rate applicable
to the Group’s investments in the individual markets.
Interest rates applied in Eastern Europe
In recent years, the macroeconomic situation has
deteriorated significantly in Eastern Europe, resulting
in interest rates and inflation increasing to a level
significantly higher than the Group’s long-term
expectations.
The use of expected future interest rates in lieu of
appropriate observable interest rates does not impact
the conclusion of the impairment test because the
relationship between discount rates and growth rates
(the real interest rate) is expected to be constant.
Expectations for the long-term real interest rate
remain a key assumption for the impairment testing
in general, and for CGUs with exposure to the Russian
market in particular.
In recent years, the Bank of Russia has expressed its
expectations of a positive future real interest rate at
around 2.5-3.0% in the short term. Due to the current
monetary situation in Russia, the short-term interest
rate is higher than the long-term interest rate and
therefore not directly comparable with the real
interest rate applied by the Group. Real interest rates
are expected to normalise in the future, with short-
term interest rates falling to a level below the long-
term interest rates.
The current economic environment in Russia indicates
that a stable long-term real interest rate lower than
the current level will be reached within a few years. In
addition, the latest published expectations from key
international financial institutions show an expected
long-term real interest rate of 2.5%. Therefore, a real
interest rate of 2.5% is maintained as the long-term
growth expectation in the impairment test.
The impairment test of the Baltika brand is sensitive
to changes in the real interest rate. Since no expected
future long-term real interest rate can be directly
observed, the estimate of a real interest rate is
subjective and associated with risk.
2.2.4 SENSITIVITY TESTS
GOODWILL
Sensitivity tests have been performed to
determine the lowest forecast and terminal
period growth rates and/or highest discount
rates that can occur in the CGUs, groups of
CGUs and brands with indefinite useful life
without leading to any impairment loss.
The risk-free interest rates observable for
Western Europe remained relatively low at the
end of 2018. The sensitivity tests calculate the
impact of higher interest rates and allow for a
double-digit percentage-point increase in risk-
free interest rates.
Due to a challenging macroeconomic situation
in some CGUs and groups of CGUs, the Group
performed additional sensitivity tests to ensure
that a potential impairment was not
overlooked. These additional sensitivity tests
did not identify any potential impairment.
The test for impairment of goodwill did not
identify any CGUs or groups of CGUs to which
goodwill is allocated where a reasonably
possible negative change in a key assumption
would cause the carrying amount to exceed the
recoverable amount.
The goodwill allocated to Eastern Europe was
primarily recognised when the Group
completed the step acquisition of the remaining
50% of the Baltic Beverage Holding Group from
Scottish & Newcastle in 2008. However, the
impairment test includes 100% of the cash flow
generated by Eastern Europe, resulting in the
recoverable amount significantly exceeding the
carrying amount.
BRANDS
Following the impairment losses recognised in
2017 and 2016 for the Baltika and Chongqing
Brewery Group brands, a reasonably possible
negative change in a key assumption would
cause the carrying amount to exceed the
recoverable amount. The sensitivity to changes
in the assumptions is shown in the table.
Key assumptions
The key assumptions relevant to the
assessment of the recoverable amount are:
• Volume
• Price
• Discount rate
The assumptions for volume and pricing are
closely linked, which, together with the
presence of multiple sub-brands in different
geographies within each brand, makes
individual sensitivity testing on the basis of
these two assumptions highly impractical.
Instead, sensitivity testing is performed for the
overall revenue growth rate, both in the
forecast period and the terminal period.
The sensitivity test for the maximum decline in
growth rate in the forecast period assumes a
year-on-year decline in the nominal growth
rate, thereby estimating the accumulated effect
of a negative change for the full forecast
period.

CARLSBERG GROUP ANNUAL REPORT 2018 CONSOLIDATED FINANCIAL STATEMENTS 79
SECTION 2.2 (CONTINUED)
IMPAIRMENT
The sensitivity tests were completed assuming
all other assumptions were unchanged, as it is
relevant to assess the sensitivity to, for
example, a decline in the growth rate
independently of changes in the discount rate.
This is because the growth rate in itself might
be impacted by changes in brand strategy and
other market factors.
The sensitivity calculated also assumes a
straight-line impact despite the fact that
changes in market dynamics and adjustments
to these will in practice have different impacts
in the individual years and might not apply in
the long term.
Western European interest rates have been
very low for several years and are currently at
a level that is below inflation. An increase in
the interest rates without a corresponding
change in inflation will result in a lower
recoverable amount of brands and could
potentially lead to impairment. The risk of a
significant write-down is considered by
management to be very low.
Baltika brand
The Baltika brand was written down to its
recoverable amount at the end of 2017. As a
result, even a small negative change in the key
assumptions could lead to further impairment.
At 31 December 2018, the carrying amount of
the Baltika brand amounted to DKK 5,585m.
Changes in the market dynamics in Russia
could have a significant negative impact on the
recoverable amount. Macroeconomic recovery
could lead to further premiumisation or
localisation, which could drive consumers
towards international brands or local/regional
brands.
An increase in the real interest rate from the
current 2.5%, either because of a higher interest
rate or lower inflation, could significantly
reduce the recoverable amount.
A 1 percentage point increase in the interest
rate would result in a reduction in the
recoverable amount of DKK 0.8bn, and a 1
percentage point decrease in the terminal
growth rate would result in a reduction in the
recoverable amount of DKK 0.3bn. The
combined effect of a 1 percentage point
negative change in the interest rate, the
terminal growth rate and the average growth
rate in the forecast period (year-on-year)
would result in a reduction in the recoverable
amount of DKK 1.5bn.
Chongqing Brewery Group brands
The Chongqing Brewery Group brands were
written down to their recoverable amount in
2016, and the recoverable amount at the end
of 2018 remained close to the carrying amount
of DKK 895m. As a result, a reasonably
possible negative change in the key
assumptions would lead to further impairment.
The brands are sensitive to developments in the
mainstream segment in China, where pressure
from premium and upper-mainstream – in
which the brands are not represented – could
lead to a further drop in market share and
thereby a further reduction of the recoverable
amount.
Similarly, a change in consumer trends towards
the discount segment could have a negative
impact on the recoverable amount.
A 1 percentage point increase in the interest
rate would result in a reduction in the
recoverable amount of DKK 0.1bn, and a
1 percentage point decrease in the terminal
growth rate would result in a reduction in the
recoverable amount of less than DKK 0.1bn.
Sensitivity test
DKKbn
Average
forecast
growth rate
Terminal
period
growth rate
Risk-free
interest rate
∆ -1 %-point -1 %-point +1 %-point
Baltika brand -0.6 -0.3 -0.8
Chongqing Brewery Group brands -0.1 -0.0 -0.1

CARLSBERG GROUP ANNUAL REPORT 2018 CONSOLIDATED FINANCIAL STATEMENTS 80
SECTION 2.3
INTANGIBLE ASSETS AND PROPERTY, PLANT AND EQUIPMENT
DKK million Intangible assets Property, plant and equipment
2018 Goodwill Brands
Other
intangible
assets Total
Land and
buildings
Plant and
machinery
Other
equipment,
fixtures and
fittings Total
Cost
Cost at 1 January 52,113 27,243 5,715 85,071 16,746 28,109 13,632 58,487
Acquisition of entities 2,047 - - 2,047 1,003 438 41 1,482
Additions - - 127 127 159 2,490 1,251 3,900
Disposal of entities - - -21 -21 -21 -5 - -26
Disposals - - -108 -108 -179 -850 -978 -2,007
Transfers - - 8 8 115 -582 458 -9
Foreign exchange adjustments etc. -1,625 -2,215 -38 -3,878 -229 -640 -207 -1,076
Cost at 31 December 52,535 25,028 5,683 83,246 17,594 28,960 14,197 60,751
Amortisation, depreciation and impairment losses
Amortisation, depreciation and impairment losses at 1 January 1,616 11,553 4,109 17,278 7,472 17,181 9,509 34,162
Disposal of entities - - -21 -21 -21 -3 - -24
Disposals - - -100 -100 -129 -631 -930 -1,690
Amortisation and depreciation - 21 516 537 469 1,374 1,684 3,527
Impairment losses - - - - 15 -3 55 67
Transfers - - - - -13 -21 -43 -77
Foreign exchange adjustments etc. -10 -1,269 -37 -1,316 -14 -450 -144 -608
Amortisation, depreciation and impairment losses at 31 December 1,606 10,305 4,467 16,378 7,779 17,447 10,131 35,357
Carrying amount at 31 December 50,929 14,723 1,216 66,868 9,815 11,513 4,066 25,394
Additions from acquisition of entities are described in section 5.2.

CARLSBERG GROUP ANNUAL REPORT 2018 CONSOLIDATED FINANCIAL STATEMENTS 81
SECTION 2.3 (CONTINUED)
INTANGIBLE ASSETS AND PROPERTY, PLANT AND EQUIPMENT
DKK million Intangible assets Property, plant and equipment
2017 Goodwill Brands
Other
intangible
assets Total
Land and
buildings
Plant and
machinery
Other
equipment,
fixtures and
fittings Total
Cost
Cost at 1 January 54,647 28,807 5,758 89,212 17,281 28,285 14,306 59,872
Additions 3 54 164 221 250 2,166 1,419 3,835
Disposal of entities -62 -8 -52 -122 -259 -235 -110 -604
Disposals - - -94 -94 -135 -333 -1,679 -2,147
Transfers - - 14 14 335 -607 269 -3
Foreign exchange adjustments etc. -2,475 -1,610 -75 -4,160 -726 -1,167 -573 -2,466
Cost at 31 December 52,113 27,243 5,715 85,071 16,746 28,109 13,632 58,487
Amortisation, depreciation and impairment losses
Amortisation, depreciation and impairment losses at 1 January 1,783 7,161 3,532 12,476 7,559 16,922 9,581 34,062
Disposal of entities -62 -8 -51 -121 -173 -216 -82 -471
Disposals - - -46 -46 -87 -255 -1,600 -1,942
Amortisation and depreciation - 24 741 765 490 1,402 1,924 3,816
Impairment losses - 4,847 -80 4,767 -30 -34 111 47
Transfers - - - - 4 26 -86 -56
Foreign exchange adjustments etc. -105 -471 13 -563 -291 -664 -339 -1,294
Amortisation, depreciation and impairment losses at 31 December 1,616 11,553 4,109 17,278 7,472 17,181 9,509 34,162
Carrying amount at 31 December 50,497 15,690 1,606 67,793 9,274 10,928 4,123 24,325
Carrying amount of assets pledged as security for borrowings - - - - - - 23 23

CARLSBERG GROUP ANNUAL REPORT 2018 CONSOLIDATED FINANCIAL STATEMENTS 82
SECTION 2.3 (CONTINUED)
INTANGIBLE ASSETS AND PROPERTY, PLANT AND EQUIPMENT
Property, plant and equipment under
construction amounted to DKK 2,126m (2017:
DKK 1,435m), impacted by the greenfield
brewery in Germany and is included in plant
and machinery.
Other equipment, fixtures and fittings include
transport, office and draught beer equipment,
coolers and returnable packaging materials.
Other intangible assets include software, land
use rights and beer delivery rights.
SERVICE AGREEMENTS
The Group has entered into service contracts of
various lengths in respect of sales, logistics and
IT. Costs related to the contracts are
recognised as the services are received.
LEASES
Operating lease liabilities totalled DKK 1,021m
(2017: DKK 912m), with DKK 326m (2017:
DKK 323m) falling due within one year from
the reporting date. Operating leases relate to
properties and transport equipment and contain
no special purchase rights etc.
Assets held under finance leases with a
carrying amount of DKK 0m (2017: DKK 23m)
have been pledged as security for lease
liabilities of DKK 0m (2017: DKK 19m).
CAPITAL COMMITMENTS
The Group has entered into various capital
commitments that will not take effect until
after the reporting date and have therefore not
been recognised in the consolidated financial
statements. Capital commitments amounted to
DKK 229m (2017: DKK 515m).
ACCOUNTING ESTIMATES AND JUDGEMENTS
Useful lives and residual value of intangible
assets with finite useful life and property,
plant and equipment
Useful life and residual value are initially assessed
both in acquisitions and in business combinations, cf.
section 5. The value of the brands acquired and their
expected useful life are assessed based on the brands’
market position and profitability, and expected long-
term developments in the relevant markets.
Management assesses brands and property, plant
and equipment for changes in useful life. If an
indication of a reduction in the value or useful life
exists, the asset is tested for impairment and is
written down if necessary, or the amortisation/
depreciation period is reassessed and if necessary
adjusted in line with the asset’s changed useful life.
Reassessment of the expected future use is made in
connection with changes in production structure,
restructuring and brewery closures. This may result in
the expected future use and residual values not being
realised, which requires reassessment of useful life,
residual value and recognition of impairment losses or
losses on disposal of non-current assets.
When changing the amortisation or depreciation
period due to a change in the useful life, the effect on
amortisation/depreciation is recognised prospectively
as a change in accounting estimates.
Lease and service agreements
Management considers the substance of the service
being rendered to classify the agreement as either a
lease or a service contract. Particular importance is
attached to whether fulfilment of the agreement
depends on the use of specific assets. The Group
assesses whether contracts are onerous by
determining only the direct variable costs and not the
costs that relate to the business as a whole.
For leases, an assessment is made as to whether the
lease is a finance or an operating lease. The Group
has entered into operating leases for standardised
assets with a short duration relative to the life of the
assets, and accordingly the leases are classified as
operating leases.
Leases are classified as finance leases if they transfer
substantially all the risks and rewards incident to
ownership to the lessee. All other leases are classified
as operating leases.
Accounting estimates and judgements related to
impairment are described in section 2.2.
Amortisation, depreciation and impairment losses
Intangible assets Property, plant and equipment
DKK million 2018 2017 2018 2017
Cost of sales 216 296 2,633 2,967
Sales and distribution expenses 197 207 748 773
Administrative expenses 124 262 173 202
Special items - 4,767 40 -79
Total 537 5,532 3,594 3,863
Gain/loss on disposal of assets
DKK million 2018 2017
Gain on disposal of property, plant and equipment and intangible assets, including
those held for sale, within beverage activities 36 62
Loss on disposal of property, plant and equipment and intangible assets within
beverage activities -23 -36
Total 13 26

CARLSBERG GROUP ANNUAL REPORT 2018 CONSOLIDATED FINANCIAL STATEMENTS 83
SECTION 2.3 (CONTINUED)
INTANGIBLE ASSETS AND PROPERTY, PLANT AND EQUIPMENT
ACCOUNTING POLICIES
Cost
Intangible assets and property, plant and equipment
are initially recognised at cost and subsequently
measured at cost less accumulated amortisation or
depreciation and impairment losses.
Cost comprises the purchase price and costs directly
attributable to the acquisition until the date when the
asset is available for use. The cost of self-constructed
assets comprises direct and indirect costs of
materials, components, sub-suppliers, wages and
salaries, and capitalised borrowing costs on specific or
general borrowings attributable to the construction of
the asset and is included in plant and machinery.
Research and development costs are recognised in
the income statement as incurred. Development costs
are recognised under other intangible assets if the
costs are expected to generate future economic
benefits.
For assets acquired in business combinations,
including brands and property, plant and equipment,
cost at initial recognition is determined by estimating
the fair value of the individual assets in the purchase
price allocation.
Goodwill is only acquired in business combinations
and is measured in the purchase price allocation.
Goodwill is not amortised but is subject to an annual
impairment test, cf. section 2.2.
Where individual components of an item of property,
plant and equipment have different useful lives, they
are accounted for as separate items.
Subsequent costs, for example in connection with
replacement of components of property, plant and
equipment, are recognised in the carrying amount of
the asset if it is probable that the costs will result in
future economic benefits for the Group. The replaced
components are derecognised from the statement of
financial position and recognised as an expense in the
income statement. Costs incurred for ordinary repairs
and maintenance are recognised in the income
statement as incurred.
Useful life, amortisation, depreciation and
impairment losses
Useful life and residual value are determined at the
acquisition date and reassessed annually. If the
residual value exceeds the carrying amount,
depreciation is discontinued.
Amortisation and depreciation are recognised on a
straight-line basis over the expected useful life of the
assets, taking into account any residual value. The
expected useful life and residual value are determined
based on past experience and expectations of the
future use of assets.
Depreciation is calculated on the basis of the cost less
the residual value and impairment losses.
Amortisation and depreciation are recognised under
cost of sales, sales and distribution expenses, and
administrative expenses to the extent that they are
included in the cost of self-constructed assets.
Impairment
Impairment losses of a non-recurring nature are
recognised under special items.
The expected useful life is as follows:
Brands with finite
useful life Normally 20 years
Software Normally 3-5 years. Group-wide
systems developed as an
integrated part of a major
business development
programme: 5-7 years
Delivery rights Depending on contract; if no
contract term has been agreed,
normally not exceeding 5 years
Customer
agreements/
relationships
Depending on contract with the
customer; if no contract exists,
normally not exceeding 20 years
Buildings 20-40 years
Technical installations 15 years
Brewery equipment 15 years
Filling and bottling equipment 8-15 years
Technical installations in warehouses 8 years
On-trade and distribution equipment 5 years
Fixtures and fittings, other plant
and equipment 5-8 years
Returnable packaging materials 3-10 years
Hardware 3-5 years
Land Not depreciated
Operating leases
Operating lease payments are recognised in the
income statement on a straight-line basis over the
lease term.
Government grants and other funding
Grants and funding received for the acquisition of
assets and development projects are recognised in the
statement of financial position by deducting the grant
from the carrying amount of the asset. The grant is
recognised in the income statement over the life of
the asset as a reduced depreciation charge.
CARLSBERG GROUP ANNUAL REPORT 2018 CONSOLIDATED FINANCIAL STATEMENTS 84
303m SPECIAL ITEMS, INCOME (DKK)
Impacted by gains on disposal of entities in
China, gain on sale of assets that were part
of a restructuring in prior years and reversal
of impairment losses in Eastern Europe.
-391m SPECIAL ITEMS, EXPENSES (DKK)
Primarily impacted by restructurings in
Western Europe.
SECTION 3.1
SPECIAL ITEMS
SPECIAL ITEMS, INCOME
In 2018, the Group recognised gains on
disposal of two minor entities in China, cf.
section 5.2.
In 2018, the Group completed a disposal of
land and buildings in Russia impaired in 2010
and a sale of assets that were part of a
restructuring project in prior years in the UK,
and also reversed provisions made for projects
in prior years.
SPECIAL ITEMS, EXPENSES
Special items, expenses consist of impairment
losses on returnable steel kegs and filling lines
due to the roll-out of the DraughtMasterTM
one-way keg system and of restructuring
projects across Western Europe. The
restructuring projects are the result of the
continued focus on cost and efficiency
initiatives, primarily in Kronenbourg, Carlsberg
Sverige, Ringnes, certain local supply
companies as well as in Asia. The restructuring
projects include changes in sales and
distribution operations and related
organisational changes, including termination
of employees. These projects typically run over
several years.
2017 was impacted by a write-down of the
Baltika brand, cf. section 2.2.
Restructurings and impairment of property
plant and equipment
DKK million 2018 2017
Restructuring in
Western Europe -263 -209
Impairment losses in
Western Europe, cf.
section 2.2 -60 -
Restructuring in Asia -54 -
Other -5 -49
Total -382 -258
SECTION 3
SPECIAL ITEMS AND PROVISIONS
Special items
DKK million 2018 2017
Special items, income
Gain on disposal of entities, cf. section 5.2 42 402
Disposal of property, plant and equipment previously impaired, including
adjustments to gains and reversal of provisions made in prior years 199 24
Reversal of impairment losses, cf. section 2.2 49 216
Revaluation gain on step acquisition of entities, cf. section 5.2 13 -
Total 303 642
Special items, expenses
Impairment of brands, cf. section 2.2 - -4,847
Restructurings and impairment of property, plant and equipment -382 -258
Loss on disposal of entities, cf. section 5.2 - -102
Costs related to acquisition of entities -9 -
Total -391 -5,207
Special items, net -88 -4,565

CARLSBERG GROUP ANNUAL REPORT 2018 CONSOLIDATED FINANCIAL STATEMENTS 85
SECTION 3.1 (CONTINUED)
SPECIAL ITEMS
ACCOUNTING ESTIMATES AND JUDGEMENTS
The use of special items entails management
judgement in the separation from ordinary items.
Management carefully considers individual items and
projects (including restructurings) in order to ensure
the correct distinction and split between operating
activities and significant income and expenses of a
special nature.
Management initially assesses the entire restructuring
project and recognises all present costs of the project,
but the project is also assessed on an ongoing basis
with additional costs possibly being incurred during
the lifetime of the project.
Management reassesses the useful life and residual
value of non-current assets used in an entity
undergoing restructuring. The extent and amount of
onerous contracts as well as employee and other
obligations arising in connection with a restructuring
are also estimated.
ACCOUNTING POLICIES
Special items include significant income and expenses
of a special nature in terms of the Group’s revenue-
generating activities that cannot be attributed directly
to the Group’s ordinary operating activities.
Special items also include significant non-recurring
items, including termination benefits related to
retirement of members of the Executive Committee,
impairment of goodwill and brands, gains and losses
on the disposal of activities and associates,
revaluation of the shareholding in an entity held
immediately before a step acquisition of that entity,
and transaction costs in a business combination.
Significant restructuring of processes and structural
adjustments are included in special items.
Special items are shown separately from the Group’s
ordinary operations to facilitate a better
understanding of the Group’s financial performance.
SECTION 3.2
PROVISIONS
Restructuring provisions relate to termination
benefits to employees made redundant,
primarily as a result of a restructuring project
accounted for as special items.
In 2018, restructuring provisions of DKK 381m
related primarily to Kronenbourg, Carlsberg
Sverige, Ringnes and certain local supply
companies, as described in section 3.1.
Other provisions of DKK 4,138m related
primarily to profit sharing in France, employee
obligations other than retirement benefits, and
ongoing disputes, lawsuits etc.
ACCOUNTING ESTIMATES AND JUDGEMENTS
In connection with restructurings, management
assesses the timing of the costs to be incurred, which
influences the classification as current or non-current
liabilities. Provision for losses on onerous contracts is
based on agreed terms with the other party and
expected fulfilment of the contract based on the
current estimate of volumes, use of raw materials etc.
Management assesses provisions, contingent assets
and liabilities and the likely outcome of pending or
probable lawsuits etc. on an ongoing basis. The
outcome depends on future events, which are by
nature uncertain. In assessing the likely outcome of
lawsuits and tax disputes etc., management bases its
assessment on external legal advice and established
precedents.
Provisions
DKK million Restructurings
Onerous
contracts Other Total
Provisions at 1 January 2018 493 451 3,258 4,202
Acquisition of entities - - 390 390
Additional provisions recognised 147 - 761 908
Used during the year -211 -40 -249 -500
Reversal of unused provisions -48 - -27 -75
Transfers - - 28 28
Discounting 6 9 69 84
Foreign exchange adjustments etc. -6 -12 -92 -110
Provisions at 31 December 2018 381 408 4,138 4,927
Recognised in the statement of
financial position
Non-current provisions 188 369 3,270 3,827
Current provisions 193 39 868 1,100
Total 381 408 4,138 4,927
Impact of special items on operating profit
DKK million 2018 2017
If special items had been recognised in operating profit before special items,
they would have been included in the following line items:
Cost of sales -112 -4,494
Sales and distribution expenses -151 -86
Administrative expenses 14 -77
Other operating income 179 522
Other operating expenses -18 -430
Special items, net -88 -4,565

CARLSBERG GROUP ANNUAL REPORT 2018 CONSOLIDATED FINANCIAL STATEMENTS 86
SECTION 3.2 (CONTINUED)
PROVISIONS
ACCOUNTING POLICIES
Provisions, including profit-sharing provisions, are
recognised when, as a result of events arising before
or at the reporting date, the Group has a legal or a
constructive obligation and it is probable that there
may be an outflow of economic benefits to settle the
obligation.
Provisions are discounted if the effect is material to
the measurement of the liability. The Group’s average
borrowing rate is used as the discount rate.
Restructuring costs are recognised when a detailed,
formal restructuring plan has been announced to
those affected no later than at the reporting date. On
acquisition of entities, restructuring provisions in the
acquiree are only included in the opening balance
when the acquiree has a restructuring liability at the
acquisition date.
A provision for onerous contracts is recognised when
the benefits expected to be derived by the Group from
a contract are lower than the unavoidable costs of
meeting its obligations under the contract.
SECTION 3.3
CONTINGENT LIABILITIES
The Group operates in very competitive
markets where consolidation is taking place
within the industry and among our customers
and suppliers, all of which in different ways
influences our business.
In the ordinary course of business, the Group is
party to certain lawsuits, disputes etc. of
various scopes, some of which are referred to
below. The resolution of these lawsuits,
disputes etc. is associated with uncertainty, as
they depend on legal proceedings, such as
negotiations between the parties affected,
governmental actions and court rulings.
In 2014, the Federal Cartel Office in Germany
issued a decision and imposed a fine of EUR
62m for alleged infringement of the
competition rules in 2007. Management does
not agree with the conclusions or findings of
the Federal Cartel Office and, accordingly,
Carlsberg Deutschland has appealed the
decision to the relevant German court.
In 2018, the Group’s associate in Portugal
received a statement of objections from the
local authorities, which was the next step
following a previously conducted dawn raid.
Furthermore, a dawn raid was conducted in the
Group’s subsidiary in India in 2018 with
investigations still ongoing.
At 31 December 2018, no final rulings had
been made in any of the entities that have
experienced dawn raids in recent years.
However, there is still a significant risk related
to these cases due to the inherent uncertainty.
Management and the general counsel
continuously assess these risks and their likely
outcome. It is the opinion of management and
the general counsel that, apart from items
recognised in the statement of financial
position, the outcome of these lawsuits,
disputes etc. cannot be reliably estimated in
terms of amount or timing. The Group does not
expect the ongoing lawsuits and disputes to
have a material impact on the Group’s financial
position, net profit or cash flow.
GUARANTEES AND COMMITMENTS
The Group has issued guarantees for loans etc.
raised by third parties (non-consolidated
entities) of DKK 511m (2017: DKK 475m).
Guarantees issued for loans raised by
associates and joint ventures are described in
section 5.4.
Certain guarantees etc. are issued in connection
with disposal of entities and activities. Apart
from items recognised in the statement of
financial position or disclosed in the
consolidated financial statements, these
guarantees etc. will not have a material effect
on the Group’s financial position.
Capital commitments, lease liabilities and
service agreements are described in section 2.3.

CARLSBERG GROUP ANNUAL REPORT 2018 CONSOLIDATED FINANCIAL STATEMENTS 87
-722m NET FINANCIAL ITEMS (DKK)
Financial items, net, amounted to DKK -722m
against DKK -788m in 2017. Excluding
currency gains and fair value adjustments,
financial items, net, amounted to DKK -758m
(2017: DKK -980m), positively impacted by
the lower net interest-bearing debt.
Leverage ratio (NIBD/EBITDA)
17.3bn NET INTEREST-BEARING DEBT (DKK)
At 31 December 2018, gross financial debt
amounted to DKK 24.0bn (2017: DKK 24.2bn).
Net interest-bearing debt was DKK 17.3bn, a
reduction of DKK 2.3bn versus year-end 2017
despite the higher dividend payout and the
acquisitions made in the year.
The difference of DKK 6.7bn between gross
financial debt and net interest-bearing debt
mainly comprised cash and cash equivalents of
DKK 5.6bn.
The leverage ratio, measured as net interest-
bearing debt to operating profit before
depreciation, amortisation and impairment
losses, was 1.29x (1.45x at year-end 2017).
Long-term and short-term borrowings
amounted to DKK 24.0bn at 31 December
2018 (2017: DKK 24.2bn). Long-term
borrowings totalled DKK 16.8bn (2017: DKK
23.3bn) and short-term borrowings totalled
DKK 7.2bn (2017: DKK 0.8bn). The shift
between long-term and short-term
borrowings was mainly due to the EUR
750m bond maturing on 3 July 2019.
Current liabilities excluding short-term
borrowings increased by DKK 3.0bn to DKK
27.2bn. The increase was mainly due to an
increase of DKK 2.7bn in trade payables. The
increase in trade payables was due to increased
volumes and focused cash discipline combined
with the acquisition of Cambrew.
47.9bn EQUITY (DKK)
Equity amounted to DKK 47.9bn at 31
December 2018 (2017: DKK 49.5bn), of which
DKK 45.3bn was attributable to shareholders in
Carlsberg A/S and DKK 2.6bn to non-
controlling interests.
The change in equity of DKK 1.6bn was mainly
the result of the consolidated profit of DKK
6.1bn being offset by the foreign exchange
loss of DKK 2.8bn and the dividend payout of
DKK 3.3bn.
1.0
1.4
1.8
2.2
2.6
2014 2015 2016 2017 2018
SECTION 4
FINANCING COSTS, CAPITAL STRUCTURE AND EQUITY
Changes in net interest-bearing debt (DKKm)
3,426
2,820
3,270 206 17,313-12,04719,638
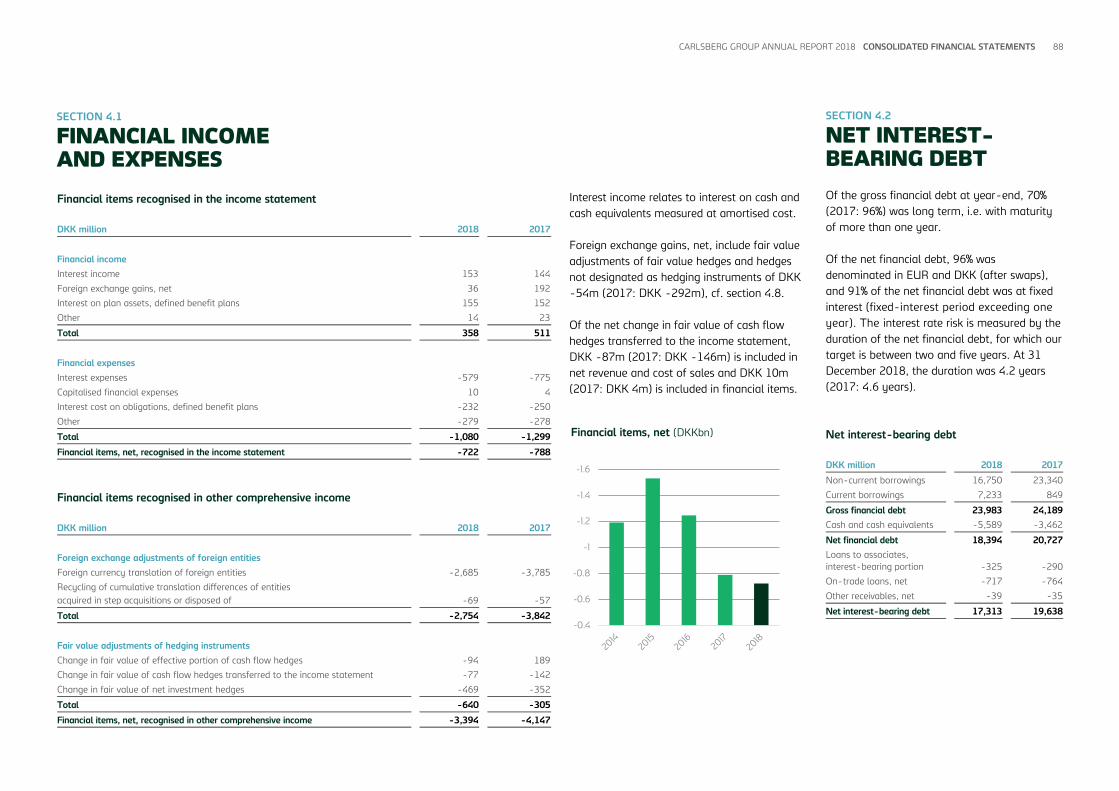
CARLSBERG GROUP ANNUAL REPORT 2018 CONSOLIDATED FINANCIAL STATEMENTS 88
SECTION 4.1
FINANCIAL INCOME AND EXPENSES
Interest income relates to interest on cash and
cash equivalents measured at amortised cost.
Foreign exchange gains, net, include fair value
adjustments of fair value hedges and hedges
not designated as hedging instruments of DKK
-54m (2017: DKK -292m), cf. section 4.8.
Of the net change in fair value of cash flow
hedges transferred to the income statement,
DKK -87m (2017: DKK -146m) is included in
net revenue and cost of sales and DKK 10m
(2017: DKK 4m) is included in financial items.
SECTION 4.2
NET INTEREST- BEARING DEBT
Of the gross financial debt at year-end, 70%
(2017: 96%) was long term, i.e. with maturity
of more than one year.
Of the net financial debt, 96% was
denominated in EUR and DKK (after swaps),
and 91% of the net financial debt was at fixed
interest (fixed-interest period exceeding one
year). The interest rate risk is measured by the
duration of the net financial debt, for which our
target is between two and five years. At 31
December 2018, the duration was 4.2 years
(2017: 4.6 years).
Net interest-bearing debt
DKK million 2018 2017
Non-current borrowings 16,750 23,340
Current borrowings 7,233 849
Gross financial debt 23,983 24,189
Cash and cash equivalents -5,589 -3,462
Net financial debt 18,394 20,727
Loans to associates,
interest-bearing portion -325 -290
On-trade loans, net -717 -764
Other receivables, net -39 -35
Net interest-bearing debt 17,313 19,638
Financial items, net (DKKbn)
-1.6
-1.4
-1.2
-1
-0.8
-0.6
-0.4
Financial items recognised in the income statement
DKK million 2018 2017
Financial income
Interest income 153 144
Foreign exchange gains, net 36 192
Interest on plan assets, defined benefit plans 155 152
Other 14 23
Total 358 511
Financial expenses
Interest expenses -579 -775
Capitalised financial expenses 10 4
Interest cost on obligations, defined benefit plans -232 -250
Other -279 -278
Total -1,080 -1,299
Financial items, net, recognised in the income statement -722 -788
Financial items recognised in other comprehensive income
DKK million 2018 2017
Foreign exchange adjustments of foreign entities
Foreign currency translation of foreign entities -2,685 -3,785
Recycling of cumulative translation differences of entities
acquired in step acquisitions or disposed of -69 -57
Total -2,754 -3,842
Fair value adjustments of hedging instruments
Change in fair value of effective portion of cash flow hedges -94 189
Change in fair value of cash flow hedges transferred to the income statement -77 -142
Change in fair value of net investment hedges -469 -352
Total -640 -305
Financial items, net, recognised in other comprehensive income -3,394 -4,147

CARLSBERG GROUP ANNUAL REPORT 2018 CONSOLIDATED FINANCIAL STATEMENTS 89
SECTION 4.3
CAPITAL STRUCTURE
4.3.1 CAPITAL STRUCTURE
Management regularly assesses whether the
Group’s capital structure is in the interests of
the Group and its shareholders.
The overall objective is to ensure a continued
development and strengthening of the Group’s
capital structure that supports long-term
profitable growth and a solid increase in key
earnings and ratios. This includes assessment
of and decisions on the split of financing
between share capital and borrowings, which is
a long-term strategic decision to be made in
connection with significant investments and
other transactions.
Carlsberg A/S’ share capital is divided into two
classes (A shares and B shares). Combined
with the Carlsberg Foundation’s position as
majority shareholder (in terms of control),
management considers that this division will
remain advantageous for all of the
shareholders, as this structure enables and
supports the long-term development of the
Group.
The Group targets a leverage ratio below 2.0x.
The leverage ratio is measured as net interest-
bearing debt to operating profit before
depreciation, amortisation and impairment
losses. At the end of 2018, the leverage ratio
was 1.29x (2017: 1.45x) and, in light of the
reduced financial leverage, the intention is to
increase the payout to shareholders.
The Group uses share buy-back programmes
to return excess cash to shareholders.
The size of any share buy-back programmes
will depend on the expected organic and
inorganic investments needed to grow the
business and the Group’s intention to maintain
net interest-bearing debt to operating profit
before depreciation, amortisation and
impairment losses below 2.0x.
The Group is rated by Moody’s Investors
Service and Fitch Ratings. As an element in
strategic decisions on capital structure,
management assesses the risk of changes in
the Group’s investment-grade rating.
Identification and monitoring of risks that could
change the rating were carried out on an
ongoing basis throughout the year.
4.3.2 EQUITY
DIVIDENDS
The Group proposes a dividend of DKK 18.00
per share (2017: DKK 16.00 per share),
amounting to DKK 2,746m (2017: DKK
2,441m). The proposed dividend has been
included in retained earnings at 31 December
2018.
Dividends paid out in 2018 for 2017, net of
dividends on treasury shares, amounted to
DKK 2,439m (paid out in 2017 for 2016: DKK
1,525m). Dividends paid out to shareholders of
Carlsberg A/S do not impact taxable income in
Carlsberg A/S.
Dividends paid to non-controlling interests
primarily related to entities in Asia. At
31 December 2018, dividends of DKK 38m
were payable to non-controlling interests.
SHARE BUY-BACK AND TREASURY SHARES
During the 12-month period from 6 February
2019, the Group intends to buy back shares
worth up to DKK 4.5bn. The share buy-back
programme will be split into two tranches of
approximately six months each and will be
executed in accordance with Article 5 of
Regulation No 596/2014 of the European
Parliament and Council of 16 April 2014
(MAR) and the Commission Delegated
Regulation (EU) 2016/1052, also referred to
as the Safe Harbour Regulation. The first
tranche is a share buy-back programme worth
up to DKK 2.5bn, with a maximum of 15
million shares. The Company is entitled to
suspend or stop the programme at any time.
According to the authorisation of the Annual
General Meeting, the Supervisory Board may,
in the period until 13 March 2023, allow the
Company to acquire treasury shares up to a
total holding of 10% of the nominal share
capital at a price quoted on Nasdaq
Copenhagen at the time of acquisition with a
deviation of up to 10%. The permitted holding
of treasury shares covers those acquired in
share buy-back programmes. The Company
holds no class A shares.
Transactions with shareholders
in Carlsberg A/S
DKK million 2018 2017
Dividends paid to
shareholders -2,439 -1,525
Acquisition of treasury
shares -128 -266
Disposal of treasury
shares 78 110
Total -2,489 -1,681
Transactions with non-controlling interests
DKK million 2018 2017
Dividends paid to NCI -831 -738
Acquisition of NCI -355 -2
Total -1,186 -740
Equity (DKKm)
49,525
-2,754
392 -3,308
-1,642
-457 47,889
6,133

CARLSBERG GROUP ANNUAL REPORT 2018 CONSOLIDATED FINANCIAL STATEMENTS 90
SECTION 4.3 (CONTINUED)
CAPITAL STRUCTURE
ACCOUNTING POLICIES
Proposed dividends
The proposed dividend is recognised as a liability at
the date when it is adopted at the Annual General
Meeting (declaration date). The dividend
recommended by the Supervisory Board, and
therefore expected to be paid for the year, is
disclosed in the statement of changes in equity.
Treasury shares
Cost of acquisition, consideration received and
dividends received from treasury shares are
recognised directly in equity as retained earnings.
Capital reductions from the cancellation of treasury
shares are deducted from the share capital at an
amount corresponding to the nominal value of
the shares and added to retained earnings.
Proceeds from the sale of treasury shares in
connection with the settlement of share-based
payments are recognised directly in equity.
4.3.3 FINANCIAL RISK MANAGEMENT
The Group’s activities give rise to exposure to a
variety of financial risks, including market risk
(foreign exchange risk, interest rate risk and
raw material risk), credit risk and liquidity risk.
These risks are described in the following
sections:
• Foreign exchange risk: sections 1.3 and 4.6
• Interest rate risk: section 4.5
• Commodity risk: section 1.2.1
• Credit risk: sections 1.5.1 and 4.4.2
• Liquidity risk: section 4.7
The Group’s financial risks are managed by
Group Treasury in accordance with the
Financial Risk Management Policy approved by
the Supervisory Board and are an integrated
part of the overall risk management process.
The risk management governance structure is
described in the Management review.
To reduce the exposure to these risks, the
Group enters into a variety of financial
instruments and generally seeks to apply
hedge accounting to reduce volatility in the
income statement.
Debt instruments and deposits in foreign
currency reduce the overall risk, but do not
achieve the objective of reducing volatility in
specific items in the income statement.
Share capital
Class A shares Class B shares Total share capital
Shares of
DKK 20
Nominal
value,
DKK ’000
Shares of
DKK 20
Nominal
value,
DKK ’000
Shares of
DKK 20
Nominal
value,
DKK ’000
1 January 2017 33,699,252 673,985
118,857,554 2,377,151 152,556,806 3,051,136
No change in 2017 - - - - - -
31 December 2017 33,699,252 673,985
118,857,554 2,377,151 152,556,806 3,051,136
No change in 2018 - - - - - -
31 December 2018 33,699,252 673,985
118,857,554 2,377,151 152,556,806 3,051,136
A shares carry 20 votes per DKK 20 share. B shares carry two votes per DKK 20 share. A preferential right to an 8%
non-cumulative dividend is attached to B shares. Apart from votes and dividends, all shares rank equally.
Treasury shares
Fair value,
DKKm
Shares of
DKK 20
Nominal
value, DKKm
Percentage of
share capital
1 January 2017 4,401 0.1 0.0%
Acquisition of treasury shares 376,888 7.5 0.2%
Used to settle share-based payments -214,947 -4.3 -0.1%
31 December 2017 124 166,342 3.3 0.1%
Acquisition of treasury shares 173,464 3.5 0.1%
Used to settle share-based payments -240,353 -4.8 -0.2%
31 December 2018 69 99,453 2.0 0.1%
To facilitate settlement of share-based incentive programmes in 2018, the Company acquired class B treasury shares at
an average price of DKK 740 (2017: DKK 706).

CARLSBERG GROUP ANNUAL REPORT 2018 CONSOLIDATED FINANCIAL STATEMENTS 91
SECTION 4.4
BORROWINGS AND CASH
4.4.1 BORROWINGS
Borrowings decreased slightly in 2018. In
addition, the distribution between current and
non-current debt changed, as a EUR 750m
bond matures in July 2019 and the certificates
arising as a consequence of the prepayment
received regarding the disposal of the Hamburg
site mature in November 2019. Both items
were reported as non-current in 2017.
Gross financial debt
DKK million 2018 2017
Non-current
Issued bonds 16,697 22,215
Bank borrowings 35 21
Other borrowings 18 1,104
Total 16,750 23,340
Current
Issued bonds 5,602 -
Current portion of other
non-current borrowings - 36
Bank borrowings 526 773
Other borrowings 1,105 40
Total 7,233 849
Total borrowings 23,983 24,189
Fair value 25,248 25,840
An overview of issued bonds (current and non-current) is
provided in section 4.5.
Changes in gross financial debt
DKK million 2018 2017
Gross financial debt at 1
January 24,189 30,204
Proceeds from issue of
bonds - 3,684
Repayment of bonds - -7,444
Instalments on and proceeds
from borrowings, long-term -38 -1,157
Repayment of mortgage - -420
Instalments on and proceeds
from borrowings, short-term -56 147
Other -29 -49
External financing -123 -5,239
Change in bank overdrafts -187 -812
Other, including foreign
exchange adjustments and
amortisation 104 36
Gross financial debt at 31
December 23,983 24,189
ACCOUNTING POLICIES
Borrowings are initially recognised at fair value less
transaction costs and subsequently measured at
amortised cost using the effective interest method.
Accordingly, the difference between the fair value less
transaction costs and the nominal value is recognised
under financial expenses over the term of the loan.
4.4.2 CASH
Cash and cash equivalents include short-term
marketable securities with a term of three
months or less at the acquisition date that are
subject to an insignificant risk of changes in
value. Short-term bank deposits amounted to
DKK 252m (2017: DKK 578m). The average
interest rate on these deposits was 6% (2017:
6.3%).
Cash and cash equivalents
DKK million 2018 2017
Cash and cash equivalents 5,589 3,462
Bank overdrafts -155 -342
Cash and cash equivalents,
net 5,434 3,120
ASSESSMENT OF CREDIT RISK
The Group is exposed to credit risk on cash and
cash equivalents (including fixed deposits),
investments and derivative financial
instruments with a positive fair value due to
uncertainty as to whether the counterparty will
be able to meet its contractual obligations as
they fall due.
The Group has established a credit policy under
which financial transactions may be entered
into only with financial institutions with a solid
credit rating. The credit exposure on financial
institutions is managed by Group Treasury.
The Group primarily enters into financial
instruments and transactions with the Group’s
relationship banks, i.e. banks extending loans
to the Group. Group Treasury monitors the
Group’s gross credit exposure to banks and
operates with individual limits on banks based
on rating and access to netting of assets and
liabilities.
EXPOSURE TO CREDIT RISK
The carrying amount of DKK 5,589m (2017:
DKK 3,462m) represents the maximum credit
exposure related to cash and cash equivalents.
Of this amount, DKK 2,760m (2017: DKK
2,131m) is cash in Asia.
The credit risk on receivables is described in
section 1.5.1.

CARLSBERG GROUP ANNUAL REPORT 2018 CONSOLIDATED FINANCIAL STATEMENTS 92
SECTION 4.5
INTEREST RATE RISK
The Group’s exposure to interest rate risk is
considered limited. At the reporting date, 91%
of the net financial debt consisted of fixed-rate
borrowings with interest rates fixed for more
than one year (2017: 113%). As 89% of the
Group’s net debt is in EUR, the interest rate
exposure primarily relates to the development
in the interest rates for EUR.
The interest rate risk is measured by the
duration of the net financial debt. The target is
to have a duration between two and five years.
At 31 December 2018, the duration was 4.2
years (2017: 4.6). Interest rate risks are mainly
managed using fixed-rate bonds.
The EUR 750m bond maturing on 3 July 2019
consists of two bond issues of EUR 250m and
EUR 500m.
SENSITIVITY ANALYSIS
It is estimated that a 1 percentage point
interest rate increase would lead to an increase
in interest expenses of DKK 16m (2017:
decrease of DKK 27m). The analysis assumes a
parallel shift in the relevant yield curves.
If the market interest rate had been 1
percentage point higher at the reporting date, it
would have led to a financial gain of DKK
766m (2017: DKK 962m), and a similar loss
had the interest rate been 1 percentage point
lower. However, since all fixed-rate borrowings
are measured at amortised cost, there is no
impact on other comprehensive income or the
income statement.
The sensitivity analysis is based on the financial
instruments recognised at the reporting date.
The sensitivity analysis assumes a parallel shift
in interest rates and that all other variables
remain constant, in particular foreign exchange
rates and interest rate differentials between the
different currencies. The analysis was
performed on the same basis as for 2017. The
Group did not enter into any new interest rate
swaps in 2018.
Interest rate risk
DKK million
2018
Interest
rate
Average
effective
interest
rate Fixed for
Carrying
amount
Interest
rate risk
Issued bonds
EUR 750m maturing 3 July 2019 Fixed 2.6% 0-1 year 5,602 Fair value
EUR 750m maturing 15 November 2022 Fixed 2.7% 3-4 years 5,580 Fair value
EUR 500m maturing 6 September 2023 Fixed 0.7% 4-5 years 3,705 Fair value
EUR 1,000m maturing 28 May 2024 Fixed 2.6% >5 years 7,412 Fair value
Total issued bonds 2.3% 22,299
Total issued bonds 2017 2.3% 22,215
Bank borrowings and other borrowings
Floating-rate Floating 1.5% <1 year 1,632 Cash flow
Fixed-rate Fixed 1.9% >1 year 52 Fair value
Total bank borrowings and other borrowings 1,684
Total bank borrowings and other borrowings 2017 1,974
Net financial debt by currency
DKK million Interest rate
2018
Net financial
debt Floating¹ Fixed¹ Floating² % Fixed² %
EUR 16,436 -339 16,775 24% 76%
DKK 1,279 1,279 - 100% -
PLN -372 -372 - 100% -
USD 986 986 - 100% -
CHF 977 977 - 100% -
RUB -58 -58 - 100% -
Other -854 -854 - 100% -
Total 18,394 1,619 16,775 9% 91%
2017
EUR 17,591 -5,790 23,381 0% 100%
DKK 1,758 1,758 - 100% -
PLN -123 -123 - 100% -
USD 1,606 1,604 2 100% -
CHF 979 979 - 100% -
RUB -1,418 -1,418 - 100% -
Other 334 336 -2 100% -
Total 20,727 -2,654 23,381 -13% 113%
¹ Net financial debt consists of current and non-current items after currency derivatives less cash and cash equivalents.
² Net financial debt consists of current and non-current items less cash and cash equivalents.
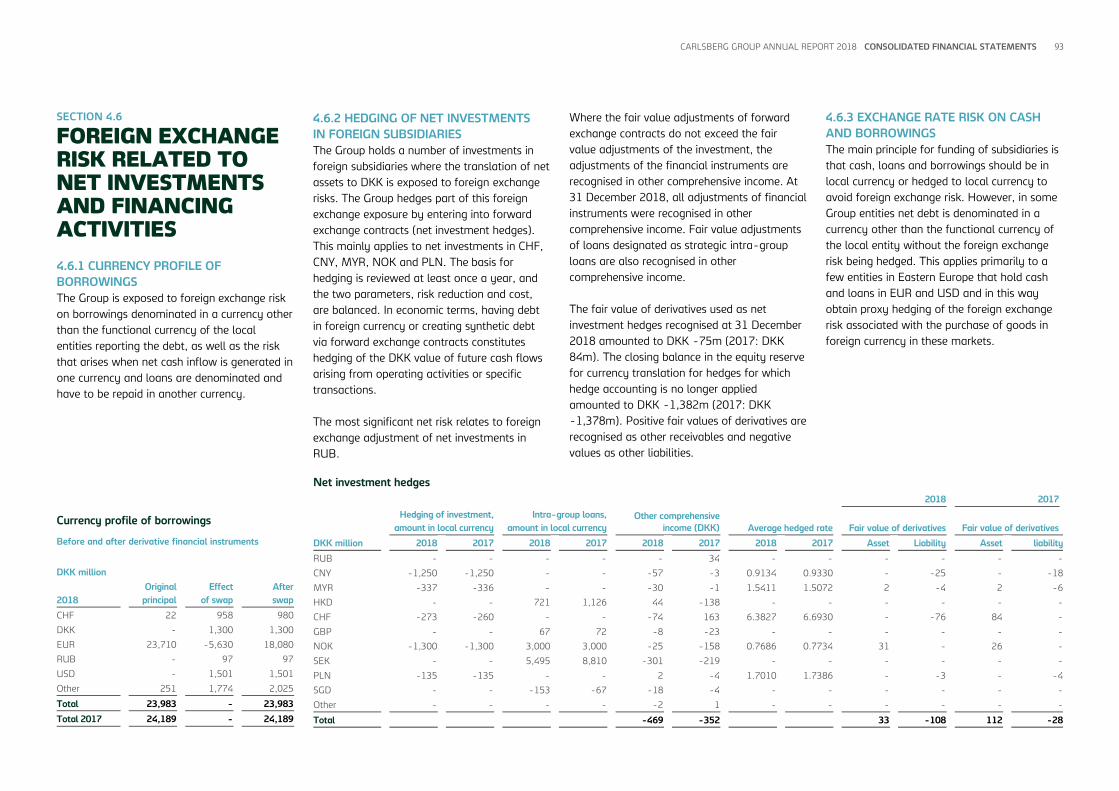
CARLSBERG GROUP ANNUAL REPORT 2018 CONSOLIDATED FINANCIAL STATEMENTS 93
SECTION 4.6
FOREIGN EXCHANGE RISK RELATED TO NET INVESTMENTS AND FINANCING ACTIVITIES
4.6.1 CURRENCY PROFILE OF
BORROWINGS
The Group is exposed to foreign exchange risk
on borrowings denominated in a currency other
than the functional currency of the local
entities reporting the debt, as well as the risk
that arises when net cash inflow is generated in
one currency and loans are denominated and
have to be repaid in another currency.
4.6.2 HEDGING OF NET INVESTMENTS
IN FOREIGN SUBSIDIARIES
The Group holds a number of investments in
foreign subsidiaries where the translation of net
assets to DKK is exposed to foreign exchange
risks. The Group hedges part of this foreign
exchange exposure by entering into forward
exchange contracts (net investment hedges).
This mainly applies to net investments in CHF,
CNY, MYR, NOK and PLN. The basis for
hedging is reviewed at least once a year, and
the two parameters, risk reduction and cost,
are balanced. In economic terms, having debt
in foreign currency or creating synthetic debt
via forward exchange contracts constitutes
hedging of the DKK value of future cash flows
arising from operating activities or specific
transactions.
The most significant net risk relates to foreign
exchange adjustment of net investments in
RUB.
Where the fair value adjustments of forward
exchange contracts do not exceed the fair
value adjustments of the investment, the
adjustments of the financial instruments are
recognised in other comprehensive income. At
31 December 2018, all adjustments of financial
instruments were recognised in other
comprehensive income. Fair value adjustments
of loans designated as strategic intra-group
loans are also recognised in other
comprehensive income.
The fair value of derivatives used as net
investment hedges recognised at 31 December
2018 amounted to DKK -75m (2017: DKK
84m). The closing balance in the equity reserve
for currency translation for hedges for which
hedge accounting is no longer applied
amounted to DKK -1,382m (2017: DKK
-1,378m). Positive fair values of derivatives are
recognised as other receivables and negative
values as other liabilities.
4.6.3 EXCHANGE RATE RISK ON CASH
AND BORROWINGS
The main principle for funding of subsidiaries is
that cash, loans and borrowings should be in
local currency or hedged to local currency to
avoid foreign exchange risk. However, in some
Group entities net debt is denominated in a
currency other than the functional currency of
the local entity without the foreign exchange
risk being hedged. This applies primarily to a
few entities in Eastern Europe that hold cash
and loans in EUR and USD and in this way
obtain proxy hedging of the foreign exchange
risk associated with the purchase of goods in
foreign currency in these markets.
Currency profile of borrowings
Before and after derivative financial instruments
DKK million
2018
Original
principal
Effect
of swap
After
swap
CHF 22 958 980
DKK - 1,300 1,300
EUR 23,710 -5,630 18,080
RUB - 97 97
USD - 1,501 1,501
Other 251 1,774 2,025
Total 23,983 - 23,983
Total 2017 24,189 - 24,189
Net investment hedges
2018 2017
Hedging of investment,
amount in local currency
Intra-group loans,
amount in local currency
Other comprehensive
income (DKK) Average hedged rate Fair value of derivatives Fair value of derivatives
DKK million 2018 2017 2018 2017 2018 2017 2018 2017 Asset Liability Asset liability
RUB - - - - - 34 - - - - - -
CNY -1,250 -1,250 - - -57 -3 0.9134 0.9330 - -25 - -18
MYR -337 -336 - - -30 -1 1.5411 1.5072 2 -4 2 -6
HKD - - 721 1,126 44 -138 - - - - - -
CHF -273 -260 - - -74 163 6.3827 6.6930 - -76 84 -
GBP - - 67 72 -8 -23 - - - - - -
NOK -1,300 -1,300 3,000 3,000 -25 -158 0.7686 0.7734 31 - 26 -
SEK - - 5,495 8,810 -301 -219 - - - - - -
PLN -135 -135 - - 2 -4 1.7010 1.7386 - -3 - -4
SGD - - -153 -67 -18 -4 - - - - - -
Other - - - - -2 1 - - - - - -
Total -469 -352 33 -108 112 -28

CARLSBERG GROUP ANNUAL REPORT 2018 CONSOLIDATED FINANCIAL STATEMENTS 94
SECTION 4.6 (CONTINUED)
FOREIGN EXCHANGE RISK RELATED TO NET INVESTMENTS AND FINANCING ACTIVITIES
4.6.4 IMPACT ON FINANCIAL
STATEMENTS AND SENSITIVITY
ANALYSIS
IMPACT ON INCOME STATEMENT
For the impact of currency on operating profit
and financial items, please refer to sections 1.3
and 4.1 respectively.
IMPACT ON STATEMENT OF FINANCIAL
POSITION
Fluctuations in foreign exchange rates will
affect the level of debt, as funding is obtained
in a number of currencies. In 2018, net
interest-bearing debt increased by DKK 142m
(2017: increased by DKK 360m) due to
changes in foreign exchange rates.
SENSITIVITY ANALYSIS
An adverse development in the exchange rates
would, all other things being unchanged, have
had the hypothetical impact on the
consolidated income statement and other
comprehensive income for 2018 illustrated in
the tables. The calculations are made on the
basis of items in the statement of financial
position at 31 December 2018.
Income statement
The hypothetical impact ignores the fact that
the subsidiaries’ initial recognition of revenue,
cost and debt would be similarly exposed to
the exchange rate developments.
Other comprehensive income
Other comprehensive income is affected by
changes in the fair value of currency derivatives
designated as cash flow hedges of future
purchases and sales.
Exchange rate sensitivity - income statement
2018 2017
DKK million
EUR
receivable
EUR
payable
EUR
cash
Gross
exposure
Exposure,
net of hedging % change
Effect
on P/L
Effect
on P/L
EUR/GBP 1,109 -639 -340 130 130 5% 7 33
EUR/NOK 121 -608 273 -214 -214 5% -11 -22
EUR/PLN 276 -195 27 108 108 5% 5 3
EUR/KZT - -5 211 206 206 10% 21 16
EUR/RUB 7 -105 237 139 139 10% 14 10
EUR/SEK 331 -291 51 91 91 5% 5 -6
EUR/CHF 89 -209 87 -33 -33 5% -2 -4
Total 39 30
2017
2018
USD
receivable
USD
payable
USD
cash
Gross
exposure
Exposure,
net of hedging % change
Effect
on P/L
Effect
on P/L
USD/RUB - -2 327 325 325 10% 33 19
USD/UAH - -1 157 156 156 10% 16 10
Total 49 29
Exchange rate sensitivity - other comprehensive income
2018 2017
DKK million
Average
hedged
rate
Notional
amount % change
Effect
on OCI
Average
hedged
rate
Effect
on OCI
NOK/DKK 0.7707 -696 5% -35 0.7768 -32
SEK/DKK 0.7227 -523 5% -26 0.7734 -30
PLN/DKK 1.6865 -451 5% -23 1.7139 -28
CHF/DKK 6.5356 -319 5% -16 6.5354 -13
RUB/DKK 0.0894 -236 10% -24 0.1089 -38
GBP/DKK 8.3284 -168 5% -8 8.2152 -6
Other - 53 5% 3 - 8
Total -129 -139

CARLSBERG GROUP ANNUAL REPORT 2018 CONSOLIDATED FINANCIAL STATEMENTS 95
SECTION 4.6 (CONTINUED)
FOREIGN EXCHANGE RISK RELATED TO NET INVESTMENTS AND FINANCING ACTIVITIES
APPLIED EXCHANGE RATES
The average exchange rate was calculated
using the monthly exchange rates weighted
according to the phasing of the net revenue per
currency throughout the year.
SECTION 4.7
LIQUIDITY RISK
Liquidity risk results from the Group’s potential
inability to meet the obligations associated
with its financial liabilities, for example settle-
ment of financial debt and paying suppliers.
The Group’s liquidity is managed by Group
Treasury. The aim is to ensure effective
liquidity management, which involves
obtaining sufficient committed credit facilities
to ensure adequate financial resources and, to
some extent, tapping a range of funding
sources.
CREDIT RESOURCES AVAILABLE
The Group uses the term “credit resources
available” to determine the adequacy of access
to credit facilities.
Net financial debt is used internally by Group
Treasury to monitor the Group’s credit
resources available. Net financial debt is the
Group’s net interest-bearing debt, excluding
interest-bearing assets other than cash, as
these assets are not actively managed in
relation to liquidity risk. Net financial debt is
shown in section 4.2.
Applied exchange rates
Closing rate Average rate
DKK 2018 2017 2018 2017
Swiss franc (CHF) 6.6512 6.3621 6.4526 6.7091
Chinese yuan (CNY) 0.9479 0.9539 0.9562 0.9764
Euro (EUR) 7.4673 7.4449 7.4529 7.4384
Pound sterling (GBP) 8.2719 8.3912 8.4234 8.4933
Laotian kip (LAK) 0.0008 0.0007 0.0007 0.0008
Norwegian krone (NOK) 0.7487 0.7566 0.7775 0.7961
Polish zloty (PLN) 1.7355 1.7824 1.7471 1.7500
Russian rouble (RUB) 0.0940 0.1081 0.1007 0.1134
Swedish krona (SEK) 0.7266 0.7563 0.7256 0.7712
Ukrainian hryvnia (UAH) 0.2355 0.2223 0.2347 0.2488
Committed credit facilities and credit resources available
DKK million
2018
Total
committed
loans and
credit
facilities
Utilised
portion of
credit
facilities
Unutilised
credit
facilities
2017
Unutilised
credit
facilities
Current
<1 year 8,764 7,233 1,531 2,079
Total current committed loans and credit facilities 8,764 7,233 1,531 2,079
Non-current
<1 year - - -7,233 -849
1-2 years 21 21 - -
2-3 years 15,004 -5 15,009 -
3-4 years 5,595 5,595 - 18,687
4-5 years 3,712 3,712 - -
>5 years 7,427 7,427 - -
Total non-current committed loans and credit facilities 31,759 16,750 7,776 17,838
Cash and cash equivalents 5,589 3,462
Credit resources available (total non-current
committed loans and credit facilities - net debt) 13,365 21,300

CARLSBERG GROUP ANNUAL REPORT 2018 CONSOLIDATED FINANCIAL STATEMENTS 96
SECTION 4.7 (CONTINUED)
LIQUIDITY RISK
At 31 December 2018, the Group had total
credit resources available of DKK 13,365m
(2017: DKK 21,300m) consisting of cash and
cash equivalents of DKK 5,589m (2017: DKK
3,462m), committed unutilised non-current
credit facilities of DKK 15,009m (2017: DKK
18,687m) and less utilisation of current
facilities of DKK -7,233m (2017: DKK -849m).
Including current credit facilities of DKK
1,531m (2017: DKK 2,079m), total committed
unutilised credit facilities amounted to DKK
16,540m (2017: DKK 20,766m).
Credit resources available were reduced by
DKK 7.9bn compared with 2017. This was
primarily due to the net effect of an EUR 750m
bond maturing in July 2019 (reducing credit
resources available by DKK 5.6bn), certificates
related to prepayments regarding disposal of
the Hamburg site of DKK 1.1bn, and a
reduction in the revolving credit facility of DKK
3.7bn. Furthermore, the reduction in net
financial debt increased credit resources
available by DKK 2.3bn. Credit resources are
also affected by planned share buy-backs.
The credit resources available and the access to
unused committed credit facilities are
considered reasonable in light of the Group’s
current needs in terms of financial flexibility.
In addition to efficient working capital manage-
ment and credit risk management, the Group
mitigates liquidity risk by arranging borrowing
facilities with solid financial institutions.
The Group uses cash pools for day-to-day
liquidity management in most of the entities in
Western Europe, as well as intra-group loans
between Group Treasury and subsidiaries.
Eastern Europe and Asia are less integrated in
terms of cash pools, and liquidity is managed
via intra-group loans.
The table lists the contractual maturities of
financial liabilities, including estimated interest
payments and excluding the impact of netting
agreements, and thus summarises the gross
liquidity risk.
The risk implied by the values reflects the one-
sided scenario of cash outflows only. Trade
payables and other financial liabilities originate
from the financing of assets in ongoing
operations, such as property, plant and
equipment, and investments in working capital,
for example inventories and trade receivables.
The nominal amount/contractual cash flow of
the gross financial debt was DKK 125m higher
(2017: DKK 163m higher) than the carrying
amount. The difference between the nominal
amount and the carrying amount comprises
differences between these amounts at initial
recognition, which are treated as a cost that is
capitalised and amortised over the duration of
the borrowings.
The interest expense is the contractual cash
flows expected on the gross financial debt
existing at 31 December 2018.
The cash flow is estimated based on the
notional amount of the above-mentioned
borrowings and expected interest rates at
year-end 2018 and 2017. Interest on debt
recognised at year-end 2018 and 2017, for
which no contractual obligation exists (current
borrowing and cash pools), has been included
for a two-year period.
Time to maturity for non-current borrowings
DKK million
2018 1-2 years 2-3 years 3-4 years 4-5 years >5 years Total
Issued bonds - - 5,580 3,705 7,412 16,697
Bank borrowings 21 -5 13 6 - 35
Other non-current borrowings - - 2 1 15 18
Total 21 -5 5,595 3,712 7,427 16,750
Total 2017 6,694 17 -28 5,569 11,088 23,340
Maturity of financial liabilities
DKK million
2018
Contractual
cash flows
Maturity
<1 year
Maturity
>1 year
<5 years
Maturity
>5 years
Carrying
amount
Derivative financial instruments
Derivative financial instruments, payables 281 272 9 - 263
Non-derivative financial instruments
Gross financial debt 24,108 7,232 9,394 7,482 23,983
Interest expenses 1,780 437 1,266 77 N/A
Trade payables and other liabilities 17,782 17,782 - - 17,782
Contingent liabilities 511 511 - - 511
Contingent considerations 6,168 - 6,168 - 6,168
Non-derivative financial instruments 50,349 25,962 16,828 7,559 -
Financial liabilities 50,630 26,234 16,837 7,559 -
Financial liabilities 2017 46,088 17,299 17,323 11,466 -

CARLSBERG GROUP ANNUAL REPORT 2018 CONSOLIDATED FINANCIAL STATEMENTS 97
SECTION 4.8
DERIVATIVE FINANCIAL INSTRUMENTS
The Group enters into various derivative
financial instruments to hedge foreign
exchange, interest rate and commodity risks
and seeks to apply hedge accounting when this
is possible. Hedging of future, highly probable
forecast transactions is designated as cash flow
hedges. Fair value adjustments of derivative
financial instruments that are not designated
either as net investment hedges or as cash flow
hedges are recognised in financial income and
expenses.
The Group monitors the cash flow hedge
relationships twice a year to assess whether
the hedge is still effective.
The ineffective portion primarily relates to
aluminium hedges. Following the adoption of
IFRS 9, there was no ineffectiveness. The
change in accounting policy did not have a
material impact on other comprehensive
income or the income statement.
Positive fair values of derivatives are recognised
as other receivables and negative values as
other liabilities.
The fair value of derivatives classified as a cash
flow hedge is presented in the cash flow hedge
section below.
Cash flow hedges comprise aluminium hedges
where the hedged item is aluminium cans that
will be used in a number of Group entities in
2019 and 2020, and currency forwards entered
into to cover the foreign exchange risk on
transactions expected to take place in 2019
and 2020.
The impact on other comprehensive income
from exchange rate instruments relates to
hedges of Group entities’ purchases and sales
in currencies other than their functional
currencies. The impact on other comprehensive
income from other instruments relates to
hedges of Group entities’ exposure to changes
in aluminium prices.
The closing balance in the equity reserve for
hedging of cash flow hedges for which hedge
accounting is no longer applied was DKK
-837m (2017: DKK -832m).
Financial derivatives not designated as hedging instruments (economic hedges)
DKK million
2018
Income
statement
Fair value
receivables
Fair value
payables
Fair value,
net
Exchange rate instruments -40 57 -55 2
Other instruments -3 - - -
Ineffectiveness -11 - - -
Total -54 57 -55 2
2017
Exchange rate instruments -292 121 -75 46
Other instruments 4 - - -
Ineffectiveness -4 - - -
Total -292 121 -75 46
Cash flow hedges
DKK million Expected recognition
2018
Other
comprehen-
sive income
Fair value
receivables
Fair value
payables
Fair value,
net 2019 2020
Exchange rate instruments -31 18 -13 5 4 1
Other instruments -140 4 -89 -85 -74 -11
Total -171 22 -102 -80 -70 -10
2017 2018 2019
Interest rate instruments 1 - - - N/A N/A
Exchange rate instruments 64 36 -9 27 26 1
Other instruments -18 65 - 65 65 -
Total 47 101 -9 92 91 1
CARLSBERG GROUP ANNUAL REPORT 2018 CONSOLIDATED FINANCIAL STATEMENTS 98
SECTION 4.8 (CONTINUED)
DERIVATIVE FINANCIAL INSTRUMENTS
ACCOUNTING ESTIMATES AND JUDGEMENTS
When entering into financial instruments,
management assesses whether the instrument is an
effective hedge of recognised assets and liabilities,
expected future cash flows or financial investments.
The effectiveness of recognised hedging instruments
is assessed at least twice a year.
Fair values of derivative financial instruments are
calculated on the basis of level 2 input consisting of
current market data and generally accepted valuation
methods. Internally calculated values are used, and
these are compared with external market quotes on a
quarterly basis. For currency and aluminium
derivatives, the calculation is as follows:
a) The forward market rate is compared with the
agreed rate on the derivatives, and the difference
in cash flow at the future point in time is
calculated.
b) The amounts are discounted to present value.
When entering into a contract, management assesses
whether the contract contains embedded derivatives
and whether they meet the criteria for separate
classification and recognition. The Group currently
does not have any embedded derivatives that meet
the criteria for separate classification and recognition.
ACCOUNTING POLICIES
Derivative financial instruments are initially
recognised at fair value on the trade date and
subsequently remeasured at their fair value at the
reporting date.
The accounting for subsequent changes in fair value
depends on whether the derivative is designated as
one of:
• Fair value hedges of the fair value of recognised
assets or liabilities
• Cash flow hedges of particular risks associated with
the cash flow from forecast transactions
• Net investment hedges of currency fluctuations in
subsidiaries, associates or joint ventures.
The fair values of derivative financial instruments are
presented in other receivables or payables, and
positive and negative values are offset only when the
Group has the right and the intention to settle several
financial instruments net.
Changes in the fair value of a fair value hedge and of
derivative financial instruments not designated in a
hedge relationship are recognised in financial income
or expenses in the income statement.
Changes in the effective portion of the fair value of
derivative financial instruments that are designated
and qualify as a cash flow hedge are recognised in
the hedging reserve within equity. When the hedged
transaction materialises, amounts previously
recognised in other comprehensive income are
transferred to the same item as the hedged item.
Derivatives designated as and qualifying for
recognition as a cash flow hedge of financial
investments are recognised in other comprehensive
income. On complete or partial disposal of the
financial investment, the portion of the hedging
instrument that is recognised in other comprehensive
income and relates to that financial investment is
recognised in the income statement when the gain or
loss on disposal is recognised.
Hedges of net investments in foreign subsidiaries,
associates and joint ventures are accounted for in the
same way as cash flow hedges.

CARLSBERG GROUP ANNUAL REPORT 2018 CONSOLIDATED FINANCIAL STATEMENTS 99
Cambrew Gained control of the Cambrew Group
through the acquisition of an additional 25%
shareholding.
Super Bock Increased the direct and indirect ownership
of the associate Super Bock Group to 60%.
SECTION 5.1
INVESTMENT MODEL AND RISKS
MARKET ACCESS
In the beer industry, access to local markets is
highly dependent on establishing good
relationships with customers in the on- and
off-trade channels, national distributors, local
suppliers of raw and packaging materials, and
relevant authorities governing the beverage
industry. Often, the most efficient way of
establishing such relations is by acquiring a
local brewer or engaging with a local partner
that already has the relevant relationships.
Therefore, when the Group expands its
business into new markets, it often does so in
collaboration with a local partner. Such a
partnership can have different legal forms and
impacts the consolidated financial statements
to a varying degree accordingly.
INVESTMENT MODEL
Entering into a partnership can both reduce the
financial exposure and mitigate the business
risks associated with entering new markets.
The financial exposure, however, varies
depending on the structure of the partnership.
In some markets, the Group enters as a non-
controlling shareholder and provides a degree
of financing and contributes knowledge of the
beer industry, but leaves the controlling
influence with the partner. Other investments
are structured as joint ventures, where the
Group and our local partner jointly make the
operational decisions and share strategic and
tactical responsibility.
More commonly, the Group structures its
partnerships such that it exercises management
control, usually by way of a majority of the
voting rights, whereby the investment is fully
consolidated. Such partnerships are just as
important as other types of partnership to be
successful in the local markets, but mean that
the Group has increased financial exposure.
Investments in businesses in which the Group
exercises management control often involve
put and/or call options or a similar structure.
IMPACT ON FINANCIAL STATEMENTS
Investments in partnerships where the Group is
the non-controlling shareholder and joint
ventures are consolidated in the financial
statements using the equity method. The
accounting risks associated with these
governance models are limited to the
investment, the proportionate share of the net
profit of the business and any specific
additional commitments to banks or other
parties, as well as specific guarantees or loans
the Group provides to the partnership.
In businesses where the Group exercises
management control, the consolidated
financials are impacted by the full exposure to
the earnings and other financial risks. From an
accounting point of view, the Group treats any
put options held by partners in such entities as
if they had already been exercised by the
partner, i.e. anticipating that the acquisition will
occur. The accounting impact is that the non-
controlling interests are not recognised, and no
part of net profits or equity is attributed to
them. Instead, the dividends the partner
receives from the business are – for accounting
purposes – classified as financial expenses.
SECTION 5
ACQUISITIONS, DISPOSALS, ASSOCIATES AND JOINT VENTURES

CARLSBERG GROUP ANNUAL REPORT 2018 CONSOLIDATED FINANCIAL STATEMENTS 100
SECTION 5.1 (CONTINUED)
INVESTMENT MODEL AND RISKS
Common to all partnerships is the risk of
disagreement and, ultimately, dissolution.
A dissolution will initially impact the accounting
treatment of an investment. The accounting
treatment will depend on whether the Group or
our partner is exiting the business. In the long
term, however, the impact can be significant to
the operation of the local entity and the
collaboration with customers, distributors,
authorities etc. if the partner was instrumental
in managing these relationships. Therefore, a
risk of a partnership dissolution may have a
negative impact on the underlying business and
the financial performance recognised in the
consolidated financial statements.
SECTION 5.2
ACQUISITIONS AND DISPOSALS
ACQUISITION OF ENTITIES
In August 2018, Carlsberg gained control of
Cambrew Group (Cambodia) through the
acquisition of an additional 25% of the shares,
giving Carlsberg a 75% ownership interest.
The step acquisition of Cambrew Group was
carried out to obtain control of the business in
order to further strengthen the Group’s
presence in the Asia region. The consideration
for the acquisition is contingent on the exercise
of a fixed-priced put option granted to the 25%
non-controlling interests and an earn-out
depending on net revenue in 2021 or 2022.
The revaluation of the equity interest held
before the acquisition resulted in a gain of DKK
13m being recognised in special items.
The calculated goodwill represents staff
competences and synergies from expected
optimisations of sales and distribution, supply
chain and procurement. The Group expects to
increase Cambrew’s market share in a beer
market that holds significant growth
opportunities.
The purchase price allocation of the fair value
of identified assets, liabilities and contingent
liabilities is ongoing. Adjustments are therefore
expected to be made to several items in the
opening balance, including to brands and
property, plant and equipment. The accounting
treatment of the acquisition will be completed
within the 12-month period required by IFRS.
The Group did not complete any acquisitions of
entities in 2017.
Entities acquired
DKK million 2018
Consideration paid 1,349
Fair value of contingent consideration 1,061
Fair value of previously held investment 843
Total cost of acquisition 3,253
Provisional fair values
Intangible assets 2,047
Property, plant and equipment 1,482
Financial assets 46
Inventories 102
Trade and other receivables 85
Cash and cash equivalents 353
Provisions and retirement benefits -393
Deferred tax liabilities -129
Trade payables -254
Other payables -83
Acquired assets and liabilities 3,256
Non-controlling interests -3
Acquired assets and liabilities attributable
to shareholders in Carlsberg A/S 3,253
ACQUISITION OF NON-CONTROLLING
INTERESTS
In February 2018, the non-controlling interest
in Olympic Brewery (Greece) exercised the put
option on the remaining 49% shareholding.
In September 2018, a non-controlling interest
in Brewery Alivaria (Belarus) exercised one half
of a put option on 21% of the shares.
DISPOSAL OF ENTITIES
The restructuring of the Group’s Chinese
activities continued in 2018 and resulted in the
disposal of two minor entities (2017: five) with
brewing activities.
In 2017, the Group also disposed of the
subsidiaries Nordic Getränke in Germany and
Carlsberg Uzbekistan as well as minor
investments in associates in Romania, Russia
and Sweden.
The disposals completed in both 2018 and
2017 were part of the structural changes under
the Funding the Journey programme and all
related to non-core assets.
Elements of cash consideration paid
and received
DKK million 2018 2017
Cash consideration
received/paid, subsidiaries,
net -1,327 270
Cash consideration
received/paid, associates -1,491 242
Cash and cash equivalents
acquired/disposed of 353 -2
Total cash consideration
received/paid, net -2,465 510
- of which consideration
paid for entities acquired -1,349 -
- of which consideration
received for entities disposed 46 519
Acquisition of associates is described in
section 5.4.

CARLSBERG GROUP ANNUAL REPORT 2018 CONSOLIDATED FINANCIAL STATEMENTS 101
SECTION 5.2 (CONTINUED)
ACQUISITIONS AND DISPOSALS
ACCOUNTING ESTIMATES AND JUDGEMENTS
Assessment of control
The classification of entities where Carlsberg controls
less than 100% of the voting rights is based on an
assessment of the contractual and operational
relationship between the parties. This includes
assessing the conditions in shareholder agreements,
contracts etc. Consideration is also given to the extent
to which each party can govern the financial and
operating policies of the entity, how the operation of
the entity is designed, and which party possesses the
relevant knowledge and competences to operate the
entity.
Another factor relevant to this assessment is the
extent to which each of the parties can direct the
activities and affect the returns, for example by
means of rights, exclusively reserved matters or
casting votes.
Remeasurement of shareholding held
before a step acquisition
The fair value of the shareholding already held before
the acquisition is measured as the net present value
of expected future cash flows (value in use). The
expected cash flows are based on budgets and
business plans for the next three years and
projections for subsequent years as well as
management’s expectations for the future
development following gain of control of the entity.
Key parameters are revenue growth, operating
margin, future capital expenditure and growth
expectations beyond the next three years. As the risk
associated with the timing and amount of cash flows
is not included in the forecast cash flows for newly
acquired entities, the forecast future cash flows are
discounted using a weighted average cost of capital
(WACC) of 12% and a residual growth rate of 4%.
Purchase price allocation
For acquisitions of entities, the assets, liabilities and
contingent liabilities of the acquiree are recognised
using the acquisition method. The most significant
assets acquired generally comprise goodwill, brands,
property, plant and equipment, receivables and
inventories.
No active market exists for the majority of the
acquired assets and liabilities, in particular in respect
of acquired intangible assets. Accordingly,
management makes estimates of the fair value of
acquired assets, liabilities and contingent liabilities.
Depending on the nature of the item, the determined
fair value of an item may be associated with
uncertainty and possibly adjusted subsequently.
The unallocated purchase price (positive amount) is
recognised in the statement of financial position as
goodwill and allocated to the Group’s cash-
generating units. Management makes estimates of
the acquired cash-generating units, the cash-
generating units that already exist in the Group and
the allocation of goodwill, cf. section 2.2.1.
Brands
The value of the brands acquired and their expected
useful life are assessed based on the brands’ market
position, expected long-term developments in the
relevant markets and profitability. The estimated
value of acquired brands includes all future cash flows
associated with the brands, including the related
value of customer relations etc.
Management determines the useful life for each
brand based on its relative local, regional and global
market strength, market share, and the current and
planned marketing efforts that are helping to
maintain and increase the value of the brand. When
the value of a well-established brand is expected to
be maintained for an indefinite period in the relevant
markets, and these markets are expected to be
profitable for a long period, the useful life of the
brand is determined to be indefinite.
For each brand or group of brands, measurement is
based on the relief from royalty method, under which
the value is calculated from expected future cash
flows for the brands. The cash flows are calculated
on the basis of key assumptions about expected
useful life, royalty rate, growth rate and a
theoretically calculated tax effect. A post-tax
discount rate is used that reflects the risk-free
interest rate with the addition of a risk premium
associated with the particular brand. The model and
assumptions applied are consistent with those used in
impairment testing, and are described in further detail
in section 2.2.3.
Customer agreements and portfolios
In business combinations, the value of acquired
customer agreements and customer portfolios is
assessed based on the local market and trading
conditions. For most entities acquired, there is a close
relationship between brands and sales. Consumer
demand for beer and other beverages drives sales,
and therefore the value of a brand is closely linked to
consumer demand, while there is no separate value
attached to customers (shops, bars etc.), as their
choice of products is driven by consumer demand.
The relationship between brands and customers is
carefully considered so that brands and customer
agreements are not both recognised on the basis of
the same underlying cash flows.
Property, plant and equipment
In business combinations, the fair value of land and
buildings, and standard production and office
equipment is based, as far as possible, on the fair
value of assets of similar type and condition that may
be bought and sold in the open market.
Property, plant and equipment for which there is no
reliable evidence of the fair value in the market (in
particular breweries, including production equipment)
are valued using the depreciated replacement
cost method.
This method is based on the replacement cost of a
similar asset with similar functionality and capacity.
The calculated replacement cost for each asset is
then reduced to reflect functional and physical
obsolescence. The expected synergies and the user-
specific intentions for the expected use of assets are
not included in the determination of the fair value.
Acquisition of Cambrew Group
Purchase price allocation
Management believes that the purchase price for
Cambrew Group accounted for in the consolidated
financial statements reflects the best estimate of the
total fair value of the business and the proportionate
value of identified assets, liabilities and contingent
liabilities of the non-controlling interests, and
accordingly the allocation of goodwill. The goodwill is
not deductible for tax purposes.
Customer agreements and portfolios
No customer relationships were recognised in the
purchase price allocation for Cambrew Group.
Property, plant and equipment
The fair value and expected useful life of brewery
equipment and related buildings in the acquisition of
Cambrew Group has been estimated with assistance
from leading external engineering experts in the
brewery industry.
Receivables
Receivables consist primarily of trade receivables and
are recognised at the amount that is expected to be
collected.
Liabilities and contingent liabilities
Potential liabilities related to tax, duties, VAT and
other disputes and lawsuits were identified and
measured. Potential legal cases were evaluated and
provisions recognised based on the expected outcome
of any identified potential claim.
Financial impact of acquisition
Revenue and net profit included in the consolidated
financial statements since the acquisition was DKK
0.4bn and DKK -0.1bn respectively. Had Cambrew
been consolidated on 1 January 2018, the figures for
consolidated revenue and net profit would have been
1.0bn and DKK -0.1bn respectively.
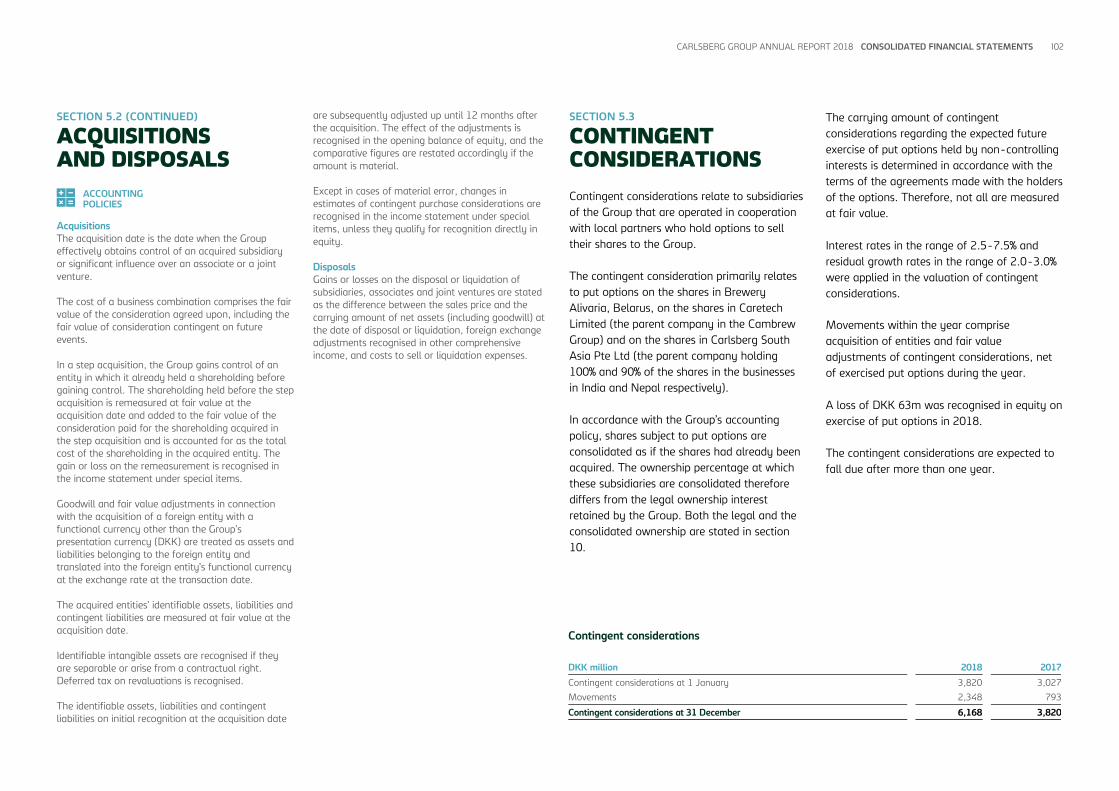
CARLSBERG GROUP ANNUAL REPORT 2018 CONSOLIDATED FINANCIAL STATEMENTS 102
SECTION 5.2 (CONTINUED)
ACQUISITIONS AND DISPOSALS
ACCOUNTING POLICIES
Acquisitions
The acquisition date is the date when the Group
effectively obtains control of an acquired subsidiary
or significant influence over an associate or a joint
venture.
The cost of a business combination comprises the fair
value of the consideration agreed upon, including the
fair value of consideration contingent on future
events.
In a step acquisition, the Group gains control of an
entity in which it already held a shareholding before
gaining control. The shareholding held before the step
acquisition is remeasured at fair value at the
acquisition date and added to the fair value of the
consideration paid for the shareholding acquired in
the step acquisition and is accounted for as the total
cost of the shareholding in the acquired entity. The
gain or loss on the remeasurement is recognised in
the income statement under special items.
Goodwill and fair value adjustments in connection
with the acquisition of a foreign entity with a
functional currency other than the Group’s
presentation currency (DKK) are treated as assets and
liabilities belonging to the foreign entity and
translated into the foreign entity’s functional currency
at the exchange rate at the transaction date.
The acquired entities’ identifiable assets, liabilities and
contingent liabilities are measured at fair value at the
acquisition date.
Identifiable intangible assets are recognised if they
are separable or arise from a contractual right.
Deferred tax on revaluations is recognised.
The identifiable assets, liabilities and contingent
liabilities on initial recognition at the acquisition date
are subsequently adjusted up until 12 months after
the acquisition. The effect of the adjustments is
recognised in the opening balance of equity, and the
comparative figures are restated accordingly if the
amount is material.
Except in cases of material error, changes in
estimates of contingent purchase considerations are
recognised in the income statement under special
items, unless they qualify for recognition directly in
equity.
Disposals
Gains or losses on the disposal or liquidation of
subsidiaries, associates and joint ventures are stated
as the difference between the sales price and the
carrying amount of net assets (including goodwill) at
the date of disposal or liquidation, foreign exchange
adjustments recognised in other comprehensive
income, and costs to sell or liquidation expenses.
SECTION 5.3
CONTINGENT CONSIDERATIONS
Contingent considerations relate to subsidiaries
of the Group that are operated in cooperation
with local partners who hold options to sell
their shares to the Group.
The contingent consideration primarily relates
to put options on the shares in Brewery
Alivaria, Belarus, on the shares in Caretech
Limited (the parent company in the Cambrew
Group) and on the shares in Carlsberg South
Asia Pte Ltd (the parent company holding
100% and 90% of the shares in the businesses
in India and Nepal respectively).
In accordance with the Group’s accounting
policy, shares subject to put options are
consolidated as if the shares had already been
acquired. The ownership percentage at which
these subsidiaries are consolidated therefore
differs from the legal ownership interest
retained by the Group. Both the legal and the
consolidated ownership are stated in section
10.
The carrying amount of contingent
considerations regarding the expected future
exercise of put options held by non-controlling
interests is determined in accordance with the
terms of the agreements made with the holders
of the options. Therefore, not all are measured
at fair value.
Interest rates in the range of 2.5-7.5% and
residual growth rates in the range of 2.0-3.0%
were applied in the valuation of contingent
considerations.
Movements within the year comprise
acquisition of entities and fair value
adjustments of contingent considerations, net
of exercised put options during the year.
A loss of DKK 63m was recognised in equity on
exercise of put options in 2018.
The contingent considerations are expected to
fall due after more than one year.
Contingent considerations
DKK million 2018 2017
Contingent considerations at 1 January 3,820 3,027
Movements 2,348 793
Contingent considerations at 31 December 6,168 3,820

CARLSBERG GROUP ANNUAL REPORT 2018 CONSOLIDATED FINANCIAL STATEMENTS 103
SECTION 5.3 (CONTINUED)
CONTINGENT CONSIDERATIONS
ACCOUNTING ESTIMATES AND JUDGEMENTS
The fair value of contingent considerations is
calculated on the basis of level 3 input consisting of
non-observable data, such as entity-specific discount
rates and industry-specific expectations of price
developments, and generally accepted valuation
methods, including discounted cash flows and
multiples.
Estimates are based on updated information since
initial recognition of the contingent consideration,
including new budgets and sales forecasts, discount
rates etc. The assumptions applied are in line with
those used in the impairment tests as described in
section 2.2, but reflecting the different models and
valuation techniques needed.
ACCOUNTING POLICIES
On acquisition of non-controlling interests, i.e.
subsequent to the Group obtaining control, acquired
net assets are not measured at fair value. The
difference between the cost and the non-controlling
interests’ share of the total carrying amount, including
goodwill, is transferred from the non-controlling
interests’ share of equity to equity attributable to
shareholders in Carlsberg A/S. The amount deducted
cannot exceed the non-controlling interests’ share of
equity immediately before the transaction.
On disposal of shareholdings to non-controlling
interests, the difference between the sales price and
the share of the total carrying amount, including
goodwill acquired by the non-controlling interests, is
transferred from equity attributable to shareholders in
Carlsberg A/S to the non-controlling interests’ share
of equity.
Fair value adjustments of put options granted to non-
controlling interests are recognised directly in the
statement of changes in equity.
SECTION 5.4
ASSOCIATES AND JOINT VENTURES
The decline in profit from associates is primarily
related to poor performance in Myanmar, and
in Cambodia prior to the acquisition.
Investments in associates and joint ventures
include the businesses in Portugal (60%),
Myanmar (51%) and five associates in China
(each 50%). The total investment in these
associates amounted to DKK 2,612m at 31
December 2018.
Investments in associates and joint ventures
increased compared with 2017, primarily due
to the acquisition of 28.5% of the shares in
Viacer (Portugal), the controlling shareholder
of Super Bock Group. The acquisition did not
result in the Group gaining control of Super
Bock Group, which remains an associate.
Following the transaction, the Carlsberg
Group’s direct and indirect ownership share in
Super Bock Group is 60%.
The increase was partially offset by the
acquisition of an additional 25% of the shares in
Cambrew Group (Cambodia), increasing our
ownership share to 75%. Following this, the
Group now exercises management control of
the business, and it has been fully consolidated
since 1 August 2018.
Despite the legal 51% ownership share in
Myanmar Carlsberg, the entity is classified as
an associate due to the shareholders’
agreement with the partner.
For associates in which the Group holds an
ownership interest of less than 20%, the Group
participates in the management of the
company and is therefore exercising significant
influence.
Fair value of investment in listed associates
DKK million 2018 2017
The Lion Brewery
Ceylon, Sri Lanka 406 442
None of the associates and joint ventures are
material to the Group.
CONTINGENT LIABILITIES
The Group did not issue any guarantees for
loans etc. raised by associates and joint
ventures in 2018 or 2017.
ACCOUNTING POLICIES
Investments in associates and joint ventures are
recognised according to the equity method, which
entails measurement at cost and adjustment for the
Group’s share of the profit or loss and other
comprehensive income of the associate after the date
of acquisition, calculated in accordance with the
Group’s accounting policies. The proportionate share
of unrealised intra-group profits and losses is
eliminated. Investments in associates and joint
ventures with negative net asset values are measured
at DKK 0.
If the Group has a legal or constructive obligation to
cover a deficit in the associate or joint venture, the
deficit is recognised under provisions. Any amounts
owed by associates and joint ventures are written
down to the extent that the amount owed is deemed
irrecoverable.
Key figures for associates and joint ventures
DKK million Carlsberg Group share
2018
Profit
after tax
Other
comprehensive
income
Total
comprehensive
income
Investments in
associates and
joint ventures
Associates 131 4 135 4,564
Joint ventures -1 - -1 -2
Total 130 4 134 4,562
2017
Associates 252 -12 240 3,200
Joint ventures 10 - 10 1,066
Total 262 -12 250 4,266
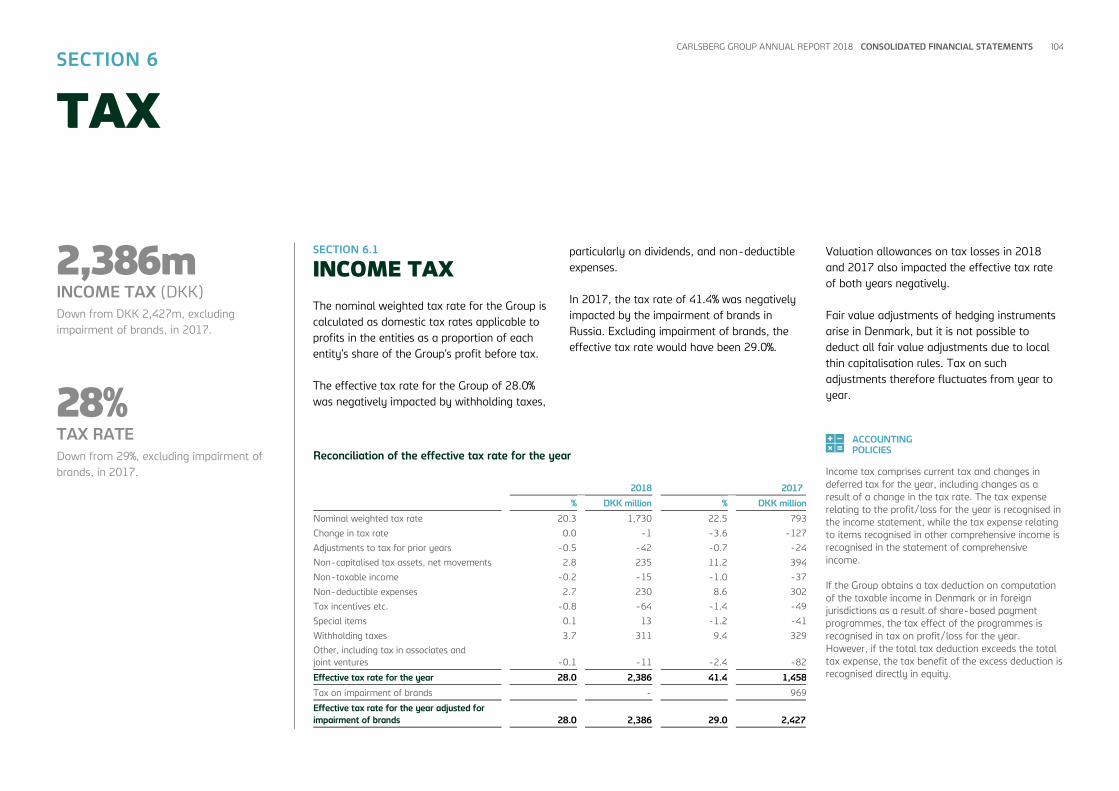
CARLSBERG GROUP ANNUAL REPORT 2018 CONSOLIDATED FINANCIAL STATEMENTS 104
2,386m INCOME TAX (DKK)
Down from DKK 2,427m, excluding
impairment of brands, in 2017.
28% TAX RATE
Down from 29%, excluding impairment of
brands, in 2017.
SECTION 6.1
INCOME TAX
The nominal weighted tax rate for the Group is
calculated as domestic tax rates applicable to
profits in the entities as a proportion of each
entity’s share of the Group’s profit before tax.
The effective tax rate for the Group of 28.0%
was negatively impacted by withholding taxes,
particularly on dividends, and non-deductible
expenses.
In 2017, the tax rate of 41.4% was negatively
impacted by the impairment of brands in
Russia. Excluding impairment of brands, the
effective tax rate would have been 29.0%.
Valuation allowances on tax losses in 2018
and 2017 also impacted the effective tax rate
of both years negatively.
Fair value adjustments of hedging instruments
arise in Denmark, but it is not possible to
deduct all fair value adjustments due to local
thin capitalisation rules. Tax on such
adjustments therefore fluctuates from year to
year.
ACCOUNTING POLICIES
Income tax comprises current tax and changes in
deferred tax for the year, including changes as a
result of a change in the tax rate. The tax expense
relating to the profit/loss for the year is recognised in
the income statement, while the tax expense relating
to items recognised in other comprehensive income is
recognised in the statement of comprehensive
income.
If the Group obtains a tax deduction on computation
of the taxable income in Denmark or in foreign
jurisdictions as a result of share-based payment
programmes, the tax effect of the programmes is
recognised in tax on profit/loss for the year.
However, if the total tax deduction exceeds the total
tax expense, the tax benefit of the excess deduction is
recognised directly in equity.
SECTION 6
TAX
Reconciliation of the effective tax rate for the year
2018 2017
% DKK million % DKK million
Nominal weighted tax rate 20.3 1,730 22.5 793
Change in tax rate 0.0 -1 -3.6 -127
Adjustments to tax for prior years -0.5 -42 -0.7 -24
Non-capitalised tax assets, net movements 2.8 235 11.2 394
Non-taxable income -0.2 -15 -1.0 -37
Non-deductible expenses 2.7 230 8.6 302
Tax incentives etc. -0.8 -64 -1.4 -49
Special items 0.1 13 -1.2 -41
Withholding taxes 3.7 311 9.4 329
Other, including tax in associates and
joint ventures -0.1 -11 -2.4 -82
Effective tax rate for the year 28.0 2,386 41.4 1,458
Tax on impairment of brands - 969
Effective tax rate for the year adjusted for
impairment of brands 28.0 2,386 29.0 2,427

CARLSBERG GROUP ANNUAL REPORT 2018 CONSOLIDATED FINANCIAL STATEMENTS 105
SECTION 6.1 (CONTINUED)
INCOME TAX
SECTION 6.2
DEFERRED TAX
Of the total deferred tax assets recognised,
DKK 506m (2017: DKK 531m) related to tax
loss carryforwards, the utilisation of which
depends on future positive taxable income
exceeding the realised deferred tax liabilities. It
is management’s opinion that these tax loss
carryforwards can be utilised.
Tax assets not recognised of DKK 1,370m
(2017: DKK 1,411m) primarily related to tax
losses that are not expected to be utilised in
the foreseeable future. Tax losses that will not
expire amounted to DKK 839m (2017: DKK
776m). Tax losses expiring within five years
amounted to DKK 531m (2017: DKK 527m).
Tax losses expiring after more than five years
amounted to DKK 0m (2017: DKK 108m).
Deferred tax of DKK 94m (2017: DKK 115m)
was recognised in respect of earnings in entities
in the Eastern Europe region that are intended
for distribution in the short term, as tax of 5% is
payable on distributions.
For other subsidiaries where reserves are
planned to be distributed, any distribution of
earnings will not trigger a significant tax
liability based on current tax legislation.
Deferred tax on temporary differences relating
to investments in subsidiaries, associates and
joint ventures amounted to DKK 0m (2017: DKK
0m).
Income tax expenses
2018 2017
DKK million
Income
statement
Other
comprehensive
income
Total
comprehensive
income
Income
statement
Other
comprehensive
income
Total
comprehensive
income
Tax for the year can be specified as follows
Current tax 2,356 -2 2,354 2,319 -36 2,283
Change in deferred tax during the year 73 -50 23 -710 152 -558
Change in deferred tax as a result of change in tax rate -1 - -1 -127 - -127
Adjustments to tax for prior years -42 - -42 -24 - -24
Total 2,386 -52 2,334 1,458 116 1,574
Tax recognised in other comprehensive income
2018 2017
DKK million
Recognised
item
before tax
Tax
income/
expense After tax
Recognised
item
before tax
Tax
income/
expense After tax
Foreign exchange adjustments 2,754 - 2,754 3,842 - 3,842
Hedging instruments 640 -85 555 305 -25 280
Retirement benefit obligations -392 33 -359 -1,266 138 -1,128
Share of other comprehensive income in associates and joint ventures -4 - -4 12 - 12
Other - - - - 3 3
Total 2,998 -52 2,946 2,893 116 3,009

CARLSBERG GROUP ANNUAL REPORT 2018 CONSOLIDATED FINANCIAL STATEMENTS 106
SECTION 6.2 (CONTINUED)
DEFERRED TAX
ACCOUNTING ESTIMATES AND JUDGEMENTS
The Group recognises deferred tax assets, including
the expected tax value of tax loss carryforwards, if
management assesses that these tax assets can be
offset against positive taxable income in the
foreseeable future. This judgement is made annually
and based on budgets and business plans for the
coming years, including planned commercial
initiatives.
Carlsberg operates in a large number of tax
jurisdictions where tax legislation is highly complex
and subject to interpretation. Management makes
judgements on uncertain tax positions to ensure
recognition and measurement of tax assets and
liabilities.
ACCOUNTING POLICIES
Current tax payable and receivable are recognised in
the statement of financial position as tax computed
on the taxable income for the year, adjusted for tax
on the taxable income of prior years and for tax paid
on account.
Deferred tax on all temporary differences between
the carrying amount and the tax base of assets and
liabilities is measured using the balance sheet liability
method. However, deferred tax is not recognised on
temporary differences relating to goodwill that is not
deductible for tax purposes or on office premises and
other items where temporary differences, apart from
business combinations, arise at the acquisition date
without affecting either profit/loss for the year or
taxable income. Where alternative tax rules can be
applied to determine the tax base, deferred tax is
measured based on management’s planned use of
the asset or settlement of the liability.
If specific dividend plans exist for subsidiaries,
associates and joint ventures in countries levying
withholding tax on distributions, deferred tax is
recognised on expected dividend payments.
Deferred tax assets related to tax loss carryforwards
are recognised under other non-current assets at the
expected value of their utilisation, either as a set-off
against tax on future income or as a set-off against
deferred tax liabilities in the same legal tax entity and
jurisdiction.
Deferred tax assets and tax liabilities are offset if the
entity has a legally enforceable right to offset current
tax liabilities and tax assets or intends either to settle
current tax liabilities and tax assets or to realise the
assets and settle the liabilities simultaneously.
Deferred tax assets are subject to annual impairment
tests and are recognised only to the extent that it is
probable that the assets will be utilised.
Deferred tax is measured according to the tax rules
and at the tax rates applicable in the respective
countries at the reporting date and when the deferred
tax is expected to materialise as current tax. The
change in deferred tax as a result of changes in tax
rates is recognised in the income statement. Changes
to deferred tax on items recognised in other
comprehensive income are, however, recognised in
other comprehensive income.
Specification of deferred tax
Deferred tax assets Deferred tax liabilities
DKK million 2018 2017 2018 2017
Intangible assets 358 1,107 3,413 4,736
Property, plant and equipment 343 528 1,861 1,727
Current assets 316 176 25 30
Provisions and retirement benefit obligations 1,217 1,094 8 30
Fair value adjustments 155 144 48 5
Tax losses etc. 1,037 1,233 2,037 1,692
Total before offset 3,426 4,282 7,392 8,220
Offset -1,733 -2,619 -1,733 -2,619
Deferred tax assets and liabilities at 31 December 1,693 1,663 5,659 5,601
Expected to be used as follows
Within one year 643 250 1,731 1,850
After more than one year 1,050 1,413 3,928 3,751
Total 1,693 1,663 5,659 5,601
Deferred tax
DKK million 2018 2017
Deferred tax at 1 January, net 3,938 4,640
Adjustments to prior years -7 12
Acquisition and disposal of entities 129 5
Recognised in other comprehensive income -50 152
Recognised in the income statement 73 -710
Change in tax rate -1 -127
Foreign exchange adjustments -116 -34
Deferred tax at 31 December, net 3,966 3,938
Recognised as follows
Deferred tax liabilities 5,659 5,601
Deferred tax assets -1,693 -1,663
Deferred tax at 31 December, net 3,966 3,938

CARLSBERG GROUP ANNUAL REPORT 2018 CONSOLIDATED FINANCIAL STATEMENTS 107
Pensions Defined benefit obligations were affected
by increased interest in the UK, the
implementation of risk-sharing in
Switzerland and by a UK High Court ruling
on equalisation of pension plans.
Remuneration A new share-based incentive programme,
Fund & Grow, was set up to improve
alignment between the interests of the
top-200 management team and the
shareholders.
Employees
By region (%)
By function (%)
SECTION 7.1
STAFF COSTS
The average number of employees decreased
during 2018 due to ongoing restructuring projects
in the UK and the outsourcing of brand
ambassadors in Vietnam. The reduction was
offset by the acquisition of Cambrew, but this did
not have a full-year effect on the 2018 average,
as the acquisition was completed in August. Staff
costs increased for several entities due to higher
performance-related payouts, but this was offset
by savings generated by restructuring projects.
Western Europe 29%
Asia 38%
Eastern Europe 30%
Other 3%
2018
(2017)
(31%)
(29%)
(38%)
(2%)
Production 33%
Distribution 16%
Sales & Marketing 41%
Administration 10%
2018
(2017)
(32%)(17%)
(41%)
(10%)
SECTION 7
STAFF COSTS AND REMUNERATION
Staff costs
DKK million 2018 2017
Salaries and other remuneration 8,491 7,980
Severance payments 75 415
Social security costs 1,294 1,321
Retirement benefit costs – defined contribution plans 286 275
Retirement benefit costs – defined benefit plans 203 219
Share-based payments 174 33
Other employee benefits 91 97
Total 10,614 10,340
Average number of employees 40,837 41,430
Staff costs are included in the following line items in the income statement
Cost of sales 2,720 2,653
Sales and distribution expenses 5,348 5,391
Administrative expenses 2,433 2,098
Other operating activities, net 54 57
Financial expenses (Pensions) 23 -
Special items (Restructurings) 36 141
Total 10,614 10,340

CARLSBERG GROUP ANNUAL REPORT 2018 CONSOLIDATED FINANCIAL STATEMENTS 108
SECTION 7.2
REMUNERATION
The remuneration of the Supervisory Board,
the executive directors and key management
personnel is described in detail in the
Remuneration report in the Management
review.
The remuneration of key management
personnel decreased in 2018 as a result of
fewer full-year members of the Executive
Committee and severance payments in 2017.
Key management personnel comprise the
Executive Committee, excluding the executive
directors. Other management personnel
included in the share-based payment schemes
comprise Vice Presidents and other key
employees in central functions as well as the
management of significant subsidiaries.
In 2018, the Supervisory Board received total
remuneration of DKK 9.35m (2017: DKK
9.58m), comprising fixed salary only.
ACCOUNTING POLICIES
Staff costs are recognised in the financial year in
which the employee renders the related service. The
cost of share-based payments, which is expensed
over the vesting period of the programme according
to the service conditions, is recognised in staff costs
and provisions or equity, depending on how the
programme is settled with the employees.
Remuneration
Executive directors
Key management
personnel
Cees 't Hart Heine Dalsgaard
DKK million 2018 2017 2016 2018 2017 2016 2018 2017
Fixed salary 12.3 12.0 12.0 7.4 7.3 4.2 25.3 30.7
Cash bonus 12.3 9.3 10.0 7.4 5.6 7.3 18.5 12.2
Other benefits 1.1 1.2 1.2 - - - 4.0 6.6
Special bonus¹ - - - - 3.1 11.9 - -
Funding the Journey cash plan - - - - - - - 10.9
Severance payments - - - - - - - 15.3
Remuneration settled in cash 25.7 22.5 23.2 14.8 16.0 23.4 47.8 75.7
Non-monetary benefits 0.1 0.1 0.1 0.3 0.3 0.2 0.5 2.6
Share-based payments² 26.7 20.6 12.8 13.3 9.0 1.9 18.8 0.7
Remuneration settled non-cash 26.8 20.7 12.9 13.6 9.3 2.1 19.3 3.3
Total 52.5 43.2 36.1 28.4 25.3 25.5 67.1 79.0
¹ Special bonus covered remuneration waived from previous employer, in total DKK 15m, paid out in 2016 and 2017.
² The amount of remuneration in the form of share-based payments in the table does not reflect the value of shares transferred to or cash equivalents received by the executive
director during the year. The amount reflects only the technical accounting charge to the income statement required by IFRS.

CARLSBERG GROUP ANNUAL REPORT 2018 CONSOLIDATED FINANCIAL STATEMENTS 109
SECTION 7.3
SHARE-BASED PAYMENTS
The Group has set up share-based incentive
programmes to attract, retain and motivate the
Group’s executive directors and other levels of
management personnel, and to align their
interests with those of the shareholders. No
share-based incentive programme has been set
up for Carlsberg A/S’ Supervisory Board.
The Group has two forms of share-based
payment: share options and performance
shares. Share options entitle the holder to
purchase class B shares in Carlsberg A/S at a
predetermined price after completing three
years of service and are exercisable for five
years. Entitlement to performance shares also
requires fulfilment of service in the vesting
period (2-3 years), but does not have any
exercise price.
Instead, the shares are transferred to the
recipients based on the achievement of the
KPIs attached to the shares. Performance
shares have been awarded under three
programmes that differ in terms of KPI
structure and vesting period.
PERFORMANCE SHARES
The number of performance shares granted is
the maximum number of performance shares
that can vest. The number of shares
outstanding at the end of the period is the
estimated number of shares expected to vest,
based on an assessment of the extent to which
the vesting conditions are expected to be met.
The number of shares expected to vest is
revised on a regular basis until vesting.
Regular performance shares
In 2018, 206 employees (2017: 2 employees)
across the Group were awarded performance
shares.
Vesting is subject to achievement of the four
KPIs: total shareholder return, adjusted EPS
growth, organic net revenue growth and
growth in ROIC. The average share price at
transfer was DKK 748 (2017: DKK 616). The
average contractual life at the end of 2018 was
1.7 years (2017: 0.8 years).
Fund & grow performance shares
In 2018, the Fund & Grow performance share
programme was set up to align the initiatives
driven by Group management in the growth
phase of our SAIL’22 strategy, which is aimed
at top- and bottom-line growth, with the
interests of our shareholders. Shares were
granted to 204 employees across the Group,
not including the executive directors. Vesting is
subject to achievement of two KPIs, organic
growth in net revenue and in operating profit,
in the two-year vesting period of the
programme. The average contractual life at the
end of 2018 was 1.1 years.
Funding the Journey performance shares
Funding the Journey performance shares were
granted to the executive directors in 2016 only.
The average contractual life at the end of 2018
was 0.2 years (2017: 1.2 years).
In a separate long-term incentive programme
based on Funding the Journey performance,
the top-60 leadership team of the Group’s
other management personnel received a cash
bonus equivalent to 120% of one year’s base
salary. Another 140 employees in this category
received a cash bonus equivalent to 60% of one
year’s base salary. The total bonus payment
amounted to DKK 250m. The executive
directors did not participate in the cash
programme.
Key information
Regular
performance shares
Fund & Grow
performance
shares
2018 2017 2018
Assumptions
Expected volatility 20.7% 22% N/A
Risk-free interest rate 0.0% 0.0% 0.0%
Expected dividend yield 2.2% 1.6% 2.2%
Expected life of options, years 3.0 3.0 2.0
Fair value at measurement date DKK 610-642 DKK 524 DKK 684
Performance shares
Executive
directors
Key
management
personnel
Other
management
personnel Total
31 December 2016 62,321 14,616 191,081 268,018
Granted 74,877 - - 74,877
Forfeited/adjusted - -4,783 -33,648 -38,431
Exercised/settled - -810 -10,053 -10,863
31 December 2017 137,198 9,023 147,380 293,601
Granted 66,286 88,919 556,614 711,819
Forfeited/adjusted - -2,578 -91,361 -93,939
Exercised/settled - -6,445 -98,972 -105,417
31 December 2018 203,484 88,919 513,661 806,064
Performance shares disclosures
Regular Fund & Grow Funding the Journey
DKK million 2018 2017 2018 2017 2018 2017
Fair value at grant date 172 39 294 - - -
Cost of shares granted in the year 46 10 120 - - -
Total cost of performance shares 42 19 120 - 8 8
Cost not yet recognised 120 38 154 - - 8
Fair value at 31 December 185 171 270 - 26 27

CARLSBERG GROUP ANNUAL REPORT 2018 CONSOLIDATED FINANCIAL STATEMENTS 110
SECTION 7.3 (CONTINUED)
SHARE-BASED PAYMENTS
SHARE OPTIONS
No share options have been granted since
2016. The outstanding options are all
exercisable at the end of the reporting period
(2017: 16,289). The average contractual life
was 4.6 years (2017: 4.9 years). The average
share price at exercise was DKK 766 (2017:
DKK 701).
Share option disclosures
Share options
DKK million 2018 2017
Cost of share options 4 7
Cost not yet recognised - 4
Fair value at 31 December 20 63
ACCOUNTING ESTIMATES AND JUDGEMENTS
The volatility of performance shares is based on the
historical volatility of the price of Carlsberg A/S’ class
B shares over the previous three years. For share
options, the volatility is based on similar data over
the previous eight years.
The share price and the exercise price of share
options are calculated as the average price of
Carlsberg A/S’ class B shares on Nasdaq Copenhagen
during the first five trading days after publication of
Carlsberg A/S’ financial statements.
The risk-free interest rate is based on Danish
government bonds of the relevant maturity. The
expected life is based on exercise at the end of the
exercise period.
ACCOUNTING POLICIES
The fair value of granted performance shares is
estimated using a stochastic (quasi-Monte Carlo)
valuation model and a Black-Scholes call option-
pricing model, taking into account the terms and
conditions upon which the performance shares were
granted.
On initial recognition of performance shares, an
estimate is made of the number of awards expected
to vest and subsequently revised for any changes.
Accordingly, recognition is based on the number of
awards that ultimately vest.
Share options Exercise price Number
Fixed,
weighted
average
Executive
directors
Other
management
personnel Total
31 December 2016 249 114,984 357,043 472,027
Forfeited 204 - -1,599 -1,599
Exercised 536 - -205,600 -205,600
31 December 2017 523 114,984 149,844 264,828
Forfeited 417 - -2,825 -2,825
Exercised 529 - -147,019 -147,019
31 December 2018 518 114,984 - 114,984

CARLSBERG GROUP ANNUAL REPORT 2018 CONSOLIDATED FINANCIAL STATEMENTS 111
SECTION 7.4
RETIREMENT BENEFIT OBLIGATIONS AND SIMILAR OBLIGATIONS
A number of the Group’s employees are
covered by retirement benefit plans. The nature
of the retirement benefit plans varies
depending on labour market conditions in the
individual countries. Benefits are generally
based on wages and salaries and length of
employment.
Retirement benefit obligations cover both
present and future retirees’ entitlement to
retirement benefits.
DEFINED CONTRIBUTION PLANS
A defined contribution plan is a post-
employment benefit plan under which the
Group pays fixed contributions into a separate
independent company. The Group’s legal or
constructive obligation is limited to the
contributions.
58% (2017: 56%) of the Group’s retirement
benefit costs relates to defined contribution
plans. In 2018, the expense recognised in
relation to these contributions was DKK 286m
(2017: DKK 275m).
DEFINED BENEFIT PLANS
The defined benefit plans guarantee employees
a certain level of pension benefits for life based
on seniority and the salary at the time of
retirement. The Group assumes the risk
associated with future developments in interest
rates, inflation, mortality and disability etc.
The majority of the obligations are funded,
with assets placed in independent pension
funds, mainly in Switzerland and the UK. In
some countries, primarily Germany, Sweden
and China, the obligation is unfunded. For
these unfunded plans, the retirement benefit
obligations amounted to DKK 1,873m (2017:
DKK 1,820m) or 15% (2017: 14%) of the gross
obligation.
In 2018, the Group’s defined benefit plans
decreased by DKK 443m compared with 2017.
The net obligation was impacted by a decrease
following the implementation of risk-sharing
methodology in Switzerland in December 2017
and gains on actuarial assumptions in the UK,
which had a combined impact of around DKK
-500m.
On 26 October 2018, the UK High Court ruled
that a practice that allowed pension savings for
men and women to rise at different rates was
discriminatory. The High Court ordered this
practice to be ended and the historical
inequality to be put right. The High Court
Judgment concluded that trustees are under a
duty to amend pension schemes to the effect
that the guaranteed minimum pension benefits
are equal for men and women. The ruling has
increased the pension obligation in the UK by
DKK 40m in 2018, equivalent to 0.7% of the
gross obligation in the UK scheme.
Although the introduction of guaranteed
minimum pension benefits impacted the UK
pensions negatively, the position at year-end
had improved compared with the position in
2017. This was due to more favourable
financial conditions, in particular a rise in the
discount rate, which led to a total decrease in
the net obligation of DKK -447m.
Obligation, net
2018 2017
DKK million
Present
value of
obligation
Fair value
of plan
assets
Obligation,
net
Present
value of
obligation
Fair value
of plan
assets
Obligation,
net
Obligation at 1 January 13,069 9,718 3,351 14,813 9,935 4,878
Recognised in the income
statement
Current service cost 194 - 194 253 - 253
Past service cost 9 - 9 -38 - -38
Net interest on the net defined
benefit obligation (asset) 232 155 77 250 152 98
Curtailments and settlements - - - 4 - 4
Total 435 155 280 469 152 317
Remeasurements
Gain/loss from changes in
demographic assumptions -203 - -203 -330 1 -331
Gain/loss from changes in financial
assumptions -561 -312 -249 -377 558 -935
Asset ceiling - -60 -60 - - -
Total -764 -372 -392 -707 559 -1,266
Other changes
Contributions to plans - 215 -215 - 209 -209
Benefits paid -633 -522 -111 -692 -570 -122
Acquisition and disposal of entities,
net 3 - 3 -3 - -3
Transfers 7 - 7 -17 1 -18
Foreign exchange adjustments etc. 122 137 -15 -794 -568 -226
Obligation at 31 December 12,239 9,331 2,908 13,069 9,718 3,351
The total return on plan assets for the year amounted to DKK -157m (2017: DKK 711m).

CARLSBERG GROUP ANNUAL REPORT 2018 CONSOLIDATED FINANCIAL STATEMENTS 112
SECTION 7.4 (CONTINUED) RETIREMENT BENEFIT OBLIGATIONS AND SIMILAR OBLIGATIONS The Group expects to contribute DKK 76m
(2017: DKK 76m) to the plan assets in 2019.
Plan assets do not include shares in or
properties used by Group companies.
Net actuarial gain and foreign exchange
adjustment recognised in other comprehensive
income for 2018 was DKK 392m (2017: DKK
1,504m), which included the asset ceiling in the
UK of DKK 60m.
The accumulated actuarial loss and foreign
exchange adjustment recognised at 31
December 2018 was DKK 3,029m (2017: DKK
3,421m), with actuarial net losses of DKK
3,097m (2017: DKK 3,548m).
The most significant plans are in the UK and
Switzerland, representing 44% and 40%
respectively (2017: 47% and 37%), while the
eurozone countries represented 6% (2017: 6%)
of the gross obligation at 31 December 2018.
Assumptions applied
In 2018, the discount rate used for the defined
benefit plans in Western Europe was
determined by reference to market yields on
corporate bonds. In the Asian countries, where
no deep market in high-quality corporate
bonds exists, the discount rate was determined
by reference to market yields on government
bonds.
The mortality tables used in Carlsberg UK are
S2PMA/S2PFA tables for post-retirement and
AMC00/AFC00 for pre-retirement, both with
CMI_2017 projections, while the Swiss entities
use BVG 2015 GT for valuation of their
retirement obligations.
Sensitivity analysis
The sensitivity analysis is based on a change in
one of the assumptions, while all other
assumptions remain constant. This is highly
unlikely, however, as a change in one
assumption would probably affect other
assumptions as well. When calculating the
obligation on the basis of a changed
assumption, the same method has been
applied as when calculating the defined benefit
obligation.
Expected maturity and duration
Defined benefit obligations are primarily
expected to mature after five years. The
expected duration of the obligations at year-
end 2018 was 20 years. The duration is
calculated using a weighted average of the
duration divided by the obligation.
Assumptions applied
2018 CHF UK EUR Other
Weighted
average
Discount rate 0.8% 3.1% 1.1-1.8% 0.5-7.6% 2.1%
Growth in wages and salaries 1.0% 2.4% 0.0-2.7% 2.0-10.0% 2.1%
2017
Discount rate 0.6% 2.5% 0.8-1.6% 0.5-7.8% 1.8%
Growth in wages and salaries 1.0% 2.3% 0.0-2.7% 2.0-10.0% 2.1%
Breakdown of plan assets
2018 2017
DKK
million %
DKK
million %
Shares 945 10 1,241 13
Bonds and other securities 6,165 65 6,314 65
Real estate 2,117 23 2,028 21
Cash and cash equivalents 164 2 135 1
Total 9,391 100 9,718 100
Sensitivity analysis
2018 2017
DKK million +0.5% -0.5% +0.5% -0.5%
Discount rate -771 942 -972 1,155
Growth in wages and salaries 90 -61 141 -110
+1 year -1 year +1 year -1 year
Mortality 429 -403 517 -484
Maturity of retirement benefit obligations
DKK million <1 year 1-5 years >5 years Total
Retirement benefits 435 1,235 3,819 5,490
CARLSBERG GROUP ANNUAL REPORT 2018 CONSOLIDATED FINANCIAL STATEMENTS 113
SECTION 7.4 (CONTINUED)
RETIREMENT BENEFIT OBLIGATIONS AND SIMILAR OBLIGATIONS
ACCOUNTING ESTIMATES AND JUDGEMENTS
The value of the Group’s defined benefit plans is
based on valuations from external actuaries. The
valuation is based on a number of actuarial
assumptions, including discount rates, expected return
on plan assets, expected growth in wages and
salaries, mortality and retirement benefits.
The present value of the net obligation is calculated
by using the projected unit credit method and
discounting the defined benefit plan by a discount
rate for each country. The discount rate is determined
by reference to market yields on high-quality
corporate bonds. Where high-quality corporate bonds
are not available, the market yields on government
bonds are used instead.
Mortality assumptions are based on the Group
entity’s best estimate of the mortality of plan
members during and after employment, and include
expected changes in mortality. Due to the broad
range of entities comprising the retirement benefit
obligation, several different mortality tables are used
to calculate the future retirement benefit obligation.
ACCOUNTING POLICIES
Contributions paid to a defined contribution plan are
recognised in the income statement in the period
during which services are rendered by employees.
Any contributions outstanding are recognised in the
statement of financial position as other liabilities.
The Group’s net obligation recognised in the
statement of financial position in respect of defined
benefit plans is the present value of the defined
benefit obligation at the reporting date less the fair
value of plan assets calculated by a qualified actuary.
The present value is determined separately for each
plan by discounting the estimated future benefits that
employees have earned in return for their service in
the current and prior years.
The costs of a defined benefit plan are recognised in
the income statement and include service costs, net
interest based on actuarial estimates and financial
expectations at the beginning of the year.
Service costs comprise current service cost and past
service cost. Current service cost is the increase in the
present value of the defined benefit obligation
resulting from employee services in the current
period. Past service cost is the change in the present
value of the obligation regarding employee services in
prior years that arises from a plan amendment or a
curtailment. Past service costs are recognised
immediately, provided employees have already
earned the changed benefits.
Realised gains and losses on curtailment or
settlement are recognised under staff costs.
Interest on retirement benefit obligations and the
interest on return on plan assets are recognised as
financial income or financial expenses.
Differences between the development in retirement
benefit assets and liabilities and realised amounts at
year-end are designated as actuarial gains or losses
and recognised in other comprehensive income. As
they will never be reclassified to the income
statement, they are presented in retained earnings.
If a retirement benefit plan constitutes a net asset,
the asset is recognised only if it offsets future refunds
from the plan or will lead to reduced future payments
to the plan.
Realised gains and losses on the adjustment of
retirement benefit obligations as a result of
termination of a significant number of positions in
connection with restructurings are recognised under
special items.
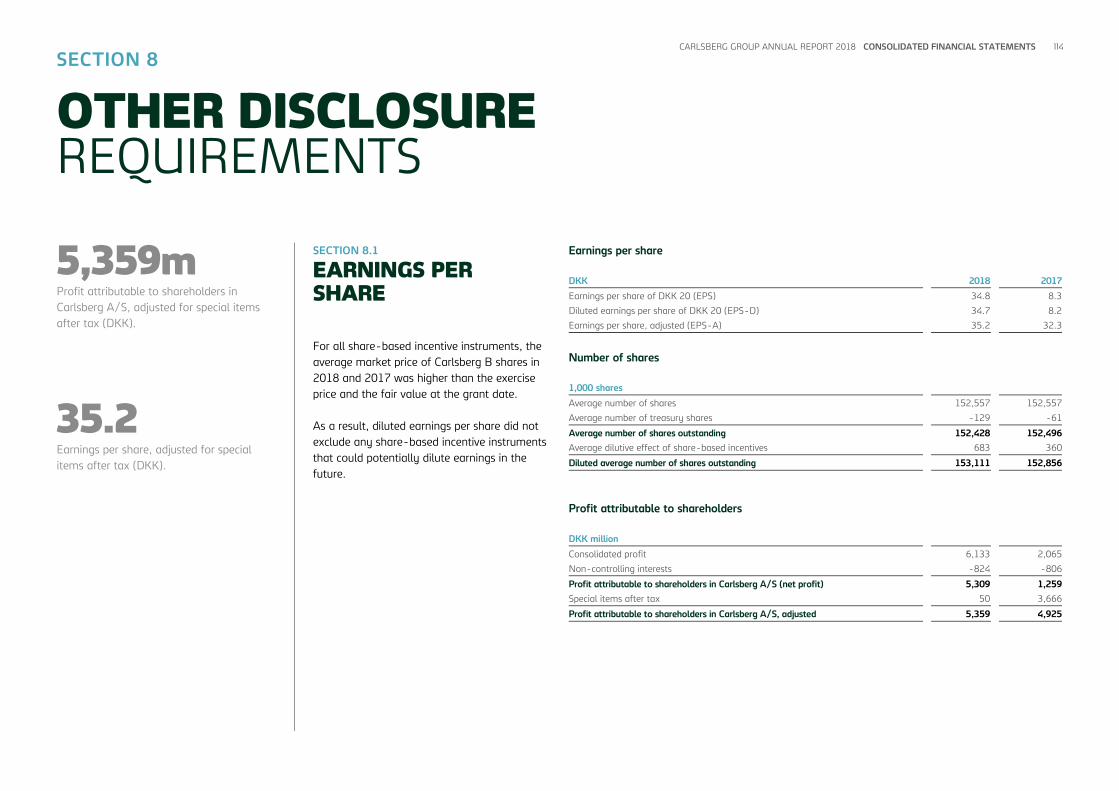
CARLSBERG GROUP ANNUAL REPORT 2018 CONSOLIDATED FINANCIAL STATEMENTS 114
5,359m Profit attributable to shareholders in
Carlsberg A/S, adjusted for special items
after tax (DKK).
35.2 Earnings per share, adjusted for special
items after tax (DKK).
SECTION 8.1
EARNINGS PER SHARE
For all share-based incentive instruments, the
average market price of Carlsberg B shares in
2018 and 2017 was higher than the exercise
price and the fair value at the grant date.
As a result, diluted earnings per share did not
exclude any share-based incentive instruments
that could potentially dilute earnings in the
future.
SECTION 8
OTHER DISCLOSURE REQUIREMENTS
Earnings per share
DKK 2018 2017
Earnings per share of DKK 20 (EPS) 34.8 8.3
Diluted earnings per share of DKK 20 (EPS-D) 34.7 8.2
Earnings per share, adjusted (EPS-A) 35.2 32.3
Number of shares
1,000 shares
Average number of shares 152,557 152,557
Average number of treasury shares -129 -61
Average number of shares outstanding 152,428 152,496
Average dilutive effect of share-based incentives 683 360
Diluted average number of shares outstanding 153,111 152,856
Profit attributable to shareholders
DKK million
Consolidated profit 6,133 2,065
Non-controlling interests -824 -806
Profit attributable to shareholders in Carlsberg A/S (net profit) 5,309 1,259
Special items after tax 50 3,666
Profit attributable to shareholders in Carlsberg A/S, adjusted 5,359 4,925

CARLSBERG GROUP ANNUAL REPORT 2018 CONSOLIDATED FINANCIAL STATEMENTS 115
SECTION 8.2
RELATED PARTIES
RELATED PARTIES EXERCISING CONTROL
The Carlsberg Foundation, H.C. Andersens
Boulevard 35, 1553 Copenhagen V, Denmark,
exercises control over Carlsberg A/S. The
Foundation holds 30.3% of the shares and
75.4% of the voting power in Carlsberg A/S,
excluding treasury shares.
The following transactions took place between
the Carlsberg Foundation and the Carlsberg
Group in 2018:
The Carlsberg Foundation received a dividend
of DKK 16.00 per share from Carlsberg A/S,
the same as every other shareholder. The
dividend received amounted to DKK 740m.
Funding and grants received for research and
development activities from the Carlsberg
Foundation amounted to DKK 38m (2017:
DKK 43m). Of the total grants, DKK 26m
(2017: DKK 17m) was deferred to be used for
research projects in the future. The grants
related to the operation of the Carlsberg
Research Laboratory.
Carlsberg Breweries A/S leases storage
facilities in the Researcher Apartments. The
annual lease, DKK 177 thousand, and the
lease terms are on market conditions.
Carlsberg A/S leases parking spaces from the
Carlsberg Foundation to provide parking for
employees at the Research Centre and Visit
Carlsberg. The annual lease, DKK 175
thousand, and the lease terms are on market
conditions.
The Carlsberg Science to Business forum is
organised by the Carlsberg Foundation and the
Group. The Carlsberg Foundation pays for
presenters’ costs, which amount to DKK 150-
200 thousand. The Group contributes the
meeting room and approximately 30 working
hours.
Carlsberg A/S held the Annual General
Meeting at Ny Carlsberg Glyptotek at a cost of
DKK 65 thousand.
Ny Carlsberg Glyptotek has received event
products free of charge from the Group as part
of the sponsorship of certain events. The
accumulated value of the products is DKK 61
thousand.
The Group’s delivery of beer and soft drinks to
the Carlsberg Foundation is charged at
ordinary listing price minus a discount. In 2018,
the deliveries amounted to a value of DKK 277
thousand (total sales of goods) (2017: DKK
227 thousand).
In accordance with the Tuborg Foundation’s
rights as a partner of Unleash (a non-profit
organisation working to promote young
people’s understanding of and contribution to
the UN Sustainable Development Goals), five
seats for an Unleash event were given to
employees in Carlsberg Breweries. The total
value of the seats is DKK 135 thousand.
It is estimated that the benefit for the Carlsberg
Group corresponds to the value of the services
provided to the Carlsberg Foundation, which in
turn corresponds to what each party would
have had to pay to have the same deliverables
provided by external parties.
OTHER RELATED PARTIES
Related parties also comprise Carlsberg A/S’
Supervisory Board and Executive Board, their
close family members and companies in which
these persons have significant influence.
During the year, there were no transactions
between these parties and the Group, except
for remuneration as disclosed in section 7.
In 2018, the Group had no significant
transactions with its associates and joint
ventures.
The income statement and the statement
of financial position include the following
transactions
DKK million 2018 2017
Associates and joint ventures
Net revenue 62 59
Cost of sales -622 -609
Loans 333 290
Receivables 104 239
Borrowings -7 -22
Trade payables and other
liabilities -15 -4
SECTION 8.3
FEES TO AUDITORS
Fees to auditors appointed by
the Annual General Meeting
DKK million 2018 2017
Statutory audit 18 19
Assurance engagements 2 1
Tax advisory 1 -
Other services 2 5
Total 23 25
Fees for services other than the statutory audit
of the financial statements provided by
PricewaterhouseCoopers Statsautoriseret
Revisionspartnerselskab amounted to DKK 3m
(2017: DKK 6m), including services relating to
information security, best practice for internal
controls, tax advice and other assurance
opinions and agreed-upon procedures, as well
as accounting advice.
SECTION 8.4
EVENTS AFTER THE REPORTING PERIOD
Apart from the events recognised or disclosed
in the consolidated financial statements, no
events have occurred after the reporting period
of importance to the consolidated financial
statements.

CARLSBERG GROUP ANNUAL REPORT 2018 CONSOLIDATED FINANCIAL STATEMENTS 116
Changes in 2018 CLASSIFICATION OF REVENUE
Adoption of the new IFRS revenue standard
changed the classification of certain
marketing activities from trade marketing
to discounts. These are recognised as
revenue as of 1 January 2018.
IMPAIRMENT OF FINANCIAL ASSETS
Adoption of the new IFRS financial
instruments standard introduces a new
impairment model based on expected credit
losses as of 1 January 2018.
SECTION 9.1
SIGNIFICANT ACCOUNTING ESTIMATES AND JUDGEMENTS
In preparation of the consolidated financial
statements, management makes various
accounting estimates and judgements that
form the basis of presentation, recognition and
measurement of the Group’s assets, liabilities,
income and expenses. The estimates and
judgements made are based on historical
experience and other factors that management
assesses to be reliable, but that, by nature, are
associated with uncertainty and unpredictability
and may therefore prove incomplete or
incorrect.
SECTION 9.2
GENERAL ACCOUNTING POLICIES
The Group’s 2018 consolidated financial
statements have been prepared in accordance
with IFRS as adopted by the EU and further
requirements in the Danish Financial
Statements Act.
The consolidated financial statements are
presented in Danish kroner (DKK), which is the
Parent Company’s functional currency, and all
values are rounded to the nearest DKK million,
except when otherwise stated.
The accounting policies set out below have
been used consistently in respect of the
financial year and the comparative figures.
DEFINING MATERIALITY
Significant items are presented individually in
the financial statements as required by IAS 1.
Other items that may not be significant but are
considered relevant to stakeholders and an
understanding of the Group’s business model,
including research, real estate, geographical
diversity etc., are also presented in the financial
statements.
BASIS OF CONSOLIDATION
The consolidated financial statements are
prepared as a consolidation of the financial
statements of the Parent Company, Carlsberg
A/S, and its subsidiaries according to the
Group’s accounting policies.
Entities over which the Group exercises
significant influence, but which it does not
control, are considered associates. Significant
influence is generally obtained by direct or
indirect ownership or control of less than 50%
of the voting rights or participation in the
management of the company. The assessment
of whether Carlsberg A/S exercises control or
significant influence includes potential voting
rights exercisable at the reporting date. Entities
that by agreement are managed jointly with
one or more other parties are considered joint
ventures.
On consolidation, intra-group income and
expenses, shareholdings, balances and
dividends, and realised and unrealised gains are
eliminated. Unrealised gains on transactions
with associates and joint ventures are
SECTION 9
BASIS FOR PREPARATION
Areas involving significant estimates and judgements:
Impairment testing, useful life and residual value Section 2
Restructurings, provisions and contingencies Section 3
Receivables Section 1
Deferred tax assets Section 6
Defined benefit obligations Section 7
Acquisitions and disposals, including contingent
considerations
Section 5

CARLSBERG GROUP ANNUAL REPORT 2018 CONSOLIDATED FINANCIAL STATEMENTS 117
SECTION 9.2 (CONTINUED)
GENERAL ACCOUNTING POLICIES
eliminated in proportion to the Group’s
ownership share of the entity. Unrealised losses
are eliminated in the same way as unrealised
gains to the extent that impairment has not
taken place.
On acquisition, investments in subsidiaries are
eliminated against the proportionate share of
the subsidiaries’ fair value of identifiable net
assets, including recognised contingent
liabilities.
The accounting items of subsidiaries are
included in full in the consolidated financial
statements. Non-controlling interests’ share of
subsidiaries’ profit/loss for the year and of
equity are included in the Group’s profit/loss
and equity, but are disclosed separately.
Entities acquired or established in the year are
recognised in the consolidated financial
statements from the date of acquisition or
formation. Entities disposed of or discontinued
are recognised in the consolidated income
statement until the date of disposal or
discontinuation. The comparative figures are
not restated.
FOREIGN CURRENCY TRANSLATION
A functional currency is determined for each of
the reporting entities in the Group. The
functional currency is the primary currency
used for the reporting entity’s operations.
Transactions denominated in currencies other
than the functional currency are considered
transactions denominated in foreign currencies.
On initial recognition, transactions
denominated in foreign currencies are
translated to the functional currency at the
exchange rates at the transaction date. Foreign
exchange differences arising between the
exchange rates at the transaction date and at
the date of payment are recognised as financial
income or expenses.
Receivables, payables and other monetary
items denominated in foreign currencies are
translated at the exchange rates at the
reporting date. The difference between the
exchange rates at the reporting date and at the
date at which the receivable or payable arose
or the exchange rate in the latest consolidated
financial statements is recognised as financial
income or expenses.
On recognition in the consolidated financial
statements of entities with a functional
currency other than the presentation currency
(DKK), the income statement and statement of
cash flows are translated at the exchange rates
at the transaction date, and the statement of
financial position items are translated at the
exchange rates at the reporting date. Foreign
exchange differences arising on translation of
the opening balance of equity of foreign
entities at the exchange rates at the reporting
date, and on translation of the income
statement from the transaction date to the
reporting date, are recognised in other
comprehensive income and attributed to a
separate translation reserve in equity. Foreign
exchange differences arising on the translation
of the proportionate share of associates and
joint ventures are likewise recognised in other
comprehensive income.
Foreign exchange adjustment of balances with
foreign entities that are considered part of the
investment in the entity is recognised in other
comprehensive income. Correspondingly,
foreign exchange gains and losses on the part
of loans and derivative financial instruments
that is designated as hedges of investments in
foreign entities, and that effectively hedges
against corresponding foreign exchange gains
and losses on the investment in the entity, are
also recognised in other comprehensive income
and attributed to a separate translation reserve
in equity.
On complete or partial disposal of a foreign
entity or on repayment of balances that
constitute part of the net investment in the
foreign entity, the share of the cumulative
amount of the exchange differences recognised
in other comprehensive income relating to that
foreign entity is recognised in the income
statement when the gain or loss on disposal is
recognised.
INCOME STATEMENT
The presentation of the Group’s income
statement is based on the internal reporting
structure, as IFRS does not provide a specific
disclosure requirement.
Special items are not directly attributable to
ordinary operating activities and are shown
separately in order to facilitate a better
understanding of the Group’s financial
performance.
CASH FLOW
Cash flow is calculated using the indirect
method and is based on operating profit before
special items adjusted for depreciation,
amortisation and impairment losses.
Cash flow cannot be derived directly from the
statement of financial position and income
statement.
FINANCIAL RATIOS AND NON-IFRS
FINANCIAL MEASURES
The Group uses certain additional financial
measures to provide management, investors
and investment analysts with additional
measures to evaluate and analyse the
Company’s results. These non-IFRS financial
measures are defined and calculated by the
Group, and therefore may not be comparable
with other companies’ measures.
The non-IFRS financial measures disclosed in
the Annual Report are:
• Earnings per share and payout ratio, adjusted
• Organic development
The Danish Finance Society does not
acknowledge use of special items and states
that adjustments of tax should be based on the
marginal tax rate. When calculating financial
measures, the Group uses operating profit
before special items as well as the effective tax
rate for measures adjusted for tax.
Other financial ratios are calculated in
accordance with the Danish Finance Society’s
online guidelines on the calculation of financial
ratios, “Recommendations and Financial
Ratios”, unless specifically stated.
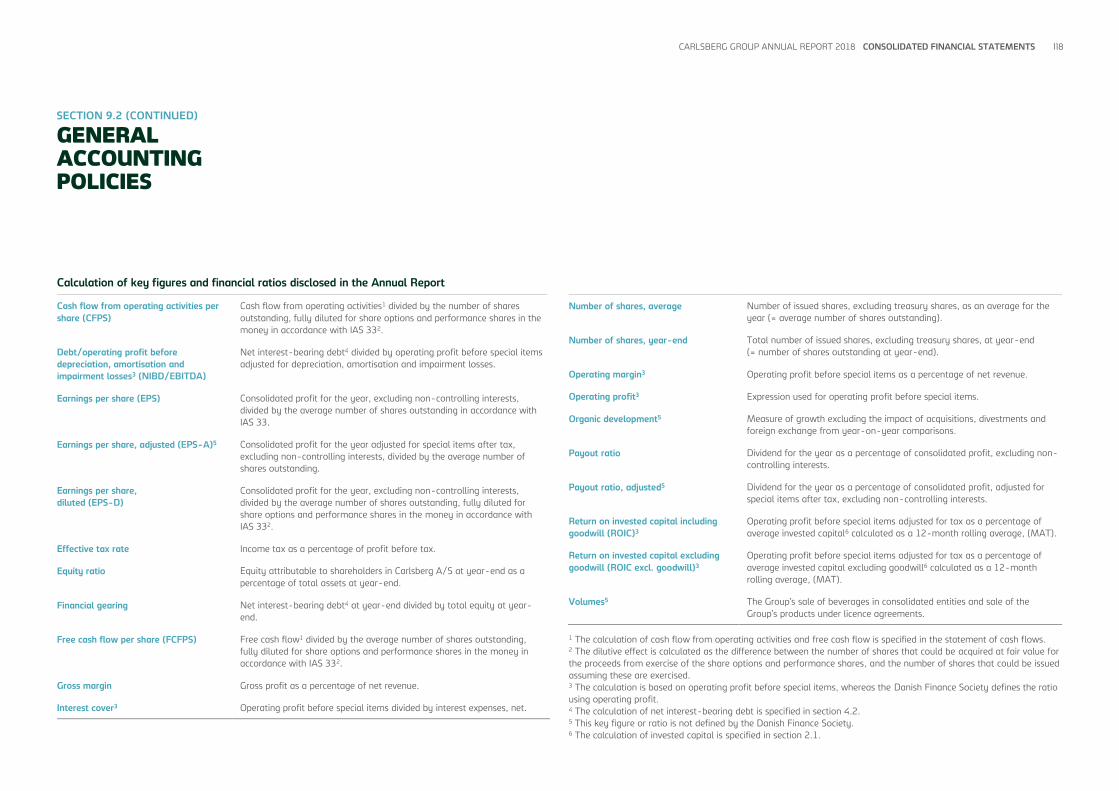
CARLSBERG GROUP ANNUAL REPORT 2018 CONSOLIDATED FINANCIAL STATEMENTS 118
SECTION 9.2 (CONTINUED)
GENERAL ACCOUNTING POLICIES
Calculation of key figures and financial ratios disclosed in the Annual Report
Cash flow from operating activities per
share (CFPS)
Cash flow from operating activities1 divided by the number of shares
outstanding, fully diluted for share options and performance shares in the
money in accordance with IAS 332.
Debt/operating profit before
depreciation, amortisation and
impairment losses3 (NIBD/EBITDA)
Net interest-bearing debt4 divided by operating profit before special items
adjusted for depreciation, amortisation and impairment losses.
Earnings per share (EPS) Consolidated profit for the year, excluding non-controlling interests,
divided by the average number of shares outstanding in accordance with
IAS 33.
Earnings per share, adjusted (EPS-A)5 Consolidated profit for the year adjusted for special items after tax,
excluding non-controlling interests, divided by the average number of
shares outstanding.
Earnings per share,
diluted (EPS-D)
Consolidated profit for the year, excluding non-controlling interests,
divided by the average number of shares outstanding, fully diluted for
share options and performance shares in the money in accordance with
IAS 332.
Effective tax rate Income tax as a percentage of profit before tax.
Equity ratio Equity attributable to shareholders in Carlsberg A/S at year-end as a
percentage of total assets at year-end.
Financial gearing Net interest-bearing debt4 at year-end divided by total equity at year-
end.
Free cash flow per share (FCFPS) Free cash flow1 divided by the average number of shares outstanding,
fully diluted for share options and performance shares in the money in
accordance with IAS 332.
Gross margin Gross profit as a percentage of net revenue.
Interest cover3 Operating profit before special items divided by interest expenses, net.
Number of shares, average Number of issued shares, excluding treasury shares, as an average for the
year (= average number of shares outstanding).
Number of shares, year-end Total number of issued shares, excluding treasury shares, at year-end
(= number of shares outstanding at year-end).
Operating margin3 Operating profit before special items as a percentage of net revenue.
Operating profit3 Expression used for operating profit before special items.
Organic development5 Measure of growth excluding the impact of acquisitions, divestments and
foreign exchange from year-on-year comparisons.
Payout ratio Dividend for the year as a percentage of consolidated profit, excluding non-
controlling interests.
Payout ratio, adjusted5 Dividend for the year as a percentage of consolidated profit, adjusted for
special items after tax, excluding non-controlling interests.
Return on invested capital including
goodwill (ROIC)3
Operating profit before special items adjusted for tax as a percentage of
average invested capital6 calculated as a 12-month rolling average, (MAT).
Return on invested capital excluding
goodwill (ROIC excl. goodwill)3
Operating profit before special items adjusted for tax as a percentage of
average invested capital excluding goodwill6 calculated as a 12-month
rolling average, (MAT).
Volumes5 The Group’s sale of beverages in consolidated entities and sale of the
Group’s products under licence agreements.
1 The calculation of cash flow from operating activities and free cash flow is specified in the statement of cash flows. 2 The dilutive effect is calculated as the difference between the number of shares that could be acquired at fair value for
the proceeds from exercise of the share options and performance shares, and the number of shares that could be issued
assuming these are exercised. 3 The calculation is based on operating profit before special items, whereas the Danish Finance Society defines the ratio
using operating profit. 4 The calculation of net interest-bearing debt is specified in section 4.2. 5 This key figure or ratio is not defined by the Danish Finance Society. 6 The calculation of invested capital is specified in section 2.1.

CARLSBERG GROUP ANNUAL REPORT 2018 CONSOLIDATED FINANCIAL STATEMENTS 119
SECTION 9.3
CHANGES IN ACCOUNTING POLICIES
9.3.1 CHANGED ACCOUNTING POLICIES
AND CLASSIFICATION IN THE ANNUAL
REPORT 2018
The Annual Report has been prepared using the
same accounting policies for recognition and
measurement as those applied to the
consolidated financial statements for 2017,
except for the following new IFRS Standards,
Improvements, Amendments and
Interpretations that were adopted as of 1
January 2018:
• IFRS 9 “Financial Instruments”
• IFRS 15 “Revenue from Contracts with
Customers”, including clarifications and
amendments to IFRS 15
• Annual Improvements to IFRS Standards
2014-2016 Cycle
• IFRIC Interpretation 22 “Foreign Currency
Transactions and Advance Consideration”
• Amendments to IFRS 2 “Classification and
Measurement of Share-based Payment
Transactions”
IFRS 9 “FINANCIAL INSTRUMENTS”
The Group has implemented the new
classifications and hedging and impairment
rules under IFRS 9. The impact of
reclassifications and the calculation of expected
credit losses arising from these are not material
to the consolidated financial statements, and
the standard has thus been implemented
without adjusting the opening balance at 1
January 2018.
The new IFRS 9 hedging rules have primarily
had an impact on the effectiveness of
aluminium hedges. The ineffective portion at
the end of 2017 related to aluminium hedges.
Following the adoption of IFRS 9, there was no
ineffectiveness. The change in accounting
policy did not have a material impact on other
comprehensive income or the income
statement.
IFRS 15 “REVENUE FROM CONTRACTS WITH
CUSTOMERS”
The Group has implemented IFRS 15 using the
fully retrospective approach. The
implementation has impacted the Group’s
financials and revenue stream, as the standard
requires certain payments to customers, such
as those supporting marketing activities and
listing fees, to be deducted from revenue.
Previously, these activities were recognised as
marketing expenses. For the Group, the
implementation of IFRS 15 was material to the
consolidated financial statements. However,
the implementation resulted only in changes in
the classification between revenue and
marketing expenses, and did not impact
operating profit before special items or the
consolidated profit, nor did it have an impact
on the timing of revenue recognition.
The comparative figures have been restated as
disclosed in the consolidated financial
statements for 2017. The impact in 2017 was
a reduction of net revenue of DKK 1.2bn.
OTHER CHANGES
Apart from the implementation of IFRS 15, the
implemented Standards, Improvements,
Amendments and Interpretations had no
impact on the Group’s accounting policies, as
they cover areas that are not material and/or
relevant to the Group.
Furthermore, as of 1 January 2018, the Group
changed:
• The definition of volume to include only the
Group’s sales of beverages in consolidated
entities.
• The classification of certain costs in the
central supply chain and IT functions from
administrative expenses to the functions they
support, primarily production, logistics and
sales.
The effect of changes in the accounting policies
and the classifications for 2017 is disclosed in
the consolidated financial statements for 2017,
sections 9.3 and 9.5.
9.3.2 NEW AND AMENDED IFRS STANDARDS
AND INTERPRETATIONS NOT YET
APPLICABLE WITHIN THE EU
The following new or amended IFRS Standards
and Interpretations of relevance to the Group
became effective as of 1 January 2019:
• IFRS 16 “Leases”.
• Annual Improvements to IFRS Standards
2015-2017 Cycle.
• Amendments to IFRS 9 “Prepayment
Features with Negative Compensation”.
• Amendments to IAS 19 “Plan Amendment,
Curtailment or Settlement”.
• Amendments to IAS 28 “Long-term Interests
in Associates and Joint Ventures”.
• IFRIC Interpretation 23 “Uncertainty over
Income Tax Treatments”.
The impact of these changes is described in
section 9.3.3.
The Annual Improvements to IFRS Standards
2015-2017 Cycle and amendments to IAS 19
and IAS 28 are expected to be adopted by the
EU in early 2019. The Group will adopt these
Improvements and Amendments when they
become mandatory.
CARLSBERG GROUP ANNUAL REPORT 2018 CONSOLIDATED FINANCIAL STATEMENTS 120
SECTION 9.3 (CONTINUED)
CHANGES IN ACCOUNTING POLICIES
9.3.3 IMPACT OF AND CHANGES IN
ACCOUNTING POLICIES FOR 2019
IFRS 16 “LEASES”
The implementation of IFRS 16 “Leases” will
result in almost all leases being recognised in
the statement of financial position, as the
distinction between operating and finance
leases has been removed. The only exceptions
are short-term leases and leases of low-value
assets.
The Group has reviewed its leasing
arrangements, which mainly comprise leases of
cars and trucks, where the value of the assets
is low and the contract periods are short. The
impact for the Group in respect of operating
leases is an increase in property, plant and
equipment and in financial liabilities.
Information on current lease agreements is
disclosed in section 2.3.
Furthermore, operating profit before special
items will be increased by approximately DKK
10m, as the lease cost includes an interest
element, which will be recognised as a financial
item. In the cash flow statement, the interest
element will be presented as interest etc. paid.
The identified right-of-use assets are expected
to increase the Group’s assets and liabilities by
approximately DKK 1.3bn. The expected
impact is calculated based on the Group’s
incremental borrowing rate of 0.75% and use of
the latest available knowledge for determining
the lease term at the time of the calculation.
The Group will apply the practical expedient to
leases retrospectively, with the cumulative
effect from the date of the initial application
recognised as an adjustment to the opening
balance of retained earnings, and will not
restate comparative figures for the year prior to
first adoption.
IMPACT OF OTHER CHANGES
Apart from the implementation of IFRS 16, the
implemented Standards, Improvements,
Amendments and Interpretations are not
expected to have any significant impact on the
financials or the Group’s accounting policies, as
they cover areas that are not material and/or
relevant for the Group.
SECTION 9.4
NEW LEGISLATION
NEW AND AMENDED IFRS STANDARDS
AND INTERPRETATIONS NOT YET
ADOPTED BY THE EU
The following new or amended IFRS Standards
and Interpretations of relevance to the Group
have been issued but not yet adopted by
the EU:
• IFRS 17 “Insurance Contracts”, effective
for financial years beginning on or after
1 January 2021.
• Amendments to IAS 1 and IAS 8 “Definition of
Material” (issued on 31 October 2018),
effective for financial years beginning on or
after 1 January 2020.
• Amendments to IFRS 3 “Business
Combinations” (issued on 22 October 2018),
effective for financial years beginning on or
after 1 January 2020.
• Amendments to “References to the
Conceptual Framework in IFRS Standards”,
effective for financial years beginning on or
after 1 January 2020.
The new and amended Standards and
Interpretations are not mandatory for the
financial reporting for 2018. The Group expects
to adopt the new Standards and Interpretations
when they become mandatory.
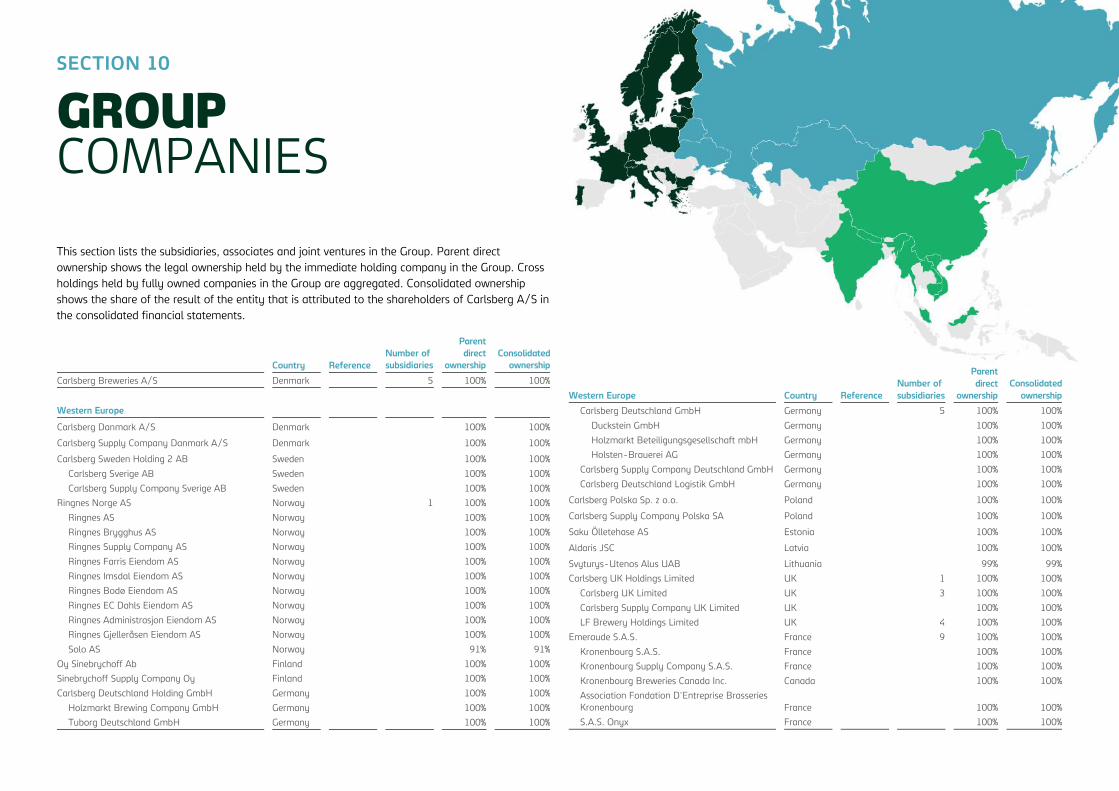
CARLSBERG GROUP ANNUAL REPORT 2018 121
This section lists the subsidiaries, associates and joint ventures in the Group. Parent direct
ownership shows the legal ownership held by the immediate holding company in the Group. Cross
holdings held by fully owned companies in the Group are aggregated. Consolidated ownership
shows the share of the result of the entity that is attributed to the shareholders of Carlsberg A/S in
the consolidated financial statements.
SECTION 10
GROUP COMPANIES
Country Reference
Number of
subsidiaries
Parent
direct
ownership
Consolidated
ownership
Carlsberg Breweries A/S Denmark 5 100% 100%
Western Europe
Carlsberg Danmark A/S Denmark 100% 100%
Carlsberg Supply Company Danmark A/S Denmark 100% 100%
Carlsberg Sweden Holding 2 AB Sweden 100% 100%
Carlsberg Sverige AB Sweden 100% 100%
Carlsberg Supply Company Sverige AB Sweden 100% 100%
Ringnes Norge AS Norway 1 100% 100%
Ringnes AS Norway 100% 100%
Ringnes Brygghus AS Norway 100% 100%
Ringnes Supply Company AS Norway 100% 100%
Ringnes Farris Eiendom AS Norway 100% 100%
Ringnes Imsdal Eiendom AS Norway 100% 100%
Ringnes Bodø Eiendom AS Norway 100% 100%
Ringnes EC Dahls Eiendom AS Norway 100% 100%
Ringnes Administrasjon Eiendom AS Norway 100% 100%
Ringnes Gjelleråsen Eiendom AS Norway 100% 100%
Solo AS Norway 91% 91%
Oy Sinebrychoff Ab Finland 100% 100%
Sinebrychoff Supply Company Oy Finland 100% 100%
Carlsberg Deutschland Holding GmbH Germany 100% 100%
Holzmarkt Brewing Company GmbH Germany 100% 100%
Tuborg Deutschland GmbH Germany 100% 100%
Western Europe Country Reference
Number of
subsidiaries
Parent
direct
ownership
Consolidated
ownership
Carlsberg Deutschland GmbH Germany 5 100% 100%
Duckstein GmbH Germany 100% 100%
Holzmarkt Beteiligungsgesellschaft mbH Germany 100% 100%
Holsten-Brauerei AG Germany 100% 100%
Carlsberg Supply Company Deutschland GmbH Germany 100% 100%
Carlsberg Deutschland Logistik GmbH Germany 100% 100%
Carlsberg Polska Sp. z o.o. Poland 100% 100%
Carlsberg Supply Company Polska SA Poland 100% 100%
Saku Ölletehase AS Estonia 100% 100%
Aldaris JSC Latvia 100% 100%
Svyturys-Utenos Alus UAB Lithuania 99% 99%
Carlsberg UK Holdings Limited UK 1 100% 100%
Carlsberg UK Limited UK 3 100% 100%
Carlsberg Supply Company UK Limited UK 100% 100%
LF Brewery Holdings Limited UK 4 100% 100%
Emeraude S.A.S. France 9 100% 100%
Kronenbourg S.A.S. France 100% 100%
Kronenbourg Supply Company S.A.S. France 100% 100%
Kronenbourg Breweries Canada Inc. Canada 100% 100%
Association Fondation D'Entreprise Brasseries
Kronenbourg France 100% 100%
S.A.S. Onyx France 100% 100%

CARLSBERG GROUP ANNUAL REPORT 2018 122
Asia Country Reference
Number of
subsidiaries
Parent
direct
ownership
Consolidated
ownership
Chongqing Brewery Co., Ltd China A 60% 60%
Chongqing Jianiang Brewery Ltd China B 5 51% 79%
Carlsberg Beer Enterprise Management
(Chongqing) Company Limited China 100% 100%
Carlsberg Brewery (Anhui) Company Ltd China 75% 75%
Carlsberg Tianmuhu Brewery (Jiangsu)
Company Ltd China 100% 100%
Carlsberg Brewery Malaysia Berhad Malaysia A 51% 51%
Carlsberg Marketing Sdn BHD Malaysia 100% 51%
Euro Distributors Sdn BHD Malaysia 100% 51%
Carlsberg Singapore Pte Ltd Singapore 100% 51%
Maybev Pte Ltd Singapore C 51% 26%
Carlsberg South Asia Pte Ltd Singapore D 67% 100%
South Asian Breweries Pte. Ltd Singapore D 100% 100%
Carlsberg India Pvt. Ltd India D 100% 100%
Gorkha Brewery Pvt. Ltd Nepal D 90% 90%
G.B. Marketing Pvt Ltd Nepal D 90% 90%
Carlsberg Vietnam Trading Co. Ltd Vietnam 100% 100%
Carlsberg Vietnam Breweries Ltd Vietnam 100% 100%
Lao Brewery Co. Ltd Laos 61% 61%
Paduak Holding Pte. Ltd Singapore 100% 100%
Caretech Limited Hong Kong E, F 1 75% 100%
Cambrew Limited Cambodia 2 100% 100%
Cambrew Properties Ltd Cambodia 99% 99%
Angkor Beverage Co Ltd Cambodia 100% 100%
CB Distribution Co., Ltd Thailand 100% 100%
Brewery Invest Pte Ltd Singapore 100% 100%
Carlsberg Asia Pte Ltd Singapore 100% 100%
KS Holding 1 Pte Ltd Singapore 100% 100%
A Listed company.
B Chongqing Jianiang Brewery Ltd is owned by Chongqing Brewery Co., Ltd (51%) and Carlsberg Brewery Hong Kong
Ltd (49%), resulting in a consolidated ownership of 79%.
C Maybev Pte Ltd is owned by Carlsberg Singapore Pte Ltd (51%), which is owned by Carlsberg Brewery Malaysia
Berhad (51%), resulting in a consolidated ownership of 26%.
D The Group owns 67% of Carlsberg South Asia Pte Ltd, which is the holding company of South Asian Breweries Pte.
Ltd, Carlsberg India Pvt. Ltd and Gorkha Brewery Pvt. Ltd (Nepal). The consolidation percentage of Carlsberg South
Asia Pte Ltd is 100% due to a written put option.
E Company not audited by PwC.
F Consolidation percentage is higher than the ownership share due to written put options.
Western Europe Country Reference
Number of
subsidiaries
Parent
direct
ownership
Consolidated
ownership
Feldschlösschen Getränke Holding AG Switzerland 1 100% 100%
Feldschlösschen Getränke AG Switzerland 100% 100%
Schlossgarten Gastronomie AG Switzerland 100% 100%
SB Swiss Beverage AG Switzerland 100% 100%
Feldschlösschen Supply Company AG Switzerland 100% 100%
Carlsberg Supply Company AG Switzerland 100% 100%
Carlsberg Italia S.p.A. Italy 100% 100%
Carlsberg Horeca Srl Italy 100% 100%
T&C Italia Srl Italy 100% 100%
Olympic Brewery SA Greece 100% 100%
Hellenic Beverage Company SA Greece 100% 100%
Carlsberg Serbia Ltd Serbia 100% 100%
Carlsberg BH d.o.o. Bosnia-
Herzegovina
100% 100%
Carlsberg Montenegro d.o.o. Montenegro 100% 100%
Carlsberg Croatia d.o.o. Croatia 100% 100%
Carlsberg Bulgaria AD Bulgaria 100% 100%
B to B Distribution EOOD Bulgaria 100% 100%
Carlsberg Hungary Kft. Hungary 100% 100%
Zatecky Pivovar spol. S.r.o. Czech
Republic
100% 100%
CTDD Beer Imports Ltd Canada 100% 100%
Carlsberg Canada Inc. Canada 100% 100%
Carlsberg USA Inc. USA 100% 100%
Asia Country Reference
Number of
subsidiaries
Parent
direct
ownership
Consolidated
ownership
Carlsberg Supply Company Asia Ltd Hong Kong 100% 100%
Carlsberg Brewery Hong Kong Ltd Hong Kong 100% 100%
Carlsberg Hong Kong Ltd Hong Kong 100% 100%
Carlsberg Procurement (Shenzhen)
Company Ltd China 100% 100%
Carlsberg Brewery (Guangdong) Ltd China 99% 99%
Kunming Huashi Brewery Company Limited China 100% 100%
Xinjiang Wusu Breweries Co., Ltd China 4 100% 100%
Ningxia Xixia Jianiang Brewery Limited China 70% 70%
Guangzhou Carlsberg Consultancy and
Management Services Co Ltd China 100% 100%
Carlsberg (China) Breweries and Trading
Company Limited China 100% 100%
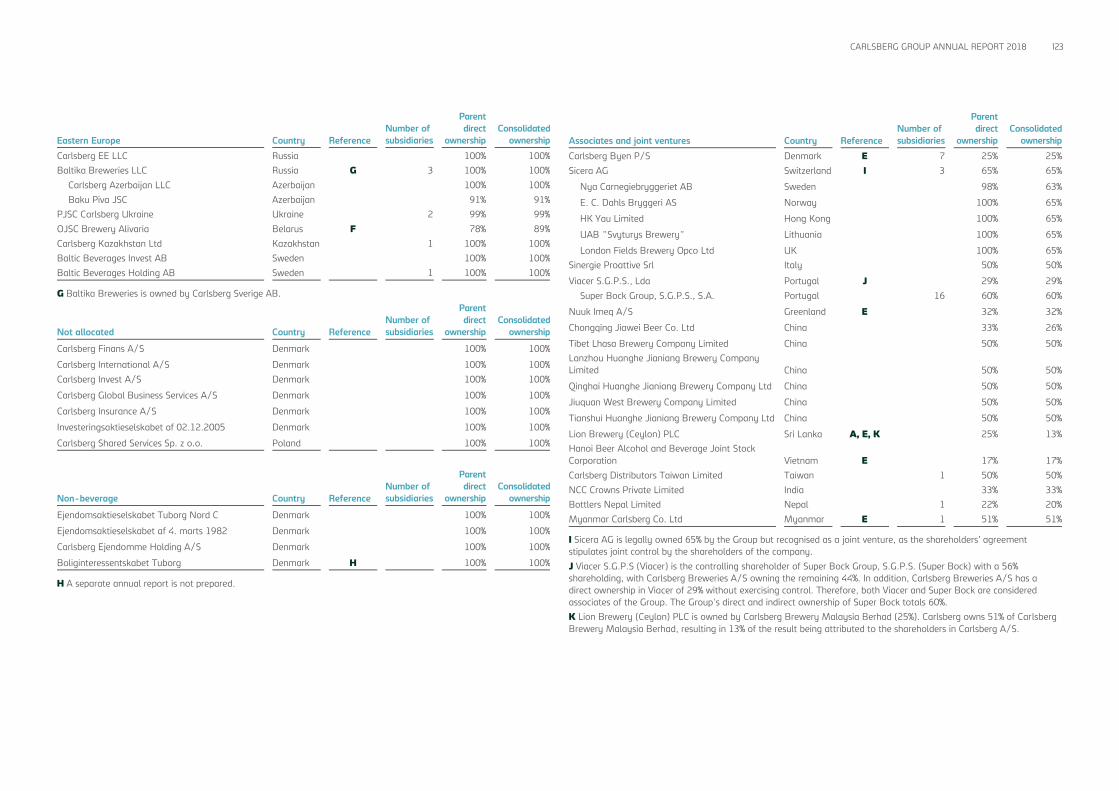
CARLSBERG GROUP ANNUAL REPORT 2018 123
Associates and joint ventures Country Reference
Number of
subsidiaries
Parent
direct
ownership
Consolidated
ownership
Carlsberg Byen P/S Denmark E 7 25% 25%
Sicera AG Switzerland I 3 65% 65%
Nya Carnegiebryggeriet AB Sweden 98% 63%
E. C. Dahls Bryggeri AS Norway 100% 65%
HK Yau Limited Hong Kong 100% 65%
UAB "Svyturys Brewery" Lithuania 100% 65%
London Fields Brewery Opco Ltd UK 100% 65%
Sinergie Proattive Srl Italy 50% 50%
Viacer S.G.P.S., Lda Portugal J 29% 29%
Super Bock Group, S.G.P.S., S.A. Portugal 16 60% 60%
Nuuk Imeq A/S Greenland E 32% 32%
Chongqing Jiawei Beer Co. Ltd China 33% 26%
Tibet Lhasa Brewery Company Limited China 50% 50%
Lanzhou Huanghe Jianiang Brewery Company
Limited China 50% 50%
Qinghai Huanghe Jianiang Brewery Company Ltd China 50% 50%
Jiuquan West Brewery Company Limited China 50% 50%
Tianshui Huanghe Jianiang Brewery Company Ltd China 50% 50%
Lion Brewery (Ceylon) PLC Sri Lanka A, E, K 25% 13%
Hanoi Beer Alcohol and Beverage Joint Stock
Corporation Vietnam E 17% 17%
Carlsberg Distributors Taiwan Limited Taiwan 1 50% 50%
NCC Crowns Private Limited India 33% 33%
Bottlers Nepal Limited Nepal 1 22% 20%
Myanmar Carlsberg Co. Ltd Myanmar E 1 51% 51%
I Sicera AG is legally owned 65% by the Group but recognised as a joint venture, as the shareholders’ agreement
stipulates joint control by the shareholders of the company.
J Viacer S.G.P.S (Viacer) is the controlling shareholder of Super Bock Group, S.G.P.S. (Super Bock) with a 56%
shareholding, with Carlsberg Breweries A/S owning the remaining 44%. In addition, Carlsberg Breweries A/S has a
direct ownership in Viacer of 29% without exercising control. Therefore, both Viacer and Super Bock are considered
associates of the Group. The Group's direct and indirect ownership of Super Bock totals 60%.
K Lion Brewery (Ceylon) PLC is owned by Carlsberg Brewery Malaysia Berhad (25%). Carlsberg owns 51% of Carlsberg
Brewery Malaysia Berhad, resulting in 13% of the result being attributed to the shareholders in Carlsberg A/S.
Eastern Europe Country Reference
Number of
subsidiaries
Parent
direct
ownership
Consolidated
ownership
Carlsberg EE LLC Russia 100% 100%
Baltika Breweries LLC Russia G 3 100% 100%
Carlsberg Azerbaijan LLC Azerbaijan 100% 100%
Baku Piva JSC Azerbaijan 91% 91%
PJSC Carlsberg Ukraine Ukraine 2 99% 99%
OJSC Brewery Alivaria Belarus F 78% 89%
Carlsberg Kazakhstan Ltd Kazakhstan 1 100% 100%
Baltic Beverages Invest AB Sweden 100% 100%
Baltic Beverages Holding AB Sweden 1 100% 100%
G Baltika Breweries is owned by Carlsberg Sverige AB.
Not allocated Country Reference
Number of
subsidiaries
Parent
direct
ownership
Consolidated
ownership
Carlsberg Finans A/S Denmark 100% 100%
Carlsberg International A/S Denmark 100% 100%
Carlsberg Invest A/S Denmark 100% 100%
Carlsberg Global Business Services A/S Denmark 100% 100%
Carlsberg Insurance A/S Denmark 100% 100%
Investeringsaktieselskabet af 02.12.2005 Denmark 100% 100%
Carlsberg Shared Services Sp. z o.o. Poland 100% 100%
Non-beverage Country Reference
Number of
subsidiaries
Parent
direct
ownership
Consolidated
ownership
Ejendomsaktieselskabet Tuborg Nord C Denmark 100% 100%
Ejendomsaktieselskabet af 4. marts 1982 Denmark 100% 100%
Carlsberg Ejendomme Holding A/S Denmark 100% 100%
Boliginteressentskabet Tuborg Denmark H 100% 100%
H A separate annual report is not prepared.

CARLSBERG GROUP ANNUAL REPORT 2018 PARENT COMPANY FINANCIAL STATEMENT 124
PARENT COMPANY FINANCIAL
STATEMENTS
Income statement ................................ 125
Statement of comprehensive
income ...................................................... 125
Statement of financial position ...... 126
Statement of changes in equity ..... 127
Statement of cash flows ................... 127
Notes ......................................................... 128
SECTION 1
SUBSIDIARIES AND RELATED PARTIES
1.1 Investments in subsidiaries ....................... 128
1.2 Related parties ............................................. 128
SECTION 2
CAPITAL STRUCTURE
2.1 Financial income and expenses .............. 129
2.2 Net interest-bearing debt ......................... 129
2.3 Share capital ................................................. 130
SECTION 3
STAFF COSTS AND REMUNERATION
3.1 Staff costs and remuneration .................. 131
3.2 Retirement benefit obligations ................ 131
SECTION 4
OTHER DISCLOSURE REQUIREMENTS
4.1 Other operating activities, net ................. 132
4.2 Provisions ....................................................... 132
4.3 Special items ................................................. 132
4.4 Asset base and leases ............................... 132
4.5 Fees to auditors ........................................... 132
4.6 Tax ................................................................... 133
4.7 Contingent liabilities and other
commitments ............................................... 134
4.8 Events after the reporting period ........... 134
SECTION 5
GENERAL ACCOUNTING POLICIES
5 General accounting policies ..................... 134
PARENT COMPANY FINANCIAL STATEMENTS
Parent Company financial statement

CARLSBERG GROUP ANNUAL REPORT 2018 PARENT COMPANY FINANCIAL STATEMENT 125
INCOME STATEMENT STATEMENT OF COMPREHENSIVE INCOME DKK million Section 2018 2017
Administrative expenses -64 -75 Other operating activities, net 4.1 -56 -48
Operating profit before special items -120 -123 Special items 4.3 - 50
Financial income 2.1 2,448 1,530 Financial expenses 2.1 -12 -6
Profit before tax 2,316 1,451 Income tax 4.6 29 31
Profit for the year 2,345 1,482
Attributable to
Dividend to shareholders 2,746 2,441 Reserves -401 -959
Profit for the year 2,345 1,482
DKK million Section 2018 2017
Profit for the year 2,345 1,482
Other comprehensive income Retirement benefit obligations 3.2 -3 3
Income tax 4.6 1 -1
Items that will not be reclassified to the income statement -2 2
Other comprehensive income -2 2
Total comprehensive income 2,343 1,484

CARLSBERG GROUP ANNUAL REPORT 2018 PARENT COMPANY FINANCIAL STATEMENT 126
STATEMENT OF FINANCIAL POSITION
DKK million Section 31 Dec. 2018 31 Dec. 2017
EQUITY AND LIABILITIES
Equity
Share capital 2.3 3,051 3,051
Retained earnings 41,937 41,908
Total equity 44,988 44,959
Non-current liabilities
Retirement benefit obligations and similar obligations 3.2 34 34
Provisions 4.2 50 51
Total non-current liabilities 84 85
Current liabilities
Borrowings 1.2 1,647 1,477
Trade payables 113 122
Provisions 4.2 35 54
Other liabilities 59 47
Total current liabilities 1,854 1,700
Total liabilities 1,938 1,785
Total equity and liabilities 46,926 46,744
DKK million Section 31 Dec. 2018 31 Dec. 2017
ASSETS
Non-current assets
Intangible assets 4.4 6 8
Property, plant and equipment 4.4 205 454
Investments in subsidiaries 1.1 45,238 45,340
Receivables 514 490
Deferred tax assets 4.6 117 127
Total non-current assets 46,080 46,419
Current assets
Receivables from subsidiaries 1.2 192 98
Tax receivables 7 12
Other receivables 1.2 647 215
Total current assets 846 325
Total assets 46,926 46,744

CARLSBERG GROUP ANNUAL REPORT 2018 PARENT COMPANY FINANCIAL STATEMENT 127
STATEMENT OF CHANGES IN EQUITY STATEMENT OF CASH FLOWS
DKK million Section Shareholders in Carlsberg A/S
2018 Share capital
Retained
earnings Total equity
Equity at 1 January 3,051 41,908 44,959
Profit for the year - 2,345 2,345
Other comprehensive income - -2 -2
Total comprehensive income for the year - 2,343 2,343
Acquisition/disposal of treasury shares 2.3 - 44 44
Settlement of share-based payments 2.3 - -94 -94
Share-based payments 3.1 - 14 14
Share-based payments to employees in subsidiaries - 161 161
Dividends paid to shareholders 2.3 - -2,439 -2,439
Total changes in equity - 29 29
Equity at 31 December 3,051 41,937 44,988
2017
Equity at 1 January 3,051 42,072 45,123
Profit for the year - 1,482 1,482
Other comprehensive income - 2 2
Total comprehensive income for the year - 1,484 1,484
Acquisition/disposal of treasury shares 2.3 - -118 -118
Settlement of share-based payments 2.3 - -38 -38
Share-based payments 3.1 - 9 9
Share-based payments to employees in subsidiaries - 24 24
Dividends paid to shareholders 2.3 - -1,525 -1,525
Total changes in equity - -164 -164
Equity at 31 December 3,051 41,908 44,959
DKK million Section 2018 2017
Operating profit before special items -120 -123
Depreciation and amortisation 10 17
Operating profit before depreciation and amortisation -110 -106
Other non-cash items 8 -12
Change in working capital¹ 17 101
Interest etc. received 6 3
Interest etc. paid -11 -6
Income tax paid 45 25
Cash flow from operating activities -45 5
Acquisition of property, plant and equipment and intangible assets -11 -205
Disposal of property, plant and equipment and intangible assets 5 -
Total operational investments -6 -205
Dividends from subsidiaries and joint ventures 1.2 2,441 1,526
Total financial investments 2,441 1,526
Other investments in property, plant and equipment -10 -
Disposal of other property, plant and equipment - 25
Total other activities² -10 25
Cash flow from investing activities 2,425 1,346
Free cash flow 2,380 1,351
Shareholders in Carlsberg A/S 2.3 -2,489 -1,681
External financing 109 330
Cash flow from financing activities -2,380 -1,351
Net cash flow - -
Cash and cash equivalents at 1 January - -
Cash and cash equivalents at 31 December - -
1 Change in working capital consists of other receivables of DKK 7m (2017: DKK 16m), trade payables and other
liabilities of DKK 33m (2017: DKK 112m) and retirement benefit obligations and other provisions of DKK -23m (2017:
DKK -27m). 2 Other activities cover real estate activities.

CARLSBERG GROUP ANNUAL REPORT 2018 PARENT COMPANY FINANCIAL STATEMENT 128
SECTION 1.1
INVESTMENTS IN SUBSIDIARIES
The carrying amount includes goodwill of DKK
11,206m (2017: DKK 11,206m) on acquisition
of subsidiaries. Share-based payments to
employees in subsidiaries comprise exercised as
well as outstanding share-based incentive
instruments.
Investments in subsidiaries
DKK million 2018 2017
Cost
Cost at 1 January 45,340 45,513
Capital injection 261 -
Share-based payments
to employees, net -363 -173
Cost at 31 December 45,238 45,340
Carrying amount at 31
December 45,238 45,340
Please see section 10 in the consolidated financial
statements for a list of companies in the Carlsberg Group.
ACCOUNTING ESTIMATES AND JUDGEMENTS
Management performs an annual test on investments
in subsidiaries for indications of impairment.
Impairment tests are conducted in the same way as
for goodwill in the Group, cf. section 2.2 in the
consolidated financial statements.
It is management’s assessment that no indications of
impairment existed at year-end 2018. Impairment
tests have therefore not been carried out for
subsidiaries.
ACCOUNTING POLICIES
Dividends on investments in subsidiaries are
recognised in the income statement of the Parent
Company in the financial year in which the dividend is
declared.
Investments in subsidiaries are measured at the lower
of cost and recoverable amount.
Share-based payments granted to employees of the
Company’s subsidiaries and the recharge of losses to
the subsidiaries in connection with the employees’
exercise of share-based awards are recognised as
contributions to and reductions of the investment in
the subsidiaries respectively.
SECTION 1.2
RELATED PARTIES
The Carlsberg Foundation, H.C. Andersens
Boulevard 35, 1553 Copenhagen V, Denmark,
exercises control over Carlsberg A/S. The
Foundation holds 30.3% of the shares and
75.4% of the voting power in Carlsberg A/S,
excluding treasury shares.
The following transactions took place between
the Carlsberg Foundation and the Carlsberg
Group in 2018:
• The Carlsberg Foundation received a dividend
from Carlsberg A/S.
• Funding and grants for research and
development activities were received from the
Carlsberg Foundation.
• Carlsberg A/S leased parking spaces from the
Carlsberg Foundation.
• The Carlsberg Science to Business forum was
organised by the Carlsberg Foundation and
the Group.
• Carlsberg A/S held the Annual General
Meeting at Ny Carlsberg Glyptotek.
The transactions are described in further detail
in section 8.2 of the consolidated financial
statements.
It is estimated that the benefit for the Carlsberg
Group corresponds to the value of the services
provided to the Carlsberg Foundation, which in
turn corresponds to what each party would
have had to pay to have the same deliverables
provided by external parties.
OTHER RELATED PARTIES
Related parties also comprise Carlsberg A/S’
Supervisory Board and Executive Board, their
close family members and companies in which
these persons have significant influence. During
the year, there were no transactions between
these parties and the Group, except for
remuneration as disclosed in section 3.
No losses on loans to or receivables from
subsidiaries or joint ventures were recognised or
provided for in either 2018 or 2017.
Transactions with subsidiaries
DKK million 2018 2017
Other operating
activities, net 25 10
Interest income 6 3
Interest expenses -8 -6
Dividends received 2,441 1,526
Capital injection 261 -
Loans 560 500
Receivables 144 86
Borrowings -1,647 -1,477
Trade payables -9 -13
The fair value of receivables and borrowings in
subsidiaries corresponds to the carrying amount in all
material respects.
SECTION 1
SUBSIDIARIES AND RELATED PARTIES

CARLSBERG GROUP ANNUAL REPORT 2018 PARENT COMPANY FINANCIAL STATEMENT 129
SECTION 2.1
FINANCIAL INCOME AND EXPENSES
Interest income relates to interest from cash
and cash equivalents and loans to subsidiaries,
whereas interest expenses relate to interest on
borrowings.
Financial items recognised in the income
statement
DKK million 2018 2017
Financial income
Interest income 7 3
Dividends from
subsidiaries 2,441 1,526
Other - 1
Total 2,448 1,530
Financial expenses
Interest expenses -8 -6
Other -4 -
Total -12 -6
Financial items, net 2,436 1,524
No financial items were recognised in other
comprehensive income.
The average effective interest rate on loans to
subsidiaries was 0.6% (2017: 0.7%) and on
loans from subsidiaries 0.5% (2017: 0.5%).
SECTION 2.2
NET INTEREST-BEARING DEBT
SECTION 2
CAPITAL STRUCTURE
Net interest-bearing debt
DKK million 2018 2017
Current borrowings 1,647 1,477
Gross interest-bearing debt 1,647 1,477
Receivables -2 -1
Loans to subsidiaries -560 -500
Net interest-bearing debt 1,085 976
Changes in net interest-bearing debt
Net interest-bearing debt at 1 January 976 646
Cash flow from operating activities, excluding interest-bearing part 45 -5
Cash flow from investing activities -2,425 -1,346
Dividends to shareholders 2,439 1,525
Acquisition/disposal of treasury shares and settlement of share-based payments 50 156
Total change 109 330
Net interest-bearing debt at 31 December 1,085 976

CARLSBERG GROUP ANNUAL REPORT 2018 PARENT COMPANY FINANCIAL STATEMENT 130
SECTION 2.3
SHARE CAPITAL
DIVIDENDS
The proposed dividend of DKK 18.00 per share,
in total DKK 2,746m (2017: DKK 16.00 per
share, in total DKK 2,441m), is included in
retained earnings at 31 December 2018.
Dividends paid out in 2018 for 2017, net of
dividends to treasury shares amount to DKK
2,439m (paid out in 2017 for 2016: DKK
1,525m). Dividends paid out to shareholders of
Carlsberg A/S do not impact taxable income in
Carlsberg A/S.
SHARE BUY-BACK AND TREASURY SHARES
During the 12-month period from 6 February
2019, the Group intends to buy back shares
worth up to DKK 4.5bn. The share buy-back
programme will be split into two tranches of
approximately six months each and will be
executed in accordance with Article 5 of
Regulation No 596/2014 of the European
Parliament and Council of 16 April 2014
(MAR) and the Commission Delegated
Regulation (EU) 2016/1052, also referred to
as the Safe Harbour Regulation. The first
tranche is a share buy-back programme worth
up to DKK 2.5bn, with a maximum of 15
million shares. The Company is entitled to
suspend or stop the programme at any time.
According to the authorisation of the Annual
General Meeting, the Supervisory Board may,
in the period until 13 March 2023, allow the
Company to acquire treasury shares up to a
total holding of 10% of the nominal share
capital at a price quoted on Nasdaq
Copenhagen at the time of acquisition with a
deviation of up to 10%.
The permitted holding of treasury shares covers
those acquired in share buy-back programmes.
In the financial year, the Company acquired
class B treasury shares of a nominal amount of
DKK 4m (2017: DKK 8m) at an average price
of DKK 740 (2017: DKK 706). Class B treasury
shares are primarily acquired and disposed of
to facilitate settlement of the share-based
incentive programmes. The Company holds no
class A shares.
At 31 December 2018, the fair value of
treasury shares amounted to DKK 69m (2017:
DKK 124m). The holdings of treasury shares
are specified in section 4.3 in the consolidated
financial statements.
Transactions with shareholders in
Carlsberg A/S
DKK million 2018 2017
Dividends to
shareholders -2,439 -1,525
Acquisition of treasury
shares -128 -266
Disposal of treasury
shares 78 110
Total -2,489 -1,681
Share capital
Class A shares Class B shares Total share capital
Shares of
DKK 20
Nominal
value, DKK
'000
Shares of
DKK 20
Nominal
value, DKK
'000
Shares of
DKK 20
Nominal value,
DKK '000
1 January 2017 33,699,252 673,985
118,857,554 2,377,151 152,556,806 3,051,136
No change in 2017 - - - - - -
31 December 2017 33,699,252 673,985
118,857,554 2,377,151 152,556,806 3,051,136
No change in 2018 - - - - - -
31 December 2018 33,699,252 673,985
118,857,554 2,377,151 152,556,806 3,051,136
A shares carry 20 votes per DKK 20 share. B shares carry two votes per DKK 20 share. A preferential right to an 8%
non-cumulative dividend is attached to B shares. Apart from votes and dividends, all shares rank equally.

CARLSBERG GROUP ANNUAL REPORT 2018 PARENT COMPANY FINANCIAL STATEMENT 131
SECTION 3.1
STAFF COSTS AND REMUNERATION
The remuneration of the Supervisory Board,
the executive directors and key management
personnel is described in detail in the
Remuneration report in the Management
review.
In 2018, the Supervisory Board received total
remuneration of DKK 9.35m (2017: DKK
9.58m), comprising fixed salary only.
SHARE-BASED INCENTIVE PROGRAMMES
The executive directors in the Parent Company
are the same as for the Carlsberg Group.
Please refer to section 7.3 in the consolidated
financial statements for share-based incentive
programmes for the executive directors.
PERFORMANCE SHARES
Besides the executive directors, one employee
in the Parent Company participates in the
Group’s performance share programmes as
described in section 7.3 in the consolidated
financial statements. Refunds etc. between
Carlsberg A/S and its subsidiaries are
recognised directly in equity.
ACCOUNTING POLICIES
Staff costs are recognised in the financial year in
which the employee renders the related service. The
fair value of share-based incentives, which is
expensed over the vesting period of the programme
according to the service conditions, is recognised in
staff costs and offset directly against equity.
The fair value of share-based incentives granted to
employees in subsidiaries is recognised as
investments in subsidiaries, and offset directly against
equity.
The difference between the purchase price and the
selling price for the exercise of share-based incentives
is settled between Carlsberg A/S and the individual
subsidiary and offset directly against investments in
subsidiaries.
The difference between the fair value of the Parent
Company’s equity instruments and the exercise price
of outstanding share-based incentives is recognised
as a receivable and offset directly against investments
in subsidiaries.
Share-based incentives granted to the Parent
Company’s own employees are recognised and
measured in accordance with the accounting policies
used by the Group.
SECTION 3.2
RETIREMENT BENEFIT OBLIGATIONS
Retirement benefit obligations and similar
obligations comprise payments to retired
directors that are not covered by an insurance
company. The plan is unfunded.
Total obligations amounted to DKK 34m
(2017: DKK 34m) and include actuarial losses
of DKK 3m (2017: DKK 3m gain) and benefits
paid in the year of DKK 3m (2017: DKK 4m).
Of the expected payment obligation, DKK 3m
is due within one year and DKK 17m after
more than five years from the reporting date.
The underlying actuarial assumptions are
based on local economic and labour market
conditions. The discount rate was 0.5%, the
same as in 2017. The rate of increase in future
retirement obligations was 1% (2017: -2%).
During the year, DKK 0m (2017: DKK 0m) was
recognised in the income statement, and DKK
-3m (2017: DKK 3m) was recognised in other
comprehensive income.
SECTION 3
STAFF COSTS AND REMUNERATION
Staff costs and remuneration
DKK million 2018 2017
Salaries and other remuneration 104 104
Retirement benefit costs - defined contribution plans 5 5
Share-based payments 40 30
Total 149 139
Staff costs are included in the following items in the income statement
Administrative expenses 43 39
Other operating activities, net 54 57
Total staff costs recognised by the Parent Company 97 96
Staff costs recognised by other Group companies 52 43
Total 149 139
The Company had an average of 80 (2017: 81) full-time employees during the year.

CARLSBERG GROUP ANNUAL REPORT 2018 PARENT COMPANY FINANCIAL STATEMENT 132
SECTION 4.1
OTHER OPERATING ACTIVITIES, NET
Other operating activities are secondary to the
principal activities of the Group and include
income and expenses relating to rental
properties, research activities, and gains and
losses on the disposal of intangible assets and
property, plant and equipment.
Other operating activities, net
DKK million 2018 2017
Gains on disposal of real
estate 5 22
Real estate, net -21 -23
Research activities,
including the Carlsberg
Research Laboratory, net -40 -47
Total -56 -48
Research expenses are partially financed
through funding received from the Carlsberg
Foundation for the operation of the Carlsberg
Research Laboratory and other grants. The
funding and grants are recognised in the
income statement in the same period as the
activities to which they relate.
SECTION 4.2
PROVISIONS
Provisions primarily comprise warranty
provisions regarding real estate disposed of
and provisions for ongoing disputes and
lawsuits etc.
At 31 December 2018, provisions amounted to
DKK 85m (2017: DKK 105m). Provisions
amounting to DKK 20m (2017: DKK 27m)
were utilised during the year. Reversal of
provisions amounted to DKK 0m (2017: DKK
53m).
Of total provisions, DKK 35m (2017: DKK
54m) falls due within one year and DKK 0m
(2017: DKK 0m) after more than five years
from the end of the reporting period.
SECTION 4.3
SPECIAL ITEMS
No special items were recognised in 2018. In
2017, special items amounted to DKK 50m
and related to reversal of provisions related to
disposal of property, plant and equipment in
prior years.
SECTION 4.4
ASSET BASE AND LEASES
The carrying amount of intangible assets was
DKK 6m (2017: DKK 8m), and the carrying
amount of property, plant and equipment was
DKK 205m (2017: DKK 454m). Property, plant
and equipment comprised mainly land and
buildings of DKK 176m (2017: DKK 182m),
and property, plant and equipment under
construction of DKK 18m (2017: DKK 262m).
The decrease in property, plant and equipment
is due to injection of property under
development into a subsidiary.
Depreciation and amortisation of DKK 10m
(2017: DKK 17m) were included in
administrative expenses.
Carlsberg A/S has entered into an operating
lease agreement relating to transport
equipment. The lease does not contain any
special purchase rights etc. Future lease
payments total DKK 2m (2017: DKK 1m).
Operating lease payments recognised in the
income statement in 2018 amounted to DKK
2m (2017: DKK 1m).
SECTION 4.5
FEES TO AUDITORS
Fees to auditors appointed by the Annual
General Meeting
DKK million 2018 2017
Statutory audit 0.3 0.3
Assurance engagements - -
Tax advisory - -
Other services - -
Total 0.3 0.3
SECTION 4
OTHER DISCLOSURE REQUIREMENTS
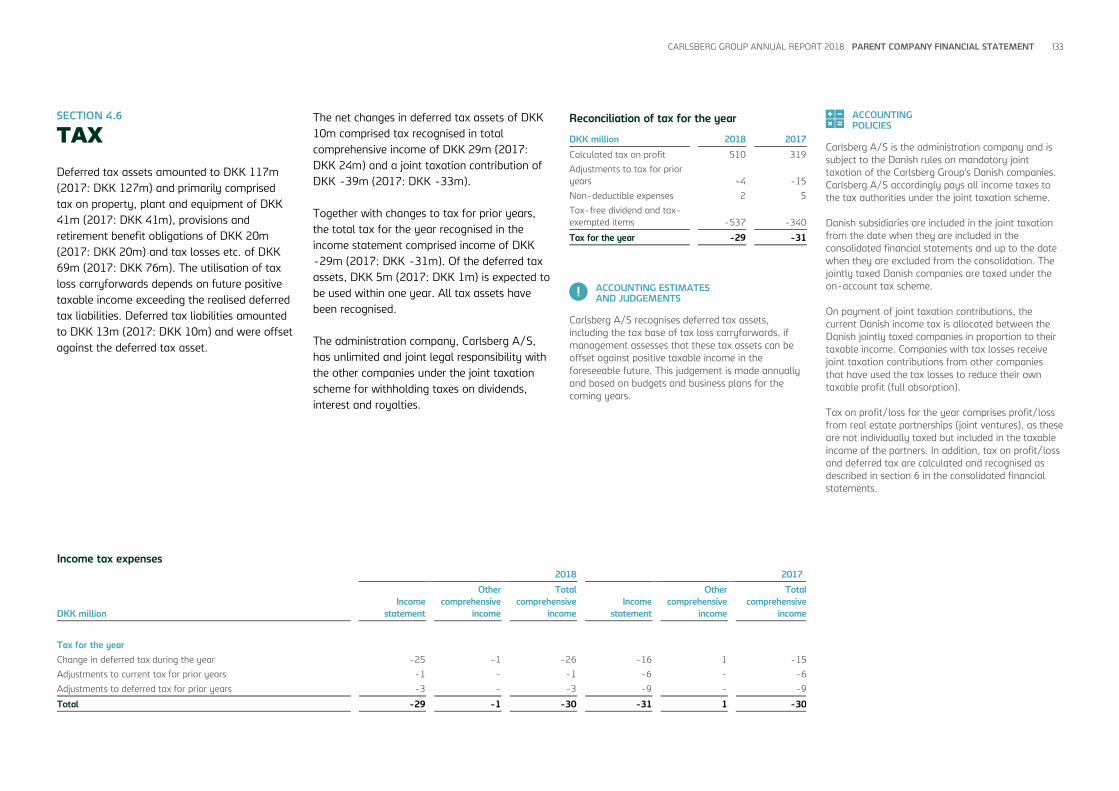
CARLSBERG GROUP ANNUAL REPORT 2018 PARENT COMPANY FINANCIAL STATEMENT 133
SECTION 4.6
TAX
Deferred tax assets amounted to DKK 117m
(2017: DKK 127m) and primarily comprised
tax on property, plant and equipment of DKK
41m (2017: DKK 41m), provisions and
retirement benefit obligations of DKK 20m
(2017: DKK 20m) and tax losses etc. of DKK
69m (2017: DKK 76m). The utilisation of tax
loss carryforwards depends on future positive
taxable income exceeding the realised deferred
tax liabilities. Deferred tax liabilities amounted
to DKK 13m (2017: DKK 10m) and were offset
against the deferred tax asset.
The net changes in deferred tax assets of DKK
10m comprised tax recognised in total
comprehensive income of DKK 29m (2017:
DKK 24m) and a joint taxation contribution of
DKK -39m (2017: DKK -33m).
Together with changes to tax for prior years,
the total tax for the year recognised in the
income statement comprised income of DKK
-29m (2017: DKK -31m). Of the deferred tax
assets, DKK 5m (2017: DKK 1m) is expected to
be used within one year. All tax assets have
been recognised.
The administration company, Carlsberg A/S,
has unlimited and joint legal responsibility with
the other companies under the joint taxation
scheme for withholding taxes on dividends,
interest and royalties.
Reconciliation of tax for the year
DKK million 2018 2017
Calculated tax on profit 510 319
Adjustments to tax for prior
years -4 -15
Non-deductible expenses 2 5
Tax-free dividend and tax-
exempted items -537 -340
Tax for the year -29 -31
ACCOUNTING ESTIMATES AND JUDGEMENTS
Carlsberg A/S recognises deferred tax assets,
including the tax base of tax loss carryforwards, if
management assesses that these tax assets can be
offset against positive taxable income in the
foreseeable future. This judgement is made annually
and based on budgets and business plans for the
coming years.
ACCOUNTING POLICIES
Carlsberg A/S is the administration company and is
subject to the Danish rules on mandatory joint
taxation of the Carlsberg Group’s Danish companies.
Carlsberg A/S accordingly pays all income taxes to
the tax authorities under the joint taxation scheme.
Danish subsidiaries are included in the joint taxation
from the date when they are included in the
consolidated financial statements and up to the date
when they are excluded from the consolidation. The
jointly taxed Danish companies are taxed under the
on-account tax scheme.
On payment of joint taxation contributions, the
current Danish income tax is allocated between the
Danish jointly taxed companies in proportion to their
taxable income. Companies with tax losses receive
joint taxation contributions from other companies
that have used the tax losses to reduce their own
taxable profit (full absorption).
Tax on profit/loss for the year comprises profit/loss
from real estate partnerships (joint ventures), as these
are not individually taxed but included in the taxable
income of the partners. In addition, tax on profit/loss
and deferred tax are calculated and recognised as
described in section 6 in the consolidated financial
statements.
Income tax expenses
2018 2017
DKK million
Income
statement
Other
comprehensive
income
Total
comprehensive
income
Income
statement
Other
comprehensive
income
Total
comprehensive
income
Tax for the year
Change in deferred tax during the year -25 -1 -26 -16 1 -15
Adjustments to current tax for prior years -1 - -1 -6 - -6
Adjustments to deferred tax for prior years -3 - -3 -9 - -9
Total -29 -1 -30 -31 1 -30

CARLSBERG GROUP ANNUAL REPORT 2018 PARENT COMPANY FINANCIAL STATEMENT 134
SECTION 4.7
CONTINGENT LIABILITIES AND OTHER COMMITMENTS
Carlsberg A/S has issued guarantees to
subsidiaries for pension obligations of DKK
339m (2017: DKK 349m).
Carlsberg A/S is jointly registered for Danish
VAT and excise duties with Carlsberg
Breweries, Carlsberg Danmark and various
other minor Danish subsidiaries, and Carlsberg
A/S is jointly and severally liable for payment
of VAT and excise duties.
Carlsberg A/S is party to certain lawsuits,
disputes etc. of various scopes. In
management’s opinion, apart from items
recognised in the statement of financial
position or disclosed in the financial
statements, the outcome of these lawsuits,
disputes etc. will not have a material negative
effect on the Company’s financial position.
Carlsberg A/S has issued a guarantee in
respect of rental obligations of DKK 32m
(2017: DKK 63m).
SECTION 4.8
EVENTS AFTER THE REPORTING PERIOD
Apart from the events recognised or disclosed
in the financial statements, no events have
occurred after the reporting date of importance
to the financial statements.
The 2018 financial statements of Carlsberg
A/S have been prepared in accordance with
International Financial Reporting Standards
(IFRS) as adopted by the EU and further
requirements in the Danish Financial
Statements Act.
The financial statements are presented in
Danish kroner (DKK), which is the presentation
currency.
The accounting policies for the Parent
Company are the same as for the Group, cf.
section 9 in the consolidated financial
statements and the individual sections.
SIGNIFICANT ACCOUNTING ESTIMATES
AND JUDGEMENTS
In preparing Carlsberg A/S’ financial
statements, management makes various
accounting estimates and judgements that
form the basis of presentation, recognition and
measurement of the Company’s assets and
liabilities.
The estimates and judgements made are based
on historical experience and other factors that
management assesses to be reliable, but that
by their very nature are associated with
uncertainty and unpredictability. These
estimates and judgements may therefore prove
incomplete or incorrect, and unexpected events
or circumstances may arise.
The significant accounting estimates and
judgements made and accounting policies
specific to the Parent Company are presented
in the explanatory notes.
SECTION 5
GENERAL ACCOUNTING POLICIES

CARLSBERG GROUP ANNUAL REPORT 2018 FINANCIAL STATEMENTS 135
The Supervisory Board and the Executive
Board have today discussed and approved the
Annual Report of the Carlsberg Group and the
Parent Company for 2018.
The Annual Report has been prepared in
accordance with International Financial
Reporting Standards as adopted by the EU and
further requirements in the Danish Financial
Statements Act.
In our opinion, the consolidated financial
statements and the Parent Company’s financial
statements give a true and fair view of the
Carlsberg Group’s and the Parent Company’s
assets, liabilities and financial position at
31 December 2018 and of the results of the
Carlsberg Group’s and the Parent Company’s
operations and cash flows for the financial
year 2018.
Further, in our opinion the Management review
includes a fair review of the development in the
Carlsberg Group’s and the Parent Company’s
operations and financial matters, of the result
for the year, and of the Carlsberg Group’s and
the Parent Company’s financial position as well
as describing the significant risks and
uncertainties affecting the Carlsberg Group and
the Parent Company.
We recommend that the Annual General
Meeting approve the Annual Report.
Copenhagen, 6 February 2019
REPORTS
MANAGEMENT STATEMENT
Financial statements
Executive Board of Carlsberg A/S
Cees 't Hart
President & CEO
Heine Dalsgaard
CFO
Supervisory Board of Carlsberg A/S
Flemming Besenbacher
Chairman
Lars Rebien Sørensen
Deputy Chairman
Hans Andersen
Carl Bache
Richard Burrows
Donna Cordner
Magdi Batato
Eva Vilstrup Decker
Erik Lund
Finn Lok
Peter Petersen
Søren-Peter Fuchs Olesen
Lars Stemmerik Nina Smith

CARLSBERG GROUP ANNUAL REPORT 2018 FINANCIAL STATEMENTS 136
TO THE SHAREHOLDERS OF
CARLSBERG A/S
OUR OPINION
In our opinion, the Consolidated Financial
Statements and the Parent Company Financial
Statements (pp 56-134) give a true and fair
view of the Group’s and the Parent Company’s
financial position at 31 December 2018 and of
the results of the Group’s and the Parent
Company’s operations and cash flows for the
financial year 1 January to 31 December 2018
in accordance with International Financial
Reporting Standards as adopted by the EU and
further requirements in the Danish Financial
Statements Act.
Our opinion is consistent with our Auditor’s
Long-form Report to the Audit Committee and
the Supervisory Board.
What we have audited
The Consolidated Financial Statements and
Parent Company Financial Statements of
Carlsberg A/S for the financial year 1 January
to 31 December 2018 comprise income
statement, statement of comprehensive
income, statement of financial position,
statement of changes in equity, statement of
cash flows and notes, including summary of
significant accounting policies for the Group as
well as for the Parent Company. Collectively
referred to as the “Financial Statements”.
BASIS FOR OPINION
We conducted our audit in accordance with
International Standards on Auditing (ISAs) and
the additional requirements applicable in
Denmark. Our responsibilities under those
standards and requirements are further
described in the Auditor’s responsibilities for the
audit of the Financial Statements section of our
report.
We believe that the audit evidence we have
obtained is sufficient and appropriate to provide
a basis for our opinion.
Independence
We are independent of the Group in
accordance with the International Ethics
Standards Board for Accountants’ Code of
Ethics for Professional Accountants (IESBA
Code) and the additional requirements
applicable in Denmark. We have also fulfilled
our other ethical responsibilities in accordance
with the IESBA Code.
To the best of our knowledge and belief,
prohibited non-audit services referred to in
Article 5(1) of Regulation (EU) No 537/2014
were not provided.
Appointment
We were first appointed auditors of Carlsberg
A/S on 30 March 2017 for the financial year
2017. We have been reappointed annually by
shareholder resolution for a total period of
uninterrupted engagement of two years
including the financial year 2018.
KEY AUDIT MATTERS
Key audit matters are those matters that, in
our professional judgement, were of most
significance in our audit of the Financial
Statements for 2018. These matters were
addressed in the context of our audit of the
Financial Statements as a whole, and in
forming our opinion thereon, and we do not
provide a separate opinion on these matters.
REPORTS
INDEPENDENT AUDITOR’S REPORT

CARLSBERG GROUP ANNUAL REPORT 2018 FINANCIAL STATEMENTS 137
Key audit matter How our audit addressed the key audit matter
Recoverability of the carrying amount of goodwill and brands
The principal risks relate to
Management’s assessment of the
future timing and amount of cash
flows, which are used to project the
recoverability of the carrying
amount of goodwill and brands.
There are specific risks related to
macroeconomic conditions and
volatile earnings caused by volume
decline, intensified competition and
changed regulations in key markets
– conditions that could also result in
Management deciding to change
brand strategy to drive business
performance.
Bearing in mind the generally long-
lived nature of the assets, the most
critical assumptions are
Management’s view of cash-
generating units, prices, volumes,
discount rates, growth rates, royalty
rates, expected useful life and costs,
and future free cash flows.
We focused on this area, as
Management is required to exercise
considerable judgement because of
the inherent complexity in
estimating future cash flows.
The key assumptions and
accounting treatment are described
in section 2.2 “Impairment” of the
Consolidated Financial Statements.
In addressing the risks, we walked through and tested relevant controls
designed and operated relating to the assessment of the carrying amount of
goodwill and brands.
We considered the appropriateness of Management’s defined cash-generating
units (CGUs) within the business. We evaluated whether there were factors
requiring Management to change their definition. We examined the
methodology used by Management to assess the carrying amount of goodwill
and brands assigned to CGUs and the process for identifying CGUs that require
impairment testing to determine compliance with IFRS.
We performed detailed testing for the assets where an impairment review was
required or indications of impairment were identified. For those assets, we
analysed the reasonableness of key assumptions in relation to the ongoing
operation of the assets.
We corroborated estimates of future cash flows and challenged whether they
are reasonable and supported by the most recent approved Management
budgets, including expected future performance of the CGUs, and challenged
whether these are appropriate in light of future macroeconomic expectations in
the markets.
We used our internal valuation specialists and evaluated the assumptions used
by Management, including assessment of price and volume forecasts, discount
rates and long-term growth rates, and tested the mathematical accuracy of
the relevant value-in-use models prepared by Management.
Further, we assessed the appropriateness of disclosures including sensitivity
analyses prepared for the key assumptions.
Key audit matter How our audit addressed the key audit matter
Revenue recognition
Recognition of revenue is complex
due to the extent of different
revenue streams ranging from sales
of goods, royalty income, porterage
income and sales of by-products
recognised when all significant risks
and rewards have been transferred
to the customer or in terms of the
licence agreement.
Complexity further includes the
implementation of IFRS 15 Revenue
from Contracts with Customers in
2018.
We focused on this area, as there is
a risk of non-compliance with
accounting policies due to
complexity originating from different
customer behaviour, structures,
market conditions and terms in the
various countries.
Furthermore, the various discounts
and locally imposed duties and fees
in regard to revenue recognition are
complex and introduce an inherent
risk to the revenue recognition
process.
Revenue recognition and accounting
treatment are described in section
1.1 “Segmentation of operations–
Accounting estimates and
judgements” of the Consolidated
Financial Statements.
Our audit procedures included considering the appropriateness of the revenue
recognition accounting policies and assessing compliance with IFRS 15.
We tested the relevant controls, including applicable information systems and
Management’s monitoring of controls used to ensure the completeness,
accuracy and timing of revenue recognised.
We discussed the key assumptions related to the recognition and classification
of revenue with Management. Further, we performed substantive procedures
regarding invoicing, significant contracts, significant transactions (including
discounts) and locally imposed duties and fees in order to assess the accounting
treatment and principles applied. In testing contracts and discounts the
implementation of IFRS 15 was assessed.
We applied data analysis in our testing of revenue transaction in order to
identify transactions outside the ordinary transaction flow, including journal
entry testing and cut-off testing at year-end.

CARLSBERG GROUP ANNUAL REPORT 2018 FINANCIAL STATEMENTS 138
STATEMENT ON THE MANAGEMENT REVIEW
Management is responsible for Management
Review (pp 3-55).
Our opinion on the Financial Statements does
not cover Management Review, and we do not
express any form of assurance conclusion
thereon.
In connection with our audit of the Financial
Statements, our responsibility is to read
Management Review and, in doing so, consider
whether Management Review is materially
inconsistent with the Financial Statements or
our knowledge obtained in the audit, or
otherwise appears to be materially misstated.
Moreover, we considered whether
Management Review includes the disclosures
required by the Danish Financial Statements
Act.
Based on the work we have performed, in our
view, Management Review is in accordance
with the Consolidated Financial Statements
and the Parent Company Financial Statements
and has been prepared in accordance with the
requirements of the Danish Financial
Statements Act. We did not identify any
material misstatement in Management Review.
MANAGEMENT’S RESPONSIBILITIES FOR THE
FINANCIAL STATEMENTS
Management is responsible for the preparation
of consolidated financial statements and parent
company financial statements that give a true
and fair view in accordance with International
Financial Reporting Standards as adopted by
the EU and further requirements in the Danish
Financial Statements Act, and for such internal
control as Management determines is
necessary to enable the preparation of financial
statements that are free from material
misstatement, whether due to fraud or error.
In preparing the Financial Statements,
Management is responsible for assessing the
Group’s and the Parent Company’s ability to
continue as a going concern, disclosing, as
applicable, matters related to going concern
and using the going concern basis of
accounting unless Management either intends
to liquidate the Group or the Parent Company
or to cease operations, or has no realistic
alternative but to do so.
AUDITOR’S RESPONSIBILITIES FOR THE AUDIT
OF THE FINANCIAL STATEMENTS
Our objectives are to obtain reasonable
assurance about whether the Financial
Statements as a whole are free from material
misstatement, whether due to fraud or error,
and to issue an auditor’s report that includes
our opinion. Reasonable assurance is a high
level of assurance, but is not a guarantee that
an audit conducted in accordance with ISAs
and the additional requirements applicable in
Denmark will always detect a material
misstatement when it exists. Misstatements
can arise from fraud or error and are
considered material if, individually or in the
aggregate, they could reasonably be expected
to influence the economic decisions of users
taken on the basis of these Financial
Statements.
As part of an audit in accordance with ISAs and
the additional requirements applicable in
Denmark, we exercise professional judgement
and maintain professional scepticism
throughout the audit. We also:
• Identify and assess the risks of material
misstatement of the Financial Statements,
whether due to fraud or error, design and
perform audit procedures responsive to those
risks, and obtain audit evidence that is
sufficient and appropriate to provide a basis
for our opinion. The risk of not detecting a
material misstatement resulting from fraud is
higher than for one resulting from error, as
fraud may involve collusion, forgery,
intentional omissions, misrepresentations, or
the override of internal control.
• Obtain an understanding of internal control
relevant to the audit in order to design audit
procedures that are appropriate in the
circumstances, but not for the purpose of
expressing an opinion on the effectiveness of
the Group’s and the Parent Company’s
internal control.
• Evaluate the appropriateness of accounting
policies used and the reasonableness of
accounting estimates and related disclosures
made by Management.
• Conclude on the appropriateness of
Management’s use of the going concern basis
of accounting and based on the audit
evidence obtained, whether a material
uncertainty exists related to events or
conditions that may cast significant doubt on
the Group’s and the Parent Company’s ability
to continue as a going concern. If we
conclude that a material uncertainty exists,
we are required to draw attention in our
auditor’s report to the related disclosures in
the Financial Statements or, if such
disclosures are inadequate, to modify our
opinion. Our conclusions are based on the
audit evidence obtained up to the date of our
auditor’s report. However, future events or
conditions may cause the Group or the Parent
Company to cease to continue as a going
concern.
• Evaluate the overall presentation, structure
and content of the Financial Statements,
including the disclosures, and whether the
Financial Statements represent the underlying
transactions and events in a manner that
achieves fair presentation.

CARLSBERG GROUP ANNUAL REPORT 2018 FINANCIAL STATEMENTS 139
• Obtain sufficient appropriate audit evidence
regarding the financial information of the
entities or business activities within the Group
to express an opinion on the Consolidated
Financial Statements. We are responsible for
the direction, supervision and performance of
the Group audit. We remain solely responsible
for our audit opinion.
We communicate with those charged with
governance regarding, among other matters,
the planned scope and timing of the audit and
significant audit findings, including any
significant deficiencies in internal control that
we identify during our audit.
We also provide those charged with
governance with a statement that we have
complied with relevant ethical requirements
regarding independence, and to communicate
with them all relationships and other matters
that may reasonably be thought to bear on our
independence, and where applicable, related
safeguards.
From the matters communicated with those
charged with governance, we determine those
matters that were of most significance in the
audit of the Financial Statements of the current
period and are therefore the key audit matters.
We describe these matters in our auditor’s
report unless law or regulation precludes public
disclosure about the matter or when, in
extremely rare circumstances, we determine
that a matter should not be communicated in
our report because the adverse consequences
of doing so would reasonably be expected to
outweigh the public interest benefits of such
communication.
Copenhagen, 6 February 2019
PricewaterhouseCoopers
Statsautoriseret Revisionspartnerselskab
CVR no 3377 1231
Mogens Nørgaard Mogensen
State Authorised Public Accountant
mne21404
Gert Fisker Tomczyk
State Authorised Public Accountant
mne9777

CARLSBERG GROUP ANNUAL REPORT 2018 FINANCIAL STATEMENTS 140
Carlsberg A/S
100 Ny Carlsberg Vej
1799 Copenhagen V
Denmark
Phone +45 3327 3300
www.carlsberggroup.com
CVR No. 61056416
Editor: Carlsberg Group Investor Relations
Design & layout: Operate & SkabelonDesign
Photos: Nana Reimers et al
Proofreading: Borella projects