ANNUAL REPORT 2018 - Bank of Botswana · BANK OF BOTSWANA ANNUAL REPORT 2018 7 Contents – Part B...
159
2018 ANNUAL REPORT
Transcript of ANNUAL REPORT 2018 - Bank of Botswana · BANK OF BOTSWANA ANNUAL REPORT 2018 7 Contents – Part B...
2018ANNUAL REPORT
STRATEGIC INTENT STATEMENTS
VISION
The Bank aspires to be a world-class central bank withthe highest standards of corporate governance and
professional excellence.
MISSION
The mission of the Bank is to contribute to the sound economic and financial well-being of the country. The Bank seeks to promote and maintain:
• monetary stability;• safe, sound and stable financial system;• efficient payments mechanism;• public confidence in the national currency;• sound international financial relations;
and to provide:− efficient banking services to its various clients; and− sound economic and financial advice to Government.
BANK OF BOTSWANA
ANNUAL REPORT
2018

BANK OF BOTSWANA ANNUAL REPORT 20182
BANK OF BOTSWANA ANNUAL REPORT 2018BANK OF BOTSWANA ANNUAL REPORT 20183
BANK OF BOTSWANA ANNUAL REPORT 20184
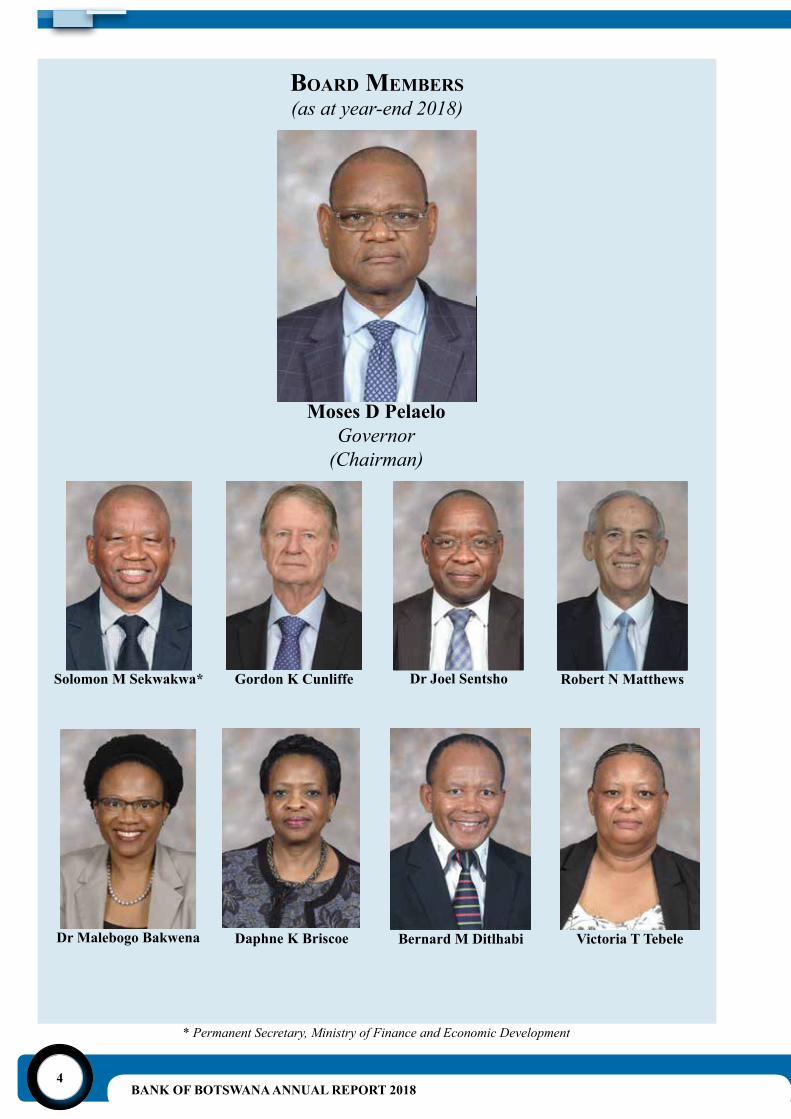
* Permanent Secretary, Ministry of Finance and Economic Development
Board MeMBers (as at year-end 2018)
Moses D PelaeloGovernor
(Chairman)
Gordon K Cunliffe Dr Joel SentshoSolomon M Sekwakwa* Robert N Matthews
Dr Malebogo Bakwena Daphne K Briscoe Victoria T TebeleBernard M Ditlhabi
BANK OF BOTSWANA ANNUAL REPORT 20185
Board MeMBers (as at year-end 2018)
Moses D Pelaelo
Governor
(Chairman)
Gordon K Cunliffe
Solomon M Sekwakwa*
Dr Joel Sentsho
Robert N Matthews
Dr Malebogo Bakwena
Daphne K Briscoe
Bernard M Ditlhabi
Victoria T Tebele
* Permanent Secretary, Ministry of Finance and Economic Development
BANK OF BOTSWANA ANNUAL REPORT 20186
Contents - Part a
Statutory Report on the Operations and FinancialStatements of the Bank - 2018
PageThe Governor’s Foreword 15
Statutory Report on the Operations and Financial Statement of the Bank in 2018 19 The Bank’s Mission and Objectives 19 Governance, Management and Organisational Structure of the Bank 21 Review of the Bank’s Main Activities in 2018 24Annual Financial Statements 35
BANK OF BOTSWANA ANNUAL REPORT 20187
Contents – Part B
CHAPTER 1 Page
1. The Botswana Economy in 2018 85 Output, Employment and Prices 85 Public Finance and the 2019/20 Budget 91 Exchange Rates, Balance of Payments and International Investment Position 96 Money and Capital Markets 105
CHAPTER 2 Page
2. Botswana: Financing Strategies for Industrialisation and Transition to High Income Status 111
Introduction 111 The Case for Special Economic Zones, Cluster and Hub Industrialisation Strategy 112 Evaluation of the Financing Options in Botswana 117 Cross-Country Experiences and Comparisons 135 Policy and Institutional Considerations Going Forward to Enhance Access to FinanceforIndustrialisationbyIdentifiedSectors 150 Conclusions and Policy Recommendations 151
Charts and taBlesCHARTS
Chart 1 Government Revenue Components 119Chart 2 DFIs’ Lending to Selected Sectors (Share of Total Credit) 123Chart 3 Annual Growth Rates in DFIs’ Lending to Selected Sectors 123Chart 4 BSE Market Capitalisation - Selected Sectors 126Chart 5 Shares Traded on the Domestic Board - Selected Sectors 126Chart 6 Total Value of Bonds Listed in the BSE - Selected Sectors 127Chart 7 Trends in Gross National Savings 129Chart 8 Commercial Bank Lending to Selected Sectors (Share of Total Credit) 130Chart 9 Annual Growth Rates in Commercial Bank Lending to Selected Sectors 130Chart 10 Pension Fund Assets 131Chart 11 Pension Fund Externally and Domestically Invested Assets 131Chart 12 DFIs Total Loans to GDP Ratio 141Chart 13 Commercial Bank Lending to the Manufacturing Sector (Share of Total Credit) 143Chart 14 Commercial Bank Lending to the Financial Sector (Share of Total Credit) 143Chart 15 Commercial Bank Lending to the Tourism Sector (Share of Total Credit) 143Chart 16 Commercial Bank Lending to the Agriculture Sector (Share of Total Credit) 143Chart 17 Market Capitalisation as a Percentage of GDP 144Chart 18 Size of Bond Market as a Percentage of GDP 144Chart 19 Pension Fund Allocation by Assets 145
BANK OF BOTSWANA ANNUAL REPORT 20188
TABLES
Table 1 Types of SEZs and their Intended Purpose 114Table 2 Country Comparisons - Rankings in Doing Business 2018 133Table 3 Botswana’s Global Competitiveness Rankings for 2018 Relative to Selected African Countries 133Table 4 DFIs. Source of Industrial Development Funding 137Table 5 Programme and Services Comparison 139Table 6 Deposit-Taking Institutions’ Total Credit to GDP Ratio 141Table 7 Key Lessons from Country Experiences 146
BANK OF BOTSWANA ANNUAL REPORT 20189
aBBreviations Used in the rePort
AACB - Association of African Central BanksAfDB - African Development BankAfrexim - African Export-ImportAML - Anti-Money LaunderingARC - Audit and Risk CommitteeBACH - Botswana Automated Clearing HouseBBS - Botswana Building SocietyBCL - Bamangwato Concessions LimitedBDC - Botswana Development CorporationBDF - Botswana Defence ForceaBEDU - Botswana Enterprises Development UnitBFS - Botswana Financial Statistics BISS - Botswana Inter-bank Settlement SystemBITRI - Botswana Institute for Technology, Research and InnovationBNDES - Brazil National Development BankBoBCs - BankofBotswanaCertificatesBSB - Botswana Savings BankBSE - Botswana Stock ExchangeCCBG - Committee of Central Bank GovernorsCEDA - Citizen Entrepreneurial Development AgencyCFT - Combating of the Financing of TerrorismCISO - ChiefInformationSecurityOfficerCITF - Construction Industry Trust FundCORFO - Corporation for Promotion of ProductionCSD - Central Securities DepositoryDBGSS - De Beers Global Sightholder SalesDBM - Development Bank of MauritiusDBS - Development Bank of SingaporeDBSA - Development Bank of Southern AfricaDFIs - Development Finance InstitutionsEDB - Economic Development BoardEFT - Electronic Funds TransferEPZ - Export Processing ZoneFAP - Financial Assistance PolicyFATF - Financial Action Task ForceFCA - Foreign Currency AccountFDI - Foreign Direct InvestmentFMIs - Financial Market InfrastructuresFSC - Financial Stability CouncilGDP - Gross Domestic ProductGEC - Governance and Ethics CommitteeGIA - Government Investment AccountGLCs - Government-Linked Companies
BANK OF BOTSWANA ANNUAL REPORT 201810
ICT - Information and Communication TechnologyIDC - Industrial Development CorporationIFC - International Finance Corporation IFRS - International Financial Reporting Standards IIP - International Investment PositionIMF - International Monetary FundKBL - Kgalagadi Breweries LimitedKDB - Korea Development BankKRB - Korea Reconstruction BankLAPCAS - Land Administration Procedures, Capacity and SystemsLEA - Local Enterprise AuthorityM&E - Monitoring and EvaluationMEFMI - Macroeconomic and Financial Management Institute of Eastern and Southern AfricaMFED - Ministry of Finance and Economic Development MITI - Ministry of Investment, Trade and IndustryMNOs - Mobile Network OperatorsMPC - Monetary Policy CommitteeMPR - Monetary Policy ReportMPS - Monetary Policy StatementNBFIs - Non-Bank Financial InstitutionsNDB - National Development BankNDP - National Development PlanNEER - Nominal Effective Exchange RateNEF - National Empowerment FundNFTRC - National Food Technology Research CentreNPLs - Non-Performing LoansNPS - National Payments SystemODC - Okavango Diamond CompanyOEHT - Austrian Tourism Development BankOPEC - Organisation of Petroleum Exporting CountriesPDSF - Public Debt Service FundPEEPA - Public Enterprises, Evaluation and Privatisation AgencyPPP - Public Private PartnershipR&D - Research and DevelopmentREER - Real Effective Exchange RateREMCO - Remuneration CommitteeRTGS - Real Time Gross SettlementSACU - Southern African Customs UnionSADC - Southern African Development CommunitySDGs - Sustainable Development GoalsSDR - Special Drawing RightsSEA - South East AsiaSEZ - Special Economic ZonesSEZA - Special Economic Zone AuthoritySIPS - Systematically Important Payments Systems

BANK OF BOTSWANA ANNUAL REPORT 201811
SMEs - Small Medium EnterprisesSMMEs - Small Micro and Medium-sized EnterprisesSOEs - State-Owned EnterprisesSPEDU - Selebi-PhikweEconomicDiversificationUnitSWFs - Sovereign Wealth FundsSWIFT - Society for Worldwide Interbank Financial TelecommunicationTHL - Temasek Holdings LimitedUK - United KingdomUNCTAD - United Nations Conference on Trade and DevelopmentUSA - United States of AmericaUSD - United States DollarUNWTO - United Nations World Tourism OrganisationVAT - Value Added TaxYDF - Youth Development Fund

BANK OF BOTSWANA ANNUAL REPORT 201812
Part a
Bank of Botswana
statUtory rePort on the oPerations and
finanCial stateMents of the Bank – 2018
BANK OF BOTSWANA ANNUAL REPORT 201814
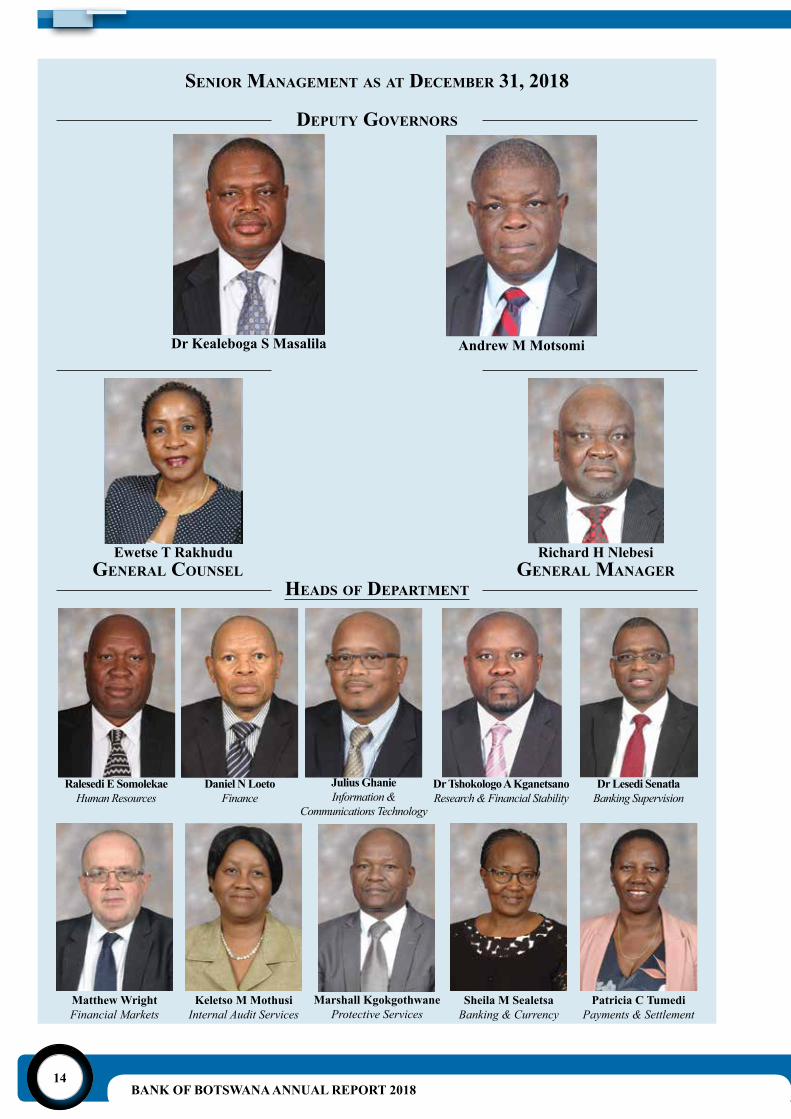
senior ManageMent as at deCeMBer 31, 2018
dePUty governors
Ewetse T Rakhudu Richard H Nlebesi
Andrew M MotsomiDr Kealeboga S Masalila
general CoUnsel general Managerheads of dePartMent
Daniel N LoetoFinance
Julius GhanieInformation &
Communications Technology
Ralesedi E SomolekaeHuman Resources
Dr Tshokologo A KganetsanoResearch & Financial Stability
Dr Lesedi SenatlaBanking Supervision
Keletso M MothusiInternal Audit Services
Marshall KgokgothwaneProtective Services
Sheila M SealetsaBanking & Currency
Patricia C TumediPayments & Settlement
Matthew WrightFinancial Markets
BANK OF BOTSWANA ANNUAL REPORT 201815
governor’s foreword
The 2018 Annual Report is published in accordance with Section 68(1) of the Bank of Botswana Act (CAP 55:01). The Report provides a summaryof theoperationsandauditedfinancial statementsof theBank for the year ended December 31, 2018.
The Report also covers the Bank’s key functions and responsibilities. It outlines the accountability framework for the Bank’s performance. These functions and responsibilities can be grouped into ten broad categories, namely:conductofmonetarypolicy;maintenanceoffinancialstability;implementation of the exchange rate policy; the design and issuance of currency; foreign exchange reserves management; regulation and supervision of banks; oversight of the payments systems; provision of banking and settlement services to Government, commercial banks and selected public institutions; economic research; policy advice to Government; and production and publication of balance of payments, financialandmonetarystatistics.
The Annual Report contains a review of recent economic developments in the Botswana economy and a theme chapter titled ‘Botswana: Financing Strategies for Industrialisation and Transition to High Income Status.’ The themechapteridentifiesandevaluatespracticalapproachestoimplementationofthecountry’sindustrialisationstrategy, in this instance,effectiveharnessingoffinanceasaresourceand input toexpansionand,also, toenhancingproductivityofidentifiedsectors.Thediscussioninthisthemechapterexpoundsonsomeoftheconcluding observations of the 2017 Annual Reportthemetopicandarticulatesalternativefinancingmodelsand resource mobilisation approaches that are likely to best serve the cluster/hub industrialisation strategy and advance the country to high - income status. In this regard, the theme chapter discusses the potential for clusters,hubs, andSMMEs in relation to the industrialisation strategy.Theexistingfinancingoptionsandimpactonindustrialisationinitiativesinthepastareassessedintermsofeither“gaps”ordesigndeficienciesand, accordingly, the theme chapter evaluates prospects for improvements to ensure sustained adequate funding ofthesectorsidentifiedforexecutionoftheindustrialisationstrategy.ThethemechaptercomparesBotswana’sfinancingandindustrialisationstrategiesandperformancewiththesuccessfulcountriesintheseareaswithaview to identifying the lessons to be drawn from such countries. Furthermore, the theme chapter provides a perspective on measures to enhance policy and institutional performance to foster industrialisation.
The Bank was successful in implementing the 2018 work programme and, in general, achieved its policy objectives for the year, notwithstanding challenges in the domestic and external environment, dominated by uncertainty and downside risks. Global economic activity was modest in 2018 with growth of 3.7 percent, comparedtothe3.8percentin2017,mainlyreflectingaslowerpaceofincreaseinglobaldemand.
For Botswana, both mining and non-mining output growth strengthened in the twelve months to September 2018, compared to the corresponding period in 2017. However, overall economic expansion was constrained by subdued domestic and global demand.
InflationinBotswanawasdampenedbymodestgrowthinpersonalincomes,themoderateincreaseinbankcredit, the resultant subdued domestic demand and benign global and trading partners’ inflation. Inflationwas, for most of 2018, within the 3 – 6 percent medium-term objective range and close to the lower bound, breachingthelowerboundtwice,inMarchandSeptember2018.AverageinflationforthetwelvemonthstoDecember 2018 was 3.2 percent.
Statutory report on the operationS and Financial StatementS oF the Bank, 2018
BANK OF BOTSWANA ANNUAL REPORT 201816
Monetarypolicywasconductedagainstthebackgroundofabelow-trendeconomicactivity(anon-inflationaryoutput gap) and a positive medium-term inflation outlook. These developments provided scope for anaccommodative monetary policy stance in support of stronger output growth. Hence the Bank Rate was maintained at 5 percent in 2018 and, consequently, the prime lending rate of commercial banks was unchanged at 6.5 percent, while deposit interest rates were similarly, virtually stable. Monetary policy entailed the use of BankofBotswanaCertificates(BoBCs)tomop-upexcessliquidityinanefforttomaintaininterestratesthatare consistent with the monetary policy stance. Consequently, outstanding BoBCs amounted to P8.2 billion inDecember2018,anincreasefromP6.3billioninDecember2017,reflectinganincreaseinbankingsystemliquidity that had to be mopped-up to anchor the monetary policy stance.
The Bank’s implementation of the exchange rate policy in 2018 entailed a 0.3 percent downward annual rate of crawl to stabilise the real effective exchange rate (REER); thus moderate the risk of a further appreciation of the REER, which was evident in the last half of 2017. The Pula basket weights were maintained at 45 percent and 55 percent for the South African rand and the Special Drawing Rights (SDR),1 respectively. The REER, however, appreciated marginally by 0.3 percent in the twelve months to December 2018, as the positive inflationdifferentialbetweenBotswanaandtradingpartnercountrieswasslightlylargerthanthedownwardrate of crawl.
With regard to the financial condition and performance, the Bank’s total assets declined by P2.1 billionto P72.2 billion in December 2018 (P74.3 billion in December 2017), of which P71.4 billion was foreign exchange reserves. In foreign currency terms (United States dollars (USD) and Special Drawing Rights), the foreign exchange reserves decreased from USD7.5 billion to USD6.7 billion and from SDR5.3 billion to SDR4.8 billion in the same period. At this level, the foreign exchange reserves were equivalent to 15 months ofimportcoverofgoodsandservices.Thedecreasereflects,amongothers,drawdownsofforeignexchangebygovernmentandsignificantadversevaluations,specificallyglobalequitymarketstowardstheendoftheyear.
The Bank’s net income for 2018 was P2.9 billion, compared to P739.5 million in 2017. After transferring non-distributable currency gains of P4 billion to the Currency Revaluation Reserve and market valuation losses of P5.9 billion to the Market Revaluation Reserve,2 the net distributable income to Government was P4.8 billion, higher than the P1.9 billion in 2017.
Thebankingindustrywassound,prudentlymanaged,solvent,liquidandprofitable.Alllicensedbanksmetthe minimum prudential requirements as set out in the Banking Act (CAP 46:04) and Banking Regulations. Thebankingsector’sstatementoffinancialposition(thebalancesheet)increasedby9.3percent,fromP83.5billion in December 2017 to P91.3 billion as at December 31, 2018. The industry’s total deposits rose by 9 percent from P63.6 billion in 2017 to P69.3 billion in 2018, while loans and advances increased by 7.6 percent from P54.2 billion to P58.3 billion during the same period. Overall, annual credit growth accelerated from 5.6 percent in 2017 to 7.7 percent in 2018, with a faster expansion in credit to business, while growth in lending to households slowed in an environment of modest increase in personal incomes.
National and international paymentswere carried out efficiently through various platforms, including theBotswana Automated Clearing House (BACH). The Bank continued to embrace improvements in the payments and settlement landscape that were driven by developments in information and communications technology, competition and customer requirements. The Bank also implemented related security and risk mitigation measures to avert any possible cyber-attacks, fraud and misuse of payments systems.
During2018,Moody’sInvestorsServiceandStandard&Poor’sGlobalRatingsaffirmedBotswana’sinvestmentgrade ratings of A2 and ‘A-/A-2’, respectively, for long and short-term bonds in domestic and foreign currency. Theoutlookwas reaffirmed tobe stablebyboth the credit rating agencies.The strongexternal andfiscal
1 The SDR is the IMF’s unit of account, comprising the US dollar, euro, Japanese yen, British pound and the Chinese renminbi (also known as the yuan).
2 The revaluation gains were due to the implementation of the new investment guidelines and rebalancing of the liquidity portfolio.
BANK OF BOTSWANA ANNUAL REPORT 201817
balance sheet, a well-managed economy and low public debt, as well as the country’s robust public institutions and a stable political environment supported the ratings. However, both rating agencies reiterated the concerns relatingtothenarroweconomicbaseandrelativelyslowprogressineconomicdiversification.
The focus on skills development, through appropriate short- and long-term training programmes, and staff welfare improvement was maintained, with a view to sustaining the Bank’s operational productivity and leadership capability.
Infulfilmentofitsstatutoryobligations,theBank’s Annual Report and Banking Supervision Annual Report for 2017 were submitted to the Minister of Finance and Economic Development on March 31 and June 30, 2018, respectively. The Bank also continued to publish the monthly Botswana Financial Statistics, the Monetary Policy Statement (MPS), the biannual Business Expectations Survey and the Research Bulletin.
TheBankpublished,forthefirsttime,theMonetary Policy Report (MPR) in August and October 2018. Going forward, the Bank will, in addition to the MPS, publish three MPRs in April, August and October each year to provide a continuous comprehensive update on the formulation and implementation of monetary policy. These servetomeetthepublic’sexpectationofatransparentandaccountablecentralbankinfulfillingthemonetarypolicy mandate set out in the Bank of Botswana Act (CAP 55:01).
In 2018, the Bank spearheaded the establishment of the Financial Stability Council (FSC), an inter-agency administrativebodyaimedatstrengtheningtheimplementationofthefinancialstabilitymandate.TheFSC’sprimaryfocusistofostercoordinatedmacro-prudentialanalysis,monitoringandresponsetofinancialsystemimbalances or distress to ensure a sound and stable financial system, which is supportive of sustainablemacroeconomic environment.
During 2018, the Bank introduced a legal function to its operations, the Corporate and Legal Affairs Department, to strengthen capacity in addressing and responding to legal matters and risks relating to the Bank’s mandates andoperations.Similarly,theBankestablishedaChiefInformationSecurityOfficer(CISO)functiontocreateinstitutional arrangements for strengthening its resilience in managing risks arising from cyber and other information technology related crimes.
Externalstakeholderrelationsweremaintainedduringtheyear.Theseincludeeconomicbriefings,consultationswith relevant international bodies and institutions, such as the Association of African Central Banks, SADC Committee of Central Bank Governors, International Monetary Fund, World Bank, Bank for International Settlements, Financial Stability Board Regional Consultative Group and the Macroeconomic and Financial Management Institute of Eastern and Southern Africa.
The management and staff of the Bank owe a debt of gratitude to the Board for the guidance and support inimplementingthe2018workprogramme.Itishopedthatstakeholderswillfindthe2018Annual Report informative.
Moses D PelaeloGOVERNOR
Statutory report on the operationS and Financial StatementS oF the Bank, 2018

BANK OF BOTSWANA ANNUAL REPORT 201818
BANK OF BOTSWANA ANNUAL REPORT 201819
statUtory rePort on the oPerations and
finanCial stateMents of the Bank – 2018the Bank’s Mission and oBjeCtives
The primary objective of the Bank, as stipulated in Section 4(1) of the Bank of Botswana Act (CAP 55:01), is topromoteandmaintainmonetarystability,anefficientpaymentsmechanismandtheliquidity,solvencyandproperfunctioningofasoundlybasedmonetary,creditandfinancialsystem.Consistentwiththemonetarystabilityobjective,theBankendeavourstofostermonetary,creditandfinancialconditionsconducivetotheorderly, balanced and sustainable economic development of the country. Based on this primary statutory mandate, the Bank’s functions and responsibilities can be grouped under the following categories.
(a) Monetary stability - a principal objective of the Bank is to preserve the purchasing power of the Pula currencybykeepingtherateofinflationlowandstable.Asoundandstablemacroeconomicenvironmentis conducive for sustainable economic growth. Price stability is achieved through monetary policy formulation and implementation, which involves the setting of the policy rate (Bank Rate) and conduct of open market operations. The Bank engages in open market operations through weekly auctions of BoBCs. It also engages in repo and reverse repo transactions and extends overnight credit facilities tobanks.TheseoperationsenabletheBanktoinfluencemonetaryconditionsandensurethatmarketinterestratesarealignedtothepolicystance,alsoservingtofostertheorderlyandefficientfunctioningofthefinancialsystem.
(b) Exchange rate policy implementation - the Bank implements the Government’s exchange rate policy, theobjectiveofwhichistopromoteandmaintaintheinternationalcompetitivenessofdomesticfirmsand contribute to overall macroeconomic stability.
(c) Financialstability-vulnerabilityassessmentsandperformancemonitoringofthefinancialsectorareconducted with the view to help inform policy and adoption of appropriate macro-prudential supervision measurestorespondtoanyfinancialsectorimbalancesand,therefore,maintainfinancialstability.
(d) Banking regulation and supervision - the Bank regulates and supervises commercial banks to ensure operational safety and soundness.
(e) Issuance of currency (banknotes and coin) - currency management ensures an adequate supply of high quality banknotes and coin to facilitate transactions and economic activity. This entails adherence to stringentstandardsindesignandproductiontoavertpossiblecounterfeitingandlossofconfidenceinthe currency.
(f) Central banking services - the Bank provides banking services to the Government, commercial banks and selected public institutions. This includes membership of Botswana Automated Clearing House (BACH) operated by the Bankers Association of Botswana.
(g) Payment infrastructure and settlement - facilitation and maintenance of the integrity of payments systems enables the flow of payments and efficient payment settlement. Moreover, oversight andregulationentrenchesconfidenceinthepaymentsandsettlementsystemsandmitigatessystemicrisks.
(h) Management of official foreign exchange reserves and making foreign payments on behalf ofGovernment - the Bank manages the country’s foreign exchange reserves on behalf of Government. Themanagement of foreign exchange reserves enables the country to meet international financialobligations. The investment guidelines ensure that the reserves are managed prudently to guarantee safety, liquidity and return within acceptable risk parameters.
(i) Economic analysis and policy advice - the Bank provides advice to Government on macroeconomic andfinancialpolicymatters.Furthermore,theBankcollectsanddisseminatesstatistics,especiallythoserelatingtomonetary,financialandinternationaltransactions.
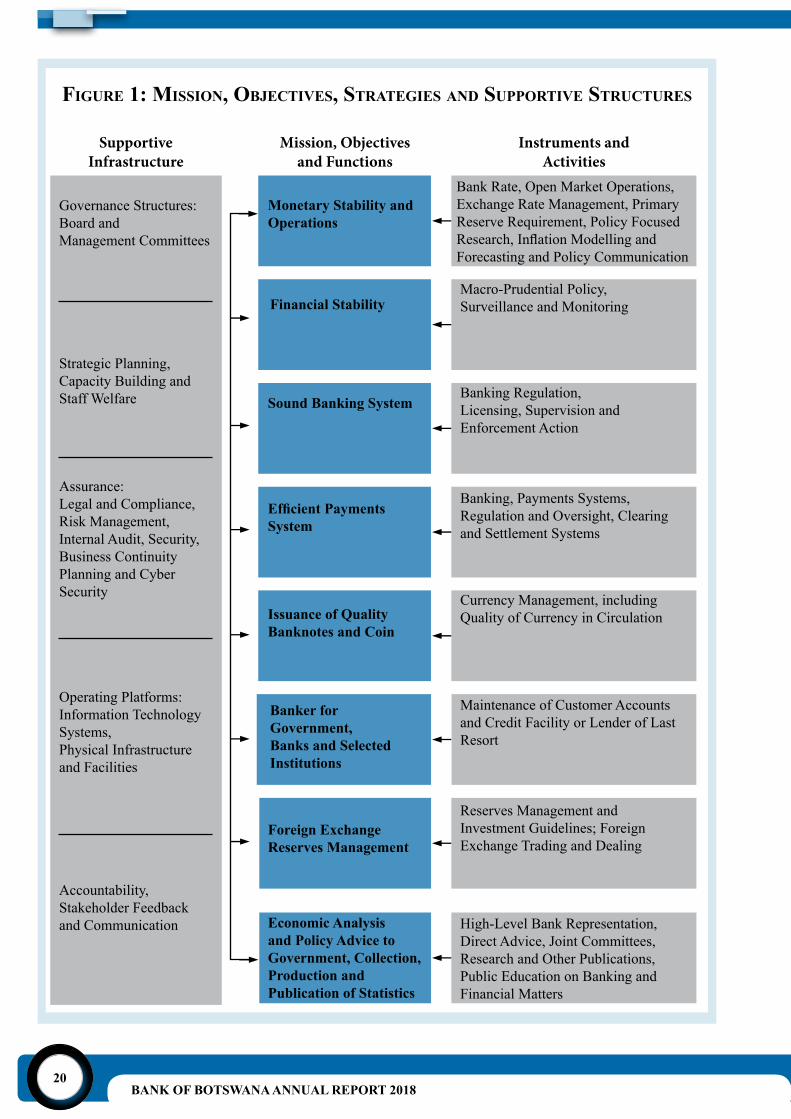
In order to achieve its mission and objectives, the Bank utilises various strategies, activities and supportive infrastructure as indicated in Figure 1.
Statutory report on the operationS and Financial StatementS oF the Bank, 2018
BANK OF BOTSWANA ANNUAL REPORT 201820
figUre 1: Mission, oBjeCtives, strategies and sUPPortive strUCtUres
Governance Structures:Board and Management Committees
Strategic Planning, Capacity Building andStaff Welfare
Assurance: Legal and Compliance,Risk Management, Internal Audit, Security, Business Continuity Planning and Cyber Security
Operating Platforms:Information Technology Systems,Physical Infrastructureand Facilities
Accountability, Stakeholder Feedbackand Communication
Monetary Stability and Operations
Bank Rate, Open Market Operations, Exchange Rate Management, Primary Reserve Requirement, Policy Focused Research,InflationModellingandForecasting and Policy Communication
Macro-Prudential Policy, Surveillance and Monitoring
Banking Regulation,Licensing, Supervision andEnforcement Action
Banking, Payments Systems,Regulation and Oversight, Clearing and Settlement Systems
Currency Management, including Quality of Currency in Circulation
Maintenance of Customer Accounts and Credit Facility or Lender of LastResort
Reserves Management and Investment Guidelines; Foreign Exchange Trading and Dealing
High-Level Bank Representation,Direct Advice, Joint Committees, Research and Other Publications, Public Education on Banking and Financial Matters
Financial Stability
Sound Banking System
Efficient PaymentsSystem
Issuance of Quality Banknotes and Coin
Banker for Government, Banks and Selected Institutions
Foreign ExchangeReserves Management
Economic Analysis and Policy Advice to Government, Collection, Production and Publication of Statistics
Instruments andActivities
SupportiveInfrastructure
Mission, Objectivesand Functions
BANK OF BOTSWANA ANNUAL REPORT 201821
governanCe, ManageMent and organisational strUCtUre of the Bank
The Bank’s functions and key responsibilities, its organisation and how it is held accountable for its performance are as described below:
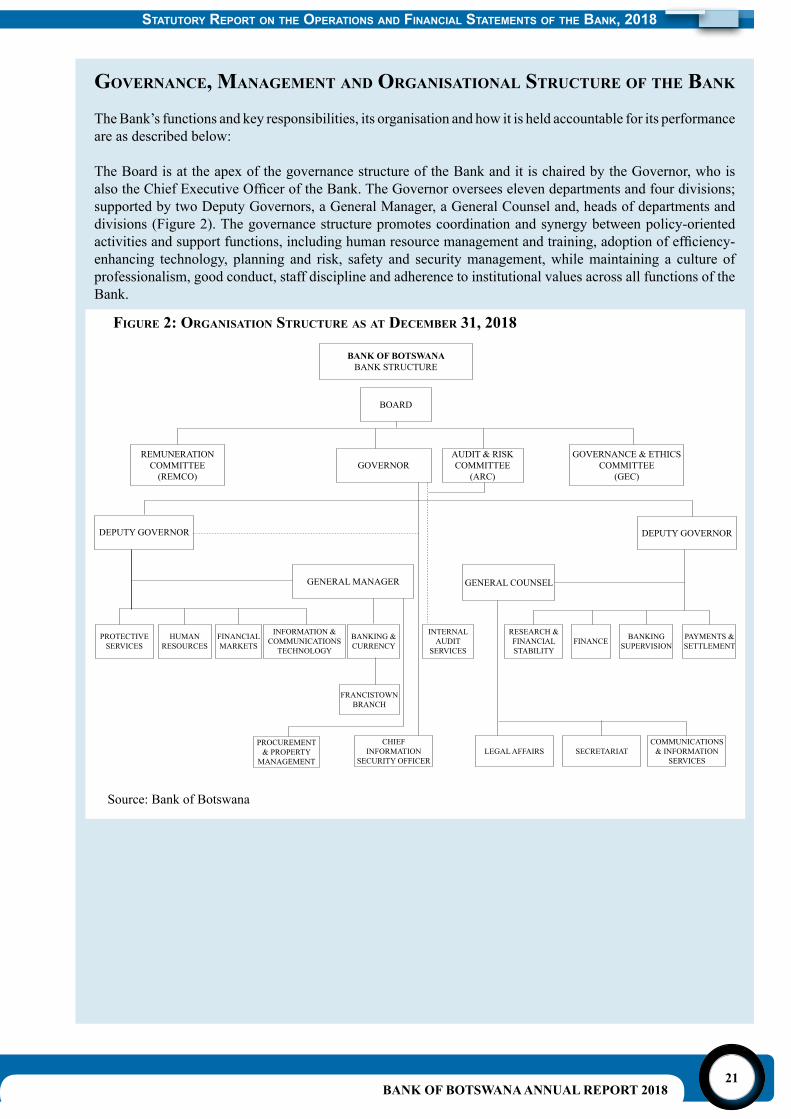
The Board is at the apex of the governance structure of the Bank and it is chaired by the Governor, who is alsotheChiefExecutiveOfficeroftheBank.TheGovernoroverseeselevendepartmentsandfourdivisions;supported by two Deputy Governors, a General Manager, a General Counsel and, heads of departments and divisions (Figure 2). The governance structure promotes coordination and synergy between policy-oriented activitiesandsupportfunctions,includinghumanresourcemanagementandtraining,adoptionofefficiency-enhancing technology, planning and risk, safety and security management, while maintaining a culture of professionalism, good conduct, staff discipline and adherence to institutional values across all functions of the Bank.
AUDIT & RISK COMMITTEE
(ARC)
GOVERNANCE & ETHICS COMMITTEE
(GEC)
BANK OF BOTSWANABANK STRUCTURE
GENERAL MANAGER
PROTECTIVE SERVICES
HUMAN RESOURCES
FINANCIAL MARKETS
BANKING & CURRENCY
FRANCISTOWN BRANCH
PROCUREMENT & PROPERTY
MANAGEMENT
CHIEF INFORMATION
SECURITY OFFICERLEGAL AFFAIRS SECRETARIAT
COMMUNICATIONS & INFORMATION
SERVICES
INTERNAL AUDIT
SERVICES
RESEARCH & FINANCIAL STABILITY
FINANCE BANKING SUPERVISION
PAYMENTS & SETTLEMENT
INFORMATION & COMMUNICATIONS
TECHNOLOGY
GENERAL COUNSEL
DEPUTY GOVERNOR DEPUTY GOVERNOR
BOARD
GOVERNORREMUNERATION
COMMITTEE(REMCO)
Source: Bank of Botswana
figUre 2: organisation strUCtUre as at deCeMBer 31, 2018
Statutory report on the operationS and Financial StatementS oF the Bank, 2018
BANK OF BOTSWANA ANNUAL REPORT 201822
Board Functions, Membership and Appointments
The Board oversees and guides the Bank’s general strategic direction, policy formulation and operations in accordance with the Bank of Botswana Act and Bye-Laws. It comprises nine members, two of whom are ex-officiomembers,beingtheGovernorandPermanentSecretaryoftheMinistryofFinanceandEconomicDevelopment (MFED). The other seven members are appointed by the Minister of Finance and Economic Developmentintheirindividualcapacity,andtwoofthemmaybepublicofficers.TheGovernorandthetwoDeputy Governors are appointed by the President. The two Deputy Governors are not Board members, but are required, and do attend all Board meetings.
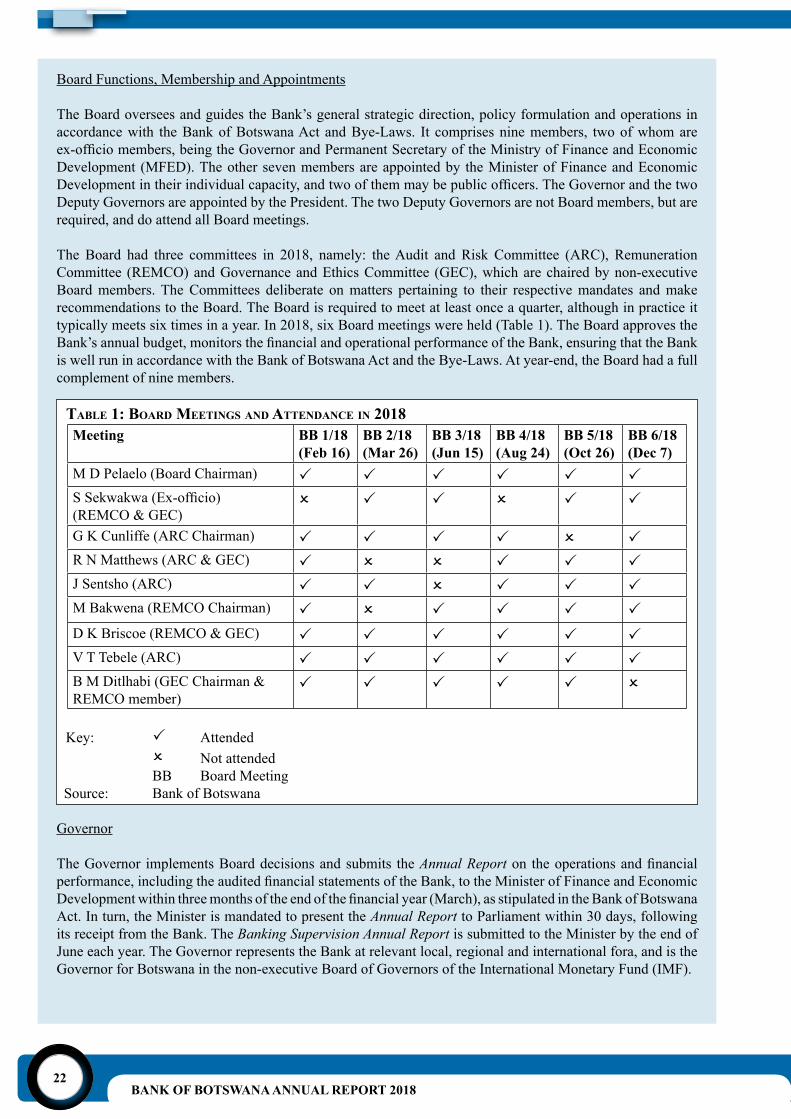
The Board had three committees in 2018, namely: the Audit and Risk Committee (ARC), Remuneration Committee (REMCO) and Governance and Ethics Committee (GEC), which are chaired by non-executive Board members. The Committees deliberate on matters pertaining to their respective mandates and make recommendations to the Board. The Board is required to meet at least once a quarter, although in practice it typically meets six times in a year. In 2018, six Board meetings were held (Table 1). The Board approves the Bank’sannualbudget,monitorsthefinancialandoperationalperformanceoftheBank,ensuringthattheBankis well run in accordance with the Bank of Botswana Act and the Bye-Laws. At year-end, the Board had a full complement of nine members.
taBle 1: Board Meetings and attendanCe in 2018Meeting BB 1/18
(Feb 16)BB 2/18(Mar 26)
BB 3/18(Jun 15)
BB 4/18(Aug 24)
BB 5/18(Oct 26)
BB 6/18(Dec 7)
M D Pelaelo (Board Chairman) P P P P P PSSekwakwa(Ex-officio)(REMCO & GEC)
O P P O P P
G K Cunliffe (ARC Chairman) P P P P O PR N Matthews (ARC & GEC) P O O P P PJ Sentsho (ARC) P P O P P PM Bakwena (REMCO Chairman) P O P P P PD K Briscoe (REMCO & GEC) P P P P P PV T Tebele (ARC) P P P P P PB M Ditlhabi (GEC Chairman & REMCO member)
P P P P P O
Key: P Attended O Not attended BB Board Meeting Source: Bank of Botswana
Governor
The Governor implements Board decisions and submits the Annual Reporton theoperationsandfinancialperformance,includingtheauditedfinancialstatementsoftheBank,totheMinisterofFinanceandEconomicDevelopmentwithinthreemonthsoftheendofthefinancialyear(March),asstipulatedintheBankofBotswanaAct. In turn, the Minister is mandated to present the Annual Report to Parliament within 30 days, following its receipt from the Bank. The Banking Supervision Annual Report is submitted to the Minister by the end of June each year. The Governor represents the Bank at relevant local, regional and international fora, and is the Governor for Botswana in the non-executive Board of Governors of the International Monetary Fund (IMF).
BANK OF BOTSWANA ANNUAL REPORT 201823
Executive Committee
The Executive Committee comprises Deputy Governors, General Manager, General Counsel and Heads of Department and is chaired by the Governor. Senior advisors may be co-opted as members. The Committee has the collective responsibility for advising the Governor on day-to-day administration, including policy formulation, risk and financialmanagement, as well as overall governance of the Bank. It meets once aweek to monitor, coordinate and review the implementation of the Bank’s work programme, as well as other developments in the Bank.
Departments and Divisions
The Bank has eleven departments, five of which fulfil the Bank’s core mandates, while six departmentsprovide auxiliary support and corporate services (Figure 2). The Research and Financial Stability Department undertakes macroeconomic forecasting and policy review in support of the Bank’s conduct of monetary policy and implementation of the exchange rate policy. The Department also conducts macro-prudential assessments and facilitates coordination with other relevant external entities to ensure macroeconomic and financial stability. Furthermore, the Department undertakes data collection, research and macroeconomicanalysis,monitorsthefinancialsectorandevaluatesemergingrisksandotherdevelopmentsemanatingfromthe macroeconomic environment. In addition, the Department is responsible for production and dissemination of the Bank’s publications, namely; the Annual Report; monthly Botswana Financial Statistics (BFS); the Research Bulletin; Monetary Policy Statement (MPS); the Monetary Policy Report (MPR) and the Business Expectations Survey (BES).
TheBankingSupervisionDepartmentlicenses,regulatesandsupervisescommercialbanksandotherfinancialinstitutions that fall under the Bank’s regulatory and supervisory purview; it also publishes the Banking Supervision Annual Report. The Department is responsible for prudential supervision, including investigating unauthorised and illegal deposit-taking activities, improper use of banking names, as well as inappropriate marketconductoffinancialinstitutionsunderitspurview,withaviewtoensuringfairtreatmentofcustomers.The Financial Markets Department manages foreign exchange reserves, foreign exchange dealing and implements monetary policy through the conduct of open market operations. The department also conducts other money and capital market activities, which include issuance of government bonds and treasury bills.
The management of currency (Pula and thebe banknotes and coin) and provision of banking services to the Government, commercial banks and selected institutions is carried out by the Banking and Currency Department, whilst oversight and regulation of payments and settlement transactions is carried out by the Payments and Settlement Department. The latter is also responsible for operating the Bank’s Real Time Gross Settlement (RTGS) system, known as the Botswana Interbank Settlement System (BISS) and overseeing the BACH system owned and operated by commercial banks.
TheFinanceDepartmentisresponsibleforaccountingandreportingontheBank’sfinancialactivities,includingproductionofmonthlyandannualfinancialstatementsof theBank,asstipulatedintheBankofBotswanaAct (CAP 55:01) and International Financial Reporting Standards (IFRS). The Department also coordinates strategic planning, risk management, and the business continuity programme. The Human Resources Department is responsible for staff recruitment, training, remuneration and welfare, while the Information and Communications Technology Department ensures that the Bank’s information technology systems and infrastructure are robust and effective in meeting the needs of the Bank. The CISO, who reports directly to the Governor, is responsible for managing risks arising from cyber and information technology related crimes. Meanwhile, the Protective Services Department has responsibility for ensuring the safety and security of Bank staff, information and property.
The Internal Audit Services Department ensures that the Bank’s operations are sound and comply with establishedfinancialandoperationalcontrolsaswellasgovernancestructuresinlinewiththeBankofBotswanaAct, Audit Committee Charter and international best practice. The Corporate and Legal Affairs Department is
Statutory report on the operationS and Financial StatementS oF the Bank, 2018
BANK OF BOTSWANA ANNUAL REPORT 201824
responsible for all matters of a legal nature, including legislature review, litigation, contracts and compliance related matters. In addition, through the Secretariat Division, the Department serves the Board, Executive Committee and provides Mail Registry and protocol services. The Communications and Information Services Division coordinates communications activities in relation to media and effective transmission of information relating to the Bank’s mandate, policies and practices to stakeholders. The Division coordinates the Bank’s PublicEducationProgrammeandrelatedpoliciestopromotefinancialandeconomicliteracyandimprovethepublic’s understanding of the Bank’s role in the economic development of the country. This ensures an overall positive image of the Bank. The Division is also responsible for the Library and records management.
Other support services are undertaken through the specialised activities of the Procurement and Property Management division, which undertakes procurement (including coordination of the tendering process), custody and maintenance of immovable and movable assets of the Bank, including related equipment.
review of the Bank’s Main aCtivities in 2018
Monetary Policy, Money and Capital Market Activities and Exchange Rate Policy
Monetary Policy
The Bank conducts monetary policy primarily through setting of the policy rate (Bank Rate), open market operations and primary reserve requirements. While the Bank may use prudential regulations and moral suasion,theprimaryinstrumentsusedtomanageliquidityandinfluenceshort-termdepositandlendinginterestratesintheeconomy,aretheBankofBotswanaCertificates(BoBCs).
In 2018, monetary policy was conducted against the background of below-trend economic activity (a non-inflationaryoutputgap)andapositivemedium-terminflationoutlook.Thesedevelopmentsprovidedscopefor an accommodative monetary policy stance in support of stronger output growth. Hence, the Bank Rate was maintained at 5 percent and consequently, the prime lending rate of commercial banks was unchanged at 6.5 percent, while deposit interest rates were, similarly, virtually stable. The nominal 3-month (88-day) deposit interest rate of commercial banks increased from 1.10 percent in December 2017 to 1.56 percent in December 2018.Meanwhile, inflationwasmostlywithin theBank’s3–6percentmedium-termobjective rangeandcloser to the lower end of the objective range throughout the year.
During2018,theBankheldsixMonetaryPolicyCommittee(MPC)meetings,allfollowedbymediabriefings,which allowed dialogue between the Bank and the media, thus enhancing the Bank’s accountability, credibility and transparency.
TheBankintroducedandpublished,forthefirsttime,theMPRinAugustandOctober2018,followingthepublication of the MPS in February. These publications are the main medium through which the Bank informs the public about the formulation and implementation of monetary policy and, therefore, serve to meet the public’sexpectationofatransparentandaccountablecentralbankinfulfillingthemonetarypolicymandatesetout in the Bank of Botswana Act (CAP 55:01). The MPS and MPRs provide a comprehensive assessment of economicandfinancialdevelopmentsthatarelikelytoinfluencetheinflationpathinthemediumtermand,inturn, the Bank’s future policy choices based on the forward-looking framework for monetary policy formulation by the MPC. The Bank increasingly uses the communication tool to clarify its mandate, policy performance and to provide guidance. In this respect, the publications promote an understanding of the conduct of monetary policyinordertoanchorpublicexpectationsofalow,predictableandsustainablelevelofinflation.
BANK OF BOTSWANA ANNUAL REPORT 201825
Money and Capital Markets
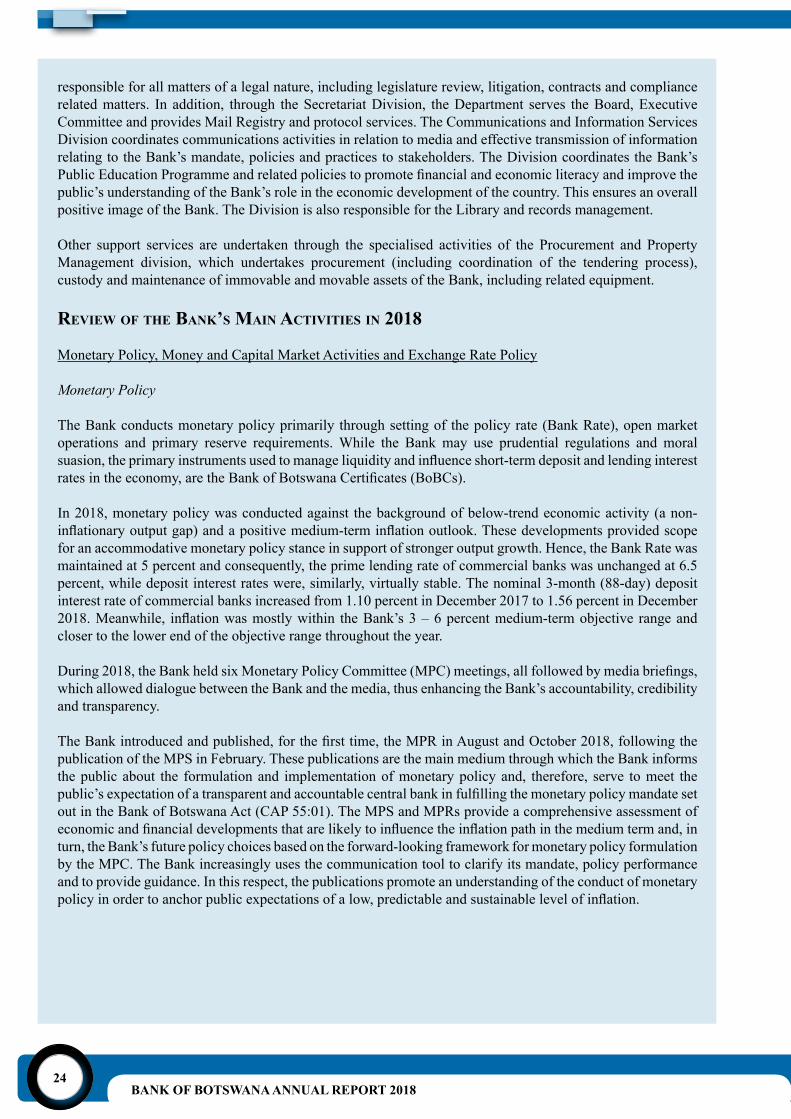
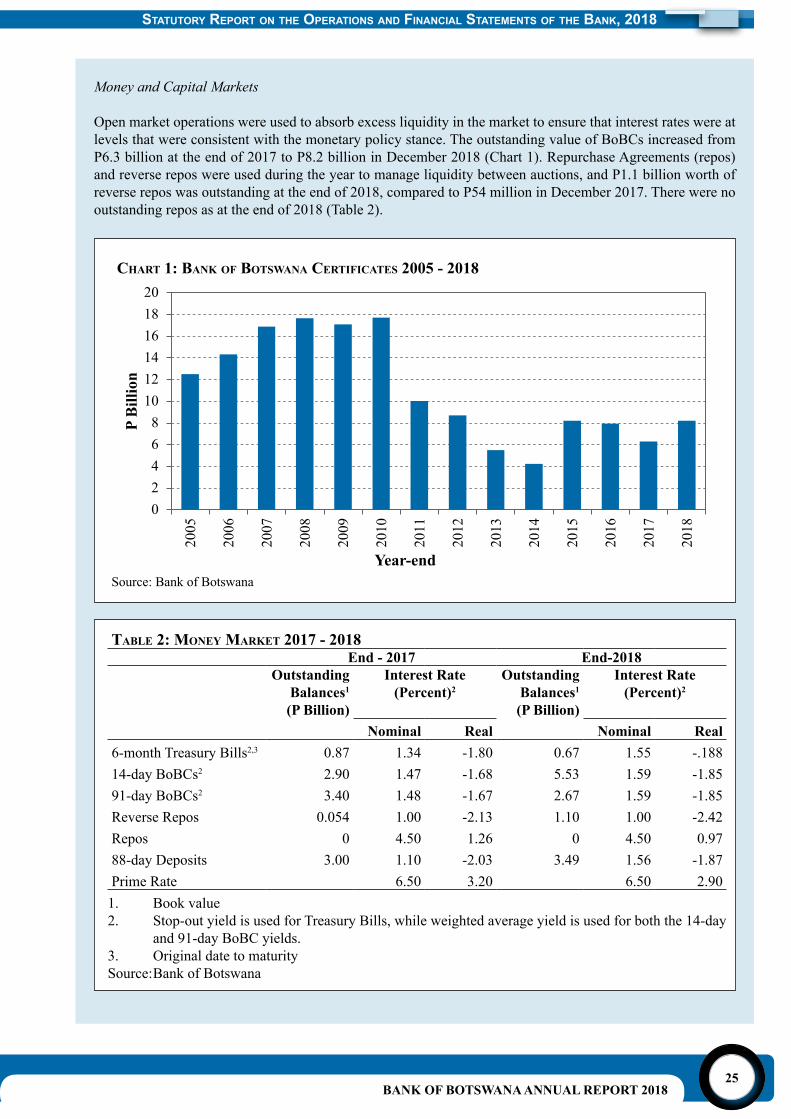
Open market operations were used to absorb excess liquidity in the market to ensure that interest rates were at levels that were consistent with the monetary policy stance. The outstanding value of BoBCs increased from P6.3 billion at the end of 2017 to P8.2 billion in December 2018 (Chart 1). Repurchase Agreements (repos) and reverse repos were used during the year to manage liquidity between auctions, and P1.1 billion worth of reverse repos was outstanding at the end of 2018, compared to P54 million in December 2017. There were no outstanding repos as at the end of 2018 (Table 2).
Chart 1: Bank of Botswana CertifiCates 2005 - 2018
taBle 2: Money Market 2017 - 2018End - 2017 End-2018
OutstandingBalances1
(P Billion)
Interest Rate(Percent)2
OutstandingBalances1
(P Billion)
Interest Rate(Percent)2
Nominal Real Nominal Real6-month Treasury Bills2,3 0.87 1.34 -1.80 0.67 1.55 -.18814-day BoBCs2 2.90 1.47 -1.68 5.53 1.59 -1.8591-day BoBCs2 3.40 1.48 -1.67 2.67 1.59 -1.85Reverse Repos 0.054 1.00 -2.13 1.10 1.00 -2.42Repos 0 4.50 1.26 0 4.50 0.9788-day Deposits 3.00 1.10 -2.03 3.49 1.56 -1.87Prime Rate 6.50 3.20 6.50 2.90
1. Book value2. Stop-out yield is used for Treasury Bills, while weighted average yield is used for both the 14-day
and 91-day BoBC yields.3. Original date to maturitySource: Bank of Botswana
Statutory report on the operationS and Financial StatementS oF the Bank, 2018
BANK OF BOTSWANA ANNUAL REPORT 201826
3 Given the Bank Rate of 5 percent, the minimum deposit interest rate was 1.5 percent for the 91-day and equivalent deposit facilities.
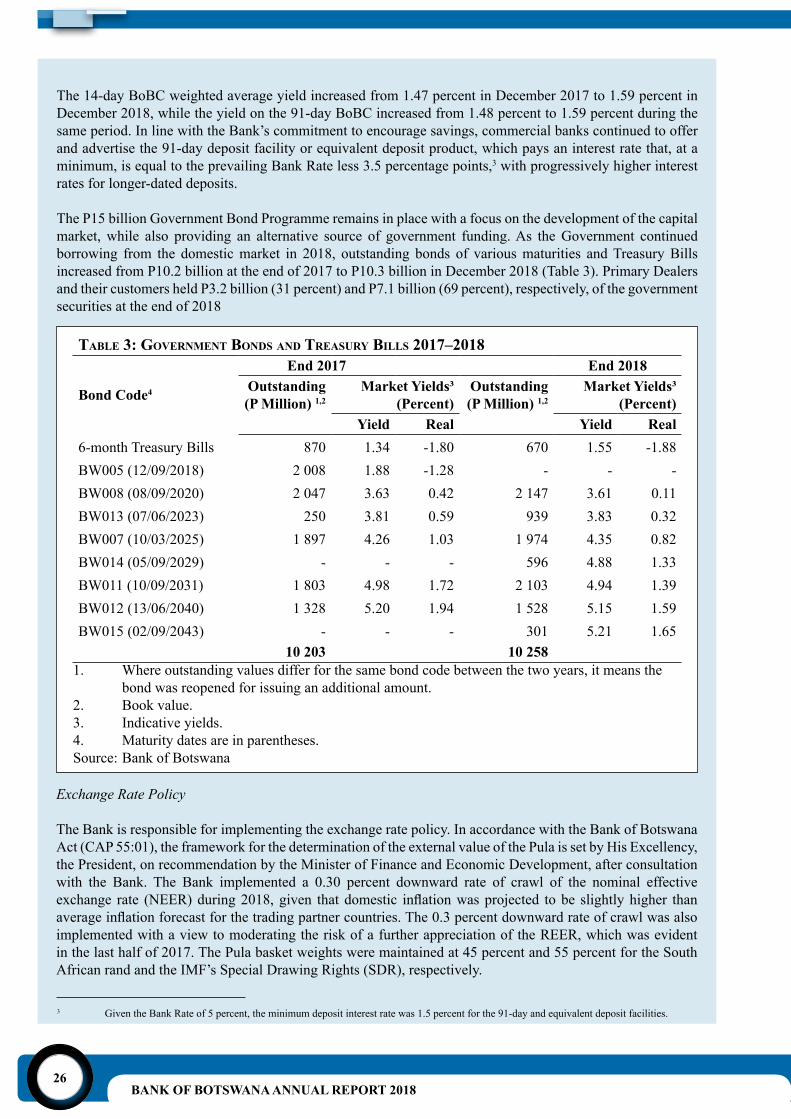
The 14-day BoBC weighted average yield increased from 1.47 percent in December 2017 to 1.59 percent in December 2018, while the yield on the 91-day BoBC increased from 1.48 percent to 1.59 percent during the same period. In line with the Bank’s commitment to encourage savings, commercial banks continued to offer and advertise the 91-day deposit facility or equivalent deposit product, which pays an interest rate that, at a minimum, is equal to the prevailing Bank Rate less 3.5 percentage points,3 with progressively higher interest rates for longer-dated deposits.
The P15 billion Government Bond Programme remains in place with a focus on the development of the capital market, while also providing an alternative source of government funding. As the Government continued borrowing from the domestic market in 2018, outstanding bonds of various maturities and Treasury Bills increased from P10.2 billion at the end of 2017 to P10.3 billion in December 2018 (Table 3). Primary Dealers and their customers held P3.2 billion (31 percent) and P7.1 billion (69 percent), respectively, of the government securities at the end of 2018
taBle 3: governMent Bonds and treasUry Bills 2017–2018
Bond Code4
End 2017 End 2018Outstanding(P Million) 1,2
Market Yields³(Percent)
Outstanding(P Million) 1,2
Market Yields³ (Percent)
Yield Real Yield Real6-month Treasury Bills 870 1.34 -1.80 670 1.55 -1.88BW005 (12/09/2018) 2 008 1.88 -1.28 - - -BW008 (08/09/2020) 2 047 3.63 0.42 2 147 3.61 0.11BW013 (07/06/2023) 250 3.81 0.59 939 3.83 0.32BW007 (10/03/2025) 1 897 4.26 1.03 1 974 4.35 0.82BW014 (05/09/2029) - - - 596 4.88 1.33BW011 (10/09/2031) 1 803 4.98 1.72 2 103 4.94 1.39BW012 (13/06/2040) 1 328 5.20 1.94 1 528 5.15 1.59BW015 (02/09/2043) - - - 301 5.21 1.65
10 203 10 2581. Where outstanding values differ for the same bond code between the two years, it means the
bond was reopened for issuing an additional amount.2. Book value.3. Indicative yields.4. Maturity dates are in parentheses.Source: Bank of Botswana
Exchange Rate Policy
The Bank is responsible for implementing the exchange rate policy. In accordance with the Bank of Botswana Act (CAP 55:01), the framework for the determination of the external value of the Pula is set by His Excellency, the President, on recommendation by the Minister of Finance and Economic Development, after consultation with the Bank. The Bank implemented a 0.30 percent downward rate of crawl of the nominal effective exchange rate (NEER)during2018,given thatdomestic inflationwasprojected tobe slightlyhigher thanaverageinflationforecastforthetradingpartnercountries.The0.3percentdownwardrateofcrawlwasalsoimplemented with a view to moderating the risk of a further appreciation of the REER, which was evident in the last half of 2017. The Pula basket weights were maintained at 45 percent and 55 percent for the South African rand and the IMF’s Special Drawing Rights (SDR), respectively.
BANK OF BOTSWANA ANNUAL REPORT 201827
4 Thefinancialintermediationratioiscalculatedastotalloansandadvancesdividedbytotaldeposits.Itisameasureofthedegreeoffinancialintermediation in an economy.
In the twelve months to December 2018, the trade-weighted NEER of the Pula depreciated by 0.3 percent, consistent with the rate of crawl of the Pula exchange rate (Table 1.5). Meanwhile, the REER appreciated marginallyby0.3percentinthetwelvemonthstoDecember2018,asthepositiveinflationdifferentialbetweenBotswana and trading partner countries was slightly larger than the downward rate of crawl. A stable REER implies maintenance of competitiveness (by this measure) of domestic producers of tradable goods and services.Nevertheless,itshouldbenotedthattheexchangeratealoneisnotsufficienttoensuresustainablecompetitiveness of local producers. The attainment of durable competitiveness of domestic producers is mainlythroughasustainedimprovementinproductivity,whichalsocontributestolowerinflation.Eventhen,the enhanced transparency engendered by the disclosure of Pula exchange rate parameters helps to reduce uncertainty surrounding the exchange rate policy and enriches information used in making financial andinvestment decisions by economic agents.
Supervision and Regulation of Banks and Bureaux de Change
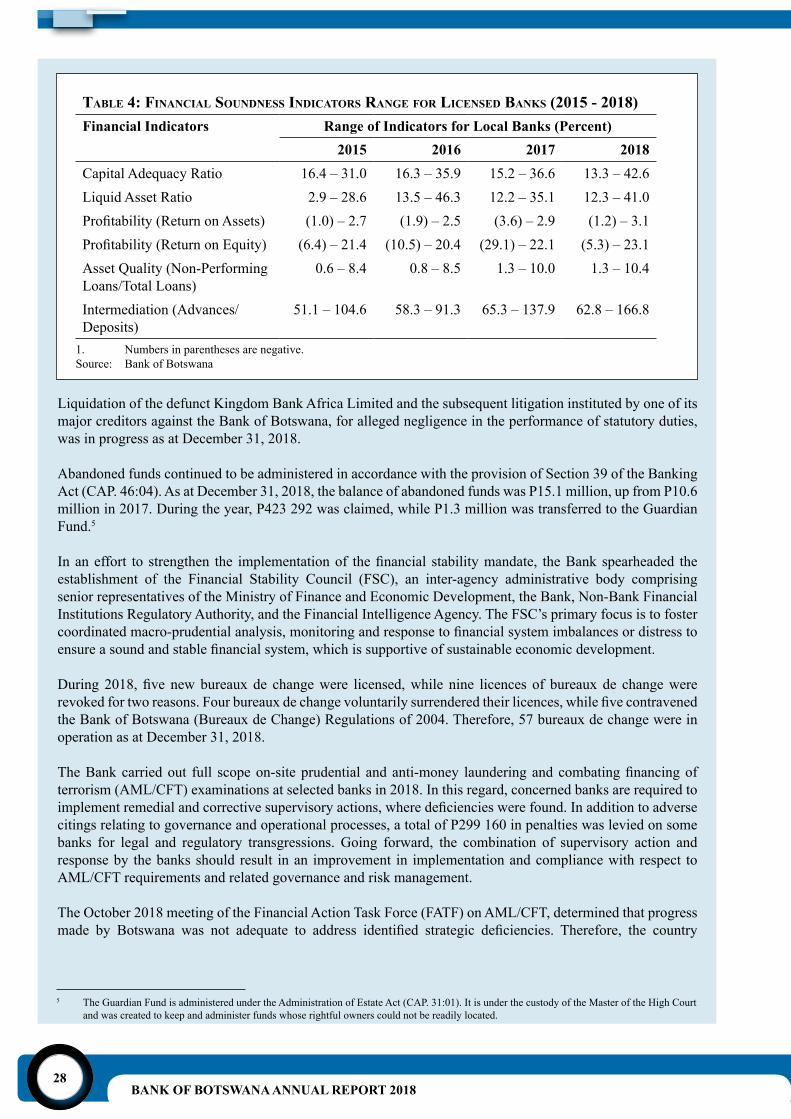
During 2018, the Bank continued to monitor the performance of banks through a system of monthly and quarterly returns; risk-based supervision; on-site examinations; bilateral and trilateral meetings (the Bank, banks and their external auditors); ad hoc consultations as necessary. The Bank also convened the biannual meetings of the BankingCommittee,which comprises the Bank and chief executive officers of banks tofacilitatediscussionofindustry-widematters.Thebankingsectorwasadequatelycapitalised,profitableandliquid as at December 31, 2018. The industry’s compliance with the regulatory and prudential requirements was satisfactory (Table 4). The asset quality of the banking sector deteriorated slightly as indicated by the increase in the ratio of non-performing loans to gross loans and advances from 5.3 percent in 2017 to 5.5 percent in 2018.
Mostbanksreportedhigherprofitlevelscomparedtothepreviousyear,withtheexceptionofonebank,whichmade a loss for the year ending December 31, 2018. The banking sector’s balance sheet increased by 9.3 percent from P83.5 billion in 2017 to P91.3 billion in 2018. Meanwhile, the industry’s total deposits rose by 9 percent from P63.6 billion in 2017 to P69.3 billion in 2018, while loans and advances increased by 7.6 percent from P54.2billiontoP58.3billioninthesameperiod.Consequently,thefinancialintermediationratio4 fell from 85.2 percent as at December 31, 2017 to 84.2 percent at the end of 2018. All banks were adequately capitalised, liquid and complied with the minimum prudential and statutory capital and liquidity requirements. However, one bank had a capital adequacy ratio below 15 percent, which is the prudential limit, as at December 31, 2018. In addition to the prudential supervisory role, the Bank continued to monitor business conduct to ensure that banks treated their customers in a fair, professional and transparent manner.
Statutory report on the operationS and Financial StatementS oF the Bank, 2018
BANK OF BOTSWANA ANNUAL REPORT 201828
5 The Guardian Fund is administered under the Administration of Estate Act (CAP. 31:01). It is under the custody of the Master of the High Court and was created to keep and administer funds whose rightful owners could not be readily located.
taBle 4: finanCial soUndness indiCators range for liCensed Banks (2015 - 2018)Financial Indicators Range of Indicators for Local Banks (Percent)
2015 2016 2017 2018Capital Adequacy Ratio 16.4 – 31.0 16.3 – 35.9 15.2 – 36.6 13.3 – 42.6Liquid Asset Ratio 2.9 – 28.6 13.5 – 46.3 12.2 – 35.1 12.3 – 41.0Profitability(ReturnonAssets) (1.0) – 2.7 (1.9) – 2.5 (3.6) – 2.9 (1.2) – 3.1Profitability(ReturnonEquity) (6.4) – 21.4 (10.5) – 20.4 (29.1) – 22.1 (5.3) – 23.1Asset Quality (Non-Performing Loans/Total Loans)
0.6 – 8.4 0.8 – 8.5 1.3 – 10.0 1.3 – 10.4
Intermediation (Advances/Deposits)
51.1 – 104.6 58.3 – 91.3 65.3 – 137.9 62.8 – 166.8
1. Numbers in parentheses are negative.Source: Bank of Botswana
Liquidation of the defunct Kingdom Bank Africa Limited and the subsequent litigation instituted by one of its major creditors against the Bank of Botswana, for alleged negligence in the performance of statutory duties, was in progress as at December 31, 2018.
Abandoned funds continued to be administered in accordance with the provision of Section 39 of the Banking Act (CAP. 46:04). As at December 31, 2018, the balance of abandoned funds was P15.1 million, up from P10.6 million in 2017. During the year, P423 292 was claimed, while P1.3 million was transferred to the Guardian Fund.5
Inaneffort to strengthen the implementationof thefinancial stabilitymandate, theBankspearheaded theestablishment of the Financial Stability Council (FSC), an inter-agency administrative body comprising senior representatives of the Ministry of Finance and Economic Development, the Bank, Non-Bank Financial Institutions Regulatory Authority, and the Financial Intelligence Agency. The FSC’s primary focus is to foster coordinatedmacro-prudentialanalysis,monitoringandresponsetofinancialsystemimbalancesordistresstoensureasoundandstablefinancialsystem,whichissupportiveofsustainableeconomicdevelopment.
During 2018, five newbureaux de changewere licensed,while nine licences of bureaux de changewererevokedfortworeasons.Fourbureauxdechangevoluntarilysurrenderedtheirlicences,whilefivecontravenedthe Bank of Botswana (Bureaux de Change) Regulations of 2004. Therefore, 57 bureaux de change were in operation as at December 31, 2018.
TheBankcarriedout full scopeon-siteprudential andanti-money launderingandcombatingfinancingofterrorism (AML/CFT) examinations at selected banks in 2018. In this regard, concerned banks are required to implementremedialandcorrectivesupervisoryactions,wheredeficiencieswerefound.Inadditiontoadversecitings relating to governance and operational processes, a total of P299 160 in penalties was levied on some banks for legal and regulatory transgressions. Going forward, the combination of supervisory action and response by the banks should result in an improvement in implementation and compliance with respect to AML/CFT requirements and related governance and risk management.
The October 2018 meeting of the Financial Action Task Force (FATF) on AML/CFT, determined that progress made by Botswana was not adequate to address identified strategic deficiencies. Therefore, the country
BANK OF BOTSWANA ANNUAL REPORT 201829
6 The calculation of import cover excludes imports of rough diamonds as these are almost entirely for re-export.
was placed under observation by the FATF and a public statement was issued on Botswana pointing out the strategicAML/CFTdeficienciesforwhichanactionplanwasdevelopedforthecountrytoaddress.TheFATFwill closely monitor the implementation of the action plan, and once a determination is made that Botswana hassubstantivelyaddressedalltheelementsintheactionplan,anon-sitevisitwillbeorganisedtoconfirmthe implementation of the necessary legal, regulatory and/or operational reforms. If the on-site visit has a favourable outcome, the FATF may decide to remove the country from the ‘grey list.’
Foreign Exchange Reserves Management
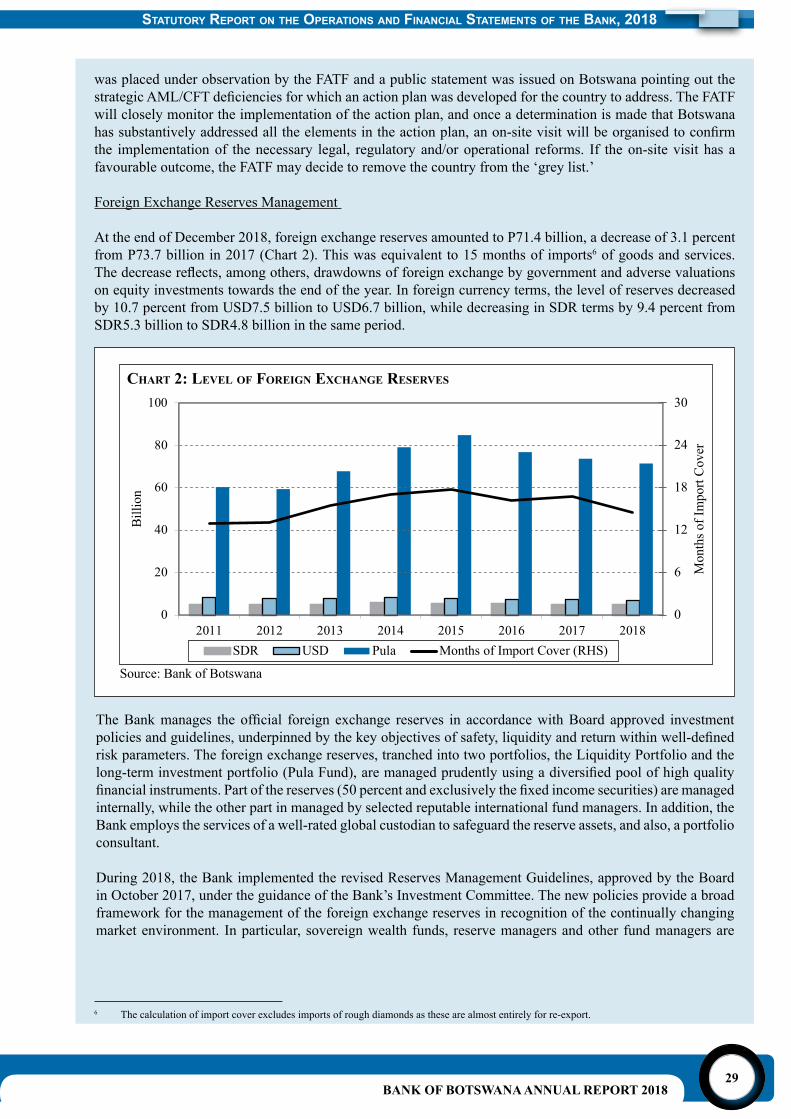
At the end of December 2018, foreign exchange reserves amounted to P71.4 billion, a decrease of 3.1 percent from P73.7 billion in 2017 (Chart 2). This was equivalent to 15 months of imports6 of goods and services. Thedecreasereflects,amongothers,drawdownsofforeignexchangebygovernmentandadversevaluationson equity investments towards the end of the year. In foreign currency terms, the level of reserves decreased by 10.7 percent from USD7.5 billion to USD6.7 billion, while decreasing in SDR terms by 9.4 percent from SDR5.3 billion to SDR4.8 billion in the same period.
Chart 2: level of foreign exChange reserves
TheBankmanages theofficial foreign exchange reserves in accordancewithBoard approved investmentpoliciesandguidelines,underpinnedbythekeyobjectivesofsafety,liquidityandreturnwithinwell-definedrisk parameters. The foreign exchange reserves, tranched into two portfolios, the Liquidity Portfolio and the long-terminvestmentportfolio(PulaFund),aremanagedprudentlyusingadiversifiedpoolofhighqualityfinancialinstruments.Partofthereserves(50percentandexclusivelythefixedincomesecurities)aremanagedinternally, while the other part in managed by selected reputable international fund managers. In addition, the Bank employs the services of a well-rated global custodian to safeguard the reserve assets, and also, a portfolio consultant.
During 2018, the Bank implemented the revised Reserves Management Guidelines, approved by the Board in October 2017, under the guidance of the Bank’s Investment Committee. The new policies provide a broad framework for the management of the foreign exchange reserves in recognition of the continually changing market environment. In particular, sovereign wealth funds, reserve managers and other fund managers are
Statutory report on the operationS and Financial StatementS oF the Bank, 2018
BANK OF BOTSWANA ANNUAL REPORT 201830
increasingly diversifying their portfolios into less traditional assets across an array of markets and risk factors, in order to generate higher returns, while continuing to keep risk within acceptable parameters. This has become increasingly relevant given the low and in some cases, negative yields on the traditional assets that continuetoprevailinmoredevelopedglobalfinancialmarkets.
Currency Operations
The Bank continued to manage the supply of banknotes and coin to ensure availability and high quality of currency in circulation. In this regard, soiled and damaged currency was withdrawn from circulation, retired and replaced, in line with the Bank’s Clean Banknote Policy. Alongside the Botswana Police Service and other law enforcement agencies, the Bank was also involved in developing strategies to address banknote counterfeiting.
On February 1, 2018, the Bank introduced a new P10 polymer banknote that circulates concurrently with the cotton-based P10 banknote, which was already in use. Unlike the conventional cotton-based banknotes, polymer banknotes are not easy to counterfeit, more durable and resistant to dirt and moisture, with an expected lifespanof3–4timeshigherthanthatofpaper-basedsubstrates.TheP10polymerbanknoteisthefirstofitskind in Botswana.
The annual rate of growth of banknotes in circulation decreased from 10 percent in 2017 to 3.7 percent in 2018. ThereweresignificantdecreasesinthenetissuanceoftheP200,P100,P50andP20banknotedenominationsfrom 10.2 percent, 6.5 percent, 9.1 percent and 18.6 percent, respectively, in 2017 to 6 percent, 2.8 percent, 5.8and-5.5percent,respectively, in2018.Conversely, therewasasignificant increaseinthenet issuanceof the P10 banknote denomination from 1.3 percent in 2017 to 14.6 percent in 2018. However, the P200 denomination continued to have the highest share of net total issuance (quantity) of banknotes, at 30.2 percent in 2018.
The net issuance (quantity) of all coin denominations increased slightly from 5.4 percent in 2017 to 5.5 percent in2018.Therelativelylownetissuancein2018wasattributabletothesufficiencyofcoininthemarketandthe fact that coin is exchanged at commercial banks and not ordinarily returned to the Bank of Botswana.
Banking Operations, Payments and Settlement
The Bank continued to discharge the oversight function of monitoring the National Payments System (NPS) operators,participantsandserviceproviderstoensuresafetyandefficiencyoftheNPS.Inthisregard,keyFinancial Market Infrastructures (FMIs), such as the BISS, BACH and Central Securities Depository (CSD), remained stable. BISS rules were revised to cater for the most recent system upgrades. Emphasis is on the application of internationally prescribed operating standards for FMIs, for effective management and mitigation of risk and fostering resilience of the FMIs. Banks continued to settle all payment transactions on a real time basisandinasecurerobustandefficientmanner.
The Bank also closely monitors the operations of the BACH, another key FMI and Systemically Important Payment System (SIPS) in the NPS, to ensure that all retail payments effected through cheques, electronic funds transfers and card payments continued to clear and settle under a well-managed risk environment. The Society for Worldwide Interbank Financial Telecommunication (SWIFT) system is also consistently upgraded in linewithevolvingmarketandfinancial infrastructuredevelopments, to improvesecurity,efficiencyandconnectivity with correspondent banks and other counterparties.
The NPS landscape continued to evolve, as evidenced by an increase in participants and new payment methods leveragingon information, communications andfinancial technology (FinTech) developments, to improveefficiencyinthedeliveryofpaymentsandinvolvingcollaboratingwithbanks.During2018,fivepaymentsproviders, all relating to mobile money services were approved, while Mobile Network Operators (MNOs) also added international markets for their existing services for payments remittances. These developments
BANK OF BOTSWANA ANNUAL REPORT 201831
necessitated a close monitoring of the operations and provision of oversight in respect of SIPS licensed by theBanktoprovidepaymentsandfinancialservices.Consistentwiththeoversightresponsibilities,theBankcontinued to foster and monitor these developments, while promoting measures aimed at mitigating related risks, such as cybercrime, money laundering, fraud and counterfeiting of the national currency.
In executing its role as a final settlement provider, theBank provided settlement services to the bankingindustryinasecure,robustandefficientmannerinrealtimethroughtheBISS.TheBankalsohasamandatetosupportinitiativesthatpromoteelectronicpaymentsandimproveefficiency.
The Bank’s payments modernisation and reform programme continued to include collaboration with other regional central banks, with the view to upgrade the regional payment system and integrate cross-border payments in line with the SADC framework and plans. Two local banks continue to participate in the SADC-Real Time Gross Settlement (SADC-RTGS) system and have registered considerable amount of transactions in volume and value terms in 2018. An additional bank is currently on-boarding the SADC-RTGS, a process which commenced in mid-2018.
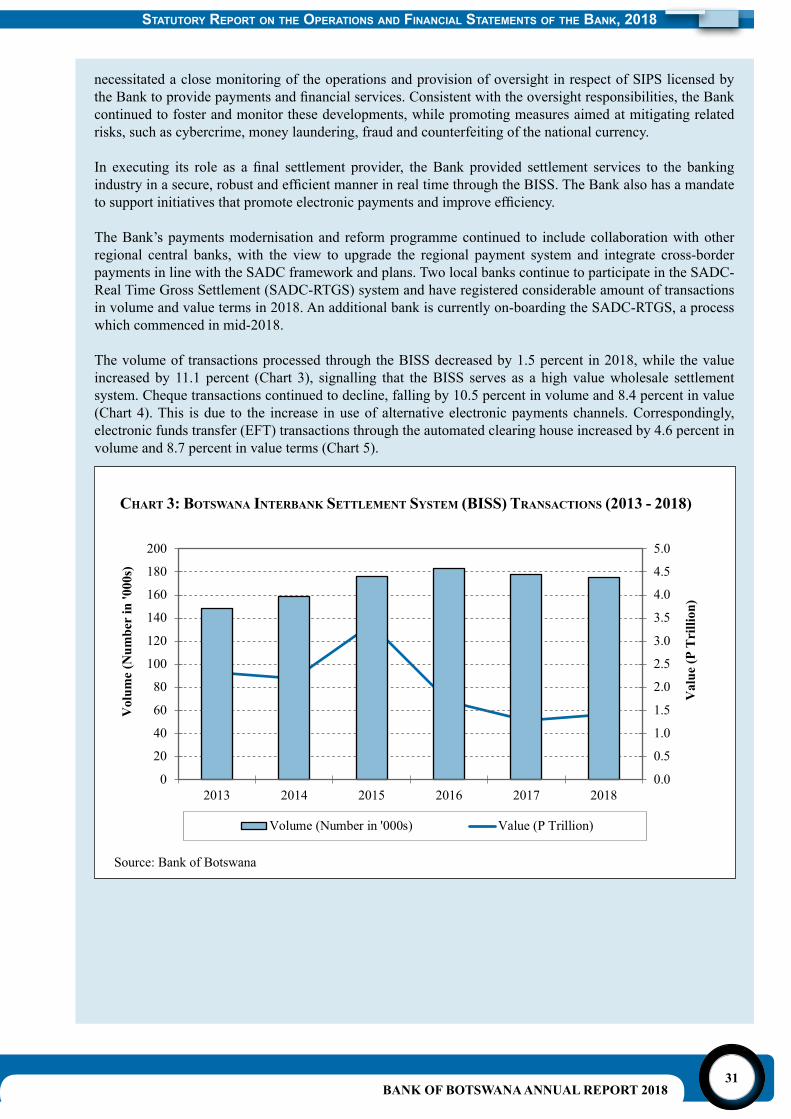
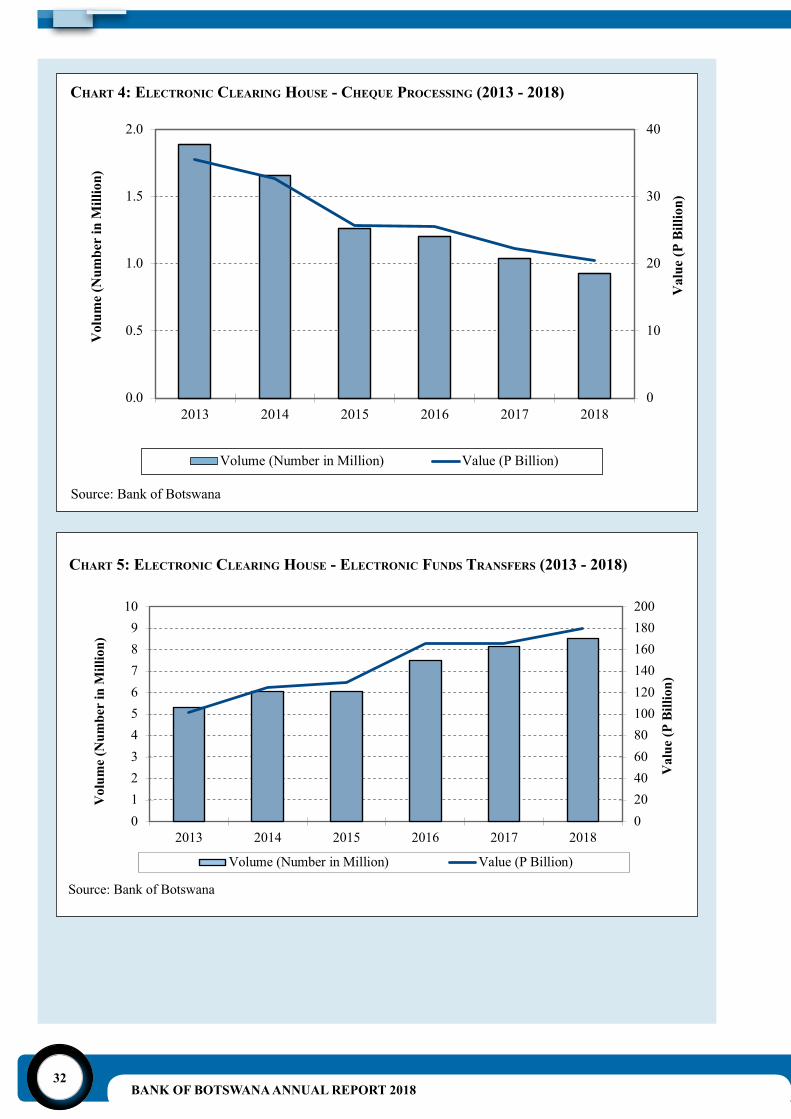
The volume of transactions processed through the BISS decreased by 1.5 percent in 2018, while the value increased by 11.1 percent (Chart 3), signalling that the BISS serves as a high value wholesale settlement system. Cheque transactions continued to decline, falling by 10.5 percent in volume and 8.4 percent in value (Chart 4). This is due to the increase in use of alternative electronic payments channels. Correspondingly, electronic funds transfer (EFT) transactions through the automated clearing house increased by 4.6 percent in volume and 8.7 percent in value terms (Chart 5).
Chart 3: Botswana interBank settleMent systeM (Biss) transaCtions (2013 - 2018)
Statutory report on the operationS and Financial StatementS oF the Bank, 2018
BANK OF BOTSWANA ANNUAL REPORT 201832
Chart 4: eleCtroniC Clearing hoUse - CheqUe ProCessing (2013 - 2018)
Chart 5: eleCtroniC Clearing hoUse - eleCtroniC fUnds transfers (2013 - 2018)
BANK OF BOTSWANA ANNUAL REPORT 201833
Information Technology
The Bank’s computing and information systems continue to be upgraded in line with innovation and technological advancements and in order to meet evolving functional and strategy requirements, while also allowing for effective connectivity. Cyber-crime and international regulatorycomplianceposemajorchallengesfortheglobalfinancialindustry.Therefore,theBank allocates the requisite resources towards upgrading information technology systems to safeguard and retain the integrity and functionality of mission-critical systems, achieve operationalefficiency,aswellastoguardagainstcyber-crime.
Human Resources, Staff Welfare and Staff Pension Fund
Human Resources and Staff Welfare
As at December 31, 2018, the Bank’s Staff Establishment was 596, marginally higher than the 590 as at December 31, 2017. The vacancy rate stood at 3.7 percent in 2018, down from 5.8 percent at the end of 2017. Twenty-seven (27) staff joined the Bank, while ten (10) terminated employment. The Bank continued to place emphasis on staff development and, in this regard, anumberofstaffmembersbenefitedfrombothshort-andlong-termtraining.Asattheendof2018, eleven staff members were on long-term post-graduate training (Masters and Doctor of Philosophy). Several staff committees and clubs coordinate staff welfare activities, including health and wellness and sports.
Staff Pension Fund
TheBank of BotswanaDefinedContribution Staff Pension Fund declared an investmentreturn of 7.58 percent and 7.02 percent for active and deferred members, respectively, for the year ended September 30, 2018. This marks a decline from the 2017 declared return of 9.45 percent and 8.89 percent for the active and deferred members, respectively. Notwithstanding, theseratesofreturnwerehigher thanaverage inflationof3.2percent inBotswanaduring2018.
External Relations and Communication
The collaboration with stakeholders on different issues of mutual interest and for purposes of coordination was maintained through membership and participation in inter-institution committees, working groups, task forces and technical fora during 2018.
External Relations
The Bank facilitated and/or participated in relevant regional and international meetings, as well as consultation, surveillance and technical assistance missions to Botswana. In this regard, the Bank took part in meetings and conferences organised by the Bank for International Settlements, the World Bank and the IMF. At a regional level, the Bank participated in meetings organised by the Southern African Customs Union (SACU), the SADC Committee
Statutory report on the operationS and Financial StatementS oF the Bank, 2018
BANK OF BOTSWANA ANNUAL REPORT 201834
of Central Bank Governors (CCBG), the Association of African Central Banks (AACB) and the Macroeconomic and Financial Management Institute of Eastern and Southern Africa (MEFMI), for which Governor Pelaelo was the Board Chairman during the period 2017-2018. Furthermore, in 2018, the Executive Board of the IMF carried out the Article IV consultation with Botswana.
During 2018, the Bank hosted the meeting of the Financial Stability Board Regional Consultative Group for Sub-Saharan Africa, co-chaired by Governor Pelaelo and Governor Kganyago of the South African Reserve Bank, in Kasane. In addition, the Bank, in collaboration with the IMF and the Bank of Canada, hosted the Fintech and Financial Inclusion conference in Gaborone in July 2018. Furthermore, during July 25 - 26, 2018, the Bank hosted the country visit by the Deputy Managing Director of the IMF, Mr Tao Zhang.
The Bank also hosted Moody’s Investors Service (Moody’s) and Standard & Poor’s (S&P) GlobalRatingssovereigncreditratingagencies,whoaffirmedBotswana’s2018investmentgrade ratings of A2 (long and short-term bonds) and ‘A- (long-term bonds in domestic and foreign currency)/A-2 (short-term bonds in domestic and foreign currency),’ respectively. The outlookwasreaffirmedtobestablebybothcreditratingagencies.Theratingsweresupportedbythestrongexternalandfiscalbalancesheets,awell-managedeconomyandlowpublicdebt,as well as the country’s robust public institutions and a stable political environment. However, there was concern raised about the narrow economic base and relatively slow progress in economicdiversification.
Publications, Communications and Public Education
The Bank submitted the 2017 Annual ReportontheBank’soperationsandfinancialstatementsand the 2017 Banking Supervision Annual Report, in accordance with statutory requirements, to the Minister of Finance and Economic Development on March 31, 2018 and June 30, 2018, respectively. The 2018 Monetary Policy Statement, Monetary Policy Reports, monthly Botswana Financial Statistics, the bi-annual Business Expectations Survey and the Research Bulletin were also published, while the Bank’s website provided timely access to data, publications, press releases and policies of the Bank.
Governance and Accountability
In fulfilment of accountability and transparency principles of governance and in theimplementationofthepublicoutreachprogramme,theBankconductedeconomicbriefingsfollowing the publication of the 2017 Annual Report. Among key stakeholders briefed were the Cabinet, heads and representatives of diplomatic missions, heads of public and private sectorinstitutions,seniorgovernmentofficialsandthemedia.
The Bank initiated the legal review of the Bank of Botswana Act, to modernise it, enhance governance and clarify the core mandate, including financial stability; expected to bepromulgated in 2019/20.
BANK OF BOTSWANA ANNUAL REPORT 201835
Bank of Botswana
annUal finanCial stateMents
2018
Statutory report on the operationS and Financial StatementS oF the Bank, 2018
BANK OF BOTSWANA ANNUAL REPORT 201836
CONTENTS
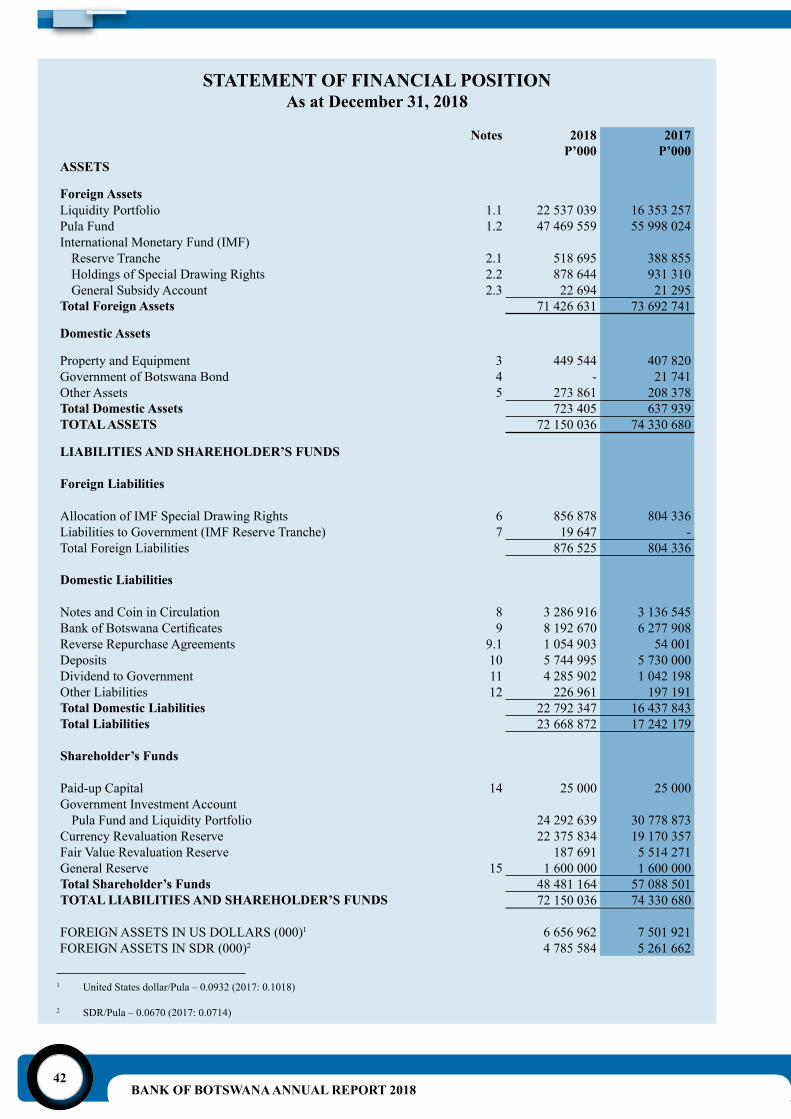
Statement of Responsibility of the Board and Approval of the AnnualFinancial Statements 37 Independent Auditor’s Report 38 - 41 Statement of Financial Position 42 StatementofProfitorLossandOtherComprehensiveIncome 43 Statement of Distribution 44 Statement of Cash Flows 44 Statement of Changes in Shareholder’s Funds 45 SignificantAccountingPolicies 46-59 Notes to the Annual Financial Statements 60 - 82
Page
BANK OF BOTSWANA ANNUAL REPORT 201837
stateMent of resPonsiBility of the Board and aPProval of the annUal finanCial stateMents
Themembersof theBoard are responsible for thepreparationof the annualfinancial statementsofthe Bank which give a true and fair view, comprising the Statement of Financial Position at December 31,2018,StatementofProfitorLoss andOtherComprehensive Income,StatementofDistribution,Statement of Cash Flows and Statement of Changes in Shareholder’s Funds for the year then ended, and thenotestothefinancialstatements,includingsignificantaccountingpolicies.
Thesefinancialstatementsincludeasummaryofsignificantaccountingpoliciesandotherexplanatorynotes, in accordance with International Financial Reporting Standards, and in the manner required by the Bank of Botswana Act (CAP 55:01).
The Board members are also responsible for such internal control as the members determine what is necessary toenable thepreparationoffinancial statements thatare free frommaterialmisstatement,whether due to fraud or error, and for maintaining adequate accounting records and an effective system of risk management.
The Board members have made an assessment of the ability of the Bank to continue as a going concern and have no reason to believe that the Bank will not be a going concern in the year ahead.
Theindependentexternalauditorisresponsibleforreportingonwhethertheannualfinancialstatementsgiveatrueandfairviewinaccordancewiththeapplicablefinancialreportingframework.
Approval of the Annual Financial Statements
TheannualfinancialstatementsoftheBank,asidentifiedinthefirstparagraph,wereapprovedbytheBoard on March 28, 2019 and signed on behalf of the Board by:
______________ _______________Victoria T Tebele
Board Member and Chairman(Audit and Risk Committee)
Moses D PelaeloGovernor
Statutory report on the operationS and Financial StatementS oF the Bank, 2018
BANK OF BOTSWANA ANNUAL REPORT 201838
KPMG, Chartered Accountants Audit Plot 67977, Off Tlokweng Road, FairgroundsOfficeParkPO Box 1519, Gaborone, Botswana Telephone +267 391 2400 Fax +267 397 5281 Web http://www.kpmg.com/
Independent Auditor’s Report
To the Shareholder of Bank of Botswana
Opinion
Wehaveaudited thefinancial statementsof theBankofBotswana (“theBank”),whichcomprise thestatementoffinancialpositionasatDecember31,2018, thestatementsofprofit or loss and other comprehensive income, distribution, cash flows and changes inshareholder’sfundsfor theyear thenendedandnotes to thefinancialstatements,whichincludeasummaryofsignificantaccountingpolicies,assetoutonpages46to59.
Inouropinion,thefinancialstatementsgiveatrueandfairviewofthefinancialpositionofBankofBotswanaasatDecember31,2018anditsfinancialperformanceandcashflowsfor the year then ended in accordance with International Financial Reporting Standards, and in the manner required by the Bank of Botswana Act (CAP 55:01).
Basis for Opinion
We conducted our audit in accordance with International Standards on Auditing (ISAs). Our responsibilities under those standards are further described in the Auditor’s Responsibilities for the Audit of the Financial Statements section of our report. We are independent of the Bank in accordance with the International Ethics Standards Board for Accountant’s Code of Ethics for Professional Accountants(IESBACode)andwehavefulfilledourotherethicalresponsibilities in accordance with the IESBA Code. We believe that the audit evidence we haveobtainedissufficientandappropriatetoprovideabasisforouropinion.
Key Audit Matters
Key audit matters are those matters that, in our professional judgment, were of most significance inourauditof thefinancial statementsof thecurrentperiod.Thesematterswereaddressedinthecontextofourauditofthefinancialstatementsasawhole,andinforming our opinion thereon, and we do not provide a separate opinion on these matters.
BANK OF BOTSWANA ANNUAL REPORT 201839
Valuation of financial assets
The disclosures associated with the valuation of financial assets are set out in thefollowingnotestothefinancialstatements:Financial instruments - page 49 to 56 Categoriesoffinancialinstruments-Note13Riskmanagementinrespectoffinancialinstruments-Note31Fairvalueoffinancialinstruments-Note32The key audit matter How the matter was addressed in our
audit Financial assets represent 99 percent of the Bank’s assets and include short term investments (Liquidity Portfolio) and long term investments (Pula Fund) in debt securities, equities, bonds and derivatives. The majority of financial assets areclassified as level 1 and 2 financialinstruments under IFRS 13 - Fair value measurement (“IFRS 13”).
Level 1 financial assets represent 65percent of the Bank’s assets. As level 1 financial instruments are valuedusing quoted market prices, they are not subject to a significant levelof judgment. However, due to their significance in the context of thefinancial statements as a whole, theyare considered to be one of the areas which required the greatest level of work effort.
Level 2 financial assets represent35 percent of the Bank’s assets. The valuation of level 2 financialinstruments are based on complex models, with certain inputs not fully observable resulting in higher degrees of management judgment required.
Due to the significance of level 1financial assets and the work effortrequired and the judgment and complex models involved in determining the fairvalueoffinancialassetsclassifiedas level 2 financial instruments thevaluation of financial assets wasconsidered to be a key audit matter.
Our procedures included, amongst others:- We obtained and reviewed the System
and Organisation Controls Reports referred to as type 2 reports for the Bank’s fund managers and investments custodian.
- We inspected the year end investment and open position reconciliations for investments held by the Bank between the investments custodian, fund managers and the Bank’s general ledger.
- We obtained confirmations directlyfrom the fund managers and investments custodian for securities and investments held by the Bank at the reporting date.
- ForfinancialinstrumentsqualifyingasLevel 1, we compared pricing inputs to external data sources and verifiedthat they were correctly input into the pricing models.
- For level2financial instruments,withthe assistance of our valuation experts, we assessed the appropriateness of models used and the reasonableness of related key inputs and assumption by revaluing the instruments using independent inputs and compared the recalculated amounts to the fair values as per the general ledger.
- We considered whether the associated disclosures in the financial statementsare compliant with IFRS.
Statutory report on the operationS and Financial StatementS oF the Bank, 2018
BANK OF BOTSWANA ANNUAL REPORT 201840
Other Information
Members of the Board are responsible for the other information. The other information obtained at the date of this auditors’ report is the “Statement of Responsibility of the Board and Approval of the Annual Financial Statements.” The other information does not include thefinancialstatementsandourauditor’sreportthereon.
Ouropiniononthefinancialstatementsdoesnotcovertheotherinformationandwedonotexpress an audit opinion or any form of assurance conclusion thereon.
Inconnectionwithourauditofthefinancialstatements,ourresponsibilityistoreadtheother information and, in doing so, consider whether the other information is materially inconsistent with the financial statements or our knowledge obtained in the audit, orotherwise appears to be materially misstated. If, based on the work we have performed, we conclude that there is a material misstatement of this other information, we are required to report that fact. We have nothing to report in this regard.
Responsibilities of Those Charged with Governance for the Financial Statements
Members of the Board are responsible for the preparation and fair presentation of the financialstatementsinaccordancewithInternationalFinancialReportingStandards,andin the manner required by the Bank of Botswana Act (Cap 55:01), and for such internal control as the members of the Board determine is necessary to enable the preparation of financialstatementsthatarefreefrommaterialmisstatement,whetherduetofraudorerror.
Inpreparingthefinancialstatements,membersoftheBoardareresponsibleforassessingthe Bank’s ability to continue as a going concern, disclosing, as applicable, matters related to going concern and using the going concern basis of accounting unless the members of the Board either intend to liquidate the Bank or to cease operations, or have no realistic alternative but to do so.
Auditor’s Responsibilities for the Audit of Financial Statements
Ourobjectivesaretoobtainreasonableassuranceaboutwhetherthefinancialstatementsas a whole are free from material misstatement, whether due to fraud or error, and to issue an auditor’s report that includes our opinion. Reasonable assurance is a high level of assurance, but is not a guarantee that an audit conducted in accordance with ISAs will always detect a material misstatement when it exists. Misstatements can arise from fraud or error and are considered material if, individually or in the aggregate, they could reasonablybeexpectedtoinfluencetheeconomicdecisionsofuserstakenonthebasisofthesefinancialstatements.
As part of an audit in accordance with ISAs, we exercise professional judgement and maintain professional scepticism throughout the audit. We also:
• Identifyandassesstherisksofmaterialmisstatementofthefinancialstatements,whether due to fraud or error, design and perform audit procedures responsive to thoserisks,andobtainauditevidencethatissufficientandappropriatetoprovidea basis for our opinion. The risk of not detecting a material misstatement resulting
BANK OF BOTSWANA ANNUAL REPORT 201841
from fraud is higher than for one resulting from error, as fraud may involve collusion, forgery, intentional omissions, misrepresentations, or the override of internal control.
• Obtain an understanding of internal control relevant to the audit in order to design audit procedures that are appropriate in the circumstances, but not for the purpose of expressing an opinion on the effectiveness of the Bank’s internal control.
• Evaluate the appropriateness of accounting policies used and the reasonableness of accounting estimates and related disclosures made by the Board members.
• Conclude on the appropriateness of the Board members’ use of the going concern basis of accounting and, based on the audit evidence obtained, whether a material uncertaintyexistsrelatedtoeventsorconditionsthatmaycastsignificantdoubtonthe Bank’s ability to continue as a going concern. If we conclude that a material uncertainty exists, we are required to draw attention in our auditor’s report to the relateddisclosuresinthefinancialstatementsor,ifsuchdisclosuresareinadequate,to modify our opinion. Our conclusions are based on the audit evidence obtained up to the date of our auditors’ report. However, future events or conditions may cause the Bank to cease to continue as a going concern.
• Evaluatetheoverallpresentation,structureandcontentofthefinancialstatements,including the disclosures, and whether the financial statements represent theunderlying transactions and events in a manner that achieves fair presentation.
We communicate with the Board members regarding, among other matters, the planned scope and timing of the audit and significant audit findings, including any significantdeficienciesininternalcontrolthatweidentifyduringouraudit.
We also provide the Board members with a statement that we have complied with relevant ethical requirements regarding independence, and to communicate with them all relationships and other matters that may reasonably be thought to bear on our independence, and where applicable, related safeguards.
From the matters communicated with the directors, we determine those matters that were ofmostsignificanceintheauditofthefinancialstatementsofthecurrentperiodandaretherefore the key audit matters. We describe these matters in our auditor’s report unless law or regulation precludes public disclosure about the matter or when, in extremely rare circumstances, we determine that a matter should not be communicated in our report because the adverse consequences of doing so would reasonably be expected to outweigh thepublicinterestbenefitsofsuchcommunication.
KPMG CertifiedAuditorsPracticing member: Francois Roos (20010078.45)March 28, 2019 Gaborone
Statutory report on the operationS and Financial StatementS oF the Bank, 2018
BANK OF BOTSWANA ANNUAL REPORT 201842
STATEMENT OF FINANCIAL POSITIONAs at December 31, 2018
Notes 2018 2017P’000 P’000
ASSETS
Foreign AssetsLiquidity Portfolio 1.1 22 537 039 16 353 257Pula Fund 1.2 47 469 559 55 998 024International Monetary Fund (IMF)
Reserve Tranche 2.1 518 695 388 855Holdings of Special Drawing Rights 2.2 878 644 931 310General Subsidy Account 2.3 22 694 21 295
Total Foreign Assets 71 426 631 73 692 741
Domestic Assets
Property and Equipment 3 449 544 407 820Government of Botswana Bond 4 - 21 741Other Assets 5 273 861 208 378Total Domestic Assets 723 405 637 939TOTAL ASSETS 72 150 036 74 330 680
LIABILITIES AND SHAREHOLDER’S FUNDS
Foreign Liabilities
Allocation of IMF Special Drawing Rights 6 856 878 804 336Liabilities to Government (IMF Reserve Tranche) 7 19 647 -Total Foreign Liabilities 876 525 804 336
Domestic Liabilities
Notes and Coin in Circulation 8 3 286 916 3 136 545BankofBotswanaCertificates 9 8 192 670 6 277 908Reverse Repurchase Agreements 9.1 1 054 903 54 001Deposits 10 5 744 995 5 730 000Dividend to Government 11 4 285 902 1 042 198Other Liabilities 12 226 961 197 191Total Domestic Liabilities 22 792 347 16 437 843Total Liabilities 23 668 872 17 242 179
Shareholder’s Funds
Paid-up Capital 14 25 000 25 000Government Investment Account
Pula Fund and Liquidity Portfolio 24 292 639 30 778 873Currency Revaluation Reserve 22 375 834 19 170 357Fair Value Revaluation Reserve 187 691 5 514 271General Reserve 15 1 600 000 1 600 000Total Shareholder’s Funds 48 481 164 57 088 501TOTAL LIABILITIES AND SHAREHOLDER’S FUNDS 72 150 036 74 330 680
FOREIGN ASSETS IN US DOLLARS (000)1 6 656 962 7 501 921FOREIGN ASSETS IN SDR (000)2 4 785 584 5 261 662
1 United States dollar/Pula – 0.0932 (2017: 0.1018)
2 SDR/Pula – 0.0670 (2017: 0.0714)
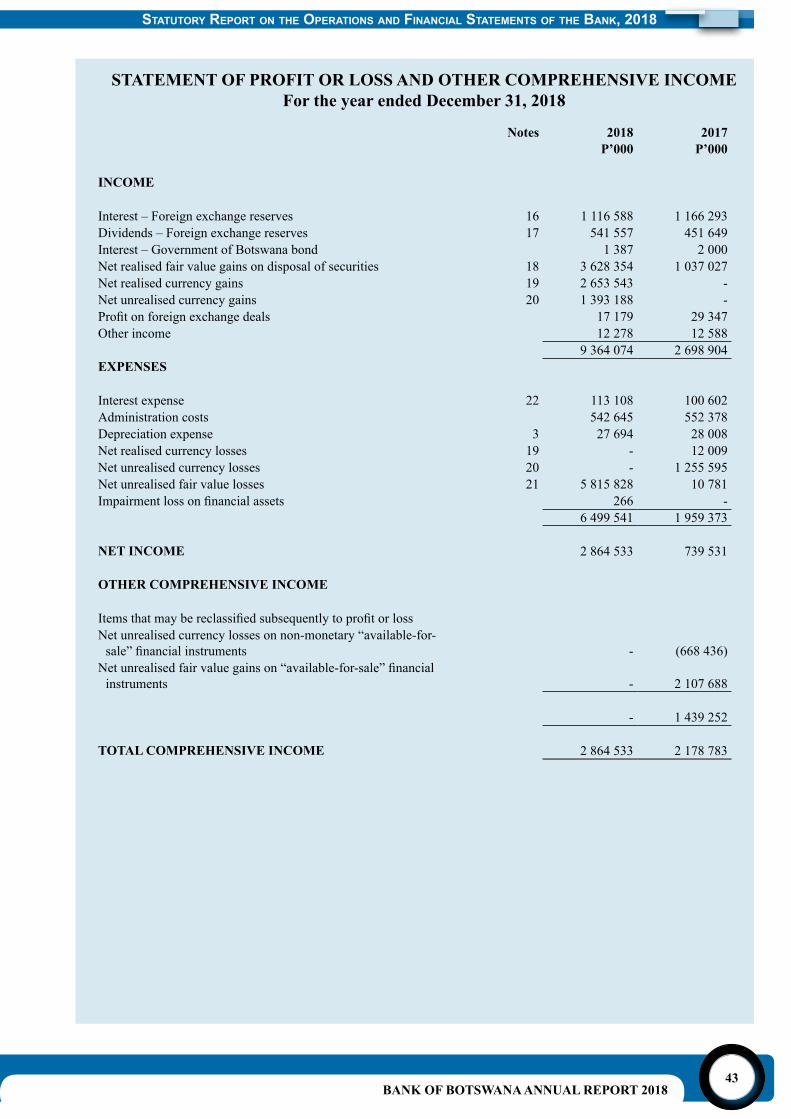
BANK OF BOTSWANA ANNUAL REPORT 201843
STATEMENT OF PROFIT OR LOSS AND OTHER COMPREHENSIVE INCOMEFor the year ended December 31, 2018
Notes 2018 2017P’000 P’000
INCOME
Interest – Foreign exchange reserves 16 1 116 588 1 166 293Dividends – Foreign exchange reserves 17 541 557 451 649Interest – Government of Botswana bond 1 387 2 000Net realised fair value gains on disposal of securities 18 3 628 354 1 037 027Net realised currency gains 19 2 653 543 -Net unrealised currency gains 20 1 393 188 -Profitonforeignexchangedeals 17 179 29 347Other income 12 278 12 588
9 364 074 2 698 904EXPENSES
Interest expense 22 113 108 100 602Administration costs 542 645 552 378Depreciation expense 3 27 694 28 008Net realised currency losses 19 - 12 009Net unrealised currency losses 20 - 1 255 595Net unrealised fair value losses 21 5 815 828 10 781Impairmentlossonfinancialassets 266 -
6 499 541 1 959 373
NET INCOME 2 864 533 739 531
OTHER COMPREHENSIVE INCOME
ItemsthatmaybereclassifiedsubsequentlytoprofitorlossNet unrealised currency losses on non-monetary “available-for-sale”financialinstruments - (668 436)
Netunrealisedfairvaluegainson“available-for-sale”financialinstruments - 2 107 688
- 1 439 252
TOTAL COMPREHENSIVE INCOME 2 864 533 2 178 783
Statutory report on the operationS and Financial StatementS oF the Bank, 2018
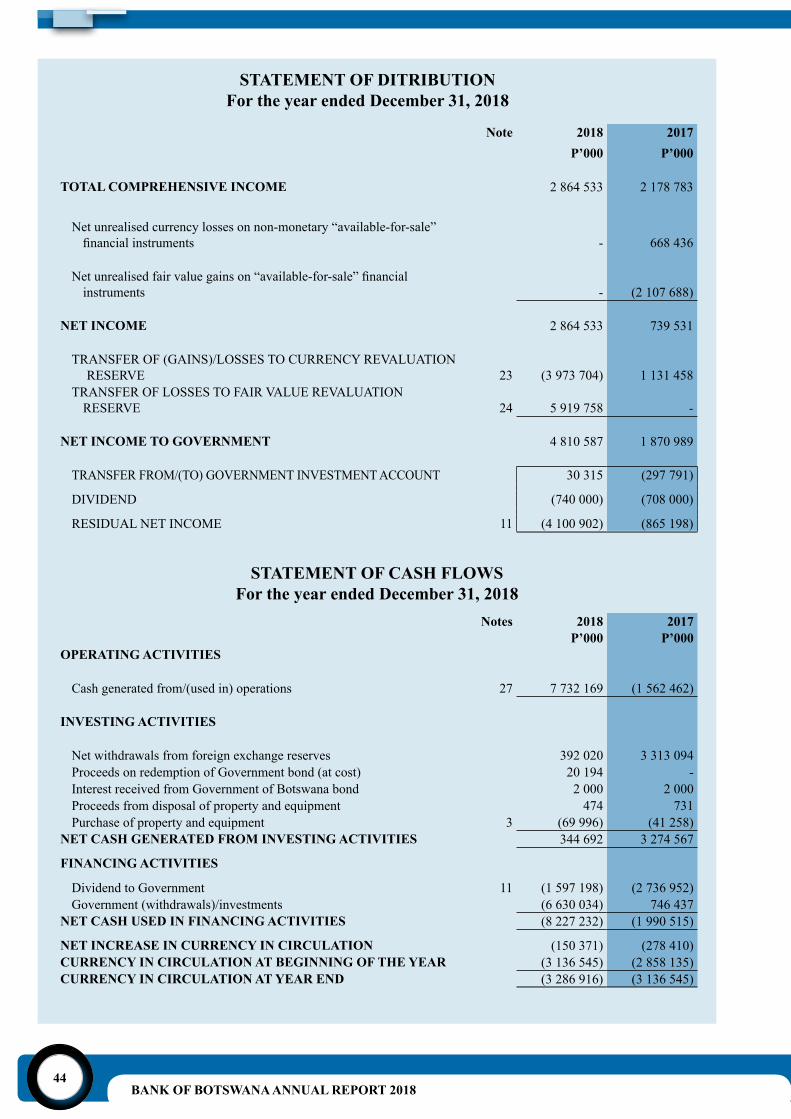
BANK OF BOTSWANA ANNUAL REPORT 201844
STATEMENT OF CASH FLOWSFor the year ended December 31, 2018
STATEMENT OF DITRIBUTIONFor the year ended December 31, 2018
Note 2018 2017P’000 P’000
TOTAL COMPREHENSIVE INCOME 2 864 533 2 178 783
Net unrealised currency losses on non-monetary “available-for-sale” financialinstruments - 668 436
Netunrealisedfairvaluegainson“available-for-sale”financialinstruments - (2 107 688)
NET INCOME 2 864 533 739 531
TRANSFER OF (GAINS)/LOSSES TO CURRENCY REVALUATION RESERVE 23 (3 973 704) 1 131 458
TRANSFER OF LOSSES TO FAIR VALUE REVALUATION RESERVE 24 5 919 758 -
NET INCOME TO GOVERNMENT 4 810 587 1 870 989
TRANSFER FROM/(TO) GOVERNMENT INVESTMENT ACCOUNT 30 315 (297 791)
DIVIDEND (740 000) (708 000)
RESIDUAL NET INCOME 11 (4 100 902) (865 198)
Notes 2018 2017P’000 P’000
OPERATING ACTIVITIES
Cash generated from/(used in) operations 27 7 732 169 (1 562 462)
INVESTING ACTIVITIES
Net withdrawals from foreign exchange reserves 392 020 3 313 094Proceeds on redemption of Government bond (at cost) 20 194 -Interest received from Government of Botswana bond 2 000 2 000Proceeds from disposal of property and equipment 474 731Purchase of property and equipment 3 (69 996) (41 258)
NET CASH GENERATED FROM INVESTING ACTIVITIES 344 692 3 274 567
FINANCING ACTIVITIES
Dividend to Government 11 (1 597 198) (2 736 952)Government (withdrawals)/investments (6 630 034) 746 437
NET CASH USED IN FINANCING ACTIVITIES (8 227 232) (1 990 515)
NET INCREASE IN CURRENCY IN CIRCULATION (150 371) (278 410)CURRENCY IN CIRCULATION AT BEGINNING OF THE YEAR (3 136 545) (2 858 135)CURRENCY IN CIRCULATION AT YEAR END (3 286 916) (3 136 545)
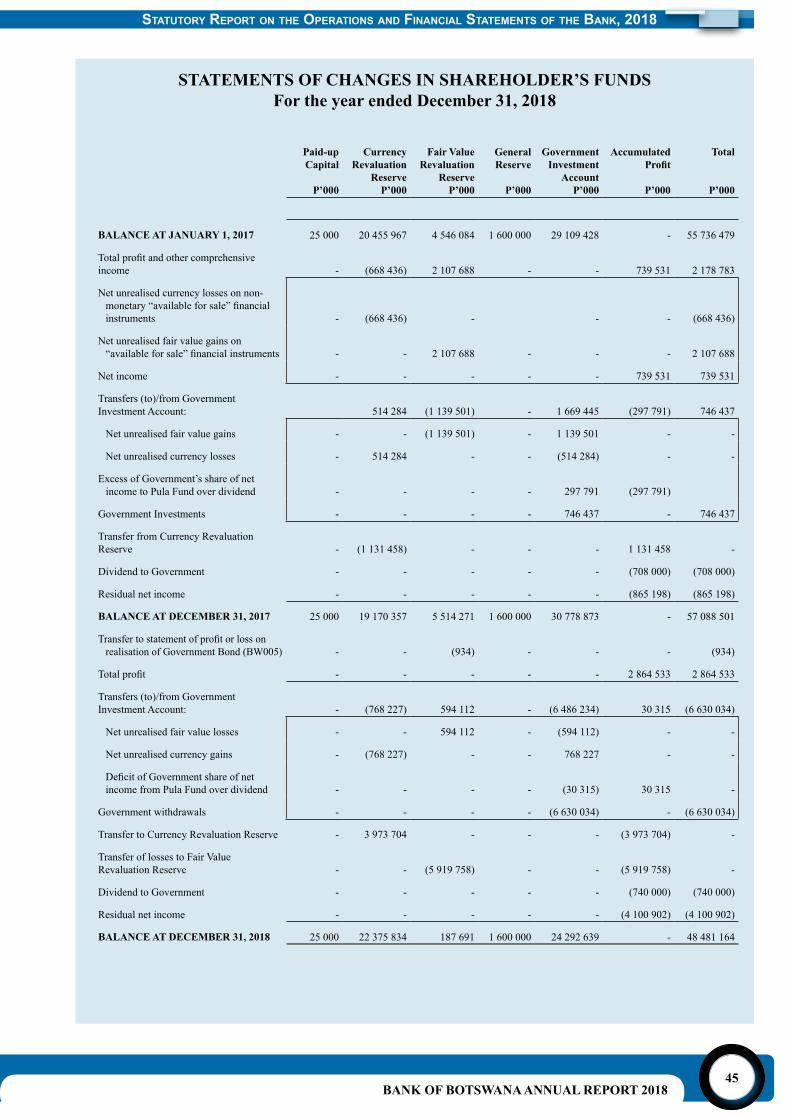
BANK OF BOTSWANA ANNUAL REPORT 201845
STATEMENTS OF CHANGES IN SHAREHOLDER’S FUNDSFor the year ended December 31, 2018
Paid-up Capital
P’000
CurrencyRevaluation
ReserveP’000
Fair ValueRevaluation
ReserveP’000
GeneralReserve
P’000
Government Investment
AccountP’000
Accumulated Profit
P’000
Total
P’000
BALANCE AT JANUARY 1, 2017 25 000 20 455 967 4 546 084 1 600 000 29 109 428 - 55 736 479
Totalprofitandothercomprehensiveincome - (668 436) 2 107 688 - - 739 531 2 178 783
Net unrealised currency losses on non-monetary“availableforsale”financialinstruments - (668 436) - - - (668 436)
Net unrealised fair value gains on “availableforsale”financialinstruments - - 2 107 688 - - - 2 107 688
Net income - - - - - 739 531 739 531
Transfers (to)/from Government Investment Account: 514 284 (1 139 501) - 1 669 445 (297 791) 746 437
Net unrealised fair value gains - - (1 139 501) - 1 139 501 - -
Net unrealised currency losses - 514 284 - - (514 284) - -
Excess of Government’s share of net income to Pula Fund over dividend - - - - 297 791 (297 791)
Government Investments - - - - 746 437 - 746 437
Transfer from Currency Revaluation Reserve - (1 131 458) - - - 1 131 458 -
Dividend to Government - - - - - (708 000) (708 000)
Residual net income - - - - - (865 198) (865 198)
BALANCE AT DECEMBER 31, 2017 25 000 19 170 357 5 514 271 1 600 000 30 778 873 - 57 088 501
Transfertostatementofprofitorlossonrealisation of Government Bond (BW005) - - (934) - - - (934)
Totalprofit - - - - - 2 864 533 2 864 533
Transfers (to)/from Government Investment Account: - (768 227) 594 112 - (6 486 234) 30 315 (6 630 034)
Net unrealised fair value losses - - 594 112 - (594 112) - -
Net unrealised currency gains - (768 227) - - 768 227 - -
DeficitofGovernmentshareofnetincome from Pula Fund over dividend - - - - (30 315) 30 315 -
Government withdrawals - - - - (6 630 034) - (6 630 034)
Transfer to Currency Revaluation Reserve - 3 973 704 - - - (3 973 704) -
Transfer of losses to Fair Value Revaluation Reserve - - (5 919 758) - - (5 919 758) -
Dividend to Government - - - - - (740 000) (740 000)
Residual net income - - - - - (4 100 902) (4 100 902)
BALANCE AT DECEMBER 31, 2018 25 000 22 375 834 187 691 1 600 000 24 292 639 - 48 481 164
Statutory report on the operationS and Financial StatementS oF the Bank, 2018
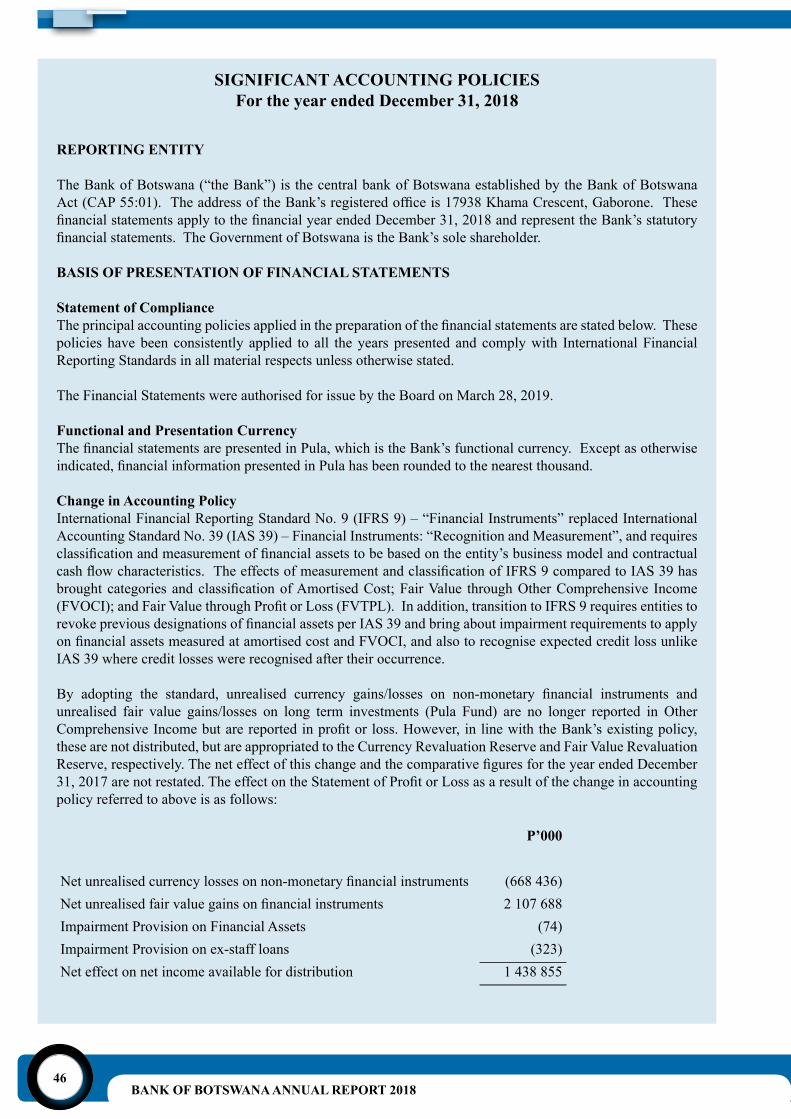
BANK OF BOTSWANA ANNUAL REPORT 201846
SIGNIFICANT ACCOUNTING POLICIESFor the year ended December 31, 2018
REPORTING ENTITY
The Bank of Botswana (“the Bank”) is the central bank of Botswana established by the Bank of Botswana Act(CAP55:01).TheaddressoftheBank’sregisteredofficeis17938KhamaCrescent,Gaborone.ThesefinancialstatementsapplytothefinancialyearendedDecember31,2018andrepresenttheBank’sstatutoryfinancialstatements.TheGovernmentofBotswanaistheBank’ssoleshareholder.
BASIS OF PRESENTATION OF FINANCIAL STATEMENTS
Statement of ComplianceTheprincipalaccountingpoliciesappliedinthepreparationofthefinancialstatementsarestatedbelow.Thesepolicies have been consistently applied to all the years presented and comply with International Financial Reporting Standards in all material respects unless otherwise stated.
The Financial Statements were authorised for issue by the Board on March 28, 2019.
Functional and Presentation CurrencyThefinancialstatementsarepresentedinPula,whichistheBank’sfunctionalcurrency.Exceptasotherwiseindicated,financialinformationpresentedinPulahasbeenroundedtothenearestthousand.
Change in Accounting PolicyInternational Financial Reporting Standard No. 9 (IFRS 9) – “Financial Instruments” replaced International Accounting Standard No. 39 (IAS 39) – Financial Instruments: “Recognition and Measurement”, and requires classificationandmeasurementoffinancialassetstobebasedontheentity’sbusinessmodelandcontractualcashflowcharacteristics.TheeffectsofmeasurementandclassificationofIFRS9comparedtoIAS39hasbroughtcategoriesandclassificationofAmortisedCost;FairValue throughOtherComprehensive Income(FVOCI);andFairValuethroughProfitorLoss(FVTPL).Inaddition,transitiontoIFRS9requiresentitiestorevokepreviousdesignationsoffinancialassetsperIAS39andbringaboutimpairmentrequirementstoapplyonfinancialassetsmeasuredatamortisedcostandFVOCI,andalsotorecogniseexpectedcreditlossunlikeIAS 39 where credit losses were recognised after their occurrence.
By adopting the standard, unrealised currency gains/losses on non-monetary financial instruments andunrealised fair value gains/losses on long term investments (Pula Fund) are no longer reported in Other ComprehensiveIncomebutarereportedinprofitorloss.However,inlinewiththeBank’sexistingpolicy,these are not distributed, but are appropriated to the Currency Revaluation Reserve and Fair Value Revaluation Reserve,respectively.TheneteffectofthischangeandthecomparativefiguresfortheyearendedDecember31,2017arenotrestated.TheeffectontheStatementofProfitorLossasaresultofthechangeinaccountingpolicy referred to above is as follows:
P’000
Netunrealisedcurrencylossesonnon-monetaryfinancialinstruments (668 436)Netunrealisedfairvaluegainsonfinancialinstruments 2 107 688Impairment Provision on Financial Assets (74)Impairment Provision on ex-staff loans (323)Net effect on net income available for distribution 1 438 855
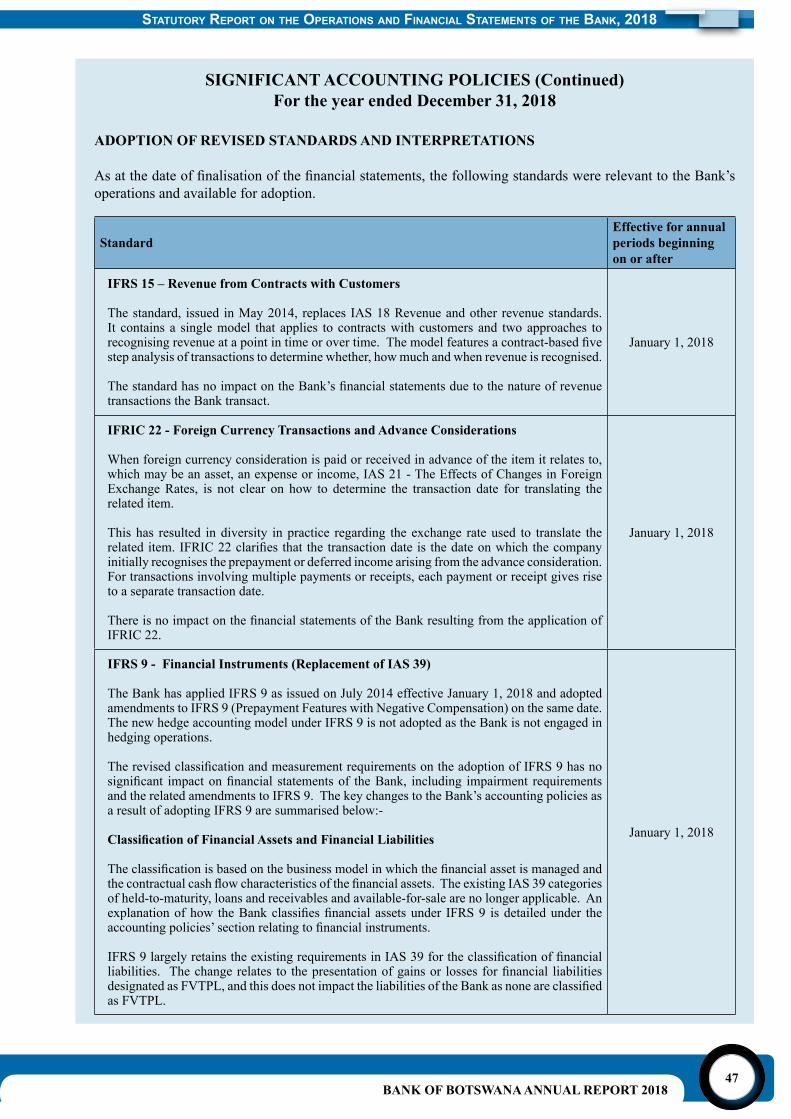
BANK OF BOTSWANA ANNUAL REPORT 201847
SIGNIFICANT ACCOUNTING POLICIES (Continued)For the year ended December 31, 2018
ADOPTION OF REVISED STANDARDS AND INTERPRETATIONS
Asatthedateoffinalisationofthefinancialstatements,thefollowingstandardswererelevanttotheBank’soperations and available for adoption.
StandardEffective for annual periods beginning on or after
IFRS 15 – Revenue from Contracts with Customers
The standard, issued in May 2014, replaces IAS 18 Revenue and other revenue standards. It contains a single model that applies to contracts with customers and two approaches to recognisingrevenueatapointintimeorovertime.Themodelfeaturesacontract-basedfivestep analysis of transactions to determine whether, how much and when revenue is recognised.
ThestandardhasnoimpactontheBank’sfinancialstatementsduetothenatureofrevenuetransactions the Bank transact.
January 1, 2018
IFRIC 22 - Foreign Currency Transactions and Advance Considerations
When foreign currency consideration is paid or received in advance of the item it relates to, which may be an asset, an expense or income, IAS 21 - The Effects of Changes in Foreign Exchange Rates, is not clear on how to determine the transaction date for translating the related item.
This has resulted in diversity in practice regarding the exchange rate used to translate the relateditem.IFRIC22clarifiesthat thetransactiondateis thedateonwhichthecompanyinitially recognises the prepayment or deferred income arising from the advance consideration. For transactions involving multiple payments or receipts, each payment or receipt gives rise to a separate transaction date.
ThereisnoimpactonthefinancialstatementsoftheBankresultingfromtheapplicationofIFRIC 22.
January 1, 2018
IFRS 9 - Financial Instruments (Replacement of IAS 39)
The Bank has applied IFRS 9 as issued on July 2014 effective January 1, 2018 and adopted amendments to IFRS 9 (Prepayment Features with Negative Compensation) on the same date. The new hedge accounting model under IFRS 9 is not adopted as the Bank is not engaged in hedging operations.
TherevisedclassificationandmeasurementrequirementsontheadoptionofIFRS9hasnosignificant impactonfinancial statementsof theBank, including impairment requirementsand the related amendments to IFRS 9. The key changes to the Bank’s accounting policies as a result of adopting IFRS 9 are summarised below:-
Classification of Financial Assets and Financial Liabilities
Theclassificationisbasedonthebusinessmodelinwhichthefinancialassetismanagedandthecontractualcashflowcharacteristicsofthefinancialassets.TheexistingIAS39categoriesof held-to-maturity, loans and receivables and available-for-sale are no longer applicable. An explanationofhow theBankclassifiesfinancialassetsunder IFRS9 isdetailedunder theaccountingpolicies’sectionrelatingtofinancialinstruments.
IFRS9largelyretainstheexistingrequirementsinIAS39fortheclassificationoffinancialliabilities. Thechangerelates to thepresentationofgainsor lossesforfinancial liabilitiesdesignatedasFVTPL,andthisdoesnotimpacttheliabilitiesoftheBankasnoneareclassifiedas FVTPL.
January 1, 2018
Statutory report on the operationS and Financial StatementS oF the Bank, 2018
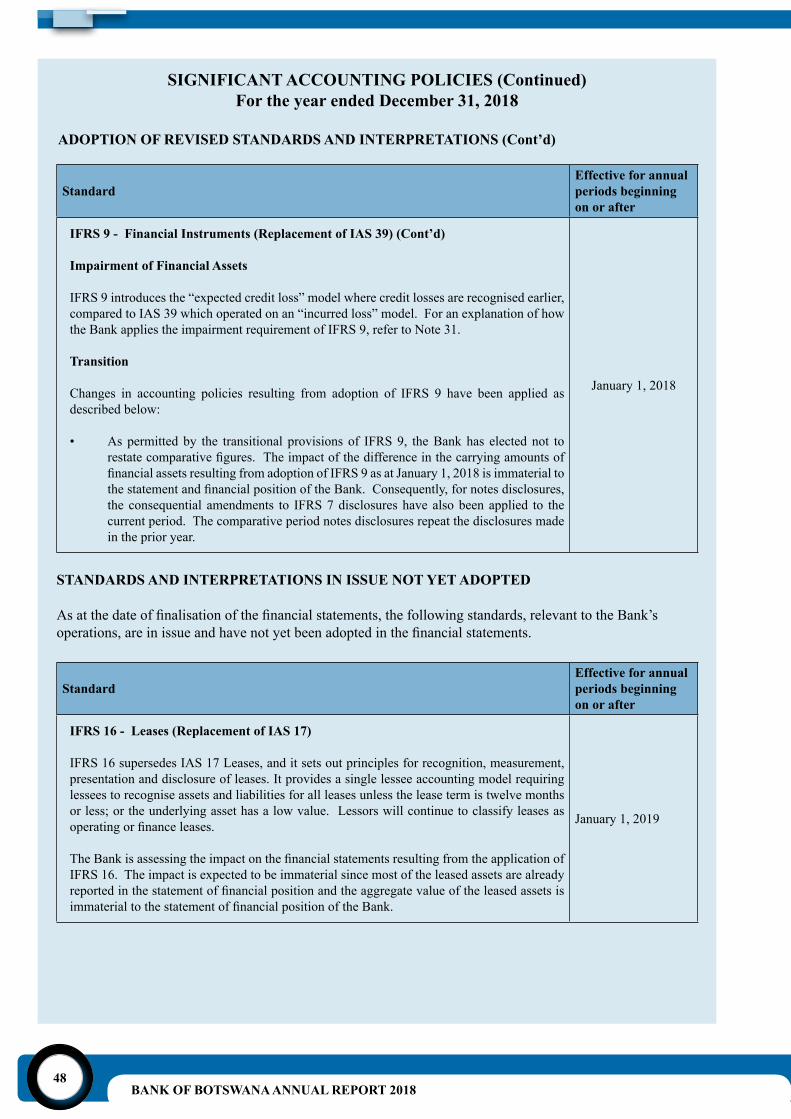
BANK OF BOTSWANA ANNUAL REPORT 201848
SIGNIFICANT ACCOUNTING POLICIES (Continued)For the year ended December 31, 2018
StandardEffective for annual periods beginning on or after
IFRS 9 - Financial Instruments (Replacement of IAS 39) (Cont’d)
Impairment of Financial Assets
IFRS 9 introduces the “expected credit loss” model where credit losses are recognised earlier, compared to IAS 39 which operated on an “incurred loss” model. For an explanation of how the Bank applies the impairment requirement of IFRS 9, refer to Note 31. Transition
Changes in accounting policies resulting from adoption of IFRS 9 have been applied as described below:
• As permitted by the transitional provisions of IFRS 9, the Bank has elected not to restatecomparativefigures.TheimpactofthedifferenceinthecarryingamountsoffinancialassetsresultingfromadoptionofIFRS9asatJanuary1,2018isimmaterialtothestatementandfinancialpositionoftheBank.Consequently,fornotesdisclosures,the consequential amendments to IFRS 7 disclosures have also been applied to the current period. The comparative period notes disclosures repeat the disclosures made in the prior year.
January 1, 2018
STANDARDS AND INTERPRETATIONS IN ISSUE NOT YET ADOPTED
Asatthedateoffinalisationofthefinancialstatements,thefollowingstandards,relevanttotheBank’soperations,areinissueandhavenotyetbeenadoptedinthefinancialstatements.
StandardEffective for annual periods beginning on or after
IFRS 16 - Leases (Replacement of IAS 17)
IFRS 16 supersedes IAS 17 Leases, and it sets out principles for recognition, measurement, presentation and disclosure of leases. It provides a single lessee accounting model requiring lessees to recognise assets and liabilities for all leases unless the lease term is twelve months or less; or the underlying asset has a low value. Lessors will continue to classify leases as operatingorfinanceleases.
TheBankisassessingtheimpactonthefinancialstatementsresultingfromtheapplicationofIFRS 16. The impact is expected to be immaterial since most of the leased assets are already reportedinthestatementoffinancialpositionandtheaggregatevalueoftheleasedassetsisimmaterialtothestatementoffinancialpositionoftheBank.
January 1, 2019
ADOPTION OF REVISED STANDARDS AND INTERPRETATIONS (Cont’d)
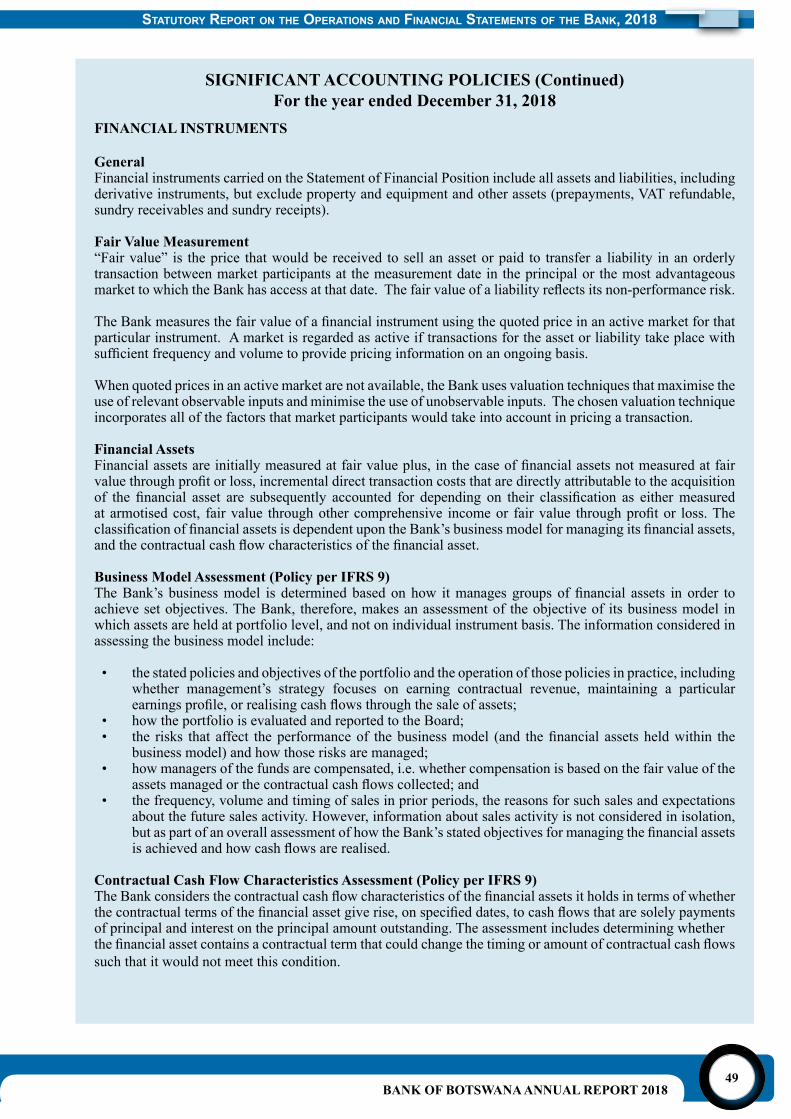
BANK OF BOTSWANA ANNUAL REPORT 201849
SIGNIFICANT ACCOUNTING POLICIES (Continued)For the year ended December 31, 2018
FINANCIAL INSTRUMENTS
GeneralFinancial instruments carried on the Statement of Financial Position include all assets and liabilities, including derivative instruments, but exclude property and equipment and other assets (prepayments, VAT refundable, sundry receivables and sundry receipts).
Fair Value Measurement“Fair value” is the price that would be received to sell an asset or paid to transfer a liability in an orderly transaction between market participants at the measurement date in the principal or the most advantageous markettowhichtheBankhasaccessatthatdate.Thefairvalueofaliabilityreflectsitsnon-performancerisk.
TheBankmeasuresthefairvalueofafinancialinstrumentusingthequotedpriceinanactivemarketforthatparticular instrument. A market is regarded as active if transactions for the asset or liability take place with sufficientfrequencyandvolumetoprovidepricinginformationonanongoingbasis.
When quoted prices in an active market are not available, the Bank uses valuation techniques that maximise the use of relevant observable inputs and minimise the use of unobservable inputs. The chosen valuation technique incorporates all of the factors that market participants would take into account in pricing a transaction.
Financial AssetsFinancialassetsareinitiallymeasuredatfairvalueplus,inthecaseoffinancialassetsnotmeasuredatfairvaluethroughprofitorloss,incrementaldirecttransactioncoststhataredirectlyattributabletotheacquisitionof the financial asset are subsequently accounted for depending on their classification as eithermeasuredatarmotisedcost, fairvalue throughothercomprehensive incomeor fairvalue throughprofitor loss.TheclassificationoffinancialassetsisdependentupontheBank’sbusinessmodelformanagingitsfinancialassets,andthecontractualcashflowcharacteristicsofthefinancialasset.
Business Model Assessment (Policy per IFRS 9)TheBank’s businessmodel is determinedbasedonhow itmanagesgroupsoffinancial assets in order toachieve set objectives. The Bank, therefore, makes an assessment of the objective of its business model in which assets are held at portfolio level, and not on individual instrument basis. The information considered in assessing the business model include:
• the stated policies and objectives of the portfolio and the operation of those policies in practice, including whether management’s strategy focuses on earning contractual revenue, maintaining a particular earningsprofile,orrealisingcashflowsthroughthesaleofassets;
• how the portfolio is evaluated and reported to the Board;• the risks that affect theperformanceof thebusinessmodel (and thefinancial assetsheldwithin the
business model) and how those risks are managed;• how managers of the funds are compensated, i.e. whether compensation is based on the fair value of the
assetsmanagedorthecontractualcashflowscollected;and• the frequency, volume and timing of sales in prior periods, the reasons for such sales and expectations
about the future sales activity. However, information about sales activity is not considered in isolation, butaspartofanoverallassessmentofhowtheBank’sstatedobjectivesformanagingthefinancialassetsisachievedandhowcashflowsarerealised.
Contractual Cash Flow Characteristics Assessment (Policy per IFRS 9)TheBankconsidersthecontractualcashflowcharacteristicsofthefinancialassetsitholdsintermsofwhetherthecontractualtermsofthefinancialassetgiverise,onspecifieddates,tocashflowsthataresolelypaymentsof principal and interest on the principal amount outstanding. The assessment includes determining whether thefinancialassetcontainsacontractualtermthatcouldchangethetimingoramountofcontractualcashflowssuch that it would not meet this condition.
Statutory report on the operationS and Financial StatementS oF the Bank, 2018
BANK OF BOTSWANA ANNUAL REPORT 201850
SIGNIFICANT ACCOUNTING POLICIES (Continued)For the year ended December 31, 2018
FINANCIAL INSTRUMENTS (Cont’d)
Financial Assets at Amortised Cost (Policy per IFRS 9)Financial assets are measured at amortised cost if they are held within a business model whose objective is toholdassets tocollectcontractualcashflows;andthecontractual termsof thefinancialassetgiveriseonspecifieddates tocashflows thataresolelypaymentsofprincipaland intereston theprincipalamountoutstanding.
Financial Assets at Fair Value through Other Comprehensive Income (Policy per IFRS 9)Financial assets are classified at fair value throughother comprehensive income if they are heldwithin abusinessmodelwhoseobjectiveisachievedbybothcollectingcontractualcashflowsandsellingfinancialassets;andthecontractualtermsofthefinancialassetmeetthesolelypaymentsofprincipalandinterestontheprincipal amount outstanding criterion.
Fairvaluegainsandlossesarerecognisedinothercomprehensiveincomeandreclassifiedtoprofitorlossonderecognitionofthefinancialasset;whileinterestincome,impairmentlossesandforeignexchangegains/lossesarerecognisedinprofitorloss.
Financial Assets at Fair Value through Profit or Loss (Policy per IFRS 9)
Financialassetsaremeasuredatfairvaluethroughprofitorlosswherethebusinessmodeldoesnotmeetthecriteriaforclassificationateitheramortisedcostorfairvaluethroughothercomprehensiveincome,thatisaresidualcategory.Thebusinessmodelisneitherhold-to-collectnorhold-to-collectandsell,andthecashflowsare not solely payments of principal and interest on the principal amount outstanding. The Bank’s investments infixedincomesecurities,derivativesandequityinstrumentsareheldfortrading,andhenceareallclassifiedatfairvaluethroughprofitorloss.
Fairvaluegainsandlossesoffinancialassetsmeasuredatfairvaluethroughprofitorlossarerecognisedinprofitorloss.
TheclassificationandmeasurementoftheBank’sfinancialassetsisdetailedasbelow.
Short-term Investments (Liquidity Portfolio) - Policy per IFRS 9The Bank has designated the Liquidity Portfolio as a fund in which money market instruments and bonds are invested to facilitate payments for regular transactions.
Securities invested in this portfolio are held for trading in support of the normal business of the Bank and measuredatfairvaluethroughprofitorloss.TheprimaryobjectiveoftheLiquidityPortfolioofmanagingliquidityisachievedbyrealisingcashflowsthroughfrequentselling,therefore,collectingcontractualcashflowsisincidental.Thebusinessmodelisneither“hold-to-collect”nor“hold-to-collectandsell”.
Short-term Investments are initially recognised at fair value and are subsequently remeasured at fair value basedonbidprices.Allrelatedrealisedandunrealisedgainsandlossesarerecognisedinprofitorloss.Inline with the Bank’s policy, realised currency gains/losses are not distributable as income, on money market instrument and bonds whose proceeds are reinvested but, are transferred to the Currency Revaluation Reserve. However,thoserealisedondomesticforeignexchangetransactionsareretainedinprofitorloss.
Therealisedandunrealisedfairvalueandcurrencygainsandlossesrecognisedintheprofitorlossexcludeinterest and dividend income.
All purchases and sales of investment securities in the portfolio are recognised at trade date, which is the date the Bank commits to purchase or sell the investments.
BANK OF BOTSWANA ANNUAL REPORT 201851
SIGNIFICANT ACCOUNTING POLICIES (Continued)For the year ended December 31, 2018
FINANCIAL INSTRUMENTS (Cont’d)
Long-term Investments (Pula Fund) - Policy per IFRS 9This is a long-term fund intended to generate returns and maintain the purchasing power of reserves, and is invested in foreign financial instruments. The Fund invests in bonds, equities and derivatives. Theseinvestments may be sold in response to needs for liquidity, changes in interest rates, market prices, exchange rates,etc.Investmentsindebtsecurities,equityandderivativesareclassifiedatfairvaluethroughprofitorloss.These securities are initially recognised at fair value (which includes transaction costs) and are subsequently remeasured at fair value, based on bid prices.
Allrealisedandunrealisedcurrencygains/lossesarerecognisedinprofitorloss.However,inlinewiththeBank policy, all currency gains/losses for this Fund are not distributable and are, therefore, transferred to the Currency Revaluation Reserve.
Allrealisedandunrealisedfairvaluechangesininvestmentsecuritiesarerecognisedinprofitorloss.Unrealisedgains and losses arising from fair value changes of the instruments in this Fund are non-distributable as per the Bank’s policy and are transferred to the Market Value Revaluation Reserve. However, when the investment securities are disposed off, the related accumulated fair value gains/losses are distributable.
All purchases and sales of investment securities in the portfolio are recognised at trade date, which is the date the Bank commits to purchase or sell the investments.
Government of Botswana Bonds (Policy per IFRS 9)The Bank acquires Government of Botswana bonds for purposes of facilitating orderly trading in the local bond market. The bonds are held with an intention to sell in response to the need to intervene in the market. These bonds held under “other” business model, do not meet the ‘hold-to-collect’ or ‘hold-to-collect and sell’ qualifyingcriteria,consequently,areclassifiedasFVTPL.
The bonds are initially recognised at fair value and are subsequently remeasured at fair value, based on bid prices.Allunrealisedgainsandlossesarisingfromchangesinthefairvaluearerecognisedintheprofitorloss. When these instruments are disposed of or impaired, the related accumulated fair value adjustments are includedinprofitorlossasgainsorlossesfromGovernmentofBotswanabonds.Allpurchasesandsalesofbonds are recognised at trade date, which is the date that the Bank commits itself to purchase or sell the bonds.
Short-Term Deposits (Policy per IFRS 9)Short-Term deposits are placed with different deposit taking institutions in the international markets. The durationof thefixeddeposits are typicallyoneweek to threemonths.Most are in theLiquidityPortfoliospecificallytomeetinternationalpaymentsandothertransactionalneeds.Thedepositsareheldwithcentralbanks and other high investment graded institutions, with the exception of South Africa where deposits are always held despite the rating because of the important economic and business relationship that exists between Botswana and South Africa. South Africa is Botswana’s largest trading partner.
The deposits are initially recognised at fair value and subsequently measured at amortised cost using the effectiveinterestmethod.Theresultinggainorlossisrecognisedintheprofitorloss.Theexpectedcreditlossmodel is applied to the deposits under this category. Risk assessment of default to calculate expected credit loss is detailed per Note 31.
Other Assets (Policy per IFRS 9)These are non-derivative financial assets with fixed or determinable payments that are not quoted in anactive market. These arise when the Bank provides a service directly to a counterparty. Other assets include prepayments, advances to banks and staff advances initially measured at fair value plus incremental direct transaction costs, and subsequently measured at amortised cost using the effective interest method less any identifiedimpairmentlossesattheendofeachreportingperiod.
Statutory report on the operationS and Financial StatementS oF the Bank, 2018
BANK OF BOTSWANA ANNUAL REPORT 201852
SIGNIFICANT ACCOUNTING POLICIES (Continued)For the year ended December 31, 2018
FINANCIAL INSTRUMENTS (Cont’d)
Derivative Instruments (Policy per IFRS 9)The Bank uses a variety of derivative instruments to manage its exposure to interest rate and foreign exchange risks. These include interest rate futures, foreign exchange forward contracts, cross-currency swaps and options.
Derivative instruments are initially recognised at fair value (including transaction costs) and are subsequently remeasured at fair value, based on bid prices for assets held or liabilities to be issued, and ask/offer prices for assetstobeacquiredorliabilitiesheld.Theresultinggainorlossisrecognisedintheprofitorloss.
Impairment of Financial Assets (Policy per IFRS 9)The Bank applies the IFRS 9 expected credit loss model for recognition and measurement of impairment losses onfinancialassetsmeasuredatamortisedcost.Thenewimpairmentmodelisforwardlookingandrecognisesexpectedcreditlosses(ECL)fromthepointatwhichfinancialassetsareoriginatedorpurchased.Thestandardstatesthatiftherehasbeensignificantincreaseinthecreditriskofthefinancialassetafterinitialrecognition,alifetime expected credit loss should be recognised. However, the Bank only invests in high quality investment gradefinancialinstrumentswhichareconsideredtohaveclosetozeroriskofdefault.TheBank,therefore,measuresimpairmentonfinancialassetsusingthe12-monthexpectedcredit loss. TheBankdeterminesateachreportingdatewhetherfinancialassetshavelowcreditrisks.
Financial assets are credit impaired when there is objective evidence that as a result of one or more events thathaveoccurredafter the initial recognitionof thefinancialasset, theestimatedfuturecashflowsof theinvestment have been adversely impacted. Evidence that a financial asset is credit-impaired include thefollowing observable data:• significantfinancialdifficultyofthedeposittaker;• a breach of contract such as a default or past due event;• itisbecomingprobablethatthedeposittakerwillenterbankruptcyorotherfinancialreorganisation;or• thedisappearanceofanactivemarketforamoneymarketinstrumentbecauseoffinancialdifficulties.
Staff advances are categorised as low risk assets, with controls on issue of loans and their recovery in place. An annual assessment of materiality of any ECL is undertaken. In the case of ex-staff debts, where there arenoterminalbenefitstorecovertheoutstandingdebt, theremainingdebtiswhollyimpaired. However,determined effort is undertaken to recover the debt. Advances to Bank’s are collaterised against Bank of BotswanaCertificates,thereforetheriskofdefaultisnone.
Forfinancialassetscarriedatamortisedcost,theamountoftheimpairmentisthedifferencebetweentheasset’scarrying amount and the present valueof estimated future cashflows, discounted at the original effectiveinterest rate.
Financial LiabilitiesAll the Bank’s financial liabilities are classified as other financial liabilities at amortised cost. Financialliabilities are initially recognised at fair value and subsequently measured at amortised cost using the effective interest method.
Derecognition TheBankderecognisesafinancialassetwhenitlosescontroloverthecontractualrightsthatcomprisetheassetandtransferssubstantiallyalltherisksandbenefitsassociatedwiththeasset.Thisariseswhentherightsarerealised,expireoraresurrendered.Afinancialliabilityisderecognisedwhenitscontractualobligationsaredischarged, cancelled or expire.
Financial Assets (Policy prior to IFRS 9)Financialassetsareinitiallymeasuredatfairvalueplus,inthecaseoffinancialassetsnotmeasuredatfairvaluethroughprofitorloss,incrementaldirecttransactioncostsandsubsequentlyaccountedfordependingon their classificationas either loansand receivables,held tomaturity, fairvalue throughprofitor lossoravailable-for-sale.
BANK OF BOTSWANA ANNUAL REPORT 201853
SIGNIFICANT ACCOUNTING POLICIES (Continued)For the year ended December 31, 2018
FINANCIAL INSTRUMENTS (Cont’d)
Loans and Receivables (Policy prior to IFRS 9)Loansandreceivablesarenon-derivativefinancialassetswithfixedordeterminablepayments thatarenotquoted in an active market. These arise when the Bank provides a service directly to a counterparty. Loans and receivables (as well as prepayments, advances to banks and staff advances) are initially measured at fair value plus incremental direct transaction costs, and subsequently measured at amortised cost using the effective interestmethodlessanyidentifiedimpairmentlossesattheendofeachreportingperiod.
Financial Assets at Fair Value through Profit or Loss (Policy prior to IFRS 9)Financialassetsareclassifiedasfairvaluethroughprofitorlosswhenthefinancialassetisheldfortrading.The Bank holds short-term investments as held for trading.
Afinancialassetisclassifiedasheldfortradingifitisacquiredprincipallyforthepurposeofsellingitintheshort-termorifsodesignatedbymanagement.Financialassetsatfairvaluethroughprofitorlossarestatedatfairvalue,withanyrealisedandunrealisedgainsandlossesarisingfromchangesinthefairvalueoffinancialassetsrecognisedinprofitorlossintheyearinwhichtheyarise.
Short-term Investments (Liquidity Portfolio) – (Policy prior to IFRS 9)The Bank has designated the Liquidity Portfolio as a fund in which money market instruments and bonds are invested to facilitate payments for regular transactions.
Securitiesinvestedinthisportfolioaremeasured“atfairvaluethroughprofitorloss”andareclassifiedasheldfor trading. They are initially recognised at fair value and are subsequently remeasured at fair value based on bidprices.Allrelatedrealisedandunrealisedgainsandlossesarerecognisedinprofitorloss.
All purchases and sales of investment securities in the portfolio are recognised at trade date, which is the date the Bank commits to purchase or sell the investments.
Therealisedandunrealisedgainsandlossesrecognisedinprofitorlossexcludeinterestanddividendincome.Derivativesareclassifiedasheldfortrading.
Available-For-Sale (Policy prior to IFRS 9)Available-for-saleassetsarenon-derivativefinancialassetsthataredesignatedasavailable-for-saleorarenotclassifiedasanothercategoryoffinancialinstruments.Available-for-saleinstrumentsareintendedtobeheldfor long periods of time but may be sold in the normal course of business of the Bank.
Long-term Investments (Pula Fund) – (Policy prior to IFRS 9)This is a long-term fund intended to generate returns and maintain the purchasing power of reserves, and is invested in foreign financial instruments. These investments,whichmay be sold in response to needsfor liquidity,changesininterestrates,exchangerates,etc.,areclassifiedas“available-for-sale”,exceptforderivatives. These securities are initially recognised at fair value (which includes transaction costs) and are subsequently remeasured at fair value, based on bid prices.
Allrealisedcurrencygains/lossesarerecognisedinprofitorloss.Unrealisedcurrencygains/lossesonmonetaryitemsarealsorecognisedinprofitorloss.Theunrealisedcurrencygains/lossesonnon-monetaryitemsarerecognised in other comprehensive income. However, in line with the Bank policy, all currency gains/losses for this Fund are not distributable and are, therefore, appropriated to the Currency Revaluation Reserve.
Realisedfairvaluechangesarerecognisedinprofitorloss.Unrealisedfairvaluechangesarerecognisedinother comprehensive income. Unrealised gains and losses arising from fair value changes of the instruments classifiedas“available-for-sale”arenon-distributableasper theBank’spolicyandareappropriated to theMarket Revaluation Reserve. When these instruments are disposed of or impaired, the related accumulated fairvalueorimpairmentadjustmentsareincludedinprofitorlossasgainsorlossesfrominvestmentsecurities.
Statutory report on the operationS and Financial StatementS oF the Bank, 2018
BANK OF BOTSWANA ANNUAL REPORT 201854
SIGNIFICANT ACCOUNTING POLICIES (Continued)For the year ended December 31, 2018
FINANCIAL INSTRUMENTS (Cont’d)
All purchases and sales of investment securities in the portfolio are recognised at trade date, which is the date the Bank commits to purchase or sell the investments.
Government of Botswana Bonds (Policy prior to IFRS 9)The Bank acquires Government of Botswana bonds for purposes of facilitating orderly trading in the local bondmarket.Thebonds,whichmaybesoldinresponsetotheneedtointerveneinthemarket,areclassifiedas “available-for-sale” securities.
The bonds are initially recognised at fair value and are subsequently remeasured at fair value, based on bid prices. All unrealised gains and losses arising from changes in the fair value are recognised in the Market Revaluation Reserve. When these instruments are disposed of or impaired, the related accumulated fair value adjustmentsareincludedinprofitorlossasgainsorlossesfromGovernmentofBotswanabonds.
All purchases and sales of bonds are recognised at trade date, which is the date that the Bank commits itself to purchase or sell the bonds.
Derivative Instruments (Policy prior to IFRS 9)The Bank uses a variety of derivative instruments to manage its exposure to interest rate and foreign exchange risks. These include interest rate futures, foreign exchange forward contracts, cross-currency swaps and options.
Derivative instruments are initially recognised at fair value (including transaction costs) and are subsequently remeasured at fair value, based on bid prices for assets held or liabilities to be issued, and ask/offer prices for assetstobeacquiredorliabilitiesheld.Theresultinggainorlossisrecognisedintheprofitorloss.
Impairment of Financial Assets (Policy prior to IFRS 9)Financial assets, other than loans and receivables, are carried at fair value. “Loans and receivables” are assessed for any evidence of impairment at each Statement of Financial Position date. Financial assets are impaired when there is objective evidence that as a result of one or more events that have occurred after the initialrecognitionofthefinancialasset,theestimatedfuturecashflowsoftheinvestmenthavebeenadverselyimpacted.Forfinancialassetscarriedatamortisedcost,theamountoftheimpairmentisthedifferencebetweentheasset’scarryingamountandthepresentvalueofestimatedfuturecashflows,discountedattheoriginaleffective interest rate. In respect of “available-for-sale” equity securities, any increase in fair value subsequent to an impairment loss is recognised directly in other comprehensive income.
Other Financial LiabilitiesOtherfinancialliabilitiesareinitiallymeasuredatfairvalue,netoftransactioncosts.
Otherfinancial liabilities are subsequentlymeasuredat amortisedcostusing theeffective interestmethod,with interest expense recognised on the effective yield basis. The effective interest method is a method of calculatingtheamortisedcostofafinancialliabilityandofallocatinginterestexpenseovertherelevantperiod.The effective interest rate is the rate that exactly discounts future cash payments through the expected life of thefinancialliability,orwhereappropriate,ashorterperiod.
Bank of Botswana CertificatesAs one of the primary tools for maintaining monetary stability in the economy, the Bank of Botswana issues itsownpaper,BankofBotswanaCertificates(BoBCs),toabsorbexcessliquidityinthemarketandtherebyinfluenceshortterminterestrates.BoBCsareissuedatadiscounttocounterparties.Theyareclassifiedas“otherfinancialliabilities”.
The Bank’s liability in respect of BoBCs is stated at offer prices on auction date, adjusted for movements in maturedandunmatureddiscountrecognisedinprofitorloss.
BANK OF BOTSWANA ANNUAL REPORT 201855
SIGNIFICANT ACCOUNTING POLICIES (Continued)For the year ended December 31, 2018
FINANCIAL INSTRUMENTS (Cont’d)
CREDIT FACILITY
Under the Credit Facility, the Bank provides emergency and intermittent funding to solvent banks, intended to bridge intra-day and overnight liquidity shortages. The advances are secured by any Government of Botswana bonds of any maturity, International Finance Corporation Pula denominated note listed on the Botswana Stock Exchange,BankofBotswanaCertificates(BoBCs)andanyothereligibleGovernmentguaranteedsecurities,valued at fair value prices on the date of the transaction. Only high quality, marketable and freely transferable paper with a minimum amount of risk is acceptable as collateral at the discretion of the Bank. A margin/haircut is applied to mitigate risk. The Bank has the right to call for additional collateral, should the value of the securitydeclineduringthetenureofthefacility.Interestearnedontheadvancesiscreditedtoprofitorloss,while advances outstanding as at the Statement of Financial Position date are recorded under “other assets”.
SECURITIES LENDING PROGRAMME
The Bank takes part in a Securities Lending Programme. Where securities are lent, the Bank holds collateral in the form of cash or other securities. The securities lent continue to be recorded in the Bank’s Statement of Financial Position.
The Bank’s global custodian administers the Securities Lending Programme and monitors the securities lent and related collateral against requirements agreed by the Bank.
The Bank records income from lending securities as it accrues.
REPURCHASE AND REVERSE REPURCHASE AGREEMENTS
Thisfacilityisoneofthemechanismsdesignedtodealwithshort-termliquidityfluctuationsinthedomesticmoney market. It is available to primary counterparties which are solvent institutions licensed and supervised by the Bank.
The term of a repurchase agreement and reverse repurchase agreement can vary from overnight to 91 days, depending on the liquidity conditions in the domestic market.
Interest earned by the Bank on repurchase agreements and interest paid by the Bank on reverse repurchase agreementsisrecognisedinprofitorloss.
OFFSETTING FINANCIAL INSTRUMENTS
TheBank offsets financial assets and liabilities and reports the net balance in the Statement of FinancialPosition where:
(a) there is a legally enforceable right to set off; and(b) there is an intention to settle on a net basis or to realise the asset and settle the liability simultaneously.
FOREIGN CURRENCIES
All transactions denominated in foreign currencies are translated to Pula at the mid exchange rate at the transaction date. All assets and liabilities denominated in foreign currencies are translated to Pula using mid ratesofexchangeatthecloseofthefinancialyear. Foreigncurrencydifferencesarisingontranslationarerecognisedinprofitorloss.However,allgainsandlossesrelatingtodisposalswhoseproceedsarereinvestedin foreign assets, and all the unrealised gains/losses arising on financial instruments are not considereddistributable in terms of Bank policy; they are appropriated to the Currency Revaluation Reserve.
Statutory report on the operationS and Financial StatementS oF the Bank, 2018
BANK OF BOTSWANA ANNUAL REPORT 201856
SIGNIFICANT ACCOUNTING POLICIES (Continued)For the year ended December 31, 2018
FINANCIAL INSTRUMENTS (Cont’d)
NON-FINANCIAL ASSETS, LIABILITIES AND RECOGNITION OF PROVISIONS
Non-financial Assets Non-financialassetsarerecognisedwhentheBankobtainscontrolofaresourceasaresultofpastevents,andfromwhichfutureeconomicbenefitsareexpectedtoflowtotheBank.
Contingent AssetsTheBankdisclosesacontingentassetarisingfrompasteventswhereitisprobablethateconomicbenefitswillflowfromit,butthiswillonlybeconfirmedbytheoccurrenceornon-occurrenceofoneormoreuncertainfuture events outside the control of the Bank.
Liabilities and ProvisionsThe Bank recognises liabilities (including provisions) when:
(a) it has a present legal obligation resulting from past events; (b) itisprobablethatanoutflowofresourcesembodyingeconomicbenefitswillberequiredtosettlethis
obligation; and(c) a reliable estimate of the amount of the obligation can be made.
INCOME AND EXPENSE RECOGNITION
Interestincomeonallassetsiscalculatedusingtheeffectiveinterestmethodandisrecognisedinprofitorloss.The ‘effective interest rate’ is the rate that exactly discounts the estimated future cash payments and receipts through theexpected lifeof thefinancialassetorfinancial liability to thecarryingamountof thefinancialassetorfinancialliability.Whencalculatingtheeffectiveinterestrate,theBankestimatesfuturecashflowsconsidering all contractual termsof thefinancial instrument, but not future credit losses. The calculationof the effective interest rate includes transaction costs that are an integral part of the effective interest rate. Transactioncostsincludeincrementalcoststhataredirectlyattributabletotheacquisitionorissueofafinancialassetorfinancialliability.
Forfinancialassetsmeasuredatamortisedcost,futurecashflowestimatesarebasedonthecarryingamountsoffinancialassetsadjustedforlossallowances.Changesincarryingamountsarerecognisedinprofitorloss.
Interest income and expense presented in the statement of profit or loss andother comprehensive incomeinclude:
(a) interestonfinancialassetsandfinancialliabilitiesmeasuredatamortisedcostcalculatedonaneffectiveinterest basis; and
(b) interestonfairvaluethroughprofitorlossinvestmentsecuritiescalculatedonaneffectiveinterestratebasis.
(c) Dividendsonfairvaluethroughprofitorlossequityinstrumentsarerecognisedinprofitorlosswhentheright to receive payment is established. Usually, this is the ex-dividend date for quoted equities.
GENERAL RESERVE
Under Section 7(1) of the Bank of Botswana Act, (CAP 55:01), the Bank of Botswana is required to establish andmaintainaGeneralReservesufficienttoensurethesustainabilityoffutureoperationsoftheBank.TheBank may transfer to the General Reserve funds from other reserves, which it maintains, for the purposes of maintaining the required level of the General Reserve.
BANK OF BOTSWANA ANNUAL REPORT 201857
CURRENCY REVALUATION RESERVE
Any changes in the valuation, in terms of Pula, of the Bank’s assets and liabilities in holdings of Special Drawing Rights and foreign currencies as a result of any change in the values of exchange rates of Special Drawing Rights or foreign currencies and in realised currency gains reinvested in foreign assets are transferred to the Currency Revaluation Reserve.
The proportion directly attributable to the Government Investment Account is transferred to such investment account.
FAIR VALUE REVALUATION RESERVE
Any changes in the value of the Bank’s long-term investments as a result of any change in the fair values of such investments are transferred to the Fair Value Revaluation Reserve.
The proportion directly attributable to the Government Investment Account is transferred to such investment account.
GOVERNMENT INVESTMENT ACCOUNT
The Government Investment Account, which was established on January 1, 1997, represents the Government’s share of foreign exchange reserves in the Pula Fund and Liquidity Portfolio including its share of unrealised fair value and currency gains and losses.
PROPERTY AND EQUIPMENT
Property and equipment are stated at cost less related accumulated depreciation and any accumulated impairment losses.
Land and buildings are carried at cost. These are valued on a fair value basis and the recoverable (revalued) amounts disclosed by way of a note to the Financial Statements, providing that revalued amounts are in excess of the carrying amounts. Where the carrying amounts are more than the revalued amounts, an impairment loss isrecognisedinprofitorloss.Thevaluationtakesplaceeverythreeyears.
At each Statement of Financial Position date, the Bank reviews the carrying amounts of its tangible and intangible assets to determine whether there is any indication that those assets have suffered an impairment loss. If any such indication exists, the recoverable amount of the asset is estimated in order to determine the extent of the impairment loss (if any).
Anyimpairmentlossisrecognisedimmediatelyinprofitorloss.
Where an impairment loss subsequently reverses, the carrying amount of the asset is increased to the revised estimate of its recoverable amount, but so that the increased carrying amount does not exceed the carrying amount that would have been determined had no impairment loss been recognised for the asset in prior years.
Ifsignificantpartsofanitemofpropertyorequipmenthavedifferentusefullives,theyareaccountedforasseparate items (major components) of property and equipment.
DepreciationDepreciation is charged so as to write-off the cost of assets less residual values, other than land and buildings under construction, over their estimated useful lives, using the straight-line method. The estimated useful lives, residual values and depreciation methods are reviewed at each year end, with the effect of any changes in the estimate accounted for on a prospective basis. Land is not depreciated because it is considered to have aninfiniteusefullife.
SIGNIFICANT ACCOUNTING POLICIES (Continued)For the year ended December 31, 2018
Statutory report on the operationS and Financial StatementS oF the Bank, 2018
BANK OF BOTSWANA ANNUAL REPORT 201858
SIGNIFICANT ACCOUNTING POLICIES (Continued)For the year ended December 31, 2018
PROPERTY AND EQUIPMENT (Cont’d)
The annual depreciation rates used are as follows:
Percent
Buildings 2.5 – 6Other AssetsFurniture,fixturesandequipment 5 – 25Computer hardware 25Computer software 20Motor vehicles 5 - 25
A gain or loss arising on disposal or retirement of an item of property and equipment is determined as the differencebetweenthenetsalesproceedsandthecarryingamountoftheassetandisrecognisedinprofitorloss.
Capital works in progress comprise costs directly attributable to the construction of an asset. Assets remain in capital works in progress until they have become available for use or commissioned, whichever is the earlier date. At that time, these assets are transferred to the appropriate class of property and equipment as additions and depreciated.
Subsequent expenditure is capitalised only when it is probable that the future economic benefits of theexpenditurewillflowtotheBank.Ongoingrepairsandmaintenanceareexpensedasincurred.
RETIREMENT BENEFITS
PensionbenefitsareprovidedforemployeesthroughtheBankofBotswanaDefinedContributionStaffPensionFund, in accordance with the Retirement Funds Act, 2014. The contribution per pensionable employee is at the rate of 21.5 percent of pensionable salary, which comprises 16 percent and 1.5 percent payable by the Bank as its contribution to the Fund and for administration costs of the Fund, respectively, and a 4 percent contribution by each pensionable employee. Other than the contributions made, the Bank has no commitments orobligationstothisFund.Obligationsforcontributionstothepensionfundarerecognisedinprofitorlossinthe periods during which services are rendered by employees.
SHORT-TERM EMPLOYEE BENEFITS
Short-termemployeebenefits obligations aremeasuredon anundiscountedbasis and are expensed as therelated service is provided.
FINANCE LEASES
Assets held under a lease agreement that transfers substantially all of the risks and rewards of ownership to the Bankareclassifiedasfinanceleases.Theleasedassetisinitiallymeasuredatanamountequaltothelowerofits fair value and the present value of the minimum lease payments. Subsequent to initial recognition, the asset is accounted for in accordance with the accounting policy applicable to that asset.
AssetsheldunderotherleasesareclassifiedasoperatingleasesandarenotrecognisedintheBank’sstatementoffinancialposition.
BANK OF BOTSWANA ANNUAL REPORT 201859
RELATED PARTY TRANSACTIONS
The Bank enters into various transactions with other wholly owned or partly owned Government institutions and its key management personnel (related parties). All related party transactions are entered into at mutually agreed terms and conditions in the ordinary course of business. The transactions with key management personnelarestaffbenefitsprovidedundertheGeneralConditionsofServiceoftheBank.
SIGNIFICANT ACCOUNTING ESTIMATES AND JUDGEMENTS IN APPLYING ACCOUNTING POLICIES
The Bank makes estimates and assumptions that affect the reported amounts of assets and liabilities within the next financial year. Estimates and judgments are continually evaluated and are based on historicalexperience and other factors, including expectations of future events that are believed to be reasonable under the circumstances.
Useful Lives of Property and Equipment Management reviews the estimated useful lives of property and equipment at the end of each annual reporting period.Inthisfinancialyear,nochangewasmadetotheusefullives,hencethedepreciationratesprovidedare similar with the prior year.
SIGNIFICANT ACCOUNTING POLICIES (Continued)For the year ended December 31, 2018
Statutory report on the operationS and Financial StatementS oF the Bank, 2018
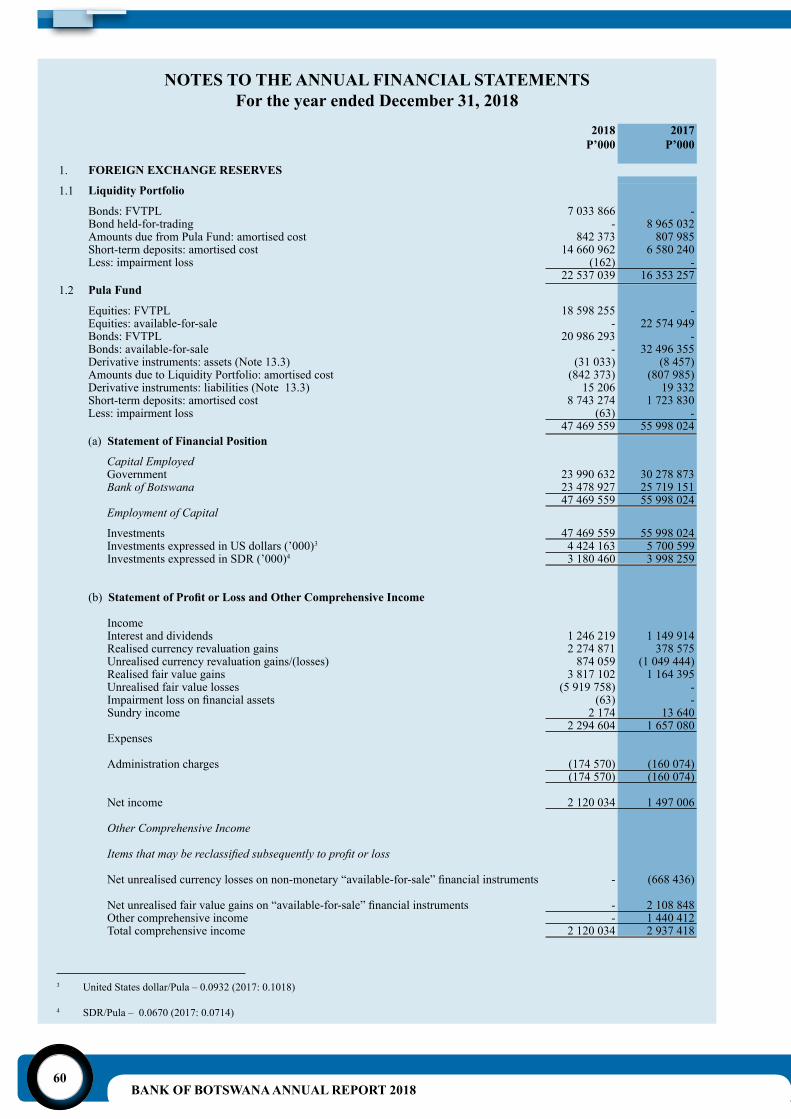
BANK OF BOTSWANA ANNUAL REPORT 201860
NOTES TO THE ANNUAL FINANCIAL STATEMENTSFor the year ended December 31, 2018
2018P’000
2017P’000
1. FOREIGN EXCHANGE RESERVES
1.1 Liquidity Portfolio
Bonds: FVTPL 7 033 866 -Bond held-for-trading - 8 965 032Amounts due from Pula Fund: amortised cost 842 373 807 985Short-term deposits: amortised cost 14 660 962 6 580 240Less: impairment loss (162) -
22 537 039 16 353 2571.2 Pula Fund
Equities: FVTPL 18 598 255 -Equities: available-for-sale - 22 574 949Bonds: FVTPL 20 986 293 -Bonds: available-for-sale - 32 496 355Derivative instruments: assets (Note 13.3) (31 033) (8 457)Amounts due to Liquidity Portfolio: amortised cost (842 373) (807 985)Derivative instruments: liabilities (Note 13.3) 15 206 19 332Short-term deposits: amortised cost 8 743 274 1 723 830Less: impairment loss (63) -
47 469 559 55 998 024(a) Statement of Financial Position
Capital EmployedGovernment 23 990 632 30 278 873Bank of Botswana 23 478 927 25 719 151
47 469 559 55 998 024Employment of Capital
Investments 47 469 559 55 998 024Investments expressed in US dollars (’000)3 4 424 163 5 700 599Investments expressed in SDR (’000)4 3 180 460 3 998 259
(b) Statement of Profit or Loss and Other Comprehensive Income
IncomeInterest and dividends 1 246 219 1 149 914Realised currency revaluation gains 2 274 871 378 575Unrealised currency revaluation gains/(losses) 874 059 (1 049 444)Realised fair value gains 3 817 102 1 164 395Unrealised fair value losses (5 919 758) -Impairmentlossonfinancialassets (63) -Sundry income 2 174 13 640
2 294 604 1 657 080Expenses
Administration charges (174 570) (160 074)(174 570) (160 074)
Net income 2 120 034 1 497 006
Other Comprehensive Income
Items that may be reclassified subsequently to profit or loss
Netunrealisedcurrencylossesonnon-monetary“available-for-sale”financialinstruments - (668 436)
Netunrealisedfairvaluegainson“available-for-sale”financialinstruments - 2 108 848Other comprehensive income - 1 440 412Total comprehensive income 2 120 034 2 937 418
3 United States dollar/Pula – 0.0932 (2017: 0.1018)
4 SDR/Pula – 0.0670 (2017: 0.0714)
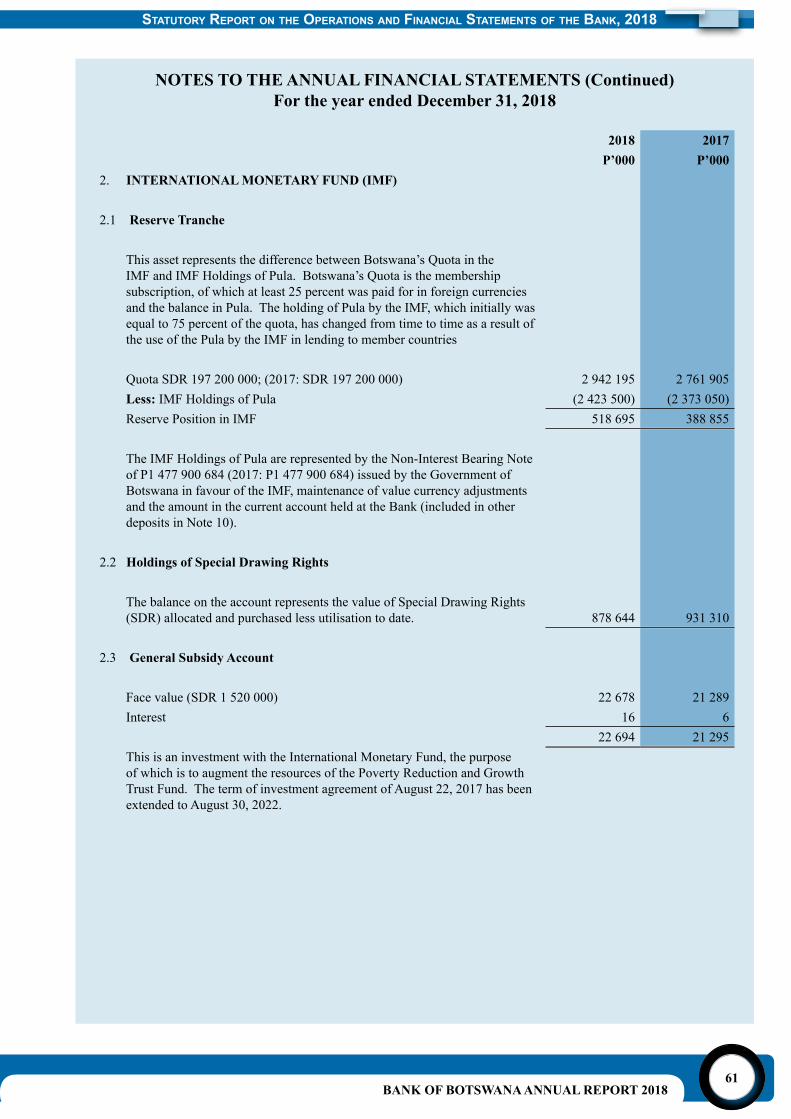
BANK OF BOTSWANA ANNUAL REPORT 201861
NOTES TO THE ANNUAL FINANCIAL STATEMENTS (Continued)For the year ended December 31, 2018
2018 2017P’000 P’000
2. INTERNATIONAL MONETARY FUND (IMF)
2.1 Reserve Tranche
This asset represents the difference between Botswana’s Quota in the IMF and IMF Holdings of Pula. Botswana’s Quota is the membership subscription, of which at least 25 percent was paid for in foreign currencies and the balance in Pula. The holding of Pula by the IMF, which initially was equal to 75 percent of the quota, has changed from time to time as a result of the use of the Pula by the IMF in lending to member countries
Quota SDR 197 200 000; (2017: SDR 197 200 000) 2 942 195 2 761 905Less: IMF Holdings of Pula (2 423 500) (2 373 050)Reserve Position in IMF 518 695 388 855
The IMF Holdings of Pula are represented by the Non-Interest Bearing Note of P1 477 900 684 (2017: P1 477 900 684) issued by the Government of Botswana in favour of the IMF, maintenance of value currency adjustments and the amount in the current account held at the Bank (included in other deposits in Note 10).
2.2 Holdings of Special Drawing Rights
The balance on the account represents the value of Special Drawing Rights (SDR) allocated and purchased less utilisation to date. 878 644 931 310
2.3 General Subsidy Account
Face value (SDR 1 520 000) 22 678 21 289Interest 16 6
22 694 21 295This is an investment with the International Monetary Fund, the purpose of which is to augment the resources of the Poverty Reduction and Growth Trust Fund. The term of investment agreement of August 22, 2017 has been extended to August 30, 2022.
Statutory report on the operationS and Financial StatementS oF the Bank, 2018
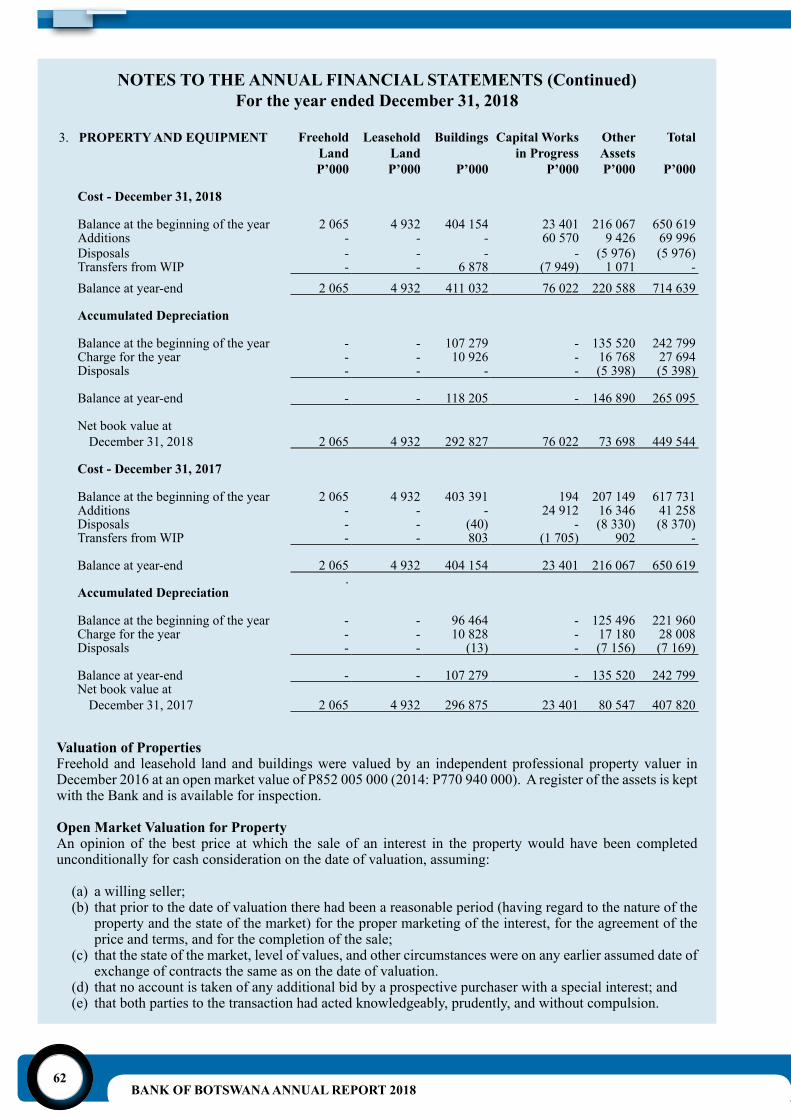
BANK OF BOTSWANA ANNUAL REPORT 201862
NOTES TO THE ANNUAL FINANCIAL STATEMENTS (Continued)For the year ended December 31, 2018
3. PROPERTY AND EQUIPMENT FreeholdLandP’000
Leasehold LandP’000
Buildings
P’000
Capital Works in Progress
P’000
OtherAssetsP’000
Total
P’000
Cost - December 31, 2018
Balance at the beginning of the year 2 065 4 932 404 154 23 401 216 067 650 619Additions - - - 60 570 9 426 69 996Disposals - - - - (5 976) (5 976)Transfers from WIP - - 6 878 (7 949) 1 071 -Balance at year-end 2 065 4 932 411 032 76 022 220 588 714 639
Accumulated Depreciation
Balance at the beginning of the year - - 107 279 - 135 520 242 799Charge for the year - - 10 926 - 16 768 27 694Disposals - - - - (5 398) (5 398)
Balance at year-end - - 118 205 - 146 890 265 095
Net book value at December 31, 2018 2 065 4 932 292 827 76 022 73 698 449 544
Cost - December 31, 2017
Balance at the beginning of the year 2 065 4 932 403 391 194 207 149 617 731Additions - - - 24 912 16 346 41 258Disposals - - (40) - (8 330) (8 370)Transfers from WIP - - 803 (1 705) 902 -
Balance at year-end 2 065 4 932 404 154 23 401 216 067 650 619.
Accumulated Depreciation
Balance at the beginning of the year - - 96 464 - 125 496 221 960Charge for the year - - 10 828 - 17 180 28 008Disposals - - (13) - (7 156) (7 169)
Balance at year-end - - 107 279 - 135 520 242 799Net book value at
December 31, 2017 2 065 4 932 296 875 23 401 80 547 407 820
Valuation of PropertiesFreehold and leasehold land and buildings were valued by an independent professional property valuer in December 2016 at an open market value of P852 005 000 (2014: P770 940 000). A register of the assets is kept with the Bank and is available for inspection.
Open Market Valuation for PropertyAn opinion of the best price at which the sale of an interest in the property would have been completed unconditionally for cash consideration on the date of valuation, assuming:
(a) a willing seller;(b) that prior to the date of valuation there had been a reasonable period (having regard to the nature of the
property and the state of the market) for the proper marketing of the interest, for the agreement of the price and terms, and for the completion of the sale;
(c) that the state of the market, level of values, and other circumstances were on any earlier assumed date of exchange of contracts the same as on the date of valuation.
(d) that no account is taken of any additional bid by a prospective purchaser with a special interest; and(e) that both parties to the transaction had acted knowledgeably, prudently, and without compulsion.
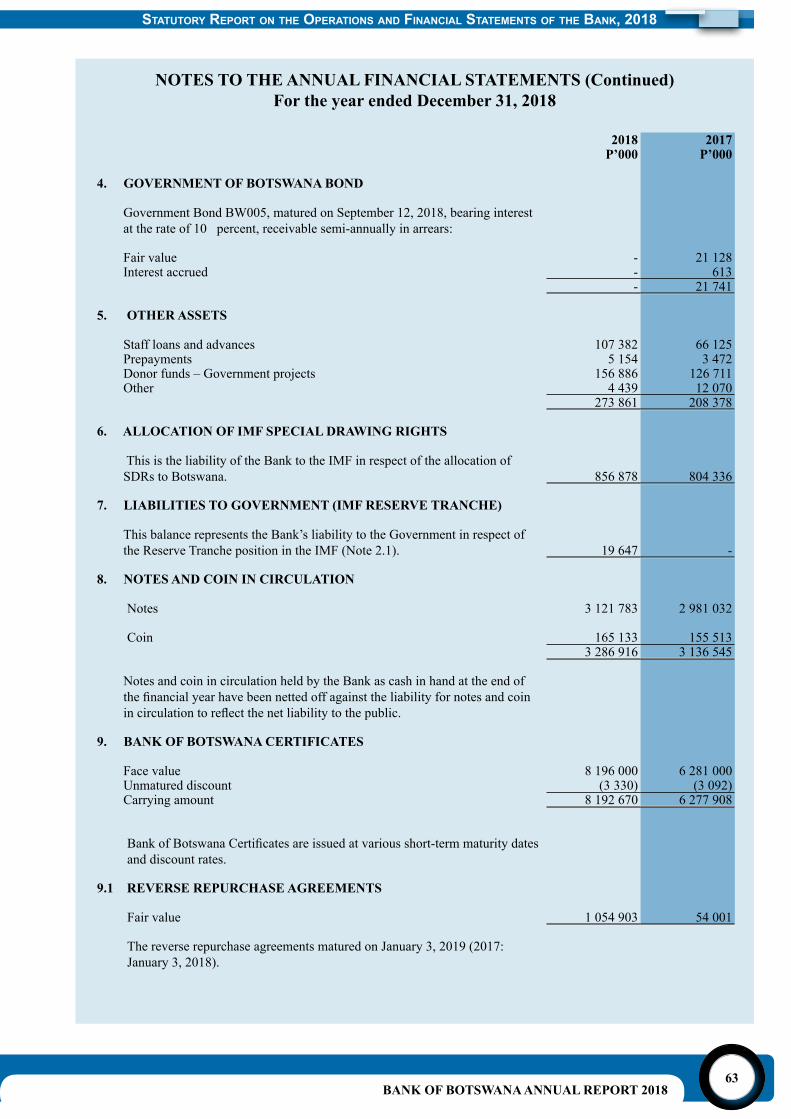
BANK OF BOTSWANA ANNUAL REPORT 201863
NOTES TO THE ANNUAL FINANCIAL STATEMENTS (Continued)For the year ended December 31, 2018
2018 2017P’000 P’000
4. GOVERNMENT OF BOTSWANA BOND
Government Bond BW005, matured on September 12, 2018, bearing interest at the rate of 10 percent, receivable semi-annually in arrears:
Fair value - 21 128Interest accrued - 613
- 21 741
5. OTHER ASSETS
Staff loans and advances 107 382 66 125Prepayments 5 154 3 472Donor funds – Government projects 156 886 126 711Other 4 439 12 070
273 861 208 378
6. ALLOCATION OF IMF SPECIAL DRAWING RIGHTS
This is the liability of the Bank to the IMF in respect of the allocation of SDRs to Botswana. 856 878 804 336
7. LIABILITIES TO GOVERNMENT (IMF RESERVE TRANCHE)
This balance represents the Bank’s liability to the Government in respect of the Reserve Tranche position in the IMF (Note 2.1). 19 647 -
8. NOTES AND COIN IN CIRCULATION
Notes 3 121 783 2 981 032
Coin 165 133 155 5133 286 916 3 136 545
Notes and coin in circulation held by the Bank as cash in hand at the end of thefinancialyearhavebeennettedoffagainsttheliabilityfornotesandcoinincirculationtoreflectthenetliabilitytothepublic.
9. BANK OF BOTSWANA CERTIFICATES
Face value 8 196 000 6 281 000Unmatured discount (3 330) (3 092)Carrying amount 8 192 670 6 277 908
BankofBotswanaCertificatesareissuedatvariousshort-termmaturitydatesand discount rates.
9.1 REVERSE REPURCHASE AGREEMENTS
Fair value 1 054 903 54 001
The reverse repurchase agreements matured on January 3, 2019 (2017: January 3, 2018).
Statutory report on the operationS and Financial StatementS oF the Bank, 2018
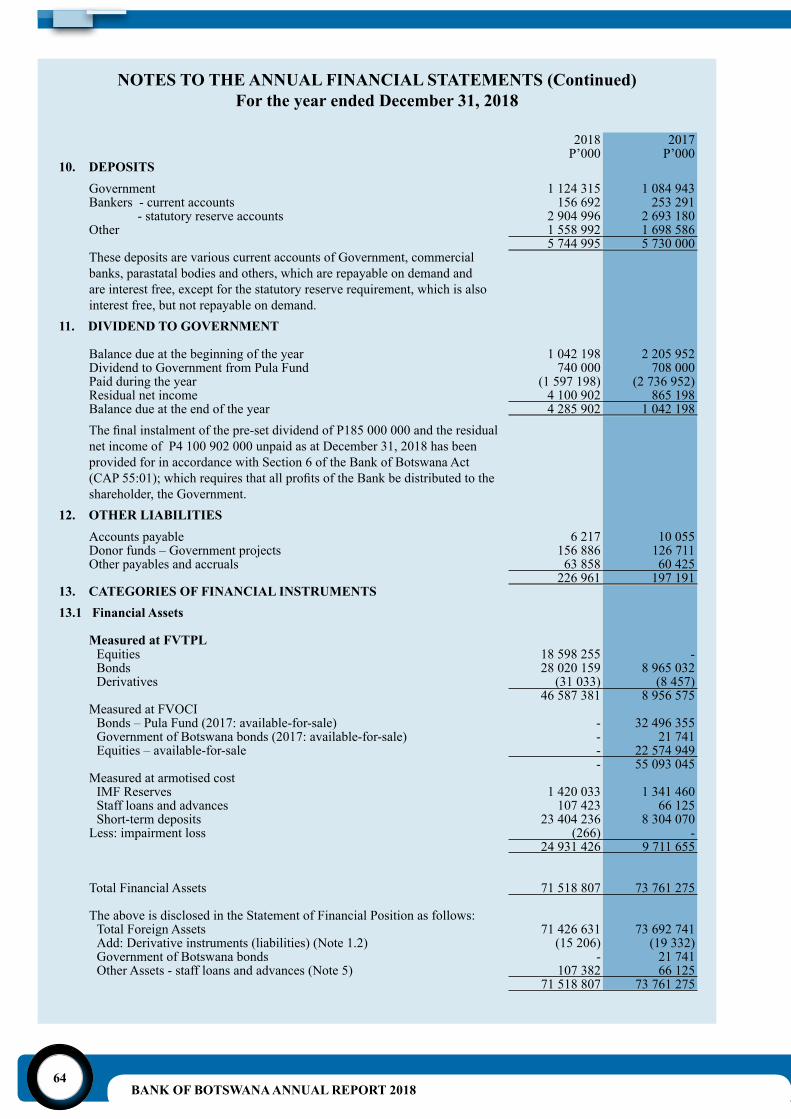
BANK OF BOTSWANA ANNUAL REPORT 201864
NOTES TO THE ANNUAL FINANCIAL STATEMENTS (Continued)For the year ended December 31, 2018
2018 2017P’000 P’000
10. DEPOSITSGovernment 1 124 315 1 084 943Bankers - current accounts 156 692 253 291
- statutory reserve accounts 2 904 996 2 693 180Other 1 558 992 1 698 586
5 744 995 5 730 000These deposits are various current accounts of Government, commercial banks, parastatal bodies and others, which are repayable on demand and are interest free, except for the statutory reserve requirement, which is also interest free, but not repayable on demand.
11. DIVIDEND TO GOVERNMENT
Balance due at the beginning of the year 1 042 198 2 205 952Dividend to Government from Pula Fund 740 000 708 000Paid during the year (1 597 198) (2 736 952)Residual net income 4 100 902 865 198Balance due at the end of the year 4 285 902 1 042 198Thefinalinstalmentofthepre-setdividendofP185000000andtheresidualnet income of P4 100 902 000 unpaid as at December 31, 2018 has been provided for in accordance with Section 6 of the Bank of Botswana Act (CAP55:01);whichrequiresthatallprofitsoftheBankbedistributedtotheshareholder, the Government.
12. OTHER LIABILITIESAccounts payable 6 217 10 055Donor funds – Government projects 156 886 126 711Other payables and accruals 63 858 60 425
226 961 197 19113. CATEGORIES OF FINANCIAL INSTRUMENTS13.1 Financial Assets
Measured at FVTPLEquities 18 598 255 -Bonds 28 020 159 8 965 032Derivatives (31 033) (8 457)
46 587 381 8 956 575Measured at FVOCI
Bonds – Pula Fund (2017: available-for-sale) - 32 496 355Government of Botswana bonds (2017: available-for-sale) - 21 741Equities – available-for-sale - 22 574 949
- 55 093 045Measured at armotised cost
IMF Reserves 1 420 033 1 341 460Staff loans and advances 107 423 66 125Short-term deposits 23 404 236 8 304 070
Less: impairment loss (266) -24 931 426 9 711 655
Total Financial Assets 71 518 807 73 761 275
The above is disclosed in the Statement of Financial Position as follows:Total Foreign Assets 71 426 631 73 692 741Add: Derivative instruments (liabilities) (Note 1.2) (15 206) (19 332)Government of Botswana bonds - 21 741Other Assets - staff loans and advances (Note 5) 107 382 66 125
71 518 807 73 761 275
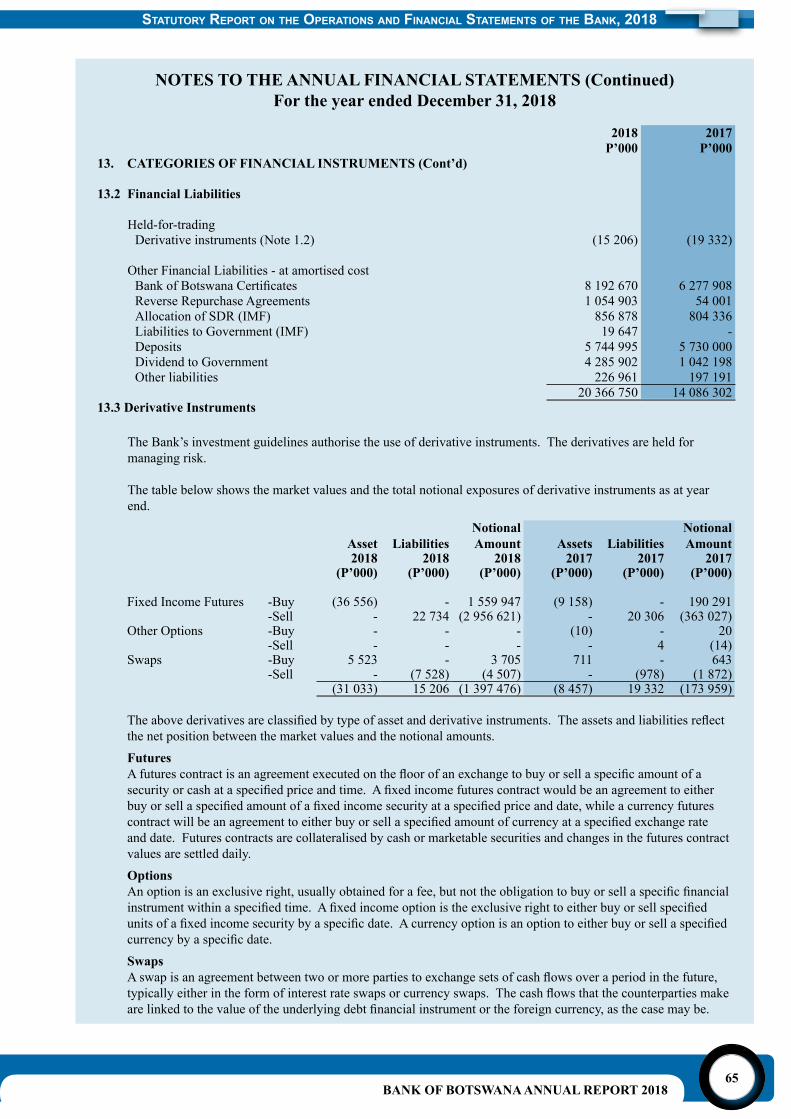
BANK OF BOTSWANA ANNUAL REPORT 201865
NOTES TO THE ANNUAL FINANCIAL STATEMENTS (Continued)For the year ended December 31, 2018
2018 2017P’000 P’000
13. CATEGORIES OF FINANCIAL INSTRUMENTS (Cont’d)
13.2 Financial Liabilities
Held-for-tradingDerivative instruments (Note 1.2) (15 206) (19 332)
Other Financial Liabilities - at amortised costBankofBotswanaCertificates 8 192 670 6 277 908Reverse Repurchase Agreements 1 054 903 54 001Allocation of SDR (IMF) 856 878 804 336Liabilities to Government (IMF) 19 647 -Deposits 5 744 995 5 730 000Dividend to Government 4 285 902 1 042 198Other liabilities 226 961 197 191
20 366 750 14 086 30213.3 Derivative Instruments
The Bank’s investment guidelines authorise the use of derivative instruments. The derivatives are held for managing risk.
The table below shows the market values and the total notional exposures of derivative instruments as at year end.
Asset LiabilitiesNotional Amount Assets Liabilities
Notional Amount
2018 2018 2018 2017 2017 2017(P’000) (P’000) (P’000) (P’000) (P’000) (P’000)
Fixed Income Futures -Buy (36 556) - 1 559 947 (9 158) - 190 291-Sell - 22 734 (2 956 621) - 20 306 (363 027)
Other Options -Buy - - - (10) - 20-Sell - - - - 4 (14)
Swaps -Buy 5 523 - 3 705 711 - 643-Sell - (7 528) (4 507) - (978) (1 872)
(31 033) 15 206 (1 397 476) (8 457) 19 332 (173 959)
Theabovederivativesareclassifiedbytypeofassetandderivativeinstruments.Theassetsandliabilitiesreflectthe net position between the market values and the notional amounts.FuturesAfuturescontractisanagreementexecutedonthefloorofanexchangetobuyorsellaspecificamountofasecurityorcashataspecifiedpriceandtime.Afixedincomefuturescontractwouldbeanagreementtoeitherbuyorsellaspecifiedamountofafixedincomesecurityataspecifiedpriceanddate,whileacurrencyfuturescontractwillbeanagreementtoeitherbuyorsellaspecifiedamountofcurrencyataspecifiedexchangerateand date. Futures contracts are collateralised by cash or marketable securities and changes in the futures contract values are settled daily. OptionsAnoptionisanexclusiveright,usuallyobtainedforafee,butnottheobligationtobuyorsellaspecificfinancialinstrumentwithinaspecifiedtime.Afixedincomeoptionistheexclusiverighttoeitherbuyorsellspecifiedunitsofafixedincomesecuritybyaspecificdate.Acurrencyoptionisanoptiontoeitherbuyorsellaspecifiedcurrencybyaspecificdate.SwapsAswapisanagreementbetweentwoormorepartiestoexchangesetsofcashflowsoveraperiodinthefuture,typicallyeitherintheformofinterestrateswapsorcurrencyswaps.Thecashflowsthatthecounterpartiesmakearelinkedtothevalueoftheunderlyingdebtfinancialinstrumentortheforeigncurrency,asthecasemaybe.
Statutory report on the operationS and Financial StatementS oF the Bank, 2018
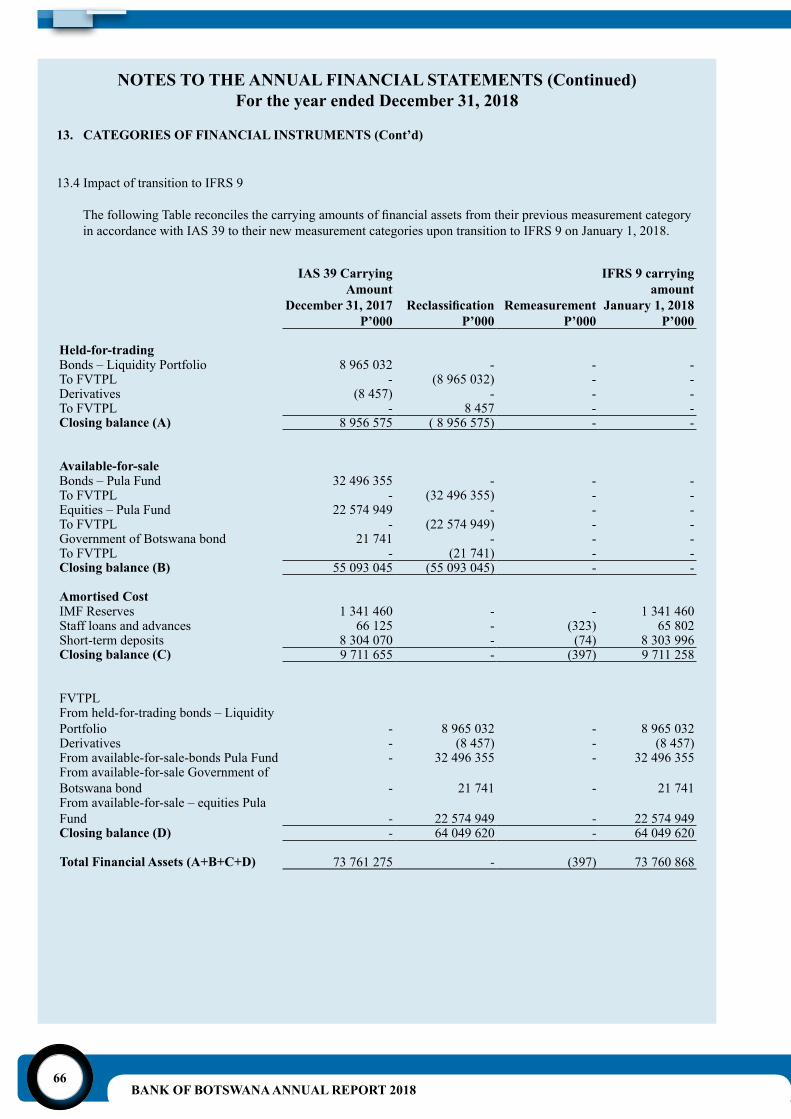
BANK OF BOTSWANA ANNUAL REPORT 201866
NOTES TO THE ANNUAL FINANCIAL STATEMENTS (Continued)For the year ended December 31, 2018
13. CATEGORIES OF FINANCIAL INSTRUMENTS (Cont’d)
13.4 Impact of transition to IFRS 9
ThefollowingTablereconcilesthecarryingamountsoffinancialassetsfromtheirpreviousmeasurementcategoryin accordance with IAS 39 to their new measurement categories upon transition to IFRS 9 on January 1, 2018.
IAS 39 Carrying Amount
December 31, 2017P’000
ReclassificationP’000
RemeasurementP’000
IFRS 9 carrying amount
January 1, 2018P’000
Held-for-tradingBonds – Liquidity Portfolio 8 965 032 - - -To FVTPL - (8 965 032) - -Derivatives (8 457) - - -To FVTPL - 8 457 - -Closing balance (A) 8 956 575 ( 8 956 575) - -
Available-for-saleBonds – Pula Fund 32 496 355 - - -To FVTPL - (32 496 355) - -Equities – Pula Fund 22 574 949 - - -To FVTPL - (22 574 949) - -Government of Botswana bond 21 741 - - -To FVTPL - (21 741) - -Closing balance (B) 55 093 045 (55 093 045) - -
Amortised CostIMF Reserves 1 341 460 - - 1 341 460Staff loans and advances 66 125 - (323) 65 802Short-term deposits 8 304 070 - (74) 8 303 996Closing balance (C) 9 711 655 - (397) 9 711 258
FVTPLFrom held-for-trading bonds – Liquidity Portfolio - 8 965 032 - 8 965 032Derivatives - (8 457) - (8 457)From available-for-sale-bonds Pula Fund - 32 496 355 - 32 496 355From available-for-sale Government of Botswana bond - 21 741 - 21 741From available-for-sale – equities Pula Fund - 22 574 949 - 22 574 949Closing balance (D) - 64 049 620 - 64 049 620
Total Financial Assets (A+B+C+D) 73 761 275 - (397) 73 760 868
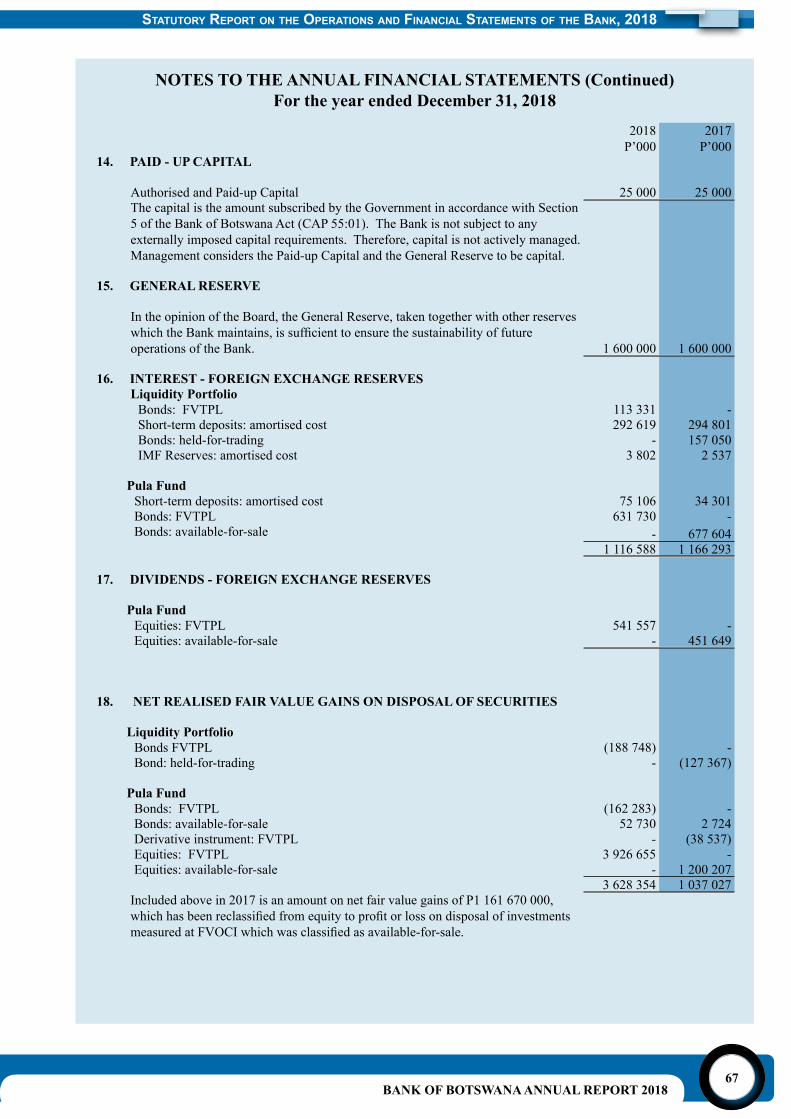
BANK OF BOTSWANA ANNUAL REPORT 201867
NOTES TO THE ANNUAL FINANCIAL STATEMENTS (Continued)For the year ended December 31, 2018
2018P’000
2017P’000
14. PAID - UP CAPITAL
Authorised and Paid-up Capital 25 000 25 000The capital is the amount subscribed by the Government in accordance with Section 5 of the Bank of Botswana Act (CAP 55:01). The Bank is not subject to any externally imposed capital requirements. Therefore, capital is not actively managed. Management considers the Paid-up Capital and the General Reserve to be capital.
15. GENERAL RESERVE
In the opinion of the Board, the General Reserve, taken together with other reserves whichtheBankmaintains,issufficienttoensurethesustainabilityoffutureoperations of the Bank. 1 600 000 1 600 000
16. INTEREST - FOREIGN EXCHANGE RESERVESLiquidity Portfolio
Bonds: FVTPL 113 331 -Short-term deposits: amortised cost 292 619 294 801Bonds: held-for-trading - 157 050IMF Reserves: amortised cost 3 802 2 537
Pula FundShort-term deposits: amortised cost 75 106 34 301Bonds: FVTPL 631 730 -Bonds: available-for-sale - 677 604
1 116 588 1 166 293
17. DIVIDENDS - FOREIGN EXCHANGE RESERVES
Pula FundEquities: FVTPL 541 557 -Equities: available-for-sale - 451 649
18. NET REALISED FAIR VALUE GAINS ON DISPOSAL OF SECURITIES
Liquidity PortfolioBonds FVTPL (188 748) -Bond: held-for-trading - (127 367)
Pula FundBonds: FVTPL (162 283) -Bonds: available-for-sale 52 730 2 724Derivative instrument: FVTPL - (38 537)Equities: FVTPL 3 926 655 -Equities: available-for-sale - 1 200 207
3 628 354 1 037 027Included above in 2017 is an amount on net fair value gains of P1 161 670 000, whichhasbeenreclassifiedfromequitytoprofitorlossondisposalofinvestmentsmeasuredatFVOCIwhichwasclassifiedasavailable-for-sale.
Statutory report on the operationS and Financial StatementS oF the Bank, 2018
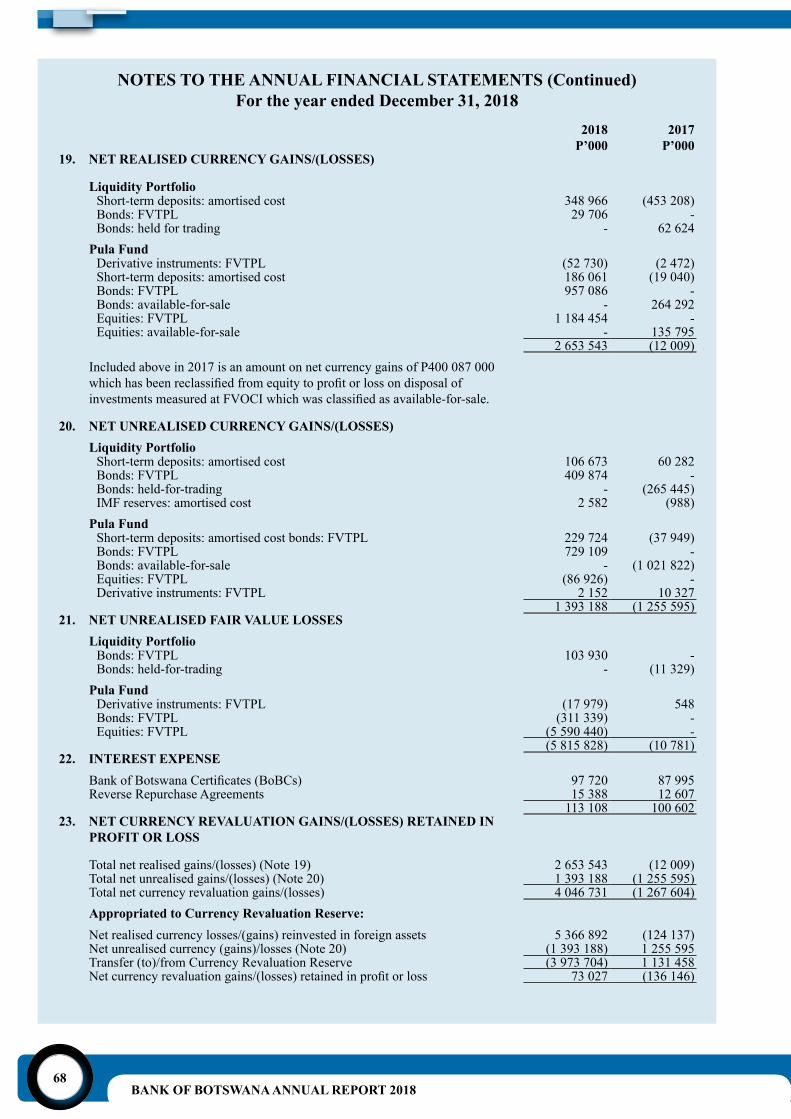
BANK OF BOTSWANA ANNUAL REPORT 201868
NOTES TO THE ANNUAL FINANCIAL STATEMENTS (Continued)For the year ended December 31, 2018
2018P’000
2017P’000
19. NET REALISED CURRENCY GAINS/(LOSSES)
Liquidity PortfolioShort-term deposits: amortised cost 348 966 (453 208)Bonds: FVTPL 29 706 -Bonds: held for trading - 62 624
Pula Fund Derivative instruments: FVTPL (52 730) (2 472)Short-term deposits: amortised cost 186 061 (19 040)Bonds: FVTPL 957 086 -Bonds: available-for-sale - 264 292Equities: FVTPL 1 184 454 -Equities: available-for-sale - 135 795
2 653 543 (12 009)Included above in 2017 is an amount on net currency gains of P400 087 000 whichhasbeenreclassifiedfromequitytoprofitorlossondisposalofinvestmentsmeasuredatFVOCIwhichwasclassifiedasavailable-for-sale.
20. NET UNREALISED CURRENCY GAINS/(LOSSES)Liquidity Portfolio
Short-term deposits: amortised cost 106 673 60 282Bonds: FVTPL 409 874 -Bonds: held-for-trading - (265 445)IMF reserves: amortised cost 2 582 (988)
Pula FundShort-term deposits: amortised cost bonds: FVTPL 229 724 (37 949)Bonds: FVTPL 729 109 -Bonds: available-for-sale - (1 021 822)Equities: FVTPL (86 926) -Derivative instruments: FVTPL 2 152 10 327
1 393 188 (1 255 595)21. NET UNREALISED FAIR VALUE LOSSES
Liquidity PortfolioBonds: FVTPL 103 930 -Bonds: held-for-trading - (11 329)
Pula FundDerivative instruments: FVTPL (17 979) 548Bonds: FVTPL (311 339) -Equities: FVTPL (5 590 440) -
(5 815 828) (10 781)22. INTEREST EXPENSE
BankofBotswanaCertificates(BoBCs) 97 720 87 995Reverse Repurchase Agreements 15 388 12 607
113 108 100 60223. NET CURRENCY REVALUATION GAINS/(LOSSES) RETAINED IN
PROFIT OR LOSS
Total net realised gains/(losses) (Note 19) 2 653 543 (12 009)Total net unrealised gains/(losses) (Note 20) 1 393 188 (1 255 595)Total net currency revaluation gains/(losses) 4 046 731 (1 267 604)Appropriated to Currency Revaluation Reserve:Net realised currency losses/(gains) reinvested in foreign assets 5 366 892 (124 137)Net unrealised currency (gains)/losses (Note 20) (1 393 188) 1 255 595Transfer (to)/from Currency Revaluation Reserve (3 973 704) 1 131 458Netcurrencyrevaluationgains/(losses)retainedinprofitorloss 73 027 (136 146)
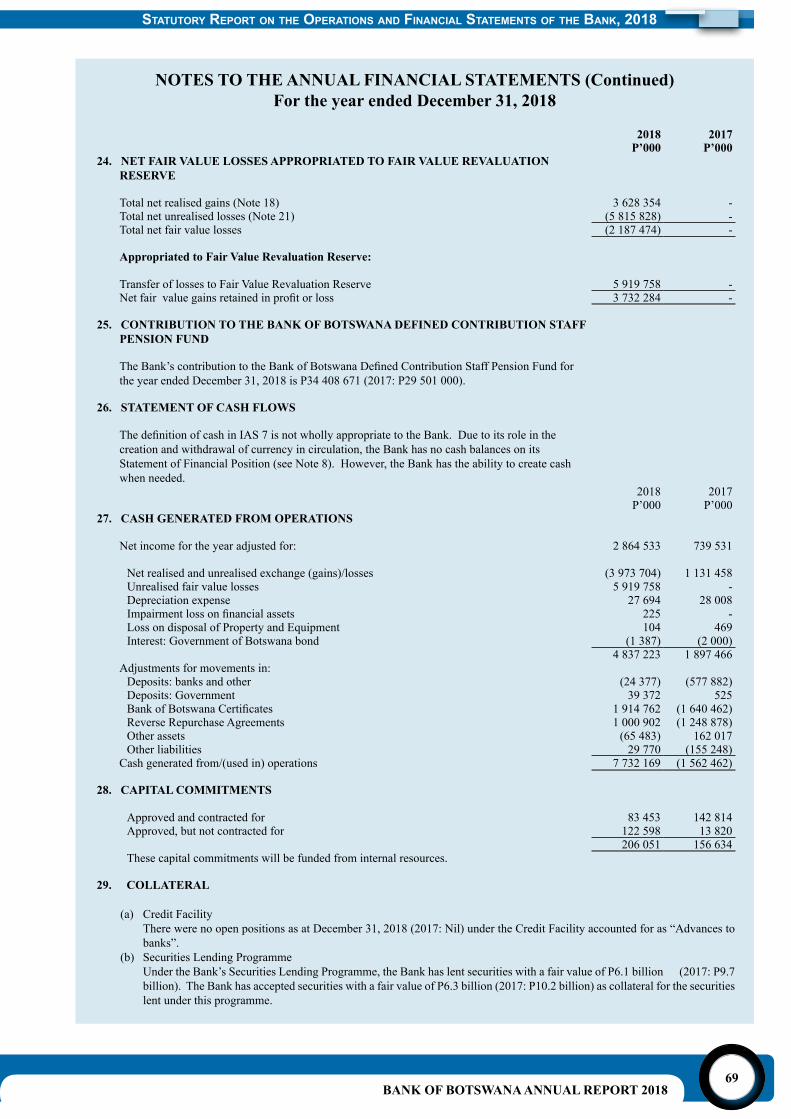
BANK OF BOTSWANA ANNUAL REPORT 201869
NOTES TO THE ANNUAL FINANCIAL STATEMENTS (Continued)For the year ended December 31, 2018
2018 2017P’000 P’000
24. NET FAIR VALUE LOSSES APPROPRIATED TO FAIR VALUE REVALUATION RESERVE
Total net realised gains (Note 18) 3 628 354 -Total net unrealised losses (Note 21) (5 815 828) -Total net fair value losses (2 187 474) -
Appropriated to Fair Value Revaluation Reserve:
Transfer of losses to Fair Value Revaluation Reserve 5 919 758 -Netfairvaluegainsretainedinprofitorloss 3 732 284 -
25. CONTRIBUTION TO THE BANK OF BOTSWANA DEFINED CONTRIBUTION STAFF PENSION FUND
TheBank’scontributiontotheBankofBotswanaDefinedContributionStaffPensionFundforthe year ended December 31, 2018 is P34 408 671 (2017: P29 501 000).
26. STATEMENT OF CASH FLOWS
ThedefinitionofcashinIAS7isnotwhollyappropriatetotheBank.Duetoitsroleinthecreation and withdrawal of currency in circulation, the Bank has no cash balances on its Statement of Financial Position (see Note 8). However, the Bank has the ability to create cash when needed.
2018 2017P’000 P’000
27. CASH GENERATED FROM OPERATIONS
Net income for the year adjusted for: 2 864 533 739 531
Net realised and unrealised exchange (gains)/losses (3 973 704) 1 131 458Unrealised fair value losses 5 919 758 -Depreciation expense 27 694 28 008Impairmentlossonfinancialassets 225 -Loss on disposal of Property and Equipment 104 469Interest: Government of Botswana bond (1 387) (2 000)
4 837 223 1 897 466Adjustments for movements in:
Deposits: banks and other (24 377) (577 882)Deposits: Government 39 372 525BankofBotswanaCertificates 1 914 762 (1 640 462)Reverse Repurchase Agreements 1 000 902 (1 248 878)Other assets (65 483) 162 017Other liabilities 29 770 (155 248)
Cash generated from/(used in) operations 7 732 169 (1 562 462)
28. CAPITAL COMMITMENTS
Approved and contracted for 83 453 142 814Approved, but not contracted for 122 598 13 820
206 051 156 634These capital commitments will be funded from internal resources.
29. COLLATERAL
(a) Credit FacilityThere were no open positions as at December 31, 2018 (2017: Nil) under the Credit Facility accounted for as “Advances to banks”.
(b) Securities Lending Programme Under the Bank’s Securities Lending Programme, the Bank has lent securities with a fair value of P6.1 billion (2017: P9.7
billion). The Bank has accepted securities with a fair value of P6.3 billion (2017: P10.2 billion) as collateral for the securities lent under this programme.
Statutory report on the operationS and Financial StatementS oF the Bank, 2018
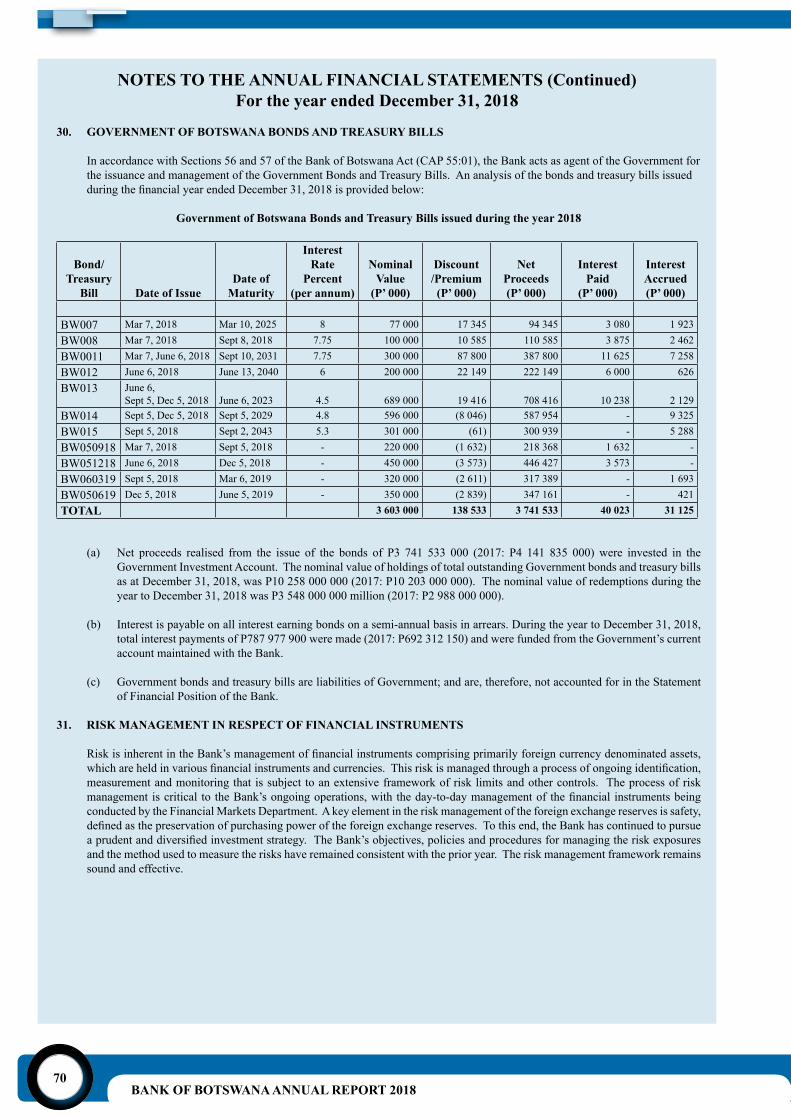
BANK OF BOTSWANA ANNUAL REPORT 201870
NOTES TO THE ANNUAL FINANCIAL STATEMENTS (Continued)For the year ended December 31, 2018
30. GOVERNMENT OF BOTSWANA BONDS AND TREASURY BILLS
In accordance with Sections 56 and 57 of the Bank of Botswana Act (CAP 55:01), the Bank acts as agent of the Government for the issuance and management of the Government Bonds and Treasury Bills. An analysis of the bonds and treasury bills issued duringthefinancialyearendedDecember31,2018isprovidedbelow:
Government of Botswana Bonds and Treasury Bills issued during the year 2018
Bond/Treasury
Bill Date of IssueDate of
Maturity
Interest Rate
Percent(per annum)
Nominal Value
(P’ 000)
Discount/Premium(P’ 000)
Net Proceeds(P’ 000)
Interest Paid
(P’ 000)
Interest Accrued(P’ 000)
BW007 Mar 7, 2018 Mar 10, 2025 8 77 000 17 345 94 345 3 080 1 923BW008 Mar 7, 2018 Sept 8, 2018 7.75 100 000 10 585 110 585 3 875 2 462BW0011 Mar 7, June 6, 2018 Sept 10, 2031 7.75 300 000 87 800 387 800 11 625 7 258BW012 June 6, 2018 June 13, 2040 6 200 000 22 149 222 149 6 000 626BW013 June 6,
Sept 5, Dec 5, 2018 June 6, 2023 4.5 689 000 19 416 708 416 10 238 2 129BW014 Sept 5, Dec 5, 2018 Sept 5, 2029 4.8 596 000 (8 046) 587 954 - 9 325BW015 Sept 5, 2018 Sept 2, 2043 5.3 301 000 (61) 300 939 - 5 288BW050918 Mar 7, 2018 Sept 5, 2018 - 220 000 (1 632) 218 368 1 632 -BW051218 June 6, 2018 Dec 5, 2018 - 450 000 (3 573) 446 427 3 573 -BW060319 Sept 5, 2018 Mar 6, 2019 - 320 000 (2 611) 317 389 - 1 693BW050619 Dec 5, 2018 June 5, 2019 - 350 000 (2 839) 347 161 - 421TOTAL 3 603 000 138 533 3 741 533 40 023 31 125
(a) Net proceeds realised from the issue of the bonds of P3 741 533 000 (2017: P4 141 835 000) were invested in the Government Investment Account. The nominal value of holdings of total outstanding Government bonds and treasury bills as at December 31, 2018, was P10 258 000 000 (2017: P10 203 000 000). The nominal value of redemptions during the year to December 31, 2018 was P3 548 000 000 million (2017: P2 988 000 000).
(b) Interest is payable on all interest earning bonds on a semi-annual basis in arrears. During the year to December 31, 2018, total interest payments of P787 977 900 were made (2017: P692 312 150) and were funded from the Government’s current account maintained with the Bank.
(c) Government bonds and treasury bills are liabilities of Government; and are, therefore, not accounted for in the Statement of Financial Position of the Bank.
31. RISK MANAGEMENT IN RESPECT OF FINANCIAL INSTRUMENTS
RiskisinherentintheBank’smanagementoffinancialinstrumentscomprisingprimarilyforeigncurrencydenominatedassets,whichareheldinvariousfinancialinstrumentsandcurrencies.Thisriskismanagedthroughaprocessofongoingidentification,measurement and monitoring that is subject to an extensive framework of risk limits and other controls. The process of risk managementiscritical to theBank’songoingoperations,withtheday-to-daymanagementof thefinancial instrumentsbeingconducted by the Financial Markets Department. A key element in the risk management of the foreign exchange reserves is safety, definedasthepreservationofpurchasingpoweroftheforeignexchangereserves.Tothisend,theBankhascontinuedtopursueaprudentanddiversifiedinvestmentstrategy.TheBank’sobjectives,policiesandproceduresformanagingtheriskexposuresand the method used to measure the risks have remained consistent with the prior year. The risk management framework remains sound and effective.
BANK OF BOTSWANA ANNUAL REPORT 201871
NOTES TO THE ANNUAL FINANCIAL STATEMENTS (Continued)For the year ended December 31, 2018
31. RISK MANAGEMENT IN RESPECT OF FINANCIAL INSTRUMENTS (Cont’d)
Risk Management Governance Structure The Bank’s risk management governance structure is broadly as follows:
(a) Board
The Board is responsible for the Bank’s overall risk management and for approving investment policies and the strategic asset allocation strategy. The Bank’s management reviews the risk management policies from time to time.
(b) Investment Committee
The Investment Committee, which is chaired by the Governor and comprises representatives from relevant areas of the Bank reviews and approves the Investment Guidelines for the foreign exchange reserves. It meets regularly to review developments in the international financial and capitalmarkets. Where necessary, the InvestmentCommitteemakesstrategic decisions on Bank-managed portfolios. The Investment Committee also monitors the performance of the external fund managers and reports on same to the Board.
(c) Financial Markets Department
The Financial Markets Department is responsible for the management of the foreign exchange reserves and has a specialised Risk Management Unit focusing on the risks associated with all the investment portfolios and ensures compliance with Investment Guidelines.
(d) External Fund Managers and Custody
External fund managers are engaged to complement the Bank’s reserve management activity. The Bank uses the services of a custodian which provides custodial services and performance measurement for the Bank’s portfolios.
(e) Segregation of Duties
At an operational level, the main feature of risk control is the segregation of duties relating to dealing, settlement, risk monitoring and recording. These responsibilities are split among three Departments: Financial Markets, Payments and Settlement and Finance.
Tranching of Foreign Exchange Reserves – Liquidity Portfolio and Pula FundThe Bank of Botswana Act (CAP 55:01) requires the Bank to maintain a primary international reserve, that is, the Liquidity Portfolio, while Section 34 provides for the establishment and maintenance of a long-term investment fund, the Pula Fund. In compliance with the statutory requirements, a major feature of the foreign exchange reserves management strategy is, therefore, to allocate a certain level of reserves to the Liquidity Portfolio, with the remaining amount invested in the Pula Fund.
Pula FundInvestments of the Pula Fund comprise long-term assets, such as long-dated bonds and equities actively traded in liquid markets, with the expectation of earning a higher return than the risk-free rate. The asset allocation between bonds and equities is determined using a combination of historical data and assumptions. Exercises are also conducted in respect of the Pula Fund risk/return sensitivity analysis, using different portfolio options, where risk is measured by a standard deviation on the rate of return.
Liquidity Portfolio In terms of the investment guidelines, the Liquidity Portfolio gives priority to liquidity over return, given the recurring need to provideforeignexchangetofinanceinternationaltransactionpayments.Whiletheeligibleinvestmentcurrenciesaresimilartothose of the Pula Fund, the Liquidity Portfolio is largely invested in shorter-dated assets. There is a sub-portfolio, the Transaction Balances Tranche (TBT), comprising highly-liquid investments in the Bank’s international transaction currencies.
There are no equities in the Liquidity Portfolio. Investment instruments include government bonds, government guaranteed bonds, supranational bonds of eligible investment grade currencies and eligible money market instruments.
Types of Risk Exposure The Bank’s investment guidelines cover basic types of risk exposures, namely, market risk (currency risk, interest rate risk and equity price risk), credit risk and liquidity risk. These types of risk apply to the foreign assets and liabilities.
Statutory report on the operationS and Financial StatementS oF the Bank, 2018
BANK OF BOTSWANA ANNUAL REPORT 201872
NOTES TO THE ANNUAL FINANCIAL STATEMENTS (Continued)For the year ended December 31, 2018
31. RISK MANAGEMENT IN RESPECT OF FINANCIAL INSTRUMENTS (Cont’d)
(a) Currency Risk
Currency risk or exchange rate risk arises when exchange rates move against the reporting currency. The reserves are invested in diverse currencies to mitigate the impact of exchange rate movements. The Bank’s policy is to invest only in currencies with investment grade ratings assigned by Moody’s Investors Services, Standard and Poor’s and Fitch Ratings. Throughadiversifiedcurrencyallocation,theBankensuresthatthepurchasingpoweroftheforeignexchangereservesispreserved. In terms of the investment guidelines, a maximum deviation from the neutral level is 15 percent for currencies rated AAA, 10 percent for currencies rated between AA+ and AA-, 7 percent for A+ to A- and 5 percent for BBB+. At the end of 2018, the Bank’s total exposure to investment currencies was P66.4 billion (2017: P70.3 billion). The Bank is also exposed to SDR currency risk on net IMF balances amounting to P582 802 000 (2017: P535 575 000).
(b) Interest Rate Risk
Interestrateriskisthepossiblelossinthevalueofafixedincomeassetresultingfromanadversemovementininterestratesandaconsequentchangeinprice.Interestrateriskismeasuredbymodifiedduration,whichmeasuresthesensitivityoftheprice of a bond to changes in interest rates expressed in years. The Bank benchmarks the interest rate risk for the Pula Fund (fixedincomeassets)toreflectthelong-termnatureoftheportfolio,withemphasisonhigherreturn.Thehigherinterestrateriskisgenerallycompensatedbyhigherreturnsexpectedfromlongermaturitybonds.Themodifieddurationbenchmarkwillvaryovertime,aschangingmarketconditionsandindexweightsimpacttheglobalmodifieddurationoftheindex.Attheendof2018,theaveragemodifieddurationofthefixedincomeportionofthePulaFundwas6.5years(2017:7.6years).As the Liquidity Portfolio gives priority to liquidity over return, given the constant need to provide foreign exchange to financeinternationaltransactionpayments,fromtheBank’sperspective,thisportfolioisexposedtominimuminterestraterisk.Attheendof2018,theLiquidityPortfolio’saveragemodifieddurationwas2.20years(2017:1.9years).
(c) Equity Price Risk
Equity price risk is the risk that the value of equities decrease as a result of changes in the level of equity indices and diminution of value of individual stocks. The geographic allocation of equity exposure follows generally the market capitalisation among the equity markets. The investment guidelines stipulate the holding levels of equities. Holdings of more than 10 percent in one company are not permitted and the portfolio must hold a reasonable number of stocks. A reasonable spread among the industry sectors is maintained in the portfolio. There are no investments in private placements or unquoted stocks. At the end of 2018, the equity portion of the Pula Fund was P18.6 billion (2017: P22.6 billion).
Market Risk Sensitivity Analysis
The set of assumptions used for each of the risk factors hereunder are not forecasts, but merely “what if” scenarios and the likely impact on the current portfolio, based on selected changes in risk variables over a one-year horizon.
The Table below gives an indication of the risk sensitivities of the portfolio to various risk parameters. Assuming that the probabilityofthebeneficialchangeintheriskvariablesareaslikelytohappenasanadversechange,bothpotentialincreaseand decrease are shown for the indicated scenarios.
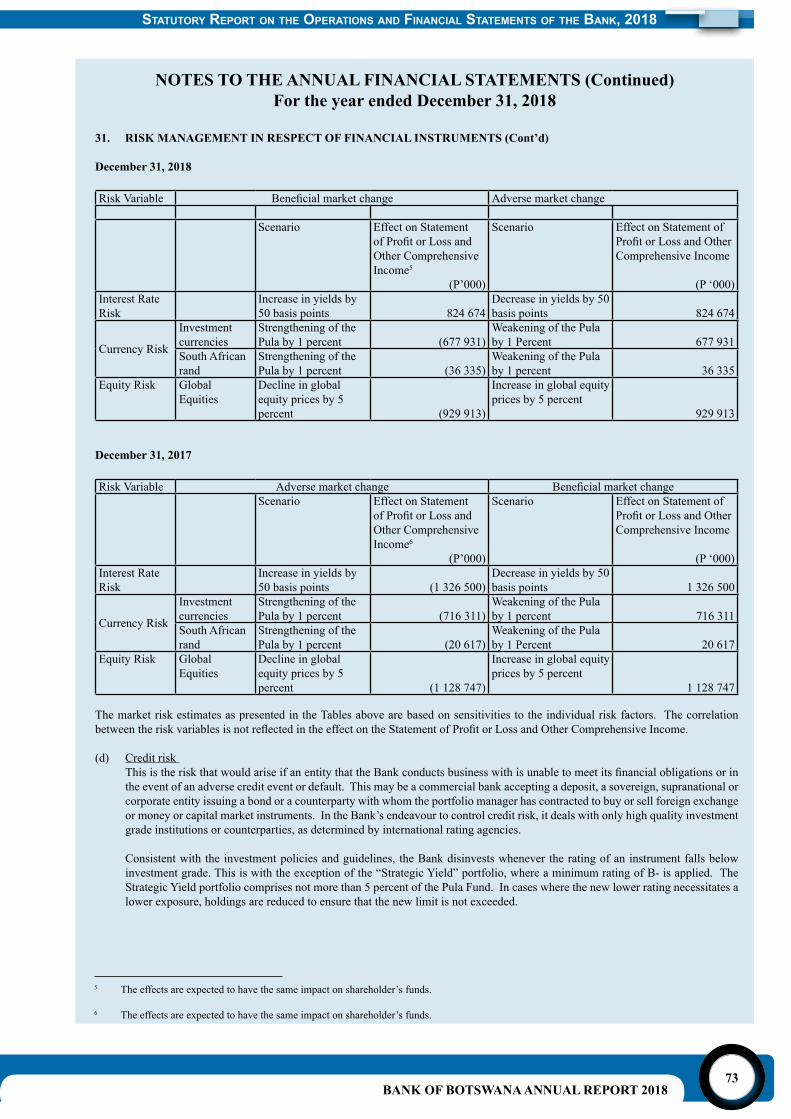
BANK OF BOTSWANA ANNUAL REPORT 201873
NOTES TO THE ANNUAL FINANCIAL STATEMENTS (Continued)For the year ended December 31, 2018
31. RISK MANAGEMENT IN RESPECT OF FINANCIAL INSTRUMENTS (Cont’d)
December 31, 2018
Risk Variable Beneficialmarketchange Adverse market change
Scenario Effect on Statement ofProfitorLossandOther Comprehensive Income5
(P’000)
Scenario Effect on Statement of ProfitorLossandOtherComprehensive Income
(P ‘000)Interest Rate Risk
Increase in yields by 50 basis points 824 674
Decrease in yields by 50 basis points 824 674
Currency Risk
Investment currencies
Strengthening of the Pula by 1 percent (677 931)
Weakening of the Pula by 1 Percent 677 931
South African rand
Strengthening of the Pula by 1 percent (36 335)
Weakening of the Pula by 1 percent 36 335
Equity Risk Global Equities
Decline in global equity prices by 5 percent (929 913)
Increase in global equity prices by 5 percent
929 913
December 31, 2017
Risk Variable Adverse market change BeneficialmarketchangeScenario Effect on Statement
ofProfitorLossandOther Comprehensive Income6
(P’000)
Scenario Effect on Statement of ProfitorLossandOtherComprehensive Income
(P ‘000)Interest Rate Risk
Increase in yields by 50 basis points (1 326 500)
Decrease in yields by 50 basis points 1 326 500
Currency Risk
Investment currencies
Strengthening of the Pula by 1 percent (716 311)
Weakening of the Pula by 1 percent 716 311
South African rand
Strengthening of the Pula by 1 percent (20 617)
Weakening of the Pula by 1 Percent 20 617
Equity Risk Global Equities
Decline in global equity prices by 5 percent (1 128 747)
Increase in global equity prices by 5 percent
1 128 747
The market risk estimates as presented in the Tables above are based on sensitivities to the individual risk factors. The correlation betweentheriskvariablesisnotreflectedintheeffectontheStatementofProfitorLossandOtherComprehensiveIncome.
(d) Credit risk ThisistheriskthatwouldariseifanentitythattheBankconductsbusinesswithisunabletomeetitsfinancialobligationsorin
the event of an adverse credit event or default. This may be a commercial bank accepting a deposit, a sovereign, supranational or corporate entity issuing a bond or a counterparty with whom the portfolio manager has contracted to buy or sell foreign exchange or money or capital market instruments. In the Bank’s endeavour to control credit risk, it deals with only high quality investment grade institutions or counterparties, as determined by international rating agencies.
Consistent with the investment policies and guidelines, the Bank disinvests whenever the rating of an instrument falls below investment grade. This is with the exception of the “Strategic Yield” portfolio, where a minimum rating of B- is applied. The Strategic Yield portfolio comprises not more than 5 percent of the Pula Fund. In cases where the new lower rating necessitates a lower exposure, holdings are reduced to ensure that the new limit is not exceeded.
5 The effects are expected to have the same impact on shareholder’s funds.
6 The effects are expected to have the same impact on shareholder’s funds.
Statutory report on the operationS and Financial StatementS oF the Bank, 2018

BANK OF BOTSWANA ANNUAL REPORT 201874
NOTES TO THE ANNUAL FINANCIAL STATEMENTS (Continued)For the year ended December 31, 2018
31. RISK MANAGEMENT IN RESPECT OF FINANCIAL INSTRUMENTS (Cont’d)
The Bank mitigates credit risk by addressing the following underlying issues:
• Definingeligibleinvestmentinstruments;• Pre-qualifyingcounterparties(financialinstitutions,brokers/dealers,andintermediaries)doingbusinesswiththeBank;and• Diversifying investment portfolios so as to minimise potential losses from securities or individual issuers.
Exposure to Credit RiskThe Table below shows the maximum exposure to credit risk for the components of the Statement of Financial Position, including derivatives. The maximum exposure is shown gross, before the effect of the above mitigation factors.
Notes 2018P’000
2017P’000
Financial Assets
Liquidity PortfolioBonds: FVTPL 1.1 7 033 866 -Bonds: held-for-trading - 8 965 032Short-term deposits: amortised cost 15 503 335 7 388 225
Pula FundBonds: FVTPL 1.2 20 986 293 -Bonds: available-for-sale - 32 496 355Derivative instruments: FVTPL (31 033) (8 457)Short-term deposits: amortised cost 7 900 901 915 845
International Monetary Fund- amortised costReserve Tranche 2.1 518 695 388 855Holdings of Special Drawing Rights 2.2 878 644 931 310General Subsidy Account 2.3 22 694 21 295
Government of Botswana bond: available-for-sale 4 - 21 741Other Assets- staff loans and advances: amortised cost 5 107 382 66 125Total 52 920 777 51 186 326
Analysis of Credit Exposure by class:
Measured at fair valueBonds 28 020 159 41 461 387Derivatives (31 033) (8 457)Government of Botswana bond - 21 741
Measured at amortised costIMF Reserves 1 420 033 1 341 460Staff advances 107 382 66 125Short-term deposits 23 404 236 8 304 070
Total 52 920 777 51 186 326
Whilesomefinancialinstrumentsarerecordedatfairvalue,theamountsshownaboverepresentthecurrentcreditriskexposure,butnotthemaximumriskexposurethatcouldariseinfutureasaresultofchangesinvalues.TheTablesbelowreflectthecreditexposure based on the fair value of the assets with counterparties as at December 31, 2018.
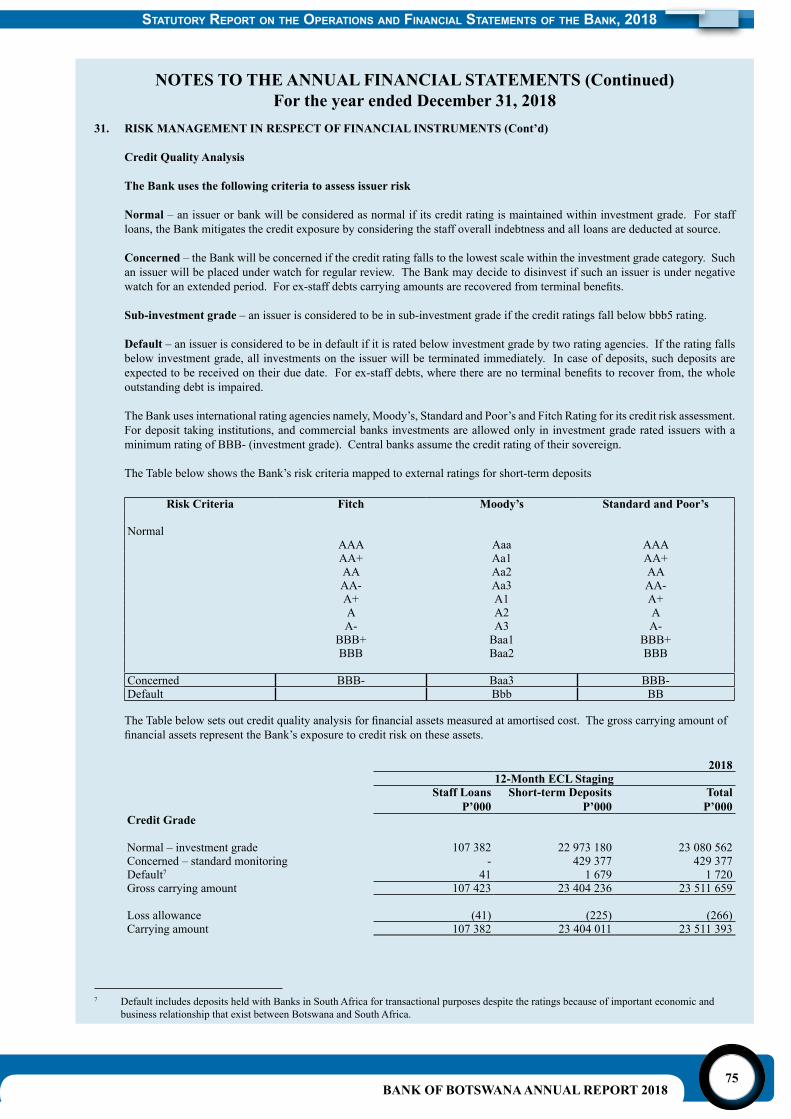
BANK OF BOTSWANA ANNUAL REPORT 201875
NOTES TO THE ANNUAL FINANCIAL STATEMENTS (Continued)For the year ended December 31, 2018
31. RISK MANAGEMENT IN RESPECT OF FINANCIAL INSTRUMENTS (Cont’d)
Credit Quality Analysis
The Bank uses the following criteria to assess issuer risk
Normal – an issuer or bank will be considered as normal if its credit rating is maintained within investment grade. For staff loans, the Bank mitigates the credit exposure by considering the staff overall indebtness and all loans are deducted at source.
Concerned – the Bank will be concerned if the credit rating falls to the lowest scale within the investment grade category. Such an issuer will be placed under watch for regular review. The Bank may decide to disinvest if such an issuer is under negative watchforanextendedperiod.Forex-staffdebtscarryingamountsarerecoveredfromterminalbenefits.
Sub-investment grade – an issuer is considered to be in sub-investment grade if the credit ratings fall below bbb5 rating.
Default – an issuer is considered to be in default if it is rated below investment grade by two rating agencies. If the rating falls below investment grade, all investments on the issuer will be terminated immediately. In case of deposits, such deposits are expectedtobereceivedontheirduedate.Forex-staffdebts,wheretherearenoterminalbenefitstorecoverfrom,thewholeoutstanding debt is impaired.
The Bank uses international rating agencies namely, Moody’s, Standard and Poor’s and Fitch Rating for its credit risk assessment. For deposit taking institutions, and commercial banks investments are allowed only in investment grade rated issuers with a minimum rating of BBB- (investment grade). Central banks assume the credit rating of their sovereign.
The Table below shows the Bank’s risk criteria mapped to external ratings for short-term deposits
Risk Criteria Fitch Moody’s Standard and Poor’s
NormalAAA Aaa AAAAA+ Aa1 AA+AA Aa2 AAAA- Aa3 AA-A+ A1 A+A A2 AA- A3 A-
BBB+ Baa1 BBB+BBB Baa2 BBB
Concerned BBB- Baa3 BBB-Default Bbb BB
TheTablebelowsetsoutcreditqualityanalysisforfinancialassetsmeasuredatamortisedcost.ThegrosscarryingamountoffinancialassetsrepresenttheBank’sexposuretocreditriskontheseassets.
201812-Month ECL Staging
Staff LoansP’000
Short-term DepositsP’000
TotalP’000
Credit Grade
Normal – investment grade 107 382 22 973 180 23 080 562Concerned – standard monitoring - 429 377 429 377Default7 41 1 679 1 720Gross carrying amount 107 423 23 404 236 23 511 659
Loss allowance (41) (225) (266)Carrying amount 107 382 23 404 011 23 511 393
7 Default includes deposits held with Banks in South Africa for transactional purposes despite the ratings because of important economic and business relationship that exist between Botswana and South Africa.
Statutory report on the operationS and Financial StatementS oF the Bank, 2018

BANK OF BOTSWANA ANNUAL REPORT 201876
NOTES TO THE ANNUAL FINANCIAL STATEMENTS (Continued)For the year ended December 31, 2018
8 Other includes investments rated below A-, but still remain within the acceptable investment grades as per the investment guidelines9 Included in AAA, AA+, AA, A and BB+ are deposits held with central banks.
31. RISK MANAGEMENT IN RESPECT OF FINANCIAL INSTRUMENTS (Cont’d)
Credit Exposure on Bonds2018 2017
Moodys/S&P Rating Government Corporate Total Total(P’000) (P’000) (P’000) (P’000)
AAA 15 670 945 174 966 15 845 911 26 297 087AA+ 1 204 533 23 152 1 227 685 1 252 318AA 2 890 722 257 763 3 148 485 7 699 839AA- 132 884 207 306 340 190 -A+ 2 310 128 373 347 2 683 475 3 206 168A 312 448 405 953 718 402 363 251Other8 1 407 175 2 633 010 4 040 185 2 642 724
23 928 835 4 075 497 28 004 332 41 461 387
Credit Exposure to Banks (Short-term deposits)
2018 2017(P’000) (P’000)
Fitch Rating
AAA9 3 665 325 3 032 728AA+ 723 643 -AA 41 329 317 492A 310 726 200 642a+5 432 165 6 020a1 1 127 589 276 232a5 1 974 408 299 530aa2 644 471 -aa-1 751 767 196 598aa-2 2 362 599 442 399aa-5 5 695 699 1 255 460a-5 966 764 435 481a-1 644 839 98 320BB+ 3 631 856 1 582 259Bbb5/bbb+5 429 377 160 909bb+3 1 679 -
23 404 236 8 304 070
Credit Exposure on Securities Lending Programme
The Bank’s global custodian manages a securities lending programme as agent of the Bank. Due to the short term nature of the securities lending transactions, the collateral received under this programme changes on a short term basis. The securities lending is regulated by a securities lending agreement with the global custodian and follows the general criteria for the Bank’s credit exposure. The global custodian monitors the market value of the collateral and, where necessary, obtains additional collateral in line with the underlying agreement.
Inputs, Assumptions and Techniques used for Estimating Impairment
The key judgements and assumptions adopted by the Bank in addressing the requirements of IFRS 9 for calculation of expected credit losses are discussed below.
Amounts arising from ECL
ECLismeasuredona12-monthbasisoninitialrecognition,subsequentmeasurementwheretherearenosignificantincreaseincreditriskandforlowriskfinancialassets.A12monthECLrepresentfinancialassets’lifetimeECLthatareexpectedtoarisefrom default events that are possible within 12 month period following origination of an asset or from each reporting date.
BANK OF BOTSWANA ANNUAL REPORT 201877
NOTES TO THE ANNUAL FINANCIAL STATEMENTS (Continued)For the year ended December 31, 2018
31. RISK MANAGEMENT IN RESPECT OF FINANCIAL INSTRUMENTS (Cont’d)
Significantincreaseincreditrisk
TheBankcarrieshighqualityfinancialinstrumentswhoseriskislow.Subsequently,notrackingofdeteriorationisrequired.Anannualassessment of the risk of default at the reporting date is done.
Measurement of ECL
The Bank has adopted the Probability of Default and Loss Given Default models in the determination of ECL. In applying these models, the Bank considers factors such as current economic circumstances of the markets in which it holds investments, forward lookingeconomicandfinancialindicatorstoconsiderthelikelihoodofadefaultoccurringwithinthenext12months.
The key inputs into the measurement of ECL are the following:▪ ProbabilityofDefault(PD)–isthelikelihoodofdefaultoveragiventimehorizonofoneyear.ThePDisbasedontheissuer’s
credit rating such that the probability of default increases as the credit quality deteriorates;▪ LossGivenDefault(LGD)–isthemagnitudeofthelikelyloss,ifthereisadefaultbytheissuer.Itisapercentageoftheexposure
atdefaultortheshareoftheexposuretoafinancialassetthattheBankcouldloseintheeventofdefault;▪ ExposureatDefault(EAD)–represents theexpectedexposureintheeventofadefault.This is thetotalvalueholdingofa
financialinstrumentatthetimeofdefault.
In determining LGD, the following formula is used:
LGD=1-Recovery Rate (RR); where
RR= Value of Collateral/Value of the fair value of investment.
The Bank places time deposits with approved correspondent banks, central banks and other reputable international deposit taking institutions, and these depositories are considered to have minimum risk of default in line with international ratings. As such, the Bank’s short term deposits are not collateralised, consequently the RR is zero; thus, the LGD remains constant at one. This results in the loss rates being equal to the PDs.
Financial instruments are grouped on the basis of shared risk characteristics that include instrument types, credit risk gradings, collateral type, date of initial recognition, remaining term to maturity, industry and geographical location of the borrower.
Model Inputs: 1-Year Default Risk
In determining the Probability of Default for the various sovereigns, PD sourced from Bloomberg are used. These probabilities are derivedfrommodelsbasedoneconomicandfinancialdatathat theBankconsiderssufficientlycomprehensivetoprovidecredibleestimates of default risk. The variables listed below are the main inputs in the calculation of the PD for each country the Bank holds investments in cash and cash equivalents.
(i) Expenditures (as a percentage of GDP)(ii) Revenues (as a percentage of GDP)(iii) Debt due in twelve months (as a percentage of GDP)(iv) Long-term debt (as a percentage of GDP)(v) Refinancingability(vi) Budgetsurplus/deficit(asapercentageofGDP)(vii) Non-performing loans (as a percentage of total loans)(viii) GDP growth(ix) Political risk score
Statutory report on the operationS and Financial StatementS oF the Bank, 2018
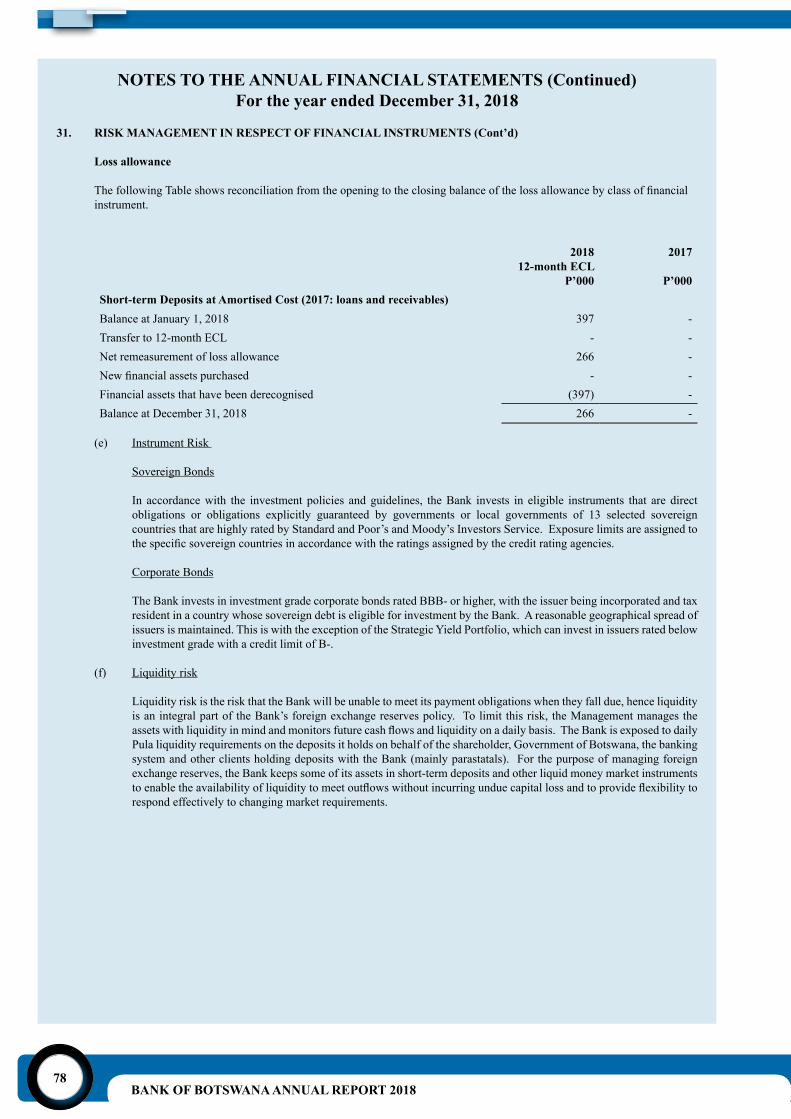
BANK OF BOTSWANA ANNUAL REPORT 201878
NOTES TO THE ANNUAL FINANCIAL STATEMENTS (Continued)For the year ended December 31, 2018
31. RISK MANAGEMENT IN RESPECT OF FINANCIAL INSTRUMENTS (Cont’d)
Loss allowance
ThefollowingTableshowsreconciliationfromtheopeningtotheclosingbalanceofthelossallowancebyclassoffinancialinstrument.
2018
12-month ECLP’000
2017
P’000Short-term Deposits at Amortised Cost (2017: loans and receivables)Balance at January 1, 2018 397 -Transfer to 12-month ECL - -Net remeasurement of loss allowance 266 -Newfinancialassetspurchased - -Financial assets that have been derecognised (397) -Balance at December 31, 2018 266 -
(e) Instrument Risk
Sovereign Bonds
In accordance with the investment policies and guidelines, the Bank invests in eligible instruments that are direct obligations or obligations explicitly guaranteed by governments or local governments of 13 selected sovereign countries that are highly rated by Standard and Poor’s and Moody’s Investors Service. Exposure limits are assigned to thespecificsovereigncountriesinaccordancewiththeratingsassignedbythecreditratingagencies.
Corporate Bonds
The Bank invests in investment grade corporate bonds rated BBB- or higher, with the issuer being incorporated and tax resident in a country whose sovereign debt is eligible for investment by the Bank. A reasonable geographical spread of issuers is maintained. This is with the exception of the Strategic Yield Portfolio, which can invest in issuers rated below investment grade with a credit limit of B-.
(f) Liquidity risk
Liquidity risk is the risk that the Bank will be unable to meet its payment obligations when they fall due, hence liquidity is an integral part of the Bank’s foreign exchange reserves policy. To limit this risk, the Management manages the assetswithliquidityinmindandmonitorsfuturecashflowsandliquidityonadailybasis.TheBankisexposedtodailyPula liquidity requirements on the deposits it holds on behalf of the shareholder, Government of Botswana, the banking system and other clients holding deposits with the Bank (mainly parastatals). For the purpose of managing foreign exchange reserves, the Bank keeps some of its assets in short-term deposits and other liquid money market instruments toenabletheavailabilityofliquiditytomeetoutflowswithoutincurringunduecapitallossandtoprovideflexibilitytorespond effectively to changing market requirements.
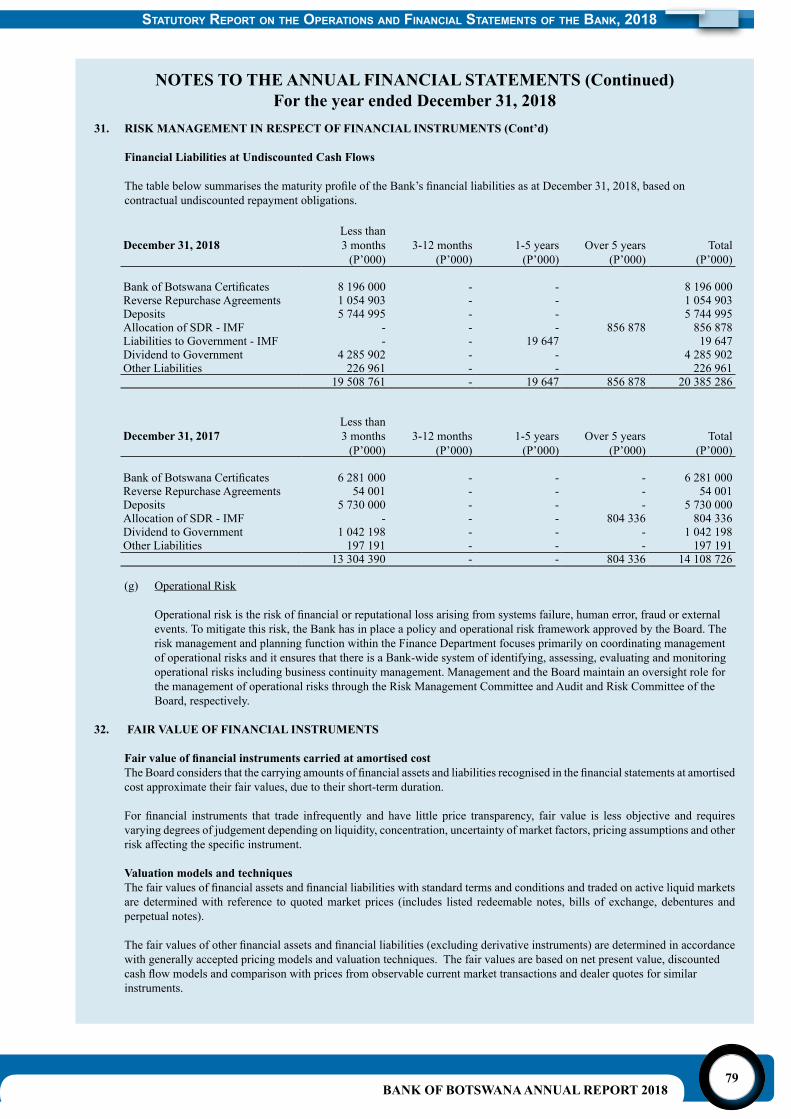
BANK OF BOTSWANA ANNUAL REPORT 201879
NOTES TO THE ANNUAL FINANCIAL STATEMENTS (Continued)For the year ended December 31, 2018
31. RISK MANAGEMENT IN RESPECT OF FINANCIAL INSTRUMENTS (Cont’d)
Financial Liabilities at Undiscounted Cash Flows
ThetablebelowsummarisesthematurityprofileoftheBank’sfinancialliabilitiesasatDecember31,2018,basedoncontractual undiscounted repayment obligations.
December 31, 2018Less than3 months
(P’000)3-12 months
(P’000)1-5 years
(P’000)Over 5 years
(P’000)Total
(P’000)
BankofBotswanaCertificates 8 196 000 - - 8 196 000Reverse Repurchase Agreements 1 054 903 - - 1 054 903Deposits 5 744 995 - - 5 744 995Allocation of SDR - IMF - - - 856 878 856 878Liabilities to Government - IMF - - 19 647 19 647Dividend to Government 4 285 902 - - 4 285 902Other Liabilities 226 961 - - 226 961
19 508 761 - 19 647 856 878 20 385 286
December 31, 2017Less than 3 months
(P’000)3-12 months
(P’000)1-5 years
(P’000)Over 5 years
(P’000)Total
(P’000)
BankofBotswanaCertificates 6 281 000 - - - 6 281 000Reverse Repurchase Agreements 54 001 - - - 54 001Deposits 5 730 000 - - - 5 730 000Allocation of SDR - IMF - - - 804 336 804 336Dividend to Government 1 042 198 - - - 1 042 198Other Liabilities 197 191 - - - 197 191
13 304 390 - - 804 336 14 108 726
(g) Operational Risk
Operationalriskistheriskoffinancialorreputationallossarisingfromsystemsfailure,humanerror,fraudorexternalevents. To mitigate this risk, the Bank has in place a policy and operational risk framework approved by the Board. The risk management and planning function within the Finance Department focuses primarily on coordinating management of operational risks and it ensures that there is a Bank-wide system of identifying, assessing, evaluating and monitoring operational risks including business continuity management. Management and the Board maintain an oversight role for the management of operational risks through the Risk Management Committee and Audit and Risk Committee of the Board, respectively.
32. FAIR VALUE OF FINANCIAL INSTRUMENTS
Fair value of financial instruments carried at amortised costTheBoardconsidersthatthecarryingamountsoffinancialassetsandliabilitiesrecognisedinthefinancialstatementsatamortisedcost approximate their fair values, due to their short-term duration.
For financial instruments that trade infrequently and have little price transparency, fair value is less objective and requiresvarying degrees of judgement depending on liquidity, concentration, uncertainty of market factors, pricing assumptions and other riskaffectingthespecificinstrument.
Valuation models and techniquesThefairvaluesoffinancialassetsandfinancialliabilitieswithstandardtermsandconditionsandtradedonactiveliquidmarketsare determined with reference to quoted market prices (includes listed redeemable notes, bills of exchange, debentures and perpetual notes).
Thefairvaluesofotherfinancialassetsandfinancialliabilities(excludingderivativeinstruments)aredeterminedinaccordancewith generally accepted pricing models and valuation techniques. The fair values are based on net present value, discounted cashflowmodelsandcomparisonwithpricesfromobservablecurrentmarkettransactionsanddealerquotesforsimilarinstruments.
Statutory report on the operationS and Financial StatementS oF the Bank, 2018
BANK OF BOTSWANA ANNUAL REPORT 201880
NOTES TO THE ANNUAL FINANCIAL STATEMENTS (Continued)For the year ended December 31, 2018
32. FAIR VALUE OF FINANCIAL INSTRUMENTS (Cont’d)
Valuation models and techniques(cont’d)
Theobjectiveofvaluationtechniquesistoarriveatafairvaluemeasurementthatreflectsthepricethatwouldbereceivedtosellthe asset or paid to transfer the liability in an orderly transaction between market participants at the measurement date.
TheBankuseswidelyrecognisedvaluationmodelsfordeterminingthefairvalueoffinancialinstruments,suchasinterestratesyields, that use only observable market data and require little management judgement and estimation.
The fair value of Government bonds is derived from market quotations. These are prices dealers will be willing to pay for similar instruments.
TheBankuses discounted cashflowanalysis to valueBankofBotswanaCertificates (BoBCs). Thevaluation is basedonobservable market prices, with the yield curve providing the discount factors needed.
The fair values of derivative instruments are calculated using quoted prices. Where such prices are not available, a discounted cashflowanalysisisperformedusingtheapplicableyieldcurveforthedurationoftheinstrumentsfornon-optionalderivatives,and option pricing models for optional derivatives.
Foreign currency forward contracts are measured using quoted forward exchange rates and yield curves derived from quoted interestratesmatchingmaturitiesofthecontracts.Interestrateswapsaremeasuredatthepresentvalueoffuturecashflowsestimated and discounted based on the applicable yield curves derived from quoted interest rates.
Fairvaluesarecategorisedintodifferentlevelsinafairvaluehierarchy,whichreflectsthesignificanceoftheinputsusedinmaking the measurements.
Level 1 fair value measurements are those derived from quoted prices (unadjusted) in active markets for identical assets or liabilities.
Level 2 fair value measurements are those derived from inputs other than quoted prices included within Level 1 that are observable for the asset or liability, either directly (i.e., as prices) or indirectly (i.e., derived from prices). This category includes instruments valued using: quoted market prices in active markets for similar instruments; quoted prices for identical or similar instrumentsinmarketsthatareconsideredlessactive;orothervaluationtechniquesinwhichallsignificantinputsaredirectlyor indirectly observable from market data.
Level 3 fair value measurements are those derived from valuation techniques that include inputs for the asset or liability that are not based on observable market data (unobservable inputs).
If the inputs used to measure the fair value of an asset or a liability are categorised in different levels of the fair value hierarchy, then the fair value measurement is categorised in its entirety in the same level of the fair value hierarchy as the lowest level input thatissignificanttotheentiremeasurement.
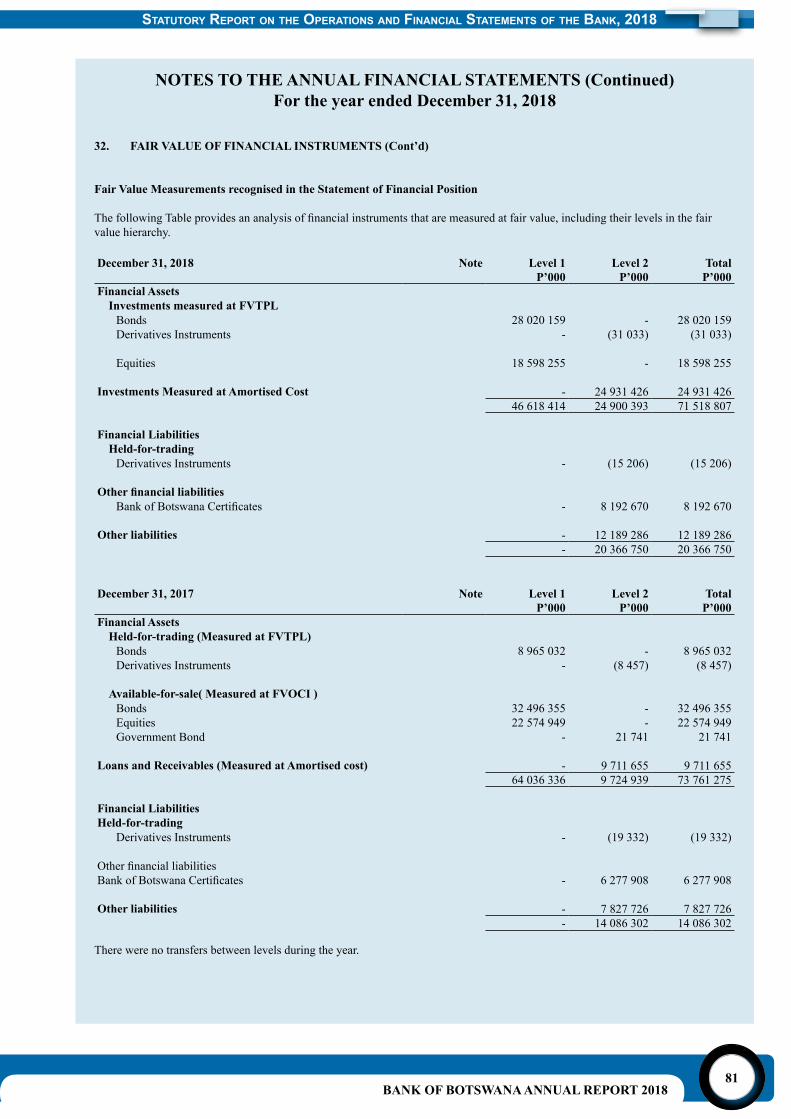
BANK OF BOTSWANA ANNUAL REPORT 201881
32. FAIR VALUE OF FINANCIAL INSTRUMENTS (Cont’d)
Fair Value Measurements recognised in the Statement of Financial Position
ThefollowingTableprovidesananalysisoffinancialinstrumentsthataremeasuredatfairvalue,includingtheirlevelsinthefairvalue hierarchy. December 31, 2018 Note Level 1 Level 2 Total
P’000 P’000 P’000Financial Assets
Investments measured at FVTPL Bonds 28 020 159 - 28 020 159Derivatives Instruments - (31 033) (31 033)
Equities 18 598 255 - 18 598 255
Investments Measured at Amortised Cost - 24 931 426 24 931 42646 618 414 24 900 393 71 518 807
Financial LiabilitiesHeld-for-trading
Derivatives Instruments - (15 206) (15 206)
Other financial liabilitiesBankofBotswanaCertificates - 8 192 670 8 192 670
Other liabilities - 12 189 286 12 189 286- 20 366 750 20 366 750
December 31, 2017 Note Level 1 Level 2 TotalP’000 P’000 P’000
Financial AssetsHeld-for-trading (Measured at FVTPL)
Bonds 8 965 032 - 8 965 032Derivatives Instruments - (8 457) (8 457)
Available-for-sale( Measured at FVOCI )Bonds 32 496 355 - 32 496 355Equities 22 574 949 - 22 574 949Government Bond - 21 741 21 741
Loans and Receivables (Measured at Amortised cost) - 9 711 655 9 711 65564 036 336 9 724 939 73 761 275
Financial LiabilitiesHeld-for-trading
Derivatives Instruments - (19 332) (19 332)
OtherfinancialliabilitiesBankofBotswanaCertificates - 6 277 908 6 277 908
Other liabilities - 7 827 726 7 827 726- 14 086 302 14 086 302
There were no transfers between levels during the year.
NOTES TO THE ANNUAL FINANCIAL STATEMENTS (Continued)For the year ended December 31, 2018
Statutory report on the operationS and Financial StatementS oF the Bank, 2018
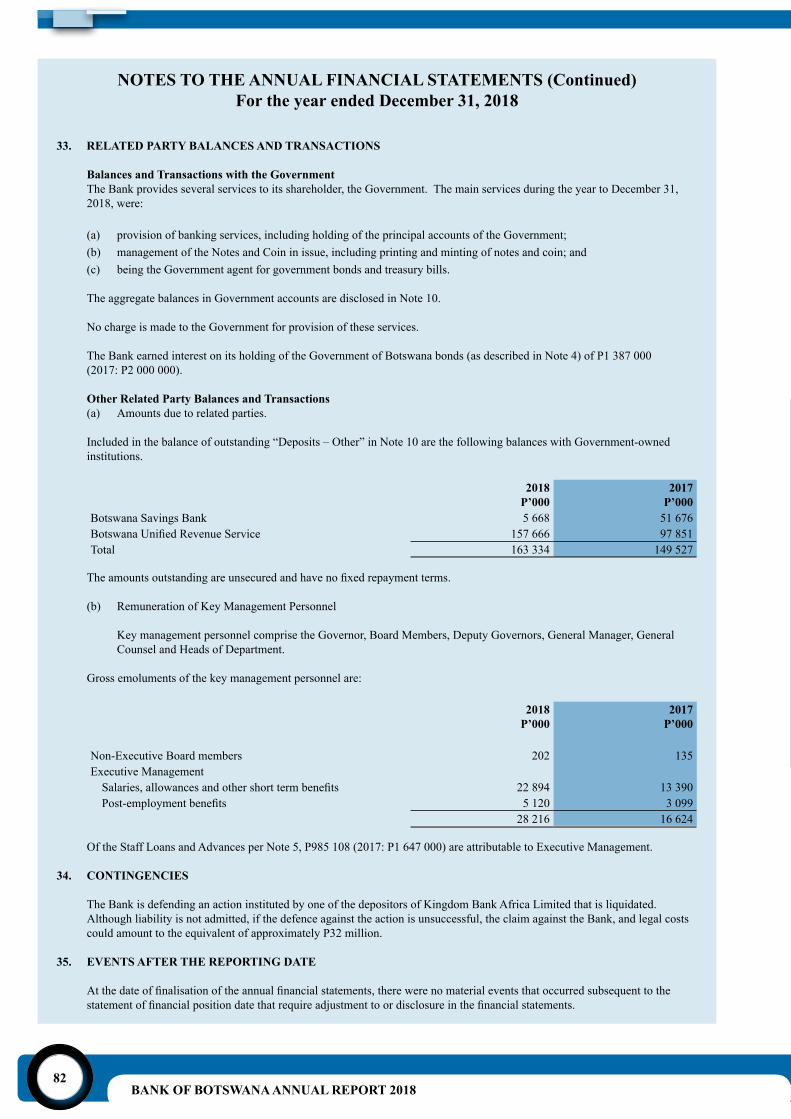
BANK OF BOTSWANA ANNUAL REPORT 201882
NOTES TO THE ANNUAL FINANCIAL STATEMENTS (Continued)For the year ended December 31, 2018
33. RELATED PARTY BALANCES AND TRANSACTIONS
Balances and Transactions with the GovernmentThe Bank provides several services to its shareholder, the Government. The main services during the year to December 31, 2018, were:
(a) provision of banking services, including holding of the principal accounts of the Government;(b) management of the Notes and Coin in issue, including printing and minting of notes and coin; and(c) being the Government agent for government bonds and treasury bills.
The aggregate balances in Government accounts are disclosed in Note 10.
No charge is made to the Government for provision of these services.
The Bank earned interest on its holding of the Government of Botswana bonds (as described in Note 4) of P1 387 000 (2017: P2 000 000).
Other Related Party Balances and Transactions(a) Amounts due to related parties.
Included in the balance of outstanding “Deposits – Other” in Note 10 are the following balances with Government-owned institutions.
2018P’000
2017P’000
Botswana Savings Bank 5 668 51 676BotswanaUnifiedRevenueService 157 666 97 851Total 163 334 149 527
Theamountsoutstandingareunsecuredandhavenofixedrepaymentterms.
(b) Remuneration of Key Management Personnel
Key management personnel comprise the Governor, Board Members, Deputy Governors, General Manager, General Counsel and Heads of Department.
Gross emoluments of the key management personnel are:
2018P’000
2017P’000
Non-Executive Board members 202 135Executive Management Salaries,allowancesandothershorttermbenefits 22 894 13 390Post-employmentbenefits 5 120 3 099
28 216 16 624
Of the Staff Loans and Advances per Note 5, P985 108 (2017: P1 647 000) are attributable to Executive Management.
34. CONTINGENCIES
The Bank is defending an action instituted by one of the depositors of Kingdom Bank Africa Limited that is liquidated. Although liability is not admitted, if the defence against the action is unsuccessful, the claim against the Bank, and legal costs could amount to the equivalent of approximately P32 million.
35. EVENTS AFTER THE REPORTING DATE
Atthedateoffinalisationoftheannualfinancialstatements,therewerenomaterialeventsthatoccurredsubsequenttothestatementoffinancialpositiondatethatrequireadjustmenttoordisclosureinthefinancialstatements.
Part B
Bank of Botswana
the BotswanaeConoMy in 2018
theMe ChaPter:
Botswana - finanCing strategies for
indUstrialisation and transition to high inCoMe
statUs

BANK OF BOTSWANA ANNUAL REPORT 201884
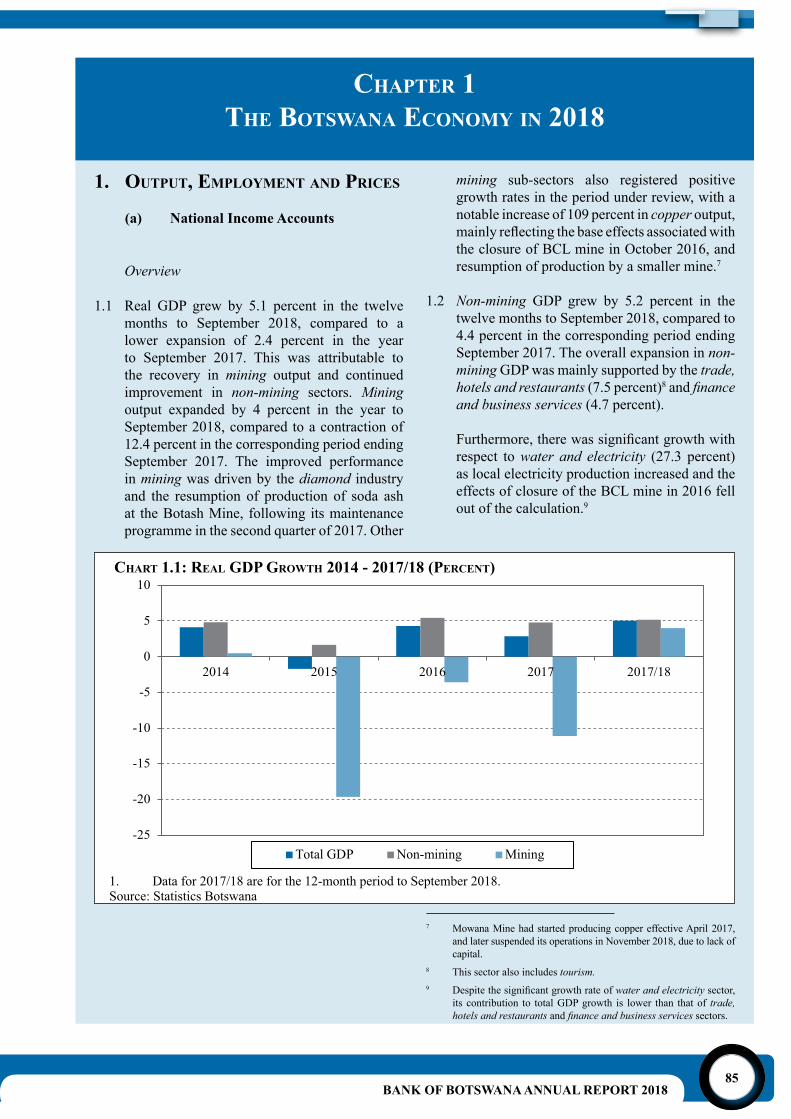
BANK OF BOTSWANA ANNUAL REPORT 201885
ChaPter 1the Botswana eConoMy in 2018
7 Mowana Mine had started producing copper effective April 2017, and later suspended its operations in November 2018, due to lack of capital.
8 This sector also includes tourism.9 Despitethesignificantgrowthrateofwater and electricity sector,
its contribution to total GDP growth is lower than that of trade, hotels and restaurants and finance and business services sectors.
1. oUtPUt, eMPloyMent and PriCes
(a) National Income Accounts
Overview
1.1 Real GDP grew by 5.1 percent in the twelve months to September 2018, compared to a lower expansion of 2.4 percent in the year to September 2017. This was attributable to the recovery in mining output and continued improvement in non-mining sectors. Mining output expanded by 4 percent in the year to September 2018, compared to a contraction of 12.4 percent in the corresponding period ending September 2017. The improved performance in mining was driven by the diamond industry and the resumption of production of soda ash at the Botash Mine, following its maintenance programme in the second quarter of 2017. Other
mining sub-sectors also registered positive growth rates in the period under review, with a notable increase of 109 percent in copper output, mainlyreflectingthebaseeffectsassociatedwiththe closure of BCL mine in October 2016, and resumption of production by a smaller mine.7
1.2 Non-mining GDP grew by 5.2 percent in the twelve months to September 2018, compared to 4.4 percent in the corresponding period ending September 2017. The overall expansion in non-mining GDP was mainly supported by the trade, hotels and restaurants (7.5 percent)8 and finance and business services (4.7 percent).
Furthermore,therewassignificantgrowthwithrespect to water and electricity (27.3 percent) as local electricity production increased and the effects of closure of the BCL mine in 2016 fell out of the calculation.9
Chart 1.1: real gdP growth 2014 - 2017/18 (PerCent)
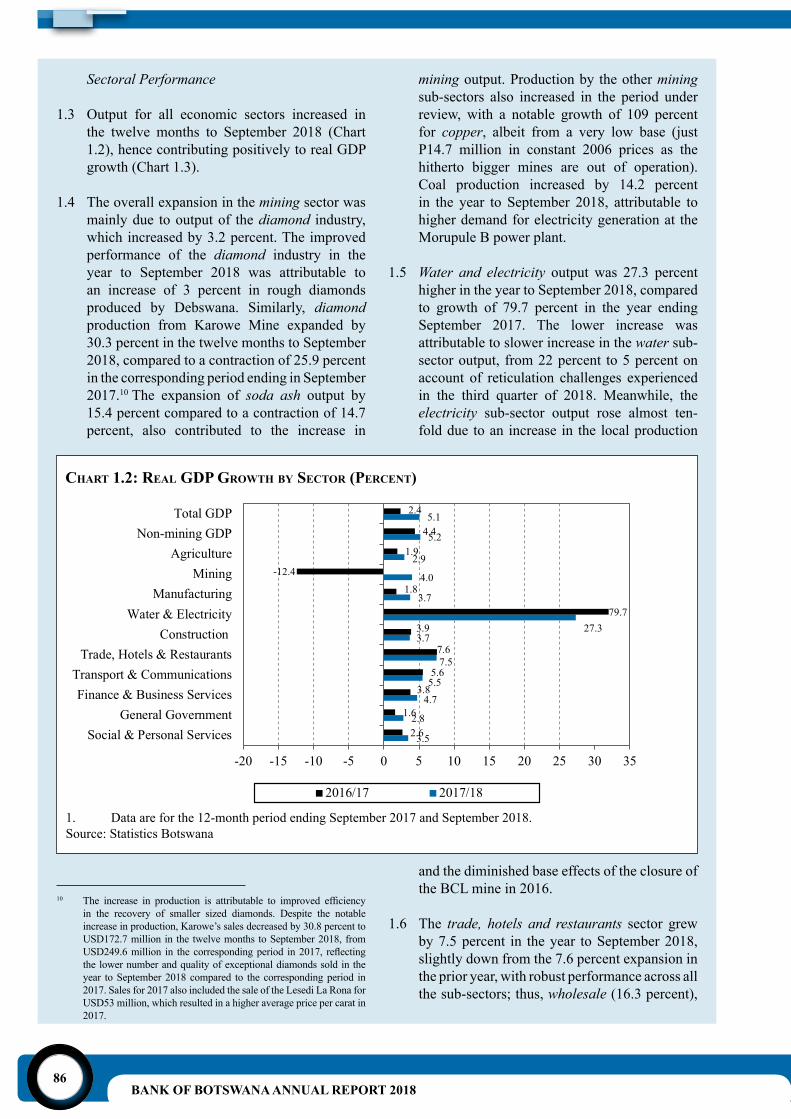
BANK OF BOTSWANA ANNUAL REPORT 201886
the BotSwana economy in 2018
Sectoral Performance
1.3 Output for all economic sectors increased in the twelve months to September 2018 (Chart 1.2), hence contributing positively to real GDP growth (Chart 1.3).
1.4 The overall expansion in the mining sector was mainly due to output of the diamond industry, which increased by 3.2 percent. The improved performance of the diamond industry in the year to September 2018 was attributable to an increase of 3 percent in rough diamonds produced by Debswana. Similarly, diamond production from Karowe Mine expanded by 30.3 percent in the twelve months to September 2018, compared to a contraction of 25.9 percent in the corresponding period ending in September 2017.10 The expansion of soda ash output by 15.4 percent compared to a contraction of 14.7 percent, also contributed to the increase in
mining output. Production by the other mining sub-sectors also increased in the period under review, with a notable growth of 109 percent for copper, albeit from a very low base (just P14.7 million in constant 2006 prices as the hitherto bigger mines are out of operation). Coal production increased by 14.2 percent in the year to September 2018, attributable to higher demand for electricity generation at the Morupule B power plant.
1.5 Water and electricity output was 27.3 percent higher in the year to September 2018, compared to growth of 79.7 percent in the year ending September 2017. The lower increase was attributable to slower increase in the water sub-sector output, from 22 percent to 5 percent on account of reticulation challenges experienced in the third quarter of 2018. Meanwhile, the electricity sub-sector output rose almost ten-fold due to an increase in the local production
Chart 1.2: real gdP growth By seCtor (PerCent)
1. Data are for the 12-month period ending September 2017 and September 2018.Source: Statistics Botswana
and the diminished base effects of the closure of the BCL mine in 2016.
1.6 The trade, hotels and restaurants sector grew by 7.5 percent in the year to September 2018, slightly down from the 7.6 percent expansion in the prior year, with robust performance across all the sub-sectors; thus, wholesale (16.3 percent),
10 The increase in production is attributable to improved efficiencyin the recovery of smaller sized diamonds. Despite the notable increase in production, Karowe’s sales decreased by 30.8 percent to USD172.7 million in the twelve months to September 2018, from USD249.6million in thecorrespondingperiod in2017, reflectingthe lower number and quality of exceptional diamonds sold in the year to September 2018 compared to the corresponding period in 2017. Sales for 2017 also included the sale of the Lesedi La Rona for USD53 million, which resulted in a higher average price per carat in 2017.
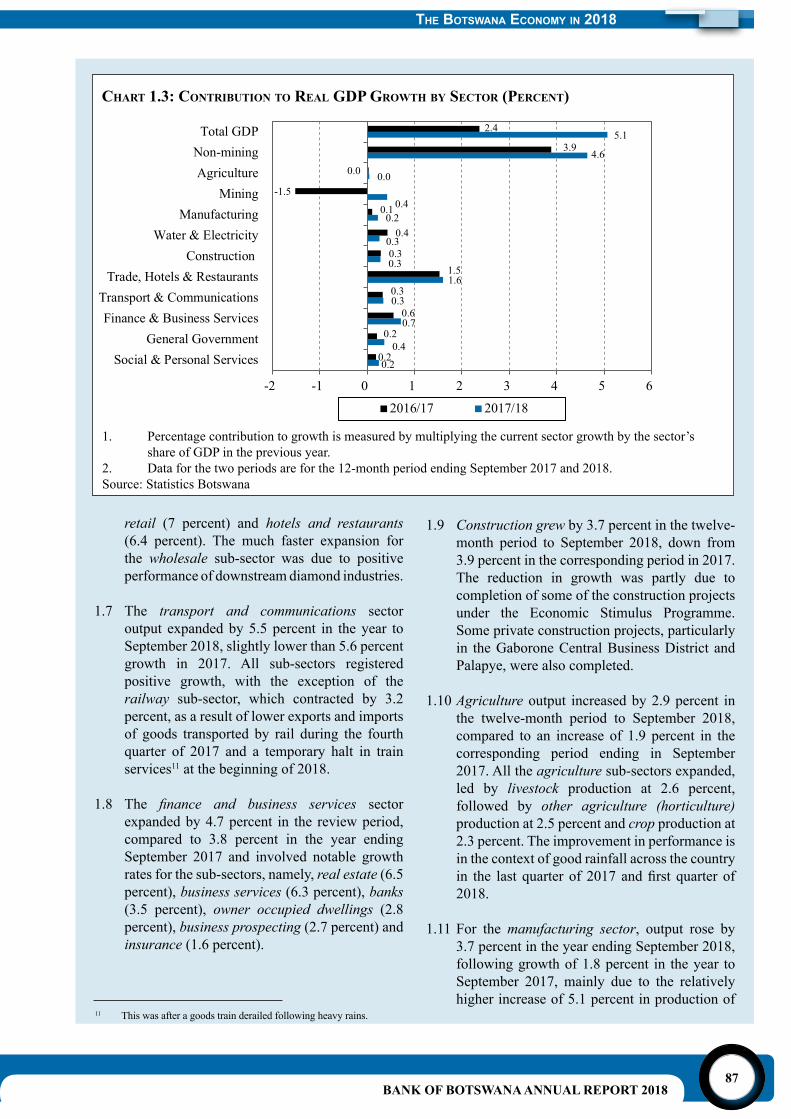
BANK OF BOTSWANA ANNUAL REPORT 201887
the BotSwana economy in 2018
Chart 1.3: ContriBUtion to real gdP growth By seCtor (PerCent)
1. Percentage contribution to growth is measured by multiplying the current sector growth by the sector’s share of GDP in the previous year.
2. Data for the two periods are for the 12-month period ending September 2017 and 2018.Source: Statistics Botswana
11 This was after a goods train derailed following heavy rains.
retail (7 percent) and hotels and restaurants (6.4 percent). The much faster expansion for the wholesale sub-sector was due to positive performance of downstream diamond industries.
1.7 The transport and communications sector output expanded by 5.5 percent in the year to September 2018, slightly lower than 5.6 percent growth in 2017. All sub-sectors registered positive growth, with the exception of the railway sub-sector, which contracted by 3.2 percent, as a result of lower exports and imports of goods transported by rail during the fourth quarter of 2017 and a temporary halt in train services11 at the beginning of 2018.
1.8 The finance and business services sector expanded by 4.7 percent in the review period, compared to 3.8 percent in the year ending September 2017 and involved notable growth rates for the sub-sectors, namely, real estate (6.5 percent), business services (6.3 percent), banks (3.5 percent), owner occupied dwellings (2.8 percent), business prospecting (2.7 percent) and insurance (1.6 percent).
1.9 Construction grew by 3.7 percent in the twelve-month period to September 2018, down from 3.9 percent in the corresponding period in 2017. The reduction in growth was partly due to completion of some of the construction projects under the Economic Stimulus Programme. Some private construction projects, particularly in the Gaborone Central Business District and Palapye, were also completed.
1.10 Agriculture output increased by 2.9 percent in the twelve-month period to September 2018, compared to an increase of 1.9 percent in the corresponding period ending in September 2017. All the agriculture sub-sectors expanded, led by livestock production at 2.6 percent, followed by other agriculture (horticulture) production at 2.5 percent and crop production at 2.3 percent. The improvement in performance is in the context of good rainfall across the country in the last quarter of 2017 andfirst quarter of2018.
1.11 For the manufacturing sector, output rose by 3.7 percent in the year ending September 2018, following growth of 1.8 percent in the year to September 2017, mainly due to the relatively higher increase of 5.1 percent in production of
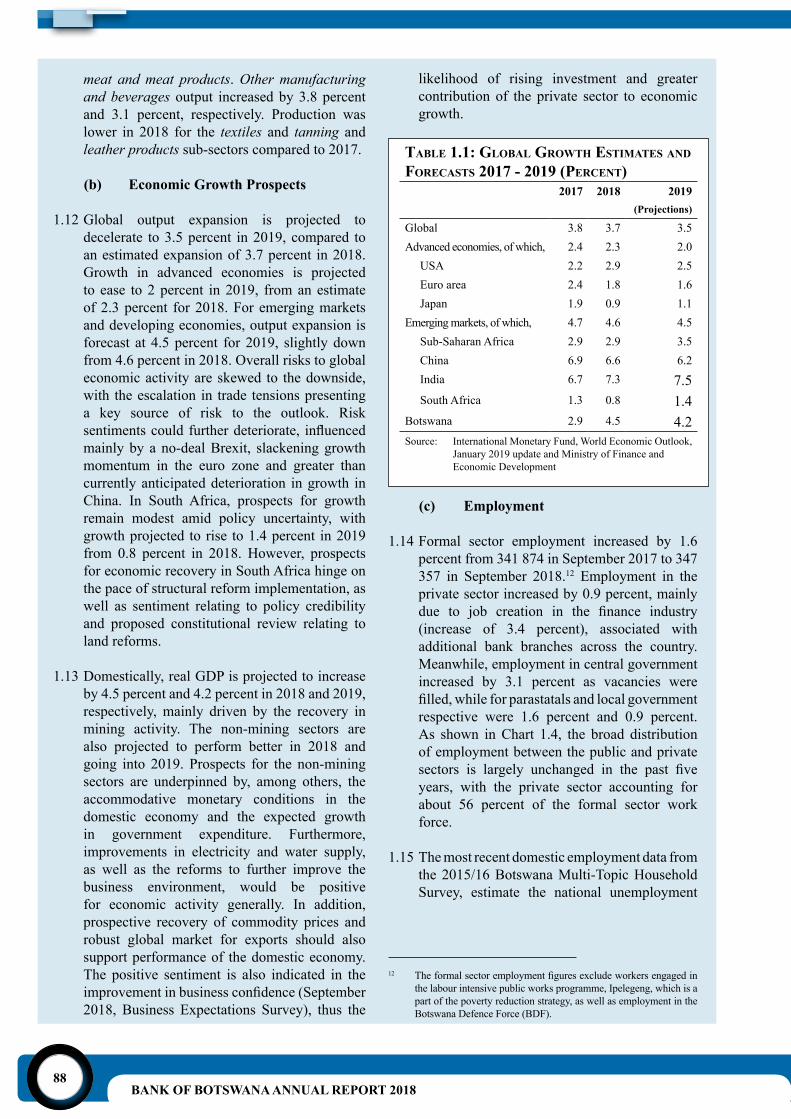
BANK OF BOTSWANA ANNUAL REPORT 201888
12 Theformalsectoremploymentfiguresexcludeworkersengagedinthe labour intensive public works programme, Ipelegeng, which is a part of the poverty reduction strategy, as well as employment in the Botswana Defence Force (BDF).
meat and meat products. Other manufacturing and beverages output increased by 3.8 percent and 3.1 percent, respectively. Production was lower in 2018 for the textiles and tanning and leather products sub-sectors compared to 2017.
(b) Economic Growth Prospects
1.12 Global output expansion is projected to decelerate to 3.5 percent in 2019, compared to an estimated expansion of 3.7 percent in 2018. Growth in advanced economies is projected to ease to 2 percent in 2019, from an estimate of 2.3 percent for 2018. For emerging markets and developing economies, output expansion is forecast at 4.5 percent for 2019, slightly down from 4.6 percent in 2018. Overall risks to global economic activity are skewed to the downside, with the escalation in trade tensions presenting a key source of risk to the outlook. Risk sentimentscouldfurtherdeteriorate, influencedmainly by a no-deal Brexit, slackening growth momentum in the euro zone and greater than currently anticipated deterioration in growth in China. In South Africa, prospects for growth remain modest amid policy uncertainty, with growth projected to rise to 1.4 percent in 2019 from 0.8 percent in 2018. However, prospects for economic recovery in South Africa hinge on the pace of structural reform implementation, as well as sentiment relating to policy credibility and proposed constitutional review relating to land reforms.
1.13 Domestically, real GDP is projected to increase by 4.5 percent and 4.2 percent in 2018 and 2019, respectively, mainly driven by the recovery in mining activity. The non-mining sectors are also projected to perform better in 2018 and going into 2019. Prospects for the non-mining sectors are underpinned by, among others, the accommodative monetary conditions in the domestic economy and the expected growth in government expenditure. Furthermore, improvements in electricity and water supply, as well as the reforms to further improve the business environment, would be positive for economic activity generally. In addition, prospective recovery of commodity prices and robust global market for exports should also support performance of the domestic economy. The positive sentiment is also indicated in the improvementinbusinessconfidence(September2018, Business Expectations Survey), thus the
likelihood of rising investment and greater contribution of the private sector to economic growth.
taBle 1.1: gloBal growth estiMates and foreCasts 2017 - 2019 (PerCent)
2017 2018 2019(Projections)
Global 3.8 3.7 3.5Advanced economies, of which, 2.4 2.3 2.0
USA 2.2 2.9 2.5Euro area 2.4 1.8 1.6Japan 1.9 0.9 1.1
Emerging markets, of which, 4.7 4.6 4.5Sub-Saharan Africa 2.9 2.9 3.5China 6.9 6.6 6.2India 6.7 7.3 7.5South Africa 1.3 0.8 1.4
Botswana 2.9 4.5 4.2Source: International Monetary Fund, World Economic Outlook, January 2019 update and Ministry of Finance and
Economic Development
(c) Employment
1.14 Formal sector employment increased by 1.6 percent from 341 874 in September 2017 to 347 357 in September 2018.12 Employment in the private sector increased by 0.9 percent, mainly due to job creation in the finance industry(increase of 3.4 percent), associated with additional bank branches across the country. Meanwhile, employment in central government increased by 3.1 percent as vacancies were filled,whileforparastatalsandlocalgovernmentrespective were 1.6 percent and 0.9 percent. As shown in Chart 1.4, the broad distribution of employment between the public and private sectors is largely unchanged in the past fiveyears, with the private sector accounting for about 56 percent of the formal sector work force.
1.15 The most recent domestic employment data from the 2015/16 Botswana Multi-Topic Household Survey, estimate the national unemployment
the BotSwana economy in 2018
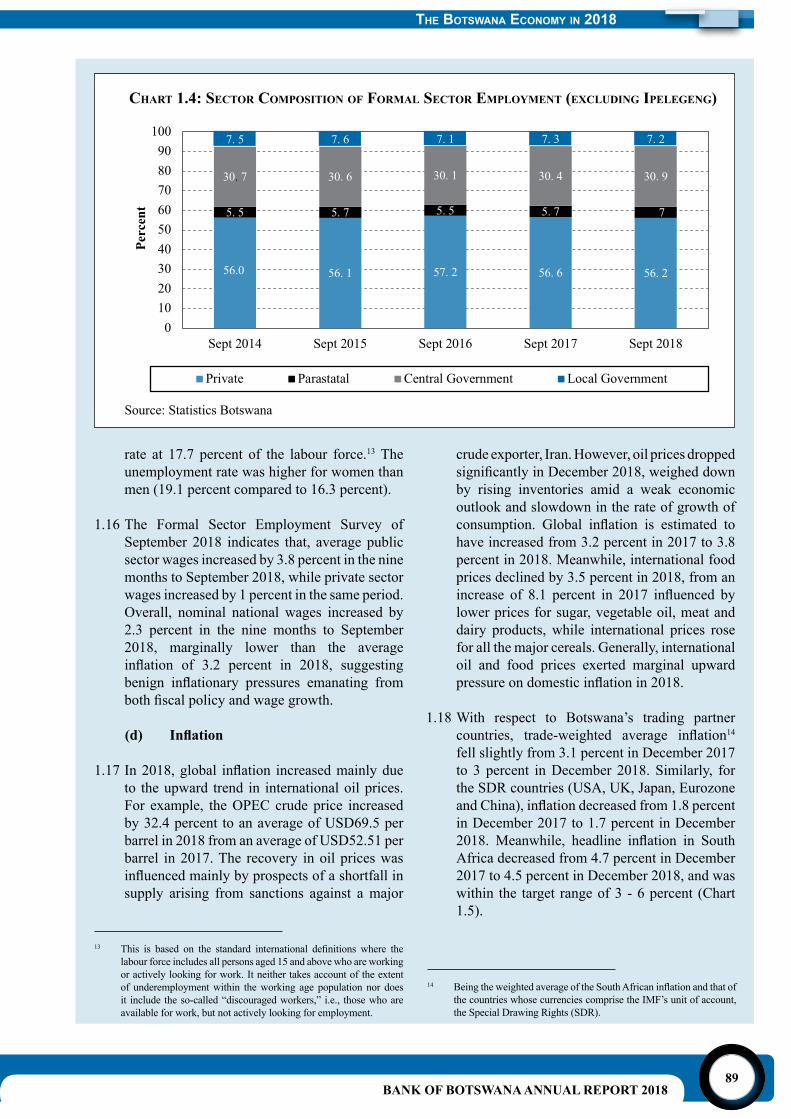
BANK OF BOTSWANA ANNUAL REPORT 201889
13 This is based on the standard international definitions where thelabour force includes all persons aged 15 and above who are working or actively looking for work. It neither takes account of the extent of underemployment within the working age population nor does it include the so-called “discouraged workers,” i.e., those who are available for work, but not actively looking for employment.
14 BeingtheweightedaverageoftheSouthAfricaninflationandthatofthe countries whose currencies comprise the IMF’s unit of account, the Special Drawing Rights (SDR).
rate at 17.7 percent of the labour force.13 The unemployment rate was higher for women than men (19.1 percent compared to 16.3 percent).
1.16 The Formal Sector Employment Survey of September 2018 indicates that, average public sector wages increased by 3.8 percent in the nine months to September 2018, while private sector wages increased by 1 percent in the same period. Overall, nominal national wages increased by 2.3 percent in the nine months to September 2018, marginally lower than the average inflation of 3.2 percent in 2018, suggestingbenign inflationary pressures emanating frombothfiscalpolicyandwagegrowth.
(d) Inflation
1.17In2018,global inflation increasedmainlydueto the upward trend in international oil prices. For example, the OPEC crude price increased by 32.4 percent to an average of USD69.5 per barrel in 2018 from an average of USD52.51 per barrel in 2017. The recovery in oil prices was influencedmainlybyprospectsofashortfallinsupply arising from sanctions against a major
Chart 1.4: seCtor CoMPosition of forMal seCtor eMPloyMent (exClUding iPelegeng)
crude exporter, Iran. However, oil prices dropped significantlyinDecember2018,weigheddownby rising inventories amid a weak economic outlook and slowdown in the rate of growth of consumption. Global inflation is estimated tohave increased from 3.2 percent in 2017 to 3.8 percent in 2018. Meanwhile, international food prices declined by 3.5 percent in 2018, from an increase of 8.1 percent in 2017 influenced bylower prices for sugar, vegetable oil, meat and dairy products, while international prices rose for all the major cereals. Generally, international oil and food prices exerted marginal upward pressureondomesticinflationin2018.
1.18 With respect to Botswana’s trading partner countries, trade-weighted average inflation14 fell slightly from 3.1 percent in December 2017 to 3 percent in December 2018. Similarly, for the SDR countries (USA, UK, Japan, Eurozone andChina),inflationdecreasedfrom1.8percentin December 2017 to 1.7 percent in December 2018. Meanwhile, headline inflation in SouthAfrica decreased from 4.7 percent in December 2017 to 4.5 percent in December 2018, and was within the target range of 3 - 6 percent (Chart 1.5).
the BotSwana economy in 2018
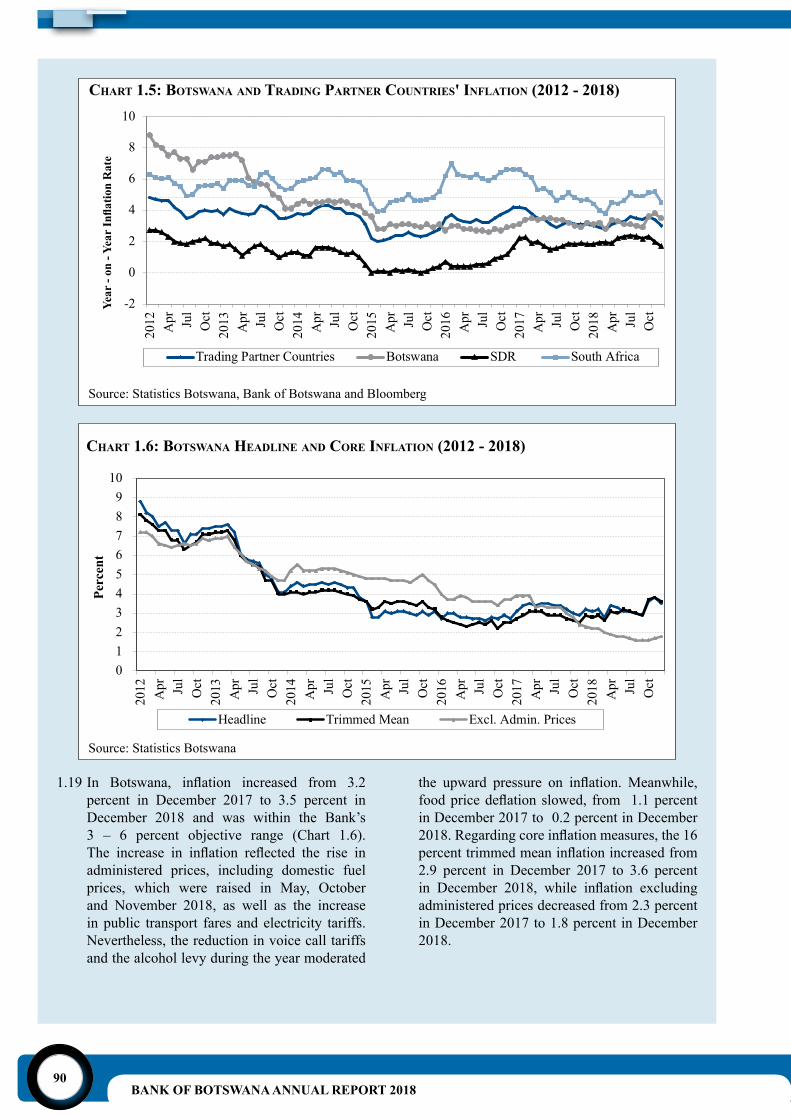
BANK OF BOTSWANA ANNUAL REPORT 201890
Chart 1.5: Botswana and trading Partner CoUntries' inflation (2012 - 2018)
Source: Statistics Botswana, Bank of Botswana and Bloomberg
Source: Statistics Botswana
Year
- on
- Ye
ar In
flatio
n R
ate
Chart 1.6: Botswana headline and Core inflation (2012 - 2018)
1.19In Botswana, inflation increased from 3.2percent in December 2017 to 3.5 percent in December 2018 and was within the Bank’s 3 – 6 percent objective range (Chart 1.6). The increase in inflation reflected the rise inadministered prices, including domestic fuel prices, which were raised in May, October and November 2018, as well as the increase in public transport fares and electricity tariffs. Nevertheless, the reduction in voice call tariffs and the alcohol levy during the year moderated
the upward pressure on inflation. Meanwhile,foodpricedeflationslowed, from 1.1percentin December 2017 to 0.2 percent in December 2018.Regardingcoreinflationmeasures,the16percenttrimmedmeaninflationincreasedfrom2.9 percent in December 2017 to 3.6 percent in December 2018, while inflation excludingadministered prices decreased from 2.3 percent in December 2017 to 1.8 percent in December 2018.
the BotSwana economy in 2018
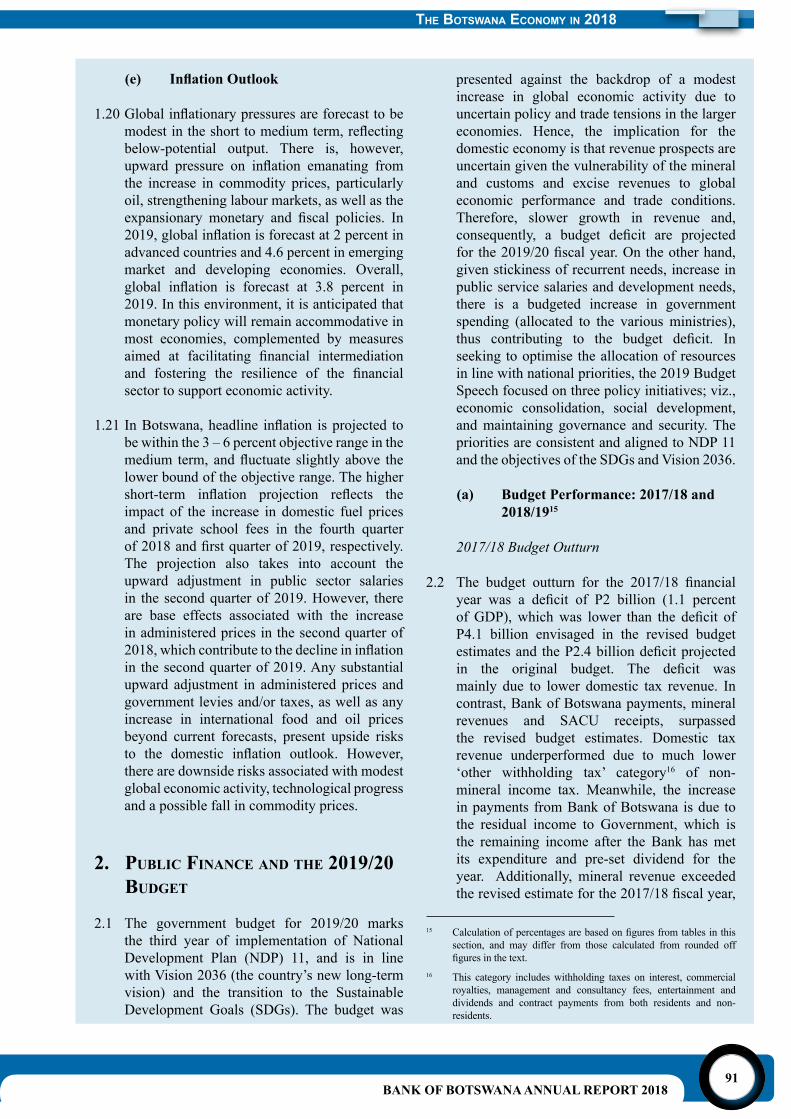
BANK OF BOTSWANA ANNUAL REPORT 201891
15 Calculationofpercentagesarebasedonfiguresfromtablesinthissection, and may differ from those calculated from rounded off figuresinthetext.
16 This category includes withholding taxes on interest, commercial royalties, management and consultancy fees, entertainment and dividends and contract payments from both residents and non- residents.
(e) Inflation Outlook
1.20Globalinflationarypressuresareforecasttobemodestintheshorttomediumterm,reflectingbelow-potential output. There is, however, upward pressure on inflation emanating fromthe increase in commodity prices, particularly oil, strengthening labour markets, as well as the expansionary monetary and fiscal policies. In2019,globalinflationisforecastat2percentinadvanced countries and 4.6 percent in emerging market and developing economies. Overall, global inflation is forecast at 3.8 percent in2019. In this environment, it is anticipated that monetary policy will remain accommodative in most economies, complemented by measures aimed at facilitating financial intermediationand fostering the resilience of the financialsector to support economic activity.
1.21InBotswana,headline inflation isprojected tobe within the 3 – 6 percent objective range in the medium term, andfluctuate slightly above thelower bound of the objective range. The higher short-term inflation projection reflects theimpact of the increase in domestic fuel prices and private school fees in the fourth quarter of2018andfirstquarterof2019,respectively.The projection also takes into account the upward adjustment in public sector salaries in the second quarter of 2019. However, there are base effects associated with the increase in administered prices in the second quarter of 2018,whichcontributetothedeclineininflationin the second quarter of 2019. Any substantial upward adjustment in administered prices and government levies and/or taxes, as well as any increase in international food and oil prices beyond current forecasts, present upside risks to the domestic inflation outlook. However,there are downside risks associated with modest global economic activity, technological progress and a possible fall in commodity prices.
2. PUBliC finanCe and the 2019/20 BUdget
2.1 The government budget for 2019/20 marks the third year of implementation of National Development Plan (NDP) 11, and is in line with Vision 2036 (the country’s new long-term vision) and the transition to the Sustainable Development Goals (SDGs). The budget was
presented against the backdrop of a modest increase in global economic activity due to uncertain policy and trade tensions in the larger economies. Hence, the implication for the domestic economy is that revenue prospects are uncertain given the vulnerability of the mineral and customs and excise revenues to global economic performance and trade conditions. Therefore, slower growth in revenue and, consequently, a budget deficit are projectedfor the2019/20fiscalyear.Ontheotherhand,given stickiness of recurrent needs, increase in public service salaries and development needs, there is a budgeted increase in government spending (allocated to the various ministries), thus contributing to the budget deficit. Inseeking to optimise the allocation of resources in line with national priorities, the 2019 Budget Speech focused on three policy initiatives; viz., economic consolidation, social development, and maintaining governance and security. The priorities are consistent and aligned to NDP 11 and the objectives of the SDGs and Vision 2036.
(a) Budget Performance: 2017/18 and 2018/1915
2017/18 Budget Outturn
2.2 The budget outturn for the 2017/18 financialyear was a deficit of P2 billion (1.1 percentofGDP),whichwas lower than the deficit ofP4.1 billion envisaged in the revised budget estimatesand theP2.4billiondeficitprojectedin the original budget. The deficit wasmainly due to lower domestic tax revenue. In contrast, Bank of Botswana payments, mineral revenues and SACU receipts, surpassed the revised budget estimates. Domestic tax revenue underperformed due to much lower ‘other withholding tax’ category16 of non-mineral income tax. Meanwhile, the increase in payments from Bank of Botswana is due to the residual income to Government, which is the remaining income after the Bank has met its expenditure and pre-set dividend for the year. Additionally, mineral revenue exceeded therevisedestimateforthe2017/18fiscalyear,
the BotSwana economy in 2018
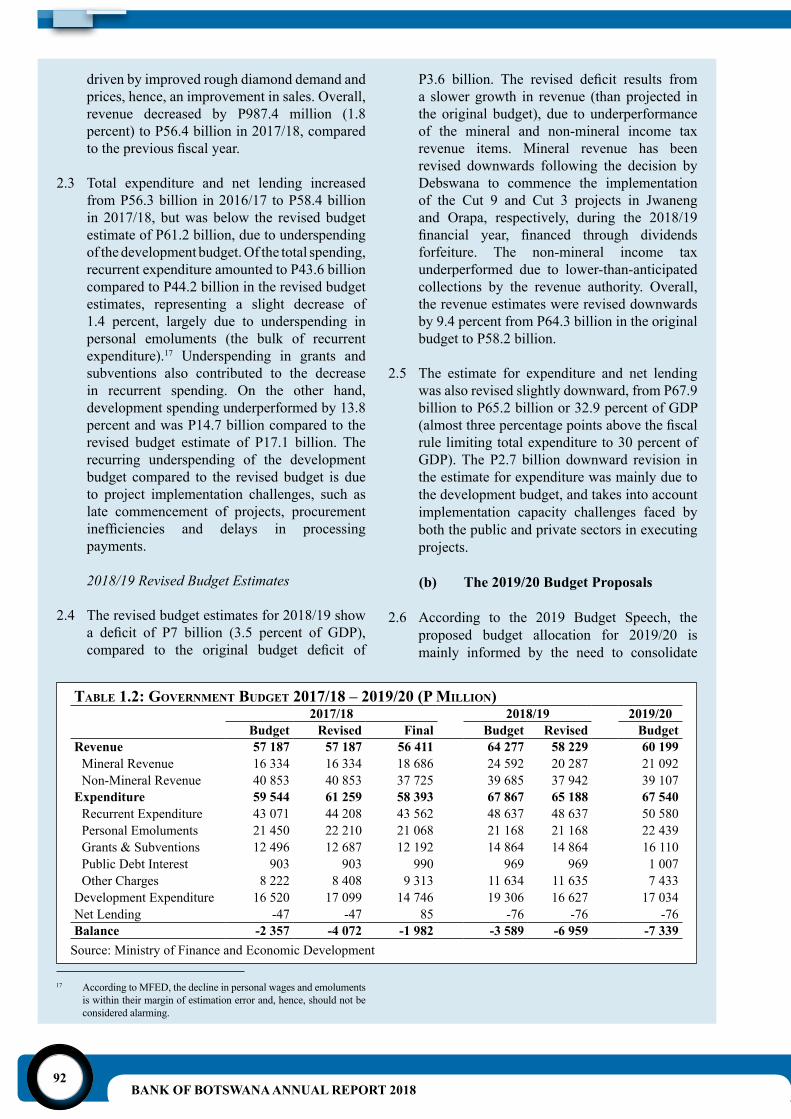
BANK OF BOTSWANA ANNUAL REPORT 201892
Source: Ministry of Finance and Economic Development
driven by improved rough diamond demand and prices, hence, an improvement in sales. Overall, revenue decreased by P987.4 million (1.8 percent) to P56.4 billion in 2017/18, compared tothepreviousfiscalyear.
2.3 Total expenditure and net lending increased from P56.3 billion in 2016/17 to P58.4 billion in 2017/18, but was below the revised budget estimate of P61.2 billion, due to underspending of the development budget. Of the total spending, recurrent expenditure amounted to P43.6 billion compared to P44.2 billion in the revised budget estimates, representing a slight decrease of 1.4 percent, largely due to underspending in personal emoluments (the bulk of recurrent expenditure).17 Underspending in grants and subventions also contributed to the decrease in recurrent spending. On the other hand, development spending underperformed by 13.8 percent and was P14.7 billion compared to the revised budget estimate of P17.1 billion. The recurring underspending of the development budget compared to the revised budget is due to project implementation challenges, such as late commencement of projects, procurement inefficiencies and delays in processingpayments.
2018/19 Revised Budget Estimates
2.4 The revised budget estimates for 2018/19 show a deficit of P7 billion (3.5 percent of GDP),compared to the original budget deficit of
17 According to MFED, the decline in personal wages and emoluments is within their margin of estimation error and, hence, should not be considered alarming.
P3.6 billion. The revised deficit results froma slower growth in revenue (than projected in the original budget), due to underperformance of the mineral and non-mineral income tax revenue items. Mineral revenue has been revised downwards following the decision by Debswana to commence the implementation of the Cut 9 and Cut 3 projects in Jwaneng and Orapa, respectively, during the 2018/19 financial year, financed through dividendsforfeiture. The non-mineral income tax underperformed due to lower-than-anticipated collections by the revenue authority. Overall, the revenue estimates were revised downwards by 9.4 percent from P64.3 billion in the original budget to P58.2 billion.
2.5 The estimate for expenditure and net lending was also revised slightly downward, from P67.9 billion to P65.2 billion or 32.9 percent of GDP (almostthreepercentagepointsabovethefiscalrule limiting total expenditure to 30 percent of GDP). The P2.7 billion downward revision in the estimate for expenditure was mainly due to the development budget, and takes into account implementation capacity challenges faced by both the public and private sectors in executing projects.
(b) The 2019/20 Budget Proposals
2.6 According to the 2019 Budget Speech, the proposed budget allocation for 2019/20 is mainly informed by the need to consolidate
taBle 1.2: governMent BUdget 2017/18 – 2019/20 (P Million)2017/18 2018/19 2019/20
Budget Revised Final Budget Revised BudgetRevenue 57 187 57 187 56 411 64 277 58 229 60 199
Mineral Revenue 16 334 16 334 18 686 24 592 20 287 21 092Non-Mineral Revenue 40 853 40 853 37 725 39 685 37 942 39 107
Expenditure 59 544 61 259 58 393 67 867 65 188 67 540Recurrent Expenditure 43 071 44 208 43 562 48 637 48 637 50 580Personal Emoluments 21 450 22 210 21 068 21 168 21 168 22 439Grants & Subventions 12 496 12 687 12 192 14 864 14 864 16 110Public Debt Interest 903 903 990 969 969 1 007Other Charges 8 222 8 408 9 313 11 634 11 635 7 433
Development Expenditure 16 520 17 099 14 746 19 306 16 627 17 034Net Lending -47 -47 85 -76 -76 -76Balance -2 357 -4 072 -1 982 -3 589 -6 959 -7 339
the BotSwana economy in 2018
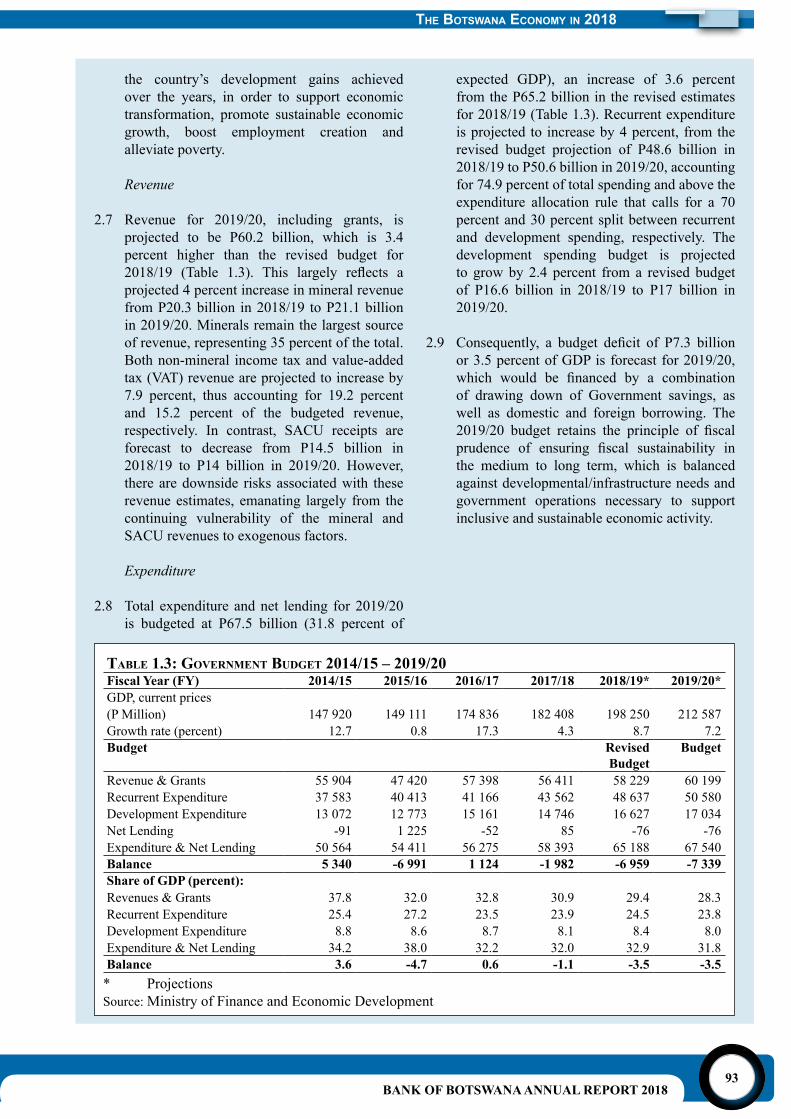
BANK OF BOTSWANA ANNUAL REPORT 201893
the country’s development gains achieved over the years, in order to support economic transformation, promote sustainable economic growth, boost employment creation and alleviate poverty.
Revenue
2.7 Revenue for 2019/20, including grants, is projected to be P60.2 billion, which is 3.4 percent higher than the revised budget for 2018/19 (Table 1.3). This largely reflects aprojected 4 percent increase in mineral revenue from P20.3 billion in 2018/19 to P21.1 billion in 2019/20. Minerals remain the largest source of revenue, representing 35 percent of the total. Both non-mineral income tax and value-added tax (VAT) revenue are projected to increase by 7.9 percent, thus accounting for 19.2 percent and 15.2 percent of the budgeted revenue, respectively. In contrast, SACU receipts are forecast to decrease from P14.5 billion in 2018/19 to P14 billion in 2019/20. However, there are downside risks associated with these revenue estimates, emanating largely from the continuing vulnerability of the mineral and SACU revenues to exogenous factors.
Expenditure
2.8 Total expenditure and net lending for 2019/20 is budgeted at P67.5 billion (31.8 percent of
expected GDP), an increase of 3.6 percent from the P65.2 billion in the revised estimates for 2018/19 (Table 1.3). Recurrent expenditure is projected to increase by 4 percent, from the revised budget projection of P48.6 billion in 2018/19 to P50.6 billion in 2019/20, accounting for 74.9 percent of total spending and above the expenditure allocation rule that calls for a 70 percent and 30 percent split between recurrent and development spending, respectively. The development spending budget is projected to grow by 2.4 percent from a revised budget of P16.6 billion in 2018/19 to P17 billion in 2019/20.
2.9 Consequently, a budget deficit of P7.3 billionor 3.5 percent of GDP is forecast for 2019/20, which would be financed by a combinationof drawing down of Government savings, as well as domestic and foreign borrowing. The 2019/20 budget retains the principle of fiscalprudence of ensuring fiscal sustainability inthe medium to long term, which is balanced against developmental/infrastructure needs and government operations necessary to support inclusive and sustainable economic activity.
* ProjectionsSource: Ministry of Finance and Economic Development
taBle 1.3: governMent BUdget 2014/15 – 2019/20Fiscal Year (FY) 2014/15 2015/16 2016/17 2017/18 2018/19* 2019/20*GDP, current prices (P Million) 147 920 149 111 174 836 182 408 198 250 212 587Growth rate (percent) 12.7 0.8 17.3 4.3 8.7 7.2Budget Revised
BudgetBudget
Revenue & Grants 55 904 47 420 57 398 56 411 58 229 60 199Recurrent Expenditure 37 583 40 413 41 166 43 562 48 637 50 580Development Expenditure 13 072 12 773 15 161 14 746 16 627 17 034Net Lending -91 1 225 -52 85 -76 -76Expenditure & Net Lending 50 564 54 411 56 275 58 393 65 188 67 540Balance 5 340 -6 991 1 124 -1 982 -6 959 -7 339Share of GDP (percent):Revenues & Grants 37.8 32.0 32.8 30.9 29.4 28.3Recurrent Expenditure 25.4 27.2 23.5 23.9 24.5 23.8Development Expenditure 8.8 8.6 8.7 8.1 8.4 8.0Expenditure & Net Lending 34.2 38.0 32.2 32.0 32.9 31.8Balance 3.6 -4.7 0.6 -1.1 -3.5 -3.5
the BotSwana economy in 2018
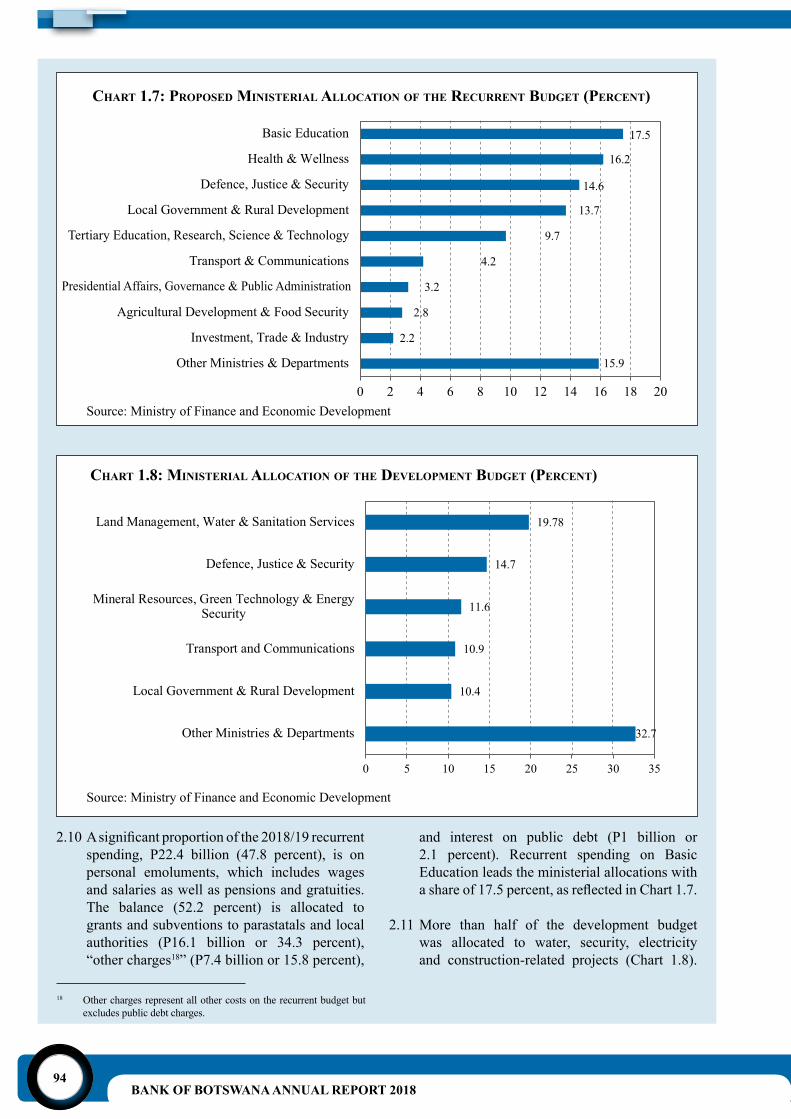
BANK OF BOTSWANA ANNUAL REPORT 201894
18 Other charges represent all other costs on the recurrent budget but excludes public debt charges.
Chart 1.7: ProPosed Ministerial alloCation of the reCUrrent BUdget (PerCent)
Chart 1.8: Ministerial alloCation of the develoPMent BUdget (PerCent)
2.10Asignificantproportionofthe2018/19recurrentspending, P22.4 billion (47.8 percent), is on personal emoluments, which includes wages and salaries as well as pensions and gratuities. The balance (52.2 percent) is allocated to grants and subventions to parastatals and local authorities (P16.1 billion or 34.3 percent), “other charges18” (P7.4 billion or 15.8 percent),
and interest on public debt (P1 billion or 2.1 percent). Recurrent spending on Basic Education leads the ministerial allocations with ashareof17.5percent,asreflectedinChart1.7.
2.11 More than half of the development budget was allocated to water, security, electricity and construction-related projects (Chart 1.8).
the BotSwana economy in 2018
Tertiary Education, Research, Science & Technology
Presidential Affairs, Governance & Public Administration
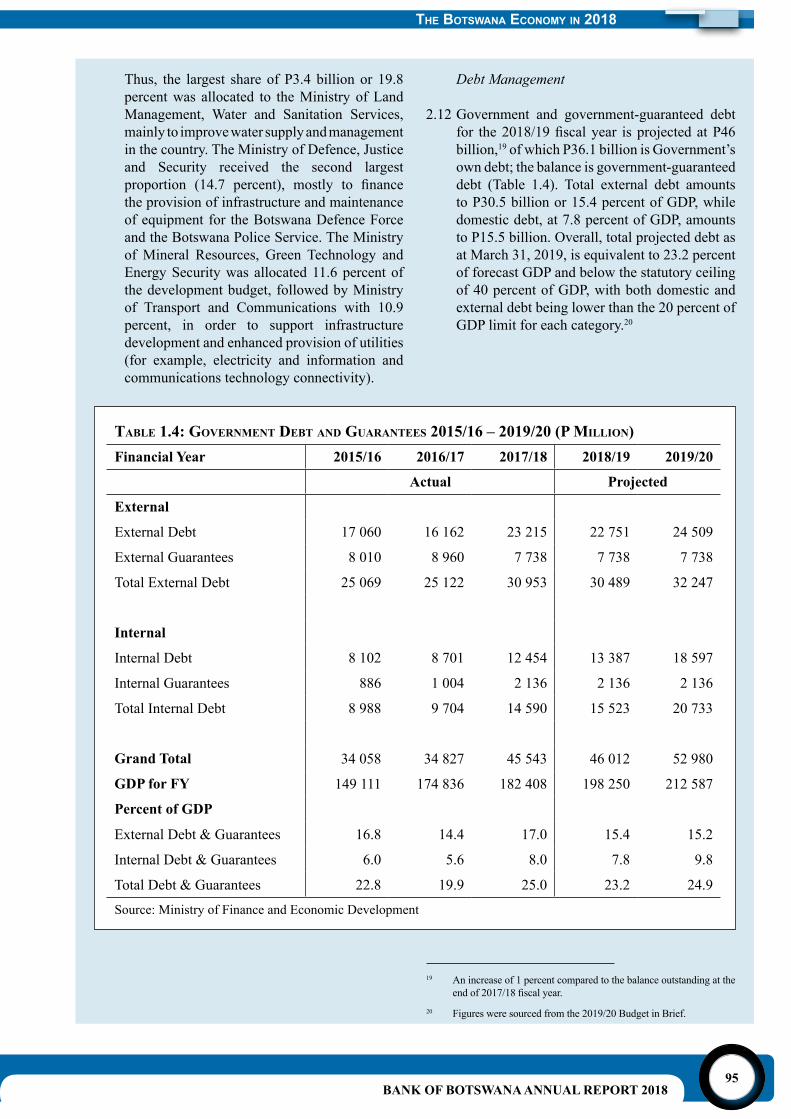
BANK OF BOTSWANA ANNUAL REPORT 201895
19 An increase of 1 percent compared to the balance outstanding at the endof2017/18fiscalyear.
20 Figures were sourced from the 2019/20 Budget in Brief.
Thus, the largest share of P3.4 billion or 19.8 percent was allocated to the Ministry of Land Management, Water and Sanitation Services, mainly to improve water supply and management in the country. The Ministry of Defence, Justice and Security received the second largest proportion (14.7 percent), mostly to financethe provision of infrastructure and maintenance of equipment for the Botswana Defence Force and the Botswana Police Service. The Ministry of Mineral Resources, Green Technology and Energy Security was allocated 11.6 percent of the development budget, followed by Ministry of Transport and Communications with 10.9 percent, in order to support infrastructure development and enhanced provision of utilities (for example, electricity and information and communications technology connectivity).
Debt Management
2.12 Government and government-guaranteed debt for the2018/19fiscalyear isprojectedatP46billion,19 of which P36.1 billion is Government’s own debt; the balance is government-guaranteed debt (Table 1.4). Total external debt amounts to P30.5 billion or 15.4 percent of GDP, while domestic debt, at 7.8 percent of GDP, amounts to P15.5 billion. Overall, total projected debt as at March 31, 2019, is equivalent to 23.2 percent of forecast GDP and below the statutory ceiling of 40 percent of GDP, with both domestic and external debt being lower than the 20 percent of GDP limit for each category.20
taBle 1.4: governMent deBt and gUarantees 2015/16 – 2019/20 (P Million)Financial Year 2015/16 2016/17 2017/18 2018/19 2019/20
Actual Projected
External
External Debt 17 060 16 162 23 215 22 751 24 509
External Guarantees 8 010 8 960 7 738 7 738 7 738
Total External Debt 25 069 25 122 30 953 30 489 32 247
Internal
Internal Debt 8 102 8 701 12 454 13 387 18 597
Internal Guarantees 886 1 004 2 136 2 136 2 136
Total Internal Debt 8 988 9 704 14 590 15 523 20 733
Grand Total 34 058 34 827 45 543 46 012 52 980
GDP for FY 149 111 174 836 182 408 198 250 212 587
Percent of GDP
External Debt & Guarantees 16.8 14.4 17.0 15.4 15.2
Internal Debt & Guarantees 6.0 5.6 8.0 7.8 9.8
Total Debt & Guarantees 22.8 19.9 25.0 23.2 24.9
Source: Ministry of Finance and Economic Development
the BotSwana economy in 2018
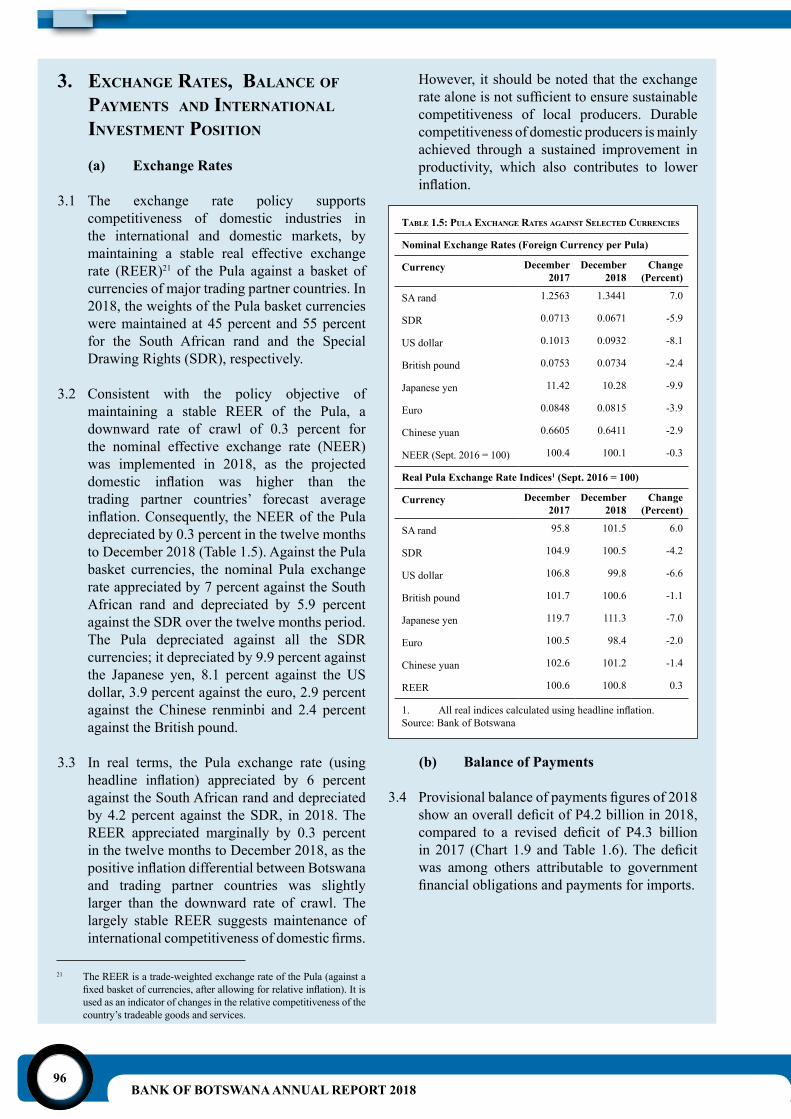
BANK OF BOTSWANA ANNUAL REPORT 201896
3. exChange rates, BalanCe of PayMents and international investMent Position
(a) Exchange Rates
3.1 The exchange rate policy supports competitiveness of domestic industries in the international and domestic markets, by maintaining a stable real effective exchange rate (REER)21 of the Pula against a basket of currencies of major trading partner countries. In 2018, the weights of the Pula basket currencies were maintained at 45 percent and 55 percent for the South African rand and the Special Drawing Rights (SDR), respectively.
3.2 Consistent with the policy objective of maintaining a stable REER of the Pula, a downward rate of crawl of 0.3 percent for the nominal effective exchange rate (NEER) was implemented in 2018, as the projected domestic inflation was higher than thetrading partner countries’ forecast average inflation.Consequently, theNEERof thePuladepreciated by 0.3 percent in the twelve months to December 2018 (Table 1.5). Against the Pula basket currencies, the nominal Pula exchange rate appreciated by 7 percent against the South African rand and depreciated by 5.9 percent against the SDR over the twelve months period. The Pula depreciated against all the SDR currencies; it depreciated by 9.9 percent against the Japanese yen, 8.1 percent against the US dollar, 3.9 percent against the euro, 2.9 percent against the Chinese renminbi and 2.4 percent against the British pound.
3.3 In real terms, the Pula exchange rate (using headline inflation) appreciated by 6 percentagainst the South African rand and depreciated by 4.2 percent against the SDR, in 2018. The REER appreciated marginally by 0.3 percent in the twelve months to December 2018, as the positiveinflationdifferentialbetweenBotswanaand trading partner countries was slightly larger than the downward rate of crawl. The largely stable REER suggests maintenance of internationalcompetitivenessofdomesticfirms.
However, it should be noted that the exchange ratealoneisnotsufficienttoensuresustainablecompetitiveness of local producers. Durable competitiveness of domestic producers is mainly achieved through a sustained improvement in productivity, which also contributes to lower inflation.
21 The REER is a trade-weighted exchange rate of the Pula (against a fixedbasketofcurrencies,afterallowingforrelativeinflation).Itisused as an indicator of changes in the relative competitiveness of the country’s tradeable goods and services.
taBle 1.5: PUla exChange rates against seleCted CUrrenCies
Nominal Exchange Rates (Foreign Currency per Pula)
Currency December 2017
December 2018
Change (Percent)
SA rand 1.2563 1.3441 7.0
SDR 0.0713 0.0671 -5.9
US dollar 0.1013 0.0932 -8.1
British pound 0.0753 0.0734 -2.4
Japanese yen 11.42 10.28 -9.9
Euro 0.0848 0.0815 -3.9
Chinese yuan 0.6605 0.6411 -2.9
NEER (Sept. 2016 = 100) 100.4 100.1 -0.3
Real Pula Exchange Rate Indices1 (Sept. 2016 = 100)
Currency December 2017
December 2018
Change (Percent)
SA rand 95.8 101.5 6.0
SDR 104.9 100.5 -4.2
US dollar 106.8 99.8 -6.6
British pound 101.7 100.6 -1.1
Japanese yen 119.7 111.3 -7.0
Euro 100.5 98.4 -2.0
Chinese yuan 102.6 101.2 -1.4
REER 100.6 100.8 0.3
1.Allrealindicescalculatedusingheadlineinflation.Source: Bank of Botswana
(b) Balance of Payments
3.4 Provisionalbalanceofpaymentsfiguresof2018showanoveralldeficitofP4.2billionin2018,compared to a revised deficit of P4.3 billionin2017 (Chart 1.9 andTable1.6).Thedeficitwas among others attributable to government financialobligationsandpaymentsforimports.
the BotSwana economy in 2018
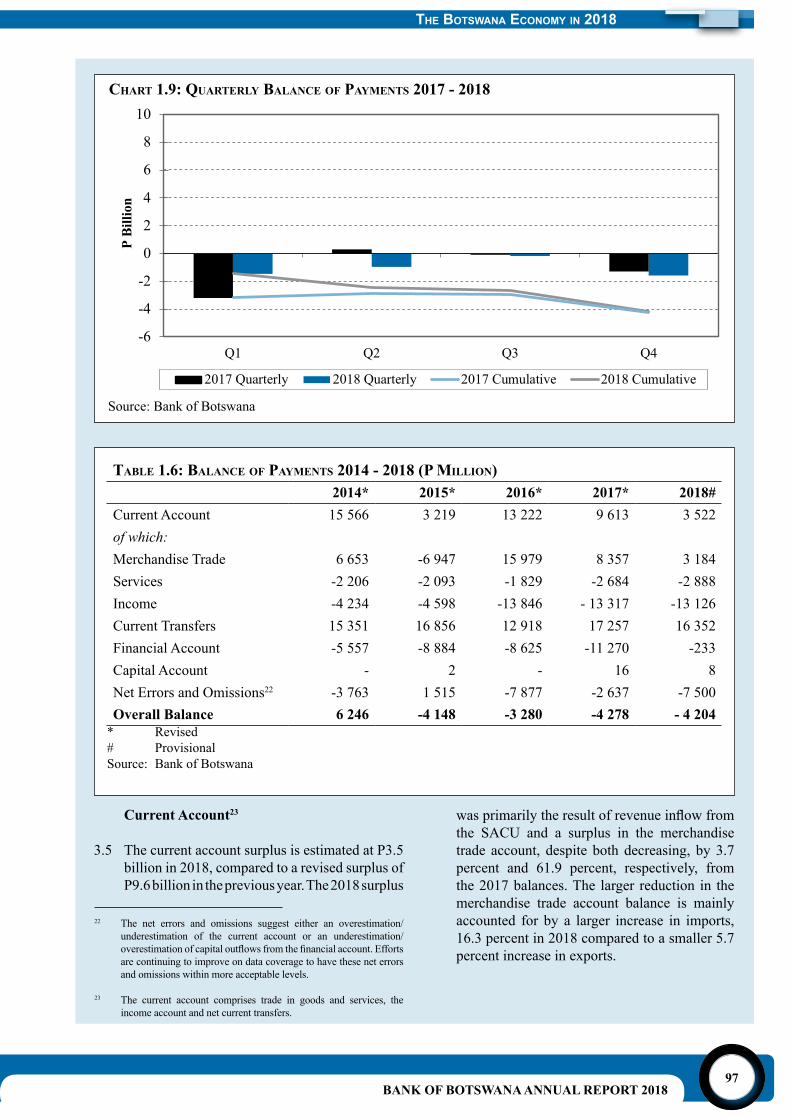
BANK OF BOTSWANA ANNUAL REPORT 201897
22 The net errors and omissions suggest either an overestimation/underestimation of the current account or an underestimation/overestimationofcapitaloutflowsfromthefinancialaccount.Effortsare continuing to improve on data coverage to have these net errors and omissions within more acceptable levels.
23 The current account comprises trade in goods and services, the income account and net current transfers.
Chart 1.9: qUarterly BalanCe of PayMents 2017 - 2018
taBle 1.6: BalanCe of PayMents 2014 - 2018 (P Million)2014* 2015* 2016* 2017* 2018#
Current Account 15 566 3 219 13 222 9 613 3 522of which:Merchandise Trade 6 653 -6 947 15 979 8 357 3 184Services -2 206 -2 093 -1 829 -2 684 -2 888Income -4 234 -4 598 -13 846 - 13 317 -13 126Current Transfers 15 351 16 856 12 918 17 257 16 352Financial Account -5 557 -8 884 -8 625 -11 270 -233Capital Account - 2 - 16 8Net Errors and Omissions22 -3 763 1 515 -7 877 -2 637 -7 500Overall Balance 6 246 -4 148 -3 280 -4 278 - 4 204
* Revised# ProvisionalSource: Bank of Botswana
Current Account23
3.5 The current account surplus is estimated at P3.5 billion in 2018, compared to a revised surplus of P9.6 billion in the previous year. The 2018 surplus
wasprimarilytheresultofrevenueinflowfromthe SACU and a surplus in the merchandise trade account, despite both decreasing, by 3.7 percent and 61.9 percent, respectively, from the 2017 balances. The larger reduction in the merchandise trade account balance is mainly accounted for by a larger increase in imports, 16.3 percent in 2018 compared to a smaller 5.7 percent increase in exports.
the BotSwana economy in 2018
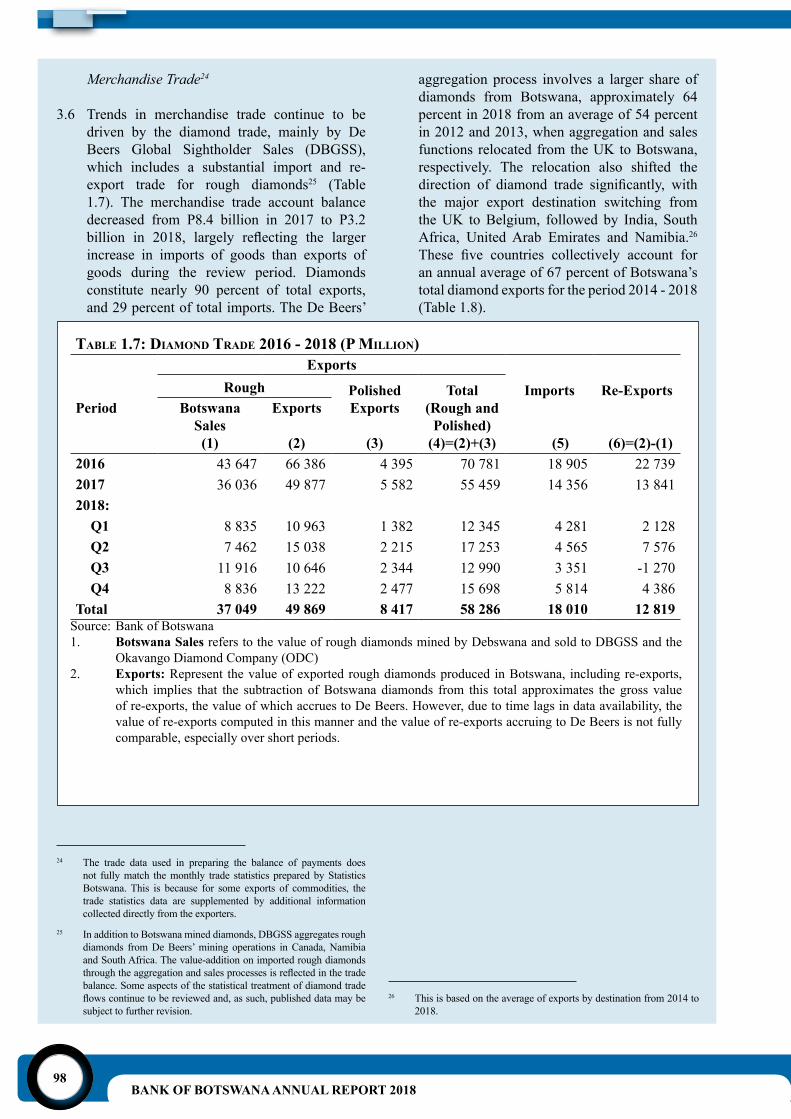
BANK OF BOTSWANA ANNUAL REPORT 201898
Merchandise Trade24
3.6 Trends in merchandise trade continue to be driven by the diamond trade, mainly by De Beers Global Sightholder Sales (DBGSS), which includes a substantial import and re-export trade for rough diamonds25 (Table 1.7). The merchandise trade account balance decreased from P8.4 billion in 2017 to P3.2 billion in 2018, largely reflecting the largerincrease in imports of goods than exports of goods during the review period. Diamonds constitute nearly 90 percent of total exports, and 29 percent of total imports. The De Beers’
24 The trade data used in preparing the balance of payments does not fully match the monthly trade statistics prepared by Statistics Botswana. This is because for some exports of commodities, the trade statistics data are supplemented by additional information collected directly from the exporters.
25 In addition to Botswana mined diamonds, DBGSS aggregates rough diamonds from De Beers’ mining operations in Canada, Namibia and South Africa. The value-addition on imported rough diamonds throughtheaggregationandsalesprocessesisreflectedinthetradebalance. Some aspects of the statistical treatment of diamond trade flowscontinuetobereviewedand,assuch,publisheddatamaybesubject to further revision.
taBle 1.7: diaMond trade 2016 - 2018 (P Million) Exports
Rough Polished Exports
(3)
Total (Rough and
Polished) (4)=(2)+(3)
Imports
(5)
Re-Exports
(6)=(2)-(1)
Period Botswana Sales(1)
Exports
(2)2016 43 647 66 386 4 395 70 781 18 905 22 7392017 36 036 49 877 5 582 55 459 14 356 13 8412018:
Q1 8 835 10 963 1 382 12 345 4 281 2 128Q2 7 462 15 038 2 215 17 253 4 565 7 576Q3 11 916 10 646 2 344 12 990 3 351 -1 270Q4 8 836 13 222 2 477 15 698 5 814 4 386
Total 37 049 49 869 8 417 58 286 18 010 12 819Source: Bank of Botswana1. Botswana Sales refers to the value of rough diamonds mined by Debswana and sold to DBGSS and the
Okavango Diamond Company (ODC)2. Exports: Represent the value of exported rough diamonds produced in Botswana, including re-exports,
which implies that the subtraction of Botswana diamonds from this total approximates the gross value of re-exports, the value of which accrues to De Beers. However, due to time lags in data availability, the value of re-exports computed in this manner and the value of re-exports accruing to De Beers is not fully comparable, especially over short periods.
aggregation process involves a larger share of diamonds from Botswana, approximately 64 percent in 2018 from an average of 54 percent in 2012 and 2013, when aggregation and sales functions relocated from the UK to Botswana, respectively. The relocation also shifted the direction of diamond trade significantly, withthe major export destination switching from the UK to Belgium, followed by India, South Africa, United Arab Emirates and Namibia.26
These five countries collectively account foran annual average of 67 percent of Botswana’s total diamond exports for the period 2014 - 2018 (Table 1.8).
26 This is based on the average of exports by destination from 2014 to 2018.
the BotSwana economy in 2018
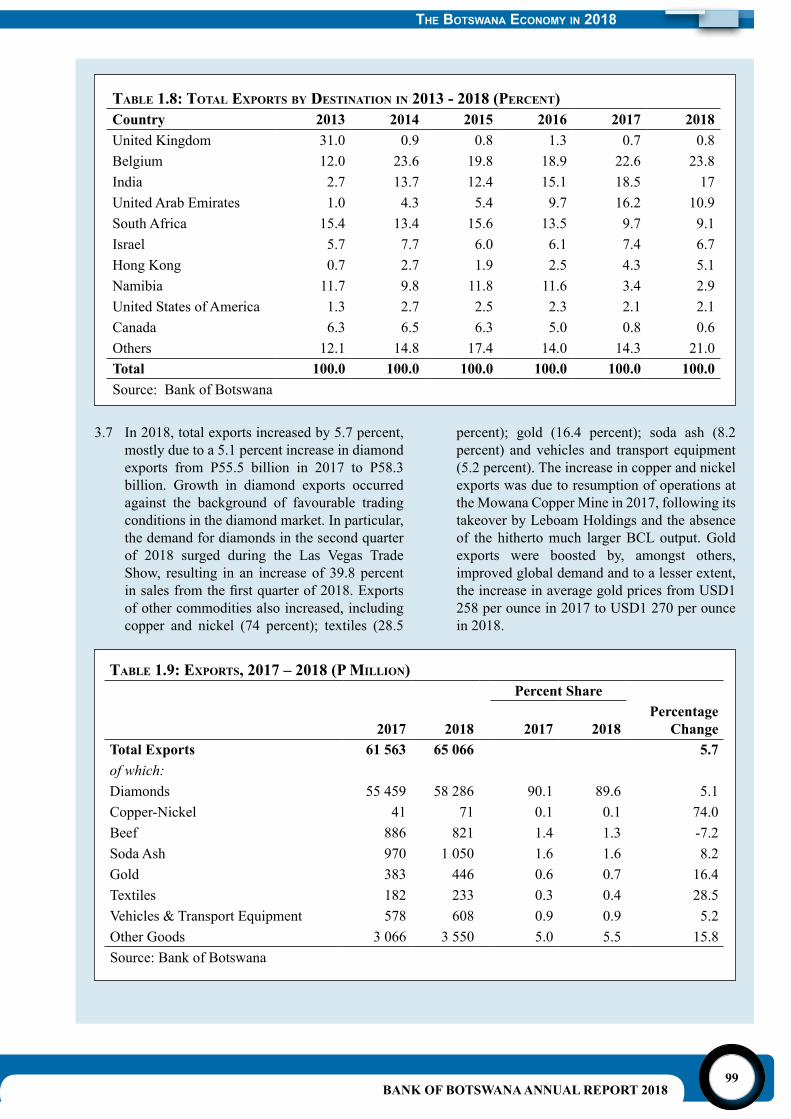
BANK OF BOTSWANA ANNUAL REPORT 201899
taBle 1.8: total exPorts By destination in 2013 - 2018 (PerCent) Country 2013 2014 2015 2016 2017 2018United Kingdom 31.0 0.9 0.8 1.3 0.7 0.8Belgium 12.0 23.6 19.8 18.9 22.6 23.8India 2.7 13.7 12.4 15.1 18.5 17United Arab Emirates 1.0 4.3 5.4 9.7 16.2 10.9South Africa 15.4 13.4 15.6 13.5 9.7 9.1Israel 5.7 7.7 6.0 6.1 7.4 6.7Hong Kong 0.7 2.7 1.9 2.5 4.3 5.1Namibia 11.7 9.8 11.8 11.6 3.4 2.9United States of America 1.3 2.7 2.5 2.3 2.1 2.1Canada 6.3 6.5 6.3 5.0 0.8 0.6Others 12.1 14.8 17.4 14.0 14.3 21.0Total 100.0 100.0 100.0 100.0 100.0 100.0Source: Bank of Botswana
3.7 In 2018, total exports increased by 5.7 percent, mostly due to a 5.1 percent increase in diamond exports from P55.5 billion in 2017 to P58.3 billion. Growth in diamond exports occurred against the background of favourable trading conditions in the diamond market. In particular, the demand for diamonds in the second quarter of 2018 surged during the Las Vegas Trade Show, resulting in an increase of 39.8 percent insalesfromthefirstquarterof2018.Exportsof other commodities also increased, including copper and nickel (74 percent); textiles (28.5
percent); gold (16.4 percent); soda ash (8.2 percent) and vehicles and transport equipment (5.2 percent). The increase in copper and nickel exports was due to resumption of operations at the Mowana Copper Mine in 2017, following its takeover by Leboam Holdings and the absence of the hitherto much larger BCL output. Gold exports were boosted by, amongst others, improved global demand and to a lesser extent, the increase in average gold prices from USD1 258 per ounce in 2017 to USD1 270 per ounce in 2018.
taBle 1.9: exPorts, 2017 – 2018 (P Million) Percent Share
2017 2018 2017 2018Percentage
ChangeTotal Exports 61 563 65 066 5.7of which:Diamonds 55 459 58 286 90.1 89.6 5.1Copper-Nickel 41 71 0.1 0.1 74.0Beef 886 821 1.4 1.3 -7.2Soda Ash 970 1 050 1.6 1.6 8.2Gold 383 446 0.6 0.7 16.4Textiles 182 233 0.3 0.4 28.5Vehicles & Transport Equipment 578 608 0.9 0.9 5.2Other Goods 3 066 3 550 5.0 5.5 15.8Source: Bank of Botswana
the BotSwana economy in 2018
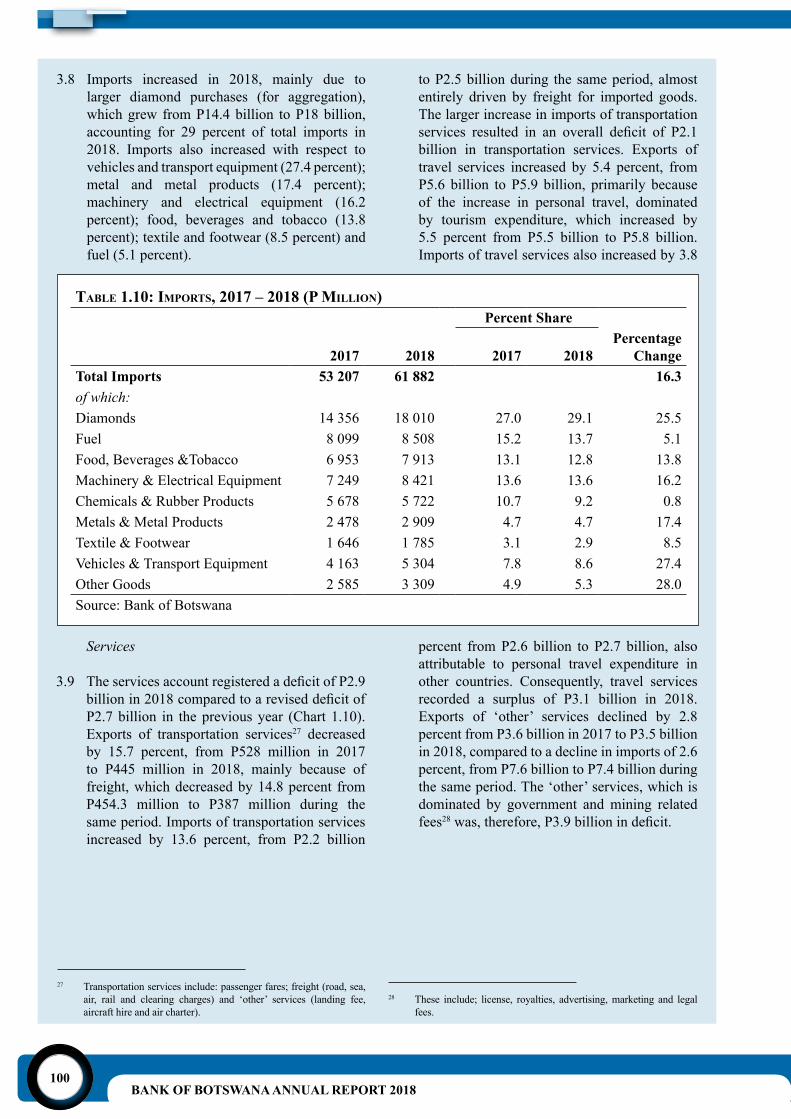
BANK OF BOTSWANA ANNUAL REPORT 2018100
3.8 Imports increased in 2018, mainly due to larger diamond purchases (for aggregation), which grew from P14.4 billion to P18 billion, accounting for 29 percent of total imports in 2018. Imports also increased with respect to vehicles and transport equipment (27.4 percent); metal and metal products (17.4 percent); machinery and electrical equipment (16.2 percent); food, beverages and tobacco (13.8 percent); textile and footwear (8.5 percent) and fuel (5.1 percent).
taBle 1.10: iMPorts, 2017 – 2018 (P Million) Percent Share
2017 2018 2017 2018Percentage
ChangeTotal Imports 53 207 61 882 16.3of which:Diamonds 14 356 18 010 27.0 29.1 25.5Fuel 8 099 8 508 15.2 13.7 5.1Food, Beverages &Tobacco 6 953 7 913 13.1 12.8 13.8Machinery & Electrical Equipment 7 249 8 421 13.6 13.6 16.2Chemicals & Rubber Products 5 678 5 722 10.7 9.2 0.8Metals & Metal Products 2 478 2 909 4.7 4.7 17.4Textile & Footwear 1 646 1 785 3.1 2.9 8.5Vehicles & Transport Equipment 4 163 5 304 7.8 8.6 27.4Other Goods 2 585 3 309 4.9 5.3 28.0Source: Bank of Botswana
Services
3.9 TheservicesaccountregisteredadeficitofP2.9billionin2018comparedtoareviseddeficitofP2.7 billion in the previous year (Chart 1.10). Exports of transportation services27 decreased by 15.7 percent, from P528 million in 2017 to P445 million in 2018, mainly because of freight, which decreased by 14.8 percent from P454.3 million to P387 million during the same period. Imports of transportation services increased by 13.6 percent, from P2.2 billion
to P2.5 billion during the same period, almost entirely driven by freight for imported goods. The larger increase in imports of transportation services resulted in an overall deficit of P2.1billion in transportation services. Exports of travel services increased by 5.4 percent, from P5.6 billion to P5.9 billion, primarily because of the increase in personal travel, dominated by tourism expenditure, which increased by 5.5 percent from P5.5 billion to P5.8 billion. Imports of travel services also increased by 3.8
percent from P2.6 billion to P2.7 billion, also attributable to personal travel expenditure in other countries. Consequently, travel services recorded a surplus of P3.1 billion in 2018. Exports of ‘other’ services declined by 2.8 percent from P3.6 billion in 2017 to P3.5 billion in 2018, compared to a decline in imports of 2.6 percent, from P7.6 billion to P7.4 billion during the same period. The ‘other’ services, which is dominated by government and mining related fees28was,therefore,P3.9billionindeficit.
27 Transportation services include: passenger fares; freight (road, sea, air, rail and clearing charges) and ‘other’ services (landing fee, aircraft hire and air charter).
28 These include; license, royalties, advertising, marketing and legal fees.
the BotSwana economy in 2018
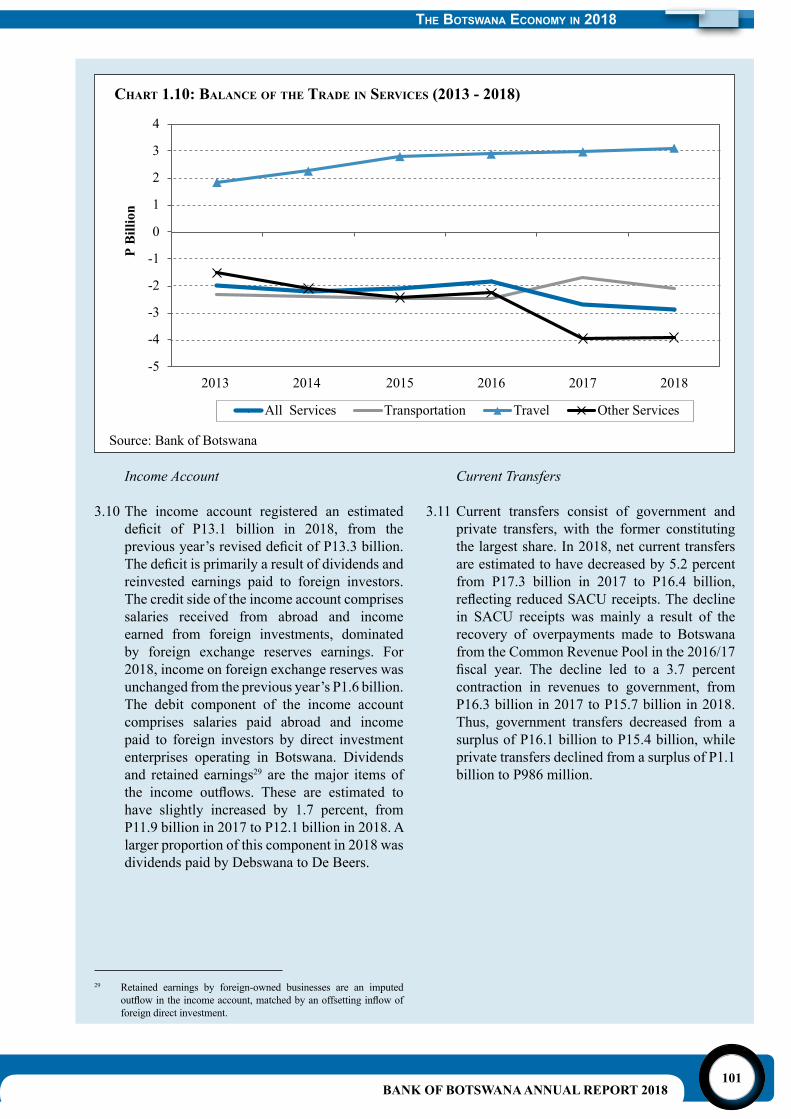
BANK OF BOTSWANA ANNUAL REPORT 2018101
Income Account
3.10 The income account registered an estimated deficit of P13.1 billion in 2018, from thepreviousyear’sreviseddeficitofP13.3billion.Thedeficitisprimarilyaresultofdividendsandreinvested earnings paid to foreign investors. The credit side of the income account comprises salaries received from abroad and income earned from foreign investments, dominated by foreign exchange reserves earnings. For 2018, income on foreign exchange reserves was unchanged from the previous year’s P1.6 billion. The debit component of the income account comprises salaries paid abroad and income paid to foreign investors by direct investment enterprises operating in Botswana. Dividends and retained earnings29 are the major items of the income outflows. These are estimated tohave slightly increased by 1.7 percent, from P11.9 billion in 2017 to P12.1 billion in 2018. A larger proportion of this component in 2018 was dividends paid by Debswana to De Beers.
Current Transfers
3.11 Current transfers consist of government and private transfers, with the former constituting the largest share. In 2018, net current transfers are estimated to have decreased by 5.2 percent from P17.3 billion in 2017 to P16.4 billion, reflectingreducedSACUreceipts.Thedeclinein SACU receipts was mainly a result of the recovery of overpayments made to Botswana from the Common Revenue Pool in the 2016/17 fiscal year. The decline led to a 3.7 percentcontraction in revenues to government, from P16.3 billion in 2017 to P15.7 billion in 2018. Thus, government transfers decreased from a surplus of P16.1 billion to P15.4 billion, while private transfers declined from a surplus of P1.1 billion to P986 million.
29 Retained earnings by foreign-owned businesses are an imputed outflowintheincomeaccount,matchedbyanoffsettinginflowofforeign direct investment.
the BotSwana economy in 2018
Chart 1.10: BalanCe of the trade in serviCes (2013 - 2018)
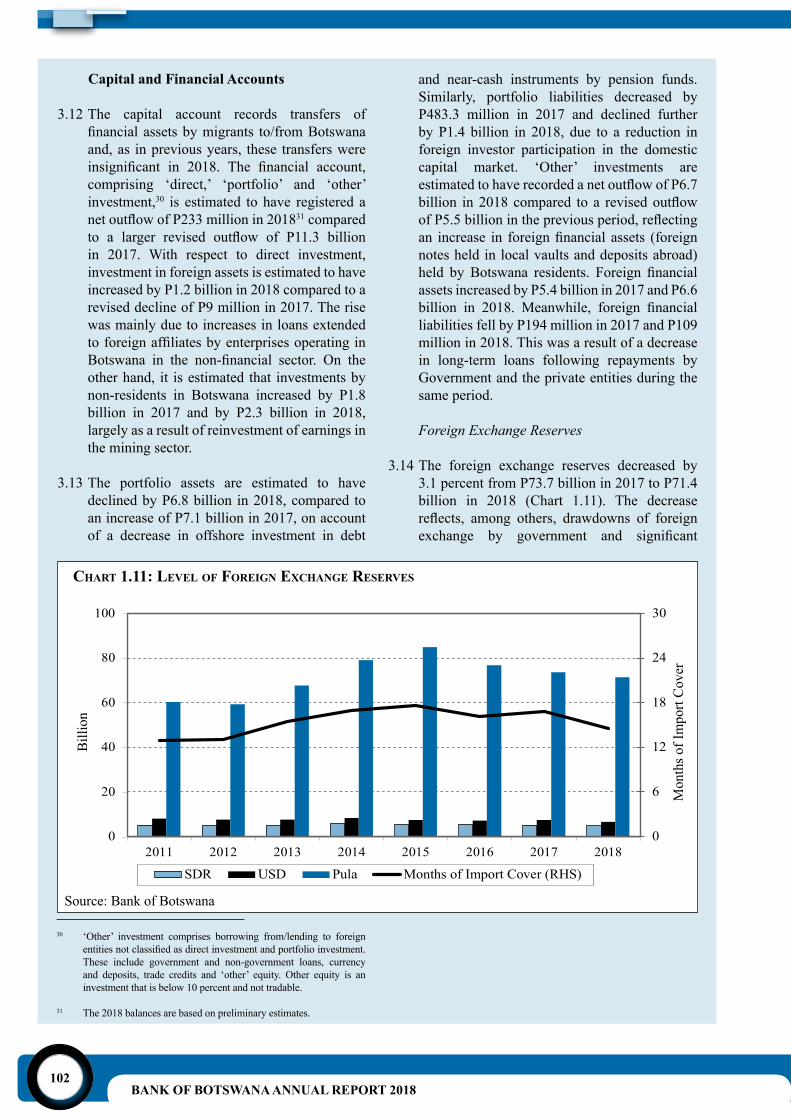
BANK OF BOTSWANA ANNUAL REPORT 2018102
Capital and Financial Accounts
3.12 The capital account records transfers of financialassetsbymigrants to/fromBotswanaand, as in previous years, these transfers were insignificant in 2018. The financial account,comprising ‘direct,’ ‘portfolio’ and ‘other’ investment,30 is estimated to have registered a netoutflowofP233millionin201831 compared to a larger revised outflow of P11.3 billionin 2017. With respect to direct investment, investment in foreign assets is estimated to have increased by P1.2 billion in 2018 compared to a revised decline of P9 million in 2017. The rise was mainly due to increases in loans extended toforeignaffiliatesbyenterprisesoperatinginBotswana in the non-financial sector. On theother hand, it is estimated that investments by non-residents in Botswana increased by P1.8 billion in 2017 and by P2.3 billion in 2018, largely as a result of reinvestment of earnings in the mining sector.
3.13 The portfolio assets are estimated to have declined by P6.8 billion in 2018, compared to an increase of P7.1 billion in 2017, on account of a decrease in offshore investment in debt
and near-cash instruments by pension funds. Similarly, portfolio liabilities decreased by P483.3 million in 2017 and declined further by P1.4 billion in 2018, due to a reduction in foreign investor participation in the domestic capital market. ‘Other’ investments are estimatedtohaverecordedanetoutflowofP6.7billion in2018compared to a revisedoutflowofP5.5billioninthepreviousperiod,reflectingan increase in foreignfinancial assets (foreignnotes held in local vaults and deposits abroad) held by Botswana residents. Foreign financialassets increased by P5.4 billion in 2017 and P6.6 billion in 2018. Meanwhile, foreign financialliabilities fell by P194 million in 2017 and P109 million in 2018. This was a result of a decrease in long-term loans following repayments by Government and the private entities during the same period.
Foreign Exchange Reserves
3.14 The foreign exchange reserves decreased by 3.1 percent from P73.7 billion in 2017 to P71.4 billion in 2018 (Chart 1.11). The decrease reflects, among others, drawdowns of foreignexchange by government and significant
30 ‘Other’ investment comprises borrowing from/lending to foreign entitiesnotclassifiedasdirectinvestmentandportfolioinvestment.These include government and non-government loans, currency and deposits, trade credits and ‘other’ equity. Other equity is an investment that is below 10 percent and not tradable.
31 The 2018 balances are based on preliminary estimates.
the BotSwana economy in 2018
Chart 1.11: level of foreign exChange reserves
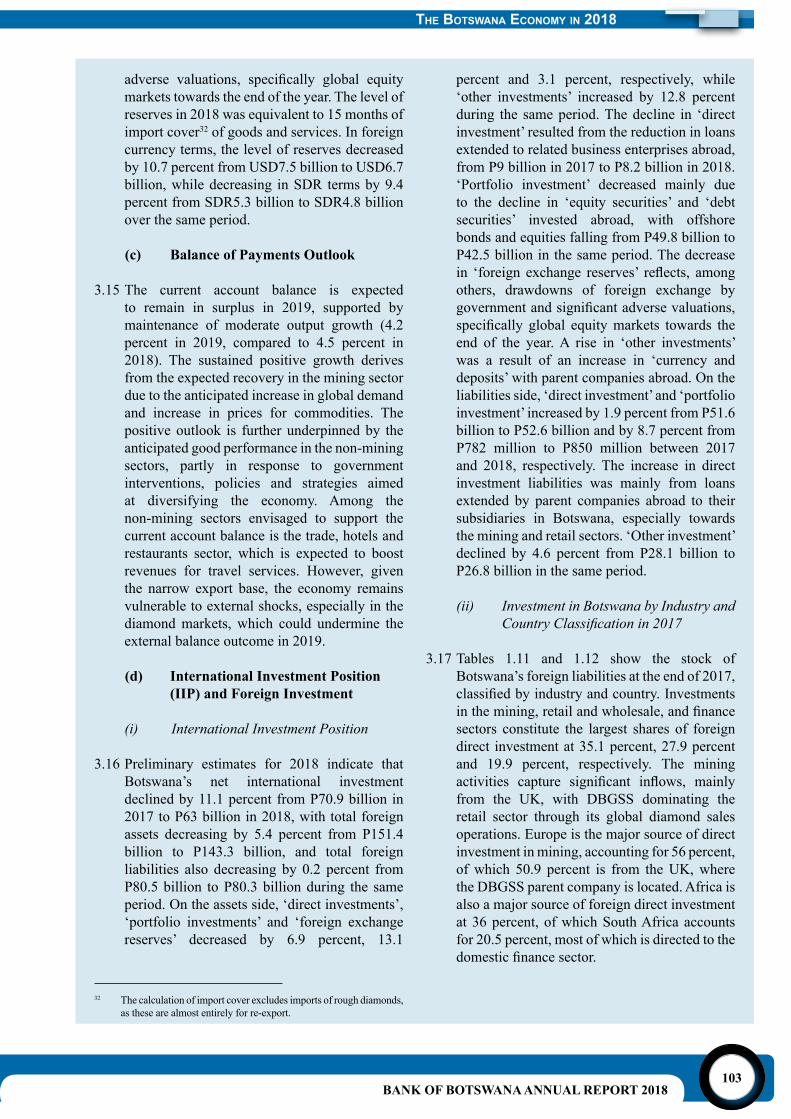
BANK OF BOTSWANA ANNUAL REPORT 2018103
32 The calculation of import cover excludes imports of rough diamonds, as these are almost entirely for re-export.
adverse valuations, specifically global equitymarkets towards the end of the year. The level of reserves in 2018 was equivalent to 15 months of import cover32 of goods and services. In foreign currency terms, the level of reserves decreased by 10.7 percent from USD7.5 billion to USD6.7 billion, while decreasing in SDR terms by 9.4 percent from SDR5.3 billion to SDR4.8 billion over the same period.
(c) Balance of Payments Outlook
3.15 The current account balance is expected to remain in surplus in 2019, supported by maintenance of moderate output growth (4.2 percent in 2019, compared to 4.5 percent in 2018). The sustained positive growth derives from the expected recovery in the mining sector due to the anticipated increase in global demand and increase in prices for commodities. The positive outlook is further underpinned by the anticipated good performance in the non-mining sectors, partly in response to government interventions, policies and strategies aimed at diversifying the economy. Among the non-mining sectors envisaged to support the current account balance is the trade, hotels and restaurants sector, which is expected to boost revenues for travel services. However, given the narrow export base, the economy remains vulnerable to external shocks, especially in the diamond markets, which could undermine the external balance outcome in 2019.
(d) International Investment Position (IIP) and Foreign Investment
(i) International Investment Position
3.16 Preliminary estimates for 2018 indicate that Botswana’s net international investment declined by 11.1 percent from P70.9 billion in 2017 to P63 billion in 2018, with total foreign assets decreasing by 5.4 percent from P151.4 billion to P143.3 billion, and total foreign liabilities also decreasing by 0.2 percent from P80.5 billion to P80.3 billion during the same period. On the assets side, ‘direct investments’, ‘portfolio investments’ and ‘foreign exchange reserves’ decreased by 6.9 percent, 13.1
percent and 3.1 percent, respectively, while ‘other investments’ increased by 12.8 percent during the same period. The decline in ‘direct investment’ resulted from the reduction in loans extended to related business enterprises abroad, from P9 billion in 2017 to P8.2 billion in 2018. ‘Portfolio investment’ decreased mainly due to the decline in ‘equity securities’ and ‘debt securities’ invested abroad, with offshore bonds and equities falling from P49.8 billion to P42.5 billion in the same period. The decrease in ‘foreign exchange reserves’ reflects, amongothers, drawdowns of foreign exchange by governmentandsignificantadversevaluations,specifically global equitymarkets towards theend of the year. A rise in ‘other investments’ was a result of an increase in ‘currency and deposits’ with parent companies abroad. On the liabilities side, ‘direct investment’ and ‘portfolio investment’ increased by 1.9 percent from P51.6 billion to P52.6 billion and by 8.7 percent from P782 million to P850 million between 2017 and 2018, respectively. The increase in direct investment liabilities was mainly from loans extended by parent companies abroad to their subsidiaries in Botswana, especially towards the mining and retail sectors. ‘Other investment’ declined by 4.6 percent from P28.1 billion to P26.8 billion in the same period.
(ii) Investment in Botswana by Industry and Country Classification in 2017
3.17 Tables 1.11 and 1.12 show the stock of Botswana’s foreign liabilities at the end of 2017, classifiedbyindustryandcountry.Investmentsinthemining,retailandwholesale,andfinancesectors constitute the largest shares of foreign direct investment at 35.1 percent, 27.9 percent and 19.9 percent, respectively. The mining activities capture significant inflows, mainlyfrom the UK, with DBGSS dominating the retail sector through its global diamond sales operations. Europe is the major source of direct investment in mining, accounting for 56 percent, of which 50.9 percent is from the UK, where the DBGSS parent company is located. Africa is also a major source of foreign direct investment at 36 percent, of which South Africa accounts for 20.5 percent, most of which is directed to the domesticfinancesector.
the BotSwana economy in 2018
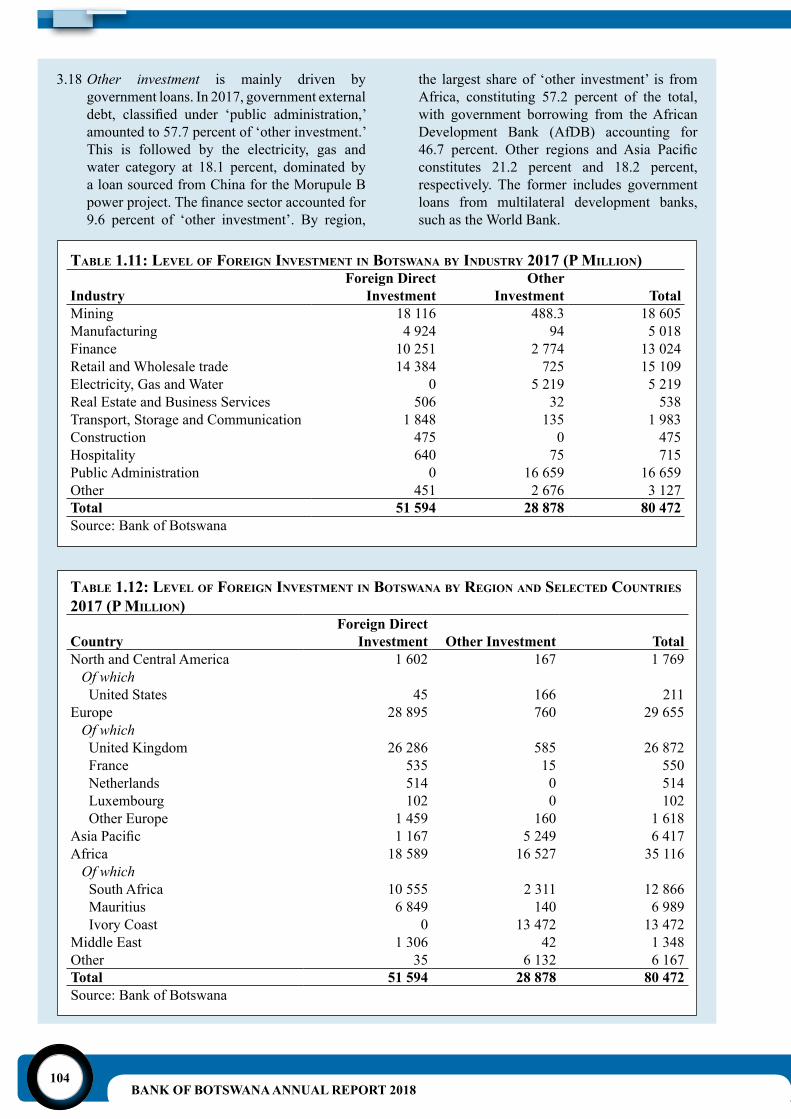
BANK OF BOTSWANA ANNUAL REPORT 2018104
3.18 Other investment is mainly driven by government loans. In 2017, government external debt, classified under ‘public administration,’amounted to 57.7 percent of ‘other investment.’ This is followed by the electricity, gas and water category at 18.1 percent, dominated by a loan sourced from China for the Morupule B powerproject.Thefinancesectoraccountedfor9.6 percent of ‘other investment’. By region,
taBle 1.11: level of foreign investMent in Botswana By indUstry 2017 (P Million)
Industry Foreign Direct
Investment Other Investment Total
Mining 18 116 488.3 18 605Manufacturing 4 924 94 5 018Finance 10 251 2 774 13 024Retail and Wholesale trade 14 384 725 15 109Electricity, Gas and Water 0 5 219 5 219Real Estate and Business Services 506 32 538Transport, Storage and Communication 1 848 135 1 983Construction 475 0 475Hospitality 640 75 715Public Administration 0 16 659 16 659Other 451 2 676 3 127Total 51 594 28 878 80 472Source: Bank of Botswana
the largest share of ‘other investment’ is from Africa, constituting 57.2 percent of the total, with government borrowing from the African Development Bank (AfDB) accounting for 46.7 percent. Other regions and Asia Pacificconstitutes 21.2 percent and 18.2 percent, respectively. The former includes government loans from multilateral development banks, such as the World Bank.
taBle 1.12: level of foreign investMent in Botswana By region and seleCted CoUntries 2017 (P Million)
CountryForeign Direct
Investment Other Investment TotalNorth and Central America 1 602 167 1 769 Of which United States 45 166 211Europe 28 895 760 29 655 Of which United Kingdom 26 286 585 26 872 France 535 15 550 Netherlands 514 0 514 Luxembourg 102 0 102 Other Europe 1 459 160 1 618AsiaPacific 1 167 5 249 6 417Africa 18 589 16 527 35 116 Of which South Africa 10 555 2 311 12 866 Mauritius 6 849 140 6 989 Ivory Coast 0 13 472 13 472Middle East 1 306 42 1 348Other 35 6 132 6 167Total 51 594 28 878 80 472Source: Bank of Botswana
the BotSwana economy in 2018
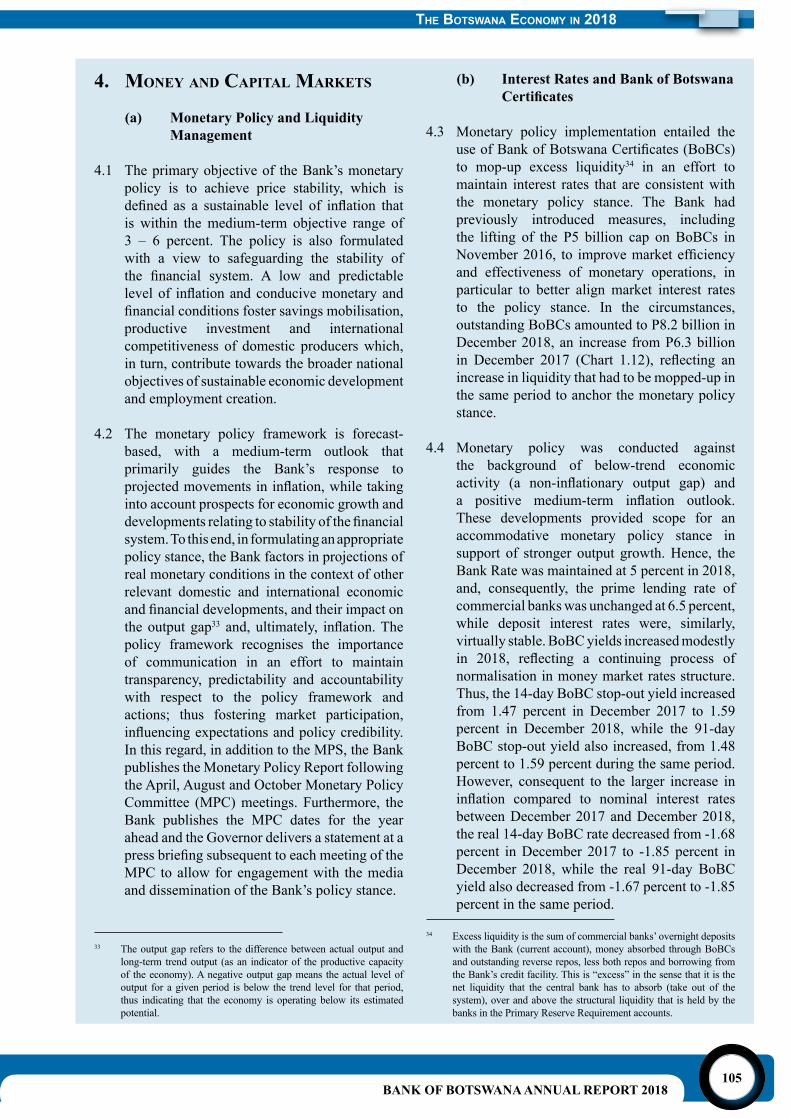
BANK OF BOTSWANA ANNUAL REPORT 2018105
4. Money and CaPital Markets
(a) Monetary Policy and Liquidity Management
4.1 The primary objective of the Bank’s monetary policy is to achieve price stability, which is defined as a sustainable level of inflation thatis within the medium-term objective range of 3 – 6 percent. The policy is also formulated with a view to safeguarding the stability of the financial system. A low and predictablelevelof inflationandconducivemonetaryandfinancialconditionsfostersavingsmobilisation,productive investment and international competitiveness of domestic producers which, in turn, contribute towards the broader national objectives of sustainable economic development and employment creation.
4.2 The monetary policy framework is forecast-based, with a medium-term outlook that primarily guides the Bank’s response to projectedmovementsininflation,whiletakinginto account prospects for economic growth and developmentsrelatingtostabilityofthefinancialsystem. To this end, in formulating an appropriate policy stance, the Bank factors in projections of real monetary conditions in the context of other relevant domestic and international economic andfinancialdevelopments,andtheirimpactonthe output gap33 and,ultimately, inflation.Thepolicy framework recognises the importance of communication in an effort to maintain transparency, predictability and accountability with respect to the policy framework and actions; thus fostering market participation, influencingexpectationsandpolicycredibility.In this regard, in addition to the MPS, the Bank publishes the Monetary Policy Report following the April, August and October Monetary Policy Committee (MPC) meetings. Furthermore, the Bank publishes the MPC dates for the year ahead and the Governor delivers a statement at a pressbriefingsubsequenttoeachmeetingoftheMPC to allow for engagement with the media and dissemination of the Bank’s policy stance.
(b) Interest Rates and Bank of Botswana Certificates
4.3 Monetary policy implementation entailed the useofBankofBotswanaCertificates(BoBCs)to mop-up excess liquidity34 in an effort to maintain interest rates that are consistent with the monetary policy stance. The Bank had previously introduced measures, including the lifting of the P5 billion cap on BoBCs in November2016, to improvemarketefficiencyand effectiveness of monetary operations, in particular to better align market interest rates to the policy stance. In the circumstances, outstanding BoBCs amounted to P8.2 billion in December 2018, an increase from P6.3 billion in December 2017 (Chart 1.12), reflecting anincrease in liquidity that had to be mopped-up in the same period to anchor the monetary policy stance.
4.4 Monetary policy was conducted against the background of below-trend economic activity (a non-inflationary output gap) anda positive medium-term inflation outlook.These developments provided scope for an accommodative monetary policy stance in support of stronger output growth. Hence, the Bank Rate was maintained at 5 percent in 2018, and, consequently, the prime lending rate of commercial banks was unchanged at 6.5 percent, while deposit interest rates were, similarly, virtually stable. BoBC yields increased modestly in 2018, reflecting a continuing process ofnormalisation in money market rates structure. Thus, the 14-day BoBC stop-out yield increased from 1.47 percent in December 2017 to 1.59 percent in December 2018, while the 91-day BoBC stop-out yield also increased, from 1.48 percent to 1.59 percent during the same period. However, consequent to the larger increase in inflation compared to nominal interest ratesbetween December 2017 and December 2018, the real 14-day BoBC rate decreased from -1.68 percent in December 2017 to -1.85 percent in December 2018, while the real 91-day BoBC yield also decreased from -1.67 percent to -1.85 percent in the same period.
33 The output gap refers to the difference between actual output and long-term trend output (as an indicator of the productive capacity of the economy). A negative output gap means the actual level of output for a given period is below the trend level for that period, thus indicating that the economy is operating below its estimated potential.
34 Excess liquidity is the sum of commercial banks’ overnight deposits with the Bank (current account), money absorbed through BoBCs and outstanding reverse repos, less both repos and borrowing from the Bank’s credit facility. This is “excess” in the sense that it is the net liquidity that the central bank has to absorb (take out of the system), over and above the structural liquidity that is held by the banks in the Primary Reserve Requirement accounts.
the BotSwana economy in 2018
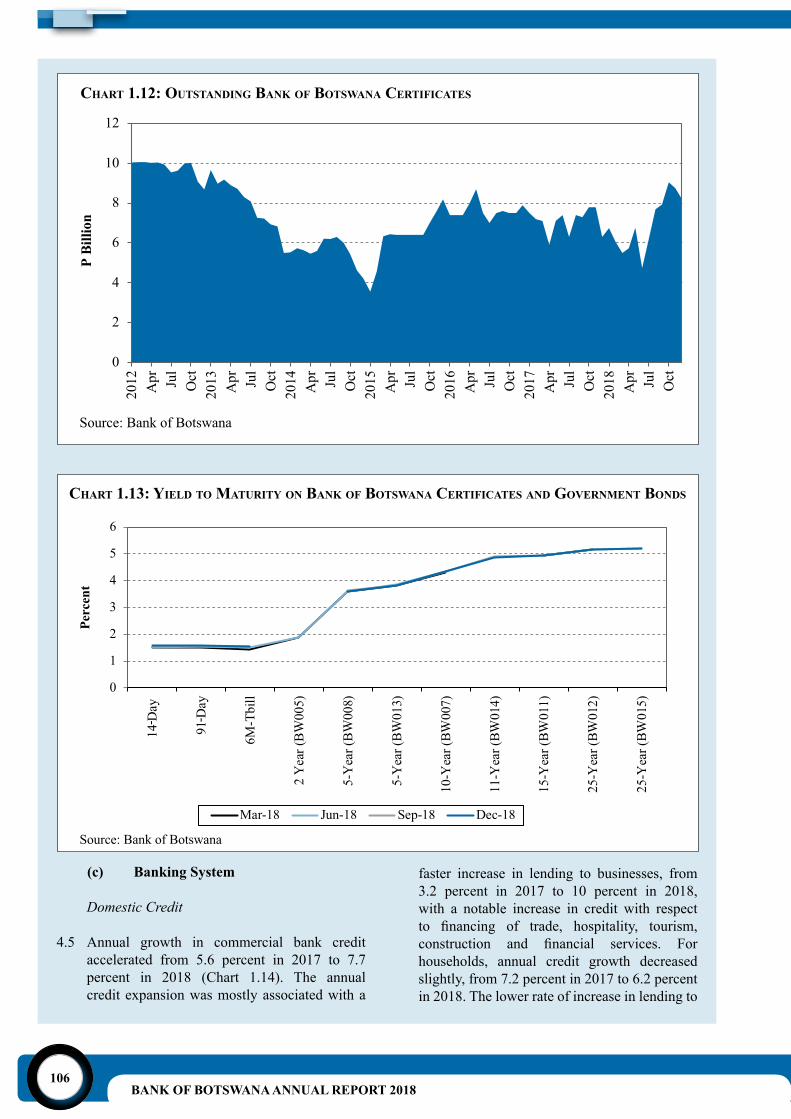
BANK OF BOTSWANA ANNUAL REPORT 2018106
the BotSwana economy in 2018
Chart 1.12: oUtstanding Bank of Botswana CertifiCates
Chart 1.13: yield to MatUrity on Bank of Botswana CertifiCates and governMent Bonds
(c) Banking System
Domestic Credit
4.5 Annual growth in commercial bank credit accelerated from 5.6 percent in 2017 to 7.7 percent in 2018 (Chart 1.14). The annual credit expansion was mostly associated with a
faster increase in lending to businesses, from 3.2 percent in 2017 to 10 percent in 2018, with a notable increase in credit with respect to financing of trade, hospitality, tourism,construction and financial services. Forhouseholds, annual credit growth decreased slightly, from 7.2 percent in 2017 to 6.2 percent in 2018. The lower rate of increase in lending to
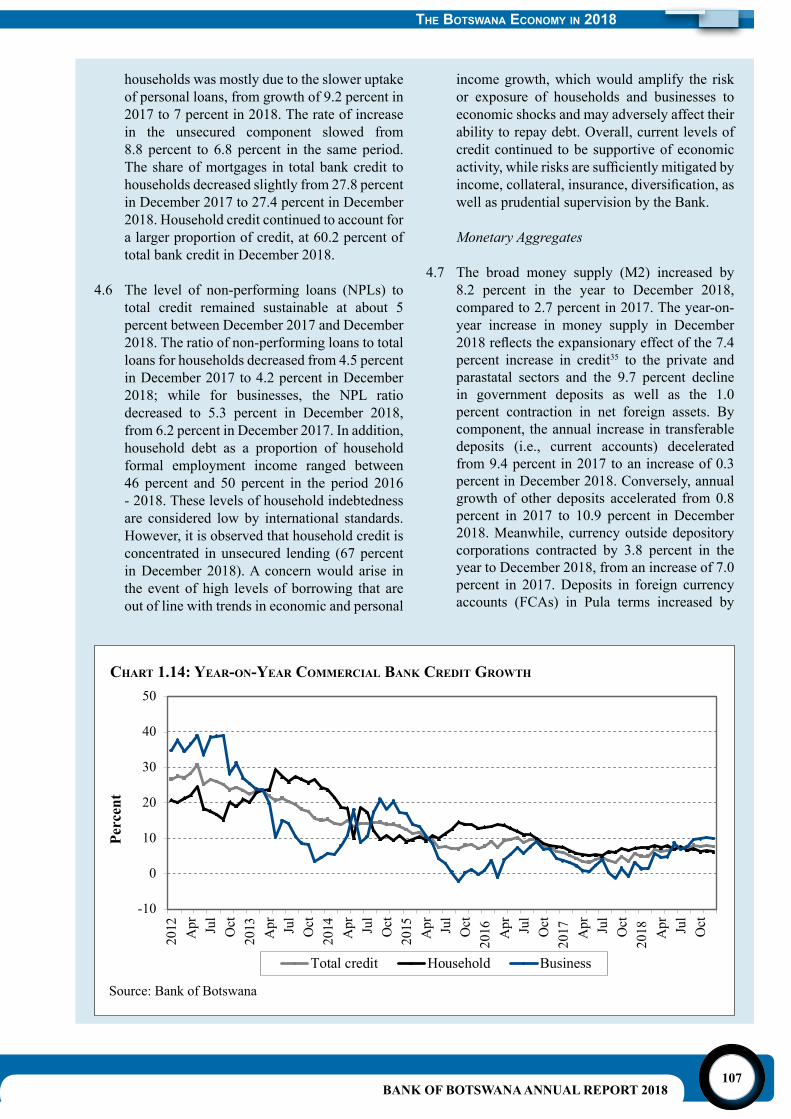
BANK OF BOTSWANA ANNUAL REPORT 2018107
households was mostly due to the slower uptake of personal loans, from growth of 9.2 percent in 2017 to 7 percent in 2018. The rate of increase in the unsecured component slowed from 8.8 percent to 6.8 percent in the same period. The share of mortgages in total bank credit to households decreased slightly from 27.8 percent in December 2017 to 27.4 percent in December 2018. Household credit continued to account for a larger proportion of credit, at 60.2 percent of total bank credit in December 2018.
4.6 The level of non-performing loans (NPLs) to total credit remained sustainable at about 5 percent between December 2017 and December 2018. The ratio of non-performing loans to total loans for households decreased from 4.5 percent in December 2017 to 4.2 percent in December 2018; while for businesses, the NPL ratio decreased to 5.3 percent in December 2018, from 6.2 percent in December 2017. In addition, household debt as a proportion of household formal employment income ranged between 46 percent and 50 percent in the period 2016 - 2018. These levels of household indebtedness are considered low by international standards. However, it is observed that household credit is concentrated in unsecured lending (67 percent in December 2018). A concern would arise in the event of high levels of borrowing that are out of line with trends in economic and personal
income growth, which would amplify the risk or exposure of households and businesses to economic shocks and may adversely affect their ability to repay debt. Overall, current levels of credit continued to be supportive of economic activity,whilerisksaresufficientlymitigatedbyincome,collateral,insurance,diversification,aswell as prudential supervision by the Bank.
Monetary Aggregates
4.7 The broad money supply (M2) increased by 8.2 percent in the year to December 2018, compared to 2.7 percent in 2017. The year-on-year increase in money supply in December 2018reflectstheexpansionaryeffectofthe7.4percent increase in credit35 to the private and parastatal sectors and the 9.7 percent decline in government deposits as well as the 1.0 percent contraction in net foreign assets. By component, the annual increase in transferable deposits (i.e., current accounts) decelerated from 9.4 percent in 2017 to an increase of 0.3 percent in December 2018. Conversely, annual growth of other deposits accelerated from 0.8 percent in 2017 to 10.9 percent in December 2018. Meanwhile, currency outside depository corporations contracted by 3.8 percent in the year to December 2018, from an increase of 7.0 percent in 2017. Deposits in foreign currency accounts (FCAs) in Pula terms increased by
the BotSwana economy in 2018
Chart 1.14: year-on-year CoMMerCial Bank Credit growth
BANK OF BOTSWANA ANNUAL REPORT 2018108
14.4 percent in 2018 after contracting by 3.6 percent in 2017, and accounted for 16.8 percent of total deposits at commercial banks in 2018.
Bank of Botswana
4.8 Total assets and liabilities of the Bank of Botswana contracted by 2.9 percent from P74.3 billion in December 2017 to P72.2 billion in December 2018. The decrease in the Bank’s balance sheet in December 2018 was mainly due to the 3.1 percent decline in foreign exchange reserves (including a 15.2 percent contractioninthePulaFund).However,fixedand other assets increased by 10.2 percent and 18 percent, respectively. The shareholder’s total funds, which largely comprise the Government Investment Account, decreased by 15.1 percent, from P57.1 billion in December 2017 to P48.5 billion in December 2018. Commercial bank deposits at the Bank of Botswana (including primary reserve requirement balances) increased slightly, from P2.9 billion in December 2017 to P3.1 billion in December 2018.
Other Depository Corporations
4.9 The balance sheet of commercial banks grew by 9.4 percent from P83.5 billion in December 2017 to P91.3 billion in 2018. On the assets side, loans and advances increased by 7.7 percent from P52.1 billion in 2017 to P56.2 billion in 2018, while the value of debt securities held by banks fell by 8.7 percent. In 2018, deposits of domestic banks in foreign banks increased by 13.2 percent, while “other assets” declined by 11 percent. With respect to liabilities, deposits at commercial banks, capital and reserves and other liabilities rose by 9.1 percent, 10.7 percent and 11.4 percent, respectively, in 2018. Wholesale business deposits remained the main source of commercial banks’ funding (76.7 percent of total deposits in 2018). The banks’ Credit to GDP ratio was 30.6 percent in September 2018, virtually the same as the 30 percent reported in September 2017.
4.10 Total assets and liabilities of the Botswana Building Society declined by 5.7 percent from P4.3 billion in 2017 to P4 billion in 2018. The decline reflects the 38.7 percent contractionin the Society’s cash and deposits in the same
35 Includes credit by commercial banks, Botswana Building Society and Botswana Savings Bank.
period. On the liabilities side, the level of capital and reserves decreased by 47.7 percent from P1.1 billion in 2017 to P595 million in 2018, while public deposits grew by 11.4 percent in the same period.
4.11 For Botswana Savings Bank, total assets and liabilities increased by 0.5 percent in 2018, while loans and other advances decreased by 3.2 percent. Savings deposits declined by 0.7 percent in 2018, from P2.14 billion to P2.13 billion, compared to an increase of 17.6 percent in 2017.
(d) Other Financial Corporations
4.12 The balance sheet of the National Development Bank (NDB) contracted by 18 percent in 2018, from P1.1 billion in 2017 to P938.7 million in 2018, compared to a decline of 30.8 percent in 2017. The bank experienced low recovery of loans, rising impairments and incurred losses. The deterioration in the balance sheet for NDB was attributable to a substantial decline in most categories of assets. Loans and advances, total liquid assets and fixed assets decreasedby 21.1 percent, 6.2 percent and 5.2 percent, respectively, in 2018.
4.13 Total assets of Botswana Development Corporation grew by 20.1 percent to P2.8 billion in 2018, from P2.3 billion in 2017. This performance was largely attributable to an increase of 165.9 percent in loans, advances and leasing,reflectingnewloansdisbursedin2018.Fixed assets increased from P6.5 billion in 2017 to P181.1 billion in 2018, due to the recording of all lease assets in compliance with the new accounting standard IFRS 16. Meanwhile, investments in related companies declined slightly by 0.4 percent in 2018.
4.14 The Domestic Companies Index of the Botswana Stock Exchange decreased further by 11.4 percent to 7853.5 in 2018, following a decline of 5.8 percent in 2017. The decline was due to the relatively weak performance, in terms of price per share, of several companies, namely: Choppies (-71.5 percent), Botswana Telecommunications Corporation Limited (-48.4 percent), Olympia (-40 percent), Standard Chartered Bank (-25.5 percent) and Letlole (-18.1 percent). There were 1.3 billion shares worth P2.4 billion traded in 2018 compared to 775 million shares valued
the BotSwana economy in 2018
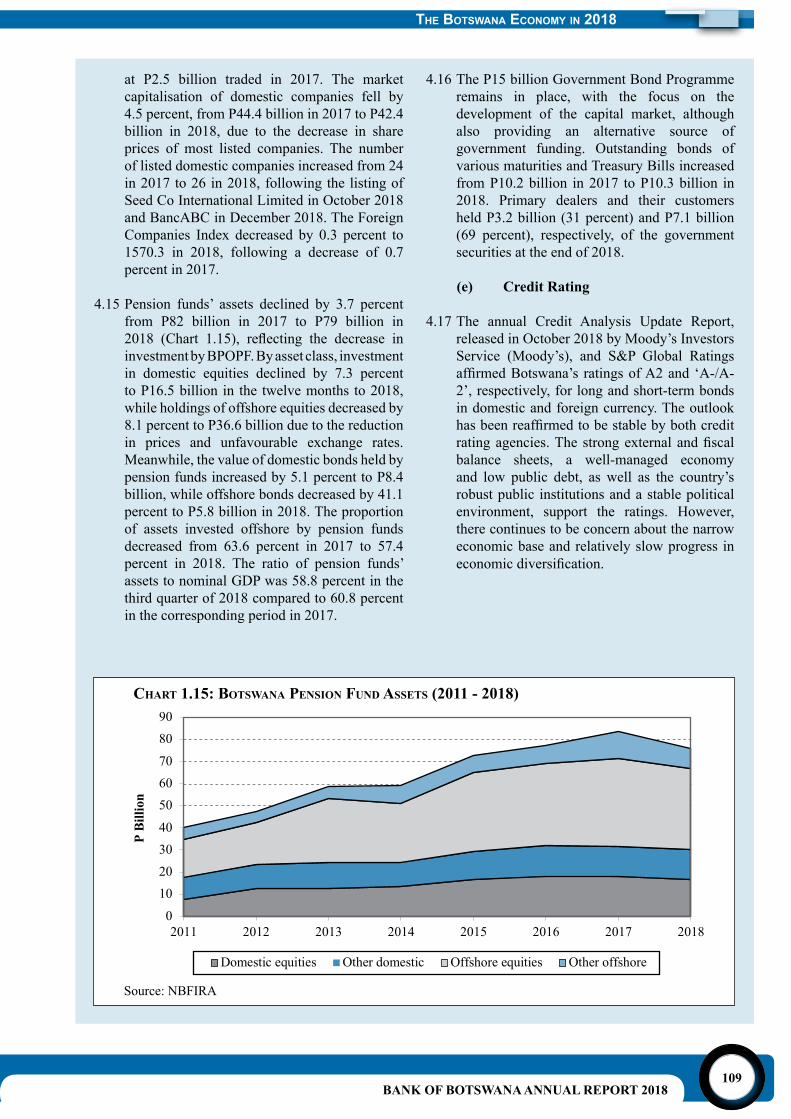
BANK OF BOTSWANA ANNUAL REPORT 2018109
at P2.5 billion traded in 2017. The market capitalisation of domestic companies fell by 4.5 percent, from P44.4 billion in 2017 to P42.4 billion in 2018, due to the decrease in share prices of most listed companies. The number of listed domestic companies increased from 24 in 2017 to 26 in 2018, following the listing of Seed Co International Limited in October 2018 and BancABC in December 2018. The Foreign Companies Index decreased by 0.3 percent to 1570.3 in 2018, following a decrease of 0.7 percent in 2017.
4.15 Pension funds’ assets declined by 3.7 percent from P82 billion in 2017 to P79 billion in 2018 (Chart 1.15), reflecting the decrease ininvestment by BPOPF. By asset class, investment in domestic equities declined by 7.3 percent to P16.5 billion in the twelve months to 2018, while holdings of offshore equities decreased by 8.1 percent to P36.6 billion due to the reduction in prices and unfavourable exchange rates. Meanwhile, the value of domestic bonds held by pension funds increased by 5.1 percent to P8.4 billion, while offshore bonds decreased by 41.1 percent to P5.8 billion in 2018. The proportion of assets invested offshore by pension funds decreased from 63.6 percent in 2017 to 57.4 percent in 2018. The ratio of pension funds’ assets to nominal GDP was 58.8 percent in the third quarter of 2018 compared to 60.8 percent in the corresponding period in 2017.
4.16 The P15 billion Government Bond Programme remains in place, with the focus on the development of the capital market, although also providing an alternative source of government funding. Outstanding bonds of various maturities and Treasury Bills increased from P10.2 billion in 2017 to P10.3 billion in 2018. Primary dealers and their customers held P3.2 billion (31 percent) and P7.1 billion (69 percent), respectively, of the government securities at the end of 2018.
(e) Credit Rating
4.17 The annual Credit Analysis Update Report, released in October 2018 by Moody’s Investors Service (Moody’s), and S&P Global Ratings affirmedBotswana’s ratingsofA2and‘A-/A-2’, respectively, for long and short-term bonds in domestic and foreign currency. The outlook hasbeenreaffirmedtobestablebybothcreditratingagencies.Thestrongexternalandfiscalbalance sheets, a well-managed economy and low public debt, as well as the country’s robust public institutions and a stable political environment, support the ratings. However, there continues to be concern about the narrow economic base and relatively slow progress in economicdiversification.
the BotSwana economy in 2018
Chart 1.15: Botswana Pension fUnd assets (2011 - 2018)

BANK OF BOTSWANA ANNUAL REPORT 2018110
BANK OF BOTSWANA ANNUAL REPORT 2018111
ChaPter 2Botswana - finanCing strategies for indUstrialisation
and transition to high inCoMe statUs 1. introdUCtion
1.1 The Government has adopted an industrialisation strategy premised on harnessing the country’s economic potential and value chains in relation to endowments, including natural resources and sectors/areas (industrial clusters and/or hubs), where there is prospective comparative advantage for the country. In this regard, mining, agriculture, tourism, health and financialservices sectors were identified as havingpotential to lead Botswana’s industrialisation. As a contribution to evaluation and propagation of the strategy, the Bank’s 2016 Annual Report highlighted the relevant broad themes. In turn, the Bank’s 2017 Annual Report narrowed the discussion to prospective developments and the relevantpoliciesforbeneficialevolutionofthefinancial sector and its impact on sustainableand inclusive growth; thus recognising the positive correlation between financial sectordevelopment and economic growth. It is, therefore, opportune that the 2018 Annual Report identifies and evaluates practicalapproaches to implementation of the country’s industrialisation strategy; in this instance, effective harnessing of finance as a resourceand input to expansion and also to enhancing productivityoftheidentifiedsectors.
1.2 As discussed in previous Bank of Botswana Annual Reports, the various requirements for industrialisation leading to sustained and inclusive growth relate to policies, regulation, institutional and governance arrangements, administrative aspects, markets and inputs, including infrastructure, utilities, skills and finance. The state of Botswana, as assessedrelative to other countries on these factors, is apparent from the Competitiveness and Doing Business indices and rankings published by, among others, the World Bank and World Economic Forum. These institutions consistently listlackofaccesstofinance,especiallytosmall,micro and medium-sized enterprises (SMMEs), as one of the top constraints to doing business in Botswana.
1.3 Internal policy review also helps to evaluate performance and inform policy initiatives, for example, as articulated in National Development Plan 11 and the Financial Sector Development Strategy 2012 – 2016. Furthermore, Business Expectation Surveys (BESs) of local firmsalso rank lack of finance as a challenge tosuccessful business operation and, in particular, entrepreneurship. In this respect, finance isrecognised as a key input to performance of individualfirms,sectorsandindustrygenerally.Therefore,having identifiedspecificsectors tospearhead industrialisation, it is appropriate, at this point, to narrow down the analysis and evaluation, to the impact of finance in raisingoutputandproductivityoftheidentifiedsectors.In particular, it would be informative to assess the existing allocation of finance/financingarrangements for these sectors and, in turn, examine the alternative approaches that could better serve the industrialisation strategy. It is recognised that idiosyncratic aspects relating to agriculture, mining, tourism and services could rank higher in influencing performanceand productivity. However, it is important to ensure that financial sector policies are nota constraint and that they are appropriately calibrated to support exploitation of business opportunities, as well as the optimisation and productiveallocationoffinance.Thefollowingkey considerations and analytical aspects are relevant for the discussion.
1.4 First, the country’s strategies for industrialisation and development of citizen businesses and entrepreneurship encompass the use of development finance institutions and targetedsupport(toaugmentself-andprivatefinancing).There is, therefore, a need for evaluation of the effectivenessofthisapproach,andidentificationof any improvements and/or variations that mightbebeneficial.Second,itcontinuestobenecessary to reconcile the apparent financinggap, in terms of both the quantum and quality of funding (therefore, productivity of investment) with the availability of funds/liquidity in the market, as well as explore the potential for external resource mobilisation. Alternatively,
BANK OF BOTSWANA ANNUAL REPORT 2018112
consideration could be given to beneficialrepatriation of externalised funds (assuming adherence to prudence and governance arrangements). Third, given the desire for Botswana to make the transition to high-income status, it would be instructive to undertake an in-depthassessmentoftheapproachestofinancingof industrialisation (in particular, any targeted sectors) by some countries that have overcome the middle-income trap.
1.5 Overall, it is appropriate to link the evaluation and policy considerations to the current structure ofallocationoffinancetotheidentifiedcluster/hub sectors and, therefore, explore the need and prospects for enhancements to ease any financingconstraints.Inaddition,thereisneedto acknowledge the prospects for adjustments and evolution with respect to macroeconomic policies and regulatory frameworks, in order to ensure they remain relevant, facilitative and appropriate for maintenance of stability.
1.6 As a thematic continuation, the discussion will expound on some of the concluding observations of the 2017 Annual Report theme topic and articulate alternative financing models andresource mobilisation approaches that are likely to best serve the cluster/hub industrialisation strategy and advance the country to high-income status.
1.7 This Theme Chapter is organised as follows. Section 2 discusses industrial clusters, hubs, and SMMEs as they relate to the industrialisation strategy.Section3reviewstheexistingfinancingoptions and their funding of industrialisation initiatives in the past; their weaknesses and ways they could be enhanced to ensure the continued adequate funding of selected sectors in order to generate well-balanced economic growth and propel the country to attain a high-income status. A comparison between Botswana’s financing and industrialisationstrategies and those of successful countries in these areas is made in Section 4, which also proposes some key lessons to be drawn from these country experiences. Section 5 provides a perspective on measures to enhance policy and institutional considerations going forward, to foster industrialisation and transition to a high-income status. Finally, Section 6 provides conclusions and recommendations.
2. the Case for sPeCial eConoMiC Zones, ClUster and hUB indUstrialisation strategy
2.1 Industrialisation through the successive stages is a key factor in the achievement of sustainable and inclusive growth, employment creation and improved standards of living. Several countries have embarked on an industrialisation drive, through the creation of Special Economic Zones (SEZs), industrial clusters and hubs. SEZs are designated areas in a country where targeted incentives that are different from other locations are provided. These include special dispensations relating to regulations, trade and tax laws, access to finance, technologyand infrastructure. Such incentives are offered in order to attract both foreign and domestic businesses to the areas, and ultimately facilitate economic growth. In addition, the SEZs are closely linked to, and nurture domestic enterprises and industrial clusters through supply or value chains. This connection does not only help with the achievement of economies of scaleandbusinessefficiency,butalsostimulatessynergistic learning and enhances industrial competitiveness.36
2.2 SEZs are selected based on, among others, the uniqueness of the locality in the economy, availability of relevant labour skills, other productive resources and infrastructure. The world’sfirstknownSEZscanbe traced to the1947 industrial park set up in Puerto Rico. This was followed in the 1960s by Ireland and Taiwan. However, a breakthrough occurred in the 1980s through China’s largest SEZ consisting of the metropolis of Shenzhen.37 In the 1990s, Africa saw a rise in the type of SEZ known as an Export Processing Zone (EPZ). Currently, the SEZs are spread globally, with the most effective ones in Asia, followed by Latin America and the Caribbean. Mauritius is considered a successful EPZ due to its high
36 Zeng, D. Z., (2010). “Building Engines for Growth and Competitiveness in China: Experience with Special Economic Zones & Industrial Clusters,” World Bank, Washington, DC.
37 http://studybay.net/it/free-essays/special-economic-zones-sez-features-and-benefits.
BANK OF BOTSWANA ANNUAL REPORT 2018113
BotSwana - Financing StrategieS For induStrialiSation and tranSition to high income StatuS
level of employment creation, gross and net exports and its ability to receive high levels of foreign direct investment (FDI).38
2.3 The most successful SEZ story is that of China which, together with economic clusters, have turned around the performance of the Chinese economy. “By 2016, Chinese SEZs contributed 22 percent of China’s gross domestic product (GDP), 45 percent of total national FDI and 60 percent of exports. These SEZs have also increased the income of participating farmers by 30 percent and accelerated industrialisation, agricultural modernisation and urbanisation.”39 However, not all SEZs have been that successful globally. In India, SEZs contributed hardly 4 percent of GDP and 25 percent of exports, while only 223 are operational out of 420 approved SEZs.40
2.4 Increasingly, there is a worldwide realisation that the creation of sustainable businesses and strong industries requires clustering together of related or mutually dependent businesses in a locality that provides a conducive operating environment. Thus, related to the SEZs are clusters and hubs, which refer to a geographic concentration of interconnected businesses, suppliers and associated institutions in a particular area. Given the market opportunities, this arrangement encourages specialisation by industries, hence increasing their productivity and output, while reducing costs. Therefore, if successfully executed, the SEZs, clusters and hubs arrangement can accelerate innovation, industrialisation, creation of employment opportunities and access to markets (domestic and foreign) through competitive products and services.
2.5 Typically, economic clusters are made of an interrelated range of small to large producers, suppliers and users of goods and services, including suppliers of support services from both the private and public sectors: thus a symbiotic market structure that incorporates services and logistical support. The cluster
38 www.specialeconomiczones.com.
39 Political Economy of Special Economic Zones: China vs India.
40 T. E. Cheong, (2018). The Key Success Factors of Special Economic Zones.
41 United Nations Conference on Trade and Development (UNCTAD), World Investment Report, 2018.
development strategy is often anchored on natural endowments, areas of competitive advantage and locations where there is concentrated government and institutional support. While, traditionally, economic clusters were established on physical locations and structures, increasingly they can also operate on virtual platforms that use the internet as a medium of operation. Broadly, in addition to key attributes relating to natural endowments and competitive advantage, the other key inputs to a successful strategy include, inter alia, the following:
(i) well-articulated policy framework and vision that covers both the investment and industrialisation aspects;
(ii) sound macroeconomic environment and policy certainty;
(iii) effective support institutions and legal framework, that is, good quality public institutions, in general;
(iv) good and accessible infrastructure, utilities and logistics;
(v) access to resources which include skills, finance and welfare elements, such aseducation, health and social amenities;
(vi) practical and detailed implementation plans, a clear timeline for action and a division of responsibilities among the public and private sectors;41
(vii) flexiblelabourmarkets;
(viii) trust in the political system;
(ix) supportive government bureaucracy;
(x) judicial efficiency reflected in, amongothers, timely adjudication and enforcement of property rights and business contracts.
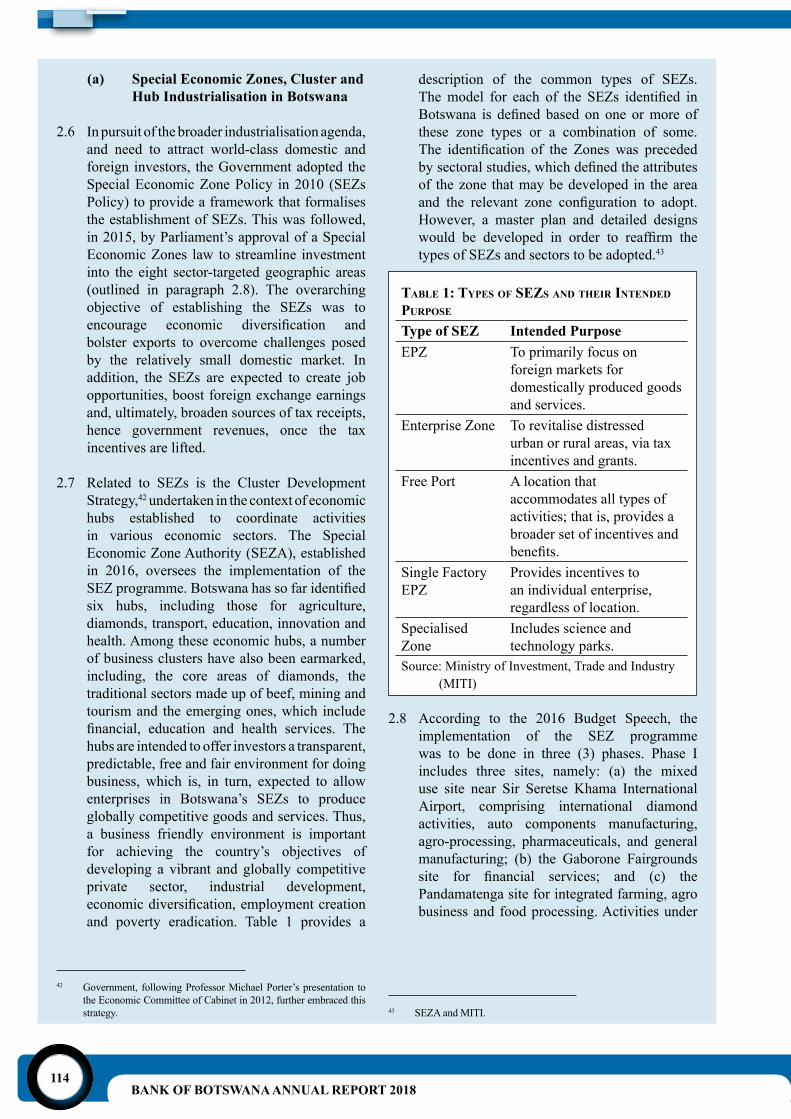
BANK OF BOTSWANA ANNUAL REPORT 2018114
(a) Special Economic Zones, Cluster and Hub Industrialisation in Botswana
2.6 In pursuit of the broader industrialisation agenda, and need to attract world-class domestic and foreign investors, the Government adopted the Special Economic Zone Policy in 2010 (SEZs Policy) to provide a framework that formalises the establishment of SEZs. This was followed, in 2015, by Parliament’s approval of a Special Economic Zones law to streamline investment into the eight sector-targeted geographic areas (outlined in paragraph 2.8). The overarching objective of establishing the SEZs was to encourage economic diversification andbolster exports to overcome challenges posed by the relatively small domestic market. In addition, the SEZs are expected to create job opportunities, boost foreign exchange earnings and, ultimately, broaden sources of tax receipts, hence government revenues, once the tax incentives are lifted.
2.7 Related to SEZs is the Cluster Development Strategy,42 undertaken in the context of economic hubs established to coordinate activities in various economic sectors. The Special Economic Zone Authority (SEZA), established in 2016, oversees the implementation of the SEZprogramme.Botswanahassofaridentifiedsix hubs, including those for agriculture, diamonds, transport, education, innovation and health. Among these economic hubs, a number of business clusters have also been earmarked, including, the core areas of diamonds, the traditional sectors made up of beef, mining and tourism and the emerging ones, which include financial, education and health services. Thehubs are intended to offer investors a transparent, predictable, free and fair environment for doing business, which is, in turn, expected to allow enterprises in Botswana’s SEZs to produce globally competitive goods and services. Thus, a business friendly environment is important for achieving the country’s objectives of developing a vibrant and globally competitive private sector, industrial development, economicdiversification,employmentcreationand poverty eradication. Table 1 provides a
description of the common types of SEZs. Themodel for each of the SEZs identified inBotswana is defined based on one ormore ofthese zone types or a combination of some. The identification of the Zones was precededbysectoralstudies,whichdefinedtheattributesof the zone that may be developed in the area and the relevant zone configuration to adopt.However, a master plan and detailed designs would be developed in order to reaffirm thetypes of SEZs and sectors to be adopted.43
taBle 1: tyPes of seZs and their intended PUrPose
Type of SEZ Intended PurposeEPZ To primarily focus on
foreign markets for domestically produced goods and services.
Enterprise Zone To revitalise distressed urban or rural areas, via tax incentives and grants.
Free Port A location that accommodates all types of activities; that is, provides a broader set of incentives and benefits.
Single Factory EPZ
Provides incentives to an individual enterprise, regardless of location.
Specialised Zone
Includes science and technology parks.
Source: Ministry of Investment, Trade and Industry (MITI)
2.8 According to the 2016 Budget Speech, the implementation of the SEZ programme was to be done in three (3) phases. Phase I includes three sites, namely: (a) the mixed use site near Sir Seretse Khama International Airport, comprising international diamond activities, auto components manufacturing, agro-processing, pharmaceuticals, and general manufacturing; (b) the Gaborone Fairgrounds site for financial services; and (c) thePandamatenga site for integrated farming, agro business and food processing. Activities under
42 Government, following Professor Michael Porter’s presentation to the Economic Committee of Cabinet in 2012, further embraced this strategy. 43 SEZA and MITI.
BANK OF BOTSWANA ANNUAL REPORT 2018115
44 Business Botswana Annual General Meeting, 2018.
45 Marandu, E. E., and Amanze, D., (2016). “Developing Sustainable Special Economic Zones in Botswana: A Conceptual Discussion.” Archives of Business Research – Vol.4, No.6.
46 Gulhati, R., and Nallari, R., (1990). “Successful Stabilisation and Recovery in Mauritius.” Economic Institute of the World Bank. Analytical Case Studies; No. 5. World Bank Institute Case Studies. Washington, DC: The World Bank.
47 Curran, S., et al., (2009). “The Impacts of Special Economic Zones,” Evans School of Policy Analysis and Research.
48 Foreign Investment Advisory Service, (2008). “Special Economic Zones: Performance, Lessons Learned, and Implications for Zone Development,” The World Bank, Washington DC.
49 World Bank Group, 2016.
Phase 1 commenced in the 2016/2017 fiscalyear. Phase II of the SEZs is planned for the Francistown, Selebi-Phikwe and Lobatse areas, while Phase III will focus on the Tuli Block and Palapye areas.
2.9 In September 2018, it was reported that Government was working on legislation, to be finalisedinDecember2019,thatwouldfasttrackthe processing of applications for the change of landusesothatthelandownerscanbenefitfromits optimal utilisation. SEZA had raised concern with regard to issues of land allocation and availability of land to be zoned and that these were impeding the Authority from performing its mandate, and thus delaying progress.44 The success of SEZs is also dependent on, among others, site location; competition policies; good/proper zone development practices; less cumbersome government procedures and controls; effective coordination and adequate administrative structures, with few bodies involved in zone administration.
2.10 Furthermore, to ensure the sustainability of the SEZs, there is a need to take advantage of achieving economies of scale within the frameworks of the Southern African Development Community (SADC) and the Southern African Customs Union (SACU) trade preferences45 to expand the limited/small domestic market. These include the SADC Free Trade Area and the European Free Trade Agreement with SACU. Additionally, the growth of local industries can be supported by prioritising the participation of SMMEs, by developing targeted local supply chain linkages, which would nurture the micro and small domestic businesses, while ensuring that they remain commercially viable. This would, in addition to other supportive factors, attract business to the SEZs, which would survive competition and continue to operate after the reduction or expiry of incentives.
2.11 Evidence from many parts of the world suggests that SEZs have the potential to spur growth and employment. For example, during the 1980-
1986 period, EPZ firms in Mauritius created30,000 jobs, and were seen as a major instrument for reducing economy-wide unemployment from 17 to 12 percent.46 The unemployment rate in Mauritius declined further to 5 percent in 1990 as growth in value added from the EPZs averaged 30 percent annually, between 1983 and 1988.47 The Jebel Ali Free Zone in Dubai experienced substantial growth in companies, from 19 in 1985 when the SEZ was established, to 7 000 in 2012, employing 170 000 people, or 13 percent of Dubai’s workforce during that year. In the Dominican Republic, employment in the industrial free zones rose from 500 in 1970 to almost 200 000 in 2007. In Costa Rica, the EPZ share of manufactured exports jumped from less than 10 percent in 1990 to 55 percent in 2003, with export items changing from mainly apparel and textile products and electronic components to a wide array of manufacturing products, including high technology exports, for example, Intel microchips.48
2.12 In Madagascar, a USD165 million World Bank SEZ-related project contributed to a tenfold increase in the stock of formal enterprises and a near sevenfold increase in the number of formal jobs in the growth poles of Fort Dauphin and Nosy Be, despite a complex political environment. The project successfully integrated a number of reforms to improve the business climate and job creation around these growth poles.49
BotSwana - Financing StrategieS For induStrialiSation and tranSition to high income StatuS
BANK OF BOTSWANA ANNUAL REPORT 2018116
(b) The Role of SMMEs in the Industrialisation Process
2.13 The contribution of SMMEs to the development of the world economy is significant, both interms of contribution to GDP and employment creation,50 in both developed and developing economies. In particular, SMMEs tend to be more adaptive, responsive to the changing economic environment, less resource intensive, work with less capital, but are more labour-intensive and operate with low cost management and support services.
2.14TheflexibilityofSMMEs,resiliencetoadverseeconomic conditions, and low contagion effect, contribute to a diverse and stable ecosystem. As a result, many countries have established policies and support structures for SMMEs, as they are considered important stakeholders for advancing competitiveness, entrepreneurship, innovation and broadening of gainful economic activity and income earning opportunities. There is, therefore, a need for an integrated strategy to support SMMEs, as part of the industrialisation strategy. Among others, this needs to encompass training, access to information, provision offinancing, assistancein accessing modern technology and a generally favourable macroeconomic environment. These efforts are in recognition of the fact that the SMME sector faces challenges that call for substantial interventions by government and other related stakeholders. These challenges include constrained operational capacity; limited management and entrepreneurial skills; lack of initiative to engage in sophisticated business endeavours; lack of bankable collateral; poor quality of products and services; lack of trade and industry-related information; and poor planning.
2.15 In the case of Botswana, the Government continues to implement strategies and policies aimed at nurturing the SMME sector. To this end, in mid-2018, the Ministry of Investment, Trade and Industry (MITI) announced the proposed new strategy of the ‘Apex Model.’51 The strategy comprises three apexes of: (a)
SMME development, (b) investment promotion and (c) export development. Under the SMME development apex, the focus would be on easing the regulatory burden on SMMEs, to facilitate their participation in the country’s industrialisation process.52 The investment promotion apex is intended to alert potential (domestic and foreign) investors, with the capacity to provide capital, jobs, skills and technology to the local market, of investment opportunities inBotswana. The final apex ofexport development seeks to explore export-led growth by promoting export of goods for which the country has a comparative advantage. This encompasses the creation of market access through negotiation of trade agreements with strategic partners, identification of prioritysectors according to export readiness and capacity development of export incentives. The objectives of the three apexes are to support the MITI mandate of creating a conducive environment for the promotion of investment and development of sustainable industries and trade, thereby diversifying and growing the economy. At the same time, wealth and employment would be generated, to facilitate prosperity for all.
2.16 In the SADC region, governments have introduced policies, initiatives and programmes that support thedevelopmentandfinancingofSMME.53 However, these efforts have been largely ineffective in sustaining and promoting the SMME sector, with the failure and exit rates of these business entities being generally high.54 In Botswana, it is estimated that SMMEs contribute about 35 percent to GDP, as well as contributing meaningfully to employment creation, economicdiversification andpovertyalleviation.55 Despite the challenges that SMMEs in Botswana face, such as competition from cheaper imports, especially from Asia, their ability to become more innovative and,
50 UNCTAD, (2018). World Investment Report.
51 The APEX Model appears to be an operational structure, rather than afully-fledgedstrategyliketheIDP.
52 Honorable Minister Kenewendo, B., (2018). Ministry of Investment, Trade and Industry, Botswana.
53 SADC, Development Finance Resource Centre website.
54 Nemaenzhe, P. P., (2010). “Retrospective Analysis of Failure Causes in South African Small Businesses,” University of Pretoria, September 2010.
55 Mutoko, W. R., (2014). “Challenges of Access to Markets and Opportunities for Small, Medium and Micro Enterprises (SMMEs) in Botswana,” Botswana Accountancy College, August 2014.
BANK OF BOTSWANA ANNUAL REPORT 2018117
hence, more competitive and their ability to access the value and supply chains of larger corporates should ensure their survival going forward. Also, adoption of appropriate technologies, including in digital marketing and sales channels (e-commerce), would help the SMMEs to become commercially competitive.
(c) Special Economic Zones/Cluster Financing
2.17 Botswana, like other developing countries, especially in Africa, is facing constraints in developing and funding infrastructure projects, which limit the speed of development and industrialisation and, therefore, restrain economic prospects. Long-term growth and competitiveness of countries, including Botswana, are very much dependent on, among others, infrastructure development and, more specifically,therelatedinfrastructureneededtosupport the cluster/hub industrialisation process. To this extent, Government has undertaken to make budgetary provisions to ensure the success of the SEZ initiative. For the six-year NDP 11 period (April 2017-March 2023), a total of P960 million has been allocated to MITI for the economic cluster project. Of this amount, P500 million under infrastructure development, is devoted to funding of the special economic zone common facilities. P225 million is allotted to the leather industry park. Furthermore, of the P230 million budgeted for the Doing Business Reforms, P100 million will be used in implementing the operations of SEZs.
2.18 The rest of the funds under the Doing Business
Reforms are devoted to measures aimed at improving the business environment, such as the establishment of the Competition and Consumer Tribunal and the Consumer Protection Unit. However, NDP 11 is in its second year of operation; hence, the Monitoring and Evaluation (M&E) strategies to be implemented during the Plan are yet to report on progress made in the 2017/18fiscalyear.TheM&Ewouldprovideanindication of whether the budgetary allocation to the SEZs project is sufficient and whethermilestones are achieved on time and within budget.
2.19 Nevertheless, in addition to public funding, it is imperative that concerted effort, through deliberate policies, be directed at devising
viable financing options for a sustainable andinclusive industrialisation drive that would boost exports and transform Botswana into a high-income country. These efforts would involve a critical analysis of the current model offinancingindustrialisationintargetedsectors,industries and locations in Botswana, which is heavily dependent on government incentives and available alternative funding methods, some of which were discussed in the Bank of Botswana 2017 Annual Report. Section 3 below considers some of the options and approaches.
3. evalUation of finanCing oPtions in Botswana
3.1 Generally,financingoptionsforindustrialisationfall under three broad categories, namely; government, development finance institutions(DFIs)andprivatesectorfinancing,withrelativesizes influenced by the national developmentpriorities, policies and market maturity. To this can be added external options such as multilateral funds and arrangements targeted at industrialisation and supportive infrastructure. Ingeneral,directgovernmentfinancingmostlyinvolves infrastructure projects and social amenities that facilitate economic activity, business processes and welfare enhancements. This is more so in a developing country context, where the size and maturity of the financialsector may be inadequate to manage relatively large and long gestation infrastructure and social projects. In addition, at a relatively small scale, governments or designated agencies engage in funding and enterpreneurial development for small scale businesses and targeted cohorts of society, such as youth, women, rural community and low income segments of society.
3.2 In turn, various forms of private sector financing options are available for generaleconomic activity, including for businesses and households. However, in several instances, it is considered that there is, for various reasons, market failure (beyond larger projects and micro and low return activity) that militates against desired development objectives and private sector needs. This is mostly the case for developing countries and where there is an urgent need for rapid industrialisation. In the circumstances,developmentfinanceinstitutionsare established to address the market failure and
BotSwana - Financing StrategieS For induStrialiSation and tranSition to high income StatuS
BANK OF BOTSWANA ANNUAL REPORT 2018118
close the funding gap, in particular. Elements of these funding options and track record for Botswana are discussed below.
(a) Government Financing and Entrepreneurship Development Programmes
(i) Large Scale Infrastructure Development and Service Provision Financing
3.3 Availability and continuous modernisation of infrastructure and public and social services is key to the industrialisation strategy, as these are inputs, as well as facilitative of business operations (although often the welfare accruing to people dominates discourse compared to emphasising the impact on business/industry operations and performance). For Botswana, there has been continuing commitment in this regard in terms of funding of infrastructure and social projects, including those dedicated to specific industrialisation projects. Significantaspects include:
(a) a medium-term planning process (National Development Plans) that identifies andallocates funding to build infrastructure and social services according to development objectives and need;
(b) afiscalrulethatincorporatestheallocationof mineral revenue to the development budget (physical infrastructure, education and health), which is targeted at 30 percent of total expenditure and net lending;
(c) average annual growth in development expenditureof13.6percentinthelastfiveyears and, on average, amounting to 25 percent of government spending;
(d) evident growth and improvement in coverage of infrastructure and services, for example, roads, electricity, water, internet and mobile connectivity and related services;
(e) development of urban infrastructure to support the mining and tourism economic hubs in Orapa, Jwaneng, Selebi-Phikwe, Sowa and Maun/Kasane; and
(f) direct equity participation and partnerships in major production and export activities, including mining (diamonds, copper and soda ash) and beef production.
3.4 Government funding in Botswana is mostly backed by revenue comprising mainly mineral and SACU receipts (33.1 percent of total revenue in 2017/18), while income, property and consumption taxes play a lesser role (Chart 1). Additionally, government has, over the years, relied on concessional debt to augment financial resources or fund specific projects.Where necessary, the goverment also withdraws savings to support spending. Up to 2000, the fiscalbudgetwasalmostalwaysperenniallyinsurplus,whiledeficitshavebeencommonsince2001.Even then,fiscal policy and rules focuson medium term budget balance, involving the accumulation and saving of surpluses that are thenavailableforcountercyclicalpolicy(deficitfinancing)whenneeded.
3.5 Going forward, there is scope to expand tax coverage and cost recovery, which could also be a derivative of enhanced industrialisation and broad-based improvement in living standards. For example, as highlighted in the International Monetary Fund (IMF) 2015 and 2018 Article IV Reports, there is significant scope to improvecollections through reforms to improve value-added-tax collection, reviewing tax exemptions and reforms to property taxation. Moreover, privatisation and, where feasible, user charges for government infrastructure and services, could contribute to revenue while at the same time reducing the fiscal burden involvedin funding state-owned enterprises and the provision of social services.
(ii) Sovereign Wealth Funds as a Potential Source of Government Financing
3.6 In certain circumstances, Sovereign Wealth Funds (SWFs) may be a source of funding for long-term investments. However, it should be recognised that SWFs must have formal governance and strategic management guidelines relating to asset allocation and selection involving diverse instruments, including bonds, equities, real estate, private equity and direct stakes in infrastructure
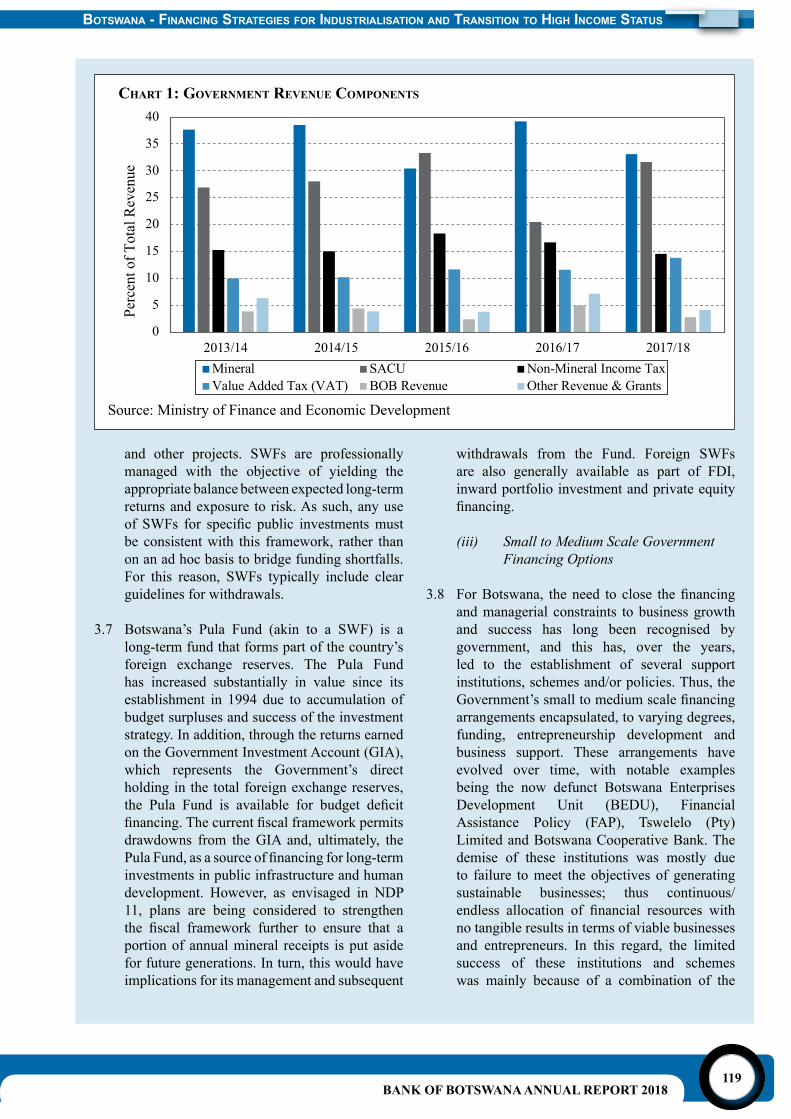
BANK OF BOTSWANA ANNUAL REPORT 2018119
and other projects. SWFs are professionally managed with the objective of yielding the appropriate balance between expected long-term returns and exposure to risk. As such, any use of SWFs for specific public investmentsmustbe consistent with this framework, rather than on an ad hoc basis to bridge funding shortfalls. For this reason, SWFs typically include clear guidelines for withdrawals.
3.7 Botswana’s Pula Fund (akin to a SWF) is a long-term fund that forms part of the country’s foreign exchange reserves. The Pula Fund has increased substantially in value since its establishment in 1994 due to accumulation of budget surpluses and success of the investment strategy. In addition, through the returns earned on the Government Investment Account (GIA), which represents the Government’s direct holding in the total foreign exchange reserves, the Pula Fund is available for budget deficitfinancing.Thecurrentfiscalframeworkpermitsdrawdowns from the GIA and, ultimately, the PulaFund,asasourceoffinancingforlong-terminvestments in public infrastructure and human development. However, as envisaged in NDP 11, plans are being considered to strengthen the fiscal framework further to ensure that aportion of annual mineral receipts is put aside for future generations. In turn, this would have implications for its management and subsequent
withdrawals from the Fund. Foreign SWFs are also generally available as part of FDI, inward portfolio investment and private equity financing.
(iii) Small to Medium Scale Government Financing Options
3.8 ForBotswana, theneed to close thefinancingand managerial constraints to business growth and success has long been recognised by government, and this has, over the years, led to the establishment of several support institutions, schemes and/or policies. Thus, the Government’ssmalltomediumscalefinancingarrangements encapsulated, to varying degrees, funding, entrepreneurship development and business support. These arrangements have evolved over time, with notable examples being the now defunct Botswana Enterprises Development Unit (BEDU), Financial Assistance Policy (FAP), Tswelelo (Pty) Limited and Botswana Cooperative Bank. The demise of these institutions was mostly due to failure to meet the objectives of generating sustainable businesses; thus continuous/endless allocation of financial resources withno tangible results in terms of viable businesses and entrepreneurs. In this regard, the limited success of these institutions and schemes was mainly because of a combination of the
BotSwana - Financing StrategieS For induStrialiSation and tranSition to high income StatuS
Chart 1: governMent revenUe CoMPonents
BANK OF BOTSWANA ANNUAL REPORT 2018120
institutional shortcomings (limitations with respect to project evaluation and monitoring) and sub-optimal performance by beneficiaries(including weak management and misdirection of funds). Thus, despite the availability of funding, clear industrialisation objectives and support initiatives, as well as business opportunities, governance and entrepreneurship (thekeysuccessfactors)deficienciesappeartohavebeenthesignificantconstraintstobusinesssuccess and industrialisation.
3.9 Even then, several development financeinstitutions remain, having survived through successive restructuring and renewal of their respective mandates or being newly established. Below is a broad generalised assessment of their impact on industrialisation and prospects/potential going forward.
Botswana Development Corporation (BDC)56
3.10The Corporation (BDC) provides financialassistance to investors with commercially viable projects and offers both debt and equity financingtopioneernewindustries;unlockvaluein existing industries; stimulate private sector growth; and foster linkages with local industry. Italsoseekstodrivediversification,growthofexports and create employment opportunities. To this end, BDC can be credited with early industrialisation efforts in manufacturing, property, air transport, financial services andagriculture. In a number of instances, there has been successful divestments to private ownership and sustained good performance and growth of individual firms. Moreover,the property development function, in terms of factory shells, office and retail space, aswell as residential property, was facilitative of industrialisation. At the same time, there have been missed opportunities, most notably the failure of the glass project in Palapye, Seleka horticultural farms and delayed uptake of the leather park project in Lobatse, where there could be potential for value-adding industry linkages and employment.
3.11 The recent consolidation and rationalisation efforts have been beneficial in terms ofimprovements in governance, financialperformance and beneficial engagement inrevitalisation and rationalisation of subsidiary companies. The key consideration going forward would be whether the level/scale of operation of the BDC can be commensurate with the envisaged cluster and SEZ industrialisation strategy and the sectoral/industry growth aspirations.Inaddition,whilethediversificationinto foreign investments makes business sense in terms of an inward-looking business viability and profit/return perspective, it may be thatthere is a resource loss from the domestic industrialisation dimension with respect to reduced local funding and managerial/strategic focus on growth of the domestic industries. Overall, there is need for focused consideration on whether the BDC is integral to the cluster and rapid industrialisation or its focus is deliberately diluted to include foreign ventures (withtheattendantbenefits).Itisnotable,inthisregard,thatresourcediversificationintoforeignmarkets already exists in the form of foreign exchange reserves (managed by the Bank), pension and other wealth management funds, as well as private investors.
National Development Bank (NDB)
3.12 The NDB57 focuses on lending to various industries and agriculture, and has more recently covered the household sector and is mostly funded by Government, augmented by borrowing from domestic banks and external entities (i.e., bonds and other wholesale credit facilities). It is possible that access to funding from NDB has contributed to business developmentand(beneficial)economicactivityover time. However, perennial lacklustre performance of the institution and the funded businesses/projects (evidenced by the number, value and persistence of non-performing loans and capital erosion) broadly suggests sub-optimal contribution and value addition to the country’s economic performance. There is, therefore, a concern that the performance of NDB has been well below expectations and its potential not fully exploited; hence sub-
56 Sentsho J. et al., (2007). “Performance and Competitiveness of Small and Medium Sized Manufacturing Enterprises in Botswana.” Bay Publishing, Gaborone.
57 Pansiri J., and Yalala, A.T., (2017). “The Evolution of Entrepreneurship and Small-to-Medium Business Development in Botswana.” Botswana Journal of Business Vol 10 No 1.
BANK OF BOTSWANA ANNUAL REPORT 2018121
optimal contribution to the industrial effort. In addition to availing funding, the development andwelfarebenefitsoffinancialintermediariesinclude infusion of business viability and value addition through professional project/proposal evaluation, disciplined monitoring of use of resources and business activity, guidance and performance support. Moreover, there is a need for inculcation of discipline and the consequences of venture or business failure are allowed to be impactful, therefore, induce appropriate learning and response. These aspects are evidently lacking in the case of the NDB, hence the lacklustre performance of funded projects, weak loan recovery and a recurrenceoffinanciallosseswhich,ultimately,are borne by the Government. Among the reasons for low achievement by NDB are the weak enforcement of loan recovery and apparent acquiescence by Government in facilitating recurring recapitalisation, not conditioned on demonstrable effective managerial performance and a viable and sustainable recovery strategy.
3.13 In the circumstances, it is clear that a refocus is needed to enable the bank to play a meaningful role in the execution of the industrialisation strategy. This is achievable to the extent that resources continually availed to NDB add to economic expansion and vibrant activity. Evidence, in this regard, should be easily demonstrated by viability of the NDB funded projects and businesses that generate positive returns and are able to pay back loans; facilitating going concern for the bank and less need for recapitalisation to cover for losses (indeed any recapitalisation should be to contribute resources for additional business and economic activity).58
Botswana Savings Bank (BSB) and Botswana Building Society (now BBS Limited)
3.14 The BSB and BBS Limited are essentially retail financial institutions. Their contribution toindustrialisation is indirect through facilitating household demand (and contribution to aggregate demand). For BSB, the potential role iswithrespecttospreadingfinancialinclusionand harnessing the opportunities provided
by financial technology; thus enhancedgeographical coverage, savings mobilisation and payments and remittance platforms. Regarding BBS Limited, there is significantscopetoincreasemortgagefinancingsupportedby land registration reforms, internal product development and strategy, as well as consumer awareness.
Citizen Entrepreneurial Development Agency (CEDA)
3.15 The establishment of CEDA followed evaluation of the Financial Assistance Policy (FAP), which, in the 1980s, was a key element of the Government’s industrial development policy, and operated for about two decades. The policy, which covered small-medium to large scale businesses, was intended to address sluggish growth in employment opportunities; lack of citizen participation in non-agricultural productive activities; and lack of access to finance by citizen-owned small- andmedium-scale enterprises. With a focus on economic diversification,thepolicywasmeanttosupportnew business ventures or expansion of existing ones and was mainly targeted at the industrial, agricultural and tourism sectors. While there are indications that FAP did address some problems faced by enterprises and helped create some employment, the policy had some limitations, including uneven geographical coverage and skilled labour constraints. In addition, some enterprises needed more than just financial assistance; they required managerialdevelopment, training and technological development in order to catapult them out of infancy. Hence, FAP was replaced with CEDA in 2001 and, subsequently, LEA was established in 2004 to provide mentorship and guidance in business skills and entrepreneurship development, as well as incubation of start-ups. LEA, in turn, collaborates with research organisations, including the Botswana Institute for Technology, Research and Innovation (BITRI), National Food Technology Research Centre, Botswana International University of Science and Technology and the University of Botswana, to enhance delivery of these services.
3.16 CEDA provides funding in the form of loans, equity, factoring and invoice discounting and, also, offers credit guarantees and supplier guarantees, as well as performance bonds. It
58 A consultancy engaged by the Government with assistance of the African Development Bank (AfDB) has started work on evaluating prospects for transformation of NDB.
BotSwana - Financing StrategieS For induStrialiSation and tranSition to high income StatuS
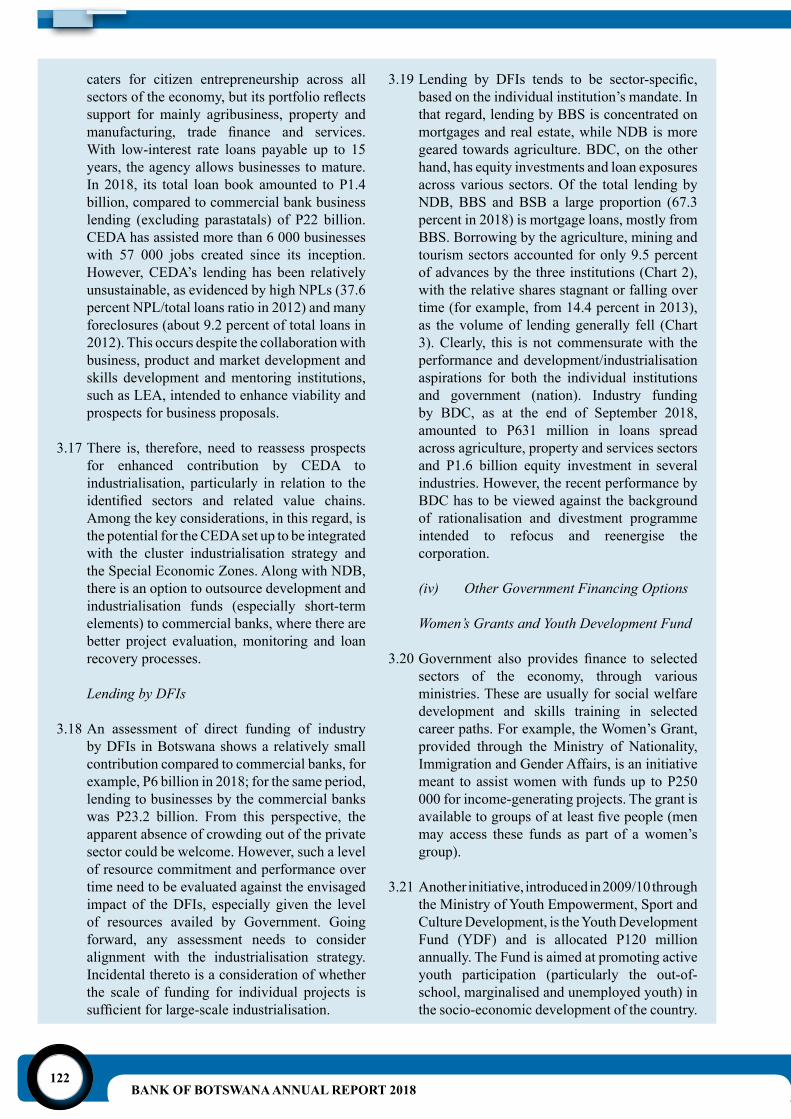
BANK OF BOTSWANA ANNUAL REPORT 2018122
caters for citizen entrepreneurship across all sectorsoftheeconomy,butitsportfolioreflectssupport for mainly agribusiness, property and manufacturing, trade finance and services.With low-interest rate loans payable up to 15 years, the agency allows businesses to mature. In 2018, its total loan book amounted to P1.4 billion, compared to commercial bank business lending (excluding parastatals) of P22 billion. CEDA has assisted more than 6 000 businesses with 57 000 jobs created since its inception. However, CEDA’s lending has been relatively unsustainable, as evidenced by high NPLs (37.6 percent NPL/total loans ratio in 2012) and many foreclosures (about 9.2 percent of total loans in 2012). This occurs despite the collaboration with business, product and market development and skills development and mentoring institutions, such as LEA, intended to enhance viability and prospects for business proposals.
3.17 There is, therefore, need to reassess prospects for enhanced contribution by CEDA to industrialisation, particularly in relation to the identified sectors and related value chains.Among the key considerations, in this regard, is the potential for the CEDA set up to be integrated with the cluster industrialisation strategy and the Special Economic Zones. Along with NDB, there is an option to outsource development and industrialisation funds (especially short-term elements) to commercial banks, where there are better project evaluation, monitoring and loan recovery processes.
Lending by DFIs
3.18 An assessment of direct funding of industry by DFIs in Botswana shows a relatively small contribution compared to commercial banks, for example, P6 billion in 2018; for the same period, lending to businesses by the commercial banks was P23.2 billion. From this perspective, the apparent absence of crowding out of the private sector could be welcome. However, such a level of resource commitment and performance over time need to be evaluated against the envisaged impact of the DFIs, especially given the level of resources availed by Government. Going forward, any assessment needs to consider alignment with the industrialisation strategy. Incidental thereto is a consideration of whether the scale of funding for individual projects is sufficientforlarge-scaleindustrialisation.
3.19Lending by DFIs tends to be sector-specific,based on the individual institution’s mandate. In that regard, lending by BBS is concentrated on mortgages and real estate, while NDB is more geared towards agriculture. BDC, on the other hand, has equity investments and loan exposures across various sectors. Of the total lending by NDB, BBS and BSB a large proportion (67.3 percent in 2018) is mortgage loans, mostly from BBS. Borrowing by the agriculture, mining and tourism sectors accounted for only 9.5 percent of advances by the three institutions (Chart 2), with the relative shares stagnant or falling over time (for example, from 14.4 percent in 2013), as the volume of lending generally fell (Chart 3). Clearly, this is not commensurate with the performance and development/industrialisation aspirations for both the individual institutions and government (nation). Industry funding by BDC, as at the end of September 2018, amounted to P631 million in loans spread across agriculture, property and services sectors and P1.6 billion equity investment in several industries. However, the recent performance by BDC has to be viewed against the background of rationalisation and divestment programme intended to refocus and reenergise the corporation.
(iv) Other Government Financing Options
Women’s Grants and Youth Development Fund
3.20Government also provides finance to selectedsectors of the economy, through various ministries. These are usually for social welfare development and skills training in selected career paths. For example, the Women’s Grant, provided through the Ministry of Nationality, Immigration and Gender Affairs, is an initiative meant to assist women with funds up to P250 000 for income-generating projects. The grant is availabletogroupsofatleastfivepeople(menmay access these funds as part of a women’s group).
3.21 Another initiative, introduced in 2009/10 through the Ministry of Youth Empowerment, Sport and Culture Development, is the Youth Development Fund (YDF) and is allocated P120 million annually. The Fund is aimed at promoting active youth participation (particularly the out-of-school, marginalised and unemployed youth) in the socio-economic development of the country.
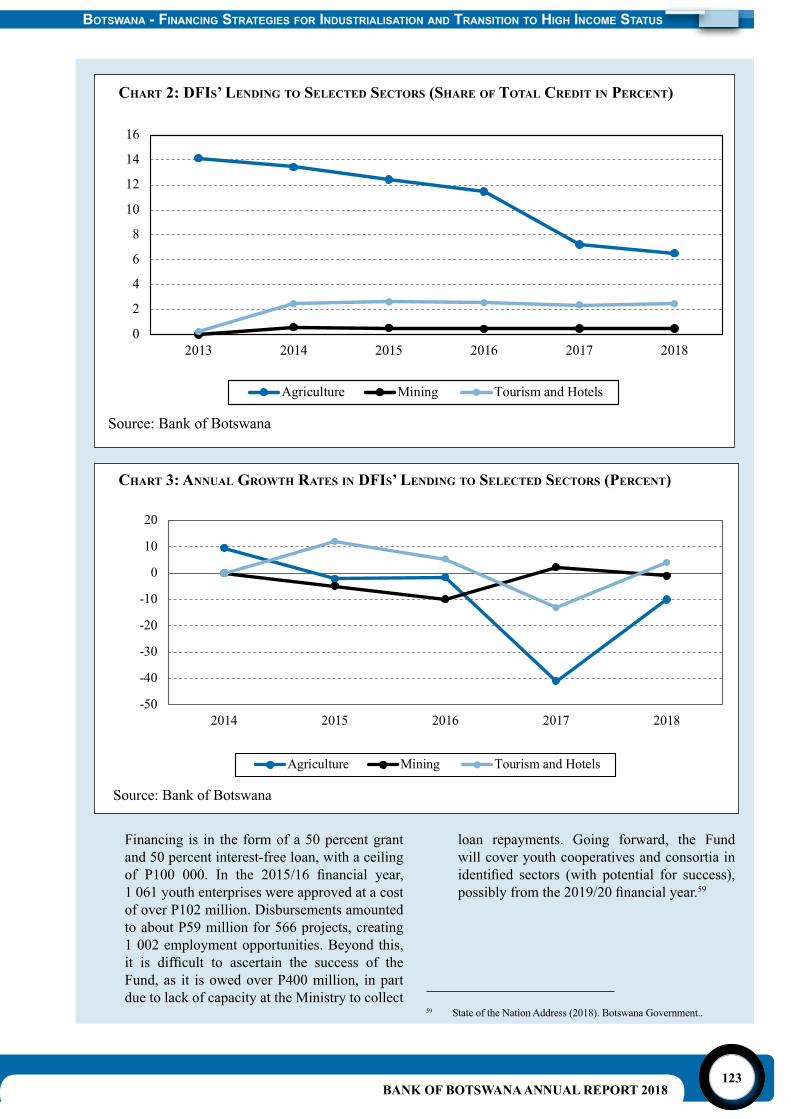
BANK OF BOTSWANA ANNUAL REPORT 2018123
Financing is in the form of a 50 percent grant and 50 percent interest-free loan, with a ceiling of P100 000. In the 2015/16 financial year,
1 061 youth enterprises were approved at a cost of over P102 million. Disbursements amounted to about P59 million for 566 projects, creating
1 002 employment opportunities. Beyond this, it is difficult to ascertain the success of theFund, as it is owed over P400 million, in part due to lack of capacity at the Ministry to collect
loan repayments. Going forward, the Fund will cover youth cooperatives and consortia in identified sectors (with potential for success),possiblyfromthe2019/20financialyear.59
59 State of the Nation Address (2018). Botswana Government..
BotSwana - Financing StrategieS For induStrialiSation and tranSition to high income StatuS
Chart 2: dfis’ lending to seleCted seCtors (share of total Credit in PerCent)
Chart 3: annUal growth rates in dfis’ lending to seleCted seCtors (PerCent)
BANK OF BOTSWANA ANNUAL REPORT 2018124
Construction Industry Trust Fund (CITF)
3.22 The CITF is also a special fund that was established by Government to address the need for semi-skilled and skilled artisans during the implementation of national development plans, particularly in the construction industry; and to fill theskillsgapintheminingindustry.CITFhas been in operation since 1991 and major developments projects, such as the Jwaneng Cut 8 and the Kazungula Bridge, have benefittedfrom artisans trained under the Fund.
Public Debt Service Fund (PDSF)
3.23 The PDSF is one other Fund, which government established in 1973 for ensuring that Government would have a source of funds to service public debt. At the same time, since the domestic capital market was not well developed, the PDSF made long-term loans to parastatals andotherofficial agencies. In the1990s,withthe development of the domestic capital market, parastatals were encouraged to seek funding on the domestic capital market, and in 2001, the PDSF temporarily stopped making new loans. Much of the existing loan book was sold to further the development of the domestic capital market, while raising revenues for the Government. A special purpose investment company, Debt Participation Capital Funding Limited, the issued capital of which is held by Government, was incorporated in 2004 to purchase from Government the rights to receive the future principal and interest payments on 72 outstanding loans owing to the PDSF and to issuebondstothepublictofinancethepurchaseof the 72 PDSF loans. However, Government has, in the intervening years, issued new loans from the PDSF, for example, P570 million was lent to De Beers in 2009/10.
(v) Domestic Capital Market and Role in Financing Industrialisation
3.24 A vibrant domestic capital market should be one of the key financing and support optionsfor industrialisation, meeting the needs of government, parastatals and the private sector in their various roles in this regard, viz., infrastructure, social services, utilities and long-term capital for businesses. In the main, the capital market is underpinned by a securities trading platform (a stock exchange to facilitate
issuance and trading of equities and fixedincome securities (bonds)), market makers as well as a government securities (bond) issuance programme to guide the market and provide liquidity and requisite vibrancy.
Botswana Stock Exchange (BSE)
3.25 In this regard, the BSE, which operates and regulatestheequitiesandfixedincomesecuritiesmarket, continues to be pivotal to Botswana’s financial system,and, inparticular, thecapitalmarket, as an avenue on which government, quasi-government and the private sector can raise debt and equity capital for financingindustrialisation projects. The BSE has recently demutualised, a move that is expected to potentially lead to growth and development of the capital market and ultimately contribute to economic expansion. A demutualised stock exchange ensures access to greater amounts of capital, which is necessary for economic development and industrialisation.
3.26 The BSE has the necessary infrastructure and capability to support the listing and trading requirements for various securities. There are ongoing efforts to introduce a single central securities depository to provide a centralised platform for trading of all securities and settlement of trades using central bank money, which should improve integrity, market integration and alignment to the monetary policy stance and monetary operations by the central bank. There is, therefore, significantscope for the stock exchange to enhance the support for the industrialisation strategy. Market capitalisation (including domestic and foreign board) of the stock exchange has been over P40 billioninthelastfiveyears.
3.27 The BSE has had good performance across several indicators (including market depth, access to foreign exchange and capacity of local investors, among others), compared to peer countries.60 As shown inChart 4, thefinancialsector dominates the domestic stock market
60 The Absa Africa Financial Markets Index 2018 provides country comparisons and highlights opportunities and challenges for the region’s financial markets. Botswana ranks second in 2018,improving from position 3 in 2017, on account of stable performance across the index’s six pillars and efforts made to improve the local investor base. .
BANK OF BOTSWANA ANNUAL REPORT 2018125
capitalisation. This, to some degree, reflectsthe capital structure of domestic firms, wherebusinesses mainly rely on internal resources (retained earnings) and short-term debt for financing operations, which, notably, is thepreferredfinancingoptionbytheminingsector.
3.28 With regard to shares traded (as a percentage of the number of shares listed in a particular sector), the financial services sector has contributedthe most over the years, except in 2017, when property made the largest contribution. Chart 5 indicates that, while most of the funding has gone to the financial services sector andproperty, over time, the tourism sector’s share has been growing (although it declined in 2017).
3.29 The bond market continues to grow, with noted improvements in both the government and corporate bond markets. Chart 6 shows some selected sectors’ bonds that have been listed on the domestic stock exchange. A total of 49 corporate bonds with a market value amounting to P2.2 billion were listed on the BSE in 2018. As a proportion of GDP, the value of these corporate bonds is very small at 1 percent, an indication that there is tremendous room and scope to grow the bond market as a source of long-termfinancing.BBSLimitedandBDCarethe only two DFIs that have listed bonds on the BSE. BBS Limited has listed bonds amounting to P225 million while BDC listed P82 million.
Government Bond Issuance Programme
3.30A significant contribution of Government todevelopment of the domestic capital market is the Government Bond Issuance Programme, initiated in 2003 and restructured to encompass a legislated amount (P15 billion) and regular issuance calendar in 2011. The programme provides a benchmark yield for private issuers and also contributes to development of related systems, infrastructure and market capabilities; thus the potential for fixed income securitiesto support real sector economic activity and industrialisation. While funds raised by the Government are available to facilitate support for industry development, ultimately an important benefit of the Programme is thepotential to facilitate mobilisation of funds by the private sector, thus, ease the long-term financingconstraint.
3.31In terms of government financing needsand complementary to the bond issuance programme, there is an option to floatinfrastructure bonds for financing specificinfrastructure projects of public interest. A potentialbenefit is that thiscouldbelinkedtoproject evaluation in relation to viability, which could also align development costs to cost recovery and user charge options. This type of bond would also increase the diversity of products on offer. However, it requires a well-developed capital market; robust legal system and trained personnel in project finance andrisk management, aspects which Botswana is yet to attain. Kenya and South Africa have been pioneers in the region in the issuance of infrastructure bonds. The government of Kenya issued a 12-year infrastructure bond valued at KSh35.85billionin2011tofundspecificnewand on-going projects, while in South Africa municipal bonds for infrastructure development amounted to R34.8 trillion in 2016.61
61 Ministry of Finance and Central Bank of Kenya (2011). “Infrastructure Bond with Kenyan Diaspora Component - General Information Supplement,” and the South African Reserve Bank’s 2017/18 Annual Report.
BotSwana - Financing StrategieS For induStrialiSation and tranSition to high income StatuS
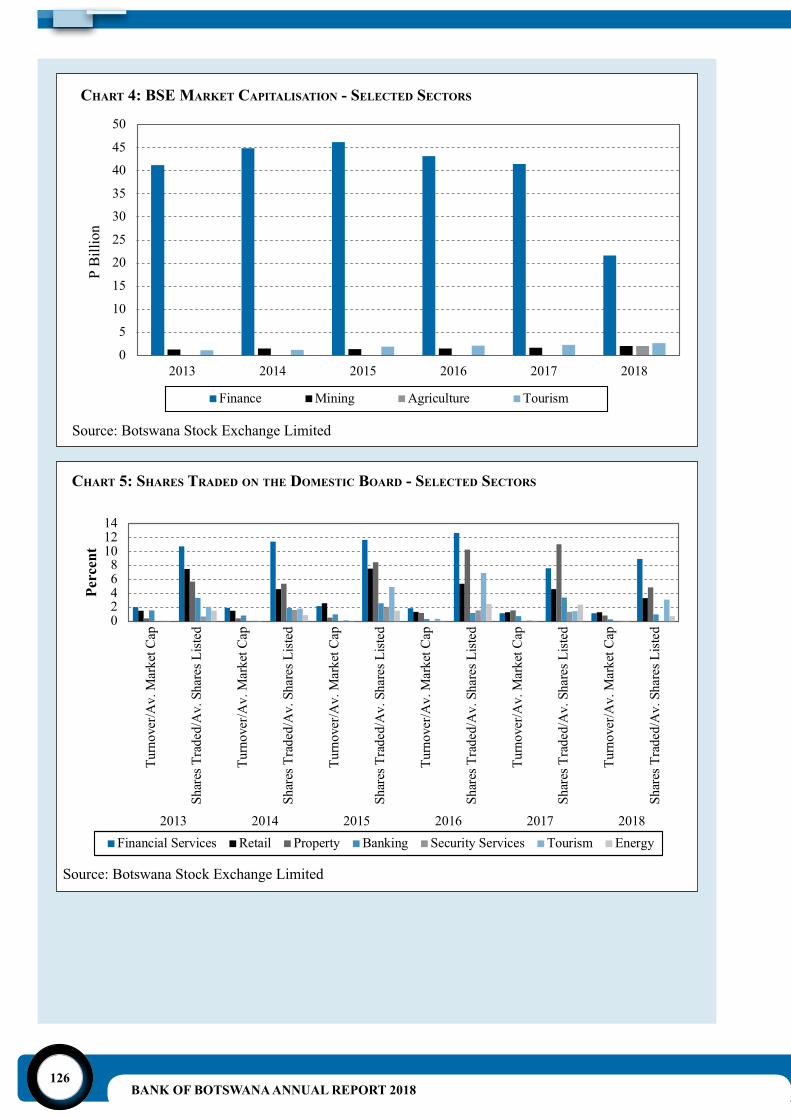
BANK OF BOTSWANA ANNUAL REPORT 2018126
Chart 4: Bse Market CaPitalisation - seleCted seCtors
Chart 5: shares traded on the doMestiC Board - seleCted seCtors
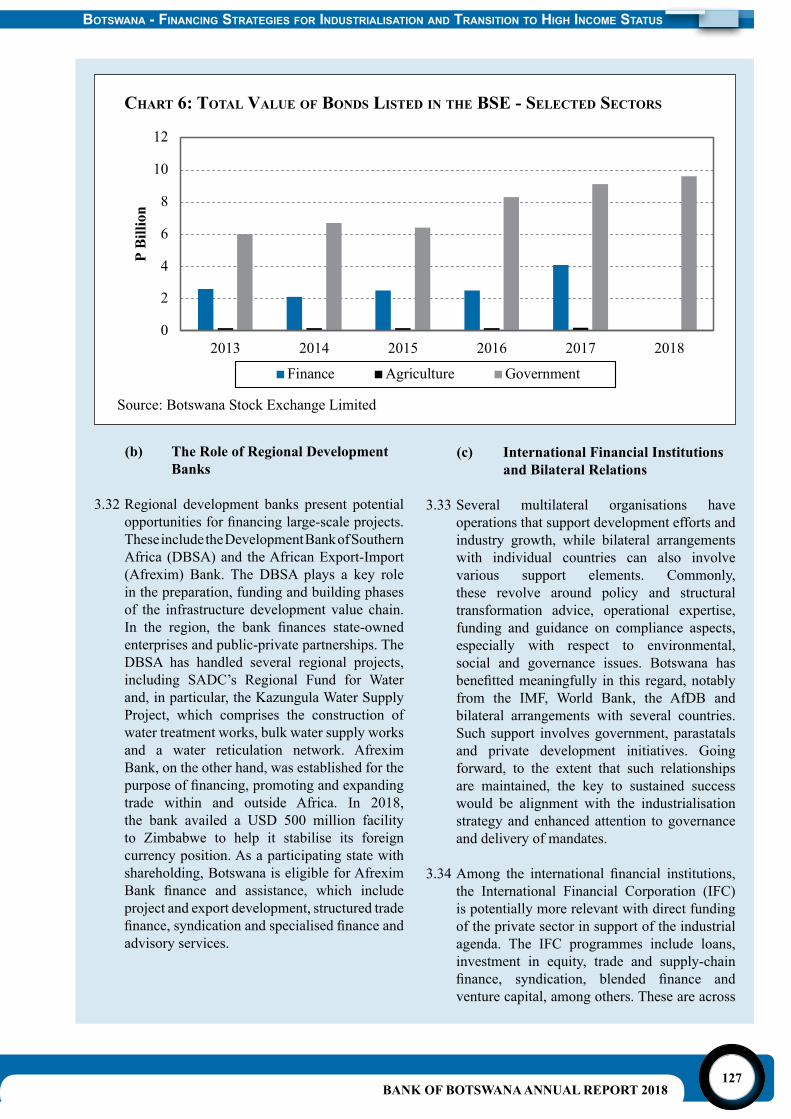
BANK OF BOTSWANA ANNUAL REPORT 2018127
BotSwana - Financing StrategieS For induStrialiSation and tranSition to high income StatuS
Chart 6: total valUe of Bonds listed in the Bse - seleCted seCtors
(b) The Role of Regional Development Banks
3.32 Regional development banks present potential opportunitiesforfinancinglarge-scaleprojects.These include the Development Bank of Southern Africa (DBSA) and the African Export-Import (Afrexim) Bank. The DBSA plays a key role in the preparation, funding and building phases of the infrastructure development value chain. In the region, the bank finances state-ownedenterprises and public-private partnerships. The DBSA has handled several regional projects, including SADC’s Regional Fund for Water and, in particular, the Kazungula Water Supply Project, which comprises the construction of water treatment works, bulk water supply works and a water reticulation network. Afrexim Bank, on the other hand, was established for the purposeoffinancing,promotingandexpandingtrade within and outside Africa. In 2018, the bank availed a USD 500 million facility to Zimbabwe to help it stabilise its foreign currency position. As a participating state with shareholding, Botswana is eligible for Afrexim Bank finance and assistance, which includeproject and export development, structured trade finance,syndicationandspecialisedfinanceandadvisory services.
(c) International Financial Institutions and Bilateral Relations
3.33 Several multilateral organisations have operations that support development efforts and industry growth, while bilateral arrangements with individual countries can also involve various support elements. Commonly, these revolve around policy and structural transformation advice, operational expertise, funding and guidance on compliance aspects, especially with respect to environmental, social and governance issues. Botswana has benefittedmeaningfully in this regard,notablyfrom the IMF, World Bank, the AfDB and bilateral arrangements with several countries. Such support involves government, parastatals and private development initiatives. Going forward, to the extent that such relationships are maintained, the key to sustained success would be alignment with the industrialisation strategy and enhanced attention to governance and delivery of mandates.
3.34Among the international financial institutions,the International Financial Corporation (IFC) is potentially more relevant with direct funding of the private sector in support of the industrial agenda. The IFC programmes include loans, investment in equity, trade and supply-chain finance, syndication, blended finance andventure capital, among others. These are across
BANK OF BOTSWANA ANNUAL REPORT 2018128
various industries including agribusiness, oil, gasandmining,infrastructure,financialmarketsand global manufacturing services.
(d) Private Sector Financing Options
(i) Foreign Direct Investment (FDI)
3.35 FDI is equity investment by a foreign entity of at least 10 percent of a domestic company’s capital. FDI is an integral part of private investment that could supplement domestic investment in driving economic growth. While FDI to developing economies has been increasing, the flowstoAfricahavebeenrelativelylower.TheconstraintstoFDIflowstoAfricaincludefactorssuch as limited degree of openness, high cost of doing business, burdensome product-market regulation, rigid labour market arrangements, high corporate tax rates, capital controls, direct FDI restrictions, restrictive trade policies and barriers, limited skills, market and incomes, inadequate infrastructure, long distance and economic instability. The expectation is that improvements in the macroeconomic policy framework, business and regulatory environment as well as growth in incomes and markets associated with policy maturity/predictability, institutional efficiency andhigher levels of economic activity should result in growth of FDI flows. In addition, positiveoutcomes of regional integration efforts should also contribute to stronger FDI for individual countries.
3.36 It is considered that, apart from adding to the financial resources and capital, FDI entailsother benefits, such as technology and skillstransfer, employment creation and improved standards of living, access to foreign markets, as well as potential agglomeration of capital and generation of value chains. Furthermore, FDI is considered a more stable component of capital flows.Itissubstantiallylessvolatilethanothertypes of cross-border financial flows since itinvolves multi-year investments and physical capital stock and, therefore, more likely to have a durable and transformative impact in the host country.
3.37Portfolioflows involveshort-terminvestmentsthat mainly come through the stock and bond markets focused on portfolio diversification,trading on volatility and expectations of
arbitrage and high returns in the short-term. The maininfluencesare,therefore,macroeconomicpolicy performance and outcomes with respect to interest rates, exchange rates, inflation andthe fiscal balance, as well as profitability oflisted corporates. In addition to prospects for providing funding capital, there are benefitsin terms of efficient pricing, market liquidityand encouraging discipline in policy design and execution. However, the inherent mobility and volatility of portfolio investment could be disruptive to economic activity and financialmarkets, especially where policy instruments are limited and less responsive. Hence other countries develop tax rules (incentives) for mitigating volatility.
3.38 Even though Botswana has no exchange controls and is an open economy, FDI continues to be limited, except in mining and, to some extent, the financial services sector.The Bank’s 2016 Annual Report identified,among others, the high cost of doing business and slow pace of improvement in the local business environment, as well as protection of some industries by Government, as some of the factors that discourage FDI in Botswana. Also, policy consistency and congruence is necessary to attract FDI.
(ii) Commercial Banks and Other Non- Bank Financial Institutions
3.39 Commercial banks are traditionally the primary source of private sector finance. In terms ofstructure, commercial bank lending is dominated by household borrowing (mostly unsecured loans), followed by credit to the trade, real estate and manufacturing sectors. These cumulatively accounted for 82 percent of commercial bank loans as at December 31, 2018. Thus, the sectors earmarked for driving industrialisation (mining, agriculture, tourism andfinance) do notmakeup much of commercial bank loan portfolios. Key constraints, in the Botswana context, are that domestic banks are over-reliant on volatile short-term deposits; there are limited stable long-term sources of funds; the inter-bank market is inefficientandhence limitedoptimaluseofdeposits. In addition, while Botswana has high levels of national savings, averaging 46 percent asaproportionofGDPoverthelastfiveyears(Chart7),financialintermediationisfragmented,with inadequate risk management tools to meet
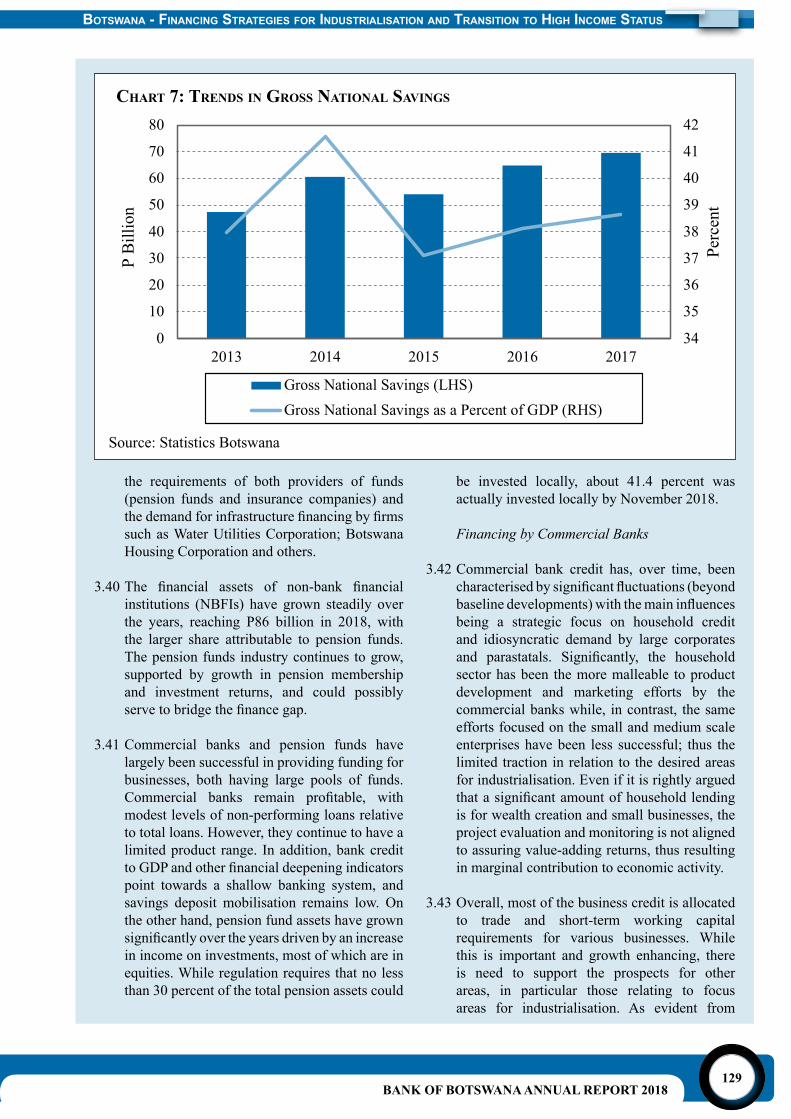
BANK OF BOTSWANA ANNUAL REPORT 2018129
BotSwana - Financing StrategieS For induStrialiSation and tranSition to high income StatuS
the requirements of both providers of funds (pension funds and insurance companies) and thedemandforinfrastructurefinancingbyfirmssuch as Water Utilities Corporation; Botswana Housing Corporation and others.
3.40The financial assets of non-bank financialinstitutions (NBFIs) have grown steadily over the years, reaching P86 billion in 2018, with the larger share attributable to pension funds. The pension funds industry continues to grow, supported by growth in pension membership and investment returns, and could possibly servetobridgethefinancegap.
3.41 Commercial banks and pension funds have largely been successful in providing funding for businesses, both having large pools of funds. Commercial banks remain profitable, withmodest levels of non-performing loans relative to total loans. However, they continue to have a limited product range. In addition, bank credit toGDPandotherfinancialdeepeningindicatorspoint towards a shallow banking system, and savings deposit mobilisation remains low. On the other hand, pension fund assets have grown significantlyovertheyearsdrivenbyanincreasein income on investments, most of which are in equities. While regulation requires that no less than 30 percent of the total pension assets could
Chart 7: trends in gross national savings
be invested locally, about 41.4 percent was actually invested locally by November 2018.
Financing by Commercial Banks
3.42 Commercial bank credit has, over time, been characterisedbysignificantfluctuations(beyondbaselinedevelopments)withthemaininfluencesbeing a strategic focus on household credit and idiosyncratic demand by large corporates and parastatals. Significantly, the householdsector has been the more malleable to product development and marketing efforts by the commercial banks while, in contrast, the same efforts focused on the small and medium scale enterprises have been less successful; thus the limited traction in relation to the desired areas for industrialisation. Even if it is rightly argued thatasignificantamountofhouseholdlendingis for wealth creation and small businesses, the project evaluation and monitoring is not aligned to assuring value-adding returns, thus resulting in marginal contribution to economic activity.
3.43 Overall, most of the business credit is allocated to trade and short-term working capital requirements for various businesses. While this is important and growth enhancing, there is need to support the prospects for other areas, in particular those relating to focus areas for industrialisation. As evident from
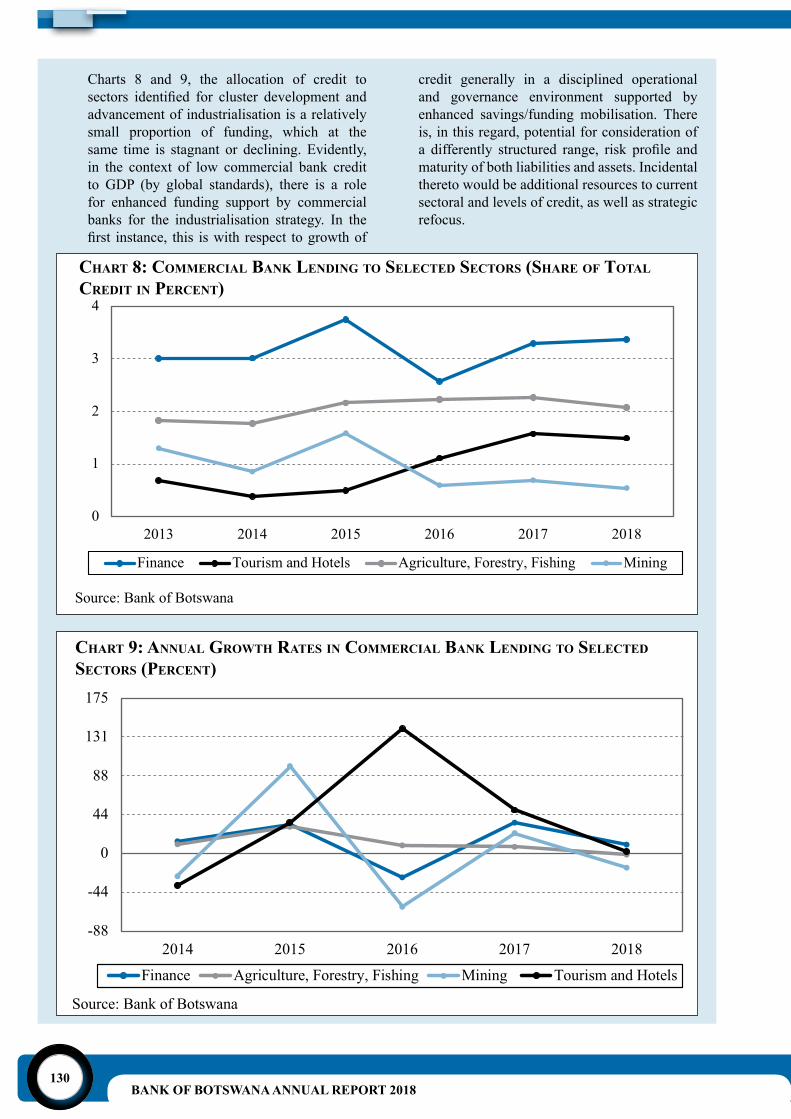
BANK OF BOTSWANA ANNUAL REPORT 2018130
Charts 8 and 9, the allocation of credit to sectors identified for cluster development andadvancement of industrialisation is a relatively small proportion of funding, which at the same time is stagnant or declining. Evidently, in the context of low commercial bank credit to GDP (by global standards), there is a role for enhanced funding support by commercial banks for the industrialisation strategy. In the first instance, this iswith respect togrowthof
credit generally in a disciplined operational and governance environment supported by enhanced savings/funding mobilisation. There is, in this regard, potential for consideration of a differently structured range, risk profile andmaturity of both liabilities and assets. Incidental thereto would be additional resources to current sectoral and levels of credit, as well as strategic refocus.
Chart 9: annUal growth rates in CoMMerCial Bank lending to seleCted seCtors (PerCent)
Chart 8: CoMMerCial Bank lending to seleCted seCtors (share of total Credit in PerCent)
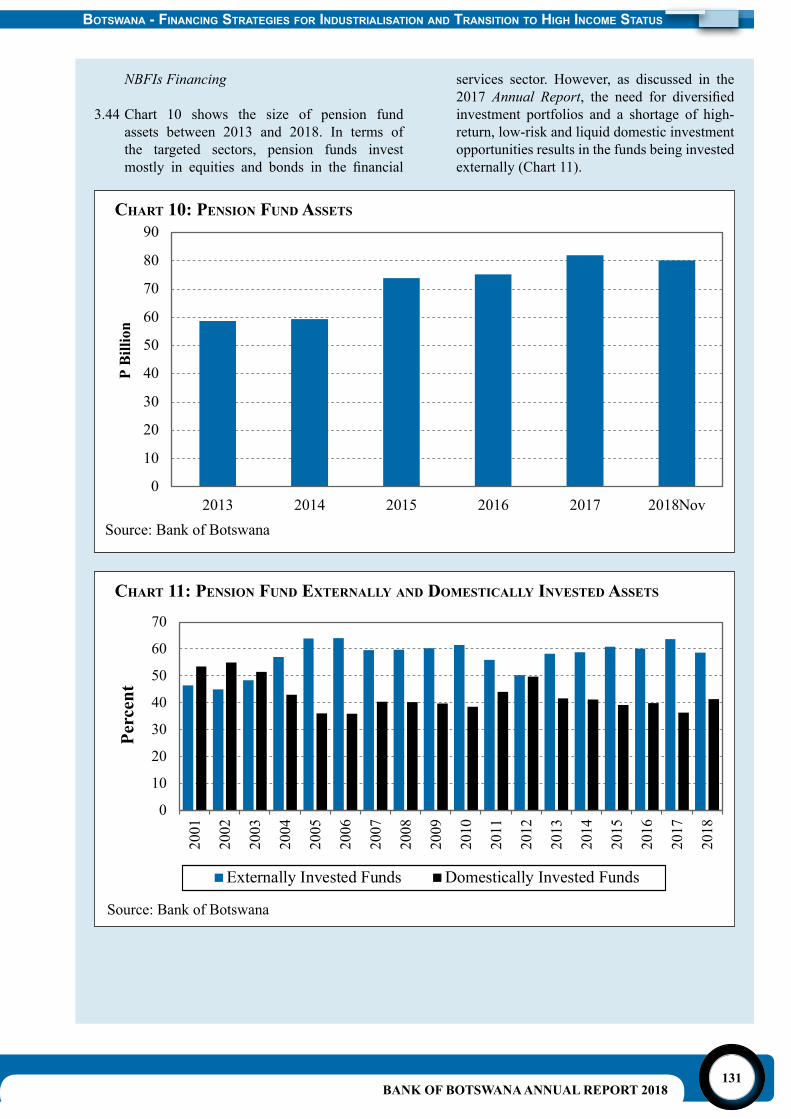
BANK OF BOTSWANA ANNUAL REPORT 2018131
BotSwana - Financing StrategieS For induStrialiSation and tranSition to high income StatuS
NBFIs Financing
3.44 Chart 10 shows the size of pension fund assets between 2013 and 2018. In terms of the targeted sectors, pension funds invest mostly in equities and bonds in the financial
services sector. However, as discussed in the 2017 Annual Report, the need for diversifiedinvestment portfolios and a shortage of high-return, low-risk and liquid domestic investment opportunities results in the funds being invested externally (Chart 11).
Chart 11: Pension fUnd externally and doMestiCally invested assets
Chart 10: Pension fUnd assets
BANK OF BOTSWANA ANNUAL REPORT 2018132
(iii) Other Private Sector Financing Options
3.45Other private sector financing options includeKgalagadi Breweries Limited (KBL) Kick-Start Finance, Debswana’s Peo Fund and micro-lenders. In the period between 2015 and 2017, the P36 million Peo Fund, which provided venture capital loans and equity financing, fundedmore than 60 businesses, creating over 1300 sustainable jobs. In the same way, Kick-Start Finance, a youth entrepreneurial development programme, benefited over 70 small mediumenterprises (SMEs) before being suspended due to lack of funds. The programme is set to be revived in 2019, with an annual budget of P1.5 million, which is expected to fund 15 new businesses each year. The potential for this type offinancingoptionissignificant,ashasbeentheexperience in countries such as South Africa. Micro-lenders are an equally viable option, with a loan portfolio of above P3.4 billion in 2018.
(e) The Impact of the Various Financing Options on Economic Activities
3.46The impact of these variousfinancing optionsvaries across countries. However, the consensus appears to be that government funding for infrastructure and social projects remains appropriate and impactful, especially for developing countries, notwithstanding that this is increasingly being mixed or privatised (in various forms) in the developed and emerging economies. In addition, the micro and social support segments continue to be an imperative for governments to support poverty alleviation, inclusive growth and entrepreneurship development programmes. Mandate-specificdevelopmentfinance institutions also continueto be involved in a wide spectrum of economic and development/inclusion-focused activity, but with mixed results specific to countries,depending on the governance culture. Overall, it is considered that the private sector has better promise in terms of productive and high return funding allocation, given better project/business proposal evaluation, monitoring and support capacity.
3.47 Periodic reviews of initiatives meant to support enterprise development are an important exercise
for ensuring that such initiatives remain relevant to their objectives. In cases where initiatives have been found to be underperforming, some have either been abandoned completely and replaced with new options or restructured accordingly.
(f) Challenges and Obstacles to Access to Finance in Botswana
3.48 As earlier discussed, Government has long recognised the financing needs for enterprisedevelopment and, to a large extent, implemented appropriate measures to bridge the financinggap. However, despite the efforts made by Government, the private sector and non-governmental organisations, access to financeremains a challenge. These range from the short-termnatureofbankingsectorfinancingtolackof a collateral registry, the land tenure system,62 as well as the shallowness of Botswana’s capital markets. The 2007 Botswana Institute for Development Policy Analysis study on SMMEs alsocitedlimitedaccesstofinanceasoneofthekey constraints to business growth in Botswana. Other studies, including the 2011 one by the World Bank Group, the Doing Business 2018 (Table 2) and the World Economic Forum’s Global Competitiveness Report (Table 3), also citelimitedaccesstofinanceasoneofthekeyconstraints to business growth in Botswana. The report ranked Botswana 90th out of 140 countries in 2018.
62 Under the current system, tribal land cannot be used as security for commercial or mortgage loans. However, Government has initiated a project, named Improvement to Land Administration Procedures, Capacity and Systems (LAPCAS), which is still ongoing. Once complete, this projectwill enable landowners to access financingfrom banks using their land as security.
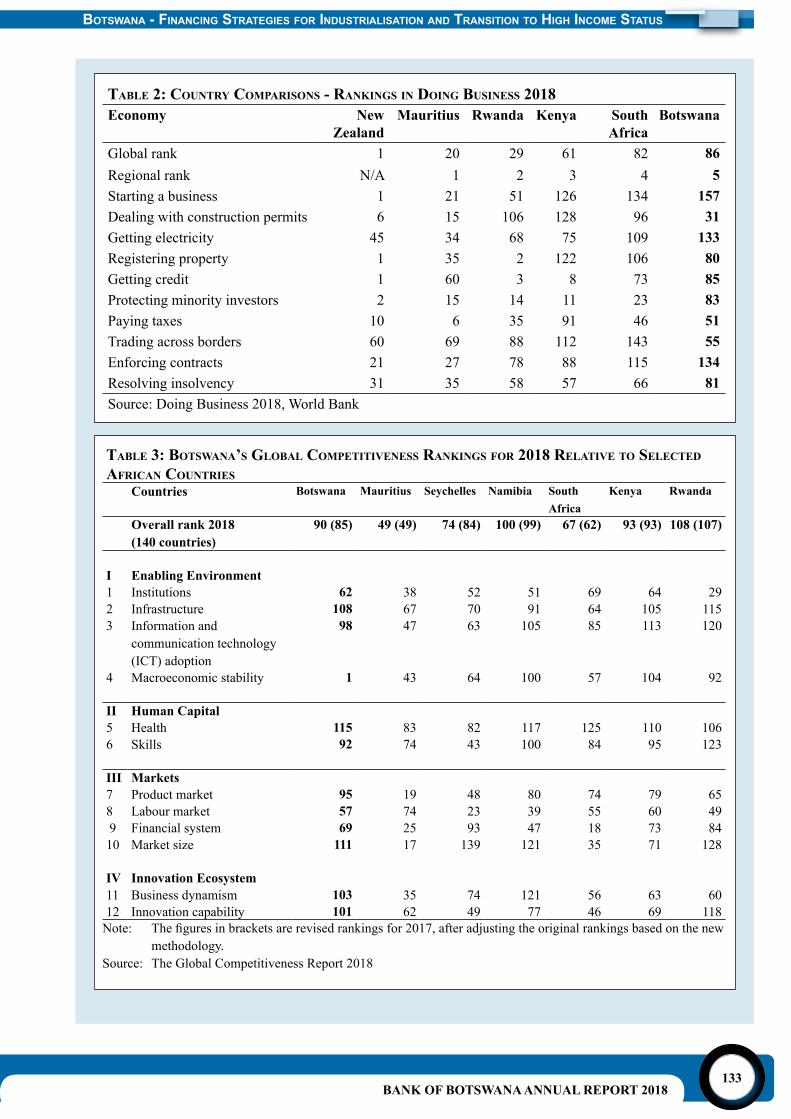
BANK OF BOTSWANA ANNUAL REPORT 2018133
BotSwana - Financing StrategieS For induStrialiSation and tranSition to high income StatuS
taBle 2: CoUntry CoMParisons - rankings in doing BUsiness 2018Economy New
ZealandMauritius Rwanda Kenya South
AfricaBotswana
Global rank 1 20 29 61 82 86Regional rank N/A 1 2 3 4 5Starting a business 1 21 51 126 134 157Dealing with construction permits 6 15 106 128 96 31Getting electricity 45 34 68 75 109 133Registering property 1 35 2 122 106 80Getting credit 1 60 3 8 73 85Protecting minority investors 2 15 14 11 23 83Paying taxes 10 6 35 91 46 51Trading across borders 60 69 88 112 143 55Enforcing contracts 21 27 78 88 115 134Resolving insolvency 31 35 58 57 66 81Source: Doing Business 2018, World Bank
taBle 3: Botswana’s gloBal CoMPetitiveness rankings for 2018 relative to seleCted afriCan CoUntries Countries Botswana Mauritius Seychelles Namibia South
AfricaKenya Rwanda
Overall rank 2018(140 countries)
90 (85) 49 (49) 74 (84) 100 (99) 67 (62) 93 (93) 108 (107)
I Enabling Environment1 Institutions 62 38 52 51 69 64 292 Infrastructure 108 67 70 91 64 105 1153 Information and
communication technology (ICT) adoption
98 47 63 105 85 113 120
4 Macroeconomic stability 1 43 64 100 57 104 92 II Human Capital5 Health 115 83 82 117 125 110 1066 Skills 92 74 43 100 84 95 123
III Markets7 Product market 95 19 48 80 74 79 658 Labour market 57 74 23 39 55 60 49 9 Financial system 69 25 93 47 18 73 8410 Market size 111 17 139 121 35 71 128
IV Innovation Ecosystem11 Business dynamism 103 35 74 121 56 63 6012 Innovation capability 101 62 49 77 46 69 118Note: Thefiguresinbracketsarerevisedrankingsfor2017,afteradjustingtheoriginalrankingsbasedonthenew
methodology.Source: The Global Competitiveness Report 2018
BANK OF BOTSWANA ANNUAL REPORT 2018134
3.49Given their role of financial intermediation,banks providemost of the finance needed forinvestment. Some of the major challenges withaccessingfinance frombanks include thematurity mismatch between loans and deposits, which limits the extent to which banking sector lending can bridge the long-term financingneeds; and low returns on financial assets,which weakens core deposit mobilisation. These challenges can be addressed by exploring options, such as loan syndication and bond issuance by banks. In addition, banks, given their interlinkages with pension funds, have the potential to access pension funds to bridge liquidity shortages.
3.50 With regard to the capital markets, it is widely recognised that well-developed capital markets are important in mobilising capital, and are able to harness a pool of savings to meet long-term investment needs. Stock and bond markets in Botswana play an important role of financing government, providing investmentopportunities for pension funds, life insurance and annuities, as well as new capital for private sector investment. However, capital markets in Botswana are shallow and illiquid, even with the marked improvements noted in recent years, in part, as a result of limited supply of government and corporate bonds.
3.51 The credit infrastructure is also a major challenge in Botswana due to the absence of well-functioning credit bureaux or collateral registry. While lenders may be justified inseeking collateral for credit extended, the lack of a formalised collateral registry means that often newfirms are unable tomeet thesedemands and this limits access to finance forstart-ups and firms wishing to expand. It isworth noting that the drafting of the Credit Information and Secured Transaction Bills is at an advance stage. Once approved by Parliament, the Credit Information Act will provide for a legal framework for the establishment and regulation of a credit information reporting regime and to appoint a supervisory authority to oversee the use of credit information, including for monitoring of risks and trends in the market, while the Secured Transaction Act will provide legal structures through which movable assets can effectively be used as collateral.
3.52 DFIs face several challenges. These include the small size of their portfolios; inability to utilise equity funding to improve local ownership of companies by citizens; the high number of non-performing assets; and limited government funding following the decision to decrease subventions. Some of these challenges have led to most of these DFIs making losses. The privately owned financial institutions are performingbetter than DFIs and they have various sources of funding they could tap into. However, their strategic objectives are not always fully aligned with government policy; hence, they may not necessarily provide funding to the target sectors without any explicit incentives.
3.53 Financing industrialisation, therefore, requires government to play a larger facilitative role in the allocation of financial resources in thedomestic economy, either through providing private financial institutions with incentivesor adequately resourcing DFIs. This calls for government to reform state-owned financialinstitutions by allowing them to source funding from both domestic and foreign markets; relieving them of non-performing assets;63 and to develop policies that will encourage privatelyownedfinancialinstitutionstopartnerwith DFIs in funding major industrial projects. There should also be incentives to ensure that the return on major industrial sector projects is better than prevailing interest rates on loans and advances.
3.54 Another challenge impeding industrialisation efforts is limited funding for Research and Development (R&D). At a nascent stage, businesses can ill-afford the high cost of R&D, and, as such, there is a need to establish funding for R&D and transferring the R&D outcomes to businesses to help improve their technological capabilities and production of high value goods, which could drive the country’s industrialisation. Government provides limited research grants to the Botswana Institute for Technology, Research and Innovation (BITRI) and other similar local institutions to conduct needs-based research and development in focussed areas. The Botswana
63 Relievingstate-ownedfinancialinstitutionsofnon-performingassetscould be in the form of setting up asset management companies. However, caution is advised regarding the moral hazard such a decision could pose, and credit-underwriting standards would have to be raised.
BANK OF BOTSWANA ANNUAL REPORT 2018135
BotSwana - Financing StrategieS For induStrialiSation and tranSition to high income StatuS
Innovation Hub is another institution which gives cash grants for R&D. The Botswana Innovation fund had P12 million for the 2018/19 financial year. While it is expected that bothBITRI and Botswana Innovation Hub should to do more to achieve their mandate of promoting research, technology and innovation-based entrepreneurship, there is need for government to develop patent laws to facilitate more funding for R&D in a secure investment environment.
3.55 A review of measures taken by other countries to address these challenges in their journey towards industrialisation provides practical experiences, which could form the basis of Botswana’s policy reforms towards financingfor industrialisation. The section that follows addresses these issues.
4. Cross-CoUntry exPerienCes and CoMParisons
4.1 To follow up the discussion in the preceding Section on the resource mobilisation for financingprospectsinBotswana,theexperienceof other countries that have pursued rapid industrialisation is germane for drawing lessons and guiding policy considerations.
4.2 Literature highlights the varying impact of alternativefinancingoptionsindifferentsettings,direct government funding, private sector led financing and private-public-partnerships.That is, whereas some governments took the lead by spending more of their budgets on industrial projects, including providing credit, others mainly relied on the private sector. For example, in Singapore and India, government setupstate-fundedfinancinginstitutions,whichwere mandated to support certain industries by offering loans at below-market interest rates; in other instances the government partnered with privatefinancialinstitutionstoprovidefunding.Notably, in Brazil, the Republic of Korea and South Africa, state-owned institutions have beenkeyinfinancingindustrialdevelopments.Most of these institutions have a diverse funding base, including resources from other financialinstitutionsandgovernmenttransfers.Furthermore, mandates of these institutions are broad, covering a wide range of sectors and activities and supporting both big and small businesses. Another successful variation is the
liberalisation of domestic markets and deliberate attraction of foreign investment in high technology sectors by using tax incentives and subsidised credit. Overall, a common success factor appears to be the attention, in terms of funding, to both targeted sectors and industries and the support infrastructure, services and resources, including research.
4.3 Traditionally, the Government has been responsible for funding and managing infrastructure development through accumulated fiscal savings from diamond sales (Section3), augmented by state-owned enterprises established to provide utilities and targeted services. While some of these were designated as commercial, the Government has, on a net basis, been a financier of these institutions(including through the provision of subsidies and/or suppressed user charges). In addition, as discussed in Section 3 and indicated in Table 4, state-owned enterprises, such as the BDC, NDB andCEDA,weresetuptobridgethefinancinggap for industrialisation. However, over time, there is a recognition that public funding alone may not be enough to finance the country’sindustrialisation process, especially considering the complementary resources required for successful and return-generating value-adding funding. Recently, the IMF Article IV Mission (2018) concluded that, “In recent years, sizable buffers and prudent policies have kept the economy stable. However, the diamond/public sector development model has reached its limit as evidenced by lower economic growth, slow job creation, and high income inequality.” The IMF, therefore, suggested “prudent financialpolicies and a focused set of reforms” towards an improvement in performance and outcomes. These reforms include the identification ofalternative sources of funding for industrial development.
(a) Development Finance Institutions
4.4 DFIs played a crucial role in industrialisation of most economies. Typically, they are state-owned and provide subsidised, long-term financing for industrial development. Unlikein Botswana where the focus for DFIs is on business financing, the initial mandate forthese institutions in some jurisdictions was on financing infrastructure as the backbone forindustrialisation (Table 4). For example, the
BANK OF BOTSWANA ANNUAL REPORT 2018136
Brazil National Development Bank (BNDES) investments included refurbishing the national railway system and building hydroelectric power plants, while in the Republic of Korea, the Korea Development Bank (KDB) invested in power plants, express highways and also aimed to accelerate the development of science and technology. In South Africa, the Industrial Development Corporation (IDC) was established to promote economic growth and industrial development with a focus on base and strategic industries, such as fuels, as well as basic chemicals and metals. In addition, the Land and Agricultural Development Bank of South Africa (LandBank), the leadingagriculturalfinancierin South Africa, focuses on primary agricultural production, offering tailor-made financialservices to both the established and emerging farmers.
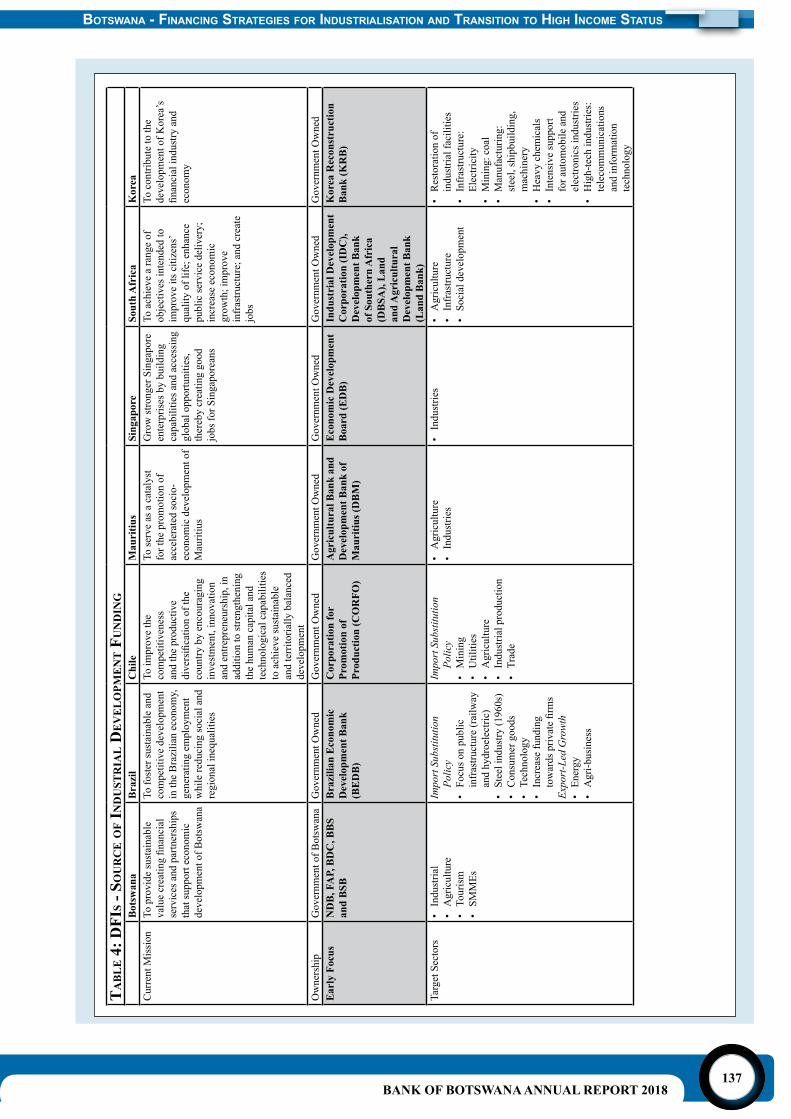
BANK OF BOTSWANA ANNUAL REPORT 2018137
BotSwana - Financing StrategieS For induStrialiSation and tranSition to high income StatuS
ta
Bl
e 4
: dfi
s - s
oU
rC
e o
f in
dU
str
ial d
ev
el
oPM
en
t f
Un
din
gB
otsw
ana
Bra
zil
Chi
leM
auri
tius
Sing
apor
eSo
uth
Afr
ica
Kor
eaC
urre
nt M
issi
onTo
pro
vide
sust
aina
ble
valuecreatingfinancial
serv
ices
and
par
tner
ship
s th
at su
ppor
t eco
nom
ic
deve
lopm
ent o
f Bot
swan
a
To fo
ster
sust
aina
ble
and
com
petit
ive
deve
lopm
ent
in th
e B
razi
lian
econ
omy,
ge
nera
ting
empl
oym
ent
whi
le re
duci
ng so
cial
and
re
gion
al in
equa
litie
s
To im
prov
e th
e co
mpe
titiv
enes
s an
d th
e pr
oduc
tive
diversificationofthe
coun
try b
y en
cour
agin
g in
vest
men
t, in
nova
tion
and
entre
pren
eurs
hip,
in
addi
tion
to st
reng
then
ing
the
hum
an c
apita
l and
te
chno
logi
cal c
apab
ilitie
s to
ach
ieve
sust
aina
ble
and
terr
itoria
lly b
alan
ced
deve
lopm
ent
To se
rve
as a
cat
alys
t fo
r the
pro
mot
ion
of
acce
lera
ted
soci
o-ec
onom
ic d
evel
opm
ent o
f M
aurit
ius
Gro
w st
rong
er S
inga
pore
en
terp
rises
by
build
ing
capa
bilit
ies a
nd a
cces
sing
gl
obal
opp
ortu
nitie
s, th
ereb
y cr
eatin
g go
od
jobs
for S
inga
pore
ans
To a
chie
ve a
rang
e of
ob
ject
ives
inte
nded
to
impr
ove
its c
itize
ns’
qual
ity o
f life
; enh
ance
pu
blic
serv
ice
deliv
ery;
in
crea
se e
cono
mic
gr
owth
; im
prov
e in
fras
truct
ure;
and
cre
ate
jobs
To c
ontri
bute
to th
e de
velo
pmen
t of K
orea
’s
financialindustryand
econ
omy
Ow
ners
hip
Gov
ernm
ent o
f Bot
swan
aG
over
nmen
t Ow
ned
Gov
ernm
ent O
wne
dG
over
nmen
t Ow
ned
Gov
ernm
ent O
wne
dG
over
nmen
t Ow
ned
Gov
ernm
ent O
wne
dE
arly
Foc
usN
DB
, FA
P, B
DC
, BB
S an
d B
SB
Bra
zilia
n E
cono
mic
D
evel
opm
ent B
ank
(BE
DB
)
Cor
pora
tion
for
Prom
otio
n of
Pr
oduc
tion
(CO
RFO
)
Agr
icul
tura
l Ban
k an
d D
evel
opm
ent B
ank
of
Mau
ritiu
s (D
BM
)
Eco
nom
ic D
evel
opm
ent
Boa
rd (E
DB
)In
dust
rial
Dev
elop
men
t C
orpo
ratio
n (I
DC
), D
evel
opm
ent B
ank
of S
outh
ern
Afr
ica
(DB
SA),
Lan
d an
d A
gric
ultu
ral
Dev
elop
men
t Ban
k (L
and
Ban
k)
Kor
ea R
econ
stru
ctio
n B
ank
(KR
B)
Targ
et S
ecto
rs•
Indu
stria
l •
Agr
icul
ture
• To
uris
m•
SMM
Es
Impo
rt S
ubst
itutio
n Po
licy
• Fo
cus o
n pu
blic
in
fras
truct
ure
(rai
lway
an
d hy
droe
lect
ric)
• St
eel i
ndus
try (1
960s
)•
Con
sum
er g
oods
• Te
chno
logy
• In
crea
se fu
ndin
g towardsprivatefirms
Expo
rt-L
ed G
row
th•
Ener
gy•
Agr
i-bus
ines
s
Impo
rt S
ubst
itutio
n Po
licy
• M
inin
g•
Util
ities
• A
gric
ultu
re•
Indu
stria
l pro
duct
ion
• Tr
ade
• A
gric
ultu
re•
Indu
strie
s•
Indu
strie
s•
Agr
icul
ture
• In
fras
truct
ure
• So
cial
dev
elop
men
t
• R
esto
ratio
n of
in
dust
rial f
acili
ties
• In
fras
truct
ure:
El
ectri
city
• M
inin
g: c
oal
• M
anuf
actu
ring:
st
eel,
ship
build
ing,
m
achi
nery
• H
eavy
che
mic
als
• In
tens
ive
supp
ort
for a
utom
obile
and
el
ectro
nics
indu
strie
s•
Hig
h-te
ch in
dust
ries:
te
leco
mm
unic
atio
ns
and
info
rmat
ion
tech
nolo
gy
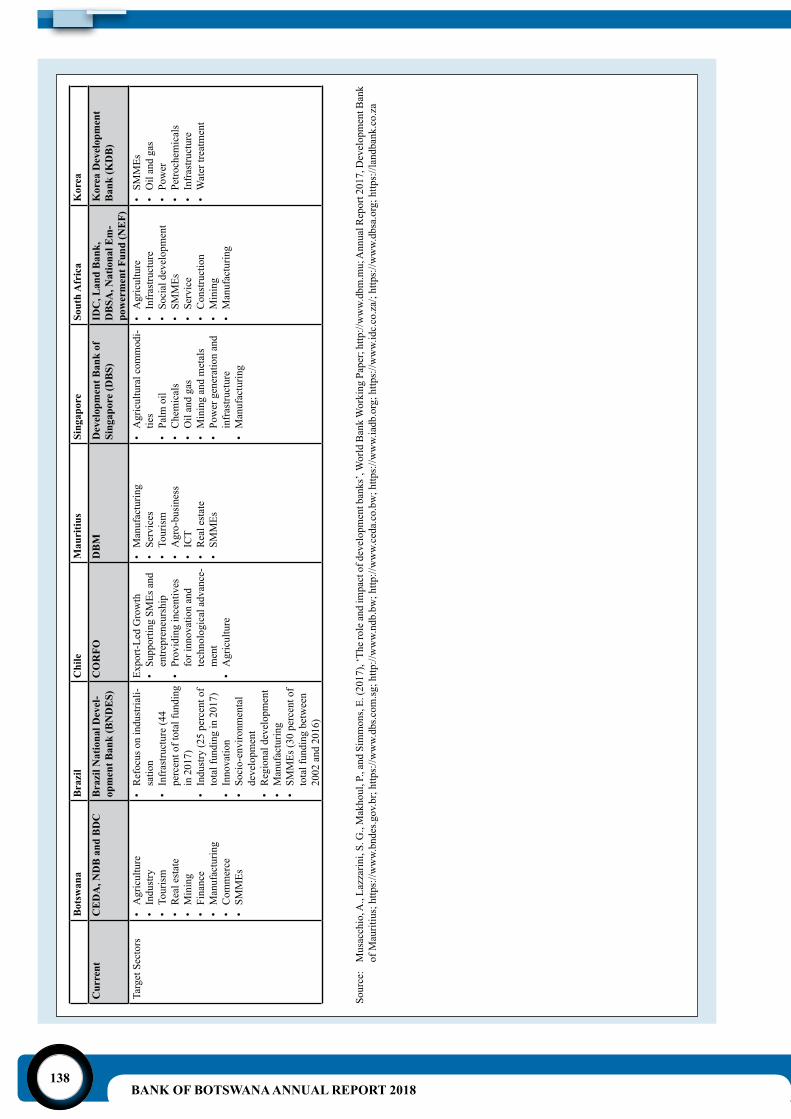
BANK OF BOTSWANA ANNUAL REPORT 2018138
Bot
swan
aB
razi
lC
hile
Mau
ritiu
sSi
ngap
ore
Sout
h A
fric
aK
orea
Cur
rent
C
ED
A, N
DB
and
BD
CB
razi
l Nat
iona
l Dev
el-
opm
ent B
ank
(BN
DE
S)C
OR
FOD
BM
Dev
elop
men
t Ban
k of
Si
ngap
ore
(DB
S)ID
C, L
and
Ban
k,
DB
SA, N
atio
nal E
m-
pow
erm
ent F
und
(NE
F)
Kor
ea D
evel
opm
ent
Ban
k (K
DB
)
Targ
et S
ecto
rs•
Agr
icul
ture
• In
dust
ry•
Tour
ism
• R
eal e
stat
e•
Min
ing
• Fi
nanc
e•
Man
ufac
turin
g•
Com
mer
ce•
SMM
Es
• R
efoc
us o
n in
dust
riali-
satio
n•
Infr
astru
ctur
e (4
4 pe
rcen
t of t
otal
fund
ing
in 2
017)
• In
dust
ry (2
5 pe
rcen
t of
tota
l fun
ding
in 2
017)
• In
nova
tion
• So
cio-
envi
ronm
enta
l de
velo
pmen
t•
Reg
iona
l dev
elop
men
t•
Man
ufac
turin
g•
SMM
Es (3
0 pe
rcen
t of
tota
l fun
ding
bet
wee
n 20
02 a
nd 2
016)
Expo
rt-Le
d G
row
th•
Supp
ortin
g SM
Es a
nd
entre
pren
eurs
hip
• Pr
ovid
ing
ince
ntiv
es
for i
nnov
atio
n an
d te
chno
logi
cal a
dvan
ce-
men
t•
Agr
icul
ture
• M
anuf
actu
ring
• Se
rvic
es•
Tour
ism
• A
gro-
busi
ness
• IC
T•
Rea
l est
ate
• SM
MEs
• A
gric
ultu
ral c
omm
odi-
ties
• Pa
lm o
il•
Che
mic
als
• O
il an
d ga
s•
Min
ing
and
met
als
• Po
wer
gen
erat
ion
and
infr
astru
ctur
e•
Man
ufac
turin
g
• A
gric
ultu
re•
Infr
astru
ctur
e•
Soci
al d
evel
opm
ent
• SM
MEs
• Se
rvic
e•
Con
stru
ctio
n•
Min
ing
• M
anuf
actu
ring
• SM
MEs
• O
il an
d ga
s•
Pow
er•
Petro
chem
ical
s •
Infr
astru
ctur
e•
Wat
er tr
eatm
ent
Sour
ce:
Mus
acch
io, A
., La
zzar
ini,
S. G
., M
akho
ul, P
., an
d Si
mm
ons,
E. (2
017)
, ‘Th
e rol
e and
impa
ct o
f dev
elop
men
t ban
ks’,
Wor
ld B
ank
Wor
king
Pap
er; h
ttp://
ww
w.db
m.m
u; A
nnua
l Rep
ort 2
017,
Dev
elop
men
t Ban
k of
Mau
ritiu
s; h
ttps:
//ww
w.bn
des.g
ov.b
r; ht
tps:
//ww
w.db
s.com
.sg; h
ttp://
ww
w.nd
b.bw
; http
://w
ww.
ceda
.co.
bw; h
ttps:
//ww
w.ia
db.o
rg; h
ttps:
//ww
w.id
c.co
.za/
; http
s://w
ww.
dbsa
.org
; http
s://l
andb
ank.
co.z
a
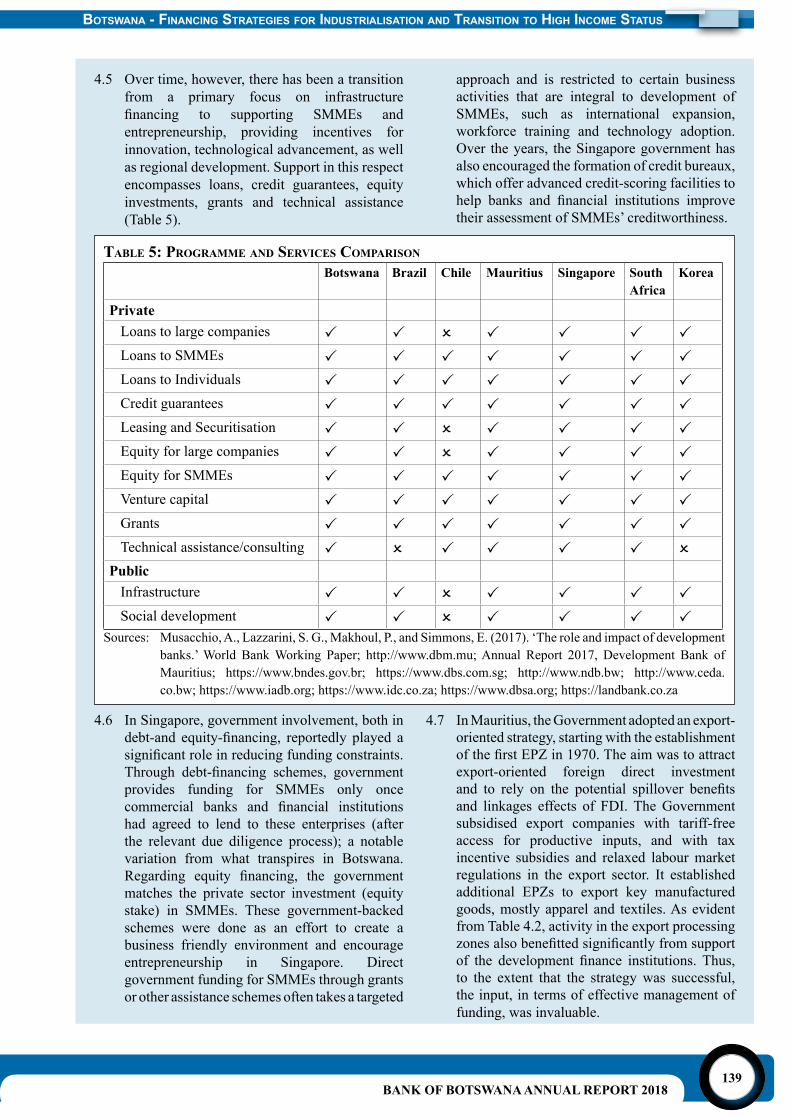
BANK OF BOTSWANA ANNUAL REPORT 2018139
BotSwana - Financing StrategieS For induStrialiSation and tranSition to high income StatuS
4.5 Over time, however, there has been a transition from a primary focus on infrastructure financing to supporting SMMEs andentrepreneurship, providing incentives for innovation, technological advancement, as well as regional development. Support in this respect encompasses loans, credit guarantees, equity investments, grants and technical assistance (Table 5).
taBle 5: PrograMMe and serviCes CoMParison
Botswana Brazil Chile Mauritius Singapore South Africa
Korea
PrivateLoans to large companies P P O P P P PLoans to SMMEs P P P P P P PLoans to Individuals P P P P P P PCredit guarantees P P P P P P PLeasing and Securitisation P P O P P P PEquity for large companies P P O P P P PEquity for SMMEs P P P P P P PVenture capital P P P P P P PGrants P P P P P P PTechnical assistance/consulting P O P P P P O
PublicInfrastructure P P O P P P PSocial development P P O P P P P
Sources: Musacchio, A., Lazzarini, S. G., Makhoul, P., and Simmons, E. (2017). ‘The role and impact of development banks.’ World Bank Working Paper; http://www.dbm.mu; Annual Report 2017, Development Bank of Mauritius; https://www.bndes.gov.br; https://www.dbs.com.sg; http://www.ndb.bw; http://www.ceda.co.bw; https://www.iadb.org; https://www.idc.co.za; https://www.dbsa.org; https://landbank.co.za
4.6 In Singapore, government involvement, both in debt-and equity-financing, reportedly played asignificantroleinreducingfundingconstraints.Through debt-financing schemes, governmentprovides funding for SMMEs only once commercial banks and financial institutionshad agreed to lend to these enterprises (after the relevant due diligence process); a notable variation from what transpires in Botswana. Regarding equity financing, the governmentmatches the private sector investment (equity stake) in SMMEs. These government-backed schemes were done as an effort to create a business friendly environment and encourage entrepreneurship in Singapore. Direct government funding for SMMEs through grants or other assistance schemes often takes a targeted
approach and is restricted to certain business activities that are integral to development of SMMEs, such as international expansion, workforce training and technology adoption. Over the years, the Singapore government has also encouraged the formation of credit bureaux, which offer advanced credit-scoring facilities to help banks and financial institutions improvetheir assessment of SMMEs’ creditworthiness.
4.7 In Mauritius, the Government adopted an export-oriented strategy, starting with the establishment ofthefirstEPZin1970.Theaimwastoattractexport-oriented foreign direct investment and to rely on the potential spillover benefitsand linkages effects of FDI. The Government subsidised export companies with tariff-free access for productive inputs, and with tax incentive subsidies and relaxed labour market regulations in the export sector. It established additional EPZs to export key manufactured goods, mostly apparel and textiles. As evident from Table 4.2, activity in the export processing zonesalsobenefittedsignificantlyfromsupportof the development finance institutions. Thus,to the extent that the strategy was successful, the input, in terms of effective management of funding, was invaluable.

BANK OF BOTSWANA ANNUAL REPORT 2018140
4.8 In Korea, initial efforts at industrialisation from the early 1960s focused on building up and expanding manufactured exports, and involved prioritising labour-intensive manufacturing. In the early phases of development, government control and direction of the banking sector ensured that credit went to these priority areas. Export promotion measures included subsidised credit for working and investment capital, preferential access to licences for imports and foreign exchange, direct cash payments, and duty-free access to imported inputs used in exports. Firms set specific export targets andreceipt of long-term credit was linked directly with past achievements in meeting these targets. From the late 1960s, priority activities shifted to the production of intermediate industrial products and capital-intensive industries in the heavy and chemical industries. This was part of a move to diversify and upgrade the structure of exports. Six sectors (steel, petrochemicals, non-ferrous metals, shipbuilding, electronics and machinery) were prioritised. These were given short-term export targets and funds (policy loans) were channelled to these priority sectors.
4.9 Around the 1980s, Korea relaxed the highly selective measures and a more functional, but nonetheless, still interventionist government strategy was followed. Bank credit allocation atthistimewasstillinfluencedbygovernment,although the role of policy loans was scaled down. Loans continued to be channelled to identified priority areas and firms, althoughthis shifted in the 1980s, with a new focus on SMMEs, advanced technology activities and firmsinneedofrestructuring.
4.10 The Chilean CORFO is relatively more focused on entrepreneurship and building a knowledge-based economy. CORFO focus on the domestic market and supports the private sector, using a combination of loans, grants and equity to promote SMMEs. On the opposite end of the spectrum, the BNDES focuses on industrial development and operates extensively in both the international markets and the Brazilian market. The BNDES providing loans and equity investments for large corporations (private and public) to both aid their growth in Brazil and support their internationalisation. The BNDES
also offers angel equity,64 venture capital funding and private equity. Angel funding is directed towards SMMEs, while private equity is directed towards innovation and supply chain improvements.
4.11 Evidently, DFIs in Botswana and in all the comparator countries focus on supporting the private sector, using a combination of loans, grants, equity and guarantees to fund large companies and promote SMMEs. However, funding in Botswana is limited compared to the comparator counties. As indicated in Chart 12 below, in Botswana, the ratio of DFIs’ total loans to GDP has been consistently low, averaging 3.5 percent in the period 2010 to 2017, compared to 29.2 percent in Singapore, 7.9 percent in South Korea, 6.6 percent in Brazil and 4.6 percent in Chile. To provide context, the relative size of deposit-taking institutions’ lending to GDP in the respective countries is significantly higherthan in Botswana (Table 6). This is clearly indicativeofasignificantfinancialresourcegapin Botswana compared to other countries.
4.12 Most of the DFIs in the comparator countries also use asset securitisation as a funding alternative, an option that is not actively used in Botswana. That is, these institutions create and issue tradable securities, such as mortgage-backed securities and credit default swaps that are backed by the income generated by an asset, a loan, a public works project or other revenue source. Furthermore, credit sharing schemes, such as loan syndications for large infrastructure projects, are widely used in comparator jurisdictions.
4.13 DFIs also require an enabling environment that enhances domestic capacity, such as good corporate governance,65 a critical component for the success of DFIs. The quality of governance and management is often the difference between the success and failure of
64 Angel equity (sometimes referred to as angel investment) refers to funding of start-up investments in exchange for ownership equity or convertible debt. This type of equity is not based on the viability of a business but rather on helping a business to take-off; thus fosters innovation, which is vital for economic growth (https://www.forbes.com/sites/allbusiness/2015/02/05/20-things-all-entrepreneurs-should-know-about-angel-investors/#4616c2dac1aa).
65 Corporate governance refers to the structures and processes for the direction and control of companies.
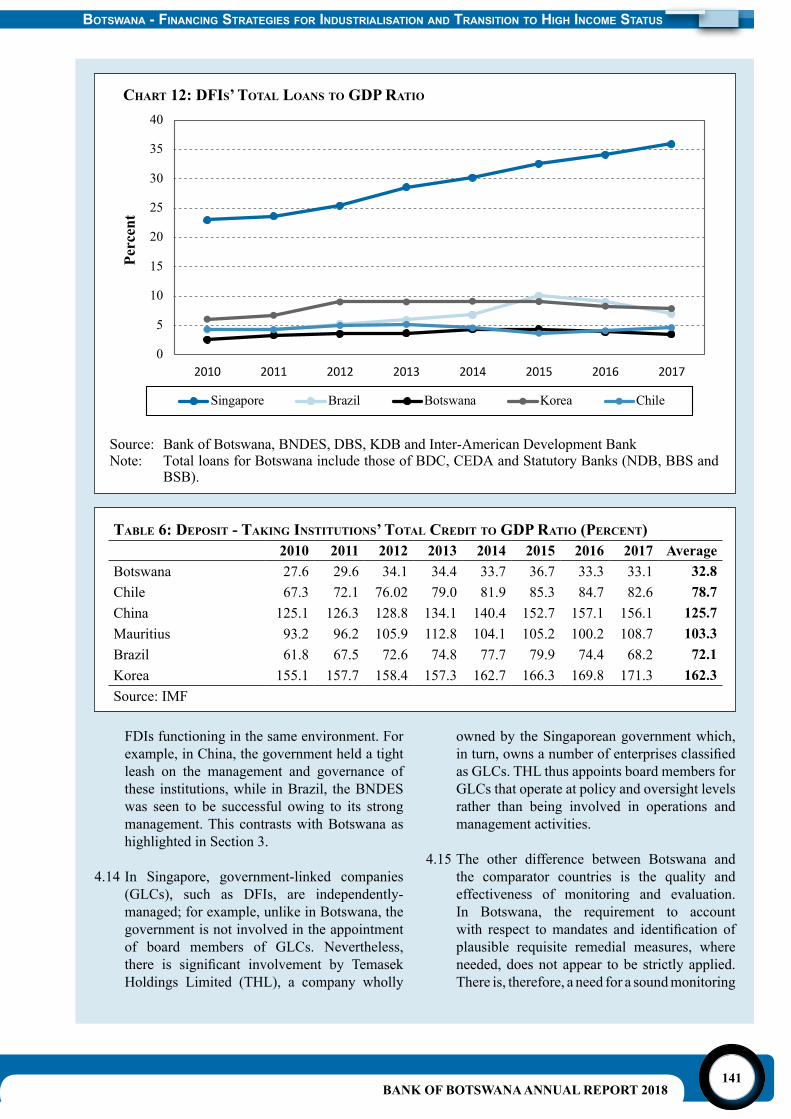
BANK OF BOTSWANA ANNUAL REPORT 2018141
BotSwana - Financing StrategieS For induStrialiSation and tranSition to high income StatuS
taBle 6: dePosit - taking institUtions’ total Credit to gdP ratio (PerCent)2010 2011 2012 2013 2014 2015 2016 2017 Average
Botswana 27.6 29.6 34.1 34.4 33.7 36.7 33.3 33.1 32.8Chile 67.3 72.1 76.02 79.0 81.9 85.3 84.7 82.6 78.7China 125.1 126.3 128.8 134.1 140.4 152.7 157.1 156.1 125.7Mauritius 93.2 96.2 105.9 112.8 104.1 105.2 100.2 108.7 103.3Brazil 61.8 67.5 72.6 74.8 77.7 79.9 74.4 68.2 72.1Korea 155.1 157.7 158.4 157.3 162.7 166.3 169.8 171.3 162.3Source: IMF
FDIs functioning in the same environment. For example, in China, the government held a tight leash on the management and governance of these institutions, while in Brazil, the BNDES was seen to be successful owing to its strong management. This contrasts with Botswana as highlighted in Section 3.
4.14 In Singapore, government-linked companies (GLCs), such as DFIs, are independently- managed; for example, unlike in Botswana, the government is not involved in the appointment of board members of GLCs. Nevertheless, there is significant involvement by TemasekHoldings Limited (THL), a company wholly
owned by the Singaporean government which, inturn,ownsanumberofenterprisesclassifiedas GLCs. THL thus appoints board members for GLCs that operate at policy and oversight levels rather than being involved in operations and management activities.
4.15 The other difference between Botswana and the comparator countries is the quality and effectiveness of monitoring and evaluation. In Botswana, the requirement to account with respect tomandates and identification ofplausible requisite remedial measures, where needed, does not appear to be strictly applied. There is, therefore, a need for a sound monitoring
Chart 12: dfis’ total loans to gdP ratio
BANK OF BOTSWANA ANNUAL REPORT 2018142
and evaluation framework, as the absence of such can progressively stretch the tolerance range for ineffective performance. Given its mandate, there is also a level of expectation for the Public Enterprises Evaluation and Privatisation Agency (PEEPA) to account for its impact in monitoring the performance of public institutions in meeting their objectives and targets. Notably, PEEPA also advises Government on the appointment of directors to serve on boards of public institutions and monitor their performance. Therefore, PEEPA should enhance their monitoring and evaluation efforts and encourage accountability of the DFIs and generate a performance scorecard, including for its own performance.
(i) Commercial Bank Funding
4.16As highlighted above, the significant publicsectorfinancingofbusinessesdoesnotdetractfrom commercial bank lending. For example, for the period 2013 – 2018, the 37.2 percent average for commercial bank lending to businesses as a share of total credit in Botswana compares with average shares of 85.9 percent, 60.2 percent and 34.8 percent for Mauritius, Singapore and Brazil, respectively. This relatively low level of access to financial resources is alsomanifest with respect to sectoral credit for targeted sectors (Charts 13 – 16). The notable example relates to the tourism sector, where a share of one percent in total commercial bank credit in Botswana compares with 15.9 percent in Mauritius. This is a relevant focus area for Botswana, as tourism is increasingly viewed by many countries as potential platform for enhanced industrialisation and development, including in the advanced and emerging market economies. Thus the investment in requisite infrastructure and improvements in service and standards to promote development of this sector. Furthermore, tourism-friendly policies and initiatives are generally implemented to allow for a conducive environment in the tourism sector. In Botswana, the tourism sector has significant potential, with scope for boththe spread of activities and value. According to the 2018 United Nations World Tourism Organisation (UNWTO) report, Botswana accounts for 1.9 percent to the international tourism receipts. Thus, the need for support for infrastructure and services and the tourism businesses/ventures. As it has been alluded
to in the previous section, there is need for infrastructure development, more especially air travel infrastructure (frequency of flights,well-equipped airports), which can boost both the tourism receipts and the number of tourist arrivals in Botswana.
4.17 Another interesting example is the stipulation of an 18 percent minimum share of lending to the agriculture sector in India where, reportedly, the impact on sectoral performance has been significant.66 However, this is in the context of substantial government ownership of commercial banks. For Botswana, the share of lending to agriculture averaged 2.1 percent for the period 2013 - 2018. The situation for the manufacturing sector, which is a target sector for economic growth in several countries, is less diverse; for instance, the respective shares in total lending for Botswana, Brazil, Mauritius and Singapore were, on average 6.1 percent, 12 percent, 7.2 percent and 4.5 percent for the period 2013 - 2018.
66 For example, credit flow to agriculture increased from Rs695.6billion to Rs4 682.9 billion between 2002-03 and 2010-11.
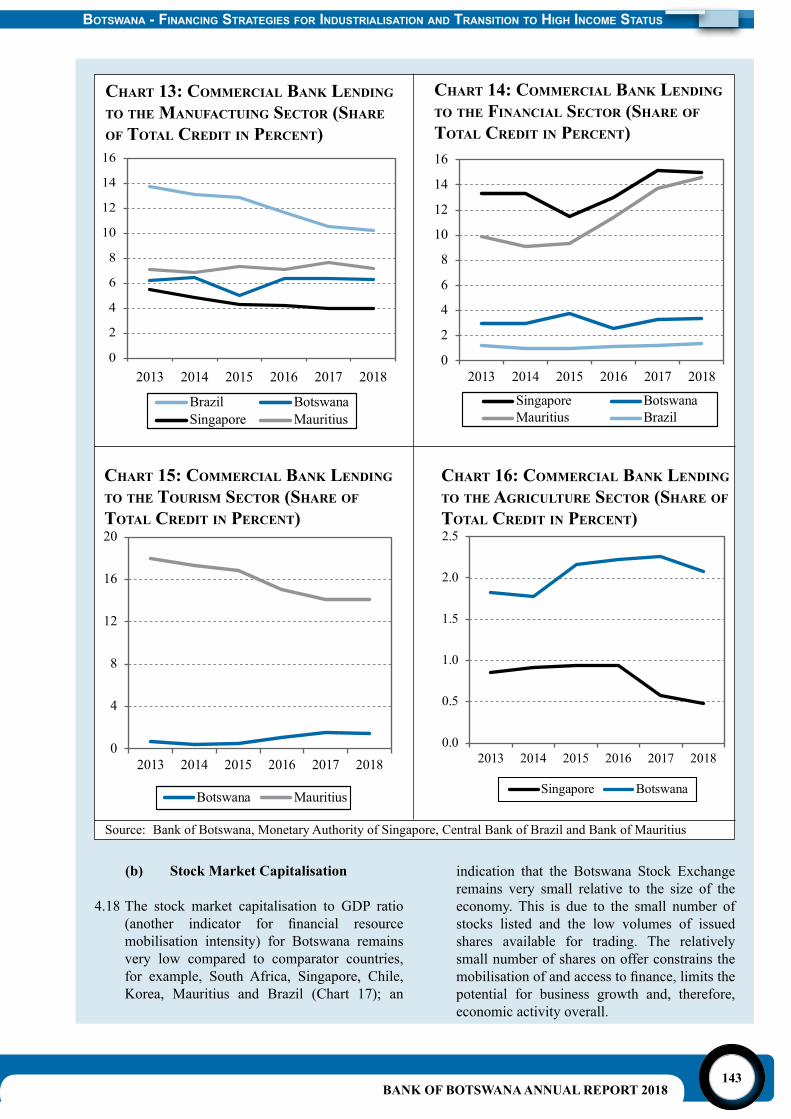
BANK OF BOTSWANA ANNUAL REPORT 2018143
BotSwana - Financing StrategieS For induStrialiSation and tranSition to high income StatuS
Chart 13: CoMMerCial Bank lending to the ManUfaCtUing seCtor (share of total Credit in PerCent)
Chart 14: CoMMerCial Bank lending to the finanCial seCtor (share of total Credit in PerCent)
Chart 15: CoMMerCial Bank lending to the toUrisM seCtor (share of total Credit in PerCent)
Chart 16: CoMMerCial Bank lending to the agriCUltUre seCtor (share of total Credit in PerCent)
Source: Bank of Botswana, Monetary Authority of Singapore, Central Bank of Brazil and Bank of Mauritius
(b) Stock Market Capitalisation
4.18 The stock market capitalisation to GDP ratio (another indicator for financial resourcemobilisation intensity) for Botswana remains very low compared to comparator countries, for example, South Africa, Singapore, Chile, Korea, Mauritius and Brazil (Chart 17); an
indication that the Botswana Stock Exchange remains very small relative to the size of the economy. This is due to the small number of stocks listed and the low volumes of issued shares available for trading. The relatively small number of shares on offer constrains the mobilisationofandaccesstofinance,limitsthepotential for business growth and, therefore, economic activity overall.
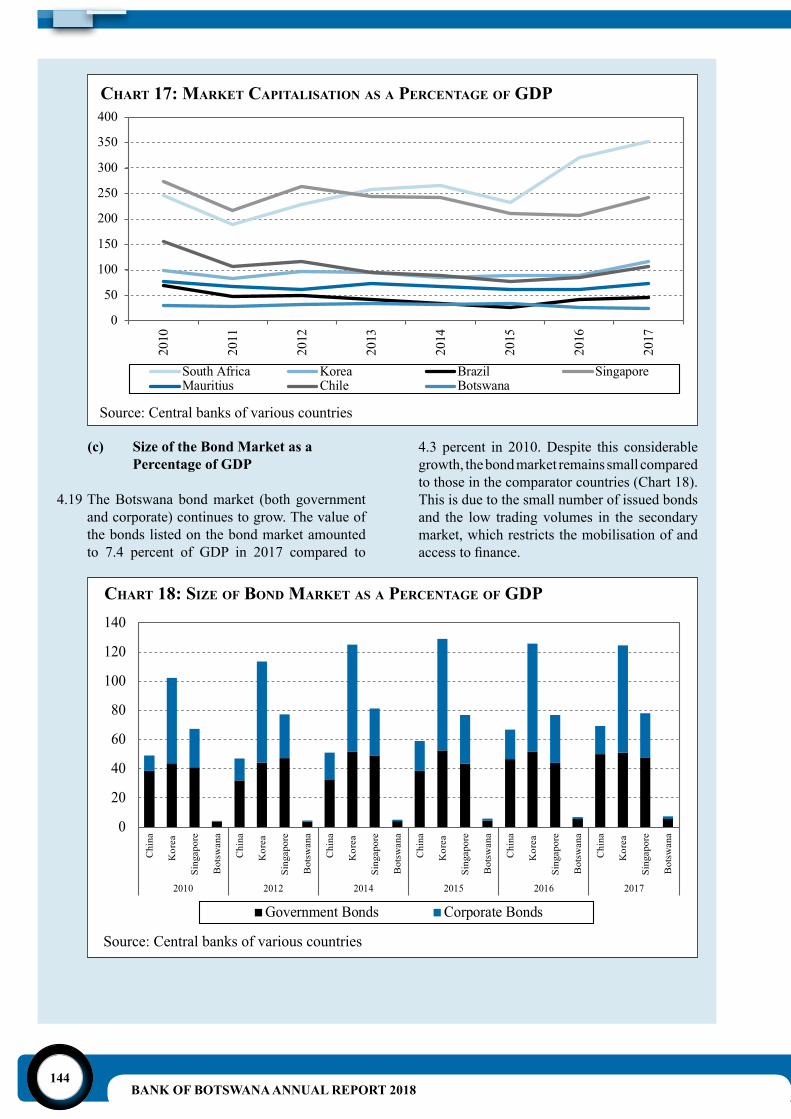
BANK OF BOTSWANA ANNUAL REPORT 2018144
Chart 17: Market CaPitalisation as a PerCentage of gdP
(c) Size of the Bond Market as a Percentage of GDP
4.19 The Botswana bond market (both government and corporate) continues to grow. The value of the bonds listed on the bond market amounted to 7.4 percent of GDP in 2017 compared to
4.3 percent in 2010. Despite this considerable growth, the bond market remains small compared to those in the comparator countries (Chart 18). This is due to the small number of issued bonds and the low trading volumes in the secondary market, which restricts the mobilisation of and accesstofinance.
Chart 18: siZe of Bond Market as a PerCentage of gdP
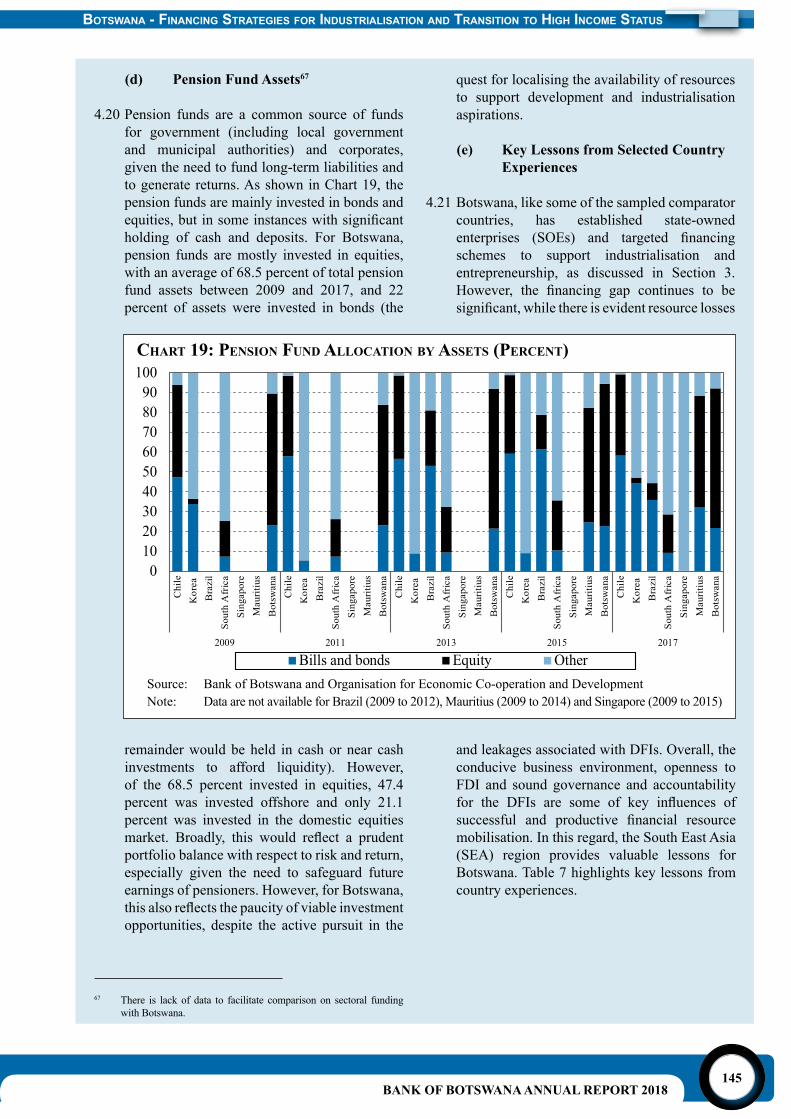
BANK OF BOTSWANA ANNUAL REPORT 2018145
BotSwana - Financing StrategieS For induStrialiSation and tranSition to high income StatuS
Chart 19: Pension fUnd alloCation By assets (PerCent)
(d) Pension Fund Assets67
4.20 Pension funds are a common source of funds for government (including local government and municipal authorities) and corporates, given the need to fund long-term liabilities and to generate returns. As shown in Chart 19, the pension funds are mainly invested in bonds and equities,butinsomeinstanceswithsignificantholding of cash and deposits. For Botswana, pension funds are mostly invested in equities, with an average of 68.5 percent of total pension fund assets between 2009 and 2017, and 22 percent of assets were invested in bonds (the
quest for localising the availability of resources to support development and industrialisation aspirations.
(e) Key Lessons from Selected Country Experiences
4.21 Botswana, like some of the sampled comparator countries, has established state-owned enterprises (SOEs) and targeted financingschemes to support industrialisation and entrepreneurship, as discussed in Section 3. However, the financing gap continues to besignificant,whilethereisevidentresourcelosses
Source: Bank of Botswana and Organisation for Economic Co-operation and DevelopmentNote: Data are not available for Brazil (2009 to 2012), Mauritius (2009 to 2014) and Singapore (2009 to 2015)
and leakages associated with DFIs. Overall, the conducive business environment, openness to FDI and sound governance and accountability for the DFIs are some of key influences ofsuccessful and productive financial resourcemobilisation. In this regard, the South East Asia (SEA) region provides valuable lessons for Botswana. Table 7 highlights key lessons from country experiences.
remainder would be held in cash or near cash investments to afford liquidity). However, of the 68.5 percent invested in equities, 47.4 percent was invested offshore and only 21.1 percent was invested in the domestic equities market. Broadly, this would reflect a prudentportfolio balance with respect to risk and return, especially given the need to safeguard future earnings of pensioners. However, for Botswana, thisalsoreflectsthepaucityofviableinvestmentopportunities, despite the active pursuit in the
67 There is lack of data to facilitate comparison on sectoral funding with Botswana.
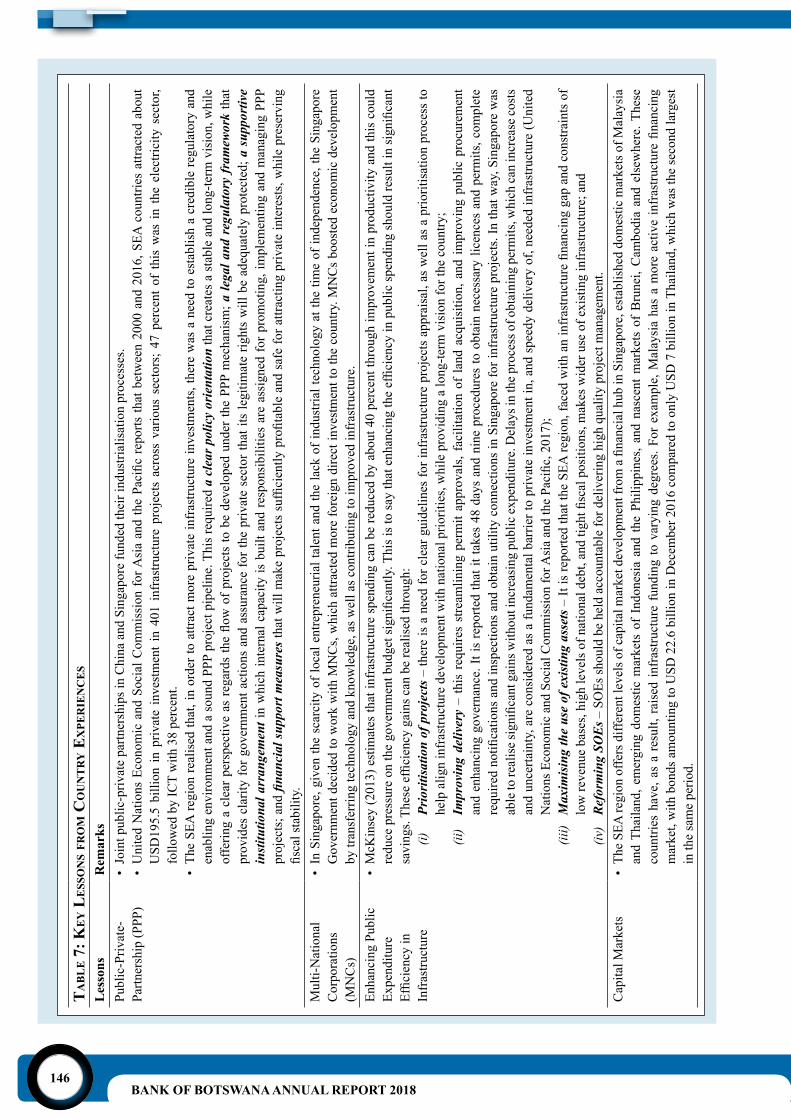
BANK OF BOTSWANA ANNUAL REPORT 2018146
ta
Bl
e 7
: ke
y l
ess
on
s fr
oM
Co
Un
tr
y e
xPe
rie
nC
es
Les
sons
Rem
arks
Publ
ic-P
rivat
e-Pa
rtner
ship
(PPP
)•
Join
t pub
lic-p
rivat
e pa
rtner
ship
s in
Chi
na a
nd S
inga
pore
fund
ed th
eir i
ndus
trial
isat
ion
proc
esse
s.•UnitedNationsEconomicandSocialC
ommissionforAsiaandthePacificreportsthatbetween2000and2016,SEA
countriesattractedabout
USD
195.
5 bi
llion
in
priv
ate
inve
stm
ent
in 4
01 i
nfra
stru
ctur
e pr
ojec
ts a
cros
s va
rious
sec
tors
; 47
per
cent
of
this
was
in
the
elec
trici
ty s
ecto
r, fo
llow
ed b
y IC
T w
ith 3
8 pe
rcen
t. •
The
SEA
regi
on re
alis
ed th
at, i
n or
der t
o at
tract
mor
e pr
ivat
e in
fras
truct
ure
inve
stm
ents
, the
re w
as a
nee
d to
est
ablis
h a
cred
ible
regu
lato
ry a
nd
enab
ling
envi
ronm
ent a
nd a
soun
d PP
P pr
ojec
t pip
elin
e. T
his r
equi
red
a cl
ear p
olic
y or
ient
atio
n th
at c
reat
es a
stab
le a
nd lo
ng-te
rm v
isio
n, w
hile
offeringaclearperspectiveasregardstheflowofprojectstobedevelopedunderthePPPmechanism
;a le
gal a
nd r
egul
ator
y fr
amew
ork
that
pr
ovid
es c
larit
y fo
r gov
ernm
ent a
ctio
ns a
nd a
ssur
ance
for t
he p
rivat
e se
ctor
that
its
legi
timat
e rig
hts
will
be
adeq
uate
ly p
rote
cted
; a s
uppo
rtiv
e in
stitu
tiona
l arr
ange
men
t in
whi
ch in
tern
al c
apac
ity is
bui
lt an
d re
spon
sibi
litie
s ar
e as
sign
ed fo
r pro
mot
ing,
impl
emen
ting
and
man
agin
g PP
P pr
ojec
ts; a
nd fi
nanc
ial s
uppo
rt m
easu
resthatwillmakeprojectssufficientlyprofitableandsafeforattractingprivateinterests,whilepreserving
fiscalstability.
Mul
ti-N
atio
nal
Cor
pora
tions
(M
NC
s)
• In
Sin
gapo
re, g
iven
the
scar
city
of l
ocal
ent
repr
eneu
rial t
alen
t and
the
lack
of i
ndus
trial
tech
nolo
gy a
t the
tim
e of
inde
pend
ence
, the
Sin
gapo
re
Gov
ernm
ent d
ecid
ed to
wor
k w
ith M
NC
s, w
hich
attr
acte
d m
ore
fore
ign
dire
ct in
vest
men
t to
the
coun
try. M
NC
s bo
oste
d ec
onom
ic d
evel
opm
ent
by tr
ansf
errin
g te
chno
logy
and
kno
wle
dge,
as w
ell a
s con
tribu
ting
to im
prov
ed in
fras
truct
ure.
Enha
ncin
g Pu
blic
Ex
pend
iture
Efficiencyin
Infr
astru
ctur
e
• M
cKin
sey
(201
3) e
stim
ates
that
infr
astru
ctur
e sp
endi
ng c
an b
e re
duce
d by
abo
ut 4
0 pe
rcen
t thr
ough
impr
ovem
ent i
n pr
oduc
tivity
and
this
cou
ld
reducepressureonthegovernmentbudgetsignificantly.Thisistosaythatenhancingtheefficiencyinpublicsp
endingsh
ouldresultinsignificant
savings.Theseefficiencygainscanberealisedthrough:
(i)
Prio
ritis
atio
n of
pro
ject
s –
ther
e is
a n
eed
for c
lear
gui
delin
es fo
r inf
rast
ruct
ure
proj
ects
app
rais
al, a
s w
ell a
s a
prio
ritis
atio
n pr
oces
s to
he
lp a
lign
infr
astru
ctur
e de
velo
pmen
t with
nat
iona
l prio
ritie
s, w
hile
pro
vidi
ng a
long
-term
vis
ion
for t
he c
ount
ry;
(ii)
Impr
ovin
g de
liver
y –
this
req
uire
s st
ream
linin
g pe
rmit
appr
oval
s, fa
cilit
atio
n of
land
acq
uisi
tion,
and
impr
ovin
g pu
blic
pro
cure
men
t an
d en
hanc
ing
gove
rnan
ce. I
t is
repo
rted
that
it ta
kes
48 d
ays
and
nine
pro
cedu
res
to o
btai
n ne
cess
ary
licen
ces
and
perm
its, c
ompl
ete
requirednotificationsandinspectionsandobtainutilityconnectionsinSingaporeforinfrastructureprojects.Inthatway,Singaporewas
abletorealisesignificantgainswithoutincreasingpublicex
penditure.D
elaysinthep
rocessofobtainingpermits,w
hichcanincreaseco
sts
and
unce
rtain
ty, a
re c
onsi
dere
d as
a fu
ndam
enta
l bar
rier t
o pr
ivat
e in
vest
men
t in,
and
spe
edy
deliv
ery
of, n
eede
d in
fras
truct
ure
(Uni
ted
NationsEconomicandSocialC
ommissionforA
siaandthePacific,2017);
(iii)
Max
imis
ing
the
use
of e
xist
ing
asse
ts–ItisreportedthattheSE
Aregion,facedwithaninfrastructurefinancinggapandconstraintsof
lowrevenuebases,highlevelsofnationaldebt,andtightfiscalpositions,makeswideruseofexistinginfrastructure;and
(iv)
Ref
orm
ing
SOE
s – S
OEs
shou
ld b
e he
ld a
ccou
ntab
le fo
r del
iver
ing
high
qua
lity
proj
ect m
anag
emen
t. C
apita
l Mar
kets
•TheSE
Aregionoffersdifferentlevelsofcapitalm
arketdevelopmentfromafinancialhubinSingapore,establisheddomesticmarketsofM
alaysia
and
Thai
land
, em
ergi
ng d
omes
tic m
arke
ts o
f In
done
sia
and
the
Phili
ppin
es, a
nd n
asce
nt m
arke
ts o
f B
rune
i, C
ambo
dia
and
else
whe
re. T
hese
countrieshave,asaresult,raisedinfrastructurefundingtovaryingdegrees.F
orexample,M
alaysiahasamoreactiveinfrastructurefinancing
mar
ket,
with
bon
ds a
mou
ntin
g to
USD
22.
6 bi
llion
in D
ecem
ber 2
016
com
pare
d to
onl
y U
SD 7
bill
ion
in T
haila
nd, w
hich
was
the
seco
nd la
rges
t in
the
sam
e pe
riod.
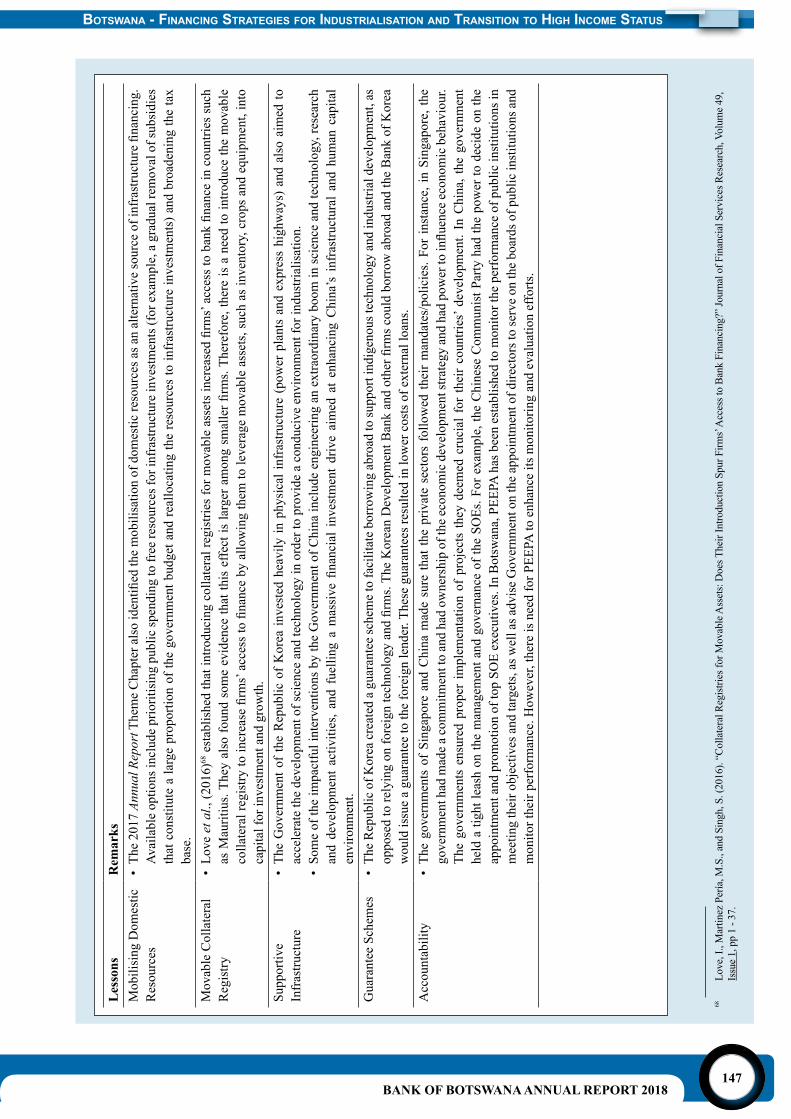
BANK OF BOTSWANA ANNUAL REPORT 2018147
68
Love
, I.,
Mar
tinez
Per
ía, M
.S.,
and
Sing
h, S
. (20
16).
“Col
late
ral R
egist
ries f
or M
ovab
le A
sset
s: D
oes T
heir
Intro
duct
ion
Spur
Firm
s’ A
cces
s to
Bank
Fin
anci
ng?”
Jour
nal o
f Fin
anci
al S
ervi
ces R
esea
rch,
Vol
ume
49,
Issu
e 1,
pp
1 - 3
7.
BotSwana - Financing StrategieS For induStrialiSation and tranSition to high income StatuS
Les
sons
Rem
arks
Mob
ilisi
ng D
omes
tic
Res
ourc
es•
The
2017
Ann
ual R
epor
tThemeChapteralsoidentifiedthemobilisationofdom
esticresourcesasanalternativesourceofinfrastructurefinancing.
Avai
labl
e op
tions
incl
ude
prio
ritis
ing
publ
ic sp
endi
ng to
free
reso
urce
s for
infr
astru
ctur
e in
vest
men
ts (f
or e
xam
ple,
a g
radu
al re
mov
al o
f sub
sidi
es
that
con
stitu
te a
larg
e pr
opor
tion
of th
e go
vern
men
t bud
get a
nd re
allo
catin
g th
e re
sour
ces
to in
fras
truct
ure
inve
stm
ents
) and
bro
aden
ing
the
tax
base
.M
ovab
le C
olla
tera
l R
egis
try•
Love
et a
l., (2
016)
68establishedthatintroducingcollateralregistriesform
ovableassetsincreasedfirms’accesstobankfinanceincountriessuch
asM
auritius.Theyalsofoundsomeevidencethatthiseffectislargeramongsm
allerfi
rms.Therefore,thereisaneedtointroducethemovable
collateralregistrytoincreasefirms’accesstofinancebyallowingthem
toleveragemovableassets,suchasinventory,cropsandequipment,into
capi
tal f
or in
vest
men
t and
gro
wth
.Su
ppor
tive
Infr
astru
ctur
e•
The
Gov
ernm
ent o
f th
e R
epub
lic o
f K
orea
inve
sted
hea
vily
in p
hysi
cal i
nfra
stru
ctur
e (p
ower
pla
nts
and
expr
ess
high
way
s) a
nd a
lso
aim
ed to
ac
cele
rate
the
deve
lopm
ent o
f sci
ence
and
tech
nolo
gy in
ord
er to
pro
vide
a c
ondu
cive
env
ironm
ent f
or in
dust
rialis
atio
n.•
Som
e of
the
impa
ctfu
l int
erve
ntio
ns b
y th
e G
over
nmen
t of C
hina
incl
ude
engi
neer
ing
an e
xtra
ordi
nary
boo
m in
scie
nce
and
tech
nolo
gy, r
esea
rch
anddevelopm
entactivities,andfuellingam
assivefinancialinvestmentdriveaimedatenhancingChina’sinfrastructuralandhum
ancapital
envi
ronm
ent.
Gua
rant
ee S
chem
es•
The
Rep
ublic
of K
orea
cre
ated
a g
uara
ntee
sche
me
to fa
cilit
ate
borr
owin
g ab
road
to su
ppor
t ind
igen
ous t
echn
olog
y an
d in
dust
rial d
evel
opm
ent,
as
opposedtorelyingonforeigntechnologyandfirms.TheKoreanDevelopmentB
ankandotherfi
rmscouldborrowabroadandtheBankofKorea
wou
ld is
sue
a gu
aran
tee
to th
e fo
reig
n le
nder
. The
se g
uara
ntee
s res
ulte
d in
low
er c
osts
of e
xter
nal l
oans
. A
ccou
ntab
ility
• Th
e go
vern
men
ts o
f Si
ngap
ore
and
Chi
na m
ade
sure
that
the
priv
ate
sect
ors
follo
wed
thei
r m
anda
tes/
polic
ies.
For
inst
ance
, in
Sing
apor
e, th
e governmenthadmadeacommitm
enttoandhadow
nershipoftheeconom
icdevelopmentstrategyandhadpow
ertoinfluenceeconomicbehaviour.
The
gove
rnm
ents
ens
ured
pro
per
impl
emen
tatio
n of
pro
ject
s th
ey d
eem
ed c
ruci
al f
or th
eir
coun
tries
’ dev
elop
men
t. In
Chi
na, t
he g
over
nmen
t he
ld a
tigh
t lea
sh o
n th
e m
anag
emen
t and
gov
erna
nce
of th
e SO
Es. F
or e
xam
ple,
the
Chi
nese
Com
mun
ist P
arty
had
the
pow
er to
dec
ide
on th
e ap
poin
tmen
t and
pro
mot
ion
of to
p SO
E ex
ecut
ives
. In
Bot
swan
a, P
EEPA
has
bee
n es
tabl
ishe
d to
mon
itor t
he p
erfo
rman
ce o
f pub
lic in
stitu
tions
in
mee
ting
thei
r obj
ectiv
es a
nd ta
rget
s, as
wel
l as a
dvis
e G
over
nmen
t on
the
appo
intm
ent o
f dire
ctor
s to
serv
e on
the
boar
ds o
f pub
lic in
stitu
tions
and
m
onito
r the
ir pe
rfor
man
ce. H
owev
er, t
here
is n
eed
for P
EEPA
to e
nhan
ce it
s mon
itorin
g an
d ev
alua
tion
effo
rts.
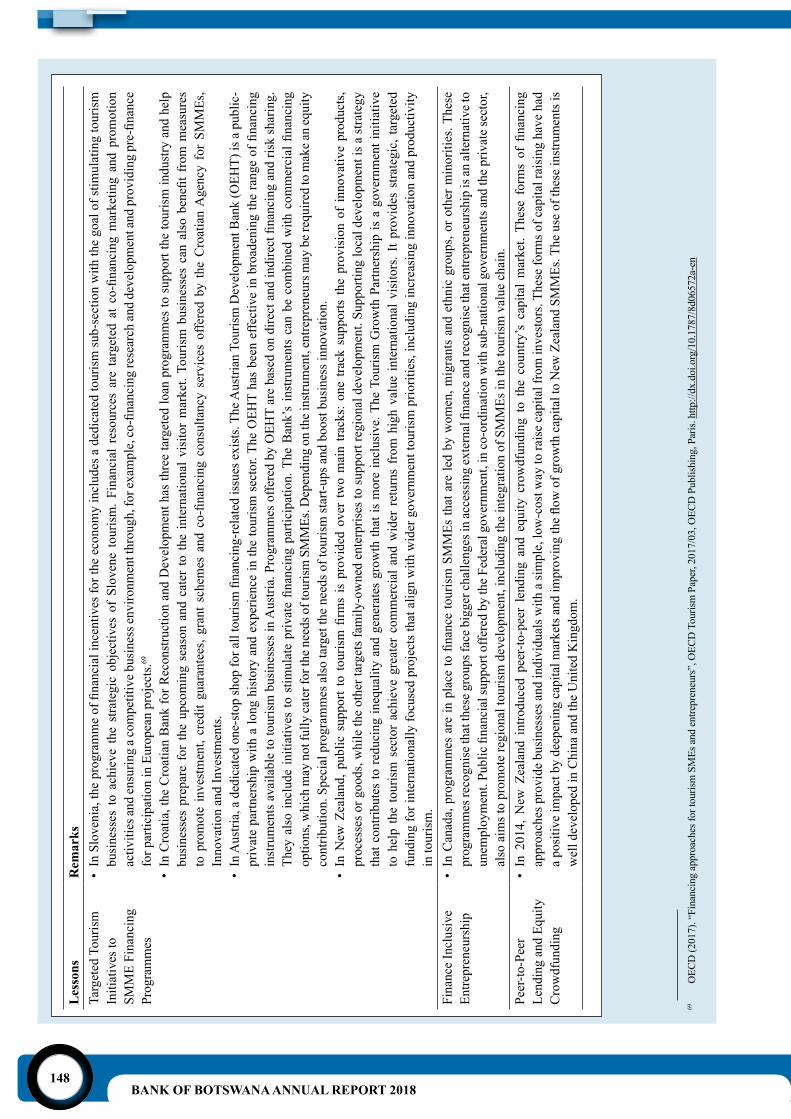
BANK OF BOTSWANA ANNUAL REPORT 2018148
Les
sons
Rem
arks
Targ
eted
Tou
rism
In
itiat
ives
to
SMM
E Fi
nanc
ing
Prog
ram
mes
•InSlovenia,theprogrammeoffinancialincentivesfortheeconomyincludesadedicatedtourismsu
b-sectionwiththegoalofstim
ulatingtourism
businessestoachievethestrategicobjectivesofSlovenetourism.F
inancialresourcesaretargetedatco-financingm
arketingandprom
otion
activitiesan
densuringacom
petitiveb
usinessenvironm
entthrough,forex
ample,co
-financingresearchan
ddevelopm
entandprovidingpre-finance
for p
artic
ipat
ion
in E
urop
ean
proj
ects
.69
• In
Cro
atia
, the
Cro
atia
n B
ank
for R
econ
stru
ctio
n an
d D
evel
opm
ent h
as th
ree
targ
eted
loan
pro
gram
mes
to s
uppo
rt th
e to
uris
m in
dust
ry a
nd h
elp
businessesprepareforth
eupcomingseasonandcaterto
theinternationalv
isitormarket.Tourismbusinessescanalsobenefitfromm
easures
topromoteinvestment,creditguarantees,g
rantschem
esandco-financingconsultancyservicesofferedbytheCroatianAgencyforSM
MEs,
Inno
vatio
n an
d In
vest
men
ts.
•InAustria,adedicatedone-stopshopforalltourismfinancing-relatedissuesexists.TheA
ustrianTourismDevelopmentB
ank(OEH
T)isapublic-
privatepartnershipwithalonghistoryandexperienceinthetourismsector.TheOEH
Thasbeeneffectiveinbroadeningtherangeoffinancing
instrumentsavailabletotourismbusinessesinAustria.Program
mesofferedbyOEH
Tarebasedondirectandindirectfinancingandrisksharing.
Theyalsoincludeinitiativesto
stim
ulateprivatefinancingparticipation.TheBank’sinstrumentscanbecombinedwithcom
mercialfinancing
optio
ns, w
hich
may
not
fully
cate
r for
the n
eeds
of t
ouris
m S
MM
Es. D
epen
ding
on
the i
nstru
men
t, en
trepr
eneu
rs m
ay b
e req
uire
d to
mak
e an
equi
ty
cont
ribut
ion.
Spe
cial
pro
gram
mes
als
o ta
rget
the
need
s of t
ouris
m st
art-u
ps a
nd b
oost
bus
ines
s inn
ovat
ion.
•InNew
Zealand,publicsupporttoto
urismfirmsisprovidedovertw
omaintracks:onetracksupportsth
eprovisionofin
novativeproducts,
proc
esse
s or g
oods
, whi
le th
e ot
her t
arge
ts fa
mily
-ow
ned
ente
rpris
es to
supp
ort r
egio
nal d
evel
opm
ent.
Supp
ortin
g lo
cal d
evel
opm
ent i
s a st
rate
gy
that
con
tribu
tes
to re
duci
ng in
equa
lity
and
gene
rate
s gr
owth
that
is m
ore
incl
usiv
e. T
he T
ouris
m G
row
th P
artn
ersh
ip is
a g
over
nmen
t ini
tiativ
e to
hel
p th
e to
uris
m s
ecto
r ac
hiev
e gr
eate
r co
mm
erci
al a
nd w
ider
ret
urns
fro
m h
igh
valu
e in
tern
atio
nal v
isito
rs. I
t pro
vide
s st
rate
gic,
targ
eted
fu
ndin
g fo
r int
erna
tiona
lly fo
cuse
d pr
ojec
ts th
at a
lign
with
wid
er g
over
nmen
t tou
rism
prio
ritie
s, in
clud
ing
incr
easi
ng in
nova
tion
and
prod
uctiv
ity
in to
uris
m.
Fina
nce
Incl
usiv
e En
trepr
eneu
rshi
p•InCanada,program
mesareinplacetofinancetourismSMMEsthatareledbywom
en,m
igrantsandethnicgroups,orotherminorities.T
hese
programmesrecognisethatthesegroupsfaceb
iggerchallengesinaccessingexternalfinanceandrecognisethatentrepreneurshipisan
alternativeto
unem
ployment.PublicfinancialsupportofferedbytheFederalgovernm
ent,inco-ordinationwithsub-nationalgovernm
entsandtheprivatesector,
also
aim
s to
prom
ote
regi
onal
tour
ism
dev
elop
men
t, in
clud
ing
the
inte
grat
ion
of S
MM
Es in
the
tour
ism
val
ue c
hain
.Pe
er-to
-Pee
r Le
ndin
g an
d Eq
uity
C
row
dfun
ding
•In2014,N
ewZealandintroducedpeer-to-peerlendingandequitycrowdfundingtothecountry’scapitalmarket.Theseformsoffinancing
appr
oach
es p
rovi
de b
usin
esse
s and
indi
vidu
als w
ith a
sim
ple,
low
-cos
t way
to ra
ise
capi
tal f
rom
inve
stor
s. Th
ese
form
s of c
apita
l rai
sing
hav
e ha
d apositiveimpactbydeepeningcapitalm
arketsandim
provingtheflowofgrowthcapitaltoNew
ZealandSMMEs.Theuseoftheseinstrumentsis
wel
l dev
elop
ed in
Chi
na a
nd th
e U
nite
d K
ingd
om.
69
OEC
D (2
017)
. “Fi
nanc
ing
appr
oach
es fo
r tou
rism
SM
Es a
nd e
ntre
pren
eurs
”, O
ECD
Tou
rism
Pap
er, 2
017/
03, O
ECD
Pub
lishi
ng, P
aris.
http
://dx
.doi
.org
/10.
1787
/8d0
6572
a-en
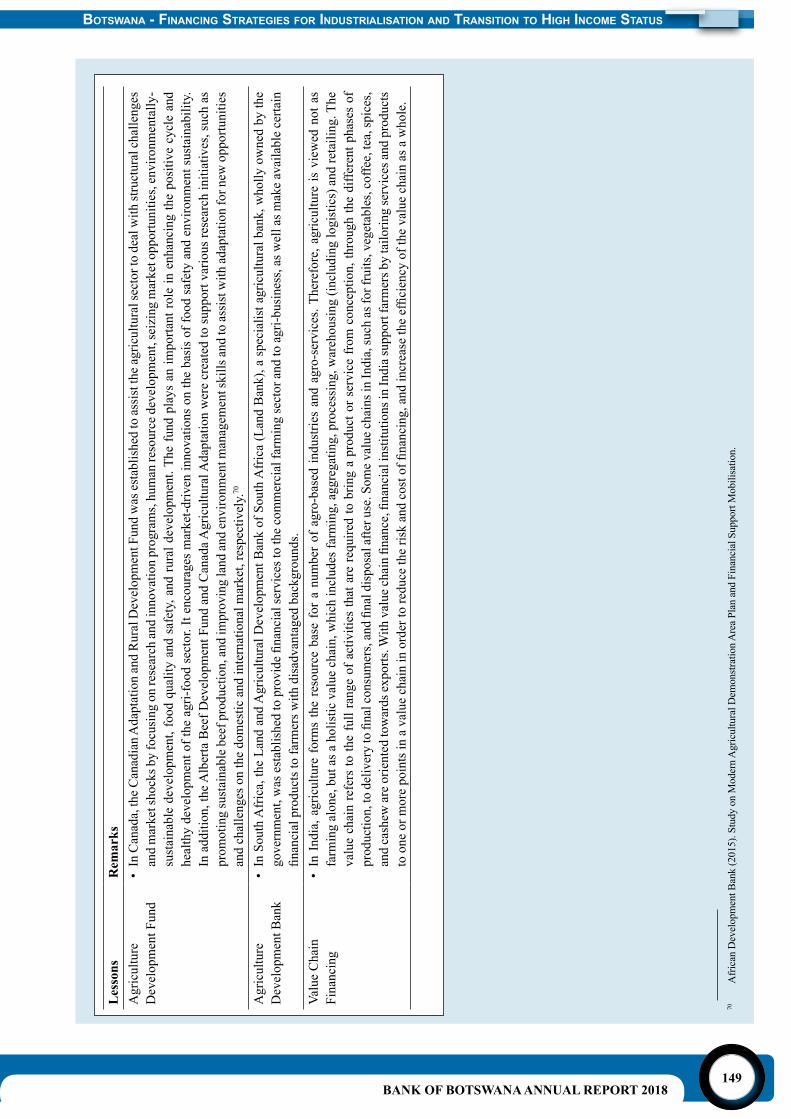
BANK OF BOTSWANA ANNUAL REPORT 2018149
BotSwana - Financing StrategieS For induStrialiSation and tranSition to high income StatuS
70
Afri
can
Dev
elop
men
t Ban
k (2
015)
. Stu
dy o
n M
oder
n A
gric
ultu
ral D
emon
strat
ion
Are
a Pl
an a
nd F
inan
cial
Sup
port
Mob
ilisa
tion.
Les
sons
Rem
arks
Agr
icul
ture
D
evel
opm
ent F
und
• In
Can
ada,
the
Can
adia
n A
dapt
atio
n an
d R
ural
Dev
elop
men
t Fun
d w
as e
stab
lishe
d to
ass
ist t
he a
gric
ultu
ral s
ecto
r to
deal
with
stru
ctur
al c
halle
nges
an
d m
arke
t sho
cks b
y fo
cusi
ng o
n re
sear
ch an
d in
nova
tion
prog
ram
s, hu
man
reso
urce
dev
elop
men
t, se
izin
g m
arke
t opp
ortu
nitie
s, en
viro
nmen
tally
-su
stai
nabl
e de
velo
pmen
t, fo
od q
ualit
y an
d sa
fety
, and
rura
l dev
elop
men
t. Th
e fu
nd p
lays
an
impo
rtant
role
in e
nhan
cing
the
posi
tive
cycl
e an
d he
alth
y de
velo
pmen
t of t
he a
gri-f
ood
sect
or. I
t enc
oura
ges
mar
ket-d
riven
inno
vatio
ns o
n th
e ba
sis
of fo
od s
afet
y an
d en
viro
nmen
t sus
tain
abili
ty.
In a
dditi
on, t
he A
lber
ta B
eef D
evel
opm
ent F
und
and
Can
ada A
gric
ultu
ral A
dapt
atio
n w
ere
crea
ted
to su
ppor
t var
ious
rese
arch
initi
ativ
es, s
uch
as
prom
otin
g su
stai
nabl
e be
ef p
rodu
ctio
n, a
nd im
prov
ing
land
and
env
ironm
ent m
anag
emen
t ski
lls a
nd to
ass
ist w
ith a
dapt
atio
n fo
r new
opp
ortu
nitie
s an
d ch
alle
nges
on
the
dom
estic
and
inte
rnat
iona
l mar
ket,
resp
ectiv
ely.
70
Agr
icul
ture
D
evel
opm
ent B
ank
• In
Sou
th A
fric
a, th
e La
nd a
nd A
gric
ultu
ral D
evel
opm
ent B
ank
of S
outh
Afr
ica
(Lan
d B
ank)
, a s
peci
alis
t agr
icul
tura
l ban
k, w
holly
ow
ned
by th
e government,wasestablishedtoprovidefinancialservicestothecommercialfarmingsectorandtoagri-business,aswellasm
akeavailablecertain
financialproductstofarmersw
ithdisadvantagedbackgrounds.
Valu
e C
hain
Fi
nanc
ing
• In
Ind
ia, a
gric
ultu
re f
orm
s th
e re
sour
ce b
ase
for
a nu
mbe
r of
agr
o-ba
sed
indu
strie
s an
d ag
ro-s
ervi
ces.
Ther
efor
e, a
gric
ultu
re is
vie
wed
not
as
farm
ing
alon
e, b
ut a
s a h
olis
tic v
alue
cha
in, w
hich
incl
udes
farm
ing,
agg
rega
ting,
pro
cess
ing,
war
ehou
sing
(inc
ludi
ng lo
gist
ics)
and
reta
iling
. The
va
lue
chai
n re
fers
to th
e fu
ll ra
nge
of a
ctiv
ities
that
are
requ
ired
to b
ring
a pr
oduc
t or s
ervi
ce fr
om c
once
ptio
n, th
roug
h th
e di
ffere
nt p
hase
s of
production,todeliverytofinalconsumers,andfinaldisposalafteruse.Som
evaluechainsinIndia,suchasforfruits,vegetables,coffee,tea,spices,
andcashew
areorientedtowardsexports.W
ithvaluechainfinance,financialinstitutionsinIndiasupportfarmersbytailoringservicesandproducts
tooneorm
orepointsinavaluechaininordertoreducetheriskandcostoffi
nancing,andincreasetheefficiencyofthevaluechainasawhole.
BANK OF BOTSWANA ANNUAL REPORT 2018150
5. PoliCy and institUtional Considerations going forward to enhanCe aCCess to finanCe for indUstrialisation By identified seCtors
5.1 As discussed extensively in the 2017 Bank of Botswana Annual Report, the quality and performance of governance and effectiveness of institutions, macroeconomic policies and the country’s industrialisation policies play a critical role in determining the ability of the economy to generate capital for funding investment and, hence, industrialisation. Good governance is the key to unlocking private resourcesandopportunities forfinancialflowsthat are essential for sustainable economic growth and development. According to the 2017 Mo Ibrahim Index of African Governance Report,Botswana rankedfifth in terms of theoverall performance for governance, and the least corrupt country in Africa in the same year. However, though Botswana’s ranking is impressive, it has deteriorated from second place in 2016, suggesting a need to review areas that have led to the slippage, which include safety and respect for the rule of law, and transparency and accountability. At the same time, there is need to capitalise on gains made in areas such as welfare and infrastructure, which have improved in the rankings.
5.2 According to Transparency International’s Corruption Perceptions Index, Botswana ranked first inAfrica and34th in the world in 2017.71 Similarly, Botswana’s credit ratings by the sovereign rating agencies have been impressive over the years, supported by, among others, its high score with respect to institutional strength. ThescorereflectsitsstrongperformanceintheWorldwide Governance Indicators, especially on control of corruption and adherence to the rule of law. Alongside these, there is also the need to ensure that macroeconomic policies, such as monetary, exchange rate and fiscalpolicies, play a supportive role in attracting investment to the country.
5.3 As is the case in other countries, fiscalpolicy in Botswana has several objectives, including revenue mobilisation, provision of public infrastructure, goods and services and redistribution of income that is biased towards vulnerable members of the society. Over the years,thecountryhasaccumulatedlargefiscalreserves,throughfiscaldisciplinethathasearnedpolicy credibility and led to the accumulation offinancialassets(Moody’sInvestorsService,October 2018). Going forward, these need to be maintained, if not improved further.
5.4 Business friendly tax policies, including tax holidays and/or reduced tax rates, among others, are among key incentives used in attracting businesses to SEZs. In China for example, companies operating in the SEZs are exempted from paying taxes for two years, followed by three years of paying half the normal tax rate. Meanwhile, in the case of Botswana, companies operating in the Selebi-Phikwe Economic Diversification Unit (SPEDU) region, areofferedafivepercentcorporatetaxforthefirstfiveyears;10percentcorporate tax thereafter;zero customs duty on imported raw material (in line with the SACU Agreement), rebates of customs duties and VAT for importation of raw materials. It is, therefore, important to ensure that tax systems, policies and administration are balanced between the need to mobilise resources for financing infrastructure development andother requirements for sustainable economic development, including providing effective incentives for private sector investment through the SEZ framework.
5.5 Monetary policy is also critical for mobilising financialresourcesthroughitsinfluenceonthecostandavailabilityofcredit,inflationandthebalance of payments. Low inflation preservesthe purchasing power of money and financialsavings, thus allowing households and private businesses to make long-term economic plans and investment decisions. The ability of the economy to maintain low and stable inflationwould complement the conducive business environment that Government is committed to supporting through measures such as the establishment of SEZs. Thus, effective monetary policy is critical in the creation and maintenance of investor confidence, which augers well forthe industrialisation drive.71 The index ranks 180 countries and territories according to their
perceived level of corruption in the public sector by experts and businesses.
BANK OF BOTSWANA ANNUAL REPORT 2018151
BotSwana - Financing StrategieS For induStrialiSation and tranSition to high income StatuS
5.6 Botswana has so far done very well on this front: inflation has been generally withinthe Bank’s medium-term inflation objectiverange of 3 – 6 percent for a period exceeding five years and inflation expectations arewell anchored. This has allowed the Bank to maintain an accommodative monetary policy stance that has so far benefitted the economy.This environment needs to be maintained going forward, for monetary policy to fully contribute towards Botswana’s efforts to transition to a high-income country. This is because a low, stable and predictable level of inflation,coupled with a conducive business-friendly environment, fosters savings mobilisation, productive investment and international competitiveness of domestic producers which, in turn, contribute towards the broader national objectives of sustainable economic development and employment creation. Equally important is asoundandstablefinancialsystem,particularlythe banking sub-sector (including the payments system), as it serves as the main transmission channel for monetary policy signals and facilitating economic activity through the provision of liquidity and risk mitigation.
5.7 In addition, it should be noted that national efforts to mobilise resources are interrelated with the external economic and financial environment.For example, adverse developments in prices of exportsduetosharpfluctuationsinkeyexchangerates can severely constrain efforts to mobilise financial resources. Inotherwords, thedegreeof exchange rate stability in a country is crucial toitssuccessinraisingresourcestofinanceitsdevelopment. The current exchange rate policy framework has served the economy well; it supports broader national policy objectives and is consistent with other macroeconomic policies.
5.8 The Pula exchange rate continues to be monitored to ensure alignment with the objective of maintaining a stable real effective exchange rate considered supportive of competitiveness of domestic industry, in competing with imports and in external markets. The IMF 2018 Article IV Mission has also come out in support of the framework, noting that the exchange rate framework, based on annual reviews to the rate of crawl and basket weights, remains appropriate. Therefore, the current crawling peg system remains appropriate for Botswana,
and has resulted in a stable external position that is consistent with fundamentals and is in congruence with other national macroeconomic policies, such as those relating to fiscal,monetary,tradeandfinancialsectorissues.
5.9 In general, macroeconomic policies have an influence on economic performance andeconomic growth and development, which are, in turn, related to the level and pace of industrialisation. Thus, the Government should continue to pursue sound macroeconomic policies, which are necessary to pave a way for the achievement of a higher level of industrialisation in the domestic economy, in order to ultimately achieve the sought-after high-income status.
6. ConClUsion and PoliCy reCoMMendations
6.1 From being classified as one of the poorestcountries in the world at the time of independence in 1966, Botswana transitioned to upper middle-income status in 1997, according to the Word Bank Rankings. However, since then, the country has been unable to escape the so-called “middle-income trap”. This is despite the relatively conducive environment characterised by a stable macroeconomic environment, full liberalisation of the capital account, good governance and resource commitments aimed at facilitatingdiversificationof theeconomyandpromoting inclusive economic growth. Indeed, theidealsfordiversifiedandinclusiveeconomicgrowth and transition to high-income status are espoused in successive National Development Plans and Visions 2016 and 2036, ‘Prosperity for All.’ The stagnation mirrors the trend decline in the GDP growth rates (from an average of 4.7 percent between 1997 and 2007 to an average of 3.9 percent in the next ten-year period from 2007); thus the pace of industrialisation and economic expansion has not been enough to raise employment and income generating opportunities to high-income status.
6.2 In the earlier years after independence, especially following discovery of the lucrative diamond mines, growth was propelled by infrastructure development and expansion of government services against the background of a stable macroeconomic environment,
BANK OF BOTSWANA ANNUAL REPORT 2018152
conducive to private economic activity. Moreover, it was considered that given a conducive environment, active intervention by Government to “choose winners” for purposes of accelerating industrialisation was unwarranted. Even then, there has, over time, been sustained support for vulnerable areas, such as agriculture, enterprise development and small and medium scale businesses and, for some time, active encouragement of export-oriented manufacturing given the employment potential. Increasingly, however, constraints with respect to inputs (enabling infrastructure, utilities, skills and productivity), competition from imports (goods, services and labour), slow adaptation of modern production methods (especially in agriculture), as well as modest effectiveness of support institutions, moderated industrialisation and growth prospects, as well as income generating opportunities. The results of continued active support for agriculture and entrepreneurship development have also been modest.
6.3 In the circumstances, Botswana has now adopted an industrialisation strategy anchored on cluster/hub approach which seeks to harness the country’s economic potential aligned to natural endowments and in areas where the country has a comparative advantage. This involvesbeneficiationandenhancedextractionof economic value with respect to natural endowments such as diamonds, beef production and tourism, as well the creation of SEZs, industrial clusters and hubs, which available literature suggests have been successful in several countries, including China, India and Mauritius. The anchor Ministry of Investment, Trade and Industry has also developed a three-pronged strategy to support SMMEs, investment and export development. The potential to execute this economic transformation agenda will clearly derive from the dedication of resources towards effective implementation. Second, it will be imperative to sustain a conducive and stable macroeconomic environment, including policy transparency and predictability. Third, the envisaged industrialisation needs to be adequately supported in terms of key inputs, among which are financial resources asdiscussed in this Theme Chapter. Even then, to be effective, the allocation of financialresources, in particular, by Government and related entities, needs to be in the context of
judicious evaluation of prospective returns and involving good governance and effective operational processes to afford circulation and perpetual growth of funds (engendered by successful recipients of funds).
6.4 For its size and prima facie, Botswana is sufficiently endowed with financial resourcesasreflectedintherelativelevelsofbothprivateand government savings; while given its debt profile and credit rating, there is considerablescope to augment financial resources throughdomestic borrowing and other capital flows.The evidence, nevertheless, suggests existence of a funding gap in the country, thus stultifying prospects for industrialisation.72 The partial allocationoffinancialresourcesdomesticallyisjustifiabletotheextentthatthereisnoeffectivedemand; that is, viable funding proposals that will ultimately contribute to an increase or, at the minimum, preserve the real value of resources.
6.5 However, in an environment where there is capacity under-utilisation; for example unemployment and unproductive land, partial deployment of resource could imply foregone or loss
of resource potential. Indicators of dynamism of thefinancialsectorinintermediation(financialsector variables relative to output) also show weaker performance by Botswana. At the same time, even in the instance of partial allocation of resources, there is evident loss of financialresources, especially those intermediated by the development finance institutions, wherefunding has not been matched by successful business ventures and projects; thus high non-performing loans and continuous capital erosion (for example NDB and CEDA).
6.6 The challenge appears to be effective harnessing of the financial resources tosupport industrialisation, including financingand facilitation of the requisite inputs. Four dimensions of effectiveness are, therefore, projected/highlighted for active consideration going forward, namely optimising domestic resource mobilisation; funding of
72 The World Bank Group’s Ease of Doing Business and the World Economic Forum’s Global Competitiveness Report consistently listlackofaccesstofinance,especiallybySMMEs,asoneoftheconstraints to doing business in Botswana. Likewise, the BES of localfirmsconductedbytheBankofBotswanaalsohighlightaccesstofinanceasoneofkeychallengestosuccessfulbusinessoperationand, in particular, entrepreneurship.
BANK OF BOTSWANA ANNUAL REPORT 2018153
BotSwana - Financing StrategieS For induStrialiSation and tranSition to high income StatuS
(industrialising) businesses and economic activity by households; financing of relatedinfrastructure, utilities and research and development; and governance, as well as process andoperationalefficiencyandeffectivenessoffinancialintermediaries.
6.7 Ostensibly, resource mobilisation is about increasing the quantum of financial resourcesto support a broad range of economic activity. However, to the extent that it involves transition from sub-optimal mobilisation, there could be added benefits such as enhanced economicvalue of resources, spread of benefits (acrossthe economy and over time), as well as improvements in governance and accountability. There are two pertinent examples. First, the increase in non-discretionary saving (pension) helps in pooling a larger quantum of long-term funds,wheregovernanceandfiduciaryrulesandresponsibilities inspire and assure investment in viable, high return projects and businesses that potentially contribute to industrialisation. Moreover,thereisreducedfiscalresponsibilityand contingent government liability associated with social safety nets.
6.8 Second, evidence from literature suggests that extension of tax coverage and responsibility beyond natural resource rents engenders demand for accountability, on the part of government, by tax payers; thus potentially better resource use(lesswastage) for long-termbenefitof theeconomy.73 Therefore, for Botswana, steps need to be taken to increase tax coverage, in particular, for property, unused land (to encourage direct use or leasing)74 and, subject tocost/benefitconsiderationeffectivemeansoftaxing the informal sector and small to medium scale businesses.75 Furthermore, it is also warranted to actively consider a national pension scheme to low-income earners, especially in the private sector, contract employees and the
self-employed (although the insurance industry is active in this regard). Aligned, thereto, there continues to be a need to accelerate development and popularisation of the capital market to facilitate the raising of funds through the stock market and issuance of debt securities by various entities. The envisaged improvements in trading and settlement infrastructure and systems at the BSEL should be helpful in this regard. There is, furthermore, scope to make improvements to the Government Bond Programme; for example, introduction of a lower maturity Treasury bill, increasing the frequency of auctions and the amount of issuance. But also longer-dated government bonds/inflation-linked bondsto meet investment requirements of annuity providers.
6.9 Regarding the funding of economic activity, the preceding discussion has demonstrated that there is considerable scope to enhance the deploymentoffinancialresources.Inparticular,thereisneedtoaligntheallocationoffinancialresources to the focus areas for industrialisation. Regardingtheprivatefinancialinstitutions,thetransition towards enhanced involvement in industrialisation would be influenced by paceand diversity of deposit/funding mobilisation (for example, a larger retail component and non-deposit liabilities), policy posture and guidance, competition and effective demand. Therefore, respective policy and regulatory authorities need to assess the impact of policy, legislation and regulation on prospects for productive deploymentoffinancialresourcestosupporttheindustrialisation strategy. As well as assessment of other areas, there are evident prospects for financial technology thatneed tobeembracedand harnessed under appropriate conditions. Overall, and fundamentally, maintenance
firms to harassment. However, research highlights the potentialbenefits.Forexample,withrespecttorevenue,theinformalsectorforms a large and, in many countries, growing share of GDP, and thus represents a potentially significant source of tax revenue.Moreover, taxing the informal sector may could be essential to sustain“taxmorale”andtaxcomplianceamonglargerfirms.Thereis also some evidence that formalisation may accelerate growth forsomeinformalsectorfirms,andmayhavebroaderbenefitsforexistingformalsectorfirms.Furthermore,thepaymentoftaxesbyfirmsintheinformaleconomymaybeamethodofengagingfirmswith the state, and thus promoting legitimacy, good governance, and political accountability (Joshi A., Prichard W., and Heady C., (2014). Taxing the Informal Economy: The Current State of Knowledge and Agendas for Future Research. The Journal of Development Studies).
73 For example, Moore M., (2007) “How Does Taxation Affect the Quality of Governance?” Institute of Development Studies; and Martin L., (2013). Taxation and Accountability: Experimental Evidence Taxation’s Effect on Citizen Behaviour, Yale University.
74 To some extent, also address concerns about “hoarding” by absentee landowners and perceptions about denial of access by locals.
75 A common argument against taxing the informal sector is that revenue yields are low, administrative costs high, tax incidence is likely to be regressive, and tax enforcement exposes vulnerable
BANK OF BOTSWANA ANNUAL REPORT 2018154
of a sound and stable financial system iskey to unfettered and productive conduct of economic activity; sound financial institutionsaremorelikelytobeamenabletothefinancialinclusion agenda, effectively transmit policy and innovation, as well as respond to effective demand.
6.10Beyond the private financial institutions,there is evidence from the experience of other countries that development financeinstitutions can be effectively harnessed to drive the industrialisation agenda. However, for Botswana, the overall performance of the development finance institutions has beenlacklustre, evidenced by recurring episodes of restructuring, refinancing and closures(Section 3). Given the desire to support the industrialisation objective and the positive experience of other countries, a reassessment of thepotentialforthelocaldevelopmentfinanceinstitutions is warranted.
6.11 Broadly, there are three areas for consideration going forward. First, is evaluating the prospects for integration and alignment of the operations and deliverables of the key development finance institutionswith the cluster/hub/SEZAindustrialisation strategy. This will also entail a domestic focus for all the development financeinstitutionstoensuretheconcentrationof resources and effort towards execution of the strategy. Second is a reconsideration of the scale of operations and, therefore, resource allocation and access. It is considered that, to be effective and have the desired impact, the scale of operations and resources availed should be much larger than current levels; a higher level of funding is needed to support large-scale industrial projects and businesses, which might also involve infrastructure development. Conceiving and allocating finance to projectswith no access to infrastructure contribute to failure (or at best inordinate delay – for example the milk and leather projects in Lobatse), as operations and viability are inevitably constrained.76
6.12 As highlighted in Section 3, Government has a well-establishedfiscalpolicy that supports thedevelopment and propagation of infrastructure and utilities to support economic activity and welfare. Indeed, the extensive involvement of Government in the initial development of mining locations essentially amounts to execution of a hub or special economic zone strategy. Viewed in this light, the same approach to supporting the current industrialisation strategy could lead to successful execution; thus facilitating the development of basic infrastructure, as well as the provision of utilities and funding by the developmentfinanceinstitutions(thisappliesinparticular to agriculture where constrained access to inputs is more debilitating). It is, therefore, notable, in this regard, that Government has committed to making budgetary provisions to ensure the success of the SEZ initiative. Funds under the Doing Business Reforms will also be made available to implement measures aimed at improving the business environment.
6.13 Third, a comparison of experience of various countries shows that governance approaches and accountability frameworksmatter significantlyin the prospects for success and positive impact of development finance institutions onindustrialisation. Thus, in general autonomous institutions are more successful compared to those that are run with active government involvement in governance; for example, through Board and Executive appointments and mandate execution approaches. There is also a strong case for outsourcing development and industrialisation funds to commercial banks, where there is better project evaluation, monitoring and loan recovery, which is an option for CEDA and NDB (allocated funds). Even then, sustained operational viability of development finance institutions could beimproved by selling non-performing loans at a discounttofirmswithresourcestorecoverandrehabilitate delinquent assets; thus generating a complementary industry.
6.14 External sources of funds remain a viable option to support industrialisation. The added benefits include scale, potential to supportinfrastructure development, expertise in project execution, transfer of skills and technology, access to markets and integration into the value chain of regional and global businesses. In particular, there is need to propagate locally the
76 For example, conditions for lending in most instances involves assurance with respect to access to land, buildings and utilities, but the same does not apply for lending for farming by NDB. While this may be contextually reasonable, a dedicated and aligned approach that involves supporting and ensuring access to infrastructure could yield better and quicker results for the funded activities.
BANK OF BOTSWANA ANNUAL REPORT 2018155
BotSwana - Financing StrategieS For induStrialiSation and tranSition to high income StatuS
potential for funding of local industry by the DBSA, Afrexim Bank and the IFC, part of the WorldBankGroup.Various financing optionsfrom these institutions exist, including advice raisingfinancethatcouldaddressvariousneedsof local industries. Thus, given a conducive policy and macroeconomic environment, strong governance, operational soundness of the local industry and development finance institutions,Botswana could attract and benefit from suchfunding. The country could also benefit fromfunds from private financial institutions andthose provided under initiatives such as the G20 Compact with Africa, which seeks to promote private investment in Africa, with a focus on policy design and governance structures for execution.
6.15 It also critical that the policy environment continues to encourage foreign direct investment withtheattendantbenefits,aswellasportfolioinvestments that add to innovation, vibrancy, beneficial price discovery (reasonablenessof cost of funds) and liquidity of the capital markets. At sovereign level, multilateral financial institutions such as theWorld Bankand the AfDB, as well as bilateral arrangements, remain available for project and infrastructure financing.
6.16 Overall, there is potential for the industrialisation strategy and prospects to accelerate employment and income opportunities, thus the transition to high-income status. Successful execution in this regard is premised on policy and structural transformation in key areas and access to inputs, amongwhich is finance. From the discussion,it is clear that the financing gap is notnecessarily due to the quantum of funds, but is fundamentally due to paucity of innovation and deficientgovernanceandoperationalprocessesin intermediation. It is, therefore, important to address the policy and administrative aspects in order to engender enhanced resource mobilisation, alignment of productive resource allocation with the industrialisation strategy and a transition towards more autonomy for development institutions, but balanced with a domestic focus and a clear accountability framework for deliverables.

BANK OF BOTSWANA ANNUAL REPORT 2018156