the impact of the organisational structure and project organisational
ANNUAL REPORT 2017/2018

CONTENTS
01Mission & Vision
03Organisational Structure
05Board of Directors
07Key Highlights and Achievements
19Outlook for the Next Fiscal Year
In the opinion of the directors, the annual report of the PUB, Singapore’s National Water Agency is drawn up
so as to present fairly the state of affairs of the PUB, Singapore’s National Water Agency
as at 31 March 2018.
On behalf of the Board of Directors,
Chiang Chie FooChairman
Ng Joo Hee
PUB, Singapore’s National Water AgencyAnnual Report for the year ended 31 March 2018
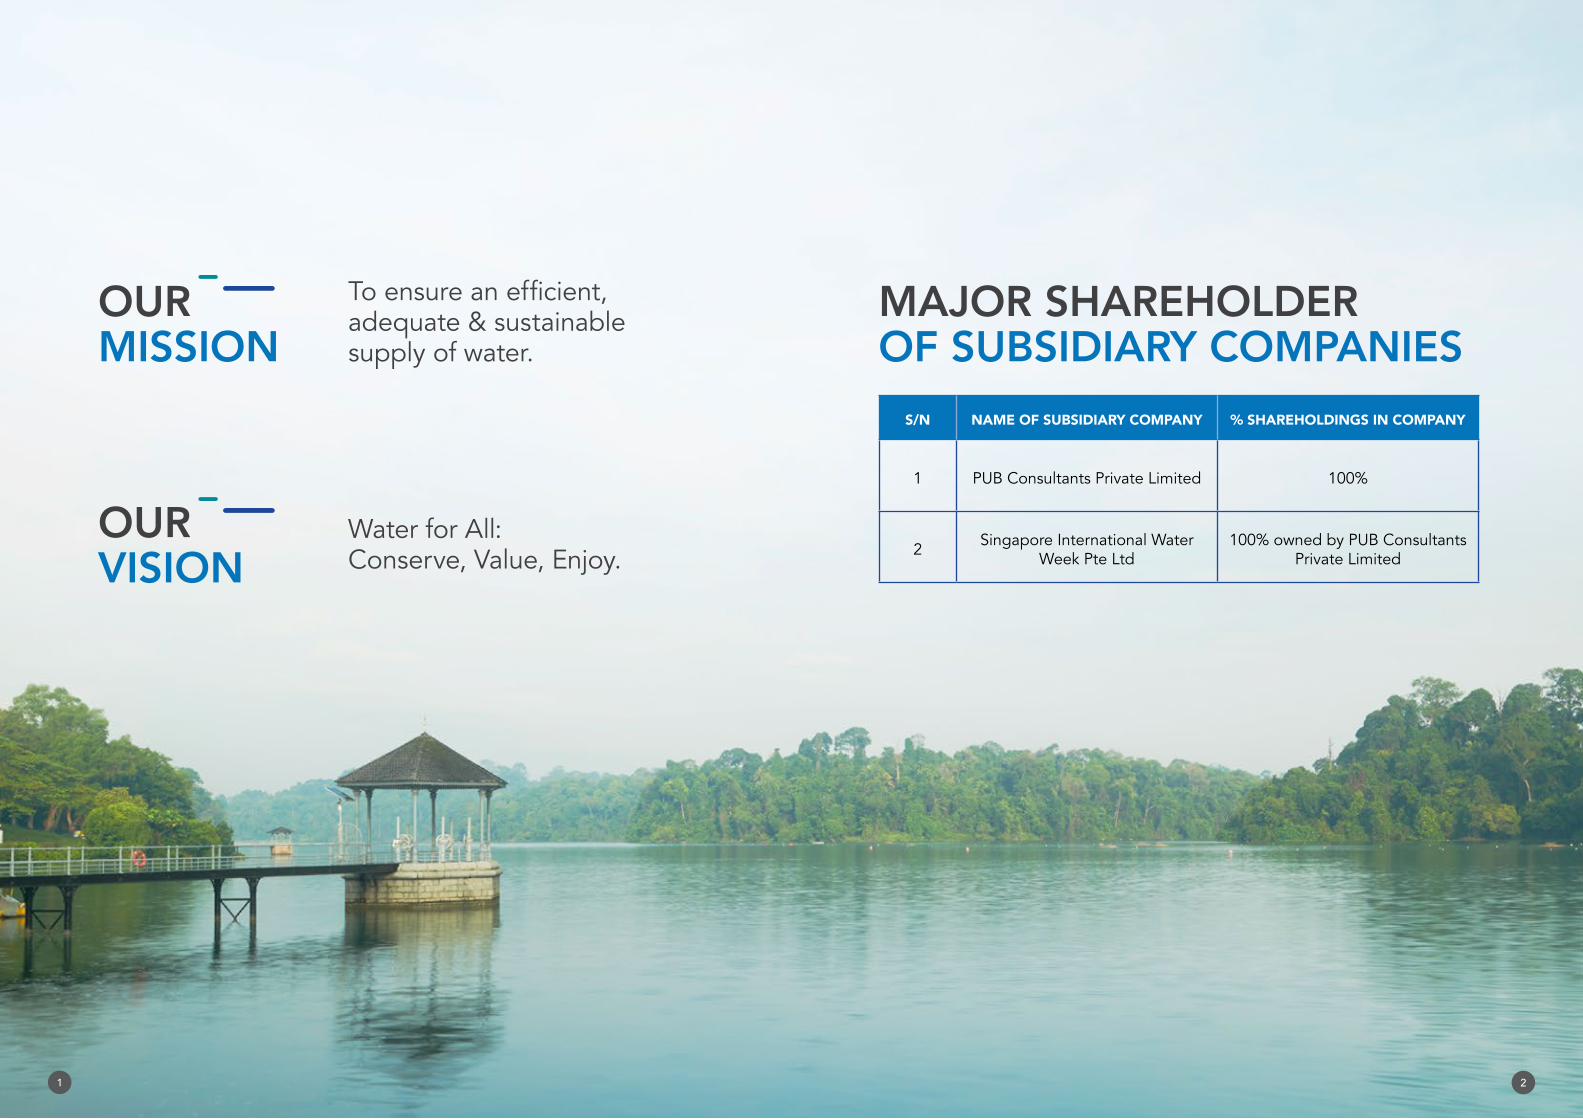
OURMISSION
adequate & sustainable supply of water.
OURVISION
Water for All: Conserve, Value, Enjoy.
S/N NAME OF SUBSIDIARY COMPANY % SHAREHOLDINGS IN COMPANY
1 PUB Consultants Private Limited 100%
2 Singapore International Water Week Pte Ltd
100% owned by PUB Consultants Private Limited
MAJOR SHAREHOLDEROF SUBSIDIARY COMPANIES
1 2

ORGANISATIONALSTRUCTURE
NG JOO HEE Chief Executive
CHAN YOON KUM Senior Consultant
RICHARD HOO Deputy Chief Executive(Policy & Development)
TAN YOK GINDeputy Chief Executive
(Operations)
Internal Audit reports to the Board
Enterprise Risk Management reports to the Board
YAHYA ABD GHANIDirector
MECHANICAL, ELECTRICAL, INSTRUMENTATION, CONTROLS
& AUTOMATION YEO KENG SOONDirector
CATCHMENT & WATERWAYS
CHIANG CHIE FOO Chairman
BOARD
WILLIAM YEODirector
POLICY & PLANNING
HARRY SEAHChief Engineering
TECHNOLOGY
PANG CHEE MENGDirector
INDUSTRY DEVELOPMENT
LAWRENCE FONGHead
INTERNAL AUDIT OFFICE
PENG KAH POHDirector
JOINT OPERATIONS BERNARD KOHDirector
WATER SUPPLY (PLANTS)
TAN THAI PIN
ENTERPRISE RISK MANAGEMENT
LIM MONG HOODirector
WATER QUALITY RIDZUAN ISMAILDirector
WATER SUPPLY (NETWORK)
ANGELA KOHDirector
HUMAN RESOURCES
GEORGE MADHAVANDirector
CENTRALISED SERVICES CINDY KENGDirector
3P NETWORK
YOUNG JOO CHYEDirector
SPECIAL PROJECTS & PROCUREMENT MAURICE NEODirector
WATER RECLAMATION (NETWORK)
CHEW CHEE KEONGDirector
SINGAPORE WATER ACADEMY
YONG WEI HINDirector
DEEP TUNNEL SEWERAGE SYSTEM PHASE 2
TAN NGUAN SEN
MICHAEL TOH
INFOTECH & DIGITAL TRANSFORMATION
CHEW SIOW NEE
FINANCE
TAN CHIAN CHERNDirector
ORGANISATIONAL EXCELLENCE
OOI KIAN ENGDirector
WATER RECLAMATION (PLANTS)
HARRY SEAHAssistant Chief Executive
(Future Systems & Technology)
The key management personnel are listed in the organisation structure above.
3 4

BOARD OFDIRECTORS
MR CHIANG CHIE FOOChairman, PUB
PROF QUEK TONG BOONChief Executive,
National Robotics Programme
MR NG JOO HEEChief Executive, PUB
MS RACHEL ENGDeputy Chairman,
WongPartnership LLP
MR ABU BAKAR BIN MOHD NORManaging Director,
Keppel Singmarine Pte LtdKeppel Offshore & Marine Limited
(Gas & Specialised Vessels)
MR TAN WAH YEOWBoard Director,
KPMG Singapore (retired)
MR S THIAGARAJANGeneral Manager,
Workplace Safety and Health Council
MR CHAN BENG SENGGroup Director,
Financial Resource Management,Healthcare Finance (Subvention)
and Sector Development &Commissioning Divisions
Ministry of Health
MR TAN SIONG LENG Deputy Chief Executive,
URA (retired)
PROF CHAN ENG SOONProvost’s Chair Professor, Faculty of Engineering,
National University of Singapore
MS JANET ANGVice President,
Industry Solutions,
Systems of Engagement & Smarter Cities
5 6
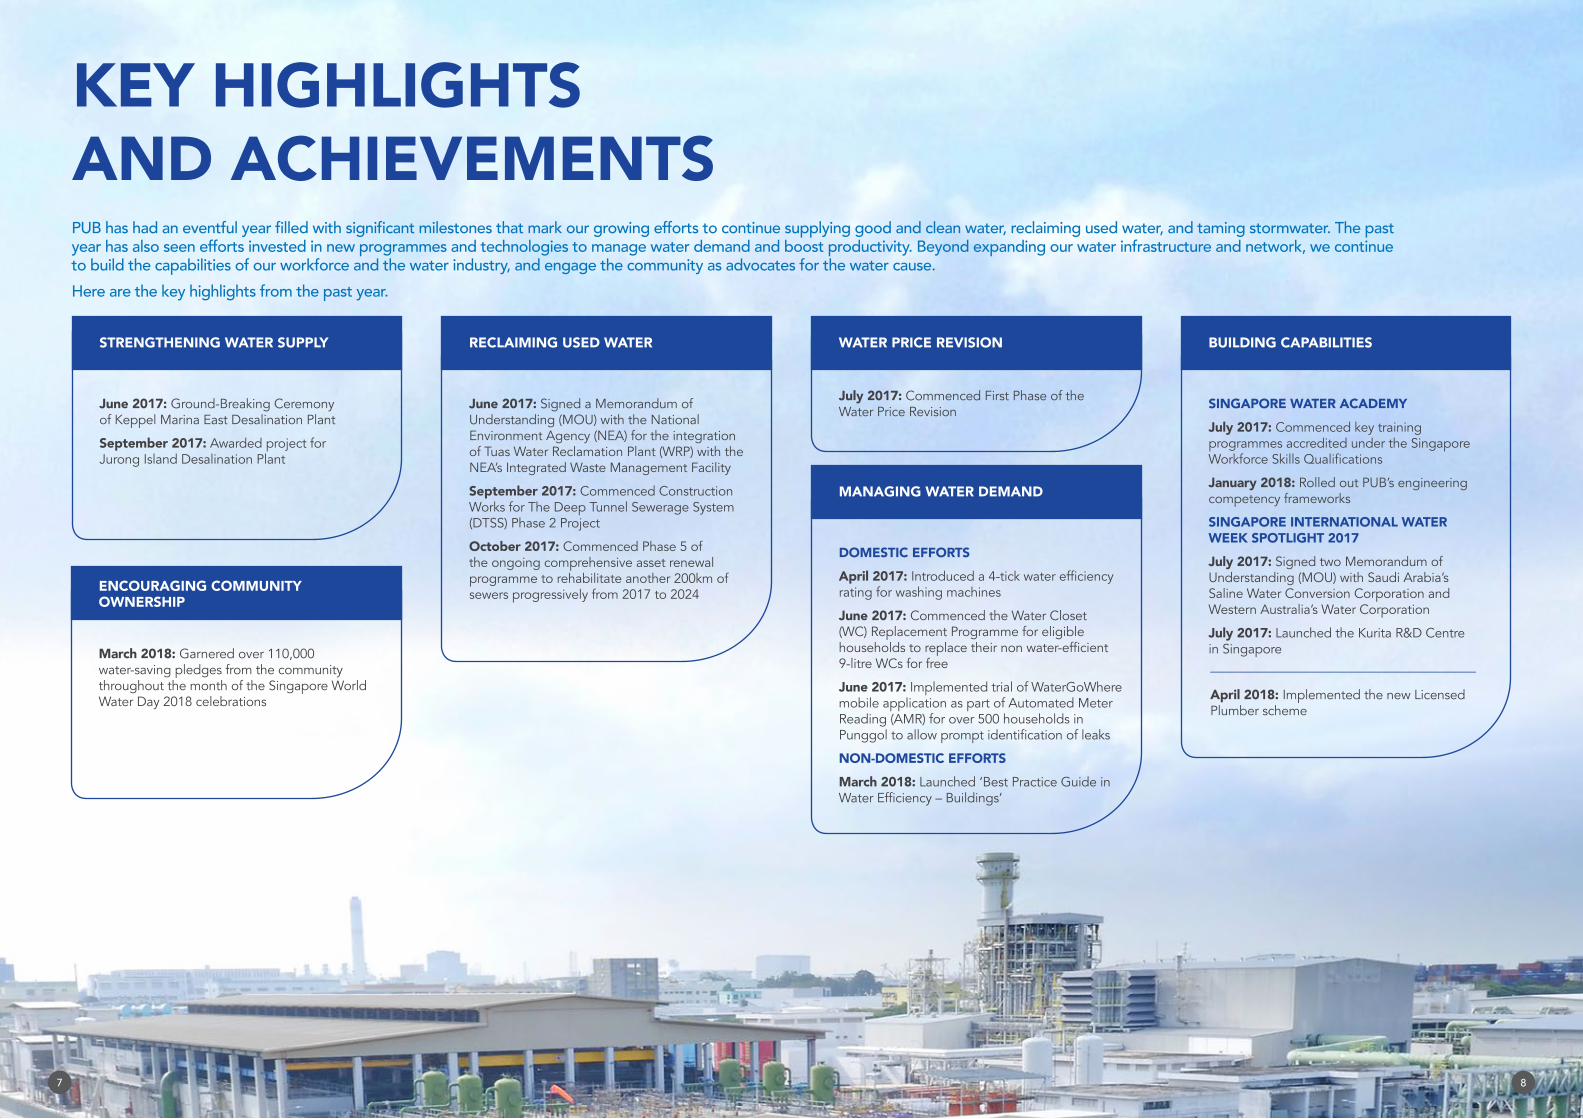
KEY HIGHLIGHTSAND ACHIEVEMENTS
June 2017: Ground-Breaking Ceremony of Keppel Marina East Desalination Plant
September 2017: Awarded project for Jurong Island Desalination Plant
STRENGTHENING WATER SUPPLY
March 2018: Garnered over 110,000 water-saving pledges from the community throughout the month of the Singapore World Water Day 2018 celebrations
ENCOURAGING COMMUNITY OWNERSHIP
SINGAPORE WATER ACADEMYJuly 2017: Commenced key training programmes accredited under the Singapore
January 2018: Rolled out PUB’s engineering competency frameworks
SINGAPORE INTERNATIONAL WATER WEEK SPOTLIGHT 2017July 2017: Signed two Memorandum of Understanding (MOU) with Saudi Arabia’s Saline Water Conversion Corporation and Western Australia’s Water Corporation
July 2017: Launched the Kurita R&D Centre in Singapore
BUILDING CAPABILITIES
July 2017: Commenced First Phase of the Water Price Revision
WATER PRICE REVISION
June 2017: Signed a Memorandum of Understanding (MOU) with the National Environment Agency (NEA) for the integration of Tuas Water Reclamation Plant (WRP) with the NEA’s Integrated Waste Management Facility
September 2017: Commenced Construction Works for The Deep Tunnel Sewerage System (DTSS) Phase 2 Project
October 2017: Commenced Phase 5 of the ongoing comprehensive asset renewal programme to rehabilitate another 200km of sewers progressively from 2017 to 2024
RECLAIMING USED WATER
April 2018: Implemented the new Licensed Plumber scheme
DOMESTIC EFFORTSApril 2017: rating for washing machines
June 2017: Commenced the Water Closet (WC) Replacement Programme for eligible
9-litre WCs for free
June 2017: Implemented trial of WaterGoWhere mobile application as part of Automated Meter Reading (AMR) for over 500 households in
NON-DOMESTIC EFFORTS March 2018: Launched ‘Best Practice Guide in
MANAGING WATER DEMAND
7 8

KEPPEL MARINA EAST DESALINATION PLANTThe ground-breaking ceremony on 29 June 2017 signalled the start of construction works on Keppel Marina East Desalination Plant, Singapore’s fourth desalination plant. The plant is due for completion
plant that can treat both freshwater from the Marina Reservoir and seawater. Water can be channelled from either source depending on weather conditions.
feature a green rooftop that can serve as a recreational area for the public, with a capacity for 700 people. Built on a three-hectare plot of land, the plant will be integrated with the Eastern Coastal Park Connector Network which connects East Coast Park and Gardens by the Bay East.
BUILDING RESILIENCE FOR THE FUTURE
STRENGTHENING WATER SUPPLY
JURONG ISLAND DESALINATION PLANTPUB is developing a plant on Jurong Island, which is expected to be operational by 2020. It will add 30 million gallons (mgd) or approximately 137,000 cubic metres of water per day to the nation’s water supply.
The project was awarded in September 2017 to Tuas Power-Singapore Technologies Marine consortium, with the water purchase agreement signing ceremony held on 6 November 2017.
9 10
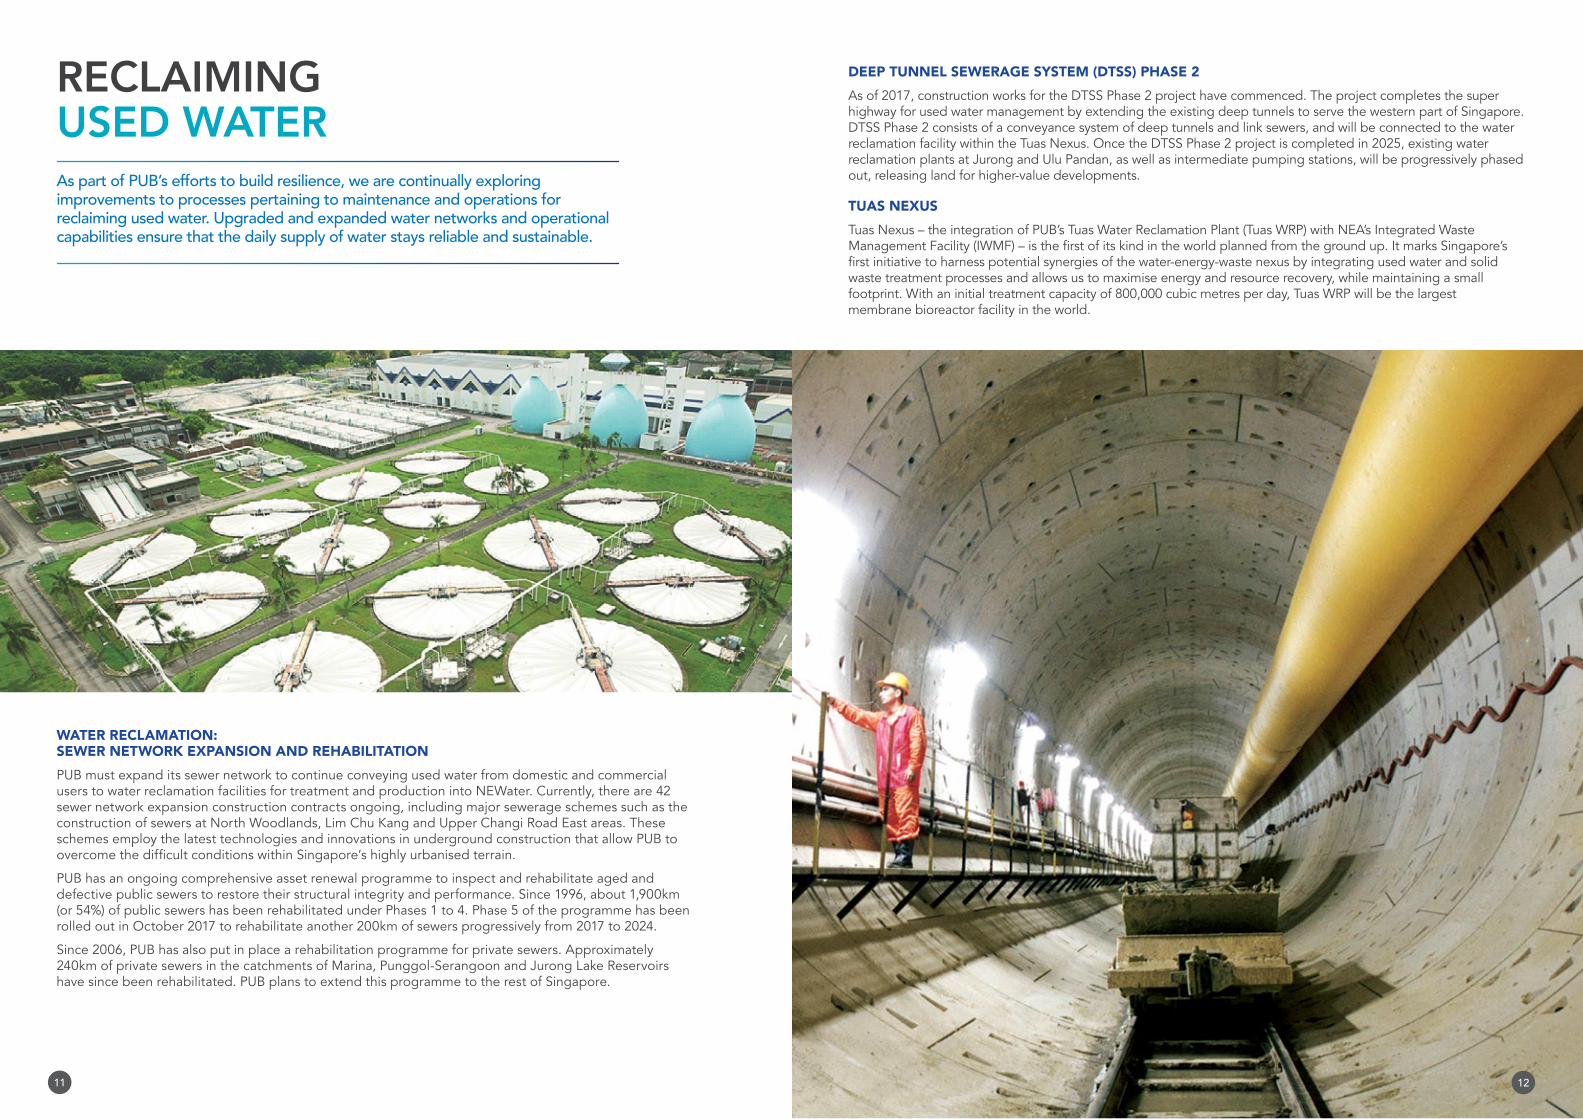
RECLAIMING USED WATER
WATER RECLAMATION: SEWER NETWORK EXPANSION AND REHABILITATIONPUB must expand its sewer network to continue conveying used water from domestic and commercial users to water reclamation facilities for treatment and production into NEWater. Currently, there are 42 sewer network expansion construction contracts ongoing, including major sewerage schemes such as the construction of sewers at North Woodlands, Lim Chu Kang and Upper Changi Road East areas. These schemes employ the latest technologies and innovations in underground construction that allow PUB to
PUB has an ongoing comprehensive asset renewal programme to inspect and rehabilitate aged and defective public sewers to restore their structural integrity and performance. Since 1996, about 1,900km (or 54%) of public sewers has been rehabilitated under Phases 1 to 4. Phase 5 of the programme has been rolled out in October 2017 to rehabilitate another 200km of sewers progressively from 2017 to 2024.
Since 2006, PUB has also put in place a rehabilitation programme for private sewers. Approximately 240km of private sewers in the catchments of Marina, Punggol-Serangoon and Jurong Lake Reservoirs have since been rehabilitated. PUB plans to extend this programme to the rest of Singapore.
DEEP TUNNEL SEWERAGE SYSTEM (DTSS) PHASE 2As of 2017, construction works for the DTSS Phase 2 project have commenced. The project completes the super highway for used water management by extending the existing deep tunnels to serve the western part of Singapore. DTSS Phase 2 consists of a conveyance system of deep tunnels and link sewers, and will be connected to the water reclamation facility within the Tuas Nexus. Once the DTSS Phase 2 project is completed in 2025, existing water reclamation plants at Jurong and Ulu Pandan, as well as intermediate pumping stations, will be progressively phased out, releasing land for higher-value developments.
TUAS NEXUS
waste treatment processes and allows us to maximise energy and resource recovery, while maintaining a small footprint. With an initial treatment capacity of 800,000 cubic metres per day, Tuas WRP will be the largest membrane bioreactor facility in the world.
11 12

WATER PRICE REVISION
MORE WATER-EFFICIENT HOME APPLIANCES
when selecting home appliances, PUB introduced a 4-tick
0-tick taps and mixers were also phased out at the same time, which means only those with 1-tick or more can be sold or supplied. From 1 October 2018, PUB will also require dishwashers for household use to be labelled with
WATER CLOSET REPLACEMENT PROGRAMME In June 2017, PUB rolled out the Water Closet (WC) Replacement Programme to help eligible households
built between 1987 and 1992 replace their non water-
and lower their monthly water usage by as much as 10%. As of end June 2018, PUB has replaced water-
continue to do so over the next two years.
DOMESTIC EFFORTS
AUTOMATED METER READING The implementation of Automated Meter Reading (AMR) will allow prompt detection of leaks. As part of a trial for some 530 households in Punggol, customers were presented with their daily water consumption
via the WaterGoWhere mobile app to challenge themselves in reducing water consumption.
Using the hourly meter readings, coupled with data analytics, leak detection has been improved. Smaller leaks that would have escaped detection using bi-monthly meter readings can now be detected with AMR.
The trial had elicited positive responses from the customers with 50% of customers signing up for the app since its introduction in June 2017. The participating households were able to achieve water savings of up to 5% of their monthly usage through early leak detection and water-saving behaviours.
WATER PRICE REVISION In February 2017, the Government announced that water prices would be increased in two steps, on 1 July 2017 and 1 July 2018. To help households manage the price hike, the Government provides eligible HDB households with permanent additional U-Save rebates, ranging from $40 to $120 per annum.
The price increase goes towards meeting the cost of water treatment, reservoir operations, NEWater production, desalination, used water collection and treatment, as well as the maintenance and expansion of the island-wide network of water pipelines.
1
introduced for households
3 to further discourage excessive
2
Key Changes to the Water Price Revision
MANAGING WATER DEMAND
13 14

MANAGING WATER DEMAND
BUILDING CAPABILITIES
NON-DOMESTIC EFFORTS
BETTER INDUSTRY PRACTICES With the data collected from WEMP and through consultations with the industry, PUB has
Singapore. The ‘Best Practice Guides’ for the wafer fabrication and semiconductor sector, and the
From 2019 onwards, at least one WEMP representative for each qualifying consumer will be
ENHANCED ENGINEERING COMPETENCY FRAMEWORKS PUB set up the Singapore Water Academy (SgWA) in February 2016 with the mission to build current and future organisational capabilities through competency-based training and development for PUB staff and the water industry.
As part of growing efforts to build capabilities and competency within the workforce, PUB’s engineering competency frameworks which document the skills and knowledge required for engineering jobs in PUB were rolled out in January 2018. These frameworks guide the implementation of structured training plans to systematically develop engineering competencies for over 2,500 PUB engineers.
Key training programmes include structured on-the-job training as well as customised technical courses curated and accredited under the Singapore Workforce Skills
Management Series (SgWM) on Sustainable Urban Stormwater Management in July 2017, attended by 25 participants.
LICENSED PLUMBER SCHEME Under the new Licensed Plumber scheme that was implemented on 1 April 2018, sanitary plumbers are required to be licensed under PUB’s revised licensing scheme. Aimed at enhancing standards in the industry, both water service plumbers and sanitary plumbers will operate under a common license and need to be competent in carrying out both types of plumbing work.
Through training, licensing and enforcement against non-compliance with PUB’s rules and regulations, PUB looks to streamline the operations of water service and sanitary plumbing.
SINGAPORE INTERNATIONAL WATER WEEKThe SIWW Spotlight 2017 was held from 17 to 19 July 2017. Over 200 utility leaders attended the event. The key highlights included the signing of two Memorandum of Understanding (MOU) by PUB with Saudi Arabia’s Saline Water Conversion Corporation and Western Australia’s Water Corporation respectively, as well as the launch of the Kurita R&D Centre in Singapore.
15 16

ENCOURAGING COMMUNITY OWNERSHIP
SINGAPORE WORLD WATER DAY Alongside World Water Day, held annually on 22 March, Singapore World Water Day (SWWD) was celebrated throughout the month of March. The theme for 2018 was “Make Every Drop Count”, which highlighted the active role each of us can play to show our care for water.
More than 3,000 participants attended the SWWD Opening Ceremony, held on 3 March 2018, with Guest-of-Honour President Halimah Yacob kicking off the celebration. Throughout the month of March, more than 110,000 water-saving pledges were rallied from the community to practise
that joined in the celebrations with water conservation activities and outreach initiatives.
17 18
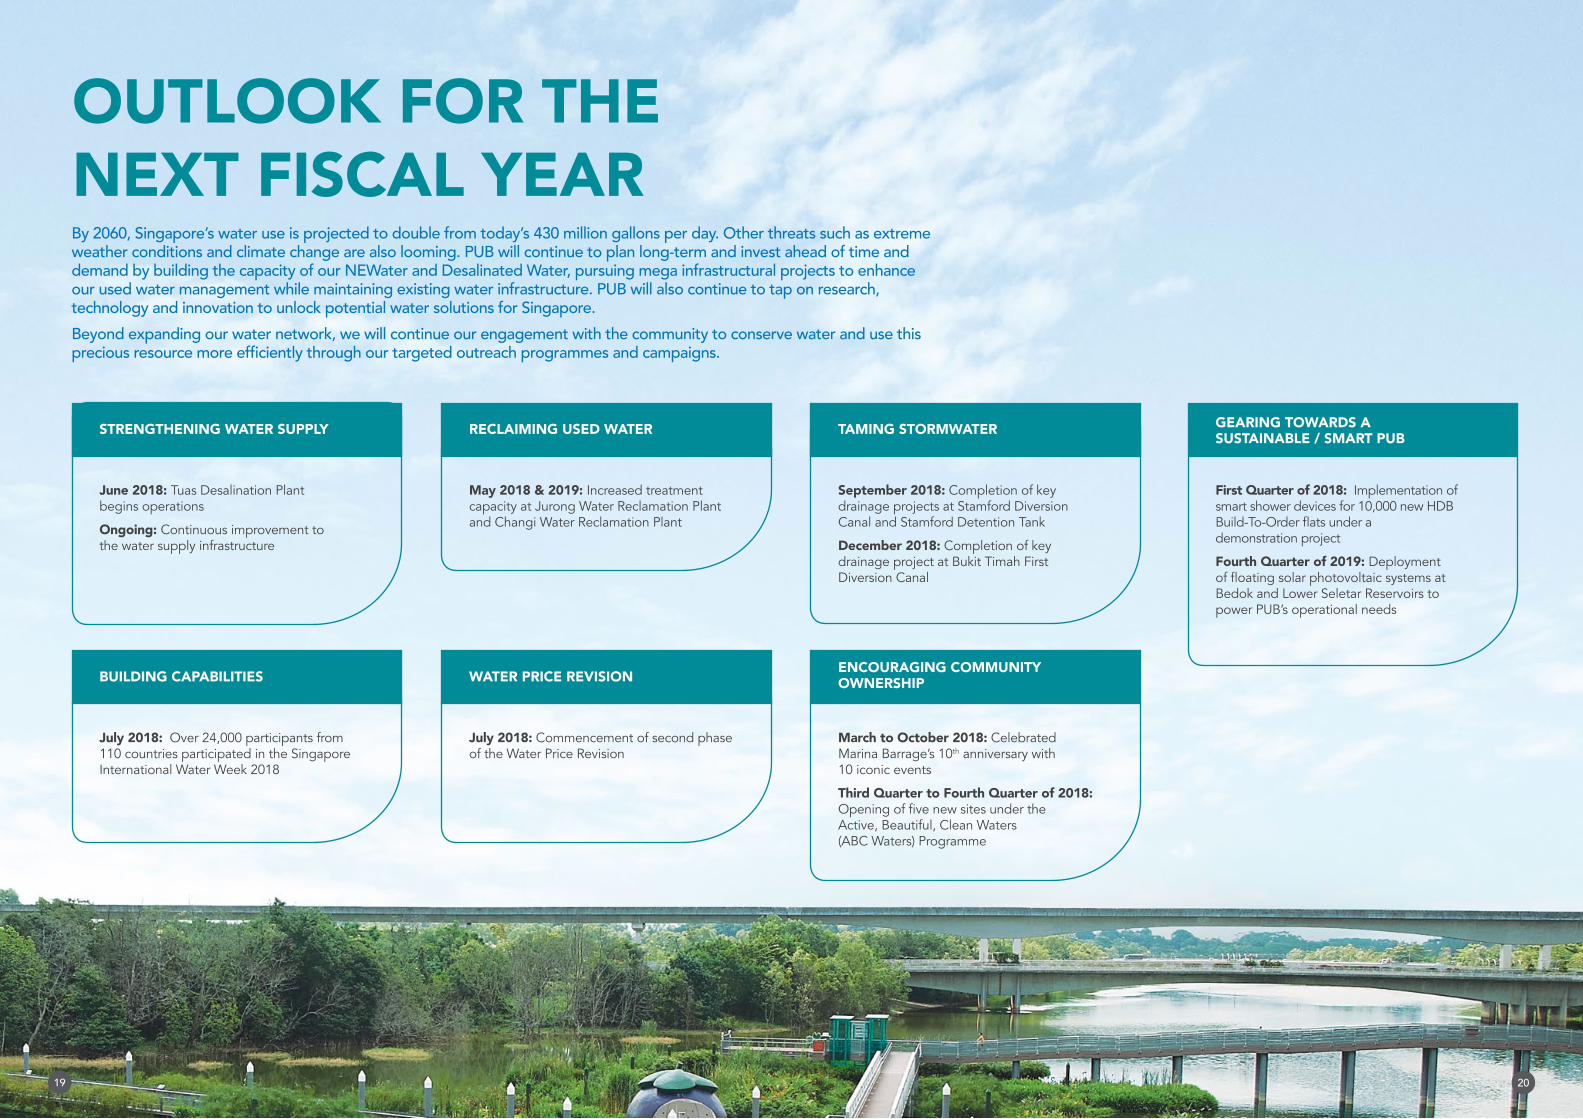
OUTLOOK FOR THE NEXT FISCAL YEAR
June 2018: Tuas Desalination Plant begins operations
Ongoing: Continuous improvement to the water supply infrastructure
STRENGTHENING WATER SUPPLY
May 2018 & 2019: Increased treatment capacity at Jurong Water Reclamation Plant and Changi Water Reclamation Plant
RECLAIMING USED WATER
September 2018: Completion of key drainage projects at Stamford Diversion Canal and Stamford Detention Tank
December 2018: Completion of key drainage project at Bukit Timah First Diversion Canal
TAMING STORMWATER
March to October 2018: Celebrated Marina Barrage’s 10th anniversary with 10 iconic events
Third Quarter to Fourth Quarter of 2018:
Active, Beautiful, Clean Waters (ABC Waters) Programme
ENCOURAGING COMMUNITY OWNERSHIP
First Quarter of 2018: Implementation of smart shower devices for 10,000 new HDB
demonstration project
Fourth Quarter of 2019: Deployment
Bedok and Lower Seletar Reservoirs to power PUB’s operational needs
GEARING TOWARDS A SUSTAINABLE / SMART PUB
July 2018: Over 24,000 participants from 110 countries participated in the Singapore International Water Week 2018
BUILDING CAPABILITIES
July 2018: Commencement of second phase of the Water Price Revision
WATER PRICE REVISION
19 20

INCREASED TREATMENT CAPACITY As part of its Phase 4 expansion for the management of industrial used water, treatment capacity at Jurong Water Reclamation Plant was increased from 45 to 57 million gallons per day (mgd) in May 2018. The project involves the installation of a thermal hydrolysis process facility, with a treatment capacity of 53 tons of dried solids per day, to improve the facility’s sludge management capability.
At Changi Water Reclamation Plant, treatment capacity will be increased from 202 to 224 mgd
STRENGTHENING WATER SUPPLY
TUAS DESALINATION PLANT
extending the lifespan of the treatment membranes.
WATER SUPPLY NETWORKPUB plans ahead of time to ensure that investment in our water supply infrastructure keeps up with the rising water demand alongside increasing urbanisation. New pipelines are laid to meet development needs. There are currently 30 ongoing network expansion projects. PUB will also be expanding the water network in tandem with the development of new desalination plants and NEWater factories.
RECLAIMING USED WATER
21 22
GEARING TOWARDS A SUSTAINABLE / SMART PUB
TAMING STORMWATER
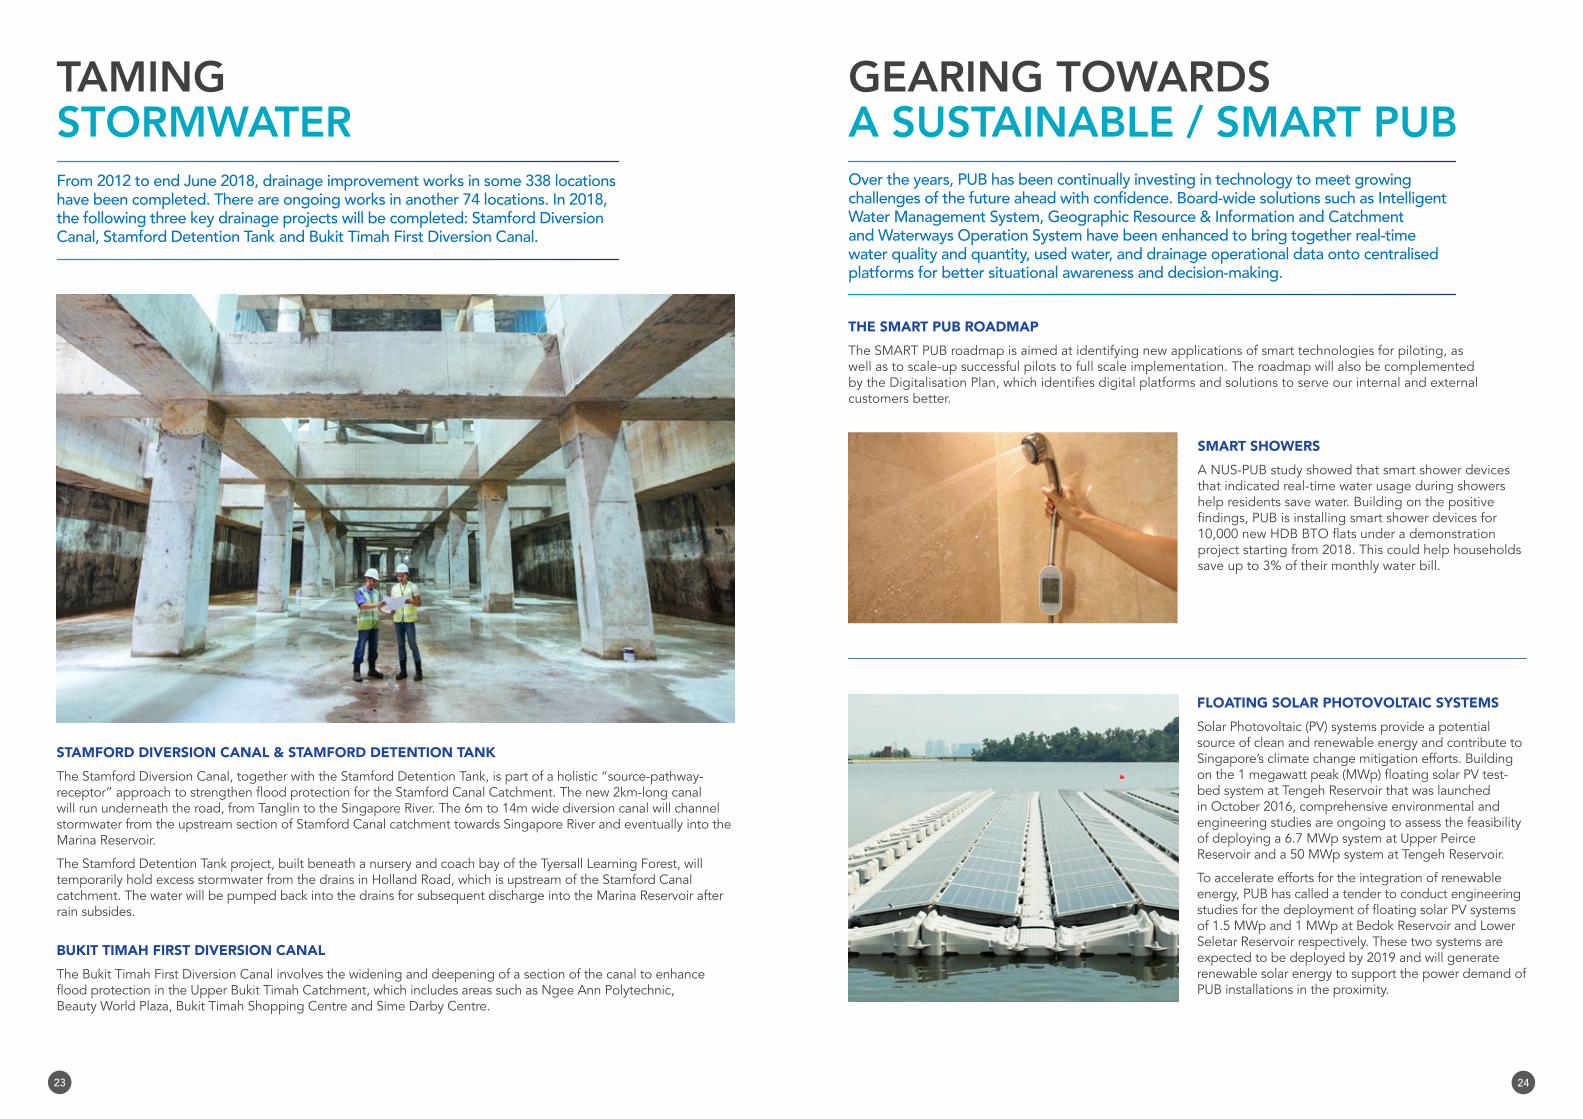
STAMFORD DIVERSION CANAL & STAMFORD DETENTION TANKThe Stamford Diversion Canal, together with the Stamford Detention Tank, is part of a holistic “source-pathway-
will run underneath the road, from Tanglin to the Singapore River. The 6m to 14m wide diversion canal will channel stormwater from the upstream section of Stamford Canal catchment towards Singapore River and eventually into the Marina Reservoir.
The Stamford Detention Tank project, built beneath a nursery and coach bay of the Tyersall Learning Forest, will temporarily hold excess stormwater from the drains in Holland Road, which is upstream of the Stamford Canal catchment. The water will be pumped back into the drains for subsequent discharge into the Marina Reservoir after rain subsides.
BUKIT TIMAH FIRST DIVERSION CANALThe Bukit Timah First Diversion Canal involves the widening and deepening of a section of the canal to enhance
Beauty World Plaza, Bukit Timah Shopping Centre and Sime Darby Centre.
SMART SHOWERS A NUS-PUB study showed that smart shower devices that indicated real-time water usage during showers help residents save water. Building on the positive
project starting from 2018. This could help households save up to 3% of their monthly water bill.
FLOATING SOLAR PHOTOVOLTAIC SYSTEMSSolar Photovoltaic (PV) systems provide a potential source of clean and renewable energy and contribute to Singapore’s climate change mitigation efforts. Building
bed system at Tengeh Reservoir that was launched in October 2016, comprehensive environmental and engineering studies are ongoing to assess the feasibility of deploying a 6.7 MWp system at Upper Peirce Reservoir and a 50 MWp system at Tengeh Reservoir.
To accelerate efforts for the integration of renewable energy, PUB has called a tender to conduct engineering
of 1.5 MWp and 1 MWp at Bedok Reservoir and Lower Seletar Reservoir respectively. These two systems are expected to be deployed by 2019 and will generate renewable solar energy to support the power demand of PUB installations in the proximity.
THE SMART PUB ROADMAPThe SMART PUB roadmap is aimed at identifying new applications of smart technologies for piloting, as well as to scale-up successful pilots to full scale implementation. The roadmap will also be complemented
customers better.
23 24

BUILDING CAPABILITIES
SINGAPORE INTERNATIONAL WATER WEEK
The biennial Singapore International Water Week (SIWW) is a leading platform for global water industry players to showcase innovations, share policy developments, and form partnerships in research and development. The SIWW welcomes the world’s top leaders in the international organisations, industry and academia, and offers an unprecedented networking opportunity to
SIWW 2018 was held from 8 to 12 July 2018. It welcomed over 24,000 participants from 110 countries, with over S$23 billion worth of business announcements being made. PUB also took the opportunity to announce Memorandum of Understanding (MOU)s with Budapest Waterworks and Grundfos, the SMART PUB roadmap, Tuas Water Reclamation Plant projects and launched the Singapore Water Exchange. SIWW 2018 focused on areas such as advanced wastewater treatment and smart water systems, commercialisation and innovation, and integrated water management.
Professor Rita Colwell was awarded the 2018 Lee Kuan Yew Water Prize Award for her pioneering insights into microbial water quality surveillance, and her pivotal contributions in translating these insights into concrete practices and policies to better manage waterborne diseases and protect public health.
ACTIVE, BEAUTIFUL, CLEAN WATERS PUB launched the Active, Beautiful, Clean Waters (ABC Waters) Programme in 2006 which aims to integrate beautiful and clean streams, rivers, and lakes into community spaces for all to enjoy. 36 projects have
Waters Programme since its launch. In addition, there are
projects by other agencies and private developers where the ABC Waters design concept is incorporated as part of their developments.
More than 100 locations across
as potential ABC Waters sites to be implemented by 2030.
ENCOURAGING COMMUNITY OWNERSHIP
MARINA BARRAGE’S 10TH ANNIVERSARY Built across the mouth of Marina Channel, Marina Barrage serves as Singapore’s 15th
opened to the public in October 2008, Marina Barrage has welcomed close to 15 million people from all over the world. A decade on, Marina Barrage is key to Singapore’s water management. The barrage has
in low-lying city areas including Jalan Besar, Boat Quay and Shenton Way. With its iconic location in the Marina Bay, the Marina Barrage has endeared itself to the young and old, transforming into a popular hangout for locals and tourists.
This year, the nation celebrates the 10th anniversary of the Marina Barrage with ten signature events held throughout the year, culminating
was also conducted for engineering students to provide technical insights to behind-the-scenes operations.
5ABC Waterssites
Hougang Town (Sungei Pinang)
Hougang Town (Hougang Avenue 10)
Hougang Town (Serangoon Reservoir)
Boon Tiong
Bukit Timah 1st Diversion Canal (Holland Plain)
WoodlandsSembawang
Nee Soon
Choa Chu Kang
Jurong
Tuas
Queenstown
Telok Blangah
Sentosa
Jurong Island
Sudong
Pawai
Bukum
Semakau
Pulau Ubin Pulau Tekong
Bedok
Serangoon
Ang Mo Kio
25 26

FINANCIAL REPORT 2017/2018

CONTENTS
08Independent Auditor’s Report
13Statements of Comprehensive Income
14Statements of Financial Position
15Consolidated Statement of Changes in Equity
17Consolidated Statement of Cash Flows
19Notes to the Financial Statements
• FINANCIAL HIGHLIGHTS
• FINANCIAL STATEMENTS
FINANCIAL HIGHLIGHTS
16Statement of Changes in Equity
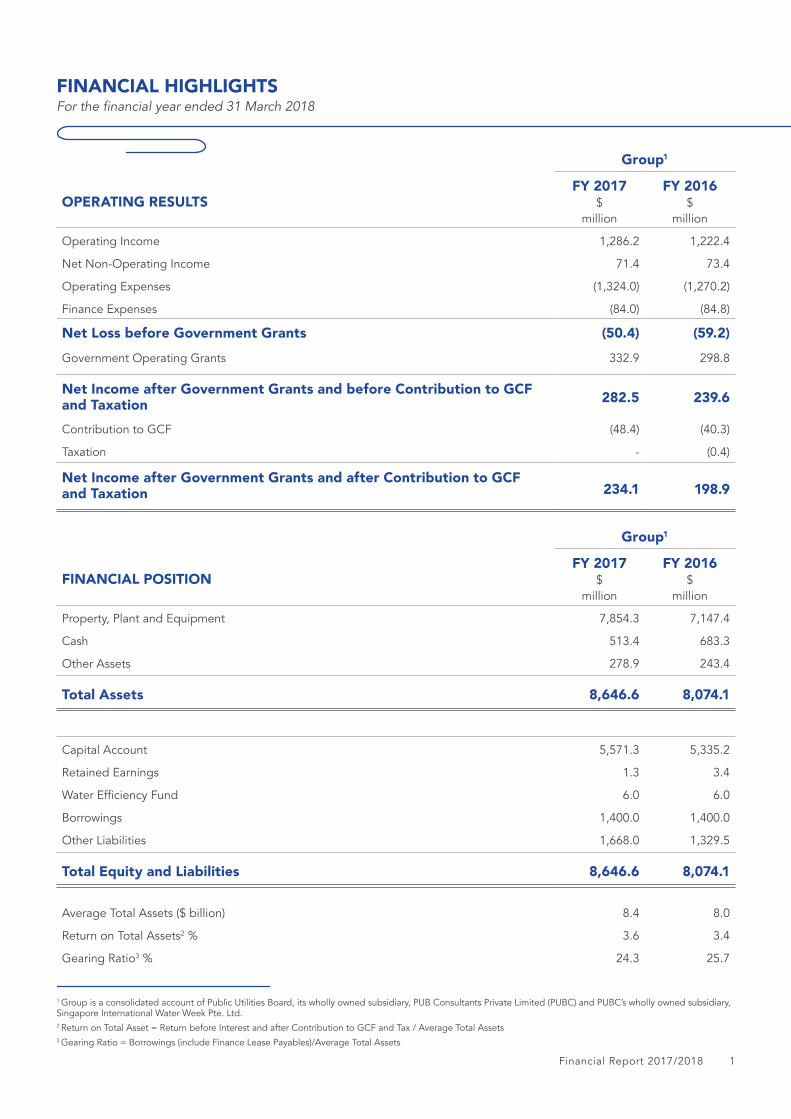
Group1
OPERATING RESULTSFY 2017
$ million
FY 2016 $
million
Operating Income 1,286.2 1,222.4
Net Non-Operating Income 71.4 73.4
Operating Expenses (1,324.0) (1,270.2)
Finance Expenses (84.0) (84.8)
Net Loss before Government Grants (50.4) (59.2)Government Operating Grants 332.9 298.8
Net Income after Government Grants and before Contribution to GCF and Taxation 282.5 239.6
Contribution to GCF (48.4) (40.3)
Taxation - (0.4)
Net Income after Government Grants and after Contribution to GCF and Taxation 234.1 198.9
Group1
FINANCIAL POSITIONFY 2017
$ million
FY 2016 $
million
Property, Plant and Equipment 7,854.3 7,147.4
Cash 513.4 683.3
Other Assets 278.9 243.4
Total Assets 8,646.6 8,074.1
Capital Account 5,571.3 5,335.2
Retained Earnings 1.3 3.4
6.0 6.0
Borrowings 1,400.0 1,400.0
Other Liabilities 1,668.0 1,329.5
Total Equity and Liabilities 8,646.6 8,074.1
Average Total Assets ($ billion) 8.4 8.0
Return on Total Assets2 % 3.6 3.4
Gearing Ratio3 % 24.3 25.7
1 Group is a consolidated account of Public Utilities Board, its wholly owned subsidiary, PUB Consultants Private Limited (PUBC) and PUBC’s wholly owned subsidiary, Singapore International Water Week Pte. Ltd.2 Return on Total Asset = Return before Interest and after Contribution to GCF and Tax / Average Total Assets3 Gearing Ratio = Borrowings (include Finance Lease Payables)/Average Total Assets
1Financial Report 2017/2018
FINANCIAL HIGHLIGHTS

PERFORMANCE OVERVIEWThe Group recorded a net income after Government grants and Contribution to GCF and Taxation of $234.1 million this year (prior year: $198.9 million). The increase in operating expenses was offset by the increase in operating income and Government operating grant bringing about a higher return by $35.2 million over the previous year and a Return on Total Assets of 3.6% (prior year: 3.4%).
OPERATING INCOME AND GOVERNMENT GRANTSThe Group’s operating income of $1,286.2 million (prior year: $1,222.4 million) was from its water supply and used water operations. The Group’s other major source of income of $332.9 million (prior year: $298.8 million) is from the Government operating grants for the operations and maintenance of the drainage systems, the Active, Beautiful, Clean Waters (ABC Waters) Programme as well as other government-funded activities.
OPERATING EXPENSESThe Group’s operating expenses4 totalled $1,324.0 million in FY2017 (prior year: $1,270.2 million). Operating expenses of the Group comprise largely of depreciation of property, plant and equipment, maintenance, manpower, electricity, research & development, administrative and other miscellaneous expenses incurred related to the collection, production, distribution and reclamation of water in Singapore.
FINANCIAL POSITIONAs at 31 March 2018, the Group’s total assets stood at $8,646.6 million (prior year: $8,074.1 million). The increase of $572.5 million was largely due to an increase in property, plant and equipment.
90.8% of the Group’s total assets or $7,854.3 million (prior year: 88.5%, $7,147.4 million) are accounted for by property, plant and equipment which comprise land, pipelines, plant, equipment and buildings (to house the plant and equipment).
4 The Group’s operating expenses do not include depreciation expense for the drainage and used water reticulation network belonging to the Government.
Water
NEWater
Used Water
Industrial Water & Others
Used Water
Drainage and Active, Beautiful, Clean Waters (ABC Waters) Programme
CAPITAL EXPENDITUREDuring the year, the capital expenditure of the Group was $1,294.5 million (prior year: $1,051.6 million). This comprises PUB-funded capital expenditure of $733.0 million and government-funded capital expenditure of $561.5 million as shown in the following charts:
PUB spent $733.0 million (prior year: $500.8 million) in capital expenditure as part of its continual efforts to replace, improve and expand water and used water infrastructure to cater for future water needs of the nation. These infrastructure are funded from cash generated from revenue collected (net of expenses) and borrowings.
Government-funded capital expenditure of $561.5 million (prior year: $550.8 million) were for drainage network, used water reticulation network and the Active, Beautiful, Clean Waters (ABC Waters) Programme projects. These assets belong to the Government.
Government-Funded ($ million)
FY 2017
FY 2016
0.0 100.0 200.0 300.0 400.0 500.0 600.0 700.0 800.0
307.0
357.5
Total:561.5
Total:550.8
PUB-Funded ($ million)
FY 2017
FY 2016
13.9
20.9
0.0 100.0 200.0 300.0 400.0 500.0 600.0 700.0 800.0
294.6
104.5 11.8
19.9Total:733.0
Total:500.8
404.6
363.6
254.5
193.3
3Financial Report 2017/20182 Financial Report 2017/2018
FINANCIAL HIGHLIGHTSFINANCIAL HIGHLIGHTS
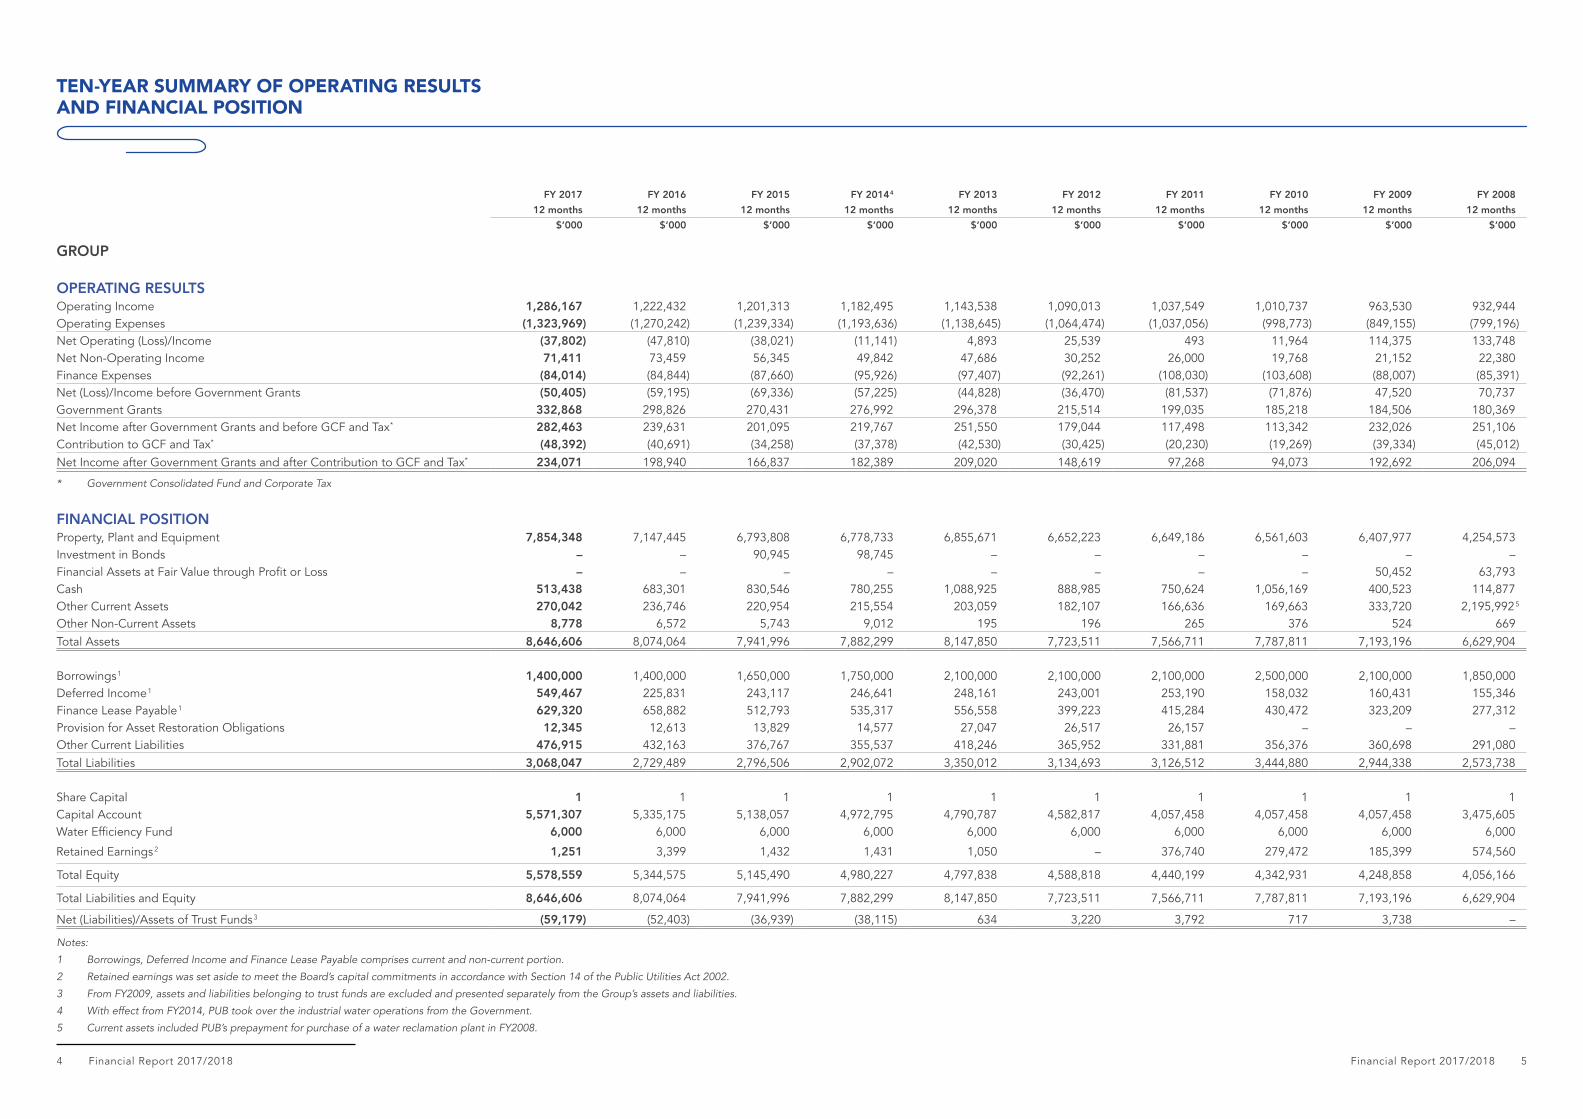
FY 2017 FY 2016 FY 2015 FY 2014 4 FY 2013 FY 2012 FY 2011 FY 2010 FY 2009 FY 200812 months 12 months 12 months 12 months 12 months 12 months 12 months 12 months 12 months 12 months
$’000 $’000 $’000 $’000 $’000 $’000 $’000 $’000 $’000 $’000
GROUP
OPERATING RESULTSOperating Income 1,286,167 1,222,432 1,201,313 1,182,495 1,143,538 1,090,013 1,037,549 1,010,737 963,530 932,944Operating Expenses (1,323,969) (1,270,242) (1,239,334) (1,193,636) (1,138,645) (1,064,474) (1,037,056) (998,773) (849,155) (799,196)Net Operating (Loss)/Income (37,802) (47,810) (38,021) (11,141) 4,893 25,539 493 11,964 114,375 133,748Net Non-Operating Income 71,411 73,459 56,345 49,842 47,686 30,252 26,000 19,768 21,152 22,380Finance Expenses (84,014) (84,844) (87,660) (95,926) (97,407) (92,261) (108,030) (103,608) (88,007) (85,391)Net (Loss)/Income before Government Grants (50,405) (59,195) (69,336) (57,225) (44,828) (36,470) (81,537) (71,876) 47,520 70,737Government Grants 332,868 298,826 270,431 276,992 296,378 215,514 199,035 185,218 184,506 180,369Net Income after Government Grants and before GCF and Tax* 282,463 239,631 201,095 219,767 251,550 179,044 117,498 113,342 232,026 251,106Contribution to GCF and Tax* (48,392) (40,691) (34,258) (37,378) (42,530) (30,425) (20,230) (19,269) (39,334) (45,012)Net Income after Government Grants and after Contribution to GCF and Tax* 234,071 198,940 166,837 182,389 209,020 148,619 97,268 94,073 192,692 206,094
FINANCIAL POSITIONProperty, Plant and Equipment 7,854,348 7,147,445 6,793,808 6,778,733 6,855,671 6,652,223 6,649,186 6,561,603 6,407,977 4,254,573Investment in Bonds – – 90,945 98,745 – – – – – –
– – – – – – – – 50,452 63,793Cash 513,438 683,301 830,546 780,255 1,088,925 888,985 750,624 1,056,169 400,523 114,877Other Current Assets 270,042 236,746 220,954 215,554 203,059 182,107 166,636 169,663 333,720 2,195,992 5
Other Non-Current Assets 8,778 6,572 5,743 9,012 195 196 265 376 524 669Total Assets 8,646,606 8,074,064 7,941,996 7,882,299 8,147,850 7,723,511 7,566,711 7,787,811 7,193,196 6,629,904
Borrowings 1 1,400,000 1,400,000 1,650,000 1,750,000 2,100,000 2,100,000 2,100,000 2,500,000 2,100,000 1,850,000Deferred Income 1 549,467 225,831 243,117 246,641 248,161 243,001 253,190 158,032 160,431 155,346Finance Lease Payable 1 629,320 658,882 512,793 535,317 556,558 399,223 415,284 430,472 323,209 277,312Provision for Asset Restoration Obligations 12,345 12,613 13,829 14,577 27,047 26,517 26,157 – – –Other Current Liabilities 476,915 432,163 376,767 355,537 418,246 365,952 331,881 356,376 360,698 291,080Total Liabilities 3,068,047 2,729,489 2,796,506 2,902,072 3,350,012 3,134,693 3,126,512 3,444,880 2,944,338 2,573,738
Share Capital 1 1 1 1 1 1 1 1 1 1Capital Account 5,571,307 5,335,175 5,138,057 4,972,795 4,790,787 4,582,817 4,057,458 4,057,458 4,057,458 3,475,605
6,000 6,000 6,000 6,000 6,000 6,000 6,000 6,000 6,000 6,000
Retained Earnings 2 1,251 3,399 1,432 1,431 1,050 – 376,740 279,472 185,399 574,560
Total Equity 5,578,559 5,344,575 5,145,490 4,980,227 4,797,838 4,588,818 4,440,199 4,342,931 4,248,858 4,056,166
Total Liabilities and Equity 8,646,606 8,074,064 7,941,996 7,882,299 8,147,850 7,723,511 7,566,711 7,787,811 7,193,196 6,629,904
Net (Liabilities)/Assets of Trust Funds 3 (59,179) (52,403) (36,939) (38,115) 634 3,220 3,792 717 3,738 –
5Financial Report 2017/20184 Financial Report 2017/2018
TEN-YEAR SUMMARY OF OPERATING RESULTS AND FINANCIAL POSITION
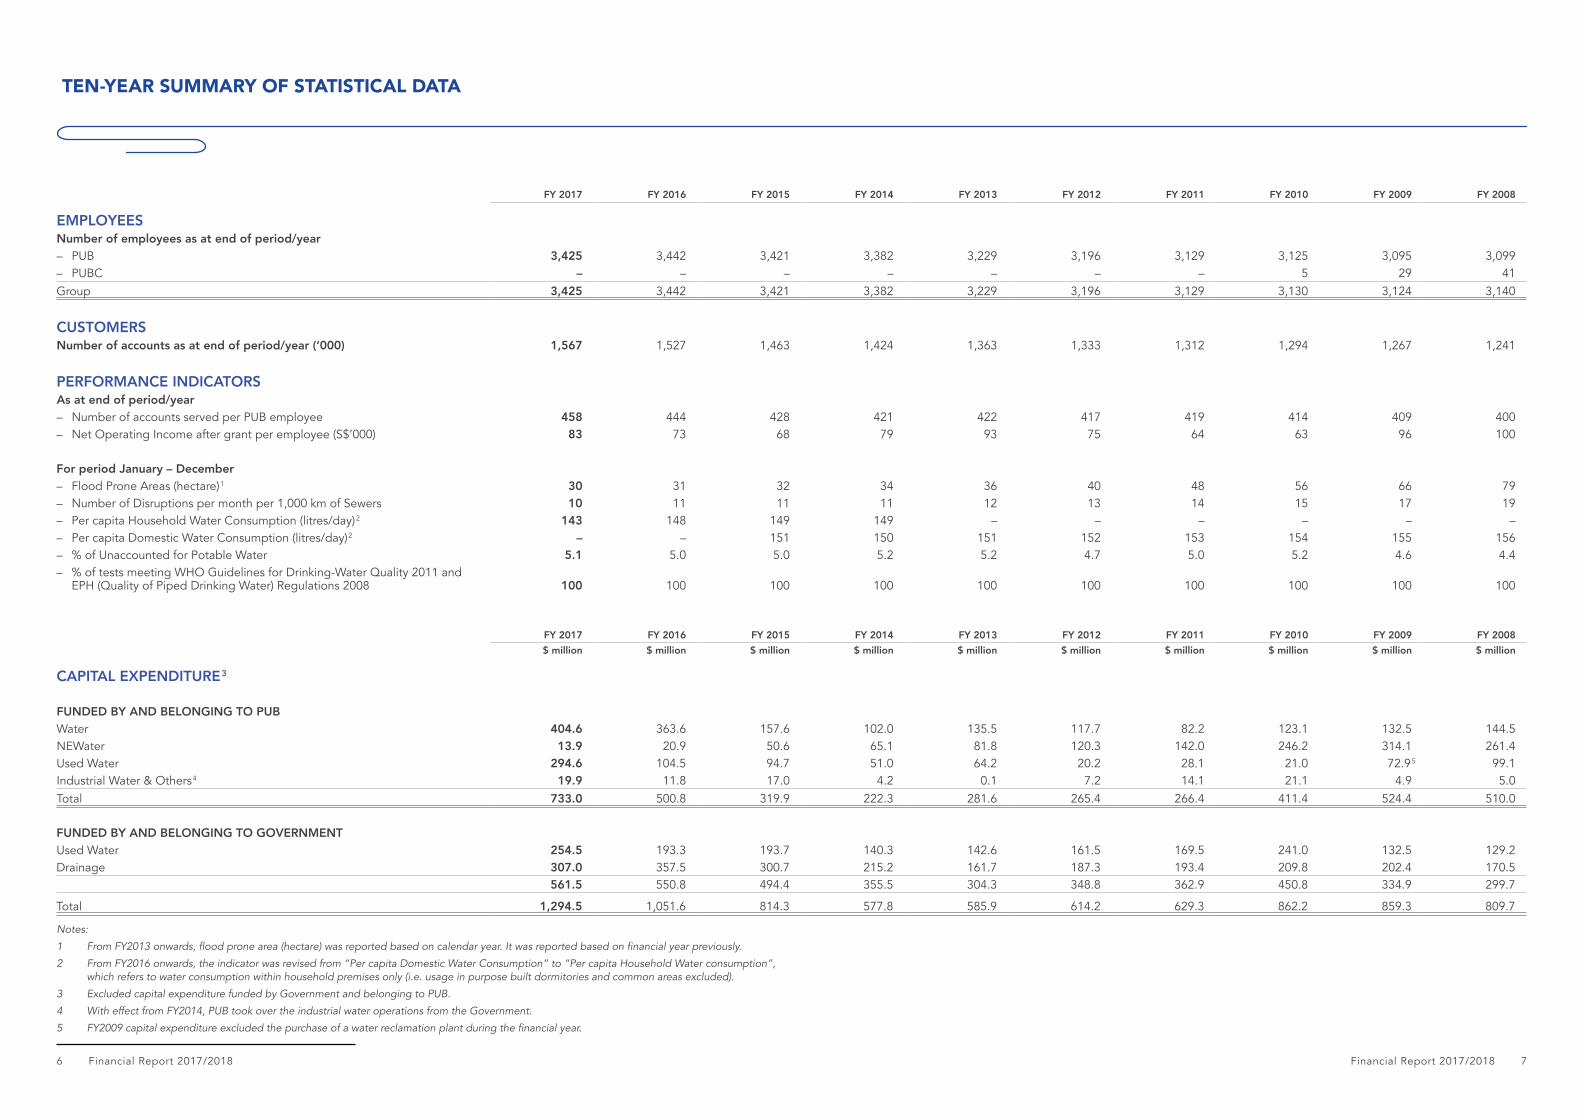
FY 2017 FY 2016 FY 2015 FY 2014 FY 2013 FY 2012 FY 2011 FY 2010 FY 2009 FY 2008
EMPLOYEESNumber of employees as at end of period/year– PUB 3,425 3,442 3,421 3,382 3,229 3,196 3,129 3,125 3,095 3,099– PUBC – – – – – – – 5 29 41Group 3,425 3,442 3,421 3,382 3,229 3,196 3,129 3,130 3,124 3,140
CUSTOMERSNumber of accounts as at end of period/year (‘000) 1,567 1,527 1,463 1,424 1,363 1,333 1,312 1,294 1,267 1,241
PERFORMANCE INDICATORSAs at end of period/year– Number of accounts served per PUB employee 458 444 428 421 422 417 419 414 409 400– Net Operating Income after grant per employee (S$’000) 83 73 68 79 93 75 64 63 96 100
For period January – December– Flood Prone Areas (hectare) 1 30 31 32 34 36 40 48 56 66 79– Number of Disruptions per month per 1,000 km of Sewers 10 11 11 11 12 13 14 15 17 19– Per capita Household Water Consumption (litres/day) 2 143 148 149 149 – – – – – –– Per capita Domestic Water Consumption (litres/day) 2 – – 151 150 151 152 153 154 155 156– % of Unaccounted for Potable Water 5.1 5.0 5.0 5.2 5.2 4.7 5.0 5.2 4.6 4.4– % of tests meeting WHO Guidelines for Drinking-Water Quality 2011 and
EPH (Quality of Piped Drinking Water) Regulations 2008 100 100 100 100 100 100 100 100 100 100
FY 2017 FY 2016 FY 2015 FY 2014 FY 2013 FY 2012 FY 2011 FY 2010 FY 2009 FY 2008$ million $ million $ million $ million $ million $ million $ million $ million $ million $ million
CAPITAL EXPENDITURE 3
FUNDED BY AND BELONGING TO PUBWater 404.6 363.6 157.6 102.0 135.5 117.7 82.2 123.1 132.5 144.5NEWater 13.9 20.9 50.6 65.1 81.8 120.3 142.0 246.2 314.1 261.4Used Water 294.6 104.5 94.7 51.0 64.2 20.2 28.1 21.0 72.9 5 99.1Industrial Water & Others 4 19.9 11.8 17.0 4.2 0.1 7.2 14.1 21.1 4.9 5.0Total 733.0 500.8 319.9 222.3 281.6 265.4 266.4 411.4 524.4 510.0
FUNDED BY AND BELONGING TO GOVERNMENTUsed Water 254.5 193.3 193.7 140.3 142.6 161.5 169.5 241.0 132.5 129.2Drainage 307.0 357.5 300.7 215.2 161.7 187.3 193.4 209.8 202.4 170.5
561.5 550.8 494.4 355.5 304.3 348.8 362.9 450.8 334.9 299.7
Total 1,294.5 1,051.6 814.3 577.8 585.9 614.2 629.3 862.2 859.3 809.7
7Financial Report 2017/20186 Financial Report 2017/2018
TEN-YEAR SUMMARY OF STATISTICAL DATA

FINANCIAL STATEMENTS

To Members of the Board
Report on the Audit of the Financial StatementsOur opinion
• the consolidated statement of changes in equity of the Group and the statement of changes in equity of the Board for the
Basis for Opinion
are further described in the section of our report.
We are independent of the Group in accordance with the Accounting and Corporate Regulatory Authority Code of Professional
accordance with these requirements and the ACRA Code.
Our Audit ApproachAs part of designing our audit, we determined materiality and assessed the risks of material misstatement in the accompanying
As in all of our audits, we also addressed the risk of management override of internal controls, including among other matters consideration of whether there was evidence of bias that represented a risk of material misstatement due to fraud.
Report on the Audit of the Financial Statements (continued)
Our Audit Approach
statements as a whole, and in forming our opinion thereon, and we do not provide a separate opinion on these matters.
Key Audit Matter How our audit addressed the matter
Carrying values of property, plant and equipment (“PPE”) and assessment of useful lives of PPE
Refer to note 2.9(b), note 3 and note 13 to the
As of 31 March 2018, the carrying value of PPE of the Group amounted to S$7,854.3 million.
We had focused our audit on the carrying value of PPE because PPE accounts for the majority of the Group’s
involved in determining the useful lives of PPE. Given the
errors in estimating the useful lives of PPE could result in a
Our audit procedures included the following:
• We obtained understanding and validated the key controls over the Group’s processes for accounting of property, plant and equipment, and noted that the determination of useful lives of PPE takes into consideration asset utilisation rate, internal technical evaluation, operational plans and technological developments.
• We reviewed the appropriateness of management’s estimates of the useful lives of PPE as follows:
(i) Discussed with management on the operational
(ii) Assessed management’s estimate for the useful lives of new PPE acquired by tracing to underlying documentary support such as project documentation, technical assessment and
(iii) Reviewed management’s analysis of estimated
to estimated useful lives such as expected usage of the asset, expected physical wear and tear, technical or commercial obsolescence and legal or similar limits on the use of the asset such as the
(iv) Compared the useful lives of the PPE against entities in the utilities industry based on published information of these entities.
Based on our audit procedures performed, we found management’s estimates of the useful lives of PPE to be reasonable.
9Financial Report 2017/20188 Financial Report 2017/2018
INDEPENDENT AUDITOR’S REPORT INDEPENDENT AUDITOR’S REPORT
Report on the Audit of the Financial Statements (continued)
Other InformationManagement is responsible for the other information. The other information refers to all the sections of the annual report but
available to us after the date of this auditor’s report.
assurance conclusion thereon.
obtained in the audit, or otherwise appears to be materially misstated.
If, based on the work we have performed on the other information that we obtained prior to the date of this auditor’s report, we conclude that there is a material misstatement of this other information, we are required to report that fact. We have nothing to report in this regard.
When we read the other information, if we conclude that there is a material misstatement therein, we are required to communicate the matter to those charged with governance and take appropriate actions in accordance with SSAs.
Responsibilities of Management and Those Charged with Governance for the Financial Statements
statements that are free from material misstatement, whether due to fraud or error.
statements, management is responsible for assessing the Group’s ability to continue as a going concern, disclosing, as applicable, matters related to going concern and using the going concern basis of accounting unless there is intention to wind up the Group or for the Group to cease operations.
Report on the Audit of the Financial Statements (continued)
Auditor’s Responsibilities for the Audit of the Financial Statements
misstatement, whether due to fraud or error, and to issue an auditor’s report that includes our opinion. Reasonable assurance is a high level of assurance, but is not a guarantee that an audit conducted in accordance with SSAs will always detect a material misstatement when it exists. Misstatements can arise from fraud or error and are considered material if, individually or in the
statements.
As part of an audit in accordance with SSAs, we exercise professional judgement and maintain professional scepticism throughout the audit. We also:
a basis for our opinion. The risk of not detecting a material misstatement resulting from fraud is higher than for one resulting from error, as fraud may involve collusion, forgery, intentional omissions, misrepresentations, or the override of internal control.
• Obtain an understanding of internal control relevant to the audit in order to design audit procedures that are appropriate in the circumstances, but not for the purpose of expressing an opinion on the effectiveness of the Group’s internal control.
• Evaluate the appropriateness of accounting policies used and the reasonableness of accounting estimates and related disclosures made by management.
• Conclude on the appropriateness of management’s use of the going concern basis of accounting and, based on the audit
the Group’s ability to continue as a going concern. If we conclude that a material uncertainty exists, we are required to draw
to modify our opinion. Our conclusions are based on the audit evidence obtained up to the date of our auditor’s report. However, future events or conditions may cause the Group to cease to continue as a going concern.
and performance of the group audit. We remain solely responsible for our audit opinion.
We communicate with those charged with governance regarding, among other matters, the planned scope and timing of the
We also provide those charged with governance with a statement that we have complied with relevant ethical requirements regarding independence, and to communicate with them all relationships and other matters that may reasonably be thought to bear on our independence, and where applicable, related safeguards.
our auditor’s report unless law or regulation precludes public disclosure about the matter or when, in extremely rare circumstances, we determine that a matter should not be communicated in our report because the adverse consequences of doing so would
11Financial Report 2017/201810 Financial Report 2017/2018
INDEPENDENT AUDITOR’S REPORT INDEPENDENT AUDITOR’S REPORT

Report on other Legal and Regulatory RequirementsOpinionIn our opinion:
(b) proper accounting and other records have been kept, including records of all assets of the Board and of those subsidiaries incorporated in Singapore of which we are the auditors whether purchased, donated or otherwise.
Basis for OpinionWe conducted our audit in accordance with SSAs. Our responsibilities under those standards are further described in the
section of our report. We are independent of the Group in accordance with the ACRA
Responsibilities of Management for Compliance with Legal and Regulatory RequirementsManagement is responsible for ensuring that the receipts, expenditure, investment of moneys and the acquisition and disposal of assets are in accordance with the provisions of the Act. This responsibility includes implementing accounting and internal controls as management determines are necessary to enable compliance with the provisions of the Act.
Auditor’s Responsibilities for the Compliance Audit
We planned and performed the compliance audit to obtain reasonable assurance about whether the receipts, expenditure, investment of moneys and the acquisition and disposal of assets are in accordance with the provisions of the Act.
Our compliance audit includes obtaining an understanding of the internal control relevant to the receipts, expenditure, investment
from non-compliance, if any, but not for the purpose of expressing an opinion on the effectiveness of the entity’s internal control. Because of the inherent limitations in any accounting and internal control system, non-compliances may nevertheless occur and not be detected.
The engagement partner on the audit resulting in this independent auditor’s report is Lee Kok Hooi.
PricewaterhouseCoopers LLPPublic Accountants and Chartered Accountants
Singapore, 5 July 2018
GROUP BOARDNote 31 March 2018 31 March 2017 31 March 2018 31 March 2017
$’000 $’000 $’000 $’000
Operating income 4 1,286,167 1,222,432 1,285,786 1,212,869Operating expenses 5 (1,323,969) (1,270,242) (1,323,440) (1,262,989)
Net operating loss (37,802) (47,810) (37,654) (50,120)
Net non-operating income 6 71,411 73,459 73,411 73,459
and operating grants 33,609 25,649 35,757 23,339
Finance expenses 7 (84,014) (84,844) (84,014) (84,844)
Net loss before operating grants (50,405) (59,195) (48,257) (61,505)Operating grants from government 332,868 298,826 332,868 298,826
Net income after government grants and before contribution to government
282,463 239,631 284,611 237,321Contribution to government consolidated fund 8(a) (48,392) (40,348) (48,392) (40,348)Taxation 8(b) – (343) – –
Net income after government grants and after contribution to government
234,071 198,940 236,219 196,973
Other comprehensive income
Net re-measurement gain/(loss) on pension obligation (87) 145 (87) 145
Total comprehensive income 233,984 199,085 236,132 197,118
Attributable to:Shareholder of the Board 233,984 199,085 236,132 197,118
Chiang Chie Foo Ng Joo HeeChairman Chief Executive
5 July 2018 5 July 2018
13Financial Report 2017/201812 Financial Report 2017/2018
PUBLIC UTILITIES BOARD AND ITS SUBSIDIARIES
INDEPENDENT AUDITOR’S REPORT STATEMENTS OF COMPREHENSIVE INCOME

GROUP BOARDNote 31 March 2018 31 March 2017 31 March 2018 31 March 2017
$’000 $’000 $’000 $’000
ASSETSCurrent assetsCash and cash equivalents 9 513,438 683,301 512,153 680,981Inventories 10 66,496 66,849 66,496 66,849Trade and other receivables 11 201,050 168,524 197,730 164,979Prepaid and deferred expenses 12 2,496 1,373 1,001 1,358
783,480 920,047 777,380 914,167
Non-current assetsProperty, plant and equipment 13 7,854,348 7,147,445 7,854,348 7,147,445Investment in subsidiaries 14 – – 100 100Other receivables 11 7 21 7 21Prepaid and deferred expenses 12 8,771 6,551 8,771 6,359
7,863,126 7,154,017 7,863,226 7,153,925Total assets 8,646,606 8,074,064 8,640,606 8,068,092
LIABILITIESCurrent liabilitiesTrade and other payables 15 233,802 220,981 233,146 219,513Other liabilities 16 194,721 170,506 194,692 170,506Provision for contribution to government
consolidated fund and taxation 48,392 40,676 48,392 40,348Finance lease payables 17 31,261 29,562 31,261 29,562Deferred income 18 21,281 13,324 17,267 13,309Borrowings 19 400,000 – 400,000 –
929,457 475,049 924,758 473,238
Non-current liabilitiesFinance lease payables 17 598,059 629,320 598,059 629,320Deferred income 18 528,186 212,507 528,136 211,745Borrowings 19 1,000,000 1,400,000 1,000,000 1,400,000Provision for asset restoration obligations 20 12,345 12,613 12,345 12,613
2,138,590 2,254,440 2,138,540 2,253,678Total liabilities 3,068,047 2,729,489 3,063,298 2,726,916NET ASSETS 5,578,559 5,344,575 5,577,308 5,341,176
EquityShare capital 21 1 1 1 1Retained earnings 1,251 3,399 – –Capital account 22 5,571,307 5,335,175 5,571,307 5,335,175
23 6,000 6,000 6,000 6,0005,578,559 5,344,575 5,577,308 5,341,176
Supplementary informationNet liabilities of trust funds 24 (59,179) (52,403) (59,179) (52,403)
GROUP
NoteShare
capitalRetained earnings
Capital account
Water Total
$’000 $’000 $’000 $’000 $’00031 March 2018
1 3,399 5,335,175 6,000 5,344,575
Net income after government grants and after contribution to government consolidated fund and taxation for the year – 234,071 – – 234,071
Other comprehensive income for the year – (87) – – (87)
Total comprehensive income for the year – 233,984 – – 233,984
Transfer to retained earnings upon utilisation 23 – 1,312 – (1,312) –
Transfer to top up water 23 – (1,312) – 1,312 –
Transfer to capital account 22 – (236,132) 236,132 – –Total transactions with
owners, recognised directly in equity – (236,132) 236,132 – –
1 1,251 5,571,307 6,000 5,578,559
31 March 20171 1,432 5,138,057 6,000 5,145,490
Net income after government grants and after contribution to government consolidated fund and taxation for the year
– 198,940 – – 198,940
Other comprehensive income for the year – 145 – – 145
Total comprehensive income for the year – 199,085 – – 199,085
Transfer to retained earnings upon utilisation 23 – 3,098 – (3,098) –
Transfer to top up water 23 – (3,098) – 3,098 –
Transfer to capital account 22 – (197,118) 197,118 – –Total transactions with
owners, recognised directly in equity – (197,118) 197,118 – –
1 3,399 5,335,175 6,000 5,344,575
15Financial Report 2017/201814 Financial Report 2017/2018
PUBLIC UTILITIES BOARD AND ITS SUBSIDIARIESPUBLIC UTILITIES BOARD AND ITS SUBSIDIARIES
STATEMENTS OF FINANCIAL POSITION CONSOLIDATED STATEMENT OF CHANGES IN EQUITY

BOARD
NoteShare
capitalRetained earnings
Capital account
Water Total
$’000 $’000 $’000 $’000 $’00031 March 2018
1 – 5,335,175 6,000 5,341,176
Net income after government grants and after contribution to government consolidated fund and taxation for the year – 236,219 – – 236,219
Other comprehensive income for the year – (87) – – (87)
Total comprehensive income for the year – 236,132 – – 236,132
Transfer to retained earnings upon utilisation 23 – 1,312 – (1,312) –
Transfer to top up water 23 – (1,312) – 1,312 –
Transfer to capital account 22 – (236,132) 236,132 – –Total transactions with
owners, recognised directly in equity – (236,132) 236,132 – –
1 – 5,571,307 6,000 5,577,308
31 March 20171 – 5,138,057 6,000 5,144,058
Net income after government grants and after contribution to government consolidated fund and taxation for the year – 196,973 – – 196,973
Other comprehensive income for the year – 145 – – 145
Total comprehensive income for the year – 197,118 – – 197,118
Transfer to retained earnings upon utilisation 23 – 3,098 – (3,098) –
Transfer to top up water 23 – (3,098) – 3,098 –
Transfer to capital account 22 – (197,118) 197,118 – –Total transactions with
owners, recognised directly in equity – (197,118) 197,118 – –
1 – 5,335,175 6,000 5,341,176
GROUPNote 31 March 2018 31 March 2017
$’000 $’000
Net loss before operating grants (50,405) (59,195)
Adjustments for:– Impairment loss on property, plant and equipment 5(c) 14,550 1,815– Allowance for doubtful receivables, net 5(c) 3,257 906– Allowance for inventory obsolescence 5(c) 623 277– Depreciation of property, plant and equipment 5(c) 316,871 312,713– Investment income from bonds – (504)– Amortisation of bond premium – 195– Loss on disposal of property, plant and equipment 6 3,530 1,191– Amortisation of deferred income 6 (16,019) (13,506)
6 (8,301) (12,519)– Finance expenses 7 84,014 84,844
348,120 316,217
Change in working capital, net of effects from acquisition and disposal of subsidiaries:
– Trade and other receivables (36,137) (10,281)– Prepaid and deferred expenses (3,343) 97– Trade and other payables, and other liabilities 20,863 26,252– Deferred income 29,904 (3,780)– Inventories (270) (7,834)
359,137 320,671Payment for government consolidated fund and tax (40,676) (34,205)Net cash provided by operating activities 318,461 286,466
Additions to property, plant and equipment (733,173) (497,102)Maturity of investments – 90,750Disposal of property, plant and equipment 500 953Interest and investment income received 12,285 13,526Net cash used in investing activities (720,388) (391,873)
17Financial Report 2017/201816 Financial Report 2017/2018
PUBLIC UTILITIES BOARD AND ITS SUBSIDIARIESPUBLIC UTILITIES BOARD AND ITS SUBSIDIARIES
STATEMENT OF CHANGES IN EQUITY CONSOLIDATED STATEMENT OF CASH FLOWS

1. General informationPublic Utilities Board (the "Board") is a statutory board continued under the Public Utilities Act (Chapter 261), which came under the purview of the Ministry of Environment and Water Resources ("MEWR") on 1 April 2001. The address of its
The principal activities of the Board established under the Public Utilities Act (Chapter 261) are to supply water to the public,
of the public sewerage systems, public sewers, and storm water drainage systems belonging to the Government. The
2.1 Basis of preparation
accordance with the provision of the Public Utilities Act (Chapter 261) and Statutory Board Financial Reporting Standards
SB-FRSs include Statutory Board Financial Reporting Standards, Interpretations of SB-FRSs and SB-FRS Guidance Notes as promulgated by the Accountant- General. The Accountant-General is appointed as the legal authority to prescribe accounting standards for statutory boards under the Accounting Standards Act 2007 (No 39 of 2007) which came into effect on 1 November 2007.
As at 31 March 2018, the Group’s and the Board’s current liabilities exceeded their current assets by $146.0 million and $147.4 million respectively.
Board will also tap the capital market to meet its funding requirements.
process of applying the Group’s accounting policies. It also requires the use of certain critical accounting estimates and assumptions. The areas involving a higher degree of judgement or complexity, or areas where assumptions and estimates
Interpretations and amendments to published standards effective in 2017
in accordance with the transitional provisions in the respective SB-FRS and INT SB-FRS.
The adoption of these new or amended SB-FRS and INT SB-FRS did not result in substantial changes to the accounting
years.
GROUPNote 31 March 2018 31 March 2017
$’000 $’000
Grants received from government 345,109 319,570Repayment of borrowings – (250,000)
(63,977) (56,139)(49,068) (55,269)
232,064 (41,838)
Net decrease in cash and cash equivalents (169,863) (147,245)
Cash and cash equivalents9 683,301 830,5469 513,438 683,301
1 April 2017 Cash changes
Non-cash changes
31 March 2018
Principal and interest
payments
Grants received
from government
Government grant utilised
Interest
$’000 $’000 $’000 $’000 $’000 $’000
Advances received for government grant 23,727 – 345,109 (329,592) – 39,244Borrowings 1,400,000 (49,068) – – 49,068 1,400,000Finance lease payables 658,882 (63,977) – – 34,415 629,320
19Financial Report 2017/201818 Financial Report 2017/2018
PUBLIC UTILITIES BOARD AND ITS SUBSIDIARIESPUBLIC UTILITIES BOARD AND ITS SUBSIDIARIES
NOTES TO THE FINANCIAL STATEMENTSCONSOLIDATED STATEMENT OF CASH FLOWS

(continued)
2.2 Revenue recognition
can be reliably measured, regardless of when the payment is made. Revenue is measured at the fair value of consideration
must also be met before revenue is recognised:
(a) Revenue from water sales and used water services are recognised upon billing, which is based on customers' consumption of water and used water services.
(b) Rental income is recognised on a straight-line basis over the period of the lease.
(c) Interest income is recognised on an accrual basis using the effective interest method.
(d) Dividend income is recognised when the shareholder's right to receive payment is established.
(e) Project management fee is recognised when the services are rendered.
2.3 Government grantsGrants are received for the operations and maintenance of drainage systems, the Active, Beautiful, Clean Water Programme and other government-funded activities.
Grants from the government are recognised as a receivable at their fair values when there is reasonable assurance that the grant will be received and the Group will comply with all the attached conditions.
Government grants receivable are recognised as income over the periods necessary to match them with the related costs which they are intended to compensate, on a systematic basis.
Government grants whose primary condition is that the Group should purchase, construct or otherwise acquire non-current
or loss over the period necessary to match the annual depreciation charge of these assets or when the assets are disposed or written off.
2.4 Group accountingSubsidiaries
Consolidation
Subsidiaries are all entities (including structured entities) over which the Group has control. The Group controls an entity when the Group is exposed to, or has rights to, variable returns from its involvement with the entity and has the ability to affect those returns through its power to direct the activities of the entity. Subsidiaries are fully consolidated from the date on which control is transferred to the Group. They are deconsolidated from the date that control ceases.
transactions between group entities are eliminated. Unrealised losses are also eliminated unless the transaction provides evidence of an impairment indicator of the transferred asset. Accounting policies of subsidiaries have been changed where necessary to ensure consistency with the policies adopted by the Group.
(continued)
(a) Contribution to government consolidated fund
In lieu of income tax, the Board is required to make contribution to the Government Consolidated Fund in accordance with the Statutory Corporations (Contributions to Consolidated Fund) Act, Chapter 319A.
(b) Income taxes
The Group’s income tax expense comprises current and deferred tax of the subsidiaries. Current income tax liabilities for current and prior periods are recognised at the amounts expected to be paid to the tax authorities, using the tax rates (and tax laws) that have been enacted or substantially enacted by the reporting date.
Deferred income tax assets/liabilities are recognised for all deductible/ taxable temporary differences arising between
income tax assets/liabilities arise from the initial recognition of an asset or liability in a transaction that is not a
against which the temporary differences can be utilised.
Deferred income tax assets and liabilities are measured at:
(i) the tax rates that are expected to apply when the related deferred income tax asset is realised or the deferred income tax liability is settled, based on tax rates (and tax laws) that have been enacted or substantially enacted
(ii) the tax consequence that would follow from the manner in which the Board's subsidiaries expect, at the reporting date, to recover or settle the carrying amounts of its assets and liabilities.
Deferred tax assets and liabilities are offset if there is a legally enforceable right to offset current tax liabilities and assets, and they relate to income taxes levied by the same tax authority on the same taxable entity, or on different tax entities, but they intend to settle current tax liabilities and assets on a net basis or their tax assets and liabilities will be realised simultaneously.
the extent that the tax arises from a transaction which is recognised directly in statement of changes in equity.
2.6 Cash and cash equivalents
as set out in the Accountant-General's Circular No. 4/2009 Centralised Liquidity Management for Statutory Boards and Ministries.
2.7 Inventories
maintenance of plant and equipment but not held for trading.
Inventories are stated at the lower of cost and net realisable value. Cost is determined on the weighted average method, and includes expenditure incurred in acquiring the inventories and other costs incurred in bringing them to their existing location and condition.
Inventories which are considered obsolete, deteriorated or damaged are recorded in the allowance for write-down of inventories before the inventories are authorised to be written off.
21Financial Report 2017/201820 Financial Report 2017/2018
PUBLIC UTILITIES BOARD AND ITS SUBSIDIARIESPUBLIC UTILITIES BOARD AND ITS SUBSIDIARIES
NOTES TO THE FINANCIAL STATEMENTS NOTES TO THE FINANCIAL STATEMENTS

(continued)
2.8 Financial assets
Financial assets are recognised when, and only when, the Group becomes a party to the contractual provisions of
Loans and receivables
an active market. They are presented as current assets, except for those expected to be realised later than 12 months
(b) Recognition and derecognition
been transferred and the Group has transferred substantially all risks and rewards of ownership. On disposal of a
(c) Initial measurement
Loans and receivables are initially recognised at fair value plus transaction costs.
(d) Subsequent measurement
Loans and receivables are subsequently carried at amortised cost using the effective interest method.
(e) Impairment
The Group assesses at each reporting date whether there is objective evidence that loan and receivables are impaired
2.9 Property, plant and equipment(a) Measurement
(i) Owned assetsOn 1 May 1963, with the establishment of the Board, property, plant and equipment of the former City Council were vested in the Board at net book value. Property, plant and equipment are stated at historical cost less accumulated depreciation and accumulated impairment losses. The cost of an item of property, plant and equipment includes its purchase price, cost of replacing part of the property, plant and equipment and any cost that is directly attributable to the acquisition, construction, production or bringing the asset to the location and condition necessary for it to be capable of operating in the manner intended by management.
capitalised and depreciated over their useful lives. The parts that are being replaced are written off. All other
The projected cost of dismantlement, removal or restoration is also included as part of the cost of property, plant and equipment if the obligation for dismantlement, removal or restoration is incurred as a consequence of acquiring or using the asset.
(continued)
2.9 Property, plant and equipment (continued) (a) Measurement (continued)
(ii) Leased assets
value and the present value of the minimum lease payments at the inception of the lease, less subsequent
and reduction of the lease liability so as to achieve a constant rate of interest on the remaining balance of the
(b) Depreciation
Depreciation of property, plant and equipment is charged from the month of acquisition of the asset or available for use as intended by management and is calculated on the straight-line method to allocate the depreciable amounts over their estimated useful lives.
The estimated useful lives of depreciable property, plant and equipment are as follows:
Useful lives
Leasehold land 18 to 99 years, or the remaining lease periodLand development and buildings (1) 30 to 100 yearsPlant and equipment 5 to 25 yearsPipelines 50 to 70 yearsOthers (mainly meters, vehicles and computer systems) 4 to 15 years
No depreciation is charged on freehold land.
Capitalised leased assets are depreciated over the shorter of the estimated useful life of the assets and the lease term.
Assets under construction included in property, plant and equipment are not depreciated as these assets are not yet available for use.
Depreciation method, useful lives and residual values are reviewed and adjusted prospectively as appropriate, at each reporting date. The Group regularly reviews the useful lives of its property, plant and equipment. Arising from
(c) Disposal of assets
its use or disposal. Gains and losses on disposal of an item of property, plant and equipment are determined by
2.10 Investments in subsidiaries
position. On disposal of an investment in subsidiary, the difference between disposal proceeds and the carrying amounts
23Financial Report 2017/201822 Financial Report 2017/2018
PUBLIC UTILITIES BOARD AND ITS SUBSIDIARIESPUBLIC UTILITIES BOARD AND ITS SUBSIDIARIES
NOTES TO THE FINANCIAL STATEMENTS NOTES TO THE FINANCIAL STATEMENTS

(continued)
Property, plant and equipment
Investments in subsidiaries
Property, plant and equipment and investments in subsidiaries are tested for impairment whenever there is any objective evidence or indication that these assets may be impaired.
For the purpose of impairment testing, the recoverable amount (i.e. the higher of the fair value less cost to sell and the
independent of those from other assets. If this is the case, the recoverable amount is determined for the cash-generating-
If the recoverable amount of the asset (or CGU) is estimated to be less than its carrying amount, the carrying amount of the asset (or CGU) is reduced to its recoverable amount.
An impairment loss for an asset (or CGU) is reversed if, and only if, there has been a change in the estimates used to determine the asset’s (or CGU’s) recoverable amount since the last impairment loss was recognised. The carrying amount of an asset (or CGU) is increased to its revised recoverable amount, provided that this amount does not exceed the carrying amount that would have been determined (net of any accumulated amortisation or depreciation) had no impairment loss been recognised for the asset (or CGU) in prior years.
2.12 Trade and other payables
presented as non-current liabilities.
Trade and other payables are initially recognised at fair value, and subsequently carried at amortised cost using the effective interest method.
2.13 ProvisionsProvisions are recognised when the Group has a present legal or constructive obligation as a result of past events, it is more
changes arise.
2.14 Employee compensation
(a) Central Provident Fund (“CPF”) contributions
Contributions to the Group’s employees’ salaries are made to the CPF as required by law. The CPF contributions are recognised as expenses in the period when the employees rendered their services.
when the employees rendered their services.
Employee entitlements to annual leave and performance bonus are recognised when they accrue to employees. A provision is made for the estimated liability for non-vesting annual leave and performance bonus as a result of services rendered by employees up to the reporting date.
(continued)
2.14 Employee compensation (continued)
present value, and the fair value of any related assets is deducted. The discount rate is the yield at the reporting date on Singapore Government Securities that have maturity dates approximating the terms of the Group's obligations
performed using the projected unit credit method.
The Board, apart from the legally required contribution plans such as the Central Provident Fund, operates pension plans for pensionable employees transferred from the former Ministry of Environment. The Board's obligation is from 1 April 2001 to the earlier of the day of retirement and death of these employees. The provision for pension is recognised based on the hypothetical gratuity for each pensionable employee accrued from 1 April 2001 up to the
based on existing guidelines found in the Pension Act and circulars issued by the Public Service Division.
2.15 Borrowings costsBorrowing costs are expensed in the period they occur. Borrowing costs consist of interest that the Group incurs in connection with its borrowings.
2.16 Leases – when the Group is the lessee(a) Finance leases
Finance leases are capitalised at the inception of the lease at the fair value of the leased asset or, if lower, at the
reduction of the lease liability so as to achieve a constant rate of interest on the remaining balance of the liability.
(b) Operating leases
lease term on a straight-line basis.
2.17 Currency translation(a) Functional and presentation currency
Singapore Dollar, which is the functional currency of the Board.
(b) Transactions and balances
currency using the exchange rates at the dates of the transactions. Currency exchange differences resulting from the translation of monetary assets and liabilities denominated in foreign currencies at the closing rates at the reporting
Non-monetary items measured at fair values in foreign currencies are translated using the exchange rates at the date when the fair values are determined.
25Financial Report 2017/201824 Financial Report 2017/2018
PUBLIC UTILITIES BOARD AND ITS SUBSIDIARIESPUBLIC UTILITIES BOARD AND ITS SUBSIDIARIES
NOTES TO THE FINANCIAL STATEMENTS NOTES TO THE FINANCIAL STATEMENTS

(continued)
fund belongs to the Board and is reviewed periodically by the Board for adequacy. Additional contributions or refunds will be made to or from the fund as appropriate. Receipts and expenditure relating to the fund are accounted for directly in this fund
2.19 Trust fundsThe Board, in its role as an agent of the Government for the sewerage and drainage functions, receives funds from the Ministry of Environment and Water Resources ("MEWR") to defray the development costs of drainage networks and used water reticulation networks owned by the Government. In addition, it receives funds from MEWR and Singapore Totalisator Board for construction of projects under the Active, Beautiful, Clean Waters Programme, also owned by the Government. These funds are held in trust by the Board.
The funds received are accounted for separately under a trust fund as set out in Note 24. All transactions pertaining to activities supported by the funds are accounted for directly in the trust fund. Annual excess or shortfall in the funds after disbursing all development expenditure for MEWR will be refunded to or recovered from MEWR accordingly. The surplus funds received from Singapore Totalisator Board are returned when the construction of assets is completed.
The net assets or liabilities of the fund do not form part of the Board's assets and liabilities but are shown separately in the
3. Critical accounting estimates, assumptions and judgements
estimates and assumptions that affect the application of accounting policies, the reported amounts of assets, liabilities, income and expenses.
Estimates and underlying assumptions are reviewed on an ongoing basis. Revisions to accounting estimates are recognised
Depreciation of property, plant and equipment
Property, plant and equipment are depreciated on a straight-line basis over their estimated useful lives. The Group reviews annually the estimated economic useful lives and residual values of property, plant and equipment based on factors that include asset utilisation rate, internal technical evaluation, operational plans and technological developments. If the estimated useful lives of property, plant and equipment were decreased/increased by 5%, the Group’s depreciation charge would increase/decrease by $16.7 million (2017: $16.5 million).
4. Operating incomeGROUP BOARD
31 March 2018 31 March 2017 31 March 2018 31 March 2017$’000 $’000 $’000 $’000
Water sales 787,943 790,281 787,943 790,281Used water services 497,843 422,588 497,843 422,588Other operating income 381 9,563 – –
1,286,167 1,222,432 1,285,786 1,212,869
GROUP BOARDNote 31 March 2018 31 March 2017 31 March 2018 31 March 2017
$’000 $’000 $’000 $’000
Direct operating expenses:– electricity 82,247 82,454 82,247 82,454– manpower 281,244 267,556 281,040 267,790– depreciation 313,737 309,955 313,737 309,955– impairment loss 14,550 1,815 14,550 1,815– plant rental 2,266 1,828 2,266 1,828– property tax 17,151 16,754 17,151 16,754– maintenance and others 5(a) 441,199 432,895 440,874 425,408
1,152,394 1,113,257 1,151,865 1,106,004Indirect operating expenses:– service departments' costs 5(b) 171,575 156,985 171,575 156,985
5(c) 1,323,969 1,270,242 1,323,440 1,262,989
(a) Included in maintenance and others are expenses related to the purchase of raw water from the Government of the State of Johor. Price for the purchase of raw water from and treated water sold to the Government of the State of Johor in accordance with the 1962 Water Agreement are based on the rate of 3 sen and 50 sen per thousand gallons respectively. In August 2002, the Johor Government had sought a review of the price of raw water. The Singapore Government's position is that Malaysia has lost the right of review.
(b) Service departments' costs comprise manpower, depreciation, maintenance, administrative and other expenses.
(c) Included in direct and indirect operating expenses are:
GROUP BOARDNote 31 March 2018 31 March 2017 31 March 2018 31 March 2017
$’000 $’000 $’000 $’000
Board members' allowance 280 236 276 236Salaries and overtime allowances 315,373 300,019 314,745 299,982Central/Employee Provident Fund 40,186 36,101 40,185 36,099Pension current service cost 16(a) 242 278 242 278
10,399 8,192 10,399 8,167Electricity 82,381 82,636 82,381 82,636Maintenance Expenses 236,033 247,531 236,033 247,531Net foreign exchange (loss)/gain (1,075) 565 (1,074) 565Research and development
expenses 19,742 17,842 19,742 17,842Allowance for inventory
obsolescence 10 623 277 623 277Allowance for doubtful
receivables 27(b) 3,257 906 3,257 970Depreciation of property, plant
and equipment 13 316,871 312,713 316,871 312,713Impairment loss of property,
plant and equipment 13 14,550 1,815 14,550 1,815
27Financial Report 2017/201826 Financial Report 2017/2018
PUBLIC UTILITIES BOARD AND ITS SUBSIDIARIESPUBLIC UTILITIES BOARD AND ITS SUBSIDIARIES
NOTES TO THE FINANCIAL STATEMENTS NOTES TO THE FINANCIAL STATEMENTS

6. Net non-operating incomeGROUP BOARD
31 March 2018 31 March 2017 31 March 2018 31 March 2017$’000 $’000 $’000 $’000
Net investment income – 309 – 309Rental income 11,827 12,143 11,827 12,143Amortisation of deferred income 16,019 13,506 16,019 13,506
8,301 12,519 8,301 12,519Project management fees 18,166 16,375 18,166 16,375Disbursement from recoverable jobs 5,170 7,058 5,170 7,058Other sundry income 15,458 12,740 15,458 12,740Dividend income – – 2,000 –Loss on disposal of property, plant and equipment (3,530) (1,191) (3,530) (1,191)
71,411 73,459 73,411 73,459
GROUP AND BOARDNote 31 March 2018 31 March 2017
$’000 $’000
Pension interest expense 16(a) 238 23034,415 30,96349,068 53,361
Accretion expense on asset restoration obligations 293 29084,014 84,844
(a) Contribution to government consolidated fund
Statutory Corporations (Contributions to Consolidated Fund) Act (Chapter 319A).
BOARD31 March 2018 31 March 2017
$’000 $’000
Net income after government grants and before contribution to GCF and taxation 284,611 237,321
Contribution to GCF calculated at rate of 17% (2017: 17%) 48,384 40,345Effects of:– Non-deductible donations 8 3
48,392 40,348
(continued)
(b) Income tax
Subsidiaries of the Board are subject to tax under the Singapore Income Tax Act.
GROUP31 March 2018 31 March 2017
$’000 $’000
– Current income tax – 338
– Deferred income tax – 5– 343
The tax on the Group’s net income after government grants and before tax differs from the theoretical amount that would arise using the Singapore standard rate of income tax as follows:
GROUP31 March 2018 31 March 2017
$’000 $’000
Net (loss)/income before tax of subsidiaries (2,148) 2,310Excluding intra group transaction 2,000 –
(148) 2,310
Tax calculated at tax rate of 17% (2017: 17%) (25) 393Effects of:– expenses not deductible for tax purposes 1 3– tax incentives (1) (42)– utilisation of previously unutilised capital allowances – (16)
– 5– deferred tax assets not recognised 25 –
– 343
(c) Deferred tax assets have not been recognised in respect of the following items:
GROUP31 March 2018 31 March 2017
$’000 $’000
Unutilised tax losses and capital allowances 865 717
Deferred tax assets have not been recognised in respect of these items because it is not probable that future taxable
29Financial Report 2017/201828 Financial Report 2017/2018
PUBLIC UTILITIES BOARD AND ITS SUBSIDIARIESPUBLIC UTILITIES BOARD AND ITS SUBSIDIARIES
NOTES TO THE FINANCIAL STATEMENTS NOTES TO THE FINANCIAL STATEMENTS

9. Cash and cash equivalentsGROUP BOARD
Note 31 March 2018 31 March 2017 31 March 2018 31 March 2017$’000 $’000 $’000 $’000
Cash with AGD– Singapore Dollar 9(a) 487,049 669,957 487,049 669,957
Fixed and ACU deposits– Malaysia Ringgit 9(b) 21,367 9,220 21,367 9,220
Cash at bank 9(c)– Singapore Dollar 2,465 3,110 1,196 807– Malaysia Ringgit 2,541 997 2,541 997– United States Dollar 16 17 – –
513,438 683,301 512,153 680,981
Government's Centralised Liquidity Management Framework for Statutory Boards and Ministries. The effective
per annum.
ended 31 March 2018 for the Group is 3.27% (2017: 3.25%).
10. InventoriesGROUP AND BOARD
Note 31 March 2018 31 March 2017$’000 $’000
1,153 937Chemicals 1,604 1,066Spare parts and accessories 59,878 60,331Fuel and lubricants 4,227 4,580Sundries and others 324 324
67,186 67,238Less: Allowance for inventory obsolescence 10(a) (690) (389)
66,496 66,849
10. Inventories (continued)
(a) Allowance for inventory obsolescence
GROUP AND BOARDNote 31 March 2018 31 March 2017
$’000 $’000
389 2,798Allowance made 628 282Reversal of write-down of inventories (5) (5)
5(c) 623 277
Allowance utilised (322) (2,686)690 389
million (2017: $39.0 million).
11. Trade and other receivablesGROUP BOARD
Note 31 March 2018 31 March 2017 31 March 2018 31 March 2017$’000 $’000 $’000 $’000
Trade receivables 11(a) 119,491 90,997 115,522 87,442Less: Allowance for impairment of
trade receivables 27(b) (5,581) (5,405) (5,581) (5,405)Trade receivables – net 113,910 85,592 109,941 82,037Sundry receivables 11(b) 72,859 70,721 72,859 70,721Less: Allowance for impairment of
sundry receivables 27(b) (2,146) (13) (2,146) (13)Sundry receivables – net 70,713 70,708 70,713 70,708Other receivables 1,277 712 1,277 712Deposits 170 191 170 191Amounts due from government 14,980 11,321 14,980 11,321Amounts due from subsidiaries – – 649 10
201,050 168,524 197,730 164,979
Other receivables 7 21 7 21Total trade and other receivables 201,057 168,545 197,737 165,000
Reconciliation to loans and receivablesAdd: Cash 9 513,438 683,301 512,153 680,981Less: Net Goods and Services Tax
receivables – (3,155) – (3,152)Total loans and receivables 27(f) 714,495 848,691 709,890 842,829
31Financial Report 2017/201830 Financial Report 2017/2018
PUBLIC UTILITIES BOARD AND ITS SUBSIDIARIESPUBLIC UTILITIES BOARD AND ITS SUBSIDIARIES
NOTES TO THE FINANCIAL STATEMENTS NOTES TO THE FINANCIAL STATEMENTS
11. Trade and other receivables (continued)
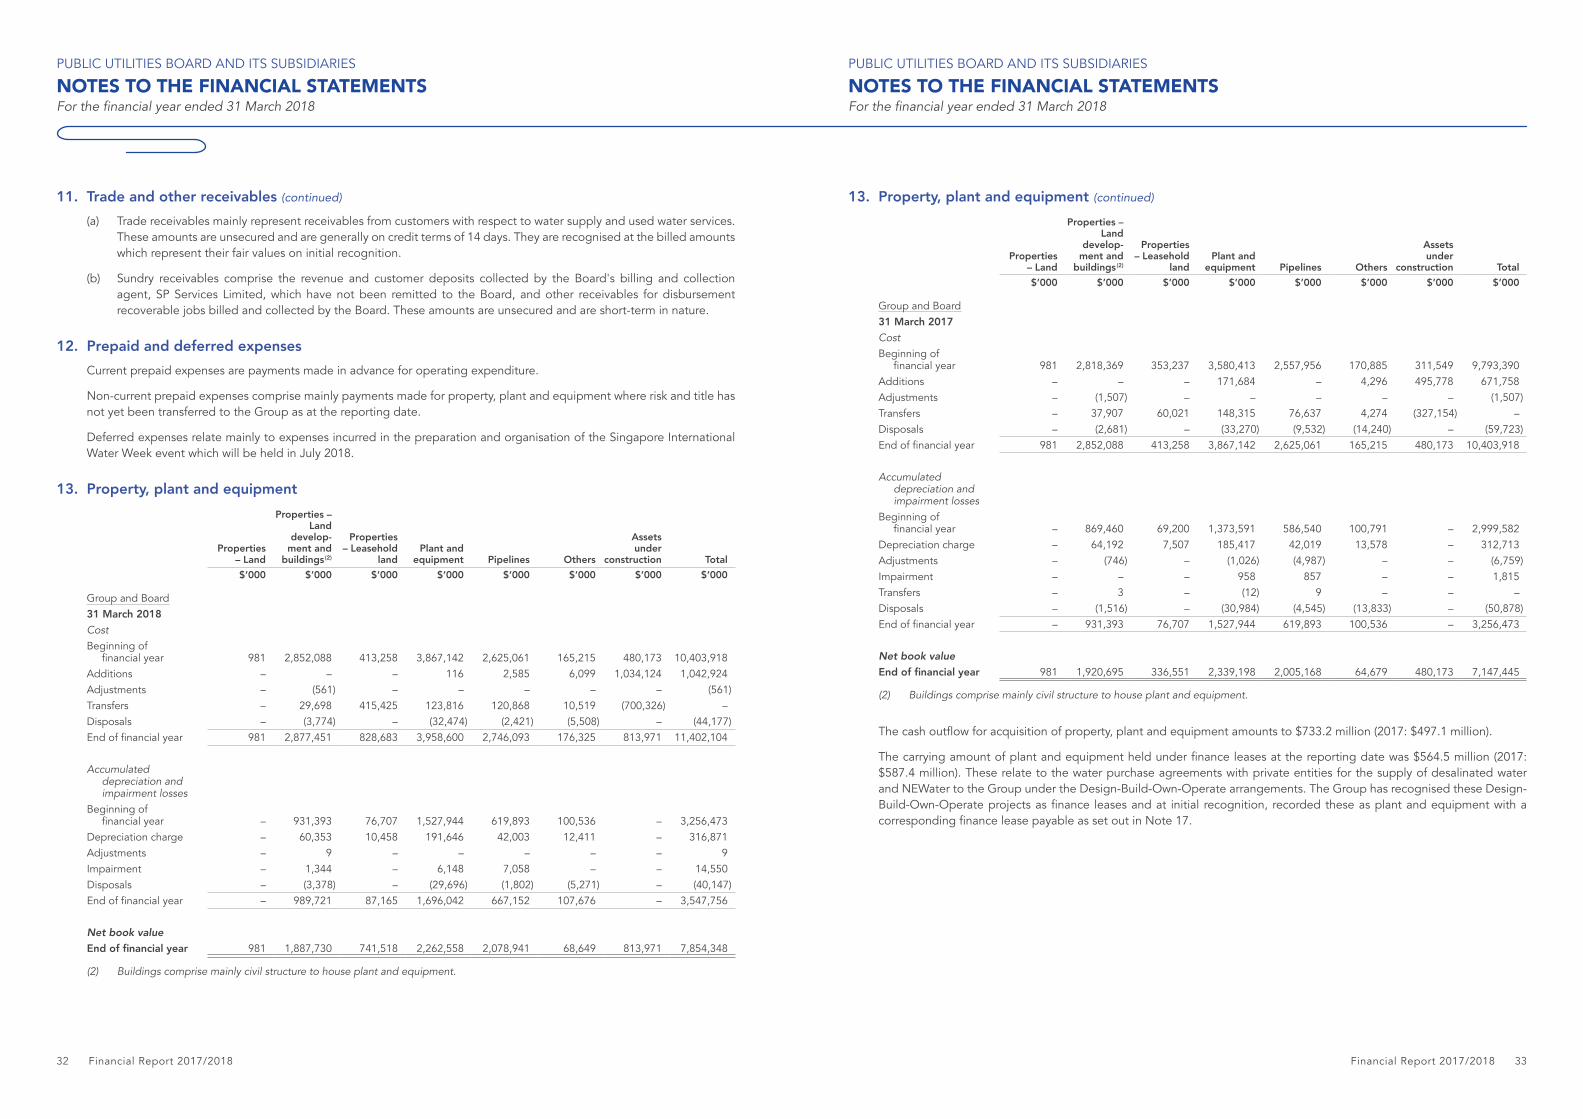
(a) Trade receivables mainly represent receivables from customers with respect to water supply and used water services. These amounts are unsecured and are generally on credit terms of 14 days. They are recognised at the billed amounts which represent their fair values on initial recognition.
(b) Sundry receivables comprise the revenue and customer deposits collected by the Board's billing and collection agent, SP Services Limited, which have not been remitted to the Board, and other receivables for disbursement recoverable jobs billed and collected by the Board. These amounts are unsecured and are short-term in nature.
Current prepaid expenses are payments made in advance for operating expenditure.
Non-current prepaid expenses comprise mainly payments made for property, plant and equipment where risk and title has not yet been transferred to the Group as at the reporting date.
Deferred expenses relate mainly to expenses incurred in the preparation and organisation of the Singapore International Water Week event which will be held in July 2018.
13. Property, plant and equipment
Properties – Land
Properties – Land
develop-ment and
buildings (2)
Properties – Leasehold
landPlant and
equipment Pipelines Others
Assets under
construction Total$’000 $’000 $’000 $’000 $’000 $’000 $’000 $’000
Group and Board31 March 2018
Beginning of 981 2,852,088 413,258 3,867,142 2,625,061 165,215 480,173 10,403,918
Additions – – – 116 2,585 6,099 1,034,124 1,042,924Adjustments – (561) – – – – – (561)Transfers – 29,698 415,425 123,816 120,868 10,519 (700,326) –Disposals – (3,774) – (32,474) (2,421) (5,508) – (44,177)
981 2,877,451 828,683 3,958,600 2,746,093 176,325 813,971 11,402,104
Beginning of – 931,393 76,707 1,527,944 619,893 100,536 – 3,256,473
Depreciation charge – 60,353 10,458 191,646 42,003 12,411 – 316,871Adjustments – 9 – – – – – 9Impairment – 1,344 – 6,148 7,058 – – 14,550Disposals – (3,378) – (29,696) (1,802) (5,271) – (40,147)
– 989,721 87,165 1,696,042 667,152 107,676 – 3,547,756
981 1,887,730 741,518 2,262,558 2,078,941 68,649 813,971 7,854,348
13. Property, plant and equipment (continued)
Properties – Land
Properties – Land
develop-ment and
buildings (2)
Properties – Leasehold
landPlant and
equipment Pipelines Others
Assets under
construction Total$’000 $’000 $’000 $’000 $’000 $’000 $’000 $’000
Group and Board31 March 2017
Beginning of 981 2,818,369 353,237 3,580,413 2,557,956 170,885 311,549 9,793,390
Additions – – – 171,684 – 4,296 495,778 671,758Adjustments – (1,507) – – – – – (1,507)Transfers – 37,907 60,021 148,315 76,637 4,274 (327,154) –Disposals – (2,681) – (33,270) (9,532) (14,240) – (59,723)
981 2,852,088 413,258 3,867,142 2,625,061 165,215 480,173 10,403,918
Beginning of – 869,460 69,200 1,373,591 586,540 100,791 – 2,999,582
Depreciation charge – 64,192 7,507 185,417 42,019 13,578 – 312,713Adjustments – (746) – (1,026) (4,987) – – (6,759)Impairment – – – 958 857 – – 1,815Transfers – 3 – (12) 9 – – –Disposals – (1,516) – (30,984) (4,545) (13,833) – (50,878)
– 931,393 76,707 1,527,944 619,893 100,536 – 3,256,473
981 1,920,695 336,551 2,339,198 2,005,168 64,679 480,173 7,147,445
$587.4 million). These relate to the water purchase agreements with private entities for the supply of desalinated water and NEWater to the Group under the Design-Build-Own-Operate arrangements. The Group has recognised these Design-
33Financial Report 2017/201832 Financial Report 2017/2018
PUBLIC UTILITIES BOARD AND ITS SUBSIDIARIESPUBLIC UTILITIES BOARD AND ITS SUBSIDIARIES
NOTES TO THE FINANCIAL STATEMENTS NOTES TO THE FINANCIAL STATEMENTS

14. Investment in subsidiariesBOARD
31 March 2018 31 March 2017$’000 $’000
Equity investments at cost100 100
The Group had the following subsidiaries as at 31 March 2018 and 2017:
Proportion of ordinary shares directly held by
parent
Proportion of ordinary shares directly held by
the Group
NamePrincipal activities
Country of business/incorporation 2018 2017 2018 2017
PUB Consultants Private Limited ("PUBC") (3) Note 14(a) Singapore 100% 100% 100% 100%
Singapore International Water Week (3)
Note 14(b) Singapore 100% 100% 100% 100%
(a) PUBC was incorporated on 2 August 1991. Its principal activity is to serve as the commercial arm of the Board and play the facilitative role in assisting the Board to achieve its roles to grow the Singapore water industry and to develop Singapore into a Global Hydrohub. PUBC harnesses the Board's operational experience and resources to support the Singapore-based companies in their overseas ventures in water related projects.
(b) SIPL was incorporated on 24 September 2007. Its principal activity is to organise the Singapore International Water Week ("SIWW"), a water event that serves as a global platform to share and co-create innovative water solutions. Stakeholders from the global water industry gather at SIWW to share business opportunities and showcase the latest water technologies. SIWW is part of the strategic programme of the Singapore Government to grow the water industry in Singapore and develop water technologies and solutions.
15. Trade and other payablesGROUP BOARD
Note 31 March 2018 31 March 2017 31 March 2018 31 March 2017$’000 $’000 $’000 $’000
Trade and other payables to:– non-related parties 111,986 113,788 111,330 112,305– government (4) 39,970 24,335 39,970 24,335– subsidiaries – – – 15
151,956 138,123 151,300 136,655Customer deposits 81,846 82,858 81,846 82,858Total trade and other payables 233,802 220,981 233,146 219,513
carried at amortised costLess: Net Goods and Services Tax payables (3,351) – (3,351) –
230,451 220,981 229,795 219,513
Accruals 16 181,966 156,773 181,937 156,773Borrowings 19 400,000 – 400,000 –Finance lease payables 17 31,261 29,562 31,261 29,562
843,678 407,316 842,993 405,848
Borrowings 19 1,000,000 1,400,000 1,000,000 1,400,000Finance lease payables 17 598,059 629,320 598,059 629,320
amortised cost 27(f) 2,441,737 2,436,636 2,441,052 2,435,168
Trade and other payables and other liabilities are unsecured and are short-term in nature. Trade payables are normally settled on credit terms of 21-30 days (2017: 21 – 30 days).
35Financial Report 2017/201834 Financial Report 2017/2018
PUBLIC UTILITIES BOARD AND ITS SUBSIDIARIESPUBLIC UTILITIES BOARD AND ITS SUBSIDIARIES
NOTES TO THE FINANCIAL STATEMENTS NOTES TO THE FINANCIAL STATEMENTS

16. Other liabilitiesGROUP BOARD
Note 31 March 2018 31 March 2017 31 March 2018 31 March 2017$’000 $’000 $’000 $’000
Accruals 181,966 156,773 181,937 156,773Provision for pension 16(a) 12,755 13,733 12,755 13,733
194,721 170,506 194,692 170,506
(a) Provision for pension
employees upon their retirement.
2001, which is to be borne by the government, is excluded from the amount stated above.
GROUP AND BOARDNote 31 March 2018 31 March 2017
$’000 $’000
13,733 14,584Current service cost 5(c) 242 278Interest expense 7 238 230Re-measurement loss/(gain) 87 (145)Liability extinguished on settlement (1,545) (1,214)
12,755 13,733
(i) All pensionable employees will retire at age of 62 years (2017: 62 years).
(ii) Pensionable employees are entitled to select one of the following state-managed pension schemes upon retirement:
(c) Lump sum gratuity payment upon retirement
(iii) The discount rate for the pension obligation is 2.05% (2017: 1.80%) per annum, which is based on the market yields on the Government bonds.
(iv) The Board’s average share of pension obligation is estimated at a factor of 0.66 (2017: 0.66).
16. Other liabilities (continued)
(a) Provision for pension (continued)
date, assuming all other assumptions were held constant is:
Change in
assumption 31 March 2018 31 March 2017$’000 $’000
Discount rate 5.0% (57) (62)(5.0)% 58 62
Retirement age 1.6% (152) (165)(1.6)% 150 163
Ratio of PUB and MEWR shares of pension 5.0% 481 521(5.0)% (481) (521)
As at 31 March 2018, the average duration of the pension obligation is 5.0 years (2017: 5.4 years).
17. Finance lease payables
GROUP AND BOARD31 March 2018 31 March 2017
$’000 $’000
Minimum lease payments due– Not later than one year 63,976 63,976
256,080 256,080626,646 690,622946,702 1,010,678(317,382) (351,796)629,320 658,882
GROUP AND BOARD31 March 2018 31 March 2017
$’000 $’000
Not later than one year 31,261 29,562
Later than one year144,388 136,443453,671 492,877598,059 629,320
Total 629,320 658,882
37Financial Report 2017/201836 Financial Report 2017/2018
PUBLIC UTILITIES BOARD AND ITS SUBSIDIARIESPUBLIC UTILITIES BOARD AND ITS SUBSIDIARIES
NOTES TO THE FINANCIAL STATEMENTS NOTES TO THE FINANCIAL STATEMENTS
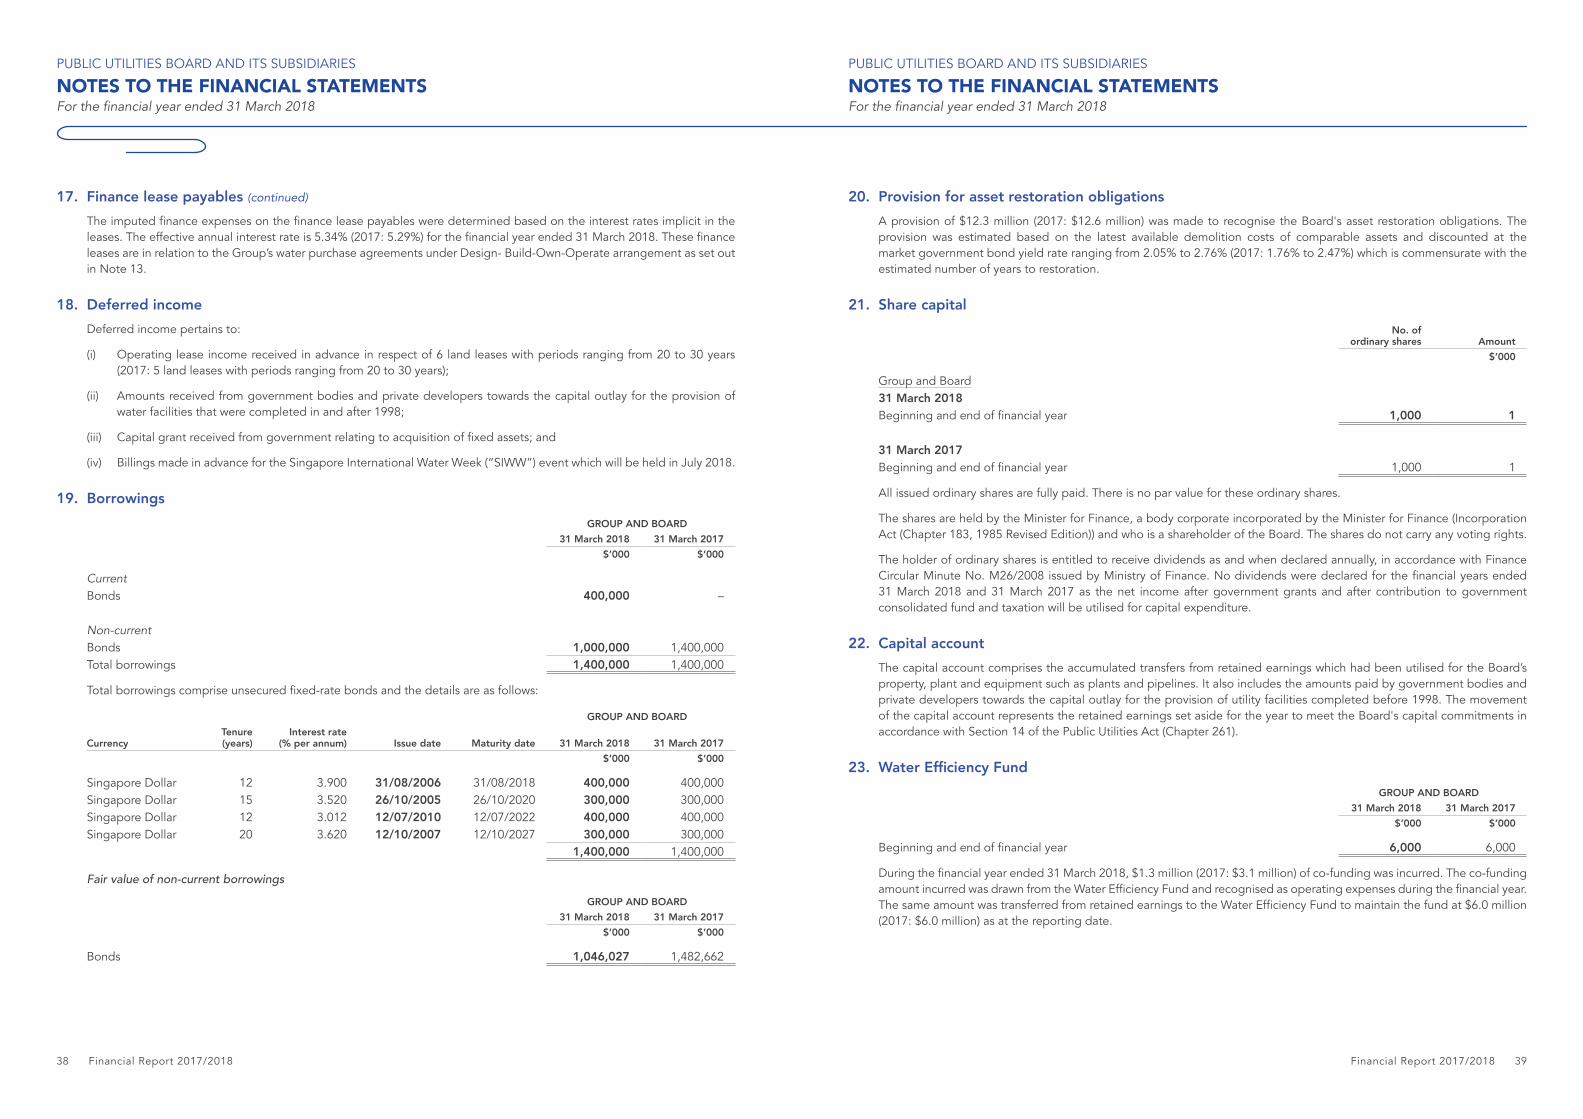
17. Finance lease payables (continued)
leases are in relation to the Group’s water purchase agreements under Design- Build-Own-Operate arrangement as set out in Note 13.
18. Deferred incomeDeferred income pertains to:
(i) Operating lease income received in advance in respect of 6 land leases with periods ranging from 20 to 30 years
(ii) Amounts received from government bodies and private developers towards the capital outlay for the provision of
19. BorrowingsGROUP AND BOARD
31 March 2018 31 March 2017$’000 $’000
Bonds 400,000 –
Bonds 1,000,000 1,400,000Total borrowings 1,400,000 1,400,000
GROUP AND BOARD
CurrencyTenure (years)
Interest rate (% per annum) Issue date Maturity date 31 March 2018 31 March 2017
$’000 $’000
Singapore Dollar 12 3.900 31/08/2006 31/08/2018 400,000 400,000Singapore Dollar 15 3.520 26/10/2005 26/10/2020 300,000 300,000Singapore Dollar 12 3.012 12/07/2010 12/07/2022 400,000 400,000Singapore Dollar 20 3.620 12/10/2007 12/10/2027 300,000 300,000
1,400,000 1,400,000
Fair value of non-current borrowings
GROUP AND BOARD31 March 2018 31 March 2017
$’000 $’000
Bonds 1,046,027 1,482,662
20. Provision for asset restoration obligationsA provision of $12.3 million (2017: $12.6 million) was made to recognise the Board's asset restoration obligations. The provision was estimated based on the latest available demolition costs of comparable assets and discounted at the market government bond yield rate ranging from 2.05% to 2.76% (2017: 1.76% to 2.47%) which is commensurate with the estimated number of years to restoration.
21. Share capitalNo. of
ordinary shares Amount$’000
Group and Board31 March 2018
1,000 1
31 March 20171,000 1
All issued ordinary shares are fully paid. There is no par value for these ordinary shares.
The shares are held by the Minister for Finance, a body corporate incorporated by the Minister for Finance (Incorporation Act (Chapter 183, 1985 Revised Edition)) and who is a shareholder of the Board. The shares do not carry any voting rights.
The holder of ordinary shares is entitled to receive dividends as and when declared annually, in accordance with Finance
31 March 2018 and 31 March 2017 as the net income after government grants and after contribution to government consolidated fund and taxation will be utilised for capital expenditure.
22. Capital accountThe capital account comprises the accumulated transfers from retained earnings which had been utilised for the Board’s property, plant and equipment such as plants and pipelines. It also includes the amounts paid by government bodies and private developers towards the capital outlay for the provision of utility facilities completed before 1998. The movement of the capital account represents the retained earnings set aside for the year to meet the Board's capital commitments in accordance with Section 14 of the Public Utilities Act (Chapter 261).
GROUP AND BOARD31 March 2018 31 March 2017
$’000 $’000
6,000 6,000
(2017: $6.0 million) as at the reporting date.
39Financial Report 2017/201838 Financial Report 2017/2018
PUBLIC UTILITIES BOARD AND ITS SUBSIDIARIESPUBLIC UTILITIES BOARD AND ITS SUBSIDIARIES
NOTES TO THE FINANCIAL STATEMENTS NOTES TO THE FINANCIAL STATEMENTS

24. Net liabilities of trust funds
Totalisator Board for the construction of assets owned by the Government as set out in Note 2.19.
The funds remaining as at the reporting date are as follows:
GROUP AND BOARD31 March 2018 31 March 2017
$’000 $’000
Ministry of Environment and Water Resources (61,174) (53,117)Singapore Totalisator Board 1,995 714
(59,179) (52,403)
The funds are accounted for as follows:
GROUP AND BOARD31 March 2018 31 March 2017
$’000 $’000
(52,403) (36,939)
Receipts:– funds received 595,013 585,458– interest income 698 468– liquidated damages 5,435 418– recovery of development expenditure 1,363 667
602,509 587,011Amount returned to Government (296) –
549,810 550,072
Expenditure:– development expenditure (569,680) (563,920)– Goods and Services Tax (39,309) (38,555)
(608,989) (602,475)
(59,179) (52,403)
Represented by:
Assets:– cash at bank 33,891 22,563– sundry receivables 369 320
34,260 22,883
Liabilities:– sundry creditors and others (93,375) (74,991)– tender deposits (64) (295)
(93,439) (75,286)
Net liabilities of trust funds (59,179) (52,403)
The assets and liabilities of the trust funds are excluded from the assets and liabilities of the Group and the Board.
25. Related party transactions
with related parties.
The Board supplies water and provides used water services to all entities in Singapore which also includes its subsidiaries and Government agencies (comprising Ministries, Organs of State and other Statutory Boards). These transactions are conducted in the ordinary course of business.
(b) Key management personnel compensation
Key management personnel compensation is as follows:
GROUP BOARD31 March 2018 31 March 2017 31 March 2018 31 March 2017
$’000 $’000 $’000 $’000
Wages, salaries and 9,596 8,558 9,587 8,531
Employer’s contribution to CPF 428 387 427 38410,024 8,945 10,014 8,915
(c) Board members' compensation
Board members' compensation is as follows:
GROUP BOARD31 March 2018 31 March 2017 31 March 2018 31 March 2017
$’000 $’000 $’000 $’000
Board Members' allowance 278 236 274 2362 – 2 –
280 236 276 236
41Financial Report 2017/201840 Financial Report 2017/2018
PUBLIC UTILITIES BOARD AND ITS SUBSIDIARIESPUBLIC UTILITIES BOARD AND ITS SUBSIDIARIES
NOTES TO THE FINANCIAL STATEMENTS NOTES TO THE FINANCIAL STATEMENTS

26. Commitments(a) Operating lease commitments – where the Group is a lessee
The Group leases a number of government-owned assets from the government under non-cancellable operating lease agreements.
As at reporting date, non-cancellable operating leases contracted for at the reporting date but not recognised as liabilities are as follows:
GROUP AND BOARD31 March 2018 31 March 2017
$’000 $’000
Not later than one year 11,940 14,384
6,411 3,69318,351 18,077
ended 31 March 2018.
(b) Capital commitments
follows:
GROUP AND BOARD31 March 2018 31 March 2017
$’000 $’000
Development projects belonging to the Board 1,318,481 1,589,488Development projects belonging to the Government (funded by trust fund) 3,612,459 1,354,207
4,930,940 2,943,695
27. Financial risk managementFinancial risk factors
The Group is exposed to foreign currency risk, interest rate risk, credit risk and liquidity risk.
The board members have overall responsibility for the establishment and oversight of the Group’s risk management framework.
performance of the Group.
the risks.
27. Financial risk management (continued)
(a) Market risk
(i) Foreign currency risk
The Group's exposure to foreign currency risk arises from its foreign currency contracts for purchase of goods and services and its operations in Malaysia.
The Group's exposures to foreign currencies at the reporting date are as follows:
USD MYR$’000 $’000
GroupAt 31 March 2018Financial assetsCash and cash equivalents 16 23,908Trade and other receivables – 397
16 24,305
Financial liabilitiesTrade and other payables (81) (5,169)
(65) 19,136
At 31 March 2017Financial assetsCash and cash equivalents 17 10,217Trade and other receivables – 378
17 10,595
Financial liabilitiesTrade and other payables (32) (811)
(15) 9,784
43Financial Report 2017/201842 Financial Report 2017/2018
PUBLIC UTILITIES BOARD AND ITS SUBSIDIARIESPUBLIC UTILITIES BOARD AND ITS SUBSIDIARIES
NOTES TO THE FINANCIAL STATEMENTS NOTES TO THE FINANCIAL STATEMENTS

27. Financial risk management (continued)
(a) Market risk (continued)
(i) Foreign currency risk (continued)
The Board’s exposures to foreign currencies at the reporting date are as follows:
USD MYR$’000 $’000
BoardAt 31 March 2018Financial assetsCash and cash equivalents – 23,908Trade and other receivables – 397
– 24,305
Financial liabilitiesTrade and other payables (81) (5,169)
(81) 19,136
At 31 March 2017Financial assetsCash and cash equivalents – 10,217Trade and other receivables – 378
– 10,595
Financial liabilitiesTrade and other payables (32) (811)
(32) 9,784
27. Financial risk management (continued)
(a) Market risk (continued)
(i) Foreign currency risk (continued)
Sensitivity analysis
If the USD and MYR strengthen/weaken against the SGD by 5% with all other variables including tax rate being
as follows:
Increase/(Decrease)31 March 2018 31 March 2017
Net income (after government grants before contribution to government
Net income (after government grants before contribution to government
GroupUSD against SGD– Strengthened 4 1– Weakened (4) (1)
MYR against SGD– Strengthened (957) (489)– Weakened 957 489
BoardUSD against SGD– Strengthened 5 2– Weakened (5) (2)
MYR against SGD– Strengthened (957) (489)– Weakened 957 489
This analysis is based on foreign currency exchange rate variances that the Group considered to be reasonably possible at the end of the reporting period.
45Financial Report 2017/201844 Financial Report 2017/2018
PUBLIC UTILITIES BOARD AND ITS SUBSIDIARIESPUBLIC UTILITIES BOARD AND ITS SUBSIDIARIES
NOTES TO THE FINANCIAL STATEMENTS NOTES TO THE FINANCIAL STATEMENTS

27. Financial risk management (continued)
(a) Market risk (continued)
(ii) Interest rate risk
of changes in market interest rates.
The Group's exposure to interest rate risk relates mainly to the cash with AGD which refers to cash managed by the Accountant- General's Department under the Centralised Liquidity Management as set out in the Accountant-General's Circular No. 4/2009 Centralised Liquidity Management for Statutory Boards and Ministries. The
the deposits are placed and are expected to move in tandem with market interest rate movements.
Effective interest rate per annum Carrying amountNote 31 March 2018 31 March 2017 31 March 2018 31 March 2017
% % $’000 $’000
Group
Fixed deposits 9 3.27 3.25 21,367 9,220
Variable-rate instrumentsCash (including cash
with AGD) 9 1.23 1.37 492,071 674,081513,438 683,301
Board
Fixed deposits 9 3.27 3.25 21,367 9,220
Variable-rate instrumentsCash (including cash
with AGD) 9 1.23 1.37 490,786 671,761512,153 680,981
27. Financial risk management (continued)
(a) Market risk (continued)
(ii) Interest rate risk (continued)
Sensitivity analysis
An increase/decrease of 50 basis point ("bps") in the interest rates at the reporting date would have increased/decreased the net income (after government grants before contribution to government consolidated fund and taxation) by the amounts shown below:
Increase/(Decrease)31 March 2018 31 March 2017
Net income (after government grants before contribution to government
Net income (after government grants before contribution to government
$’000 $’000
GroupVariable-rate instrumentsCash (including cash with AGD)– Increase 2,460 3,370– Decrease (2,460) (3,370)
BoardVariable-rate instrumentsCash (including cash with AGD)– Increase 2,454 3,359– Decrease (2,454) (3,359)
This analysis assumes that all other variables, in particular foreign currency rates, remain constant.
(b) Credit risk
obligations.
The Group's exposure to credit risk arises mainly from trade and other receivables. Cash which mainly comprised of cash managed by Accountant- General's Department under the Centralised Liquidity Management are placed in Singapore dollar deposits with banks (and cash is made available to the Board upon request) while foreign currency deposits (these are denominated in Malaysian Ringgit) are placed with licensed commercial banks in Malaysia. For trade receivables, the Group has policies in place to ensure that customers maintain deposits with the Group.
The Group establishes an allowance account that represents its estimate of incurred losses in respect of trade and
47Financial Report 2017/201846 Financial Report 2017/2018
PUBLIC UTILITIES BOARD AND ITS SUBSIDIARIESPUBLIC UTILITIES BOARD AND ITS SUBSIDIARIES
NOTES TO THE FINANCIAL STATEMENTS NOTES TO THE FINANCIAL STATEMENTS
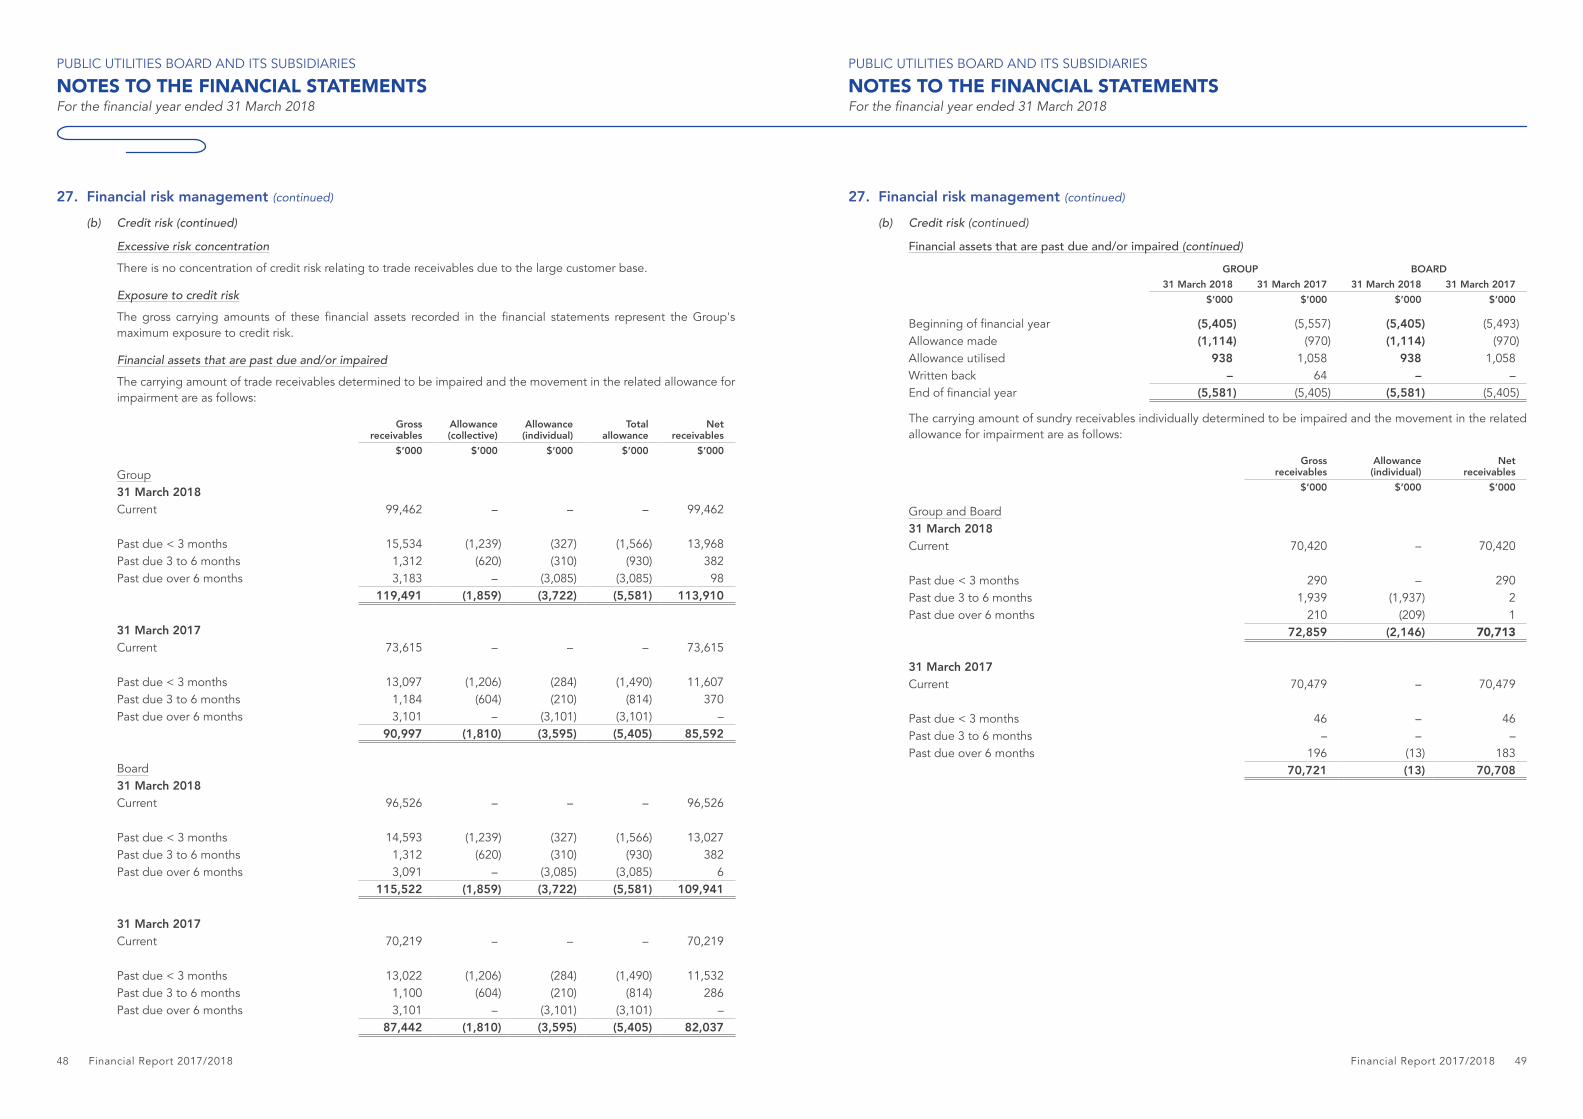
27. Financial risk management (continued)
(b) Credit risk (continued)
Excessive risk concentration
There is no concentration of credit risk relating to trade receivables due to the large customer base.
Exposure to credit risk
maximum exposure to credit risk.
Financial assets that are past due and/or impaired
The carrying amount of trade receivables determined to be impaired and the movement in the related allowance for impairment are as follows:
Gross receivables
Allowance (collective)
Allowance (individual)
Total allowance
Net receivables
$’000 $’000 $’000 $’000 $’000
Group31 March 2018Current 99,462 – – – 99,462
Past due < 3 months 15,534 (1,239) (327) (1,566) 13,968Past due 3 to 6 months 1,312 (620) (310) (930) 382Past due over 6 months 3,183 – (3,085) (3,085) 98
119,491 (1,859) (3,722) (5,581) 113,910
31 March 2017Current 73,615 – – – 73,615
Past due < 3 months 13,097 (1,206) (284) (1,490) 11,607Past due 3 to 6 months 1,184 (604) (210) (814) 370Past due over 6 months 3,101 – (3,101) (3,101) –
90,997 (1,810) (3,595) (5,405) 85,592
Board31 March 2018Current 96,526 – – – 96,526
Past due < 3 months 14,593 (1,239) (327) (1,566) 13,027Past due 3 to 6 months 1,312 (620) (310) (930) 382Past due over 6 months 3,091 – (3,085) (3,085) 6
115,522 (1,859) (3,722) (5,581) 109,941
31 March 2017Current 70,219 – – – 70,219
Past due < 3 months 13,022 (1,206) (284) (1,490) 11,532Past due 3 to 6 months 1,100 (604) (210) (814) 286Past due over 6 months 3,101 – (3,101) (3,101) –
87,442 (1,810) (3,595) (5,405) 82,037
27. Financial risk management (continued)
(b) Credit risk (continued)
Financial assets that are past due and/or impaired (continued)
GROUP BOARD31 March 2018 31 March 2017 31 March 2018 31 March 2017
$’000 $’000 $’000 $’000
(5,405) (5,557) (5,405) (5,493)Allowance made (1,114) (970) (1,114) (970)Allowance utilised 938 1,058 938 1,058Written back – 64 – –
(5,581) (5,405) (5,581) (5,405)
The carrying amount of sundry receivables individually determined to be impaired and the movement in the related allowance for impairment are as follows:
Gross receivables
Allowance (individual)
Net receivables
$’000 $’000 $’000
Group and Board31 March 2018Current 70,420 – 70,420
Past due < 3 months 290 – 290Past due 3 to 6 months 1,939 (1,937) 2Past due over 6 months 210 (209) 1
72,859 (2,146) 70,713
31 March 2017Current 70,479 – 70,479
Past due < 3 months 46 – 46Past due 3 to 6 months – – –Past due over 6 months 196 (13) 183
70,721 (13) 70,708
49Financial Report 2017/201848 Financial Report 2017/2018
PUBLIC UTILITIES BOARD AND ITS SUBSIDIARIESPUBLIC UTILITIES BOARD AND ITS SUBSIDIARIES
NOTES TO THE FINANCIAL STATEMENTS NOTES TO THE FINANCIAL STATEMENTS

27. Financial risk management (continued)
(b) Credit risk (continued)
Financial assets that are past due and/or impaired (continued)
GROUP AND BOARD31 March 2018 31 March 2017
$’000 $’000
(13) (17)Allowance made (2,143) –Allowance utilised 10 4
(2,146) (13)
and 31 March 2017.
(c) Liquidity risk
The Group's exposure to liquidity risk is minimal as it adopts prudent liquidity risk management by regularly reviewing
approved and funded by the Government are based on forecasted payment schedule.
Less than 1 year
Between 1 and 5 years
Over 5 years
$’000 $’000 $’000
GroupAt 31 March 2018Trade and other payables 230,451 – –Accruals 181,966 – –Finance lease payables 63,976 256,080 626,646Borrowings 439,964 399,621 749,242
At 31 March 2017Trade and other payables 220,981 – –Accruals 156,773 – –Finance lease payables 63,976 256,080 690,622Borrowings 49,068 825,358 763,469
27. Financial risk management (continued)
(c) Liquidity risk (continued)
Less than 1 year
Between 1 and 5 years
Over 5 years
$’000 $’000 $’000
BoardAt 31 March 2018Trade and other payables 229,795 – –Accruals 181,937 – –Finance lease payables 63,976 256,080 626,646Borrowings 439,964 399,621 749,242
At 31 March 2017Trade and other payables 219,513 – –Accruals 156,773 – –Finance lease payables 63,976 256,080 690,622Borrowings 49,068 825,358 763,469
(d) Capital management
its share capital, retained earnings, capital account and borrowings.
2018 and 31 March 2017. The Group is not subject to any externally imposed capital requirements.
(e) Fair value measurements
The Group categorises fair value measurements using a fair value hierarchy that is dependent on the valuation inputs used as follows:
Level 1 – Quoted prices (unadjusted) in active market for identical assets or liabilities that the Group can access at the measurement date,
Level 2 – Inputs other than quoted prices included within Level 1 that are observable for the asset or liability, either directly or indirectly, and
Level 3 – Unobservable inputs for the asset or liability.
Fair value measurements that use inputs of different hierarchy levels are categorised in its entirety in the same level
51Financial Report 2017/201850 Financial Report 2017/2018
PUBLIC UTILITIES BOARD AND ITS SUBSIDIARIESPUBLIC UTILITIES BOARD AND ITS SUBSIDIARIES
NOTES TO THE FINANCIAL STATEMENTS NOTES TO THE FINANCIAL STATEMENTS

27. Financial risk management (continued)
(e) Fair value measurements (continued)
The following table shows an analysis of the Group’s and Board’s assets and liabilities not measured at fair value as at the reporting date but for which fair value is disclosed:
Level 1 Level 2 Level 3 Total$’000 $’000 $’000 $’000
Group and Board31 March 2018
Borrowings – 1,449,147 – 1,449,147
31 March 2017
Borrowings – 1,482,662 – 1,482,662
Determination of fair valueThe fair values of the assets and liabilities, for disclosure purposes, are calculated based on prices at reporting date obtained from Bloomberg (2017: Thomson Reuters).
reasonable approximation of fair value
GROUP AND BOARDNote Carrying amount Fair value
$’000 $’000
Group and Board31 March 2018
Borrowings 19 1,400,000 1,449,147
31 March 2017
Borrowings 19 1,400,000 1,482,662
(f) Financial instruments by category
GROUP BOARD31 March 2018 31 March 2017 31 March 2018 31 March 2017
$’000 $’000 $’000 $’000
Loans and receivables 714,495 848,691 709,890 842,829
Financial liabilities at amortised cost 2,441,737 2,436,636 2,441,052 2,435,168
28. New or revised accounting standards and interpretationsBelow are the mandatory standards, amendments and interpretations to existing standards that have been published, and are relevant for the Group’s accounting periods beginning on or after 1 April 2018 and which the Group has not early adopted:
(a) SB-FRS 109 Financial instruments (effective for annual periods beginning on or after 1 January 2018)
irrevocable option at inception to present changes in fair value in OCI (FVOCI). Gains and losses realised on the sale
retained earnings.
except for the recognition of fair changes arising from changes in own credit risk. For liabilities designed at fair value
SB-FRS 109 relaxes the requirements for hedge effectiveness by replacing the bright line hedge effectiveness tests. It requires an economic relationship between the hedged item and hedging instrument and for the ‘hedged ratio’ to be the same as the one management actually use for risk management purposes.
There is also now a new expected credit losses model that replaces the incurred loss impairment model used in SB-
contract assets under SB-FRS 115 , lease receivables, loan commitments and
The new standard also introduces expanded disclosure requirements and changes in presentation.
– Trade and other receivables
.
(b) SB-FRS 115 Revenue from contracts with customers (effective for annual periods beginning on or after 1 January 2018)SB-FRS 115 replaces SB-FRS 11 , SB-FRS 18 , and related interpretations.
Revenue is recognised when a customer obtains control of a good or service. A customer obtains control when it has
that an entity recognises revenue to depict the transfer of promised goods or services to customers in an amount that
recognises revenue in accordance with that core principle by applying the following steps:
• Step 1: Identify the contract(s) with a customer
• Step 2: Identify the performance obligations in the contract
• Step 3: Determine the transaction price
• Step 4: Allocate the transaction price to the performance obligations in the contract
53Financial Report 2017/201852 Financial Report 2017/2018
PUBLIC UTILITIES BOARD AND ITS SUBSIDIARIESPUBLIC UTILITIES BOARD AND ITS SUBSIDIARIES
NOTES TO THE FINANCIAL STATEMENTS NOTES TO THE FINANCIAL STATEMENTS

28. New or revised accounting standards and interpretations (continued)
(b) SB-FRS 115 Revenue from contracts with customers (effective for annual periods beginning on or after 1 January 2018) (continued)
SB-FRS 115 also includes a cohesive set of disclosure requirements that will result in an entity providing users of
.
(c) SB-FRS 116 Leases (effective for annual periods beginning on or after 1 January 2019)SB-FRS 116 will result in almost all leases being recognised on the balance sheet, as the distinction between operating
liability to pay rentals are recognised. The only exceptions are short-term and low-value leases. The accounting for
Some of the commitments may be covered by the exception for short-term and low-value leases and some commitments may relate to arrangements that will not qualify as leases under SB-FRS 116.
The new standard also introduces expanded disclosure requirements and changes in presentation.
The Group is currently assessing the extent of the commitments as at the reporting date that will result in the
29. Segment reportingThe Group’s chief operating decision-maker comprises the senior management. The Group has only one reportable operating segment as it operates in the water industry as one business segment in the provision of water and related facilities for the public and majority of its activities are located in Singapore. The reportable segment is reviewed regularly by the chief operating decision-maker.
54 Financial Report 2017/2018
PUBLIC UTILITIES BOARD AND ITS SUBSIDIARIES
NOTES TO THE FINANCIAL STATEMENTS