Annual Report 2017 - Sumitomo Electric...
70
Annual Report 2017 Year Ended March 31, 2017
Transcript of Annual Report 2017 - Sumitomo Electric...

Annual Report2017
Year Ended March 31, 2017
Sumitomo Electr ic Industr ies, Ltd. celebrates its 120th anniversary this year. The
Company would like to express its sincere appreciation to customers and all other parties
concerned for their long-term support, which has enabled the Company to continue to
operate for so many years.
The Company's history dates back to April 1897, to the establishment of Sumitomo
Copper Rolling Works. Originating from the manufacture of electric wire and cable, the
Company, including its group companies, has steadily expanded the �eld of operations
over the years. While promoting diversi�cation of operations starting from around 1960,
and then globalization, and by making unwavering efforts to achieve technological
developments, the Company has been extensively contributing to the development and
progress of society not only in Japan but also in other parts of the world.
As a company that underpins the social infrastructure and people's dai ly l ives,
Sumitomo Electric continues to accommodate new needs generated by social change
through the innovation and integration of the wide variety of products and technological
assets accumulated so far. The Company continues to demonstrate ingenuity in creating
excellent, original technologies, thereby contributing to society.
Contents
Forward-Looking Statements
Message for the 120th Anniversary
Profile and History
Financial Highlights
To Our Stakeholders
Review of Operations
Automotive
Infocommunications
Electronics
Environment and Energy
Industrial Materials and Others
Topics
01
02
04
06
11
12
13
14
15
16
17
Consolidated Statements of Income
Consolidated Statements of Changes in Net Assets
Consolidated Statements of Cash Flows
Notes to Consolidated Financial Statements
Independent Auditor’s Report
History
Company Information
34
36
38
40
65
66
67
This presentation material contains various outlook and perspective information derived from our own presumptions and judgements based on currently available information on conditions and prospects of each market and economic circumstances such as currency exchange rate �uctuations. All �gures and statements with respect to the future performances, projections, and business plans of Sumitomo Electric and its af�liated companies are constituted by the aforementioned outlook and perspective information.Factors that could cause actual results to differ materially include but are not limited to:1. Market and economic conditions in the U.S., Europe, Japan and other Asian countries, especially increases and decreases in personal consumption and capital expenditures.2. Fluctuations in currency exchange rates, especially between the Japanese yen and the U.S. dollar, the euro and Asian currencies.3. The ability of Sumitomo Electric and its af�liated companies to cope with rapid technological developments.
4. Changes in �nancial, management, environmental and other assumptions.5. Current and future laws and regulations in other countries involving trade and other activities.6. Changes in the market value of securities owned by Sumitomo Electric and its af�liated companies.
There are possibilities that actual sales and pro�ts may be materially different from those described in this material. Sumitomo Electric and its af�liated companies are not obliged to update or make public any future performances, projections or business plans after releasing this material.
18
20
22
24
27
28
29
30
32
Expanding Business on the World Stage
Research & Development
Directors, Audit & Supervisory Board Members and Executive Officers
Corporate Governance
Compliance
Risk Management
Five-Year Financial Data and Indexes
Management’s Discussion and Analysis
Consolidated Balance Sheets
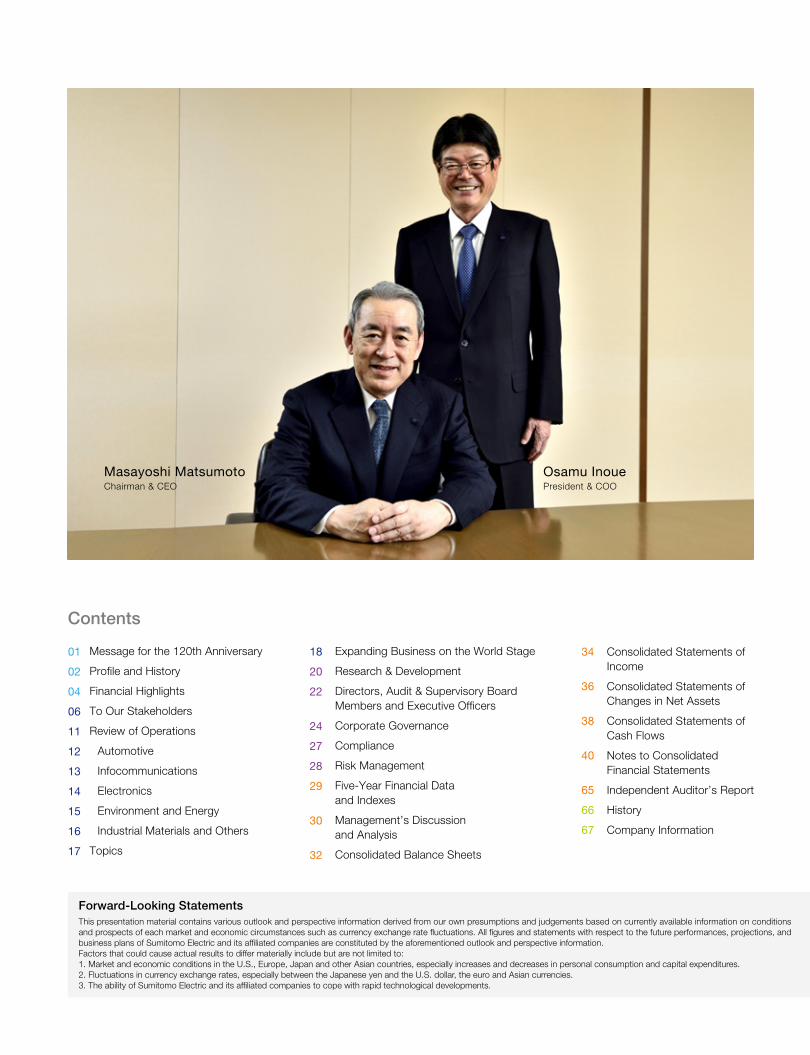
Masayoshi MatsumotoChairman & CEO
Osamu InouePresident & COO
Sumitomo Electr ic Industr ies, Ltd. celebrates its 120th anniversary this year. The
Company would like to express its sincere appreciation to customers and all other parties
concerned for their long-term support, which has enabled the Company to continue to
operate for so many years.
The Company's history dates back to April 1897, to the establishment of Sumitomo
Copper Rolling Works. Originating from the manufacture of electric wire and cable, the
Company, including its group companies, has steadily expanded the �eld of operations
over the years. While promoting diversi�cation of operations starting from around 1960,
and then globalization, and by making unwavering efforts to achieve technological
developments, the Company has been extensively contributing to the development and
progress of society not only in Japan but also in other parts of the world.
As a company that underpins the social infrastructure and people's dai ly l ives,
Sumitomo Electric continues to accommodate new needs generated by social change
through the innovation and integration of the wide variety of products and technological
assets accumulated so far. The Company continues to demonstrate ingenuity in creating
excellent, original technologies, thereby contributing to society.
Contents
Forward-Looking Statements
Message for the 120th Anniversary
Profile and History
Financial Highlights
To Our Stakeholders
Review of Operations
Automotive
Infocommunications
Electronics
Environment and Energy
Industrial Materials and Others
Topics
01
02
04
06
11
12
13
14
15
16
17
Consolidated Statements of Income
Consolidated Statements of Changes in Net Assets
Consolidated Statements of Cash Flows
Notes to Consolidated Financial Statements
Independent Auditor’s Report
History
Company Information
34
36
38
40
65
66
67
This presentation material contains various outlook and perspective information derived from our own presumptions and judgements based on currently available information on conditions and prospects of each market and economic circumstances such as currency exchange rate �uctuations. All �gures and statements with respect to the future performances, projections, and business plans of Sumitomo Electric and its af�liated companies are constituted by the aforementioned outlook and perspective information.Factors that could cause actual results to differ materially include but are not limited to:1. Market and economic conditions in the U.S., Europe, Japan and other Asian countries, especially increases and decreases in personal consumption and capital expenditures.2. Fluctuations in currency exchange rates, especially between the Japanese yen and the U.S. dollar, the euro and Asian currencies.3. The ability of Sumitomo Electric and its af�liated companies to cope with rapid technological developments.
4. Changes in �nancial, management, environmental and other assumptions.5. Current and future laws and regulations in other countries involving trade and other activities.6. Changes in the market value of securities owned by Sumitomo Electric and its af�liated companies.
There are possibilities that actual sales and pro�ts may be materially different from those described in this material. Sumitomo Electric and its af�liated companies are not obliged to update or make public any future performances, projections or business plans after releasing this material.
18
20
22
24
27
28
29
30
32
Expanding Business on the World Stage
Research & Development
Directors, Audit & Supervisory Board Members and Executive Officers
Corporate Governance
Compliance
Risk Management
Five-Year Financial Data and Indexes
Management’s Discussion and Analysis
Consolidated Balance Sheets
SUMITOMO ELECTRIC Annual Report 2017 1
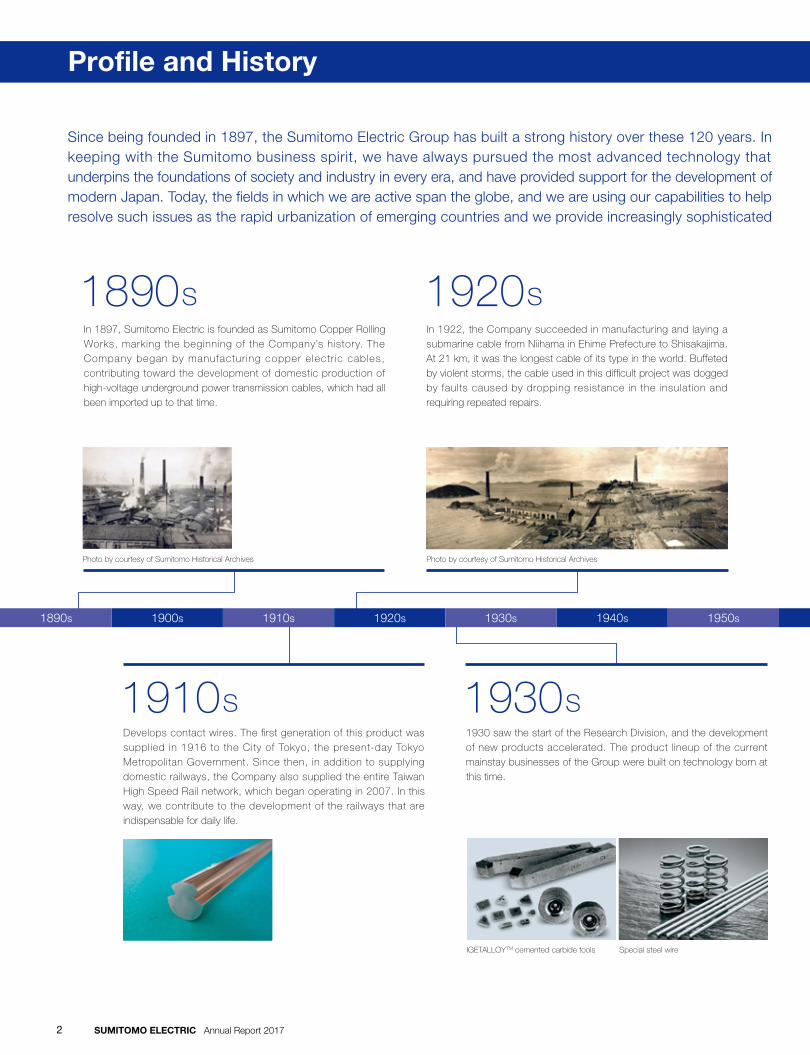
Since being founded in 1897, the Sumitomo Electric Group has built a strong history over these 120 years. In keeping with the Sumitomo business spirit, we have always pursued the most advanced technology that underpins the foundations of society and industry in every era, and have provided support for the development of modern Japan. Today, the �elds in which we are active span the globe, and we are using our capabilities to help resolve such issues as the rapid urbanization of emerging countries and we provide increasingly sophisticated
1890s
1910s
1920s
1930s
1960s
1970s
1980s 2010s
Recently
In 1897, Sumitomo Electric is founded as Sumitomo Copper Rolling Works, marking the beginning of the Company’s history. The Company began by manufactur ing copper e lectr ic cables, contributing toward the development of domestic production of high-voltage underground power transmission cables, which had all been imported up to that time.
1930 saw the start of the Research Division, and the development of new products accelerated. The product lineup of the current mainstay businesses of the Group were built on technology born at this time.
In 1969, we began making �exible printed circuits (FPCs). This technology made a signi�cant contr ibution to the spread of portable electronic devices, such as modern smartphones and notebook PCs.
A communication network project in Nigeria that was awarded to the Company by the Nigerian Ministry of Communications in 1976 was at that time unprecedented anywhere in the world: the largest urban telephone network construction work order taken on by a single company. Three-hundred Japanese employees and 2,000 local people worked on this project, which took 11.5 years to go from order to completion.
In 1982, the Company succeeded in the single-crystal synthesis of a diamond with a diameter of 6 mm (1.2 carats). It was listed in the 1984 edition of the Guinness Book of Records as the world’s largest synthetic d iamond. In 1989, we began vo lume production of large single-crystal synthetic diamonds of around 1 cm.
The electric wiring used in wire harnesses in cars is typically made of copper because of its superior conductivity, but the Group developed new aluminum alloy wires that have the same conductivity, though only half the weight. The aluminum harnesses made from these wires were positively received by both domestic and overseas auto manufacturers, and have now been adopted for a large number of models, thus contributing to reduced vehicle weights and cost.
infrastructure in developed countries, as we are called upon to make a broader contribution to social progress.The strength of our Group lies in a deep understanding of customer needs across a wide range of industries,
including automotive, information technology, electronics, environmental energy and industrial materials, and in drawing together and providing solutions for these industries. We manifest this strength through repeated effort and innovation to remain a vital presence for all our stakeholders around the world.
Develops contact wires. The �rst generation of this product was supplied in 1916 to the City of Tokyo, the present-day Tokyo Metropolitan Government. Since then, in addition to supplying domestic railways, the Company also supplied the entire Taiwan High Speed Rail network, which began operating in 2007. In this way, we contribute to the development of the railways that are indispensable for daily life.
In 1922, the Company succeeded in manufacturing and laying a submarine cable from Niihama in Ehime Prefecture to Shisakajima. At 21 km, it was the longest cable of its type in the world. Buffeted by violent storms, the cable used in this dif�cult project was dogged by faults caused by dropping resistance in the insulation and requiring repeated repairs.
1890s 1910s1900s 1920s 1930s 1940s 1950s 1960s 1970s 1980s 1990s 2000s 2010s Recently
Special steel wire
Photo by courtesy of Sumitomo Historical Archives Photo by courtesy of Sumitomo Historical Archives
IGETALLOYTM cemented carbide tools
We continue to move ahead with projects that support social infrastructure both in Japan and overseas, including the manufacture of cables linking Montenegro with Italy and demonstration tests performed jointly with Hokkaido Electric Power Co., Inc. at the Minami Hayakita substation for one of the world’s largest redox �ow battery installations, and work by the Company and subsidiary J-Power Systems
on the design, manufacture, cable laying, servicing and maintenance of a transmission cable system
providing unbroken links between the UK and Belgium.
Profile and History
SUMITOMO ELECTRIC Annual Report 20172

Since being founded in 1897, the Sumitomo Electric Group has built a strong history over these 120 years. In keeping with the Sumitomo business spirit, we have always pursued the most advanced technology that underpins the foundations of society and industry in every era, and have provided support for the development of modern Japan. Today, the �elds in which we are active span the globe, and we are using our capabilities to help resolve such issues as the rapid urbanization of emerging countries and we provide increasingly sophisticated
1890s
1910s
1920s
1930s
1960s
1970s
1980s 2010s
Recently
In 1897, Sumitomo Electric is founded as Sumitomo Copper Rolling Works, marking the beginning of the Company’s history. The Company began by manufactur ing copper e lectr ic cables, contributing toward the development of domestic production of high-voltage underground power transmission cables, which had all been imported up to that time.
1930 saw the start of the Research Division, and the development of new products accelerated. The product lineup of the current mainstay businesses of the Group were built on technology born at this time.
In 1969, we began making �exible printed circuits (FPCs). This technology made a signi�cant contr ibution to the spread of portable electronic devices, such as modern smartphones and notebook PCs.
A communication network project in Nigeria that was awarded to the Company by the Nigerian Ministry of Communications in 1976 was at that time unprecedented anywhere in the world: the largest urban telephone network construction work order taken on by a single company. Three-hundred Japanese employees and 2,000 local people worked on this project, which took 11.5 years to go from order to completion.
In 1982, the Company succeeded in the single-crystal synthesis of a diamond with a diameter of 6 mm (1.2 carats). It was listed in the 1984 edition of the Guinness Book of Records as the world’s largest synthetic d iamond. In 1989, we began vo lume production of large single-crystal synthetic diamonds of around 1 cm.
The electric wiring used in wire harnesses in cars is typically made of copper because of its superior conductivity, but the Group developed new aluminum alloy wires that have the same conductivity, though only half the weight. The aluminum harnesses made from these wires were positively received by both domestic and overseas auto manufacturers, and have now been adopted for a large number of models, thus contributing to reduced vehicle weights and cost.
infrastructure in developed countries, as we are called upon to make a broader contribution to social progress.The strength of our Group lies in a deep understanding of customer needs across a wide range of industries,
including automotive, information technology, electronics, environmental energy and industrial materials, and in drawing together and providing solutions for these industries. We manifest this strength through repeated effort and innovation to remain a vital presence for all our stakeholders around the world.
Develops contact wires. The �rst generation of this product was supplied in 1916 to the City of Tokyo, the present-day Tokyo Metropolitan Government. Since then, in addition to supplying domestic railways, the Company also supplied the entire Taiwan High Speed Rail network, which began operating in 2007. In this way, we contribute to the development of the railways that are indispensable for daily life.
In 1922, the Company succeeded in manufacturing and laying a submarine cable from Niihama in Ehime Prefecture to Shisakajima. At 21 km, it was the longest cable of its type in the world. Buffeted by violent storms, the cable used in this dif�cult project was dogged by faults caused by dropping resistance in the insulation and requiring repeated repairs.
1890s 1910s1900s 1920s 1930s 1940s 1950s 1960s 1970s 1980s 1990s 2000s 2010s Recently
Special steel wire
Photo by courtesy of Sumitomo Historical Archives Photo by courtesy of Sumitomo Historical Archives
IGETALLOYTM cemented carbide tools
We continue to move ahead with projects that support social infrastructure both in Japan and overseas, including the manufacture of cables linking Montenegro with Italy and demonstration tests performed jointly with Hokkaido Electric Power Co., Inc. at the Minami Hayakita substation for one of the world’s largest redox �ow battery installations, and work by the Company and subsidiary J-Power Systems
on the design, manufacture, cable laying, servicing and maintenance of a transmission cable system
providing unbroken links between the UK and Belgium.
SUMITOMO ELECTRIC Annual Report 2017 3
Millions of yen Thousands of U.S. dollars
FY2016Mar. 31, 2017
FY2015Mar. 31, 2016
FY2014Mar. 31, 2015
FY2013Mar. 31, 2014
FY2012Mar. 31, 2013
FY2016Mar. 31, 2017
For the Year:
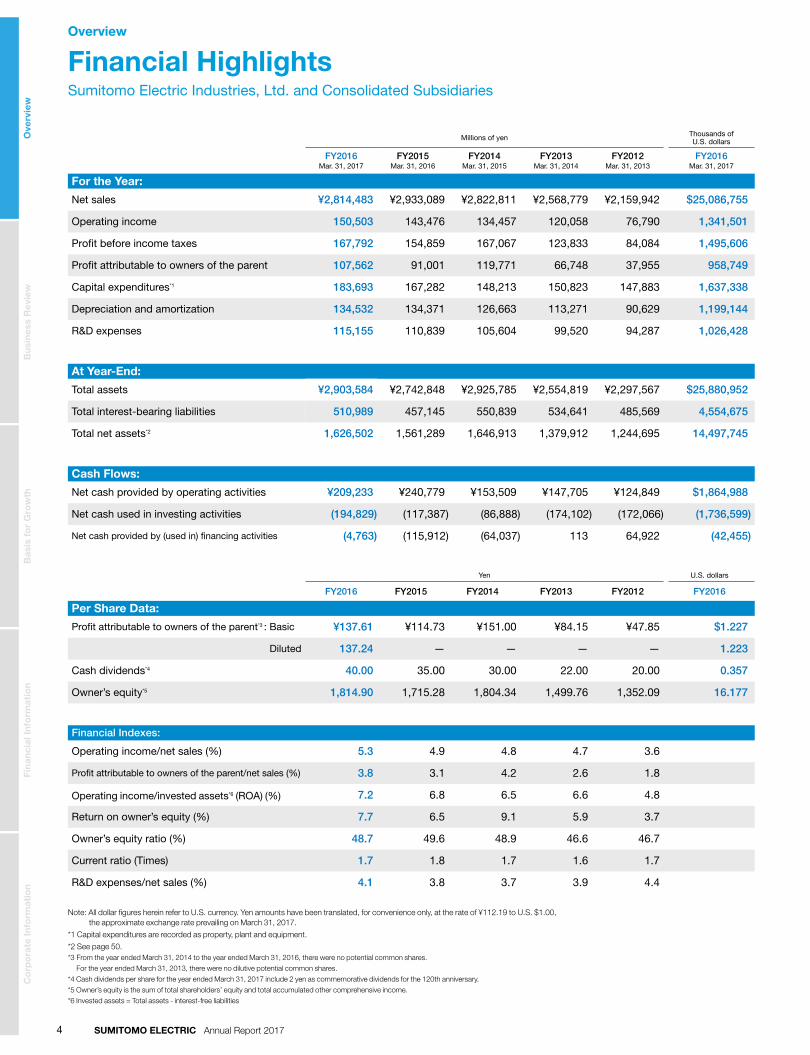
Net sales ¥2,814,483 ¥2,933,089 ¥2,822,811 ¥2,568,779 ¥2,159,942 $25,086,755
Operating income 150,503 143,476 134,457 120,058 76,790 1,341,501
Profit before income taxes 167,792 154,859 167,067 123,833 84,084 1,495,606
Profit attributable to owners of the parent 107,562 91,001 119,771 66,748 37,955 958,749
Capital expenditures*1 183,693 167,282 148,213 150,823 147,883 1,637,338
Depreciation and amortization 134,532 134,371 126,663 113,271 90,629 1,199,144
R&D expenses 115,155 110,839 105,604 99,520 94,287 1,026,428
At Year-End:
Total assets ¥2,903,584 ¥2,742,848 ¥2,925,785 ¥2,554,819 ¥2,297,567 $25,880,952
Total interest-bearing liabilities 510,989 457,145 550,839 534,641 485,569 4,554,675
Total net assets*2 1,626,502 1,561,289 1,646,913 1,379,912 1,244,695 14,497,745
Cash Flows:
Net cash provided by operating activities ¥209,233 ¥240,779 ¥153,509 ¥147,705 ¥124,849 $1,864,988
Net cash used in investing activities (194,829) (117,387) (86,888) (174,102) (172,066) (1,736,599)
Net cash provided by (used in) financing activities (4,763) (115,912) (64,037) 113 64,922 (42,455)
Yen U.S. dollars
FY2016 FY2015 FY2014 FY2013 FY2012 FY2016
Per Share Data:
Profit attributable to owners of the parent*3 : Basic ¥137.61 ¥114.73 ¥151.00 ¥84.15 ¥47.85 $1.227
Diluted 137.24 — — — — 1.223
Cash dividends*4 40.00 35.00 30.00 22.00 20.00 0.357
Owner’s equity*5 1,814.90 1,715.28 1,804.34 1,499.76 1,352.09 16.177
Financial Indexes:
Operating income/net sales (%) 5.3 4.9 4.8 4.7 3.6
Profit attributable to owners of the parent/net sales (%) 3.8 3.1 4.2 2.6 1.8
Operating income/invested assets*6 (ROA) (%) 7.2 6.8 6.5 6.6 4.8
Return on owner’s equity (%) 7.7 6.5 9.1 5.9 3.7
Owner’s equity ratio (%) 48.7 49.6 48.9 46.6 46.7
Current ratio (Times) 1.7 1.8 1.7 1.6 1.7
R&D expenses/net sales (%) 4.1 3.8 3.7 3.9 4.4
Note: All dollar figures herein refer to U.S. currency. Yen amounts have been translated, for convenience only, at the rate of ¥112.19 to U.S. $1.00, the approximate exchange rate prevailing on March 31, 2017.
*1 Capital expenditures are recorded as property, plant and equipment.
*2 See page 50.*3 From the year ended March 31, 2014 to the year ended March 31, 2016, there were no potential common shares.
For the year ended March 31, 2013, there were no dilutive potential common shares.*4 Cash dividends per share for the year ended March 31, 2017 include 2 yen as commemorative dividends for the 120th anniversary.*5 Owner’s equity is the sum of total shareholders’ equity and total accumulated other comprehensive income.*6 Invested assets = Total assets - interest-free liabilities
Sumitomo Electric Industries, Ltd. and Consolidated Subsidiaries
Financial HighlightsOverview
Ove
rvie
wB
usi
nes
s R
evie
wB
asis
fo
r G
row
thF
inan
cial
Info
rmat
ion
Co
rpo
rate
Info
rmat
ion
SUMITOMO ELECTRIC Annual Report 20174
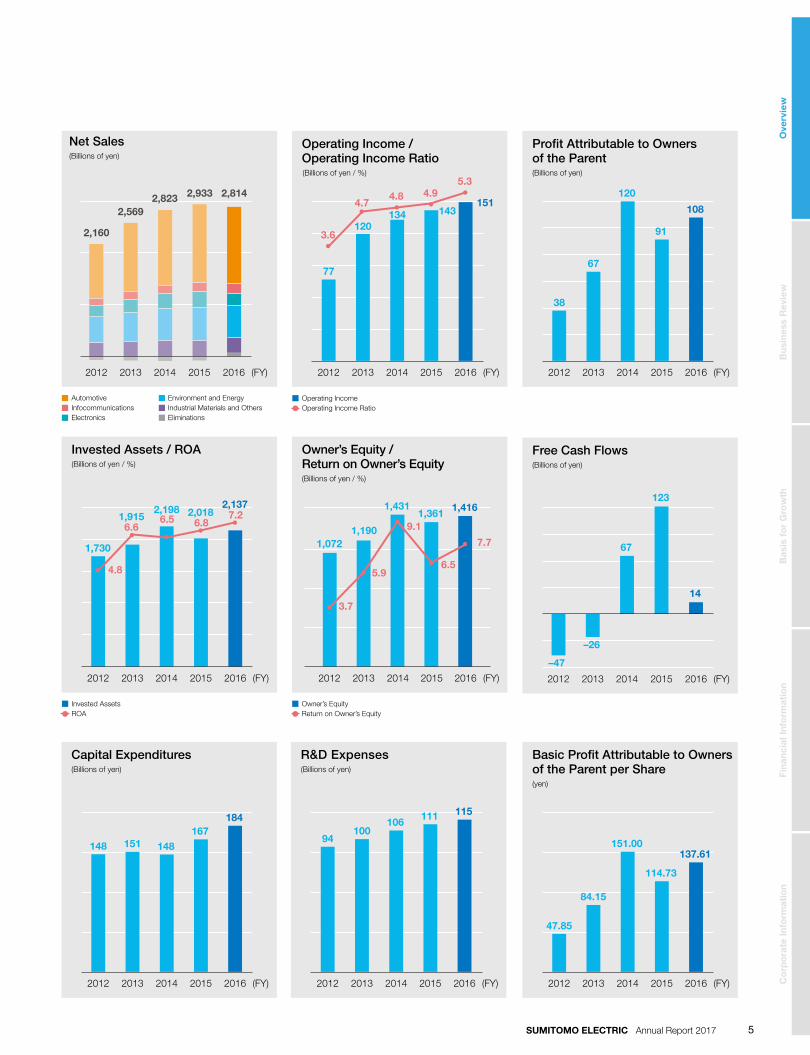
Pro�t Attributable to Owners of the Parent(Billions of yen)
Net Sales(Billions of yen)
Basic Pro�t Attributable to Owners of the Parent per Share(yen)
Free Cash Flows(Billions of yen)
R&D Expenses(Billions of yen)
Capital Expenditures(Billions of yen)
Operating Income / Operating Income Ratio(Billions of yen / %)
Owner’s Equity /Return on Owner’s Equity(Billions of yen / %)
Invested Assets / ROA(Billions of yen / %)
AutomotiveInfocommunicationsElectronics
■■■
■■■
Environment and EnergyIndustrial Materials and OthersEliminations
Operating Income Operating Income Ratio
■●
108
137.61
115184
2,1377.2
1,416
7.7
2,814151
5.3
14
Owner’s EquityReturn on Owner’s Equity
■●
Invested AssetsROA
■●
(FY) (FY)2016
67
120
38
91
2012 2013 2014 2015
(FY)2016
84.15
151.00
47.85
114.73
2012 2013 2014 2015
(FY)
(FY)2016
100106
94
111
2012 2013 2014 2015(FY)
(FY)
(FY)(FY)
2016
148148 151167
2012 2013 2014 2015
2016
2,198
4.8
6.66.5
1,730
1,915 2,0186.8
2012 2013 2014 2015 2016
1,431
5.9
9.1
1,0721,190
3.7
1,361
6.5
2012 2013 2014 2015
2016
2,5692,823
2,160
2,933
2012 2013 2014 2015 2016
120
77
3.6
4.74.8
143
4.9
134
2012 2013 2014 2015
2016
67
–47
–26
123
2012 2013 2014 2015
Ove
rvie
wB
usi
nes
s R
evie
wB
asis
fo
r G
row
thF
inan
cial
Info
rmat
ion
Co
rpo
rate
Info
rmat
ion
SUMITOMO ELECTRIC Annual Report 2017 5
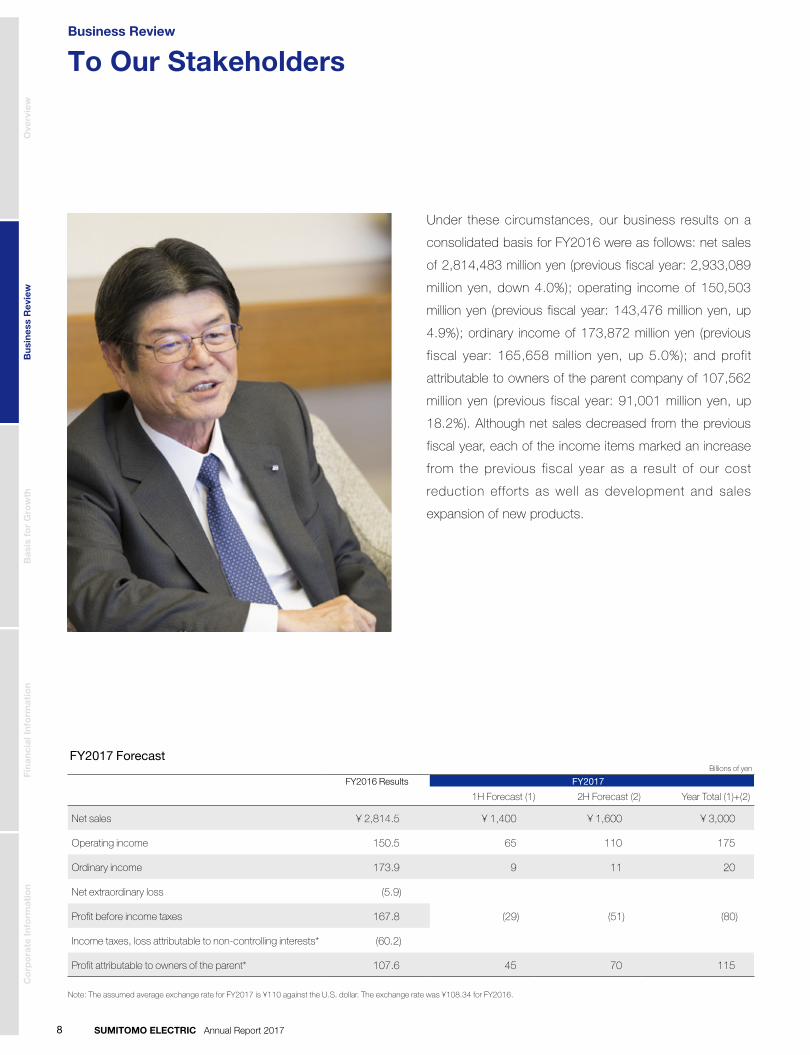
To Our StakeholdersBusiness Review
Osamu Inoue President & COO
Ove
rvie
wB
usi
nes
s R
evie
wB
asis
fo
r G
row
thF
inan
cial
Info
rmat
ion
Co
rpo
rate
Info
rmat
ion
SUMITOMO ELECTRIC Annual Report 20176

Net Sales / Operating Income(Billions of yen)
FY2016 Results
2nd half1st half
For the year ended Mar. 31, 2017
Automotive Infocommunications Electronics Environment and Energy Industrial Materials and Others Eliminations
Net Sales 1,312.1
Net Sales 1,502.4
OperatingIncome
103.4
OperatingIncome
47.1
Net Sales 1,439.4
Net Sales 1,493.7
OperatingIncome
90.6
OperatingIncome
52.9
FY2015 Results
2nd half1st half
For the year ended Mar. 31, 2016
When looking at the global economy for FY 2016,
although a moderate recovery trend continued in general,
the business climate remained unpredictable, mainly due
to the increasing uncertainty triggered by the UK’s
decision to withdraw from the EU and the inauguration of
the new administration in the United States, as well as
concerns over the slowdown in the growth of emerging
economies. At the same time, the Japanese economy
also came to a standstill, mainly because of sluggish
consumer spending.
Now that I have assumed the position of president in
this very obscure and uncertain time, I am feeling how
heavy my respons ib i l i t y i s . However, Cha i rman
Matsumoto continues to be involved in the management
of the Sumitomo Electric Group, and I will dedicate
myself wholeheartedly to the Group’s development in
compliance with the Sumitomo Spirit with over 400 years
of history.
I would like to ask all of you at the Group to continue
offering your generous cooperation and support.
The business environment surrounding the Sumitomo
Electric Group was severe. The demand for some
products, such as automotive wiring harnesses, optical
fiber cables, and optical and electronic devices, was
steady especially outside Japan. However, we were
considerably affected by the decline in demand for
flexible printed circuits (FPCs) for mobile devices, the
appreciation of the yen, and the decline in copper prices.
Ove
rvie
wB
usi
nes
s R
evie
wB
asis
fo
r G
row
thF
inan
cial
Info
rmat
ion
Co
rpo
rate
Info
rmat
ion
SUMITOMO ELECTRIC Annual Report 2017 7
To Our Stakeholders
Business Review
FY2017 ForecastBillions of yen
FY2016 Results FY2017
1H Forecast (1) 2H Forecast (2) Year Total (1)+(2)
Net sales ¥ 2,814.5 ¥ 1,400 ¥ 1,600 ¥ 3,000
Operating income 150.5 65 110 175
Ordinary income 173.9 9 11 20
Net extraordinary loss (5.9)
Profit before income taxes 167.8 (29) (51) (80)
Income taxes, loss attributable to non-controlling interests* (60.2)
Profit attributable to owners of the parent* 107.6 45 70 115
Note: The assumed average exchange rate for FY2017 is ¥110 against the U.S. dollar. The exchange rate was ¥108.34 for FY2016.
Under these circumstances, our business results on a
consolidated basis for FY2016 were as follows: net sales
of 2,814,483 million yen (previous fiscal year: 2,933,089
million yen, down 4.0%); operating income of 150,503
million yen (previous fiscal year: 143,476 million yen, up
4.9%); ordinary income of 173,872 million yen (previous
fiscal year: 165,658 million yen, up 5.0%); and profit
attributable to owners of the parent company of 107,562
million yen (previous fiscal year: 91,001 million yen, up
18.2%). Although net sales decreased from the previous
fiscal year, each of the income items marked an increase
from the previous fiscal year as a result of our cost
reduction efforts as well as development and sales
expansion of new products.
Ove
rvie
wB
usi
nes
s R
evie
wB
asis
fo
r G
row
thF
inan
cial
Info
rmat
ion
Co
rpo
rate
Info
rmat
ion
SUMITOMO ELECTRIC Annual Report 20178

focus on the sales expansion of new products related to
access network equipment, thereby aiming to further
increase our profitability.
In our electronics-related business, we recorded
sluggish business results in FY 2016 in the field of FPCs
for mobile devices, mainly due to shrinking demand and
intensified competition, as well as the delay in the launch
of new products. However, while committing ourselves to
thorough quality improvement, cost reduction, and sales
expansion on a global scale, we will strengthen our
profitability by leveraging the integrated capabilities of the
Sumitomo Electric Group to develop new products with
advanced features, such as increased high-definition,
ultra-thinness, or high heat-resistance, and to grow our
business in the in-car product market. Furthermore, in
the field of electronic wires and irradiated tubes, we will
also accelerate our efforts on a global scale to reinforce
production and expand sales.
In our business related to the environment and energy,
last November, we concluded a long-term agreement
with the Saudi Arabian national oil company, Saudi
Arabian Oil Company regarding submarine power cables.
In addition, this March, we agreed to cooperate with the
German company Siemens for high-voltage direct current
transmission. By combining advanced technologies,
such as the company’s converters and our high-voltage
direct current power cables, we will provide optimized
solutions for our customers, thereby accelerating sales
In our automotive-related business, we are aiming to
become a g loba l comprehens i ve componen ts
manufacturer. To this end, we wil l accelerate our
development and sales expansion of durable, high-
strength aluminum wiring harnesses, which will contribute
to weight reduction in automobiles; high-voltage wiring
harnesses for environment-friendly automobiles; and
electronic equipment and high-speed communication
connectors for the increasingly compl icated and
sophisticated electronic control systems.
Moreover, while striving to increase our share of
markets targeting overseas customers, we will focus on
further cost reductions. At the same time, Sumitomo Riko
Co., Ltd. will take advantage of the production bases,
sales channels, technologies, and other assets that the
company has obtained by acquir ing an overseas
business in the field of anti-vibration rubber and hoses for
automobiles to expand sales on a global basis and
continue to reinforce the business structure, thereby
improving profitability.
In our infocommunications-related business, we will
continue to catch steady overseas demand for optical
fiber cables, 100 Gbps high-speed optical devices, and
gallium nitride (GaN) devices for mobile base stations. In
addition, we will make further efforts to expand the sales
of ultra-low-loss optical fibers for submarine cables, ultra-
high-fiber-count optical cables used in data centers, and
intelligent transport systems. We will also continue to
Ove
rvie
wB
usi
nes
s R
evie
wB
asis
fo
r G
row
thF
inan
cial
Info
rmat
ion
Co
rpo
rate
Info
rmat
ion
SUMITOMO ELECTRIC Annual Report 2017 9
Main ProductsBusiness OverviewNet SalesSegment
Automotive
Infocommunications
Electronics
Environment and Energy
Industrial Materials and Others
The Sumitomo Electric Group is a global supplier of wiring harnesses and anti-vibration rubber, as well as safe, comfortable and environment-friendly automotive components and systems.53%
¥1,513.2 billion
Share of net sales
Net sales • Wiring harnesses• Anti-vibration rubber• Automotive hoses• Car electrical equipment
Building on its communication cable technologies accumulated for more than 100 years, the Sumitomo Electric Group supplies products and systems that support today’s Internet services such as optical �ber cable, opto-electronic devices, gigabit Ethernet-passive optical network (GE-PON), and other devices. We also supply traf�c control systems and other systems drawing on our telecoms expertise and portfolio of control technologies.
7%
¥198.2 billion
Share of net sales
Net sales
Using its proprietary materials technologies, the Sumitomo Electric Group supports the increasing use of electronics devices in society through a diverse range of products such as electronic wires, �exible printed circuits, other highly functional wiring materials and �uorine resin products.
8%
¥251.1billion
Share of net sales
Net sales
Since its inception, the Sumitomo Electric Group has helped underpin modern daily life through its energy transmission businesses, supplying products such as cables for power distribution, railway trolley wires, and wire coils used in home appliances, automobiles, and other applications.
22%
¥621.4 billion
Share of net sales
Net sales
Through the manufacture of electric wire and cable, the Sumitomo Electric Group has developed and built up proprietary technologies and products that underpin industry and society. Its cutting tools have contributed to greater ef�ciency in manufacturing and its sintered parts and special metal wires are used in automotive and a wide range of other industrial �elds.
10%
¥303.9 billion
Share of net sales
Net sales
• Electronic wire products• Metallic material for
electronic parts• Electric-beam irradiation
products• Flexible printed circuits• Fluorine resin products• Micro filtration membrane
module
• Electric conductors• Power transmission
wires/cables/equipment• Magnet wires• Air cushions for railroad
vehicles• Power systems• Equipment such as substation
equipment/control systems• Charged beam equipment
and processing• Electrical/power supply work
and engineering, porous metals
• Tensioning materials for prestressed concrete
• Precision spring steel wires, steel tire cords, cemented carbide tools
• Diamond and CBN tools, laser optics, sintered powder metal parts
• Semiconductor heatspreader materials
• Grinding tools• Tungsten and molybdenum
materials• Heat sinks
• Optical fiber cables• Telecommunication cables
and equipment• Fusion splicers• Optical/wireless devices such
as optical transceiver modules/wireless communication devices
• Network system products such as access network equipment (GE-PONs, content delivery networks, CATV-related products, traffic control)
• Compound semiconductors
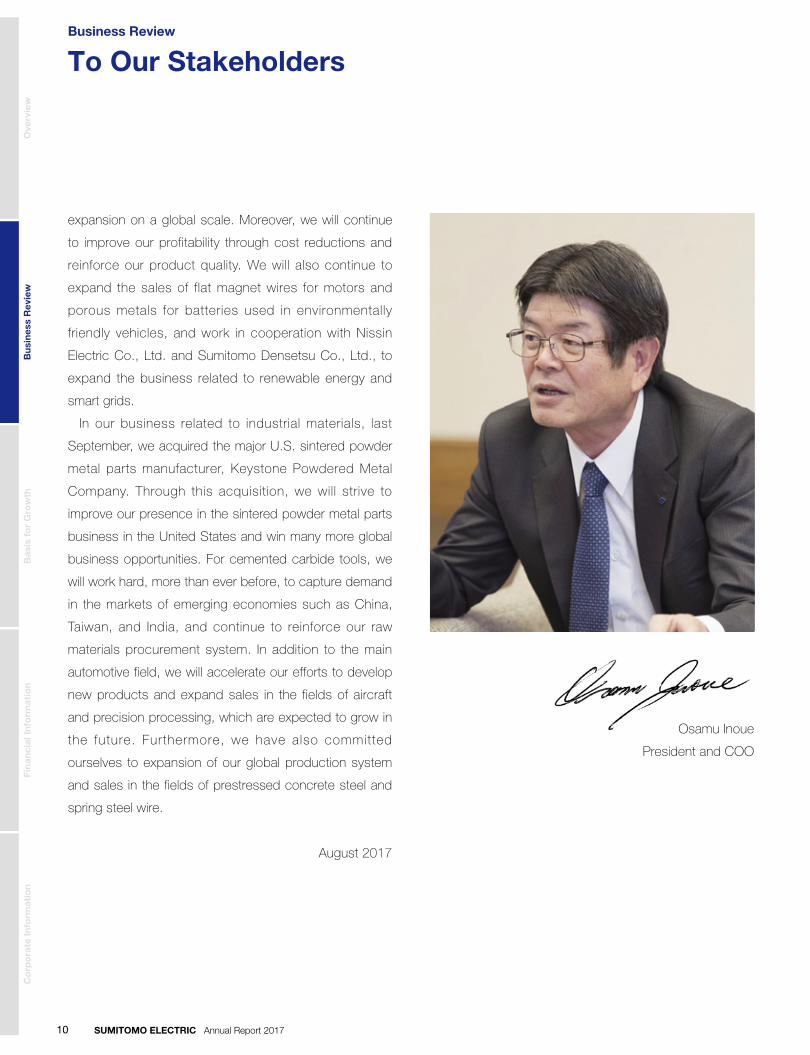
To Our StakeholdersBusiness Review
Osamu Inoue
President and COO
expansion on a global scale. Moreover, we will continue
to improve our profitability through cost reductions and
reinforce our product quality. We will also continue to
expand the sales of flat magnet wires for motors and
porous metals for batteries used in environmentally
friendly vehicles, and work in cooperation with Nissin
Electric Co., Ltd. and Sumitomo Densetsu Co., Ltd., to
expand the business related to renewable energy and
smart grids.
In our business related to industrial materials, last
September, we acquired the major U.S. sintered powder
metal parts manufacturer, Keystone Powdered Metal
Company. Through this acquisition, we will strive to
improve our presence in the sintered powder metal parts
business in the United States and win many more global
business opportunities. For cemented carbide tools, we
will work hard, more than ever before, to capture demand
in the markets of emerging economies such as China,
Taiwan, and India, and continue to reinforce our raw
materials procurement system. In addition to the main
automotive field, we will accelerate our efforts to develop
new products and expand sales in the fields of aircraft
and precision processing, which are expected to grow in
the future. Furthermore, we have also committed
ourselves to expansion of our global production system
and sales in the fields of prestressed concrete steel and
spring steel wire.
August 2017
Ove
rvie
wB
usi
nes
s R
evie
wB
asis
fo
r G
row
thF
inan
cial
Info
rmat
ion
Co
rpo
rate
Info
rmat
ion
SUMITOMO ELECTRIC Annual Report 201710

Main ProductsBusiness OverviewNet SalesSegment
Automotive
Infocommunications
Electronics
Environment and Energy
Industrial Materials and Others
The Sumitomo Electric Group is a global supplier of wiring harnesses and anti-vibration rubber, as well as safe, comfortable and environment-friendly automotive components and systems.53%
¥1,513.2 billion
Share of net sales
Net sales • Wiring harnesses• Anti-vibration rubber• Automotive hoses• Car electrical equipment
Building on its communication cable technologies accumulated for more than 100 years, the Sumitomo Electric Group supplies products and systems that support today’s Internet services such as optical �ber cable, opto-electronic devices, gigabit Ethernet-passive optical network (GE-PON), and other devices. We also supply traf�c control systems and other systems drawing on our telecoms expertise and portfolio of control technologies.
7%
¥198.2 billion
Share of net sales
Net sales
Using its proprietary materials technologies, the Sumitomo Electric Group supports the increasing use of electronics devices in society through a diverse range of products such as electronic wires, �exible printed circuits, other highly functional wiring materials and �uorine resin products.
8%
¥251.1billion
Share of net sales
Net sales
Since its inception, the Sumitomo Electric Group has helped underpin modern daily life through its energy transmission businesses, supplying products such as cables for power distribution, railway trolley wires, and wire coils used in home appliances, automobiles, and other applications.
22%
¥621.4 billion
Share of net sales
Net sales
Through the manufacture of electric wire and cable, the Sumitomo Electric Group has developed and built up proprietary technologies and products that underpin industry and society. Its cutting tools have contributed to greater ef�ciency in manufacturing and its sintered parts and special metal wires are used in automotive and a wide range of other industrial �elds.
10%
¥303.9 billion
Share of net sales
Net sales
• Electronic wire products• Metallic material for
electronic parts• Electric-beam irradiation
products• Flexible printed circuits• Fluorine resin products• Micro filtration membrane
module
• Electric conductors• Power transmission
wires/cables/equipment• Magnet wires• Air cushions for railroad
vehicles• Power systems• Equipment such as substation
equipment/control systems• Charged beam equipment
and processing• Electrical/power supply work
and engineering, porous metals
• Tensioning materials for prestressed concrete
• Precision spring steel wires, steel tire cords, cemented carbide tools
• Diamond and CBN tools, laser optics, sintered powder metal parts
• Semiconductor heatspreader materials
• Grinding tools• Tungsten and molybdenum
materials• Heat sinks
• Optical fiber cables• Telecommunication cables
and equipment• Fusion splicers• Optical/wireless devices such
as optical transceiver modules/wireless communication devices
• Network system products such as access network equipment (GE-PONs, content delivery networks, CATV-related products, traffic control)
• Compound semiconductors
Review of OperationsBusiness Review
Sumitomo Electric operates in five segments: Automotive, Infocommunications, Electronics, Environment and Energy, and Industrial Materials and Others businesses.
Ove
rvie
wB
usi
nes
s R
evie
wB
asis
fo
r G
row
thF
inan
cial
Info
rmat
ion
Co
rpo
rate
Info
rmat
ion
SUMITOMO ELECTRIC Annual Report 2017 11
Automotive
6.5
99
6.05.3
72
89
5.7
8977
71
8876 76
62 64 68
(FY)
1,513
2016
1,3511,488
2013 2014
1,542
2015 (FY)20162013 2014 2015 (FY)20162013 2014 2015
R&D ExpensesCapital Expenditure
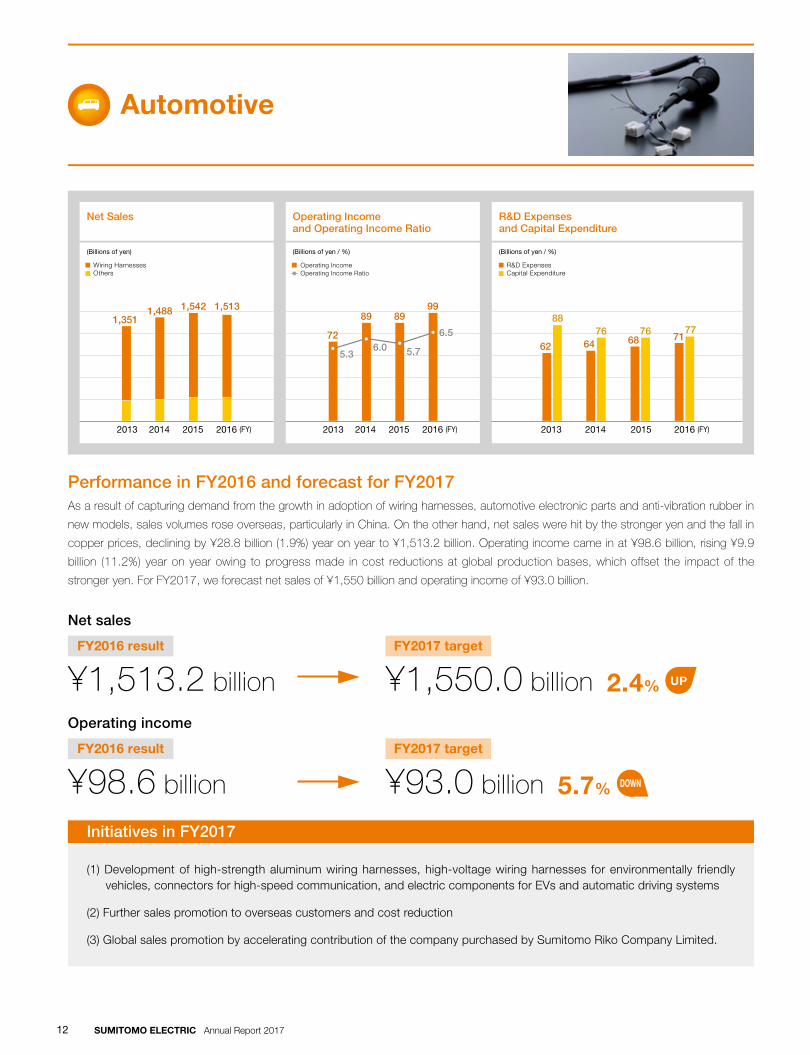
Operating Income Operating Income Ratio
Operating Income and Operating Income Ratio
R&D Expenses and Capital Expenditure
Net Sales
(Billions of yen / %) (Billions of yen / %)(Billions of yen)
Wiring Harnesses Others
Performance in FY2016 and forecast for FY2017As a result of capturing demand from the growth in adoption of wiring harnesses, automotive electronic parts and anti-vibration rubber in
new models, sales volumes rose overseas, particularly in China. On the other hand, net sales were hit by the stronger yen and the fall in
copper prices, declining by ¥28.8 billion (1.9%) year on year to ¥1,513.2 billion. Operating income came in at ¥98.6 billion, rising ¥9.9
billion (11.2%) year on year owing to progress made in cost reductions at global production bases, which offset the impact of the
stronger yen. For FY2017, we forecast net sales of ¥1,550 billion and operating income of ¥93.0 billion.
UP
Net sales
Operating income
¥1,513.2 billion
¥98.6 billion
¥1,550.0 billion
¥93.0 billion
2.4%
FY2016 result
FY2016 result
FY2017 target
FY2017 target
DOWN5.7%
Initiatives in FY2017
(1) Development of high-strength aluminum wiring harnesses, high-voltage wiring harnesses for environmentally friendly vehicles, connectors for high-speed communication, and electric components for EVs and automatic driving systems
(2) Further sales promotion to overseas customers and cost reduction
(3) Global sales promotion by accelerating contribution of the company purchased by Sumitomo Riko Company Limited.
SUMITOMO ELECTRIC Annual Report 201712
Infocommunications
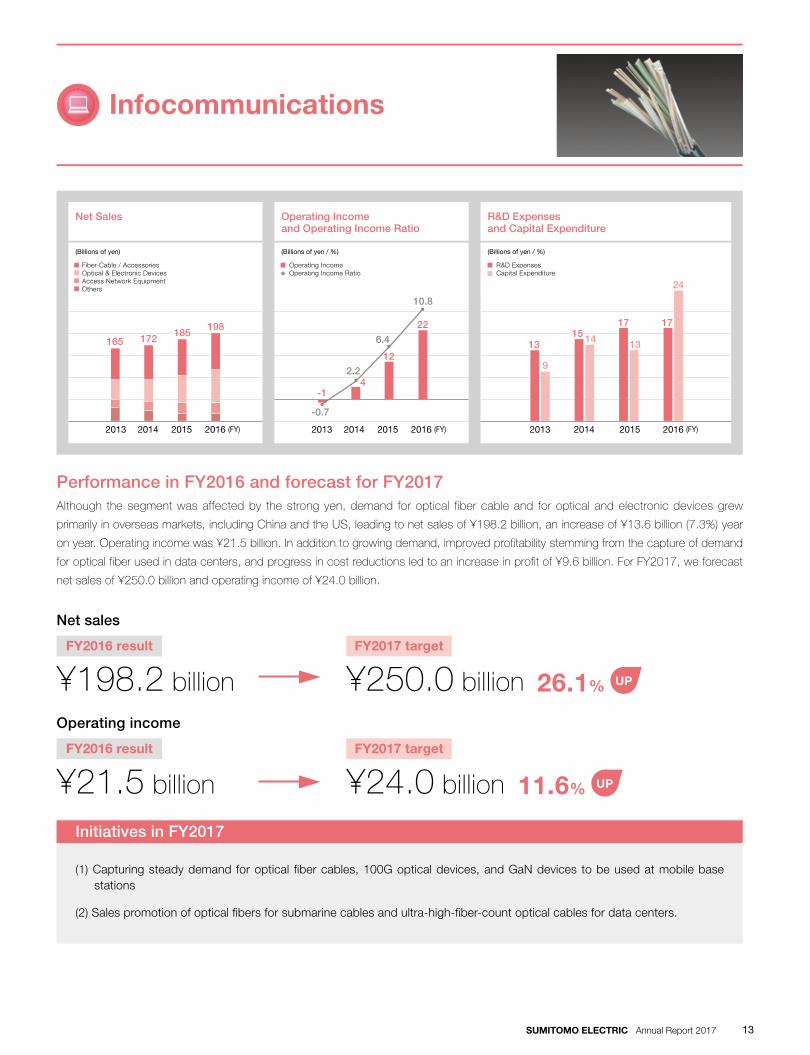
Performance in FY2016 and forecast for FY2017Although the segment was affected by the strong yen, demand for optical fiber cable and for optical and electronic devices grew
primarily in overseas markets, including China and the US, leading to net sales of ¥198.2 billion, an increase of ¥13.6 billion (7.3%) year
on year. Operating income was ¥21.5 billion. In addition to growing demand, improved profitability stemming from the capture of demand
for optical fiber used in data centers, and progress in cost reductions led to an increase in profit of ¥9.6 billion. For FY2017, we forecast
net sales of ¥250.0 billion and operating income of ¥24.0 billion.
UP
UP
Net sales
Operating income
¥198.2 billion
¥21.5 billion
¥250.0 billion
¥24.0 billion
26.1%
FY2016 result
FY2016 result
FY2017 target
FY2017 target
11.6%
Initiatives in FY2017
(1) Capturing steady demand for optical fiber cables, 100G optical devices, and GaN devices to be used at mobile base stations
(2) Sales promotion of optical fibers for submarine cables and ultra-high-fiber-count optical cables for data centers.
(FY)20162013 2014 2015 (FY)20162013 2014 2015 (FY)20162013 2014 2015
24
17
9
14 131315
17
Operating Income and Operating Income Ratio
R&D Expenses and Capital Expenditure
Net Sales
(Billions of yen / %) (Billions of yen / %)(Billions of yen)
R&D ExpensesCapital Expenditure
Fiber∙Cable / AccessoriesOptical & Electronic Devices Access Network EquipmentOthers
Operating Income Operating Income Ratio
198
165 172185
2.2
-0.7
-14
6.4
12
10.8
22
SUMITOMO ELECTRIC Annual Report 2017 13

(FY)20162013 2014 2015 (FY)20162013 2014 2015 (FY)20162013 2014 2015
Operating Income and Operating Income Ratio
R&D Expenses and Capital Expenditure
Net Sales
(Billions of yen / %) (Billions of yen / %)(Billions of yen)
FPCsSemiconductorsFine PolymerElectronic WiresOthers
Operating Income Operating Income Ratio
R&D ExpensesCapital Expenditure
263292
312
251
5
1215
4
29
3
34
3
-4.4
5 53.3
10
-11
2.0 1.9
Electronics
Performance in FY2016 and forecast for FY2017Although the sales volume of electronic wires increased as a result of the development of new sources of demand, demand for FPCs for
mobile devices declined and sales volume fell due to delays in starting production of new products. Price competition intensified, and
the strong yen also had an effect. As a result, net sales were ¥251.1 billion, down ¥60.9 billion (19.5%) year on year. The operating loss
was ¥10.9 billion, with worsening profitability caused in part by the fall in FPC production volumes, contributing to a drastic deterioration
of ¥21.1 billion. For FY2017, we forecast net sales of ¥240.0 billion and operating income of ¥5.0 billion.
UP
Net sales
Operating income
¥251.1 billion
¥(10.9) billion
¥240.0 billion
¥5.0 billion
4.4%
FY2016 result
FY2016 result
FY2017 target
FY2017 target
145.8%
Initiatives in FY2017
(1) Further global quality improvements and cost reduction for FPCs by utilizing all resources
(2) Development of ultra-thin, fine-pitch, and high-temperature resistant FPCs and expansion of automotive business
DOWN
SUMITOMO ELECTRIC Annual Report 201714
(FY)20162013 2014 2015 (FY)20162013 2014 2015 (FY)20162013 2014 2015
Operating Income and Operating Income Ratio
R&D Expenses and Capital Expenditure
Net Sales
(Billions of yen / %) (Billions of yen / %)(Billions of yen)
R&D ExpensesCapital Expenditure
Copper Wire RodsElectric Power CablesMagnet Wires & Others Sumitomo DensetsuNissin Electric
Operating Income Operating Income Ratio
564637 660 621
18
13
20
14
27
15
24
16
4.3
24
14
2.0
133.3
21
2.1
Environment and Energy
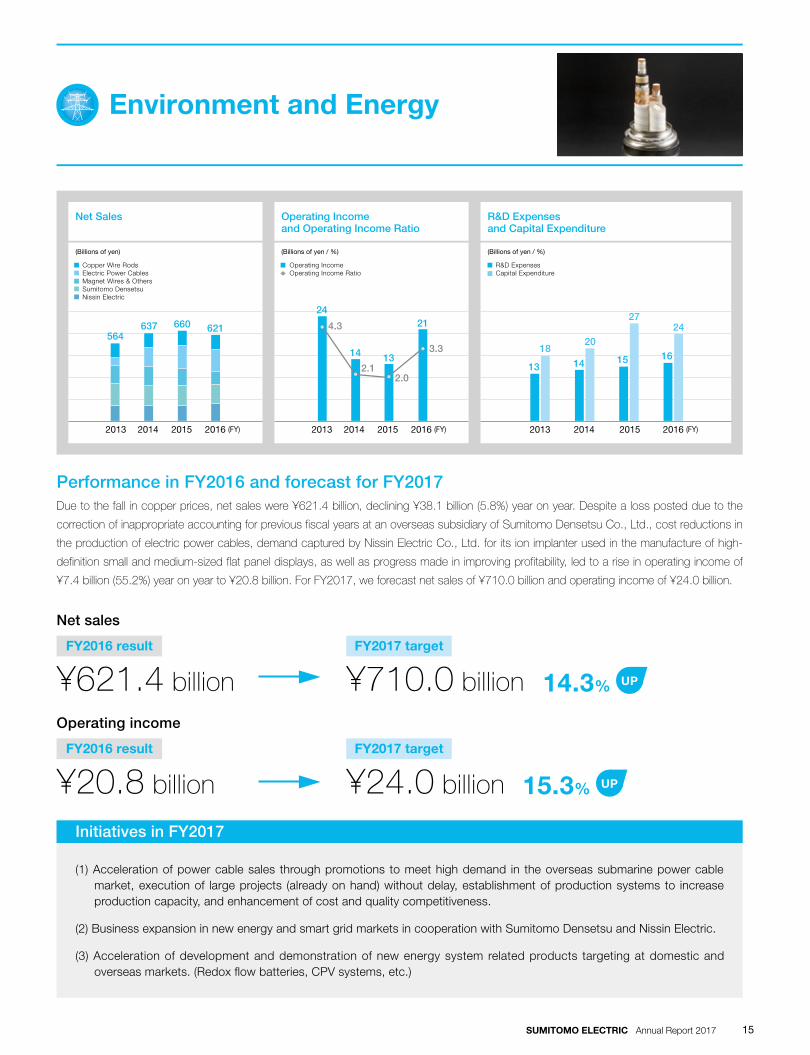
Performance in FY2016 and forecast for FY2017Due to the fall in copper prices, net sales were ¥621.4 billion, declining ¥38.1 billion (5.8%) year on year. Despite a loss posted due to the
correction of inappropriate accounting for previous fiscal years at an overseas subsidiary of Sumitomo Densetsu Co., Ltd., cost reductions in
the production of electric power cables, demand captured by Nissin Electric Co., Ltd. for its ion implanter used in the manufacture of high-
definition small and medium-sized flat panel displays, as well as progress made in improving profitability, led to a rise in operating income of
¥7.4 billion (55.2%) year on year to ¥20.8 billion. For FY2017, we forecast net sales of ¥710.0 billion and operating income of ¥24.0 billion.
UP
UP
Net sales
Operating income
¥621.4 billion
¥20.8 billion
¥710.0 billion
¥24.0 billion
14.3%
FY2016 result
FY2016 result
FY2017 target
FY2017 target
15.3%
Initiatives in FY2017
(1) Acceleration of power cable sales through promotions to meet high demand in the overseas submarine power cable market, execution of large projects (already on hand) without delay, establishment of production systems to increase production capacity, and enhancement of cost and quality competitiveness.
(2) Business expansion in new energy and smart grid markets in cooperation with Sumitomo Densetsu and Nissin Electric.
(3) Acceleration of development and demonstration of new energy system related products targeting at domestic and overseas markets. (Redox flow batteries, CPV systems, etc.)
SUMITOMO ELECTRIC Annual Report 2017 15

(FY)20162013 2014 2015 (FY)20162013 2014 2015 (FY)20162013 2014 2015
Operating Income and Operating Income Ratio
R&D Expenses and Capital Expenditure
Net Sales
(Billions of yen / %) (Billions of yen / %)(Billions of yen)
R&D ExpensesCapital Expenditure
Special Steel WiresSintered PartsHard MetalA.L.M.T.Others
Operating Income Operating Income Ratio
304303 317 31224
8
24
8
22
8
7.26.8
2123
6.2
19
6.7
20 25
8
Industrial Materials and Others
Performance in FY2016 and forecast for FY2017Due to the effects of the strong yen and other factors, net sales declined by ¥8.2 billion (2.6%) to ¥303.9 billion. As a result of such
factors as the removal in the fiscal year under review of the mark-to-market valuation loss on raw materials recorded by A.L.M.T. Corp. in
the previous fiscal year resulting from falling prices for tungsten and molybdenum, and the progress made overseas in cost reductions
for steel tire cords that led to improvements in profitability, operating income rose ¥1.3 billion (6.5%) year on year to ¥20.5 billion. For
FY2017, we forecast net sales of ¥340.0 billion and operating income of ¥29.0 billion.
UP
UP
Net sales
Operating income
¥303.9 billion
¥20.5 billion
¥340.0 billion
¥29.0 billion
11.9%
FY2016 result
FY2016 result
FY2017 target
FY2017 target
41.5%
Initiatives in FY2017
(1) Acceleration of global deployment for sintered parts through the purchased US company, Keystone Powdered Metal Company
(2) Establishment of new business models centering material technology Hard Metal: Sales expansion to aircraft and precision processing markets as well as such emerging economies as China, Taiwan, and India.
Allied Material: Intensive cost reduction and concentration of resources in growing areas Prestressed Concrete Steel wire and Steel Wire for Springs: Sales and production promotion to the US, Indonesia, and other countries.
SUMITOMO ELECTRIC Annual Report 201716
Topics
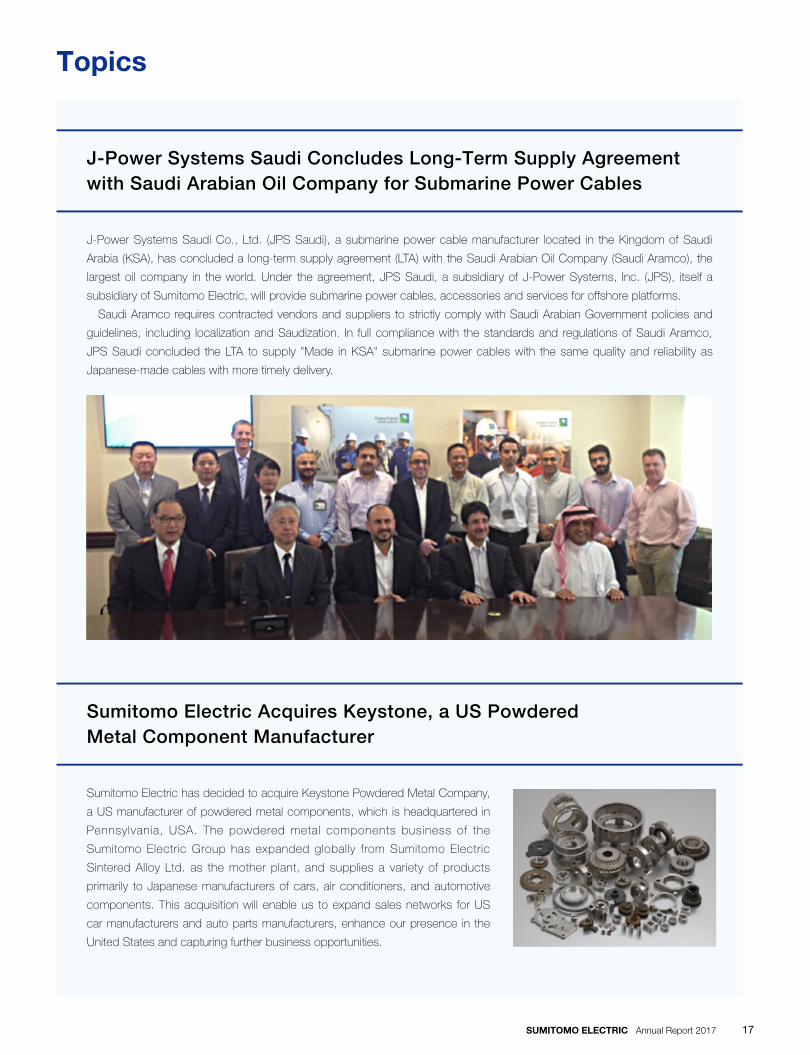
J-Power Systems Saudi Co., Ltd. (JPS Saudi), a submarine power cable manufacturer located in the Kingdom of Saudi
Arabia (KSA), has concluded a long-term supply agreement (LTA) with the Saudi Arabian Oil Company (Saudi Aramco), the
largest oil company in the world. Under the agreement, JPS Saudi, a subsidiary of J-Power Systems, Inc. (JPS), itself a
subsidiary of Sumitomo Electric, will provide submarine power cables, accessories and services for offshore platforms.
Saudi Aramco requires contracted vendors and suppliers to strictly comply with Saudi Arabian Government policies and
guidelines, including localization and Saudization. In full compliance with the standards and regulations of Saudi Aramco,
JPS Saudi concluded the LTA to supply "Made in KSA" submarine power cables with the same quality and reliability as
Japanese-made cables with more timely delivery.
Sumitomo Electric has decided to acquire Keystone Powdered Metal Company,
a US manufacturer of powdered metal components, which is headquartered in
Pennsylvania, USA. The powdered metal components business of the
Sumitomo Electric Group has expanded globally from Sumitomo Electric
Sintered Alloy Ltd. as the mother plant, and supplies a variety of products
primarily to Japanese manufacturers of cars, air conditioners, and automotive
components. This acquisition will enable us to expand sales networks for US
car manufacturers and auto parts manufacturers, enhance our presence in the
United States and capturing further business opportunities.
J-Power Systems Saudi Concludes Long-Term Supply Agreement with Saudi Arabian Oil Company for Submarine Power Cables
Sumitomo Electric Acquires Keystone, a US Powdered Metal Component Manufacturer
SUMITOMO ELECTRIC Annual Report 2017 17

Expanding Business on the World StageBusiness Review
The Sumitomo Electric Group is expanding marketing bases and optimally recon�guring production bases around the
world to respond more precisely to growing global demand driven by emerging economies. As a result, sales of the
Company and its consolidated subsidiaries outside Japan (overseas sales) totaled ¥1,653.7 billion in FY2016, a
decrease of ¥92.4 billion from the previous �scal year. Overseas sales were 58.8% of total sales on a consolidated basis,
a year-on-year decrease of 0.7 percentage points.
Number of Consolidated Subsidiaries and Equity-Method Af�liates
Sales in China decreased by ¥52.6 billion year on year to ¥479.4 billion, or 17.0% of all consolidated sales. Sales in other Asian markets increased ¥6.8 billion to ¥350.9 billion, accounting for 12.5% of total sales on a consolidated basis.
Sales of consolidated subsidiaries in Asia, including China, (to external customers) totaled ¥753 billion, a decrease of ¥64.1 billion from the previous �scal year. Operating income also decreased ¥6.0 billion year on year to ¥71.4 bil l ion. Operating income generated in this region was 47.3% of total operating income on a consolidated basis.
Sales in Europe and other regions came to ¥328.7 billion, or 11.7% of total consolidated sales. This was a decrease of ¥15.0 billion compared with the previous �scal year.
At the same time, sales of consolidated subsidiaries (to external customers) decreased ¥19.3 billion to ¥307.0 billion. Operating income was ¥5.2 billion, down ¥0.9 billion. Operating income generated was 3.5% of total operating income on a consolidated basis.
394 (As of March 31, 2017)
114Japan
163Asia
Europe andOthers
69 48Americas
Asia
Europe and Others
Currently, the Sumitomo Electric Group employs around 240,000 people in diversi�ed technological and regional occupations in over 40 countries. It is essential for us to make full use of all of our resources if we are to survive and thrive amid global competition in terms of technology, products and business model. It is also vital to attract and mobilize highly talented employees to support our business. The Group has long emphasized the importance of human resources, as stated in the Sumitomo Spirit. In September 2011, the Group compiled the Global Human Resource Management Policy, clearly laying down its basic human resource policy. This policy explicitly commits Sumitomo Electric to further accelerating the globalization of human resources and organizational systems and providing training for fostering global players and leaders and career opportunities regardless of nationality, race, ethnicity, religion or gender. The policy has been widely promulgated internally and externally. We are promoting speci�c policies for cross-border personnel exchanges and training, and for compiling global guidelines for personnel deployment.
Global Human Resource Management Policy Website: http://global-sei.com/ghrm/
Global Human Resource Management Policy
Overseas Sales(Billions of yen)
(FY)
Europe and OthersAsia Americas
Geographical Segment Sales
(Billions of yen)
(FY)
JapanEurope and OthersAsia Americas
2016
307
753
1,266
488
2012 2013 2014
185
520
1,161
294
293
671
1,208
396
331
761
1,249
482
2015
326
818
1,274
516
Segment Information by Geographic Area
In FY2016, sales in the Americas decreased by ¥31.6 billion year on year to ¥494.7 billion, or 17.6% of all consolidated sales.
Sales of consolidated subsidiaries in the Americas (to external customers) declined ¥27.6 billion year on year to ¥488 billion, while operating income decreased ¥10.0 billion to ¥24.4 billion. Operating income generated in the region was 16.1% of consolidated operating income.
Americas
2016
495
830
329
2012 2013 2014
403294
561
194
716
298
495
806
346
2015
526
876
344
Ove
rvie
wB
usi
nes
s R
evie
wB
asis
fo
r G
row
thF
inan
cial
Info
rmat
ion
Co
rpo
rate
Info
rmat
ion
SUMITOMO ELECTRIC Annual Report 201718
The Sumitomo Electric Group is expanding marketing bases and optimally recon�guring production bases around the
world to respond more precisely to growing global demand driven by emerging economies. As a result, sales of the
Company and its consolidated subsidiaries outside Japan (overseas sales) totaled ¥1,653.7 billion in FY2016, a
decrease of ¥92.4 billion from the previous �scal year. Overseas sales were 58.8% of total sales on a consolidated basis,
a year-on-year decrease of 0.7 percentage points.
Number of Consolidated Subsidiaries and Equity-Method Af�liates
Sales in China decreased by ¥52.6 billion year on year to ¥479.4 billion, or 17.0% of all consolidated sales. Sales in other Asian markets increased ¥6.8 billion to ¥350.9 billion, accounting for 12.5% of total sales on a consolidated basis.
Sales of consolidated subsidiaries in Asia, including China, (to external customers) totaled ¥753 billion, a decrease of ¥64.1 billion from the previous �scal year. Operating income also decreased ¥6.0 billion year on year to ¥71.4 bil l ion. Operating income generated in this region was 47.3% of total operating income on a consolidated basis.
Sales in Europe and other regions came to ¥328.7 billion, or 11.7% of total consolidated sales. This was a decrease of ¥15.0 billion compared with the previous �scal year.
At the same time, sales of consolidated subsidiaries (to external customers) decreased ¥19.3 billion to ¥307.0 billion. Operating income was ¥5.2 billion, down ¥0.9 billion. Operating income generated was 3.5% of total operating income on a consolidated basis.
394 (As of March 31, 2017)
114Japan
163Asia
Europe andOthers
69 48Americas
Asia
Europe and Others
Currently, the Sumitomo Electric Group employs around 240,000 people in diversi�ed technological and regional occupations in over 40 countries. It is essential for us to make full use of all of our resources if we are to survive and thrive amid global competition in terms of technology, products and business model. It is also vital to attract and mobilize highly talented employees to support our business. The Group has long emphasized the importance of human resources, as stated in the Sumitomo Spirit. In September 2011, the Group compiled the Global Human Resource Management Policy, clearly laying down its basic human resource policy. This policy explicitly commits Sumitomo Electric to further accelerating the globalization of human resources and organizational systems and providing training for fostering global players and leaders and career opportunities regardless of nationality, race, ethnicity, religion or gender. The policy has been widely promulgated internally and externally. We are promoting speci�c policies for cross-border personnel exchanges and training, and for compiling global guidelines for personnel deployment.
Global Human Resource Management Policy Website: http://global-sei.com/ghrm/
Global Human Resource Management Policy
Overseas Sales(Billions of yen)
(FY)
Europe and OthersAsia Americas
Geographical Segment Sales
(Billions of yen)
(FY)
JapanEurope and OthersAsia Americas
2016
307
753
1,266
488
2012 2013 2014
185
520
1,161
294
293
671
1,208
396
331
761
1,249
482
2015
326
818
1,274
516
Segment Information by Geographic Area
In FY2016, sales in the Americas decreased by ¥31.6 billion year on year to ¥494.7 billion, or 17.6% of all consolidated sales.
Sales of consolidated subsidiaries in the Americas (to external customers) declined ¥27.6 billion year on year to ¥488 billion, while operating income decreased ¥10.0 billion to ¥24.4 billion. Operating income generated in the region was 16.1% of consolidated operating income.
Americas
2016
495
830
329
2012 2013 2014
403294
561
194
716
298
495
806
346
2015
526
876
344
Ove
rvie
wB
usi
nes
s R
evie
wB
asis
fo
r G
row
thF
inan
cial
Info
rmat
ion
Co
rpo
rate
Info
rmat
ion
SUMITOMO ELECTRIC Annual Report 2017 19
Research & DevelopmentBasis for Growth
In line with our commitment in the Sumitomo Electric Group Corporate Principles to build technical expertise, realize
changes and strive for consistent growth, we focus on growing business areas and develop original businesses and
new products with strong earnings potential. Anticipating future technological needs, we are committed to identifying
and developing new research areas that will drive next-generation growth.
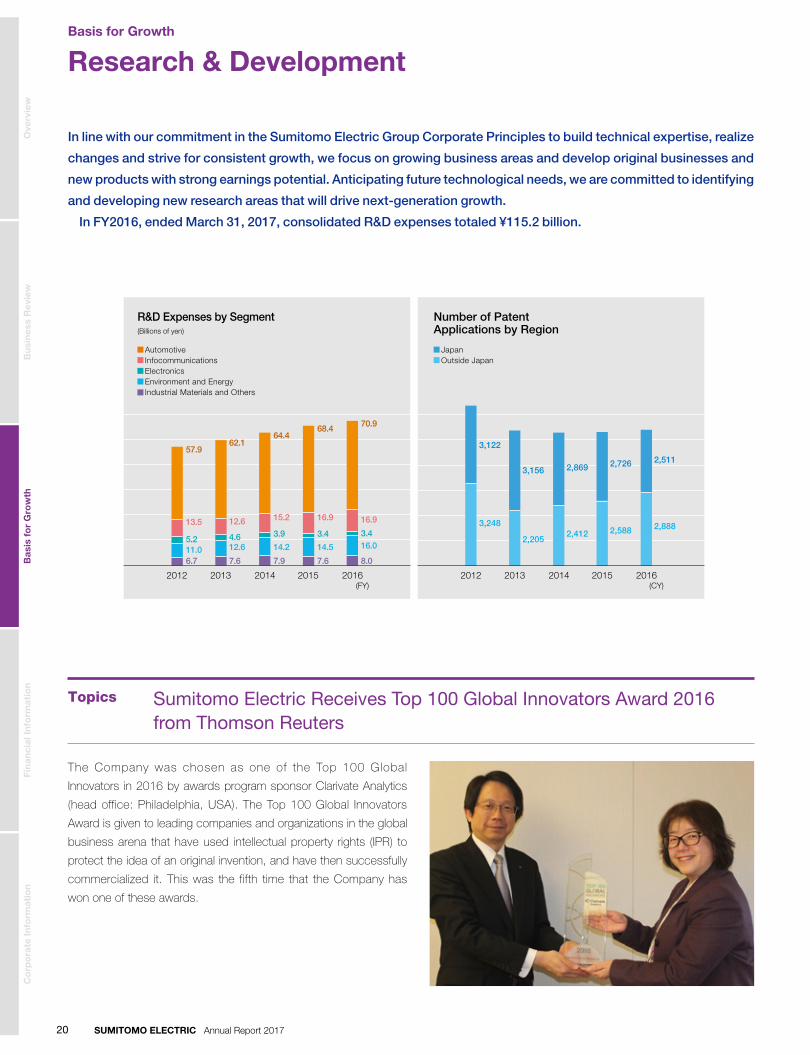
In FY2016, ended March 31, 2017, consolidated R&D expenses totaled ¥115.2 billion.
R&D Expenses by Segment(Billions of yen)
(FY)
AutomotiveInfocommunications ElectronicsEnvironment and EnergyIndustrial Materials and Others
2016
8.0
16.03.4
16.9
70.9
2012 2013 2014
7.9
14.2
3.9
15.2
64.4
7.6
12.64.6
12.6
62.1
6.711.05.2
13.5
57.9
2015(CY)
20162012 2013 2014 2015
7.6
14.5
3.4
16.9
68.4
2,511
2,888
3,156
2,205
3,122
3,248
2,869
2,412
2,726
2,588
Number of Patent Applications by Region
JapanOutside Japan
The Company was chosen as one of the Top 100 Global
Innovators in 2016 by awards program sponsor Clarivate Analytics
(head office: Philadelphia, USA). The Top 100 Global Innovators
Award is given to leading companies and organizations in the global
business arena that have used intellectual property rights (IPR) to
protect the idea of an original invention, and have then successfully
commercialized it. This was the fifth time that the Company has
won one of these awards.
Topics Sumitomo Electric Receives Top 100 Global Innovators Award 2016 from Thomson Reuters
Ove
rvie
wB
usi
nes
s R
evie
wB
asis
fo
r G
row
thF
inan
cial
Info
rmat
ion
Co
rpo
rate
Info
rmat
ion
SUMITOMO ELECTRIC Annual Report 201720
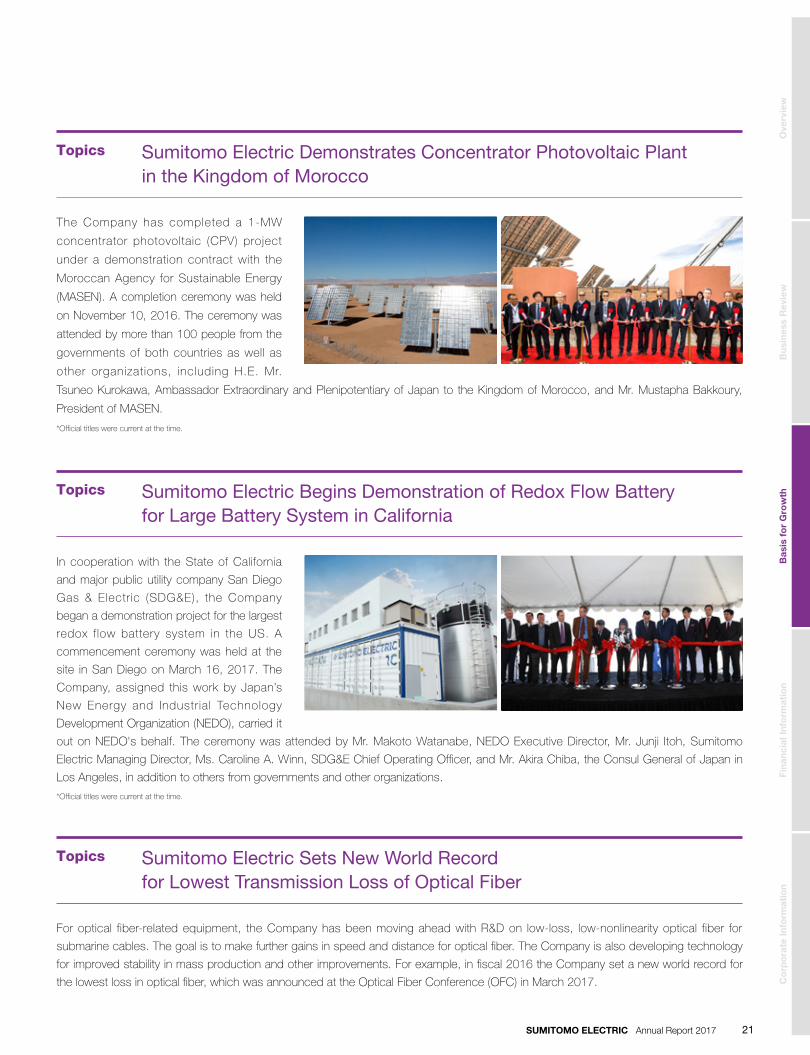
The Company has completed a 1-MW
concentrator photovoltaic (CPV) project
under a demonstration contract with the
Moroccan Agency for Sustainable Energy
(MASEN). A completion ceremony was held
on November 10, 2016. The ceremony was
attended by more than 100 people from the
governments of both countries as well as
other organizations, including H.E. Mr.
Tsuneo Kurokawa, Ambassador Extraordinary and Plenipotentiary of Japan to the Kingdom of Morocco, and Mr. Mustapha Bakkoury,
President of MASEN.
*Official titles were current at the time.
In cooperation with the State of California
and major public utility company San Diego
Gas & Electric (SDG&E), the Company
began a demonstration project for the largest
redox flow battery system in the US. A
commencement ceremony was held at the
site in San Diego on March 16, 2017. The
Company, assigned this work by Japan’s
New Energy and Industr ial Technology
Development Organization (NEDO), carried it
out on NEDO's behalf. The ceremony was attended by Mr. Makoto Watanabe, NEDO Executive Director, Mr. Junji Itoh, Sumitomo
Electric Managing Director, Ms. Caroline A. Winn, SDG&E Chief Operating Officer, and Mr. Akira Chiba, the Consul General of Japan in
Los Angeles, in addition to others from governments and other organizations.
*Official titles were current at the time.
Topics Sumitomo Electric Demonstrates Concentrator Photovoltaic Plant in the Kingdom of Morocco
Topics Sumitomo Electric Begins Demonstration of Redox Flow Battery for Large Battery System in California
For optical fiber-related equipment, the Company has been moving ahead with R&D on low-loss, low-nonlinearity optical fiber for
submarine cables. The goal is to make further gains in speed and distance for optical fiber. The Company is also developing technology
for improved stability in mass production and other improvements. For example, in fiscal 2016 the Company set a new world record for
the lowest loss in optical fiber, which was announced at the Optical Fiber Conference (OFC) in March 2017.
Topics Sumitomo Electric Sets New World Record for Lowest Transmission Loss of Optical Fiber
Ove
rvie
wB
usi
nes
s R
evie
wB
asis
fo
r G
row
thF
inan
cial
Info
rmat
ion
Co
rpo
rate
Info
rmat
ion
SUMITOMO ELECTRIC Annual Report 2017 21
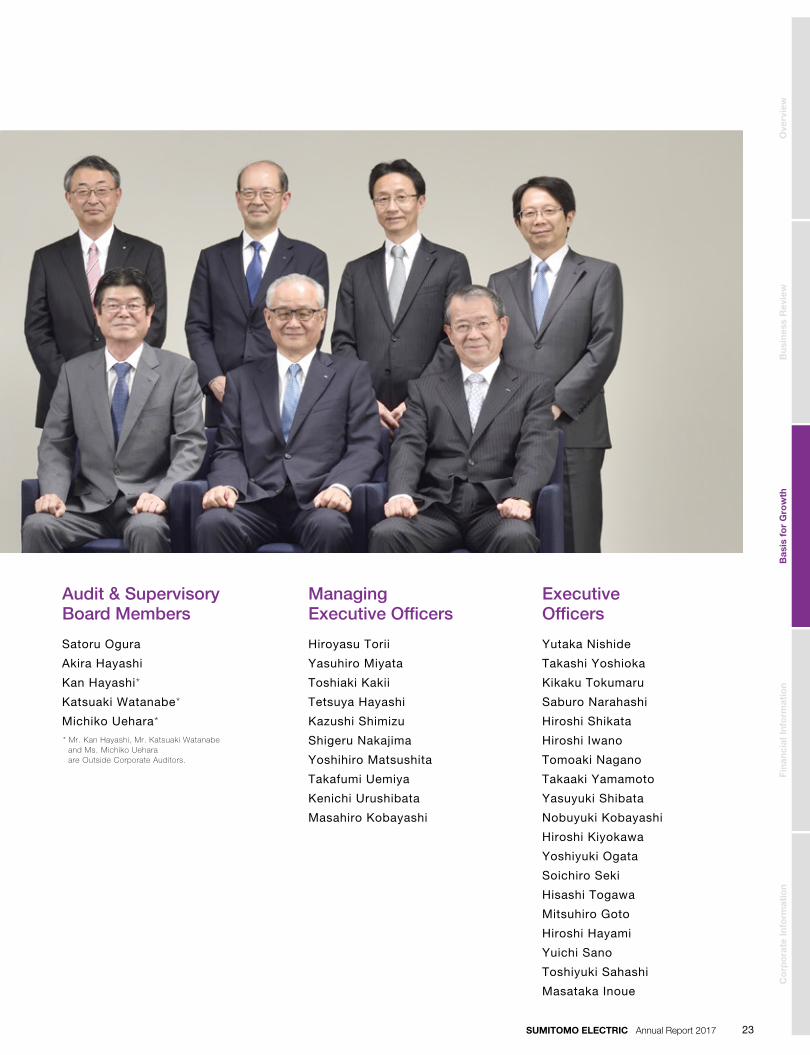
Managing Executive Of�cers
Executive Of�cers
Hiroyasu Torii
Yasuhiro Miyata
Toshiaki Kakii
Tetsuya Hayashi
Kazushi Shimizu
Shigeru Nakajima
Yoshihiro Matsushita
Takafumi Uemiya
Kenichi Urushibata
Masahiro Kobayashi
Yutaka Nishide
Takashi Yoshioka
Kikaku Tokumaru
Saburo Narahashi
Hiroshi Shikata
Hiroshi Iwano
Tomoaki Nagano
Takaaki Yamamoto
Yasuyuki Shibata
Nobuyuki Kobayashi
Hiroshi Kiyokawa
Yoshiyuki Ogata
Soichiro Seki
Hisashi Togawa
Mitsuhiro Goto
Hiroshi Hayami
Yuichi Sano
Toshiyuki Sahashi
Masataka Inoue
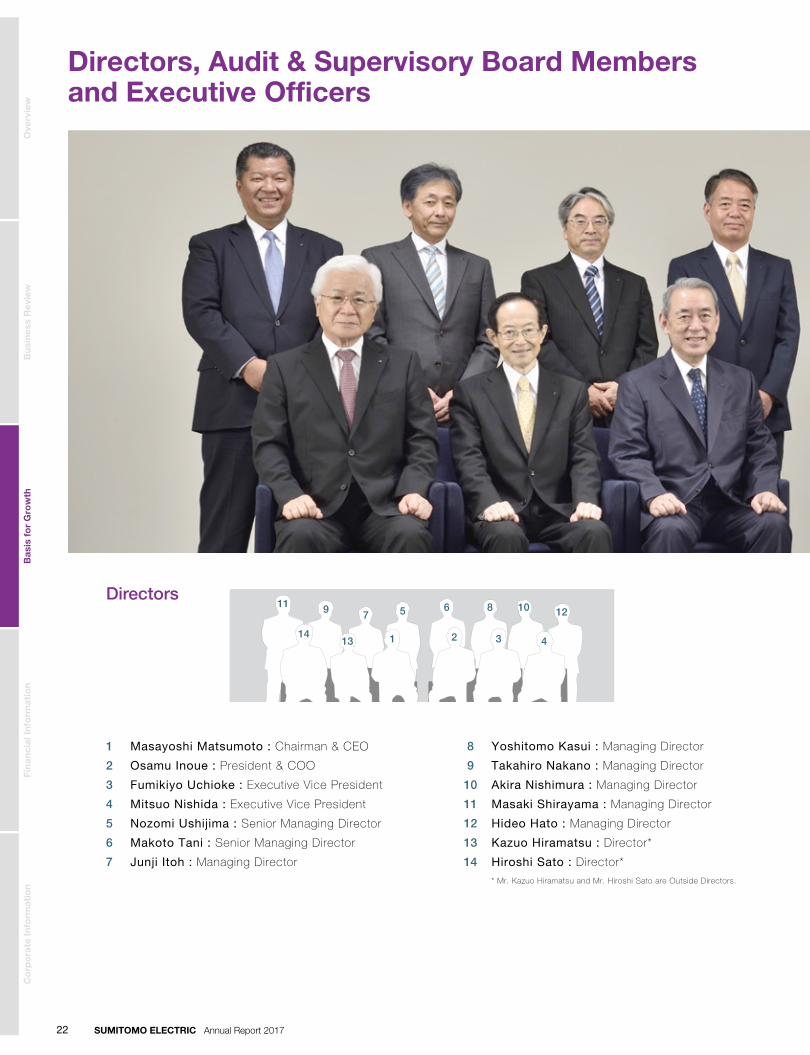
Directors
Masayoshi Matsumoto : Chairman & CEO
Osamu Inoue : President & COO
Fumikiyo Uchioke : Executive Vice President
Mitsuo Nishida : Executive Vice President
Nozomi Ushijima : Senior Managing Director
Makoto Tani : Senior Managing Director
Junji Itoh : Managing Director
1
2
3
4
5
6
7
Yoshitomo Kasui : Managing Director
Takahiro Nakano : Managing Director
Akira Nishimura : Managing Director
Masaki Shirayama : Managing Director
Hideo Hato : Managing Director
Kazuo Hiramatsu : Director*
Hiroshi Sato : Director*
8
9
10
11
12
13
14* Mr. Kazuo Hiramatsu and Mr. Hiroshi Sato are Outside Directors.
Audit & Supervisory Board Members
Satoru Ogura
Akira Hayashi
Kan Hayashi*
Katsuaki Watanabe*
Michiko Uehara*
* Mr. Kan Hayashi, Mr. Katsuaki Watanabe and Ms. Michiko Uehara are Outside Corporate Auditors.
12
1 2 3
107
4
8911
1314
65
Directors, Audit & Supervisory Board Members and Executive Officers
Ove
rvie
wB
usi
nes
s R
evie
wB
asis
fo
r G
row
thF
inan
cial
Info
rmat
ion
Co
rpo
rate
Info
rmat
ion
SUMITOMO ELECTRIC Annual Report 201722
Managing Executive Of�cers
Executive Of�cers
Hiroyasu Torii
Yasuhiro Miyata
Toshiaki Kakii
Tetsuya Hayashi
Kazushi Shimizu
Shigeru Nakajima
Yoshihiro Matsushita
Takafumi Uemiya
Kenichi Urushibata
Masahiro Kobayashi
Yutaka Nishide
Takashi Yoshioka
Kikaku Tokumaru
Saburo Narahashi
Hiroshi Shikata
Hiroshi Iwano
Tomoaki Nagano
Takaaki Yamamoto
Yasuyuki Shibata
Nobuyuki Kobayashi
Hiroshi Kiyokawa
Yoshiyuki Ogata
Soichiro Seki
Hisashi Togawa
Mitsuhiro Goto
Hiroshi Hayami
Yuichi Sano
Toshiyuki Sahashi
Masataka Inoue
Directors
Masayoshi Matsumoto : Chairman & CEO
Osamu Inoue : President & COO
Fumikiyo Uchioke : Executive Vice President
Mitsuo Nishida : Executive Vice President
Nozomi Ushijima : Senior Managing Director
Makoto Tani : Senior Managing Director
Junji Itoh : Managing Director
1
2
3
4
5
6
7
Yoshitomo Kasui : Managing Director
Takahiro Nakano : Managing Director
Akira Nishimura : Managing Director
Masaki Shirayama : Managing Director
Hideo Hato : Managing Director
Kazuo Hiramatsu : Director*
Hiroshi Sato : Director*
8
9
10
11
12
13
14* Mr. Kazuo Hiramatsu and Mr. Hiroshi Sato are Outside Directors.
Audit & Supervisory Board Members
Satoru Ogura
Akira Hayashi
Kan Hayashi*
Katsuaki Watanabe*
Michiko Uehara*
* Mr. Kan Hayashi, Mr. Katsuaki Watanabe and Ms. Michiko Uehara are Outside Corporate Auditors.
12
1 2 3
107
4
8911
1314
65
Directors, Audit & Supervisory Board Members and Executive Officers
Ove
rvie
wB
usi
nes
s R
evie
wB
asis
fo
r G
row
thF
inan
cial
Info
rmat
ion
Co
rpo
rate
Info
rmat
ion
SUMITOMO ELECTRIC Annual Report 2017 23
Corporate GovernanceBasis for Growth
Basic Policy for Corporate Governance
The consistent basic policy of the Sumitomo Electric Group is to
continue to make a positive contribution to society through the
pursuit of fair business practices, aligned with the Sumitomo Spirit
and the Sumitomo Electric Group Corporate Principles. While
maintaining this basic stance, the Group is working to ensure
transparent and fair management based on sound corporate
governance, and to determine and implement innovation-focused
growth strategies that make the most of operational resources,
recognizing that these endeavors are important for both
sustaining growth and increasing corporate value over the
medium to long term.
1. Overview of the Corporate Governance System and Reasons for Adopting It
Sumitomo Electric chose to adopt an Audit & Supervisory Board
system since the roles of such a board and its members under
this system are clearly intended for ensuring sound management.
With the Board of Directors, executive officers, and Audit &
Supervisory Board members clearly specified, the Company
intends to pursue sustainable growth and increase its corporate
value over the medium and long term according to the following
basic principles.
• Under the Audit & Supervisory Board system, the Company’s
Board of Directors is responsible for making decisions on the
execution of business and supervising those operations. To
enable the Board of Directors to make sound decisions on
important matters that could affect the future course of the
Company, and to effectively carry out its supervisory duties,
deliberations on particular matters, such as investments, are
limited to those of high importance. Management decisions are
implemented while placing importance on deliberations on the
medium-term management plan and fiscal year plans, as well
as analysis of the results for each fiscal quarter.
• When carrying out its supervisory duties, the Board of Directors
pays serious attention to the opinions of independent officers,
particularly outside directors, to ensure a more independent and
objective standpoint. To help make the Board of Directors more
effective, the Company established an advisory committee
responsible for decisions regarding the nominations and
remuneration of directors and executive managers, chaired by
an outside director and comprised of a majority of outside
directors.
2. Current Framework for Internal Audits and Audits by Audit & Supervisory Board Members
The Company receives three types of audits—Audit & Supervisory
Board members’ audits, internal audits, and accounting audits—
to ensure the legality and appropriateness of its business
management. In the Audit & Supervisory Board members’ audits,
five Audit & Supervisory Board members, three of whom are
outside auditors, inspect the performance of the Board of
Directors in business execution, supported by the corporate
auditor assistants (the Office of Audit & Supervisory Board
members).
3. Outside Directors and Outside Audit & Supervisory Board Members
Sumitomo Electric has two outside directors for the purpose of
improving the supervisory function of the Board of Directors from
an external standpoint, as well as increasing the transparency and
objectivity of management. To enhance its supervisory system
and ensure that management is conducted appropriately and
within the scope of the law, the Company has three outside Audit
& Supervisory Board members—the majority of its Audit &
Supervisory Board members—with diverse perspectives and
broad areas of expertise.
Outside Directors
Kazuo Hiramatsu
Administrative Trustee, Kwansei GakuinFrom June 2008, Director of the CompanyReasons for election: The high degree of knowledge he has
gained as a university professor in accounting, his main field of
research, as well as his extensive experience in such areas as
university management as president of Kwansei Gakuin University.
Hiroshi Sato
Senior Adviser and Director, Kobe Steel, Ltd.From June 2016, Director of the CompanyReasons for election: His extensive experience and high degree
of knowledge in all aspects of corporate management derived
from his involvement with a company engaged in a range of
business domains, including materials (primarily steel), machinery
and energy.
Ove
rvie
wB
usi
nes
s R
evie
wB
asis
fo
r G
row
thF
inan
cial
Info
rmat
ion
Co
rpo
rate
Info
rmat
ion
SUMITOMO ELECTRIC Annual Report 201724

Audit
Audit
AccountingAudit
Sumitomo Electric Group’s Corporate Governance Structure
General Meeting of Shareholders
Risk Management Committee
Corporate Environment Committee
Compliance Committee
CSR Committee
Information Management Committee
Af�liates in Japan and OverseasProduction Units
Af�liates in Japan and OverseasR&D Unit
Af�liates in Japan and Overseas
Audit & Supervisory Board
Members
Audit & Supervisory Board
PresidentManagementConference
Corporate StaffGroup
AccountingAuditors
Internal AuditingDepartment
Board of Directors
Sales Units
Appointment / Dismissal
Cooperation
Cross-Sectional Risk Management Activity, etc.
Ove
rvie
wB
usi
nes
s R
evie
wB
asis
fo
r G
row
thF
inan
cial
Info
rmat
ion
Co
rpo
rate
Info
rmat
ion
SUMITOMO ELECTRIC Annual Report 2017 25

Corporate GovernanceBasis for Growth
Outside Audit & Supervisory Board Members
Kan Hayashi
Until June 2010, CEO of PricewaterhouseCoopers Tax JapanFrom June 2010, Audit & Supervisory Board Member of the CompanyReasons for election: His specialized knowledge and experience
as a certified public accountant and licensed tax accountant,
which covers the field of international taxation, in addition to his
deep insight into the global business activities of companies that
he accumulated during his practice, including corporate
acquisitions and restructuring, as well as when he lived overseas.
Katsuaki Watanabe
Advisor, Toyota Motor CorporationFrom June 2013, Audit & Supervisory Board Member of the CompanyReasons for election: His extensive experience and high degree
of knowledge of all aspects of corporate management derived
from his involvement over many years with a company that
expanded its business activities globally.
Michiko Uehara
Attorney at LawFrom June 2016, Audit & Supervisory Board Member of the CompanyReasons for election: Her extensive experience and high degree
of knowledge in relation to corporate law, including compliance,
derived from her work in the judicial system as a judge and
attorney.
The Sumitomo Electric Corporate Governance Guidelines are
available online:
http://global-sei.com/company/governance.html
Ove
rvie
wB
usi
nes
s R
evie
wB
asis
fo
r G
row
thF
inan
cial
Info
rmat
ion
Co
rpo
rate
Info
rmat
ion
SUMITOMO ELECTRIC Annual Report 201726
ComplianceBasis for Growth
Basic Stance on Compliance
Compliance with laws and regulations and maintenance of our
corporate eth ics form the core of Sumitomo Electr ic ’s
management and are part of our social responsibility. At the same
time, they are the absolute foundation of the Company’s
continued existence and development. For this reason, we have
long operated a compliance system. Since the Japan Fair Trade
Commission gave Sumitomo Electric a cease and desist warning
based on the Antimonopoly Act in February 2003, the Company
has made every effort to strengthen the compliance system.
Compliance Committee
The Sumitomo Electric Group established the Compliance
Committee, chaired by the president, as an organization that
promotes measures necessary to develop and further strengthen
its compliance system. The committee engages in various
activities, including preparing and distributing the Sumitomo
Electric Group Compliance Manual and organizing compliance
training seminars. In addition, the committee identifies and
analyzes group-wide compliance risks, disseminates preventive
measures and monitors compliance activities implemented by
each division and subsidiary.
Initiatives to Deepen Awareness of Compliance
1. Compliance ManualThe Company’s Compliance Manual is a reference work with real-
life examples showing employees how to behave in a socially
acceptable way from a legal and ethical perspective. The manual
is distributed not only to Sumitomo Electric employees but also to
employees of group companies in Japan.
2. Compliance EducationTo check compliance risks, ensure implementation of preventive
measures, as well as enhance and spread awareness of
compliance, the Compliance Committee organizes regular training
seminars for all officers and managers every year. New employees
and newly promoted personnel are also provided with training
seminars. At overseas consolidated subsidiaries, a business code
of conduct in line with local laws is being introduced along with
compliance training.
3. Speak-Up SystemOffices have been established both in Sumitomo Electric and
outside legal offices to enable employees of group companies
and other parties to raise matters of concern to attention, allowing
the Company to discover compliance problems and to correct
them. Information offered in this way is quickly investigated by the
Compliance Committee, which then takes appropriate measures.
The Speak-Up System is publicized monthly in the Company’s
internal newsletter.
4. Competition Law Compliance SystemThe Competition Law Compliance Office has been set up within
the Corporate Staff Group to investigate suspicious behavior
involving the Group, including cartels and bid rigging, as well as to
implement compliance education based on the Competition Law.
In partnership with dedicated organizations within each business
unit, or with the Competition Law Compliance promotion leaders,
this office manages and monitors the state of compliance based
on the Competition Law Compliance Action Guidelines, including
rules restricting contact with competitors in the same industry.
Ove
rvie
wB
usi
nes
s R
evie
wB
asis
fo
r G
row
thF
inan
cial
Info
rmat
ion
Co
rpo
rate
Info
rmat
ion
SUMITOMO ELECTRIC Annual Report 2017 27
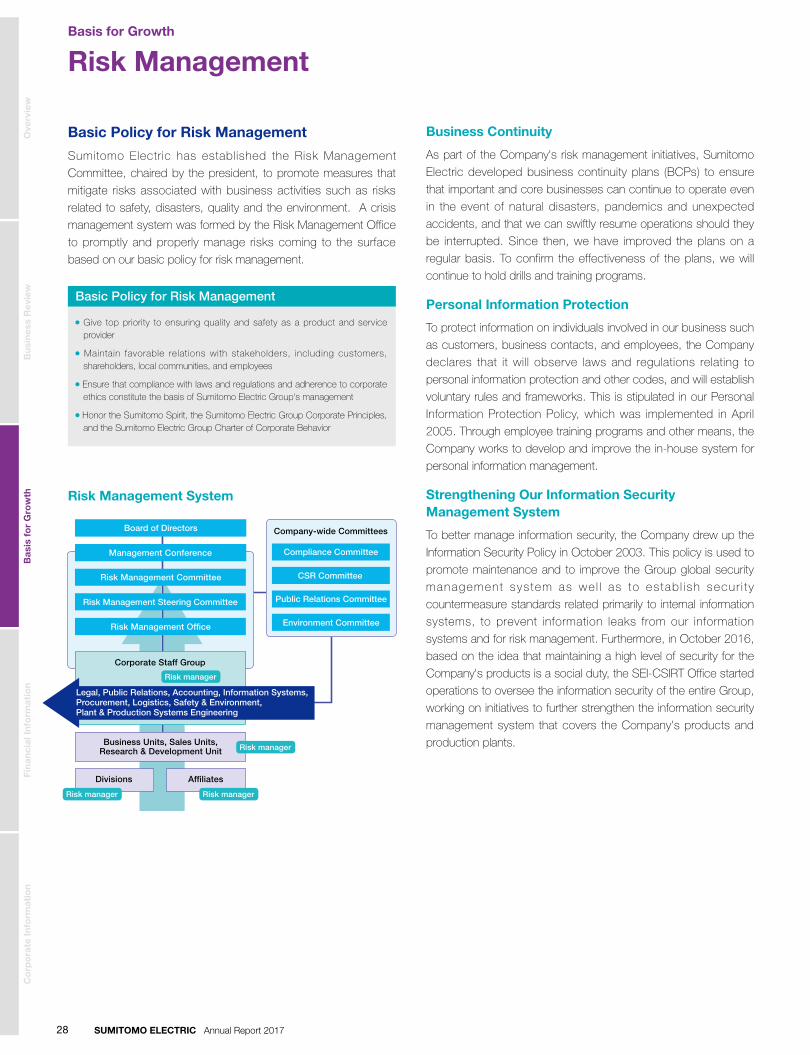
Risk ManagementBasis for Growth
Risk Management System
Company-wide Committees
Corporate Staff Group
Business Units, Sales Units,Research & Development Unit
Divisions Af�liates
Risk manager
Risk manager
Risk manager Risk manager
Risk Management Committee
Risk Management Of�ce
Risk Management Steering Committee
Management Conference
Board of Directors
Compliance Committee
Public Relations Committee
Environment Committee
CSR Committee
Legal, Public Relations, Accounting, Information Systems,Procurement, Logistics, Safety & Environment, Plant & Production Systems Engineering
Basic Policy for Risk Management
Sumitomo Electric has established the Risk Management
Committee, chaired by the president, to promote measures that
mitigate risks associated with business activities such as risks
related to safety, disasters, quality and the environment. A crisis
management system was formed by the Risk Management Office
to promptly and properly manage risks coming to the surface
based on our basic policy for risk management.
Business Continuity
As part of the Company's risk management initiatives, Sumitomo
Electric developed business continuity plans (BCPs) to ensure
that important and core businesses can continue to operate even
in the event of natural disasters, pandemics and unexpected
accidents, and that we can swiftly resume operations should they
be interrupted. Since then, we have improved the plans on a
regular basis. To confirm the effectiveness of the plans, we will
continue to hold drills and training programs.
Personal Information Protection
To protect information on individuals involved in our business such
as customers, business contacts, and employees, the Company
declares that it will observe laws and regulations relating to
personal information protection and other codes, and will establish
voluntary rules and frameworks. This is stipulated in our Personal
Information Protection Policy, which was implemented in April
2005. Through employee training programs and other means, the
Company works to develop and improve the in-house system for
personal information management.
Strengthening Our Information Security Management System
To better manage information security, the Company drew up the
Information Security Policy in October 2003. This policy is used to
promote maintenance and to improve the Group global security
management system as we l l as to estab l ish secur i ty
countermeasure standards related primarily to internal information
systems, to prevent information leaks from our information
systems and for risk management. Furthermore, in October 2016,
based on the idea that maintaining a high level of security for the
Company's products is a social duty, the SEI-CSIRT Office started
operations to oversee the information security of the entire Group,
working on initiatives to further strengthen the information security
management system that covers the Company's products and
production plants.
Risk Management System
Give top priority to ensuring quality and safety as a product and service provider
Maintain favorable relations with stakeholders, including customers, shareholders, local communities, and employees
Ensure that compliance with laws and regulations and adherence to corporate ethics constitute the basis of Sumitomo Electric Group's management
Honor the Sumitomo Spirit, the Sumitomo Electric Group Corporate Principles, and the Sumitomo Electric Group Charter of Corporate Behavior
Basic Policy for Risk Management
Ove
rvie
wB
usi
nes
s R
evie
wB
asis
fo
r G
row
thF
inan
cial
Info
rmat
ion
Co
rpo
rate
Info
rmat
ion
SUMITOMO ELECTRIC Annual Report 201728
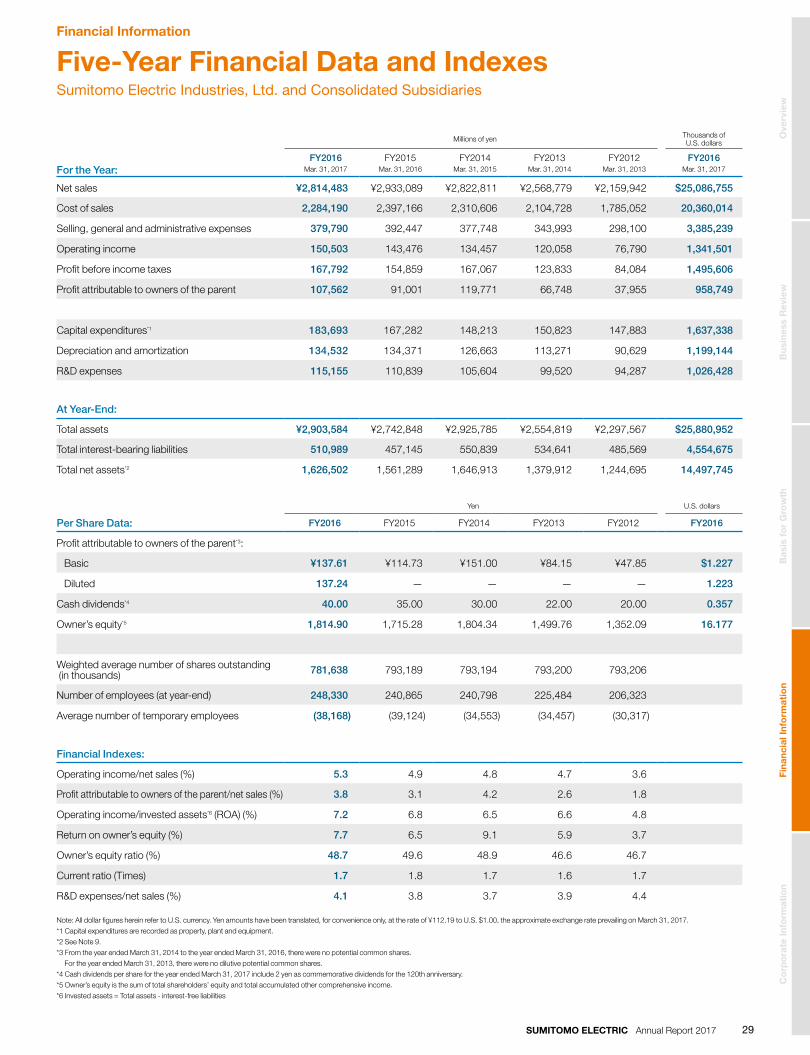
Five-Year Financial Data and IndexesSumitomo Electric Industries, Ltd. and Consolidated Subsidiaries
Financial Information
Note: All dollar figures herein refer to U.S. currency. Yen amounts have been translated, for convenience only, at the rate of ¥112.19 to U.S. $1.00, the approximate exchange rate prevailing on March 31, 2017.*1 Capital expenditures are recorded as property, plant and equipment.*2 See Note 9.*3 From the year ended March 31, 2014 to the year ended March 31, 2016, there were no potential common shares.
For the year ended March 31, 2013, there were no dilutive potential common shares.*4 Cash dividends per share for the year ended March 31, 2017 include 2 yen as commemorative dividends for the 120th anniversary.*5 Owner’s equity is the sum of total shareholders’ equity and total accumulated other comprehensive income.*6 Invested assets = Total assets - interest-free liabilities
Millions of yen Thousands of U.S. dollars
For the Year:FY2016
Mar. 31, 2017FY2015
Mar. 31, 2016FY2014
Mar. 31, 2015FY2013
Mar. 31, 2014FY2012
Mar. 31, 2013FY2016
Mar. 31, 2017
Net sales ¥2,814,483 ¥2,933,089 ¥2,822,811 ¥2,568,779 ¥2,159,942 $25,086,755
Cost of sales 2,284,190 2,397,166 2,310,606 2,104,728 1,785,052 20,360,014
Selling, general and administrative expenses 379,790 392,447 377,748 343,993 298,100 3,385,239
Operating income 150,503 143,476 134,457 120,058 76,790 1,341,501
Profit before income taxes 167,792 154,859 167,067 123,833 84,084 1,495,606
Profit attributable to owners of the parent 107,562 91,001 119,771 66,748 37,955 958,749
Capital expenditures*1 183,693 167,282 148,213 150,823 147,883 1,637,338
Depreciation and amortization 134,532 134,371 126,663 113,271 90,629 1,199,144
R&D expenses 115,155 110,839 105,604 99,520 94,287 1,026,428
At Year-End:
Total assets ¥2,903,584 ¥2,742,848 ¥2,925,785 ¥2,554,819 ¥2,297,567 $25,880,952
Total interest-bearing liabilities 510,989 457,145 550,839 534,641 485,569 4,554,675
Total net assets*2 1,626,502 1,561,289 1,646,913 1,379,912 1,244,695 14,497,745
Yen U.S. dollars
Per Share Data: FY2016 FY2015 FY2014 FY2013 FY2012 FY2016
Profit attributable to owners of the parent*3:
Basic ¥137.61 ¥114.73 ¥151.00 ¥84.15 ¥47.85 $1.227
Diluted 137.24 — — — — 1.223
Cash dividends*4 40.00 35.00 30.00 22.00 20.00 0.357
Owner’s equity*5 1,814.90 1,715.28 1,804.34 1,499.76 1,352.09 16.177
Weighted average number of shares outstanding (in thousands) 781,638 793,189 793,194 793,200 793,206
Number of employees (at year-end) 248,330 240,865 240,798 225,484 206,323
Average number of temporary employees (38,168) (39,124) (34,553) (34,457) (30,317)
Financial Indexes:
Operating income/net sales (%) 5.3 4.9 4.8 4.7 3.6
Profit attributable to owners of the parent/net sales (%) 3.8 3.1 4.2 2.6 1.8
Operating income/invested assets*6 (ROA) (%) 7.2 6.8 6.5 6.6 4.8
Return on owner’s equity (%) 7.7 6.5 9.1 5.9 3.7
Owner’s equity ratio (%) 48.7 49.6 48.9 46.6 46.7
Current ratio (Times) 1.7 1.8 1.7 1.6 1.7
R&D expenses/net sales (%) 4.1 3.8 3.7 3.9 4.4
Ove
rvie
wB
usi
nes
s R
evie
wB
asis
fo
r G
row
thF
inan
cial
Info
rmat
ion
Co
rpo
rate
Info
rmat
ion
SUMITOMO ELECTRIC Annual Report 2017 29

Business Conditions in FY2016
In the 2016 consolidated fiscal year ended on March 31, 2017,
the overall trend of a moderate recovery in the global economy
continued. However, due to increased unpredictability — caused
by factors such as the decision of the UK to leave the EU, a new
administration in the US, and the impact of slowing growth in
emerging economies — concern grew over uncertainty for the
future. Also, the Japanese economy came to a standstill due to
low consumer spending.
Review of Operations in FY2016
For the business environment surrounding us, demand grew
strongly for automotive wiring harnesses, optical fiber cables, and
optical and electronic devices, primarily in overseas markets. On the
other hand, demand fell for flexible printed circuits (FPCs) used in
mobile devices, and there was a significant impact from the strong
yen and falling copper prices, leading to challenging circumstances
for our operations. Against this backdrop, consolidated net sales for
FY2016 came in at ¥2,814.5 billion (a decrease of 4.0% from
¥2,933.1 billion in FY2015), a relative decline from the previous
fiscal year. For profits, however, we pushed ahead with worldwide
cost reduction initiatives, new product development, and sales
expansion programs. As a result, operating income came to ¥150.5
billion (an increase of 4.9% over ¥143.5 billion in FY2015). Profit
attributable to owners of the parent was ¥107.6 billion, rising 18.2%
from ¥91.0 billion in FY2015. Consequently, every profit category
posted a year-on-year increase.
Segment InformationAutomotive
Sales volumes rose overseas, particularly in China, due to our
worldwide initiatives to capture demand for wiring harnesses,
automotive electronic parts, and anti-vibration rubber to be used
in new models. On the other hand, net sales were affected by the
strong yen and a drop in copper prices, falling by ¥28.8 billion
(1.9%) to ¥1,513.2 billion. Operating income came in at ¥98.6
billion, rising ¥10.0 billion year on year owing to progress made in
reducing costs at production bases around the world, which
offset the impact of the strong yen. The operating income margin
improved by 0.8 percentage points to 6.5%.
Infocommunications
Although this segment was affected by the strong yen, demand
for optical fiber cables and optical and electronic devices grew
primarily in overseas markets, including China and the US, leading
to net sales of ¥198.2 billion, an increase of ¥13.6 billion (7.3%)
year on year. Operating income was ¥21.5 billion. In addition to
rising demand, profits grew from capitalizing on the demand for
optical fibers used in data centers, and further cost cutting led to
an increase in profits of ¥9.6 billion. The operating income margin
improved by 4.4 percentage points to 10.8%.
ElectronicsAlthough sales of electronic wires increased as a result of
developing new sources for sales, demand declined for FPCs for
mobile devices. FPC sales volume fell due to delays in beginning
production of new products, intensified price competition, and the
strong yen. As a result, net sales were ¥251.1 billion, down ¥60.9
billion (19.5%) year on year. The operating loss was ¥10.9 billion,
a sharp fall of ¥21.1 billion.
Operating Income /Operating Income Ratio
(FY)2016
2,814
(Billions of yen)
Net Sales
2012 2013 2014
2,569
2,160
2,823
2015
2,933
(FY)
(Billions of yen / %)
(FY)
Operating IncomeOperating Income Ratio
Pro�t Attributable to Owners of the Parent /Return on Owner’s Equity(Billions of yen / %)
Pro�t Attributable to Owners of the ParentReturn on Owner’s Equity
Invested Assets / ROA
(FY)
(Billions of yen / %)
(FY)
Invested AssetsROA
Capital Expenditures /Depreciation and Amortization(Billions of yen)
Capital ExpendituresDepreciation and Amortization
Overseas Sales /Overseas Sales Ratio
(FY)
(Billions of yen / %)
Overseas SalesOverseas Sales Ratio
135
184
2016
127113
91
148 151 148
2012 2013 2014
134
167
20152016
2,137
7.2
2012 2013 2014
1,9151,730
2,1984.8
6.6 6.5
2015
2,018
6.8
2016
151
5.3
2016
1,654
58.8
2012 2013 2014
1,417
1,049
1,64748.6
55.258.3
2015
1,746
59.5
2016
108
7.7
2012 2013 2014
120
77
1343.6
4.7 4.8
2015
143
4.9
2012 2013 2014
67
38
3.7
5.9
9.1
2015
91
6.5
120
Management’s Discussion and AnalysisFinancial Information
Ove
rvie
wB
usi
nes
s R
evie
wB
asis
fo
r G
row
thF
inan
cial
Info
rmat
ion
Co
rpo
rate
Info
rmat
ion
SUMITOMO ELECTRIC Annual Report 201730
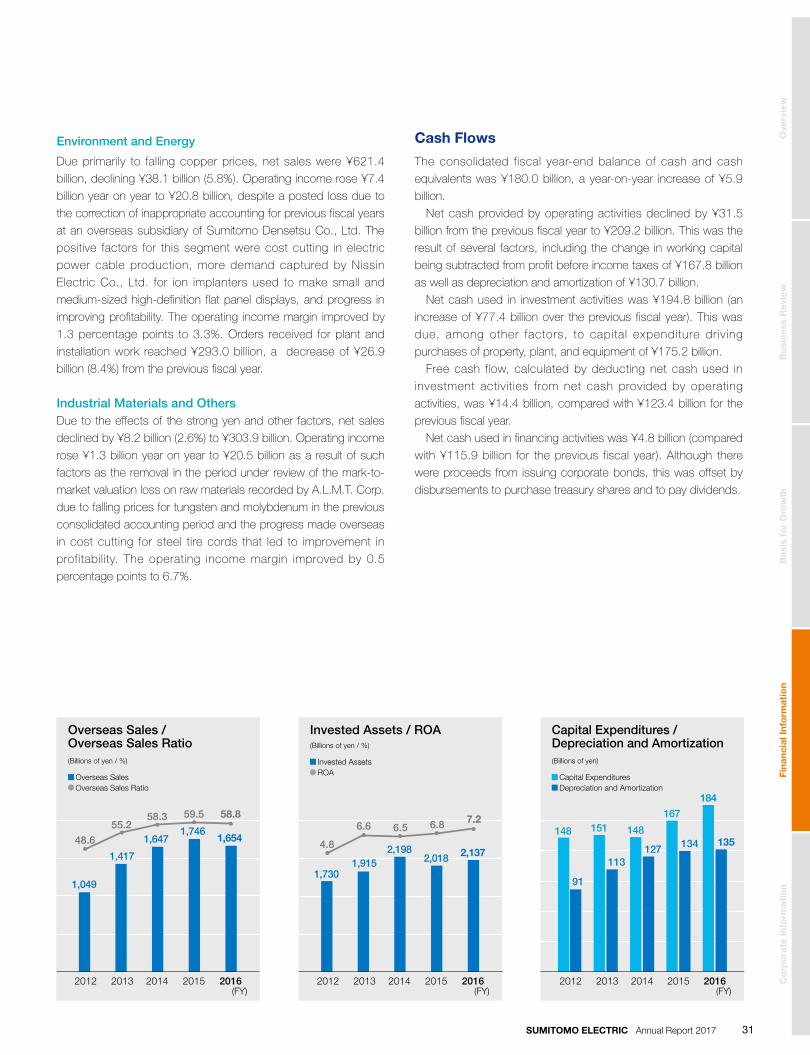
Environment and Energy
Due primarily to falling copper prices, net sales were ¥621.4
billion, declining ¥38.1 billion (5.8%). Operating income rose ¥7.4
billion year on year to ¥20.8 billion, despite a posted loss due to
the correction of inappropriate accounting for previous fiscal years
at an overseas subsidiary of Sumitomo Densetsu Co., Ltd. The
positive factors for this segment were cost cutting in electric
power cable production, more demand captured by Nissin
Electric Co., Ltd. for ion implanters used to make small and
medium-sized high-definition flat panel displays, and progress in
improving profitability. The operating income margin improved by
1.3 percentage points to 3.3%. Orders received for plant and
installation work reached ¥293.0 billion, a decrease of ¥26.9
billion (8.4%) from the previous fiscal year.
Industrial Materials and OthersDue to the effects of the strong yen and other factors, net sales
declined by ¥8.2 billion (2.6%) to ¥303.9 billion. Operating income
rose ¥1.3 billion year on year to ¥20.5 billion as a result of such
factors as the removal in the period under review of the mark-to-
market valuation loss on raw materials recorded by A.L.M.T. Corp.
due to falling prices for tungsten and molybdenum in the previous
consolidated accounting period and the progress made overseas
in cost cutting for steel tire cords that led to improvement in
profitability. The operating income margin improved by 0.5
percentage points to 6.7%.
Cash Flows
The consolidated fiscal year-end balance of cash and cash
equivalents was ¥180.0 billion, a year-on-year increase of ¥5.9
billion.
Net cash provided by operating activities declined by ¥31.5
billion from the previous fiscal year to ¥209.2 billion. This was the
result of several factors, including the change in working capital
being subtracted from profit before income taxes of ¥167.8 billion
as well as depreciation and amortization of ¥130.7 billion.
Net cash used in investment activities was ¥194.8 billion (an
increase of ¥77.4 billion over the previous fiscal year). This was
due, among other factors, to capital expenditure driving
purchases of property, plant, and equipment of ¥175.2 billion.
Free cash flow, calculated by deducting net cash used in
investment activities from net cash provided by operating
activities, was ¥14.4 billion, compared with ¥123.4 billion for the
previous fiscal year.
Net cash used in financing activities was ¥4.8 billion (compared
with ¥115.9 billion for the previous fiscal year). Although there
were proceeds from issuing corporate bonds, this was offset by
disbursements to purchase treasury shares and to pay dividends.
Operating Income /Operating Income Ratio
(FY)2016
2,814
(Billions of yen)
Net Sales
2012 2013 2014
2,569
2,160
2,823
2015
2,933
(FY)
(Billions of yen / %)
(FY)
Operating IncomeOperating Income Ratio
Pro�t Attributable to Owners of the Parent /Return on Owner’s Equity(Billions of yen / %)
Pro�t Attributable to Owners of the ParentReturn on Owner’s Equity
Invested Assets / ROA
(FY)
(Billions of yen / %)
(FY)
Invested AssetsROA
Capital Expenditures /Depreciation and Amortization(Billions of yen)
Capital ExpendituresDepreciation and Amortization
Overseas Sales /Overseas Sales Ratio
(FY)
(Billions of yen / %)
Overseas SalesOverseas Sales Ratio
135
184
2016
127113
91
148 151 148
2012 2013 2014
134
167
20152016
2,137
7.2
2012 2013 2014
1,9151,730
2,1984.8
6.6 6.5
2015
2,018
6.8
2016
151
5.3
2016
1,654
58.8
2012 2013 2014
1,417
1,049
1,64748.6
55.258.3
2015
1,746
59.5
2016
108
7.7
2012 2013 2014
120
77
1343.6
4.7 4.8
2015
143
4.9
2012 2013 2014
67
38
3.7
5.9
9.1
2015
91
6.5
120
Ove
rvie
wB
usi
nes
s R
evie
wB
asis
fo
r G
row
thF
inan
cial
Info
rmat
ion
Co
rpo
rate
Info
rmat
ion
SUMITOMO ELECTRIC Annual Report 2017 31

Consolidated Balance SheetsSUMITOMO ELECTRIC INDUSTRIES, LTD. AND CONSOLIDATED SUBSIDIARIES
Millions of yen Thousands of U.S. dollars
(Note 1)
FY2016 FY2015 FY2016 As of March 31, 2017 March 31, 2016 March 31, 2017
ASSETS
Current Assets:
Cash and time deposits (Notes 3 and 4) ¥ 180,034 ¥ 174,686 $1,604,724 Trade notes and accounts receivable (Note 4) 648,411 622,944 5,779,579 Securities (Notes 3, 4 and 5) 792 57 7,059
Inventories (Note 7) 449,070 422,976 4,002,763
Deferred tax assets (Note 12) 49,734 48,764 443,302 Other current assets 101,245 91,359 902,442 Allowance for doubtful receivables (2,733) (3,590) (24,360)
Total current assets 1,426,553 1,357,196 12,715,509
Non-Current Assets:
Property, Plant and Equipment (Note 8):
Buildings and structures 644,054 620,088 5,740,743 Machinery, equipment and others 1,604,321 1,511,016 14,300,036 Land 87,904 87,512 783,528 Construction in progress 46,813 48,505 417,265 2,383,092 2,267,121 21,241,572 Accumulated depreciation (1,559,907) (1,487,001) (13,904,153)
Net property, plant and equipment 823,185 780,120 7,337,419
Intangible Assets 54,316 51,733 484,143
Investments and Other Assets:
Investments in unconsolidated subsidiaries and affiliates (Note 4)
283,540 264,986 2,527,320
Investment securities (Notes 4 and 5) 153,792 155,773 1,370,817 Net defined benefit assets (Note 13) 98,739 75,728 880,105 Deferred tax assets (Note 12) 19,680 17,829 175,417 Other 46,219 40,911 411,971 Allowance for doubtful receivables (2,440) (1,428) (21,749)
Total investments and other assets 599,530 553,799 5,343,881 Total non-current assets 1,477,031 1,385,652 13,165,443
Total assets ¥2,903,584 ¥2,742,848 $25,880,952 The accompanying notes to consolidated financial statements are an integral part of these statements.
- 3 -
Ove
rvie
wB
usi
nes
s R
evie
wB
asis
fo
r G
row
thF
inan
cial
Info
rmat
ion
Co
rpo
rate
Info
rmat
ion
SUMITOMO ELECTRIC Annual Report 201732
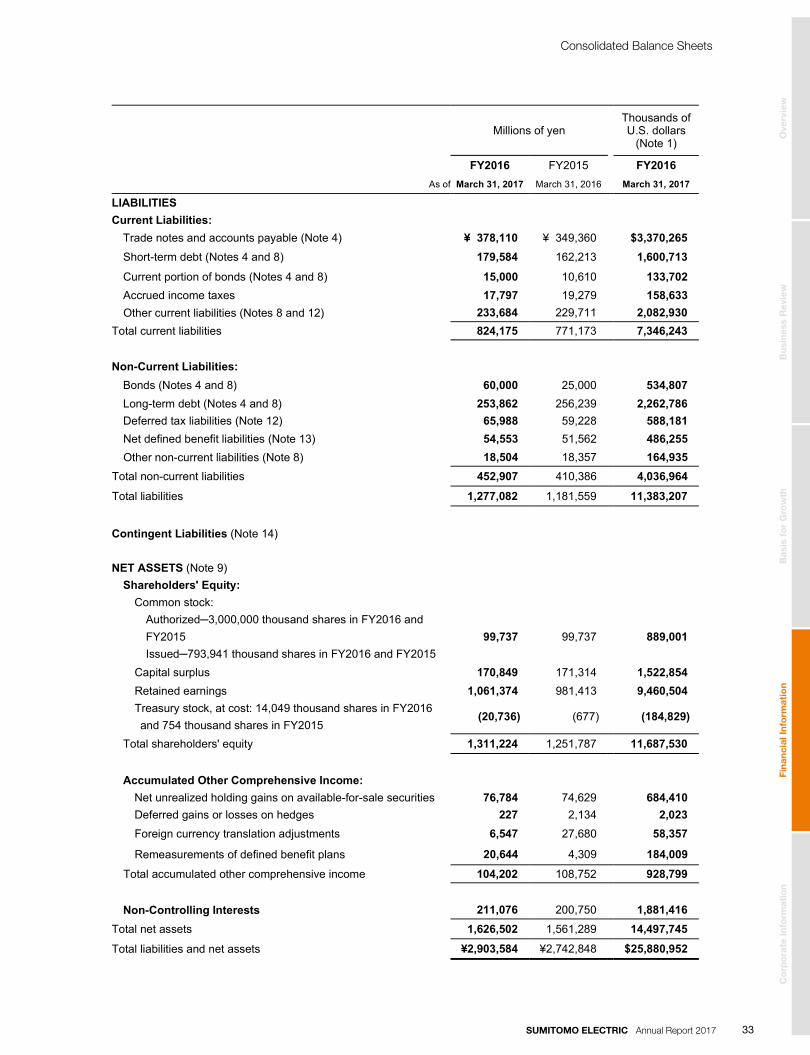
Millions of yen Thousands of U.S. dollars
(Note 1)
FY2016 FY2015 FY2016 As of March 31, 2017 March 31, 2016 March 31, 2017
LIABILITIES
Current Liabilities:
Trade notes and accounts payable (Note 4) ¥ 378,110 ¥ 349,360 $3,370,265 Short-term debt (Notes 4 and 8) 179,584 162,213 1,600,713
Current portion of bonds (Notes 4 and 8) 15,000 10,610 133,702 Accrued income taxes 17,797 19,279 158,633 Other current liabilities (Notes 8 and 12) 233,684 229,711 2,082,930
Total current liabilities 824,175 771,173 7,346,243
Non-Current Liabilities:
Bonds (Notes 4 and 8) 60,000 25,000 534,807 Long-term debt (Notes 4 and 8) 253,862 256,239 2,262,786 Deferred tax liabilities (Note 12) 65,988 59,228 588,181 Net defined benefit liabilities (Note 13) 54,553 51,562 486,255 Other non-current liabilities (Note 8) 18,504 18,357 164,935
Total non-current liabilities 452,907 410,386 4,036,964
Total liabilities 1,277,082 1,181,559 11,383,207
Contingent Liabilities (Note 14)
NET ASSETS (Note 9)
Shareholders' Equity:
Common stock:
Authorized─3,000,000 thousand shares in FY2016 and FY2015 Issued─793,941 thousand shares in FY2016 and FY2015
99,737 99,737 889,001
Capital surplus 170,849 171,314 1,522,854 Retained earnings 1,061,374 981,413 9,460,504 Treasury stock, at cost: 14,049 thousand shares in FY2016 and 754 thousand shares in FY2015
(20,736) (677) (184,829)
Total shareholders' equity 1,311,224 1,251,787 11,687,530
Accumulated Other Comprehensive Income:
Net unrealized holding gains on available-for-sale securities 76,784 74,629 684,410 Deferred gains or losses on hedges 227 2,134 2,023 Foreign currency translation adjustments 6,547 27,680 58,357
Remeasurements of defined benefit plans 20,644 4,309 184,009 Total accumulated other comprehensive income 104,202 108,752 928,799
Non-Controlling Interests 211,076 200,750 1,881,416 Total net assets 1,626,502 1,561,289 14,497,745
Total liabilities and net assets ¥2,903,584 ¥2,742,848 $25,880,952
- 4 -
Consolidated Balance Sheets
Ove
rvie
wB
usi
nes
s R
evie
wB
asis
fo
r G
row
thF
inan
cial
Info
rmat
ion
Co
rpo
rate
Info
rmat
ion
SUMITOMO ELECTRIC Annual Report 2017 33

Consolidated Statements of IncomeSUMITOMO ELECTRIC INDUSTRIES, LTD. AND CONSOLIDATED SUBSIDIARIES
Millions of yen Thousands of U.S. dollars
(Note 1)
FY2016 FY2015 FY2016 For the years ended March 31, 2017 March 31, 2016 March 31, 2017
Net Sales ¥2,814,483 ¥2,933,089 $25,086,755 Cost of Sales 2,284,190 2,397,166 20,360,014
Gross profit 530,293 535,923 4,726,740 Selling, General and Administrative Expenses 379,790 392,447 3,385,239
Operating income 150,503 143,476 1,341,501
Other Income (Expenses):
Interest and dividend income 4,833 5,271 43,079 Interest expenses (4,831) (5,271) (43,061) Share of profit of investments accounted for using the equity method
28,200 29,645 251,359
Gain on sales of investment securities 14,432 32,186 128,639 Foreign exchange losses ー (3,907) ー
Loss on disposal of property, plant and equipment (4,331) (3,275) (38,604) Impairment loss on fixed assets (Notes 15 and 16) ー (12,479) ー
Restructuring expenses (Note 16) (6,046) (6,046) (53,891) Special transportation expenses (Note 17) ー (524) ー
Settlement package (10,135) (20,661) (90,338) Other, net (4,833) (3,556) (43,079)
17,289 11,383 154,105 Profit before Income Taxes 167,792 154,859 1,495,606 Income Taxes (Note 12):
Current 39,068 50,002 348,231 Deferred 2,379 (176) 21,205
41,447 49,826 369,436
Profit for the year 126,345 105,033 1,126,170
Profit Attributable to Non-Controlling Interests (18,783) (14,032) (167,421)
Profit Attributable to Owners of the Parent ¥ 107,562 ¥ 91,001 $ 958,749
Yen U.S. dollars
(Note 1)
Per Share of Common Stock (Note 10):
Basic ¥137.61 ¥114.73 $1.227 Diluted 137.24 ー 1.223 Cash dividends 40.00 35.00 0.357
The accompanying notes to consolidated financial statements are an integral part of these statements.
- 5 -
Ove
rvie
wB
usi
nes
s R
evie
wB
asis
fo
r G
row
thF
inan
cial
Info
rmat
ion
Co
rpo
rate
Info
rmat
ion
SUMITOMO ELECTRIC Annual Report 201734
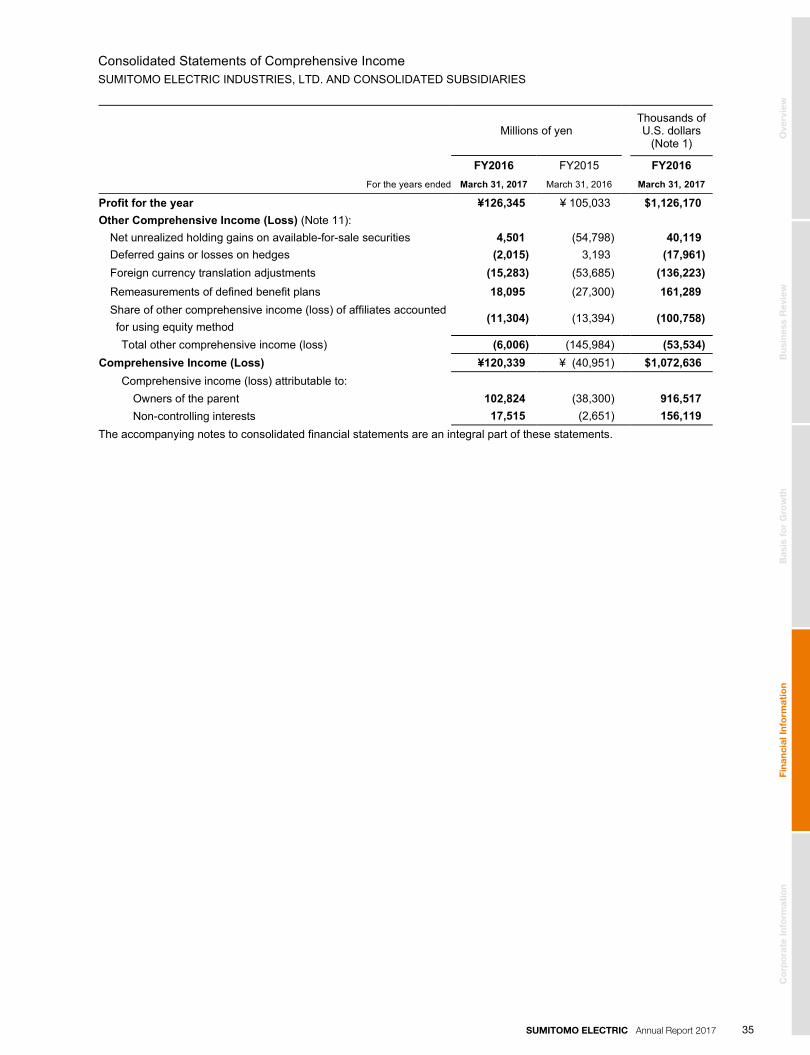
Consolidated Statements of Comprehensive IncomeSUMITOMO ELECTRIC INDUSTRIES, LTD. AND CONSOLIDATED SUBSIDIARIES
Millions of yen Thousands of U.S. dollars
(Note 1)
FY2016 FY2015 FY2016 For the years ended March 31, 2017 March 31, 2016 March 31, 2017
Profit for the year ¥126,345 ¥ 105,033 $1,126,170 Other Comprehensive Income (Loss) (Note 11):
Net unrealized holding gains on available-for-sale securities 4,501 (54,798) 40,119 Deferred gains or losses on hedges (2,015) 3,193 (17,961) Foreign currency translation adjustments (15,283) (53,685) (136,223) Remeasurements of defined benefit plans 18,095 (27,300) 161,289 Share of other comprehensive income (loss) of affiliates accounted for using equity method
(11,304) (13,394) (100,758)
Total other comprehensive income (loss) (6,006) (145,984) (53,534) Comprehensive Income (Loss) ¥120,339 ¥ (40,951) $1,072,636
Comprehensive income (loss) attributable to:
Owners of the parent 102,824 (38,300) 916,517 Non-controlling interests 17,515 (2,651) 156,119
The accompanying notes to consolidated financial statements are an integral part of these statements.
- 6 -
Ove
rvie
wB
usi
nes
s R
evie
wB
asis
fo
r G
row
thF
inan
cial
Info
rmat
ion
Co
rpo
rate
Info
rmat
ion
SUMITOMO ELECTRIC Annual Report 2017 35

Consolidated Statements of Changes in Net AssetsSUMITOMO ELECTRIC INDUSTRIES, LTD. AND CONSOLIDATED SUBSIDIARIES
Millions of yen
Shareholders' Equity Accumulated Other Comprehensive Income
Common stock
Capital surplus
Retained earnings
Treasury stock
Net unrealized holding gains on available-
for-sale securities
Deferred gains or losses on
hedges
Foreign currency
translation adjustments
Remeasure- ments of
defined benefit plans
Non-controlling interests
Total net assets (Note 9)
Balance at Beginning of FY2015 ¥99,737 ¥171,020 ¥920,850 ¥(667) ¥127,416 ¥ (838) ¥88,444 ¥25,224 ¥215,727 ¥1,646,913
Cash dividends (27,767) (27,767)
Profit attributable to owners of the parent for the year 91,001 91,001
Purchases of treasury stock (10) (10)
Disposal of treasury stock 0 0 0
Effect arising from net change in scope of consolidation
(61) (61)
Change in ownership interests arising from transactions with non-controlling shareholders
294 294
Other (Note 9) (2,610) (52,787) 2,972 (60,764) (20,915) (14,977) (149,081)
Balance at End of FY2015 ¥99,737 ¥171,314 ¥981,413 ¥(677) ¥ 74,629 ¥2,134 ¥27,680 ¥ 4,309 ¥200,750 ¥1,561,289
Balance at Beginning of FY2016 ¥99,737 ¥171,314 ¥ 981,413 ¥(677) ¥ 74,629 ¥2,134 ¥27,680 ¥ 4,309 ¥200,750 ¥1,561,289
Cash dividends (27,541) (27,541)
Profit attributable to owners of the parent for the year 107,562 107,562
Purchases of treasury stock (20,059) (20,059)
Disposal of treasury stock 0 0 0
Effect arising from net change in scope of consolidation
(60) (60)
Change in ownership interests arising from transactions with non-controlling shareholders
(465) (465)
Other 2,155 (1,907) (21,133) 16,335 10,326 5,776
Balance at End of FY2016 ¥99,737 ¥170,849 ¥1,061,374 ¥(20,736) ¥76,784 ¥ 227 ¥ 6,547 ¥20,644 ¥211,076 ¥1,626,502
The accompanying notes to consolidated financial statements are an integral part of these statements.
- 7 -
Ove
rvie
wB
usi
nes
s R
evie
wB
asis
fo
r G
row
thF
inan
cial
Info
rmat
ion
Co
rpo
rate
Info
rmat
ion
SUMITOMO ELECTRIC Annual Report 201736
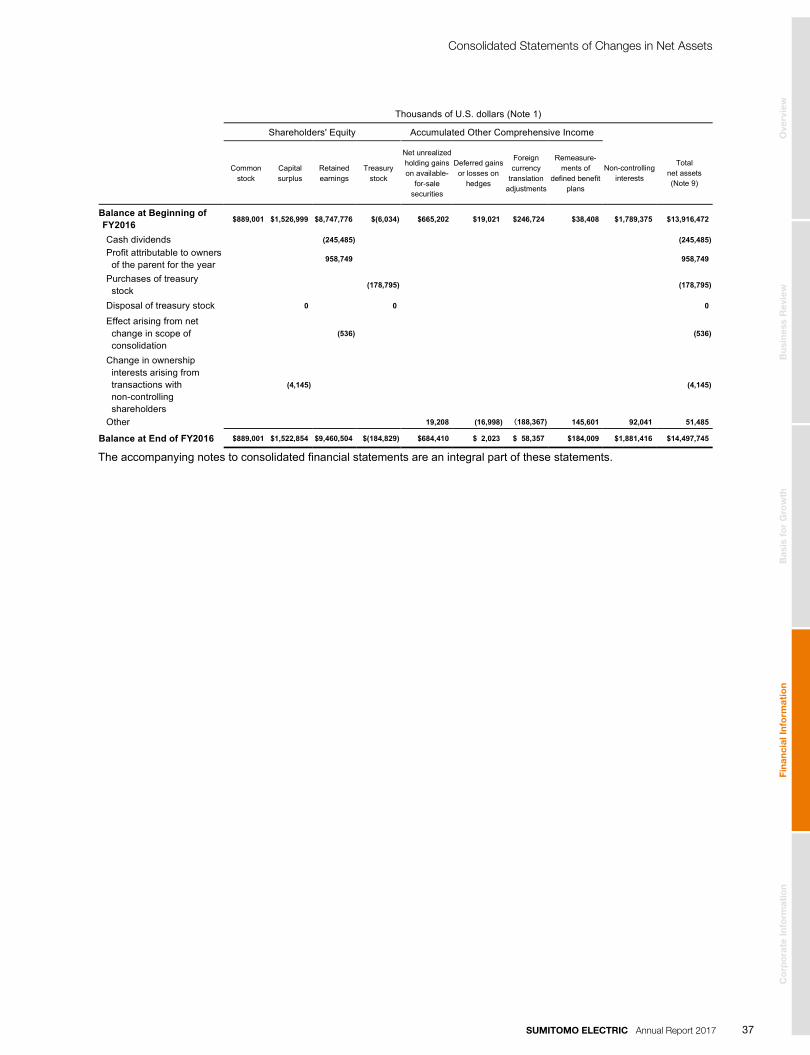
Thousands of U.S. dollars (Note 1)
Shareholders' Equity Accumulated Other Comprehensive Income
Common stock
Capital surplus
Retained earnings
Treasury stock
Net unrealized holding gains on available-
for-sale securities
Deferred gains or losses on
hedges
Foreign currency
translation adjustments
Remeasure- ments of
defined benefit plans
Non-controlling interests
Total net assets (Note 9)
Balance at Beginning of FY2016 $889,001 $1,526,999 $8,747,776 $(6,034) $665,202 $19,021 $246,724 $38,408 $1,789,375 $13,916,472
Cash dividends (245,485) (245,485) Profit attributable to owners of the parent for the year 958,749 958,749
Purchases of treasury stock (178,795) (178,795)
Disposal of treasury stock 0 0 0
Effect arising from net change in scope of consolidation
(536) (536)
Change in ownership interests arising from transactions with non-controlling shareholders
(4,145) (4,145)
Other 19,208 (16,998) (188,367) 145,601 92,041 51,485
Balance at End of FY2016 $889,001 $1,522,854 $9,460,504 $(184,829) $684,410 $ 2,023 $ 58,357 $184,009 $1,881,416 $14,497,745
The accompanying notes to consolidated financial statements are an integral part of these statements.
- 8 -
Consolidated Statements of Changes in Net Assets
Ove
rvie
wB
usi
nes
s R
evie
wB
asis
fo
r G
row
thF
inan
cial
Info
rmat
ion
Co
rpo
rate
Info
rmat
ion
SUMITOMO ELECTRIC Annual Report 2017 37
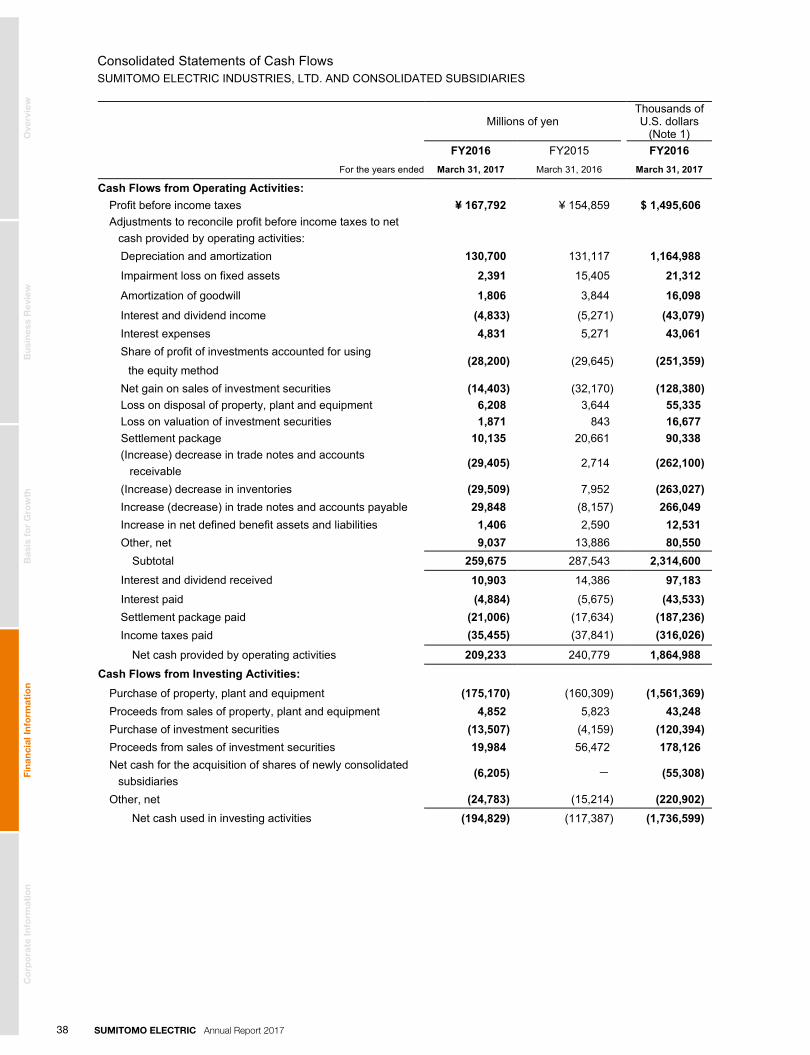
Consolidated Statements of Cash FlowsSUMITOMO ELECTRIC INDUSTRIES, LTD. AND CONSOLIDATED SUBSIDIARIES
Millions of yen Thousands of U.S. dollars
(Note 1) FY2016 FY2015 FY2016
For the years ended March 31, 2017 March 31, 2016 March 31, 2017
Cash Flows from Operating Activities:
Profit before income taxes ¥ 167,792 ¥ 154,859 $ 1,495,606 Adjustments to reconcile profit before income taxes to net cash provided by operating activities:
Depreciation and amortization 130,700 131,117 1,164,988 Impairment loss on fixed assets 2,391 15,405 21,312
Amortization of goodwill 1,806 3,844 16,098
Interest and dividend income (4,833) (5,271) (43,079) Interest expenses 4,831 5,271 43,061 Share of profit of investments accounted for using
(28,200) (29,645)
(251,359) the equity method
Net gain on sales of investment securities (14,403) (32,170) (128,380) Loss on disposal of property, plant and equipment 6,208 3,644 55,335 Loss on valuation of investment securities 1,871 843 16,677 Settlement package 10,135 20,661 90,338 (Increase) decrease in trade notes and accounts receivable
(29,405) 2,714 (262,100)
(Increase) decrease in inventories (29,509) 7,952 (263,027) Increase (decrease) in trade notes and accounts payable 29,848 (8,157) 266,049 Increase in net defined benefit assets and liabilities 1,406 2,590 12,531 Other, net 9,037 13,886 80,550
Subtotal 259,675 287,543 2,314,600 Interest and dividend received 10,903 14,386 97,183 Interest paid (4,884) (5,675) (43,533) Settlement package paid (21,006) (17,634) (187,236) Income taxes paid (35,455) (37,841) (316,026)
Net cash provided by operating activities 209,233 240,779 1,864,988 Cash Flows from Investing Activities:
Purchase of property, plant and equipment (175,170) (160,309) (1,561,369) Proceeds from sales of property, plant and equipment 4,852 5,823 43,248 Purchase of investment securities (13,507) (4,159) (120,394) Proceeds from sales of investment securities 19,984 56,472 178,126 Net cash for the acquisition of shares of newly consolidated subsidiaries
(6,205) - (55,308)
Other, net (24,783) (15,214) (220,902) Net cash used in investing activities (194,829) (117,387) (1,736,599)
- 9 -
Ove
rvie
wB
usi
nes
s R
evie
wB
asis
fo
r G
row
thF
inan
cial
Info
rmat
ion
Co
rpo
rate
Info
rmat
ion
SUMITOMO ELECTRIC Annual Report 201738
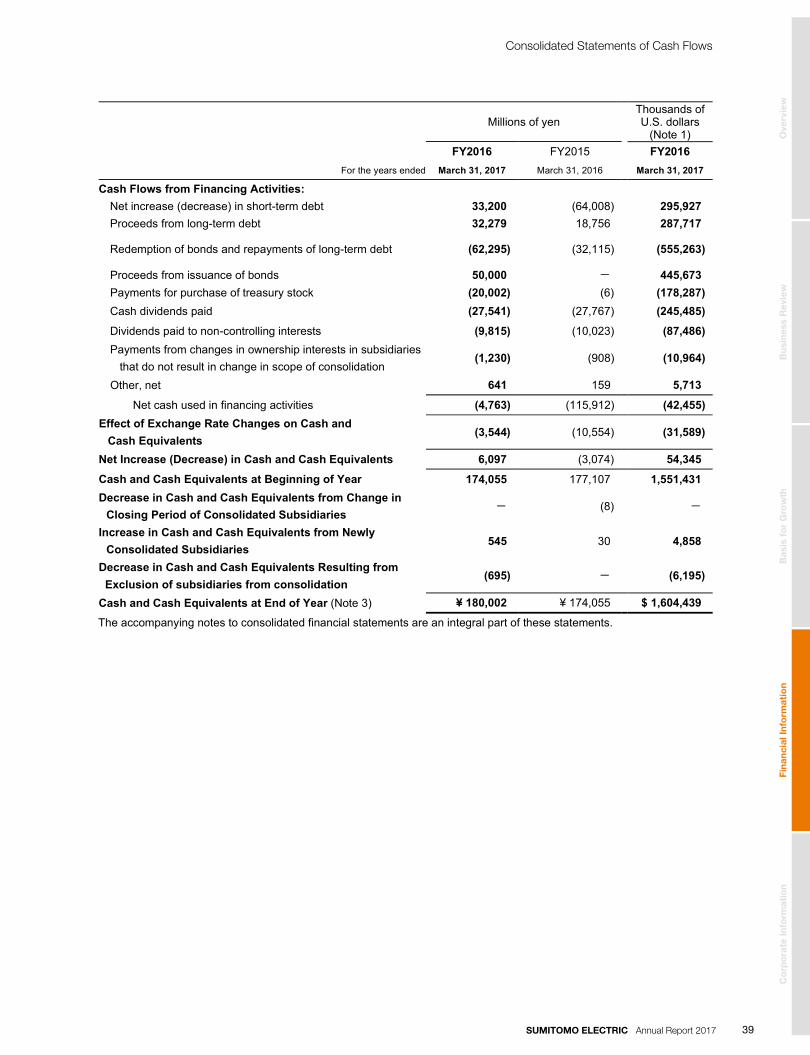
Millions of yen Thousands of U.S. dollars
(Note 1) FY2016 FY2015 FY2016
For the years ended March 31, 2017 March 31, 2016 March 31, 2017
Cash Flows from Financing Activities:
Net increase (decrease) in short-term debt 33,200 (64,008) 295,927 Proceeds from long-term debt 32,279 18,756 287,717
Redemption of bonds and repayments of long-term debt (62,295) (32,115) (555,263)
Proceeds from issuance of bonds 50,000 - 445,673 Payments for purchase of treasury stock (20,002) (6) (178,287) Cash dividends paid (27,541) (27,767) (245,485)
Dividends paid to non-controlling interests (9,815) (10,023) (87,486) Payments from changes in ownership interests in subsidiaries that do not result in change in scope of consolidation
(1,230) (908) (10,964)
Other, net 641 159 5,713
Net cash used in financing activities (4,763) (115,912) (42,455) Effect of Exchange Rate Changes on Cash and Cash Equivalents
(3,544) (10,554) (31,589)
Net Increase (Decrease) in Cash and Cash Equivalents 6,097 (3,074) 54,345
Cash and Cash Equivalents at Beginning of Year 174,055 177,107 1,551,431 Decrease in Cash and Cash Equivalents from Change in Closing Period of Consolidated Subsidiaries
- (8) -
Increase in Cash and Cash Equivalents from Newly Consolidated Subsidiaries
545 30 4,858
Decrease in Cash and Cash Equivalents Resulting from
Exclusion of subsidiaries from consolidation (695) - (6,195)
Cash and Cash Equivalents at End of Year (Note 3) ¥ 180,002 ¥ 174,055 $ 1,604,439
The accompanying notes to consolidated financial statements are an integral part of these statements.
- 10 -
Consolidated Statements of Cash Flows
Ove
rvie
wB
usi
nes
s R
evie
wB
asis
fo
r G
row
thF
inan
cial
Info
rmat
ion
Co
rpo
rate
Info
rmat
ion
SUMITOMO ELECTRIC Annual Report 2017 39

Notes to Consolidated Financial StatementsSUMITOMO ELECTRIC INDUSTRIES, LTD. AND CONSOLIDATED SUBSIDIARIES March 31, 2017 and 2016
1. BASIS OF PRESENTING CONSOLIDATED FINANCIAL STATEMENTSSumitomo Electric Industries, Ltd. (the “Company”) and its domestic consolidated subsidiaries maintain their accounts and records in Japanese yen and in accordance with the provisions set forth in the Japanese Corporate Law (the “Law”), the Japanese Financial Instruments and Exchange Act and its related accounting regulations and in conformity with accounting principles generally accepted in Japan (“Japanese GAAP”), which are different in certain respects as to application and disclosure requirements from International Financial Reporting Standards. The accounts of overseas consolidated subsidiaries are prepared in accordance with either International Financial Reporting Standards or U.S. generally accepted accounting principles, with adjustments for the specified following four items as applicable. a) Goodwill not subject to amortization b) Actuarial gains and losses of defined benefit retirement plans recognized outside profit and loss c) Capitalized expenditures for research and development activities d) Fair value measurement of investment properties and revaluation of property, plant and equipment and intangible
assets The accompanying consolidated financial statements have been restructured and translated into English, with some expanded descriptions, from the consolidated financial statements of the Company prepared in accordance with Japanese GAAP and filed with the appropriate Local Finance Bureau of the Ministry of Finance in Japan as required by the Japanese Financial Instruments and Exchange Act. Some supplementary information included in the statutory consolidated financial statements prepared in Japanese, but not required for fair presentation, is not presented in the accompanying consolidated financial statements. The translations of the Japanese yen amounts into U.S. dollar amounts are included solely for the convenience of readers outside Japan, using the prevailing exchange rate at March 31, 2017, which was ¥112.19 to U.S. $1.00. These translations should not be construed as representations that the Japanese yen amounts have been, could have been or could in the future be converted into U.S. dollars at this or any other rate of exchange.
2. SUMMARY OF SIGNIFICANT ACCOUNTING POLICIESa) Consolidation The consolidated financial statements include the accounts of the Company and all of its significant subsidiaries. All significant intercompany transactions and balances have been eliminated. The difference between the cost of investments in consolidated subsidiaries and the underlying equity at dates of acquisition is treated as goodwill. Investments in unconsolidated subsidiaries and affiliates are, with minor exceptions, accounted for using the equity method. Investments in unconsolidated subsidiaries and affiliates not accounted for using the equity method are stated at cost. All but 5 of the overseas consolidated subsidiaries that have a fiscal year ending other than March 31 have processed additional annual financial closings at March-end for consolidation purposes, aiming at a more appropriate disclosure. The remaining 5 overseas consolidated subsidiaries that have a fiscal year ending December 31 reported on a calendar year for consolidation purpose in fiscal year 2016. Any significant transactions that occurred between January 1 and March 31, 2017 have been adjusted for, if necessary.
b) Translation of Foreign Currencies All assets and liabilities of overseas subsidiaries and affiliates are translated into Japanese yen at current exchange rates at the respective fiscal year end, revenues and expenses are translated at the average exchange rates, and shareholders' equity is translated at historical rates. The resulting foreign currency translation adjustments are shown as a separate component of net assets, net of Non-controlling interests.
c) Cash and Time Deposits Cash and time deposits include cash on hand, readily available deposits and deposits with a maturity of one year or less.
d) Securities The Company and its domestic consolidated subsidiaries classify and account for securities as follows: Held-to-maturity debt securities are stated at amortized cost. Investments in unconsolidated subsidiaries and affiliates, excluding those accounted for using the equity method, are stated at cost. Debt and equity securities not classified as above are classified as available-for-sale securities. Available-for-sale securities which have fair values are stated at the fair value at the fiscal year end, and unrealized gains and losses, net of
- 11 -
Ove
rvie
wB
usi
nes
s R
evie
wB
asis
fo
r G
row
thF
inan
cial
Info
rmat
ion
Co
rpo
rate
Info
rmat
ion
SUMITOMO ELECTRIC Annual Report 201740
related taxes and non-controlling interests, are reported as a separate component of net assets. Available-for-sale securities which do not have fair values are stated at moving average cost. Realized gains and losses on sales of such securities are computed using moving average cost. Held-to-maturity debt securities and available-for-sale securities maturing within one year from the fiscal year end, and highly liquid investment funds are included in securities in current assets. Other securities are included in investments in unconsolidated subsidiaries and affiliates and investment securities.
e) Derivatives and Hedging Transactions The Company and its consolidated subsidiaries utilize hedge accounting for foreign currency forward exchange contracts hedging foreign currency monetary assets and liabilities, foreign currency swap contracts hedging foreign currency debt and others, interest rate swap contracts hedging interest on debt and others and commodity forward contracts, etc., hedging raw materials. Derivative financial instruments are stated at fair value. If the derivative financial instruments meet certain hedging criteria, the Company and its consolidated subsidiaries defer the recognition of gains or losses until the hedged transactions occur. Certain foreign currency forward exchange contracts and foreign currency swap contracts meeting certain conditions, are accounted for as a part of translating foreign currency monetary assets and liabilities in the consolidated balance sheets. In cases in which an interest rate swap contract is used as a hedge and meets certain hedging criteria, the net amount to be paid or received under the interest rate swap contract is added to or deducted from the interest on the assets or liabilities for which the swap contract was executed. The Company and its consolidated subsidiaries utilize hedging instruments to hedge risks of future changes in foreign exchange rates, interest rates and prices of raw materials in accordance with respective internal policies and procedures on risk control. The Company and its consolidated subsidiaries assess the effectiveness of each hedge contract by comparing the total cash flow fluctuation of hedging instruments and hedged items, except in cases in which interest rate swap contracts are used as hedges and meet certain hedging criteria.
f) Allowance for Doubtful Receivables The allowance for doubtful receivables is provided based upon estimated uncollectible amounts for individually identified doubtful receivables and historical loss experience for other receivables.
g) Inventories Inventories are mainly stated at the lower of the cost using the weighted average method or net realizable value.
h) Property, Plant and Equipment (Excluding Leases) The Company and its consolidated subsidiaries use the straight-line method over the estimated useful life to depreciate property, plant and equipment.
i) Goodwill Goodwill is amortized on a straight-line basis over a period within 20 years (mostly 5 or 10 years).
j) Revenue Recognition (Construction contracts) For construction contracts, when the outcome of individual contracts can be estimated reliably, the percentage-of- completion method is applied, otherwise the completed contract method is applied. The percentage of completion at the end of the reporting period is measured by the proportion of the cost incurred to the estimated total cost.
k) Research and Development Expenses relating to research and development activities are charged to expenses as incurred and totaled ¥115,155 million (US$1,026,428 thousand) and ¥110,839 million for the years ended March 31, 2017 and 2016, respectively.
- 12 -
Notes to Consolidated Financial Statements
Ove
rvie
wB
usi
nes
s R
evie
wB
asis
fo
r G
row
thF
inan
cial
Info
rmat
ion
Co
rpo
rate
Info
rmat
ion
SUMITOMO ELECTRIC Annual Report 2017 41
l) Retirement Benefits (1) Method of attributing expected benefit to periods of service When calculating retirement benefit obligations, a benefit formula basis is used for attributing expected retirement benefits to periods of service.
(2) Method for calculating expenses for actuarial gains and losses and past service cost The amount for defined benefit liabilities (assets) is based on the benefit obligation and fair value of plan assets at the end of the fiscal year. Past service cost is amortized on a straight-line basis over certain periods within the average remaining service years of employees (mainly 15 years) from the year in which it arises, or accounted for as an expense when it arises at some consolidated subsidiaries. Actuarial gains and losses are amortized on a straight-line basis over certain periods within the average remaining service years of employees (mainly 15 years) from the year following that in which they arise. At some consolidated subsidiaries, it is accounted for as an expense when it arises.
m) Income Taxes Income tax expense comprises current and deferred tax. Current tax comprises the expected tax payable or receivable on the taxable income or loss for the year and any adjustment to the tax payable or receivable in respect of previous years. It is measured using tax rates enacted (or substantively enacted at the reporting date). Deferred tax is accounted for under the asset-liability method. Deferred tax assets and liabilities are determined based on the financial statements carrying amounts and tax bases of assets and liabilities, using the effective tax rates in effect for the year in which the temporary differences are expected to be recovered or settled. Deferred tax assets are also recognized for the estimated future tax effects attributable to operating loss carryforwards.
n) Leases Finance leases which do not transfer ownership are accounted for as purchase and sale transactions and are depreciated to a residual value of zero by the straight-line method over their lease terms.
o) Consolidated Statements of Cash Flows In preparing the consolidated statements of cash flows, cash on hand, readily available deposits and short-term highly liquid investments with maturities not exceeding three months at the time of purchase are considered to be cash and cash equivalents.
p) Appropriation of Retained Earnings The Company and its domestic consolidated subsidiaries record, as a charge directly to retained earnings, cash dividends in the fiscal year in which the appropriation of retained earnings is approved at the shareholders' meeting.
q) Use of Estimates The management has made estimates and assumptions that affect the reported amounts of assets, liabilities, revenues and expenses and the disclosure of contingent assets and liabilities in preparing these financial statements in conformity with generally accepted accounting principles. Actual results could differ from those estimates.
r) Reclassifications and Restatements Certain prior year amounts are reclassified and restated to conform to the current year presentation. These reclassifications and restatements have no effect on previously reported results of operations or retained earnings.
s) Accounting for Consumption Taxes Transactions subject to consumption taxes are recorded at amounts exclusive of consumption taxes.
t) Adoption of Consolidated Taxation System
The Company and its wholly owned domestic consolidated subsidiaries have adopted the consolidated taxation system.
- 13 -
Notes to Consolidated Financial Statements
Ove
rvie
wB
usi
nes
s R
evie
wB
asis
fo
r G
row
thF
inan
cial
Info
rmat
ion
Co
rpo
rate
Info
rmat
ion
SUMITOMO ELECTRIC Annual Report 201742

u) Additional Information Effective from the fiscal year ended March 31, 2017, the Company and its domestic subsidiaries have adopted “Revised Implementation Guidance on Recoverability of Deferred Tax Assets” (Accounting Standards Board of Japan (“ASBJ”) Guidance No. 26, March 28, 2016).
v) Standard Issued but Not Yet Adopted ・Practical Solution on Unification of Accounting Policies Applied to Foreign Subsidiaries, etc. for Consolidated Financial Statements (ASBJ PITF No. 18 revised on March 29, 2017) ・Practical Solution on Unification of Accounting Policies Applied to Associates Accounted for Using the Equity Method (ASBJ PITF No. 24 revised on March 29, 2017)
(1) Summary PITF No.18, etc., are amended to include domestic subsidiaries and affiliates which apply the designated IFRSs or Japan's Modified International Standards to their consolidated financial statements prepared and disclosed in accordance with Financial Instruments and Exchange Act.
(2) Effective Date Effective from the beginning of the fiscal year ending March 31, 2018.
(3) Impact of Adoption The Company is currently in the process of estimating the effects of the revised practical solutions on the consolidated financial statements.
3. CASH AND CASH EQUIVALENTSThe reconciliations between cash and time deposits in the consolidated balance sheets and cash and cash equivalents in the consolidated statements of cash flows as of March 31, 2017 and 2016 are as follows:
Millions of yen Thousands of U.S. dollars
FY2016 FY2015 FY2016 As of March 31, 2017 March 31, 2016 March 31, 2017
Cash and time deposits ¥180,034 ¥174,686 $1,604,724 Cash equivalents included in securities 792 57 7,059 Deposits placed with banks with a maturity of over three months (824) (688) (7,344) Cash and cash equivalents ¥180,002 ¥174,055 $1,604,439
- 14 -
Notes to Consolidated Financial Statements
Ove
rvie
wB
usi
nes
s R
evie
wB
asis
fo
r G
row
thF
inan
cial
Info
rmat
ion
Co
rpo
rate
Info
rmat
ion
SUMITOMO ELECTRIC Annual Report 2017 43

4. FINANCIAL INSTRUMENTSa) Qualitative Information on Financial Instruments (1) Policies for using financial instruments The Company and its consolidated subsidiaries finance investment in equipment and operating capital for business mainly through borrowings from banks and the issuance of bonds based on their cash flow planning. Temporary excess cash is managed with low risk financial assets. The Company and its consolidated subsidiaries use derivative transactions only to hedge risks of future changes in cash flows and fair values not for trading purpose.
(2) Details of financial instruments used and the exposures to risk and how they arise Trade notes and accounts receivable are exposed to the credit risks of customers, but the Company and its consolidated subsidiaries try to reduce the risk according to rules for credit control. Operating receivables denominated in foreign currency are exposed to foreign exchange risks, but the Company and its consolidated subsidiaries hedge the risks using forward exchange contracts, etc., for the net position of foreign currency operating receivables and payables. Securities and investment securities are held mainly to build and maintain good trading relationships and are exposed to market value fluctuation risks. The Company and its consolidated subsidiaries review the circumstances periodically and evaluate the fair value of the securities and investment securities and the financial condition of the issuers, which are generally business counterparties. Payment terms of operating payables such as trade notes and accounts payable are mostly less than one year. Operating payables denominated in foreign currency are exposed to foreign exchange risks, but it is consistently less than the accounts receivable balance denominated in the same foreign currency. The main purpose of holding debt and issuing bonds is to secure financing for equipment and operating capital. The derivative transactions entered into comprise forward exchange contracts to hedge exchange risks of foreign currency debts and credits, interest swap contracts to hedge fluctuation risks of interest rates and fair value for debt and bonds and commodity forward transactions to hedge the risk of price fluctuation for raw materials. The Company and its consolidated subsidiaries manage and control these risks according to management's rules for derivative transactions.
b) Fair Value of Financial Instruments The carrying amounts and fair values of the financial instruments on the consolidated balance sheet as of March 31, 2017 and 2016 are as follows. Financial instruments whose fair value is hard to determine are not included in the table.
Millions of yen Thousands of U.S. dollars
FY2016 FY2015 FY2016 As of March 31, 2017 March 31, 2016 March 31, 2017
Carrying amount Fair value Difference Carrying
amount Fair value Difference Carrying amount Fair value Difference
Cash and time deposits ¥180,034 ¥180,034 ¥- ¥ 174,686 ¥ 174,686 ¥ - $1,604,724 $1,604,724 $-
Trade notes and accounts receivable
648,411 648,411 - 622,944 622,944 - 5,779,579 5,779,579 -
Securities, investments in unconsolidated subsidiaries and affiliates and investment securities
348,381 548,312 199,931 327,993 455,109 127,116 3,105,277 4,887,352 1,782,075
Total assets 1,176,826 1,376,757 199,931 1,125,623 1,252,739 127,116 10,489,580 12,271,655 1,782,075 Trade notes and accounts payable
378,110 378,110 - 349,360 349,360 - 3,370,265 3,370,265 -
Short-term debt 179,584 179,584 - 162,213 162,213 - 1,600,713 1,600,713 -
Bonds 75,000 75,164 164 35,610 36,124 514 668,509 669,971 1,462 Long-term debt 253,862 258,115 4,253 256,239 263,376 7,137 2,262,786 2,300,695 37,909 Total liabilities 886,556 890,973 4,417 803,422 811,073 7,651 7,902,273 7,941,644 39,371
Derivative transactions 280 280 - 2,101 2,101 - 2,496 2,496 -
- 15 -
Notes to Consolidated Financial Statements
Ove
rvie
wB
usi
nes
s R
evie
wB
asis
fo
r G
row
thF
inan
cial
Info
rmat
ion
Co
rpo
rate
Info
rmat
ion
SUMITOMO ELECTRIC Annual Report 201744
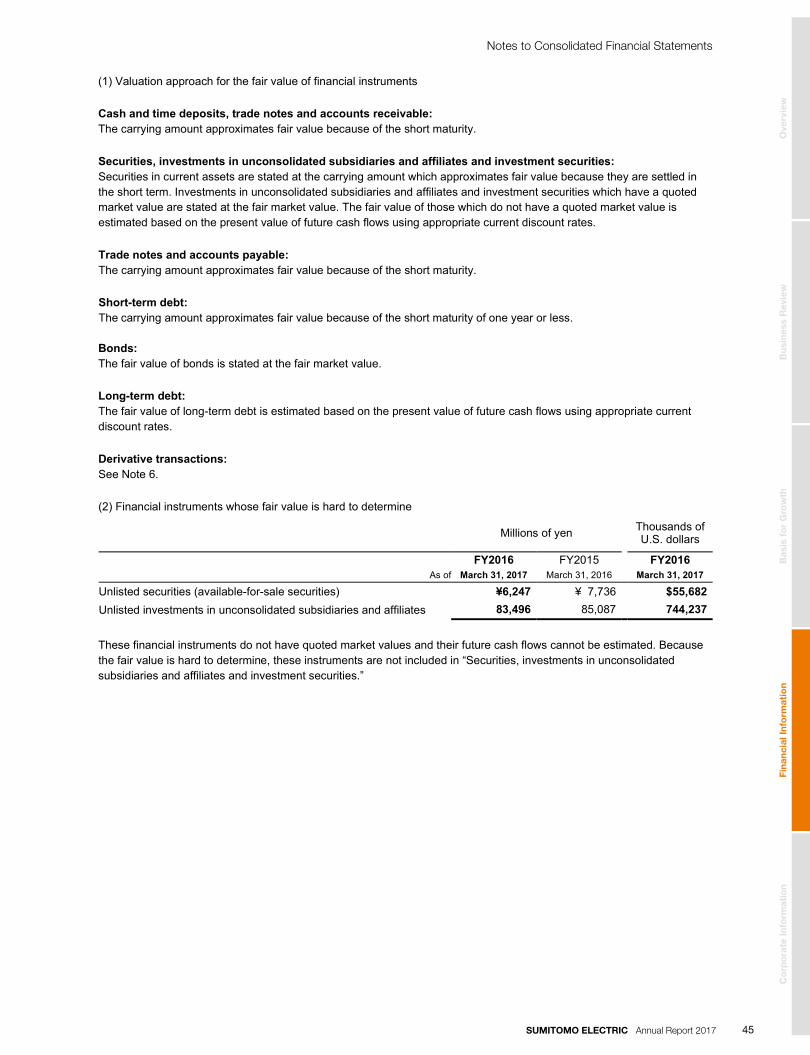
(1) Valuation approach for the fair value of financial instruments
Cash and time deposits, trade notes and accounts receivable: The carrying amount approximates fair value because of the short maturity.
Securities, investments in unconsolidated subsidiaries and affiliates and investment securities: Securities in current assets are stated at the carrying amount which approximates fair value because they are settled in the short term. Investments in unconsolidated subsidiaries and affiliates and investment securities which have a quoted market value are stated at the fair market value. The fair value of those which do not have a quoted market value is estimated based on the present value of future cash flows using appropriate current discount rates.
Trade notes and accounts payable: The carrying amount approximates fair value because of the short maturity.
Short-term debt: The carrying amount approximates fair value because of the short maturity of one year or less.
Bonds: The fair value of bonds is stated at the fair market value.
Long-term debt: The fair value of long-term debt is estimated based on the present value of future cash flows using appropriate current discount rates.
Derivative transactions: See Note 6.
(2) Financial instruments whose fair value is hard to determine
Millions of yen Thousands of U.S. dollars
FY2016 FY2015 FY2016 As of March 31, 2017 March 31, 2016 March 31, 2017
Unlisted securities (available-for-sale securities) ¥6,247 ¥ 7,736 $55,682 Unlisted investments in unconsolidated subsidiaries and affiliates 83,496 85,087 744,237
These financial instruments do not have quoted market values and their future cash flows cannot be estimated. Because the fair value is hard to determine, these instruments are not included in “Securities, investments in unconsolidated subsidiaries and affiliates and investment securities.”
- 16 -
Notes to Consolidated Financial Statements
Ove
rvie
wB
usi
nes
s R
evie
wB
asis
fo
r G
row
thF
inan
cial
Info
rmat
ion
Co
rpo
rate
Info
rmat
ion
SUMITOMO ELECTRIC Annual Report 2017 45

5. SECURITIESThe carrying amounts of securities in current assets and investment securities as of March 31, 2017 and 2016 consist of the following:
Millions of yen Thousands of U.S. dollars
As of
FY2016 March 31, 2017
FY2015 March 31, 2016
FY2016 March 31, 2017
Securities in current assets:
Available-for-sale securities ¥792 ¥57 $7,059 Held-to-maturity debt securities - - -
¥792 ¥57 $7,059 Investment securities:
Available-for-sale securities ¥153,792 ¥155,773 $1,370,817 Held-to-maturity debt securities - -
¥153,792 ¥155,773 $1,370,817
Available-for-sale securities with fair values or quoted market values included in securities in current assets and
investment securities as of March 31, 2017 and 2016 are as follows:
Millions of yen
FY2016
Acquisition cost Gross unrealized gains
Gross unrealized losses
Book value (Fair value)
Equity securities ¥25,828 ¥111,377 ¥(49) ¥137,156 Other 10,792 389 - 11,181 ¥36,620 ¥111,766 ¥(49) ¥148,337
Millions of yen
FY2015
Acquisition cost Gross unrealized gains
Gross unrealized losses
Book value (Fair value)
Equity securities ¥26,024 ¥111,762 ¥(412) ¥137,374 Other 10,156 564 - 10,720
¥36,180 ¥112,326 ¥(412) ¥148,094
Thousands of U.S. dollars
FY2016
Acquisition cost Gross unrealized gains
Gross unrealized losses
Book value (Fair value)
Equity securities $230,217 $992,753 $(437) $1,222,533 Other 96,194 3,467 - 99,661 $326,411 $996,220 $(437) $1,322,194
Proceeds from sales of available-for-sale securities were ¥20,290 million (US$180,854 thousand) and ¥38,265 million for the years ended March 31, 2017 and 2016, respectively. The net realized gains on those sales were ¥14,408 million (US$128,425 thousand) and ¥32,063 million for the years ended March 31, 2017 and 2016, respectively. Impairment loss on securities during fiscal year 2016 amounted to ¥1,871 million (US$16,677 thousand), which consist of ¥26 million (US$232 thousand) for available-for-sale securities, ¥1,838 million (US$16,383 thousand) for investments in unconsolidated subsidiaries and ¥7 million (US$62 thousand) for investments in affiliated companies not accounted for using the equity method. Impairment losses of securities during fiscal year 2015 amounted to ¥843 million, which consist of ¥63 million for available-for-sale securities, ¥286 million for the investments in unconsolidated subsidiaries and ¥494 million for investments in affiliated companies not accounted for using the equity method.
- 17 -
Notes to Consolidated Financial Statements
Ove
rvie
wB
usi
nes
s R
evie
wB
asis
fo
r G
row
thF
inan
cial
Info
rmat
ion
Co
rpo
rate
Info
rmat
ion
SUMITOMO ELECTRIC Annual Report 201746
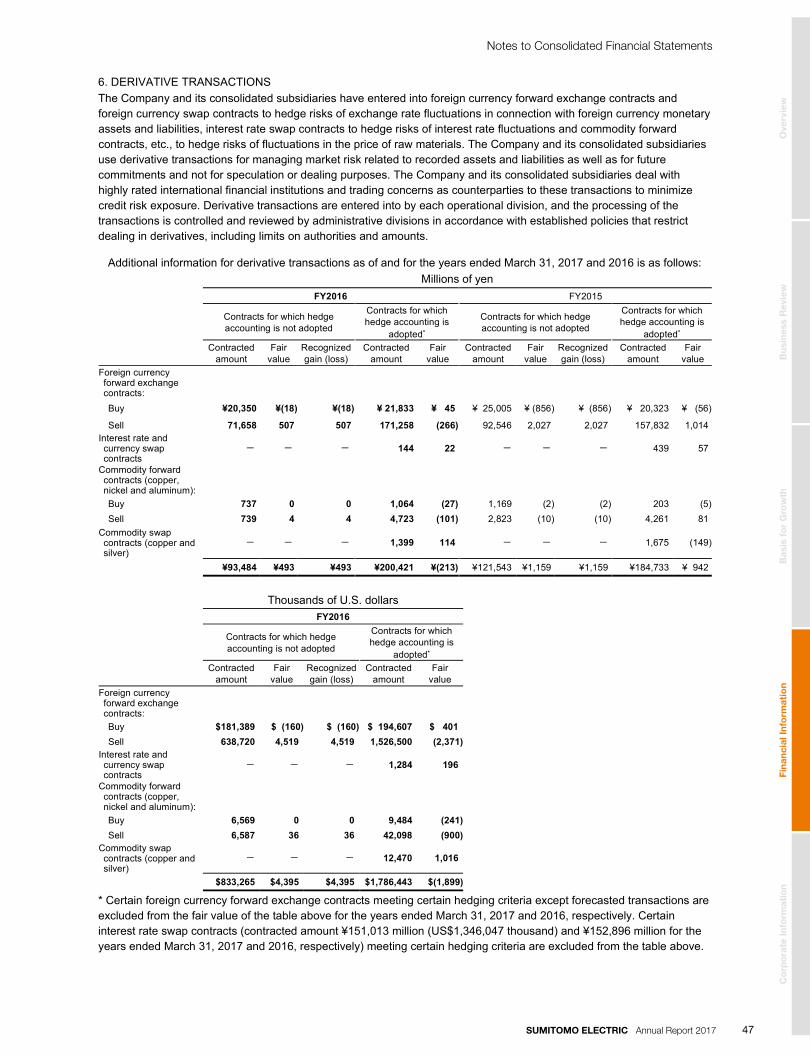
6. DERIVATIVE TRANSACTIONSThe Company and its consolidated subsidiaries have entered into foreign currency forward exchange contracts and foreign currency swap contracts to hedge risks of exchange rate fluctuations in connection with foreign currency monetary assets and liabilities, interest rate swap contracts to hedge risks of interest rate fluctuations and commodity forward contracts, etc., to hedge risks of fluctuations in the price of raw materials. The Company and its consolidated subsidiaries use derivative transactions for managing market risk related to recorded assets and liabilities as well as for future commitments and not for speculation or dealing purposes. The Company and its consolidated subsidiaries deal with highly rated international financial institutions and trading concerns as counterparties to these transactions to minimize credit risk exposure. Derivative transactions are entered into by each operational division, and the processing of the transactions is controlled and reviewed by administrative divisions in accordance with established policies that restrict dealing in derivatives, including limits on authorities and amounts.
Additional information for derivative transactions as of and for the years ended March 31, 2017 and 2016 is as follows:
Millions of yen FY2016 FY2015
Contracts for which hedge accounting is not adopted
Contracts for which hedge accounting is
adopted*
Contracts for which hedge accounting is not adopted
Contracts for which hedge accounting is
adopted*
Contracted
amount Fair
value Recognized gain (loss)
Contracted amount
Fair value
Contracted amount
Fair value
Recognized gain (loss)
Contracted amount
Fair value
Foreign currency forward exchange contracts:
Buy ¥20,350 ¥(18) ¥(18) ¥ 21,833 ¥ 45 ¥ 25,005 ¥ (856) ¥ (856) ¥ 20,323 ¥ (56)
Sell 71,658 507 507 171,258 (266) 92,546 2,027 2,027 157,832 1,014 Interest rate and currency swap contracts
- - - 144 22 - - - 439 57
Commodity forward contracts (copper, nickel and aluminum):
Buy 737 0 0 1,064 (27) 1,169 (2) (2) 203 (5) Sell 739 4 4 4,723 (101) 2,823 (10) (10) 4,261 81
Commodity swap contracts (copper and silver)
- - - 1,399 114 - - - 1,675 (149)
¥93,484 ¥493 ¥493 ¥200,421 ¥(213) ¥121,543 ¥1,159 ¥1,159 ¥184,733 ¥ 942
Thousands of U.S. dollars FY2016
Contracts for which hedge accounting is not adopted
Contracts for which hedge accounting is
adopted*
Contracted
amount Fair
value Recognized gain (loss)
Contracted amount
Fair value
Foreign currency forward exchange contracts:
Buy $181,389 $ (160) $ (160) $ 194,607 $ 401 Sell 638,720 4,519 4,519 1,526,500 (2,371)
Interest rate and currency swap contracts
- - - 1,284 196
Commodity forward contracts (copper, nickel and aluminum):
Buy 6,569 0 0 9,484 (241) Sell 6,587 36 36 42,098 (900)
Commodity swap contracts (copper and silver)
- - - 12,470 1,016
$833,265 $4,395 $4,395 $1,786,443 $(1,899) * Certain foreign currency forward exchange contracts meeting certain hedging criteria except forecasted transactions are excluded from the fair value of the table above for the years ended March 31, 2017 and 2016, respectively. Certain interest rate swap contracts (contracted amount ¥151,013 million (US$1,346,047 thousand) and ¥152,896 million for the years ended March 31, 2017 and 2016, respectively) meeting certain hedging criteria are excluded from the table above.
- 18 -
Notes to Consolidated Financial Statements
Ove
rvie
wB
usi
nes
s R
evie
wB
asis
fo
r G
row
thF
inan
cial
Info
rmat
ion
Co
rpo
rate
Info
rmat
ion
SUMITOMO ELECTRIC Annual Report 2017 47

7. INVENTORIESInventories as of March 31, 2017 and 2016 consist of the following:
Millions of yen Thousands of U.S. dollars
As of FY2016
March 31,2017 FY2015
March 31,2016 FY2016
March 31,2017
Merchandise and finished goods ¥138,595 ¥134,696 $1,235,360 Work in process 167,635 153,257 1,494,206 Raw materials and supplies 142,840 135,023 1,273,197 ¥449,070 ¥422,976 $4,002,763
8. INTEREST-BEARING LIABILITIESa) Short-Term Debt and Bonds in Current Liabilities Short-term debt and bonds in current liabilities at March 31, 2017 and 2016 consist of the following:
Millions of yen Thousands of U.S. dollars
FY2016 FY2015 FY2016
As of March 31, 2017 March 31, 2016 March 31, 2017
Short-term debt, principally from banks, with a weighted-average interest rate of 1.51% at March 31, 2017
¥146,733 ¥113,453 $1,307,897
Current portion of long-term debt, principally from banks and insurance companies, with a weighted-average interest rate of 0.93% at March 31, 2017
32,851 48,760 292,816
Current portion of bonds, interest rate of 0.288% 15,000 10,610 133,702 ¥194,584 ¥172,823 $1,734,415
b) Bonds and Long-Term Debt Bonds and long-term debt at March 31, 2017 and 2016 consist of the following:
Millions of yen Thousands of U.S. dollars
FY2016 FY2015 FY2016 As of March 31, 2017 March 31, 2016 March 31, 2017
Unsecured bonds, due 2018 to 2031, interest rate of 0.08%-0.936%
¥ 75,000 ¥ 35,610 $ 668,509
Long-term debt, principally from banks and insurance companies, due 2017 to 2024, with a weighted-average interest rate of 0.51% at March 31, 2017
286,713 304,999 2,555,602
361,713 340,609 3,224,111 Current portion of bonds and long-term debt (47,851) (59,370) (426,518) ¥313,862 ¥281,239 $2,797,593
The aggregate annual maturities of bonds and long-term debt at March 31, 2017 are as follows: (Bonds)
March 31 Millions of yen Thousands of U.S. dollars
2018 (= current portion) ¥15,000 $133,702 2019 ー ー
2020 ー ー
2021 ー ー
2022 10,000 89,135 2023 and thereafter 50,000 445,672
¥75,000 $668,509
- 19 -
Notes to Consolidated Financial Statements
Ove
rvie
wB
usi
nes
s R
evie
wB
asis
fo
r G
row
thF
inan
cial
Info
rmat
ion
Co
rpo
rate
Info
rmat
ion
SUMITOMO ELECTRIC Annual Report 201748

(Long-term debt)
March 31 Millions of yen Thousands of U.S. dollars
2018 (= current portion) ¥ 32,851 $ 292,816 2019 47,230 420,982 2020 56,104 500,080 2021 45,928 403,761 2022 34,900 311,079 2023 and thereafter 69,700 626,884
¥286,713 $2,555,602
The following assets were pledged as collateral for short-term debt and long-term debt, including the current portion, at March 31, 2017 and 2016.
Millions of yen Thousands of U.S. dollars
FY2016 FY2015 FY2016 As of March 31, 2017 March 31, 2016 March 31, 2017
Property, plant and equipment, net of accumulated depreciation
¥2,956 ¥3,044 $26,348
c) Lease Obligations Lease obligations are disclosed as other current liabilities and other non-current liabilities in the consolidated balance sheets. The aggregate annual maturities of lease obligations at March 31, 2017 are as follows:
March 31 Millions of yen Thousands of U.S. dollars
2018 (= current portion) ¥ 518 $ 4,617 2019 151 1,346 2020 186 1,658 2021 158 1,408 2022 155 1,382 2023 and thereafter 1,375 12,256
¥2,543 $22,667
- 20 -
Notes to Consolidated Financial Statements
Ove
rvie
wB
usi
nes
s R
evie
wB
asis
fo
r G
row
thF
inan
cial
Info
rmat
ion
Co
rpo
rate
Info
rmat
ion
SUMITOMO ELECTRIC Annual Report 2017 49
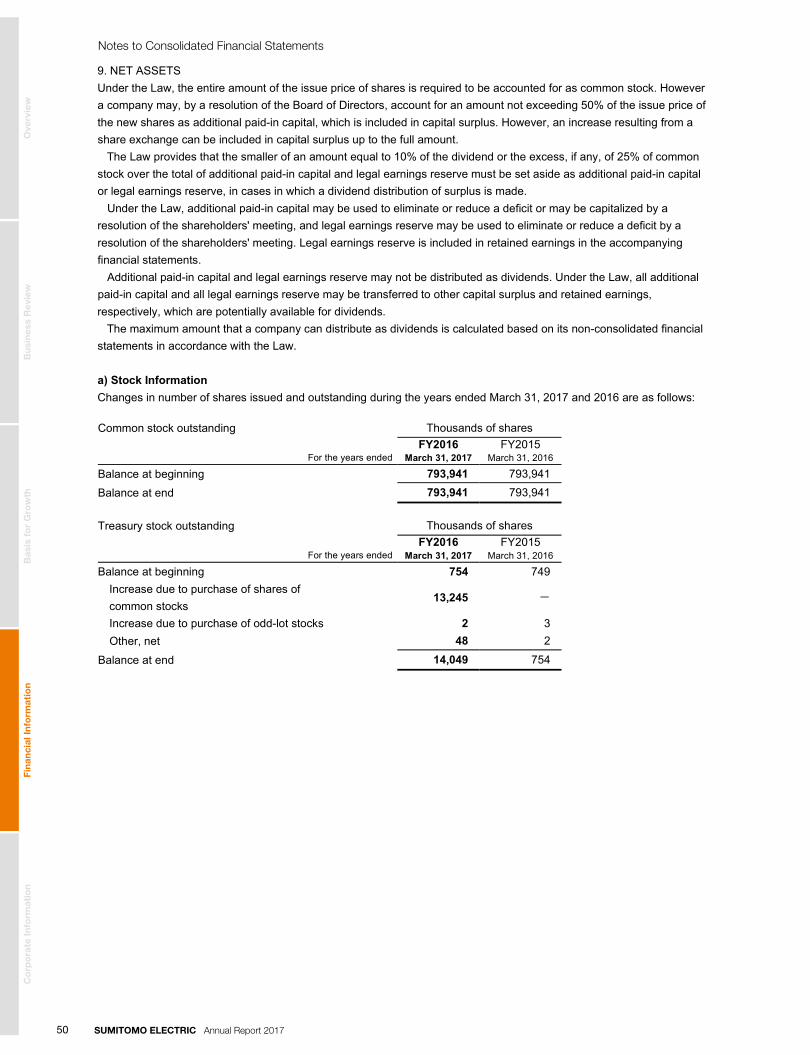
9. NET ASSETSUnder the Law, the entire amount of the issue price of shares is required to be accounted for as common stock. However a company may, by a resolution of the Board of Directors, account for an amount not exceeding 50% of the issue price of the new shares as additional paid-in capital, which is included in capital surplus. However, an increase resulting from a share exchange can be included in capital surplus up to the full amount. The Law provides that the smaller of an amount equal to 10% of the dividend or the excess, if any, of 25% of common stock over the total of additional paid-in capital and legal earnings reserve must be set aside as additional paid-in capital or legal earnings reserve, in cases in which a dividend distribution of surplus is made. Under the Law, additional paid-in capital may be used to eliminate or reduce a deficit or may be capitalized by a resolution of the shareholders' meeting, and legal earnings reserve may be used to eliminate or reduce a deficit by a resolution of the shareholders' meeting. Legal earnings reserve is included in retained earnings in the accompanying financial statements. Additional paid-in capital and legal earnings reserve may not be distributed as dividends. Under the Law, all additional paid-in capital and all legal earnings reserve may be transferred to other capital surplus and retained earnings, respectively, which are potentially available for dividends. The maximum amount that a company can distribute as dividends is calculated based on its non-consolidated financial statements in accordance with the Law.
a) Stock Information Changes in number of shares issued and outstanding during the years ended March 31, 2017 and 2016 are as follows:
Common stock outstanding Thousands of shares
For the years ended FY2016
March 31, 2017 FY2015
March 31, 2016
Balance at beginning 793,941 793,941
Balance at end 793,941 793,941
Treasury stock outstanding Thousands of shares
For the years ended FY2016
March 31, 2017 FY2015
March 31, 2016
Balance at beginning 754 749 Increase due to purchase of shares of common stocks
13,245 -
Increase due to purchase of odd-lot stocks 2 3 Other, net 48 2
Balance at end 14,049 754
- 21 -
Notes to Consolidated Financial Statements
Ove
rvie
wB
usi
nes
s R
evie
wB
asis
fo
r G
row
thF
inan
cial
Info
rmat
ion
Co
rpo
rate
Info
rmat
ion
SUMITOMO ELECTRIC Annual Report 201750

b) Dividend Information
Dividends paid in fiscal year 2016 Total amount
Resolution Record date Effective date Millions of yen Thousands of U.S. dollars
Shareholders' meeting on June 24, 2016
March 31, 2016 June 27, 2016 ¥14,280 $127,284
Board of Directors on November 1, 2016
September 30, 2016 December 1, 2016 ¥13,261 $118,201
Dividend paid after March 31, 2017 with respect to fiscal year 2016 Total amount
Resolution Record date Effective date Millions of yen Thousands of U.S. dollars
Shareholders' meeting on June 28, 2017
March 31, 2017 June 29, 2017 ¥17,942 $159,925
Dividends paid in fiscal year 2015 Total amount
Resolution Record date Effective date Millions of yen
Shareholders' meeting on June 25, 2015
March 31, 2015 June 26, 2015 ¥14,280
Board of Directors on October 29, 2015
September 30, 2015 December 1, 2015 ¥13,487
Dividend paid after March 31, 2016 with respect to fiscal year 2015 Total amount
Resolution Record date Effective date Millions of yen
Shareholders' meeting on June 24, 2016
March 31, 2016 June 27, 2016 ¥14,280
c) Other In fiscal year 2015, other changes in retained earnings of ¥(1,631) million are a result of affiliates accounted for using the equity method that have a fiscal year ending December 31 having changed the method for calculating retirement benefit obligation and service cost pursuant to "Accounting Standard for Retirement Benefits" (ASBJ Statement No. 26, May 17, 2012) and "Guidance on Accounting Standard for Retirement Benefits" (ASBJ Guidance No. 25, March 26, 2015) and ¥(979) million as a result of some overseas consolidated subsidiaries having changed their fiscal year-end from December 31 to March 31 or having processed additional financial closings at March-end for consolidation purposes.
- 22 -
Notes to Consolidated Financial Statements
Ove
rvie
wB
usi
nes
s R
evie
wB
asis
fo
r G
row
thF
inan
cial
Info
rmat
ion
Co
rpo
rate
Info
rmat
ion
SUMITOMO ELECTRIC Annual Report 2017 51
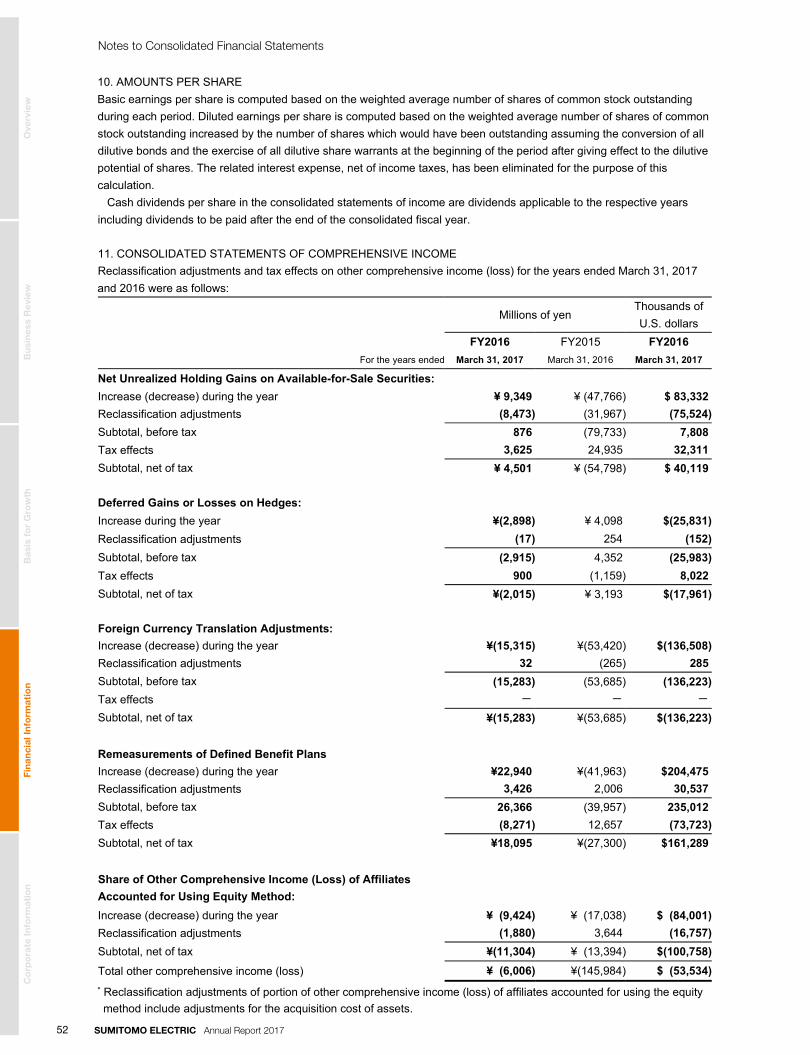
10. AMOUNTS PER SHAREBasic earnings per share is computed based on the weighted average number of shares of common stock outstanding during each period. Diluted earnings per share is computed based on the weighted average number of shares of common stock outstanding increased by the number of shares which would have been outstanding assuming the conversion of all dilutive bonds and the exercise of all dilutive share warrants at the beginning of the period after giving effect to the dilutive potential of shares. The related interest expense, net of income taxes, has been eliminated for the purpose of this calculation. Cash dividends per share in the consolidated statements of income are dividends applicable to the respective years including dividends to be paid after the end of the consolidated fiscal year.
11. CONSOLIDATED STATEMENTS OF COMPREHENSIVE INCOMEReclassification adjustments and tax effects on other comprehensive income (loss) for the years ended March 31, 2017 and 2016 were as follows:
Millions of yen Thousands of
U.S. dollars FY2016 FY2015 FY2016
For the years ended March 31, 2017 March 31, 2016 March 31, 2017
Net Unrealized Holding Gains on Available-for-Sale Securities:
Increase (decrease) during the year ¥ 9,349 ¥ (47,766) $ 83,332 Reclassification adjustments (8,473) (31,967) (75,524) Subtotal, before tax 876 (79,733) 7,808 Tax effects 3,625 24,935 32,311 Subtotal, net of tax ¥ 4,501 ¥ (54,798) $ 40,119
Deferred Gains or Losses on Hedges:
Increase during the year ¥(2,898) ¥ 4,098 $(25,831) Reclassification adjustments (17) 254 (152) Subtotal, before tax (2,915) 4,352 (25,983) Tax effects 900 (1,159) 8,022 Subtotal, net of tax ¥(2,015) ¥ 3,193 $(17,961)
Foreign Currency Translation Adjustments:
Increase (decrease) during the year ¥(15,315) ¥(53,420) $(136,508) Reclassification adjustments 32 (265) 285 Subtotal, before tax (15,283) (53,685) (136,223) Tax effects - - -
Subtotal, net of tax ¥(15,283) ¥(53,685) $(136,223)
Remeasurements of Defined Benefit Plans
Increase (decrease) during the year ¥22,940 ¥(41,963) $204,475 Reclassification adjustments 3,426 2,006 30,537 Subtotal, before tax 26,366 (39,957) 235,012 Tax effects (8,271) 12,657 (73,723) Subtotal, net of tax ¥18,095 ¥(27,300) $161,289
Share of Other Comprehensive Income (Loss) of Affiliates Accounted for Using Equity Method:
Increase (decrease) during the year ¥ (9,424) ¥ (17,038) $ (84,001) Reclassification adjustments (1,880) 3,644 (16,757) Subtotal, net of tax ¥(11,304) ¥ (13,394) $(100,758) Total other comprehensive income (loss) ¥ (6,006) ¥(145,984) $ (53,534) * Reclassification adjustments of portion of other comprehensive income (loss) of affiliates accounted for using the equity method include adjustments for the acquisition cost of assets.
- 23 -
Notes to Consolidated Financial Statements
Ove
rvie
wB
usi
nes
s R
evie
wB
asis
fo
r G
row
thF
inan
cial
Info
rmat
ion
Co
rpo
rate
Info
rmat
ion
SUMITOMO ELECTRIC Annual Report 201752

12. INCOME TAXESThe Company and its domestic consolidated subsidiaries are subject to several taxes based on income which, in the aggregate, result in a statutory tax rate of approximately 30.8% and 33.0% for the years ended March 31, 2017 and 2016, respectively. The following table summarizes the significant differences between the statutory tax rate and the effective tax rate for financial statement purposes for the years ended March 31, 2017 and 2016:
For the years ended
FY2016 March 31, 2017
FY2015 March 31, 2016
Statutory tax rate 30.8% 33.0%
Share of profit of investments accounted for using the equity method (5.1) (6.2) Expenses not deductible for tax purposes 0.2 0.2 Dividend income from overseas consolidated subsidiaries 0.5 0.6 Tax credits (1.2) (1.3) Effect of lower tax rates for overseas consolidated subsidiaries (3.8) (5.7) Change in valuation allowance 1.6 3.9 Intercompany profits (0.1) (0.7) Change in undistributed earnings of consolidated subsidiaries and affiliates (2.0) 0.1 Amortization of goodwill 0.3 2.4 Other 3.5 5.9
Effective tax rate 24.7% 32.2%
Deferred tax assets and liabilities included in the consolidated balance sheets at March 31, 2017 and 2016 are as follows:
Millions of yen Thousands of U.S. dollars
As of
FY2016 March 31, 2017
FY2015 March 31, 2016
FY2016 March 31, 2017
Deferred tax assets (current assets) ¥ 49,734 ¥ 48,764 $ 443,302 Deferred tax assets (investments and other assets) 19,680 17,829 175,417 Other current liabilities (814) (55) (7,256) Deferred tax liabilities (non-current liabilities) (65,988) (59,228) (588,181) ¥ 2,612 ¥ 7,310 $ 23,282
- 24 -
Notes to Consolidated Financial Statements
Ove
rvie
wB
usi
nes
s R
evie
wB
asis
fo
r G
row
thF
inan
cial
Info
rmat
ion
Co
rpo
rate
Info
rmat
ion
SUMITOMO ELECTRIC Annual Report 2017 53

Significant components of the deferred tax assets and liabilities at March 31, 2017 and 2016 are as follows:
Millions of yen Thousands of U.S. dollars
As of
FY2016 March 31, 2017
FY2015 March 31, 2016
FY2016 March 31, 2017
Deferred tax assets:
Net operating loss carryforwards ¥ 52,943 ¥ 56,544 $ 471,905 Fixed assets 18,169 19,241 161,948 Net defined benefit liabilities 17,343 16,491 154,586 Accrued expenses 13,345 13,344 118,950 Inventories 10,923 10,122 97,362 Intercompany profits 9,901 10,003 88,252 Investment securities 3,961 3,954 35,306 Allowance for doubtful receivables 1,606 1,424 14,315 Other 30,831 34,376 274,811
159,022 165,499 1,417,435 Valuation allowance (60,322) (62,015) (537,677) Total deferred tax assets 98,700 103,484 879,758
Deferred tax liabilities:
Net unrealized holding gains on available-for-sale securities (33,700) (37,293) (300,383) Undistributed earnings of consolidated subsidiaries and affiliates
(23,162) (26,349) (206,453)
Net defined benefit assets (22,831) (16,695) (203,503) Accelerated depreciation of overseas consolidated subsidiaries (5,756) (4,623) (51,306) Excess of fair value over the book value of assets and liabilities of consolidated subsidiaries at the acquisition dates
(5,495) (5,406) (48,979)
Reserve for deferred gains on sales of fixed assets (978) (1,001) (8,717) Other (4,166) (4,807) (37,135)
Total deferred tax liabilities (96,088) (96,174) (856,476) Net deferred tax assets (liabilities) ¥ 2,612 ¥ 7,310 $ 23,282
- 25 -
Notes to Consolidated Financial Statements
Ove
rvie
wB
usi
nes
s R
evie
wB
asis
fo
r G
row
thF
inan
cial
Info
rmat
ion
Co
rpo
rate
Info
rmat
ion
SUMITOMO ELECTRIC Annual Report 201754

13. RETIREMENT BENEFITSThe Company and most of its domestic consolidated subsidiaries have contributory and noncontributory defined benefit plans and lump-sum retirement benefit plans, while the Company and some of its subsidiaries have defined contribution plans and prepaid retirement allowance plans. Some overseas subsidiaries have defined benefit plans and defined contribution plans. And some subsidiaries apply the simplified method for the computation of benefit obligations.
a) Defined benefit plans (1) Movements in retirement benefit obligations, except plans applying the simplified method
Millions of yen
Thousands of U.S. dollars
For the years ended FY2016
March 31, 2017 FY2015
March 31, 2016 FY2016
March 31, 2017
Balance at beginning of year ¥301,449 ¥288,032 $2,686,951 Service cost 13,608 12,662 121,294 Interest cost 3,772 4,474 33,622 Actuarial gains and losses 395 10,634 3,521 Benefits paid (14,185) (12,940) (126,437) Net change as a result of business combinations 10,481 - 93,422 Other (79) (1,413) (705) Balance at end of year ¥315,441 ¥301,449 $2,811,668
(2) Movements in plan assets, except plans applying the simplified method
Millions of yen
Thousands of U.S. dollars
For the years ended FY2016
March 31, 2017 FY2015
March 31, 2016 FY2016
March 31, 2017
Balance at beginning of year ¥327,281 ¥355,915 $2,917,203 Expected return on plan assets 3,899 3,454 34,754 Actuarial gains and losses 23,465 (35,014) 209,154 Contributions paid by the employer 10,428 13,580 92,949 Benefits paid (9,229) (8,529) (82,262) Net change as a result of business combinations 5,916 - 52,732 Other (298) (2,125) (2,656) Balance at end of year ¥361,462 ¥327,281 $3,221,874
(3) Movements in net defined benefit liabilities (or assets) for defined benefit plans applying the simplified method
Millions of yen
Thousands of U.S. dollars
For the years ended FY2016
March 31, 2017 FY2015
March 31, 2016 FY2016
March 31, 2017
Balance at beginning of year ¥1,666 ¥1,986 $14,850 Retirement benefit costs 859 404 7,657 Benefits paid (64) (111) (570) Contributions paid by the employer (106) (136) (945) Other (520) (477) (4,636) Balance at end of year ¥1,835 ¥1,666 $16,356
- 26 -
Notes to Consolidated Financial Statements
Ove
rvie
wB
usi
nes
s R
evie
wB
asis
fo
r G
row
thF
inan
cial
Info
rmat
ion
Co
rpo
rate
Info
rmat
ion
SUMITOMO ELECTRIC Annual Report 2017 55
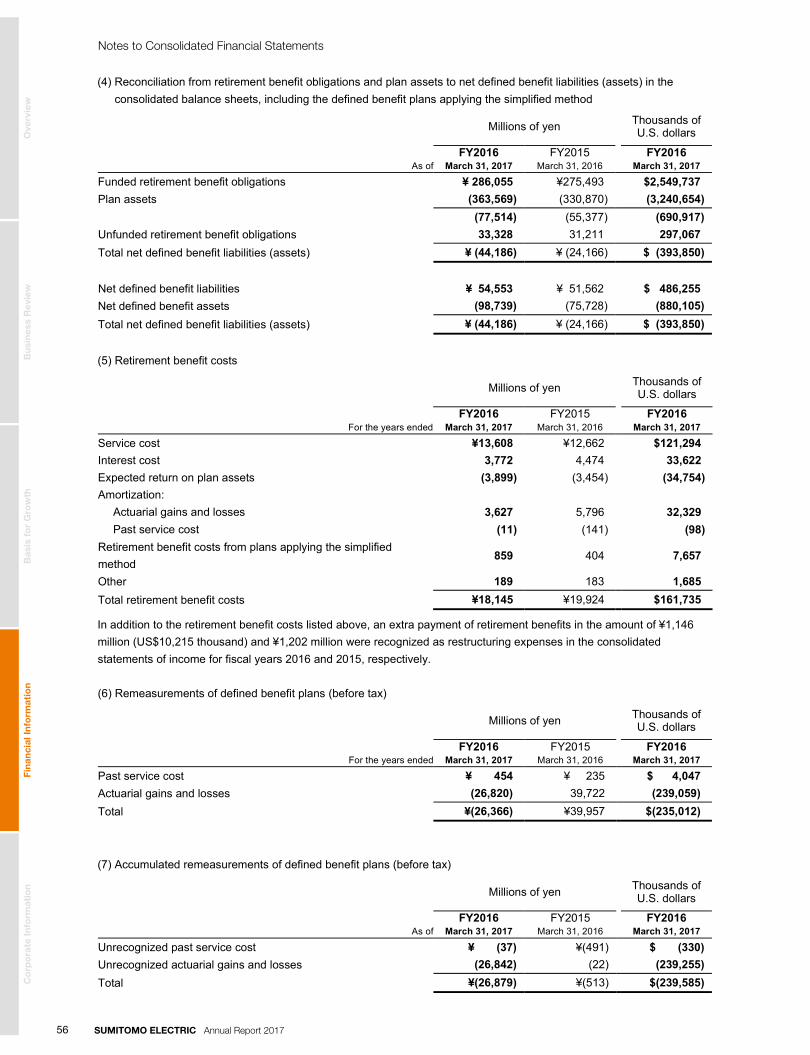
(4) Reconciliation from retirement benefit obligations and plan assets to net defined benefit liabilities (assets) in the consolidated balance sheets, including the defined benefit plans applying the simplified method
Millions of yen
Thousands of U.S. dollars
As of FY2016
March 31, 2017 FY2015
March 31, 2016 FY2016
March 31, 2017
Funded retirement benefit obligations ¥ 286,055 ¥275,493 $2,549,737 Plan assets (363,569) (330,870) (3,240,654) (77,514) (55,377) (690,917) Unfunded retirement benefit obligations 33,328 31,211 297,067 Total net defined benefit liabilities (assets) ¥ (44,186) ¥ (24,166) $ (393,850)
Net defined benefit liabilities ¥ 54,553 ¥ 51,562 $ 486,255 Net defined benefit assets (98,739) (75,728) (880,105) Total net defined benefit liabilities (assets) ¥ (44,186) ¥ (24,166) $ (393,850)
(5) Retirement benefit costs
Millions of yen
Thousands of U.S. dollars
For the years ended FY2016
March 31, 2017 FY2015
March 31, 2016 FY2016
March 31, 2017
Service cost ¥13,608 ¥12,662 $121,294 Interest cost 3,772 4,474 33,622 Expected return on plan assets (3,899) (3,454) (34,754) Amortization:
Actuarial gains and losses 3,627 5,796 32,329 Past service cost (11) (141) (98) Retirement benefit costs from plans applying the simplified method
859 404 7,657
Other 189 183 1,685 Total retirement benefit costs ¥18,145 ¥19,924 $161,735
In addition to the retirement benefit costs listed above, an extra payment of retirement benefits in the amount of ¥1,146 million (US$10,215 thousand) and ¥1,202 million were recognized as restructuring expenses in the consolidated statements of income for fiscal years 2016 and 2015, respectively.
(6) Remeasurements of defined benefit plans (before tax)
Millions of yen
Thousands of U.S. dollars
For the years ended FY2016
March 31, 2017 FY2015
March 31, 2016 FY2016
March 31, 2017
Past service cost ¥ 454 ¥ 235 $ 4,047 Actuarial gains and losses (26,820) 39,722 (239,059) Total ¥(26,366) ¥39,957 $(235,012)
(7) Accumulated remeasurements of defined benefit plans (before tax)
Millions of yen
Thousands of U.S. dollars
As of FY2016
March 31, 2017 FY2015
March 31, 2016 FY2016
March 31, 2017
Unrecognized past service cost ¥ (37) ¥(491) $ (330) Unrecognized actuarial gains and losses (26,842) (22) (239,255) Total ¥(26,879) ¥(513) $(239,585)
- 27 -
Notes to Consolidated Financial Statements
Ove
rvie
wB
usi
nes
s R
evie
wB
asis
fo
r G
row
thF
inan
cial
Info
rmat
ion
Co
rpo
rate
Info
rmat
ion
SUMITOMO ELECTRIC Annual Report 201756
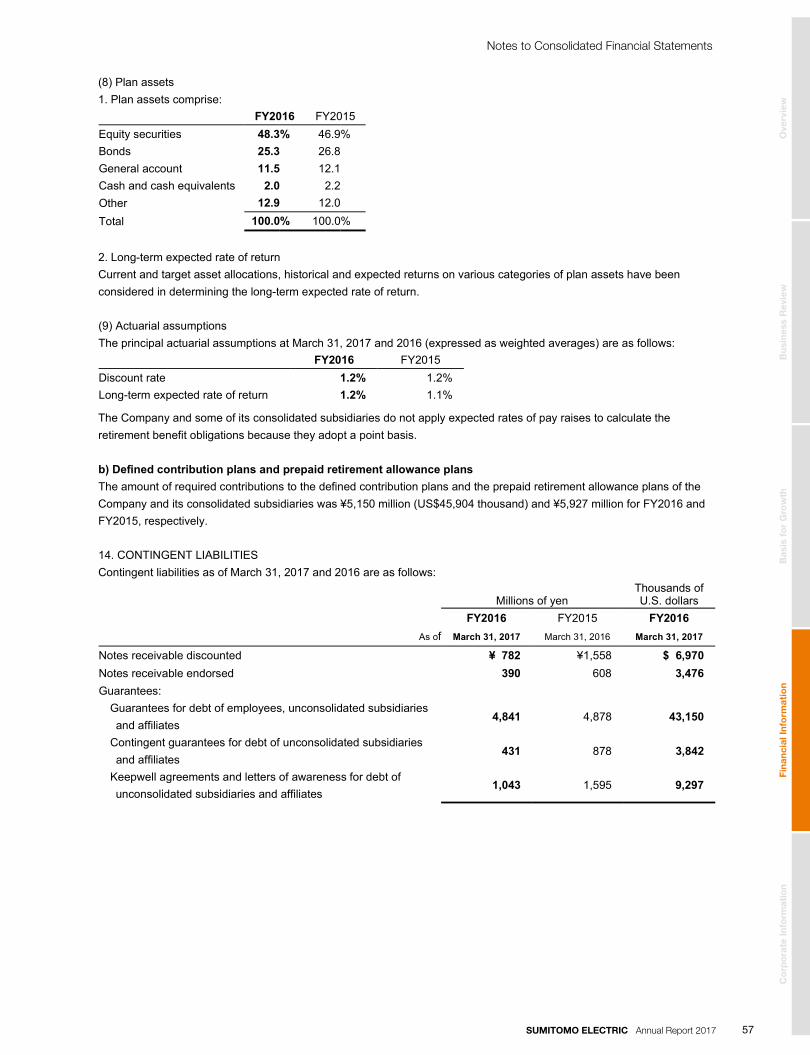
(8) Plan assets 1. Plan assets comprise:
FY2016 FY2015 Equity securities 48.3 % 46.9 %
Bonds 25.3 26.8 General account 11.5 12.1 Cash and cash equivalents 2.0 2.2 Other 12.9 12.0 Total 100.0 % 100.0 %
2. Long-term expected rate of return Current and target asset allocations, historical and expected returns on various categories of plan assets have been considered in determining the long-term expected rate of return.
(9) Actuarial assumptions The principal actuarial assumptions at March 31, 2017 and 2016 (expressed as weighted averages) are as follows:
FY2016 FY2015 Discount rate 1.2% 1.2%
Long-term expected rate of return 1.2% 1.1%
The Company and some of its consolidated subsidiaries do not apply expected rates of pay raises to calculate the retirement benefit obligations because they adopt a point basis.
b) Defined contribution plans and prepaid retirement allowance plans The amount of required contributions to the defined contribution plans and the prepaid retirement allowance plans of the Company and its consolidated subsidiaries was ¥5,150 million (US$45,904 thousand) and ¥5,927 million for FY2016 and FY2015, respectively.
14. CONTINGENT LIABILITIESContingent liabilities as of March 31, 2017 and 2016 are as follows:
Millions of yen Thousands of U.S. dollars
FY2016 FY2015 FY2016 As of March 31, 2017 March 31, 2016 March 31, 2017
Notes receivable discounted ¥ 782 ¥1,558 $ 6,970 Notes receivable endorsed 390 608 3,476 Guarantees:
Guarantees for debt of employees, unconsolidated subsidiaries and affiliates
4,841 4,878 43,150
Contingent guarantees for debt of unconsolidated subsidiaries and affiliates
431 878 3,842
Keepwell agreements and letters of awareness for debt of unconsolidated subsidiaries and affiliates
1,043 1,595 9,297
- 28 -
Notes to Consolidated Financial Statements
Ove
rvie
wB
usi
nes
s R
evie
wB
asis
fo
r G
row
thF
inan
cial
Info
rmat
ion
Co
rpo
rate
Info
rmat
ion
SUMITOMO ELECTRIC Annual Report 2017 57

15. IMPAIRMENT LOSS ON FIXED ASSETSThe Company and its consolidated subsidiaries grouped long-lived assets into asset groups by business segment and conducted impairment tests with the conclusion that the carrying amounts should be reduced by ¥2,391 million (US$21,312 thousand) and ¥15,405 million to the recoverable amounts in FY2016 and FY2015, respectively. The recoverable amount is mainly the net selling price. Impairment loss on fixed assets for each reportable segment are disclosed in Note 18 b), for the years ended March 31, 2017 and 2016.
Details of impairment loss on fixed assets for the years ended March 31, 2017 and 2016 are as follows:
FY2016 Millions of yen Thousands of U.S. dollars
Buildings and structures ¥1,293 $11,525 Machinery, equipment and others 482 4,296 Other 616 5,491 ¥2,391*1 $21,312*1
*1 The amount of ¥2,391 million (US$21,312 thousand) is included in "Restructuring expenses" (Note 16) in the
consolidated statement of income for fiscal year 2016.
FY2015 Millions of yen
Goodwill ¥ 7,315 Machinery, equipment and others 5,338 Buildings and structures 1,651 Other 1,101
¥15,405*2
*2 The amount of ¥12,479 million is shown as "Impairment loss on fixed assets," and the amount of ¥2,926 million is included in "Restructuring expenses" (Note 16) in the consolidated statement of income for fiscal year 2015.
16. RESTRUCTURING EXPENSESIn fiscal year 2016, restructuring expenses of ¥6,046 million (US$53,891 thousand) are related to the reorganization of the business locations, to improve the efficiency of tensioning materials for prestressed concrete business and Brazil wiring harnesses business, etc. In fiscal year 2015, restructuring expenses of ¥6,046 million are related to the reorganization of the business locations and the restructuring of some part of the R&D themes to make work productivity more efficient and strengthen new product development of the Company and certain consolidated subsidiaries in response to the rapid deceleration of the business environment. The expenses are also related to optimizing the work force according to the size of the business to strengthen profitability.
The major details of the expenses for the years ended March 31, 2017 and 2016 are as follows:
FY2016 Millions of yen Thousands of
U.S. dollars Impairment loss on fixed assets (Note 15) ¥2,391 $21,312 Loss on disposal of property, plant and equipment
1,877 16,731
FY2015 Millions of yen
Impairment loss on fixed assets (Note 15) ¥2,926 Extra payment of retirement benefits 1,202
- 29 -
Notes to Consolidated Financial Statements
Ove
rvie
wB
usi
nes
s R
evie
wB
asis
fo
r G
row
thF
inan
cial
Info
rmat
ion
Co
rpo
rate
Info
rmat
ion
SUMITOMO ELECTRIC Annual Report 201758
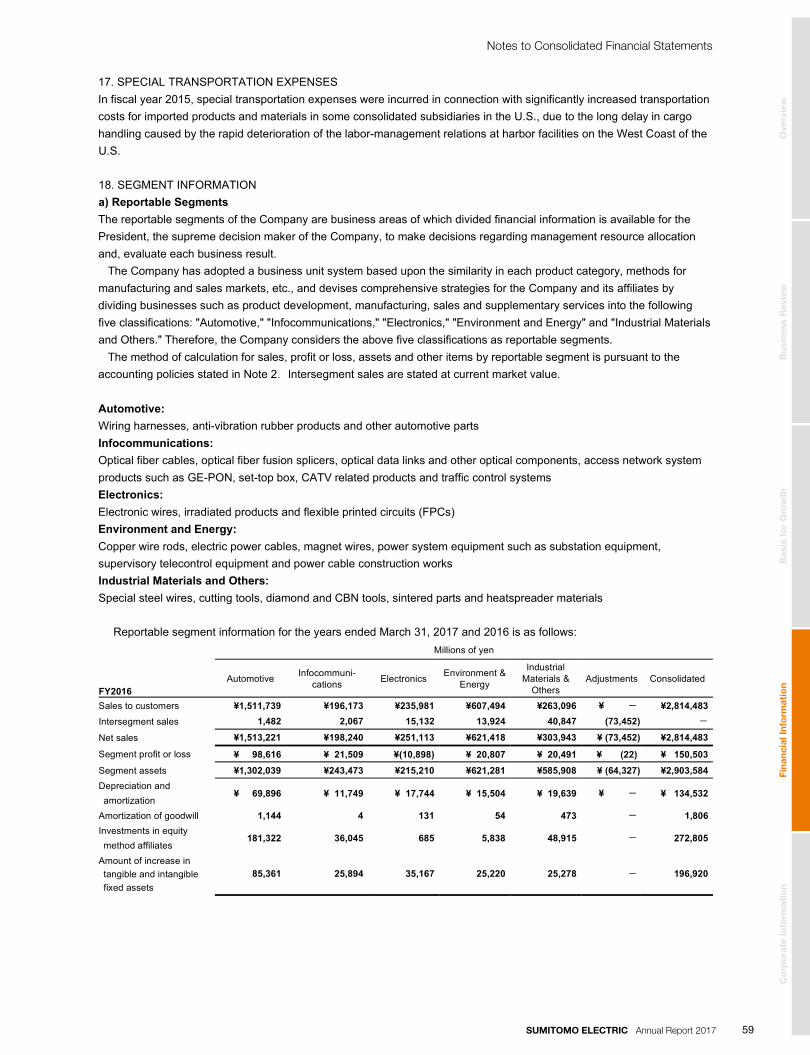
17. SPECIAL TRANSPORTATION EXPENSESIn fiscal year 2015, special transportation expenses were incurred in connection with significantly increased transportation costs for imported products and materials in some consolidated subsidiaries in the U.S., due to the long delay in cargo handling caused by the rapid deterioration of the labor-management relations at harbor facilities on the West Coast of the U.S.
18. SEGMENT INFORMATIONa) Reportable Segments The reportable segments of the Company are business areas of which divided financial information is available for the President, the supreme decision maker of the Company, to make decisions regarding management resource allocation and, evaluate each business result. The Company has adopted a business unit system based upon the similarity in each product category, methods for manufacturing and sales markets, etc., and devises comprehensive strategies for the Company and its affiliates by dividing businesses such as product development, manufacturing, sales and supplementary services into the following five classifications: "Automotive," "Infocommunications," "Electronics," "Environment and Energy" and "Industrial Materials and Others." Therefore, the Company considers the above five classifications as reportable segments. The method of calculation for sales, profit or loss, assets and other items by reportable segment is pursuant to the accounting policies stated in Note 2. Intersegment sales are stated at current market value.
Automotive: Wiring harnesses, anti-vibration rubber products and other automotive parts Infocommunications: Optical fiber cables, optical fiber fusion splicers, optical data links and other optical components, access network system products such as GE-PON, set-top box, CATV related products and traffic control systems Electronics: Electronic wires, irradiated products and flexible printed circuits (FPCs) Environment and Energy: Copper wire rods, electric power cables, magnet wires, power system equipment such as substation equipment, supervisory telecontrol equipment and power cable construction works Industrial Materials and Others: Special steel wires, cutting tools, diamond and CBN tools, sintered parts and heatspreader materials
Reportable segment information for the years ended March 31, 2017 and 2016 is as follows:
FY2016
Millions of yen
Automotive Infocommuni- cations Electronics Environment &
Energy
Industrial Materials &
Others Adjustments Consolidated
Sales to customers ¥1,511,739 ¥196,173 ¥235,981 ¥607,494 ¥263,096 ¥ - ¥2,814,483 Intersegment sales 1,482 2,067 15,132 13,924 40,847 (73,452) -
Net sales ¥1,513,221 ¥198,240 ¥251,113 ¥621,418 ¥303,943 ¥ (73,452) ¥2,814,483
Segment profit or loss ¥ 98,616 ¥ 21,509 ¥(10,898) ¥ 20,807 ¥ 20,491 ¥ (22) ¥ 150,503 Segment assets ¥1,302,039 ¥243,473 ¥215,210 ¥621,281 ¥585,908 ¥ (64,327) ¥2,903,584 Depreciation and amortization
¥ 69,896 ¥ 11,749 ¥ 17,744 ¥ 15,504 ¥ 19,639 ¥ - ¥ 134,532
Amortization of goodwill 1,144 4 131 54 473 - 1,806 Investments in equity method affiliates
181,322 36,045 685 5,838 48,915 - 272,805
Amount of increase in tangible and intangible fixed assets
85,361 25,894 35,167 25,220 25,278 - 196,920
- 30 -
Notes to Consolidated Financial Statements
Ove
rvie
wB
usi
nes
s R
evie
wB
asis
fo
r G
row
thF
inan
cial
Info
rmat
ion
Co
rpo
rate
Info
rmat
ion
SUMITOMO ELECTRIC Annual Report 2017 59

FY2015
Millions of yen
Automotive Infocommuni- cations Electronics Environment &
Energy
Industrial Materials &
Others Adjustments Consolidated
Sales to customers ¥1,540,817 ¥182,685 ¥297,330 ¥641,515 ¥270,742 ¥ - ¥2,933,089
Intersegment sales 1,168 2,003 14,691 18,028 41,412 (77,302) -
Net sales ¥1,541,985 ¥184,688 ¥312,021 ¥659,543 ¥312,154 ¥ (77,302) ¥2,933,089
Segment profit or loss ¥ 88,654 ¥ 11,903 ¥ 10,203 ¥ 13,404 ¥ 19,234 ¥ 78 ¥ 143,476
Segment assets ¥1,242,498 ¥218,229 ¥215,032 ¥571,483 ¥541,037 ¥ (45,431) ¥2,742,848 Depreciation and amortization
¥ 71,696 ¥ 11,368 ¥ 15,949 ¥ 14,577 ¥ 20,781 ¥ - ¥ 134,371
Amortization of goodwill 1,342 5 181 2,278 38 - 3,844 Investments in equity method affiliates
178,562 26,178 488 6,197 39,714 ー 251,139
Amount of increase in tangible and intangible fixed assets
86,052 15,230 29,693 28,902 22,948 ー 182,825
FY2016
Thousands of U.S. dollars
Automotive Infocommuni- cations Electronics Environment &
Energy
Industrial Materials &
Others Adjustments Consolidated
Sales to customers $13,474,811 $1,748,578 $2,103,405 $5,414,868 $2,345,093 $ ー $25,086,755 Intersegment sales 13,209 18,424 134,878 124,111 364,088 (654,710) ー
Net sales $13,488,020 $1,767,002 $2,238,283 $5,538,979 $2,709,181 $(654,710) $25,086,755
Segment profit or loss $ 879,009 $ 191,719 $ (97,139) $ 185,462 $ 182,646 $ (196) $1,341,501 Segment assets $11,605,660 $2,170,185 $1,918,264 $5,537,757 $5,222,462 $(573,376) $25,880,952 Depreciation and amortization
$ 623,015 $ 104,724 $ 158,160 $ 138,194 $ 175,051 $ ー $ 1,199,144
Amortization of goodwill 10,197 36 1,168 481 4,216 ー 16,098 Investments in equity method affiliates
1,616,205 321,285 6,106 52,037 436,001 ー 2,431,634
Amount of increase in tangible and intangible fixed assets
760,861 230,805 313,459 224,797 225,315 ー 1,755,237
1. Segment profit or loss included in Adjustments of \(22) million (US$196 thousand) and \78 million for FY2016 and
FY2015, respectively, consists mainly of unrealized profits caused by intersegment transactions. 2. Segment assets included in Adjustments of \(64,327) million (US$(573,376) thousand) and \(45,431) million as of
March 31, 2017 and 2016, respectively, consist mainly of elimination of receivables caused by intersegment transactions, cash and time deposits and investment securities owned by the Company.
3. Segment profit or loss is reconciled with operating income in the consolidated statements of income.
b) Related Information (1) Information about products and services
FY2016
Millions of yen Wiring harnesses Others Total
Sales to customers ¥1,091,006 ¥1,723,477 ¥2,814,483
FY2015
Millions of yen Wiring harnesses Others Total
Sales to customers ¥1,116,901 ¥1,816,188 ¥2,933,089
FY2016
Thousands of U.S. dollars Wiring harnesses Others Total
Sales to customers $9,724,628 $15,362,127 $25,086,755
- 31 -
Notes to Consolidated Financial Statements
Ove
rvie
wB
usi
nes
s R
evie
wB
asis
fo
r G
row
thF
inan
cial
Info
rmat
ion
Co
rpo
rate
Info
rmat
ion
SUMITOMO ELECTRIC Annual Report 201760
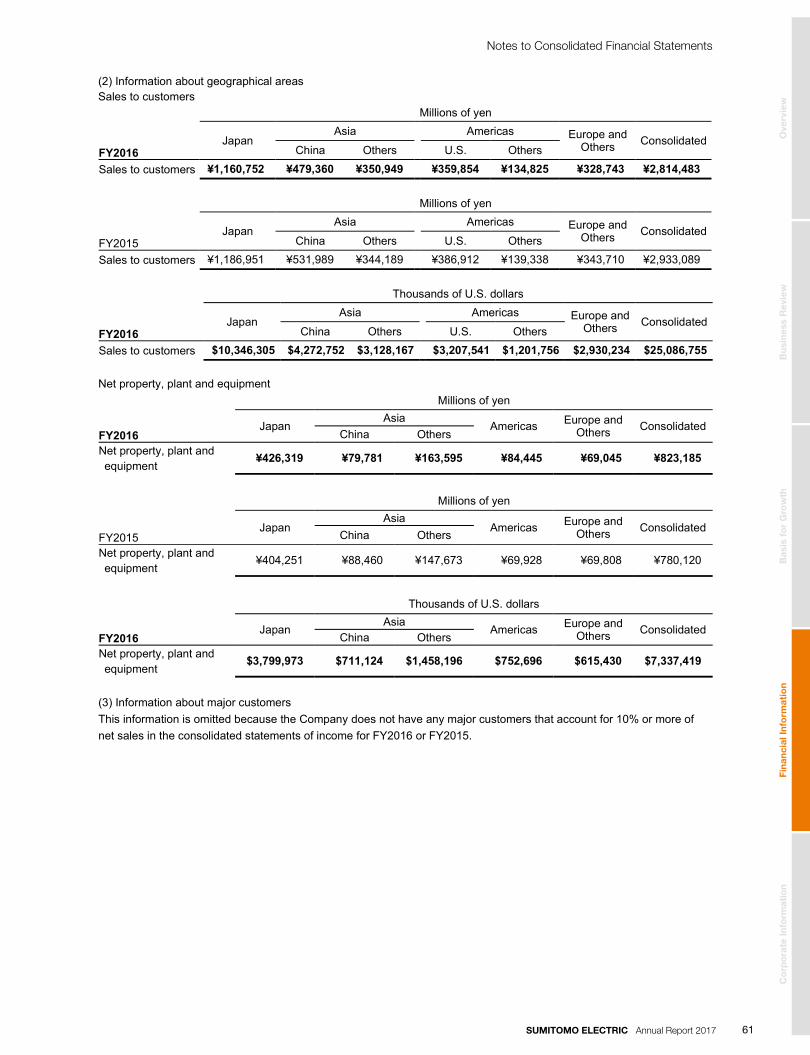
(2) Information about geographical areas Sales to customers FY2016
Millions of yen
Japan Asia Americas Europe and
Others Consolidated China Others U.S. Others
Sales to customers ¥1,160,752 ¥479,360 ¥350,949 ¥359,854 ¥134,825 ¥328,743 ¥2,814,483
FY2015
Millions of yen
Japan Asia Americas Europe and
Others Consolidated China Others U.S. Others
Sales to customers ¥1,186,951 ¥531,989 ¥344,189 ¥386,912 ¥139,338 ¥343,710 ¥2,933,089
FY2016
Thousands of U.S. dollars
Japan Asia Americas Europe and
Others Consolidated China Others U.S. Others
Sales to customers $10,346,305 $4,272,752 $3,128,167 $3,207,541 $1,201,756 $2,930,234 $25,086,755
Net property, plant and equipment FY2016
Millions of yen
Japan Asia
Americas Europe and Others Consolidated
China Others Net property, plant and equipment
¥426,319 ¥79,781 ¥163,595 ¥84,445 ¥69,045 ¥823,185
FY2015
Millions of yen
Japan Asia
Americas Europe and Others Consolidated
China Others Net property, plant and equipment
¥404,251 ¥88,460 ¥147,673 ¥69,928 ¥69,808 ¥780,120
FY2016
Thousands of U.S. dollars
Japan Asia
Americas Europe and Others Consolidated
China Others Net property, plant and equipment
$3,799,973 $711,124 $1,458,196 $752,696 $615,430 $7,337,419
(3) Information about major customers This information is omitted because the Company does not have any major customers that account for 10% or more of net sales in the consolidated statements of income for FY2016 or FY2015.
- 32 -
Notes to Consolidated Financial Statements
Ove
rvie
wB
usi
nes
s R
evie
wB
asis
fo
r G
row
thF
inan
cial
Info
rmat
ion
Co
rpo
rate
Info
rmat
ion
SUMITOMO ELECTRIC Annual Report 2017 61
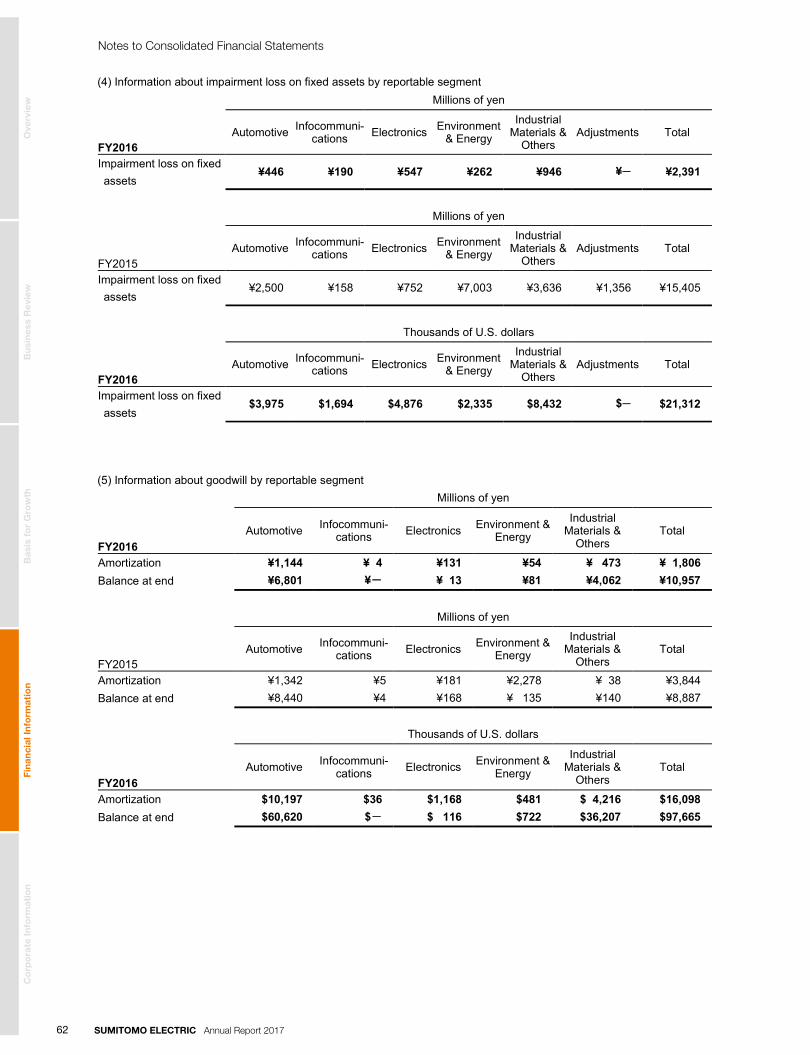
(4) Information about impairment loss on fixed assets by reportable segment FY2016
Millions of yen
Automotive Infocommuni- cations Electronics Environment
& Energy
Industrial Materials &
Others Adjustments Total
Impairment loss on fixed assets
¥446 ¥190 ¥547 ¥262 ¥946 ¥ー ¥2,391
FY2015
Millions of yen
Automotive Infocommuni- cations Electronics Environment
& Energy
Industrial Materials &
Others Adjustments Total
Impairment loss on fixed assets
¥2,500 ¥158 ¥752 ¥7,003 ¥3,636 ¥1,356 ¥15,405
FY2016
Thousands of U.S. dollars
Automotive Infocommuni- cations Electronics Environment
& Energy
Industrial Materials &
Others Adjustments Total
Impairment loss on fixed assets
$3,975 $1,694 $4,876 $2,335 $8,432 $ー $21,312
(5) Information about goodwill by reportable segment FY2016
Millions of yen
Automotive Infocommuni- cations Electronics Environment &
Energy
Industrial Materials &
Others Total
Amortization ¥1,144 ¥ 4 ¥131 ¥54 ¥ 473 ¥ 1,806 Balance at end ¥6,801 ¥- ¥ 13 ¥81 ¥4,062 ¥10,957
FY2015
Millions of yen
Automotive Infocommuni- cations Electronics Environment &
Energy
Industrial Materials &
Others Total
Amortization ¥1,342 ¥5 ¥181 ¥2,278 ¥ 38 ¥3,844 Balance at end ¥8,440 ¥4 ¥168 ¥ 135 ¥140 ¥8,887
FY2016
Thousands of U.S. dollars
Automotive Infocommuni- cations Electronics Environment &
Energy
Industrial Materials &
Others Total
Amortization $10,197 $36 $1,168 $481 $ 4,216 $16,098 Balance at end $60,620 $- $ 116 $722 $36,207 $97,665
- 33 -
Notes to Consolidated Financial Statements
Ove
rvie
wB
usi
nes
s R
evie
wB
asis
fo
r G
row
thF
inan
cial
Info
rmat
ion
Co
rpo
rate
Info
rmat
ion
SUMITOMO ELECTRIC Annual Report 201762
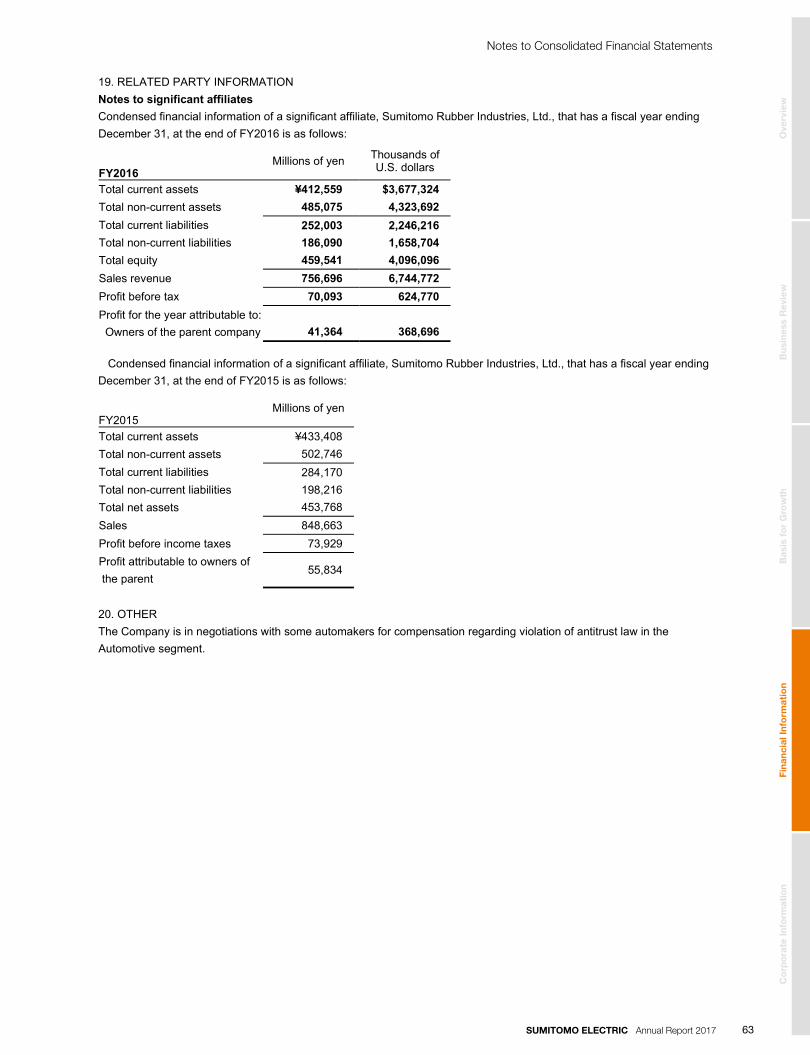
19. RELATED PARTY INFORMATIONNotes to significant affiliates Condensed financial information of a significant affiliate, Sumitomo Rubber Industries, Ltd., that has a fiscal year ending December 31, at the end of FY2016 is as follows:
FY2016
Millions of yen Thousands of U.S. dollars
Total current assets ¥412,559 $3,677,324 Total non-current assets 485,075 4,323,692 Total current liabilities 252,003 2,246,216 Total non-current liabilities 186,090 1,658,704 Total equity 459,541 4,096,096 Sales revenue 756,696 6,744,772 Profit before tax 70,093 624,770 Profit for the year attributable to: Owners of the parent company
41,364
368,696
Condensed financial information of a significant affiliate, Sumitomo Rubber Industries, Ltd., that has a fiscal year ending December 31, at the end of FY2015 is as follows:
FY2015
Millions of yen
Total current assets ¥433,408 Total non-current assets 502,746 Total current liabilities 284,170 Total non-current liabilities 198,216 Total net assets 453,768 Sales 848,663 Profit before income taxes 73,929 Profit attributable to owners of the parent
55,834
20. OTHERThe Company is in negotiations with some automakers for compensation regarding violation of antitrust law in the Automotive segment.
- 34 -
Notes to Consolidated Financial Statements
Ove
rvie
wB
usi
nes
s R
evie
wB
asis
fo
r G
row
thF
inan
cial
Info
rmat
ion
Co
rpo
rate
Info
rmat
ion
SUMITOMO ELECTRIC Annual Report 2017 63

Ove
rvie
wB
usi
nes
s R
evie
wB
asis
fo
r G
row
thF
inan
cial
Info
rmat
ion
Co
rpo
rate
Info
rmat
ion
SUMITOMO ELECTRIC Annual Report 201764
Ove
rvie
wB
usi
nes
s R
evie
wB
asis
fo
r G
row
thF
inan
cial
Info
rmat
ion
Co
rpo
rate
Info
rmat
ion
SUMITOMO ELECTRIC Annual Report 2017 65
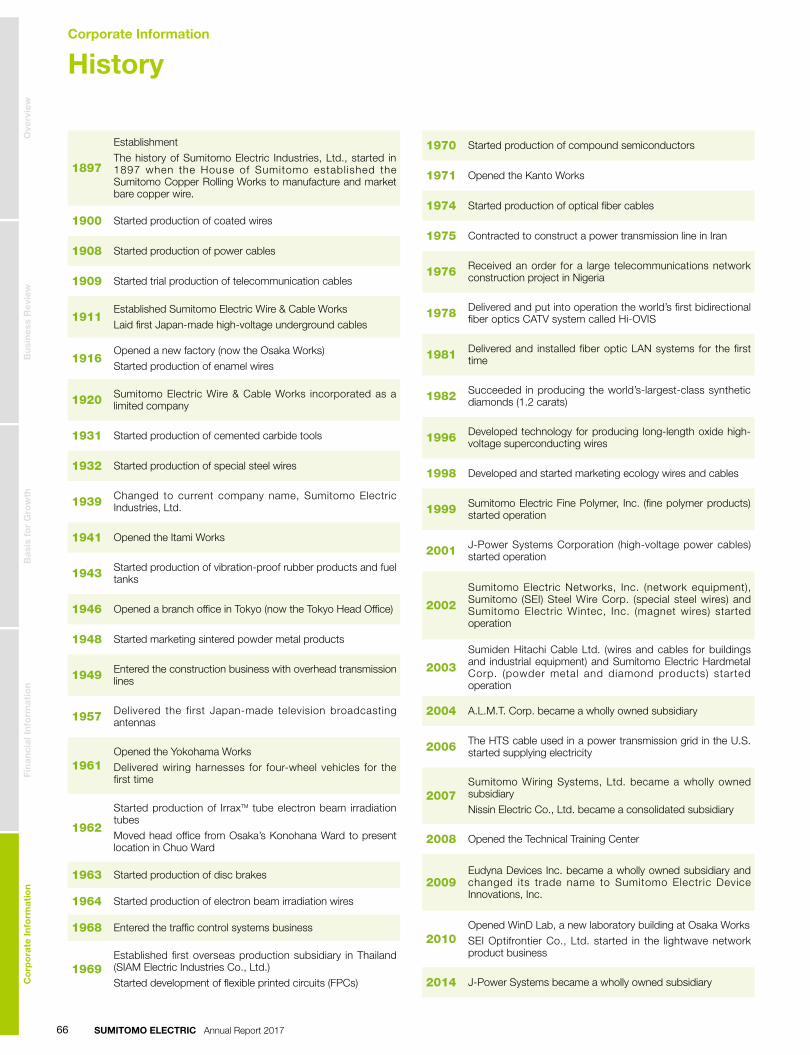
HistoryCorporate Information
1897
Establishment
The history of Sumitomo Electric Industries, Ltd., started in 1897 when the House of Sumitomo establ ished the Sumitomo Copper Rolling Works to manufacture and market bare copper wire.
1900 Started production of coated wires
1908 Started production of power cables
1909 Started trial production of telecommunication cables
1911Established Sumitomo Electric Wire & Cable Works
Laid first Japan-made high-voltage underground cables
1916Opened a new factory (now the Osaka Works)
Started production of enamel wires
1920 Sumitomo Electric Wire & Cable Works incorporated as a limited company
1931 Started production of cemented carbide tools
1932 Started production of special steel wires
1939 Changed to current company name, Sumitomo Electric Industries, Ltd.
1941 Opened the Itami Works
1943 Started production of vibration-proof rubber products and fuel tanks
1946 Opened a branch office in Tokyo (now the Tokyo Head Office)
1948 Started marketing sintered powder metal products
1949 Entered the construction business with overhead transmission lines
1957 Delivered the first Japan-made television broadcasting antennas
1961Opened the Yokohama Works
Delivered wiring harnesses for four-wheel vehicles for the first time
1962
Started production of IrraxTM tube electron beam irradiation tubes
Moved head office from Osaka’s Konohana Ward to present location in Chuo Ward
1963 Started production of disc brakes
1964 Started production of electron beam irradiation wires
1968 Entered the traffic control systems business
1969Established first overseas production subsidiary in Thailand (SIAM Electric Industries Co., Ltd.)
Started development of flexible printed circuits (FPCs)
1970 Started production of compound semiconductors
1971 Opened the Kanto Works
1974 Started production of optical fiber cables
1975 Contracted to construct a power transmission line in Iran
1976 Received an order for a large telecommunications network construction project in Nigeria
1978 Delivered and put into operation the world’s first bidirectional fiber optics CATV system called Hi-OVIS
1981 Delivered and installed fiber optic LAN systems for the first time
1982 Succeeded in producing the world’s-largest-class synthetic diamonds (1.2 carats)
1996 Developed technology for producing long-length oxide high-voltage superconducting wires
1998 Developed and started marketing ecology wires and cables
1999 Sumitomo Electric Fine Polymer, Inc. (fine polymer products) started operation
2001 J-Power Systems Corporation (high-voltage power cables) started operation
2002
Sumitomo Electric Networks, Inc. (network equipment), Sumitomo (SEI) Steel Wire Corp. (special steel wires) and Sumitomo Electric Wintec, Inc. (magnet wires) started operation
2003
Sumiden Hitachi Cable Ltd. (wires and cables for buildings and industrial equipment) and Sumitomo Electric Hardmetal Corp. (powder metal and diamond products) started operation
2004 A.L.M.T. Corp. became a wholly owned subsidiary
2006 The HTS cable used in a power transmission grid in the U.S. started supplying electricity
2007Sumitomo Wiring Systems, Ltd. became a wholly owned subsidiary
Nissin Electric Co., Ltd. became a consolidated subsidiary
2008 Opened the Technical Training Center
2009Eudyna Devices Inc. became a wholly owned subsidiary and changed its trade name to Sumitomo Electric Device Innovations, Inc.
2010Opened WinD Lab, a new laboratory building at Osaka Works
SEI Optifrontier Co., Ltd. started in the lightwave network product business
2014 J-Power Systems became a wholly owned subsidiary
Ove
rvie
wB
usi
nes
s R
evie
wB
asis
fo
r G
row
thF
inan
cial
Info
rmat
ion
Co
rpo
rate
Info
rmat
ion
SUMITOMO ELECTRIC Annual Report 201766
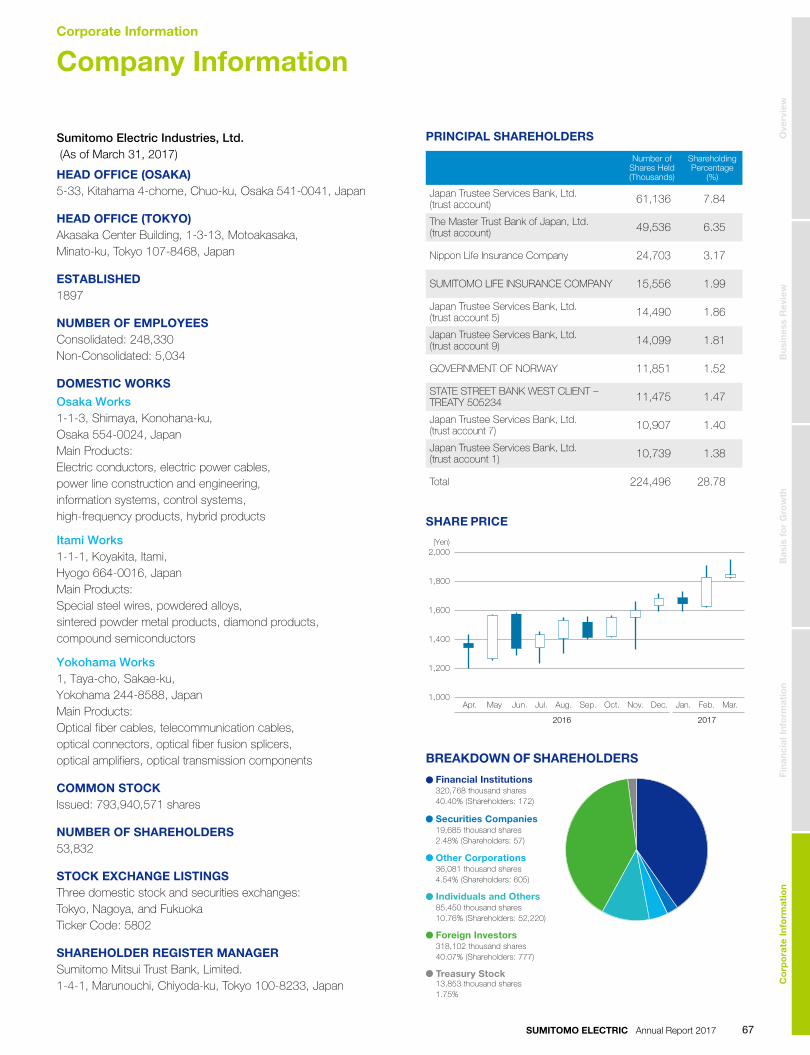
Company InformationCorporate Information
Sumitomo Electric Industries, Ltd. (As of March 31, 2017)
HEAD OFFICE (OSAKA)5-33, Kitahama 4-chome, Chuo-ku, Osaka 541-0041, Japan
HEAD OFFICE (TOKYO)Akasaka Center Building, 1-3-13, Motoakasaka, Minato-ku, Tokyo 107-8468, Japan
ESTABLISHED1897
NUMBER OF EMPLOYEESConsolidated: 248,330Non-Consolidated: 5,034
DOMESTIC WORKS
Osaka Works1-1-3, Shimaya, Konohana-ku, Osaka 554-0024, JapanMain Products:Electric conductors, electric power cables, power line construction and engineering, information systems, control systems, high-frequency products, hybrid products
Itami Works1-1-1, Koyakita, Itami, Hyogo 664-0016, JapanMain Products:Special steel wires, powdered alloys, sintered powder metal products, diamond products, compound semiconductors
Yokohama Works1, Taya-cho, Sakae-ku, Yokohama 244-8588, JapanMain Products:Optical fiber cables, telecommunication cables, optical connectors, optical fiber fusion splicers, optical amplifiers, optical transmission components
COMMON STOCKIssued: 793,940,571 shares
NUMBER OF SHAREHOLDERS53,832
STOCK EXCHANGE LISTINGSThree domestic stock and securities exchanges: Tokyo, Nagoya, and FukuokaTicker Code: 5802
SHAREHOLDER REGISTER MANAGERSumitomo Mitsui Trust Bank, Limited.1-4-1, Marunouchi, Chiyoda-ku, Tokyo 100-8233, Japan
PRINCIPAL SHAREHOLDERS
SHARE PRICE
2,000
1,800
1,600
1,400
1,200
1,000
2016 2017
Apr. May Jun. Jul. Aug. Sep. Oct. Nov. Jan. Feb.Dec. Mar.
(Yen)
BREAKDOWN OF SHAREHOLDERS
Treasury Stock13,853 thousand shares1.75%
Financial Institutions320,768 thousand shares40.40% (Shareholders: 172)
Other Corporations36,081 thousand shares4.54% (Shareholders: 605)
Securities Companies19,685 thousand shares2.48% (Shareholders: 57)
Individuals and Others85,450 thousand shares10.76% (Shareholders: 52,220)
Foreign Investors318,102 thousand shares40.07% (Shareholders: 777)
Number of Shares Held (Thousands)
Shareholding Percentage
(%)
Japan Trustee Services Bank, Ltd.(trust account) 61,136 7.84
The Master Trust Bank of Japan, Ltd.(trust account) 49,536 6.35
Nippon Life Insurance Company 24,703 3.17
SUMITOMO LIFE INSURANCE COMPANY 15,556 1.99
Japan Trustee Services Bank, Ltd.(trust account 5) 14,490 1.86
Japan Trustee Services Bank, Ltd.(trust account 9) 14,099 1.81
GOVERNMENT OF NORWAY 11,851 1.52
STATE STREET BANK WEST CLIENT – TREATY 505234 11,475 1.47
Japan Trustee Services Bank, Ltd.(trust account 7) 10,907 1.40
Japan Trustee Services Bank, Ltd.(trust account 1) 10,739 1.38
Total 224,496 28.78
Ove
rvie
wB
usi
nes
s R
evie
wB
asis
fo
r G
row
thF
inan
cial
Info
rmat
ion
Co
rpo
rate
Info
rmat
ion
SUMITOMO ELECTRIC Annual Report 2017 67
Annual Report2017
Year Ended March 31, 2017
4-5-33, Kitahama, Chuo-ku, Osaka 541-0041, Japan
Tel: +81 (6) 6220-4141
Fax: +81 (6) 6222-3380
http://global-sei.com/